Table of Contents
UNITED STATES
SECURITIES AND EXCHANGE COMMISSION
Washington, D.C. 20549
FORM N-CSR
CERTIFIED SHAREHOLDER REPORT OF REGISTERED MANAGEMENT
INVESTMENT COMPANIES
Investment Company Act file number: 811-22375
PIMCO Equity Series
(Exact name of registrant as specified in charter)
650 Newport Center Drive, Newport Beach, CA 92660
(Address of principal executive office)
Trent W. Walker
Treasurer (Principal Financial & Accounting Officer)
PIMCO Equity Series
650 Newport Center Drive
Newport Beach, CA 92660
(Name and address of agent for service)
Copies to:
Brendan C. Fox
Dechert LLP
1900 K Street, N.W.
Washington, D.C. 20006
Registrant’s telephone number, including area code: (888) 877-4626
Date of fiscal year end: June 30
Date of reporting period: June 30, 2018
Form N-CSR is to be used by management investment companies to file reports with the Commission not later than 10 days after the transmission to stockholders of any report that is required to be transmitted to stockholders under Rule 30e-1 under the Investment Company Act of 1940 (17 CFR 270.30e-1). The Commission may use the information provided on Form N-CSR in its regulatory, disclosure review, inspection, and policymaking roles.
A registrant is required to disclose the information specified by Form N-CSR, and the Commission will make this information public. A registrant is not required to respond to the collection of information contained in Form N-CSR unless the Form displays a currently valid Office of Management and Budget (“OMB”) control number. Please direct comments concerning the accuracy of the information collection burden estimate and any suggestions for reducing the burden to Secretary, Securities and Exchange Commission, 450 Fifth Street, NW, Washington, DC 20549-0609. The OMB has reviewed this collection of information under the clearance requirements of 44 U.S.C. § 3507.
Table of Contents
| Item 1. | Reports to Shareholders. |
The following are copies of the reports transmitted to shareholders pursuant to Rule 30e-1 under the Investment Company Act of 1940, as amended (the “Act”) (17 CFR 270.30e-1).
| • | PIMCO Equity Series Funds |
| • | PIMCO Equity Series RAE Funds |
| • | PIMCO Equity Series RealPath® Blend Funds |
| • | PIMCO RAFI Dynamic Multi-Factor U.S. Equity ETF |
| • | PIMCO RAFI Dynamic Multi-Factor Emerging Markets Equity ETF |
| • | PIMCO RAFI Dynamic Multi-Factor International Equity ETF |
Table of Contents

PIMCO Equity Series®
Annual Report
June 30, 2018
PIMCO Dividend and Income Fund
PIMCO EqS® Long/Short Fund
Table of Contents
| Page | ||||||||
| 2 | ||||||||
| 4 | ||||||||
| 10 | ||||||||
| 12 | ||||||||
| 16 | ||||||||
| 18 | ||||||||
| 19 | ||||||||
| 20 | ||||||||
| 46 | ||||||||
| 67 | ||||||||
| 68 | ||||||||
| 69 | ||||||||
| 70 | ||||||||
| 73 | ||||||||
| Fund | Fund Summary | Schedule of Investments | ||||||
| 6 | 21 | |||||||
| 8 | | 40 | | |||||
This material is authorized for use only when preceded or accompanied by the current PIMCO Equity Series prospectus. The Shareholder Reports for the other series of the PIMCO Equity Series are printed separately.
Table of Contents
Dear Shareholder,
Following is the PIMCO Equity Series Annual Report, which covers the 12-month reporting period ended June 30, 2018. On the subsequent pages you will find specific details regarding investment results and a discussion of factors that most affected performance over the reporting period.
For the 12-month reporting period ended June 30, 2018
The U.S. economy continued to expand during the reporting period. Looking back, U.S. gross domestic product (GDP) expanded at a revised annual pace of 2.8% and 2.3% during the third and fourth quarters of 2017, respectively. First-quarter 2018 GDP then moderated to a revised annual pace of 2.2%. The Commerce Department’s initial reading — released after the reporting period had ended — showed that second-quarter 2018 GDP grew at an annual pace of 4.1%.
The Federal Reserve (Fed) continued to normalize monetary policy during the reporting period. After raising interest rates in March and June 2017, the Fed again raised rates in December, moving the federal funds rate up to a range between 1.25% and 1.50%. And, in October 2017, the Fed started to reduce its balance sheet. At its March 2018 meeting, the Fed again increased rates to a range between 1.50% and 1.75%. Finally, at its meeting that concluded on June 13, 2018, the Fed raised rates to a range between 1.75% and 2.00%.
Economic activity outside the U.S. initially accelerated during the reporting period, but then moderated somewhat as the reporting period progressed. Against this backdrop, the European Central Bank (ECB) and Bank of Japan largely maintained their highly accommodative monetary policies. Other central banks took a more hawkish stance. In November 2017, the Bank of England instituted its first rate hike since 2007, and the Bank of Canada raised rates twice during the reporting period. Meanwhile, in June 2018, the ECB indicated that it plans to end its quantitative easing program by the end of the year, but it did not expect to raise interest rates “at least through the summer of 2019.”
The U.S. Treasury yield curve flattened during the reporting period, as short-term rates moved up more than their longer-term counterparts. The increase in rates at the short end of the yield curve was mostly due to Fed interest rate hikes. The yield on the benchmark 10-year U.S. Treasury note was 2.85% at the end of the reporting period, up from 2.31% on June 30, 2017. U.S. Treasuries, as measured by the Bloomberg Barclays U.S. Treasury Index, returned -0.65% over the 12 months ended June 30, 2018. Meanwhile, the Bloomberg Barclays U.S. Aggregate Bond Index, a widely used index of U.S. investment grade bonds, returned -0.40% over the period. Riskier fixed income asset classes, including high yield corporate bonds and emerging market debt, generated mixed results versus the broad U.S. market. The ICE BofAML U.S. High Yield Index gained 2.53% over the reporting period, whereas emerging market external debt, as represented by the JPMorgan Emerging Markets Bond Index (EMBI) Global, returned -2.45% over the reporting period. Emerging market local bonds, as represented by the JPMorgan Government Bond Index-Emerging Markets Global Diversified Index (Unhedged), returned -2.33% over the period.
Global equities generally rose over the first seven months of the period. This rally was driven by a number of factors, including improving global growth, corporate profits that often exceeded expectations and, in the U.S., optimism surrounding the passage of a tax reform bill in December 2017. In the U.S., a portion of those gains were given back in February and March 2018. This was partially due to concerns over less accommodative central bank policies and fears of a trade war. However, U.S. equites then rallied over the last three months of the reporting period. All told, U.S. equities, as represented by the S&P 500 Index, returned 14.37% during the reporting period. Emerging market equities, as measured by the MSCI Emerging Markets Index, returned 8.20% over the period, whereas global equities, as represented by the MSCI World Index, returned 11.09%. Elsewhere, Japanese equities, as represented by the Nikkei 225 Index (in JPY), returned 13.45% over the reporting period and European equities, as represented by the MSCI Europe Index (in EUR), returned 2.85%.
Commodity prices fluctuated but generally moved higher during the 12 months ended June 30, 2018. When the reporting period began, crude oil was approximately $46 a barrel. By the end of the period, it was roughly $74 a
| 2 | PIMCO EQUITY SERIES |
Table of Contents
barrel. This ascent was driven in part by planned and observed production cuts by OPEC and the collapse in Venezuelan oil production, as well as global growth maintaining demand. Elsewhere, gold and copper prices moved modestly higher over the reporting period.
Finally, during the reporting period, there were periods of volatility in the foreign exchange markets, due in part to signs of improving global growth, decoupling central bank policies, and a number of geopolitical events. The U.S. dollar generally weakened against other major currencies over the reporting period. For example, the U.S. dollar returned -2.26%, -1.40% and -1.45% versus the euro, British pound and Japanese yen, respectively, during the 12 months ended June 30, 2018.
Thank you for the assets you have placed with us. We deeply value your trust, and will continue to work diligently to meet your broad investment needs. For any questions regarding the funds, please contact your account manager or financial adviser, or call one of our shareholder associates at 888.87.PIMCO. We also invite you to visit our website at pimco.com to learn more about our global viewpoints.
 | Sincerely,
Brent R. Harris Chairman of the Board
August 23, 2018 |

Past performance is no guarantee of future results. Unless otherwise noted, index returns reflect the reinvestment of income distributions and capital gains, if any, but do not reflect fees, brokerage commissions or other expenses of investing. It is not possible to invest directly in an unmanaged index.
| ANNUAL REPORT | JUNE 30, 2018 | 3 |
Table of Contents
Important Information About the Funds
PIMCO Equity Series (the “Trust”) is an open-end management investment company that includes PIMCO Dividend and Income Fund and PIMCO EqS® Long/Short Fund (each, a “Fund” and collectively, the “Funds”).
We believe that equity funds have an important role to play in a well-diversified investment portfolio. It is important to note, however, that equity funds are subject to notable risks. Among other things, equity and equity-related securities may decline in value due to both real and perceived general market, economic, and industry conditions.
The values of equity securities, such as common stocks and preferred securities, have historically risen and fallen in periodic cycles and may decline due to general market conditions, which are not specifically related to a particular company, such as real or perceived adverse economic conditions, changes in the general outlook for corporate earnings, changes in interest or currency rates or adverse investor sentiment generally. Equity securities may also decline due to factors that affect a particular industry or industries, such as labor shortages, increased production costs and competitive conditions within an industry. In addition, the value of an equity security may decline for a number of reasons that directly relate to the issuer, such as management performance, financial leverage and reduced demand for the issuer’s goods or services, as well as the historical and prospective earnings of the issuer and the value of its assets. Different types of equity securities may react differently to these developments and a change in the financial condition of a single issuer may affect securities markets as a whole.
During a general downturn in the securities markets, multiple asset classes, including equity securities, may decline in value simultaneously. The market price of equity securities owned by a Fund may go up or down, sometimes rapidly or unpredictably. Equity securities generally have greater price volatility than fixed income securities and common stocks generally have the greatest appreciation and depreciation potential of all equity securities.
The Funds may be subject to various risks as described in each Fund’s prospectus and in the Principal Risks in the Notes to Financial Statements.
The geographical classification of foreign (non-U.S.) securities in this report are classified by the country of incorporation of a holding. In
certain instances, a security’s country of incorporation may be different from its country of economic exposure. The United States presidential administration’s enforcement of tariffs on goods from other countries, with a focus on China, has contributed to international trade tensions and may impact portfolio securities.
On each individual Fund Summary page in this Shareholder Report, the Average Annual Total Return table and Cumulative Returns chart measure performance assuming that any dividend and capital gain distributions were reinvested. Returns do not reflect the deduction of taxes that a shareholder would pay on (i) Fund distributions or (ii) the redemption of Fund shares. The Cumulative Returns chart and Average Annual Total Return table reflect any sales load that would have applied at the time of purchase or any Contingent Deferred Sales Charge (“CDSC”) that would have applied if a full redemption occurred on the last business day of the period shown in the Cumulative Returns chart. Class A shares are subject to an initial sales charge. A CDSC may be imposed in certain circumstances on Class A shares that are purchased without an initial sales charge and then redeemed during the first 12 months after purchase. Class C shares are subject to a 1% CDSC, which may apply in the first year. The Cumulative Returns chart reflects only Institutional Class performance. Performance may vary by share class based on each class’s expense ratios. Performance shown is net of fees and expenses. The minimum initial investment amount for Institutional Class, I-2 and I-3 shares is $1,000,000. The minimum initial investment amount for Class A and Class C shares is $1,000. Each Fund measures its performance against at least one broad-based securities market index (“benchmark index”). The benchmark index does not take into account fees, expenses, or taxes. A Fund’s past performance, before and after taxes, is not necessarily an indication of how the Fund will perform in the future. There is no assurance that any Fund, including any Fund that has experienced high or unusual performance for one or more periods, will experience similar levels of performance in the future. High performance is defined as a significant increase in either 1) a Fund’s total return in excess of that of the Fund’s benchmark between reporting periods or 2) a Fund’s total return in excess of the Fund’s historical returns between reporting periods. Unusual performance is defined as a significant change in a Fund’s performance as compared to one or more previous reporting periods.
| 4 | PIMCO EQUITY SERIES |
Table of Contents
The following table discloses the inception dates of each Fund and its respective share classes along with each Fund’s diversification status as of period end:
| Fund Name | Fund Inception | Institutional Class | I-2* | I-3 | Class A** | Class C | Diversification Status | |||||||||||||||||||||
PIMCO Dividend and Income Fund | 12/14/11 | 12/14/11 | 12/14/11 | — | 12/14/11 | 12/14/11 | Diversified | |||||||||||||||||||||
PIMCO EqS® Long/Short Fund | 04/20/12 | 04/20/12 | 04/30/12 | 04/27/2018 | 04/30/12 | 04/30/12 | Non-diversified | |||||||||||||||||||||
| * | On February 13, 2018, the Board approved a proposal to change the name of Class P for all Funds of the Trust that offer such class to I-2. The name change occurred on April 27, 2018. |
| ** | Effective March 23, 2018, Class D shares were automatically converted into Class A shares of the same Fund. |
An investment in a Fund is not a bank deposit and is not guaranteed or insured by the Federal Deposit Insurance Corporation (“FDIC”) or any other government agency. It is possible to lose money on investments in a Fund.
The Trustees are responsible generally for overseeing the management of the Trust. The Trustees authorize the Trust to enter into service agreements with the Adviser, the Distributor, the Administrator and other service providers in order to provide, and in some cases authorize service providers to procure through other parties, necessary or desirable services on behalf of the Trust and the Funds. Shareholders are not parties to or third-party beneficiaries of such service agreements. Neither a Fund’s prospectus nor a Fund’s summary prospectus, the Trust’s Statement of Additional Information (“SAI”), any contracts filed as exhibits to the Trust’s registration statement, nor any other communications, disclosure documents or regulatory filings (including this report) from or on behalf of the Trust or a Fund creates a contract between or among any shareholder of a Fund, on the one hand, and the Trust, a Fund, a service provider to the Trust or a Fund, and/or the Trustees or officers of the Trust, on the other hand. The Trustees (or the Trust and its officers, service providers or other delegates acting under authority of the Trustees) may amend the most recent prospectus or use a new prospectus, summary prospectus or SAI with respect to a Fund or the Trust, and/or amend, file and/or issue any other communications, disclosure documents or regulatory filings, and may amend or enter into any contracts to which the Trust or a Fund is a party, and interpret the investment objective(s), policies, restrictions and contractual provisions applicable to any Fund, without shareholder input or approval, except in circumstances in which shareholder approval is specifically required by law (such as changes to fundamental investment policies) or where a shareholder approval requirement is specifically disclosed in the Trust’s then-current prospectus or SAI.
PIMCO has adopted written proxy voting policies and procedures (“Proxy Policy”) as required by Rule 206(4)-6 under the Investment Advisers Act of 1940, as amended. The Proxy Policy has been adopted by the Trust as the policies and procedures that PIMCO will use when voting proxies on behalf of a Fund. A description of the policies and procedures that PIMCO uses to vote proxies relating to portfolio securities of a Fund, and information about how the Fund voted proxies relating to portfolio securities held during the most recent twelve-month period ended June 30th, are available without charge, upon request, by calling the Trust at (888) 87-PIMCO, on the Fund’s website at www.pimco.com, and on the Securities and Exchange Commission’s (“SEC”) website at www.sec.gov.
The Trust files a complete schedule of each Fund’s holdings with the SEC for the first and third quarters of each fiscal year on Form N-Q. A copy of a Fund’s Form N-Q is available on the SEC’s website at www.sec.gov and may be reviewed and copied at the SEC’s Public Reference Room in Washington, D.C. A Fund’s Form N-Q is also available without charge, upon request, by calling the Trust at (888) 87-PIMCO and on the Fund’s website at www.pimco.com. Information on the operation of the Public Reference Room may be obtained by calling 1-800-SEC-0330.
The SEC adopted a rule that generally allows funds to deliver shareholder reports to investors by providing access to such reports online free of charge and by mailing a notice that the report is electronically available. Pursuant to the rule, investors may still elect to receive a complete shareholder report in the mail. PIMCO is evaluating how to make the electronic delivery option available to shareholders in the future.
| ANNUAL REPORT | JUNE 30, 2018 | 5 |
Table of Contents
PIMCO Dividend and Income Fund
Cumulative Returns Through June 30, 2018
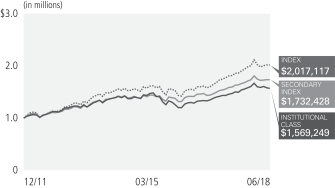
$1,000,000 invested at the end of the month when the Fund’s Institutional Class commenced operations.
Investment Objective and Strategy Overview
PIMCO Dividend and Income Fund seeks to provide current income that exceeds the average yield on global stocks, and as a secondary objective, seeks to provide long-term capital appreciation, by investing under normal circumstances at least 80% of its assets in a diversified portfolio of income-producing investments, and will typically invest between 60-80% of its assets in equity and equity-related securities (such portion of the Fund’s portfolio, the “Equity Sleeve”) providing exposure to a portfolio of stocks (the “RAE Income Global Portfolio”) through investment in the securities that comprise the RAE Income Global Portfolio. Equity-related securities include securities having an equity component (e.g., hybrids, bank capital) and equity derivatives. With respect to investments in equity securities, there is no limitation on the market capitalization range of the issuers in which the Fund may invest. The stocks for the Equity Sleeve are selected by the Fund’s sub-adviser, Research Affiliates, LLC, from a broad universe of global equities. Fund strategies may change from time to time. Please refer to the Fund’s current prospectus for more information regarding the Fund’s strategy.
| Average Annual Total Return for the period ended June 30, 2018 | ||||||||||||||
| 1 Year | 5 Year | Fund Inception (12/14/11) | ||||||||||||
 | PIMCO Dividend and Income Fund Institutional Class | 6.89% | 5.35% | 7.46% | ||||||||||
| PIMCO Dividend and Income Fund I-2 | 6.80% | 5.25% | 7.39% | |||||||||||
| PIMCO Dividend and Income Fund Class A | 6.60% | 4.98% | 7.10% | |||||||||||
| PIMCO Dividend and Income Fund Class A (adjusted) | 0.78% | 3.79% | 6.19% | |||||||||||
| PIMCO Dividend and Income Fund Class C | 5.72% | 4.18% | 6.29% | |||||||||||
| PIMCO Dividend and Income Fund Class C (adjusted) | 4.72% | 4.18% | 6.29% | |||||||||||
 | MSCI World Index± | 11.09% | 9.94% | 11.96% | ||||||||||
 | 75% MSCI World Index/25% Bloomberg Barclays Global Aggregate USD Unhedged±± | 8.64% | 7.87% | 9.27% | ||||||||||
All Fund returns are net of fees and expenses.
± The MSCI World Index is a free float-adjusted market capitalization weighted index that is designed to measure the equity market performance of developed markets. The MSCI World Index consists of 23 developed market country indices.
±± The benchmark is a blend of 75% MSCI World Index/25% Bloomberg Barclays Global Aggregate USD Unhedged Index. The MSCI World Index is a free float-adjusted market capitalization weighted index that is designed to measure the equity market performance of developed markets. The MSCI World Index consists of 23 developed market country indices. Bloomberg Barclays Global Aggregate USD Unhedged Index provides a broad-based measure of the global investment-grade fixed income markets. The three major components of this index are the U.S. Aggregate, the Pan-European Aggregate, and the Asian-Pacific Aggregate Indices. The index also includes Eurodollar and Euro-Yen corporate bonds, Canadian Government securities, and USD investment grade 144A securities.
It is not possible to invest directly in an unmanaged index.
Performance quoted represents past performance. Past performance is not a guarantee or a reliable indicator of future results. Current performance may be lower or higher than performance shown. Investment return and the principal value of an investment will fluctuate. Shares may be worth more or less than original cost when redeemed. Returns shown do not reflect the deduction of taxes that a shareholder would pay on fund distributions or the redemption of fund shares. Differences in the Fund’s performance versus the index and related attribution information with respect to particular categories of securities or individual positions may be attributable, in part, to differences in the pricing methodologies used by the Fund and the index. The adjusted returns take into account the maximum sales charge of 5.50% on Class A shares and 1.00% CDSC on Class C shares. For performance data current to the most recent month-end, visit www.pimco.com or via (888) 87-PIMCO.
The Fund’s total annual operating expense ratio in effect as of period end, was 0.81% for the Institutional Class shares, 0.91% for the I-2 shares, 1.16% for the Class A shares, and 1.91% for the Class C shares. Details regarding any changes to the Fund’s operating expenses, subsequent to period end, can be found in the Fund’s current prospectus, as supplemented.
| 6 | PIMCO EQUITY SERIES |
Table of Contents
| Institutional Class - PQIIX | I-2 - PQIPX | Class A - PQIZX | Class C - PQICX |
Geographic Breakdown as of 06/30/20181§
United States | 55.4% | |||||||
Japan | 9.8% | |||||||
United Kingdom | 8.0% | |||||||
France | 4.7% | |||||||
Germany | 3.6% | |||||||
Australia | 2.7% | |||||||
Netherlands | 2.1% | |||||||
Spain | 2.0% | |||||||
Switzerland | 2.0% | |||||||
Canada | 1.4% | |||||||
Italy | 1.3% | |||||||
Cayman Islands | 1.1% | |||||||
Other | 5.1% |
Sector Breakdown as of 06/30/20181§
Financials | 21.0% | |||||||
Energy | 8.7% | |||||||
Industrials | 8.4% | |||||||
U.S. Treasury Obligations | 8.3% | |||||||
Consumer Discretionary | 7.6% | |||||||
Health Care | 7.2% | |||||||
Utilities | 5.7% | |||||||
Information Technology | 5.1% | |||||||
Telecommunication Services | 4.9% | |||||||
Consumer Staples | 4.5% | |||||||
Asset-Backed Securities | 4.3% | |||||||
Non-Agency Mortgage-Backed Securities | 3.3% | |||||||
U.S. Government Agencies | 3.3% | |||||||
Materials | 3.1% | |||||||
Other | 3.9% |
1 % of Investments, at value.
§ Geographic and Sector Breakdown and % of Investments exclude securities sold short, financial derivative instruments and short-term instruments, if any.
Fund Insights
The following affected performance during the reporting period:
| » | Overweight exposure to, and security selection in, the energy sector contributed to relative returns, as the sector and the Fund’s holdings outperformed the benchmark index. |
| » | Overweight exposure to, and security selection in, the materials sector contributed to relative returns, as the sector and the Fund’s holdings outperformed the benchmark index. |
| » | Holdings of non-agency mortgage-backed securities contributed to absolute returns, as the securities appreciated. |
| » | Equity holdings in Caesars Entertainment Corporation contributed to absolute returns, as the securities appreciated. After buying Caesar’s distressed debt at a discount, PIMCO received cash and securities, including dividend-paying stocks after the company was restructured. |
| » | Underweight exposure to, and security selection in, the information technology sector detracted from relative returns, as the sector outperformed the benchmark index, and the Fund’s holdings underperformed the benchmark index. |
| » | Overweight exposure to, and security selection in, the financials sector detracted from relative returns, as the sector and the Fund’s holdings underperformed the benchmark index. |
| » | U.S. interest rate strategies detracted from performance, as U.S. Treasury yields increased. |
| ANNUAL REPORT | JUNE 30, 2018 | 7 |
Table of Contents
Cumulative Returns Through June 30, 2018
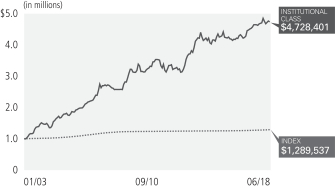
$1,000,000 invested at the end of the month when the Fund’s Institutional Class commenced operations.
Investment Objective and Strategy Overview
PIMCO EqS® Long/Short Fund seeks long-term capital appreciation by investing under normal circumstances in long and short positions of equity and equity-related securities, including common and preferred securities (and securities convertible into, or that PIMCO expects to be exchanged for, common or preferred securities), utilizing a fundamental investing style that integrates bottom-up and top-down research. The Fund will normally invest a substantial portion of its assets in equity and equity-related securities. Equity-related securities include securities having an equity component (e.g., hybrids, bank capital) and equity derivatives. With respect to investments in equity securities, there is no limitation on the market capitalization range of the issuers in which the Fund may invest. The Fund may also invest in fixed income securities of varying maturities, cash and cash equivalents. Fund strategies may change from time to time. Please refer to the Fund’s current prospectus for more information regarding the Fund’s strategy.
| Average Annual Total Return for the period ended June 30, 2018* | ||||||||||||||||||
| 1 Year | 5 Year | 10 Year | Fund Inception (01/01/03) | |||||||||||||||
| PIMCO EqS® Long/Short Fund Institutional Class | 2.03% | 4.98% | 5.91% | 10.64% | |||||||||||||
| PIMCO EqS® Long/Short Fund I-2 | 1.96% | 4.88% | 5.85% | 10.60% | ||||||||||||||
| PIMCO EqS® Long/Short Fund I-3 | 1.90% | 4.82% | 5.80% | 10.56% | ||||||||||||||
| PIMCO EqS® Long/Short Fund Class A | 1.64% | 4.60% | 5.67% | 10.47% | ||||||||||||||
| PIMCO EqS® Long/Short Fund Class A (adjusted) | (3.94)% | 3.43% | 5.07% | 10.07% | ||||||||||||||
| PIMCO EqS® Long/Short Fund Class C | 0.99% | 3.83% | 5.19% | 10.15% | ||||||||||||||
| PIMCO EqS® Long/Short Fund Class C (adjusted) | 0.03% | 3.83% | 5.19% | 10.15% | ||||||||||||||
| 3 Month USD LIBOR Index± | 1.67% | 0.71% | 0.73% | 1.66% | |||||||||||||
All Fund returns are net of fees and expenses.
± The 3 Month USD LIBOR (London Interbank Offered Rate) Index is an average interest rate, determined by the ICE Benchmark Administration, that banks charge one another for the use of short-term money (3 months) in England’s Eurodollar market.
It is not possible to invest directly in an unmanaged index.
* For periods prior to April 20, 2012, the Fund’s performance reflects the performance when the Fund was a partnership, net of actual fees and expenses charged to individual partnership accounts in the aggregate. If the performance had been restated to reflect the applicable fees and expenses of each share class, the performance may have been higher or lower. The Fund began operations as a partnership on January 1, 2003 and, on April 20, 2012, was reorganized into a newly-formed fund that was registered as an investment company under the Investment Company Act of 1940. Prior to the reorganization, the Fund had an investment objective, investment strategies, investment guidelines, and restrictions that were substantially similar to those currently applicable to the Fund; however, the Fund was not registered as an investment company under the Investment Company Act of 1940 and was not subject to its requirements or requirements imposed by the Internal Revenue Code of 1986 which, if applicable, may have adversely affected its performance. For periods prior to the inception date of each of the I-2, I-3, Class A and C shares’ performance is based on the performance of the Institutional Class shares of the Fund. The performance of each class of shares will differ as a result of the different levels of fees and expenses applicable to each class of shares.
Performance quoted represents past performance. Past performance is not a guarantee or a reliable indicator of future results. Current performance may be lower or higher than performance shown. Investment return and the principal value of an investment will fluctuate. Shares may be worth more or less than original cost when redeemed. Returns shown do not reflect the deduction of taxes that a shareholder would pay on fund distributions or the redemption of fund shares. Differences in the Fund’s performance versus the index and related attribution information with respect to particular categories of securities or individual positions may be attributable, in part, to differences in the pricing methodologies used by the Fund and the index. The adjusted returns take into account the maximum sales charge of 5.50% on Class A shares and 1.00% CDSC on Class C shares. For performance data current to the most recent month-end, visit www.pimco.com or via (888) 87-PIMCO.
The Fund’s total annual operating expense ratio in effect as of period end, were 1.87% for the Institutional Class shares, 1.97% for the I-2 shares, 2.07% for the I-3 shares, 2.22% for the Class A shares, and 2.97% for the Class C shares. Details regarding any changes to the Fund’s operating expenses, subsequent to period end, can be found in the Fund’s current prospectus, as supplemented.
| 8 | PIMCO EQUITY SERIES |
Table of Contents
| Institutional Class - PMHIX | I-2 - PMHBX | Class A - PMHAX | I-3 - PMHNX | Class C - PMHCX |
Top 10 Long Exposure Holdings as of 06/30/20181§
Norfolk Southern Corp. | 5.8 | % | ||||||
Union Pacific Corp. | 5.5 | % | ||||||
Berkshire Hathaway, Inc. ‘B’ | 4.7 | % | ||||||
SPDR S&P Oil & Gas Exploration & Production ETF | 4.0 | % | ||||||
SPDR S&P Regional Banking ETF | 3.9 | % | ||||||
ONEOK, Inc. | 3.6 | % | ||||||
JPMorgan Chase & Co. | 3.3 | % | ||||||
Samsung Electronics Co. Ltd. | 3.1 | % | ||||||
Las Vegas Sands Corp. | 3.1 | % | ||||||
Deutsche Boerse AG | 3.0 | % |
Long Exposure Sector Breakdown as of 06/30/20181§
Financials | 21.1 | % | ||||||
Energy | 16.5 | % | ||||||
Health Care | 14.9 | % | ||||||
Consumer Discretionary | 14.3 | % | ||||||
Industrials | 14.1 | % | ||||||
Information Technology | 10.9 | % |
Top 10 Short Exposure Holdings as of 06/30/20181§
iShares MSCI Emerging Markets ETF | (2.2 | )% | ||||||
Clorox Co. | (2.1 | )% | ||||||
Brink’s Co. | (1.8 | )% | ||||||
Affiliated Managers Group, Inc. | (1.6 | )% | ||||||
Amgen, Inc. | (1.5 | )% | ||||||
Iron Mountain, Inc. | (1.4 | )% | ||||||
Walmart, Inc. | (1.4 | )% | ||||||
TransCanada Corp. | (1.4 | )% | ||||||
Franklin Resources, Inc. | (1.3 | )% | ||||||
T Rowe Price Group, Inc. | (1.3 | )% |
Short Exposure Sector Breakdown as of 06/30/20181§
Financials | (10.5 | )% | ||||||
Industrials | (6.9 | )% | ||||||
Consumer Discretionary | (5.5 | )% | ||||||
Consumer Staples | (4.2 | )% | ||||||
Health Care | (3.6 | )% | ||||||
Energy | (3.4 | )% | ||||||
Real Estate | (1.4 | )% | ||||||
Information Technology | (1.3 | )% |
1 % of net exposure (Investments, at value net Securities Sold Short). Financial derivative instruments and short-term instruments are not taken into consideration.
§ Top 10 Holdings, Sector Breakdown and % of Investments exclude financial derivative instruments and short-term instruments, if any.
Fund Insights
The following affected performance during the reporting period:
| » | The Fund’s long position in ONEOK, Inc. contributed to absolute returns, as the price of the security rose. |
| » | The Fund’s long position in SPDR S&P Oil & Gas Exploration and Production ETF contributed to absolute returns, as the price of the security rose. |
| » | The Fund’s long position in Union Pacific Corporation contributed to absolute returns, as the price of the security rose. |
| » | The Fund’s short equity positions detracted from absolute returns, as the prices of these securities generally rose. |
| » | The Fund’s long position in Vulcan Materials Company detracted from absolute returns, as the price of the security fell. |
| » | The Fund’s long position in Newell Brands Inc. detracted from absolute returns, as the price of the security fell. |
| ANNUAL REPORT | JUNE 30, 2018 | 9 |
Table of Contents
Example
As a shareholder of a Fund, you incur two types of costs: (1) transaction costs, including sales charges (loads) on purchase payments and exchange fees and (2) ongoing costs, including management fees, distribution and/or service (12b-1) fees, and other Fund expenses. The Example is intended to help you understand your ongoing costs (in dollars) of investing in a Fund and to compare these costs with the ongoing costs of investing in other mutual funds.
The Example is based on an investment of $1,000 invested at the beginning of the period and held for the entire period indicated, which for all Funds and share classes is from January 1, 2018 to June 30, 2018 unless noted otherwise in the table and footnotes below.
Actual Expenses
The information in the table under the heading “Actual” provides information about actual account values and actual expenses. You may use this information, together with the amount you invested, to estimate the expenses that you paid over the period. Simply divide your account value by $1,000 (for example, an $8,600 account value divided by $1,000 = 8.60), then multiply the result by the number in the appropriate row for your share class, in the column entitled “Expenses Paid During Period” to estimate the expenses you paid on your account during this period.
Hypothetical Example for Comparison Purposes
The information in the table under the heading “Hypothetical (5% return before expenses)” provides information about hypothetical account values and hypothetical expenses based on a Fund’s actual expense ratio and an assumed rate of return of 5% per year before expenses, which is not the Fund’s actual return. The hypothetical account values and expenses may not be used to estimate the actual ending account balance or expenses you paid for the period. You may use this information to compare the ongoing costs of investing in a Fund and other funds. To do so, compare this 5% hypothetical example with the 5% hypothetical examples that appear in the shareholder reports of the other funds.
Please note that the expenses shown in the table are meant to highlight your ongoing costs only and do not reflect any transactional costs, such as sales charges (loads) on purchase payments and exchange fees. Therefore, the information under the heading “Hypothetical (5% return before expenses)” is useful in comparing ongoing costs only, and will not help you determine the relative total costs of owning different funds. In addition, if these transactional costs were included, your costs would have been higher.
Expense ratios may vary from period to period because of various factors such as an increase in expenses that are not covered by the management fees, such as fees and expenses of the independent trustees and their counsel, extraordinary expenses and interest expense.
| Actual | Hypothetical (5% return before expenses) | |||||||||||||||||||||||||||||||||||||||
| Beginning Account Value (01/01/18) | Ending Account Value (06/30/18) | Expenses Paid During Period* | Beginning Account Value (01/01/18) | Ending Account Value (06/30/18) | Expenses Paid During Period* | Net Annualized Expense Ratio** | ||||||||||||||||||||||||||||||||||
PIMCO Dividend and Income Fund | ||||||||||||||||||||||||||||||||||||||||
| Institutional Class | $ | 1,000.00 | $ | 978.00 | $ | 4.22 | $ | 1,000.00 | $ | 1,020.64 | $ | 4.31 | 0.86 | |||||||||||||||||||||||||||
| I-2 | 1,000.00 | 977.90 | 4.71 | 1,000.00 | 1,020.14 | 4.81 | 0.96 | |||||||||||||||||||||||||||||||||
| Class A | 1,000.00 | 977.00 | 5.93 | 1,000.00 | 1,018.90 | 6.06 | 1.21 | |||||||||||||||||||||||||||||||||
| Class C | 1,000.00 | 973.00 | 9.64 | 1,000.00 | 1,015.16 | 9.84 | 1.97 | |||||||||||||||||||||||||||||||||
PIMCO EqS® Long/Short Fund | ||||||||||||||||||||||||||||||||||||||||
| Institutional Class | $ | 1,000.00 | $ | 1,006.80 | $ | 10.80 | $ | 1,000.00 | $ | 1,014.21 | $ | 10.84 | 2.17 | |||||||||||||||||||||||||||
| I-2 | 1,000.00 | 1,006.80 | 11.25 | 1,000.00 | 1,013.71 | 11.28 | 2.26 | |||||||||||||||||||||||||||||||||
| I-3(a) | 1,000.00 | 1,001.70 | 4.06 | 1,000.00 | 1,004.57 | 4.07 | 2.35 | |||||||||||||||||||||||||||||||||
| Class A | 1,000.00 | 1,004.30 | 12.52 | 1,000.00 | 1,012.47 | 12.57 | 2.52 | |||||||||||||||||||||||||||||||||
| Class C | 1,000.00 | 1,001.80 | 16.23 | 1,000.00 | 1,008.73 | 16.29 | 3.27 | |||||||||||||||||||||||||||||||||
* Expenses Paid During Period are equal to the net annualized expense ratio for the class, multiplied by the average account value over the period, multiplied by 181/365 (to reflect the one-half year period).
** Net Annualized Expense Ratio is reflective of any applicable contractual fee waivers and/or expense reimbursements or voluntary fee waivers. Details regarding fee waivers, if any, can be found in Note 9, Fees and Expenses, in the Notes to Financial Statements.
(a) The Beginning Account Value is reflective as of 04/27/18 for Actual expense. Expenses paid in the Actual expense section are equal to the Net Annualized Expense Ratio for the Class, multiplied by the average account value over the period, multiplied by 63/365 for the I-3 shares of the PIMCO EqS® Long/Short Fund to reflect the period since the inception date of 04/27/18).
| 10 | PIMCO EQUITY SERIES |
Table of Contents
(THIS PAGE INTENTIONALLY LEFT BLANK)
| ANNUAL REPORT | JUNE 30, 2018 | 11 |
Table of Contents
| Investment Operations | Less Distributions(b) | |||||||||||||||||||||||||||||||||||
| Selected Per Share Data for the Year or Period Ended^: | Net Asset Value Beginning of Year or Period | Net Investment Income (Loss)(a) | Net Realized/ Unrealized Gain (Loss) | Total | From Net Investment Income | From Net Realized Capital Gains | Tax Basis Return of Capital | Total | ||||||||||||||||||||||||||||
PIMCO Dividend and Income Fund | ||||||||||||||||||||||||||||||||||||
| Institutional Class | ||||||||||||||||||||||||||||||||||||
06/30/2018 | $ | 11.09 | $ | 0.36 | $ | 0.41 | $ | 0.77 | $ | (0.32 | ) | $ | 0.00 | $ | 0.00 | $ | (0.32 | ) | ||||||||||||||||||
06/30/2017 | 9.94 | 0.30 | 1.08 | 1.38 | (0.23 | ) | 0.00 | 0.00 | (0.23 | ) | ||||||||||||||||||||||||||
06/30/2016 | 12.29 | 0.43 | (1.58 | ) | (1.15 | ) | (0.44 | ) | (0.76 | ) | 0.00 | (1.20 | ) | |||||||||||||||||||||||
06/30/2015 | 13.12 | 0.47 | (0.50 | ) | (0.03 | ) | (0.46 | ) | (0.34 | ) | 0.00 | (0.80 | ) | |||||||||||||||||||||||
06/30/2014 | 11.60 | 0.44 | 1.54 | 1.98 | (0.46 | ) | 0.00 | 0.00 | (0.46 | ) | ||||||||||||||||||||||||||
| I-2 | ||||||||||||||||||||||||||||||||||||
06/30/2018 | 11.11 | 0.34 | 0.42 | 0.76 | (0.31 | ) | 0.00 | 0.00 | (0.31 | ) | ||||||||||||||||||||||||||
06/30/2017 | 9.96 | 0.30 | 1.07 | 1.37 | (0.22 | ) | 0.00 | 0.00 | (0.22 | ) | ||||||||||||||||||||||||||
06/30/2016 | 12.30 | 0.39 | (1.54 | ) | (1.15 | ) | (0.43 | ) | (0.76 | ) | 0.00 | (1.19 | ) | |||||||||||||||||||||||
06/30/2015 | 13.13 | 0.46 | (0.50 | ) | (0.04 | ) | (0.45 | ) | (0.34 | ) | 0.00 | (0.79 | ) | |||||||||||||||||||||||
06/30/2014 | 11.62 | 0.44 | 1.52 | 1.96 | (0.45 | ) | 0.00 | 0.00 | (0.45 | ) | ||||||||||||||||||||||||||
| Class A | ||||||||||||||||||||||||||||||||||||
06/30/2018 | 11.08 | 0.31 | 0.42 | 0.73 | (0.28 | ) | 0.00 | 0.00 | (0.28 | ) | ||||||||||||||||||||||||||
06/30/2017 | 9.94 | 0.27 | 1.07 | 1.34 | (0.20 | ) | 0.00 | 0.00 | (0.20 | ) | ||||||||||||||||||||||||||
06/30/2016 | 12.29 | 0.39 | (1.57 | ) | (1.18 | ) | (0.41 | ) | (0.76 | ) | 0.00 | (1.17 | ) | |||||||||||||||||||||||
06/30/2015 | 13.12 | 0.43 | (0.50 | ) | (0.07 | ) | (0.42 | ) | (0.34 | ) | 0.00 | (0.76 | ) | |||||||||||||||||||||||
06/30/2014 | 11.61 | 0.42 | 1.51 | 1.93 | (0.42 | ) | 0.00 | 0.00 | (0.42 | ) | ||||||||||||||||||||||||||
| Class C | ||||||||||||||||||||||||||||||||||||
06/30/2018 | 11.06 | 0.22 | 0.42 | 0.64 | (0.22 | ) | 0.00 | 0.00 | (0.22 | ) | ||||||||||||||||||||||||||
06/30/2017 | 9.92 | 0.18 | 1.07 | 1.25 | (0.11 | ) | 0.00 | 0.00 | (0.11 | ) | ||||||||||||||||||||||||||
06/30/2016 | 12.27 | 0.31 | (1.57 | ) | (1.26 | ) | (0.33 | ) | (0.76 | ) | 0.00 | (1.09 | ) | |||||||||||||||||||||||
06/30/2015 | 13.10 | 0.34 | (0.51 | ) | (0.17 | ) | (0.32 | ) | (0.34 | ) | 0.00 | (0.66 | ) | |||||||||||||||||||||||
06/30/2014 | 11.59 | 0.33 | 1.51 | 1.84 | (0.33 | ) | 0.00 | 0.00 | (0.33 | ) | ||||||||||||||||||||||||||
PIMCO EqS® Long/Short Fund | ||||||||||||||||||||||||||||||||||||
| Institutional Class | ||||||||||||||||||||||||||||||||||||
06/30/2018 | $ | 12.26 | $ | (0.01 | ) | $ | 0.25 | $ | 0.24 | $ | 0.00 | $ | (0.64 | ) | $ | 0.00 | $ | (0.64 | ) | |||||||||||||||||
06/30/2017 | 11.69 | (0.04 | ) | 1.20 | 1.16 | (0.36 | ) | (0.23 | ) | 0.00 | (0.59 | ) | ||||||||||||||||||||||||
06/30/2016 | 12.07 | (0.17 | ) | (0.07 | ) | (0.24 | ) | 0.00 | (0.14 | ) | 0.00 | (0.14 | ) | |||||||||||||||||||||||
06/30/2015 | 11.92 | 0.02 | 0.18 | 0.20 | 0.00 | (0.05 | ) | 0.00 | (0.05 | ) | ||||||||||||||||||||||||||
06/30/2014 | 11.09 | (0.10 | ) | 1.60 | 1.50 | (0.06 | ) | (0.61 | ) | 0.00 | (0.67 | ) | ||||||||||||||||||||||||
| I-2 | ||||||||||||||||||||||||||||||||||||
06/30/2018 | 12.19 | (0.03 | ) | 0.26 | 0.23 | 0.00 | (0.64 | ) | 0.00 | (0.64 | ) | |||||||||||||||||||||||||
06/30/2017 | 11.63 | (0.05 | ) | 1.19 | 1.14 | (0.35 | ) | (0.23 | ) | 0.00 | (0.58 | ) | ||||||||||||||||||||||||
06/30/2016 | 12.02 | (0.18 | ) | (0.07 | ) | (0.25 | ) | 0.00 | (0.14 | ) | 0.00 | (0.14 | ) | |||||||||||||||||||||||
06/30/2015 | 11.88 | 0.02 | 0.17 | 0.19 | 0.00 | (0.05 | ) | 0.00 | (0.05 | ) | ||||||||||||||||||||||||||
06/30/2014 | 11.08 | (0.08 | ) | 1.56 | 1.48 | (0.07 | ) | (0.61 | ) | 0.00 | (0.68 | ) | ||||||||||||||||||||||||
| I-3 | ||||||||||||||||||||||||||||||||||||
04/27/2018 - 06/30/2018 | 11.76 | 0.01 | 0.01 | 0.02 | 0.00 | 0.00 | 0.00 | 0.00 | ||||||||||||||||||||||||||||
| Class A | ||||||||||||||||||||||||||||||||||||
06/30/2018 | 12.05 | (0.05 | ) | 0.24 | 0.19 | 0.00 | (0.64 | ) | 0.00 | (0.64 | ) | |||||||||||||||||||||||||
06/30/2017 | 11.52 | (0.08 | ) | 1.18 | 1.10 | (0.34 | ) | (0.23 | ) | 0.00 | (0.57 | ) | ||||||||||||||||||||||||
06/30/2016 | 11.94 | (0.21 | ) | (0.07 | ) | (0.28 | ) | 0.00 | (0.14 | ) | 0.00 | (0.14 | ) | |||||||||||||||||||||||
06/30/2015 | 11.83 | (0.02 | ) | 0.18 | 0.16 | 0.00 | (0.05 | ) | 0.00 | (0.05 | ) | |||||||||||||||||||||||||
06/30/2014 | 11.05 | (0.12 | ) | 1.57 | 1.45 | (0.06 | ) | (0.61 | ) | 0.00 | (0.67 | ) | ||||||||||||||||||||||||
| 12 | PIMCO EQUITY SERIES | See Accompanying Notes |
Table of Contents
| Ratios/Supplemental Data | ||||||||||||||||||||||||||||||||||
| Ratios to Average Net Assets | ||||||||||||||||||||||||||||||||||
| Net Asset Value End of Year or Period | Total Return | Net Assets End of Year or Period (000s) | Expenses | Expenses Excluding Waivers | Expenses Excluding Interest Expense and Dividends on Securities Sold Short | Expenses Excluding | Net Investment Income (Loss) | Portfolio Turnover Rate | ||||||||||||||||||||||||||
| $ | 11.54 | 6.89 | % | $ | 23,027 | 0.85 | % | 0.86 | % | 0.80 | % | 0.81 | % | 3.04 | % | 80 | % | |||||||||||||||||
| 11.09 | 14.01 | 23,087 | 0.80 | 0.81 | 0.79 | 0.80 | 2.88 | 93 | ||||||||||||||||||||||||||
| 9.94 | (9.06 | ) | 31,840 | 0.83 | (c) | 1.00 | (c) | 0.83 | (c) | 1.00 | (c) | 4.03 | 114 | |||||||||||||||||||||
| 12.29 | (0.12 | ) | 68,607 | 0.83 | 1.00 | 0.83 | 1.00 | 3.70 | 98 | |||||||||||||||||||||||||
| 13.12 | 17.23 | 90,408 | 0.84 | 1.00 | 0.84 | 1.00 | 3.56 | 79 | ||||||||||||||||||||||||||
| 11.56 | 6.80 | 27,286 | 0.95 | 0.96 | 0.90 | 0.91 | 2.94 | 80 | ||||||||||||||||||||||||||
| 11.11 | 13.86 | 24,731 | 0.90 | 0.91 | 0.89 | 0.90 | 2.79 | 93 | ||||||||||||||||||||||||||
| 9.96 | (9.05 | ) | 34,120 | 0.93 | (c) | 1.10 | (c) | 0.93 | (c) | 1.10 | (c) | 3.53 | 114 | |||||||||||||||||||||
| 12.30 | (0.22 | ) | 169,790 | 0.93 | 1.10 | 0.93 | 1.10 | 3.64 | 98 | |||||||||||||||||||||||||
| 13.13 | 17.05 | 158,122 | 0.94 | 1.10 | 0.94 | 1.10 | 3.53 | 79 | ||||||||||||||||||||||||||
| 11.53 | 6.60 | 138,561 | 1.20 | 1.21 | 1.15 | 1.16 | 2.70 | 80 | ||||||||||||||||||||||||||
| 11.08 | 13.54 | 144,912 | 1.15 | 1.16 | 1.14 | 1.15 | 2.53 | 93 | ||||||||||||||||||||||||||
| 9.94 | (9.38 | ) | 167,857 | 1.18 | (c) | 1.35 | (c) | 1.18 | (c) | 1.35 | (c) | 3.67 | 114 | |||||||||||||||||||||
| 12.29 | (0.49 | ) | 296,317 | 1.18 | 1.35 | 1.18 | 1.35 | 3.39 | 98 | |||||||||||||||||||||||||
| 13.12 | 16.78 | 320,719 | 1.19 | 1.35 | 1.19 | 1.35 | 3.34 | 79 | ||||||||||||||||||||||||||
| 11.48 | 5.72 | 115,183 | 1.95 | 1.96 | 1.90 | 1.91 | 1.91 | 80 | ||||||||||||||||||||||||||
| 11.06 | 12.70 | 140,710 | 1.90 | 1.91 | 1.89 | 1.90 | 1.75 | 93 | ||||||||||||||||||||||||||
| 9.92 | (10.07 | ) | 195,393 | 1.93 | (c) | 2.10 | (c) | 1.93 | (c) | 2.10 | (c) | 2.91 | 114 | |||||||||||||||||||||
| 12.27 | (1.23 | ) | 358,171 | 1.93 | 2.10 | 1.93 | 2.10 | 2.67 | 98 | |||||||||||||||||||||||||
| 13.10 | 15.97 | 353,287 | 1.94 | 2.10 | 1.94 | 2.10 | 2.67 | 79 | ||||||||||||||||||||||||||
| $ | 11.86 | 2.03 | % | $ | 174,777 | 2.05 | % | 2.06 | % | 1.50 | % | 1.51 | % | (0.11 | )% | 276 | % | |||||||||||||||||
| 12.26 | 10.38 | 188,022 | 1.86 | 1.87 | 1.49 | 1.50 | (0.32 | ) | 251 | |||||||||||||||||||||||||
| 11.69 | (2.02 | ) | 243,341 | 2.44 | 2.45 | 1.50 | 1.51 | (1.46 | ) | 672 | ||||||||||||||||||||||||
| 12.07 | 1.74 | 299,808 | 1.91 | 1.92 | 1.49 | 1.50 | 0.20 | 450 | ||||||||||||||||||||||||||
| 11.92 | 13.59 | 545,346 | 2.02 | 2.04 | 1.48 | 1.50 | (0.82 | ) | 522 | |||||||||||||||||||||||||
| 11.78 | 1.96 | 115,469 | 2.15 | 2.16 | 1.60 | 1.61 | (0.22 | ) | 276 | |||||||||||||||||||||||||
| 12.19 | 10.28 | 138,946 | 1.96 | 1.97 | 1.59 | 1.60 | (0.44 | ) | 251 | |||||||||||||||||||||||||
| 11.63 | (2.11 | ) | 249,973 | 2.54 | 2.55 | 1.60 | 1.61 | (1.51 | ) | 672 | ||||||||||||||||||||||||
| 12.02 | 1.66 | 207,511 | 2.01 | 2.02 | 1.59 | 1.60 | 0.16 | 450 | ||||||||||||||||||||||||||
| 11.88 | 13.40 | 277,661 | 2.00 | 2.02 | 1.58 | 1.60 | (0.71 | ) | 522 | |||||||||||||||||||||||||
| 11.78 | 0.17 | 18 | 2.25 | * | 2.26 | * | 1.70 | * | 1.71 | * | 0.41 | * | 276 | |||||||||||||||||||||
| 11.60 | 1.64 | 113,499 | 2.40 | 2.41 | 1.85 | 1.86 | (0.41 | ) | 276 | |||||||||||||||||||||||||
| 12.05 | 9.97 | 88,636 | 2.21 | 2.22 | 1.84 | 1.85 | (0.67 | ) | 251 | |||||||||||||||||||||||||
| 11.52 | (2.38 | ) | 147,582 | 2.79 | 2.80 | 1.85 | 1.86 | (1.79 | ) | 672 | ||||||||||||||||||||||||
| 11.94 | 1.41 | 172,843 | 2.26 | 2.27 | 1.84 | 1.85 | (0.18 | ) | 450 | |||||||||||||||||||||||||
| 11.83 | 13.17 | 382,160 | 2.27 | 2.29 | 1.83 | 1.85 | (0.98 | ) | 522 | |||||||||||||||||||||||||
| ANNUAL REPORT | JUNE 30, 2018 | 13 |
Table of Contents
Financial Highlights (Cont.)
| Investment Operations | Less Distributions(b) | |||||||||||||||||||||||||||||||||||
| Selected Per Share Data for the Year or Period Ended^: | Net Asset Value Beginning of Year or Period | Net Investment Income (Loss)(a) | Net Realized/ Unrealized Gain (Loss) | Total | From Net Investment Income | From Net Realized Capital Gains | Tax Basis Return of Capital | Total | ||||||||||||||||||||||||||||
PIMCO EqS® Long/Short Fund (Cont.) | ||||||||||||||||||||||||||||||||||||
| Class C | ||||||||||||||||||||||||||||||||||||
06/30/2018 | $ | 11.65 | $ | (0.14 | ) | $ | 0.25 | $ | 0.11 | $ | 0.00 | $ | (0.64 | ) | $ | 0.00 | $ | (0.64 | ) | |||||||||||||||||
06/30/2017 | 11.20 | (0.16 | ) | 1.13 | 0.97 | (0.29 | ) | (0.23 | ) | 0.00 | (0.52 | ) | ||||||||||||||||||||||||
06/30/2016 | 11.69 | (0.29 | ) | (0.06 | ) | (0.35 | ) | 0.00 | (0.14 | ) | 0.00 | (0.14 | ) | |||||||||||||||||||||||
06/30/2015 | 11.67 | (0.11 | ) | 0.18 | 0.07 | 0.00 | (0.05 | ) | 0.00 | (0.05 | ) | |||||||||||||||||||||||||
06/30/2014 | 10.98 | (0.20 | ) | 1.55 | 1.35 | (0.05 | ) | (0.61 | ) | 0.00 | (0.66 | ) | ||||||||||||||||||||||||
| ^ | A zero balance may reflect actual amounts rounding to less than $0.01 or 0.01%. |
| * | Annualized |
| (a) | Per share amounts based on average number of shares outstanding during the year or period. |
| (b) | The tax characterization of distributions is determined in accordance with Federal income tax regulations. See Note 2, Distributions to Shareholders, in the Notes to Financial Statements for more information. |
| (c) | Effective June 16, 2016, the Fund’s Investment advisory fee was decreased by 0.20% to an annual rate of 0.49%. |
| 14 | PIMCO EQUITY SERIES | See Accompanying Notes |
Table of Contents
| Ratios/Supplemental Data | ||||||||||||||||||||||||||||||||||
| Ratios to Average Net Assets | ||||||||||||||||||||||||||||||||||
| Net Asset Value End of Year or Period | Total Return | Net Assets End of Year or Period (000s) | Expenses | Expenses Excluding Waivers | Expenses Excluding Interest Expense and Dividends on Securities Sold Short | Expenses Excluding | Net Investment Income (Loss) | Portfolio Turnover Rate | ||||||||||||||||||||||||||
| $ | 11.12 | 0.99 | % | $ | 71,218 | 3.15 | % | 3.16 | % | 2.60 | % | 2.61 | % | (1.23 | )% | 276 | % | |||||||||||||||||
| 11.65 | 9.07 | 91,557 | 2.96 | 2.97 | 2.59 | 2.60 | (1.41 | ) | 251 | |||||||||||||||||||||||||
| 11.20 | (3.03 | ) | 145,358 | 3.54 | 3.55 | 2.60 | 2.61 | (2.52 | ) | 672 | ||||||||||||||||||||||||
| 11.69 | 0.66 | 140,719 | 3.01 | 3.02 | 2.59 | 2.60 | (0.95 | ) | 450 | |||||||||||||||||||||||||
| 11.67 | 12.26 | 214,485 | 3.00 | 3.02 | 2.58 | 2.60 | (1.71 | ) | 522 | |||||||||||||||||||||||||
| ANNUAL REPORT | JUNE 30, 2018 | 15 |
Table of Contents
Statements of Assets and Liabilities
| (Amounts in thousands†, except per share amounts) | PIMCO Dividend and Income Fund | PIMCO EqS® Long/Short Fund | ||||||
Assets: | ||||||||
Investments, at value | ||||||||
Investments in securities* | $ | 320,099 | $ | 335,729 | ||||
Investments in Affiliates | 2,007 | 141,419 | ||||||
Financial Derivative Instruments | ||||||||
Exchange-traded or centrally cleared | 38 | 71 | ||||||
Over the counter | 275 | 814 | ||||||
Cash | 0 | 1 | ||||||
Deposits with counterparty | 1,138 | 130,959 | ||||||
Foreign currency, at value | 1,669 | 756 | ||||||
Receivable for investments sold | 15,649 | 336 | ||||||
Receivable for TBA investments sold | 14,228 | 0 | ||||||
Receivable for Fund shares sold | 191 | 269 | ||||||
Interest and/or dividends receivable | 1,749 | 404 | ||||||
Dividends receivable from Affiliates | 1 | 269 | ||||||
Reimbursement receivable from PIMCO | 5 | 8 | ||||||
Other assets | 1 | 1 | ||||||
Total Assets | 357,050 | 611,036 | ||||||
Liabilities: | ||||||||
Borrowings & Other Financing Transactions | ||||||||
Payable for reverse repurchase agreements | $ | 10,225 | $ | 0 | ||||
Payable for sale-buyback transactions | 857 | 0 | ||||||
Payable for short sales | 0 | 128,390 | ||||||
Financial Derivative Instruments | ||||||||
Exchange-traded or centrally cleared | 24 | 167 | ||||||
Over the counter | 445 | 302 | ||||||
Payable for investments purchased | 15,594 | 4,863 | ||||||
Payable for investments in Affiliates purchased | 1 | 269 | ||||||
Payable for TBA investments purchased | 24,687 | 0 | ||||||
Payable for unfunded loan commitments | 50 | 0 | ||||||
Deposits from counterparty | 40 | 871 | ||||||
Payable for Fund shares redeemed | 521 | 467 | ||||||
Overdraft due to custodian | 185 | 0 | ||||||
Accrued investment advisory fees | 130 | 429 | ||||||
Accrued supervisory and administrative fees | 104 | 211 | ||||||
Accrued distribution fees | 75 | 46 | ||||||
Accrued servicing fees | 55 | 40 | ||||||
Total Liabilities | 52,993 | 136,055 | ||||||
Net Assets | $ | 304,057 | $ | 474,981 | ||||
Net Assets Consist of: | ||||||||
Paid in capital | $ | 386,124 | $ | 442,143 | ||||
Undistributed (overdistributed) net investment income | 2,916 | (473 | ) | |||||
Accumulated undistributed net realized gain (loss) | (104,106 | ) | 11,840 | |||||
Net unrealized appreciation (depreciation) | 19,123 | 21,471 | ||||||
Net Assets | $ | 304,057 | $ | 474,981 | ||||
Cost of investments in securities | $ | 300,964 | $ | 317,047 | ||||
Cost of investments in Affiliates | $ | 2,007 | $ | 141,380 | ||||
Cost of foreign currency held | $ | 1,679 | $ | 770 | ||||
Proceeds received on short sales | $ | 0 | $ | 130,003 | ||||
Cost or premiums of financial derivative instruments, net | $ | (155 | ) | $ | (3,368 | ) | ||
* Includes repurchase agreements of: | $ | 1,419 | $ | 549 | ||||
| † | A zero balance may reflect actual amounts rounding to less than one thousand. |
| 16 | PIMCO EQUITY SERIES | See Accompanying Notes |
Table of Contents
June 30, 2018
| PIMCO Dividend and Income Fund | PIMCO EqS® Long/Short Fund | |||||||
Net Assets: | ||||||||
Institutional Class | $ | 23,027 | $ | 174,777 | ||||
I-2 | 27,286 | 115,469 | ||||||
I-3 | N/A | 18 | ||||||
Class A | 138,561 | 113,499 | ||||||
Class C | 115,183 | 71,218 | ||||||
Shares Issued and Outstanding: | ||||||||
Institutional Class | 1,995 | 14,737 | ||||||
I-2 | 2,360 | 9,805 | ||||||
I-3 | N/A | 2 | ||||||
Class A | 12,021 | 9,781 | ||||||
Class C | 10,030 | 6,406 | ||||||
Net Asset Value Per Share Outstanding: | ||||||||
Institutional Class | $ | 11.54 | $ | 11.86 | ||||
I-2 | 11.56 | 11.78 | ||||||
I-3 | N/A | 11.78 | ||||||
Class A | 11.53 | 11.60 | ||||||
Class C | 11.48 | 11.12 | ||||||
| † | A zero balance may reflect actual amounts rounding to less than one thousand. |
| ANNUAL REPORT | JUNE 30, 2018 | 17 |
Table of Contents
| Year Ended June 30, 2018 | ||||||||
| (Amounts in thousands†) | PIMCO Dividend and Income Fund | PIMCO EqS® Long/Short Fund | ||||||
Investment Income: | ||||||||
Interest | $ | 4,063 | $ | 1,491 | ||||
Dividends, net of foreign taxes* | 8,811 | 6,194 | ||||||
Dividends from Investments in Affiliates | 16 | 2,367 | ||||||
Total Income | 12,890 | 10,052 | ||||||
Expenses: | ||||||||
Investment advisory fees | 1,633 | 5,443 | ||||||
Supervisory and administrative fees | 1,309 | 2,688 | ||||||
Distribution and/or servicing fees - Class D | 15 | (a) | 89 | (a) | ||||
Distribution fees - Class C | 985 | 606 | ||||||
Servicing fees - Class A | 361 | 234 | ||||||
Servicing fees - Class C | 328 | 202 | ||||||
Dividends on short sales | 0 | 2,603 | ||||||
Trustee fees | 24 | 38 | ||||||
Interest expense | 165 | 235 | ||||||
Miscellaneous expense | 21 | 33 | ||||||
Total Expenses | 4,841 | 12,171 | ||||||
Waiver and/or Reimbursement by PIMCO | (24 | ) | (38 | ) | ||||
Net Expenses | 4,817 | 12,133 | ||||||
Net Investment Income (Loss) | 8,073 | (2,081 | ) | |||||
Net Realized Gain (Loss): | ||||||||
Investments in securities | 17,279 | 31,226 | ||||||
Investments in Affiliates | 2 | (50 | ) | |||||
Exchange-traded or centrally cleared financial derivative instruments | (453 | ) | (5,818 | ) | ||||
Over the counter financial derivative instruments | 56 | (1,756 | ) | |||||
Short sales | 0 | (8,875 | ) | |||||
Foreign currency | (122 | ) | 38 | |||||
Net Realized Gain (Loss) | 16,762 | 14,765 | ||||||
Net Change in Unrealized Appreciation (Depreciation): | ||||||||
Investments in securities | (3,607 | ) | (7,738 | ) | ||||
Investments in Affiliates | 0 | 35 | ||||||
Exchange-traded or centrally cleared financial derivative instruments | 56 | 1,087 | ||||||
Over the counter financial derivative instruments | 32 | 1,625 | ||||||
Short sales | 0 | 2,520 | ||||||
Foreign currency assets and liabilities | (34 | ) | (503 | ) | ||||
Net Change in Unrealized Appreciation (Depreciation) | (3,553 | ) | (2,974 | ) | ||||
Net Increase (Decrease) in Net Assets Resulting from Operations | $ | 21,282 | $ | 9,710 | ||||
* Foreign tax withholdings - Dividends | $ | 572 | $ | 110 | ||||
| † | A zero balance may reflect actual amounts rounding to less than one thousand. |
| (a) | Class D shares converted into Class A shares on March 23, 2018, and are no longer available for purchase or as an exchange. |
| 18 | PIMCO EQUITY SERIES | See Accompanying Notes |
Table of Contents
Statements of Changes in Net Assets
| PIMCO Dividend and Income Fund | PIMCO EqS® Long/Short Fund | |||||||||||||||
| (Amounts in thousands†) | Year Ended June 30, 2018 | Year Ended June 30, 2017 | Year Ended June 30, 2018 | Year Ended June 30, 2017 | ||||||||||||
Increase (Decrease) in Net Assets from: | ||||||||||||||||
Operations: | ||||||||||||||||
Net investment income (loss) | $ | 8,073 | $ | 8,411 | $ | (2,081 | ) | $ | (4,055 | ) | ||||||
Net realized gain (loss) | 16,762 | 10,969 | 14,765 | 77,048 | ||||||||||||
Net change in unrealized appreciation (depreciation) | (3,553 | ) | 27,793 | (2,974 | ) | (15,261 | ) | |||||||||
Net Increase (Decrease) in Net Assets Resulting from Operations | 21,282 | 47,173 | 9,710 | 57,732 | ||||||||||||
Distributions to Shareholders: | ||||||||||||||||
From net investment income | ||||||||||||||||
Institutional Class | (650 | ) | (525 | ) | 0 | (5,009 | ) | |||||||||
I-2 | (724 | ) | (468 | ) | 0 | (4,762 | ) | |||||||||
I-3 | 0 | 0 | 0 | 0 | ||||||||||||
Class D | (152 | )(a) | (156 | ) | 0 | (a) | (1,056 | ) | ||||||||
Class A | (3,458 | ) | (2,620 | ) | 0 | (3,239 | ) | |||||||||
Class C | (2,417 | ) | (1,732 | ) | 0 | (2,934 | ) | |||||||||
From net realized capital gains | ||||||||||||||||
Institutional Class | 0 | 0 | (9,995 | ) | (3,352 | ) | ||||||||||
I-2 | 0 | 0 | (6,284 | ) | (3,145 | ) | ||||||||||
I-3 | 0 | 0 | 0 | 0 | ||||||||||||
Class D | 0 | (a) | 0 | (2,640 | )(a) | (852 | ) | |||||||||
Class A | 0 | 0 | (4,412 | ) | (2,245 | ) | ||||||||||
Class C | 0 | 0 | (4,484 | ) | (2,370 | ) | ||||||||||
Total Distributions(b) | (7,401 | ) | (5,501 | ) | (27,815 | ) | (28,964 | ) | ||||||||
Portfolio Share Transactions: | ||||||||||||||||
Net increase (decrease) resulting from Portfolio share transactions** | (51,381 | ) | (139,948 | ) | (60,493 | ) | (323,573 | ) | ||||||||
Total Increase (Decrease) in Net Assets | (37,500 | ) | (98,276 | ) | (78,598 | ) | (294,805 | ) | ||||||||
Net Assets: | ||||||||||||||||
Beginning of year | 341,557 | 439,833 | 553,579 | 848,384 | ||||||||||||
End of year* | $ | 304,057 | $ | 341,557 | $ | 474,981 | $ | 553,579 | ||||||||
* Including undistributed (overdistributed) net investment income of: | $ | 2,916 | $ | 1,723 | $ | (473 | ) | $ | 1,167 | |||||||
| † | A zero balance may reflect actual amounts rounding to less than one thousand. |
| ** | See Note 13, Shares of Beneficial Interest, in the Notes to Financial Statements. |
| (a) | Class D shares converted into Class A shares on March 23, 2018, and are no longer available for purchase or as an exchange. |
| (b) | The tax characterization of distributions is determined in accordance with Federal income tax regulations. See Note 2, Distributions to Shareholders, in the Notes to Financial Statements for more information. |
| ANNUAL REPORT | JUNE 30, 2018 | 19 |
Table of Contents
| Year Ended June 30, 2018 | ||||
| (Amounts in thousands†) | PIMCO EqS® Long/Short Fund | |||
Cash Flows Provided by (Used for) Operating Activities: | ||||
Net increase (decrease) in net assets resulting from operations | $ | 9,710 | ||
Adjustments to Reconcile Net Increase (Decrease) in Net Assets from Operations to Net Cash Provided by (Used for) Operating Activities: | ||||
Purchases of long-term securities | (945,582 | ) | ||
Proceeds from sales of long-term securities | 1,008,662 | |||
(Purchases) Proceeds from sales of short-term portfolio investments, net | 33,884 | |||
(Increase) decrease in deposits with counterparty | (31,173 | ) | ||
(Increase) decrease in receivable for investments sold | 15,963 | |||
(Increase) decrease in interest and/or dividends receivable | 346 | |||
(Increase) decrease in dividends receivable from Affiliates | (77 | ) | ||
Proceeds from (Payments on) exchange-traded or centrally cleared financial derivative instruments | (4,704 | ) | ||
Proceeds from (Payments on) over the counter financial derivative instruments | (1,756 | ) | ||
Increase (decrease) in reimbursement receivable from PIMCO | (5 | ) | ||
Increase (decrease) in payable for investments purchased | (8,146 | ) | ||
Increase (decrease) in deposits from counterparty | 871 | |||
Increase (decrease) in accrued investment advisory fees | (75 | ) | ||
Increase (decrease) in accrued supervisory and administrative fees | (38 | ) | ||
Increase (decrease) in accrued distribution fees | (24 | ) | ||
Increase (decrease) in accrued servicing fees | 1 | |||
Proceeds from (Payments on) short sales transactions, net | 24,276 | |||
Proceeds from (Payments on) foreign currency transactions | (465 | ) | ||
Increase (decrease) in other liabilities | (52 | ) | ||
Net Realized (Gain) Loss | ||||
Investments in securities | (31,226 | ) | ||
Investments in Affiliates | 50 | |||
Exchange-traded or centrally cleared financial derivative instruments | 5,818 | |||
Over the counter financial derivative instruments | 1,756 | |||
Short sales | 8,875 | |||
Foreign currency | (38 | ) | ||
Net Change in Unrealized (Appreciation) Depreciation | ||||
Investments in securities | 7,738 | |||
Investments in Affiliates | (35 | ) | ||
Exchange-traded or centrally cleared financial derivative instruments | (1,087 | ) | ||
Over the counter financial derivative instruments | (1,625 | ) | ||
Short sales | (2,520 | ) | ||
Foreign currency assets and liabilities | 503 | |||
Net amortization (accretion) on investments | (461 | ) | ||
Net Cash Provided by (Used for) Operating Activities | 89,364 | |||
Cash Flows Received from (Used for) Financing Activities: | ||||
Proceeds from shares sold | 142,631 | |||
Payments on shares redeemed | (231,427 | ) | ||
Cash distributions paid* | (47 | ) | ||
Net Cash Received from (Used for) Financing Activities | (88,843 | ) | ||
Net Increase (Decrease) in Cash and Foreign Currency | 521 | |||
Cash and Foreign Currency: | ||||
Beginning of year | 236 | |||
End of year | $ | 757 | ||
* Reinvestment of distributions | $ | 27,768 | ||
Supplemental Disclosure of Cash Flow Information: | ||||
Dividends on short sales paid during the year | $ | 2,523 | ||
Interest expense paid during the year | $ | 142 | ||
| † | A zero balance may reflect actual amounts rounding to less than one thousand. |
A Statement of Cash Flows is presented when a Fund has a significant amount of borrowing during the year, based on the average total borrowing outstanding in relation to total assets or when substantially all of a Fund’s investments are not classified as Level 1 or 2 in the fair value hierarchy.
| 20 | PIMCO EQUITY SERIES | See Accompanying Notes |
Table of Contents
Schedule of Investments PIMCO Dividend and Income Fund
June 30, 2018
(Amounts in thousands*, except number of shares, contracts and units, if any)
| PRINCIPAL AMOUNT (000S) | MARKET VALUE (000S) | |||||||||||
| INVESTMENTS IN SECURITIES 105.2% |
| |||||||||||
| ASSET-BACKED SECURITIES 4.5% |
| |||||||||||
| CAYMAN ISLANDS 0.8% |
| |||||||||||
Evans Grove CLO Ltd. |
| |||||||||||
3.239% due 05/28/2028 ~ | $ | 800 | $ | 800 | ||||||||
NewMark Capital Funding CLO Ltd. |
| |||||||||||
3.441% (US0003M + 1.120%) due 06/02/2025 ~ | 465 | 466 | ||||||||||
Palmer Square CLO Ltd. |
| |||||||||||
3.573% (US0003M + 1.220%) due 10/17/2027 ~ | 700 | 701 | ||||||||||
TruPS Financials Note Securitization Ltd. |
| |||||||||||
3.895% due 09/20/2039 ~ | 575 | 569 | ||||||||||
|
| |||||||||||
Total Cayman Islands | 2,536 | |||||||||||
|
| |||||||||||
| NETHERLANDS 0.1% |
| |||||||||||
Pallas CDO BV |
| |||||||||||
0.000% (EUR006M + 0.258%) due 07/16/2082 ~ | EUR | 296 | 348 | |||||||||
|
| |||||||||||
Total Netherlands | 348 | |||||||||||
|
| |||||||||||
| UNITED STATES 3.6% |
| |||||||||||
Conseco Finance Corp. |
| |||||||||||
6.280% due 09/01/2030 | $ | 432 | 464 | |||||||||
Credit Suisse First Boston Mortgage Securities Corp. |
| |||||||||||
2.711% (US0001M + 0.620%) due 01/25/2032 ~ | 1,376 | 1,353 | ||||||||||
EMC Mortgage Loan Trust |
| |||||||||||
3.391% (LIBOR01M + 1.300%) due 02/25/2041 ~ | 36 | 36 | ||||||||||
Legacy Mortgage Asset Trust |
| |||||||||||
3.852% (US0001M + 1.750%) due 01/28/2070 ~ | 1,475 | 1,509 | ||||||||||
Morgan Stanley Home Equity Loan Trust |
| |||||||||||
2.191% (US0001M + 0.100%) due 12/25/2036 ~ | 1,907 | 1,172 | ||||||||||
Navient Student Loan Trust |
| |||||||||||
3.141% (US0001M + 1.050%) due 12/27/2066 ~ | 670 | 681 | ||||||||||
Progress Residential Trust |
| |||||||||||
3.585% (LIBOR01M + 1.500%) due 09/17/2033 ~ | 988 | 990 | ||||||||||
Residential Asset Securities Corp. Trust |
| |||||||||||
2.976% (US0001M + 0.885%) due 01/25/2034 ~ | 1,628 | 1,626 | ||||||||||
Structured Asset Investment Loan Trust |
| |||||||||||
2.241% (US0001M + 0.150%) due 09/25/2036 ~ | 3,091 | 2,998 | ||||||||||
|
| |||||||||||
Total United States | 10,829 | |||||||||||
|
| |||||||||||
Total Asset-Backed Securities (Cost $12,701) | 13,713 | |||||||||||
|
| |||||||||||
| LOAN PARTICIPATIONS AND ASSIGNMENTS 0.5% |
| |||||||||||
| CANADA 0.0% |
| |||||||||||
B.C. Unlimited Liability Co. |
| |||||||||||
4.344% due 02/16/2024 | 10 | 10 | ||||||||||
Valeant Pharmaceuticals International, Inc. |
| |||||||||||
4.982% due 06/02/2025 | 5 | 5 | ||||||||||
|
| |||||||||||
Total Canada | 15 | |||||||||||
|
| |||||||||||
| UNITED ARAB EMIRATES 0.0% |
| |||||||||||
Dubai World |
| |||||||||||
TBD% - 2.000% due 09/30/2022 | 100 | 95 | ||||||||||
|
| |||||||||||
Total United Arab Emirates | 95 | |||||||||||
|
| |||||||||||
| UNITED STATES 0.5% |
| |||||||||||
Avolon Holdings Ltd. |
| |||||||||||
4.088% due 01/15/2025 | 39 | 38 | ||||||||||
| PRINCIPAL AMOUNT (000S) | MARKET VALUE (000S) | |||||||||||
Beacon Roofing Supply, Inc. |
| |||||||||||
TBD% - 6.250% due 01/02/2025 | $ | 10 | $ | 10 | ||||||||
BWAY Holding Co. |
| |||||||||||
TBD% - 7.250% due 04/03/2024 | 10 | 10 | ||||||||||
Caesars Resort Collection LLC |
| |||||||||||
4.844% due 12/22/2024 | 100 | 99 | ||||||||||
Community Health Systems, Inc. |
| |||||||||||
5.307% due 12/31/2019 | 10 | 10 | ||||||||||
5.557% due 01/27/2021 | 53 | 52 | ||||||||||
Core & Main LP |
| |||||||||||
TBD% - 5.300% due 08/01/2024 | 10 | 10 | ||||||||||
Diamond Resorts Corp. |
| |||||||||||
TBD% - 6.084% due 09/02/2023 | 98 | 96 | ||||||||||
Drillship Kithira Owners, Inc. |
| |||||||||||
TBD% due 09/20/2024 « | 6 | 6 | ||||||||||
Financial & Risk U.S. Holdings |
| |||||||||||
TBD% due 05/31/2019 «∎ | 50 | 50 | ||||||||||
Hilton Worldwide Finance LLC |
| |||||||||||
3.841% due 10/25/2023 | 252 | 252 | ||||||||||
iHeartCommunications, Inc. |
| |||||||||||
TBD% - 9.052% due 01/30/2019 ^(c) | 310 | 237 | ||||||||||
Las Vegas Sands LLC |
| |||||||||||
3.844% due 03/27/2025 | 393 | 391 | ||||||||||
MH Sub LLC |
| |||||||||||
5.835% due 09/13/2024 | 20 | 20 | ||||||||||
Multi Color Corp. |
| |||||||||||
4.344% due 10/31/2024 | 2 | 2 | ||||||||||
PetSmart, Inc. |
| |||||||||||
5.010% due 03/11/2022 | 20 | 17 | ||||||||||
Post Holdings, Inc. |
| |||||||||||
4.100% due 05/24/2024 | 10 | 10 | ||||||||||
Sprint Communications, Inc. |
| |||||||||||
4.625% due 02/02/2024 | 99 | 98 | ||||||||||
TEX Operations Co. LLC |
| |||||||||||
4.094% due 08/04/2023 | 23 | 23 | ||||||||||
West Corp. |
| |||||||||||
6.094% due 10/10/2024 | 9 | 9 | ||||||||||
|
| |||||||||||
Total United States | 1,440 | |||||||||||
|
| |||||||||||
Total Loan Participations and Assignments (Cost $1,624) |
| 1,550 | ||||||||||
|
| |||||||||||
| SHARES | ||||||||||||
| COMMON STOCKS 73.3% |
| |||||||||||
| AUSTRALIA 2.7% |
| |||||||||||
| CONSUMER DISCRETIONARY 0.0% |
| |||||||||||
Crown Resorts Ltd. | 2,223 | 22 | ||||||||||
Myer Holdings Ltd. | 81,363 | 22 | ||||||||||
Tabcorp Holdings Ltd. | 13,219 | 44 | ||||||||||
|
| |||||||||||
| 88 | ||||||||||||
|
| |||||||||||
| CONSUMER STAPLES 0.6% |
| |||||||||||
Coca-Cola Amatil Ltd. | 19,622 | 134 | ||||||||||
Metcash Ltd. | 37,507 | 72 | ||||||||||
Wesfarmers Ltd. | 12,668 | 462 | ||||||||||
Woolworths Ltd. | 46,429 | 1,049 | ||||||||||
|
| |||||||||||
| 1,717 | ||||||||||||
|
| |||||||||||
| ENERGY 0.2% |
| |||||||||||
Woodside Petroleum Ltd. | 8,864 | 232 | ||||||||||
WorleyParsons Ltd. | 24,013 | 310 | ||||||||||
|
| |||||||||||
| 542 | ||||||||||||
|
| |||||||||||
| FINANCIALS 1.1% |
| |||||||||||
AMP Ltd. | 86,737 | 228 | ||||||||||
Australia & New Zealand Banking Group Ltd. | 61,614 | 1,290 | ||||||||||
| SHARES | MARKET VALUE (000S) | |||||||||||
Genworth Mortgage Insurance Australia Ltd. | 47,832 | $ | 91 | |||||||||
National Australia Bank Ltd. | 41,857 | 850 | ||||||||||
Suncorp Group Ltd. | 64,293 | 693 | ||||||||||
Westpac Banking Corp. | 16,124 | 350 | ||||||||||
|
| |||||||||||
| 3,502 | ||||||||||||
|
| |||||||||||
| HEALTH CARE 0.1% |
| |||||||||||
Primary Health Care Ltd. | 63,754 | 164 | ||||||||||
Sonic Healthcare Ltd. | 3,674 | 67 | ||||||||||
|
| |||||||||||
| 231 | ||||||||||||
|
| |||||||||||
| INDUSTRIALS 0.0% |
| |||||||||||
Downer EDI Ltd. | 27,559 | 138 | ||||||||||
|
| |||||||||||
| MATERIALS 0.5% |
| |||||||||||
BHP Billiton Ltd. | 53,264 | 1,333 | ||||||||||
Incitec Pivot Ltd. | 28,945 | 77 | ||||||||||
OZ Minerals Ltd. | 5,575 | 39 | ||||||||||
|
| |||||||||||
| 1,449 | ||||||||||||
|
| |||||||||||
| TELECOMMUNICATION SERVICES 0.2% |
| |||||||||||
Telstra Corp. Ltd. | 270,814 | 524 | ||||||||||
|
| |||||||||||
Total Australia | 8,191 | |||||||||||
|
| |||||||||||
| AUSTRIA 0.3% |
| |||||||||||
| ENERGY 0.1% |
| |||||||||||
OMV AG | 6,110 | 346 | ||||||||||
|
| |||||||||||
| FINANCIALS 0.2% |
| |||||||||||
Raiffeisen Bank International AG | 10,221 | 313 | ||||||||||
Vienna Insurance Group AG Wiener Versicherung Gruppe | 2,148 | 59 | ||||||||||
|
| |||||||||||
| 372 | ||||||||||||
|
| |||||||||||
| INDUSTRIALS 0.0% |
| |||||||||||
Oesterreichische Post AG | 528 | 24 | ||||||||||
|
| |||||||||||
| MATERIALS 0.0% |
| |||||||||||
voestalpine AG | 1,422 | 65 | ||||||||||
|
| |||||||||||
Total Austria | 807 | |||||||||||
|
| |||||||||||
| BELGIUM 0.1% |
| |||||||||||
| FINANCIALS 0.1% |
| |||||||||||
Ageas | 4,024 | 203 | ||||||||||
|
| |||||||||||
| INDUSTRIALS 0.0% |
| |||||||||||
bpost S.A. | 3,463 | 55 | ||||||||||
|
| |||||||||||
| TELECOMMUNICATION SERVICES 0.0% |
| |||||||||||
Proximus S.A. | 7,527 | 169 | ||||||||||
|
| |||||||||||
Total Belgium | 427 | |||||||||||
|
| |||||||||||
| BRAZIL 0.0% |
| |||||||||||
| ENERGY 0.0% |
| |||||||||||
Dommo Energia S.A. «(d)(k) | 347,361 | 95 | ||||||||||
Dommo Energia S.A. SP - ADR « | 63 | 2 | ||||||||||
|
| |||||||||||
| 97 | ||||||||||||
|
| |||||||||||
| See Accompanying Notes | ANNUAL REPORT | JUNE 30, 2018 | 21 |
Table of Contents
Schedule of Investments PIMCO Dividend and Income Fund (Cont.)
| SHARES | MARKET VALUE (000S) | |||||||||||
| UTILITIES 0.0% |
| |||||||||||
Eneva S.A. (d)(k) | 239 | $ | 1 | |||||||||
|
| |||||||||||
Total Brazil | 98 | |||||||||||
|
| |||||||||||
| CANADA 1.3% |
| |||||||||||
| CONSUMER DISCRETIONARY 0.0% |
| |||||||||||
Hudson’s Bay Co. | 2,993 | 26 | ||||||||||
Shaw Communications, Inc. ‘B’ | 4,947 | 101 | ||||||||||
|
| |||||||||||
| 127 | ||||||||||||
|
| |||||||||||
| ENERGY 0.2% |
| |||||||||||
Baytex Energy Corp. (d) | 12,646 | 42 | ||||||||||
Crescent Point Energy Corp. | 37,690 | 277 | ||||||||||
Husky Energy, Inc. | 21,484 | 335 | ||||||||||
Obsidian Energy Ltd. (d) | 42,171 | 48 | ||||||||||
|
| |||||||||||
| 702 | ||||||||||||
|
| |||||||||||
| FINANCIALS 0.8% |
| |||||||||||
Bank of Montreal | 7,001 | 541 | ||||||||||
Canadian Imperial Bank of Commerce | 10,060 | 875 | ||||||||||
Home Capital Group, Inc. | 6,410 | 73 | ||||||||||
IGM Financial, Inc. | 3,010 | 87 | ||||||||||
National Bank of Canada | 7,416 | 356 | ||||||||||
Power Corp. of Canada | 14,351 | 322 | ||||||||||
Power Financial Corp. | 4,575 | 107 | ||||||||||
|
| |||||||||||
| 2,361 | ||||||||||||
|
| |||||||||||
| INDUSTRIALS 0.0% |
| |||||||||||
WestJet Airlines Ltd. | 9,950 | 137 | ||||||||||
|
| |||||||||||
| MATERIALS 0.1% |
| |||||||||||
Nutrien Ltd. | 4,845 | 264 | ||||||||||
|
| |||||||||||
| UTILITIES 0.2% |
| |||||||||||
Atco Ltd. ‘I’ | 7,548 | 233 | ||||||||||
Capital Power Corp. | 4,349 | 83 | ||||||||||
Just Energy Group, Inc. | 5,497 | 20 | ||||||||||
TransAlta Corp. | 24,291 | 122 | ||||||||||
|
| |||||||||||
| 458 | ||||||||||||
|
| |||||||||||
Total Canada | 4,049 | |||||||||||
|
| |||||||||||
| DENMARK 0.1% |
| |||||||||||
| INDUSTRIALS 0.1% |
| |||||||||||
AP Moller - Maersk A/S ‘B’ | 174 | 215 | ||||||||||
|
| |||||||||||
Total Denmark | 215 | |||||||||||
|
| |||||||||||
| FINLAND 0.2% |
| |||||||||||
| MATERIALS 0.1% |
| |||||||||||
Stora Enso Oyj ‘R’ | 18,162 | 354 | ||||||||||
|
| |||||||||||
| UTILITIES 0.1% |
| |||||||||||
Fortum Oyj | 13,031 | 310 | ||||||||||
|
| |||||||||||
Total Finland | 664 | |||||||||||
|
| |||||||||||
| FRANCE 4.7% |
| |||||||||||
| CONSUMER DISCRETIONARY 0.5% |
| |||||||||||
Cie Generale des Etablissements Michelin S.C.A. | 3,924 | 475 | ||||||||||
Eutelsat Communications S.A. | 1,116 | 23 | ||||||||||
| SHARES | MARKET VALUE (000S) | |||||||||||
Lagardere S.C.A. | 17,215 | $ | 453 | |||||||||
Television Francaise | 8,089 | 85 | ||||||||||
Vivendi S.A. | 24,389 | 597 | ||||||||||
|
| |||||||||||
| 1,633 | ||||||||||||
|
| |||||||||||
| CONSUMER STAPLES 0.4% |
| |||||||||||
Carrefour S.A. | 44,292 | 715 | ||||||||||
Casino Guichard Perrachon S.A. | 11,634 | 450 | ||||||||||
|
| |||||||||||
| 1,165 | ||||||||||||
|
| |||||||||||
| ENERGY 0.3% |
| |||||||||||
Total S.A. | 13,493 | 819 | ||||||||||
|
| |||||||||||
| FINANCIALS 1.1% |
| |||||||||||
BNP Paribas S.A. | 23,061 | 1,426 | ||||||||||
Eurazeo S.A. | 2,653 | 201 | ||||||||||
Natixis S.A. | 11,465 | 81 | ||||||||||
Societe Generale S.A. | 39,088 | 1,643 | ||||||||||
|
| |||||||||||
| 3,351 | ||||||||||||
|
| |||||||||||
| HEALTH CARE 0.9% |
| |||||||||||
Sanofi | 33,412 | 2,682 | ||||||||||
|
| |||||||||||
| INDUSTRIALS 0.5% |
| |||||||||||
Alstom S.A. | 3,999 | 183 | ||||||||||
Bouygues S.A. | 14,773 | 635 | ||||||||||
Cie de Saint-Gobain | 12,028 | 536 | ||||||||||
Rexel S.A. | 12,721 | 183 | ||||||||||
|
| |||||||||||
| 1,537 | ||||||||||||
|
| |||||||||||
| TELECOMMUNICATION SERVICES 0.4% |
| |||||||||||
Orange S.A. | 78,718 | 1,314 | ||||||||||
|
| |||||||||||
| UTILITIES 0.6% |
| |||||||||||
Electricite de France S.A. | 82,387 | 1,130 | ||||||||||
Engie S.A. | 41,370 | 633 | ||||||||||
|
| |||||||||||
| 1,763 | ||||||||||||
|
| |||||||||||
Total France | 14,264 | |||||||||||
|
| |||||||||||
| GERMANY 3.1% |
| |||||||||||
| CONSUMER DISCRETIONARY 0.7% |
| |||||||||||
Bayerische Motoren Werke AG | 11,760 | 1,063 | ||||||||||
Ceconomy AG | 13,993 | 117 | ||||||||||
Daimler AG | 14,176 | 908 | ||||||||||
Hugo Boss AG | 500 | 45 | ||||||||||
|
| |||||||||||
| 2,133 | ||||||||||||
|
| |||||||||||
| CONSUMER STAPLES 0.0% |
| |||||||||||
Suedzucker AG | 1,510 | 24 | ||||||||||
|
| |||||||||||
| FINANCIALS 0.5% |
| |||||||||||
Aareal Bank AG | 523 | 23 | ||||||||||
Muenchener Rueckversicherungs-Gesellschaft AG in Muenchen | 6,077 | 1,278 | ||||||||||
Talanx AG (d) | 4,011 | 146 | ||||||||||
|
| |||||||||||
| 1,447 | ||||||||||||
|
| |||||||||||
| HEALTH CARE 0.3% |
| |||||||||||
Bayer AG | 9,357 | 1,027 | ||||||||||
|
| |||||||||||
| SHARES | MARKET VALUE (000S) | |||||||||||
| INDUSTRIALS 0.4% |
| |||||||||||
Bilfinger SE | 2,259 | $ | 115 | |||||||||
Deutsche Lufthansa AG | 39,740 | 952 | ||||||||||
Deutsche Post AG | 5,974 | 194 | ||||||||||
|
| |||||||||||
| 1,261 | ||||||||||||
|
| |||||||||||
| MATERIALS 0.7% |
| |||||||||||
BASF SE | 15,319 | 1,462 | ||||||||||
Evonik Industries AG | 5,379 | 184 | ||||||||||
K+S AG | 12,811 | 315 | ||||||||||
|
| |||||||||||
| 1,961 | ||||||||||||
|
| |||||||||||
| UTILITIES 0.5% |
| |||||||||||
E.ON SE | 36,556 | 390 | ||||||||||
Innogy SE | 3,024 | 129 | ||||||||||
RWE AG | 44,447 | 1,010 | ||||||||||
|
| |||||||||||
| 1,529 | ||||||||||||
|
| |||||||||||
Total Germany | 9,382 | |||||||||||
|
| |||||||||||
| HONG KONG 0.7% |
| |||||||||||
| CONSUMER DISCRETIONARY 0.2% |
| |||||||||||
Li & Fung Ltd. | 516,000 | 189 | ||||||||||
SJM Holdings Ltd. | 294,000 | 365 | ||||||||||
|
| |||||||||||
| 554 | ||||||||||||
|
| |||||||||||
| INFORMATION TECHNOLOGY 0.0% |
| |||||||||||
Kingboard Chemical Holdings Ltd. | 15,000 | 55 | ||||||||||
|
| |||||||||||
| REAL ESTATE 0.5% |
| |||||||||||
China South City Holdings Ltd. | 278,000 | 54 | ||||||||||
Kerry Properties Ltd. | 55,500 | 265 | ||||||||||
New World Development Co. Ltd. | 61,000 | 85 | ||||||||||
Shimao Property Holdings Ltd. | 133,000 | 347 | ||||||||||
Swire Pacific Ltd. ‘A’ | 49,000 | 518 | ||||||||||
Wheelock & Co. Ltd. | 23,000 | 160 | ||||||||||
|
| |||||||||||
| 1,429 | ||||||||||||
|
| |||||||||||
Total Hong Kong | 2,038 | |||||||||||
|
| |||||||||||
| ISRAEL 0.1% |
| |||||||||||
| MATERIALS 0.1% |
| |||||||||||
Israel Chemicals Ltd. | 47,612 | 218 | ||||||||||
|
| |||||||||||
| TELECOMMUNICATION SERVICES 0.0% |
| |||||||||||
Bezeq The Israeli Telecommunication Corp. Ltd. | 172,980 | 195 | ||||||||||
|
| |||||||||||
Total Israel | 413 | |||||||||||
|
| |||||||||||
| ITALY 1.4% |
| |||||||||||
| ENERGY 0.5% |
| |||||||||||
Eni SpA | 74,162 | 1,375 | ||||||||||
Snam SpA | 5,466 | 23 | ||||||||||
|
| |||||||||||
| 1,398 | ||||||||||||
|
| |||||||||||
| FINANCIALS 0.4% |
| |||||||||||
Assicurazioni Generali SpA | 11,733 | 196 | ||||||||||
Poste Italiane SpA | 106,398 | 888 | ||||||||||
Unipol Gruppo Finanziario SpA | 29,459 | 114 | ||||||||||
|
| |||||||||||
| 1,198 | ||||||||||||
|
| |||||||||||
| 22 | PIMCO EQUITY SERIES | See Accompanying Notes |
Table of Contents
June 30, 2018
| SHARES | MARKET VALUE (000S) | |||||||||||
| INDUSTRIALS 0.0% |
| |||||||||||
Societa Iniziative Autostradali e Servizi SpA | 6,700 | $ | 100 | |||||||||
|
| |||||||||||
| UTILITIES 0.5% |
| |||||||||||
Enel SpA | 289,140 | 1,602 | ||||||||||
|
| |||||||||||
Total Italy | 4,298 | |||||||||||
|
| |||||||||||
| JAPAN 10.3% |
| |||||||||||
| CONSUMER DISCRETIONARY 1.9% |
| |||||||||||
Aisin Seiki Co. Ltd. | 2,600 | 118 | ||||||||||
Aoyama Trading Co. Ltd. | 1,200 | 40 | ||||||||||
Benesse Holdings, Inc. | 1,000 | 35 | ||||||||||
Bridgestone Corp. | 12,100 | 473 | ||||||||||
DCM Holdings Co. Ltd. | 2,300 | 22 | ||||||||||
EDION Corp. | 3,600 | 36 | ||||||||||
Fuji Media Holdings, Inc. | 6,400 | 109 | ||||||||||
Geo Holdings Corp. | 5,500 | 74 | ||||||||||
Honda Motor Co. Ltd. | 37,400 | 1,097 | ||||||||||
Isuzu Motors Ltd. | 10,000 | 133 | ||||||||||
Kohnan Shoji Co. Ltd. | 1,200 | 28 | ||||||||||
Mazda Motor Corp. | 15,400 | 189 | ||||||||||
Mitsubishi Motors Corp. | 7,000 | 56 | ||||||||||
Nikon Corp. | 3,600 | 57 | ||||||||||
Nissan Motor Co. Ltd. | 109,500 | 1,065 | ||||||||||
Showa Corp. | 2,100 | 35 | ||||||||||
Skylark Co. Ltd. | 5,600 | 83 | ||||||||||
Subaru Corp. | 4,300 | 125 | ||||||||||
Sumitomo Rubber Industries Ltd. | 13,700 | 217 | ||||||||||
Toyota Motor Corp. | 26,400 | 1,707 | ||||||||||
Yokohama Rubber Co. Ltd. | 5,700 | 118 | ||||||||||
|
| |||||||||||
| 5,817 | ||||||||||||
|
| |||||||||||
| CONSUMER STAPLES 0.3% |
| |||||||||||
Japan Tobacco, Inc. | 12,200 | 341 | ||||||||||
Kirin Holdings Co. Ltd. | 23,000 | 616 | ||||||||||
Seven & i Holdings Co. Ltd. | 1,600 | 70 | ||||||||||
|
| |||||||||||
| 1,027 | ||||||||||||
|
| |||||||||||
| ENERGY 0.3% |
| |||||||||||
Cosmo Energy Holdings Co. Ltd. | 1,500 | 52 | ||||||||||
Inpex Corp. | 49,300 | 512 | ||||||||||
Japan Petroleum Exploration Co. Ltd. | 4,900 | 128 | ||||||||||
JXTG Holdings, Inc. | 43,100 | 299 | ||||||||||
|
| |||||||||||
| 991 | ||||||||||||
|
| |||||||||||
| FINANCIALS 2.3% |
| |||||||||||
Chiba Bank Ltd. | 10,800 | 76 | ||||||||||
Concordia Financial Group Ltd. | 4,500 | 23 | ||||||||||
Daiwa Securities Group, Inc. | 57,000 | 330 | ||||||||||
Fukuoka Financial Group, Inc. | 15,000 | 75 | ||||||||||
Gunma Bank Ltd. | 18,900 | 99 | ||||||||||
Hachijuni Bank Ltd. | 4,100 | 18 | ||||||||||
Hokuhoku Financial Group, Inc. | 10,200 | 135 | ||||||||||
Iyo Bank Ltd. | 6,100 | 40 | ||||||||||
Mitsubishi UFJ Financial Group, Inc. | 306,100 | 1,734 | ||||||||||
Mizuho Financial Group, Inc. | 869,700 | 1,465 | ||||||||||
North Pacific Bank Ltd. | 14,800 | 49 | ||||||||||
ORIX Corp. | 10,900 | 172 | ||||||||||
Resona Holdings, Inc. | 56,000 | 299 | ||||||||||
SBI Holdings, Inc. | 7,800 | 200 | ||||||||||
| SHARES | MARKET VALUE (000S) | |||||||||||
Sumitomo Mitsui Financial Group, Inc. | 39,200 | $ | 1,529 | |||||||||
Sumitomo Mitsui Trust Holdings, Inc. | 13,600 | 537 | ||||||||||
T&D Holdings, Inc. | 14,300 | 215 | ||||||||||
Yamaguchi Financial Group, Inc. | 8,000 | 90 | ||||||||||
|
| |||||||||||
| 7,086 | ||||||||||||
|
| |||||||||||
| HEALTH CARE 0.3% |
| |||||||||||
Daiichi Sankyo Co. Ltd. | 14,700 | 561 | ||||||||||
Takeda Pharmaceutical Co. Ltd. | 6,600 | 278 | ||||||||||
|
| |||||||||||
| 839 | ||||||||||||
|
| |||||||||||
| INDUSTRIALS 2.0% |
| |||||||||||
Asahi Glass Co. Ltd. | 7,100 | 276 | ||||||||||
Dai Nippon Printing Co. Ltd. | 11,900 | 266 | ||||||||||
Hitachi Construction Machinery Co. Ltd. | 1,100 | 35 | ||||||||||
Hitachi Zosen Corp. | 19,700 | 93 | ||||||||||
ITOCHU Corp. | 34,900 | 631 | ||||||||||
Japan Airlines Co. Ltd. | 12,100 | 429 | ||||||||||
Kanematsu Corp. | 9,200 | 133 | ||||||||||
Kawasaki Heavy Industries Ltd. | 7,200 | 212 | ||||||||||
Komatsu Ltd. | 4,800 | 136 | ||||||||||
Marubeni Corp. | 65,700 | 500 | ||||||||||
Mitsubishi Corp. | 20,400 | 566 | ||||||||||
Mitsubishi Heavy Industries Ltd. | 19,200 | 698 | ||||||||||
Mitsui & Co. Ltd. | 42,400 | 706 | ||||||||||
Mitsui E&S Holdings Co. Ltd. (d) | 7,000 | 91 | ||||||||||
Nippon Yusen KK | 11,300 | 224 | ||||||||||
Sumitomo Corp. | 38,700 | 635 | ||||||||||
Toppan Printing Co. Ltd. | 16,000 | 125 | ||||||||||
Toyota Tsusho Corp. | 5,200 | 174 | ||||||||||
|
| |||||||||||
| 5,930 | ||||||||||||
|
| |||||||||||
| INFORMATION TECHNOLOGY 1.8% |
| |||||||||||
Anritsu Corp. | 2,300 | 31 | ||||||||||
Canon, Inc. | 31,300 | 1,026 | ||||||||||
Fujitsu Ltd. | 124,000 | 750 | ||||||||||
Gree, Inc. (d) | 17,500 | 94 | ||||||||||
GungHo Online Entertainment, Inc. | 6,900 | 18 | ||||||||||
Hitachi Ltd. | 296,000 | 2,085 | ||||||||||
Ibiden Co. Ltd. | 6,600 | 105 | ||||||||||
Konica Minolta, Inc. | 24,500 | 227 | ||||||||||
Nippon Electric Glass Co. Ltd. | 3,700 | 103 | ||||||||||
Oki Electric Industry Co. Ltd. | 11,800 | 132 | ||||||||||
Ricoh Co. Ltd. | 82,400 | 755 | ||||||||||
|
| |||||||||||
| 5,326 | ||||||||||||
|
| |||||||||||
| MATERIALS 0.4% |
| |||||||||||
Asahi Kasei Corp. | 4,900 | 62 | ||||||||||
Denka Co. Ltd. | 2,300 | 77 | ||||||||||
DIC Corp. | 2,300 | 72 | ||||||||||
Kobe Steel Ltd. | 17,300 | 158 | ||||||||||
Kuraray Co. Ltd. | 4,700 | 65 | ||||||||||
Mitsubishi Materials Corp. | 7,000 | 192 | ||||||||||
Nippon Paper Industries Co. Ltd. | 6,200 | 99 | ||||||||||
Oji Holdings Corp. | 38,000 | 235 | ||||||||||
Showa Denko KK | 3,400 | 150 | ||||||||||
Ube Industries Ltd. | 2,800 | 73 | ||||||||||
|
| |||||||||||
| 1,183 | ||||||||||||
|
| |||||||||||
| SHARES | MARKET VALUE (000S) | |||||||||||
| REAL ESTATE 0.0% |
| |||||||||||
Nomura Real Estate Holdings, Inc. | 6,500 | $ | 144 | |||||||||
|
| |||||||||||
| TELECOMMUNICATION SERVICES 0.6% |
| |||||||||||
Nippon Telegraph & Telephone Corp. | 34,800 | 1,581 | ||||||||||
NTT DOCOMO, Inc. | 4,500 | 115 | ||||||||||
|
| |||||||||||
| 1,696 | ||||||||||||
|
| |||||||||||
| UTILITIES 0.4% |
| |||||||||||
Chugoku Electric Power Co., Inc. | 26,800 | 346 | ||||||||||
Electric Power Development Co. Ltd. | 8,600 | 222 | ||||||||||
Hokuriku Electric Power Co. | 28,100 | 282 | ||||||||||
Osaka Gas Co. Ltd. | 1,000 | 21 | ||||||||||
Tohoku Electric Power Co., Inc. | 16,500 | 202 | ||||||||||
Tokyo Gas Co. Ltd. | 7,500 | 199 | ||||||||||
|
| |||||||||||
| 1,272 | ||||||||||||
|
| |||||||||||
Total Japan | 31,311 | |||||||||||
|
| |||||||||||
| LUXEMBOURG 0.0% |
| |||||||||||
| CONSUMER DISCRETIONARY 0.0% |
| |||||||||||
RTL Group S.A. | 1,850 | 126 | ||||||||||
|
| |||||||||||
Total Luxembourg | 126 | |||||||||||
|
| |||||||||||
| MACAU 0.0% |
| |||||||||||
| CONSUMER DISCRETIONARY 0.0% |
| |||||||||||
Wynn Macau Ltd. | 16,800 | 54 | ||||||||||
|
| |||||||||||
Total Macau | 54 | |||||||||||
|
| |||||||||||
| MEXICO 0.0% |
| |||||||||||
| CONSUMER DISCRETIONARY 0.0% |
| |||||||||||
Desarrolladora Homex S.A.B. de C.V. (d) | 41,996 | 0 | ||||||||||
|
| |||||||||||
Total Mexico | 0 | |||||||||||
|
| |||||||||||
| NETHERLANDS 2.0% |
| |||||||||||
| CONSUMER STAPLES 0.1% |
| |||||||||||
Heineken Holding NV | 883 | 84 | ||||||||||
Koninklijke Ahold Delhaize NV | 11,540 | 276 | ||||||||||
|
| |||||||||||
| 360 | ||||||||||||
|
| |||||||||||
| ENERGY 1.2% |
| |||||||||||
Fugro NV (d) | 5,236 | 76 | ||||||||||
Royal Dutch Shell PLC ‘A’ | 99,742 | 3,461 | ||||||||||
|
| |||||||||||
| 3,537 | ||||||||||||
|
| |||||||||||
| FINANCIALS 0.2% |
| |||||||||||
Aegon NV | 90,085 | 538 | ||||||||||
ASR Nederland NV | 2,712 | 110 | ||||||||||
|
| |||||||||||
| 648 | ||||||||||||
|
| |||||||||||
| HEALTH CARE 0.3% |
| |||||||||||
Koninklijke Philips NV | 22,691 | 961 | ||||||||||
|
| |||||||||||
| INDUSTRIALS 0.1% |
| |||||||||||
Arcadis NV | 1,299 | 23 | ||||||||||
Boskalis Westminster | 777 | 23 | ||||||||||
PostNL NV | 19,369 | 73 | ||||||||||
|
| |||||||||||
| 119 | ||||||||||||
|
| |||||||||||
| See Accompanying Notes | ANNUAL REPORT | JUNE 30, 2018 | 23 |
Table of Contents
Schedule of Investments PIMCO Dividend and Income Fund (Cont.)
| SHARES | MARKET VALUE (000S) | |||||||||||
| TELECOMMUNICATION SERVICES 0.1% |
| |||||||||||
Koninklijke KPN NV | 55,167 | $ | 150 | |||||||||
VEON Ltd. ADR | 106,585 | 254 | ||||||||||
|
| |||||||||||
| 404 | ||||||||||||
|
| |||||||||||
Total Netherlands | 6,029 | |||||||||||
|
| |||||||||||
| NEW ZEALAND 0.0% |
| |||||||||||
| INDUSTRIALS 0.0% |
| |||||||||||
Air New Zealand Ltd. | 9,922 | 21 | ||||||||||
|
| |||||||||||
| MATERIALS 0.0% |
| |||||||||||
Fletcher Building Ltd. | 8,935 | 42 | ||||||||||
|
| |||||||||||
Total New Zealand | 63 | |||||||||||
|
| |||||||||||
| NORWAY 0.6% |
| |||||||||||
| ENERGY 0.3% |
| |||||||||||
Equinor ASA | 37,573 | 994 | ||||||||||
|
| |||||||||||
| FINANCIALS 0.1% |
| |||||||||||
DNB ASA | 8,932 | 174 | ||||||||||
|
| |||||||||||
| MATERIALS 0.1% |
| |||||||||||
Yara International ASA | 8,320 | 344 | ||||||||||
|
| |||||||||||
| TELECOMMUNICATION SERVICES 0.1% |
| |||||||||||
Telenor ASA | 11,141 | 228 | ||||||||||
|
| |||||||||||
Total Norway | 1,740 | |||||||||||
|
| |||||||||||
| PORTUGAL 0.2% |
| |||||||||||
| CONSUMER STAPLES 0.0% |
| |||||||||||
Sonae SGPS S.A. | 68,855 | 82 | ||||||||||
|
| |||||||||||
| MATERIALS 0.0% |
| |||||||||||
Navigator Co. S.A. | 8,072 | 48 | ||||||||||
|
| |||||||||||
| UTILITIES 0.2% |
| |||||||||||
EDP - Energias de Portugal S.A. | 132,878 | 527 | ||||||||||
|
| |||||||||||
Total Portugal | 657 | |||||||||||
|
| |||||||||||
| SINGAPORE 0.2% |
| |||||||||||
| INDUSTRIALS 0.2% |
| |||||||||||
Keppel Corp. Ltd. | 84,800 | 444 | ||||||||||
|
| |||||||||||
| INFORMATION TECHNOLOGY 0.0% |
| |||||||||||
Venture Corp. Ltd. | 2,900 | 38 | ||||||||||
|
| |||||||||||
Total Singapore | 482 | |||||||||||
|
| |||||||||||
| SOUTH AFRICA 0.2% |
| |||||||||||
| FINANCIALS 0.2% |
| |||||||||||
Old Mutual Ltd. (d) | 286,939 | 567 | ||||||||||
|
| |||||||||||
Total South Africa | 567 | |||||||||||
|
| |||||||||||
| SPAIN 1.9% |
| |||||||||||
| CONSUMER STAPLES 0.0% |
| |||||||||||
Distribuidora Internacional de Alimentacion S.A. | 11,348 | 33 | ||||||||||
|
| |||||||||||
| SHARES | MARKET VALUE (000S) | |||||||||||
| FINANCIALS 1.0% |
| |||||||||||
Banco Santander S.A. | 561,325 | $ | 3,000 | |||||||||
Mapfre S.A. | 37,914 | 114 | ||||||||||
|
| |||||||||||
| 3,114 | ||||||||||||
|
| |||||||||||
| INDUSTRIALS 0.3% |
| |||||||||||
ACS Actividades de Construccion y Servicios S.A. | 17,535 | 708 | ||||||||||
Obrascon Huarte Lain S.A. | 47,093 | 150 | ||||||||||
|
| |||||||||||
| 858 | ||||||||||||
|
| |||||||||||
| TELECOMMUNICATION SERVICES 0.4% |
| |||||||||||
Telefonica S.A. | 127,990 | 1,086 | ||||||||||
|
| |||||||||||
| UTILITIES 0.2% |
| |||||||||||
Endesa S.A. | 28,382 | 624 | ||||||||||
|
| |||||||||||
Total Spain | 5,715 | |||||||||||
|
| |||||||||||
| SWEDEN 0.5% |
| |||||||||||
| FINANCIALS 0.2% |
| |||||||||||
Nordea Bank AB | 43,920 | 421 | ||||||||||
Ratos AB ‘B’ | 12,523 | 42 | ||||||||||
|
| |||||||||||
| 463 | ||||||||||||
|
| |||||||||||
| HEALTH CARE 0.0% |
| |||||||||||
Arjo AB ‘B’ | 7,782 | 28 | ||||||||||
Getinge AB ‘B’ | 9,973 | 90 | ||||||||||
|
| |||||||||||
| 118 | ||||||||||||
|
| |||||||||||
| TELECOMMUNICATION SERVICES 0.3% |
| |||||||||||
Tele2 AB ‘B’ | 30,406 | 356 | ||||||||||
Telia Co. AB | 100,664 | 459 | ||||||||||
|
| |||||||||||
| 815 | ||||||||||||
|
| |||||||||||
Total Sweden | 1,396 | |||||||||||
|
| |||||||||||
| SWITZERLAND 2.1% |
| |||||||||||
| CONSUMER DISCRETIONARY 0.0% |
| |||||||||||
Garmin Ltd. | 1,051 | 64 | ||||||||||
|
| |||||||||||
| ENERGY 0.2% |
| |||||||||||
Transocean Ltd. | 45,087 | 606 | ||||||||||
|
| |||||||||||
| FINANCIALS 1.1% |
| |||||||||||
Baloise Holding AG | 912 | 132 | ||||||||||
Swiss Life Holding AG | 1,983 | 688 | ||||||||||
Swiss Re AG | 12,990 | 1,134 | ||||||||||
Zurich Insurance Group AG | 4,858 | 1,437 | ||||||||||
|
| |||||||||||
| 3,391 | ||||||||||||
|
| |||||||||||
| HEALTH CARE 0.6% |
| |||||||||||
Roche Holding AG | 7,814 | 1,734 | ||||||||||
|
| |||||||||||
| INDUSTRIALS 0.0% |
| |||||||||||
ABB Ltd. | 2,925 | 64 | ||||||||||
| �� |
|
| ||||||||||
| INFORMATION TECHNOLOGY 0.1% |
| |||||||||||
TE Connectivity Ltd. | 2,803 | 252 | ||||||||||
|
| |||||||||||
| SHARES | MARKET VALUE (000S) | |||||||||||
| TELECOMMUNICATION SERVICES 0.1% |
| |||||||||||
Swisscom AG | 391 | $ | 174 | |||||||||
|
| |||||||||||
Total Switzerland | 6,285 | |||||||||||
|
| |||||||||||
| UNITED KINGDOM 6.0% |
| |||||||||||
| CONSUMER DISCRETIONARY 0.5% |
| |||||||||||
Berkeley Group Holdings PLC | 1,979 | 99 | ||||||||||
InterContinental Hotels Group PLC | 388 | 24 | ||||||||||
Kingfisher PLC | 36,920 | 144 | ||||||||||
Marks & Spencer Group PLC | 148,248 | 576 | ||||||||||
Next PLC | 4,061 | 323 | ||||||||||
Pearson PLC | 28,213 | 329 | ||||||||||
|
| |||||||||||
| 1,495 | ||||||||||||
|
| |||||||||||
| CONSUMER STAPLES 0.3% |
| |||||||||||
J Sainsbury PLC | 147,206 | 623 | ||||||||||
Tate & Lyle PLC | 2,675 | 23 | ||||||||||
WM Morrison Supermarkets PLC | 114,581 | 380 | ||||||||||
|
| |||||||||||
| 1,026 | ||||||||||||
|
| |||||||||||
| ENERGY 0.9% |
| |||||||||||
BP PLC | 346,700 | 2,638 | ||||||||||
|
| |||||||||||
| FINANCIALS 2.3% |
| |||||||||||
Barclays PLC | 223,953 | 553 | ||||||||||
Direct Line Insurance Group PLC | 74,460 | 336 | ||||||||||
HSBC Holdings PLC | 525,962 | 4,915 | ||||||||||
Intermediate Capital Group PLC | 1,503 | 22 | ||||||||||
Legal & General Group PLC | 11,534 | 40 | ||||||||||
Quilter PLC (d) | 95,646 | 183 | ||||||||||
Standard Chartered PLC | 93,139 | 846 | ||||||||||
|
| |||||||||||
| 6,895 | ||||||||||||
|
| |||||||||||
| HEALTH CARE 0.4% |
| |||||||||||
GlaxoSmithKline PLC | 69,024 | 1,392 | ||||||||||
|
| |||||||||||
| INDUSTRIALS 0.6% |
| |||||||||||
Aggreko PLC | 5,168 | 46 | ||||||||||
BAE Systems PLC | 18,896 | 161 | ||||||||||
Capita PLC | 24,675 | 52 | ||||||||||
easyJet PLC | 14,710 | 324 | ||||||||||
Firstgroup PLC (d) | 58,804 | 64 | ||||||||||
Rolls-Royce Holdings PLC | 29,695 | 387 | ||||||||||
Royal Mail PLC | 91,010 | 605 | ||||||||||
Stagecoach Group PLC | 38,954 | 72 | ||||||||||
|
| |||||||||||
| 1,711 | ||||||||||||
|
| |||||||||||
| MATERIALS 0.1% |
| |||||||||||
Rio Tinto PLC | 5,767 | 318 | ||||||||||
|
| |||||||||||
| TELECOMMUNICATION SERVICES 0.6% |
| |||||||||||
BT Group PLC | 38,082 | 109 | ||||||||||
Vodafone Group PLC | 672,482 | 1,629 | ||||||||||
|
| |||||||||||
| 1,738 | ||||||||||||
|
| |||||||||||
| UTILITIES 0.3% |
| |||||||||||
Centrica PLC | 354,037 | 735 | ||||||||||
Drax Group PLC | 12,474 | 54 | ||||||||||
National Grid PLC | 22,202 | 245 | ||||||||||
| 24 | PIMCO EQUITY SERIES | See Accompanying Notes |
Table of Contents
June 30, 2018
| SHARES | MARKET VALUE (000S) | |||||||||||
Severn Trent PLC | 2,378 | $ | 62 | |||||||||
|
| |||||||||||
| 1,096 | ||||||||||||
|
| |||||||||||
Total United Kingdom | 18,309 | |||||||||||
|
| |||||||||||
| UNITED STATES 34.6% |
| |||||||||||
| CONSUMER DISCRETIONARY 4.0% |
| |||||||||||
Abercrombie & Fitch Co. ‘A’ | 30,613 | 749 | ||||||||||
American Eagle Outfitters, Inc. | 9,578 | 223 | ||||||||||
Bed Bath & Beyond, Inc. | 20,701 | 412 | ||||||||||
Caesars Entertainment Corp. (d) | 18,339 | 196 | ||||||||||
Dillard’s, Inc. ‘A’ | 4,941 | 467 | ||||||||||
Ford Motor Co. | 69,387 | 768 | ||||||||||
GameStop Corp. ‘A’ | 29,187 | 425 | ||||||||||
Gap, Inc. | 21,137 | 685 | ||||||||||
General Motors Co. | 18,259 | 719 | ||||||||||
GNC Holdings, Inc. ‘A’ (d) | 70,642 | 249 | ||||||||||
Goodyear Tire & Rubber Co. | 7,224 | 168 | ||||||||||
H&R Block, Inc. | 2,699 | 62 | ||||||||||
Kohl’s Corp. | 21,903 | 1,597 | ||||||||||
L Brands, Inc. | 7,141 | 263 | ||||||||||
Macy’s, Inc. | 30,408 | 1,138 | ||||||||||
Mattel, Inc. | 13,372 | 220 | ||||||||||
Nordstrom, Inc. | 9,546 | 494 | ||||||||||
Tapestry, Inc. | 3,040 | 142 | ||||||||||
Target Corp. | 15,312 | 1,166 | ||||||||||
Tribune Media Co. ‘A’ | 1,359 | 52 | ||||||||||
Tupperware Brands Corp. | 3,197 | 132 | ||||||||||
Viacom, Inc. ‘B’ | 43,441 | 1,310 | ||||||||||
Visteon Corp. (d) | 1,433 | 185 | ||||||||||
Weight Watchers International, Inc. (d) | 3,536 | 358 | ||||||||||
Wyndham Destinations, Inc. | 502 | 22 | ||||||||||
Wynn Resorts Ltd. | 328 | 55 | ||||||||||
|
| |||||||||||
| 12,257 | ||||||||||||
|
| |||||||||||
| CONSUMER STAPLES 3.0% |
| |||||||||||
Altria Group, Inc. | 1,302 | 74 | ||||||||||
Archer-Daniels-Midland Co. | 13,777 | 631 | ||||||||||
Bunge Ltd. | 3,216 | 224 | ||||||||||
General Mills, Inc. | 1,768 | 78 | ||||||||||
Herbalife Nutrition Ltd. (d) | 8,925 | 480 | ||||||||||
Kroger Co. | 30,710 | 874 | ||||||||||
Nu Skin Enterprises, Inc. ‘A’ | 756 | 59 | ||||||||||
Philip Morris International, Inc. | 17,829 | 1,440 | ||||||||||
Procter & Gamble Co. | 22,277 | 1,739 | ||||||||||
Wal-Mart Stores, Inc. | 41,660 | 3,568 | ||||||||||
|
| |||||||||||
| 9,167 | ||||||||||||
|
| |||||||||||
| ENERGY 5.1% |
| |||||||||||
Andeavor | 2,328 | 305 | ||||||||||
Chevron Corp. | 23,330 | 2,950 | ||||||||||
ConocoPhillips | 19,527 | 1,359 | ||||||||||
CVR Energy, Inc. | 2,528 | 94 | ||||||||||
Diamond Offshore Drilling, Inc. (d) | 13,926 | 291 | ||||||||||
Exxon Mobil Corp. | 61,631 | 5,099 | ||||||||||
Helmerich & Payne, Inc. | 349 | 22 | ||||||||||
Hess Corp. | 6,545 | 438 | ||||||||||
HollyFrontier Corp. | 11,606 | 794 | ||||||||||
Marathon Oil Corp. | 13,304 | 278 | ||||||||||
Marathon Petroleum Corp. | 13,065 | 917 | ||||||||||
Murphy Oil Corp. | 8,294 | 280 | ||||||||||
National Oilwell Varco, Inc. | 7,474 | 324 | ||||||||||
Occidental Petroleum Corp. | 2,784 | 233 | ||||||||||
| SHARES | MARKET VALUE (000S) | |||||||||||
Oceaneering International, Inc. | 4,968 | $ | 126 | |||||||||
Phillips 66 | 1,160 | 130 | ||||||||||
Rowan Cos. PLC ‘A’ (d) | 8,075 | 131 | ||||||||||
Valero Energy Corp. | 14,064 | 1,559 | ||||||||||
Williams Cos., Inc. | 5,070 | 137 | ||||||||||
|
| |||||||||||
| 15,467 | ||||||||||||
|
| |||||||||||
| FINANCIALS 6.5% |
| |||||||||||
Aflac, Inc. | 11,954 | 514 | ||||||||||
Ally Financial, Inc. | 27,689 | 727 | ||||||||||
American Express Co. | 16,432 | 1,610 | ||||||||||
American International Group, Inc. | 66,270 | 3,514 | ||||||||||
Assurant, Inc. | 1,599 | 166 | ||||||||||
Capital One Financial Corp. | 16,628 | 1,528 | ||||||||||
CNO Financial Group, Inc. | 5,389 | 103 | ||||||||||
Discover Financial Services | 12,912 | 909 | ||||||||||
Fifth Third Bancorp | 14,045 | 403 | ||||||||||
Franklin Resources, Inc. | 7,376 | 236 | ||||||||||
Goldman Sachs Group, Inc. | 729 | 161 | ||||||||||
JPMorgan Chase & Co. | 31,038 | 3,234 | ||||||||||
Loews Corp. | 2,741 | 132 | ||||||||||
LPL Financial Holdings, Inc. | 2,026 | 133 | ||||||||||
Navient Corp. | 44,788 | 584 | ||||||||||
New York Community Bancorp, Inc. | 7,328 | 81 | ||||||||||
PNC Financial Services Group, Inc. | 2,133 | 288 | ||||||||||
Progressive Corp. | 444 | 26 | ||||||||||
Santander Consumer USA Holdings, Inc. | 19,823 | 378 | ||||||||||
SLM Corp. (d) | 4,798 | 55 | ||||||||||
T Rowe Price Group, Inc. | 2,181 | 253 | ||||||||||
Travelers Cos., Inc. | 12,936 | 1,583 | ||||||||||
U.S. Bancorp | 10,667 | 534 | ||||||||||
Voya Financial, Inc. | 14,552 | 684 | ||||||||||
Wells Fargo & Co. | 32,579 | 1,806 | ||||||||||
|
| |||||||||||
| 19,642 | ||||||||||||
|
| |||||||||||
| HEALTH CARE 4.6% |
| |||||||||||
Anthem, Inc. | 8,328 | 1,982 | ||||||||||
Community Health Systems, Inc. (d) | 49,780 | 165 | ||||||||||
CVS Health Corp. | 9,422 | 606 | ||||||||||
Encompass Health Corp. | 336 | 23 | ||||||||||
Gilead Sciences, Inc. | 16,207 | 1,148 | ||||||||||
HCA Healthcare, Inc. | 15,705 | 1,612 | ||||||||||
Merck & Co., Inc. | 45,091 | 2,737 | ||||||||||
Pfizer, Inc. | 149,474 | 5,423 | ||||||||||
Quest Diagnostics, Inc. | 3,347 | 368 | ||||||||||
|
| |||||||||||
| 14,064 | ||||||||||||
|
| |||||||||||
| INDUSTRIALS 2.1% |
| |||||||||||
AGCO Corp. | 2,432 | 148 | ||||||||||
American Airlines Group, Inc. | 14,115 | 536 | ||||||||||
Caterpillar, Inc. | 7,225 | 980 | ||||||||||
CSX Corp. | 5,245 | 335 | ||||||||||
Cummins, Inc. | 1,090 | 145 | ||||||||||
Deere & Co. | 8,335 | 1,165 | ||||||||||
Delta Air Lines, Inc. | 1,845 | 91 | ||||||||||
Emerson Electric Co. | 13,171 | 911 | ||||||||||
Fluor Corp. | 6,219 | 303 | ||||||||||
ManpowerGroup, Inc. | 397 | 34 | ||||||||||
Norfolk Southern Corp. | 3,193 | 482 | ||||||||||
Pitney Bowes, Inc. | 30,777 | 264 | ||||||||||
Ryder System, Inc. | 3,013 | 216 | ||||||||||
| SHARES | MARKET VALUE (000S) | |||||||||||
Trinity Industries, Inc. | 5,610 | $ | 192 | |||||||||
United Technologies Corp. | 2,981 | 373 | ||||||||||
WW Grainger, Inc. | 386 | 119 | ||||||||||
|
| |||||||||||
| 6,294 | ||||||||||||
|
| |||||||||||
| INFORMATION TECHNOLOGY 3.6% |
| |||||||||||
Avnet, Inc. | 5,894 | 253 | ||||||||||
Booz Allen Hamilton Holding Corp. | 8,422 | 368 | ||||||||||
CA, Inc. | 10,483 | 374 | ||||||||||
Corning, Inc. | 32,922 | 906 | ||||||||||
Intel Corp. | 22,094 | 1,098 | ||||||||||
International Business Machines Corp. | 34,358 | 4,800 | ||||||||||
Jabil, Inc. | 7,167 | 198 | ||||||||||
KLA-Tencor Corp. | 2,290 | 235 | ||||||||||
Seagate Technology PLC | 27,690 | 1,563 | ||||||||||
Symantec Corp. | 14,601 | 301 | ||||||||||
Western Union Co. | 20,448 | 416 | ||||||||||
Xerox Corp. | 16,120 | 387 | ||||||||||
|
| |||||||||||
| 10,899 | ||||||||||||
|
| |||||||||||
| MATERIALS 1.2% |
| |||||||||||
CF Industries Holdings, Inc. | 6,387 | 284 | ||||||||||
Cleveland-Cliffs, Inc. (d) | 3,827 | 32 | ||||||||||
Domtar Corp. | 8,389 | 401 | ||||||||||
DowDuPont, Inc. | 1,334 | 88 | ||||||||||
Eastman Chemical Co. | 228 | 23 | ||||||||||
Huntsman Corp. | 1,131 | 33 | ||||||||||
International Paper Co. | 5,998 | 312 | ||||||||||
LyondellBasell Industries NV ‘A’ | 15,341 | 1,685 | ||||||||||
Mosaic Co. | 29,569 | 829 | ||||||||||
|
| |||||||||||
| 3,687 | ||||||||||||
|
| |||||||||||
| TELECOMMUNICATION SERVICES 2.5% |
| |||||||||||
AT&T, Inc. | 71,186 | 2,286 | ||||||||||
CenturyLink, Inc. | 63,291 | 1,180 | ||||||||||
Frontier Communications Corp. | 71,798 | 385 | ||||||||||
Telephone & Data Systems, Inc. | 6,259 | 172 | ||||||||||
Verizon Communications, Inc. | 68,885 | 3,465 | ||||||||||
Windstream Holdings, Inc. | 13,671 | 72 | ||||||||||
|
| |||||||||||
| 7,560 | ||||||||||||
|
| |||||||||||
| UTILITIES 2.0% |
| |||||||||||
American Electric Power Co., Inc. | 7,703 | 534 | ||||||||||
CenterPoint Energy, Inc. | 13,319 | 369 | ||||||||||
Consolidated Edison, Inc. | 8,246 | 643 | ||||||||||
Entergy Corp. | 12,460 | 1,007 | ||||||||||
Exelon Corp. | 32,051 | 1,365 | ||||||||||
FirstEnergy Corp. | 18,083 | 649 | ||||||||||
Pinnacle West Capital Corp. | 2,211 | 178 | ||||||||||
PPL Corp. | 11,180 | 319 | ||||||||||
Public Service Enterprise Group, Inc. | 12,744 | 690 | ||||||||||
SCANA Corp. | 3,860 | 149 | ||||||||||
Vistra Energy Corp. (d) | 10,892 | 258 | ||||||||||
|
| |||||||||||
| 6,161 | ||||||||||||
|
| |||||||||||
Total United States | 105,198 | |||||||||||
|
| |||||||||||
Total Common Stocks (Cost $203,238) | 222,778 | |||||||||||
|
| |||||||||||
| See Accompanying Notes | ANNUAL REPORT | JUNE 30, 2018 | 25 |
Table of Contents
Schedule of Investments PIMCO Dividend and Income Fund (Cont.)
| PRINCIPAL AMOUNT (000S) | MARKET VALUE (000S) | |||||||||||
| CONVERTIBLE BONDS & NOTES 0.0% |
| |||||||||||
| UNITED STATES 0.0% |
| |||||||||||
| INDUSTRIALS 0.0% |
| |||||||||||
Caesars Entertainment Corp. |
| |||||||||||
5.000% due 10/01/2024 | $ | 9 | $ | 15 | ||||||||
|
| |||||||||||
Total Convertible Bonds & Notes | 15 | |||||||||||
|
| |||||||||||
| CORPORATE BONDS & NOTES 7.3% |
| |||||||||||
| AUSTRALIA 0.1% |
| |||||||||||
| BANKING & FINANCE 0.1% |
| |||||||||||
National Australia Bank Ltd. |
| |||||||||||
1.375% due 07/12/2019 | 400 | 394 | ||||||||||
|
| |||||||||||
Total Australia | 394 | |||||||||||
|
| |||||||||||
| BERMUDA 0.0% |
| |||||||||||
| BANKING & FINANCE 0.0% |
| |||||||||||
Athene Holding Ltd. |
| |||||||||||
4.125% due 01/12/2028 | 6 | 6 | ||||||||||
|
| |||||||||||
| INDUSTRIALS 0.0% |
| |||||||||||
VOC Escrow Ltd. |
| |||||||||||
5.000% due 02/15/2028 | 10 | 9 | ||||||||||
|
| |||||||||||
Total Bermuda | 15 | |||||||||||
|
| |||||||||||
| BRAZIL 0.3% |
| |||||||||||
| INDUSTRIALS 0.0% |
| |||||||||||
Odebrecht Oil & Gas Finance Ltd. |
| |||||||||||
0.000% due 07/30/2018 (f)(i) | 46 | 1 | ||||||||||
|
| |||||||||||
| UTILITIES 0.3% |
| |||||||||||
Petrobras Global Finance BV |
| |||||||||||
6.125% due 01/17/2022 | 23 | 23 | ||||||||||
5.299% due 01/27/2025 | 50 | 46 | ||||||||||
5.999% due 01/27/2028 | 587 | 532 | ||||||||||
6.250% due 12/14/2026 | GBP | 100 | 134 | |||||||||
|
| |||||||||||
| 735 | ||||||||||||
|
| |||||||||||
Total Brazil | 736 | |||||||||||
|
| |||||||||||
| CANADA 0.0% |
| |||||||||||
| BANKING & FINANCE 0.0% |
| |||||||||||
Brookfield Finance, Inc. |
| |||||||||||
4.700% due 09/20/2047 | $ | 28 | 27 | |||||||||
3.900% due 01/25/2028 | 12 | 11 | ||||||||||
Fairfax Financial Holdings Ltd. |
| |||||||||||
4.850% due 04/17/2028 | 8 | 8 | ||||||||||
|
| |||||||||||
| 46 | ||||||||||||
|
| |||||||||||
| INDUSTRIALS 0.0% |
| |||||||||||
Air Canada Pass-Through Trust |
| |||||||||||
3.700% due 07/15/2027 | 4 | 4 | ||||||||||
BC Unlimited Liability Co. |
| |||||||||||
4.250% due 05/15/2024 | 38 | 36 | ||||||||||
Valeant Pharmaceuticals International, Inc. |
| |||||||||||
6.500% due 03/15/2022 | 13 | 14 | ||||||||||
7.000% due 03/15/2024 | 25 | 26 | ||||||||||
|
| |||||||||||
| 80 | ||||||||||||
|
| |||||||||||
Total Canada | 126 | |||||||||||
|
| |||||||||||
| PRINCIPAL AMOUNT (000S) | MARKET VALUE (000S) | |||||||||||
| CAYMAN ISLANDS 0.4% |
| |||||||||||
| BANKING & FINANCE 0.3% |
| |||||||||||
Ambac LSNI LLC |
| |||||||||||
7.337% due 02/12/2023 ~ | $ | 55 | $ | 56 | ||||||||
Avolon Holdings Funding Ltd. |
| |||||||||||
5.500% due 01/15/2023 | 20 | 20 | ||||||||||
U.S. Capital Funding Ltd. |
| |||||||||||
2.617% (US0003M + 0.280%) due 07/10/2043 ~ | 1,013 | 891 | ||||||||||
|
| |||||||||||
| 967 | ||||||||||||
|
| |||||||||||
| INDUSTRIALS 0.0% |
| |||||||||||
Park Aerospace Holdings Ltd. |
| |||||||||||
5.250% due 08/15/2022 | 27 | 27 | ||||||||||
5.500% due 02/15/2024 | 13 | 13 | ||||||||||
4.500% due 03/15/2023 | 23 | 22 | ||||||||||
3.625% due 03/15/2021 | 13 | 12 | ||||||||||
Shelf Drilling Holdings Ltd. |
| |||||||||||
8.250% due 02/15/2025 | 6 | 6 | ||||||||||
|
| |||||||||||
| 80 | ||||||||||||
|
| |||||||||||
| UTILITIES 0.1% |
| |||||||||||
Odebrecht Drilling Norbe Ltd. |
| |||||||||||
6.350% due 12/01/2021 | 49 | 46 | ||||||||||
Odebrecht Drilling Norbe Ltd. (6.350% Cash or 7.350% PIK) |
| |||||||||||
7.350% due 12/01/2026 (b) | 85 | 42 | ||||||||||
Odebrecht Offshore Drilling Finance Ltd. |
| |||||||||||
6.720% due 12/01/2022 | 2 | 2 | ||||||||||
Transocean Phoenix Ltd. |
| |||||||||||
7.750% due 10/15/2024 | 4 | 5 | ||||||||||
|
| |||||||||||
| 95 | ||||||||||||
|
| |||||||||||
Total Cayman Islands | 1,142 | |||||||||||
|
| |||||||||||
| FINLAND 0.0% |
| |||||||||||
| INDUSTRIALS 0.0% |
| |||||||||||
Nokia Oyj |
| |||||||||||
4.375% due 06/12/2027 | �� | 6 | 6 | |||||||||
|
| |||||||||||
Total Finland | 6 | |||||||||||
|
| |||||||||||
| FRANCE 0.2% |
| |||||||||||
| INDUSTRIALS 0.2% |
| |||||||||||
Altice France S.A. |
| |||||||||||
7.375% due 05/01/2026 | 700 | 687 | ||||||||||
|
| |||||||||||
Total France | 687 | |||||||||||
|
| |||||||||||
| GERMANY 0.2% |
| |||||||||||
| BANKING & FINANCE 0.2% |
| |||||||||||
Deutsche Bank AG |
| |||||||||||
2.700% due 07/13/2020 | 26 | 25 | ||||||||||
3.312% (US0003M + 0.970%) due 07/13/2020 ~ | 28 | 28 | ||||||||||
4.250% due 10/14/2021 | 590 | 581 | ||||||||||
|
| |||||||||||
| 634 | ||||||||||||
|
| |||||||||||
Total Germany | 634 | |||||||||||
|
| |||||||||||
| IRELAND 0.2% |
| |||||||||||
| INDUSTRIALS 0.2% |
| |||||||||||
Russian Railways via RZD Capital PLC |
| |||||||||||
7.487% due 03/25/2031 | GBP | 300 | 497 | |||||||||
|
| |||||||||||
Total Ireland | 497 | |||||||||||
|
| |||||||||||
| PRINCIPAL AMOUNT (000S) | MARKET VALUE (000S) | |||||||||||
| LUXEMBOURG 0.7% |
| |||||||||||
| BANKING & FINANCE 0.2% |
| |||||||||||
Emerald Bay S.A. |
| |||||||||||
0.000% due 10/08/2020 (f) | EUR | 4 | $ | 4 | ||||||||
Sberbank of Russia Via SB Capital S.A. |
| |||||||||||
3.352% due 11/15/2019 | 200 | 240 | ||||||||||
6.125% due 02/07/2022 | $ | 400 | 419 | |||||||||
|
| |||||||||||
| 663 | ||||||||||||
|
| |||||||||||
| INDUSTRIALS 0.1% |
| |||||||||||
Intelsat Jackson Holdings S.A. |
| |||||||||||
9.750% due 07/15/2025 | 18 | 19 | ||||||||||
7.250% due 10/15/2020 | 186 | 186 | ||||||||||
7.500% due 04/01/2021 | 22 | 22 | ||||||||||
5.500% due 08/01/2023 | 28 | 25 | ||||||||||
|
| |||||||||||
| 252 | ||||||||||||
|
| |||||||||||
| UTILITIES 0.4% |
| |||||||||||
Gazprom Neft OAO Via GPN Capital S.A. |
| |||||||||||
4.375% due 09/19/2022 | 300 | 294 | ||||||||||
6.000% due 11/27/2023 | 300 | 313 | ||||||||||
Gazprom OAO Via Gaz Capital S.A. |
| |||||||||||
9.250% due 04/23/2019 | 600 | 627 | ||||||||||
5.999% due 01/23/2021 | 30 | 31 | ||||||||||
|
| |||||||||||
| 1,265 | ||||||||||||
|
| |||||||||||
Total Luxembourg | 2,180 | |||||||||||
|
| |||||||||||
| MEXICO 0.0% |
| |||||||||||
| INDUSTRIALS 0.0% |
| |||||||||||
Corp. GEO S.A.B. de C.V. |
| |||||||||||
9.250% due 06/30/2020 ^(c) | 100 | 0 | ||||||||||
8.875% due 03/27/2022 ^(c) | 300 | 0 | ||||||||||
Petroleos Mexicanos |
| |||||||||||
6.750% due 09/21/2047 | 10 | 9 | ||||||||||
6.500% due 03/13/2027 | 40 | 41 | ||||||||||
|
| |||||||||||
| 50 | ||||||||||||
|
| |||||||||||
Total Mexico | 50 | |||||||||||
|
| |||||||||||
| NETHERLANDS 0.1% |
| |||||||||||
| BANKING & FINANCE 0.1% |
| |||||||||||
Cooperatieve Rabobank UA |
| |||||||||||
6.625% due 06/29/2021 •(i)(j) | EUR | 200 | 263 | |||||||||
Stichting AK Rabobank Certificaten |
| |||||||||||
6.500% (i) | 25 | 35 | ||||||||||
|
| |||||||||||
| 298 | ||||||||||||
|
| |||||||||||
Total Netherlands | 298 | |||||||||||
|
| |||||||||||
| NORWAY 0.0% |
| |||||||||||
| INDUSTRIALS 0.0% |
| |||||||||||
Yara International ASA |
| |||||||||||
4.750% due 06/01/2028 | $ | 20 | 20 | |||||||||
|
| |||||||||||
Total Norway | 20 | |||||||||||
|
| |||||||||||
| SPAIN 0.2% |
| |||||||||||
| BANKING & FINANCE 0.2% |
| |||||||||||
Banco Bilbao Vizcaya Argentaria S.A. |
| |||||||||||
6.750% due 02/18/2020 •(i)(j) | EUR | 400 | 487 | |||||||||
Banco Santander S.A. |
| |||||||||||
6.250% due 09/11/2021 •(i)(j) | 100 | 123 | ||||||||||
|
| |||||||||||
| 610 | ||||||||||||
|
| |||||||||||
Total Spain | 610 | |||||||||||
|
| |||||||||||
| 26 | PIMCO EQUITY SERIES | See Accompanying Notes |
Table of Contents
June 30, 2018
| PRINCIPAL AMOUNT (000S) | MARKET VALUE (000S) | |||||||||||
| UNITED KINGDOM 1.7% |
| |||||||||||
| BANKING & FINANCE 1.4% |
| |||||||||||
Barclays Bank PLC |
| |||||||||||
7.625% due 11/21/2022 (j) | $ | 430 | $ | 464 | ||||||||
14.000% due 06/15/2019 •(i) | GBP | 300 | 439 | |||||||||
HSBC Holdings PLC |
| |||||||||||
6.000% due 09/29/2023 •(i)(j) | EUR | 320 | 419 | |||||||||
3.600% due 05/25/2023 | $ | 200 | 198 | |||||||||
Lloyds Banking Group PLC |
| |||||||||||
7.625% due 06/27/2023 •(i)(j) | GBP | 200 | 289 | |||||||||
7.875% due 06/27/2029 •(i)(j) | 200 | 307 | ||||||||||
Nationwide Building Society |
| |||||||||||
10.250% ~(i) | 1 | 227 | ||||||||||
Royal Bank of Scotland Group PLC |
| |||||||||||
2.500% due 03/22/2023 | EUR | 350 | 431 | |||||||||
7.500% due 08/10/2020 •(i)(j) | $ | 360 | 368 | |||||||||
Santander UK Group Holdings PLC |
| |||||||||||
4.750% due 09/15/2025 | 460 | 450 | ||||||||||
Tesco Property Finance PLC |
| |||||||||||
6.052% due 10/13/2039 | GBP | 405 | 633 | |||||||||
|
| |||||||||||
| 4,225 | ||||||||||||
|
| |||||||||||
| INDUSTRIALS 0.3% |
| |||||||||||
EI Group PLC |
| |||||||||||
6.875% due 02/15/2021 | 200 | 287 | ||||||||||
Marston’s Issuer PLC |
| |||||||||||
5.641% due 07/15/2035 • | 200 | 239 | ||||||||||
Mitchells & Butlers Finance PLC |
| |||||||||||
1.081% (BP0003M + 0.450%) due 12/15/2030 ~ | 134 | 168 | ||||||||||
Spirit Issuer PLC |
| |||||||||||
6.582% due 12/28/2027 | 138 | 187 | ||||||||||
3.368% (BP0003M + 2.700%) due 12/28/2031 ~ | 22 | 29 | ||||||||||
Unique Pub Finance Co. PLC |
| |||||||||||
5.659% due 06/30/2027 | 44 | 64 | ||||||||||
|
| |||||||||||
| 974 | ||||||||||||
|
| |||||||||||
| UTILITIES 0.0% |
| |||||||||||
Vodafone Group PLC |
| |||||||||||
3.750% due 01/16/2024 | $ | 22 | 22 | |||||||||
4.125% due 05/30/2025 | 10 | 10 | ||||||||||
4.375% due 05/30/2028 | 20 | 19 | ||||||||||
3.290% due 01/16/2024 ~ | 16 | 16 | ||||||||||
|
| |||||||||||
| 67 | ||||||||||||
|
| |||||||||||
Total United Kingdom | 5,266 | |||||||||||
|
| |||||||||||
| UNITED STATES 3.2% |
| |||||||||||
| BANKING & FINANCE 1.7% |
| |||||||||||
American International Group, Inc. |
| |||||||||||
4.200% due 04/01/2028 | 6 | 6 | ||||||||||
5.750% due 04/01/2048 • | 18 | 18 | ||||||||||
American Tower Corp. |
| |||||||||||
3.000% due 06/15/2023 | 16 | 15 | ||||||||||
Assurant, Inc. |
| |||||||||||
4.200% due 09/27/2023 | 8 | 8 | ||||||||||
AXA Equitable Holdings, Inc. |
| |||||||||||
3.900% due 04/20/2023 | 2 | 2 | ||||||||||
4.350% due 04/20/2028 | 18 | 17 | ||||||||||
5.000% due 04/20/2048 | 10 | 9 | ||||||||||
Bank of America Corp. |
| |||||||||||
5.875% due 03/15/2028 •(i) | 428 | 419 | ||||||||||
Boston Properties LP |
| |||||||||||
3.200% due 01/15/2025 | 8 | 8 | ||||||||||
Brighthouse Financial, Inc. |
| |||||||||||
3.700% due 06/22/2027 | 12 | 11 | ||||||||||
Cantor Fitzgerald LP |
| |||||||||||
7.875% due 10/15/2019 | 280 | 293 | ||||||||||
| PRINCIPAL AMOUNT (000S) | MARKET VALUE (000S) | |||||||||||
CIT Group, Inc. |
| |||||||||||
4.125% due 03/09/2021 | $ | 8 | $ | 8 | ||||||||
5.250% due 03/07/2025 | 8 | 8 | ||||||||||
Crown Castle International Corp. |
| |||||||||||
4.000% due 03/01/2027 | 8 | 8 | ||||||||||
3.200% due 09/01/2024 | 10 | 9 | ||||||||||
3.650% due 09/01/2027 | 44 | 41 | ||||||||||
CTR Partnership LP |
| |||||||||||
5.250% due 06/01/2025 | 12 | 11 | ||||||||||
Digital Realty Trust LP |
| |||||||||||
3.700% due 08/15/2027 | 2 | 2 | ||||||||||
ERP Operating LP |
| |||||||||||
3.250% due 08/01/2027 | 4 | 4 | ||||||||||
3.500% due 03/01/2028 | 6 | 6 | ||||||||||
Fortress Transportation & Infrastructure Investors LLC |
| |||||||||||
6.750% due 03/15/2022 | 16 | 16 | ||||||||||
Freedom Mortgage Corp. |
| |||||||||||
8.250% due 04/15/2025 | 14 | 14 | ||||||||||
Howard Hughes Corp. |
| |||||||||||
5.375% due 03/15/2025 | 27 | 26 | ||||||||||
Hudson Pacific Properties LP |
| |||||||||||
3.950% due 11/01/2027 | 5 | 5 | ||||||||||
Hunt Cos., Inc. |
| |||||||||||
6.250% due 02/15/2026 | 2 | 2 | ||||||||||
International Lease Finance Corp. |
| |||||||||||
7.125% due 09/01/2018 | 325 | 327 | ||||||||||
6.250% due 05/15/2019 | 1,110 | 1,138 | ||||||||||
iStar, Inc. |
| |||||||||||
4.625% due 09/15/2020 | 2 | 2 | ||||||||||
5.250% due 09/15/2022 | 7 | 7 | ||||||||||
Kennedy-Wilson, Inc. |
| |||||||||||
5.875% due 04/01/2024 | 10 | 10 | ||||||||||
Life Storage LP |
| |||||||||||
3.875% due 12/15/2027 | 4 | 4 | ||||||||||
MetLife, Inc. |
| |||||||||||
5.875% due 03/15/2028 •(i) | 20 | 20 | ||||||||||
Navient Corp. |
| |||||||||||
6.500% due 06/15/2022 | 66 | 68 | ||||||||||
8.000% due 03/25/2020 | 600 | 634 | ||||||||||
Oppenheimer Holdings, Inc. |
| |||||||||||
6.750% due 07/01/2022 | 6 | 6 | ||||||||||
Physicians Realty LP |
| |||||||||||
3.950% due 01/15/2028 | 8 | 7 | ||||||||||
Provident Funding Associates LP |
| |||||||||||
6.375% due 06/15/2025 | 4 | 4 | ||||||||||
Santander Holdings USA, Inc. |
| |||||||||||
4.400% due 07/13/2027 | 7 | 7 | ||||||||||
3.400% due 01/18/2023 | 8 | 8 | ||||||||||
3.700% due 03/28/2022 | 6 | 6 | ||||||||||
SL Green Operating Partnership LP |
| |||||||||||
3.250% due 10/15/2022 | 2 | 2 | ||||||||||
Springleaf Finance Corp. |
| |||||||||||
6.125% due 05/15/2022 | 292 | 299 | ||||||||||
5.625% due 03/15/2023 | 200 | 199 | ||||||||||
6.875% due 03/15/2025 | 48 | 48 | ||||||||||
7.125% due 03/15/2026 | 74 | 74 | ||||||||||
8.250% due 12/15/2020 | 980 | 1,061 | ||||||||||
Starwood Property Trust, Inc. |
| |||||||||||
4.750% due 03/15/2025 | 10 | 10 | ||||||||||
STORE Capital Corp. |
| |||||||||||
4.500% due 03/15/2028 | 6 | 6 | ||||||||||
UDR, Inc. |
| |||||||||||
4.625% due 01/10/2022 | 2 | 2 | ||||||||||
3.500% due 01/15/2028 | 6 | 6 | ||||||||||
VEREIT Operating Partnership LP |
| |||||||||||
3.950% due 08/15/2027 | 8 | 7 | ||||||||||
Vornado Realty LP |
| |||||||||||
3.500% due 01/15/2025 | 4 | 4 | ||||||||||
Welltower, Inc. |
| |||||||||||
4.250% due 04/15/2028 | 4 | 4 | ||||||||||
WeWork Cos., Inc. |
| |||||||||||
7.875% due 05/01/2025 | 10 | 10 | ||||||||||
|
| |||||||||||
| 4,946 | ||||||||||||
|
| |||||||||||
| PRINCIPAL AMOUNT (000S) | MARKET VALUE (000S) | |||||||||||
| INDUSTRIALS 1.2% |
| |||||||||||
American Airlines Pass-Through Trust |
| |||||||||||
3.350% due 04/15/2031 | $ | 10 | $ | 10 | ||||||||
Andeavor Logistics LP |
| |||||||||||
3.500% due 12/01/2022 | 2 | 2 | ||||||||||
4.250% due 12/01/2027 | 2 | 2 | ||||||||||
Anthem, Inc. |
| |||||||||||
4.101% due 03/01/2028 | 4 | 4 | ||||||||||
Arrow Electronics, Inc. |
| |||||||||||
3.250% due 09/08/2024 | 6 | 6 | ||||||||||
BMC Software Finance, Inc. |
| |||||||||||
8.125% due 07/15/2021 | 78 | 80 | ||||||||||
Booking Holdings, Inc. |
| |||||||||||
3.550% due 03/15/2028 | 8 | 8 | ||||||||||
Broadcom Corp. |
| |||||||||||
3.000% due 01/15/2022 | 68 | 66 | ||||||||||
3.625% due 01/15/2024 | 6 | 6 | ||||||||||
3.875% due 01/15/2027 | 20 | 19 | ||||||||||
Campbell Soup Co. |
| |||||||||||
2.835% due 03/16/2020 ~ | 20 | 20 | ||||||||||
2.971% due 03/15/2021 ~ | 10 | 10 | ||||||||||
3.300% due 03/15/2021 | 8 | 8 | ||||||||||
3.650% due 03/15/2023 | 20 | 20 | ||||||||||
3.950% due 03/15/2025 | 20 | 19 | ||||||||||
4.150% due 03/15/2028 | 20 | 19 | ||||||||||
Centene Escrow Corp. |
| |||||||||||
5.375% due 06/01/2026 | 26 | 26 | ||||||||||
CH Robinson Worldwide, Inc. |
| |||||||||||
4.200% due 04/15/2028 | 10 | 10 | ||||||||||
Charles River Laboratories International, Inc. |
| |||||||||||
5.500% due 04/01/2026 | 4 | 4 | ||||||||||
Charter Communications Operating LLC |
| |||||||||||
4.200% due 03/15/2028 | 19 | 18 | ||||||||||
4.043% due 02/01/2024 ~(a) | 18 | 18 | ||||||||||
4.500% due 02/01/2024 (a) | 10 | 10 | ||||||||||
Cheniere Energy Partners LP |
| |||||||||||
5.250% due 10/01/2025 | 2 | 2 | ||||||||||
Clear Channel Worldwide Holdings, Inc. |
| |||||||||||
7.625% due 03/15/2020 | 10 | 10 | ||||||||||
6.500% due 11/15/2022 | 3 | 3 | ||||||||||
Cleveland-Cliffs, Inc. |
| |||||||||||
4.875% due 01/15/2024 | 4 | 4 | ||||||||||
Community Health Systems, Inc. |
| |||||||||||
6.250% due 03/31/2023 | 88 | 81 | ||||||||||
5.125% due 08/01/2021 | 80 | 74 | ||||||||||
8.625% due 01/15/2024 (a) | 50 | 50 | ||||||||||
CVS Health Corp. |
| |||||||||||
3.700% due 03/09/2023 | 28 | 28 | ||||||||||
4.300% due 03/25/2028 | 60 | 59 | ||||||||||
CVS Pass-Through Trust |
| |||||||||||
8.353% due 07/10/2031 | 500 | 605 | ||||||||||
DAE Funding LLC |
| |||||||||||
4.500% due 08/01/2022 | 10 | 10 | ||||||||||
5.000% due 08/01/2024 | 22 | 21 | ||||||||||
4.000% due 08/01/2020 | 10 | 10 | ||||||||||
Diamond Resorts International, Inc. |
| |||||||||||
7.750% due 09/01/2023 | 103 | 108 | ||||||||||
Discovery Communications LLC |
| |||||||||||
2.950% due 03/20/2023 | 5 | 5 | ||||||||||
3.950% due 03/20/2028 | 6 | 6 | ||||||||||
Energizer Gamma Acquisition, Inc. |
| |||||||||||
6.375% due 07/15/2026 (a) | 2 | 2 | ||||||||||
Energy Transfer Partners LP |
| |||||||||||
4.200% due 09/15/2023 | 8 | 8 | ||||||||||
6.000% due 06/15/2048 | 6 | 6 | ||||||||||
4.950% due 06/15/2028 | 12 | 12 | ||||||||||
EQT Corp. |
| |||||||||||
3.107% due 10/01/2020 ~ | 15 | 15 | ||||||||||
Equifax, Inc. |
| |||||||||||
3.600% due 08/15/2021 | 4 | 4 | ||||||||||
3.200% due 08/15/2021 ~ | 12 | 12 | ||||||||||
Exela Intermediate LLC |
| |||||||||||
10.000% due 07/15/2023 | 16 | 16 | ||||||||||
| See Accompanying Notes | ANNUAL REPORT | JUNE 30, 2018 | 27 |
Table of Contents
Schedule of Investments PIMCO Dividend and Income Fund (Cont.)
| PRINCIPAL AMOUNT (000S) | MARKET VALUE (000S) | |||||||||||
General Electric Co. |
| |||||||||||
5.000% due 01/21/2021 •(i) | $ | 176 | $ | 174 | ||||||||
General Mills, Inc. |
| |||||||||||
2.893% due 04/16/2021 ~ | 17 | 17 | ||||||||||
3.200% due 04/16/2021 | 3 | 3 | ||||||||||
4.200% due 04/17/2028 | 4 | 4 | ||||||||||
Hadrian Merger Sub, Inc. |
| |||||||||||
8.500% due 05/01/2026 | 10 | 10 | ||||||||||
Harland Clarke Holdings Corp. |
| |||||||||||
8.375% due 08/15/2022 | 6 | 6 | ||||||||||
Hilton Domestic Operating Co., Inc. |
| |||||||||||
5.125% due 05/01/2026 | 16 | 16 | ||||||||||
iHeartCommunications, Inc. |
| |||||||||||
10.625% due 03/15/2023 ^(c) | 4 | 3 | ||||||||||
11.250% due 03/01/2021 ^(c) | 60 | 45 | ||||||||||
9.000% due 03/01/2021 ^(c) | 19 | 14 | ||||||||||
9.000% due 12/15/2019 ^(c) | 80 | 61 | ||||||||||
9.000% due 09/15/2022 ^(c) | 403 | 308 | ||||||||||
Intrepid Aviation Group Holdings LLC |
| |||||||||||
6.875% due 02/15/2019 | 10 | 10 | ||||||||||
Live Nation Entertainment, Inc. |
| |||||||||||
5.625% due 03/15/2026 | 4 | 4 | ||||||||||
Matterhorn Merger Sub LLC |
| |||||||||||
8.500% due 06/01/2026 | 20 | 19 | ||||||||||
NetApp, Inc. |
| |||||||||||
3.300% due 09/29/2024 | 7 | 7 | ||||||||||
PetSmart, Inc. |
| |||||||||||
5.875% due 06/01/2025 | 16 | 12 | ||||||||||
Pisces Midco, Inc. |
| |||||||||||
8.000% due 04/15/2026 | 23 | 22 | ||||||||||
Pitney Bowes, Inc. |
| |||||||||||
4.700% due 04/01/2023 | 6 | 5 | ||||||||||
Radiate Holdco LLC |
| |||||||||||
6.875% due 02/15/2023 | 10 | 10 | ||||||||||
Scientific Games International, Inc. |
| |||||||||||
5.000% due 10/15/2025 | 2 | 2 | ||||||||||
Standard Industries, Inc. |
| |||||||||||
4.750% due 01/15/2028 | 10 | 9 | ||||||||||
Sunoco LP |
| |||||||||||
4.875% due 01/15/2023 | 8 | 8 | ||||||||||
Tech Data Corp. |
| |||||||||||
3.700% due 02/15/2022 | 5 | 5 | ||||||||||
4.950% due 02/15/2027 | 6 | 6 | ||||||||||
Tenet Healthcare Corp. |
| |||||||||||
4.625% due 07/15/2024 | 34 | 32 | ||||||||||
Textron, Inc. |
| |||||||||||
2.903% due 11/10/2020 ~ | 40 | 40 | ||||||||||
Time Warner Cable LLC |
| |||||||||||
6.750% due 07/01/2018 | 500 | 500 | ||||||||||
5.000% due 02/01/2020 | 600 | 613 | ||||||||||
Univision Communications, Inc. |
| |||||||||||
5.125% due 02/15/2025 | 100 | 93 | ||||||||||
ViaSat, Inc. |
| |||||||||||
5.625% due 09/15/2025 | 8 | 7 | ||||||||||
VMware, Inc. |
| |||||||||||
2.300% due 08/21/2020 | 10 | 10 | ||||||||||
2.950% due 08/21/2022 | 10 | 10 | ||||||||||
3.900% due 08/21/2027 | 10 | 9 | ||||||||||
Warner Media LLC |
| |||||||||||
3.800% due 02/15/2027 | 14 | 13 | ||||||||||
Western Digital Corp. |
| |||||||||||
4.750% due 02/15/2026 | 40 | 39 | ||||||||||
Wyndham Destinations, Inc. |
| |||||||||||
4.500% due 04/01/2027 | 6 | 6 | ||||||||||
4.150% due 04/01/2024 | 5 | 5 | ||||||||||
|
| |||||||||||
| 3,693 | ||||||||||||
|
| |||||||||||
| UTILITIES 0.3% |
| |||||||||||
AT&T, Inc. |
| |||||||||||
3.298% (US0003M + 0.950%) due 07/15/2021 ~ | 102 | 103 | ||||||||||
5.300% due 08/15/2058 | 22 | 20 | ||||||||||
5.150% due 02/15/2050 | 68 | 64 | ||||||||||
| PRINCIPAL AMOUNT (000S) | MARKET VALUE (000S) | |||||||||||
4.900% due 08/15/2037 | $ | 50 | $ | 48 | ||||||||
5.000% due 03/01/2021 | 2 | 2 | ||||||||||
5.650% due 02/15/2047 | 6 | 6 | ||||||||||
Enable Midstream Partners LP |
| |||||||||||
4.950% due 05/15/2028 | 8 | 8 | ||||||||||
ONEOK, Inc. |
| |||||||||||
4.550% due 07/15/2028 (a) | 10 | 10 | ||||||||||
5.200% due 07/15/2048 (a) | 10 | 10 | ||||||||||
Sprint Communications, Inc. |
| |||||||||||
7.000% due 08/15/2020 | 310 | 322 | ||||||||||
9.000% due 11/15/2018 | 240 | 245 | ||||||||||
Sprint Corp. |
| |||||||||||
7.625% due 03/01/2026 | 40 | 41 | ||||||||||
Verizon Communications, Inc. |
| |||||||||||
5.250% due 03/16/2037 | 50 | 51 | ||||||||||
|
| |||||||||||
| 930 | ||||||||||||
|
| |||||||||||
Total United States | 9,569 | |||||||||||
|
| |||||||||||
| VENEZUELA 0.0% |
| |||||||||||
| INDUSTRIALS 0.0% |
| |||||||||||
Petroleos de Venezuela S.A. |
| |||||||||||
6.000% due 11/15/2026 ^(c) | 300 | 65 | ||||||||||
6.000% due 05/16/2024 ^(c) | 20 | 4 | ||||||||||
9.750% due 05/17/2035 ^(c) | 20 | 5 | ||||||||||
|
| |||||||||||
| 74 | ||||||||||||
|
| |||||||||||
Total Venezuela | 74 | |||||||||||
|
| |||||||||||
Total Corporate Bonds & Notes (Cost $22,579) | 22,304 | |||||||||||
|
| |||||||||||
| NON-AGENCY MORTGAGE-BACKED SECURITIES 3.5% |
| |||||||||||
| UNITED KINGDOM 0.6% |
| |||||||||||
Eurosail PLC |
| |||||||||||
1.577% (BP0003M + 0.950%) due 06/13/2045 ~ | GBP | 1,042 | 1,372 | |||||||||
Grifonas Finance PLC |
| |||||||||||
0.009% (EUR006M + 0.280%) due 08/28/2039 ~ | EUR | 374 | 392 | |||||||||
Juno Eclipse Ltd. |
| |||||||||||
0.000% (EUR003M + 0.180%) due 11/20/2022 ~ | 160 | 185 | ||||||||||
|
| |||||||||||
Total United Kingdom | 1,949 | |||||||||||
|
| |||||||||||
| UNITED STATES 2.9% |
| |||||||||||
Banc of America Alternative Loan Trust |
| |||||||||||
6.000% due 04/25/2036 ^ | $ | 46 | 46 | |||||||||
6.000% due 07/25/2046 ^ | 102 | 92 | ||||||||||
Banc of America Funding Trust |
| |||||||||||
3.742% due 05/20/2036 ^~ | 19 | 18 | ||||||||||
Banc of America Mortgage Trust |
| |||||||||||
3.619% due 11/20/2046 ^~ | 9 | 9 | ||||||||||
6.000% due 10/25/2036 ^ | 24 | 23 | ||||||||||
Bear Stearns Mortgage Funding Trust |
| |||||||||||
7.500% due 08/25/2036 × | 109 | 99 | ||||||||||
Chase Mortgage Finance Trust |
| |||||||||||
3.581% due 09/25/2036 ^~ | 55 | 51 | ||||||||||
Countrywide Alternative Loan Trust |
| |||||||||||
2.791% (US0001M + 0.700%) due 10/25/2037 ^~ | 5,216 | 1,836 | ||||||||||
6.000% due 06/25/2036 ^ | 150 | 126 | ||||||||||
6.000% due 02/25/2037 ^ | 72 | 49 | ||||||||||
6.250% (US0001M + 0.650%) due 12/25/2036 ^~ | 31 | 23 | ||||||||||
Countrywide Home Loan Mortgage Pass-Through Trust |
| |||||||||||
2.591% (US0001M + 0.500%) due 07/25/2037 ^~ | 23 | 14 | ||||||||||
Credit Suisse First Boston Mortgage Securities Corp. |
| |||||||||||
6.000% due 01/25/2036 | 47 | 43 | ||||||||||
Credit Suisse First Boston Mortgage-Backed Pass-through Certificates |
| |||||||||||
6.000% due 11/25/2035 ^ | 380 | 224 | ||||||||||
| PRINCIPAL AMOUNT (000S) | MARKET VALUE (000S) | |||||||||||
Credit Suisse Mortgage Capital Certificates |
| |||||||||||
3.151% due 12/29/2037 ~ | $ | 192 | $ | 160 | ||||||||
First Horizon Alternative Mortgage Securities Trust |
| |||||||||||
4.012% due 06/25/2036 ~ | 416 | 385 | ||||||||||
HSI Asset Loan Obligation Trust |
| |||||||||||
6.000% due 06/25/2037 ^ | 11 | 10 | ||||||||||
JPMorgan Alternative Loan Trust |
| |||||||||||
5.668% due 05/26/2037 «~ | 92 | 79 | ||||||||||
JPMorgan Mortgage Trust |
| |||||||||||
6.500% due 07/25/2036 ^ | 113 | 87 | ||||||||||
Merrill Lynch Mortgage Investors Trust |
| |||||||||||
3.612% due 03/25/2036 ^~ | 18 | 14 | ||||||||||
Residential Accredit Loans, Inc. Trust |
| |||||||||||
2.891% (US0001M + 0.800%) due 10/25/2045 ~ | 109 | 99 | ||||||||||
5.500% due 03/25/2037 | 525 | 475 | ||||||||||
6.250% due 03/25/2037 ^ | 39 | 35 | ||||||||||
Structured Adjustable Rate Mortgage Loan Trust |
| |||||||||||
3.720% due 10/25/2036 ^~ | 2,585 | 2,330 | ||||||||||
Wells Fargo Alternative Loan Trust |
| |||||||||||
4.260% due 07/25/2037 ^~ | 1,386 | 1,298 | ||||||||||
Wells Fargo Commercial Mortgage Trust |
| |||||||||||
3.412% due 09/15/2058 | 1,156 | 1,159 | ||||||||||
|
| |||||||||||
Total United States | 8,784 | |||||||||||
|
| |||||||||||
Total Non-Agency Mortgage-Backed Securities (Cost $11,028) | 10,733 | |||||||||||
|
| |||||||||||
| MUNICIPAL BONDS & NOTES 0.6% |
| |||||||||||
| CALIFORNIA 0.1% |
| |||||||||||
California State Public Works Board Revenue Notes, Series 2011 |
| |||||||||||
5.786% due 12/01/2021 | 617 | 649 | ||||||||||
|
| |||||||||||
Total California | 649 | |||||||||||
|
| |||||||||||
| ILLINOIS 0.1% |
| |||||||||||
Illinois State General Obligation Bonds, (BABs), Series 2010 |
| |||||||||||
6.630% due 02/01/2035 | 15 | 16 | ||||||||||
7.350% due 07/01/2035 | 5 | 6 | ||||||||||
Illinois State General Obligation Bonds, Series 2003 |
| |||||||||||
5.100% due 06/01/2033 | 150 | 142 | ||||||||||
|
| |||||||||||
Total Illinois | 164 | |||||||||||
|
| |||||||||||
| MICHIGAN 0.1% |
| |||||||||||
Michigan Tobacco Settlement Finance Authority Revenue Bonds, Series 2006 |
| |||||||||||
7.309% due 06/01/2034 | 205 | 209 | ||||||||||
|
| |||||||||||
Total Michigan | 209 | |||||||||||
|
| |||||||||||
| PUERTO RICO 0.1% |
| |||||||||||
Commonwealth of Puerto Rico General Obligation Bonds, Series 2001 |
| |||||||||||
5.125% due 07/01/2031 ^(c) | 30 | 13 | ||||||||||
Commonwealth of Puerto Rico General Obligation Bonds, Series 2007 |
| |||||||||||
5.250% due 07/01/2034 ^(c) | 5 | 2 | ||||||||||
5.250% due 07/01/2037 ^(c) | 5 | 2 | ||||||||||
Commonwealth of Puerto Rico General Obligation Bonds, Series 2008 |
| |||||||||||
5.500% due 07/01/2032 ^(c) | 20 | 9 | ||||||||||
5.700% due 07/01/2023 ^(c) | 10 | 4 | ||||||||||
Commonwealth of Puerto Rico General Obligation Bonds, Series 2009 |
| |||||||||||
6.000% due 07/01/2039 ^(c) | 5 | 2 | ||||||||||
Commonwealth of Puerto Rico General Obligation Bonds, Series 2011 |
| |||||||||||
5.375% due 07/01/2030 ^(c) | 10 | 4 | ||||||||||
| 28 | PIMCO EQUITY SERIES | See Accompanying Notes |
Table of Contents
June 30, 2018
| PRINCIPAL AMOUNT (000S) | MARKET VALUE (000S) | |||||||||||
Commonwealth of Puerto Rico General Obligation Bonds, Series 2012 |
| |||||||||||
5.000% due 07/01/2041 ^(c) | $ | 120 | $ | 49 | ||||||||
5.125% due 07/01/2037 ^(c) | 10 | 4 | ||||||||||
5.500% due 07/01/2039 ^(c) | 125 | 53 | ||||||||||
Commonwealth of Puerto Rico General Obligation Notes, Series 2012 |
| |||||||||||
5.000% due 07/01/2021 ^(c) | 10 | 4 | ||||||||||
Puerto Rico Electric Power Authority Revenue Bonds, (BABs), Series 2010 |
| |||||||||||
6.125% due 07/01/2040 ^(c) | 100 | 42 | ||||||||||
|
| |||||||||||
Total Puerto Rico | 188 | |||||||||||
|
| |||||||||||
| VIRGINIA 0.1% |
| |||||||||||
Tobacco Settlement Financing Corp., Virginia Revenue Bonds, Series 2007 |
| |||||||||||
6.706% due 06/01/2046 | 385 | 382 | ||||||||||
|
| |||||||||||
Total Virginia | 382 | |||||||||||
|
| |||||||||||
| WEST VIRGINIA 0.1% |
| |||||||||||
Tobacco Settlement Finance Authority, West Virginia Revenue Bonds, Series 2007 |
| |||||||||||
7.467% due 06/01/2047 | 355 | 355 | ||||||||||
|
| |||||||||||
Total West Virginia | 355 | |||||||||||
|
| |||||||||||
Total Municipal Bonds & Notes | 1,947 | |||||||||||
|
| |||||||||||
| SHARES | ||||||||||||
| PREFERRED STOCKS 0.5% |
| |||||||||||
| GERMANY 0.5% |
| |||||||||||
| INDUSTRIALS 0.5% |
| |||||||||||
Schaeffler AG | 1,645 | 21 | ||||||||||
Volkswagen AG | 9,455 | 1,562 | ||||||||||
|
| |||||||||||
| 1,583 | ||||||||||||
|
| |||||||||||
Total Preferred Stocks (Cost $1,332) | 1,583 | |||||||||||
|
| |||||||||||
| REAL ESTATE INVESTMENT TRUSTS 0.6% |
| |||||||||||
| CANADA 0.1% |
| |||||||||||
| REAL ESTATE 0.1% |
| |||||||||||
Artis Real Estate Investment Trust | 5,580 | 56 | ||||||||||
Cominar Real Estate Investment Trust | 16,451 | 160 | ||||||||||
Dream Office Real Estate Investment Trust | 13,050 | 233 | ||||||||||
|
| |||||||||||
| 449 | ||||||||||||
|
| |||||||||||
Total Canada | 449 | |||||||||||
|
| |||||||||||
| UNITED STATES 0.5% |
| |||||||||||
| FINANCIALS 0.2% |
| |||||||||||
AGNC Investment Corp. | 7,674 | 142 | ||||||||||
Annaly Capital Management, Inc. | 27,885 | 287 | ||||||||||
Granite Point Mortgage Trust, Inc. | 1,521 | 28 | ||||||||||
Two Harbors Investment Corp. | 3,464 | 55 | ||||||||||
|
| |||||||||||
| 512 | ||||||||||||
|
| |||||||||||
| REAL ESTATE 0.3% |
| |||||||||||
CoreCivic, Inc. | 11,808 | 282 | ||||||||||
Hospitality Properties Trust | 1,685 | 48 | ||||||||||
Iron Mountain, Inc. | 2,984 | 104 | ||||||||||
| SHARES | MARKET VALUE (000S) | |||||||||||
VICI Properties, Inc. | 26,432 | $ | 546 | |||||||||
|
| |||||||||||
| 980 | ||||||||||||
|
| |||||||||||
| Total United States | 1,492 | |||||||||||
|
| |||||||||||
Total Real Estate Investment Trusts | 1,941 | |||||||||||
|
| |||||||||||
| RIGHTS 0.0% |
| |||||||||||
| SPAIN 0.0% |
| |||||||||||
| INDUSTRIALS 0.0% |
| |||||||||||
ACS Actividades de Construccion y Servicios S.A. - Exp. 07/11/2018 | 17,784 | 18 | ||||||||||
|
| |||||||||||
Total Rights (Cost $19) | 18 | |||||||||||
|
| |||||||||||
| PRINCIPAL AMOUNT (000S) | ||||||||||||
| SOVEREIGN ISSUES 1.0% |
| |||||||||||
| ARGENTINA 0.3% |
| |||||||||||
Argentina Government International Bond |
| |||||||||||
2.260% due 12/31/2038 × | EUR | 135 | 93 | |||||||||
7.820% due 12/31/2033 | 227 | 265 | ||||||||||
22.844% (BADLARPP) due 10/04/2022 ~ | ARS | 28 | 1 | |||||||||
34.188% (BADLARPP + 2.000%) due 04/03/2022 ~ | 2,600 | 82 | ||||||||||
34.660% (BADLARPP + 3.250%) due 03/01/2020 ~ | 400 | 14 | ||||||||||
40.000% due 06/21/2020 ~ | 11,314 | 408 | ||||||||||
|
| |||||||||||
Total Argentina | 863 | |||||||||||
|
| |||||||||||
| BRAZIL 0.1% |
| |||||||||||
Brazil Notas do Tesouro Nacional |
| |||||||||||
6.000% due 05/15/2045 (h) | BRL | 1,303 | 340 | |||||||||
|
| |||||||||||
Total Brazil | 340 | |||||||||||
|
| |||||||||||
| GREECE 0.1% |
| |||||||||||
Republic of Greece Government International Bond |
| |||||||||||
4.750% due 04/17/2019 | EUR | 200 | 241 | |||||||||
|
| |||||||||||
Total Greece | 241 | |||||||||||
|
| |||||||||||
| KUWAIT 0.1% |
| |||||||||||
Kuwait International Government Bond |
| |||||||||||
3.500% due 03/20/2027 | $ | 385 | 376 | |||||||||
|
| |||||||||||
Total Kuwait | 376 | |||||||||||
|
| |||||||||||
| PERU 0.1% |
| |||||||||||
Peru Government International Bond |
| |||||||||||
6.150% due 08/12/2032 | PEN | 260 | 82 | |||||||||
6.900% due 08/12/2037 | 7 | 2 | ||||||||||
6.950% due 08/12/2031 | 100 | 33 | ||||||||||
|
| |||||||||||
Total Peru | 117 | |||||||||||
|
| |||||||||||
| SAUDI ARABIA 0.3% |
| |||||||||||
Saudi Government International Bond |
| |||||||||||
2.875% due 03/04/2023 | $ | 200 | 193 | |||||||||
4.000% due 04/17/2025 | 400 | 398 | ||||||||||
4.500% due 10/26/2046 | 200 | 185 | ||||||||||
4.625% due 10/04/2047 | 200 | 187 | ||||||||||
|
| |||||||||||
Total Saudi Arabia | 963 | |||||||||||
|
| |||||||||||
| SPAIN 0.0% |
| |||||||||||
Autonomous Community of Catalonia |
| |||||||||||
4.900% due 09/15/2021 | EUR | 50 | 63 | |||||||||
|
| |||||||||||
Total Spain | 63 | |||||||||||
|
| |||||||||||
| PRINCIPAL AMOUNT (000S) | MARKET VALUE (000S) | |||||||||||
| VENEZUELA 0.0% |
| |||||||||||
Venezuela Government International Bond |
| |||||||||||
6.000% due 12/09/2020 ^(c) | $ | 100 | $ | 27 | ||||||||
9.250% due 09/15/2027 ^(c) | 44 | 12 | ||||||||||
|
| |||||||||||
| Total Venezuela | 39 | |||||||||||
|
| |||||||||||
| Total Sovereign Issues (Cost $3,612) | 3,002 | |||||||||||
|
| |||||||||||
| U.S. GOVERNMENT AGENCIES 3.5% |
| |||||||||||
| UNITED STATES 3.5% |
| |||||||||||
Fannie Mae |
| |||||||||||
3.000% due 11/01/2029 | 27 | 27 | ||||||||||
Fannie Mae, TBA |
| |||||||||||
3.000% due 07/01/2048 | 1,500 | 1,453 | ||||||||||
4.000% due 08/01/2048 - | 7,000 | 7,124 | ||||||||||
Freddie Mac, TBA |
| |||||||||||
3.000% due 07/01/2048 | 2,000 | 1,935 | ||||||||||
|
| |||||||||||
Total U.S. Government Agencies (Cost $10,486) | 10,539 | |||||||||||
|
| |||||||||||
| U.S. TREASURY OBLIGATIONS 8.8% |
| |||||||||||
| UNITED STATES 8.8% |
| |||||||||||
U.S. Treasury Bonds |
| |||||||||||
2.875% due 11/15/2046 | 1,000 | 978 | ||||||||||
U.S. Treasury Notes |
| |||||||||||
1.750% due 03/31/2022 | 300 | 290 | ||||||||||
1.750% due 05/15/2022 | 300 | 290 | ||||||||||
1.750% due 09/30/2022 | 500 | 481 | ||||||||||
1.750% due 05/15/2023 | 700 | 669 | ||||||||||
1.875% due 01/31/2022 | 1,600 | 1,556 | ||||||||||
1.875% due 02/28/2022 | 1,400 | 1,361 | ||||||||||
1.875% due 08/31/2022 | 500 | 484 | ||||||||||
1.875% due 08/31/2024 | 200 | 190 | ||||||||||
2.000% due 07/31/2022 | 400 | 389 | ||||||||||
2.000% due 05/31/2024 | 200 | 191 | ||||||||||
2.000% due 06/30/2024 (m) | 4,300 | 4,112 | ||||||||||
2.000% due 11/15/2026 | 760 | 712 | ||||||||||
2.125% due 12/31/2021 | 1,500 | 1,473 | ||||||||||
2.125% due 06/30/2022 | 1,000 | 978 | ||||||||||
2.125% due 02/29/2024 | 400 | 386 | ||||||||||
2.125% due 07/31/2024 | �� | 400 | 385 | |||||||||
2.250% due 12/31/2023 | 3,610 | 3,515 | ||||||||||
2.250% due 01/31/2024 | 190 | 185 | ||||||||||
2.250% due 10/31/2024 | 3,500 | 3,388 | ||||||||||
2.250% due 11/15/2024 | 300 | 290 | ||||||||||
2.250% due 02/15/2027 | 500 | 477 | ||||||||||
2.500% due 05/15/2024 | 500 | 492 | ||||||||||
2.500% due 01/31/2025 | 3,200 | 3,141 | ||||||||||
2.750% due 02/15/2028 | 400 | 397 | ||||||||||
|
| |||||||||||
Total U.S. Treasury Obligations | 26,810 | |||||||||||
|
| |||||||||||
| SHORT-TERM INSTRUMENTS 1.1% |
| |||||||||||
| CERTIFICATES OF DEPOSIT 0.1% |
| |||||||||||
Barclays Bank PLC |
| |||||||||||
1.940% due 09/04/2018 | 300 | 300 | ||||||||||
|
| |||||||||||
| COMMERCIAL PAPER 0.3% |
| |||||||||||
HP, Inc. |
| |||||||||||
2.566% due 07/02/2018 | 800 | 800 | ||||||||||
|
| |||||||||||
| REPURCHASE AGREEMENTS (l) 0.5% |
| |||||||||||
| 1,419 | ||||||||||||
|
| |||||||||||
| See Accompanying Notes | ANNUAL REPORT | JUNE 30, 2018 | 29 |
Table of Contents
Schedule of Investments PIMCO Dividend and Income Fund (Cont.)
| PRINCIPAL AMOUNT (000S) | MARKET VALUE (000S) | |||||||||||
| SHORT-TERM NOTES 0.0% |
| |||||||||||
Letras del Banco Central de la Republica Argentina |
| |||||||||||
25.600% due 07/18/2018 (g) | ARS | 1,044 | $ | 35 | ||||||||
25.650% due 08/15/2018 (g) | 1,640 | 54 | ||||||||||
33.500% due 07/18/2018 (g) | 50 | 2 | ||||||||||
|
| |||||||||||
Total Short-Term Notes (Cost $131) |
| 91 | ||||||||||
|
| |||||||||||
| GREECE TREASURY BILLS 0.1% |
| |||||||||||
0.957% due 10/05/2018 - | EUR | 168 | 196 | |||||||||
|
| |||||||||||
| ARGENTINA TREASURY BILLS 0.1% |
| |||||||||||
22.918% due 09/14/2018 - | ARS | 7,986 | 261 | |||||||||
2.919% due 07/13/2018 - | $ | 99 | 99 | |||||||||
|
| |||||||||||
Total Argentina Treasury Bills | 360 | |||||||||||
|
| |||||||||||
| Total Short-Term Instruments (Cost $3,351) | 3,166 | |||||||||||
|
| |||||||||||
| Total Investments in Securities (Cost $300,964) | 320,099 | |||||||||||
|
| |||||||||||
| SHARES | MARKET VALUE (000S) | |||||||||||
| INVESTMENTS IN AFFILIATES 0.7% |
| |||||||||||
| SHORT-TERM INSTRUMENTS 0.7% |
| |||||||||||
| CENTRAL FUNDS USED FOR CASH MANAGEMENT PURPOSES 0.7% |
| |||||||||||
PIMCO Short-Term | 202,994 | $ | 2,007 | |||||||||
|
| |||||||||||
| Total Short-Term Instruments (Cost $2,007) | 2,007 | |||||||||||
|
| |||||||||||
| Total Investments in Affiliates (Cost $2,007) | 2,007 | |||||||||||
| Total Investments 105.9% (Cost $302,971) | $ | 322,106 | ||||||||||
Financial Derivative (Cost or Premiums, net $(155)) | (156 | ) | ||||||||||
| Other Assets and Liabilities, net (5.9)% |
| (17,893 | ) | |||||||||
|
| |||||||||||
| Net Assets 100.0% | $ | 304,057 | ||||||||||
|
| |||||||||||
NOTES TO SCHEDULE OF INVESTMENTS:
| * | A zero balance may reflect actual amounts rounding to less than one thousand. |
| ^ | Security is in default. |
| « | Security valued using significant unobservable inputs (Level 3). |
| ∎ | All or a portion of this amount represent unfunded loan commitments. The interest rate for the unfunded portion will be determined at the time of funding. See Note 4, Securities and Other Investments, in the Notes to Financial Statements for more information regarding unfunded loan commitments. |
| ~ | Variable or Floating rate security. Rate shown is the rate in effect as of period end. Certain variable rate securities are not based on a published reference rate and spread, rather are determined by the issuer or agent and are based on current market conditions. Reference rate is as of reset date, which may vary by security. These securities may not indicate a reference rate and/or spread in their description. |
| • | Rate shown is the rate in effect as of period end. The rate may be based on a fixed rate, a capped rate or a floor rate and may convert to a variable or floating rate in the future. These securities do not indicate a reference rate and spread in their description. |
| × | Coupon represents a rate which changes periodically based on a predetermined schedule. Rate shown is the rate in effect as of period end. |
| (a) | When-issued security. |
| (b) | Payment in-kind security. |
| (c) | Security is not accruing income as of the date of this report. |
| (d) | Security did not produce income within the last twelve months. |
| (e) | Coupon represents a weighted average yield to maturity. |
| (f) | Zero coupon security. |
| (g) | Coupon represents a yield to maturity. |
| (h) | Principal amount of security is adjusted for inflation. |
| (i) | Perpetual maturity; date shown, if applicable, represents next contractual call date. |
| (j) | Contingent convertible security. |
(k) RESTRICTED SECURITIES:
| Issuer Description | Acquisition Date | Cost | Market Value | Market Value as Percentage of Net Assets | ||||||||||
Dommo Energia S.A. | 12/21/2017 - 12/26/2017 | $ | 9 | $ | 95 | 0.03 | % | |||||||
Eneva S.A. | 12/21/2017 | 1 | 1 | 0.00 | ||||||||||
|
|
|
|
|
| |||||||||
| $ | 10 | $ | 96 | 0.03 | % | |||||||||
|
|
|
|
|
| |||||||||
| 30 | PIMCO EQUITY SERIES | See Accompanying Notes |
Table of Contents
June 30, 2018
BORROWINGS AND OTHER FINANCING TRANSACTIONS
(l) REPURCHASE AGREEMENTS:
| Counterparty | Lending Rate | Settlement Date | Maturity Date | Principal Amount | Collateralized By | Collateral (Received) | Repurchase Agreements, at Value | Repurchase Agreement Proceeds to be Received(1) | ||||||||||||||||||||||
| FICC | 1.500 | % | 06/29/2018 | 07/02/2018 | $ | 1,419 | U.S. Treasury Notes 1.875% - 2.125% due 08/15/2021 - 01/31/2022 | $ | (1,454 | ) | $ | 1,419 | $ | 1,419 | ||||||||||||||||
|
|
|
|
|
| |||||||||||||||||||||||||
Total Repurchase Agreements |
| $ | (1,454 | ) | $ | 1,419 | $ | 1,419 | ||||||||||||||||||||||
|
|
|
|
|
| |||||||||||||||||||||||||
REVERSE REPURCHASE AGREEMENTS:
| Counterparty | Borrowing Rate(2) | Settlement Date | Maturity Date | Amount Borrowed(2) | Payable for Reverse Repurchase Agreements | |||||||||||||||
BOS | 2.180 | % | 06/20/2018 | 07/05/2018 | $ | (1,384 | ) | $ | (1,385 | ) | ||||||||||
BSN | 1.960 | 05/02/2018 | 07/10/2018 | (3,520 | ) | (3,532 | ) | |||||||||||||
GRE | 2.170 | 06/18/2018 | 07/18/2018 | (398 | ) | (398 | ) | |||||||||||||
RCY | 2.070 | 05/16/2018 | 07/16/2018 | (1,524 | ) | (1,528 | ) | |||||||||||||
SCX | 2.160 | 06/13/2018 | 08/13/2018 | (3,378 | ) | (3,382 | ) | |||||||||||||
|
| |||||||||||||||||||
Total Reverse Repurchase Agreements |
| $ | (10,225 | ) | ||||||||||||||||
|
| |||||||||||||||||||
SALE-BUYBACK TRANSACTIONS:
| Counterparty | Borrowing Rate(2) | Borrowing Date | Maturity Date | Amount Borrowed(2) | Payable for Sale-Buyback Transactions | |||||||||||||||
UBS | 1.980 | % | 05/07/2018 | 07/12/2018 | $ | (854 | ) | $ | (857 | ) | ||||||||||
|
| |||||||||||||||||||
Total Sale-Buyback Transactions |
| $ | (857 | ) | ||||||||||||||||
|
| |||||||||||||||||||
BORROWINGS AND OTHER FINANCING TRANSACTIONS SUMMARY
The following is a summary by counterparty of the market value of Borrowings and Other Financing Transactions and collateral pledged/(received) as of June 30, 2018:
| Counterparty | Repurchase Agreement Proceeds to be Received(1) | Payable for Reverse Repurchase Agreements | Payable for Sale-Buyback Transactions | Total Borrowings and Other Financing Transactions | Collateral Pledged/(Received) | Net Exposure(3) | ||||||||||||||||||
Global/Master Repurchase Agreement | ||||||||||||||||||||||||
BOS | $ | 0 | $ | (1,385 | ) | $ | 0 | $ | (1,385 | ) | $ | 1,374 | $ | (11 | ) | |||||||||
BSN | 0 | (3,532 | ) | 0 | (3,532 | ) | 3,515 | (17 | ) | |||||||||||||||
FICC | 1,419 | 0 | 0 | 1,419 | (1,454 | ) | (35 | ) | ||||||||||||||||
GRE | 0 | (398 | ) | 0 | (398 | ) | 396 | (2 | ) | |||||||||||||||
RCY | 0 | (1,528 | ) | 0 | (1,528 | ) | 1,530 | 2 | ||||||||||||||||
SCX | 0 | (3,382 | ) | 0 | (3,382 | ) | 3,388 | 6 | ||||||||||||||||
Master Securities Forward Transaction Agreement | ||||||||||||||||||||||||
UBS | 0 | 0 | (857 | ) | (857 | ) | 861 | 4 | ||||||||||||||||
|
|
|
|
|
| |||||||||||||||||||
Total Borrowings and Other Financing Transactions | $ | 1,419 | $ | (10,225 | ) | $ | (857 | ) | ||||||||||||||||
|
|
|
|
|
| |||||||||||||||||||
CERTAIN TRANSFERS ACCOUNTED FOR AS SECURED BORROWINGS
Remaining Contractual Maturity of the Agreements
| Overnight and Continuous | Up to 30 days | 31-90 days | Greater Than 90 days | Total | ||||||||||||||||
Reverse Repurchase Agreements |
| |||||||||||||||||||
U.S. Treasury Obligations | $ | 0 | $ | (6,843 | ) | $ | (3,382 | ) | $ | 0 | $ | (10,225 | ) | |||||||
|
|
|
|
|
|
|
|
|
| |||||||||||
Total | $ | 0 | $ | (6,843 | ) | $ | (3,382 | ) | $ | 0 | $ | (10,225 | ) | |||||||
|
|
|
|
|
|
|
|
|
| |||||||||||
Sale-Buyback Transactions |
| |||||||||||||||||||
U.S. Treasury Obligations | 0 | (857 | ) | 0 | 0 | (857 | ) | |||||||||||||
|
|
|
|
|
|
|
|
|
| |||||||||||
Total | $ | 0 | $ | (857 | ) | $ | 0 | $ | 0 | $ | (857 | ) | ||||||||
|
|
|
|
|
|
|
|
|
| |||||||||||
Total Borrowings | $ | 0 | $ | (7,700 | ) | $ | (3,382 | ) | $ | 0 | $ | (11,082 | ) | |||||||
|
|
|
|
|
|
|
|
|
| |||||||||||
Payable for reverse repurchase agreements and sale-buyback financing transactions |
| $ | (11,082 | ) | ||||||||||||||||
|
| |||||||||||||||||||
| See Accompanying Notes | ANNUAL REPORT | JUNE 30, 2018 | 31 |
Table of Contents
Schedule of Investments PIMCO Dividend and Income Fund (Cont.)
| (m) | Securities with an aggregate market value of $11,064 have been pledged as collateral under the terms of the above master agreements as of June 30, 2018. |
| (1) | Includes accrued interest. |
| (2) | The average amount of borrowings outstanding during the period ended June 30, 2018 was $(10,387) at a weighted average interest rate of 1.513%. Average borrowings may include sale-buyback transactions and reverse repurchase agreements, if held during the period. |
| (3) | Net Exposure represents the net receivable/(payable) that would be due from/to the counterparty in the event of default. Exposure from borrowings and other financing transactions can only be netted across transactions governed under the same master agreement with the same legal entity. See Note 8, Master Netting Arrangements, in the Notes to Financial Statements for more information regarding master netting arrangements. |
(n) FINANCIAL DERIVATIVE INSTRUMENTS: EXCHANGE-TRADED OR CENTRALLY CLEARED
FUTURES CONTRACTS:
LONG FUTURES CONTRACTS
| Description | Expiration Month | # of Contracts | Notional Amount | Unrealized Appreciation/ (Depreciation) | Variation Margin | |||||||||||||||||||||
| Asset | Liability | |||||||||||||||||||||||||
Australia Government 10-Year Bond September Futures | 09/2018 | 2 | AUD | 191 | $ | 3 | $ | 0 | $ | 0 | ||||||||||||||||
U.S. Treasury 10-Year Note September Futures | 09/2018 | 123 | $ | 14,783 | 79 | 0 | 0 | |||||||||||||||||||
|
|
|
|
|
| |||||||||||||||||||||
Total Futures Contracts |
| $ | 82 | $ | 0 | $ | 0 | |||||||||||||||||||
|
|
|
|
|
| |||||||||||||||||||||
SWAP AGREEMENTS:
CREDIT DEFAULT SWAPS ON CORPORATE ISSUES - SELL PROTECTION(1)
| Reference Entity | Fixed Receive Rate | Payment Frequency | Maturity Date | Implied Credit Spread at June 30, 2018(3) | Notional Amount(4) | Premiums Paid/(Received) | Unrealized Appreciation/ (Depreciation) | Market Value(5) | Variation Margin | |||||||||||||||||||||||||||||
| Asset | Liability | |||||||||||||||||||||||||||||||||||||
Ally Financial, Inc. | 5.000% | Quarterly | 12/20/2022 | 1.312% | $ 300 | $ | 51 | $ | (5 | ) | $ | 46 | $ | 0 | $ | 0 | ||||||||||||||||||||||
|
|
|
|
|
|
|
|
|
| |||||||||||||||||||||||||||||
CREDIT DEFAULT SWAPS ON CREDIT INDICES - BUY PROTECTION(2)
| Index/Tranches | Fixed (Pay) Rate | Payment Frequency | Maturity Date | Notional Amount(4) | Premiums Paid/(Received) | Unrealized Appreciation/ (Depreciation) | Market Value(5) | Variation Margin | ||||||||||||||||||||||||||||
| Asset | Liability | |||||||||||||||||||||||||||||||||||
CDX.HY-29 5-Year Index | (5.000 | )% | Quarterly | 12/20/2022 | $ 850 | $ | (55 | ) | $ | 1 | $ | (54 | ) | $ | 0 | $ | 0 | |||||||||||||||||||
CDX.HY-30 5-Year Index | (5.000 | ) | Quarterly | 06/20/2023 | 375 | (24 | ) | 1 | (23 | ) | 0 | 0 | ||||||||||||||||||||||||
CDX.IG-30 5-Year Index | (1.000 | ) | Quarterly | 06/20/2023 | 800 | (15 | ) | 3 | (12 | ) | 0 | (1 | ) | |||||||||||||||||||||||
|
|
|
|
|
|
|
|
|
| |||||||||||||||||||||||||||
| $ | (94 | ) | $ | 5 | $ | (89 | ) | $ | 0 | $ | (1 | ) | ||||||||||||||||||||||||
|
|
|
|
|
|
|
|
|
| |||||||||||||||||||||||||||
INTEREST RATE SWAPS
| Pay/Receive Floating Rate | Floating Rate Index | Fixed Rate | Payment Frequency | Maturity Date | Notional Amount | Premiums Paid/(Received) | Unrealized Appreciation/ (Depreciation) | Market Value | Variation Margin | |||||||||||||||||||||||||||||||
| Asset | Liability | |||||||||||||||||||||||||||||||||||||||
Receive | 3-Month USD-LIBOR | 2.250 | % | Semi-Annual | 06/20/2028 | $ | 4,900 | $ | 108 | $ | 184 | $ | 292 | $ | 4 | $ | 0 | |||||||||||||||||||||||
Receive | 3-Month USD-LIBOR | 2.500 | Semi-Annual | 06/20/2048 | 1,000 | 38 | 61 | 99 | 2 | 0 | ||||||||||||||||||||||||||||||
Pay(6) | 3-Month ZAR-JIBAR | 7.250 | Quarterly | 09/19/2023 | ZAR | 900 | 0 | (2 | ) | (2 | ) | 0 | 0 | |||||||||||||||||||||||||||
Receive | 3-Month ZAR-JIBAR | 8.300 | Quarterly | 03/15/2027 | 600 | (2 | ) | 2 | 0 | 0 | 0 | |||||||||||||||||||||||||||||
Pay | 6-Month AUD-BBR-BBSW | 2.750 | Semi-Annual | 06/17/2026 | AUD | 6,200 | 221 | (209 | ) | 12 | 0 | (1 | ) | |||||||||||||||||||||||||||
Receive(6) | 6-Month EUR-EURIBOR | 1.250 | Annual | 09/19/2028 | EUR | 800 | (11 | ) | (19 | ) | (30 | ) | 0 | (1 | ) | |||||||||||||||||||||||||
Receive(6) | 6-Month GBP-LIBOR | 1.500 | Semi-Annual | 09/19/2028 | GBP | 1,793 | 41 | (30 | ) | 11 | 3 | 0 | ||||||||||||||||||||||||||||
Receive | 6-Month JPY-LIBOR | 0.354 | Semi-Annual | 01/18/2028 | JPY | 20,000 | 0 | (2 | ) | (2 | ) | 0 | 0 | |||||||||||||||||||||||||||
Receive | 6-Month JPY-LIBOR | 0.300 | Semi-Annual | 03/20/2028 | 140,000 | 10 | (14 | ) | (4 | ) | 0 | (1 | ) | |||||||||||||||||||||||||||
Receive | 6-Month JPY-LIBOR | 0.380 | Semi-Annual | 06/18/2028 | 10,000 | 0 | (1 | ) | (1 | ) | 0 | 0 | ||||||||||||||||||||||||||||
Receive(6) | 6-Month JPY-LIBOR | 0.450 | Semi-Annual | 03/20/2029 | 1,460,000 | (64 | ) | (77 | ) | (141 | ) | 0 | (5 | ) | ||||||||||||||||||||||||||
Receive(6) | 6-Month JPY-LIBOR | 0.415 | Semi-Annual | 03/25/2029 | 20,000 | 0 | (1 | ) | (1 | ) | 0 | 0 | ||||||||||||||||||||||||||||
Receive(6) | 6-Month JPY-LIBOR | 0.400 | Semi-Annual | 03/27/2029 | 40,000 | 0 | (2 | ) | (2 | ) | 0 | 0 | ||||||||||||||||||||||||||||
Receive(6) | 6-Month JPY-LIBOR | 0.450 | Semi-Annual | 03/29/2029 | 40,000 | (1 | ) | (3 | ) | (4 | ) | 0 | 0 | |||||||||||||||||||||||||||
Pay | 28-Day MXN-TIIE | 5.610 | Lunar | 07/07/2021 | MXN | 700 | (2 | ) | 0 | (2 | ) | 0 | 0 | |||||||||||||||||||||||||||
Pay | 28-Day MXN-TIIE | 6.750 | Lunar | 08/31/2021 | 2,000 | (1 | ) | (2 | ) | (3 | ) | 0 | 0 | |||||||||||||||||||||||||||
Pay | 28-Day MXN-TIIE | 5.798 | Lunar | 09/06/2021 | 2,500 | (8 | ) | 0 | (8 | ) | 0 | 0 | ||||||||||||||||||||||||||||
Pay | 28-Day MXN-TIIE | 7.350 | Lunar | 11/17/2021 | 600 | 0 | (1 | ) | (1 | ) | 0 | 0 | ||||||||||||||||||||||||||||
Pay | 28-Day MXN-TIIE | 7.388 | Lunar | 11/17/2021 | 500 | 0 | 0 | 0 | 0 | 0 | ||||||||||||||||||||||||||||||
Pay | 28-Day MXN-TIIE | 7.199 | Lunar | 12/03/2021 | 500 | 0 | (1 | ) | (1 | ) | 0 | 0 | ||||||||||||||||||||||||||||
Pay | 28-Day MXN-TIIE | 7.538 | Lunar | 02/23/2022 | 1,000 | 0 | (1 | ) | (1 | ) | 0 | 0 | ||||||||||||||||||||||||||||
Receive | 28-Day MXN-TIIE | 6.950 | Lunar | 06/17/2022 | 32,100 | (5 | ) | 59 | 54 | 0 | (6 | ) | ||||||||||||||||||||||||||||
Pay | 28-Day MXN-TIIE | 7.875 | Lunar | 12/16/2022 | 400 | 0 | 0 | 0 | 0 | 0 | ||||||||||||||||||||||||||||||
Pay | 28-Day MXN-TIIE | 7.880 | Lunar | 12/27/2022 | 21,200 | 10 | (10 | ) | 0 | 5 | 0 | |||||||||||||||||||||||||||||
| 32 | PIMCO EQUITY SERIES | See Accompanying Notes |
Table of Contents
June 30, 2018
| Pay/Receive Floating Rate | Floating Rate Index | Fixed Rate | Payment Frequency | Maturity Date | Notional Amount | Premiums Paid/(Received) | Unrealized Appreciation/ (Depreciation) | Market Value | Variation Margin | |||||||||||||||||||||||||||||||
| Asset | Liability | |||||||||||||||||||||||||||||||||||||||
Pay | 28-Day MXN-TIIE | 7.640 | % | Lunar | 01/03/2023 | MXN | 200 | $ | 0 | $ | 0 | $ | 0 | $ | 0 | $ | 0 | |||||||||||||||||||||||
Pay | 28-Day MXN-TIIE | 7.645 | Lunar | 01/03/2023 | 2,000 | 0 | (1 | ) | (1 | ) | 1 | 0 | ||||||||||||||||||||||||||||
Pay | 28-Day MXN-TIIE | 7.745 | Lunar | 01/05/2023 | 1,400 | 0 | 0 | 0 | 0 | 0 | ||||||||||||||||||||||||||||||
Pay | 28-Day MXN-TIIE | 7.610 | Lunar | 01/23/2023 | 6,000 | (2 | ) | (1 | ) | (3 | ) | 1 | 0 | |||||||||||||||||||||||||||
Pay | 28-Day MXN-TIIE | 7.805 | Lunar | 02/06/2023 | 3,400 | 0 | 0 | 0 | 1 | 0 | ||||||||||||||||||||||||||||||
Pay | 28-Day MXN-TIIE | 7.820 | Lunar | 02/06/2023 | 3,400 | (1 | ) | 1 | 0 | 1 | 0 | |||||||||||||||||||||||||||||
Pay | 28-Day MXN-TIIE | 5.950 | Lunar | 01/30/2026 | 600 | (4 | ) | 1 | (3 | ) | 0 | 0 | ||||||||||||||||||||||||||||
Pay | 28-Day MXN-TIIE | 5.990 | Lunar | 01/30/2026 | 4,300 | (4 | ) | (21 | ) | (25 | ) | 1 | 0 | |||||||||||||||||||||||||||
Pay | 28-Day MXN-TIIE | 6.080 | Lunar | 03/10/2026 | 15,500 | (15 | ) | (73 | ) | (88 | ) | 4 | 0 | |||||||||||||||||||||||||||
Pay | 28-Day MXN-TIIE | 6.490 | Lunar | 09/08/2026 | 30,000 | 13 | (153 | ) | (140 | ) | 9 | 0 | ||||||||||||||||||||||||||||
Pay | 28-Day MXN-TIIE | 7.380 | Lunar | 11/04/2026 | 100 | 0 | 0 | 0 | 0 | 0 | ||||||||||||||||||||||||||||||
Pay | 28-Day MXN-TIIE | 8.090 | Lunar | 01/15/2027 | 3,300 | 0 | 1 | 1 | 1 | 0 | ||||||||||||||||||||||||||||||
Pay | 28-Day MXN-TIIE | 8.120 | Lunar | 01/15/2027 | 700 | 0 | 0 | 0 | 0 | 0 | ||||||||||||||||||||||||||||||
Pay | 28-Day MXN-TIIE | 7.865 | Lunar | 02/02/2027 | 2,400 | 0 | (1 | ) | (1 | ) | 1 | 0 | ||||||||||||||||||||||||||||
Pay | 28-Day MXN-TIIE | 8.010 | Lunar | 02/04/2027 | 1,200 | 0 | 0 | 0 | 1 | 0 | ||||||||||||||||||||||||||||||
Pay | 28-Day MXN-TIIE | 7.818 | Lunar | 02/17/2027 | 1,100 | 0 | (1 | ) | (1 | ) | 1 | 0 | ||||||||||||||||||||||||||||
Pay | 28-Day MXN-TIIE | 7.150 | Lunar | 06/11/2027 | 1,200 | (1 | ) | (2 | ) | (3 | ) | 1 | 0 | |||||||||||||||||||||||||||
Pay | 28-Day MXN-TIIE | 7.370 | Lunar | 10/11/2027 | 2,500 | 0 | (5 | ) | (5 | ) | 1 | 0 | ||||||||||||||||||||||||||||
Receive | 28-Day MXN-TIIE | 7.984 | Lunar | 12/10/2027 | 2,900 | 0 | 0 | 0 | 0 | (1 | ) | |||||||||||||||||||||||||||||
Receive | 28-Day MXN-TIIE | 8.005 | Lunar | 12/21/2027 | 11,400 | (6 | ) | 6 | 0 | 0 | (4 | ) | ||||||||||||||||||||||||||||
Receive | 28-Day MXN-TIIE | 7.800 | Lunar | 12/28/2027 | 1,200 | 0 | 1 | 1 | 0 | (1 | ) | |||||||||||||||||||||||||||||
Receive | 28-Day MXN-TIIE | 7.910 | Lunar | 12/30/2027 | 700 | 0 | 0 | 0 | 0 | 0 | ||||||||||||||||||||||||||||||
Receive | 28-Day MXN-TIIE | 8.030 | Lunar | 01/31/2028 | 2,000 | 0 | 0 | 0 | 0 | (1 | ) | |||||||||||||||||||||||||||||
Receive | 28-Day MXN-TIIE | 8.050 | Lunar | 01/31/2028 | 1,900 | 1 | (1 | ) | 0 | 0 | (1 | ) | ||||||||||||||||||||||||||||
Pay | 28-Day MXN-TIIE | 7.165 | Lunar | 09/06/2032 | 400 | 0 | (2 | ) | (2 | ) | 0 | 0 | ||||||||||||||||||||||||||||
Pay | 28-Day MXN-TIIE | 7.380 | Lunar | 08/14/2037 | 100 | 0 | 0 | 0 | 0 | 0 | ||||||||||||||||||||||||||||||
Pay | 28-Day MXN-TIIE | 7.360 | Lunar | 08/21/2037 | 100 | 0 | 0 | 0 | 0 | 0 | ||||||||||||||||||||||||||||||
Receive | 28-Day MXN-TIIE | 8.103 | Lunar | 01/04/2038 | 900 | 1 | 0 | 1 | 0 | (1 | ) | |||||||||||||||||||||||||||||
|
|
|
|
|
|
|
|
|
| |||||||||||||||||||||||||||||||
| $ | 316 | $ | (320 | ) | $ | (4 | ) | $ | 38 | $ | (23 | ) | ||||||||||||||||||||||||||||
|
|
|
|
|
|
|
|
|
| |||||||||||||||||||||||||||||||
Total Swap Agreements |
| $ | 273 | $ | (320 | ) | $ | (47 | ) | $ | 38 | $ | (24 | ) | ||||||||||||||||||||||||||
|
|
|
|
|
|
|
|
|
| |||||||||||||||||||||||||||||||
FINANCIAL DERIVATIVE INSTRUMENTS: EXCHANGE-TRADED OR CENTRALLY CLEARED SUMMARY
The following is a summary of the market value and variation margin of Exchange-Traded or Centrally Cleared Financial Derivative Instruments as of June 30, 2018:
| Financial Derivative Assets | Financial Derivative Liabilities | |||||||||||||||||||||||||||||||||||
| Market Value | Variation Margin Asset | Market Value | Variation Margin Liability | |||||||||||||||||||||||||||||||||
| Purchased Options | Futures | Swap Agreements | Total | Written Options | Futures | Swap Agreements | Total | |||||||||||||||||||||||||||||
Total Exchange-Traded or Centrally Cleared | $ | 0 | $ | 0 | $ | 38 | $ | 38 | $ | 0 | $ | 0 | $ | (24 | ) | $ | (24 | ) | ||||||||||||||||||
|
|
|
|
|
|
|
|
|
|
|
|
|
|
|
| |||||||||||||||||||||
Cash of $1,138 has been pledged as collateral for exchange-traded and centrally cleared financial derivative instruments as of June 30, 2018. See Note 8, Master Netting Arrangements, in the Notes to Financial Statements for more information regarding master netting arrangements.
| (1) | If the Fund is a seller of protection and a credit event occurs, as defined under the terms of that particular swap agreement, the Fund will either (i) pay to the buyer of protection an amount equal to the notional amount of the swap and take delivery of the referenced obligation or underlying securities comprising the referenced index or (ii) pay a net settlement amount in the form of cash, securities or other deliverable obligations equal to the notional amount of the swap less the recovery value of the referenced obligation or underlying securities comprising the referenced index. |
| (2) | If the Fund is a buyer of protection and a credit event occurs, as defined under the terms of that particular swap agreement, the Fund will either (i) receive from the seller of protection an amount equal to the notional amount of the swap and deliver the referenced obligation or underlying securities comprising the referenced index or (ii) receive a net settlement amount in the form of cash, securities or other deliverable obligations equal to the notional amount of the swap less the recovery value of the referenced obligation or underlying securities comprising the referenced index. |
| (3) | Implied credit spreads, represented in absolute terms, utilized in determining the market value of credit default swap agreements on corporate or sovereign issues as of period end serve as indicators of the current status of the payment/performance risk and represent the likelihood or risk of default for the credit derivative. The implied credit spread of a particular referenced entity reflects the cost of buying/selling protection and may include upfront payments required to be made to enter into the agreement. Wider credit spreads represent a deterioration of the referenced entity’s credit soundness and a greater likelihood or risk of default or other credit event occurring as defined under the terms of the agreement. |
| (4) | The maximum potential amount the Fund could be required to pay as a seller of credit protection or receive as a buyer of credit protection if a credit event occurs as defined under the terms of that particular swap agreement. |
| (5) | The prices and resulting values for credit default swap agreements on credit indices serve as indicators of the current status of the payment/performance risk and represent the likelihood of an expected liability (or profit) for the credit derivative should the notional amount of the swap agreement be closed/sold as of the period end. Increasing market values, in absolute terms when compared to the notional amount of the swap, represent a deterioration of the referenced indices’ credit soundness and a greater likelihood or risk of default or other credit event occurring as defined under the terms of the agreement. |
| (6) | This instrument has a forward starting effective date. See Note 2, Securities Transactions and Investment Income, in the Notes to Financial Statements for further information. |
| See Accompanying Notes | ANNUAL REPORT | JUNE 30, 2018 | 33 |
Table of Contents
Schedule of Investments PIMCO Dividend and Income Fund (Cont.)
(o) FINANCIAL DERIVATIVE INSTRUMENTS: OVER THE COUNTER
FORWARD FOREIGN CURRENCY CONTRACTS:
| Counterparty | Settlement Month | Currency to be Delivered | Currency to be Received | Unrealized Appreciation/ (Depreciation) | ||||||||||||||||||||
| Asset | Liability | |||||||||||||||||||||||
BOA | 07/2018 | $ | 1,299 | AUD | 1,760 | $ | 3 | $ | 0 | |||||||||||||||
| 08/2018 | AUD | 1,760 | $ | 1,299 | 0 | (3 | ) | |||||||||||||||||
| 08/2018 | MXN | 1,006 | 50 | 0 | 0 | |||||||||||||||||||
| 09/2018 | $ | 80 | RUB | 4,987 | 0 | (1 | ) | |||||||||||||||||
BPS | 07/2018 | ARS | 3,230 | $ | 124 | 13 | 0 | |||||||||||||||||
| 07/2018 | BRL | 251 | 65 | 0 | 0 | |||||||||||||||||||
| 07/2018 | EUR | 3,681 | 4,269 | 0 | (29 | ) | ||||||||||||||||||
| 07/2018 | JPY | 386,851 | 3,562 | 68 | 0 | |||||||||||||||||||
| 07/2018 | PEN | 425 | 130 | 1 | 0 | |||||||||||||||||||
| 07/2018 | $ | 86 | ARS | 2,350 | 0 | (5 | ) | |||||||||||||||||
| 07/2018 | 67 | BRL | 251 | 0 | (2 | ) | ||||||||||||||||||
| 07/2018 | 130 | PEN | 425 | 0 | (1 | ) | ||||||||||||||||||
| 08/2018 | ARS | 1,640 | $ | 76 | 22 | 0 | ||||||||||||||||||
| 08/2018 | $ | 1,588 | MXN | 30,178 | 0 | (81 | ) | |||||||||||||||||
| 09/2018 | PEN | 425 | $ | 130 | 1 | 0 | ||||||||||||||||||
| 09/2018 | $ | 18 | AUD | 23 | 0 | (1 | ) | |||||||||||||||||
| 09/2018 | 419 | INR | 28,672 | 0 | (5 | ) | ||||||||||||||||||
BRC | 09/2018 | AUD | 30 | $ | 23 | 1 | 0 | |||||||||||||||||
| 09/2018 | $ | 18 | AUD | 23 | 0 | (1 | ) | |||||||||||||||||
CBK | 07/2018 | ARS | 174 | $ | 8 | 2 | 0 | |||||||||||||||||
| 07/2018 | GBP | 3,948 | 5,231 | 20 | 0 | |||||||||||||||||||
| 07/2018 | $ | 15 | ARS | 416 | 0 | (1 | ) | |||||||||||||||||
| 07/2018 | 149 | GBP | 111 | 0 | (3 | ) | ||||||||||||||||||
| 08/2018 | 79 | MXN | 1,640 | 3 | 0 | |||||||||||||||||||
| 08/2018 | 1,617 | TRY | 7,158 | 0 | (87 | ) | ||||||||||||||||||
DUB | 07/2018 | ARS | 425 | $ | 15 | 1 | 0 | |||||||||||||||||
| 07/2018 | BRL | 2,244 | 603 | 24 | 0 | |||||||||||||||||||
| 07/2018 | $ | 15 | ARS | 425 | 0 | 0 | ||||||||||||||||||
| 07/2018 | 582 | BRL | 2,244 | 0 | (3 | ) | ||||||||||||||||||
| 08/2018 | 406 | SEK | 3,465 | 0 | (18 | ) | ||||||||||||||||||
FBF | 07/2018 | BRL | 1,993 | $ | 517 | 3 | 0 | |||||||||||||||||
| 07/2018 | $ | 525 | BRL | 1,993 | 0 | (10 | ) | |||||||||||||||||
| 08/2018 | BRL | 1,993 | $ | 523 | 11 | 0 | ||||||||||||||||||
GLM | 07/2018 | AUD | 1,760 | 1,323 | 20 | 0 | ||||||||||||||||||
| 08/2018 | NZD | 905 | 629 | 16 | 0 | |||||||||||||||||||
| 08/2018 | $ | 39 | EUR | 33 | 0 | 0 | ||||||||||||||||||
HUS | 07/2018 | ARS | 1,496 | $ | 71 | 20 | 0 | |||||||||||||||||
| 07/2018 | RUB | 7,321 | 116 | 0 | 0 | |||||||||||||||||||
| 07/2018 | $ | 8 | ARS | 210 | 0 | (1 | ) | |||||||||||||||||
| 07/2018 | 115 | RUB | 7,321 | 2 | 0 | |||||||||||||||||||
| 08/2018 | 854 | 53,463 | 0 | (8 | ) | |||||||||||||||||||
JPM | 07/2018 | ARS | 153 | $ | 7 | 2 | 0 | |||||||||||||||||
| 07/2018 | $ | 5 | ARS | 153 | 0 | 0 | ||||||||||||||||||
MSB | 07/2018 | 3,506 | JPY | 386,851 | 0 | (12 | ) | |||||||||||||||||
| 08/2018 | JPY | 386,851 | $ | 3,513 | 12 | 0 | ||||||||||||||||||
| 09/2018 | AUD | 25 | 20 | 1 | 0 | |||||||||||||||||||
SCX | 08/2018 | $ | 214 | JPY | 23,257 | 0 | (3 | ) | ||||||||||||||||
SSB | 07/2018 | 4,285 | EUR | 3,681 | 13 | 0 | ||||||||||||||||||
| 08/2018 | EUR | 3,681 | $ | 4,295 | 0 | (13 | ) | |||||||||||||||||
UAG | 07/2018 | $ | 5,073 | GBP | 3,837 | 0 | (10 | ) | ||||||||||||||||
| 08/2018 | GBP | 3,837 | $ | 5,081 | 10 | 0 | ||||||||||||||||||
| 09/2018 | 22 | 29 | 0 | 0 | ||||||||||||||||||||
|
|
|
| |||||||||||||||||||||
Total Forward Foreign Currency Contracts |
| $ | 269 | $ | (298 | ) | ||||||||||||||||||
|
|
|
| |||||||||||||||||||||
WRITTEN OPTIONS:
CREDIT DEFAULT SWAPTIONS ON CREDIT INDICES
| Counterparty | Description | Buy/Sell Protection | Exercise Rate | Expiration Date | Notional Amount | Premiums (Received) | Market Value | |||||||||||||||||
BOA | Put - OTC CDX.IG-30 5-Year Index | Sell | 0.800% | 07/18/2018 | $ | 2,000 | $ (2 | ) | $ | (1 | ) | |||||||||||||
Put - OTC CDX.IG-30 5-Year Index | Sell | 0.850 | 08/15/2018 | 1,600 | (2 | ) | (1 | ) | ||||||||||||||||
| 34 | PIMCO EQUITY SERIES | See Accompanying Notes |
Table of Contents
June 30, 2018
| Counterparty | Description | Buy/Sell Protection | Exercise Rate | Expiration Date | Notional Amount | Premiums (Received) | Market Value | |||||||||||||||||||
BPS | Put - OTC CDX.HY-30 5-Year Index | Sell | 103.000% | 09/19/2018 | $ | 200 | $ (1 | ) | $ | (1 | ) | |||||||||||||||
Put - OTC CDX.HY-30 5-Year Index | Sell | 101.000 | 11/21/2018 | 200 | (2 | ) | (2 | ) | ||||||||||||||||||
Put - OTC CDX.IG-30 5-Year Index | Sell | 0.950 | 08/15/2018 | 800 | 0 | 0 | ||||||||||||||||||||
CBK | Put - OTC CDX.HY-30 5-Year Index | Sell | 101.000 | 10/17/2018 | 200 | (1 | ) | (1 | ) | |||||||||||||||||
Put - OTC CDX.IG-30 5-Year Index | Sell | 0.750 | 07/18/2018 | 900 | (1 | ) | 0 | |||||||||||||||||||
Put - OTC CDX.IG-30 5-Year Index | Sell | 0.800 | 08/15/2018 | 500 | (1 | ) | (1 | ) | ||||||||||||||||||
Put - OTC CDX.IG-30 5-Year Index | Sell | 0.900 | 09/19/2018 | 100 | 0 | 0 | ||||||||||||||||||||
GST | Put - OTC CDX.HY-30 5-Year Index | Sell | 102.000 | 09/19/2018 | 200 | (2 | ) | (1 | ) | |||||||||||||||||
JPM | Put - OTC CDX.IG-30 5-Year Index | Sell | 0.725 | 07/18/2018 | 100 | 0 | 0 | |||||||||||||||||||
|
|
|
| |||||||||||||||||||||||
| $ (12 | ) | $ | (8 | ) | ||||||||||||||||||||||
|
|
|
| |||||||||||||||||||||||
FOREIGN CURRENCY OPTIONS
| Counterparty | Description | Strike Price | Expiration Date | Notional Amount | Premiums (Received) | Market Value | ||||||||||||||||||||
| UBS | Put - OTC GBP versus USD | $ | 1.287 | 09/20/2018 | GBP | 100 | $ | (1 | ) | $ | (1 | ) | ||||||||||||||
|
|
|
| |||||||||||||||||||||||
OPTIONS ON SECURITIES
| Counterparty | Description | Strike Price | Expiration Date | Notional Amount | Premiums (Received) | Market Value | ||||||||||||||||||||
| FBF | Call - OTC Fannie Mae, TBA 4.000% due 07/01/2048 | $ | 101.039 | 07/05/2018 | $ | 500 | $ | (2 | ) | $ | (4 | ) | ||||||||||||||
| JPM | Call - OTC Fannie Mae, TBA 3.500% due 07/01/2048 | 99.688 | 07/05/2018 | 1,500 | (3 | ) | (1 | ) | ||||||||||||||||||
| SAL | Put - OTC Fannie Mae, TBA 3.500% due 07/01/2048 | 97.813 | 07/05/2018 | 300 | (1 | ) | 0 | |||||||||||||||||||
Put - OTC Fannie Mae, TBA 3.500% due 07/01/2048 | 98.531 | 07/05/2018 | 500 | (1 | ) | 0 | ||||||||||||||||||||
Call - OTC Fannie Mae, TBA 3.500% due 07/01/2048 | 99.813 | 07/05/2018 | 300 | (1 | ) | 0 | ||||||||||||||||||||
Call - OTC Fannie Mae, TBA 3.500% due 07/01/2048 | 100.031 | 07/05/2018 | 200 | 0 | 0 | |||||||||||||||||||||
Put - OTC Fannie Mae, TBA 4.000% due 08/01/2048 | 99.781 | 08/06/2018 | 500 | (1 | ) | 0 | ||||||||||||||||||||
Put - OTC Fannie Mae, TBA 4.000% due 08/01/2048 | 99.859 | 08/06/2018 | 1,000 | (2 | ) | 0 | ||||||||||||||||||||
Call - OTC Fannie Mae, TBA 4.000% due 08/01/2048 | 101.359 | 08/06/2018 | 500 | (2 | ) | (3 | ) | |||||||||||||||||||
Call - OTC Fannie Mae, TBA 4.000% due 08/01/2048 | 101.781 | 08/06/2018 | 500 | (1 | ) | (2 | ) | |||||||||||||||||||
Call - OTC Fannie Mae, TBA 4.000% due 08/01/2048 | 101.859 | 08/06/2018 | 1,000 | (2 | ) | (3 | ) | |||||||||||||||||||
Call - OTC Fannie Mae, TBA 4.000% due 08/01/2048 | 102.289 | 08/06/2018 | 500 | (1 | ) | (1 | ) | |||||||||||||||||||
Call - OTC Fannie Mae, TBA 4.000% due 08/01/2048 | 102.648 | 08/06/2018 | 300 | (1 | ) | 0 | ||||||||||||||||||||
|
|
|
| |||||||||||||||||||||||
| $ | (18 | ) | $ | (14 | ) | |||||||||||||||||||||
|
|
|
| |||||||||||||||||||||||
Total Written Options | $ | (31 | ) | $ | (23 | ) | ||||||||||||||||||||
|
|
|
| |||||||||||||||||||||||
SWAP AGREEMENTS:
CREDIT DEFAULT SWAPS ON CORPORATE AND SOVEREIGN ISSUES - SELL PROTECTION(1)
Counterparty | Reference Entity | Fixed Receive Rate | Payment Frequency | Maturity Date | Implied Credit Spread at June 30, 2018(2) | Notional Amount(3) | Premiums Paid/(Received) | Unrealized Appreciation/ (Depreciation) | Swap Agreements, at Value | |||||||||||||||||||||||||||||
| Asset | Liability | |||||||||||||||||||||||||||||||||||||
| CBK | Brazil Government International Bond | 1.000 | % | Quarterly | 12/20/2022 | 2.512 | % | $ | 245 | $ | (8 | ) | $ | (7 | ) | $ | 0 | $ | (15 | ) | ||||||||||||||||||
Mexico Government International Bond | 1.000 | Quarterly | 06/20/2023 | 1.337 | 45 | (1 | ) | 0 | 0 | (1 | ) | |||||||||||||||||||||||||||
| DUB | Argentine Republic Government International Bond | 5.000 | Quarterly | 12/20/2022 | 4.419 | 250 | 29 | (23 | ) | 6 | 0 | |||||||||||||||||||||||||||
| GST | Mexico Government International Bond | 1.000 | Quarterly | 06/20/2023 | 1.337 | 300 | (3 | ) | (2 | ) | 0 | (5 | ) | |||||||||||||||||||||||||
Petrobras Global Finance BV | 1.000 | Quarterly | 12/20/2021 | 2.789 | 200 | (36 | ) | 25 | 0 | (11 | ) | |||||||||||||||||||||||||||
| HUS | Brazil Government International Bond | 1.000 | Quarterly | 06/20/2023 | 2.683 | 600 | (38 | ) | (6 | ) | 0 | (44 | ) | |||||||||||||||||||||||||
Colombia Government International Bond | 1.000 | Quarterly | 12/20/2022 | 1.125 | 50 | 0 | 0 | 0 | 0 | |||||||||||||||||||||||||||||
Mexico Government International Bond | 1.000 | Quarterly | 06/20/2023 | 1.337 | 850 | (7 | ) | (6 | ) | 0 | (13 | ) | ||||||||||||||||||||||||||
| MYC | South Africa Government International Bond | 1.000 | Quarterly | 12/20/2022 | 2.011 | 400 | (8 | ) | (8 | ) | 0 | (16 | ) | |||||||||||||||||||||||||
|
|
|
|
|
|
|
| |||||||||||||||||||||||||||||||
| $ | (72 | ) | $ | (27 | ) | $ | 6 | $ | (105 | ) | ||||||||||||||||||||||||||||
|
|
|
|
|
|
|
| |||||||||||||||||||||||||||||||
| See Accompanying Notes | ANNUAL REPORT | JUNE 30, 2018 | 35 |
Table of Contents
Schedule of Investments PIMCO Dividend and Income Fund (Cont.)
CREDIT DEFAULT SWAPS ON CREDIT INDICES - SELL PROTECTION(1)
Counterparty | Index/Tranches | Fixed Receive Rate | Payment Frequency | Maturity Date | Notional Amount(3) | Premiums Paid/(Received) | Unrealized Appreciation/ (Depreciation) | Swap Agreements, at Value(4) | ||||||||||||||||||||||||||
| Asset | Liability | |||||||||||||||||||||||||||||||||
| DUB | CMBX.NA.AAA.9 Index | 0.500 | % | Monthly | 09/17/2058 | $ 2,300 | $ | (128 | ) | $ | 127 | $ | 0 | $ | (1 | ) | ||||||||||||||||||
| FBF | CMBX.NA.AAA.9 Index | 0.500 | Monthly | 09/17/2058 | 600 | (24 | ) | 24 | 0 | 0 | ||||||||||||||||||||||||
| GST | CMBX.NA.AAA.10 Index | 0.500 | Monthly | 11/17/2059 | 4,000 | (85 | ) | 68 | 0 | (17 | ) | |||||||||||||||||||||||
| MYC | CMBX.NA.AAA.9 Index | 0.500 | Monthly | 09/17/2058 | 1,600 | (88 | ) | 87 | 0 | (1 | ) | |||||||||||||||||||||||
|
|
|
|
|
|
|
| |||||||||||||||||||||||||||
| $ | (325 | ) | $ | 306 | $ | 0 | $ | (19 | ) | |||||||||||||||||||||||||
|
|
|
|
|
|
|
| |||||||||||||||||||||||||||
Total Swap Agreements | $ | (397 | ) | $ | 279 | $ | 6 | $ | (124 | ) | ||||||||||||||||||||||||
|
|
|
|
|
|
|
| |||||||||||||||||||||||||||
FINANCIAL DERIVATIVE INSTRUMENTS: OVER THE COUNTER SUMMARY
The following is a summary by counterparty of the market value of OTC financial derivative instruments and collateral pledged/(received) as of June 30, 2018:
| Financial Derivative Assets | Financial Derivative Liabilities | |||||||||||||||||||||||||||||||||||||||||||||||
| Counterparty | Forward Foreign Currency Contracts | Purchased Options | Swap Agreements | Total Over the Counter | Forward Foreign Currency Contracts | Written Options | Swap Agreements | Total Over the Counter | Net Market Value of OTC Derivatives | Collateral Pledged/ (Received) | Net Exposure(5) | |||||||||||||||||||||||||||||||||||||
BOA | $ | 3 | $ | 0 | $ | 0 | $ | 3 | $ | (4 | ) | $ | (2 | ) | $ | 0 | $ | (6 | ) | $ | (3 | ) | $ | 0 | $ | (3 | ) | |||||||||||||||||||||
BPS | 105 | 0 | 0 | 105 | (124 | ) | (3 | ) | 0 | (127 | ) | (22 | ) | 0 | (22 | ) | ||||||||||||||||||||||||||||||||
BRC | 1 | 0 | 0 | 1 | (1 | ) | 0 | 0 | (1 | ) | 0 | 0 | 0 | |||||||||||||||||||||||||||||||||||
CBK | 25 | 0 | 0 | 25 | (91 | ) | (2 | ) | (16 | ) | (109 | ) | (84 | ) | 40 | (44 | ) | |||||||||||||||||||||||||||||||
DUB | 25 | 0 | 6 | 31 | (21 | ) | 0 | (1 | ) | (22 | ) | 9 | 0 | 9 | ||||||||||||||||||||||||||||||||||
FBF | 14 | 0 | 0 | 14 | (10 | ) | (4 | ) | 0 | (14 | ) | 0 | 0 | 0 | ||||||||||||||||||||||||||||||||||
GLM | 36 | 0 | 0 | 36 | 0 | 0 | 0 | 0 | 36 | 0 | 36 | |||||||||||||||||||||||||||||||||||||
GST | 0 | 0 | 0 | 0 | 0 | (1 | ) | (33 | ) | (34 | ) | (34 | ) | 0 | (34 | ) | ||||||||||||||||||||||||||||||||
HUS | 22 | 0 | 0 | 22 | (9 | ) | 0 | (57 | ) | (66 | ) | (44 | ) | 0 | (44 | ) | ||||||||||||||||||||||||||||||||
JPM | 2 | 0 | 0 | 2 | 0 | (1 | ) | 0 | (1 | ) | 1 | 0 | 1 | |||||||||||||||||||||||||||||||||||
MSB | 13 | 0 | 0 | 13 | (12 | ) | 0 | 0 | (12 | ) | 1 | 0 | 1 | |||||||||||||||||||||||||||||||||||
MYC | 0 | 0 | 0 | 0 | 0 | 0 | (17 | ) | (17 | ) | (17 | ) | 0 | (17 | ) | |||||||||||||||||||||||||||||||||
SAL | 0 | 0 | 0 | 0 | 0 | (9 | ) | 0 | (9 | ) | (9 | ) | 0 | (9 | ) | |||||||||||||||||||||||||||||||||
SCX | 0 | 0 | 0 | 0 | (3 | ) | 0 | 0 | (3 | ) | (3 | ) | 0 | (3 | ) | |||||||||||||||||||||||||||||||||
SSB | 13 | 0 | 0 | 13 | (13 | ) | 0 | 0 | (13 | ) | 0 | 0 | 0 | |||||||||||||||||||||||||||||||||||
UAG | 10 | 0 | 0 | 10 | (10 | ) | 0 | 0 | (10 | ) | 0 | 0 | 0 | |||||||||||||||||||||||||||||||||||
UBS | 0 | 0 | 0 | 0 | 0 | (1 | ) | 0 | (1 | ) | (1 | ) | 0 | (1 | ) | |||||||||||||||||||||||||||||||||
|
|
|
|
|
|
|
|
|
|
|
|
|
|
|
| |||||||||||||||||||||||||||||||||
Total Over the Counter | $ | 269 | $ | 0 | $ | 6 | $ | 275 | $ | (298 | ) | $ | (23 | ) | $ | (124 | ) | $ | (445 | ) | ||||||||||||||||||||||||||||
|
|
|
|
|
|
|
|
|
|
|
|
|
|
|
| |||||||||||||||||||||||||||||||||
| (1) | If the Fund is a seller of protection and a credit event occurs, as defined under the terms of that particular swap agreement, the Fund will either (i) pay to the buyer of protection an amount equal to the notional amount of the swap and take delivery of the referenced obligation or underlying securities comprising the referenced index or (ii) pay a net settlement amount in the form of cash, securities or other deliverable obligations equal to the notional amount of the swap less the recovery value of the referenced obligation or underlying securities comprising the referenced index. |
| (2) | Implied credit spreads, represented in absolute terms, utilized in determining the market value of credit default swap agreements on corporate or sovereign issues as of period end serve as indicators of the current status of the payment/performance risk and represent the likelihood or risk of default for the credit derivative. The implied credit spread of a particular referenced entity reflects the cost of buying/selling protection and may include upfront payments required to be made to enter into the agreement. Wider credit spreads represent a deterioration of the referenced entity’s credit soundness and a greater likelihood or risk of default or other credit event occurring as defined under the terms of the agreement. |
| (3) | The maximum potential amount the Fund could be required to pay as a seller of credit protection or receive as a buyer of credit protection if a credit event occurs as defined under the terms of that particular swap agreement. |
| (4) | The prices and resulting values for credit default swap agreements on credit indices serve as indicators of the current status of the payment/performance risk and represent the likelihood of an expected liability (or profit) for the credit derivative should the notional amount of the swap agreement be closed/sold as of the period end. Increasing market values, in absolute terms when compared to the notional amount of the swap, represent a deterioration of the referenced indices’ credit soundness and a greater likelihood or risk of default or other credit event occurring as defined under the terms of the agreement. |
| (5) | Net Exposure represents the net receivable/(payable) that would be due from/to the counterparty in the event of default. Exposure from OTC financial derivative instruments can only be netted across transactions governed under the same master agreement with the same legal entity. See Note 8, Master Netting Arrangements, in the Notes to Financial Statements for more information regarding master netting arrangements. |
| 36 | PIMCO EQUITY SERIES | See Accompanying Notes |
Table of Contents
June 30, 2018
FAIR VALUE OF FINANCIAL DERIVATIVE INSTRUMENTS
The following is a summary of the fair valuation of the Fund’s derivative instruments categorized by risk exposure. See Note 7, Principal Risks, in the Notes to Financial Statements on risks of the Fund.
Fair Values of Financial Derivative Instruments on the Statements of Assets and Liabilities as of June 30, 2018:
| Derivatives not accounted for as hedging instruments | ||||||||||||||||||||||||
| Commodity Contracts | Credit Contracts | Equity Contracts | Foreign Exchange Contracts | Interest Rate Contracts | Total | |||||||||||||||||||
Financial Derivative Instruments - Assets |
| |||||||||||||||||||||||
Exchange-traded or centrally cleared | ||||||||||||||||||||||||
Swap Agreements | $ | 0 | $ | 0 | $ | 0 | $ | 0 | $ | 38 | $ | 38 | ||||||||||||
|
|
|
|
|
|
|
|
|
|
|
| |||||||||||||
Over the counter | ||||||||||||||||||||||||
Forward Foreign Currency Contracts | $ | 0 | $ | 0 | $ | 0 | $ | 269 | $ | 0 | $ | 269 | ||||||||||||
Swap Agreements | 0 | 6 | 0 | 0 | 0 | 6 | ||||||||||||||||||
|
|
|
|
|
|
|
|
|
|
|
| |||||||||||||
| $ | 0 | $ | 6 | $ | 0 | $ | 269 | $ | 0 | $ | 275 | |||||||||||||
|
|
|
|
|
|
|
|
|
|
|
| |||||||||||||
| $ | 0 | $ | 6 | $ | 0 | $ | 269 | $ | 38 | $ | 313 | |||||||||||||
|
|
|
|
|
|
|
|
|
|
|
| |||||||||||||
Financial Derivative Instruments - Liabilities |
| |||||||||||||||||||||||
Exchange-traded or centrally cleared |
| |||||||||||||||||||||||
Swap Agreements | $ | 0 | $ | 1 | $ | 0 | $ | 0 | $ | 23 | $ | 24 | ||||||||||||
|
|
|
|
|
|
|
|
|
|
|
| |||||||||||||
Over the counter | ||||||||||||||||||||||||
Forward Foreign Currency Contracts | $ | 0 | $ | 0 | $ | 0 | $ | 298 | $ | 0 | $ | 298 | ||||||||||||
Written Options | 0 | 8 | 0 | 1 | 14 | 23 | ||||||||||||||||||
Swap Agreements | 0 | 124 | 0 | 0 | 0 | 124 | ||||||||||||||||||
|
|
|
|
|
|
|
|
|
|
|
| |||||||||||||
| $ | 0 | $ | 132 | $ | 0 | $ | 299 | $ | 14 | $ | 445 | |||||||||||||
|
|
|
|
|
|
|
|
|
|
|
| |||||||||||||
| $ | 0 | $ | 133 | $ | 0 | $ | 299 | $ | 37 | $ | 469 | |||||||||||||
|
|
|
|
|
|
|
|
|
|
|
| |||||||||||||
The effect of Financial Derivative Instruments on the Statements of Operations for the period ended June 30, 2018:
| Derivatives not accounted for as hedging instruments | ||||||||||||||||||||||||
| Commodity Contracts | Credit Contracts | Equity Contracts | Foreign Exchange Contracts | Interest Rate Contracts | Total | |||||||||||||||||||
Net Realized Gain (Loss) on Financial Derivative Instruments |
| |||||||||||||||||||||||
Exchange-traded or centrally cleared | ||||||||||||||||||||||||
Futures | $ | 0 | $ | 0 | $ | 0 | $ | 0 | $ | (143 | ) | $ | (143 | ) | ||||||||||
Swap Agreements | 0 | (119 | ) | 0 | 0 | (191 | ) | (310 | ) | |||||||||||||||
|
|
|
|
|
|
|
|
|
|
|
| |||||||||||||
| $ | 0 | $ | (119 | ) | $ | 0 | $ | 0 | $ | (334 | ) | $ | (453 | ) | ||||||||||
|
|
|
|
|
|
|
|
|
|
|
| |||||||||||||
Over the counter |
| |||||||||||||||||||||||
Forward Foreign Currency Contracts | $ | 0 | $ | 0 | $ | 0 | $ | (38 | ) | $ | 0 | $ | (38 | ) | ||||||||||
Purchased Options | 0 | 0 | 0 | (3 | ) | 0 | (3 | ) | ||||||||||||||||
Written Options | 0 | 9 | 0 | 7 | 4 | 20 | ||||||||||||||||||
Swap Agreements | 0 | 59 | 0 | 0 | 18 | 77 | ||||||||||||||||||
|
|
|
|
|
|
|
|
|
|
|
| |||||||||||||
| $ | 0 | $ | 68 | $ | 0 | $ | (34 | ) | $ | 22 | $ | 56 | ||||||||||||
|
|
|
|
|
|
|
|
|
|
|
| |||||||||||||
| $ | 0 | $ | (51 | ) | $ | 0 | $ | (34 | ) | $ | (312 | ) | $ | (397 | ) | |||||||||
|
|
|
|
|
|
|
|
|
|
|
| |||||||||||||
Net Change in Unrealized Appreciation (Depreciation) on Financial Derivative Instruments |
| |||||||||||||||||||||||
Exchange-traded or centrally cleared | ||||||||||||||||||||||||
Futures | $ | 0 | $ | 0 | $ | 0 | $ | 0 | $ | 83 | $ | 83 | ||||||||||||
Swap Agreements | 0 | 19 | 0 | 0 | (46 | ) | (27 | ) | ||||||||||||||||
|
|
|
|
|
|
|
|
|
|
|
| |||||||||||||
| $ | 0 | $ | 19 | $ | 0 | $ | 0 | $ | 37 | $ | 56 | |||||||||||||
|
|
|
|
|
|
|
|
|
|
|
| |||||||||||||
Over the counter | ||||||||||||||||||||||||
Forward Foreign Currency Contracts | $ | 0 | $ | 0 | $ | 0 | $ | (58 | ) | $ | 0 | $ | (58 | ) | ||||||||||
Written Options | 0 | 5 | 0 | (3 | ) | 4 | 6 | |||||||||||||||||
Swap Agreements | 0 | 84 | 0 | 0 | 0 | 84 | ||||||||||||||||||
|
|
|
|
|
|
|
|
|
|
|
| |||||||||||||
| $ | 0 | $ | 89 | $ | 0 | $ | (61 | ) | $ | 4 | $ | 32 | ||||||||||||
|
|
|
|
|
|
|
|
|
|
|
| |||||||||||||
| $ | 0 | $ | 108 | $ | 0 | $ | (61 | ) | $ | 41 | $ | 88 | ||||||||||||
|
|
|
|
|
|
|
|
|
|
|
| |||||||||||||
| See Accompanying Notes | ANNUAL REPORT | JUNE 30, 2018 | 37 |
Table of Contents
Schedule of Investments PIMCO Dividend and Income Fund (Cont.)
FAIR VALUE MEASUREMENTS
The following is a summary of the fair valuations according to the inputs used as of June 30, 2018 in valuing the Fund’s assets and liabilities:
| Category and Subcategory | Level 1 | Level 2 | Level 3 | Fair Value at 06/30/2018 | ||||||||||||
Investments in Securities, at Value | ||||||||||||||||
Asset-Backed Securities | ||||||||||||||||
Cayman Islands | $ | 0 | $ | 2,536 | $ | 0 | $ | 2,536 | ||||||||
Netherlands | 0 | 348 | 0 | 348 | ||||||||||||
United States | 0 | 10,829 | 0 | 10,829 | ||||||||||||
Loan Participations and Assignments | ||||||||||||||||
Canada | 0 | 15 | 0 | 15 | ||||||||||||
United Arab Emirates | 0 | 95 | 0 | 95 | ||||||||||||
United States | 0 | 1,384 | 56 | 1,440 | ||||||||||||
Common Stocks | ||||||||||||||||
Australia | ||||||||||||||||
Consumer Discretionary | 0 | 88 | 0 | 88 | ||||||||||||
Consumer Staples | 0 | 1,717 | 0 | 1,717 | ||||||||||||
Energy | 0 | 542 | 0 | 542 | ||||||||||||
Financials | 0 | 3,502 | 0 | 3,502 | ||||||||||||
Health Care | 0 | 231 | 0 | 231 | ||||||||||||
Industrials | 0 | 138 | 0 | 138 | ||||||||||||
Materials | 0 | 1,449 | 0 | 1,449 | ||||||||||||
Telecommunication Services | 0 | 524 | 0 | 524 | ||||||||||||
Austria | ||||||||||||||||
Energy | 0 | 346 | 0 | 346 | ||||||||||||
Financials | 0 | 372 | 0 | 372 | ||||||||||||
Industrials | 0 | 24 | 0 | 24 | ||||||||||||
Materials | 0 | 65 | 0 | 65 | ||||||||||||
Belgium | ||||||||||||||||
Financials | 0 | 203 | 0 | 203 | ||||||||||||
Industrials | 55 | 0 | 0 | 55 | ||||||||||||
Telecommunication Services | 0 | 169 | 0 | 169 | ||||||||||||
Brazil | ||||||||||||||||
Energy | 0 | 0 | 97 | 97 | ||||||||||||
Utilities | 1 | 0 | 0 | 1 | ||||||||||||
Canada | ||||||||||||||||
Consumer Discretionary | 127 | 0 | 0 | 127 | ||||||||||||
Energy | 702 | 0 | 0 | 702 | ||||||||||||
Financials | 2,361 | 0 | 0 | 2,361 | ||||||||||||
Industrials | 137 | 0 | 0 | 137 | ||||||||||||
Materials | 264 | 0 | 0 | 264 | ||||||||||||
Utilities | 458 | 0 | 0 | 458 | ||||||||||||
Denmark | ||||||||||||||||
Industrials | 0 | 215 | 0 | 215 | ||||||||||||
Finland | ||||||||||||||||
Materials | 0 | 354 | 0 | 354 | ||||||||||||
Utilities | 0 | 310 | 0 | 310 | ||||||||||||
France | ||||||||||||||||
Consumer Discretionary | 0 | 1,633 | 0 | 1,633 | ||||||||||||
Consumer Staples | 0 | 1,165 | 0 | 1,165 | ||||||||||||
Energy | 0 | 819 | 0 | 819 | ||||||||||||
Financials | 0 | 3,351 | 0 | 3,351 | ||||||||||||
Health Care | 0 | 2,682 | 0 | 2,682 | ||||||||||||
Industrials | 0 | 1,537 | 0 | 1,537 | ||||||||||||
Telecommunication Services | 0 | 1,314 | 0 | 1,314 | ||||||||||||
Utilities | 0 | 1,763 | 0 | 1,763 | ||||||||||||
Germany | ||||||||||||||||
Consumer Discretionary | 0 | 2,133 | 0 | 2,133 | ||||||||||||
Consumer Staples | 0 | 24 | 0 | 24 | ||||||||||||
Financials | 0 | 1,447 | 0 | 1,447 | ||||||||||||
Health Care | 0 | 1,027 | 0 | 1,027 | ||||||||||||
Industrials | 0 | 1,261 | 0 | 1,261 | ||||||||||||
Materials | 0 | 1,961 | 0 | 1,961 | ||||||||||||
Utilities | 0 | 1,529 | 0 | 1,529 | ||||||||||||
Hong Kong | ||||||||||||||||
Consumer Discretionary | 0 | 554 | 0 | 554 | ||||||||||||
Information Technology | 0 | 55 | 0 | 55 | ||||||||||||
Real Estate | 0 | 1,429 | 0 | 1,429 | ||||||||||||
Israel | ||||||||||||||||
Materials | 0 | 218 | 0 | 218 | ||||||||||||
Telecommunication Services | 0 | 195 | 0 | 195 | ||||||||||||
| Category and Subcategory | Level 1 | Level 2 | Level 3 | Fair Value at 06/30/2018 | ||||||||||||
Italy | ||||||||||||||||
Energy | $ | 0 | $ | 1,398 | $ | 0 | $ | 1,398 | ||||||||
Financials | 0 | 1,198 | 0 | 1,198 | ||||||||||||
Industrials | 0 | 100 | 0 | 100 | ||||||||||||
Utilities | 0 | 1,602 | 0 | 1,602 | ||||||||||||
Japan |
| |||||||||||||||
Consumer Discretionary | 0 | 5,817 | 0 | 5,817 | ||||||||||||
Consumer Staples | 0 | 1,027 | 0 | 1,027 | ||||||||||||
Energy | 0 | 991 | 0 | 991 | ||||||||||||
Financials | 0 | 7,086 | 0 | 7,086 | ||||||||||||
Health Care | 0 | 839 | 0 | 839 | ||||||||||||
Industrials | 0 | 5,930 | 0 | 5,930 | ||||||||||||
Information Technology | 0 | 5,326 | 0 | 5,326 | ||||||||||||
Materials | 0 | 1,183 | 0 | 1,183 | ||||||||||||
Real Estate | 0 | 144 | 0 | 144 | ||||||||||||
Telecommunication Services | 0 | 1,696 | 0 | 1,696 | ||||||||||||
Utilities | 0 | 1,272 | 0 | 1,272 | ||||||||||||
Luxembourg |
| |||||||||||||||
Consumer Discretionary | 0 | 126 | 0 | 126 | ||||||||||||
Macau |
| |||||||||||||||
Consumer Discretionary | 0 | 54 | 0 | 54 | ||||||||||||
Netherlands |
| |||||||||||||||
Consumer Staples | 0 | 360 | 0 | 360 | ||||||||||||
Energy | 0 | 3,537 | 0 | 3,537 | ||||||||||||
Financials | 0 | 648 | 0 | 648 | ||||||||||||
Health Care | 0 | 961 | 0 | 961 | ||||||||||||
Industrials | 0 | 119 | 0 | 119 | ||||||||||||
Telecommunication Services | 254 | 150 | 0 | 404 | ||||||||||||
New Zealand |
| |||||||||||||||
Industrials | 0 | 21 | 0 | 21 | ||||||||||||
Materials | 0 | 42 | 0 | 42 | ||||||||||||
Norway |
| |||||||||||||||
Energy | 0 | 994 | 0 | 994 | ||||||||||||
Financials | 0 | 174 | 0 | 174 | ||||||||||||
Materials | 0 | 344 | 0 | 344 | ||||||||||||
Telecommunication Services | 0 | 228 | 0 | 228 | ||||||||||||
Portugal |
| |||||||||||||||
Consumer Staples | 0 | 82 | 0 | 82 | ||||||||||||
Materials | 0 | 48 | 0 | 48 | ||||||||||||
Utilities | 0 | 527 | 0 | 527 | ||||||||||||
Singapore |
| |||||||||||||||
Industrials | 0 | 444 | 0 | 444 | ||||||||||||
Information Technology | 0 | 38 | 0 | 38 | ||||||||||||
South Africa |
| |||||||||||||||
Financials | 0 | 567 | 0 | 567 | ||||||||||||
Spain |
| |||||||||||||||
Consumer Staples | 0 | 33 | 0 | 33 | ||||||||||||
Financials | 0 | 3,114 | 0 | 3,114 | ||||||||||||
Industrials | 0 | 858 | 0 | 858 | ||||||||||||
Telecommunication Services | 0 | 1,086 | 0 | 1,086 | ||||||||||||
Utilities | 0 | 624 | 0 | 624 | ||||||||||||
Sweden |
| |||||||||||||||
Financials | 0 | 463 | 0 | 463 | ||||||||||||
Health Care | 28 | 90 | 0 | 118 | ||||||||||||
Telecommunication Services | 0 | 815 | 0 | 815 | ||||||||||||
Switzerland |
| |||||||||||||||
Consumer Discretionary | 64 | 0 | 0 | 64 | ||||||||||||
Energy | 606 | 0 | 0 | 606 | ||||||||||||
Financials | 0 | 3,391 | 0 | 3,391 | ||||||||||||
Health Care | 0 | 1,734 | 0 | 1,734 | ||||||||||||
Industrials | 0 | 64 | 0 | 64 | ||||||||||||
Information Technology | 252 | 0 | 0 | 252 | ||||||||||||
Telecommunication Services | 0 | 174 | 0 | 174 | ||||||||||||
United Kingdom |
| |||||||||||||||
Consumer Discretionary | 0 | 1,495 | 0 | 1,495 | ||||||||||||
Consumer Staples | 0 | 1,026 | 0 | 1,026 | ||||||||||||
Energy | 0 | 2,638 | 0 | 2,638 | ||||||||||||
| 38 | PIMCO EQUITY SERIES | See Accompanying Notes |
Table of Contents
June 30, 2018
| Category and Subcategory | Level 1 | Level 2 | Level 3 | Fair Value at 06/30/2018 | ||||||||||||
Financials | $ | 183 | $ | 6,712 | $ | 0 | $ | 6,895 | ||||||||
Health Care | 0 | 1,392 | 0 | 1,392 | ||||||||||||
Industrials | 0 | 1,711 | 0 | 1,711 | ||||||||||||
Materials | 0 | 318 | 0 | 318 | ||||||||||||
Telecommunication Services | 0 | 1,738 | 0 | 1,738 | ||||||||||||
Utilities | 0 | 1,096 | 0 | 1,096 | ||||||||||||
United States |
| |||||||||||||||
Consumer Discretionary | 12,257 | 0 | 0 | 12,257 | ||||||||||||
Consumer Staples | 9,167 | 0 | 0 | 9,167 | ||||||||||||
Energy | 15,467 | 0 | 0 | 15,467 | ||||||||||||
Financials | 19,642 | 0 | 0 | 19,642 | ||||||||||||
Health Care | 14,064 | 0 | 0 | 14,064 | ||||||||||||
Industrials | 6,294 | 0 | 0 | 6,294 | ||||||||||||
Information Technology | 10,899 | 0 | 0 | 10,899 | ||||||||||||
Materials | 3,687 | 0 | 0 | 3,687 | ||||||||||||
Telecommunication Services | 7,560 | 0 | 0 | 7,560 | ||||||||||||
Utilities | 6,161 | 0 | 0 | 6,161 | ||||||||||||
Convertible Bonds & Notes |
| |||||||||||||||
United States |
| |||||||||||||||
Industrials | 0 | 15 | 0 | 15 | ||||||||||||
Corporate Bonds & Notes |
| |||||||||||||||
Australia |
| |||||||||||||||
Banking & Finance | 0 | 394 | 0 | 394 | ||||||||||||
Bermuda |
| |||||||||||||||
Banking & Finance | 0 | 6 | 0 | 6 | ||||||||||||
Industrials | 0 | 9 | 0 | 9 | ||||||||||||
Brazil |
| |||||||||||||||
Industrials | 0 | 1 | 0 | 1 | ||||||||||||
Utilities | 0 | 735 | 0 | 735 | ||||||||||||
Canada |
| |||||||||||||||
Banking & Finance | 0 | 46 | 0 | 46 | ||||||||||||
Industrials | 0 | 80 | 0 | 80 | ||||||||||||
Cayman Islands |
| |||||||||||||||
Banking & Finance | 0 | 967 | 0 | 967 | ||||||||||||
Industrials | 0 | 80 | 0 | 80 | ||||||||||||
Utilities | 0 | 95 | 0 | 95 | ||||||||||||
Finland |
| |||||||||||||||
Industrials | 0 | 6 | 0 | 6 | ||||||||||||
France |
| |||||||||||||||
Industrials | 0 | 687 | 0 | 687 | ||||||||||||
Germany |
| |||||||||||||||
Banking & Finance | 0 | 634 | 0 | 634 | ||||||||||||
Ireland |
| |||||||||||||||
Industrials | 0 | 497 | 0 | 497 | ||||||||||||
Luxembourg |
| |||||||||||||||
Banking & Finance | 0 | 663 | 0 | 663 | ||||||||||||
Industrials | 0 | 252 | 0 | 252 | ||||||||||||
Utilities | 0 | 1,265 | 0 | 1,265 | ||||||||||||
Mexico |
| |||||||||||||||
Industrials | 0 | 50 | 0 | 50 | ||||||||||||
Netherlands |
| |||||||||||||||
Banking & Finance | 0 | 298 | 0 | 298 | ||||||||||||
Norway |
| |||||||||||||||
Industrials | 0 | 20 | 0 | 20 | ||||||||||||
Spain |
| |||||||||||||||
Banking & Finance | 0 | 610 | 0 | 610 | ||||||||||||
United Kingdom |
| |||||||||||||||
Banking & Finance | 0 | 4,225 | 0 | 4,225 | ||||||||||||
Industrials | 0 | 974 | 0 | 974 | ||||||||||||
Utilities | 0 | 67 | 0 | 67 | ||||||||||||
United States |
| |||||||||||||||
Banking & Finance | 0 | 4,946 | 0 | 4,946 | ||||||||||||
Industrials | 0 | 3,693 | 0 | 3,693 | ||||||||||||
Utilities | 0 | 930 | 0 | 930 | ||||||||||||
Venezuela |
| |||||||||||||||
Industrials | 0 | 74 | 0 | 74 | ||||||||||||
| Category and Subcategory | Level 1 | Level 2 | Level 3 | Fair Value at 06/30/2018 | ||||||||||||
Non-Agency Mortgage-Backed Securities |
| |||||||||||||||
United Kingdom | $ | 0 | $ | 1,949 | $ | 0 | $ | 1,949 | ||||||||
United States | 0 | 8,705 | 79 | 8,784 | ||||||||||||
Municipal Bonds & Notes |
| |||||||||||||||
California | 0 | 649 | 0 | 649 | ||||||||||||
Illinois | 0 | 164 | 0 | 164 | ||||||||||||
Michigan | 0 | 209 | 0 | 209 | ||||||||||||
Puerto Rico | 0 | 188 | 0 | 188 | ||||||||||||
Virginia | 0 | 382 | 0 | 382 | ||||||||||||
West Virginia | 0 | 355 | 0 | 355 | ||||||||||||
Preferred Stocks |
| |||||||||||||||
Germany |
| |||||||||||||||
Industrials | 0 | 1,583 | 0 | 1,583 | ||||||||||||
Real Estate Investment Trusts |
| |||||||||||||||
Canada |
| |||||||||||||||
Real Estate | 449 | 0 | 0 | 449 | ||||||||||||
United States |
| |||||||||||||||
Financials | 512 | 0 | 0 | 512 | ||||||||||||
Real Estate | 980 | 0 | 0 | 980 | ||||||||||||
Rights |
| |||||||||||||||
Spain |
| |||||||||||||||
Industrials | 18 | 0 | 0 | 18 | ||||||||||||
Sovereign Issues |
| |||||||||||||||
Argentina | 0 | 863 | 0 | 863 | ||||||||||||
Brazil | 0 | 340 | 0 | 340 | ||||||||||||
Greece | 0 | 241 | 0 | 241 | ||||||||||||
Kuwait | 0 | 376 | 0 | 376 | ||||||||||||
Peru | 0 | 117 | 0 | 117 | ||||||||||||
Saudi Arabia | 0 | 963 | 0 | 963 | ||||||||||||
Spain | 0 | 63 | 0 | 63 | ||||||||||||
Venezuela | 0 | 39 | 0 | 39 | ||||||||||||
U.S. Government Agencies |
| |||||||||||||||
United States | 0 | 10,539 | 0 | 10,539 | ||||||||||||
U.S. Treasury Obligations |
| |||||||||||||||
United States | 0 | 26,810 | 0 | 26,810 | ||||||||||||
Short-Term Instruments |
| |||||||||||||||
Certificates of Deposit | 0 | 300 | 0 | 300 | ||||||||||||
Commercial Paper | 0 | 800 | 0 | 800 | ||||||||||||
Repurchase Agreements | 0 | 1,419 | 0 | 1,419 | ||||||||||||
Short-Term Notes | 0 | 91 | 0 | 91 | ||||||||||||
Greece Treasury Bills | 0 | 196 | 0 | 196 | ||||||||||||
Argentina Treasury Bills | 0 | 360 | 0 | 360 | ||||||||||||
|
|
|
|
|
|
|
| |||||||||
| $ | 112,649 | $ | 207,218 | $ | 232 | $ | 320,099 | |||||||||
|
|
|
|
|
|
|
| |||||||||
Investments in Affiliates, at Value |
| |||||||||||||||
Short-Term Instruments |
| |||||||||||||||
Central Funds Used for Cash Management Purposes | $ | 2,007 | $ | 0 | $ | 0 | $ | 2,007 | ||||||||
|
|
|
|
|
|
|
| |||||||||
Total Investments | $ | 114,656 | $ | 207,218 | $ | 232 | $ | 322,106 | ||||||||
|
|
|
|
|
|
|
| |||||||||
Financial Derivative Instruments - Assets |
| |||||||||||||||
Exchange-traded or centrally cleared | 0 | 38 | 0 | 38 | ||||||||||||
Over the counter | 0 | 275 | 0 | 275 | ||||||||||||
|
|
|
|
|
|
|
| |||||||||
| $ | 0 | $ | 313 | $ | 0 | $ | 313 | |||||||||
|
|
|
|
|
|
|
| |||||||||
Financial Derivative Instruments - Liabilities |
| |||||||||||||||
Exchange-traded or centrally cleared | 0 | (24 | ) | 0 | (24 | ) | ||||||||||
Over the counter | 0 | (445 | ) | 0 | (445 | ) | ||||||||||
|
|
|
|
|
|
|
| |||||||||
| $ | 0 | $ | (469 | ) | $ | 0 | $ | (469 | ) | |||||||
|
|
|
|
|
|
|
| |||||||||
Total Financial Derivative Instruments | $ | 0 | $ | (156 | ) | $ | 0 | $ | (156 | ) | ||||||
|
|
|
|
|
|
|
| |||||||||
Totals | $ | 114,656 | $ | 207,062 | $ | 232 | $ | 321,950 | ||||||||
|
|
|
|
|
|
|
| |||||||||
There were no significant transfers among Levels 1, 2, or 3 during the period ended June 30, 2018.
| See Accompanying Notes | ANNUAL REPORT | JUNE 30, 2018 | 39 |
Table of Contents
Schedule of Investments PIMCO EqS® Long/Short Fund
(Amounts in thousands*, except number of shares, contracts and units, if any)
| SHARES | MARKET VALUE (000S) | |||||||||||
| INVESTMENTS IN SECURITIES 70.7% |
| |||||||||||
| COMMON STOCKS 61.4% |
| |||||||||||
| GERMANY 3.9% |
| |||||||||||
| FINANCIALS 2.2% | ||||||||||||
Deutsche Boerse AG | 80,000 | $ | 10,636 | |||||||||
|
| |||||||||||
| HEALTH CARE 1.7% | ||||||||||||
Bayer AG | 73,913 | 8,118 | ||||||||||
|
| |||||||||||
Total Germany | 18,754 | |||||||||||
|
| |||||||||||
| IRELAND 2.0% |
| |||||||||||
| HEALTH CARE 2.0% | ||||||||||||
Medtronic PLC | 110,000 | 9,417 | ||||||||||
|
| |||||||||||
Total Ireland | 9,417 | |||||||||||
|
| |||||||||||
| SOUTH KOREA 2.3% |
| |||||||||||
| INFORMATION TECHNOLOGY 2.3% |
| |||||||||||
Samsung Electronics Co. Ltd. | 259,000 | 10,849 | ||||||||||
|
| |||||||||||
Total South Korea | 10,849 | |||||||||||
|
| |||||||||||
| SWEDEN 1.8% |
| |||||||||||
| INFORMATION TECHNOLOGY 1.8% |
| |||||||||||
Spotify Technology S.A. (a) | 50,000 | 8,412 | ||||||||||
|
| |||||||||||
Total Sweden | 8,412 | |||||||||||
|
| |||||||||||
| UNITED STATES 51.4% |
| |||||||||||
| CONSUMER DISCRETIONARY 10.5% |
| |||||||||||
Amazon.com, Inc. (a) | 4,000 | 6,799 | ||||||||||
AutoZone, Inc. (a)(f) | 10,000 | 6,709 | ||||||||||
BJ’s Wholesale Club Holdings, Inc. (a) | 5,000 | 118 | ||||||||||
Expedia, Inc. | 61,000 | 7,332 | ||||||||||
Las Vegas Sands Corp. | 140,000 | 10,691 | ||||||||||
Royal Caribbean Cruises Ltd. | 83,000 | 8,599 | ||||||||||
TJX Cos., Inc. | 102,000 | 9,708 | ||||||||||
|
| |||||||||||
| 49,956 | ||||||||||||
|
| |||||||||||
| ENERGY 9.2% | ||||||||||||
Anadarko Petroleum Corp. | 80,000 | 5,860 | ||||||||||
ONEOK, Inc. | 180,000 | 12,570 | ||||||||||
| SHARES | MARKET VALUE (000S) | |||||||||||
Pioneer Natural Resources Co. | 30,000 | $ | 5,677 | |||||||||
Plains All American Pipeline LP | 210,000 | 4,964 | ||||||||||
Williams Cos., Inc. | 330,000 | 8,946 | ||||||||||
WPX Energy, Inc. (a) | 300,000 | 5,409 | ||||||||||
|
| |||||||||||
| 43,426 | ||||||||||||
|
| |||||||||||
| FINANCIALS 10.3% | ||||||||||||
Berkshire Hathaway, Inc. ‘B’ (a) | 88,000 | 16,425 | ||||||||||
Discover Financial Services | 97,000 | 6,830 | ||||||||||
JPMorgan Chase & Co. | 110,000 | 11,462 | ||||||||||
Synchrony Financial | 140,000 | 4,673 | ||||||||||
Wells Fargo & Co. (f) | 170,000 | 9,425 | ||||||||||
|
| |||||||||||
| 48,815 | ||||||||||||
|
| |||||||||||
| HEALTH CARE 7.2% | ||||||||||||
Centene Corp. (a) | 45,000 | 5,545 | ||||||||||
Laboratory Corp. of America Holdings (a) | 44,000 | 7,899 | ||||||||||
Pfizer, Inc. | 200,000 | 7,256 | ||||||||||
Quest Diagnostics, Inc. | 57,000 | 6,267 | ||||||||||
UnitedHealth Group, Inc. | 30,000 | 7,360 | ||||||||||
|
| |||||||||||
| 34,327 | ||||||||||||
|
| |||||||||||
| INDUSTRIALS 10.3% | ||||||||||||
KAR Auction Services, Inc. | 113,548 | 6,222 | ||||||||||
Kirby Corp. (a)(f) | 42,000 | 3,511 | ||||||||||
Norfolk Southern Corp. | 134,000 | 20,217 | ||||||||||
Union Pacific Corp. | 135,000 | 19,127 | ||||||||||
|
| |||||||||||
| 49,077 | ||||||||||||
|
| |||||||||||
| INFORMATION TECHNOLOGY 3.9% |
| |||||||||||
Activision Blizzard, Inc. | 70,000 | 5,342 | ||||||||||
Cisco Systems, Inc. (f) | 160,000 | 6,885 | ||||||||||
Zillow Group, Inc. ‘C’ (a)(f) | 110,000 | 6,497 | ||||||||||
|
| |||||||||||
| 18,724 | ||||||||||||
|
| |||||||||||
Total United States | 244,325 | |||||||||||
|
| |||||||||||
Total Common Stocks (Cost $274,772) |
| 291,757 | ||||||||||
|
| |||||||||||
| EXCHANGE-TRADED FUNDS 6.0% |
| |||||||||||
| UNITED STATES 6.0% |
| |||||||||||
iShares U.S. Medical Devices ETF | 3,091 | 620 | ||||||||||
SPDR S&P Oil & Gas Exploration & Production ETF | 325,000 | 13,995 | ||||||||||
| SHARES | MARKET VALUE (000S) | |||||||||||
SPDR S&P Regional Banking ETF | 222,000 | $ | 13,542 | |||||||||
|
| |||||||||||
Total Exchange-Traded Funds |
| 28,157 | ||||||||||
|
| |||||||||||
| SHORT-TERM INSTRUMENTS 3.3% |
| |||||||||||
| REPURCHASE AGREEMENTS (d) 0.1% |
| |||||||||||
| 549 | ||||||||||||
|
| |||||||||||
| PRINCIPAL AMOUNT (000S) | ||||||||||||
| U.S. TREASURY BILLS 3.2% |
| |||||||||||
1.848% due 07/19/2018 - 09/27/2018 (b)(c)(h) | $ | 15,300 | 15,266 | |||||||||
|
| |||||||||||
| Total Short-Term Instruments (Cost $15,815) | 15,815 | |||||||||||
|
| |||||||||||
| Total Investments in Securities (Cost $317,047) | 335,729 | |||||||||||
|
| |||||||||||
| SHARES | ||||||||||||
| INVESTMENTS IN AFFILIATES 29.8% |
| |||||||||||
| SHORT-TERM INSTRUMENTS 29.8% |
| |||||||||||
| CENTRAL FUNDS USED FOR CASH MANAGEMENT PURPOSES 29.8% |
| |||||||||||
PIMCO Short-Term Floating NAV Portfolio III | 14,305,026 | 141,419 | ||||||||||
|
| |||||||||||
| Total Short-Term Instruments (Cost $141,380) | 141,419 | |||||||||||
|
| |||||||||||
| Total Investments in Affiliates (Cost $141,380) | 141,419 | |||||||||||
| Total Investments 100.5% (Cost $458,427) | $ | 477,148 | ||||||||||
Securities Sold Short (e) (27.0)% (Proceeds $130,003) |
| (128,390 | ) | |||||||||
Financial Derivative (Cost or Premiums, net $(3,368)) |
| 416 | ||||||||||
| Other Assets and Liabilities, net 26.4% |
| 125,807 | ||||||||||
|
| |||||||||||
| Net Assets 100.0% | $ | 474,981 | ||||||||||
|
| |||||||||||
NOTES TO SCHEDULE OF INVESTMENTS:
| * | A zero balance may reflect actual amounts rounding to less than one thousand. |
| (a) | Security did not produce income within the last twelve months. |
| (b) | Coupon represents a weighted average yield to maturity. |
| (c) | Zero coupon security. |
BORROWINGS AND OTHER FINANCING TRANSACTIONS
(d) REPURCHASE AGREEMENTS:
| Counterparty | Lending Rate | Settlement Date | Maturity Date | Principal Amount | Collateralized By | Collateral (Received) | Repurchase Agreements, at Value | Repurchase Agreement Proceeds to be Received(1) | ||||||||||||||||||||||
| FICC | 1.500 | % | 06/29/2018 | 07/02/2018 | $ | 549 | U.S. Treasury Notes 2.125% due 08/15/2021 | $ | (561 | ) | $ | 549 | $ | 549 | ||||||||||||||||
|
|
|
|
|
| |||||||||||||||||||||||||
Total Repurchase Agreements |
| $ | (561 | ) | $ | 549 | $ | 549 | ||||||||||||||||||||||
|
|
|
|
|
| |||||||||||||||||||||||||
| 40 | PIMCO EQUITY SERIES | See Accompanying Notes |
Table of Contents
June 30, 2018
(e) SECURITIES SOLD SHORT
| Counterparty | Description | Shares | Proceeds | Payable for Short Sales(2) | ||||||||||
| Common Stocks (22.7)% | ||||||||||||||
Canada (1.5)% | ||||||||||||||
Energy (1.5)% | ||||||||||||||
GSC | Enbridge, Inc. | 70,000 | $ | (2,247 | ) | $ | (2,503 | ) | ||||||
TransCanada Corp. | 108,000 | (4,571 | ) | (4,729 | ) | |||||||||
|
|
|
| |||||||||||
Total Canada | (6,818 | ) | (7,232 | ) | ||||||||||
|
|
|
| |||||||||||
Switzerland (0.3)% | ||||||||||||||
Information Technology (0.3)% | ||||||||||||||
Logitech International S.A. | 34,000 | (1,166 | ) | (1,490 | ) | |||||||||
|
|
|
| |||||||||||
Total Switzerland | (1,166 | ) | (1,490 | ) | ||||||||||
|
|
|
| |||||||||||
United States (20.9)% | ||||||||||||||
Consumer Discretionary (4.1)% | ||||||||||||||
Aramark | 50,000 | (2,127 | ) | (1,855 | ) | |||||||||
FOB | Choice Hotels International, Inc. | 16,000 | (1,277 | ) | (1,213 | ) | ||||||||
Deckers Outdoor Corp. | 10,000 | (1,195 | ) | (1,129 | ) | |||||||||
GSC | Hasbro, Inc. | 20,000 | (1,743 | ) | (1,846 | ) | ||||||||
FOB | Hyatt Hotels Corp. ‘A’ | 21,181 | (1,624 | ) | (1,634 | ) | ||||||||
KB Home | 89,000 | (2,824 | ) | (2,424 | ) | |||||||||
GSC | NVR, Inc. | 750 | (2,181 | ) | (2,228 | ) | ||||||||
FOB | Omnicom Group, Inc. | 16,000 | (1,201 | ) | (1,220 | ) | ||||||||
PulteGroup, Inc. | 77,000 | (2,347 | ) | (2,221 | ) | |||||||||
GSC | Restoration Hardware Holdings, Inc. | 16,000 | (2,436 | ) | (2,235 | ) | ||||||||
FOB | Wayfair, Inc. ‘A’ | 11,000 | (1,239 | ) | (1,307 | ) | ||||||||
|
|
|
| |||||||||||
| (20,194 | ) | (19,312 | ) | |||||||||||
|
|
|
| |||||||||||
Consumer Staples (3.1)% | ||||||||||||||
GSC | Church & Dwight Co., Inc. | 45,000 | (2,070 | ) | (2,392 | ) | ||||||||
Clorox Co. | 55,000 | (7,153 | ) | (7,439 | ) | |||||||||
FOB | Walmart, Inc. | 56,000 | (4,758 | ) | (4,796 | ) | ||||||||
|
|
|
| |||||||||||
| (13,981 | ) | (14,627 | ) | |||||||||||
|
|
|
| |||||||||||
Energy (0.9)% | ||||||||||||||
GSC | Exxon Mobil Corp. | 55,000 | (4,343 | ) | (4,550 | ) | ||||||||
|
|
|
| |||||||||||
Financials (4.4)% | ||||||||||||||
Affiliated Managers Group, Inc. | 37,500 | (6,363 | ) | (5,575 | ) | |||||||||
Franklin Resources, Inc. | 145,000 | (4,845 | ) | (4,681 | ) | |||||||||
Invesco Ltd. | 150,000 | (4,668 | ) | (3,984 | ) | |||||||||
FOB | T Rowe Price Group, Inc. | 40,000 | (4,786 | ) | (4,643 | ) | ||||||||
Virtu Financial, Inc. ‘A’ | 80,000 | (2,380 | ) | (2,124 | ) | |||||||||
|
|
|
| |||||||||||
| (23,042 | ) | (21,007 | ) | |||||||||||
|
|
|
| |||||||||||
Health Care (2.7)% | ||||||||||||||
Aetna, Inc. | 7,000 | (1,241 | ) | (1,284 | ) | |||||||||
Amgen, Inc. | 29,000 | (4,928 | ) | (5,353 | ) | |||||||||
Anthem, Inc. | 5,000 | (1,160 | ) | (1,190 | ) | |||||||||
GSC | Eli Lilly & Co. | 30,000 | (2,512 | ) | (2,560 | ) | ||||||||
Mettler-Toledo International, Inc. | 4,000 | (2,307 | ) | (2,315 | ) | |||||||||
|
|
|
| |||||||||||
| (12,148 | ) | (12,702 | ) | |||||||||||
|
|
|
| |||||||||||
Industrials (5.1)% | ||||||||||||||
FOB | Brink’s Co. | 80,000 | (6,144 | ) | (6,380 | ) | ||||||||
GSC | General Dynamics Corp. | 14,427 | (2,872 | ) | (2,689 | ) | ||||||||
FOB | Harris Corp. | 24,000 | (3,665 | ) | (3,469 | ) | ||||||||
Northrop Grumman Corp. | 3,859 | (1,264 | ) | (1,187 | ) | |||||||||
Raytheon Co. | 18,000 | (3,750 | ) | (3,477 | ) | |||||||||
Schneider National, Inc. ‘B’ | 110,000 | (3,015 | ) | (3,033 | ) | |||||||||
Werner Enterprises, Inc. | 101,500 | (3,644 | ) | (3,821 | ) | |||||||||
|
|
|
| |||||||||||
| (24,354 | ) | (24,056 | ) | |||||||||||
|
|
|
| |||||||||||
Information Technology (0.6)% | ||||||||||||||
PayPal Holdings, Inc. | 35,000 | (2,724 | ) | (2,915 | ) | |||||||||
|
|
|
| |||||||||||
Total United States | (100,786 | ) | (99,169 | ) | ||||||||||
|
|
|
| |||||||||||
Total Common Stocks | (108,770 | ) | (107,891 | ) | ||||||||||
|
|
|
| |||||||||||
| See Accompanying Notes | ANNUAL REPORT | JUNE 30, 2018 | 41 |
Table of Contents
Schedule of Investments PIMCO EqS® Long/Short Fund (Cont.)
| Counterparty | Description | Shares | Proceeds | Payable for Short Sales(2) | ||||||||||
Exchange-Traded Funds (2.2)% | ||||||||||||||
United States (2.2)% | ||||||||||||||
iShares Nasdaq Biotechnology ETF | 23,000 | $ | (2,478 | ) | $ | (2,530 | ) | |||||||
GSC | iShares MSCI Emerging Markets ETF | 180,000 | (8,338 | ) | (7,799 | ) | ||||||||
|
|
|
| |||||||||||
Total Exchange-Traded Funds | (10,816 | ) | (10,329 | ) | ||||||||||
|
|
|
| |||||||||||
Real Estate Investment Trusts (2.1)% | ||||||||||||||
United States (2.1)% | ||||||||||||||
FOB | Apollo Commercial Real Estate Finance, Inc. | 76,000 | (1,427 | ) | (1,424 | ) | ||||||||
Blackstone Mortgage Trust, Inc. ‘A’ | 44,000 | (1,435 | ) | (1,410 | ) | |||||||||
GSC | Iron Mountain, Inc. | 140,000 | (5,177 | ) | (4,984 | ) | ||||||||
FOB | Starwood Property Trust, Inc. | 106,000 | (2,378 | ) | (2,352 | ) | ||||||||
|
|
|
| |||||||||||
Total Real Estate Investment Trusts | (10,417 | ) | (10,170 | ) | ||||||||||
|
|
|
| |||||||||||
Total Short Sales (27.0)% | $ | (130,003 | ) | $ | (128,390 | ) | ||||||||
|
|
|
| |||||||||||
BORROWINGS AND OTHER FINANCING TRANSACTIONS SUMMARY
The following is a summary by counterparty of the market value of Borrowings and Other Financing Transactions and collateral pledged/(received) as of June 30, 2018:
| Counterparty | �� | Repurchase Agreement Proceeds to be Received(1) | Payable for Reverse Repurchase Agreements | Payable for Sale-Buyback Transactions | Payable for Short Sales(2) | Total Borrowings and Other Financing Transactions | Collateral Pledged/(Received) | Net Exposure(3) | ||||||||||||||||||||
Global/Master Repurchase Agreement |
| |||||||||||||||||||||||||||
FICC | $ | 549 | $ | 0 | $ | 0 | $ | 0 | $ | 549 | $ | (561 | ) | $ | (12 | ) | ||||||||||||
Prime Brokerage Agreement |
| |||||||||||||||||||||||||||
FOB | 0 | 0 | 0 | (62,536 | ) | (62,536 | ) | 83,752 | 21,216 | |||||||||||||||||||
GSC | 0 | 0 | 0 | (65,854 | ) | (65,854 | ) | 70,433 | 4,579 | |||||||||||||||||||
|
|
|
|
|
|
|
| |||||||||||||||||||||
Total Borrowings and Other Financing Transactions | $ | 549 | $ | 0 | $ | 0 | $ | (128,390 | ) | |||||||||||||||||||
|
|
|
|
|
|
|
| |||||||||||||||||||||
| (f) | Securities with an aggregate market value of $24,754 and cash of $129,431 have been pledged as collateral as of June 30, 2018 for equity short sales and equity options as governed by prime brokerage agreements and agreements governing listed equity option transactions. |
| (1) | Includes accrued interest. |
| (2) | Payable for short sales includes $315 of dividends payable. |
| (3) | Net Exposure represents the net receivable/(payable) that would be due from/to the counterparty in the event of default. Exposure from borrowings and other financing transactions can only be netted across transactions governed under the same master agreement with the same legal entity. See Note 8, Master Netting Arrangements, in the Notes to Financial Statements for more information regarding master netting arrangements. |
(g) FINANCIAL DERIVATIVE INSTRUMENTS: EXCHANGE-TRADED OR CENTRALLY CLEARED
FUTURES CONTRACTS:
SHORT FUTURES CONTRACTS
| Description | Expiration Month | # of Contracts | Notional Amount | Unrealized Appreciation/ (Depreciation) | Variation Margin | |||||||||||||||||||||||
| Asset | Liability | |||||||||||||||||||||||||||
E-mini S&P 500 Index September Futures | 09/2018 | 230 | $ | (31,298 | ) | $ | 626 | $ | 0 | $ | (24 | ) | ||||||||||||||||
Euro STOXX 50 September Futures | 09/2018 | 180 | EUR | (7,128 | ) | 162 | 71 | (84 | ) | |||||||||||||||||||
WTI Crude December Futures | 11/2018 | 73 | $ | (5,073 | ) | (1,097 | ) | 0 | (51 | ) | ||||||||||||||||||
|
|
|
|
|
| |||||||||||||||||||||||
Total Futures Contracts |
| $ | (309 | ) | $ | 71 | $ | (159 | ) | |||||||||||||||||||
|
|
|
|
|
| |||||||||||||||||||||||
SWAP AGREEMENTS:
CREDIT DEFAULT SWAPS ON CREDIT INDICES - BUY PROTECTION(1)
| Index/Tranches | Fixed (Pay) Rate | Payment Frequency | Maturity Date | Notional Amount(2) | Premiums Paid/(Received) | Unrealized Appreciation/ (Depreciation) | Market Value(3) | Variation Margin | ||||||||||||||||||||||||||
| Asset | Liability | |||||||||||||||||||||||||||||||||
CDX.HY-29 5-Year Index | (5.000)% | Quarterly | 12/20/2022 | $ | 41,800 | $ | (3,368 | ) | $ | 704 | $ | (2,664 | ) | $ | 0 | $ | (8 | ) | ||||||||||||||||
|
|
|
|
|
|
|
|
|
| |||||||||||||||||||||||||
Total Swap Agreements | $ | (3,368 | ) | $ | 704 | $ | (2,664 | ) | $ | 0 | $ | (8 | ) | |||||||||||||||||||||
|
|
|
|
|
|
|
|
|
| |||||||||||||||||||||||||
| 42 | PIMCO EQUITY SERIES | See Accompanying Notes |
Table of Contents
June 30, 2018
FINANCIAL DERIVATIVE INSTRUMENTS: EXCHANGE-TRADED OR CENTRALLY CLEARED SUMMARY
The following is a summary of the market value and variation margin of Exchange-Traded or Centrally Cleared Financial Derivative Instruments as of June 30, 2018:
| Financial Derivative Assets | Financial Derivative Liabilities | |||||||||||||||||||||||||||||||||||
| Market Value | Variation Margin Asset | Total | Market Value | Variation Margin Liability | Total | |||||||||||||||||||||||||||||||
| Purchased Options | Futures | Swap Agreements | Written Options | Futures | Swap Agreements | |||||||||||||||||||||||||||||||
Total Exchange-Traded or Centrally Cleared | $ | 0 | $ | 71 | $ | 0 | $ | 71 | $ | 0 | $ | (159) | $ | (8) | $ | (167) | ||||||||||||||||||||
|
|
|
|
|
|
|
|
|
|
|
|
|
|
|
| |||||||||||||||||||||
| (h) | Securities with an aggregate market value of $1,665 and cash of $1,660 have been pledged as collateral for exchange-traded and centrally cleared financial derivative instruments as of June 30, 2018. See Note 8, Master Netting Arrangements, in the Notes to Financial Statements for more information regarding master netting arrangements. |
| (1) | If the Fund is a buyer of protection and a credit event occurs, as defined under the terms of that particular swap agreement, the Fund will either (i) receive from the seller of protection an amount equal to the notional amount of the swap and deliver the referenced obligation or underlying securities comprising the referenced index or (ii) receive a net settlement amount in the form of cash, securities or other deliverable obligations equal to the notional amount of the swap less the recovery value of the referenced obligation or underlying securities comprising the referenced index. |
| (2) | The maximum potential amount the Fund could be required to pay as a seller of credit protection or receive as a buyer of credit protection if a credit event occurs as defined under the terms of that particular swap agreement. |
| (3) | The prices and resulting values for credit default swap agreements on credit indices serve as indicators of the current status of the payment/performance risk and represent the likelihood of an expected liability (or profit) for the credit derivative should the notional amount of the swap agreement be closed/sold as of the period end. Increasing market values, in absolute terms when compared to the notional amount of the swap, represent a deterioration of the referenced indices’ credit soundness and a greater likelihood or risk of default or other credit event occurring as defined under the terms of the agreement. |
(i) FINANCIAL DERIVATIVE INSTRUMENTS: OVER THE COUNTER
FORWARD FOREIGN CURRENCY CONTRACTS:
Counterparty | Settlement | Currency to | Currency to be Received | Unrealized Appreciation/ (Depreciation) | ||||||||||||||||||||
| Asset | Liability | |||||||||||||||||||||||
BPS | 07/2018 | EUR | 14,725 | $ | 17,079 | $ | 0 | $ | (117 | ) | ||||||||||||||
BRC | 09/2018 | $ | 1,203 | KRW | 1,337,977 | 1 | 0 | |||||||||||||||||
GLM | 07/2018 | CAD | 202 | $ | 152 | 0 | (2 | ) | ||||||||||||||||
| 09/2018 | $ | 2,404 | KRW | 2,579,603 | 0 | (82 | ) | |||||||||||||||||
SCX | 09/2018 | KRW | 15,641,658 | $ | 14,552 | 473 | 0 | |||||||||||||||||
SSB | 07/2018 | $ | 17,141 | EUR | 14,725 | 55 | 0 | |||||||||||||||||
| 08/2018 | EUR | 14,725 | $ | 17,179 | 0 | (54 | ) | |||||||||||||||||
|
|
|
| |||||||||||||||||||||
Total Forward Foreign Currency Contracts |
| $ | 529 | $ | (255 | ) | ||||||||||||||||||
|
|
|
| |||||||||||||||||||||
SWAP AGREEMENTS:
TOTAL RETURN SWAPS ON EQUITY INDICES
| Counterparty | Pay/Receive(1) | Underlying Reference | # of Units | Financing Rate | Payment Frequency | Maturity Date | Notional Amount | Premiums Paid/(Received) | Unrealized Appreciation/ (Depreciation) | Swap Agreements, at Value | ||||||||||||||||||||||||
| Asset | Liability | |||||||||||||||||||||||||||||||||
BPS | Receive | AMZX Index | 1 | 3-Month USD-LIBOR plus a specified spread | Quarterly | 11/28/2018 | $ | 2,683 | $ | 0 | $ | (47 | ) | $ | 0 | $ | (47 | ) | ||||||||||||||||
CBK | Receive | AMZX Index | 1 | 3-Month USD-LIBOR plus a specified spread | Quarterly | 02/15/2019 | 14,984 | 0 | 285 | 285 | 0 | |||||||||||||||||||||||
|
|
|
|
|
|
|
| |||||||||||||||||||||||||||
Total Swap Agreements |
| $ | 0 | $ | 238 | $ | 285 | $ | (47 | ) | ||||||||||||||||||||||||
|
|
|
|
|
|
|
| |||||||||||||||||||||||||||
FINANCIAL DERIVATIVE INSTRUMENTS: OVER THE COUNTER SUMMARY
The following is a summary by counterparty of the market value of OTC financial derivative instruments and collateral (received) as of June 30, 2018:
| Financial Derivative Assets | Financial Derivative Liabilities | |||||||||||||||||||||||||||||||||||||||||||||||
| Counterparty | Forward Foreign Currency Contracts | Purchased Options | Swap Agreements | Total Over the Counter | Forward Foreign Currency Contracts | Written Options | Swap Agreements | Total Over the Counter | Net Market Value of OTC Derivatives | Collateral (Received) | Net Exposure(2) | |||||||||||||||||||||||||||||||||||||
BPS | $ | 0 | $ | 0 | $ | 0 | $ | 0 | $ | (117 | ) | $ | 0 | $ | (47 | ) | $ | (164 | ) | $ | (164 | ) | $ | 0 | $ | (164 | ) | |||||||||||||||||||||
BRC | 1 | 0 | 0 | 1 | 0 | 0 | 0 | 0 | 1 | 0 | 1 | |||||||||||||||||||||||||||||||||||||
CBK | 0 | 0 | 285 | 285 | 0 | 0 | 0 | 0 | 285 | (260 | ) | 25 | ||||||||||||||||||||||||||||||||||||
| See Accompanying Notes | ANNUAL REPORT | JUNE 30, 2018 | 43 |
Table of Contents
Schedule of Investments PIMCO EqS® Long/Short Fund (Cont.)
| Financial Derivative Assets | Financial Derivative Liabilities | |||||||||||||||||||||||||||||||||||||||||||||||
| Counterparty | Forward Foreign Currency Contracts | Purchased Options | Swap Agreements | Total Over the Counter | Forward Foreign Currency Contracts | Written Options | Swap Agreements | Total Over the Counter | Net Market Value of OTC Derivatives | Collateral (Received) | Net Exposure(2) | |||||||||||||||||||||||||||||||||||||
GLM | $ | 0 | $ | 0 | $ | 0 | $ | 0 | $ | (84 | ) | $ | 0 | $ | 0 | $ | (84 | ) | $ | (84 | ) | $ | 0 | $ | (84 | ) | ||||||||||||||||||||||
SCX | 473 | 0 | 0 | 473 | 0 | 0 | 0 | 0 | 473 | (610 | ) | (137 | ) | |||||||||||||||||||||||||||||||||||
SSB | 55 | 0 | 0 | 55 | (54 | ) | 0 | 0 | (54 | ) | 1 | 0 | 1 | |||||||||||||||||||||||||||||||||||
|
|
|
|
|
|
|
|
|
|
|
|
|
|
|
| |||||||||||||||||||||||||||||||||
Total Over the Counter | $ | 529 | $ | 0 | $ | 285 | $ | 814 | $ | (255 | ) | $ | 0 | $ | (47 | ) | $ | (302 | ) | |||||||||||||||||||||||||||||
|
|
|
|
|
|
|
|
|
|
|
|
|
|
|
| |||||||||||||||||||||||||||||||||
| (1) | Receive represents that the Fund receives payments for any positive net return on the underlying reference. The Fund makes payments for any negative net return on such underlying reference. Pay represents that the Fund receives payments for any negative net return on the underlying reference. The Fund makes payments for any positive net return on such underlying reference. |
| (2) | Net Exposure represents the net receivable/(payable) that would be due from/to the counterparty in the event of default. Exposure from OTC financial derivative instruments can only be netted across transactions governed under the same master agreement with the same legal entity. See Note 8, Master Netting Arrangements, in the Notes to Financial Statements for more information regarding master netting arrangements. |
FAIR VALUE OF FINANCIAL DERIVATIVE INSTRUMENTS
The following is a summary of the fair valuation of the Fund’s derivative instruments categorized by risk exposure. See Note 7, Principal Risks, in the Notes to Financial Statements on risks of the Fund.
Fair Values of Financial Derivative Instruments on the Statements of Assets and Liabilities as of June 30, 2018:
| Derivatives not accounted for as hedging instruments | ||||||||||||||||||||||||
| Commodity Contracts | Credit Contracts | Equity Contracts | Foreign Exchange Contracts | Interest Rate Contracts | Total | |||||||||||||||||||
Financial Derivative Instruments - Assets |
| |||||||||||||||||||||||
Exchange-traded or centrally cleared |
| |||||||||||||||||||||||
Futures | $ | 0 | $ | 0 | $ | 71 | $ | 0 | $ | 0 | $ | 71 | ||||||||||||
|
|
|
|
|
|
|
|
|
|
|
| |||||||||||||
Over the counter |
| |||||||||||||||||||||||
Forward Foreign Currency Contracts | $ | 0 | $ | 0 | $ | 0 | $ | 529 | $ | 0 | $ | 529 | ||||||||||||
Swap Agreements | 0 | 0 | 285 | 0 | 0 | 285 | ||||||||||||||||||
|
|
|
|
|
|
|
|
|
|
|
| |||||||||||||
| $ | 0 | $ | 0 | $ | 285 | $ | 529 | $ | 0 | $ | 814 | |||||||||||||
|
|
|
|
|
|
|
|
|
|
|
| |||||||||||||
| $ | 0 | $ | 0 | $ | 356 | $ | 529 | $ | 0 | $ | 885 | |||||||||||||
|
|
|
|
|
|
|
|
|
|
|
| |||||||||||||
Financial Derivative Instruments - Liabilities |
| |||||||||||||||||||||||
Exchange-traded or centrally cleared |
| |||||||||||||||||||||||
Futures | $ | 51 | $ | 0 | $ | 108 | $ | 0 | $ | 0 | $ | 159 | ||||||||||||
Swap Agreements | 0 | 8 | 0 | 0 | 0 | 8 | ||||||||||||||||||
|
|
|
|
|
|
|
|
|
|
|
| |||||||||||||
| $ | 51 | $ | 8 | $ | 108 | $ | 0 | $ | 0 | $ | 167 | |||||||||||||
|
|
|
|
|
|
|
|
|
|
|
| |||||||||||||
Over the counter |
| |||||||||||||||||||||||
Forward Foreign Currency Contracts | $ | 0 | $ | 0 | $ | 0 | $ | 255 | $ | 0 | $ | 255 | ||||||||||||
Swap Agreements | 0 | 0 | 47 | 0 | 0 | 47 | ||||||||||||||||||
|
|
|
|
|
|
|
|
|
|
|
| |||||||||||||
| $ | 0 | $ | 0 | $ | 47 | $ | 255 | $ | 0 | $ | 302 | |||||||||||||
|
|
|
|
|
|
|
|
|
|
|
| |||||||||||||
| $ | 51 | $ | 8 | $ | 155 | $ | 255 | $ | 0 | $ | 469 | |||||||||||||
|
|
|
|
|
|
|
|
|
|
|
| |||||||||||||
The effect of Financial Derivative Instruments on the Statements of Operations for the period ended June 30, 2018:
| Derivatives not accounted for as hedging instruments | ||||||||||||||||||||||||
| Commodity Contracts | Credit Contracts | Equity Contracts | Foreign Exchange Contracts | Interest Rate Contracts | Total | |||||||||||||||||||
Net Realized (Loss) on Financial Derivative Instruments |
| |||||||||||||||||||||||
Exchange-traded or centrally cleared |
| |||||||||||||||||||||||
Futures | $ | (996 | ) | $ | 0 | $ | (1,739 | ) | $ | 0 | $ | 0 | $ | (2,735 | ) | |||||||||
Swap Agreements | 0 | (3,082 | ) | 0 | 0 | (1 | ) | (3,083 | ) | |||||||||||||||
|
|
|
|
|
|
|
|
|
|
|
| |||||||||||||
| $ | (996 | ) | $ | (3,082 | ) | $ | (1,739 | ) | $ | 0 | $ | (1 | ) | $ | (5,818 | ) | ||||||||
|
|
|
|
|
|
|
|
|
|
|
| |||||||||||||
Over the counter |
| |||||||||||||||||||||||
Forward Foreign Currency Contracts | $ | 0 | $ | 0 | $ | 0 | $ | (1,324 | ) | $ | 0 | $ | (1,324 | ) | ||||||||||
Swap Agreements | 0 | 0 | (432 | ) | 0 | 0 | (432 | ) | ||||||||||||||||
|
|
|
|
|
|
|
|
|
|
|
| |||||||||||||
| $ | 0 | $ | 0 | $ | (432 | ) | $ | (1,324 | ) | $ | 0 | $ | (1,756 | ) | ||||||||||
|
|
|
|
|
|
|
|
|
|
|
| |||||||||||||
| $ | (996 | ) | $ | (3,082 | ) | $ | (2,171 | ) | $ | (1,324 | ) | $ | (1 | ) | $ | (7,574 | ) | |||||||
|
|
|
|
|
|
|
|
|
|
|
| |||||||||||||
| 44 | PIMCO EQUITY SERIES | See Accompanying Notes |
Table of Contents
June 30, 2018
| Derivatives not accounted for as hedging instruments | ||||||||||||||||||||||||
| Commodity Contracts | Credit Contracts | Equity Contracts | Foreign Exchange Contracts | Interest Rate Contracts | Total | |||||||||||||||||||
Net Change in Unrealized Appreciation (Depreciation) on Financial Derivative Instruments |
| |||||||||||||||||||||||
Exchange-traded or centrally cleared |
| |||||||||||||||||||||||
Futures | $ | (1,096 | ) | $ | 0 | $ | 820 | $ | 0 | $ | 0 | $ | (276 | ) | ||||||||||
Swap Agreements | 0 | 1,363 | 0 | 0 | 0 | 1,363 | ||||||||||||||||||
|
|
|
|
|
|
|
|
|
|
|
| |||||||||||||
| $ | (1,096 | ) | $ | 1,363 | $ | 820 | $ | 0 | $ | 0 | $ | 1,087 | ||||||||||||
|
|
|
|
|
|
|
|
|
|
|
| |||||||||||||
Over the counter |
| |||||||||||||||||||||||
Forward Foreign Currency Contracts | $ | 0 | $ | 0 | $ | 0 | $ | 1,387 | $ | 0 | $ | 1,387 | ||||||||||||
Swap Agreements | 0 | 0 | 238 | 0 | 0 | 238 | ||||||||||||||||||
|
|
|
|
|
|
|
|
|
|
|
| |||||||||||||
| $ | 0 | $ | 0 | $ | 238 | $ | 1,387 | $ | 0 | $ | 1,625 | |||||||||||||
|
|
|
|
|
|
|
|
|
|
|
| |||||||||||||
| $ | (1,096 | ) | $ | 1,363 | $ | 1,058 | $ | 1,387 | $ | 0 | $ | 2,712 | ||||||||||||
|
|
|
|
|
|
|
|
|
|
|
| |||||||||||||
FAIR VALUE MEASUREMENTS
The following is a summary of the fair valuations according to the inputs used as of June 30, 2018 in valuing the Fund’s assets and liabilities:
| Category and Subcategory | Level 1 | Level 2 | Level 3 | Fair Value at 06/30/2018 | ||||||||||||
Investments in Securities, at Value |
| |||||||||||||||
Common Stocks |
| |||||||||||||||
Germany |
| |||||||||||||||
Financials | $ | 0 | $ | 10,636 | $ | 0 | $ | 10,636 | ||||||||
Health Care | 0 | 8,118 | 0 | 8,118 | ||||||||||||
Ireland |
| |||||||||||||||
Health Care | 9,417 | 0 | 0 | 9,417 | ||||||||||||
South Korea |
| |||||||||||||||
Information Technology | 0 | 10,849 | 0 | 10,849 | ||||||||||||
Sweden |
| |||||||||||||||
Information Technology | 8,412 | 0 | 0 | 8,412 | ||||||||||||
United States |
| |||||||||||||||
Consumer Discretionary | 49,956 | 0 | 0 | 49,956 | ||||||||||||
Energy | 43,426 | 0 | 0 | 43,426 | ||||||||||||
Financials | 48,815 | 0 | 0 | 48,815 | ||||||||||||
Health Care | 34,327 | 0 | 0 | 34,327 | ||||||||||||
Industrials | 49,077 | 0 | 0 | 49,077 | ||||||||||||
Information Technology | 18,724 | 0 | 0 | 18,724 | ||||||||||||
Exchange-Traded Funds |
| |||||||||||||||
United States | 28,157 | 0 | 0 | 28,157 | ||||||||||||
Short-Term Instruments |
| |||||||||||||||
Repurchase Agreements | 0 | 549 | 0 | 549 | ||||||||||||
U.S. Treasury Bills | 0 | 15,266 | 0 | 15,266 | ||||||||||||
|
|
|
|
|
|
|
| |||||||||
| $ | 290,311 | $ | 45,418 | $ | 0 | $ | 335,729 | |||||||||
|
|
|
|
|
|
|
| |||||||||
Investments in Affiliates, at Value |
| |||||||||||||||
Short-Term Instruments |
| |||||||||||||||
Central Funds Used for Cash Management Purposes | $ | 141,419 | $ | 0 | $ | 0 | $ | 141,419 | ||||||||
|
|
|
|
|
|
|
| |||||||||
Total Investments | $ | 431,730 | $ | 45,418 | $ | 0 | $ | 477,148 | ||||||||
|
|
|
|
|
|
|
| |||||||||
| Category and Subcategory | Level 1 | Level 2 | Level 3 | Fair Value at 06/30/2018 | ||||||||||||
Short Sales, at Value - Liabilities |
| |||||||||||||||
Common Stocks |
| |||||||||||||||
Canada | ||||||||||||||||
Energy | $ | (7,232 | ) | $ | 0 | $ | 0 | $ | (7,232 | ) | ||||||
Switzerland | ||||||||||||||||
Information Technology | 0 | (1,490 | ) | 0 | (1,490 | ) | ||||||||||
United States | ||||||||||||||||
Consumer Discretionary | (19,312 | ) | 0 | 0 | (19,312 | ) | ||||||||||
Consumer Staples | (14,627 | ) | 0 | 0 | (14,627 | ) | ||||||||||
Energy | (4,550 | ) | 0 | 0 | (4,550 | ) | ||||||||||
Financials | (21,007 | ) | 0 | 0 | (21,007 | ) | ||||||||||
Health Care | (12,702 | ) | 0 | 0 | (12,702 | ) | ||||||||||
Industrials | (24,056 | ) | 0 | 0 | (24,056 | ) | ||||||||||
Information Technology | (2,915 | ) | 0 | 0 | (2,915 | ) | ||||||||||
Exchange-Traded Funds | ||||||||||||||||
United States | (10,329 | ) | 0 | 0 | (10,329 | ) | ||||||||||
Real Estate Investment Trusts | ||||||||||||||||
United States | (10,170 | ) | 0 | 0 | (10,170 | ) | ||||||||||
|
|
|
|
|
|
|
| |||||||||
| $ | (126,900 | ) | $ | (1,490 | ) | $ | 0 | $ | (128,390 | ) | ||||||
|
|
|
|
|
|
|
| |||||||||
Financial Derivative Instruments - Assets |
| |||||||||||||||
Exchange-traded or centrally cleared | 71 | 0 | 0 | 71 | ||||||||||||
Over the counter | 0 | 814 | 0 | 814 | ||||||||||||
|
|
|
|
|
|
|
| |||||||||
| $ | 71 | $ | 814 | $ | 0 | $ | 885 | |||||||||
|
|
|
|
|
|
|
| |||||||||
Financial Derivative Instruments - Liabilities |
| |||||||||||||||
Exchange-traded or centrally cleared | (159 | ) | (8 | ) | 0 | (167 | ) | |||||||||
Over the counter | 0 | (302 | ) | 0 | (302 | ) | ||||||||||
|
|
|
|
|
|
|
| |||||||||
| $ | (159 | ) | $ | (310 | ) | $ | 0 | $ | (469 | ) | ||||||
|
|
|
|
|
|
|
| |||||||||
Total Financial Derivative Instruments | $ | (88 | ) | $ | 504 | $ | 0 | $ | 416 | |||||||
|
|
|
|
|
|
|
| |||||||||
Totals | $ | 304,742 | $ | 44,432 | $ | 0 | $ | 349,174 | ||||||||
|
|
|
|
|
|
|
| |||||||||
There were no significant transfers among Levels 1, 2, or 3 during the period ended June 30, 2018.
| See Accompanying Notes | ANNUAL REPORT | JUNE 30, 2018 | 45 |
Table of Contents
1. ORGANIZATION
PIMCO Equity Series (the “Trust”) was established as a Delaware statutory trust on March 30, 2010. The Trust is registered under the Investment Company Act of 1940, as amended (the “Act”), as an open-end management investment company. Information presented in these financial statements pertains to the Institutional Class, I-2, I-3, Class A and Class C shares of the funds (each a “Fund” and collectively the “Funds”) indicated on the cover of this report. Pacific Investment Management Company LLC (“PIMCO”) serves as the investment adviser (the “Adviser”) for the Funds. Research Affiliates, LLC (“Research Affiliates”) serves as the sub-adviser for the equity portion of the PIMCO Dividend and Income Fund. PIMCO and Research Affiliates have also engaged Parametric Portfolio Associates, LLC (“Parametric”) to implement the investment strategies of the equity portion of the PIMCO Dividend and Income Fund.
On March 23, 2018, PIMCO processed an automatic conversion of all Class D shares of the following Funds into Class A shares of the same Fund: PIMCO Dividend and Income Fund and PIMCO EqS® Long/Short Fund. Shareholders of Class D of a Fund received Class A shares of equal value to their outstanding shares of Class D as of March 23, 2018. The conversion was tax-free and shareholders did not have to pay any sales charge, fee or other charge in connection with the conversion.
2. SIGNIFICANT ACCOUNTING POLICIES
The following is a summary of significant accounting policies consistently followed by the Trust in the preparation of its financial statements in conformity with accounting principles generally accepted in the United States of America (“U.S. GAAP”). Each Fund is treated as an investment company under the reporting requirements of U.S. GAAP. The functional and reporting currency for the Funds is the U.S. dollar. The preparation of financial statements in accordance with U.S. GAAP requires management to make estimates and assumptions that affect the reported amounts of assets and liabilities and disclosure of contingent assets and liabilities at the date of the financial statements and the reported amounts of increases and decreases in net assets from operations during the reporting period. Actual results could differ from those estimates.
(a) Securities Transactions and Investment Income Securities transactions are recorded as of the trade date for financial reporting purposes. Securities purchased or sold on a when-issued or delayed-delivery basis may be settled beyond a standard settlement period for the security after the trade date. Realized gains (losses) from securities sold are recorded on the identified cost basis. Dividend income is recorded on the ex-dividend date, except certain dividends from foreign securities where the ex-dividend date may have passed, which are recorded as soon as a Fund is informed of the ex-dividend date.
Interest income, adjusted for the accretion of discounts and amortization of premiums, is recorded on the accrual basis from settlement date, with the exception of securities with a forward starting effective date, where interest income is recorded on the accrual basis from effective date. For convertible securities, premiums attributable to the conversion feature are not amortized. Estimated tax liabilities on certain foreign securities are recorded on an accrual basis and are reflected as components of interest income or net change in unrealized appreciation (depreciation) on investments on the Statements of Operations, as appropriate. Tax liabilities realized as a result of such security sales are reflected as a component of net realized gain (loss) on investments on the Statements of Operations. Paydown gains (losses) on mortgage-related and other asset-backed securities, if any, are recorded as components of interest income on the Statements of Operations. Income or short-term capital gain distributions received from registered investment companies, if any, are recorded as dividend income. Long-term capital gain distributions received from registered investment companies, if any, are recorded as realized gains.
Debt obligations may be placed on non-accrual status and related interest income may be reduced by ceasing current accruals and writing off interest receivable when the collection of all or a portion of interest has become doubtful based on consistently applied procedures. A debt obligation is removed from non-accrual status when the issuer resumes interest payments or when collectability of interest is probable.
(b) Cash and Foreign Currency The market values of foreign securities, currency holdings and other assets and liabilities denominated in foreign currencies are translated into U.S. dollars based on the current exchange rates each business day. Purchases and sales of securities and income and expense items denominated in foreign currencies, if any, are translated into U.S. dollars at the exchange rate in effect on the transaction date. The Funds do not separately report the effects of changes in foreign exchange rates from changes in market prices on securities held. Such changes are included in net realized gain (loss) and net change in unrealized appreciation (depreciation) from investments on the Statements of Operations. The Funds may invest in foreign currency-denominated securities and may engage in foreign currency transactions either on a spot (cash) basis at the rate prevailing in the currency exchange market at the time or through a forward foreign currency contract. Realized foreign exchange gains (losses) arising from sales of spot foreign currencies, currency gains (losses) realized between the trade and settlement dates on securities transactions and the difference between the recorded amounts of dividends, interest, and foreign withholding taxes and the U.S. dollar equivalent of the amounts actually received or paid are included in net realized gain (loss) on foreign currency transactions on the Statements of Operations. Net unrealized foreign exchange gains
| 46 | PIMCO EQUITY SERIES |
Table of Contents
June 30, 2018
(losses) arising from changes in foreign exchange rates on foreign denominated assets and liabilities other than investments in securities held at the end of the reporting period are included in net change in unrealized appreciation (depreciation) on foreign currency assets and liabilities on the Statements of Operations.
(c) Multiclass Operations Each class offered by the Trust has equal rights as to assets and voting privileges (except that shareholders of a class have exclusive voting rights regarding any matter relating solely to that class of shares). Income and non-class specific expenses are allocated daily to each class on the basis of the relative net assets. Realized and unrealized capital gains (losses) are allocated daily based on the relative net assets of each class of the respective Fund. Class specific expenses, where applicable, currently include supervisory and administrative and distribution and servicing fees. Under certain circumstances, the per share net asset value (“NAV”) of a class of the respective Fund’s shares may be different from the per share NAV of another class of shares as a result of the different daily expense accruals applicable to each class of shares.
(d) Distributions to Shareholders The following table shows the anticipated frequency of distributions from net investment income, if any, for each Fund.
| Distribution Frequency | ||||||||||||
| Fund Name | Declared | Distributed | ||||||||||
PIMCO Dividend and Income Fund | Quarterly | Quarterly | ||||||||||
PIMCO EqS® Long/Short Fund | Annually | Annually | ||||||||||
Net realized capital gains earned by each Fund, if any, will be distributed no less frequently than once each year.
Income distributions and capital gain distributions are determined in accordance with income tax regulations which may differ from U.S. GAAP. Differences between tax regulations and U.S. GAAP may cause timing differences between income and capital gain recognition. Further, the character of investment income and capital gains may be different for certain transactions under the two methods of accounting. As a result, income distributions and capital gain distributions declared during a fiscal period may differ significantly from the net investment income (loss) and realized gains (losses) reported on each Fund’s annual financial statements presented under U.S. GAAP.
If a Fund estimates that a portion of its distribution may be comprised of amounts from sources other than net investment income in accordance with its policies and good accounting practices, the Fund will notify shareholders of the estimated composition of such distribution through a Section 19 Notice. For these purposes, a Fund estimates the source or sources from which a distribution is paid, to the close of the period as of which it is paid, in reference to its internal accounting records and related accounting practices. If, based on such
accounting records and practices, it is estimated that a particular distribution does not include capital gains or paid-in surplus or other capital sources, a Section 19 Notice generally would not be issued. It is important to note that differences exist between a Fund’s daily internal accounting records and practices, a Fund’s financial statements presented in accordance with U.S. GAAP, and recordkeeping practices under income tax regulations. For instance, a Fund’s internal accounting records and practices may take into account, among other factors, tax-related characteristics of certain sources of distributions that differ from treatment under U.S. GAAP. Examples of such differences may include, among others, the treatment of paydowns on mortgage-backed securities purchased at a discount and periodic payments under interest rate swap contracts. Accordingly, among other consequences, it is possible that a Fund may not issue a Section 19 Notice in situations where the Fund’s financial statements prepared later and in accordance with U.S. GAAP and/or the final tax character of those distributions might later report that the sources of those distributions included capital gains and/or a return of capital. Please visit www.pimco.com for the most recent Section 19 Notice, if applicable, for additional information regarding the estimated composition of distributions. Final determination of a distribution’s tax character will be reported on Form 1099 DIV sent to shareholders for the calendar year.
Distributions classified as a tax basis return of capital, if any, are reflected on the Statements of Changes in Net Assets and have been recorded to paid in capital. In addition, other amounts have been reclassified between undistributed (overdistributed) net investment income (loss), accumulated undistributed (overdistributed) net realized gain (loss) and/or paid in capital to more appropriately conform U.S. GAAP to tax characterizations of distributions.
(e) New Accounting Pronouncements In March 2016, the Financial Accounting Standards Board (“FASB”) issued an Accounting Standards Update (“ASU”), ASU 2016-05, which provides guidance related to the impact of derivative contract novations on certain relationships under Accounting Standards Codification (“ASC”) 815. The ASU is effective for annual periods beginning after December 15, 2016, and interim periods within those annual periods. The Funds have adopted the ASU. The implementation of the ASU did not have an impact on the Funds’ financial statements.
In August 2016, the FASB issued ASU 2016-15 which amends ASC 230 to clarify guidance on the classification of certain cash receipts and cash payments in the Statement of Cash Flows. The ASU is effective for annual periods beginning after December 15, 2017, and interim periods within those annual periods. The Funds have adopted the ASU. The implementation of the ASU did not have an impact on the Funds’ financial statements.
| ANNUAL REPORT | JUNE 30, 2018 | 47 |
Table of Contents
Notes to Financial Statements (Cont.)
In October 2016, the U.S. Securities and Exchange Commission (“SEC”) adopted new rules and forms, and amendments to certain current rules and forms, to modernize reporting and disclosure of information by registered investment companies. The amendments to Regulation S-X require standardized, enhanced disclosure about derivatives in investment company financial statements, and also change the rules governing the form and content of such financial statements. The compliance date for these amendments was August 1, 2017. Compliance is based on reporting period-end date. Management has adopted these amendments and the changes are incorporated in the financial statements.
In November 2016, the FASB issued ASU 2016-18 which amends ASC 230 to provide guidance on the classification and presentation of changes in restricted cash and restricted cash equivalents on the Statement of Cash Flows. The ASU is effective for annual periods beginning after December 15, 2017, and interim periods within those annual periods. The Funds have adopted the ASU. The implementation of the ASU did not have an impact on the Funds’ financial statements.
In March 2017, the FASB issued ASU 2017-08 which provides guidance related to the amortization period for certain purchased callable debt securities held at a premium. The ASU is effective for annual periods beginning after December 15, 2018, and interim periods within those annual periods. The Funds have adopted the ASU. The implementation of the ASU did not have an impact on the Funds’ financial statements.
3. INVESTMENT VALUATION AND FAIR VALUE MEASUREMENTS
(a) Investment Valuation Policies The price of a Fund’s shares is based on the Fund’s NAV. The NAV of a Fund, or each of its share classes, as applicable, is determined by dividing the total value of portfolio investments and other assets, less any liabilities attributable to that Fund or class, by the total number of shares outstanding of that Fund or class.
On each day that the New York Stock Exchange (“NYSE”) is open, Fund shares are ordinarily valued as of the close of regular trading (“NYSE Close”). Information that becomes known to the Funds or their agents after the time as of which NAV has been calculated on a particular day will not generally be used to retroactively adjust the price of a security or the NAV determined earlier that day. Each Fund reserves the right to change the time as of which its respective NAV is calculated if the Fund closes earlier, or as permitted by the SEC.
For purposes of calculating a NAV, portfolio securities and other assets for which market quotes are readily available are valued at market value. Market value is generally determined on the basis of official closing prices or the last reported sales prices, or if no sales are
reported, based on quotes obtained from established market makers or prices (including evaluated prices) supplied by the Funds’ approved pricing services, quotation reporting systems and other third-party sources (together, “Pricing Services”). The Funds will normally use pricing data for domestic equity securities received shortly after the NYSE Close and do not normally take into account trading, clearances or settlements that take place after the NYSE Close. If market value pricing is used, a foreign (non-U.S.) equity security traded on a foreign exchange or on more than one exchange is typically valued using pricing information from the exchange considered by the Adviser to be the primary exchange. A foreign (non-U.S.) equity security will be valued as of the close of trading on the foreign exchange, or the NYSE Close, if the NYSE Close occurs before the end of trading on the foreign exchange. Domestic and foreign (non-U.S.) fixed income securities, non-exchange traded derivatives, and equity options are normally valued on the basis of quotes obtained from brokers and dealers or Pricing Services using data reflecting the earlier closing of the principal markets for those securities. Prices obtained from Pricing Services may be based on, among other things, information provided by market makers or estimates of market values obtained from yield data relating to investments or securities with similar characteristics. Certain fixed income securities purchased on a delayed-delivery basis are marked to market daily until settlement at the forward settlement date. Exchange-traded options, except equity options, futures and options on futures are valued at the settlement price determined by the relevant exchange. Swap agreements are valued on the basis of bid quotes obtained from brokers and dealers or market-based prices supplied by Pricing Services. A Fund’s investments in open-end management investment companies, other than exchange-traded funds (“ETFs”), are valued at the NAVs of such investments. Open-end management investment companies may include affiliated funds.
If a foreign (non-U.S.) equity security’s value has materially changed after the close of the security’s primary exchange or principal market but before the NYSE Close, the security may be valued at fair value based on procedures established and approved by the Board of Trustees of the Trust (the “Board”). Foreign (non-U.S.) equity securities that do not trade when the NYSE is open are also valued at fair value. With respect to foreign (non-U.S.) equity securities, a Fund may determine the fair value of investments based on information provided by Pricing Services and other third-party vendors, which may recommend fair value or adjustments with reference to other securities, indices or assets. In considering whether fair valuation is required and in determining fair values, a Fund may, among other things, consider significant events (which may be considered to include changes in the value of U.S. securities or securities indices) that occur after the close of the relevant market and before the NYSE Close. A Fund may utilize modeling tools provided by third-party vendors to determine fair values
| 48 | PIMCO EQUITY SERIES |
Table of Contents
June 30, 2018
of foreign (non-U.S.) securities. For these purposes, any movement in the applicable reference index or instrument (“zero trigger”) between the earlier close of the applicable foreign market and the NYSE Close may be deemed to be a significant event, prompting the application of the pricing model (effectively resulting in daily fair valuations). Foreign exchanges may permit trading in foreign (non-U.S.) equity securities on days when the Trust is not open for business, which may result in a Fund’s portfolio investments being affected when shareholders are unable to buy or sell shares.
Senior secured floating rate loans for which an active secondary market exists to a reliable degree will be valued at the mean of the last available bid/ask prices in the market for such loans, as provided by a Pricing Service. Senior secured floating rate loans for which an active secondary market does not exist to a reliable degree will be valued at fair value, which is intended to approximate market value. In valuing a senior secured floating rate loan at fair value, the factors considered may include, but are not limited to, the following: (a) the creditworthiness of the borrower and any intermediate participants, (b) the terms of the loan, (c) recent prices in the market for similar loans, if any, and (d) recent prices in the market for instruments of similar quality, rate, period until next interest rate reset and maturity.
Investments valued in currencies other than the U.S. dollar are converted to the U.S. dollar using exchange rates obtained from Pricing Services. As a result, the value of such investments and, in turn, the NAV of a Fund’s shares may be affected by changes in the value of currencies in relation to the U.S. dollar. The value of investments traded in markets outside the United States or denominated in currencies other than the U.S. dollar may be affected significantly on a day that the Trust is not open for business. As a result, to the extent that a Fund holds foreign (non-U.S.) investments, the value of those investments may change at times when shareholders are unable to buy or sell shares and the value of such investments will be reflected in the Fund’s next calculated NAV.
Investments for which market quotes or market based valuations are not readily available are valued at fair value as determined in good faith by the Board or persons acting at their direction. The Board has adopted methods for valuing securities and other assets in circumstances where market quotes are not readily available, and has delegated to the Adviser the responsibility for applying the fair valuation methods. In the event that market quotes or market based valuations are not readily available, and the security or asset cannot be valued pursuant to a Board approved valuation method, the value of the security or asset will be determined in good faith by the Valuation Oversight Committee of the Board (“Valuation Oversight Committee”), generally based on recommendations provided by the Adviser. The Adviser may consult with the Sub-Adviser or Parametric in providing
such recommendations or otherwise with respect to valuation of the PIMCO Dividend and Income Fund’s portfolio securities or other assets. Market quotes are considered not readily available in circumstances where there is an absence of current or reliable market-based data (e.g., trade information, bid/ask information, indicative market quotations (“Broker Quotes”), Pricing Services’ prices), including where events occur after the close of the relevant market, but prior to the NYSE Close, that materially affect the values of a Fund’s securities or assets. In addition, market quotes are considered not readily available when, due to extraordinary circumstances, the exchanges or markets on which the securities trade do not open for trading for the entire day and no other market prices are available. The Board has delegated to the Adviser the responsibility for monitoring significant events that may materially affect the values of a Fund’s securities or assets and for determining whether the value of the applicable securities or assets should be reevaluated in light of such significant events.
When a Fund uses fair valuation to determine the value of a portfolio security or other asset for purposes of calculating its NAV, such investments will not be priced on the basis of quotes from the primary market in which they are traded, but rather may be priced by another method that the Board or persons acting at their direction believe reflects fair value. Fair valuation may require subjective determinations about the value of a security. While the Trust’s policy is intended to result in a calculation of a Fund’s NAV that fairly reflects security values as of the time of pricing, the Trust cannot ensure that fair values determined by the Board or persons acting at their direction would accurately reflect the price that a Fund could obtain for a security if it were to dispose of that security as of the time of pricing (for instance, in a forced or distressed sale). The prices used by a Fund may differ from the value that would be realized if the securities were sold. The Funds’ use of fair valuation may also help to deter “stale price arbitrage” as discussed under the “Abusive Trading Practices” section in each Fund’s prospectus.
(b) Fair Value Hierarchy U.S. GAAP describes fair value as the price that a Fund would receive to sell an asset or pay to transfer a liability in an orderly transaction between market participants at the measurement date. It establishes a fair value hierarchy that prioritizes inputs to valuation methods and requires disclosure of the fair value hierarchy, separately for each major category of assets and liabilities, that segregates fair value measurements into levels (Level 1, 2, or 3). The inputs or methodology used for valuing securities are not necessarily an indication of the risks associated with investing in those securities. Levels 1, 2, and 3 of the fair value hierarchy are defined as follows:
| ∎ | Level 1 — Quoted prices in active markets or exchanges for identical assets and liabilities. |
| ANNUAL REPORT | JUNE 30, 2018 | 49 |
Table of Contents
Notes to Financial Statements (Cont.)
| ∎ | Level 2 — Significant other observable inputs, which may include, but are not limited to, quoted prices for similar assets or liabilities in markets that are active, quoted prices for identical or similar assets or liabilities in markets that are not active, inputs other than quoted prices that are observable for the assets or liabilities (such as interest rates, yield curves, volatilities, prepayment speeds, loss severities, credit risks and default rates) or other market corroborated inputs. |
| ∎ | Level 3 — Significant unobservable inputs based on the best information available in the circumstances, to the extent observable inputs are not available, which may include assumptions made by the Board or persons acting at their direction that are used in determining the fair value of investments. |
In accordance with the requirements of U.S. GAAP, the amounts of transfers between Levels 1 and 2 and transfers into and out of Level 3, if material, are disclosed in the Notes to Schedule of Investments for each respective Fund.
For fair valuations using significant unobservable inputs, U.S. GAAP requires a reconciliation of the beginning to ending balances for reported fair values that presents changes attributable to realized gain (loss), unrealized appreciation (depreciation), purchases and sales, accrued discounts (premiums), and transfers into and out of the Level 3 category during the period. The end of period value is used for the transfers between Levels of a Fund’s assets and liabilities. Additionally, U.S. GAAP requires quantitative information regarding the significant unobservable inputs used in the determination of fair value of assets or liabilities categorized as Level 3 in the fair value hierarchy. In accordance with the requirements of U.S. GAAP, a fair value hierarchy, and if material, a Level 3 reconciliation and details of significant unobservable inputs, have been included in the Notes to Schedule of Investments for each respective Fund.
(c) Valuation Techniques and the Fair Value Hierarchy
Level 1 and Level 2 trading assets and trading liabilities, at fair value The valuation methods (or “techniques”) and significant inputs used in determining the fair values of portfolio securities or other assets and liabilities categorized as Level 1 and Level 2 of the fair value hierarchy are as follows:
Fixed income securities including corporate, convertible and municipal bonds and notes, U.S. government agencies, U.S. treasury obligations, sovereign issues, bank loans, convertible preferred securities and non-U.S. bonds are normally valued on the basis of quotes obtained from brokers and dealers or Pricing Services that use broker-dealer quotations, reported trades or valuation estimates from their internal pricing models. The Pricing Services’ internal models use inputs that are observable such as issuer details, interest rates, yield curves, prepayment speeds, credit risks/spreads, default rates and quoted
prices for similar assets. Securities that use similar valuation techniques and inputs as described above are categorized as Level 2 of the fair value hierarchy.
Fixed income securities purchased on a delayed-delivery basis or as a repurchase commitment in a sale-buyback transaction are marked to market daily until settlement at the forward settlement date and are categorized as Level 2 of the fair value hierarchy.
Mortgage-related and asset-backed securities are usually issued as separate tranches, or classes, of securities within each deal. These securities are also normally valued by Pricing Services that use broker-dealer quotations, reported trades or valuation estimates from their internal pricing models. The pricing models for these securities usually consider tranche-level attributes, current market data, estimated cash flows and market-based yield spreads for each tranche, and incorporate deal collateral performance, as available. Mortgage-related and asset-backed securities that use similar valuation techniques and inputs as described above are categorized as Level 2 of the fair value hierarchy.
Common stocks, ETFs, exchange-traded notes and financial derivative instruments, such as futures contracts, rights and warrants, or options on futures that are traded on a national securities exchange, are stated at the last reported sale or settlement price on the day of valuation. To the extent these securities are actively traded and valuation adjustments are not applied, they are categorized as Level 1 of the fair value hierarchy.
Valuation adjustments may be applied to certain securities that are solely traded on a foreign exchange to account for the market movement between the close of the foreign market and the NYSE Close. These securities are valued using Pricing Services that consider the correlation of the trading patterns of the foreign security to the intraday trading in the U.S. markets for investments. Securities using these valuation adjustments are categorized as Level 2 of the fair value hierarchy. Preferred securities and other equities traded on inactive markets or valued by reference to similar instruments are also categorized as Level 2 of the fair value hierarchy.
Equity-linked securities are valued by referencing the last reported sale or settlement price of the linked referenced equity on the day of valuation. Foreign exchange adjustments are applied to the last reported price to convert the linked equity’s trading currency to the contract’s settling currency. These investments are categorized as Level 2 of the fair value hierarchy.
Investments in registered open-end investment companies (other than ETFs) will be valued based upon the NAVs of such investments and are categorized as Level 1 of the fair value hierarchy. Investments in unregistered open-end investment companies will be calculated based
| 50 | PIMCO EQUITY SERIES |
Table of Contents
June 30, 2018
upon the NAVs of such investments and are considered Level 1 provided that the NAVs are observable, calculated daily and are the value at which both purchases and sales will be conducted.
Equity exchange-traded options and over the counter financial derivative instruments, such as forward foreign currency contracts and options contracts derive their value from underlying asset prices, indices, reference rates, and other inputs or a combination of these factors. These contracts are normally valued on the basis of quotes obtained from a quotation reporting system, established market makers or Pricing Services (normally determined as of the NYSE Close). Depending on the product and the terms of the transaction, financial derivative instruments can be valued by Pricing Services using a series of techniques, including simulation pricing models. The pricing models use inputs that are observed from actively quoted markets such as quoted prices, issuer details, indices, bid/ask spreads, interest rates, implied volatilities, yield curves, dividends and exchange rates. Financial derivative instruments that use similar valuation techniques and inputs as described above are categorized as Level 2 of the fair value hierarchy.
Centrally cleared swaps and over the counter swaps derive their value from underlying asset prices, indices, reference rates, and other inputs or a combination of these factors. They are valued using a broker-dealer bid
quotation or on market-based prices provided by Pricing Services (normally determined as of the NYSE close). Centrally cleared swaps and over the counter swaps can be valued by Pricing Services using a series of techniques, including simulation pricing models. The pricing models may use inputs that are observed from actively quoted markets such as the overnight index swap rate (“OIS”), London Interbank Offered Rate (“LIBOR”) forward rate, interest rates, yield curves and credit spreads. These securities are categorized as Level 2 of the fair value hierarchy.
Level 3 trading assets and trading liabilities, at fair value When a fair valuation method is applied by the Adviser that uses significant unobservable inputs, investments will be priced by a method that the Board or persons acting at their direction believe reflects fair value and are categorized as Level 3 of the fair value hierarchy.
Short-term debt instruments (such as commercial paper) having a remaining maturity of 60 days or less may be valued at amortized cost, so long as the amortized cost value of such short-term debt instruments is approximately the same as the fair value of the instrument as determined without the use of amortized cost valuation. These securities are categorized as Level 2 or Level 3 of the fair value hierarchy depending on the source of the base price.
4. SECURITIES AND OTHER INVESTMENTS
(a) Investments in Affiliates
Each Fund may invest in the PIMCO Short Asset Portfolio and the PIMCO Short-Term Floating NAV Portfolio III (“Central Funds”) to the extent permitted by the Act and rules thereunder. The Central Funds are registered investment companies created for use solely by the series of the Trust and other series of registered investment companies advised by the Adviser, in connection with their cash management activities. The main investments of the Central Funds are money market and short maturity fixed income instruments. The Central Funds may incur expenses related to their investment activities, but do not pay Investment Advisory Fees or Supervisory and Administrative Fees to the Adviser. The Central Funds are considered to be affiliated with the Funds. The table below shows the Funds’ transactions in and earnings from investments in the affiliated Funds for the period ended June 30, 2018 (amounts in thousands†):
Investments in PIMCO Short-Term Floating NAV Portfolio III
| Fund Name | Market Value 06/30/2017 | Purchases at Cost | Proceeds from Sales | Net Realized Gain (Loss) | Change in Unrealized Appreciation (Depreciation) | Market Value 06/30/2018 | Dividend Income(1) | Realized Net Capital Gain Distributions(1) | ||||||||||||||||||||||||||||
PIMCO Dividend and Income Fund | $ | 2,789 | $ | 38,416 | $ | (39,200 | ) | $ | 2 | $ | 0 | $ | 2,007 | $ | 16 | $ | 0 | |||||||||||||||||||
PIMCO EqS® Long/Short Fund | 166,968 | 489,766 | (515,300 | ) | (50 | ) | 35 | 141,419 | 2,367 | 0 | ||||||||||||||||||||||||||
| † | A zero balance may reflect actual amounts rounding to less than one thousand. |
| (1) | The tax characterization of distributions is determined in accordance with Federal income tax regulations and may contain a return of capital. The actual tax characterization of distributions received is determined at the end of the fiscal year of the affiliated fund. See Note 2, Distributions to Shareholders, in the Notes to Financial Statements for more information. |
(b) Investments in Securities
The Funds may utilize the investments and strategies described below to the extent permitted by each Fund’s respective investment policies.
Exchange-Traded Funds typically are index-based investment companies that hold substantially all of their assets in securities
representing their specific index, but may also be actively-managed investment companies. Shares of ETFs trade throughout the day on an exchange and represent an investment in a portfolio of securities and other assets. As a shareholder of another investment company, a Fund would bear their pro rata portion of the other investment company’s expenses, including advisory fees, in addition to the expenses the
| ANNUAL REPORT | JUNE 30, 2018 | 51 |
Table of Contents
Notes to Financial Statements (Cont.)
Funds bear directly in connection with their own operations. Investments in ETFs entail certain risks; in particular, investments in index ETFs involve the risk that the ETF’s performance may not track the performance of the index the ETF is designed to track.
Inflation-Indexed Bonds are fixed income securities whose principal value is periodically adjusted by the rate of inflation. The interest rate on these bonds is generally fixed at issuance at a rate lower than typical bonds. Over the life of an inflation-indexed bond, however, interest will be paid based on a principal value which is adjusted for inflation. Any increase or decrease in the principal amount of an inflation-indexed bond will be included as interest income on the Statements of Operations, even though investors do not receive their principal until maturity. Repayment of the original bond principal upon maturity (as adjusted for inflation) is guaranteed in the case of U.S. Treasury Inflation-Protected Securities (“TIPS”). For bonds that do not provide a similar guarantee, the adjusted principal value of the bond repaid at maturity may be less than the original principal.
Loan Participations, Assignments and Originations are direct debt instruments which are interests in amounts owed to lenders or lending syndicates by corporate, governmental, or other borrowers. A Fund’s investments in loans may be in the form of participations in loans or assignments of all or a portion of loans from third parties or investments in or originations of loans by the Fund or Funds. A loan is often administered by a bank or other financial institution (the “agent”) that acts as agent for all holders. The agent administers the terms of the loan, as specified in the loan agreement. A Fund may invest in multiple series or tranches of a loan, which may have varying terms and carry different associated risks. When a Fund purchases assignments from agents it acquires direct rights against the borrowers of the loans. These loans may include participations in bridge loans, which are loans taken out by borrowers for a short period (typically less than one year) pending arrangement of more permanent financing through, for example, the issuance of bonds, frequently high yield bonds issued for the purpose of acquisitions.
The types of loans and related investments in which the Funds may invest include, among others, senior loans, subordinated loans (including second lien loans, B-Notes and mezzanine loans), whole loans, commercial real estate and other commercial loans and structured loans. The Funds may originate loans or acquire direct interests in loans through primary loan distributions and/or in private transactions. In the case of subordinated loans, there may be significant indebtedness ranking ahead of the borrower’s obligation to the holder of such a loan, including in the event of the borrower’s insolvency. Mezzanine loans are typically secured by a pledge of an equity interest in the mortgage borrower that owns the real estate rather than an interest in a mortgage.
Investments in loans may include unfunded loan commitments, which are contractual obligations for funding. Unfunded loan commitments may include revolving credit facilities, which may obligate a Fund to supply additional cash to the borrower on demand. Unfunded loan commitments represent a future obligation in full, even though a percentage of the committed amount may not be utilized by the borrower. When investing in a loan participation, a Fund has the right to receive payments of principal, interest and any fees to which it is entitled only from the agent selling the loan agreement and only upon receipt of payments by the agent from the borrower. A Fund may receive a commitment fee based on the undrawn portion of the underlying line of credit portion of a loan. In certain circumstances, a Fund may receive a penalty fee upon the prepayment of a loan by a borrower. Fees earned or paid are recorded as a component of interest income or interest expense, respectively, on the Statements of Operations. Unfunded loan commitments are reflected as a liability on the Statements of Assets and Liabilities.
Mortgage-Related and Other Asset-Backed Securities directly or indirectly represent a participation in, or are secured by and payable from, loans on real property. Mortgage-related securities are created from pools of residential or commercial mortgage loans, including mortgage loans made by savings and loan institutions, mortgage bankers, commercial banks and others. These securities provide a monthly payment which consists of both interest and principal. Interest may be determined by fixed or adjustable rates. The rate of prepayments on underlying mortgages will affect the price and volatility of a mortgage-related security, and may have the effect of shortening or extending the effective duration of the security relative to what was anticipated at the time of purchase. The timely payment of principal and interest of certain mortgage-related securities is guaranteed with the full faith and credit of the U.S. Government. Pools created and guaranteed by non-governmental issuers, including government-sponsored corporations, may be supported by various forms of insurance or guarantees, but there can be no assurance that private insurers or guarantors can meet their obligations under the insurance policies or guarantee arrangements. Many of the risks of investing in mortgage-related securities secured by commercial mortgage loans reflect the effects of local and other economic conditions on real estate markets, the ability of tenants to make lease payments, and the ability of a property to attract and retain tenants. These securities may be less liquid and may exhibit greater price volatility than other types of mortgage-related or other asset-backed securities. Other asset-backed securities are created from many types of assets, including auto loans, credit card receivables, home equity loans, and student loans.
Collateralized Debt Obligations (“CDOs”) include Collateralized Bond Obligations (“CBOs”), Collateralized Loan Obligations (“CLOs”) and
| 52 | PIMCO EQUITY SERIES |
Table of Contents
June 30, 2018
other similarly structured securities. CBOs and CLOs are types of asset-backed securities. A CBO is a trust which is backed by a diversified pool of high risk, below investment grade fixed income securities. A CLO is a trust typically collateralized by a pool of loans, which may include, among others, domestic and foreign senior secured loans, senior unsecured loans, and subordinate corporate loans, including loans that may be rated below investment grade or equivalent unrated loans. The risks of an investment in a CDO depend largely on the type of the collateral securities and the class of the CDO in which a Fund invests. In addition to the normal risks associated with fixed income securities discussed elsewhere in this report and each Fund’s prospectus and statement of additional information (e.g., prepayment risk, credit risk, liquidity risk, market risk, structural risk, legal risk and interest rate risk (which may be exacerbated if the interest rate payable on a structured financing changes based on multiples of changes in interest rates or inversely to changes in interest rates)), CBOs, CLOs and other CDOs carry additional risks including, but not limited to, (i) the possibility that distributions from collateral securities will not be adequate to make interest or other payments, (ii) the quality of the collateral may decline in value or default, (iii) a Fund may invest in CBOs, CLOs, or other CDOs that are subordinate to other classes, and (iv) the complex structure of the security may not be fully understood at the time of investment and may produce disputes with the issuer or unexpected investment results.
Collateralized Mortgage Obligations (“CMOs”) are debt obligations of a legal entity that are collateralized by whole mortgage loans or private mortgage bonds and divided into classes. CMOs are structured into multiple classes, often referred to as “tranches”, with each class bearing a different stated maturity and entitled to a different schedule for payments of principal and interest, including prepayments. CMOs may be less liquid and may exhibit greater price volatility than other types of mortgage-related or asset-backed securities.
Payment In-Kind Securities (“PIKs”) may give the issuer the option at each interest payment date of making interest payments in either cash and/or additional debt securities. Those additional debt securities usually have the same terms, including maturity dates and interest rates, and associated risks as the original bonds. The daily market quotations of the original bonds may include the accrued interest (referred to as a dirty price) and require a pro rata adjustment from the unrealized appreciation (depreciation) on investments to interest receivable on the Statements of Assets and Liabilities.
Real Estate Investment Trusts (“REITs”) are pooled investment vehicles that own, and typically operate, income-producing real estate. If a REIT meets certain requirements, including distributing to shareholders substantially all of its taxable income (other than net capital gains), then it is not taxed on the income distributed to
shareholders. Distributions received from REITs may be characterized as income, capital gain or a return of capital. A return of capital is recorded by a Fund as a reduction to the cost basis of its investment in the REIT. REITs are subject to management fees and other expenses, and so the Funds that invest in REITs will bear their proportionate share of the costs of the REITs’ operations.
Restricted Investments are subject to legal or contractual restrictions on resale and may generally be sold privately, but may be required to be registered or exempted from such registration before being sold to the public. Private placement securities are generally considered to be restricted except for those securities traded between qualified institutional investors under the provisions of Rule 144A of the Securities Act of 1933. Disposal of restricted investments may involve time-consuming negotiations and expenses, and prompt sale at an acceptable price may be difficult to achieve. Restricted investments held by the Funds at June 30, 2018 are disclosed in the Notes to Schedules of Investments.
Securities Issued by U.S. Government Agencies or Government-Sponsored Enterprises are obligations of and, in certain cases, guaranteed by, the U.S. Government, its agencies or instrumentalities. Some U.S. Government securities, such as Treasury bills, notes and bonds, and securities guaranteed by the Government National Mortgage Association (“GNMA” or “Ginnie Mae”), are supported by the full faith and credit of the U.S. Government; others, such as those of the Federal Home Loan Banks, are supported by the right of the issuer to borrow from the U.S. Department of the Treasury (the “U.S. Treasury”); and others, such as those of the Federal National Mortgage Association (“FNMA” or “Fannie Mae”), are supported by the discretionary authority of the U.S. Government to purchase the agency’s obligations. U.S. Government securities may include zero coupon securities. Zero coupon securities do not distribute interest on a current basis and tend to be subject to a greater risk than interest-paying securities.
Government-related guarantors (i.e., not backed by the full faith and credit of the U.S. Government) include FNMA and the Federal Home Loan Mortgage Corporation (“FHLMC” or “Freddie Mac”). FNMA is a government-sponsored corporation. FNMA purchases conventional (i.e., not insured or guaranteed by any government agency) residential mortgages from a list of approved seller/servicers which include state and federally chartered savings and loan associations, mutual savings banks, commercial banks and credit unions and mortgage bankers. Pass-through securities issued by FNMA are guaranteed as to timely payment of principal and interest by FNMA, but are not backed by the full faith and credit of the U.S. Government. FHLMC issues Participation Certificates (“PCs”), which are pass-through securities, each representing an undivided interest in a pool of residential mortgages.
| ANNUAL REPORT | JUNE 30, 2018 | 53 |
Table of Contents
Notes to Financial Statements (Cont.)
FHLMC guarantees the timely payment of interest and ultimate collection of principal, but PCs are not backed by the full faith and credit of the U.S. Government.
Roll-timing strategies can be used where a Fund seeks to extend the expiration or maturity of a position, such as a TBA security on an underlying asset, by closing out the position before expiration and opening a new position with respect to substantially the same underlying asset with a later expiration date. TBA securities purchased or sold are reflected on the Statements of Assets and Liabilities as an asset or liability, respectively.
Warrants are securities that are usually issued together with a debt security or preferred security and that give the holder the right to buy a proportionate amount of common stock at a specified price. Warrants are freely transferable and are often traded on major exchanges. Warrants normally have a life that is measured in years and entitle the holder to buy common stock of a company at a price that is usually higher than the market price at the time the warrant is issued. Warrants may entail greater risks than certain other types of investments. Generally, warrants do not carry the right to receive dividends or exercise voting rights with respect to the underlying securities, and they do not represent any rights in the assets of the issuer. In addition, their value does not necessarily change with the value of the underlying securities, and they cease to have value if they are not exercised on or before their expiration date. If the market price of the underlying stock does not exceed the exercise price during the life of the warrant, the warrant will expire worthless. Warrants may increase the potential profit or loss to be realized from the investment as compared with investing the same amount in the underlying securities. Similarly, the percentage increase or decrease in the value of an equity security warrant may be greater than the percentage increase or decrease in the value of the underlying common stock. Warrants may relate to the purchase of equity or debt securities. Debt obligations with warrants attached to purchase equity securities have many characteristics of convertible securities and their prices may, to some degree, reflect the performance of the underlying stock. Debt obligations also may be issued with warrants attached to purchase additional debt securities at the same coupon rate. A decline in interest rates would permit a Fund to sell such warrants at a profit. If interest rates rise, these warrants would generally expire with no value.
When-Issued Transactions are purchases or sales made on a when-issued basis. These transactions are made conditionally because a security, although authorized, has not yet been issued in the market. Transactions to purchase or sell securities on a when-issued basis involve a commitment by a Fund to purchase or sell these securities for a predetermined price or yield, with payment and delivery taking place
beyond the customary settlement period. A Fund may sell when-issued securities before they are delivered, which may result in a realized gain (loss).
5. BORROWINGS AND OTHER FINANCING TRANSACTIONS
The Funds may enter into the borrowings and other financing transactions described below to the extent permitted by each Fund’s respective investment policies.
The following disclosures contain information on a Fund’s ability to lend or borrow cash or securities to the extent permitted under the Act, which may be viewed as borrowing or financing transactions by a Fund. The location of these instruments in each Fund’s financial statements is described below.
(a) Repurchase Agreements Under the terms of a typical repurchase agreement, a Fund purchases an underlying debt obligation (collateral) subject to an obligation of the seller to repurchase, and a Fund to resell, the obligation at an agreed-upon price and time. In an open maturity repurchase agreement, there is no pre-determined repurchase date and the agreement can be terminated by the Fund or counterparty at any time. The underlying securities for all repurchase agreements are held by a Fund’s custodian or designated subcustodians under tri-party repurchase agreements and in certain instances will remain in custody with the counterparty. The market value of the collateral must be equal to or exceed the total amount of the repurchase obligations, including interest. Repurchase agreements, if any, including accrued interest, are included on the Statements of Assets and Liabilities. Interest earned is recorded as a component of interest income on the Statements of Operations. In periods of increased demand for collateral, a Fund may pay a fee for the receipt of collateral, which may result in interest expense to the Fund.
(b) Reverse Repurchase Agreements In a reverse repurchase agreement, a Fund delivers a security in exchange for cash to a financial institution, the counterparty, with a simultaneous agreement to repurchase the same or substantially the same security at an agreed upon price and date. In an open maturity reverse repurchase agreement, there is no pre-determined repurchase date and the agreement can be terminated by the Fund or counterparty at any time. A Fund is entitled to receive principal and interest payments, if any, made on the security delivered to the counterparty during the term of the agreement. Cash received in exchange for securities delivered plus accrued interest payments to be made by a Fund to counterparties are reflected as a liability on the Statements of Assets and Liabilities. Interest payments made by a Fund to counterparties are recorded as a component of interest expense on the Statements of Operations. In
| 54 | PIMCO EQUITY SERIES |
Table of Contents
June 30, 2018
periods of increased demand for the security, a Fund may receive a fee for use of the security by the counterparty, which may result in interest income to the Fund. A Fund will segregate assets determined to be liquid by the Adviser or will otherwise cover its obligations under reverse repurchase agreements.
(c) Sale-Buybacks A sale-buyback financing transaction consists of a sale of a security by a Fund to a financial institution, the counterparty, with a simultaneous agreement to repurchase the same or substantially the same security at an agreed-upon price and date. A Fund is not entitled to receive principal and interest payments, if any, made on the security sold to the counterparty during the term of the agreement. The agreed-upon proceeds for securities to be repurchased by a Fund are reflected as a liability on the Statements of Assets and Liabilities. A Fund will recognize net income represented by the price differential between the price received for the transferred security and the agreed-upon repurchase price. This is commonly referred to as the ‘price drop’. A price drop consists of (i) the foregone interest and inflationary income adjustments, if any, a Fund would have otherwise received had the security not been sold and (ii) the negotiated financing terms between a Fund and counterparty. Foregone interest and inflationary income adjustments, if any, are recorded as components of interest income on the Statements of Operations. Interest payments based upon negotiated financing terms made by a Fund to counterparties are recorded as a component of interest expense on the Statements of Operations. In periods of increased demand for the security, a Fund may receive a fee for use of the security by the counterparty, which may result in interest income to the Fund. A Fund will segregate assets determined to be liquid by the Adviser or will otherwise cover its obligations under sale-buyback transactions.
(d) Short Sales Short sales are transactions in which a Fund sells a security that it may not own. A Fund may make short sales of securities to (i) offset potential declines in long positions in similar securities, (ii) to increase the flexibility of the Fund, (iii) for investment return, (iv) as part of a risk arbitrage strategy, and (v) as part of its overall portfolio management strategies involving the use of derivative instruments. When a Fund engages in a short sale, it may borrow the security sold short and deliver it to the counterparty. A Fund will ordinarily have to pay a fee or premium to borrow a security and be obligated to repay the lender of the security any dividend or interest that accrues on the security during the period of the loan. Securities sold in short sale transactions and the dividend or interest payable on such securities, if any, are reflected as payable for short sales on the Statements of Assets and Liabilities. Short sales expose a Fund to the risk that it will be required to cover its short position at a time when the security or other asset has appreciated in value, thus resulting in losses to a Fund. A short sale is “against the box” if a Fund holds in its
portfolio or has the right to acquire the security sold short, or securities identical to the security sold short, at no additional cost. A Fund will be subject to additional risks to the extent that it engages in short sales that are not “against the box.” A Fund’s loss on a short sale could theoretically be unlimited in cases where a Fund is unable, for whatever reason, to close out its short position.
6. FINANCIAL DERIVATIVE INSTRUMENTS
The Funds may enter into the financial derivative instruments described below to the extent permitted by each Fund’s respective investment policies.
The following disclosures contain information on how and why the Funds use financial derivative instruments, and how financial derivative instruments affect the Funds’ financial position, results of operations and cash flows. The location and fair value amounts of these instruments on the Statements of Assets and Liabilities and the net realized gain (loss) and net change in unrealized appreciation (depreciation) on the Statements of Operations, each categorized by type of financial derivative contract and related risk exposure, are included in a table in the Notes to Schedules of Investments. The financial derivative instruments outstanding as of period end and the amounts of net realized gain (loss) and net change in unrealized appreciation (depreciation) on financial derivative instruments during the period, as disclosed in the Notes to Schedules of Investments, serve as indicators of the volume of financial derivative activity for the Funds.
(a) Forward Foreign Currency Contracts may be engaged, in connection with settling planned purchases or sales of securities, to hedge the currency exposure associated with some or all of a Fund’s securities or as part of an investment strategy. A forward foreign currency contract is an agreement between two parties to buy and sell a currency at a set price on a future date. The market value of a forward foreign currency contract fluctuates with changes in foreign currency exchange rates. Forward foreign currency contracts are marked to market daily, and the change in value is recorded by a Fund as an unrealized gain (loss). Realized gains (losses) are equal to the difference between the value of the contract at the time it was opened and the value at the time it was closed and are recorded upon delivery or receipt of the currency. These contracts may involve market risk in excess of the unrealized gain (loss) reflected on the Statements of Assets and Liabilities. In addition, a Fund could be exposed to risk if the counterparties are unable to meet the terms of the contracts or if the value of the currency changes unfavorably to the U.S. dollar. To mitigate such risk, cash or securities may be exchanged as collateral pursuant to the terms of the underlying contracts.
(b) Futures Contracts are agreements to buy or sell a security or other asset for a set price on a future date. A Fund may use futures contracts
| ANNUAL REPORT | JUNE 30, 2018 | 55 |
Table of Contents
Notes to Financial Statements (Cont.)
to manage its exposure to the securities markets or to movements in interest rates and currency values. The primary risks associated with the use of futures contracts are the imperfect correlation between the change in market value of the securities held by a Fund and the prices of futures contracts and the possibility of an illiquid market. Futures contracts are valued based upon their quoted daily settlement prices. Upon entering into a futures contract, a Fund is required to deposit with its futures broker an amount of cash, U.S. Government and Agency Obligations, or select sovereign debt, in accordance with the initial margin requirements of the broker or exchange. Futures contracts are marked to market daily and based on such movements in the price of the contracts, an appropriate payable or receivable for the change in value may be posted or collected by the Fund (“Futures Variation Margin”). Gains (losses) are recognized but not considered realized until the contracts expire or close. Futures contracts involve, to varying degrees, risk of loss in excess of the Futures Variation Margin included within exchange traded or centrally cleared financial derivative instruments on the Statements of Assets and Liabilities.
(c) Options Contracts may be written or purchased to enhance returns or to hedge an existing position or future investment. A Fund may write call and put options on securities and financial derivative instruments it owns or in which it may invest. Writing put options tends to increase a Fund’s exposure to the underlying instrument. Writing call options tends to decrease a Fund’s exposure to the underlying instrument. When a Fund writes a call or put, an amount equal to the premium received is recorded and subsequently marked to market to reflect the current value of the option written. These amounts are included on the Statements of Assets and Liabilities. Premiums received from writing options which expire are treated as realized gains. Premiums received from writing options which are exercised or closed are added to the proceeds or offset against amounts paid on the underlying futures, swap, security or currency transaction to determine the realized gain (loss). Certain options may be written with premiums to be determined on a future date. The premiums for these options are based upon implied volatility parameters at specified terms. A Fund as a writer of an option has no control over whether the underlying instrument may be sold (“call”) or purchased (“put”) and as a result bears the market risk of an unfavorable change in the price of the instrument underlying the written option. There is the risk a Fund may not be able to enter into a closing transaction because of an illiquid market.
Purchasing call options tends to increase a Fund’s exposure to the underlying instrument. Purchasing put options tends to decrease a Fund’s exposure to the underlying instrument. A Fund pays a premium which is included as an asset on the Statements of Assets and Liabilities and subsequently marked to market to reflect the current value of the option. Premiums paid for purchasing options which expire
are treated as realized losses. Certain options may be purchased with premiums to be determined on a future date. The premiums for these options are based upon implied volatility parameters at specified terms. The risk associated with purchasing put and call options is limited to the premium paid. Premiums paid for purchasing options which are exercised or closed are added to the amounts paid or offset against the proceeds on the underlying investment transaction to determine the realized gain (loss) when the underlying transaction is executed.
Credit Default Swaptions may be written or purchased to hedge exposure to the credit risk of an investment without making a commitment to the underlying instrument. A credit default swaption is an option to sell or buy credit protection on a specific reference by entering into a pre-defined swap agreement by some specified date in the future.
Foreign Currency Options may be written or purchased to be used as a short or long hedge against possible variations in foreign exchange rates or to gain exposure to foreign currencies.
Options on Securities may be written or purchased to enhance returns or to hedge an existing position or future investment. An option on a security uses a specified security as the underlying instrument for the option contract.
(d) Swap Agreements are bilaterally negotiated agreements between a Fund and a counterparty to exchange or swap investment cash flows, assets, foreign currencies or market-linked returns at specified, future intervals. Swap agreements may be privately negotiated in the over the counter market (“OTC swaps”) or may be cleared through a third party, known as a central counterparty or derivatives clearing organization (“Centrally Cleared Swaps”). A Fund may enter into asset, credit default, cross-currency, interest rate, total return, variance and other forms of swap agreements to manage its exposure to credit, currency, interest rate, commodity, equity and inflation risk. In connection with these agreements, securities or cash may be identified as collateral or margin in accordance with the terms of the respective swap agreements to provide assets of value and recourse in the event of default or bankruptcy/insolvency.
Centrally Cleared Swaps are marked to market daily based upon valuations as determined from the underlying contract or in accordance with the requirements of the central counterparty or derivatives clearing organization. Changes in market value, if any, are reflected as a component of net change in unrealized appreciation (depreciation) on the Statements of Operations. Daily changes in valuation of centrally cleared swaps (“Swap Variation Margin”), if any, are disclosed within centrally cleared financial derivative instruments on the Statements of Assets and Liabilities. Centrally Cleared and OTC swap payments
| 56 | PIMCO EQUITY SERIES |
Table of Contents
June 30, 2018
received or paid at the beginning of the measurement period are included on the Statements of Assets and Liabilities and represent premiums paid or received upon entering into the swap agreement to compensate for differences between the stated terms of the swap agreement and prevailing market conditions (credit spreads, currency exchange rates, interest rates, and other relevant factors). Upfront premiums received (paid) are initially recorded as liabilities (assets) and subsequently marked to market to reflect the current value of the swap. These upfront premiums are recorded as realized gain (loss) on the Statements of Operations upon termination or maturity of the swap. A liquidation payment received or made at the termination of the swap is recorded as realized gain (loss) on the Statements of Operations. Net periodic payments received or paid by a Fund are included as part of realized gain (loss) on the Statements of Operations.
For purposes of applying certain of a Fund’s investment policies and restrictions, swap agreements, like other derivative instruments, may be valued by a Fund at market value, notional value or full exposure value. In the case of a credit default swap, in applying certain of a Fund’s investment policies and restrictions, the Funds will value the credit default swap at its notional value or its full exposure value (i.e., the sum of the notional amount for the contract plus the market value), but may value the credit default swap at market value for purposes of applying certain of a Fund’s other investment policies and restrictions. For example, a Fund may value credit default swaps at full exposure value for purposes of a Fund’s credit quality guidelines (if any) because such value in general better reflects a Fund’s actual economic exposure during the term of the credit default swap agreement. As a result, a Fund may, at times, have notional exposure to an asset class (before netting) that is greater or lesser than the stated limit or restriction noted in a Fund’s prospectus. In this context, both the notional amount and the market value may be positive or negative depending on whether a Fund is selling or buying protection through the credit default swap. The manner in which certain securities or other instruments are valued by a Fund for purposes of applying investment policies and restrictions may differ from the manner in which those investments are valued by other types of investors.
Entering into swap agreements involves, to varying degrees, elements of interest, credit, market and documentation risk in excess of the amounts recognized on the Statements of Assets and Liabilities. Such risks involve the possibility that there will be no liquid market for these agreements, that the counterparty to the agreements may default on its obligation to perform or disagree as to the meaning of contractual terms in the agreements and that there may be unfavorable changes in interest rates or the values of the asset upon which the swap is based.
A Fund’s maximum risk of loss from counterparty credit risk is the discounted net value of the cash flows to be received from the
counterparty over the contract’s remaining life, to the extent that amount is positive. The risk may be mitigated by having a master netting arrangement between a Fund and the counterparty and by the posting of collateral to a Fund to cover a Fund’s exposure to the counterparty.
To the extent a Fund has a policy to limit the net amount owed to or to be received from a single counterparty under existing swap agreements, such limitation only applies to counterparties to OTC swaps and does not apply to centrally cleared swaps where the counterparty is a central counterparty or derivatives clearing organization.
Credit Default Swap Agreements on corporate, loan, sovereign, U.S. municipal or U.S. Treasury issues are entered into to provide a measure of protection against defaults of the issuers (i.e., to reduce risk where a Fund owns or has exposure to the referenced obligation) or to take an active long or short position with respect to the likelihood of a particular issuer’s default. Credit default swap agreements involve one party making a stream of payments (referred to as the buyer of protection) to another party (the seller of protection) in exchange for the right to receive a specified return in the event that the referenced entity, obligation or index, as specified in the swap agreement, undergoes a certain credit event. As a seller of protection on credit default swap agreements, a Fund will generally receive from the buyer of protection a fixed rate of income throughout the term of the swap provided that there is no credit event. As the seller, a Fund would effectively add leverage to its portfolio because, in addition to its total net assets, a Fund would be subject to investment exposure on the notional amount of the swap.
If a Fund is a seller of protection and a credit event occurs, as defined under the terms of that particular swap agreement, a Fund will either (i) pay to the buyer of protection an amount equal to the notional amount of the swap and take delivery of the referenced obligation, other deliverable obligations or underlying securities comprising the referenced index or (ii) pay a net settlement amount in the form of cash or securities equal to the notional amount of the swap less the recovery value of the referenced obligation or underlying securities comprising the referenced index. If a Fund is a buyer of protection and a credit event occurs, as defined under the terms of that particular swap agreement, a Fund will either (i) receive from the seller of protection an amount equal to the notional amount of the swap and deliver the referenced obligation, other deliverable obligations or underlying securities comprising the referenced index or (ii) receive a net settlement amount in the form of cash or securities equal to the notional amount of the swap less the recovery value of the referenced obligation or underlying securities comprising the referenced index. Recovery values are estimated by market makers considering either industry standard recovery rates or entity specific factors and
| ANNUAL REPORT | JUNE 30, 2018 | 57 |
Table of Contents
Notes to Financial Statements (Cont.)
considerations until a credit event occurs. If a credit event has occurred, the recovery value is determined by a facilitated auction whereby a minimum number of allowable broker bids, together with a specified valuation method, are used to calculate the settlement value. The ability to deliver other obligations may result in a cheapest-to-deliver option (the buyer of protection’s right to choose the deliverable obligation with the lowest value following a credit event).
Credit default swap agreements on credit indices involve one party making a stream of payments to another party in exchange for the right to receive a specified return in the event of a write-down, principal shortfall, interest shortfall or default of all or part of the referenced entities comprising the credit index. A credit index is a basket of credit instruments or exposures designed to be representative of some part of the credit market as a whole. These indices are made up of reference credits that are judged by a poll of dealers to be the most liquid entities in the credit default swap market based on the sector of the index. Components of the indices may include, but are not limited to, investment grade securities, high yield securities, asset-backed securities, emerging markets, and/or various credit ratings within each sector. Credit indices are traded using credit default swaps with standardized terms including a fixed spread and standard maturity dates. An index credit default swap references all the names in the index, and if there is a default, the credit event is settled based on that name’s weight in the index. The composition of the indices changes periodically, usually every six months, and for most indices, each name has an equal weight in the index. A Fund may use credit default swaps on credit indices to hedge a portfolio of credit default swaps or bonds, which is less expensive than it would be to buy many credit default swaps to achieve a similar effect. Credit default swaps on indices are instruments for protecting investors owning bonds against default, and traders use them to speculate on changes in credit quality.
Implied credit spreads, represented in absolute terms, utilized in determining the market value of credit default swap agreements on corporate, loan, sovereign, U.S. municipal or U.S. Treasury issues as of period end, if any, are disclosed in the Notes to Schedules of Investments. They serve as an indicator of the current status of payment/performance risk and represent the likelihood or risk of default for the reference entity. The implied credit spread of a particular referenced entity reflects the cost of buying/selling protection and may include upfront payments required to be made to enter into the agreement. Wider credit spreads represent a deterioration of the referenced entity’s credit soundness and a greater likelihood or risk of default or other credit event occurring as defined under the terms of the agreement. For credit default swap agreements on asset-backed securities and credit indices, the quoted market prices and resulting values serve as the indicator of the current status of the payment/
performance risk. Increasing market values, in absolute terms when compared to the notional amount of the swap, represent a deterioration of the referenced entity’s credit soundness and a greater likelihood or risk of default or other credit event occurring as defined under the terms of the agreement.
The maximum potential amount of future payments (undiscounted) that a Fund as a seller of protection could be required to make under a credit default swap agreement equals the notional amount of the agreement. Notional amounts of each individual credit default swap agreement outstanding as of period end for which a Fund is the seller of protection are disclosed in the Notes to Schedules of Investments. These potential amounts would be partially offset by any recovery values of the respective referenced obligations, upfront payments received upon entering into the agreement, or net amounts received from the settlement of buy protection credit default swap agreements entered into by a Fund for the same referenced entity or entities.
Interest Rate Swap Agreements may be entered into to help hedge against interest rate risk exposure and to maintain a Fund’s ability to generate income at prevailing market rates. The value of the fixed rate bonds that the Funds hold may decrease if interest rates rise. To help hedge against this risk and to maintain its ability to generate income at prevailing market rates, a Fund may enter into interest rate swap agreements. Interest rate swap agreements involve the exchange by a Fund with another party for their respective commitment to pay or receive interest on the notional amount of principal. Certain forms of interest rate swap agreements may include: (i) interest rate caps, under which, in return for a premium, one party agrees to make payments to the other to the extent that interest rates exceed a specified rate, or “cap”, (ii) interest rate floors, under which, in return for a premium, one party agrees to make payments to the other to the extent that interest rates fall below a specified rate, or “floor”, (iii) interest rate collars, under which a party sells a cap and purchases a floor or vice versa in an attempt to protect itself against interest rate movements exceeding given minimum or maximum levels, (iv) callable interest rate swaps, under which the buyer pays an upfront fee in consideration for the right to early terminate the swap transaction in whole, at zero cost and at a predetermined date and time prior to the maturity date, (v) spreadlocks, which allow the interest rate swap users to lock in the forward differential (or spread) between the interest rate swap rate and a specified benchmark, or (vi) basis swaps, under which two parties can exchange variable interest rates based on different segments of money markets.
Total Return Swap Agreements are entered into to gain or mitigate exposure to the underlying reference asset. Total return swap agreements involve commitments where single or multiple cash flows are exchanged based on the price of an underlying reference asset and on a fixed or variable interest rate. Total return swap agreements may
| 58 | PIMCO EQUITY SERIES |
Table of Contents
June 30, 2018
involve commitments to pay interest in exchange for a market-linked return. One counterparty pays out the total return of a specific underlying reference asset, which may include a single security, a basket of securities, or an index, and in return receives a fixed or variable rate. At the maturity date, a net cash flow is exchanged where the total return is equivalent to the return of the underlying reference asset less a financing rate, if any. As a receiver, a Fund would receive payments based on any net positive total return and would owe payments in the event of a net negative total return. As the payer, a Fund would owe payments on any net positive total return, and would receive payments in the event of a net negative total return.
7. PRINCIPAL RISKS
The principal risks of investing in a Fund, which could adversely affect its net asset value, yield and total return, are listed below.
| Risks | PIMCO Dividend Income Fund | PIMCO EqS® Long/Short Fund | ||||||||||
Equity | X | X | ||||||||||
Dividend-Oriented Stocks | X | |||||||||||
Value Investing | X | X | ||||||||||
Foreign (Non-U.S.) Investment | X | X | ||||||||||
Emerging Markets | X | X | ||||||||||
Sovereign Debt | X | X | ||||||||||
Market | X | X | ||||||||||
Issuer | X | X | ||||||||||
Interest Rate | X | X | ||||||||||
Call | X | X | ||||||||||
Credit | X | X | ||||||||||
High Yield and Distressed Company | X | X | ||||||||||
Currency | X | X | ||||||||||
Real Estate | X | X | ||||||||||
Liquidity | X | X | ||||||||||
Leveraging | X | X | ||||||||||
Issuer Non-Diversification | X | |||||||||||
Management | X | X | ||||||||||
Small-Cap and Mid-Cap Company | X | X | ||||||||||
Derivatives | X | X | ||||||||||
Model | X | |||||||||||
Mortgage-Related and Other Asset-Backed | X | |||||||||||
Short Exposure | X | X | ||||||||||
Convertible Securities | X | X | ||||||||||
Cash Holdings | X | |||||||||||
Please see “Description of Principal Risks” in a Fund’s prospectus for a more detailed description of the risks of investing in a Fund.
Equity Risk is the risk that the value of equity securities, such as common stocks and preferred securities, may decline due to general market conditions which are not specifically related to a particular
company or to factors affecting a particular industry or industries. Equity securities generally have greater price volatility than fixed income securities.
Dividend-Oriented Stocks Risk is the risk that companies that have paid regular dividends to shareholders may decrease or eliminate dividend payments in the future. A decrease in dividend payments by an issuer may result in a decrease in the value of the security held by a Fund or a Fund receiving less income. In addition, equity securities with higher dividend yields may be sensitive to changes in interest rates, and as interest rates rise, the prices of such securities may fall. A Fund’s use of a dividend capture strategy (i.e., purchasing an equity security shortly before the issuer pays a dividend and selling it shortly thereafter) exposes a Fund to higher portfolio turnover, increased trading costs, the potential for capital loss, particularly in the event of significant short-term price movements of stocks subject to dividend capture trading and may result in negative tax consequences.
Value Investing Risk is the risk that a value stock may decrease in price or may not increase in price as anticipated by PIMCO if it continues to be undervalued by the market or the factors that the portfolio manager believes will cause the stock price to increase do not occur.
Foreign (Non-U.S.) Investment Risk is the risk that investing in foreign (non-U.S.) securities may result in a Fund experiencing more rapid and extreme changes in value than a fund that invests exclusively in securities of U.S. companies, due to smaller markets, differing reporting, accounting and auditing standards, increased risk of delayed settlement of portfolio transactions or loss of certificates of portfolio securities, and the risk of unfavorable foreign government actions, including nationalization, expropriation or confiscatory taxation, currency blockage, or political changes or diplomatic developments. Foreign securities may also be less liquid and more difficult to value than securities of U.S. issuers.
Emerging Markets Risk is the risk of investing in emerging market securities, primarily increased foreign (non-U.S.) investment risk.
Sovereign Debt Risk is the risk that investments in fixed income instruments issued by sovereign entities may decline in value as a result of default or other adverse credit event resulting from an issuer’s inability or unwillingness to make principal or interest payments in a timely fashion.
Market Risk is the risk that the value of securities owned by a Fund may go up or down, sometimes rapidly or unpredictably, due to factors affecting securities markets generally or particular industries.
Issuer Risk is the risk that the value of a security may decline for a reason directly related to the issuer, such as management performance, financial leverage and reduced demand for the issuer’s goods or services.
| ANNUAL REPORT | JUNE 30, 2018 | 59 |
Table of Contents
Notes to Financial Statements (Cont.)
Interest Rate Risk is the risk that fixed income securities and dividend-paying equity securities will decline in value because of an increase in interest rates; a fund with a longer average portfolio duration will be more sensitive to changes in interest rates than a fund with a shorter average portfolio duration.
Call Risk is the risk that an issuer may exercise its right to redeem a fixed income security earlier than expected (a call). Issuers may call outstanding securities prior to their maturity for a number of reasons (e.g., declining interest rates, changes in credit spreads and improvements in the issuer’s credit quality). If an issuer calls a security that a Fund has invested in, a Fund may not recoup the full amount of its initial investment and may be forced to reinvest in lower-yielding securities, securities with greater credit risks or securities with other, less favorable features.
Credit Risk is the risk that a Fund could lose money if the issuer or guarantor of a fixed income security, or the counterparty to a derivative contract, is unable or unwilling to meet its financial obligations.
High Yield and Distressed Company Risk is the risk that high yield securities and unrated securities of similar credit quality (commonly known as “junk bonds”) and securities of distressed companies may be subject to greater levels of credit, issuer and liquidity risks. Securities of distressed companies include both debt and equity securities. High yield securities and debt securities of distressed companies are considered primarily speculative with respect to the issuer’s continuing ability to make principal and interest payments. Distressed companies may be engaged in restructurings or bankruptcy proceedings.
Currency Risk is the risk that foreign (non-U.S.) currencies will change in value relative to the U.S. dollar and affect a Fund’s investments in foreign (non-U.S.) currencies or in securities that trade in, and receive revenues in, or in derivatives that provide exposure to, foreign (non-U.S.) currencies.
Real Estate Risk is the risk that a Fund’s investments in Real Estate Investment Trusts (“REITs”) or real estate-linked derivative instruments will subject a Fund to risks similar to those associated with direct ownership of real estate, including losses from casualty or condemnation, and changes in local and general economic conditions, supply and demand, interest rates, zoning laws, regulatory limitations on rents, property taxes and operating expenses. A Fund’s investments in REITs or real estate-linked derivative instruments subject it to management and tax risks. In addition, privately traded REITs subject a Fund to liquidity and valuation risk.
Liquidity Risk is the risk that a particular investment may be difficult to purchase or sell and that a Fund may be unable to sell illiquid securities at an advantageous time or price or achieve its desired level of exposure to a certain sector.
Leveraging Risk is the risk that certain transactions of a Fund, such as reverse repurchase agreements, loans of portfolio securities, and the use of when-issued, delayed delivery or forward commitment transactions, or derivative instruments, may give rise to leverage, magnifying gains and losses and causing a Fund to be more volatile than if it had not been leveraged. This means that leverage entails a heightened risk of loss.
Issuer Non-Diversification Risk is the risk of focusing investments in a small number of issuers, including being more susceptible to risks associated with a single economic, political or regulatory occurrence than a more diversified portfolio might be. Funds that are “non-diversified” may invest a greater percentage of their assets in the securities of a single issuer than funds that are “diversified”.
Management Risk is the risk that the investment techniques and risk analyses applied by PIMCO will not produce the desired results and that legislative, regulatory, or tax restrictions, policies or developments may affect the investment techniques available to PIMCO and the individual portfolio manager in connection with managing a Fund. There is no guarantee that the investment objective of a Fund will be achieved.
Small-Cap and Mid-Cap Company Risk is the risk that the value of securities issued by small-capitalization and mid-capitalization companies may go up or down, sometimes rapidly and unpredictably, due to narrow markets and limited managerial and financial resources.
Derivatives Risk is the risk of investing in derivative instruments (such as futures, swaps and structured securities), including leverage, liquidity, interest rate, market, credit and management risks, mispricing or valuation complexity. Changes in the value of the derivative may not correlate perfectly with, and may be more sensitive to market events than, the underlying asset, rate or index, and a Fund could lose more than the initial amount invested. A Fund’s use of derivatives may result in losses to the Fund, a reduction in a Fund’s returns and/or increased volatility. Over-the-counter (“OTC”) derivatives are also subject to the risk that a counterparty to the transaction will not fulfill its contractual obligations to the other party, as many of the protections afforded to centrally-cleared derivative transactions might not be available for OTC derivatives. For derivatives traded on an exchange or through a central counterparty, credit risk resides with a Fund’s clearing broker, or the clearinghouse itself, rather than with a counterparty in an OTC derivative transaction. Changes in regulation relating to a mutual fund’s use of derivatives and related instruments could potentially limit or impact a Fund’s ability to invest in derivatives, limit a Fund’s ability to employ certain strategies that use derivatives and/or adversely affect the value of derivatives and a Fund’s performance.
| 60 | PIMCO EQUITY SERIES |
Table of Contents
June 30, 2018
Model Risk is the risk that a Fund’s investment models used in making investment allocation decisions may not adequately take into account certain factors and may result in a decline in the value of an investment in a Fund.
Mortgage-Related and Other Asset-Backed Risk is the risk of investing in mortgage-related and other asset-backed securities, including interest rate risk, extension risk, prepayment risk and credit risk.
Short Exposure Risk is the risk of entering into short sales, including the potential loss of more money than the actual cost of the investment, and the risk that the third party to the short sale will not fulfill its contractual obligations, causing a loss to a Fund.
Convertible Securities Risk is the risk that arises when convertible securities share both fixed income and equity characteristics. Convertible securities are subject to risks to which fixed income and equity investments are subject. These risks include equity risk, interest rate risk and credit risk.
Cash Holdings Risk is the risk of holding large cash positions, including lower returns and potential lost opportunities to participate in market appreciation.
8. MASTER NETTING ARRANGEMENTS
A Fund may be subject to various netting arrangements (“Master Agreements”) with select counterparties. Master Agreements govern the terms of certain transactions, and are intended to reduce the counterparty risk associated with relevant transactions by specifying credit protection mechanisms and providing standardization that is intended to improve legal certainty. Each type of Master Agreement governs certain types of transactions. Different types of transactions may be traded out of different legal entities or affiliates of a particular organization, resulting in the need for multiple agreements with a single counterparty. As the Master Agreements are specific to unique operations of different asset types, they allow a Fund to close out and net its total exposure to a counterparty in the event of a default with respect to all the transactions governed under a single Master Agreement with a counterparty. For financial reporting purposes the Statements of Assets and Liabilities generally present derivative assets and liabilities on a gross basis, which reflects the full risks and exposures prior to netting.
Master Agreements can also help limit counterparty risk by specifying collateral posting arrangements at pre-arranged exposure levels. Under most Master Agreements, collateral is routinely transferred if the total net exposure to certain transactions (net of existing collateral already in place) governed under the relevant Master Agreement with a counterparty in a given account exceeds a specified threshold, which typically ranges from zero to $250,000 depending on the counterparty
and the type of Master Agreement. United States Treasury Bills and U.S. dollar cash are generally the preferred forms of collateral, although other forms of AAA rated paper or sovereign securities may be used depending on the terms outlined in the applicable Master Agreement. Securities and cash pledged as collateral are reflected as assets on the Statements of Assets and Liabilities as either a component of Investments at value (securities) or Deposits with counterparty. Cash collateral received is not typically held in a segregated account and as such is reflected as a liability on the Statements of Assets and Liabilities as Deposits from counterparty. The market value of any securities received as collateral is not reflected as a component of NAV. A Fund’s overall exposure to counterparty risk can change substantially within a short period, as it is affected by each transaction subject to the relevant Master Agreement.
Master Repurchase Agreements and Global Master Repurchase Agreements (individually and collectively “Master Repo Agreements”) govern repurchase, reverse repurchase, and sale-buyback transactions between a Fund and select counterparties. Master Repo Agreements maintain provisions for, among other things, initiation, income payments, events of default, and maintenance of collateral. The market value of transactions under the Master Repo Agreement, collateral pledged or received, and the net exposure by counterparty as of period end are disclosed in the Notes to Schedules of Investments.
Master Securities Forward Transaction Agreements (“Master Forward Agreements”) govern certain forward settling transactions, such as TBA securities, delayed-delivery or sale-buyback transactions by and between a Fund and select counterparties. The Master Forward Agreements maintain provisions for, among other things, transaction initiation and confirmation, payment and transfer, events of default, termination, and maintenance of collateral. The market value of forward settling transactions, collateral pledged or received, and the net exposure by counterparty as of period end is disclosed in the Notes to Schedules of Investments.
Customer Account Agreements and related addenda govern cleared derivatives transactions such as futures, options on futures, and cleared OTC derivatives. Such transactions require posting of initial margin as determined by each relevant clearing agency which is segregated in an account at a futures commission merchant (“FCM”) registered with the Commodity Futures Trading Commission (“CFTC”). In the United States, counterparty risk may be reduced as creditors of an FCM cannot have a claim to Fund assets in the segregated account. Portability of exposure reduces risk to the Funds. Variation margin, or changes in market value, are exchanged daily, but may not be netted between futures and cleared OTC derivatives unless the parties have agreed to a separate arrangement in respect of portfolio margining. The market value or accumulated unrealized appreciation (depreciation), initial
| ANNUAL REPORT | JUNE 30, 2018 | 61 |
Table of Contents
Notes to Financial Statements (Cont.)
margin posted, and any unsettled variation margin as of period end are disclosed in the Notes to Schedules of Investments.
Prime Broker Arrangements may be entered into to facilitate execution and/or clearing of listed equity option transactions or short sales of equity securities between a Fund and selected counterparties. The arrangements provide guidelines surrounding the rights, obligations, and other events, including, but not limited to, margin, execution, and settlement. These agreements maintain provisions for, among other things, payments, maintenance of collateral, events of default, and termination. Margin and other assets delivered as collateral are typically in the possession of the prime broker and would offset any obligations due to the prime broker. The market values of listed options and securities sold short and related collateral are disclosed in the Notes to Schedules of Investments.
International Swaps and Derivatives Association, Inc. Master Agreements and Credit Support Annexes (“ISDA Master Agreements”) govern bilateral OTC derivative transactions entered into by a Fund with select counterparties. ISDA Master Agreements maintain provisions for general obligations, representations, agreements, collateral posting and events of default or termination. Events of termination include conditions that may entitle counterparties to elect to terminate early and cause settlement of all outstanding transactions under the applicable ISDA Master Agreement. Any election to terminate early could be material to the financial statements. In limited
circumstances, the ISDA Master Agreement may contain additional provisions that add counterparty protection beyond coverage of existing daily exposure if the counterparty has a decline in credit quality below a predefined level. These amounts, if any, may be segregated with a third-party custodian. The market value of OTC financial derivative instruments, collateral received or pledged, and net exposure by counterparty as of period end are disclosed in the Notes to Schedules of Investments.
9. FEES AND EXPENSES
(a) Investment Advisory Fee PIMCO is a majority-owned subsidiary of Allianz Asset Management of America L.P. (“Allianz Asset Management”) and serves as the Adviser to the Trust, pursuant to an investment advisory contract. The Adviser receives a monthly fee from each Fund at an annual rate based on average daily net assets (the “Investment Advisory Fee”). The Investment Advisory Fee for all classes is charged at an annual rate as noted in the table in note (b) below.
(b) Supervisory and Administrative Fee PIMCO serves as administrator (the “Administrator”) and provides supervisory and administrative services to the Trust for which it receives a monthly supervisory and administrative fee based on each share class’s average daily net assets (the “Supervisory and Administrative Fee”). As the Administrator, PIMCO bears the costs of various third-party services, including audit, custodial, portfolio accounting, legal, transfer agency and printing costs.
The Investment Advisory Fees and Supervisory and Administrative Fees for all classes, as applicable, are charged at the annual rate as noted in the following table (calculated as a percentage of each Fund’s average daily net assets attributable to each class):
| Investment Advisory Fee | Supervisory and Administrative Fee | |||||||||||||||||||||||||||||||
| Fund Name | All Classes | Institutional Class | I-2 | I-3 | Class A | Class C | ||||||||||||||||||||||||||
PIMCO Dividend and Income Fund | 0.49% | 0.30% | 0.40% | N/A | 0.40% | 0.40% | ||||||||||||||||||||||||||
PIMCO EqS® Long/Short Fund(1) | 1.04% | 0.45% | 0.55% | 0.65% | 0.55% | 0.55% | ||||||||||||||||||||||||||
| (1) | PIMCO has contractually agreed, through October 31, 2019, to waive its supervisory and administrative fee for I-3 shares by 0.05% of the average daily net assets attributable to I-3 shares of the Fund. |
(c) Distribution and Servicing Fees PIMCO Investments LLC, a wholly-owned subsidiary of PIMCO, serves as the distributor (“Distributor”) of the Trust’s shares.
The Trust has adopted separate Distribution and Servicing Plans with respect to the Class A and Class C shares of the Trust pursuant to Rule 12b-1 under the Act. In connection with the distribution of Class C shares of the Trust, the Distributor receives distribution fees from the Trust of up to 0.75% for Class C shares, and in connection with personal services rendered to Class A and Class C shareholders and the maintenance of such shareholder accounts, the Distributor receives servicing fees from the Trust of up to 0.25% for each of Class A and
Class C shares (percentages reflect annual rates of the average daily net assets attributable to the applicable class).
The Trust paid distribution and servicing fees at effective rates as noted in the following table (calculated as a percentage of each Fund’s average daily net assets attributable to each class):
| Distribution Fee | Servicing Fee | |||||||||||
Class A | — | 0.25% | ||||||||||
Class C | 0.75% | 0.25% | ||||||||||
The Distributor also received the proceeds of the initial sales charges paid by the shareholders upon the purchase of Class A shares and the contingent deferred sales charges paid by the shareholders upon
| 62 | PIMCO EQUITY SERIES |
Table of Contents
June 30, 2018
certain redemptions of Class A and Class C shares. For the period ended June 30, 2018, the Distributor retained $95,781 representing commissions (sales charges) and contingent deferred sales charges from the Trust.
(d) Fund Expenses PIMCO provides or procures supervisory and administrative services for shareholders and also bears the costs of various third-party services required by the Funds, including audit, custodial, portfolio accounting, legal, transfer agency and printing costs. The Trust is responsible for the following expenses: (i) taxes and governmental fees; (ii) brokerage fees and commissions and other portfolio transaction expenses; (iii) the costs of borrowing money, including interest expense; (iv) fees and expenses of the Trustees who are not “interested persons” of PIMCO or the Trust, and any counsel retained exclusively for their benefit; (v) extraordinary expense, including costs of litigation and indemnification expenses; (vi) organizational expenses; and (vii) any expenses allocated or allocable to a specific class of shares, and may include certain other expenses as permitted by the Trust’s Multi-Class Plan adopted pursuant to Rule 18f-3 under the Act and subject to review and approval by the Trustees The ratio of expenses to average net assets per share class, as disclosed on the Financial Highlights, may differ from the annual fund operating expenses per share class.
Each Trustee, other than those affiliated with PIMCO or its affiliates, receives an annual retainer of $62,000, plus $6,250 for each Board meeting attended in person, $375 ($750 in the case of the audit committee chair with respect to audit committee meetings) for each committee meeting attended and $750 for each Board meeting attended telephonically, plus reimbursement of related expenses. In addition, the audit committee chair receives an additional annual retainer of $9,000, the valuation oversight committee lead receives an additional annual retainer of $2,000 (to the extent there are co-leads of the valuation oversight committee, the annual retainer will be split
evenly between the co-leads, so that each co-lead individually receives an additional retainer of $1,000) and the governance committee chair receives an additional annual retainer of $750.
These expenses are allocated on a pro rata basis to each Fund of the Trust according to its respective net assets. The Trust pays no compensation directly to any Trustee or any other officer who is affiliated with the Administrator, all of whom receive remuneration for their services to the Trust from the Administrator or its affiliates.
(e) Expense Limitation Pursuant to the Expense Limitation Agreement, PIMCO has agreed to waive a portion of the Funds’ Supervisory and Administrative Fee, or reimburse each Fund, to the extent that each Fund’s organizational expenses, pro rata share of expenses related to obtaining or maintaining a Legal Entity Identifier and pro rata share of Trustee Fees exceed 0.0049%, the “Expense Limit” (calculated as a percentage of each Fund’s average daily net assets attributable to each class). The Expense Limitation Agreement will automatically renew for one-year terms unless PIMCO provides written notice to the Trust at least 30 days prior to the end of the then current term.
Pursuant to a Fee Waiver Agreement, PIMCO previously contractually agreed to reduce its Advisory Fee for the PIMCO Dividend and Income Fund. Effective June 16, 2016, this contractual agreement has been terminated. The waiver is reflected in the Statement of Operations as a component of Waiver and/or Reimbursement by PIMCO.
Pursuant to a Fee Waiver Agreement, PIMCO contractually agreed to reduce its supervisory and administrative fee for I-3 shares of the PIMCO EqS® Long/Short Fund. This Fee Waiver Agreement will automatically renew for one-year terms unless PIMCO provides written notice to the Trust at least 30 days prior to the end of the then current term. The waiver is reflected on the Statements of Operations as a component of Waiver and/or Reimbursement by PIMCO.
Under certain conditions, PIMCO may be reimbursed for certain of these waived amounts in future periods, not to exceed thirty-six months after the waiver. The total recoverable amounts to PIMCO at June 30, 2018, were as follows (amounts in thousands†):
| Expiring within | ||||||||||||||||||||
| Fund Name | 12 months | 13-24 months | 25-36 months | Total | ||||||||||||||||
PIMCO Dividend and Income Fund | $ | 1,078 | $ | 54 | $ | 24 | $ | 1,156 | ||||||||||||
PIMCO EqS® Long/Short Fund | 88 | 94 | 38 | 220 | ||||||||||||||||
| † | A zero balance may reflect actual amounts rounding to less than one thousand. |
10. RELATED PARTY TRANSACTIONS
The Adviser, Administrator, and Distributor are related parties. Fees paid to these parties are disclosed in Note 9, Fees and Expenses, and the accrued related party fee amounts are disclosed on the Statements of Assets and Liabilities.
Certain Funds are permitted to purchase or sell securities from or to certain related affiliated funds under specified conditions outlined in procedures adopted by the Board. The procedures have been designed to ensure that any purchase or sale of securities by the Funds from or to another fund or portfolio that are, or could be, considered an
| ANNUAL REPORT | JUNE 30, 2018 | 63 |
Table of Contents
Notes to Financial Statements (Cont.)
affiliate, or an affiliate of an affiliate, by virtue of having a common investment adviser (or affiliated investment advisers), common Trustees and/or common officers complies with Rule 17a-7 under the Act. Further, as defined under the procedures, each transaction is effected at the current market price. During the period ended June 30, 2018, the Funds below engaged in purchases and sales of securities pursuant to Rule 17a-7 under the Act (amounts in thousands†):
| Fund Name | Purchases | Sales | ||||||||||
PIMCO Dividend and Income Fund | $ | 2,011 | $ | 2,333 | ||||||||
PIMCO EqS® Long/Short Fund | 0 | 621 | ||||||||||
| † | A zero balance may reflect actual amounts rounding to less than one thousand. |
11. GUARANTEES AND INDEMNIFICATIONS
Under the Trust’s organizational documents, each Trustee or officer of the Trust is indemnified and each employee or other agent of the Trust (including the Trust’s investment manager) may be indemnified, to the extent permitted by the Act, against certain liabilities that may arise out of performance of their duties to the Funds. Additionally, in the normal course of business, the Funds enter into contracts that contain a variety
of indemnification clauses. The Funds’ maximum exposure under these arrangements is unknown as this would involve future claims that may be made against the Funds that have not yet occurred. However, the Funds have not had prior claims or losses pursuant to these contracts.
12. PURCHASES AND SALES OF SECURITIES
The length of time a Fund has held a particular security is not generally a consideration in investment decisions. A change in the securities held by a Fund is known as “portfolio turnover.” Each Fund may engage in frequent and active trading of portfolio securities to achieve its investment objective, particularly during periods of volatile market movements. High portfolio turnover may involve correspondingly greater transaction costs to a Fund, including brokerage commissions or dealer mark-ups and other transaction costs on the sale of securities and reinvestments in other securities. Such sales may also result in realization of taxable capital gains, including short-term capital gains (which are generally taxed at ordinary income tax rates). The transaction costs and tax effects associated with portfolio turnover may adversely affect a Fund’s performance. The portfolio turnover rates are reported in the Financial Highlights.
Purchases and sales of securities (excluding short-term investments) for the period ended June 30, 2018, were as follows (amounts in thousands†):
| U.S. Government/Agency | All Other | |||||||||||||||||||
| Fund Name | Purchases | Sales | Purchases | Sales | ||||||||||||||||
PIMCO Dividend and Income Fund | $ | 197,669 | $ | 183,391 | $ | 78,401 | $ | 130,813 | ||||||||||||
PIMCO EqS® Long/Short Fund | 0 | 3,203 | 1,204,937 | 1,288,268 | ||||||||||||||||
| † | A zero balance may reflect actual amounts rounding to less than one thousand. |
| 64 | PIMCO EQUITY SERIES |
Table of Contents
June 30, 2018
13. SHARES OF BENEFICIAL INTEREST
The Trust may issue an unlimited number of shares of beneficial interest with a $0.001 par value. Changes in shares of beneficial interest were as follows (shares and amounts in thousands†):
| PIMCO Dividend and Income Fund | PIMCO EqS® Long/Short Fund | |||||||||||||||||||||||||||||||||
Year Ended 06/30/2018 | Year Ended 06/30/2017 | Year Ended 06/30/2018 | Year Ended 06/30/2017 | |||||||||||||||||||||||||||||||
| Shares | Amount | Shares | Amount | Shares | Amount | Shares | Amount | |||||||||||||||||||||||||||
Receipts for shares sold | ||||||||||||||||||||||||||||||||||
Institutional Class | 521 | $ | 6,106 | 481 | $ | 5,077 | 5,993 | $ | 72,343 | 7,197 | $ | 85,903 | ||||||||||||||||||||||
I-2 | 1,178 | 13,779 | 1,301 | 13,940 | 2,466 | 29,527 | 3,787 | 44,711 | ||||||||||||||||||||||||||
I-3 | 0 | 0 | 0 | 0 | 2 | 18 | 0 | 0 | ||||||||||||||||||||||||||
Class D | 80 | 935 | 239 | 2,512 | 1,764 | 21,142 | 1,894 | 22,459 | ||||||||||||||||||||||||||
Class A | 2,541 | (a) | 29,861 | (a) | 2,502 | 26,751 | 5,044 | (b) | 58,073 | (b) | 1,094 | 12,795 | ||||||||||||||||||||||
Class C | 688 | 8,096 | 1,240 | 13,111 | 455 | 5,181 | 733 | 8,292 | ||||||||||||||||||||||||||
Issued as reinvestment of distributions | ||||||||||||||||||||||||||||||||||
Institutional Class | 55 | 650 | 49 | 525 | 850 | 9,984 | 729 | 8,346 | ||||||||||||||||||||||||||
I-2 | 41 | 487 | 29 | 313 | 537 | 6,263 | 693 | 7,887 | ||||||||||||||||||||||||||
I-3 | 0 | 0 | 0 | 0 | 0 | 0 | 0 | 0 | ||||||||||||||||||||||||||
Class D | 13 | 151 | 14 | 153 | 229 | 2,640 | 169 | 1,907 | ||||||||||||||||||||||||||
Class A | 255 | 2,994 | 207 | 2,207 | 382 | 4,401 | 485 | 5,471 | ||||||||||||||||||||||||||
Class C | 175 | 2,049 | 134 | 1,419 | 405 | 4,480 | 484 | 5,287 | ||||||||||||||||||||||||||
Cost of shares redeemed | ||||||||||||||||||||||||||||||||||
Institutional Class | (662 | ) | (7,742 | ) | (1,652 | ) | (17,251 | ) | (7,452 | ) | (89,807 | ) | (13,394 | ) | (159,365 | ) | ||||||||||||||||||
I-2 | (1,085 | ) | (12,726 | ) | (2,530 | ) | (26,477 | ) | (4,603 | ) | (55,234 | ) | (14,564 | ) | (171,916 | ) | ||||||||||||||||||
I-3 | 0 | 0 | 0 | 0 | 0 | 0 | 0 | 0 | ||||||||||||||||||||||||||
Class D | (825 | )(a) | (9,540 | )(a) | (590 | ) | (6,226 | ) | (5,839 | )(b) | (67,810 | )(b) | (3,606 | ) | (41,959 | ) | ||||||||||||||||||
Class A | (3,850 | ) | (45,103 | ) | (6,527 | ) | (68,337 | ) | (3,005 | ) | (35,350 | ) | (7,030 | ) | (81,866 | ) | ||||||||||||||||||
Class C | (3,554 | ) | (41,378 | ) | (8,358 | ) | (87,665 | ) | (2,314 | ) | (26,344 | ) | (6,340 | ) | (71,525 | ) | ||||||||||||||||||
Net increase (decrease) resulting from Fund share transactions | (4,429 | ) | $ | (51,381 | ) | (13,461 | ) | $ | (139,948 | ) | (5,086 | ) | $ | (60,493 | ) | (27,669 | ) | $ | (323,573 | ) | ||||||||||||||
| † | A zero balance may reflect actual amounts rounding to less than one thousand. |
| (a) | On March 23, 2018, 625 Class D shares in the amount of $7,204 converted into Class A shares of the Fund. |
| (b) | On March 23, 2018, 3,827 Class D shares in the amount of $43,813 converted into Class A shares of the Fund. |
14. REGULATORY AND LITIGATION MATTERS
The Funds are not named as defendants in any material litigation or arbitration proceedings and are not aware of any material litigation or claim pending or threatened against them.
The foregoing speaks only as of the date of this report.
15. FEDERAL INCOME TAX MATTERS
Each Fund intends to qualify as a regulated investment company under Subchapter M of the Internal Revenue Code (the “Code”) and distribute all of its taxable income and net realized gains, if applicable, to shareholders. Accordingly, no provision for Federal income taxes has been made.
A Fund may be subject to local withholding taxes, including those imposed on realized capital gains. Any applicable foreign capital gains
tax is accrued daily based upon net unrealized gains, and may be payable following the sale of any applicable investments.
In accordance with U.S. GAAP, the Adviser has reviewed the Funds’ tax positions for all open tax years. As of June 30, 2018, the Funds have recorded no liability for net unrecognized tax benefits relating to uncertain income tax positions they have taken or expect to take in future tax returns.
The Funds file U.S. federal, state, and local tax returns as required. The Funds’ tax returns are subject to examination by relevant tax authorities until expiration of the applicable statute of limitations, which is generally three years after the filing of the tax return but which can be extended to six years in certain circumstances. Tax returns for open years have incorporated no uncertain tax positions that require a provision for income taxes.
| ANNUAL REPORT | JUNE 30, 2018 | 65 |
Table of Contents
Notes to Financial Statements (Cont.)
June 30, 2018
As of June 30, 2018, the components of distributable taxable earnings are as follows (amounts in thousands†):
| Undistributed Ordinary Income(1) | Undistributed Long-Term Capital Gains | Net Tax Basis Unrealized Appreciation/ (Depreciation)(2) | Other Book-to-Tax Accounting Differences(3) | Accumulated Capital Losses(4) | Qualified Late-Year Loss Deferral - Capital(5) | Qualified Late-Year Loss Deferral - Ordinary(6) | ||||||||||||||||||||||||||
PIMCO Dividend and Income Fund | $ | 3,608 | $ | 0 | $ | 18,087 | $ | (24 | ) | $ | (103,738 | ) | $ | 0 | $ | 0 | ||||||||||||||||
PIMCO EqS® Long/Short Fund | 9,711 | 5,280 | 17,878 | (31 | ) | 0 | 0 | 0 | ||||||||||||||||||||||||
| † | A zero balance may reflect actual amounts rounding to less than one thousand. |
| (1) | Includes undistributed short-term capital gains, if any. |
| (2) | Adjusted for open wash sale loss deferrals and accelerated recognition of unrealized gain (loss) on certain futures and forward contracts for federal income tax purposes. Also adjusted for differences between book and tax realized and unrealized gain (loss) on swap contracts, short dividend expenditures, passive foreign investment companies (PFICs), convertible preferred securities, and straddle loss deferrals. |
| (3) | Represents differences in income tax regulations and financial accounting principles generally accepted in the United States of America, mainly for organizational expenditures. |
| (4) | Capital losses available to offset future net capital gains expire in varying amounts as shown below. |
| (5) | Capital losses realized during the period November 1, 2017 through June 30, 2018 which the Funds elected to defer to the following taxable year pursuant to income tax regulations. |
| (6) | Specified losses realized during the period November 1, 2017 through June 30, 2018 and Ordinary losses realized during the period January 1, 2018 through June 30, 2018, which the Funds elected to defer to the following taxable year pursuant to income tax regulations. |
Under the Regulated Investment Company Act of 2010, a fund is permitted to carry forward any new capital losses for an unlimited period. Additionally, such capital losses that are carried forward will retain their character as either short-term or long-term capital losses rather than being considereed all short-term under previous law.
As of June 30, 2018, the Funds had the following post-effective capital losses with no expiration (amounts in thousands†):
| Short-Term | Long-Term | |||||||||||
PIMCO Dividend and Income Fund | $ | 66,535 | $ | 37,203 | ||||||||
PIMCO EqS® Long/Short Fund | 0 | 0 | ||||||||||
| † | A zero balance may reflect actual amounts rounding to less than one thousand. |
As of June 30, 2018, the aggregate cost and the net unrealized appreciation/(depreciation) of investments for federal income tax purposes are as follows (amounts in thousands†):
| Federal Tax Cost | Unrealized Appreciation | Unrealized (Depreciation) | Net Unrealized Appreciation/ | |||||||||||||||||
PIMCO Dividend and Income Fund | $ | 303,852 | $ | 33,255 | $ | (15,136 | ) | $ | 18,119 | |||||||||||
PIMCO EqS® Long/Short Fund | 328,648 | 27,368 | (9,718 | ) | 17,650 | |||||||||||||||
| † | A zero balance may reflect actual amounts rounding to less than one thousand. |
| (7) | Primary differences, if any, between book and tax net unrealized appreciation/(depreciation) on investments are attributable to open wash sale loss deferrals, short dividend expenditures, passive foreign investment companies (PFICs), convertible preferred stock, straddle loss deferrals, realized and unrealized gain (loss) swap contracts, and unrealized gain (loss) on certain futures and forward contracts. |
For the fiscal years ended June 30, 2018 and June 30, 2017, respectively, the Funds made the following tax basis distributions (amounts in thousands†):
| June 30, 2018 | June 30, 2017 | |||||||||||||||||||||||||||
| Ordinary Income Distributions(8) | Long-Term Capital Gain Distributions | Return of Capital(9) | Ordinary Income Distributions(8) | Long-Term Capital Gain Distributions | Return of Capital(9) | |||||||||||||||||||||||
PIMCO Dividend and Income Fund | $ | 7,401 | $ | 0 | $ | 0 | $ | 5,501 | $ | 0 | $ | 0 | ||||||||||||||||
PIMCO EqS® Long/Short Fund | 11,008 | 16,807 | 0 | 27,119 | 1,845 | 0 | ||||||||||||||||||||||
| † | A zero balance may reflect actual amounts rounding to less than one thousand. |
| (8) | Includes short-term capital gains distributed, if any. |
| (9) | A portion of the distributions made represents a tax return of capital. Return of capital distributions have been reclassified from undistributed net investment income to paid-in capital to more appropriately conform financial accounting to tax accounting. |
| 66 | PIMCO EQUITY SERIES |
Table of Contents
Report of Independent Registered Public Accounting Firm
To the Board of Trustees of PIMCO Equity Series® and Shareholders of PIMCO Dividend and Income Fund and PIMCO EqS® Long/Short Fund
Opinions on the Financial Statements
We have audited the accompanying statements of assets and liabilities, including the schedules of investments, of PIMCO Dividend and Income Fund and PIMCO EqS® Long/Short Fund (two of the funds constituting PIMCO Equity Series®, hereafter collectively referred to as the “Funds”) as of June 30, 2018, the related statements of operations for the year ended June 30, 2018, the statements of changes in net assets for each of the two years in the period ended June 30, 2018, and for PIMCO EqS® Long/Short Fund the statement of cash flows for the year ended June 30, 2018, including the related notes, and the financial highlights for each of the periods indicated therein (collectively referred to as the “financial statements”). In our opinion, the financial statements present fairly, in all material respects, the financial position of each of the Funds as of June 30, 2018, the results of each of their operations for the year then ended, the changes in each of their net assets for each of the two years in the period ended June 30, 2018, for PIMCO EqS® Long/Short Fund, the results of its cash flows for the year then ended and each of the financial highlights for each of the periods indicated therein in conformity with accounting principles generally accepted in the United States of America.
Basis for Opinions
These financial statements are the responsibility of the Funds’ management. Our responsibility is to express an opinion on the Funds’ financial statements based on our audits. We are a public accounting firm registered with the Public Company Accounting Oversight Board (United States) (“PCAOB”) and are required to be independent with respect to the Funds in accordance with the U.S. federal securities laws and the applicable rules and regulations of the Securities and Exchange Commission and the PCAOB.
We conducted our audits of these financial statements in accordance with the standards of the PCAOB. Those standards require that we plan and perform the audit to obtain reasonable assurance about whether the financial statements are free of material misstatement, whether due to error or fraud.
Our audits included performing procedures to assess the risks of material misstatement of the financial statements, whether due to error or fraud, and performing procedures that respond to those risks. Such procedures included examining, on a test basis, evidence regarding the amounts and disclosures in the financial statements. Our audits also included evaluating the accounting principles used and significant estimates made by management, as well as evaluating the overall presentation of the financial statements. Our procedures included confirmation of securities owned as of June 30, 2018 by correspondence with the custodian, transfer agent and brokers; when replies were not received from brokers, we performed other auditing procedures. We believe that our audits provide a reasonable basis for our opinions.
/s/ PricewaterhouseCoopers LLP
Kansas City, Missouri
August 23, 2018
We have served as the auditor of one or more investment companies in PIMCO Equity Series® since 2010.
| ANNUAL REPORT | JUNE 30, 2018 | 67 |
Table of Contents
Glossary: (abbreviations that may be used in the preceding statements)
(Unaudited)
Counterparty Abbreviations: | ||||||||||
| BOA | Bank of America N.A. | FICC | Fixed Income Clearing Corporation | MSB | Morgan Stanley Bank, N.A | |||||
| BOS | Banc of America Securities LLC | FOB | Credit Suisse Securities (USA) LLC | MYC | Morgan Stanley Capital Services, Inc. | |||||
| BPS | BNP Paribas S.A. | GLM | Goldman Sachs Bank USA | RCY | Royal Bank of Canada | |||||
| BRC | Barclays Bank PLC | GRE | RBS Securities, Inc. | SAL | Citigroup Global Markets, Inc. | |||||
| BSN | Bank of Nova Scotia | GSC | Goldman Sachs & Co. | SCX | Standard Chartered Bank | |||||
| CBK | Citibank N.A. | GST | Goldman Sachs International | SSB | State Street Bank and Trust Co. | |||||
| DUB | Deutsche Bank AG | HUS | HSBC Bank USA N.A. | UAG | UBS AG Stamford | |||||
| FBF | Credit Suisse International | JPM | JP Morgan Chase Bank N.A. | UBS | UBS Securities LLC | |||||
Currency Abbreviations: | ||||||||||
| ARS | Argentine Peso | INR | Indian Rupee | RUB | Russian Ruble | |||||
| AUD | Australian Dollar | JPY | Japanese Yen | SEK | Swedish Krona | |||||
| BRL | Brazilian Real | KRW | South Korean Won | TRY | Turkish New Lira | |||||
| CAD | Canadian Dollar | MXN | Mexican Peso | USD (or $) | United States Dollar | |||||
| EUR | Euro | NZD | New Zealand Dollar | ZAR | South African Rand | |||||
| GBP | British Pound | PEN | Peruvian New Sol | |||||||
Exchange Abbreviations: | ||||||||||
| OTC | Over the Counter | |||||||||
Index/Spread Abbreviations: | ||||||||||
| AMZX | Alerian MLP Total Return Index | CDX.IG | Credit Derivatives Index - Investment Grade | LIBOR01M | 1 Month USD-LIBOR | |||||
| BADLARPP | Argentina Badlar Floating Rate Notes | CMBX | Commercial Mortgage-Backed Index | S&P 500 | Standard & Poor’s 500 Index | |||||
| BP0003M | 3 Month GBP-LIBOR | EUR003M | 3 Month EUR Swap Rate | US0001M | 1 Month USD Swap Rate | |||||
| CDX.HY | Credit Derivatives Index - High Yield | EUR006M | 6 Month EUR Swap Rate | US0003M | 3 Month USD Swap Rate | |||||
Other Abbreviations: | ||||||||||
| ADR | American Depositary Receipt | EURIBOR | Euro Interbank Offered Rate | SP - ADR | Sponsored American Depositary Receipt | |||||
| BABs | Build America Bonds | JIBAR | Johannesburg Interbank Agreed Rate | SPDR | Standard & Poor’s Depositary Receipts | |||||
| BBR | Bank Bill Rate | LIBOR | London Interbank Offered Rate | TBA | To-Be-Announced | |||||
| BBSW | Bank Bill Swap Reference Rate | Lunar | Monthly payment based on 28-day periods. One year consists of 13 periods. | TBD% | Interest rate to be determined when loan settles | |||||
| CDO | Collateralized Debt Obligation | MSCI | Morgan Stanley Capital International | TIIE | Tasa de Interés Interbancaria de Equilibrio “Equilibrium Interbank Interest Rate” | |||||
| CLO | Collateralized Loan Obligation | PIK | Payment-in-Kind | WTI | West Texas Intermediate | |||||
| 68 | PIMCO EQUITY SERIES |
Table of Contents
Federal Income Tax Information
(Unaudited)
As required by the Internal Revenue Code (“Code”) and Treasury Regulations, if applicable, shareholders must be notified within 60 days of the Funds’ fiscal year end regarding the status of qualified dividend income and the dividend received deduction.
Dividend Received Deduction. Corporate shareholders are generally entitled to take the dividend received deduction on the portion of a Funds’ dividend distribution that qualifies under tax law. The percentage of the following Funds’ Fiscal 2018 ordinary income dividend that qualifies for the corporate dividend received deduction is set forth below:
Qualified Dividend Income. Under the Jobs and Growth Tax Relief Reconciliation Act of 2003 (the “Act”), the following percentage of ordinary dividends paid during the fiscal year ended June 30, 2018 was designated as ‘qualified dividend income’ as defined in the Act subject to reduced tax rates in 2018:
Qualified Interest Income and Qualified Short-Term Capital Gain (for non-U.S. resident shareholders only). Under the American Jobs Creation Act of 2004, the following amounts of ordinary dividends paid during the fiscal year ended June 30, 2018 are considered to be derived from “qualified interest income,” as defined in Section 871(k)(1)(E) of the Code, and therefore are designated as interest-related dividends, as defined in Section 871(k)(1)(C) of the Code. Further, the following amounts of ordinary dividends paid during the fiscal year ended June 30, 2018 are considered to be derived from “qualified short-term capital gain,” as defined in Section 871(k)(2)(D) of the Code, and therefore are designated as qualified short-term gain dividends, as defined by Section 871(k)(2)(C) of the Code.
| Dividend Received Deduction % | Qualified Dividend Income % | Qualified Interest Income (000s† ) | Qualified Short-Term Capital Gain (000s†) | |||||||||||||||||
PIMCO Dividend and Income Fund | 39.95% | 100% | $ | 0 | $ | 0 | ||||||||||||||
PIMCO EqS® Long/Short Fund | 0% | 0% | 0 | 11,008 | ||||||||||||||||
| † | A zero balance may reflect actual amounts rounding to less than one thousand. |
Shareholders are advised to consult their own tax advisor with respect to the tax consequences of their investment in the Trust. In January 2019, you will be advised on IRS Form 1099-DIV as to the federal tax status of the dividends and distributions received by you in calendar year 2018.
| ANNUAL REPORT | JUNE 30, 2018 | 69 |
Table of Contents
The charts below identify the Trustees and executive officers of the Trust. Unless otherwise indicated, the address of all persons below is 650 Newport Center Drive, Newport Beach, CA 92660.
The Funds’ Statement of Additional Information includes more information about the Trustees and Officers. To request a free copy, call PIMCO at (888) 87-PIMCO or visit the Funds’ website at www.pimco.com.
| Name, Year of Birth and Position Held with Trust* | Term of Office and Length of Time Served† | Principal Occupation(s) During Past 5 Years | Number of Funds in Fund Complex Overseen by Trustee | Other Public Company and Investment Company Directorships Held by Trustee During the Past 5 Years | ||||
| Interested Trustees1 | ||||||||
Brent R. Harris (1959) Chairman of the Board | 03/2010 to present | Managing Director, PIMCO. Senior Vice President of the Trust, PIMCO Equity Series VIT, PIMCO Funds, PIMCO Variable Insurance Trust and PIMCO ETF Trust. Formerly, member of Executive Committee, PIMCO. | 162 | Chairman and Trustee, PIMCO Equity Series VIT, PIMCO Funds, PIMCO Variable Insurance Trust, PIMCO ETF Trust; Director, StocksPLUS® Management, Inc; and member of Board of Governors, Investment Company Institute. | ||||
| Independent Trustees | ||||||||
Jennifer Holden Dunbar (1963) Trustee | 02/2016 to present | Managing Director, Dunbar Partners, LLC (business consulting and investments). Formerly, Partner, Leonard Green & Partners, L.P. | 162 | Trustee, PIMCO Equity Series VIT, PIMCO Funds, PIMCO Variable Insurance and PIMCO ETF Trust; Director, PS Business Parks; Director, Big 5 Sporting Goods Corporation. | ||||
Peter B. McCarthy (1950) Trustee | 09/2011 to present | Formerly, Assistant Secretary and Chief Financial Officer, United States Department of Treasury; Deputy Managing Director, Institute of International Finance. | 162 | Trustee, PIMCO Equity Series VIT, PIMCO Funds, PIMCO Variable Insurance and PIMCO ETF Trust. | ||||
Ronald C. Parker (1951) Trustee | 02/2016 to present | Director of Roseburg Forest Products Company. Formerly, Chairman of the Board, The Ford Family Foundation; and President, Chief Executive Officer, Hampton Affiliates (forestry products). | 162 | Trustee, PIMCO Equity Series VIT; Lead Independent Trustee, PIMCO Funds, PIMCO Variable Insurance and PIMCO ETF Trust. | ||||
| * | Unless otherwise noted, the information for the individuals listed is as of June 30, 2018. |
| 1 | Mr. Harris is an “interested persons” of the Trust (as that term is defined in the 1940 Act) because of his affiliations with PIMCO. |
| † | Trustees serve until their successors are duly elected and qualified. |
| 70 | PIMCO EQUITY SERIES |
Table of Contents
(Unaudited)
Executive Officers
Name, Year of Birth and Position Held with Trust* | Term of Office and Length of Time Served | Principal Occupation(s) During Past 5 Years† | ||
Peter G. Strelow (1970) President | 02/2014 to present
Senior Vice President 11/2013 to 02/2014
Vice President 03/2010 to 11/2013 | Managing Director and Co-Chief Operating Officer, PIMCO. President, PIMCO Funds, PIMCO Variable Insurance Trust, PIMCO ETF Trust, PIMCO Equity Series VIT, PIMCO Managed Accounts Trust, PIMCO-Sponsored Interval Funds and PIMCO-Sponsored Closed-End Funds. Formerly, Chief Administrative Officer, PIMCO. | ||
David C. Flattum (1964) Chief Legal Officer | 03/2010 to present | Managing Director and General Counsel, PIMCO. Chief Legal Officer, PIMCO Funds, PIMCO Variable Insurance Trust, PIMCO ETF Trust and PIMCO Equity Series VIT. Formerly, Managing Director, Chief Operating Officer and General Counsel, Allianz Asset Management of America L.P. | ||
Jennifer E. Durham (1970) Chief Compliance Officer | 03/2010 to present | Managing Director and Chief Compliance Officer, PIMCO. Chief Compliance Officer, PIMCO Funds, PIMCO Variable Insurance Trust, PIMCO ETF Trust and PIMCO Equity Series VIT. | ||
Brent R. Harris (1959) Senior Vice President | 03/2010 to present | Managing Director, PIMCO. Senior Vice President, PIMCO Funds, PIMCO Variable Insurance Trust, PIMCO ETF Trust and PIMCO Equity Series VIT. Formerly, member of Executive Committee, PIMCO. | ||
Joshua D. Ratner (1976)** Vice President - Senior Counsel, Secretary | 11/2013 to present
Assistant Secretary 03/2010 to 01/2011 | Executive Vice President and General Deputy Counsel, PIMCO. Chief Legal Officer, PIMCO Investments LLC. Vice President – Senior Counsel, Secretary, PIMCO Funds, PIMCO Variable Insurance Trust, PIMCO ETF Trust and PIMCO Equity Series VIT. Vice President, Secretary and Chief Legal Officer, PIMCO Managed Accounts Trust, PIMCO-Sponsored Interval Funds and PIMCO-Sponsored Closed-End Funds. | ||
Ryan G. Leshaw (1980) Assistant Secretary | 05/2012 to present | Senior Vice President and Senior Counsel, PIMCO. Assistant Secretary, PIMCO Funds, PIMCO Variable Insurance Trust, PIMCO ETF Trust, PIMCO Equity Series VIT, PIMCO Managed Accounts Trust, PIMCO-Sponsored Interval Funds and PIMCO-Sponsored Closed-End Funds. Formerly, Associate, Willkie Farr & Gallagher LLP. | ||
Wu-Kwan Kit (1981) Assistant Secretary | 08/2017 to present | Vice President and Counsel, PIMCO. Assistant Secretary, PIMCO Funds, PIMCO Variable Insurance Trust, PIMCO ETF Trust, PIMCO Equity Series VIT, PIMCO Managed Accounts Trust, PIMCO-Sponsored Interval Funds and PIMCO-Sponsored Closed-End Funds. Formerly, Assistant General Counsel, VanEck Associates Corp. | ||
Stacie D. Anctil (1969) Vice President | 05/2015 to present
Assistant Treasurer 03/2010 to 05/2015 | Executive Vice President, PIMCO. Vice President, PIMCO Funds, PIMCO Variable Insurance Trust, PIMCO ETF Trust, PIMCO Equity Series VIT, PIMCO Managed Accounts Trust, PIMCO-Sponsored Interval Funds and PIMCO-Sponsored Closed-End Funds. | ||
William G. Galipeau (1974) Vice President | 11/2013 to present | Executive Vice President, PIMCO. Vice President, PIMCO Funds, PIMCO Variable Insurance Trust, PIMCO ETF Trust, PIMCO Equity Series VIT, PIMCO Managed Accounts Trust, PIMCO-Sponsored Interval Funds and PIMCO-Sponsored Closed-End Funds. | ||
Eric D. Johnson (1970) Vice President | 05/2011 to present | Executive Vice President, PIMCO. Vice President, PIMCO Funds, PIMCO Variable Insurance Trust, PIMCO ETF Trust, PIMCO Equity Series VIT, PIMCO Managed Accounts Trust, PIMCO-Sponsored Interval Funds and PIMCO-Sponsored Closed-End Funds. | ||
Henrik P. Larsen (1970) Vice President | 03/2010 to present | Senior Vice President, PIMCO. Vice President, PIMCO Funds, PIMCO Variable Insurance Trust, PIMCO ETF Trust and PIMCO Equity Series VIT. | ||
Bijal Y. Parikh (1978) Vice President | 02/2017 to present | Senior Vice President, PIMCO. Vice President, PIMCO Funds, PIMCO Variable Insurance Trust, PIMCO ETF Trust, PIMCO Equity Series VIT, PIMCO Managed Accounts Trust, PIMCO-Sponsored Interval Funds and PIMCO-Sponsored Closed-End Funds. | ||
Greggory S. Wolf (1970) Vice President | 05/2011 to present | Senior Vice President, PIMCO. Vice President, PIMCO Funds, PIMCO Variable Insurance Trust, PIMCO ETF Trust and PIMCO Equity Series VIT. | ||
Trent W. Walker (1974) Treasurer | 11/2013 to present Assistant Treasurer
03/2010 to 11/2013 | Executive Vice President, PIMCO. Treasurer, PIMCO Funds, PIMCO Variable Insurance Trust, PIMCO ETF Trust, PIMCO Equity Series VIT, PIMCO Managed Accounts Trust, PIMCO-Sponsored Interval Funds and PIMCO-Sponsored Closed-End Funds. | ||
Erik C. Brown (1967) Assistant Treasurer | 03/2010 to present | Executive Vice President, PIMCO. Assistant Treasurer, PIMCO Funds, PIMCO Variable Insurance Trust, PIMCO ETF Trust, PIMCO Equity Series VIT, PIMCO Managed Accounts Trust, PIMCO-Sponsored Interval Funds and PIMCO-Sponsored Closed-End Funds. | ||
Colleen D. Miller (1980)** Assistant Treasurer | 02/2017 to present | Senior Vice President, PIMCO. Assistant Treasurer, PIMCO Funds, PIMCO Variable Insurance Trust, PIMCO ETF Trust, PIMCO Equity Series VIT, PIMCO Managed Accounts Trust, PIMCO-Sponsored Interval Funds and PIMCO-Sponsored Closed-End Funds. Formerly, Vice President Cohen & Steers Capital Management. | ||
Christopher M. Morin (1980) Assistant Treasurer | 08/2016 to present | Senior Vice President, PIMCO. Assistant Treasurer, PIMCO Funds, PIMCO Variable Insurance Trust, PIMCO ETF Trust, PIMCO Equity Series VIT, PIMCO Managed Accounts Trust, PIMCO-Sponsored Interval Funds and PIMCO-Sponsored Closed-End Funds. | ||
| ANNUAL REPORT | JUNE 30, 2018 | 71 |
Table of Contents
Management of the Trust (Cont.)
(Unaudited)
Name, Year of Birth and Position Held with Trust* | Term of Office and Length of Time Served | Principal Occupation(s) During Past 5 Years† | ||
Jason J. Nagler (1982)** Assistant Treasurer | 05/2015 to present | Vice President, PIMCO. Assistant Treasurer, PIMCO Funds, PIMCO Variable Insurance Trust, PIMCO ETF Trust, PIMCO Equity Series VIT, PIMCO Managed Accounts Trust, PIMCO-Sponsored Interval Funds and PIMCO-Sponsored Closed-End Funds. Formerly, Head of Mutual Fund Reporting, GMO and Assistant Treasurer, GMO Trust and GMO Series Trust Funds. | ||
| * | Unless otherwise noted, the information for the individuals listed is as of June 30, 2018. |
| † | The term “PIMCO Closed-End Funds” as used herein includes: PIMCO California Municipal Income Fund, PIMCO California Municipal Income Fund II, PIMCO California Municipal Income Fund III, PIMCO Municipal Income Fund, PIMCO Municipal Income Fund II, PIMCO Municipal Income Fund III, PIMCO New York Municipal Income Fund, PIMCO New York Municipal Income Fund II, PIMCO New York Municipal Income Fund III, PCM Fund Inc., PIMCO Corporate & Income Opportunity Fund, PIMCO Corporate & Income Strategy Fund, PIMCO Dynamic Credit and Mortgage Income Fund, PIMCO Dynamic Income Fund, PIMCO Global StocksPLUS® & Income Fund, PIMCO High Income Fund, PIMCO Income Opportunity Fund, PIMCO Income Strategy Fund, PIMCO Income Strategy Fund II and PIMCO Strategic Income Fund, Inc.; the term “PIMCO-Sponsored Interval Funds” as used herein includes: PIMCO Flexible Credit Income Fund and PIMCO Flexible Municipal Income Fund. |
| ** | The address of these officers is Pacific Investment Management Company LLC, 1633 Broadway, New York, New York 10019. |
| 72 | PIMCO EQUITY SERIES |
Table of Contents
(Unaudited)
The Funds2,3 consider customer privacy to be a fundamental aspect of their relationships with shareholders and are committed to maintaining the confidentiality, integrity and security of their current, prospective and former shareholders’ non-public personal information. The Funds have developed policies that are designed to protect this confidentiality, while allowing shareholder needs to be served.
OBTAINING PERSONAL INFORMATION
In the course of providing shareholders with products and services, the Funds and certain service providers to the Funds, such as the Funds’ investment advisers or sub-advisers (“Advisers”), may obtain non-public personal information about shareholders, which may come from sources such as account applications and other forms, from other written, electronic or verbal correspondence, from shareholder transactions, from a shareholder’s brokerage or financial advisory firm, financial advisor or consultant, and/or from information captured on applicable websites.
RESPECTING YOUR PRIVACY
As a matter of policy, the Funds do not disclose any non-public personal information provided by shareholders or gathered by the Funds to non-affiliated third parties, except as required or permitted by law or as necessary for such third parties to perform their agreements with respect to the Funds. As is common in the industry, non-affiliated companies may from time to time be used to provide certain services, such as preparing and mailing prospectuses, reports, account statements and other information, conducting research on shareholder satisfaction and gathering shareholder proxies. The Funds or their affiliates may also retain non-affiliated companies to market Fund shares or products which use Fund shares and enter into joint marketing arrangements with them and other companies. These companies may have access to a shareholder’s personal and account information, but are permitted to use this information solely to provide the specific service or as otherwise permitted by law. In most cases, the shareholders will be clients of a third party, but the Funds may also provide a shareholder’s personal and account information to the shareholder’s respective brokerage or financial advisory firm and/or financial advisor or consultant.
SHARING INFORMATION WITH THIRD PARTIES
The Funds reserve the right to disclose or report personal or account information to non-affiliated third parties in limited circumstances where the Funds believe in good faith that disclosure is required under law, to cooperate with regulators or law enforcement authorities, to protect their rights or property, or upon reasonable request by any fund advised by PIMCO in which a shareholder has invested. In addition, the Funds may disclose information about a shareholder or a
shareholder’s accounts to a non-affiliated third party at the shareholder’s request or with the consent of the shareholder.
SHARING INFORMATION WITH AFFILIATES
The Funds may share shareholder information with their affiliates in connection with servicing shareholders’ accounts, and subject to applicable law may provide shareholders with information about products and services that the Funds or their Advisers, distributors or their affiliates (“Service Affiliates”) believe may be of interest to such shareholders. The information that the Funds may share may include, for example, a shareholder’s participation in the Funds or in other investment programs sponsored by a Service Affiliate, a shareholder’s ownership of certain types of accounts (such as IRAs), information about the Funds’ experiences or transactions with a shareholder, information captured on applicable websites, or other data about a shareholder’s accounts, subject to applicable law. The Funds’ Service Affiliates, in turn, are not permitted to share shareholder information with non-affiliated entities, except as required or permitted by law.
PROCEDURES TO SAFEGUARD PRIVATE INFORMATION
The Funds take seriously the obligation to safeguard shareholder non-public personal information. In addition to this policy, the Funds have implemented procedures that are designed to restrict access to a shareholder’s non-public personal information to internal personnel who need to know that information to perform their jobs, such as servicing shareholder accounts or notifying shareholders of new products or services. Physical, electronic and procedural safeguards are in place to guard a shareholder’s non-public personal information.
INFORMATION COLLECTED FROM WEBSITES
Websites maintained by the Funds or their service providers may use a variety of technologies to collect information that help the Funds and their service providers understand how the website is used. Information collected from your web browser (including small files stored on your device that are commonly referred to as “cookies”) allow the websites to recognize your web browser and help to personalize and improve your user experience and enhance navigation of the website. In addition, the Funds or their Service Affiliates may use third parties to place advertisements for the Funds on other websites, including banner advertisements. Such third parties may collect anonymous information through the use of cookies or action tags (such as web beacons). The information these third parties collect is generally limited to technical and web navigation information, such as your IP address, web pages visited and browser type, and does not include personally identifiable information such as name, address, phone number or email address. If you are a registered user of the Funds’ website, the Funds or their service providers or third party firms
| ANNUAL REPORT | JUNE 30, 2018 | 73 |
Table of Contents
Privacy Policy1 (Cont.)
(Unaudited)
engaged by the Funds or their service providers may collect or share information submitted by you, which may include personally identifiable information. This information can be useful to the Funds when assessing and offering services and website features. You can change your cookie preferences by changing the setting on your web browser to delete or reject cookies. If you delete or reject cookies, some website pages may not function properly. The Funds do not look for web browser “do not track” requests.
CHANGES TO THE PRIVACY POLICY
From time to time, the Funds may update or revise this privacy policy. If there are changes to the terms of this privacy policy, documents containing the revised policy on the relevant website will be updated.
1 Amended as of February 14, 2017.
2 PIMCO Investments LLC (“PI”) serves as the Funds’ distributor. This Privacy Policy applies to the activities of PI to the extent that PI regularly effects or engages in transactions with or for a Fund shareholder who is the record owner of such shares. For purposes of this Privacy Policy, references to “the Funds” shall include PI when acting in this capacity.
3 When distributing this Policy, a Fund may combine the distribution with any similar distribution of its investment adviser’s privacy policy. The distributed, combined policy may be written in the first person (i.e., by using “we” instead of “the Funds”).
| 74 | PIMCO EQUITY SERIES |
Table of Contents
General Information
Investment Adviser and Administrator
Pacific Investment Management Company LLC
650 Newport Center Drive
Newport Beach, CA 92660
Investment Sub-Adviser
Research Affiliates, LLC
620 Newport Center Drive, Suite 900
Newport Beach, CA 92660
Portfolio Implementer
Parametric Portfolio Associates
1918 Eighth Avenue, Suite 3100
Seattle, WA 98101
Distributor
PIMCO Investments LLC
1633 Broadway
New York, NY 10019
Custodian
State Street Bank and Trust Company
801 Pennsylvania Avenue
Kansas City, MO 64105
Transfer Agent
DST Asset Manager Solutions, Inc.
Institutional Class, I-2, Administrative Class
430 W 7th Street STE 219024
Kansas City, MO 64105-1407
DST Asset Manager Solutions, Inc.
Class A, Class C, Class R
430 W 7th Street STE 219294
Kansas City, MO 64105-1407
Legal Counsel
Dechert LLP
1900 K Street, N.W.
Washington, D.C. 20006
Independent Registered Public Accounting Firm
PricewaterhouseCoopers LLP
1100 Walnut Street, Suite 1300
Kansas City, MO 64106
This report is submitted for the general information of the shareholders of the Funds listed on the Report cover.
Table of Contents

PES3001AR_063018
Table of Contents

PIMCO Equity Series®
Annual Report
June 30, 2018
PIMCO RAE Emerging Markets Fund
PIMCO RAE Global Fund
PIMCO RAE Global ex-US Fund
PIMCO RAE International Fund
PIMCO RAE US Fund
PIMCO RAE US Small Fund
Table of Contents
| Page | ||||||||
| 2 | ||||||||
| 4 | ||||||||
| 18 | ||||||||
| 20 | ||||||||
| 26 | ||||||||
| 28 | ||||||||
| 30 | ||||||||
| 64 | ||||||||
| 80 | ||||||||
| 81 | ||||||||
| 82 | ||||||||
| 83 | ||||||||
| 86 | ||||||||
| Fund | Fund Summary | Schedule of Investments | ||||||
| 6 | 32 | |||||||
| 8 | 41 | |||||||
| 10 | 43 | |||||||
| 12 | 44 | |||||||
| 14 | 53 | |||||||
| 16 | 57 | |||||||
| 1 | Effective July 30, 2018 the Fund’s name was changed from PIMCO RAE Fundamental Emerging Markets Fund to PIMCO RAE Emerging Markets Fund. |
| 2 | Effective July 30, 2018 the Fund’s name was changed from PIMCO RAE Fundamental Global Fund to PIMCO RAE Global Fund. |
| 3 | Effective July 30, 2018 the Fund’s name was changed from PIMCO RAE Fundamental Global ex-US Fund to PIMCO RAE Global ex-US Fund. |
| 4 | Effective July 30, 2018 the Fund’s name was changed from PIMCO RAE Fundamental International Fund to PIMCO RAE International Fund. |
| 5 | Effective July 30, 2018 the Fund’s name was changed from PIMCO RAE Fundamental US Fund to PIMCO RAE US Fund. |
| 6 | Effective July 30, 2018 the Fund’s name was changed from PIMCO RAE Fundamental US Small Fund to PIMCO RAE US Small Fund. |
This material is authorized for use only when preceded or accompanied by the current PIMCO Equity Series prospectus. The Shareholder Reports for the other series of the PIMCO Equity Series are printed separately.
Table of Contents
Dear Shareholder,
Following is the PIMCO Equity Series Annual Report, which covers the 12-month reporting period ended June 30, 2018. On the subsequent pages you will find specific details regarding investment results and a discussion of factors that most affected performance over the reporting period.
For the 12-month reporting period ended June 30, 2018
The U.S. economy continued to expand during the reporting period. Looking back, U.S. gross domestic product (GDP) expanded at a revised annual pace of 2.8% and 2.3% during the third and fourth quarters of 2017, respectively. First-quarter 2018 GDP then moderated to a revised annual pace of 2.2%. The Commerce Department’s initial reading — released after the reporting period had ended — showed that second-quarter 2018 GDP grew at an annual pace of 4.1%.
The Federal Reserve (Fed) continued to normalize monetary policy during the reporting period. After raising interest rates in March and June 2017, the Fed again raised rates in December, moving the federal funds rate up to a range between 1.25% and 1.50%. And, in October 2017, the Fed started to reduce its balance sheet. At its March 2018 meeting, the Fed again increased rates to a range between 1.50% and 1.75%. Finally, at its meeting that concluded on June 13, 2018, the Fed raised rates to a range between 1.75% and 2.00%.
Economic activity outside the U.S. initially accelerated during the reporting period, but then moderated somewhat as the reporting period progressed. Against this backdrop, the European Central Bank (ECB) and Bank of Japan largely maintained their highly accommodative monetary policies. Other central banks took a more hawkish stance. In November 2017, the Bank of England instituted its first rate hike since 2007, and the Bank of Canada raised rates twice during the reporting period. Meanwhile, in June 2018, the ECB indicated that it plans to end its quantitative easing program by the end of the year, but it did not expect to raise interest rates “at least through the summer of 2019.”
The U.S. Treasury yield curve flattened during the reporting period, as short-term rates moved up more than their longer-term counterparts. The increase in rates at the short end of the yield curve was mostly due to Fed interest rate hikes. The yield on the benchmark 10-year U.S. Treasury note was 2.85% at the end of the reporting period, up from 2.31% on June 30, 2017. U.S. Treasuries, as measured by the Bloomberg Barclays U.S. Treasury Index, returned -0.65% over the 12 months ended June 30, 2018. Meanwhile, the Bloomberg Barclays U.S. Aggregate Bond Index, a widely used index of U.S. investment grade bonds, returned -0.40% over the period. Riskier fixed income asset classes, including high yield corporate bonds and emerging market debt, generated mixed results versus the broad U.S. market. The ICE BofAML U.S. High Yield Index gained 2.53% over the reporting period, whereas emerging market external debt, as represented by the JPMorgan Emerging Markets Bond Index (EMBI) Global, returned -2.45% over the reporting period. Emerging market local bonds, as represented by the JPMorgan Government Bond Index-Emerging Markets Global Diversified Index (Unhedged), returned -2.33% over the period.
Global equities generally rose over the first seven months of the period. This rally was driven by a number of factors, including improving global growth, corporate profits that often exceeded expectations and, in the U.S., optimism surrounding the passage of a tax reform bill in December 2017. In the U.S., a portion of those gains were given back in February and March 2018. This was partially due to concerns over less accommodative central bank policies and fears of a trade war. However, U.S. equities then rallied over the last three months of the reporting period. All told, U.S. equities, as represented by the S&P 500 Index, returned 14.37% during the reporting period. Emerging market equities, as measured by the MSCI Emerging Markets Index, returned 8.20% over the period, whereas global equities, as represented by the MSCI World Index, returned 11.09%. Elsewhere, Japanese equities, as represented by the Nikkei 225 Index (in JPY), returned 13.45% over the reporting period and European equities, as represented by the MSCI Europe Index (in EUR), returned 2.85%.
Commodity prices fluctuated but generally moved higher during the 12 months ended June 30, 2018. When the reporting period began, crude oil was approximately $46 a barrel. By the end of the period, it was roughly $74 a
| 2 | PIMCO EQUITY SERIES |
Table of Contents
barrel. This ascent was driven in part by planned and observed production cuts by OPEC and the collapse in Venezuelan oil production, as well as global growth maintaining demand. Elsewhere, gold and copper prices moved modestly higher over the reporting period.
Finally, during the reporting period, there were periods of volatility in the foreign exchange markets, due in part to signs of improving global growth, decoupling central bank policies, and a number of geopolitical events. The U.S. dollar generally weakened against other major currencies over the reporting period. For example, the U.S. dollar returned -2.26%, -1.40% and -1.45% versus the euro, British pound and Japanese yen, respectively, during the 12 months ended June 30, 2018.
Thank you for the assets you have placed with us. We deeply value your trust, and will continue to work diligently to meet your broad investment needs. For any questions regarding the funds, please contact your account manager or financial adviser, or call one of our shareholder associates at 888.87.PIMCO. We also invite you to visit our website at pimco.com to learn more about our global viewpoints.
 | Sincerely,
Brent R. Harris Chairman of the Board
August 23, 2018
|

Past performance is no guarantee of future results. Unless otherwise noted, index returns reflect the reinvestment of income distributions and capital gains, if any, but do not reflect fees, brokerage commissions or other expenses of investing. It is not possible to invest directly in an unmanaged index.
| ANNUAL REPORT | JUNE 30, 2018 | 3 |
Table of Contents
Important Information About the Funds
PIMCO Equity Series (the “Trust”) is an open-end management investment company that includes PIMCO RAE Emerging Markets Fund, PIMCO RAE Global Fund, PIMCO RAE Global ex-US Fund, PIMCO RAE International Fund, PIMCO RAE US Fund and PIMCO RAE US Small Fund (each, a “Fund” and collectively, the “Funds”).
We believe that equity funds have an important role to play in a well-diversified investment portfolio. It is important to note, however, that equity funds are subject to notable risks. Among other things, equity and equity-related securities may decline in value due to both real and perceived general market, economic, and industry conditions.
The PIMCO RAE Global Fund and PIMCO RAE Global ex-US Fund are each “fund of funds,” which is a term used to describe mutual funds that pursue their investment objective by investing in other mutual funds instead of investing directly in stocks or bonds of other issuers. Under normal circumstances, the PIMCO RAE Global Fund invests substantially all of its assets in Institutional Class shares of the PIMCO RAE US Fund, PIMCO RAE International Fund (“International Fund”) and PIMCO RAE Emerging Markets Fund (“Emerging Markets Fund”) (collectively, “Underlying Funds”), and equity securities that are eligible investments for the Underlying Funds. Under normal circumstances, the PIMCO RAE Global ex-US Fund invests substantially all of its assets in Institutional Class shares of the International Fund and Emerging Markets Fund, equity securities of small companies economically tied to non-U.S. countries, and securities that are eligible investments for the International Fund and Emerging Markets Fund. The PIMCO RAE Global Fund and PIMCO RAE Global ex-US Fund may invest in other affiliated funds and unaffiliated funds, which may or may not be registered under the Investment Company Act of 1940 (together with the Underlying Funds, “Acquired Funds”). The cost of investing in these Funds will generally be higher than the cost of investing in a mutual fund that invests directly in individual stocks and bonds.
The values of equity securities, such as common stocks and preferred securities, have historically risen and fallen in periodic cycles and may decline due to general market conditions, which are not specifically related to a particular company, such as real or perceived adverse economic conditions, changes in the general outlook for corporate earnings, changes in interest or currency rates or adverse investor sentiment generally. Equity securities may also decline due to factors that affect a particular industry or industries, such as labor shortages, increased production costs and competitive conditions within an industry. In addition, the value of an equity security may decline for a number of reasons that directly relate to the issuer, such as management performance, financial leverage and reduced demand for the issuer’s goods or services, as well as the historical and prospective earnings of the issuer and the value of its assets. Different types of
equity securities may react differently to these developments and a change in the financial condition of a single issuer may affect securities markets as a whole.
During a general downturn in the securities markets, multiple asset classes, including equity securities, may decline in value simultaneously. The market price of equity securities owned by a Fund may go up or down, sometimes rapidly or unpredictably. Equity securities generally have greater price volatility than fixed income securities and common stocks generally have the greatest appreciation and depreciation potential of all corporate securities.
The Funds may be subject to various risks as described in each Fund’s prospectus and in the Principal Risks in the Notes to Financial Statements.
The geographical classification of foreign (non-U.S.) securities in this report are classified by the country of incorporation of a holding. In certain instances, a security’s country of incorporation may be different from its country of economic exposure. The United States presidential administration’s enforcement of tariffs on goods from other countries, with a focus on China, has contributed to international trade tensions and may impact portfolio securities.
On each individual Fund Summary page in this Shareholder Report, the Average Annual Total Return table and Cumulative Returns chart measure performance assuming that any dividend and capital gain distributions were reinvested. Returns do not reflect the deduction of taxes that a shareholder would pay on (i) Fund distributions or (ii) the redemption of Fund shares. The Cumulative Returns chart and Average Annual Total Return table reflect any sales load that would have applied at the time of purchase or any Contingent Deferred Sales Charge (“CDSC”) that would have applied if a full redemption occurred on the last business day of the period shown in the Cumulative Returns chart. Class A shares are subject to an initial sales charge. A CDSC may be imposed in certain circumstances on Class A shares that are purchased without an initial sales charge and then redeemed during the first 12 months after purchase. Class C shares are subject to a 1% CDSC, which may apply in the first year. The Cumulative Returns chart reflects only Institutional Class performance. Performance may vary by share class based on each class’s expense ratios. Performance shown is net of fees and expenses. The minimum initial investment amount for Institutional Class, I-2 and I-3 shares is $1,000,000. The minimum initial investment amount for Class A and Class C shares is $1,000. Each Fund measures its performance against at least one broad-based securities market index (“benchmark index”). The benchmark index does not take into account fees, expenses, or taxes. A Fund’s past performance, before and after taxes, is not necessarily an indication of how the Fund will perform in the future. There is no assurance that any Fund, including any Fund that has experienced high or unusual
| 4 | PIMCO EQUITY SERIES |
Table of Contents
performance for one or more periods, will experience similar levels of performance in the future. High performance is defined as a significant increase in either 1) a Fund’s total return in excess of that of the Fund’s benchmark between reporting periods or 2) a Fund’s total return in
excess of the Fund’s historical returns between reporting periods. Unusual performance is defined as a significant change in a Fund’s performance as compared to one or more previous reporting periods.
The following table discloses the inception dates of each Fund and its respective share classes along with the Fund’s diversification status as of period end:
| Fund Name | Fund Inception | Institutional Class | I-2* | I-3 | Class A | Class C | Diversification Status | |||||||||||||||||||||||||
PIMCO RAE Emerging Markets Fund | 06/05/15 | 06/05/15 | 06/05/15 | — | 06/05/15 | 06/05/15 | Non-diversified | |||||||||||||||||||||||||
PIMCO RAE Global Fund | 06/05/15 | 06/05/15 | 06/05/15 | — | 06/05/15 | 06/05/15 | Non-diversified | |||||||||||||||||||||||||
PIMCO RAE Global ex-US Fund | 06/05/15 | 06/05/15 | 06/05/15 | — | 06/05/15 | 06/05/15 | Non-diversified | |||||||||||||||||||||||||
PIMCO RAE International Fund | 06/05/15 | 06/05/15 | 06/05/15 | — | 06/05/15 | 06/05/15 | Non-diversified | |||||||||||||||||||||||||
PIMCO RAE US Fund | 06/05/15 | 06/05/15 | 06/05/15 | — | 06/05/15 | 06/05/15 | Non-diversified | |||||||||||||||||||||||||
PIMCO RAE US Small Fund | 06/05/15 | 06/05/15 | 06/05/15 | — | 06/05/15 | 06/05/15 | Non-diversified | |||||||||||||||||||||||||
| * | On February 13, 2018, the Board approved a proposal to change the name of Class P for all Funds of the Trust that offer such class to I-2. The name change occurred on April 27, 2018. |
An investment in a Fund is not a bank deposit and is not guaranteed or insured by the Federal Deposit Insurance Corporation (“FDIC”) or any other government agency. It is possible to lose money on investments in a Fund.
The Trustees are responsible generally for overseeing the management of the Trust. The Trustees authorize the Trust to enter into service agreements with the Adviser, the Distributor, the Administrator and other service providers in order to provide, and in some cases authorize service providers to procure through other parties, necessary or desirable services on behalf of the Trust and the Funds. Shareholders are not parties to or third-party beneficiaries of such service agreements. Neither a Fund’s prospectus nor a Fund’s summary prospectus, the Trust’s Statement of Additional Information (“SAI”), any contracts filed as exhibits to the Trust’s registration statement, nor any other communications, disclosure documents or regulatory filings (including this report) from or on behalf of the Trust or a Fund creates a contract between or among any shareholder of a Fund, on the one hand, and the Trust, a Fund, a service provider to the Trust or a Fund, and/or the Trustees or officers of the Trust, on the other hand. The Trustees (or the Trust and its officers, service providers or other delegates acting under authority of the Trustees) may amend the most recent prospectus or use a new prospectus, summary prospectus or SAI with respect to a Fund or the Trust, and/or amend, file and/or issue any other communications, disclosure documents or regulatory filings, and may amend or enter into any contracts to which the Trust or a Fund is a party, and interpret the investment objective(s), policies, restrictions and contractual provisions applicable to any Fund, without shareholder input or approval, except in circumstances in which shareholder approval is specifically required by law (such as changes to fundamental investment policies) or where a shareholder approval
requirement is specifically disclosed in the Trust’s then-current prospectus or SAI.
PIMCO has adopted written proxy voting policies and procedures (“Proxy Policy”) as required by Rule 206(4)-6 under the Investment Advisers Act of 1940, as amended. The Proxy Policy has been adopted by the Trust as the policies and procedures that PIMCO will use when voting proxies on behalf of a Fund. A description of the policies and procedures that PIMCO uses to vote proxies relating to portfolio securities of a Fund, and information about how the Fund voted proxies relating to portfolio securities held during the most recent twelve-month period ended June 30th, are available without charge, upon request, by calling the Trust at (888) 87-PIMCO, on the Fund’s website at www.pimco.com, and on the Securities and Exchange Commission’s (“SEC”) website at www.sec.gov.
The Trust files a complete schedule of each Fund’s holdings with the SEC for the first and third quarters of each fiscal year on Form N-Q. A copy of a Fund’s Form N-Q is available on the SEC’s website at www.sec.gov and may be reviewed and copied at the SEC’s Public Reference Room in Washington, D.C. A Fund’s Form N-Q is also available without charge, upon request, by calling the Trust at (888) 87-PIMCO and on the Fund’s website at www.pimco.com. Information on the operation of the Public Reference Room may be obtained by calling 1-800-SEC-0330.
The SEC adopted a rule that generally allows funds to deliver shareholder reports to investors by providing access to such reports online free of charge and by mailing a notice that the report is electronically available. Pursuant to the rule, investors may still elect to receive a complete shareholder report in the mail. PIMCO is evaluating how to make the electronic delivery option available to shareholders in the future.
| ANNUAL REPORT | JUNE 30, 2018 | 5 |
Table of Contents
PIMCO RAE Emerging Markets Fund
Cumulative Returns Through June 30, 2018
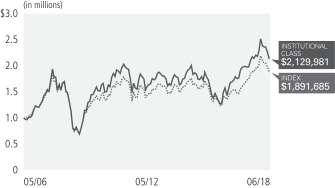
$1,000,000 invested at the end of the month when the Fund’s Institutional Class commenced operations.
Investment Objective and Strategy Overview
PIMCO RAE Emerging Markets Fund seeks long-term capital appreciation by investing under normal circumstances at least 80% of its assets in investments that are economically tied to emerging market countries. Specifically, under normal circumstances, the Fund will obtain exposure to a portfolio of stocks economically tied to emerging market countries (“RAE Emerging Markets Portfolio”) through investment in the securities that comprise the RAE Emerging Markets Portfolio. The stocks are selected by the Fund’s sub-adviser, Research Affiliates, LLC, from a broad universe of companies which satisfy certain liquidity and capacity requirements. Fund strategies may change from time to time. Please refer to the Fund’s current prospectus for more information regarding the Fund’s strategy.
| Average Annual Total Return for the period ended June 30, 2018* | ||||||||||||||||||
| 1 Year | 5 Year | 10 Year | Fund Inception (05/31/06) | |||||||||||||||
 | PIMCO RAE Emerging Markets Fund Institutional Class | 7.50% | 5.69% | 3.52% | 6.46% | |||||||||||||
| PIMCO RAE Emerging Markets Fund I-2 | 7.26% | 5.60% | 3.48% | 6.42% | ||||||||||||||
| PIMCO RAE Emerging Markets Fund Class A | 7.08% | 5.48% | 3.42% | 6.37% | ||||||||||||||
| PIMCO RAE Emerging Markets Fund Class A (adjusted) | 3.08% | 4.68% | 3.03% | 6.04% | ||||||||||||||
| PIMCO RAE Emerging Markets Fund Class C | 6.32% | 4.98% | 3.18% | 6.16% | ||||||||||||||
| PIMCO RAE Emerging Markets Fund Class C (adjusted) | 5.34% | 4.98% | 3.18% | 6.16% | ||||||||||||||
 | MSCI Emerging Markets Index± | 8.20% | 5.01% | 2.26% | 5.42% | |||||||||||||
All Fund returns are net of fees and expenses.
± The MSCI Emerging Markets Index is a free float-adjusted market capitalization index that is designed to measure equity market performance of emerging markets. It is not possible to invest directly in an unmanaged index.
* For periods prior to June 5, 2015, the Fund’s performance reflects the performance when the Fund was a partnership, net of actual fees and expenses charged to individual partnership accounts in the aggregate. If the performance had been restated to reflect the applicable fees and expenses of each share class, the performance may have been higher or lower. The Fund began operations as a partnership on May 31, 2006 and, on June 5, 2015, was reorganized into a newly-formed fund that was registered as an investment company under the Investment Company Act of 1940. Prior to the reorganization, the Fund had an investment objective, investment strategies, investment guidelines, and restrictions that were substantially similar to those currently applicable to the Fund; however, the Fund was not registered as an investment company under the Investment Company Act of 1940 and was not subject to its requirements or requirements imposed by the Internal Revenue Code of 1986 which, if applicable, may have adversely affected its performance. The performance of each class of shares will differ as a result of the different levels of fees and expenses applicable to each class of shares.
Performance quoted represents past performance. Past performance is not a guarantee or a reliable indicator of future results. Current performance may be lower or higher than performance shown. Investment return and the principal value of an investment will fluctuate. Shares may be worth more or less than original cost when redeemed. Returns shown do not reflect the deduction of taxes that a shareholder would pay on fund distributions or the redemption of fund shares. Differences in the Fund’s performance versus the index and related attribution information with respect to particular categories of securities or individual positions may be attributable, in part, to differences in the pricing methodologies used by the Fund and the index. The adjusted returns take into account the maximum sales charge of 3.75% on Class A shares and 1.00% CDSC on Class C shares. For performance data current to the most recent month-end, visit www.pimco.com or via (888) 87-PIMCO.
The Fund’s total annual operating expense ratio in effect as of period end, were 0.96% for the Institutional Class shares, 1.06% for the I-2 shares, 1.31% for the Class A shares and 2.06% for the Class C shares. Details regarding any changes to the Fund’s operating expenses, subsequent to period end, can be found in the Fund’s current prospectus, as supplemented.
| 6 | PIMCO EQUITY SERIES |
Table of Contents
| Institutional Class - PEIFX | I-2 - PEPFX | Class A - PEAFX | Class C - PECFX |
Geographic Breakdown as of 06/30/20181§
China | 24.1% | |||||||
South Korea | 20.1% | |||||||
Russia | 10.2% | |||||||
Taiwan | 10.0% | |||||||
Brazil | 5.7% | |||||||
Hong Kong | 5.7% | |||||||
South Africa | 4.9% | |||||||
India | 4.6% | |||||||
Thailand | 2.8% | |||||||
Turkey | 2.4% | |||||||
Malaysia | 2.0% | |||||||
Mexico | 1.8% | |||||||
Poland | 1.8% | |||||||
Greece | 1.4% | |||||||
Indonesia | 1.0% | |||||||
Other | 1.2% |
1 % of Investments, at value.
§ Geographic Breakdown and % of Investments exclude securities sold short, financial derivative instruments and short-term instruments, if any.
Fund Insights
The following affected performance during the reporting period:
| » | Overweight exposure to, and security selection in, the materials sector contributed to relative returns, as the sector and the Fund’s holdings outperformed the benchmark index. |
| » | Overweight exposure to, and security selection in, the energy sector contributed to relative returns, as the sector and the Fund’s holdings outperformed the benchmark index. |
| » | Security selection in the real estate sector contributed to relative returns, as the Fund’s holdings outperformed the benchmark index. |
| » | Underweight exposure to, and security selection in, the information technology sector detracted from relative returns, as the sector outperformed the benchmark index, and the Fund’s holdings underperformed the benchmark index. |
| » | Overweight exposure to, and security selection in, the financials sector detracted from relative returns, as the sector and the Fund’s holdings underperformed the benchmark index. |
| » | Overweight exposure to, and security selection in, the utilities sector detracted from relative returns, as the sector and the Fund’s holdings underperformed the benchmark index. |
| ANNUAL REPORT | JUNE 30, 2018 | 7 |
Table of Contents
Cumulative Returns Through June 30, 2018
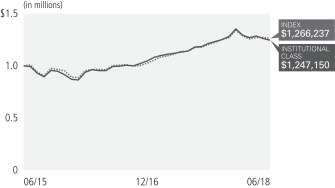
$1,000,000 invested at the end of the month when the Fund’s Institutional Class commenced operations.
Investment Objective and Strategy Overview
PIMCO RAE Global Fund seeks long-term capital appreciation by investing under normal circumstances substantially all of its assets in three PIMCO Funds (the “Underlying Funds”) and equity securities that are eligible investments for the Underlying Funds. Under normal circumstances, each of the Underlying Funds obtains exposure to a portfolio of stocks (each, a “RAE Portfolio”) through investment in the securities that comprise the RAE Portfolio. The stocks are selected by the Fund’s sub-adviser, Research Affiliates, LLC, from a broad universe of companies which satisfy certain liquidity and capacity requirements. Fund strategies may change from time to time. Please refer to the Fund’s current prospectus for more information regarding the Fund’s strategy.
| Average Annual Total Return for the period ended June 30, 2018 | ||||||||||
| 1 Year | Fund Inception (06/05/15) | |||||||||
| PIMCO RAE Global Fund Institutional Class | 9.05% | 6.97% | |||||||
| PIMCO RAE Global Fund I-2 | 8.93% | 6.84% | ||||||||
| PIMCO RAE Global Fund Class A | 8.64% | 6.60% | ||||||||
| PIMCO RAE Global Fund Class A (adjusted) | 4.54% | 5.27% | ||||||||
| PIMCO RAE Global Fund Class C | 7.83% | 5.80% | ||||||||
| PIMCO RAE Global Fund Class C (adjusted) | 6.83% | 5.80% | ||||||||
| MSCI All Country World Index± | 10.73% | 7.56% | |||||||
All Fund returns are net of fees and expenses.
± The MSCI All Country World Index is a free float-adjusted market capitalization weighted index that is designed to measure the equity market performance of developed and emerging markets. The Index consists of 47 country indices comprising 23 developed and 24 emerging market country indices.
It is not possible to invest directly in an unmanaged index.
Performance quoted represents past performance. Past performance is not a guarantee or a reliable indicator of future results. Current performance may be lower or higher than performance shown. Investment return and the principal value of an investment will fluctuate. Shares may be worth more or less than original cost when redeemed. Returns shown do not reflect the deduction of taxes that a shareholder would pay on fund distributions or the redemption of fund shares. Differences in the Fund’s performance versus the index and related attribution information with respect to particular categories of securities or individual positions may be attributable, in part, to differences in the pricing methodologies used by the Fund and the index. The adjusted returns take into account the maximum sales charge of 3.75% on Class A shares and 1.00% CDSC on Class C shares. For performance data current to the most recent month-end, visit www.pimco.com or via (888) 87-PIMCO.
The Fund’s total annual operating expense ratio in effect as of period end, which includes the Acquired Fund Fees and Expenses (Underlying PIMCO Fund Expenses), were 1.20% for the Institutional Class shares, 1.30% for the I-2 shares, 1.55% for the Class A shares and 2.30% for the Class C shares. Details regarding any changes to he Fund’s operating expenses, subsequent to period end, can be found in the Fund’s current prospectus, as supplemented.
| 8 | PIMCO EQUITY SERIES |
Table of Contents
| Institutional Class - PFQIX | I-2 - PFQPX | Class A - PFQAX | Class C - PFQCX |
Top Holdings as of 06/30/20181§
PIMCO RAE International Fund | 44.2% | |||||||
PIMCO RAE US Fund | 44.0% | |||||||
PIMCO RAE Emerging Markets Fund | 11.7% |
1 % of Investments, at value.
§ Top Holdings and % of Investments exclude securities sold short, financial derivative instruments and short-term instruments, if any.
Fund Insights
The following affected performance during the reporting period:
| » | Overweight exposure to, and security selection in, the materials sector contributed to relative returns, as the sector and the Fund’s holdings outperformed the benchmark index. |
| » | Underweight exposure to, and security selection in, the consumer staples sector contributed to relative returns, as the sector underperformed the benchmark index, and the Fund’s holdings outperformed the benchmark index. |
| » | Security selection in the energy sector contributed to relative returns, as the Fund’s holdings outperformed the benchmark index. |
| » | Underweight exposure to, and security selection in, the information technology sector detracted from relative returns, as the sector outperformed the benchmark index, and the Fund’s holdings underperformed the benchmark index. |
| » | Overweight exposure to, and security selection in, the financials sector detracted from relative returns, as the sector and the Fund’s holdings underperformed the benchmark index. |
| » | Underweight exposure to, and security selection in, the consumer discretionary sector detracted from relative returns, as the sector outperformed the benchmark index, and the Fund’s holdings underperformed the benchmark index. |
| » | Overweight exposure to the telecommunications services sector detracted from relative returns, as the sector underperformed the benchmark index. |
| ANNUAL REPORT | JUNE 30, 2018 | 9 |
Table of Contents
Cumulative Returns Through June 30, 2018
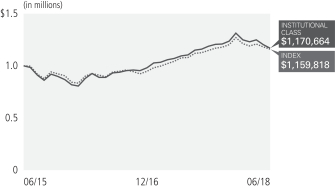
$1,000,000 invested at the end of the month when the Fund’s Institutional Class commenced operations.
Investment Objective and Strategy Overview
PIMCO RAE Global ex-US Fund seeks long-term capital appreciation by investing under normal circumstances substantially all of its assets in two PIMCO Funds (the “Underlying Funds”) and securities that are eligible investment for the Underlying Funds. Each of the Underlying Funds obtains exposure to a portfolio of stocks (each, a “RAE Portfolio”) through investment in the securities that comprise the RAE Portfolio. The stocks are selected by the Fund’s sub-adviser, Research Affiliates, LLC, from a broad universe of companies which satisfy certain liquidity and capacity requirements. Fund strategies may change from time to time. Please refer to the Fund’s current prospectus for more information regarding the Fund’s strategy.
| Average Annual Total Return for the period ended June 30, 2018 | ||||||||||
| 1 Year | Fund Inception (06/05/15) | |||||||||
| PIMCO RAE Global ex-US Fund Institutional Class | 6.01% | 4.79% | |||||||
| PIMCO RAE Global ex-US Fund I-2 | 5.88% | 4.66% | ||||||||
| PIMCO RAE Global ex-US Fund Class A | 5.69% | 4.45% | ||||||||
| PIMCO RAE Global ex-US Fund Class A (adjusted) | 1.70% | 3.16% | ||||||||
| PIMCO RAE Global ex-US Fund Class C | 4.83% | 3.64% | ||||||||
| PIMCO RAE Global ex-US Fund Class C (adjusted) | 3.83% | 3.64% | ||||||||
| MSCI All Country World ex US Index± | 7.28% | 4.56% | |||||||
All Fund returns are net of fees and expenses.
± The MSCI All Country World ex US Index is a free float-adjusted market capitalization weighted index that is designed to measure the equity market performance of developed and emerging markets. The Index consists of 46 country indices comprising 22 developed and 24 emerging market country indices.
It is not possible to invest directly in an unmanaged index.
Performance quoted represents past performance. Past performance is not a guarantee or a reliable indicator of future results. Current performance may be lower or higher than performance shown. Investment return and the principal value of an investment will fluctuate. Shares may be worth more or less than original cost when redeemed. Returns shown do not reflect the deduction of taxes that a shareholder would pay on fund distributions or the redemption of fund shares. Differences in the Fund’s performance versus the index and related attribution information with respect to particular categories of securities or individual positions may be attributable, in part, to differences in the pricing methodologies used by the Fund and the index. The adjusted returns take into account the maximum sales charge of 3.75% on Class A shares and 1.00% CDSC on Class C shares. For performance data current to the most recent month-end, visit www.pimco.com or via (888) 87-PIMCO.
The Fund’s total annual operating expense ratio in effect as of period end, which includes the Acquired Fund Fees and Expenses (Underlying PIMCO Fund Expenses), were 1.31% for the Institutional Class shares, 1.41% for the I-2 shares, 1.66% for the Class A shares and 2.41% for the Class C shares. Details regarding any changes to he Fund’s operating expenses, subsequent to period end, can be found in the Fund’s current prospectus, as supplemented.
| 10 | PIMCO EQUITY SERIES |
Table of Contents
| Institutional Class - PZRIX | I-2 - PZRPX | Class A - PZRAX | Class C - PZRCX |
Top Holdings as of 06/30/20181§
PIMCO RAE International Fund | 79.0% | |||||||
PIMCO RAE Emerging Markets Fund | 21.0% |
1 % of Investments, at value.
§ Top Holdings and % of Investments exclude securities sold short, financial derivative instruments and short-term instruments, if any.
Fund Insights
The following affected performance during the reporting period:
| » | Overweight exposure to, and security selection in, the materials sector contributed to relative returns, as the sector and the Fund’s holdings outperformed the benchmark index. |
| » | Underweight exposure to, and security selection in, the consumer staples sector contributed to relative returns, as the sector underperformed the benchmark index and the Fund’s holdings outperformed the benchmark index. |
| » | Overweight exposure to, and security selection in, the energy sector contributed to relative returns, as the sector and the Fund’s holdings outperformed the benchmark index. |
| » | Underweight exposure to, and security selection in, the information technology sector detracted from relative returns, as the sector outperformed the benchmark index and the Fund’s holdings underperformed the benchmark index. |
| » | Overweight exposure to, and security selection in, the financials sector detracted from relative returns, as the sector and the Fund’s holdings underperformed the benchmark index. |
| » | Security selection in the industrials sector detracted from relative returns, as the Fund’s holdings underperformed the benchmark index. |
| » | Underweight exposure to, and security selection in, the consumer discretionary sector detracted from relative returns, as the sector outperformed the benchmark index, and the Fund’s holdings underperformed the benchmark index. |
| ANNUAL REPORT | JUNE 30, 2018 | 11 |
Table of Contents
Cumulative Returns Through June 30, 2018
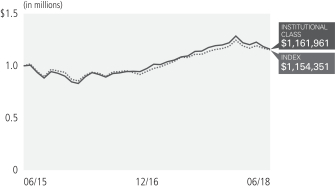
$1,000,000 invested at the end of the month when the Fund’s Institutional Class commenced operations.
Investment Objective and Strategy Overview
PIMCO RAE International Fund seeks long-term capital appreciation under normal circumstances by obtaining exposure to a portfolio of stocks economically tied to at least three foreign (non-U.S.) countries (“RAE International Portfolio”) through investment in the securities that comprise the RAE International Portfolio. The stocks are selected by the Fund’s sub-adviser, Research Affiliates, LLC, from a broad universe of companies which satisfy certain liquidity and capacity requirements. Fund strategies may change from time to time. Please refer to the Fund’s current prospectus for more information regarding the Fund’s strategy.
| Average Annual Total Return for the period ended June 30, 2018 | ||||||||||
| 1 Year | Fund Inception (06/05/15) | |||||||||
| PIMCO RAE International Fund Institutional Class | 5.88% | 4.43% | |||||||
| PIMCO RAE International Fund I-2 | 5.84% | 4.35% | ||||||||
| PIMCO RAE International Fund Class A | 5.53% | 4.07% | ||||||||
| PIMCO RAE International Fund Class A (adjusted) | 1.56% | 2.78% | ||||||||
| PIMCO RAE International Fund Class C | 4.76% | 3.29% | ||||||||
| PIMCO RAE International Fund Class C (adjusted) | 3.76% | 3.29% | ||||||||
| MSCI EAFE Index± | 6.84% | 4.39% | |||||||
All Fund returns are net of fees and expenses.
± MSCI EAFE Index is an unmanaged index designed to represent the performance of large and mid-cap securities across 21 developed markets, including countries in Europe, Australasia and the Far East, excluding the U.S. and Canada.
It is not possible to invest directly in an unmanaged index.
Performance quoted represents past performance. Past performance is not a guarantee or a reliable indicator of future results. Current performance may be lower or higher than performance shown. Investment return and the principal value of an investment will fluctuate. Shares may be worth more or less than original cost when redeemed. Returns shown do not reflect the deduction of taxes that a shareholder would pay on fund distributions or the redemption of fund shares. Differences in the Fund’s performance versus the index and related attribution information with respect to particular categories of securities or individual positions may be attributable, in part, to differences in the pricing methodologies used by the Fund and the index. The adjusted returns take into account the maximum sales charge of 3.75% on Class A shares and 1.00% CDSC on Class C shares. For performance data current to the most recent month-end, visit www.pimco.com or via (888) 87-PIMCO.
The Fund’s total annual operating expense ratio in effect as of period end, were 0.61% for the Institutional Class shares, 0.71% for the I-2 shares, 0.96% for the Class A shares and 1.71% for the Class C shares. Details regarding any changes to the Fund’s operating expenses, subsequent to period end, can be found in the Fund’s current prospectus, as supplemented.
| 12 | PIMCO EQUITY SERIES |
Table of Contents
| Institutional Class - PPYIX | I-2 - PPYPX | Class A - PPYAX | Class C - PPYCX |
Geographic Breakdown as of 06/30/20181§
Japan | 25.5% | |||||||
United Kingdom | 15.9% | |||||||
France | 10.1% | |||||||
Germany | 9.2% | |||||||
Australia | 6.6% | |||||||
Canada | 6.3% | |||||||
Switzerland | 5.3% | |||||||
Spain | 3.6% | |||||||
Netherlands | 3.4% | |||||||
Italy | 3.4% | |||||||
Hong Kong | 2.3% | |||||||
Sweden | 1.6% | |||||||
Singapore | 1.3% | |||||||
Other | 5.5% |
1 % of Investments, at value.
§ Geographic Breakdown and % of Investments exclude securities sold short, financial derivative instruments and short-term instruments, if any.
Fund Insights
The following affected performance during the reporting period:
| » | Overweight exposure to, and security selection in, the materials sector contributed to relative returns, as the sector and the Fund’s holdings outperformed the benchmark index. |
| » | Underweight exposure to, and security selection in, the consumer staples sector contributed to relative returns, as the sector underperformed the benchmark index and the Fund’s holdings outperformed the benchmark index. |
| » | Security selection in the utilities sector contributed to relative returns, as the Fund’s holdings outperformed the benchmark index. |
| » | Overweight exposure to, and security selection in, the financials sector detracted from relative returns, as the sector and the Fund’s holdings underperformed the benchmark index. |
| » | Underweight exposure to, and security selection in, the information technology sector detracted from relative returns, as the sector outperformed the benchmark index, and the Fund’s holdings underperformed the benchmark index. |
| » | Underweight exposure to, and security selection in, the consumer discretionary sector detracted from relative returns, as the sector outperformed the benchmark index, and the Fund’s holdings underperformed the benchmark index. |
| » | Security selection in the industrials sector detracted from relative returns, as the Fund’s holdings underperformed the benchmark index. |
| ANNUAL REPORT | JUNE 30, 2018 | 13 |
Table of Contents
Cumulative Returns Through June 30, 2018
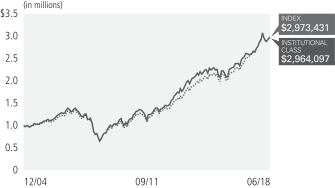
$1,000,000 invested at the end of the month when the Fund’s Institutional Class commenced operations.
Investment Objective and Strategy Overview
PIMCO RAE US Fund seeks long-term capital appreciation by investing under normal circumstances at least 80% of its assets in securities of companies economically tied to the United States (“U.S.” companies”). Specifically, under normal circumstances, the Fund will obtain exposure to a portfolio of stocks of U.S. companies (“RAE US Portfolio”) through investment in the securities that comprise the RAE US Portfolio. The stocks are selected by the Fund’s sub-adviser, Research Affiliates, LLC, from a broad universe of companies which satisfy certain liquidity and capacity requirements. Fund strategies may change from time to time. Please refer to the Fund’s current prospectus for more information regarding the Fund’s strategy.
| Average Annual Total Return for the period ended June 30, 2018* | ||||||||||||||||||
| 1 Year | 5 Year | 10 Year | Fund Inception (12/22/04) | |||||||||||||||
| PIMCO RAE US Fund Institutional Class | 13.22% | 11.43% | 10.02% | 8.36% | |||||||||||||
| PIMCO RAE US Fund I-2 | 13.10% | 11.36% | 9.99% | 8.33% | ||||||||||||||
| PIMCO RAE US Fund Class A | 12.73% | 11.16% | 9.88% | 8.26% | ||||||||||||||
| PIMCO RAE US Fund Class A (adjusted) | 8.49% | 10.31% | 9.47% | 7.95% | ||||||||||||||
| PIMCO RAE US Fund Class C | 11.98% | 10.64% | 9.63% | 8.07% | ||||||||||||||
| PIMCO RAE US Fund Class C (adjusted) | 10.98% | 10.64% | 9.63% | 8.07% | ||||||||||||||
| S&P 500 Index± | 14.37% | 13.42% | 10.17% | 8.41% ¨ | |||||||||||||
All Fund returns are net of fees and expenses.
¨ Average annual total return since 12/31/2004.
± S&P 500 Index is an unmanaged market index generally considered representative of the stock market as a whole. The Index focuses on the large-cap segment of the U.S. equities market. It is not possible to invest directly in an unmanaged index.
* For periods prior to June 5, 2015, the Fund’s performance reflects the performance when the Fund was a partnership, net of actual fees and expenses charged to individual partnership accounts in the aggregate. If the performance had been restated to reflect the applicable fees and expenses of each share class, the performance may have been higher or lower. The Fund began operations as a partnership on December 22, 2004 and, on June 5, 2015, was reorganized into a newly-formed fund that was registered as an investment company under the Investment Company Act of 1940. Prior to the reorganization, the Fund had an investment objective, investment strategies, investment guidelines, and restrictions that were substantially similar to those currently applicable to the Fund; however, the Fund was not registered as an investment company under the Investment Company Act of 1940 and was not subject to its requirements or requirements imposed by the Internal Revenue Code of 1986 which, if applicable, may have adversely affected its performance. The performance of each class of shares will differ as a result of the different levels of fees and expenses applicable to each class of shares.
Performance quoted represents past performance. Past performance is not a guarantee or a reliable indicator of future results. Current performance may be lower or higher than performance shown. Investment return and the principal value of an investment will fluctuate. Shares may be worth more or less than original cost when redeemed. Returns shown do not reflect the deduction of taxes that a shareholder would pay on fund distributions or the redemption of fund shares. Differences in the Fund’s performance versus the index and related attribution information with respect to particular categories of securities or individual positions may be attributable, in part, to differences in the pricing methodologies used by the Fund and the index. The adjusted returns take into account the maximum sales charge of 3.75% on Class A shares and 1.00% CDSC on Class C shares. For performance data current to the most recent month-end, visit www.pimco.com or via (888) 87-PIMCO.
The Fund’s total annual operating expense ratio in effect as of period end, were 0.51% for the Institutional Class shares, 0.61% for the I-2 shares, 0.91% for the Class A shares and 1.66% for the Class C shares. Details regarding any changes to the Fund’s operating expenses, subsequent to period end, can be found in the Fund’s current prospectus, as supplemented.
| 14 | PIMCO EQUITY SERIES |
Table of Contents
| Institutional Class - PKAIX | I-2 - PKAPX | Class A - PKAAX | Class C - PKACX |
Sector Breakdown as of 06/30/20181§
Financials | 19.1% | |||||||
Information Technology | 16.9% | |||||||
Consumer Discretionary | 14.1% | |||||||
Health Care | 13.9% | |||||||
Industrials | 8.7% | |||||||
Consumer Staples | 7.5% | |||||||
Energy | 7.3% | |||||||
Utilities | 5.4% | |||||||
Telecommunication Services | 3.5% | |||||||
Materials | 2.4% | |||||||
Other | 0.7% |
1 % of Investments, at value.
§ Sector Breakdown and % of Investments exclude securities sold short, financial derivative instruments and short-term instruments, if any.
Fund Insights
The following affected performance during the reporting period:
| » | Underweight exposure to, and security selection in, the healthcare sector contributed to relative returns, as the sector underperformed the benchmark index, and the Fund’s holdings outperformed the benchmark index. |
| » | Underweight exposure to, and security selection in, the consumer staples sector contributed to relative returns, as the sector underperformed the benchmark index, and the Fund’s holdings outperformed the benchmark index. |
| » | Security selection in the energy sector contributed to relative returns, as the Fund’s holdings outperformed the benchmark index. |
| » | Underweight exposure to, and security selection in, the information technology sector detracted from relative returns, as the sector outperformed the benchmark index, and the Fund’s holdings underperformed the benchmark index. |
| » | Overweight exposure to, and security selection in, the financials sector detracted from relative returns, as the sector and the Fund’s holdings underperformed the benchmark index. |
| » | Security selection in the consumer discretionary sector detracted from relative returns, as the Fund’s holdings underperformed the benchmark index. |
| » | Overweight exposure to, and security selection in, the telecommunications services sector detracted from relative returns, as the sector and the Fund’s holdings underperformed the benchmark index. |
| ANNUAL REPORT | JUNE 30, 2018 | 15 |
Table of Contents
Cumulative Returns Through June 30, 2018
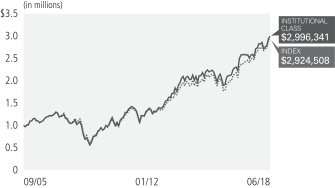
$1,000,000 invested at the end of the month when the Fund’s Institutional Class commenced operations.
Investment Objective and Strategy Overview
PIMCO RAE US Small Fund seeks long-term capital appreciation by investing under normal circumstances at least 80% of its assets in securities of small companies economically tied to the United States (“U.S. companies”). Specifically, under normal circumstances, the Fund will obtain exposure to a portfolio of stocks of small U.S. companies (“RAE US Small Portfolio”) through investment in the securities that comprise the RAE US Small Portfolio. The stocks are selected by the Fund’s sub-adviser, Research Affiliates, LLC, from a broad universe of companies which satisfy certain liquidity and capacity requirements. Fund strategies may change from time to time. Please refer to the Fund’s current prospectus for more information regarding the Fund’s strategy.
| Average Annual Total Return for the period ended June 30, 2018* | ||||||||||||||||||
| 1 Year | 5 Year | 10 Year | Fund Inception (09/29/05) | |||||||||||||||
| PIMCO RAE US Small Fund Institutional Class | 16.37% | 11.74% | 11.35% | 9.01% | |||||||||||||
| PIMCO RAE US Small Fund I-2 | 16.27% | 11.66% | 11.31% | 8.98% | ||||||||||||||
| PIMCO RAE US Small Fund Class A | 15.83% | 11.45% | 11.21% | 8.90% | ||||||||||||||
| PIMCO RAE US Small Fund Class A (adjusted) | 11.49% | 10.60% | 10.78% | 8.57% | ||||||||||||||
| PIMCO RAE US Small Fund Class C | 15.03% | 10.96% | 10.96% | 8.71% | ||||||||||||||
| PIMCO RAE US Small Fund Class C (adjusted) | 14.03% | 10.96% | 10.96% | 8.71% | ||||||||||||||
| Russell 2000 Index± | 17.57% | 12.46% | 10.60% | 8.78% ¨ | |||||||||||||
All Fund returns are net of fees and expenses.
¨ Average annual total return since 9/30/2005
± Russell 2000® Index is composed of 2,000 of the smallest companies in the Russell 3000 Index and is considered to be representative of the small cap market in general.
It is not possible to invest directly in an unmanaged index.
* For periods prior to June 5, 2015, the Fund’s performance reflects the performance when the Fund was a partnership, net of actual fees and expenses charged to individual partnership accounts in the aggregate. If the performance had been restated to reflect the applicable fees and expenses of each share class, the performance may have been higher or lower. The Fund began operations as a partnership on September 29, 2005 and, on June 5, 2015, was reorganized into a newly-formed fund that was registered as an investment company under the Investment Company Act of 1940. Prior to the reorganization, the Fund had an investment objective, investment strategies, investment guidelines, and restrictions that were substantially similar to those currently applicable to the Fund; however, the Fund was not registered as an investment company under the Investment Company Act of 1940 and was not subject to its requirements or requirements imposed by the Internal Revenue Code of 1986 which, if applicable, may have adversely affected its performance. The performance of each class of shares will differ as a result of the different levels of fees and expenses applicable to each class of shares.
Performance quoted represents past performance. Past performance is not a guarantee or a reliable indicator of future results. Current performance may be lower or higher than performance shown. Investment return and the principal value of an investment will fluctuate. Shares may be worth more or less than original cost when redeemed. Returns shown do not reflect the deduction of taxes that a shareholder would pay on fund distributions or the redemption of fund shares. Differences in the Fund’s performance versus the index and related attribution information with respect to particular categories of securities or individual positions may be attributable, in part, to differences in the pricing methodologies used by the Fund and the index. The adjusted returns take into account the maximum sales charge of 3.75% on Class A shares and 1.00% CDSC on Class C shares. For performance data current to the most recent month-end, visit www.pimco.com or via (888) 87-PIMCO.
The Fund’s total annual operating expense ratio in effect as of period end, were 0.61% for the Institutional Class shares, 0.71% for the I-2 shares, 1.01% for the Class A shares and 1.76% for the Class C shares. Details regarding any changes to the Fund’s operating expenses, subsequent to period end, can be found in the Fund’s current prospectus, as supplemented.
| 16 | PIMCO EQUITY SERIES |
Table of Contents
| Institutional Class - PMJIX | I-2 - PMJPX | Class A - PMJAX | Class C - PMJCX |
Sector Breakdown as of 06/30/20181§
Consumer Discretionary | 20.4% | |||||||
Financials | 17.4% | |||||||
Industrials | 16.3% | |||||||
Information Technology | 11.4% | |||||||
Real Estate | 10.4% | |||||||
Health Care | 6.9% | |||||||
Materials | 4.6% | |||||||
Consumer Staples | 4.2% | |||||||
Energy | 3.9% | |||||||
Utilities | 3.2% | |||||||
Telecommunication and Services | 1.0% |
1 % of Investments, at value.
§ Sector Breakdown and % of Investments exclude securities sold short, financial derivative instruments and short-term instruments, if any.
Fund Insights
The following affected performance during the reporting period:
| » | Security selection in the energy sector contributed to relative returns, as the Fund’s holdings outperformed the benchmark index. |
| » | Security selection in the utilities sector contributed to relative returns, as the Fund’s holdings outperformed the benchmark index. |
| » | Overweight exposure to, and security selection in, the consumer discretionary sector contributed to relative returns, as the sector and the Fund’s holdings outperformed the benchmark index. |
| » | Underweight exposure to, and security selection in, the healthcare sector detracted from relative returns, as the sector outperformed the benchmark index, and the Fund’s holdings underperformed the benchmark index. |
| » | Underweight exposure to, and security selection in, the information technology sector detracted from relative returns, as the sector outperformed the benchmark index, and the Fund’s holdings underperformed the benchmark index. |
| » | Overweight exposure to the telecommunications services sector detracted from relative returns, as the sector underperformed the benchmark index. |
| ANNUAL REPORT | JUNE 30, 2018 | 17 |
Table of Contents
Example
As a shareholder of a Fund, you incur two types of costs: (1) transaction costs, including sales charges (loads) on purchase payments and exchange fees and (2) ongoing costs, including management fees, distribution and/or service (12b-1) fees, and other Fund expenses. The Example is intended to help you understand your ongoing costs (in dollars) of investing in a Fund and to compare these costs with the ongoing costs of investing in other mutual funds.
The Example is based on an investment of $1,000 invested at the beginning of the period and held for the entire period indicated, which for all Funds and share classes is from January 1, 2018 to June 30, 2018 unless noted otherwise in the table and footnotes below.
Actual Expenses
The information in the table under the heading “Actual” provides information about actual account values and actual expenses. You may use this information, together with the amount you invested, to estimate the expenses that you paid over the period. Simply divide your account value by $1,000 (for example, an $8,600 account value divided by $1,000 = 8.60), then multiply the result by the number in the appropriate row for your share class, in the column entitled “Expenses Paid During Period” to estimate the expenses you paid on your account during this period.
Hypothetical Example for Comparison Purposes
The information in the table under the heading “Hypothetical (5% return before expenses)” provides information about hypothetical account values and hypothetical expenses based on a Fund’s actual expense ratio and an assumed rate of return of 5% per year before expenses, which is not the Fund’s actual return. The hypothetical account values and expenses may not be used to estimate the actual ending account balance or expenses you paid for the period. You may use this information to compare the ongoing costs of investing in a Fund and other funds. To do so, compare this 5% hypothetical example with the 5% hypothetical examples that appear in the shareholder reports of the other funds.
Please note that the expenses shown in the table are meant to highlight your ongoing costs only and do not reflect any transactional costs, such as sales charges (loads) on purchase payments and exchange fees. Therefore, the information under the heading “Hypothetical (5% return before expenses)” is useful in comparing ongoing costs only, and will not help you determine the relative total costs of owning different funds. In addition, if these transactional costs were included, your costs would have been higher.
Expense ratios may vary from period to period because of various factors such as an increase in expenses that are not covered by the management fees, such as fees and expenses of the independent trustees and their counsel, extraordinary expenses and interest expense.
| Actual | Hypothetical (5% return before expenses) | |||||||||||||||||||||||||||||||||||||||
| Beginning Account Value (01/01/18) | Ending Account Value (06/30/18) | Expenses Paid During Period* | Beginning Account Value (01/01/18) | Ending Account Value (06/30/18) | Expenses Paid During Period* | Net Annualized Expense Ratio** | ||||||||||||||||||||||||||||||||||
PIMCO RAE Emerging Markets Fund | ||||||||||||||||||||||||||||||||||||||||
| Institutional Class | $ | 1,000.00 | $ | 929.90 | $ | 3.64 | $ | 1,000.00 | $ | 1,021.03 | $ | 3.81 | 0.76 | % | ||||||||||||||||||||||||||
| I-2 | 1,000.00 | 929.50 | 4.11 | 1,000.00 | 1,020.53 | 4.31 | 0.86 | |||||||||||||||||||||||||||||||||
| Class A | 1,000.00 | 927.90 | 5.31 | 1,000.00 | 1,019.29 | 5.56 | 1.11 | |||||||||||||||||||||||||||||||||
| Class C | 1,000.00 | 925.00 | 8.88 | 1,000.00 | 1,015.57 | 9.30 | 1.86 | |||||||||||||||||||||||||||||||||
PIMCO RAE Global Fund | ||||||||||||||||||||||||||||||||||||||||
| Institutional Class | $ | 1,000.00 | $ | 972.70 | $ | 0.10 | $ | 1,000.00 | $ | 1,024.70 | $ | 0.10 | 0.02 | % | ||||||||||||||||||||||||||
| I-2 | 1,000.00 | 971.80 | 0.59 | 1,000.00 | 1,024.20 | 0.60 | 0.12 | |||||||||||||||||||||||||||||||||
| Class A | 1,000.00 | 970.70 | 1.81 | 1,000.00 | 1,022.96 | 1.86 | 0.37 | |||||||||||||||||||||||||||||||||
| Class C | 1,000.00 | 966.80 | 5.46 | 1,000.00 | 1,019.24 | 5.61 | 1.12 | |||||||||||||||||||||||||||||||||
PIMCO RAE Global ex-US Fund | ||||||||||||||||||||||||||||||||||||||||
| Institutional Class | $ | 1,000.00 | $ | 945.10 | $ | 0.00 | $ | 1,000.00 | $ | 1,024.79 | $ | 0.00 | 0.00 | % | ||||||||||||||||||||||||||
| I-2 | 1,000.00 | 945.00 | 0.48 | 1,000.00 | 1,024.30 | 0.50 | 0.10 | |||||||||||||||||||||||||||||||||
| Class A | 1,000.00 | 944.00 | 1.69 | 1,000.00 | 1,023.06 | 1.76 | 0.35 | |||||||||||||||||||||||||||||||||
| Class C | 1,000.00 | 939.70 | 5.29 | 1,000.00 | 1,019.34 | 5.51 | 1.10 | |||||||||||||||||||||||||||||||||
| 18 | PIMCO EQUITY SERIES |
Table of Contents
| Actual | Hypothetical (5% return before expenses) | |||||||||||||||||||||||||||||||||||||||
| Beginning Account Value (01/01/18) | Ending Account Value (06/30/18) | Expenses Paid During Period* | Beginning Account Value (01/01/18) | Ending Account Value (06/30/18) | Expenses Paid During Period* | Net Annualized Expense Ratio** | ||||||||||||||||||||||||||||||||||
PIMCO RAE International Fund | ||||||||||||||||||||||||||||||||||||||||
| Institutional Class | $ | 1,000.00 | $ | 951.50 | $ | 2.47 | $ | 1,000.00 | $ | 1,022.27 | $ | 2.56 | 0.51 | % | ||||||||||||||||||||||||||
| I-2 | 1,000.00 | 950.50 | 2.95 | 1,000.00 | 1,021.77 | 3.06 | 0.61 | |||||||||||||||||||||||||||||||||
| Class A | 1,000.00 | 949.50 | 4.16 | 1,000.00 | 1,020.53 | 4.31 | 0.86 | |||||||||||||||||||||||||||||||||
| Class C | 1,000.00 | 945.90 | 7.77 | 1,000.00 | 1,016.81 | 8.05 | 1.61 | |||||||||||||||||||||||||||||||||
PIMCO RAE US Fund | ||||||||||||||||||||||||||||||||||||||||
| Institutional Class | $ | 1,000.00 | $ | 1,011.60 | $ | 2.04 | $ | 1,000.00 | $ | 1,022.76 | $ | 2.06 | 0.41 | % | ||||||||||||||||||||||||||
| I-2 | 1,000.00 | 1,010.80 | 2.54 | 1,000.00 | 1,022.27 | 2.56 | 0.51 | |||||||||||||||||||||||||||||||||
| Class A | 1,000.00 | 1,009.00 | 4.03 | 1,000.00 | 1,020.78 | 4.06 | 0.81 | |||||||||||||||||||||||||||||||||
| Class C | 1,000.00 | 1,005.50 | 7.76 | 1,000.00 | 1,017.06 | 7.80 | 1.56 | |||||||||||||||||||||||||||||||||
PIMCO RAE US Small Fund | ||||||||||||||||||||||||||||||||||||||||
| Institutional Class | $ | 1,000.00 | $ | 1,061.10 | $ | 2.56 | $ | 1,000.00 | $ | 1,022.32 | $ | 2.51 | 0.50 | % | ||||||||||||||||||||||||||
| I-2 | 1,000.00 | 1,061.30 | 3.07 | 1,000.00 | 1,021.82 | 3.01 | 0.60 | |||||||||||||||||||||||||||||||||
| Class A | 1,000.00 | 1,058.80 | 4.59 | 1,000.00 | 1,020.33 | 4.51 | 0.90 | |||||||||||||||||||||||||||||||||
| Class C | 1,000.00 | 1,055.50 | 8.41 | 1,000.00 | 1,016.61 | 8.25 | 1.65 | |||||||||||||||||||||||||||||||||
* Expenses Paid During Period are equal to the net annualized expense ratio for the class, multiplied by the average account value over the period, multiplied by 181/365 (to reflect the one-half year period).
** Net Annualized Expense Ratio is reflective of any applicable contractual fee waivers and/or expense reimbursements or voluntary fee waivers. Details regarding fee waivers, if any, can be found in Note 9, Fees and Expenses, in the Notes to Financial Statements.
| ANNUAL REPORT | JUNE 30, 2018 | 19 |
Table of Contents
| Investment Operations | Less Distributions(b) | |||||||||||||||||||||||||||||||||||
| Selected Per Share Data for the Year or Period Ended^: | Net Asset Value Beginning of Year or | Net Investment Income (Loss)(a) | Net Realized/ Unrealized Gain (Loss) | Total | From Net Investment Income | Realized Capital Gains | Tax Basis Return of Capital | Total | ||||||||||||||||||||||||||||
PIMCO RAE Emerging Markets Fund | ||||||||||||||||||||||||||||||||||||
| Institutional Class | ||||||||||||||||||||||||||||||||||||
06/30/2018 | $ | 10.83 | $ | 0.25 | $ | 0.59 | $ | 0.84 | $ | (0.19 | ) | $ | (0.74 | ) | $ | 0.00 | $ | (0.93 | ) | |||||||||||||||||
06/30/2017 | 8.73 | 0.20 | 2.17 | 2.37 | (0.27 | ) | 0.00 | 0.00 | (0.27 | ) | ||||||||||||||||||||||||||
06/30/2016 | 9.95 | 0.32 | (1.37 | ) | (1.05 | ) | (0.17 | ) | 0.00 | 0.00 | (0.17 | ) | ||||||||||||||||||||||||
06/05/2015 - 06/30/2015 | 10.00 | 0.06 | (0.11 | ) | (0.05 | ) | 0.00 | 0.00 | 0.00 | 0.00 | ||||||||||||||||||||||||||
| I-2 | ||||||||||||||||||||||||||||||||||||
06/30/2018 | 10.79 | 0.24 | 0.57 | 0.81 | (0.18 | ) | (0.74 | ) | 0.00 | (0.92 | ) | |||||||||||||||||||||||||
06/30/2017 | 8.70 | 0.23 | 2.12 | 2.35 | (0.26 | ) | 0.00 | 0.00 | (0.26 | ) | ||||||||||||||||||||||||||
06/30/2016 | 9.96 | 0.25 | (1.33 | ) | (1.08 | ) | (0.18 | ) | 0.00 | 0.00 | (0.18 | ) | ||||||||||||||||||||||||
06/05/2015 - 06/30/2015 | 10.00 | 0.06 | (0.10 | ) | (0.04 | ) | 0.00 | 0.00 | 0.00 | 0.00 | ||||||||||||||||||||||||||
| Class A | ||||||||||||||||||||||||||||||||||||
06/30/2018 | 10.81 | 0.21 | 0.59 | 0.80 | (0.19 | ) | (0.74 | ) | 0.00 | (0.93 | ) | |||||||||||||||||||||||||
06/30/2017 | 8.73 | 0.14 | 2.19 | 2.33 | (0.25 | ) | 0.00 | 0.00 | (0.25 | ) | ||||||||||||||||||||||||||
06/30/2016 | 9.96 | 0.22 | (1.30 | ) | (1.08 | ) | (0.15 | ) | 0.00 | 0.00 | (0.15 | ) | ||||||||||||||||||||||||
06/05/2015 - 06/30/2015 | 10.00 | 0.08 | (0.12 | ) | (0.04 | ) | 0.00 | 0.00 | 0.00 | 0.00 | ||||||||||||||||||||||||||
| Class C | ||||||||||||||||||||||||||||||||||||
06/30/2018 | 10.66 | 0.09 | 0.61 | 0.70 | (0.14 | ) | (0.74 | ) | 0.00 | (0.88 | ) | |||||||||||||||||||||||||
06/30/2017 | 8.67 | 0.12 | 2.12 | 2.24 | (0.25 | ) | 0.00 | 0.00 | (0.25 | ) | ||||||||||||||||||||||||||
06/30/2016 | 9.95 | 0.21 | (1.36 | ) | (1.15 | ) | (0.13 | ) | 0.00 | 0.00 | (0.13 | ) | ||||||||||||||||||||||||
06/05/2015 - 06/30/2015 | 10.00 | 0.06 | (0.11 | ) | (0.05 | ) | 0.00 | 0.00 | 0.00 | 0.00 | ||||||||||||||||||||||||||
PIMCO RAE Global Fund | ||||||||||||||||||||||||||||||||||||
| Institutional Class | ||||||||||||||||||||||||||||||||||||
06/30/2018 | $ | 10.78 | $ | 0.35 | $ | 0.64 | $ | 0.99 | $ | (0.46 | ) | $ | (0.27 | ) | $ | 0.00 | $ | (0.73 | ) | |||||||||||||||||
06/30/2017 | 9.32 | 0.24 | 1.55 | 1.79 | (0.24 | ) | (0.09 | ) | 0.00 | (0.33 | ) | |||||||||||||||||||||||||
06/30/2016 | 9.86 | 0.14 | (0.58 | ) | (0.44 | ) | (0.10 | ) | 0.00 | 0.00 | (0.10 | ) | ||||||||||||||||||||||||
06/05/2015 - 06/30/2015 | 10.00 | (0.00 | ) | (0.14 | ) | (0.14 | ) | 0.00 | 0.00 | 0.00 | 0.00 | |||||||||||||||||||||||||
| I-2 | ||||||||||||||||||||||||||||||||||||
06/30/2018 | 10.76 | 0.35 | 0.62 | 0.97 | (0.45 | ) | (0.27 | ) | 0.00 | (0.72 | ) | |||||||||||||||||||||||||
06/30/2017 | 9.31 | 0.02 | 1.76 | 1.78 | (0.24 | ) | (0.09 | ) | 0.00 | (0.33 | ) | |||||||||||||||||||||||||
06/30/2016 | 9.85 | 0.08 | (0.52 | ) | (0.44 | ) | (0.10 | ) | 0.00 | 0.00 | (0.10 | ) | ||||||||||||||||||||||||
06/05/2015 - 06/30/2015 | 10.00 | (0.00 | ) | (0.15 | ) | (0.15 | ) | 0.00 | 0.00 | 0.00 | 0.00 | |||||||||||||||||||||||||
| Class A | ||||||||||||||||||||||||||||||||||||
06/30/2018 | 10.72 | 0.24 | 0.70 | 0.94 | (0.44 | ) | (0.27 | ) | 0.00 | (0.71 | ) | |||||||||||||||||||||||||
06/30/2017 | 9.29 | 0.18 | 1.57 | 1.75 | (0.23 | ) | (0.09 | ) | 0.00 | (0.32 | ) | |||||||||||||||||||||||||
06/30/2016 | 9.85 | 0.02 | (0.48 | ) | (0.46 | ) | (0.10 | ) | 0.00 | 0.00 | (0.10 | ) | ||||||||||||||||||||||||
06/05/2015 - 06/30/2015 | 10.00 | (0.00 | ) | (0.15 | ) | (0.15 | ) | 0.00 | 0.00 | 0.00 | 0.00 | |||||||||||||||||||||||||
| Class C | ||||||||||||||||||||||||||||||||||||
06/30/2018 | 10.59 | 0.22 | 0.63 | 0.85 | (0.41 | ) | (0.27 | ) | 0.00 | (0.68 | ) | |||||||||||||||||||||||||
06/30/2017 | 9.22 | 0.11 | 1.55 | 1.66 | (0.20 | ) | (0.09 | ) | 0.00 | (0.29 | ) | |||||||||||||||||||||||||
06/30/2016 | 9.84 | 0.00 | (0.52 | ) | (0.52 | ) | (0.10 | ) | 0.00 | 0.00 | (0.10 | ) | ||||||||||||||||||||||||
06/05/2015 - 06/30/2015 | 10.00 | (0.01 | ) | (0.15 | ) | (0.16 | ) | 0.00 | 0.00 | 0.00 | 0.00 | |||||||||||||||||||||||||
PIMCO RAE Global ex-US Fund | ||||||||||||||||||||||||||||||||||||
| Institutional Class | ||||||||||||||||||||||||||||||||||||
06/30/2018 | $ | 10.49 | $ | 0.38 | $ | 0.28 | $ | 0.66 | $ | (0.42 | ) | $ | 0.00 | $ | (0.05 | ) | $ | (0.47 | ) | |||||||||||||||||
06/30/2017 | 8.68 | 0.22 | 1.83 | 2.05 | (0.22 | ) | 0.00 | (0.02 | ) | (0.24 | ) | |||||||||||||||||||||||||
06/30/2016 | 9.86 | 0.10 | (1.18 | ) | (1.08 | ) | (0.10 | ) | 0.00 | (0.00 | ) | (0.10 | ) | |||||||||||||||||||||||
06/05/2015 - 06/30/2015 | 10.00 | (0.00 | ) | (0.14 | ) | (0.14 | ) | 0.00 | 0.00 | 0.00 | 0.00 | |||||||||||||||||||||||||
| I-2 | ||||||||||||||||||||||||||||||||||||
06/30/2018 | 10.47 | 0.29 | 0.35 | 0.64 | (0.41 | ) | 0.00 | (0.05 | ) | (0.46 | ) | |||||||||||||||||||||||||
06/30/2017 | 8.67 | 0.07 | 1.97 | 2.04 | (0.22 | ) | 0.00 | (0.02 | ) | (0.24 | ) | |||||||||||||||||||||||||
06/30/2016 | 9.86 | 0.09 | (1.18 | ) | (1.09 | ) | (0.10 | ) | 0.00 | (0.00 | ) | (0.10 | ) | |||||||||||||||||||||||
06/05/2015 - 06/30/2015 | 10.00 | (0.00 | ) | (0.14 | ) | (0.14 | ) | 0.00 | 0.00 | 0.00 | 0.00 | |||||||||||||||||||||||||
| Class A | ||||||||||||||||||||||||||||||||||||
06/30/2018 | 10.44 | 0.24 | 0.38 | 0.62 | (0.40 | ) | 0.00 | (0.05 | ) | (0.45 | ) | |||||||||||||||||||||||||
06/30/2017 | 8.66 | 0.10 | 1.92 | 2.02 | (0.22 | ) | 0.00 | (0.02 | ) | (0.24 | ) | |||||||||||||||||||||||||
06/30/2016 | 9.86 | 0.00 | (1.11 | ) | (1.11 | ) | (0.09 | ) | 0.00 | (0.00 | ) | (0.09 | ) | |||||||||||||||||||||||
06/05/2015 - 06/30/2015 | 10.00 | (0.00 | ) | (0.14 | ) | (0.14 | ) | 0.00 | 0.00 | 0.00 | 0.00 | |||||||||||||||||||||||||
| 20 | PIMCO EQUITY SERIES | See Accompanying Notes |
Table of Contents
| Ratios/Supplemental Data | ||||||||||||||||||||||||||||||||||
| Ratios to Average Net Assets(c) | ||||||||||||||||||||||||||||||||||
Net Asset Value End of | Total Return | Net Assets End of Year or Period (000s) | Expenses | Expenses Excluding Waivers | Expenses Excluding Interest Expense | Expenses Excluding Interest Expense and | Net Investment Income (Loss) | Portfolio Turnover | ||||||||||||||||||||||||||
| $ | 10.74 | 7.50 | % | $ | 1,848,953 | 0.76 | % | 0.97 | % | 0.76 | % | 0.97 | % | 2.13 | % | 28 | % | |||||||||||||||||
| 10.83 | 27.53 | 1,510,983 | 0.75 | 0.96 | 0.75 | 0.96 | 1.99 | 43 | ||||||||||||||||||||||||||
| 8.73 | (10.32 | ) | 1,379,204 | 0.76 | 0.96 | 0.76 | 0.96 | 3.92 | 30 | |||||||||||||||||||||||||
| 9.95 | (0.50 | ) | 199,378 | 0.75 | * | 0.98 | * | 0.75 | * | 0.98 | * | 10.11 | * | 7 | ||||||||||||||||||||
| 10.68 | 7.26 | 17,486 | 0.86 | 1.07 | 0.86 | 1.07 | 2.07 | 28 | ||||||||||||||||||||||||||
| 10.79 | 27.46 | 14,664 | 0.85 | 1.06 | 0.85 | 1.06 | 2.18 | 43 | ||||||||||||||||||||||||||
| 8.70 | (10.54 | ) | 1,827 | 0.86 | 1.06 | 0.86 | 1.06 | 3.25 | 30 | |||||||||||||||||||||||||
| 9.96 | (0.40 | ) | 10 | 0.85 | * | 1.08 | * | 0.85 | * | 1.08 | * | 10.09 | * | 7 | ||||||||||||||||||||
| 10.68 | 7.08 | 7,350 | 1.11 | 1.32 | 1.11 | 1.32 | 1.76 | 28 | ||||||||||||||||||||||||||
| 10.81 | 27.06 | 1,937 | 1.10 | 1.31 | 1.10 | 1.31 | 1.35 | 43 | ||||||||||||||||||||||||||
| 8.73 | (10.61 | ) | 146 | 1.11 | 1.31 | 1.11 | 1.31 | 2.64 | 30 | |||||||||||||||||||||||||
| 9.96 | (0.40 | ) | 19 | 1.10 | * | 1.33 | * | 1.10 | * | 1.33 | * | 13.46 | * | 7 | ||||||||||||||||||||
| 10.48 | 6.32 | 2,011 | 1.86 | 2.07 | 1.86 | 2.07 | 0.80 | 28 | ||||||||||||||||||||||||||
| 10.66 | 26.13 | 1,081 | 1.85 | 2.06 | 1.85 | 2.06 | 1.18 | 43 | ||||||||||||||||||||||||||
| 8.67 | (11.33 | ) | 95 | 1.86 | 2.06 | 1.86 | 2.06 | 2.56 | 30 | |||||||||||||||||||||||||
| 9.95 | (0.50 | ) | 10 | 1.85 | * | 2.08 | * | 1.85 | * | 2.08 | * | 9.08 | * | 7 | ||||||||||||||||||||
| $ | 11.04 | 9.05 | % | $ | 359,953 | 0.02 | % | 0.72 | % | 0.02 | % | 0.72 | % | 3.07 | % | 19 | % | |||||||||||||||||
| 10.78 | 19.60 | 409,144 | 0.01 | 0.71 | 0.01 | 0.71 | 2.36 | 20 | ||||||||||||||||||||||||||
| 9.32 | (4.38 | ) | 282,274 | 0.04 | 0.71 | 0.04 | 0.71 | 1.59 | 13 | |||||||||||||||||||||||||
| 9.86 | (1.40 | ) | 38,160 | 0.04 | * | 0.86 | * | 0.04 | * | 0.86 | * | (0.04 | )* | 2 | ||||||||||||||||||||
| 11.01 | 8.93 | 3,293 | 0.12 | 0.82 | 0.12 | 0.82 | 3.09 | 19 | ||||||||||||||||||||||||||
| 10.76 | 19.49 | 3,127 | 0.11 | 0.81 | 0.11 | 0.81 | 0.22 | 20 | ||||||||||||||||||||||||||
| 9.31 | (4.44 | ) | 57 | 0.14 | 0.81 | 0.14 | 0.81 | 0.92 | 13 | |||||||||||||||||||||||||
| 9.85 | (1.50 | ) | 10 | 0.14 | * | 0.96 | * | 0.14 | * | 0.96 | * | (0.14 | )* | 2 | ||||||||||||||||||||
| 10.95 | 8.64 | 1,505 | 0.37 | 1.07 | 0.37 | 1.07 | 2.09 | 19 | ||||||||||||||||||||||||||
| 10.72 | 19.18 | 1,009 | 0.36 | 1.06 | 0.36 | 1.06 | 1.79 | 20 | ||||||||||||||||||||||||||
| 9.29 | (4.61 | ) | 286 | 0.39 | 1.06 | 0.39 | 1.06 | 0.23 | 13 | |||||||||||||||||||||||||
| 9.85 | (1.50 | ) | 10 | 0.39 | * | 1.21 | * | 0.39 | * | 1.21 | * | (0.40 | )* | 2 | ||||||||||||||||||||
| 10.76 | 7.83 | 1,466 | 1.12 | 1.82 | 1.12 | 1.82 | 1.96 | 19 | ||||||||||||||||||||||||||
| 10.59 | 18.30 | 1,469 | 1.11 | 1.81 | 1.11 | 1.81 | 1.11 | 20 | ||||||||||||||||||||||||||
| 9.22 | (5.29 | ) | 667 | 1.14 | 1.81 | 1.14 | 1.81 | (0.04 | ) | 13 | ||||||||||||||||||||||||
| 9.84 | (1.60 | ) | 17 | 1.14 | * | 1.96 | * | 1.14 | * | 1.96 | * | (1.06 | )* | 2 | ||||||||||||||||||||
| $ | 10.68 | 6.01 | % | $ | 75,994 | 0.00 | % | 0.77 | % | 0.00 | % | 0.77 | % | 3.36 | % | 9 | % | |||||||||||||||||
| 10.49 | 23.98 | 78,610 | 0.00 | 0.76 | 0.00 | 0.76 | 2.23 | 8 | ||||||||||||||||||||||||||
| 8.68 | (10.93 | ) | 62,809 | 0.00 | 0.76 | 0.00 | 0.76 | 1.10 | 8 | |||||||||||||||||||||||||
| 9.86 | (1.40 | ) | 70,077 | 0.01 | * | 0.84 | * | 0.01 | * | 0.84 | * | (0.02 | )* | 2 | ||||||||||||||||||||
| 10.65 | 5.88 | 900 | 0.10 | 0.87 | 0.10 | 0.87 | 2.58 | 9 | ||||||||||||||||||||||||||
| 10.47 | 23.87 | 349 | 0.10 | 0.86 | 0.10 | 0.86 | 0.69 | 8 | ||||||||||||||||||||||||||
| 8.67 | (11.07 | ) | 9 | 0.10 | 0.86 | 0.10 | 0.86 | 1.01 | 8 | |||||||||||||||||||||||||
| 9.86 | (1.40 | ) | 10 | 0.11 | * | 0.94 | * | 0.11 | * | 0.94 | * | (0.11 | )* | 2 | ||||||||||||||||||||
| 10.61 | 5.69 | 1,531 | 0.35 | 1.12 | 0.35 | 1.12 | 2.14 | 9 | ||||||||||||||||||||||||||
| 10.44 | 23.65 | 717 | 0.35 | 1.11 | 0.35 | 1.11 | 1.02 | 8 | ||||||||||||||||||||||||||
| 8.66 | (11.29 | ) | 9 | 0.35 | 1.11 | 0.35 | 1.11 | (0.02 | ) | 8 | ||||||||||||||||||||||||
| 9.86 | (1.40 | ) | 10 | 0.36 | * | 1.19 | * | 0.36 | * | 1.19 | * | (0.37 | )* | 2 | ||||||||||||||||||||
| ANNUAL REPORT | JUNE 30, 2018 | 21 |
Table of Contents
Financial Highlights (Cont.)
| Investment Operations | Less Distributions(b) | |||||||||||||||||||||||||||||||||||
| Selected Per Share Data for the Year or Period Ended^: | Net Asset Value Beginning of Year or | Net Investment Income (Loss)(a) | Net Realized/ Unrealized Gain (Loss) | Total | From Net Investment Income | Realized Capital Gains | Tax Basis Return of Capital | Total | ||||||||||||||||||||||||||||
PIMCO RAE Global ex-US Fund (Cont.) | ||||||||||||||||||||||||||||||||||||
| Class C | ||||||||||||||||||||||||||||||||||||
06/30/2018 | $ | 10.34 | $ | 0.24 | $ | 0.29 | $ | 0.53 | $ | (0.37 | ) | $ | 0.00 | $ | (0.05 | ) | $ | (0.42 | ) | |||||||||||||||||
06/30/2017 | 8.61 | 0.10 | 1.83 | 1.93 | (0.18 | ) | 0.00 | (0.02 | ) | (0.20 | ) | |||||||||||||||||||||||||
06/30/2016 | 9.85 | (0.06 | ) | (1.11 | ) | (1.17 | ) | (0.07 | ) | 0.00 | (0.00 | ) | (0.07 | ) | ||||||||||||||||||||||
06/05/2015 - 06/30/2015 | 10.00 | (0.01 | ) | (0.14 | ) | (0.15 | ) | 0.00 | 0.00 | 0.00 | 0.00 | |||||||||||||||||||||||||
PIMCO RAE International Fund | ||||||||||||||||||||||||||||||||||||
| Institutional Class | ||||||||||||||||||||||||||||||||||||
06/30/2018 | $ | 10.27 | $ | 0.33 | $ | 0.29 | $ | 0.62 | $ | (0.28 | ) | $ | (0.01 | ) | $ | 0.00 | $ | (0.29 | ) | |||||||||||||||||
06/30/2017 | 8.56 | 0.28 | 1.64 | 1.92 | (0.21 | ) | 0.00 | 0.00 | (0.21 | ) | ||||||||||||||||||||||||||
06/30/2016 | 9.83 | 0.28 | (1.32 | ) | (1.04 | ) | (0.08 | ) | (0.15 | ) | 0.00 | (0.23 | ) | |||||||||||||||||||||||
06/05/2015 - 06/30/2015 | 10.00 | 0.02 | (0.19 | ) | (0.17 | ) | 0.00 | 0.00 | 0.00 | 0.00 | ||||||||||||||||||||||||||
| I-2 | ||||||||||||||||||||||||||||||||||||
06/30/2018 | 10.24 | 0.26 | 0.35 | 0.61 | (0.27 | ) | (0.01 | ) | 0.00 | (0.28 | ) | |||||||||||||||||||||||||
06/30/2017 | 8.55 | 0.29 | 1.62 | 1.91 | (0.22 | ) | 0.00 | 0.00 | (0.22 | ) | ||||||||||||||||||||||||||
06/30/2016 | 9.83 | 0.28 | (1.33 | ) | (1.05 | ) | (0.08 | ) | (0.15 | ) | 0.00 | (0.23 | ) | |||||||||||||||||||||||
06/05/2015 - 06/30/2015 | 10.00 | 0.02 | (0.19 | ) | (0.17 | ) | 0.00 | 0.00 | 0.00 | 0.00 | ||||||||||||||||||||||||||
| Class A | ||||||||||||||||||||||||||||||||||||
06/30/2018 | 10.24 | 0.37 | 0.21 | 0.58 | (0.28 | ) | (0.01 | ) | 0.00 | (0.29 | ) | |||||||||||||||||||||||||
06/30/2017 | 8.55 | 0.29 | 1.60 | 1.89 | (0.20 | ) | 0.00 | 0.00 | (0.20 | ) | ||||||||||||||||||||||||||
06/30/2016 | 9.83 | 0.34 | (1.42 | ) | (1.08 | ) | (0.05 | ) | (0.15 | ) | 0.00 | (0.20 | ) | |||||||||||||||||||||||
06/05/2015 - 06/30/2015 | 10.00 | 0.01 | (0.18 | ) | (0.17 | ) | 0.00 | 0.00 | 0.00 | 0.00 | ||||||||||||||||||||||||||
| Class C | ||||||||||||||||||||||||||||||||||||
06/30/2018 | 10.07 | 0.20 | 0.30 | 0.50 | (0.24 | ) | (0.01 | ) | 0.00 | (0.25 | ) | |||||||||||||||||||||||||
06/30/2017 | 8.45 | 0.16 | 1.63 | 1.79 | (0.17 | ) | 0.00 | 0.00 | (0.17 | ) | ||||||||||||||||||||||||||
06/30/2016 | 9.83 | 0.28 | (1.43 | ) | (1.15 | ) | (0.08 | ) | (0.15 | ) | 0.00 | (0.23 | ) | |||||||||||||||||||||||
06/05/2015 - 06/30/2015 | 10.00 | 0.01 | (0.18 | ) | (0.17 | ) | 0.00 | 0.00 | 0.00 | 0.00 | ||||||||||||||||||||||||||
PIMCO RAE US Fund | ||||||||||||||||||||||||||||||||||||
| Institutional Class | ||||||||||||||||||||||||||||||||||||
06/30/2018 | $ | 10.57 | $ | 0.23 | $ | 1.16 | $ | 1.39 | $ | (0.22 | ) | $ | (0.44 | ) | $ | 0.00 | $ | (0.66 | ) | |||||||||||||||||
06/30/2017 | 9.82 | 0.22 | 1.07 | 1.29 | (0.22 | ) | (0.32 | ) | 0.00 | (0.54 | ) | |||||||||||||||||||||||||
06/30/2016 | 9.85 | 0.22 | 0.08 | 0.30 | (0.11 | ) | (0.22 | ) | 0.00 | (0.33 | ) | |||||||||||||||||||||||||
06/05/2015 - 06/30/2015 | 10.00 | 0.01 | (0.16 | ) | (0.15 | ) | 0.00 | 0.00 | 0.00 | 0.00 | ||||||||||||||||||||||||||
| I-2 | ||||||||||||||||||||||||||||||||||||
06/30/2018 | 10.54 | 0.22 | 1.15 | 1.37 | (0.21 | ) | (0.44 | ) | 0.00 | (0.65 | ) | |||||||||||||||||||||||||
06/30/2017 | 9.81 | 0.21 | 1.06 | 1.27 | (0.22 | ) | (0.32 | ) | 0.00 | (0.54 | ) | |||||||||||||||||||||||||
06/30/2016 | 9.85 | 0.21 | 0.08 | 0.29 | (0.11 | ) | (0.22 | ) | 0.00 | (0.33 | ) | |||||||||||||||||||||||||
06/05/2015 - 06/30/2015 | 10.00 | 0.01 | (0.16 | ) | (0.15 | ) | 0.00 | 0.00 | 0.00 | 0.00 | ||||||||||||||||||||||||||
| Class A | ||||||||||||||||||||||||||||||||||||
06/30/2018 | 10.50 | 0.18 | 1.15 | 1.33 | (0.20 | ) | (0.44 | ) | 0.00 | (0.64 | ) | |||||||||||||||||||||||||
06/30/2017 | 9.79 | 0.17 | 1.07 | 1.24 | (0.21 | ) | (0.32 | ) | 0.00 | (0.53 | ) | |||||||||||||||||||||||||
06/30/2016 | 9.86 | 0.18 | 0.07 | 0.25 | (0.10 | ) | (0.22 | ) | 0.00 | (0.32 | ) | |||||||||||||||||||||||||
06/05/2015 - 06/30/2015 | 10.00 | 0.01 | (0.15 | ) | (0.14 | ) | 0.00 | 0.00 | 0.00 | 0.00 | ||||||||||||||||||||||||||
| Class C | ||||||||||||||||||||||||||||||||||||
06/30/2018 | 10.34 | 0.10 | 1.13 | 1.23 | (0.15 | ) | (0.44 | ) | 0.00 | (0.59 | ) | |||||||||||||||||||||||||
06/30/2017 | 9.71 | 0.09 | 1.06 | 1.15 | (0.20 | ) | (0.32 | ) | 0.00 | (0.52 | ) | |||||||||||||||||||||||||
06/30/2016 | 9.85 | 0.11 | 0.06 | 0.17 | (0.09 | ) | (0.22 | ) | 0.00 | (0.31 | ) | |||||||||||||||||||||||||
06/05/2015 - 06/30/2015 | 10.00 | 0.01 | (0.16 | ) | (0.15 | ) | 0.00 | 0.00 | 0.00 | 0.00 | ||||||||||||||||||||||||||
PIMCO RAE US Small Fund | ||||||||||||||||||||||||||||||||||||
| Institutional Class | ||||||||||||||||||||||||||||||||||||
06/30/2018 | $ | 11.10 | $ | 0.15 | $ | 1.63 | $ | 1.78 | $ | (0.17 | ) | $ | (0.38 | ) | $ | 0.00 | $ | (0.55 | ) | |||||||||||||||||
06/30/2017 | 9.31 | 0.12 | 1.81 | 1.93 | (0.14 | ) | 0.00 | 0.00 | (0.14 | ) | ||||||||||||||||||||||||||
06/30/2016 | 9.93 | 0.10 | (0.57 | ) | (0.47 | ) | (0.04 | ) | (0.11 | ) | 0.00 | (0.15 | ) | |||||||||||||||||||||||
06/05/2015 - 06/30/2015 | 10.00 | 0.01 | (0.08 | ) | (0.07 | ) | 0.00 | 0.00 | 0.00 | 0.00 | ||||||||||||||||||||||||||
| 22 | PIMCO EQUITY SERIES | See Accompanying Notes |
Table of Contents
| Ratios/Supplemental Data | ||||||||||||||||||||||||||||||||||
| Ratios to Average Net Assets(c) | ||||||||||||||||||||||||||||||||||
Net Asset Value End of | Total Return | Net Assets End of Year or Period (000s) | Expenses | Expenses Excluding Waivers | Expenses Excluding Interest Expense | Expenses Excluding Interest Expense and | Net Investment Income (Loss) | Portfolio Turnover | ||||||||||||||||||||||||||
| $ | 10.45 | 4.83 | % | $ | 1,623 | 1.10 | % | 1.87 | % | 1.10 | % | 1.87 | % | 2.12 | % | 9 | % | |||||||||||||||||
| 10.34 | 22.68 | 1,009 | 1.10 | 1.86 | 1.10 | 1.86 | 0.99 | 8 | ||||||||||||||||||||||||||
| 8.61 | (11.90 | ) | 354 | 1.10 | 1.86 | 1.10 | 1.86 | (0.67 | ) | 8 | ||||||||||||||||||||||||
| 9.85 | (1.50 | ) | 10 | 1.11 | * | 1.94 | * | 1.11 | * | 1.94 | * | (1.12 | )* | 2 | ||||||||||||||||||||
| $ | 10.60 | 5.88 | % | $ | 543,875 | 0.51 | % | 0.62 | % | 0.51 | % | 0.62 | % | 3.04 | % | 47 | % | |||||||||||||||||
| 10.27 | 22.76 | 475,759 | 0.50 | 0.61 | 0.50 | 0.61 | 2.90 | 20 | ||||||||||||||||||||||||||
| 8.56 | (10.60 | ) | 247,182 | 0.50 | 0.61 | 0.50 | 0.61 | 3.25 | 39 | |||||||||||||||||||||||||
| 9.83 | (1.70 | ) | 151,532 | 0.50 | * | 0.64 | * | 0.50 | * | 0.64 | * | 2.68 | * | 7 | ||||||||||||||||||||
| 10.57 | 5.84 | 1,994 | 0.61 | 0.72 | 0.61 | 0.72 | 2.33 | 47 | ||||||||||||||||||||||||||
| 10.24 | 22.67 | 4,998 | 0.60 | 0.71 | 0.60 | 0.71 | 3.03 | 20 | ||||||||||||||||||||||||||
| 8.55 | (10.70 | ) | 1,041 | 0.60 | 0.71 | 0.60 | 0.71 | 3.24 | 39 | |||||||||||||||||||||||||
| 9.83 | (1.70 | ) | 10 | 0.60 | * | 0.74 | * | 0.60 | * | 0.74 | * | 2.57 | * | 7 | ||||||||||||||||||||
| 10.53 | 5.53 | 5,007 | 0.86 | 0.97 | 0.86 | 0.97 | 3.34 | 47 | ||||||||||||||||||||||||||
| 10.24 | 22.34 | 323 | 0.85 | 0.96 | 0.85 | 0.96 | 2.99 | 20 | ||||||||||||||||||||||||||
| 8.55 | (10.95 | ) | 46 | 0.85 | 0.96 | 0.85 | 0.96 | 3.94 | 39 | |||||||||||||||||||||||||
| 9.83 | (1.70 | ) | 10 | 0.85 | * | 0.99 | * | 0.85 | * | 0.99 | * | 2.32 | * | 7 | ||||||||||||||||||||
| 10.32 | 4.76 | 877 | 1.61 | 1.72 | 1.61 | 1.72 | 1.88 | 47 | ||||||||||||||||||||||||||
| 10.07 | 21.44 | 507 | 1.60 | 1.71 | 1.60 | 1.71 | 1.69 | 20 | ||||||||||||||||||||||||||
| 8.45 | (11.69 | ) | 300 | 1.60 | 1.71 | 1.60 | 1.71 | 3.28 | 39 | |||||||||||||||||||||||||
| 9.83 | (1.70 | ) | 10 | 1.60 | * | 1.74 | * | 1.60 | * | 1.74 | * | 1.56 | * | 7 | ||||||||||||||||||||
| $ | 11.30 | 13.22 | % | $ | 771,581 | 0.41 | % | 0.52 | % | 0.41 | % | 0.52 | % | 2.06 | % | 44 | % | |||||||||||||||||
| 10.57 | 13.33 | 620,951 | 0.40 | 0.51 | 0.40 | 0.51 | 2.08 | 31 | ||||||||||||||||||||||||||
| 9.82 | 3.16 | 511,838 | 0.40 | 0.51 | 0.40 | 0.51 | 2.29 | 42 | ||||||||||||||||||||||||||
| 9.85 | (1.50 | ) | 447,755 | 0.40 | * | 0.51 | * | 0.40 | * | 0.51 | * | 2.03 | * | 5 | ||||||||||||||||||||
| 11.26 | 13.10 | 7,265 | 0.51 | 0.62 | 0.51 | 0.62 | 1.96 | 44 | ||||||||||||||||||||||||||
| 10.54 | 13.15 | 7,769 | 0.50 | 0.61 | 0.50 | 0.61 | 1.99 | 31 | ||||||||||||||||||||||||||
| 9.81 | 3.09 | 3,372 | 0.50 | 0.61 | 0.50 | 0.61 | 2.23 | 42 | ||||||||||||||||||||||||||
| 9.85 | (1.50 | ) | 10 | 0.50 | * | 0.61 | * | 0.50 | * | 0.61 | * | 1.92 | * | 5 | ||||||||||||||||||||
| 11.19 | 12.73 | 6,973 | 0.81 | 0.92 | 0.81 | 0.92 | 1.65 | 44 | ||||||||||||||||||||||||||
| 10.50 | 12.83 | 7,259 | 0.80 | 0.91 | 0.80 | 0.91 | 1.68 | 31 | ||||||||||||||||||||||||||
| 9.79 | 2.67 | 2,982 | 0.80 | 0.91 | 0.80 | 0.91 | 1.88 | 42 | ||||||||||||||||||||||||||
| 9.86 | (1.40 | ) | 14 | 0.80 | * | 0.91 | * | 0.80 | * | 0.91 | * | 1.67 | * | 5 | ||||||||||||||||||||
| 10.98 | 11.98 | 4,714 | 1.56 | 1.67 | 1.56 | 1.67 | 0.91 | 44 | ||||||||||||||||||||||||||
| 10.34 | 11.94 | 5,452 | 1.55 | 1.66 | 1.55 | 1.66 | 0.92 | 31 | ||||||||||||||||||||||||||
| 9.71 | 1.89 | 1,765 | 1.55 | 1.66 | 1.55 | 1.66 | 1.15 | 42 | ||||||||||||||||||||||||||
| 9.85 | (1.50 | ) | 10 | 1.55 | * | 1.66 | * | 1.55 | * | 1.66 | * | 0.86 | * | 5 | ||||||||||||||||||||
| $ | 12.33 | 16.37 | % | $ | 128,985 | 0.50 | % | 0.62 | % | 0.50 | % | 0.62 | % | 1.30 | % | 30 | % | |||||||||||||||||
| 11.10 | 20.70 | 93,541 | 0.50 | 0.61 | 0.50 | 0.61 | 1.13 | 45 | ||||||||||||||||||||||||||
| 9.31 | (4.68 | ) | 81,226 | 0.50 | 0.61 | 0.50 | 0.61 | 1.10 | 85 | |||||||||||||||||||||||||
| 9.93 | (0.70 | ) | 46,426 | 0.50 | * | 0.73 | * | 0.50 | * | 0.73 | * | 1.44 | * | 9 | ||||||||||||||||||||
| ANNUAL REPORT | JUNE 30, 2018 | 23 |
Table of Contents
Financial Highlights (Cont.)
| Investment Operations | Less Distributions(b) | |||||||||||||||||||||||||||||||||||
| Selected Per Share Data for the Year or Period Ended^: | Net Asset Value Beginning of Year or | Net Investment Income (Loss)(a) | Net Realized/ Unrealized Gain (Loss) | Total | From Net Investment Income | Realized Capital Gains | Tax Basis Return of Capital | Total | ||||||||||||||||||||||||||||
PIMCO RAE US Small Fund (Cont.) | ||||||||||||||||||||||||||||||||||||
| I-2 | ||||||||||||||||||||||||||||||||||||
06/30/2018 | $ | 11.07 | $ | 0.14 | $ | 1.62 | $ | 1.76 | $ | (0.16 | ) | $ | (0.38 | ) | $ | 0.00 | $ | (0.54 | ) | |||||||||||||||||
06/30/2017 | 9.29 | 0.12 | 1.79 | 1.91 | (0.13 | ) | 0.00 | 0.00 | (0.13 | ) | ||||||||||||||||||||||||||
06/30/2016 | 9.92 | 0.11 | (0.59 | ) | (0.48 | ) | (0.04 | ) | (0.11 | ) | 0.00 | (0.15 | ) | |||||||||||||||||||||||
06/05/2015 - 06/30/2015 | 10.00 | 0.01 | (0.09 | ) | (0.08 | ) | 0.00 | 0.00 | 0.00 | 0.00 | ||||||||||||||||||||||||||
| Class A | ||||||||||||||||||||||||||||||||||||
06/30/2018 | 11.05 | 0.09 | 1.62 | 1.71 | (0.14 | ) | (0.38 | ) | 0.00 | (0.52 | ) | |||||||||||||||||||||||||
06/30/2017 | 9.29 | 0.10 | 1.79 | 1.89 | (0.13 | ) | 0.00 | 0.00 | (0.13 | ) | ||||||||||||||||||||||||||
06/30/2016 | 9.92 | 0.08 | (0.60 | ) | (0.52 | ) | (0.00 | ) | (0.11 | ) | 0.00 | (0.11 | ) | |||||||||||||||||||||||
06/05/2015 - 06/30/2015 | 10.00 | 0.01 | (0.09 | ) | (0.08 | ) | 0.00 | 0.00 | 0.00 | 0.00 | ||||||||||||||||||||||||||
| Class C | ||||||||||||||||||||||||||||||||||||
06/30/2018 | 10.87 | 0.02 | 1.58 | 1.60 | (0.11 | ) | (0.38 | ) | 0.00 | (0.49 | ) | |||||||||||||||||||||||||
06/30/2017 | 9.19 | 0.01 | 1.77 | 1.78 | (0.10 | ) | 0.00 | 0.00 | (0.10 | ) | ||||||||||||||||||||||||||
06/30/2016 | 9.91 | 0.01 | (0.58 | ) | (0.57 | ) | (0.04 | ) | (0.11 | ) | 0.00 | (0.15 | ) | |||||||||||||||||||||||
06/05/2015 - 06/30/2015 | 10.00 | 0.00 | (0.09 | ) | (0.09 | ) | 0.00 | 0.00 | 0.00 | 0.00 | ||||||||||||||||||||||||||
| ^ | A zero balance may reflect actual amounts rounding to less than $0.01 or 0.01%. |
| * | Annualized |
| (a) | Per share amounts based on average number of shares outstanding during the year or period. |
| (b) | The tax characterization of distributions is determined in accordance with Federal income tax regulations. See Note 2, Distributions to Shareholders, in the Notes to Financial Statements for more information. |
| (c) | Ratios shown do not include expenses of the investment companies in which a Fund may invest. See Note 9, Fees and Expenses, in the Notes to Financial Statements for more information regarding the expenses and any applicable fee waivers associated with these investments. |
| 24 | PIMCO EQUITY SERIES | See Accompanying Notes |
Table of Contents
| Ratios/Supplemental Data | ||||||||||||||||||||||||||||||||||
| Ratios to Average Net Assets(c) | ||||||||||||||||||||||||||||||||||
Net Asset Value End of | Total Return | Net Assets End of Year or Period (000s) | Expenses | Expenses Excluding Waivers | Expenses Excluding Interest Expense | Expenses Excluding Interest Expense and | Net Investment Income (Loss) | Portfolio Turnover | ||||||||||||||||||||||||||
| $ | 12.29 | 16.27 | % | $ | 4,366 | 0.60 | % | 0.72 | % | 0.60 | % | 0.72 | % | 1.19 | % | 30 | % | |||||||||||||||||
| 11.07 | 20.59 | 3,902 | 0.60 | 0.71 | 0.60 | 0.71 | 1.12 | 45 | ||||||||||||||||||||||||||
| 9.29 | (4.79 | ) | 1,456 | 0.60 | 0.71 | 0.60 | 0.71 | 1.26 | 85 | |||||||||||||||||||||||||
| 9.92 | (0.80 | ) | 10 | 0.60 | * | 0.83 | * | 0.60 | * | 0.83 | * | 1.33 | * | 9 | ||||||||||||||||||||
| 12.24 | 15.83 | 4,875 | 0.90 | 1.02 | 0.90 | 1.02 | 0.82 | 30 | ||||||||||||||||||||||||||
| 11.05 | 20.32 | 8,549 | 0.90 | 1.01 | 0.90 | 1.01 | 0.88 | 45 | ||||||||||||||||||||||||||
| 9.29 | (5.11 | ) | 1,699 | 0.90 | 1.01 | 0.90 | 1.01 | 0.85 | 85 | |||||||||||||||||||||||||
| 9.92 | (0.80 | ) | 10 | 0.90 | * | 1.13 | * | 0.90 | * | 1.13 | * | 1.04 | * | 9 | ||||||||||||||||||||
| 11.98 | 15.03 | 768 | 1.65 | 1.77 | 1.65 | 1.77 | 0.16 | 30 | ||||||||||||||||||||||||||
| 10.87 | 19.37 | 558 | 1.65 | 1.76 | 1.65 | 1.76 | 0.08 | 45 | ||||||||||||||||||||||||||
| 9.19 | (5.69 | ) | 247 | 1.65 | 1.76 | 1.65 | 1.76 | 0.08 | 85 | |||||||||||||||||||||||||
| 9.91 | (0.90 | ) | 10 | 1.65 | * | 1.88 | * | 1.65 | * | 1.88 | * | 0.28 | * | 9 | ||||||||||||||||||||
| ANNUAL REPORT | JUNE 30, 2018 | 25 |
Table of Contents
Statements of Assets and Liabilities
| (Amounts in thousands†, except per share amounts) | PIMCO RAE Emerging Markets Fund | PIMCO RAE Global Fund | PIMCO RAE Global ex-US Fund | PIMCO RAE International Fund | PIMCO RAE US Fund | PIMCO RAE US Small Fund | ||||||||||||||||||
Assets: | ||||||||||||||||||||||||
Investments, at value | ||||||||||||||||||||||||
Investments in securities* | $ | 1,864,438 | $ | 173 | $ | 0 | $ | 545,556 | $ | 791,050 | $ | 138,802 | ||||||||||||
Investments in Affiliates | 0 | 366,045 | 79,969 | 0 | 0 | 0 | ||||||||||||||||||
Cash | 0 | 1 | 79 | 0 | 0 | 1 | ||||||||||||||||||
Foreign currency, at value | 3,160 | 0 | 0 | 2,254 | 0 | 0 | ||||||||||||||||||
Receivable for investments sold | 1,417 | 0 | 0 | 13,931 | 0 | 1 | ||||||||||||||||||
Receivable for Fund shares sold | 7 | 0 | 0 | 1,708 | 391 | 0 | ||||||||||||||||||
Interest and/or dividends receivable | 8,369 | 0 | 0 | 2,125 | 929 | 251 | ||||||||||||||||||
Reimbursement receivable from PIMCO | 357 | 224 | 54 | 59 | 81 | 14 | ||||||||||||||||||
Other assets | 3 | 0 | 0 | 13 | 0 | 0 | ||||||||||||||||||
Total Assets | 1,877,751 | 366,443 | 80,102 | 565,646 | 792,451 | 139,069 | ||||||||||||||||||
Liabilities: | ||||||||||||||||||||||||
Payable for investments purchased | $ | 3 | $ | 0 | $ | 0 | $ | 4 | $ | 0 | $ | 0 | ||||||||||||
Payable for Fund shares redeemed | 0 | 2 | 0 | 16 | 1,561 | 0 | ||||||||||||||||||
Overdraft due to custodian | 395 | 0 | 0 | 13,566 | 0 | 0 | ||||||||||||||||||
Accrued investment advisory fees | 815 | 127 | 28 | 152 | 175 | 42 | ||||||||||||||||||
Accrued supervisory and administrative fees | 735 | 95 | 24 | 153 | 177 | 31 | ||||||||||||||||||
Accrued distribution fees | 1 | 1 | 1 | 1 | 3 | 1 | ||||||||||||||||||
Accrued servicing fees | 2 | 1 | 1 | 1 | 2 | 1 | ||||||||||||||||||
Total Liabilities | 1,951 | 226 | 54 | 13,893 | 1,918 | 75 | ||||||||||||||||||
Net Assets | $ | 1,875,800 | $ | 366,217 | $ | 80,048 | $ | 551,753 | $ | 790,533 | $ | 138,994 | ||||||||||||
Net Assets Consist of: | ||||||||||||||||||||||||
Paid in capital | $ | 1,517,057 | $ | 302,161 | $ | 73,982 | $ | 483,462 | $ | 601,810 | $ | 106,611 | ||||||||||||
Undistributed (overdistributed) net investment income | 7,303 | (6 | ) | (3 | ) | 9,392 | 6,001 | 152 | ||||||||||||||||
Accumulated undistributed net realized gain (loss) | 102,661 | 7,812 | (238 | ) | (434 | ) | 8,163 | 3,939 | ||||||||||||||||
Net unrealized appreciation (depreciation) | 248,779 | 56,250 | 6,307 | 59,333 | 174,559 | 28,292 | ||||||||||||||||||
Net Assets | $ | 1,875,800 | $ | 366,217 | $ | 80,048 | $ | 551,753 | $ | 790,533 | $ | 138,994 | ||||||||||||
Cost of investments in securities | $ | 1,615,622 | $ | 173 | $ | 0 | $ | 486,210 | $ | 616,491 | $ | 110,510 | ||||||||||||
Cost of investments in Affiliates | $ | 0 | $ | 309,795 | $ | 73,662 | $ | 0 | $ | 0 | $ | 0 | ||||||||||||
Cost of foreign currency held | $ | 3,167 | $ | 0 | $ | 0 | $ | 2,253 | $ | 0 | $ | 0 | ||||||||||||
* Includes repurchase agreements of: | $ | 4,731 | $ | 173 | $ | 0 | $ | 0 | $ | 4,267 | $ | 541 | ||||||||||||
| † | A zero balance may reflect actual amounts rounding to less than one thousand. |
| 26 | PIMCO EQUITY SERIES | See Accompanying Notes |
Table of Contents
June 30, 2018
| PIMCO RAE Emerging Markets Fund | PIMCO RAE Global Fund | PIMCO RAE Global ex-US Fund | PIMCO RAE International Fund | PIMCO RAE US Fund | PIMCO RAE US Small Fund | |||||||||||||||||||
Net Assets: | ||||||||||||||||||||||||
Institutional Class | $ | 1,848,953 | $ | 359,953 | $ | 75,994 | $ | 543,875 | $ | 771,581 | $ | 128,985 | ||||||||||||
I-2 | 17,486 | 3,293 | 900 | 1,994 | 7,265 | 4,366 | ||||||||||||||||||
Class A | 7,350 | 1,505 | 1,531 | 5,007 | 6,973 | 4,875 | ||||||||||||||||||
Class C | 2,011 | 1,466 | 1,623 | 877 | 4,714 | 768 | ||||||||||||||||||
Shares Issued and Outstanding: | ||||||||||||||||||||||||
Institutional Class | 172,182 | 32,603 | 7,114 | 51,299 | 68,287 | 10,462 | ||||||||||||||||||
I-2 | 1,637 | 299 | 85 | 189 | 645 | 355 | ||||||||||||||||||
Class A | 688 | 137 | 144 | 475 | 623 | 398 | ||||||||||||||||||
Class C | 192 | 136 | 155 | 85 | 429 | 64 | ||||||||||||||||||
Net Asset Value Per Share Outstanding: | ||||||||||||||||||||||||
Institutional Class | $ | 10.74 | $ | 11.04 | $ | 10.68 | $ | 10.60 | $ | 11.30 | $ | 12.33 | ||||||||||||
I-2 | 10.68 | 11.01 | 10.65 | 10.57 | 11.26 | 12.29 | ||||||||||||||||||
Class A | 10.68 | 10.95 | 10.61 | 10.53 | 11.19 | 12.24 | ||||||||||||||||||
Class C | 10.48 | 10.76 | 10.45 | 10.32 | 10.98 | 11.98 | ||||||||||||||||||
| ANNUAL REPORT | JUNE 30, 2018 | 27 |
Table of Contents
| Year Ended June 30, 2018 | ||||||||||||||||||||||||
| (Amounts in thousands†) | PIMCO RAE Emerging Markets Fund | PIMCO RAE Global Fund | PIMCO RAE Global ex-US Fund | PIMCO RAE International Fund | PIMCO RAE US Fund | PIMCO RAE US Small Fund | ||||||||||||||||||
Investment Income: | ||||||||||||||||||||||||
Interest | $ | 49 | $ | 2 | $ | 1 | $ | 9 | $ | 25 | $ | 4 | ||||||||||||
Dividends, net of foreign taxes* | 54,828 | 0 | 0 | 18,823 | 16,592 | 2,079 | ||||||||||||||||||
Dividends from Investments in Affiliates | 0 | 12,901 | 2,872 | 0 | 0 | 0 | ||||||||||||||||||
Total Income | 54,877 | 12,903 | 2,873 | 18,832 | 16,617 | 2,083 | ||||||||||||||||||
Expenses: | ||||||||||||||||||||||||
Investment advisory fees | 9,501 | 1,675 | 343 | 1,595 | 1,685 | 406 | ||||||||||||||||||
Supervisory and administrative fees | 8,576 | 1,262 | 304 | 1,603 | 1,711 | 305 | ||||||||||||||||||
Distribution fees - Class C | 16 | 12 | 12 | 7 | 38 | 5 | ||||||||||||||||||
Servicing fees - Class A | 13 | 3 | 3 | 6 | 19 | 17 | ||||||||||||||||||
Servicing fees - Class C | 6 | 4 | 4 | 2 | 13 | 2 | ||||||||||||||||||
Trustee fees | 126 | 30 | 6 | 36 | 46 | 8 | ||||||||||||||||||
Interest expense | 11 | 5 | 0 | 13 | 6 | 0 | ||||||||||||||||||
Miscellaneous expense | 103 | 31 | 14 | 36 | 43 | 15 | ||||||||||||||||||
Total Expenses | 18,352 | 3,022 | 686 | 3,298 | 3,561 | 758 | ||||||||||||||||||
Waiver and/or Reimbursement by PIMCO | (3,936 | ) | (2,936 | ) | (659 | ) | (577 | ) | (730 | ) | (134 | ) | ||||||||||||
Net Expenses | 14,416 | 86 | 27 | 2,721 | 2,831 | 624 | ||||||||||||||||||
Net Investment Income (Loss) | 40,461 | 12,817 | 2,846 | 16,111 | 13,786 | 1,459 | ||||||||||||||||||
Net Realized Gain (Loss): | ||||||||||||||||||||||||
Investments in securities | 157,809 | 0 | 0 | 11,931 | 16,790 | 7,106 | ||||||||||||||||||
Investments in Affiliates | 0 | 11,117 | 487 | 0 | 0 | 0 | ||||||||||||||||||
Net capital gain distributions received from Affiliate investments | 0 | 6,166 | 240 | 0 | 0 | 0 | ||||||||||||||||||
Over the counter financial derivative instruments | 311 | 0 | 0 | (21 | ) | 0 | 0 | |||||||||||||||||
Foreign currency | (1,118 | ) | 0 | 0 | (185 | ) | 0 | 0 | ||||||||||||||||
Net Realized Gain (Loss) | 157,002 | 17,283 | 727 | 11,725 | 16,790 | 7,106 | ||||||||||||||||||
Net Change in Unrealized Appreciation (Depreciation): | ||||||||||||||||||||||||
Investments in securities | (85,660 | ) | 0 | 0 | (8,845 | ) | 47,903 | 9,575 | ||||||||||||||||
Investments in Affiliates | 0 | 7,299 | 1,530 | 0 | 0 | 0 | ||||||||||||||||||
Over the counter financial derivative instruments | 2 | 0 | 0 | 0 | 0 | 0 | ||||||||||||||||||
Foreign currency assets and liabilities | 45 | 0 | 0 | (31 | ) | 0 | 0 | |||||||||||||||||
Net Change in Unrealized Appreciation (Depreciation) | (85,613 | ) | 7,299 | 1,530 | (8,876 | ) | 47,903 | 9,575 | ||||||||||||||||
Net Increase (Decrease) in Net Assets Resulting from Operations | $ | 111,850 | $ | 37,399 | $ | 5,103 | $ | 18,960 | $ | 78,479 | $ | 18,140 | ||||||||||||
* Foreign tax withholdings - Dividends | $ | 7,538 | $ | 0 | $ | 0 | $ | 1,842 | $ | 1 | $ | 0 | ||||||||||||
| † | A zero balance may reflect actual amounts rounding to less than one thousand. |
| 28 | PIMCO EQUITY SERIES | See Accompanying Notes |
Table of Contents
(THIS PAGE INTENTIONALLY LEFT BLANK)
| ANNUAL REPORT | JUNE 30, 2018 | 29 |
Table of Contents
Statements of Changes in Net Assets
| PIMCO RAE Emerging Markets Fund | PIMCO RAE Global Fund | PIMCO RAE Global ex-US Fund | ||||||||||||||||||||||
| (Amounts in thousands†) | Year Ended June 30, 2018 | Year Ended June 30, 2017 | Year Ended June 30, 2018 | Year Ended June 30, 2017 | Year Ended June 30, 2018 | Year Ended June 30, 2017 | ||||||||||||||||||
Increase (Decrease) in Net Assets from: | ||||||||||||||||||||||||
Operations: | ||||||||||||||||||||||||
Net investment income (loss) | $ | 40,461 | $ | 29,711 | $ | 12,817 | $ | 9,024 | $ | 2,846 | $ | 1,572 | ||||||||||||
Net realized gain (loss) | 157,002 | 96,595 | 17,283 | 6,425 | 727 | (306 | ) | |||||||||||||||||
Net change in unrealized appreciation (depreciation) | (85,613 | ) | 239,626 | 7,299 | 51,717 | 1,530 | 13,744 | |||||||||||||||||
Net Increase (Decrease) in Net Assets Resulting from Operations | 111,850 | 365,932 | 37,399 | 67,166 | 5,103 | 15,010 | ||||||||||||||||||
Distributions to Shareholders: | ||||||||||||||||||||||||
From net investment income | ||||||||||||||||||||||||
Institutional Class | (31,636 | ) | (40,860 | ) | (16,750 | ) | (9,363 | ) | (3,011 | ) | (1,557 | ) | ||||||||||||
I-2 | (260 | ) | (92 | ) | (148 | ) | (4 | ) | (16 | ) | (1 | ) | ||||||||||||
Class A | (75 | ) | (40 | ) | (41 | ) | (12 | ) | (29 | ) | (4 | ) | ||||||||||||
Class C | (29 | ) | (9 | ) | (61 | ) | (21 | ) | (47 | ) | (10 | ) | ||||||||||||
From net realized capital gains | ||||||||||||||||||||||||
Institutional Class | (112,594 | ) | 0 | (9,742 | ) | (3,530 | ) | 0 | 0 | |||||||||||||||
I-2 | (999 | ) | 0 | (87 | ) | (1 | ) | 0 | 0 | |||||||||||||||
Class A | (286 | ) | 0 | (26 | ) | (5 | ) | 0 | 0 | |||||||||||||||
Class C | (137 | ) | 0 | (40 | ) | (10 | ) | 0 | 0 | |||||||||||||||
Tax basis return of capital | ||||||||||||||||||||||||
Institutional Class | 0 | 0 | 0 | 0 | (381 | ) | (126 | ) | ||||||||||||||||
I-2 | 0 | 0 | 0 | 0 | (3 | ) | 0 | |||||||||||||||||
Class A | 0 | 0 | 0 | 0 | (6 | ) | 0 | |||||||||||||||||
Class C | 0 | 0 | 0 | 0 | (7 | ) | (2 | ) | ||||||||||||||||
Total Distributions(a) | (146,016 | ) | (41,001 | ) | (26,895 | ) | (12,946 | ) | (3,500 | ) | (1,700 | ) | ||||||||||||
Portfolio Share Transactions: | ||||||||||||||||||||||||
Net increase (decrease) resulting from Portfolio share transactions** | 381,301 | (177,538 | ) | (59,036 | ) | 77,245 | (2,240 | ) | 4,194 | |||||||||||||||
Total Increase (Decrease) in Net Assets | 347,135 | 147,393 | (48,532 | ) | 131,465 | (637 | ) | 17,504 | ||||||||||||||||
Net Assets: | ||||||||||||||||||||||||
Beginning of year | 1,528,665 | 1,381,272 | 414,749 | 283,284 | 80,685 | 63,181 | ||||||||||||||||||
End of year* | $ | 1,875,800 | $ | 1,528,665 | $ | 366,217 | $ | 414,749 | $ | 80,048 | $ | 80,685 | ||||||||||||
* Including undistributed (overdistributed) net investment income of: | $ | 7,303 | $ | 146 | $ | (6 | ) | $ | (6 | ) | $ | (3 | ) | $ | (3 | ) | ||||||||
| † | A zero balance may reflect actual amounts rounding to less than one thousand. |
| ** | See Note 13, Shares of Beneficial Interest, in the Notes to Financial Statements. |
| (a) | The tax characterization of distributions is determined in accordance with Federal income tax regulations. See Note 2, Distributions to Shareholders, in the Notes to Financial Statements for more information. |
| 30 | PIMCO EQUITY SERIES | See Accompanying Notes |
Table of Contents
| PIMCO RAE International Fund | PIMCO RAE US Fund | PIMCO RAE US Small Fund | ||||||||||||||||||||
| Year Ended June 30, 2018 | Year Ended June 30, 2017 | Year Ended June 30, 2018 | Year Ended June 30, 2017 | Year Ended June 30, 2018 | Year Ended June 30, 2017 | |||||||||||||||||
| $ | 16,111 | $ | 9,950 | $ | 13,786 | $ | 12,040 | $ | 1,459 | $ | 1,101 | |||||||||||
| 11,725 | 4,152 | 16,790 | 26,145 | 7,106 | 8,359 | |||||||||||||||||
| (8,876 | ) | 56,171 | 47,903 | 33,222 | 9,575 | 8,156 | ||||||||||||||||
| 18,960 | 70,273 | 78,479 | 71,407 | 18,140 | 17,616 | |||||||||||||||||
| (12,799 | ) | (7,439 | ) | (12,630 | ) | (12,165 | ) | (1,435 | ) | (1,184 | ) | |||||||||||
| (122 | ) | (152 | ) | (156 | ) | (138 | ) | (60 | ) | (22 | ) | |||||||||||
| (61 | ) | (1 | ) | (143 | ) | (103 | ) | (99 | ) | (39 | ) | |||||||||||
| (20 | ) | (9 | ) | (71 | ) | (94 | ) | (6 | ) | (4 | ) | |||||||||||
| (302 | ) | 0 | (24,086 | ) | (16,709 | ) | (3,201 | ) | 0 | |||||||||||||
| (3 | ) | 0 | (312 | ) | (167 | ) | (137 | ) | 0 | |||||||||||||
| (1 | ) | 0 | (304 | ) | (137 | ) | (272 | ) | 0 | |||||||||||||
| (1 | ) | 0 | (196 | ) | (133 | ) | (23 | ) | 0 | |||||||||||||
| 0 | 0 | 0 | 0 | 0 | 0 | |||||||||||||||||
| 0 | 0 | 0 | 0 | 0 | 0 | |||||||||||||||||
| 0 | 0 | 0 | 0 | 0 | 0 | |||||||||||||||||
| 0 | 0 | 0 | 0 | 0 | 0 | |||||||||||||||||
| (13,309 | ) | (7,601 | ) | (37,898 | ) | (29,646 | ) | (5,233 | ) | (1,249 | ) | |||||||||||
| 64,515 | 170,346 | 108,521 | 79,713 | 19,537 | 5,555 | |||||||||||||||||
| 70,166 | 233,018 | 149,102 | 121,474 | 32,444 | 21,922 | |||||||||||||||||
| 481,587 | 248,569 | 641,431 | 519,957 | 106,550 | 84,628 | |||||||||||||||||
| $ | 551,753 | $ | 481,587 | $ | 790,533 | $ | 641,431 | $ | 138,994 | $ | 106,550 | |||||||||||
| $ | 9,392 | $ | 6,420 | $ | 6,001 | $ | 5,215 | $ | 152 | $ | 292 | |||||||||||
| ANNUAL REPORT | JUNE 30, 2018 | 31 |
Table of Contents
Schedule of Investments PIMCO RAE Emerging Markets Fund
(Amounts in thousands*, except number of shares, contracts and units, if any)
| SHARES | MARKET VALUE (000S) | |||||||||||
| INVESTMENTS IN SECURITIES 99.4% |
| |||||||||||
| COMMON STOCKS 97.8% |
| |||||||||||
| AUSTRALIA 0.0% |
| |||||||||||
| MATERIALS 0.0% |
| |||||||||||
MMG Ltd. (a) | 372,000 | $ | 259 | |||||||||
|
| |||||||||||
Total Australia | 259 | |||||||||||
|
| |||||||||||
| BRAZIL 4.7% |
| |||||||||||
| CONSUMER DISCRETIONARY 0.2% |
| |||||||||||
Grendene S.A. | 268,500 | 549 | ||||||||||
Guararapes Confeccoes S.A. | 4,600 | 112 | ||||||||||
MRV Engenharia e Participacoes S.A. | 163,500 | 508 | ||||||||||
Via Varejo S.A. | 500,900 | 2,405 | ||||||||||
|
| |||||||||||
| 3,574 | ||||||||||||
|
| |||||||||||
| CONSUMER STAPLES 0.6% |
| |||||||||||
Ambev S.A. ADR | 113,057 | 523 | ||||||||||
BRF S.A. (a) | 119,100 | 553 | ||||||||||
JBS S.A. | 2,317,600 | 5,561 | ||||||||||
Marfrig Global Foods S.A. (a) | 1,130,600 | 2,375 | ||||||||||
Natura Cosmeticos S.A. | 220,900 | 1,725 | ||||||||||
|
| |||||||||||
| 10,737 | ||||||||||||
|
| |||||||||||
| ENERGY 0.5% |
| |||||||||||
Petroleo Brasileiro S.A. SP - ADR | 994,594 | 9,976 | ||||||||||
|
| |||||||||||
| FINANCIALS 1.4% |
| |||||||||||
Banco Bradesco S.A. ADR | 854,503 | 5,862 | ||||||||||
Banco BTG Pactual S.A. | 250,986 | 1,198 | ||||||||||
Banco do Brasil S.A. | 1,234,300 | 9,124 | ||||||||||
Banco Santander Brasil S.A. | 46,300 | 350 | ||||||||||
Itau Unibanco Holding S.A. SP - ADR ‘H’ | 783,433 | 8,132 | ||||||||||
Porto Seguro S.A. | 51,100 | 536 | ||||||||||
PPLA Participations Ltd. (a) | 10,876 | 3 | ||||||||||
Sul America S.A. | 137,146 | 647 | ||||||||||
|
| |||||||||||
| 25,852 | ||||||||||||
|
| |||||||||||
| INDUSTRIALS 0.1% |
| |||||||||||
Embraer S.A. SP - ADR | 56,541 | 1,408 | ||||||||||
|
| |||||||||||
| MATERIALS 1.4% |
| |||||||||||
Cia Siderurgica Nacional S.A. SP - ADR (a) | 766,997 | 1,549 | ||||||||||
Duratex S.A. | 57,100 | 128 | ||||||||||
Fibria Celulose S.A. - ADR | 174,999 | 3,253 | ||||||||||
Gerdau S.A. SP - ADR | 207,158 | 734 | ||||||||||
Nexa Resources S.A. | 35,986 | 424 | ||||||||||
Vale S.A. | 1,539,539 | 19,698 | ||||||||||
|
| |||||||||||
| 25,786 | ||||||||||||
|
| |||||||||||
| TELECOMMUNICATION SERVICES 0.1% |
| |||||||||||
Telefonica Brasil S.A. ADR | 54,800 | 651 | ||||||||||
TIM Participacoes S.A. ADR | 104,692 | 1,765 | ||||||||||
|
| |||||||||||
| 2,416 | ||||||||||||
|
| |||||||||||
| UTILITIES 0.4% |
| |||||||||||
AES Tiete Energia S.A. | 420,500 | 1,047 | ||||||||||
Cia de Saneamento de Minas Gerais-COPASA | 38,500 | 407 | ||||||||||
| SHARES | MARKET VALUE (000S) | |||||||||||
Cia Energetica de Minas | 2,705,861 | $ | 4,979 | |||||||||
Engie Brasil Energia S.A. | 38,100 | 337 | ||||||||||
Light S.A. | 177,300 | 515 | ||||||||||
Transmissora Alianca de Energia Eletrica S.A. | 98,900 | 477 | ||||||||||
|
| |||||||||||
| 7,762 | ||||||||||||
|
| |||||||||||
Total Brazil | 87,511 | |||||||||||
|
| |||||||||||
| CHILE 0.8% |
| |||||||||||
| CONSUMER DISCRETIONARY 0.0% |
| |||||||||||
Ripley Corp. S.A. | 809,914 | 769 | ||||||||||
|
| |||||||||||
| CONSUMER STAPLES 0.1% |
| |||||||||||
Cencosud S.A. | 894,108 | 2,210 | ||||||||||
Cia Cervecerias Unidas S.A. | 6,271 | 156 | ||||||||||
|
| |||||||||||
| 2,366 | ||||||||||||
|
| |||||||||||
| ENERGY 0.1% |
| |||||||||||
Empresas COPEC S.A. | 76,721 | 1,174 | ||||||||||
|
| |||||||||||
| FINANCIALS 0.2% |
| |||||||||||
Banco de Chile | 4,449,781 | 688 | ||||||||||
Banco Santander Chile ADR | 45,042 | 1,416 | ||||||||||
Sociedad Matriz del Banco de Chile S.A. ‘B’ | 2,068,377 | 994 | ||||||||||
|
| |||||||||||
| 3,098 | ||||||||||||
|
| |||||||||||
| MATERIALS 0.3% |
| |||||||||||
Antofagasta PLC | 128,198 | 1,666 | ||||||||||
CAP S.A. | 209,588 | 2,084 | ||||||||||
Empresas CMPC S.A. | 555,234 | 2,022 | ||||||||||
|
| |||||||||||
| 5,772 | ||||||||||||
|
| |||||||||||
| UTILITIES 0.1% |
| |||||||||||
AES Gener S.A. | 763,651 | 189 | ||||||||||
Enel Americas S.A. ADR | 71,872 | 633 | ||||||||||
Enel Chile S.A. | 11,003,083 | 1,086 | ||||||||||
|
| |||||||||||
| 1,908 | ||||||||||||
|
| |||||||||||
Total Chile | 15,087 | |||||||||||
|
| |||||||||||
| CHINA 24.0% |
| |||||||||||
| CONSUMER DISCRETIONARY 0.2% |
| |||||||||||
BAIC Motor Corp. Ltd. | 200,000 | 190 | ||||||||||
Dongfeng Motor Group Co. Ltd. ‘H’ | 1,402,000 | 1,478 | ||||||||||
GOME Retail Holdings Ltd. | 14,250,000 | 1,451 | ||||||||||
Great Wall Motor Co. Ltd. ‘H’ | 564,500 | 429 | ||||||||||
Shanghai Jin Jiang International Hotels Group Co. Ltd. | 920,000 | 372 | ||||||||||
|
| |||||||||||
| 3,920 | ||||||||||||
|
| |||||||||||
| CONSUMER STAPLES 0.3% |
| |||||||||||
Hengan International Group Co. Ltd. | 84,500 | 810 | ||||||||||
Tingyi Cayman Islands Holding Corp. | 1,510,000 | 3,503 | ||||||||||
Uni-President China Holdings Ltd. | 244,000 | 313 | ||||||||||
| SHARES | MARKET VALUE (000S) | |||||||||||
Want Want China Holdings Ltd. | 1,918,000 | $ | 1,706 | |||||||||
|
| |||||||||||
| 6,332 | ||||||||||||
|
| |||||||||||
| ENERGY 3.6% |
| |||||||||||
China Coal Energy Co. Ltd. ‘H’ | 455,000 | 188 | ||||||||||
China Oilfield Services Ltd. ‘H’ | 320,000 | 301 | ||||||||||
China Petroleum & Chemical Corp. ‘H’ | 20,236,400 | 18,114 | ||||||||||
China Shenhua Energy Co. Ltd. ‘H’ | 3,987,500 | 9,431 | ||||||||||
CNOOC Ltd. | 17,026,000 | 29,175 | ||||||||||
PetroChina Co. Ltd. ‘H’ | 12,134,000 | 9,244 | ||||||||||
Yanzhou Coal Mining Co. Ltd. ‘H’ | 470,000 | 612 | ||||||||||
|
| |||||||||||
| 67,065 | ||||||||||||
|
| |||||||||||
| FINANCIALS 12.6% |
| |||||||||||
Agricultural Bank of China Ltd. ‘H’ | 37,430,000 | 17,470 | ||||||||||
Bank of China Ltd. ‘H’ | 83,668,000 | 41,493 | ||||||||||
Bank of Chongqing Co. Ltd. ‘H’ | 1,019,000 | 646 | ||||||||||
Bank of Communications Co. Ltd. ‘H’ | 11,039,000 | 8,449 | ||||||||||
China Cinda Asset Management Co. Ltd. ‘H’ | 3,956,000 | 1,267 | ||||||||||
China CITIC Bank Corp. Ltd. ‘H’ | 11,149,000 | 6,963 | ||||||||||
China Construction Bank Corp. ‘H’ | 82,708,000 | 75,681 | ||||||||||
China Everbright Bank Co. Ltd. ‘H’ | 4,132,000 | 1,773 | ||||||||||
China Huarong Asset Management Co. Ltd. ‘H’ | 7,377,000 | 2,126 | ||||||||||
China Life Insurance Co. Ltd. ‘H’ | 914,000 | 2,345 | ||||||||||
China Merchants Bank Co. Ltd. ‘H’ | 1,626,000 | 5,981 | ||||||||||
China Minsheng Banking Corp. Ltd. ‘H’ | 6,838,920 | 4,887 | ||||||||||
Chongqing Rural Commercial Bank Co. Ltd. ‘H’ | 4,988,000 | 2,961 | ||||||||||
CSC Financial Co. Ltd. ‘H’ | 1,003,000 | 712 | ||||||||||
Industrial & Commercial Bank of China Ltd. ‘H’ | 56,615,000 | 42,226 | ||||||||||
People’s Insurance Co. Group of China Ltd. ‘H’ | 9,291,000 | 4,349 | ||||||||||
PICC Property & Casualty Co. Ltd. ‘H’ | 1,092,000 | 1,174 | ||||||||||
Ping An Insurance Group Co. of China Ltd. ‘H’ | 926,500 | 8,484 | ||||||||||
Postal Savings Bank of China Co. Ltd. ‘H’ | 10,829,000 | 7,030 | ||||||||||
|
| |||||||||||
| 236,017 | ||||||||||||
|
| |||||||||||
| HEALTH CARE 0.2% |
| |||||||||||
China Resources Pharmaceutical Group Ltd. | 2,487,000 | 3,439 | ||||||||||
Sihuan Pharmaceutical Holdings Group Ltd. | 1,163,000 | 258 | ||||||||||
Sinopharm Group Co. Ltd. | 95,200 | 383 | ||||||||||
|
| |||||||||||
| 4,080 | ||||||||||||
|
| |||||||||||
| INDUSTRIALS 1.0% |
| |||||||||||
Air China Ltd. ‘H’ | 1,208,000 | 1,161 | ||||||||||
China Communications Construction Co. Ltd. ‘H’ | 1,012,000 | 975 | ||||||||||
China Eastern Airlines Corp. Ltd. ‘H’ | 1,020,000 | 688 | ||||||||||
| 32 | PIMCO EQUITY SERIES | See Accompanying Notes |
Table of Contents
June 30, 2018
| SHARES | MARKET VALUE (000S) | |||||||||||
China Lesso Group Holdings Ltd. | 746,000 | $ | 472 | |||||||||
China Machinery Engineering Corp. | 349,000 | 167 | ||||||||||
China Railway Construction Corp. Ltd. ‘H’ | 629,500 | 637 | ||||||||||
China Railway Group Ltd. ‘H’ | 582,000 | 439 | ||||||||||
China Southern Airlines Co. Ltd. ‘H’ | 2,552,000 | 2,000 | ||||||||||
COSCO SHIPPING Energy Transportation Co. Ltd. | 384,000 | 185 | ||||||||||
Country Garden Services Holdings Co. Ltd. (a) | 92,298 | 118 | ||||||||||
Dongfang Electric Corp. Ltd.‘H’ | 170,800 | 112 | ||||||||||
Fosun International Ltd. | 256,500 | 480 | ||||||||||
Harbin Electric Co. Ltd. ‘H’ | 2,586,000 | 756 | ||||||||||
Jiangsu Expressway Co. Ltd. ‘H’ | 280,000 | 333 | ||||||||||
Shenzhen Expressway Co. Ltd. ‘H’ | 196,000 | 192 | ||||||||||
Sinopec Engineering Group Co. Ltd. ‘H’ | 1,619,000 | 1,689 | ||||||||||
Sinotrans Ltd. ‘H’ | 1,977,000 | 1,040 | ||||||||||
Sinotruk Hong Kong Ltd. | 1,438,000 | 2,357 | ||||||||||
Weichai Power Co. Ltd. ‘H’ | 905,000 | 1,243 | ||||||||||
Yangzijiang Shipbuilding Holdings Ltd. | 2,284,900 | 1,512 | ||||||||||
Zhejiang Expressway Co. Ltd. ‘H’ | 1,420,000 | 1,265 | ||||||||||
Zoomlion Heavy Industry Science and Technology Co. Ltd. ‘H’ | 2,296,200 | 977 | ||||||||||
|
| |||||||||||
| 18,798 | ||||||||||||
|
| |||||||||||
| INFORMATION TECHNOLOGY 0.8% |
| |||||||||||
AVIC International Holdings Ltd. | 348,000 | 198 | ||||||||||
Changyou.com Ltd. ADR | 43,649 | 727 | ||||||||||
Fang Holdings Ltd. ADR (a) | 75,070 | 291 | ||||||||||
FIH Mobile Ltd. | 1,748,000 | 271 | ||||||||||
Legend Holdings Corp. ‘H’ | 1,000,700 | 3,043 | ||||||||||
Lenovo Group Ltd. | 13,896,000 | 7,480 | ||||||||||
Sohu.com Ltd. ADR (a) | 48,954 | 1,738 | ||||||||||
ZTE Corp. ‘H’ (a) | 66,200 | 100 | ||||||||||
|
| |||||||||||
| 13,848 | ||||||||||||
|
| |||||||||||
| MATERIALS 1.5% |
| |||||||||||
Anhui Conch Cement Co. Ltd. ‘H’ | 343,500 | 1,959 | ||||||||||
China BlueChemical Ltd. ‘H’ | 5,404,000 | 1,984 | ||||||||||
China Hongqiao Group Ltd. | 369,000 | 347 | ||||||||||
China National Building Material Co. Ltd. ‘H’ | 21,169,400 | 20,836 | ||||||||||
China Zhongwang Holdings Ltd. | 3,711,200 | 1,960 | ||||||||||
Jiangxi Copper Co. Ltd. ‘H’ | 434,000 | 551 | ||||||||||
Maanshan Iron & Steel Co. Ltd. ‘H’ (a) | 458,000 | 203 | ||||||||||
|
| |||||||||||
| 27,840 | ||||||||||||
|
| |||||||||||
| REAL ESTATE 2.4% |
| |||||||||||
Agile Group Holdings Ltd. | 4,130,000 | 7,027 | ||||||||||
Beijing Capital Land Ltd. ‘H’ | 1,604,000 | 689 | ||||||||||
Central China Real Estate Ltd. | 1,968,000 | 917 | ||||||||||
China Aoyuan Property Group Ltd. | 1,104,000 | 804 | ||||||||||
China Evergrande Group | 485,000 | 1,231 | ||||||||||
China SCE Property Holdings Ltd. | 427,000 | 202 | ||||||||||
China Vanke Co. Ltd. ‘H’ | 147,300 | 514 | ||||||||||
| SHARES | MARKET VALUE (000S) | |||||||||||
CIFI Holdings Group Co. Ltd. | 638,000 | $ | 404 | |||||||||
Country Garden Holdings Co. Ltd. | 803,000 | 1,408 | ||||||||||
Fantasia Holdings Group Co. Ltd. | 4,131,000 | 686 | ||||||||||
Future Land Development Holdings Ltd. | 2,361,138 | 2,127 | ||||||||||
Greentown China Holdings Ltd. | 2,102,500 | 2,809 | ||||||||||
Guangzhou R&F Properties Co. Ltd. ‘H’ | 2,320,600 | 4,657 | ||||||||||
Kaisa Group Holdings Ltd. | 4,025,000 | 1,712 | ||||||||||
KWG Property Holding Ltd. | 2,722,000 | 3,400 | ||||||||||
Logan Property Holdings Co. Ltd. | 438,000 | 590 | ||||||||||
Longfor Properties Co. Ltd. | 585,000 | 1,573 | ||||||||||
Powerlong Real Estate Holdings Ltd. | 3,071,000 | 1,653 | ||||||||||
Red Star Macalline Group Corp. Ltd. ‘H’ | 512,000 | 690 | ||||||||||
Shui On Land Ltd. | 9,791,000 | 2,476 | ||||||||||
Sino-Ocean Group Holding Ltd. | 6,162,000 | 3,566 | ||||||||||
SOHO China Ltd. | 7,199,500 | 3,415 | ||||||||||
Times China Holdings Ltd. | 515,000 | 764 | ||||||||||
Yuzhou Properties Co. Ltd. | 2,943,000 | 1,729 | ||||||||||
|
| |||||||||||
| 45,043 | ||||||||||||
|
| |||||||||||
| TELECOMMUNICATION SERVICES 0.6% |
| |||||||||||
China Communications Services Corp. Ltd. ‘H’ | 3,634,000 | 2,297 | ||||||||||
China Telecom Corp. Ltd. ‘H’ | 20,598,000 | 9,665 | ||||||||||
|
| |||||||||||
| 11,962 | ||||||||||||
|
| |||||||||||
| UTILITIES 0.8% |
| |||||||||||
Beijing Jingneng Clean Energy Co. Ltd. ‘H’ | 2,012,000 | 466 | ||||||||||
China Datang Corp. Renewable Power Co. Ltd. | 987,000 | 168 | ||||||||||
China Longyuan Power Group Corp. Ltd. ‘H’ | 1,910,000 | 1,534 | ||||||||||
Datang International Power Generation Co. Ltd. ‘H’ (a) | 8,244,000 | 2,515 | ||||||||||
ENN Energy Holdings Ltd. | 20,000 | 196 | ||||||||||
Huadian Fuxin Energy Corp. Ltd. ‘H’ | 6,028,000 | 1,410 | ||||||||||
Huadian Power International Corp. Ltd. ‘H’ | 6,708,000 | 2,647 | ||||||||||
Huaneng Power International, Inc. ‘H’ | 9,332,000 | 6,167 | ||||||||||
|
| |||||||||||
| 15,103 | ||||||||||||
|
| |||||||||||
Total China | 450,008 | |||||||||||
|
| |||||||||||
| GREECE 1.4% |
| |||||||||||
| CONSUMER DISCRETIONARY 0.1% |
| |||||||||||
FF Group «(a) | 51,384 | 288 | ||||||||||
OPAP S.A. | 181,918 | 2,051 | ||||||||||
|
| |||||||||||
| 2,339 | ||||||||||||
|
| |||||||||||
| ENERGY 0.1% |
| |||||||||||
Hellenic Petroleum S.A. | 49,185 | 410 | ||||||||||
Motor Oil Hellas Corinth Refineries S.A. | 21,952 | 441 | ||||||||||
|
| |||||||||||
| 851 | ||||||||||||
|
| |||||||||||
| SHARES | MARKET VALUE (000S) | |||||||||||
| FINANCIALS 1.1% |
| |||||||||||
Alpha Bank AE (a) | 3,797,284 | $ | 8,462 | |||||||||
Eurobank Ergasias S.A. (a) | 706,769 | 735 | ||||||||||
National Bank of Greece S.A. (a) | 22,990,297 | 7,016 | ||||||||||
Piraeus Bank S.A. (a) | 1,275,299 | 4,315 | ||||||||||
|
| |||||||||||
| 20,528 | ||||||||||||
|
| |||||||||||
| TELECOMMUNICATION SERVICES 0.1% |
| |||||||||||
Hellenic Telecommunications Organization S.A. | 219,323 | 2,706 | ||||||||||
|
| |||||||||||
| UTILITIES 0.0% |
| |||||||||||
Public Power Corp. S.A. (a) | 220,031 | 474 | ||||||||||
|
| |||||||||||
Total Greece | 26,898 | |||||||||||
|
| |||||||||||
| HONG KONG 5.6% |
| |||||||||||
| CONSUMER DISCRETIONARY 0.1% |
| |||||||||||
China Travel International Investment Hong Kong Ltd. | 3,476,000 | 1,352 | ||||||||||
Dah Chong Hong Holdings Ltd. | 1,417,000 | 704 | ||||||||||
|
| |||||||||||
| 2,056 | ||||||||||||
|
| |||||||||||
| CONSUMER STAPLES 0.6% |
| |||||||||||
China Agri-Industries Holdings Ltd. | 2,944,000 | 1,123 | ||||||||||
China Resources Beer Holdings Co. Ltd. | 2,244,000 | 10,866 | ||||||||||
|
| |||||||||||
| 11,989 | ||||||||||||
|
| |||||||||||
| ENERGY 0.2% |
| |||||||||||
Kunlun Energy Co. Ltd. | 3,854,000 | 3,366 | ||||||||||
|
| |||||||||||
| FINANCIALS 0.6% |
| |||||||||||
BOC Hong Kong Holdings Ltd. | 1,163,000 | 5,466 | ||||||||||
China Everbright Ltd. | 278,000 | 509 | ||||||||||
China Taiping Insurance Holdings Co. Ltd. | 1,801,800 | 5,602 | ||||||||||
Far East Horizon Ltd. | 359,000 | 347 | ||||||||||
|
| |||||||||||
| 11,924 | ||||||||||||
|
| |||||||||||
| INDUSTRIALS 0.7% |
| |||||||||||
China Merchants Port Holdings Co. Ltd. | 276,000 | 559 | ||||||||||
CITIC Ltd. | 5,593,000 | 7,868 | ||||||||||
COSCO SHIPPING Ports Ltd. | 2,212,000 | 1,840 | ||||||||||
Shanghai Industrial Holdings Ltd. | 1,000,000 | 2,323 | ||||||||||
Shenzhen International Holdings Ltd. | 283,000 | 584 | ||||||||||
Tianjin Port Development Holdings Ltd. | 2,540,000 | 307 | ||||||||||
|
| |||||||||||
| 13,481 | ||||||||||||
|
| |||||||||||
| MATERIALS 0.3% |
| |||||||||||
China Resources Cement Holdings Ltd. | 3,194,000 | 3,214 | ||||||||||
Shougang Fushan Resources Group Ltd. | 7,462,000 | 1,771 | ||||||||||
|
| |||||||||||
| 4,985 | ||||||||||||
|
| |||||||||||
| See Accompanying Notes | ANNUAL REPORT | JUNE 30, 2018 | 33 |
Table of Contents
Schedule of Investments PIMCO RAE Emerging Markets Fund (Cont.)
| SHARES | MARKET VALUE (000S) | |||||||||||
| REAL ESTATE 1.0% |
| |||||||||||
China Jinmao Holdings Group Ltd. | 7,058,000 | $ | 3,531 | |||||||||
China Overseas Grand Oceans Group Ltd. | 2,582,000 | 947 | ||||||||||
China Overseas Land & Investment Ltd. | 810,000 | 2,658 | ||||||||||
China Resources Land Ltd. | 894,000 | 3,003 | ||||||||||
Joy City Property Ltd. | 832,000 | 104 | ||||||||||
Poly Property Group Co. Ltd. | 7,036,000 | 2,895 | ||||||||||
Shenzhen Investment Ltd. | 4,960,000 | 1,802 | ||||||||||
Yuexiu Property Co. Ltd. | 19,676,000 | 3,747 | ||||||||||
|
| |||||||||||
| 18,687 | ||||||||||||
|
| |||||||||||
| TELECOMMUNICATION SERVICES 1.5% |
| |||||||||||
China Mobile Ltd. | 2,291,500 | 20,333 | ||||||||||
China Unicom Hong Kong Ltd. | 6,918,000 | 8,623 | ||||||||||
|
| |||||||||||
| 28,956 | ||||||||||||
|
| |||||||||||
| UTILITIES 0.6% |
| |||||||||||
Beijing Enterprises Holdings Ltd. | 32,000 | 155 | ||||||||||
China Power International Development Ltd. | 16,112,000 | 3,711 | ||||||||||
China Resources Power Holdings Co. Ltd. | 3,670,000 | 6,450 | ||||||||||
|
| |||||||||||
| 10,316 | ||||||||||||
|
| |||||||||||
Total Hong Kong | 105,760 | |||||||||||
|
| |||||||||||
| INDIA 4.5% |
| |||||||||||
| CONSUMER DISCRETIONARY 0.2% |
| |||||||||||
Tata Motors Ltd. | 821,618 | 3,225 | ||||||||||
|
| |||||||||||
| ENERGY 0.6% |
| |||||||||||
Coal India Ltd. | 827,741 | 3,191 | ||||||||||
Oil & Natural Gas Corp. Ltd. | 1,284,319 | 2,962 | ||||||||||
Oil India Ltd. | 256,311 | 788 | ||||||||||
Reliance Industries Ltd. | 320,609 | 4,559 | ||||||||||
|
| |||||||||||
| 11,500 | ||||||||||||
|
| |||||||||||
| FINANCIALS 1.5% |
| |||||||||||
Aditya Birla Capital Ltd. (a) | 94,818 | 184 | ||||||||||
Allahabad Bank | 1,720,447 | 1,051 | ||||||||||
Andhra Bank (a) | 3,513,434 | 1,667 | ||||||||||
Bank of Baroda | 842,443 | 1,389 | ||||||||||
Bank of India (a) | 842,441 | 1,077 | ||||||||||
Canara Bank | 576,761 | 2,120 | ||||||||||
ICICI Bank Ltd. | 817,500 | 3,280 | ||||||||||
IDBI Bank Ltd. (a) | 514,150 | 413 | ||||||||||
IDFC Ltd. | 257,000 | 174 | ||||||||||
Indian Bank (a) | 90,650 | 454 | ||||||||||
Oriental Bank of Commerce (a) | 1,708,729 | 1,891 | ||||||||||
Power Finance Corp. Ltd. | 1,455,292 | 1,646 | ||||||||||
Punjab National Bank (a) | 1,201,791 | 1,340 | ||||||||||
Rural Electrification Corp. Ltd. | 1,796,040 | 2,771 | ||||||||||
State Bank of India | 1,328,096 | 5,032 | ||||||||||
Syndicate Bank | 990,920 | 597 | ||||||||||
Union Bank of India | 1,814,689 | 2,179 | ||||||||||
|
| |||||||||||
| 27,265 | ||||||||||||
|
| |||||||||||
| INDUSTRIALS 0.4% |
| |||||||||||
Adani Enterprises Ltd. | 930,400 | 1,532 | ||||||||||
| SHARES | MARKET VALUE (000S) | |||||||||||
Bharat Heavy Electricals Ltd. | 880,956 | $ | 924 | |||||||||
GMR Infrastructure Ltd. (a) | 1,163,229 | 262 | ||||||||||
Jaiprakash Associates Ltd. (a) | 19,703,351 | 4,602 | ||||||||||
|
| |||||||||||
| 7,320 | ||||||||||||
|
| |||||||||||
| INFORMATION TECHNOLOGY 0.0% |
| |||||||||||
Infosys Ltd. SP - ADR | 11,985 | 233 | ||||||||||
Mphasis Ltd. | 24,090 | 380 | ||||||||||
Tech Mahindra Ltd. | 19,302 | 184 | ||||||||||
|
| |||||||||||
| 797 | ||||||||||||
|
| |||||||||||
| MATERIALS 1.3% |
| |||||||||||
Hindalco Industries Ltd. | 1,114,483 | 3,748 | ||||||||||
Jindal Steel & Power Ltd. (a) | 1,856,413 | 6,041 | ||||||||||
National Aluminium Co. Ltd. | 805,510 | 761 | ||||||||||
NMDC Ltd. | 155,459 | 245 | ||||||||||
Steel Authority of India Ltd. (a) | 1,003,129 | 1,214 | ||||||||||
Tata Chemicals Ltd. | 113,762 | 1,156 | ||||||||||
Tata Steel Ltd. | 887,415 | 7,346 | ||||||||||
Vedanta Ltd. | 468,904 | 1,618 | ||||||||||
Vedanta Resources PLC | 203,924 | 1,730 | ||||||||||
|
| |||||||||||
| 23,859 | ||||||||||||
|
| |||||||||||
| REAL ESTATE 0.0% |
| |||||||||||
DLF Ltd. | 104,717 | 289 | ||||||||||
|
| |||||||||||
| TELECOMMUNICATION SERVICES 0.2% |
| |||||||||||
Bharti Airtel Ltd. | 74,994 | 418 | ||||||||||
Idea Cellular Ltd. (a) | 125,689 | 108 | ||||||||||
Reliance Communications Ltd. (a) | 17,420,307 | 3,468 | ||||||||||
|
| |||||||||||
| 3,994 | ||||||||||||
|
| |||||||||||
| UTILITIES 0.3% |
| |||||||||||
Adani Green Energy Ltd. (a) | 708,034 | 280 | ||||||||||
Adani Power Ltd. (a) | 1,185,770 | 279 | ||||||||||
CESC Ltd. | 15,099 | 202 | ||||||||||
Jaiprakash Power Ventures Ltd. (a) | 3,337,994 | 141 | ||||||||||
JSW Energy Ltd. | 785,430 | 748 | ||||||||||
NHPC Ltd. | 3,047,482 | 1,046 | ||||||||||
NTPC Ltd. | 317,117 | 738 | ||||||||||
Reliance Infrastructure Ltd. | 241,332 | 1,380 | ||||||||||
Reliance Power Ltd. (a) | 699,040 | 326 | ||||||||||
Tata Power Co. Ltd. | 1,352,354 | 1,455 | ||||||||||
|
| |||||||||||
| 6,595 | ||||||||||||
|
| |||||||||||
Total India | 84,844 | |||||||||||
|
| |||||||||||
| INDONESIA 1.0% |
| |||||||||||
| CONSUMER DISCRETIONARY 0.0% |
| |||||||||||
Astra International Tbk PT | 1,407,800 | 648 | ||||||||||
|
| |||||||||||
| CONSUMER STAPLES 0.1% |
| |||||||||||
Indofood Sukses Makmur Tbk PT | 2,296,700 | 1,066 | ||||||||||
|
| |||||||||||
| ENERGY 0.2% |
| |||||||||||
Adaro Energy Tbk PT | 8,115,900 | 1,013 | ||||||||||
Bukit Asam Tbk PT | 3,048,190 | 842 | ||||||||||
Indo Tambangraya Megah Tbk PT | 1,340,300 | 2,090 | ||||||||||
| SHARES | MARKET VALUE (000S) | |||||||||||
United Tractors Tbk PT | 491,700 | $ | 1,083 | |||||||||
|
| |||||||||||
| 5,028 | ||||||||||||
|
| |||||||||||
| FINANCIALS 0.3% |
| |||||||||||
Bank CIMB Niaga Tbk PT | 1,542,000 | 102 | ||||||||||
Bank Danamon Indonesia Tbk PT | 1,293,600 | 576 | ||||||||||
Bank Mandiri Persero Tbk PT | 3,540,000 | 1,694 | ||||||||||
Bank Negara Indonesia Persero Tbk PT | 2,575,900 | 1,266 | ||||||||||
Bank Rakyat Indonesia Persero Tbk PT | 8,621,900 | 1,705 | ||||||||||
Bank Tabungan Negara Persero Tbk PT | 788,500 | 134 | ||||||||||
|
| |||||||||||
| 5,477 | ||||||||||||
|
| |||||||||||
| INDUSTRIALS 0.0% |
| |||||||||||
Berlian Laju Tanker Tbk PT «(a) | 707,200 | 0 | ||||||||||
|
| |||||||||||
| MATERIALS 0.2% |
| |||||||||||
Indah Kiat Pulp & Paper Corp. Tbk PT | 3,166,300 | 4,106 | ||||||||||
Indocement Tunggal Prakarsa Tbk PT | 607,700 | 578 | ||||||||||
Semen Indonesia Persero Tbk PT | 965,100 | 479 | ||||||||||
|
| |||||||||||
| 5,163 | ||||||||||||
|
| |||||||||||
| TELECOMMUNICATION SERVICES 0.1% |
| |||||||||||
Telekomunikasi Indonesia Persero Tbk PT | 3,089,600 | 809 | ||||||||||
XL Axiata Tbk PT | 841,500 | 148 | ||||||||||
|
| |||||||||||
| 957 | ||||||||||||
|
| |||||||||||
| UTILITIES 0.1% |
| |||||||||||
Perusahaan Gas Negara Persero Tbk | 7,089,500 | 984 | ||||||||||
|
| |||||||||||
Total Indonesia | 19,323 | |||||||||||
|
| |||||||||||
| MALAYSIA 2.0% |
| |||||||||||
| CONSUMER DISCRETIONARY 0.2% |
| |||||||||||
Astro Malaysia Holdings Bhd. | 834,600 | 328 | ||||||||||
DRB-Hicom Bhd. | 3,701,000 | 1,793 | ||||||||||
Genting Bhd. | 1,020,000 | 2,122 | ||||||||||
UMW Holdings Bhd. | 284,500 | 421 | ||||||||||
|
| |||||||||||
| 4,664 | ||||||||||||
|
| |||||||||||
| CONSUMER STAPLES 0.2% |
| |||||||||||
British American Tobacco Malaysia Bhd. | 185,400 | 1,596 | ||||||||||
Felda Global Ventures Holdings Bhd. | 2,878,700 | 1,076 | ||||||||||
Sime Darby Plantation Bhd. | 283,900 | 373 | ||||||||||
|
| |||||||||||
| 3,045 | ||||||||||||
|
| |||||||||||
| ENERGY 0.1% |
| |||||||||||
Sapura Energy Bhd. (a) | 12,564,400 | 1,986 | ||||||||||
|
| |||||||||||
| FINANCIALS 0.9% |
| |||||||||||
Alliance Bank Malaysia Bhd. | 419,400 | 420 | ||||||||||
AMMB Holdings Bhd. | 1,857,800 | 1,723 | ||||||||||
CIMB Group Holdings Bhd. | 2,617,400 | 3,529 | ||||||||||
Hong Leong Bank Bhd. | 44,700 | 201 | ||||||||||
| 34 | PIMCO EQUITY SERIES | See Accompanying Notes |
Table of Contents
June 30, 2018
| SHARES | MARKET VALUE (000S) | |||||||||||
Malayan Banking Bhd. | 2,967,900 | $ | 6,610 | |||||||||
Public Bank Bhd. | 370,800 | 2,145 | ||||||||||
RHB Bank Bhd. | 1,056,900 | 1,426 | ||||||||||
|
| |||||||||||
| 16,054 | ||||||||||||
|
| |||||||||||
| INDUSTRIALS 0.2% |
| |||||||||||
AirAsia Group Bhd. | 1,853,200 | 1,373 | ||||||||||
Berjaya Corp. Bhd. (a) | 4,595,200 | 340 | ||||||||||
IJM Corp. Bhd. | 291,200 | 129 | ||||||||||
MISC Bhd. | 195,200 | 286 | ||||||||||
Sime Darby Bhd. | 1,407,200 | 853 | ||||||||||
|
| |||||||||||
| 2,981 | ||||||||||||
|
| |||||||||||
| MATERIALS 0.0% |
| |||||||||||
Petronas Chemicals Group Bhd. | 175,900 | 367 | ||||||||||
|
| |||||||||||
| REAL ESTATE 0.0% |
| |||||||||||
Sime Darby Property Bhd. | 283,900 | 84 | ||||||||||
Sunway Bhd. | 1,986,533 | 762 | ||||||||||
|
| |||||||||||
| 846 | ||||||||||||
|
| |||||||||||
| TELECOMMUNICATION SERVICES 0.1% |
| |||||||||||
Axiata Group Bhd. | 1,330,900 | 1,253 | ||||||||||
Maxis Bhd. | 233,500 | 316 | ||||||||||
Telekom Malaysia Bhd. | 964,400 | 742 | ||||||||||
|
| |||||||||||
| 2,311 | ||||||||||||
|
| |||||||||||
| UTILITIES 0.3% |
| |||||||||||
Malakoff Corp. Bhd. | 2,414,400 | 493 | ||||||||||
Tenaga Nasional Bhd. | 782,700 | 2,838 | ||||||||||
YTL Corp. Bhd. | 3,922,202 | 1,097 | ||||||||||
YTL Power International Bhd. | 1,933,914 | 492 | ||||||||||
|
| |||||||||||
| 4,920 | ||||||||||||
|
| |||||||||||
Total Malaysia | 37,174 | |||||||||||
|
| |||||||||||
| MALTA 0.0% |
| |||||||||||
| FINANCIALS 0.0% |
| |||||||||||
Brait SE | 65,820 | 204 | ||||||||||
|
| |||||||||||
Total Malta | 204 | |||||||||||
|
| |||||||||||
| MEXICO 1.8% |
| |||||||||||
| CONSUMER DISCRETIONARY 0.0% |
| |||||||||||
Megacable Holdings S.A.B. de C.V. | 44,200 | 182 | ||||||||||
|
| |||||||||||
| CONSUMER STAPLES 0.3% |
| |||||||||||
Coca-Cola Femsa S.A.B. de C.V. SP - ADR | 9,294 | 524 | ||||||||||
Fomento Economico Mexicano S.A.B. de C.V. SP - ADR | 21,265 | 1,867 | ||||||||||
Grupo Bimbo S.A.B. de C.V. ‘A’ | 465,300 | 907 | ||||||||||
Kimberly-Clark de Mexico S.A.B. de C.V. ‘A’ | 187,900 | 318 | ||||||||||
Wal-Mart de Mexico S.A.B. de C.V. | 720,300 | 1,901 | ||||||||||
|
| |||||||||||
| 5,517 | ||||||||||||
|
| |||||||||||
| FINANCIALS 0.3% |
| |||||||||||
Banco Santander Mexico S.A. Institucion de Banca Multiple Grupo Financiero Santand ADR | 103,046 | 689 | ||||||||||
| SHARES | MARKET VALUE (000S) | |||||||||||
Gentera S.A.B. de C.V. | 1,360,400 | $ | 1,199 | |||||||||
Grupo Elektra S.A.B. de C.V. | 28,835 | 786 | ||||||||||
Grupo Financiero Banorte S.A.B. de C.V. ‘O’ | 299,600 | 1,762 | ||||||||||
Grupo Financiero Inbursa S.A.B. de C.V. ‘O’ | 246,600 | 346 | ||||||||||
|
| |||||||||||
| 4,782 | ||||||||||||
|
| |||||||||||
| INDUSTRIALS 0.3% |
| |||||||||||
Alfa S.A.B. de C.V. ‘A’ | 4,124,100 | 4,789 | ||||||||||
|
| |||||||||||
| MATERIALS 0.4% |
| |||||||||||
Cemex S.A.B. de C.V. SP - ADR (a) | 836,868 | 5,490 | ||||||||||
Grupo Mexico S.A.B. de C.V. ‘B’ | 949,200 | 2,690 | ||||||||||
|
| |||||||||||
| 8,180 | ||||||||||||
|
| |||||||||||
| TELECOMMUNICATION SERVICES 0.5% |
| |||||||||||
America Movil S.A.B. de C.V. SP - ADR ‘L’ | 623,082 | 10,380 | ||||||||||
|
| |||||||||||
Total Mexico | 33,830 | |||||||||||
|
| |||||||||||
| PHILIPPINES 0.4% |
| |||||||||||
| FINANCIALS 0.0% |
| |||||||||||
Metropolitan Bank & Trust Co. | 139,455 | 192 | ||||||||||
|
| |||||||||||
| INDUSTRIALS 0.1% |
| |||||||||||
Alliance Global Group, Inc. (a) | 5,393,000 | 1,174 | ||||||||||
DMCI Holdings, Inc. | 1,751,800 | 345 | ||||||||||
San Miguel Corp. | 232,470 | 600 | ||||||||||
|
| |||||||||||
| 2,119 | ||||||||||||
|
| |||||||||||
| TELECOMMUNICATION SERVICES 0.3% |
| |||||||||||
Globe Telecom, Inc. | 22,680 | 654 | ||||||||||
PLDT, Inc. | 152,460 | 3,650 | ||||||||||
|
| |||||||||||
| 4,304 | ||||||||||||
|
| |||||||||||
| UTILITIES 0.0% |
| |||||||||||
Manila Electric Co. | 73,220 | 488 | ||||||||||
|
| |||||||||||
Total Philippines | 7,103 | |||||||||||
|
| |||||||||||
| POLAND 1.8% |
| |||||||||||
| ENERGY 0.2% |
| |||||||||||
Grupa Lotos S.A. | 62,046 | 940 | ||||||||||
Polski Koncern Naftowy ORLEN S.A. | 39,506 | 885 | ||||||||||
Polskie Gornictwo Naftowe i Gazownictwo S.A. | 1,331,590 | 2,027 | ||||||||||
|
| |||||||||||
| 3,852 | ||||||||||||
|
| |||||||||||
| FINANCIALS 0.8% |
| |||||||||||
Bank Handlowy w Warszawie S.A. | 33,170 | 626 | ||||||||||
Bank Millennium S.A. (a) | 78,236 | 167 | ||||||||||
Bank Polska Kasa Opieki S.A. | 160,400 | 4,828 | ||||||||||
Getin Noble Bank S.A. (a) | 1,505,212 | 401 | ||||||||||
Powszechna Kasa Oszczednosci Bank Polski S.A. (a) | 380,280 | 3,736 | ||||||||||
Powszechny Zaklad Ubezpieczen S.A. | 407,960 | 4,230 | ||||||||||
|
| |||||||||||
| 13,988 | ||||||||||||
|
| |||||||||||
| SHARES | MARKET VALUE (000S) | |||||||||||
| INFORMATION TECHNOLOGY 0.1% |
| |||||||||||
Asseco Poland S.A. | 96,012 | $ | 1,023 | |||||||||
|
| |||||||||||
| MATERIALS 0.2% |
| |||||||||||
Grupa Azoty S.A. | 9,319 | 107 | ||||||||||
Jastrzebska Spolka Weglowa S.A. | 13,511 | 275 | ||||||||||
KGHM Polska Miedz S.A. | 160,001 | 3,751 | ||||||||||
|
| |||||||||||
| 4,133 | ||||||||||||
|
| |||||||||||
| TELECOMMUNICATION SERVICES 0.1% |
| |||||||||||
Orange Polska S.A. | 1,768,809 | 2,184 | ||||||||||
PLAY Communications S.A. | 80,338 | 547 | ||||||||||
|
| |||||||||||
| 2,731 | ||||||||||||
|
| |||||||||||
| UTILITIES 0.4% |
| |||||||||||
Enea S.A. | 437,735 | 1,065 | ||||||||||
Energa S.A. | 820,088 | 1,951 | ||||||||||
PGE Polska Grupa Energetyczna S.A. (a) | 1,093,029 | 2,716 | ||||||||||
Tauron Polska Energia S.A. | 2,870,499 | 1,751 | ||||||||||
|
| |||||||||||
| 7,483 | ||||||||||||
|
| |||||||||||
Total Poland | 33,210 | |||||||||||
|
| |||||||||||
| RUSSIA 9.8% |
| |||||||||||
| CONSUMER DISCRETIONARY 0.0% |
| |||||||||||
M.Video PJSC | 27,340 | 176 | ||||||||||
|
| |||||||||||
| CONSUMER STAPLES 0.1% |
| |||||||||||
Magnit PJSC | 10,897 | 802 | ||||||||||
X5 Retail Group NV GDR | 64,859 | 1,713 | ||||||||||
|
| |||||||||||
| 2,515 | ||||||||||||
|
| |||||||||||
| ENERGY 6.7% |
| |||||||||||
Gazprom Neft PJSC SP - ADR | 55,312 | 1,411 | ||||||||||
Gazprom PJSC SP - ADR | 14,302,820 | 62,846 | ||||||||||
Lukoil PJSC SP - ADR | 498,842 | 33,994 | ||||||||||
Rosneft Oil, Co. PJSC GDR | 1,259,573 | 7,807 | ||||||||||
Surgutneftegas OJSC SP - ADR | 3,422,512 | 15,191 | ||||||||||
Tatneft PJSC SP - ADR | 57,394 | 3,615 | ||||||||||
TMK PJSC | 366,980 | 446 | ||||||||||
|
| |||||||||||
| 125,310 | ||||||||||||
|
| |||||||||||
| FINANCIALS 0.5% |
| |||||||||||
Sberbank of Russia PJSC | 519,933 | 7,437 | ||||||||||
VTB Bank PJSC GDR | 609,706 | 929 | ||||||||||
|
| |||||||||||
| 8,366 | ||||||||||||
|
| |||||||||||
| INDUSTRIALS 0.1% |
| |||||||||||
Aeroflot PJSC | 696,760 | 1,553 | ||||||||||
Globaltrans Investment PLC GDR | 75,640 | 772 | ||||||||||
|
| |||||||||||
| 2,325 | ||||||||||||
|
| |||||||||||
| INFORMATION TECHNOLOGY 0.0% |
| |||||||||||
Mail.Ru Group Ltd. SP - GDR (a) | 27,199 | 789 | ||||||||||
|
| |||||||||||
| MATERIALS 1.0% |
| |||||||||||
Alrosa PJSC | 132,700 | 211 | ||||||||||
Evraz PLC | 411,100 | 2,744 | ||||||||||
| See Accompanying Notes | ANNUAL REPORT | JUNE 30, 2018 | 35 |
Table of Contents
Schedule of Investments PIMCO RAE Emerging Markets Fund (Cont.)
| SHARES | MARKET VALUE (000S) | |||||||||||
Mechel PJSC SP - ADR | 673,901 | $ | 2,109 | |||||||||
MMC Norilsk Nickel PJSC ADR | 511,384 | 9,146 | ||||||||||
Novolipetsk Steel PJSC GDR | 21,709 | 530 | ||||||||||
PhosAgro PJSC GDR | 43,490 | 559 | ||||||||||
Polyus PJSC GDR | 11,785 | 387 | ||||||||||
Severstal PJSC GDR | 195,721 | 2,851 | ||||||||||
|
| |||||||||||
| 18,537 | ||||||||||||
|
| |||||||||||
| TELECOMMUNICATION SERVICES 1.0% |
| |||||||||||
MegaFon PJSC SP - GDR | 541,342 | 4,782 | ||||||||||
Mobile TeleSystems PJSC | 2,167,470 | 9,594 | ||||||||||
Rostelecom PJSC | 2,369,570 | 2,770 | ||||||||||
Sistema PJSC FC SP - GDR | 897,398 | 2,448 | ||||||||||
|
| |||||||||||
| 19,594 | ||||||||||||
|
| |||||||||||
| UTILITIES 0.4% |
| |||||||||||
Federal Grid Co. Unified Energy System PJSC | 385,860,000 | 1,150 | ||||||||||
Inter RAO UES PJSC | 9,678,000 | 630 | ||||||||||
Mosenergo PJSC | 11,879,000 | 443 | ||||||||||
Rosseti PJSC | 203,062,012 | 2,558 | ||||||||||
RusHydro PJSC | 118,522,000 | 1,278 | ||||||||||
Unipro PJSC | 10,847,000 | 500 | ||||||||||
|
| |||||||||||
| 6,559 | ||||||||||||
|
| |||||||||||
Total Russia | 184,171 | |||||||||||
|
| |||||||||||
| SINGAPORE 0.0% |
| |||||||||||
| INDUSTRIALS 0.0% |
| |||||||||||
BOC Aviation Ltd. | 102,100 | 634 | ||||||||||
|
| |||||||||||
Total Singapore | 634 | |||||||||||
|
| |||||||||||
| SOUTH AFRICA 4.9% |
| |||||||||||
| CONSUMER DISCRETIONARY 0.1% |
| |||||||||||
Imperial Holdings Ltd. | 138,289 | 1,973 | ||||||||||
Tsogo Sun Holdings Ltd. | 233,065 | 348 | ||||||||||
Woolworths Holdings Ltd. | 41,066 | 166 | ||||||||||
|
| |||||||||||
| 2,487 | ||||||||||||
|
| |||||||||||
| CONSUMER STAPLES 0.0% |
| |||||||||||
Massmart Holdings Ltd. | 56,671 | 461 | ||||||||||
|
| |||||||||||
| ENERGY 0.0% |
| |||||||||||
Exxaro Resources Ltd. | 56,128 | 513 | ||||||||||
|
| |||||||||||
| FINANCIALS 1.8% |
| |||||||||||
Barclays Africa Group Ltd. | 824,733 | 9,576 | ||||||||||
FirstRand Ltd. | 527,110 | 2,449 | ||||||||||
Investec Ltd. | 465,724 | 3,261 | ||||||||||
Liberty Holdings Ltd. | 402,942 | 3,417 | ||||||||||
MMI Holdings Ltd. | 1,566,711 | 2,019 | ||||||||||
Nedbank Group Ltd. | 196,959 | 3,577 | ||||||||||
Standard Bank Group Ltd. | 604,424 | 8,439 | ||||||||||
|
| |||||||||||
| 32,738 | ||||||||||||
|
| |||||||||||
| HEALTH CARE 0.2% |
| |||||||||||
Life Healthcare Group Holdings Ltd. | 586,540 | 1,064 | ||||||||||
Netcare Ltd. | 741,372 | 1,486 | ||||||||||
|
| |||||||||||
| 2,550 | ||||||||||||
|
| |||||||||||
| SHARES | MARKET VALUE (000S) | |||||||||||
| INDUSTRIALS 0.2% |
| |||||||||||
Barloworld Ltd. | 340,360 | $ | 3,210 | |||||||||
|
| |||||||||||
| MATERIALS 1.8% |
| |||||||||||
African Rainbow Minerals Ltd. | 58,690 | 466 | ||||||||||
Gold Fields Ltd. SP - ADR | 1,086,276 | 3,878 | ||||||||||
Impala Platinum Holdings Ltd. (a) | 458,069 | 676 | ||||||||||
Kumba Iron Ore Ltd. | 237,085 | 5,074 | ||||||||||
Mondi Ltd. | 119,500 | 3,237 | ||||||||||
Nampak Ltd. (a) | 1,370,958 | 1,569 | ||||||||||
Sappi Ltd. | 63,275 | 421 | ||||||||||
Sasol Ltd. | 518,739 | 18,865 | ||||||||||
|
| |||||||||||
| 34,186 | ||||||||||||
|
| |||||||||||
| TELECOMMUNICATION SERVICES 0.8% |
| |||||||||||
MTN Group Ltd. | 1,547,140 | 12,170 | ||||||||||
Telkom S.A. SOC Ltd. | 626,750 | 2,235 | ||||||||||
Vodacom Group Ltd. | 90,258 | 808 | ||||||||||
|
| |||||||||||
| 15,213 | ||||||||||||
|
| |||||||||||
Total South Africa | 91,358 | |||||||||||
|
| |||||||||||
| SOUTH KOREA 20.0% |
| |||||||||||
| CONSUMER DISCRETIONARY 4.0% |
| |||||||||||
CJ O Shopping Co. Ltd. | 15,645 | 3,922 | ||||||||||
Hankook Tire Co. Ltd. | 33,529 | 1,267 | ||||||||||
Hotel Shilla Co. Ltd. | 2,710 | 300 | ||||||||||
Hyundai Department Store Co. Ltd. | 27,834 | 2,886 | ||||||||||
Hyundai Mobis Co. Ltd. | 13,654 | 2,597 | ||||||||||
Hyundai Motor Co. | 184,879 | 20,779 | ||||||||||
Hyundai Wia Corp. | 35,819 | 1,309 | ||||||||||
Kia Motors Corp. | 428,614 | 11,842 | ||||||||||
Kumho Tire Co., Inc. (a) | 643,810 | 3,635 | ||||||||||
LG Electronics, Inc. | 189,158 | 14,084 | ||||||||||
LOTTE Himart Co. Ltd. | 21,619 | 1,530 | ||||||||||
Lotte Shopping Co. Ltd. | 31,032 | 5,851 | ||||||||||
Mando Corp. | 11,495 | 396 | ||||||||||
Shinsegae, Inc. | 12,430 | 4,471 | ||||||||||
|
| |||||||||||
| 74,869 | ||||||||||||
|
| |||||||||||
| CONSUMER STAPLES 0.5% |
| |||||||||||
CJ CheilJedang Corp. | 3,238 | 1,025 | ||||||||||
E-MART, Inc. | 22,195 | 5,065 | ||||||||||
Hite Jinro Co. Ltd. | 83,440 | 1,471 | ||||||||||
KT&G Corp. | 16,586 | 1,594 | ||||||||||
Lotte Chilsung Beverage Co. Ltd. | 81 | 112 | ||||||||||
|
| |||||||||||
| 9,267 | ||||||||||||
|
| |||||||||||
| ENERGY 0.4% |
| |||||||||||
GS Holdings Corp. | 61,262 | 2,989 | ||||||||||
SK Innovation Co. Ltd. | 19,084 | 3,456 | ||||||||||
|
| |||||||||||
| 6,445 | ||||||||||||
|
| |||||||||||
| FINANCIALS 4.6% |
| |||||||||||
BNK Financial Group, Inc. | 419,143 | 3,512 | ||||||||||
DGB Financial Group, Inc. | 369,433 | 3,398 | ||||||||||
Dongbu Insurance Co. Ltd. | 14,534 | 770 | ||||||||||
Hana Financial Group, Inc. | 317,177 | 12,180 | ||||||||||
Hanwha Life Insurance Co. Ltd. | 981,260 | 4,664 | ||||||||||
Hyundai Marine & Fire Insurance Co. Ltd. | 65,808 | 1,993 | ||||||||||
| SHARES | MARKET VALUE (000S) | |||||||||||
Industrial Bank of Korea | 553,286 | $ | 7,631 | |||||||||
ING Life Insurance Korea Ltd. (a) | 14,981 | 562 | ||||||||||
JB Financial Group Co. Ltd. | 244,310 | 1,218 | ||||||||||
KB Financial Group, Inc. | 183,455 | 8,636 | ||||||||||
Korea Investment Holdings Co. Ltd. | 8,660 | 653 | ||||||||||
Meritz Financial Group, Inc. | 29,984 | 360 | ||||||||||
Meritz Fire & Marine Insurance Co. Ltd. | 66,750 | 1,149 | ||||||||||
Mirae Asset Life Insurance Co. Ltd. | 273,944 | 1,364 | ||||||||||
Samsung Card Co. Ltd. | 46,037 | 1,583 | ||||||||||
Samsung Fire & Marine Insurance Co. Ltd. | 10,677 | 2,530 | ||||||||||
Samsung Life Insurance Co. Ltd. | 64,337 | 5,679 | ||||||||||
Shinhan Financial Group Co. Ltd. | 406,496 | 15,739 | ||||||||||
Tongyang Life Insurance Co. Ltd. | 144,760 | 959 | ||||||||||
Woori Bank | 824,005 | 12,019 | ||||||||||
|
| |||||||||||
| 86,599 | ||||||||||||
|
| |||||||||||
| INDUSTRIALS 2.0% |
| |||||||||||
Asiana Airlines, Inc. (a) | 544,220 | 2,019 | ||||||||||
CJ Corp. | 31,109 | 3,964 | ||||||||||
Daewoo Engineering & Construction Co. Ltd. (a) | 77,830 | 410 | ||||||||||
Doosan Bobcat, Inc. (a) | 5,515 | 158 | ||||||||||
Doosan Corp. | 28,553 | 2,666 | ||||||||||
Doosan Heavy Industries & Construction Co. Ltd. | 323,794 | 4,550 | ||||||||||
Doosan Infracore Co. Ltd. (a) | 512,594 | 4,440 | ||||||||||
Hanwha Corp. | 124,235 | 3,515 | ||||||||||
Hyundai Engineering & Construction Co. Ltd. | 56,706 | 2,930 | ||||||||||
KCC Corp. | 3,267 | 962 | ||||||||||
Korean Air Lines Co. Ltd. | 194,036 | 4,916 | ||||||||||
LG Corp. | 6,883 | 445 | ||||||||||
LS Corp. | 44,825 | 3,018 | ||||||||||
Samsung Heavy Industries Co. Ltd. | 53,902 | 345 | ||||||||||
SK Holdings Co. Ltd. (a) | 784 | 182 | ||||||||||
SK Networks Co. Ltd. | 468,378 | 1,892 | ||||||||||
|
| |||||||||||
| 36,412 | ||||||||||||
|
| |||||||||||
| INFORMATION TECHNOLOGY 4.1% |
| |||||||||||
LG Display Co. Ltd. | 311,882 | 5,116 | ||||||||||
LG Innotek Co. Ltd. | 6,908 | 896 | ||||||||||
Samsung Electro-Mechanics Co. Ltd. | 19,006 | 2,530 | ||||||||||
Samsung Electronics Co. Ltd. | 1,458,279 | 61,087 | ||||||||||
Samsung SDI Co. Ltd. | 3,345 | 642 | ||||||||||
SK Hynix, Inc. | 91,699 | 7,039 | ||||||||||
|
| |||||||||||
| 77,310 | ||||||||||||
|
| |||||||||||
| MATERIALS 1.6% |
| |||||||||||
Dongkuk Steel Mill Co. Ltd. | 222,411 | 1,684 | ||||||||||
Hanwha Chemical Corp. | 23,300 | 457 | ||||||||||
Hyosung Corp. « | 5,267 | 633 | ||||||||||
Hyundai Steel Co. | 106,514 | 5,025 | ||||||||||
Kolon Industries, Inc. | 31,703 | 1,923 | ||||||||||
LG Chem Ltd. | 6,370 | 1,907 | ||||||||||
OCI Co. Ltd. | 3,518 | 325 | ||||||||||
POSCO | 60,344 | 17,805 | ||||||||||
Taekwang Industrial Co. Ltd. | 429 | 535 | ||||||||||
|
| |||||||||||
| 30,294 | ||||||||||||
|
| |||||||||||
| 36 | PIMCO EQUITY SERIES | See Accompanying Notes |
Table of Contents
June 30, 2018
| SHARES | MARKET VALUE (000S) | |||||||||||
| TELECOMMUNICATION SERVICES 1.8% |
| |||||||||||
KT Corp. SP - ADR | 1,163,510 | $ | 15,451 | |||||||||
LG Uplus Corp. | 612,339 | 7,691 | ||||||||||
SK Telecom Co. Ltd. SP - ADR | 464,530 | 10,833 | ||||||||||
|
| |||||||||||
| 33,975 | ||||||||||||
|
| |||||||||||
| UTILITIES 1.0% |
| |||||||||||
Korea Electric Power Corp. | 502,326 | 14,408 | ||||||||||
Korea Gas Corp. | 83,376 | 4,792 | ||||||||||
|
| |||||||||||
| 19,200 | ||||||||||||
|
| |||||||||||
Total South Korea | 374,371 | |||||||||||
|
| |||||||||||
| TAIWAN 9.9% |
| |||||||||||
| CONSUMER DISCRETIONARY 0.4% |
| |||||||||||
Cheng Shin Rubber Industry Co. Ltd. | 1,150,000 | 1,730 | ||||||||||
Far Eastern Department Stores Ltd. | 1,029,000 | 659 | ||||||||||
Formosa Taffeta Co. Ltd. | 175,000 | 191 | ||||||||||
Pou Chen Corp. | 2,690,000 | 3,121 | ||||||||||
Ruentex Industries Ltd. | 832,000 | 1,695 | ||||||||||
Yulon Motor Co. Ltd. | 1,615,000 | 1,117 | ||||||||||
|
| |||||||||||
| 8,513 | ||||||||||||
|
| |||||||||||
| CONSUMER STAPLES 0.2% |
| |||||||||||
Uni-President Enterprises Corp. | 1,558,640 | 3,951 | ||||||||||
|
| |||||||||||
| FINANCIALS 2.7% |
| |||||||||||
Cathay Financial Holding Co. Ltd. | 2,557,000 | 4,504 | ||||||||||
Chailease Holding Co. Ltd. | 316,000 | 1,033 | ||||||||||
Chang Hwa Commercial Bank Ltd. | 704,000 | 408 | ||||||||||
China Development Financial Holding Corp. | 8,878,000 | 3,241 | ||||||||||
China Life Insurance Co. Ltd. | 4,820,608 | 5,069 | ||||||||||
CTBC Financial Holding Co. Ltd. | 3,715,000 | 2,669 | ||||||||||
E.Sun Financial Holding Co. Ltd. | 724,000 | 504 | ||||||||||
First Financial Holding Co. Ltd. | 3,695,020 | 2,495 | ||||||||||
Fubon Financial Holding Co. Ltd. | 2,542,000 | 4,253 | ||||||||||
Hua Nan Financial Holdings Co. Ltd. | 3,499,995 | 2,036 | ||||||||||
Mega Financial Holding Co. Ltd. | 4,825,658 | 4,255 | ||||||||||
Mercuries Life Insurance Co. Ltd. (a) | 1,875,717 | 1,005 | ||||||||||
Shin Kong Financial Holding Co. Ltd. | 20,778,903 | 7,993 | ||||||||||
SinoPac Financial Holdings Co. Ltd. | 10,246,622 | 3,693 | ||||||||||
Taishin Financial Holding Co. Ltd. | 5,431,719 | 2,563 | ||||||||||
Taiwan Business Bank | 5,175,552 | 1,596 | ||||||||||
Taiwan Cooperative Financial Holding Co. Ltd. | 2,505,501 | 1,466 | ||||||||||
Yuanta Financial Holding Co. Ltd. | 4,267,000 | 1,943 | ||||||||||
|
| |||||||||||
| 50,726 | ||||||||||||
|
| |||||||||||
| INDUSTRIALS 0.4% |
| |||||||||||
China Airlines Ltd. (a) | 4,513,000 | 1,407 | ||||||||||
| SHARES | MARKET VALUE (000S) | |||||||||||
Eva Airways Corp. | 812,000 | $ | 393 | |||||||||
Far Eastern New Century Corp. | 4,027,520 | 3,814 | ||||||||||
Taiwan High Speed Rail Corp. | 662,000 | 519 | ||||||||||
Teco Electric and Machinery Co. Ltd. | 856,000 | 642 | ||||||||||
|
| |||||||||||
| 6,775 | ||||||||||||
|
| |||||||||||
| INFORMATION TECHNOLOGY 5.5% |
| |||||||||||
Acer, Inc. | 3,274,000 | 2,670 | ||||||||||
ASE Technology Holding Co. Ltd. | 471,790 | 1,108 | ||||||||||
Asustek Computer, Inc. | 825,000 | 7,528 | ||||||||||
AU Optronics Corp. | 15,321,000 | 6,491 | ||||||||||
Catcher Technology Co. Ltd. | 80,000 | 893 | ||||||||||
Chicony Electronics Co. Ltd. | 445,000 | 1,002 | ||||||||||
Compal Electronics, Inc. | 6,803,000 | 4,280 | ||||||||||
Delta Electronics, Inc. | 53,000 | 190 | ||||||||||
Foxconn Technology Co. Ltd. | 208,000 | 508 | ||||||||||
Hon Hai Precision Industry Co. Ltd. | 4,104,145 | 11,184 | ||||||||||
HTC Corp. | 1,147,000 | 2,138 | ||||||||||
Innolux Corp. | 21,292,000 | 7,638 | ||||||||||
Inventec Corp. | 2,859,000 | 2,242 | ||||||||||
Lite-On Technology Corp. | 2,519,035 | 3,044 | ||||||||||
MediaTek, Inc. | 462,000 | 4,535 | ||||||||||
Novatek Microelectronics Corp. | 480,000 | 2,160 | ||||||||||
Pegatron Corp. | 1,647,000 | 3,382 | ||||||||||
Powertech Technology, Inc. | 348,000 | 1,009 | ||||||||||
Quanta Computer, Inc. | 1,441,000 | 2,525 | ||||||||||
Synnex Technology International Corp. | 1,138,650 | 1,717 | ||||||||||
Taiwan Semiconductor Manufacturing Co. Ltd. | 285,537 | 10,439 | ||||||||||
TPK Holding Co. Ltd. (a) | 889,000 | 1,872 | ||||||||||
Unimicron Technology Corp. | 3,105,000 | 1,656 | ||||||||||
United Microelectronics Corp. | 16,301,000 | 9,134 | ||||||||||
Wistron Corp. | 5,132,229 | 3,806 | ||||||||||
WPG Holdings Ltd. | 1,697,000 | 2,403 | ||||||||||
Yageo Corp. | 189,938 | 6,981 | ||||||||||
Zhen Ding Technology Holding Ltd. | 391,000 | 863 | ||||||||||
|
| |||||||||||
| 103,398 | ||||||||||||
|
| |||||||||||
| MATERIALS 0.4% |
| |||||||||||
Asia Cement Corp. | 2,201,000 | 2,416 | ||||||||||
China Steel Corp. | 1,444,000 | 1,122 | ||||||||||
Formosa Chemicals & Fibre Corp. | 52,000 | 207 | ||||||||||
Nan Ya Plastics Corp. | 164,000 | 468 | ||||||||||
Taiwan Cement Corp. | 2,708,000 | 3,758 | ||||||||||
|
| |||||||||||
| 7,971 | ||||||||||||
|
| |||||||||||
| REAL ESTATE 0.1% |
| |||||||||||
Farglory Land Development Co. Ltd. | 395,000 | 419 | ||||||||||
Highwealth Construction Corp. | 563,000 | 835 | ||||||||||
|
| |||||||||||
| 1,254 | ||||||||||||
|
| |||||||||||
| TELECOMMUNICATION SERVICES 0.2% |
| |||||||||||
Chunghwa Telecom Co. Ltd. | 659,000 | 2,375 | ||||||||||
| SHARES | MARKET VALUE (000S) | |||||||||||
Far EasTone Telecommunications Co. Ltd. | 272,000 | $ | 703 | |||||||||
|
| |||||||||||
| 3,078 | ||||||||||||
|
| |||||||||||
Total Taiwan | 185,666 | |||||||||||
|
| |||||||||||
| THAILAND 2.8% |
| |||||||||||
| CONSUMER STAPLES 0.0% |
| |||||||||||
Charoen Pokphand Foods PCL | 257,400 | 188 | ||||||||||
|
| |||||||||||
| ENERGY 1.1% |
| |||||||||||
Banpu PCL | 3,417,700 | 2,010 | ||||||||||
IRPC PCL | 2,653,700 | 464 | ||||||||||
PTT Exploration & Production PCL | 2,002,300 | 8,476 | ||||||||||
PTT PCL | 6,133,000 | 8,867 | ||||||||||
Thai Oil PCL | 63,500 | 149 | ||||||||||
|
| |||||||||||
| 19,966 | ||||||||||||
|
| |||||||||||
| FINANCIALS 1.3% |
| |||||||||||
Bangkok Bank PCL | 1,269,100 | 7,493 | ||||||||||
Kasikornbank PCL | 657,700 | 3,848 | ||||||||||
Kiatnakin Bank PCL | 291,600 | 596 | ||||||||||
Krung Thai Bank PCL | 7,391,575 | 3,723 | ||||||||||
Siam Commercial Bank PCL | 1,104,800 | 3,945 | ||||||||||
Thanachart Capital PCL | 2,065,600 | 2,915 | ||||||||||
Tisco Financial Group PCL | 226,300 | 573 | ||||||||||
TMB Bank PCL | 10,159,100 | 706 | ||||||||||
|
| |||||||||||
| 23,799 | ||||||||||||
|
| |||||||||||
| INDUSTRIALS 0.1% |
| |||||||||||
Thai Airways International PCL (a) | 5,320,000 | 2,023 | ||||||||||
|
| |||||||||||
| MATERIALS 0.1% |
| |||||||||||
PTT Global Chemical PCL | 856,000 | 1,884 | ||||||||||
Siam Cement PCL | 57,500 | 718 | ||||||||||
|
| |||||||||||
| 2,602 | ||||||||||||
|
| |||||||||||
| REAL ESTATE 0.0% |
| |||||||||||
Pruksa Holding PCL | 699,600 | 402 | ||||||||||
|
| |||||||||||
| TELECOMMUNICATION SERVICES 0.2% |
| |||||||||||
Advanced Info Service PCL | 247,300 | 1,380 | ||||||||||
Total Access Communication PCL | 2,102,900 | 2,329 | ||||||||||
|
| |||||||||||
| 3,709 | ||||||||||||
|
| |||||||||||
Total Thailand | 52,689 | |||||||||||
|
| |||||||||||
| TURKEY 2.4% |
| |||||||||||
| CONSUMER DISCRETIONARY 0.1% |
| |||||||||||
Arcelik A/S | 183,857 | 610 | ||||||||||
Ford Otomotiv Sanayi A/S | 13,770 | 183 | ||||||||||
Vestel Elektronik Sanayi ve Ticaret A/S (a) | 545,676 | 1,058 | ||||||||||
|
| |||||||||||
| 1,851 | ||||||||||||
|
| |||||||||||
| CONSUMER STAPLES 0.1% |
| |||||||||||
Anadolu Efes Biracilik Ve Malt Sanayii A/S | 114,070 | 586 | ||||||||||
Migros Ticaret A/S | 228,088 | 1,018 | ||||||||||
|
| |||||||||||
| 1,604 | ||||||||||||
|
| |||||||||||
| See Accompanying Notes | ANNUAL REPORT | JUNE 30, 2018 | 37 |
Table of Contents
Schedule of Investments PIMCO RAE Emerging Markets Fund (Cont.)
| SHARES | MARKET VALUE (000S) | |||||||||||
| ENERGY 0.1% |
| |||||||||||
Tupras Turkiye Petrol Rafinerileri A/S | 48,220 | $ | 1,137 | |||||||||
|
| |||||||||||
| FINANCIALS 1.4% |
| |||||||||||
Akbank Turk A/S | 1,826,760 | 2,986 | ||||||||||
Haci Omer Sabanci Holding A/S | 3,172,070 | 6,090 | ||||||||||
Sekerbank TAS (a) | 3,928,770 | 1,090 | ||||||||||
Turkiye Garanti Bankasi A/S | 1,684,000 | 3,072 | ||||||||||
Turkiye Halk Bankasi A/S | 2,656,460 | 4,286 | ||||||||||
Turkiye Is Bankasi ‘C’ | 3,943,200 | 4,892 | ||||||||||
Turkiye Vakiflar Bankasi TAO ‘D’ | 1,659,870 | 1,771 | ||||||||||
Yapi ve Kredi Bankasi A/S (a) | 5,108,812 | 2,749 | ||||||||||
|
| |||||||||||
| 26,936 | ||||||||||||
|
| |||||||||||
| INDUSTRIALS 0.4% |
| |||||||||||
KOC Holding A/S | 416,580 | 1,287 | ||||||||||
TAV Havalimanlari Holding A/S | 252,072 | 1,234 | ||||||||||
Turk Hava Yollari AO (a) | 1,514,110 | 4,466 | ||||||||||
Turkiye Sise ve Cam Fabrikalari A/S | 426,883 | 393 | ||||||||||
|
| |||||||||||
| 7,380 | ||||||||||||
|
| |||||||||||
| MATERIALS 0.1% |
| |||||||||||
Eregli Demir ve Celik Fabrikalari TAS | 932,550 | 2,068 | ||||||||||
|
| |||||||||||
| SHARES | MARKET VALUE (000S) | |||||||||||
| TELECOMMUNICATION SERVICES 0.2% |
| |||||||||||
Turk Telekomunikasyon A/S | 1,236,285 | $ | 1,344 | |||||||||
Turkcell Iletisim Hizmetleri A/S | 688,922 | 1,826 | ||||||||||
|
| |||||||||||
| 3,170 | ||||||||||||
|
| |||||||||||
Total Turkey | 44,146 | |||||||||||
|
| |||||||||||
Total Common Stocks (Cost $1,593,607) |
| 1,834,246 | ||||||||||
|
| |||||||||||
| PREFERRED STOCKS 1.3% |
| |||||||||||
| BRAZIL 1.0% |
| |||||||||||
| BANKING & FINANCE 0.1% |
| |||||||||||
Banco do Estado do Rio Grande do Sul S.A. | 449,800 | 1,712 | ||||||||||
|
| |||||||||||
| INDUSTRIALS 0.6% |
| |||||||||||
Braskem S.A. | 90,400 | 1,184 | ||||||||||
Cia Brasileira de Distribuicao | 210,900 | 4,238 | ||||||||||
Metalurgica Gerdau S.A. | 4,302,900 | 6,861 | ||||||||||
|
| |||||||||||
| 12,283 | ||||||||||||
|
| |||||||||||
| UTILITIES 0.3% |
| |||||||||||
Centrais Eletricas Brasileiras S.A. | 149,300 | 522 | ||||||||||
Cia de Saneamento do Parana | 342,200 | 793 | ||||||||||
Cia Energetica de Sao Paulo | 623,400 | 2,632 | ||||||||||
Cia Paranaense de Energia | 239,100 | 1,352 | ||||||||||
|
| |||||||||||
| 5,299 | ||||||||||||
|
| |||||||||||
Total Brazil | 19,294 | |||||||||||
|
| |||||||||||
| SHARES | MARKET VALUE (000S) | |||||||||||
| RUSSIA 0.3% |
| |||||||||||
| ENERGY 0.3% |
| |||||||||||
Bashneft PJSC | 53,283 | $ | 1,462 | |||||||||
Transneft PJSC | 1,701 | 4,529 | ||||||||||
|
| |||||||||||
| 5,991 | ||||||||||||
|
| |||||||||||
Total Russia | 5,991 | |||||||||||
|
| |||||||||||
Total Preferred Stocks (Cost $17,091) |
| 25,285 | ||||||||||
|
| |||||||||||
| REAL ESTATE INVESTMENT TRUSTS 0.0% |
| |||||||||||
| SOUTH AFRICA 0.0% |
| |||||||||||
| REAL ESTATE 0.0% |
| |||||||||||
Growthpoint Properties Ltd. | 90,449 | 176 | ||||||||||
|
| |||||||||||
Total Real Estate Investment Trusts |
| 176 | ||||||||||
|
| |||||||||||
| SHORT-TERM INSTRUMENTS 0.3% |
| |||||||||||
| REPURCHASE AGREEMENTS (b) 0.3% |
| |||||||||||
| 4,731 | ||||||||||||
|
| |||||||||||
| Total Short-Term Instruments (Cost $4,731) | 4,731 | |||||||||||
|
| |||||||||||
| Total Investments in Securities (Cost $1,615,622) | 1,864,438 | |||||||||||
| Total Investments 99.4% (Cost $1,615,622) | $ | 1,864,438 | ||||||||||
| Other Assets and Liabilities, net 0.6% |
| 11,362 | ||||||||||
|
| |||||||||||
| Net Assets 100.0% | $ | 1,875,800 | ||||||||||
|
| |||||||||||
NOTES TO SCHEDULE OF INVESTMENTS:
| * | A zero balance may reflect actual amounts rounding to less than one thousand. |
| « | Security valued using significant unobservable inputs (Level 3). |
| (a) | Security did not produce income within the last twelve months. |
BORROWINGS AND OTHER FINANCING TRANSACTIONS
(b) REPURCHASE AGREEMENTS:
| Counterparty | Lending Rate | Settlement Date | Maturity Date | Principal Amount | Collateralized By | Collateral (Received) | Repurchase Agreements, at Value | Repurchase Agreement Proceeds to be Received(1) | ||||||||||||||||||||||
| FICC | 1.500 | % | 06/29/2018 | 07/02/2018 | $ | 4,731 | U.S. Treasury Notes 2.125% due 08/15/2021 | $ | (4,829 | ) | $ | 4,731 | $ | 4,731 | ||||||||||||||||
|
|
|
|
|
| |||||||||||||||||||||||||
Total Repurchase Agreements |
| $ | (4,829 | ) | $ | 4,731 | $ | 4,731 | ||||||||||||||||||||||
|
|
|
|
|
| |||||||||||||||||||||||||
BORROWINGS AND OTHER FINANCING TRANSACTIONS SUMMARY
The following is a summary by counterparty of the market value of Borrowings and Other Financing Transactions and collateral pledged/(received) as of June 30, 2018:
| Counterparty | Repurchase Agreement Proceeds to be Received(1) | Payable for Reverse Repurchase Agreements | Payable for Sale-Buyback Transactions | Total Borrowings and Other Financing Transactions | Collateral Pledged/(Received) | Net Exposure(2) | ||||||||||||||||||
Global/Master Repurchase Agreement |
| |||||||||||||||||||||||
FICC | $ | 4,731 | $ | 0 | $ | 0 | $ | 4,731 | $ | (4,829 | ) | $ | (98 | ) | ||||||||||
|
|
|
|
|
| |||||||||||||||||||
Total Borrowings and Other Financing Transactions | $ | 4,731 | $ | 0 | $ | 0 | ||||||||||||||||||
|
|
|
|
|
| |||||||||||||||||||
| (1) | Includes accrued interest. |
| 38 | PIMCO EQUITY SERIES | See Accompanying Notes |
Table of Contents
June 30, 2018
| (2) | Net Exposure represents the net receivable/(payable) that would be due from/to the counterparty in the event of default. Exposure from borrowings and other financing transactions can only be netted across transactions governed under the same master agreement with the same legal entity. See Note 8, Master Netting Arrangements, in the Notes to Financial Statements for more information regarding master netting arrangements. |
FAIR VALUE OF FINANCIAL DERIVATIVE INSTRUMENTS
The following is a summary of the fair valuation of the Fund’s derivative instruments categorized by risk exposure. See Note 7, Principal Risks, in the Notes to Financial Statements on risks of the Fund.
The effect of Financial Derivative Instruments on the Statements of Operations for the period ended June 30, 2018:
| Derivatives not accounted for as hedging instruments | ||||||||||||||||||||||||
| Commodity Contracts | Credit Contracts | Equity Contracts | Foreign Exchange Contracts | Interest Rate Contracts | Total | |||||||||||||||||||
Net Realized Gain on Financial Derivative Instruments |
| |||||||||||||||||||||||
Over the counter |
| |||||||||||||||||||||||
Forward Foreign Currency Contracts | $ | 0 | $ | 0 | $ | 0 | $ | 311 | $ | 0 | $ | 311 | ||||||||||||
|
|
|
|
|
|
|
|
|
|
|
| |||||||||||||
Net Change in Unrealized Appreciation on Financial Derivative Instruments | �� | |||||||||||||||||||||||
Over the counter |
| |||||||||||||||||||||||
Forward Foreign Currency Contracts | $ | 0 | $ | 0 | $ | 0 | $ | 2 | $ | 0 | $ | 2 | ||||||||||||
|
|
|
|
|
|
|
|
|
|
|
| |||||||||||||
FAIR VALUE MEASUREMENTS
The following is a summary of the fair valuations according to the inputs used as of June 30, 2018 in valuing the Fund’s assets and liabilities:
| Category and Subcategory | Level 1 | Level 2 | Level 3 | Fair Value at 06/30/2018 | ||||||||||||
Investments in Securities, at Value |
| |||||||||||||||
Common Stocks |
| |||||||||||||||
Australia |
| |||||||||||||||
Materials | $ | 0 | $ | 259 | $ | 0 | $ | 259 | ||||||||
Brazil |
| |||||||||||||||
Consumer Discretionary | 3,574 | 0 | 0 | 3,574 | ||||||||||||
Consumer Staples | 10,737 | 0 | 0 | 10,737 | ||||||||||||
Energy | 9,976 | 0 | 0 | 9,976 | ||||||||||||
Financials | 25,852 | 0 | 0 | 25,852 | ||||||||||||
Industrials | 1,408 | 0 | 0 | 1,408 | ||||||||||||
Materials | 25,786 | 0 | 0 | 25,786 | ||||||||||||
Telecommunication Services | 2,416 | 0 | 0 | 2,416 | ||||||||||||
Utilities | 7,762 | 0 | 0 | 7,762 | ||||||||||||
Chile |
| |||||||||||||||
Consumer Discretionary | 769 | 0 | 0 | 769 | ||||||||||||
Consumer Staples | 2,366 | 0 | 0 | 2,366 | ||||||||||||
Energy | 1,174 | 0 | 0 | 1,174 | ||||||||||||
Financials | 3,098 | 0 | 0 | 3,098 | ||||||||||||
Materials | 4,106 | 1,666 | 0 | 5,772 | ||||||||||||
Utilities | 1,908 | 0 | 0 | 1,908 | ||||||||||||
China |
| |||||||||||||||
Consumer Discretionary | 0 | 3,920 | 0 | 3,920 | ||||||||||||
Consumer Staples | 3,503 | 2,829 | 0 | 6,332 | ||||||||||||
Energy | 0 | 67,065 | 0 | 67,065 | ||||||||||||
Financials | 0 | 236,017 | 0 | 236,017 | ||||||||||||
Health Care | 383 | 3,697 | 0 | 4,080 | ||||||||||||
Industrials | 118 | 18,680 | 0 | 18,798 | ||||||||||||
Information Technology | 2,756 | 11,092 | 0 | 13,848 | ||||||||||||
Materials | 0 | 27,840 | 0 | 27,840 | ||||||||||||
Real Estate | 0 | 45,043 | 0 | 45,043 | ||||||||||||
Telecommunication Services | 0 | 11,962 | 0 | 11,962 | ||||||||||||
Utilities | 0 | 15,103 | 0 | 15,103 | ||||||||||||
Greece |
| |||||||||||||||
Consumer Discretionary | 0 | 2,051 | 288 | 2,339 | ||||||||||||
Energy | 441 | 410 | 0 | 851 | ||||||||||||
Financials | 0 | 20,528 | 0 | 20,528 | ||||||||||||
Telecommunication Services | 0 | 2,706 | 0 | 2,706 | ||||||||||||
Utilities | 0 | 474 | 0 | 474 | ||||||||||||
Hong Kong |
| |||||||||||||||
Consumer Discretionary | 0 | 2,056 | 0 | 2,056 | ||||||||||||
Consumer Staples | 0 | 11,989 | 0 | 11,989 | ||||||||||||
Energy | 0 | 3,366 | 0 | 3,366 | ||||||||||||
Financials | 0 | 11,924 | 0 | 11,924 | ||||||||||||
| Category and Subcategory | Level 1 | Level 2 | Level 3 | Fair Value at 06/30/2018 | ||||||||||||
Industrials | $ | 0 | $ | 13,481 | $ | 0 | $ | 13,481 | ||||||||
Materials | 0 | 4,985 | 0 | 4,985 | ||||||||||||
Real Estate | 0 | 18,687 | 0 | 18,687 | ||||||||||||
Telecommunication Services | 0 | 28,956 | 0 | 28,956 | ||||||||||||
Utilities | 0 | 10,316 | 0 | 10,316 | ||||||||||||
India |
| |||||||||||||||
Consumer Discretionary | 0 | 3,225 | 0 | 3,225 | ||||||||||||
Energy | 0 | 11,500 | 0 | 11,500 | ||||||||||||
Financials | 0 | 27,265 | 0 | 27,265 | ||||||||||||
Industrials | 0 | 7,320 | 0 | 7,320 | ||||||||||||
Information Technology | 233 | 564 | 0 | 797 | ||||||||||||
Materials | 0 | 23,859 | 0 | 23,859 | ||||||||||||
Real Estate | 0 | 289 | 0 | 289 | ||||||||||||
Telecommunication Services | 0 | 3,994 | 0 | 3,994 | ||||||||||||
Utilities | 280 | 6,315 | 0 | 6,595 | ||||||||||||
Indonesia |
| |||||||||||||||
Consumer Discretionary | 0 | 648 | 0 | 648 | ||||||||||||
Consumer Staples | 0 | 1,066 | 0 | 1,066 | ||||||||||||
Energy | 0 | 5,028 | 0 | 5,028 | ||||||||||||
Financials | 102 | 5,375 | 0 | 5,477 | ||||||||||||
Materials | 0 | 5,163 | 0 | 5,163 | ||||||||||||
Telecommunication Services | 0 | 957 | 0 | 957 | ||||||||||||
Utilities | 0 | 984 | 0 | 984 | ||||||||||||
Malaysia |
| |||||||||||||||
Consumer Discretionary | 0 | 4,664 | 0 | 4,664 | ||||||||||||
Consumer Staples | 1,596 | 1,449 | 0 | 3,045 | ||||||||||||
Energy | 0 | �� | 1,986 | 0 | 1,986 | |||||||||||
Financials | 0 | 16,054 | 0 | 16,054 | ||||||||||||
Industrials | 0 | 2,981 | 0 | 2,981 | ||||||||||||
Materials | 0 | 367 | 0 | 367 | ||||||||||||
Real Estate | 0 | 846 | 0 | 846 | ||||||||||||
Telecommunication Services | 0 | 2,311 | 0 | 2,311 | ||||||||||||
Utilities | 0 | 4,920 | 0 | 4,920 | ||||||||||||
Malta |
| |||||||||||||||
Financials | 204 | 0 | 0 | 204 | ||||||||||||
Mexico |
| |||||||||||||||
Consumer Discretionary | 182 | 0 | 0 | 182 | ||||||||||||
Consumer Staples | 5,517 | 0 | 0 | 5,517 | ||||||||||||
Financials | 4,782 | 0 | 0 | 4,782 | ||||||||||||
Industrials | 4,789 | 0 | 0 | 4,789 | ||||||||||||
Materials | 8,180 | 0 | 0 | 8,180 | ||||||||||||
Telecommunication Services | 10,380 | 0 | 0 | 10,380 | ||||||||||||
| See Accompanying Notes | ANNUAL REPORT | JUNE 30, 2018 | 39 |
Table of Contents
Schedule of Investments PIMCO RAE Emerging Markets Fund (Cont.)
June 30, 2018
| Category and Subcategory | Level 1 | Level 2 | Level 3 | Fair Value at 06/30/2018 | ||||||||||||
Philippines |
| |||||||||||||||
Financials | $ | 0 | $ | 192 | $ | 0 | $ | 192 | ||||||||
Industrials | 1,174 | 945 | 0 | 2,119 | ||||||||||||
Telecommunication Services | 654 | 3,650 | 0 | 4,304 | ||||||||||||
Utilities | 0 | 488 | 0 | 488 | ||||||||||||
Poland |
| |||||||||||||||
Energy | 0 | 3,852 | 0 | 3,852 | ||||||||||||
Financials | 167 | 13,821 | 0 | 13,988 | ||||||||||||
Information Technology | 0 | 1,023 | 0 | 1,023 | ||||||||||||
Materials | 107 | 4,026 | 0 | 4,133 | ||||||||||||
Telecommunication Services | 0 | 2,731 | 0 | 2,731 | ||||||||||||
Utilities | 0 | 7,483 | 0 | 7,483 | ||||||||||||
Russia |
| |||||||||||||||
Consumer Discretionary | 176 | 0 | 0 | 176 | ||||||||||||
Consumer Staples | 0 | 2,515 | 0 | 2,515 | ||||||||||||
Energy | 29,966 | 95,344 | 0 | 125,310 | ||||||||||||
Financials | 929 | 7,437 | 0 | 8,366 | ||||||||||||
Industrials | 772 | 1,553 | 0 | 2,325 | ||||||||||||
Information Technology | 789 | 0 | 0 | 789 | ||||||||||||
Materials | 4,414 | 14,123 | 0 | 18,537 | ||||||||||||
Telecommunication Services | 4,646 | 14,948 | 0 | 19,594 | ||||||||||||
Utilities | 0 | 6,559 | 0 | 6,559 | ||||||||||||
Singapore |
| |||||||||||||||
Industrials | 0 | 634 | 0 | 634 | ||||||||||||
South Africa |
| |||||||||||||||
Consumer Discretionary | 348 | 2,139 | 0 | 2,487 | ||||||||||||
Consumer Staples | 461 | 0 | 0 | 461 | ||||||||||||
Energy | 0 | 513 | 0 | 513 | ||||||||||||
Financials | 6,678 | 26,060 | 0 | 32,738 | ||||||||||||
Health Care | 1,064 | 1,486 | 0 | 2,550 | ||||||||||||
Industrials | 0 | 3,210 | 0 | 3,210 | ||||||||||||
Materials | 4,554 | 29,632 | 0 | 34,186 | ||||||||||||
Telecommunication Services | 12,978 | 2,235 | 0 | 15,213 | ||||||||||||
South Korea |
| |||||||||||||||
Consumer Discretionary | 0 | 74,869 | 0 | 74,869 | ||||||||||||
Consumer Staples | 0 | 9,267 | 0 | 9,267 | ||||||||||||
Energy | 0 | 6,445 | 0 | 6,445 | ||||||||||||
Financials | 0 | 86,599 | 0 | 86,599 | ||||||||||||
Industrials | 0 | 36,412 | 0 | 36,412 | ||||||||||||
Information Technology | 0 | 77,310 | 0 | 77,310 | ||||||||||||
Materials | 535 | 29,759 | 0 | 30,294 | ||||||||||||
| Category and Subcategory | Level 1 | Level 2 | Level 3 | Fair Value at 06/30/2018 | ||||||||||||
Telecommunication Services | $ | 26,284 | $ | 7,691 | $ | 0 | $ | 33,975 | ||||||||
Utilities | 0 | 19,200 | 0 | 19,200 | ||||||||||||
Taiwan |
| |||||||||||||||
Consumer Discretionary | 0 | 8,513 | 0 | 8,513 | ||||||||||||
Consumer Staples | 0 | 3,951 | 0 | 3,951 | ||||||||||||
Financials | 0 | 50,726 | 0 | 50,726 | ||||||||||||
Industrials | 0 | 6,775 | 0 | 6,775 | ||||||||||||
Information Technology | 11,547 | 91,851 | 0 | 103,398 | ||||||||||||
Materials | 0 | 7,971 | 0 | 7,971 | ||||||||||||
Real Estate | 0 | 1,254 | 0 | 1,254 | ||||||||||||
Telecommunication Services | 0 | 3,078 | 0 | 3,078 | ||||||||||||
Thailand |
| |||||||||||||||
Consumer Staples | 0 | 188 | 0 | 188 | ||||||||||||
Energy | 0 | 19,966 | 0 | 19,966 | ||||||||||||
Financials | 0 | 23,799 | 0 | 23,799 | ||||||||||||
Industrials | 0 | 2,023 | 0 | 2,023 | ||||||||||||
Materials | 0 | 2,602 | 0 | 2,602 | ||||||||||||
Real Estate | 0 | 402 | 0 | 402 | ||||||||||||
Telecommunication Services | 0 | 3,709 | 0 | 3,709 | ||||||||||||
Turkey |
| |||||||||||||||
Consumer Discretionary | 0 | 1,851 | 0 | 1,851 | ||||||||||||
Consumer Staples | 0 | 1,604 | 0 | 1,604 | ||||||||||||
Energy | 0 | 1,137 | 0 | 1,137 | ||||||||||||
Financials | 0 | 26,936 | 0 | 26,936 | ||||||||||||
Industrials | 0 | 7,380 | 0 | 7,380 | ||||||||||||
Materials | 0 | 2,068 | 0 | 2,068 | ||||||||||||
Telecommunication Services | 0 | 3,170 | 0 | 3,170 | ||||||||||||
Preferred Stocks |
| |||||||||||||||
Brazil |
| |||||||||||||||
Banking & Finance | 1,712 | 0 | 0 | 1,712 | ||||||||||||
Industrials | 12,283 | 0 | 0 | 12,283 | ||||||||||||
Utilities | 5,299 | 0 | 0 | 5,299 | ||||||||||||
Russia |
| |||||||||||||||
Energy | 0 | 5,991 | 0 | 5,991 | ||||||||||||
Real Estate Investment Trusts |
| |||||||||||||||
South Africa |
| |||||||||||||||
Real Estate | 176 | 0 | 0 | 176 | ||||||||||||
Short-Term Instruments | ||||||||||||||||
Repurchase Agreements | 0 | 4,731 | 0 | 4,731 | ||||||||||||
|
|
|
|
|
|
|
| |||||||||
Total Investments | $ | 272,091 | $ | 1,592,059 | $ | 288 | $ | 1,864,438 | ||||||||
|
|
|
|
|
|
|
| |||||||||
There were assets and liabilities valued at $23,421 transferred from Level 1 to Level 2 during the period ended June 30, 2018. There were assets and liabilities valued at $24,088 transferred from Level 2 to Level 1 during the period ended June 30, 2018. There were no significant transfers among Levels 2 and 3 during the period ended June 30, 2018.
| 40 | PIMCO EQUITY SERIES | See Accompanying Notes |
Table of Contents
Schedule of Investments PIMCO RAE Global Fund
June 30, 2018
(Amounts in thousands*, except number of shares, contracts and units, if any)
| MARKET VALUE (000S) | ||||||||||||
| INVESTMENTS IN SECURITIES 0.0% |
| |||||||||||
| SHORT-TERM INSTRUMENTS 0.0% |
| |||||||||||
| REPURCHASE AGREEMENTS (b) 0.0% |
| |||||||||||
| $ | 173 | |||||||||||
|
| |||||||||||
| Total Short-Term Instruments (Cost $173) |
| 173 | ||||||||||
|
| |||||||||||
| Total Investments in Securities (Cost $173) |
| 173 | ||||||||||
|
| |||||||||||
| SHARES | MARKET VALUE (000S) | |||||||||||
| INVESTMENTS IN AFFILIATES 100.0% |
| |||||||||||
| MUTUAL FUNDS (a) 100.0% |
| |||||||||||
| UNITED STATES 100.0% |
| |||||||||||
PIMCO RAE Emerging Markets Fund | 4,003,821 | $ | 43,001 | |||||||||
PIMCO RAE International Fund | 15,258,843 | 161,744 | ||||||||||
PIMCO RAE US Fund | 14,274,366 | 161,300 | ||||||||||
|
| |||||||||||
Total Mutual Funds (Cost $309,795) |
| 366,045 | ||||||||||
|
| |||||||||||
Total Investments in Affiliates (Cost $309,795) |
| 366,045 | ||||||||||
Total Investments 100.0% (Cost $309,968) |
| $ | 366,218 | |||||||||
| Other Assets and Liabilities, net (0.0)% |
| (1 | ) | |||||||||
|
| |||||||||||
| Net Assets 100.0% | $ | 366,217 | ||||||||||
|
| |||||||||||
NOTES TO SCHEDULE OF INVESTMENTS:
| * | A zero balance may reflect actual amounts rounding to less than one thousand. |
| (a) | Institutional Class Shares of each Fund. |
BORROWINGS AND OTHER FINANCING TRANSACTIONS
(b) REPURCHASE AGREEMENTS:
| Counterparty | Lending Rate | Settlement Date | Maturity Date | Principal Amount | Collateralized By | Collateral (Received) | Repurchase Agreements, at Value | Repurchase Agreement Proceeds to be Received(1) | ||||||||||||||||||||||
| FICC | 1.500 | % | 06/29/2018 | 07/02/2018 | $ | 173 | U.S. Treasury Notes 1.875% due 01/31/2022 | $ | (177 | ) | $ | 173 | $ | 173 | ||||||||||||||||
|
|
|
|
|
| |||||||||||||||||||||||||
Total Repurchase Agreements |
| $ | (177 | ) | $ | 173 | $ | 173 | ||||||||||||||||||||||
|
|
|
|
|
| |||||||||||||||||||||||||
BORROWINGS AND OTHER FINANCING TRANSACTIONS SUMMARY
The following is a summary by counterparty of the market value of Borrowings and Other Financing Transactions and collateral pledged/(received) as of June 30, 2018:
| Counterparty | Repurchase Agreement Proceeds to be Received(1) | Payable for Reverse Repurchase Agreements | Payable for Sale-Buyback Transactions | Total Borrowings and Other Financing Transactions | Collateral Pledged/(Received) | Net Exposure(2) | ||||||||||||||||||
Global/Master Repurchase Agreement |
| |||||||||||||||||||||||
FICC | $ | 173 | $ | 0 | $ | 0 | $ | 173 | $ | (177 | ) | $ | (4 | ) | ||||||||||
|
|
|
|
|
| |||||||||||||||||||
Total Borrowings and Other Financing Transactions | $ | 173 | $ | 0 | $ | 0 | ||||||||||||||||||
|
|
|
|
|
| |||||||||||||||||||
| (1) | Includes accrued interest. |
| (2) | Net Exposure represents the net receivable/(payable) that would be due from/to the counterparty in the event of default. Exposure from borrowings and other financing transactions can only be netted across transactions governed under the same master agreement with the same legal entity. See Note 8, Master Netting Arrangements, in the Notes to Financial Statements for more information regarding master netting arrangements. |
| See Accompanying Notes | ANNUAL REPORT | JUNE 30, 2018 | 41 |
Table of Contents
Schedule of Investments PIMCO RAE Global Fund (Cont.)
June 30, 2018
FAIR VALUE MEASUREMENTS
The following is a summary of the fair valuations according to the inputs used as of June 30, 2018 in valuing the Fund’s assets and liabilities:
| Category and Subcategory | Level 1 | Level 2 | Level 3 | Fair Value at 06/30/2018 | ||||||||||||
Investments in Securities, at Value |
| |||||||||||||||
Short-Term Instruments |
| |||||||||||||||
Repurchase Agreements | $ | 0 | $ | 173 | $ | 0 | $ | 173 | ||||||||
|
|
|
|
|
|
|
| |||||||||
| $ | 0 | $ | 173 | $ | 0 | $ | 173 | |||||||||
Investments in Affiliates, at Value |
| |||||||||||||||
Mutual Funds |
| |||||||||||||||
United States | 366,045 | 0 | 0 | 366,045 | ||||||||||||
|
|
|
|
|
|
|
| |||||||||
Total Investments | $ | 366,045 | $ | 173 | $ | 0 | $ | 366,218 | ||||||||
|
|
|
|
|
|
|
| |||||||||
There were no significant transfers among Levels 1, 2, or 3 during the period ended June 30, 2018.
| 42 | PIMCO EQUITY SERIES | See Accompanying Notes |
Table of Contents
Schedule of Investments PIMCO RAE Global ex-US Fund
June 30, 2018
(Amounts in thousands*, except number of shares, contracts and units, if any)
| SHARES | MARKET VALUE (000S) | |||||||||||
| INVESTMENTS IN AFFILIATES 99.9% | ||||||||||||
| MUTUAL FUNDS (a) 99.9% | ||||||||||||
| UNITED STATES 99.9% | ||||||||||||
PIMCO RAE Emerging Markets Fund | 1,564,763 | $ | 16,805 | |||||||||
PIMCO RAE International Fund | 5,958,858 | 63,164 | ||||||||||
|
| |||||||||||
Total Mutual Funds (Cost $73,662) |
| 79,969 | ||||||||||
|
| |||||||||||
Total Investments in Affiliates (Cost $73,662) |
| 79,969 | ||||||||||
Total Investments 99.9% (Cost $73,662) |
| $ | 79,969 | |||||||||
| Other Assets and Liabilities, net 0.1% | 79 | |||||||||||
|
| |||||||||||
| Net Assets 100.0% | $ | 80,048 | ||||||||||
|
| |||||||||||
NOTES TO SCHEDULE OF INVESTMENTS:
| * | A zero balance may reflect actual amounts rounding to less than one thousand. |
| (a) | Institutional Class Shares of each Fund. |
FAIR VALUE MEASUREMENTS
The following is a summary of the fair valuations according to the inputs used as of June 30, 2018 in valuing the Fund’s assets and liabilities:
| Category and Subcategory | Level 1 | Level 2 | Level 3 | Fair Value at 06/30/2018 | ||||||||||||
Investments in Affiliates, at Value |
| |||||||||||||||
Mutual Funds |
| |||||||||||||||
United States | $ | 79,969 | $ | 0 | $ | 0 | $ | 79,969 | ||||||||
|
|
|
|
|
|
|
| |||||||||
Total Investments | $ | 79,969 | $ | 0 | $ | 0 | $ | 79,969 | ||||||||
|
|
|
|
|
|
|
| |||||||||
There were no significant transfers among Levels 1, 2, or 3 during the period ended June 30, 2018.
| See Accompanying Notes | ANNUAL REPORT | JUNE 30, 2018 | 43 |
Table of Contents
Schedule of Investments PIMCO RAE International Fund
(Amounts in thousands*, except number of shares, contracts and units, if any)
| SHARES | MARKET VALUE (000S) | |||||||||||
| INVESTMENTS IN SECURITIES 98.9% |
| |||||||||||
| COMMON STOCKS 97.7% |
| |||||||||||
| AUSTRALIA 6.4% |
| |||||||||||
| CONSUMER DISCRETIONARY 0.1% |
| |||||||||||
Automotive Holdings Group Ltd. | 32,213 | $ | 68 | |||||||||
Crown Resorts Ltd. | 22,669 | 226 | ||||||||||
Flight Centre Travel Group Ltd. | 3,786 | 178 | ||||||||||
Star Entertainment Grp Ltd. | 22,826 | 83 | ||||||||||
Tabcorp Holdings Ltd. | 69,987 | 231 | ||||||||||
|
| |||||||||||
| 786 | ||||||||||||
|
| |||||||||||
| CONSUMER STAPLES 0.9% |
| |||||||||||
Coca-Cola Amatil Ltd. | 42,768 | 291 | ||||||||||
Inghams Group Ltd. | 48,768 | 138 | ||||||||||
Metcash Ltd. | 169,726 | 327 | ||||||||||
Wesfarmers Ltd. | 51,696 | 1,886 | ||||||||||
Woolworths Ltd. | 94,953 | 2,145 | ||||||||||
|
| |||||||||||
| 4,787 | ||||||||||||
|
| |||||||||||
| ENERGY 0.2% |
| |||||||||||
Origin Energy Ltd. | 22,759 | 169 | ||||||||||
Woodside Petroleum Ltd. | 20,593 | 540 | ||||||||||
WorleyParsons Ltd. | 45,764 | 591 | ||||||||||
|
| |||||||||||
| 1,300 | ||||||||||||
|
| |||||||||||
| FINANCIALS 2.7% |
| |||||||||||
AMP Ltd. | 187,652 | 494 | ||||||||||
Australia & New Zealand Banking Group Ltd. | 134,191 | 2,809 | ||||||||||
Bendigo & Adelaide Bank Ltd. | 49,016 | 393 | ||||||||||
Commonwealth Bank of Australia | 47,438 | 2,558 | ||||||||||
Genworth Mortgage Insurance Australia Ltd. | 106,424 | 202 | ||||||||||
Insurance Australia Group Ltd. | 62,767 | 396 | ||||||||||
Macquarie Group Ltd. | 11,282 | 1,028 | ||||||||||
National Australia Bank Ltd. | 121,670 | 2,470 | ||||||||||
QBE Insurance Group Ltd. | 46,224 | 333 | ||||||||||
Suncorp Group Ltd. | 159,142 | 1,716 | ||||||||||
Westpac Banking Corp. | 122,764 | 2,666 | ||||||||||
|
| |||||||||||
| 15,065 | ||||||||||||
|
| |||||||||||
| HEALTH CARE 0.2% |
| |||||||||||
CSL Ltd. | 1,914 | 272 | ||||||||||
Primary Health Care Ltd. | 116,728 | 301 | ||||||||||
Sonic Healthcare Ltd. | 16,037 | 291 | ||||||||||
|
| |||||||||||
| 864 | ||||||||||||
|
| |||||||||||
| INDUSTRIALS 0.4% |
| |||||||||||
Aurizon Holdings Ltd. | 133,327 | 427 | ||||||||||
CIMIC Group Ltd. | 13,927 | 435 | ||||||||||
Downer EDI Ltd. | 147,431 | 738 | ||||||||||
Qantas Airways Ltd. | 131,979 | 601 | ||||||||||
|
| |||||||||||
| 2,201 | ||||||||||||
|
| |||||||||||
| MATERIALS 1.6% |
| |||||||||||
BHP Billiton Ltd. | 188,083 | 4,706 | ||||||||||
BHP Billiton PLC | 156,910 | 3,522 | ||||||||||
Fortescue Metals Group Ltd. | 35,045 | 114 | ||||||||||
Incitec Pivot Ltd. | 104,780 | 281 | ||||||||||
Orica Ltd. | 10,843 | 142 | ||||||||||
|
| |||||||||||
| 8,765 | ||||||||||||
|
| |||||||||||
| SHARES | MARKET VALUE (000S) | |||||||||||
| REAL ESTATE 0.1% |
| |||||||||||
Lend Lease Group | 23,139 | $ | 339 | |||||||||
|
| |||||||||||
| TELECOMMUNICATION SERVICES 0.2% |
| |||||||||||
Telstra Corp. Ltd. | 563,710 | 1,090 | ||||||||||
|
| |||||||||||
| UTILITIES 0.0% |
| |||||||||||
AGL Energy Ltd. | 7,410 | 123 | ||||||||||
|
| |||||||||||
Total Australia | 35,320 | |||||||||||
|
| |||||||||||
| AUSTRIA 0.6% |
| |||||||||||
| ENERGY 0.2% |
| |||||||||||
OMV AG | 13,262 | 750 | ||||||||||
|
| |||||||||||
| FINANCIALS 0.4% |
| |||||||||||
Erste Group Bank AG | 27,330 | 1,139 | ||||||||||
Raiffeisen Bank International AG | 22,401 | 686 | ||||||||||
Vienna Insurance Group AG Wiener Versicherung Gruppe | 6,707 | 183 | ||||||||||
|
| |||||||||||
| 2,008 | ||||||||||||
|
| |||||||||||
| INDUSTRIALS 0.0% |
| |||||||||||
Oesterreichische Post AG | 2,412 | 110 | ||||||||||
|
| |||||||||||
| MATERIALS 0.0% |
| |||||||||||
voestalpine AG | 3,545 | 163 | ||||||||||
|
| |||||||||||
Total Austria | 3,031 | |||||||||||
|
| |||||||||||
| BELGIUM 0.6% |
| |||||||||||
| CONSUMER STAPLES 0.0% |
| |||||||||||
Anheuser-Busch InBev S.A. NV | 1,338 | 135 | ||||||||||
|
| |||||||||||
| FINANCIALS 0.4% |
| |||||||||||
Ageas | 29,539 | 1,487 | ||||||||||
KBC Group NV | 9,293 | 714 | ||||||||||
|
| |||||||||||
| 2,201 | ||||||||||||
|
| |||||||||||
| HEALTH CARE 0.0% |
| |||||||||||
UCB S.A. | 1,400 | 109 | ||||||||||
|
| |||||||||||
| INDUSTRIALS 0.1% |
| |||||||||||
bpost S.A. | 13,341 | 211 | ||||||||||
|
| |||||||||||
| TELECOMMUNICATION SERVICES 0.1% |
| |||||||||||
Proximus S.A. | 19,827 | 446 | ||||||||||
|
| |||||||||||
Total Belgium | 3,102 | |||||||||||
|
| |||||||||||
| CANADA 6.0% |
| |||||||||||
| CONSUMER DISCRETIONARY 0.5% |
| |||||||||||
Aimia, Inc. | 37,463 | 66 | ||||||||||
Canadian Tire Corp. Ltd. ‘A’ | 4,523 | 590 | ||||||||||
Hudson’s Bay Co. | 28,581 | 255 | ||||||||||
Magna International, Inc. | 25,493 | 1,482 | ||||||||||
Quebecor, Inc. ‘B’ | 8,335 | 171 | ||||||||||
Shaw Communications, Inc. ‘B’ | 15,948 | 325 | ||||||||||
|
| |||||||||||
| 2,889 | ||||||||||||
|
| |||||||||||
| SHARES | MARKET VALUE (000S) | |||||||||||
| CONSUMER STAPLES 0.2% |
| |||||||||||
Empire Co. Ltd. ‘A’ | 16,716 | $ | 336 | |||||||||
George Weston Ltd. | 7,593 | 619 | ||||||||||
Loblaw Cos. Ltd. | 2,520 | 130 | ||||||||||
|
| |||||||||||
| 1,085 | ||||||||||||
|
| |||||||||||
| ENERGY 0.9% |
| |||||||||||
Baytex Energy Corp. (a) | 112,837 | 375 | ||||||||||
Bonavista Energy Corp. | 61,130 | 69 | ||||||||||
Canadian Natural Resources Ltd. | 6,362 | 230 | ||||||||||
Cenovus Energy, Inc. | 21,648 | 225 | ||||||||||
Crescent Point Energy Corp. | 69,932 | 514 | ||||||||||
Enerplus Corp. | 10,331 | 130 | ||||||||||
Husky Energy, Inc. | 39,510 | 616 | ||||||||||
Imperial Oil Ltd. | 3,732 | 124 | ||||||||||
MEG Energy Corp. (a) | 23,625 | 197 | ||||||||||
Obsidian Energy Ltd. (a) | 121,444 | 138 | ||||||||||
Suncor Energy, Inc. | 51,075 | 2,078 | ||||||||||
TransCanada Corp. | 2,902 | 126 | ||||||||||
Vermilion Energy, Inc. | 3,560 | 128 | ||||||||||
|
| |||||||||||
| 4,950 | ||||||||||||
|
| |||||||||||
| FINANCIALS 3.0% |
| |||||||||||
Bank of Montreal | 29,893 | 2,311 | ||||||||||
Bank of Nova Scotia | 36,051 | 2,041 | ||||||||||
Brookfield Asset Management, Inc. ‘A’ | 3,149 | 128 | ||||||||||
Canadian Imperial Bank of Commerce | 19,586 | 1,704 | ||||||||||
CI Financial Corp. | 6,328 | 114 | ||||||||||
Genworth MI Canada, Inc. | 3,904 | 127 | ||||||||||
Home Capital Group, Inc. | 24,494 | 280 | ||||||||||
IGM Financial, Inc. | 6,056 | 175 | ||||||||||
Manulife Financial Corp. | 23,651 | 425 | ||||||||||
National Bank of Canada | 12,868 | 618 | ||||||||||
Onex Corp. | 9,510 | 698 | ||||||||||
Power Corp. of Canada | 36,961 | 828 | ||||||||||
Power Financial Corp. | 16,558 | 387 | ||||||||||
Royal Bank of Canada | 36,054 | 2,715 | ||||||||||
Sun Life Financial, Inc. | 12,299 | 494 | ||||||||||
Thomson Reuters Corp. | 12,544 | 506 | ||||||||||
Toronto-Dominion Bank | 49,318 | 2,854 | ||||||||||
|
| |||||||||||
| 16,405 | ||||||||||||
|
| |||||||||||
| INDUSTRIALS 0.6% |
| |||||||||||
Air Canada (a) | 86,757 | 1,402 | ||||||||||
Canadian National Railway Co. | 8,660 | 708 | ||||||||||
Canadian Pacific Railway Ltd. | 904 | 166 | ||||||||||
Russel Metals, Inc. | 5,372 | 110 | ||||||||||
TFI International, Inc. | 7,966 | 246 | ||||||||||
WestJet Airlines Ltd. | 27,840 | 384 | ||||||||||
WSP Global, Inc. | 2,355 | 124 | ||||||||||
|
| |||||||||||
| 3,140 | ||||||||||||
|
| |||||||||||
| INFORMATION TECHNOLOGY 0.0% |
| |||||||||||
Canadian Solar, Inc. (a) | 8,270 | 101 | ||||||||||
Celestica, Inc. (a) | 12,958 | 154 | ||||||||||
|
| |||||||||||
| 255 | ||||||||||||
|
| |||||||||||
| MATERIALS 0.3% |
| |||||||||||
First Quantum Minerals Ltd. | 8,223 | 121 | ||||||||||
Goldcorp, Inc. | 16,856 | 231 | ||||||||||
Methanex Corp. | 1,884 | 133 | ||||||||||
| 44 | PIMCO EQUITY SERIES | See Accompanying Notes |
Table of Contents
June 30, 2018
| SHARES | MARKET VALUE (000S) | |||||||||||
Nutrien Ltd. | 18,157 | $ | 987 | |||||||||
Resolute Forest Products, Inc. (a) | 12,629 | 131 | ||||||||||
Teck Resources Ltd. ‘B’ | 10,139 | 258 | ||||||||||
Yamana Gold, Inc. | 49,165 | 143 | ||||||||||
|
| |||||||||||
| 2,004 | ||||||||||||
|
| |||||||||||
| TELECOMMUNICATION SERVICES 0.2% |
| |||||||||||
BCE, Inc. | 9,284 | 376 | ||||||||||
Rogers Communications, Inc. ‘B’ | 2,818 | 134 | ||||||||||
TELUS Corp. | 16,845 | 598 | ||||||||||
|
| |||||||||||
| 1,108 | ||||||||||||
|
| |||||||||||
| UTILITIES 0.3% |
| |||||||||||
Atco Ltd. ‘I’ | 11,523 | 356 | ||||||||||
Canadian Utilities Ltd. ‘A’ | 4,980 | 126 | ||||||||||
Capital Power Corp. | 16,517 | 317 | ||||||||||
Hydro One Ltd. | 11,947 | 182 | ||||||||||
Just Energy Group, Inc. | 32,296 | 116 | ||||||||||
Superior Plus Corp. | 11,914 | 115 | ||||||||||
TransAlta Corp. | 50,109 | 252 | ||||||||||
|
| |||||||||||
| 1,464 | ||||||||||||
|
| |||||||||||
Total Canada | 33,300 | |||||||||||
|
| |||||||||||
| DENMARK 0.6% |
| |||||||||||
| CONSUMER STAPLES 0.1% |
| |||||||||||
Carlsberg A/S ‘B’ | 3,063 | 360 | ||||||||||
|
| |||||||||||
| FINANCIALS 0.0% |
| |||||||||||
Danske Bank A/S | 3,844 | 120 | ||||||||||
|
| |||||||||||
| HEALTH CARE 0.2% |
| |||||||||||
Novo Nordisk A/S ‘B’ | 16,901 | 781 | ||||||||||
|
| |||||||||||
| INDUSTRIALS 0.3% |
| |||||||||||
AP Moller - Maersk A/S ‘B’ | 449 | 555 | ||||||||||
ISS A/S | 36,906 | 1,264 | ||||||||||
|
| |||||||||||
| 1,819 | ||||||||||||
|
| |||||||||||
Total Denmark | 3,080 | |||||||||||
|
| |||||||||||
| FINLAND 0.4% |
| |||||||||||
| CONSUMER STAPLES 0.0% |
| |||||||||||
Kesko Oyj ‘B’ | 1,986 | 122 | ||||||||||
|
| |||||||||||
| MATERIALS 0.3% |
| |||||||||||
Stora Enso Oyj ‘R’ | 39,625 | 772 | ||||||||||
UPM-Kymmene Oyj | 18,377 | 654 | ||||||||||
|
| |||||||||||
| 1,426 | ||||||||||||
|
| |||||||||||
| UTILITIES 0.1% |
| |||||||||||
Fortum Oyj | 25,149 | 599 | ||||||||||
|
| |||||||||||
Total Finland | 2,147 | |||||||||||
|
| |||||||||||
| FRANCE 10.0% |
| |||||||||||
| CONSUMER DISCRETIONARY 1.4% |
| |||||||||||
Accor S.A. | 3,139 | 154 | ||||||||||
Christian Dior SE | 262 | 109 | ||||||||||
Cie Generale des Etablissements Michelin S.C.A. | 10,627 | 1,286 | ||||||||||
Elior Group S.A. | 8,265 | 119 | ||||||||||
Eutelsat Communications S.A. | 4,034 | 83 | ||||||||||
| SHARES | MARKET VALUE (000S) | |||||||||||
Kering S.A. | 1,129 | $ | 636 | |||||||||
Lagardere S.C.A. | 30,054 | 792 | ||||||||||
LVMH Moet Hennessy Louis Vuitton SE | 3,014 | 1,001 | ||||||||||
Peugeot S.A. | 24,680 | 562 | ||||||||||
Publicis Groupe S.A. | 7,907 | 542 | ||||||||||
Renault S.A. | 8,872 | 752 | ||||||||||
Television Francaise | 20,124 | 212 | ||||||||||
Vivendi S.A. | 56,705 | 1,387 | ||||||||||
|
| |||||||||||
| 7,635 | ||||||||||||
|
| |||||||||||
| CONSUMER STAPLES 0.6% |
| |||||||||||
Carrefour S.A. | 96,785 | 1,561 | ||||||||||
Casino Guichard Perrachon S.A. | 26,847 | 1,039 | ||||||||||
Danone S.A. | 3,658 | 267 | ||||||||||
Pernod-Ricard S.A. | 1,940 | 317 | ||||||||||
|
| |||||||||||
| 3,184 | ||||||||||||
|
| |||||||||||
| ENERGY 0.5% |
| |||||||||||
Total S.A. | 48,618 | 2,952 | ||||||||||
|
| |||||||||||
| FINANCIALS 2.4% |
| |||||||||||
AXA S.A. | 100,390 | 2,453 | ||||||||||
BNP Paribas S.A. | 70,420 | 4,356 | ||||||||||
CNP Assurances | 6,928 | 157 | ||||||||||
Credit Agricole S.A. | 90,401 | 1,200 | ||||||||||
Eurazeo S.A. | 10,169 | 770 | ||||||||||
Natixis S.A. | 60,821 | 430 | ||||||||||
SCOR SE | 10,927 | 404 | ||||||||||
Societe Generale S.A. | 84,618 | 3,557 | ||||||||||
Wendel S.A. | 815 | 112 | ||||||||||
|
| |||||||||||
| 13,439 | ||||||||||||
|
| |||||||||||
| HEALTH CARE 1.1% |
| |||||||||||
Sanofi | 74,433 | 5,974 | ||||||||||
|
| |||||||||||
| INDUSTRIALS 1.9% |
| |||||||||||
Air France-KLM (a) | 211,024 | 1,724 | ||||||||||
Airbus SE | 1,788 | 209 | ||||||||||
Alstom S.A. | 13,328 | 611 | ||||||||||
Bouygues S.A. | 31,831 | 1,368 | ||||||||||
Bureau Veritas S.A. | 4,863 | 130 | ||||||||||
Cie de Saint-Gobain | 35,308 | 1,573 | ||||||||||
Eiffage S.A. | 8,198 | 891 | ||||||||||
Europcar Groupe S.A. | 12,631 | 131 | ||||||||||
Rexel S.A. | 37,087 | 532 | ||||||||||
Safran S.A. | 3,372 | 408 | ||||||||||
Schneider Electric SE | 10,085 | 839 | ||||||||||
SPIE S.A. | 5,615 | 114 | ||||||||||
Teleperformance | 645 | 114 | ||||||||||
Vinci S.A. | 19,856 | 1,906 | ||||||||||
|
| |||||||||||
| 10,550 | ||||||||||||
|
| |||||||||||
| INFORMATION TECHNOLOGY 0.1% |
| |||||||||||
Atos SE | 4,335 | 589 | ||||||||||
Neopost S.A. | 4,279 | 115 | ||||||||||
|
| |||||||||||
| 704 | ||||||||||||
|
| |||||||||||
| MATERIALS 0.1% |
| |||||||||||
Air Liquide S.A. | 1,359 | 171 | ||||||||||
Arkema S.A. | 849 | 100 | ||||||||||
|
| |||||||||||
| 271 | ||||||||||||
|
| |||||||||||
| SHARES | MARKET VALUE (000S) | |||||||||||
| REAL ESTATE 0.0% |
| |||||||||||
Nexity S.A. | 1,704 | $ | 108 | |||||||||
|
| |||||||||||
| TELECOMMUNICATION SERVICES 0.6% |
| |||||||||||
Orange S.A. | 184,775 | 3,084 | ||||||||||
|
| |||||||||||
| UTILITIES 1.3% |
| |||||||||||
Electricite de France S.A. | 146,594 | 2,012 | ||||||||||
Engie S.A. | 253,685 | 3,880 | ||||||||||
Suez | 48,847 | 632 | ||||||||||
Veolia Environnement S.A. | 40,270 | 860 | ||||||||||
|
| |||||||||||
| 7,384 | ||||||||||||
|
| |||||||||||
Total France | 55,285 | |||||||||||
|
| |||||||||||
| GERMANY 8.4% |
| |||||||||||
| CONSUMER DISCRETIONARY 1.6% |
| |||||||||||
adidas AG | 541 | 118 | ||||||||||
Axel Springer SE | 2,185 | 158 | ||||||||||
Bayerische Motoren Werke AG | 27,754 | 2,509 | ||||||||||
Ceconomy AG | 39,719 | 330 | ||||||||||
Continental AG | 2,860 | 651 | ||||||||||
Daimler AG | 66,891 | 4,285 | ||||||||||
Hugo Boss AG | 5,392 | 489 | ||||||||||
ProSiebenSat.1 Media SE | 8,911 | 225 | ||||||||||
|
| |||||||||||
| 8,765 | ||||||||||||
|
| |||||||||||
| CONSUMER STAPLES 0.2% |
| |||||||||||
METRO AG | 57,012 | 703 | ||||||||||
Suedzucker AG | 10,886 | 173 | ||||||||||
|
| |||||||||||
| 876 | ||||||||||||
|
| |||||||||||
| FINANCIALS 1.7% |
| |||||||||||
Aareal Bank AG | 2,809 | 123 | ||||||||||
Commerzbank AG | 197,697 | 1,886 | ||||||||||
Deutsche Bank AG | 275,145 | 2,944 | ||||||||||
Deutsche Pfandbriefbank AG | 39,123 | 546 | ||||||||||
Hannover Rueck SE | 2,871 | 357 | ||||||||||
Muenchener Rueckversicherungs-Gesellschaft AG in Muenchen | 15,165 | 3,188 | ||||||||||
Talanx AG (a) | 16,479 | 600 | ||||||||||
|
| |||||||||||
| 9,644 | ||||||||||||
|
| |||||||||||
| HEALTH CARE 0.7% |
| |||||||||||
Bayer AG | 27,180 | 2,985 | ||||||||||
Fresenius Medical Care AG & Co. KGaA | 4,447 | 448 | ||||||||||
Fresenius SE & Co. KGaA | 3,461 | 277 | ||||||||||
|
| |||||||||||
| 3,710 | ||||||||||||
|
| |||||||||||
| INDUSTRIALS 1.2% |
| |||||||||||
Bilfinger SE | 6,872 | 348 | ||||||||||
Deutsche Lufthansa AG | 101,994 | 2,444 | ||||||||||
Deutsche Post AG | 52,871 | 1,718 | ||||||||||
Fraport AG Frankfurt Airport Services Worldwide | 3,886 | 374 | ||||||||||
Hapag-Lloyd AG (a) | 2,924 | 104 | ||||||||||
Hochtief AG | 545 | 98 | ||||||||||
Rheinmetall AG | 1,826 | 201 | ||||||||||
Siemens AG | 12,253 | 1,614 | ||||||||||
|
| |||||||||||
| 6,901 | ||||||||||||
|
| |||||||||||
| See Accompanying Notes | ANNUAL REPORT | JUNE 30, 2018 | 45 |
Table of Contents
Schedule of Investments PIMCO RAE International Fund (Cont.)
| SHARES | MARKET VALUE (000S) | |||||||||||
| INFORMATION TECHNOLOGY 0.1% |
| |||||||||||
SAP SE | 3,786 | $ | 437 | |||||||||
|
| |||||||||||
| MATERIALS 1.1% |
| |||||||||||
BASF SE | 31,979 | 3,053 | ||||||||||
Evonik Industries AG | 12,822 | 439 | ||||||||||
HeidelbergCement AG | 5,709 | 479 | ||||||||||
K+S AG | 23,790 | 585 | ||||||||||
Lanxess AG | 1,877 | 146 | ||||||||||
Linde AG | 3,161 | 751 | ||||||||||
Salzgitter AG | 10,272 | 447 | ||||||||||
|
| |||||||||||
| 5,900 | ||||||||||||
|
| |||||||||||
| REAL ESTATE 0.0% |
| |||||||||||
Vonovia SE | 4,581 | 218 | ||||||||||
|
| |||||||||||
| TELECOMMUNICATION SERVICES 0.4% |
| |||||||||||
Deutsche Telekom AG | 145,653 | 2,251 | ||||||||||
|
| |||||||||||
| UTILITIES 1.4% |
| |||||||||||
E.ON SE | 236,194 | 2,516 | ||||||||||
Innogy SE | 18,481 | 790 | ||||||||||
RWE AG | 152,584 | 3,467 | ||||||||||
Uniper SE | 35,361 | 1,053 | ||||||||||
|
| |||||||||||
| 7,826 | ||||||||||||
|
| |||||||||||
Total Germany | 46,528 | |||||||||||
|
| |||||||||||
| HONG KONG 2.3% |
| |||||||||||
| CONSUMER DISCRETIONARY 0.3% |
| |||||||||||
Li & Fung Ltd. | 790,000 | 289 | ||||||||||
Luk Fook Holdings International Ltd. | 31,000 | 128 | ||||||||||
Shangri-La Asia Ltd. | 72,000 | 135 | ||||||||||
SJM Holdings Ltd. | 632,000 | 784 | ||||||||||
Yue Yuen Industrial Holdings Ltd. | 54,500 | 154 | ||||||||||
|
| |||||||||||
| 1,490 | ||||||||||||
|
| |||||||||||
| FINANCIALS 0.1% |
| |||||||||||
Dah Sing Financial Holdings Ltd. | 22,400 | 131 | ||||||||||
Hang Seng Bank Ltd. | 21,600 | 539 | ||||||||||
|
| |||||||||||
| 670 | ||||||||||||
|
| |||||||||||
| INDUSTRIALS 0.3% |
| |||||||||||
Cathay Pacific Airways Ltd. | 222,000 | 349 | ||||||||||
CK Hutchison Holdings Ltd. | 24,500 | 259 | ||||||||||
Jardine Matheson Holdings Ltd. | 2,000 | 126 | ||||||||||
MTR Corp. Ltd. | 58,000 | 320 | ||||||||||
Noble Group Ltd. (a) | 188,480 | 18 | ||||||||||
Orient Overseas International Ltd. | 12,500 | 122 | ||||||||||
Seaspan Corp. | 24,056 | 245 | ||||||||||
|
| |||||||||||
| 1,439 | ||||||||||||
|
| |||||||||||
| INFORMATION TECHNOLOGY 0.1% |
| |||||||||||
GCL-Poly Energy Holdings Ltd. (a) | 687,000 | 65 | ||||||||||
Kingboard Chemical Holdings Ltd. | 92,000 | 335 | ||||||||||
|
| |||||||||||
| 400 | ||||||||||||
|
| |||||||||||
| MATERIALS 0.0% |
| |||||||||||
Nine Dragons Paper Holdings Ltd. | 74,000 | 94 | ||||||||||
|
| |||||||||||
| SHARES | MARKET VALUE (000S) | |||||||||||
| REAL ESTATE 1.4% |
| |||||||||||
China South City Holdings Ltd. | 626,000 | $ | 122 | |||||||||
CK Asset Holdings Ltd. | 42,000 | 332 | ||||||||||
Hang Lung Properties Ltd. | 94,000 | 193 | ||||||||||
Henderson Land Development Co. Ltd. | 27,500 | 145 | ||||||||||
Hongkong Land Holdings Ltd. | 73,700 | 527 | ||||||||||
Hysan Development Co. Ltd. | 50,000 | 279 | ||||||||||
Kerry Properties Ltd. | 93,500 | 447 | ||||||||||
New World Development Co. Ltd. | 663,000 | 927 | ||||||||||
Shimao Property Holdings Ltd. | 328,000 | 855 | ||||||||||
Sino Land Co. Ltd. | 130,000 | 211 | ||||||||||
Sun Hung Kai Properties Ltd. | 71,000 | 1,070 | ||||||||||
Swire Pacific Ltd. ‘A’ | 101,500 | 1,073 | ||||||||||
Swire Properties Ltd. | 37,600 | 139 | ||||||||||
Wharf Holdings Ltd. | 216,000 | 692 | ||||||||||
Wharf Real Estate Investment Co. Ltd. | 80,000 | 568 | ||||||||||
Wheelock & Co. Ltd. | 51,000 | 354 | ||||||||||
|
| |||||||||||
| 7,934 | ||||||||||||
|
| |||||||||||
| TELECOMMUNICATION SERVICES 0.0% |
| |||||||||||
PCCW Ltd. | 174,000 | 98 | ||||||||||
|
| |||||||||||
| UTILITIES 0.1% |
| |||||||||||
CLP Holdings Ltd. | 30,000 | 323 | ||||||||||
|
| |||||||||||
Total Hong Kong | 12,448 | |||||||||||
|
| |||||||||||
| IRELAND 0.6% |
| |||||||||||
| FINANCIALS 0.1% |
| |||||||||||
Bank of Ireland Group PLC | 37,409 | 290 | ||||||||||
|
| |||||||||||
| HEALTH CARE 0.3% |
| |||||||||||
Endo International PLC (a) | 62,167 | 586 | ||||||||||
Medtronic PLC | 14,222 | 1,218 | ||||||||||
|
| |||||||||||
| 1,804 | ||||||||||||
|
| |||||||||||
| INDUSTRIALS 0.1% |
| |||||||||||
AerCap Holdings NV (a) | 5,643 | 305 | ||||||||||
|
| |||||||||||
| MATERIALS 0.1% |
| |||||||||||
CRH PLC | 4,018 | 141 | ||||||||||
Smurfit Kappa Group PLC | 23,773 | 960 | ||||||||||
|
| |||||||||||
| 1,101 | ||||||||||||
|
| |||||||||||
Total Ireland | 3,500 | |||||||||||
|
| |||||||||||
| ISRAEL 0.9% |
| |||||||||||
| FINANCIALS 0.3% |
| |||||||||||
Bank Hapoalim BM | 93,276 | 632 | ||||||||||
Bank Leumi Le-Israel BM | 140,086 | 829 | ||||||||||
Israel Discount Bank Ltd. ‘A’ | 126,878 | 371 | ||||||||||
Mizrahi Tefahot Bank Ltd. | 7,086 | 130 | ||||||||||
|
| |||||||||||
| 1,962 | ||||||||||||
|
| |||||||||||
| HEALTH CARE 0.4% |
| |||||||||||
Teva Pharmaceutical Industries Ltd. SP - ADR | 87,373 | 2,125 | ||||||||||
|
| |||||||||||
| MATERIALS 0.1% |
| |||||||||||
Israel Chemicals Ltd. | 94,001 | 431 | ||||||||||
|
| |||||||||||
| SHARES | MARKET VALUE (000S) | |||||||||||
| TELECOMMUNICATION SERVICES 0.1% |
| |||||||||||
Bezeq The Israeli Telecommunication Corp. Ltd. | 414,573 | $ | 467 | |||||||||
|
| |||||||||||
Total Israel | 4,985 | |||||||||||
|
| |||||||||||
| ITALY 3.3% |
| |||||||||||
| CONSUMER DISCRETIONARY 0.0% |
| |||||||||||
Mediaset SpA (a) | 32,624 | 104 | ||||||||||
|
| |||||||||||
| ENERGY 0.6% |
| |||||||||||
Eni SpA | 162,081 | 3,005 | ||||||||||
Snam SpA | 36,401 | 152 | ||||||||||
|
| |||||||||||
| 3,157 | ||||||||||||
|
| |||||||||||
| FINANCIALS 1.8% |
| |||||||||||
Assicurazioni Generali SpA | 117,886 | 1,971 | ||||||||||
Banca Monte dei Paschi di Siena SpA (a) | 41,407 | 119 | ||||||||||
Banco BPM SpA (a) | 80,957 | 235 | ||||||||||
BPER Banca | 81,904 | 447 | ||||||||||
Intesa Sanpaolo SpA | 634,238 | 1,835 | ||||||||||
Poste Italiane SpA | 237,008 | 1,978 | ||||||||||
UniCredit SpA | 102,721 | 1,703 | ||||||||||
Unione di Banche Italiane SpA | 262,927 | 1,007 | ||||||||||
Unipol Gruppo Finanziario SpA | 156,747 | 604 | ||||||||||
UnipolSai Assicurazioni SpA | 53,684 | 118 | ||||||||||
|
| |||||||||||
| 10,017 | ||||||||||||
|
| |||||||||||
| INDUSTRIALS 0.1% |
| |||||||||||
Leonardo SpA | 13,450 | 133 | ||||||||||
Societa Iniziative Autostradali e Servizi SpA | 17,014 | 255 | ||||||||||
|
| |||||||||||
| 388 | ||||||||||||
|
| |||||||||||
| TELECOMMUNICATION SERVICES 0.1% |
| |||||||||||
Telecom Italia SpA (a) | 1,093,238 | 810 | ||||||||||
|
| |||||||||||
| UTILITIES 0.7% |
| |||||||||||
Enel SpA | 663,380 | 3,676 | ||||||||||
Iren SpA | 69,802 | 178 | ||||||||||
|
| |||||||||||
| 3,854 | ||||||||||||
|
| |||||||||||
Total Italy | 18,330 | |||||||||||
|
| |||||||||||
| JAPAN 25.2% |
| |||||||||||
| CONSUMER DISCRETIONARY 5.3% |
| |||||||||||
Aisin Seiki Co. Ltd. | 9,300 | 423 | ||||||||||
Aoyama Trading Co. Ltd. | 5,200 | 173 | ||||||||||
Benesse Holdings, Inc. | 4,500 | 160 | ||||||||||
Bic Camera, Inc. | 12,000 | 185 | ||||||||||
Bridgestone Corp. | 36,800 | 1,437 | ||||||||||
Canon Marketing Japan, Inc. | 9,400 | 196 | ||||||||||
Casio Computer Co. Ltd. | 8,000 | 130 | ||||||||||
DCM Holdings Co. Ltd. | 19,800 | 185 | ||||||||||
Denso Corp. | 16,500 | 805 | ||||||||||
Dentsu, Inc. | 3,500 | 166 | ||||||||||
EDION Corp. | 17,500 | 176 | ||||||||||
Fuji Media Holdings, Inc. | 16,600 | 283 | ||||||||||
Geo Holdings Corp. | 11,500 | 154 | ||||||||||
H2O Retailing Corp. | 18,000 | 287 | ||||||||||
Honda Motor Co. Ltd. | 114,400 | 3,354 | ||||||||||
Isetan Mitsukoshi Holdings Ltd. ‘L’ | 46,700 | 583 | ||||||||||
| 46 | PIMCO EQUITY SERIES | See Accompanying Notes |
Table of Contents
June 30, 2018
| SHARES | MARKET VALUE (000S) | |||||||||||
Isuzu Motors Ltd. | 25,800 | $ | 342 | |||||||||
J Front Retailing Co. Ltd. | 16,700 | 254 | ||||||||||
JVC Kenwood Corp. | 96,900 | 274 | ||||||||||
K’s Holdings Corp. | 13,600 | 141 | ||||||||||
Kohnan Shoji Co. Ltd. | 8,800 | 205 | ||||||||||
Marui Group Co. Ltd. | 5,200 | 109 | ||||||||||
Mazda Motor Corp. | 74,400 | 913 | ||||||||||
Mitsubishi Motors Corp. | 28,900 | 230 | ||||||||||
Nikon Corp. | 30,600 | 486 | ||||||||||
Nissan Motor Co. Ltd. | 252,600 | 2,458 | ||||||||||
NOK Corp. | 6,600 | 127 | ||||||||||
Onward Holdings Co. Ltd. | 33,600 | 258 | ||||||||||
Panasonic Corp. | 128,600 | 1,734 | ||||||||||
Pioneer Corp. (a) | 220,000 | 305 | ||||||||||
Seiko Holdings Corp. | 11,500 | 247 | ||||||||||
Sekisui Chemical Co. Ltd. | 23,800 | 405 | ||||||||||
Sekisui House Ltd. | 27,900 | 493 | ||||||||||
Shimachu Co. Ltd. | 5,700 | 181 | ||||||||||
Skylark Co. Ltd. | 22,100 | 327 | ||||||||||
Sony Corp. | 19,400 | 994 | ||||||||||
Subaru Corp. | 20,100 | 585 | ||||||||||
Sumitomo Electric Industries Ltd. | 46,700 | 695 | ||||||||||
Sumitomo Forestry Co. Ltd. | 7,400 | 112 | ||||||||||
Sumitomo Rubber Industries Ltd. | 27,900 | 442 | ||||||||||
Suzuki Motor Corp. | 14,000 | 771 | ||||||||||
Takashimaya Co. Ltd. | 41,000 | 351 | ||||||||||
Tokai Rika Co. Ltd. | 6,400 | 121 | ||||||||||
Toyo Tire & Rubber Co. Ltd. | 15,200 | 222 | ||||||||||
Toyoda Gosei Co. Ltd. | 6,200 | 157 | ||||||||||
Toyota Industries Corp. | 5,800 | 325 | ||||||||||
Toyota Motor Corp. | 82,000 | 5,303 | ||||||||||
Unipres Corp. | 8,400 | 164 | ||||||||||
Wacoal Holdings Corp. | 7,400 | 215 | ||||||||||
Yamada Denki Co. Ltd. | 40,900 | 203 | ||||||||||
Yamaha Motor Co. Ltd. | 4,500 | 113 | ||||||||||
Yokohama Rubber Co. Ltd. | 14,500 | 301 | ||||||||||
Yoshinoya Holdings Co. Ltd. | 6,800 | 136 | ||||||||||
|
| |||||||||||
| 29,396 | ||||||||||||
|
| |||||||||||
| CONSUMER STAPLES 1.6% |
| |||||||||||
Aeon Co. Ltd. | 112,647 | 2,410 | ||||||||||
Ajinomoto Co., Inc. | 6,900 | 131 | ||||||||||
Asahi Group Holdings Ltd. | 8,300 | 426 | ||||||||||
cocokara fine, Inc. | 1,900 | 117 | ||||||||||
Japan Tobacco, Inc. | 24,956 | 697 | ||||||||||
Kao Corp. | 5,300 | 404 | ||||||||||
Kirin Holdings Co. Ltd. | 50,900 | 1,364 | ||||||||||
Matsumotokiyoshi Holdings Co. Ltd. | 2,500 | 112 | ||||||||||
Morinaga Milk Industry Co. Ltd. | 6,300 | 235 | ||||||||||
Nippon Suisan Kaisha Ltd. | 25,900 | 128 | ||||||||||
Sapporo Holdings Ltd. | 13,500 | 339 | ||||||||||
Seven & i Holdings Co. Ltd. | 21,700 | 946 | ||||||||||
Shiseido Co. Ltd. | 12,700 | 1,008 | ||||||||||
Suntory Beverage & Food Ltd. | 2,600 | 111 | ||||||||||
Yamazaki Baking Co. Ltd. | 15,100 | 396 | ||||||||||
|
| |||||||||||
| 8,824 | ||||||||||||
|
| |||||||||||
| ENERGY 0.5% |
| |||||||||||
Cosmo Energy Holdings Co. Ltd. | 7,100 | 248 | ||||||||||
Idemitsu Kosan Co. Ltd. | 3,000 | 107 | ||||||||||
Inpex Corp. | 115,500 | 1,199 | ||||||||||
Japan Petroleum Exploration Co. Ltd. | 13,800 | 360 | ||||||||||
| SHARES | MARKET VALUE (000S) | |||||||||||
JXTG Holdings, Inc. | 132,150 | $ | 917 | |||||||||
|
| |||||||||||
| 2,831 | ||||||||||||
|
| |||||||||||
| FINANCIALS 4.5% |
| |||||||||||
77 Bank Ltd. | 11,200 | 243 | ||||||||||
Bank of Kyoto Ltd. | 5,800 | 268 | ||||||||||
Chiba Bank Ltd. | 52,900 | 373 | ||||||||||
Credit Saison Co. Ltd. | 7,100 | 112 | ||||||||||
Dai-ichi Life Holdings, Inc. | 122,000 | 2,171 | ||||||||||
Daiwa Securities Group, Inc. | 131,600 | 763 | ||||||||||
Fukuoka Financial Group, Inc. | 72,000 | 361 | ||||||||||
Gunma Bank Ltd. | 56,100 | 294 | ||||||||||
Hachijuni Bank Ltd. | 39,000 | 166 | ||||||||||
Hokuhoku Financial Group, Inc. | 8,200 | 109 | ||||||||||
Iyo Bank Ltd. | 39,200 | 258 | ||||||||||
Japan Post Bank Co. Ltd. | 22,300 | 259 | ||||||||||
Japan Post Holdings Co. Ltd. | 117,500 | 1,286 | ||||||||||
Mitsubishi UFJ Financial Group, Inc. | 643,400 | 3,645 | ||||||||||
Mizuho Financial Group, Inc. | 1,973,300 | 3,324 | ||||||||||
MS&AD Insurance Group Holdings, Inc. | 29,200 | 907 | ||||||||||
Nomura Holdings, Inc. | 118,400 | 573 | ||||||||||
North Pacific Bank Ltd. | 34,700 | 116 | ||||||||||
Okasan Securities Group, Inc. | 29,000 | 142 | ||||||||||
ORIX Corp. | 67,300 | 1,061 | ||||||||||
Resona Holdings, Inc. | 67,200 | 358 | ||||||||||
SBI Holdings, Inc. | 28,200 | 723 | ||||||||||
Shinsei Bank Ltd. | 13,100 | 201 | ||||||||||
Shizuoka Bank Ltd. | 40,000 | 360 | ||||||||||
Sompo Holdings, Inc. | 4,900 | 198 | ||||||||||
Sony Financial Holdings, Inc. | 23,600 | 450 | ||||||||||
Sumitomo Mitsui Financial Group, Inc. | 89,600 | 3,495 | ||||||||||
Sumitomo Mitsui Trust Holdings, Inc. | 28,100 | 1,109 | ||||||||||
T&D Holdings, Inc. | 51,700 | 775 | ||||||||||
Tokio Marine Holdings, Inc. | 12,300 | 575 | ||||||||||
Yamaguchi Financial Group, Inc. | 24,000 | 270 | ||||||||||
|
| |||||||||||
| 24,945 | ||||||||||||
|
| |||||||||||
| HEALTH CARE 0.9% |
| |||||||||||
Alfresa Holdings Corp. | 6,300 | 148 | ||||||||||
Astellas Pharma, Inc. | 73,300 | 1,116 | ||||||||||
Daiichi Sankyo Co. Ltd. | 30,716 | 1,173 | ||||||||||
Hoya Corp. | 3,800 | 216 | ||||||||||
Medipal Holdings Corp. | 10,000 | 201 | ||||||||||
Nipro Corp. | 7,100 | 82 | ||||||||||
Otsuka Holdings Co. Ltd. | 9,228 | 446 | ||||||||||
Rohto Pharmaceutical Co. Ltd. | 3,700 | 119 | ||||||||||
Suzuken Co. Ltd. | 7,200 | 304 | ||||||||||
Takeda Pharmaceutical Co. Ltd. | 23,100 | 972 | ||||||||||
Toho Holdings Co. Ltd. | 6,700 | 163 | ||||||||||
|
| |||||||||||
| 4,940 | ||||||||||||
|
| |||||||||||
| INDUSTRIALS 4.8% |
| |||||||||||
ANA Holdings, Inc. | 18,700 | 686 | ||||||||||
Asahi Glass Co. Ltd. | 17,600 | 684 | ||||||||||
Central Glass Co. Ltd. | 5,500 | 115 | ||||||||||
Central Japan Railway Co. | 3,200 | 662 | ||||||||||
Dai Nippon Printing Co. Ltd. | 32,400 | 724 | ||||||||||
Duskin Co. Ltd. | 3,800 | 95 | ||||||||||
East Japan Railway Co. | 16,600 | 1,590 | ||||||||||
Fuji Electric Co. Ltd. | 43,000 | 327 | ||||||||||
| SHARES | MARKET VALUE (000S) | |||||||||||
Fujikura Ltd. | 27,800 | $ | 177 | |||||||||
Furukawa Electric Co. Ltd. | 3,900 | 136 | ||||||||||
Hankyu Hanshin Holdings, Inc. | 3,200 | 128 | ||||||||||
Hino Motors Ltd. | 10,700 | 114 | ||||||||||
Hitachi Construction Machinery Co. Ltd. | 4,700 | 152 | ||||||||||
Hitachi Zosen Corp. | 61,600 | 290 | ||||||||||
IHI Corp. | 7,100 | 247 | ||||||||||
ITOCHU Corp. | 78,000 | 1,411 | ||||||||||
Iwatani Corp. | 6,100 | 212 | ||||||||||
Japan Airlines Co. Ltd. | 31,200 | 1,105 | ||||||||||
JTEKT Corp. | 18,000 | 244 | ||||||||||
Kanematsu Corp. | 25,700 | 371 | ||||||||||
Kawasaki Heavy Industries Ltd. | 16,400 | 482 | ||||||||||
Komatsu Ltd. | 12,900 | 367 | ||||||||||
Kubota Corp. | 11,000 | 173 | ||||||||||
LIXIL Group Corp. | 13,700 | 274 | ||||||||||
Marubeni Corp. | 146,400 | 1,115 | ||||||||||
Mitsubishi Corp. | 33,200 | 921 | ||||||||||
Mitsubishi Electric Corp. | 72,000 | 955 | ||||||||||
Mitsubishi Heavy Industries Ltd. | 44,500 | 1,618 | ||||||||||
Mitsui & Co. Ltd. | 97,300 | 1,620 | ||||||||||
Mitsui E&S Holdings Co. Ltd. (a) | 24,000 | 314 | ||||||||||
Mitsui OSK Lines Ltd. | 8,600 | 207 | ||||||||||
Nagase & Co. Ltd. | 6,800 | 106 | ||||||||||
Nippon Express Co. Ltd. | 5,200 | 377 | ||||||||||
Nippon Sheet Glass Co. Ltd. | 61,700 | 592 | ||||||||||
Nippon Yusen KK | 37,300 | 739 | ||||||||||
Nisshinbo Holdings, Inc. | 28,300 | 303 | ||||||||||
NSK Ltd. | 13,400 | 138 | ||||||||||
NTN Corp. | 79,000 | 323 | ||||||||||
Okamura Corp. | 8,800 | 129 | ||||||||||
Recruit Holdings Co. Ltd. | 7,300 | 202 | ||||||||||
Secom Co. Ltd. | 1,800 | 138 | ||||||||||
Sojitz Corp. | 157,400 | 570 | ||||||||||
Sumitomo Corp. | 89,500 | 1,468 | ||||||||||
Sumitomo Heavy Industries Ltd. | 7,200 | 243 | ||||||||||
Tobu Railway Co. Ltd. | 5,200 | 159 | ||||||||||
Tokyu Corp. | 9,100 | 157 | ||||||||||
Toppan Printing Co. Ltd. | 49,000 | 383 | ||||||||||
Toshiba Corp. (a) | 411,000 | 1,234 | ||||||||||
Toyota Tsusho Corp. | 21,300 | 712 | ||||||||||
West Japan Railway Co. | 10,800 | 795 | ||||||||||
|
| |||||||||||
| 26,284 | ||||||||||||
|
| |||||||||||
| INFORMATION TECHNOLOGY 3.4% |
| |||||||||||
Anritsu Corp. | 8,200 | 112 | ||||||||||
Brother Industries Ltd. | 7,300 | 144 | ||||||||||
Canon, Inc. | 58,150 | 1,907 | ||||||||||
Citizen Watch Co. Ltd. | 35,300 | 231 | ||||||||||
FUJIFILM Holdings Corp. | 39,500 | 1,541 | ||||||||||
Fujitsu Ltd. | 285,000 | 1,725 | ||||||||||
Gree, Inc. (a) | 45,300 | 242 | ||||||||||
GungHo Online Entertainment, Inc. | 81,000 | 206 | ||||||||||
Hitachi Ltd. | 666,000 | 4,692 | ||||||||||
Ibiden Co. Ltd. | 21,500 | 344 | ||||||||||
Japan Display, Inc. (a) | 177,800 | 231 | ||||||||||
Konica Minolta, Inc. | 117,400 | 1,089 | ||||||||||
Kyocera Corp. | 9,000 | 506 | ||||||||||
Murata Manufacturing Co. Ltd. | 700 | 117 | ||||||||||
NEC Corp. | 48,600 | 1,332 | ||||||||||
Nippon Electric Glass Co. Ltd. | 10,900 | 302 | ||||||||||
NTT Data Corp. | 11,500 | 132 | ||||||||||
Oki Electric Industry Co. Ltd. | 24,400 | 273 | ||||||||||
| See Accompanying Notes | ANNUAL REPORT | JUNE 30, 2018 | 47 |
Table of Contents
Schedule of Investments PIMCO RAE International Fund (Cont.)
| SHARES | MARKET VALUE (000S) | |||||||||||
Omron Corp. | 2,400 | $ | 112 | |||||||||
Ricoh Co. Ltd. | 177,700 | 1,627 | ||||||||||
Rohm Co. Ltd. | 2,500 | 209 | ||||||||||
Seiko Epson Corp. | 16,200 | 281 | ||||||||||
Taiyo Yuden Co. Ltd. | 12,500 | 348 | ||||||||||
TDK Corp. | 7,300 | 743 | ||||||||||
TIS, Inc. | 2,800 | 129 | ||||||||||
Toshiba TEC Corp. | 23,000 | 140 | ||||||||||
|
| |||||||||||
| 18,715 | ||||||||||||
|
| |||||||||||
| MATERIALS 1.3% |
| |||||||||||
Asahi Kasei Corp. | 46,200 | 586 | ||||||||||
Denka Co. Ltd. | 5,600 | 186 | ||||||||||
DIC Corp. | 8,100 | 253 | ||||||||||
JFE Holdings, Inc. | 26,900 | 508 | ||||||||||
Kaneka Corp. | 42,000 | 376 | ||||||||||
Kobe Steel Ltd. | 56,900 | 520 | ||||||||||
Kuraray Co. Ltd. | 11,300 | 155 | ||||||||||
Mitsubishi Chemical Holdings Corp. | 100,900 | 843 | ||||||||||
Mitsubishi Gas Chemical Co., Inc. | 4,700 | 106 | ||||||||||
Mitsubishi Materials Corp. | 12,500 | 343 | ||||||||||
Mitsui Chemicals, Inc. | 5,600 | 149 | ||||||||||
Nippon Light Metal Holdings Co. Ltd. | 40,400 | 91 | ||||||||||
Nippon Paper Industries Co. Ltd. | 28,618 | 456 | ||||||||||
Oji Holdings Corp. | 109,000 | 676 | ||||||||||
Showa Denko KK | 9,700 | 429 | ||||||||||
Sumitomo Chemical Co. Ltd. | 140,000 | 792 | ||||||||||
Taiheiyo Cement Corp. | 2,900 | 95 | ||||||||||
Teijin Ltd. | 13,600 | 249 | ||||||||||
Toray Industries, Inc. | 14,600 | 115 | ||||||||||
Tosoh Corp. | 5,400 | 84 | ||||||||||
Toyo Seikan Group Holdings Ltd. ‘L’ | 15,000 | 263 | ||||||||||
Ube Industries Ltd. | 6,600 | 171 | ||||||||||
|
| |||||||||||
| 7,446 | ||||||||||||
|
| |||||||||||
| REAL ESTATE 0.3% |
| |||||||||||
Daiwa House Industry Co. Ltd. | 15,400 | 524 | ||||||||||
Leopalace21 Corp. | 16,600 | 91 | ||||||||||
Mitsui Fudosan Co. Ltd. | 6,800 | 164 | ||||||||||
Nomura Real Estate Holdings, Inc. | 18,400 | 407 | ||||||||||
Sumitomo Realty & Development Co. Ltd. | 4,000 | 147 | ||||||||||
Tokyu Fudosan Holdings Corp. | 41,800 | 295 | ||||||||||
|
| |||||||||||
| 1,628 | ||||||||||||
|
| |||||||||||
| TELECOMMUNICATION SERVICES 1.0% |
| |||||||||||
KDDI Corp. | 35,500 | 971 | ||||||||||
Nippon Telegraph & Telephone Corp. | 76,500 | 3,475 | ||||||||||
NTT DOCOMO, Inc. | 19,200 | 489 | ||||||||||
SoftBank Group Corp. | 7,300 | 522 | ||||||||||
|
| |||||||||||
| 5,457 | ||||||||||||
|
| |||||||||||
| UTILITIES 1.6% |
| |||||||||||
Chubu Electric Power Co., Inc. | 101,000 | 1,514 | ||||||||||
Chugoku Electric Power Co., Inc. | 40,900 | 528 | ||||||||||
Electric Power Development Co. Ltd. | 14,100 | 364 | ||||||||||
Hokkaido Electric Power Co., Inc. | 17,700 | 121 | ||||||||||
Hokuriku Electric Power Co. | 65,188 | 655 | ||||||||||
Kansai Electric Power Co., Inc. | 98,100 | 1,431 | ||||||||||
| SHARES | MARKET VALUE (000S) | |||||||||||
Kyushu Electric Power Co., Inc. | 15,600 | $ | 174 | |||||||||
Shikoku Electric Power Co., Inc. | 28,300 | 379 | ||||||||||
Tohoku Electric Power Co., Inc. | 61,900 | 756 | ||||||||||
Tokyo Electric Power Co. Holdings, Inc. (a) | 497,500 | 2,316 | ||||||||||
Tokyo Gas Co. Ltd. | 13,900 | 369 | ||||||||||
|
| |||||||||||
| 8,607 | ||||||||||||
|
| |||||||||||
Total Japan | 139,073 | |||||||||||
|
| |||||||||||
| LUXEMBOURG 0.1% |
| |||||||||||
| CONSUMER DISCRETIONARY 0.1% |
| |||||||||||
RTL Group S.A. | 6,397 | 434 | ||||||||||
|
| |||||||||||
| MATERIALS 0.0% |
| |||||||||||
ArcelorMittal | 3,747 | 109 | ||||||||||
|
| |||||||||||
Total Luxembourg | 543 | |||||||||||
|
| |||||||||||
| MACAU 0.1% |
| |||||||||||
| CONSUMER DISCRETIONARY 0.1% |
| |||||||||||
Sands China Ltd. | 29,600 | 158 | ||||||||||
Wynn Macau Ltd. | 107,600 | 345 | ||||||||||
|
| |||||||||||
| 503 | ||||||||||||
|
| |||||||||||
Total Macau | 503 | |||||||||||
|
| |||||||||||
| NETHERLANDS 3.4% |
| |||||||||||
| CONSUMER STAPLES 0.5% |
| |||||||||||
Heineken Holding NV | 7,324 | 700 | ||||||||||
Heineken NV | 1,319 | 132 | ||||||||||
Koninklijke Ahold Delhaize NV | 79,521 | 1,899 | ||||||||||
|
| |||||||||||
| 2,731 | ||||||||||||
|
| |||||||||||
| ENERGY 1.2% |
| |||||||||||
Fugro NV (a) | 16,633 | 241 | ||||||||||
Royal Dutch Shell PLC ‘A’ | 180,889 | 6,278 | ||||||||||
|
| |||||||||||
| 6,519 | ||||||||||||
|
| |||||||||||
| FINANCIALS 0.8% |
| |||||||||||
ABN AMRO Group NV | 4,560 | 118 | ||||||||||
Aegon NV | 226,501 | 1,352 | ||||||||||
ASR Nederland NV | 22,851 | 930 | ||||||||||
ING Groep NV | 108,107 | 1,552 | ||||||||||
NN Group NV | 15,038 | 610 | ||||||||||
|
| |||||||||||
| 4,562 | ||||||||||||
|
| |||||||||||
| HEALTH CARE 0.3% |
| |||||||||||
Koninklijke Philips NV | 45,507 | 1,928 | ||||||||||
|
| |||||||||||
| INDUSTRIALS 0.2% |
| |||||||||||
Arcadis NV | 6,930 | 125 | ||||||||||
PostNL NV | 32,396 | 121 | ||||||||||
Signify NV | 25,083 | 649 | ||||||||||
Wolters Kluwer NV | 3,578 | 201 | ||||||||||
|
| |||||||||||
| 1,096 | ||||||||||||
|
| |||||||||||
| MATERIALS 0.2% |
| |||||||||||
Akzo Nobel NV | 8,294 | 708 | ||||||||||
Koninklijke DSM NV | 2,910 | 291 | ||||||||||
|
| |||||||||||
| 999 | ||||||||||||
|
| |||||||||||
| SHARES | MARKET VALUE (000S) | |||||||||||
| TELECOMMUNICATION SERVICES 0.2% |
| |||||||||||
Koninklijke KPN NV | 131,152 | $ | 357 | |||||||||
VEON Ltd. ADR | 248,926 | 592 | ||||||||||
|
| |||||||||||
| 949 | ||||||||||||
|
| |||||||||||
Total Netherlands | 18,784 | |||||||||||
|
| |||||||||||
| NEW ZEALAND 0.2% |
| |||||||||||
| MATERIALS 0.1% |
| |||||||||||
Fletcher Building Ltd. | 86,594 | 406 | ||||||||||
|
| |||||||||||
| TELECOMMUNICATION SERVICES 0.1% |
| |||||||||||
Spark New Zealand Ltd. | 131,306 | 331 | ||||||||||
|
| |||||||||||
| UTILITIES 0.0% |
| |||||||||||
Contact Energy Ltd. | 32,227 | 128 | ||||||||||
|
| |||||||||||
Total New Zealand | 865 | |||||||||||
|
| |||||||||||
| NORWAY 0.8% |
| |||||||||||
| CONSUMER STAPLES 0.0% |
| |||||||||||
Marine Harvest ASA | 7,090 | 141 | ||||||||||
|
| |||||||||||
| ENERGY 0.4% |
| |||||||||||
Equinor ASA | 85,392 | 2,258 | ||||||||||
|
| |||||||||||
| FINANCIALS 0.1% |
| |||||||||||
DNB ASA | 26,257 | 511 | ||||||||||
|
| |||||||||||
| MATERIALS 0.1% |
| |||||||||||
Yara International ASA | 16,802 | 695 | ||||||||||
|
| |||||||||||
| TELECOMMUNICATION SERVICES 0.2% |
| |||||||||||
Telenor ASA | 38,101 | 781 | ||||||||||
|
| |||||||||||
Total Norway | 4,386 | |||||||||||
|
| |||||||||||
| PORTUGAL 0.3% |
| |||||||||||
| FINANCIALS 0.0% |
| |||||||||||
Banco Espirito Santo S.A. «(a) | 59,573 | 1 | ||||||||||
|
| |||||||||||
| MATERIALS 0.1% |
| |||||||||||
Navigator Co. S.A. | 61,735 | 367 | ||||||||||
|
| |||||||||||
| UTILITIES 0.2% |
| |||||||||||
EDP - Energias de Portugal S.A. | 329,390 | 1,305 | ||||||||||
|
| |||||||||||
Total Portugal | 1,673 | |||||||||||
|
| |||||||||||
| SINGAPORE 1.2% |
| |||||||||||
| CONSUMER DISCRETIONARY 0.0% |
| |||||||||||
Singapore Press Holdings Ltd. | 74,400 | 142 | ||||||||||
|
| |||||||||||
| FINANCIALS 0.8% |
| |||||||||||
DBS Group Holdings Ltd. | 83,910 | 1,632 | ||||||||||
Oversea-Chinese Banking Corp. Ltd. | 142,500 | 1,214 | ||||||||||
United Overseas Bank Ltd. | 64,200 | 1,258 | ||||||||||
|
| |||||||||||
| 4,104 | ||||||||||||
|
| |||||||||||
| INDUSTRIALS 0.3% |
| |||||||||||
ComfortDelGro Corp. Ltd. | 181,600 | 313 | ||||||||||
Hutchison Port Holdings Trust | 220,700 | 62 | ||||||||||
| 48 | PIMCO EQUITY SERIES | See Accompanying Notes |
Table of Contents
June 30, 2018
| SHARES | MARKET VALUE (000S) | |||||||||||
Keppel Corp. Ltd. | 179,600 | $ | 939 | |||||||||
Singapore Airlines Ltd. | 40,267 | 315 | ||||||||||
|
| |||||||||||
| 1,629 | ||||||||||||
|
| |||||||||||
| INFORMATION TECHNOLOGY 0.0% | ||||||||||||
Venture Corp. Ltd. | 11,800 | 154 | ||||||||||
|
| |||||||||||
| REAL ESTATE 0.1% | ||||||||||||
CapitaLand Ltd. | 120,600 | 279 | ||||||||||
City Developments Ltd. | 22,600 | 181 | ||||||||||
UOL Group Ltd. | 27,400 | 153 | ||||||||||
Yanlord Land Group Ltd. | 112,500 | 131 | ||||||||||
|
| |||||||||||
| 744 | ||||||||||||
|
| |||||||||||
| TELECOMMUNICATION SERVICES 0.0% | ||||||||||||
Singapore Telecommunications Ltd. | 48,500 | 110 | ||||||||||
|
| |||||||||||
Total Singapore | 6,883 | |||||||||||
|
| |||||||||||
| SOUTH AFRICA 0.3% | ||||||||||||
| CONSUMER DISCRETIONARY 0.0% | ||||||||||||
Steinhoff International Holdings NV (a) | 218,725 | 21 | ||||||||||
|
| |||||||||||
| FINANCIALS 0.3% | ||||||||||||
Investec PLC | 57,392 | 406 | ||||||||||
Old Mutual Ltd. (a) | 710,870 | 1,405 | ||||||||||
|
| |||||||||||
| 1,811 | ||||||||||||
|
| |||||||||||
Total South Africa | 1,832 | |||||||||||
|
| |||||||||||
| SPAIN 3.6% | ||||||||||||
| ENERGY 0.1% | ||||||||||||
Repsol S.A. | 20,557 | 401 | ||||||||||
|
| |||||||||||
| FINANCIALS 1.7% | ||||||||||||
Banco Bilbao Vizcaya Argentaria S.A. | 177,956 | 1,255 | ||||||||||
Banco de Sabadell S.A. | 264,386 | 442 | ||||||||||
Banco Santander S.A. | 1,291,142 | 6,900 | ||||||||||
CaixaBank S.A. | 84,356 | 363 | ||||||||||
Mapfre S.A. | 85,598 | 257 | ||||||||||
Unicaja Banco S.A. | 79,969 | 137 | ||||||||||
|
| |||||||||||
| 9,354 | ||||||||||||
|
| |||||||||||
| INDUSTRIALS 0.5% | ||||||||||||
Abengoa S.A. ‘B’ (a) | 226,011 | 2 | ||||||||||
Abertis Infraestructuras S.A. | 13,807 | 296 | ||||||||||
ACS Actividades de Construccion y Servicios S.A. | 38,286 | 1,545 | ||||||||||
Ferrovial S.A. | 17,294 | 354 | ||||||||||
Obrascon Huarte Lain S.A. | 129,403 | 413 | ||||||||||
|
| |||||||||||
| 2,610 | ||||||||||||
|
| |||||||||||
| TELECOMMUNICATION SERVICES 0.5% | ||||||||||||
Telefonica S.A. | 359,130 | 3,048 | ||||||||||
|
| |||||||||||
| UTILITIES 0.8% | ||||||||||||
Acciona S.A. | 5,518 | 455 | ||||||||||
Endesa S.A. | 60,327 | 1,327 | ||||||||||
Gas Natural SDG S.A. | 29,151 | 771 | ||||||||||
| SHARES | MARKET VALUE (000S) | |||||||||||
Iberdrola S.A. | 231,722 | $ | 1,787 | |||||||||
|
| |||||||||||
| 4,340 | ||||||||||||
|
| |||||||||||
Total Spain | 19,753 | |||||||||||
|
| |||||||||||
| SWEDEN 1.6% | ||||||||||||
| CONSUMER DISCRETIONARY 0.1% | ||||||||||||
Electrolux AB ‘B’ | 5,242 | 119 | ||||||||||
Hennes & Mauritz AB ‘B’ | 28,380 | 422 | ||||||||||
|
| |||||||||||
| 541 | ||||||||||||
|
| |||||||||||
| CONSUMER STAPLES 0.0% | ||||||||||||
Swedish Match AB | 4,332 | 214 | ||||||||||
|
| |||||||||||
| FINANCIALS 0.5% | ||||||||||||
Nordea Bank AB | 140,060 | 1,343 | ||||||||||
Ratos AB ‘B’ | 38,884 | 130 | ||||||||||
Skandinaviska Enskilda Banken AB ‘A’ | 61,531 | 582 | ||||||||||
Swedbank AB ‘A’ | 29,516 | 629 | ||||||||||
|
| |||||||||||
| 2,684 | ||||||||||||
|
| |||||||||||
| HEALTH CARE 0.0% | ||||||||||||
Getinge AB ‘B’ | 19,168 | 174 | ||||||||||
|
| |||||||||||
| INDUSTRIALS 0.3% | ||||||||||||
Atlas Copco AB ‘A’ | 4,965 | 144 | ||||||||||
Epiroc AB (a) | 9,570 | 100 | ||||||||||
S.A.S. AB (a) | 181,855 | 347 | ||||||||||
Sandvik AB | 17,391 | 307 | ||||||||||
Volvo AB ‘B’ | 31,052 | 494 | ||||||||||
|
| |||||||||||
| 1,392 | ||||||||||||
|
| |||||||||||
| INFORMATION TECHNOLOGY 0.3% | ||||||||||||
Telefonaktiebolaget LM Ericsson ‘B’ | 236,688 | 1,824 | ||||||||||
|
| |||||||||||
| TELECOMMUNICATION SERVICES 0.4% | ||||||||||||
Tele2 AB ‘B’ | 72,537 | 850 | ||||||||||
Telia Co. AB | 231,502 | 1,055 | ||||||||||
|
| |||||||||||
| 1,905 | ||||||||||||
|
| |||||||||||
Total Sweden | 8,734 | |||||||||||
|
| |||||||||||
| SWITZERLAND 5.2% | ||||||||||||
| CONSUMER DISCRETIONARY 0.1% | ||||||||||||
Cie Financiere Richemont S.A. | 1,634 | 138 | ||||||||||
Garmin Ltd. | 2,675 | 163 | ||||||||||
|
| |||||||||||
| 301 | ||||||||||||
|
| |||||||||||
| CONSUMER STAPLES 0.7% | ||||||||||||
Aryzta AG (a) | 11,018 | 165 | ||||||||||
Nestle S.A. | 52,326 | 4,055 | ||||||||||
|
| |||||||||||
| 4,220 | ||||||||||||
|
| |||||||||||
| ENERGY 0.2% | ||||||||||||
Transocean Ltd. | 86,444 | 1,162 | ||||||||||
|
| |||||||||||
| FINANCIALS 2.1% | ||||||||||||
Baloise Holding AG | 2,469 | 358 | ||||||||||
Credit Suisse Group AG | 109,732 | 1,641 | ||||||||||
Helvetia Holding AG | 228 | 130 | ||||||||||
| SHARES | MARKET VALUE (000S) | |||||||||||
Swiss Life Holding AG | 4,627 | $ | 1,604 | |||||||||
Swiss Re AG | 33,074 | 2,888 | ||||||||||
UBS Group AG | 96,418 | 1,478 | ||||||||||
Zurich Insurance Group AG | 11,671 | 3,452 | ||||||||||
|
| |||||||||||
| 11,551 | ||||||||||||
|
| |||||||||||
| HEALTH CARE 1.5% | ||||||||||||
Novartis AG | 60,282 | 4,567 | ||||||||||
Roche Holding AG | 17,259 | 3,829 | ||||||||||
|
| |||||||||||
| 8,396 | ||||||||||||
|
| |||||||||||
| INDUSTRIALS 0.3% | ||||||||||||
ABB Ltd. | 26,201 | 572 | ||||||||||
Adecco Group AG | 4,782 | 282 | ||||||||||
Ferguson PLC | 7,458 | 603 | ||||||||||
Kuehne + Nagel International AG | 897 | 135 | ||||||||||
|
| |||||||||||
| 1,592 | ||||||||||||
|
| |||||||||||
| INFORMATION TECHNOLOGY 0.1% | ||||||||||||
STMicroelectronics NV | 10,105 | 224 | ||||||||||
TE Connectivity Ltd. | 5,103 | 460 | ||||||||||
|
| |||||||||||
| 684 | ||||||||||||
|
| |||||||||||
| MATERIALS 0.1% | ||||||||||||
Glencore PLC | 104,250 | 495 | ||||||||||
LafargeHolcim Ltd. | 2,333 | 113 | ||||||||||
|
| |||||||||||
| 608 | ||||||||||||
|
| |||||||||||
| TELECOMMUNICATION SERVICES 0.1% | ||||||||||||
Swisscom AG | 879 | 392 | ||||||||||
|
| |||||||||||
Total Switzerland | 28,906 | |||||||||||
|
| |||||||||||
| UNITED KINGDOM 15.5% | ||||||||||||
| CONSUMER DISCRETIONARY 2.4% | ||||||||||||
Barratt Developments PLC | 31,315 | 212 | ||||||||||
Berkeley Group Holdings PLC | 9,967 | 497 | ||||||||||
Burberry Group PLC | 6,238 | 177 | ||||||||||
Compass Group PLC | 39,304 | 838 | ||||||||||
Dixons Carphone PLC | 57,254 | 141 | ||||||||||
Fiat Chrysler Automobiles NV | 150,541 | 2,844 | ||||||||||
Greene King PLC | 27,978 | 212 | ||||||||||
Inchcape PLC | 24,961 | 257 | ||||||||||
InterContinental Hotels Group PLC | 4,893 | 304 | ||||||||||
ITV PLC | 170,337 | 389 | ||||||||||
Kingfisher PLC | 281,320 | 1,100 | ||||||||||
Marks & Spencer Group PLC | 347,816 | 1,351 | ||||||||||
Next PLC | 12,853 | 1,023 | ||||||||||
Pearson PLC | 95,654 | 1,114 | ||||||||||
Persimmon PLC | 6,626 | 221 | ||||||||||
Sky PLC | 6,762 | 130 | ||||||||||
Sports Direct International PLC | 22,016 | 116 | ||||||||||
Taylor Wimpey PLC | 88,896 | 209 | ||||||||||
Thomas Cook Group PLC | 309,306 | 438 | ||||||||||
Whitbread PLC | 2,181 | 114 | ||||||||||
William Hill PLC | 112,774 | 450 | ||||||||||
WPP PLC | 71,361 | 1,121 | ||||||||||
|
| |||||||||||
| 13,258 | ||||||||||||
|
| |||||||||||
| CONSUMER STAPLES 1.7% | ||||||||||||
British American Tobacco PLC | 12,893 | 649 | ||||||||||
Diageo PLC | 17,677 | 635 | ||||||||||
| See Accompanying Notes | ANNUAL REPORT | JUNE 30, 2018 | 49 |
Table of Contents
Schedule of Investments PIMCO RAE International Fund (Cont.)
| SHARES | MARKET VALUE (000S) | |||||||||||
Imperial Brands PLC | 41,258 | $ | 1,532 | |||||||||
J Sainsbury PLC | 337,564 | 1,429 | ||||||||||
Reckitt Benckiser Group PLC | 4,422 | 363 | ||||||||||
Tate & Lyle PLC | 14,449 | 123 | ||||||||||
Tesco PLC | 83,353 | 282 | ||||||||||
Unilever NV | 34,050 | 1,897 | ||||||||||
Unilever PLC | 29,139 | 1,610 | ||||||||||
WM Morrison Supermarkets PLC | 256,206 | 850 | ||||||||||
|
| |||||||||||
| 9,370 | ||||||||||||
|
| |||||||||||
| ENERGY 1.1% | ||||||||||||
BP PLC | 763,780 | 5,811 | ||||||||||
Petrofac Ltd. | 15,966 | 123 | ||||||||||
|
| |||||||||||
| 5,934 | ||||||||||||
|
| |||||||||||
| FINANCIALS 4.9% | ||||||||||||
3i Group PLC | 12,796 | 152 | ||||||||||
Aviva PLC | 235,676 | 1,564 | ||||||||||
Barclays PLC | 1,935,633 | 4,784 | ||||||||||
CYBG PLC | 80,011 | 335 | ||||||||||
Direct Line Insurance Group PLC | 199,934 | 902 | ||||||||||
HSBC Holdings PLC | 1,195,877 | 11,175 | ||||||||||
Intermediate Capital Group PLC | 21,169 | 307 | ||||||||||
Legal & General Group PLC | 159,331 | 557 | ||||||||||
Lloyds Banking Group PLC | 3,341,112 | 2,772 | ||||||||||
Man Group PLC | 135,526 | 314 | ||||||||||
Provident Financial PLC | 24,753 | 195 | ||||||||||
Quilter PLC (a) | 236,957 | 453 | ||||||||||
Royal Bank of Scotland Group PLC (a) | 466,072 | 1,569 | ||||||||||
Standard Chartered PLC | 218,712 | 1,987 | ||||||||||
Standard Life Aberdeen PLC | 28,948 | 124 | ||||||||||
|
| |||||||||||
| 27,190 | ||||||||||||
|
| |||||||||||
| HEALTH CARE 1.1% | ||||||||||||
AstraZeneca PLC | 39,744 | 2,749 | ||||||||||
GlaxoSmithKline PLC | 162,811 | 3,282 | ||||||||||
Smith & Nephew PLC | 6,112 | 113 | ||||||||||
|
| |||||||||||
| 6,144 | ||||||||||||
|
| |||||||||||
| INDUSTRIALS 1.5% | ||||||||||||
Aggreko PLC | 16,953 | 151 | ||||||||||
BAE Systems PLC | 132,727 | 1,129 | ||||||||||
Capita PLC | 350,444 | 737 | ||||||||||
CNH Industrial NV | 10,140 | 107 | ||||||||||
easyJet PLC | 35,424 | 779 | ||||||||||
Experian PLC | 4,845 | 119 | ||||||||||
Firstgroup PLC (a) | 118,606 | 130 | ||||||||||
G4S PLC | 48,741 | 172 | ||||||||||
International Consolidated Airlines Group S.A. | 107,159 | 935 | ||||||||||
National Express Group PLC | 43,212 | 228 | ||||||||||
RELX NV | 12,466 | 265 | ||||||||||
RELX PLC | 7,592 | 162 | ||||||||||
Rolls-Royce Holdings PLC | 80,064 | 1,043 | ||||||||||
Royal Mail PLC | 300,389 | 1,998 | ||||||||||
Stagecoach Group PLC | 93,266 | 174 | ||||||||||
Travis Perkins PLC | 19,670 | 369 | ||||||||||
|
| |||||||||||
| 8,498 | ||||||||||||
|
| |||||||||||
| INFORMATION TECHNOLOGY 0.0% | ||||||||||||
Sage Group PLC | 13,646 | 113 | ||||||||||
|
| |||||||||||
| SHARES | MARKET VALUE (000S) | |||||||||||
| MATERIALS 1.1% | ||||||||||||
Anglo American PLC | 20,780 | $ | 461 | |||||||||
Mondi PLC | 8,735 | 236 | ||||||||||
Rio Tinto Ltd. | 38,633 | 2,387 | ||||||||||
Rio Tinto PLC | 49,791 | 2,744 | ||||||||||
|
| |||||||||||
| 5,828 | ||||||||||||
|
| |||||||||||
| TELECOMMUNICATION SERVICES 0.8% | ||||||||||||
BT Group PLC | 226,696 | 650 | ||||||||||
Inmarsat PLC | 18,412 | 133 | ||||||||||
TalkTalk Telecom Group PLC | 87,480 | 121 | ||||||||||
Vodafone Group PLC | 1,457,126 | 3,530 | ||||||||||
|
| |||||||||||
| 4,434 | ||||||||||||
|
| |||||||||||
| UTILITIES 0.9% | ||||||||||||
Centrica PLC | 771,735 | 1,603 | ||||||||||
Drax Group PLC | 27,366 | 118 | ||||||||||
National Grid PLC | 158,929 | 1,756 | ||||||||||
Severn Trent PLC | 11,169 | 291 | ||||||||||
SSE PLC | 38,684 | 691 | ||||||||||
United Utilities Group PLC | 29,954 | 301 | ||||||||||
|
| |||||||||||
| 4,760 | ||||||||||||
|
| |||||||||||
Total United Kingdom | 85,529 | |||||||||||
|
| |||||||||||
| UNITED STATES 0.1% | ||||||||||||
| CONSUMER DISCRETIONARY 0.1% | ||||||||||||
Carnival PLC | 10,431 | 596 | ||||||||||
|
| |||||||||||
Total United States | 596 | |||||||||||
|
| |||||||||||
Total Common Stocks (Cost $479,910) | 539,116 | |||||||||||
|
| |||||||||||
| PREFERRED STOCKS 0.7% | ||||||||||||
| GERMANY 0.7% | ||||||||||||
| INDUSTRIALS 0.7% | ||||||||||||
Schaeffler AG | 8,180 | 106 | ||||||||||
Volkswagen AG | 21,215 | 3,505 | ||||||||||
|
| |||||||||||
| 3,611 | ||||||||||||
|
| |||||||||||
Total Preferred Stocks (Cost $3,369) | 3,611 | |||||||||||
|
| |||||||||||
| REAL ESTATE INVESTMENT TRUSTS 0.5% | ||||||||||||
| AUSTRALIA 0.1% | ||||||||||||
| REAL ESTATE 0.1% | ||||||||||||
Mirvac Group | 169,008 | 271 | ||||||||||
Stockland | 83,606 | 246 | ||||||||||
|
| |||||||||||
| 517 | ||||||||||||
|
| |||||||||||
Total Australia | 517 | |||||||||||
|
| |||||||||||
| CANADA 0.2% | ||||||||||||
| REAL ESTATE 0.2% | ||||||||||||
Artis Real Estate Investment Trust | 22,259 | 222 | ||||||||||
Cominar Real Estate Investment Trust | 34,373 | 335 | ||||||||||
Dream Office Real Estate Investment Trust | 24,278 | 433 | ||||||||||
|
| |||||||||||
| 990 | ||||||||||||
|
| |||||||||||
Total Canada | 990 | |||||||||||
|
| |||||||||||
| SHARES | MARKET VALUE (000S) | |||||||||||
| HONG KONG 0.0% | ||||||||||||
| REAL ESTATE 0.0% | ||||||||||||
Link REIT | 26,500 | $ | 241 | |||||||||
|
| |||||||||||
Total Hong Kong | 241 | |||||||||||
|
| |||||||||||
| UNITED KINGDOM 0.2% | ||||||||||||
| REAL ESTATE 0.2% | ||||||||||||
British Land Co. PLC | 21,848 | 193 | ||||||||||
Intu Properties PLC | 76,546 | 182 | ||||||||||
Land Securities Group PLC | 51,361 | 647 | ||||||||||
|
| |||||||||||
| 1,022 | ||||||||||||
|
| |||||||||||
Total United Kingdom | 1,022 | |||||||||||
|
| |||||||||||
Total Real Estate Investment Trusts (Cost $2,873) |
| 2,770 | ||||||||||
|
| |||||||||||
| RIGHTS 0.0% | ||||||||||||
| ITALY 0.0% | ||||||||||||
| FINANCIALS 0.0% | ||||||||||||
Intesa Sanpaolo SpA - Exp. 07/17/2018 | 679,328 | 0 | ||||||||||
|
| |||||||||||
Total Italy | 0 | |||||||||||
|
| |||||||||||
| SPAIN 0.0% | ||||||||||||
| ENERGY 0.0% | ||||||||||||
Repsol S.A. - Exp. 07/06/2018 | 24,644 | 14 | ||||||||||
|
| |||||||||||
| INDUSTRIALS 0.0% | ||||||||||||
ACS Actividades de Construccion y Servicios S.A. - Exp. 07/11/2018 | 40,482 | 42 | ||||||||||
|
| |||||||||||
Total Spain | 56 | |||||||||||
|
| |||||||||||
Total Rights (Cost $58) | 56 | |||||||||||
|
| |||||||||||
| WARRANTS 0.0% | ||||||||||||
| SPAIN 0.0% | ||||||||||||
| INDUSTRIALS 0.0% | ||||||||||||
Abengoa S.A. ‘B’ - Exp. 03/31/2025 | 226,011 | 3 | ||||||||||
|
| |||||||||||
Total Warrants (Cost $0) | 3 | |||||||||||
|
| |||||||||||
| Total Investments in Securities (Cost $486,210) | 545,556 | |||||||||||
| Total Investments 98.9% (Cost $486,210) | $ | 545,556 | ||||||||||
| Other Assets and Liabilities, net 1.1% | 6,197 | |||||||||||
|
| |||||||||||
| Net Assets 100.0% | $ | 551,753 | ||||||||||
|
| |||||||||||
| 50 | PIMCO EQUITY SERIES | See Accompanying Notes |
Table of Contents
June 30, 2018
NOTES TO SCHEDULE OF INVESTMENTS:
| * | A zero balance may reflect actual amounts rounding to less than one thousand. |
| « | Security valued using significant unobservable inputs (Level 3). |
| (a) | Security did not produce income within the last twelve months. |
FAIR VALUE OF FINANCIAL DERIVATIVE INSTRUMENTS
The following is a summary of the fair valuation of the Fund’s derivative instruments categorized by risk exposure. See Note 7, Principal Risks, in the Notes to Financial Statements on risks of the Fund.
The effect of Financial Derivative Instruments on the Statements of Operations for the period ended June 30, 2018:
| Derivatives not accounted for as hedging instruments | ||||||||||||||||||||||||
| Commodity Contracts | Credit Contracts | Equity Contracts | Foreign Exchange Contracts | Interest Rate Contracts | Total | |||||||||||||||||||
Net Realized (Loss) on Financial Derivative Instruments |
| |||||||||||||||||||||||
Over the counter |
| |||||||||||||||||||||||
Forward Foreign Currency Contracts | $ | 0 | $ | 0 | $ | 0 | $ | (21 | ) | $ | 0 | $ | (21 | ) | ||||||||||
|
|
|
|
|
|
|
|
|
|
|
| |||||||||||||
FAIR VALUE MEASUREMENTS
The following is a summary of the fair valuations according to the inputs used as of June 30, 2018 in valuing the Fund’s assets and liabilities:
| Category and Subcategory | Level 1 | Level 2 | Level 3 | Fair Value at 06/30/2018 | ||||||||||||
Investments in Securities, at Value |
| |||||||||||||||
Common Stocks |
| |||||||||||||||
Australia |
| |||||||||||||||
Consumer Discretionary | $ | 0 | $ | 786 | $ | 0 | $ | 786 | ||||||||
Consumer Staples | 0 | 4,787 | 0 | 4,787 | ||||||||||||
Energy | 0 | 1,300 | 0 | 1,300 | ||||||||||||
Financials | 0 | 15,065 | 0 | 15,065 | ||||||||||||
Health Care | 0 | 864 | 0 | 864 | ||||||||||||
Industrials | 0 | 2,201 | 0 | 2,201 | ||||||||||||
Materials | 0 | 8,765 | 0 | 8,765 | ||||||||||||
Real Estate | 0 | 339 | 0 | 339 | ||||||||||||
Telecommunication Services | 0 | 1,090 | 0 | 1,090 | ||||||||||||
Utilities | 0 | 123 | 0 | 123 | ||||||||||||
Austria |
| |||||||||||||||
Energy | 0 | 750 | 0 | 750 | ||||||||||||
Financials | 0 | 2,008 | 0 | 2,008 | ||||||||||||
Industrials | 0 | 110 | 0 | 110 | ||||||||||||
Materials | 0 | 163 | 0 | 163 | ||||||||||||
Belgium |
| |||||||||||||||
Consumer Staples | 0 | 135 | 0 | 135 | ||||||||||||
Financials | 0 | 2,201 | 0 | 2,201 | ||||||||||||
Health Care | 0 | 109 | 0 | 109 | ||||||||||||
Industrials | 211 | 0 | 0 | 211 | ||||||||||||
Telecommunication Services | 0 | 446 | 0 | 446 | ||||||||||||
Canada |
| |||||||||||||||
Consumer Discretionary | 2,889 | 0 | 0 | 2,889 | ||||||||||||
Consumer Staples | 1,085 | 0 | 0 | 1,085 | ||||||||||||
Energy | 4,950 | 0 | 0 | 4,950 | ||||||||||||
Financials | 16,405 | 0 | 0 | 16,405 | ||||||||||||
Industrials | 3,140 | 0 | 0 | 3,140 | ||||||||||||
Information Technology | 255 | 0 | 0 | 255 | ||||||||||||
Materials | 2,004 | 0 | 0 | 2,004 | ||||||||||||
Telecommunication Services | 1,108 | 0 | 0 | 1,108 | ||||||||||||
Utilities | 1,464 | 0 | 0 | 1,464 | ||||||||||||
Denmark |
| |||||||||||||||
Consumer Staples | 0 | 360 | 0 | 360 | ||||||||||||
Financials | 0 | 120 | 0 | 120 | ||||||||||||
Health Care | 0 | 781 | 0 | 781 | ||||||||||||
Industrials | 0 | 1,819 | 0 | 1,819 | ||||||||||||
Finland |
| |||||||||||||||
Consumer Staples | 0 | 122 | 0 | 122 | ||||||||||||
Materials | 0 | 1,426 | 0 | 1,426 | ||||||||||||
Utilities | 0 | 599 | 0 | 599 | ||||||||||||
| Category and Subcategory | Level 1 | Level 2 | Level 3 | Fair Value at 06/30/2018 | ||||||||||||
France |
| |||||||||||||||
Consumer Discretionary | $ | 0 | $ | 7,635 | $ | 0 | $ | 7,635 | ||||||||
Consumer Staples | 0 | 3,184 | 0 | 3,184 | ||||||||||||
Energy | 0 | 2,952 | 0 | 2,952 | ||||||||||||
Financials | 0 | 13,439 | 0 | 13,439 | ||||||||||||
Health Care | 0 | 5,974 | 0 | 5,974 | ||||||||||||
Industrials | 0 | 10,550 | 0 | 10,550 | ||||||||||||
Information Technology | 115 | 589 | 0 | 704 | ||||||||||||
Materials | 0 | 271 | 0 | 271 | ||||||||||||
Real Estate | 0 | 108 | 0 | 108 | ||||||||||||
Telecommunication Services | 0 | 3,084 | 0 | 3,084 | ||||||||||||
Utilities | 0 | 7,384 | 0 | 7,384 | ||||||||||||
Germany |
| |||||||||||||||
Consumer Discretionary | 0 | 8,765 | 0 | 8,765 | ||||||||||||
Consumer Staples | 0 | 876 | 0 | 876 | ||||||||||||
Financials | 0 | 9,644 | 0 | 9,644 | ||||||||||||
Health Care | 0 | 3,710 | 0 | 3,710 | ||||||||||||
Industrials | 0 | 6,901 | 0 | 6,901 | ||||||||||||
Information Technology | 0 | 437 | 0 | 437 | ||||||||||||
Materials | 0 | 5,900 | 0 | 5,900 | ||||||||||||
Real Estate | 0 | 218 | 0 | 218 | ||||||||||||
Telecommunication Services | 0 | 2,251 | 0 | 2,251 | ||||||||||||
Utilities | 0 | 7,826 | 0 | 7,826 | ||||||||||||
Hong Kong |
| |||||||||||||||
Consumer Discretionary | 0 | 1,490 | 0 | 1,490 | ||||||||||||
Financials | 0 | 670 | 0 | 670 | ||||||||||||
Industrials | 245 | 1,194 | 0 | 1,439 | ||||||||||||
Information Technology | 0 | 400 | 0 | 400 | ||||||||||||
Materials | 0 | 94 | 0 | 94 | ||||||||||||
Real Estate | 0 | 7,934 | 0 | 7,934 | ||||||||||||
Telecommunication Services | 0 | 98 | 0 | 98 | ||||||||||||
Utilities | 0 | 323 | 0 | 323 | ||||||||||||
Ireland |
| |||||||||||||||
Financials | 0 | 290 | 0 | 290 | ||||||||||||
Health Care | 1,804 | 0 | 0 | 1,804 | ||||||||||||
Industrials | 305 | 0 | 0 | 305 | ||||||||||||
Materials | 0 | 1,101 | 0 | 1,101 | ||||||||||||
Israel |
| |||||||||||||||
Financials | 0 | 1,962 | 0 | 1,962 | ||||||||||||
Health Care | 2,125 | 0 | 0 | 2,125 | ||||||||||||
Materials | 0 | 431 | 0 | 431 | ||||||||||||
Telecommunication Services | 0 | 467 | 0 | 467 | ||||||||||||
| See Accompanying Notes | ANNUAL REPORT | JUNE 30, 2018 | 51 |
Table of Contents
Schedule of Investments PIMCO RAE International Fund (Cont.)
June 30, 2018
| Category and Subcategory | Level 1 | Level 2 | Level 3 | Fair Value at 06/30/2018 | ||||||||||||
Italy |
| |||||||||||||||
Consumer Discretionary | $ | 0 | $ | 104 | $ | 0 | $ | 104 | ||||||||
Energy | 0 | 3,157 | 0 | 3,157 | ||||||||||||
Financials | 0 | 10,017 | 0 | 10,017 | ||||||||||||
Industrials | 0 | 388 | 0 | 388 | ||||||||||||
Telecommunication Services | 0 | 810 | 0 | 810 | ||||||||||||
Utilities | 0 | 3,854 | 0 | 3,854 | ||||||||||||
Japan |
| |||||||||||||||
Consumer Discretionary | 0 | 29,396 | 0 | 29,396 | ||||||||||||
Consumer Staples | 0 | 8,824 | 0 | 8,824 | ||||||||||||
Energy | 0 | 2,831 | 0 | 2,831 | ||||||||||||
Financials | 0 | 24,945 | 0 | 24,945 | ||||||||||||
Health Care | 0 | 4,940 | 0 | 4,940 | ||||||||||||
Industrials | 0 | 26,284 | 0 | 26,284 | ||||||||||||
Information Technology | 0 | 18,715 | 0 | 18,715 | ||||||||||||
Materials | 0 | 7,446 | 0 | 7,446 | ||||||||||||
Real Estate | 0 | 1,628 | 0 | 1,628 | ||||||||||||
Telecommunication Services | 0 | 5,457 | 0 | 5,457 | ||||||||||||
Utilities | 0 | 8,607 | 0 | 8,607 | ||||||||||||
Luxembourg |
| |||||||||||||||
Consumer Discretionary | 0 | 434 | 0 | 434 | ||||||||||||
Materials | 0 | 109 | 0 | 109 | ||||||||||||
Macau |
| |||||||||||||||
Consumer Discretionary | 0 | 503 | 0 | 503 | ||||||||||||
Netherlands |
| |||||||||||||||
Consumer Staples | 0 | 2,731 | 0 | 2,731 | ||||||||||||
Energy | 0 | 6,519 | 0 | 6,519 | ||||||||||||
Financials | 0 | 4,562 | 0 | 4,562 | ||||||||||||
Health Care | 0 | 1,928 | 0 | 1,928 | ||||||||||||
Industrials | 0 | 1,096 | 0 | 1,096 | ||||||||||||
Materials | 0 | 999 | 0 | 999 | ||||||||||||
Telecommunication Services | 592 | 357 | 0 | 949 | ||||||||||||
New Zealand |
| |||||||||||||||
Materials | 0 | 406 | 0 | 406 | ||||||||||||
Telecommunication Services | 0 | 331 | 0 | 331 | ||||||||||||
Utilities | 0 | 128 | 0 | 128 | ||||||||||||
Norway |
| |||||||||||||||
Consumer Staples | 0 | 141 | 0 | 141 | ||||||||||||
Energy | 0 | 2,258 | 0 | 2,258 | ||||||||||||
Financials | 0 | 511 | 0 | 511 | ||||||||||||
Materials | 0 | 695 | 0 | 695 | ||||||||||||
Telecommunication Services | 0 | 781 | 0 | 781 | ||||||||||||
Portugal |
| |||||||||||||||
Financials | 0 | 0 | 1 | 1 | ||||||||||||
Materials | 0 | 367 | 0 | 367 | ||||||||||||
Utilities | 0 | 1,305 | 0 | 1,305 | ||||||||||||
Singapore |
| |||||||||||||||
Consumer Discretionary | 0 | 142 | 0 | 142 | ||||||||||||
Financials | 0 | 4,104 | 0 | 4,104 | ||||||||||||
Industrials | 0 | 1,629 | 0 | 1,629 | ||||||||||||
Information Technology | 0 | 154 | 0 | 154 | ||||||||||||
Real Estate | 0 | 744 | 0 | 744 | ||||||||||||
Telecommunication Services | 0 | 110 | 0 | 110 | ||||||||||||
South Africa |
| |||||||||||||||
Consumer Discretionary | 21 | 0 | 0 | 21 | ||||||||||||
Financials | 0 | 1,811 | 0 | 1,811 | ||||||||||||
Spain |
| |||||||||||||||
Energy | 0 | 401 | 0 | 401 | ||||||||||||
Financials | 0 | 9,354 | 0 | 9,354 | ||||||||||||
| Category and Subcategory | Level 1 | Level 2 | Level 3 | Fair Value at 06/30/2018 | ||||||||||||
Industrials | $ | 2 | $ | 2,608 | $ | 0 | $ | 2,610 | ||||||||
Telecommunication Services | 0 | 3,048 | 0 | 3,048 | ||||||||||||
Utilities | 0 | 4,340 | 0 | 4,340 | ||||||||||||
Sweden |
| |||||||||||||||
Consumer Discretionary | 0 | 541 | 0 | 541 | ||||||||||||
Consumer Staples | 0 | 214 | 0 | 214 | ||||||||||||
Financials | 0 | 2,684 | 0 | 2,684 | ||||||||||||
Health Care | 0 | 174 | 0 | 174 | ||||||||||||
Industrials | 100 | 1,292 | 0 | 1,392 | ||||||||||||
Information Technology | 0 | 1,824 | 0 | 1,824 | ||||||||||||
Telecommunication Services | 0 | 1,905 | 0 | 1,905 | ||||||||||||
Switzerland |
| |||||||||||||||
Consumer Discretionary | 163 | 138 | 0 | 301 | ||||||||||||
Consumer Staples | 0 | 4,220 | 0 | 4,220 | ||||||||||||
Energy | 1,162 | 0 | 0 | 1,162 | ||||||||||||
Financials | 0 | 11,551 | 0 | 11,551 | ||||||||||||
Health Care | 0 | 8,396 | 0 | 8,396 | ||||||||||||
Industrials | 0 | 1,592 | 0 | 1,592 | ||||||||||||
Information Technology | 460 | 224 | 0 | 684 | ||||||||||||
Materials | 0 | 608 | 0 | 608 | ||||||||||||
Telecommunication Services | 0 | 392 | 0 | 392 | ||||||||||||
United Kingdom |
| |||||||||||||||
Consumer Discretionary | 2,844 | 10,414 | 0 | 13,258 | ||||||||||||
Consumer Staples | 0 | 9,370 | 0 | 9,370 | ||||||||||||
Energy | 0 | 5,934 | 0 | 5,934 | ||||||||||||
Financials | 453 | 26,737 | 0 | 27,190 | ||||||||||||
Health Care | 0 | 6,144 | 0 | 6,144 | ||||||||||||
Industrials | 0 | 8,498 | 0 | 8,498 | ||||||||||||
Information Technology | 0 | 113 | 0 | 113 | ||||||||||||
Materials | 0 | 5,828 | 0 | 5,828 | ||||||||||||
Telecommunication Services | 0 | 4,434 | 0 | 4,434 | ||||||||||||
Utilities | 0 | 4,760 | 0 | 4,760 | ||||||||||||
United States |
| |||||||||||||||
Consumer Discretionary | 0 | 596 | 0 | 596 | ||||||||||||
Preferred Stocks |
| |||||||||||||||
Germany |
| |||||||||||||||
Industrials | 0 | 3,611 | 0 | 3,611 | ||||||||||||
Real Estate Investment Trusts |
| |||||||||||||||
Australia |
| |||||||||||||||
Real Estate | 0 | 517 | 0 | 517 | ||||||||||||
Canada |
| |||||||||||||||
Real Estate | 990 | 0 | 0 | 990 | ||||||||||||
Hong Kong |
| |||||||||||||||
Real Estate | 0 | 241 | 0 | 241 | ||||||||||||
United Kingdom |
| |||||||||||||||
Real Estate | 0 | 1,022 | 0 | 1,022 | ||||||||||||
Rights |
| |||||||||||||||
Spain |
| |||||||||||||||
Energy | 14 | 0 | 0 | 14 | ||||||||||||
Industrials | 42 | 0 | 0 | 42 | ||||||||||||
Warrants |
| |||||||||||||||
Spain |
| |||||||||||||||
Industrials | 3 | 0 | 0 | 3 | ||||||||||||
|
|
|
|
|
|
|
| |||||||||
Total Investments | $ | 44,951 | $ | 500,604 | $ | 1 | $ | 545,556 | ||||||||
|
|
|
|
|
|
|
| |||||||||
There were no significant transfers among Levels 1, 2, or 3 during the period ended June 30, 2018.
| 52 | PIMCO EQUITY SERIES | See Accompanying Notes |
Table of Contents
Schedule of Investments PIMCO RAE US Fund
June 30, 2018
(Amounts in thousands*, except number of shares, contracts and units, if any)
| SHARES | MARKET VALUE (000S) | |||||||||||
| INVESTMENTS IN SECURITIES 100.1% |
| |||||||||||
| COMMON STOCKS 98.7% |
| |||||||||||
| BERMUDA 0.3% |
| |||||||||||
| FINANCIALS 0.3% |
| |||||||||||
XL Group Ltd. | 37,108 | $ | 2,076 | |||||||||
|
| |||||||||||
Total Bermuda | 2,076 | |||||||||||
|
| |||||||||||
| IRELAND 0.2% |
| |||||||||||
| INFORMATION TECHNOLOGY 0.2% |
| |||||||||||
Accenture PLC ‘A’ | 6,881 | 1,126 | ||||||||||
|
| |||||||||||
Total Ireland | 1,126 | |||||||||||
|
| |||||||||||
| UNITED STATES 98.2% |
| |||||||||||
| CONSUMER DISCRETIONARY 14.1% |
| |||||||||||
Abercrombie & Fitch Co. ‘A’ | 104,297 | 2,553 | ||||||||||
Adient PLC | 1,545 | 76 | ||||||||||
American Eagle Outfitters, Inc. | 32,777 | 762 | ||||||||||
Ascena Retail Group, Inc. (a) | 37,187 | 148 | ||||||||||
AutoNation, Inc. (a) | 5,305 | 258 | ||||||||||
Bed Bath & Beyond, Inc. | 133,229 | 2,655 | ||||||||||
Best Buy Co., Inc. | 28,299 | 2,110 | ||||||||||
Big Lots, Inc. | 17,374 | 726 | ||||||||||
Brinker International, Inc. | 11,047 | 526 | ||||||||||
Caesars Entertainment Corp. (a) | 36,177 | 387 | ||||||||||
Carnival Corp. | 18,996 | 1,089 | ||||||||||
Carter’s, Inc. | 2,214 | 240 | ||||||||||
CBS Corp. NVDR ‘B’ | 38,955 | 2,190 | ||||||||||
Chico’s FAS, Inc. | 54,500 | 444 | ||||||||||
Comcast Corp. ‘A’ | 126,076 | 4,136 | ||||||||||
Dick’s Sporting Goods, Inc. | 13,803 | 486 | ||||||||||
Dillard’s, Inc. ‘A’ | 17,945 | 1,696 | ||||||||||
Discovery, Inc. (a) | 22,804 | 627 | ||||||||||
Dollar General Corp. | 10,798 | 1,065 | ||||||||||
Foot Locker, Inc. | 12,286 | 647 | ||||||||||
Ford Motor Co. | 214,890 | 2,379 | ||||||||||
Fossil Group, Inc. (a) | 93,363 | 2,509 | ||||||||||
GameStop Corp. ‘A’ | 94,821 | 1,381 | ||||||||||
Gap, Inc. | 70,970 | 2,299 | ||||||||||
General Motors Co. | 101,451 | 3,997 | ||||||||||
Genuine Parts Co. | 4,182 | 384 | ||||||||||
GNC Holdings, Inc. ‘A’ (a) | 149,647 | 527 | ||||||||||
Goodyear Tire & Rubber Co. | 24,252 | 565 | ||||||||||
Graham Holdings Co. ‘B’ | 216 | 127 | ||||||||||
H&R Block, Inc. | 18,476 | 421 | ||||||||||
Harley-Davidson, Inc. | 7,083 | 298 | ||||||||||
Home Depot, Inc. | 36,797 | 7,179 | ||||||||||
International Game Technology PLC | 10,392 | 241 | ||||||||||
Interpublic Group of Cos., Inc. | 28,840 | 676 | ||||||||||
JC Penney Co., Inc. (a) | 278,182 | 651 | ||||||||||
Kohl’s Corp. | 75,427 | 5,499 | ||||||||||
L Brands, Inc. | 23,535 | 868 | ||||||||||
Las Vegas Sands Corp. | 7,253 | 554 | ||||||||||
Liberty Media Corp-Liberty SiriusXM (a) | 24,521 | 1,112 | ||||||||||
Lowe’s Cos., Inc. | 46,425 | 4,437 | ||||||||||
Macy’s, Inc. | 114,928 | 4,302 | ||||||||||
Mattel, Inc. | 44,221 | 726 | ||||||||||
McDonald’s Corp. | 32,852 | 5,147 | ||||||||||
NIKE, Inc. ‘B’ | 16,412 | 1,308 | ||||||||||
Nordstrom, Inc. | 33,299 | 1,724 | ||||||||||
NVR, Inc. (a) | 84 | 249 | ||||||||||
O’Reilly Automotive, Inc. (a) | 2,222 | 608 | ||||||||||
| SHARES | MARKET VALUE (000S) | |||||||||||
Office Depot, Inc. | 216,647 | $ | 552 | |||||||||
Omnicom Group, Inc. | 12,195 | 930 | ||||||||||
Polaris Industries, Inc. | 742 | 91 | ||||||||||
PulteGroup, Inc. | 13,082 | 376 | ||||||||||
PVH Corp. | 2,556 | 383 | ||||||||||
Qurate Retail, Inc. (a) | 73,157 | 1,552 | ||||||||||
Ralph Lauren Corp. | 10,369 | 1,304 | ||||||||||
Royal Caribbean Cruises Ltd. | 2,439 | 253 | ||||||||||
Sally Beauty Holdings, Inc. (a) | 45,991 | 737 | ||||||||||
Sears Holdings Corp. (a) | 45,969 | 109 | ||||||||||
Signet Jewelers Ltd. | 8,299 | 463 | ||||||||||
Six Flags Entertainment Corp. | 4,016 | 281 | ||||||||||
Tapestry, Inc. | 16,229 | 758 | ||||||||||
Target Corp. | 88,337 | 6,724 | ||||||||||
TEGNA, Inc. | 9,478 | 103 | ||||||||||
Tiffany & Co. | 1,125 | 148 | ||||||||||
TJX Cos., Inc. | 12,647 | 1,204 | ||||||||||
Tribune Media Co. ‘A’ | 19,545 | 748 | ||||||||||
Tupperware Brands Corp. | 9,383 | 387 | ||||||||||
Twenty-First Century Fox, Inc. ‘A’ | 94,518 | 4,697 | ||||||||||
Urban Outfitters, Inc. (a) | 12,841 | 572 | ||||||||||
VF Corp. | 11,091 | 904 | ||||||||||
Viacom, Inc. ‘B’ | 141,456 | 4,266 | ||||||||||
Visteon Corp. (a) | 7,295 | 943 | ||||||||||
Walt Disney Co. | 41,211 | 4,319 | ||||||||||
Weight Watchers International, Inc. (a) | 14,629 | 1,479 | ||||||||||
Wendy’s Co. | 32,815 | 564 | ||||||||||
Whirlpool Corp. | 1,981 | 290 | ||||||||||
Williams-Sonoma, Inc. | 4,644 | 285 | ||||||||||
Wyndham Destinations, Inc. | 15,594 | 690 | ||||||||||
Wyndham Hotels & Resorts, Inc. | 15,594 | 917 | ||||||||||
Wynn Resorts Ltd. | 965 | 161 | ||||||||||
Yum! Brands, Inc. | 13,449 | 1,052 | ||||||||||
|
| |||||||||||
| 111,231 | ||||||||||||
|
| |||||||||||
| CONSUMER STAPLES 7.5% |
| |||||||||||
Altria Group, Inc. | 20,310 | 1,153 | ||||||||||
Archer-Daniels-Midland Co. | 42,154 | 1,932 | ||||||||||
Bunge Ltd. | 7,885 | 550 | ||||||||||
Coca-Cola Co. | 115,325 | 5,058 | ||||||||||
Colgate-Palmolive Co. | 16,995 | 1,102 | ||||||||||
Costco Wholesale Corp. | 7,565 | 1,581 | ||||||||||
Dr Pepper Snapple Group, Inc. | 8,510 | 1,038 | ||||||||||
Estee Lauder Cos., Inc. ‘A’ | 3,177 | 453 | ||||||||||
Flowers Foods, Inc. | 5,658 | 118 | ||||||||||
General Mills, Inc. | 29,135 | 1,290 | ||||||||||
Herbalife Nutrition Ltd. (a) | 30,666 | 1,647 | ||||||||||
HRG Group, Inc. (a) | 40,477 | 530 | ||||||||||
JM Smucker Co. | 4,199 | 451 | ||||||||||
Kimberly-Clark Corp. | 2,647 | 279 | ||||||||||
Kraft Heinz Co. | 2,672 | 168 | ||||||||||
Kroger Co. | 204,574 | 5,820 | ||||||||||
Mondelez International, Inc. ‘A’ | 65,922 | 2,703 | ||||||||||
Nu Skin Enterprises, Inc. ‘A’ | 6,635 | 519 | ||||||||||
PepsiCo, Inc. | 53,560 | 5,831 | ||||||||||
Philip Morris International, Inc. | 55,216 | 4,458 | ||||||||||
Procter & Gamble Co. | 104,321 | 8,143 | ||||||||||
Rite Aid Corp. (a) | 257,256 | 445 | ||||||||||
Sysco Corp. | 10,473 | 715 | ||||||||||
U.S. Foods Holding Corp. (a) | 26,407 | 999 | ||||||||||
Wal-Mart Stores, Inc. | 137,752 | 11,799 | ||||||||||
Walgreens Boots Alliance, Inc. | 6,154 | 369 | ||||||||||
|
| |||||||||||
| 59,151 | ||||||||||||
|
| |||||||||||
| SHARES | MARKET VALUE (000S) | |||||||||||
| ENERGY 7.3% |
| |||||||||||
Andeavor | 7,587 | $ | 995 | |||||||||
Antero Resources Corp. (a) | 4,372 | 93 | ||||||||||
Apache Corp. | 4,170 | 195 | ||||||||||
Chesapeake Energy Corp. (a) | 223,199 | 1,170 | ||||||||||
Chevron Corp. | 74,614 | 9,434 | ||||||||||
ConocoPhillips | 65,070 | 4,530 | ||||||||||
CONSOL Energy, Inc. (a) | 2,620 | 101 | ||||||||||
CVR Energy, Inc. | 15,162 | 561 | ||||||||||
Diamond Offshore Drilling, Inc. (a) | 38,565 | 805 | ||||||||||
Exxon Mobil Corp. | 188,631 | 15,605 | ||||||||||
Helmerich & Payne, Inc. | 2,413 | 154 | ||||||||||
Hess Corp. | 24,753 | 1,656 | ||||||||||
HollyFrontier Corp. | 41,294 | 2,826 | ||||||||||
Kinder Morgan, Inc. | 65,272 | 1,153 | ||||||||||
Marathon Oil Corp. | 27,565 | 575 | ||||||||||
Marathon Petroleum Corp. | 44,769 | 3,141 | ||||||||||
Murphy Oil Corp. | 23,614 | 797 | ||||||||||
Nabors Industries Ltd. | 66,929 | 429 | ||||||||||
National Oilwell Varco, Inc. | 21,161 | 918 | ||||||||||
Occidental Petroleum Corp. | 32,532 | 2,722 | ||||||||||
Oceaneering International, Inc. | 15,347 | 391 | ||||||||||
PBF Energy, Inc. ‘A’ | 11,334 | 475 | ||||||||||
Phillips 66 | 23,180 | 2,603 | ||||||||||
Rowan Cos. PLC ‘A’ (a) | 19,162 | 311 | ||||||||||
Valero Energy Corp. | 49,058 | 5,437 | ||||||||||
Whiting Petroleum Corp. (a) | 3,192 | 168 | ||||||||||
Williams Cos., Inc. | 15,377 | 417 | ||||||||||
|
| |||||||||||
| 57,662 | ||||||||||||
|
| |||||||||||
| FINANCIALS 18.6% |
| |||||||||||
Aflac, Inc. | 41,895 | 1,802 | ||||||||||
Allstate Corp. | 28,993 | 2,646 | ||||||||||
Ally Financial, Inc. | 160,100 | 4,206 | ||||||||||
American Express Co. | 57,512 | 5,636 | ||||||||||
American Financial Group, Inc. | 3,190 | 342 | ||||||||||
American International Group, Inc. | 210,979 | 11,186 | ||||||||||
Ameriprise Financial, Inc. | 12,419 | 1,737 | ||||||||||
Assurant, Inc. | 11,071 | 1,146 | ||||||||||
Bank of America Corp. | 382,984 | 10,796 | ||||||||||
Bank of New York Mellon Corp. | 49,237 | 2,655 | ||||||||||
BB&T Corp. | 28,115 | 1,418 | ||||||||||
Berkshire Hathaway, Inc. ‘B’ (a) | 32,892 | 6,139 | ||||||||||
BlackRock, Inc. | 2,250 | 1,123 | ||||||||||
Brighthouse Financial, Inc. (a) | 5,740 | 230 | ||||||||||
Capital One Financial Corp. | 57,194 | 5,256 | ||||||||||
CIT Group, Inc. | 26,162 | 1,319 | ||||||||||
Citigroup, Inc. | 191,089 | 12,788 | ||||||||||
Citizens Financial Group, Inc. | 30,661 | 1,193 | ||||||||||
CNO Financial Group, Inc. | 29,556 | 563 | ||||||||||
Comerica, Inc. | 2,624 | 239 | ||||||||||
Discover Financial Services | 44,722 | 3,149 | ||||||||||
Fifth Third Bancorp | 57,872 | 1,661 | ||||||||||
Franklin Resources, Inc. | 27,769 | 890 | ||||||||||
Genworth Financial, Inc. ‘A’ (a) | 194,381 | 875 | ||||||||||
Goldman Sachs Group, Inc. | 13,169 | 2,905 | ||||||||||
Hartford Financial Services Group, Inc. | 34,678 | 1,773 | ||||||||||
Invesco Ltd. | 23,670 | 629 | ||||||||||
Jefferies Financial Group, Inc. | 6,947 | 158 | ||||||||||
JPMorgan Chase & Co. | 156,645 | 16,322 | ||||||||||
KeyCorp | 9,822 | 192 | ||||||||||
Legg Mason, Inc. | 30,554 | 1,061 | ||||||||||
Lincoln National Corp. | 12,394 | 772 | ||||||||||
| See Accompanying Notes | ANNUAL REPORT | JUNE 30, 2018 | 53 |
Table of Contents
Schedule of Investments PIMCO RAE US Fund (Cont.)
| SHARES | MARKET VALUE (000S) | |||||||||||
Loews Corp. | 22,392 | $ | 1,081 | |||||||||
LPL Financial Holdings, Inc. | 9,349 | 613 | ||||||||||
MetLife, Inc. | 46,091 | 2,010 | ||||||||||
Morgan Stanley | 4,783 | 227 | ||||||||||
Navient Corp. | 140,122 | 1,826 | ||||||||||
New York Community Bancorp, Inc. | 39,926 | 441 | ||||||||||
Northern Trust Corp. | 784 | 81 | ||||||||||
Old Republic International Corp. | 6,334 | 126 | ||||||||||
OneMain Holdings, Inc. (a) | 10,775 | 359 | ||||||||||
People’s United Financial, Inc. | 5,814 | 105 | ||||||||||
PHH Corp. (a) | 15,770 | 171 | ||||||||||
PNC Financial Services Group, Inc. | 20,096 | 2,715 | ||||||||||
Principal Financial Group, Inc. | 1,424 | 75 | ||||||||||
Progressive Corp. | 6,533 | 386 | ||||||||||
Prudential Financial, Inc. | 13,493 | 1,262 | ||||||||||
Raymond James Financial, Inc. | 885 | 79 | ||||||||||
Regions Financial Corp. | 62,372 | 1,109 | ||||||||||
Reinsurance Group of America, Inc. | 3,480 | 464 | ||||||||||
Santander Consumer USA Holdings, Inc. | 66,149 | 1,263 | ||||||||||
SLM Corp. (a) | 46,137 | 528 | ||||||||||
State Street Corp. | 21,771 | 2,027 | ||||||||||
SunTrust Banks, Inc. | 21,030 | 1,388 | ||||||||||
Synchrony Financial | 55,055 | 1,838 | ||||||||||
T Rowe Price Group, Inc. | 7,995 | 928 | ||||||||||
Travelers Cos., Inc. | 42,506 | 5,200 | ||||||||||
U.S. Bancorp | 62,535 | 3,128 | ||||||||||
Unum Group | 4,231 | 156 | ||||||||||
Voya Financial, Inc. | 64,245 | 3,019 | ||||||||||
Wells Fargo & Co. | 201,218 | 11,156 | ||||||||||
White Mountains Insurance Group Ltd. | 623 | 565 | ||||||||||
|
| |||||||||||
| 147,133 | ||||||||||||
|
| |||||||||||
| HEALTH CARE 13.9% | ||||||||||||
Abbott Laboratories | 35,205 | 2,147 | ||||||||||
AbbVie, Inc. | 38,534 | 3,570 | ||||||||||
Aetna, Inc. | 17,423 | 3,197 | ||||||||||
Allergan PLC | 11,259 | 1,877 | ||||||||||
Amgen, Inc. | 22,198 | 4,098 | ||||||||||
Anthem, Inc. | 28,936 | 6,888 | ||||||||||
Baxter International, Inc. | 1,170 | 86 | ||||||||||
Bio-Rad Laboratories, Inc. ‘A’ (a) | 539 | 155 | ||||||||||
Bristol-Myers Squibb Co. | 24,727 | 1,368 | ||||||||||
Brookdale Senior Living, Inc. (a) | 102,258 | 930 | ||||||||||
Cardinal Health, Inc. | 16,419 | 802 | ||||||||||
Celgene Corp. (a) | 2,056 | 163 | ||||||||||
Cigna Corp. | 5,300 | 901 | ||||||||||
Community Health Systems, Inc. (a) | 139,439 | 463 | ||||||||||
CVS Health Corp. | 73,839 | 4,752 | ||||||||||
DaVita, Inc. (a) | 4,020 | 279 | ||||||||||
Eli Lilly & Co. | 22,813 | 1,947 | ||||||||||
Encompass Health Corp. | 3,552 | 241 | ||||||||||
Envision Healthcare Corp. (a) | 2,809 | 124 | ||||||||||
Express Scripts Holding Co. (a) | 69,361 | 5,355 | ||||||||||
Gilead Sciences, Inc. | 81,595 | 5,780 | ||||||||||
HCA Healthcare, Inc. | 55,457 | 5,690 | ||||||||||
Henry Schein, Inc. (a) | 1,198 | 87 | ||||||||||
Humana, Inc. | 5,874 | 1,748 | ||||||||||
Johnson & Johnson | 75,489 | 9,160 | ||||||||||
Kindred Healthcare, Inc. (a) | 60,020 | 540 | ||||||||||
Laboratory Corp. of America Holdings (a) | 618 | 111 | ||||||||||
| SHARES | MARKET VALUE (000S) | |||||||||||
LifePoint Health, Inc. (a) | 24,017 | $ | 1,172 | |||||||||
Mallinckrodt PLC (a) | 6,832 | 127 | ||||||||||
McKesson Corp. | 5,289 | 706 | ||||||||||
MEDNAX, Inc. (a) | 6,546 | 283 | ||||||||||
Merck & Co., Inc. | 145,563 | 8,836 | ||||||||||
Mylan NV (a) | 1,858 | 67 | ||||||||||
Patterson Cos., Inc. | 16,647 | 377 | ||||||||||
Pfizer, Inc. | 511,980 | 18,575 | ||||||||||
Quest Diagnostics, Inc. | 10,439 | 1,148 | ||||||||||
Tenet Healthcare Corp. (a) | 128,491 | 4,313 | ||||||||||
United Therapeutics Corp. (a) | 2,554 | 289 | ||||||||||
UnitedHealth Group, Inc. | 26,177 | 6,422 | ||||||||||
Universal Health Services, Inc. ‘B’ | 6,005 | 669 | ||||||||||
Valeant Pharmaceuticals International, Inc. (a) | 189,555 | 4,405 | ||||||||||
Varian Medical Systems, Inc. (a) | 824 | 94 | ||||||||||
|
| |||||||||||
| 109,942 | ||||||||||||
|
| |||||||||||
| INDUSTRIALS 8.7% | ||||||||||||
3M Co. | 13,319 | 2,620 | ||||||||||
AGCO Corp. | 9,509 | 577 | ||||||||||
American Airlines Group, Inc. | 71,329 | 2,708 | ||||||||||
Avis Budget Group, Inc. (a) | 55,903 | 1,817 | ||||||||||
Boeing Co. | 16,692 | 5,600 | ||||||||||
Caterpillar, Inc. | 24,385 | 3,308 | ||||||||||
CSX Corp. | 27,896 | 1,779 | ||||||||||
Cummins, Inc. | 4,451 | 592 | ||||||||||
Deere & Co. | 28,036 | 3,920 | ||||||||||
Delta Air Lines, Inc. | 8,752 | 434 | ||||||||||
Dover Corp. | 2,913 | 213 | ||||||||||
Dun & Bradstreet Corp. | 3,789 | 465 | ||||||||||
Eaton Corp. PLC | 5,637 | 421 | ||||||||||
Emerson Electric Co. | 41,078 | 2,840 | ||||||||||
Expeditors International of Washington, Inc. | 1,582 | 116 | ||||||||||
FedEx Corp. | 6,016 | 1,366 | ||||||||||
Flowserve Corp. | 10,977 | 444 | ||||||||||
Fluor Corp. | 20,465 | 998 | ||||||||||
General Dynamics Corp. | 5,394 | 1,006 | ||||||||||
General Electric Co. | 739,333 | 10,062 | ||||||||||
Hertz Global Holdings, Inc. (a) | 92,691 | 1,422 | ||||||||||
Honeywell International, Inc. | 7,381 | 1,063 | ||||||||||
Illinois Tool Works, Inc. | 10,238 | 1,418 | ||||||||||
JetBlue Airways Corp. (a) | 12,875 | 244 | ||||||||||
L3 Technologies, Inc. | 1,449 | 279 | ||||||||||
Lockheed Martin Corp. | 1,269 | 375 | ||||||||||
ManpowerGroup, Inc. | 7,568 | 651 | ||||||||||
Neilsen Holdings PLC | 9,996 | 309 | ||||||||||
Norfolk Southern Corp. | 8,555 | 1,291 | ||||||||||
Northrop Grumman Corp. | 8,714 | 2,681 | ||||||||||
Oshkosh Corp. | 1,125 | 79 | ||||||||||
Owens Corning | 2,768 | 175 | ||||||||||
Parker-Hannifin Corp. | 1,286 | 200 | ||||||||||
Pitney Bowes, Inc. | 76,263 | 654 | ||||||||||
Quanta Services, Inc. (a) | 7,740 | 259 | ||||||||||
Raytheon Co. | 7,157 | 1,383 | ||||||||||
Republic Services, Inc. | 4,175 | 285 | ||||||||||
Robert Half International, Inc. | 6,766 | 441 | ||||||||||
Ryder System, Inc. | 9,676 | 695 | ||||||||||
Southwest Airlines Co. | 1,820 | 93 | ||||||||||
Stanley Black & Decker, Inc. | 3,105 | 412 | ||||||||||
Timken Co. | 3,373 | 147 | ||||||||||
TransDigm Group, Inc. | 253 | 87 | ||||||||||
Trinity Industries, Inc. | 17,983 | 616 | ||||||||||
Union Pacific Corp. | 31,176 | 4,417 | ||||||||||
| SHARES | MARKET VALUE (000S) | |||||||||||
United Continental Holdings, Inc. (a) | 12,679 | $ | 884 | |||||||||
United Parcel Service, Inc. ‘B’ | 1,405 | 149 | ||||||||||
United Rentals, Inc. (a) | 2,401 | 355 | ||||||||||
United Technologies Corp. | 35,111 | 4,390 | ||||||||||
Waste Management, Inc. | 7,328 | 596 | ||||||||||
WESCO International, Inc. (a) | 4,468 | 255 | ||||||||||
WW Grainger, Inc. | 4,737 | 1,461 | ||||||||||
|
| |||||||||||
| 69,052 | ||||||||||||
|
| |||||||||||
| INFORMATION TECHNOLOGY 16.8% | ||||||||||||
Activision Blizzard, Inc. | 15,025 | 1,147 | ||||||||||
Alphabet, Inc. ‘C’ (a) | 1,671 | 1,864 | ||||||||||
Amdocs Ltd. | 8,760 | 580 | ||||||||||
Apple, Inc. | 164,549 | 30,460 | ||||||||||
Applied Materials, Inc. | 9,440 | 436 | ||||||||||
Arrow Electronics, Inc. (a) | 11,428 | 860 | ||||||||||
Avaya Holdings Corp. (a) | 12,832 | 258 | ||||||||||
Avnet, Inc. | 25,170 | 1,080 | ||||||||||
Booz Allen Hamilton Holding Corp. | 25,697 | 1,124 | ||||||||||
CA, Inc. | 38,627 | 1,377 | ||||||||||
Cisco Systems, Inc. | 149,810 | 6,446 | ||||||||||
Citrix Systems, Inc. (a) | 804 | 84 | ||||||||||
Conduent, Inc. (a) | 21,097 | 383 | ||||||||||
Corning, Inc. | 142,156 | 3,911 | ||||||||||
DXC Technology Co. | 4,520 | 364 | ||||||||||
eBay, Inc. (a) | 13,838 | 502 | ||||||||||
EchoStar Corp. ‘A’ (a) | 2,203 | 98 | ||||||||||
F5 Networks, Inc. (a) | 1,343 | 232 | ||||||||||
First Solar, Inc. (a) | 7,945 | 418 | ||||||||||
Fiserv, Inc. (a) | 2,513 | 186 | ||||||||||
Flex Ltd. (a) | 21,858 | 309 | ||||||||||
Genpact Ltd. | 3,643 | 105 | ||||||||||
Hewlett Packard Enterprise Co. | 205,286 | 2,999 | ||||||||||
HP, Inc. | 108,213 | 2,455 | ||||||||||
Intel Corp. | 257,281 | 12,790 | ||||||||||
InterActiveCorp (a) | 5,517 | 841 | ||||||||||
International Business Machines Corp. | 105,300 | 14,710 | ||||||||||
Intuit, Inc. | 2,987 | 610 | ||||||||||
Jabil, Inc. | 25,454 | 704 | ||||||||||
Juniper Networks, Inc. | 40,532 | 1,111 | ||||||||||
KLA-Tencor Corp. | 7,531 | 772 | ||||||||||
Maxim Integrated Products, Inc. | 1,947 | 114 | ||||||||||
Micron Technology, Inc. (a) | 7,632 | 400 | ||||||||||
Microsoft Corp. | 140,252 | 13,830 | ||||||||||
Motorola Solutions, Inc. | 20,117 | 2,341 | ||||||||||
NetApp, Inc. | 34,458 | 2,706 | ||||||||||
Oracle Corp. | 135,580 | 5,974 | ||||||||||
Perspecta, Inc. | 2,260 | 47 | ||||||||||
Qorvo, Inc. (a) | 5,954 | 477 | ||||||||||
QUALCOMM, Inc. | 92,618 | 5,198 | ||||||||||
Seagate Technology PLC | 88,559 | 5,001 | ||||||||||
Symantec Corp. | 50,025 | 1,033 | ||||||||||
Tech Data Corp. (a) | 2,867 | 236 | ||||||||||
Teradata Corp. (a) | 26,390 | 1,060 | ||||||||||
Texas Instruments, Inc. | 17,362 | 1,914 | ||||||||||
Western Digital Corp. | 10,463 | 810 | ||||||||||
Western Union Co. | 65,635 | 1,334 | ||||||||||
Xerox Corp. | 48,187 | 1,157 | ||||||||||
Xilinx, Inc. | 1,230 | 80 | ||||||||||
|
| |||||||||||
| 132,928 | ||||||||||||
|
| |||||||||||
| 54 | PIMCO EQUITY SERIES | See Accompanying Notes |
Table of Contents
June 30, 2018
| SHARES | MARKET VALUE (000S) | |||||||||||
| MATERIALS 2.4% |
| |||||||||||
Alcoa Corp. (a) | 34,713 | $ | 1,627 | |||||||||
Ashland Global Holdings, Inc. | 6,754 | 528 | ||||||||||
Avery Dennison Corp. | 2,467 | 252 | ||||||||||
Bemis Co., Inc. | 7,554 | 319 | ||||||||||
CF Industries Holdings, Inc. | 22,247 | 988 | ||||||||||
Cleveland-Cliffs, Inc. (a) | 18,608 | 157 | ||||||||||
Domtar Corp. | 26,816 | 1,280 | ||||||||||
DowDuPont, Inc. | 27,517 | 1,814 | ||||||||||
Eastman Chemical Co. | 3,338 | 334 | ||||||||||
Graphic Packaging Holding Co. | 9,424 | 137 | ||||||||||
Huntsman Corp. | 5,008 | 146 | ||||||||||
International Paper Co. | 20,210 | 1,052 | ||||||||||
LyondellBasell Industries NV ‘A’ | 48,679 | 5,347 | ||||||||||
Mosaic Co. | 92,045 | 2,582 | ||||||||||
Newmont Mining Corp. | 4,109 | 155 | ||||||||||
PPG Industries, Inc. | 10,408 | 1,079 | ||||||||||
Praxair, Inc. | 4,146 | 656 | ||||||||||
Reliance Steel & Aluminum Co. | 4,966 | 435 | ||||||||||
Sealed Air Corp. | 4,759 | 202 | ||||||||||
WestRock Co. | 2,662 | 152 | ||||||||||
|
| |||||||||||
| 19,242 | ||||||||||||
|
| |||||||||||
| REAL ESTATE 0.0% |
| |||||||||||
Jones Lang LaSalle, Inc. | 2,036 | 338 | ||||||||||
|
| |||||||||||
| TELECOMMUNICATION SERVICES 3.5% |
| |||||||||||
AT&T, Inc. | 328,266 | 10,541 | ||||||||||
CenturyLink, Inc. | 208,469 | 3,886 | ||||||||||
Frontier Communications Corp. | 139,571 | 748 | ||||||||||
Sprint Corp. (a) | 27,204 | 148 | ||||||||||
Telephone & Data Systems, Inc. | 29,154 | 799 | ||||||||||
Verizon Communications, Inc. | 222,573 | 11,198 | ||||||||||
Windstream Holdings, Inc. | 21,644 | 114 | ||||||||||
|
| |||||||||||
| 27,434 | ||||||||||||
|
| |||||||||||
| UTILITIES 5.4% |
| |||||||||||
AES Corp. | 210,802 | 2,827 | ||||||||||
Ameren Corp. | 25,116 | 1,528 | ||||||||||
| SHARES | MARKET VALUE (000S) | |||||||||||
American Electric Power Co., Inc. | 35,274 | $ | 2,443 | |||||||||
CenterPoint Energy, Inc. | 38,627 | 1,070 | ||||||||||
CMS Energy Corp. | 11,338 | 536 | ||||||||||
Consolidated Edison, Inc. | 29,032 | 2,264 | ||||||||||
DTE Energy Co. | 2,403 | 249 | ||||||||||
Duke Energy Corp. | 51,049 | 4,037 | ||||||||||
Edison International | 18,815 | 1,191 | ||||||||||
Entergy Corp. | 38,686 | 3,126 | ||||||||||
Evergy, Inc. | 6,916 | 388 | ||||||||||
Eversource Energy | 13,304 | 780 | ||||||||||
Exelon Corp. | 93,756 | 3,994 | ||||||||||
FirstEnergy Corp. | 88,061 | 3,162 | ||||||||||
Hawaiian Electric Industries, Inc. | 7,662 | 263 | ||||||||||
MDU Resources Group, Inc. | 27,272 | 782 | ||||||||||
NextEra Energy, Inc. | 5,736 | 958 | ||||||||||
NRG Energy, Inc. | 42,764 | 1,313 | ||||||||||
PG&E Corp. | 44,389 | 1,889 | ||||||||||
Pinnacle West Capital Corp. | 8,754 | 705 | ||||||||||
Portland General Electric Co. | 7,861 | 336 | ||||||||||
PPL Corp. | 42,698 | 1,219 | ||||||||||
Public Service Enterprise Group, Inc. | 40,680 | 2,203 | ||||||||||
SCANA Corp. | 25,547 | 984 | ||||||||||
Sempra Energy | 3,362 | 390 | ||||||||||
Southern Co. | 28,095 | 1,301 | ||||||||||
UGI Corp. | 1,715 | 89 | ||||||||||
Vectren Corp. | 3,670 | 262 | ||||||||||
Vistra Energy Corp. (a) | 43,910 | 1,039 | ||||||||||
Xcel Energy, Inc. | 23,561 | 1,076 | ||||||||||
|
| |||||||||||
| 42,404 | ||||||||||||
|
| |||||||||||
Total United States | 776,517 | |||||||||||
|
| |||||||||||
Total Common Stocks (Cost $605,697) |
| 779,719 | ||||||||||
|
| |||||||||||
| REAL ESTATE INVESTMENT TRUSTS 0.9% |
| |||||||||||
| UNITED STATES 0.9% |
| |||||||||||
| FINANCIALS 0.2% |
| |||||||||||
AGNC Investment Corp. | 28,915 | 537 | ||||||||||
Annaly Capital Management, Inc. | 94,731 | 975 | ||||||||||
| SHARES | MARKET VALUE (000S) | |||||||||||
Chimera Investment Corp. | 6,363 | $ | 116 | |||||||||
Two Harbors Investment Corp. | 5,310 | 84 | ||||||||||
|
| |||||||||||
| 1,712 | ||||||||||||
|
| |||||||||||
| REAL ESTATE 0.7% |
| |||||||||||
Brixmor Property Group, Inc. | 15,513 | 270 | ||||||||||
CoreCivic, Inc. | 37,227 | 889 | ||||||||||
DDR Corp. | 10,268 | 184 | ||||||||||
Equity Residential | 2,587 | 165 | ||||||||||
HCP, Inc. | 15,730 | 406 | ||||||||||
Hospitality Properties Trust | 12,878 | 369 | ||||||||||
Host Hotels & Resorts, Inc. | 11,388 | 240 | ||||||||||
Iron Mountain, Inc. | 10,495 | 367 | ||||||||||
Kimco Realty Corp. | 15,279 | 260 | ||||||||||
Macerich Co. | 1,832 | 104 | ||||||||||
Quality Care Properties, Inc. (a) | 21,541 | 463 | ||||||||||
Senior Housing Properties Trust | 23,188 | 420 | ||||||||||
Spirit MTA REIT (a) | 1,853 | 19 | ||||||||||
Spirit Realty Capital, Inc. | 18,539 | 149 | ||||||||||
Ventas, Inc. | 7,337 | 418 | ||||||||||
VEREIT, Inc. | 34,243 | 255 | ||||||||||
Welltower, Inc. | 5,970 | 374 | ||||||||||
|
| |||||||||||
| 5,352 | ||||||||||||
|
| |||||||||||
Total Real Estate Investment Trusts (Cost $6,527) |
| 7,064 | ||||||||||
|
| |||||||||||
| SHORT-TERM INSTRUMENTS 0.5% |
| |||||||||||
| REPURCHASE AGREEMENTS (b) 0.5% |
| |||||||||||
| 4,267 | ||||||||||||
|
| |||||||||||
| Total Short-Term Instruments (Cost $4,267) | 4,267 | |||||||||||
|
| |||||||||||
| Total Investments in Securities (Cost $616,491) | 791,050 | |||||||||||
| Total Investments 100.1% (Cost $616,491) | $ | 791,050 | ||||||||||
| Other Assets and Liabilities, net (0.1)% |
| (517 | ) | |||||||||
|
| |||||||||||
| Net Assets 100.0% | $ | 790,533 | ||||||||||
|
| |||||||||||
NOTES TO SCHEDULE OF INVESTMENTS:
| * | A zero balance may reflect actual amounts rounding to less than one thousand. |
| (a) | Security did not produce income within the last twelve months. |
BORROWINGS AND OTHER FINANCING TRANSACTIONS
(b) REPURCHASE AGREEMENTS:
| Counterparty | Lending Rate | Settlement Date | Maturity Date | Principal Amount | Collateralized By | Collateral (Received) | Repurchase Agreements, at Value | Repurchase Agreement Proceeds to be Received(1) | ||||||||||||||||||||||
| FICC | 1.500 | % | 06/29/2018 | 07/02/2018 | $ | 4,267 | U.S. Treasury Notes 1.875% due 01/31/2022 | $ | (4,354 | ) | $ | 4,267 | $ | 4,267 | ||||||||||||||||
|
|
|
|
|
| |||||||||||||||||||||||||
Total Repurchase Agreements |
| $ | (4,354 | ) | $ | 4,267 | $ | 4,267 | ||||||||||||||||||||||
|
|
|
|
|
| |||||||||||||||||||||||||
| See Accompanying Notes | ANNUAL REPORT | JUNE 30, 2018 | 55 |
Table of Contents
Schedule of Investments PIMCO RAE US Fund (Cont.)
June 30, 2018
BORROWINGS AND OTHER FINANCING TRANSACTIONS SUMMARY
The following is a summary by counterparty of the market value of Borrowings and Other Financing Transactions and collateral pledged/(received) as of June 30, 2018:
| Counterparty | Repurchase Agreement Proceeds to be Received(1) | Payable for Reverse Repurchase Agreements | Payable for Sale-Buyback Transactions | Total Borrowings and Other Financing Transactions | Collateral Pledged/(Received) | Net Exposure(2) | ||||||||||||||||||
Global/Master Repurchase Agreement |
| |||||||||||||||||||||||
FICC | $ | 4,267 | $ | 0 | $ | 0 | $ | 4,267 | $ | (4,354 | ) | $ | (87 | ) | ||||||||||
|
|
|
|
|
| |||||||||||||||||||
Total Borrowings and Other Financing Transactions | $ | 4,267 | $ | 0 | $ | 0 | ||||||||||||||||||
|
|
|
|
|
| |||||||||||||||||||
| (1) | Includes accrued interest. |
| (2) | Net Exposure represents the net receivable/(payable) that would be due from/to the counterparty in the event of default. Exposure from borrowings and other financing transactions can only be netted across transactions governed under the same master agreement with the same legal entity. See Note 8, Master Netting Arrangements, in the Notes to Financial Statements for more information regarding master netting arrangements. |
FAIR VALUE MEASUREMENTS
The following is a summary of the fair valuations according to the inputs used as of June 30, 2018 in valuing the Fund’s assets and liabilities:
| Category and Subcategory | Level 1 | Level 2 | Level 3 | Fair Value at 06/30/2018 | ||||||||||||
Investments in Securities, at Value |
| |||||||||||||||
Common Stocks |
| |||||||||||||||
Bermuda |
| |||||||||||||||
Financials | $ | 2,076 | $ | 0 | $ | 0 | $ | 2,076 | ||||||||
Ireland |
| |||||||||||||||
Information Technology | 1,126 | 0 | 0 | 1,126 | ||||||||||||
United States |
| |||||||||||||||
Consumer Discretionary | 111,231 | 0 | 0 | 111,231 | ||||||||||||
Consumer Staples | 59,151 | 0 | 0 | 59,151 | ||||||||||||
Energy | 57,662 | 0 | 0 | 57,662 | ||||||||||||
Financials | 147,133 | 0 | 0 | 147,133 | ||||||||||||
Health Care | 109,942 | 0 | 0 | 109,942 | ||||||||||||
Industrials | 69,052 | 0 | 0 | 69,052 | ||||||||||||
Information Technology | 132,928 | 0 | 0 | 132,928 | ||||||||||||
| Category and Subcategory | Level 1 | Level 2 | Level 3 | Fair Value at 06/30/2018 | ||||||||||||
Materials | $ | 19,242 | $ | 0 | $ | 0 | $ | 19,242 | ||||||||
Real Estate | 338 | 0 | 0 | 338 | ||||||||||||
Telecommunication Services | 27,434 | 0 | 0 | 27,434 | ||||||||||||
Utilities | 42,404 | 0 | 0 | 42,404 | ||||||||||||
Real Estate Investment Trusts |
| |||||||||||||||
United States |
| |||||||||||||||
Financials | 1,712 | 0 | 0 | 1,712 | ||||||||||||
Real Estate | 5,352 | 0 | 0 | �� | 5,352 | |||||||||||
Short-Term Instruments |
| |||||||||||||||
Repurchase Agreements | 0 | 4,267 | 0 | 4,267 | ||||||||||||
|
|
|
|
|
|
|
| |||||||||
Total Investments | $ | 786,783 | $ | 4,267 | $ | 0 | $ | 791,050 | ||||||||
|
|
|
|
|
|
|
| |||||||||
There were no significant transfers among Levels 1, 2, or 3 during the period ended June 30, 2018.
| 56 | PIMCO EQUITY SERIES | See Accompanying Notes |
Table of Contents
Schedule of Investments PIMCO RAE US Small Fund
June 30, 2018
(Amounts in thousands*, except number of shares, contracts and units, if any)
| SHARES | MARKET VALUE (000S) | |||||||||||
| INVESTMENTS IN SECURITIES 99.9% |
| |||||||||||
| COMMON STOCKS 86.4% |
| |||||||||||
| UNITED STATES 86.4% |
| |||||||||||
| CONSUMER DISCRETIONARY 20.3% |
| |||||||||||
Aaron’s, Inc. | 15,974 | $ | 694 | |||||||||
Acushnet Holdings Corp. | 2,963 | 72 | ||||||||||
Adtalem Global Education, Inc. (a) | 9,348 | 450 | ||||||||||
AMC Entertainment Holdings, Inc. ‘A’ | 4,283 | 68 | ||||||||||
AMC Networks, Inc. ‘A’ (a) | 1,454 | 90 | ||||||||||
America’s Car-Mart, Inc. (a) | 1,261 | 78 | ||||||||||
American Axle & Manufacturing Holdings, Inc. (a) | 5,921 | 92 | ||||||||||
American Outdoor Brands Corp. (a) | 7,290 | 88 | ||||||||||
American Public Education, Inc. (a) | 2,846 | 120 | ||||||||||
Asbury Automotive Group, Inc. (a) | 5,379 | 369 | ||||||||||
Barnes & Noble Education, Inc. (a) | 14,532 | 82 | ||||||||||
Barnes & Noble, Inc. | 30,543 | 194 | ||||||||||
Bassett Furniture Industries, Inc. | 1,083 | 30 | ||||||||||
Beazer Homes USA, Inc. (a) | 5,020 | 74 | ||||||||||
Big 5 Sporting Goods Corp. | 3,776 | 29 | ||||||||||
Biglari Holdings, Inc. (a) | 7 | 7 | ||||||||||
BJ’s Restaurants, Inc. | 2,264 | 136 | ||||||||||
Bloomin’ Brands, Inc. | 11,739 | 236 | ||||||||||
Boot Barn Holdings, Inc. (a) | 1,141 | 24 | ||||||||||
Boyd Gaming Corp. | 7,262 | 252 | ||||||||||
Bridgepoint Education, Inc. (a) | 8,390 | 55 | ||||||||||
Brinker International, Inc. | 7,562 | 360 | ||||||||||
Buckle, Inc. | 14,105 | 379 | ||||||||||
Cable One, Inc. | 29 | 21 | ||||||||||
Caleres, Inc. | 7,954 | 274 | ||||||||||
Callaway Golf Co. | 4,407 | 84 | ||||||||||
Capella Education Co. | 1,216 | 120 | ||||||||||
Career Education Corp. (a) | 11,719 | 189 | ||||||||||
Carrols Restaurant Group, Inc. (a) | 8,123 | 121 | ||||||||||
Cato Corp. ‘A’ | 10,990 | 271 | ||||||||||
Century Communities, Inc. (a) | 2,206 | 70 | ||||||||||
Cheesecake Factory, Inc. | 5,074 | 279 | ||||||||||
Chegg, Inc. (a) | 1,890 | 52 | ||||||||||
Chico’s FAS, Inc. | 23,309 | 190 | ||||||||||
Children’s Place, Inc. | 1,476 | 178 | ||||||||||
Churchill Downs, Inc. | 734 | 218 | ||||||||||
Citi Trends, Inc. | 2,760 | 76 | ||||||||||
Conn’s, Inc. (a) | 4,232 | 140 | ||||||||||
Container Store Group, Inc. (a) | 6,427 | 54 | ||||||||||
Cooper Tire & Rubber Co. | 9,440 | 248 | ||||||||||
Cooper-Standard Holding, Inc. (a) | 2,098 | 274 | ||||||||||
Core-Mark Holding Co., Inc. | 3,706 | 84 | ||||||||||
Cracker Barrel Old Country Store, Inc. | 364 | 57 | ||||||||||
Crocs, Inc. (a) | 13,478 | 237 | ||||||||||
CSS Industries, Inc. | 1,573 | 27 | ||||||||||
Dana, Inc. | 10,275 | 207 | ||||||||||
Dave & Buster’s Entertainment, Inc. (a) | 3,048 | 145 | ||||||||||
Deckers Outdoor Corp. (a) | 4,352 | 491 | ||||||||||
Denny’s Corp. (a) | 5,770 | 92 | ||||||||||
Dine Brands Global, Inc. | 4,223 | 316 | ||||||||||
Dorman Products, Inc. (a) | 1,263 | 86 | ||||||||||
Drive Shack, Inc. (a) | 19,478 | 150 | ||||||||||
DSW Inc. ‘A’ | 15,426 | 398 | ||||||||||
Eldorado Resorts, Inc. (a) | 4,364 | 171 | ||||||||||
Ethan Allen Interiors, Inc. | 3,376 | 83 | ||||||||||
EW Scripps Co. ‘A’ | 1,766 | 24 | ||||||||||
Express, Inc. (a) | 41,352 | 378 | ||||||||||
Extended Stay America, Inc. | 5,999 | 130 | ||||||||||
| SHARES | MARKET VALUE (000S) | |||||||||||
Fiesta Restaurant Group, Inc. (a) | 1,787 | $ | 51 | |||||||||
Five Below, Inc. (a) | 1,006 | 98 | ||||||||||
Fox Factory Holding Corp. (a) | 1,140 | 53 | ||||||||||
Francesca’s Holdings Corp. (a) | 6,494 | 49 | ||||||||||
Fred’s, Inc. ‘A’ | 14,435 | 33 | ||||||||||
FTD Cos., Inc. (a) | 5,489 | 25 | ||||||||||
G-III Apparel Group Ltd. (a) | 6,397 | 284 | ||||||||||
Gannett Co., Inc. | 42,770 | 458 | ||||||||||
Genesco, Inc. (a) | 13,587 | 539 | ||||||||||
Gentherm, Inc. (a) | 830 | 33 | ||||||||||
GoPro, Inc. ‘A’ (a) | 9,860 | 63 | ||||||||||
Graham Holdings Co. ‘B’ | 221 | 130 | ||||||||||
Grand Canyon Education, Inc. (a) | 804 | 90 | ||||||||||
Gray Television, Inc. (a) | 5,670 | 90 | ||||||||||
Group 1 Automotive, Inc. | 3,613 | 228 | ||||||||||
Groupon, Inc. (a) | 71,738 | 308 | ||||||||||
Guess?, Inc. | 24,414 | 522 | ||||||||||
Hamilton Beach Brands Holding Co. | 1,552 | 45 | ||||||||||
Haverty Furniture Cos., Inc. | 4,405 | 95 | ||||||||||
Helen of Troy Ltd. (a) | 2,696 | 265 | ||||||||||
Hibbett Sports, Inc. (a) | 9,464 | 217 | ||||||||||
Hilton Grand Vacations, Inc. (a) | 2,506 | 87 | ||||||||||
Houghton Mifflin Harcourt Co. (a) | 20,112 | 154 | ||||||||||
Hovnanian Enterprises, Inc. ‘A’ (a) | 14,394 | 23 | ||||||||||
Iconix Brand Group, Inc. (a) | 12,437 | 7 | ||||||||||
ILG, Inc. | 5,370 | 177 | ||||||||||
International Speedway Corp. ‘A’ | 2,594 | 116 | ||||||||||
iRobot Corp. (a) | 1,087 | 82 | ||||||||||
Jack in the Box, Inc. | 3,739 | 318 | ||||||||||
John Wiley & Sons, Inc. ‘A’ | 6,665 | 416 | ||||||||||
K12, Inc. (a) | 6,560 | 107 | ||||||||||
KB Home | 9,386 | 256 | ||||||||||
Kirkland’s, Inc. (a) | 5,832 | 68 | ||||||||||
La-Z-Boy, Inc. | 5,451 | 167 | ||||||||||
Lands’ End, Inc. (a) | 6,292 | 176 | ||||||||||
Laureate Education, Inc. ‘A’ (a) | 5,627 | 81 | ||||||||||
LCI Industries | 1,054 | 95 | ||||||||||
LGI Homes, Inc. (a) | 415 | 24 | ||||||||||
Libbey, Inc. | 3,874 | 31 | ||||||||||
Liberty Expedia Holdings, Inc. (a) | 2,877 | 126 | ||||||||||
Liberty TripAdvisor Holdings, Inc. ‘A’ (a) | 14,838 | 239 | ||||||||||
Lithia Motors, Inc. ‘A’ | 1,443 | 136 | ||||||||||
Lumber Liquidators Holdings, Inc. (a) | 3,247 | 79 | ||||||||||
M/I Homes, Inc. (a) | 3,877 | 103 | ||||||||||
Marcus Corp. | 1,776 | 58 | ||||||||||
Marriott Vacations Worldwide Corp. | 2,498 | 282 | ||||||||||
MDC Holdings, Inc. | 4,613 | 142 | ||||||||||
MDC Partners, Inc. ‘A’ (a) | 8,296 | 38 | ||||||||||
Media General, Inc. CVR « | 2,855 | 0 | ||||||||||
Meredith Corp. | 5,126 | 261 | ||||||||||
Meritage Homes Corp. (a) | 3,609 | 159 | ||||||||||
Modine Manufacturing Co. (a) | 2,717 | 50 | ||||||||||
Monarch Casino & Resort, Inc. (a) | 461 | 20 | ||||||||||
Monro, Inc. | 1,424 | 83 | ||||||||||
Movado Group, Inc. | 3,230 | 156 | ||||||||||
MSG Networks, Inc. ‘A’ (a) | 2,301 | 55 | ||||||||||
Murphy USA, Inc. (a) | 4,668 | 347 | ||||||||||
National CineMedia, Inc. | 26,332 | 221 | ||||||||||
New Media Investment Group, Inc. | 4,228 | 78 | ||||||||||
New York Times Co. ‘A’ | 11,866 | 307 | ||||||||||
Nexstar Media Group, Inc. ‘A’ | 1,250 | 92 | ||||||||||
Nutrisystem, Inc. | 1,430 | 55 | ||||||||||
Ollie’s Bargain Outlet Holdings, Inc. (a) | 2,542 | 184 | ||||||||||
| SHARES | MARKET VALUE (000S) | |||||||||||
Overstock.com, Inc. (a) | 1,972 | $ | 66 | |||||||||
Oxford Industries, Inc. | 1,699 | 141 | ||||||||||
Papa John’s International, Inc. | 1,118 | 57 | ||||||||||
Party City Holdco, Inc. (a) | 5,172 | 79 | ||||||||||
Penn National Gaming, Inc. (a) | 16,963 | 570 | ||||||||||
Perry Ellis International, Inc. (a) | 3,276 | 89 | ||||||||||
PetMed Express, Inc. | 1,594 | 70 | ||||||||||
Pier 1 Imports, Inc. | 90,791 | 216 | ||||||||||
Pinnacle Entertainment, Inc. (a) | 18,979 | 640 | ||||||||||
Planet Fitness, Inc. ‘A’ (a) | 993 | 44 | ||||||||||
RCI Hospitality Holdings, Inc. | 694 | 22 | ||||||||||
Red Robin Gourmet Burgers, Inc. (a) | 1,823 | 85 | ||||||||||
Red Rock Resorts, Inc. ‘A’ | 6,008 | 201 | ||||||||||
Regis Corp. (a) | 11,169 | 185 | ||||||||||
Rent-A-Center, Inc. | 40,322 | 594 | ||||||||||
RH (a) | 3,463 | 484 | ||||||||||
Ruth’s Hospitality Group, Inc. | 2,064 | 58 | ||||||||||
Scholastic Corp. | 4,280 | 190 | ||||||||||
Scientific Games Corp. ‘A’ (a) | 2,004 | 98 | ||||||||||
SeaWorld Entertainment, Inc. (a) | 25,362 | 553 | ||||||||||
Shoe Carnival, Inc. | 3,113 | 101 | ||||||||||
Shutterfly, Inc. (a) | 3,431 | 309 | ||||||||||
Sinclair Broadcast Group, Inc. ‘A’ | 3,820 | 123 | ||||||||||
Sleep Number Corp. (a) | 6,591 | 191 | ||||||||||
Sonic Automotive, Inc. ‘A’ | 9,024 | 186 | ||||||||||
Sonic Corp. | 4,800 | 165 | ||||||||||
Sotheby’s (a) | 5,928 | 322 | ||||||||||
Sportsman’s Warehouse Holdings, Inc. (a) | 5,395 | 28 | ||||||||||
Standard Motor Products, Inc. | 1,518 | 73 | ||||||||||
Steven Madden Ltd. | 4,619 | 245 | ||||||||||
Stoneridge, Inc. (a) | 707 | 25 | ||||||||||
Strayer Education, Inc. | 1,409 | 159 | ||||||||||
Sturm Ruger & Co., Inc. | 2,243 | 126 | ||||||||||
Superior Industries International, Inc. | 3,386 | 61 | ||||||||||
Tailored Brands, Inc. | 8,179 | 209 | ||||||||||
Taylor Morrison Home Corp. ‘A’ (a) | 8,941 | 186 | ||||||||||
Tempur Sealy International, Inc. (a) | 3,062 | 147 | ||||||||||
Tenneco, Inc. | 5,684 | 250 | ||||||||||
Texas Roadhouse, Inc. | 1,752 | 115 | ||||||||||
TopBuild Corp. (a) | 3,155 | 247 | ||||||||||
Tower International, Inc. | 2,741 | 87 | ||||||||||
Town Sports International Holdings, Inc. (a) | 3,532 | 51 | ||||||||||
TravelCenters of America LLC (a) | 9,552 | 33 | ||||||||||
TRI Pointe Group, Inc. (a) | 9,376 | 153 | ||||||||||
tronc, Inc. (a) | 5,184 | 90 | ||||||||||
Universal Electronics, Inc. (a) | 621 | 21 | ||||||||||
Vera Bradley, Inc. (a) | 4,188 | 59 | ||||||||||
Vista Outdoor, Inc. (a) | 9,603 | 149 | ||||||||||
Vitamin Shoppe, Inc. (a) | 5,463 | 38 | ||||||||||
VOXX International Corp. (a) | 2,357 | 13 | ||||||||||
WideOpenWest, Inc. (a) | 5,405 | 52 | ||||||||||
William Lyon Homes ‘A’ (a) | 2,781 | 64 | ||||||||||
Wingstop, Inc. | 398 | 21 | ||||||||||
Winnebago Industries, Inc. | 377 | 15 | ||||||||||
Wolverine World Wide, Inc. | 7,452 | 259 | ||||||||||
World Wrestling Entertainment, Inc. ‘A’ | 835 | 61 | ||||||||||
ZAGG, Inc. (a) | 1,857 | 32 | ||||||||||
Zumiez, Inc. (a) | 4,790 | 120 | ||||||||||
|
| |||||||||||
| 28,274 | ||||||||||||
|
| |||||||||||
| See Accompanying Notes | ANNUAL REPORT | JUNE 30, 2018 | 57 |
Table of Contents
Schedule of Investments PIMCO RAE US Small Fund (Cont.)
| SHARES | MARKET VALUE (000S) | |||||||||||
| CONSUMER STAPLES 4.2% |
| |||||||||||
Alliance One International, Inc. (a) | 2,068 | $ | 33 | |||||||||
Andersons, Inc. | 1,996 | 68 | ||||||||||
B&G Foods, Inc. | 2,486 | 74 | ||||||||||
Boston Beer Co., Inc. ‘A’ (a) | 454 | 136 | ||||||||||
Cal-Maine Foods, Inc. (a) | 2,337 | 107 | ||||||||||
Calavo Growers, Inc. | 211 | 20 | ||||||||||
Casey’s General Stores, Inc. | 753 | 79 | ||||||||||
Central Garden & Pet Co. ‘A’ (a) | 3,814 | 154 | ||||||||||
Chefs’ Warehouse, Inc. (a) | 815 | 23 | ||||||||||
Coca-Cola Bottling Co. Consolidated | 428 | 58 | ||||||||||
Darling Ingredients, Inc. (a) | 14,676 | 292 | ||||||||||
Dean Foods Co. | 40,854 | 429 | ||||||||||
Edgewell Personal Care Co. (a) | 3,818 | 193 | ||||||||||
Energizer Holdings, Inc. | 2,346 | 148 | ||||||||||
Fresh Del Monte Produce, Inc. | 3,010 | 134 | ||||||||||
Hain Celestial Group, Inc. (a) | 3,095 | 92 | ||||||||||
Hostess Brands, Inc. (a) | 1,363 | 19 | ||||||||||
Ingles Markets, Inc. ‘A’ | 5,069 | 161 | ||||||||||
Inter Parfums, Inc. | 1,295 | 69 | ||||||||||
J&J Snack Foods Corp. | 615 | 94 | ||||||||||
Lancaster Colony Corp. | 733 | 102 | ||||||||||
Medifast, Inc. | 1,298 | 208 | ||||||||||
Performance Food Group Co. (a) | 12,568 | 461 | ||||||||||
PriceSmart, Inc. | 1,192 | 108 | ||||||||||
Revlon, Inc. ‘A’ (a) | 1,304 | 23 | ||||||||||
Sanderson Farms, Inc. | 1,770 | 186 | ||||||||||
Smart & Final Stores, Inc. (a) | 6,991 | 39 | ||||||||||
SpartanNash Co. | 8,541 | 218 | ||||||||||
Sprouts Farmers Market, Inc. (a) | 10,298 | 227 | ||||||||||
SUPERVALU, Inc. (a) | 30,484 | 626 | ||||||||||
TreeHouse Foods, Inc. (a) | 1,502 | 79 | ||||||||||
United Natural Foods, Inc. (a) | 6,202 | 265 | ||||||||||
Universal Corp. | 5,214 | 344 | ||||||||||
USANA Health Sciences, Inc. (a) | 1,779 | 205 | ||||||||||
Vector Group Ltd. | 8,996 | 172 | ||||||||||
Village Super Market, Inc. ‘A’ | 646 | 19 | ||||||||||
WD-40 Co. | 808 | 118 | ||||||||||
Weis Markets, Inc. | 1,655 | 88 | ||||||||||
|
| |||||||||||
| 5,871 | ||||||||||||
|
| |||||||||||
| ENERGY 3.9% |
| |||||||||||
Arch Coal, Inc. ‘A’ | 253 | 20 | ||||||||||
Archrock, Inc. | 4,983 | 60 | ||||||||||
Basic Energy Services, Inc. (a) | 3,527 | 39 | ||||||||||
Bristow Group, Inc. | 16,545 | 233 | ||||||||||
California Resources Corp. (a) | 10,878 | 494 | ||||||||||
CARBO Ceramics, Inc. (a) | 6,601 | 60 | ||||||||||
Cloud Peak Energy, Inc. (a) | 46,968 | 164 | ||||||||||
CNX Resources Corp. (a) | 7,713 | 137 | ||||||||||
Delek U.S. Holdings, Inc. | 6,157 | 309 | ||||||||||
Denbury Resources, Inc. (a) | 77,000 | 370 | ||||||||||
Dorian LPG Ltd. (a) | 7,949 | 61 | ||||||||||
Dril-Quip, Inc. (a) | 3,330 | 171 | ||||||||||
Enbridge Energy Management LLC « | 58,437 | 0 | ||||||||||
EP Energy Corp. ‘A’ (a) | 12,303 | 37 | ||||||||||
Exterran Corp. (a) | 5,926 | 148 | ||||||||||
Green Plains, Inc. | 3,228 | 59 | ||||||||||
Gulfport Energy Corp. (a) | 3,248 | 41 | ||||||||||
Halcon Resources Corp. (a) | 7,510 | 33 | ||||||||||
Helix Energy Solutions Group, Inc. (a) | 6,792 | 57 | ||||||||||
HighPoint Resources Corp. (a) | 11,621 | 71 | ||||||||||
International Seaways, Inc. (a) | 8,959 | 207 | ||||||||||
Kosmos Energy Ltd. (a) | 4,217 | 35 | ||||||||||
| SHARES | MARKET VALUE (000S) | |||||||||||
Matrix Service Co. (a) | 1,058 | $ | 19 | |||||||||
McDermott International, Inc. (a) | 3,394 | 67 | ||||||||||
NACCO Industries, Inc. ‘A’ | 1,022 | 34 | ||||||||||
Newpark Resources, Inc. (a) | 1,538 | 17 | ||||||||||
Oasis Petroleum, Inc. (a) | 4,138 | 54 | ||||||||||
Oil States International, Inc. (a) | 3,142 | 101 | ||||||||||
Overseas Shipholding Group, Inc. ‘A’ (a) | 30,282 | 117 | ||||||||||
PBF Energy, Inc. ‘A’ | 8,854 | 371 | ||||||||||
PDC Energy, Inc. (a) | 1,085 | 66 | ||||||||||
Peabody Energy Corp. | 6,430 | 292 | ||||||||||
Pioneer Energy Services Corp. (a) | 12,627 | 74 | ||||||||||
QEP Resources, Inc. (a) | 9,415 | 115 | ||||||||||
Renewable Energy Group, Inc. (a) | 7,452 | 133 | ||||||||||
REX American Resources Corp. (a) | 477 | 39 | ||||||||||
SandRidge Energy, Inc. (a) | 6,461 | 115 | ||||||||||
SEACOR Holdings, Inc. (a) | 2,387 | 137 | ||||||||||
SEACOR Marine Holdings, Inc. (a) | 2,342 | 54 | ||||||||||
SemGroup Corp. ‘A’ | 1,532 | 39 | ||||||||||
SM Energy Co. | 1,956 | 50 | ||||||||||
Southwestern Energy Co. (a) | 11,367 | 60 | ||||||||||
Superior Energy Services, Inc. (a) | 11,177 | 109 | ||||||||||
TETRA Technologies, Inc. (a) | 4,651 | 21 | ||||||||||
Tidewater, Inc. (a) | 3,658 | 106 | ||||||||||
Unit Corp. (a) | 1,501 | 38 | ||||||||||
W&T Offshore, Inc. (a) | 27,354 | 196 | ||||||||||
World Fuel Services Corp. | 8,806 | 180 | ||||||||||
|
| |||||||||||
| 5,410 | ||||||||||||
|
| |||||||||||
| FINANCIALS 14.3% |
| |||||||||||
Ambac Financial Group, Inc. (a) | 18,537 | 368 | ||||||||||
American Equity Investment Life Holding Co. | 19,390 | 698 | ||||||||||
Ameris Bancorp | 301 | 16 | ||||||||||
AMERISAFE, Inc. | 828 | 48 | ||||||||||
AmTrust Financial Services, Inc. | 5,704 | 83 | ||||||||||
Arlington Asset Investment Corp. ‘A’ | 3,238 | 33 | ||||||||||
Artisan Partners Asset Management, Inc. ‘A’ | 1,929 | 58 | ||||||||||
Associated Banc-Corp. | 8,084 | 221 | ||||||||||
Banc of California, Inc. | 2,743 | 54 | ||||||||||
BancFirst Corp. | 899 | 53 | ||||||||||
Bancorp, Inc. (a) | 6,237 | 65 | ||||||||||
BancorpSouth Bank | 4,992 | 165 | ||||||||||
Bank of Hawaii Corp. | 3,284 | 274 | ||||||||||
BankUnited, Inc. | 2,624 | 107 | ||||||||||
Banner Corp. | 1,668 | 100 | ||||||||||
Beneficial Bancorp, Inc. | 5,427 | 88 | ||||||||||
Berkshire Hills Bancorp, Inc. | 2,089 | 85 | ||||||||||
BGC Partners, Inc. ‘A’ | 11,908 | 135 | ||||||||||
BofI Holding, Inc. (a) | 1,808 | 74 | ||||||||||
Boston Private Financial Holdings, Inc. | 6,124 | 97 | ||||||||||
Brookline Bancorp, Inc. | 6,800 | 127 | ||||||||||
Bryn Mawr Bank Corp. | 668 | 31 | ||||||||||
Camden National Corp. | 1,477 | 68 | ||||||||||
Cannae Holdings, Inc. (a) | 9,823 | 182 | ||||||||||
Capitol Federal Financial, Inc. | 16,772 | 221 | ||||||||||
Cathay General Bancorp | 4,305 | 174 | ||||||||||
CenterState Banks, Inc. | 1,286 | 38 | ||||||||||
Central Pacific Financial Corp. | 2,212 | 63 | ||||||||||
Chemical Financial Corp. | 1,139 | 63 | ||||||||||
City Holding Co. | 1,159 | 87 | ||||||||||
Cohen & Steers, Inc. | 1,721 | 72 | ||||||||||
Columbia Banking System, Inc. | 3,599 | 147 | ||||||||||
| SHARES | MARKET VALUE (000S) | |||||||||||
Community Bank System, Inc. | 2,691 | $ | 159 | |||||||||
Community Trust Bancorp, Inc. | 1,577 | 79 | ||||||||||
Cowen, Inc. (a) | 8,767 | 121 | ||||||||||
Customers Bancorp, Inc. (a) | 2,200 | 62 | ||||||||||
CVB Financial Corp. | 4,433 | 99 | ||||||||||
Dime Community Bancshares, Inc. | 4,050 | 79 | ||||||||||
Donnelley Financial Solutions, Inc. (a) | 12,388 | 215 | ||||||||||
Eagle Bancorp, Inc. (a) | 1,148 | 70 | ||||||||||
eHealth, Inc. (a) | 2,965 | 66 | ||||||||||
Employers Holdings, Inc. | 3,410 | 137 | ||||||||||
Encore Capital Group, Inc. (a) | 3,136 | 115 | ||||||||||
Enova International, Inc. (a) | 6,017 | 220 | ||||||||||
Enterprise Financial Services Corp. | 665 | 36 | ||||||||||
Essent Group Ltd. (a) | 1,291 | 46 | ||||||||||
Evercore, Inc. ‘A’ | 2,134 | 225 | ||||||||||
EZCORP, Inc. ‘A’ (a) | 17,661 | 213 | ||||||||||
FBL Financial Group, Inc. ‘A’ | 1,155 | 91 | ||||||||||
FCB Financial Holdings, Inc. ‘A’ (a) | 1,030 | 61 | ||||||||||
Federal Agricultural Mortgage Corp. ‘C’ | 1,097 | 98 | ||||||||||
Federated Investors, Inc. ‘B’ | 10,010 | 233 | ||||||||||
Financial Institutions, Inc. | 1,679 | 55 | ||||||||||
First Bancorp | 1,185 | 49 | ||||||||||
First Busey Corp. | 2,773 | 88 | ||||||||||
First Commonwealth Financial Corp. | 9,139 | 142 | ||||||||||
First Community Bancshares, Inc. | 806 | 26 | ||||||||||
First Financial Bancorp | 5,854 | 179 | ||||||||||
First Financial Bankshares, Inc. | 1,348 | 69 | ||||||||||
First Financial Corp. | 1,856 | 84 | ||||||||||
First Hawaiian, Inc. | 724 | 21 | ||||||||||
First Interstate BancSystem, Inc. ‘A’ | 1,662 | 70 | ||||||||||
First Merchants Corp. | 1,988 | 92 | ||||||||||
First Midwest Bancorp, Inc. | 4,436 | 113 | ||||||||||
FirstCash, Inc. | 2,445 | 220 | ||||||||||
Flagstar Bancorp, Inc. (a) | 3,297 | 113 | ||||||||||
Flushing Financial Corp. | 3,355 | 88 | ||||||||||
Fulton Financial Corp. | 23,144 | 382 | ||||||||||
GAIN Capital Holdings, Inc. | 2,464 | 19 | ||||||||||
Glacier Bancorp, Inc. | 3,632 | 141 | ||||||||||
Great Southern Bancorp, Inc. | 1,081 | 62 | ||||||||||
Great Western Bancorp, Inc. | 3,192 | 134 | ||||||||||
Green Dot Corp. ‘A’ (a) | 2,773 | 204 | ||||||||||
Greenhill & Co., Inc. | 7,508 | 213 | ||||||||||
Hanmi Financial Corp. | 1,209 | 34 | ||||||||||
HCI Group, Inc. | 1,318 | 55 | ||||||||||
Heartland Financial USA, Inc. | 1,410 | 77 | ||||||||||
Hercules Capital, Inc. | 5,600 | 71 | ||||||||||
Heritage Financial Corp. | 2,416 | 84 | ||||||||||
Heritage Insurance Holdings, Inc. | 3,910 | 65 | ||||||||||
Hilltop Holdings, Inc. | 4,521 | 100 | ||||||||||
Home BancShares, Inc. | 526 | 12 | ||||||||||
HomeStreet, Inc. (a) | 1,552 | 42 | ||||||||||
HomeTrust Bancshares, Inc. (a) | 927 | 26 | ||||||||||
Hope Bancorp, Inc. | 3,787 | 68 | ||||||||||
Horace Mann Educators Corp. | 3,372 | 150 | ||||||||||
Houlihan Lokey, Inc. | 991 | 51 | ||||||||||
Independent Bank Corp. | 1,408 | 110 | ||||||||||
Infinity Property & Casualty Corp. | 1,082 | 154 | ||||||||||
International Bancshares Corp. | 5,220 | 223 | ||||||||||
INTL FCStone, Inc. (a) | 439 | 23 | ||||||||||
Investment Technology Group, Inc. | 3,744 | 78 | ||||||||||
Kearny Financial Corp. | 2,330 | 31 | ||||||||||
Kemper Corp. | 6,278 | 475 | ||||||||||
Lakeland Bancorp, Inc. | 695 | 14 | ||||||||||
Lakeland Financial Corp. | 917 | 44 | ||||||||||
| 58 | PIMCO EQUITY SERIES | See Accompanying Notes |
Table of Contents
June 30, 2018
| SHARES | MARKET VALUE (000S) | |||||||||||
LegacyTexas Financial Group, Inc. | 488 | $ | 19 | |||||||||
MB Financial, Inc. | 1,946 | 91 | ||||||||||
MBIA, Inc. (a) | 53,985 | 488 | ||||||||||
Mercantile Bank Corp. | 328 | 12 | ||||||||||
Mercury General Corp. | 2,086 | 95 | ||||||||||
Morningstar, Inc. | 1,141 | 146 | ||||||||||
National Bank Holdings Corp. ‘A’ | 4,662 | 180 | ||||||||||
National Western Life Group, Inc. ‘A’ | 212 | 65 | ||||||||||
Nationstar Mortgage Holdings, Inc. (a) | 5,092 | 89 | ||||||||||
Navigators Group, Inc. | 1,864 | 106 | ||||||||||
NBT Bancorp, Inc. | 4,638 | 177 | ||||||||||
Nelnet, Inc. ‘A’ | 4,170 | 244 | ||||||||||
Northfield Bancorp, Inc. | 4,807 | 80 | ||||||||||
Northwest Bancshares, Inc. | 14,903 | 259 | ||||||||||
OceanFirst Financial Corp. | 971 | 29 | ||||||||||
Ocwen Financial Corp. (a) | 50,312 | 199 | ||||||||||
Old National Bancorp | 14,751 | 274 | ||||||||||
Oppenheimer Holdings, Inc. ‘A’ | 1,608 | 45 | ||||||||||
Opus Bank | 693 | 20 | ||||||||||
Oritani Financial Corp. | 7,013 | 114 | ||||||||||
Park National Corp. | 1,260 | 140 | ||||||||||
Peoples Bancorp, Inc. | 866 | 33 | ||||||||||
PHH Corp. (a) | 5,653 | 61 | ||||||||||
Piper Jaffray Cos. | 2,027 | 156 | ||||||||||
PRA Group, Inc. (a) | 5,803 | 224 | ||||||||||
ProAssurance Corp. | 7,559 | 268 | ||||||||||
Provident Financial Services, Inc. | 6,405 | 176 | ||||||||||
Regional Management Corp. (a) | 2,285 | 80 | ||||||||||
Renasant Corp. | 1,527 | 70 | ||||||||||
RLI Corp. | 3,071 | 203 | ||||||||||
S&T Bancorp, Inc. | 2,249 | 97 | ||||||||||
Safety Insurance Group, Inc. | 1,190 | 102 | ||||||||||
Sandy Spring Bancorp, Inc. | 1,845 | 76 | ||||||||||
Selective Insurance Group, Inc. | 2,790 | 153 | ||||||||||
Simmons First National Corp. ‘A’ | 2,126 | 64 | ||||||||||
South State Corp. | 948 | 82 | ||||||||||
Southside Bancshares, Inc. | 575 | 19 | ||||||||||
State Bank Financial Corp. | 1,280 | 43 | ||||||||||
Sterling Bancorp | 4,808 | 113 | ||||||||||
Stewart Information Services Corp. | 1,393 | 60 | ||||||||||
Stifel Financial Corp. | 2,982 | 156 | ||||||||||
Stock Yards Bancorp, Inc. | 353 | 13 | ||||||||||
TCF Financial Corp. | 15,625 | 385 | ||||||||||
Tompkins Financial Corp. | 813 | 70 | ||||||||||
Towne Bank | 3,032 | 97 | ||||||||||
TriCo Bancshares | 1,623 | 61 | ||||||||||
TrustCo Bank Corp. | 11,620 | 103 | ||||||||||
Trustmark Corp. | 6,859 | 224 | ||||||||||
UMB Financial Corp. | 1,644 | 125 | ||||||||||
Union Bankshares Corp. | 3,710 | 144 | ||||||||||
United Bankshares, Inc. | 2,828 | 103 | ||||||||||
United Community Banks, Inc. | 1,858 | 57 | ||||||||||
United Financial Bancorp, Inc. | 3,869 | 68 | ||||||||||
United Fire Group, Inc. | 1,634 | 89 | ||||||||||
Universal Insurance Holdings, Inc. | 2,513 | 88 | ||||||||||
Univest Corp. of Pennsylvania | 1,904 | 52 | ||||||||||
Valley National Bancorp | 17,842 | 217 | ||||||||||
Virtus Investment Partners, Inc. | 317 | 41 | ||||||||||
Waddell & Reed Financial, Inc. ‘A’ | 29,520 | 531 | ||||||||||
Walker & Dunlop, Inc. | 2,006 | 112 | ||||||||||
Washington Federal, Inc. | 11,724 | 383 | ||||||||||
Washington Trust Bancorp, Inc. | 731 | 43 | ||||||||||
Waterstone Financial, Inc. | 3,864 | 66 | ||||||||||
WesBanco, Inc. | 2,490 | 112 | ||||||||||
| SHARES | MARKET VALUE (000S) | |||||||||||
Westamerica Bancorporation | 2,371 | $ | 134 | |||||||||
World Acceptance Corp. (a) | 2,539 | 282 | ||||||||||
WSFS Financial Corp. | 1,243 | 66 | ||||||||||
|
| |||||||||||
| 19,845 | ||||||||||||
|
| |||||||||||
| HEALTH CARE 6.9% | ||||||||||||
Abaxis, Inc. | 1,238 | 103 | ||||||||||
Acadia Healthcare Co., Inc. (a) | 7,541 | 308 | ||||||||||
Acorda Therapeutics, Inc. (a) | 6,033 | 173 | ||||||||||
Akorn, Inc. (a) | 2,744 | 46 | ||||||||||
Allscripts Healthcare Solutions, Inc. (a) | 17,271 | 207 | ||||||||||
AMAG Pharmaceuticals, Inc. (a) | 9,851 | 192 | ||||||||||
Amedisys, Inc. (a) | 2,683 | 229 | ||||||||||
Amicus Therapeutics, Inc. (a) | 1,605 | 25 | ||||||||||
AMN Healthcare Services, Inc. (a) | 1,985 | 116 | ||||||||||
Amneal Pharmaceuticals, Inc. (a) | 10,160 | 167 | ||||||||||
Amphastar Pharmaceuticals, Inc. (a) | 1,035 | 16 | ||||||||||
AngioDynamics, Inc. (a) | 6,152 | 137 | ||||||||||
Anika Therapeutics, Inc. (a) | 430 | 14 | ||||||||||
Avanos Medical, Inc. | 6,087 | 348 | ||||||||||
BioScrip, Inc. (a) | 15,165 | 44 | ||||||||||
Cambrex Corp. (a) | 1,509 | 79 | ||||||||||
Cantel Medical Corp. | 461 | 45 | ||||||||||
Capital Senior Living Corp. (a) | 4,253 | 45 | ||||||||||
Chemed Corp. | 979 | 315 | ||||||||||
Civitas Solutions, Inc. (a) | 3,159 | 52 | ||||||||||
Computer Programs & Systems, Inc. | 1,992 | 66 | ||||||||||
CONMED Corp. | 3,102 | 227 | ||||||||||
Cotiviti Holdings, Inc. (a) | 577 | 25 | ||||||||||
Depomed, Inc. (a) | 13,392 | 89 | ||||||||||
Diplomat Pharmacy, Inc. (a) | 1,792 | 46 | ||||||||||
Emergent BioSolutions, Inc. (a) | 3,979 | 201 | ||||||||||
Enanta Pharmaceuticals, Inc. (a) | 703 | 81 | ||||||||||
Ensign Group, Inc. | 2,778 | 100 | ||||||||||
Five Prime Therapeutics, Inc. (a) | 885 | 14 | ||||||||||
Globus Medical, Inc. ‘A’ (a) | 2,373 | 120 | ||||||||||
Haemonetics Corp. (a) | 2,480 | 222 | ||||||||||
HMS Holdings Corp. (a) | 4,319 | 93 | ||||||||||
Horizon Pharma PLC (a) | 10,489 | 174 | ||||||||||
ICU Medical, Inc. (a) | 149 | 44 | ||||||||||
Insmed, Inc. (a) | 840 | 20 | ||||||||||
Integer Holdings Corp. (a) | 2,904 | 188 | ||||||||||
Integra LifeSciences Holdings Corp. (a) | 1,362 | 88 | ||||||||||
Invacare Corp. | 7,631 | 142 | ||||||||||
K2M Group Holdings, Inc. (a) | 1,035 | 23 | ||||||||||
Lannett Co., Inc. (a) | 5,112 | 70 | ||||||||||
Lantheus Holdings, Inc. (a) | 1,162 | 17 | ||||||||||
LHC Group, Inc. (a) | 2,420 | 207 | ||||||||||
Ligand Pharmaceuticals, Inc. (a) | 153 | 32 | ||||||||||
Luminex Corp. | 3,873 | 114 | ||||||||||
Magellan Health, Inc. (a) | 4,749 | 456 | ||||||||||
Medicines Co. (a) | 2,577 | 95 | ||||||||||
Medidata Solutions, Inc. (a) | 570 | 46 | ||||||||||
Medpace Holdings, Inc. (a) | 508 | 22 | ||||||||||
Meridian Bioscience, Inc. | 6,167 | 98 | ||||||||||
Merit Medical Systems, Inc. (a) | 3,180 | 163 | ||||||||||
Myriad Genetics, Inc. (a) | 19,980 | 747 | ||||||||||
National HealthCare Corp. | 956 | 67 | ||||||||||
Natus Medical, Inc. (a) | 2,256 | 78 | ||||||||||
Neogen Corp. (a) | 1,250 | 100 | ||||||||||
NuVasive, Inc. (a) | 2,695 | 140 | ||||||||||
NxStage Medical, Inc. (a) | 684 | 19 | ||||||||||
Omnicell, Inc. (a) | 1,662 | 87 | ||||||||||
| SHARES | MARKET VALUE (000S) | |||||||||||
OPKO Health, Inc. (a) | 17,128 | $ | 80 | |||||||||
Orthofix International NV (a) | 2,863 | 163 | ||||||||||
Owens & Minor, Inc. | 23,735 | 397 | ||||||||||
PDL BioPharma, Inc. (a) | 86,189 | 202 | ||||||||||
Penumbra, Inc. (a) | 162 | 22 | ||||||||||
Portola Pharmaceuticals, Inc. (a) | 405 | 15 | ||||||||||
Prestige Brands Holdings, Inc. (a) | 3,973 | 152 | ||||||||||
Providence Service Corp. (a) | 1,479 | 116 | ||||||||||
Quality Systems, Inc. (a) | 7,068 | 138 | ||||||||||
Quidel Corp. (a) | 1,598 | 106 | ||||||||||
Quorum Health Corp. (a) | 11,028 | 55 | ||||||||||
R1 RCM, Inc. (a) | 4,898 | 43 | ||||||||||
RadNet, Inc. (a) | 7,937 | 119 | ||||||||||
Select Medical Holdings Corp. (a) | 23,630 | 429 | ||||||||||
Spectrum Pharmaceuticals, Inc. (a) | 3,974 | 83 | ||||||||||
SurModics, Inc. (a) | 602 | 33 | ||||||||||
Syneos Health, Inc. (a) | 1,952 | 92 | ||||||||||
Tivity Health, Inc. (a) | 2,462 | 87 | ||||||||||
U.S. Physical Therapy, Inc. | 823 | 79 | ||||||||||
Varex Imaging Corp. (a) | 527 | 20 | ||||||||||
|
| |||||||||||
| 9,613 | ||||||||||||
|
| |||||||||||
| INDUSTRIALS 16.2% | ||||||||||||
AAR Corp. | 3,647 | 170 | ||||||||||
ABM Industries, Inc. | 4,466 | 130 | ||||||||||
ACCO Brands Corp. | 9,425 | 131 | ||||||||||
Actuant Corp. ‘A’ | 9,106 | 267 | ||||||||||
Advanced Disposal Services, Inc. (a) | 2,514 | 62 | ||||||||||
Advanced Drainage Systems, Inc. | 1,620 | 46 | ||||||||||
Aegion Corp. (a) | 3,409 | 88 | ||||||||||
Aerojet Rocketdyne Holdings, Inc. (a) | 645 | 19 | ||||||||||
Aerovironment, Inc. (a) | 1,002 | 72 | ||||||||||
Air Transport Services Group, Inc. (a) | 2,979 | 67 | ||||||||||
Aircastle Ltd. | 11,243 | 230 | ||||||||||
Alamo Group, Inc. | 153 | 14 | ||||||||||
Albany International Corp. ‘A’ | 2,036 | 122 | ||||||||||
Allegiant Travel Co. | 1,472 | 205 | ||||||||||
Altra Industrial Motion Corp. | 1,785 | 77 | ||||||||||
American Railcar Industries, Inc. | 1,133 | 45 | ||||||||||
American Woodmark Corp. (a) | 210 | 19 | ||||||||||
Apogee Enterprises, Inc. | 1,305 | 63 | ||||||||||
Applied Industrial Technologies, Inc. | 3,423 | 240 | ||||||||||
ArcBest Corp. | 3,197 | 146 | ||||||||||
Armstrong Flooring, Inc. (a) | 6,436 | 90 | ||||||||||
Armstrong World Industries, Inc. (a) | 5,773 | 365 | ||||||||||
ASGN, Inc. (a) | 1,703 | 133 | ||||||||||
Astec Industries, Inc. | 1,114 | 67 | ||||||||||
Astronics Corp. (a) | 521 | 19 | ||||||||||
Atkore International Group, Inc. (a) | 3,273 | 68 | ||||||||||
Atlas Air Worldwide Holdings, Inc. (a) | 3,897 | 279 | ||||||||||
AZZ, Inc. | 892 | 39 | ||||||||||
Babcock & Wilcox Enterprises, Inc. (a) | 49,306 | 117 | ||||||||||
Barnes Group, Inc. | 3,070 | 181 | ||||||||||
Beacon Roofing Supply, Inc. (a) | 2,289 | 98 | ||||||||||
BlueLinx Holdings, Inc. (a) | 444 | 17 | ||||||||||
BMC Stock Holdings, Inc. (a) | 1,572 | 33 | ||||||||||
Brady Corp. ‘A’ | 5,255 | 203 | ||||||||||
Briggs & Stratton Corp. | 6,727 | 118 | ||||||||||
Brink’s Co. | 882 | 70 | ||||||||||
Builders FirstSource, Inc. (a) | 5,159 | 94 | ||||||||||
CAI International, Inc. (a) | 3,928 | 91 | ||||||||||
Casella Waste Systems, Inc. ‘A’ (a) | 3,427 | 88 | ||||||||||
CBIZ, Inc. (a) | 5,549 | 128 | ||||||||||
| See Accompanying Notes | ANNUAL REPORT | JUNE 30, 2018 | 59 |
Table of Contents
Schedule of Investments PIMCO RAE US Small Fund (Cont.)
| SHARES | MARKET VALUE (000S) | |||||||||||
Chart Industries, Inc. (a) | 1,779 | $ | 110 | |||||||||
Civeo Corp. (a) | 36,383 | 159 | ||||||||||
Clean Harbors, Inc. (a) | 4,260 | 237 | ||||||||||
Columbus McKinnon Corp. | 602 | 26 | ||||||||||
Comfort Systems USA, Inc. | 2,320 | 106 | ||||||||||
Continental Building Products, Inc. (a) | 906 | 29 | ||||||||||
Covanta Holding Corp. | 14,828 | 245 | ||||||||||
Covenant Transportation Group, Inc. ‘A’ (a) | 653 | 21 | ||||||||||
CRA International, Inc. | 1,005 | 51 | ||||||||||
Cubic Corp. | 1,753 | 113 | ||||||||||
Deluxe Corp. | 4,444 | 294 | ||||||||||
Douglas Dynamics, Inc. | 1,153 | 55 | ||||||||||
Dycom Industries, Inc. (a) | 1,135 | 107 | ||||||||||
Echo Global Logistics, Inc. (a) | 663 | 19 | ||||||||||
Encore Wire Corp. | 1,218 | 58 | ||||||||||
EnerSys | 3,032 | 226 | ||||||||||
Ennis, Inc. | 3,843 | 78 | ||||||||||
EnPro Industries, Inc. | 1,738 | 122 | ||||||||||
ESCO Technologies, Inc. | 1,393 | 80 | ||||||||||
Essendant, Inc. | 17,754 | 235 | ||||||||||
Esterline Technologies Corp. (a) | 3,316 | 245 | ||||||||||
Exponent, Inc. | 2,546 | 123 | ||||||||||
Federal Signal Corp. | 4,675 | 109 | ||||||||||
Forward Air Corp. | 510 | 30 | ||||||||||
Franklin Electric Co., Inc. | 2,051 | 93 | ||||||||||
FTI Consulting, Inc. (a) | 5,497 | 332 | ||||||||||
GATX Corp. | 7,301 | 542 | ||||||||||
Generac Holdings, Inc. (a) | 7,075 | 366 | ||||||||||
Gibraltar Industries, Inc. (a) | 918 | 34 | ||||||||||
Global Brass & Copper Holdings, Inc. | 2,055 | 64 | ||||||||||
GMS, Inc. (a) | 1,993 | 54 | ||||||||||
Granite Construction, Inc. | 1,757 | 98 | ||||||||||
Greenbrier Cos., Inc. | 3,213 | 170 | ||||||||||
Griffon Corp. | 6,134 | 109 | ||||||||||
H&E Equipment Services, Inc. | 6,326 | 238 | ||||||||||
Harsco Corp. (a) | 8,899 | 197 | ||||||||||
Hawaiian Holdings, Inc. | 4,962 | 178 | ||||||||||
HC2 Holdings, Inc. (a) | 4,243 | 25 | ||||||||||
Healthcare Services Group, Inc. | 1,018 | 44 | ||||||||||
Heartland Express, Inc. | 2,687 | 50 | ||||||||||
Heidrick & Struggles International, Inc. | 3,999 | 140 | ||||||||||
Herc Holdings, Inc. (a) | 2,716 | 153 | ||||||||||
Herman Miller, Inc. | 5,441 | 184 | ||||||||||
Hillenbrand, Inc. | 3,689 | 174 | ||||||||||
HNI Corp. | 4,486 | 167 | ||||||||||
Hub Group, Inc. ‘A’ (a) | 1,128 | 56 | ||||||||||
Huron Consulting Group, Inc. (a) | 1,909 | 78 | ||||||||||
Hyster-Yale Materials Handling, Inc. | 833 | 54 | ||||||||||
ICF International, Inc. | 2,890 | 205 | ||||||||||
InnerWorkings, Inc. (a) | 6,661 | 58 | ||||||||||
Insperity, Inc. | 2,386 | 227 | ||||||||||
Interface, Inc. | 4,541 | 104 | ||||||||||
ITT, Inc. | 794 | 42 | ||||||||||
John Bean Technologies Corp. | 559 | 50 | ||||||||||
Kadant, Inc. | 899 | 86 | ||||||||||
Kaman Corp. | 2,401 | 167 | ||||||||||
KBR, Inc. | 8,580 | 154 | ||||||||||
Kelly Services, Inc. ‘A’ | 7,047 | 158 | ||||||||||
Kennametal, Inc. | 5,668 | 203 | ||||||||||
Kforce, Inc. | 6,330 | 217 | ||||||||||
Kimball International, Inc. ‘B’ | 1,391 | 22 | ||||||||||
Kirby Corp. (a) | 1,081 | 90 | ||||||||||
| SHARES | MARKET VALUE (000S) | |||||||||||
KLX, Inc. (a) | 2,262 | $ | 163 | |||||||||
Knight-Swift Transportation Holdings, Inc. | 3,976 | 152 | ||||||||||
Knoll, Inc. | 3,379 | 70 | ||||||||||
Korn/Ferry International | 3,210 | 199 | ||||||||||
Kratos Defense & Security Solutions, Inc. (a) | 2,753 | 32 | ||||||||||
Landstar System, Inc. | 716 | 78 | ||||||||||
Lindsay Corp. | 907 | 88 | ||||||||||
LSC Communications, Inc. | 15,100 | 236 | ||||||||||
Marten Transport Ltd. | 2,680 | 63 | ||||||||||
Masonite International Corp. (a) | 1,551 | 111 | ||||||||||
MasTec, Inc. (a) | 398 | 20 | ||||||||||
Matson, Inc. | 2,632 | 101 | ||||||||||
Matthews International Corp. ‘A’ | 1,559 | 92 | ||||||||||
McGrath RentCorp | 3,355 | 212 | ||||||||||
Mercury Systems, Inc. (a) | 1,168 | 44 | ||||||||||
Meritor, Inc. (a) | 5,423 | 112 | ||||||||||
Milacron Holdings Corp. (a) | 3,630 | 69 | ||||||||||
Mobile Mini, Inc. | 3,072 | 144 | ||||||||||
Moog, Inc. ‘A’ | 4,667 | 364 | ||||||||||
MRC Global, Inc. (a) | 9,277 | 201 | ||||||||||
MSA Safety, Inc. | 2,099 | 202 | ||||||||||
Mueller Industries, Inc. | 6,333 | 187 | ||||||||||
Mueller Water Products, Inc. ‘A’ | 5,597 | 66 | ||||||||||
MYR Group, Inc. (a) | 1,498 | 53 | ||||||||||
National Presto Industries, Inc. | 651 | 81 | ||||||||||
Navigant Consulting, Inc. (a) | 4,034 | 89 | ||||||||||
Navistar International Corp. (a) | 1,419 | 58 | ||||||||||
NCI Building Systems, Inc. (a) | 1,126 | 24 | ||||||||||
NOW, Inc. (a) | 2,358 | 31 | ||||||||||
Park-Ohio Holdings Corp. | 327 | 12 | ||||||||||
Primoris Services Corp. | 1,581 | 43 | ||||||||||
Proto Labs, Inc. (a) | 368 | 44 | ||||||||||
Quad/Graphics, Inc. | 7,127 | 148 | ||||||||||
Quanex Building Products Corp. | 2,216 | 40 | ||||||||||
Raven Industries, Inc. | 1,193 | 46 | ||||||||||
RBC Bearings, Inc. (a) | 96 | 12 | ||||||||||
Regal Beloit Corp. | 1,397 | 114 | ||||||||||
Resources Connection, Inc. | 7,159 | 121 | ||||||||||
Rexnord Corp. (a) | 9,018 | 262 | ||||||||||
Roadrunner Transportation Systems, Inc. (a) | 7,087 | 15 | ||||||||||
RR Donnelley & Sons Co. | 43,205 | 249 | ||||||||||
Rush Enterprises, Inc. ‘A’ (a) | 5,203 | 226 | ||||||||||
Saia, Inc. (a) | 2,121 | 171 | ||||||||||
Scorpio Bulkers, Inc. | 7,864 | 56 | ||||||||||
Simpson Manufacturing Co., Inc. | 3,002 | 187 | ||||||||||
SiteOne Landscape Supply, Inc. (a) | 2,006 | 168 | ||||||||||
SkyWest, Inc. | 10,185 | 529 | ||||||||||
Spirit Airlines, Inc. (a) | 3,953 | 144 | ||||||||||
SPX Corp. (a) | 1,426 | 50 | ||||||||||
SPX FLOW, Inc. (a) | 7,135 | 312 | ||||||||||
Standex International Corp. | 612 | 63 | ||||||||||
Steelcase, Inc. ‘A’ | 12,990 | 175 | ||||||||||
Sun Hydraulics Corp. | 798 | 38 | ||||||||||
Sunrun, Inc. (a) | 1,443 | 19 | ||||||||||
Systemax, Inc. | 1,350 | 46 | ||||||||||
Tennant Co. | 1,352 | 107 | ||||||||||
Terex Corp. | 3,447 | 145 | ||||||||||
Tetra Tech, Inc. | 3,364 | 197 | ||||||||||
Textainer Group Holdings Ltd. (a) | 8,318 | 132 | ||||||||||
Thermon Group Holdings, Inc. (a) | 1,343 | 31 | ||||||||||
Titan Machinery, Inc. (a) | 5,616 | 87 | ||||||||||
Trex Co., Inc. (a) | 1,594 | 100 | ||||||||||
| SHARES | MARKET VALUE (000S) | |||||||||||
TriMas Corp. (a) | 3,080 | $ | 91 | |||||||||
TriNet Group, Inc. (a) | 1,595 | 89 | ||||||||||
Triumph Group, Inc. | 5,960 | 117 | ||||||||||
TrueBlue, Inc. (a) | 4,412 | 119 | ||||||||||
Tutor Perini Corp. (a) | 3,398 | 63 | ||||||||||
UniFirst Corp. | 940 | 166 | ||||||||||
Universal Forest Products, Inc. | 3,150 | 115 | ||||||||||
Valmont Industries, Inc. | 1,962 | 296 | ||||||||||
Vectrus, Inc. (a) | 748 | 23 | ||||||||||
Veritiv Corp. (a) | 5,367 | 214 | ||||||||||
Viad Corp. | 1,271 | 69 | ||||||||||
Wabash National Corp. | 4,624 | 86 | ||||||||||
Watts Water Technologies, Inc. ‘A’ | 2,137 | 168 | ||||||||||
Welbilt, Inc. (a) | 10,422 | 233 | ||||||||||
Werner Enterprises, Inc. | 4,253 | 160 | ||||||||||
Wesco Aircraft Holdings, Inc. (a) | 5,668 | 64 | ||||||||||
WESCO International, Inc. (a) | 3,457 | 197 | ||||||||||
YRC Worldwide, Inc. (a) | 8,981 | 90 | ||||||||||
|
| |||||||||||
| 22,563 | ||||||||||||
|
| |||||||||||
| INFORMATION TECHNOLOGY 11.4% | ||||||||||||
2U, Inc. (a) | 230 | 19 | ||||||||||
ACI Worldwide, Inc. (a) | 5,978 | 148 | ||||||||||
Acxiom Corp. (a) | 3,888 | 116 | ||||||||||
ADTRAN, Inc. | 8,121 | 121 | ||||||||||
Advanced Energy Industries, Inc. (a) | 1,167 | 68 | ||||||||||
Ambarella, Inc. (a) | 1,026 | 40 | ||||||||||
Amkor Technology, Inc. (a) | 15,060 | 129 | ||||||||||
Anixter International, Inc. (a) | 4,104 | 260 | ||||||||||
Avid Technology, Inc. (a) | 15,430 | 80 | ||||||||||
AVX Corp. | 4,322 | 68 | ||||||||||
Axcelis Technologies, Inc. (a) | 800 | 16 | ||||||||||
Badger Meter, Inc. | 820 | 37 | ||||||||||
Belden, Inc. | 2,506 | 153 | ||||||||||
Benchmark Electronics, Inc. | 5,990 | 175 | ||||||||||
Blucora, Inc. (a) | 4,064 | 150 | ||||||||||
Bottomline Technologies de, Inc. (a) | 2,019 | 101 | ||||||||||
Brooks Automation, Inc. | 4,262 | 139 | ||||||||||
Cabot Microelectronics Corp. | 1,900 | 204 | ||||||||||
CACI International, Inc. ‘A’ (a) | 3,728 | 628 | ||||||||||
Cars.com, Inc. (a) | 4,792 | 136 | ||||||||||
Ciena Corp. (a) | 6,278 | 166 | ||||||||||
Cirrus Logic, Inc. (a) | 1,823 | 70 | ||||||||||
Cohu, Inc. | 898 | 22 | ||||||||||
CommVault Systems, Inc. (a) | 2,373 | 156 | ||||||||||
Comtech Telecommunications Corp. | 10,949 | 349 | ||||||||||
Convergys Corp. | 22,306 | 545 | ||||||||||
CoreLogic, Inc. (a) | 2,331 | 121 | ||||||||||
Cray, Inc. (a) | 4,167 | 103 | ||||||||||
Cree, Inc. (a) | 11,903 | 495 | ||||||||||
CSG Systems International, Inc. | 3,473 | 142 | ||||||||||
CTS Corp. | 2,412 | 87 | ||||||||||
Diebold Nixdorf, Inc. | 8,578 | 103 | ||||||||||
Diodes, Inc. (a) | 3,687 | 127 | ||||||||||
Eastman Kodak Co. (a) | 13,691 | 52 | ||||||||||
Ebix, Inc. | 1,016 | 77 | ||||||||||
Electro Scientific Industries, Inc. (a) | 3,238 | 51 | ||||||||||
Electronics For Imaging, Inc. (a) | 3,617 | 118 | ||||||||||
Envestnet, Inc. (a) | 729 | 40 | ||||||||||
ePlus, Inc. (a) | 1,710 | 161 | ||||||||||
Etsy, Inc. (a) | 2,123 | 90 | ||||||||||
Everi Holdings, Inc. (a) | 7,086 | 51 | ||||||||||
ExlService Holdings, Inc. (a) | 1,499 | 85 | ||||||||||
Extreme Networks, Inc. (a) | 5,727 | 46 | ||||||||||
| 60 | PIMCO EQUITY SERIES | See Accompanying Notes |
Table of Contents
June 30, 2018
| SHARES | MARKET VALUE (000S) | |||||||||||
FARO Technologies, Inc. (a) | 1,680 | $ | 91 | |||||||||
Finisar Corp. (a) | 3,877 | 70 | ||||||||||
FireEye, Inc. (a) | 3,955 | 61 | ||||||||||
Fitbit, Inc. ‘A’ (a) | 22,596 | 148 | ||||||||||
Glu Mobile, Inc. (a) | 6,132 | 39 | ||||||||||
GTT Communications, Inc. (a) | 402 | 18 | ||||||||||
Harmonic, Inc. (a) | 20,177 | 86 | ||||||||||
II-VI, Inc. (a) | 2,622 | 114 | ||||||||||
Infinera Corp. (a) | 5,019 | 50 | ||||||||||
Insight Enterprises, Inc. (a) | 8,169 | 400 | ||||||||||
Integrated Device Technology, Inc. (a) | 5,081 | 162 | ||||||||||
InterDigital, Inc. | 2,613 | 211 | ||||||||||
Internap Corp. (a) | 4,222 | 44 | ||||||||||
Itron, Inc. (a) | 2,368 | 142 | ||||||||||
j2 Global, Inc. | 1,368 | 119 | ||||||||||
KEMET Corp. (a) | 3,534 | 85 | ||||||||||
Knowles Corp. (a) | 9,273 | 142 | ||||||||||
LivePerson, Inc. (a) | 2,001 | 42 | ||||||||||
Lumentum Holdings, Inc. (a) | 761 | 44 | ||||||||||
Manhattan Associates, Inc. (a) | 3,259 | 153 | ||||||||||
ManTech International Corp. ‘A’ | 3,226 | 173 | ||||||||||
Methode Electronics, Inc. | 1,791 | 72 | ||||||||||
MicroStrategy, Inc. ‘A’ (a) | 776 | 99 | ||||||||||
MoneyGram International, Inc. (a) | 7,888 | 53 | ||||||||||
Monotype Imaging Holdings, Inc. | 2,806 | 57 | ||||||||||
MTS Systems Corp. | 2,065 | 109 | ||||||||||
NETGEAR, Inc. (a) | 2,824 | 177 | ||||||||||
NetScout Systems, Inc. (a) | 7,383 | 219 | ||||||||||
NIC, Inc. | 3,096 | 48 | ||||||||||
Novanta, Inc. (a) | 1,337 | 83 | ||||||||||
OSI Systems, Inc. (a) | 1,454 | 112 | ||||||||||
Pandora Media, Inc. (a) | 4,444 | 35 | ||||||||||
Park Electrochemical Corp. | 3,194 | 74 | ||||||||||
Pegasystems, Inc. | 507 | 28 | ||||||||||
Perficient, Inc. (a) | 2,714 | 72 | ||||||||||
Photronics, Inc. (a) | 11,828 | 94 | ||||||||||
Plantronics, Inc. | 4,925 | 376 | ||||||||||
Plexus Corp. (a) | 3,096 | 184 | ||||||||||
Power Integrations, Inc. | 1,192 | 87 | ||||||||||
Presidio, Inc. (a) | 1,232 | 16 | ||||||||||
Progress Software Corp. | 6,959 | 270 | ||||||||||
Qualys, Inc. (a) | 487 | 41 | ||||||||||
Quantum Corp. (a) | 4,729 | 10 | ||||||||||
Rambus, Inc. (a) | 4,930 | 62 | ||||||||||
RealPage, Inc. (a) | 791 | 44 | ||||||||||
Ribbon Communications, Inc. (a) | 7,182 | 51 | ||||||||||
Rogers Corp. (a) | 1,160 | 129 | ||||||||||
Rudolph Technologies, Inc. (a) | 1,317 | 39 | ||||||||||
Sanmina Corp. (a) | 8,777 | 257 | ||||||||||
ScanSource, Inc. (a) | 3,548 | 143 | ||||||||||
Science Applications International Corp. | 2,122 | 172 | ||||||||||
Semtech Corp. (a) | 2,971 | 140 | ||||||||||
Silicon Laboratories, Inc. (a) | 1,575 | 157 | ||||||||||
Stamps.com, Inc. (a) | 92 | 23 | ||||||||||
Stratasys Ltd. (a) | 3,244 | 62 | ||||||||||
Super Micro Computer, Inc. (a) | 3,098 | 73 | ||||||||||
Sykes Enterprises, Inc. (a) | 4,784 | 138 | ||||||||||
Synaptics, Inc. (a) | 2,848 | 143 | ||||||||||
Syntel, Inc. (a) | 7,636 | 245 | ||||||||||
Tech Data Corp. (a) | 2,067 | 170 | ||||||||||
TiVo Corp. | 21,598 | 291 | ||||||||||
TTEC Holdings, Inc. | 1,727 | 60 | ||||||||||
TTM Technologies, Inc. (a) | 8,576 | 151 | ||||||||||
| SHARES | MARKET VALUE (000S) | |||||||||||
Ultra Clean Holdings, Inc. (a) | 1,771 | $ | 29 | |||||||||
Unisys Corp. (a) | 24,199 | 312 | ||||||||||
Veeco Instruments, Inc. (a) | 2,451 | 35 | ||||||||||
VeriFone Systems, Inc. (a) | 15,518 | 354 | ||||||||||
Verint Systems, Inc. (a) | 6,348 | 282 | ||||||||||
Versum Materials, Inc. | 576 | 21 | ||||||||||
ViaSat, Inc. (a) | 463 | 30 | ||||||||||
Viavi Solutions, Inc. (a) | 11,453 | 117 | ||||||||||
Virtusa Corp. (a) | 1,952 | 95 | ||||||||||
Vishay Intertechnology, Inc. | 21,944 | 509 | ||||||||||
Web.com Group, Inc. (a) | 4,950 | 128 | ||||||||||
Xcerra Corp. (a) | 5,086 | 71 | ||||||||||
XO Group, Inc. (a) | 2,790 | 89 | ||||||||||
Xperi Corp. | 5,913 | 95 | ||||||||||
Yelp, Inc. (a) | 1,462 | 57 | ||||||||||
Zendesk, Inc. (a) | 410 | 22 | ||||||||||
Zynga, Inc. ‘A’ (a) | 68,255 | 278 | ||||||||||
|
| |||||||||||
| 15,829 | ||||||||||||
|
| |||||||||||
| MATERIALS 4.6% | ||||||||||||
A Schulman, Inc. | 1,831 | 82 | ||||||||||
AdvanSix, Inc. (a) | 5,578 | 204 | ||||||||||
AK Steel Holding Corp. (a) | 4,970 | 22 | ||||||||||
Allegheny Technologies, Inc. (a) | 4,220 | 106 | ||||||||||
Balchem Corp. | 448 | 44 | ||||||||||
Boise Cascade Co. | 3,393 | 152 | ||||||||||
Cabot Corp. | 1,035 | 64 | ||||||||||
Carpenter Technology Corp. | 3,035 | 160 | ||||||||||
Century Aluminum Co. (a) | 2,562 | 40 | ||||||||||
Clearwater Paper Corp. (a) | 3,674 | 85 | ||||||||||
Cleveland-Cliffs, Inc. (a) | 20,670 | 174 | ||||||||||
Commercial Metals Co. | 13,692 | 289 | ||||||||||
Compass Minerals International, Inc. | 1,930 | 127 | ||||||||||
Ferro Corp. (a) | 2,623 | 55 | ||||||||||
FutureFuel Corp. | 2,947 | 41 | ||||||||||
GCP Applied Technologies, Inc. (a) | 6,096 | 176 | ||||||||||
Gold Resource Corp. | 2,932 | 19 | ||||||||||
Greif, Inc. ‘A’ | 4,095 | 217 | ||||||||||
HB Fuller Co. | 3,074 | 165 | ||||||||||
Hecla Mining Co. | 5,141 | 18 | ||||||||||
Ingevity Corp. (a) | 2,054 | 166 | ||||||||||
Innophos Holdings, Inc. | 3,199 | 152 | ||||||||||
Innospec, Inc. | 1,537 | 118 | ||||||||||
Intrepid Potash, Inc. (a) | 7,561 | 31 | ||||||||||
Kaiser Aluminum Corp. | 1,307 | 136 | ||||||||||
KapStone Paper and Packaging Corp. | 5,695 | 196 | ||||||||||
Koppers Holdings, Inc. (a) | 1,011 | 39 | ||||||||||
Kraton Corp. (a) | 897 | 41 | ||||||||||
Kronos Worldwide, Inc. | 1,598 | 36 | ||||||||||
Louisiana-Pacific Corp. | 1,889 | 51 | ||||||||||
Materion Corp. | 1,931 | 105 | ||||||||||
Minerals Technologies, Inc. | 1,451 | 109 | ||||||||||
Myers Industries, Inc. | 4,065 | 78 | ||||||||||
Neenah Paper, Inc. | 981 | 83 | ||||||||||
Olympic Steel, Inc. | 1,132 | 23 | ||||||||||
OMNOVA Solutions, Inc. (a) | 5,868 | 61 | ||||||||||
Owens-Illinois, Inc. (a) | 10,045 | 169 | ||||||||||
PH Glatfelter Co. | 5,577 | 109 | ||||||||||
Platform Specialty Products Corp. (a) | 11,435 | 133 | ||||||||||
PolyOne Corp. | 7,219 | 312 | ||||||||||
Quaker Chemical Corp. | 576 | 89 | ||||||||||
Rayonier Advanced Materials, Inc. | 5,860 | 100 | ||||||||||
| SHARES | MARKET VALUE (000S) | |||||||||||
Ryerson Holding Corp. (a) | 7,486 | $ | 83 | |||||||||
Schnitzer Steel Industries, Inc. ‘A’ | 1,874 | 63 | ||||||||||
Schweitzer-Mauduit International, Inc. | 2,441 | 107 | ||||||||||
Sensient Technologies Corp. | 2,442 | 175 | ||||||||||
Silgan Holdings, Inc. | 10,450 | 280 | ||||||||||
Stepan Co. | 1,427 | 111 | ||||||||||
Summit Materials, Inc. ‘A’ (a) | 4,193 | 110 | ||||||||||
SunCoke Energy, Inc. (a) | 5,335 | 72 | ||||||||||
Tahoe Resources, Inc. | 17,061 | 84 | ||||||||||
TimkenSteel Corp. (a) | 1,763 | 29 | ||||||||||
Tredegar Corp. | 1,004 | 24 | ||||||||||
Trinseo S.A. | 1,776 | 126 | ||||||||||
Tronox Ltd. ‘A’ | 10,024 | 197 | ||||||||||
Verso Corp. (a) | 10,464 | 228 | ||||||||||
Worthington Industries, Inc. | 2,424 | 102 | ||||||||||
|
| |||||||||||
| 6,368 | ||||||||||||
|
| |||||||||||
| REAL ESTATE 0.4% | ||||||||||||
Alexander & Baldwin, Inc. | 2,618 | 62 | ||||||||||
HFF, Inc. ‘A’ | 1,758 | 60 | ||||||||||
Kennedy-Wilson Holdings, Inc. | 4,802 | 102 | ||||||||||
Rafael Holdings, Inc. (a) | 1,015 | 9 | ||||||||||
RE/MAX Holdings, Inc. ‘A’ | 496 | 26 | ||||||||||
Realogy Holdings Corp. | 6,301 | 144 | ||||||||||
St. Joe Co. (a) | 4,189 | 75 | ||||||||||
|
| |||||||||||
| 478 | ||||||||||||
|
| |||||||||||
| TELECOMMUNICATION SERVICES 1.0% | ||||||||||||
ATN International, Inc. | 1,386 | 73 | ||||||||||
Cincinnati Bell, Inc. (a) | 15,856 | 249 | ||||||||||
Cogent Communications Holdings, Inc. | 2,436 | 130 | ||||||||||
Consolidated Communications Holdings, Inc. | 12,247 | 151 | ||||||||||
IDT Corp. ‘B’ | 2,030 | 11 | ||||||||||
Iridium Communications, Inc. (a) | 17,825 | 287 | ||||||||||
NII Holdings, Inc. (a) | 11,662 | 46 | ||||||||||
Shenandoah Telecommunications Co. | 2,192 | 72 | ||||||||||
Spok Holdings, Inc. | 4,442 | 67 | ||||||||||
Vonage Holdings Corp. (a) | 20,294 | 262 | ||||||||||
|
| |||||||||||
| 1,348 | ||||||||||||
|
| |||||||||||
| UTILITIES 3.2% | ||||||||||||
ALLETE, Inc. | 1,460 | 113 | ||||||||||
American States Water Co. | 3,273 | 187 | ||||||||||
Atlantic Power Corp. (a) | 8,032 | 18 | ||||||||||
Avista Corp. | 10,335 | 544 | ||||||||||
Black Hills Corp. | 2,503 | 153 | ||||||||||
California Water Service Group | 4,272 | 166 | ||||||||||
Chesapeake Utilities Corp. | 889 | 71 | ||||||||||
El Paso Electric Co. | 6,032 | 357 | ||||||||||
MGE Energy, Inc. | 2,712 | 171 | ||||||||||
New Jersey Resources Corp. | 2,294 | 103 | ||||||||||
Northwest Natural Gas Co. | 3,824 | 244 | ||||||||||
NorthWestern Corp. | 6,475 | 371 | ||||||||||
NRG Yield, Inc. ‘C’ | 5,507 | 95 | ||||||||||
ONE Gas, Inc. | 1,619 | 121 | ||||||||||
Ormat Technologies, Inc. | 1,148 | 61 | ||||||||||
Otter Tail Corp. | 4,583 | 218 | ||||||||||
Pattern Energy Group, Inc. | 4,316 | 81 | ||||||||||
PNM Resources, Inc. | 12,989 | 505 | ||||||||||
SJW Group | 1,722 | 114 | ||||||||||
South Jersey Industries, Inc. | 4,462 | 149 | ||||||||||
| See Accompanying Notes | ANNUAL REPORT | JUNE 30, 2018 | 61 |
Table of Contents
Schedule of Investments PIMCO RAE US Small Fund (Cont.)
| SHARES | MARKET VALUE (000S) | |||||||||||
Southwest Gas Holdings, Inc. | 2,613 | $ | 199 | |||||||||
Spire, Inc. | 3,145 | 222 | ||||||||||
TerraForm Power, Inc. | 6,361 | 75 | ||||||||||
Unitil Corp. | 2,208 | 113 | ||||||||||
|
| |||||||||||
| 4,451 | ||||||||||||
|
| |||||||||||
Total Common Stocks (Cost $92,918) |
| 120,050 | ||||||||||
|
| |||||||||||
| REAL ESTATE INVESTMENT TRUSTS 13.1% |
| |||||||||||
| UNITED STATES 13.1% |
| |||||||||||
| FINANCIALS 3.1% |
| |||||||||||
AG Mortgage Investment Trust, Inc. | 6,509 | 122 | ||||||||||
Anworth Mortgage Asset Corp. | 26,602 | 132 | ||||||||||
Apollo Commercial Real Estate Finance, Inc. | 7,145 | 131 | ||||||||||
Arbor Realty Trust, Inc. | 4,145 | 43 | ||||||||||
Ares Commercial Real Estate Corp. | 5,017 | 69 | ||||||||||
ARMOUR Residential REIT, Inc. | 3,720 | 85 | ||||||||||
Blackstone Mortgage Trust, Inc. ‘A’ | 5,099 | 160 | ||||||||||
Capstead Mortgage Corp. | 31,788 | 285 | ||||||||||
Chimera Investment Corp. | 15,725 | 287 | ||||||||||
CYS Investments, Inc. | 31,697 | 238 | ||||||||||
Dynex Capital, Inc. | 21,615 | 141 | ||||||||||
Exantas Capital Corp. | 11,716 | 119 | ||||||||||
Invesco Mortgage Capital, Inc. | 24,628 | 392 | ||||||||||
Ladder Capital Corp. | 9,170 | 143 | ||||||||||
MFA Financial, Inc. | 70,029 | 531 | ||||||||||
MTGE Investment Corp. | 7,058 | 138 | ||||||||||
New York Mortgage Trust, Inc. | 26,710 | 161 | ||||||||||
PennyMac Mortgage Investment Trust | 19,774 | 376 | ||||||||||
Redwood Trust, Inc. | 17,034 | 281 | ||||||||||
TPG RE Finance Trust, Inc. | 987 | 20 | ||||||||||
Two Harbors Investment Corp. | 18,433 | 291 | ||||||||||
Western Asset Mortgage Capital Corp. | 12,878 | 134 | ||||||||||
|
| |||||||||||
| 4,279 | ||||||||||||
|
| |||||||||||
| REAL ESTATE 10.0% |
| |||||||||||
Acadia Realty Trust | 4,084 | 112 | ||||||||||
Alexander’s, Inc. | 103 | 39 | ||||||||||
American Assets Trust, Inc. | 2,232 | 85 | ||||||||||
Ashford Hospitality Trust, Inc. | 24,896 | 202 | ||||||||||
Braemar Hotels & Resorts, Inc. | 5,751 | 66 | ||||||||||
Brandywine Realty Trust | 20,630 | 348 | ||||||||||
CareTrust REIT, Inc. | 2,379 | 40 | ||||||||||
CBL & Associates Properties, Inc. | 95,899 | 534 | ||||||||||
| SHARES | MARKET VALUE (000S) | |||||||||||
Cedar Realty Trust, Inc. | 18,198 | $ | 86 | |||||||||
Chatham Lodging Trust | 4,251 | 90 | ||||||||||
Chesapeake Lodging Trust | 5,205 | 165 | ||||||||||
Columbia Property Trust, Inc. | 27,945 | 635 | ||||||||||
CorEnergy Infrastructure Trust, Inc. | 871 | 33 | ||||||||||
CorePoint Lodging, Inc. (a) | 5,901 | 153 | ||||||||||
Corporate Office Properties Trust | 8,040 | 233 | ||||||||||
DiamondRock Hospitality Co. | 20,439 | 251 | ||||||||||
EastGroup Properties, Inc. | 1,395 | 133 | ||||||||||
Education Realty Trust, Inc. | 2,667 | 111 | ||||||||||
Empire State Realty Trust, Inc. ‘A’ | 3,981 | 68 | ||||||||||
Equity Commonwealth (a) | 5,468 | 172 | ||||||||||
First Industrial Realty Trust, Inc. | 3,033 | 101 | ||||||||||
Franklin Street Properties Corp. | 18,723 | 160 | ||||||||||
GEO Group, Inc. | 9,123 | 251 | ||||||||||
Getty Realty Corp. | 1,851 | 52 | ||||||||||
Gladstone Commercial Corp. | 1,856 | 36 | ||||||||||
Global Net Lease, Inc. | 6,483 | 132 | ||||||||||
Government Properties Income Trust | 8,516 | 135 | ||||||||||
Gramercy Property Trust | 4,422 | 121 | ||||||||||
Healthcare Realty Trust, Inc. | 1,640 | 48 | ||||||||||
Hersha Hospitality Trust | 7,120 | 153 | ||||||||||
Independence Realty Trust, Inc. | 2,128 | 22 | ||||||||||
InfraREIT, Inc. (a) | 4,057 | 90 | ||||||||||
Investors Real Estate Trust | 26,249 | 145 | ||||||||||
iStar Inc. (a) | 7,238 | 78 | ||||||||||
Kite Realty Group Trust | 13,823 | 236 | ||||||||||
LaSalle Hotel Properties | 10,909 | 373 | ||||||||||
Lexington Realty Trust | 27,475 | 240 | ||||||||||
Life Storage, Inc. | 1,464 | 142 | ||||||||||
LTC Properties, Inc. | 1,318 | 56 | ||||||||||
Mack-Cali Realty Corp. | 10,635 | 216 | ||||||||||
National Health Investors, Inc. | 1,389 | 102 | ||||||||||
National Storage Affiliates Trust | 795 | 25 | ||||||||||
New Senior Investment Group, Inc. | 21,318 | 161 | ||||||||||
New York REIT, Inc. | 1,870 | 34 | ||||||||||
NorthStar Realty Europe Corp. | 5,393 | 78 | ||||||||||
Outfront Media, Inc. | 20,100 | 391 | ||||||||||
Paramount Group, Inc. | 10,243 | 158 | ||||||||||
Pebblebrook Hotel Trust | 4,425 | 172 | ||||||||||
Pennsylvania Real Estate Investment Trust | 11,594 | 127 | ||||||||||
Physicians Realty Trust | 2,444 | 39 | ||||||||||
Piedmont Office Realty Trust, Inc. ‘A’ | 23,490 | 468 | ||||||||||
Potlatch Corp. | 1,976 | 101 | ||||||||||
Preferred Apartment Communities, Inc. ‘A’ | 3,268 | 56 | ||||||||||
PS Business Parks, Inc. | 1,083 | 139 | ||||||||||
QTS Realty Trust, Inc. ‘A’ | 1,635 | 65 | ||||||||||
| SHARES | MARKET VALUE (000S) | |||||||||||
Quality Care Properties, Inc. (a) | 14,737 | $ | 317 | |||||||||
Ramco-Gershenson Properties Trust | 11,195 | 148 | ||||||||||
Retail Opportunity Investments Corp. | 5,623 | 108 | ||||||||||
Retail Properties of America, Inc. ‘A’ | 35,425 | 453 | ||||||||||
Rexford Industrial Realty, Inc. | 1,373 | 43 | ||||||||||
RLJ Lodging Trust | 20,748 | 458 | ||||||||||
Ryman Hospitality Properties, Inc. | 3,645 | 303 | ||||||||||
Sabra Health Care REIT, Inc. | 8,520 | 185 | ||||||||||
Select Income REIT | 5,524 | 124 | ||||||||||
Seritage Growth Properties ‘A’ | 1,744 | 74 | ||||||||||
Spirit MTA REIT (a) | 1,262 | 13 | ||||||||||
Spirit Realty Capital, Inc. | 12,623 | 101 | ||||||||||
STAG Industrial, Inc. | 3,320 | 90 | ||||||||||
Summit Hotel Properties, Inc. | 5,270 | 75 | ||||||||||
Sunstone Hotel Investors, Inc. | 20,999 | 349 | ||||||||||
Tanger Factory Outlet Centers, Inc. | 6,403 | 150 | ||||||||||
Taubman Centers, Inc. | 4,797 | 282 | ||||||||||
Terreno Realty Corp. | 2,030 | 76 | ||||||||||
Tier REIT, Inc. | 9,224 | 219 | ||||||||||
Uniti Group, Inc. (a) | 9,098 | 182 | ||||||||||
Urban Edge Properties | 2,750 | 63 | ||||||||||
Urstadt Biddle Properties, Inc. ‘A’ | 2,590 | 59 | ||||||||||
Washington Prime Group, Inc. | 85,077 | 690 | ||||||||||
Washington Real Estate Investment Trust | 5,755 | 175 | ||||||||||
Weingarten Realty Investors | 3,180 | 98 | ||||||||||
Whitestone REIT | 1,848 | 23 | ||||||||||
Xenia Hotels & Resorts, Inc. | 25,238 | 615 | ||||||||||
|
| |||||||||||
| 13,932 | ||||||||||||
|
| |||||||||||
Total Real Estate Investment Trusts |
| 18,211 | ||||||||||
|
| |||||||||||
| SHORT-TERM INSTRUMENTS 0.4% |
| |||||||||||
| REPURCHASE AGREEMENTS (b) 0.4% |
| |||||||||||
| 541 | ||||||||||||
|
| |||||||||||
| Total Short-Term Instruments (Cost $541) | 541 | |||||||||||
|
| |||||||||||
| Total Investments in Securities (Cost $110,510) | 138,802 | |||||||||||
| Total Investments 99.9% (Cost $110,510) | $ | 138,802 | ||||||||||
| Other Assets and Liabilities, net 0.1% |
| 192 | ||||||||||
|
| |||||||||||
| Net Assets 100.0% | $ | 138,994 | ||||||||||
|
| |||||||||||
NOTES TO SCHEDULE OF INVESTMENTS:
| * | A zero balance may reflect actual amounts rounding to less than one thousand. |
| (a) | Security did not produce income within the last twelve months. |
| 62 | PIMCO EQUITY SERIES | See Accompanying Notes |
Table of Contents
June 30, 2018
BORROWINGS AND OTHER FINANCING TRANSACTIONS
(b) REPURCHASE AGREEMENTS:
| Counterparty | Lending Rate | Settlement Date | Maturity Date | Principal Amount | Collateralized By | Collateral (Received) | Repurchase Agreements, at Value | Repurchase Agreement Proceeds to be Received(1) | ||||||||||||||||||||||
| FICC | 1.500 | % | 06/29/2018 | 07/02/2018 | $ | 541 | U.S. Treasury Notes 1.875% due 01/31/2022 | $ | (554 | ) | $ | 541 | $ | 541 | ||||||||||||||||
|
|
|
|
|
| |||||||||||||||||||||||||
Total Repurchase Agreements |
| $ | (554 | ) | $ | 541 | $ | 541 | ||||||||||||||||||||||
|
|
|
|
|
| |||||||||||||||||||||||||
BORROWINGS AND OTHER FINANCING TRANSACTIONS SUMMARY
The following is a summary by counterparty of the market value of Borrowings and Other Financing Transactions and collateral pledged/(received) as of June 30, 2018:
| Counterparty | Repurchase Agreement Proceeds to be Received(1) | Payable for Reverse Repurchase Agreements | Payable for Sale-Buyback Transactions | Total Borrowings and Other Financing Transactions | Collateral Pledged/(Received) | Net Exposure(2) | ||||||||||||||||||
Global/Master Repurchase Agreement |
| |||||||||||||||||||||||
FICC | $ | 541 | $ | 0 | $ | 0 | $ | 541 | $ | (554 | ) | $ | (13 | ) | ||||||||||
|
|
|
|
|
| |||||||||||||||||||
Total Borrowings and Other Financing Transactions | $ | 541 | $ | 0 | $ | 0 | ||||||||||||||||||
|
|
|
|
|
| |||||||||||||||||||
| (1) | Includes accrued interest. |
| (2) | Net Exposure represents the net receivable/(payable) that would be due from/to the counterparty in the event of default. Exposure from borrowings and other financing transactions can only be netted across transactions governed under the same master agreement with the same legal entity. See Note 8, Master Netting Arrangements, in the Notes to Financial Statements for more information regarding master netting arrangements. |
FAIR VALUE MEASUREMENTS
The following is a summary of the fair valuations according to the inputs used as of June 30, 2018 in valuing the Fund’s assets and liabilities:
| Category and Subcategory | Level 1 | Level 2 | Level 3 | Fair Value at 06/30/2018 | ||||||||||||
Investments in Securities, at Value |
| |||||||||||||||
Common Stocks |
| |||||||||||||||
United States |
| |||||||||||||||
Consumer Discretionary | $ | 28,274 | $ | 0 | $ | 0 | $ | 28,274 | ||||||||
Consumer Staples | 5,871 | 0 | 0 | 5,871 | ||||||||||||
Energy | 5,410 | 0 | 0 | 5,410 | ||||||||||||
Financials | 19,845 | 0 | 0 | 19,845 | ||||||||||||
Health Care | 9,613 | 0 | 0 | 9,613 | ||||||||||||
Industrials | 22,563 | 0 | 0 | 22,563 | ||||||||||||
Information Technology | 15,829 | 0 | 0 | 15,829 | ||||||||||||
Materials | 6,368 | 0 | 0 | 6,368 | ||||||||||||
Real Estate | 478 | 0 | 0 | 478 | ||||||||||||
| Category and Subcategory | Level 1 | Level 2 | Level 3 | Fair Value at 06/30/2018 | ||||||||||||
Telecommunication Services | $ | 1,348 | $ | 0 | $ | 0 | $ | 1,348 | ||||||||
Utilities | 4,451 | 0 | 0 | 4,451 | ||||||||||||
Real Estate Investment Trusts |
| |||||||||||||||
United States |
| |||||||||||||||
Financials | 4,279 | 0 | 0 | 4,279 | ||||||||||||
Real Estate | 13,932 | 0 | 0 | 13,932 | ||||||||||||
Short-Term Instruments |
| |||||||||||||||
Repurchase Agreements | 0 | 541 | 0 | 541 | ||||||||||||
|
|
|
|
|
|
|
| |||||||||
Total Investments | $ | 138,261 | $ | 541 | $ | 0 | $ | 138,802 | ||||||||
|
|
|
|
|
|
|
| |||||||||
There were no significant transfers among Levels 1, 2, or 3 during the period ended June 30, 2018.
| See Accompanying Notes | ANNUAL REPORT | JUNE 30, 2018 | 63 |
Table of Contents
1. ORGANIZATION
PIMCO Equity Series (the “Trust”) was established as a Delaware statutory trust on March 30, 2010. The Trust is registered under the Investment Company Act of 1940, as amended (the “Act”), as an open-end management investment company. Information presented in these financial statements pertains to the Institutional Class, I-2, Class A, and Class C shares of the funds (each a “Fund” and collectively, the “Funds”) indicated on the cover of this report. Pacific Investment Management Company LLC (“PIMCO”) serves as the investment adviser (the “Adviser”) for the Funds. Research Affiliates, LLC (“Research Affiliates”) serves as the sub-adviser for the Funds. PIMCO and Research Affiliates have also engaged Parametric Portfolio Associates, LLC (“Parametric”) to implement all or a portion of each Fund’s investment strategies. The PIMCO RAE Global Fund (formerly PIMCO RAE Fundamental Global Fund) may invest substantially all of its assets in Institutional Class shares of the PIMCO RAE US Fund (formerly PIMCO RAE Fundamental US Fund), PIMCO RAE International Fund (formerly PIMCO RAE Fundamental International Fund) (“International Fund”) and PIMCO RAE Emerging Markets Fund (formerly PIMCO RAE Fundamental Emerging Markets Fund) (“Emerging Markets Fund”) (collectively, “Underlying Funds”), and equity securities that are eligible investments for the Underlying Funds. The PIMCO RAE Global ex-US Fund (formerly PIMCO RAE Fundamental Global ex-US Fund) may invest substantially all of its assets in Institutional Class shares of the International Fund and Emerging Markets Fund, equity securities of small companies economically tied to non-U.S. countries, and securities that are eligible investments for the International Fund and Emerging Markets Fund. The PIMCO RAE Global Fund and PIMCO RAE Global ex-US Fund may invest in other affiliated funds and unaffiliated funds, which may or may not be registered under the Investment Company Act of 1940 (together with the Underlying Funds, “Acquired Funds”).
2. SIGNIFICANT ACCOUNTING POLICIES
The following is a summary of significant accounting policies consistently followed by the Trust in the preparation of its financial statements in conformity with accounting principles generally accepted in the United States of America (“U.S. GAAP”). Each Fund is treated as an investment company under the reporting requirements of U.S. GAAP. The functional and reporting currency for the Funds is the U.S. dollar. The preparation of financial statements in accordance with U.S. GAAP requires management to make estimates and assumptions that affect the reported amounts of assets and liabilities and disclosure of contingent assets and liabilities at the date of the financial statements and the reported amounts of increases and decreases in net assets from operations during the reporting period. Actual results could differ from those estimates.
(a) Securities Transactions and Investment Income Securities transactions are recorded as of the trade date for financial reporting purposes. Securities purchased or sold on a when-issued or delayed-delivery basis may be settled beyond a standard settlement period for the security after the trade date. Realized gains (losses) from securities sold are recorded on the identified cost basis. Dividend income is recorded on the ex-dividend date, except certain dividends from foreign securities where the ex-dividend date may have passed, which are recorded as soon as a Fund is informed of the ex-dividend date. Interest income, adjusted for the accretion of discounts and amortization of premiums, is recorded on the accrual basis from settlement date, with the exception of securities with a forward starting effective date, where interest income is recorded on the accrual basis from effective date. For convertible securities, premiums attributable to the conversion feature are not amortized. Estimated tax liabilities on certain foreign securities are recorded on an accrual basis and are reflected as components of interest income or net change in unrealized appreciation (depreciation) on investments on the Statements of Operations, as appropriate. Tax liabilities realized as a result of such security sales are reflected as a component of net realized gain (loss) on investments on the Statements of Operations. Paydown gains (losses) on mortgage-related and other asset-backed securities, if any, are recorded as components of interest income on the Statements of Operations. Income or short-term capital gain distributions received from registered investment companies, if any, are recorded as dividend income. Long-term capital gain distributions received from registered investment companies, if any, are recorded as realized gains.
(b) Cash and Foreign Currency The market values of foreign securities, currency holdings and other assets and liabilities denominated in foreign currencies are translated into U.S. dollars based on the current exchange rates each business day. Purchases and sales of securities and income and expense items denominated in foreign currencies, if any, are translated into U.S. dollars at the exchange rate in effect on the transaction date. The Funds do not separately report the effects of changes in foreign exchange rates from changes in market prices on securities held. Such changes are included in net realized gain (loss) and net change in unrealized appreciation (depreciation) from investments on the Statements of Operations. The Funds may invest directly or indirectly through investments in Underlying Funds or Acquired Funds, as applicable, in foreign currency-denominated securities and may engage in foreign currency transactions either on a spot (cash) basis at the rate prevailing in the currency exchange market at the time or through a forward foreign currency contract. Realized foreign exchange gains (losses) arising from sales of spot foreign currencies, currency gains (losses) realized between the trade and settlement dates on securities transactions and the difference between the recorded amounts of dividends, interest,
| 64 | PIMCO EQUITY SERIES |
Table of Contents
June 30, 2018
and foreign withholding taxes and the U.S. dollar equivalent of the amounts actually received or paid are included in net realized gain (loss) on foreign currency transactions on the Statements of Operations. Net unrealized foreign exchange gains (losses) arising from changes in foreign exchange rates on foreign denominated assets and liabilities other than investments in securities held at the end of the reporting period are included in net change in unrealized appreciation (depreciation) on foreign currency assets and liabilities on the Statements of Operations.
(c) Multiclass Operations Each class offered by the Trust has equal rights as to assets and voting privileges (except that shareholders of a class have exclusive voting rights regarding any matter relating solely to that class of shares). Income and non-class specific expenses are allocated daily to each class on the basis of the relative net assets. Realized and unrealized capital gains (losses) are allocated daily based on the relative net assets of each class of the respective Fund. Class specific expenses, where applicable, currently include supervisory and administrative and distribution and servicing fees. Under certain circumstances, the per share net asset value (“NAV”) of a class of the respective Fund’s shares may be different from the per share NAV of another class of shares as a result of the different daily expense accruals applicable to each class of shares.
(d) Distributions to Shareholders The following table shows the anticipated frequency of distributions from net investment income, if any, for each Fund.
| Distribution Frequency | ||||||||||||
| Fund Name | Declared | Distributed | ||||||||||
PIMCO RAE Emerging Markets Fund | Annually | Annually | ||||||||||
PIMCO RAE Global Fund | Annually | Annually | ||||||||||
PIMCO RAE Global ex-US Fund | Annually | Annually | ||||||||||
PIMCO RAE International Fund | Annually | Annually | ||||||||||
PIMCO RAE US Fund | Annually | Annually | ||||||||||
PIMCO RAE US Small Fund | Annually | Annually | ||||||||||
Net realized capital gains earned by each Fund, if any, will be distributed no less frequently than once each year.
Income distributions and capital gain distributions are determined in accordance with income tax regulations which may differ from U.S. GAAP. Differences between tax regulations and U.S. GAAP may cause timing differences between income and capital gain recognition. Further, the character of investment income and capital gains may be different for certain transactions under the two methods of accounting. As a result, income distributions and capital gain distributions declared during a fiscal period may differ significantly from the net investment income (loss) and realized gains (losses) reported on each Fund’s annual financial statements presented under U.S. GAAP.
If a Fund estimates that a portion of its distribution may be comprised of amounts from sources other than net investment income in accordance with its policies and good accounting practices, the Fund will notify shareholders of the estimated composition of such distribution through a Section 19 Notice. For these purposes, a Fund estimates the source or sources from which a distribution is paid, to the close of the period as of which it is paid, in reference to its internal accounting records and related accounting practices. If, based on such accounting records and practices, it is estimated that a particular distribution does not include capital gains or paid-in surplus or other capital sources, a Section 19 Notice generally would not be issued. It is important to note that differences exist between a Fund’s daily internal accounting records and practices, a Fund’s financial statements presented in accordance with U.S. GAAP, and recordkeeping practices under income tax regulations. For instance, a Fund’s internal accounting records and practices may take into account, among other factors, tax-related characteristics of certain sources of distributions that differ from treatment under U.S. GAAP. Examples of such differences may include, among others, the treatment of paydowns on mortgage-backed securities purchased at a discount and periodic payments under interest rate swap contracts. Accordingly, among other consequences, it is possible that a Fund may not issue a Section 19 Notice in situations where the Fund’s financial statements prepared later and in accordance with U.S. GAAP and/or the final tax character of those distributions might later report that the sources of those distributions included capital gains and/or a return of capital. Please visit www.pimco.com for the most recent Section 19 Notice, if applicable, for additional information regarding the estimated composition of distributions. Final determination of a distribution’s tax character will be reported on Form 1099 DIV sent to shareholders for the calendar year.
Distributions classified as a tax basis return of capital, if any, are reflected on the Statements of Changes in Net Assets and have been recorded to paid in capital. In addition, other amounts have been reclassified between undistributed (overdistributed) net investment income (loss), accumulated undistributed (overdistributed) net realized gain (loss) and/or paid in capital to more appropriately conform U.S. GAAP to tax characterizations of distributions.
(e) New Accounting Pronouncements In March 2016, the Financial Accounting Standards Board (“FASB”) issued an Accounting Standards Update (“ASU”), ASU 2016-05, which provides guidance related to the impact of derivative contract novations on certain relationships under Accounting Standards Codification (“ASC”) 815. The ASU is effective for annual periods beginning after December 15, 2016, and interim periods within those annual periods. The Funds have adopted the ASU. The implementation of the ASU did not have an impact on the Funds’ financial statements.
| ANNUAL REPORT | JUNE 30, 2018 | 65 |
Table of Contents
Notes to Financial Statements (Cont.)
In August 2016, the FASB issued ASU 2016-15 which amends ASC 230 to clarify guidance on the classification of certain cash receipts and cash payments in the Statement of Cash Flows. The ASU is effective for annual periods beginning after December 15, 2017, and interim periods within those annual periods. The Funds have adopted the ASU. The implementation of the ASU did not have an impact on the Funds’ financial statements.
In October 2016, the U.S. Securities and Exchange Commission (“SEC”) adopted new rules and forms, and amendments to certain current rules and forms, to modernize reporting and disclosure of information by registered investment companies. The amendments to Regulation S-X require standardized, enhanced disclosure about derivatives in investment company financial statements, and also change the rules governing the form and content of such financial statements. The compliance date for these amendments was August 1, 2017. Compliance is based on reporting period-end date. Management has adopted these amendments and the changes are incorporated in the financial statements.
In November 2016, the FASB issued ASU 2016-18 which amends ASC 230 to provide guidance on the classification and presentation of changes in restricted cash and restricted cash equivalents on the Statement of Cash Flows. The ASU is effective for annual periods beginning after December 15, 2017, and interim periods within those annual periods. The Funds have adopted the ASU. The implementation of the ASU did not have an impact on the Funds’ financial statements.
In March 2017, the FASB issued ASU 2017-08 which provides guidance related to the amortization period for certain purchased callable debt securities held at a premium. The ASU is effective for annual periods beginning after December 15, 2018, and interim periods within those annual periods. The Funds have adopted the ASU. The implementation of the ASU did not have an impact on the Funds’ financial statements.
3. INVESTMENT VALUATION AND FAIR VALUE MEASUREMENTS
(a) Investment Valuation Policies The price of a Fund’s shares is based on the Fund’s NAV. The NAV of a Fund, or each of its share classes, as applicable, is determined by dividing the total value of portfolio investments and other assets, less any liabilities attributable to that Fund or class, by the total number of shares outstanding of that Fund or class.
On each day that the New York Stock Exchange (“NYSE”) is open, Fund shares are ordinarily valued as of the close of regular trading (“NYSE Close”). Information that becomes known to the Funds or their agents after the time as of which NAV has been calculated on a particular day will not generally be used to retroactively adjust the price
of a security or the NAV determined earlier that day. Each Fund reserves the right to change the time as of which its respective NAV is calculated if the Fund closes earlier, or as permitted by the SEC.
For purposes of calculating a NAV, portfolio securities and other assets for which market quotes are readily available are valued at market value. Market value is generally determined on the basis of official closing prices or the last reported sales prices, or if no sales are reported, based on quotes obtained from established market makers or prices (including evaluated prices) supplied by the Funds’ approved pricing services, quotation reporting systems and other third-party sources (together, “Pricing Services”). The Funds will normally use pricing data for domestic equity securities received shortly after the NYSE Close and do not normally take into account trading, clearances or settlements that take place after the NYSE Close. If market value pricing is used, a foreign (non-U.S.) equity security traded on a foreign exchange or on more than one exchange is typically valued using pricing information from the exchange considered by the Adviser to be the primary exchange. A foreign (non-U.S.) equity security will be valued as of the close of trading on the foreign exchange, or the NYSE Close, if the NYSE Close occurs before the end of trading on the foreign exchange. Domestic and foreign (non-U.S.) fixed income securities, non-exchange traded derivatives, and equity options are normally valued on the basis of quotes obtained from brokers and dealers or Pricing Services using data reflecting the earlier closing of the principal markets for those securities. Prices obtained from Pricing Services may be based on, among other things, information provided by market makers or estimates of market values obtained from yield data relating to investments or securities with similar characteristics. Certain fixed income securities purchased on a delayed-delivery basis are marked to market daily until settlement at the forward settlement date. Exchange-traded options, except equity options, futures and options on futures are valued at the settlement price determined by the relevant exchange. Swap agreements are valued on the basis of bid quotes obtained from brokers and dealers or market-based prices supplied by Pricing Services. A Fund’s investments in open-end management investment companies, other than exchange-traded funds (“ETFs”), are valued at the NAVs of such investments. Open-end management investment companies may include affiliated funds.
If a foreign (non-U.S.) equity security’s value has materially changed after the close of the security’s primary exchange or principal market but before the NYSE Close, the security may be valued at fair value based on procedures established and approved by the Board of Trustees of the Trust (the “Board”). Foreign (non-U.S.) equity securities that do not trade when the NYSE is open are also valued at fair value. With respect to foreign (non-U.S.) equity securities, a Fund may determine the fair value of investments based on information provided by Pricing Services and other third-party vendors, which may recommend fair value or adjustments with
| 66 | PIMCO EQUITY SERIES |
Table of Contents
June 30, 2018
reference to other securities, indices or assets. In considering whether fair valuation is required and in determining fair values, a Fund may, among other things, consider significant events (which may be considered to include changes in the value of U.S. securities or securities indices) that occur after the close of the relevant market and before the NYSE Close. A Fund may utilize modeling tools provided by third-party vendors to determine fair values of foreign (non-U.S.) securities. For these purposes, any movement in the applicable reference index or instrument (“zero trigger”) between the earlier close of the applicable foreign market and the NYSE Close may be deemed to be a significant event, prompting the application of the pricing model (effectively resulting in daily fair valuations). Foreign exchanges may permit trading in foreign (non-U.S.) equity securities on days when the Trust is not open for business, which may result in a Fund’s portfolio investments being affected when shareholders are unable to buy or sell shares.
Senior secured floating rate loans for which an active secondary market exists to a reliable degree will be valued at the mean of the last available bid/ask prices in the market for such loans, as provided by a Pricing Service. Senior secured floating rate loans for which an active secondary market does not exist to a reliable degree will be valued at fair value, which is intended to approximate market value. In valuing a senior secured floating rate loan at fair value, the factors considered may include, but are not limited to, the following: (a) the creditworthiness of the borrower and any intermediate participants, (b) the terms of the loan, (c) recent prices in the market for similar loans, if any, and (d) recent prices in the market for instruments of similar quality, rate, period until next interest rate reset and maturity.
Investments valued in currencies other than the U.S. dollar are converted to the U.S. dollar using exchange rates obtained from Pricing Services. As a result, the value of such investments and, in turn, the NAV of a Fund’s shares may be affected by changes in the value of currencies in relation to the U.S. dollar. The value of investments traded in markets outside the United States or denominated in currencies other than the U.S. dollar may be affected significantly on a day that the Trust is not open for business. As a result, to the extent that a Fund holds foreign (non-U.S.) investments, the value of those investments may change at times when shareholders are unable to buy or sell shares and the value of such investments will be reflected in the Fund’s next calculated NAV.
Investments for which market quotes or market based valuations are not readily available are valued at fair value as determined in good faith by the Board or persons acting at their direction. The Board has adopted methods for valuing securities and other assets in circumstances where market quotes are not readily available, and has delegated to the Adviser the responsibility for applying the fair valuation methods. In the event that market quotes or market based
valuations are not readily available, and the security or asset cannot be valued pursuant to a Board approved valuation method, the value of the security or asset will be determined in good faith by the Valuation Oversight Committee of the Board (“Valuation Oversight Committee”), generally based on recommendations provided by the Adviser. The Adviser may consult with the Sub-Adviser or Parametric in providing such recommendations or otherwise with respect to valuation of the PIMCO Dividend and Income Fund’s portfolio securities or other assets. Market quotes are considered not readily available in circumstances where there is an absence of current or reliable market-based data (e.g., trade information, bid/ask information, indicative market quotations (“Broker Quotes”), Pricing Services’ prices), including where events occur after the close of the relevant market, but prior to the NYSE Close, that materially affect the values of a Fund’s securities or assets. In addition, market quotes are considered not readily available when, due to extraordinary circumstances, the exchanges or markets on which the securities trade do not open for trading for the entire day and no other market prices are available. The Board has delegated to the Adviser the responsibility for monitoring significant events that may materially affect the values of a Fund’s securities or assets and for determining whether the value of the applicable securities or assets should be reevaluated in light of such significant events.
When a Fund (or, in each instance in this paragraph, as applicable, an Underlying PIMCO Fund or Acquired Fund) uses fair valuation to determine the value of a portfolio security or other asset for purposes of calculating its NAV, such investments will not be priced on the basis of quotes from the primary market in which they are traded, but rather may be priced by another method that the Board or persons acting at their direction believe reflects fair value. Fair valuation may require subjective determinations about the value of a security. While the Trust’s policy is intended to result in a calculation of a Fund’s NAV that fairly reflects security values as of the time of pricing, the Trust cannot ensure that fair values determined by the Board or persons acting at their direction would accurately reflect the price that a Fund could obtain for a security if it were to dispose of that security as of the time of pricing (for instance, in a forced or distressed sale). The prices used by a Fund may differ from the value that would be realized if the securities were sold. The Funds’ use of fair valuation may also help to deter “stale price arbitrage” as discussed under the “Abusive Trading Practices” section in each Fund’s prospectus.
(b) Fair Value Hierarchy U.S. GAAP describes fair value as the price that a Fund would receive to sell an asset or pay to transfer a liability in an orderly transaction between market participants at the measurement date. It establishes a fair value hierarchy that prioritizes inputs to valuation methods and requires disclosure of the fair value hierarchy, separately for each major category of assets and liabilities, that
| ANNUAL REPORT | JUNE 30, 2018 | 67 |
Table of Contents
Notes to Financial Statements (Cont.)
segregates fair value measurements into levels (Level 1, 2, or 3). The inputs or methodology used for valuing securities are not necessarily an indication of the risks associated with investing in those securities. Levels 1, 2, and 3 of the fair value hierarchy are defined as follows:
| ∎ | Level 1 — Quoted prices in active markets or exchanges for identical assets and liabilities. |
| ∎ | Level 2 — Significant other observable inputs, which may include, but are not limited to, quoted prices for similar assets or liabilities in markets that are active, quoted prices for identical or similar assets or liabilities in markets that are not active, inputs other than quoted prices that are observable for the assets or liabilities (such as interest rates, yield curves, volatilities, prepayment speeds, loss severities, credit risks and default rates) or other market corroborated inputs. |
| ∎ | Level 3 — Significant unobservable inputs based on the best information available in the circumstances, to the extent observable inputs are not available, which may include assumptions made by the Board or persons acting at their direction that are used in determining the fair value of investments. |
Any assets or liabilities categorized as Level 1 or 2 as of period end that have been transferred between Levels 1 and 2 since the prior period are due to changes in the method utilized in valuing the investments. Transfers from Level 1 to Level 2 are a result of a change, in the normal course of business, from the use of an exchange traded price or a trade price on the initial purchase date (Level 1) to methods used by Pricing Services including valuation adjustments applied to certain securities that are solely traded on a foreign exchange to account for the market movement between the close of the foreign market and the close of the NYSE (Level 2). Transfers from Level 2 to Level 1 are a result of exchange traded products for which quoted prices from an active market were not available (Level 2) and have become available (Level 1). In accordance with the requirements of U.S. GAAP, the amounts of transfers between Levels 1 and 2 and transfers into and out of Level 3, if material, are disclosed in the Notes to Schedule of Investments for each respective Fund.
For fair valuations using significant unobservable inputs, U.S. GAAP requires a reconciliation of the beginning to ending balances for reported fair values that presents changes attributable to realized gain (loss), unrealized appreciation (depreciation), purchases and sales, accrued discounts (premiums), and transfers into and out of the Level 3 category during the period. The end of period value is used for the transfers between Levels of a Fund’s assets and liabilities. Additionally, U.S. GAAP requires quantitative information regarding the significant unobservable inputs used in the determination of fair value of assets or liabilities categorized as Level 3 in the fair value hierarchy. In accordance with the requirements of U.S. GAAP, a fair value hierarchy, and if material, a Level 3 reconciliation and details of significant
unobservable inputs, have been included in the Notes to Schedule of Investments for each respective Fund.
(c) Valuation Techniques and the Fair Value Hierarchy
Level 1 and Level 2 trading assets and trading liabilities, at fair value The valuation methods (or “techniques”) and significant inputs used in determining the fair values of portfolio securities or other assets and liabilities categorized as Level 1 and Level 2 of the fair value hierarchy are as follows:
Common stocks, ETFs, exchange-traded notes and financial derivative instruments, such as futures contracts, rights and warrants, or options on futures that are traded on a national securities exchange, are stated at the last reported sale or settlement price on the day of valuation. To the extent these securities are actively traded and valuation adjustments are not applied, they are categorized as Level 1 of the fair value hierarchy.
Valuation adjustments may be applied to certain securities that are solely traded on a foreign exchange to account for the market movement between the close of the foreign market and the NYSE Close. These securities are valued using Pricing Services that consider the correlation of the trading patterns of the foreign security to the intraday trading in the U.S. markets for investments. Securities using these valuation adjustments are categorized as Level 2 of the fair value hierarchy. Preferred securities and other equities traded on inactive markets or valued by reference to similar instruments are also categorized as Level 2 of the fair value hierarchy.
Equity-linked securities are valued by referencing the last reported sale or settlement price of the linked referenced equity on the day of valuation. Foreign exchange adjustments are applied to the last reported price to convert the linked equity’s trading currency to the contract’s settling currency. These investments are categorized as Level 2 of the fair value hierarchy.
Investments in registered open-end investment companies (other than ETFs) will be valued based upon the NAVs of such investments and are categorized as Level 1 of the fair value hierarchy. Investments in unregistered open-end investment companies will be calculated based upon the NAVs of such investments and are considered Level 1 provided that the NAVs are observable, calculated daily and are the value at which both purchases and sales will be conducted.
Level 3 trading assets and trading liabilities, at fair value When a fair valuation method is applied by the Adviser that uses significant unobservable inputs, investments will be priced by a method that the Board or persons acting at their direction believe reflects fair value and are categorized as Level 3 of the fair value hierarchy.
| 68 | PIMCO EQUITY SERIES |
Table of Contents
June 30, 2018
Short-term debt instruments (such as commercial paper) having a remaining maturity of 60 days or less may be valued at amortized cost, so long as the amortized cost value of such short-term debt instruments is approximately the same as the fair value of the instrument as determined without the use of amortized cost valuation. These securities are categorized as Level 2 or Level 3 of the fair value hierarchy depending on the source of the base price.
4. SECURITIES AND OTHER INVESTMENTS
(a) Investments in Affiliates
The PIMCO RAE Global Fund may invest substantially all or a significant portion of its assets in Acquired Funds and equity securities that are eligible investments for the Underlying Funds. The PIMCO RAE Global ex-US Fund may invest substantially all of its assets in Acquired Funds (except the PIMCO RAE US Fund), equity securities of small companies economically tied to non-U.S. countries, and securities that are eligible investments for the International Fund and Emerging Markets Fund. The Underlying Funds are considered to be affiliated with the PIMCO RAE Global Fund and PIMCO RAE Global ex-US Fund.
Each Fund may invest in the PIMCO Short Asset Portfolio and the PIMCO Short-Term Floating NAV Portfolio III (“Central Funds”) to the extent permitted by the Act and rules thereunder. The Central Funds are registered investment companies created for use solely by the series of the Trust and other series of registered investment companies advised by the Adviser, in connection with their cash management activities. The main investments of the Central Funds are money market and short maturity fixed income instruments. The Central Funds may incur expenses related to their investment activities, but do not pay Investment Advisory Fees or Supervisory and Administrative Fees to the Adviser. The Central Funds are considered to be affiliated with the Funds. The tables below show the Funds’ transactions in and earnings from investments in the affiliated Funds for the period ended June 30, 2018 (amounts in thousands†):
| PIMCO RAE Global Fund | ||||||||||||||||||||||||||||||||||||
| Underlying PIMCO Funds | Market Value 06/30/2017 | Purchases at Cost | Proceeds from Sales | Net Realized Gain (Loss) | Change in Unrealized Appreciation (Depreciation) | Market Value 06/30/2018 | Dividend Income(1) | Realized Net Capital Gain Distributions(1) | ||||||||||||||||||||||||||||
PIMCO RAE Emerging Markets Fund | $ | 52,176 | $ | 14,065 | $ | (23,130 | ) | $ | 1,155 | $ | (1,265 | ) | $ | 43,001 | $ | 3,364 | $ | 588 | ||||||||||||||||||
PIMCO RAE International Fund | 203,628 | 21,624 | (71,242 | ) | 7,317 | 417 | 161,744 | 5,161 | 124 | |||||||||||||||||||||||||||
PIMCO RAE US Fund | 158,436 | 45,065 | (52,993 | ) | 2,645 | 8,147 | 161,300 | 4,376 | 5,454 | |||||||||||||||||||||||||||
Totals | $ | 414,240 | $ | 80,754 | $ | (147,365 | ) | $ | 11,117 | $ | 7,299 | $ | 366,045 | $ | 12,901 | $ | 6,166 | |||||||||||||||||||
| PIMCO RAE Global ex-US Fund | ||||||||||||||||||||||||||||||||||||
| Underlying PIMCO Funds | Market Value 06/30/2017 | Purchases at Cost | Proceeds from Sales | Net Realized Gain (Loss) | Change in Unrealized Appreciation (Depreciation) | Market Value 06/30/2018 | Dividend Income(1) | Realized Net Capital Gain Distributions(1) | ||||||||||||||||||||||||||||
PIMCO RAE Emerging Markets Fund | $ | 16,414 | $ | 3,572 | $ | (2,988 | ) | $ | 167 | $ | (360 | ) | $ | 16,805 | $ | 1,133 | $ | 198 | ||||||||||||||||||
PIMCO RAE International Fund | 64,060 | 4,144 | (7,250 | ) | 320 | 1,890 | 63,164 | 1,739 | 42 | |||||||||||||||||||||||||||
Totals | $ | 80,474 | $ | 7,716 | $ | (10,238 | ) | $ | 487 | $ | 1,530 | $ | 79,969 | $ | 2,872 | $ | 240 | |||||||||||||||||||
| † | A zero balance may reflect actual amounts rounding to less than one thousand. |
| (1) | The tax characterization of distributions is determined in accordance with Federal income tax regulations and may contain a return of capital. The actual tax characterization of distributions received is determined at the end of the fiscal year of the affiliated fund. See Note 2, Distributions to Shareholders, in the Notes to Financial Statements for more information. |
(b) Investments in Securities
The Funds (and where applicable, certain Acquired Funds and Underlying Funds) may utilize the investments and strategies described below to the extent permitted by each Fund’s respective investment policies.
Real Estate Investment Trusts (“REITs”) are pooled investment vehicles that own, and typically operate, income-producing real estate. If a REIT meets certain requirements, including distributing to
shareholders substantially all of its taxable income (other than net capital gains), then it is not taxed on the income distributed to shareholders. Distributions received from REITs may be characterized as income, capital gain or a return of capital. A return of capital is recorded by a Fund as a reduction to the cost basis of its investment in the REIT. REITs are subject to management fees and other expenses, and so the Funds that invest in REITs will bear their proportionate share of the costs of the REITs’ operations.
| ANNUAL REPORT | JUNE 30, 2018 | 69 |
Table of Contents
Notes to Financial Statements (Cont.)
Restricted Investments are subject to legal or contractual restrictions on resale and may generally be sold privately, but may be required to be registered or exempted from such registration before being sold to the public. Private placement securities are generally considered to be restricted except for those securities traded between qualified institutional investors under the provisions of Rule 144A of the Securities Act of 1933. Disposal of restricted investments may involve time-consuming negotiations and expenses, and prompt sale at an acceptable price may be difficult to achieve. Restricted investments held by the Funds at June 30, 2018 are disclosed in the Notes to Schedules of Investments.
Warrants are securities that are usually issued together with a debt security or preferred security and that give the holder the right to buy a proportionate amount of common stock at a specified price. Warrants are freely transferable and are often traded on major exchanges. Warrants normally have a life that is measured in years and entitle the holder to buy common stock of a company at a price that is usually higher than the market price at the time the warrant is issued. Warrants may entail greater risks than certain other types of investments. Generally, warrants do not carry the right to receive dividends or exercise voting rights with respect to the underlying securities, and they do not represent any rights in the assets of the issuer. In addition, their value does not necessarily change with the value of the underlying securities, and they cease to have value if they are not exercised on or before their expiration date. If the market price of the underlying stock does not exceed the exercise price during the life of the warrant, the warrant will expire worthless. Warrants may increase the potential profit or loss to be realized from the investment as compared with investing the same amount in the underlying securities. Similarly, the percentage increase or decrease in the value of an equity security warrant may be greater than the percentage increase or decrease in the value of the underlying common stock. Warrants may relate to the purchase of equity or debt securities. Debt obligations with warrants attached to purchase equity securities have many characteristics of convertible securities and their prices may, to some degree, reflect the performance of the underlying stock. Debt obligations also may be issued with warrants attached to purchase additional debt securities at the same coupon rate. A decline in interest rates would permit a Fund to sell such warrants at a profit. If interest rates rise, these warrants would generally expire with no value.
5. BORROWINGS AND OTHER FINANCING TRANSACTIONS
The Funds (and where applicable, certain Acquired Funds and Underlying Funds) may enter into the borrowings and other financing transactions described below to the extent permitted by each Fund’s respective investment policies.
The following disclosures contain information on a Fund’s ability to lend or borrow cash or securities to the extent permitted under the Act, which may be viewed as borrowing or financing transactions by a Fund. The location of these instruments in each Fund’s financial statements is described below.
(a) Repurchase Agreements Under the terms of a typical repurchase agreement, a Fund purchases an underlying debt obligation (collateral) subject to an obligation of the seller to repurchase, and a Fund to resell, the obligation at an agreed-upon price and time. In an open maturity repurchase agreement, there is no pre-determined repurchase date and the agreement can be terminated by the Fund or counterparty at any time. The underlying securities for all repurchase agreements are held by a Fund’s custodian or designated subcustodians under tri-party repurchase agreements and in certain instances will remain in custody with the counterparty. The market value of the collateral must be equal to or exceed the total amount of the repurchase obligations, including interest. Repurchase agreements, if any, including accrued interest, are included on the Statements of Assets and Liabilities. Interest earned is recorded as a component of interest income on the Statements of Operations. In periods of increased demand for collateral, a Fund may pay a fee for the receipt of collateral, which may result in interest expense to the Fund.
6. FINANCIAL DERIVATIVE INSTRUMENTS
The Funds (and where applicable, certain Acquired Funds and Underlying Funds) may enter into the financial derivative instruments described below to the extent permitted by each Fund’s respective investment policies.
The following disclosures contain information on how and why the Funds use financial derivative instruments, and how financial derivative instruments affect the Funds’ financial position, results of operations and cash flows. The location and fair value amounts of these instruments on the Statements of Assets and Liabilities and the net realized gain (loss) and net change in unrealized appreciation (depreciation) on the Statements of Operations, each categorized by type of financial derivative contract and related risk exposure, are included in a table in the Notes to Schedules of Investments. The financial derivative instruments outstanding as of period end and the amounts of net realized gain (loss) and net change in unrealized appreciation (depreciation) on financial derivative instruments during the period, as disclosed in the Notes to Schedules of Investments, serve as indicators of the volume of financial derivative activity for the Funds.
(a) Forward Foreign Currency Contracts may be engaged, in connection with settling planned purchases or sales of securities, to hedge the currency exposure associated with some or all of a Fund’s securities or as part of an investment strategy. A forward foreign
| 70 | PIMCO EQUITY SERIES |
Table of Contents
June 30, 2018
currency contract is an agreement between two parties to buy and sell a currency at a set price on a future date. The market value of a forward foreign currency contract fluctuates with changes in foreign currency exchange rates. Forward foreign currency contracts are marked to market daily, and the change in value is recorded by a Fund as an unrealized gain (loss). Realized gains (losses) are equal to the difference between the value of the contract at the time it was opened and the value at the time it was closed and are recorded upon delivery
or receipt of the currency. These contracts may involve market risk in excess of the unrealized gain (loss) reflected on the Statements of Assets and Liabilities. In addition, a Fund could be exposed to risk if the counterparties are unable to meet the terms of the contracts or if the value of the currency changes unfavorably to the U.S. dollar. To mitigate such risk, cash or securities may be exchanged as collateral pursuant to the terms of the underlying contracts.
7. PRINCIPAL RISKS
The principal risks of investing in a Fund, which could adversely affect its net asset value, yield and total return, are listed below.
| Risks | PIMCO RAE Fundamental Emerging Markets Fund | PIMCO RAE Fundamental Global Fund | PIMCO RAE Fundamental Global ex-US Fund | PIMCO RAE Fundamental International Fund | PIMCO RAE Fundamental US Fund | PIMCO RAE Fundamental US Small Fund | ||||||||||
New/Small Fund | X | |||||||||||||||
Allocation | X | X | ||||||||||||||
Acquired Fund | X | X | ||||||||||||||
Equity | X | X | X | X | X | X | ||||||||||
Value Investing | X | X | X | X | X | X | ||||||||||
Foreign (Non-U.S.) Investment | X | X | X | X | ||||||||||||
Emerging Markets | X | X | X | X | ||||||||||||
Issuer Non-Diversification | X | X | X | X | X | X | ||||||||||
Market | X | X | X | X | X | X | ||||||||||
Issuer | X | X | X | X | X | X | ||||||||||
Credit | X | X | X | X | X | X | ||||||||||
Distressed Company | X | X | X | |||||||||||||
Currency | X | X | X | X | ||||||||||||
Real Estate | X | X | X | X | X | X | ||||||||||
Liquidity | X | X | X | X | X | X | ||||||||||
Leveraging | X | X | X | X | X | X | ||||||||||
Management | X | X | X | X | X | X | ||||||||||
Small Company | X | X | X | |||||||||||||
Derivatives | X | X | X | X | X | X | ||||||||||
Model | X | X | X | X | X | X | ||||||||||
The principal risks of investing in a Fund include risks from direct investments and/or for certain Funds that invest in Acquired Funds or Underlying PIMCO Funds, indirect exposure through investment in such Acquired Funds or Underlying PIMCO Funds. Please see “Description of Principal Risks” in a Fund’s prospectus for a more detailed description of the risks of investing in a Fund.
New/Small Fund Risk is the risk that a new or smaller Fund’s performance may not represent how a Fund is expected to or may perform in the long term. In addition, new Funds have limited operating histories for investors to evaluate and new and smaller Funds may not attract sufficient assets to achieve investment and trading efficiencies.
Allocation Risk is the risk that a Fund could lose money as a result of less than optimal or poor asset allocation decisions as to how its assets are allocated or reallocated. A Fund could miss attractive investment
opportunities by underweighting markets that subsequently experience significant returns and could lose value by overweighting markets that subsequently experience significant declines.
Acquired Fund Risk is the risk that a Fund’s performance is closely related to the risks associated with the securities and other investments held by the Acquired Funds and that the ability of a Fund to achieve its investment objective will depend upon the ability of the Acquired Funds to achieve their investment objectives.
Equity Risk is the risk that the value of equity securities, such as common stocks and preferred securities, may decline due to general market conditions which are not specifically related to a particular company or to factors affecting a particular industry or industries. Equity securities generally have greater price volatility than fixed income securities.
| ANNUAL REPORT | JUNE 30, 2018 | 71 |
Table of Contents
Notes to Financial Statements (Cont.)
Value Investing Risk is the risk that a value stock may decrease in price or may not increase in price as anticipated by the Sub-Adviser if it continues to be undervalued by the market or the factors that the portfolio manager believes will cause the stock price to increase do not occur.
Foreign (Non-U.S.) Investment Risk is the risk that investing in foreign (non-U.S.) securities may result in a Fund experiencing more rapid and extreme changes in value than a fund that invests exclusively in securities of U.S. companies, due to smaller markets, differing reporting, accounting and auditing standards, increased risk of delayed settlement of portfolio transactions or loss of certificates of portfolio securities, and the risk of unfavorable foreign government actions, including nationalization, expropriation or confiscatory taxation, currency blockage, or political changes or diplomatic developments. Foreign securities may also be less liquid and more difficult to value than securities of U.S. issuers.
Emerging Markets Risk is the risk of investing in emerging market securities, primarily increased foreign (non-U.S.) investment risk.
Issuer Non-Diversification Risk is the risk of focusing investments in a small number of issuers, including being more susceptible to risks associated with a single economic, political or regulatory occurrence than a more diversified portfolio might be. Funds that are “non-diversified” may invest a greater percentage of their assets in the securities of a single issuer than funds that are “diversified”.
Market Risk is the risk that the value of securities owned by a Fund may go up or down, sometimes rapidly or unpredictably, due to factors affecting securities markets generally or particular industries.
Issuer Risk is the risk that the value of a security may decline for a reason directly related to the issuer, such as management performance, financial leverage and reduced demand for the issuer’s goods or services.
Credit Risk is the risk that a Fund could lose money if the counterparty to a derivative contract is unable or unwilling to meet its financial obligations.
Distressed Company Risk is the risk that securities of distressed companies may be subject to greater levels of market, issuer and liquidity risks. Distressed companies may be engaged in restructurings or bankruptcy proceedings, which may cause the value of their securities to fluctuate rapidly or unpredictably.
Currency Risk is the risk that foreign (non-U.S.) currencies will change in value relative to the U.S. dollar and affect a Fund’s investments in foreign (non-U.S.) currencies or in securities that trade in, and receive revenues in, or in derivatives that provide exposure to, foreign (non-U.S.) currencies.
Real Estate Risk is the risk that a Fund’s investments in Real Estate Investment Trusts (“REITs”) or real estate-linked derivative instruments will subject a Fund to risks similar to those associated with direct ownership of real estate, including losses from casualty or condemnation, and changes in local and general economic conditions, supply and demand, interest rates, zoning laws, regulatory limitations on rents, property taxes and operating expenses. A Fund’s investments in REITs or real estate-linked derivative instruments subject it to management and tax risks. In addition, privately traded REITs subject a Fund to liquidity and valuation risk.
Liquidity Risk is the risk that a particular investment may be difficult to purchase or sell and that a Fund may be unable to sell illiquid securities at an advantageous time or price or achieve its desired level of exposure to a certain sector.
Leveraging Risk is the risk that certain transactions of a Fund, such as reverse repurchase agreements, loans of portfolio securities, and the use of when-issued, delayed delivery or forward commitment transactions, or derivative instruments, may give rise to leverage, magnifying gains and losses and causing a Fund to be more volatile than if it had not been leveraged. This means that leverage entails a heightened risk of loss.
Management Risk is the risk that the investment techniques and risk analyses applied by the Sub-Adviser will not produce the desired results and that legislative, regulatory, or tax restrictions, policies or developments may affect the investment techniques available to the Sub-Adviser and the individual portfolio manager in connection with managing a Fund. There is no guarantee that the investment objective of a Fund will be achieved.
Small Company Risk is the risk that the value of equity securities issued by small companies, ranked by fundamental size as determined by the Sub-Adviser, may go up or down, sometimes rapidly and unpredictably, due to narrow markets and limited managerial and financial resources.
Derivatives Risk is the risk of investing in derivative instruments (such as futures, swaps and structured securities), including leverage, liquidity, interest rate, market, credit and management risks, mispricing or valuation complexity. Changes in the value of the derivative may not correlate perfectly with, and may be more sensitive to market events than, the underlying asset, rate or index, and a Fund could lose more than the initial amount invested. A Fund’s use of derivatives may result in losses to a Fund, a reduction in a Fund’s returns and/or increased volatility. Over-the-counter (“OTC”) derivatives are also subject to the risk that a counterparty to the transaction will not fulfill its contractual obligations to the other party, as many of the protections afforded to centrally-cleared derivative transactions might not be available for OTC
| 72 | PIMCO EQUITY SERIES |
Table of Contents
June 30, 2018
derivatives. For derivatives traded on an exchange or through a central counterparty, credit risk resides with a Fund’s clearing broker, or the clearinghouse itself, rather than with a counterparty in an OTC derivative transaction. Changes in regulation relating to a mutual fund’s use of derivatives and related instruments could potentially limit or impact a Fund’s ability to invest in derivatives, limit a Fund’s ability to employ certain strategies that use derivatives and/or adversely affect the value of derivatives and a Fund’s performance.
Model Risk is the risk that a Fund’s investment models used in making investment allocation decisions may not adequately take into account certain factors and may result in a decline in the value of an investment in a Fund.
8. MASTER NETTING ARRANGEMENTS
A Fund may be subject to various netting arrangements (“Master Agreements”) with select counterparties. Master Agreements govern the terms of certain transactions, and are intended to reduce the counterparty risk associated with relevant transactions by specifying credit protection mechanisms and providing standardization that is intended to improve legal certainty. Each type of Master Agreement governs certain types of transactions. Different types of transactions may be traded out of different legal entities or affiliates of a particular organization, resulting in the need for multiple agreements with a single counterparty. As the Master Agreements are specific to unique operations of different asset types, they allow a Fund to close out and net its total exposure to a counterparty in the event of a default with respect to all the transactions governed under a single Master Agreement with a counterparty. For financial reporting purposes the Statements of Assets and Liabilities generally present derivative assets and liabilities on a gross basis, which reflects the full risks and exposures prior to netting.
Master Agreements can also help limit counterparty risk by specifying collateral posting arrangements at pre-arranged exposure levels. Under most Master Agreements, collateral is routinely transferred if the total net exposure to certain transactions (net of existing collateral already in place) governed under the relevant Master Agreement with a counterparty in a given account exceeds a specified threshold, which typically ranges from zero to $250,000 depending on the counterparty and the type of Master Agreement. United States Treasury Bills and U.S. dollar cash are generally the preferred forms of collateral, although other forms of AAA rated paper or sovereign securities may be used depending on the terms outlined in the applicable Master Agreement. Securities and cash pledged as collateral are reflected as assets on the Statements of Assets and Liabilities as either a component of Investments at value (securities) or Deposits with counterparty. Cash collateral received is not typically held in a segregated account and as such is reflected as a liability on the Statements of Assets and Liabilities
as Deposits from counterparty. The market value of any securities received as collateral is not reflected as a component of NAV. A Fund’s overall exposure to counterparty risk can change substantially within a short period, as it is affected by each transaction subject to the relevant Master Agreement.
Master Repurchase Agreements and Global Master Repurchase Agreements (individually and collectively “Master Repo Agreements”) govern repurchase, reverse repurchase, and sale-buyback transactions between a Fund and select counterparties. Master Repo Agreements maintain provisions for, among other things, initiation, income payments, events of default, and maintenance of collateral. The market value of transactions under the Master Repo Agreement, collateral pledged or received, and the net exposure by counterparty as of period end are disclosed in the Notes to Schedules of Investments.
Master Securities Forward Transaction Agreements (“Master Forward Agreements”) govern certain forward settling transactions, such as TBA securities, delayed-delivery or sale-buyback transactions by and between a Fund and select counterparties. The Master Forward Agreements maintain provisions for, among other things, transaction initiation and confirmation, payment and transfer, events of default, termination, and maintenance of collateral. The market value of forward settling transactions, collateral pledged or received, and the net exposure by counterparty as of period end is disclosed in the Notes to Schedules of Investments.
Customer Account Agreements and related addenda govern cleared derivatives transactions such as futures, options on futures, and cleared OTC derivatives. Such transactions require posting of initial margin as determined by each relevant clearing agency which is segregated in an account at a futures commission merchant (“FCM”) registered with the Commodity Futures Trading Commission (“CFTC”). In the United States, counterparty risk may be reduced as creditors of an FCM cannot have a claim to Fund assets in the segregated account. Portability of exposure reduces risk to the Funds. Variation margin, or changes in market value, are exchanged daily, but may not be netted between futures and cleared OTC derivatives unless the parties have agreed to a separate arrangement in respect of portfolio margining. The market value or accumulated unrealized appreciation (depreciation), initial margin posted, and any unsettled variation margin as of period end are disclosed in the Notes to Schedules of Investments.
International Swaps and Derivatives Association, Inc. Master Agreements and Credit Support Annexes (“ISDA Master Agreements”) govern bilateral OTC derivative transactions entered into by a Fund with select counterparties. ISDA Master Agreements maintain provisions for general obligations, representations, agreements, collateral posting and events of default or termination. Events of
| ANNUAL REPORT | JUNE 30, 2018 | 73 |
Table of Contents
Notes to Financial Statements (Cont.)
termination include conditions that may entitle counterparties to elect to terminate early and cause settlement of all outstanding transactions under the applicable ISDA Master Agreement. Any election to terminate early could be material to the financial statements. In limited circumstances, the ISDA Master Agreement may contain additional provisions that add counterparty protection beyond coverage of
existing daily exposure if the counterparty has a decline in credit quality below a predefined level. These amounts, if any, may be segregated with a third-party custodian. The market value of OTC financial derivative instruments, collateral received or pledged, and net exposure by counterparty as of period end are disclosed in the Notes to Schedules of Investments.
9. FEES AND EXPENSES
(a) Investment Advisory Fee PIMCO is a majority-owned subsidiary of Allianz Asset Management of America L.P. (“Allianz Asset Management”) and serves as the Adviser to the Trust, pursuant to an investment advisory contract. The Adviser receives a monthly fee from each Fund at an annual rate based on average daily net assets (the “Investment Advisory Fee”). The Investment Advisory Fee for all classes is charged at an annual rate as noted in the table in note (b) below.
(b) Supervisory and Administrative Fee PIMCO serves as administrator (the “Administrator”) and provides supervisory and administrative services to the Trust for which it receives a monthly supervisory and administrative fee based on each share class’s average daily net assets (the “Supervisory and Administrative Fee”). As the Administrator, PIMCO bears the costs of various third-party services, including audit, custodial, portfolio accounting, legal, transfer agency and printing costs.
The Investment Advisory Fees and Supervisory and Administrative Fees for all classes, as applicable, are charged at the annual rate as noted in the following table (calculated as a percentage of each Fund’s average daily net assets attributable to each class):
| Investment Advisory Fee | Supervisory and Administrative Fee | |||||||||||||||||||||||||||
| Fund Name | All Classes | Institutional Class | I-2 | Class A | Class C | |||||||||||||||||||||||
PIMCO RAE Emerging Markets Fund | 0.50% | 0.45% | 0.55% | 0.55% | 0.55% | |||||||||||||||||||||||
PIMCO RAE Global Fund | 0.40% | 0.30% | 0.40% | 0.40% | 0.40% | |||||||||||||||||||||||
PIMCO RAE Global ex-US Fund | 0.40% | 0.35% | 0.45% | 0.45% | 0.45% | |||||||||||||||||||||||
PIMCO RAE International Fund | 0.30% | 0.30% | 0.40% | 0.40% | 0.40% | |||||||||||||||||||||||
PIMCO RAE US Fund | 0.25% | 0.25% | 0.35% | 0.40% | 0.40% | |||||||||||||||||||||||
PIMCO RAE US Small Fund | 0.35% | 0.25% | 0.35% | 0.40% | 0.40% | |||||||||||||||||||||||
(c) Distribution and Servicing Fees PIMCO Investments LLC, a wholly-owned subsidiary of PIMCO, serves as the distributor (“Distributor”) of the Trust’s shares.
The Trust has adopted separate Distribution and Servicing Plans with respect to the Class A and Class C shares of the Trust pursuant to Rule 12b-1 under the Act. In connection with the distribution of Class C shares of the Trust, the Distributor receives distribution fees from the Trust of up to 0.75% for Class C shares, and in connection with personal services rendered to Class A and Class C shareholders and the maintenance of such shareholder accounts, the Distributor receives servicing fees from the Trust of up to 0.25% for each of Class A and Class C shares (percentages reflect annual rates of the average daily net assets attributable to the applicable class).
The Trust paid distribution and servicing fees at effective rates as noted in the following table (calculated as a percentage of each Fund’s average daily net assets attributable to each class):
| Allowable Rate | ||||||||||||
| Distribution Fee | Servicing Fee | |||||||||||
Class A | — | 0.25% | ||||||||||
Class C | 0.75% | 0.25% | ||||||||||
The Distributor also received the proceeds of the initial sales charges paid by the shareholders upon the purchase of Class A shares and the contingent deferred sales charges paid by the shareholders upon certain redemptions of Class A and Class C shares. For the period ended June 30, 2018, the Distributor retained $95,781 representing commissions (sales charges) and contingent deferred sales charges from the Trust.
(d) Fund Expenses PIMCO provides or procures supervisory and administrative services for shareholders and also bears the costs of various third-party services required by the Funds, including audit, custodial, portfolio accounting, legal, transfer agency and printing costs. The Trust is responsible for the following expenses: (i) taxes and governmental fees; (ii) brokerage fees and commissions and other portfolio transaction expenses; (iii) the costs of borrowing money, including interest expense; (iv) fees and expenses of the Trustees who are
| 74 | PIMCO EQUITY SERIES |
Table of Contents
June 30, 2018
not “interested persons” of PIMCO or the Trust, and any counsel retained exclusively for their benefit; (v) extraordinary expense, including costs of litigation and indemnification expenses; (vi) organizational expenses; and (vii) any expenses allocated or allocable to a specific class of shares, and may include certain other expenses as permitted by the Trust’s Multi-Class Plan adopted pursuant to Rule 18f-3 under the Act and subject to review and approval by the Trustees.. The ratio of expenses to average net assets per share class, as disclosed on the Financial Highlights, may differ from the annual fund operating expenses per share class.
Each Trustee, other than those affiliated with PIMCO or its affiliates, receives an annual retainer of $62,000, plus $6,250 for each Board meeting attended in person, $375 ($750 in the case of the audit committee chair with respect to audit committee meetings) for each committee meeting attended and $750 for each Board meeting attended telephonically, plus reimbursement of related expenses. In addition, the audit committee chair receives an additional annual retainer of $9,000, the valuation oversight committee lead receives an additional annual retainer of $2,000 (to the extent there are co-leads of the valuation oversight committee, the annual retainer will be split evenly between the co-leads, so that each co-lead individually receives an additional retainer of $1,000) and the governance committee chair receives an additional annual retainer of $750.
These expenses are allocated on a pro rata basis to each Fund of the Trust according to its respective net assets. The Trust pays no compensation directly to any Trustee or any other officer who is
affiliated with the Administrator, all of whom receive remuneration for their services to the Trust from the Administrator or its affiliates.
(e) Expense Limitation Pursuant to the Expense Limitation Agreement, PIMCO has agreed to waive a portion of the Funds’ Supervisory and Administrative Fee, or reimburse each Fund, to the extent that each Fund’s organizational expenses, pro rata share of expenses related to obtaining or maintaining a Legal Entity Identifier and pro rata share of Trustee Fees exceed 0.0049%, the “Expense Limit” (calculated as a percentage of each Fund’s average daily net assets attributable to each class). The Expense Limitation Agreement will automatically renew for one-year terms unless PIMCO provides written notice to the Trust at least 30 days prior to the end of the then current term.
Pursuant to the Fee Waiver Agreement, PIMCO has contractually agreed, through October 31, 2018, to waive a portion of the Investment Advisory Fee as set forth in the following table (calculated as a percentage of each Fund’s average daily net assets). This Fee Waiver Agreement will automatically renew for one-year terms unless PIMCO provides written notice to the Trust at least 30 days prior to the end of the then current term. The waiver is reflected in the Statements of Operations as a component of Waiver and/or Reimbursement by PIMCO.
| Fund Name | Fee Waiver | Expiration Date | ||||||||||
PIMCO RAE Emerging Markets Fund | 0.20% | 10/31/2018 | ||||||||||
PIMCO RAE Global Fund | 0.20% | 10/31/2018 | ||||||||||
PIMCO RAE Global ex-US Fund | 0.20% | 10/31/2018 | ||||||||||
PIMCO RAE International Fund | 0.10% | 10/31/2018 | ||||||||||
PIMCO RAE US Fund | 0.10% | 10/31/2018 | ||||||||||
PIMCO RAE US Small Fund | 0.10% | 10/31/2018 | ||||||||||
Under certain conditions, PIMCO may be reimbursed for these waived amounts in future periods, not to exceed thirty-six months after the waiver. The total recoverable amounts to PIMCO (from the Fee Waiver Agreement and Expense Limitation Agreement combined) at June 30, 2018, were as follows (amounts in thousands†):
| Expiring within | ||||||||||||||||||||
| Fund Name | 12 months | 13-24 months | 25-36 months | Total | ||||||||||||||||
PIMCO RAE Emerging Markets Fund | $ | 767 | $ | 3,159 | $ | 3,937 | $ | 7,863 | ||||||||||||
PIMCO RAE Global Fund | 293 | 811 | 877 | 1,981 | ||||||||||||||||
PIMCO RAE Global ex-US Fund | 132 | 151 | 187 | 470 | ||||||||||||||||
PIMCO RAE International Fund | 195 | 380 | 577 | 1,152 | ||||||||||||||||
PIMCO RAE US Fund | 510 | 653 | 730 | 1,893 | ||||||||||||||||
PIMCO RAE US Small Fund | 93 | 111 | 133 | 337 | ||||||||||||||||
| † | A zero balance may reflect actual amounts rounding to less than one thousand. |
(f) Acquired Fund Fees and Expenses Acquired Fund expenses incurred by the Funds, if any, will vary with changes in the expenses of the Acquired Funds, as well as the allocation of the Funds’ assets.
The expenses associated with investing in a fund of funds are generally higher than those for mutual funds that do not invest in other mutual funds. The cost of investing in a fund of funds will generally be higher
than the cost of investing in a mutual fund that invests directly in individual stocks and bonds. By investing in a fund of funds, an investor will indirectly bear fees and expenses charged by Acquired Funds in addition to each Fund’s direct fees and expenses. In addition, the use of a fund of funds structure could affect the timing, amount and character of distributions to the shareholders and may therefore increase the amount of taxes payable by shareholders.
| ANNUAL REPORT | JUNE 30, 2018 | 75 |
Table of Contents
Notes to Financial Statements (Cont.)
PIMCO has contractually agreed, through October 31, 2018, to waive, first, the Investment Advisory Fee and, second, to the extent necessary, the Supervisory and Administrative Fee it receives from the PIMCO RAE Global Fund in an amount equal to its proportionate share of the Investment Advisory Fees and Supervisory and Administrative Fees charged by PIMCO to the Underlying Funds in which the Fund invests (the “Underlying Fund Fees”) indirectly incurred by the Fund in connection with its investments in Underlying Funds, to the extent the Fund’s Investment Advisory Fee or Investment Advisory Fee and Supervisory and Administrative Fee, taken together, are greater than or equal to the Underlying Fund Fees. This waiver will automatically renew for one-year terms unless PIMCO provides written notice to the Trust at least 30 days prior to the end of the then current term.
PIMCO has contractually agreed, through October 31, 2018, to waive, first, the Investment Advisory Fee and, second, to the extent necessary, the Supervisory and Administrative Fee it receives from the PIMCO RAE Global ex-US Fund in an amount equal to the Underlying Fund Fees indirectly incurred by the Fund in connection with its investments in Underlying Funds, to the extent the Fund’s Investment Advisory Fee or Investment Advisory Fee and Supervisory and Administrative Fee, taken together, are greater than or equal to the Underlying Fund Fees. This waiver will automatically renew for one-year terms unless PIMCO provides written notice to the Trust at least 30 days prior to the end of the then current term.
The waivers are reflected on the Statements of Operations as a component of Waiver and/or Reimbursement by PIMCO. For the period ended June 30, 2018, the amounts were (in thousands†):
| Fund Name | Waived Fees | |||||||
PIMCO RAE Global Fund | $ | 2,059 | ||||||
PIMCO RAE Global ex-US Fund | 472 | |||||||
| † | A zero balance may reflect actual amounts rounding to less than one thousand. |
10. RELATED PARTY TRANSACTIONS
The Adviser, Administrator, and Distributor are related parties. Fees paid to these parties are disclosed in Note 9, Fees and Expenses, and the accrued related party fee amounts are disclosed on the Statements of Assets and Liabilities.
11. GUARANTEES AND INDEMNIFICATIONS
Under the Trust’s organizational documents, each Trustee or officer of the Trust is indemnified and each employee or other agent of the Trust (including the Trust’s investment manager) may be indemnified, to the extent permitted by the Act, against certain liabilities that may arise out of performance of their duties to the Funds. Additionally, in the normal course of business, the Funds enter into contracts that contain a variety of indemnification clauses. The Funds’ maximum exposure under these arrangements is unknown as this would involve future claims that may be made against the Funds that have not yet occurred. However, the Funds have not had prior claims or losses pursuant to these contracts.
12. PURCHASES AND SALES OF SECURITIES
The length of time a Fund has held a particular security is not generally a consideration in investment decisions. A change in the securities held by a Fund is known as “portfolio turnover.” Each Fund may engage in frequent and active trading of portfolio securities to achieve its investment objective, particularly during periods of volatile market movements. High portfolio turnover may involve correspondingly greater transaction costs to a Fund, including brokerage commissions or dealer mark-ups and other transaction costs on the sale of securities and reinvestments in other securities. Such sales may also result in realization of taxable capital gains, including short-term capital gains (which are generally taxed at ordinary income tax rates). The transaction costs and tax effects associated with portfolio turnover may adversely affect a Fund’s performance. The portfolio turnover rates are reported in the Financial Highlights.
Purchases and sales of securities (excluding short-term investments) for the period ended June 30, 2018, were as follows (amounts in thousands†):
| U.S. Government/Agency | All Other | |||||||||||||||||||
| Fund Name | Purchases | Sales | Purchases | Sales | ||||||||||||||||
PIMCO RAE Emerging Markets Fund | $ | 0 | $ | 0 | $ | 789,435 | $ | 518,137 | ||||||||||||
PIMCO RAE Global Fund | 0 | 0 | 80,754 | 147,366 | ||||||||||||||||
PIMCO RAE Global ex-US Fund | 0 | 0 | 7,717 | 10,239 | ||||||||||||||||
PIMCO RAE International Fund | 0 | 0 | 308,678 | 245,475 | ||||||||||||||||
PIMCO RAE US Fund | 0 | 0 | 379,998 | 293,139 | ||||||||||||||||
PIMCO RAE US Small Fund | 0 | 0 | 50,573 | 34,547 | ||||||||||||||||
| † | A zero balance may reflect actual amounts rounding to less than one thousand. |
| 76 | PIMCO EQUITY SERIES |
Table of Contents
June 30, 2018
13. SHARES OF BENEFICIAL INTEREST
The Trust may issue an unlimited number of shares of beneficial interest with a $0.001 par value. Changes in shares of beneficial interest were as follows (shares and amounts in thousands†):
| PIMCO RAE Emerging Markets Fund | PIMCO RAE Global Fund | PIMCO RAE Global ex-US Fund | ||||||||||||||||||||||||||||||||||||||||||||||||
| Year Ended 06/30/2018 | Year Ended 06/30/2017 | Year Ended 06/30/2018 | Year Ended 06/30/2017 | Year Ended 06/30/2018 | Year Ended 06/30/2017 | |||||||||||||||||||||||||||||||||||||||||||||
| Shares | Amount | Shares | Amount | Shares | Amount | Shares | Amount | Shares | Amount | Shares | Amount | |||||||||||||||||||||||||||||||||||||||
Receipts for shares sold | ||||||||||||||||||||||||||||||||||||||||||||||||||
Institutional Class | 30,347 | $ | 349,297 | 25,177 | $ | 257,984 | 5,200 | $ | 59,960 | 8,572 | $ | 83,162 | 57 | $ | 648 | 374 | $ | 3,637 | ||||||||||||||||||||||||||||||||
I-2 | 845 | 9,918 | 1,697 | 17,758 | 82 | 929 | 357 | 3,687 | 62 | 692 | 33 | 334 | ||||||||||||||||||||||||||||||||||||||
Class A | 628 | 7,473 | 559 | 5,606 | 81 | 940 | 71 | 731 | 88 | 1,003 | 69 | 671 | ||||||||||||||||||||||||||||||||||||||
Class C | 208 | 2,439 | 107 | 1,103 | 60 | 688 | 97 | 964 | 82 | 926 | 66 | 635 | ||||||||||||||||||||||||||||||||||||||
Issued as reinvestment of distributions | ||||||||||||||||||||||||||||||||||||||||||||||||||
Institutional Class | 12,803 | 144,230 | 4,256 | 40,860 | 2,182 | 25,015 | 1,225 | 12,217 | 300 | 3,392 | 180 | 1,683 | ||||||||||||||||||||||||||||||||||||||
I-2 | 112 | 1,259 | 10 | 91 | 21 | 235 | 1 | 5 | 2 | 19 | 0 | 1 | ||||||||||||||||||||||||||||||||||||||
Class A | 32 | 361 | 4 | 40 | 6 | 67 | 2 | 17 | 3 | 35 | 0 | 4 | ||||||||||||||||||||||||||||||||||||||
Class C | 15 | 166 | 1 | 9 | 9 | 100 | 3 | 31 | 5 | 54 | 1 | 12 | ||||||||||||||||||||||||||||||||||||||
Cost of shares redeemed | ||||||||||||||||||||||||||||||||||||||||||||||||||
Institutional Class | (10,430 | ) | (122,669 | ) | (47,996 | ) | (491,118 | ) | (12,724 | ) | (144,589 | ) | (2,141 | ) | (22,369 | ) | (739 | ) | (8,369 | ) | (296 | ) | (2,660 | ) | ||||||||||||||||||||||||||
I-2 | (680 | ) | (7,893 | ) | (557 | ) | (5,597 | ) | (95 | ) | (1,074 | ) | (73 | ) | (759 | ) | (12 | ) | (133 | ) | (1 | ) | (15 | ) | ||||||||||||||||||||||||||
Class A | (151 | ) | (1,744 | ) | (401 | ) | (4,097 | ) | (44 | ) | (497 | ) | (10 | ) | (104 | ) | (16 | ) | (176 | ) | (1 | ) | (10 | ) | ||||||||||||||||||||||||||
Class C | (132 | ) | (1,536 | ) | (18 | ) | (177 | ) | (72 | ) | (810 | ) | (33 | ) | (337 | ) | (30 | ) | (331 | ) | (10 | ) | (98 | ) | ||||||||||||||||||||||||||
Net increase (decrease) resulting from Fund share transactions | 33,597 | $ | 381,301 | (17,161 | ) | $ | (177,538 | ) | (5,294 | ) | $ | (59,036 | ) | 8,071 | $ | 77,245 | (198 | ) | $ | (2,240 | ) | 415 | $ | 4,194 | ||||||||||||||||||||||||||
| PIMCO RAE International Fund | PIMCO RAE US Fund | PIMCO RAE US Small Fund | ||||||||||||||||||||||||||||||||||||||||||||||||
| Year Ended 06/30/2018 | Year Ended 06/30/2017 | Year Ended 06/30/2018 | Year Ended 06/30/2017 | Year Ended 06/30/2018 | Year Ended 06/30/2017 | |||||||||||||||||||||||||||||||||||||||||||||
| Shares | Amount | Shares | Amount | Shares | Amount | Shares | Amount | Shares | Amount | Shares | Amount | |||||||||||||||||||||||||||||||||||||||
Receipts for shares sold | ||||||||||||||||||||||||||||||||||||||||||||||||||
Institutional Class | 22,737 | $ | 256,560 | 19,815 | $ | 189,367 | 23,795 | $ | 269,702 | 13,507 | $ | 139,095 | 2,176 | $ | 25,480 | 850 | $ | 9,150 | ||||||||||||||||||||||||||||||||
I-2 | 213 | 2,339 | 806 | 7,617 | 226 | 2,500 | 762 | 7,885 | 79 | 896 | 356 | 3,909 | ||||||||||||||||||||||||||||||||||||||
Class A | 447 | 4,961 | 28 | 257 | 206 | 2,288 | 449 | 4,662 | 214 | 2,481 | 647 | 7,142 | ||||||||||||||||||||||||||||||||||||||
Class C | 76 | 820 | 32 | 304 | 124 | 1,362 | 440 | 4,491 | 30 | 349 | 44 | 479 | ||||||||||||||||||||||||||||||||||||||
Issued as reinvestment of distributions | ||||||||||||||||||||||||||||||||||||||||||||||||||
Institutional Class | 1,176 | 13,088 | 815 | 7,429 | 3,244 | 36,389 | 2,784 | 28,874 | 401 | 4,636 | 106 | 1,184 | ||||||||||||||||||||||||||||||||||||||
I-2 | 11 | 125 | 17 | 152 | 42 | 468 | 29 | 305 | 17 | 197 | 2 | 22 | ||||||||||||||||||||||||||||||||||||||
Class A | 6 | 62 | 0 | 1 | 40 | 444 | 23 | 236 | 32 | 371 | 4 | 39 | ||||||||||||||||||||||||||||||||||||||
Class C | 2 | 20 | 1 | 9 | 24 | 267 | 22 | 226 | 2 | 27 | 0 | 3 | ||||||||||||||||||||||||||||||||||||||
Cost of shares redeemed | ||||||||||||||||||||||||||||||||||||||||||||||||||
Institutional Class | (18,960 | ) | (207,043 | ) | (3,164 | ) | (30,253 | ) | (17,502 | ) | (194,714 | ) | (9,645 | ) | (99,837 | ) | (541 | ) | (6,516 | ) | (1,256 | ) | (13,718 | ) | ||||||||||||||||||||||||||
I-2 | (523 | ) | (5,840 | ) | (457 | ) | (4,350 | ) | (360 | ) | (4,009 | ) | (398 | ) | (4,142 | ) | (93 | ) | (1,083 | ) | (163 | ) | (1,775 | ) | ||||||||||||||||||||||||||
Class A | (10 | ) | (105 | ) | (1 | ) | (11 | ) | (314 | ) | (3,470 | ) | (86 | ) | (885 | ) | (621 | ) | (7,084 | ) | (61 | ) | (666 | ) | ||||||||||||||||||||||||||
Class C | (43 | ) | (472 | ) | (19 | ) | (176 | ) | (246 | ) | (2,706 | ) | (117 | ) | (1,197 | ) | (19 | ) | (217 | ) | (20 | ) | (214 | ) | ||||||||||||||||||||||||||
Net increase (decrease) resulting from Fund share transactions | 5,132 | $ | 64,515 | 17,873 | $ | 170,346 | 9,279 | $ | 108,521 | 7,770 | $ | 79,713 | 1,677 | $ | 19,537 | 509 | $ | 5,555 | ||||||||||||||||||||||||||||||||
| † | A zero balance may reflect actual amounts rounding to less than one thousand. |
| ANNUAL REPORT | JUNE 30, 2018 | 77 |
Table of Contents
Notes to Financial Statements (Cont.)
The following table discloses the number of shareholders that own 10% or more of the outstanding shares of a Fund along with their respective percent ownership, if any, for the period ended June 30, 2018. Some of these shareholders may be considered related parties, which may include, but are not limited to, the investment adviser and its affiliates, affiliated broker dealers, fund of funds and directors or employees of the Trust or Adviser.
| Shareholders that own 10% or more of outstanding shares | Total percentage of portfolio held by shareholders that own 10% or more of outstanding shares | |||||||||||||||||||
| Non-Related Parties | Related Parties | Non-Related Parties | Related Parties | |||||||||||||||||
RAE Emerging Markets Fund | 0 | 2 | 0% | 83% | ||||||||||||||||
RAE Global Fund | 1 | 0 | 21% | 0% | ||||||||||||||||
RAE Global ex-US Fund | 2 | 0 | 90% | 0% | ||||||||||||||||
RAE International Fund | 0 | 2 | 0% | 41% | ||||||||||||||||
RAE US Fund | 0 | 1 | 0% | 20% | ||||||||||||||||
RAE US Small Fund | 2 | 1 | 51% | 18% | ||||||||||||||||
14. REGULATORY AND LITIGATION MATTERS
The Funds are not named as defendants in any material litigation or arbitration proceedings and are not aware of any material litigation or claim pending or threatened against them.
The foregoing speaks only as of the date of this report.
15. FEDERAL INCOME TAX MATTERS
Each Fund intends to qualify as a regulated investment company under Subchapter M of the Internal Revenue Code (the “Code”) and distribute all of its taxable income and net realized gains, if applicable, to shareholders. Accordingly, no provision for Federal income taxes has been made.
A Fund may be subject to local withholding taxes, including those imposed on realized capital gains. Any applicable foreign capital gains
tax is accrued daily based upon net unrealized gains, and may be payable following the sale of any applicable investments.
In accordance with U.S. GAAP, the Adviser has reviewed the Funds’ tax positions for all open tax years. As of June 30, 2018, the Funds have recorded no liability for net unrecognized tax benefits relating to uncertain income tax positions they have taken or expect to take in future tax returns.
The Funds file U.S. federal, state, and local tax returns as required. The Funds’ tax returns are subject to examination by relevant tax authorities until expiration of the applicable statute of limitations, which is generally three years after the filing of the tax return but which can be extended to six years in certain circumstances. Tax returns for open years have incorporated no uncertain tax positions that require a provision for income taxes.
As of June 30, 2018, the components of distributable taxable earnings are as follows (amounts in thousands†):
| Undistributed Ordinary Income(1) | Undistributed Long-Term Capital Gains | Net Tax Basis Unrealized Appreciation/ (Depreciation)(2) | Other Book-to-Tax Accounting Differences(3) | Accumulated Capital Losses(4) | Qualified Late-Year Loss Deferral - Capital(5) | Qualified Late-Year Loss Deferral - Ordinary(6) | ||||||||||||||||||||||||||
PIMCO RAE Emerging Markets Fund | $ | 24,543 | $ | 117,540 | $ | 232,066 | $ | (16 | ) | $ | (15,390 | ) | $ | 0 | $ | 0 | ||||||||||||||||
PIMCO RAE Global Fund | 0 | 9,050 | 55,011 | (5 | ) | 0 | 0 | 0 | ||||||||||||||||||||||||
PIMCO RAE Global ex-US Fund | 0 | 0 | 6,068 | (2 | ) | 0 | 0 | 0 | ||||||||||||||||||||||||
PIMCO RAE International Fund | 12,067 | 13,005 | 43,226 | (7 | ) | 0 | 0 | 0 | ||||||||||||||||||||||||
PIMCO RAE US Fund | 8,765 | 17,481 | 162,495 | (18 | ) | 0 | 0 | 0 | ||||||||||||||||||||||||
PIMCO RAE US Small Fund | 1,095 | 4,552 | 26,739 | (3 | ) | 0 | 0 | 0 | ||||||||||||||||||||||||
| † | A zero balance may reflect actual amounts rounding to less than one thousand. |
| (1) | Includes undistributed short-term capital gains, if any. |
| (2) | Adjusted for open wash sale loss deferrals and the accelerated recognition of unrealized gain or loss on certain forward contracts for federal income tax purposes. Also adjusted for differences between book and tax realized and unrealized gain (loss) on convertible preferred securities, non-REIT return of capital, and passive foreign investment companies (PFICs). |
| (3) | Represents differences in income tax regulations and financial accounting principles generally accepted in the United States of America, mainly for organizational expenditures. |
| (4) | Capital losses available to offset future net capital gains expire in varying amounts as shown below. |
| (5) | Capital losses realized during the period November 1, 2017 through June 30, 2018 which the Funds elected to defer to the following taxable year pursuant to income tax regulations. |
| (6) | Specified losses realized during the period November 1, 2017 through June 30, 2018 and Ordinary losses realized during the period January 1, 2018 through June 30, 2018, which the Funds elected to defer to the following taxable year pursuant to income tax regulations. |
| 78 | PIMCO EQUITY SERIES |
Table of Contents
June 30, 2018
Under the Regulated Investment Company Act of 2010, a fund is permitted to carry forward any new capital losses for an unlimited period. Additionally, such capital losses that are carried forward will retain their character as either short-term or long-term capital losses rather than being considereed all short-term under previous law.
As of June 30, 2018, the Funds had the following post-effective capital losses with no expiration (amounts in thousands†):
| Short-Term | Long-Term | |||||||||||
PIMCO RAE Emerging Markets Fund* | $ | 2,812 | $ | 12,578 | ||||||||
PIMCO RAE Global Fund | 0 | 0 | ||||||||||
PIMCO RAE Global ex-US Fund | 0 | 0 | ||||||||||
PIMCO RAE International Fund | 0 | 0 | ||||||||||
PIMCO RAE US Fund | 0 | 0 | ||||||||||
PIMCO RAE US Small Fund | 0 | 0 | ||||||||||
| † | A zero balance may reflect actual amounts rounding to less than one thousand. |
| (7) | *Portion of amount represents realized loss and recognized built-in loss, which is carried forward to future years to offset future realized gain subject to certain limitations. |
As of June 30, 2018, the aggregate cost and the net unrealized appreciation/(depreciation) of investments for federal income tax purposes are as follows (amounts in thousands†):
| Federal Tax Cost | Unrealized Appreciation | Unrealized (Depreciation) | Net Unrealized Appreciation/ (Depreciation)(7) | |||||||||||||||||
PIMCO RAE Emerging Markets Fund | $ | 1,632,335 | $ | 331,499 | $ | (99,396 | ) | $ | 232,103 | |||||||||||
PIMCO RAE Global Fund | 311,205 | 55,013 | 0 | 55,013 | ||||||||||||||||
PIMCO RAE Global ex-US Fund | 73,900 | 6,069 | 0 | 6,069 | ||||||||||||||||
PIMCO RAE International Fund | 502,316 | 58,374 | (15,135 | ) | 43,239 | |||||||||||||||
PIMCO RAE US Fund | 628,555 | 175,384 | (12,889 | ) | 162,495 | |||||||||||||||
PIMCO RAE US Small Fund | 112,062 | 31,188 | (4,449 | ) | 26,739 | |||||||||||||||
| † | A zero balance may reflect actual amounts rounding to less than one thousand. |
| (8) | Primary differences, if any, between book and tax net unrealized appreciation/(depreciation) on investments are attributable to open wash sale loss deferrals, unrealized gain or loss on certain forward contracts, passive foreign investment companies (PFICs), convertible preferred securities and, non-REIT return of capital. |
For the fiscal years ended June 30, 2018 and June 30, 2017, respectively, the Funds made the following tax basis distributions (amounts in thousands†):
| June 30, 2018 | June 30, 2017 | |||||||||||||||||||||||||||
| Ordinary Income Distributions(8) | Long-Term Capital Gain Distributions | Return of Capital(9) | Ordinary Income Distributions(8) | Long-Term Capital Gain Distributions | Return of Capital(9) | |||||||||||||||||||||||
PIMCO RAE Emerging Markets Fund | $ | 124,456 | $ | 21,560 | $ | 0 | $ | 41,001 | $ | 0 | $ | 0 | ||||||||||||||||
PIMCO RAE Global Fund | 16,660 | 10,235 | 0 | 9,400 | 3,546 | 0 | ||||||||||||||||||||||
PIMCO RAE Global ex-US Fund | 2,846 | 257 | 397 | 1,572 | 0 | 128 | ||||||||||||||||||||||
PIMCO RAE International Fund | 13,002 | 307 | 0 | 7,601 | 0 | 0 | ||||||||||||||||||||||
PIMCO RAE US Fund | 17,000 | 20,898 | 0 | 13,428 | 16,218 | 0 | ||||||||||||||||||||||
PIMCO RAE US Small Fund | 1,600 | 3,633 | 0 | 1,249 | 0 | 0 | ||||||||||||||||||||||
| † | A zero balance may reflect actual amounts rounding to less than one thousand. |
| (9) | Includes short-term capital gains distributed, if any. |
| (10) | A portion of the distributions made represents a tax return of capital. Return of capital distributions have been reclassified from undistributed net investment income to paid-in capital to more appropriately conform financial accounting to tax accounting. |
16. SUBSEQUENT EVENTS
Effective July 30, 2018, certain funds as indicated in the table below had name changes.
Current Fund Name | Former Fund Name | |
PIMCO RAE Emerging Markets Fund | PIMCO RAE Fundamental Emerging Markets Fund | |
PIMCO RAE Global Fund | PIMCO RAE Fundamental Global Fund | |
PIMCO RAE Global ex-US Fund | PIMCO RAE Fundamental Global ex-US Fund | |
PIMCO RAE International Fund | PIMCO RAE Fundamental International Fund | |
PIMCO RAE US Fund | PIMCO RAE Fundamental US Fund | |
PIMCO RAE US Small Fund | PIMCO RAE Fundamental US Small Fund |
There were no other subsequent events identified that require recognition or disclosure.
| ANNUAL REPORT | JUNE 30, 2018 | 79 |
Table of Contents
Report of Independent Registered Public Accounting Firm
To the Board of Trustees of PIMCO Equity Series® and Shareholders of PIMCO RAE Emerging Markets Fund, PIMCO RAE Global Fund, PIMCO RAE Global ex-US Fund, PIMCO RAE International Fund, PIMCO RAE US Fund and PIMCO RAE US Small Fund
Opinions on the Financial Statements
We have audited the accompanying statements of assets and liabilities, including the schedules of investments, of PIMCO RAE Emerging Markets Fund (formerly PIMCO RAE Fundamental Emerging Markets Fund), PIMCO RAE Global Fund (formerly PIMCO RAE Fundamental Global Fund), PIMCO RAE Global ex-US Fund (formerly PIMCO RAE Fundamental Global ex-US Fund), PIMCO RAE International Fund (formerly PIMCO RAE Fundamental International Fund), PIMCO RAE US Fund (formerly PIMCO RAE Fundamental US Fund) and PIMCO RAE US Small Fund (formerly PIMCO RAE Fundamental US Small Fund) (six of the funds constituting PIMCO Equity Series®, hereafter collectively referred to as the “Funds”) as of June 30, 2018, the related statements of operations for the year ended June 30, 2018, the statements of changes in net assets for each of the two years in the period ended June 30, 2018, including the related notes, and the financial highlights for each of the periods indicated therein (collectively referred to as the “financial statements”). In our opinion, the financial statements present fairly, in all material respects, the financial position of each of the Funds as of June 30, 2018, the results of each of their operations for the year then ended, the changes in each of their net assets for each of the two years in the period ended June 30, 2018 and each of the financial highlights for each of the periods indicated therein in conformity with accounting principles generally accepted in the United States of America.
Basis for Opinions
These financial statements are the responsibility of the Funds’ management. Our responsibility is to express an opinion on the Funds’ financial statements based on our audits. We are a public accounting firm registered with the Public Company Accounting Oversight Board (United States) (“PCAOB”) and are required to be independent with respect to the Funds in accordance with the U.S. federal securities laws and the applicable rules and regulations of the Securities and Exchange Commission and the PCAOB.
We conducted our audits of these financial statements in accordance with the standards of the PCAOB. Those standards require that we plan and perform the audit to obtain reasonable assurance about whether the financial statements are free of material misstatement, whether due to error or fraud.
Our audits included performing procedures to assess the risks of material misstatement of the financial statements, whether due to error or fraud, and performing procedures that respond to those risks. Such procedures included examining, on a test basis, evidence regarding the amounts and disclosures in the financial statements. Our audits also included evaluating the accounting principles used and significant estimates made by management, as well as evaluating the overall presentation of the financial statements. Our procedures included confirmation of securities owned as of June 30, 2018 by correspondence with the custodian, transfer agent and brokers; when replies were not received from brokers, we performed other auditing procedures. We believe that our audits provide a reasonable basis for our opinions.
/s/ PricewaterhouseCoopers LLP
Kansas City, Missouri
August 23, 2018
We have served as the auditor of one or more investment companies in PIMCO Equity Series® since 2010.
| 80 | PIMCO EQUITY SERIES |
Table of Contents
Glossary: (abbreviations that may be used in the preceding statements)
(Unaudited)
Counterparty Abbreviations: | ||||||||||
| FICC | Fixed Income Clearing Corporation | |||||||||
Currency Abbreviations: | ||||||||||
| USD (or $) | United States Dollar | |||||||||
Other Abbreviations: | ||||||||||
| ADR | American Depositary Receipt | REIT | Real Estate Investment Trust | SP - GDR | Sponsored Global Depositary Receipt | |||||
| GDR | Global Depositary Receipt | SP - ADR | Sponsored American Depositary Receipt | TBA | To-Be-Announced | |||||
| NVDR | Non-Voting Depositary Receipt | |||||||||
| ANNUAL REPORT | JUNE 30, 2018 | 81 |
Table of Contents
Federal Income Tax Information
(Unaudited)
As required by the Internal Revenue Code (“Code”) and Treasury Regulations, if applicable, shareholders must be notified within 60 days of the Funds’ fiscal year end regarding the status of qualified dividend income and the dividend received deduction.
Dividend Received Deduction. Corporate shareholders are generally entitled to take the dividend received deduction on the portion of a Funds’ dividend distribution that qualifies under tax law. The percentage of the following Funds’ Fiscal 2018 ordinary income dividend that qualifies for the corporate dividend received deduction is set forth below:
Qualified Dividend Income. Under the Jobs and Growth Tax Relief Reconciliation Act of 2003 (the “Act”), the following percentage of ordinary dividends paid during the fiscal year ended June 30, 2018 was designated as ‘qualified dividend income’ as defined in the Act subject to reduced tax rates in 2018:
Qualified Interest Income and Qualified Short-Term Capital Gain (for non-U.S. resident shareholders only). Under the American Jobs Creation Act of 2004, the following amounts of ordinary dividends paid during the fiscal year ended June 30, 2018 are considered to be derived from “qualified interest income,” as defined in Section 871(k)(1)(E) of the Code, and therefore are designated as interest-related dividends, as defined in Section 871(k)(1)(C) of the Code. Further, the following amounts of ordinary dividends paid during the fiscal year ended June 30, 2018 are considered to be derived from “qualified short-term capital gain,” as defined in Section 871(k)(2)(D) of the Code, and therefore are designated as qualified short-term gain dividends, as defined by Section 871(k)(2)(C) of the Code.
| Dividend Received Deduction % | Qualified Dividend Income % | Qualified Interest Income (000s† ) | Qualified Short-Term Capital Gain (000s†) | Foreign Source Income | Foreign Taxes Pass Through | |||||||||||||||||||||||
PIMCO RAE Emerging Markets Fund | 0% | 100% | $ | 0 | $ | 92,457 | $ | 61,799,004 | $ | 7,381,117 | ||||||||||||||||||
PIMCO RAE Global Fund | 25.74% | 54.91% | 0 | 3,919 | 9,141,934 | 213,383 | ||||||||||||||||||||||
PIMCO RAE Global ex-US Fund | 0% | 57.79% | 0 | 0 | 3,082,356 | 71,852 | ||||||||||||||||||||||
PIMCO RAE International Fund | 0% | 100% | 0 | 0 | 20,444,755 | 1,819,391 | ||||||||||||||||||||||
PIMCO RAE US Fund | 100% | 100% | 0 | 4,000 | 0 | 0 | ||||||||||||||||||||||
PIMCO RAE US Small Fund | 86.31% | 86.34% | 0 | 0 | 0 | 0 | ||||||||||||||||||||||
| † | A zero balance may reflect actual amounts rounding to less than one thousand. |
Shareholders are advised to consult their own tax advisor with respect to the tax consequences of their investment in the Trust. In January 2019, you will be advised on IRS Form 1099-DIV as to the federal tax status of the dividends and distributions received by you in calendar year 2018.
| 82 | PIMCO EQUITY SERIES |
Table of Contents
(Unaudited)
The charts below identify the Trustees and executive officers of the Trust. Unless otherwise indicated, the address of all persons below is 650 Newport Center Drive, Newport Beach, CA 92660.
The Funds’ Statement of Additional Information includes more information about the Trustees and Officers. To request a free copy, call PIMCO at (888) 87-PIMCO or visit the Funds’ website at www.pimco.com.
| Name, Year of Birth and Position Held with Trust* | Term of Office and Length of Time Served† | Principal Occupation(s) During Past 5 Years | Number of Funds in Fund Complex Overseen by Trustee | Other Public Company and Investment Company Directorships Held by Trustee During the Past 5 Years | ||||
| Interested Trustees1 | ||||||||
Brent R. Harris (1959) Chairman of the Board | 03/2010 to present | Managing Director, PIMCO. Senior Vice President of the Trust, PIMCO Equity Series VIT, PIMCO Funds, PIMCO Variable Insurance Trust and PIMCO ETF Trust. Formerly, member of Executive Committee, PIMCO. | 162 | Chairman and Trustee, PIMCO Equity Series VIT, PIMCO Funds, PIMCO Variable Insurance Trust, PIMCO ETF Trust; Director, StocksPLUS® Management, Inc; and member of Board of Governors, Investment Company Institute. | ||||
| Independent Trustees | ||||||||
Jennifer Holden Dunbar (1963) Trustee | 02/2016 to present | Managing Director, Dunbar Partners, LLC (business consulting and investments). Formerly, Partner, Leonard Green & Partners, L.P. | 162 | Trustee, PIMCO Equity Series VIT, PIMCO Funds, PIMCO Variable Insurance and PIMCO ETF Trust; Director, PS Business Parks; Director, Big 5 Sporting Goods Corporation. | ||||
Peter B. McCarthy (1950) Trustee | 09/2011 to present | Formerly, Assistant Secretary and Chief Financial Officer, United States Department of Treasury; Deputy Managing Director, Institute of International Finance. | 162 | Trustee, PIMCO Equity Series VIT, PIMCO Funds, PIMCO Variable Insurance and PIMCO ETF Trust. | ||||
Ronald C. Parker (1951) Trustee | 02/2016 to present | Director of Roseburg Forest Products Company. Formerly, Chairman of the Board, The Ford Family Foundation; and President, Chief Executive Officer, Hampton Affiliates (forestry products). | 162 | Trustee, PIMCO Equity Series VIT; Lead Independent Trustee, PIMCO Funds, PIMCO Variable Insurance and PIMCO ETF Trust. | ||||
| * | Unless otherwise noted, the information for the individuals listed is as of June 30, 2018. |
| 1 | Mr. Harris is an “interested persons” of the Trust (as that term is defined in the 1940 Act) because of his affiliations with PIMCO. |
| † | Trustees serve until their successors are duly elected and qualified. |
| ANNUAL REPORT | JUNE 30, 2018 | 83 |
Table of Contents
Management of the Trust (Cont.)
Executive Officers
| Name, Year of Birth and Position Held with Trust* | Term of Office and Length of Time Served | Principal Occupation(s) During Past 5 Years† | ||
Peter G. Strelow (1970) President | 02/2014 to present
Senior Vice President 11/2013 to 02/2014
Vice President 03/2010 to 11/2013 | Managing Director and Co-Chief Operating Officer, PIMCO. President, PIMCO Funds, PIMCO Variable Insurance Trust, PIMCO ETF Trust, PIMCO Equity Series VIT, PIMCO Managed Accounts Trust, PIMCO-Sponsored Interval Funds and PIMCO-Sponsored Closed-End Funds. Formerly, Chief Administrative Officer, PIMCO. | ||
David C. Flattum (1964) Chief Legal Officer | 03/2010 to present | Managing Director and General Counsel, PIMCO. Chief Legal Officer, PIMCO Funds, PIMCO Variable Insurance Trust, PIMCO ETF Trust and PIMCO Equity Series VIT. Formerly, Managing Director, Chief Operating Officer and General Counsel, Allianz Asset Management of America L.P. | ||
Jennifer E. Durham (1970) Chief Compliance Officer | 03/2010 to present | Managing Director and Chief Compliance Officer, PIMCO. Chief Compliance Officer, PIMCO Funds, PIMCO Variable Insurance Trust, PIMCO ETF Trust and PIMCO Equity Series VIT. | ||
Brent R. Harris (1959) Senior Vice President | 03/2010 to present | Managing Director, PIMCO. Senior Vice President, PIMCO Funds, PIMCO Variable Insurance Trust, PIMCO ETF Trust and PIMCO Equity Series VIT. Formerly, member of Executive Committee, PIMCO. | ||
Joshua D. Ratner (1976)** Vice President - Senior Counsel, Secretary | 11/2013 to present
Assistant Secretary 03/2010 to 01/2011 | Executive Vice President and General Deputy Counsel, PIMCO. Chief Legal Officer, PIMCO Investments LLC. Vice President - Senior Counsel, Secretary, PIMCO Funds, PIMCO Variable Insurance Trust, PIMCO ETF Trust and PIMCO Equity Series VIT. Vice President, Secretary and Chief Legal Officer, PIMCO Managed Accounts Trust, PIMCO-Sponsored Interval Funds and PIMCO-Sponsored Closed-End Funds. | ||
Ryan G. Leshaw (1980) Assistant Secretary | 05/2012 to present | Senior Vice President and Senior Counsel, PIMCO. Assistant Secretary, PIMCO Funds, PIMCO Variable Insurance Trust, PIMCO ETF Trust, PIMCO Equity Series VIT, PIMCO Managed Accounts Trust, PIMCO-Sponsored Interval Funds and PIMCO-Sponsored Closed-End Funds. Formerly, Associate, Willkie Farr & Gallagher LLP. | ||
Wu-Kwan Kit (1981) Assistant Secretary | 08/2017 to present | Vice President and Counsel, PIMCO. Assistant Secretary, PIMCO Funds, PIMCO Variable Insurance Trust, PIMCO ETF Trust, PIMCO Equity Series VIT, PIMCO Managed Accounts Trust, PIMCO-Sponsored Interval Funds and PIMCO-Sponsored Closed-End Funds. Formerly, Assistant General Counsel, VanEck Associates Corp. | ||
Stacie D. Anctil (1969) Vice President | 05/2015 to present
Assistant Treasurer 03/2010 to 05/2015 | Executive Vice President, PIMCO. Vice President, PIMCO Funds, PIMCO Variable Insurance Trust, PIMCO ETF Trust, PIMCO Equity Series VIT, PIMCO Managed Accounts Trust, PIMCO-Sponsored Interval Funds and PIMCO-Sponsored Closed-End Funds. | ||
William G. Galipeau (1974) Vice President | 11/2013 to present | Executive Vice President, PIMCO. Vice President, PIMCO Funds, PIMCO Variable Insurance Trust, PIMCO ETF Trust, PIMCO Equity Series VIT, PIMCO Managed Accounts Trust, PIMCO-Sponsored Interval Funds and PIMCO-Sponsored Closed-End Funds. | ||
Eric D. Johnson (1970) Vice President | 05/2011 to present | Executive Vice President, PIMCO. Vice President, PIMCO Funds, PIMCO Variable Insurance Trust, PIMCO ETF Trust, PIMCO Equity Series VIT, PIMCO Managed Accounts Trust, PIMCO-Sponsored Interval Funds and PIMCO-Sponsored Closed-End Funds. | ||
Henrik P. Larsen (1970) Vice President | 03/2010 to present | Senior Vice President, PIMCO. Vice President, PIMCO Funds, PIMCO Variable Insurance Trust, PIMCO ETF Trust and PIMCO Equity Series VIT. | ||
Bijal Y. Parikh (1978) Vice President | 02/2017 to present | Senior Vice President, PIMCO. Vice President, PIMCO Funds, PIMCO Variable Insurance Trust, PIMCO ETF Trust, PIMCO Equity Series VIT, PIMCO Managed Accounts Trust, PIMCO-Sponsored Interval Funds and PIMCO-Sponsored Closed-End Funds. | ||
Greggory S. Wolf (1970) Vice President | 05/2011 to present | Senior Vice President, PIMCO. Vice President, PIMCO Funds, PIMCO Variable Insurance Trust, PIMCO ETF Trust and PIMCO Equity Series VIT. | ||
Trent W. Walker (1974) Treasurer | 11/2013 to present
Assistant Treasurer 03/2010 to 11/2013 | Executive Vice President, PIMCO. Treasurer, PIMCO Funds, PIMCO Variable Insurance Trust, PIMCO ETF Trust, PIMCO Equity Series VIT, PIMCO Managed Accounts Trust, PIMCO-Sponsored Interval Funds and PIMCO-Sponsored Closed-End Funds. | ||
Erik C. Brown (1967) Assistant Treasurer | 03/2010 to present | Executive Vice President, PIMCO. Assistant Treasurer, PIMCO Funds, PIMCO Variable Insurance Trust, PIMCO ETF Trust, PIMCO Equity Series VIT, PIMCO Managed Accounts Trust, PIMCO-Sponsored Interval Funds and PIMCO-Sponsored Closed-End Funds. | ||
Colleen D. Miller (1980)** Assistant Treasurer | 02/2017 to present | Senior Vice President, PIMCO. Assistant Treasurer, PIMCO Funds, PIMCO Variable Insurance Trust, PIMCO ETF Trust, PIMCO Equity Series VIT, PIMCO Managed Accounts Trust, PIMCO-Sponsored Interval Funds and PIMCO-Sponsored Closed-End Funds. Formerly, Vice President Cohen & Steers Capital Management. | ||
Christopher M. Morin (1980) Assistant Treasurer | 08/2016 to present | Senior Vice President, PIMCO. Assistant Treasurer, PIMCO Funds, PIMCO Variable Insurance Trust, PIMCO ETF Trust, PIMCO Equity Series VIT, PIMCO Managed Accounts Trust, PIMCO-Sponsored Interval Funds and PIMCO-Sponsored Closed-End Funds. | ||
| 84 | PIMCO EQUITY SERIES |
Table of Contents
(Unaudited)
| Name, Year of Birth and Position Held with Trust* | Term of Office and Length of Time Served | Principal Occupation(s) During Past 5 Years† | ||
Jason J. Nagler (1982)** Assistant Treasurer | 05/2015 to present | Vice President, PIMCO. Assistant Treasurer, PIMCO Funds, PIMCO Variable Insurance Trust, PIMCO ETF Trust, PIMCO Equity Series VIT, PIMCO Managed Accounts Trust, PIMCO-Sponsored Interval Funds and PIMCO-Sponsored Closed-End Funds. Formerly, Head of Mutual Fund Reporting, GMO and Assistant Treasurer, GMO Trust and GMO Series Trust Funds. | ||
| * | Unless otherwise noted, the information for the individuals listed is as of June 30, 2018. |
| † | The term “PIMCO Closed-End Funds” as used herein includes: PIMCO California Municipal Income Fund, PIMCO California Municipal Income Fund II, PIMCO California Municipal Income Fund III, PIMCO Municipal Income Fund, PIMCO Municipal Income Fund II, PIMCO Municipal Income Fund III, PIMCO New York Municipal Income Fund, PIMCO New York Municipal Income Fund II, PIMCO New York Municipal Income Fund III, PCM Fund Inc., PIMCO Corporate & Income Opportunity Fund, PIMCO Corporate & Income Strategy Fund, PIMCO Dynamic Credit and Mortgage Income Fund, PIMCO Dynamic Income Fund, PIMCO Global StocksPLUS® & Income Fund, PIMCO High Income Fund, PIMCO Income Opportunity Fund, PIMCO Income Strategy Fund, PIMCO Income Strategy Fund II and PIMCO Strategic Income Fund, Inc.; the term “PIMCO-Sponsored Interval Funds” as used herein includes: PIMCO Flexible Credit Income Fund and PIMCO Flexible Municipal Income Fund. |
| ** | The address of these officers is Pacific Investment Management Company LLC, 1633 Broadway, New York, New York 10019. |
| ANNUAL REPORT | JUNE 30, 2018 | 85 |
Table of Contents
The Funds2,3 consider customer privacy to be a fundamental aspect of their relationships with shareholders and are committed to maintaining the confidentiality, integrity and security of their current, prospective and former shareholders’ non-public personal information. The Funds have developed policies that are designed to protect this confidentiality, while allowing shareholder needs to be served.
OBTAINING PERSONAL INFORMATION
In the course of providing shareholders with products and services, the Funds and certain service providers to the Funds, such as the Funds’ investment advisers or sub-advisers (“Advisers”), may obtain non-public personal information about shareholders, which may come from sources such as account applications and other forms, from other written, electronic or verbal correspondence, from shareholder transactions, from a shareholder’s brokerage or financial advisory firm, financial advisor or consultant, and/or from information captured on applicable websites.
RESPECTING YOUR PRIVACY
As a matter of policy, the Funds do not disclose any non-public personal information provided by shareholders or gathered by the Funds to non-affiliated third parties, except as required or permitted by law or as necessary for such third parties to perform their agreements with respect to the Funds. As is common in the industry, non-affiliated companies may from time to time be used to provide certain services, such as preparing and mailing prospectuses, reports, account statements and other information, conducting research on shareholder satisfaction and gathering shareholder proxies. The Funds or their affiliates may also retain non-affiliated companies to market Fund shares or products which use Fund shares and enter into joint marketing arrangements with them and other companies. These companies may have access to a shareholder’s personal and account information, but are permitted to use this information solely to provide the specific service or as otherwise permitted by law. In most cases, the shareholders will be clients of a third party, but the Funds may also provide a shareholder’s personal and account information to the shareholder’s respective brokerage or financial advisory firm and/or financial advisor or consultant.
SHARING INFORMATION WITH THIRD PARTIES
The Funds reserve the right to disclose or report personal or account information to non-affiliated third parties in limited circumstances where the Funds believe in good faith that disclosure is required under law, to cooperate with regulators or law enforcement authorities, to protect their rights or property, or upon reasonable request by any fund advised by PIMCO in which a shareholder has invested. In addition, the Funds may disclose information about a shareholder or a shareholder’s accounts to a non-affiliated third party at the shareholder’s request or with the consent of the shareholder.
SHARING INFORMATION WITH AFFILIATES
The Funds may share shareholder information with their affiliates in connection with servicing shareholders’ accounts, and subject to applicable law may provide shareholders with information about products and services that the Funds or their Advisers, distributors or their affiliates (“Service Affiliates”) believe may be of interest to such shareholders. The information that the Funds may share may include, for example, a shareholder’s participation in the Funds or in other investment programs sponsored by a Service Affiliate, a shareholder’s ownership of certain types of accounts (such as IRAs), information about the Funds’ experiences or transactions with a shareholder, information captured on applicable websites, or other data about a shareholder’s accounts, subject to applicable law. The Funds’ Service Affiliates, in turn, are not permitted to share shareholder information with non-affiliated entities, except as required or permitted by law.
PROCEDURES TO SAFEGUARD PRIVATE INFORMATION
The Funds take seriously the obligation to safeguard shareholder non-public personal information. In addition to this policy, the Funds have implemented procedures that are designed to restrict access to a shareholder’s non-public personal information to internal personnel who need to know that information to perform their jobs, such as servicing shareholder accounts or notifying shareholders of new products or services. Physical, electronic and procedural safeguards are in place to guard a shareholder’s non-public personal information.
INFORMATION COLLECTED FROM WEBSITES
Websites maintained by the Funds or their service providers may use a variety of technologies to collect information that help the Funds and their service providers understand how the website is used. Information collected from your web browser (including small files stored on your device that are commonly referred to as “cookies”) allow the websites to recognize your web browser and help to personalize and improve your user experience and enhance navigation of the website. In addition, the Funds or their Service Affiliates may use third parties to place advertisements for the Funds on other websites, including banner advertisements. Such third parties may collect anonymous information through the use of cookies or action tags (such as web beacons). The information these third parties collect is generally limited to technical and web navigation information, such as your IP address, web pages visited and browser type, and does not include personally identifiable information such as name, address, phone number or email address. If you are a registered user of the Funds’ website, the Funds or their service providers or third party firms engaged by the Funds or their service providers may collect or share information submitted by you, which may include personally identifiable information. This information can be useful to the Funds
| 86 | PIMCO EQUITY SERIES |
Table of Contents
(Unaudited)
when assessing and offering services and website features. You can change your cookie preferences by changing the setting on your web browser to delete or reject cookies. If you delete or reject cookies, some website pages may not function properly. The Funds do not look for web browser “do not track” requests.
CHANGES TO THE PRIVACY POLICY
From time to time, the Funds may update or revise this privacy policy. If there are changes to the terms of this privacy policy, documents containing the revised policy on the relevant website will be updated.
1 Amended as of February 14, 2017.
2 PIMCO Investments LLC (“PI”) serves as the Funds’ distributor. This Privacy Policy applies to the activities of PI to the extent that PI regularly effects or engages in transactions with or for a Fund shareholder who is the record owner of such shares. For purposes of this Privacy Policy, references to “the Funds” shall include PI when acting in this capacity.
3 When distributing this Policy, a Fund may combine the distribution with any similar distribution of its investment adviser’s privacy policy. The distributed, combined policy may be written in the first person (i.e., by using “we” instead of “the Funds”).
| ANNUAL REPORT | JUNE 30, 2018 | 87 |
Table of Contents
General Information
Investment Adviser and Administrator
Pacific Investment Management Company LLC
650 Newport Center Drive
Newport Beach, CA 92660
Investment Sub-Adviser
Research Affiliates, LLC
620 Newport Center Drive, Suite 900
Newport Beach, CA 92660
Portfolio Implementer
Parametric Portfolio Associates
1918 Eighth Avenue, Suite 3100
Seattle, WA 98101
Distributor
PIMCO Investments LLC
1633 Broadway
New York, NY 10019
Custodian
State Street Bank and Trust Company
801 Pennsylvania Avenue
Kansas City, MO 64105
Transfer Agent
DST Asset Manager Solutions, Inc.
Institutional Class, I-2, Administrative Class
430 W 7th Street STE 219024
Kansas City, MO 64105-1407
DST Asset Manager Solutions, Inc.
Class A, Class C, Class R
430 W 7th Street STE 219294
Kansas City, MO 64105-1407
Legal Counsel
Dechert LLP
1900 K Street, N.W.
Washington, D.C. 20006
Independent Registered Public Accounting Firm
PricewaterhouseCoopers LLP
1100 Walnut Street, Suite 1300
Kansas City, MO 64106
This report is submitted for the general information of the shareholders of the Funds listed on the Report cover.
Table of Contents

PES3003AR_063018
Table of Contents

PIMCO Equity Series®
Annual Report
June 30, 2018
PIMCO REALPATH® Blend 2020 Fund
PIMCO REALPATH® Blend 2025 Fund
PIMCO REALPATH® Blend 2030 Fund
PIMCO REALPATH® Blend 2035 Fund
PIMCO REALPATH® Blend 2040 Fund
PIMCO REALPATH® Blend 2045 Fund
PIMCO REALPATH® Blend 2050 Fund
PIMCO REALPATH® Blend 2055 Fund
PIMCO REALPATH® Blend Income Fund
Table of Contents
| Page | ||||||||
| 2 | ||||||||
| 4 | ||||||||
| 26 | ||||||||
| 28 | ||||||||
| 34 | ||||||||
| 38 | ||||||||
| 40 | ||||||||
| 72 | ||||||||
| 93 | ||||||||
| 94 | ||||||||
| 95 | ||||||||
| 96 | ||||||||
| 99 | ||||||||
| Fund | Fund Summary | Schedule of Investments | ||||||
| 8 | 42 | |||||||
| 10 | 46 | |||||||
| 12 | 50 | |||||||
| 14 | 53 | |||||||
| 16 | 56 | |||||||
| 18 | 59 | |||||||
| 20 | 62 | |||||||
| 22 | 65 | |||||||
| 24 | 68 | |||||||
This material is authorized for use only when preceded or accompanied by the current PIMCO Equity Series prospectus. The Shareholder Reports for the other series of PIMCO Equity Series are printed separately.
Table of Contents
Dear Shareholder,
Following is the PIMCO Equity Series Annual Report, which covers the 12-month reporting period ended June 30, 2018. On the subsequent pages you will find specific details regarding investment results and a discussion of factors that most affected performance over the reporting period.
For the 12-month reporting period ended June 30, 2018
The U.S. economy continued to expand during the reporting period. Looking back, U.S. gross domestic product (GDP) expanded at a revised annual pace of 2.8% and 2.3% during the third and fourth quarters of 2017, respectively. First-quarter 2018 GDP then moderated to a revised annual pace of 2.2%. The Commerce Department’s initial reading — released after the reporting period had ended — showed that second-quarter 2018 GDP grew at an annual pace of 4.1%.
The Federal Reserve (Fed) continued to normalize monetary policy during the reporting period. After raising interest rates in March and June 2017, the Fed again raised rates in December, moving the federal funds rate up to a range between 1.25% and 1.50%. And, in October 2017, the Fed started to reduce its balance sheet. At its March 2018 meeting, the Fed again increased rates to a range between 1.50% and 1.75%. Finally, at its meeting that concluded on June 13, 2018, the Fed raised rates to a range between 1.75% and 2.00%.
Economic activity outside the U.S. initially accelerated during the reporting period, but then moderated somewhat as the reporting period progressed. Against this backdrop, the European Central Bank (ECB) and Bank of Japan largely maintained their highly accommodative monetary policies. Other central banks took a more hawkish stance. In November 2017, the Bank of England instituted its first rate hike since 2007, and the Bank of Canada raised rates twice during the reporting period. Meanwhile, in June 2018, the ECB indicated that it plans to end its quantitative easing program by the end of the year, but it did not expect to raise interest rates “at least through the summer of 2019.”
The U.S. Treasury yield curve flattened during the reporting period, as short-term rates moved up more than their longer-term counterparts. The increase in rates at the short end of the yield curve was mostly due to Fed interest rate hikes. The yield on the benchmark 10-year U.S. Treasury note was 2.85% at the end of the reporting period, up from 2.31% on June 30, 2017. U.S. Treasuries, as measured by the Bloomberg Barclays U.S. Treasury Index, returned -0.65% over the 12 months ended June 30, 2018. Meanwhile, the Bloomberg Barclays U.S. Aggregate Bond Index, a widely used index of U.S. investment grade bonds, returned -0.40% over the period. Riskier fixed income asset classes, including high yield corporate bonds and emerging market debt, generated mixed results versus the broad U.S. market. The ICE BofAML U.S. High Yield Index gained 2.53% over the reporting period, whereas emerging market external debt, as represented by the JPMorgan Emerging Markets Bond Index (EMBI) Global, returned -2.45% over the reporting period. Emerging market local bonds, as represented by the JPMorgan Government Bond Index-Emerging Markets Global Diversified Index (Unhedged), returned -2.33% over the period.
Global equities generally rose over the first seven months of the period. This rally was driven by a number of factors, including improving global growth, corporate profits that often exceeded expectations and, in the U.S., optimism surrounding the passage of a tax reform bill in December 2017. In the U.S., a portion of those gains were given back in February and March 2018. This was partially due to concerns over less accommodative central bank policies and fears of a trade war. However, U.S. equities then rallied over the last three months of the reporting period. All told, U.S. equities, as represented by the S&P 500 Index, returned 14.37% during the reporting period. Emerging market equities, as measured by the MSCI Emerging Markets Index, returned 8.20% over the period, whereas global equities, as represented by the MSCI World Index, returned 11.09%. Elsewhere, Japanese equities, as represented by the Nikkei 225 Index (in JPY), returned 13.45% over the reporting period and European equities, as represented by the MSCI Europe Index (in EUR), returned 2.85%.
| 2 | PIMCO EQUITY SERIES |
Table of Contents
Commodity prices fluctuated but generally moved higher during the 12 months ended June 30, 2018. When the reporting period began, crude oil was approximately $46 a barrel. By the end of the period, it was roughly $74 a barrel. This ascent was driven in part by planned and observed production cuts by OPEC and the collapse in Venezuelan oil production, as well as global growth maintaining demand. Elsewhere, gold and copper prices moved modestly higher over the reporting period.
Finally, during the reporting period, there were periods of volatility in the foreign exchange markets, due in part to signs of improving global growth, decoupling central bank policies, and a number of geopolitical events. The U.S. dollar generally weakened against other major currencies over the reporting period. For example, the U.S. dollar returned -2.26%, -1.40% and -1.45% versus the euro, British pound and Japanese yen, respectively, during the 12 months ended June 30, 2018.
Thank you for the assets you have placed with us. We deeply value your trust, and will continue to work diligently to meet your broad investment needs. For any questions regarding the funds, please contact your account manager or financial adviser, or call one of our shareholder associates at 888.87.PIMCO. We also invite you to visit our website at pimco.com to learn more about our global viewpoints.
 | Sincerely,
Brent R. Harris Chairman of the Board PIMCO Equity Series
August 23, 2018
|

Past performance is no guarantee of future results. Unless otherwise noted, index returns reflect the reinvestment of income distributions and capital gains, if any, but do not reflect fees, brokerage commissions or other expenses of investing. It is not possible to invest directly in an unmanaged index.
| ANNUAL REPORT | JUNE 30, 2018 | 3 |
Table of Contents
Important Information About the Funds
PIMCO Equity Series (the “Trust”) is an open-end management investment company that includes PIMCO REALPATH® Blend 2020 Fund, PIMCO REALPATH® Blend 2025 Fund, PIMCO REALPATH® Blend 2030 Fund, PIMCO REALPATH® Blend 2035 Fund, PIMCO REALPATH® Blend 2040 Fund, PIMCO REALPATH® Blend 2045 Fund, PIMCO REALPATH® Blend 2050 Fund, PIMCO REALPATH® Blend 2055 Fund and PIMCO REALPATH® Blend Income Fund (each, a “Fund” and collectively, the “Funds”).
We believe that equity funds have an important role to play in a well-diversified investment portfolio. It is important to note, however, that equity funds are subject to notable risks. Among other things, equity and equity-related securities may decline in value due to both real and perceived general market, economic, and industry conditions.
The Funds are each “fund of funds,” which is a term used to describe mutual funds that pursue their investment objective by investing in other mutual funds instead of investing directly in stocks or bonds of other issuers. Under normal circumstances, the Funds invest in a combination of affiliated and unaffiliated funds that are registered under the Investment Company Act of 1940, as amended, equity securities, fixed income instruments of varying maturities, or related derivatives on any of the preceding securities mentioned. The Funds may invest in Institutional Class or Class M shares of any funds of the Trust and PIMCO Funds, and in other affiliated funds, including funds of PIMCO ETF Trust, except funds of funds (collectively, “Underlying PIMCO Funds”), and unaffiliated funds that are registered under the Investment Company Act of 1940 (collectively, “Acquired Funds”). The risks and strategies associated with an investment in the Fund may result from direct investments and/or indirect exposure through investment in Acquired Funds.
In an environment where interest rates may trend upward, rising rates would negatively impact the performance of certain funds, and fixed income securities held by a Fund (and/or Underlying PIMCO Funds or Acquired Funds, as applicable) are likely to decrease in value. A number of factors can cause interest rates to rise (e.g., central bank monetary policies, inflation rates, general economic conditions, etc.). In addition, changes in interest rates can be sudden and significant, and there is no guarantee that management will anticipate such movement accurately.
The values of equity securities, such as common stocks and preferred securities, have historically risen and fallen in periodic cycles and may decline due to general market conditions, which are not specifically related to a particular company, such as real or perceived adverse economic conditions, changes in the general outlook for corporate earnings, changes in interest or currency rates or adverse investor sentiment generally. Equity securities may also decline due to factors that affect a particular industry or industries, such as labor shortages, increased production costs and competitive conditions within an
industry. In addition, the value of an equity security may decline for a number of reasons that directly relate to the issuer, such as management performance, financial leverage and reduced demand for the issuer’s goods or services, as well as the historical and prospective earnings of the issuer and the value of its assets. Different types of equity securities may react differently to these developments and a change in the financial condition of a single issuer may affect securities markets as a whole.
During a general downturn in the securities markets, multiple asset classes, including equity securities, may decline in value simultaneously. The market price of equity securities owned by a Fund may go up or down, sometimes rapidly or unpredictably. Equity securities generally have greater price volatility than fixed income securities and common stocks generally have the greatest appreciation and depreciation potential of all equity securities.
Interest rates in the U.S. are at or near historically low levels. As such, funds that invest in fixed income securities may currently face an increased exposure to the risks associated with a rising interest rate environment. This is especially true as the Fed ended its quantitative easing program in October 2014 and has begun, and may continue, to raise interest rates. To the extent the Fed continues to raise interest rates, there is a risk that rates across the financial system may rise. Further, while the U.S. bond market has steadily grown over the past three decades, dealer inventories of corporate bonds have remained relatively stagnant. As a result, there has been a significant reduction in the ability of dealers to “make markets.”
Bond funds and individual bonds with a longer duration (a measure used to determine the sensitivity of a security’s price to changes in interest rates) tend to be more sensitive to changes in interest rates, usually making them more volatile than securities or funds with shorter durations. All of the factors mentioned above, individually or collectively, could lead to increased volatility and/or lower liquidity in the fixed income markets or negatively impact a Fund’s performance or cause the Fund to incur losses. As a result, a Fund may experience increased shareholder redemptions, which, among other things, could further reduce the net assets of the Fund.
The Funds may be subject to various risks as described in each Fund’s prospectus and in the Principal Risks in the Notes to Financial Statements.
The geographical classification of foreign (non-U.S.) securities in this report are classified by the country of incorporation of a holding. In certain instances, a security’s country of incorporation may be different from its country of economic exposure. The United States presidential administration’s enforcement of tariffs on goods from other countries, with a focus on China, has contributed to international trade tensions and may impact portfolio securities.
| 4 | PIMCO EQUITY SERIES |
Table of Contents
The PIMCO REALPATH® Blend Funds are intended for investors who prefer to have their asset allocation decisions made by professional
money managers and are designed to offer individual investors comprehensive asset allocation strategies tailored to the time when they expect to retire or to begin withdrawing assets. Each PIMCO REALPATH® Blend Fund is designed for investors expecting to retire or to begin withdrawing portions of their investments around the year indicated in the Fund’s name. The retirement year included in the REALPATH® Blend Fund’s name does not necessarily represent the specific year you expect to begin withdrawing your assets. It is intended only as a general guide.
The PIMCO REALPATH® Blend Funds are designed to provide investors with a comprehensive retirement solution tailored to the time when they expect to retire or plan to start withdrawing money (the “target date”). Each PIMCO REALPATH® Blend Fund follows a target asset allocation schedule that changes over time to help reduce portfolio risk, increasing its exposure to conservative investments as the target date approaches. The principal value of a Fund is not guaranteed at any time, including the target date. A Fund’s shareholders may experience losses, including losses near, at, or after the target year indicated in the PIMCO REALPATH® Blend Fund’s name.
On each individual Fund Summary page in this Shareholder Report, the Average Annual Total Return table and Cumulative Returns chart measure performance assuming that any dividend and capital gain distributions were reinvested. Returns do not reflect the deduction of taxes that a shareholder would pay on (i) Fund distributions or (ii) the
redemption of Fund shares. The Cumulative Returns chart and Average Annual Total Return table reflect any sales load that would have applied at the time of purchase or any Contingent Deferred Sales Charge (“CDSC”) that would have applied if a full redemption occurred on the last business day of the period shown in the Cumulative Returns chart. Class A shares are subject to an initial sales charge. A CDSC may be imposed in certain circumstances on Class A shares that are purchased without an initial sales charge and then redeemed during the first 12 months after purchase. The Cumulative Returns chart reflects only Institutional Class performance. Performance may vary by share class based on each class’s expense ratios. Performance shown is net of fees and expenses. The minimum initial investment amount for Institutional Class and Administrative Class shares is $1,000,000. The minimum initial investment amount for Class A shares is $1,000. Each Fund measures its performance against at least one broad-based securities market index (“benchmark index”). The benchmark index does not take into account fees, expenses, or taxes. A Fund’s past performance, before and after taxes, is not necessarily an indication of how the Fund will perform in the future. There is no assurance that any Fund, including any Fund that has experienced high or unusual performance for one or more periods, will experience similar levels of performance in the future. High performance is defined as a significant increase in either 1) a Fund’s total return in excess of that of the Fund’s benchmark between reporting periods or 2) a Fund’s total return in excess of the Fund’s historical returns between reporting periods. Unusual performance is defined as a significant change in a Fund’s performance as compared to one or more previous reporting periods.
The following table discloses the inception dates of each Fund and its respective share classes along with each Fund’s diversification status as of period end:
| Fund Name | Fund Inception | Institutional Class | Administrative Class | Class A | Class R | Diversification Status | ||||||||||||||||||||||
PIMCO REALPATH® Blend 2020 Fund | 12/31/14 | 12/31/14 | 12/31/14 | 12/31/14 | — | Diversified | ||||||||||||||||||||||
PIMCO REALPATH® Blend 2025 Fund | 12/31/14 | 12/31/14 | 12/31/14 | 12/31/14 | — | Diversified | ||||||||||||||||||||||
PIMCO REALPATH® Blend 2030 Fund | 12/31/14 | 12/31/14 | 12/31/14 | 12/31/14 | — | Diversified | ||||||||||||||||||||||
PIMCO REALPATH® Blend 2035 Fund | 12/31/14 | 12/31/14 | 12/31/14 | 12/31/14 | — | Diversified | ||||||||||||||||||||||
PIMCO REALPATH® Blend 2040 Fund | 12/31/14 | 12/31/14 | 12/31/14 | 12/31/14 | — | Diversified | ||||||||||||||||||||||
PIMCO REALPATH® Blend 2045 Fund | 12/31/14 | 12/31/14 | 12/31/14 | 12/31/14 | — | Diversified | ||||||||||||||||||||||
PIMCO REALPATH® Blend 2050 Fund | 12/31/14 | 12/31/14 | 12/31/14 | 12/31/14 | — | Diversified | ||||||||||||||||||||||
PIMCO REALPATH® Blend 2055 Fund | 12/31/14 | 12/31/14 | 12/31/14 | 12/31/14 | — | Diversified | ||||||||||||||||||||||
PIMCO REALPATH® Blend Income Fund | 12/31/14 | 12/31/14 | 12/31/14 | 12/31/14 | — | Diversified | ||||||||||||||||||||||
An investment in a Fund is not a bank deposit and is not guaranteed or insured by the Federal Deposit Insurance Corporation (“FDIC”) or any other government agency. It is possible to lose money on investments in a Fund.
The Trustees are responsible generally for overseeing the management of the Trust. The Trustees authorize the Trust to enter into service
agreements with the Adviser, the Distributor, the Administrator and other service providers in order to provide, and in some cases authorize service providers to procure through other parties, necessary or desirable services on behalf of the Trust and the Funds. Shareholders are not parties to or third-party beneficiaries of such service agreements. Neither a Fund’s prospectus nor a Fund’s summary prospectus, the Trust’s Statement of Additional Information (“SAI”),
| ANNUAL REPORT | JUNE 30, 2018 | 5 |
Table of Contents
Important Information About the Funds (cont.)
any contracts filed as exhibits to the Trust’s registration statement, nor any other communications, disclosure documents or regulatory filings (including this report) from or on behalf of the Trust or a Fund creates a contract between or among any shareholder of a Fund, on the one hand, and the Trust, a Fund, a service provider to the Trust or a Fund, and/or the Trustees or officers of the Trust, on the other hand. The Trustees (or the Trust and its officers, service providers or other delegates acting under authority of the Trustees) may amend the most recent prospectus or use a new prospectus, summary prospectus or SAI with respect to a Fund or the Trust, and/or amend, file and/or issue any other communications, disclosure documents or regulatory filings, and may amend or enter into any contracts to which the Trust or a Fund is a party, and interpret the investment objective(s), policies, restrictions and contractual provisions applicable to any Fund, without shareholder input or approval, except in circumstances in which shareholder approval is specifically required by law (such as changes to fundamental investment policies) or where a shareholder approval requirement is specifically disclosed in the Trust’s then-current prospectus or SAI.
PIMCO has adopted written proxy voting policies and procedures (“Proxy Policy”) as required by Rule 206(4)-6 under the Investment Advisers Act of 1940, as amended. The Proxy Policy has been adopted by the Trust as the policies and procedures that PIMCO will use when voting proxies on behalf of a Fund. A description of the policies and
procedures that PIMCO uses to vote proxies relating to portfolio securities of a Fund, and information about how the Fund voted proxies relating to portfolio securities held during the most recent twelve-month period ended June 30th, are available without charge, upon request, by calling the Trust at (888) 87-PIMCO, on the Fund’s website at www.pimco.com, and on the Securities and Exchange Commission’s (“SEC”) website at www.sec.gov.
The Trust files a complete schedule of each Fund’s holdings with the SEC for the first and third quarters of each fiscal year on Form N-Q. A copy of a Fund’s Form N-Q is available on the SEC’s website at www.sec.gov and may be reviewed and copied at the SEC’s Public Reference Room in Washington, D.C. A Fund’s Form N-Q is also available without charge, upon request, by calling the Trust at (888) 87-PIMCO and on the Fund’s website at www.pimco.com. Information on the operation of the Public Reference Room may be obtained by calling 1-800-SEC-0330.
The SEC adopted a rule that generally allows funds to deliver shareholder reports to investors by providing access to such reports online free of charge and by mailing a notice that the report is electronically available. Pursuant to the rule, investors may still elect to receive a complete shareholder report in the mail. PIMCO is evaluating how to make the electronic delivery option available to shareholders in the future.
| 6 | PIMCO EQUITY SERIES |
Table of Contents
(THIS PAGE INTENTIONALLY LEFT BLANK)
| ANNUAL REPORT | JUNE 30, 2018 | 7 |
Table of Contents
PIMCO REALPATH® Blend 2020 Fund
Cumulative Returns Through June 30, 2018
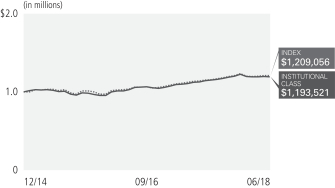
$1,000,000 invested at the end of the month when the Fund’s Institutional Class commenced operations.
Investment Objective and Strategy Overview
PIMCO REALPATH® Blend 2020 Fund seeks to maximize total return, consistent with prudent investment management, by investing under normal circumstances in a combination of affiliated and unaffiliated funds that are registered under the Investment Company Act of 1940, as amended (the “1940 Act”), equity securities, Fixed Income Instruments of varying maturities, or related derivatives on any securities mentioned above. Under normal circumstances, the Fund seeks to invest substantially all of its equity exposure in index tracking securities, including investments in affiliated or unaffiliated investment companies, which will be registered under the 1940 Act, or related derivatives on such securities or indexes. “Fixed Income Instruments” include bonds, debt securities and other similar instruments issued by various U.S. and non-U.S. public- or private-sector entities. The Fund will invest in such funds, securities, instruments and other investments to the extent permitted under the 1940 Act, or any exemptive relief therefrom. Fund strategies may change from time to time. Please refer to the Fund’s current prospectus for more information regarding the Fund’s strategy.
| Average Annual Total Return for the period ended June 30, 2018 | ||||||||||
| 1 Year | Fund Inception (12/31/14) | |||||||||
 | PIMCO REALPATH® Blend 2020 Fund Institutional Class | 6.03% | 5.19% | |||||||
| PIMCO REALPATH® Blend 2020 Fund Administrative Class | 5.74% | 4.91% | ||||||||
| PIMCO REALPATH® Blend 2020 Fund Class A | 5.57% | 4.69% | ||||||||
| PIMCO REALPATH® Blend 2020 Fund Class A (adjusted) | (0.28)% | 3.02% | ||||||||
 | S&P Target Date 2020 Index± | 6.27% | 5.58% | |||||||
All Fund returns are net of fees and expenses.
± The S&P Target Date Index Series is comprised of eleven multi-asset class indices, each corresponding to a particular target retirement date. Each index provides varying levels of exposure to each asset class. Each target date allocation is created and retired according to a pre-determined schedule related to the respective target date, as indicated in the index name, and is based on market observations through an annual survey of target date fund managers.
It is not possible to invest directly in an unmanaged index.
Performance quoted represents past performance. Past performance is not a guarantee or a reliable indicator of future results. Current performance may be lower or higher than performance shown. Investment return and the principal value of an investment will fluctuate. Shares may be worth more or less than original cost when redeemed. Returns shown do not reflect the deduction of taxes that a shareholder would pay on fund distributions or the redemption of fund shares. Differences in the Fund’s performance versus the index and related attribution information with respect to particular categories of securities or individual positions may be attributable, in part, to differences in the pricing methodologies used by the Fund and the index. The adjusted returns take into account the maximum sales charge of 5.50% on Class A shares. For performance data current to the most recent month-end is available at visit www.pimco.com or via (888) 87-PIMCO.
The Fund’s total annual operating expense ratio in effect as of period end, were 0.42% for the Institutional Class shares, 0.67% for the Administrative shares, and 0.92% for the Class A shares. Details regarding any changes to the Fund’s operating expenses, subsequent to period end, can be found in the Fund’s current prospectus, as supplemented.
| 8 | PIMCO EQUITY SERIES |
Table of Contents
| Institutional Class - PBZNX | Administrative Class - PBZDX | Class A - PBZAX |
Top 10 Holdings as of 06/30/20181§
Vanguard Institutional Index Fund ‘Institutional’ | 21.4% | |||||||
PIMCO Income Fund | 13.8% | |||||||
Vanguard Developed Markets Index Fund ‘Admiral’ | 10.9% | |||||||
PIMCO Total Return Fund | 9.3% | |||||||
PIMCO Real Return Fund | 8.0% | |||||||
PIMCO International Bond Fund (U.S. Dollar-Hedged) | 5.1% | |||||||
PIMCO Long-Term Real Return Fund | 5.0% | |||||||
Vanguard Emerging Markets Stock Index Fund ‘Admiral’ | 4.9% | |||||||
PIMCO High Yield Fund | 4.6% | |||||||
PIMCO Long Duration Total Return Fund | 3.7% |
1 % of Investments, at value.
§ Top 10 Holdings and % of Investments exclude securities sold short, financial derivative instruments and short-term instruments, if any.
Fund Insights
The following affected performance during the reporting period:
| » | Exposure to U.S. large market capitalization equities benefited absolute performance, as U.S. large market capitalization equities posted positive returns. |
| » | Exposure to developed ex U.S. equities benefited absolute performance, as developed ex U.S. equities posted positive returns. |
| » | Exposure to U.S. small market capitalization equities benefited absolute performance, as U.S. small market capitalization equities posted positive returns. |
| » | Exposure to emerging market equities benefited absolute performance, as emerging market equities posted positive returns. |
| » | Exposure to long-term U.S. Treasury Inflation-Protected Securities (TIPS) benefited absolute performance, as long-term TIPS posted positive returns. |
| ANNUAL REPORT | JUNE 30, 2018 | 9 |
Table of Contents
PIMCO REALPATH® Blend 2025 Fund
Cumulative Returns Through June 30, 2018

$1,000,000 invested at the end of the month when the Fund’s Institutional Class commenced operations.
Investment Objective and Strategy Overview
PIMCO REALPATH® Blend 2025 Fund seeks to maximize total return, consistent with prudent investment management, by investing under normal circumstances in a combination of affiliated and unaffiliated funds that are registered under the Investment Company Act of 1940, as amended (the “1940 Act”), equity securities, Fixed Income Instruments of varying maturities, or related derivatives on any securities mentioned above. Under normal circumstances, the Fund seeks to invest substantially all of its equity exposure in index tracking securities, including investments in affiliated or unaffiliated investment companies, which will be registered under the 1940 Act, or related derivatives on such securities or indexes. “Fixed Income Instruments” include bonds, debt securities and other similar instruments issued by various U.S. and non-U.S. public- or private-sector entities. The Fund will invest in such funds, securities, instruments and other investments to the extent permitted under the 1940 Act, or any exemptive relief therefrom. Fund strategies may change from time to time. Please refer to the Fund’s current prospectus for more information regarding the Fund’s strategy.
| Average Annual Total Return for the period ended June 30, 2018 | ||||||||||
| 1 Year | Fund Inception (12/31/14) | |||||||||
| PIMCO REALPATH® Blend 2025 Fund Institutional Class | 6.92% | 5.58% | |||||||
| PIMCO REALPATH® Blend 2025 Fund Administrative Class | 6.65% | 5.30% | ||||||||
| PIMCO REALPATH® Blend 2025 Fund Class A | 6.36% | 5.05% | ||||||||
| PIMCO REALPATH® Blend 2025 Fund Class A (adjusted) | 0.50% | 3.37% | ||||||||
| S&P Target Date 2025 Index± | 7.38% | 6.23% | |||||||
All Fund returns are net of fees and expenses.
± The S&P Target Date Index Series is comprised of eleven multi-asset class indices, each corresponding to a particular target retirement date. Each index provides varying levels of exposure to each asset class. Each target date allocation is created and retired according to a pre-determined schedule related to the respective target date, as indicated in the index name, and is based on market observations through an annual survey of target date fund managers.
It is not possible to invest directly in an unmanaged index.
Performance quoted represents past performance. Past performance is not a guarantee or a reliable indicator of future results. Current performance may be lower or higher than performance shown. Investment return and the principal value of an investment will fluctuate. Shares may be worth more or less than original cost when redeemed. Returns shown do not reflect the deduction of taxes that a shareholder would pay on fund distributions or the redemption of fund shares. Differences in the Fund’s performance versus the index and related attribution information with respect to particular categories of securities or individual positions may be attributable, in part, to differences in the pricing methodologies used by the Fund and the index. The adjusted returns take into account the maximum sales charge of 5.50% on Class A shares. For performance data current to the most recent month-end is available at visit www.pimco.com or via (888) 87-PIMCO.
The Fund’s total annual operating expense ratio in effect as of period end, were 0.38% for the Institutional Class shares, 0.63% for the Administrative shares, and 0.88% for the Class A shares. Details regarding any changes to the Fund’s operating expenses, subsequent to period end, can be found in the Fund’s current prospectus, as supplemented.
| 10 | PIMCO EQUITY SERIES |
Table of Contents
| Institutional Class - PPZRX | Administrative Class - PPZDX | Class A - PPZAX |
Top 10 Holdings as of 06/30/20181§
Vanguard Institutional Index Fund ‘Institutional’ | 26.5% | |||||||
Vanguard Developed Markets Index Fund ‘Admiral’ | 13.6% | |||||||
PIMCO Income Fund | 9.7% | |||||||
PIMCO Long-Term Real Return Fund | 6.6% | |||||||
Vanguard Emerging Markets Stock Index Fund ‘Admiral’ | 6.1% | |||||||
PIMCO Total Return Fund | 6.0% | |||||||
PIMCO Real Return Fund | 5.1% | |||||||
PIMCO Long Duration Total Return Fund | 4.9% | |||||||
PIMCO Long-Term Credit Bond Fund | 4.8% | |||||||
PIMCO High Yield Fund | 3.8% |
1 % of Investments, at value.
§ Top 10 Holdings and % of Investments exclude securities sold short, financial derivative instruments and short-term instruments, if any.
Fund Insights
The following affected performance during the reporting period:
| » | Exposure to U.S. large market capitalization equities benefited absolute performance, as U.S. large market capitalization equities posted positive returns. |
| » | Exposure to developed ex U.S. equities benefited absolute performance, as developed ex U.S. equities posted positive returns. |
| » | Exposure to U.S. small market capitalization equities benefited absolute performance, as U.S. small market capitalization equities posted positive returns. |
| » | Exposure to emerging market equities benefited absolute performance, as emerging market equities posted positive returns. |
| » | Exposure to long-term U.S. Treasury Inflation-Protected Securities (TIPS) benefited absolute performance, as long-term TIPS posted positive returns. |
| ANNUAL REPORT | JUNE 30, 2018 | 11 |
Table of Contents
PIMCO REALPATH® Blend 2030 Fund
Cumulative Returns Through June 30, 2018
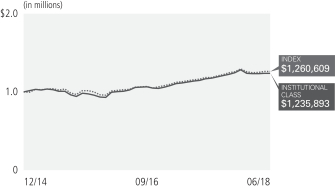
$1,000,000 invested at the end of the month when the Fund’s Institutional Class commenced operations.
Investment Objective and Strategy Overview
PIMCO REALPATH® Blend 2030 Fund seeks to maximize total return, consistent with prudent investment management, by investing under normal circumstances in a combination of affiliated and unaffiliated funds that are registered under the Investment Company Act of 1940, as amended (the “1940 Act”), equity securities, Fixed Income Instruments of varying maturities, or related derivatives on any securities mentioned above. Under normal circumstances, the Fund seeks to invest substantially all of its equity exposure in index tracking securities, including investments in affiliated or unaffiliated investment companies, which will be registered under the 1940 Act, or related derivatives on such securities or indexes. “Fixed Income Instruments” include bonds, debt securities and other similar instruments issued by various U.S. and non-U.S. public- or private-sector entities. The Fund will invest in such funds, securities, instruments and other investments to the extent permitted under the 1940 Act, or any exemptive relief therefrom. Fund strategies may change from time to time. Please refer to the Fund’s current prospectus for more information regarding the Fund’s strategy.
| Average Annual Total Return for the period ended June 30, 2018 | ||||||||||
| 1 Year | Fund Inception (12/31/14) | |||||||||
| PIMCO REALPATH® Blend 2030 Fund Institutional Class | 7.81% | 6.25% | |||||||
| PIMCO REALPATH® Blend 2030 Fund Administrative Class | 7.64% | 5.99% | ||||||||
| PIMCO REALPATH® Blend 2030 Fund Class A | 7.36% | 5.74% | ||||||||
| PIMCO REALPATH® Blend 2030 Fund Class A (adjusted) | 1.43% | 4.05% | ||||||||
| S&P Target Date 2030 Index± | 8.47% | 6.84% | |||||||
All Fund returns are net of fees and expenses.
± The S&P Target Date Index Series is comprised of eleven multi-asset class indices, each corresponding to a particular target retirement date. Each index provides varying levels of exposure to each asset class. Each target date allocation is created and retired according to a pre-determined schedule related to the respective target date, as indicated in the index name, and is based on market observations through an annual survey of target date fund managers.
It is not possible to invest directly in an unmanaged index.
Performance quoted represents past performance. Past performance is not a guarantee or a reliable indicator of future results. Current performance may be lower or higher than performance shown. Investment return and the principal value of an investment will fluctuate. Shares may be worth more or less than original cost when redeemed. Returns shown do not reflect the deduction of taxes that a shareholder would pay on fund distributions or the redemption of fund shares. Differences in the Fund’s performance versus the index and related attribution information with respect to particular categories of securities or individual positions may be attributable, in part, to differences in the pricing methodologies used by the Fund and the index. The adjusted returns take into account the maximum sales charge of 5.50% on Class A shares. For performance data current to the most recent month-end is available at visit www.pimco.com or via (888) 87-PIMCO.
The Fund’s total annual operating expense ratio in effect as of period end, were 0.33% for the Institutional Class shares, 0.58% for the Administrative shares, and 0.83% for the Class A shares. Details regarding any changes to the Fund’s operating expenses, subsequent to period end, can be found in the Fund’s current prospectus, as supplemented.
| 12 | PIMCO EQUITY SERIES |
Table of Contents
| Institutional Class - PBPNX | Administrative Class - PBPRX | Class A - PBPAX |
Top 10 Holdings as of 06/30/20181§
Vanguard Institutional Index Fund ‘Institutional’ | 30.7% | |||||||
Vanguard Developed Markets Index Fund ‘Institutional’ | 15.7% | |||||||
PIMCO Income Fund | 7.3% | |||||||
Vanguard Emerging Markets Stock Index Fund ‘Admiral’ | 7.1% | |||||||
PIMCO Long-Term Real Return Fund | 5.8% | |||||||
PIMCO Long Duration Total Return Fund | 4.3% | |||||||
PIMCO Total Return Fund | 4.2% | |||||||
PIMCO Long-Term Credit Bond Fund | 4.2% | |||||||
PIMCO Real Return Fund | 3.6% | |||||||
Vanguard Small-Cap Index Fund ‘Admiral’ | 3.5% |
1 % of Investments, at value.
§ Top 10 Holdings and % of Investments exclude securities sold short, financial derivative instruments and short-term instruments, if any.
Fund Insights
The following affected performance during the reporting period:
| » | Exposure to U.S. large market capitalization equities benefited absolute performance, as U.S. large market capitalization equities posted positive returns. |
| » | Exposure to developed ex U.S. equities benefited absolute performance, as developed ex U.S. equities posted positive returns. |
| » | Exposure to U.S. small market capitalization equities benefited absolute performance, as U.S. small market capitalization equities posted positive returns. |
| » | Exposure to emerging market equities benefited absolute performance, as emerging market equities posted positive returns. |
| » | Exposure to long-term U.S. Treasury Inflation-Protected Securities (TIPS) benefited absolute performance, as long-term TIPS posted positive returns. |
| ANNUAL REPORT | JUNE 30, 2018 | 13 |
Table of Contents
PIMCO REALPATH® Blend 2035 Fund
Cumulative Returns Through June 30, 2018
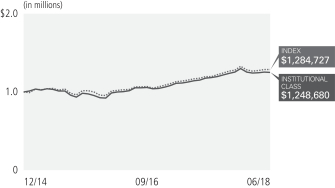
$1,000,000 invested at the end of the month when the Fund’s Institutional Class commenced operations.
Investment Objective and Strategy Overview
PIMCO REALPATH® Blend 2035 Fund seeks to maximize total return, consistent with prudent investment management, by investing under normal circumstances in a combination of affiliated and unaffiliated funds that are registered under the Investment Company Act of 1940, as amended (the “1940 Act”), equity securities, Fixed Income Instruments of varying maturities, or related derivatives on any securities mentioned above. Under normal circumstances, the Fund seeks to invest substantially all of its equity exposure in index tracking securities, including investments in affiliated or unaffiliated investment companies, which will be registered under the 1940 Act, or related derivatives on such securities or indexes. “Fixed Income Instruments” include bonds, debt securities and other similar instruments issued by various U.S. and non-U.S. public- or private-sector entities. The Fund will invest in such funds, securities, instruments and other investments to the extent permitted under the 1940 Act, or any exemptive relief therefrom. Fund strategies may change from time to time. Please refer to the Fund’s current prospectus for more information regarding the Fund’s strategy.
| Average Annual Total Return for the period ended June 30, 2018 | ||||||||||
| 1 Year | Fund Inception (12/31/14) | |||||||||
| PIMCO REALPATH® Blend 2035 Fund Institutional Class | 8.56% | 6.56% | |||||||
| PIMCO REALPATH® Blend 2035 Fund Administrative Class | 8.29% | 6.28% | ||||||||
| PIMCO REALPATH® Blend 2035 Fund Class A | 8.06% | 6.05% | ||||||||
| PIMCO REALPATH® Blend 2035 Fund Class A (adjusted) | 2.09% | 4.35% | ||||||||
| S&P Target Date 2035 Index± | 9.47% | 7.42% | |||||||
All Fund returns are net of fees and expenses.
± The S&P Target Date Index Series is comprised of eleven multi-asset class indices, each corresponding to a particular target retirement date. Each index provides varying levels of exposure to each asset class. Each target date allocation is created and retired according to a pre-determined schedule related to the respective target date, as indicated in the index name, and is based on market observations through an annual survey of target date fund managers.
It is not possible to invest directly in an unmanaged index.
Performance quoted represents past performance. Past performance is not a guarantee or a reliable indicator of future results. Current performance may be lower or higher than performance shown. Investment return and the principal value of an investment will fluctuate. Shares may be worth more or less than original cost when redeemed. Returns shown do not reflect the deduction of taxes that a shareholder would pay on fund distributions or the redemption of fund shares. Differences in the Fund’s performance versus the index and related attribution information with respect to particular categories of securities or individual positions may be attributable, in part, to differences in the pricing methodologies used by the Fund and the index. The adjusted returns take into account the maximum sales charge of 5.50% on Class A shares. For performance data current to the most recent month-end is available at visit www.pimco.com or via (888) 87-PIMCO.
The Fund’s total annual operating expense ratio in effect as of period end, were 0.28% for the Institutional Class shares, 0.53% for the Administrative shares, and 0.78% for the Class A shares. Details regarding any changes to the Fund’s operating expenses, subsequent to period end, can be found in the Fund’s current prospectus, as supplemented.
| 14 | PIMCO EQUITY SERIES |
Table of Contents
| Institutional Class - PDGZX | Administrative Class - PDGDX | Class A - PDGAX |
Top 10 Holdings as of 06/30/20181§
Vanguard Institutional Index Fund ‘Institutional’ | 35.0% | |||||||
Vanguard Developed Markets Index Fund ‘Institutional’ | 17.9% | |||||||
Vanguard Emerging Markets Stock Index Fund ‘Admiral’ | 8.1% | |||||||
PIMCO Income Fund | 5.8% | |||||||
PIMCO Long-Term Real Return Fund | 4.2% | |||||||
Vanguard Small-Cap Index Fund ‘Admiral’ | 4.0% | |||||||
PIMCO Total Return Fund | 3.2% | |||||||
PIMCO Long Duration Total Return Fund | 3.2% | |||||||
PIMCO Long-Term Credit Bond Fund | 3.1% | |||||||
PIMCO Real Return Fund | 2.7% |
1 % of Investments, at value.
§ Top 10 Holdings and % of Investments exclude securities sold short, financial derivative instruments and short-term instruments, if any.
Fund Insights
The following affected performance during the reporting period:
| » | Exposure to U.S. large market capitalization equities benefited absolute performance, as U.S. large market capitalization equities posted positive returns. |
| » | Exposure to developed ex U.S. equities benefited absolute performance, as developed ex U.S. equities posted positive returns. |
| » | Exposure to U.S. small market capitalization equities benefited absolute performance, as U.S. small market capitalization equities posted positive returns. |
| » | Exposure to emerging market equities benefited absolute performance, as emerging market equities posted positive returns. |
| » | Exposure to real estate investment trusts (REITs) benefited absolute performance, as REITs posted positive returns. |
| ANNUAL REPORT | JUNE 30, 2018 | 15 |
Table of Contents
PIMCO REALPATH® Blend 2040 Fund
Cumulative Returns Through June 30, 2018

$1,000,000 invested at the end of the month when the Fund’s Institutional Class commenced operations.
Investment Objective and Strategy Overview
PIMCO REALPATH® Blend 2040 Fund seeks to maximize total return, consistent with prudent investment management, by investing under normal circumstances in a combination of affiliated and unaffiliated funds that are registered under the Investment Company Act of 1940, as amended (the “1940 Act”), equity securities, Fixed Income Instruments of varying maturities, or related derivatives on any securities mentioned above. Under normal circumstances, the Fund seeks to invest substantially all of its equity exposure in index tracking securities, including investments in affiliated or unaffiliated investment companies, which will be registered under the 1940 Act, or related derivatives on such securities or indexes. “Fixed Income Instruments” include bonds, debt securities and other similar instruments issued by various U.S. and non-U.S. public- or private-sector entities. The Fund will invest in such funds, securities, instruments and other investments to the extent permitted under the 1940 Act, or any exemptive relief therefrom. Fund strategies may change from time to time. Please refer to the Fund’s current prospectus for more information regarding the Fund’s strategy.
| Average Annual Total Return for the period ended June 30, 2018 | ||||||||||
| 1 Year | Fund Inception (12/31/14) | |||||||||
| PIMCO REALPATH® Blend 2040 Fund Institutional Class | 9.17% | 6.89% | |||||||
| PIMCO REALPATH® Blend 2040 Fund Administrative Class | 8.90% | 6.61% | ||||||||
| PIMCO REALPATH® Blend 2040 Fund Class A | 8.52% | 6.34% | ||||||||
| PIMCO REALPATH® Blend 2040 Fund Class A (adjusted) | 2.54% | 4.63% | ||||||||
| S&P Target Date 2040 Index± | 10.20% | 7.83% | |||||||
All Fund returns are net of fees and expenses.
± The S&P Target Date Index Series is comprised of eleven multi-asset class indices, each corresponding to a particular target retirement date. Each index provides varying levels of exposure to each asset class. Each target date allocation is created and retired according to a pre-determined schedule related to the respective target date, as indicated in the index name, and is based on market observations through an annual survey of target date fund managers.
It is not possible to invest directly in an unmanaged index.
Performance quoted represents past performance. Past performance is not a guarantee or a reliable indicator of future results. Current performance may be lower or higher than performance shown. Investment return and the principal value of an investment will fluctuate. Shares may be worth more or less than original cost when redeemed. Returns shown do not reflect the deduction of taxes that a shareholder would pay on fund distributions or the redemption of fund shares. Differences in the Fund’s performance versus the index and related attribution information with respect to particular categories of securities or individual positions may be attributable, in part, to differences in the pricing methodologies used by the Fund and the index. The adjusted returns take into account the maximum sales charge of 5.50% on Class A shares. For performance data current to the most recent month-end is available at visit www.pimco.com or via (888) 87-PIMCO.
The Fund’s total annual operating expense ratio in effect as of period end, were 0.25% for the Institutional Class shares, 0.50% for the Administrative shares, and 0.75% for the Class A shares. Details regarding any changes to the Fund’s operating expenses, subsequent to period end, can be found in the Fund’s current prospectus, as supplemented.
| 16 | PIMCO EQUITY SERIES |
Table of Contents
| Institutional Class - PVPNX | Administrative Class - PVPRX | Class A - PVPAX |
Top 10 Holdings as of 06/30/20181§
Vanguard Institutional Index Fund ‘Institutional’ | 38.7% | |||||||
Vanguard Developed Markets Index Fund ‘Institutional’ | 19.8% | |||||||
Vanguard Emerging Markets Stock Index Fund ‘Admiral’ | 8.9% | |||||||
PIMCO Income Fund | 4.5% | |||||||
Vanguard Small-Cap Index Fund ‘Admiral’ | 4.5% | |||||||
PIMCO Long-Term Real Return Fund | 2.9% | |||||||
PIMCO Total Return Fund | 2.3% | |||||||
PIMCO High Yield Fund | 2.2% | |||||||
PIMCO Long Duration Total Return Fund | 2.1% | |||||||
PIMCO Long-Term Credit Bond Fund | 2.1% |
1 % of Investments, at value.
§ Top 10 Holdings and % of Investments exclude securities sold short, financial derivative instruments and short-term instruments, if any.
Fund Insights
The following affected performance during the reporting period:
| » | Exposure to U.S. large market capitalization equities benefited absolute performance, as U.S. large market capitalization equities posted positive returns. |
| » | Exposure to developed ex U.S. equities benefited absolute performance, as developed ex U.S. equities posted positive returns. |
| » | Exposure to U.S. small market capitalization equities benefited absolute performance, as U.S. small market capitalization equities posted positive returns. |
| » | Exposure to emerging market equities benefited absolute performance, as emerging market equities posted positive returns. |
| » | Exposure to real estate investment trusts (REITs) benefited absolute performance, as REITs posted positive returns. |
| ANNUAL REPORT | JUNE 30, 2018 | 17 |
Table of Contents
PIMCO REALPATH® Blend 2045 Fund
Cumulative Returns Through June 30, 2018
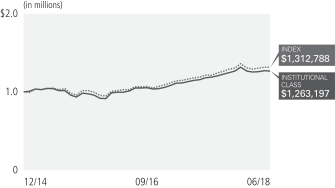
$1,000,000 invested at the end of the month when the Fund’s Institutional Class commenced operations.
Investment Objective and Strategy Overview
PIMCO REALPATH® Blend 2045 Fund seeks to maximize total return, consistent with prudent investment management, by investing under normal circumstances in a combination of affiliated and unaffiliated funds that are registered under the Investment Company Act of 1940, as amended (the “1940 Act”), equity securities, Fixed Income Instruments of varying maturities, or related derivatives on any securities mentioned above. Under normal circumstances, the Fund seeks to invest substantially all of its equity exposure in index tracking securities, including investments in affiliated or unaffiliated investment companies, which will be registered under the 1940 Act, or related derivatives on such securities or indexes. “Fixed Income Instruments” include bonds, debt securities and other similar instruments issued by various U.S. and non-U.S. public- or private-sector entities. The Fund will invest in such funds, securities, instruments and other investments to the extent permitted under the 1940 Act, or any exemptive relief therefrom. Fund strategies may change from time to time. Please refer to the Fund’s current prospectus for more information regarding the Fund’s strategy.
| Average Annual Total Return for the period ended June 30, 2018 | ||||||||||
| 1 Year | Fund Inception (12/31/14) | |||||||||
| PIMCO REALPATH® Blend 2045 Fund Institutional Class | 9.57% | 6.91% | |||||||
| PIMCO REALPATH® Blend 2045 Fund Administrative Class | 9.31% | 6.65% | ||||||||
| PIMCO REALPATH® Blend 2045 Fund Class A | 9.01% | 6.38% | ||||||||
| PIMCO REALPATH® Blend 2045 Fund Class A (adjusted) | 3.01% | 4.68% | ||||||||
| S&P Target Date 2045 Index± | 10.55% | 8.09% | |||||||
All Fund returns are net of fees and expenses.
± The S&P Target Date Index Series is comprised of eleven multi-asset class indices, each corresponding to a particular target retirement date. Each index provides varying levels of exposure to each asset class. Each target date allocation is created and retired according to a pre-determined schedule related to the respective target date, as indicated in the index name, and is based on market observations through an annual survey of target date fund managers.
It is not possible to invest directly in an unmanaged index.
Performance quoted represents past performance. Past performance is not a guarantee or a reliable indicator of future results. Current performance may be lower or higher than performance shown. Investment return and the principal value of an investment will fluctuate. Shares may be worth more or less than original cost when redeemed. Returns shown do not reflect the deduction of taxes that a shareholder would pay on fund distributions or the redemption of fund shares. Differences in the Fund’s performance versus the index and related attribution information with respect to particular categories of securities or individual positions may be attributable, in part, to differences in the pricing methodologies used by the Fund and the index. The adjusted returns take into account the maximum sales charge of 5.50% on Class A shares. For performance data current to the most recent month-end is available at visit www.pimco.com or via (888) 87-PIMCO.
The Fund’s total annual operating expense ratio in effect as of period end, were 0.23% for the Institutional Class shares, 0.48% for the Administrative shares, and 0.73% for the Class A shares. Details regarding any changes to the Fund’s operating expenses, subsequent to period end, can be found in the Fund’s current prospectus, as supplemented.
| 18 | PIMCO EQUITY SERIES |
Table of Contents
| Institutional Class - PVQNX | Administrative Class - PVQDX | Class A - PVQAX |
Top 10 Holdings as of 06/30/20181§
Vanguard Institutional Index Fund ‘Institutional’ | 41.2% | |||||||
Vanguard Developed Markets Index Fund ‘Institutional’ | 21.1% | |||||||
Vanguard Emerging Markets Stock Index Fund ‘Institutional’ | 9.5% | |||||||
Vanguard Small-Cap Index Fund ‘Admiral’ | 4.7% | |||||||
PIMCO Income Fund | 3.1% | |||||||
PIMCO Long-Term Real Return Fund | 2.3% | |||||||
PIMCO Long Duration Total Return Fund | 1.6% | |||||||
PIMCO Long-Term Credit Bond Fund | 1.6% | |||||||
PIMCO Total Return Fund | 1.6% | |||||||
PIMCO High Yield Fund | 1.6% |
1 % of Investments, at value.
§ Top 10 Holdings and % of Investments exclude securities sold short, financial derivative instruments and short-term instruments, if any.
Fund Insights
The following affected performance during the reporting period:
| » | Exposure to U.S. large market capitalization equities benefited absolute performance, as U.S. large market capitalization equities posted positive returns. |
| » | Exposure to developed ex U.S. equities benefited absolute performance, as developed ex U.S. equities posted positive returns. |
| » | Exposure to U.S. small market capitalization equities benefited absolute performance, as U.S. small market capitalization equities posted positive returns. |
| » | Exposure to emerging market equities benefited absolute performance, as emerging market equities posted positive returns. |
| » | Exposure to real estate investment trusts (REITs) benefited absolute performance, as REITs posted positive returns. |
| ANNUAL REPORT | JUNE 30, 2018 | 19 |
Table of Contents
PIMCO REALPATH® Blend 2050 Fund
Cumulative Returns Through June 30, 2018

$1,000,000 invested at the end of the month when the Fund’s Institutional Class commenced operations.
Investment Objective and Strategy Overview
PIMCO REALPATH® Blend 2050 Fund seeks to maximize total return, consistent with prudent investment management, by investing under normal circumstances in a combination of affiliated and unaffiliated funds that are registered under the Investment Company Act of 1940, as amended (the “1940 Act”), equity securities, Fixed Income Instruments of varying maturities, or related derivatives on any securities mentioned above. Under normal circumstances, the Fund seeks to invest substantially all of its equity exposure in index tracking securities, including investments in affiliated or unaffiliated investment companies, which will be registered under the 1940 Act, or related derivatives on such securities or indexes. “Fixed Income Instruments” include bonds, debt securities and other similar instruments issued by various U.S. and non-U.S. public- or private-sector entities. The Fund will invest in such funds, securities, instruments and other investments to the extent permitted under the 1940 Act, or any exemptive relief therefrom. Fund strategies may change from time to time. Please refer to the Fund’s current prospectus for more information regarding the Fund’s strategy.
| Average Annual Total Return for the period ended June 30, 2018 | ||||||||||
| 1 Year | Fund Inception (12/31/14) | |||||||||
| PIMCO REALPATH® Blend 2050 Fund Institutional Class | 9.69% | 7.07% | |||||||
| PIMCO REALPATH® Blend 2050 Fund Administrative Class | 9.44% | 6.79% | ||||||||
| PIMCO REALPATH® Blend 2050 Fund Class A | 9.20% | 6.52% | ||||||||
| PIMCO REALPATH® Blend 2050 Fund Class A (adjusted) | 3.20% | 4.82% | ||||||||
| S&P Target Date 2050 Index± | 10.85% | 8.32% | |||||||
All Fund returns are net of fees and expenses.
± The S&P Target Date Index Series is comprised of eleven multi-asset class indices, each corresponding to a particular target retirement date. Each index provides varying levels of exposure to each asset class. Each target date allocation is created and retired according to a pre-determined schedule related to the respective target date, as indicated in the index name, and is based on market observations through an annual survey of target date fund managers.
It is not possible to invest directly in an unmanaged index.
Performance quoted represents past performance. Past performance is not a guarantee or a reliable indicator of future results. Current performance may be lower or higher than performance shown. Investment return and the principal value of an investment will fluctuate. Shares may be worth more or less than original cost when redeemed. Returns shown do not reflect the deduction of taxes that a shareholder would pay on fund distributions or the redemption of fund shares. Differences in the Fund’s performance versus the index and related attribution information with respect to particular categories of securities or individual positions may be attributable, in part, to differences in the pricing methodologies used by the Fund and the index. The adjusted returns take into account the maximum sales charge of 5.50% on Class A shares. For performance data current to the most recent month-end is available at visit www.pimco.com or via (888) 87-PIMCO.
The Fund’s total annual operating expense ratio in effect as of period end, were 0.22% for the Institutional Class shares, 0.47% for the Administrative shares, and 0.72% for the Class A shares. Details regarding any changes to the Fund’s operating expenses, subsequent to period end, can be found in the Fund’s current prospectus, as supplemented.
| 20 | PIMCO EQUITY SERIES |
Table of Contents
| Institutional Class - PPQZX | Administrative Class - PPQDX | Class A - PPQAX |
Top 10 Holdings as of 06/30/20181§
Vanguard Institutional Index Fund ‘Institutional’ | 43.0% | |||||||
Vanguard Developed Markets Index Fund ‘Institutional’ | 22.0% | |||||||
Vanguard Emerging Markets Stock Index Fund ‘Institutional’ | 10.0% | |||||||
Vanguard Small-Cap Index Fund ‘Admiral’ | 5.0% | |||||||
PIMCO Income Fund | 2.3% | |||||||
PIMCO Long-Term Real Return Fund | 2.1% | |||||||
PIMCO Long Duration Total Return Fund | 1.5% | |||||||
PIMCO Long-Term Credit Bond Fund | 1.4% | |||||||
PIMCO High Yield Fund | 1.2% | |||||||
PIMCO Total Return Fund | 1.1% |
1 % of Investments, at value.
§ Top 10 Holdings and % of Investments exclude securities sold short, financial derivative instruments and short-term instruments, if any.
Fund Insights
The following affected performance during the reporting period:
| » | Exposure to U.S. large market capitalization equities benefited absolute performance, as U.S. large market capitalization equities posted positive returns. |
| » | Exposure to developed ex U.S. equities benefited absolute performance, as developed ex U.S. equities posted positive returns. |
| » | Exposure to U.S. small market capitalization equities benefited absolute performance, as U.S. small market capitalization equities posted positive returns. |
| » | Exposure to emerging market equities benefited absolute performance, as emerging market equities posted positive returns. |
| » | Exposure to real estate investment trusts (REITs) benefited absolute performance, as REITs posted positive returns. |
| ANNUAL REPORT | JUNE 30, 2018 | 21 |
Table of Contents
PIMCO REALPATH® Blend 2055 Fund
Cumulative Returns Through June 30, 2018
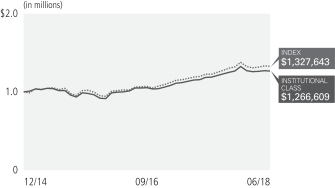
$1,000,000 invested at the end of the month when the Fund’s Institutional Class commenced operations.
Investment Objective and Strategy Overview
PIMCO REALPATH® Blend 2055 Fund seeks to maximize total return, consistent with prudent investment management, by investing under normal circumstances in a combination of affiliated and unaffiliated funds that are registered under the Investment Company Act of 1940, as amended (the “1940 Act”), equity securities, Fixed Income Instruments of varying maturities, or related derivatives on any securities mentioned above. Under normal circumstances, the Fund seeks to invest substantially all of its equity exposure in index tracking securities, including investments in affiliated or unaffiliated investment companies, which will be registered under the 1940 Act, or related derivatives on such securities or indexes. “Fixed Income Instruments” include bonds, debt securities and other similar instruments issued by various U.S. and non-U.S. public- or private-sector entities. The Fund will invest in such funds, securities, instruments and other investments to the extent permitted under the 1940 Act, or any exemptive relief therefrom. Fund strategies may change from time to time. Please refer to the Fund’s current prospectus for more information regarding the Fund’s strategy.
| Average Annual Total Return for the period ended June 30, 2018 | ||||||||||
| 1 Year | Fund Inception (12/31/14) | |||||||||
| PIMCO REALPATH® Blend 2055 Fund Institutional Class | 9.56% | 6.99% | |||||||
| PIMCO REALPATH® Blend 2055 Fund Administrative Class | 9.37% | 6.75% | ||||||||
| PIMCO REALPATH® Blend 2055 Fund Class A | 9.04% | 6.42% | ||||||||
| PIMCO REALPATH® Blend 2055 Fund Class A (adjusted) | 3.04% | 4.72% | ||||||||
| S&P Target Date 2055+ Index± | 10.96% | 8.44% | |||||||
All Fund returns are net of fees and expenses.
± The S&P Target Date Index Series is comprised of eleven multi-asset class indices, each corresponding to a particular target retirement date. Each index provides varying levels of exposure to each asset class. Each target date allocation is created and retired according to a pre-determined schedule related to the respective target date, as indicated in the index name, and is based on market observations through an annual survey of target date fund managers.
It is not possible to invest directly in an unmanaged index.
Performance quoted represents past performance. Past performance is not a guarantee or a reliable indicator of future results. Current performance may be lower or higher than performance shown. Investment return and the principal value of an investment will fluctuate. Shares may be worth more or less than original cost when redeemed. Returns shown do not reflect the deduction of taxes that a shareholder would pay on fund distributions or the redemption of fund shares. Differences in the Fund’s performance versus the index and related attribution information with respect to particular categories of securities or individual positions may be attributable, in part, to differences in the pricing methodologies used by the Fund and the index. The adjusted returns take into account the maximum sales charge of 5.50% on Class A shares. For performance data current to the most recent month-end is available at visit www.pimco.com or via (888) 87-PIMCO.
The Fund’s total annual operating expense ratio in effect as of period end, were 0.22% for the Institutional Class shares, 0.47% for the Administrative shares, and 0.72% for the Class A shares. Details regarding any changes to the Fund’s operating expenses, subsequent to period end, can be found in the Fund’s current prospectus, as supplemented.
| 22 | PIMCO EQUITY SERIES |
Table of Contents
| Institutional Class - PRQZX | Administrative Class - PRQDX | Class A - PRQAX |
Top 10 Holdings as of 06/30/20181§
Vanguard Institutional Index Fund ‘Institutional’ | 43.1% | |||||||
Vanguard Developed Markets Index Fund ‘Admiral’ | 22.1% | |||||||
Vanguard Emerging Markets Stock Index Fund ‘Admiral’ | 9.9% | |||||||
Vanguard Small-Cap Index Fund ‘Admiral’ | 5.0% | |||||||
PIMCO Income Fund | 2.4% | |||||||
PIMCO Long-Term Real Return Fund | 2.0% | |||||||
PIMCO Long Duration Total Return Fund | 1.5% | |||||||
PIMCO Long-Term Credit Bond Fund | 1.4% | |||||||
PIMCO High Yield Fund | 1.2% | |||||||
PIMCO Total Return Fund | 1.2% |
1 % of Investments, at value.
§ Top 10 Holdings and % of Investments exclude securities sold short, financial derivative instruments and short-term instruments, if any.
Fund Insights
The following affected performance during the reporting period:
| » | Exposure to U.S. large market capitalization equities benefited absolute performance, as U.S. large market capitalization equities posted positive returns. |
| » | Exposure to developed ex U.S. equities benefited absolute performance, as developed ex U.S. equities posted positive returns. |
| » | Exposure to U.S. small market capitalization equities benefited absolute performance, as U.S. small market capitalization equities posted positive returns. |
| » | Exposure to emerging market equities benefited absolute performance, as emerging market equities posted positive returns. |
| » | Exposure to real estate investment trusts (REITs) benefited absolute performance, as REITs posted positive returns. |
| ANNUAL REPORT | JUNE 30, 2018 | 23 |
Table of Contents
PIMCO REALPATH® Blend Income Fund
Cumulative Returns Through June 30, 2018
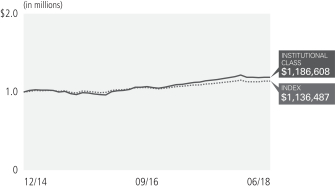
$1,000,000 invested at the end of the month when the Fund’s Institutional Class commenced operations.
Investment Objective and Strategy Overview
PIMCO REALPATH® Blend Income Fund seeks to maximize total return, consistent with prudent investment management, by investing under normal circumstances in a combination of affiliated and unaffiliated funds that are registered under the Investment Company Act of 1940, as amended (the “1940 Act”), equity securities, Fixed Income Instruments of varying maturities, or related derivatives on any securities mentioned above. Under normal circumstances, the Fund seeks to invest substantially all of its equity exposure in index tracking securities, including investments in affiliated or unaffiliated investment companies, which will be registered under the 1940 Act, or related derivatives on such securities or indexes. “Fixed Income Instruments” include bonds, debt securities and other similar instruments issued by various U.S. and non-U.S. public- or private-sector entities. The Fund will invest in such funds, securities, instruments and other investments to the extent permitted under the 1940 Act, or any exemptive relief therefrom. Fund strategies may change from time to time. Please refer to the Fund’s current prospectus for more information regarding the Fund’s strategy.
| Average Annual Total Return for the period ended June 30, 2018 | ||||||||||
| 1 Year | Fund Inception (12/31/14) | |||||||||
| PIMCO REALPATH® Blend Income Fund Institutional Class | 5.52% | 5.02% | |||||||
| PIMCO REALPATH® Blend Income Fund Administrative Class | 5.17% | 4.75% | ||||||||
| PIMCO REALPATH® Blend Income Fund Class A | 4.91% | 4.48% | ||||||||
| PIMCO REALPATH® Blend Income Fund Class A (adjusted) | (0.84)% | 2.81% | ||||||||
| S&P Target Date Retirement Income Index± | 4.23% | 3.72% | |||||||
All Fund returns are net of fees and expenses.
± The S&P Target Date Index Series is comprised of eleven multi-asset class indices, each corresponding to a particular target retirement date. Each index provides varying levels of exposure to each asset class. Each target date allocation is created and retired according to a pre-determined schedule related to the respective target date, as indicated in the index name, and is based on market observations through an annual survey of target date fund managers.
It is not possible to invest directly in an unmanaged index.
Performance quoted represents past performance. Past performance is not a guarantee or a reliable indicator of future results. Current performance may be lower or higher than performance shown. Investment return and the principal value of an investment will fluctuate. Shares may be worth more or less than original cost when redeemed. Returns shown do not reflect the deduction of taxes that a shareholder would pay on fund distributions or the redemption of fund shares. Differences in the Fund’s performance versus the index and related attribution information with respect to particular categories of securities or individual positions may be attributable, in part, to differences in the pricing methodologies used by the Fund and the index. The adjusted returns take into account the maximum sales charge of 5.50% on Class A shares. For performance data current to the most recent month-end is available at visit www.pimco.com or via (888) 87-PIMCO.
The Fund’s total annual operating expense ratio in effect as of period end, were 0.43% for the Institutional Class shares, 0.68% for the Administrative shares, and 0.93% for the Class A shares. Details regarding any changes to the Fund’s operating expenses, subsequent to period end, can be found in the Fund’s current prospectus, as supplemented.
| 24 | PIMCO EQUITY SERIES |
Table of Contents
| Institutional Class - PBRNX | Administrative Class - PBRDX | Class A - PBRAX |
Top 10 Holdings as of 06/30/20181§
Vanguard 500 Index Fund ‘Admiral’ | 19.1% | |||||||
PIMCO Income Fund | 15.9% | |||||||
PIMCO Total Return Fund | 10.9% | |||||||
Vanguard Developed Markets Index Fund ‘Admiral’ | 9.8% | |||||||
PIMCO Real Return Fund | 9.3% | |||||||
PIMCO International Bond Fund (U.S. Dollar-Hedged) | 6.0% | |||||||
PIMCO High Yield Fund | 5.1% | |||||||
Vanguard Emerging Markets Stock Index Fund ‘Admiral’ | 4.5% | |||||||
PIMCO Long-Term Real Return Fund | 4.1% | |||||||
PIMCO Long Duration Total Return Fund | 3.1% |
1 % of Investments, at value.
§ Top 10 Holdings and % of Investments exclude securities sold short, financial derivative instruments and short-term instruments, if any.
Fund Insights
The following affected performance during the reporting period:
| » | Exposure to U.S. large market capitalization equities benefited absolute performance, as U.S. large market capitalization equities posted positive returns. |
| » | Exposure to developed ex U.S. equities benefited absolute performance, as developed ex U.S. equities posted positive returns. |
| » | Exposure to U.S. small market capitalization equities benefited absolute performance, as U.S. small market capitalization equities posted positive returns. |
| » | Exposure to emerging market equities benefited absolute performance, as emerging market equities posted positive returns. |
| » | Exposure to long-term U.S. Treasury Inflation-Protected Securities (TIPS) benefited absolute performance, as long-term TIPS posted positive returns. |
| ANNUAL REPORT | JUNE 30, 2018 | 25 |
Table of Contents
Example
As a shareholder of a Fund, you incur two types of costs: (1) transaction costs, including sales charges (loads) on purchase payments and exchange fees and (2) ongoing costs, including management fees, distribution and/or service (12b-1) fees, and other Fund expenses. The Example is intended to help you understand your ongoing costs (in dollars) of investing in a Fund and to compare these costs with the ongoing costs of investing in other mutual funds.
The Example is based on an investment of $1,000 invested at the beginning of the period and held for the entire period indicated, which for all Funds and share classes is from January 1, 2018 to June 30, 2018 unless noted otherwise in the table and footnotes below.
Actual Expenses
The information in the table under the heading “Actual” provides information about actual account values and actual expenses. You may use this information, together with the amount you invested, to estimate the expenses that you paid over the period. Simply divide your account value by $1,000 (for example, an $8,600 account value divided by $1,000 = 8.60), then multiply the result by the number in the appropriate row for your share class, in the column entitled “Expenses Paid During Period” to estimate the expenses you paid on your account during this period.
Hypothetical Example for Comparison Purposes
The information in the table under the heading “Hypothetical (5% return before expenses)” provides information about hypothetical account values and hypothetical expenses based on a Fund’s actual expense ratio and an assumed rate of return of 5% per year before expenses, which is not the Fund’s actual return. The hypothetical account values and expenses may not be used to estimate the actual ending account balance or expenses you paid for the period. You may use this information to compare the ongoing costs of investing in a Fund and other funds. To do so, compare this 5% hypothetical example with the 5% hypothetical examples that appear in the shareholder reports of the other funds.
Please note that the expenses shown in the table are meant to highlight your ongoing costs only and do not reflect any transactional costs, such as sales charges (loads) on purchase payments and exchange fees. Therefore, the information under the heading “Hypothetical (5% return before expenses)” is useful in comparing ongoing costs only, and will not help you determine the relative total costs of owning different funds. In addition, if these transactional costs were included, your costs would have been higher.
Expense ratios may vary from period to period because of various factors such as an increase in expenses that are not covered by the management fees, such as fees and expenses of the independent trustees and their counsel, extraordinary expenses and interest expense.
Actual | Hypothetical (5% return before expenses) | |||||||||||||||||||||||||||||||||||||||
| Beginning Account Value (01/01/18) | Ending Account Value (06/30/18) | Expenses Paid During Period* | Beginning Account Value (01/01/18) | Ending Account Value (06/30/18) | Expenses Paid During Period* | Net Annualized Expense Ratio** | ||||||||||||||||||||||||||||||||||
PIMCO REALPATH® Blend 2020 Fund | ||||||||||||||||||||||||||||||||||||||||
| Institutional Class | $ | 1,000.00 | $ | 992.70 | $ | 0.20 | $ | 1,000.00 | $ | 1,024.73 | $ | 0.20 | 0.04 | % | ||||||||||||||||||||||||||
| Administrative Class | 1,000.00 | 991.50 | 1.43 | 1,000.00 | 1,023.49 | 1.45 | 0.29 | |||||||||||||||||||||||||||||||||
| Class A | 1,000.00 | 990.50 | 2.67 | 1,000.00 | 1,022.24 | 2.71 | 0.54 | |||||||||||||||||||||||||||||||||
PIMCO REALPATH® Blend 2025 Fund | ||||||||||||||||||||||||||||||||||||||||
| Institutional Class | $ | 1,000.00 | $ | 993.50 | $ | 0.20 | $ | 1,000.00 | $ | 1,024.73 | $ | 0.20 | 0.04 | % | ||||||||||||||||||||||||||
| Administrative Class | 1,000.00 | 992.40 | 1.43 | 1,000.00 | 1,023.49 | 1.45 | 0.29 | |||||||||||||||||||||||||||||||||
| Class A | 1,000.00 | 990.40 | 2.67 | 1,000.00 | 1,022.24 | 2.71 | 0.54 | |||||||||||||||||||||||||||||||||
PIMCO REALPATH® Blend 2030 Fund | ||||||||||||||||||||||||||||||||||||||||
| Institutional Class | $ | 1,000.00 | $ | 994.70 | $ | 0.25 | $ | 1,000.00 | $ | 1,024.68 | $ | 0.25 | 0.05 | % | ||||||||||||||||||||||||||
| Administrative Class | 1,000.00 | 994.50 | 1.48 | 1,000.00 | 1,023.44 | 1.51 | 0.30 | |||||||||||||||||||||||||||||||||
| Class A | 1,000.00 | 992.50 | 2.72 | �� | 1,000.00 | 1,022.19 | 2.76 | 0.55 | ||||||||||||||||||||||||||||||||
PIMCO REALPATH® Blend 2035 Fund | ||||||||||||||||||||||||||||||||||||||||
| Institutional Class | $ | 1,000.00 | $ | 996.80 | $ | 0.30 | $ | 1,000.00 | $ | 1,024.63 | $ | 0.30 | 0.06 | % | ||||||||||||||||||||||||||
| Administrative Class | 1,000.00 | 995.70 | 1.53 | 1,000.00 | 1,023.39 | 1.56 | 0.31 | |||||||||||||||||||||||||||||||||
| Class A | 1,000.00 | 994.60 | 2.77 | 1,000.00 | 1,022.14 | 2.81 | 0.56 | |||||||||||||||||||||||||||||||||
| 26 | PIMCO EQUITY SERIES |
Table of Contents
Actual | Hypothetical (5% return before expenses) | |||||||||||||||||||||||||||||||||||||||
| Beginning Account Value (01/01/18) | Ending Account Value (06/30/18) | Expenses Paid During Period* | Beginning Account Value (01/01/18) | Ending Account Value (06/30/18) | Expenses Paid During Period* | Net Annualized Expense Ratio** | ||||||||||||||||||||||||||||||||||
PIMCO REALPATH® Blend 2040 Fund | ||||||||||||||||||||||||||||||||||||||||
| Institutional Class | $ | 1,000.00 | $ | 999.50 | $ | 0.30 | $ | 1,000.00 | $ | 1,024.63 | $ | 0.30 | 0.06 | % | ||||||||||||||||||||||||||
| Administrative Class | 1,000.00 | 997.50 | 1.54 | 1,000.00 | 1,023.39 | 1.56 | 0.31 | |||||||||||||||||||||||||||||||||
| Class A | 1,000.00 | 996.40 | 2.77 | 1,000.00 | 1,022.14 | 2.81 | 0.56 | |||||||||||||||||||||||||||||||||
PIMCO REALPATH® Blend 2045 Fund | ||||||||||||||||||||||||||||||||||||||||
| Institutional Class | $ | 1,000.00 | $ | 999.60 | $ | 0.30 | $ | 1,000.00 | $ | 1,024.63 | $ | 0.30 | 0.06 | % | ||||||||||||||||||||||||||
| Administrative Class | 1,000.00 | 999.40 | 1.55 | 1,000.00 | 1,023.39 | 1.56 | 0.31 | |||||||||||||||||||||||||||||||||
| Class A | 1,000.00 | 998.30 | 2.79 | 1,000.00 | 1,022.14 | 2.82 | 0.56 | |||||||||||||||||||||||||||||||||
PIMCO REALPATH® Blend 2050 Fund | ||||||||||||||||||||||||||||||||||||||||
| Institutional Class | $ | 1,000.00 | $ | 1,000.10 | $ | 0.30 | $ | 1,000.00 | $ | 1,024.63 | $ | 0.30 | 0.06 | % | ||||||||||||||||||||||||||
| Administrative Class | 1,000.00 | 999.90 | 1.54 | 1,000.00 | 1,023.39 | 1.56 | 0.31 | |||||||||||||||||||||||||||||||||
| Class A | 1,000.00 | 997.50 | 2.77 | 1,000.00 | 1,022.14 | 2.81 | 0.56 | |||||||||||||||||||||||||||||||||
PIMCO REALPATH® Blend 2055 Fund | ||||||||||||||||||||||||||||||||||||||||
| Institutional Class | $ | 1,000.00 | $ | 1,000.20 | $ | 0.30 | $ | 1,000.00 | $ | 1,024.63 | $ | 0.30 | 0.06 | % | ||||||||||||||||||||||||||
| Administrative Class | 1,000.00 | 999.60 | 1.54 | 1,000.00 | 1,023.39 | 1.56 | 0.31 | |||||||||||||||||||||||||||||||||
| Class A | 1,000.00 | 997.40 | 2.77 | 1,000.00 | 1,022.14 | 2.81 | 0.56 | |||||||||||||||||||||||||||||||||
PIMCO REALPATH® Blend Income Fund | ||||||||||||||||||||||||||||||||||||||||
| Institutional Class | $ | 1,000.00 | $ | 993.10 | $ | 0.20 | $ | 1,000.00 | $ | 1,024.73 | $ | 0.20 | 0.04 | % | ||||||||||||||||||||||||||
| Administrative Class | 1,000.00 | 991.90 | 1.43 | 1,000.00 | 1,023.49 | 1.45 | 0.29 | |||||||||||||||||||||||||||||||||
| Class A | 1,000.00 | 990.90 | 2.67 | 1,000.00 | 1,022.24 | 2.71 | 0.54 | |||||||||||||||||||||||||||||||||
* Expenses Paid During Period are equal to the net annualized expense ratio for the class, multiplied by the average account value over the period, multiplied by 181/365 (to reflect the one-half year period).
** Net Annualized Expense Ratio is reflective of any applicable contractual fee waivers and/or expense reimbursements or voluntary fee waivers. Details regarding fee waivers, if any, can be found in Note 9, Fees and Expenses, in the Notes to Financial Statements.
| ANNUAL REPORT | JUNE 30, 2018 | 27 |
Table of Contents
| Investment Operations | Less Distributions(b) | |||||||||||||||||||||||||||||||||||
| Selected Per Share Data for the Year or Period Ended^: | Beginning of | Net Investment Income (Loss)(a) | Net Realized/ Unrealized Gain (Loss) | Total | From Net Investment Income | From Net Realized Capital Gains | Tax Basis Return of Capital | Total | ||||||||||||||||||||||||||||
PIMCO REALPATH® Blend 2020 Fund | ||||||||||||||||||||||||||||||||||||
| Institutional Class | ||||||||||||||||||||||||||||||||||||
06/30/2018 | $ | 10.58 | $ | 0.31 | $ | 0.33 | $ | 0.64 | $ | (0.24 | ) | $ | 0.00 | $ | 0.00 | $ | (0.24 | ) | ||||||||||||||||||
06/30/2017 | 9.90 | 0.31 | 0.60 | 0.91 | (0.23 | ) | 0.00 | 0.00 | (0.23 | ) | ||||||||||||||||||||||||||
06/30/2016 | 9.97 | 0.32 | (0.06 | ) | 0.26 | (0.31 | ) | (0.02 | ) | 0.00 | (0.33 | ) | ||||||||||||||||||||||||
12/31/2014 - 06/30/2015 | 10.00 | 0.11 | (0.09 | ) | 0.02 | (0.05 | ) | 0.00 | 0.00 | (0.05 | ) | |||||||||||||||||||||||||
| Administrative Class | ||||||||||||||||||||||||||||||||||||
06/30/2018 | 10.58 | 0.33 | 0.28 | 0.61 | (0.22 | ) | 0.00 | 0.00 | (0.22 | ) | ||||||||||||||||||||||||||
06/30/2017 | 9.90 | 0.27 | 0.62 | 0.89 | (0.21 | ) | 0.00 | 0.00 | (0.21 | ) | ||||||||||||||||||||||||||
06/30/2016 | 9.97 | 0.29 | (0.06 | ) | 0.23 | (0.28 | ) | (0.02 | ) | 0.00 | (0.30 | ) | ||||||||||||||||||||||||
12/31/2014 - 06/30/2015 | 10.00 | 0.10 | (0.09 | ) | 0.01 | (0.04 | ) | 0.00 | 0.00 | (0.04 | ) | |||||||||||||||||||||||||
| Class A | ||||||||||||||||||||||||||||||||||||
06/30/2018 | 10.57 | 0.26 | 0.33 | 0.59 | (0.19 | ) | 0.00 | 0.00 | (0.19 | ) | ||||||||||||||||||||||||||
06/30/2017 | 9.91 | 0.33 | 0.53 | 0.86 | (0.20 | ) | 0.00 | 0.00 | (0.20 | ) | ||||||||||||||||||||||||||
06/30/2016 | 9.97 | 0.27 | (0.06 | ) | 0.21 | (0.25 | ) | (0.02 | ) | 0.00 | (0.27 | ) | ||||||||||||||||||||||||
12/31/2014 - 06/30/2015 | 10.00 | 0.09 | (0.09 | ) | 0.00 | (0.03 | ) | 0.00 | 0.00 | (0.03 | ) | |||||||||||||||||||||||||
PIMCO REALPATH® Blend 2025 Fund | ||||||||||||||||||||||||||||||||||||
| Institutional Class | ||||||||||||||||||||||||||||||||||||
06/30/2018 | $ | 10.63 | $ | 0.31 | $ | 0.43 | $ | 0.74 | $ | (0.22 | ) | $ | 0.00 | $ | 0.00 | $ | (0.22 | ) | ||||||||||||||||||
06/30/2017 | 9.85 | 0.30 | 0.70 | 1.00 | (0.22 | ) | 0.00 | 0.00 | (0.22 | ) | ||||||||||||||||||||||||||
06/30/2016 | 9.99 | 0.32 | (0.12 | ) | 0.20 | (0.32 | ) | (0.02 | ) | 0.00 | (0.34 | ) | ||||||||||||||||||||||||
12/31/2014 - 06/30/2015 | 10.00 | 0.12 | (0.08 | ) | 0.04 | (0.05 | ) | 0.00 | 0.00 | (0.05 | ) | |||||||||||||||||||||||||
| Administrative Class | ||||||||||||||||||||||||||||||||||||
06/30/2018 | 10.62 | 0.33 | 0.38 | 0.71 | (0.20 | ) | 0.00 | 0.00 | (0.20 | ) | ||||||||||||||||||||||||||
06/30/2017 | 9.85 | 0.28 | 0.69 | 0.97 | (0.20 | ) | 0.00 | 0.00 | (0.20 | ) | ||||||||||||||||||||||||||
06/30/2016 | 9.99 | 0.28 | (0.11 | ) | 0.17 | (0.29 | ) | (0.02 | ) | 0.00 | (0.31 | ) | ||||||||||||||||||||||||
12/31/2014 - 06/30/2015 | 10.00 | 0.11 | (0.08 | ) | 0.03 | (0.04 | ) | 0.00 | 0.00 | (0.04 | ) | |||||||||||||||||||||||||
| Class A | ||||||||||||||||||||||||||||||||||||
06/30/2018 | 10.62 | 0.25 | 0.43 | 0.68 | (0.17 | ) | 0.00 | 0.00 | (0.17 | ) | ||||||||||||||||||||||||||
06/30/2017 | 9.85 | 0.32 | 0.64 | 0.96 | (0.19 | ) | 0.00 | 0.00 | (0.19 | ) | ||||||||||||||||||||||||||
06/30/2016 | 9.99 | 0.24 | (0.10 | ) | 0.14 | (0.26 | ) | (0.02 | ) | 0.00 | (0.28 | ) | ||||||||||||||||||||||||
12/31/2014 - 06/30/2015 | 10.00 | 0.10 | (0.08 | ) | 0.02 | (0.03 | ) | 0.00 | 0.00 | (0.03 | ) | |||||||||||||||||||||||||
PIMCO REALPATH® Blend 2030 Fund | ||||||||||||||||||||||||||||||||||||
| Institutional Class | ||||||||||||||||||||||||||||||||||||
06/30/2018 | $ | 10.81 | $ | 0.30 | $ | 0.54 | $ | 0.84 | $ | (0.24 | ) | $ | (0.02 | ) | $ | 0.00 | $ | (0.26 | ) | |||||||||||||||||
06/30/2017 | 9.87 | 0.31 | 0.88 | 1.19 | (0.25 | ) | 0.00 | 0.00 | (0.25 | ) | ||||||||||||||||||||||||||
06/30/2016 | 10.00 | 0.31 | (0.16 | ) | 0.15 | (0.25 | ) | (0.03 | ) | 0.00 | (0.28 | ) | ||||||||||||||||||||||||
12/31/2014 - 06/30/2015 | 10.00 | 0.13 | (0.08 | ) | 0.05 | (0.05 | ) | 0.00 | 0.00 | (0.05 | ) | |||||||||||||||||||||||||
| Administrative Class | ||||||||||||||||||||||||||||||||||||
06/30/2018 | 10.80 | 0.32 | 0.50 | 0.82 | (0.22 | ) | (0.02 | ) | 0.00 | (0.24 | ) | |||||||||||||||||||||||||
06/30/2017 | 9.88 | 0.29 | 0.85 | 1.14 | (0.22 | ) | 0.00 | 0.00 | (0.22 | ) | ||||||||||||||||||||||||||
06/30/2016 | 10.00 | 0.29 | (0.15 | ) | 0.14 | (0.23 | ) | (0.03 | ) | 0.00 | (0.26 | ) | ||||||||||||||||||||||||
12/31/2014 - 06/30/2015 | 10.00 | 0.12 | (0.08 | ) | 0.04 | (0.04 | ) | 0.00 | 0.00 | (0.04 | ) | |||||||||||||||||||||||||
| Class A | ||||||||||||||||||||||||||||||||||||
06/30/2018 | 10.78 | 0.25 | 0.54 | 0.79 | (0.19 | ) | (0.02 | ) | 0.00 | (0.21 | ) | |||||||||||||||||||||||||
06/30/2017 | 9.87 | 0.33 | 0.80 | 1.13 | (0.22 | ) | 0.00 | 0.00 | (0.22 | ) | ||||||||||||||||||||||||||
06/30/2016 | 10.00 | 0.26 | (0.16 | ) | 0.10 | (0.20 | ) | (0.03 | ) | 0.00 | (0.23 | ) | ||||||||||||||||||||||||
12/31/2014 - 06/30/2015 | 10.00 | 0.10 | (0.07 | ) | 0.03 | (0.03 | ) | 0.00 | 0.00 | (0.03 | ) | |||||||||||||||||||||||||
| 28 | PIMCO EQUITY��SERIES | See Accompanying Notes |
Table of Contents
| Ratios/Supplemental Data | ||||||||||||||||||||||||||||||||||
| Ratios to Average Net Assets(c) | ||||||||||||||||||||||||||||||||||
Net Asset Value End of | Total Return | Net Assets End of Year or | Expenses | Expenses Excluding Waivers | Expenses Excluding Interest Expense | Expenses Excluding Interest Expense and | Net Investment Income (Loss) | Portfolio Turnover | ||||||||||||||||||||||||||
| $ | 10.98 | 6.03 | % | $ | 10,812 | 0.04 | % | 0.05 | % | 0.04 | % | 0.05 | % | 2.86 | % | 71 | % | |||||||||||||||||
| 10.58 | 9.33 | 8,511 | 0.04 | 0.05 | 0.04 | 0.05 | 2.97 | 36 | ||||||||||||||||||||||||||
| 9.90 | 2.77 | 4,152 | 0.03 | 0.03 | 0.03 | 0.03 | 3.28 | 45 | ||||||||||||||||||||||||||
| 9.97 | 0.19 | 3,007 | 0.03 | * | 0.57 | * | 0.03 | * | 0.57 | * | 2.20 | * | 5 | |||||||||||||||||||||
| 10.97 | 5.74 | 12,407 | 0.29 | 0.30 | 0.29 | 0.30 | 2.97 | 71 | ||||||||||||||||||||||||||
| 10.58 | 9.06 | 11 | 0.29 | 0.30 | 0.29 | 0.30 | 2.63 | 36 | ||||||||||||||||||||||||||
| 9.90 | 2.45 | 10 | 0.28 | 0.28 | 0.28 | 0.28 | 3.01 | 45 | ||||||||||||||||||||||||||
| 9.97 | 0.08 | 10 | 0.28 | * | 0.82 | * | 0.28 | * | 0.82 | * | 1.92 | * | 5 | |||||||||||||||||||||
| 10.97 | 5.57 | 5,302 | 0.54 | 0.55 | 0.54 | 0.55 | 2.41 | 71 | ||||||||||||||||||||||||||
| 10.57 | 8.73 | 2,394 | 0.54 | 0.55 | 0.54 | 0.55 | 3.12 | 36 | ||||||||||||||||||||||||||
| 9.91 | 2.29 | 10 | 0.53 | 0.53 | 0.53 | 0.53 | 2.81 | 45 | ||||||||||||||||||||||||||
| 9.97 | (0.03 | ) | 10 | 0.53 | * | 1.07 | * | 0.53 | * | 1.07 | * | 1.70 | * | 5 | ||||||||||||||||||||
| $ | 11.15 | 6.92 | % | $ | 6,824 | 0.04 | % | 0.04 | % | 0.04 | % | 0.04 | % | 2.75 | % | 75 | % | |||||||||||||||||
| 10.63 | 10.33 | 6,131 | 0.04 | 0.05 | 0.04 | 0.05 | 2.94 | 27 | ||||||||||||||||||||||||||
| 9.85 | 2.10 | 3,395 | 0.03 | 0.03 | 0.03 | 0.03 | 3.32 | 59 | ||||||||||||||||||||||||||
| 9.99 | 0.39 | 3,026 | 0.03 | * | 0.57 | * | 0.03 | * | 0.57 | * | 2.38 | * | 5 | |||||||||||||||||||||
| 11.13 | 6.65 | 19,661 | 0.29 | 0.29 | 0.29 | 0.29 | 2.90 | 75 | ||||||||||||||||||||||||||
| 10.62 | 9.98 | 28 | 0.29 | 0.30 | 0.29 | 0.30 | 2.72 | 27 | ||||||||||||||||||||||||||
| 9.85 | 1.81 | 16 | 0.28 | 0.28 | 0.28 | 0.28 | 2.96 | 59 | ||||||||||||||||||||||||||
| 9.99 | 0.30 | 15 | 0.28 | * | 0.82 | * | 0.28 | * | 0.82 | * | 2.20 | * | 5 | |||||||||||||||||||||
| 11.13 | 6.36 | 5,078 | 0.54 | 0.54 | 0.54 | 0.54 | 2.30 | 75 | ||||||||||||||||||||||||||
| 10.62 | 9.85 | 3,899 | 0.54 | 0.55 | 0.54 | 0.55 | 3.06 | 27 | ||||||||||||||||||||||||||
| 9.85 | 1.50 | 27 | 0.53 | 0.53 | 0.53 | 0.53 | 2.49 | 59 | ||||||||||||||||||||||||||
| 9.99 | 0.17 | 11 | 0.53 | * | 1.07 | * | 0.53 | * | 1.07 | * | 1.92 | * | 5 | |||||||||||||||||||||
| $ | 11.39 | 7.81 | % | $ | 13,974 | 0.05 | % | 0.05 | % | 0.05 | % | 0.05 | % | 2.63 | % | 98 | % | |||||||||||||||||
| 10.81 | 12.20 | 12,978 | 0.05 | 0.06 | 0.05 | 0.06 | 2.99 | 23 | ||||||||||||||||||||||||||
| 9.87 | 1.67 | 6,409 | 0.04 | 0.04 | 0.04 | 0.04 | 3.22 | 65 | ||||||||||||||||||||||||||
| 10.00 | 0.49 | 3,015 | 0.04 | * | 0.58 | * | 0.04 | * | 0.58 | * | 2.55 | * | 6 | |||||||||||||||||||||
| 11.38 | 7.64 | 20,114 | 0.30 | 0.30 | 0.30 | 0.30 | 2.77 | 98 | ||||||||||||||||||||||||||
| 10.80 | 11.76 | 39 | 0.30 | 0.31 | 0.30 | 0.31 | 2.75 | 23 | ||||||||||||||||||||||||||
| 9.88 | 1.52 | 23 | 0.29 | 0.29 | 0.29 | 0.29 | 3.05 | 65 | ||||||||||||||||||||||||||
| 10.00 | 0.37 | 10 | 0.29 | * | 0.83 | * | 0.29 | * | 0.83 | * | 2.30 | * | 6 | |||||||||||||||||||||
| 11.36 | 7.36 | 4,169 | 0.55 | 0.55 | 0.55 | 0.55 | 2.20 | 98 | ||||||||||||||||||||||||||
| 10.78 | 11.64 | 3,118 | 0.55 | 0.56 | 0.55 | 0.56 | 3.13 | 23 | ||||||||||||||||||||||||||
| 9.87 | 1.15 | 13 | 0.54 | 0.54 | 0.54 | 0.54 | 2.74 | 65 | ||||||||||||||||||||||||||
| 10.00 | 0.27 | 10 | 0.54 | * | 1.08 | * | 0.54 | * | 1.08 | * | 2.04 | * | 6 | |||||||||||||||||||||
| ANNUAL REPORT | JUNE 30, 2018 | 29 |
Table of Contents
Financial Highlights (Cont.)
| Investment Operations | Less Distributions(b) | |||||||||||||||||||||||||||||||||||
| Selected Per Share Data for the Year or Period Ended^: | Beginning of | Net Investment Income (Loss)(a) | Net Realized/ Unrealized Gain (Loss) | Total | From Net Investment Income | From Net Realized Capital Gains | Tax Basis Return of Capital | Total | ||||||||||||||||||||||||||||
PIMCO REALPATH® Blend 2035 Fund | ||||||||||||||||||||||||||||||||||||
| Institutional Class | ||||||||||||||||||||||||||||||||||||
06/30/2018 | $ | 10.91 | $ | 0.29 | $ | 0.64 | $ | 0.93 | $ | (0.26 | ) | $ | 0.00 | $ | 0.00 | $ | (0.26 | ) | ||||||||||||||||||
06/30/2017 | 9.83 | 0.31 | 0.98 | 1.29 | (0.21 | ) | 0.00 | 0.00 | (0.21 | ) | ||||||||||||||||||||||||||
06/30/2016 | 10.04 | 0.29 | (0.24 | ) | 0.05 | (0.23 | ) | (0.03 | ) | 0.00 | (0.26 | ) | ||||||||||||||||||||||||
12/31/2014 - 06/30/2015 | 10.00 | 0.13 | (0.04 | ) | 0.09 | (0.05 | ) | 0.00 | 0.00 | (0.05 | ) | |||||||||||||||||||||||||
| Administrative Class | ||||||||||||||||||||||||||||||||||||
06/30/2018 | 10.91 | 0.31 | 0.59 | 0.90 | (0.24 | ) | 0.00 | 0.00 | (0.24 | ) | ||||||||||||||||||||||||||
06/30/2017 | 9.83 | 0.25 | 1.01 | 1.26 | (0.18 | ) | 0.00 | 0.00 | (0.18 | ) | ||||||||||||||||||||||||||
06/30/2016 | 10.04 | 0.26 | (0.24 | ) | 0.02 | (0.20 | ) | (0.03 | ) | 0.00 | (0.23 | ) | ||||||||||||||||||||||||
12/31/2014 - 06/30/2015 | 10.00 | 0.11 | (0.03 | ) | 0.08 | (0.04 | ) | 0.00 | 0.00 | (0.04 | ) | |||||||||||||||||||||||||
| Class A | ||||||||||||||||||||||||||||||||||||
06/30/2018 | 10.94 | 0.24 | 0.64 | 0.88 | (0.21 | ) | 0.00 | 0.00 | (0.21 | ) | ||||||||||||||||||||||||||
06/30/2017 | 9.88 | 0.32 | 0.92 | 1.24 | (0.18 | ) | 0.00 | 0.00 | (0.18 | ) | ||||||||||||||||||||||||||
06/30/2016 | 10.03 | 0.20 | (0.19 | ) | 0.01 | (0.13 | ) | (0.03 | ) | 0.00 | (0.16 | ) | ||||||||||||||||||||||||
12/31/2014 - 06/30/2015 | 10.00 | 0.12 | (0.05 | ) | 0.07 | (0.04 | ) | 0.00 | 0.00 | (0.04 | ) | |||||||||||||||||||||||||
PIMCO REALPATH® Blend 2040 Fund | ||||||||||||||||||||||||||||||||||||
| Institutional Class | ||||||||||||||||||||||||||||||||||||
06/30/2018 | $ | 11.00 | $ | 0.29 | $ | 0.71 | $ | 1.00 | $ | (0.27 | ) | $ | (0.02 | ) | $ | 0.00 | $ | (0.29 | ) | |||||||||||||||||
06/30/2017 | 9.84 | 0.34 | 1.00 | 1.34 | (0.18 | ) | 0.00 | 0.00 | (0.18 | ) | ||||||||||||||||||||||||||
06/30/2016 | 10.07 | 0.28 | (0.24 | ) | 0.04 | (0.24 | ) | (0.03 | ) | 0.00 | (0.27 | ) | ||||||||||||||||||||||||
12/31/2014 - 06/30/2015 | 10.00 | 0.12 | 0.00 | 0.12 | (0.05 | ) | 0.00 | 0.00 | (0.05 | ) | ||||||||||||||||||||||||||
| Administrative Class | ||||||||||||||||||||||||||||||||||||
06/30/2018 | 10.99 | 0.31 | 0.66 | 0.97 | (0.25 | ) | (0.02 | ) | 0.00 | (0.27 | ) | |||||||||||||||||||||||||
06/30/2017 | 9.83 | 0.24 | 1.07 | 1.31 | (0.15 | ) | 0.00 | 0.00 | (0.15 | ) | ||||||||||||||||||||||||||
06/30/2016 | 10.07 | 0.27 | (0.27 | ) | 0.00 | (0.21 | ) | (0.03 | ) | 0.00 | (0.24 | ) | ||||||||||||||||||||||||
12/31/2014 - 06/30/2015 | 10.00 | 0.11 | 0.00 | 0.11 | (0.04 | ) | 0.00 | 0.00 | (0.04 | ) | ||||||||||||||||||||||||||
| Class A | ||||||||||||||||||||||||||||||||||||
06/30/2018 | 10.98 | 0.23 | 0.70 | 0.93 | (0.22 | ) | (0.02 | ) | 0.00 | (0.24 | ) | |||||||||||||||||||||||||
06/30/2017 | 9.83 | 0.32 | 0.97 | 1.29 | (0.14 | ) | 0.00 | 0.00 | (0.14 | ) | ||||||||||||||||||||||||||
06/30/2016 | 10.07 | 0.25 | (0.27 | ) | (0.02 | ) | (0.19 | ) | (0.03 | ) | 0.00 | (0.22 | ) | |||||||||||||||||||||||
12/31/2014 - 06/30/2015 | 10.00 | 0.10 | 0.00 | 0.10 | (0.03 | ) | 0.00 | 0.00 | (0.03 | ) | ||||||||||||||||||||||||||
PIMCO REALPATH® Blend 2045 Fund | ||||||||||||||||||||||||||||||||||||
| Institutional Class | ||||||||||||||||||||||||||||||||||||
06/30/2018 | $ | 11.00 | $ | 0.28 | $ | 0.77 | $ | 1.05 | $ | (0.26 | ) | $ | 0.00 | $ | 0.00 | $ | (0.26 | ) | ||||||||||||||||||
06/30/2017 | 9.79 | 0.35 | 1.02 | 1.37 | (0.16 | ) | 0.00 | 0.00 | (0.16 | ) | ||||||||||||||||||||||||||
06/30/2016 | 10.10 | 0.27 | (0.32 | ) | (0.05 | ) | (0.23 | ) | (0.03 | ) | 0.00 | (0.26 | ) | |||||||||||||||||||||||
12/31/2014 - 06/30/2015 | 10.00 | 0.12 | 0.03 | 0.15 | (0.05 | ) | 0.00 | 0.00 | (0.05 | ) | ||||||||||||||||||||||||||
| Administrative Class | ||||||||||||||||||||||||||||||||||||
06/30/2018 | 10.99 | 0.31 | 0.71 | 1.02 | (0.24 | ) | 0.00 | 0.00 | (0.24 | ) | ||||||||||||||||||||||||||
06/30/2017 | 9.79 | 0.25 | 1.09 | 1.34 | (0.14 | ) | 0.00 | 0.00 | (0.14 | ) | ||||||||||||||||||||||||||
06/30/2016 | 10.09 | 0.24 | (0.31 | ) | (0.07 | ) | (0.20 | ) | (0.03 | ) | 0.00 | (0.23 | ) | |||||||||||||||||||||||
12/31/2014 - 06/30/2015 | 10.00 | 0.14 | (0.01 | ) | 0.13 | (0.04 | ) | 0.00 | 0.00 | (0.04 | ) | |||||||||||||||||||||||||
| Class A | ||||||||||||||||||||||||||||||||||||
06/30/2018 | 10.99 | 0.22 | 0.77 | 0.99 | (0.21 | ) | 0.00 | 0.00 | (0.21 | ) | ||||||||||||||||||||||||||
06/30/2017 | 9.80 | 0.32 | 0.99 | 1.31 | (0.12 | ) | 0.00 | 0.00 | (0.12 | ) | ||||||||||||||||||||||||||
06/30/2016 | 10.09 | 0.22 | (0.31 | ) | (0.09 | ) | (0.17 | ) | (0.03 | ) | 0.00 | (0.20 | ) | |||||||||||||||||||||||
12/31/2014 - 06/30/2015 | 10.00 | 0.09 | 0.03 | 0.12 | (0.03 | ) | 0.00 | 0.00 | (0.03 | ) | ||||||||||||||||||||||||||
| 30 | PIMCO EQUITY SERIES | See Accompanying Notes |
Table of Contents
| Ratios/Supplemental Data | ||||||||||||||||||||||||||||||||||
| Ratios to Average Net Assets(c) | ||||||||||||||||||||||||||||||||||
Net Asset Value End of | Total Return | Net Assets End of Year or | Expenses | Expenses Excluding Waivers | Expenses Excluding Interest Expense | Expenses Excluding Interest Expense and | Net Investment Income (Loss) | Portfolio Turnover | ||||||||||||||||||||||||||
| $ | 11.58 | 8.56 | % | $ | 16,958 | 0.06 | % | 0.07 | % | 0.06 | % | 0.07 | % | 2.52 | % | 101 | % | |||||||||||||||||
| 10.91 | 13.29 | 17,276 | 0.06 | 0.07 | 0.06 | 0.07 | 2.95 | 20 | ||||||||||||||||||||||||||
| 9.83 | 0.64 | 5,958 | 0.05 | 0.05 | 0.05 | 0.05 | 3.05 | 56 | ||||||||||||||||||||||||||
| 10.04 | 0.89 | 3,027 | 0.05 | * | 0.58 | * | 0.05 | * | 0.58 | * | 2.48 | * | 6 | |||||||||||||||||||||
| 11.57 | 8.29 | 17,270 | 0.31 | 0.32 | 0.31 | 0.32 | 2.69 | 101 | ||||||||||||||||||||||||||
| 10.91 | 13.01 | 34 | 0.31 | 0.32 | 0.31 | 0.32 | 2.35 | 20 | ||||||||||||||||||||||||||
| 9.83 | 0.34 | 10 | 0.30 | 0.30 | 0.30 | 0.30 | 2.69 | 56 | ||||||||||||||||||||||||||
| 10.04 | 0.77 | 10 | 0.30 | * | 0.83 | * | 0.30 | * | 0.83 | * | 2.22 | * | 6 | |||||||||||||||||||||
| 11.61 | 8.06 | 4,330 | 0.56 | 0.57 | 0.56 | 0.57 | 2.10 | 101 | ||||||||||||||||||||||||||
| 10.94 | 12.66 | 3,296 | 0.56 | 0.57 | 0.56 | 0.57 | 2.96 | 20 | ||||||||||||||||||||||||||
| 9.88 | 0.21 | 10 | 0.55 | 0.55 | 0.55 | 0.55 | 2.10 | 56 | ||||||||||||||||||||||||||
| 10.03 | 0.65 | 22 | 0.55 | * | 1.08 | * | 0.55 | * | 1.08 | * | 2.33 | * | 6 | |||||||||||||||||||||
| $ | 11.71 | 9.17 | % | $ | 26,413 | 0.06 | % | 0.07 | % | 0.06 | % | 0.07 | % | 2.50 | % | 95 | % | |||||||||||||||||
| 11.00 | 13.73 | 24,381 | 0.06 | 0.07 | 0.06 | 0.07 | 3.16 | 15 | ||||||||||||||||||||||||||
| 9.84 | 0.48 | 3,509 | 0.05 | 0.05 | 0.05 | 0.05 | 2.90 | 43 | ||||||||||||||||||||||||||
| 10.07 | 1.19 | 3,036 | 0.05 | * | 0.58 | * | 0.05 | * | 0.58 | * | 2.39 | * | 6 | |||||||||||||||||||||
| 11.69 | 8.90 | 11,003 | 0.31 | 0.32 | 0.31 | 0.32 | 2.66 | 95 | ||||||||||||||||||||||||||
| 10.99 | 13.48 | 52 | 0.31 | 0.32 | 0.31 | 0.32 | 2.33 | 15 | ||||||||||||||||||||||||||
| 9.83 | 0.14 | 36 | 0.30 | 0.30 | 0.30 | 0.30 | 2.89 | 43 | ||||||||||||||||||||||||||
| 10.07 | 1.08 | 12 | 0.30 | * | 0.83 | * | 0.30 | * | 0.83 | * | 2.20 | * | 6 | |||||||||||||||||||||
| 11.67 | 8.52 | 5,484 | 0.56 | 0.57 | 0.56 | 0.57 | 2.03 | 95 | ||||||||||||||||||||||||||
| 10.98 | 13.24 | 5,285 | 0.56 | 0.57 | 0.56 | 0.57 | 2.98 | 15 | ||||||||||||||||||||||||||
| 9.83 | (0.10 | ) | 30 | 0.55 | 0.55 | 0.55 | 0.55 | 2.63 | 43 | |||||||||||||||||||||||||
| 10.07 | 0.98 | 11 | 0.55 | * | 1.08 | * | 0.55 | * | 1.08 | * | 1.93 | * | 6 | |||||||||||||||||||||
| $ | 11.79 | 9.57 | % | $ | 41,708 | 0.06 | % | 0.07 | % | 0.06 | % | 0.07 | % | 2.43 | % | 105 | % | |||||||||||||||||
| 11.00 | 14.12 | 36,311 | 0.06 | 0.07 | 0.06 | 0.07 | 3.27 | 10 | ||||||||||||||||||||||||||
| 9.79 | (0.45 | ) | 3,415 | 0.05 | 0.05 | 0.05 | 0.05 | 2.84 | 41 | |||||||||||||||||||||||||
| 10.10 | 1.48 | 3,044 | 0.05 | * | 0.58 | * | 0.05 | * | 0.58 | * | 2.37 | * | 6 | |||||||||||||||||||||
| 11.77 | 9.31 | 10,287 | 0.31 | 0.32 | 0.31 | 0.32 | 2.58 | 105 | ||||||||||||||||||||||||||
| 10.99 | 13.77 | 60 | 0.31 | 0.32 | 0.31 | 0.32 | 2.35 | 10 | ||||||||||||||||||||||||||
| 9.79 | (0.63 | ) | 39 | 0.30 | 0.30 | 0.30 | 0.30 | 2.55 | 41 | |||||||||||||||||||||||||
| 10.09 | 1.33 | 39 | 0.30 | * | 0.83 | * | 0.30 | * | 0.83 | * | 2.69 | * | 6 | |||||||||||||||||||||
| 11.77 | 9.01 | 3,569 | 0.56 | 0.57 | 0.56 | 0.57 | 1.93 | 105 | ||||||||||||||||||||||||||
| 10.99 | 13.50 | 3,071 | 0.56 | 0.57 | 0.56 | 0.57 | 2.94 | 10 | ||||||||||||||||||||||||||
| 9.80 | (0.81 | ) | 10 | 0.55 | 0.55 | 0.55 | 0.55 | 2.31 | 41 | |||||||||||||||||||||||||
| 10.09 | 1.16 | 10 | 0.55 | * | 1.08 | * | 0.55 | * | 1.08 | * | 1.86 | * | 6 | |||||||||||||||||||||
| ANNUAL REPORT | JUNE 30, 2018 | 31 |
Table of Contents
Financial Highlights (Cont.)
| Investment Operations | Less Distributions(b) | |||||||||||||||||||||||||||||||||||
| Selected Per Share Data for the Year or Period Ended^: | Beginning of Period | Net Investment Income (Loss)(a) | Net Realized/ Unrealized Gain (Loss) | Total | From Net Investment Income | From Net Realized Capital Gains | Tax Basis Return of Capital | Total | ||||||||||||||||||||||||||||
PIMCO REALPATH® Blend 2050 Fund | ||||||||||||||||||||||||||||||||||||
| Institutional Class | ||||||||||||||||||||||||||||||||||||
06/30/2018 | $ | 11.05 | $ | 0.28 | $ | 0.79 | $ | 1.07 | $ | (0.26 | ) | $ | 0.00 | $ | 0.00 | $ | (0.26 | ) | ||||||||||||||||||
06/30/2017 | 9.82 | 0.35 | 1.05 | 1.40 | (0.17 | ) | 0.00 | 0.00 | (0.17 | ) | ||||||||||||||||||||||||||
06/30/2016 | 10.11 | 0.27 | (0.32 | ) | (0.05 | ) | (0.21 | ) | (0.03 | ) | 0.00 | (0.24 | ) | |||||||||||||||||||||||
12/31/2014 - 06/30/2015 | 10.00 | 0.12 | 0.04 | 0.16 | (0.05 | ) | 0.00 | 0.00 | (0.05 | ) | ||||||||||||||||||||||||||
| Administrative Class | ||||||||||||||||||||||||||||||||||||
06/30/2018 | 11.04 | 0.31 | 0.73 | 1.04 | (0.24 | ) | 0.00 | 0.00 | (0.24 | ) | ||||||||||||||||||||||||||
06/30/2017 | 9.82 | 0.24 | 1.13 | 1.37 | (0.15 | ) | 0.00 | 0.00 | (0.15 | ) | ||||||||||||||||||||||||||
06/30/2016 | 10.10 | 0.24 | (0.30 | ) | (0.06 | ) | (0.19 | ) | (0.03 | ) | 0.00 | (0.22 | ) | |||||||||||||||||||||||
12/31/2014 - 06/30/2015 | 10.00 | 0.12 | 0.02 | 0.14 | (0.04 | ) | 0.00 | 0.00 | (0.04 | ) | ||||||||||||||||||||||||||
| Class A | ||||||||||||||||||||||||||||||||||||
06/30/2018 | 11.00 | 0.22 | 0.79 | 1.01 | (0.21 | ) | 0.00 | 0.00 | (0.21 | ) | ||||||||||||||||||||||||||
06/30/2017 | 9.80 | 0.30 | 1.03 | 1.33 | (0.13 | ) | 0.00 | 0.00 | (0.13 | ) | ||||||||||||||||||||||||||
06/30/2016 | 10.10 | 0.23 | (0.32 | ) | (0.09 | ) | (0.18 | ) | (0.03 | ) | 0.00 | (0.21 | ) | |||||||||||||||||||||||
12/31/2014 - 06/30/2015 | 10.00 | 0.10 | 0.03 | 0.13 | (0.03 | ) | 0.00 | 0.00 | (0.03 | ) | ||||||||||||||||||||||||||
PIMCO REALPATH® Blend 2055 Fund | ||||||||||||||||||||||||||||||||||||
| Institutional Class | ||||||||||||||||||||||||||||||||||||
06/30/2018 | $ | 11.02 | $ | 0.28 | $ | 0.77 | $ | 1.05 | $ | (0.33 | ) | $ | 0.00 | $ | 0.00 | $ | (0.33 | ) | ||||||||||||||||||
06/30/2017 | 9.80 | 0.27 | 1.12 | 1.39 | (0.17 | ) | 0.00 | 0.00 | (0.17 | ) | ||||||||||||||||||||||||||
06/30/2016 | 10.11 | 0.27 | (0.33 | ) | (0.06 | ) | (0.22 | ) | (0.03 | ) | 0.00 | (0.25 | ) | |||||||||||||||||||||||
12/31/2014 - 06/30/2015 | 10.00 | 0.12 | 0.04 | 0.16 | (0.05 | ) | 0.00 | 0.00 | (0.05 | ) | ||||||||||||||||||||||||||
| Administrative Class | ||||||||||||||||||||||||||||||||||||
06/30/2018 | 11.03 | 0.30 | 0.73 | 1.03 | (0.31 | ) | 0.00 | 0.00 | (0.31 | ) | ||||||||||||||||||||||||||
06/30/2017 | 9.80 | 0.22 | 1.15 | 1.37 | (0.14 | ) | 0.00 | 0.00 | (0.14 | ) | ||||||||||||||||||||||||||
06/30/2016 | 10.11 | 0.24 | (0.33 | ) | (0.09 | ) | (0.19 | ) | (0.03 | ) | 0.00 | (0.22 | ) | |||||||||||||||||||||||
12/31/2014 - 06/30/2015 | 10.00 | 0.11 | 0.04 | 0.15 | (0.04 | ) | 0.00 | 0.00 | (0.04 | ) | ||||||||||||||||||||||||||
| Class A | ||||||||||||||||||||||||||||||||||||
06/30/2018 | 10.98 | 0.21 | 0.78 | 0.99 | (0.28 | ) | 0.00 | 0.00 | (0.28 | ) | ||||||||||||||||||||||||||
06/30/2017 | 9.79 | 0.31 | 1.01 | 1.32 | (0.13 | ) | 0.00 | 0.00 | (0.13 | ) | ||||||||||||||||||||||||||
06/30/2016 | 10.09 | 0.22 | (0.32 | ) | (0.10 | ) | (0.17 | ) | (0.03 | ) | 0.00 | (0.20 | ) | |||||||||||||||||||||||
12/31/2014 - 06/30/2015 | 10.00 | 0.13 | 0.00 | 0.13 | (0.04 | ) | 0.00 | 0.00 | (0.04 | ) | ||||||||||||||||||||||||||
PIMCO REALPATH® Blend Income Fund | ||||||||||||||||||||||||||||||||||||
| Institutional Class | ||||||||||||||||||||||||||||||||||||
06/30/2018 | $ | 10.54 | $ | 0.32 | $ | 0.26 | $ | 0.58 | $ | (0.20 | ) | $ | 0.00 | $ | 0.00 | $ | (0.20 | ) | ||||||||||||||||||
06/30/2017 | 9.92 | 0.31 | 0.56 | 0.87 | (0.25 | ) | 0.00 | 0.00 | (0.25 | ) | ||||||||||||||||||||||||||
06/30/2016 | 9.95 | 0.32 | 0.00 | 0.32 | (0.32 | ) | (0.02 | ) | (0.01 | ) | (0.35 | ) | ||||||||||||||||||||||||
12/31/2014 - 06/30/2015 | 10.00 | 0.10 | (0.10 | ) | 0.00 | (0.05 | ) | 0.00 | 0.00 | (0.05 | ) | |||||||||||||||||||||||||
| Administrative Class | ||||||||||||||||||||||||||||||||||||
06/30/2018 | 10.55 | 0.33 | 0.22 | 0.55 | (0.18 | ) | 0.00 | 0.00 | (0.18 | ) | ||||||||||||||||||||||||||
06/30/2017 | 9.92 | 0.28 | 0.57 | 0.85 | (0.22 | ) | 0.00 | 0.00 | (0.22 | ) | ||||||||||||||||||||||||||
06/30/2016 | 9.94 | 0.29 | 0.01 | 0.30 | (0.29 | ) | (0.02 | ) | (0.01 | ) | (0.32 | ) | ||||||||||||||||||||||||
12/31/2014 - 06/30/2015 | 10.00 | 0.09 | (0.11 | ) | (0.02 | ) | (0.04 | ) | 0.00 | 0.00 | (0.04 | ) | ||||||||||||||||||||||||
| Class A | ||||||||||||||||||||||||||||||||||||
06/30/2018 | 10.52 | 0.27 | 0.25 | 0.52 | (0.16 | ) | 0.00 | 0.00 | (0.16 | ) | ||||||||||||||||||||||||||
06/30/2017 | 9.91 | 0.31 | 0.51 | 0.82 | (0.21 | ) | 0.00 | 0.00 | (0.21 | ) | ||||||||||||||||||||||||||
06/30/2016 | 9.94 | 0.28 | (0.01 | ) | 0.27 | (0.27 | ) | (0.02 | ) | (0.01 | ) | (0.30 | ) | |||||||||||||||||||||||
12/31/2014 - 06/30/2015 | 10.00 | 0.13 | (0.15 | ) | (0.02 | ) | (0.04 | ) | 0.00 | 0.00 | (0.04 | ) | ||||||||||||||||||||||||
| ^ | A zero balance may reflect actual amounts rounding to less than $0.01 or 0.01%. |
| * | Annualized |
| (a) | Per share amounts based on average number of shares outstanding during the year or period. |
| (b) | The tax characterization of distributions is determined in accordance with Federal income tax regulations. See Note 2, Distributions to Shareholders, in the Notes to Financial Statements for more information. |
| (c) | Ratios shown do not include expenses of the investment companies in which a Fund may invest. See Note 9, Fees and Expenses, in the Notes to Financial Statements for more information regarding the expenses and any applicable fee waivers associated with these investments. |
| 32 | PIMCO EQUITY SERIES | See Accompanying Notes |
Table of Contents
| Ratios/Supplemental Data | ||||||||||||||||||||||||||||||||||
| Ratios to Average Net Assets(c) | ||||||||||||||||||||||||||||||||||
Net Asset Value End of | Total Return | Net Assets End of Year or | Expenses | Expenses Excluding Waivers | Expenses Excluding Interest Expense | Expenses Excluding Interest Expense and | Net Investment Income (Loss) | Portfolio Turnover | ||||||||||||||||||||||||||
| $ | 11.86 | 9.69 | % | $ | 50,057 | 0.06 | % | 0.07 | % | 0.06 | % | 0.07 | % | 2.39 | % | 108 | % | |||||||||||||||||
| 11.05 | 14.40 | 43,554 | 0.06 | 0.07 | 0.06 | 0.07 | 3.26 | 10 | ||||||||||||||||||||||||||
| 9.82 | (0.40 | ) | 3,934 | 0.05 | 0.05 | 0.05 | 0.05 | 2.86 | 38 | |||||||||||||||||||||||||
| 10.11 | 1.59 | 3,046 | 0.05 | * | 0.58 | * | 0.05 | * | 0.58 | * | 2.39 | * | 6 | |||||||||||||||||||||
| 11.84 | 9.44 | 14,382 | 0.31 | 0.32 | 0.31 | 0.32 | 2.58 | 108 | ||||||||||||||||||||||||||
| 11.04 | 14.05 | 21 | 0.31 | 0.32 | 0.31 | 0.32 | 2.26 | 10 | ||||||||||||||||||||||||||
| 9.82 | (0.60 | ) | 13 | 0.30 | 0.30 | 0.30 | 0.30 | 2.53 | 38 | |||||||||||||||||||||||||
| 10.10 | 1.39 | 14 | 0.30 | * | 0.83 | * | 0.30 | * | 0.83 | * | 2.33 | * | 6 | |||||||||||||||||||||
| 11.80 | 9.20 | 3,782 | 0.56 | 0.57 | 0.56 | 0.57 | 1.90 | 108 | ||||||||||||||||||||||||||
| 11.00 | 13.74 | 3,440 | 0.56 | 0.57 | 0.56 | 0.57 | 2.79 | 10 | ||||||||||||||||||||||||||
| 9.80 | (0.89 | ) | 110 | 0.55 | 0.55 | 0.55 | 0.55 | 2.47 | 38 | |||||||||||||||||||||||||
| 10.10 | 1.31 | 15 | 0.55 | * | 1.08 | * | 0.55 | * | 1.08 | * | 2.05 | * | 6 | |||||||||||||||||||||
| $ | 11.74 | 9.56 | % | $ | 10,558 | 0.06 | % | 0.07 | % | 0.06 | % | 0.07 | % | 2.43 | % | 67 | % | |||||||||||||||||
| 11.02 | 14.35 | 6,555 | 0.06 | 0.07 | 0.06 | 0.07 | 2.56 | 14 | ||||||||||||||||||||||||||
| 9.80 | (0.47 | ) | 3,388 | 0.05 | 0.05 | 0.05 | 0.05 | 2.83 | 38 | |||||||||||||||||||||||||
| 10.11 | 1.58 | 3,048 | 0.05 | * | 0.58 | * | 0.05 | * | 0.58 | * | 2.39 | * | 5 | |||||||||||||||||||||
| 11.75 | 9.37 | 152 | 0.31 | 0.32 | 0.31 | 0.32 | 2.54 | 67 | ||||||||||||||||||||||||||
| 11.03 | 14.11 | 16 | 0.31 | 0.32 | 0.31 | 0.32 | 2.11 | 14 | ||||||||||||||||||||||||||
| 9.80 | (0.77 | ) | 11 | 0.30 | 0.30 | 0.30 | 0.30 | 2.54 | 38 | |||||||||||||||||||||||||
| 10.11 | 1.47 | 11 | 0.30 | * | 0.83 | * | 0.30 | * | 0.83 | * | 2.18 | * | 5 | |||||||||||||||||||||
| 11.69 | 9.04 | 2,038 | 0.56 | 0.57 | 0.56 | 0.57 | 1.85 | 67 | ||||||||||||||||||||||||||
| 10.98 | 13.62 | 1,799 | 0.56 | 0.57 | 0.56 | 0.57 | 2.85 | 14 | ||||||||||||||||||||||||||
| 9.79 | (0.94 | ) | 60 | 0.55 | 0.55 | 0.55 | 0.55 | 2.29 | 38 | |||||||||||||||||||||||||
| 10.09 | 1.28 | 66 | 0.55 | * | 1.08 | * | 0.55 | * | 1.08 | * | 2.53 | * | 5 | |||||||||||||||||||||
| $ | 10.92 | 5.52 | % | $ | 7,556 | 0.04 | % | 0.04 | % | 0.04 | % | 0.04 | % | 2.91 | % | 34 | % | |||||||||||||||||
| 10.54 | 8.85 | 6,027 | 0.04 | 0.05 | 0.04 | 0.05 | 2.95 | 30 | ||||||||||||||||||||||||||
| 9.92 | 3.33 | 3,317 | 0.03 | 0.03 | 0.03 | 0.03 | 3.34 | 41 | ||||||||||||||||||||||||||
| 9.95 | (0.02 | ) | 3,035 | 0.03 | * | 0.56 | * | 0.03 | * | 0.56 | * | 2.03 | * | 4 | ||||||||||||||||||||
| 10.92 | 5.17 | 13,340 | 0.29 | 0.29 | 0.29 | 0.29 | 2.98 | 34 | ||||||||||||||||||||||||||
| 10.55 | 8.71 | 74 | 0.29 | 0.30 | 0.29 | 0.30 | 2.68 | 30 | ||||||||||||||||||||||||||
| 9.92 | 3.08 | 50 | 0.28 | 0.28 | 0.28 | 0.28 | 2.95 | 41 | ||||||||||||||||||||||||||
| 9.94 | (0.21 | ) | 14 | 0.28 | * | 0.81 | * | 0.28 | * | 0.81 | * | 1.84 | * | 4 | ||||||||||||||||||||
| 10.88 | 4.91 | 3,535 | 0.54 | 0.54 | 0.54 | 0.54 | 2.51 | 34 | ||||||||||||||||||||||||||
| 10.52 | 8.39 | 1,661 | 0.54 | 0.55 | 0.54 | 0.55 | 2.91 | 30 | ||||||||||||||||||||||||||
| 9.91 | 2.75 | 70 | 0.53 | 0.53 | 0.53 | 0.53 | 2.84 | 41 | ||||||||||||||||||||||||||
| 9.94 | (0.22 | ) | 73 | 0.53 | * | 1.06 | * | 0.53 | * | 1.06 | * | 2.61 | * | 4 | ||||||||||||||||||||
| ANNUAL REPORT | JUNE 30, 2018 | 33 |
Table of Contents
Statements of Assets and Liabilities
| (Amounts in thousands†, except per share amounts) | PIMCO REALPATH® Blend 2020 Fund | PIMCO REALPATH® Blend 2025 Fund | PIMCO REALPATH® Blend 2030 Fund | PIMCO REALPATH® Blend 2035 Fund | ||||||||||||
Assets: | ||||||||||||||||
Investments, at value | ||||||||||||||||
Investments in securities* | $ | 11,390 | $ | 15,580 | $ | 21,780 | $ | 25,312 | ||||||||
Investments in Affiliates | 16,846 | 15,730 | 16,172 | 13,226 | ||||||||||||
Financial Derivative Instruments | ||||||||||||||||
Exchange-traded or centrally cleared | 127 | 144 | 0 | 0 | ||||||||||||
Over the counter | 29 | 41 | 56 | 65 | ||||||||||||
Cash | 0 | 0 | 0 | 0 | ||||||||||||
Receivable for investments sold | 0 | 38 | 0 | 0 | ||||||||||||
Receivable for Fund shares sold | 196 | 65 | 258 | 63 | ||||||||||||
Dividends receivable from Affiliates | 62 | 59 | 59 | 47 | ||||||||||||
Reimbursement receivable from PIMCO | 0 | 1 | 1 | 1 | ||||||||||||
Total Assets | 28,650 | 31,658 | 38,326 | 38,714 | ||||||||||||
Liabilities: | ||||||||||||||||
Financial Derivative Instruments | ||||||||||||||||
Exchange-traded or centrally cleared | $ | 23 | $ | 27 | $ | 0 | $ | 0 | ||||||||
Over the counter | 2 | 2 | 2 | 3 | ||||||||||||
Payable for investments purchased | 37 | 0 | 0 | 0 | ||||||||||||
Payable for investments in Affiliates purchased | 62 | 59 | 59 | 47 | ||||||||||||
Payable for Fund shares redeemed | 0 | 0 | 0 | 99 | ||||||||||||
Accrued investment advisory fees | 0 | 0 | 1 | 1 | ||||||||||||
Accrued supervisory and administrative fees | 1 | 2 | 2 | 1 | ||||||||||||
Accrued distribution fees | 3 | 4 | 4 | 4 | ||||||||||||
Accrued servicing fees | 1 | 1 | 1 | 1 | ||||||||||||
Total Liabilities | 129 | 95 | 69 | 156 | ||||||||||||
Net Assets | $ | 28,521 | $ | 31,563 | $ | 38,257 | $ | 38,558 | ||||||||
Net Assets Consist of: | ||||||||||||||||
Paid in capital | $ | 27,905 | $ | 30,919 | $ | 36,534 | $ | 36,323 | ||||||||
Undistributed (overdistributed) net investment income | 205 | 224 | 312 | 285 | ||||||||||||
Accumulated undistributed net realized gain (loss) | 522 | 623 | 1,163 | 1,510 | ||||||||||||
Net unrealized appreciation (depreciation) | (111 | ) | (203 | ) | 248 | 440 | ||||||||||
Net Assets | $ | 28,521 | $ | 31,563 | $ | 38,257 | $ | 38,558 | ||||||||
Cost of investments in securities | $ | 11,221 | $ | 15,432 | $ | 21,325 | $ | 24,752 | ||||||||
Cost of investments in Affiliates | $ | 17,126 | $ | 16,092 | $ | 16,431 | $ | 13,409 | ||||||||
Cost or premiums of financial derivative instruments, net | $ | 130 | $ | 144 | $ | 0 | $ | 0 | ||||||||
* Includes repurchase agreements of: | $ | 157 | $ | 129 | $ | 152 | $ | 268 | ||||||||
| † | A zero balance may reflect actual amounts rounding to less than one thousand. |
| 34 | PIMCO EQUITY SERIES | See Accompanying Notes |
Table of Contents
June 30, 2018
| PIMCO REALPATH® Blend 2040 Fund | PIMCO REALPATH® Blend 2045 Fund | PIMCO REALPATH® Blend 2050 Fund | PIMCO REALPATH® Blend 2055 Fund | PIMCO REALPATH® Blend Income Fund | ||||||||||||||
| $ | 30,697 | $ | 42,774 | $ | 54,551 | $ | 10,057 | $ | 8,729 | |||||||||
| 11,834 | 12,486 | 13,285 | 2,485 | 15,560 | ||||||||||||||
| 0 | 0 | 0 | 0 | 107 | ||||||||||||||
| 79 | 109 | 141 | 26 | 24 | ||||||||||||||
| 1 | 1 | 1 | 42 | 0 | ||||||||||||||
| 0 | 0 | 0 | 0 | 0 | ||||||||||||||
| 298 | 205 | 254 | 141 | 220 | ||||||||||||||
| 40 | 40 | 42 | 8 | 56 | ||||||||||||||
| 1 | 1 | 1 | 0 | 1 | ||||||||||||||
| 42,950 | 55,616 | 68,275 | 12,759 | 24,697 | ||||||||||||||
| $ | 0 | $ | 0 | $ | 0 | $ | 0 | $ | 20 | |||||||||
| 3 | 4 | 5 | 1 | 2 | ||||||||||||||
| 0 | 0 | 0 | 0 | 0 | ||||||||||||||
| 40 | 40 | 42 | 8 | 56 | ||||||||||||||
| 0 | 2 | 0 | 1 | 184 | ||||||||||||||
| 1 | 1 | 1 | 0 | 0 | ||||||||||||||
| 2 | 2 | 2 | 1 | 1 | ||||||||||||||
| 3 | 2 | 3 | 0 | 2 | ||||||||||||||
| 1 | 1 | 1 | 0 | 1 | ||||||||||||||
| 50 | 52 | 54 | 11 | 266 | ||||||||||||||
| $ | 42,900 | $ | 55,564 | $ | 68,221 | $ | 12,748 | $ | 24,431 | |||||||||
| $ | 40,156 | $ | 51,709 | $ | 63,448 | $ | 11,691 | $ | 24,066 | |||||||||
| 333 | 454 | 527 | 57 | 201 | ||||||||||||||
| 1,884 | 2,658 | 3,290 | 718 | (79 | ) | |||||||||||||
| 527 | 743 | 956 | 282 | 243 | ||||||||||||||
| $ | 42,900 | $ | 55,564 | $ | 68,221 | $ | 12,748 | $ | 24,431 | |||||||||
| $ | 30,077 | $ | 41,962 | $ | 53,574 | $ | 9,780 | $ | 8,202 | |||||||||
| $ | 12,003 | $ | 12,660 | $ | 13,441 | $ | 2,505 | $ | 15,844 | |||||||||
| $ | 0 | $ | 0 | $ | 0 | $ | 0 | $ | 110 | |||||||||
| $ | 122 | $ | 485 | $ | 299 | $ | 0 | $ | 105 | |||||||||
| ANNUAL REPORT | JUNE 30, 2018 | 35 |
Table of Contents
Statements of Assets and Liabilities (Cont.)
| PIMCO REALPATH® Blend 2020 Fund | PIMCO REALPATH® Blend 2025 Fund | PIMCO REALPATH® Blend 2030 Fund | PIMCO REALPATH® Blend 2035 Fund | |||||||||||||
Net Assets: | ||||||||||||||||
Institutional Class | $ | 10,812 | $ | 6,824 | $ | 13,974 | $ | 16,958 | ||||||||
Administrative Class | 12,407 | 19,661 | 20,114 | 17,270 | ||||||||||||
Class A | 5,302 | 5,078 | 4,169 | 4,330 | ||||||||||||
Shares Issued and Outstanding: | ||||||||||||||||
Institutional Class | 985 | 612 | 1,226 | 1,464 | ||||||||||||
Administrative Class | 1,131 | 1,767 | 1,768 | 1,492 | ||||||||||||
Class A | 483 | 456 | 367 | 373 | ||||||||||||
Net Asset Value Per Share Outstanding: | ||||||||||||||||
Institutional Class | $ | 10.98 | $ | 11.15 | $ | 11.39 | $ | 11.58 | ||||||||
Administrative Class | 10.97 | 11.13 | 11.38 | 11.57 | ||||||||||||
Class A | 10.97 | 11.13 | 11.36 | 11.61 | ||||||||||||
| 36 | PIMCO EQUITY SERIES | See Accompanying Notes |
Table of Contents
June 30, 2018
| PIMCO REALPATH® Blend 2040 Fund | PIMCO REALPATH® Blend 2045 Fund | PIMCO REALPATH® Blend 2050 Fund | PIMCO REALPATH® Blend 2055 Fund | PIMCO REALPATH® Blend Income Fund | ||||||||||||||
| $ | 26,413 | $ | 41,708 | $ | 50,057 | $ | 10,558 | $ | 7,556 | |||||||||
| 11,003 | 10,287 | 14,382 | 152 | 13,340 | ||||||||||||||
| 5,484 | 3,569 | 3,782 | 2,038 | 3,535 | ||||||||||||||
| 2,256 | 3,537 | 4,221 | 899 | 692 | ||||||||||||||
| 941 | 874 | 1,215 | 13 | 1,222 | ||||||||||||||
| 470 | 303 | 320 | 174 | 325 | ||||||||||||||
| $ | 11.71 | $ | 11.79 | $ | 11.86 | $ | 11.74 | $ | 10.92 | |||||||||
| 11.69 | 11.77 | 11.84 | 11.75 | 10.92 | ||||||||||||||
| 11.67 | 11.77 | 11.80 | 11.69 | 10.88 | ||||||||||||||
| ANNUAL REPORT | JUNE 30, 2018 | 37 |
Table of Contents
| Year Ended June 30, 2018 | ||||||||||||||||
| (Amounts in thousands†) | PIMCO REALPATH® Blend 2020 Fund | PIMCO REALPATH® Blend 2025 Fund | PIMCO REALPATH® Blend 2030 Fund | PIMCO REALPATH® Blend 2035 Fund | ||||||||||||
Investment Income: | ||||||||||||||||
Interest | $ | 1 | $ | 1 | $ | 1 | $ | 1 | ||||||||
Dividends | 219 | 298 | 415 | 489 | ||||||||||||
Dividends from Investments in Affiliates | 411 | 383 | 399 | 351 | ||||||||||||
Total Income | 631 | 682 | 815 | 841 | ||||||||||||
Expenses: | ||||||||||||||||
Investment advisory fees | 2 | 2 | 6 | 9 | ||||||||||||
Supervisory and administrative fees | 14 | 16 | 15 | 16 | ||||||||||||
Distribution and/or servicing fees - Administrative Class | 18 | 28 | 28 | 24 | ||||||||||||
Servicing fees - Class A | 10 | 12 | 9 | 10 | ||||||||||||
Trustee fees | 1 | 1 | 2 | 2 | ||||||||||||
Miscellaneous expense | 1 | 2 | 1 | 2 | ||||||||||||
Total Expenses | 46 | 61 | 61 | 63 | ||||||||||||
Waiver and/or Reimbursement by PIMCO | (1 | ) | (1 | ) | (2 | ) | (2 | ) | ||||||||
Net Expenses | 45 | 60 | 59 | 61 | ||||||||||||
Net Investment Income (Loss) | 586 | 622 | 756 | 780 | ||||||||||||
Net Realized Gain (Loss): | ||||||||||||||||
Investments in securities | 613 | 753 | 1,234 | 1,553 | ||||||||||||
Investments in Affiliates | (39 | ) | (28 | ) | (46 | ) | (31 | ) | ||||||||
Net capital gain distributions received from Affiliate investments | 19 | 27 | 24 | 19 | ||||||||||||
Exchange-traded or centrally cleared financial derivative instruments | (23 | ) | (42 | ) | (15 | ) | (6 | ) | ||||||||
Over the counter financial derivative instruments | 32 | 32 | 52 | 65 | ||||||||||||
Net Realized Gain (Loss) | 602 | 742 | 1,249 | 1,600 | ||||||||||||
Net Change in Unrealized Appreciation (Depreciation): | ||||||||||||||||
Investments in securities | (210 | ) | (222 | ) | (401 | ) | (350 | ) | ||||||||
Investments in Affiliates | (385 | ) | (433 | ) | (388 | ) | (292 | ) | ||||||||
Exchange-traded or centrally cleared financial derivative instruments | (20 | ) | (21 | ) | 3 | 3 | ||||||||||
Over the counter financial derivative instruments | 15 | 28 | 32 | 34 | ||||||||||||
Net Change in Unrealized Appreciation (Depreciation) | (600 | ) | (648 | ) | (754 | ) | (605 | ) | ||||||||
Net Increase (Decrease) in Net Assets Resulting from Operations | $ | 588 | $ | 716 | $ | 1,251 | $ | 1,775 | ||||||||
| † | A zero balance may reflect actual amounts rounding to less than one thousand. |
| 38 | PIMCO EQUITY SERIES | See Accompanying Notes |
Table of Contents
| PIMCO REALPATH® Blend 2040 Fund | PIMCO REALPATH® Blend 2045 Fund | PIMCO REALPATH® Blend 2050 Fund | PIMCO REALPATH® Blend 2055 Fund | PIMCO REALPATH® Blend Income Fund | ||||||||||||||
| $ | 1 | $ | 2 | $ | 2 | $ | 1 | $ | 3 | |||||||||
| 625 | 859 | 1,087 | 191 | 171 | ||||||||||||||
| 342 | 360 | 391 | 66 | 360 | ||||||||||||||
| 968 | 1,221 | 1,480 | 258 | 534 | ||||||||||||||
| 11 | 14 | 18 | 3 | 2 | ||||||||||||||
| 21 | 18 | 21 | 7 | 10 | ||||||||||||||
| 15 | 14 | 19 | 0 | 20 | ||||||||||||||
| 13 | 9 | 9 | 5 | 6 | ||||||||||||||
| 2 | 3 | 4 | 1 | 1 | ||||||||||||||
| 2 | 3 | 3 | 1 | 1 | ||||||||||||||
| 64 | 61 | 74 | 17 | 40 | ||||||||||||||
| (2 | ) | (3 | ) | (4 | ) | (1 | ) | (1 | ) | |||||||||
| 62 | 58 | 70 | 16 | 39 | ||||||||||||||
| 906 | 1,163 | 1,410 | 242 | 495 | ||||||||||||||
| 1,978 | 2,682 | 3,309 | 754 | (3 | ) | |||||||||||||
| (3 | ) | (2 | ) | (15 | ) | 3 | (32 | ) | ||||||||||
| 16 | 15 | 15 | 2 | 13 | ||||||||||||||
| (2 | ) | (1 | ) | 0 | (3 | ) | (31 | ) | ||||||||||
| 99 | 133 | 163 | 32 | 21 | ||||||||||||||
| 2,088 | 2,827 | 3,472 | 788 | (32 | ) | |||||||||||||
| (125 | ) | (18 | ) | (47 | ) | (171 | ) | 281 | ||||||||||
| (237 | ) | (219 | ) | (197 | ) | (34 | ) | (347 | ) | |||||||||
| 2 | 2 | 2 | 2 | (17 | ) | |||||||||||||
| 34 | 49 | 69 | 13 | 15 | ||||||||||||||
| (326 | ) | (186 | ) | (173 | ) | (190 | ) | (68 | ) | |||||||||
| $ | 2,668 | $ | 3,804 | $ | 4,709 | $ | 840 | $ | 395 | |||||||||
| ANNUAL REPORT | JUNE 30, 2018 | 39 |
Table of Contents
Statements of Changes in Net Assets
| PIMCO REALPATH® Blend 2020 Fund | PIMCO REALPATH® Blend 2025 Fund | PIMCO REALPATH® Blend 2030 Fund | PIMCO REALPATH® Blend 2035 Fund | |||||||||||||||||||||||||||||
| (Amounts in thousands†) | Year Ended June 30, 2018 | Year Ended June 30, 2017 | Year Ended June 30, 2018 | Year Ended June 30, 2017 | Year Ended June 30, 2018 | Year Ended June 30, 2017 | Year Ended June 30, 2018 | Year Ended June 30, 2017 | ||||||||||||||||||||||||
Increase (Decrease) in Net Assets from: | ||||||||||||||||||||||||||||||||
Operations: | ||||||||||||||||||||||||||||||||
Net investment income (loss) | $ | 586 | $ | 191 | $ | 622 | $ | 169 | $ | 756 | $ | 277 | $ | 780 | $ | 277 | ||||||||||||||||
Net realized gain (loss) | 602 | (36 | ) | 742 | (39 | ) | 1,249 | 32 | 1,600 | (5 | ) | |||||||||||||||||||||
Net change in unrealized appreciation (depreciation) | (600 | ) | 430 | (648 | ) | 439 | (754 | ) | 742 | (605 | ) | 874 | ||||||||||||||||||||
Net Increase (Decrease) in Net Assets Resulting from Operations | 588 | 585 | 716 | 569 | 1,251 | 1,051 | 1,775 | 1,146 | ||||||||||||||||||||||||
Distributions to Shareholders: | ||||||||||||||||||||||||||||||||
From net investment income | ||||||||||||||||||||||||||||||||
Institutional Class | (202 | ) | (133 | ) | (134 | ) | (100 | ) | (290 | ) | (185 | ) | (397 | ) | (154 | ) | ||||||||||||||||
Administrative Class | (187 | ) | 0 | (256 | ) | 0 | (243 | ) | (1 | ) | (216 | ) | 0 | |||||||||||||||||||
Class A | (56 | ) | (14 | ) | (70 | ) | (19 | ) | (62 | ) | (4 | ) | (72 | ) | (5 | ) | ||||||||||||||||
From net realized capital gains | ||||||||||||||||||||||||||||||||
Institutional Class | 0 | 0 | 0 | 0 | (25 | ) | 0 | 0 | 0 | |||||||||||||||||||||||
Administrative Class | 0 | 0 | 0 | 0 | (26 | ) | 0 | 0 | 0 | |||||||||||||||||||||||
Class A | 0 | 0 | 0 | 0 | (7 | ) | 0 | 0 | 0 | |||||||||||||||||||||||
Tax basis return of capital | ||||||||||||||||||||||||||||||||
Institutional Class | 0 | 0 | 0 | 0 | 0 | 0 | 0 | 0 | ||||||||||||||||||||||||
Administrative Class | 0 | 0 | 0 | 0 | 0 | 0 | 0 | 0 | ||||||||||||||||||||||||
Class A | 0 | 0 | 0 | 0 | 0 | 0 | 0 | 0 | ||||||||||||||||||||||||
Total Distributions(a) | (445 | ) | (147 | ) | (460 | ) | (119 | ) | (653 | ) | (190 | ) | (685 | ) | (159 | ) | ||||||||||||||||
Portfolio Share Transactions: | ||||||||||||||||||||||||||||||||
Net increase (decrease) resulting from Portfolio share transactions** | 17,462 | 6,306 | 21,249 | 6,170 | 21,524 | 8,829 | 16,862 | 13,641 | ||||||||||||||||||||||||
Total Increase (Decrease) in Net Assets | 17,605 | 6,744 | 21,505 | 6,620 | 22,122 | 9,690 | 17,952 | 14,628 | ||||||||||||||||||||||||
Net Assets: | ||||||||||||||||||||||||||||||||
Beginning of year | 10,916 | 4,172 | 10,058 | 3,438 | 16,135 | 6,445 | 20,606 | 5,978 | ||||||||||||||||||||||||
End of year* | $ | 28,521 | $ | 10,916 | $ | 31,563 | $ | 10,058 | $ | 38,257 | $ | 16,135 | $ | 38,558 | $ | 20,606 | ||||||||||||||||
* Including undistributed (overdistributed) net investment income of: | $ | 205 | $ | 33 | $ | 224 | $ | 30 | $ | 312 | $ | 90 | $ | 285 | $ | 116 | ||||||||||||||||
| † | A zero balance may reflect actual amounts rounding to less than one thousand. |
| ** | See Note 13, Shares of Beneficial Interest, in the Notes to Financial Statements. |
| (a) | The tax characterization of distributions is determined in accordance with Federal income tax regulations. See Note 2, Distributions to Shareholders, in the Notes to Financial Statements for more information. |
| 40 | PIMCO EQUITY SERIES | See Accompanying Notes |
Table of Contents
| PIMCO REALPATH® Blend 2040 Fund | PIMCO REALPATH® Blend 2045 Fund | PIMCO REALPATH® Blend 2050 Fund | PIMCO REALPATH® Blend 2055 Fund | PIMCO REALPATH® Blend Income Fund | ||||||||||||||||||||||||||||||||||
| Year Ended June 30, 2018 | Year Ended June 30, 2017 | Year Ended June 30, 2018 | Year Ended June 30, 2017 | Year Ended June 30, 2018 | Year Ended June 30, 2017 | Year Ended June 30, 2018 | Year Ended June 30, 2017 | Year Ended June 30, 2018 | Year Ended June 30, 2017 | |||||||||||||||||||||||||||||
| $ | 906 | $ | 281 | $ | 1,163 | $ | 323 | $ | 1,410 | $ | 377 | $ | 242 | $ | 122 | $ | 495 | $ | 144 | |||||||||||||||||||
| 2,088 | (24 | ) | 2,827 | (27 | ) | 3,472 | (20 | ) | 788 | (15 | ) | (32 | ) | (26 | ) | |||||||||||||||||||||||
| (326 | ) | 863 | (186 | ) | 964 | (173 | ) | 1,135 | (190 | ) | 508 | (68 | ) | 310 | ||||||||||||||||||||||||
| | 2,668 | 1,120 | 3,804 | 1,260 | 4,709 | 1,492 | 840 | 615 | 395 | 428 | ||||||||||||||||||||||||||||
| (581 | ) | (106 | ) | (858 | ) | (94 | ) | (1,050 | ) | (108 | ) | (229 | ) | (66 | ) | (121 | ) | (102 | ) | |||||||||||||||||||
| (150 | ) | (1 | ) | (135 | ) | (1 | ) | (185 | ) | 0 | (1 | ) | (1 | ) | (171 | ) | (1 | ) | ||||||||||||||||||||
| (99 | ) | (4 | ) | (63 | ) | 0 | (65 | ) | (1 | ) | (45 | ) | (2 | ) | (38 | ) | (11 | ) | ||||||||||||||||||||
| (52 | ) | 0 | 0 | 0 | 0 | 0 | 0 | 0 | 0 | 0 | ||||||||||||||||||||||||||||
| (17 | ) | 0 | 0 | 0 | 0 | 0 | 0 | 0 | 0 | 0 | ||||||||||||||||||||||||||||
| (11 | ) | 0 | 0 | 0 | 0 | 0 | 0 | 0 | 0 | 0 | ||||||||||||||||||||||||||||
| 0 | 0 | 0 | 0 | 0 | 0 | 0 | 0 | 0 | 0 | |||||||||||||||||||||||||||||
| 0 | 0 | 0 | 0 | 0 | 0 | 0 | 0 | 0 | 0 | |||||||||||||||||||||||||||||
| 0 | 0 | 0 | 0 | 0 | 0 | 0 | 0 | 0 | 0 | |||||||||||||||||||||||||||||
| (910 | ) | (111 | ) | (1,056 | ) | (95 | ) | (1,300 | ) | (109 | ) | (275 | ) | (69 | ) | (330 | ) | (114 | ) | |||||||||||||||||||
| | 11,424 | 25,134 | 13,374 | 34,813 | 17,797 | 41,575 | 3,813 | 4,365 | 16,604 | 4,011 | ||||||||||||||||||||||||||||
| 13,182 | 26,143 | 16,122 | 35,978 | 21,206 | 42,958 | 4,378 | 4,911 | 16,669 | 4,325 | |||||||||||||||||||||||||||||
| 29,718 | 3,575 | 39,442 | 3,464 | 47,015 | 4,057 | 8,370 | 3,459 | 7,762 | 3,437 | |||||||||||||||||||||||||||||
| $ | 42,900 | $ | 29,718 | $ | 55,564 | $ | 39,442 | $ | 68,221 | $ | 47,015 | $ | 12,748 | $ | 8,370 | $ | 24,431 | $ | 7,762 | |||||||||||||||||||
| $ | 333 | $ | 152 | $ | 454 | $ | 208 | $ | 527 | $ | 247 | $ | 57 | $ | 54 | $ | 201 | $ | 15 | |||||||||||||||||||
| ANNUAL REPORT | JUNE 30, 2018 | 41 |
Table of Contents
Schedule of Investments PIMCO REALPATH® Blend 2020 Fund
(Amounts in thousands*, except number of shares, contracts and units, if any)
| SHARES | MARKET VALUE (000S) | |||||||||||
| INVESTMENTS IN SECURITIES 39.9% |
| |||||||||||
| MUTUAL FUNDS 39.3% |
| |||||||||||
Vanguard Developed Markets Index Fund ‘Admiral’ | 224,001 | $ | 3,091 | |||||||||
Vanguard Emerging Markets Stock Index Fund ‘Admiral’ | 39,742 | 1,396 | ||||||||||
Vanguard Institutional Index Fund ‘Institutional’ | 24,426 | 6,052 | ||||||||||
Vanguard Small-Cap Index Fund ‘Admiral’ | 9,306 | 694 | ||||||||||
|
| |||||||||||
Total Mutual Funds (Cost $11,064) | 11,233 | |||||||||||
|
| |||||||||||
| SHORT-TERM INSTRUMENTS 0.6% |
| |||||||||||
| REPURCHASE AGREEMENTS (b) 0.6% |
| |||||||||||
| 157 | ||||||||||||
|
| |||||||||||
| Total Short-Term Instruments (Cost $157) | 157 | |||||||||||
|
| |||||||||||
| Total Investments in Securities (Cost $11,221) | 11,390 | |||||||||||
|
| |||||||||||
| SHARES | MARKET VALUE (000S) | |||||||||||
| INVESTMENTS IN AFFILIATES 59.1% |
| |||||||||||
| MUTUAL FUNDS (a) 55.0% |
| |||||||||||
PIMCO Emerging Local Bond Fund | 92,272 | $ | 629 | |||||||||
PIMCO High Yield Fund | 150,918 | 1,306 | ||||||||||
PIMCO Income Fund | 325,849 | 3,907 | ||||||||||
PIMCO International Bond Fund (U.S. Dollar-Hedged) | 133,951 | 1,445 | ||||||||||
PIMCO Long Duration Total Return Fund | 101,853 | 1,053 | ||||||||||
PIMCO Long-Term Credit Bond Fund | 91,271 | 1,038 | ||||||||||
PIMCO Long-Term Real Return Fund | 169,994 | 1,423 | ||||||||||
PIMCO Real Return Fund | 207,085 | 2,249 | ||||||||||
PIMCO Total Return Fund | 263,864 | 2,631 | ||||||||||
|
| |||||||||||
Total Mutual Funds (Cost $15,961) | 15,681 | |||||||||||
|
| |||||||||||
| SHARES | MARKET VALUE (000S) | |||||||||||
| SHORT-TERM INSTRUMENTS 4.1% |
| |||||||||||
| CENTRAL FUNDS USED FOR CASH MANAGEMENT PURPOSES 4.1% |
| |||||||||||
PIMCO Short-Term Floating NAV Portfolio III | 117,919 | $ | 1,165 | |||||||||
|
| |||||||||||
| Total Short-Term Instruments (Cost $1,165) | 1,165 | |||||||||||
|
| |||||||||||
| Total Investments in Affiliates (Cost $17,126) | 16,846 | |||||||||||
| Total Investments 99.0% (Cost $28,347) | $ | 28,236 | ||||||||||
Financial Derivative (Cost or Premiums, net $130) | 131 | |||||||||||
| Other Assets and Liabilities, net 0.5% |
| 154 | ||||||||||
|
| |||||||||||
| Net Assets 100.0% | $ | 28,521 | ||||||||||
|
| |||||||||||
NOTES TO SCHEDULE OF INVESTMENTS:
| * | A zero balance may reflect actual amounts rounding to less than one thousand. |
| (a) | Institutional Class Shares of each Fund. |
BORROWINGS AND OTHER FINANCING TRANSACTIONS
(b) REPURCHASE AGREEMENTS:
| Counterparty | Lending Rate | Settlement Date | Maturity Date | Principal Amount | Collateralized By | Collateral (Received) | Repurchase Agreements, at Value | Repurchase Agreement Proceeds to be Received(1) | ||||||||||||||||||||||
| FICC | 1.500 | % | 06/29/2018 | 07/02/2018 | $ | 157 | U.S. Treasury Notes 2.125% due 08/15/2021 | $ | (164 | ) | $ | 157 | $ | 157 | ||||||||||||||||
|
|
|
|
|
| |||||||||||||||||||||||||
Total Repurchase Agreements |
| $ | (164 | ) | $ | 157 | $ | 157 | ||||||||||||||||||||||
|
|
|
|
|
| |||||||||||||||||||||||||
BORROWINGS AND OTHER FINANCING TRANSACTIONS SUMMARY
The following is a summary by counterparty of the market value of Borrowings and Other Financing Transactions and collateral pledged/(received) as of June 30, 2018:
| Counterparty | Repurchase Agreement Proceeds to be Received(1) | Payable for Reverse Repurchase Agreements | Payable for Sale-Buyback Transactions | Total Borrowings and Other Financing Transactions | Collateral Pledged/(Received) | Net Exposure(2) | ||||||||||||||||||
Global/Master Repurchase Agreement |
| |||||||||||||||||||||||
FICC | $ | 157 | $ | 0 | $ | 0 | $ | 157 | $ | (164 | ) | $ | (7 | ) | ||||||||||
|
|
|
|
|
| |||||||||||||||||||
Total Borrowings and Other Financing Transactions | $ | 157 | $ | 0 | $ | 0 | ||||||||||||||||||
|
|
|
|
|
| |||||||||||||||||||
| (1) | Includes accrued interest. |
| (2) | Net Exposure represents the net receivable/(payable) that would be due from/to the counterparty in the event of default. Exposure from borrowings and other financing transactions can only be netted across transactions governed under the same master agreement with the same legal entity. See Note 8, Master Netting Arrangements, in the Notes to Financial Statements for more information regarding master netting arrangements. |
(c) FINANCIAL DERIVATIVE INSTRUMENTS: EXCHANGE-TRADED OR CENTRALLY CLEARED
PURCHASED OPTIONS:
OPTIONS ON INDICES
| Description | Strike Value | Expiration Date | # of Contracts | Notional Amount | Cost | Market Value | ||||||||||||||||||
Put - CBOE S&P 500 | 1,950.000 | 09/21/2018 | 4 | $ | 0 | $ | 8 | $ | 1 | |||||||||||||||
Put - CBOE S&P 500 | 2,075.000 | 09/21/2018 | 6 | 1 | 17 | 3 | ||||||||||||||||||
Put - CBOE S&P 500 | 2,250.000 | 12/21/2018 | 6 | 1 | 19 | 14 | ||||||||||||||||||
Put - CBOE S&P 500 | 2,400.000 | 12/21/2018 | 6 | 1 | 28 | 23 | ||||||||||||||||||
| 42 | PIMCO EQUITY SERIES | See Accompanying Notes |
Table of Contents
June 30, 2018
| Description | Strike Value | Expiration Date | # of Contracts | Notional Amount | Cost | Market Value | ||||||||||||||||||
Put - CBOE S&P 500 | 2,000.000 | 03/15/2019 | 5 | $ | 0 | $ | 17 | $ | 9 | |||||||||||||||
Put - CBOE S&P 500 | 2,175.000 | 03/15/2019 | 4 | 0 | 22 | 12 | ||||||||||||||||||
Put - CBOE S&P 500 | 2,175.000 | 06/21/2019 | 6 | 1 | 20 | 27 | ||||||||||||||||||
Put - CBOE S&P 500 | 2,325.000 | 06/21/2019 | 6 | 0 | 30 | 38 | ||||||||||||||||||
|
|
|
| |||||||||||||||||||||
| $ | 161 | $ | 127 | |||||||||||||||||||||
|
|
|
| |||||||||||||||||||||
Total Purchased Options |
| $ | 161 | $ | 127 | |||||||||||||||||||
|
|
|
| |||||||||||||||||||||
WRITTEN OPTIONS:
OPTIONS ON INDICES
| Description | Strike Value | Expiration Date | # of Contracts | Notional Amount | Premiums (Received) | Market Value | ||||||||||||||||||
Put - CBOE S&P 500 | 1,725.000 | 09/21/2018 | 6 | $ | 1 | $ | (6 | ) | $ | (1 | ) | |||||||||||||
Put - CBOE S&P 500 | 1,975.000 | 12/21/2018 | 6 | 0 | (9 | ) | (6 | ) | ||||||||||||||||
Put - CBOE S&P 500 | 1,725.000 | 03/15/2019 | 4 | 0 | (6 | ) | (3 | ) | ||||||||||||||||
Put - CBOE S&P 500 | 1,900.000 | 06/21/2019 | 6 | 1 | (10 | ) | (13 | ) | ||||||||||||||||
|
|
|
| |||||||||||||||||||||
| $ | (31 | ) | $ | (23 | ) | |||||||||||||||||||
|
|
|
| |||||||||||||||||||||
Total Written Options |
| $ | (31 | ) | $ | (23 | ) | |||||||||||||||||
|
|
|
| |||||||||||||||||||||
FINANCIAL DERIVATIVE INSTRUMENTS: EXCHANGE-TRADED OR CENTRALLY CLEARED SUMMARY
The following is a summary of the market value and variation margin of Exchange-Traded or Centrally Cleared Financial Derivative Instruments as of June 30, 2018:
| Financial Derivative Assets | Financial Derivative Liabilities | |||||||||||||||||||||||||||||||||||
| Market Value | Variation Margin Asset | Total | Market Value | Variation Margin Liability | Total | |||||||||||||||||||||||||||||||
| Purchased Options | Futures | Swap Agreements | Written Options | Futures | Swap Agreements | |||||||||||||||||||||||||||||||
Total Exchange-Traded or Centrally Cleared | $ | 127 | $ | 0 | $ | 0 | $ | 127 | $ | (23) | $ | 0 | $ | 0 | $ | (23) | ||||||||||||||||||||
|
|
|
|
|
|
|
|
|
|
|
|
|
|
|
| |||||||||||||||||||||
(d) FINANCIAL DERIVATIVE INSTRUMENTS: OVER THE COUNTER
SWAP AGREEMENTS:
TOTAL RETURN SWAPS ON COMMODITY AND EQUITY INDICES
| Counterparty | Pay/Receive(1) | Underlying Reference | # of Units | Financing Rate | Payment Frequency | Maturity Date | Notional Amount | Premiums Paid/(Received) | Unrealized Appreciation/ (Depreciation) | Swap Agreements, at Value | ||||||||||||||||||||||||
| Asset | Liability | |||||||||||||||||||||||||||||||||
BPS | Receive | DWRTFT Index | 55 | 1-Month USD-LIBOR plus a specified spread | Monthly | 11/07/2018 | $ | 529 | $ | 0 | $ | 16 | $ | 16 | $ | 0 | ||||||||||||||||||
CBK | Receive | BCOMTR Index | 2,916 | 3-Month U.S. Treasury Bill rate plus a specified spread | Monthly | 08/15/2018 | 526 | 0 | (2 | ) | 0 | (2 | ) | |||||||||||||||||||||
JPM | Receive | BCOMTR Index | 200 | 3-Month U.S. Treasury Bill rate plus a specified spread | Monthly | 08/15/2018 | 36 | 0 | 0 | 0 | 0 | |||||||||||||||||||||||
MYI | Receive | DWRTFT Index | 34 | 1-Month USD-LIBOR plus a specified spread | Monthly | 09/12/2018 | 324 | 0 | 13 | 13 | 0 | |||||||||||||||||||||||
|
|
|
|
|
|
|
| |||||||||||||||||||||||||||
| $ | 0 | $ | 27 | $ | 29 | $ | (2 | ) | ||||||||||||||||||||||||||
|
|
|
|
|
|
|
| |||||||||||||||||||||||||||
Total Swap Agreements |
| $ | 0 | $ | 27 | $ | 29 | $ | (2 | ) | ||||||||||||||||||||||||
|
|
|
|
|
|
|
| |||||||||||||||||||||||||||
FINANCIAL DERIVATIVE INSTRUMENTS: OVER THE COUNTER SUMMARY
The following is a summary by counterparty of the market value of OTC financial derivative instruments and collateral pledged/(received) as of June 30, 2018:
| Financial Derivative Assets | Financial Derivative Liabilities | |||||||||||||||||||||||||||||||||||||||||||||||
| Counterparty | Forward Foreign Currency Contracts | Purchased Options | Swap Agreements | Total Over the Counter | Forward Foreign Currency Contracts | Written Options | Swap Agreements | Total Over the Counter | Net Market Value of OTC Derivatives | Collateral Pledged/ (Received) | Net Exposure(2) | |||||||||||||||||||||||||||||||||||||
BPS | $ | 0 | $ | 0 | $ | 16 | $ | 16 | $ | 0 | $ | 0 | $ | 0 | $ | 0 | $ | 16 | $ | 0 | $ | 16 | ||||||||||||||||||||||||||
CBK | 0 | 0 | 0 | 0 | 0 | 0 | (2 | ) | (2 | ) | (2 | ) | 0 | (2 | ) | |||||||||||||||||||||||||||||||||
MYI | 0 | 0 | 13 | 13 | 0 | 0 | 0 | 0 | 13 | 0 | 13 | |||||||||||||||||||||||||||||||||||||
|
|
|
|
|
|
|
|
|
|
|
|
|
|
|
| |||||||||||||||||||||||||||||||||
Total Over the Counter | $ | 0 | $ | 0 | $ | 29 | $ | 29 | $ | 0 | $ | 0 | $ | (2 | ) | $ | (2 | ) | ||||||||||||||||||||||||||||||
|
|
|
|
|
|
|
|
|
|
|
|
|
|
|
| |||||||||||||||||||||||||||||||||
| See Accompanying Notes | ANNUAL REPORT | JUNE 30, 2018 | 43 |
Table of Contents
Schedule of Investments PIMCO REALPATH® Blend 2020 Fund (Cont.)
| (1) | Receive represents that the Fund receives payments for any positive net return on the underlying reference. The Fund makes payments for any negative net return on such underlying reference. Pay represents that the Fund receives payments for any negative net return on the underlying reference. The Fund makes payments for any positive net return on such underlying reference. |
| (2) | Net Exposure represents the net receivable/(payable) that would be due from/to the counterparty in the event of default. Exposure from OTC financial derivative instruments can only be netted across transactions governed under the same master agreement with the same legal entity. See Note 8, Master Netting Arrangements, in the Notes to Financial Statements for more information regarding master netting arrangements. |
FAIR VALUE OF FINANCIAL DERIVATIVE INSTRUMENTS
The following is a summary of the fair valuation of the Fund’s derivative instruments categorized by risk exposure. See Note 7, Principal Risks, in the Notes to Financial Statements on risks of the Fund.
Fair Values of Financial Derivative Instruments on the Statements of Assets and Liabilities as of June 30, 2018:
| Derivatives not accounted for as hedging instruments | ||||||||||||||||||||||||
| Commodity Contracts | Credit Contracts | Equity Contracts | Foreign Exchange Contracts | Interest Rate Contracts | Total | |||||||||||||||||||
Financial Derivative Instruments - Assets |
| |||||||||||||||||||||||
Exchange-traded or centrally cleared |
| |||||||||||||||||||||||
Purchased Options | $ | 0 | $ | 0 | $ | 127 | $ | 0 | $ | 0 | $ | 127 | ||||||||||||
|
|
|
|
|
|
|
|
|
|
|
| |||||||||||||
Over the counter |
| |||||||||||||||||||||||
Swap Agreements | $ | 0 | $ | 0 | $ | 29 | $ | 0 | $ | 0 | $ | 29 | ||||||||||||
|
|
|
|
|
|
|
|
|
|
|
| |||||||||||||
| $ | 0 | $ | 0 | $ | 156 | $ | 0 | $ | 0 | $ | 156 | |||||||||||||
|
|
|
|
|
|
|
|
|
|
|
| |||||||||||||
Financial Derivative Instruments - Liabilities |
| |||||||||||||||||||||||
Exchange-traded or centrally cleared |
| |||||||||||||||||||||||
Written Options | $ | 0 | $ | 0 | $ | 23 | $ | 0 | $ | 0 | $ | 23 | ||||||||||||
|
|
|
|
|
|
|
|
|
|
|
| |||||||||||||
Over the counter |
| |||||||||||||||||||||||
Swap Agreements | $ | 2 | $ | 0 | $ | 0 | $ | 0 | $ | 0 | $ | 2 | ||||||||||||
|
|
|
|
|
|
|
|
|
|
|
| |||||||||||||
| $ | 2 | $ | 0 | $ | 23 | $ | 0 | $ | 0 | $ | 25 | |||||||||||||
|
|
|
|
|
|
|
|
|
|
|
| |||||||||||||
The effect of Financial Derivative Instruments on the Statements of Operations for the period ended June 30, 2018:
| Derivatives not accounted for as hedging instruments | ||||||||||||||||||||||||
| Commodity Contracts | Credit Contracts | Equity Contracts | Foreign Exchange Contracts | Interest Rate Contracts | Total | |||||||||||||||||||
Net Realized Gain (Loss) on Financial Derivative Instruments |
| |||||||||||||||||||||||
Exchange-traded or centrally cleared |
| |||||||||||||||||||||||
Purchased Options | $ | 0 | $ | 0 | $ | (29 | ) | $ | 0 | $ | 0 | $ | (29 | ) | ||||||||||
Written Options | 0 | 0 | 9 | 0 | 0 | 9 | ||||||||||||||||||
Futures | 0 | 0 | (2 | ) | 0 | (1 | ) | (3 | ) | |||||||||||||||
|
|
|
|
|
|
|
|
|
|
|
| |||||||||||||
| $ | 0 | $ | 0 | $ | (22 | ) | $ | 0 | $ | (1 | ) | $ | (23 | ) | ||||||||||
|
|
|
|
|
|
|
|
|
|
|
| |||||||||||||
Over the counter |
| |||||||||||||||||||||||
Swap Agreements | $ | 26 | $ | 0 | $ | 6 | $ | 0 | $ | 0 | $ | 32 | ||||||||||||
|
|
|
|
|
|
|
|
|
|
|
| |||||||||||||
| $ | 26 | $ | 0 | $ | (16 | ) | $ | 0 | $ | (1 | ) | $ | 9 | |||||||||||
|
|
|
|
|
|
|
|
|
|
|
| |||||||||||||
Net Change in Unrealized Appreciation (Depreciation) on Financial Derivative Instruments |
| |||||||||||||||||||||||
Exchange-traded or centrally cleared |
| |||||||||||||||||||||||
Purchased Options | $ | 0 | $ | 0 | $ | (27 | ) | $ | 0 | $ | 0 | $ | (27 | ) | ||||||||||
Written Options | 0 | 0 | 7 | 0 | 0 | 7 | ||||||||||||||||||
|
|
|
|
|
|
|
|
|
|
|
| |||||||||||||
| $ | 0 | $ | 0 | $ | (20 | ) | $ | 0 | $ | 0 | $ | (20 | ) | |||||||||||
|
|
|
|
|
|
|
|
|
|
|
| |||||||||||||
Over the counter |
| |||||||||||||||||||||||
Swap Agreements | $ | (7 | ) | $ | 0 | $ | 22 | $ | 0 | $ | 0 | $ | 15 | |||||||||||
|
|
|
|
|
|
|
|
|
|
|
| |||||||||||||
| $ | (7 | ) | $ | 0 | $ | 2 | $ | 0 | $ | 0 | $ | (5 | ) | |||||||||||
|
|
|
|
|
|
|
|
|
|
|
| |||||||||||||
| 44 | PIMCO EQUITY SERIES | See Accompanying Notes |
Table of Contents
June 30, 2018
FAIR VALUE MEASUREMENTS
The following is a summary of the fair valuations according to the inputs used as of June 30, 2018 in valuing the Fund’s assets and liabilities:
| Category and Subcategory | Level 1 | Level 2 | Level 3 | Fair Value at 06/30/2018 | ||||||||||||
Investments in Securities, at Value |
| |||||||||||||||
Mutual Funds | $ | 11,233 | $ | 0 | $ | 0 | $ | 11,233 | ||||||||
Short-Term Instruments |
| |||||||||||||||
Repurchase Agreements | 0 | 157 | 0 | 157 | ||||||||||||
|
|
|
|
|
|
|
| |||||||||
| $ | 11,233 | $ | 157 | $ | 0 | $ | 11,390 | |||||||||
|
|
|
|
|
|
|
| |||||||||
Investments in Affiliates, at Value |
| |||||||||||||||
Mutual Funds | 15,681 | 0 | 0 | 15,681 | ||||||||||||
Short-Term Instruments |
| |||||||||||||||
Central Funds Used for Cash Management Purposes | 1,165 | 0 | 0 | 1,165 | ||||||||||||
|
|
|
|
|
|
|
| |||||||||
| $ | 16,846 | $ | 0 | $ | 0 | $ | 16,846 | |||||||||
|
|
|
|
|
|
|
| |||||||||
Total Investments | $ | 28,079 | $ | 157 | $ | 0 | $ | 28,236 | ||||||||
|
|
|
|
|
|
|
| |||||||||
| Category and Subcategory | Level 1 | Level 2 | Level 3 | Fair Value at 06/30/2018 | ||||||||||||
Financial Derivative Instruments - Assets |
| |||||||||||||||
Exchange-traded or centrally cleared | $ | 0 | $ | 127 | $ | 0 | $ | 127 | ||||||||
Over the counter | 0 | 29 | 0 | 29 | ||||||||||||
|
|
|
|
|
|
|
| |||||||||
| $ | 0 | $ | 156 | $ | 0 | $ | 156 | |||||||||
|
|
|
|
|
|
|
| |||||||||
Financial Derivative Instruments - Liabilities |
| |||||||||||||||
Exchange-traded or centrally cleared | 0 | (23 | ) | 0 | (23 | ) | ||||||||||
Over the counter | 0 | (2 | ) | 0 | (2 | ) | ||||||||||
|
|
|
|
|
|
|
| |||||||||
| $ | 0 | $ | (25 | ) | $ | 0 | $ | (25 | ) | |||||||
|
|
|
|
|
|
|
| |||||||||
Total Financial Derivative Instruments | $ | 0 | $ | 131 | $ | 0 | $ | 131 | ||||||||
|
|
|
|
|
|
|
| |||||||||
Totals | $ | 28,079 | $ | 288 | $ | 0 | $ | 28,367 | ||||||||
|
|
|
|
|
|
|
| |||||||||
There were no significant transfers among Levels 1, 2, or 3 during the period ended June 30, 2018.
| See Accompanying Notes | ANNUAL REPORT | JUNE 30, 2018 | 45 |
Table of Contents
Schedule of Investments PIMCO REALPATH® Blend 2025 Fund
(Amounts in thousands*, except number of shares, contracts and units, if any)
| SHARES | MARKET VALUE (000S) | |||||||||||
| INVESTMENTS IN SECURITIES 49.3% |
| |||||||||||
| MUTUAL FUNDS 48.9% |
| |||||||||||
Vanguard Developed Markets Index Fund ‘Admiral’ | 308,897 | $ | 4,263 | |||||||||
Vanguard Emerging Markets Stock Index Fund ‘Admiral’ | 54,804 | 1,925 | ||||||||||
Vanguard Institutional Index Fund ‘Institutional’ | 33,525 | 8,306 | ||||||||||
Vanguard Small-Cap Index Fund ‘Admiral’ | 12,832 | 957 | ||||||||||
|
| |||||||||||
Total Mutual Funds (Cost $15,303) | 15,451 | |||||||||||
|
| |||||||||||
| SHORT-TERM INSTRUMENTS 0.4% |
| |||||||||||
| REPURCHASE AGREEMENTS (b) 0.4% |
| |||||||||||
| 129 | ||||||||||||
|
| |||||||||||
| Total Short-Term Instruments (Cost $129) | 129 | |||||||||||
|
| |||||||||||
| Total Investments in Securities (Cost $15,432) | 15,580 | |||||||||||
|
| |||||||||||
| SHARES | MARKET VALUE (000S) | |||||||||||
| INVESTMENTS IN AFFILIATES 49.9% |
| |||||||||||
| MUTUAL FUNDS (a) 45.7% |
| |||||||||||
PIMCO Emerging Local Bond Fund | 82,984 | $ | 566 | |||||||||
PIMCO High Yield Fund | 137,887 | 1,193 | ||||||||||
PIMCO Income Fund | 254,202 | 3,048 | ||||||||||
PIMCO International Bond Fund (U.S. Dollar-Hedged) | 95,455 | 1,030 | ||||||||||
PIMCO Long Duration Total Return Fund | 148,030 | 1,531 | ||||||||||
PIMCO Long-Term Credit Bond Fund | 132,658 | 1,509 | ||||||||||
PIMCO Long-Term Real Return Fund | 245,988 | 2,059 | ||||||||||
PIMCO Real Return Fund | 147,972 | 1,607 | ||||||||||
PIMCO Total Return Fund | 187,463 | 1,868 | ||||||||||
|
| |||||||||||
Total Mutual Funds (Cost $14,773) | 14,411 | |||||||||||
|
| |||||||||||
| SHARES | MARKET VALUE (000S) | |||||||||||
| SHORT-TERM INSTRUMENTS 4.2% |
| |||||||||||
| CENTRAL FUNDS USED FOR CASH MANAGEMENT PURPOSES 4.2% |
| |||||||||||
PIMCO Short-Term | 133,516 | $ | 1,319 | |||||||||
|
| |||||||||||
| Total Short-Term Instruments (Cost $1,319) | 1,319 | |||||||||||
|
| |||||||||||
| Total Investments in Affiliates (Cost $16,092) | 15,730 | |||||||||||
| Total Investments 99.2% (Cost $31,524) | $ | 31,310 | ||||||||||
Financial Derivative (Cost or Premiums, net $144) |
| 156 | ||||||||||
Other Assets and Liabilities, net 0.3% |
| 97 | ||||||||||
|
| |||||||||||
Net Assets 100.0% | $ | 31,563 | ||||||||||
|
| |||||||||||
NOTES TO SCHEDULE OF INVESTMENTS:
| * | A zero balance may reflect actual amounts rounding to less than one thousand. |
| (a) | Institutional Class Shares of each Fund. |
BORROWINGS AND OTHER FINANCING TRANSACTIONS
(b) REPURCHASE AGREEMENTS:
| Counterparty | Lending Rate | Settlement Date | Maturity Date | Principal Amount | Collateralized By | Collateral (Received) | Repurchase Agreements, at Value | Repurchase Agreement Proceeds to be Received(1) | ||||||||||||||||||||||
| FICC | 1.500 | % | 06/29/2018 | 07/02/2018 | $ | 129 | U.S. Treasury Notes 2.125% due 08/15/2021 | $ | (134 | ) | $ | 129 | $ | 129 | ||||||||||||||||
|
|
|
|
|
| |||||||||||||||||||||||||
Total Repurchase Agreements |
| $ | (134 | ) | $ | 129 | $ | 129 | ||||||||||||||||||||||
|
|
|
|
|
| |||||||||||||||||||||||||
BORROWINGS AND OTHER FINANCING TRANSACTIONS SUMMARY
The following is a summary by counterparty of the market value of Borrowings and Other Financing Transactions and collateral pledged/(received) as of June 30, 2018:
| Counterparty | Repurchase Agreement Proceeds to be Received(1) | Payable for Reverse Repurchase Agreements | Payable for Sale-Buyback Transactions | Total Borrowings and Other Financing Transactions | Collateral Pledged/(Received) | Net Exposure(2) | ||||||||||||||||||
Global/Master Repurchase Agreement |
| |||||||||||||||||||||||
FICC | $ | 129 | $ | 0 | $ | 0 | $ | 129 | $ | (134 | ) | $ | (5 | ) | ||||||||||
|
|
|
|
|
| |||||||||||||||||||
Total Borrowings and Other Financing Transactions | $ | 129 | $ | 0 | $ | 0 | ||||||||||||||||||
|
|
|
|
|
| |||||||||||||||||||
| (1) | Includes accrued interest. |
| (2) | Net Exposure represents the net receivable/(payable) that would be due from/to the counterparty in the event of default. Exposure from borrowings and other financing transactions can only be netted across transactions governed under the same master agreement with the same legal entity. See Note 8, Master Netting Arrangements, in the Notes to Financial Statements for more information regarding master netting arrangements. |
(c) FINANCIAL DERIVATIVE INSTRUMENTS: EXCHANGE-TRADED OR CENTRALLY CLEARED
PURCHASED OPTIONS:
OPTIONS ON INDICES
| Description | Strike Value | Expiration Date | # of Contracts | Notional Amount | Cost | Market Value | ||||||||||||||||||
Put - CBOE S&P 500 | 1,950.000 | 09/21/2018 | 4 | 0 | $ | 8 | $ | 1 | ||||||||||||||||
Put - CBOE S&P 500 | 2,075.000 | 09/21/2018 | 4 | 0 | 11 | 2 | ||||||||||||||||||
Put - CBOE S&P 500 | 2,250.000 | 12/21/2018 | 7 | 1 | 23 | 16 | ||||||||||||||||||
| 46 | PIMCO EQUITY SERIES | See Accompanying Notes |
Table of Contents
June 30, 2018
| Description | Strike Value | Expiration Date | # of Contracts | Notional Amount | Cost | Market Value | ||||||||||||||||||
Put - CBOE S&P 500 | 2,400.000 | 12/21/2018 | 7 | 1 | $ | 33 | $ | 26 | ||||||||||||||||
Put - CBOE S&P 500 | 2,000.000 | 03/15/2019 | 6 | 1 | 21 | 11 | ||||||||||||||||||
Put - CBOE S&P 500 | 2,175.000 | 03/15/2019 | 5 | 0 | 27 | 16 | ||||||||||||||||||
Put - CBOE S&P 500 | 2,175.000 | 06/21/2019 | 6 | 1 | 20 | 27 | ||||||||||||||||||
Put - CBOE S&P 500 | 2,325.000 | 06/21/2019 | 7 | 1 | 35 | 45 | ||||||||||||||||||
|
|
|
| |||||||||||||||||||||
| $ | 178 | $ | 144 | |||||||||||||||||||||
|
|
|
| |||||||||||||||||||||
Total Purchased Options |
| $ | 178 | $ | 144 | |||||||||||||||||||
|
|
|
| |||||||||||||||||||||
WRITTEN OPTIONS:
OPTIONS ON INDICES
| Description | Strike Value | Expiration Date | # of Contracts | Notional Amount | Premiums (Received) | Market Value | ||||||||||||||||||
Put - CBOE S&P 500 | 1,725.000 | 09/21/2018 | 4 | 0 | $ | (4 | ) | $ | (1 | ) | ||||||||||||||
Put - CBOE S&P 500 | 1,975.000 | 12/21/2018 | 7 | 1 | (10 | ) | (7 | ) | ||||||||||||||||
Put - CBOE S&P 500 | 1,725.000 | 03/15/2019 | 5 | 0 | (8 | ) | (4 | ) | ||||||||||||||||
Put - CBOE S&P 500 | 1,900.000 | 06/21/2019 | 7 | 1 | (12 | ) | (15 | ) | ||||||||||||||||
|
|
|
| |||||||||||||||||||||
| $ | (34 | ) | $ | (27 | ) | |||||||||||||||||||
|
|
|
| |||||||||||||||||||||
Total Written Options |
| $ | (34 | ) | $ | (27 | ) | |||||||||||||||||
|
|
|
| |||||||||||||||||||||
FINANCIAL DERIVATIVE INSTRUMENTS: EXCHANGE-TRADED OR CENTRALLY CLEARED SUMMARY
The following is a summary of the market value and variation margin of Exchange-Traded or Centrally Cleared Financial Derivative Instruments as of June 30, 2018:
| Financial Derivative Assets | Financial Derivative Liabilities | |||||||||||||||||||||||||||||||||||
| Market Value | Variation Margin Asset | Total | Market Value | Variation Margin Liability | Total | |||||||||||||||||||||||||||||||
| Purchased Options | Futures | Swap Agreements | Written Options | Futures | Swap Agreements | |||||||||||||||||||||||||||||||
Total Exchange-Traded or Centrally Cleared | $ | 144 | $ | 0 | $ | 0 | $ | 144 | $ | (27) | $ | 0 | $ | 0 | $ (27) | |||||||||||||||||||||
|
|
|
|
|
|
|
|
|
|
|
|
|
|
|
| |||||||||||||||||||||
(d) FINANCIAL DERIVATIVE INSTRUMENTS: OVER THE COUNTER
SWAP AGREEMENTS:
TOTAL RETURN SWAPS ON COMMODITY AND EQUITY INDICES
Counterparty | Pay/Receive(1) | Underlying Reference | # of Units | Financing Rate | Payment | Maturity | Notional | Premiums Paid/(Received) | Unrealized Appreciation/ (Depreciation) | Swap Agreements, at Value | ||||||||||||||||||||||||||||||
| Asset | Liability | |||||||||||||||||||||||||||||||||||||||
BPS | Receive | DWRTFT Index | 37 | 1-Month USD-LIBOR plus a specified spread | Monthly | 11/07/2018 | $ | 702 | $ | 0 | $ | 22 | $ | 22 | $ | 0 | ||||||||||||||||||||||||
CBK | Receive | BCOMTR Index | 3,655 | 3-Month U.S. Treasury Bill rate plus a specified spread | Monthly | 08/15/2018 | 614 | 0 | (2 | ) | 0 | (2 | ) | |||||||||||||||||||||||||||
JPM | Receive | BCOMTR Index | 41 | 3-Month U.S. Treasury Bill rate plus a specified spread | Monthly | 08/15/2018 | 7 | 0 | 0 | 0 | 0 | |||||||||||||||||||||||||||||
MYI | Receive | DWRTFT Index | 33 | 1-Month USD-LIBOR plus a specified spread | Monthly | 09/12/2018 | 476 | 0 | 19 | 19 | 0 | |||||||||||||||||||||||||||||
|
|
|
|
|
|
|
| |||||||||||||||||||||||||||||||||
| $ | 0 | $ | 39 | $ | 41 | $ | (2 | ) | ||||||||||||||||||||||||||||||||
|
|
|
|
|
|
|
| |||||||||||||||||||||||||||||||||
Total Swap Agreements |
| $ | 0 | $ | 39 | $ | 41 | $ | (2 | ) | ||||||||||||||||||||||||||||||
|
|
|
|
|
|
|
| |||||||||||||||||||||||||||||||||
FINANCIAL DERIVATIVE INSTRUMENTS: OVER THE COUNTER SUMMARY
The following is a summary by counterparty of the market value of OTC financial derivative instruments and collateral pledged/(received) as of June 30, 2018:
| Financial Derivative Assets | Financial Derivative Liabilities | |||||||||||||||||||||||||||||||||||||||||||||||
| Counterparty | Forward Foreign Currency Contracts | Purchased Options | Swap Agreements | Total Over the Counter | Forward Foreign Currency Contracts | Written Options | Swap Agreements | Total Over the Counter | Net Market Value of OTC Derivatives | Collateral Pledged/ (Received) | Net Exposure(2) | |||||||||||||||||||||||||||||||||||||
BPS | $ | 0 | $ | 0 | $ | 22 | $ | 22 | $ | 0 | $ | 0 | $ | 0 | $ | 0 | $ | 22 | $ | 0 | $ | 22 | ||||||||||||||||||||||||||
CBK | 0 | 0 | 0 | 0 | 0 | 0 | (2 | ) | (2 | ) | (2 | ) | 0 | (2 | ) | |||||||||||||||||||||||||||||||||
MYI | 0 | 0 | 19 | 19 | 0 | 0 | 0 | 0 | 19 | 0 | 19 | |||||||||||||||||||||||||||||||||||||
|
|
|
|
|
|
|
|
|
|
|
|
|
|
|
| |||||||||||||||||||||||||||||||||
Total Over the Counter | $ | 0 | $ | 0 | $ | 41 | $ | 41 | $ | 0 | $ | 0 | $ | (2 | ) | $ | (2 | ) | ||||||||||||||||||||||||||||||
|
|
|
|
|
|
|
|
|
|
|
|
|
|
|
| |||||||||||||||||||||||||||||||||
| See Accompanying Notes | ANNUAL REPORT | JUNE 30, 2018 | 47 |
Table of Contents
Schedule of Investments PIMCO REALPATH® Blend 2025 Fund (Cont.)
| (1) | Receive represents that the Fund receives payments for any positive net return on the underlying reference. The Fund makes payments for any negative net return on such underlying reference. Pay represents that the Fund receives payments for any negative net return on the underlying reference. The Fund makes payments for any positive net return on such underlying reference. |
| (2) | Net Exposure represents the net receivable/(payable) that would be due from/to the counterparty in the event of default. Exposure from OTC financial derivative instruments can only be netted across transactions governed under the same master agreement with the same legal entity. See Note 8, Master Netting Arrangements, in the Notes to Financial Statements for more information regarding master netting arrangements. |
FAIR VALUE OF FINANCIAL DERIVATIVE INSTRUMENTS
The following is a summary of the fair valuation of the Fund’s derivative instruments categorized by risk exposure. See Note 7, Principal Risks, in the Notes to Financial Statements on risks of the Fund.
Fair Values of Financial Derivative Instruments on the Statements of Assets and Liabilities as of June 30, 2018:
| Derivatives not accounted for as hedging instruments | ||||||||||||||||||||||||
| Commodity Contracts | Credit Contracts | Equity Contracts | Foreign Exchange Contracts | Interest Rate Contracts | Total | |||||||||||||||||||
Financial Derivative Instruments - Assets |
| |||||||||||||||||||||||
Exchange-traded or centrally cleared |
| |||||||||||||||||||||||
Purchased Options | $ | 0 | $ | 0 | $ | 144 | $ | 0 | $ | 0 | $ | 144 | ||||||||||||
|
|
|
|
|
|
|
|
|
|
|
| |||||||||||||
Over the counter |
| |||||||||||||||||||||||
Swap Agreements | $ | 0 | $ | 0 | $ | 41 | $ | 0 | $ | 0 | $ | 41 | ||||||||||||
|
|
|
|
|
|
|
|
|
|
|
| |||||||||||||
| $ | 0 | $ | 0 | $ | 185 | $ | 0 | $ | 0 | $ | 185 | |||||||||||||
|
|
|
|
|
|
|
|
|
|
|
| |||||||||||||
Financial Derivative Instruments - Liabilities |
| |||||||||||||||||||||||
Exchange-traded or centrally cleared |
| |||||||||||||||||||||||
Written Options | $ | 0 | $ | 0 | $ | 27 | $ | 0 | $ | 0 | $ | 27 | ||||||||||||
|
|
|
|
|
|
|
|
|
|
|
| |||||||||||||
Over the counter |
| |||||||||||||||||||||||
Swap Agreements | $ | 2 | $ | 0 | $ | 0 | $ | 0 | $ | 0 | $ | 2 | ||||||||||||
|
|
|
|
|
|
|
|
|
|
|
| |||||||||||||
| $ | 2 | $ | 0 | $ | 27 | $ | 0 | $ | 0 | $ | 29 | |||||||||||||
|
|
|
|
|
|
|
|
|
|
|
| |||||||||||||
The effect of Financial Derivative Instruments on the Statements of Operations for the period ended June 30, 2018:
| Derivatives not accounted for as hedging instruments | ||||||||||||||||||||||||
| Commodity Contracts | Credit Contracts | Equity Contracts | Foreign Exchange Contracts | Interest Rate Contracts | Total | |||||||||||||||||||
Net Realized Gain (Loss) on Financial Derivative Instruments |
| |||||||||||||||||||||||
Exchange-traded or centrally cleared |
| |||||||||||||||||||||||
Purchased Options | $ | 0 | $ | 0 | $ | (29 | ) | $ | 0 | $ | 0 | $ | (29 | ) | ||||||||||
Written Options | 0 | 0 | 9 | 0 | 0 | 9 | ||||||||||||||||||
Futures | 0 | 0 | (22 | ) | 0 | 0 | (22 | ) | ||||||||||||||||
|
|
|
|
|
|
|
|
|
|
|
| |||||||||||||
| $ | 0 | $ | 0 | $ | (42 | ) | $ | 0 | $ | 0 | $ | (42 | ) | |||||||||||
|
|
|
|
|
|
|
|
|
|
|
| |||||||||||||
Over the counter |
| |||||||||||||||||||||||
Swap Agreements | $ | 28 | $ | 0 | $ | 4 | $ | 0 | $ | 0 | $ | 32 | ||||||||||||
|
|
|
|
|
|
|
|
|
|
|
| |||||||||||||
| $ | 28 | $ | 0 | $ | (38 | ) | $ | 0 | $ | 0 | $ | (10 | ) | |||||||||||
|
|
|
|
|
|
|
|
|
|
|
| |||||||||||||
Net Change in Unrealized Appreciation (Depreciation) on Financial Derivative Instruments |
| |||||||||||||||||||||||
Exchange-traded or centrally cleared |
| |||||||||||||||||||||||
Purchased Options | $ | 0 | $ | 0 | $ | (27 | ) | $ | 0 | $ | 0 | $ | (27 | ) | ||||||||||
Written Options | 0 | 0 | 6 | 0 | 0 | 6 | ||||||||||||||||||
|
|
|
|
|
|
|
|
|
|
|
| |||||||||||||
| $ | 0 | $ | 0 | $ | (21 | ) | $ | 0 | $ | 0 | $ | (21 | ) | |||||||||||
|
|
|
|
|
|
|
|
|
|
|
| |||||||||||||
Over the counter |
| |||||||||||||||||||||||
Swap Agreements | $ | (6 | ) | $ | 0 | $ | 34 | $ | 0 | $ | 0 | $ | 28 | |||||||||||
|
|
|
|
|
|
|
|
|
|
|
| |||||||||||||
| $ | (6 | ) | $ | 0 | $ | 13 | $ | 0 | $ | 0 | $ | 7 | ||||||||||||
|
|
|
|
|
|
|
|
|
|
|
| |||||||||||||
| 48 | PIMCO EQUITY SERIES | See Accompanying Notes |
Table of Contents
June 30, 2018
FAIR VALUE MEASUREMENTS
The following is a summary of the fair valuations according to the inputs used as of June 30, 2018 in valuing the Fund’s assets and liabilities:
| Category and Subcategory | Level 1 | Level 2 | Level 3 | Fair Value at 06/30/2018 | ||||||||||||
Investments in Securities, at Value |
| |||||||||||||||
Mutual Funds | $ | 15,451 | $ | 0 | $ | 0 | $ | 15,451 | ||||||||
Short-Term Instruments |
| |||||||||||||||
Repurchase Agreements | 0 | 129 | 0 | 129 | ||||||||||||
|
|
|
|
|
|
|
| |||||||||
| $ | 15,451 | $ | 129 | $ | 0 | $ | 15,580 | |||||||||
|
|
|
|
|
|
|
| |||||||||
Investments in Affiliates, at Value |
| |||||||||||||||
Mutual Funds | 14,411 | 0 | 0 | 14,411 | ||||||||||||
Short-Term Instruments |
| |||||||||||||||
Central Funds Used for Cash Management Purposes | 1,319 | 0 | 0 | 1,319 | ||||||||||||
|
|
|
|
|
|
|
| |||||||||
| $ | 15,730 | $ | 0 | $ | 0 | $ | 15,730 | |||||||||
|
|
|
|
|
|
|
| |||||||||
Total Investments | $ | 31,181 | $ | 129 | $ | 0 | $ | 31,310 | ||||||||
|
|
|
|
|
|
|
| |||||||||
| Category and Subcategory | Level 1 | Level 2 | Level 3 | Fair Value at 06/30/2018 | ||||||||||||
Financial Derivative Instruments - Assets |
| |||||||||||||||
Exchange-traded or centrally cleared | $ | 0 | $ | 144 | $ | 0 | $ | 144 | ||||||||
Over the counter | 0 | 41 | 0 | 41 | ||||||||||||
|
|
|
|
|
|
|
| |||||||||
| $ | 0 | $ | 185 | $ | 0 | $ | 185 | |||||||||
|
|
|
|
|
|
|
| |||||||||
Financial Derivative Instruments - Liabilities |
| |||||||||||||||
Exchange-traded or centrally cleared | 0 | (27 | ) | 0 | (27 | ) | ||||||||||
Over the counter | 0 | (2 | ) | 0 | (2 | ) | ||||||||||
|
|
|
|
|
|
|
| |||||||||
| $ | 0 | $ | (29 | ) | $ | 0 | $ | (29 | ) | |||||||
|
|
|
|
|
|
|
| |||||||||
Total Financial Derivative Instruments | $ | 0 | $ | 156 | $ | 0 | $ | 156 | ||||||||
|
|
|
|
|
|
|
| |||||||||
Totals | $ | 31,181 | $ | 285 | $ | 0 | $ | 31,466 | ||||||||
|
|
|
|
|
|
|
| |||||||||
There were no significant transfers among Levels 1, 2, or 3 during the period ended June 30, 2018.
| See Accompanying Notes | ANNUAL REPORT | JUNE 30, 2018 | 49 |
Table of Contents
Schedule of Investments PIMCO REALPATH® Blend 2030 Fund
(Amounts in thousands*, except number of shares, contracts and units, if any)
| SHARES | MARKET VALUE (000S) | |||||||||||
| INVESTMENTS IN SECURITIES 56.9% |
| |||||||||||
| MUTUAL FUNDS 56.5% |
| |||||||||||
Vanguard Developed Markets Index Fund ‘Institutional’ |
| 430,805 |
| $ | 5,954 | |||||||
Vanguard Emerging Markets Stock Index Fund ‘Admiral’ | 76,539 | 2,689 | ||||||||||
Vanguard Institutional Index Fund ‘Institutional’ | 47,014 | 11,648 | ||||||||||
Vanguard Small-Cap Index Fund ‘Admiral’ | 17,923 | 1,337 | ||||||||||
|
| |||||||||||
Total Mutual Funds (Cost $21,173) | 21,628 | |||||||||||
|
| |||||||||||
| SHORT-TERM INSTRUMENTS 0.4% |
| |||||||||||
| REPURCHASE AGREEMENTS (b) 0.4% |
| |||||||||||
| 152 | ||||||||||||
|
| |||||||||||
| Total Short-Term Instruments (Cost $152) | 152 | |||||||||||
|
| |||||||||||
| Total Investments in Securities (Cost $21,325) | 21,780 | |||||||||||
|
| |||||||||||
| SHARES | MARKET VALUE (000S) | |||||||||||
| INVESTMENTS IN AFFILIATES 42.3% |
| |||||||||||
| MUTUAL FUNDS (a) 36.2% |
| |||||||||||
PIMCO Emerging Local Bond Fund | 82,215 | $ | 561 | |||||||||
PIMCO High Yield Fund | 135,167 | 1,169 | ||||||||||
PIMCO Income Fund | 232,122 | 2,783 | ||||||||||
PIMCO International Bond Fund (U.S. Dollar-Hedged) | 81,786 | 882 | ||||||||||
PIMCO Long Duration Total Return Fund | 157,792 | 1,632 | ||||||||||
PIMCO Long-Term Credit Bond Fund | 141,401 | 1,608 | ||||||||||
PIMCO Long-Term Real Return Fund | 263,942 | 2,209 | ||||||||||
PIMCO Real Return Fund | 127,118 | 1,381 | ||||||||||
PIMCO Total Return Fund | 161,412 | 1,609 | ||||||||||
|
| |||||||||||
Total Mutual Funds (Cost $14,093) | 13,834 | |||||||||||
|
| |||||||||||
| SHARES | MARKET VALUE (000S) | |||||||||||
| SHORT-TERM INSTRUMENTS 6.1% |
| |||||||||||
| CENTRAL FUNDS USED FOR CASH MANAGEMENT PURPOSES 6.1% |
| |||||||||||
PIMCO Short-Term | 236,554 | $ | 2,338 | |||||||||
|
| |||||||||||
| Total Short-Term Instruments (Cost $2,338) | 2,338 | |||||||||||
|
| |||||||||||
| Total Investments in Affiliates (Cost $16,431) | 16,172 | |||||||||||
| Total Investments 99.2% (Cost $37,756) | $ | 37,952 | ||||||||||
Financial Derivative (Cost or Premiums, net $0) | 54 | |||||||||||
Other Assets and Liabilities, net 0.7% |
| 251 | ||||||||||
|
| |||||||||||
Net Assets 100.0% | $ | 38,257 | ||||||||||
|
| |||||||||||
NOTES TO SCHEDULE OF INVESTMENTS:
| * | A zero balance may reflect actual amounts rounding to less than one thousand. |
| (a) | Institutional Class Shares of each Fund. |
BORROWINGS AND OTHER FINANCING TRANSACTIONS
(b) REPURCHASE AGREEMENTS:
| Counterparty | Lending Rate | Settlement Date | Maturity Date | Principal Amount | Collateralized By | Collateral (Received) | Repurchase Agreements, at Value | Repurchase Agreement Proceeds to be Received(1) | ||||||||||||||||||||||
| FICC | 1.500 | % | 06/29/2018 | 07/02/2018 | $ | 152 | U.S. Treasury Notes 2.125% due 08/15/2021 | $ | (159 | ) | $ | 152 | $ | 152 | ||||||||||||||||
|
|
|
|
|
| |||||||||||||||||||||||||
Total Repurchase Agreements |
| $ | (159 | ) | $ | 152 | $ | 152 | ||||||||||||||||||||||
|
|
|
|
|
| |||||||||||||||||||||||||
BORROWINGS AND OTHER FINANCING TRANSACTIONS SUMMARY
The following is a summary by counterparty of the market value of Borrowings and Other Financing Transactions and collateral pledged/(received) as of June 30, 2018:
| Counterparty | Repurchase Agreement Proceeds to be Received(1) | Payable for Reverse Repurchase Agreements | Payable for Sale-Buyback Transactions | Total Borrowings and Other Financing Transactions | Collateral Pledged/(Received) | Net Exposure(2) | ||||||||||||||||||
Global/Master Repurchase Agreement |
| |||||||||||||||||||||||
FICC | $ | 152 | $ | 0 | $ | 0 | $ | 152 | $ | (159 | ) | $ | (7 | ) | ||||||||||
|
|
|
|
|
| |||||||||||||||||||
Total Borrowings and Other Financing Transactions | $ | 152 | $ | 0 | $ | 0 | ||||||||||||||||||
|
|
|
|
|
| |||||||||||||||||||
| (1) | Includes accrued interest. |
| (2) | Net Exposure represents the net receivable/(payable) that would be due from/to the counterparty in the event of default. Exposure from borrowings and other financing transactions can only be netted across transactions governed under the same master agreement with the same legal entity. See Note 8, Master Netting Arrangements, in the Notes to Financial Statements for more information regarding master netting arrangements. |
| 50 | PIMCO EQUITY SERIES | See Accompanying Notes |
Table of Contents
June 30, 2018
(c) FINANCIAL DERIVATIVE INSTRUMENTS: OVER THE COUNTER
SWAP AGREEMENTS:
TOTAL RETURN SWAPS ON COMMODITY AND EQUITY INDICES
| Counterparty | Pay/Receive(1) | Underlying Reference | # of Units | Financing Rate | Payment Frequency | Maturity Date | Notional Amount | Premiums Paid/(Received) | Unrealized Appreciation/ (Depreciation) | Swap Agreements, at Value | ||||||||||||||||||||||||||||||
| Asset | Liability | |||||||||||||||||||||||||||||||||||||||
BPS | Receive | DWRTFT Index | 25 | 1-Month USD-LIBOR plus a specified spread | Monthly | 11/07/2018 | $ | 1,153 | $ | 0 | $ | 36 | $ | 36 | $ | 0 | ||||||||||||||||||||||||
CBK | Receive | BCOMTR Index | 3,785 | 3-Month U.S. Treasury Bill rate plus a specified spread | Monthly | 08/15/2018 | 638 | 0 | (2 | ) | 0 | (2 | ) | |||||||||||||||||||||||||||
JPM | Receive | BCOMTR Index | 574 | 3-Month U.S. Treasury Bill rate plus a specified spread | Monthly | 08/15/2018 | 104 | 0 | 0 | 0 | 0 | |||||||||||||||||||||||||||||
MYI | Receive | DWRTFT Index | 14 | 1-Month USD-LIBOR plus a specified spread | Monthly | 09/12/2018 | 495 | 0 | 20 | 20 | 0 | |||||||||||||||||||||||||||||
|
|
|
|
|
|
|
| |||||||||||||||||||||||||||||||||
| $ | 0 | $ | 54 | $ | 56 | $ | (2 | ) | ||||||||||||||||||||||||||||||||
|
|
|
|
|
|
|
| |||||||||||||||||||||||||||||||||
Total Swap Agreements |
| $ | 0 | $ | 54 | $ | 56 | $ | (2 | ) | ||||||||||||||||||||||||||||||
|
|
|
|
|
|
|
| |||||||||||||||||||||||||||||||||
FINANCIAL DERIVATIVE INSTRUMENTS: OVER THE COUNTER SUMMARY
The following is a summary by counterparty of the market value of OTC financial derivative instruments and collateral pledged/(received) as of June 30, 2018:
| Financial Derivative Assets | Financial Derivative Liabilities | |||||||||||||||||||||||||||||||||||||||||||||||
| Counterparty | Forward Foreign Currency Contracts | Purchased Options | Swap Agreements | Total Over the Counter | Forward Foreign Currency Contracts | Written Options | Swap Agreements | Total Over the Counter | Net Market Value of OTC Derivatives | Collateral Pledged/ (Received) | Net Exposure(2) | |||||||||||||||||||||||||||||||||||||
BPS | $ | 0 | $ | 0 | $ | 36 | $ | 36 | $ | 0 | $ | 0 | $ | 0 | $ | 0 | $ | 36 | $ | 0 | $ | 36 | ||||||||||||||||||||||||||
CBK | 0 | 0 | 0 | 0 | 0 | 0 | (2 | ) | (2 | ) | (2 | ) | 0 | (2 | ) | |||||||||||||||||||||||||||||||||
MYI | 0 | 0 | 20 | 20 | 0 | 0 | 0 | 0 | 20 | 0 | 20 | |||||||||||||||||||||||||||||||||||||
|
|
|
|
|
|
|
|
|
|
|
|
|
|
|
| |||||||||||||||||||||||||||||||||
Total Over the Counter | $ | 0 | $ | 0 | $ | 56 | $ | 56 | $ | 0 | $ | 0 | $ | (2 | ) | $ | (2 | ) | ||||||||||||||||||||||||||||||
|
|
|
|
|
|
|
|
|
|
|
|
|
|
|
| |||||||||||||||||||||||||||||||||
| (1) | Receive represents that the Fund receives payments for any positive net return on the underlying reference. The Fund makes payments for any negative net return on such underlying reference. Pay represents that the Fund receives payments for any negative net return on the underlying reference. The Fund makes payments for any positive net return on such underlying reference. |
| (2) | Net Exposure represents the net receivable/(payable) that would be due from/to the counterparty in the event of default. Exposure from OTC financial derivative instruments can only be netted across transactions governed under the same master agreement with the same legal entity. See Note 8, Master Netting Arrangements, in the Notes to Financial Statements for more information regarding master netting arrangements. |
FAIR VALUE OF FINANCIAL DERIVATIVE INSTRUMENTS
The following is a summary of the fair valuation of the Fund’s derivative instruments categorized by risk exposure. See Note 7, Principal Risks, in the Notes to Financial Statements on risks of the Fund.
Fair Values of Financial Derivative Instruments on the Statements of Assets and Liabilities as of June 30, 2018:
| Derivatives not accounted for as hedging instruments | ||||||||||||||||||||||||
| Commodity Contracts | Credit Contracts | Equity Contracts | Foreign Exchange Contracts | Interest Rate Contracts | Total | |||||||||||||||||||
Financial Derivative Instruments - Assets |
| |||||||||||||||||||||||
Over the counter |
| |||||||||||||||||||||||
Swap Agreements | $ | 0 | $ | 0 | $ | 56 | $ | 0 | $ | 0 | $ | 56 | ||||||||||||
|
|
|
|
|
|
|
|
|
|
|
| |||||||||||||
Financial Derivative Instruments - Liabilities |
| |||||||||||||||||||||||
Over the counter |
| |||||||||||||||||||||||
Swap Agreements | $ | 2 | $ | 0 | $ | 0 | $ | 0 | $ | 0 | $ | 2 | ||||||||||||
|
|
|
|
|
|
|
|
|
|
|
| |||||||||||||
| See Accompanying Notes | ANNUAL REPORT | JUNE 30, 2018 | 51 |
Table of Contents
Schedule of Investments PIMCO REALPATH® Blend 2030 Fund (Cont.)
June 30, 2018
The effect of Financial Derivative Instruments on the Statements of Operations for the period ended June 30, 2018:
| Derivatives not accounted for as hedging instruments | ||||||||||||||||||||||||
| Commodity Contracts | Credit Contracts | Equity Contracts | Foreign Exchange Contracts | Interest Rate Contracts | Total | |||||||||||||||||||
Net Realized Gain (Loss) on Financial Derivative Instruments |
| |||||||||||||||||||||||
Exchange-traded or centrally cleared |
| |||||||||||||||||||||||
Purchased Options | $ | 0 | $ | 0 | $ | (20 | ) | $ | 0 | $ | 0 | $ | (20 | ) | ||||||||||
Written Options | 0 | 0 | 15 | 0 | 0 | 15 | ||||||||||||||||||
Futures | 0 | 0 | (9 | ) | 0 | (1 | ) | (10 | ) | |||||||||||||||
|
|
|
|
|
|
|
|
|
|
|
| |||||||||||||
| $ | 0 | $ | 0 | $ | (14 | ) | $ | 0 | $ | (1 | ) | $ | (15 | ) | ||||||||||
|
|
|
|
|
|
|
|
|
|
|
| |||||||||||||
Over the counter |
| |||||||||||||||||||||||
Swap Agreements | $ | 37 | $ | 0 | $ | 15 | $ | 0 | $ | 0 | $ | 52 | ||||||||||||
|
|
|
|
|
|
|
|
|
|
|
| |||||||||||||
| $ | 37 | $ | 0 | $ | 1 | $ | 0 | $ | (1 | ) | $ | 37 | ||||||||||||
|
|
|
|
|
|
|
|
|
|
|
| |||||||||||||
Net Change in Unrealized Appreciation (Depreciation) on Financial Derivative Instruments |
| |||||||||||||||||||||||
Exchange-traded or centrally cleared |
| |||||||||||||||||||||||
Purchased Options | $ | 0 | $ | 0 | $ | 15 | $ | 0 | $ | 0 | $ | 15 | ||||||||||||
Written Options | 0 | 0 | (12 | ) | 0 | 0 | (12 | ) | ||||||||||||||||
|
|
|
|
|
|
|
|
|
|
|
| |||||||||||||
| $ | 0 | $ | 0 | $ | 3 | $ | 0 | $ | 0 | $ | 3 | |||||||||||||
|
|
|
|
|
|
|
|
|
|
|
| |||||||||||||
Over the counter |
| |||||||||||||||||||||||
Swap Agreements | $ | (9 | ) | $ | 0 | $ | 41 | $ | 0 | $ | 0 | $ | 32 | |||||||||||
|
|
|
|
|
|
|
|
|
|
|
| |||||||||||||
| $ | (9 | ) | $ | 0 | $ | 44 | $ | 0 | $ | 0 | $ | 35 | ||||||||||||
|
|
|
|
|
|
|
|
|
|
|
| |||||||||||||
FAIR VALUE MEASUREMENTS
The following is a summary of the fair valuations according to the inputs used as of June 30, 2018 in valuing the Fund’s assets and liabilities:
| Category and Subcategory | Level 1 | Level 2 | Level 3 | Fair Value at 06/30/2018 | ||||||||||||
Investments in Securities, at Value |
| |||||||||||||||
Mutual Funds | $ | 21,628 | $ | 0 | $ | 0 | $ | 21,628 | ||||||||
Short-Term Instruments |
| |||||||||||||||
Repurchase Agreements | 0 | 152 | 0 | 152 | ||||||||||||
|
|
|
|
|
|
|
| |||||||||
| $ | 21,628 | $ | 152 | $ | 0 | $ | 21,780 | |||||||||
|
|
|
|
|
|
|
| |||||||||
Investments in Affiliates, at Value |
| |||||||||||||||
Mutual Funds | 13,834 | 0 | 0 | 13,834 | ||||||||||||
Short-Term Instruments |
| |||||||||||||||
Central Funds Used for Cash Management Purposes | 2,338 | 0 | 0 | 2,338 | ||||||||||||
|
|
|
|
|
|
|
| |||||||||
| $ | 16,172 | $ | 0 | $ | 0 | $ | 16,172 | |||||||||
|
|
|
|
|
|
|
| |||||||||
Total Investments | $ | 37,800 | $ | 152 | $ | 0 | $ | 37,952 | ||||||||
|
|
|
|
|
|
|
| |||||||||
| Category and Subcategory | Level 1 | Level 2 | Level 3 | Fair Value at 06/30/2018 | ||||||||||||
Financial Derivative Instruments - Assets |
| |||||||||||||||
Over the counter | $ | 0 | $ | 56 | $ | 0 | $ | 56 | ||||||||
|
|
|
|
|
|
|
| |||||||||
Financial Derivative Instruments - Liabilities |
| |||||||||||||||
Over the counter | $ | 0 | $ | (2 | ) | $ | 0 | $ | (2 | ) | ||||||
|
|
|
|
|
|
|
| |||||||||
Total Financial Derivative Instruments | $ | 0 | $ | 54 | $ | 0 | $ | 54 | ||||||||
|
|
|
|
|
|
|
| |||||||||
Totals | $ | 37,800 | $ | 206 | $ | 0 | $ | 38,006 | ||||||||
|
|
|
|
|
|
|
| |||||||||
There were no significant transfers among Levels 1, 2, or 3 during the period ended June 30, 2018.
| 52 | PIMCO EQUITY SERIES | See Accompanying Notes |
Table of Contents
Schedule of Investments PIMCO REALPATH® Blend 2035 Fund
June 30, 2018
(Amounts in thousands*, except number of shares, contracts and units, if any)
| SHARES | MARKET VALUE (000S) | |||||||||||
| INVESTMENTS IN SECURITIES 65.7% |
| |||||||||||
| MUTUAL FUNDS 65.0% |
| |||||||||||
Vanguard Developed Markets Index Fund ‘Institutional’ | 498,864 | $ | 6,894 | |||||||||
Vanguard Emerging Markets Stock Index Fund ‘Admiral’ | 88,629 | 3,114 | ||||||||||
Vanguard Institutional Index Fund ‘Institutional’ | 54,441 | 13,488 | ||||||||||
Vanguard Small-Cap Index Fund ‘Admiral’ | 20,755 | 1,548 | ||||||||||
|
| |||||||||||
Total Mutual Funds (Cost $24,484) | 25,044 | |||||||||||
|
| |||||||||||
| SHORT-TERM INSTRUMENTS 0.7% |
| |||||||||||
| REPURCHASE AGREEMENTS (b) 0.7% |
| |||||||||||
| 268 | ||||||||||||
|
| |||||||||||
| Total Short-Term Instruments (Cost $268) | 268 | |||||||||||
|
| |||||||||||
| Total Investments in Securities (Cost $24,752) | 25,312 | |||||||||||
|
| |||||||||||
| SHARES | MARKET VALUE (000S) | |||||||||||
| INVESTMENTS IN AFFILIATES 34.2% |
| |||||||||||
| MUTUAL FUNDS (a) 27.6% |
| |||||||||||
PIMCO Emerging Local Bond Fund | 72,546 | $ | 495 | |||||||||
PIMCO High Yield Fund | 116,730 | 1,010 | ||||||||||
PIMCO Income Fund | 187,240 | 2,245 | ||||||||||
PIMCO International Bond Fund (U.S. Dollar-Hedged) | 60,945 | 658 | ||||||||||
PIMCO Long Duration Total Return Fund | 117,607 | 1,216 | ||||||||||
PIMCO Long-Term Credit Bond Fund | 105,156 | 1,196 | ||||||||||
PIMCO Long-Term Real Return Fund | 192,519 | 1,612 | ||||||||||
PIMCO Real Return Fund | 94,749 | 1,029 | ||||||||||
PIMCO Total Return Fund | 123,087 | 1,227 | ||||||||||
|
| |||||||||||
Total Mutual Funds (Cost $10,871) | 10,688 | |||||||||||
|
| |||||||||||
| SHARES | MARKET VALUE (000S) | |||||||||||
| SHORT-TERM INSTRUMENTS 6.6% |
| |||||||||||
| CENTRAL FUNDS USED FOR CASH MANAGEMENT PURPOSES 6.6% |
| |||||||||||
PIMCO Short-Term Floating NAV Portfolio III | 256,850 | $ | 2,538 | |||||||||
|
| |||||||||||
| Total Short-Term Instruments (Cost $2,538) | 2,538 | |||||||||||
|
| |||||||||||
| Total Investments in Affiliates (Cost $13,409) | 13,226 | |||||||||||
| Total Investments 99.9% (Cost $38,161) | $ | 38,538 | ||||||||||
Financial Derivative (Cost or Premiums, net $0) | 62 | |||||||||||
| Other Assets and Liabilities, net (0.1)% |
| (42 | ) | |||||||||
|
| |||||||||||
| Net Assets 100.0% | $ | 38,558 | ||||||||||
|
| |||||||||||
NOTES TO SCHEDULE OF INVESTMENTS:
| * | A zero balance may reflect actual amounts rounding to less than one thousand. |
| (a) | Institutional Class Shares of each Fund. |
BORROWINGS AND OTHER FINANCING TRANSACTIONS
(b) REPURCHASE AGREEMENTS:
| Counterparty | Lending Rate | Settlement Date | Maturity Date | Principal Amount | Collateralized By | Collateral (Received) | Repurchase Agreements, at Value | Repurchase Agreement Proceeds to be Received(1) | ||||||||||||||||||||||
| FICC | 1.500 | % | 06/29/2018 | 07/02/2018 | $ | 268 | U.S. Treasury Notes 2.125% due 08/15/2021 | $ | (278 | ) | $ | 268 | $ | 268 | ||||||||||||||||
|
|
|
|
|
| |||||||||||||||||||||||||
Total Repurchase Agreements |
| $ | (278 | ) | $ | 268 | $ | 268 | ||||||||||||||||||||||
|
|
|
|
|
| |||||||||||||||||||||||||
BORROWINGS AND OTHER FINANCING TRANSACTIONS SUMMARY
The following is a summary by counterparty of the market value of Borrowings and Other Financing Transactions and collateral pledged/(received) as of June 30, 2018:
| Counterparty | Repurchase Agreement Proceeds to be Received(1) | Payable for Reverse Repurchase Agreements | Payable for Sale-Buyback Transactions | Total Borrowings and Other Financing Transactions | Collateral Pledged/(Received) | Net Exposure(2) | ||||||||||||||||||
Global/Master Repurchase Agreement |
| |||||||||||||||||||||||
FICC | $ | 268 | $ | 0 | $ | 0 | $ | 268 | $ | (278 | ) | $ | (10 | ) | ||||||||||
|
|
|
|
|
| |||||||||||||||||||
Total Borrowings and Other Financing Transactions | $ | 268 | $ | 0 | $ | 0 | ||||||||||||||||||
|
|
|
|
|
| |||||||||||||||||||
| (1) | Includes accrued interest. |
| (2) | Net Exposure represents the net receivable/(payable) that would be due from/to the counterparty in the event of default. Exposure from borrowings and other financing transactions can only be netted across transactions governed under the same master agreement with the same legal entity. See Note 8, Master Netting Arrangements, in the Notes to Financial Statements for more information regarding master netting arrangements. |
| See Accompanying Notes | ANNUAL REPORT | JUNE 30, 2018 | 53 |
Table of Contents
Schedule of Investments PIMCO REALPATH® Blend 2035 Fund (Cont.)
(c) FINANCIAL DERIVATIVE INSTRUMENTS: OVER THE COUNTER
SWAP AGREEMENTS:
TOTAL RETURN SWAPS ON COMMODITY AND EQUITY INDICES
| Counterparty | Pay/Receive(1) | Underlying Reference | # of Units | Financing Rate | Payment Frequency | Maturity Date | Notional Amount | Premiums Paid/(Received) | Unrealized Appreciation/ (Depreciation) | Swap Agreements, at Value | ||||||||||||||||||||||||||||||
| Asset | Liability | |||||||||||||||||||||||||||||||||||||||
BPS | Receive | DWRTFT Index | 131 | 1-Month USD-LIBOR plus a specified spread | Monthly | 11/07/2018 | $ | 1,260 | $ | 0 | $ | 39 | $ | 39 | $ | 0 | ||||||||||||||||||||||||
CBK | Receive | BCOMTR Index | 3,845 | 3-Month U.S. Treasury Bill rate plus a specified spread | Monthly | 08/15/2018 | 694 | 0 | (3 | ) | 0 | (3 | ) | |||||||||||||||||||||||||||
JPM | Receive | BCOMTR Index | 334 | 3-Month U.S. Treasury Bill rate plus a specified spread | Monthly | 08/15/2018 | 60 | 0 | 0 | 0 | 0 | |||||||||||||||||||||||||||||
MYI | Receive | DWRTFT Index | 68 | 1-Month USD-LIBOR plus a specified spread | Monthly | 09/12/2018 | 647 | 0 | 26 | 26 | 0 | |||||||||||||||||||||||||||||
|
|
|
|
|
|
|
| |||||||||||||||||||||||||||||||||
| $ | 0 | $ | 62 | $ | 65 | $ | (3 | ) | ||||||||||||||||||||||||||||||||
|
|
|
|
|
|
|
| |||||||||||||||||||||||||||||||||
Total Swap Agreements |
| $ | 0 | $ | 62 | $ | 65 | $ | (3 | ) | ||||||||||||||||||||||||||||||
|
|
|
|
|
|
|
| |||||||||||||||||||||||||||||||||
FINANCIAL DERIVATIVE INSTRUMENTS: OVER THE COUNTER SUMMARY
The following is a summary by counterparty of the market value of OTC financial derivative instruments and collateral pledged/(received) as of June 30, 2018:
| Financial Derivative Assets | Financial Derivative Liabilities | |||||||||||||||||||||||||||||||||||||||||||||||
| Counterparty | Forward Foreign Currency Contracts | Purchased Options | Swap Agreements | Total Over the Counter | Forward Foreign Currency Contracts | Written Options | Swap Agreements | Total Over the Counter | Net Market Value of OTC Derivatives | Collateral Pledged/ (Received) | Net Exposure(2) | |||||||||||||||||||||||||||||||||||||
BPS | $ | 0 | $ | 0 | $ | 39 | $ | 39 | $ | 0 | $ | 0 | $ | 0 | $ | 0 | $ | 39 | $ | 0 | $ | 39 | ||||||||||||||||||||||||||
CBK | 0 | 0 | 0 | 0 | 0 | 0 | (3 | ) | (3 | ) | (3 | ) | 0 | (3 | ) | |||||||||||||||||||||||||||||||||
MYI | 0 | 0 | 26 | 26 | 0 | 0 | 0 | 0 | 26 | 0 | 26 | |||||||||||||||||||||||||||||||||||||
|
|
|
|
|
|
|
|
|
|
|
|
|
|
|
| |||||||||||||||||||||||||||||||||
Total Over the Counter | $ | 0 | $ | 0 | $ | 65 | $ | 65 | $ | 0 | $ | 0 | $ | (3 | ) | $ | (3 | ) | ||||||||||||||||||||||||||||||
|
|
|
|
|
|
|
|
|
|
|
|
|
|
|
| |||||||||||||||||||||||||||||||||
| (1) | Receive represents that the Fund receives payments for any positive net return on the underlying reference. The Fund makes payments for any negative net return on such underlying reference. Pay represents that the Fund receives payments for any negative net return on the underlying reference. The Fund makes payments for any positive net return on such underlying reference. |
| (2) | Net Exposure represents the net receivable/(payable) that would be due from/to the counterparty in the event of default. Exposure from OTC financial derivative instruments can only be netted across transactions governed under the same master agreement with the same legal entity. See Note 8, Master Netting Arrangements, in the Notes to Financial Statements for more information regarding master netting arrangements. |
FAIR VALUE OF FINANCIAL DERIVATIVE INSTRUMENTS
The following is a summary of the fair valuation of the Fund’s derivative instruments categorized by risk exposure. See Note 7, Principal Risks, in the Notes to Financial Statements on risks of the Fund.
Fair Values of Financial Derivative Instruments on the Statements of Assets and Liabilities as of June 30, 2018:
| Derivatives not accounted for as hedging instruments | ||||||||||||||||||||||||
| Commodity Contracts | Credit Contracts | Equity Contracts | Foreign Exchange Contracts | Interest Rate Contracts | Total | |||||||||||||||||||
Financial Derivative Instruments - Assets |
| |||||||||||||||||||||||
Over the counter |
| |||||||||||||||||||||||
Swap Agreements | $ | 0 | $ | 0 | $ | 65 | $ | 0 | $ | 0 | $ | 65 | ||||||||||||
|
|
|
|
|
|
|
|
|
|
|
| |||||||||||||
Financial Derivative Instruments - Liabilities |
| |||||||||||||||||||||||
Over the counter |
| |||||||||||||||||||||||
Swap Agreements | $ | 3 | $ | 0 | $ | 0 | $ | 0 | $ | 0 | $ | 3 | ||||||||||||
|
|
|
|
|
|
|
|
|
|
|
| |||||||||||||
| 54 | PIMCO EQUITY SERIES | See Accompanying Notes |
Table of Contents
June 30, 2018
The effect of Financial Derivative Instruments on the Statements of Operations for the period ended June 30, 2018:
| Derivatives not accounted for as hedging instruments | ||||||||||||||||||||||||
| Commodity Contracts | Credit Contracts | Equity Contracts | Foreign Exchange Contracts | Interest Rate Contracts | Total | |||||||||||||||||||
Net Realized Gain (Loss) on Financial Derivative Instruments |
| |||||||||||||||||||||||
Exchange-traded or centrally cleared |
| |||||||||||||||||||||||
Purchased Options | $ | 0 | $ | 0 | $ | (20 | ) | $ | 0 | $ | 0 | $ | (20 | ) | ||||||||||
Written Options | 0 | 0 | 15 | 0 | 0 | 15 | ||||||||||||||||||
Futures | 0 | 0 | (1 | ) | 0 | 0 | (1 | ) | ||||||||||||||||
|
|
|
|
|
|
|
|
|
|
|
| |||||||||||||
| $ | 0 | $ | 0 | $ | (6 | ) | $ | 0 | $ | 0 | $ | (6 | ) | |||||||||||
|
|
|
|
|
|
|
|
|
|
|
| |||||||||||||
Over the counter |
| |||||||||||||||||||||||
Swap Agreements | $ | 42 | $ | 0 | $ | 23 | $ | 0 | $ | 0 | $ | 65 | ||||||||||||
|
|
|
|
|
|
|
|
|
|
|
| |||||||||||||
| $ | 42 | $ | 0 | $ | 17 | $ | 0 | $ | 0 | $ | 59 | |||||||||||||
|
|
|
|
|
|
|
|
|
|
|
| |||||||||||||
Net Change in Unrealized Appreciation (Depreciation) on Financial Derivative Instruments |
| |||||||||||||||||||||||
Exchange-traded or centrally cleared |
| |||||||||||||||||||||||
Purchased Options | $ | 0 | $ | 0 | $ | 15 | $ | 0 | $ | 0 | $ | 15 | ||||||||||||
Written Options | 0 | 0 | (12 | ) | 0 | 0 | (12 | ) | ||||||||||||||||
|
|
|
|
|
|
|
|
|
|
|
| |||||||||||||
| $ | 0 | $ | 0 | $ | 3 | $ | 0 | $ | 0 | $ | 3 | |||||||||||||
|
|
|
|
|
|
|
|
|
|
|
| |||||||||||||
Over the counter |
| |||||||||||||||||||||||
Swap Agreements | $ | (11 | ) | $ | 0 | $ | 45 | $ | 0 | $ | 0 | $ | 34 | |||||||||||
|
|
|
|
|
|
|
|
|
|
|
| |||||||||||||
| $ | (11 | ) | $ | 0 | $ | 48 | $ | 0 | $ | 0 | $ | 37 | ||||||||||||
|
|
|
|
|
|
|
|
|
|
|
| |||||||||||||
FAIR VALUE MEASUREMENTS
The following is a summary of the fair valuations according to the inputs used as of June 30, 2018 in valuing the Fund’s assets and liabilities:
| Category and Subcategory | Level 1 | Level 2 | Level 3 | Fair Value at 06/30/2018 | ||||||||||||
Investments in Securities, at Value |
| |||||||||||||||
Mutual Funds | $ | 25,044 | $ | 0 | $ | 0 | $ | 25,044 | ||||||||
Short-Term Instruments |
| |||||||||||||||
Repurchase Agreements | 0 | 268 | 0 | 268 | ||||||||||||
|
|
|
|
|
|
|
| |||||||||
| $ | 25,044 | $ | 268 | $ | 0 | $ | 25,312 | |||||||||
|
|
|
|
|
|
|
| |||||||||
Investments in Affiliates, at Value |
| |||||||||||||||
Mutual Funds | 10,688 | 0 | 0 | 10,688 | ||||||||||||
Short-Term Instruments |
| |||||||||||||||
Central Funds Used for Cash Management Purposes | 2,538 | 0 | 0 | 2,538 | ||||||||||||
|
|
|
|
|
|
|
| |||||||||
| $ | 13,226 | $ | 0 | $ | 0 | $ | 13,226 | |||||||||
|
|
|
|
|
|
|
| |||||||||
Total Investments | $ | 38,270 | $ | 268 | $ | 0 | $ | 38,538 | ||||||||
|
|
|
|
|
|
|
| |||||||||
| Category and Subcategory | Level 1 | Level 2 | Level 3 | Fair Value at 06/30/2018 | ||||||||||||
Financial Derivative Instruments - Assets |
| |||||||||||||||
Over the counter | $ | 0 | $ | 65 | $ | 0 | $ | 65 | ||||||||
|
|
|
|
|
|
|
| |||||||||
Financial Derivative Instruments - Liabilities |
| |||||||||||||||
Over the counter | $ | 0 | $ | (3 | ) | $ | 0 | $ | (3 | ) | ||||||
|
|
|
|
|
|
|
| |||||||||
Total Financial Derivative Instruments | $ | 0 | $ | 62 | $ | 0 | $ | 62 | ||||||||
|
|
|
|
|
|
|
| |||||||||
Totals | $ | 38,270 | $ | 330 | $ | 0 | $ | 38,600 | ||||||||
|
|
|
|
|
|
|
| |||||||||
There were no significant transfers among Levels 1, 2, or 3 during the period ended June 30, 2018.
| See Accompanying Notes | ANNUAL REPORT | JUNE 30, 2018 | 55 |
Table of Contents
Schedule of Investments PIMCO REALPATH® Blend 2040 Fund
(Amounts in thousands*, except number of shares, contracts and units, if any)
| SHARES | MARKET VALUE (000S) | |||||||||||
| INVESTMENTS IN SECURITIES 71.5% |
| |||||||||||
| MUTUAL FUNDS 71.2% |
| |||||||||||
Vanguard Developed Markets Index Fund ‘Institutional’ | 609,588 | $ | 8,425 | |||||||||
Vanguard Emerging Markets Stock Index Fund ‘Admiral’ | 108,299 | 3,804 | ||||||||||
Vanguard Institutional Index Fund ‘Institutional’ | 66,410 | 16,453 | ||||||||||
Vanguard Small-Cap Index Fund ‘Admiral’ | 25,366 | 1,893 | ||||||||||
|
| |||||||||||
| Total Mutual Funds (Cost $29,955) |
| 30,575 | ||||||||||
|
| |||||||||||
| SHORT-TERM INSTRUMENTS 0.3% |
| |||||||||||
| REPURCHASE AGREEMENTS (b) 0.3% | ||||||||||||
| 122 | ||||||||||||
|
| |||||||||||
| Total Short-Term Instruments (Cost $122) |
| 122 | ||||||||||
|
| |||||||||||
| Total Investments in Securities (Cost $30,077) |
| 30,697 | ||||||||||
|
| |||||||||||
| SHARES | MARKET VALUE (000S) | |||||||||||
| INVESTMENTS IN AFFILIATES 27.6% |
| |||||||||||
| MUTUAL FUNDS (a) 20.3% |
| |||||||||||
PIMCO Emerging Local Bond Fund | 60,004 | $ | 409 | |||||||||
PIMCO High Yield Fund | 106,968 | 925 | ||||||||||
PIMCO Income Fund | 159,578 | 1,913 | ||||||||||
PIMCO International Bond Fund (U.S. Dollar-Hedged) | 50,532 | 545 | ||||||||||
PIMCO Long Duration Total Return Fund | 87,758 | 908 | ||||||||||
PIMCO Long-Term Credit Bond Fund | 78,649 | 894 | ||||||||||
PIMCO Long-Term Real Return Fund | 148,923 | 1,247 | ||||||||||
PIMCO Real Return Fund | 78,521 | 853 | ||||||||||
PIMCO Total Return Fund | 99,688 | 994 | ||||||||||
|
| |||||||||||
| Total Mutual Funds (Cost $8,858) |
| 8,688 | ||||||||||
|
| |||||||||||
| SHARES | MARKET VALUE (000S) | |||||||||
| SHORT-TERM INSTRUMENTS 7.3% |
| |||||||||
| CENTRAL FUNDS USED FOR CASH MANAGEMENT PURPOSES 7.3% |
| |||||||||
PIMCO Short-Term | 318,246 | $ | 3,146 | |||||||
|
| |||||||||
| Total Short-Term Instruments (Cost $3,145) | 3,146 | |||||||||
|
| |||||||||
| Total Investments in Affiliates (Cost $12,003) | 11,834 | |||||||||
| Total Investments 99.1% (Cost $42,080) | $ | 42,531 | ||||||||
Financial Derivative (Cost or Premiums, net $0) | 76 | |||||||||
| Other Assets and Liabilities, net 0.7% | 293 | |||||||||
|
| |||||||||
| Net Assets 100.0% | $ | 42,900 | ||||||||
|
| |||||||||
NOTES TO SCHEDULE OF INVESTMENTS:
| * | A zero balance may reflect actual amounts rounding to less than one thousand. |
| (a) | Institutional Class Shares of each Fund. |
BORROWINGS AND OTHER FINANCING TRANSACTIONS
(b) REPURCHASE AGREEMENTS:
| Counterparty | Lending Rate | Settlement Date | Maturity Date | Principal Amount | Collateralized By | Collateral (Received) | Repurchase Agreements, at Value | Repurchase Agreement Proceeds to be Received(1) | ||||||||||||||||||||||
| FICC | 1.500 | % | 06/29/2018 | 07/02/2018 | $ | 122 | U.S. Treasury Notes 2.125% due 08/15/2021 | $ | (129 | ) | $ | 122 | $ | 122 | ||||||||||||||||
|
|
|
|
|
| |||||||||||||||||||||||||
Total Repurchase Agreements |
| $ | (129 | ) | $ | 122 | $ | 122 | ||||||||||||||||||||||
|
|
|
|
|
| |||||||||||||||||||||||||
BORROWINGS AND OTHER FINANCING TRANSACTIONS SUMMARY
The following is a summary by counterparty of the market value of Borrowings and Other Financing Transactions and collateral pledged/(received) as of June 30, 2018:
| Counterparty | Repurchase Agreement Proceeds to be Received(1) | Payable for Reverse Repurchase Agreements | Payable for Sale-Buyback Transactions | Total Borrowings and Other Financing Transactions | Collateral Pledged/(Received) | Net Exposure(2) | ||||||||||||||||||
Global/Master Repurchase Agreement |
| |||||||||||||||||||||||
FICC | $ | 122 | $ | 0 | $ | 0 | $ | 122 | $ | (129 | ) | $ | (7 | ) | ||||||||||
|
|
|
|
|
| |||||||||||||||||||
Total Borrowings and Other Financing Transactions | $ | 122 | $ | 0 | $ | 0 | ||||||||||||||||||
|
|
|
|
|
| |||||||||||||||||||
| (1) | Includes accrued interest. |
| (2) | Net Exposure represents the net receivable/(payable) that would be due from/to the counterparty in the event of default. Exposure from borrowings and other financing transactions can only be netted across transactions governed under the same master agreement with the same legal entity. See Note 8, Master Netting Arrangements, in the Notes to Financial Statements for more information regarding master netting arrangements. |
| 56 | PIMCO EQUITY SERIES | See Accompanying Notes |
Table of Contents
June 30, 2018
(c) FINANCIAL DERIVATIVE INSTRUMENTS: OVER THE COUNTER
SWAP AGREEMENTS:
TOTAL RETURN SWAPS ON COMMODITY AND EQUITY INDICES
| Counterparty | Pay/Receive(1) | Underlying Reference | # of Units | Financing Rate | Payment Frequency | Maturity Date | Notional Amount | Premiums Paid/(Received) | Unrealized Appreciation/ (Depreciation) | Swap Agreements, at Value | ||||||||||||||||||||||||||||||
| Asset | Liability | |||||||||||||||||||||||||||||||||||||||
BPS | Receive | DWRTFT Index | 47 | 1-Month USD-LIBOR plus a specified spread | Monthly | 11/07/2018 | $ | 1,748 | $ | 0 | $ | 55 | $ | 55 | $ | 0 | ||||||||||||||||||||||||
CBK | Receive | BCOMTR Index | 4,413 | 3-Month U.S. Treasury Bill rate plus a specified spread | Monthly | 08/15/2018 | 847 | 0 | (3 | ) | 0 | (3 | ) | |||||||||||||||||||||||||||
JPM | Receive | BCOMTR Index | 48 | 3-Month U.S. Treasury Bill rate plus a specified spread | Monthly | 08/15/2018 | 9 | 0 | 0 | 0 | 0 | |||||||||||||||||||||||||||||
MYI | Receive | DWRTFT Index | 13 | 1-Month USD-LIBOR plus a specified spread | Monthly | 09/12/2018 | 580 | 0 | 24 | 24 | 0 | |||||||||||||||||||||||||||||
|
|
|
|
|
|
|
| |||||||||||||||||||||||||||||||||
| $ | 0 | $ | 76 | $ | 79 | $ | (3 | ) | ||||||||||||||||||||||||||||||||
|
|
|
|
|
|
|
| |||||||||||||||||||||||||||||||||
Total Swap Agreements |
| $ | 0 | $ | 76 | $ | 79 | $ | (3 | ) | ||||||||||||||||||||||||||||||
|
|
|
|
|
|
|
| |||||||||||||||||||||||||||||||||
FINANCIAL DERIVATIVE INSTRUMENTS: OVER THE COUNTER SUMMARY
The following is a summary by counterparty of the market value of OTC financial derivative instruments and collateral pledged/(received) as of June 30, 2018:
| Financial Derivative Assets | Financial Derivative Liabilities | |||||||||||||||||||||||||||||||||||||||||||||||
| Counterparty | Forward Foreign Currency Contracts | Purchased Options | Swap Agreements | Total Over the Counter | Forward Foreign Currency Contracts | Written Options | Swap Agreements | Total Over the Counter | Net Market Value of OTC Derivatives | Collateral Pledged/ (Received) | Net Exposure(2) | |||||||||||||||||||||||||||||||||||||
BPS | $ | 0 | $ | 0 | $ | 55 | $ | 55 | $ | 0 | $ | 0 | $ | 0 | $ | 0 | $ | 55 | $ | 0 | $ | 55 | ||||||||||||||||||||||||||
CBK | 0 | 0 | 0 | 0 | 0 | 0 | (3 | ) | (3 | ) | (3 | ) | 0 | (3 | ) | |||||||||||||||||||||||||||||||||
MYI | 0 | 0 | 24 | 24 | 0 | 0 | 0 | 0 | 24 | 0 | 24 | |||||||||||||||||||||||||||||||||||||
|
|
|
|
|
|
|
|
|
|
|
|
|
|
|
| |||||||||||||||||||||||||||||||||
Total Over the Counter | $ | 0 | $ | 0 | $ | 79 | $ | 79 | $ | 0 | $ | 0 | $ | (3 | ) | $ | (3 | ) | ||||||||||||||||||||||||||||||
|
|
|
|
|
|
|
|
|
|
|
|
|
|
|
| |||||||||||||||||||||||||||||||||
| (1) | Receive represents that the Fund receives payments for any positive net return on the underlying reference. The Fund makes payments for any negative net return on such underlying reference. Pay represents that the Fund receives payments for any negative net return on the underlying reference. The Fund makes payments for any positive net return on such underlying reference. |
| (2) | Net Exposure represents the net receivable/(payable) that would be due from/to the counterparty in the event of default. Exposure from OTC financial derivative instruments can only be netted across transactions governed under the same master agreement with the same legal entity. See Note 8, Master Netting Arrangements, in the Notes to Financial Statements for more information regarding master netting arrangements. |
FAIR VALUE OF FINANCIAL DERIVATIVE INSTRUMENTS
The following is a summary of the fair valuation of the Fund’s derivative instruments categorized by risk exposure. See Note 7, Principal Risks, in the Notes to Financial Statements on risks of the Fund.
Fair Values of Financial Derivative Instruments on the Statements of Assets and Liabilities as of June 30, 2018:
| Derivatives not accounted for as hedging instruments | ||||||||||||||||||||||||
| Commodity Contracts | Credit Contracts | Equity Contracts | Foreign Exchange Contracts | Interest Rate Contracts | Total | |||||||||||||||||||
Financial Derivative Instruments - Assets |
| |||||||||||||||||||||||
Over the counter | ||||||||||||||||||||||||
Swap Agreements | $ | 0 | $ | 0 | $ | 79 | $ | 0 | $ | 0 | $ | 79 | ||||||||||||
|
|
|
|
|
|
|
|
|
|
|
| |||||||||||||
Financial Derivative Instruments - Liabilities |
| |||||||||||||||||||||||
Over the counter | ||||||||||||||||||||||||
Swap Agreements | $ | 3 | $ | 0 | $ | 0 | $ | 0 | $ | 0 | $ | 3 | ||||||||||||
|
|
|
|
|
|
|
|
|
|
|
| |||||||||||||
| See Accompanying Notes | ANNUAL REPORT | JUNE 30, 2018 | 57 |
Table of Contents
Schedule of Investments PIMCO REALPATH® Blend 2040 Fund (Cont.)
June 30, 2018
The effect of Financial Derivative Instruments on the Statements of Operations for the period ended June 30, 2018:
| Derivatives not accounted for as hedging instruments | ||||||||||||||||||||||||
| Commodity Contracts | Credit Contracts | Equity Contracts | Foreign Exchange Contracts | Interest Rate Contracts | Total | |||||||||||||||||||
Net Realized Gain (Loss) on Financial Derivative Instruments |
| |||||||||||||||||||||||
Exchange-traded or centrally cleared | ||||||||||||||||||||||||
Purchased Options | $ | 0 | $ | 0 | $ | (10 | ) | $ | 0 | $ | 0 | $ | (10 | ) | ||||||||||
Written Options | 0 | 0 | 8 | 0 | 0 | 8 | ||||||||||||||||||
|
|
|
|
|
|
|
|
|
|
|
| |||||||||||||
| $ | 0 | $ | 0 | $ | (2 | ) | $ | 0 | $ | 0 | $ | (2 | ) | |||||||||||
|
|
|
|
|
|
|
|
|
|
|
| |||||||||||||
Over the counter | ||||||||||||||||||||||||
Swap Agreements | $ | 52 | $ | 0 | $ | 47 | $ | 0 | $ | 0 | $ | 99 | ||||||||||||
|
|
|
|
|
|
|
|
|
|
|
| |||||||||||||
| $ | 52 | $ | 0 | $ | 45 | $ | 0 | $ | 0 | $ | 97 | |||||||||||||
|
|
|
|
|
|
|
|
|
|
|
| |||||||||||||
Net Change in Unrealized Appreciation (Depreciation) on Financial Derivative Instruments |
| |||||||||||||||||||||||
Exchange-traded or centrally cleared | ||||||||||||||||||||||||
Purchased Options | $ | 0 | $ | 0 | $ | 8 | $ | 0 | $ | 0 | $ | 8 | ||||||||||||
Written Options | 0 | 0 | (6 | ) | 0 | 0 | (6 | ) | ||||||||||||||||
|
|
|
|
|
|
|
|
|
|
|
| |||||||||||||
| $ | 0 | $ | 0 | $ | 2 | $ | 0 | $ | 0 | $ | 2 | |||||||||||||
|
|
|
|
|
|
|
|
|
|
|
| |||||||||||||
Over the counter | ||||||||||||||||||||||||
Swap Agreements | $ | (15 | ) | $ | 0 | $ | 49 | $ | 0 | $ | 0 | $ | 34 | |||||||||||
|
|
|
|
|
|
|
|
|
|
|
| |||||||||||||
| $ | (15 | ) | $ | 0 | $ | 51 | $ | 0 | $ | 0 | $ | 36 | ||||||||||||
|
|
|
|
|
|
|
|
|
|
|
| |||||||||||||
FAIR VALUE MEASUREMENTS
The following is a summary of the fair valuations according to the inputs used as of June 30, 2018 in valuing the Fund’s assets and liabilities:
| Category and Subcategory | Level 1 | Level 2 | Level 3 | Fair Value at 06/30/2018 | ||||||||||||
Investments in Securities, at Value |
| |||||||||||||||
Mutual Funds | $ | 30,575 | $ | 0 | $ | 0 | $ | 30,575 | ||||||||
Short-Term Instruments |
| |||||||||||||||
Repurchase Agreements | 0 | 122 | 0 | 122 | ||||||||||||
|
|
|
|
|
|
|
| |||||||||
| $ | 30,575 | $ | 122 | $ | 0 | $ | 30,697 | |||||||||
|
|
|
|
|
|
|
| |||||||||
Investments in Affiliates, at Value |
| |||||||||||||||
Mutual Funds | 8,688 | 0 | 0 | 8,688 | ||||||||||||
Short-Term Instruments |
| |||||||||||||||
Central Funds Used for Cash Management Purposes | 3,146 | 0 | 0 | 3,146 | ||||||||||||
|
|
|
|
|
|
|
| |||||||||
| $ | 11,834 | $ | 0 | $ | 0 | $ | 11,834 | |||||||||
|
|
|
|
|
|
|
| |||||||||
Total Investments | $ | 42,409 | $ | 122 | $ | 0 | $ | 42,531 | ||||||||
|
|
|
|
|
|
|
| |||||||||
| Category and Subcategory | Level 1 | Level 2 | Level 3 | Fair Value at 06/30/2018 | ||||||||||||
Financial Derivative Instruments - Assets |
| |||||||||||||||
Over the counter | $ | 0 | $ | 79 | $ | 0 | $ | 79 | ||||||||
|
|
|
|
|
|
|
| |||||||||
Financial Derivative Instruments - Liabilities |
| |||||||||||||||
Over the counter | $ | 0 | $ | (3 | ) | $ | 0 | $ | (3 | ) | ||||||
�� |
|
|
|
|
|
|
| |||||||||
Total Financial Derivative Instruments | $ | 0 | $ | 76 | $ | 0 | $ | 76 | ||||||||
|
|
|
|
|
|
|
| |||||||||
Totals | $ | 42,409 | $ | 198 | $ | 0 | $ | 42,607 | ||||||||
|
|
|
|
|
|
|
| |||||||||
There were no significant transfers among Levels 1, 2, or 3 during the period ended June 30, 2018.
| 58 | PIMCO EQUITY SERIES | See Accompanying Notes |
Table of Contents
Schedule of Investments PIMCO REALPATH® Blend 2045 Fund
June 30, 2018
(Amounts in thousands*, except number of shares, contracts and units, if any)
| SHARES | MARKET VALUE (000S) | |||||||||||
| INVESTMENTS IN SECURITIES 77.0% |
| |||||||||||
| MUTUAL FUNDS 76.1% |
| |||||||||||
Vanguard Developed Markets Index Fund ‘Institutional’ | 843,219 | $ | 11,653 | |||||||||
Vanguard Emerging Markets Stock Index Fund ‘Institutional’ | 197,003 | 5,262 | ||||||||||
Vanguard Institutional Index Fund ‘Institutional’ | 91,850 | 22,756 | ||||||||||
Vanguard Small-Cap Index Fund ‘Admiral’ | 35,088 | 2,618 | ||||||||||
|
| |||||||||||
| Total Mutual Funds (Cost $41,478) |
| 42,289 | ||||||||||
|
| |||||||||||
| SHORT-TERM INSTRUMENTS 0.9% |
| |||||||||||
| REPURCHASE AGREEMENTS (b) 0.9% |
| |||||||||||
| 485 | ||||||||||||
|
| |||||||||||
| Total Short-Term Instruments (Cost $485) | 485 | |||||||||||
|
| |||||||||||
| Total Investments in Securities (Cost $41,963) | 42,774 | |||||||||||
|
| |||||||||||
| SHARES | MARKET VALUE (000S) | |||||||||||
| INVESTMENTS IN AFFILIATES 22.5% |
| |||||||||||
| MUTUAL FUNDS (a) 14.6% |
| |||||||||||
PIMCO Emerging Local Bond Fund | 55,550 | $ | 379 | |||||||||
PIMCO High Yield Fund | 98,914 | 856 | ||||||||||
PIMCO Income Fund | 143,725 | 1,723 | ||||||||||
PIMCO International Bond Fund (U.S. Dollar-Hedged) | 45,577 | 492 | ||||||||||
PIMCO Long Duration Total Return Fund | 87,163 | 901 | ||||||||||
PIMCO Long-Term Credit Bond Fund | 78,105 | 888 | ||||||||||
PIMCO Long-Term Real Return Fund | 150,636 | 1,261 | ||||||||||
PIMCO Real Return Fund | 69,066 | 750 | ||||||||||
PIMCO Total Return Fund | 87,583 | 873 | ||||||||||
|
| |||||||||||
| Total Mutual Funds (Cost $8,298) |
| 8,123 | ||||||||||
|
| |||||||||||
| SHARES | MARKET VALUE (000S) | |||||||||||
| SHORT-TERM INSTRUMENTS 7.9% |
| |||||||||||
| CENTRAL FUNDS USED FOR CASH MANAGEMENT PURPOSES 7.9% |
| |||||||||||
PIMCO Short-Term | 441,301 | $ | 4,363 | |||||||||
|
| |||||||||||
| Total Short-Term Instruments (Cost $4,362) | 4,363 | |||||||||||
|
| |||||||||||
| Total Investments in Affiliates (Cost $12,660) | 12,486 | |||||||||||
| Total Investments 99.5% (Cost $54,623) | $ | 55,260 | ||||||||||
Financial Derivative (Cost or Premiums, net $0) | 105 | |||||||||||
| Other Assets and Liabilities, net 0.3% |
| 199 | ||||||||||
|
| |||||||||||
| Net Assets 100.0% | $ | 55,564 | ||||||||||
|
| |||||||||||
NOTES TO SCHEDULE OF INVESTMENTS:
| * | A zero balance may reflect actual amounts rounding to less than one thousand. |
| (a) | Institutional Class Shares of each Fund. |
BORROWINGS AND OTHER FINANCING TRANSACTIONS
(b) REPURCHASE AGREEMENTS:
| Counterparty | Lending Rate | Settlement Date | Maturity Date | Principal Amount | Collateralized By | Collateral (Received) | Repurchase Agreements, at Value | Repurchase Agreement Proceeds to be Received(1) | ||||||||||||||||||||||
| FICC | 1.500 | % | 06/29/2018 | 07/02/2018 | $ | 485 | U.S. Treasury Notes 1.875% due 01/31/2022 | $ | (495 | ) | $ | 485 | $ | 485 | ||||||||||||||||
|
|
|
|
|
| |||||||||||||||||||||||||
Total Repurchase Agreements |
| $ | (495 | ) | $ | 485 | $ | 485 | ||||||||||||||||||||||
|
|
|
|
|
| |||||||||||||||||||||||||
BORROWINGS AND OTHER FINANCING TRANSACTIONS SUMMARY
The following is a summary by counterparty of the market value of Borrowings and Other Financing Transactions and collateral pledged/(received) as of June 30, 2018:
| Counterparty | Repurchase Agreement Proceeds to be Received(1) | Payable for Reverse Repurchase Agreements | Payable for Sale-Buyback Transactions | Total Borrowings and Other Financing Transactions | Collateral Pledged/(Received) | Net Exposure(2) | ||||||||||||||||||
Global/Master Repurchase Agreement |
| |||||||||||||||||||||||
FICC | $ | 485 | $ | 0 | $ | 0 | $ | 485 | $ | (495 | ) | $ | (10 | ) | ||||||||||
|
|
|
|
|
| |||||||||||||||||||
Total Borrowings and Other Financing Transactions | $ | 485 | $ | 0 | $ | 0 | ||||||||||||||||||
|
|
|
|
|
| |||||||||||||||||||
| (1) | Includes accrued interest. |
| (2) | Net Exposure represents the net receivable/(payable) that would be due from/to the counterparty in the event of default. Exposure from borrowings and other financing transactions can only be netted across transactions governed under the same master agreement with the same legal entity. See Note 8, Master Netting Arrangements, in the Notes to Financial Statements for more information regarding master netting arrangements. |
| See Accompanying Notes | ANNUAL REPORT | JUNE 30, 2018 | 59 |
Table of Contents
Schedule of Investments PIMCO REALPATH® Blend 2045 Fund (Cont.)
(c) FINANCIAL DERIVATIVE INSTRUMENTS: OVER THE COUNTER
SWAP AGREEMENTS:
TOTAL RETURN SWAPS ON COMMODITY AND EQUITY INDICES
| Counterparty | Pay/Receive(1) | Underlying Reference | # of Units | Financing Rate | Payment Frequency | Maturity Date | Notional Amount | Premiums Paid/(Received) | Unrealized Appreciation/ (Depreciation) | Swap Agreements, at Value | ||||||||||||||||||||||||||||||
| Asset | Liability | |||||||||||||||||||||||||||||||||||||||
BPS | Receive | DWRTFT Index | 24 | 1-Month USD-LIBOR plus a specified spread | Monthly | 11/07/2018 | $ | 2,402 | $ | 0 | $ | 76 | $ | 76 | $ | 0 | ||||||||||||||||||||||||
CBK | Receive | BCOMTR Index | 5,739 | 3-Month U.S. Treasury Bill rate plus a specified spread | Monthly | 08/15/2018 | 1,096 | 0 | (4 | ) | 0 | (4 | ) | |||||||||||||||||||||||||||
MYI | Receive | DWRTFT Index | 12 | 1-Month USD-LIBOR plus a specified spread | Monthly | 09/12/2018 | 819 | 0 | 33 | 33 | 0 | |||||||||||||||||||||||||||||
|
|
|
|
|
|
|
| |||||||||||||||||||||||||||||||||
Total Swap Agreements | $ | 0 | $ | 105 | $ | 109 | $ | (4 | ) | |||||||||||||||||||||||||||||||
|
|
|
|
|
|
|
| |||||||||||||||||||||||||||||||||
FINANCIAL DERIVATIVE INSTRUMENTS: OVER THE COUNTER SUMMARY
The following is a summary by counterparty of the market value of OTC financial derivative instruments and collateral pledged/(received) as of June 30, 2018:
| Financial Derivative Assets | Financial Derivative Liabilities | |||||||||||||||||||||||||||||||||||||||||||||||
| Counterparty | Forward Foreign Currency Contracts | Purchased Options | Swap Agreements | Total Over the Counter | Forward Foreign Currency Contracts | Written Options | Swap Agreements | Total Over the Counter | Net Market Value of OTC Derivatives | Collateral Pledged/ (Received) | Net Exposure(2) | |||||||||||||||||||||||||||||||||||||
BPS | $ | 0 | $ | 0 | $ | 76 | $ | 76 | $ | 0 | $ | 0 | $ | 0 | $ | 0 | $ | 76 | $ | 0 | $ | 76 | ||||||||||||||||||||||||||
CBK | 0 | 0 | 0 | 0 | 0 | 0 | (4 | ) | (4 | ) | (4 | ) | 0 | (4 | ) | |||||||||||||||||||||||||||||||||
MYI | 0 | 0 | 33 | 33 | 0 | 0 | 0 | 0 | 33 | 0 | 33 | |||||||||||||||||||||||||||||||||||||
|
|
|
|
|
|
|
|
|
|
|
|
|
|
|
| |||||||||||||||||||||||||||||||||
Total Over the Counter | $ | 0 | $ | 0 | $ | 109 | $ | 109 | $ | 0 | $ | 0 | $ | (4 | ) | $ | (4 | ) | ||||||||||||||||||||||||||||||
|
|
|
|
|
|
|
|
|
|
|
|
|
|
|
| |||||||||||||||||||||||||||||||||
| (1) | Receive represents that the Fund receives payments for any positive net return on the underlying reference. The Fund makes payments for any negative net return on such underlying reference. Pay represents that the Fund receives payments for any negative net return on the underlying reference. The Fund makes payments for any positive net return on such underlying reference. |
| (2) | Net Exposure represents the net receivable/(payable) that would be due from/to the counterparty in the event of default. Exposure from OTC financial derivative instruments can only be netted across transactions governed under the same master agreement with the same legal entity. See Note 8, Master Netting Arrangements, in the Notes to Financial Statements for more information regarding master netting arrangements. |
FAIR VALUE OF FINANCIAL DERIVATIVE INSTRUMENTS
The following is a summary of the fair valuation of the Fund’s derivative instruments categorized by risk exposure. See Note 7, Principal Risks, in the Notes to Financial Statements on risks of the Fund.
Fair Values of Financial Derivative Instruments on the Statements of Assets and Liabilities as of June 30, 2018:
| Derivatives not accounted for as hedging instruments | ||||||||||||||||||||||||
| Commodity Contracts | Credit Contracts | Equity Contracts | Foreign Exchange Contracts | Interest Rate Contracts | Total | |||||||||||||||||||
Financial Derivative Instruments - Assets |
| |||||||||||||||||||||||
Over the counter |
| |||||||||||||||||||||||
Swap Agreements | $ | 0 | $ | 0 | $ | 109 | $ | 0 | $ | 0 | $ | 109 | ||||||||||||
|
|
|
|
|
|
|
|
|
|
|
| |||||||||||||
Financial Derivative Instruments - Liabilities |
| |||||||||||||||||||||||
Over the counter |
| |||||||||||||||||||||||
Swap Agreements | $ | 4 | $ | 0 | $ | 0 | $ | 0 | $ | 0 | $ | 4 | ||||||||||||
|
|
|
|
|
|
|
|
|
|
|
| |||||||||||||
| 60 | PIMCO EQUITY SERIES | See Accompanying Notes |
Table of Contents
June 30, 2018
The effect of Financial Derivative Instruments on the Statements of Operations for the period ended June 30, 2018:
| Derivatives not accounted for as hedging instruments | ||||||||||||||||||||||||
| Commodity Contracts | Credit Contracts | Equity Contracts | Foreign Exchange Contracts | Interest Rate Contracts | Total | |||||||||||||||||||
Net Realized Gain (Loss) on Financial Derivative Instruments |
| |||||||||||||||||||||||
Exchange-traded or centrally cleared |
| |||||||||||||||||||||||
Purchased Options | $ | 0 | $ | 0 | $ | (10 | ) | $ | 0 | $ | 0 | $ | (10 | ) | ||||||||||
Written Options | 0 | 0 | 8 | 0 | 0 | 8 | ||||||||||||||||||
Futures | 0 | 0 | 1 | 0 | 0 | 1 | ||||||||||||||||||
|
|
|
|
|
|
|
|
|
|
|
| |||||||||||||
| $ | 0 | $ | 0 | $ | (1 | ) | $ | 0 | $ | 0 | $ | (1 | ) | |||||||||||
|
|
|
|
|
|
|
|
|
|
|
| |||||||||||||
Over the counter |
| |||||||||||||||||||||||
Swap Agreements | $ | 67 | $ | 0 | $ | 66 | $ | 0 | $ | 0 | $ | 133 | ||||||||||||
|
|
|
|
|
|
|
|
|
|
|
| |||||||||||||
| $ | 67 | $ | 0 | $ | 65 | $ | 0 | $ | 0 | $ | 132 | |||||||||||||
|
|
|
|
|
|
|
|
|
|
|
| |||||||||||||
Net Change in Unrealized Appreciation (Depreciation) on Financial Derivative Instruments |
| |||||||||||||||||||||||
Exchange-traded or centrally cleared |
| |||||||||||||||||||||||
Purchased Options | $ | 0 | $ | 0 | $ | 8 | $ | 0 | $ | 0 | $ | 8 | ||||||||||||
Written Options | 0 | 0 | (6 | ) | 0 | 0 | (6 | ) | ||||||||||||||||
|
|
|
|
|
|
|
|
|
|
|
| |||||||||||||
| $ | 0 | $ | 0 | $ | 2 | $ | 0 | $ | 0 | $ | 2 | |||||||||||||
|
|
|
|
|
|
|
|
|
|
|
| |||||||||||||
Over the counter |
| |||||||||||||||||||||||
Swap Agreements | $ | (19 | ) | $ | 0 | $ | 68 | $ | 0 | $ | 0 | $ | 49 | |||||||||||
|
|
|
|
|
|
|
|
|
|
|
| |||||||||||||
| $ | (19 | ) | $ | 0 | $ | 70 | $ | 0 | $ | 0 | $ | 51 | ||||||||||||
|
|
|
|
|
|
|
|
|
|
|
| |||||||||||||
FAIR VALUE MEASUREMENTS
The following is a summary of the fair valuations according to the inputs used as of June 30, 2018 in valuing the Fund’s assets and liabilities:
| Category and Subcategory | Level 1 | Level 2 | Level 3 | Fair Value at 06/30/2018 | ||||||||||||
Investments in Securities, at Value |
| |||||||||||||||
Mutual Funds | $ | 42,289 | $ | 0 | $ | 0 | $ | 42,289 | ||||||||
Short-Term Instruments |
| |||||||||||||||
Repurchase Agreements | 0 | 485 | 0 | 485 | ||||||||||||
|
|
|
|
|
|
|
| |||||||||
| $ | 42,289 | $ | 485 | $ | 0 | $ | 42,774 | |||||||||
|
|
|
|
|
|
|
| |||||||||
Investments in Affiliates, at Value |
| |||||||||||||||
Mutual Funds | 8,123 | 0 | 0 | 8,123 | ||||||||||||
Short-Term Instruments |
| |||||||||||||||
Central Funds Used for Cash Management Purposes | 4,363 | 0 | 0 | 4,363 | ||||||||||||
|
|
|
|
|
|
|
| |||||||||
| $ | 12,486 | $ | 0 | $ | 0 | $ | 12,486 | |||||||||
|
|
|
|
|
|
|
| |||||||||
Total Investments | $ | 54,775 | $ | 485 | $ | 0 | $ | 55,260 | ||||||||
|
|
|
|
|
|
|
| |||||||||
| Category and Subcategory | Level 1 | Level 2 | Level 3 | Fair Value at 06/30/2018 | ||||||||||||
Financial Derivative Instruments - Assets |
| |||||||||||||||
Over the counter | $ | 0 | $ | 109 | $ | 0 | $ | 109 | ||||||||
|
|
|
|
|
|
|
| |||||||||
Financial Derivative Instruments - Liabilities |
| |||||||||||||||
Over the counter | $ | 0 | $ | (4 | ) | $ | 0 | $ | (4 | ) | ||||||
|
|
|
|
|
|
|
| |||||||||
Total Financial Derivative Instruments | $ | 0 | $ | 105 | $ | 0 | $ | 105 | ||||||||
|
|
|
|
|
|
|
| |||||||||
Totals | $ | 54,775 | $ | 590 | $ | 0 | $ | 55,365 | ||||||||
|
|
|
|
|
|
|
| |||||||||
There were no significant transfers among Levels 1, 2, or 3 during the period ended June 30, 2018.
| See Accompanying Notes | ANNUAL REPORT | JUNE 30, 2018 | 61 |
Table of Contents
Schedule of Investments PIMCO REALPATH® Blend 2050 Fund
(Amounts in thousands*, except number of shares, contracts and units, if any)
| SHARES | MARKET VALUE (000S) | |||||||||||
| INVESTMENTS IN SECURITIES 79.9% |
| |||||||||||
| MUTUAL FUNDS 79.5% |
| |||||||||||
Vanguard Developed Markets Index Fund ‘Institutional’ | 1,081,844 | $ | 14,951 | |||||||||
Vanguard Emerging Markets Stock Index Fund ‘Institutional’ | 252,754 | 6,751 | ||||||||||
Vanguard Institutional Index Fund ‘Institutional’ | 117,824 | 29,191 | ||||||||||
Vanguard Small-Cap Index Fund ‘Admiral’ | 45,020 | 3,359 | ||||||||||
|
| |||||||||||
| Total Mutual Funds (Cost $53,275) |
| 54,252 | ||||||||||
|
| |||||||||||
| SHORT-TERM INSTRUMENTS 0.4% |
| |||||||||||
| REPURCHASE AGREEMENTS (b) 0.4% | ||||||||||||
| 299 | ||||||||||||
|
| |||||||||||
| Total Short-Term Instruments (Cost $299) |
| 299 | ||||||||||
|
| |||||||||||
| Total Investments in Securities (Cost $53,574) |
| 54,551 | ||||||||||
|
| |||||||||||
| SHARES | MARKET VALUE (000S) | |||||||||||
| INVESTMENTS IN AFFILIATES 19.5% |
| |||||||||||
| MUTUAL FUNDS (a) 11.8% |
| |||||||||||
PIMCO Emerging Local Bond Fund | 52,544 | $ | 358 | |||||||||
PIMCO High Yield Fund | 93,537 | 809 | ||||||||||
PIMCO Income Fund | 131,979 | 1,582 | ||||||||||
PIMCO International Bond Fund (U.S. Dollar-Hedged) | 41,217 | 445 | ||||||||||
PIMCO Long Duration Total Return Fund | 95,600 | 989 | ||||||||||
PIMCO Long-Term Credit Bond Fund | 85,654 | 974 | ||||||||||
PIMCO Long-Term Real Return Fund | 167,133 | 1,399 | ||||||||||
PIMCO Real Return Fund | 61,675 | 670 | ||||||||||
PIMCO Total Return Fund | 78,106 | 779 | ||||||||||
|
| |||||||||||
| Total Mutual Funds (Cost $8,162) |
| 8,005 | ||||||||||
|
| |||||||||||
| SHARES | MARKET VALUE (000S) | |||||||||||
| SHORT-TERM INSTRUMENTS 7.7% |
| |||||||||||
| CENTRAL FUNDS USED FOR CASH MANAGEMENT PURPOSES 7.7% |
| |||||||||||
PIMCO Short-Term | 534,110 | $ | 5,280 | |||||||||
|
| |||||||||||
| Total Short-Term Instruments (Cost $5,279) | 5,280 | |||||||||||
|
| |||||||||||
| Total Investments in Affiliates (Cost $13,441) | 13,285 | |||||||||||
| Total Investments 99.4% (Cost $67,015) | $ | 67,836 | ||||||||||
Financial Derivative (Cost or Premiums, net $0) | 136 | |||||||||||
| Other Assets and Liabilities, net 0.4% |
| 249 | ||||||||||
|
| |||||||||||
| Net Assets 100.0% | $ | 68,221 | ||||||||||
|
| |||||||||||
NOTES TO SCHEDULE OF INVESTMENTS:
| * | A zero balance may reflect actual amounts rounding to less than one thousand. |
| (a) | Institutional Class Shares of each Fund. |
BORROWINGS AND OTHER FINANCING TRANSACTIONS
(b) REPURCHASE AGREEMENTS:
| Counterparty | Lending Rate | Settlement Date | Maturity Date | Principal Amount | Collateralized By | Collateral (Received) | Repurchase Agreements, at Value | Repurchase Agreement Proceeds to be Received(1) | ||||||||||||||||||||||
| FICC | 1.500 | % | 06/29/2018 | 07/02/2018 | $ | 299 | U.S. Treasury Notes 1.875% due 01/31/2022 | $ | (309 | ) | $ | 299 | $ | 299 | ||||||||||||||||
|
|
|
|
|
| |||||||||||||||||||||||||
Total Repurchase Agreements |
| $ | (309 | ) | $ | 299 | $ | 299 | ||||||||||||||||||||||
|
|
|
|
|
| |||||||||||||||||||||||||
BORROWINGS AND OTHER FINANCING TRANSACTIONS SUMMARY
The following is a summary by counterparty of the market value of Borrowings and Other Financing Transactions and collateral pledged/(received) as of June 30, 2018:
| Counterparty | Repurchase Agreement Proceeds to be Received(1) | Payable for Reverse Repurchase Agreements | Payable for Sale-Buyback Transactions | Total Borrowings and Other Financing Transactions | Collateral Pledged/(Received) | Net Exposure(2) | ||||||||||||||||||
Global/Master Repurchase Agreement |
| |||||||||||||||||||||||
FICC | $ | 299 | $ | 0 | $ | 0 | $ | 299 | $ | (309 | ) | $ | (10 | ) | ||||||||||
|
|
|
|
|
| |||||||||||||||||||
Total Borrowings and Other Financing Transactions | $ | 299 | $ | 0 | $ | 0 | ||||||||||||||||||
|
|
|
|
|
| |||||||||||||||||||
| (1) | Includes accrued interest. |
| (2) | Net Exposure represents the net receivable/(payable) that would be due from/to the counterparty in the event of default. Exposure from borrowings and other financing transactions can only be netted across transactions governed under the same master agreement with the same legal entity. See Note 8, Master Netting Arrangements, in the Notes to Financial Statements for more information regarding master netting arrangements. |
| 62 | PIMCO EQUITY SERIES | See Accompanying Notes |
Table of Contents
June 30, 2018
(c) FINANCIAL DERIVATIVE INSTRUMENTS: OVER THE COUNTER
SWAP AGREEMENTS:
TOTAL RETURN SWAPS ON COMMODITY AND EQUITY INDICES
| Counterparty | Pay/Receive(1) | Underlying Reference | # of Units | Financing Rate | Payment Frequency | Maturity Date | Notional Amount | Premiums Paid/(Received) | Unrealized Appreciation/ (Depreciation) | Swap Agreements, at Value | ||||||||||||||||||||||||||||||
| Asset | Liability | |||||||||||||||||||||||||||||||||||||||
BPS | Receive | DWRTFT Index | 319 | 1-Month USD-LIBOR plus a specified spread | Monthly | 11/07/2018 | $ | 3,065 | $ | 0 | $ | 97 | $ | 97 | $ | 0 | ||||||||||||||||||||||||
CBK | Receive | BCOMTR Index | 7,573 | 3-Month U.S. Treasury Bill rate plus a specified spread | Monthly | 08/15/2018 | 1,366 | 0 | (5 | ) | 0 | (5 | ) | |||||||||||||||||||||||||||
MYI | Receive | DWRTFT Index | 113 | 1-Month USD-LIBOR plus a specified spread | Monthly | 09/12/2018 | 1,076 | 0 | 44 | 44 | 0 | |||||||||||||||||||||||||||||
|
|
|
|
|
|
|
| |||||||||||||||||||||||||||||||||
Total Swap Agreements |
| $ | 0 | $ | 136 | $ | 141 | $ | (5 | ) | ||||||||||||||||||||||||||||||
|
|
|
|
|
|
|
| |||||||||||||||||||||||||||||||||
FINANCIAL DERIVATIVE INSTRUMENTS: OVER THE COUNTER SUMMARY
The following is a summary by counterparty of the market value of OTC financial derivative instruments and collateral pledged/(received) as of June 30, 2018:
| Financial Derivative Assets | Financial Derivative Liabilities | |||||||||||||||||||||||||||||||||||||||||||||||
| Counterparty | Forward Foreign Currency Contracts | Purchased Options | Swap Agreements | Total Over the Counter | Forward Foreign Currency Contracts | Written Options | Swap Agreements | Total Over the Counter | Net Market Value of OTC Derivatives | Collateral Pledged/ (Received) | Net Exposure(2) | |||||||||||||||||||||||||||||||||||||
BPS | $ | 0 | $ | 0 | $ | 97 | $ | 97 | $ | 0 | $ | 0 | $ | 0 | $ | 0 | $ | 97 | $ | 0 | $ | 97 | ||||||||||||||||||||||||||
CBK | 0 | 0 | 0 | 0 | 0 | 0 | (5 | ) | (5 | ) | (5 | ) | 0 | (5 | ) | |||||||||||||||||||||||||||||||||
MYI | 0 | 0 | 44 | 44 | 0 | 0 | 0 | 0 | 44 | 0 | 44 | |||||||||||||||||||||||||||||||||||||
|
|
|
|
|
|
|
|
|
|
|
|
|
|
|
| |||||||||||||||||||||||||||||||||
Total Over the Counter | $ | 0 | $ | 0 | $ | 141 | $ | 141 | $ | 0 | $ | 0 | $ | (5 | ) | $ | (5 | ) | ||||||||||||||||||||||||||||||
|
|
|
|
|
|
|
|
|
|
|
|
|
|
|
| |||||||||||||||||||||||||||||||||
| (1) | Receive represents that the Fund receives payments for any positive net return on the underlying reference. The Fund makes payments for any negative net return on such underlying reference. Pay represents that the Fund receives payments for any negative net return on the underlying reference. The Fund makes payments for any positive net return on such underlying reference. |
| (2) | Net Exposure represents the net receivable/(payable) that would be due from/to the counterparty in the event of default. Exposure from OTC financial derivative instruments can only be netted across transactions governed under the same master agreement with the same legal entity. See Note 8, Master Netting Arrangements, in the Notes to Financial Statements for more information regarding master netting arrangements. |
FAIR VALUE OF FINANCIAL DERIVATIVE INSTRUMENTS
The following is a summary of the fair valuation of the Fund’s derivative instruments categorized by risk exposure. See Note 7, Principal Risks, in the Notes to Financial Statements on risks of the Fund.
Fair Values of Financial Derivative Instruments on the Statements of Assets and Liabilities as of June 30, 2018:
| Derivatives not accounted for as hedging instruments | ||||||||||||||||||||||||
| Commodity Contracts | Credit Contracts | Equity Contracts | Foreign Exchange Contracts | Interest Rate Contracts | Total | |||||||||||||||||||
Financial Derivative Instruments - Assets |
| |||||||||||||||||||||||
Over the counter |
| |||||||||||||||||||||||
Swap Agreements | $ | 0 | $ | 0 | $ | 141 | $ | 0 | $ | 0 | $ | 141 | ||||||||||||
|
|
|
|
|
|
|
|
|
|
|
| |||||||||||||
Financial Derivative Instruments - Liabilities |
| |||||||||||||||||||||||
Over the counter |
| |||||||||||||||||||||||
Swap Agreements | $ | 5 | $ | 0 | $ | 0 | $ | 0 | $ | 0 | $ | 5 | ||||||||||||
|
|
|
|
|
|
|
|
|
|
|
| |||||||||||||
| See Accompanying Notes | ANNUAL REPORT | JUNE 30, 2018 | 63 |
Table of Contents
Schedule of Investments PIMCO REALPATH® Blend 2050 Fund (Cont.)
June 30, 2018
The effect of Financial Derivative Instruments on the Statements of Operations for the period ended June 30, 2018:
| Derivatives not accounted for as hedging instruments | ||||||||||||||||||||||||
| Commodity Contracts | Credit Contracts | Equity Contracts | Foreign Exchange Contracts | Interest Rate Contracts | Total | |||||||||||||||||||
Net Realized Gain (Loss) on Financial Derivative Instruments |
| |||||||||||||||||||||||
Exchange-traded or centrally cleared |
| |||||||||||||||||||||||
Purchased Options | $ | 0 | $ | 0 | $ | (10 | ) | $ | 0 | $ | 0 | $ | (10 | ) | ||||||||||
Written Options | 0 | 0 | 7 | 0 | 0 | 7 | ||||||||||||||||||
Futures | 0 | 0 | 3 | 0 | 0 | 3 | ||||||||||||||||||
|
|
|
|
|
|
|
|
|
|
|
| |||||||||||||
| $ | 0 | $ | 0 | $ | 0 | $ | 0 | $ | 0 | $ | 0 | |||||||||||||
|
|
|
|
|
|
|
|
|
|
|
| |||||||||||||
Over the counter |
| |||||||||||||||||||||||
Swap Agreements | $ | 84 | $ | 0 | $ | 79 | $ | 0 | $ | 0 | $ | 163 | ||||||||||||
|
|
|
|
|
|
|
|
|
|
|
| |||||||||||||
| $ | 84 | $ | 0 | $ | 79 | $ | 0 | $ | 0 | $ | 163 | |||||||||||||
|
|
|
|
|
|
|
|
|
|
|
| |||||||||||||
Net Change in Unrealized Appreciation (Depreciation) on Financial Derivative Instruments |
| |||||||||||||||||||||||
Exchange-traded or centrally cleared |
| |||||||||||||||||||||||
Purchased Options | $ | 0 | $ | 0 | $ | 8 | $ | 0 | $ | 0 | $ | 8 | ||||||||||||
Written Options | 0 | 0 | (6 | ) | 0 | 0 | (6 | ) | ||||||||||||||||
|
|
|
|
|
|
|
|
|
|
|
| |||||||||||||
| $ | 0 | $ | 0 | $ | 2 | $ | 0 | $ | 0 | $ | 2 | |||||||||||||
|
|
|
|
|
|
|
|
|
|
|
| |||||||||||||
Over the counter |
| |||||||||||||||||||||||
Swap Agreements | $ | (23 | ) | $ | 0 | $ | 92 | $ | 0 | $ | 0 | $ | 69 | |||||||||||
|
|
|
|
|
|
|
|
|
|
|
| |||||||||||||
| $ | (23 | ) | $ | 0 | $ | 94 | $ | 0 | $ | 0 | $ | 71 | ||||||||||||
|
|
|
|
|
|
|
|
|
|
|
| |||||||||||||
FAIR VALUE MEASUREMENTS
The following is a summary of the fair valuations according to the inputs used as of June 30, 2018 in valuing the Fund’s assets and liabilities:
| Category and Subcategory | Level 1 | Level 2 | Level 3 | Fair Value at 06/30/2018 | ||||||||||||
Investments in Securities, at Value |
| |||||||||||||||
Mutual Funds | $ | 54,252 | $ | 0 | $ | 0 | $ | 54,252 | ||||||||
Short-Term Instruments |
| |||||||||||||||
Repurchase Agreements | 0 | 299 | 0 | 299 | ||||||||||||
|
|
|
|
|
|
|
| |||||||||
| $ | 54,252 | $ | 299 | $ | 0 | $ | 54,551 | |||||||||
|
|
|
|
|
|
|
| |||||||||
Investments in Affiliates, at Value |
| |||||||||||||||
Mutual Funds | 8,005 | 0 | 0 | 8,005 | ||||||||||||
Short-Term Instruments |
| |||||||||||||||
Central Funds Used for Cash Management Purposes | 5,280 | 0 | 0 | 5,280 | ||||||||||||
|
|
|
|
|
|
|
| |||||||||
| $ | 13,285 | $ | 0 | $ | 0 | $ | 13,285 | |||||||||
|
|
|
|
|
|
|
| |||||||||
Total Investments | $ | 67,537 | $ | 299 | $ | 0 | $ | 67,836 | ||||||||
|
|
|
|
|
|
|
| |||||||||
| Category and Subcategory | Level 1 | Level 2 | Level 3 | Fair Value at 06/30/2018 | ||||||||||||
Financial Derivative Instruments - Assets |
| |||||||||||||||
Over the counter | $ | 0 | $ | 141 | $ | 0 | $ | 141 | ||||||||
|
|
|
|
|
|
|
| |||||||||
Financial Derivative Instruments - Liabilities |
| |||||||||||||||
Over the counter | $ | 0 | $ | (5 | ) | $ | 0 | $ | (5 | ) | ||||||
|
|
|
|
|
|
|
| |||||||||
Total Financial Derivative Instruments | $ | 0 | $ | 136 | $ | 0 | $ | 136 | ||||||||
|
|
|
|
|
|
|
| |||||||||
Totals | $ | 67,537 | $ | 435 | $ | 0 | $ | 67,972 | ||||||||
|
|
|
|
|
|
|
| |||||||||
There were no significant transfers among Levels 1, 2, or 3 during the period ended June 30, 2018.
| 64 | PIMCO EQUITY SERIES | See Accompanying Notes |
Table of Contents
Schedule of Investments PIMCO REALPATH® Blend 2055 Fund
June 30, 2018
(Amounts in thousands*, except number of shares, contracts and units, if any)
| SHARES | MARKET VALUE (000S) | |||||||||||
| INVESTMENTS IN SECURITIES 78.9% |
| |||||||||||
| MUTUAL FUNDS 78.9% |
| |||||||||||
Vanguard Developed Markets Index Fund ‘Admiral’ | 200,971 | $ | 2,773 | |||||||||
Vanguard Emerging Markets Stock Index Fund ‘Admiral’ | 35,511 | 1,247 | ||||||||||
Vanguard Institutional Index Fund ‘Institutional’ | 21,835 | 5,410 | ||||||||||
Vanguard Small-Cap Index Fund ‘Admiral’ | 8,399 | 627 | ||||||||||
|
| |||||||||||
Total Mutual Funds (Cost $9,780) | 10,057 | |||||||||||
|
| |||||||||||
| Total Investments in Securities (Cost $9,780) | 10,057 | |||||||||||
|
| |||||||||||
| INVESTMENTS IN AFFILIATES 19.5% |
| |||||||||||
| MUTUAL FUNDS (a) 11.5% |
| |||||||||||
PIMCO Emerging Local Bond Fund | 9,068 | 62 | ||||||||||
PIMCO High Yield Fund | 17,664 | 153 | ||||||||||
PIMCO Income Fund | 25,193 | 302 | ||||||||||
PIMCO International Bond Fund | 7,259 | 78 | ||||||||||
PIMCO Long Duration Total Return Fund | 17,774 | 184 | ||||||||||
PIMCO Long-Term Credit Bond Fund | 15,892 | 181 | ||||||||||
| SHARES | MARKET VALUE (000S) | |||||||||||
PIMCO Long-Term Real Return Fund | 29,446 | $ | 246 | |||||||||
PIMCO Real Return Fund | 10,647 | 116 | ||||||||||
PIMCO Total Return Fund | 14,753 | 147 | ||||||||||
|
| |||||||||||
Total Mutual Funds (Cost $1,489) | 1,469 | |||||||||||
|
| |||||||||||
| SHORT-TERM INSTRUMENTS 8.0% |
| |||||||||||
| CENTRAL FUNDS USED FOR CASH MANAGEMENT PURPOSES 8.0% |
| |||||||||||
PIMCO Short-Term | 102,766 | 1,016 | ||||||||||
|
| |||||||||||
| Total Short-Term Instruments (Cost $1,016) | 1,016 | |||||||||||
|
| |||||||||||
| Total Investments in Affiliates (Cost $2,505) | 2,485 | |||||||||||
| Total Investments 98.4% (Cost $12,285) | $ | 12,542 | ||||||||||
Financial Derivative (Cost or Premiums, net $0) | 25 | |||||||||||
| Other Assets and Liabilities, net 1.4% | 181 | |||||||||||
|
| |||||||||||
| Net Assets 100.0% | $ | 12,748 | ||||||||||
|
| |||||||||||
NOTES TO SCHEDULE OF INVESTMENTS
| * | A zero balance may reflect actual amounts rounding to less than one thousand. |
| (a) | Institutional Class Shares of each Fund. |
BORROWINGS AND OTHER FINANCING TRANSACTIONS
(b) FINANCIAL DERIVATIVE INSTRUMENTS: OVER THE COUNTER
SWAP AGREEMENTS:
TOTAL RETURN SWAPS ON COMMODITY AND EQUITY INDICES
| Counterparty | Pay/Receive(1) | Underlying Reference | # of Units | Financing Rate | Payment Frequency | Maturity Date | Notional Amount | Premiums Paid/(Received) | Unrealized Appreciation/ (Depreciation) | Swap Agreements, at Value | ||||||||||||||||||||||||||||||
| Asset | Liability | |||||||||||||||||||||||||||||||||||||||
BPS | Receive | DWRTFT Index | 52 | 1-Month USD-LIBOR plus a specified spread | Monthly | 11/07/2018 | $ | 519 | $ | 0 | $ | 16 | $ | 16 | $ | 0 | ||||||||||||||||||||||||
CBK | Receive | BCOMTR Index | 1,098 | 3-Month U.S. Treasury Bill rate plus a specified spread | Monthly | 08/15/2018 | 221 | 0 | (1 | ) | 0 | (1 | ) | |||||||||||||||||||||||||||
JPM | Receive | BCOMTR Index | 100 | 3-Month U.S. Treasury Bill rate plus a specified spread | Monthly | 08/15/2018 | 18 | 0 | 0 | 0 | 0 | |||||||||||||||||||||||||||||
MYI | Receive | DWRTFT Index | 6 | 1-Month USD-LIBOR plus a specified spread | Monthly | 09/12/2018 | 238 | 0 | 10 | 10 | 0 | |||||||||||||||||||||||||||||
|
|
|
|
|
|
|
| |||||||||||||||||||||||||||||||||
Total Swap Agreements | $ | 0 | $ | 25 | $ | 26 | $ | (1 | ) | |||||||||||||||||||||||||||||||
|
|
|
|
|
|
|
| |||||||||||||||||||||||||||||||||
FINANCIAL DERIVATIVE INSTRUMENTS: OVER THE COUNTER SUMMARY
The following is a summary by counterparty of the market value of OTC financial derivative instruments and collateral pledged/(received) as of June 30, 2018:
| Financial Derivative Assets | Financial Derivative Liabilities | |||||||||||||||||||||||||||||||||||||||||||||||
| Counterparty | Forward Foreign Currency Contracts | Purchased Options | Swap Agreements | Total Over the Counter | Forward Foreign Currency Contracts | Written Options | Swap Agreements | Total Over the Counter | Net Market Value of OTC Derivatives | Collateral Pledged/ (Received) | Net Exposure(2) | |||||||||||||||||||||||||||||||||||||
BPS | $ | 0 | $ | 0 | $ | 16 | $ | 16 | $ | 0 | $ | 0 | $ | 0 | $ | 0 | $ | 16 | $ | 0 | $ | 16 | ||||||||||||||||||||||||||
CBK | 0 | 0 | 0 | 0 | 0 | 0 | (1 | ) | (1 | ) | (1 | ) | 0 | (1 | ) | |||||||||||||||||||||||||||||||||
MYI | 0 | 0 | 10 | 10 | 0 | 0 | 0 | 0 | 10 | 0 | 10 | |||||||||||||||||||||||||||||||||||||
|
|
|
|
|
|
|
|
|
|
|
|
|
|
|
| |||||||||||||||||||||||||||||||||
Total Over the Counter | $ | 0 | $ | 0 | $ | 26 | $ | 26 | $ | 0 | $ | 0 | $ | (1 | ) | $ | (1 | ) | ||||||||||||||||||||||||||||||
|
|
|
|
|
|
|
|
|
|
|
|
|
|
|
| |||||||||||||||||||||||||||||||||
| See Accompanying Notes | ANNUAL REPORT | JUNE 30, 2018 | 65 |
Table of Contents
Schedule of Investments PIMCO REALPATH® Blend 2055 Fund (Cont.)
| (1) | Receive represents that the Fund receives payments for any positive net return on the underlying reference. The Fund makes payments for any negative net return on such underlying reference. Pay represents that the Fund receives payments for any negative net return on the underlying reference. The Fund makes payments for any positive net return on such underlying reference. |
| (2) | Net Exposure represents the net receivable/(payable) that would be due from/to the counterparty in the event of default. Exposure from OTC financial derivative instruments can only be netted across transactions governed under the same master agreement with the same legal entity. See Note 8, Master Netting Arrangements, in the Notes to Financial Statements for more information regarding master netting arrangements. |
FAIR VALUE OF FINANCIAL DERIVATIVE INSTRUMENTS
The following is a summary of the fair valuation of the Fund’s derivative instruments categorized by risk exposure. See Note 7, Principal Risks, in the Notes to Financial Statements on risks of the Fund.
Fair Values of Financial Derivative Instruments on the Statements of Assets and Liabilities as of June 30, 2018:
| Derivatives not accounted for as hedging instruments | ||||||||||||||||||||||||
| Commodity Contracts | Credit Contracts | Equity Contracts | Foreign Exchange Contracts | Interest Rate Contracts | Total | |||||||||||||||||||
Financial Derivative Instruments - Assets |
| |||||||||||||||||||||||
Over the counter |
| |||||||||||||||||||||||
Swap Agreements | $ | 0 | $ | 0 | $ | 26 | $ | 0 | $ | 0 | $ | 26 | ||||||||||||
|
|
|
|
|
|
|
|
|
|
|
| |||||||||||||
Financial Derivative Instruments - Liabilities |
| |||||||||||||||||||||||
Over the counter |
| |||||||||||||||||||||||
Swap Agreements | $ | 1 | $ | 0 | $ | 0 | $ | 0 | $ | 0 | $ | 1 | ||||||||||||
|
|
|
|
|
|
|
|
|
|
|
| �� | ||||||||||||
The effect of Financial Derivative Instruments on the Statements of Operations for the period ended June 30, 2018:
| Derivatives not accounted for as hedging instruments | ||||||||||||||||||||||||
| Commodity Contracts | Credit Contracts | Equity Contracts | Foreign Exchange Contracts | Interest Rate Contracts | Total | |||||||||||||||||||
Net Realized Gain (Loss) on Financial Derivative Instruments |
| |||||||||||||||||||||||
Exchange-traded or centrally cleared |
| |||||||||||||||||||||||
Purchased Options | $ | 0 | $ | 0 | $ | (10 | ) | $ | 0 | $ | 0 | $ | (10 | ) | ||||||||||
Written Options | 0 | 0 | 7 | 0 | 0 | 7 | ||||||||||||||||||
|
|
|
|
|
|
|
|
|
|
|
| |||||||||||||
| $ | 0 | $ | 0 | $ | (3 | ) | $ | 0 | $ | 0 | $ | (3 | ) | |||||||||||
|
|
|
|
|
|
|
|
|
|
|
| |||||||||||||
Over the counter |
| |||||||||||||||||||||||
Swap Agreements | $ | 13 | $ | 0 | $ | 19 | $ | 0 | $ | 0 | $ | 32 | ||||||||||||
|
|
|
|
|
|
|
|
|
|
|
| |||||||||||||
| $ | 13 | $ | 0 | $ | 16 | $ | 0 | $ | 0 | $ | 29 | |||||||||||||
|
|
|
|
|
|
|
|
|
|
|
| |||||||||||||
Net Change in Unrealized Appreciation (Depreciation) on Financial Derivative Instruments |
| |||||||||||||||||||||||
Exchange-traded or centrally cleared |
| |||||||||||||||||||||||
Purchased Options | $ | 0 | $ | 0 | $ | 8 | $ | 0 | $ | 0 | $ | 8 | ||||||||||||
Written Options | 0 | 0 | (6 | ) | 0 | 0 | (6 | ) | ||||||||||||||||
|
|
|
|
|
|
|
|
|
|
|
| |||||||||||||
| $ | 0 | $ | 0 | $ | 2 | $ | 0 | $ | 0 | $ | 2 | |||||||||||||
|
|
|
|
|
|
|
|
|
|
|
| |||||||||||||
Over the counter |
| |||||||||||||||||||||||
Swap Agreements | $ | (4 | ) | $ | 0 | $ | 17 | $ | 0 | $ | 0 | $ | 13 | |||||||||||
|
|
|
|
|
|
|
|
|
|
|
| |||||||||||||
| $ | (4 | ) | $ | 0 | $ | 19 | $ | 0 | $ | 0 | $ | 15 | ||||||||||||
|
|
|
|
|
|
|
|
|
|
|
| |||||||||||||
| 66 | PIMCO EQUITY SERIES | See Accompanying Notes |
Table of Contents
June 30, 2018
FAIR VALUE MEASUREMENTS
The following is a summary of the fair valuations according to the inputs used as of June 30, 2018 in valuing the Fund’s assets and liabilities:
| Category and Subcategory | Level 1 | Level 2 | Level 3 | Fair Value at 06/30/2018 | ||||||||||||
Investments in Securities, at Value |
| |||||||||||||||
Mutual Funds | $ | 10,057 | $ | 0 | $ | 0 | $ | 10,057 | ||||||||
|
|
|
|
|
|
|
| |||||||||
| $ | 10,057 | $ | 0 | $ | 0 | $ | 10,057 | |||||||||
|
|
|
|
|
|
|
| |||||||||
Investments in Affiliates, at Value |
| |||||||||||||||
Mutual Funds | 1,469 | 0 | 0 | 1,469 | ||||||||||||
Short-Term Instruments | ||||||||||||||||
Central Funds Used for Cash Management Purposes | 1,016 | 0 | 0 | 1,016 | ||||||||||||
|
|
|
|
|
|
|
| |||||||||
| $ | 2,485 | $ | 0 | $ | 0 | $ | 2,485 | |||||||||
|
|
|
|
|
|
|
| |||||||||
Total Investments | $ | 12,542 | $ | 0 | $ | 0 | $ | 12,542 | ||||||||
|
|
|
|
|
|
|
| |||||||||
| Category and Subcategory | Level 1 | Level 2 | Level 3 | Fair Value at 06/30/2018 | ||||||||||||
Financial Derivative Instruments - Assets |
| |||||||||||||||
Over the counter | $ | 0 | $ | 26 | $ | 0 | $ | 26 | ||||||||
|
|
|
|
|
|
|
| |||||||||
Financial Derivative Instruments - Liabilities |
| |||||||||||||||
Over the counter | $ | 0 | $ | (1 | ) | $ | 0 | $ | (1 | ) | ||||||
|
|
|
|
|
|
|
| |||||||||
Total Financial Derivative Instruments | $ | 0 | $ | 25 | $ | 0 | $ | 25 | ||||||||
|
|
|
|
|
|
|
| |||||||||
Totals | $ | 12,542 | $ | 25 | $ | 0 | $ | 12,567 | ||||||||
|
|
|
|
|
|
|
| |||||||||
There were no significant transfers among Levels 1, 2, or 3 during the period ended June 30, 2018.
| See Accompanying Notes | ANNUAL REPORT | JUNE 30, 2018 | 67 |
Table of Contents
Schedule of Investments PIMCO REALPATH® Blend Income Fund
(Amounts in thousands*, except number of shares, contracts and units, if any)
| SHARES | MARKET VALUE (000S) | |||||||||||
| INVESTMENTS IN SECURITIES 35.7% |
| |||||||||||
| MUTUAL FUNDS (a) 35.3% |
| |||||||||||
Vanguard 500 Index Fund ‘Admiral’ | 18,446 | $ | 4,630 | |||||||||
Vanguard Developed Markets Index Fund ‘Admiral’ | 171,988 | 2,373 | ||||||||||
Vanguard Emerging Markets Stock Index Fund ‘Admiral’ | 30,889 | 1,085 | ||||||||||
Vanguard Small-Cap Index Fund ‘Admiral’ | 7,184 | 536 | ||||||||||
|
| |||||||||||
Total Mutual Funds (Cost $8,097) | 8,624 | |||||||||||
|
| |||||||||||
| SHORT-TERM INSTRUMENTS 0.4% |
| |||||||||||
| REPURCHASE AGREEMENTS (b) 0.4% |
| |||||||||||
| 105 | ||||||||||||
|
| |||||||||||
| Total Short-Term Instruments (Cost $105) |
| 105 | ||||||||||
|
| |||||||||||
| Total Investments in Securities (Cost $8,202) |
| 8,729 | ||||||||||
|
| |||||||||||
| SHARES | MARKET VALUE (000S) | |||||||||||
| INVESTMENTS IN AFFILIATES 63.7% |
| |||||||||||
| MUTUAL FUNDS (a) 59.5% |
| |||||||||||
PIMCO Emerging Local Bond Fund | 86,618 | $ | 591 | |||||||||
PIMCO High Yield Fund | 142,347 | 1,231 | ||||||||||
PIMCO Income Fund | 321,903 | 3,860 | ||||||||||
PIMCO International Bond Fund | 135,744 | 1,465 | ||||||||||
PIMCO Long Duration Total Return Fund | 72,097 | 745 | ||||||||||
PIMCO Long-Term Credit Bond Fund | 64,607 | 735 | ||||||||||
PIMCO Long-Term Real Return Fund | 119,289 | 998 | ||||||||||
PIMCO Real Return Fund | 208,655 | 2,266 | ||||||||||
PIMCO Total Return Fund | 265,913 | 2,651 | ||||||||||
|
| |||||||||||
Total Mutual Funds (Cost $14,827) | 14,542 | |||||||||||
|
| |||||||||||
| SHARES | MARKET VALUE (000S) | |||||||||||
| SHORT-TERM INSTRUMENTS 4.2% |
| |||||||||||
| CENTRAL FUNDS USED FOR CASH MANAGEMENT PURPOSES 4.2% |
| |||||||||||
PIMCO Short-Term | 102,945 | $ | 1,018 | |||||||||
|
| |||||||||||
| Total Short-Term Instruments (Cost $1,017) | 1,018 | |||||||||||
|
| |||||||||||
| Total Investments in Affiliates (Cost $15,844) | 15,560 | |||||||||||
| Total Investments 99.4% (Cost $24,046) | $ | 24,289 | ||||||||||
Financial Derivative (Cost or Premiums, net $110) | 109 | |||||||||||
| Other Assets and Liabilities, net 0.1% | 33 | |||||||||||
|
| |||||||||||
| Net Assets 100.0% | $ | 24,431 | ||||||||||
|
| |||||||||||
NOTES TO SCHEDULE OF INVESTMENTS:
| * | A zero balance may reflect actual amounts rounding to less than one thousand. |
| (a) | Institutional Class Shares of each Fund. |
BORROWINGS AND OTHER FINANCING TRANSACTIONS
(b) REPURCHASE AGREEMENTS:
| Counterparty | Lending Rate | Settlement Date | Maturity Date | Principal Amount | Collateralized By | Collateral (Received) | Repurchase Agreements, at Value | Repurchase Agreement Proceeds to be Received(1) | ||||||||||||||||||||||
| FICC | 1.500 | % | 06/29/2018 | 07/02/2018 | $ | 105 | U.S. Treasury Notes 1.875% due 01/31/2022 | $ | (108 | ) | $ | 105 | $ | 105 | ||||||||||||||||
|
|
|
|
|
| |||||||||||||||||||||||||
Total Repurchase Agreements |
| $ | (108 | ) | $ | 105 | $ | 105 | ||||||||||||||||||||||
|
|
|
|
|
| |||||||||||||||||||||||||
BORROWINGS AND OTHER FINANCING TRANSACTIONS SUMMARY
The following is a summary by counterparty of the market value of Borrowings and Other Financing Transactions and collateral pledged/(received) as of June 30, 2018:
| Counterparty | Repurchase Agreement Proceeds to be Received(1) | Payable for Reverse Repurchase Agreements | Payable for Sale-Buyback Transactions | Total Borrowings and Other Financing Transactions | Collateral Pledged/(Received) | Net Exposure(2) | ||||||||||||||||||
Global/Master Repurchase Agreement |
| |||||||||||||||||||||||
FICC | $ | 105 | $ | 0 | $ | 0 | $ | 105 | $ | (108 | ) | $ | (3 | ) | ||||||||||
|
|
|
|
|
| |||||||||||||||||||
Total Borrowings and Other Financing Transactions | $ | 105 | $ | 0 | $ | 0 | ||||||||||||||||||
|
|
|
|
|
| |||||||||||||||||||
| (1) | Includes accrued interest. |
| (2) | Net Exposure represents the net receivable/(payable) that would be due from/to the counterparty in the event of default. Exposure from borrowings and other financing transactions can only be netted across transactions governed under the same master agreement with the same legal entity. See Note 8, Master Netting Arrangements, in the Notes to Financial Statements for more information regarding master netting arrangements. |
(c) FINANCIAL DERIVATIVE INSTRUMENTS: EXCHANGE-TRADED OR CENTRALLY CLEARED
PURCHASED OPTIONS:
OPTIONS ON INDICES
| Description | Strike Value | Expiration Date | # of Contracts | Notional Amount | Cost | Market Value | ||||||||||||||||||
Put - CBOE S&P 500 | 1,950.000 | 09/21/2018 | 4 | $ | 0 | $ | 8 | $ | 1 | |||||||||||||||
Put - CBOE S&P 500 | 2,075.000 | 09/21/2018 | 4 | 0 | 11 | 2 | ||||||||||||||||||
Put - CBOE S&P 500 | 2,250.000 | 12/21/2018 | 5 | 1 | 16 | 12 | ||||||||||||||||||
| 68 | PIMCO EQUITY SERIES | See Accompanying Notes |
Table of Contents
June 30, 2018
| Description | Strike Value | Expiration Date | # of Contracts | Notional Amount | Cost | Market Value | ||||||||||||||||||
Put - CBOE S&P 500 | 2,400.000 | 12/21/2018 | 5 | $ | 1 | $ | 23 | $ | 19 | |||||||||||||||
Put - CBOE S&P 500 | 2,000.000 | 03/15/2019 | 4 | 0 | 14 | 7 | ||||||||||||||||||
Put - CBOE S&P 500 | 2,175.000 | 03/15/2019 | 4 | 0 | 22 | 12 | ||||||||||||||||||
Put - CBOE S&P 500 | 2,175.000 | 06/21/2019 | 5 | 1 | 17 | 22 | ||||||||||||||||||
Put - CBOE S&P 500 | 2,325.000 | 06/21/2019 | 5 | 1 | 25 | 32 | ||||||||||||||||||
|
|
|
| |||||||||||||||||||||
| $ | 136 | $ | 107 | |||||||||||||||||||||
|
|
|
| |||||||||||||||||||||
Total Purchased Options |
| $ | 136 | $ | 107 | |||||||||||||||||||
|
|
|
| |||||||||||||||||||||
WRITTEN OPTIONS:
OPTIONS ON INDICES
| Description | Strike Value | Expiration Date | # of Contracts | Notional Amount | Premiums (Received) | Market Value | ||||||||||||||||||
Put - CBOE S&P 500 | 1,725.000 | 09/21/2018 | 4 | $ | 0 | $ | (4 | ) | $ | (1 | ) | |||||||||||||
Put - CBOE S&P 500 | 1,975.000 | 12/21/2018 | 5 | 1 | (7 | ) | (5 | ) | ||||||||||||||||
Put - CBOE S&P 500 | 1,725.000 | 03/15/2019 | 4 | 0 | (7 | ) | (3 | ) | ||||||||||||||||
Put - CBOE S&P 500 | 1,900.000 | 06/21/2019 | 5 | 1 | (8 | ) | (11 | ) | ||||||||||||||||
|
|
|
| |||||||||||||||||||||
| $ | (26 | ) | $ | (20 | ) | |||||||||||||||||||
|
|
|
| |||||||||||||||||||||
Total Written Options |
| $ | (26 | ) | $ | (20 | ) | |||||||||||||||||
|
|
|
| |||||||||||||||||||||
FINANCIAL DERIVATIVE INSTRUMENTS: EXCHANGE-TRADED OR CENTRALLY CLEARED SUMMARY
The following is a summary of the market value and variation margin of Exchange-Traded or Centrally Cleared Financial Derivative Instruments as of June 30, 2018:
| Financial Derivative Assets | Financial Derivative Liabilities | |||||||||||||||||||||||||||||||||||
| Market Value | Variation Margin Asset | Total | Market Value | Variation Margin Liability | Total | |||||||||||||||||||||||||||||||
| Purchased Options | Futures | Swap Agreements | Written Options | Futures | Swap Agreements | |||||||||||||||||||||||||||||||
Total Exchange-Traded or Centrally Cleared | $ | 107 | $ | 0 | $ | 0 | $ | 107 | $ | (20 | ) | $ | 0 | $ | 0 | $ | (20 | ) | ||||||||||||||||||
|
|
|
|
|
|
|
|
|
|
|
|
|
|
|
| |||||||||||||||||||||
(d) FINANCIAL DERIVATIVE INSTRUMENTS: OVER THE COUNTER
SWAP AGREEMENTS:
TOTAL RETURN SWAPS ON COMMODITY AND EQUITY INDICES
| Counterparty | Pay/Receive(1) | Underlying Reference | # of Units | Financing Rate | Payment Frequency | Maturity Date | Notional Amount | Premiums Paid/(Received) | Unrealized Appreciation/ (Depreciation) | Swap Agreements, | ||||||||||||||||||||||||||||||
| Asset | Liability | |||||||||||||||||||||||||||||||||||||||
BPS | Receive | DWRTFT Index | 12 | 1-Month USD-LIBOR plus a specified spread | Monthly | 11/07/2018 | $ | 413 | $ | 0 | $ | 13 | $ | 13 | $ | 0 | ||||||||||||||||||||||||
CBK | Receive | BCOMTR Index | 2,593 | 3-Month U.S. Treasury Bill rate plus a specified spread | Monthly | 08/15/2018 | 495 | 0 | (2 | ) | 0 | (2 | ) | |||||||||||||||||||||||||||
MYI | Receive | DWRTFT Index | 20 | 1-Month USD-LIBOR plus a specified spread | Monthly | 09/12/2018 | 266 | 0 | 11 | 11 | 0 | |||||||||||||||||||||||||||||
|
|
|
|
|
|
|
| |||||||||||||||||||||||||||||||||
| $ | 0 | $ | 22 | $ | 24 | $ | (2 | ) | ||||||||||||||||||||||||||||||||
|
|
|
|
|
|
|
| |||||||||||||||||||||||||||||||||
Total Swap Agreements |
| $ | 0 | $ | 22 | $ | 24 | $ | (2 | ) | ||||||||||||||||||||||||||||||
|
|
|
|
|
|
|
| |||||||||||||||||||||||||||||||||
FINANCIAL DERIVATIVE INSTRUMENTS: OVER THE COUNTER SUMMARY
The following is a summary by counterparty of the market value of OTC financial derivative instruments and collateral pledged/(received) as of June 30, 2018:
| Financial Derivative Assets | Financial Derivative Liabilities | |||||||||||||||||||||||||||||||||||||||||||||||
| Counterparty | Forward Foreign Currency Contracts | Purchased Options | Swap Agreements | Total Over the Counter | Forward Foreign Currency Contracts | Written Options | Swap Agreements | Total Over the Counter | Net Market Value of OTC Derivatives | Collateral Pledged/ (Received) | Net Exposure(2) | |||||||||||||||||||||||||||||||||||||
BPS | $ | 0 | $ | 0 | $ | 13 | $ | 13 | $ | 0 | $ | 0 | $ | 0 | $ | 0 | $ | 13 | $ | 0 | $ | 13 | ||||||||||||||||||||||||||
CBK | 0 | 0 | 0 | 0 | 0 | 0 | (2 | ) | (2 | ) | (2 | ) | 0 | (2 | ) | |||||||||||||||||||||||||||||||||
MYI | 0 | 0 | 11 | 11 | 0 | 0 | 0 | 0 | 11 | 0 | 11 | |||||||||||||||||||||||||||||||||||||
|
|
|
|
|
|
|
|
|
|
|
|
|
|
|
| |||||||||||||||||||||||||||||||||
Total Over the Counter | $ | 0 | $ | 0 | $ | 24 | $ | 24 | $ | 0 | $ | 0 | $ | (2 | ) | $ | (2 | ) | ||||||||||||||||||||||||||||||
|
|
|
|
|
|
|
|
|
|
|
|
|
|
|
| |||||||||||||||||||||||||||||||||
| See Accompanying Notes | ANNUAL REPORT | JUNE 30, 2018 | 69 |
Table of Contents
Schedule of Investments PIMCO REALPATH® Blend Income Fund (Cont.)
| (1) | Receive represents that the Fund receives payments for any positive net return on the underlying reference. The Fund makes payments for any negative net return on such underlying reference. Pay represents that the Fund receives payments for any negative net return on the underlying reference. The Fund makes payments for any positive net return on such underlying reference. |
| (2) | Net Exposure represents the net receivable/(payable) that would be due from/to the counterparty in the event of default. Exposure from OTC financial derivative instruments can only be netted across transactions governed under the same master agreement with the same legal entity. See Note 8, Master Netting Arrangements, in the Notes to Financial Statements for more information regarding master netting arrangements. |
FAIR VALUE OF FINANCIAL DERIVATIVE INSTRUMENTS
The following is a summary of the fair valuation of the Fund’s derivative instruments categorized by risk exposure. See Note 7, Principal Risks, in the Notes to Financial Statements on risks of the Fund.
Fair Values of Financial Derivative Instruments on the Statements of Assets and Liabilities as of June 30, 2018:
| Derivatives not accounted for as hedging instruments | ||||||||||||||||||||||||
| Commodity Contracts | Credit Contracts | Equity Contracts | Foreign Exchange Contracts | Interest Rate Contracts | Total | |||||||||||||||||||
Financial Derivative Instruments - Assets |
| |||||||||||||||||||||||
Exchange-traded or centrally cleared |
| |||||||||||||||||||||||
Purchased Options | $ | 0 | $ | 0 | $ | 107 | $ | 0 | $ | 0 | $ | 107 | ||||||||||||
|
|
|
|
|
|
|
|
|
|
|
| |||||||||||||
Over the counter |
| |||||||||||||||||||||||
Swap Agreements | $ | 0 | $ | 0 | $ | 24 | $ | 0 | $ | 0 | $ | 24 | ||||||||||||
|
|
|
|
|
|
|
|
|
|
|
| |||||||||||||
| $ | 0 | $ | 0 | $ | 131 | $ | 0 | $ | 0 | $ | 131 | |||||||||||||
|
|
|
|
|
|
|
|
|
|
|
| |||||||||||||
Financial Derivative Instruments - Liabilities |
| |||||||||||||||||||||||
Exchange-traded or centrally cleared |
| |||||||||||||||||||||||
Written Options | $ | 0 | $ | 0 | $ | 20 | $ | 0 | $ | 0 | $ | 20 | ||||||||||||
|
|
|
|
|
|
|
|
|
|
|
| |||||||||||||
Over the counter |
| |||||||||||||||||||||||
Swap Agreements | $ | 2 | $ | 0 | $ | 0 | $ | 0 | $ | 0 | $ | 2 | ||||||||||||
|
|
|
|
|
|
|
|
|
|
|
| |||||||||||||
| $ | 2 | $ | 0 | $ | 20 | $ | 0 | $ | 0 | $ | 22 | |||||||||||||
|
|
|
|
|
|
|
|
|
|
|
| |||||||||||||
The effect of Financial Derivative Instruments on the Statements of Operations for the period ended June 30, 2018:
| Derivatives not accounted for as hedging instruments | ||||||||||||||||||||||||
| Commodity Contracts | Credit Contracts | Equity Contracts | Foreign Exchange Contracts | Interest Rate Contracts | Total | |||||||||||||||||||
Net Realized Gain (Loss) on Financial Derivative Instruments |
| |||||||||||||||||||||||
Exchange-traded or centrally cleared |
| |||||||||||||||||||||||
Purchased Options | $ | 0 | $ | 0 | $ | (25 | ) | $ | 0 | $ | 0 | $ | (25 | ) | ||||||||||
Written Options | 0 | 0 | 8 | 0 | 0 | 8 | ||||||||||||||||||
Futures | 0 | 0 | (13 | ) | 0 | (1 | ) | (14 | ) | |||||||||||||||
|
|
|
|
|
|
|
|
|
|
|
| |||||||||||||
| $ | 0 | $ | 0 | $ | (30 | ) | $ | 0 | $ | (1 | ) | $ | (31 | ) | ||||||||||
|
|
|
|
|
|
|
|
|
|
|
| |||||||||||||
Over the counter |
| |||||||||||||||||||||||
Swap Agreements | $ | 21 | $ | 0 | $ | 0 | $ | 0 | $ | 0 | $ | 21 | ||||||||||||
|
|
|
|
|
|
|
|
|
|
|
| |||||||||||||
| $ | 21 | $ | 0 | $ | (30 | ) | $ | 0 | $ | (1 | ) | $ | (10 | ) | ||||||||||
|
|
|
|
|
|
|
|
|
|
|
| |||||||||||||
Net Change in Unrealized Appreciation (Depreciation) on Financial Derivative Instruments |
| |||||||||||||||||||||||
Exchange-traded or centrally cleared |
| |||||||||||||||||||||||
Purchased Options | $ | 0 | $ | 0 | $ | (22 | ) | $ | 0 | $ | 0 | $ | (22 | ) | ||||||||||
Written Options | 0 | 0 | 5 | 0 | 0 | 5 | ||||||||||||||||||
|
|
|
|
|
|
|
|
|
|
|
| |||||||||||||
| $ | 0 | $ | 0 | $ | (17 | ) | $ | 0 | $ | 0 | $ | (17 | ) | |||||||||||
|
|
|
|
|
|
|
|
|
|
|
| |||||||||||||
Over the counter |
| |||||||||||||||||||||||
Swap Agreements | $ | (5 | ) | $ | 0 | $ | 20 | $ | 0 | $ | 0 | $ | 15 | |||||||||||
|
|
|
|
|
|
|
|
|
|
|
| |||||||||||||
| $ | (5 | ) | $ | 0 | $ | 3 | $ | 0 | $ | 0 | $ | (2 | ) | |||||||||||
|
|
|
|
|
|
|
|
|
|
|
| |||||||||||||
| 70 | PIMCO EQUITY SERIES | See Accompanying Notes |
Table of Contents
June 30, 2018
FAIR VALUE MEASUREMENTS
The following is a summary of the fair valuations according to the inputs used as of June 30, 2018 in valuing the Fund’s assets and liabilities:
| Category and Subcategory | Level 1 | Level 2 | Level 3 | Fair Value at 06/30/2018 | ||||||||||||
Investments in Securities, at Value |
| |||||||||||||||
Mutual Funds | $ | 8,624 | $ | 0 | $ | 0 | $ | 8,624 | ||||||||
Short-Term Instruments |
| |||||||||||||||
Repurchase Agreements | 0 | 105 | 0 | 105 | ||||||||||||
|
|
|
|
|
|
|
| |||||||||
| $ | 8,624 | $ | 105 | $ | 0 | $ | 8,729 | |||||||||
|
|
|
|
|
|
|
| |||||||||
Investments in Affiliates, at Value |
| |||||||||||||||
Mutual Funds | 14,542 | 0 | 0 | 14,542 | ||||||||||||
Short-Term Instruments |
| |||||||||||||||
Central Funds Used for Cash Management Purposes | 1,018 | 0 | 0 | 1,018 | ||||||||||||
|
|
|
|
|
|
|
| |||||||||
| $ | 15,560 | $ | 0 | $ | 0 | $ | 15,560 | |||||||||
|
|
|
|
|
|
|
| |||||||||
Total Investments | $ | 24,184 | $ | 105 | $ | 0 | $ | 24,289 | ||||||||
|
|
|
|
|
|
|
| |||||||||
| Category and Subcategory | Level 1 | Level 2 | Level 3 | Fair Value at 06/30/2018 | ||||||||||||
Financial Derivative Instruments - Assets |
| |||||||||||||||
Exchange-traded or centrally cleared | $ | 0 | $ | 107 | $ | 0 | $ | 107 | ||||||||
Over the counter | 0 | 24 | 0 | 24 | ||||||||||||
|
|
|
|
|
|
|
| |||||||||
| $ | 0 | $ | 131 | $ | 0 | $ | 131 | |||||||||
|
|
|
|
|
|
|
| |||||||||
Financial Derivative Instruments - Liabilities |
| |||||||||||||||
Exchange-traded or centrally cleared | 0 | (20 | ) | 0 | (20 | ) | ||||||||||
Over the counter | 0 | (2 | ) | 0 | (2 | ) | ||||||||||
|
|
|
|
|
|
|
| |||||||||
| $ | 0 | $ | (22 | ) | $ | 0 | $ | (22 | ) | |||||||
|
|
|
|
|
|
|
| |||||||||
Total Financial Derivative Instruments | $ | 0 | $ | 109 | $ | 0 | $ | 109 | ||||||||
|
|
|
|
|
|
|
| |||||||||
Totals | $ | 24,184 | $ | 214 | $ | 0 | $ | 24,398 | ||||||||
|
|
|
|
|
|
|
| |||||||||
There were no significant transfers among Levels 1, 2, or 3 during the period ended June 30, 2018.
| See Accompanying Notes | ANNUAL REPORT | JUNE 30, 2018 | 71 |
Table of Contents
1. ORGANIZATION
PIMCO Equity Series (the “Trust”) was established as a Delaware statutory trust on March 30, 2010. The Trust is registered under the Investment Company Act of 1940, as amended (the “Act”), as an open-end management investment company. Information presented in these financial statements pertains to the Institutional Class, Administrative Class, and Class A shares of the funds (each a “Fund” and collectively the “Funds”) indicated on the cover of this report. Pacific Investment Management Company LLC (“PIMCO”) serves as the investment adviser (the “Adviser”) for the Funds. Each Fund may invest substantially all of its assets in Institutional Class or Class M shares of any funds of the Trust and PIMCO Funds, and in other affiliated funds, including funds of PIMCO ETF Trust, except funds of funds (“Underlying PIMCO Funds”), and unaffiliated funds that are registered under the Act (collectively, “Acquired Funds”).
2. SIGNIFICANT ACCOUNTING POLICIES
The following is a summary of significant accounting policies consistently followed by the Trust in the preparation of its financial statements in conformity with accounting principles generally accepted in the United States of America (“U.S. GAAP”). Each Fund is treated as an investment company under the reporting requirements of U.S. GAAP. The functional and reporting currency for the Funds is the U.S. dollar. The preparation of financial statements in accordance with U.S. GAAP requires management to make estimates and assumptions that affect the reported amounts of assets and liabilities and disclosure of contingent assets and liabilities at the date of the financial statements and the reported amounts of increases and decreases in net assets from operations during the reporting period. Actual results could differ from those estimates.
(a) Securities Transactions and Investment Income Securities transactions are recorded as of the trade date for financial reporting purposes. Securities purchased or sold on a when-issued or delayed-delivery basis may be settled beyond a standard settlement period for the security after the trade date. Realized gains (losses) from securities sold are recorded on the identified cost basis. Dividend income is recorded on the ex-dividend date, except certain dividends from foreign securities where the ex-dividend date may have passed, which are recorded as soon as a Fund is informed of the ex-dividend date. Interest income, adjusted for the accretion of discounts and amortization of premiums, is recorded on the accrual basis from settlement date, with the exception of securities with a forward starting effective date, where interest income is recorded on the accrual basis from effective date. For convertible securities, premiums attributable to the conversion feature are not amortized. Estimated tax liabilities on certain foreign securities are recorded on an accrual basis and are reflected as components of interest income or net change in unrealized
appreciation (depreciation) on investments on the Statements of Operations, as appropriate. Tax liabilities realized as a result of such security sales are reflected as a component of net realized gain (loss) on investments on the Statements of Operations. Paydown gains (losses) on mortgage-related and other asset-backed securities, if any, are recorded as components of interest income on the Statements of Operations. Income or short-term capital gain distributions received from registered investment companies, if any, are recorded as dividend income. Long-term capital gain distributions received from registered investment companies, if any, are recorded as realized gains.
(b) Multiclass Operations Each class offered by the Trust has equal rights as to assets and voting privileges (except that shareholders of a class have exclusive voting rights regarding any matter relating solely to that class of shares). Income and non-class specific expenses are allocated daily to each class on the basis of the relative net assets. Realized and unrealized capital gains (losses) are allocated daily based on the relative net assets of each class of the respective Fund. Class specific expenses, where applicable, currently include supervisory and administrative and distribution and servicing fees. Under certain circumstances, the per share net asset value (“NAV”) of a class of the respective Fund’s shares may be different from the per share NAV of another class of shares as a result of the different daily expense accruals applicable to each class of shares.
(c) Distributions to Shareholders The following table shows the anticipated frequency of distributions from net investment income, if any, for each Fund.
| Distribution Frequency | ||||||||||||
| Fund Name | Declared | Distributed | ||||||||||
PIMCO REALPATH® Blend 2020 Fund | Quarterly | Quarterly | ||||||||||
PIMCO REALPATH® Blend 2025 Fund | Quarterly | Quarterly | ||||||||||
PIMCO REALPATH® Blend 2030 Fund | Quarterly | Quarterly | ||||||||||
PIMCO REALPATH® Blend 2035 Fund | Quarterly | Quarterly | ||||||||||
PIMCO REALPATH® Blend 2040 Fund | Quarterly | Quarterly | ||||||||||
PIMCO REALPATH® Blend 2045 Fund | Quarterly | Quarterly | ||||||||||
PIMCO REALPATH® Blend 2050 Fund | Quarterly | Quarterly | ||||||||||
PIMCO REALPATH® Blend 2055 Fund | Quarterly | Quarterly | ||||||||||
PIMCO REALPATH® Blend Income Fund | Quarterly | Quarterly | ||||||||||
Net realized capital gains earned by each Fund, if any, will be distributed no less frequently than once each year.
Income distributions and capital gain distributions are determined in accordance with income tax regulations which may differ from U.S. GAAP. Differences between tax regulations and U.S. GAAP may cause timing differences between income and capital gain recognition. Further, the character of investment income and capital gains may be different for certain transactions under the two methods of accounting. As a result, income distributions and capital gain distributions declared
| 72 | PIMCO EQUITY SERIES |
Table of Contents
June 30, 2018
during a fiscal period may differ significantly from the net investment income (loss) and realized gains (losses) reported on each Fund’s annual financial statements presented under U.S. GAAP.
If a Fund estimates that a portion of its distribution may be comprised of amounts from sources other than net investment income in accordance with its policies and good accounting practices, the Fund will notify shareholders of the estimated composition of such distribution through a Section 19 Notice. For these purposes, a Fund estimates the source or sources from which a distribution is paid, to the close of the period as of which it is paid, in reference to its internal accounting records and related accounting practices. If, based on such accounting records and practices, it is estimated that a particular distribution does not include capital gains or paid-in surplus or other capital sources, a Section 19 Notice generally would not be issued. It is important to note that differences exist between a Fund’s daily internal accounting records and practices, a Fund’s financial statements presented in accordance with U.S. GAAP, and recordkeeping practices under income tax regulations. For instance, a Fund’s internal accounting records and practices may take into account, among other factors, tax-related characteristics of certain sources of distributions that differ from treatment under U.S. GAAP. Examples of such differences may include, among others, the treatment of paydowns on mortgage-backed securities purchased at a discount and periodic payments under interest rate swap contracts. Accordingly, among other consequences, it is possible that a Fund may not issue a Section 19 Notice in situations where the Fund’s financial statements prepared later and in accordance with U.S. GAAP and/or the final tax character of those distributions might later report that the sources of those distributions included capital gains and/or a return of capital. Please visit www.pimco.com for the most recent Section 19 Notice, if applicable, for additional information regarding the estimated composition of distributions. Final determination of a distribution’s tax character will be reported on Form 1099 DIV sent to shareholders for the calendar year.
Distributions classified as a tax basis return of capital, if any, are reflected on the Statements of Changes in Net Assets and have been recorded to paid in capital. In addition, other amounts have been reclassified between undistributed (overdistributed) net investment income (loss), accumulated undistributed (overdistributed) net realized gain (loss) and/or paid in capital to more appropriately conform U.S. GAAP to tax characterizations of distributions.
(d) New Accounting Pronouncements In March 2016, the Financial Accounting Standards Board (“FASB”) issued an Accounting Standards Update (“ASU”), ASU 2016-05, which provides guidance related to the impact of derivative contract novations on certain relationships under Accounting Standards Codification (“ASC”) 815. The ASU is effective
for annual periods beginning after December 15, 2016, and interim periods within those annual periods. The Funds have adopted the ASU. The implementation of the ASU did not have an impact on the Funds’ financial statements.
In August 2016, the FASB issued ASU 2016-15 which amends ASC 230 to clarify guidance on the classification of certain cash receipts and cash payments in the Statement of Cash Flows. The ASU is effective for annual periods beginning after December 15, 2017, and interim periods within those annual periods. The Funds have adopted the ASU. The implementation of the ASU did not have an impact on the Funds’ financial statements.
In October 2016, the U.S. Securities and Exchange Commission (��SEC”) adopted new rules and forms, and amendments to certain current rules and forms, to modernize reporting and disclosure of information by registered investment companies. The amendments to Regulation S-X require standardized, enhanced disclosure about derivatives in investment company financial statements, and also change the rules governing the form and content of such financial statements. The compliance date for these amendments was August 1, 2017. Compliance is based on reporting period-end date. Management has adopted these amendments and the changes are incorporated in the financial statements.
In November 2016, the FASB issued ASU 2016-18 which amends ASC 230 to provide guidance on the classification and presentation of changes in restricted cash and restricted cash equivalents on the Statement of Cash Flows. The ASU is effective for annual periods beginning after December 15, 2017, and interim periods within those annual periods. The Funds have adopted the ASU. The implementation of the ASU did not have an impact on the Funds’ financial statements.
In March 2017, the FASB issued ASU 2017-08 which provides guidance related to the amortization period for certain purchased callable debt securities held at a premium. The ASU is effective for annual periods beginning after December 15, 2018, and interim periods within those annual periods. The Funds have adopted the ASU. The implementation of the ASU did not have an impact on the Funds’ financial statements.
3. INVESTMENT VALUATION AND FAIR VALUE MEASUREMENTS
(a) Investment Valuation Policies The price of a Fund’s shares is based on the Fund’s NAV. The NAV of a Fund, or each of its share classes, as applicable, is determined by dividing the total value of portfolio investments and other assets, less any liabilities attributable to that Fund or class, by the total number of shares outstanding of that Fund or class.
| ANNUAL REPORT | JUNE 30, 2018 | 73 |
Table of Contents
Notes to Financial Statements (Cont.)
On each day that the New York Stock Exchange (“NYSE”) is open, Fund shares are ordinarily valued as of the close of regular trading (“NYSE Close”). Information that becomes known to the Funds or their agents after the time as of which NAV has been calculated on a particular day will not generally be used to retroactively adjust the price of a security or the NAV determined earlier that day. Each Fund reserves the right to change the time as of which its respective NAV is calculated if the Fund closes earlier, or as permitted by the SEC.
For purposes of calculating a NAV, portfolio securities and other assets for which market quotes are readily available are valued at market value. Market value is generally determined on the basis of official closing prices or the last reported sales prices, or if no sales are reported, based on quotes obtained from established market makers or prices (including evaluated prices) supplied by the Funds’ approved pricing services, quotation reporting systems and other third-party sources (together, “Pricing Services”). The Funds will normally use pricing data for domestic equity securities received shortly after the NYSE Close and do not normally take into account trading, clearances or settlements that take place after the NYSE Close. If market value pricing is used, a foreign (non-U.S.) equity security traded on a foreign exchange or on more than one exchange is typically valued using pricing information from the exchange considered by the Adviser to be the primary exchange. A foreign (non-U.S.) equity security will be valued as of the close of trading on the foreign exchange, or the NYSE Close, if the NYSE Close occurs before the end of trading on the foreign exchange. Domestic and foreign (non-U.S.) fixed income securities, non-exchange traded derivatives, and equity options are normally valued on the basis of quotes obtained from brokers and dealers or Pricing Services using data reflecting the earlier closing of the principal markets for those securities. Prices obtained from Pricing Services may be based on, among other things, information provided by market makers or estimates of market values obtained from yield data relating to investments or securities with similar characteristics. Certain fixed income securities purchased on a delayed-delivery basis are marked to market daily until settlement at the forward settlement date. Exchange-traded options, except equity options, futures and options on futures are valued at the settlement price determined by the relevant exchange. Swap agreements are valued on the basis of bid quotes obtained from brokers and dealers or market-based prices supplied by Pricing Services. A Fund’s investments in open-end management investment companies, other than exchange-traded funds (“ETFs”), are valued at the NAVs of such investments. Open-end management investment companies may include affiliated funds.
If a foreign (non-U.S.) equity security’s value has materially changed after the close of the security’s primary exchange or principal market but before the NYSE Close, the security may be valued at fair value
based on procedures established and approved by the Board of Trustees of the Trust (the “Board”). Foreign (non-U.S.) equity securities that do not trade when the NYSE is open are also valued at fair value. With respect to foreign (non-U.S.) equity securities, a Fund may determine the fair value of investments based on information provided by Pricing Services and other third-party vendors, which may recommend fair value or adjustments with reference to other securities, indices or assets. In considering whether fair valuation is required and in determining fair values, a Fund may, among other things, consider significant events (which may be considered to include changes in the value of U.S. securities or securities indices) that occur after the close of the relevant market and before the NYSE Close. A Fund may utilize modeling tools provided by third-party vendors to determine fair values of foreign (non-U.S.) securities. For these purposes, any movement in the applicable reference index or instrument (“zero trigger”) between the earlier close of the applicable foreign market and the NYSE Close may be deemed to be a significant event, prompting the application of the pricing model (effectively resulting in daily fair valuations). Foreign exchanges may permit trading in foreign (non-U.S.) equity securities on days when the Trust is not open for business, which may result in a Fund’s portfolio investments being affected when shareholders are unable to buy or sell shares.
Senior secured floating rate loans for which an active secondary market exists to a reliable degree will be valued at the mean of the last available bid/ask prices in the market for such loans, as provided by a Pricing Service. Senior secured floating rate loans for which an active secondary market does not exist to a reliable degree will be valued at fair value, which is intended to approximate market value. In valuing a senior secured floating rate loan at fair value, the factors considered may include, but are not limited to, the following: (a) the creditworthiness of the borrower and any intermediate participants, (b) the terms of the loan, (c) recent prices in the market for similar loans, if any, and (d) recent prices in the market for instruments of similar quality, rate, period until next interest rate reset and maturity.
Investments valued in currencies other than the U.S. dollar are converted to the U.S. dollar using exchange rates obtained from Pricing Services. As a result, the value of such investments and, in turn, the NAV of a Fund’s shares may be affected by changes in the value of currencies in relation to the U.S. dollar. The value of investments traded in markets outside the United States or denominated in currencies other than the U.S. dollar may be affected significantly on a day that the Trust is not open for business. As a result, to the extent that a Fund holds foreign (non-U.S.) investments, the value of those investments may change at times when shareholders are unable to buy or sell shares and the value of such investments will be reflected in the Fund’s next calculated NAV.
| 74 | PIMCO EQUITY SERIES |
Table of Contents
June 30, 2018
Investments for which market quotes or market based valuations are not readily available are valued at fair value as determined in good faith by the Board or persons acting at their direction. The Board has adopted methods for valuing securities and other assets in circumstances where market quotes are not readily available, and has delegated to the Adviser the responsibility for applying the fair valuation methods. In the event that market quotes or market based valuations are not readily available, and the security or asset cannot be valued pursuant to a Board approved valuation method, the value of the security or asset will be determined in good faith by the Valuation Oversight Committee of the Board (“Valuation Oversight Committee”), generally based on recommendations provided by the Adviser. The Adviser may consult with the Sub-Adviser or Parametric in providing such recommendations or otherwise with respect to valuation of the PIMCO Dividend and Income Fund’s portfolio securities or other assets. Market quotes are considered not readily available in circumstances where there is an absence of current or reliable market-based data (e.g., trade information, bid/ask information, indicative market quotations (“Broker Quotes”), Pricing Services’ prices), including where events occur after the close of the relevant market, but prior to the NYSE Close, that materially affect the values of a Fund’s securities or assets. In addition, market quotes are considered not readily available when, due to extraordinary circumstances, the exchanges or markets on which the securities trade do not open for trading for the entire day and no other market prices are available. The Board has delegated to the Adviser the responsibility for monitoring significant events that may materially affect the values of a Fund’s securities or assets and for determining whether the value of the applicable securities or assets should be reevaluated in light of such significant events.
When a Fund (or, in each instance in this paragraph, as applicable, an Underlying PIMCO Fund or Acquired Fund) uses fair valuation to determine the value of a portfolio security or other asset for purposes of calculating its NAV, such investments will not be priced on the basis of quotes from the primary market in which they are traded, but rather may be priced by another method that the Board or persons acting at their direction believe reflects fair value. Fair valuation may require subjective determinations about the value of a security. While the Trust’s policy is intended to result in a calculation of a Fund’s NAV that fairly reflects security values as of the time of pricing, the Trust cannot ensure that fair values determined by the Board or persons acting at their direction would accurately reflect the price that a Fund could obtain for a security if it were to dispose of that security as of the time of pricing (for instance, in a forced or distressed sale). The prices used by a Fund may differ from the value that would be realized if the securities were sold. The Funds’ use of fair valuation may also help to deter “stale price arbitrage” as discussed under the “Abusive Trading Practices” section in each Fund’s prospectus.
(b) Fair Value Hierarchy U.S. GAAP describes fair value as the price that a Fund would receive to sell an asset or pay to transfer a liability in an orderly transaction between market participants at the measurement date. It establishes a fair value hierarchy that prioritizes inputs to valuation methods and requires disclosure of the fair value hierarchy, separately for each major category of assets and liabilities, that segregates fair value measurements into levels (Level 1, 2, or 3). The inputs or methodology used for valuing securities are not necessarily an indication of the risks associated with investing in those securities. Levels 1, 2, and 3 of the fair value hierarchy are defined as follows:
| ∎ | Level 1 — Quoted prices in active markets or exchanges for identical assets and liabilities. |
| ∎ | Level 2 — Significant other observable inputs, which may include, but are not limited to, quoted prices for similar assets or liabilities in markets that are active, quoted prices for identical or similar assets or liabilities in markets that are not active, inputs other than quoted prices that are observable for the assets or liabilities (such as interest rates, yield curves, volatilities, prepayment speeds, loss severities, credit risks and default rates) or other market corroborated inputs. |
| ∎ | Level 3 — Significant unobservable inputs based on the best information available in the circumstances, to the extent observable inputs are not available, which may include assumptions made by the Board or persons acting at their direction that are used in determining the fair value of investments. |
In accordance with the requirements of U.S. GAAP, the amounts of transfers between Levels 1 and 2 and transfers into and out of Level 3, if material, are disclosed in the Notes to Schedule of Investments for each respective Fund.
For fair valuations using significant unobservable inputs, U.S. GAAP requires a reconciliation of the beginning to ending balances for reported fair values that presents changes attributable to realized gain (loss), unrealized appreciation (depreciation), purchases and sales, accrued discounts (premiums), and transfers into and out of the Level 3 category during the period. The end of period value is used for the transfers between Levels of a Fund’s assets and liabilities. Additionally, U.S. GAAP requires quantitative information regarding the significant unobservable inputs used in the determination of fair value of assets or liabilities categorized as Level 3 in the fair value hierarchy. In accordance with the requirements of U.S. GAAP, a fair value hierarchy, and if material, a Level 3 reconciliation and details of significant unobservable inputs, have been included in the Notes to Schedule of Investments for each respective Fund.
(c) Valuation Techniques and the Fair Value Hierarchy
Level 1 and Level 2 trading assets and trading liabilities, at fair value The valuation methods (or “techniques”) and significant inputs
| ANNUAL REPORT | JUNE 30, 2018 | 75 |
Table of Contents
Notes to Financial Statements (Cont.)
used in determining the fair values of portfolio securities or other assets and liabilities categorized as Level 1 and Level 2 of the fair value hierarchy are as follows:
Common stocks, ETFs, exchange-traded notes and financial derivative instruments, such as futures contracts, rights and warrants, or options on futures that are traded on a national securities exchange, are stated at the last reported sale or settlement price on the day of valuation. To the extent these securities are actively traded and valuation adjustments are not applied, they are categorized as Level 1 of the fair value hierarchy.
Investments in registered open-end investment companies (other than ETFs) will be valued based upon the NAVs of such investments and are categorized as Level 1 of the fair value hierarchy. Investments in unregistered open-end investment companies will be calculated based upon the NAVs of such investments and are considered Level 1 provided that the NAVs are observable, calculated daily and are the value at which both purchases and sales will be conducted.
Equity exchange-traded options and over the counter financial derivative instruments, such as forward foreign currency contracts and options contracts derive their value from underlying asset prices, indices, reference rates, and other inputs or a combination of these factors. These contracts are normally valued on the basis of quotes obtained from a quotation reporting system, established market makers or Pricing Services (normally determined as of the NYSE Close). Depending on the product and the terms of the transaction, financial derivative instruments can be valued by Pricing Services using a series of techniques, including simulation pricing models. The pricing models use inputs that are observed from actively quoted markets such as quoted prices, issuer details, indices, bid/ask spreads, interest rates, implied volatilities, yield curves, dividends and exchange rates. Financial derivative instruments that use similar valuation techniques and inputs as described above are categorized as Level 2 of the fair value hierarchy.
Centrally cleared swaps and over the counter swaps derive their value from underlying asset prices, indices, reference rates, and other inputs or
a combination of these factors. They are valued using a broker-dealer bid quotation or on market-based prices provided by Pricing Services (normally determined as of the NYSE close). Centrally cleared swaps and over the counter swaps can be valued by Pricing Services using a series of techniques, including simulation pricing models. The pricing models may use inputs that are observed from actively quoted markets such as the overnight index swap rate (“OIS”), London Interbank Offered Rate (“LIBOR”) forward rate, interest rates, yield curves and credit spreads. These securities are categorized as Level 2 of the fair value hierarchy.
Level 3 trading assets and trading liabilities, at fair value When a fair valuation method is applied by the Adviser that uses significant unobservable inputs, investments will be priced by a method that the Board or persons acting at their direction believe reflects fair value and are categorized as Level 3 of the fair value hierarchy.
Short-term debt instruments (such as commercial paper) having a remaining maturity of 60 days or less may be valued at amortized cost, so long as the amortized cost value of such short-term debt instruments is approximately the same as the fair value of the instrument as determined without the use of amortized cost valuation. These securities are categorized as Level 2 or Level 3 of the fair value hierarchy depending on the source of the base price.
4. SECURITIES AND OTHER INVESTMENTS
(a) Investments in Affiliates
Each Fund may invest substantially all or a significant portion of its assets in Underlying PIMCO Funds and Acquired Funds. The Underlying PIMCO Funds are considered to be affiliated with the Funds. Each Fund may also invest in the PIMCO Short Asset Portfolio and the PIMCO Short-Term Floating NAV Portfolio III (“Central Funds”) to the extent permitted by the Act and rules thereunder. The Central Funds are registered investment companies created for use solely by the series of the Trust and other series of registered investment companies advised by the Adviser, in connection with their cash management activities. The main investments of the Central Funds are money market and short maturity fixed income instruments. The Central Funds may incur expenses related to their investment activities, but do not pay Investment Advisory Fees or
| 76 | PIMCO EQUITY SERIES |
Table of Contents
June 30, 2018
Supervisory and Administrative Fees to the Adviser. The Central Funds are considered to be affiliated with the Funds. The tables below show the Funds’ transactions in and earnings from investments in the affiliated Funds for the period ended June 30, 2018 (amounts in thousands†):
PIMCO REALPATH® Blend 2020 Fund
| Underlying PIMCO Funds | Market Value 06/30/2017 | Purchases at Cost | Proceeds from Sales | Net Realized Gain (Loss) | Change in Unrealized Appreciation (Depreciation) | Market Value 06/30/2018 | Dividend Income(1) | Realized Net Capital Gain Distributions(1) | ||||||||||||||||||||||||||||
PIMCO Emerging Local Bond Fund | $ | 239 | $ | 535 | $ | (96 | ) | $ | 0 | $ | (49 | ) | $ | 629 | $ | 20 | $ | 0 | ||||||||||||||||||
PIMCO High Yield Fund | 478 | 1,080 | (203 | ) | (3 | ) | (46 | ) | 1,306 | 46 | 0 | |||||||||||||||||||||||||
PIMCO Income Fund | 1,262 | 3,468 | (697 | ) | (7 | ) | (119 | ) | 3,907 | 143 | 0 | |||||||||||||||||||||||||
PIMCO International Bond Fund (U.S. Dollar-Hedged) | 482 | 1,193 | (249 | ) | (1 | ) | 20 | 1,445 | 18 | 0 | ||||||||||||||||||||||||||
PIMCO Long Duration Total Return Fund | 350 | 950 | (178 | ) | (8 | ) | (61 | ) | 1,053 | 28 | 19 | |||||||||||||||||||||||||
PIMCO Long-Term Credit Bond Fund | 351 | 889 | (135 | ) | 0 | (67 | ) | 1,038 | 33 | 0 | ||||||||||||||||||||||||||
PIMCO Long-Term Real Return Fund | 706 | 1,516 | (806 | ) | (10 | ) | 17 | 1,423 | 28 | 0 | ||||||||||||||||||||||||||
PIMCO Real Return Fund | 776 | 1,970 | (467 | ) | (5 | ) | (25 | ) | 2,249 | 46 | 0 | |||||||||||||||||||||||||
PIMCO Short-Term Floating NAV Portfolio III | 352 | 11,113 | (10,300 | ) | 0 | 0 | 1,165 | 14 | 0 | |||||||||||||||||||||||||||
PIMCO Total Return Fund | 778 | 2,321 | (408 | ) | (5 | ) | (55 | ) | 2,631 | 35 | 0 | |||||||||||||||||||||||||
Totals | $ | 5,774 | $ | 25,035 | $ | (13,539 | ) | $ | (39 | ) | $ | (385 | ) | $ | 16,846 | $ | 411 | $ | 19 | |||||||||||||||||
PIMCO REALPATH® Blend 2025 Fund
| Underlying PIMCO Funds | Market Value 06/30/2017 | Purchases at Cost | Proceeds from Sales | Net Realized Gain (Loss) | Change in Unrealized Appreciation (Depreciation) | Market Value 06/30/2018 | Dividend Income(1) | Realized Net Capital Gain Distributions(1) | ||||||||||||||||||||||||||||
PIMCO Emerging Local Bond Fund | $ | 195 | $ | 544 | $ | (134 | ) | $ | 4 | $ | (43 | ) | $ | 566 | $ | 18 | $ | 0 | ||||||||||||||||||
PIMCO High Yield Fund | 398 | 1,036 | (194 | ) | (4 | ) | (43 | ) | 1,193 | 43 | 0 | |||||||||||||||||||||||||
PIMCO Income Fund | 903 | 2,699 | (447 | ) | (7 | ) | (100 | ) | 3,048 | 117 | 0 | |||||||||||||||||||||||||
PIMCO International Bond Fund (U.S. Dollar-Hedged) | 215 | 871 | (66 | ) | 0 | 10 | 1,030 | 11 | 0 | |||||||||||||||||||||||||||
PIMCO Long Duration Total Return Fund | 369 | 1,322 | (56 | ) | (1 | ) | (103 | ) | 1,531 | 39 | 27 | |||||||||||||||||||||||||
PIMCO Long-Term Credit Bond Fund | 369 | 1,297 | (55 | ) | 0 | (102 | ) | 1,509 | 45 | 0 | ||||||||||||||||||||||||||
PIMCO Long-Term Real Return Fund | 735 | 2,063 | (735 | ) | (14 | ) | 10 | 2,059 | 37 | 0 | ||||||||||||||||||||||||||
PIMCO Real Return Fund | 356 | 1,414 | (143 | ) | (2 | ) | (18 | ) | 1,607 | 29 | 0 | |||||||||||||||||||||||||
PIMCO Short-Term Floating NAV Portfolio III | 502 | 11,917 | (11,100 | ) | 0 | 0 | 1,319 | 18 | 0 | |||||||||||||||||||||||||||
PIMCO Total Return Fund | 506 | 1,625 | (216 | ) | (4 | ) | (43 | ) | 1,868 | 26 | 0 | |||||||||||||||||||||||||
Totals | $ | 4,548 | $ | 24,788 | $ | (13,146 | ) | $ | (28 | ) | $ | (432 | ) | $ | 15,730 | $ | 383 | $ | 27 | |||||||||||||||||
PIMCO REALPATH® Blend 2030 Fund
| Underlying PIMCO Funds | Market Value 06/30/2017 | Purchases at Cost | Proceeds from Sales | Net Realized Gain (Loss) | Change in Unrealized Appreciation (Depreciation) | Market Value 06/30/2018 | Dividend Income(1) | Realized Net Capital Gain Distributions(1) | ||||||||||||||||||||||||||||
PIMCO Emerging Local Bond Fund | $ | 320 | $ | 513 | $ | (241 | ) | $ | 11 | $ | (42 | ) | $ | 561 | $ | 20 | $ | 0 | ||||||||||||||||||
PIMCO High Yield Fund | 636 | 1,078 | (489 | ) | (14 | ) | (42 | ) | 1,169 | 51 | 0 | |||||||||||||||||||||||||
PIMCO Income Fund | 1,256 | 2,447 | (824 | ) | (15 | ) | (81 | ) | 2,783 | 117 | 0 | |||||||||||||||||||||||||
PIMCO International Bond Fund (U.S. Dollar-Hedged) | 179 | 696 | 0 | 0 | 7 | 882 | 8 | 0 | ||||||||||||||||||||||||||||
PIMCO Long Duration Total Return Fund | 486 | 1,291 | (45 | ) | (4 | ) | (96 | ) | 1,632 | 41 | 24 | |||||||||||||||||||||||||
PIMCO Long-Term Credit Bond Fund | 486 | 1,270 | (43 | ) | (2 | ) | (103 | ) | 1,608 | 48 | 0 | |||||||||||||||||||||||||
PIMCO Long-Term Real Return Fund | 948 | 1,843 | (582 | ) | (16 | ) | 16 | 2,209 | 41 | 0 | ||||||||||||||||||||||||||
PIMCO Real Return Fund | 285 | 1,152 | (44 | ) | (1 | ) | (11 | ) | 1,381 | 23 | 0 | |||||||||||||||||||||||||
PIMCO Short-Term Floating NAV Portfolio III | 812 | 13,127 | (11,600 | ) | (1 | ) | 0 | 2,338 | 27 | 0 | ||||||||||||||||||||||||||
PIMCO Total Return Fund | 614 | 1,211 | (176 | ) | (4 | ) | (36 | ) | 1,609 | 23 | 0 | |||||||||||||||||||||||||
Totals | $ | 6,022 | $ | 24,628 | $ | (14,044 | ) | $ | (46 | ) | $ | (388 | ) | $ | 16,172 | $ | 399 | $ | 24 | |||||||||||||||||
| ANNUAL REPORT | JUNE 30, 2018 | 77 |
Table of Contents
Notes to Financial Statements (Cont.)
PIMCO REALPATH® Blend 2035 Fund
| Underlying PIMCO Funds | Market Value 06/30/2017 | Purchases at Cost | Proceeds from Sales | Net Realized Gain (Loss) | Change in Unrealized Appreciation (Depreciation) | Market Value 06/30/2018 | Dividend Income(1) | Realized Net Capital Gain Distributions(1) | ||||||||||||||||||||||||||||
PIMCO Emerging Local Bond Fund | $ | 404 | $ | 422 | $ | (314 | ) | $ | 18 | $ | (35 | ) | $ | 495 | $ | 19 | $ | 0 | ||||||||||||||||||
PIMCO High Yield Fund | 802 | 919 | (656 | ) | (17 | ) | (38 | ) | 1,010 | 53 | 0 | |||||||||||||||||||||||||
PIMCO Income Fund | 1,370 | 1,878 | (924 | ) | (15 | ) | (64 | ) | 2,245 | 107 | 0 | |||||||||||||||||||||||||
PIMCO International Bond Fund (U.S. Dollar-Hedged) | 178 | 474 | 0 | 0 | 6 | 658 | 6 | 0 | ||||||||||||||||||||||||||||
PIMCO Long Duration Total Return Fund | 463 | 878 | (54 | ) | (5 | ) | (66 | ) | 1,216 | 32 | 19 | |||||||||||||||||||||||||
PIMCO Long-Term Credit Bond Fund | 463 | 859 | (53 | ) | (3 | ) | (70 | ) | 1,196 | 37 | 0 | |||||||||||||||||||||||||
PIMCO Long-Term Real Return Fund | 706 | 1,099 | (197 | ) | (6 | ) | 10 | 1,612 | 29 | 0 | ||||||||||||||||||||||||||
PIMCO Real Return Fund | 282 | 755 | 0 | 0 | (8 | ) | 1,029 | 17 | 0 | |||||||||||||||||||||||||||
PIMCO Short-Term Floating NAV Portfolio III | 1,008 | 14,230 | (12,700 | ) | (1 | ) | 1 | 2,538 | 31 | 0 | ||||||||||||||||||||||||||
PIMCO Total Return Fund | 586 | 774 | (103 | ) | (2 | ) | (28 | ) | 1,227 | 20 | 0 | |||||||||||||||||||||||||
Totals | $ | 6,262 | $ | 22,288 | $ | (15,001 | ) | $ | (31 | ) | $ | (292 | ) | $ | 13,226 | $ | 351 | $ | 19 | |||||||||||||||||
PIMCO REALPATH® Blend 2040 Fund
| Underlying PIMCO Funds | Market Value 06/30/2017 | Purchases at Cost | Proceeds from Sales | Net Realized Gain (Loss) | Change in Unrealized Appreciation (Depreciation) | Market Value 06/30/2018 | Dividend Income(1) | Realized Net Capital Gain Distributions(1) | ||||||||||||||||||||||||||||
PIMCO Emerging Local Bond Fund | $ | 520 | $ | 212 | $ | (311 | ) | $ | 20 | $ | (32 | ) | $ | 409 | $ | 22 | $ | 0 | ||||||||||||||||||
PIMCO High Yield Fund | 1,034 | 580 | (637 | ) | (16 | ) | (36 | ) | 925 | 56 | 0 | |||||||||||||||||||||||||
PIMCO Income Fund | 1,619 | 981 | (621 | ) | (6 | ) | (60 | ) | 1,913 | 102 | 0 | |||||||||||||||||||||||||
PIMCO International Bond Fund (U.S. Dollar-Hedged) | 244 | 294 | 0 | 0 | 7 | 545 | 6 | 0 | ||||||||||||||||||||||||||||
PIMCO Long Duration Total Return Fund | 520 | 441 | 0 | 0 | (53 | ) | 908 | 28 | 16 | |||||||||||||||||||||||||||
PIMCO Long-Term Credit Bond Fund | 520 | 427 | 0 | 0 | (53 | ) | 894 | 32 | 0 | |||||||||||||||||||||||||||
PIMCO Long-Term Real Return Fund | 716 | 515 | 0 | 0 | 16 | 1,247 | 25 | 0 | ||||||||||||||||||||||||||||
PIMCO Real Return Fund | 380 | 479 | 0 | 0 | (6 | ) | 853 | 16 | 0 | |||||||||||||||||||||||||||
PIMCO Short-Term Floating NAV Portfolio III | 1,407 | 13,439 | (11,700 | ) | (1 | ) | 1 | 3,146 | 39 | 0 | ||||||||||||||||||||||||||
PIMCO Total Return Fund | 579 | 436 | 0 | 0 | (21 | ) | 994 | 16 | 0 | |||||||||||||||||||||||||||
Totals | $ | 7,539 | $ | 17,804 | $ | (13,269 | ) | $ | (3 | ) | $ | (237 | ) | $ | 11,834 | $ | 342 | $ | 16 | |||||||||||||||||
PIMCO REALPATH® Blend 2045 Fund
| Underlying PIMCO Funds | Market Value 06/30/2017 | Purchases at Cost | Proceeds from Sales | Net Realized Gain (Loss) | Change in Unrealized Appreciation (Depreciation) | Market Value 06/30/2018 | Dividend Income(1) | Realized Net Capital Gain Distributions(1) | ||||||||||||||||||||||||||||
PIMCO Emerging Local Bond Fund | $ | 579 | $ | 241 | $ | (436 | ) | $ | 27 | $ | (32 | ) | $ | 379 | $ | 22 | $ | 0 | ||||||||||||||||||
PIMCO High Yield Fund | 1,150 | 588 | (825 | ) | (21 | ) | (36 | ) | 856 | 61 | 0 | |||||||||||||||||||||||||
PIMCO Income Fund | 1,622 | 954 | (793 | ) | (7 | ) | (53 | ) | 1,723 | 100 | 0 | |||||||||||||||||||||||||
PIMCO International Bond Fund (U.S. Dollar-Hedged) | 285 | 199 | 0 | 0 | 8 | 492 | 6 | 0 | ||||||||||||||||||||||||||||
PIMCO Long Duration Total Return Fund | 474 | 477 | 0 | 0 | (50 | ) | 901 | 27 | 15 | |||||||||||||||||||||||||||
PIMCO Long-Term Credit Bond Fund | 474 | 466 | 0 | 0 | (52 | ) | 888 | 31 | 0 | |||||||||||||||||||||||||||
PIMCO Long-Term Real Return Fund | 821 | 421 | 0 | 0 | 19 | 1,261 | 27 | 0 | ||||||||||||||||||||||||||||
PIMCO Real Return Fund | 454 | 302 | 0 | 0 | (6 | ) | 750 | 17 | 0 | |||||||||||||||||||||||||||
PIMCO Short-Term Floating NAV Portfolio III | 2,508 | 8,655 | (6,800 | ) | (1 | ) | 1 | 4,363 | 55 | 0 | ||||||||||||||||||||||||||
PIMCO Total Return Fund | 466 | 425 | 0 | 0 | (18 | ) | 873 | 14 | 0 | |||||||||||||||||||||||||||
Totals | $ | 8,833 | $ | 12,728 | $ | (8,854 | ) | $ | (2 | ) | $ | (219 | ) | $ | 12,486 | $ | 360 | $ | 15 | |||||||||||||||||
| 78 | PIMCO EQUITY SERIES |
Table of Contents
June 30, 2018
PIMCO REALPATH® Blend 2050 Fund
| Underlying PIMCO Funds | Market Value 06/30/2017 | Purchases at Cost | Proceeds from Sales | Net Realized Gain (Loss) | Change in Unrealized Appreciation (Depreciation) | Market Value 06/30/2018 | Dividend Income(1) | Realized Net Capital Gain Distributions(1) | ||||||||||||||||||||||||||||
PIMCO Emerging Local Bond Fund | $ | 644 | $ | 243 | $ | (536 | ) | $ | 28 | $ | (21 | ) | $ | 358 | $ | 25 | $ | 0 | ||||||||||||||||||
PIMCO High Yield Fund | 1,280 | 705 | (1,113 | ) | (33 | ) | (30 | ) | 809 | 67 | 0 | |||||||||||||||||||||||||
PIMCO Income Fund | 1,697 | 935 | (990 | ) | (7 | ) | (53 | ) | 1,582 | 104 | 0 | |||||||||||||||||||||||||
PIMCO International Bond Fund (U.S. Dollar-Hedged) | 316 | 120 | 0 | 0 | 9 | 445 | 7 | 0 | ||||||||||||||||||||||||||||
PIMCO Long Duration Total Return Fund | 465 | 576 | 0 | 0 | (52 | ) | 989 | 27 | 15 | |||||||||||||||||||||||||||
PIMCO Long-Term Credit Bond Fund | 465 | 562 | 0 | 0 | (53 | ) | 974 | 32 | 0 | |||||||||||||||||||||||||||
PIMCO Long-Term Real Return Fund | 893 | 484 | 0 | 0 | 22 | 1,399 | 29 | 0 | ||||||||||||||||||||||||||||
PIMCO Real Return Fund | 516 | 295 | (135 | ) | (1 | ) | (5 | ) | 670 | 17 | 0 | |||||||||||||||||||||||||
PIMCO Short-Term Floating NAV Portfolio III | 3,110 | 14,371 | (12,200 | ) | (2 | ) | 1 | 5,280 | 71 | 0 | ||||||||||||||||||||||||||
PIMCO Total Return Fund | 411 | 383 | 0 | 0 | (15 | ) | 779 | 12 | 0 | |||||||||||||||||||||||||||
Totals | $ | 9,797 | $ | 18,674 | $ | (14,974 | ) | $ | (15 | ) | $ | (197 | ) | $ | 13,285 | $ | 391 | $ | 15 | |||||||||||||||||
PIMCO REALPATH® Blend 2055 Fund
| Underlying PIMCO Funds | Market Value 06/30/2017 | Purchases at Cost | Proceeds from Sales | Net Realized Gain (Loss) | Change in Unrealized Appreciation (Depreciation) | Market Value 06/30/2018 | Dividend Income(1) | Realized Net Capital Gain Distributions(1) | ||||||||||||||||||||||||||||
PIMCO Emerging Local Bond Fund | $ | 110 | $ | 36 | $ | (87 | ) | $ | 7 | $ | (4 | ) | $ | 62 | $ | 3 | $ | 0 | ||||||||||||||||||
PIMCO High Yield Fund | 228 | 112 | (176 | ) | (4 | ) | (7 | ) | 153 | 11 | 0 | |||||||||||||||||||||||||
PIMCO Income Fund | 308 | 161 | (158 | ) | 0 | (9 | ) | 302 | 17 | 0 | ||||||||||||||||||||||||||
PIMCO International Bond Fund (U.S. Dollar-Hedged) | 54 | 22 | 0 | 0 | 2 | 78 | 1 | 0 | ||||||||||||||||||||||||||||
PIMCO Long Duration Total Return Fund | 80 | 112 | 0 | 0 | (8 | ) | 184 | 5 | 2 | |||||||||||||||||||||||||||
PIMCO Long-Term Credit Bond Fund | 80 | 109 | 0 | 0 | (8 | ) | 181 | 6 | 0 | |||||||||||||||||||||||||||
PIMCO Long-Term Real Return Fund | 163 | 79 | 0 | 0 | 4 | 246 | 6 | 0 | ||||||||||||||||||||||||||||
PIMCO Real Return Fund | 88 | 48 | (19 | ) | 0 | (1 | ) | 116 | 3 | 0 | ||||||||||||||||||||||||||
PIMCO Short-Term Floating NAV Portfolio III | 503 | 1,413 | (900 | ) | 0 | 0 | 1,016 | 12 | 0 | |||||||||||||||||||||||||||
PIMCO Total Return Fund | 70 | 80 | 0 | 0 | (3 | ) | 147 | 2 | 0 | |||||||||||||||||||||||||||
Totals | $ | 1,684 | $ | 2,172 | $ | (1,340 | ) | $ | 3 | $ | (34 | ) | $ | 2,485 | $ | 66 | $ | 2 | ||||||||||||||||||
PIMCO REALPATH® Blend Income Fund
| Underlying PIMCO Funds | Market Value 06/30/2017 | Purchases at Cost | Proceeds from Sales | Net Realized Gain (Loss) | Change in Unrealized Appreciation (Depreciation) | Market Value 06/30/2018 | Dividend Income(1) | Realized Net Capital Gain Distributions(1) | ||||||||||||||||||||||||||||
PIMCO Emerging Local Bond Fund | $ | 192 | $ | 488 | $ | (46 | ) | $ | 1 | $ | (44 | ) | $ | 591 | $ | 16 | $ | 0 | ||||||||||||||||||
PIMCO High Yield Fund | 390 | 1,017 | (132 | ) | (2 | ) | (42 | ) | 1,231 | 42 | 0 | |||||||||||||||||||||||||
PIMCO Income Fund | 1,050 | 3,525 | (590 | ) | (9 | ) | (116 | ) | 3,860 | 134 | 0 | |||||||||||||||||||||||||
PIMCO International Bond Fund (U.S. Dollar-Hedged) | 476 | 1,245 | (274 | ) | (1 | ) | 19 | 1,465 | 20 | 0 | ||||||||||||||||||||||||||
PIMCO Long Duration Total Return Fund | 186 | 633 | (25 | ) | (1 | ) | (48 | ) | 745 | 18 | 13 | |||||||||||||||||||||||||
PIMCO Long-Term Credit Bond Fund | 184 | 620 | (21 | ) | 0 | (48 | ) | 735 | 21 | 0 | ||||||||||||||||||||||||||
PIMCO Long-Term Real Return Fund | 398 | 1,026 | (427 | ) | (6 | ) | 7 | 998 | 18 | 0 | ||||||||||||||||||||||||||
PIMCO Real Return Fund | 763 | 2,055 | (522 | ) | (6 | ) | (24 | ) | 2,266 | 47 | 0 | |||||||||||||||||||||||||
PIMCO Short-Term Floating NAV Portfolio III | 109 | 9,109 | (8,200 | ) | 0 | 0 | 1,018 | 9 | 0 | |||||||||||||||||||||||||||
PIMCO Total Return Fund | 655 | 2,397 | (342 | ) | (8 | ) | (51 | ) | 2,651 | 35 | 0 | |||||||||||||||||||||||||
Totals | $ | 4,403 | $ | 22,115 | $ | (10,579 | ) | $ | (32 | ) | $ | (347 | ) | $ | 15,560 | $ | 360 | $ | 13 | |||||||||||||||||
| † | A zero balance may reflect actual amounts rounding to less than one thousand. |
| (1) | The tax characterization of distributions is determined in accordance with Federal income tax regulations and may contain a return of capital. The actual tax characterization of distributions received is determined at the end of the fiscal year of the affiliated fund. See Note 2, Distributions to Shareholders, in the Notes to Financial Statements for more information. |
(b) Investments in Securities
The Funds (and where applicable, certain Acquired Funds and Underlying PIMCO Funds) may utilize the investments and strategies described below to the extent permitted by each Fund’s respective investment policies.
| ANNUAL REPORT | JUNE 30, 2018 | 79 |
Table of Contents
Notes to Financial Statements (Cont.)
Securities Issued by U.S. Government Agencies or Government-Sponsored Enterprises are obligations of and, in certain cases, guaranteed by, the U.S. Government, its agencies or instrumentalities. Some U.S. Government securities, such as Treasury bills, notes and bonds, and securities guaranteed by the Government National Mortgage Association (“GNMA” or “Ginnie Mae”), are supported by the full faith and credit of the U.S. Government; others, such as those of the Federal Home Loan Banks, are supported by the right of the issuer to borrow from the U.S. Department of the Treasury (the “U.S. Treasury”); and others, such as those of the Federal National Mortgage Association (“FNMA” or “Fannie Mae”), are supported by the discretionary authority of the U.S. Government to purchase the agency’s obligations. U.S. Government securities may include zero coupon securities. Zero coupon securities do not distribute interest on a current basis and tend to be subject to a greater risk than interest-paying securities.
Government-related guarantors (i.e., not backed by the full faith and credit of the U.S. Government) include FNMA and the Federal Home Loan Mortgage Corporation (“FHLMC” or “Freddie Mac”). FNMA is a government-sponsored corporation. FNMA purchases conventional (i.e., not insured or guaranteed by any government agency) residential mortgages from a list of approved seller/servicers which include state and federally chartered savings and loan associations, mutual savings banks, commercial banks and credit unions and mortgage bankers. Pass-through securities issued by FNMA are guaranteed as to timely payment of principal and interest by FNMA, but are not backed by the full faith and credit of the U.S. Government. FHLMC issues Participation Certificates (“PCs”), which are pass-through securities, each representing an undivided interest in a pool of residential mortgages. FHLMC guarantees the timely payment of interest and ultimate collection of principal, but PCs are not backed by the full faith and credit of the U.S. Government.
5. BORROWINGS AND OTHER FINANCING TRANSACTIONS
The Funds (and where applicable, certain Acquired Funds and Underlying PIMCO Funds) may enter into the borrowings and other financing transactions described below to the extent permitted by each Fund’s respective investment policies.
The following disclosures contain information on a Fund’s ability to lend or borrow cash or securities to the extent permitted under the Act, which may be viewed as borrowing or financing transactions by a Fund. The location of these instruments in each Fund’s financial statements is described below.
(a) Repurchase Agreements Under the terms of a typical repurchase agreement, a Fund purchases an underlying debt obligation (collateral)
subject to an obligation of the seller to repurchase, and a Fund to resell, the obligation at an agreed-upon price and time. In an open maturity repurchase agreement, there is no pre-determined repurchase date and the agreement can be terminated by the Fund or counterparty at any time. The underlying securities for all repurchase agreements are held by a Fund’s custodian or designated subcustodians under tri-party repurchase agreements and in certain instances will remain in custody with the counterparty. The market value of the collateral must be equal to or exceed the total amount of the repurchase obligations, including interest. Repurchase agreements, if any, including accrued interest, are included on the Statements of Assets and Liabilities. Interest earned is recorded as a component of interest income on the Statements of Operations. In periods of increased demand for collateral, a Fund may pay a fee for the receipt of collateral, which may result in interest expense to the Fund.
6. FINANCIAL DERIVATIVE INSTRUMENTS
The Funds (and where applicable, certain Acquired Funds and Underlying PIMCO Funds) may enter into the financial derivative instruments described below to the extent permitted by each Fund’s respective investment policies.
The following disclosures contain information on how and why the Funds use financial derivative instruments, and how financial derivative instruments affect the Funds’ financial position, results of operations and cash flows. The location and fair value amounts of these instruments on the Statements of Assets and Liabilities and the net realized gain (loss) and net change in unrealized appreciation (depreciation) on the Statements of Operations, each categorized by type of financial derivative contract and related risk exposure, are included in a table in the Notes to Schedules of Investments. The financial derivative instruments outstanding as of period end and the amounts of net realized gain (loss) and net change in unrealized appreciation (depreciation) on financial derivative instruments during the period, as disclosed in the Notes to Schedules of Investments, serve as indicators of the volume of financial derivative activity for the Funds.
(a) Futures Contracts are agreements to buy or sell a security or other asset for a set price on a future date. A Fund may use futures contracts to manage its exposure to the securities markets or to movements in interest rates and currency values. The primary risks associated with the use of futures contracts are the imperfect correlation between the change in market value of the securities held by a Fund and the prices of futures contracts and the possibility of an illiquid market. Futures contracts are valued based upon their quoted daily settlement prices. Upon entering into a futures contract, a Fund is required to deposit with its futures broker an amount of cash, U.S. Government and Agency Obligations, or select sovereign debt, in accordance with the
| 80 | PIMCO EQUITY SERIES |
Table of Contents
June 30, 2018
initial margin requirements of the broker or exchange. Futures contracts are marked to market daily and based on such movements in the price of the contracts, an appropriate payable or receivable for the change in value may be posted or collected by the Fund (“Futures Variation Margin”). Gains (losses) are recognized but not considered realized until the contracts expire or close. Futures contracts involve, to varying degrees, risk of loss in excess of the Futures Variation Margin included within exchange traded or centrally cleared financial derivative instruments on the Statements of Assets and Liabilities.
(b) Options Contracts may be written or purchased to enhance returns or to hedge an existing position or future investment. A Fund may write call and put options on securities and financial derivative instruments it owns or in which it may invest. Writing put options tends to increase a Fund’s exposure to the underlying instrument. Writing call options tends to decrease a Fund’s exposure to the underlying instrument. When a Fund writes a call or put, an amount equal to the premium received is recorded and subsequently marked to market to reflect the current value of the option written. These amounts are included on the Statements of Assets and Liabilities. Premiums received from writing options which expire are treated as realized gains. Premiums received from writing options which are exercised or closed are added to the proceeds or offset against amounts paid on the underlying futures, swap, security or currency transaction to determine the realized gain (loss). Certain options may be written with premiums to be determined on a future date. The premiums for these options are based upon implied volatility parameters at specified terms. A Fund as a writer of an option has no control over whether the underlying instrument may be sold (“call”) or purchased (“put”) and as a result bears the market risk of an unfavorable change in the price of the instrument underlying the written option. There is the risk a Fund may not be able to enter into a closing transaction because of an illiquid market.
Purchasing call options tends to increase a Fund’s exposure to the underlying instrument. Purchasing put options tends to decrease a Fund’s exposure to the underlying instrument. A Fund pays a premium which is included as an asset on the Statements of Assets and Liabilities and subsequently marked to market to reflect the current value of the option. Premiums paid for purchasing options which expire are treated as realized losses. Certain options may be purchased with premiums to be determined on a future date. The premiums for these options are based upon implied volatility parameters at specified terms. The risk associated with purchasing put and call options is limited to the premium paid. Premiums paid for purchasing options which are exercised or closed are added to the amounts paid or offset against the proceeds on the underlying investment transaction to determine the realized gain (loss) when the underlying transaction is executed.
Options on Indices (“Index Option”) use a specified index as the underlying instrument for the option contract. The exercise for an Index Option will not include physical delivery of the underlying index but will result in a cash transfer of the amount of the difference between the settlement price of the underlying index and the strike price.
(c) Swap Agreements are bilaterally negotiated agreements between a Fund and a counterparty to exchange or swap investment cash flows, assets, foreign currencies or market-linked returns at specified, future intervals. Swap agreements may be privately negotiated in the over the counter market (“OTC swaps”) or may be cleared through a third party, known as a central counterparty or derivatives clearing organization (“Centrally Cleared Swaps”). A Fund may enter into asset, credit default, cross-currency, interest rate, total return, variance and other forms of swap agreements to manage its exposure to credit, currency, interest rate, commodity, equity and inflation risk. In connection with these agreements, securities or cash may be identified as collateral or margin in accordance with the terms of the respective swap agreements to provide assets of value and recourse in the event of default or bankruptcy/insolvency.
Centrally Cleared Swaps are marked to market daily based upon valuations as determined from the underlying contract or in accordance with the requirements of the central counterparty or derivatives clearing organization. Changes in market value, if any, are reflected as a component of net change in unrealized appreciation (depreciation) on the Statements of Operations. Daily changes in valuation of centrally cleared swaps (“Swap Variation Margin”), if any, are disclosed within centrally cleared financial derivative instruments on the Statements of Assets and Liabilities. Centrally Cleared and OTC swap payments received or paid at the beginning of the measurement period are included on the Statements of Assets and Liabilities and represent premiums paid or received upon entering into the swap agreement to compensate for differences between the stated terms of the swap agreement and prevailing market conditions (credit spreads, currency exchange rates, interest rates, and other relevant factors). Upfront premiums received (paid) are initially recorded as liabilities (assets) and subsequently marked to market to reflect the current value of the swap. These upfront premiums are recorded as realized gain (loss) on the Statements of Operations upon termination or maturity of the swap. A liquidation payment received or made at the termination of the swap is recorded as realized gain (loss) on the Statements of Operations. Net periodic payments received or paid by a Fund are included as part of realized gain (loss) on the Statements of Operations.
For purposes of applying certain of a Fund’s investment policies and restrictions, swap agreements, like other derivative instruments, may be valued by a Fund at market value, notional value or full exposure value. In the case of a credit default swap, in applying certain of a Fund’s
| ANNUAL REPORT | JUNE 30, 2018 | 81 |
Table of Contents
Notes to Financial Statements (Cont.)
investment policies and restrictions, the Funds will value the credit default swap at its notional value or its full exposure value (i.e., the sum of the notional amount for the contract plus the market value), but may value the credit default swap at market value for purposes of applying certain of a Fund’s other investment policies and restrictions. For example, a Fund may value credit default swaps at full exposure value for purposes of a Fund’s credit quality guidelines (if any) because such value in general better reflects a Fund’s actual economic exposure during the term of the credit default swap agreement. As a result, a Fund may, at times, have notional exposure to an asset class (before netting) that is greater or lesser than the stated limit or restriction noted in a Fund’s prospectus. In this context, both the notional amount and the market value may be positive or negative depending on whether a Fund is selling or buying protection through the credit default swap. The manner in which certain securities or other instruments are valued by a Fund for purposes of applying investment policies and restrictions may differ from the manner in which those investments are valued by other types of investors.
Entering into swap agreements involves, to varying degrees, elements of interest, credit, market and documentation risk in excess of the amounts recognized on the Statements of Assets and Liabilities. Such risks involve the possibility that there will be no liquid market for these agreements, that the counterparty to the agreements may default on its obligation to perform or disagree as to the meaning of contractual terms in the agreements and that there may be unfavorable changes in interest rates or the values of the asset upon which the swap is based.
A Fund’s maximum risk of loss from counterparty credit risk is the discounted net value of the cash flows to be received from the
counterparty over the contract’s remaining life, to the extent that amount is positive. The risk may be mitigated by having a master netting arrangement between a Fund and the counterparty and by the posting of collateral to a Fund to cover a Fund’s exposure to the counterparty.
To the extent a Fund has a policy to limit the net amount owed to or to be received from a single counterparty under existing swap agreements, such limitation only applies to counterparties to OTC swaps and does not apply to centrally cleared swaps where the counterparty is a central counterparty or derivatives clearing organization.
Total Return Swap Agreements are entered into to gain or mitigate exposure to the underlying reference asset. Total return swap agreements involve commitments where single or multiple cash flows are exchanged based on the price of an underlying reference asset and on a fixed or variable interest rate. Total return swap agreements may involve commitments to pay interest in exchange for a market-linked return. One counterparty pays out the total return of a specific underlying reference asset, which may include a single security, a basket of securities, or an index, and in return receives a fixed or variable rate. At the maturity date, a net cash flow is exchanged where the total return is equivalent to the return of the underlying reference asset less a financing rate, if any. As a receiver, a Fund would receive payments based on any net positive total return and would owe payments in the event of a net negative total return. As the payer, a Fund would owe payments on any net positive total return, and would receive payments in the event of a net negative total return.
7. PRINCIPAL RISKS
The principal risks of investing in a Fund, which could adversely affect its net asset value, yield and total return, are listed below.
| Risks | PIMCO REALPATH® Blend 2020 Fund | PIMCO REALPATH® Blend 2025 Fund | PIMCO REALPATH® Blend 2030 Fund | PIMCO REALPATH® Blend 2035 Fund | PIMCO REALPATH® Blend 2040 Fund | PIMCO REALPATH® Blend 2045 Fund | PIMCO REALPATH® Blend 2050 Fund | PIMCO REALPATH® Blend 2055 Fund | PIMCO REALPATH® Blend Income Fund | |||||||||||||||||||||||||||||||
New/Small Fund | X | X | X | X | X | X | X | X | X | |||||||||||||||||||||||||||||||
Allocation | X | X | X | X | X | X | X | X | X | |||||||||||||||||||||||||||||||
Acquired Fund | X | X | X | X | X | X | X | X | X | |||||||||||||||||||||||||||||||
Investment in Acquired Fund Risks | ||||||||||||||||||||||||||||||||||||||||
New/Small Fund | X | X | X | X | X | X | X | X | X | |||||||||||||||||||||||||||||||
Equity | X | X | X | X | X | X | X | X | X | |||||||||||||||||||||||||||||||
Value Investing | X | X | X | X | X | X | X | X | X | |||||||||||||||||||||||||||||||
Interest Rate | X | X | X | X | X | X | X | X | X | |||||||||||||||||||||||||||||||
Call | X | X | X | X | X | X | X | X | X | |||||||||||||||||||||||||||||||
Credit | X | X | X | X | X | X | X | X | X | |||||||||||||||||||||||||||||||
High Yield and Distressed Company | X | X | X | X | X | X | X | X | X | |||||||||||||||||||||||||||||||
Market | X | X | X | X | X | X | X | X | X | |||||||||||||||||||||||||||||||
Issuer | X | X | X | X | X | X | X | X | X | |||||||||||||||||||||||||||||||
Liquidity | X | X | X | X | X | X | X | X | X | |||||||||||||||||||||||||||||||
| 82 | PIMCO EQUITY SERIES |
Table of Contents
June 30, 2018
| Investment in Acquired Fund Risks | PIMCO REALPATH® Blend 2020 Fund | PIMCO REALPATH® Blend 2025 Fund | PIMCO REALPATH® Blend 2030 Fund | PIMCO REALPATH® Blend 2035 Fund | PIMCO REALPATH® Blend 2040 Fund | PIMCO REALPATH® Blend 2045 Fund | PIMCO REALPATH® Blend 2050 Fund | PIMCO REALPATH® Blend 2055 Fund | PIMCO REALPATH® Blend Income Fund | |||||||||||||||||||||||||||||||
Derivatives | X | X | X | X | X | X | X | X | X | |||||||||||||||||||||||||||||||
Commodity | X | X | X | X | X | X | X | X | X | |||||||||||||||||||||||||||||||
Mortgage-Related and Other Asset-Backed Securities | X | X | X | X | X | X | X | X | X | |||||||||||||||||||||||||||||||
Foreign (Non-U.S.) Investment | X | X | X | X | X | X | X | X | X | |||||||||||||||||||||||||||||||
Real Estate | X | X | X | X | X | X | X | X | X | |||||||||||||||||||||||||||||||
Emerging Markets | X | X | X | X | X | X | X | X | X | |||||||||||||||||||||||||||||||
Sovereign Debt | X | X | X | X | X | X | X | X | X | |||||||||||||||||||||||||||||||
Currency | X | X | X | X | X | X | X | X | X | |||||||||||||||||||||||||||||||
Leveraging | X | X | X | X | X | X | X | X | X | |||||||||||||||||||||||||||||||
Small-Cap and Mid-Cap Company | X | X | X | X | X | X | X | X | X | |||||||||||||||||||||||||||||||
Management | X | X | X | X | X | X | X | X | X | |||||||||||||||||||||||||||||||
Short Exposure | X | X | X | X | X | X | X | X | X | |||||||||||||||||||||||||||||||
Tax | X | X | X | X | X | X | X | X | X | |||||||||||||||||||||||||||||||
Subsidiary | X | X | X | X | X | X | X | X | X | |||||||||||||||||||||||||||||||
Arbitrage | X | X | X | X | X | X | X | X | X | |||||||||||||||||||||||||||||||
Convertible Securities | X | X | X | X | X | X | X | X | X | |||||||||||||||||||||||||||||||
Exchange-Traded Fund | X | X | X | X | X | X | X | X | X | |||||||||||||||||||||||||||||||
A Fund is generally subject to a different level and amount of risk relative to its target date and time horizon. The principal risks of investing in a Fund include risks from direct investments and/or for certain Funds that invest in Acquired Funds or Underlying PIMCO Funds, indirect exposure through investment in such Acquired Funds or Underlying PIMCO Funds. Please see “Description of Principal Risks” in a Fund’s prospectus for a more detailed description of the risks of investing in a Fund.
The following risks are principal risks of investing in a Fund.
New/Small Fund Risk is the risk that a new or smaller Fund’s performance may not represent how a Fund is expected to or may perform in the long term. In addition, new Funds have limited operating histories for investors to evaluate and new and smaller Funds may not attract sufficient assets to achieve investment and trading efficiencies.
Allocation Risk is the risk that a Fund could lose money as a result of less than optimal or poor asset allocation decisions. A Fund could miss attractive investment opportunities by underweighting markets that subsequently experience significant returns and could lose value by overweighting markets that subsequently experience significant declines.
Acquired Fund Risk is the risk that a Fund’s performance is closely related to the risks associated with the securities and other investments held by the Acquired Funds and that the ability of a Fund to achieve its investment objective will depend upon the ability of the Acquired Funds to achieve their investment objectives.
The following risks are principal risks of investing in a Fund that include risks from direct investments and/or indirect exposure through investment in Acquired Funds.
New/Small Fund Risk is the risk that a new or smaller Fund’s performance may not represent how a Fund is expected to or may perform in the long term. In addition, new Funds have limited operating histories for investors to evaluate and new and smaller Funds may not attract sufficient assets to achieve investment and trading efficiencies.
Equity Risk is the risk that the value of equity securities, such as common stocks and preferred securities, may decline due to general market conditions which are not specifically related to a particular company or to factors affecting a particular industry or industries. Equity securities generally have greater price volatility than fixed income securities.
Value Investing Risk is the risk that a value stock may decrease in price or may not increase in price as anticipated by PIMCO if it continues to be undervalued by the market or the factors that the portfolio manager believes will cause the stock price to increase do not occur.
Interest Rate Risk is the risk that fixed income securities will decline in value because of an increase in interest rates; a fund with a longer average portfolio duration will be more sensitive to changes in interest rates than a fund with a shorter average portfolio duration.
Call Risk is the risk that an issuer may exercise its right to redeem a fixed income security earlier than expected (a call). Issuers may call
| ANNUAL REPORT | JUNE 30, 2018 | 83 |
Table of Contents
Notes to Financial Statements (Cont.)
outstanding securities prior to their maturity for a number of reasons (e.g., declining interest rates, changes in credit spreads and improvements in the issuer’s credit quality). If an issuer calls a security that a Fund has invested in, a Fund may not recoup the full amount of its initial investment and may be forced to reinvest in lower-yielding securities, securities with greater credit risks or securities with other, less favorable features.
Credit Risk is the risk that a Fund could lose money if the issuer or guarantor of a fixed income security, or the counterparty to a derivative contract, is unable or unwilling to meet its financial obligations.
High Yield and Distressed Company Risk is the risk that high yield securities and unrated securities of similar credit quality (commonly known as “junk bonds”) and securities of distressed companies may be subject to greater levels of credit, issuer and liquidity risks. Securities of distressed companies include both debt and equity securities. High yield securities and debt securities of distressed companies are considered primarily speculative with respect to the issuer’s continuing ability to make principal and interest payments. Distressed companies may be engaged in restructurings or bankruptcy proceedings.
Market Risk is the risk that the value of securities owned by a Fund may go up or down, sometimes rapidly or unpredictably, due to factors affecting securities markets generally or particular industries.
Issuer Risk is the risk that the value of a security may decline for a reason directly related to the issuer, such as management performance, financial leverage and reduced demand for the issuer’s goods or services.
Liquidity Risk is the risk that a particular investment may be difficult to purchase or sell and that a Fund may be unable to sell illiquid securities at an advantageous time or price or achieve its desired level of exposure to a certain sector. Liquidity risk may result from the lack of an active market, reduced number and capacity of traditional market participants to make a market in fixed income securities, and may be magnified in a rising interest rate environment or other circumstances where investor redemptions from fixed income mutual funds may be higher than normal, causing increased supply in the market due to selling activity.
Derivatives Risk is the risk of investing in derivative instruments (such as futures, swaps and structured securities), including leverage, liquidity, interest rate, market, credit and management risks, mispricing or valuation complexity. Changes in the value of the derivative may not correlate perfectly with, and may be more sensitive to market events than, the underlying asset, rate or index, and a Fund could lose more than the initial amount invested. A Fund’s use of derivatives may result in losses to the Fund, a reduction in a Fund’s returns and/or increased
volatility. Over-the-counter (“OTC”) derivatives are also subject to the risk that a counterparty to the transaction will not fulfill its contractual obligations to the other party, as many of the protections afforded to centrally-cleared derivative transactions might not be available for OTC derivatives. For derivatives traded on an exchange or through a central counterparty, credit risk resides with the Fund’s clearing broker, or the clearinghouse itself, rather than with a counterparty in an OTC derivative transaction. Changes in regulation relating to a mutual fund’s use of derivatives and related instruments could potentially limit or impact a Fund’s ability to invest in derivatives, limit a Fund’s ability to employ certain strategies that use derivatives and/or adversely affect the value of derivatives and a Fund’s performance.
Commodity Risk is the risk that investing in commodity-linked derivative instruments may subject a Fund to greater volatility than investments in traditional securities. The value of commodity-linked derivative instruments may be affected by changes in overall market movements, commodity index volatility, changes in interest rates, or factors affecting a particular industry or commodity, such as drought, floods, weather, livestock disease, embargoes, tariffs and international economic, political and regulatory developments.
Mortgage-Related and Other Asset-Backed Securities Risk is the risk of investing in mortgage-related and other asset-backed securities, including interest rate risk, extension risk, prepayment risk and credit risk.
Foreign (Non-U.S.) Investment Risk is the risk that investing in foreign (non-U.S.) securities may result in a Fund experiencing more rapid and extreme changes in value than a fund that invests exclusively in securities of U.S. companies, due to smaller markets, differing reporting, accounting and auditing standards, increased risk of delayed settlement of portfolio transactions or loss of certificates of portfolio securities, and the risk of unfavorable foreign government actions, including nationalization, expropriation or confiscatory taxation, currency blockage, or political changes or diplomatic developments. Foreign securities may also be less liquid and more difficult to value than securities of U.S. issuers.
Real Estate Risk is the risk that a Fund’s investments in Real Estate Investment Trusts (“REITs”) or real estate-linked derivative instruments will subject a Fund to risks similar to those associated with direct ownership of real estate, including losses from casualty or condemnation, and changes in local and general economic conditions, supply and demand, interest rates, zoning laws, regulatory limitations on rents, property taxes and operating expenses. A Fund’s investments in REITs or real estate-linked derivative instruments subject it to management and tax risks. In addition, privately traded REITs subject a Fund to liquidity and valuation risk.
| 84 | PIMCO EQUITY SERIES |
Table of Contents
June 30, 2018
Emerging Markets Risk is the risk of investing in emerging market securities, primarily increased foreign (non-U.S.) investment risk.
Sovereign Debt Risk is the risk that investments in fixed income instruments issued by sovereign entities may decline in value as a result of default or other adverse credit event resulting from an issuer’s inability or unwillingness to make principal or interest payments in a timely fashion.
Currency Risk is the risk that foreign (non-U.S.) currencies will change in value relative to the U.S. dollar and affect a Fund’s investments in foreign (non-U.S.) currencies or in securities that trade in, and receive revenues in, or in derivatives that provide exposure to, foreign (non-U.S.) currencies.
Leveraging Risk is the risk that certain transactions of a Fund, such as reverse repurchase agreements, loans of portfolio securities, and the use of when-issued, delayed delivery or forward commitment transactions, or derivative instruments, may give rise to leverage, magnifying gains and losses and causing a Fund to be more volatile than if it had not been leveraged. This means that leverage entails a heightened risk of loss.
Small-Cap and Mid-Cap Company Risk is the risk that the value of securities issued by small-capitalization and mid-capitalization companies may go up or down, sometimes rapidly and unpredictably, due to narrow markets and limited managerial and financial resources.
Management Risk is the risk that the investment techniques and risk analyses applied by PIMCO will not produce the desired results and that legislative, regulatory, or tax restrictions, policies or developments may affect the investment techniques available to PIMCO and the individual portfolio manager in connection with managing a Fund. There is no guarantee that the investment objective of a Fund will be achieved.
Short Exposure Risk is the risk of entering into short sales, including the potential loss of more money than the actual cost of the investment, and the risk that the third party to the short sale will not fulfill its contractual obligations, causing a loss to a Fund.
Tax Risk is the risk that the tax treatment of swap agreements and other derivative instruments, such as commodity-linked derivative instruments, including commodity index-linked notes, swap agreements, commodity options, futures, and options on futures, may be affected by future regulatory or legislative changes that could affect whether income from such investments is “qualifying income” under Subchapter M of the Internal Revenue Code, or otherwise affect the character, timing and/or amount of the Fund’s taxable income or gains and distributions.
Subsidiary Risk is the risk that, by investing in certain Underlying PIMCO Funds that invest in a subsidiary (each a “Subsidiary”), a Fund is indirectly exposed to the risks associated with a Subsidiary’s investments. The Subsidiaries are not registered under the 1940 Act and may not be subject to all the investor protections of the 1940 Act. There is no guarantee that the investment objective of a Subsidiary will be achieved.
Arbitrage Risk is the risk that securities purchased pursuant to an arbitrage strategy intended to take advantage of a perceived relationship between the value of two securities may not perform as expected.
Convertible Securities Risk is the risk that arises when convertible securities share both fixed income and equity characteristics. Convertible securities are subject to risks to which fixed income and equity investments are subject. These risks include equity risk, interest rate risk and credit risk.
Exchange-Traded Fund Risk is the risk that an exchange-traded fund may not track the performance of the index it is designed to track, market prices of shares of an exchange-traded fund may fluctuate rapidly and materially, or shares of an exchange-traded fund may trade significantly above or below net asset value, any of which may cause losses to a Fund invested in the exchange-traded fund.
8. MASTER NETTING ARRANGEMENTS
A Fund may be subject to various netting arrangements (“Master Agreements”) with select counterparties. Master Agreements govern the terms of certain transactions, and are intended to reduce the counterparty risk associated with relevant transactions by specifying credit protection mechanisms and providing standardization that is intended to improve legal certainty. Each type of Master Agreement governs certain types of transactions. Different types of transactions may be traded out of different legal entities or affiliates of a particular organization, resulting in the need for multiple agreements with a single counterparty. As the Master Agreements are specific to unique operations of different asset types, they allow a Fund to close out and net its total exposure to a counterparty in the event of a default with respect to all the transactions governed under a single Master Agreement with a counterparty. For financial reporting purposes the Statements of Assets and Liabilities generally present derivative assets and liabilities on a gross basis, which reflects the full risks and exposures prior to netting.
Master Agreements can also help limit counterparty risk by specifying collateral posting arrangements at pre-arranged exposure levels. Under most Master Agreements, collateral is routinely transferred if the total net exposure to certain transactions (net of existing collateral already in place) governed under the relevant Master Agreement with a
| ANNUAL REPORT | JUNE 30, 2018 | 85 |
Table of Contents
Notes to Financial Statements (Cont.)
counterparty in a given account exceeds a specified threshold, which typically ranges from zero to $250,000 depending on the counterparty and the type of Master Agreement. United States Treasury Bills and U.S. dollar cash are generally the preferred forms of collateral, although other forms of AAA rated paper or sovereign securities may be used depending on the terms outlined in the applicable Master Agreement. Securities and cash pledged as collateral are reflected as assets on the Statements of Assets and Liabilities as either a component of Investments at value (securities) or Deposits with counterparty. Cash collateral received is not typically held in a segregated account and as such is reflected as a liability on the Statements of Assets and Liabilities as Deposits from counterparty. The market value of any securities received as collateral is not reflected as a component of NAV. A Fund’s overall exposure to counterparty risk can change substantially within a short period, as it is affected by each transaction subject to the relevant Master Agreement.
Master Repurchase Agreements and Global Master Repurchase Agreements (individually and collectively “Master Repo Agreements”) govern repurchase, reverse repurchase, and sale-buyback transactions between a Fund and select counterparties. Master Repo Agreements maintain provisions for, among other things, initiation, income payments, events of default, and maintenance of collateral. The market value of transactions under the Master Repo Agreement, collateral pledged or received, and the net exposure by counterparty as of period end are disclosed in the Notes to Schedules of Investments.
Master Securities Forward Transaction Agreements (“Master Forward Agreements”) govern certain forward settling transactions, such as TBA securities, delayed-delivery or sale-buyback transactions by and between a Fund and select counterparties. The Master Forward Agreements maintain provisions for, among other things, transaction initiation and confirmation, payment and transfer, events of default, termination, and maintenance of collateral. The market value of forward settling transactions, collateral pledged or received, and the net exposure by counterparty as of period end is disclosed in the Notes to Schedules of Investments.
Customer Account Agreements and related addenda govern cleared derivatives transactions such as futures, options on futures, and cleared OTC derivatives. Such transactions require posting of initial margin as determined by each relevant clearing agency which is segregated in an account at a futures commission merchant (“FCM”) registered with the Commodity Futures Trading Commission (“CFTC”). In the United States, counterparty risk may be reduced as creditors of an FCM cannot
have a claim to Fund assets in the segregated account. Portability of exposure reduces risk to the Funds. Variation margin, or changes in market value, are exchanged daily, but may not be netted between futures and cleared OTC derivatives unless the parties have agreed to a separate arrangement in respect of portfolio margining. The market value or accumulated unrealized appreciation (depreciation), initial margin posted, and any unsettled variation margin as of period end are disclosed in the Notes to Schedules of Investments.
International Swaps and Derivatives Association, Inc. Master Agreements and Credit Support Annexes (“ISDA Master Agreements”) govern bilateral OTC derivative transactions entered into by a Fund with select counterparties. ISDA Master Agreements maintain provisions for general obligations, representations, agreements, collateral posting and events of default or termination. Events of termination include conditions that may entitle counterparties to elect to terminate early and cause settlement of all outstanding transactions under the applicable ISDA Master Agreement. Any election to terminate early could be material to the financial statements. In limited circumstances, the ISDA Master Agreement may contain additional provisions that add counterparty protection beyond coverage of existing daily exposure if the counterparty has a decline in credit quality below a predefined level. These amounts, if any, may be segregated with a third-party custodian. The market value of OTC financial derivative instruments, collateral received or pledged, and net exposure by counterparty as of period end are disclosed in the Notes to Schedules of Investments.
9. FEES AND EXPENSES
(a) Investment Advisory Fee PIMCO is a majority-owned subsidiary of Allianz Asset Management of America L.P. (“Allianz Asset Management”) and serves as the Adviser to the Trust, pursuant to an investment advisory contract. The Adviser receives a monthly fee from each Fund at an annual rate based on average daily net assets (the “Investment Advisory Fee”). The Investment Advisory Fee for all classes is charged at an annual rate as noted in the table in note (b) below.
(b) Supervisory and Administrative Fee PIMCO serves as administrator (the “Administrator”) and provides supervisory and administrative services to the Trust for which it receives a monthly supervisory and administrative fee based on each share class’s average daily net assets (the “Supervisory and Administrative Fee”). As the Administrator, PIMCO bears the costs of various third-party services, including audit, custodial, portfolio accounting, legal, transfer agency and printing costs.
| 86 | PIMCO EQUITY SERIES |
Table of Contents
June 30, 2018
The Investment Advisory Fees and Supervisory and Administrative Fees for all classes, as applicable, are charged at the annual rate as noted in the following table (calculated as a percentage of each Fund’s average daily net assets attributable to each class):
| Investment Advisory Fee | Supervisory and Administrative Fee | |||||||||||||||||||||||||||
| Fund Name | All Classes | Institutional Class | Administrative Class | Class A | Class R | |||||||||||||||||||||||
PIMCO REALPATH® Blend 2020 Fund | 0.01% | 0.02% | 0.02% | 0.27% | 0.27% | * | ||||||||||||||||||||||
PIMCO REALPATH® Blend 2025 Fund | 0.01% | 0.02% | 0.02% | 0.27% | 0.27% | * | ||||||||||||||||||||||
PIMCO REALPATH® Blend 2030 Fund | 0.02% | 0.02% | 0.02% | 0.27% | 0.27% | * | ||||||||||||||||||||||
PIMCO REALPATH® Blend 2035 Fund | 0.03% | 0.02% | 0.02% | 0.27% | 0.27% | * | ||||||||||||||||||||||
PIMCO REALPATH® Blend 2040 Fund | 0.03% | 0.02% | 0.02% | 0.27% | 0.27% | * | ||||||||||||||||||||||
PIMCO REALPATH® Blend 2045 Fund | 0.03% | 0.02% | 0.02% | 0.27% | 0.27% | * | ||||||||||||||||||||||
PIMCO REALPATH® Blend 2050 Fund | 0.03% | 0.02% | 0.02% | 0.27% | 0.27% | * | ||||||||||||||||||||||
PIMCO REALPATH® Blend 2055 Fund | 0.03% | 0.02% | 0.02% | 0.27% | 0.27% | * | ||||||||||||||||||||||
PIMCO REALPATH® Blend Income Fund | 0.01% | 0.02% | 0.02% | 0.27% | 0.27% | * | ||||||||||||||||||||||
| * | This particular share class has been registered with the SEC, but has not yet launched. |
(c) Distribution and Servicing Fees PIMCO Investments LLC, a wholly-owned subsidiary of PIMCO, serves as the distributor (“Distributor”) of the Trust’s shares.
The Trust has adopted separate Distribution and Servicing Plans with respect to the Class A and Class R shares of the Trust pursuant to Rule 12b-1 under the Act. In connection with the distribution of Class R shares of the Trust, the Distributor receives distribution fees from the Trust of up to 0.25% for Class R shares and in connection with personal services rendered to Class A and Class R shareholders and the maintenance of such shareholder accounts, the Distributor receives servicing fees from the Trust of up to 0.25% for each of Class A and Class R shares (percentages reflect annual rates of the average daily net assets attributable to the applicable class).
The Trust has adopted a Distribution and Servicing Plan with respect to the Administrative Class shares of each Fund pursuant to Rule 12b-1 under the Act (the “Administrative Class Plan”). Under the terms of the Administrative Class Plan, a Fund may compensate the Distributor for providing, or procuring through financial intermediaries, distribution, administrative, recordkeeping, shareholder and/or related services with respect to Administrative Class shares. The Administrative Class Plan permits a Fund to make total payments at an annual rate of up to 0.25% of the average daily net assets attributable to the Administrative Class shares.
The Trust paid distribution and servicing fees at effective rates as noted in the following table (calculated as a percentage of each Fund’s average daily net assets attributable to each class):
| Distribution Fee | Servicing Fee | |||||||||||
Administrative Class | — | 0.25% | ||||||||||
Class A | — | 0.25% | ||||||||||
Class R | 0.25% | * | 0.25% | * | ||||||||
| * | This particular share class has been registered with the SEC, but has not yet launched. |
The Distributor also received the proceeds of the initial sales charges paid by the shareholders upon the purchase of Class A shares and the contingent deferred sales charges paid by the shareholders upon certain redemptions of Class A and Class C shares. For the period ended June 30, 2018, the Distributor retained $95,781 representing commissions (sales charges) and contingent deferred sales charges from the Trust.
(d) Fund Expenses PIMCO provides or procures supervisory and administrative services for shareholders and also bears the costs of various third-party services required by the Funds, including audit, custodial, portfolio accounting, legal, transfer agency and printing costs. The Trust is responsible for the following expenses: (i) taxes and governmental fees; (ii) brokerage fees and commissions and other portfolio transaction expenses; (iii) the costs of borrowing money, including interest expense; (iv) fees and expenses of the Trustees who are not “interested persons” of PIMCO or the Trust, and any counsel retained exclusively for their benefit; (v) extraordinary expense, including costs of litigation and indemnification expenses; (vi) organizational expenses; and (vii) any expenses allocated or allocable to a specific class of shares, which include service fees payable with respect to the Administrative Class Shares, and may include certain other expenses as permitted by the Trust’s Multi-Class Plan adopted pursuant to Rule 18f-3 under the Act and subject to review and approval by the Trustees. The ratio of expenses to average net assets per share class, as disclosed on the Financial Highlights, may differ from the annual fund operating expenses per share class.
Each Trustee, other than those affiliated with PIMCO or its affiliates, receives an annual retainer of $62,000, plus $6,250 for each Board meeting attended in person, $375 ($750 in the case of the audit committee chair with respect to audit committee meetings) for each committee meeting attended and $750 for each Board meeting
| ANNUAL REPORT | JUNE 30, 2018 | 87 |
Table of Contents
Notes to Financial Statements (Cont.)
attended telephonically, plus reimbursement of related expenses. In addition, the audit committee chair receives an additional annual retainer of $9,000, the valuation oversight committee lead receives an additional annual retainer of $2,000 (to the extent there are co-leads of the valuation oversight committee, the annual retainer will be split evenly between the co-leads, so that each co-lead individually receives an additional retainer of $1,000) and the governance committee chair receives an additional annual retainer of $750.
These expenses are allocated on a pro rata basis to each Fund of the Trust according to its respective net assets. The Trust pays no compensation directly to any Trustee or any other officer who is
affiliated with the Administrator, all of whom receive remuneration for their services to the Trust from the Administrator or its affiliates.
(e) Expense Limitation Pursuant to the Expense Limitation Agreement, PIMCO has agreed to waive a portion of the Funds’ Supervisory and Administrative Fee, or reimburse each Fund, to the extent that each Fund’s organizational expenses, pro rata share of expenses related to obtaining or maintaining a Legal Entity Identifier and pro rata share of Trustee Fees exceed 0.0049%, the “Expense Limit” (calculated as a percentage of each Fund’s average daily net assets attributable to each class). The Expense Limitation Agreement will automatically renew for one-year terms unless PIMCO provides written notice to the Trust at least 30 days prior to the end of the then current term.
Under certain conditions, PIMCO may be reimbursed for these waived amounts in future periods, not to exceed thirty-six months after the waiver. The total recoverable amounts to PIMCO at June 30, 2018, were as follows (amounts in thousands†):
| Expiring within | ||||||||||||||||||||
| Fund Name | 12 months | 13-24 months | 25-36 months | Total | ||||||||||||||||
PIMCO RealPath® Blend 2020 Fund | $ | 0 | $ | 1 | $ | 1 | $ | 2 | ||||||||||||
PIMCO RealPath® Blend 2025 Fund | 0 | 1 | 1 | 2 | ||||||||||||||||
PIMCO RealPath® Blend 2030 Fund | 0 | 1 | 2 | 3 | ||||||||||||||||
PIMCO RealPath® Blend 2035 Fund | 0 | 1 | 2 | 3 | ||||||||||||||||
PIMCO RealPath® Blend 2040 Fund | 0 | 1 | 2 | 3 | ||||||||||||||||
PIMCO RealPath® Blend 2045 Fund | 0 | 1 | 3 | 4 | ||||||||||||||||
PIMCO RealPath® Blend 2050 Fund | 0 | 0 | 4 | 4 | ||||||||||||||||
PIMCO RealPath® Blend 2055 Fund | 0 | 0 | 1 | 1 | ||||||||||||||||
PIMCO RealPath® Blend Income Fund | 0 | 1 | 1 | 2 | ||||||||||||||||
| † | A zero balance may reflect actual amounts rounding to less than one thousand. |
(f) Acquired Fund Fees and Expenses Acquired Fund expenses incurred by the Funds, if any, will vary with changes in the expenses of the Acquired Funds, as well as the allocation of the Funds’ assets.
The expenses associated with investing in a fund of funds are generally higher than those for mutual funds that do not invest in other mutual funds. The cost of investing in a fund of funds will generally be higher than the cost of investing in a mutual fund that invests directly in individual stocks and bonds. By investing in a fund of funds, an investor will indirectly bear fees and expenses charged by Acquired Funds in addition to each Fund’s direct fees and expenses. In addition, the use of a fund of funds structure could affect the timing, amount and character of distributions to the shareholders and may therefore increase the amount of taxes payable by shareholders.
10. RELATED PARTY TRANSACTIONS
The Adviser, Administrator, and Distributor are related parties. Fees paid to these parties are disclosed in Note 9, Fees and Expenses, and the accrued related party fee amounts are disclosed on the Statements of Assets and Liabilities.
11. GUARANTEES AND INDEMNIFICATIONS
Under the Trust’s organizational documents, each Trustee or officer of the Trust is indemnified and each employee or other agent of the Trust (including the Trust’s investment manager) may be indemnified, to the extent permitted by the Act, against certain liabilities that may arise out of performance of their duties to the Funds. Additionally, in the normal course of business, the Funds enter into contracts that contain a variety of indemnification clauses. The Funds’ maximum exposure under these arrangements is unknown as this would involve future claims that may be made against the Funds that have not yet occurred. However, the Funds have not had prior claims or losses pursuant to these contracts.
12. PURCHASES AND SALES OF SECURITIES
The length of time a Fund has held a particular security is not generally a consideration in investment decisions. A change in the securities held by a Fund is known as “portfolio turnover.” Each Fund may engage in frequent and active trading of portfolio securities to achieve its investment objective, particularly during periods of volatile market movements. High portfolio turnover may involve correspondingly greater transaction costs to a Fund, including brokerage commissions or dealer mark-ups and other transaction costs on the sale of securities
| 88 | PIMCO EQUITY SERIES |
Table of Contents
June 30, 2018
and reinvestments in other securities. Such sales may also result in realization of taxable capital gains, including short-term capital gains (which are generally taxed at ordinary income tax rates). The transaction costs and tax effects associated with portfolio turnover may adversely affect a Fund’s performance. The portfolio turnover rates are reported in the Financial Highlights.
Purchases and sales of securities (excluding short-term investments) for the period ended June 30, 2018, were as follows (amounts in thousands†):
U.S. Government/Agency | All Other | |||||||||||||||||||
| Fund Name | Purchases | Sales | Purchases | Sales | ||||||||||||||||
PIMCO REALPATH® Blend 2020 Fund | $ | 0 | $ | 0 | $ | 30,519 | $ | 13,854 | ||||||||||||
PIMCO REALPATH® Blend 2025 Fund | 0 | 0 | 36,326 | 15,857 | ||||||||||||||||
PIMCO REALPATH® Blend 2030 Fund | 0 | 0 | 46,012 | 26,043 | ||||||||||||||||
PIMCO REALPATH® Blend 2035 Fund | 0 | 0 | 44,713 | 29,089 | ||||||||||||||||
PIMCO REALPATH® Blend 2040 Fund | 0 | 0 | 42,099 | 32,524 | ||||||||||||||||
PIMCO REALPATH® Blend 2045 Fund | 0 | 0 | 58,259 | 47,008 | ||||||||||||||||
PIMCO REALPATH® Blend 2050 Fund | 0 | 0 | 74,986 | 59,141 | ||||||||||||||||
PIMCO REALPATH® Blend 2055 Fund | 0 | 0 | 9,736 | 6,452 | ||||||||||||||||
PIMCO REALPATH® Blend Income Fund | 0 | 0 | 21,319 | 5,406 | ||||||||||||||||
| † | A zero balance may reflect actual amounts rounding to less than one thousand. |
13. SHARES OF BENEFICIAL INTEREST
The Trust may issue an unlimited number of shares of beneficial interest with a $0.001 par value. Changes in shares of beneficial interest were as follows (shares and amounts in thousands†):
| PIMCO REALPATH® Blend 2020 Fund | PIMCO REALPATH® Blend 2025 Fund | |||||||||||||||||||||||||||||||||
| Year Ended 06/30/2018 | Year Ended 06/30/2017 | Year Ended 06/30/2018 | Year Ended 06/30/2017 | |||||||||||||||||||||||||||||||
| Shares | Amount | Shares | Amount | Shares | Amount | Shares | Amount | |||||||||||||||||||||||||||
Receipts for shares sold | ||||||||||||||||||||||||||||||||||
Institutional Class | 466 | $ | 5,145 | 770 | $ | 8,002 | 302 | $ | 3,386 | 549 | $ | 5,708 | ||||||||||||||||||||||
Administrative Class | 1,426 | 15,852 | 0 | 2 | 2,134 | 24,027 | 1 | 11 | ||||||||||||||||||||||||||
Class A | 273 | 3,051 | 247 | 2,555 | 100 | 1,115 | 363 | 3,763 | ||||||||||||||||||||||||||
Issued as reinvestment of distributions | ||||||||||||||||||||||||||||||||||
Institutional Class | 18 | 202 | 13 | 133 | 12 | 134 | 10 | 100 | ||||||||||||||||||||||||||
Administrative Class | 17 | 187 | 0 | 0 | 23 | 256 | 0 | 0 | ||||||||||||||||||||||||||
Class A | 5 | 56 | 1 | 14 | 6 | 70 | 2 | 19 | ||||||||||||||||||||||||||
Cost of shares redeemed | ||||||||||||||||||||||||||||||||||
Institutional Class | (304 | ) | (3,335 | ) | (397 | ) | (4,160 | ) | (279 | ) | (3,129 | ) | (326 | ) | (3,420 | ) | ||||||||||||||||||
Administrative Class | (313 | ) | (3,464 | ) | 0 | (2 | ) | (393 | ) | (4,416 | ) | 0 | 0 | |||||||||||||||||||||
Class A | (21 | ) | (232 | ) | (23 | ) | (238 | ) | (17 | ) | (194 | ) | (1 | ) | (11 | ) | ||||||||||||||||||
Net increase (decrease) resulting from Fund share transactions | 1,567 | $ | 17,462 | 611 | $ | 6,306 | 1,888 | $ | 21,249 | 598 | $ | 6,170 | ||||||||||||||||||||||
| PIMCO REALPATH® Blend 2030 Fund | PIMCO REALPATH® Blend 2035 Fund | |||||||||||||||||||||||||||||||||
| Year Ended 06/30/2018 | Year Ended 06/30/2017 | Year Ended 06/30/2018 | Year Ended 06/30/2017 | |||||||||||||||||||||||||||||||
| Shares | Amount | Shares | Amount | Shares | Amount | Shares | Amount | |||||||||||||||||||||||||||
Receipts for shares sold | ||||||||||||||||||||||||||||||||||
Institutional Class | 433 | $ | 4,973 | 908 | $ | 9,604 | 278 | $ | 3,228 | 1,341 | $ | 14,359 | ||||||||||||||||||||||
Administrative Class | 1,986 | 22,882 | 2 | 12 | 1,684 | 19,711 | 3 | 32 | ||||||||||||||||||||||||||
Class A | 82 | 924 | 291 | 3,032 | 72 | 831 | 303 | 3,207 | ||||||||||||||||||||||||||
Issued as reinvestment of distributions | ||||||||||||||||||||||||||||||||||
Institutional Class | 28 | 315 | 18 | 185 | 34 | 397 | 15 | 154 | ||||||||||||||||||||||||||
Administrative Class | 23 | 269 | 0 | 1 | 19 | 216 | 0 | 0 | ||||||||||||||||||||||||||
Class A | 6 | 69 | 0 | 4 | 6 | 72 | 1 | 5 | ||||||||||||||||||||||||||
Cost of shares redeemed | ||||||||||||||||||||||||||||||||||
Institutional Class | (436 | ) | (5,003 | ) | (375 | ) | (3,980 | ) | (431 | ) | (5,015 | ) | (379 | ) | (4,065 | ) | ||||||||||||||||||
Administrative Class | (245 | ) | (2,798 | ) | 0 | 0 | (214 | ) | (2,505 | ) | (1 | ) | (11 | ) | ||||||||||||||||||||
Class A | (10 | ) | (107 | ) | (3 | ) | (29 | ) | (6 | ) | (73 | ) | (4 | ) | (40 | ) | ||||||||||||||||||
Net increase (decrease) resulting from Fund share transactions | 1,867 | $ | 21,524 | 841 | $ | 8,829 | 1,442 | $ | 16,862 | 1,279 | $ | 13,641 | ||||||||||||||||||||||
| ANNUAL REPORT | JUNE 30, 2018 | 89 |
Table of Contents
Notes to Financial Statements (Cont.)
| PIMCO REALPATH® Blend 2040 Fund | PIMCO REALPATH® Blend 2045 Fund | |||||||||||||||||||||||||||||||||
| Year Ended 06/30/2018 | Year Ended 06/30/2017 | Year Ended 06/30/2018 | Year Ended 06/30/2017 | |||||||||||||||||||||||||||||||
| Shares | Amount | Shares | Amount | Shares | Amount | Shares | Amount | |||||||||||||||||||||||||||
Receipts for shares sold | ||||||||||||||||||||||||||||||||||
Institutional Class | 381 | $ | 4,467 | 2,275 | $ | 24,531 | 538 | $ | 6,329 | 3,323 | $ | 35,870 | ||||||||||||||||||||||
Administrative Class | 1,028 | 12,149 | 1 | 12 | 980 | 11,605 | 5 | 52 | ||||||||||||||||||||||||||
Class A | 93 | 1,071 | 481 | 5,113 | 46 | 543 | 281 | 2,982 | ||||||||||||||||||||||||||
Issued as reinvestment of distributions | ||||||||||||||||||||||||||||||||||
Institutional Class | 54 | 633 | 10 | 106 | 73 | 858 | 9 | 94 | ||||||||||||||||||||||||||
Administrative Class | 14 | 167 | 0 | 1 | 11 | 135 | 0 | 1 | ||||||||||||||||||||||||||
Class A | 9 | 109 | 0 | 4 | 5 | 63 | 0 | 0 | ||||||||||||||||||||||||||
Cost of shares redeemed | ||||||||||||||||||||||||||||||||||
Institutional Class | (395 | ) | (4,620 | ) | (425 | ) | (4,596 | ) | (374 | ) | (4,373 | ) | (381 | ) | (4,124 | ) | ||||||||||||||||||
Administrative Class | (106 | ) | (1,256 | ) | 0 | (1 | ) | (122 | ) | (1,456 | ) | (4 | ) | (39 | ) | |||||||||||||||||||
Class A | (113 | ) | (1,296 | ) | (3 | ) | (36 | ) | (28 | ) | (330 | ) | (2 | ) | (23 | ) | ||||||||||||||||||
Net increase (decrease) resulting from Fund share transactions | 965 | $ | 11,424 | 2,339 | $ | 25,134 | 1,129 | $ | 13,374 | 3,231 | $ | 34,813 | ||||||||||||||||||||||
| PIMCO REALPATH® Blend 2050 Fund | PIMCO REALPATH® Blend 2055 Fund | |||||||||||||||||||||||||||||||||
| Year Ended 06/30/2018 | Year Ended 06/30/2017 | Year Ended 06/30/2018 | Year Ended 06/30/2017 | |||||||||||||||||||||||||||||||
| Shares | Amount | Shares | Amount | Shares | Amount | Shares | Amount | |||||||||||||||||||||||||||
Receipts for shares sold | ||||||||||||||||||||||||||||||||||
Institutional Class | 652 | $ | 7,661 | 3,959 | $ | 42,900 | 347 | $ | 4,050 | 263 | $ | 2,836 | ||||||||||||||||||||||
Administrative Class | 1,379 | 16,415 | 1 | 5 | 14 | 161 | 6 | 66 | ||||||||||||||||||||||||||
Class A | 50 | 591 | 305 | 3,233 | 40 | 466 | 169 | 1,791 | ||||||||||||||||||||||||||
Issued as reinvestment of distributions | ||||||||||||||||||||||||||||||||||
Institutional Class | 89 | 1,050 | 10 | 108 | 19 | 229 | 6 | 66 | ||||||||||||||||||||||||||
Administrative Class | 16 | 185 | 0 | 0 | 0 | 1 | 0 | 1 | ||||||||||||||||||||||||||
Class A | 6 | 65 | 0 | 1 | 4 | 45 | 0 | 2 | ||||||||||||||||||||||||||
Cost of shares redeemed | ||||||||||||||||||||||||||||||||||
Institutional Class | (462 | ) | (5,442 | ) | (428 | ) | (4,643 | ) | (62 | ) | (725 | ) | (20 | ) | (216 | ) | ||||||||||||||||||
Administrative Class | (182 | ) | (2,172 | ) | 0 | 0 | (2 | ) | (27 | ) | (6 | ) | (66 | ) | ||||||||||||||||||||
Class A | (49 | ) | (556 | ) | (3 | ) | (29 | ) | (34 | ) | (387 | ) | (11 | ) | (115 | ) | ||||||||||||||||||
Net increase (decrease) resulting from Fund share transactions | 1,499 | $ | 17,797 | 3,844 | $ | 41,575 | 326 | $ | 3,813 | 407 | $ | 4,365 | ||||||||||||||||||||||
| PIMCO REALPATH® Blend Income Fund | ||||||||||||||||||||||||||||||||||
| Year Ended 06/30/2018 | Year Ended 06/30/2017 | |||||||||||||||||||||||||||||||||
| Shares | Amount | Shares | Amount | |||||||||||||||||||||||||||||||
Receipts for shares sold | ||||||||||||||||||||||||||||||||||
Institutional Class | 638 | $ | 7,015 | 675 | $ | 7,015 | ||||||||||||||||||||||||||||
Administrative Class | 1,409 | 15,565 | 3 | 26 | ||||||||||||||||||||||||||||||
Class A | 205 | 2,249 | 151 | 1,554 | ||||||||||||||||||||||||||||||
Issued as reinvestment of distributions | ||||||||||||||||||||||||||||||||||
Institutional Class | 11 | 121 | 10 | 102 | ||||||||||||||||||||||||||||||
Administrative Class | 16 | 171 | 0 | 1 | ||||||||||||||||||||||||||||||
Class A | 3 | 38 | 1 | 11 | ||||||||||||||||||||||||||||||
Cost of shares redeemed | ||||||||||||||||||||||||||||||||||
Institutional Class | (529 | ) | (5,794 | ) | (448 | ) | (4,682 | ) | ||||||||||||||||||||||||||
Administrative Class | (210 | ) | (2,309 | ) | (1 | ) | (7 | ) | ||||||||||||||||||||||||||
Class A | (41 | ) | (452 | ) | (1 | ) | (9 | ) | ||||||||||||||||||||||||||
Net increase (decrease) resulting from Fund share transactions | 1,502 | $ | 16,604 | 390 | $ | 4,011 | ||||||||||||||||||||||||||||
| † | A zero balance may reflect actual amounts rounding to less than one thousand. |
| 90 | PIMCO EQUITY SERIES |
Table of Contents
June 30, 2018
The following table discloses the number of shareholders that own 10% or more of the outstanding shares of a Fund along with their respective percent ownership, if any, for the period ended June 30, 2018. Some of these shareholders may be considered related parties, which may include, but are not limited to, the investment adviser and its affiliates, affiliated broker dealers, fund of funds and directors or employees of the Trust or Adviser.
| Shareholders that own 10% or more of outstanding shares | Total percentage of portfolio held by shareholders that own 10% or more of outstanding shares | |||||||||||||||||||
| Non-Related Parties | Related Parties | Non-Related Parties | Related Parties | |||||||||||||||||
REALPATH® Blend 2025 Fund | 1 | 0 | 12% | 0% | ||||||||||||||||
REALPATH® Blend 2040 Fund | 1 | 0 | 12% | 0% | ||||||||||||||||
REALPATH® Blend 2055 Fund | 1 | 1 | 15% | 30% | ||||||||||||||||
14. REGULATORY AND LITIGATION MATTERS
The Funds are not named as defendants in any material litigation or arbitration proceedings and are not aware of any material litigation or claim pending or threatened against them.
The foregoing speaks only as of the date of this report.
15. FEDERAL INCOME TAX MATTERS
Each Fund intends to qualify as a regulated investment company under Subchapter M of the Internal Revenue Code (the “Code”) and distribute all of its taxable income and net realized gains, if applicable, to shareholders. Accordingly, no provision for Federal income taxes has been made.
A Fund may be subject to local withholding taxes, including those imposed on realized capital gains. Any applicable foreign capital gains
tax is accrued daily based upon net unrealized gains, and may be payable following the sale of any applicable investments.
In accordance with U.S. GAAP, the Adviser has reviewed the Funds’ tax positions for all open tax years. As of June 30, 2018, the Funds have recorded no liability for net unrecognized tax benefits relating to uncertain income tax positions they have taken or expect to take in future tax returns.
The Funds file U.S. federal, state, and local tax returns as required. The Funds’ tax returns are subject to examination by relevant tax authorities until expiration of the applicable statute of limitations, which is generally three years after the filing of the tax return but which can be extended to six years in certain circumstances. Tax returns for open years have incorporated no uncertain tax positions that require a provision for income taxes.
As of June 30, 2018, the components of distributable taxable earnings are as follows (amounts in thousands†):
| Undistributed Ordinary Income(1) | Undistributed Long-Term Capital Gains | Net Tax Basis Unrealized Appreciation/ (Depreciation)(2) | Other Book-to-Tax Accounting Differences(3) | Accumulated Capital Losses(4) | Qualified Late-Year Loss Deferral - Capital(5) | Qualified Late-Year Loss Deferral - Ordinary(6) | ||||||||||||||||||||||||||
PIMCO REALPATH® Blend 2020 Fund | $ | 298 | $ | 504 | $ | (186 | ) | $ | 0 | $ | 0 | $ | 0 | $ | 0 | |||||||||||||||||
PIMCO REALPATH® Blend 2025 Fund | 398 | 535 | (289 | ) | 0 | 0 | 0 | 0 | ||||||||||||||||||||||||
PIMCO REALPATH® Blend 2030 Fund | 466 | 1,114 | 143 | 0 | 0 | 0 | 0 | |||||||||||||||||||||||||
PIMCO REALPATH® Blend 2035 Fund | 476 | 1,424 | 335 | 0 | 0 | 0 | 0 | |||||||||||||||||||||||||
PIMCO REALPATH® Blend 2040 Fund | 499 | 1,817 | 428 | 0 | 0 | 0 | 0 | |||||||||||||||||||||||||
PIMCO REALPATH® Blend 2045 Fund | 686 | 2,545 | 624 | 0 | 0 | 0 | 0 | |||||||||||||||||||||||||
PIMCO REALPATH® Blend 2050 Fund | 862 | 3,100 | 811 | 0 | 0 | 0 | 0 | |||||||||||||||||||||||||
PIMCO REALPATH® Blend 2055 Fund | 138 | 680 | 239 | 0 | 0 | 0 | 0 | |||||||||||||||||||||||||
PIMCO REALPATH® Blend Income Fund | 224 | 0 | 190 | 0 | (49 | ) | 0 | 0 | ||||||||||||||||||||||||
| † | A zero balance may reflect actual amounts rounding to less than one thousand. |
| (1) | Includes undistributed short-term capital gains, if any. |
| (2) | Adjusted for open wash sale loss deferrals and the accelerated recognition of unrealized gain or loss on certain options contracts for federal income tax purposes. Also adjusted for differences between book and tax realized and unrealized gain (loss) on swap contracts. |
| (3) | Represents differences in income tax regulations and financial accounting principles generally accepted in the United States of America, mainly for organizational costs. |
| (4) | Capital losses available to offset future net capital gains expire in varying amounts as shown below. |
| (5) | Capital losses realized during the period November 1, 2017 through June 30, 2018 which the Funds elected to defer to the following taxable year pursuant to income tax regulations. |
| (6) | Specified losses realized during the period November 1, 2017 through June 30, 2018 and Ordinary losses realized during the period January 1, 2018 through June 30, 2018, which the Funds elected to defer to the following taxable year pursuant to income tax regulations. |
| ANNUAL REPORT | JUNE 30, 2018 | 91 |
Table of Contents
Notes to Financial Statements (Cont.)
June 30, 2018
Under the Regulated Investment Company Act of 2010, a fund is permitted to carry forward any new capital losses for an unlimited period. Additionally, such capital losses that are carried forward will retain their character as either short-term or long-term capital losses rather than being considereed all short-term under previous law.
As of June 30, 2018, the Funds had the following post-effective capital losses with no expiration (amounts in thousands†):
| Short-Term | Long-Term | |||||||||||
PIMCO REALPATH® Blend 2020 Fund | $ | 0 | $ | 0 | ||||||||
PIMCO REALPATH® Blend 2025 Fund | 0 | 0 | ||||||||||
PIMCO REALPATH® Blend 2030 Fund | 0 | 0 | ||||||||||
PIMCO REALPATH® Blend 2035 Fund | 0 | 0 | ||||||||||
PIMCO REALPATH® Blend 2040 Fund | 0 | 0 | ||||||||||
PIMCO REALPATH® Blend 2045 Fund | 0 | 0 | ||||||||||
PIMCO REALPATH® Blend 2050 Fund | 0 | 0 | ||||||||||
PIMCO REALPATH® Blend 2055 Fund | 0 | 0 | ||||||||||
PIMCO REALPATH® Blend Income Fund | 25 | 24 | ||||||||||
| † | A zero balance may reflect actual amounts rounding to less than one thousand. |
As of June 30, 2018, the aggregate cost and the net unrealized appreciation/(depreciation) of investments for federal income tax purposes are as follows (amounts in thousands†):
| Federal Tax Cost | Unrealized Appreciation | Unrealized (Depreciation) | Net Unrealized Appreciation/ (Depreciation)(7) | |||||||||||||||||
PIMCO REALPATH® Blend 2020 Fund | $ | 28,553 | $ | 306 | $ | (491 | ) | $ | (185 | ) | ||||||||||
PIMCO REALPATH® Blend 2025 Fund | 31,755 | 299 | (587 | ) | (288 | ) | ||||||||||||||
PIMCO REALPATH® Blend 2030 Fund | 37,862 | 517 | (373 | ) | 144 | |||||||||||||||
PIMCO REALPATH® Blend 2035 Fund | 38,264 | 633 | (297 | ) | 336 | |||||||||||||||
PIMCO REALPATH® Blend 2040 Fund | 42,178 | 728 | (300 | ) | 428 | |||||||||||||||
PIMCO REALPATH® Blend 2045 Fund | 54,739 | 973 | (347 | ) | 626 | |||||||||||||||
PIMCO REALPATH® Blend 2050 Fund | 67,159 | 1,183 | (371 | ) | 812 | |||||||||||||||
PIMCO REALPATH® Blend 2055 Fund | 12,328 | 294 | (54 | ) | 240 | |||||||||||||||
PIMCO REALPATH® Blend Income Fund | 24,209 | 549 | (359 | ) | 190 | |||||||||||||||
| † | A zero balance may reflect actual amounts rounding to less than one thousand. |
| (7) | Primary differences, if any, between book and tax net unrealized appreciation/(depreciation) on investments are attributable to open wash sale loss deferrals, unrealized gain or loss on certain options contracts, and, realized and unrealized gain (loss) swap contracts. |
For the fiscal years ended June 30, 2018 and June 30, 2017, respectively, the Funds made the following tax basis distributions (amounts in thousands†):
| June 30, 2018 | June 30, 2017 | |||||||||||||||||||||||||||
| Ordinary Income Distributions(8) | Long-Term Capital Gain Distributions | Return of Capital(9) | Ordinary Income Distributions(8) | Long-Term Capital Gain Distributions | Return of Capital(9) | |||||||||||||||||||||||
PIMCO REALPATH® Blend 2020 Fund | $ | 445 | $ | 0 | $ | 0 | $ | 147 | $ | 0 | $ | 0 | ||||||||||||||||
PIMCO REALPATH® Blend 2025 Fund | 460 | 0 | 0 | 119 | 0 | 0 | ||||||||||||||||||||||
PIMCO REALPATH® Blend 2030 Fund | 618 | 35 | 0 | 190 | 0 | 0 | ||||||||||||||||||||||
PIMCO REALPATH® Blend 2035 Fund | 685 | 0 | 0 | 159 | 0 | 0 | ||||||||||||||||||||||
PIMCO REALPATH® Blend 2040 Fund | 910 | 0 | 0 | 111 | 0 | 0 | ||||||||||||||||||||||
PIMCO REALPATH® Blend 2045 Fund | 1,056 | 0 | 0 | 95 | 0 | 0 | ||||||||||||||||||||||
PIMCO REALPATH® Blend 2050 Fund | 1,300 | 0 | 0 | 109 | 0 | 0 | ||||||||||||||||||||||
PIMCO REALPATH® Blend 2055 Fund | 275 | 0 | 0 | 69 | 0 | 0 | ||||||||||||||||||||||
PIMCO REALPATH® Blend Income Fund | 330 | 0 | 0 | 114 | 0 | 0 | ||||||||||||||||||||||
| † | A zero balance may reflect actual amounts rounding to less than one thousand. |
| (8) | Includes short-term capital gains distributed, if any. |
| (9) | A portion of the distributions made represents a tax return of capital. Return of capital distributions have been reclassified from undistributed net investment income to paid-in capital to more appropriately conform financial accounting to tax accounting. |
| 92 | PIMCO EQUITY SERIES |
Table of Contents
Report of Independent Registered Public Accounting Firm
To the Board of Trustees of PIMCO Equity Series® and Shareholders of PIMCO REALPATH® Blend 2020 Fund, PIMCO REALPATH® Blend 2025 Fund, PIMCO REALPATH® Blend 2030 Fund, PIMCO REALPATH® Blend 2035 Fund, PIMCO REALPATH® Blend 2040 Fund, PIMCO REALPATH® Blend 2045 Fund, PIMCO REALPATH® Blend 2050 Fund, PIMCO REALPATH® Blend 2055 Fund and PIMCO REALPATH® Blend Income Fund
Opinions on the Financial Statements
We have audited the accompanying statements of assets and liabilities, including the schedules of investments, of PIMCO REALPATH® Blend 2020 Fund, PIMCO REALPATH® Blend 2025 Fund, PIMCO REALPATH® Blend 2030 Fund, PIMCO REALPATH® Blend 2035 Fund, PIMCO REALPATH® Blend 2040 Fund, PIMCO REALPATH® Blend 2045 Fund, PIMCO REALPATH® Blend 2050 Fund, PIMCO REALPATH® Blend 2055 Fund and PIMCO REALPATH® Blend Income Fund (nine of the funds constituting PIMCO Equity Series®, hereafter collectively referred to as the “Funds”) as of June 30, 2018, the related statements of operations for the year ended June 30, 2018, the statements of changes in net assets for each of the two years in the period ended June 30, 2018, including the related notes, and the financial highlights for each of the periods indicated therein (collectively referred to as the “financial statements”). In our opinion, the financial statements present fairly, in all material respects, the financial position of each of the Funds as of June 30, 2018, the results of each of their operations for the year then ended, the changes in each of their net assets for each of the two years in the period ended June 30, 2018 and each of the financial highlights for each of the periods indicated therein in conformity with accounting principles generally accepted in the United States of America.
Basis for Opinions
These financial statements are the responsibility of the Funds’ management. Our responsibility is to express an opinion on the Funds’ financial statements based on our audits. We are a public accounting firm registered with the Public Company Accounting Oversight Board (United States) (“PCAOB”) and are required to be independent with respect to the Funds in accordance with the U.S. federal securities laws and the applicable rules and regulations of the Securities and Exchange Commission and the PCAOB.
We conducted our audits of these financial statements in accordance with the standards of the PCAOB. Those standards require that we plan and perform the audit to obtain reasonable assurance about whether the financial statements are free of material misstatement, whether due to error or fraud.
Our audits included performing procedures to assess the risks of material misstatement of the financial statements, whether due to error or fraud, and performing procedures that respond to those risks. Such procedures included examining, on a test basis, evidence regarding the amounts and disclosures in the financial statements. Our audits also included evaluating the accounting principles used and significant estimates made by management, as well as evaluating the overall presentation of the financial statements. Our procedures included confirmation of securities owned as of June 30, 2018 by correspondence with the custodian, transfer agents and brokers. We believe that our audits provide a reasonable basis for our opinions.
/s/ PricewaterhouseCoopers LLP
Kansas City, Missouri
August 23, 2018
We have served as the auditor of one or more investment companies in PIMCO Equity Series® since 2010.
| ANNUAL REPORT | JUNE 30, 2018 | 93 |
Table of Contents
Glossary: (abbreviations that may be used in the preceding statements)
(Unaudited)
Counterparty Abbreviations: | ||||||||||
| BPS | BNP Paribas S.A. | FICC | Fixed Income Clearing Corporation | MYI | Morgan Stanley & Co. International PLC | |||||
| CBK | Citibank N.A. | JPM | JP Morgan Chase Bank N.A. | |||||||
Currency Abbreviations: | ||||||||||
| USD (or $) | United States Dollar | |||||||||
Exchange Abbreviations: | ||||||||||
| CBOE | Chicago Board Options Exchange | OTC | Over the Counter | |||||||
Index/Spread Abbreviations: | ||||||||||
| BCOMTR | Bloomberg Commodity Index Total Return | DWRTFT | Dow Jones Wilshire REIT Total Return Index | S&P 500 | Standard & Poor’s 500 Index | |||||
Other Abbreviations: | ||||||||||
| LIBOR | London Interbank Offered Rate | TBA | To-Be-Announced | |||||||
| 94 | PIMCO EQUITY SERIES |
Table of Contents
Federal Income Tax Information
(Unaudited)
As required by the Internal Revenue Code (“Code”) and Treasury Regulations, if applicable, shareholders must be notified within 60 days of the Funds’ fiscal year end regarding the status of qualified dividend income and the dividend received deduction.
Dividend Received Deduction. Corporate shareholders are generally entitled to take the dividend received deduction on the portion of a Funds’ dividend distribution that qualifies under tax law. The percentage of the following Funds’ Fiscal 2018 ordinary income dividend that qualifies for the corporate dividend received deduction is set forth below:
Qualified Dividend Income. Under the Jobs and Growth Tax Relief Reconciliation Act of 2003 (the “Act”), the following percentage of ordinary dividends paid during the fiscal year ended June 30, 2018 was designated as ‘qualified dividend income’ as defined in the Act subject to reduced tax rates in 2018:
Qualified Interest Income and Qualified Short-Term Capital Gain (for non-U.S. resident shareholders only). Under the American Jobs Creation Act of 2004, the following amounts of ordinary dividends paid during the fiscal year ended June 30, 2018 are considered to be derived from “qualified interest income,” as defined in Section 871(k)(1)(E) of the Code, and therefore are designated as interest-related dividends, as defined in Section 871(k)(1)(C) of the Code. Further, the following amounts of ordinary dividends paid during the fiscal year ended June 30, 2018 are considered to be derived from “qualified short-term capital gain,” as defined in Section 871(k)(2)(D) of the Code, and therefore are designated as qualified short-term gain dividends, as defined by Section 871(k)(2)(C) of the Code.
| Dividend Received Deduction % | Qualified Dividend Income % | Qualified Interest Income (000s† ) | Qualified Short-Term Capital Gain (000s†) | |||||||||||||||||
PIMCO REALPATH® Blend 2020 Fund | 0% | 0% | $ | 0 | $ | 0 | ||||||||||||||
PIMCO REALPATH® Blend 2025 Fund | 0% | 0% | 0 | 0 | ||||||||||||||||
PIMCO REALPATH® Blend 2030 Fund | 0% | 0% | 0 | 23 | ||||||||||||||||
PIMCO REALPATH® Blend 2035 Fund | 0% | 0% | 0 | 0 | ||||||||||||||||
PIMCO REALPATH® Blend 2040 Fund | 0% | 0% | 0 | 79 | ||||||||||||||||
PIMCO REALPATH® Blend 2045 Fund | 0% | 0% | 0 | 0 | ||||||||||||||||
PIMCO REALPATH® Blend 2050 Fund | 0% | 0% | 0 | 0 | ||||||||||||||||
PIMCO REALPATH® Blend 2055 Fund | 0% | 0% | 0 | 0 | ||||||||||||||||
PIMCO REALPATH® Blend Income Fund | 0% | 0% | 0 | 0 | ||||||||||||||||
| † | A zero balance may reflect actual amounts rounding to less than one thousand. |
Shareholders are advised to consult their own tax advisor with respect to the tax consequences of their investment in the Trust. In January 2019, you will be advised on IRS Form 1099-DIV as to the federal tax status of the dividends and distributions received by you in calendar year 2018.
| ANNUAL REPORT | JUNE 30, 2018 | 95 |
Table of Contents
The charts below identify the Trustees and executive officers of the Trust. Unless otherwise indicated, the address of all persons below is 650 Newport Center Drive, Newport Beach, CA 92660.
The Funds’ Statement of Additional Information includes more information about the Trustees and Officers. To request a free copy, call PIMCO at (888) 87-PIMCO or visit the Funds’ website at www.pimco.com.
| Name, Year of Birth and Position Held with Trust* | Term of Office and Length of Time Served† | Principal Occupation(s) During Past 5 Years | Number of Funds in Fund Complex Overseen by Trustee | Other Public Company and Investment Company Directorships Held by Trustee During the Past 5 Years | ||||
| Interested Trustees1 | ||||||||
Brent R. Harris (1959) Chairman of the Board | 03/2010 to present | Managing Director, PIMCO. Senior Vice President of the Trust, PIMCO Equity Series VIT, PIMCO Funds, PIMCO Variable Insurance Trust and PIMCO ETF Trust. Formerly, member of Executive Committee, PIMCO. | 162 | Chairman and Trustee, PIMCO Equity Series VIT, PIMCO Funds, PIMCO Variable Insurance Trust, PIMCO ETF Trust; Director, StocksPLUS® Management, Inc; and member of Board of Governors, Investment Company Institute. | ||||
| Independent Trustees | ||||||||
Jennifer Holden Dunbar (1963) Trustee | 02/2016 to present | Managing Director, Dunbar Partners, LLC (business consulting and investments). Formerly, Partner, Leonard Green & Partners, L.P. | 162 | Trustee, PIMCO Equity Series VIT, PIMCO Funds, PIMCO Variable Insurance and PIMCO ETF Trust; Director, PS Business Parks; Director, Big 5 Sporting Goods Corporation. | ||||
Peter B. McCarthy (1950) Trustee | 09/2011 to present | Formerly, Assistant Secretary and Chief Financial Officer, United States Department of Treasury; Deputy Managing Director, Institute of International Finance. | 162 | Trustee, PIMCO Equity Series VIT, PIMCO Funds, PIMCO Variable Insurance and PIMCO ETF Trust. | ||||
Ronald C. Parker (1951) Trustee | 02/2016 to present | Director of Roseburg Forest Products Company. Formerly, Chairman of the Board, The Ford Family Foundation; and President, Chief Executive Officer, Hampton Affiliates (forestry products). | 162 | Trustee, PIMCO Equity Series VIT; Lead Independent Trustee, PIMCO Funds, PIMCO Variable Insurance and PIMCO ETF Trust. | ||||
| * | Unless otherwise noted, the information for the individuals listed is as of June 30, 2018. |
| 1 | Mr. Harris is an “interested persons” of the Trust (as that term is defined in the 1940 Act) because of his affiliations with PIMCO. |
| † | Trustees serve until their successors are duly elected and qualified. |
| 96 | PIMCO EQUITY SERIES |
Table of Contents
(Unaudited)
Executive Officers
Name, Year of Birth and Position Held with Trust* | Term of Office and Length of Time Served | Principal Occupation(s) During Past 5 Years† | ||
Peter G. Strelow (1970) President | 02/2014 to present
Senior Vice President 11/2013 to 02/2014
Vice President 03/2010 to 11/2013 | Managing Director and Co-Chief Operating Officer, PIMCO. President, PIMCO Funds, PIMCO Variable Insurance Trust, PIMCO ETF Trust, PIMCO Equity Series VIT, PIMCO Managed Accounts Trust, PIMCO-Sponsored Interval Funds and PIMCO-Sponsored Closed-End Funds. Formerly, Chief Administrative Officer, PIMCO. | ||
David C. Flattum (1964) Chief Legal Officer | 03/2010 to present | Managing Director and General Counsel, PIMCO. Chief Legal Officer, PIMCO Funds, PIMCO Variable Insurance Trust, PIMCO ETF Trust and PIMCO Equity Series VIT. Formerly, Managing Director, Chief Operating Officer and General Counsel, Allianz Asset Management of America L.P. | ||
Jennifer E. Durham (1970) Chief Compliance Officer | 03/2010 to present | Managing Director and Chief Compliance Officer, PIMCO. Chief Compliance Officer, PIMCO Funds, PIMCO Variable Insurance Trust, PIMCO ETF Trust and PIMCO Equity Series VIT. | ||
Brent R. Harris (1959) Senior Vice President | 03/2010 to present | Managing Director, PIMCO. Senior Vice President, PIMCO Funds, PIMCO Variable Insurance Trust, PIMCO ETF Trust and PIMCO Equity Series VIT. Formerly, member of Executive Committee, PIMCO. | ||
Joshua D. Ratner (1976)** Vice President - Senior Counsel, Secretary | 11/2013 to present
Assistant Secretary 03/2010 to 01/2011 | Executive Vice President and General Deputy Counsel, PIMCO. Chief Legal Officer, PIMCO Investments LLC. Vice President - Senior Counsel, Secretary, PIMCO Funds, PIMCO Variable Insurance Trust, PIMCO ETF Trust and PIMCO Equity Series VIT. Vice President, Secretary and Chief Legal Officer, PIMCO Managed Accounts Trust, PIMCO-Sponsored Interval Funds and PIMCO-Sponsored Closed-End Funds. | ||
Ryan G. Leshaw (1980) Assistant Secretary | 05/2012 to present | Senior Vice President and Senior Counsel, PIMCO. Assistant Secretary, PIMCO Funds, PIMCO Variable Insurance Trust, PIMCO ETF Trust, PIMCO Equity Series VIT, PIMCO Managed Accounts Trust, PIMCO-Sponsored Interval Funds and PIMCO-Sponsored Closed-End Funds. Formerly, Associate, Willkie Farr & Gallagher LLP. | ||
Wu-Kwan Kit (1981) Assistant Secretary | 08/2017 to present | Vice President and Counsel, PIMCO. Assistant Secretary, PIMCO Funds, PIMCO Variable Insurance Trust, PIMCO ETF Trust, PIMCO Equity Series VIT, PIMCO Managed Accounts Trust, PIMCO-Sponsored Interval Funds and PIMCO-Sponsored Closed-End Funds. Formerly, Assistant General Counsel, VanEck Associates Corp. | ||
Stacie D. Anctil (1969) Vice President | 05/2015 to present
Assistant Treasurer 03/2010 to 05/2015 | Executive Vice President, PIMCO. Vice President, PIMCO Funds, PIMCO Variable Insurance Trust, PIMCO ETF Trust, PIMCO Equity Series VIT, PIMCO Managed Accounts Trust, PIMCO-Sponsored Interval Funds and PIMCO-Sponsored Closed-End Funds. | ||
William G. Galipeau (1974) Vice President | 11/2013 to present | Executive Vice President, PIMCO. Vice President, PIMCO Funds, PIMCO Variable Insurance Trust, PIMCO ETF Trust, PIMCO Equity Series VIT, PIMCO Managed Accounts Trust, PIMCO-Sponsored Interval Funds and PIMCO-Sponsored Closed-End Funds. | ||
Eric D. Johnson (1970) Vice President | 05/2011 to present | Executive Vice President, PIMCO. Vice President, PIMCO Funds, PIMCO Variable Insurance Trust, PIMCO ETF Trust, PIMCO Equity Series VIT, PIMCO Managed Accounts Trust, PIMCO-Sponsored Interval Funds and PIMCO-Sponsored Closed-End Funds. | ||
Henrik P. Larsen (1970) Vice President | 03/2010 to present | Senior Vice President, PIMCO. Vice President, PIMCO Funds, PIMCO Variable Insurance Trust, PIMCO ETF Trust and PIMCO Equity Series VIT. | ||
Bijal Y. Parikh (1978) Vice President | 02/2017 to present | Senior Vice President, PIMCO. Vice President, PIMCO Funds, PIMCO Variable Insurance Trust, PIMCO ETF Trust, PIMCO Equity Series VIT, PIMCO Managed Accounts Trust, PIMCO-Sponsored Interval Funds and PIMCO-Sponsored Closed-End Funds. | ||
Greggory S. Wolf (1970) Vice President | 05/2011 to present | Senior Vice President, PIMCO. Vice President, PIMCO Funds, PIMCO Variable Insurance Trust, PIMCO ETF Trust and PIMCO Equity Series VIT. | ||
Trent W. Walker (1974) Treasurer | 11/2013 to present
Assistant Treasurer 03/2010 to 11/2013 | Executive Vice President, PIMCO. Treasurer, PIMCO Funds, PIMCO Variable Insurance Trust, PIMCO ETF Trust, PIMCO Equity Series VIT, PIMCO Managed Accounts Trust, PIMCO-Sponsored Interval Funds and PIMCO-Sponsored Closed-End Funds. | ||
Erik C. Brown (1967) Assistant Treasurer | 03/2010 to present | Executive Vice President, PIMCO. Assistant Treasurer, PIMCO Funds, PIMCO Variable Insurance Trust, PIMCO ETF Trust, PIMCO Equity Series VIT, PIMCO Managed Accounts Trust, PIMCO-Sponsored Interval Funds and PIMCO-Sponsored Closed-End Funds. | ||
Colleen D. Miller (1980)** Assistant Treasurer | 02/2017 to present | Senior Vice President, PIMCO. Assistant Treasurer, PIMCO Funds, PIMCO Variable Insurance Trust, PIMCO ETF Trust, PIMCO Equity Series VIT, PIMCO Managed Accounts Trust, PIMCO-Sponsored Interval Funds and PIMCO-Sponsored Closed-End Funds. Formerly, Vice President Cohen & Steers Capital Management. | ||
Christopher M. Morin (1980) Assistant Treasurer | 08/2016 to present | Senior Vice President, PIMCO. Assistant Treasurer, PIMCO Funds, PIMCO Variable Insurance Trust, PIMCO ETF Trust, PIMCO Equity Series VIT, PIMCO Managed Accounts Trust, PIMCO-Sponsored Interval Funds and PIMCO-Sponsored Closed-End Funds. | ||
| ANNUAL REPORT | JUNE 30, 2018 | 97 |
Table of Contents
Management of the Trust (Cont.)
(Unaudited)
Name, Year of Birth and Position Held with Trust* | Term of Office and Length of Time Served | Principal Occupation(s) During Past 5 Years† | ||
Jason J. Nagler (1982)** Assistant Treasurer | 05/2015 to present | Vice President, PIMCO. Assistant Treasurer, PIMCO Funds, PIMCO Variable Insurance Trust, PIMCO ETF Trust, PIMCO Equity Series VIT, PIMCO Managed Accounts Trust, PIMCO-Sponsored Interval Funds and PIMCO-Sponsored Closed-End Funds. Formerly, Head of Mutual Fund Reporting, GMO and Assistant Treasurer, GMO Trust and GMO Series Trust Funds. | ||
| * | Unless otherwise noted, the information for the individuals listed is as of June 30, 2018. |
| † | The term “PIMCO Closed-End Funds” as used herein includes: PIMCO California Municipal Income Fund, PIMCO California Municipal Income Fund II, PIMCO California Municipal Income Fund III, PIMCO Municipal Income Fund, PIMCO Municipal Income Fund II, PIMCO Municipal Income Fund III, PIMCO New York Municipal Income Fund, PIMCO New York Municipal Income Fund II, PIMCO New York Municipal Income Fund III, PCM Fund Inc., PIMCO Corporate & Income Opportunity Fund, PIMCO Corporate & Income Strategy Fund, PIMCO Dynamic Credit and Mortgage Income Fund, PIMCO Dynamic Income Fund, PIMCO Global StocksPLUS® & Income Fund, PIMCO High Income Fund, PIMCO Income Opportunity Fund, PIMCO Income Strategy Fund, PIMCO Income Strategy Fund II and PIMCO Strategic Income Fund, Inc.; the term “PIMCO-Sponsored Interval Funds” as used herein includes: PIMCO Flexible Credit Income Fund and PIMCO Flexible Municipal Income Fund. |
| ** | The address of these officers is Pacific Investment Management Company LLC, 1633 Broadway, New York, New York 10019. |
| 98 | PIMCO EQUITY SERIES |
Table of Contents
(Unaudited)
The Funds2,3 consider customer privacy to be a fundamental aspect of their relationships with shareholders and are committed to maintaining the confidentiality, integrity and security of their current, prospective and former shareholders’ non-public personal information. The Funds have developed policies that are designed to protect this confidentiality, while allowing shareholder needs to be served.
OBTAINING PERSONAL INFORMATION
In the course of providing shareholders with products and services, the Funds and certain service providers to the Funds, such as the Funds’ investment advisers or sub-advisers (“Advisers”), may obtain non-public personal information about shareholders, which may come from sources such as account applications and other forms, from other written, electronic or verbal correspondence, from shareholder transactions, from a shareholder’s brokerage or financial advisory firm, financial advisor or consultant, and/or from information captured on applicable websites.
RESPECTING YOUR PRIVACY
As a matter of policy, the Funds do not disclose any non-public personal information provided by shareholders or gathered by the Funds to non-affiliated third parties, except as required or permitted by law or as necessary for such third parties to perform their agreements with respect to the Funds. As is common in the industry, non-affiliated companies may from time to time be used to provide certain services, such as preparing and mailing prospectuses, reports, account statements and other information, conducting research on shareholder satisfaction and gathering shareholder proxies. The Funds or their affiliates may also retain non-affiliated companies to market Fund shares or products which use Fund shares and enter into joint marketing arrangements with them and other companies. These companies may have access to a shareholder’s personal and account information, but are permitted to use this information solely to provide the specific service or as otherwise permitted by law. In most cases, the shareholders will be clients of a third party, but the Funds may also provide a shareholder’s personal and account information to the shareholder’s respective brokerage or financial advisory firm and/or financial advisor or consultant.
SHARING INFORMATION WITH THIRD PARTIES
The Funds reserve the right to disclose or report personal or account information to non-affiliated third parties in limited circumstances where the Funds believe in good faith that disclosure is required under law, to cooperate with regulators or law enforcement authorities, to protect their rights or property, or upon reasonable request by any fund advised by PIMCO in which a shareholder has invested. In addition, the Funds may disclose information about a shareholder or a
shareholder’s accounts to a non-affiliated third party at the shareholder’s request or with the consent of the shareholder.
SHARING INFORMATION WITH AFFILIATES
The Funds may share shareholder information with their affiliates in connection with servicing shareholders’ accounts, and subject to applicable law may provide shareholders with information about products and services that the Funds or their Advisers, distributors or their affiliates (“Service Affiliates”) believe may be of interest to such shareholders. The information that the Funds may share may include, for example, a shareholder’s participation in the Funds or in other investment programs sponsored by a Service Affiliate, a shareholder’s ownership of certain types of accounts (such as IRAs), information about the Funds’ experiences or transactions with a shareholder, information captured on applicable websites, or other data about a shareholder’s accounts, subject to applicable law. The Funds’ Service Affiliates, in turn, are not permitted to share shareholder information with non-affiliated entities, except as required or permitted by law.
PROCEDURES TO SAFEGUARD PRIVATE INFORMATION
The Funds take seriously the obligation to safeguard shareholder non-public personal information. In addition to this policy, the Funds have implemented procedures that are designed to restrict access to a shareholder’s non-public personal information to internal personnel who need to know that information to perform their jobs, such as servicing shareholder accounts or notifying shareholders of new products or services. Physical, electronic and procedural safeguards are in place to guard a shareholder’s non-public personal information.
INFORMATION COLLECTED FROM WEBSITES
Websites maintained by the Funds or their service providers may use a variety of technologies to collect information that help the Funds and their service providers understand how the website is used. Information collected from your web browser (including small files stored on your device that are commonly referred to as “cookies”) allow the websites to recognize your web browser and help to personalize and improve your user experience and enhance navigation of the website. In addition, the Funds or their Service Affiliates may use third parties to place advertisements for the Funds on other websites, including banner advertisements. Such third parties may collect anonymous information through the use of cookies or action tags (such as web beacons). The information these third parties collect is generally limited to technical and web navigation information, such as your IP address, web pages visited and browser type, and does not include personally identifiable information such as name, address, phone number or email address. If you are a registered user of the Funds’ website, the Funds or their service providers or third party firms engaged by the Funds or their service providers may collect or share
| ANNUAL REPORT | JUNE 30, 2018 | 99 |
Table of Contents
Privacy Policy1 (Cont.)
(Unaudited)
information submitted by you, which may include personally identifiable information. This information can be useful to the Funds when assessing and offering services and website features. You can change your cookie preferences by changing the setting on your web browser to delete or reject cookies. If you delete or reject cookies, some website pages may not function properly. The Funds do not look for web browser “do not track” requests.
CHANGES TO THE PRIVACY POLICY
From time to time, the Funds may update or revise this privacy policy. If there are changes to the terms of this privacy policy, documents containing the revised policy on the relevant website will be updated.
1 Amended as of February 14, 2017.
2 PIMCO Investments LLC (“PI”) serves as the Funds’ distributor. This Privacy Policy applies to the activities of PI to the extent that PI regularly effects or engages in transactions with or for a Fund shareholder who is the record owner of such shares. For purposes of this Privacy Policy, references to “the Funds” shall include PI when acting in this capacity.
3 When distributing this Policy, a Fund may combine the distribution with any similar distribution of its investment adviser’s privacy policy. The distributed, combined policy may be written in the first person (i.e., by using “we” instead of “the Funds”).
| 100 | PIMCO EQUITY SERIES |
Table of Contents
General Information
Investment Adviser and Administrator
Pacific Investment Management Company LLC
650 Newport Center Drive
Newport Beach, CA 92660
Distributor
PIMCO Investments LLC
1633 Broadway
New York, NY 10019
Custodian
State Street Bank and Trust Company
801 Pennsylvania Avenue
Kansas City, MO 64105
Transfer Agent
DST Asset Manager Solutions, Inc.
Institutional Class, I-2, Administrative Class
430 W 7th Street STE 219024
Kansas City, MO 64105-1407
DST Asset Manager Solutions, Inc.
Class A, Class C, Class R
430 W 7th Street STE 219294
Kansas City, MO 64105-1407
Legal Counsel
Dechert LLP
1900 K Street, N.W.
Washington, D.C. 20006
Independent Registered Public Accounting Firm
PricewaterhouseCoopers LLP
1100 Walnut Street, Suite 1300
Kansas City, MO 64106
This report is submitted for the general information of the shareholders of the Funds listed on the Report cover.
Table of Contents

PES3002AR_063018
Table of Contents

PIMCO Equity Series®
Annual Report
June 30, 2018
PIMCO RAFI Dynamic Multi-Factor Emerging Markets Equity ETF | MFEM | NYSE Arca
PIMCO RAFI Dynamic Multi-Factor International Equity ETF | MFDX | NYSE Arca
PIMCO RAFI Dynamic Multi-Factor U.S. Equity ETF | MFUS | NYSE Arca
Table of Contents
| Page | ||||||||
| 2 | ||||||||
| 4 | ||||||||
| 12 | ||||||||
| 14 | ||||||||
| 16 | ||||||||
| 17 | ||||||||
| 18 | ||||||||
| 49 | ||||||||
| 62 | ||||||||
| 63 | ||||||||
| 64 | ||||||||
| 65 | ||||||||
| 68 | ||||||||
| Fund | Fund Summary | Schedule of Investments | ||||||
| 6 | 19 | |||||||
| 8 | 29 | |||||||
| 10 | 43 | |||||||
This material is authorized for use only when preceded or accompanied by the current PIMCO Equity Series prospectus. The Shareholder Reports for the other series of the PIMCO Equity Series are printed separately.
Table of Contents
Dear Shareholder,
Following is the PIMCO Equity Series Annual Report, which covers the 12-month reporting period ended June 30, 2018. On the subsequent pages you will find specific details regarding investment results and a discussion of factors that most affected performance over the reporting period.
For the 12-month reporting period ended June 30, 2018
The U.S. economy continued to expand during the reporting period. Looking back, U.S. gross domestic product (GDP) expanded at a revised annual pace of 2.8% and 2.3% during the third and fourth quarters of 2017, respectively. First-quarter 2018 GDP then moderated to a revised annual pace of 2.2%. The Commerce Department’s initial reading — released after the reporting period had ended — showed that second-quarter 2018 GDP grew at an annual pace of 4.1%.
The Federal Reserve (Fed) continued to normalize monetary policy during the reporting period. After raising interest rates in March and June 2017, the Fed again raised rates in December, moving the federal funds rate up to a range between 1.25% and 1.50%. And, in October 2017, the Fed started to reduce its balance sheet. At its March 2018 meeting, the Fed again increased rates to a range between 1.50% and 1.75%. Finally, at its meeting that concluded on June 13, 2018, the Fed raised rates to a range between 1.75% and 2.00%.
Economic activity outside the U.S. initially accelerated during the reporting period, but then moderated somewhat as the reporting period progressed. Against this backdrop, the European Central Bank (ECB) and Bank of Japan largely maintained their highly accommodative monetary policies. Other central banks took a more hawkish stance. In November 2017, the Bank of England instituted its first rate hike since 2007, and the Bank of Canada raised rates twice during the reporting period. Meanwhile, in June 2018, the ECB indicated that it plans to end its quantitative easing program by the end of the year, but it did not expect to raise interest rates “at least through the summer of 2019.”
The U.S. Treasury yield curve flattened during the reporting period, as short-term rates moved up more than their longer-term counterparts. The increase in rates at the short end of the yield curve was mostly due to Fed interest rate hikes. The yield on the benchmark 10-year U.S. Treasury note was 2.85% at the end of the reporting period, up from 2.31% on June 30, 2017. U.S. Treasuries, as measured by the Bloomberg Barclays U.S. Treasury Index, returned -0.65% over the 12 months ended June 30, 2018. Meanwhile, the Bloomberg Barclays U.S. Aggregate Bond Index, a widely used index of U.S. investment grade bonds, returned -0.40% over the period. Riskier fixed income asset classes, including high yield corporate bonds and emerging market debt, generated mixed results versus the broad U.S. market. The ICE BofAML U.S. High Yield Index gained 2.53% over the reporting period, whereas emerging market external debt, as represented by the JPMorgan Emerging Markets Bond Index (EMBI) Global, returned -2.45% over the reporting period. Emerging market local bonds, as represented by the JPMorgan Government Bond Index-Emerging Markets Global Diversified Index (Unhedged), returned -2.33% over the period.
Global equities generally rose over the first seven months of the period. This rally was driven by a number of factors, including improving global growth, corporate profits that often exceeded expectations and, in the U.S., optimism surrounding the passage of a tax reform bill in December 2017. In the U.S., a portion of those gains were given back in February and March 2018. This was partially due to concerns over less accommodative central bank policies and fears of a trade war. However, U.S. equities then rallied over the last three months of the reporting period. All told, U.S. equities, as represented by the S&P 500 Index, returned 14.37% during the reporting period. Emerging market equities, as measured by the MSCI Emerging Markets Index, returned 8.20% over the period, whereas global equities, as represented by the MSCI World Index, returned 11.09%. Elsewhere, Japanese equities, as represented by the Nikkei 225 Index (in JPY), returned 13.45% over the reporting period and European equities, as represented by the MSCI Europe Index (in EUR), returned 2.85%.
Commodity prices fluctuated but generally moved higher during the 12 months ended June 30, 2018. When the reporting period began, crude oil was approximately $46 a barrel. By the end of the period, it was roughly $74 a
| 2 | PIMCO EQUITY SERIES |
Table of Contents
barrel. This ascent was driven in part by planned and observed production cuts by OPEC and the collapse in Venezuelan oil production, as well as global growth maintaining demand. Elsewhere, gold and copper prices moved modestly higher over the reporting period.
Finally, during the reporting period, there were periods of volatility in the foreign exchange markets, due in part to signs of improving global growth, decoupling central bank policies, and a number of geopolitical events. The U.S. dollar generally weakened against other major currencies over the reporting period. For example, the U.S. dollar returned -2.26%, -1.40% and -1.45% versus the euro, British pound and Japanese yen, respectively, during the 12 months ended June 30, 2018.
Thank you for the assets you have placed with us. We deeply value your trust, and will continue to work diligently to meet your broad investment needs. For any questions regarding the funds, please contact your account manager or financial adviser, or call one of our shareholder associates at 888.87.PIMCO. We also invite you to visit our website at pimco.com to learn more about our global viewpoints.
 | Sincerely,
Brent R. Harris Chairman of the Board PIMCO Equity Series
August 23, 2018 |

Past performance is no guarantee of future results. Unless otherwise noted, index returns reflect the reinvestment of income distributions and capital gains, if any, but do not reflect fees, brokerage commissions or other expenses of investing. It is not possible to invest directly in an unmanaged index.
| ANNUAL REPORT | JUNE 30, 2018 | 3 |
Table of Contents
Important Information About the Funds
PIMCO Equity Series (the “Trust”) is an open-end management investment company that includes PIMCO RAFI Dynamic Multi-Factor Emerging Markets Equity ETF, PIMCO RAFI Dynamic Multi-Factor International Equity ETF, and PIMCO RAFI Dynamic Multi-Factor U.S. Equity ETF, which are exchange-traded funds (“ETFs”) that seek to provide total return that closely corresponds, before fees and expenses, to the total return of a specified index (each, a “Fund” and collectively, the “Funds”). Each Fund employs a representative sampling strategy in seeking to achieve its investment objective. In using this strategy, PIMCO seeks to invest in a combination of instruments such that the portfolio effectively provides exposure to the underlying index. A Fund may not track its underlying index with the same degree of accuracy as a fund that replicates the composition and weighting of the underlying index. Shares of the Funds will be listed and traded at market prices on NYSE Arca, Inc. (“NYSE Arca”) and other secondary markets. The market price for each Fund’s shares may be different from the Fund’s net asset value (“NAV”). Each Fund issues and redeems shares at its NAV only in blocks of a specified number of shares (“Creation Units”). Only certain large institutional investors may purchase or redeem Creation Units directly with the Funds at NAV (“Authorized Participants”). These transactions are in exchange for certain securities similar to a Fund’s portfolio and/or cash. Except when aggregated in Creation Units, shares of a Fund are not redeemable securities. Shareholders who are not Authorized Participants may not redeem shares from the Funds at NAV.
We believe that equity funds have an important role to play in a well-diversified investment portfolio. It is important to note, however, that equity funds are subject to notable risks. Among other things, equity and equity-related securities may decline in value due to both real and perceived general market, economic, and industry conditions.
The values of equity securities, such as common stocks and preferred securities, have historically risen and fallen in periodic cycles and may decline due to general market conditions, which are not specifically related to a particular company, such as real or perceived adverse economic conditions, changes in the general outlook for corporate earnings, changes in interest or currency rates or adverse investor sentiment generally. Equity securities may also decline due to factors that affect a particular industry or industries, such as labor shortages, increased production costs and competitive conditions within an industry. In addition, the value of an equity security may decline for a number of reasons that directly relate to the issuer, such as management performance, financial leverage and reduced demand for the issuer’s goods or services, as well as the historical and prospective earnings of the issuer and the value of its assets. Different types of equity securities may react differently to these developments and a change in the financial condition of a single issuer may affect securities markets as a whole.
During a general downturn in the securities markets, multiple asset classes, including equity securities, may decline in value simultaneously. The market price of equity securities owned by a Fund may go up or down, sometimes rapidly or unpredictably. Equity securities generally have greater price volatility than fixed income securities and common stocks generally have the greatest appreciation and depreciation potential of all equity securities.
The Funds may be subject to various risks as described in each Fund’s prospectus and in the Principal Risks in the Notes to Financial Statements.
The geographical classification of foreign (non-U.S.) securities in this report are classified by the country of incorporation of a holding. In certain instances, a security’s country of incorporation may be different from its country of economic exposure. The United States presidential administration’s enforcement of tariffs on goods from other countries, with a focus on China, has contributed to international trade tensions and may impact portfolio securities.
On each individual Fund Summary page in this Shareholder Report, the Average Annual Total Return table and the Cumulative Returns chart measure performance assuming that any dividend and capital gain distributions were reinvested. Returns do not reflect the deduction of taxes that a shareholder would pay on: (i) Fund distributions; or (ii) the sale of Fund shares. Each Fund’s performance is measured against the performance of at least one broad-based securities market index (“benchmark index”). A Fund’s past performance, before and after taxes, is not necessarily an indication of how the Fund will perform in the future. There is no assurance that any Fund, including any Fund that has experienced high or unusual performance for one or more periods, will experience similar levels of performance in the future. High performance is defined as a significant increase in either 1) a Fund’s total return in excess of that of the Fund’s benchmark between reporting periods or 2) a Fund’s total return in excess of the Fund’s historical returns between reporting periods. Unusual performance is defined as a significant change in a Fund’s performance as compared to one or more previous reporting periods.
The following table discloses the inception dates of each Fund along with each Fund’s diversification status as of period end:
| Fund Name | Fund Inception | Diversification Status | ||||||||||
PIMCO RAFI Dynamic Multi-Factor Emerging Markets Equity ETF | 08/31/17 | Diversified | ||||||||||
PIMCO RAFI Dynamic Multi-Factor International Equity ETF | 08/31/17 | Diversified | ||||||||||
PIMCO RAFI Dynamic Multi-Factor U.S. Equity ETF | 08/31/17 | Diversified | ||||||||||
| 4 | PIMCO EQUITY SERIES |
Table of Contents
An investment in a Fund is not a bank deposit and is not guaranteed or insured by the Federal Deposit Insurance Corporation (“FDIC”) or any other government agency. It is possible to lose money on investments in the Funds.
The Trustees are responsible generally for overseeing the management of the Trust. The Trustees authorize the Trust to enter into service
agreements with the Adviser, the Distributor, the Administrator and other service providers in order to provide, and in some cases authorize service providers to procure through other parties, necessary or desirable services on behalf of the Trust and the Funds. Shareholders are not parties to or third-party beneficiaries of such service agreements. Neither a Fund’s prospectus nor a Fund’s summary prospectus, the Trust’s Statement of Additional Information (“SAI”), any contracts filed as exhibits to the Trust’s registration statement, nor any other communications, disclosure documents or regulatory filings (including this report) from or on behalf of the Trust or a Fund creates a contract between or among any shareholder of a Fund, on the one hand, and the Trust, a Fund, a service provider to the Trust or a Fund, and/or the Trustees or officers of the Trust, on the other hand. The Trustees (or the Trust and its officers, service providers or other delegates acting under authority of the Trustees) may amend the most recent prospectus or use a new prospectus, summary prospectus or SAI with respect to a Fund or the Trust, and/or amend, file and/or issue any other communications, disclosure documents or regulatory filings, and may amend or enter into any contracts to which the Trust or a Fund is a party, and interpret the investment objective(s), policies, restrictions and contractual provisions applicable to any Fund, without shareholder input or approval, except in circumstances in which shareholder approval is specifically required by law (such as changes to fundamental investment policies) or where a shareholder approval requirement is specifically disclosed in the Trust’s then-current prospectus or SAI.
The Funds may make available a complete schedule of portfolio holdings and the percentages they represent of the Fund’s net assets. The frequency at which the daily market prices were at a discount or
premium to each Fund’s NAV is disclosed on www.pimcoetfs.com. Please see “Disclosure of Portfolio Holdings” in the SAI for information about the availability of the complete schedule of each Fund’s holdings. Fund fact sheets provide additional information regarding a Fund and may be requested by calling (888) 400-4ETF and are available on the Fund’s website at www.pimcoetfs.com.
PIMCO has adopted written proxy voting policies and procedures (“Proxy Policy”) as required by Rule 206(4)-6 under the Investment Advisers Act of 1940, as amended. The Proxy Policy has been adopted by the Trust as the policies and procedures that PIMCO will use when voting proxies on behalf of a Fund. A description of the policies and procedures that PIMCO uses to vote proxies relating to portfolio securities of a Fund, and information about how the Fund voted proxies relating to portfolio securities held during the most recent twelve-month period ended June 30th, are available without charge, upon request, by calling the Trust at (888) 400-4ETF, on the Fund’s website at www.pimcoetfs.com, and on the Securities and Exchange Commission’s (“SEC”) website at www.sec.gov.
The Trust files a complete schedule of each Fund’s holdings with the SEC for the first and third quarters of each fiscal year on Form N-Q. A copy of a Fund’s Form N-Q is available on the SEC’s website at www.sec.gov and may be reviewed and copied at the SEC’s Public Reference Room in Washington, D.C. A copy of the Funds’ Form N-Q is also available without charge, upon request, by calling the Trust at (888) 400-4ETF and on the Funds’ website at www.pimcoetfs.com. Information on the operation of the Public Reference Room may be obtained by calling 1-800-SEC-0330.
The SEC adopted a rule that generally allows funds to deliver shareholder reports to investors by providing access to such reports online free of charge and by mailing a notice that the report is electronically available. Pursuant to the rule, investors may still elect to receive a complete shareholder report in the mail. PIMCO is evaluating how to make the electronic delivery option available to shareholders in the future.
| ANNUAL REPORT | JUNE 30, 2018 | 5 |
Table of Contents
PIMCO RAFI Dynamic Multi-Factor Emerging Markets Equity ETF
Cumulative Returns Through June 30, 2018
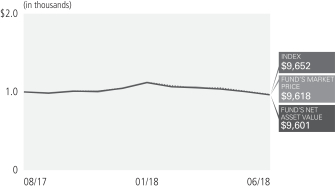
$10,000 invested at the end of the month when the Fund commenced operations.
Investment Objective and Strategy Overview
PIMCO RAFI Dynamic Multi-Factor Emerging Markets Equity ETF seeks to track the investment results of the RAFI Dynamic Multi-Factor Emerging Markets Index (the “Underlying Index”) by investing under normal circumstances at least 80% of its total assets (exclusive of collateral held from securities lending) in the component securities (“Component Securities”) of the Underlying Index. The Fund may invest the remainder of its assets in cash, securities and instruments that are not Component Securities, but which the Fund’s sub-adviser, Parametric Portfolio Associates LLC, believes will help the Fund track its Underlying Index. The Underlying Index is designed to provide long-only exposure to multiple equity factors that seek to produce attractive long-term returns, and which may lower risk compared to less diversified strategies. Please refer to the Fund’s current prospectus for more information regarding the Fund’s strategy.
| Cumulative Total Return for the period ended June 30, 2018 | ||||||
| Fund Inception (08/31/17) | ||||||
 | PIMCO RAFI Dynamic Multi-Factor Emerging Markets Equity ETF (Based on Net Asset Value) | (3.99)% | ||||
 | PIMCO RAFI Dynamic Multi-Factor Emerging Markets Equity ETF (At Market Price)(1)(2) | (3.82)% | ||||
 | RAFI Dynamic Multi-Factor Emerging Markets Index± | (3.48)% | ||||
All Fund returns are net of fees and expenses.
Market Returns do not include brokerage commissions that may be payable on secondary market transactions. If brokerage commissions were included, market returns would be lower. Market and NAV returns assume that dividends and capital gain distributions have been reinvested in the Fund at market price and NAV, respectively.
| (1) | The market price is determined using the midpoint between the highest bid and the lowest offer on the listing exchange, as of the time that the Fund’s NAV is calculated. |
| (2) | The Fund was seeded on August 31, 2017, but was not listed for trading until September 6, 2017. Accordingly, there is no Market Price information for August 31, 2017 through September 5, 2017. |
± The RAFI Dynamic Multi-Factor Emerging Market index strategy takes time-varying exposures to four return factors; value, low volatility, quality, and momentum. The index uses recent and historical metrics to tilt toward factor portfolios which are particularly attractive on a forward looking basis.
It is not possible to invest directly in an unmanaged index.
Performance quoted represents past performance. Past performance is not a guarantee or a reliable indicator of future results. Current performance may be lower or higher than performance shown. Investment return and the principal value of an investment will fluctuate. Shares may be worth more or less than original cost when redeemed by authorized participants. Returns shown do not reflect the deduction of taxes that a shareholder would pay on Fund distributions or on the redemption of Fund shares. Differences in the Fund’s performance versus the index and related attribution information with respect to particular categories of securities or individual positions may be attributable, in part, to differences in the pricing methodologies used by the Fund and the index. Performance data current to the most recent month-end is available at www.pimcoetfs.com or via (888) 400-4ETF.
The Fund’s total annual operating expense ratio in effect as of period end was 0.59%. Details regarding any changes to the Fund’s operating expenses, subsequent to period end, can be found in the Fund’s current prospectus, as supplemented.
| 6 | PIMCO EQUITY SERIES |
Table of Contents
| Ticker symbol - MFEM |
Geographic Breakdown as of 06/30/20181§
South Korea | 18.1% | |||||||
China | 15.9% | |||||||
Taiwan | 12.9% | |||||||
Russia | 9.7% | |||||||
Brazil | 9.4% | |||||||
South Africa | 7.2% | |||||||
India | 5.0% | |||||||
Ireland | 4.6% | |||||||
Thailand | 4.0% | |||||||
Hong Kong | 2.6% | |||||||
Malaysia | 2.5% | |||||||
Mexico | 1.8% | |||||||
Chile | 1.7% | |||||||
Indonesia | 1.6% | |||||||
Others | 3.0% |
1 % of Investments, at value.
§ Geographic Breakdown and % of Investments exclude securities sold short, financial derivative instruments and short-term instruments, if any.
Fund Insights
The following affected performance during the reporting period:
| » | Holdings in the information technology sector contributed to absolute returns for both the Fund and the Underlying Index. |
| » | Holdings in the energy sector contributed to absolute returns for both the Fund and the Underlying Index. |
| » | Holdings in the financials sector detracted from absolute returns for both the Fund and the Underlying Index. |
| » | Holdings in the consumer discretionary sector detracted from absolute returns for both the Fund and the Underlying Index. |
| » | Holdings in the telecommunication services sector detracted from absolute returns for both the Fund and the Underlying Index. |
| » | Holdings in the utilities sector detracted from absolute returns for both the Fund and the Underlying Index. |
| ANNUAL REPORT | JUNE 30, 2018 | 7 |
Table of Contents
PIMCO RAFI Dynamic Multi-Factor International Equity ETF
Cumulative Returns Through June 30, 2018
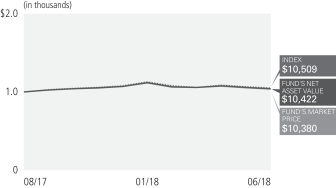
$10,000 invested at the end of the month when the Fund commenced operations.
Investment Objective and Strategy Overview
PIMCO RAFI Dynamic Multi-Factor International Equity ETF seeks to track the investment results of the RAFI Dynamic Multi-Factor Developed Ex-U.S. Index (the “Underlying Index”) by investing under normal circumstances at least 80% of its total assets (exclusive of collateral held from securities lending) in the component securities (“Component Securities”) of the Underlying Index. The Fund may invest the remainder of its assets in cash, securities and instruments that are not Component Securities, but which the Fund’s sub-adviser, Parametric Portfolio Associates LLC, believes will help the Fund track its Underlying Index. The Underlying Index is designed to provide long-only exposure to multiple equity factors that seek to produce attractive long-term returns, and which may lower risk compared to less diversified strategies. Please refer to the Fund’s current prospectus for more information regarding the Fund’s strategy.
| Cumulative Total Return for the period ended June 30, 2018 | ||||||
| Fund Inception (08/31/2017) | ||||||
| PIMCO RAFI Dynamic Multi-Factor International Equity ETF (Based on Net Asset Value) | 4.22% | ||||
| PIMCO RAFI Dynamic Multi-Factor International Equity ETF (At Market Price)(1)(2) | 3.80% | ||||
| RAFI Dynamic Multi-Factor Developed Ex-U.S. Index± | 5.09% | ||||
All Fund returns are net of fees and expenses.
Market Returns do not include brokerage commissions that may be payable on secondary market transactions. If brokerage commissions were included, market returns would be lower. Market and NAV returns assume that dividends and capital gain distributions have been reinvested in the Fund at market price and NAV, respectively.
| (1) | The market price is determined using the midpoint between the highest bid and the lowest offer on the listing exchange, as of the time that the Fund’s NAV is calculated. |
| (2) | The Fund was seeded on August 31, 2017, but was not listed for trading until September 6, 2017. Accordingly, there is no Market Price information for August 31, 2017 through September 5, 2017. |
± The RAFI Dynamic Multi-Factor Developed ex-US index takes time-varying exposures to five return factors; value, low volatility, quality, momentum and size. The index uses recent and historical metrics to tilt toward factor portfolios which are particularly attractive on a forward looking basis.
It is not possible to invest directly in an unmanaged index.
Performance quoted represents past performance. Past performance is not a guarantee or a reliable indicator of future results. Current performance may be lower or higher than performance shown. Investment return and the principal value of an investment will fluctuate. Shares may be worth more or less than original cost when redeemed by authorized participants. Returns shown do not reflect the deduction of taxes that a shareholder would pay on Fund distributions or on the redemption of Fund shares. Differences in the Fund’s performance versus the index and related attribution information with respect to particular categories of securities or individual positions may be attributable, in part, to differences in the pricing methodologies used by the Fund and the index. Performance data current to the most recent month-end is available at www.pimcoetfs.com or via (888) 400-4ETF.
The Fund’s total annual operating expense ratio in effect as of period end was 0.49%. Details regarding any changes to the Fund’s operating expenses, subsequent to period end, can be found in the Fund’s current prospectus, as supplemented.
| 8 | PIMCO EQUITY SERIES |
Table of Contents
| Ticker symbol - MFDX |
Geographic Breakdown as of 06/30/20181§
Japan | 25.60% | |||||||
United Kingdom | 14.80% | |||||||
France | 7.70% | |||||||
Switzerland | 7.50% | |||||||
Germany | 6.60% | |||||||
Canada | 6.40% | |||||||
Australia | 5.50% | |||||||
Netherlands | 4.40% | |||||||
Sweden | 3.10% | |||||||
Hong Kong | 2.70% | |||||||
Spain | 2.70% | |||||||
Italy | 2.70% | |||||||
Singapore | 1.60% | |||||||
Norway | 1.50% | |||||||
Denmark | 1.30% | |||||||
Ireland | 1.20% | |||||||
Finland | 1.10% | |||||||
Other | 3.60% |
1 % of Investments, at value.
§ Geographic Breakdown and % of Investments exclude securities sold short, financial derivative instruments and short-term instruments, if any.
Fund Insights
The following affected performance during the reporting period:
| » | Holdings in the energy sector contributed to absolute returns for both the Fund and the Underlying Index. |
| » | Holdings in the consumer discretionary sector contributed to absolute returns for both the Fund and the Underlying Index. |
| » | Holdings in the industrials sector contributed to absolute returns for both the Fund and the Underlying Index. |
| » | Holdings in the information technology sector contributed to absolute returns for both the Fund and the Underlying Index. |
| » | Holdings in the materials sector contributed to absolute returns for both the Fund and the Underlying Index. |
| » | Holdings in the telecommunication services sector detracted from absolute returns for both the Fund and the Underlying Index. |
| ANNUAL REPORT | JUNE 30, 2018 | 9 |
Table of Contents
PIMCO RAFI Dynamic Multi-Factor U.S. Equity ETF
Cumulative Returns Through June 30, 2018
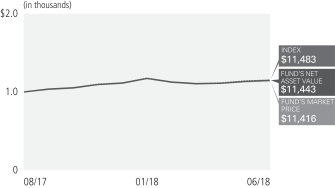
$10,000 invested at the end of the month when the Fund commenced operations.
Investment Objective and Strategy Overview
PIMCO RAFI Dynamic Multi-Factor U.S. Equity ETF seeks to track the investment results of the RAFI Dynamic Multi-Factor U.S. Index (the “Underlying Index”) by investing under normal circumstances at least 80% of its total assets (exclusive of collateral held from securities lending) in the component securities (“Component Securities”) of the Underlying Index. The Fund may invest the remainder of its assets in cash, securities and instruments that are not Component Securities, but which the Fund’s sub-adviser, Parametric Portfolio Associates LLC, believes will help the Fund track its Underlying Index. The Underlying Index is designed to provide long-only exposure to multiple equity factors that seek to produce attractive long-term returns, and which may lower risk compared to less diversified strategies. Please refer to the Fund’s current prospectus for more information regarding the Fund’s strategy.
| Cumulative Total Return for the period ended June 30, 2018 | ||||||
| Fund Inception (08/31/17) | ||||||
| PIMCO RAFI Dynamic Multi-Factor U.S. Equity ETF (Based on Net Asset Value) | 14.43% | ||||
| PIMCO RAFI Dynamic Multi-Factor U.S. Equity ETF (At Market Price)(1)(2) | 14.16% | ||||
| RAFI Dynamic Multi-Factor U.S. Index± | 14.83% | ||||
All Fund returns are net of fees and expenses.
Market Returns do not include brokerage commissions that may be payable on secondary market transactions. If brokerage commissions were included, market returns would be lower. Market and NAV returns assume that dividends and capital gain distributions have been reinvested in the Fund at market price and NAV, respectively.
| (1) | The market price is determined using the midpoint between the highest bid and the lowest offer on the listing exchange, as of the time that the Fund’s NAV is calculated. |
| (2) | The Fund was seeded on August 31, 2017, but was not listed for trading until September 6, 2017. Accordingly, there is no Market Price information for August 31, 2017 through September 5, 2017. |
± The RAFI Dynamic Multi-Factor U.S. index takes time-varying exposures to five return factors; value, low volatility, quality, momentum and size. The index uses recent and historical metrics to tilt toward factor portfolios which are particularly attractive on a forward looking basis.
It is not possible to invest directly in an unmanaged index.
Performance quoted represents past performance. Past performance is not a guarantee or a reliable indicator of future results. Current performance may be lower or higher than performance shown. Investment return and the principal value of an investment will fluctuate. Shares may be worth more or less than original cost when redeemed by authorized participants. Returns shown do not reflect the deduction of taxes that a shareholder would pay on Fund distributions or on the redemption of Fund shares. Differences in the Fund’s performance versus the index and related attribution information with respect to particular categories of securities or individual positions may be attributable, in part, to differences in the pricing methodologies used by the Fund and the index. Performance data current to the most recent month-end is available at www.pimcoetfs.com or via (888) 400-4ETF.
The Fund’s total annual operating expense ratio in effect as of period end was 0.39%. Details regarding any changes to the Fund’s operating expenses, subsequent to period end, can be found in the Fund’s current prospectus, as supplemented.
| 10 | PIMCO EQUITY SERIES |
Table of Contents
| Ticker symbol - MFUS |
Sector Breakdown as of 06/30/20181§
Consumer Discretionary | 18.6% | |||||||
Information Technology | 18.2% | |||||||
Energy | 12.0% | |||||||
Industrials | 11.7% | |||||||
Consumer Staples | 10.0% | |||||||
Health Care | 9.9% | |||||||
Financials | 7.9% | |||||||
Materials | 3.7% | |||||||
Real Estate | 3.7% | |||||||
Telecommunication Services | 2.6% | |||||||
Utilities | 1.7% |
1 % of Investments, at value.
§ Top 10 Holdings and Sector Breakdown and % of Investments exclude securities sold short, financial derivative instruments and short-term instruments, if any.
Fund Insights
The following affected performance during the reporting period:
| » | Holdings in the consumer discretionary sector contributed to absolute returns for both the Fund and the Underlying Index. |
| » | Holdings in the Information technology sector contributed to absolute returns for both the Fund and the Underlying Index. |
| » | Holdings in the energy sector contributed to absolute returns for both the Fund and the Underlying Index. |
| » | Holdings in the industrials sector contributed to absolute returns for both the Fund and the Underlying Index. |
| » | Holdings in the financials sector contributed to absolute returns for both the Fund and the Underlying Index. |
| » | Holdings in the materials sector contributed to absolute returns for both the Fund and the Underlying Index. |
| ANNUAL REPORT | JUNE 30, 2018 | 11 |
Table of Contents
Example
As a shareholder of a Fund, you incur two types of costs: (1) transaction costs, including brokerage commissions paid on purchases and sales of Fund shares and (2) ongoing costs, including management fees, distribution and/or service (12b-1) fees, and other Fund expenses. The Example is intended to help you understand your ongoing costs (in dollars) of investing in a Fund and to compare these costs with the ongoing costs of investing in other exchange-traded funds.
The Example is based on an investment of $1,000 invested at the beginning of the period and held for the entire period indicated, which for all Funds and share classes is from January 1, 2018 to June 30, 2018 unless noted otherwise in the table and footnotes below.
Actual Expenses
The information in the table under the heading “Actual” provides information about actual account values and actual expenses. You may use this information, together with the amount you invested, to estimate the expenses that you paid over the period. Simply divide your account value by $1,000 (for example, an $8,600 account value divided by $1,000 = 8.60), then multiply the result by the number in the appropriate row for your share class, in the column entitled “Expenses Paid During Period” to estimate the expenses you paid on your account during this period.
Hypothetical Example for Comparison Purposes
The information in the table under the heading “Hypothetical (5% return before expenses)” provides information about hypothetical account values and hypothetical expenses based on a Fund’s actual expense ratio and an assumed rate of return of 5% per year before expenses, which is not the Fund’s actual return. The hypothetical account values and expenses may not be used to estimate the actual ending account balance or expenses you paid for the period. You may use this information to compare the ongoing costs of investing in a Fund and other funds. To do so, compare this 5% hypothetical example with the 5% hypothetical examples that appear in the shareholder reports of the other funds.
Please note that the expenses shown in the table are meant to highlight your ongoing costs only and do not reflect any transactional costs, such as sales charges (loads) on purchase payments and exchange fees. Therefore, the information under the heading “Hypothetical (5% return before expenses)” is useful in comparing ongoing costs only, and will not help you determine the relative total costs of owning different funds. In addition, if these transactional costs were included, your costs would have been higher.
Expense ratios may vary from period to period because of various factors such as an increase in expenses that are not covered by the management fees, such as fees and expenses of the independent trustees and their counsel, extraordinary expenses and interest expense.
| Actual | Hypothetical (5% return before expenses) | |||||||||||||||||||||||||||||||||||||||
| Beginning Account Value (01/01/18) | Ending Account Value (06/30/18) | Expenses Paid During Period* | Beginning Account Value (01/01/18) | Ending Account Value (06/30/18) | Expenses Paid During Period* | Net Annualized Expense Ratio** | ||||||||||||||||||||||||||||||||||
| PIMCO RAFI Dynamic Multi-Factor Emerging Markets Equity ETF | $ | 1,000.00 | $ | 920.20 | $ | 2.38 | $ | 1,000.00 | $ | 1,022.32 | $ | 2.51 | 0.50 | % | ||||||||||||||||||||||||||
| PIMCO RAFI Dynamic Multi-Factor International Equity ETF | 1,000.00 | 972.60 | 1.96 | 1,000.00 | 1,022.81 | 2.01 | 0.40 | |||||||||||||||||||||||||||||||||
| PIMCO RAFI Dynamic Multi-Factor U.S. Equity ETF | 1,000.00 | 1,029.90 | 1.41 | 1,000.00 | 1,023.41 | 1.40 | 0.28 | |||||||||||||||||||||||||||||||||
* Expenses Paid During Period are equal to the net annualized expense ratio for the class, multiplied by the average account value over the period, multiplied by 181/365 (to reflect the one-half year period). Overall fees and expenses of investing in the Fund will be higher because the example does not reflect variable contract fees and expenses.
** Net Annualized Expense Ratio is reflective of any applicable contractual fee waivers and/or expense reimbursements or voluntary fee waivers. Details regarding fee waivers, if any, can be found in Note 8, Fees and Expenses, in the Notes to Financial Statements.
| 12 | PIMCO EQUITY SERIES |
Table of Contents
(THIS PAGE INTENTIONALLY LEFT BLANK)
| ANNUAL REPORT | JUNE 30, 2018 | 13 |
Table of Contents
| Investment Operations | Less Distributions(b) | |||||||||||||||||||||||||||||||||||
| Selected Per Share Data for the Year or Period Ended^: | Net Asset Value Beginning of Year or | Net Investment Income (Loss)(a) | Net Realized/ Unrealized Gain (Loss) | Total | From Net Investment Income | From Net | Tax Basis Return of Capital | Total | ||||||||||||||||||||||||||||
PIMCO RAFI Dynamic Multi-Factor Emerging Markets Equity ETF | ||||||||||||||||||||||||||||||||||||
08/31/2017 - 06/30/2018 | $ | 25.00 | $ | 0.42 | $ | (1.41 | ) | $ | (0.99 | ) | $ | (0.07 | ) | $ | 0.00 | $ | 0.00 | $ | (0.07 | ) | ||||||||||||||||
PIMCO RAFI Dynamic Multi-Factor International Equity ETF | ||||||||||||||||||||||||||||||||||||
08/31/2017 - 06/30/2018 | $ | 25.00 | $ | 0.62 | $ | 0.44 | $ | 1.06 | $ | (0.19 | ) | $ | 0.00 | $ | 0.00 | $ | (0.19 | ) | ||||||||||||||||||
PIMCO RAFI Dynamic Multi-Factor U.S. Equity ETF | ||||||||||||||||||||||||||||||||||||
08/31/2017 - 06/30/2018 | $ | 25.00 | $ | 0.43 | $ | 3.17 | $ | 3.60 | $ | (0.30 | ) | $ | 0.00 | $ | 0.00 | $ | (0.30 | ) | ||||||||||||||||||
| ^ | A zero balance may reflect actual amounts rounding to less than $0.01 or 0.01%. |
| * | Annualized |
| (a) | Per share amounts based on average number of shares outstanding during the year or period. |
| (b) | The tax characterization of distributions is determined in accordance with Federal income tax regulations. See Note 2, Distributions to Shareholders, in the Notes to Financial Statements for more information. |
| 14 | PIMCO EQUITY SERIES | See Accompanying Notes |
Table of Contents
| Ratios/Supplemental Data | ||||||||||||||||||||||||||||||||||
| Ratios to Average Net Assets | ||||||||||||||||||||||||||||||||||
Net Asset Value End of Year or | Total Return | Net Assets End of Year or Period (000s) | Expenses | Expenses Excluding Waivers | Expenses Excluding Interest Expense | Expenses Excluding Interest Expense and Waivers | Net Investment Income (Loss) | Portfolio Turnover Rate | ||||||||||||||||||||||||||
| $ | 23.94 | (3.99 | )% | $ | 357,169 | 0.50 | %* | 0.55 | %* | 0.50 | %* | 0.55 | %* | 1.94 | %* | 52 | % | |||||||||||||||||
| $ | 25.87 | 4.22 | % | $ | 28,976 | 0.40 | %* | 0.87 | %* | 0.40 | %* | 0.87 | %* | 2.81 | %* | 36 | % | |||||||||||||||||
| $ | 28.30 | 14.43 | % | $ | 65,658 | 0.29 | %* | 0.60 | %* | 0.29 | %* | 0.60 | %* | 1.89 | %* | 56 | % | |||||||||||||||||
| ANNUAL REPORT | JUNE 30, 2018 | 15 |
Table of Contents
Statements of Assets and Liabilities
June 30, 2018
| (Amounts in thousands†, except per share amounts) | PIMCO RAFI Dynamic Multi-Factor Emerging Markets Equity ETF | PIMCO RAFI Dynamic Multi-Factor International Equity ETF | PIMCO RAFI Dynamic Multi-Factor U.S. Equity ETF | |||||||||
Assets: | ||||||||||||
Investments, at value | ||||||||||||
Investments in securities | $ | 352,066 | $ | 28,395 | $ | 64,965 | ||||||
Cash | 2,108 | 498 | 742 | |||||||||
Foreign currency, at value | 463 | 70 | 0 | |||||||||
Receivable for investments sold | 43,653 | 6,726 | 11,124 | |||||||||
Interest and/or dividends receivable | 1,458 | 94 | 70 | |||||||||
Total Assets | 399,748 | 35,783 | 76,901 | |||||||||
Liabilities: | ||||||||||||
Financial Derivative Instruments | ||||||||||||
Over the counter | $ | 1 | $ | 0 | $ | 0 | ||||||
Payable for investments purchased | 42,422 | 1,622 | 8,397 | |||||||||
Payable for Fund shares redeemed | 0 | 5,175 | 2,830 | |||||||||
Accrued management fees | 153 | 10 | 16 | |||||||||
Accrued reimbursement to PIMCO | 3 | 0 | 0 | |||||||||
Total Liabilities | 42,579 | 6,807 | 11,243 | |||||||||
Net Assets | $ | 357,169 | $ | 28,976 | $ | 65,658 | ||||||
Net Assets Consist of: | ||||||||||||
Paid in capital | $ | 401,242 | $ | 29,644 | $ | 65,375 | ||||||
Undistributed (overdistributed) net investment income | 2,839 | 451 | 364 | |||||||||
Accumulated undistributed net realized gain (loss) | (15,086 | ) | (750 | ) | (1,379 | ) | ||||||
Net unrealized appreciation (depreciation) | (31,826 | ) | (369 | ) | 1,298 | |||||||
Net Assets | $ | 357,169 | $ | 28,976 | $ | 65,658 | ||||||
Shares Issued and Outstanding | 14,920 | 1,120 | 2,320 | |||||||||
Net Asset Value Per Share Outstanding: | $ | 23.94 | $ | 25.87 | $ | 28.30 | ||||||
Cost of investments in securities | $ | 383,871 | $ | 28,763 | $ | 63,667 | ||||||
Cost of foreign currency held | $ | 471 | $ | 70 | $ | 0 | ||||||
| † | A zero balance may reflect actual amounts rounding to less than one thousand. |
| 16 | PIMCO EQUITY SERIES | See Accompanying Notes |
Table of Contents
| Period Ended June 30, 2018 | ||||||||||||
| (Amounts in thousands†) | PIMCO RAFI Dynamic Multi-Factor Emerging Markets Equity ETF(1) | PIMCO RAFI Dynamic Multi-Factor International Equity ETF(1) | PIMCO RAFI Dynamic Multi-Factor U.S. Equity ETF(1) | |||||||||
Investment Income: | ||||||||||||
Dividends, net of foreign taxes* | $ | 4,675 | $ | 687 | $ | 710 | ||||||
Total Income | 4,675 | 687 | 710 | |||||||||
Expenses: | ||||||||||||
Management fees | 936 | 83 | 94 | |||||||||
Trustee fees | 6 | 1 | 2 | |||||||||
Interest expense | 3 | 0 | 0 | |||||||||
Organizational expense | 122 | 122 | 122 | |||||||||
Miscellaneous expense | 1 | 1 | 0 | |||||||||
Total Expenses | 1,068 | 207 | 218 | |||||||||
Waiver and/or Reimbursement by PIMCO | (119 | ) | (122 | ) | (122 | ) | ||||||
Net Expenses | 949 | 85 | 96 | |||||||||
Net Investment Income (Loss) | 3,726 | 602 | 614 | |||||||||
Net Realized Gain (Loss): | ||||||||||||
Investments in securities | (15,082 | ) | (710 | ) | (1,404 | ) | ||||||
In-kind redemptions | 0 | 1,349 | 2,876 | |||||||||
Over the counter financial derivative instruments | (299 | ) | (3 | ) | 0 | |||||||
Foreign currency | (149 | ) | (12 | ) | 0 | |||||||
Net Realized Gain (Loss) | (15,530 | ) | 624 | 1,472 | ||||||||
Net Change in Unrealized Appreciation (Depreciation): | ||||||||||||
Investments in securities | (31,805 | ) | (368 | ) | 1,298 | |||||||
Over the counter financial derivative instruments | (1 | ) | 0 | 0 | ||||||||
Foreign currency assets and liabilities | (20 | ) | (1 | ) | 0 | |||||||
Net Change in Unrealized Appreciation (Depreciation) | (31,826 | ) | (369 | ) | 1,298 | |||||||
Net Increase (Decrease) in Net Assets Resulting from Operations | $ | (43,630 | ) | $ | 857 | $ | 3,384 | |||||
* Foreign tax withholdings - Dividends | $ | 602 | $ | 73 | $ | 0 | ||||||
| † | A zero balance may reflect actual amounts rounding to less than one thousand. |
| (1) | Period from August 31, 2017 to June 30, 2018. |
| ANNUAL REPORT | JUNE 30, 2018 | 17 |
Table of Contents
Statements of Changes in Net Assets
PIMCO | PIMCO RAFI Dynamic Multi-Factor International Equity ETF | PIMCO RAFI Dynamic Multi-Factor U.S. Equity ETF | ||||||||||
| (Amounts in thousands†) | Inception date through June 30, 2018 | Inception date through June 30, 2018 | Inception date through June 30, 2018 | |||||||||
Increase (Decrease) in Net Assets from: | ||||||||||||
Operations: | ||||||||||||
Net investment income (loss) | $ | 3,726 | $ | 602 | $ | 614 | ||||||
Net realized gain (loss) | (15,530 | ) | 624 | 1,472 | ||||||||
Net change in unrealized appreciation (depreciation) | (31,826 | ) | (369 | ) | 1,298 | |||||||
Net Increase (Decrease) in Net Assets Resulting from Operations | (43,630 | ) | 857 | 3,384 | ||||||||
Distributions to Shareholders: | ||||||||||||
From net investment income | (443 | ) | (176 | ) | (226 | ) | ||||||
Tax basis return of capital | 0 | 0 | 0 | |||||||||
Total Distributions(a) | (443 | ) | (176 | ) | (226 | ) | ||||||
Fund Share Transactions: | ||||||||||||
Receipts for shares sold | 401,242 | 43,985 | 89,841 | |||||||||
Cost of shares redeemed | 0 | (15,690 | ) | (27,341 | ) | |||||||
Net increase (decrease) resulting from Fund share transactions | 401,242 | 28,295 | 62,500 | |||||||||
Total Increase (Decrease) in Net Assets | 357,169 | 28,976 | 65,658 | |||||||||
Net Assets: | ||||||||||||
Beginning of year | 0 | 0 | 0 | |||||||||
End of year* | $ | 357,169 | $ | 28,976 | $ | 65,658 | ||||||
* Including undistributed (overdistributed) net investment income of: | $ | 2,839 | $ | 451 | $ | 364 | ||||||
Shares of Beneficial Interest: | ||||||||||||
Shares sold | 14,920 | 1,720 | 3,320 | |||||||||
Shares redeemed | 0 | (600 | ) | (1,000 | ) | |||||||
Net increase (decrease) in shares outstanding | 14,920 | 1,120 | 2,320 | |||||||||
| † | A zero balance may reflect actual amounts rounding to less than one thousand. |
| (a) | The tax characterization of distributions is determined in accordance with Federal income tax regulations. See Note 2, Distributions to Shareholders, in the Notes to Financial Statements for more information. |
| 18 | PIMCO EQUITY SERIES | See Accompanying Notes |
Table of Contents
Schedule of Investments PIMCO RAFI Dynamic Multi-Factor Emerging Markets Equity ETF
June 30, 2018
(Amounts in thousands*, except number of shares, contracts and units, if any)
| SHARES | MARKET VALUE (000S) | |||||||||||
| INVESTMENTS IN SECURITIES 98.6% | ||||||||||||
| COMMON STOCKS 90.5% | ||||||||||||
| BRAZIL 6.6% | ||||||||||||
| CONSUMER DISCRETIONARY 0.2% | ||||||||||||
Cyrela Brazil Realty S.A. Empreendimentos e Participacoes | 32,000 | $ | 91 | |||||||||
Grendene S.A. | 10,800 | 22 | ||||||||||
Kroton Educacional S.A. | 27,700 | 67 | ||||||||||
Lojas Renner S.A. | 45,600 | 345 | ||||||||||
Via Varejo S.A. | 36,100 | 173 | ||||||||||
|
| |||||||||||
| 698 | ||||||||||||
|
| |||||||||||
| CONSUMER STAPLES 1.0% | ||||||||||||
Ambev S.A. ADR | 308,706 | 1,429 | ||||||||||
BRF S.A. (a) | 83,700 | 389 | ||||||||||
JBS S.A. | 470,000 | 1,128 | ||||||||||
M Dias Branco S.A. | 7,500 | 72 | ||||||||||
Natura Cosmeticos S.A. | 34,300 | 268 | ||||||||||
Raia Drogasil S.A. | 9,000 | 154 | ||||||||||
|
| |||||||||||
| 3,440 | ||||||||||||
|
| |||||||||||
| ENERGY 1.8% | ||||||||||||
Cosan Ltd. ‘A’ | 4,522 | 34 | ||||||||||
Cosan S.A. Industria e Comercio | 2,300 | 21 | ||||||||||
Petroleo Brasileiro S.A. SP - ADR | 575,974 | 5,777 | ||||||||||
Ultrapar Participacoes S.A. | 53,100 | 630 | ||||||||||
|
| |||||||||||
| 6,462 | ||||||||||||
|
| |||||||||||
| FINANCIALS 0.4% | ||||||||||||
B3 S.A. - Brasil Bolsa Balcao | 77,100 | 407 | ||||||||||
Banco BTG Pactual S.A. | 4,300 | 20 | ||||||||||
Banco do Brasil S.A. | 87,200 | 645 | ||||||||||
Banco Santander Brasil S.A. ADR | 8,140 | 61 | ||||||||||
BB Seguridade Participacoes S.A. | 22,500 | 142 | ||||||||||
Porto Seguro S.A. | 7,400 | 78 | ||||||||||
|
| |||||||||||
| 1,353 | ||||||||||||
|
| |||||||||||
| HEALTH CARE 0.0% | ||||||||||||
Hypermarcas S.A. | 17,000 | 121 | ||||||||||
|
| |||||||||||
| INDUSTRIALS 0.3% | ||||||||||||
CCR S.A. | 8,400 | 22 | ||||||||||
Embraer S.A. SP - ADR | 19,908 | 496 | ||||||||||
WEG S.A. | 96,330 | 404 | ||||||||||
|
| |||||||||||
| 922 | ||||||||||||
|
| |||||||||||
| INFORMATION TECHNOLOGY 0.0% | ||||||||||||
Cielo S.A. | 4,700 | 20 | ||||||||||
|
| |||||||||||
| MATERIALS 2.7% | ||||||||||||
Cia Siderurgica Nacional S.A. (a) | 189,200 | 384 | ||||||||||
Fibria Celulose S.A. | 31,300 | 586 | ||||||||||
Klabin S.A. | 36,500 | 185 | ||||||||||
Vale S.A. SP - ADR | 667,730 | 8,560 | ||||||||||
|
| |||||||||||
| 9,715 | ||||||||||||
|
| |||||||||||
| UTILITIES 0.2% | ||||||||||||
AES Tiete Energia S.A. | 44,500 | 111 | ||||||||||
| SHARES | MARKET VALUE (000S) | |||||||||||
Cia de Saneamento Basico do Estado de Sao Paulo ADR | 7,324 | $ | 44 | |||||||||
Cia de Saneamento de Minas Gerais-COPASA | 6,200 | 66 | ||||||||||
Energisa S.A. | 14,800 | 112 | ||||||||||
Engie Brasil Energia S.A. | 29,700 | 262 | ||||||||||
Light S.A. | 31,400 | 91 | ||||||||||
Transmissora Alianca de Energia Eletrica S.A. | 37,400 | 180 | ||||||||||
|
| |||||||||||
| 866 | ||||||||||||
|
| |||||||||||
Total Brazil | 23,597 | |||||||||||
|
| |||||||||||
| CHILE 1.6% | ||||||||||||
| CONSUMER DISCRETIONARY 0.1% | ||||||||||||
SACI Falabella | 56,069 | 514 | ||||||||||
|
| |||||||||||
| CONSUMER STAPLES 0.3% | ||||||||||||
Cencosud S.A. | 227,854 | 563 | ||||||||||
Cia Cervecerias Unidas S.A. | 18,748 | 468 | ||||||||||
|
| |||||||||||
| 1,031 | ||||||||||||
|
| |||||||||||
| ENERGY 0.2% | ||||||||||||
Empresas COPEC S.A. | 36,718 | 562 | ||||||||||
|
| |||||||||||
| FINANCIALS 0.3% | ||||||||||||
Banco de Chile | 3,163,559 | 489 | ||||||||||
Banco de Credito e Inversiones | 2,464 | 164 | ||||||||||
Banco Santander Chile ADR | 8,008 | 252 | ||||||||||
Itau CorpBanca | 18,720,237 | 183 | ||||||||||
Sociedad Matriz del Banco de Chile S.A. ‘B’ | 133,794 | 64 | ||||||||||
|
| |||||||||||
| 1,152 | ||||||||||||
|
| |||||||||||
| INDUSTRIALS 0.1% | ||||||||||||
Cia Sud Americana de Vapores S.A. (a) | 3,346,923 | 95 | ||||||||||
Latam Airlines Group S.A. | 21,500 | 212 | ||||||||||
|
| |||||||||||
| 307 | ||||||||||||
|
| |||||||||||
| MATERIALS 0.3% | ||||||||||||
CAP S.A. | 11,391 | 113 | ||||||||||
Empresas CMPC S.A. | 126,019 | 459 | ||||||||||
Sociedad Quimica y Minera de Chile S.A. SP - ADR | 7,641 | 367 | ||||||||||
|
| |||||||||||
| 939 | ||||||||||||
|
| |||||||||||
| TELECOMMUNICATION SERVICES 0.0% | ||||||||||||
Empresa Nacional de Telecomunicaciones S.A. | 13,236 | 121 | ||||||||||
|
| |||||||||||
| UTILITIES 0.3% | ||||||||||||
AES Gener S.A. | 201,894 | 50 | ||||||||||
Aguas Andinas S.A. ‘A’ | 260,747 | 142 | ||||||||||
Colbun S.A. | 555,054 | 115 | ||||||||||
Enel Americas S.A. | 3,041,308 | 538 | ||||||||||
Enel Chile S.A. | 2,027,133 | 200 | ||||||||||
Engie Energia Chile S.A. | 18,735 | 34 | ||||||||||
|
| |||||||||||
| 1,079 | ||||||||||||
|
| |||||||||||
Total Chile | 5,705 | |||||||||||
|
| |||||||||||
| SHARES | MARKET VALUE (000S) | |||||||||||
| CHINA 15.7% | ||||||||||||
| CONSUMER DISCRETIONARY 0.9% | ||||||||||||
ANTA Sports Products Ltd. | 105,000 | $ | 554 | |||||||||
China ZhengTong Auto Services Holdings Ltd. | 58,000 | 39 | ||||||||||
GOME Retail Holdings Ltd. | 288,000 | 29 | ||||||||||
Great Wall Motor Co. Ltd. ‘H’ | 240,000 | 183 | ||||||||||
New Oriental Education & Technology Group, Inc. SP - ADR | 9,029 | 855 | ||||||||||
Shenzhou International Group Holdings Ltd. | 89,000 | 1,095 | ||||||||||
Yum China Holdings, Inc. | 8,869 | 341 | ||||||||||
Zhongsheng Group Holdings Ltd. | 36,500 | 109 | ||||||||||
|
| |||||||||||
| 3,205 | ||||||||||||
|
| |||||||||||
| CONSUMER STAPLES 1.0% | ||||||||||||
Dali Foods Group Co. Ltd. | 247,000 | 190 | ||||||||||
Hengan International Group Co. Ltd. | 132,500 | 1,271 | ||||||||||
Tingyi Cayman Islands Holding Corp. | 370,000 | 858 | ||||||||||
Tsingtao Brewery Co. Ltd. ‘H’ | 42,000 | 230 | ||||||||||
Uni-President China Holdings Ltd. | 212,000 | 272 | ||||||||||
Want Want China Holdings Ltd. | 995,000 | 885 | ||||||||||
|
| |||||||||||
| 3,706 | ||||||||||||
|
| |||||||||||
| ENERGY 3.6% | ||||||||||||
China Petroleum & Chemical Corp. ‘H’ | 8,138,000 | 7,285 | ||||||||||
CNOOC Ltd. | 2,593,000 | 4,443 | ||||||||||
PetroChina Co. Ltd. ‘H’ | 1,048,000 | 798 | ||||||||||
Yanzhou Coal Mining Co. Ltd. ‘H’ | 100,000 | 130 | ||||||||||
|
| |||||||||||
| 12,656 | ||||||||||||
|
| |||||||||||
| FINANCIALS 1.1% | ||||||||||||
China Galaxy Securities Co. Ltd. | 45,500 | 23 | ||||||||||
China Huarong Asset Management Co. Ltd. ‘H’ | 73,000 | 21 | ||||||||||
China Merchants Bank Co. Ltd. ‘H’ | 234,500 | 863 | ||||||||||
China Reinsurance Group Corp. ‘H’ | 729,000 | 160 | ||||||||||
GF Securities Co. Ltd. | 16,834 | 24 | ||||||||||
Guotai Junan Securities Co. Ltd. | 17,600 | 37 | ||||||||||
Huatai Securities Co. Ltd. | 16,063 | 26 | ||||||||||
PICC Property & Casualty Co. Ltd. ‘H’ | 160,000 | 172 | ||||||||||
Ping An Insurance Group Co. of China Ltd. ‘H’ | 294,500 | 2,697 | ||||||||||
|
| |||||||||||
| 4,023 | ||||||||||||
|
| |||||||||||
| HEALTH CARE 0.4% | ||||||||||||
China Resources Pharmaceutical Group Ltd. | 70,000 | 97 | ||||||||||
CSPC Pharmaceutical Group Ltd. | 336,000 | 1,009 | ||||||||||
Guangzhou Baiyunshan Pharmaceutical Holdings Co. Ltd. | 10,000 | 44 | ||||||||||
Shanghai Fosun Pharmaceutical Group Co. Ltd. | 20,500 | 112 | ||||||||||
Sihuan Pharmaceutical Holdings Group Ltd. | 90,000 | 20 | ||||||||||
Sinopharm Group Co. Ltd. | 27,200 | 109 | ||||||||||
|
| |||||||||||
| 1,391 | ||||||||||||
|
| |||||||||||
| See Accompanying Notes | ANNUAL REPORT | JUNE 30, 2018 | 19 |
Table of Contents
Schedule of Investments PIMCO RAFI Dynamic Multi-Factor Emerging Markets Equity ETF (Cont.)
| SHARES | MARKET VALUE (000S) | |||||||||||
| INDUSTRIALS 0.8% | ||||||||||||
Air China Ltd. ‘H’ | 122,000 | $ | 117 | |||||||||
AviChina Industry & Technology Co. Ltd. | 106,000 | 63 | ||||||||||
Beijing Capital International Airport Co. Ltd. ‘H’ | 36,000 | 38 | ||||||||||
China Eastern Airlines Corp. Ltd. ‘H’ | 42,000 | 28 | ||||||||||
China Southern Airlines Co. Ltd. ‘H’ | 290,000 | 227 | ||||||||||
COSCO SHIPPING Energy Transportation Co. Ltd. | 74,000 | 36 | ||||||||||
Country Garden Services Holdings Co. Ltd. (a) | 68,505 | 88 | ||||||||||
Fosun International Ltd. | 187,000 | 350 | ||||||||||
Harbin Electric Co. Ltd. ‘H’ | 124,000 | 36 | ||||||||||
Jiangsu Expressway Co. Ltd. ‘H’ | 150,000 | 179 | ||||||||||
Sinopec Engineering Group Co. Ltd. ‘H’ | 144,500 | 151 | ||||||||||
Sinotrans Ltd. ‘H’ | 273,000 | 143 | ||||||||||
Sinotruk Hong Kong Ltd. | 73,500 | 120 | ||||||||||
Weichai Power Co. Ltd. ‘H’ | 128,000 | 176 | ||||||||||
Yangzijiang Shipbuilding Holdings Ltd. | 220,100 | 146 | ||||||||||
Zhejiang Expressway Co. Ltd. ‘H’ | 118,000 | 105 | ||||||||||
Zhuzhou CRRC Times Electric Co. Ltd. | 5,000 | 24 | ||||||||||
ZTO Express Cayman, Inc. ADR | 41,547 | 831 | ||||||||||
|
| |||||||||||
| 2,858 | ||||||||||||
|
| |||||||||||
| INFORMATION TECHNOLOGY 4.7% | ||||||||||||
AAC Technologies Holdings, Inc. | 55,000 | 772 | ||||||||||
Alibaba Group Holding Ltd. SP - ADR (a) | 28,581 | 5,303 | ||||||||||
AVIC International Holdings Ltd. | 62,000 | 35 | ||||||||||
Baidu, Inc. SP - ADR (a) | 15,456 | 3,756 | ||||||||||
FIH Mobile Ltd. | 727,000 | 113 | ||||||||||
Legend Holdings Corp. ‘H’ | 85,100 | 259 | ||||||||||
Lenovo Group Ltd. | 1,186,000 | 638 | ||||||||||
Tencent Holdings Ltd. | 113,300 | 5,689 | ||||||||||
ZTE Corp. ‘H’ (a) | 44,800 | 68 | ||||||||||
|
| |||||||||||
| 16,633 | ||||||||||||
|
| |||||||||||
| MATERIALS 0.9% | ||||||||||||
Angang Steel Co. Ltd. ‘H’ | 38,000 | 34 | ||||||||||
Anhui Conch Cement Co. Ltd. ‘H’ | 92,000 | 525 | ||||||||||
China BlueChemical Ltd. ‘H’ | 344,000 | 126 | ||||||||||
China Molybdenum Co. Ltd. ‘H’ | 278,000 | 134 | ||||||||||
China National Building Material Co. Ltd. ‘H’ | 1,494,000 | 1,471 | ||||||||||
China Oriental Group Co. Ltd. | 240,000 | 168 | ||||||||||
Jiangxi Copper Co. Ltd. ‘H’ | 324,000 | 411 | ||||||||||
Sinopec Shanghai Petrochemical Co. Ltd. ‘H’ | 598,000 | 364 | ||||||||||
Zijin Mining Group Co. Ltd. | 326,000 | 125 | ||||||||||
|
| |||||||||||
| 3,358 | ||||||||||||
|
| |||||||||||
| REAL ESTATE 1.4% | ||||||||||||
Agile Group Holdings Ltd. | 578,000 | 983 | ||||||||||
China Evergrande Group | 28,000 | 71 | ||||||||||
China Vanke Co. Ltd. ‘H’ | 97,200 | 339 | ||||||||||
CIFI Holdings Group Co. Ltd. | 144,000 | 91 | ||||||||||
Country Garden Holdings Co. Ltd. | 492,000 | 863 | ||||||||||
Future Land Development Holdings Ltd. | 84,000 | 76 | ||||||||||
| SHARES | MARKET VALUE (000S) | |||||||||||
Greentown China Holdings Ltd. | 75,000 | $ | 100 | |||||||||
Guangzhou R&F Properties Co. Ltd. ‘H’ | 149,600 | 300 | ||||||||||
Kaisa Group Holdings Ltd. | 678,000 | 288 | ||||||||||
KWG Property Holding Ltd. | 121,000 | 151 | ||||||||||
Logan Property Holdings Co. Ltd. | 72,000 | 97 | ||||||||||
Longfor Properties Co. Ltd. | 85,000 | 229 | ||||||||||
Powerlong Real Estate Holdings Ltd. | 203,000 | 109 | ||||||||||
Red Star Macalline Group Corp. Ltd. ‘H’ | 51,800 | 70 | ||||||||||
Shui On Land Ltd. | 783,000 | 198 | ||||||||||
Sino-Ocean Group Holding Ltd. | 477,000 | 276 | ||||||||||
SOHO China Ltd. | 613,000 | 291 | ||||||||||
Sunac China Holdings Ltd. | 129,000 | 449 | ||||||||||
|
| |||||||||||
| 4,981 | ||||||||||||
|
| |||||||||||
| TELECOMMUNICATION SERVICES 0.2% | ||||||||||||
China Communications Services Corp. Ltd. ‘H’ | 386,000 | 244 | ||||||||||
China Telecom Corp. Ltd. ‘H’ | 810,000 | 380 | ||||||||||
|
| |||||||||||
| 624 | ||||||||||||
|
| |||||||||||
| UTILITIES 0.7% | ||||||||||||
Beijing Jingneng Clean Energy Co. Ltd. ‘H’ | 398,000 | 92 | ||||||||||
CGN Power Co. Ltd. ‘H’ | 1,128,000 | 291 | ||||||||||
China Longyuan Power Group Corp. Ltd. ‘H’ | 175,000 | 140 | ||||||||||
Datang International Power Generation Co. Ltd. ‘H’ (a) | 292,000 | 89 | ||||||||||
ENN Energy Holdings Ltd. | 127,000 | 1,244 | ||||||||||
Huadian Fuxin Energy Corp. Ltd. ‘H’ | 582,000 | 136 | ||||||||||
Huadian Power International Corp. Ltd. ‘H’ | 174,000 | 69 | ||||||||||
Huaneng Power International, Inc. ‘H’ | 514,000 | 340 | ||||||||||
Huaneng Renewables Corp. Ltd. | 268,000 | 89 | ||||||||||
|
| |||||||||||
| 2,490 | ||||||||||||
|
| |||||||||||
Total China | 55,925 | |||||||||||
|
| |||||||||||
| GREECE 0.6% | ||||||||||||
| CONSUMER DISCRETIONARY 0.1% | ||||||||||||
OPAP S.A. | 27,116 | 306 | ||||||||||
|
| |||||||||||
| ENERGY 0.1% | ||||||||||||
Hellenic Petroleum S.A. | 3,045 | 25 | ||||||||||
Motor Oil Hellas Corinth Refineries S.A. | 5,804 | 117 | ||||||||||
|
| |||||||||||
| 142 | ||||||||||||
|
| |||||||||||
| FINANCIALS 0.4% | ||||||||||||
Alpha Bank AE (a) | 272,455 | 607 | ||||||||||
National Bank of Greece S.A. (a) | 1,570,015 | 479 | ||||||||||
Piraeus Bank S.A. (a) | 133,727 | 453 | ||||||||||
|
| |||||||||||
| 1,539 | ||||||||||||
|
| |||||||||||
| UTILITIES 0.0% | ||||||||||||
Public Power Corp. S.A. (a) | 32,177 | 69 | ||||||||||
|
| |||||||||||
Total Greece | 2,056 | |||||||||||
|
| |||||||||||
| SHARES | MARKET VALUE (000S) | |||||||||||
| HONG KONG 2.6% | ||||||||||||
| CONSUMER DISCRETIONARY 0.0% | ||||||||||||
Dah Chong Hong Holdings Ltd. | 286,000 | $ | 142 | |||||||||
|
| |||||||||||
| CONSUMER STAPLES 0.8% | ||||||||||||
China Agri-Industries Holdings Ltd. | 718,000 | 274 | ||||||||||
China Mengniu Dairy Co. Ltd. | 162,000 | 546 | ||||||||||
China Resources Beer Holdings Co. Ltd. | 378,000 | 1,831 | ||||||||||
|
| |||||||||||
| 2,651 | ||||||||||||
|
| |||||||||||
| ENERGY 0.1% | ||||||||||||
Kunlun Energy Co. Ltd. | 580,000 | 506 | ||||||||||
|
| |||||||||||
| FINANCIALS 0.1% | ||||||||||||
China Everbright Ltd. | 16,000 | 29 | ||||||||||
China Taiping Insurance Holdings Co. Ltd. | 104,000 | 324 | ||||||||||
|
| |||||||||||
| 353 | ||||||||||||
|
| |||||||||||
| INDUSTRIALS 0.2% | ||||||||||||
China Everbright International Ltd. | 56,000 | 72 | ||||||||||
China Merchants Port Holdings Co. Ltd. | 14,000 | 28 | ||||||||||
China State Construction International Holdings Ltd. | 152,000 | 156 | ||||||||||
COSCO SHIPPING Ports Ltd. | 148,000 | 123 | ||||||||||
Shenzhen International Holdings Ltd. | 29,500 | 61 | ||||||||||
Tianjin Port Development Holdings Ltd. | 650,000 | 79 | ||||||||||
|
| |||||||||||
| 519 | ||||||||||||
|
| |||||||||||
| MATERIALS 0.1% | ||||||||||||
China Resources Cement Holdings Ltd. | 96,000 | 97 | ||||||||||
Shougang Fushan Resources Group Ltd. | 676,000 | 160 | ||||||||||
Sinofert Holdings Ltd. | 666,000 | 79 | ||||||||||
|
| |||||||||||
| 336 | ||||||||||||
|
| |||||||||||
| REAL ESTATE 0.7% | ||||||||||||
China Jinmao Holdings Group Ltd. | 376,000 | 188 | ||||||||||
China Overseas Land & Investment Ltd. | 196,000 | 643 | ||||||||||
China Resources Land Ltd. | 292,000 | 981 | ||||||||||
Poly Property Group Co. Ltd. | 434,000 | 179 | ||||||||||
Shenzhen Investment Ltd. | 74,000 | 27 | ||||||||||
Yuexiu Property Co. Ltd. | 1,646,000 | 313 | ||||||||||
|
| |||||||||||
| 2,331 | ||||||||||||
|
| |||||||||||
| TELECOMMUNICATION SERVICES 0.1% | ||||||||||||
China Unicom Hong Kong Ltd. | 314,000 | 391 | ||||||||||
|
| |||||||||||
| UTILITIES 0.5% | ||||||||||||
China Power International Development Ltd. | 1,226,000 | 282 | ||||||||||
China Resources Gas Group Ltd. | 64,000 | 277 | ||||||||||
China Resources Power Holdings Co. Ltd. | 464,000 | 815 | ||||||||||
| 20 | PIMCO EQUITY SERIES | See Accompanying Notes |
Table of Contents
June 30, 2018
| SHARES | MARKET VALUE (000S) | |||||||||||
Guangdong Investment Ltd. | 312,000 | $ | 494 | |||||||||
|
| |||||||||||
| 1,868 | ||||||||||||
|
| |||||||||||
Total Hong Kong | 9,097 | |||||||||||
|
| |||||||||||
| INDIA 4.9% | ||||||||||||
| CONSUMER DISCRETIONARY 0.5% | ||||||||||||
Mahindra & Mahindra Ltd. GDR | 70,000 | 913 | ||||||||||
Tata Motors Ltd. ADR (a) | 43,410 | 849 | ||||||||||
|
| |||||||||||
| 1,762 | ||||||||||||
|
| |||||||||||
| FINANCIALS 1.4% | ||||||||||||
HDFC Bank Ltd. ADR | 49,267 | 5,174 | ||||||||||
|
| |||||||||||
| HEALTH CARE 0.2% | ||||||||||||
Dr Reddy’s Laboratories Ltd. ADR | 26,925 | 867 | ||||||||||
|
| |||||||||||
| INDUSTRIALS 0.4% | ||||||||||||
Larsen & Toubro Ltd. GDR | 70,000 | 1,284 | ||||||||||
|
| |||||||||||
| INFORMATION TECHNOLOGY 2.1% | ||||||||||||
Infosys Ltd. SP - ADR | 315,854 | 6,137 | ||||||||||
Wipro Ltd. ADR | 257,929 | 1,235 | ||||||||||
|
| |||||||||||
| 7,372 | ||||||||||||
|
| |||||||||||
| MATERIALS 0.3% | ||||||||||||
Tata Steel Ltd. GDR | 144,750 | 1,190 | ||||||||||
|
| |||||||||||
Total India | 17,649 | |||||||||||
|
| |||||||||||
| INDONESIA 1.6% | ||||||||||||
| CONSUMER DISCRETIONARY 0.2% | ||||||||||||
Astra International Tbk PT | 1,707,000 | 786 | ||||||||||
|
| |||||||||||
| CONSUMER STAPLES 0.2% | ||||||||||||
Astra Agro Lestari Tbk PT | 29,900 | 23 | ||||||||||
Charoen Pokphand Indonesia Tbk PT | 123,800 | 32 | ||||||||||
Gudang Garam Tbk PT | 37,200 | 174 | ||||||||||
Hanjaya Mandala Sampoerna Tbk PT | 820,000 | 204 | ||||||||||
Indofood CBP Sukses Makmur Tbk PT | 259,800 | 161 | ||||||||||
Indofood Sukses Makmur Tbk PT | 57,300 | 27 | ||||||||||
Unilever Indonesia Tbk PT | 66,300 | 213 | ||||||||||
|
| |||||||||||
| 834 | ||||||||||||
|
| |||||||||||
| ENERGY 0.2% | ||||||||||||
Bukit Asam Tbk PT | 867,200 | 239 | ||||||||||
Indo Tambangraya Megah Tbk PT | 106,200 | 166 | ||||||||||
United Tractors Tbk PT | 205,300 | 452 | ||||||||||
|
| |||||||||||
| 857 | ||||||||||||
|
| |||||||||||
| FINANCIALS 0.3% | ||||||||||||
Bank Central Asia Tbk PT | 424,400 | 634 | ||||||||||
Bank Negara Indonesia Persero Tbk PT | 463,000 | 228 | ||||||||||
|
| |||||||||||
| 862 | ||||||||||||
|
| |||||||||||
| HEALTH CARE 0.0% | ||||||||||||
Kalbe Farma Tbk PT | 294,400 | 25 | ||||||||||
|
| |||||||||||
| SHARES | MARKET VALUE (000S) | |||||||||||
| MATERIALS 0.4% | ||||||||||||
Indah Kiat Pulp & Paper Corp. Tbk PT | 761,500 | $ | 987 | |||||||||
Indocement Tunggal Prakarsa Tbk PT | 114,700 | 109 | ||||||||||
Semen Indonesia Persero Tbk PT | 371,500 | 185 | ||||||||||
|
| |||||||||||
| 1,281 | ||||||||||||
|
| |||||||||||
| TELECOMMUNICATION SERVICES 0.3% | ||||||||||||
Telekomunikasi Indonesia Persero Tbk PT | 3,635,900 | 952 | ||||||||||
|
| |||||||||||
| UTILITIES 0.0% | ||||||||||||
Perusahaan Gas Negara Persero Tbk | 589,500 | 82 | ||||||||||
|
| |||||||||||
Total Indonesia | 5,679 | |||||||||||
|
| |||||||||||
| MALAYSIA 2.4% | ||||||||||||
| CONSUMER DISCRETIONARY 0.3% | ||||||||||||
Astro Malaysia Holdings Bhd. | 56,800 | 22 | ||||||||||
Genting Bhd. | 249,200 | 518 | ||||||||||
Genting Malaysia Bhd. | 290,400 | 351 | ||||||||||
UMW Holdings Bhd. | 72,600 | 108 | ||||||||||
|
| |||||||||||
| 999 | ||||||||||||
|
| |||||||||||
| CONSUMER STAPLES 0.3% | ||||||||||||
British American Tobacco Malaysia Bhd. | 22,000 | 190 | ||||||||||
Felda Global Ventures Holdings Bhd. | 581,300 | 217 | ||||||||||
IOI Corp. Bhd. | 195,700 | 220 | ||||||||||
Kuala Lumpur Kepong Bhd. | 30,000 | 180 | ||||||||||
Nestle Malaysia Bhd. | 1,600 | 58 | ||||||||||
PPB Group Bhd. | 37,400 | 182 | ||||||||||
|
| |||||||||||
| 1,047 | ||||||||||||
|
| |||||||||||
| ENERGY 0.1% | ||||||||||||
Petronas Dagangan Bhd. | 34,900 | 214 | ||||||||||
|
| |||||||||||
| FINANCIALS 0.8% | ||||||||||||
AMMB Holdings Bhd. | 169,100 | 157 | ||||||||||
CIMB Group Holdings Bhd. | 274,600 | 370 | ||||||||||
Hong Leong Bank Bhd. | 45,300 | 204 | ||||||||||
Malayan Banking Bhd. | 354,400 | 789 | ||||||||||
Public Bank Bhd. | 234,300 | 1,356 | ||||||||||
|
| |||||||||||
| 2,876 | ||||||||||||
|
| |||||||||||
| HEALTH CARE 0.0% | ||||||||||||
IHH Healthcare Bhd. | 19,400 | 29 | ||||||||||
|
| |||||||||||
| INDUSTRIALS 0.2% | ||||||||||||
Berjaya Corp. Bhd. (a) | 1,365,200 | 101 | ||||||||||
IJM Corp. Bhd. | 233,900 | 104 | ||||||||||
MISC Bhd. | 96,700 | 141 | ||||||||||
Sime Darby Bhd. | 867,900 | 526 | ||||||||||
|
| |||||||||||
| 872 | ||||||||||||
|
| |||||||||||
| MATERIALS 0.1% | ||||||||||||
Petronas Chemicals Group Bhd. | 141,000 | 294 | ||||||||||
|
| |||||||||||
| SHARES | MARKET VALUE (000S) | |||||||||||
| REAL ESTATE 0.0% | ||||||||||||
IOI Properties Group Bhd. | 77,300 | $ | 31 | |||||||||
Sunway Bhd. | 75,300 | 29 | ||||||||||
|
| |||||||||||
| 60 | ||||||||||||
|
| |||||||||||
| TELECOMMUNICATION SERVICES 0.2% | ||||||||||||
Axiata Group Bhd. | 272,700 | 257 | ||||||||||
DiGi.Com Bhd. | 154,300 | 158 | ||||||||||
Maxis Bhd. | 155,800 | 211 | ||||||||||
Telekom Malaysia Bhd. | 118,900 | 91 | ||||||||||
|
| |||||||||||
| 717 | ||||||||||||
|
| |||||||||||
| UTILITIES 0.4% | ||||||||||||
Petronas Gas Bhd. | 37,400 | 160 | ||||||||||
Tenaga Nasional Bhd. | 331,400 | 1,202 | ||||||||||
YTL Corp. Bhd. | 569,008 | 159 | ||||||||||
YTL Power International Bhd. | 106,300 | 27 | ||||||||||
|
| |||||||||||
| 1,548 | ||||||||||||
|
| |||||||||||
Total Malaysia | 8,656 | |||||||||||
|
| |||||||||||
| MEXICO 1.8% | ||||||||||||
| CONSUMER STAPLES 1.0% | ||||||||||||
Arca Continental S.A.B. de C.V. | 22,600 | 139 | ||||||||||
Coca-Cola Femsa S.A.B. de C.V. SP - ADR | 4,921 | 278 | ||||||||||
Gruma S.A.B. de C.V. ‘B’ | 22,255 | 272 | ||||||||||
Grupo Lala S.A.B. de C.V. | 66,600 | 69 | ||||||||||
Industrias Bachoco S.A.B. de C.V. | 7,100 | 34 | ||||||||||
Kimberly-Clark de Mexico S.A.B. de C.V. ‘A’ | 219,200 | 370 | ||||||||||
Wal-Mart de Mexico S.A.B. de C.V. | 936,700 | 2,472 | ||||||||||
|
| |||||||||||
| 3,634 | ||||||||||||
|
| |||||||||||
| FINANCIALS 0.0% | ||||||||||||
Gentera S.A.B. de C.V. | 40,900 | 36 | ||||||||||
Grupo Elektra S.A.B. de C.V. | 2,760 | 75 | ||||||||||
|
| |||||||||||
| 111 | ||||||||||||
|
| |||||||||||
| INDUSTRIALS 0.1% | ||||||||||||
Grupo Carso S.A.B. de C.V. | 34,400 | 116 | ||||||||||
|
| |||||||||||
| MATERIALS 0.3% | ||||||||||||
Alpek S.A.B. de C.V. | 34,200 | 51 | ||||||||||
Grupo Mexico S.A.B. de C.V. ‘B’ | 369,600 | 1,047 | ||||||||||
|
| |||||||||||
| 1,098 | ||||||||||||
|
| |||||||||||
| TELECOMMUNICATION SERVICES 0.3% | ||||||||||||
America Movil S.A.B. de C.V. SP - ADR ‘L’ | 67,811 | 1,130 | ||||||||||
|
| |||||||||||
| UTILITIES 0.1% | ||||||||||||
Infraestructura Energetica Nova S.A.B. de C.V. | 30,900 | 139 | ||||||||||
|
| |||||||||||
Total Mexico | 6,228 | |||||||||||
|
| |||||||||||
| PHILIPPINES 0.7% | ||||||||||||
| CONSUMER STAPLES 0.0% | ||||||||||||
Universal Robina Corp. | 15,620 | 35 | ||||||||||
|
| |||||||||||
| ENERGY 0.0% | ||||||||||||
Petron Corp. | 453,600 | 76 | ||||||||||
|
| |||||||||||
| See Accompanying Notes | ANNUAL REPORT | JUNE 30, 2018 | 21 |
Table of Contents
Schedule of Investments PIMCO RAFI Dynamic Multi-Factor Emerging Markets Equity ETF (Cont.)
| SHARES | MARKET VALUE (000S) | |||||||||||
| FINANCIALS 0.3% | ||||||||||||
Ayala Corp. | 15,300 | $ | 264 | |||||||||
Bank of the Philippine Islands | 94,381 | 157 | ||||||||||
BDO Unibank, Inc. | 113,800 | 267 | ||||||||||
Metropolitan Bank & Trust Co. | 96,296 | 132 | ||||||||||
|
| |||||||||||
| 820 | ||||||||||||
|
| |||||||||||
| INDUSTRIALS 0.1% | ||||||||||||
Alliance Global Group, Inc. (a) | 123,100 | 27 | ||||||||||
DMCI Holdings, Inc. | 553,900 | 109 | ||||||||||
International Container Terminal Services, Inc. | 15,670 | 23 | ||||||||||
San Miguel Corp. | 11,320 | 29 | ||||||||||
SM Investments Corp. | 13,000 | 213 | ||||||||||
|
| |||||||||||
| 401 | ||||||||||||
|
| |||||||||||
| REAL ESTATE 0.1% | ||||||||||||
Ayala Land, Inc. | 417,500 | 297 | ||||||||||
|
| |||||||||||
| TELECOMMUNICATION SERVICES 0.1% | ||||||||||||
Globe Telecom, Inc. | 3,250 | 94 | ||||||||||
PLDT, Inc. | 11,275 | 270 | ||||||||||
|
| |||||||||||
| 364 | ||||||||||||
|
| |||||||||||
| UTILITIES 0.1% | ||||||||||||
Aboitiz Power Corp. | 173,400 | 113 | ||||||||||
Manila Electric Co. | 31,140 | 207 | ||||||||||
|
| |||||||||||
| 320 | ||||||||||||
|
| |||||||||||
Total Philippines | 2,313 | |||||||||||
|
| |||||||||||
| POLAND 0.9% | ||||||||||||
| CONSUMER DISCRETIONARY 0.0% | ||||||||||||
Cyfrowy Polsat S.A. | 18,260 | 112 | ||||||||||
|
| |||||||||||
| ENERGY 0.2% | ||||||||||||
Grupa Lotos S.A. | 20,068 | 304 | ||||||||||
Polski Koncern Naftowy ORLEN S.A. | 16,967 | 380 | ||||||||||
Polskie Gornictwo Naftowe i Gazownictwo S.A. | 108,094 | 165 | ||||||||||
|
| |||||||||||
| 849 | ||||||||||||
|
| |||||||||||
| FINANCIALS 0.3% | ||||||||||||
Bank Handlowy w Warszawie S.A. | 1,529 | 29 | ||||||||||
Powszechna Kasa Oszczednosci Bank Polski S.A. (a) | 49,156 | 483 | ||||||||||
Powszechny Zaklad Ubezpieczen S.A. | 44,942 | 466 | ||||||||||
|
| |||||||||||
| 978 | ||||||||||||
|
| |||||||||||
| INFORMATION TECHNOLOGY 0.0% | ||||||||||||
Asseco Poland S.A. | 3,281 | 35 | ||||||||||
|
| |||||||||||
| MATERIALS 0.2% | ||||||||||||
Grupa Azoty S.A. | 3,041 | 35 | ||||||||||
KGHM Polska Miedz S.A. | 21,967 | 515 | ||||||||||
|
| |||||||||||
| 550 | ||||||||||||
|
| |||||||||||
| TELECOMMUNICATION SERVICES 0.0% | ||||||||||||
Orange Polska S.A. | 101,349 | 125 | ||||||||||
PLAY Communications S.A. | 5,036 | 34 | ||||||||||
|
| |||||||||||
| 159 | ||||||||||||
|
| |||||||||||
| SHARES | MARKET VALUE (000S) | |||||||||||
| UTILITIES 0.2% | ||||||||||||
Enea S.A. | 34,170 | $ | 83 | |||||||||
Energa S.A. | 47,395 | 113 | ||||||||||
PGE Polska Grupa Energetyczna S.A. (a) | 127,937 | 318 | ||||||||||
Tauron Polska Energia S.A. | 253,078 | 154 | ||||||||||
|
| |||||||||||
| 668 | ||||||||||||
|
| |||||||||||
Total Poland | 3,351 | |||||||||||
|
| |||||||||||
| RUSSIA 9.1% | ||||||||||||
| CONSUMER STAPLES 0.2% | ||||||||||||
Magnit PJSC SP - GDR | 36,901 | 662 | ||||||||||
|
| |||||||||||
| ENERGY 5.1% | ||||||||||||
Gazprom Neft PJSC | 34,700 | 179 | ||||||||||
Gazprom PJSC | 3,088,050 | 6,947 | ||||||||||
Lukoil PJSC SP - ADR | 111,393 | 7,626 | ||||||||||
Novatek PJSC GDR | 3,053 | 453 | ||||||||||
Rosneft Oil, Co. PJSC GDR | 115,998 | 722 | ||||||||||
Tatneft PJSC SP - ADR | 32,846 | 2,065 | ||||||||||
TMK PJSC | 32,420 | 39 | ||||||||||
|
| |||||||||||
| 18,031 | ||||||||||||
|
| |||||||||||
| FINANCIALS 0.9% | ||||||||||||
Sberbank of Russia PJSC | 794,150 | 2,751 | ||||||||||
VTB Bank PJSC | 599,500,000 | 463 | ||||||||||
|
| |||||||||||
| 3,214 | ||||||||||||
|
| |||||||||||
| INDUSTRIALS 0.0% | ||||||||||||
Aeroflot PJSC | 10,900 | 24 | ||||||||||
Globaltrans Investment PLC GDR | 2,500 | 26 | ||||||||||
|
| |||||||||||
| 50 | ||||||||||||
|
| |||||||||||
| INFORMATION TECHNOLOGY 0.2% | ||||||||||||
Yandex NV (a) | 16,454 | 591 | ||||||||||
|
| |||||||||||
| MATERIALS 1.6% | ||||||||||||
Alrosa PJSC | 510,000 | 812 | ||||||||||
Evraz PLC | 18,880 | 126 | ||||||||||
Magnitogorsk Iron & Steel Works PJSC | 444,300 | 302 | ||||||||||
MMC Norilsk Nickel PJSC ADR | 163,055 | 2,917 | ||||||||||
Novolipetsk Steel PJSC | 216,850 | 525 | ||||||||||
PhosAgro PJSC GDR | 14,264 | 183 | ||||||||||
Polymetal International PLC | 19,065 | 169 | ||||||||||
Polyus PJSC | 1,850 | 122 | ||||||||||
Severstal PJSC GDR | 45,839 | 668 | ||||||||||
|
| |||||||||||
| 5,824 | ||||||||||||
|
| |||||||||||
| REAL ESTATE 0.0% | ||||||||||||
LSR Group PJSC GDR | 10,070 | 27 | ||||||||||
|
| |||||||||||
| TELECOMMUNICATION SERVICES 0.8% | ||||||||||||
MegaFon PJSC SP - GDR | 59,347 | 524 | ||||||||||
Mobile TeleSystems PJSC SP - ADR | 216,674 | 1,913 | ||||||||||
Rostelecom PJSC | 192,890 | 225 | ||||||||||
Sistema PJSC FC | 1,694,700 | 240 | ||||||||||
|
| |||||||||||
| 2,902 | ||||||||||||
|
| |||||||||||
| SHARES | MARKET VALUE (000S) | |||||||||||
| UTILITIES 0.3% | ||||||||||||
Federal Grid Co. Unified Energy System PJSC | 22,060,000 | $ | 66 | |||||||||
Inter RAO UES PJSC | 3,969,000 | 258 | ||||||||||
Mosenergo PJSC | 2,653,000 | 99 | ||||||||||
OGK-2 PJSC | 12,083,000 | 76 | ||||||||||
Rosseti PJSC | 10,810,000 | 136 | ||||||||||
RusHydro PJSC | 27,969,000 | 302 | ||||||||||
Unipro PJSC | 3,168,000 | 146 | ||||||||||
|
| |||||||||||
| 1,083 | ||||||||||||
|
| |||||||||||
Total Russia | 32,384 | |||||||||||
|
| |||||||||||
| SINGAPORE 0.0% | ||||||||||||
| INDUSTRIALS 0.0% | ||||||||||||
BOC Aviation Ltd. | 5,700 | 35 | ||||||||||
|
| |||||||||||
Total Singapore | 35 | |||||||||||
|
| |||||||||||
| SOUTH AFRICA 6.9% | ||||||||||||
| CONSUMER DISCRETIONARY 2.1% | ||||||||||||
Foschini Group Ltd. | 17,729 | 224 | ||||||||||
Imperial Holdings Ltd. | 44,969 | 641 | ||||||||||
Mr Price Group Ltd. | 33,438 | 549 | ||||||||||
Naspers Ltd. ‘N’ | 23,195 | 5,849 | ||||||||||
Truworths International Ltd. | 70,770 | 396 | ||||||||||
|
| |||||||||||
| 7,659 | ||||||||||||
|
| |||||||||||
| CONSUMER STAPLES 0.5% | ||||||||||||
Massmart Holdings Ltd. | 17,546 | 143 | ||||||||||
Pick n Pay Stores Ltd. | 11,497 | 63 | ||||||||||
Shoprite Holdings Ltd. | 60,388 | 968 | ||||||||||
SPAR Group Ltd. | 8,994 | 121 | ||||||||||
Tiger Brands Ltd. | 13,315 | 322 | ||||||||||
|
| |||||||||||
| 1,617 | ||||||||||||
|
| |||||||||||
| ENERGY 0.1% | ||||||||||||
Exxaro Resources Ltd. | 19,494 | 178 | ||||||||||
|
| |||||||||||
| FINANCIALS 1.2% | ||||||||||||
Barclays Africa Group Ltd. | 59,394 | 689 | ||||||||||
Discovery Ltd. | 27,956 | 300 | ||||||||||
FirstRand Ltd. | 236,875 | 1,100 | ||||||||||
Liberty Holdings Ltd. | 5,864 | 50 | ||||||||||
Nedbank Group Ltd. | 10,561 | 192 | ||||||||||
Sanlam Ltd. | 133,858 | 680 | ||||||||||
Standard Bank Group Ltd. | 92,156 | 1,287 | ||||||||||
|
| |||||||||||
| 4,298 | ||||||||||||
|
| |||||||||||
| HEALTH CARE 0.1% | ||||||||||||
Life Healthcare Group Holdings Ltd. | 134,145 | 243 | ||||||||||
Netcare Ltd. | 119,057 | 239 | ||||||||||
|
| |||||||||||
| 482 | ||||||||||||
|
| |||||||||||
| INDUSTRIALS 0.2% | ||||||||||||
Barloworld Ltd. | 53,042 | 500 | ||||||||||
Bidvest Group Ltd. | 21,451 | 307 | ||||||||||
|
| |||||||||||
| 807 | ||||||||||||
|
| |||||||||||
| INFORMATION TECHNOLOGY 0.0% | ||||||||||||
DataTec Ltd. | 39,741 | 62 | ||||||||||
|
| |||||||||||
| 22 | PIMCO EQUITY SERIES | See Accompanying Notes |
Table of Contents
June 30, 2018
| SHARES | MARKET VALUE (000S) | |||||||||||
| MATERIALS 1.8% | ||||||||||||
African Rainbow Minerals Ltd. | 24,711 | $ | 196 | |||||||||
Anglo American Platinum Ltd. | 2,743 | 72 | ||||||||||
AngloGold Ashanti Ltd. SP - ADR | 72,296 | 594 | ||||||||||
Gold Fields Ltd. SP - ADR | 290,776 | 1,038 | ||||||||||
Harmony Gold Mining Co. Ltd. SP - ADR | 132,192 | 206 | ||||||||||
Impala Platinum Holdings Ltd. (a) | 220,053 | 325 | ||||||||||
Kumba Iron Ore Ltd. | 21,834 | 467 | ||||||||||
Mondi Ltd. | 4,616 | 125 | ||||||||||
Sappi Ltd. | 70,066 | 466 | ||||||||||
Sasol Ltd. | 76,000 | 2,764 | ||||||||||
|
| |||||||||||
| 6,253 | ||||||||||||
|
| |||||||||||
| TELECOMMUNICATION SERVICES 0.9% |
| |||||||||||
MTN Group Ltd. | 290,801 | 2,287 | ||||||||||
Telkom S.A. SOC Ltd. | 20,646 | 74 | ||||||||||
Vodacom Group Ltd. | 105,264 | 942 | ||||||||||
|
| |||||||||||
| 3,303 | ||||||||||||
|
| |||||||||||
Total South Africa | 24,659 | |||||||||||
|
| |||||||||||
| SOUTH KOREA 17.8% |
| |||||||||||
| CONSUMER DISCRETIONARY 4.4% |
| |||||||||||
Coway Co. Ltd. | 6,235 | 484 | ||||||||||
Hankook Tire Co. Ltd. | 8,248 | 312 | ||||||||||
Hanon Systems | 27,189 | 258 | ||||||||||
Hyundai Department Store Co. Ltd. | 2,013 | 209 | ||||||||||
Hyundai Mobis Co. Ltd. | 16,386 | 3,117 | ||||||||||
Hyundai Motor Co. | 41,019 | 4,610 | ||||||||||
Hyundai Wia Corp. | 8,912 | 326 | ||||||||||
Kangwon Land, Inc. | 12,054 | 283 | ||||||||||
Kia Motors Corp. | 65,619 | 1,813 | ||||||||||
LG Electronics, Inc. | 38,791 | 2,888 | ||||||||||
LOTTE Himart Co. Ltd. | 2,807 | 199 | ||||||||||
Lotte Shopping Co. Ltd. | 4,722 | 890 | ||||||||||
Mando Corp. | 3,310 | 114 | ||||||||||
Shinsegae, Inc. | 1,042 | 375 | ||||||||||
|
| |||||||||||
| 15,878 | ||||||||||||
|
| |||||||||||
| CONSUMER STAPLES 1.5% | ||||||||||||
Amorepacific Corp. | 2,797 | 809 | ||||||||||
Amorepacific Group | 2,090 | 232 | ||||||||||
CJ CheilJedang Corp. | 522 | 165 | ||||||||||
E-MART, Inc. | 4,325 | 987 | ||||||||||
GS Retail Co. Ltd. | 2,003 | 79 | ||||||||||
KT&G Corp. | 15,870 | 1,525 | ||||||||||
LG Household & Health Care Ltd. | 1,058 | 1,326 | ||||||||||
Lotte Chilsung Beverage Co. Ltd. | 23 | 32 | ||||||||||
NongShim Co. Ltd. | 114 | 33 | ||||||||||
|
| |||||||||||
| 5,188 | ||||||||||||
|
| |||||||||||
| ENERGY 1.1% | ||||||||||||
E1 Corp. | 602 | 37 | ||||||||||
GS Holdings Corp. | 11,378 | 555 | ||||||||||
S-Oil Corp. | 4,897 | 481 | ||||||||||
SK Gas Ltd. | 1,717 | 145 | ||||||||||
SK Innovation Co. Ltd. | 14,920 | 2,702 | ||||||||||
|
| |||||||||||
| 3,920 | ||||||||||||
|
| |||||||||||
| FINANCIALS 2.3% |
| |||||||||||
BNK Financial Group, Inc. | 32,627 | 273 | ||||||||||
| SHARES | MARKET VALUE (000S) | |||||||||||
DGB Financial Group, Inc. | 24,687 | $ | 227 | |||||||||
Dongbu Insurance Co. Ltd. | 4,674 | 248 | ||||||||||
Hanwha Life Insurance Co. Ltd. | 55,146 | 262 | ||||||||||
Hyundai Marine & Fire Insurance Co. Ltd. | 6,278 | 190 | ||||||||||
Industrial Bank of Korea | 49,367 | 681 | ||||||||||
KB Financial Group, Inc. | 29,110 | 1,370 | ||||||||||
Korea Investment Holdings Co. Ltd. | 1,578 | 119 | ||||||||||
Meritz Fire & Marine Insurance Co. Ltd. | 7,855 | 135 | ||||||||||
Samsung Card Co. Ltd. | 5,251 | 181 | ||||||||||
Samsung Fire & Marine Insurance Co. Ltd. | 3,801 | 901 | ||||||||||
Samsung Life Insurance Co. Ltd. | 8,047 | 710 | ||||||||||
Shinhan Financial Group Co. Ltd. | 50,317 | 1,948 | ||||||||||
Tongyang Life Insurance Co. Ltd. | 4,400 | 29 | ||||||||||
Woori Bank | 53,549 | 781 | ||||||||||
|
| |||||||||||
| 8,055 | ||||||||||||
|
| |||||||||||
| INDUSTRIALS 1.6% |
| |||||||||||
CJ Corp. | 3,056 | 389 | ||||||||||
CJ Logistics Corp. (a) | 246 | 37 | ||||||||||
Daelim Industrial Co. Ltd. | 3,174 | 218 | ||||||||||
Doosan Corp. | 308 | 29 | ||||||||||
Doosan Heavy Industries & Construction Co. Ltd. | 21,986 | 309 | ||||||||||
Doosan Infracore Co. Ltd. (a) | 14,135 | 123 | ||||||||||
GS Engineering & Construction Corp. | 5,255 | 217 | ||||||||||
Hanwha Aerospace Co. Ltd. | 5,146 | 108 | ||||||||||
Hanwha Corp. | 3,614 | 102 | ||||||||||
Hyundai Engineering & Construction Co. Ltd. | 11,346 | 586 | ||||||||||
Hyundai Glovis Co. Ltd. | 1,523 | 158 | ||||||||||
Hyundai Heavy Industries Co. Ltd. (a) | 2,096 | 192 | ||||||||||
KCC Corp. | 525 | 155 | ||||||||||
Korea Aerospace Industries Ltd. | 660 | 24 | ||||||||||
Korean Air Lines Co. Ltd. | 13,866 | 351 | ||||||||||
LG Corp. | 9,425 | 609 | ||||||||||
LG International Corp. | 8,314 | 180 | ||||||||||
Lotte Confectionery Co. Ltd. | 1,638 | 84 | ||||||||||
LS Corp. | 6,098 | 411 | ||||||||||
Pan Ocean Co. Ltd. | 9,667 | 42 | ||||||||||
Posco Daewoo Corp. | 20,697 | 398 | ||||||||||
S-1 Corp. | 337 | 29 | ||||||||||
Samsung Heavy Industries Co. Ltd. | 16,771 | 107 | ||||||||||
SK Holdings Co. Ltd. (a) | 2,626 | 610 | ||||||||||
SK Networks Co. Ltd. | 75,655 | 306 | ||||||||||
|
| |||||||||||
| 5,774 | ||||||||||||
|
| |||||||||||
| INFORMATION TECHNOLOGY 2.4% | ||||||||||||
LG Display Co. Ltd. | 108,316 | 1,777 | ||||||||||
LG Innotek Co. Ltd. | 1,052 | 136 | ||||||||||
NAVER Corp. | 277 | 190 | ||||||||||
Samsung Electro-Mechanics Co. Ltd. | 10,257 | 1,366 | ||||||||||
Samsung SDS Co. Ltd. | 3,416 | 613 | ||||||||||
SK Hynix, Inc. | 59,006 | 4,529 | ||||||||||
|
| |||||||||||
| 8,611 | ||||||||||||
|
| |||||||||||
| MATERIALS 2.3% | ||||||||||||
Dongkuk Steel Mill Co. Ltd. | 22,893 | 173 | ||||||||||
Hyosung Corp. | 272 | 33 | ||||||||||
Hyundai Steel Co. | 20,916 | 987 | ||||||||||
| SHARES | MARKET VALUE (000S) | |||||||||||
Kolon Industries, Inc. | 4,106 | $ | 249 | |||||||||
Korea Zinc Co. Ltd. | 1,066 | 369 | ||||||||||
Kumho Petrochemical Co. Ltd. | 810 | 85 | ||||||||||
LG Chem Ltd. | 2,539 | 760 | ||||||||||
Lotte Chemical Corp. | 704 | 219 | ||||||||||
OCI Co. Ltd. | 2,018 | 187 | ||||||||||
POSCO | 17,180 | 5,069 | ||||||||||
Seah Besteel Corp. | 1,780 | 34 | ||||||||||
SK Chemicals Co. Ltd. | 1,134 | 37 | ||||||||||
Taekwang Industrial Co. Ltd. | 88 | 110 | ||||||||||
Young Poong Corp. | 37 | 27 | ||||||||||
|
| |||||||||||
| 8,339 | ||||||||||||
|
| |||||||||||
| TELECOMMUNICATION SERVICES 0.9% |
| |||||||||||
KT Corp. SP - ADR | 115,408 | 1,533 | ||||||||||
LG Uplus Corp. | 34,749 | 436 | ||||||||||
SK Telecom Co. Ltd. | 5,984 | 1,251 | ||||||||||
|
| |||||||||||
| 3,220 | ||||||||||||
|
| |||||||||||
| UTILITIES 1.3% | ||||||||||||
Korea District Heating Corp. | 598 | 36 | ||||||||||
Korea Electric Power Corp. | 116,314 | 3,336 | ||||||||||
Korea Gas Corp. | 23,809 | 1,369 | ||||||||||
|
| |||||||||||
| 4,741 | ||||||||||||
|
| |||||||||||
Total South Korea | 63,726 | |||||||||||
|
| |||||||||||
| TAIWAN 12.7% |
| |||||||||||
| CONSUMER DISCRETIONARY 0.3% |
| |||||||||||
Cheng Shin Rubber Industry Co. Ltd. | 332,000 | 499 | ||||||||||
China Motor Corp. | 38,000 | 35 | ||||||||||
Formosa Taffeta Co. Ltd. | 71,000 | 78 | ||||||||||
Hotai Motor Co. Ltd. | 5,000 | 44 | ||||||||||
Pou Chen Corp. | 238,000 | 276 | ||||||||||
Yulon Motor Co. Ltd. | 199,000 | 138 | ||||||||||
|
| |||||||||||
| 1,070 | ||||||||||||
|
| |||||||||||
| CONSUMER STAPLES 0.5% | ||||||||||||
President Chain Store Corp. | 42,000 | 476 | ||||||||||
Uni-President Enterprises Corp. | 499,000 | 1,265 | ||||||||||
|
| |||||||||||
| 1,741 | ||||||||||||
|
| |||||||||||
| ENERGY 0.2% | ||||||||||||
Formosa Petrochemical Corp. | 167,000 | 670 | ||||||||||
|
| |||||||||||
| FINANCIALS 1.7% |
| |||||||||||
Chang Hwa Commercial Bank Ltd. | 375,000 | 217 | ||||||||||
China Development Financial Holding Corp. | 919,000 | 335 | ||||||||||
CTBC Financial Holding Co. Ltd. | 1,199,000 | 862 | ||||||||||
E.Sun Financial Holding Co. Ltd. | 801,000 | 558 | ||||||||||
First Financial Holding Co. Ltd. | 710,000 | 479 | ||||||||||
Fubon Financial Holding Co. Ltd. | 513,000 | 858 | ||||||||||
Hua Nan Financial Holdings Co. Ltd. | 564,000 | 328 | ||||||||||
Mega Financial Holding Co. Ltd. | 830,000 | 732 | ||||||||||
Shin Kong Financial Holding Co. Ltd. | 1,192,000 | 459 | ||||||||||
SinoPac Financial Holdings Co. Ltd. | 1,138,400 | 410 | ||||||||||
Taishin Financial Holding Co. Ltd. | 1,099,000 | 519 | ||||||||||
| See Accompanying Notes | ANNUAL REPORT | JUNE 30, 2018 | 23 |
Table of Contents
Schedule of Investments PIMCO RAFI Dynamic Multi-Factor Emerging Markets Equity ETF (Cont.)
| SHARES | MARKET VALUE (000S) | |||||||||||
Taiwan Cooperative Financial Holding Co. Ltd. | 714,000 | $ | 418 | |||||||||
|
| |||||||||||
| 6,175 | ||||||||||||
|
| |||||||||||
| INDUSTRIALS 0.4% | ||||||||||||
China Airlines Ltd. (a) | 390,000 | 122 | ||||||||||
Eva Airways Corp. | 348,000 | 168 | ||||||||||
Evergreen Marine Corp. Taiwan Ltd. (a) | 61,000 | 26 | ||||||||||
Far Eastern New Century Corp. | 407,000 | 385 | ||||||||||
Taiwan High Speed Rail Corp. | 226,000 | 177 | ||||||||||
Walsin Lihwa Corp. | 876,000 | 594 | ||||||||||
Wan Hai Lines Ltd. | 279,000 | 154 | ||||||||||
|
| |||||||||||
| 1,626 | ||||||||||||
|
| |||||||||||
| INFORMATION TECHNOLOGY 6.6% | ||||||||||||
Acer, Inc. | 1,134,000 | 925 | ||||||||||
Advantech Co. Ltd. | 6,000 | 39 | ||||||||||
Asustek Computer, Inc. | 94,000 | 858 | ||||||||||
AU Optronics Corp. | 2,404,000 | 1,019 | ||||||||||
Catcher Technology Co. Ltd. | 21,000 | 234 | ||||||||||
Chicony Electronics Co. Ltd. | 12,000 | 27 | ||||||||||
Compal Electronics, Inc. | 638,000 | 401 | ||||||||||
Delta Electronics, Inc. | 18,000 | 65 | ||||||||||
Foxconn Technology Co. Ltd. | 113,000 | 276 | ||||||||||
Hon Hai Precision Industry Co. Ltd. | 1,098,000 | 2,992 | ||||||||||
HTC Corp. | 281,000 | 524 | ||||||||||
Innolux Corp. | 3,452,000 | 1,238 | ||||||||||
Inventec Corp. | 598,000 | 469 | ||||||||||
Largan Precision Co. Ltd. | 2,320 | 341 | ||||||||||
Lite-On Technology Corp. | 400,000 | 483 | ||||||||||
MediaTek, Inc. | 177,000 | 1,737 | ||||||||||
Micro-Star International Co. Ltd. | 213,000 | 656 | ||||||||||
Novatek Microelectronics Corp. | 82,000 | 369 | ||||||||||
Pegatron Corp. | 485,000 | 996 | ||||||||||
Powertech Technology, Inc. | 142,000 | 412 | ||||||||||
Quanta Computer, Inc. | 438,000 | 768 | ||||||||||
Synnex Technology International Corp. | 220,000 | 332 | ||||||||||
Taiwan Semiconductor Manufacturing Co. Ltd. SP - ADR | 140,952 | 5,153 | ||||||||||
TPK Holding Co. Ltd. (a) | 53,000 | 112 | ||||||||||
Unimicron Technology Corp. | 331,000 | 177 | ||||||||||
United Microelectronics Corp. | 1,391,000 | 779 | ||||||||||
Wistron Corp. | 863,000 | 640 | ||||||||||
WPG Holdings Ltd. | 289,000 | 409 | ||||||||||
Yageo Corp. | 28,000 | 1,029 | ||||||||||
Zhen Ding Technology Holding Ltd. | 12,000 | 26 | ||||||||||
|
| |||||||||||
| 23,486 | ||||||||||||
|
| |||||||||||
| MATERIALS 1.9% | ||||||||||||
Asia Cement Corp. | 378,000 | 415 | ||||||||||
China Steel Corp. | 876,000 | 680 | ||||||||||
Formosa Chemicals & Fibre Corp. | 463,000 | 1,842 | ||||||||||
Formosa Plastics Corp. | 424,000 | 1,563 | ||||||||||
Nan Ya Plastics Corp. | 459,000 | 1,311 | ||||||||||
Taiwan Cement Corp. | 700,000 | 971 | ||||||||||
|
| |||||||||||
| 6,782 | ||||||||||||
|
| |||||||||||
| REAL ESTATE 0.0% | ||||||||||||
Highwealth Construction Corp. | 45,000 | 67 | ||||||||||
|
| |||||||||||
| SHARES | MARKET VALUE (000S) | |||||||||||
| TELECOMMUNICATION SERVICES 1.1% | ||||||||||||
Chunghwa Telecom Co. Ltd. | 616,000 | $ | 2,220 | |||||||||
Far EasTone Telecommunications Co. Ltd. | 258,000 | 666 | ||||||||||
Taiwan Mobile Co. Ltd. | 277,000 | 1,004 | ||||||||||
|
| |||||||||||
| 3,890 | ||||||||||||
|
| |||||||||||
Total Taiwan | 45,507 | |||||||||||
|
| |||||||||||
| THAILAND 3.9% | ||||||||||||
| CONSUMER STAPLES 0.4% | ||||||||||||
Berli Jucker PCL | 22,900 | 35 | ||||||||||
Charoen Pokphand Foods PCL | 46,500 | 34 | ||||||||||
CP ALL PCL | 555,700 | 1,232 | ||||||||||
Thai Union Group PCL ‘F’ | 451,200 | 215 | ||||||||||
|
| |||||||||||
| 1,516 | ||||||||||||
|
| |||||||||||
| ENERGY 1.3% | ||||||||||||
Bangchak Corp. PCL | 467,400 | 451 | ||||||||||
Banpu PCL | 263,000 | 155 | ||||||||||
Esso Thailand PCL | 67,500 | 24 | ||||||||||
IRPC PCL | 3,802,200 | 665 | ||||||||||
PTT Exploration & Production PCL | 76,600 | 324 | ||||||||||
PTT PCL | 1,261,000 | 1,823 | ||||||||||
Star Petroleum Refining PCL | 915,000 | 359 | ||||||||||
Thai Oil PCL | 283,500 | 664 | ||||||||||
|
| |||||||||||
| 4,465 | ||||||||||||
|
| |||||||||||
| FINANCIALS 0.2% | ||||||||||||
Bangkok Bank PCL | 108,400 | 640 | ||||||||||
Thanachart Capital PCL | 124,700 | 176 | ||||||||||
TMB Bank PCL | 597,000 | 42 | ||||||||||
|
| |||||||||||
| 858 | ||||||||||||
|
| |||||||||||
| HEALTH CARE 0.2% | ||||||||||||
Bangkok Dusit Medical Services PCL ‘F’ | 884,900 | 667 | ||||||||||
|
| |||||||||||
| INDUSTRIALS 0.2% | ||||||||||||
Airports of Thailand PCL | 392,800 | 747 | ||||||||||
Delta Electronics Thailand PCL | 34,900 | 61 | ||||||||||
Thai Airways International PCL (a) | 142,100 | 54 | ||||||||||
|
| |||||||||||
| 862 | ||||||||||||
|
| |||||||||||
| MATERIALS 0.8% | ||||||||||||
Indorama Ventures PCL | 141,500 | 234 | ||||||||||
PTT Global Chemical PCL | 480,300 | 1,057 | ||||||||||
Siam Cement PCL | 115,100 | 1,437 | ||||||||||
|
| |||||||||||
| 2,728 | ||||||||||||
|
| |||||||||||
| REAL ESTATE 0.2% | ||||||||||||
Central Pattana PCL | 159,100 | 335 | ||||||||||
Land & Houses PCL NVDR | 681,300 | 232 | ||||||||||
|
| |||||||||||
| 567 | ||||||||||||
|
| |||||||||||
| TELECOMMUNICATION SERVICES 0.5% | ||||||||||||
Advanced Info Service PCL | 239,000 | 1,334 | ||||||||||
Total Access Communication PCL | 305,000 | 338 | ||||||||||
True Corp. PCL | 1,467,300 | 234 | ||||||||||
|
| |||||||||||
| 1,906 | ||||||||||||
|
| |||||||||||
| SHARES | MARKET VALUE (000S) | |||||||||||
| UTILITIES 0.1% | ||||||||||||
Electricity Generating PCL | 4,100 | $ | 28 | |||||||||
Glow Energy PCL | 88,300 | 253 | ||||||||||
Ratchaburi Electricity Generating Holding PCL | 50,100 | 77 | ||||||||||
|
| |||||||||||
| 358 | ||||||||||||
|
| |||||||||||
Total Thailand | 13,927 | |||||||||||
|
| |||||||||||
| TURKEY 0.7% | ||||||||||||
| CONSUMER DISCRETIONARY 0.1% | ||||||||||||
Ford Otomotiv Sanayi A/S | 15,654 | 208 | ||||||||||
|
| |||||||||||
| CONSUMER STAPLES 0.1% | ||||||||||||
Anadolu Efes Biracilik Ve Malt Sanayii A/S | 4,490 | 23 | ||||||||||
BIM Birlesik Magazalar A/S | 16,314 | 238 | ||||||||||
|
| |||||||||||
| 261 | ||||||||||||
|
| |||||||||||
| ENERGY 0.1% | ||||||||||||
Tupras Turkiye Petrol Rafinerileri A/S | 14,763 | 348 | ||||||||||
|
| |||||||||||
| FINANCIALS 0.1% | ||||||||||||
Turkiye Halk Bankasi A/S | 53,067 | 86 | ||||||||||
Turkiye Is Bankasi ‘C’ | 52,517 | 65 | ||||||||||
Turkiye Vakiflar Bankasi TAO ‘D’ | 18,304 | 19 | ||||||||||
Yapi ve Kredi Bankasi A/S (a) | 113,207 | 61 | ||||||||||
|
| |||||||||||
| 231 | ||||||||||||
|
| |||||||||||
| INDUSTRIALS 0.2% | ||||||||||||
Enka Insaat ve Sanayi A/S | 35,532 | 36 | ||||||||||
Turk Hava Yollari AO (a) | 216,616 | 639 | ||||||||||
|
| |||||||||||
| 675 | ||||||||||||
|
| |||||||||||
| MATERIALS 0.0% | ||||||||||||
Eregli Demir ve Celik Fabrikalari TAS | 71,902 | 160 | ||||||||||
|
| |||||||||||
| TELECOMMUNICATION SERVICES 0.1% | ||||||||||||
Turk Telekomunikasyon A/S | 128,788 | 140 | ||||||||||
Turkcell Iletisim Hizmetleri A/S | 190,613 | 505 | ||||||||||
|
| |||||||||||
| 645 | ||||||||||||
|
| |||||||||||
| UTILITIES 0.0% | ||||||||||||
Aygaz A/S | 29,103 | 70 | ||||||||||
|
| |||||||||||
Total Turkey | 2,598 | |||||||||||
|
| |||||||||||
| UKRAINE 0.0% | ||||||||||||
| CONSUMER STAPLES 0.0% | ||||||||||||
Kernel Holding S.A. | 2,055 | 26 | ||||||||||
|
| |||||||||||
Total Ukraine | 26 | |||||||||||
|
| |||||||||||
| UNITED STATES 0.0% | ||||||||||||
| CONSUMER DISCRETIONARY 0.0% | ||||||||||||
Nexteer Automotive Group Ltd. | 21,000 | 31 | ||||||||||
|
| |||||||||||
Total United States | 31 | |||||||||||
|
| |||||||||||
Total Common Stocks (Cost $352,190) |
| 323,149 | ||||||||||
|
| |||||||||||
| 24 | PIMCO EQUITY SERIES | See Accompanying Notes |
Table of Contents
June 30, 2018
| UNITS | MARKET VALUE (000S) | |||||||||||
| EQUITY-LINKED SECURITIES 4.6% | ||||||||||||
| IRELAND 4.5% | ||||||||||||
| CONSUMER DISCRETIONARY 0.2% | ||||||||||||
Citigroup Global Markets Holdings, Inc., Hero MotoCorp Ltd. - Exp. 02/15/2019 | 13,799 | $ | 700 | |||||||||
Citigroup Global Markets Holdings, Inc., InterGlobe Aviation Ltd. - Exp. 02/15/2019 | 1,559 | 25 | ||||||||||
|
| |||||||||||
| 725 | ||||||||||||
|
| |||||||||||
| CONSUMER STAPLES 0.9% | ||||||||||||
Citigroup Global Markets Holdings, Inc., Hindustan Unilever Ltd. - Exp. 02/15/2019 | 58,173 | 1,394 | ||||||||||
Citigroup Global Markets Holdings, Inc., ITC Ltd. - Exp. 02/15/2019 | 459,223 | 1,786 | ||||||||||
|
| |||||||||||
| 3,180 | ||||||||||||
|
| |||||||||||
| ENERGY 1.3% | ||||||||||||
Citigroup Global Markets Holdings, Inc., Bharat Petroleum Corp. Ltd. - Exp. 02/15/2019 | 85,392 | 466 | ||||||||||
Citigroup Global Markets Holdings, Inc., Coal India Ltd. - Exp. 02/15/2019 | 189,848 | 733 | ||||||||||
Citigroup Global Markets Holdings, Inc., Hindustan Petroleum Corp. Ltd. - Exp. 02/15/2019 | 152,510 | 577 | ||||||||||
Citigroup Global Markets Holdings, Inc., Indian Oil Corp. Ltd. - Exp. 02/15/2019 | 127,757 | 291 | ||||||||||
Citigroup Global Markets Holdings, Inc., Jindal Steel & Power Ltd. - Exp. 02/15/2019 | 121,795 | 397 | ||||||||||
Citigroup Global Markets Holdings, Inc., Reliance Industries Ltd. - Exp. 02/15/2019 | 161,839 | 2,299 | ||||||||||
|
| |||||||||||
| 4,763 | ||||||||||||
|
| |||||||||||
| FINANCIALS 0.3% | ||||||||||||
Citigroup Global Markets Holdings, Inc., Indiabulls Housing Finance Ltd. - Exp. 02/15/2019 | 11,087 | 185 | ||||||||||
Citigroup Global Markets Holdings, Inc., Kotak Mahindra Bank Ltd. - Exp. 02/15/2019 | 50,787 | 996 | ||||||||||
|
| |||||||||||
| 1,181 | ||||||||||||
|
| |||||||||||
| HEALTH CARE 0.1% | ||||||||||||
Citigroup Global Markets Holdings, Inc., Lupin Ltd. - Exp. 02/15/2019 | 5,323 | 70 | ||||||||||
Citigroup Global Markets Holdings, Inc., Sun Pharmaceutical Industries Ltd. - Exp. 02/15/2019 | 50,973 | 420 | ||||||||||
|
| |||||||||||
| 490 | ||||||||||||
|
| |||||||||||
| INDUSTRIALS 0.0% | ||||||||||||
Citigroup Global Markets Holdings, Inc., Container Corp. Of India Ltd. - Exp. 02/15/2019 | 4,160 | 40 | ||||||||||
|
| |||||||||||
| INFORMATION TECHNOLOGY 1.4% | ||||||||||||
Citigroup Global Markets Holdings, Inc., HCL Technologies Ltd. - Exp. 02/15/2019 | 40,687 | 551 | ||||||||||
| UNITS | MARKET VALUE (000S) | |||||||||||
Citigroup Global Markets Holdings, Inc., Tata Consultancy Services Ltd. - Exp. 02/15/2019 | 132,273 | $ | 3,570 | |||||||||
Citigroup Global Markets Holdings, Inc., Tech Mahindra Ltd. - Exp. 02/05/2019 | 92,229 | 883 | ||||||||||
|
| |||||||||||
| 5,004 | ||||||||||||
|
| |||||||||||
| MATERIALS 0.1% | ||||||||||||
Citigroup Global Markets Holdings, Inc., Asian Paints Ltd. - Exp. 02/15/2019 | 6,399 | 118 | ||||||||||
Citigroup Global Markets Holdings, Inc., NMDC Ltd. - Exp. 02/15/2019 | 15,947 | 25 | ||||||||||
|
| |||||||||||
| 143 | ||||||||||||
|
| |||||||||||
| TELECOMMUNICATION SERVICES 0.2% | ||||||||||||
Citigroup Global Markets Holdings, Inc., Bharti Airtel Ltd. - Exp. 02/15/2019 | 66,726 | 372 | ||||||||||
Citigroup Global Markets Holdings, Inc., Idea Cellular Ltd. - Exp. 02/15/2019 | 46,104 | 40 | ||||||||||
Citigroup Global Markets Holdings, Inc., Reliance Communications Ltd. - Exp. 02/15/2019 | 874,002 | 176 | ||||||||||
|
| |||||||||||
| 588 | ||||||||||||
|
| |||||||||||
| UTILITIES 0.0% | ||||||||||||
Citigroup Global Markets Holdings, Inc., NTPC Ltd. - Exp. 02/15/2019 | 37,280 | 87 | ||||||||||
|
| |||||||||||
Total Ireland | 16,201 | |||||||||||
|
| |||||||||||
| UNITED STATES 0.1% | ||||||||||||
| FINANCIALS 0.0% | ||||||||||||
Citigroup Global Markets Holdings, Inc., Bank of India - Exp. 02/15/2019 | 27,103 | 35 | ||||||||||
Citigroup Global Markets Holdings, Inc., Oracle Finance Ltd. - Exp. 02/15/2019 | 595 | 35 | ||||||||||
|
| |||||||||||
| 70 | ||||||||||||
|
| |||||||||||
| INDUSTRIALS 0.1% | ||||||||||||
Citigroup Global Markets Holdings, Inc., Reliance Infrastructure Ltd. - Exp. 02/15/2019 | 6,074 | 35 | ||||||||||
Citigroup Global Markets Holdings, Inc., Shriram Transport Finance Corporation Ltd. - Exp. 02/15/2019 | 3,380 | 64 | ||||||||||
|
| |||||||||||
| 99 | ||||||||||||
|
| |||||||||||
Total United States | 169 | |||||||||||
|
| |||||||||||
Total Equity-Linked Securities |
| 16,370 | ||||||||||
|
| |||||||||||
| SHARES | ||||||||||||
| PREFERRED STOCKS 3.2% | ||||||||||||
| BRAZIL 2.6% | ||||||||||||
| BANKING & FINANCE 1.2% | ||||||||||||
Banco do Estado do Rio Grande do Sul S.A. | 5,300 | 20 | ||||||||||
| SHARES | MARKET VALUE (000S) | |||||||||||
Itau Unibanco Holding S.A. | 295,700 | $ | 3,078 | |||||||||
Itausa - Investimentos Itau S.A. | 483,250 | 1,145 | ||||||||||
|
| |||||||||||
| 4,243 | ||||||||||||
|
| |||||||||||
| CONSUMER DISCRETIONARY 0.1% | ||||||||||||
Lojas Americanas S.A. | 47,300 | 203 | ||||||||||
|
| |||||||||||
| INDUSTRIALS 0.4% | ||||||||||||
Braskem S.A. | 39,100 | 512 | ||||||||||
Cia Brasileira de Distribuicao | 8,400 | 169 | ||||||||||
Metalurgica Gerdau S.A. | 487,100 | 777 | ||||||||||
|
| |||||||||||
| 1,458 | ||||||||||||
|
| |||||||||||
| MATERIALS 0.4% | ||||||||||||
Gerdau S.A. | 409,400 | 1,469 | ||||||||||
Usinas Siderurgicas de Minas Gerais S.A. | 35,000 | 66 | ||||||||||
|
| |||||||||||
| 1,535 | ||||||||||||
|
| |||||||||||
| UTILITIES 0.5% | ||||||||||||
Centrais Eletricas Brasileiras S.A. | 28,200 | 98 | ||||||||||
Cia de Gas de Sao Paulo - COMGAS | 7,400 | 113 | ||||||||||
Cia de Transmissao de Energia Eletrica Paulista | 1,600 | 24 | ||||||||||
Cia Energetica de Minas Gerais | 528,169 | 995 | ||||||||||
Cia Energetica de Sao Paulo | 93,500 | 395 | ||||||||||
Cia Paranaense de Energia | 57,600 | 326 | ||||||||||
|
| |||||||||||
| 1,951 | ||||||||||||
|
| |||||||||||
Total Brazil | 9,390 | |||||||||||
|
| |||||||||||
| CHILE 0.1% | ||||||||||||
| CONSUMER STAPLES 0.1% | ||||||||||||
Embotelladora Andina S.A. | 50,847 | 198 | ||||||||||
|
| |||||||||||
Total Chile | 198 | |||||||||||
|
| |||||||||||
| RUSSIA 0.5% | ||||||||||||
| ENERGY 0.5% | ||||||||||||
Bashneft PJSC | 4,778 | 131 | ||||||||||
Surgutneftegas OJSC | 2,790,800 | 1,389 | ||||||||||
Transneft PJSC | 94 | 250 | ||||||||||
|
| |||||||||||
| 1,770 | ||||||||||||
|
| |||||||||||
| UTILITIES 0.0% | ||||||||||||
Lenenergo PJSC | 22,200 | 34 | ||||||||||
|
| |||||||||||
Total Russia | 1,804 | |||||||||||
|
| |||||||||||
Total Preferred Stocks (Cost $13,953) |
| 11,392 | ||||||||||
|
| |||||||||||
| REAL ESTATE INVESTMENT TRUSTS 0.3% | ||||||||||||
| MEXICO 0.1% | ||||||||||||
| REAL ESTATE 0.1% | ||||||||||||
Fibra Uno Administracion S.A. de C.V. | 198,000 | 288 | ||||||||||
|
| |||||||||||
Total Mexico | 288 | |||||||||||
|
| |||||||||||
| SOUTH AFRICA 0.2% | ||||||||||||
| REAL ESTATE 0.2% | ||||||||||||
Growthpoint Properties Ltd. | 285,521 | 556 | ||||||||||
| See Accompanying Notes | ANNUAL REPORT | JUNE 30, 2018 | 25 |
Table of Contents
Schedule of Investments PIMCO RAFI Dynamic Multi-Factor Emerging Markets Equity ETF (Cont.)
| SHARES | MARKET VALUE (000S) | |||||||||||
Redefine Properties Ltd. | 262,047 | $ | 200 | |||||||||
|
| |||||||||||
| 756 | ||||||||||||
|
| |||||||||||
Total South Africa | 756 | |||||||||||
|
| |||||||||||
Total Real Estate Investment Trusts |
| 1,044 | ||||||||||
|
| |||||||||||
| WARRANTS 0.0% |
| |||||||||||
| IRELAND 0.0% |
| |||||||||||
| ENERGY 0.0% |
| |||||||||||
Petronet LNG Ltd. - Exp. 02/15/2019 | 34,599 | 111 | ||||||||||
|
| |||||||||||
Total Warrants (Cost $119) | 111 | |||||||||||
|
| |||||||||||
| Total Investments in Securities (Cost $383,871) | 352,066 | |||||||||||
| Total Investments 98.6% (Cost $383,871) | $ | 352,066 | ||||||||||
Financial Derivative (Cost or Premiums, net $0) | (1 | ) | ||||||||||
| Other Assets and Liabilities, net 1.4% |
| 5,104 | ||||||||||
|
| |||||||||||
| Net Assets 100.0% | $ | 357,169 | ||||||||||
|
| |||||||||||
NOTES TO SCHEDULE OF INVESTMENTS:
| * | A zero balance may reflect actual amounts rounding to less than one thousand. |
| (a) | Security did not produce income within the last twelve months. |
(b) FINANCIAL DERIVATIVE INSTRUMENTS: OVER THE COUNTER
FORWARD FOREIGN CURRENCY CONTRACTS:
| Counterparty | Settlement | Currency to be Delivered | Currency to be Received | Unrealized Appreciation/ (Depreciation) | ||||||||||||||||||||
| Asset | Liability | |||||||||||||||||||||||
SSB | 07/2018 | HKD | 11,001 | $ | 1,402 | $ | 0 | $ | 0 | |||||||||||||||
| 07/2018 | MYR | 2,043 | 505 | 0 | (1 | ) | ||||||||||||||||||
| 07/2018 | SGD | 195 | 143 | 0 | 0 | |||||||||||||||||||
|
|
|
| |||||||||||||||||||||
Total Forward Foreign Currency Contracts |
| $ | 0 | $ | (1 | ) | ||||||||||||||||||
|
|
|
| |||||||||||||||||||||
FINANCIAL DERIVATIVE INSTRUMENTS: OVER THE COUNTER SUMMARY
The following is a summary by counterparty of the market value of OTC financial derivative instruments and collateral pledged/(received) as of June 30, 2018:
| Financial Derivative Assets | Financial Derivative Liabilities | |||||||||||||||||||||||||||||||||||||||||||||||
| Counterparty | Forward Foreign Currency Contracts | Purchased Options | Swap Agreements | Total Over the Counter | Forward Foreign Currency Contracts | Written Options | Swap Agreements | Total Over the Counter | Net Market Value of OTC Derivatives | Collateral Pledged/ (Received) | Net Exposure(1) | |||||||||||||||||||||||||||||||||||||
SSB | $ | 0 | $ | 0 | $ | 0 | $ | 0 | $ | (1 | ) | $ | 0 | $ | 0 | $ | (1 | ) | $ | (1 | ) | $ | 0 | $ | (1 | ) | ||||||||||||||||||||||
|
|
|
|
|
|
|
|
|
|
|
|
|
|
|
| |||||||||||||||||||||||||||||||||
| (1) | Net Exposure represents the net receivable/(payable) that would be due from/to the counterparty in the event of default. Exposure from OTC financial derivative instruments can only be netted across transactions governed under the same master agreement with the same legal entity. See Note 7, Master Netting Arrangements, in the Notes to Financial Statements for more information regarding master netting arrangements. |
| 26 | PIMCO EQUITY SERIES | See Accompanying Notes |
Table of Contents
June 30, 2018
FAIR VALUE OF FINANCIAL DERIVATIVE INSTRUMENTS
The following is a summary of the fair valuation of the Fund’s derivative instruments categorized by risk exposure. See Note 6, Principal Risks, in the Notes to Financial Statements on risks of the Fund.
Fair Values of Financial Derivative Instruments on the Statements of Assets and Liabilities as of June 30, 2018:
| Derivatives not accounted for as hedging instruments | ||||||||||||||||||||||||
| Commodity Contracts | Credit Contracts | Equity Contracts | Foreign Exchange Contracts | Interest Rate Contracts | Total | |||||||||||||||||||
Financial Derivative Instruments - Liabilities |
| |||||||||||||||||||||||
Over the counter |
| |||||||||||||||||||||||
Forward Foreign Currency Contracts | $ | 0 | $ | 0 | $ | 0 | $ | 1 | $ | 0 | $ | 1 | ||||||||||||
|
|
|
|
|
|
|
|
|
|
|
| |||||||||||||
The effect of Financial Derivative Instruments on the Statements of Operations for the period ended June 30, 2018:
| Derivatives not accounted for as hedging instruments | ||||||||||||||||||||||||
| Commodity Contracts | Credit Contracts | Equity Contracts | Foreign Exchange Contracts | Interest Rate Contracts | Total | |||||||||||||||||||
Net Realized (Loss) on Financial Derivative Instruments |
| |||||||||||||||||||||||
Over the counter |
| |||||||||||||||||||||||
Forward Foreign Currency Contracts | $ | 0 | $ | 0 | $ | 0 | $ | (299 | ) | $ | 0 | $ | (299 | ) | ||||||||||
|
|
|
|
|
|
|
|
|
|
|
| |||||||||||||
Net Change in Unrealized (Depreciation) on Financial Derivative Instruments |
| |||||||||||||||||||||||
Over the counter |
| |||||||||||||||||||||||
Forward Foreign Currency Contracts | $ | 0 | $ | 0 | $ | 0 | $ | (1 | ) | $ | 0 | $ | (1 | ) | ||||||||||
|
|
|
|
|
|
|
|
|
|
|
| |||||||||||||
FAIR VALUE MEASUREMENTS
The following is a summary of the fair valuations according to the inputs used as of June 30, 2018 in valuing the Fund’s assets and liabilities:
| Category and Subcategory | Level 1 | Level 2 | Level 3 | Fair Value at 06/30/2018 | ||||||||||||
Investments in Securities, at Value |
| |||||||||||||||
Common Stocks | ||||||||||||||||
Brazil | ||||||||||||||||
Consumer Discretionary | $ | 698 | $ | 0 | $ | 0 | $ | 698 | ||||||||
Consumer Staples | 3,440 | 0 | 0 | 3,440 | ||||||||||||
Energy | 6,462 | 0 | 0 | 6,462 | ||||||||||||
Financials | 1,353 | 0 | 0 | 1,353 | ||||||||||||
Health Care | 121 | 0 | 0 | 121 | ||||||||||||
Industrials | 922 | 0 | 0 | 922 | ||||||||||||
Information Technology | 20 | 0 | 0 | 20 | ||||||||||||
Materials | 9,715 | 0 | 0 | 9,715 | ||||||||||||
Utilities | 866 | 0 | 0 | 866 | ||||||||||||
Chile | ||||||||||||||||
Consumer Discretionary | 514 | 0 | 0 | 514 | ||||||||||||
Consumer Staples | 1,031 | 0 | 0 | 1,031 | ||||||||||||
Energy | 562 | 0 | 0 | 562 | ||||||||||||
Financials | 1,152 | 0 | 0 | 1,152 | ||||||||||||
Industrials | 307 | 0 | 0 | 307 | ||||||||||||
Materials | 939 | 0 | 0 | 939 | ||||||||||||
Telecommunication Services | 121 | 0 | 0 | 121 | ||||||||||||
Utilities | 1,079 | 0 | 0 | 1,079 | ||||||||||||
China | ||||||||||||||||
Consumer Discretionary | 1,196 | 2,009 | 0 | 3,205 | ||||||||||||
Consumer Staples | 858 | 2,848 | 0 | 3,706 | ||||||||||||
Energy | 0 | 12,656 | 0 | 12,656 | ||||||||||||
Financials | 0 | 4,023 | 0 | 4,023 | ||||||||||||
Health Care | 109 | 1,282 | 0 | 1,391 | ||||||||||||
Industrials | 919 | 1,939 | 0 | 2,858 | ||||||||||||
Information Technology | 9,059 | 7,574 | 0 | 16,633 | ||||||||||||
Materials | 0 | 3,358 | 0 | 3,358 | ||||||||||||
Real Estate | 0 | 4,981 | 0 | 4,981 | ||||||||||||
Telecommunication Services | 0 | 624 | 0 | 624 | ||||||||||||
Utilities | 0 | 2,490 | 0 | 2,490 | ||||||||||||
| Category and Subcategory | Level 1 | Level 2 | Level 3 | Fair Value at 06/30/2018 | ||||||||||||
Greece | ||||||||||||||||
Consumer Discretionary | $ | 0 | $ | 306 | $ | 0 | $ | 306 | ||||||||
Energy | 117 | 25 | 0 | 142 | ||||||||||||
Financials | 0 | 1,539 | 0 | 1,539 | ||||||||||||
Utilities | 0 | 69 | 0 | 69 | ||||||||||||
Hong Kong | ||||||||||||||||
Consumer Discretionary | 0 | 142 | 0 | 142 | ||||||||||||
Consumer Staples | 0 | 2,651 | 0 | 2,651 | ||||||||||||
Energy | 0 | 506 | 0 | 506 | ||||||||||||
Financials | 0 | 353 | 0 | 353 | ||||||||||||
Industrials | 72 | 447 | 0 | 519 | ||||||||||||
Materials | 0 | 336 | 0 | 336 | ||||||||||||
Real Estate | 0 | 2,331 | 0 | 2,331 | ||||||||||||
Telecommunication Services | 0 | 391 | 0 | 391 | ||||||||||||
Utilities | 0 | 1,868 | 0 | 1,868 | ||||||||||||
India | ||||||||||||||||
Consumer Discretionary | 1,762 | 0 | 0 | 1,762 | ||||||||||||
Financials | 5,174 | 0 | 0 | 5,174 | ||||||||||||
Health Care | 867 | 0 | 0 | 867 | ||||||||||||
Industrials | 1,284 | 0 | 0 | 1,284 | ||||||||||||
Information Technology | 7,372 | 0 | 0 | 7,372 | ||||||||||||
Materials | 264 | 926 | 0 | 1,190 | ||||||||||||
Indonesia | ||||||||||||||||
Consumer Discretionary | 0 | 786 | 0 | 786 | ||||||||||||
Consumer Staples | 0 | 834 | 0 | 834 | ||||||||||||
Energy | 0 | 857 | 0 | 857 | ||||||||||||
Financials | 0 | 862 | 0 | 862 | ||||||||||||
Health Care | 0 | 25 | 0 | 25 | ||||||||||||
Materials | 0 | 1,281 | 0 | 1,281 | ||||||||||||
Telecommunication Services | 0 | 952 | 0 | 952 | ||||||||||||
Utilities | 0 | 82 | 0 | 82 | ||||||||||||
Malaysia | ||||||||||||||||
Consumer Discretionary | 0 | 999 | 0 | 999 | ||||||||||||
Consumer Staples | 552 | 495 | 0 | 1,047 | ||||||||||||
Energy | 0 | 214 | 0 | 214 | ||||||||||||
| See Accompanying Notes | ANNUAL REPORT | JUNE 30, 2018 | 27 |
Table of Contents
Schedule of Investments PIMCO RAFI Dynamic Multi-Factor Emerging Markets Equity ETF (Cont.)
June 30, 2018
| Category and Subcategory | Level 1 | Level 2 | Level 3 | Fair Value at 06/30/2018 | ||||||||||||
Financials | $ | 0 | $ | 2,876 | $ | 0 | $ | 2,876 | ||||||||
Health Care | 0 | 29 | 0 | 29 | ||||||||||||
Industrials | 0 | 872 | 0 | 872 | ||||||||||||
Materials | 0 | 294 | 0 | 294 | ||||||||||||
Real Estate | 0 | 60 | 0 | 60 | ||||||||||||
Telecommunication Services | 0 | 717 | 0 | 717 | ||||||||||||
Utilities | 0 | 1,548 | 0 | 1,548 | ||||||||||||
Mexico | ||||||||||||||||
Consumer Staples | 3,634 | 0 | 0 | 3,634 | ||||||||||||
Financials | 111 | 0 | 0 | 111 | ||||||||||||
Industrials | 116 | 0 | 0 | 116 | ||||||||||||
Materials | 1,098 | 0 | 0 | 1,098 | ||||||||||||
Telecommunication Services | 1,130 | 0 | 0 | 1,130 | ||||||||||||
Utilities | 139 | 0 | 0 | 139 | ||||||||||||
Philippines | ||||||||||||||||
Consumer Staples | 0 | 35 | 0 | 35 | ||||||||||||
Energy | 76 | 0 | 0 | 76 | ||||||||||||
Financials | 0 | 820 | 0 | 820 | ||||||||||||
Industrials | 50 | 351 | 0 | 401 | ||||||||||||
Real Estate | 0 | 297 | 0 | 297 | ||||||||||||
Telecommunication Services | 94 | 270 | 0 | 364 | ||||||||||||
Utilities | 113 | 207 | 0 | 320 | ||||||||||||
Poland | ||||||||||||||||
Consumer Discretionary | 0 | 112 | 0 | 112 | ||||||||||||
Energy | 0 | 849 | 0 | 849 | ||||||||||||
Financials | 0 | 978 | 0 | 978 | ||||||||||||
Information Technology | 0 | 35 | 0 | 35 | ||||||||||||
Materials | 35 | 515 | 0 | 550 | ||||||||||||
Telecommunication Services | 0 | 159 | 0 | 159 | ||||||||||||
Utilities | 0 | 668 | 0 | 668 | ||||||||||||
Russia | ||||||||||||||||
Consumer Staples | 142 | 520 | 0 | 662 | ||||||||||||
Energy | 4,528 | 13,503 | 0 | 18,031 | ||||||||||||
Financials | 0 | 3,214 | 0 | 3,214 | ||||||||||||
Industrials | 26 | 24 | 0 | 50 | ||||||||||||
Information Technology | 591 | 0 | 0 | 591 | ||||||||||||
Materials | 575 | 5,249 | 0 | 5,824 | ||||||||||||
Real Estate | 27 | 0 | 0 | 27 | ||||||||||||
Telecommunication Services | 1,914 | 988 | 0 | 2,902 | ||||||||||||
Utilities | 0 | 1,083 | 0 | 1,083 | ||||||||||||
Singapore | ||||||||||||||||
Industrials | 0 | 35 | 0 | 35 | ||||||||||||
South Africa | ||||||||||||||||
Consumer Discretionary | 0 | 7,659 | 0 | 7,659 | ||||||||||||
Consumer Staples | 327 | 1,290 | 0 | 1,617 | ||||||||||||
Energy | 0 | 178 | 0 | 178 | ||||||||||||
Financials | 50 | 4,248 | 0 | 4,298 | ||||||||||||
Health Care | 243 | 239 | 0 | 482 | ||||||||||||
Industrials | 0 | 807 | 0 | 807 | ||||||||||||
Information Technology | 62 | 0 | 0 | 62 | ||||||||||||
Materials | 2,163 | 4,090 | 0 | 6,253 | ||||||||||||
Telecommunication Services | 3,229 | 74 | 0 | 3,303 | ||||||||||||
South Korea | ||||||||||||||||
Consumer Discretionary | 484 | 15,394 | 0 | 15,878 | ||||||||||||
Consumer Staples | 0 | 5,188 | 0 | 5,188 | ||||||||||||
Energy | 0 | 3,920 | 0 | 3,920 | ||||||||||||
Financials | 0 | 8,055 | 0 | 8,055 | ||||||||||||
Industrials | 29 | 5,745 | 0 | 5,774 | ||||||||||||
Information Technology | 0 | 8,611 | 0 | 8,611 | ||||||||||||
Materials | 195 | 8,144 | 0 | 8,339 | ||||||||||||
Telecommunication Services | 1,533 | 1,687 | 0 | 3,220 | ||||||||||||
Utilities | 0 | 4,741 | 0 | 4,741 | ||||||||||||
Taiwan | ||||||||||||||||
Consumer Discretionary | 0 | 1,070 | 0 | 1,070 | ||||||||||||
Consumer Staples | 0 | 1,741 | 0 | 1,741 | ||||||||||||
Energy | 0 | 670 | 0 | 670 | ||||||||||||
Financials | 0 | 6,175 | 0 | 6,175 | ||||||||||||
Industrials | 0 | 1,626 | 0 | 1,626 | ||||||||||||
Information Technology | 5,153 | 18,333 | 0 | 23,486 | ||||||||||||
Materials | 0 | 6,782 | 0 | 6,782 | ||||||||||||
| Category and Subcategory | Level 1 | Level 2 | Level 3 | Fair Value at 06/30/2018 | ||||||||||||
Real Estate | $ | 0 | $ | 67 | $ | 0 | $ | 67 | ||||||||
Telecommunication Services | 0 | 3,890 | 0 | 3,890 | ||||||||||||
Thailand | ||||||||||||||||
Consumer Staples | 0 | 1,516 | 0 | 1,516 | ||||||||||||
Energy | 0 | 4,465 | 0 | 4,465 | ||||||||||||
Financials | 0 | 858 | 0 | 858 | ||||||||||||
Health Care | 0 | 667 | 0 | 667 | ||||||||||||
Industrials | 61 | 801 | 0 | 862 | ||||||||||||
Materials | 0 | 2,728 | 0 | 2,728 | ||||||||||||
Real Estate | 232 | 335 | 0 | 567 | ||||||||||||
Telecommunication Services | 0 | 1,906 | 0 | 1,906 | ||||||||||||
Utilities | 0 | 358 | 0 | 358 | ||||||||||||
Turkey | ||||||||||||||||
Consumer Discretionary | 0 | 208 | 0 | 208 | ||||||||||||
Consumer Staples | 0 | 261 | 0 | 261 | ||||||||||||
Energy | 0 | 348 | 0 | 348 | ||||||||||||
Financials | 0 | 231 | 0 | 231 | ||||||||||||
Industrials | 0 | 675 | 0 | 675 | ||||||||||||
Materials | 0 | 160 | 0 | 160 | ||||||||||||
Telecommunication Services | 0 | 645 | 0 | 645 | ||||||||||||
Utilities | 0 | 70 | 0 | 70 | ||||||||||||
Ukraine | ||||||||||||||||
Consumer Staples | 26 | 0 | 0 | 26 | ||||||||||||
United States | ||||||||||||||||
Consumer Discretionary | 0 | 31 | 0 | 31 | ||||||||||||
Equity-Linked Securities | ||||||||||||||||
Ireland | ||||||||||||||||
Consumer Discretionary | 0 | 725 | 0 | 725 | ||||||||||||
Consumer Staples | 0 | 3,180 | 0 | 3,180 | ||||||||||||
Energy | 0 | 4,763 | 0 | 4,763 | ||||||||||||
Financials | 0 | 1,181 | 0 | 1,181 | ||||||||||||
Health Care | 0 | 490 | 0 | 490 | ||||||||||||
Industrials | 0 | 40 | 0 | 40 | ||||||||||||
Information Technology | 0 | 5,004 | 0 | 5,004 | ||||||||||||
Materials | 0 | 143 | 0 | 143 | ||||||||||||
Telecommunication Services | 0 | 588 | 0 | 588 | ||||||||||||
Utilities | 0 | 87 | 0 | 87 | ||||||||||||
United States | ||||||||||||||||
Financials | 70 | 0 | 0 | 70 | ||||||||||||
Industrials | 99 | 0 | 0 | 99 | ||||||||||||
Preferred Stocks | ||||||||||||||||
Brazil | ||||||||||||||||
Banking & Finance | 4,243 | 0 | 0 | 4,243 | ||||||||||||
Consumer Discretionary | 0 | 203 | 0 | 203 | ||||||||||||
Industrials | 1,458 | 0 | 0 | 1,458 | ||||||||||||
Materials | 1,535 | 0 | 0 | 1,535 | ||||||||||||
Utilities | 1,951 | 0 | 0 | 1,951 | ||||||||||||
Chile | ||||||||||||||||
Consumer Staples | 198 | 0 | 0 | 198 | ||||||||||||
Russia | ||||||||||||||||
Energy | 0 | 1,770 | 0 | 1,770 | ||||||||||||
Utilities | 0 | 34 | 0 | 34 | ||||||||||||
Real Estate Investment Trusts | ||||||||||||||||
Mexico | ||||||||||||||||
Real Estate | 288 | 0 | 0 | 288 | ||||||||||||
South Africa | ||||||||||||||||
Real Estate | 756 | 0 | 0 | 756 | ||||||||||||
Warrants | ||||||||||||||||
Ireland | ||||||||||||||||
Energy | 0 | 111 | 0 | 111 | ||||||||||||
|
|
|
|
|
|
|
| |||||||||
Total Investments | $ | 97,691 | $ | 254,375 | $ | 0 | $ | 352,066 | ||||||||
|
|
|
|
|
|
|
| |||||||||
Financial Derivative Instruments - Liabilities |
| |||||||||||||||
Over the counter | $ | 0 | $ | (1 | ) | $ | 0 | $ | (1 | ) | ||||||
|
|
|
|
|
|
|
| |||||||||
Total Financial Derivative Instruments | $ | 0 | $ | (1 | ) | $ | 0 | $ | (1 | ) | ||||||
|
|
|
|
|
|
|
| |||||||||
Totals | $ | 97,691 | $ | 254,374 | $ | 0 | $ | 352,065 | ||||||||
|
|
|
|
|
|
|
| |||||||||
There were no significant transfers among Levels 1, 2, or 3 during the period ended June 30, 2018.
| 28 | PIMCO EQUITY SERIES | See Accompanying Notes |
Table of Contents
Schedule of Investments PIMCO RAFI Dynamic Multi-Factor International Equity ETF
June 30, 2018
(Amounts in thousands*, except number of shares, contracts and units, if any)
| SHARES | MARKET VALUE (000S) | |||||||||||
| INVESTMENTS IN SECURITIES 98.0% | ||||||||||||
| COMMON STOCKS 94.7% | ||||||||||||
| AUSTRALIA 5.2% | ||||||||||||
| CONSUMER DISCRETIONARY 0.2% | ||||||||||||
Aristocrat Leisure Ltd. | 1,046 | $ | 24 | |||||||||
JB Hi-Fi Ltd. | 521 | 9 | ||||||||||
Nine Entertainment Co. Holdings Ltd. | 4,557 | 8 | ||||||||||
Super Retail Group Ltd. | 1,389 | 8 | ||||||||||
|
| |||||||||||
| 49 | ||||||||||||
|
| |||||||||||
| CONSUMER STAPLES 0.9% | ||||||||||||
GrainCorp Ltd. | 1,674 | 9 | ||||||||||
Inghams Group Ltd. | 3,026 | 9 | ||||||||||
Metcash Ltd. | 5,596 | 11 | ||||||||||
Treasury Wine Estates Ltd. | 895 | 11 | ||||||||||
Wesfarmers Ltd. | 3,209 | 117 | ||||||||||
Woolworths Ltd. | 4,549 | 103 | ||||||||||
|
| |||||||||||
| 260 | ||||||||||||
|
| |||||||||||
| ENERGY 0.5% | ||||||||||||
Caltex Australia Ltd. | 1,856 | 45 | ||||||||||
Oil Search Ltd. | 1,327 | 9 | ||||||||||
Origin Energy Ltd. | 5,870 | 43 | ||||||||||
Santos Ltd. (a) | 3,292 | 15 | ||||||||||
Woodside Petroleum Ltd. | 993 | 26 | ||||||||||
WorleyParsons Ltd. | 920 | 12 | ||||||||||
|
| |||||||||||
| 150 | ||||||||||||
|
| |||||||||||
| FINANCIALS 0.8% | ||||||||||||
AMP Ltd. | 14,948 | 39 | ||||||||||
Genworth Mortgage Insurance Australia Ltd. | 5,290 | 10 | ||||||||||
Insurance Australia Group Ltd. | 4,091 | 26 | ||||||||||
Macquarie Group Ltd. | 478 | 44 | ||||||||||
Medibank Pvt Ltd. | 9,773 | 21 | ||||||||||
National Australia Bank Ltd. | 469 | 10 | ||||||||||
nib holdings Ltd. | 2,060 | 9 | ||||||||||
QBE Insurance Group Ltd. | 4,638 | 33 | ||||||||||
Suncorp Group Ltd. | 3,045 | 33 | ||||||||||
|
| |||||||||||
| 225 | ||||||||||||
|
| |||||||||||
| HEALTH CARE 0.5% | ||||||||||||
Ansell Ltd. | 419 | 8 | ||||||||||
Australian Pharmaceutical Industries Ltd. | 7,030 | 9 | ||||||||||
Cochlear Ltd. | 119 | 18 | ||||||||||
CSL Ltd. | 856 | 122 | ||||||||||
|
| |||||||||||
| 157 | ||||||||||||
|
| |||||||||||
| INDUSTRIALS 0.5% | ||||||||||||
Brambles Ltd. | 3,816 | 25 | ||||||||||
CIMIC Group Ltd. | 453 | 14 | ||||||||||
Downer EDI Ltd. | 2,455 | 12 | ||||||||||
Monadelphous Group Ltd. | 964 | 11 | ||||||||||
Qantas Airways Ltd. | 1,822 | 8 | ||||||||||
SEEK Ltd. | 771 | 13 | ||||||||||
Sydney Airport | 3,009 | 16 | ||||||||||
Transurban Group | 3,602 | 32 | ||||||||||
|
| |||||||||||
| 131 | ||||||||||||
|
| |||||||||||
| SHARES | MARKET VALUE (000S) | |||||||||||
| INFORMATION TECHNOLOGY 0.2% | ||||||||||||
Atlassian Corp. PLC ‘A’ (a) | 140 | $ | 9 | |||||||||
carsales.com Ltd. | 760 | 8 | ||||||||||
Computershare Ltd. | 1,216 | 17 | ||||||||||
REA Group Ltd. | 125 | 8 | ||||||||||
|
| |||||||||||
| 42 | ||||||||||||
|
| |||||||||||
| MATERIALS 1.4% | ||||||||||||
Adelaide Brighton Ltd. | 1,668 | 9 | ||||||||||
Alumina Ltd. | 4,239 | 9 | ||||||||||
Amcor Ltd. | 1,969 | 21 | ||||||||||
BHP Billiton Ltd. | 5,693 | 142 | ||||||||||
BHP Billiton PLC | 4,060 | 91 | ||||||||||
BlueScope Steel Ltd. | 1,062 | 14 | ||||||||||
CSR Ltd. | 2,710 | 9 | ||||||||||
DuluxGroup Ltd. | 1,500 | 8 | ||||||||||
Iluka Resources Ltd. | 1,254 | 10 | ||||||||||
Incitec Pivot Ltd. | 3,275 | 9 | ||||||||||
Mineral Resources Ltd. | 722 | 9 | ||||||||||
Newcrest Mining Ltd. | 1,816 | 29 | ||||||||||
Northern Star Resources Ltd. | 2,084 | 11 | ||||||||||
Orica Ltd. | 914 | 12 | ||||||||||
Regis Resources Ltd. | 2,883 | 11 | ||||||||||
South32 Ltd. | 3,229 | 9 | ||||||||||
Western Areas Ltd. | 4,084 | 11 | ||||||||||
|
| |||||||||||
| 414 | ||||||||||||
|
| |||||||||||
| REAL ESTATE 0.0% | ||||||||||||
Lend Lease Group | 697 | 10 | ||||||||||
|
| |||||||||||
| TELECOMMUNICATION SERVICES 0.2% | ||||||||||||
Telstra Corp. Ltd. | 36,104 | 70 | ||||||||||
|
| |||||||||||
| UTILITIES 0.0% | ||||||||||||
AGL Energy Ltd. | 611 | 10 | ||||||||||
|
| |||||||||||
Total Australia | 1,518 | |||||||||||
|
| |||||||||||
| AUSTRIA 0.4% | ||||||||||||
| ENERGY 0.1% | ||||||||||||
OMV AG | 746 | 42 | ||||||||||
|
| |||||||||||
| FINANCIALS 0.1% | ||||||||||||
Raiffeisen Bank International AG | 314 | 10 | ||||||||||
UNIQA Insurance Group AG | 897 | 8 | ||||||||||
Vienna Insurance Group AG Wiener Versicherung Gruppe | 346 | 9 | ||||||||||
|
| |||||||||||
| 27 | ||||||||||||
|
| |||||||||||
| INDUSTRIALS 0.1% | ||||||||||||
ANDRITZ AG | 161 | 9 | ||||||||||
Oesterreichische Post AG | 205 | 9 | ||||||||||
|
| |||||||||||
| 18 | ||||||||||||
|
| |||||||||||
| INFORMATION TECHNOLOGY 0.0% | ||||||||||||
ams AG | 87 | 7 | ||||||||||
|
| |||||||||||
| MATERIALS 0.1% | ||||||||||||
voestalpine AG | 221 | 10 | ||||||||||
Wienerberger AG | 354 | 9 | ||||||||||
|
| |||||||||||
| 19 | ||||||||||||
|
| |||||||||||
| SHARES | MARKET VALUE (000S) | |||||||||||
| REAL ESTATE 0.0% | ||||||||||||
CA Immobilien Anlagen AG | 336 | $ | 11 | |||||||||
|
| |||||||||||
Total Austria | 124 | |||||||||||
|
| |||||||||||
| BELGIUM 0.8% | ||||||||||||
| CONSUMER STAPLES 0.3% | ||||||||||||
Anheuser-Busch InBev S.A. NV | 747 | 75 | ||||||||||
Colruyt S.A. | 261 | 15 | ||||||||||
|
| |||||||||||
| 90 | ||||||||||||
|
| |||||||||||
| ENERGY 0.0% | ||||||||||||
Euronav NV | 1,245 | 11 | ||||||||||
|
| |||||||||||
| FINANCIALS 0.2% | ||||||||||||
Ageas | 1,032 | 52 | ||||||||||
Gimv NV | 141 | 9 | ||||||||||
|
| |||||||||||
| 61 | ||||||||||||
|
| |||||||||||
| HEALTH CARE 0.1% | ||||||||||||
UCB S.A. | 164 | 13 | ||||||||||
|
| |||||||||||
| INDUSTRIALS 0.0% | ||||||||||||
bpost S.A. | 534 | 8 | ||||||||||
|
| |||||||||||
| MATERIALS 0.1% | ||||||||||||
Umicore S.A. | 486 | 28 | ||||||||||
|
| |||||||||||
| TELECOMMUNICATION SERVICES 0.1% | ||||||||||||
Proximus S.A. | 630 | 14 | ||||||||||
|
| |||||||||||
| UTILITIES 0.0% | ||||||||||||
Elia System Operator S.A. | 169 | 11 | ||||||||||
|
| |||||||||||
Total Belgium | 236 | |||||||||||
|
| |||||||||||
| CAMBODIA 0.0% | ||||||||||||
| CONSUMER DISCRETIONARY 0.0% | ||||||||||||
NagaCorp Ltd. | 10,000 | 9 | ||||||||||
|
| |||||||||||
Total Cambodia | 9 | |||||||||||
|
| |||||||||||
| CANADA 5.9% | ||||||||||||
| CONSUMER DISCRETIONARY 1.1% | ||||||||||||
Canadian Tire Corp. Ltd. ‘A’ | 168 | 22 | ||||||||||
Cineplex, Inc. | 404 | 9 | ||||||||||
Cogeco, Inc. (b) | 176 | 8 | ||||||||||
Dollarama, Inc. | 771 | 30 | ||||||||||
Enercare, Inc. | 628 | 9 | ||||||||||
Gildan Activewear, Inc. | 417 | 12 | ||||||||||
Great Canadian Gaming Corp. (a) | 411 | 14 | ||||||||||
Lululemon Athletica, Inc. (a) | 169 | 21 | ||||||||||
Magna International, Inc. | 2,688 | 156 | ||||||||||
Martinrea International, Inc. (b) | 765 | 8 | ||||||||||
Quebecor, Inc. ‘B’ | 604 | 12 | ||||||||||
Restaurant Brands International, Inc. | 145 | 9 | ||||||||||
Shaw Communications, Inc. ‘B’ | 618 | 13 | ||||||||||
|
| |||||||||||
| 323 | ||||||||||||
|
| |||||||||||
| CONSUMER STAPLES 0.5% | ||||||||||||
Alimentation Couche-Tard, Inc. ‘B’ | 446 | 19 | ||||||||||
| See Accompanying Notes | ANNUAL REPORT | JUNE 30, 2018 | 29 |
Table of Contents
Schedule of Investments PIMCO RAFI Dynamic Multi-Factor International Equity ETF (Cont.)
| SHARES | MARKET VALUE (000S) | |||||||||||
Empire Co. Ltd. ‘A’ | 857 | $ | 17 | |||||||||
George Weston Ltd. | 138 | 11 | ||||||||||
Loblaw Cos. Ltd. | 407 | 21 | ||||||||||
Maple Leaf Foods, Inc. | 351 | 9 | ||||||||||
Metro, Inc. | 1,078 | 37 | ||||||||||
North West Co., Inc. | 513 | 12 | ||||||||||
Premium Brands Holdings Corp. | 119 | 10 | ||||||||||
Saputo, Inc. | 353 | 12 | ||||||||||
|
| |||||||||||
| 148 | ||||||||||||
|
| |||||||||||
| ENERGY 1.1% | ||||||||||||
Baytex Energy Corp. (a) | 2,712 | 9 | ||||||||||
Calfrac Well Services Ltd. (a)(b) | 2,282 | 10 | ||||||||||
Cameco Corp. | 765 | 9 | ||||||||||
Canadian Natural Resources Ltd. | 1,124 | 40 | ||||||||||
Cenovus Energy, Inc. | 4,564 | 47 | ||||||||||
Crescent Point Energy Corp. | 3,508 | 26 | ||||||||||
Encana Corp. | 904 | 12 | ||||||||||
Enerplus Corp. | 927 | 12 | ||||||||||
Gibson Energy, Inc. | 913 | 12 | ||||||||||
Husky Energy, Inc. | 1,379 | 21 | ||||||||||
Imperial Oil Ltd. | 300 | 10 | ||||||||||
MEG Energy Corp. (a) | 1,396 | 12 | ||||||||||
Obsidian Energy Ltd. (a) | 7,590 | 9 | ||||||||||
Precision Drilling Corp. (a) | 2,541 | 8 | ||||||||||
ShawCor Ltd. | 544 | 10 | ||||||||||
Suncor Energy, Inc. | 1,324 | 54 | ||||||||||
Trican Well Service Ltd. (a) | 3,648 | 8 | ||||||||||
|
| |||||||||||
| 309 | ||||||||||||
|
| |||||||||||
| FINANCIALS 1.0% | ||||||||||||
Canadian Imperial Bank of Commerce | 259 | 23 | ||||||||||
CI Financial Corp. | 812 | 15 | ||||||||||
Fairfax Financial Holdings Ltd. | 43 | 24 | ||||||||||
Great-West Lifeco, Inc. (b) | 711 | 17 | ||||||||||
IGM Financial, Inc. | 292 | 8 | ||||||||||
Intact Financial Corp. | 121 | 9 | ||||||||||
National Bank of Canada | 317 | 15 | ||||||||||
Onex Corp. | 120 | 9 | ||||||||||
Power Corp. of Canada | 1,830 | 41 | ||||||||||
Power Financial Corp. | 451 | 11 | ||||||||||
Sun Life Financial, Inc. | 479 | 19 | ||||||||||
Thomson Reuters Corp. | 780 | 31 | ||||||||||
Toronto-Dominion Bank | 1,223 | 71 | ||||||||||
|
| |||||||||||
| 293 | ||||||||||||
|
| |||||||||||
| HEALTH CARE 0.0% | ||||||||||||
Chartwell Retirement Residences | 742 | 9 | ||||||||||
|
| |||||||||||
| INDUSTRIALS 0.8% | ||||||||||||
Aecon Group, Inc. | 1,078 | 13 | ||||||||||
Air Canada (a) | 681 | 11 | ||||||||||
Bombardier, Inc. ‘B’ (a) | 2,668 | 11 | ||||||||||
CAE, Inc. | 623 | 13 | ||||||||||
Canadian National Railway Co. | 446 | 37 | ||||||||||
Canadian Pacific Railway Ltd. | 319 | 58 | ||||||||||
Finning International, Inc. | 619 | 15 | ||||||||||
NFI Group, Inc. | 199 | 7 | ||||||||||
Ritchie Bros Auctioneers, Inc. | 277 | 9 | ||||||||||
Russel Metals, Inc. | 409 | 8 | ||||||||||
TFI International, Inc. | 513 | 16 | ||||||||||
Toromont Industries Ltd. | 243 | 11 | ||||||||||
Transcontinental, Inc. ‘A’ | 613 | 14 | ||||||||||
| SHARES | MARKET VALUE (000S) | |||||||||||
WestJet Airlines Ltd. | 920 | $ | 13 | |||||||||
|
| |||||||||||
| 236 | ||||||||||||
|
| |||||||||||
| INFORMATION TECHNOLOGY 0.2% | ||||||||||||
BlackBerry Ltd. (a) | 840 | 8 | ||||||||||
Celestica, Inc. (a) | 1,059 | 13 | ||||||||||
CGI Group, Inc. ‘A’ (a) | 260 | 16 | ||||||||||
Constellation Software, Inc. (b) | 39 | 30 | ||||||||||
|
| |||||||||||
| 67 | ||||||||||||
|
| |||||||||||
| MATERIALS 0.7% | ||||||||||||
Agnico Eagle Mines Ltd. | 192 | 9 | ||||||||||
Barrick Gold Corp. | 670 | 9 | ||||||||||
CCL Industries, Inc. ‘B’ | 211 | 10 | ||||||||||
First Quantum Minerals Ltd. | 1,037 | 15 | ||||||||||
Franco-Nevada Corp. | 297 | 22 | ||||||||||
Goldcorp, Inc. | 641 | 9 | ||||||||||
Kirkland Lake Gold Ltd. (b) | 414 | 9 | ||||||||||
Labrador Iron Ore Royalty Corp. | 483 | 9 | ||||||||||
Methanex Corp. | 229 | 16 | ||||||||||
Nevsun Resources Ltd. | 2,611 | 9 | ||||||||||
Teck Resources Ltd. ‘B’ | 1,066 | 27 | ||||||||||
Western Forest Products, Inc. | 5,344 | 11 | ||||||||||
Wheaton Precious Metals Corp. | 392 | 8 | ||||||||||
Winpak Ltd. | 281 | 9 | ||||||||||
Yamana Gold, Inc. | 3,743 | 11 | ||||||||||
|
| |||||||||||
| 183 | ||||||||||||
|
| |||||||||||
| REAL ESTATE 0.0% | ||||||||||||
Colliers International Group, Inc. | 115 | 9 | ||||||||||
|
| |||||||||||
| TELECOMMUNICATION SERVICES 0.3% | ||||||||||||
BCE, Inc. | 637 | 26 | ||||||||||
Rogers Communications, Inc. ‘B’ | 650 | 31 | ||||||||||
TELUS Corp. | 596 | 21 | ||||||||||
|
| |||||||||||
| 78 | ||||||||||||
|
| |||||||||||
| UTILITIES 0.2% | ||||||||||||
Atco Ltd. ‘I’ | 295 | 9 | ||||||||||
Capital Power Corp. | 447 | 9 | ||||||||||
Fortis, Inc. | 269 | 9 | ||||||||||
Superior Plus Corp. | 1,078 | 10 | ||||||||||
TransAlta Corp. | 2,184 | 11 | ||||||||||
|
| |||||||||||
| 48 | ||||||||||||
|
| |||||||||||
Total Canada | 1,703 | |||||||||||
|
| |||||||||||
| DENMARK 1.3% | ||||||||||||
| CONSUMER DISCRETIONARY 0.0% | ||||||||||||
Pandora A/S | 142 | 10 | ||||||||||
|
| |||||||||||
| CONSUMER STAPLES 0.1% | ||||||||||||
Carlsberg A/S ‘B’ | 244 | 29 | ||||||||||
Royal Unibrew A/S | 144 | 11 | ||||||||||
|
| |||||||||||
| 40 | ||||||||||||
|
| |||||||||||
| FINANCIALS 0.1% | ||||||||||||
Topdanmark A/S | 199 | 9 | ||||||||||
Tryg A/S | 368 | 8 | ||||||||||
|
| |||||||||||
| 17 | ||||||||||||
|
| |||||||||||
| SHARES | MARKET VALUE (000S) | |||||||||||
| HEALTH CARE 0.6% | ||||||||||||
Coloplast A/S ‘B’ | 212 | $ | 21 | |||||||||
GN Store Nord A/S | 187 | 9 | ||||||||||
H Lundbeck A/S | 35 | 3 | ||||||||||
Novo Nordisk A/S ‘B’ | 2,538 | 117 | ||||||||||
William Demant Holding A/S (a) | 283 | 11 | ||||||||||
|
| |||||||||||
| 161 | ||||||||||||
|
| |||||||||||
| INDUSTRIALS 0.3% | ||||||||||||
AP Moller - Maersk A/S ‘B’ | 52 | 64 | ||||||||||
Dfds A/S | 135 | 9 | ||||||||||
DSV A/S | 162 | 13 | ||||||||||
ISS A/S | 347 | 12 | ||||||||||
|
| |||||||||||
| 98 | ||||||||||||
|
| |||||||||||
| MATERIALS 0.1% | ||||||||||||
Chr Hansen Holding A/S | 181 | 17 | ||||||||||
Novozymes A/S ‘B’ | 483 | 24 | ||||||||||
|
| |||||||||||
| 41 | ||||||||||||
|
| |||||||||||
| UTILITIES 0.1% | ||||||||||||
Orsted A/S | 204 | 12 | ||||||||||
|
| |||||||||||
Total Denmark | 379 | |||||||||||
|
| |||||||||||
| FAROE ISLANDS 0.0% | ||||||||||||
| CONSUMER STAPLES 0.0% | ||||||||||||
Bakkafrost P/F | 151 | 8 | ||||||||||
|
| |||||||||||
Total Faroe Islands | 8 | |||||||||||
|
| |||||||||||
| FINLAND 1.1% | ||||||||||||
| CONSUMER DISCRETIONARY 0.0% | ||||||||||||
Nokian Renkaat Oyj | 213 | 8 | ||||||||||
|
| |||||||||||
| CONSUMER STAPLES 0.1% | ||||||||||||
Kesko Oyj ‘B’ | 334 | 20 | ||||||||||
|
| |||||||||||
| ENERGY 0.1% | ||||||||||||
Neste Oyj | 372 | 29 | ||||||||||
|
| |||||||||||
| FINANCIALS 0.1% | ||||||||||||
Sampo Oyj ‘A’ | 562 | 27 | ||||||||||
|
| |||||||||||
| HEALTH CARE 0.0% | ||||||||||||
Orion Oyj ‘B’ | 346 | 9 | ||||||||||
|
| |||||||||||
| INDUSTRIALS 0.3% | ||||||||||||
Finnair Oyj | 922 | 10 | ||||||||||
Kone Oyj ‘B’ | 824 | 42 | ||||||||||
Wartsila Oyj Abp | 962 | 19 | ||||||||||
YIT OYJ | 1,726 | 10 | ||||||||||
|
| |||||||||||
| 81 | ||||||||||||
|
| |||||||||||
| INFORMATION TECHNOLOGY 0.0% | ||||||||||||
Tieto OYJ | 263 | 9 | ||||||||||
|
| |||||||||||
| MATERIALS 0.2% | ||||||||||||
Kemira Oyj | 803 | 11 | ||||||||||
Stora Enso Oyj ‘R’ | 1,472 | 29 | ||||||||||
| 30 | PIMCO EQUITY SERIES | See Accompanying Notes |
Table of Contents
June 30, 2018
| SHARES | MARKET VALUE (000S) | |||||||||||
UPM-Kymmene Oyj | 544 | $ | 19 | |||||||||
|
| |||||||||||
| 59 | ||||||||||||
|
| |||||||||||
| TELECOMMUNICATION SERVICES 0.1% | ||||||||||||
Elisa Oyj | 491 | 23 | ||||||||||
|
| |||||||||||
| UTILITIES 0.2% | ||||||||||||
Fortum Oyj | 1,786 | 43 | ||||||||||
|
| |||||||||||
Total Finland | 308 | |||||||||||
|
| |||||||||||
| FRANCE 7.3% | ||||||||||||
| CONSUMER DISCRETIONARY 1.7% | ||||||||||||
Accor S.A. | 257 | 12 | ||||||||||
Cie Generale des Etablissements Michelin S.C.A. | 84 | 10 | ||||||||||
Elior Group S.A. | 666 | 10 | ||||||||||
Eutelsat Communications S.A. | 422 | 9 | ||||||||||
Hermes International | 41 | 25 | ||||||||||
JCDecaux S.A. | 297 | 10 | ||||||||||
Kering S.A. | 78 | 44 | ||||||||||
Lagardere S.C.A. | 968 | 25 | ||||||||||
LVMH Moet Hennessy Louis Vuitton SE | 311 | 103 | ||||||||||
Metropole Television S.A. | 496 | 10 | ||||||||||
Peugeot S.A. | 1,216 | 28 | ||||||||||
Publicis Groupe S.A. | 287 | 20 | ||||||||||
Renault S.A. | 305 | 26 | ||||||||||
Sodexo S.A. | 239 | 24 | ||||||||||
Television Francaise | 774 | 8 | ||||||||||
Vivendi S.A. | 4,861 | 119 | ||||||||||
|
| |||||||||||
| 483 | ||||||||||||
|
| |||||||||||
| CONSUMER STAPLES 0.8% | ||||||||||||
Carrefour S.A. | 1,477 | 24 | ||||||||||
Casino Guichard Perrachon S.A. | 528 | 20 | ||||||||||
Danone S.A. | 1,317 | 96 | ||||||||||
L’Oreal S.A. | 188 | 46 | ||||||||||
Pernod-Ricard S.A. | 354 | 58 | ||||||||||
|
| |||||||||||
| 244 | ||||||||||||
|
| |||||||||||
| ENERGY 0.8% | ||||||||||||
CGG S.A. (a) | 3,427 | 9 | ||||||||||
Total S.A. | 3,334 | 202 | ||||||||||
Vallourec S.A. (a) | 2,400 | 14 | ||||||||||
|
| |||||||||||
| 225 | ||||||||||||
|
| |||||||||||
| FINANCIALS 0.2% | ||||||||||||
Coface S.A. | 884 | 10 | ||||||||||
Eurazeo S.A. | 239 | 18 | ||||||||||
Natixis S.A. | 1,222 | 8 | ||||||||||
SCOR SE | 234 | 9 | ||||||||||
Societe Generale S.A. | 349 | 15 | ||||||||||
|
| |||||||||||
| 60 | ||||||||||||
|
| |||||||||||
| HEALTH CARE 0.1% | ||||||||||||
BioMerieux | 95 | 8 | ||||||||||
Essilor International Cie Generale d’Optique S.A. | 97 | 14 | ||||||||||
Korian S.A. | 257 | 9 | ||||||||||
Orpea | 64 | 8 | ||||||||||
|
| |||||||||||
| 39 | ||||||||||||
|
| |||||||||||
| SHARES | MARKET VALUE (000S) | |||||||||||
| INDUSTRIALS 1.8% | ||||||||||||
Aeroports de Paris | 66 | $ | 15 | |||||||||
Airbus SE | 852 | 99 | ||||||||||
Alstom S.A. | 786 | 36 | ||||||||||
Bouygues S.A. | 1,099 | 47 | ||||||||||
Bureau Veritas S.A. | 536 | 14 | ||||||||||
Dassault Aviation S.A. | 3 | 6 | ||||||||||
Edenred | 383 | 12 | ||||||||||
Elis S.A. | 372 | 9 | ||||||||||
Getlink | 871 | 12 | ||||||||||
Legrand S.A. | 445 | 33 | ||||||||||
Rexel S.A. | 1,313 | 19 | ||||||||||
Safran S.A. | 470 | 57 | ||||||||||
Schneider Electric SE | 249 | 21 | ||||||||||
Societe BIC S.A. | 112 | 10 | ||||||||||
Thales S.A. | 124 | 16 | ||||||||||
Vinci S.A. | 1,179 | 113 | ||||||||||
|
| |||||||||||
| 519 | ||||||||||||
|
| |||||||||||
| INFORMATION TECHNOLOGY 0.4% | ||||||||||||
Alten S.A. | 84 | 9 | ||||||||||
Atos SE | 106 | 14 | ||||||||||
Capgemini SE | 196 | 26 | ||||||||||
Dassault Systemes | 219 | 31 | ||||||||||
Neopost S.A. | 319 | 9 | ||||||||||
Ubisoft Entertainment SA (a) | 99 | 11 | ||||||||||
Worldline S.A. (a) | 149 | 8 | ||||||||||
|
| |||||||||||
| 108 | ||||||||||||
|
| |||||||||||
| MATERIALS 0.1% | ||||||||||||
Eramet | 64 | 9 | ||||||||||
Vicat S.A. | 127 | 8 | ||||||||||
|
| |||||||||||
| 17 | ||||||||||||
|
| |||||||||||
| REAL ESTATE 0.0% | ||||||||||||
Nexity S.A. | 188 | 12 | ||||||||||
|
| |||||||||||
| TELECOMMUNICATION SERVICES 0.5% | ||||||||||||
Iliad S.A. | 48 | 8 | ||||||||||
Orange S.A. | 8,479 | 141 | ||||||||||
|
| |||||||||||
| 149 | ||||||||||||
|
| |||||||||||
| UTILITIES 0.9% | ||||||||||||
Electricite de France S.A. | 4,338 | 59 | ||||||||||
Engie S.A. | 9,201 | 141 | ||||||||||
Rubis S.C.A. | 138 | 9 | ||||||||||
Veolia Environnement S.A. | 1,892 | 40 | ||||||||||
|
| |||||||||||
| 249 | ||||||||||||
|
| |||||||||||
Total France | 2,105 | |||||||||||
|
| |||||||||||
| GERMANY 5.7% | ||||||||||||
| CONSUMER DISCRETIONARY 1.0% | ||||||||||||
adidas AG | 302 | 66 | ||||||||||
Axel Springer SE | 162 | 12 | ||||||||||
Bayerische Motoren Werke AG | 410 | 37 | ||||||||||
Continental AG | 253 | 57 | ||||||||||
CTS Eventim AG & Co. KGaA | 177 | 9 | ||||||||||
Daimler AG | 189 | 12 | ||||||||||
ElringKlinger AG | 549 | 7 | ||||||||||
Fielmann AG | 144 | 10 | ||||||||||
Hella GmbH & Co. KGaA | 144 | 8 | ||||||||||
| SHARES | MARKET VALUE (000S) | |||||||||||
Hugo Boss AG | 239 | $ | 21 | |||||||||
Leoni AG | 194 | 10 | ||||||||||
ProSiebenSat.1 Media SE | 313 | 8 | ||||||||||
Puma SE | 7 | 4 | ||||||||||
TUI AG | 1,048 | 23 | ||||||||||
|
| |||||||||||
| 284 | ||||||||||||
|
| |||||||||||
| CONSUMER STAPLES 0.1% | ||||||||||||
Beiersdorf AG | 139 | 16 | ||||||||||
METRO AG | 595 | 7 | ||||||||||
Suedzucker AG | 639 | 10 | ||||||||||
|
| |||||||||||
| 33 | ||||||||||||
|
| |||||||||||
| FINANCIALS 0.9% | ||||||||||||
Commerzbank AG | 3,740 | 36 | ||||||||||
Deutsche Bank AG | 3,125 | 33 | ||||||||||
Deutsche Boerse AG | 441 | 59 | ||||||||||
Deutsche Pfandbriefbank AG | 961 | 13 | ||||||||||
Hannover Rueck SE | 119 | 15 | ||||||||||
Muenchener Rueckversicherungs-Gesellschaft AG in Muenchen | 400 | 84 | ||||||||||
Talanx AG | 290 | 11 | ||||||||||
Wuestenrot & Wuerttembergische AG | 454 | 9 | ||||||||||
|
| |||||||||||
| 260 | ||||||||||||
|
| |||||||||||
| HEALTH CARE 0.4% | ||||||||||||
Carl Zeiss Meditec AG | 125 | 9 | ||||||||||
Fresenius Medical Care AG & Co. KGaA | 648 | 65 | ||||||||||
Fresenius SE & Co. KGaA | 418 | 34 | ||||||||||
Rhoen Klinikum AG | 288 | 8 | ||||||||||
|
| |||||||||||
| 116 | ||||||||||||
|
| |||||||||||
| INDUSTRIALS 0.7% | ||||||||||||
Bilfinger SE | 291 | 15 | ||||||||||
Brenntag AG | 273 | 15 | ||||||||||
Deutsche Lufthansa AG | 2,155 | 52 | ||||||||||
Deutsche Post AG | 1,005 | 33 | ||||||||||
Deutz AG | 1,094 | 8 | ||||||||||
Duerr AG | 210 | 10 | ||||||||||
Fraport AG Frankfurt Airport Services Worldwide | 91 | 9 | ||||||||||
Hapag-Lloyd AG (a) | 200 | 7 | ||||||||||
Hochtief AG | 62 | 11 | ||||||||||
Kloeckner & Co. SE | 1,102 | 11 | ||||||||||
Rational AG | 15 | 10 | ||||||||||
Rheinmetall AG | 77 | 8 | ||||||||||
Siemens AG | 127 | 17 | ||||||||||
Wacker Neuson SE | 292 | 7 | ||||||||||
|
| |||||||||||
| 213 | ||||||||||||
|
| |||||||||||
| INFORMATION TECHNOLOGY 0.7% | ||||||||||||
Infineon Technologies AG | 1,227 | 31 | ||||||||||
SAP SE | 893 | 103 | ||||||||||
Scout24 AG | 198 | 10 | ||||||||||
SMA Solar Technology AG | 158 | 7 | ||||||||||
Software AG | 185 | 9 | ||||||||||
United Internet AG | 234 | 13 | ||||||||||
Wirecard AG | 105 | 17 | ||||||||||
|
| |||||||||||
| 190 | ||||||||||||
|
| |||||||||||
| See Accompanying Notes | ANNUAL REPORT | JUNE 30, 2018 | 31 |
Table of Contents
Schedule of Investments PIMCO RAFI Dynamic Multi-Factor International Equity ETF (Cont.)
| SHARES | MARKET VALUE (000S) | |||||||||||
| MATERIALS 0.7% | ||||||||||||
Aurubis AG | 418 | $ | 32 | |||||||||
BASF SE | 885 | 84 | ||||||||||
Covestro AG | 209 | 19 | ||||||||||
Evonik Industries AG | 343 | 12 | ||||||||||
K+S AG | 852 | 21 | ||||||||||
Linde AG | 57 | 13 | ||||||||||
Salzgitter AG | 323 | 14 | ||||||||||
|
| |||||||||||
| 195 | ||||||||||||
|
| |||||||||||
| REAL ESTATE 0.4% | ||||||||||||
Deutsche Wohnen SE | 624 | 30 | ||||||||||
LEG Immobilien AG | 93 | 10 | ||||||||||
TAG Immobilien AG | 779 | 17 | ||||||||||
TLG Immobilien AG | 508 | 14 | ||||||||||
Vonovia SE | 1,071 | 51 | ||||||||||
|
| |||||||||||
| 122 | ||||||||||||
|
| |||||||||||
| TELECOMMUNICATION SERVICES 0.1% | ||||||||||||
Freenet AG | 319 | 8 | ||||||||||
Telefonica Deutschland Holding AG | 2,774 | 11 | ||||||||||
|
| |||||||||||
| 19 | ||||||||||||
|
| |||||||||||
| UTILITIES 0.7% | ||||||||||||
E.ON SE | 8,712 | 93 | ||||||||||
Innogy SE | 200 | 9 | ||||||||||
RWE AG | 2,880 | 65 | ||||||||||
Uniper SE | 1,599 | 48 | ||||||||||
|
| |||||||||||
| 215 | ||||||||||||
|
| |||||||||||
Total Germany | 1,647 | |||||||||||
|
| |||||||||||
| HONG KONG 2.5% | ||||||||||||
| CONSUMER DISCRETIONARY 0.4% | ||||||||||||
Chow Tai Fook Jewellery Group Ltd. | 7,600 | 9 | ||||||||||
Galaxy Entertainment Group Ltd. | 2,000 | 15 | ||||||||||
Li & Fung Ltd. | 26,000 | 10 | ||||||||||
Luk Fook Holdings International Ltd. | 2,000 | 8 | ||||||||||
Melco Resorts & Entertainment Ltd. | 747 | 21 | ||||||||||
Shangri-La Asia Ltd. | 4,000 | 7 | ||||||||||
SJM Holdings Ltd. | 17,000 | 21 | ||||||||||
Techtronic Industries Co. Ltd. | 1,500 | 8 | ||||||||||
Xinyi Glass Holdings Ltd. | 8,000 | 10 | ||||||||||
Yue Yuen Industrial Holdings Ltd. | 3,500 | 10 | ||||||||||
|
| |||||||||||
| 119 | ||||||||||||
|
| |||||||||||
| CONSUMER STAPLES 0.1% | ||||||||||||
Dairy Farm International Holdings Ltd. | 1,500 | 13 | ||||||||||
Sun Art Retail Group Ltd. | 6,500 | 9 | ||||||||||
WH Group Ltd. | 15,000 | 12 | ||||||||||
|
| |||||||||||
| 34 | ||||||||||||
|
| |||||||||||
| FINANCIALS 0.5% | ||||||||||||
AIA Group Ltd. | 8,200 | 71 | ||||||||||
Hang Seng Bank Ltd. | 800 | 20 | ||||||||||
Hong Kong Exchanges and Clearing Ltd. | 1,100 | 33 | ||||||||||
Kingston Financial Group Ltd. | 6,000 | 2 | ||||||||||
|
| |||||||||||
| 126 | ||||||||||||
|
| |||||||||||
| SHARES | MARKET VALUE (000S) | |||||||||||
| HEALTH CARE 0.1% | ||||||||||||
Sino Biopharmaceutical Ltd. | 17,500 | $ | 27 | |||||||||
SSY Group Ltd. | 8,000 | 9 | ||||||||||
|
| |||||||||||
| 36 | ||||||||||||
|
| |||||||||||
| INDUSTRIALS 0.3% | ||||||||||||
Cathay Pacific Airways Ltd. | 8,000 | 12 | ||||||||||
Jardine Matheson Holdings Ltd. | 400 | 25 | ||||||||||
Jardine Strategic Holdings Ltd. | 200 | 7 | ||||||||||
MTR Corp. Ltd. | 3,000 | 17 | ||||||||||
Orient Overseas International Ltd. | 500 | 5 | ||||||||||
Pacific Basin Shipping Ltd. (a) | 33,000 | 9 | ||||||||||
Seaspan Corp. | 1,480 | 15 | ||||||||||
|
| |||||||||||
| 90 | ||||||||||||
|
| |||||||||||
| INFORMATION TECHNOLOGY 0.1% | ||||||||||||
GCL-Poly Energy Holdings Ltd. (a) | 88,000 | 8 | ||||||||||
Kingboard Chemical Holdings Ltd. | 2,500 | 9 | ||||||||||
Truly International Holdings Ltd. | 10,000 | 2 | ||||||||||
VTech Holdings Ltd. | 700 | 8 | ||||||||||
|
| |||||||||||
| 27 | ||||||||||||
|
| |||||||||||
| MATERIALS 0.0% | ||||||||||||
Lee & Man Paper Manufacturing Ltd. | 8,000 | 8 | ||||||||||
|
| |||||||||||
| REAL ESTATE 0.5% | ||||||||||||
CK Asset Holdings Ltd. | 3,500 | 28 | ||||||||||
Henderson Land Development Co. Ltd. | 1,100 | 6 | ||||||||||
Hongkong Land Holdings Ltd. | 1,700 | 12 | ||||||||||
Hysan Development Co. Ltd. | 1,000 | 6 | ||||||||||
Kerry Properties Ltd. | 2,500 | 12 | ||||||||||
New World Development Co. Ltd. | 19,000 | 27 | ||||||||||
Shimao Property Holdings Ltd. | 4,000 | 10 | ||||||||||
Sun Hung Kai Properties Ltd. | 1,000 | 15 | ||||||||||
Swire Pacific Ltd. ‘A’ | 2,500 | 26 | ||||||||||
Wheelock & Co. Ltd. | 1,000 | 7 | ||||||||||
|
| |||||||||||
| 149 | ||||||||||||
|
| |||||||||||
| TELECOMMUNICATION SERVICES 0.1% | ||||||||||||
HKT Trust & HKT Ltd. | 15,000 | 19 | ||||||||||
PCCW Ltd. | 15,000 | 9 | ||||||||||
|
| |||||||||||
| 28 | ||||||||||||
|
| |||||||||||
| UTILITIES 0.4% | ||||||||||||
China Gas Holdings Ltd. | 3,400 | 14 | ||||||||||
CLP Holdings Ltd. | 4,000 | 43 | ||||||||||
Hong Kong & China Gas Co. Ltd. | 24,100 | 46 | ||||||||||
Power Assets Holdings Ltd. | 1,000 | 7 | ||||||||||
|
| |||||||||||
| 110 | ||||||||||||
|
| |||||||||||
Total Hong Kong | 727 | |||||||||||
|
| |||||||||||
| IRELAND 1.2% | ||||||||||||
| CONSUMER DISCRETIONARY 0.1% | ||||||||||||
Paddy Power Betfair PLC | 108 | 12 | ||||||||||
|
| |||||||||||
| CONSUMER STAPLES 0.2% | ||||||||||||
C&C Group PLC | 2,301 | 8 | ||||||||||
Glanbia PLC | 749 | 14 | ||||||||||
Kerry Group PLC ‘A’ | 313 | 33 | ||||||||||
|
| |||||||||||
| 55 | ||||||||||||
|
| |||||||||||
| SHARES | MARKET VALUE (000S) | |||||||||||
| HEALTH CARE 0.6% | ||||||||||||
ICON PLC (a) | 166 | $ | 22 | |||||||||
Jazz Pharmaceuticals PLC (a) | 49 | 9 | ||||||||||
Medtronic PLC | 1,512 | 129 | ||||||||||
Perrigo Co. PLC | 198 | 14 | ||||||||||
UDG Healthcare PLC | 778 | 9 | ||||||||||
|
| |||||||||||
| 183 | ||||||||||||
|
| |||||||||||
| INDUSTRIALS 0.2% | ||||||||||||
AerCap Holdings NV (a) | 205 | 11 | ||||||||||
Allegion PLC | 110 | 8 | ||||||||||
DCC PLC | 108 | 10 | ||||||||||
Grafton Group PLC | 915 | 10 | ||||||||||
Kingspan Group PLC | 246 | 12 | ||||||||||
|
| |||||||||||
| 51 | ||||||||||||
|
| |||||||||||
| MATERIALS 0.1% | ||||||||||||
James Hardie Industries PLC ADR | 516 | 9 | ||||||||||
Smurfit Kappa Group PLC | 674 | 27 | ||||||||||
|
| |||||||||||
| 36 | ||||||||||||
|
| |||||||||||
Total Ireland | 337 | |||||||||||
|
| |||||||||||
| ISRAEL 0.5% | ||||||||||||
| FINANCIALS 0.2% | ||||||||||||
Bank Hapoalim BM | 1,540 | 10 | ||||||||||
Bank Leumi Le-Israel BM | 3,280 | 19 | ||||||||||
Harel Insurance Investments & Financial Services Ltd. | 1,128 | 9 | ||||||||||
Israel Discount Bank Ltd. ‘A’ | 4,779 | 14 | ||||||||||
Mizrahi Tefahot Bank Ltd. | 482 | 9 | ||||||||||
Plus500 Ltd. | 394 | 8 | ||||||||||
|
| |||||||||||
| 69 | ||||||||||||
|
| |||||||||||
| HEALTH CARE 0.1% | ||||||||||||
Teva Pharmaceutical Industries Ltd. | 620 | 15 | ||||||||||
|
| |||||||||||
| INDUSTRIALS 0.0% | ||||||||||||
Elbit Systems Ltd. | 74 | 9 | ||||||||||
|
| |||||||||||
| INFORMATION TECHNOLOGY 0.1% | ||||||||||||
Check Point Software Technologies Ltd. (a) | 160 | 15 | ||||||||||
Nice Ltd. (a) | 134 | 14 | ||||||||||
|
| |||||||||||
| 29 | ||||||||||||
|
| |||||||||||
| MATERIALS 0.1% | ||||||||||||
Frutarom Industries Ltd. | 86 | 9 | ||||||||||
Israel Chemicals Ltd. | 2,640 | 12 | ||||||||||
|
| |||||||||||
| 21 | ||||||||||||
|
| |||||||||||
| TELECOMMUNICATION SERVICES 0.0% | ||||||||||||
Bezeq The Israeli Telecommunication Corp. Ltd. | 10,860 | 12 | ||||||||||
|
| |||||||||||
Total Israel | 155 | |||||||||||
|
| |||||||||||
| ITALY 2.6% | ||||||||||||
| CONSUMER DISCRETIONARY 0.3% | ||||||||||||
Brembo SpA | 626 | 8 | ||||||||||
De’ Longhi SpA | 308 | 9 | ||||||||||
Ferrari NV | 161 | 22 | ||||||||||
| 32 | PIMCO EQUITY SERIES | See Accompanying Notes |
Table of Contents
June 30, 2018
| SHARES | MARKET VALUE (000S) | |||||||||||
Luxottica Group SpA | 179 | $ | 12 | |||||||||
Moncler SpA | 383 | 17 | ||||||||||
PRADA SpA | 2,400 | 11 | ||||||||||
|
| |||||||||||
| 79 | ||||||||||||
|
| |||||||||||
| CONSUMER STAPLES 0.0% | ||||||||||||
MARR SpA | 346 | 9 | ||||||||||
|
| |||||||||||
| ENERGY 0.8% | ||||||||||||
Eni SpA | 9,725 | 180 | ||||||||||
Saipem SpA (a) | 3,153 | 15 | ||||||||||
Saras SpA | 7,114 | 17 | ||||||||||
Snam SpA | 8,280 | 35 | ||||||||||
|
| |||||||||||
| 247 | ||||||||||||
|
| |||||||||||
| FINANCIALS 0.5% | ||||||||||||
Anima Holding SpA | 1,595 | 9 | ||||||||||
Banca Popolare di Sondrio SCPA | 2,594 | 10 | ||||||||||
BPER Banca | 2,787 | 15 | ||||||||||
FinecoBank Banca Fineco SpA | 852 | 10 | ||||||||||
Societa Cattolica di Assicurazioni S.C. | 1,039 | 9 | ||||||||||
UniCredit SpA | 3,351 | 56 | ||||||||||
Unione di Banche Italiane SpA | 5,083 | 19 | ||||||||||
Unipol Gruppo Finanziario SpA | 2,921 | 11 | ||||||||||
|
| |||||||||||
| 139 | ||||||||||||
|
| |||||||||||
| HEALTH CARE 0.1% | ||||||||||||
DiaSorin SpA | 112 | 13 | ||||||||||
Recordati SpA | 219 | 8 | ||||||||||
|
| |||||||||||
| 21 | ||||||||||||
|
| |||||||||||
| INDUSTRIALS 0.2% | ||||||||||||
ASTM SpA | 373 | 9 | ||||||||||
Atlantia SpA | 936 | 27 | ||||||||||
Societa Iniziative Autostradali e Servizi SpA | 684 | 10 | ||||||||||
|
| |||||||||||
| 46 | ||||||||||||
|
| |||||||||||
| TELECOMMUNICATION SERVICES 0.1% | ||||||||||||
Telecom Italia SpA | 41,624 | 31 | ||||||||||
|
| |||||||||||
| UTILITIES 0.6% | ||||||||||||
Enel SpA | 22,802 | 126 | ||||||||||
ERG SpA | 575 | 13 | ||||||||||
Iren SpA | 3,373 | 9 | ||||||||||
Terna Rete Elettrica Nazionale SpA | 5,432 | 29 | ||||||||||
|
| |||||||||||
| 177 | ||||||||||||
|
| |||||||||||
Total Italy | 749 | |||||||||||
|
| |||||||||||
| JAPAN 24.2% | ||||||||||||
| CONSUMER DISCRETIONARY 5.4% | ||||||||||||
Adastria Co. Ltd. | 700 | 9 | ||||||||||
Aisin Seiki Co. Ltd. | 400 | 18 | ||||||||||
Arata Corp. | 100 | 6 | ||||||||||
ASKUL Corp. | 300 | 10 | ||||||||||
Autobacs Seven Co. Ltd. | 700 | 12 | ||||||||||
Avex, Inc. | 700 | 10 | ||||||||||
Bandai Namco Holdings, Inc. | 500 | 21 | ||||||||||
Benesse Holdings, Inc. | 200 | 7 | ||||||||||
Bridgestone Corp. | 1,400 | 55 | ||||||||||
Canon Marketing Japan, Inc. | 500 | 10 | ||||||||||
| SHARES | MARKET VALUE (000S) | |||||||||||
Casio Computer Co. Ltd. | 600 | $ | 10 | |||||||||
CyberAgent, Inc. | 400 | 24 | ||||||||||
Daiichikosho Co. Ltd. | 100 | 5 | ||||||||||
DCM Holdings Co. Ltd. | 1,400 | 13 | ||||||||||
Denso Corp. | 1,100 | 54 | ||||||||||
Don Quijote Holdings Co. Ltd. | 100 | 5 | ||||||||||
Eagle Industry Co. Ltd. | 500 | 8 | ||||||||||
EDION Corp. | 1,000 | 10 | ||||||||||
FCC Co. Ltd. | 300 | 8 | ||||||||||
Foster Electric Co. Ltd. | 700 | 10 | ||||||||||
Fuji Media Holdings, Inc. | 1,400 | 24 | ||||||||||
Geo Holdings Corp. | 700 | 9 | ||||||||||
H2O Retailing Corp. | 500 | 8 | ||||||||||
Happinet Corp. | 700 | 9 | ||||||||||
Honda Motor Co. Ltd. | 2,100 | 62 | ||||||||||
Iida Group Holdings Co. Ltd. | 500 | 10 | ||||||||||
Isetan Mitsukoshi Holdings Ltd. ‘L’ | 1,500 | 19 | ||||||||||
Isuzu Motors Ltd. | 1,700 | 22 | ||||||||||
J Front Retailing Co. Ltd. | 500 | 8 | ||||||||||
JVC Kenwood Corp. | 3,100 | 9 | ||||||||||
K’s Holdings Corp. | 1,600 | 17 | ||||||||||
Keihin Corp. | 400 | 8 | ||||||||||
Kohnan Shoji Co. Ltd. | 500 | 12 | ||||||||||
Koito Manufacturing Co. Ltd. | 200 | 13 | ||||||||||
Komeri Co. Ltd. | 400 | 10 | ||||||||||
Kura Corp. | 100 | 7 | ||||||||||
KYB Corp. | 100 | 4 | ||||||||||
Mazda Motor Corp. | 1,300 | 16 | ||||||||||
McDonald’s Holdings Co. Japan Ltd. | 100 | 5 | ||||||||||
Mitsubishi Motors Corp. | 1,500 | 12 | ||||||||||
Musashi Seimitsu Industry Co. Ltd. | 300 | 10 | ||||||||||
NHK Spring Co. Ltd. | 900 | 8 | ||||||||||
Nifco, Inc. | 500 | 15 | ||||||||||
Nikon Corp. | 900 | 14 | ||||||||||
Nishimatsuya Chain Co. Ltd. | 800 | 9 | ||||||||||
Nissan Motor Co. Ltd. | 9,000 | 87 | ||||||||||
Nitori Holdings Co. Ltd. | 200 | 31 | ||||||||||
Nojima Corp. | 400 | 9 | ||||||||||
NOK Corp. | 500 | 10 | ||||||||||
Oriental Land Co. Ltd. | 200 | 21 | ||||||||||
Paltac Corp. | 100 | 6 | ||||||||||
Panasonic Corp. | 3,700 | 50 | ||||||||||
Pioneer Corp. (a) | 6,200 | 9 | ||||||||||
Plenus Co. Ltd. | 600 | 10 | ||||||||||
Round One Corp. | 500 | 8 | ||||||||||
Royal Holdings Co. Ltd. | 300 | 8 | ||||||||||
Saizeriya Co. Ltd. | 400 | 9 | ||||||||||
Sanden Holdings Corp. (a) | 800 | 10 | ||||||||||
Sanrio Co. Ltd. | 600 | 12 | ||||||||||
Sekisui Chemical Co. Ltd. | 1,300 | 22 | ||||||||||
Seria Co. Ltd. | 200 | 10 | ||||||||||
Shimachu Co. Ltd. | 500 | 16 | ||||||||||
Shimano, Inc. | 100 | 15 | ||||||||||
Shochiku Co. Ltd. | 100 | 14 | ||||||||||
Showa Corp. | 500 | 8 | ||||||||||
Sony Corp. | 1,400 | 72 | ||||||||||
Stanley Electric Co. Ltd. | 200 | 7 | ||||||||||
Start Today Co. Ltd. | 400 | 14 | ||||||||||
Subaru Corp. | 300 | 9 | ||||||||||
Sumitomo Electric Industries Ltd. | 1,500 | 22 | ||||||||||
Sumitomo Forestry Co. Ltd. | 800 | 12 | ||||||||||
Sumitomo Rubber Industries Ltd. | 1,000 | 16 | ||||||||||
Suzuki Motor Corp. | 1,000 | 55 | ||||||||||
Takashimaya Co. Ltd. | 1,000 | 8 | ||||||||||
Tokai Rika Co. Ltd. | 500 | 9 | ||||||||||
| SHARES | MARKET VALUE (000S) | |||||||||||
Toridoll Holdings Corp. | 300 | $ | 7 | |||||||||
Toyoda Gosei Co. Ltd. | 400 | 10 | ||||||||||
Toyota Industries Corp. | 300 | 17 | ||||||||||
Toyota Motor Corp. | 2,400 | 155 | ||||||||||
TS Tech Co. Ltd. | 200 | 8 | ||||||||||
Unipres Corp. | 500 | 10 | ||||||||||
United Arrows Ltd. | 200 | 7 | ||||||||||
USS Co. Ltd. | 400 | 8 | ||||||||||
Yamada Denki Co. Ltd. | 6,400 | 32 | ||||||||||
Yamaha Corp. | 400 | 21 | ||||||||||
Yamaha Motor Co. Ltd. | 400 | 10 | ||||||||||
Yokohama Rubber Co. Ltd. | 500 | 10 | ||||||||||
Yondoshi Holdings, Inc. | 400 | 10 | ||||||||||
Yoshinoya Holdings Co. Ltd. | 800 | 16 | ||||||||||
Zensho Holdings Co. Ltd. | 300 | 8 | ||||||||||
|
| |||||||||||
| 1,563 | ||||||||||||
|
| |||||||||||
| CONSUMER STAPLES 2.7% | ||||||||||||
Aeon Co. Ltd. | 2,300 | 49 | ||||||||||
Ain Holdings, Inc. | 100 | 7 | ||||||||||
Ajinomoto Co., Inc. | 1,900 | 36 | ||||||||||
Ariake Japan Co. Ltd. | 100 | 9 | ||||||||||
Asahi Group Holdings Ltd. | 800 | 41 | ||||||||||
Ci:z Holdings Co. Ltd. | 200 | 9 | ||||||||||
Coca-Cola Bottlers Japan, Inc. | 200 | 8 | ||||||||||
cocokara fine, Inc. | 100 | 6 | ||||||||||
Earth Chemical Co. Ltd. | 100 | 5 | ||||||||||
FamilyMart UNY Holdings Co. Ltd. | 100 | 11 | ||||||||||
Fancl Corp. | 300 | 15 | ||||||||||
Heiwado Co. Ltd. | 400 | 10 | ||||||||||
J-Oil Mills, Inc. | 300 | 11 | ||||||||||
Japan Tobacco, Inc. | 2,900 | 81 | ||||||||||
Kao Corp. | 1,000 | 76 | ||||||||||
Kikkoman Corp. | 400 | 20 | ||||||||||
Kirin Holdings Co. Ltd. | 3,200 | 86 | ||||||||||
Kobayashi Pharmaceutical Co. Ltd. | 100 | 9 | ||||||||||
Kyokuyo Co. Ltd. | 300 | 10 | ||||||||||
Mandom Corp. | 400 | 12 | ||||||||||
Maruha Nichiro Corp. | 400 | 16 | ||||||||||
Matsumotokiyoshi Holdings Co. Ltd. | 200 | 9 | ||||||||||
MEIJI Holdings Co. Ltd. | 200 | 17 | ||||||||||
Mitsui Sugar Co. Ltd. | 200 | 6 | ||||||||||
Morinaga & Co. Ltd. | 100 | 5 | ||||||||||
Nichirei Corp. | 300 | 8 | ||||||||||
Nisshin Oillio Group Ltd. | 300 | 9 | ||||||||||
Nisshin Seifun Group, Inc. | 1,000 | 21 | ||||||||||
Nissin Foods Holdings Co. Ltd. | 100 | 7 | ||||||||||
Noevir Holdings Co. Ltd. | 100 | 7 | ||||||||||
Pigeon Corp. | 500 | 24 | ||||||||||
Pola Orbis Holdings, Inc. | 200 | 9 | ||||||||||
Prima Meat Packers Ltd. | 1,000 | 6 | ||||||||||
S Foods, Inc. | 100 | 4 | ||||||||||
Sakata Seed Corp. | 200 | 8 | ||||||||||
Seven & i Holdings Co. Ltd. | 100 | 4 | ||||||||||
Shiseido Co. Ltd. | 600 | 48 | ||||||||||
Sundrug Co. Ltd. | 100 | 4 | ||||||||||
Tsuruha Holdings, Inc. | 100 | 12 | ||||||||||
Unicharm Corp. | 500 | 15 | ||||||||||
Valor Holdings Co. Ltd. | 400 | 9 | ||||||||||
Warabeya Nichiyo Holdings Co. Ltd. | 300 | 7 | ||||||||||
Yakult Honsha Co. Ltd. | 100 | 7 | ||||||||||
Yamazaki Baking Co. Ltd. | 300 | 8 | ||||||||||
|
| |||||||||||
| 781 | ||||||||||||
|
| |||||||||||
| See Accompanying Notes | ANNUAL REPORT | JUNE 30, 2018 | 33 |
Table of Contents
Schedule of Investments PIMCO RAFI Dynamic Multi-Factor International Equity ETF (Cont.)
| SHARES | MARKET VALUE (000S) | |||||||||||
| ENERGY 0.9% | ||||||||||||
Cosmo Energy Holdings Co. Ltd. | 200 | $ | 7 | |||||||||
Idemitsu Kosan Co. Ltd. | 1,100 | 39 | ||||||||||
Inpex Corp. | 4,100 | 43 | ||||||||||
Japan Petroleum Exploration Co. Ltd. | 400 | 10 | ||||||||||
JXTG Holdings, Inc. | 19,100 | 133 | ||||||||||
Showa Shell Sekiyu KK | 1,900 | 28 | ||||||||||
|
| |||||||||||
| 260 | ||||||||||||
|
| |||||||||||
| FINANCIALS 0.5% | ||||||||||||
Dai-ichi Life Holdings, Inc. | 2,000 | 36 | ||||||||||
Daiwa Securities Group, Inc. | 3,400 | 20 | ||||||||||
Ehime Bank Ltd. | 800 | 9 | ||||||||||
Fuyo General Lease Co. Ltd. | 100 | 7 | ||||||||||
Jafco Co. Ltd. | 200 | 8 | ||||||||||
Japan Post Holdings Co. Ltd. | 3,200 | 35 | ||||||||||
North Pacific Bank Ltd. | 2,500 | 8 | ||||||||||
Okasan Securities Group, Inc. | 1,000 | 5 | ||||||||||
SBI Holdings, Inc. | 300 | 8 | ||||||||||
Zenkoku Hosho Co. Ltd. | 400 | 18 | ||||||||||
|
| |||||||||||
| 154 | ||||||||||||
|
| |||||||||||
| HEALTH CARE 1.9% | ||||||||||||
Alfresa Holdings Corp. | 1,000 | 24 | ||||||||||
Astellas Pharma, Inc. | 5,200 | 79 | ||||||||||
Chugai Pharmaceutical Co. Ltd. | 200 | 10 | ||||||||||
Daiichi Sankyo Co. Ltd. | 700 | 27 | ||||||||||
Eisai Co. Ltd. | 500 | 35 | ||||||||||
Hisamitsu Pharmaceutical Co., Inc. | 200 | 17 | ||||||||||
Hogy Medical Co. Ltd. | 200 | 9 | ||||||||||
Hoya Corp. | 400 | 23 | ||||||||||
Kaken Pharmaceutical Co. Ltd. | 100 | 5 | ||||||||||
M3, Inc. | 600 | 24 | ||||||||||
Medipal Holdings Corp. | 1,000 | 20 | ||||||||||
Nihon Kohden Corp. | 400 | 11 | ||||||||||
Nippon Shinyaku Co. Ltd. | 200 | 12 | ||||||||||
Olympus Corp. | 200 | 8 | ||||||||||
Ono Pharmaceutical Co. Ltd. | 600 | 14 | ||||||||||
Otsuka Holdings Co. Ltd. | 1,000 | 48 | ||||||||||
Paramount Bed Holdings Co. Ltd. | 200 | 9 | ||||||||||
Rohto Pharmaceutical Co. Ltd. | 500 | 16 | ||||||||||
Santen Pharmaceutical Co. Ltd. | 1,000 | 17 | ||||||||||
Sawai Pharmaceutical Co. Ltd. | 100 | 5 | ||||||||||
Suzuken Co. Ltd. | 200 | 8 | ||||||||||
Sysmex Corp. | 100 | 9 | ||||||||||
Taisho Pharmaceutical Holdings Co. Ltd. | 100 | 12 | ||||||||||
Takeda Pharmaceutical Co. Ltd. | 1,000 | 42 | ||||||||||
Terumo Corp. | 700 | 40 | ||||||||||
Toho Holdings Co. Ltd. | 500 | 12 | ||||||||||
Tsumura & Co. | 400 | 13 | ||||||||||
|
| |||||||||||
| 549 | ||||||||||||
|
| |||||||||||
| INDUSTRIALS 5.7% | ||||||||||||
Aida Engineering Ltd. | 900 | 9 | ||||||||||
Alconix Corp. | 600 | 9 | ||||||||||
ANA Holdings, Inc. | 700 | 26 | ||||||||||
Asahi Glass Co. Ltd. | 500 | 19 | ||||||||||
Central Glass Co. Ltd. | 400 | 8 | ||||||||||
Central Japan Railway Co. | 200 | 41 | ||||||||||
Dai Nippon Printing Co. Ltd. | 1,200 | 27 | ||||||||||
Daifuku Co. Ltd. | 300 | 13 | ||||||||||
Daikin Industries Ltd. | 300 | 36 | ||||||||||
| SHARES | MARKET VALUE (000S) | |||||||||||
Daiseki Co. Ltd. | 200 | $ | 6 | |||||||||
East Japan Railway Co. | 200 | 19 | ||||||||||
FANUC Corp. | 100 | 20 | ||||||||||
Fuji Electric Co. Ltd. | 2,000 | 15 | ||||||||||
Fujikura Ltd. | 1,400 | 9 | ||||||||||
Fujitec Co. Ltd. | 700 | 9 | ||||||||||
Furukawa Co. Ltd. | 500 | 7 | ||||||||||
Hankyu Hanshin Holdings, Inc. | 200 | 8 | ||||||||||
Hanwa Co. Ltd. | 200 | 8 | ||||||||||
Hazama Ando Corp. | 900 | 8 | ||||||||||
Hino Motors Ltd. | 1,600 | 17 | ||||||||||
ITOCHU Corp. | 1,800 | 33 | ||||||||||
Iwatani Corp. | 300 | 10 | ||||||||||
Japan Airlines Co. Ltd. | 2,000 | 71 | ||||||||||
JGC Corp. | 500 | 10 | ||||||||||
JTEKT Corp. | 900 | 12 | ||||||||||
Kajima Corp. | 1,000 | 8 | ||||||||||
Kanematsu Corp. | 800 | 12 | ||||||||||
Kawasaki Heavy Industries Ltd. | 300 | 9 | ||||||||||
Kawasaki Kisen Kaisha Ltd. | 500 | 9 | ||||||||||
Kinden Corp. | 800 | 13 | ||||||||||
Kintetsu Group Holdings Co. Ltd. | 200 | 8 | ||||||||||
Komatsu Ltd. | 2,300 | 65 | ||||||||||
Kumagai Gumi Co. Ltd. | 300 | 11 | ||||||||||
Kurita Water Industries Ltd. | 400 | 11 | ||||||||||
Kyowa Exeo Corp. | 400 | 10 | ||||||||||
Kyudenko Corp. | 200 | 10 | ||||||||||
LIXIL Group Corp. | 500 | 10 | ||||||||||
Makita Corp. | 600 | 27 | ||||||||||
Marubeni Corp. | 8,200 | 62 | ||||||||||
Meitec Corp. | 200 | 10 | ||||||||||
Minebea Mitsumi, Inc. | 500 | 8 | ||||||||||
Mirait Holdings Corp. | 800 | 12 | ||||||||||
MISUMI Group, Inc. | 400 | 12 | ||||||||||
Mitsubishi Corp. | 1,400 | 39 | ||||||||||
Mitsubishi Heavy Industries Ltd. | 600 | 22 | ||||||||||
Mitsui & Co. Ltd. | 7,600 | 127 | ||||||||||
Mitsui E&S Holdings Co. Ltd. | 800 | 10 | ||||||||||
Mitsui OSK Lines Ltd. | 500 | 12 | ||||||||||
Miura Co. Ltd. | 400 | 10 | ||||||||||
Nagase & Co. Ltd. | 800 | 12 | ||||||||||
Nagoya Railroad Co. Ltd. | 300 | 8 | ||||||||||
Nidec Corp. | 200 | 30 | ||||||||||
Nippon Express Co. Ltd. | 200 | 14 | ||||||||||
Nippon Sheet Glass Co. Ltd. | 1,200 | 11 | ||||||||||
Nippon Yusen KK | 900 | 18 | ||||||||||
Nisshinbo Holdings, Inc. | 900 | 10 | ||||||||||
Nomura Co. Ltd. | 400 | 9 | ||||||||||
NSK Ltd. | 900 | 9 | ||||||||||
NTN Corp. | 2,100 | 9 | ||||||||||
Obara Group, Inc. | 100 | 6 | ||||||||||
Obayashi Corp. | 2,200 | 23 | ||||||||||
OSG Corp. | 400 | 8 | ||||||||||
Park24 Co. Ltd. | 400 | 11 | ||||||||||
Pasona Group, Inc. | 500 | 8 | ||||||||||
Penta-Ocean Construction Co. Ltd. | 1,200 | 8 | ||||||||||
Recruit Holdings Co. Ltd. | 2,100 | 58 | ||||||||||
Ryobi Ltd. | 300 | 10 | ||||||||||
Sakai Moving Service Co. Ltd. | 100 | 5 | ||||||||||
Sankyu, Inc. | 100 | 5 | ||||||||||
Sanwa Holdings Corp. | 800 | 8 | ||||||||||
Sanyo Denki Co. Ltd. | 100 | 7 | ||||||||||
Seino Holdings Co. Ltd. | 1,000 | 18 | ||||||||||
Shimizu Corp. | 800 | 8 | ||||||||||
SHO-BOND Holdings Co. Ltd. | 100 | 7 | ||||||||||
| SHARES | MARKET VALUE (000S) | |||||||||||
SMC Corp. | 100 | $ | 37 | |||||||||
Sohgo Security Services Co. Ltd. | 200 | 9 | ||||||||||
Sojitz Corp. | 7,600 | 28 | ||||||||||
Star Micronics Co. Ltd. | 600 | 9 | ||||||||||
Sumitomo Corp. | 1,600 | 26 | ||||||||||
Sumitomo Mitsui Construction Co. Ltd. | 1,220 | 8 | ||||||||||
Taikisha Ltd. | 200 | 6 | ||||||||||
Taisei Corp. | 800 | 44 | ||||||||||
Takeuchi Manufacturing Co. Ltd. | 400 | 8 | ||||||||||
Toa Corp. | 400 | 10 | ||||||||||
Tobu Railway Co. Ltd. | 600 | 18 | ||||||||||
TOKAI Holdings Corp. | 900 | 9 | ||||||||||
Tokyu Construction Co. Ltd. | 900 | 9 | ||||||||||
Tokyu Corp. | 500 | 9 | ||||||||||
Toppan Printing Co. Ltd. | 2,000 | 16 | ||||||||||
Toshiba Corp. (a) | 11,000 | 33 | ||||||||||
Toshiba Plant Systems & Services Corp. | 400 | 9 | ||||||||||
TOTO Ltd. | 200 | 9 | ||||||||||
Toyota Tsusho Corp. | 1,200 | 40 | ||||||||||
West Japan Railway Co. | 200 | 15 | ||||||||||
Yamato Holdings Co. Ltd. | 200 | 6 | ||||||||||
Yuasa Trading Co. Ltd. | 300 | 10 | ||||||||||
|
| |||||||||||
| 1,665 | ||||||||||||
|
| |||||||||||
| INFORMATION TECHNOLOGY 2.9% | ||||||||||||
Advantest Corp. | 500 | 10 | ||||||||||
Amano Corp. | 300 | 7 | ||||||||||
Anritsu Corp. | 600 | 8 | ||||||||||
Canon, Inc. | 2,200 | 72 | ||||||||||
Capcom Co. Ltd. | 600 | 15 | ||||||||||
Daiwabo Holdings Co. Ltd. | 200 | 11 | ||||||||||
Fujitsu Ltd. | 1,000 | 6 | ||||||||||
Gree, Inc. | 1,600 | 9 | ||||||||||
Hitachi Ltd. | 23,000 | 162 | ||||||||||
Horiba Ltd. | 100 | 7 | ||||||||||
Ibiden Co. Ltd. | 500 | 8 | ||||||||||
Kaga Electronics Co. Ltd. | 300 | 7 | ||||||||||
Kakaku.com, Inc. | 500 | 11 | ||||||||||
Keyence Corp. | 100 | 56 | ||||||||||
Konami Holdings Corp. | 200 | 10 | ||||||||||
Konica Minolta, Inc. | 2,200 | 20 | ||||||||||
Murata Manufacturing Co. Ltd. | 100 | 17 | ||||||||||
NEC Corp. | 1,300 | 36 | ||||||||||
NET One Systems Co. Ltd. | 900 | 16 | ||||||||||
Nexon Co. Ltd. (a) | 600 | 9 | ||||||||||
Nihon Unisys Ltd. | 600 | 15 | ||||||||||
Nintendo Co. Ltd. | 100 | 33 | ||||||||||
Nippon Electric Glass Co. Ltd. | 300 | 8 | ||||||||||
Nomura Research Institute Ltd. | 200 | 10 | ||||||||||
Obic Co. Ltd. | 100 | 8 | ||||||||||
Oki Electric Industry Co. Ltd. | 700 | 8 | ||||||||||
Omron Corp. | 500 | 23 | ||||||||||
Otsuka Corp. | 300 | 12 | ||||||||||
Ricoh Co. Ltd. | 4,600 | 42 | ||||||||||
Rohm Co. Ltd. | 100 | 8 | ||||||||||
Sanken Electric Co. Ltd. | 1,000 | 5 | ||||||||||
SCREEN Holdings Co. Ltd. | 200 | 14 | ||||||||||
Seiko Epson Corp. | 500 | 9 | ||||||||||
Shimadzu Corp. | 500 | 15 | ||||||||||
Square Enix Holdings Co. Ltd. | 100 | 5 | ||||||||||
SUMCO Corp. | 500 | 10 | ||||||||||
Taiyo Yuden Co. Ltd. | 300 | 8 | ||||||||||
TDK Corp. | 100 | 10 | ||||||||||
| 34 | PIMCO EQUITY SERIES | See Accompanying Notes |
Table of Contents
June 30, 2018
| SHARES | MARKET VALUE (000S) | |||||||||||
TIS, Inc. | 200 | $ | 9 | |||||||||
Tokyo Electron Ltd. | 200 | 34 | ||||||||||
Tokyo Seimitsu Co. Ltd. | 300 | 10 | ||||||||||
Trend Micro, Inc. | 100 | 6 | ||||||||||
Wacom Co. Ltd. | 1,500 | 9 | ||||||||||
Yahoo Japan Corp. | 3,000 | 10 | ||||||||||
Yaskawa Electric Corp. | 400 | 14 | ||||||||||
|
| |||||||||||
| 832 | ||||||||||||
|
| |||||||||||
| MATERIALS 1.7% | ||||||||||||
Asahi Kasei Corp. | 1,900 | 24 | ||||||||||
Daicel Corp. | 1,100 | 12 | ||||||||||
Daido Steel Co. Ltd. | 100 | 5 | ||||||||||
FP Corp. | 100 | 5 | ||||||||||
Fuji Seal International, Inc. | 200 | 7 | ||||||||||
Hitachi Metals Ltd. | 900 | 9 | ||||||||||
JFE Holdings, Inc. | 2,600 | 49 | ||||||||||
Kansai Paint Co. Ltd. | 400 | 8 | ||||||||||
Kobe Steel Ltd. | 2,000 | 18 | ||||||||||
Kuraray Co. Ltd. | 600 | 8 | ||||||||||
Mitsubishi Chemical Holdings Corp. | 1,000 | 8 | ||||||||||
Mitsubishi Materials Corp. | 400 | 11 | ||||||||||
Mitsui Chemicals, Inc. | 400 | 11 | ||||||||||
Mitsui Mining & Smelting Co. Ltd. | 100 | 4 | ||||||||||
Nippon Light Metal Holdings Co. Ltd. | 3,900 | 9 | ||||||||||
Nippon Paint Holdings Co. Ltd. | 200 | 9 | ||||||||||
Nippon Paper Industries Co. Ltd. | 900 | 14 | ||||||||||
Nippon Steel & Sumitomo Metal Corp. | 2,600 | 51 | ||||||||||
Nissan Chemical Industries Ltd. | 200 | 9 | ||||||||||
Nittetsu Mining Co. Ltd. | 100 | 5 | ||||||||||
Nitto Denko Corp. | 200 | 15 | ||||||||||
Oji Holdings Corp. | 5,000 | 31 | ||||||||||
Osaka Soda Co. Ltd. | 300 | 9 | ||||||||||
Rengo Co. Ltd. | 2,100 | 18 | ||||||||||
Sanyo Special Steel Co. Ltd. | 300 | 7 | ||||||||||
Showa Denko KK | 400 | 18 | ||||||||||
Sumitomo Chemical Co. Ltd. | 2,000 | 11 | ||||||||||
Sumitomo Metal Mining Co. Ltd. | 200 | 8 | ||||||||||
Taiheiyo Cement Corp. | 200 | 7 | ||||||||||
Tokai Carbon Co. Ltd. | 500 | 9 | ||||||||||
Tokuyama Corp. | 400 | 13 | ||||||||||
Tokyo Ohka Kogyo Co. Ltd. | 200 | 8 | ||||||||||
Tokyo Steel Manufacturing Co. Ltd. | 1,100 | 10 | ||||||||||
Toray Industries, Inc. | 3,500 | 28 | ||||||||||
Toyo Kohan Co. Ltd. | 500 | 3 | ||||||||||
Toyo Seikan Group Holdings Ltd. ‘L’ | 1,000 | 18 | ||||||||||
Toyobo Co. Ltd. | 600 | 10 | ||||||||||
Ube Industries Ltd. | 400 | 10 | ||||||||||
|
| |||||||||||
| 509 | ||||||||||||
|
| |||||||||||
| REAL ESTATE 0.2% | ||||||||||||
Daito Trust Construction Co. Ltd. | 200 | 33 | ||||||||||
Leopalace21 Corp. | 1,800 | 10 | ||||||||||
Open House Co. Ltd. | 100 | 6 | ||||||||||
Relo Group, Inc. | 500 | 13 | ||||||||||
|
| |||||||||||
| 62 | ||||||||||||
|
| |||||||||||
| TELECOMMUNICATION SERVICES 1.1% | ||||||||||||
KDDI Corp. | 2,900 | 79 | ||||||||||
Nippon Telegraph & Telephone Corp. | 2,500 | 114 | ||||||||||
NTT DOCOMO, Inc. | 3,200 | 81 | ||||||||||
SoftBank Group Corp. | 500 | 36 | ||||||||||
|
| |||||||||||
| 310 | ||||||||||||
|
| |||||||||||
| SHARES | MARKET VALUE (000S) | |||||||||||
| UTILITIES 1.2% | ||||||||||||
Chubu Electric Power Co., Inc. | 3,400 | $ | 51 | |||||||||
Chugoku Electric Power Co., Inc. | 2,500 | 32 | ||||||||||
Electric Power Development Co. Ltd. | 1,100 | 28 | ||||||||||
Hokuriku Electric Power Co. | 2,000 | 20 | ||||||||||
Kansai Electric Power Co., Inc. | 800 | 12 | ||||||||||
Nippon Gas Co. Ltd. | 200 | 12 | ||||||||||
Osaka Gas Co. Ltd. | 2,200 | 46 | ||||||||||
Shizuoka Gas Co. Ltd. | 900 | 8 | ||||||||||
Toho Gas Co. Ltd. | 400 | 14 | ||||||||||
Tokyo Electric Power Co. Holdings, Inc. (a) | 13,000 | 60 | ||||||||||
Tokyo Gas Co. Ltd. | 2,000 | 53 | ||||||||||
|
| |||||||||||
| 336 | ||||||||||||
|
| |||||||||||
Total Japan | 7,021 | |||||||||||
|
| |||||||||||
| LUXEMBOURG 0.6% | ||||||||||||
| CONSUMER DISCRETIONARY 0.1% | ||||||||||||
RTL Group S.A. | 238 | 16 | ||||||||||
SES S.A. | 927 | 17 | ||||||||||
|
| |||||||||||
| 33 | ||||||||||||
|
| |||||||||||
| MATERIALS 0.4% | ||||||||||||
APERAM S.A. | 202 | 9 | ||||||||||
ArcelorMittal | 3,264 | 95 | ||||||||||
|
| |||||||||||
| 104 | ||||||||||||
|
| |||||||||||
| REAL ESTATE 0.1% | ||||||||||||
Aroundtown S.A. | 1,499 | 12 | ||||||||||
Grand City Properties S.A. | 554 | 15 | ||||||||||
|
| |||||||||||
| 27 | ||||||||||||
|
| |||||||||||
Total Luxembourg | 164 | |||||||||||
|
| |||||||||||
| MACAU 0.2% | ||||||||||||
| CONSUMER DISCRETIONARY 0.2% | ||||||||||||
MGM China Holdings Ltd. | 3,600 | 8 | ||||||||||
Sands China Ltd. | 6,000 | 32 | ||||||||||
Wynn Macau Ltd. | 4,400 | 14 | ||||||||||
|
| |||||||||||
| 54 | ||||||||||||
|
| |||||||||||
Total Macau | 54 | |||||||||||
|
| |||||||||||
| NETHERLANDS 4.3% | ||||||||||||
| CONSUMER STAPLES 0.8% | ||||||||||||
Heineken Holding NV | 399 | 38 | ||||||||||
Heineken NV | 424 | 43 | ||||||||||
Koninklijke Ahold Delhaize NV | 6,342 | 151 | ||||||||||
Sligro Food Group NV | 188 | 10 | ||||||||||
|
| |||||||||||
| 242 | ||||||||||||
|
| |||||||||||
| ENERGY 1.5% | ||||||||||||
Core Laboratories NV | 124 | 16 | ||||||||||
Fugro NV (a) | 1,278 | 18 | ||||||||||
Royal Dutch Shell PLC ‘A’ | 11,575 | 401 | ||||||||||
|
| |||||||||||
| 435 | ||||||||||||
|
| |||||||||||
| FINANCIALS 0.6% | ||||||||||||
Aegon NV | 8,865 | 53 | ||||||||||
ASR Nederland NV | 216 | 9 | ||||||||||
Euronext NV | 134 | 8 | ||||||||||
ING Groep NV | 3,736 | 54 | ||||||||||
| SHARES | MARKET VALUE (000S) | |||||||||||
NN Group NV | 992 | $ | 40 | |||||||||
|
| |||||||||||
| 164 | ||||||||||||
|
| |||||||||||
| HEALTH CARE 0.1% | ||||||||||||
Koninklijke Philips NV | 843 | 36 | ||||||||||
|
| |||||||||||
| INDUSTRIALS 0.4% | ||||||||||||
Arcadis NV | 470 | 8 | ||||||||||
Boskalis Westminster | 351 | 10 | ||||||||||
Cimpress NV (a) | 66 | 10 | ||||||||||
Koninklijke BAM Groep NV | 2,026 | 8 | ||||||||||
PostNL NV | 2,650 | 10 | ||||||||||
Signify NV | 411 | 11 | ||||||||||
TKH Group NV | 134 | 8 | ||||||||||
Wolters Kluwer NV | 673 | 38 | ||||||||||
|
| |||||||||||
| 103 | ||||||||||||
|
| |||||||||||
| INFORMATION TECHNOLOGY 0.5% | ||||||||||||
ASML Holding NV | 489 | 97 | ||||||||||
NXP Semiconductors NV (a) | 307 | 33 | ||||||||||
|
| |||||||||||
| 130 | ||||||||||||
|
| |||||||||||
| MATERIALS 0.3% | ||||||||||||
Akzo Nobel NV | 517 | 44 | ||||||||||
Corbion NV | 268 | 9 | ||||||||||
Koninklijke DSM NV | 410 | 41 | ||||||||||
|
| |||||||||||
| 94 | ||||||||||||
|
| |||||||||||
| TELECOMMUNICATION SERVICES 0.1% | ||||||||||||
Koninklijke KPN NV | 8,474 | 23 | ||||||||||
VEON Ltd. ADR | 4,306 | 10 | ||||||||||
|
| |||||||||||
| 33 | ||||||||||||
|
| |||||||||||
Total Netherlands | 1,237 | |||||||||||
|
| |||||||||||
| NEW ZEALAND 0.3% | ||||||||||||
| CONSUMER DISCRETIONARY 0.0% | ||||||||||||
SKYCITY Entertainment Group Ltd. | 3,463 | 9 | ||||||||||
|
| |||||||||||
| HEALTH CARE 0.1% | ||||||||||||
Fisher & Paykel Healthcare Corp. Ltd. | 1,900 | 19 | ||||||||||
|
| |||||||||||
| MATERIALS 0.0% | ||||||||||||
Fletcher Building Ltd. | 3,545 | 17 | ||||||||||
|
| |||||||||||
| TELECOMMUNICATION SERVICES 0.1% | ||||||||||||
Chorus Ltd. | 2,991 | 9 | ||||||||||
Spark New Zealand Ltd. | 7,996 | 20 | ||||||||||
|
| |||||||||||
| 29 | ||||||||||||
|
| |||||||||||
| UTILITIES 0.1% | ||||||||||||
Contact Energy Ltd. | 2,151 | 8 | ||||||||||
Genesis Energy Ltd. | 5,843 | 10 | ||||||||||
|
| |||||||||||
| 18 | ||||||||||||
|
| |||||||||||
Total New Zealand | 92 | |||||||||||
|
| |||||||||||
| NORWAY 1.5% | ||||||||||||
| CONSUMER STAPLES 0.2% | ||||||||||||
Austevoll Seafood ASA | 1,214 | 15 | ||||||||||
| See Accompanying Notes | ANNUAL REPORT | JUNE 30, 2018 | 35 |
Table of Contents
Schedule of Investments PIMCO RAFI Dynamic Multi-Factor International Equity ETF (Cont.)
| SHARES | MARKET VALUE (000S) | |||||||||||
Marine Harvest ASA | 960 | $ | 19 | |||||||||
Orkla ASA | 1,514 | 13 | ||||||||||
Salmar ASA | 201 | 8 | ||||||||||
|
| |||||||||||
| 55 | ||||||||||||
|
| |||||||||||
| ENERGY 0.7% | ||||||||||||
Aker BP ASA | 220 | 8 | ||||||||||
Aker Solutions ASA (a) | 1,218 | 8 | ||||||||||
BW Offshore Ltd. (a) | 1,869 | 10 | ||||||||||
Equinor ASA | 5,599 | 148 | ||||||||||
Petroleum Geo-Services ASA | 4,463 | 21 | ||||||||||
Ship Finance International Ltd. | 569 | 9 | ||||||||||
TGS NOPEC Geophysical Co. ASA | 242 | 9 | ||||||||||
|
| |||||||||||
| 213 | ||||||||||||
|
| |||||||||||
| FINANCIALS 0.2% | ||||||||||||
DNB ASA | 1,151 | 22 | ||||||||||
Gjensidige Forsikring ASA | 560 | 9 | ||||||||||
SpareBank 1 SMN | 828 | 9 | ||||||||||
SpareBank 1 SR-Bank ASA | 943 | 10 | ||||||||||
|
| |||||||||||
| 50 | ||||||||||||
|
| |||||||||||
| INDUSTRIALS 0.0% | ||||||||||||
Tomra Systems ASA | 397 | 8 | ||||||||||
|
| |||||||||||
| MATERIALS 0.2% | ||||||||||||
Yara International ASA | 1,205 | 50 | ||||||||||
|
| |||||||||||
| TELECOMMUNICATION SERVICES 0.2% | ||||||||||||
Telenor ASA | 2,866 | 59 | ||||||||||
|
| |||||||||||
Total Norway | 435 | |||||||||||
|
| |||||||||||
| PORTUGAL 0.4% | ||||||||||||
| CONSUMER STAPLES 0.1% | ||||||||||||
Jeronimo Martins SGPS S.A. | 762 | 11 | ||||||||||
Sonae SGPS S.A. | 9,407 | 11 | ||||||||||
|
| |||||||||||
| 22 | ||||||||||||
|
| |||||||||||
| FINANCIALS 0.0% | ||||||||||||
Banco Comercial Portugues S.A. ‘R’ (a) | 28,283 | 8 | ||||||||||
|
| |||||||||||
| INDUSTRIALS 0.0% | ||||||||||||
CTT-Correios de Portugal S.A. | 1,913 | 7 | ||||||||||
|
| |||||||||||
| MATERIALS 0.0% | ||||||||||||
Navigator Co. S.A. | 1,769 | 11 | ||||||||||
|
| |||||||||||
| UTILITIES 0.3% | ||||||||||||
EDP - Energias de Portugal S.A. | 14,757 | 58 | ||||||||||
REN - Redes Energeticas Nacionais SGPS S.A. | 3,805 | 11 | ||||||||||
|
| |||||||||||
| 69 | ||||||||||||
|
| |||||||||||
Total Portugal | 117 | |||||||||||
|
| |||||||||||
| SINGAPORE 1.5% | ||||||||||||
| CONSUMER DISCRETIONARY 0.1% | ||||||||||||
Genting Singapore Ltd. | 9,600 | 8 | ||||||||||
Jardine Cycle & Carriage Ltd. | 200 | 5 | ||||||||||
| SHARES | MARKET VALUE (000S) | |||||||||||
Singapore Press Holdings Ltd. | 6,900 | $ | 13 | |||||||||
|
| |||||||||||
| 26 | ||||||||||||
|
| |||||||||||
| CONSUMER STAPLES 0.1% | ||||||||||||
Golden Agri-Resources Ltd. | 38,100 | 9 | ||||||||||
Wilmar International Ltd. | 9,100 | 20 | ||||||||||
|
| |||||||||||
| 29 | ||||||||||||
|
| |||||||||||
| ENERGY 0.0% | ||||||||||||
BW LPG Ltd. | 2,398 | 10 | ||||||||||
|
| |||||||||||
| FINANCIALS 0.6% | ||||||||||||
DBS Group Holdings Ltd. | 3,000 | 58 | ||||||||||
Oversea-Chinese Banking Corp. Ltd. | 4,900 | 42 | ||||||||||
Singapore Exchange Ltd. | 1,600 | 9 | ||||||||||
United Overseas Bank Ltd. | 2,400 | 47 | ||||||||||
|
| |||||||||||
| 156 | ||||||||||||
|
| |||||||||||
| INDUSTRIALS 0.5% | ||||||||||||
Chip Eng Seng Corp. Ltd. | 15,000 | 9 | ||||||||||
ComfortDelGro Corp. Ltd. | 12,500 | 22 | ||||||||||
Hutchison Port Holdings Trust | 36,800 | 10 | ||||||||||
Keppel Corp. Ltd. | 6,000 | 31 | ||||||||||
SATS Ltd. | 2,700 | 10 | ||||||||||
Sembcorp Industries Ltd. | 4,900 | 10 | ||||||||||
Singapore Airlines Ltd. | 2,900 | 23 | ||||||||||
Singapore Post Ltd. | 12,000 | 11 | ||||||||||
Singapore Technologies Engineering Ltd. | 5,000 | 12 | ||||||||||
|
| |||||||||||
| 138 | ||||||||||||
|
| |||||||||||
| INFORMATION TECHNOLOGY 0.0% | ||||||||||||
Venture Corp. Ltd. | 800 | 11 | ||||||||||
|
| |||||||||||
| REAL ESTATE 0.0% | ||||||||||||
UOL Group Ltd. | 1,500 | 8 | ||||||||||
|
| |||||||||||
| TELECOMMUNICATION SERVICES 0.2% | ||||||||||||
Singapore Telecommunications Ltd. | 27,200 | 61 | ||||||||||
|
| |||||||||||
Total Singapore | 439 | |||||||||||
|
| |||||||||||
| SOUTH AFRICA 0.1% | ||||||||||||
| FINANCIALS 0.1% | ||||||||||||
Old Mutual Ltd. (a) | 9,294 | 18 | ||||||||||
|
| |||||||||||
| HEALTH CARE 0.0% | ||||||||||||
Mediclinic International PLC | 1,211 | 9 | ||||||||||
|
| |||||||||||
Total South Africa | 27 | |||||||||||
|
| |||||||||||
| SPAIN 2.6% | ||||||||||||
| CONSUMER DISCRETIONARY 0.1% | ||||||||||||
Industria de Diseno Textil S.A. | 783 | 27 | ||||||||||
Mediaset Espana Comunicacion S.A. | 1,086 | 9 | ||||||||||
|
| |||||||||||
| 36 | ||||||||||||
|
| |||||||||||
| CONSUMER STAPLES 0.1% | ||||||||||||
Distribuidora Internacional de Alimentacion S.A. | 2,878 | 9 | ||||||||||
Ebro Foods S.A. | 476 | 11 | ||||||||||
| SHARES | MARKET VALUE (000S) | |||||||||||
Viscofan S.A. | 284 | $ | 19 | |||||||||
|
| |||||||||||
| 39 | ||||||||||||
|
| |||||||||||
| ENERGY 0.6% | ||||||||||||
Enagas S.A. | 641 | 18 | ||||||||||
Repsol S.A. | 7,468 | 146 | ||||||||||
|
| |||||||||||
| 164 | ||||||||||||
|
| |||||||||||
| FINANCIALS 0.2% | ||||||||||||
Banco Santander S.A. | 8,107 | 43 | ||||||||||
Bankia S.A. | 2,630 | 10 | ||||||||||
Mapfre S.A. | 3,189 | 10 | ||||||||||
|
| |||||||||||
| 63 | ||||||||||||
|
| |||||||||||
| HEALTH CARE 0.1% | ||||||||||||
Grifols S.A. | 609 | 18 | ||||||||||
|
| |||||||||||
| INDUSTRIALS 0.4% | ||||||||||||
ACS Actividades de Construccion y Servicios S.A. | 616 | 25 | ||||||||||
Aena SME S.A. | 210 | 38 | ||||||||||
Cia de Distribucion Integral Logista Holdings S.A. | 483 | 13 | ||||||||||
Ferrovial S.A. | 606 | 12 | ||||||||||
Obrascon Huarte Lain S.A. | 2,218 | 7 | ||||||||||
Prosegur Cia de Seguridad S.A. | 1,557 | 10 | ||||||||||
|
| |||||||||||
| 105 | ||||||||||||
|
| |||||||||||
| INFORMATION TECHNOLOGY 0.2% | ||||||||||||
Amadeus IT Group S.A. | 910 | 71 | ||||||||||
|
| |||||||||||
| MATERIALS 0.0% | ||||||||||||
Ence Energia y Celulosa S.A. | 994 | 9 | ||||||||||
|
| |||||||||||
| TELECOMMUNICATION SERVICES 0.1% | ||||||||||||
Telefonica S.A. | 2,279 | 19 | ||||||||||
|
| |||||||||||
| UTILITIES 0.8% | ||||||||||||
Endesa S.A. | 3,786 | 83 | ||||||||||
Gas Natural SDG S.A. | 1,167 | 31 | ||||||||||
Iberdrola S.A. | 11,428 | 88 | ||||||||||
Red Electrica Corp. S.A. | 1,002 | 21 | ||||||||||
|
| |||||||||||
| 223 | ||||||||||||
|
| |||||||||||
Total Spain | 747 | |||||||||||
|
| |||||||||||
| SWEDEN 3.1% | ||||||||||||
| CONSUMER DISCRETIONARY 0.5% | ||||||||||||
Autoliv, Inc. | 354 | 51 | ||||||||||
Electrolux AB ‘B’ | 602 | 14 | ||||||||||
Hennes & Mauritz AB ‘B’ | 3,377 | 50 | ||||||||||
Husqvarna AB ‘B’ | 1,047 | 10 | ||||||||||
JM AB | 537 | 10 | ||||||||||
Nobia AB | 1,231 | 9 | ||||||||||
|
| |||||||||||
| 144 | ||||||||||||
|
| |||||||||||
| CONSUMER STAPLES 0.2% | ||||||||||||
Axfood AB | 1,166 | 22 | ||||||||||
Swedish Match AB | 616 | 31 | ||||||||||
|
| |||||||||||
| 53 | ||||||||||||
|
| |||||||||||
| 36 | PIMCO EQUITY SERIES | See Accompanying Notes |
Table of Contents
June 30, 2018
| SHARES | MARKET VALUE (000S) | |||||||||||
| FINANCIALS 0.1% | ||||||||||||
Industrivarden AB ‘C’ | 620 | $ | 12 | |||||||||
Ratos AB ‘B’ | 2,623 | 9 | ||||||||||
Svenska Handelsbanken AB ‘A’ | 1,461 | 16 | ||||||||||
|
| |||||||||||
| 37 | ||||||||||||
|
| |||||||||||
| INDUSTRIALS 0.9% | ||||||||||||
Alfa Laval AB | 438 | 10 | ||||||||||
Assa Abloy AB ‘B’ | 954 | 20 | ||||||||||
Atlas Copco AB ‘A’ | 1,921 | 56 | ||||||||||
Epiroc AB (a) | 1,992 | 21 | ||||||||||
NCC AB ‘B’ | 514 | 8 | ||||||||||
S.A.S. AB (a) | 4,674 | 9 | ||||||||||
Sandvik AB | 2,506 | 44 | ||||||||||
Securitas AB ‘B’ | 525 | 9 | ||||||||||
SKF AB ‘B’ | 759 | 14 | ||||||||||
Volvo AB ‘B’ | 3,327 | 53 | ||||||||||
|
| |||||||||||
| 244 | ||||||||||||
|
| |||||||||||
| INFORMATION TECHNOLOGY 0.7% | ||||||||||||
Hexagon AB ‘B’ | 258 | 15 | ||||||||||
Telefonaktiebolaget LM Ericsson ‘B’ | 25,721 | 198 | ||||||||||
|
| |||||||||||
| 213 | ||||||||||||
|
| |||||||||||
| MATERIALS 0.1% | ||||||||||||
BillerudKorsnas AB | 603 | 8 | ||||||||||
Hexpol AB | 826 | 9 | ||||||||||
Svenska Cellulosa AB S.C.A. ‘B’ | 1,423 | 15 | ||||||||||
|
| |||||||||||
| 32 | ||||||||||||
|
| |||||||||||
| TELECOMMUNICATION SERVICES 0.6% | ||||||||||||
Tele2 AB ‘B’ | 4,588 | 54 | ||||||||||
Telia Co. AB | 24,888 | 113 | ||||||||||
|
| |||||||||||
| 167 | ||||||||||||
|
| |||||||||||
Total Sweden | 890 | |||||||||||
|
| |||||||||||
| SWITZERLAND 7.3% | ||||||||||||
| CONSUMER DISCRETIONARY 0.5% | ||||||||||||
Cie Financiere Richemont S.A. | 856 | 72 | ||||||||||
Forbo Holding AG | 6 | 9 | ||||||||||
Garmin Ltd. | 449 | 27 | ||||||||||
Swatch Group AG | 40 | 19 | ||||||||||
Valora Holding AG | 30 | 10 | ||||||||||
|
| |||||||||||
| 137 | ||||||||||||
|
| |||||||||||
| CONSUMER STAPLES 0.9% | ||||||||||||
Aryzta AG (a) | 513 | 8 | ||||||||||
Barry Callebaut AG | 6 | 11 | ||||||||||
Chocoladefabriken Lindt & Spruengli AG | 1 | 6 | ||||||||||
Coca-Cola HBC AG | 291 | 10 | ||||||||||
Emmi AG | 13 | 11 | ||||||||||
Nestle S.A. | 2,727 | 211 | ||||||||||
|
| |||||||||||
| 257 | ||||||||||||
|
| |||||||||||
| ENERGY 0.3% | ||||||||||||
Transocean Ltd. | 4,611 | 62 | ||||||||||
Weatherford International PLC (a) | 2,845 | 9 | ||||||||||
|
| |||||||||||
| 71 | ||||||||||||
|
| |||||||||||
| SHARES | MARKET VALUE (000S) | |||||||||||
| FINANCIALS 1.8% | ||||||||||||
Baloise Holding AG | 96 | $ | 14 | |||||||||
Banque Cantonale Vaudoise | 12 | 9 | ||||||||||
Cembra Money Bank AG | 117 | 9 | ||||||||||
Credit Suisse Group AG | 2,512 | 38 | ||||||||||
GAM Holding AG | 850 | 12 | ||||||||||
Julius Baer Group Ltd. | 197 | 12 | ||||||||||
St Galler Kantonalbank AG | 19 | 10 | ||||||||||
Swiss Life Holding AG | 44 | 15 | ||||||||||
Swiss Re AG | 2,102 | 183 | ||||||||||
Valiant Holding AG | 90 | 10 | ||||||||||
Zurich Insurance Group AG | 667 | 197 | ||||||||||
|
| |||||||||||
| 509 | ||||||||||||
|
| |||||||||||
| HEALTH CARE 1.1% | ||||||||||||
Lonza Group AG | 119 | 31 | ||||||||||
Novartis AG | 2,021 | 153 | ||||||||||
Roche Holding AG | 454 | 101 | ||||||||||
Sonova Holding AG | 96 | 17 | ||||||||||
Straumann Holding AG | 14 | 11 | ||||||||||
Vifor Pharma AG | 115 | 18 | ||||||||||
|
| |||||||||||
| 331 | ||||||||||||
|
| |||||||||||
| INDUSTRIALS 1.0% | ||||||||||||
ABB Ltd. | 5,080 | 111 | ||||||||||
Adecco Group AG | 145 | 8 | ||||||||||
Bucher Industries AG | 26 | 9 | ||||||||||
Conzzeta AG | 7 | 8 | ||||||||||
Ferguson PLC | 107 | 9 | ||||||||||
Flughafen Zurich AG | 50 | 10 | ||||||||||
Geberit AG | 38 | 16 | ||||||||||
Georg Fischer AG | 13 | 17 | ||||||||||
Kuehne + Nagel International AG | 141 | 21 | ||||||||||
Panalpina Welttransport Holding AG | 64 | 9 | ||||||||||
Schindler Holding AG | 75 | 16 | ||||||||||
Schweiter Technologies AG | 9 | 9 | ||||||||||
SGS S.A. | 15 | 40 | ||||||||||
Wizz Air Holdings PLC (a) | 181 | 9 | ||||||||||
|
| |||||||||||
| 292 | ||||||||||||
|
| |||||||||||
| INFORMATION TECHNOLOGY 0.3% | ||||||||||||
Logitech International S.A. | 193 | 9 | ||||||||||
STMicroelectronics NV | 585 | 13 | ||||||||||
TE Connectivity Ltd. | 868 | 78 | ||||||||||
|
| |||||||||||
| 100 | ||||||||||||
|
| |||||||||||
| MATERIALS 1.1% | ||||||||||||
Clariant AG | 361 | 9 | ||||||||||
EMS-Chemie Holding AG | 14 | 9 | ||||||||||
Ferrexpo PLC | 3,466 | 8 | ||||||||||
Givaudan S.A. | 19 | 43 | ||||||||||
Glencore PLC | 48,365 | 230 | ||||||||||
Sika AG | 213 | 29 | ||||||||||
|
| |||||||||||
| 328 | ||||||||||||
|
| |||||||||||
| REAL ESTATE 0.1% | ||||||||||||
Allreal Holding AG (a) | 69 | 11 | ||||||||||
PSP Swiss Property AG | 147 | 14 | ||||||||||
|
| |||||||||||
| 25 | ||||||||||||
|
| |||||||||||
| TELECOMMUNICATION SERVICES 0.2% | ||||||||||||
Sunrise Communications Group AG | 125 | 10 | ||||||||||
| SHARES | MARKET VALUE (000S) | |||||||||||
Swisscom AG | 111 | $ | 50 | |||||||||
|
| |||||||||||
| 60 | ||||||||||||
|
| |||||||||||
| UTILITIES 0.0% | ||||||||||||
BKW AG | 135 | 9 | ||||||||||
|
| |||||||||||
Total Switzerland | 2,119 | |||||||||||
|
| |||||||||||
| THAILAND 0.0% | ||||||||||||
| CONSUMER STAPLES 0.0% | ||||||||||||
Thai Beverage PCL | 15,800 | 8 | ||||||||||
|
| |||||||||||
Total Thailand | 8 | |||||||||||
|
| |||||||||||
| UNITED KINGDOM 14.0% | ||||||||||||
| CONSUMER DISCRETIONARY 2.3% | ||||||||||||
BCA Marketplace PLC | 2,997 | 9 | ||||||||||
Bellway PLC | 234 | 9 | ||||||||||
Berkeley Group Holdings PLC | 265 | 13 | ||||||||||
Bovis Homes Group PLC | 618 | 9 | ||||||||||
Burberry Group PLC | 440 | 13 | ||||||||||
Cineworld Group PLC | 2,070 | 7 | ||||||||||
Compass Group PLC | 3,201 | 68 | ||||||||||
Daily Mail & General Trust PLC ‘A’ | 1,130 | 11 | ||||||||||
Dixons Carphone PLC | 4,062 | 10 | ||||||||||
Dunelm Group PLC | 1,315 | 9 | ||||||||||
Fiat Chrysler Automobiles NV | 2,741 | 52 | ||||||||||
Greene King PLC | 1,109 | 8 | ||||||||||
Greggs PLC | 702 | 9 | ||||||||||
Halfords Group PLC | 2,239 | 10 | ||||||||||
Inchcape PLC | 1,051 | 11 | ||||||||||
Informa PLC | 1,026 | 11 | ||||||||||
InterContinental Hotels Group PLC | 277 | 17 | ||||||||||
ITV PLC | 3,890 | 9 | ||||||||||
J D Wetherspoon PLC | 517 | 9 | ||||||||||
JD Sports Fashion PLC | 1,489 | 9 | ||||||||||
Kingfisher PLC | 18,982 | 74 | ||||||||||
Marks & Spencer Group PLC | 12,827 | 50 | ||||||||||
Marston’s PLC | 7,985 | 11 | ||||||||||
Next PLC | 483 | 39 | ||||||||||
Pearson PLC | 6,780 | 79 | ||||||||||
Persimmon PLC | 503 | 17 | ||||||||||
Sky PLC | 1,880 | 36 | ||||||||||
Sports Direct International PLC | 1,601 | 9 | ||||||||||
SSP Group PLC | 1,113 | 9 | ||||||||||
Taylor Wimpey PLC | 6,057 | 14 | ||||||||||
WH Smith PLC | 527 | 14 | ||||||||||
Whitbread PLC | 161 | 8 | ||||||||||
William Hill PLC | 2,353 | 9 | ||||||||||
|
| |||||||||||
| 672 | ||||||||||||
|
| |||||||||||
| CONSUMER STAPLES 2.7% | ||||||||||||
Associated British Foods PLC | 420 | 15 | ||||||||||
British American Tobacco PLC | 1,379 | 70 | ||||||||||
Britvic PLC | 833 | 9 | ||||||||||
Diageo PLC | 4,484 | 161 | ||||||||||
Imperial Brands PLC | 1,222 | 45 | ||||||||||
J Sainsbury PLC | 20,542 | 87 | ||||||||||
Reckitt Benckiser Group PLC | 779 | 64 | ||||||||||
Tate & Lyle PLC | 1,948 | 17 | ||||||||||
Tesco PLC | 38,848 | 131 | ||||||||||
Unilever NV | 1,460 | 81 | ||||||||||
Unilever PLC | 790 | 44 | ||||||||||
| See Accompanying Notes | ANNUAL REPORT | JUNE 30, 2018 | 37 |
Table of Contents
Schedule of Investments PIMCO RAFI Dynamic Multi-Factor International Equity ETF (Cont.)
| SHARES | MARKET VALUE (000S) | |||||||||||
WM Morrison Supermarkets PLC | 18,419 | $ | 61 | |||||||||
|
| |||||||||||
| 785 | ||||||||||||
|
| |||||||||||
| ENERGY 1.7% | ||||||||||||
BP PLC | 56,703 | 431 | ||||||||||
Hunting PLC (a) | 1,074 | 11 | ||||||||||
Petrofac Ltd. | 1,418 | 11 | ||||||||||
Premier Oil PLC | 11,551 | 20 | ||||||||||
Subsea 7 S.A. | 766 | 12 | ||||||||||
Tullow Oil PLC (a) | 2,585 | 8 | ||||||||||
|
| |||||||||||
| 493 | ||||||||||||
|
| |||||||||||
| FINANCIALS 1.8% | ||||||||||||
3i Group PLC | 1,544 | 18 | ||||||||||
Admiral Group PLC | 726 | 18 | ||||||||||
Ashmore Group PLC | 1,947 | 10 | ||||||||||
Barclays PLC | 23,947 | 59 | ||||||||||
Direct Line Insurance Group PLC | 9,532 | 43 | ||||||||||
esure Group PLC | 3,065 | 9 | ||||||||||
Hargreaves Lansdown PLC | 556 | 14 | ||||||||||
HSBC Holdings PLC | 2,417 | 23 | ||||||||||
IG Group Holdings PLC | 2,024 | 23 | ||||||||||
Jardine Lloyd Thompson Group PLC | 498 | 8 | ||||||||||
Jupiter Fund Management PLC | 1,647 | 10 | ||||||||||
Lancashire Holdings Ltd. | 1,319 | 10 | ||||||||||
Legal & General Group PLC | 5,471 | 19 | ||||||||||
Lloyds Banking Group PLC | 66,283 | 55 | ||||||||||
London Stock Exchange Group PLC | 471 | 28 | ||||||||||
Man Group PLC | 3,556 | 8 | ||||||||||
NEX Group PLC | 677 | 9 | ||||||||||
Provident Financial PLC | 1,305 | 10 | ||||||||||
Quilter PLC (a) | 4,152 | 8 | ||||||||||
Royal Bank of Scotland Group PLC (a) | 8,168 | 28 | ||||||||||
RSA Insurance Group PLC | 1,183 | 11 | ||||||||||
Saga PLC | 5,242 | 9 | ||||||||||
Schroders PLC | 271 | 11 | ||||||||||
Standard Chartered PLC | 8,721 | 79 | ||||||||||
Standard Life Aberdeen PLC | 1,955 | 8 | ||||||||||
|
| |||||||||||
| 528 | ||||||||||||
|
| |||||||||||
| HEALTH CARE 0.9% | ||||||||||||
AstraZeneca PLC | 355 | 25 | ||||||||||
GlaxoSmithKline PLC | 9,662 | 195 | ||||||||||
Indivior PLC (a) | 2,094 | 10 | ||||||||||
Smith & Nephew PLC | 1,835 | 34 | ||||||||||
|
| |||||||||||
| 264 | ||||||||||||
|
| |||||||||||
| INDUSTRIALS 1.7% | ||||||||||||
Aggreko PLC | 1,223 | 11 | ||||||||||
Ashtead Group PLC | 466 | 14 | ||||||||||
Babcock International Group PLC | 781 | 8 | ||||||||||
BAE Systems PLC | 3,387 | 29 | ||||||||||
Balfour Beatty PLC | 3,263 | 12 | ||||||||||
Bunzl PLC | 286 | 9 | ||||||||||
CNH Industrial NV | 903 | 9 | ||||||||||
easyJet PLC | 1,275 | 28 | ||||||||||
Experian PLC | 1,202 | 30 | ||||||||||
Firstgroup PLC (a) | 8,723 | 10 | ||||||||||
Galliford Try PLC | 720 | 8 | ||||||||||
Hays PLC | 3,551 | 9 | ||||||||||
HomeServe PLC | 830 | 10 | ||||||||||
Howden Joinery Group PLC | 2,023 | 14 | ||||||||||
IMI PLC | 564 | 8 | ||||||||||
| SHARES | MARKET VALUE (000S) | |||||||||||
International Consolidated Airlines Group S.A. | 2,482 | $ | 22 | |||||||||
Intertek Group PLC | 226 | 17 | ||||||||||
Meggitt PLC | 1,333 | 9 | ||||||||||
Pagegroup PLC | 1,164 | 9 | ||||||||||
QinetiQ Group PLC | 3,721 | 13 | ||||||||||
RELX NV | 1,141 | 24 | ||||||||||
RELX PLC | 1,002 | 21 | ||||||||||
Rentokil Initial PLC | 4,185 | 19 | ||||||||||
Royal Mail PLC | 11,351 | 75 | ||||||||||
Senior PLC | 2,398 | 10 | ||||||||||
SIG PLC | 5,456 | 10 | ||||||||||
Spirax-Sarco Engineering PLC | 157 | 13 | ||||||||||
Stagecoach Group PLC | 4,827 | 9 | ||||||||||
Travis Perkins PLC | 579 | 11 | ||||||||||
Vesuvius PLC | 1,257 | 10 | ||||||||||
|
| |||||||||||
| 481 | ||||||||||||
|
| |||||||||||
| INFORMATION TECHNOLOGY 0.2% |
| |||||||||||
Halma PLC | 468 | 8 | ||||||||||
Micro Focus International PLC | 503 | 9 | ||||||||||
Moneysupermarket.com Group PLC | 2,505 | 10 | ||||||||||
Renishaw PLC | 121 | 9 | ||||||||||
Sage Group PLC | 2,185 | 18 | ||||||||||
|
| |||||||||||
| 54 | ||||||||||||
|
| |||||||||||
| MATERIALS 1.2% | ||||||||||||
Anglo American PLC | 2,219 | 49 | ||||||||||
Croda International PLC | 344 | 22 | ||||||||||
DS Smith PLC | 1,229 | 8 | ||||||||||
Johnson Matthey PLC | 996 | 48 | ||||||||||
KAZ Minerals PLC (a) | 819 | 9 | ||||||||||
Mondi PLC | 346 | 9 | ||||||||||
Rio Tinto Ltd. | 1,620 | 100 | ||||||||||
Rio Tinto PLC | 1,518 | 84 | ||||||||||
Synthomer PLC | 1,223 | 9 | ||||||||||
Victrex PLC | 314 | 12 | ||||||||||
|
| |||||||||||
| 350 | ||||||||||||
|
| |||||||||||
| TELECOMMUNICATION SERVICES 0.8% |
| |||||||||||
BT Group PLC | 8,013 | 23 | ||||||||||
TalkTalk Telecom Group PLC | 6,667 | 9 | ||||||||||
Vodafone Group PLC | 87,631 | 212 | ||||||||||
|
| |||||||||||
| 244 | ||||||||||||
|
| |||||||||||
| UTILITIES 0.7% | ||||||||||||
Centrica PLC | 13,714 | 29 | ||||||||||
Drax Group PLC | 2,646 | 11 | ||||||||||
National Grid PLC | 4,838 | 53 | ||||||||||
Pennon Group PLC | 1,342 | 14 | ||||||||||
Severn Trent PLC | 618 | 16 | ||||||||||
SSE PLC | 3,174 | 57 | ||||||||||
United Utilities Group PLC | 1,054 | 11 | ||||||||||
|
| |||||||||||
| 191 | ||||||||||||
|
| |||||||||||
Total United Kingdom | 4,062 | |||||||||||
|
| |||||||||||
| UNITED STATES 0.1% |
| |||||||||||
| CONSUMER DISCRETIONARY 0.1% |
| |||||||||||
Carnival PLC | 144 | 8 | ||||||||||
Samsonite International S.A. | 2,400 | 9 | ||||||||||
|
| |||||||||||
| 17 | ||||||||||||
|
| |||||||||||
| SHARES | MARKET VALUE (000S) | |||||||||||
| MATERIALS 0.0% | ||||||||||||
Sims Metal Management Ltd. | 924 | $ | 11 | |||||||||
|
| |||||||||||
Total United States | 28 | |||||||||||
|
| |||||||||||
Total Common Stocks (Cost $27,793) |
| 27,445 | ||||||||||
|
| |||||||||||
| PREFERRED STOCKS 0.8% |
| |||||||||||
| GERMANY 0.8% |
| |||||||||||
| CONSUMER DISCRETIONARY 0.0% |
| |||||||||||
Porsche Automobil Holding SE | 151 | 10 | ||||||||||
|
| |||||||||||
| CONSUMER STAPLES 0.1% | ||||||||||||
Henkel AG & Co. KGaA | 248 | 32 | ||||||||||
|
| |||||||||||
| HEALTH CARE 0.1% | ||||||||||||
Draegerwerk AG & Co. KGaA | 106 | 7 | ||||||||||
Sartorius AG | 58 | 9 | ||||||||||
|
| |||||||||||
| 16 | ||||||||||||
|
| |||||||||||
| INDUSTRIALS 0.5% | ||||||||||||
Volkswagen AG | 893 | 147 | ||||||||||
|
| |||||||||||
| MATERIALS 0.1% | ||||||||||||
Fuchs Petrolub SE | 204 | 10 | ||||||||||
|
| |||||||||||
Total Preferred Stocks (Cost $234) | 215 | |||||||||||
|
| |||||||||||
| REAL ESTATE INVESTMENT TRUSTS 2.5% |
| |||||||||||
| AUSTRALIA 0.1% |
| |||||||||||
| REAL ESTATE 0.1% | ||||||||||||
Goodman Group | 2,689 | 19 | ||||||||||
GPT Group | 2,247 | 8 | ||||||||||
Scentre Group | 3,526 | 12 | ||||||||||
|
| |||||||||||
| 39 | ||||||||||||
|
| |||||||||||
Total Australia | 39 | |||||||||||
|
| |||||||||||
| BELGIUM 0.1% |
| |||||||||||
| REAL ESTATE 0.1% | ||||||||||||
Befimmo S.A. | 164 | 10 | ||||||||||
Cofinimmo S.A. | 70 | 9 | ||||||||||
|
| |||||||||||
| 19 | ||||||||||||
|
| |||||||||||
Total Belgium | 19 | |||||||||||
|
| |||||||||||
| CANADA 0.4% |
| |||||||||||
| REAL ESTATE 0.4% | ||||||||||||
Allied Properties Real Estate Investment Trust | 572 | 18 | ||||||||||
Artis Real Estate Investment Trust | 853 | 9 | ||||||||||
Canadian Apartment Properties REIT | 434 | 14 | ||||||||||
Cominar Real Estate Investment Trust | 1,173 | 11 | ||||||||||
Dream Global Real Estate Investment Trust | 791 | 9 | ||||||||||
Dream Office Real Estate Investment Trust | 573 | 10 | ||||||||||
Granite Real Estate Investment Trust | 211 | 9 | ||||||||||
H&R Real Estate Investment Trust | 880 | 13 | ||||||||||
| 38 | PIMCO EQUITY SERIES | See Accompanying Notes |
Table of Contents
June 30, 2018
| SHARES | MARKET VALUE (000S) | |||||||||||
RioCan Real Estate Investment Trust | 783 | $ | 14 | |||||||||
|
| |||||||||||
| 107 | ||||||||||||
|
| |||||||||||
Total Canada | 107 | |||||||||||
|
| |||||||||||
| FRANCE 0.3% | ||||||||||||
| REAL ESTATE 0.3% | ||||||||||||
Covivio | 93 | 10 | ||||||||||
Gecina S.A. | 72 | 12 | ||||||||||
ICADE | 131 | 12 | ||||||||||
Klepierre S.A. | 309 | 12 | ||||||||||
Mercialys S.A. | 605 | 10 | ||||||||||
Unibail-Rodamco-Westfield (a) | 18 | 4 | ||||||||||
Unibail-Rodamco-Westfield | 126 | 28 | ||||||||||
|
| |||||||||||
| 88 | ||||||||||||
|
| |||||||||||
Total France | 88 | |||||||||||
|
| |||||||||||
| GERMANY 0.0% | ||||||||||||
| REAL ESTATE 0.0% | ||||||||||||
alstria office REIT-AG | 677 | 10 | ||||||||||
|
| |||||||||||
Total Germany | 10 | |||||||||||
|
| |||||||||||
| HONG KONG 0.1% | ||||||||||||
| REAL ESTATE 0.1% | ||||||||||||
Link REIT | 4,000 | 36 | ||||||||||
|
| |||||||||||
Total Hong Kong | 36 | |||||||||||
|
| |||||||||||
| ITALY 0.0% | ||||||||||||
| REAL ESTATE 0.0% | ||||||||||||
Beni Stabili SpA SIIQ | 9,879 | 9 | ||||||||||
|
| |||||||||||
Total Italy | 9 | |||||||||||
|
| |||||||||||
| JAPAN 0.9% | ||||||||||||
| REAL ESTATE 0.9% | ||||||||||||
Activia Properties, Inc. | 2 | 9 | ||||||||||
Advance Residence Investment Corp. | 6 | 15 | ||||||||||
Aeon REIT Investment Corp. | 10 | 12 | ||||||||||
Daiwa Office Investment Corp. | 2 | 11 | ||||||||||
| SHARES | MARKET VALUE (000S) | |||||||||||
Frontier Real Estate Investment Corp. | 2 | $ | 8 | |||||||||
Fukuoka REIT Corp. | 5 | 8 | ||||||||||
GLP J-Reit | 10 | 11 | ||||||||||
Heiwa Real Estate REIT, Inc. | 10 | 10 | ||||||||||
Industrial & Infrastructure Fund Investment Corp. | 8 | 9 | ||||||||||
Invincible Investment Corp. | 19 | 9 | ||||||||||
Japan Excellent, Inc. | 9 | 12 | ||||||||||
Japan Hotel REIT Investment Corp. | 11 | 8 | ||||||||||
Japan Logistics Fund, Inc. | 5 | 10 | ||||||||||
Japan Prime Realty Investment Corp. | 5 | 18 | ||||||||||
Japan Real Estate Investment Corp. | 1 | 5 | ||||||||||
Kenedix Office Investment Corp. | 1 | 6 | ||||||||||
MCUBS MidCity Investment Corp. | 15 | 11 | ||||||||||
Mori Hills REIT Investment Corp. | 9 | 12 | ||||||||||
Mori Trust Sogo Reit, Inc. | 6 | 9 | ||||||||||
Nippon Accommodations Fund, Inc. | 2 | 9 | ||||||||||
Nippon Building Fund, Inc. | 2 | 12 | ||||||||||
Nippon Prologis REIT, Inc. | 7 | 14 | ||||||||||
Orix JREIT, Inc. | 6 | 10 | ||||||||||
Premier Investment Corp. | 9 | 9 | ||||||||||
Tokyu REIT, Inc. | 9 | 12 | ||||||||||
|
| |||||||||||
| 259 | ||||||||||||
|
| |||||||||||
Total Japan | 259 | |||||||||||
|
| |||||||||||
| SINGAPORE 0.1% | ||||||||||||
| REAL ESTATE 0.1% | ||||||||||||
CDL Hospitality Trusts | 7,300 | 8 | ||||||||||
Mapletree Commercial Trust | 7,400 | 9 | ||||||||||
Mapletree Logistics Trust | 9,400 | 8 | ||||||||||
|
| |||||||||||
| 25 | ||||||||||||
|
| |||||||||||
Total Singapore | 25 | |||||||||||
|
| |||||||||||
| SPAIN 0.0% | ||||||||||||
| REAL ESTATE 0.0% | ||||||||||||
Inmobiliaria Colonial Socimi S.A. | 777 | 9 | ||||||||||
|
| |||||||||||
Total Spain | 9 | |||||||||||
|
| |||||||||||
| SHARES | MARKET VALUE (000S) | |||||||||||
| UNITED KINGDOM 0.5% | ||||||||||||
| REAL ESTATE 0.5% | ||||||||||||
British Land Co. PLC | 2,730 | $ | 24 | |||||||||
Derwent London PLC | 375 | 15 | ||||||||||
Great Portland Estates PLC | 921 | 9 | ||||||||||
Hansteen Holdings PLC | 5,765 | 8 | ||||||||||
Land Securities Group PLC | 1,810 | 23 | ||||||||||
Segro PLC | 2,634 | 23 | ||||||||||
Shaftesbury PLC | 915 | 11 | ||||||||||
UNITE Group PLC | 1,489 | 17 | ||||||||||
|
| |||||||||||
| 130 | ||||||||||||
|
| |||||||||||
Total United Kingdom | 130 | |||||||||||
|
| |||||||||||
Total Real Estate Investment Trusts (Cost $732) | 731 | |||||||||||
|
| |||||||||||
| RIGHTS 0.0% | ||||||||||||
| ITALY 0.0% | ||||||||||||
| FINANCIALS 0.0% | ||||||||||||
Intesa Sanpaolo SpA - Exp. 07/17/2018 | 13,805 | 0 | ||||||||||
|
| |||||||||||
Total Italy | 0 | |||||||||||
|
| |||||||||||
| SPAIN 0.0% | ||||||||||||
| ENERGY 0.0% | ||||||||||||
Repsol S.A. - Exp. 07/06/2018 | 6,323 | 3 | ||||||||||
|
| |||||||||||
| INDUSTRIALS 0.0% | ||||||||||||
ACS Actividades de Construccion y Servicios S.A. - Exp. 07/11/2018 | 522 | 1 | ||||||||||
|
| |||||||||||
Total Spain | 4 | |||||||||||
|
| |||||||||||
Total Rights (Cost $4) | 4 | |||||||||||
|
| |||||||||||
| Total Investments in Securities (Cost $28,763) | 28,395 | |||||||||||
| Total Investments 98.0% (Cost $28,763) | $ | 28,395 | ||||||||||
| Other Assets and Liabilities, net 2.0% | 581 | |||||||||||
|
| |||||||||||
| Net Assets 100.0% | $ | 28,976 | ||||||||||
|
| |||||||||||
NOTES TO SCHEDULE OF INVESTMENTS:
| * | A zero balance may reflect actual amounts rounding to less than one thousand. |
| (a) | Security did not produce income within the last twelve months. |
(b) RESTRICTED SECURITIES:
| Issuer Description | Acquisition Date | Cost | Market Value | Market Value as Percentage of Net Assets | ||||||||||
Calfrac Well Services Ltd. | 12/15/2017 - 06/27/2018 | $ | 10 | $ | 10 | 0.03 | % | |||||||
Cogeco, Inc. | 09/29/2017 - 06/27/2018 | 10 | 8 | 0.03 | ||||||||||
Constellation Software, Inc. | 08/31/2017 - 06/27/2018 | 25 | 30 | 0.10 | ||||||||||
Great-West Lifeco, Inc. | 08/31/2017 - 06/27/2018 | 19 | 17 | 0.06 | ||||||||||
Kirkland Lake Gold Ltd. | 06/29/2018 | 9 | 9 | 0.03 | ||||||||||
Martinrea International, Inc. | 08/31/2017 - 06/27/2018 | 9 | 8 | 0.03 | ||||||||||
|
|
|
|
|
| |||||||||
| $ | 82 | $ | 82 | 0.28 | % | |||||||||
|
|
|
|
|
| |||||||||
| See Accompanying Notes | ANNUAL REPORT | JUNE 30, 2018 | 39 |
Table of Contents
Schedule of Investments PIMCO RAFI Dynamic Multi-Factor International Equity ETF (Cont.)
(c) FINANCIAL DERIVATIVE INSTRUMENTS: OVER THE COUNTER
FORWARD FOREIGN CURRENCY CONTRACTS:
| Counterparty | Settlement Month | Currency to be Delivered | Currency to be Received | Unrealized Appreciation/ (Depreciation) | ||||||||||||||||||||
| Asset | Liability | |||||||||||||||||||||||
SSB | 07/2018 | CAD | 29 | $ | 22 | $ | 0 | $ | 0 | |||||||||||||||
| 07/2018 | HKD | 358 | 46 | 0 | 0 | |||||||||||||||||||
| 07/2018 | SGD | 55 | 40 | 0 | 0 | |||||||||||||||||||
|
|
|
| |||||||||||||||||||||
Total Forward Foreign Currency Contracts |
| $ | 0 | $ | 0 | |||||||||||||||||||
|
|
|
| |||||||||||||||||||||
FAIR VALUE OF FINANCIAL DERIVATIVE INSTRUMENTS
The following is a summary of the fair valuation of the Fund’s derivative instruments categorized by risk exposure. See Note 6, Principal Risks, in the Notes to Financial Statements on risks of the Fund.
The effect of Financial Derivative Instruments on the Statements of Operations for the period ended June 30, 2018:
| Derivatives not accounted for as hedging instruments | ||||||||||||||||||||||||
| Commodity Contracts | Credit Contracts | Equity Contracts | Foreign Exchange Contracts | Interest Rate Contracts | Total | |||||||||||||||||||
Net Realized (Loss) on Financial Derivative Instruments |
| |||||||||||||||||||||||
Over the counter |
| |||||||||||||||||||||||
Forward Foreign Currency Contracts | $ | 0 | $ | 0 | $ | 0 | $ | (3 | ) | $ | 0 | $ | (3 | ) | ||||||||||
|
|
|
|
|
|
|
|
|
|
|
| |||||||||||||
FAIR VALUE MEASUREMENTS
The following is a summary of the fair valuations according to the inputs used as of June 30, 2018 in valuing the Fund’s assets and liabilities:
| Category and Subcategory | Level 1 | Level 2 | Level 3 | Fair Value at 06/30/2018 | ||||||||||||
Investments in Securities, at Value |
| |||||||||||||||
Common Stocks | ||||||||||||||||
Australia | ||||||||||||||||
Consumer Discretionary | $ | 0 | $ | 49 | $ | 0 | $ | 49 | ||||||||
Consumer Staples | 0 | 260 | 0 | 260 | ||||||||||||
Energy | 0 | 150 | 0 | 150 | ||||||||||||
Financials | 0 | 225 | 0 | 225 | ||||||||||||
Health Care | 0 | 157 | 0 | 157 | ||||||||||||
Industrials | 0 | 131 | 0 | 131 | ||||||||||||
Information Technology | 9 | 33 | 0 | 42 | ||||||||||||
Materials | 0 | 414 | 0 | 414 | ||||||||||||
Real Estate | 0 | 10 | 0 | 10 | ||||||||||||
Telecommunication Services | 0 | 70 | 0 | 70 | ||||||||||||
Utilities | 0 | 10 | 0 | 10 | ||||||||||||
Austria | ||||||||||||||||
Energy | 0 | 42 | 0 | 42 | ||||||||||||
Financials | 0 | 27 | 0 | 27 | ||||||||||||
Industrials | 0 | 18 | 0 | 18 | ||||||||||||
Information Technology | 0 | 7 | 0 | 7 | ||||||||||||
Materials | 0 | 19 | 0 | 19 | ||||||||||||
Real Estate | 11 | 0 | 0 | 11 | ||||||||||||
Belgium | ||||||||||||||||
Consumer Staples | 15 | 75 | 0 | 90 | ||||||||||||
Energy | 0 | 11 | 0 | 11 | ||||||||||||
Financials | 0 | 61 | 0 | 61 | ||||||||||||
Health Care | 0 | 13 | 0 | 13 | ||||||||||||
Industrials | 8 | 0 | 0 | 8 | ||||||||||||
Materials | 0 | 28 | 0 | 28 | ||||||||||||
Telecommunication Services | 0 | 14 | 0 | 14 | ||||||||||||
Utilities | 0 | 11 | 0 | 11 | ||||||||||||
Cambodia | ||||||||||||||||
Consumer Discretionary | 0 | 9 | 0 | 9 | ||||||||||||
Canada | ||||||||||||||||
Consumer Discretionary | 323 | 0 | 0 | 323 | ||||||||||||
Consumer Staples | 148 | 0 | 0 | 148 | ||||||||||||
| Category and Subcategory | Level 1 | Level 2 | Level 3 | Fair Value at 06/30/2018 | ||||||||||||
Energy | $ | 309 | $ | 0 | $ | 0 | $ | 309 | ||||||||
Financials | 293 | 0 | 0 | 293 | ||||||||||||
Health Care | 9 | 0 | 0 | 9 | ||||||||||||
Industrials | 236 | 0 | 0 | 236 | ||||||||||||
Information Technology | 67 | 0 | 0 | 67 | ||||||||||||
Materials | 183 | 0 | 0 | 183 | ||||||||||||
Real Estate | 9 | 0 | 0 | 9 | ||||||||||||
Telecommunication Services | 78 | 0 | 0 | 78 | ||||||||||||
Utilities | 48 | 0 | 0 | 48 | ||||||||||||
Denmark | ||||||||||||||||
Consumer Discretionary | 0 | 10 | 0 | 10 | ||||||||||||
Consumer Staples | 0 | 40 | 0 | 40 | ||||||||||||
Financials | 0 | 17 | 0 | 17 | ||||||||||||
Health Care | 0 | 161 | 0 | 161 | ||||||||||||
Industrials | 0 | 98 | 0 | 98 | ||||||||||||
Materials | 0 | 41 | 0 | 41 | ||||||||||||
Utilities | 0 | 12 | 0 | 12 | ||||||||||||
Faroe Islands | ||||||||||||||||
Consumer Staples | 0 | 8 | 0 | 8 | ||||||||||||
Finland | ||||||||||||||||
Consumer Discretionary | 0 | 8 | 0 | 8 | ||||||||||||
Consumer Staples | 0 | 20 | 0 | 20 | ||||||||||||
Energy | 0 | 29 | 0 | 29 | ||||||||||||
Financials | 0 | 27 | 0 | 27 | ||||||||||||
Health Care | 0 | 9 | 0 | 9 | ||||||||||||
Industrials | 0 | 81 | 0 | 81 | ||||||||||||
Information Technology | 0 | 9 | 0 | 9 | ||||||||||||
Materials | 0 | 59 | 0 | 59 | ||||||||||||
Telecommunication Services | 0 | 23 | 0 | 23 | ||||||||||||
Utilities | 0 | 43 | 0 | 43 | ||||||||||||
France | ||||||||||||||||
Consumer Discretionary | 0 | 483 | 0 | 483 | ||||||||||||
Consumer Staples | 0 | 244 | 0 | 244 | ||||||||||||
Energy | 0 | 225 | 0 | 225 | ||||||||||||
Financials | 0 | 60 | 0 | 60 | ||||||||||||
| 40 | PIMCO EQUITY SERIES | See Accompanying Notes |
Table of Contents
June 30, 2018
| Category and Subcategory | Level 1 | Level 2 | Level 3 | Fair Value at 06/30/2018 | ||||||||||||
Health Care | $ | 0 | $ | 39 | $ | 0 | $ | 39 | ||||||||
Industrials | 10 | 509 | 0 | 519 | ||||||||||||
Information Technology | 9 | 99 | 0 | 108 | ||||||||||||
Materials | 0 | 17 | 0 | 17 | ||||||||||||
Real Estate | 0 | 12 | 0 | 12 | ||||||||||||
Telecommunication Services | 0 | 149 | 0 | 149 | ||||||||||||
Utilities | 0 | 249 | 0 | 249 | ||||||||||||
Germany | ||||||||||||||||
Consumer Discretionary | 0 | 284 | 0 | 284 | ||||||||||||
Consumer Staples | 0 | 33 | 0 | 33 | ||||||||||||
Financials | 0 | 260 | 0 | 260 | ||||||||||||
Health Care | 8 | 108 | 0 | 116 | ||||||||||||
Industrials | 0 | 213 | 0 | 213 | ||||||||||||
Information Technology | 0 | 190 | 0 | 190 | ||||||||||||
Materials | 0 | 195 | 0 | 195 | ||||||||||||
Real Estate | 0 | 122 | 0 | 122 | ||||||||||||
Telecommunication Services | 0 | 19 | 0 | 19 | ||||||||||||
Utilities | 0 | 215 | 0 | 215 | ||||||||||||
Hong Kong | ||||||||||||||||
Consumer Discretionary | 21 | 98 | 0 | 119 | ||||||||||||
Consumer Staples | 0 | 34 | 0 | 34 | ||||||||||||
Financials | 0 | 126 | 0 | 126 | ||||||||||||
Health Care | 0 | 36 | 0 | 36 | ||||||||||||
Industrials | 15 | 75 | 0 | 90 | ||||||||||||
Information Technology | 0 | 27 | 0 | 27 | ||||||||||||
Materials | 0 | 8 | 0 | 8 | ||||||||||||
Real Estate | 0 | 149 | 0 | 149 | ||||||||||||
Telecommunication Services | 0 | 28 | 0 | 28 | ||||||||||||
Utilities | 7 | 103 | 0 | 110 | ||||||||||||
Ireland | ||||||||||||||||
Consumer Discretionary | 0 | 12 | 0 | 12 | ||||||||||||
Consumer Staples | 55 | 0 | 0 | 55 | ||||||||||||
Health Care | 174 | 9 | 0 | 183 | ||||||||||||
Industrials | 31 | 20 | 0 | 51 | ||||||||||||
Materials | 9 | 27 | 0 | 36 | ||||||||||||
Israel | ||||||||||||||||
Financials | 0 | 69 | 0 | 69 | ||||||||||||
Health Care | 0 | 15 | 0 | 15 | ||||||||||||
Industrials | 0 | 9 | 0 | 9 | ||||||||||||
Information Technology | 15 | 14 | 0 | 29 | ||||||||||||
Materials | 0 | 21 | 0 | 21 | ||||||||||||
Telecommunication Services | 0 | 12 | 0 | 12 | ||||||||||||
Italy | ||||||||||||||||
Consumer Discretionary | 0 | 79 | 0 | 79 | ||||||||||||
Consumer Staples | 0 | 9 | 0 | 9 | ||||||||||||
Energy | 0 | 247 | 0 | 247 | ||||||||||||
Financials | 0 | 139 | 0 | 139 | ||||||||||||
Health Care | 0 | 21 | 0 | 21 | ||||||||||||
Industrials | 0 | 46 | 0 | 46 | ||||||||||||
Telecommunication Services | 0 | 31 | 0 | 31 | ||||||||||||
Utilities | 0 | 177 | 0 | 177 | ||||||||||||
Japan | ||||||||||||||||
Consumer Discretionary | 0 | 1,563 | 0 | 1,563 | ||||||||||||
Consumer Staples | 0 | 781 | 0 | 781 | ||||||||||||
Energy | 0 | 260 | 0 | 260 | ||||||||||||
Financials | 0 | 154 | 0 | 154 | ||||||||||||
Health Care | 0 | 549 | 0 | 549 | ||||||||||||
Industrials | 0 | 1,665 | 0 | 1,665 | ||||||||||||
Information Technology | 0 | 832 | 0 | 832 | ||||||||||||
Materials | 0 | 509 | 0 | 509 | ||||||||||||
Real Estate | 0 | 62 | 0 | 62 | ||||||||||||
Telecommunication Services | 0 | 310 | 0 | 310 | ||||||||||||
Utilities | 0 | 336 | 0 | 336 | ||||||||||||
Luxembourg | ||||||||||||||||
Consumer Discretionary | 0 | 33 | 0 | 33 | ||||||||||||
Materials | 0 | 104 | 0 | 104 | ||||||||||||
Real Estate | 0 | 27 | 0 | 27 | ||||||||||||
Macau | ||||||||||||||||
Consumer Discretionary | 0 | 54 | 0 | 54 | ||||||||||||
Netherlands | ||||||||||||||||
Consumer Staples | 0 | 242 | 0 | 242 | ||||||||||||
| Category and Subcategory | Level 1 | Level 2 | Level 3 | Fair Value at 06/30/2018 | ||||||||||||
Energy | $ | 16 | $ | 419 | $ | 0 | $ | 435 | ||||||||
Financials | 0 | 164 | 0 | 164 | ||||||||||||
Health Care | 0 | 36 | 0 | 36 | ||||||||||||
Industrials | 10 | 93 | 0 | 103 | ||||||||||||
Information Technology | 33 | 97 | 0 | 130 | ||||||||||||
Materials | 0 | 94 | 0 | 94 | ||||||||||||
Telecommunication Services | 10 | 23 | 0 | 33 | ||||||||||||
New Zealand | ||||||||||||||||
Consumer Discretionary | 0 | 9 | 0 | 9 | ||||||||||||
Health Care | 0 | 19 | 0 | 19 | ||||||||||||
Materials | 0 | 17 | 0 | 17 | ||||||||||||
Telecommunication Services | 0 | 29 | 0 | 29 | ||||||||||||
Utilities | 10 | 8 | 0 | 18 | ||||||||||||
Norway | ||||||||||||||||
Consumer Staples | 0 | 55 | 0 | 55 | ||||||||||||
Energy | 9 | 204 | 0 | 213 | ||||||||||||
Financials | 0 | 50 | 0 | 50 | ||||||||||||
Industrials | 8 | 0 | 0 | 8 | ||||||||||||
Materials | 0 | 50 | 0 | 50 | ||||||||||||
Telecommunication Services | 0 | 59 | 0 | 59 | ||||||||||||
Portugal | ||||||||||||||||
Consumer Staples | 0 | 22 | 0 | 22 | ||||||||||||
Financials | 0 | 8 | 0 | 8 | ||||||||||||
Industrials | 0 | 7 | 0 | 7 | ||||||||||||
Materials | 0 | 11 | 0 | 11 | ||||||||||||
Utilities | 0 | 69 | 0 | 69 | ||||||||||||
Singapore | ||||||||||||||||
Consumer Discretionary | 8 | 18 | 0 | 26 | ||||||||||||
Consumer Staples | 0 | 29 | 0 | 29 | ||||||||||||
Energy | 0 | 10 | 0 | 10 | ||||||||||||
Financials | 0 | 156 | 0 | 156 | ||||||||||||
Industrials | 0 | 138 | 0 | 138 | ||||||||||||
Information Technology | 0 | 11 | 0 | 11 | ||||||||||||
Real Estate | 0 | 8 | 0 | 8 | ||||||||||||
Telecommunication Services | 0 | 61 | 0 | 61 | ||||||||||||
South Africa | ||||||||||||||||
Financials | 0 | 18 | 0 | 18 | ||||||||||||
Health Care | 0 | 9 | 0 | 9 | ||||||||||||
Spain | ||||||||||||||||
Consumer Discretionary | 0 | 36 | 0 | 36 | ||||||||||||
Consumer Staples | 0 | 39 | 0 | 39 | ||||||||||||
Energy | 0 | 164 | 0 | 164 | ||||||||||||
Financials | 0 | 63 | 0 | 63 | ||||||||||||
Health Care | 0 | 18 | 0 | 18 | ||||||||||||
Industrials | 0 | 105 | 0 | 105 | ||||||||||||
Information Technology | 0 | 71 | 0 | 71 | ||||||||||||
Materials | 0 | 9 | 0 | 9 | ||||||||||||
Telecommunication Services | 0 | 19 | 0 | 19 | ||||||||||||
Utilities | 0 | 223 | 0 | 223 | ||||||||||||
Sweden | ||||||||||||||||
Consumer Discretionary | 51 | 93 | 0 | 144 | ||||||||||||
Consumer Staples | 0 | 53 | 0 | 53 | ||||||||||||
Financials | 0 | 37 | 0 | 37 | ||||||||||||
Industrials | 21 | 223 | 0 | 244 | ||||||||||||
Information Technology | 0 | 213 | 0 | 213 | ||||||||||||
Materials | 0 | 32 | 0 | 32 | ||||||||||||
Telecommunication Services | 0 | 167 | 0 | 167 | ||||||||||||
Switzerland | ||||||||||||||||
Consumer Discretionary | 27 | 110 | 0 | 137 | ||||||||||||
Consumer Staples | 0 | 257 | 0 | 257 | ||||||||||||
Energy | 71 | 0 | 0 | 71 | ||||||||||||
Financials | 0 | 509 | 0 | 509 | ||||||||||||
Health Care | 0 | 331 | 0 | 331 | ||||||||||||
Industrials | 8 | 284 | 0 | 292 | ||||||||||||
Information Technology | 78 | 22 | 0 | 100 | ||||||||||||
Materials | 0 | 328 | 0 | 328 | ||||||||||||
Real Estate | 0 | 25 | 0 | 25 | ||||||||||||
Telecommunication Services | 0 | 60 | 0 | 60 | ||||||||||||
Utilities | 0 | 9 | 0 | 9 | ||||||||||||
Thailand | ||||||||||||||||
Consumer Staples | 0 | 8 | 0 | 8 | ||||||||||||
| See Accompanying Notes | ANNUAL REPORT | JUNE 30, 2018 | 41 |
Table of Contents
Schedule of Investments PIMCO RAFI Dynamic Multi-Factor International Equity ETF (Cont.)
June 30, 2018
| Category and Subcategory | Level 1 | Level 2 | Level 3 | Fair Value at 06/30/2018 | ||||||||||||
United Kingdom | ||||||||||||||||
Consumer Discretionary | $ | 31 | $ | 641 | $ | 0 | $ | 672 | ||||||||
Consumer Staples | 0 | 785 | 0 | 785 | ||||||||||||
Energy | 0 | 493 | 0 | 493 | ||||||||||||
Financials | 16 | 512 | 0 | 528 | ||||||||||||
Health Care | 0 | 264 | 0 | 264 | ||||||||||||
Industrials | 0 | 481 | 0 | 481 | ||||||||||||
Information Technology | 10 | 44 | 0 | 54 | ||||||||||||
Materials | 0 | 350 | 0 | 350 | ||||||||||||
Telecommunication Services | 0 | 244 | 0 | 244 | ||||||||||||
Utilities | 0 | 191 | 0 | 191 | ||||||||||||
United States | ||||||||||||||||
Consumer Discretionary | 0 | 17 | 0 | 17 | ||||||||||||
Materials | 0 | 11 | 0 | 11 | ||||||||||||
Preferred Stocks | ||||||||||||||||
Germany | ||||||||||||||||
Consumer Discretionary | 0 | 10 | 0 | 10 | ||||||||||||
Consumer Staples | 0 | 32 | 0 | 32 | ||||||||||||
Health Care | 0 | 16 | 0 | 16 | ||||||||||||
Industrials | 0 | 147 | 0 | 147 | ||||||||||||
Materials | 0 | 10 | 0 | 10 | ||||||||||||
Real Estate Investment Trusts | ||||||||||||||||
Australia | ||||||||||||||||
Real Estate | 0 | 39 | 0 | 39 | ||||||||||||
Belgium | ||||||||||||||||
Real Estate | 19 | 0 | 0 | 19 | ||||||||||||
| Category and Subcategory | Level 1 | Level 2 | Level 3 | Fair Value at 06/30/2018 | ||||||||||||
Canada | ||||||||||||||||
Real Estate | $ | 107 | $ | 0 | $ | 0 | $ | 107 | ||||||||
France | ||||||||||||||||
Real Estate | 32 | 56 | 0 | 88 | ||||||||||||
Germany | ||||||||||||||||
Real Estate | 0 | 10 | 0 | 10 | ||||||||||||
Hong Kong | ||||||||||||||||
Real Estate | 0 | 36 | 0 | 36 | ||||||||||||
Italy | ||||||||||||||||
Real Estate | 0 | 9 | 0 | 9 | ||||||||||||
Japan | ||||||||||||||||
Real Estate | 0 | 259 | 0 | 259 | ||||||||||||
Singapore | ||||||||||||||||
Real Estate | 0 | 25 | 0 | 25 | ||||||||||||
Spain | ||||||||||||||||
Real Estate | 0 | 9 | 0 | 9 | ||||||||||||
United Kingdom | ||||||||||||||||
Real Estate | 8 | 122 | 0 | 130 | ||||||||||||
Rights | ||||||||||||||||
Spain | ||||||||||||||||
Energy | 3 | 0 | 0 | 3 | ||||||||||||
Industrials | 1 | 0 | 0 | 1 | ||||||||||||
|
|
|
|
|
|
|
| |||||||||
Total Investments | $ | 2,687 | $ | 25,708 | $ | 0 | $ | 28,395 | ||||||||
|
|
|
|
|
|
|
| |||||||||
There were no significant transfers among Levels 1, 2, or 3 during the period ended June 30, 2018.
| 42 | PIMCO EQUITY SERIES | See Accompanying Notes |
Table of Contents
Schedule of Investments PIMCO RAFI Dynamic Multi-Factor U.S. Equity ETF
June 30, 2018
(Amounts in thousands*, except number of shares, contracts and units, if any)
| SHARES | MARKET VALUE (000S) | |||||||||||
| INVESTMENTS IN SECURITIES 98.9% | ||||||||||||
| COMMON STOCKS 94.9% | ||||||||||||
| BERMUDA 0.2% | ||||||||||||
| FINANCIALS 0.2% | ||||||||||||
XL Group Ltd. | 1,857 | $ | 104 | |||||||||
|
| |||||||||||
Total Bermuda | 104 | |||||||||||
|
| |||||||||||
| IRELAND 0.5% | ||||||||||||
| INFORMATION TECHNOLOGY 0.5% | ||||||||||||
Accenture PLC ‘A’ | 2,171 | 355 | ||||||||||
|
| |||||||||||
Total Ireland | 355 | |||||||||||
|
| |||||||||||
| SWITZERLAND 0.1% | ||||||||||||
| FINANCIALS 0.1% | ||||||||||||
Chubb Ltd. | 381 | 48 | ||||||||||
|
| |||||||||||
Total Switzerland | 48 | |||||||||||
|
| |||||||||||
| UNITED STATES 94.1% | ||||||||||||
| CONSUMER DISCRETIONARY 18.4% | ||||||||||||
Aaron’s, Inc. | 298 | 13 | ||||||||||
Abercrombie & Fitch Co. ‘A’ | 2,050 | 50 | ||||||||||
Adient PLC | 796 | 39 | ||||||||||
Adtalem Global Education, Inc. (a) | 625 | 30 | ||||||||||
Advance Auto Parts, Inc. | 157 | 21 | ||||||||||
Amazon.com, Inc. (a) | 523 | 889 | ||||||||||
American Eagle Outfitters, Inc. | 5,089 | 118 | ||||||||||
Aramark | 202 | 8 | ||||||||||
Asbury Automotive Group, Inc. (a) | 271 | 19 | ||||||||||
AutoNation, Inc. (a) | 510 | 25 | ||||||||||
AutoZone, Inc. (a) | 144 | 97 | ||||||||||
Bed Bath & Beyond, Inc. | 5,974 | 119 | ||||||||||
Best Buy Co., Inc. | 2,587 | 193 | ||||||||||
Big Lots, Inc. | 778 | 33 | ||||||||||
Bloomin’ Brands, Inc. | 540 | 11 | ||||||||||
Booking Holdings, Inc. (a) | 11 | 22 | ||||||||||
Bright Horizons Family Solutions, Inc. (a) | 227 | 23 | ||||||||||
Brinker International, Inc. | 2,117 | 101 | ||||||||||
Buckle, Inc. | 747 | 20 | ||||||||||
Cable One, Inc. | 15 | 11 | ||||||||||
Caleres, Inc. | 498 | 17 | ||||||||||
Carter’s, Inc. | 583 | 63 | ||||||||||
CBS Corp. NVDR ‘B’ | 1,919 | 108 | ||||||||||
Cheesecake Factory, Inc. | 935 | 51 | ||||||||||
Chico’s FAS, Inc. | 3,736 | 30 | ||||||||||
Children’s Place, Inc. | 87 | 11 | ||||||||||
Chipotle Mexican Grill, Inc. (a) | 80 | 35 | ||||||||||
Choice Hotels International, Inc. | 182 | 14 | ||||||||||
Churchill Downs, Inc. | 56 | 17 | ||||||||||
Cinemark Holdings, Inc. | 582 | 20 | ||||||||||
Columbia Sportswear Co. | 88 | 8 | ||||||||||
Cooper Tire & Rubber Co. | 1,114 | 29 | ||||||||||
Cooper-Standard Holding, Inc. (a) | 160 | 21 | ||||||||||
Core-Mark Holding Co., Inc. | 783 | 18 | ||||||||||
Cracker Barrel Old Country Store, Inc. | 221 | 35 | ||||||||||
Dana, Inc. | 1,203 | 24 | ||||||||||
Darden Restaurants, Inc. | 351 | 38 | ||||||||||
Deckers Outdoor Corp. (a) | 335 | 38 | ||||||||||
Dick’s Sporting Goods, Inc. | 722 | 25 | ||||||||||
Dillard’s, Inc. ‘A’ | 364 | 34 | ||||||||||
Dine Brands Global, Inc. | 471 | 35 | ||||||||||
| SHARES | MARKET VALUE (000S) | |||||||||||
Discovery, Inc. (a) | 582 | $ | 16 | |||||||||
Dollar General Corp. | 1,959 | 193 | ||||||||||
Dollar Tree, Inc. (a) | 413 | 35 | ||||||||||
Domino’s Pizza, Inc. | 217 | 61 | ||||||||||
Dorman Products, Inc. (a) | 208 | 14 | ||||||||||
DR Horton, Inc. | 629 | 26 | ||||||||||
DSW Inc. ‘A’ | 2,085 | 54 | ||||||||||
Dunkin’ Brands Group, Inc. | 315 | 22 | ||||||||||
Extended Stay America, Inc. | 617 | 13 | ||||||||||
Foot Locker, Inc. | 1,408 | 74 | ||||||||||
Ford Motor Co. | 32,211 | 357 | ||||||||||
Fossil Group, Inc. (a) | 2,818 | 76 | ||||||||||
G-III Apparel Group Ltd. (a) | 524 | 23 | ||||||||||
GameStop Corp. ‘A’ | 2,935 | 43 | ||||||||||
Gannett Co., Inc. | 1,740 | 19 | ||||||||||
Gap, Inc. | 5,372 | 174 | ||||||||||
General Motors Co. | 11,085 | 437 | ||||||||||
Genesco, Inc. (a) | 444 | 18 | ||||||||||
Gentex Corp. | 1,651 | 38 | ||||||||||
Genuine Parts Co. | 305 | 28 | ||||||||||
Goodyear Tire & Rubber Co. | 593 | 14 | ||||||||||
Graham Holdings Co. ‘B’ | 35 | 21 | ||||||||||
Grand Canyon Education, Inc. (a) | 86 | 10 | ||||||||||
Group 1 Automotive, Inc. | 330 | 21 | ||||||||||
Guess?, Inc. | 1,421 | 30 | ||||||||||
H&R Block, Inc. | 1,589 | 36 | ||||||||||
Hanesbrands, Inc. | 1,353 | 30 | ||||||||||
Harley-Davidson, Inc. | 790 | 33 | ||||||||||
Hasbro, Inc. | 90 | 8 | ||||||||||
Hilton Worldwide Holdings, Inc. | 518 | 41 | ||||||||||
Home Depot, Inc. | 4,565 | 891 | ||||||||||
Houghton Mifflin Harcourt Co. (a) | 918 | 7 | ||||||||||
ILG, Inc. | 195 | 6 | ||||||||||
International Game Technology PLC | 818 | 19 | ||||||||||
Interpublic Group of Cos., Inc. | 1,611 | 38 | ||||||||||
Jack in the Box, Inc. | 304 | 26 | ||||||||||
JC Penney Co., Inc. (a) | 4,031 | 9 | ||||||||||
John Wiley & Sons, Inc. ‘A’ | 146 | 9 | ||||||||||
Kohl’s Corp. | 3,570 | 260 | ||||||||||
L Brands, Inc. | 1,360 | 50 | ||||||||||
La-Z-Boy, Inc. | 454 | 14 | ||||||||||
Las Vegas Sands Corp. | 1,642 | 125 | ||||||||||
Lear Corp. | 306 | 57 | ||||||||||
Leggett & Platt, Inc. | 717 | 32 | ||||||||||
Liberty Media Corp-Liberty SiriusXM (a) | 1,464 | 66 | ||||||||||
Live Nation Entertainment, Inc. (a) | 251 | 12 | ||||||||||
Lowe’s Cos., Inc. | 4,484 | 429 | ||||||||||
Macy’s, Inc. | 7,425 | 278 | ||||||||||
Madison Square Garden Co. ‘A’ (a) | 60 | 19 | ||||||||||
Marriott International, Inc. ‘A’ | 763 | 97 | ||||||||||
Marriott Vacations Worldwide Corp. | 104 | 12 | ||||||||||
Mattel, Inc. | 2,764 | 45 | ||||||||||
McDonald’s Corp. | 2,761 | 433 | ||||||||||
MDC Holdings, Inc. | 314 | 10 | ||||||||||
Meritage Homes Corp. (a) | 144 | 6 | ||||||||||
Michaels Cos., Inc. (a) | 497 | 10 | ||||||||||
Murphy USA, Inc. (a) | 760 | 56 | ||||||||||
Netflix, Inc. (a) | 489 | 191 | ||||||||||
New Media Investment Group, Inc. | 451 | 8 | ||||||||||
News Corp. ‘A’ | 4,684 | 73 | ||||||||||
NIKE, Inc. ‘B’ | 4,988 | 397 | ||||||||||
Nordstrom, Inc. | 1,998 | 103 | ||||||||||
NVR, Inc. (a) | 18 | 53 | ||||||||||
O’Reilly Automotive, Inc. (a) | 477 | 131 | ||||||||||
| SHARES | MARKET VALUE (000S) | |||||||||||
Office Depot, Inc. | 7,322 | $ | 19 | |||||||||
Omnicom Group, Inc. | 999 | 76 | ||||||||||
Penn National Gaming, Inc. (a) | 343 | 12 | ||||||||||
Penske Automotive Group, Inc. | 296 | 14 | ||||||||||
Polaris Industries, Inc. | 208 | 25 | ||||||||||
Pool Corp. | 136 | 21 | ||||||||||
PVH Corp. | 136 | 20 | ||||||||||
Qurate Retail, Inc. (a) | 3,455 | 73 | ||||||||||
Ralph Lauren Corp. | 686 | 86 | ||||||||||
Red Rock Resorts, Inc. ‘A’ | 208 | 7 | ||||||||||
Ross Stores, Inc. | 1,328 | 113 | ||||||||||
Sally Beauty Holdings, Inc. (a) | 2,650 | 42 | ||||||||||
Scholastic Corp. | 221 | 10 | ||||||||||
SeaWorld Entertainment, Inc. (a) | 1,561 | 34 | ||||||||||
Service Corp. International | 633 | 23 | ||||||||||
ServiceMaster Global Holdings, Inc. (a) | 439 | 26 | ||||||||||
Shutterfly, Inc. (a) | 110 | 10 | ||||||||||
Signet Jewelers Ltd. | 586 | 33 | ||||||||||
Sinclair Broadcast Group, Inc. ‘A’ | 239 | 8 | ||||||||||
Sirius XM Holdings, Inc. | 3,361 | 23 | ||||||||||
Six Flags Entertainment Corp. | 686 | 48 | ||||||||||
Sleep Number Corp. (a) | 295 | 9 | ||||||||||
Sonic Automotive, Inc. ‘A’ | 390 | 8 | ||||||||||
Sotheby’s (a) | 136 | 7 | ||||||||||
Starbucks Corp. | 1,890 | 92 | ||||||||||
Steven Madden Ltd. | 424 | 23 | ||||||||||
Sturm Ruger & Co., Inc. | 361 | 20 | ||||||||||
Target Corp. | 9,858 | 750 | ||||||||||
TEGNA, Inc. | 1,436 | 16 | ||||||||||
Tempur Sealy International, Inc. (a) | 132 | 6 | ||||||||||
Tenneco, Inc. | 450 | 20 | ||||||||||
Texas Roadhouse, Inc. | 265 | 17 | ||||||||||
Thor Industries, Inc. | 202 | 20 | ||||||||||
Tiffany & Co. | 212 | 28 | ||||||||||
TJX Cos., Inc. | 2,997 | 285 | ||||||||||
Tractor Supply Co. | 695 | 53 | ||||||||||
Tribune Media Co. ‘A’ | 1,003 | 38 | ||||||||||
TripAdvisor, Inc. (a) | 193 | 11 | ||||||||||
Tupperware Brands Corp. | 390 | 16 | ||||||||||
Twenty-First Century Fox, Inc. ‘A’ | 11,015 | 547 | ||||||||||
Ulta Salon Cosmetics & Fragrance, Inc. (a) | 32 | 7 | ||||||||||
Urban Outfitters, Inc. (a) | 1,440 | 64 | ||||||||||
Vail Resorts, Inc. | 148 | 41 | ||||||||||
VF Corp. | 1,488 | 121 | ||||||||||
Viacom, Inc. ‘B’ | 5,630 | 170 | ||||||||||
Vista Outdoor, Inc. (a) | 1,557 | 24 | ||||||||||
Visteon Corp. (a) | 281 | 36 | ||||||||||
Walt Disney Co. | 1,282 | 134 | ||||||||||
Weight Watchers International, Inc. (a) | 329 | 33 | ||||||||||
Wendy’s Co. | 3,705 | 64 | ||||||||||
Williams-Sonoma, Inc. | 983 | 60 | ||||||||||
Wyndham Destinations, Inc. | 352 | 16 | ||||||||||
Wyndham Hotels & Resorts, Inc. | 352 | 21 | ||||||||||
Wynn Resorts Ltd. | 246 | 41 | ||||||||||
Yum! Brands, Inc. | 1,482 | 116 | ||||||||||
|
| |||||||||||
| 12,087 | ||||||||||||
|
| |||||||||||
| CONSUMER STAPLES 9.9% | ||||||||||||
Altria Group, Inc. | 2,990 | 170 | ||||||||||
Archer-Daniels-Midland Co. | 7,215 | 331 | ||||||||||
B&G Foods, Inc. | 276 | 8 | ||||||||||
Boston Beer Co., Inc. ‘A’ (a) | 97 | 29 | ||||||||||
| See Accompanying Notes | ANNUAL REPORT | JUNE 30, 2018 | 43 |
Table of Contents
Schedule of Investments PIMCO RAFI Dynamic Multi-Factor U.S. Equity ETF (Cont.)
| SHARES | MARKET VALUE (000S) | |||||||||||
Brown-Forman Corp. ‘B’ | 1,547 | $ | 76 | |||||||||
Bunge Ltd. | 2,507 | 175 | ||||||||||
Cal-Maine Foods, Inc. (a) | 430 | 20 | ||||||||||
Campbell Soup Co. | 611 | 25 | ||||||||||
Casey’s General Stores, Inc. | 367 | 39 | ||||||||||
Church & Dwight Co., Inc. | 778 | 41 | ||||||||||
Clorox Co. | 279 | 38 | ||||||||||
Coca-Cola Co. | 12,400 | 544 | ||||||||||
Colgate-Palmolive Co. | 2,248 | 146 | ||||||||||
Conagra Brands, Inc. | 924 | 33 | ||||||||||
Constellation Brands, Inc. ‘A’ | 343 | 75 | ||||||||||
Costco Wholesale Corp. | 2,027 | 424 | ||||||||||
Coty, Inc. ‘A’ | 1,049 | 15 | ||||||||||
Dean Foods Co. | 848 | 9 | ||||||||||
Dr Pepper Snapple Group, Inc. | 970 | 118 | ||||||||||
Edgewell Personal Care Co. (a) | 356 | 18 | ||||||||||
Estee Lauder Cos., Inc. ‘A’ | 870 | 124 | ||||||||||
Flowers Foods, Inc. | 1,866 | 39 | ||||||||||
Fresh Del Monte Produce, Inc. | 271 | 12 | ||||||||||
General Mills, Inc. | 2,327 | 103 | ||||||||||
Herbalife Nutrition Ltd. (a) | 712 | 38 | ||||||||||
Hershey Co. | 365 | 34 | ||||||||||
Hormel Foods Corp. | 471 | 17 | ||||||||||
Ingredion, Inc. | 78 | 9 | ||||||||||
J&J Snack Foods Corp. | 60 | 9 | ||||||||||
JM Smucker Co. | 166 | 18 | ||||||||||
Kellogg Co. | 786 | 55 | ||||||||||
Kimberly-Clark Corp. | 803 | 85 | ||||||||||
Kroger Co. | 13,382 | 381 | ||||||||||
Lamb Weston Holdings, Inc. | 686 | 47 | ||||||||||
Lancaster Colony Corp. | 143 | 20 | ||||||||||
McCormick & Co., Inc. | 266 | 31 | ||||||||||
Mondelez International, Inc. ‘A’ | 2,699 | 111 | ||||||||||
Monster Beverage Corp. (a) | 987 | 56 | ||||||||||
Nu Skin Enterprises, Inc. ‘A’ | 743 | 58 | ||||||||||
PepsiCo, Inc. | 4,522 | 492 | ||||||||||
Performance Food Group Co. (a) | 763 | 28 | ||||||||||
Philip Morris International, Inc. | 5,044 | 407 | ||||||||||
Pinnacle Foods, Inc. | 392 | 25 | ||||||||||
Procter & Gamble Co. | 2,900 | 226 | ||||||||||
Sanderson Farms, Inc. | 400 | 42 | ||||||||||
Spectrum Brands Holdings, Inc. | 77 | 6 | ||||||||||
Sprouts Farmers Market, Inc. (a) | 808 | 18 | ||||||||||
Sysco Corp. | 2,285 | 156 | ||||||||||
TreeHouse Foods, Inc. (a) | 385 | 20 | ||||||||||
Tyson Foods, Inc. ‘A’ | 928 | 64 | ||||||||||
U.S. Foods Holding Corp. (a) | 1,034 | 39 | ||||||||||
United Natural Foods, Inc. (a) | 676 | 29 | ||||||||||
Universal Corp. | 325 | 21 | ||||||||||
USANA Health Sciences, Inc. (a) | 88 | 10 | ||||||||||
Vector Group Ltd. | 723 | 14 | ||||||||||
Wal-Mart Stores, Inc. | 15,342 | 1,314 | ||||||||||
Weis Markets, Inc. | 136 | 7 | ||||||||||
|
| |||||||||||
| 6,499 | ||||||||||||
|
| |||||||||||
| ENERGY 11.9% | ||||||||||||
Anadarko Petroleum Corp. | 914 | 67 | ||||||||||
Andeavor | 1,265 | 166 | ||||||||||
Apache Corp. | 828 | 39 | ||||||||||
Archrock, Inc. | 879 | 11 | ||||||||||
Chevron Corp. | 10,665 | 1,348 | ||||||||||
CNX Resources Corp. (a) | 1,793 | 32 | ||||||||||
ConocoPhillips | 12,583 | 876 | ||||||||||
Continental Resources, Inc. (a) | 162 | 10 | ||||||||||
| SHARES | MARKET VALUE (000S) | |||||||||||
Devon Energy Corp. | 906 | $ | 40 | |||||||||
Diamond Offshore Drilling, Inc. (a) | 1,727 | 36 | ||||||||||
Diamondback Energy, Inc. | 181 | 24 | ||||||||||
Dril-Quip, Inc. (a) | 440 | 23 | ||||||||||
Energen Corp. (a) | 180 | 13 | ||||||||||
EOG Resources, Inc. | 1,025 | 127 | ||||||||||
Exterran Corp. (a) | 222 | 6 | ||||||||||
Exxon Mobil Corp. | 10,597 | 877 | ||||||||||
Forum Energy Technologies, Inc. (a) | 555 | 7 | ||||||||||
Green Plains, Inc. | 772 | 14 | ||||||||||
Halliburton Co. | 1,447 | 65 | ||||||||||
Helix Energy Solutions Group, Inc. (a) | 1,230 | 10 | ||||||||||
Helmerich & Payne, Inc. | 531 | 34 | ||||||||||
Hess Corp. | 4,929 | 330 | ||||||||||
HollyFrontier Corp. | 5,090 | 348 | ||||||||||
Marathon Oil Corp. | 13,835 | 289 | ||||||||||
Marathon Petroleum Corp. | 6,294 | 442 | ||||||||||
McDermott International, Inc. (a) | 793 | 16 | ||||||||||
Murphy Oil Corp. | 3,240 | 109 | ||||||||||
Nabors Industries Ltd. | 5,350 | 34 | ||||||||||
National Oilwell Varco, Inc. | 5,290 | 230 | ||||||||||
Noble Energy, Inc. | 851 | 30 | ||||||||||
Oasis Petroleum, Inc. (a) | 1,599 | 21 | ||||||||||
Occidental Petroleum Corp. | 2,619 | 219 | ||||||||||
Oceaneering International, Inc. | 1,769 | 45 | ||||||||||
Oil States International, Inc. (a) | 871 | 28 | ||||||||||
ONEOK, Inc. | 1,182 | 82 | ||||||||||
Patterson-UTI Energy, Inc. | 837 | 15 | ||||||||||
PBF Energy, Inc. ‘A’ | 1,619 | 68 | ||||||||||
PDC Energy, Inc. (a) | 122 | 7 | ||||||||||
Peabody Energy Corp. | 780 | 35 | ||||||||||
Phillips 66 | 5,090 | 572 | ||||||||||
Pioneer Natural Resources Co. | 301 | 57 | ||||||||||
QEP Resources, Inc. (a) | 3,645 | 45 | ||||||||||
Rowan Cos. PLC ‘A’ (a) | 2,765 | 45 | ||||||||||
RSP Permian, Inc. (a) | 239 | 10 | ||||||||||
SEACOR Holdings, Inc. (a) | 254 | 14 | ||||||||||
SM Energy Co. | 1,503 | 39 | ||||||||||
Superior Energy Services, Inc. (a) | 3,288 | 32 | ||||||||||
Unit Corp. (a) | 408 | 10 | ||||||||||
Valero Energy Corp. | 6,354 | 704 | ||||||||||
Whiting Petroleum Corp. (a) | 1,554 | 82 | ||||||||||
World Fuel Services Corp. | 1,506 | 31 | ||||||||||
WPX Energy, Inc. (a) | 739 | 13 | ||||||||||
|
| |||||||||||
| 7,827 | ||||||||||||
|
| |||||||||||
| FINANCIALS 7.1% | ||||||||||||
Affiliated Managers Group, Inc. | 114 | 17 | ||||||||||
Aflac, Inc. | 2,470 | 106 | ||||||||||
Alleghany Corp. | 20 | 12 | ||||||||||
Allstate Corp. | 1,081 | 99 | ||||||||||
Ally Financial, Inc. | 5,560 | 146 | ||||||||||
Ambac Financial Group, Inc. (a) | 692 | 14 | ||||||||||
American Equity Investment Life Holding Co. | 325 | 12 | ||||||||||
American Express Co. | 1,256 | 123 | ||||||||||
American Financial Group, Inc. | 79 | 9 | ||||||||||
American International Group, Inc. | 11,075 | 587 | ||||||||||
American National Insurance Co. | 77 | 9 | ||||||||||
AmTrust Financial Services, Inc. | 686 | 10 | ||||||||||
Arthur J Gallagher & Co. | 452 | 30 | ||||||||||
Assurant, Inc. | 530 | 55 | ||||||||||
BankUnited, Inc. | 196 | 8 | ||||||||||
Berkshire Hathaway, Inc. ‘B’ (a) | 3,447 | 643 | ||||||||||
| SHARES | MARKET VALUE (000S) | |||||||||||
BlackRock, Inc. | 205 | $ | 102 | |||||||||
Brighthouse Financial, Inc. (a) | 355 | 14 | ||||||||||
Brown & Brown, Inc. | 1,278 | 35 | ||||||||||
Capital One Financial Corp. | 756 | 70 | ||||||||||
Capitol Federal Financial, Inc. | 583 | 8 | ||||||||||
CBOE Holdings, Inc. | 326 | 34 | ||||||||||
Charles Schwab Corp. | 2,155 | 110 | ||||||||||
Cincinnati Financial Corp. | 161 | 11 | ||||||||||
CIT Group, Inc. | 420 | 21 | ||||||||||
CME Group, Inc. | 831 | 136 | ||||||||||
CNO Financial Group, Inc. | 1,476 | 28 | ||||||||||
Comerica, Inc. | 304 | 28 | ||||||||||
Credit Acceptance Corp. (a) | 25 | 9 | ||||||||||
Discover Financial Services | 526 | 37 | ||||||||||
E*TRADE Financial Corp. (a) | 490 | 30 | ||||||||||
Evercore, Inc. ‘A’ | 96 | 10 | ||||||||||
FactSet Research Systems, Inc. | 146 | 29 | ||||||||||
Federated Investors, Inc. ‘B’ | 571 | 13 | ||||||||||
First American Financial Corp. | 816 | 42 | ||||||||||
FirstCash, Inc. | 218 | 20 | ||||||||||
FNF Group | 686 | 26 | ||||||||||
Franklin Resources, Inc. | 1,198 | 38 | ||||||||||
Genworth Financial, Inc. ‘A’ (a) | 5,836 | 26 | ||||||||||
Hanover Insurance Group, Inc. | 286 | 34 | ||||||||||
Hartford Financial Services Group, Inc. | 573 | 29 | ||||||||||
Infinity Property & Casualty Corp. | 77 | 11 | ||||||||||
Interactive Brokers Group, Inc. ‘A’ | 162 | 10 | ||||||||||
Intercontinental Exchange, Inc. | 251 | 18 | ||||||||||
Kemper Corp. | 414 | 31 | ||||||||||
Legg Mason, Inc. | 967 | 34 | ||||||||||
Loews Corp. | 2,361 | 114 | ||||||||||
LPL Financial Holdings, Inc. | 899 | 59 | ||||||||||
Markel Corp. (a) | 9 | 10 | ||||||||||
Marsh & McLennan Cos., Inc. | 1,324 | 109 | ||||||||||
MBIA, Inc. (a) | 2,205 | 20 | ||||||||||
Mercury General Corp. | 226 | 10 | ||||||||||
Moody’s Corp. | 478 | 82 | ||||||||||
Morningstar, Inc. | 123 | 16 | ||||||||||
MSCI, Inc. | 375 | 62 | ||||||||||
Nasdaq, Inc. | 295 | 27 | ||||||||||
National General Holdings Corp. | 357 | 9 | ||||||||||
Navient Corp. | 4,442 | 58 | ||||||||||
New York Community Bancorp, Inc. | 742 | 8 | ||||||||||
Old Republic International Corp. | 1,184 | 24 | ||||||||||
PRA Group, Inc. (a) | 299 | 12 | ||||||||||
Primerica, Inc. | 79 | 8 | ||||||||||
ProAssurance Corp. | 405 | 14 | ||||||||||
Progressive Corp. | 1,602 | 95 | ||||||||||
S&P Global, Inc. | 732 | 149 | ||||||||||
Santander Consumer USA Holdings, Inc. | 1,172 | 22 | ||||||||||
SEI Investments Co. | 679 | 42 | ||||||||||
SLM Corp. (a) | 789 | 9 | ||||||||||
Stewart Information Services Corp. | 309 | 13 | ||||||||||
SVB Financial Group (a) | 98 | 28 | ||||||||||
T Rowe Price Group, Inc. | 1,145 | 133 | ||||||||||
TCF Financial Corp. | 277 | 7 | ||||||||||
TD Ameritrade Holding Corp. | 525 | 29 | ||||||||||
Travelers Cos., Inc. | 2,810 | 344 | ||||||||||
Umpqua Holdings Corp. | 406 | 9 | ||||||||||
Voya Financial, Inc. | 2,142 | 101 | ||||||||||
Waddell & Reed Financial, Inc. ‘A’ | 1,529 | 27 | ||||||||||
White Mountains Insurance Group Ltd. | 42 | 38 | ||||||||||
| 44 | PIMCO EQUITY SERIES | See Accompanying Notes |
Table of Contents
June 30, 2018
| SHARES | MARKET VALUE (000S) | |||||||||||
World Acceptance Corp. (a) | 128 | $ | 14 | |||||||||
WR Berkley Corp. | 123 | 9 | ||||||||||
|
| |||||||||||
| 4,635 | ||||||||||||
|
| |||||||||||
| HEALTH CARE 9.8% | ||||||||||||
Abbott Laboratories | 3,094 | 189 | ||||||||||
AbbVie, Inc. | 3,880 | 360 | ||||||||||
Aetna, Inc. | 580 | 106 | ||||||||||
Align Technology, Inc. (a) | 139 | 48 | ||||||||||
AmerisourceBergen Corp. | 116 | 10 | ||||||||||
Anthem, Inc. | 2,111 | 503 | ||||||||||
Baxter International, Inc. | 1,691 | 125 | ||||||||||
Becton Dickinson and Co. | 601 | 144 | ||||||||||
Bio-Rad Laboratories, Inc. ‘A’ (a) | 110 | 32 | ||||||||||
Bio-Techne Corp. | 68 | 10 | ||||||||||
Biogen, Inc. (a) | 168 | 49 | ||||||||||
Brookdale Senior Living, Inc. (a) | 1,097 | 10 | ||||||||||
Bruker Corp. | 239 | 7 | ||||||||||
Cardinal Health, Inc. | 2,929 | 143 | ||||||||||
Catalent, Inc. (a) | 209 | 9 | ||||||||||
Centene Corp. (a) | 352 | 43 | ||||||||||
Chemed Corp. | 166 | 53 | ||||||||||
Cigna Corp. | 148 | 25 | ||||||||||
Cooper Cos., Inc. | 104 | 25 | ||||||||||
CVS Health Corp. | 12,769 | 822 | ||||||||||
Danaher Corp. | 1,433 | 141 | ||||||||||
DaVita, Inc. (a) | 176 | 12 | ||||||||||
Dentsply Sirona, Inc. | 100 | 4 | ||||||||||
Diplomat Pharmacy, Inc. (a) | 393 | 10 | ||||||||||
Edwards Lifesciences Corp. (a) | 372 | 54 | ||||||||||
Encompass Health Corp. | 311 | 21 | ||||||||||
Express Scripts Holding Co. (a) | 7,233 | 559 | ||||||||||
Gilead Sciences, Inc. | 3,896 | 276 | ||||||||||
HCA Healthcare, Inc. | 482 | 49 | ||||||||||
Henry Schein, Inc. (a) | 172 | 13 | ||||||||||
Humana, Inc. | 434 | 129 | ||||||||||
Illumina, Inc. (a) | 303 | 85 | ||||||||||
Intuitive Surgical, Inc. (a) | 230 | 110 | ||||||||||
IQVIA Holdings, Inc. (a) | 354 | 35 | ||||||||||
Johnson & Johnson | 4,706 | 571 | ||||||||||
Kindred Healthcare, Inc. (a) | 1,497 | 14 | ||||||||||
Laboratory Corp. of America Holdings (a) | 68 | 12 | ||||||||||
LifePoint Health, Inc. (a) | 631 | 31 | ||||||||||
Magellan Health, Inc. (a) | 332 | 32 | ||||||||||
Mallinckrodt PLC (a) | 573 | 11 | ||||||||||
Masimo Corp. (a) | 93 | 9 | ||||||||||
McKesson Corp. | 407 | 54 | ||||||||||
MEDNAX, Inc. (a) | 633 | 27 | ||||||||||
Merck & Co., Inc. | 1,635 | 99 | ||||||||||
Mettler-Toledo International, Inc. (a) | 50 | 29 | ||||||||||
Molina Healthcare, Inc. (a) | 106 | 10 | ||||||||||
Myriad Genetics, Inc. (a) | 942 | 35 | ||||||||||
Owens & Minor, Inc. | 1,517 | 25 | ||||||||||
Patterson Cos., Inc. | 532 | 12 | ||||||||||
Quest Diagnostics, Inc. | 176 | 19 | ||||||||||
ResMed, Inc. | 968 | 100 | ||||||||||
Select Medical Holdings Corp. (a) | 844 | 15 | ||||||||||
Stryker Corp. | 692 | 117 | ||||||||||
Teleflex, Inc. | 176 | 47 | ||||||||||
Tenet Healthcare Corp. (a) | 2,748 | 92 | ||||||||||
Thermo Fisher Scientific, Inc. | 714 | 148 | ||||||||||
United Therapeutics Corp. (a) | 217 | 25 | ||||||||||
UnitedHealth Group, Inc. | 1,682 | 413 | ||||||||||
| SHARES | MARKET VALUE (000S) | |||||||||||
Valeant Pharmaceuticals International, Inc. (a) | 3,425 | $ | 80 | |||||||||
Varian Medical Systems, Inc. (a) | 306 | 35 | ||||||||||
Waters Corp. (a) | 43 | 8 | ||||||||||
WellCare Health Plans, Inc. (a) | 83 | 20 | ||||||||||
Zoetis, Inc. | 1,389 | 118 | ||||||||||
|
| |||||||||||
| 6,419 | ||||||||||||
|
| |||||||||||
| INDUSTRIALS 11.5% | ||||||||||||
3M Co. | 1,782 | 351 | ||||||||||
AAR Corp. | 308 | 14 | ||||||||||
ABM Industries, Inc. | 1,061 | 31 | ||||||||||
ACCO Brands Corp. | 626 | 9 | ||||||||||
Actuant Corp. ‘A’ | 644 | 19 | ||||||||||
AECOM (a) | 235 | 8 | ||||||||||
AGCO Corp. | 572 | 35 | ||||||||||
Air Lease Corp. | 174 | 7 | ||||||||||
Aircastle Ltd. | 411 | 8 | ||||||||||
Alaska Air Group, Inc. | 171 | 10 | ||||||||||
Allegiant Travel Co. | 76 | 11 | ||||||||||
Allison Transmission Holdings, Inc. | 894 | 36 | ||||||||||
AMERCO | 27 | 10 | ||||||||||
American Airlines Group, Inc. | 2,470 | 94 | ||||||||||
AMETEK, Inc. | 405 | 29 | ||||||||||
AO Smith Corp. | 343 | 20 | ||||||||||
Applied Industrial Technologies, Inc. | 266 | 19 | ||||||||||
ArcBest Corp. | 423 | 19 | ||||||||||
Armstrong World Industries, Inc. (a) | 184 | 12 | ||||||||||
ASGN, Inc. (a) | 90 | 7 | ||||||||||
Atlas Air Worldwide Holdings, Inc. (a) | 284 | 20 | ||||||||||
Avis Budget Group, Inc. (a) | 1,594 | 52 | ||||||||||
Boeing Co. | 2,022 | 678 | ||||||||||
Briggs & Stratton Corp. | 435 | 8 | ||||||||||
BWX Technologies, Inc. | 663 | 41 | ||||||||||
Carlisle Cos., Inc. | 112 | 12 | ||||||||||
Caterpillar, Inc. | 1,062 | 144 | ||||||||||
CH Robinson Worldwide, Inc. | 992 | 83 | ||||||||||
Cintas Corp. | 388 | 72 | ||||||||||
Copart, Inc. (a) | 1,585 | 90 | ||||||||||
CoStar Group, Inc. (a) | 67 | 28 | ||||||||||
Covanta Holding Corp. | 1,144 | 19 | ||||||||||
Crane Co. | 149 | 12 | ||||||||||
Cummins, Inc. | 629 | 84 | ||||||||||
Curtiss-Wright Corp. | 199 | 24 | ||||||||||
Deere & Co. | 2,428 | 339 | ||||||||||
Delta Air Lines, Inc. | 388 | 19 | ||||||||||
Deluxe Corp. | 254 | 17 | ||||||||||
Donaldson Co., Inc. | 460 | 21 | ||||||||||
Dun & Bradstreet Corp. | 110 | 14 | ||||||||||
Emerson Electric Co. | 2,935 | 203 | ||||||||||
Expeditors International of Washington, Inc. | 1,210 | 88 | ||||||||||
Fastenal Co. | 1,164 | 56 | ||||||||||
FedEx Corp. | 439 | 100 | ||||||||||
Flowserve Corp. | 491 | 20 | ||||||||||
Fluor Corp. | 1,896 | 93 | ||||||||||
Fortive Corp. | 731 | 56 | ||||||||||
Fortune Brands Home & Security, Inc. | 156 | 8 | ||||||||||
FTI Consulting, Inc. (a) | 403 | 24 | ||||||||||
GATX Corp. | 349 | 26 | ||||||||||
Generac Holdings, Inc. (a) | 511 | 26 | ||||||||||
General Dynamics Corp. | 721 | 134 | ||||||||||
General Electric Co. | 12,733 | 173 | ||||||||||
Graco, Inc. | 616 | 28 | ||||||||||
| SHARES | MARKET VALUE (000S) | |||||||||||
Greenbrier Cos., Inc. | 546 | $ | 29 | |||||||||
H&E Equipment Services, Inc. | 485 | 18 | ||||||||||
Harris Corp. | 248 | 36 | ||||||||||
HD Supply Holdings, Inc. (a) | 752 | 32 | ||||||||||
Healthcare Services Group, Inc. | 426 | 18 | ||||||||||
HEICO Corp. | 178 | 13 | ||||||||||
Herman Miller, Inc. | 328 | 11 | ||||||||||
Hertz Global Holdings, Inc. (a) | 2,225 | 34 | ||||||||||
Hexcel Corp. | 502 | 33 | ||||||||||
Hillenbrand, Inc. | 284 | 13 | ||||||||||
HNI Corp. | 272 | 10 | ||||||||||
Honeywell International, Inc. | 1,324 | 191 | ||||||||||
Hub Group, Inc. ‘A’ (a) | 441 | 22 | ||||||||||
Hubbell, Inc. | 151 | 16 | ||||||||||
Huntington Ingalls Industries, Inc. | 224 | 49 | ||||||||||
IDEX Corp. | 311 | 42 | ||||||||||
Illinois Tool Works, Inc. | 854 | 118 | ||||||||||
ITT, Inc. | 444 | 23 | ||||||||||
Jacobs Engineering Group, Inc. | 895 | 57 | ||||||||||
JB Hunt Transport Services, Inc. | 419 | 51 | ||||||||||
Kaman Corp. | 227 | 16 | ||||||||||
KAR Auction Services, Inc. | 749 | 41 | ||||||||||
KBR, Inc. | 2,465 | 44 | ||||||||||
Kelly Services, Inc. ‘A’ | 346 | 8 | ||||||||||
Kirby Corp. (a) | 100 | 8 | ||||||||||
KLX, Inc. (a) | 89 | 6 | ||||||||||
Knight-Swift Transportation Holdings, Inc. | 200 | 8 | ||||||||||
L3 Technologies, Inc. | 139 | 27 | ||||||||||
Landstar System, Inc. | 450 | 49 | ||||||||||
Lennox International, Inc. | 161 | 32 | ||||||||||
Lincoln Electric Holdings, Inc. | 353 | 31 | ||||||||||
Lockheed Martin Corp. | 1,030 | 304 | ||||||||||
Macquarie Infrastructure Corp. | 448 | 19 | ||||||||||
ManpowerGroup, Inc. | 581 | 50 | ||||||||||
Masco Corp. | 666 | 25 | ||||||||||
Masonite International Corp. (a) | 146 | 11 | ||||||||||
Moog, Inc. ‘A’ | 162 | 13 | ||||||||||
MRC Global, Inc. (a) | 1,020 | 22 | ||||||||||
MSC Industrial Direct Co., Inc. ‘A’ | 593 | 50 | ||||||||||
Mueller Industries, Inc. | 399 | 12 | ||||||||||
Neilsen Holdings PLC | 123 | 4 | ||||||||||
Nordson Corp. | 155 | 20 | ||||||||||
Northrop Grumman Corp. | 984 | 303 | ||||||||||
NOW, Inc. (a) | 1,914 | 26 | ||||||||||
Old Dominion Freight Line, Inc. | 229 | 34 | ||||||||||
Oshkosh Corp. | 109 | 8 | ||||||||||
Parker-Hannifin Corp. | 296 | 46 | ||||||||||
Pitney Bowes, Inc. | 2,807 | 24 | ||||||||||
Quad/Graphics, Inc. | 455 | 10 | ||||||||||
Quanta Services, Inc. (a) | 1,212 | 41 | ||||||||||
Raytheon Co. | 768 | 148 | ||||||||||
Republic Services, Inc. | 211 | 14 | ||||||||||
Robert Half International, Inc. | 694 | 45 | ||||||||||
Rockwell Automation, Inc. | 235 | 39 | ||||||||||
Rockwell Collins, Inc. | 687 | 93 | ||||||||||
Rollins, Inc. | 482 | 25 | ||||||||||
Roper Technologies, Inc. | 179 | 49 | ||||||||||
Rush Enterprises, Inc. ‘A’ (a) | 314 | 14 | ||||||||||
Ryder System, Inc. | 521 | 37 | ||||||||||
SkyWest, Inc. | 356 | 19 | ||||||||||
Snap-on, Inc. | 62 | 10 | ||||||||||
Southwest Airlines Co. | 198 | 10 | ||||||||||
Spirit AeroSystems Holdings, Inc. ‘A’ | 658 | 57 | ||||||||||
SPX FLOW, Inc. (a) | 390 | 17 | ||||||||||
| See Accompanying Notes | ANNUAL REPORT | JUNE 30, 2018 | 45 |
Table of Contents
Schedule of Investments PIMCO RAFI Dynamic Multi-Factor U.S. Equity ETF (Cont.)
| SHARES | MARKET VALUE (000S) | |||||||||||
Steelcase, Inc. ‘A’ | 776 | $ | 10 | |||||||||
Stericycle, Inc. (a) | 296 | 19 | ||||||||||
Teledyne Technologies, Inc. (a) | 150 | 30 | ||||||||||
Terex Corp. | 747 | 32 | ||||||||||
Textron, Inc. | 415 | 27 | ||||||||||
Timken Co. | 670 | 29 | ||||||||||
Toro Co. | 482 | 29 | ||||||||||
TransDigm Group, Inc. | 120 | 41 | ||||||||||
TransUnion | 341 | 24 | ||||||||||
Trinity Industries, Inc. | 1,171 | 40 | ||||||||||
Triumph Group, Inc. | 536 | 11 | ||||||||||
TrueBlue, Inc. (a) | 291 | 8 | ||||||||||
Tutor Perini Corp. (a) | 551 | 10 | ||||||||||
Union Pacific Corp. | 1,367 | 194 | ||||||||||
United Parcel Service, Inc. ‘B’ | 1,467 | 156 | ||||||||||
United Rentals, Inc. (a) | 396 | 58 | ||||||||||
United Technologies Corp. | 491 | 61 | ||||||||||
Universal Forest Products, Inc. | 349 | 13 | ||||||||||
Verisk Analytics, Inc. (a) | 617 | 66 | ||||||||||
Wabash National Corp. | 711 | 13 | ||||||||||
WABCO Holdings, Inc. (a) | 188 | 22 | ||||||||||
Wabtec Corp. | 170 | 17 | ||||||||||
Waste Connections, Inc. | 249 | 19 | ||||||||||
Waste Management, Inc. | 1,130 | 92 | ||||||||||
Watsco, Inc. | 274 | 49 | ||||||||||
Werner Enterprises, Inc. | 418 | 16 | ||||||||||
WESCO International, Inc. (a) | 610 | 35 | ||||||||||
WW Grainger, Inc. | 473 | 146 | ||||||||||
XPO Logistics, Inc. (a) | 222 | 22 | ||||||||||
Xylem, Inc. | 711 | 48 | ||||||||||
|
| |||||||||||
| 7,583 | ||||||||||||
|
| |||||||||||
| INFORMATION TECHNOLOGY 17.4% | ||||||||||||
Activision Blizzard, Inc. | 1,271 | 97 | ||||||||||
Adobe Systems, Inc. (a) | 873 | 213 | ||||||||||
ADTRAN, Inc. | 798 | 12 | ||||||||||
Akamai Technologies, Inc. (a) | 309 | 23 | ||||||||||
Alliance Data Systems Corp. | 90 | 21 | ||||||||||
Amdocs Ltd. | 182 | 12 | ||||||||||
Amphenol Corp. ‘A’ | 528 | 46 | ||||||||||
Anixter International, Inc. (a) | 290 | 18 | ||||||||||
ANSYS, Inc. (a) | 315 | 55 | ||||||||||
Apple, Inc. | 3,890 | 720 | ||||||||||
Applied Materials, Inc. | 817 | 38 | ||||||||||
Arista Networks, Inc. (a) | 95 | 24 | ||||||||||
Arrow Electronics, Inc. (a) | 860 | 65 | ||||||||||
Autodesk, Inc. (a) | 407 | 53 | ||||||||||
Automatic Data Processing, Inc. | 731 | 98 | ||||||||||
Avnet, Inc. | 1,404 | 60 | ||||||||||
Benchmark Electronics, Inc. | 521 | 15 | ||||||||||
Booz Allen Hamilton Holding Corp. | 1,033 | 45 | ||||||||||
Broadridge Financial Solutions, Inc. | 546 | 63 | ||||||||||
CACI International, Inc. ‘A’ (a) | 204 | 34 | ||||||||||
Cadence Design Systems, Inc. (a) | 943 | 41 | ||||||||||
Cars.com, Inc. (a) | 298 | 8 | ||||||||||
CDK Global, Inc. | 265 | 17 | ||||||||||
CDW Corp. | 690 | 56 | ||||||||||
Cisco Systems, Inc. | 8,358 | 360 | ||||||||||
Citrix Systems, Inc. (a) | 225 | 24 | ||||||||||
Cognizant Technology Solutions Corp. ‘A’ | 1,037 | 82 | ||||||||||
Conduent, Inc. (a) | 1,425 | 26 | ||||||||||
Convergys Corp. | 1,233 | 30 | ||||||||||
CoreLogic, Inc. (a) | 144 | 7 | ||||||||||
| SHARES | MARKET VALUE (000S) | |||||||||||
Corning, Inc. | 6,668 | $ | 183 | |||||||||
Cree, Inc. (a) | 1,013 | 42 | ||||||||||
Cypress Semiconductor Corp. | 649 | 10 | ||||||||||
Dolby Laboratories, Inc. ‘A’ | 351 | 22 | ||||||||||
DXC Technology Co. | 505 | 41 | ||||||||||
eBay, Inc. (a) | 1,416 | 51 | ||||||||||
Electronic Arts, Inc. (a) | 596 | 84 | ||||||||||
Entegris, Inc. | 254 | 9 | ||||||||||
EPAM Systems, Inc. (a) | 93 | 12 | ||||||||||
F5 Networks, Inc. (a) | 329 | 57 | ||||||||||
Facebook, Inc. ‘A’ (a) | 4,193 | 815 | ||||||||||
Fair Isaac Corp. (a) | 124 | 24 | ||||||||||
Fidelity National Information Services, Inc. | 584 | 62 | ||||||||||
First Solar, Inc. (a) | 403 | 21 | ||||||||||
Fiserv, Inc. (a) | 1,475 | 109 | ||||||||||
FleetCor Technologies, Inc. (a) | 166 | 35 | ||||||||||
FLIR Systems, Inc. | 752 | 39 | ||||||||||
Gartner, Inc. (a) | 69 | 9 | ||||||||||
Genpact Ltd. | 1,063 | 31 | ||||||||||
Global Payments, Inc. | 295 | 33 | ||||||||||
Hewlett Packard Enterprise Co. | 5,486 | 80 | ||||||||||
HP, Inc. | 10,994 | 249 | ||||||||||
Insight Enterprises, Inc. (a) | 456 | 22 | ||||||||||
Integrated Device Technology, Inc. (a) | 530 | 17 | ||||||||||
Intel Corp. | 8,287 | 412 | ||||||||||
InterActiveCorp (a) | 144 | 22 | ||||||||||
International Business Machines Corp. | 7,886 | 1,102 | ||||||||||
Intuit, Inc. | 806 | 165 | ||||||||||
IPG Photonics Corp. (a) | 80 | 18 | ||||||||||
Jabil, Inc. | 1,518 | 42 | ||||||||||
Jack Henry & Associates, Inc. | 500 | 65 | ||||||||||
Juniper Networks, Inc. | 1,954 | 54 | ||||||||||
Keysight Technologies, Inc. (a) | 348 | 21 | ||||||||||
KLA-Tencor Corp. | 385 | 39 | ||||||||||
Lam Research Corp. | 291 | 50 | ||||||||||
Leidos Holdings, Inc. | 454 | 27 | ||||||||||
Littelfuse, Inc. | 45 | 10 | ||||||||||
Manhattan Associates, Inc. (a) | 192 | 9 | ||||||||||
ManTech International Corp. ‘A’ | 322 | 17 | ||||||||||
Mastercard, Inc. ‘A’ | 2,512 | 494 | ||||||||||
Maxim Integrated Products, Inc. | 494 | 29 | ||||||||||
Methode Electronics, Inc. | 162 | 7 | ||||||||||
Micron Technology, Inc. (a) | 2,055 | 108 | ||||||||||
Microsoft Corp. | 8,629 | 851 | ||||||||||
MKS Instruments, Inc. | 98 | 9 | ||||||||||
Motorola Solutions, Inc. | 2,074 | 241 | ||||||||||
NetApp, Inc. | 476 | 37 | ||||||||||
NETGEAR, Inc. (a) | 228 | 14 | ||||||||||
NVIDIA Corp. | 977 | 231 | ||||||||||
ON Semiconductor Corp. (a) | 773 | 17 | ||||||||||
Paychex, Inc. | 1,260 | 86 | ||||||||||
PayPal Holdings, Inc. (a) | 2,006 | 167 | ||||||||||
Perspecta, Inc. | 286 | 6 | ||||||||||
Plantronics, Inc. | 318 | 24 | ||||||||||
Plexus Corp. (a) | 267 | 16 | ||||||||||
PTC, Inc. (a) | 213 | 20 | ||||||||||
Qorvo, Inc. (a) | 381 | 31 | ||||||||||
QUALCOMM, Inc. | 4,357 | 245 | ||||||||||
Red Hat, Inc. (a) | 330 | 44 | ||||||||||
Sabre Corp. | 499 | 12 | ||||||||||
salesforce.com, Inc. (a) | 1,255 | 171 | ||||||||||
Sanmina Corp. (a) | 988 | 29 | ||||||||||
| SHARES | MARKET VALUE (000S) | |||||||||||
ScanSource, Inc. (a) | 158 | $ | 6 | |||||||||
Science Applications International Corp. | 171 | 14 | ||||||||||
Seagate Technology PLC | 6,390 | 361 | ||||||||||
Silicon Laboratories, Inc. (a) | 76 | 8 | ||||||||||
Skyworks Solutions, Inc. | 146 | 14 | ||||||||||
SS&C Technologies Holdings, Inc. | 384 | 20 | ||||||||||
Symantec Corp. | 689 | 14 | ||||||||||
SYNNEX Corp. | 150 | 14 | ||||||||||
Synopsys, Inc. (a) | 276 | 24 | ||||||||||
Syntel, Inc. (a) | 553 | 18 | ||||||||||
Take-Two Interactive Software, Inc. (a) | 211 | 25 | ||||||||||
Tech Data Corp. (a) | 576 | 47 | ||||||||||
Teradata Corp. (a) | 1,191 | 48 | ||||||||||
Teradyne, Inc. | 475 | 18 | ||||||||||
Texas Instruments, Inc. | 3,674 | 405 | ||||||||||
Total System Services, Inc. | 628 | 53 | ||||||||||
Twitter, Inc. (a) | 1,236 | 54 | ||||||||||
VeriSign, Inc. (a) | 389 | 53 | ||||||||||
Visa, Inc. ‘A’ | 4,617 | 612 | ||||||||||
Vishay Intertechnology, Inc. | 1,328 | 31 | ||||||||||
VMware, Inc. ‘A’ (a) | 142 | 21 | ||||||||||
Western Union Co. | 2,122 | 43 | ||||||||||
WEX, Inc. (a) | 79 | 15 | ||||||||||
Worldpay, Inc. ‘A’ (a) | 630 | 52 | ||||||||||
Xerox Corp. | 2,619 | 63 | ||||||||||
Xilinx, Inc. | 476 | 31 | ||||||||||
Zebra Technologies Corp. ‘A’ (a) | 98 | 14 | ||||||||||
Zillow Group, Inc. ‘C’ (a) | 313 | 19 | ||||||||||
|
| |||||||||||
| 11,459 | ||||||||||||
|
| |||||||||||
| MATERIALS 3.7% | ||||||||||||
Air Products & Chemicals, Inc. | 389 | 60 | ||||||||||
Alcoa Corp. (a) | 2,553 | 120 | ||||||||||
Allegheny Technologies, Inc. (a) | 1,448 | 36 | ||||||||||
AptarGroup, Inc. | 425 | 40 | ||||||||||
Ashland Global Holdings, Inc. | 113 | 9 | ||||||||||
Avery Dennison Corp. | 442 | 45 | ||||||||||
Axalta Coating Systems Ltd. (a) | 382 | 11 | ||||||||||
Ball Corp. | 357 | 13 | ||||||||||
Bemis Co., Inc. | 1,084 | 46 | ||||||||||
Boise Cascade Co. | 478 | 21 | ||||||||||
Carpenter Technology Corp. | 471 | 25 | ||||||||||
Celanese Corp. ‘A’ | 87 | 10 | ||||||||||
CF Industries Holdings, Inc. | 2,171 | 96 | ||||||||||
Cleveland-Cliffs, Inc. (a) | 3,693 | 31 | ||||||||||
Commercial Metals Co. | 1,704 | 36 | ||||||||||
Compass Minerals International, Inc. | 355 | 23 | ||||||||||
Crown Holdings, Inc. (a) | 434 | 19 | ||||||||||
Domtar Corp. | 961 | 46 | ||||||||||
Eastman Chemical Co. | 231 | 23 | ||||||||||
Ecolab, Inc. | 83 | 12 | ||||||||||
Freeport-McMoRan, Inc. | 10,302 | 178 | ||||||||||
Graphic Packaging Holding Co. | 1,901 | 28 | ||||||||||
Huntsman Corp. | 225 | 6 | ||||||||||
Innophos Holdings, Inc. | 184 | 9 | ||||||||||
Innospec, Inc. | 102 | 8 | ||||||||||
International Flavors & Fragrances, Inc. | 227 | 28 | ||||||||||
Kaiser Aluminum Corp. | 193 | 20 | ||||||||||
Louisiana-Pacific Corp. | 259 | 7 | ||||||||||
LyondellBasell Industries NV ‘A’ | 4,194 | 461 | ||||||||||
Materion Corp. | 171 | 9 | ||||||||||
| 46 | PIMCO EQUITY SERIES | See Accompanying Notes |
Table of Contents
June 30, 2018
| SHARES | MARKET VALUE (000S) | |||||||||||
Mosaic Co. | 5,880 | $ | 165 | |||||||||
NewMarket Corp. | 69 | 28 | ||||||||||
Newmont Mining Corp. | 945 | 36 | ||||||||||
Owens-Illinois, Inc. (a) | 689 | 12 | ||||||||||
Packaging Corp. of America | 319 | 36 | ||||||||||
PolyOne Corp. | 485 | 21 | ||||||||||
PPG Industries, Inc. | 518 | 54 | ||||||||||
Praxair, Inc. | 1,191 | 188 | ||||||||||
Reliance Steel & Aluminum Co. | 776 | 68 | ||||||||||
Royal Gold, Inc. | 118 | 11 | ||||||||||
RPM International, Inc. | 403 | 23 | ||||||||||
Schnitzer Steel Industries, Inc. ‘A’ | 430 | 14 | ||||||||||
Schweitzer-Mauduit International, Inc. | 255 | 11 | ||||||||||
Scotts Miracle-Gro Co. | 207 | 17 | ||||||||||
Sealed Air Corp. | 674 | 29 | ||||||||||
Sensient Technologies Corp. | 226 | 16 | ||||||||||
Sherwin-Williams Co. | 177 | 72 | ||||||||||
Silgan Holdings, Inc. | 694 | 19 | ||||||||||
Sonoco Products Co. | 832 | 44 | ||||||||||
Steel Dynamics, Inc. | 453 | 21 | ||||||||||
TimkenSteel Corp. (a) | 579 | 9 | ||||||||||
Trinseo S.A. | 156 | 11 | ||||||||||
Tronox Ltd. ‘A’ | 454 | 9 | ||||||||||
United States Steel Corp. | 873 | 30 | ||||||||||
Worthington Industries, Inc. | 158 | 7 | ||||||||||
WR Grace & Co. | 149 | 11 | ||||||||||
|
| |||||||||||
| 2,438 | ||||||||||||
|
| |||||||||||
| REAL ESTATE 0.1% | ||||||||||||
CBRE Group, Inc. ‘A’ (a) | 589 | 28 | ||||||||||
Jones Lang LaSalle, Inc. | 83 | 14 | ||||||||||
St. Joe Co. (a) | 488 | 9 | ||||||||||
|
| |||||||||||
| 51 | ||||||||||||
|
| |||||||||||
| TELECOMMUNICATION SERVICES 2.6% | ||||||||||||
AT&T, Inc. | 8,368 | 269 | ||||||||||
CenturyLink, Inc. | 12,075 | 225 | ||||||||||
Telephone & Data Systems, Inc. | 1,124 | 31 | ||||||||||
Verizon Communications, Inc. | 23,201 | 1,167 | ||||||||||
|
| |||||||||||
| 1,692 | ||||||||||||
|
| |||||||||||
| UTILITIES 1.7% | ||||||||||||
AES Corp. | 11,133 | 149 | ||||||||||
ALLETE, Inc. | 92 | 7 | ||||||||||
Aqua America, Inc. | 324 | 12 | ||||||||||
Avista Corp. | 121 | 6 | ||||||||||
Entergy Corp. | 845 | 68 | ||||||||||
Evergy, Inc. | 510 | 29 | ||||||||||
Exelon Corp. | 7,681 | 327 | ||||||||||
FirstEnergy Corp. | 2,740 | 98 | ||||||||||
Hawaiian Electric Industries, Inc. | 352 | 12 | ||||||||||
IDACORP, Inc. | 93 | 9 | ||||||||||
MDU Resources Group, Inc. | 871 | 25 | ||||||||||
New Jersey Resources Corp. | 156 | 7 | ||||||||||
NextEra Energy, Inc. | 836 | 140 | ||||||||||
NRG Energy, Inc. | 1,340 | 41 | ||||||||||
PPL Corp. | 1,129 | 32 | ||||||||||
Public Service Enterprise Group, Inc. | 897 | 49 | ||||||||||
Southern Co. | 699 | 32 | ||||||||||
Spire, Inc. | 202 | 14 | ||||||||||
Vectren Corp. | 151 | 11 | ||||||||||
Vistra Energy Corp. (a) | 2,132 | 51 | ||||||||||
| SHARES | MARKET VALUE (000S) | |||||||||||
WGL Holdings, Inc. | 92 | $ | 8 | |||||||||
|
| |||||||||||
| 1,127 | ||||||||||||
|
| |||||||||||
Total United States | 61,817 | |||||||||||
|
| |||||||||||
Total Common Stocks (Cost $61,130) |
| 62,324 | ||||||||||
|
| |||||||||||
| REAL ESTATE INVESTMENT TRUSTS 4.0% | ||||||||||||
| UNITED STATES 4.0% | ||||||||||||
| FINANCIALS 0.5% | ||||||||||||
AGNC Investment Corp. | 1,064 | 20 | ||||||||||
Annaly Capital Management, Inc. | 1,619 | 17 | ||||||||||
Apollo Commercial Real Estate Finance, Inc. | 512 | 9 | ||||||||||
Blackstone Mortgage Trust, Inc. ‘A’ | 497 | 16 | ||||||||||
Capstead Mortgage Corp. | 1,090 | 10 | ||||||||||
Chimera Investment Corp. | 1,619 | 30 | ||||||||||
CYS Investments, Inc. | 2,297 | 17 | ||||||||||
Invesco Mortgage Capital, Inc. | 1,587 | 25 | ||||||||||
Ladder Capital Corp. | 756 | 12 | ||||||||||
MFA Financial, Inc. | 2,826 | 21 | ||||||||||
New Residential Investment Corp. | 2,194 | 38 | ||||||||||
PennyMac Mortgage Investment Trust | 808 | 15 | ||||||||||
Redwood Trust, Inc. | 653 | 11 | ||||||||||
Starwood Property Trust, Inc. | 1,500 | 33 | ||||||||||
Two Harbors Investment Corp. | 2,666 | 42 | ||||||||||
|
| |||||||||||
| 316 | ||||||||||||
|
| |||||||||||
| REAL ESTATE 3.5% | ||||||||||||
Acadia Realty Trust | 328 | 9 | ||||||||||
Alexandria Real Estate Equities, Inc. | 255 | 32 | ||||||||||
American Campus Communities, Inc. | 587 | 25 | ||||||||||
American Homes 4 Rent ‘A’ | 612 | 14 | ||||||||||
American Tower Corp. | 108 | 16 | ||||||||||
Apartment Investment & Management Co. ‘A’ | 517 | 22 | ||||||||||
Apple Hospitality REIT, Inc. | 1,099 | 20 | ||||||||||
AvalonBay Communities, Inc. | 85 | 15 | ||||||||||
Boston Properties, Inc. | 125 | 16 | ||||||||||
Brandywine Realty Trust | 1,030 | 17 | ||||||||||
Brixmor Property Group, Inc. | 1,959 | 34 | ||||||||||
Camden Property Trust | 354 | 32 | ||||||||||
CBL & Associates Properties, Inc. | 4,005 | 22 | ||||||||||
Columbia Property Trust, Inc. | 1,258 | 29 | ||||||||||
CoreCivic, Inc. | 1,466 | 35 | ||||||||||
Corporate Office Properties Trust | 490 | 14 | ||||||||||
Crown Castle International Corp. | 882 | 95 | ||||||||||
CubeSmart | 851 | 27 | ||||||||||
CyrusOne, Inc. | 152 | 9 | ||||||||||
DCT Industrial Trust, Inc. | 432 | 29 | ||||||||||
DDR Corp. | 1,845 | 33 | ||||||||||
Digital Realty Trust, Inc. | 91 | 10 | ||||||||||
Douglas Emmett, Inc. | 456 | 18 | ||||||||||
Duke Realty Corp. | 1,234 | 36 | ||||||||||
Education Realty Trust, Inc. | 294 | 12 | ||||||||||
Empire State Realty Trust, Inc. ‘A’ | 377 | 6 | ||||||||||
EPR Properties | 243 | 16 | ||||||||||
Equinix, Inc. | 11 | 5 | ||||||||||
Equity Commonwealth (a) | 699 | 22 | ||||||||||
Equity LifeStyle Properties, Inc. | 304 | 28 | ||||||||||
Equity Residential | 782 | 50 | ||||||||||
Essex Property Trust, Inc. | 36 | 9 | ||||||||||
Extra Space Storage, Inc. | 500 | 50 | ||||||||||
Federal Realty Investment Trust | 198 | 25 | ||||||||||
| SHARES | MARKET VALUE (000S) | |||||||||||
First Industrial Realty Trust, Inc. | 450 | $ | 15 | |||||||||
Gaming and Leisure Properties, Inc. | 596 | 21 | ||||||||||
GGP, Inc. | 541 | 11 | ||||||||||
Government Properties Income Trust | 518 | 8 | ||||||||||
Gramercy Property Trust | 579 | 16 | ||||||||||
HCP, Inc. | 595 | 15 | ||||||||||
Healthcare Realty Trust, Inc. | 445 | 13 | ||||||||||
Healthcare Trust of America, Inc. ‘A’ | 497 | 13 | ||||||||||
Highwoods Properties, Inc. | 423 | 21 | ||||||||||
Hospitality Properties Trust | 745 | 21 | ||||||||||
Hudson Pacific Properties, Inc. | 382 | 14 | ||||||||||
Iron Mountain, Inc. | 688 | 24 | ||||||||||
Kilroy Realty Corp. | 310 | 23 | ||||||||||
Kimco Realty Corp. | 957 | 16 | ||||||||||
Kite Realty Group Trust | 579 | 10 | ||||||||||
Lamar Advertising Co. ‘A’ | 520 | 36 | ||||||||||
Lexington Realty Trust | 1,361 | 12 | ||||||||||
Liberty Property Trust | 697 | 31 | ||||||||||
Life Storage, Inc. | 248 | 24 | ||||||||||
Macerich Co. | 608 | 35 | ||||||||||
Mack-Cali Realty Corp. | 686 | 14 | ||||||||||
Medical Properties Trust, Inc. | 1,323 | 19 | ||||||||||
Mid-America Apartment Communities, Inc. | 356 | 36 | ||||||||||
National Health Investors, Inc. | 108 | 8 | ||||||||||
National Retail Properties, Inc. | 813 | 36 | ||||||||||
Omega Healthcare Investors, Inc. | 941 | 29 | ||||||||||
Outfront Media, Inc. | 1,057 | 21 | ||||||||||
Paramount Group, Inc. | 1,299 | 20 | ||||||||||
Park Hotels & Resorts, Inc. | 375 | 12 | ||||||||||
Piedmont Office Realty Trust, Inc. ‘A’ | 1,181 | 24 | ||||||||||
Prologis, Inc. | 324 | 21 | ||||||||||
PS Business Parks, Inc. | 112 | 14 | ||||||||||
Public Storage | 243 | 55 | ||||||||||
Quality Care Properties, Inc. (a) | 935 | 20 | ||||||||||
Rayonier, Inc. | 989 | 38 | ||||||||||
Realty Income Corp. | 161 | 9 | ||||||||||
Regency Centers Corp. | 313 | 19 | ||||||||||
Retail Opportunity Investments Corp. | 390 | 7 | ||||||||||
Retail Properties of America, Inc. ‘A’ | 1,692 | 22 | ||||||||||
RLJ Lodging Trust | 604 | 13 | ||||||||||
Ryman Hospitality Properties, Inc. | 269 | 22 | ||||||||||
Sabra Health Care REIT, Inc. | 401 | 9 | ||||||||||
SBA Communications Corp. (a) | 287 | 47 | ||||||||||
Select Income REIT | 444 | 10 | ||||||||||
Senior Housing Properties Trust | 1,862 | 34 | ||||||||||
Simon Property Group, Inc. | 1,199 | 204 | ||||||||||
SL Green Realty Corp. | 98 | 10 | ||||||||||
Spirit MTA REIT (a) | 371 | 4 | ||||||||||
Spirit Realty Capital, Inc. | 3,960 | 32 | ||||||||||
STORE Capital Corp. | 813 | 22 | ||||||||||
Sun Communities, Inc. | 320 | 31 | ||||||||||
Tanger Factory Outlet Centers, Inc. | 543 | 13 | ||||||||||
Taubman Centers, Inc. | 285 | 17 | ||||||||||
UDR, Inc. | 841 | 32 | ||||||||||
Ventas, Inc. | 341 | 19 | ||||||||||
VEREIT, Inc. | 1,263 | 9 | ||||||||||
Vornado Realty Trust | 146 | 11 | ||||||||||
Washington Prime Group, Inc. | 3,120 | 25 | ||||||||||
Washington Real Estate Investment Trust | 360 | 11 | ||||||||||
Weingarten Realty Investors | 799 | 25 | ||||||||||
Welltower, Inc. | 388 | 24 | ||||||||||
Weyerhaeuser Co. | 142 | 5 | ||||||||||
WP Carey, Inc. | 563 | 37 | ||||||||||
| See Accompanying Notes | ANNUAL REPORT | JUNE 30, 2018 | 47 |
Table of Contents
Schedule of Investments PIMCO RAFI Dynamic Multi-Factor U.S. Equity ETF (Cont.)
June 30, 2018
| SHARES | MARKET VALUE (000S) | |||||||||||
Xenia Hotels & Resorts, Inc. | 980 | $ | 24 | |||||||||
|
| |||||||||||
| 2,325 | ||||||||||||
|
| |||||||||||
Total Real Estate Investment Trusts (Cost $2,537) | 2,641 | |||||||||||
|
| |||||||||||
| Total Investments in Securities (Cost $63,667) | 64,965 | |||||||||||
| Total Investments 98.9% (Cost $63,667) | $ | 64,965 | ||||||||||
| Other Assets and Liabilities, net 1.1% | 693 | |||||||||||
|
| |||||||||||
| Net Assets 100.0% | $ | 65,658 | ||||||||||
|
| |||||||||||
NOTES TO SCHEDULE OF INVESTMENTS:
| * | A zero balance may reflect actual amounts rounding to less than one thousand. |
| (a) | Security did not produce income within the last twelve months. |
FAIR VALUE MEASUREMENTS
The following is a summary of the fair valuations according to the inputs used as of June 30, 2018 in valuing the Fund’s assets and liabilities:
| Category and Subcategory | Level 1 | Level 2 | Level 3 | Fair Value at 06/30/2018 | ||||||||||||
Investments in Securities, at Value |
| |||||||||||||||
Common Stocks |
| |||||||||||||||
Bermuda | ||||||||||||||||
Financials | $ | 104 | $ | 0 | $ | 0 | $ | 104 | ||||||||
Ireland | ||||||||||||||||
Information Technology | 355 | 0 | 0 | 355 | ||||||||||||
Switzerland | ||||||||||||||||
Financials | 48 | 0 | 0 | 48 | ||||||||||||
United States | ||||||||||||||||
Consumer Discretionary | 12,087 | 0 | 0 | 12,087 | ||||||||||||
Consumer Staples | 6,499 | 0 | 0 | 6,499 | ||||||||||||
Energy | 7,827 | 0 | 0 | 7,827 | ||||||||||||
Financials | 4,635 | 0 | 0 | 4,635 | ||||||||||||
Health Care | 6,419 | 0 | 0 | 6,419 | ||||||||||||
| Category and Subcategory | Level 1 | Level 2 | Level 3 | Fair Value at 06/30/2018 | ||||||||||||
Industrials | $ | 7,583 | $ | 0 | $ | 0 | $ | 7,583 | ||||||||
Information Technology | 11,459 | 0 | 0 | 11,459 | ||||||||||||
Materials | 2,438 | 0 | 0 | 2,438 | ||||||||||||
Real Estate | 51 | 0 | 0 | 51 | ||||||||||||
Telecommunication Services | 1,692 | 0 | 0 | 1,692 | ||||||||||||
Utilities | 1,127 | 0 | 0 | 1,127 | ||||||||||||
Real Estate Investment Trusts |
| |||||||||||||||
United States | ||||||||||||||||
Financials | 316 | 0 | 0 | 316 | ||||||||||||
Real Estate | 2,325 | 0 | 0 | 2,325 | ||||||||||||
|
|
|
|
|
|
|
| |||||||||
Total Investments | $ | 64,965 | $ | 0 | $ | 0 | $ | 64,965 | ||||||||
|
|
|
|
|
|
|
| |||||||||
There were no significant transfers among Levels 1, 2, or 3 during the period ended June 30, 2018.
| 48 | PIMCO EQUITY SERIES | See Accompanying Notes |
Table of Contents
June 30, 2018
1. ORGANIZATION
PIMCO Equity Series (the “Trust”) was established as a Delaware statutory trust on March 30, 2010. The Trust is registered under the Investment Company Act of 1940, as amended (the “Act”), as an open-end management investment company. Information presented in these financial statements pertains to the funds (each a “Fund” and collectively the “Funds”) indicated on the cover of this report. Pacific Investment Management Company LLC (“PIMCO” or “Manager”) serves as the investment adviser for the Funds. PIMCO has engaged Parametric Portfolio Associates LLC (“Parametric” or “Sub-Adviser”) to serve as the sub-adviser to each Fund.
Each Fund is an exchange-traded fund (“ETF”). ETFs are funds that trade like other publicly-traded securities and may be designed to track an index or to be actively managed. Unlike shares of a mutual fund, which can be bought from and redeemed by the issuing fund by all shareholders at a price based on net asset value (“NAV”), shares of a Fund may be directly purchased from and redeemed by a Fund at NAV solely by certain large institutional investors. Also unlike shares of a mutual fund, shares of each Fund are listed on a national securities exchange and trade in the secondary market at market prices that change throughout the day.
2. SIGNIFICANT ACCOUNTING POLICIES
The following is a summary of significant accounting policies consistently followed by the Trust in the preparation of its financial statements in conformity with accounting principles generally accepted in the United States of America (“U.S. GAAP”). Each Fund is treated as an investment company under the reporting requirements of U.S. GAAP. The functional and reporting currency for the Funds is the U.S. dollar. The preparation of financial statements in accordance with U.S. GAAP requires management to make estimates and assumptions that affect the reported amounts of assets and liabilities and disclosure of contingent assets and liabilities at the date of the financial statements and the reported amounts of increases and decreases in net assets from operations during the reporting period. Actual results could differ from those estimates.
(a) Securities Transactions and Investment Income Securities transactions are recorded as of the trade date for financial reporting purposes. Securities purchased or sold on a when-issued or delayed-delivery basis may be settled beyond a standard settlement period for the security after the trade date. Realized gains (losses) from securities sold are recorded on the identified cost basis. Dividend income is recorded on the ex-dividend date, except certain dividends from foreign securities where the ex-dividend date may have passed, which are recorded as soon as a Fund is informed of the ex-dividend date. Interest income, adjusted for the accretion of discounts and amortization of premiums, is
recorded on the accrual basis from settlement date, with the exception of securities with a forward starting effective date, where interest income is recorded on the accrual basis from effective date. For convertible securities, premiums attributable to the conversion feature are not amortized. Estimated tax liabilities on certain foreign securities are recorded on an accrual basis and are reflected as components of interest income or net change in unrealized appreciation (depreciation) on investments on the Statements of Operations, as appropriate. Tax liabilities realized as a result of such security sales are reflected as a component of net realized gain (loss) on investments on the Statements of Operations. Paydown gains (losses) on mortgage-related and other asset-backed securities, if any, are recorded as components of interest income on the Statements of Operations. Income or short-term capital gain distributions received from registered investment companies, if any, are recorded as dividend income. Long-term capital gain distributions received from registered investment companies, if any, are recorded as realized gains.
(b) Cash and Foreign Currency The market values of foreign securities, currency holdings and other assets and liabilities denominated in foreign currencies are translated into U.S. dollars based on the current exchange rates each business day. Purchases and sales of securities and income and expense items denominated in foreign currencies, if any, are translated into U.S. dollars at the exchange rate in effect on the transaction date. The Funds do not separately report the effects of changes in foreign exchange rates from changes in market prices on securities held. Such changes are included in net realized gain (loss) and net change in unrealized appreciation (depreciation) from investments on the Statements of Operations. The Funds may invest in foreign currency-denominated securities and may engage in foreign currency transactions either on a spot (cash) basis at the rate prevailing in the currency exchange market at the time or through a forward foreign currency contract. Realized foreign exchange gains (losses) arising from sales of spot foreign currencies, currency gains (losses) realized between the trade and settlement dates on securities transactions and the difference between the recorded amounts of dividends, interest, and foreign withholding taxes and the U.S. dollar equivalent of the amounts actually received or paid are included in net realized gain (loss) on foreign currency transactions on the Statements of Operations. Net unrealized foreign exchange gains (losses) arising from changes in foreign exchange rates on foreign denominated assets and liabilities other than investments in securities held at the end of the reporting period are included in net change in unrealized appreciation (depreciation) on foreign currency assets and liabilities on the Statements of Operations.
(c) Distributions to Shareholders The following table shows the anticipated frequency of distributions from net investment income, if any, for each Fund.
| ANNUAL REPORT | JUNE 30, 2018 | 49 |
Table of Contents
Notes to Financial Statements (Cont.)
| Distribution Frequency | ||||||||||||
| Fund Name | Declared | Distributed | ||||||||||
PIMCO RAFI Dynamic Multi-Factor Emerging Markets Equity ETF | Quarterly | Quarterly | ||||||||||
PIMCO RAFI Dynamic Multi-Factor International Equity ETF | Quarterly | Quarterly | ||||||||||
PIMCO RAFI Dynamic Multi-Factor U.S. Equity ETF | Quarterly | Quarterly | ||||||||||
Net realized capital gains earned by each Fund, if any, will be distributed no less frequently than once each year. The Trust does not provide an automatic dividend and/or distributions reinvestment service.
Income distributions and capital gain distributions are determined in accordance with income tax regulations which may differ from U.S. GAAP. Differences between tax regulations and U.S. GAAP may cause timing differences between income and capital gain recognition. Further, the character of investment income and capital gains may be different for certain transactions under the two methods of accounting. As a result, income distributions and capital gain distributions declared during a fiscal period may differ significantly from the net investment income (loss) and realized gains (losses) reported on each Fund’s annual financial statements presented under U.S. GAAP.
If a Fund estimates that a portion of its distribution may be comprised of amounts from sources other than net investment income in accordance with its policies and good accounting practices, the Fund will notify shareholders of the estimated composition of such distribution through a Section 19 Notice. For these purposes, a Fund estimates the source or sources from which a distribution is paid, to the close of the period as of which it is paid, in reference to its internal accounting records and related accounting practices. If, based on such accounting records and practices, it is estimated that a particular distribution does not include capital gains or paid-in surplus or other capital sources, a Section 19 Notice generally would not be issued. It is important to note that differences exist between a Fund’s daily internal accounting records and practices, a Fund’s financial statements presented in accordance with U.S. GAAP, and recordkeeping practices under income tax regulations. For instance, a Fund’s internal accounting records and practices may take into account, among other factors, tax-related characteristics of certain sources of distributions that differ from treatment under U.S. GAAP. Examples of such differences may include, among others, the treatment of paydowns on mortgage-backed securities purchased at a discount and periodic payments under interest rate swap contracts. Accordingly, among other consequences, it is possible that a Fund may not issue a Section 19 Notice in situations where the Fund’s financial statements prepared later and in accordance with U.S. GAAP and/or the final tax character of those distributions might later report that the sources of those distributions included capital gains and/or a return of capital. Please visit www.pimco.com for the most recent Section 19 Notice, if
applicable, for additional information regarding the estimated composition of distributions. Final determination of a distribution’s tax character will be reported on Form 1099 DIV sent to shareholders for the calendar year.
Distributions classified as a tax basis return of capital, if any, are reflected on the Statements of Changes in Net Assets and have been recorded to paid in capital. In addition, other amounts have been reclassified between undistributed (overdistributed) net investment income (loss), accumulated undistributed (overdistributed) net realized gain (loss) and/or paid in capital to more appropriately conform U.S. GAAP to tax characterizations of distributions.
(d) New Accounting Pronouncements In August 2016, the Financial Accounting Standards Board (“FASB”) issued an Accounting Standards Update (“ASU”), ASU 2016-15, which amends Accounting Standards Codification (“ASC”) 230 to clarify guidance on the classification of certain cash receipts and cash payments in the Statement of Cash Flows. The ASU is effective for annual periods beginning after December 15, 2017, and interim periods within those annual periods. The Funds have adopted the ASU. The implementation of the ASU did not have an impact on the Funds’ financial statements.
In October 2016, the U.S. Securities and Exchange Commission (“SEC”) adopted new rules and forms, and amendments to certain current rules and forms, to modernize reporting and disclosure of information by registered investment companies. The amendments to Regulation S-X require standardized, enhanced disclosure about derivatives in investment company financial statements, and also change the rules governing the form and content of such financial statements. The compliance date for these amendments was August 1, 2017. Compliance is based on reporting period-end date. Management has adopted these amendments and the changes are incorporated in the financial statements.
In November 2016, the FASB issued ASU 2016-18 which amends ASC 230 to provide guidance on the classification and presentation of changes in restricted cash and restricted cash equivalents on the Statement of Cash Flows. The ASU is effective for annual periods beginning after December 15, 2017, and interim periods within those annual periods. The Funds have adopted the ASU. The implementation of the ASU did not have an impact on the Funds’ financial statements.
In March 2017, the FASB issued ASU 2017-08 which provides guidance related to the amortization period for certain purchased callable debt securities held at a premium. The ASU is effective for annual periods beginning after December 15, 2018, and interim periods within those annual periods. The Funds have adopted the ASU. The implementation of the ASU did not have an impact on the Funds’ financial statements.
| 50 | PIMCO EQUITY SERIES |
Table of Contents
June 30, 2018
3. INVESTMENT VALUATION AND FAIR VALUE MEASUREMENTS
(a) Investment Valuation Policies The NAV of the Fund’s shares is determined by dividing the total value of the Fund’s portfolio investments and other assets, less any liabilities attributable to that Fund, by the total number of shares outstanding.
On each day that the NYSE Arca is open, Fund shares are ordinarily valued as of the close of regular trading (“NYSE Close”). Information that becomes known to the Funds or their agents after the time as of which NAV has been calculated on a particular day will not generally be used to retroactively adjust the price of a security or the NAV determined earlier that day. Each Fund reserves the right to change the time as of which its respective NAV is calculated if the Fund closes earlier, or as permitted by the SEC.
For purposes of calculating a NAV, portfolio securities and other assets for which market quotes are readily available are valued at market value. Market value is generally determined on the basis of official closing prices or the last reported sales prices, or if no sales are reported, based on quotes obtained from established market makers or prices (including evaluated prices) supplied by the Funds’ approved pricing services, quotation reporting systems and other third-party sources (together, “Pricing Services”). The Funds will normally use pricing data for domestic equity securities received shortly after the NYSE Close and do not normally take into account trading, clearances or settlements that take place after the NYSE Close. If market value pricing is used, a foreign (non-U.S.) equity security traded on a foreign exchange or on more than one exchange is typically valued using pricing information from the exchange considered by the Manager to be the primary exchange. A foreign (non-U.S.) equity security will be valued as of the close of trading on the foreign exchange, or the NYSE Close, if the NYSE Close occurs before the end of trading on the foreign exchange. Domestic and foreign (non-U.S.) fixed income securities, non-exchange traded derivatives, and equity options are normally valued on the basis of quotes obtained from brokers and dealers or Pricing Services using data reflecting the earlier closing of the principal markets for those securities. Prices obtained from Pricing Services may be based on, among other things, information provided by market makers or estimates of market values obtained from yield data relating to investments or securities with similar characteristics. Certain fixed income securities purchased on a delayed-delivery basis are marked to market daily until settlement at the forward settlement date. Exchange-traded options, except equity options, futures and options on futures are valued at the settlement price determined by the relevant exchange. Swap agreements are valued on the basis of bid quotes obtained from brokers and dealers or market-based prices supplied by Pricing Services. A Fund’s investments in open-end management
investment companies, other than exchange-traded funds (“ETFs”), are valued at the NAVs of such investments. Open-end management investment companies may include affiliated funds.
If a foreign (non-U.S.) equity security’s value has materially changed after the close of the security’s primary exchange or principal market but before the NYSE Close, the security may be valued at fair value based on procedures established and approved by the Board of Trustees of the Trust (the “Board”). Foreign (non-U.S.) equity securities that do not trade when the NYSE is open are also valued at fair value. With respect to foreign (non-U.S.) equity securities, a Fund may determine the fair value of investments based on information provided by Pricing Services and other third-party vendors, which may recommend fair value or adjustments with reference to other securities, indices or assets. In considering whether fair valuation is required and in determining fair values, a Fund may, among other things, consider significant events (which may be considered to include changes in the value of U.S. securities or securities indices) that occur after the close of the relevant market and before the NYSE Close. A Fund may utilize modeling tools provided by third-party vendors to determine fair values of foreign (non-U.S.) securities. For these purposes, any movement in the applicable reference index or instrument (“zero trigger”) between the earlier close of the applicable foreign market and the NYSE Close may be deemed to be a significant event, prompting the application of the pricing model (effectively resulting in daily fair valuations). Foreign exchanges may permit trading in foreign (non-U.S.) equity securities on days when the Trust is not open for business, which may result in a Fund’s portfolio investments being affected when shareholders are unable to buy or sell shares.
Senior secured floating rate loans for which an active secondary market exists to a reliable degree will be valued at the mean of the last available bid/ask prices in the market for such loans, as provided by a Pricing Service. Senior secured floating rate loans for which an active secondary market does not exist to a reliable degree will be valued at fair value, which is intended to approximate market value. In valuing a senior secured floating rate loan at fair value, the factors considered may include, but are not limited to, the following: (a) the creditworthiness of the borrower and any intermediate participants, (b) the terms of the loan, (c) recent prices in the market for similar loans, if any, and (d) recent prices in the market for instruments of similar quality, rate, period until next interest rate reset and maturity.
Investments valued in currencies other than the U.S. dollar are converted to the U.S. dollar using exchange rates obtained from Pricing Services. As a result, the value of such investments and, in turn, the NAV of a Fund’s shares may be affected by changes in the value of currencies in relation to the U.S. dollar. The value of investments traded in markets outside the United States or denominated in currencies
| ANNUAL REPORT | JUNE 30, 2018 | 51 |
Table of Contents
Notes to Financial Statements (Cont.)
other than the U.S. dollar may be affected significantly on a day that the Trust is not open for business. As a result, to the extent that a Fund holds foreign (non-U.S.) investments, the value of those investments may change at times when shareholders are unable to buy or sell shares and the value of such investments will be reflected in the Fund’s next calculated NAV.
Investments for which market quotes or market based valuations are not readily available are valued at fair value as determined in good faith by the Board or persons acting at their direction. The Board has adopted methods for valuing securities and other assets in circumstances where market quotes are not readily available, and has delegated to the Manager the responsibility for applying the fair valuation methods. In the event that market quotes or market based valuations are not readily available, and the security or asset cannot be valued pursuant to a Board approved valuation method, the value of the security or asset will be determined in good faith by the Valuation Oversight Committee of the Board (“Valuation Oversight Committee”), generally based on recommendations provided by the Manager. The Manager may consult with the Sub-Adviser or Parametric in providing such recommendations or otherwise with respect to valuation of a Fund’s portfolio securities or other assets. Market quotes are considered not readily available in circumstances where there is an absence of current or reliable market-based data (e.g., trade information, bid/ask information, indicative market quotations (“Broker Quotes”), Pricing Services’ prices), including where events occur after the close of the relevant market, but prior to the NYSE Close, that materially affect the values of a Fund’s securities or assets. In addition, market quotes are considered not readily available when, due to extraordinary circumstances, the exchanges or markets on which the securities trade do not open for trading for the entire day and no other market prices are available. The Board has delegated to the Manager the responsibility for monitoring significant events that may materially affect the values of a Fund’s securities or assets and for determining whether the value of the applicable securities or assets should be reevaluated in light of such significant events.
When a Fund uses fair valuation to determine the value of a portfolio security or other asset for purposes of calculating its NAV, such investments will not be priced on the basis of quotes from the primary market in which they are traded, but rather may be priced by another method that the Board or persons acting at their direction believe reflects fair value. Fair valuation may require subjective determinations about the value of a security. While the Trust’s policy is intended to result in a calculation of a Fund’s NAV that fairly reflects security values as of the time of pricing, the Trust cannot ensure that fair values determined by the Board or persons acting at their direction would accurately reflect the price that a Fund could obtain for a security if it
were to dispose of that security as of the time of pricing (for instance, in a forced or distressed sale). The prices used by a Fund may differ from the value that would be realized if the securities were sold. The Funds’ use of fair valuation may also help to deter “stale price arbitrage” as discussed under the “Abusive Trading Practices” section in each Fund’s prospectus.
(b) Fair Value Hierarchy U.S. GAAP describes fair value as the price that a Fund would receive to sell an asset or pay to transfer a liability in an orderly transaction between market participants at the measurement date. It establishes a fair value hierarchy that prioritizes inputs to valuation methods and requires disclosure of the fair value hierarchy, separately for each major category of assets and liabilities, that segregates fair value measurements into levels (Level 1, 2, or 3). The inputs or methodology used for valuing securities are not necessarily an indication of the risks associated with investing in those securities. Levels 1, 2, and 3 of the fair value hierarchy are defined as follows:
| ∎ | Level 1 — Quoted prices in active markets or exchanges for identical assets and liabilities. |
| ∎ | Level 2 — Significant other observable inputs, which may include, but are not limited to, quoted prices for similar assets or liabilities in markets that are active, quoted prices for identical or similar assets or liabilities in markets that are not active, inputs other than quoted prices that are observable for the assets or liabilities (such as interest rates, yield curves, volatilities, prepayment speeds, loss severities, credit risks and default rates) or other market corroborated inputs. |
| ∎ | Level 3 — Significant unobservable inputs based on the best information available in the circumstances, to the extent observable inputs are not available, which may include assumptions made by the Board or persons acting at their direction that are used in determining the fair value of investments. |
In accordance with the requirements of U.S. GAAP, the amounts of transfers between Levels 1 and 2 and transfers into and out of Level 3, if material, are disclosed in the Notes to Schedule of Investments for each respective Fund.
For fair valuations using significant unobservable inputs, U.S. GAAP requires a reconciliation of the beginning to ending balances for reported fair values that presents changes attributable to realized gain (loss), unrealized appreciation (depreciation), purchases and sales, accrued discounts (premiums), and transfers into and out of the Level 3 category during the period. The end of period value is used for the transfers between Levels of a Fund’s assets and liabilities. Additionally, U.S. GAAP requires quantitative information regarding the significant unobservable inputs used in the determination of fair value of assets or liabilities categorized as Level 3 in the fair value hierarchy. In accordance with the
| 52 | PIMCO EQUITY SERIES |
Table of Contents
June 30, 2018
requirements of U.S. GAAP, a fair value hierarchy, and if material, a Level 3 reconciliation and details of significant unobservable inputs, have been included in the Notes to Schedule of Investments for each respective Fund.
(c) Valuation Techniques and the Fair Value Hierarchy
Level 1 and Level 2 trading assets and trading liabilities, at fair value The valuation methods (or “techniques”) and significant inputs used in determining the fair values of portfolio securities or other assets and liabilities categorized as Level 1 and Level 2 of the fair value hierarchy are as follows:
Fixed income securities including corporate, convertible and municipal bonds and notes, U.S. government agencies, U.S. treasury obligations, sovereign issues, bank loans, convertible preferred securities and non-U.S. bonds are normally valued on the basis of quotes obtained from brokers and dealers or Pricing Services that use broker-dealer quotations, reported trades or valuation estimates from their internal pricing models. The Pricing Services’ internal models use inputs that are observable such as issuer details, interest rates, yield curves, prepayment speeds, credit risks/spreads, default rates and quoted prices for similar assets. Securities that use similar valuation techniques and inputs as described above are categorized as Level 2 of the fair value hierarchy.
Fixed income securities purchased on a delayed-delivery basis or as a repurchase commitment in a sale-buyback transaction are marked to market daily until settlement at the forward settlement date and are categorized as Level 2 of the fair value hierarchy.
Mortgage-related and asset-backed securities are usually issued as separate tranches, or classes, of securities within each deal. These securities are also normally valued by Pricing Services that use broker-dealer quotations, reported trades or valuation estimates from their internal pricing models. The pricing models for these securities usually consider tranche-level attributes, current market data, estimated cash flows and market-based yield spreads for each tranche, and incorporate deal collateral performance, as available. Mortgage-related and asset-backed securities that use similar valuation techniques and inputs as described above are categorized as Level 2 of the fair value hierarchy.
Common stocks, ETFs, exchange-traded notes and financial derivative instruments, such as futures contracts, rights and warrants, or options on futures that are traded on a national securities exchange, are stated at the last reported sale or settlement price on the day of valuation. To the extent these securities are actively traded and valuation adjustments are not applied, they are categorized as Level 1 of the fair value hierarchy.
Valuation adjustments may be applied to certain securities that are solely traded on a foreign exchange to account for the market
movement between the close of the foreign market and the NYSE Close. These securities are valued using Pricing Services that consider the correlation of the trading patterns of the foreign security to the intraday trading in the U.S. markets for investments. Securities using these valuation adjustments are categorized as Level 2 of the fair value hierarchy. Preferred securities and other equities traded on inactive markets or valued by reference to similar instruments are also categorized as Level 2 of the fair value hierarchy.
Equity-linked securities are valued by referencing the last reported sale or settlement price of the linked referenced equity on the day of valuation. Foreign exchange adjustments are applied to the last reported price to convert the linked equity’s trading currency to the contract’s settling currency. These investments are categorized as Level 2 of the fair value hierarchy.
Investments in registered open-end investment companies (other than ETFs) will be valued based upon the NAVs of such investments and are categorized as Level 1 of the fair value hierarchy. Investments in unregistered open-end investment companies will be calculated based upon the NAVs of such investments and are considered Level 1 provided that the NAVs are observable, calculated daily and are the value at which both purchases and sales will be conducted.
Equity exchange-traded options and over the counter financial derivative instruments, such as forward foreign currency contracts and options contracts derive their value from underlying asset prices, indices, reference rates, and other inputs or a combination of these factors. These contracts are normally valued on the basis of quotes obtained from a quotation reporting system, established market makers or Pricing Services (normally determined as of the NYSE Close). Depending on the product and the terms of the transaction, financial derivative instruments can be valued by Pricing Services using a series of techniques, including simulation pricing models. The pricing models use inputs that are observed from actively quoted markets such as quoted prices, issuer details, indices, bid/ask spreads, interest rates, implied volatilities, yield curves, dividends and exchange rates. Financial derivative instruments that use similar valuation techniques and inputs as described above are categorized as Level 2 of the fair value hierarchy.
Centrally cleared swaps and over the counter swaps derive their value from underlying asset prices, indices, reference rates, and other inputs or a combination of these factors. They are valued using a broker-dealer bid quotation or on market-based prices provided by Pricing Services (normally determined as of the NYSE close). Centrally cleared swaps and over the counter swaps can be valued by Pricing Services using a series of techniques, including simulation pricing models. The pricing models may use inputs that are observed from actively quoted
| ANNUAL REPORT | JUNE 30, 2018 | 53 |
Table of Contents
Notes to Financial Statements (Cont.)
markets such as the overnight index swap rate (“OIS”), London Interbank Offered Rate (“LIBOR”) forward rate, interest rates, yield curves and credit spreads. These securities are categorized as Level 2 of the fair value hierarchy.
Level 3 trading assets and trading liabilities, at fair value When a fair valuation method is applied by the Manager that uses significant unobservable inputs, investments will be priced by a method that the Board or persons acting at their direction believe reflects fair value and are categorized as Level 3 of the fair value hierarchy.
Short-term debt instruments (such as commercial paper) having a remaining maturity of 60 days or less may be valued at amortized cost, so long as the amortized cost value of such short-term debt instruments is approximately the same as the fair value of the instrument as determined without the use of amortized cost valuation. These securities are categorized as Level 2 or Level 3 of the fair value hierarchy depending on the source of the base price.
4. SECURITIES AND OTHER INVESTMENTS
(a) Investments in Securities
The Funds may utilize the investments and strategies described below to the extent permitted by each Fund’s respective investment policies.
Equity-Linked Securities are privately issued securities that have a return component based on the performance of a single stock, a basket of stocks, or a stock index. Equity-linked securities are often used for many of the same purposes as, and share many of the same risks with, derivative instruments.
Real Estate Investment Trusts (“REITs”) are pooled investment vehicles that own, and typically operate, income-producing real estate. If a REIT meets certain requirements, including distributing to shareholders substantially all of its taxable income (other than net capital gains), then it is not taxed on the income distributed to shareholders. Distributions received from REITs may be characterized as income, capital gain or a return of capital. A return of capital is recorded by a Fund as a reduction to the cost basis of its investment in the REIT. REITs are subject to management fees and other expenses, and so the Funds that invest in REITs will bear their proportionate share of the costs of the REITs’ operations.
Restricted Investments are subject to legal or contractual restrictions on resale and may generally be sold privately, but may be required to be registered or exempted from such registration before being sold to the public. Private placement securities are generally considered to be restricted except for those securities traded between qualified institutional investors under the provisions of Rule 144A of the Securities Act of 1933. Disposal of restricted investments may involve
time-consuming negotiations and expenses, and prompt sale at an acceptable price may be difficult to achieve. Restricted investments held by the Funds at June 30, 2018 are disclosed in the Notes to Schedules of Investments.
Warrants are securities that are usually issued together with a debt security or preferred security and that give the holder the right to buy a proportionate amount of common stock at a specified price. Warrants are freely transferable and are often traded on major exchanges. Warrants normally have a life that is measured in years and entitle the holder to buy common stock of a company at a price that is usually higher than the market price at the time the warrant is issued. Warrants may entail greater risks than certain other types of investments. Generally, warrants do not carry the right to receive dividends or exercise voting rights with respect to the underlying securities, and they do not represent any rights in the assets of the issuer. In addition, their value does not necessarily change with the value of the underlying securities, and they cease to have value if they are not exercised on or before their expiration date. If the market price of the underlying stock does not exceed the exercise price during the life of the warrant, the warrant will expire worthless. Warrants may increase the potential profit or loss to be realized from the investment as compared with investing the same amount in the underlying securities. Similarly, the percentage increase or decrease in the value of an equity security warrant may be greater than the percentage increase or decrease in the value of the underlying common stock. Warrants may relate to the purchase of equity or debt securities. Debt obligations with warrants attached to purchase equity securities have many characteristics of convertible securities and their prices may, to some degree, reflect the performance of the underlying stock. Debt obligations also may be issued with warrants attached to purchase additional debt securities at the same coupon rate. A decline in interest rates would permit a Fund to sell such warrants at a profit. If interest rates rise, these warrants would generally expire with no value.
5. FINANCIAL DERIVATIVE INSTRUMENTS
The Funds may enter into the financial derivative instruments described below to the extent permitted by each Fund’s respective investment policies.
The following disclosures contain information on how and why the Funds use financial derivative instruments, and how financial derivative instruments affect the Funds’ financial position, results of operations and cash flows. The location and fair value amounts of these instruments on the Statements of Assets and Liabilities and the net realized gain (loss) and net change in unrealized appreciation (depreciation) on the Statements of Operations, each categorized by type of financial derivative contract and related risk exposure, are
| 54 | PIMCO EQUITY SERIES |
Table of Contents
June 30, 2018
included in a table in the Notes to Schedules of Investments. The financial derivative instruments outstanding as of period end and the amounts of net realized gain (loss) and net change in unrealized appreciation (depreciation) on financial derivative instruments during the period, as disclosed in the Notes to Schedules of Investments, serve as indicators of the volume of financial derivative activity for the Funds.
(a) Forward Foreign Currency Contracts may be engaged, in connection with settling planned purchases or sales of securities, to hedge the currency exposure associated with some or all of a Fund’s securities or as part of an investment strategy. A forward foreign currency contract is an agreement between two parties to buy and sell a currency at a set price on a future date. The market value of a
forward foreign currency contract fluctuates with changes in foreign currency exchange rates. Forward foreign currency contracts are marked to market daily, and the change in value is recorded by a Fund as an unrealized gain (loss). Realized gains (losses) are equal to the difference between the value of the contract at the time it was opened and the value at the time it was closed and are recorded upon delivery or receipt of the currency. These contracts may involve market risk in excess of the unrealized gain (loss) reflected on the Statements of Assets and Liabilities. In addition, a Fund could be exposed to risk if the counterparties are unable to meet the terms of the contracts or if the value of the currency changes unfavorably to the U.S. dollar. To mitigate such risk, cash or securities may be exchanged as collateral pursuant to the terms of the underlying contracts.
6. PRINCIPAL RISKS
The principal risks of investing in a Fund, which could adversely affect its net asset value, yield and total return, are listed below.
| Risks | PIMCO RAFI Dynamic Multi-Factor Emerging Markets Equity ETF | PIMCO RAFI Dynamic Multi-Factor International Equity ETF | PIMCO RAFI Dynamic Multi-Factor U.S. Equity ETF | |||||||||||||
New/Small Fund | X | X | X | |||||||||||||
Market Trading | X | X | X | |||||||||||||
Equity | X | X | X | |||||||||||||
Credit | X | X | X | |||||||||||||
Market | X | X | X | |||||||||||||
Liquidity | X | X | X | |||||||||||||
Issuer | X | X | X | |||||||||||||
Derivatives | X | X | X | |||||||||||||
Foreign (Non-U.S.) Investment | X | X | ||||||||||||||
Emerging Markets | X | |||||||||||||||
Currency | X | X | ||||||||||||||
Model | X | X | X | |||||||||||||
Leveraging | X | X | X | |||||||||||||
Management and Tracking Error | X | X | X | |||||||||||||
Indexing | X | X | X | |||||||||||||
Please see “Description of Principal Risks” in a Fund’s prospectus for a more detailed description of the risks of investing in a Fund.
New/Small Fund Risk is the risk that a new or smaller Fund’s performance may not represent how a Fund is expected to or may perform in the long term. In addition, new Funds have limited operating histories for investors to evaluate and new and smaller Funds may not attract sufficient assets to achieve investment and trading efficiencies.
Market Trading Risk is the risk that an active secondary trading market for Fund shares does not continue once developed, that a Fund may not continue to meet a listing exchange’s trading or listing requirements, or that Fund shares trade at prices other than a Fund’s net asset value.
Equity Risk is the risk that the value of equity securities, such as common stocks and preferred securities, may decline due to general market conditions which are not specifically related to a particular company or to factors affecting a particular industry or industries. Equity securities generally have greater price volatility than fixed income securities.
Credit Risk is the risk that a Fund could lose money if the counterparty to a derivative contract is unable or unwilling to meet its financial obligations.
Market Risk is the risk that the value of securities owned by a Fund may go up or down, sometimes rapidly or unpredictably, due to factors affecting securities markets generally or particular industries.
| ANNUAL REPORT | JUNE 30, 2018 | 55 |
Table of Contents
Notes to Financial Statements (Cont.)
Liquidity Risk is the risk that a particular investment may be difficult to purchase or sell and that a Fund may be unable to sell illiquid securities at an advantageous time or price or achieve its desired level of exposure to a certain sector. The liquidity of a Fund’s shares may be constrained by the liquidity of a Fund’s portfolio holdings.
Issuer Risk is the risk that the value of a security may decline for a reason directly related to the issuer, such as management performance, financial leverage and reduced demand for the issuer’s goods or services.
Derivatives Risk is the risk of investing in derivative instruments (such as futures, swaps and structured securities), including leverage, liquidity, interest rate, market, credit and management risks, mispricing or valuation complexity. Changes in the value of the derivative may not correlate perfectly with, and may be more sensitive to market events than, the underlying asset, rate or index, and a Fund could lose more than the initial amount invested. A Fund’s use of derivatives may result in losses to a Fund, a reduction in a Fund’s returns and/or increased volatility. Over-the-counter (“OTC”) derivatives are also subject to the risk that a counterparty to the transaction will not fulfill its contractual obligations to the other party, as many of the protections afforded to centrally-cleared derivative transactions might not be available for OTC derivatives. For derivatives traded on an exchange or through a central counterparty, credit risk resides with a Fund’s clearing broker, or the clearinghouse itself, rather than with a counterparty in an OTC derivative transaction. Changes in regulation relating to a fund’s use of derivatives and related instruments could potentially limit or impact the Fund’s ability to invest in derivatives, limit a Fund’s ability to employ certain strategies that use derivatives and/ or adversely affect the value of derivatives and a Fund’s performance.
Foreign (Non-U.S.) Investment Risk is the risk that investing in foreign (non-U.S.) securities may result in a Fund experiencing more rapid and extreme changes in value than a fund that invests exclusively in securities of U.S. companies, due to smaller markets, differing reporting, accounting and auditing standards, increased risk of delayed settlement of portfolio transactions or loss of certificates of portfolio securities, and the risk of unfavorable foreign government actions, including nationalization, expropriation or confiscatory taxation, currency blockage, or political changes or diplomatic developments. Foreign securities may also be less liquid and more difficult to value than securities of U.S. issuers.
Emerging Markets Risk is the risk of investing in emerging market securities, primarily increased foreign (non-U.S.) investment risk.
Currency Risk is the risk that foreign (non-U.S.) currencies will change in value relative to the U.S. dollar and affect a Fund’s investments in
foreign (non-U.S.) currencies or in securities that trade in, and receive revenues in, or in derivatives that provide exposure to, foreign (non-U.S.) currencies.
Model Risk is the risk that a Fund’s investment models used in making investment allocation decisions, including the indexation methodologies used in constructing the Underlying Index, may not adequately take into account certain factors and may result in a decline in the value of an investment in a Fund.
Leveraging Risk is the risk that certain transactions of a Fund, such as reverse repurchase agreements, loans of portfolio securities, and the use of when-issued, delayed delivery or forward commitment transactions, or derivative instruments, may give rise to leverage, magnifying gains and losses and causing a Fund to be more volatile than if it had not been leveraged. This means that leverage entails a heightened risk of loss.
Management and Tracking Error Risk is the risk that the portfolio manager’s investment decisions may not produce the desired results or that a Fund’s portfolio may not closely track the Underlying Index for a number of reasons. A Fund incurs operating expenses, which are not applicable to the Underlying Index, and the costs of buying and selling securities, especially when rebalancing a Fund’s portfolio to reflect changes in the composition of the Underlying Index. Performance of a Fund and the Underlying Index may vary due to asset valuation differences and differences between a Fund’s portfolio and the Underlying Index due to legal restrictions, cost or liquidity restraints. The risk that performance of a Fund and the Underlying Index may vary may be heightened during periods of increased market volatility or other unusual market conditions. In addition, a Fund’s use of a representative sampling approach may cause a Fund to be less correlated to the return of the Underlying Index than if a Fund held all of the securities in the Underlying Index.
Indexing Risk is the risk that a Fund is negatively affected by general declines in the asset classes represented by the Underlying Index.
7. MASTER NETTING ARRANGEMENTS
A Fund may be subject to various netting arrangements (“Master Agreements”) with select counterparties. Master Agreements govern the terms of certain transactions, and are intended to reduce the counterparty risk associated with relevant transactions by specifying credit protection mechanisms and providing standardization that is intended to improve legal certainty. Each type of Master Agreement governs certain types of transactions. Different types of transactions may be traded out of different legal entities or affiliates of a particular organization, resulting in the need for multiple agreements with a single counterparty. As the Master Agreements are specific to unique
| 56 | PIMCO EQUITY SERIES |
Table of Contents
June 30, 2018
operations of different asset types, they allow a Fund to close out and net its total exposure to a counterparty in the event of a default with respect to all the transactions governed under a single Master Agreement with a counterparty. For financial reporting purposes the Statements of Assets and Liabilities generally present derivative assets and liabilities on a gross basis, which reflects the full risks and exposures prior to netting.
Master Agreements can also help limit counterparty risk by specifying collateral posting arrangements at pre-arranged exposure levels. Under most Master Agreements, collateral is routinely transferred if the total net exposure to certain transactions (net of existing collateral already in place) governed under the relevant Master Agreement with a counterparty in a given account exceeds a specified threshold, which typically ranges from zero to $250,000 depending on the counterparty and the type of Master Agreement. United States Treasury Bills and U.S. dollar cash are generally the preferred forms of collateral, although other forms of AAA rated paper or sovereign securities may be used depending on the terms outlined in the applicable Master Agreement. Securities and cash pledged as collateral are reflected as assets on the Statements of Assets and Liabilities as either a component of Investments at value (securities) or Deposits with counterparty. Cash collateral received is not typically held in a segregated account and as such is reflected as a liability on the Statements of Assets and Liabilities as Deposits from counterparty. The market value of any securities received as collateral is not reflected as a component of NAV. A Fund’s overall exposure to counterparty risk can change substantially within a short period, as it is affected by each transaction subject to the relevant Master Agreement.
Master Repurchase Agreements and Global Master Repurchase Agreements (individually and collectively “Master Repo Agreements”) govern repurchase, reverse repurchase, and sale-buyback transactions between a Fund and select counterparties. Master Repo Agreements maintain provisions for, among other things, initiation, income payments, events of default, and maintenance of collateral. The market value of transactions under the Master Repo Agreement, collateral pledged or received, and the net exposure by counterparty as of period end are disclosed in the Notes to Schedules of Investments.
Master Securities Forward Transaction Agreements (“Master Forward Agreements”) govern certain forward settling transactions, such as TBA securities, delayed-delivery or sale-buyback transactions by and between a Fund and select counterparties. The Master Forward Agreements maintain provisions for, among other things, transaction initiation and confirmation, payment and transfer, events of default, termination, and maintenance of collateral. The market value of forward settling transactions, collateral pledged or received, and the net exposure by counterparty as of period end is disclosed in the Notes to Schedules of Investments.
Customer Account Agreements and related addenda govern cleared derivatives transactions such as futures, options on futures, and cleared OTC derivatives. Such transactions require posting of initial margin as determined by each relevant clearing agency which is segregated in an account at a futures commission merchant (“FCM”) registered with the Commodity Futures Trading Commission (“CFTC”). In the United States, counterparty risk may be reduced as creditors of an FCM cannot have a claim to Fund assets in the segregated account. Portability of exposure reduces risk to the Funds. Variation margin, or changes in market value, are exchanged daily, but may not be netted between futures and cleared OTC derivatives unless the parties have agreed to a separate arrangement in respect of portfolio margining. The market value or accumulated unrealized appreciation (depreciation), initial margin posted, and any unsettled variation margin as of period end are disclosed in the Notes to Schedules of Investments.
International Swaps and Derivatives Association, Inc. Master Agreements and Credit Support Annexes (“ISDA Master Agreements”) govern bilateral OTC derivative transactions entered into by a Fund with select counterparties. ISDA Master Agreements maintain provisions for general obligations, representations, agreements, collateral posting and events of default or termination. Events of termination include conditions that may entitle counterparties to elect to terminate early and cause settlement of all outstanding transactions under the applicable ISDA Master Agreement. Any election to terminate early could be material to the financial statements. In limited circumstances, the ISDA Master Agreement may contain additional provisions that add counterparty protection beyond coverage of existing daily exposure if the counterparty has a decline in credit quality below a predefined level. These amounts, if any, may be segregated with a third-party custodian. The market value of OTC financial derivative instruments, collateral received or pledged, and net exposure by counterparty as of period end are disclosed in the Notes to Schedules of Investments.
8. FEES AND EXPENSES
(a) Management Fee PIMCO, a majority-owned subsidiary of Allianz Asset Management of America L.P. (“Allianz Asset Management”), serves as the Manager to the Trust, pursuant to an investment management agreement. Each Fund pays PIMCO fees in return for providing investment advisory, supervisory and administrative services under an all-in fee structure. Each Fund will pay monthly management fees to PIMCO at an annual rate based on average daily net assets (the “Management Fee”), at an annual rate as noted in the table below.
| Fund Name | Management Fee | |||||||
PIMCO RAFI Dynamic Multi-Factor Emerging Markets Equity ETF | 0.49% | |||||||
PIMCO RAFI Dynamic Multi-Factor International Equity ETF | 0.39% | |||||||
PIMCO RAFI Dynamic Multi-Factor U.S. Equity ETF | 0.29% | |||||||
| ANNUAL REPORT | JUNE 30, 2018 | 57 |
Table of Contents
Notes to Financial Statements (Cont.)
(b) Distribution and Servicing Fees PIMCO Investments LLC, a wholly-owned subsidiary of PIMCO, serves as the distributor (“Distributor”) of each Fund’s Creation Units. The Distributor does not maintain a secondary market in shares of the Funds. During the period ended June 30, 2018 each Fund was permitted to compensate the Distributor at an annual rate of up to 0.25% of a Fund’s average daily net assets (the “12b-1 Plan Fee”). However, the Board of Trustees has determined not to authorize payment of a 12b-1 Plan Fee at this time. The 12b-1 Plan Fee may only be imposed or increased when the Board determines that it is in the best interests of shareholders to do so. Because these fees are paid out of a Fund’s assets on an ongoing basis, to the extent that a fee is authorized, over time it will increase the cost of an investment in the Fund. The 12b-1 Plan Fee may cost an investor more than other types of sales charges.
(c) Fund Expenses PIMCO provides or procures supervisory and administrative services for shareholders and also bears the costs of various third-party services required by the Funds, including audit, custodial, portfolio accounting, legal, transfer agency and printing costs. The Funds bear other expenses which are not covered under the Management Fee which may vary and affect the total level of expenses paid by shareholders, such as (i) taxes and governmental fees; (ii) brokerage fees and commissions and other portfolio transaction expenses; (iii) costs of borrowing money, including interest expense; (iv) securities lending fees and expenses; (v) fees and expenses of the Trustees who are not “interested persons” of PIMCO or the Trust, and any counsel retained exclusively for their benefit; (vi) extraordinary expense, including costs of litigation and indemnification expenses; and (vii) organizational expenses. The ratio of expenses to average net assets, as disclosed on the Financial Highlights, may differ from the annual fund operating expenses as disclosed in the Prospectus.
Each Trustee, other than those affiliated with PIMCO or its affiliates, receives an annual retainer of $62,000, plus $6,250 for each Board meeting attended in person, $375 ($750 in the case of the audit committee chair with respect to audit committee meetings) for each committee meeting attended and $750 for each Board meeting attended telephonically, plus reimbursement of related expenses. In addition, the audit committee chair receives an additional annual retainer of $9,000, the valuation oversight committee lead receives an additional annual retainer of $2,000 (to the extent there are co-leads of the valuation oversight committee, the annual retainer will be split evenly between the co-leads, so that each co-lead individually receives an additional retainer of $1,000) and the governance committee chair receives an additional annual retainer of $750.
These expenses are allocated on a pro rata basis to each Fund of the Trust according to its respective net assets. The Trust pays no compensation directly to any Trustee or any other officer who is affiliated with the Manager, all of whom receive remuneration for their services to the Trust from the Manager or its affiliates.
(d) Expense Limitation Pursuant to the Expense Limitation Agreement, PIMCO has agreed to waive a portion of the Funds’ Management Fee, or reimburse each Fund, to the extent that each Fund’s organizational expenses, pro rata share of expenses related to obtaining or maintaining a Legal Entity Identifier and pro rata share of Trustee Fees exceed 0.0049%, the “Expense Limit” (calculated as a percentage of the Fund’s average daily net assets). The Expense Limitation Agreement will automatically renew for one-year terms unless PIMCO provides written notice to the Trust at least 30 days prior to the end of the then current term.
Under certain conditions, PIMCO may be reimbursed for these waived amounts in future periods, not to exceed thirty-six months after the waiver. The total recoverable amounts to PIMCO (from the applicable Fee Waiver Agreements and Expense Limitation Agreement combined) at June 30, 2018, were as follows (amounts in thousands†):
| Expiring within | ||||||||||||||||||||
| Fund Name | 12 months | 13-24 months | 25-36 months | Total | ||||||||||||||||
PIMCO RAFI Dynamic Multi-Factor Emerging Markets Equity ETF | $ | 0 | $ | 0 | $ | 119 | $ | 119 | ||||||||||||
PIMCO RAFI Dynamic Multi-Factor International Equity ETF | 0 | 0 | 122 | 122 | ||||||||||||||||
PIMCO RAFI Dynamic Multi-Factor U.S. Equity ETF | 0 | 0 | 122 | 122 | ||||||||||||||||
| † | A zero balance may reflect actual amounts rounding to less than one thousand. |
9. RELATED PARTY TRANSACTIONS
The Manager and Distributor are related parties. Fees paid to these parties are disclosed in Note 8, Fees and Expenses, and the accrued related party fee amounts are disclosed on the Statements of Assets and Liabilities.
10. GUARANTEES AND INDEMNIFICATIONS
Under the Trust’s organizational documents, each Trustee or officer of the Trust is indemnified and each employee or other agent of the Trust (including the Trust’s investment manager) may be indemnified, to the extent permitted by the Act, against certain liabilities that may arise out of performance of their duties to the Funds. Additionally, in the normal
| 58 | PIMCO EQUITY SERIES |
Table of Contents
June 30, 2018
course of business, the Funds enter into contracts that contain a variety of indemnification clauses. The Funds’ maximum exposure under these arrangements is unknown as this would involve future claims that may be made against the Funds that have not yet occurred. However, the Funds have not had prior claims or losses pursuant to these contracts.
11. PURCHASES AND SALES OF SECURITIES
The length of time a Fund has held a particular security is not generally a consideration in investment decisions. A change in the securities held by a Fund is known as “portfolio turnover.” Each Fund may engage in frequent and active trading of portfolio securities to achieve its
investment objective, particularly during periods of volatile market movements. High portfolio turnover may involve correspondingly greater transaction costs to a Fund, including brokerage commissions or dealer mark-ups and other transaction costs on the sale of securities and reinvestments in other securities. Such sales may also result in realization of taxable capital gains, including short-term capital gains (which are generally taxed at ordinary income tax rates). The transaction costs and tax effects associated with portfolio turnover may adversely affect a Fund’s performance. The portfolio turnover rates are reported in the Financial Highlights.
Purchases and sales of securities (excluding short-term investments) for the period ended June 30, 2018, were as follows (amounts in thousands†):
| U.S. Government/Agency | All Other | |||||||||||||||||||||||
| Fund Name | Purchases | Sales | Purchases | Sales | ||||||||||||||||||||
PIMCO RAFI Dynamic Multi-Factor Emerging Markets Equity ETF | $ | 0 | $ | 0 | $ | 373,424 | $ | 118,734 | ||||||||||||||||
PIMCO RAFI Dynamic Multi-Factor International Equity ETF | 0 | 0 | 11,424 | 9,335 | ||||||||||||||||||||
PIMCO RAFI Dynamic Multi-Factor U.S. Equity ETF | 0 | 0 | 24,825 | 22,040 | ||||||||||||||||||||
| † | A zero balance may reflect actual amounts rounding to less than one thousand. |
12. CAPITAL SHARE TRANSACTIONS
Capital shares are issued and redeemed by a Fund only in Creation Units. Except when aggregated in Creation Units, shares of a Fund are not redeemable. Transactions in capital shares for a Fund are disclosed in detail on the Statements of Changes in Net Assets.
The consideration for the purchase of Creation Units of a Fund generally consists of a basket of cash and/or securities that the Fund specifies each business day. Authorized Participants may be charged transaction fees as set forth below. To offset transfer and other transaction costs associated with the issuance and redemption of Creation Units, Authorized Participants are subject to standard creation and redemption transaction fees payable directly to State Street Bank and Trust Company, the sub-administrator of the Funds. PIMCO may, from time to time, at its own expense, compensate purchasers of Creation Units who have purchased substantial amounts of Creation Units and other financial institutions for administrative or marketing services. Creations and redemptions for cash (when cash creations and redemptions are available or specified) may be subject to an additional variable charge up to the maximum amount shown in the table below.
| Fund Name | Standard Creation/ Redemption Transaction Fee* | Maximum Variable Charge for Cash Creations** | Maximum Variable Charge for Cash Redemptions** | |||||||||||||
PIMCO RAFI Dynamic Multi-Factor Emerging Markets Equity ETF | $ | 2,250 | 3.00% | 2.00% | ||||||||||||
PIMCO RAFI Dynamic Multi-Factor International Equity ETF | $ | 5,000 | 3.00% | 2.00% | ||||||||||||
PIMCO RAFI Dynamic Multi-Factor U.S. Equity ETF | $ | 2,250 | 3.00% | 2.00% | ||||||||||||
| * | Applicable to in-kind contributions or redemptions only. |
| ** | As a percentage of the net asset value per Creation Unit purchased or redeemed, inclusive of the standard creation transaction fee (if imposed). |
13. INVESTMENT TRANSACTIONS
For the period ended June 30, 2018, certain Funds had in-kind contributions and in-kind redemptions as follows (amounts in thousands†):
| Fund Name | Contributions | Redemptions | ||||||||||
PIMCO RAFI Dynamic Multi-Factor Emerging Markets Equity ETF | $ | 140,344 | $ | 0 | ||||||||
PIMCO RAFI Dynamic Multi-Factor International Equity ETF | 40,382 | 14,327 | ||||||||||
PIMCO RAFI Dynamic Multi-Factor U.S. Equity ETF | 86,263 | 26,768 | ||||||||||
| † | A zero balance may reflect actual amounts rounding to less than one thousand. |
| ANNUAL REPORT | JUNE 30, 2018 | 59 |
Table of Contents
Notes to Financial Statements (Cont.)
The in-kind contributions and in-kind redemptions in this table may not agree with the Fund Share Transactions on the Statements of Changes in Net Assets. The table represents the accumulation of each Fund’s daily net shareholder transactions while the Statements of Changes in Net Assets reflect gross shareholder transactions including any cash component of the transactions.
14. REGULATORY AND LITIGATION MATTERS
The Funds are not named as defendants in any material litigation or arbitration proceedings and are not aware of any material litigation or claim pending or threatened against them.
The foregoing speaks only as of the date of this report.
15. FEDERAL INCOME TAX MATTERS
Each Fund intends to qualify as a regulated investment company under Subchapter M of the Internal Revenue Code (the “Code”) and distribute all of its taxable income and net realized gains, if applicable, to shareholders. Accordingly, no provision for Federal income taxes has been made.
A Fund may be subject to local withholding taxes, including those imposed on realized capital gains. Any applicable foreign capital gains tax is accrued daily based upon net unrealized gains, and may be payable following the sale of any applicable investments.
In accordance with U.S. GAAP, the Manager has reviewed the Funds’ tax positions for all open tax years. As of June 30, 2018, the Funds have recorded no liability for net unrecognized tax benefits relating to uncertain income tax positions they have taken or expect to take in future tax returns.
The Funds file U.S. federal, state, and local tax returns as required. The Funds’ tax returns are subject to examination by relevant tax authorities until expiration of the applicable statute of limitations, which is generally three years after the filing of the tax return but which can be extended to six years in certain circumstances. Tax returns for open years have incorporated no uncertain tax positions that require a provision for income taxes.
As of June 30, 2018, the components of distributable taxable earnings are as follows (amounts in thousands†):
| Undistributed Ordinary Income(1) | Undistributed Long-Term Capital Gains | Net Tax Basis Unrealized Appreciation/ (Depreciation)(2) | Other Book-to-Tax Accounting Differences(3) | Accumulated Capital Losses(4) | Qualified Late-Year Loss Deferral - Capital(5) | Qualified Late-Year Loss Deferral - Ordinary(6) | ||||||||||||||||||||||||||
PIMCO RAFI Dynamic Multi-Factor Emerging Markets Equity ETF | $ | 2,890 | $ | 0 | $ | (32,766 | ) | $ | 0 | $ | (14,197 | ) | $ | 0 | $ | 0 | ||||||||||||||||
PIMCO RAFI Dynamic Multi-Factor International Equity ETF | 487 | 0 | (404 | ) | 0 | (751 | ) | 0 | 0 | |||||||||||||||||||||||
PIMCO RAFI Dynamic Multi-Factor U.S. Equity ETF | 364 | 0 | 1,301 | 0 | (1,382 | ) | 0 | 0 | ||||||||||||||||||||||||
| † | A zero balance may reflect actual amounts rounding to less than one thousand. |
| (1) | Includes undistributed short-term capital gains, if any. |
| (2) | Adjusted for open wash sale loss deferrals and the accelerated recognition of unrealized gain (loss) on certain forward contracts for federal income tax purposes. Also adjusted for differences between book and tax realized and unrealized gain (loss) on convertible preferred securities, Passive Foreign Investment Companies (PFICs), Real Estate Investment Trusts (REITs), and non-REIT Return of Capital. |
| (3) | Represents differences in income tax regulations and financial accounting principles generally accepted in the United States of America. |
| (4) | Capital losses available to offset future net capital gains expire in varying amounts as shown below. |
| (5) | Capital losses realized during the period November 1, 2017 through June 30, 2018 which the Funds elected to defer to the following taxable year pursuant to income tax regulations. |
| (6) | Specified losses realized during the period November 1, 2017 through June 30, 2018 and Ordinary losses realized during the period January 1, 2018 through June 30, 2018, which the Funds elected to defer to the following taxable year pursuant to income tax regulations. |
Under the Regulated Investment Company Act of 2010, a fund is permitted to carry forward any new capital losses for an unlimited period. Additionally, such capital losses that are carried forward will retain their character as either short-term or long-term capital losses rather than being considered all short-term under previous law. As of June 30, 2018, the Funds had the following post-effective capital losses with no expiration (amounts in thousands†):
| Short-Term | Long-Term | |||||||||||
PIMCO RAFI Dynamic Multi-Factor Emerging Markets Equity ETF | $ | 14,197 | $ | 0 | ||||||||
PIMCO RAFI Dynamic Multi-Factor International Equity ETF | 751 | 0 | ||||||||||
PIMCO RAFI Dynamic Multi-Factor U.S. Equity ETF | 1,382 | 0 | ||||||||||
| † | A zero balance may reflect actual amounts rounding to less than one thousand. |
| 60 | PIMCO EQUITY SERIES |
Table of Contents
June 30, 2018
As of June 30, 2018, the aggregate cost and the net unrealized appreciation/(depreciation) of investments for federal income tax purposes are as follows (amounts in thousands†):
| Federal Tax Cost | Unrealized Appreciation | Unrealized (Depreciation) | Net Unrealized Appreciation/ (Depreciation)(7) | |||||||||||||||||
PIMCO RAFI Dynamic Multi-Factor Emerging Markets Equity ETF | $ | 384,811 | $ | 10,014 | $ | (42,759 | ) | $ | (32,745 | ) | ||||||||||
PIMCO RAFI Dynamic Multi-Factor International Equity ETF | 28,798 | 1,030 | (1,433 | ) | (403 | ) | ||||||||||||||
PIMCO RAFI Dynamic Multi-Factor U.S. Equity ETF | 63,665 | 3,112 | (1,812 | ) | 1,300 | |||||||||||||||
| † | A zero balance may reflect actual amounts rounding to less than one thousand. |
| (7) | Primary differences, if any, between book and tax net unrealized appreciation/(depreciation) are attributable to open wash sale loss deferrals, convertible preferred securities, unrealized gain or loss on Passive Foreign Investment Companies (PFICs), Real Estate Investment Trusts (REITs), and non-REIT Return of Capital. |
For the fiscal years ended June 30, 2018 and June 30, 2017, respectively, the Funds made the following tax basis distributions (amounts in thousands†):
| June 30, 2018 | June 30, 2017 | |||||||||||||||||||||||||||
| Ordinary Income Distributions(8) | Long-Term Capital Gain Distributions | Return of Capital(9) | Ordinary Income Distributions(8) | Long-Term Capital Gain Distributions | Return of Capital(9) | |||||||||||||||||||||||
PIMCO RAFI Dynamic Multi-Factor Emerging Markets Equity ETF | $ | 443 | $ | 0 | $ | 0 | $ | 0 | $ | 0 | $ | 0 | ||||||||||||||||
PIMCO RAFI Dynamic Multi-Factor International Equity ETF | 176 | 0 | 0 | 0 | 0 | 0 | ||||||||||||||||||||||
PIMCO RAFI Dynamic Multi-Factor U.S. Equity ETF | 226 | 0 | 0 | 0 | 0 | 0 | ||||||||||||||||||||||
| † | A zero balance may reflect actual amounts rounding to less than one thousand. |
| (8) | Includes short-term capital gains distributed, if any. |
| (9) | A portion of the distributions made represents a tax return of capital. Return of capital distributions have been reclassified from undistributed net investment income to paid-in capital to more appropriately conform financial accounting to tax accounting. |
| ANNUAL REPORT | JUNE 30, 2018 | 61 |
Table of Contents
Report of Independent Registered Public Accounting Firm
To the Board of Trustees of PIMCO Equity Series® and Shareholders of PIMCO RAFI Dynamic Multi-Factor Emerging Markets Equity ETF, PIMCO RAFI Dynamic Multi-Factor International Equity ETF and PIMCO RAFI Dynamic Multi-Factor U.S. Equity ETF
Opinions on the Financial Statements
We have audited the accompanying statements of assets and liabilities, including the schedules of investments, of PIMCO RAFI Dynamic Multi-Factor Emerging Markets Equity ETF, PIMCO RAFI Dynamic Multi-Factor International Equity ETF and PIMCO RAFI Dynamic Multi-Factor U.S. Equity ETF (three of the funds constituting PIMCO Equity Series®, hereafter collectively referred to as the “Funds”) as of June 30, 2018, and the related statements of operations and changes in net assets, including the related notes, and the financial highlights for the period August 31, 2017 (inception date) through June 30, 2018 (collectively referred to as the “financial statements”). In our opinion, the financial statements present fairly, in all material respects, the financial position of each of the Funds as of June 30, 2018, the results of each of their operations, changes in each of their net assets and each of the financial highlights for the period August 31, 2017 (inception date) through June 30, 2018 in conformity with accounting principles generally accepted in the United States of America.
Basis for Opinions
These financial statements are the responsibility of the Funds’ management. Our responsibility is to express an opinion on the Funds’ financial statements based on our audits. We are a public accounting firm registered with the Public Company Accounting Oversight Board (United States) (“PCAOB”) and are required to be independent with respect to the Funds in accordance with the U.S. federal securities laws and the applicable rules and regulations of the Securities and Exchange Commission and the PCAOB.
We conducted our audits of these financial statements in accordance with the standards of the PCAOB. Those standards require that we plan and perform the audit to obtain reasonable assurance about whether the financial statements are free of material misstatement, whether due to error or fraud.
Our audits included performing procedures to assess the risks of material misstatement of the financial statements, whether due to error or fraud, and performing procedures that respond to those risks. Such procedures included examining, on a test basis, evidence regarding the amounts and disclosures in the financial statements. Our audits also included evaluating the accounting principles used and significant estimates made by management, as well as evaluating the overall presentation of the financial statements. Our procedures included confirmation of securities owned as of June 30, 2018 by correspondence with the custodian and brokers; when replies were not received from brokers, we performed other auditing procedures. We believe that our audits provide a reasonable basis for our opinions.
/s/ PricewaterhouseCoopers LLP
Kansas City, Missouri
August 23, 2018
We have served as the auditor of one or more investment companies in PIMCO Equity Series® since 2010.
| 62 | PIMCO EQUITY SERIES |
Table of Contents
Glossary: (abbreviations that may be used in the preceding statements)
(Unaudited)
Counterparty Abbreviations: | ||||||||||
| SSB | State Street Bank and Trust Co. | |||||||||
Currency Abbreviations: | ||||||||||
| CAD | Canadian Dollar | MYR | Malaysian Ringgit | USD (or $) | United States Dollar | |||||
| HKD | Hong Kong Dollar | SGD | Singapore Dollar | |||||||
Exchange Abbreviations: | ||||||||||
| OTC | Over the Counter | |||||||||
Other Abbreviations: | ||||||||||
| ADR | American Depositary Receipt | REIT | Real Estate Investment Trust | SP - GDR | Sponsored Global Depositary Receipt | |||||
| GDR | Global Depositary Receipt | SP - ADR | Sponsored American Depositary Receipt | TBA | To-Be-Announced | |||||
| NVDR | Non-Voting Depositary Receipt | |||||||||
| ANNUAL REPORT | JUNE 30, 2018 | 63 |
Table of Contents
Federal Income Tax Information
(Unaudited)
As required by the Internal Revenue Code (“Code”) and Treasury Regulations, if applicable, shareholders must be notified within 60 days of the Funds’ fiscal year end regarding the status of qualified dividend income and the dividend received deduction.
Dividend Received Deduction. Corporate shareholders are generally entitled to take the dividend received deduction on the portion of a Funds’ dividend distribution that qualifies under tax law. The percentage of the following Funds’ Fiscal 2018 ordinary income dividend that qualifies for the corporate dividend received deduction is set forth below:
Qualified Dividend Income. Under the Jobs and Growth Tax Relief Reconciliation Act of 2003 (the “Act”), the following percentage of ordinary dividends paid during the fiscal year ended June 30, 2018 was designated as ‘qualified dividend income’ as defined in the Act subject to reduced tax rates in 2018:
Qualified Interest Income and Qualified Short-Term Capital Gain (for non-U.S. resident shareholders only). Under the American Jobs Creation Act of 2004, the following amounts of ordinary dividends paid during the fiscal year ended June 30, 2018 are considered to be derived from “qualified interest income,” as defined in Section 871(k)(1)(E) of the Code, and therefore are designated as interest-related dividends, as defined in Section 871(k)(1)(C) of the Code. Further, the following amounts of ordinary dividends paid during the fiscal year ended June 30, 2018 are considered to be derived from “qualified short-term capital gain,” as defined in Section 871(k)(2)(D) of the Code, and therefore are designated as qualified short-term gain dividends, as defined by Section 871(k)(2)(C) of the Code.
Foreign Taxes. The Funds’ have made an election under the Internal Revenue Code Section 853 to pass through foreign taxes paid. Shareholders will receive more detailed information along with their Form 1099-DIV.
| Dividend Received Deduction % | Qualified Dividend Income % | Qualified Interest Income (000s† ) | Qualified Short-Term Capital Gain (000s†) | Foreign Source Income | Foreign Taxes Pass Through | |||||||||||||||||||||||
PIMCO RAFI Dynamic Multi-Factor Emerging Markets Equity ETF | 1.40% | 100.00% | $ | 0 | $ | 0 | $ | 5,093,387 | $ | 600,733 | ||||||||||||||||||
PIMCO RAFI Dynamic Multi-Factor International Equity ETF | 0% | 100.00% | 0 | 0 | 721,094 | 69,063 | ||||||||||||||||||||||
PIMCO RAFI Dynamic Multi-Factor U.S. Equity ETF | 100.00% | 100.00% | 0 | 0 | 0 | 0 | ||||||||||||||||||||||
| † | A zero balance may reflect actual amounts rounding to less than one thousand. |
Shareholders are advised to consult their own tax advisor with respect to the tax consequences of their investment in the Trust. In January 2019, you will be advised on IRS Form 1099-DIV as to the federal tax status of the dividends and distributions received by you in calendar year 2018.
| 64 | PIMCO EQUITY SERIES |
Table of Contents
(Unaudited)
The charts below identify the Trustees and executive officers of the Trust. Unless otherwise indicated, the address of all persons below is 650 Newport Center Drive, Newport Beach, CA 92660.
The Funds’ Statement of Additional Information includes more information about the Trustees and Officers. To request a free copy, call PIMCO at (888) 87-PIMCO or visit the Funds’ website at www.pimco.com.
| Name, Year of Birth and Position Held with Trust* | Term of Office and Length of Time Served† | Principal Occupation(s) During Past 5 Years | Number of Funds in Fund Complex Overseen by Trustee | Other Public Company and Investment Company Directorships Held by Trustee During the Past 5 Years | ||||
| Interested Trustees1 | ||||||||
Brent R. Harris (1959) Chairman of the Board | 03/2010 to present | Managing Director, PIMCO. Senior Vice President of the Trust, PIMCO Equity Series VIT, PIMCO Funds, PIMCO Variable Insurance Trust and PIMCO ETF Trust. Formerly, member of Executive Committee, PIMCO. | 162 | Chairman and Trustee, PIMCO Equity Series VIT, PIMCO Funds, PIMCO Variable Insurance Trust, PIMCO ETF Trust; Director, StocksPLUS® Management, Inc; and member of Board of Governors, Investment Company Institute. | ||||
| Independent Trustees | ||||||||
Jennifer Holden Dunbar (1963) Trustee | 02/2016 to present | Managing Director, Dunbar Partners, LLC (business consulting and investments). Formerly, Partner, Leonard Green & Partners, L.P. | 162 | Trustee, PIMCO Equity Series VIT, PIMCO Funds, PIMCO Variable Insurance and PIMCO ETF Trust; Director, PS Business Parks; Director, Big 5 Sporting Goods Corporation. | ||||
Peter B. McCarthy (1950) Trustee | 09/2011 to present | Formerly, Assistant Secretary and Chief Financial Officer, United States Department of Treasury; Deputy Managing Director, Institute of International Finance. | 162 | Trustee, PIMCO Equity Series VIT, PIMCO Funds, PIMCO Variable Insurance and PIMCO ETF Trust. | ||||
Ronald C. Parker (1951) Trustee | 02/2016 to present | Director of Roseburg Forest Products Company. Formerly, Chairman of the Board, The Ford Family Foundation; and President, Chief Executive Officer, Hampton Affiliates (forestry products). | 162 | Trustee, PIMCO Equity Series VIT; Lead Independent Trustee, PIMCO Funds, PIMCO Variable Insurance and PIMCO ETF Trust. | ||||
| * | Unless otherwise noted, the information for the individuals listed is as of June 30, 2018. |
| 1 | Mr. Harris is an “interested persons” of the Trust (as that term is defined in the 1940 Act) because of his affiliations with PIMCO. |
| † | Trustees serve until their successors are duly elected and qualified. |
| ANNUAL REPORT | JUNE 30, 2018 | 65 |
Table of Contents
Management of the Trust (Cont.)
Executive Officers
| Name, Year of Birth and Position Held with Trust* | Term of Office and Length of Time Served | Principal Occupation(s) During Past 5 Years† | ||
Peter G. Strelow (1970) President | 02/2014 to present
Senior Vice President 11/2013 to 02/2014
Vice President 03/2010 to 11/2013 | Managing Director and Co-Chief Operating Officer, PIMCO. President, PIMCO Funds, PIMCO Variable Insurance Trust, PIMCO ETF Trust, PIMCO Equity Series VIT, PIMCO Managed Accounts Trust, PIMCO-Sponsored Interval Funds and PIMCO-Sponsored Closed-End Funds. Formerly, Chief Administrative Officer, PIMCO. | ||
David C. Flattum (1964) Chief Legal Officer | 03/2010 to present | Managing Director and General Counsel, PIMCO. Chief Legal Officer, PIMCO Funds, PIMCO Variable Insurance Trust, PIMCO ETF Trust and PIMCO Equity Series VIT. Formerly, Managing Director, Chief Operating Officer and General Counsel, Allianz Asset Management of America L.P. | ||
Jennifer E. Durham (1970) Chief Compliance Officer | 03/2010 to present | Managing Director and Chief Compliance Officer, PIMCO. Chief Compliance Officer, PIMCO Funds, PIMCO Variable Insurance Trust, PIMCO ETF Trust and PIMCO Equity Series VIT. | ||
Brent R. Harris (1959) Senior Vice President | 03/2010 to present | Managing Director, PIMCO. Senior Vice President, PIMCO Funds, PIMCO Variable Insurance Trust, PIMCO ETF Trust and PIMCO Equity Series VIT. Formerly, member of Executive Committee, PIMCO. | ||
Joshua D. Ratner (1976)** Vice President - Senior Counsel, Secretary | 11/2013 to present
Assistant Secretary 03/2010 to 01/2011 | Executive Vice President and General Deputy Counsel, PIMCO. Chief Legal Officer, PIMCO Investments LLC. Vice President - Senior Counsel, Secretary, PIMCO Funds, PIMCO Variable Insurance Trust, PIMCO ETF Trust and PIMCO Equity Series VIT. Vice President, Secretary and Chief Legal Officer, PIMCO Managed Accounts Trust, PIMCO-Sponsored Interval Funds and PIMCO-Sponsored Closed-End Funds. | ||
Ryan G. Leshaw (1980) Assistant Secretary | 05/2012 to present | Senior Vice President and Senior Counsel, PIMCO. Assistant Secretary, PIMCO Funds, PIMCO Variable Insurance Trust, PIMCO ETF Trust, PIMCO Equity Series VIT, PIMCO Managed Accounts Trust, PIMCO-Sponsored Interval Funds and PIMCO-Sponsored Closed-End Funds. Formerly, Associate, Willkie Farr & Gallagher LLP. | ||
Wu-Kwan Kit (1981) Assistant Secretary | 08/2017 to present | Vice President and Counsel, PIMCO. Assistant Secretary, PIMCO Funds, PIMCO Variable Insurance Trust, PIMCO ETF Trust, PIMCO Equity Series VIT, PIMCO Managed Accounts Trust, PIMCO-Sponsored Interval Funds and PIMCO-Sponsored Closed-End Funds. Formerly, Assistant General Counsel, VanEck Associates Corp. | ||
Stacie D. Anctil (1969) Vice President | 05/2015 to present
Assistant Treasurer 03/2010 to 05/2015 | Executive Vice President, PIMCO. Vice President, PIMCO Funds, PIMCO Variable Insurance Trust, PIMCO ETF Trust, PIMCO Equity Series VIT, PIMCO Managed Accounts Trust, PIMCO-Sponsored Interval Funds and PIMCO-Sponsored Closed-End Funds. | ||
William G. Galipeau (1974) Vice President | 11/2013 to present | Executive Vice President, PIMCO. Vice President, PIMCO Funds, PIMCO Variable Insurance Trust, PIMCO ETF Trust, PIMCO Equity Series VIT, PIMCO Managed Accounts Trust, PIMCO-Sponsored Interval Funds and PIMCO-Sponsored Closed-End Funds. | ||
Eric D. Johnson (1970) Vice President | 05/2011 to present | Executive Vice President, PIMCO. Vice President, PIMCO Funds, PIMCO Variable Insurance Trust, PIMCO ETF Trust, PIMCO Equity Series VIT, PIMCO Managed Accounts Trust, PIMCO-Sponsored Interval Funds and PIMCO-Sponsored Closed-End Funds. | ||
Henrik P. Larsen (1970) Vice President | 03/2010 to present | Senior Vice President, PIMCO. Vice President, PIMCO Funds, PIMCO Variable Insurance Trust, PIMCO ETF Trust and PIMCO Equity Series VIT. | ||
Bijal Y. Parikh (1978) Vice President | 02/2017 to present | Senior Vice President, PIMCO. Vice President, PIMCO Funds, PIMCO Variable Insurance Trust, PIMCO ETF Trust, PIMCO Equity Series VIT, PIMCO Managed Accounts Trust, PIMCO-Sponsored Interval Funds and PIMCO-Sponsored Closed-End Funds. | ||
Greggory S. Wolf (1970) Vice President | 05/2011 to present | Senior Vice President, PIMCO. Vice President, PIMCO Funds, PIMCO Variable Insurance Trust, PIMCO ETF Trust and PIMCO Equity Series VIT. | ||
Trent W. Walker (1974) Treasurer | 11/2013 to present
Assistant Treasurer 03/2010 to 11/2013 | Executive Vice President, PIMCO. Treasurer, PIMCO Funds, PIMCO Variable Insurance Trust, PIMCO ETF Trust, PIMCO Equity Series VIT, PIMCO Managed Accounts Trust, PIMCO-Sponsored Interval Funds and PIMCO-Sponsored Closed-End Funds. | ||
Erik C. Brown (1967) Assistant Treasurer | 03/2010 to present | Executive Vice President, PIMCO. Assistant Treasurer, PIMCO Funds, PIMCO Variable Insurance Trust, PIMCO ETF Trust, PIMCO Equity Series VIT, PIMCO Managed Accounts Trust, PIMCO-Sponsored Interval Funds and PIMCO-Sponsored Closed-End Funds. | ||
Colleen D. Miller (1980)** Assistant Treasurer | 02/2017 to present | Senior Vice President, PIMCO. Assistant Treasurer, PIMCO Funds, PIMCO Variable Insurance Trust, PIMCO ETF Trust, PIMCO Equity Series VIT, PIMCO Managed Accounts Trust, PIMCO-Sponsored Interval Funds and PIMCO-Sponsored Closed-End Funds. Formerly, Vice President Cohen & Steers Capital Management. | ||
Christopher M. Morin (1980) Assistant Treasurer | 08/2016 to present | Senior Vice President, PIMCO. Assistant Treasurer, PIMCO Funds, PIMCO Variable Insurance Trust, PIMCO ETF Trust, PIMCO Equity Series VIT, PIMCO Managed Accounts Trust, PIMCO-Sponsored Interval Funds and PIMCO-Sponsored Closed-End Funds. | ||
| 66 | PIMCO EQUITY SERIES |
Table of Contents
(Unaudited)
| Name, Year of Birth and Position Held with Trust* | Term of Office and Length of Time Served | Principal Occupation(s) During Past 5 Years† | ||
Jason J. Nagler (1982)** Assistant Treasurer | 05/2015 to present | Vice President, PIMCO. Assistant Treasurer, PIMCO Funds, PIMCO Variable Insurance Trust, PIMCO ETF Trust, PIMCO Equity Series VIT, PIMCO Managed Accounts Trust, PIMCO-Sponsored Interval Funds and PIMCO-Sponsored Closed-End Funds. Formerly, Head of Mutual Fund Reporting, GMO and Assistant Treasurer, GMO Trust and GMO Series Trust Funds. | ||
| * | Unless otherwise noted, the information for the individuals listed is as of June 30, 2018. |
| † | The term “PIMCO Closed-End Funds” as used herein includes: PIMCO California Municipal Income Fund, PIMCO California Municipal Income Fund II, PIMCO California Municipal Income Fund III, PIMCO Municipal Income Fund, PIMCO Municipal Income Fund II, PIMCO Municipal Income Fund III, PIMCO New York Municipal Income Fund, PIMCO New York Municipal Income Fund II, PIMCO New York Municipal Income Fund III, PCM Fund Inc., PIMCO Corporate & Income Opportunity Fund, PIMCO Corporate & Income Strategy Fund, PIMCO Dynamic Credit and Mortgage Income Fund, PIMCO Dynamic Income Fund, PIMCO Global StocksPLUS® & Income Fund, PIMCO High Income Fund, PIMCO Income Opportunity Fund, PIMCO Income Strategy Fund, PIMCO Income Strategy Fund II and PIMCO Strategic Income Fund, Inc.; the term “PIMCO-Sponsored Interval Funds” as used herein includes: PIMCO Flexible Credit Income Fund and PIMCO Flexible Municipal Income Fund. |
| ** | The address of these officers is Pacific Investment Management Company LLC, 1633 Broadway, New York, New York 10019. |
| ANNUAL REPORT | JUNE 30, 2018 | 67 |
Table of Contents
The Funds2,3 consider customer privacy to be a fundamental aspect of their relationships with shareholders and are committed to maintaining the confidentiality, integrity and security of their current, prospective and former shareholders’ non-public personal information. The Funds have developed policies that are designed to protect this confidentiality, while allowing shareholder needs to be served.
OBTAINING PERSONAL INFORMATION
In the course of providing shareholders with products and services, the Funds and certain service providers to the Funds, such as the Funds’ investment advisers or sub-advisers (“Advisers”), may obtain non-public personal information about shareholders, which may come from sources such as account applications and other forms, from other written, electronic or verbal correspondence, from shareholder transactions, from a shareholder’s brokerage or financial advisory firm, financial advisor or consultant, and/or from information captured on applicable websites.
RESPECTING YOUR PRIVACY
As a matter of policy, the Funds do not disclose any non-public personal information provided by shareholders or gathered by the Funds to non-affiliated third parties, except as required or permitted by law or as necessary for such third parties to perform their agreements with respect to the Funds. As is common in the industry, non-affiliated companies may from time to time be used to provide certain services, such as preparing and mailing prospectuses, reports, account statements and other information, conducting research on shareholder satisfaction and gathering shareholder proxies. The Funds or their affiliates may also retain non-affiliated companies to market Fund shares or products which use Fund shares and enter into joint marketing arrangements with them and other companies. These companies may have access to a shareholder’s personal and account information, but are permitted to use this information solely to provide the specific service or as otherwise permitted by law. In most cases, the shareholders will be clients of a third party, but the Funds may also provide a shareholder’s personal and account information to the shareholder’s respective brokerage or financial advisory firm and/or financial advisor or consultant.
SHARING INFORMATION WITH THIRD PARTIES
The Funds reserve the right to disclose or report personal or account information to non-affiliated third parties in limited circumstances where the Funds believe in good faith that disclosure is required under law, to cooperate with regulators or law enforcement authorities, to protect their rights or property, or upon reasonable request by any fund advised by PIMCO in which a shareholder has invested. In addition, the Funds may disclose information about a shareholder or a shareholder’s accounts to a non-affiliated third party at the shareholder’s request or with the consent of the shareholder.
SHARING INFORMATION WITH AFFILIATES
The Funds may share shareholder information with their affiliates in connection with servicing shareholders’ accounts, and subject to applicable law may provide shareholders with information about products and services that the Funds or their Advisers, distributors or their affiliates (“Service Affiliates”) believe may be of interest to such shareholders. The information that the Funds may share may include, for example, a shareholder’s participation in the Funds or in other investment programs sponsored by a Service Affiliate, a shareholder’s ownership of certain types of accounts (such as IRAs), information about the Funds’ experiences or transactions with a shareholder, information captured on applicable websites, or other data about a shareholder’s accounts, subject to applicable law. The Funds’ Service Affiliates, in turn, are not permitted to share shareholder information with non-affiliated entities, except as required or permitted by law.
PROCEDURES TO SAFEGUARD PRIVATE INFORMATION
The Funds take seriously the obligation to safeguard shareholder non-public personal information. In addition to this policy, the Funds have implemented procedures that are designed to restrict access to a shareholder’s non-public personal information to internal personnel who need to know that information to perform their jobs, such as servicing shareholder accounts or notifying shareholders of new products or services. Physical, electronic and procedural safeguards are in place to guard a shareholder’s non-public personal information.
INFORMATION COLLECTED FROM WEBSITES
Websites maintained by the Funds or their service providers may use a variety of technologies to collect information that help the Funds and their service providers understand how the website is used. Information collected from your web browser (including small files stored on your device that are commonly referred to as “cookies”) allow the websites to recognize your web browser and help to personalize and improve your user experience and enhance navigation of the website. In addition, the Funds or their Service Affiliates may use third parties to place advertisements for the Funds on other websites, including banner advertisements. Such third parties may collect anonymous information through the use of cookies or action tags (such as web beacons). The information these third parties collect is generally limited to technical and web navigation information, such as your IP address, web pages visited and browser type, and does not include personally identifiable information such as name, address, phone number or email address. If you are a registered user of the Funds’ website, the Funds or their service providers or third party firms engaged by the Funds or their service providers may collect or share information submitted by you, which may include personally identifiable information. This information can be useful to the Funds
| 68 | PIMCO EQUITY SERIES |
Table of Contents
(Unaudited)
when assessing and offering services and website features. You can change your cookie preferences by changing the setting on your web browser to delete or reject cookies. If you delete or reject cookies, some website pages may not function properly. The Funds do not look for web browser “do not track” requests.
CHANGES TO THE PRIVACY POLICY
From time to time, the Funds may update or revise this privacy policy. If there are changes to the terms of this privacy policy, documents containing the revised policy on the relevant website will be updated.
1 Amended as of February 14, 2017.
2 PIMCO Investments LLC (“PI”) serves as the Funds’ distributor. This Privacy Policy applies to the activities of PI to the extent that PI regularly effects or engages in transactions with or for a Fund shareholder who is the record owner of such shares. For purposes of this Privacy Policy, references to “the Funds” shall include PI when acting in this capacity.
3 When distributing this Policy, a Fund may combine the distribution with any similar distribution of its investment adviser’s privacy policy. The distributed, combined policy may be written in the first person (i.e., by using “we” instead of “the Funds”).
| ANNUAL REPORT | JUNE 30, 2018 | 69 |
Table of Contents
General Information
Investment Adviser and Administrator
Pacific Investment Management Company LLC
650 Newport Center Drive
Newport Beach, CA 92660
Investment Sub-Adviser
Parametric Portfolio Associates
1918 Eighth Avenue, Suite 3100
Seattle, WA 98101
Distributor
PIMCO Investments LLC
1633 Broadway
New York, NY 10019
Custodian
State Street Bank and Trust Company
801 Pennsylvania Avenue
Kansas City, MO 64105
Transfer Agent
State Street Bank and Trust Company
1 Heritage Drive
Quincy, MA 02171
Legal Counsel
Dechert LLP
1900 K Street, N.W.
Washington, D.C. 20006
Independent Registered Public Accounting Firm
PricewaterhouseCoopers LLP
1100 Walnut Street, Suite 1300
Kansas City, MO 64106
This report is submitted for the general information of the shareholders of the Funds listed on the Report cover.
Table of Contents

PES3004AR_063018
Table of Contents
| Item 2. | Code of Ethics. |
As of the end of the period covered by this report, the Registrant has adopted a code of ethics (the “Code”) that applies to the Registrant’s principal executive officer and principal financial officer. The Registrant did not grant any waivers, including implicit waivers, from any provisions of the Code to the principal executive officer or principal financial officer during the period covered by this report.
A copy of the Code is included as an exhibit to this report.
| Item 3. | Audit Committee Financial Expert. |
| (a) | The Board of Trustees has determined that Peter B. McCarthy, who serves on the Board’s audit committee, qualifies as an “audit committee financial expert” as such term is defined in the instructions to this Item 3. The Board has also determined that Mr. McCarthy is “independent” as such term is interpreted under this Item 3. |
| Item 4. | Principal Accountant Fees and Services. |
| (a) | Fiscal Year Ended | Audit Fees | ||||
| June 30, 2018 | $616,834 | |||||
| June 30, 2017 | $491,328 | |||||
| (b) | Fiscal Year Ended | Audit-Related Fees (1) | ||||
| June 30, 2018 | $— | |||||
| June 30, 2017 | $— | |||||
| (c) | Fiscal Year Ended | Tax Fees | ||||
| June 30, 2018 | $— | |||||
| June 30, 2017 | $24,550 | |||||
| (d) | Fiscal Year Ended | All Other Fees (2) | ||||
| June 30, 2018 | $— | |||||
| June 30, 2017 | $— | |||||
“Audit Fees” represents aggregate fees billed for each of the last two fiscal years for professional services rendered for the audit of the PIMCO Equity Series (the “Trust” or “Registrant”) annual financial statements or services that are normally provided by the accountant in connection with statutory or regulatory filings or engagements for those fiscal years.
“Audit-Related Fees” represents aggregate fees billed for each of the last two fiscal years for assurance and related services reasonably related to the performance of the audit of the Trust’s annual financial statements for those years.
“Tax Fees” represents aggregate fees billed for each of the last two fiscal years for professional services related to tax compliance, tax advice and tax planning, including review of federal and state income tax returns, review of excise tax distribution requirements and preparation of excise tax returns.
Table of Contents
“All Other Fees” represents aggregate fees, if any, billed for other products and services rendered by the principal accountant to the Trust for the last two fiscal years.
| (1) | There were no “Audit-Related Fees” for the last two fiscal years. |
| (2) | There were no “All Other Fees” for the last two fiscal years. |
| (e) | Pre-approval policies and procedures |
(1) The Registrant’s Audit Committee has adopted pre-approval policies and procedures (the “Procedures”) to govern the Audit Committee’s pre-approval of (i) all audit services and permissible non-audit services to be provided to the Registrant by its independent accountant, and (ii) all permissible non-audit services to be provided by such independent accountant to the Registrant’s investment adviser and to any entity controlling, controlled by, or under common control with the investment adviser that provides ongoing services to the Registrant (collectively, the “Service Affiliates”) if the services provided directly relate to the Registrant’s operations and financial reporting. In accordance with the Procedures, the Audit Committee is responsible for the engagement of the independent accountant to certify the Registrant’s financial statements for each fiscal year. With respect to the pre-approval of non-audit services provided to the Registrant and its Service Affiliates, the Procedures provide that the Audit Committee may annually pre-approve a list of types or categories of non-audit services that may be provided to the Registrant or its Service Affiliates, or the Audit Committee may pre-approve such services on a project-by-project basis as they arise. Unless a type of service has received general pre-approval, it will require specific pre-approval by the Audit Committee if it is to be provided by the independent accountant. The Procedures also permit the Audit Committee to delegate authority to one or more of its members to pre-approve any proposed non-audit services that have not been previously pre-approved by the Audit Committee, subject to the ratification by the full Audit Committee no later than its next scheduled meeting.
(2) With respect to the services described in paragraphs (b) through (d) of this Item 4, no amount was approved by the Audit Committee pursuant to paragraph (c)(7)(i)(C) of Rule 2-01 of Regulation S-X.
| (f) | Not applicable. |
(g)
| Aggregate Non-Audit Fees Billed to Entity | ||||||||||
| Entity | June 30, 2018 | June 30, 2017 | ||||||||
PIMCO Equity Series Trust | $ | — | $ | 24,550 | ||||||
Pacific Investment Management Company LLC (“PIMCO”) |
| 7,397,858
|
| 8,531,028 | ||||||
|
|
|
| |||||||
Totals | $ | 7,397,858 | $ | 8,555,578 | ||||||
|
|
|
| |||||||
| (h) | The Registrant’s Audit Committee has considered whether the provision of non-audit services that were rendered to the Registrant’s investment adviser, and any entity controlling, controlled by, or under common control with the investment adviser that provides ongoing services to the Registrant which were not pre-approved (not requiring pre-approval) is compatible with maintaining the principal accountant’s independence. |
| Item 5. | Audit Committee of Listed Registrants. |
The Registrant has a separately-designated standing audit committee established in accordance with Section 3(a)(58)(A) of the Securities Exchange Act of 1934, as amended. The audit committee is comprised of:
Jennifer Holden Dunbar
Peter B. McCarthy
Ronald C. Parker
.
Table of Contents
| Item 6. | Schedule of Investments. |
The information required by this Item 6 is included as part of the annual reports to shareholders filed under Item 1 of this Form N-CSR.
| Item 7. | Disclosure of Proxy Voting Policies and Procedures for Closed-End Management Investment Companies. |
Not applicable to open-end investment companies.
| Item 8. | Portfolio Managers of Closed-End Management Investment Companies. |
Not applicable to open-end investment companies.
| Item 9. | Purchases of Equity Securities by Closed-End Management Investment Company and Affiliated Purchasers. |
Not applicable to open-end investment companies.
| Item 10. | Submission of Matters to a Vote of Security Holders. |
There have been no material changes to the procedures by which shareholders may recommend nominees to the Trust’s Board of Trustees since the Trust last provided disclosure in response to this item.
| Item 11. | Controls and Procedures. |
(a) The principal executive officer and principal financial & accounting officer have concluded that the Registrant’s disclosure controls and procedures (as defined in Rule 30a-3(c) under the Act) provide reasonable assurances that material information relating to the Registrant is made known to them by the appropriate persons, based on their evaluation of these controls and procedures as of a date within 90 days of the filing of this report.
(b) There were no changes in the Registrant’s internal control over financial reporting (as defined in Rule 30a-3(d) under the Act) that occurred during the last fiscal quarter of the period covered by this report that have materially affected, or are reasonably likely to materially affect, the Registrant’s internal control over financial reporting.
| Item 12. | Disclosure of Securities Lending Activities for Closed-End Management Investment Companies. |
Not applicable to open-end investment companies.
| Item 13. | Exhibits. |
(a)(1) | Exhibit 99.CODE— Code of Ethics pursuant to Section 406 of the Sarbanes-Oxley Act of 2002. | |||
(a)(2) | Exhibit 99.CERT—Certifications pursuant to Section 302 of the Sarbanes-Oxley Act of 2002. | |||
(a)(3) | Not applicable to open-end investment companies. | |||
(a)(4) | There was no change in the registrant’s independent public accountant for the period covered by this report. | |||
(b) | Exhibit 99.906CERT—Certifications pursuant to Section 906 of the Sarbanes-Oxley Act of 2002. |
Table of Contents
Signatures
Pursuant to the requirements of the Securities Exchange Act of 1934 and the Investment Company Act of 1940, the registrant has duly caused this report to be signed on its behalf by the undersigned, thereunto duly authorized.
| PIMCO Equity Series | ||
| By: | /s/ Peter G. Strelow
| |
| Peter G. Strelow | ||
| President (Principal Executive Officer) | ||
| Date: | August 28, 2018 | |
Pursuant to the requirements of the Securities Exchange Act of 1934 and the Investment Company Act of 1940, this report has been signed below by the following persons on behalf of the registrant and in the capacities and on the dates indicated.
| By: | /s/ Peter G. Strelow
| |
| Peter G. Strelow | ||
| President (Principal Executive Officer) | ||
| Date: | August 28, 2018 | |
| By: | /s/ Trent W. Walker
| |
| Trent W. Walker | ||
| Treasurer (Principal Financial & Accounting Officer) | ||
| Date: | August 28, 2018 | |