UNITED STATES
SECURITIES AND EXCHANGE COMMISSION
Washington, D.C. 20549
FORM N-CSR
CERTIFIED SHAREHOLDER REPORT OF REGISTERED
MANAGEMENT INVESTMENT COMPANIES
Investment Company Act file number: 811-22903
J.P. Morgan Exchange-Traded Fund Trust
(Exact name of registrant as specified in charter)
277 Park Avenue
New York, NY 10172
(Address of principal executive offices) (Zip code)
Gregory S. Samuels
J.P. Morgan Investment Management Inc.
277 Park Avenue
New York, NY 10172
(Name and Address of Agent for Service)
With copies to:
Elizabeth A. Davin, Esq. JPMorgan Chase & Co. 1111 Polaris Parkway Columbus, OH 43240 | Jon S. Rand, Esq. Dechert LLP 1095 Avenue of the Americas New York, NY 10036 |
Registrant’s telephone number, including area code: 1-844-457-6383
Date of fiscal year end: October 31
Date of reporting period: November 1, 2023 through April 30, 2024
Form N-CSR is to be used by management investment companies to file reports with the Commission not later than 10 days after the transmission to stockholders of any report that is required to be transmitted to stockholders under Rule 30e-1 under the Investment Company Act of 1940 (17 CFR 270.30e-1). The Commission may use the information provided on Form N-CSR in its regulatory, disclosure review, inspection, and policymaking roles.
A registrant is required to disclose the information specified by Form N-CSR, and the Commission will make this information public. A registrant is not required to respond to the collection of information contained in Form N-CSR unless the Form displays a currently valid Office of Management and Budget (“OMB”) control number. Please direct comments concerning the accuracy of the information collection burden estimate and any suggestions for reducing the burden to Secretary, Securities and Exchange Commission, 450 Fifth Street, NW, Washington, DC 20549-0609. The OMB has reviewed this collection of information under the clearance requirements of 44 U.S.C. Section 3507.
ITEM 1. REPORTS TO STOCKHOLDERS.
a.) The following is a copy of the report transmitted to shareholders pursuant to Rule 30e-1 under the Investment Company Act of 1940 (17 CFR 270.30e-1).
b.) A copy of the notice transmitted to shareholders in reliance on Rule 30e-3 under the 1940 Act that contains disclosures specified by paragraph (c)(3) of that rule is included in the Annual Reports. Not Applicable. Notices do not incorporate disclosures from the shareholder report.
Fund | Ticker | Listing Exchange |
JPMorgan BetaBuilders Canada ETF | BBCA | Cboe BZX Exchange, Inc. |
JPMorgan BetaBuilders Developed Asia Pacific ex-Japan ETF | BBAX | Cboe BZX Exchange, Inc. |
JPMorgan BetaBuilders Emerging Markets Equity ETF | BBEM | Cboe BZX Exchange, Inc. |
JPMorgan BetaBuilders Europe ETF | BBEU | Cboe BZX Exchange, Inc. |
JPMorgan BetaBuilders International Equity ETF | BBIN | Cboe BZX Exchange, Inc. |
JPMorgan BetaBuilders Japan ETF | BBJP | Cboe BZX Exchange, Inc. |
JPMorgan BetaBuilders U.S. Equity ETF | BBUS | Cboe BZX Exchange, Inc. |
JPMorgan BetaBuilders U.S. Mid Cap Equity ETF | BBMC | NYSE Arca, Inc. |
JPMorgan BetaBuilders U.S. Small Cap Equity ETF | BBSC | NYSE Arca, Inc. |
JPMorgan Carbon Transition U.S. Equity ETF | JCTR | NYSE Arca, Inc. |
JPMorgan Diversified Return Emerging Markets Equity ETF | JPEM | NYSE Arca, Inc. |
JPMorgan Diversified Return International Equity ETF | JPIN | NYSE Arca, Inc. |
JPMorgan Diversified Return U.S. Equity ETF | JPUS | NYSE Arca, Inc. |
JPMorgan Diversified Return U.S. Mid Cap Equity ETF | JPME | NYSE Arca, Inc. |
JPMorgan Diversified Return U.S. Small Cap Equity ETF | JPSE | NYSE Arca, Inc. |
JPMorgan U.S. Momentum Factor ETF | JMOM | NYSE Arca, Inc. |
JPMorgan U.S. Quality Factor ETF | JQUA | NYSE Arca, Inc. |
JPMorgan U.S. Value Factor ETF | JVAL | NYSE Arca, Inc. |

1 | |
2 | |
3 | |
6 | |
9 | |
12 | |
15 | |
18 | |
21 | |
24 | |
27 | |
30 | |
33 | |
36 | |
39 | |
42 | |
45 | |
48 | |
51 | |
54 | |
57 | |
198 | |
218 | |
228 | |
263 | |
265 |
 | “The U.S. economic expansion has entered its fifth year, led by consumer spending, an increase in immigrant workers and receding inflation.” — Brian S. Shlissel |

President, J.P. Morgan Exchange-Traded Funds
J.P. Morgan Asset Management
1-844-4JPM-ETF or jpmorgan.com/etfs for more information
April 30, 2024 | J.P. Morgan Exchange-Traded Funds | 1 |
2 | J.P. Morgan Exchange-Traded Funds | April 30, 2024 |
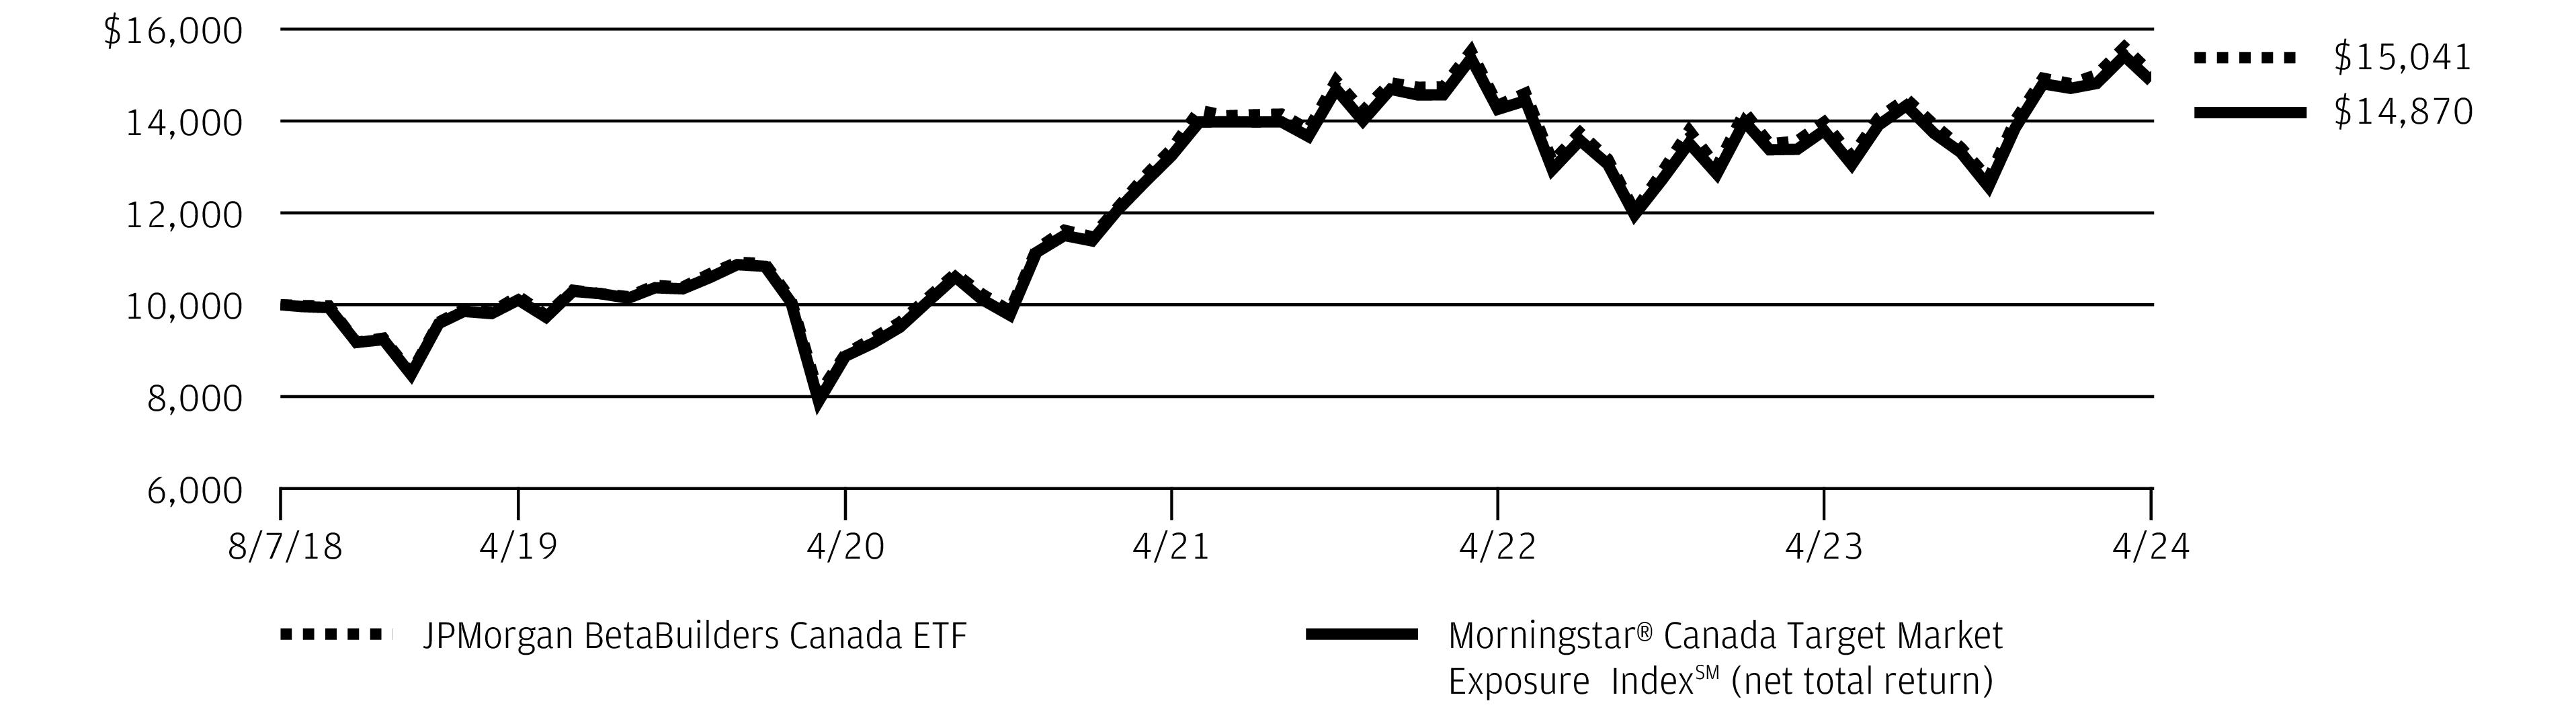
REPORTING PERIOD RETURN: | |
Net Asset Value * | 18.03% |
Market Price ** | 18.11% |
Morningstar® Canada Target Market Exposure IndexSM (net total return) | 18.31% |
Net Assets as of 4/30/2024 | $6,960,812,129 |
Fund Ticker | BBCA |
TOP TEN HOLDINGS OF THE PORTFOLIO AS OF April 30, 2024 | PERCENT OF TOTAL INVESTMENTS | |
1. | Royal Bank of Canada (Canada) | 7.1 % |
2. | Toronto-Dominion Bank (The) (Canada) | 5.5 |
3. | Shopify, Inc., Class A (Canada) | 4.2 |
4. | Canadian Natural Resources Ltd. (Canada) | 4.2 |
5. | Enbridge, Inc. (Canada) | 4.0 |
6. | Canadian Pacific Kansas City Ltd. (Canada) | 3.8 |
7. | Canadian National Railway Co. (Canada) | 3.4 |
8. | Bank of Montreal (Canada) | 3.3 |
9. | Brookfield Corp. (Canada) | 3.0 |
10. | Bank of Nova Scotia (The) (Canada) | 2.9 |
PORTFOLIO COMPOSITION BY SECTOR AS OF April 30, 2024 | PERCENT OF TOTAL INVESTMENTS |
Financials | 34.8% |
Energy | 18.2 |
Industrials | 13.7 |
Materials | 10.4 |
Information Technology | 8.6 |
Consumer Staples | 4.5 |
Consumer Discretionary | 3.6 |
Utilities | 2.6 |
Communication Services | 1.8 |
Others (each less than 1.0%) | 0.5 |
Short-Term Investments | 1.3 |
April 30, 2024 | J.P. Morgan Exchange-Traded Funds | 3 |
4 | J.P. Morgan Exchange-Traded Funds | April 30, 2024 |
INCEPTION DATE | SIX MONTHS* | 1 YEAR | 5 YEAR | SINCE INCEPTION | |
JPMorgan BetaBuilders Canada ETF | |||||
Net Asset Value | August 7, 2018 | 18.03 % | 7.64 % | 8.11 % | 7.39 % |
Market Price | 18.11 | 7.63 | 8.12 | 7.40 |
* | Not annualized. |
April 30, 2024 | J.P. Morgan Exchange-Traded Funds | 5 |
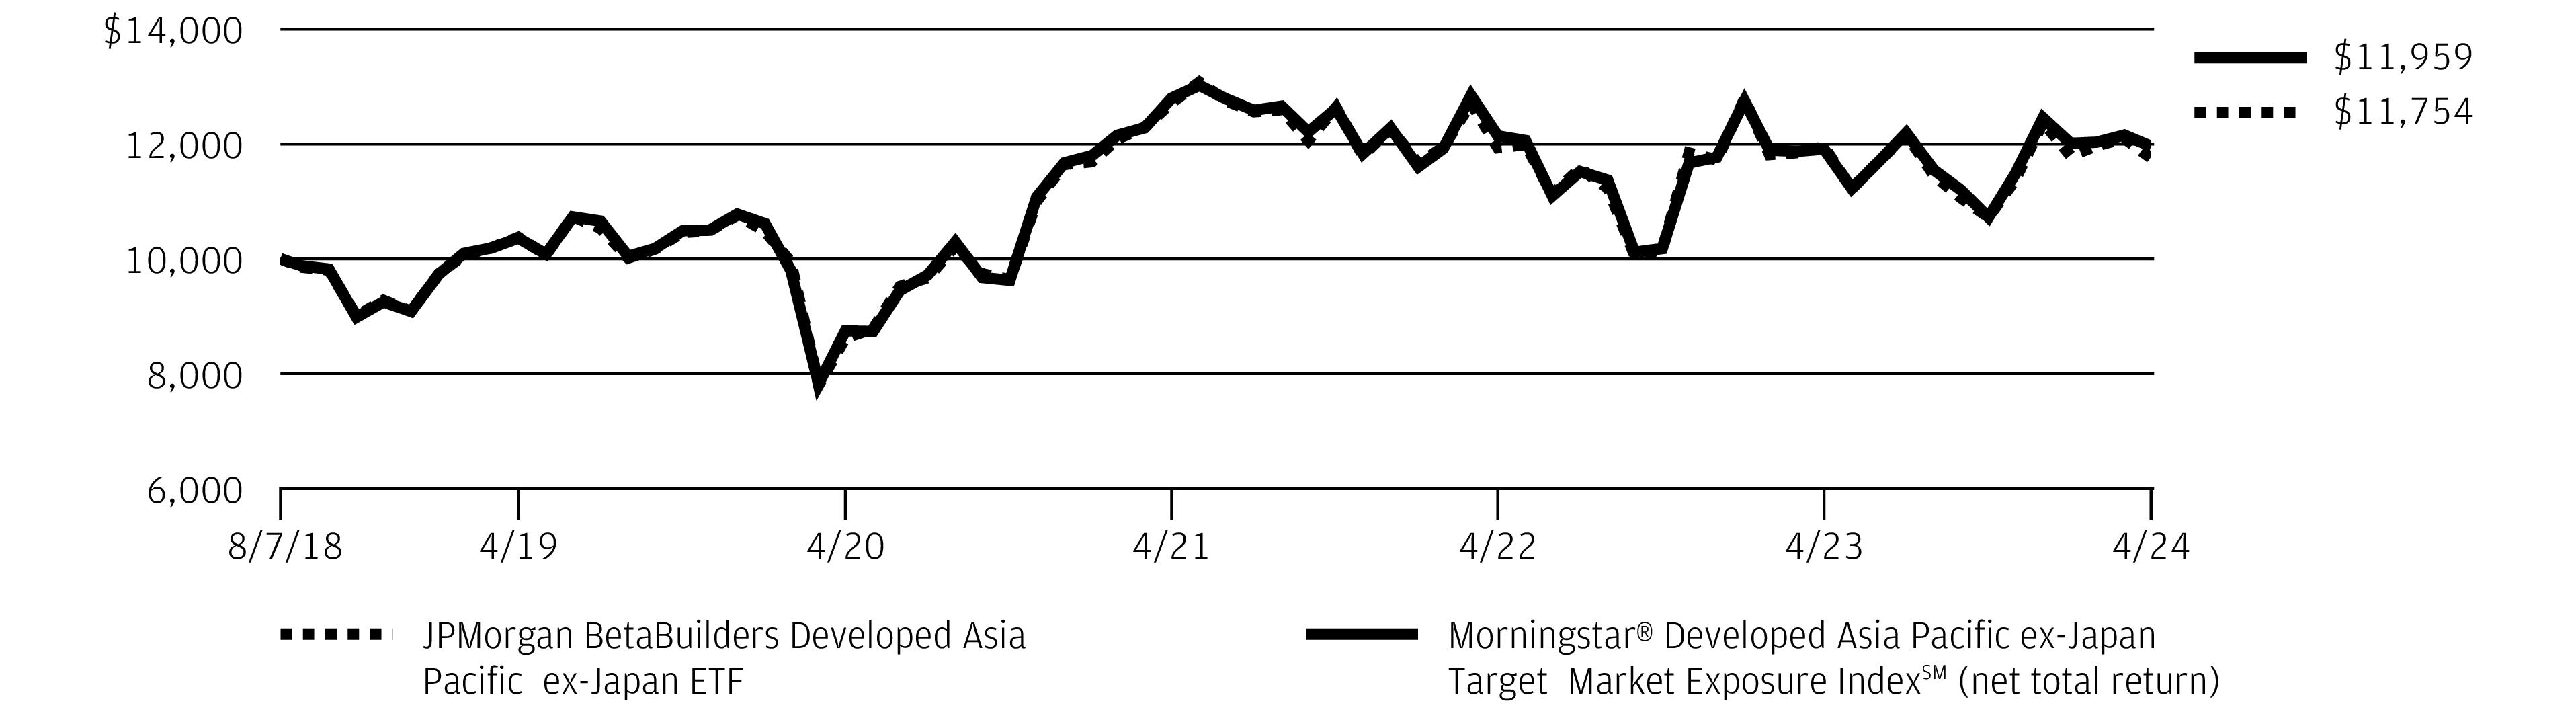
REPORTING PERIOD RETURN: | |
Net Asset Value * | 9.60% |
Market Price ** | 9.56% |
Morningstar® Developed Asia Pacific ex-Japan Target Market Exposure IndexSM (net total return) | 11.52% |
Net Assets as of 4/30/2024 | $4,469,759,510 |
Fund Ticker | BBAX |
TOP TEN HOLDINGS OF THE PORTFOLIO AS OF April 30, 2024 | PERCENT OF TOTAL INVESTMENTS | |
1. | BHP Group Ltd. (Australia) | 8.2 % |
2. | Commonwealth Bank of Australia (Australia) | 7.3 |
3. | CSL Ltd. | 5.1 |
4. | AIA Group Ltd. (Hong Kong) | 4.9 |
5. | National Australia Bank Ltd. (Australia) | 4.0 |
6. | Westpac Banking Corp. (Australia) | 3.4 |
7. | ANZ Group Holdings Ltd. (Australia) | 3.2 |
8. | DBS Group Holdings Ltd. (Singapore) | 3.0 |
9. | Wesfarmers Ltd. (Australia) | 2.9 |
10. | Macquarie Group Ltd. (Australia) | 2.7 |
PORTFOLIO COMPOSITION BY COUNTRY AS OF April 30, 2024 | PERCENT OF TOTAL INVESTMENTS |
Australia | 62.7% |
Hong Kong | 15.7 |
Singapore | 10.8 |
United States | 6.0 |
New Zealand | 1.9 |
China | 1.1 |
Others (each less than 1.0%) | 1.7 |
Short-Term Investments | 0.1 |
6 | J.P. Morgan Exchange-Traded Funds | April 30, 2024 |
April 30, 2024 | J.P. Morgan Exchange-Traded Funds | 7 |
INCEPTION DATE | SIX MONTHS* | 1 YEAR | 5 YEAR | SINCE INCEPTION | |
JPMorgan BetaBuilders Developed Asia Pacific ex-Japan ETF | |||||
Net Asset Value | August 7, 2018 | 9.60 % | (1.66 )% | 2.53 % | 2.86 % |
Market Price | 9.56 | (1.96 ) | 2.47 | 2.84 |
* | Not annualized. |
8 | J.P. Morgan Exchange-Traded Funds | April 30, 2024 |
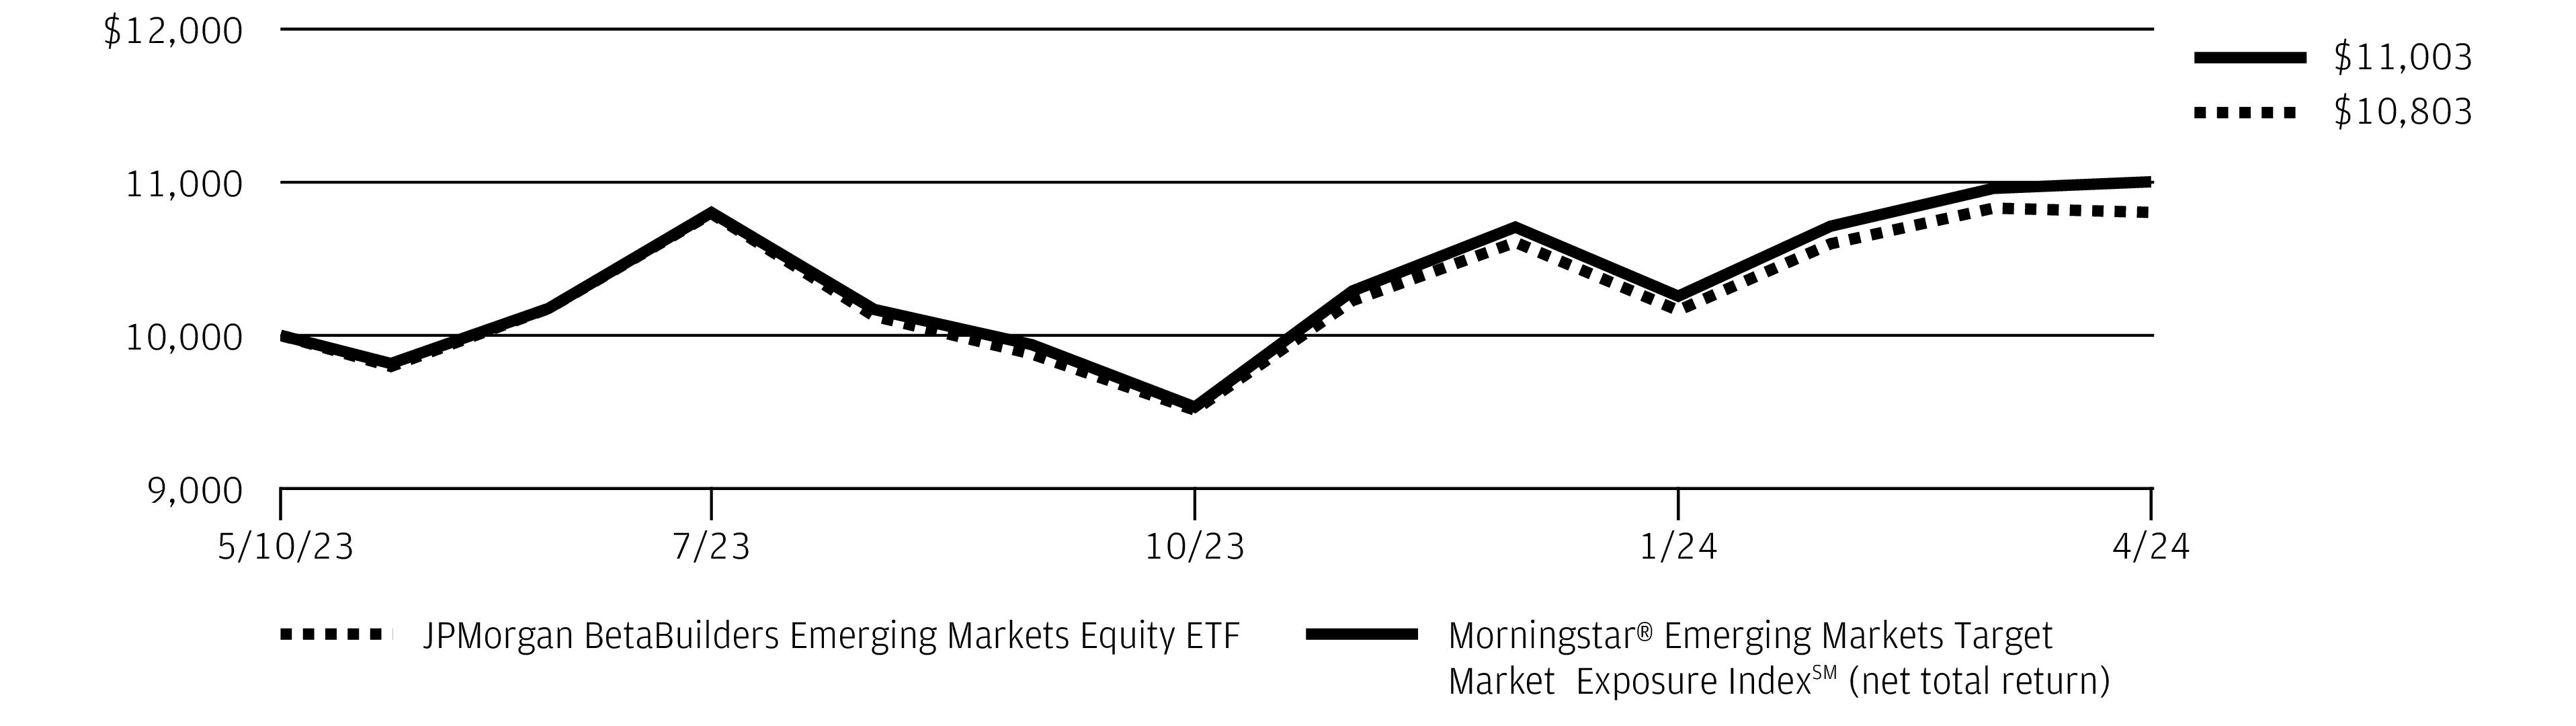
REPORTING PERIOD RETURN: | |
Net Asset Value * | 13.57% |
Market Price ** | 12.91% |
Morningstar® Emerging Markets Target Market Exposure IndexSM (net total return) | 15.43% |
Net Assets as of 4/30/2024 | $574,939,352 |
Fund Ticker | BBEM |
TOP TEN HOLDINGS OF THE PORTFOLIO AS OF April 30, 2024 | PERCENT OF TOTAL INVESTMENTS | |
1. | Taiwan Semiconductor Manufacturing Co. Ltd. (Taiwan) | 7.5 % |
2. | Samsung Electronics Co. Ltd. (South Korea) | 3.7 |
3. | Tencent Holdings Ltd. (China) | 3.5 |
4. | Alibaba Group Holding Ltd. (China) | 2.1 |
5. | Reliance Industries Ltd. (India) | 1.9 |
6. | HDFC Bank Ltd. (India) | 1.3 |
7. | International Holding Co. PJSC (United Arab Emirates) | 1.0 |
8. | PDD Holdings, Inc., ADR (China) | 1.0 |
9. | Meituan (China) | 1.0 |
10. | ICICI Bank Ltd. (India) | 0.9 |
PORTFOLIO COMPOSITION BY COUNTRY AS OF April 30, 2024 | PERCENT OF TOTAL INVESTMENTS |
China | 25.0% |
India | 20.3 |
Taiwan | 16.7 |
South Korea | 11.6 |
Brazil | 4.5 |
Saudi Arabia | 3.8 |
South Africa | 2.5 |
United Arab Emirates | 2.4 |
Mexico | 2.1 |
Indonesia | 1.9 |
Malaysia | 1.6 |
Thailand | 1.4 |
Others (each less than 1.0%) | 4.9 |
Short-Term Investments | 1.3 |
April 30, 2024 | J.P. Morgan Exchange-Traded Funds | 9 |
10 | J.P. Morgan Exchange-Traded Funds | April 30, 2024 |
INCEPTION DATE | SIX MONTHS* | CUMULATIVE SINCE INCEPTION | |
JPMorgan BetaBuilders Emerging Markets Equity ETF | |||
Net Asset Value | May 10, 2023 | 13.57 % | 8.03 % |
Market Price | 12.91 | 7.64 |
* | Not annualized. |
April 30, 2024 | J.P. Morgan Exchange-Traded Funds | 11 |
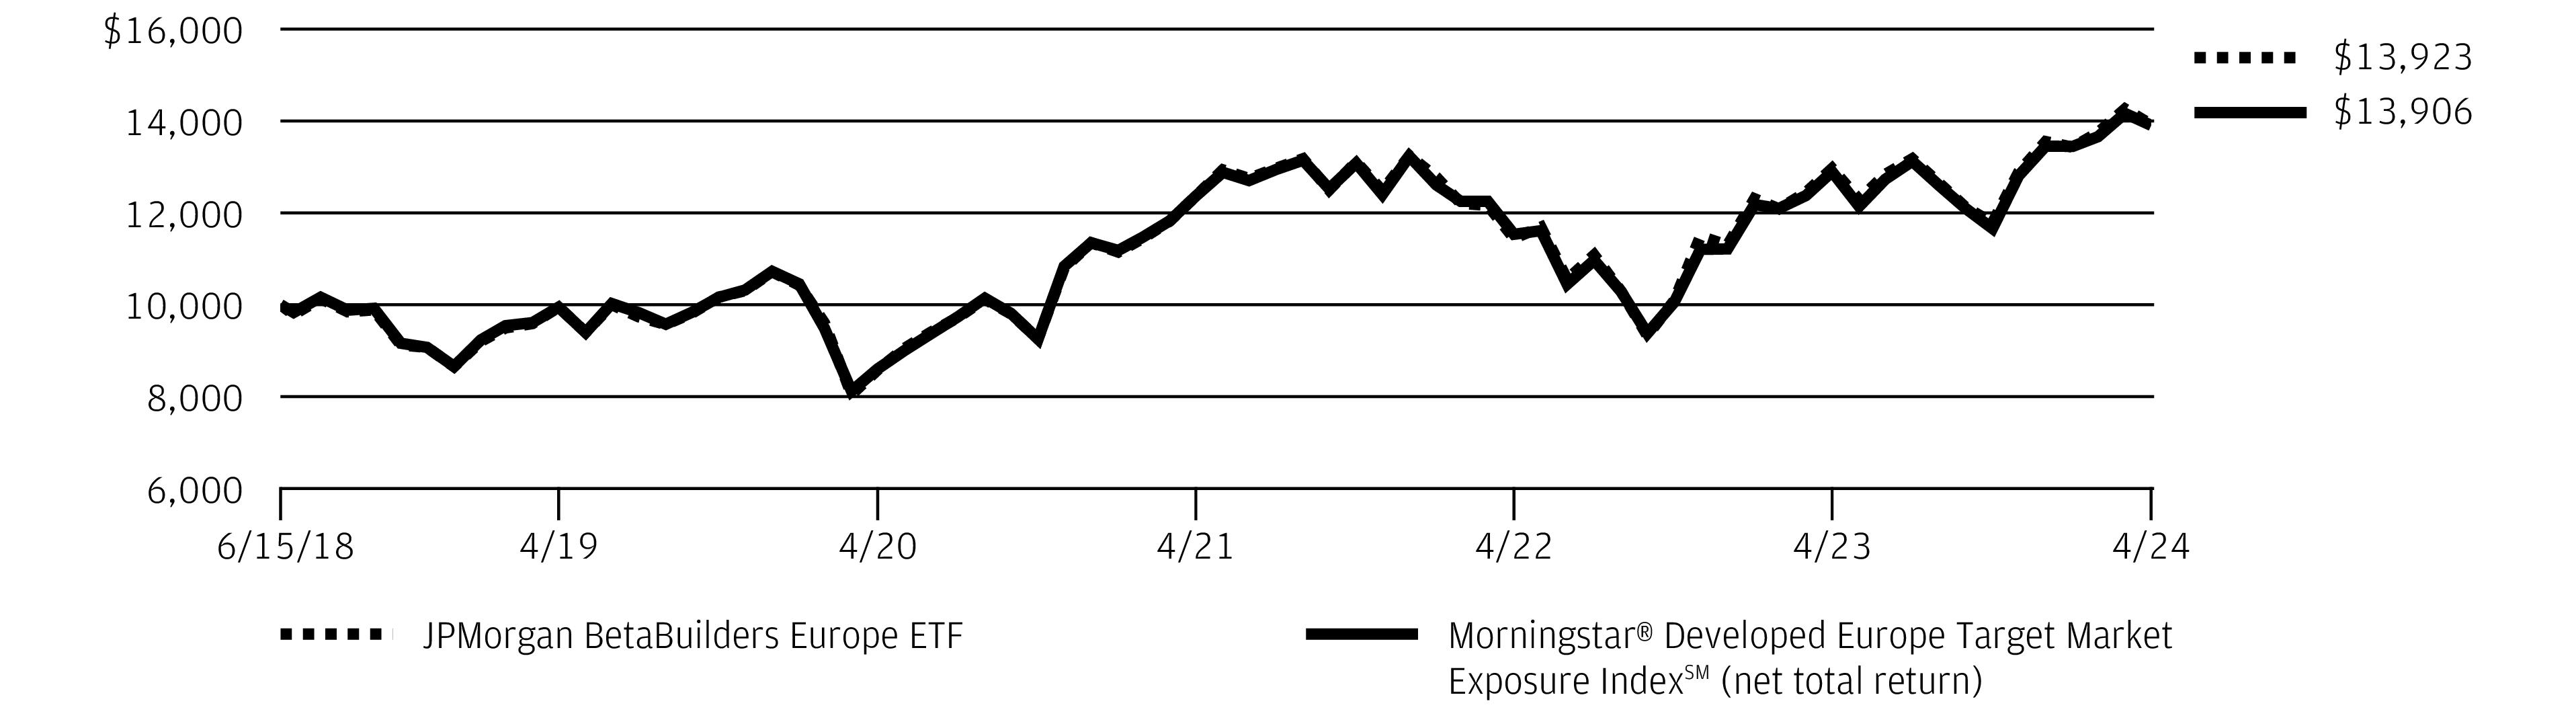
REPORTING PERIOD RETURN: | |
Net Asset Value * | 18.18% |
Market Price ** | 18.31% |
Morningstar® Developed Europe Target Market Exposure IndexSM (net total return) | 19.27% |
Net Assets as of 4/30/2024 | $7,583,939,266 |
Fund Ticker | BBEU |
TOP TEN HOLDINGS OF THE PORTFOLIO AS OF April 30, 2024 | PERCENT OF TOTAL INVESTMENTS | |
1. | Novo Nordisk A/S, Class B (Denmark) | 4.0 % |
2. | ASML Holding NV (Netherlands) | 3.2 |
3. | Nestle SA (Registered) | 2.5 |
4. | AstraZeneca plc (United Kingdom) | 2.2 |
5. | Shell plc | 2.1 |
6. | LVMH Moet Hennessy Louis Vuitton SE (France) | 2.0 |
7. | Novartis AG (Registered) (Switzerland) | 1.8 |
8. | SAP SE (Germany) | 1.8 |
9. | Roche Holding AG | 1.5 |
10. | HSBC Holdings plc (United Kingdom) | 1.5 |
PORTFOLIO COMPOSITION BY COUNTRY AS OF April 30, 2024 | PERCENT OF TOTAL INVESTMENTS |
United Kingdom | 15.9% |
France | 14.6 |
United States | 12.1 |
Germany | 12.0 |
Switzerland | 8.4 |
Netherlands | 6.5 |
Denmark | 5.7 |
Sweden | 5.1 |
Italy | 3.9 |
Spain | 3.8 |
Finland | 1.6 |
Belgium | 1.2 |
Australia | 1.2 |
Norway | 1.0 |
Others (each less than 1.0%) | 3.2 |
Short-Term Investments | 3.8 |
12 | J.P. Morgan Exchange-Traded Funds | April 30, 2024 |
April 30, 2024 | J.P. Morgan Exchange-Traded Funds | 13 |
INCEPTION DATE | SIX MONTHS* | 1 YEAR | 5 YEAR | SINCE INCEPTION | |
JPMorgan BetaBuilders Europe ETF | |||||
Net Asset Value | June 15, 2018 | 18.18 % | 7.38 % | 6.95 % | 5.80 % |
Market Price | 18.31 | 7.57 | 6.96 | 5.83 |
* | Not annualized. |
14 | J.P. Morgan Exchange-Traded Funds | April 30, 2024 |
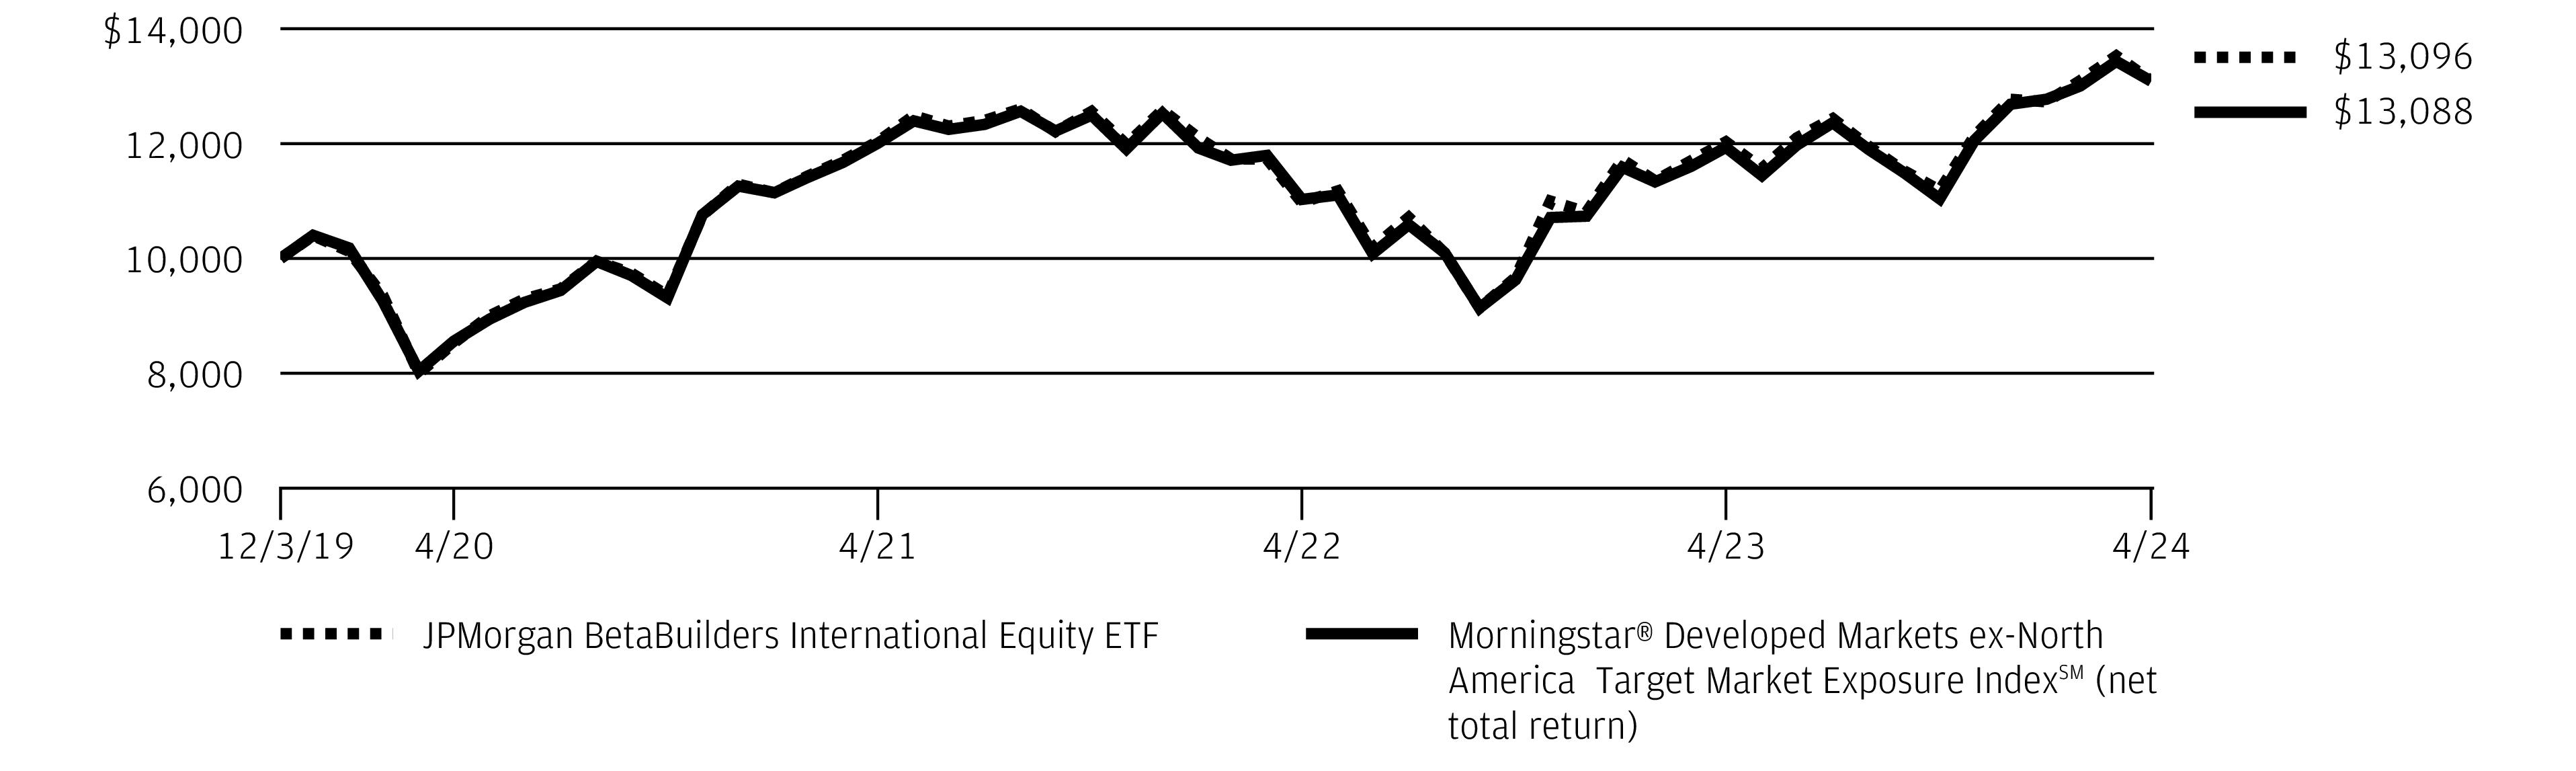
REPORTING PERIOD RETURN: | |
Net Asset Value * | 17.08% |
Market Price ** | 16.56% |
Morningstar® Developed Markets ex-North America Target Market Exposure IndexSM (net total return) | 18.56% |
Net Assets as of 4/30/2024 | $3,980,814,171 |
Fund Ticker | BBIN |
TOP TEN HOLDINGS OF THE PORTFOLIO AS OF April 30, 2024 | PERCENT OF TOTAL INVESTMENTS | |
1. | Novo Nordisk A/S, Class B (Denmark) | 2.6 % |
2. | ASML Holding NV (Netherlands) | 2.0 |
3. | Toyota Motor Corp. (Japan) | 1.6 |
4. | Nestle SA (Registered) | 1.6 |
5. | AstraZeneca plc (United Kingdom) | 1.4 |
6. | Shell plc | 1.4 |
7. | LVMH Moet Hennessy Louis Vuitton SE (France) | 1.3 |
8. | Novartis AG (Registered) (Switzerland) | 1.2 |
9. | SAP SE (Germany) | 1.1 |
10. | Roche Holding AG | 1.0 |
PORTFOLIO COMPOSITION BY COUNTRY AS OF April 30, 2024 | PERCENT OF TOTAL INVESTMENTS |
Japan | 24.2% |
United Kingdom | 10.4 |
France | 9.4 |
United States | 8.4 |
Germany | 7.7 |
Australia | 7.1 |
Switzerland | 5.4 |
Netherlands | 4.2 |
Denmark | 3.7 |
Sweden | 3.3 |
Italy | 2.5 |
Spain | 2.5 |
Hong Kong | 1.7 |
Singapore | 1.2 |
Finland | 1.0 |
Others (each less than 1.0%) | 4.1 |
Short-Term Investments | 3.2 |
April 30, 2024 | J.P. Morgan Exchange-Traded Funds | 15 |
16 | J.P. Morgan Exchange-Traded Funds | April 30, 2024 |
INCEPTION DATE | SIX MONTHS* | 1 YEAR | SINCE INCEPTION | |
JPMorgan BetaBuilders International Equity ETF | ||||
Net Asset Value | December 3, 2019 | 17.08 % | 8.85 % | 6.31 % |
Market Price | 16.56 | 8.67 | 6.29 |
* | Not annualized. |
April 30, 2024 | J.P. Morgan Exchange-Traded Funds | 17 |
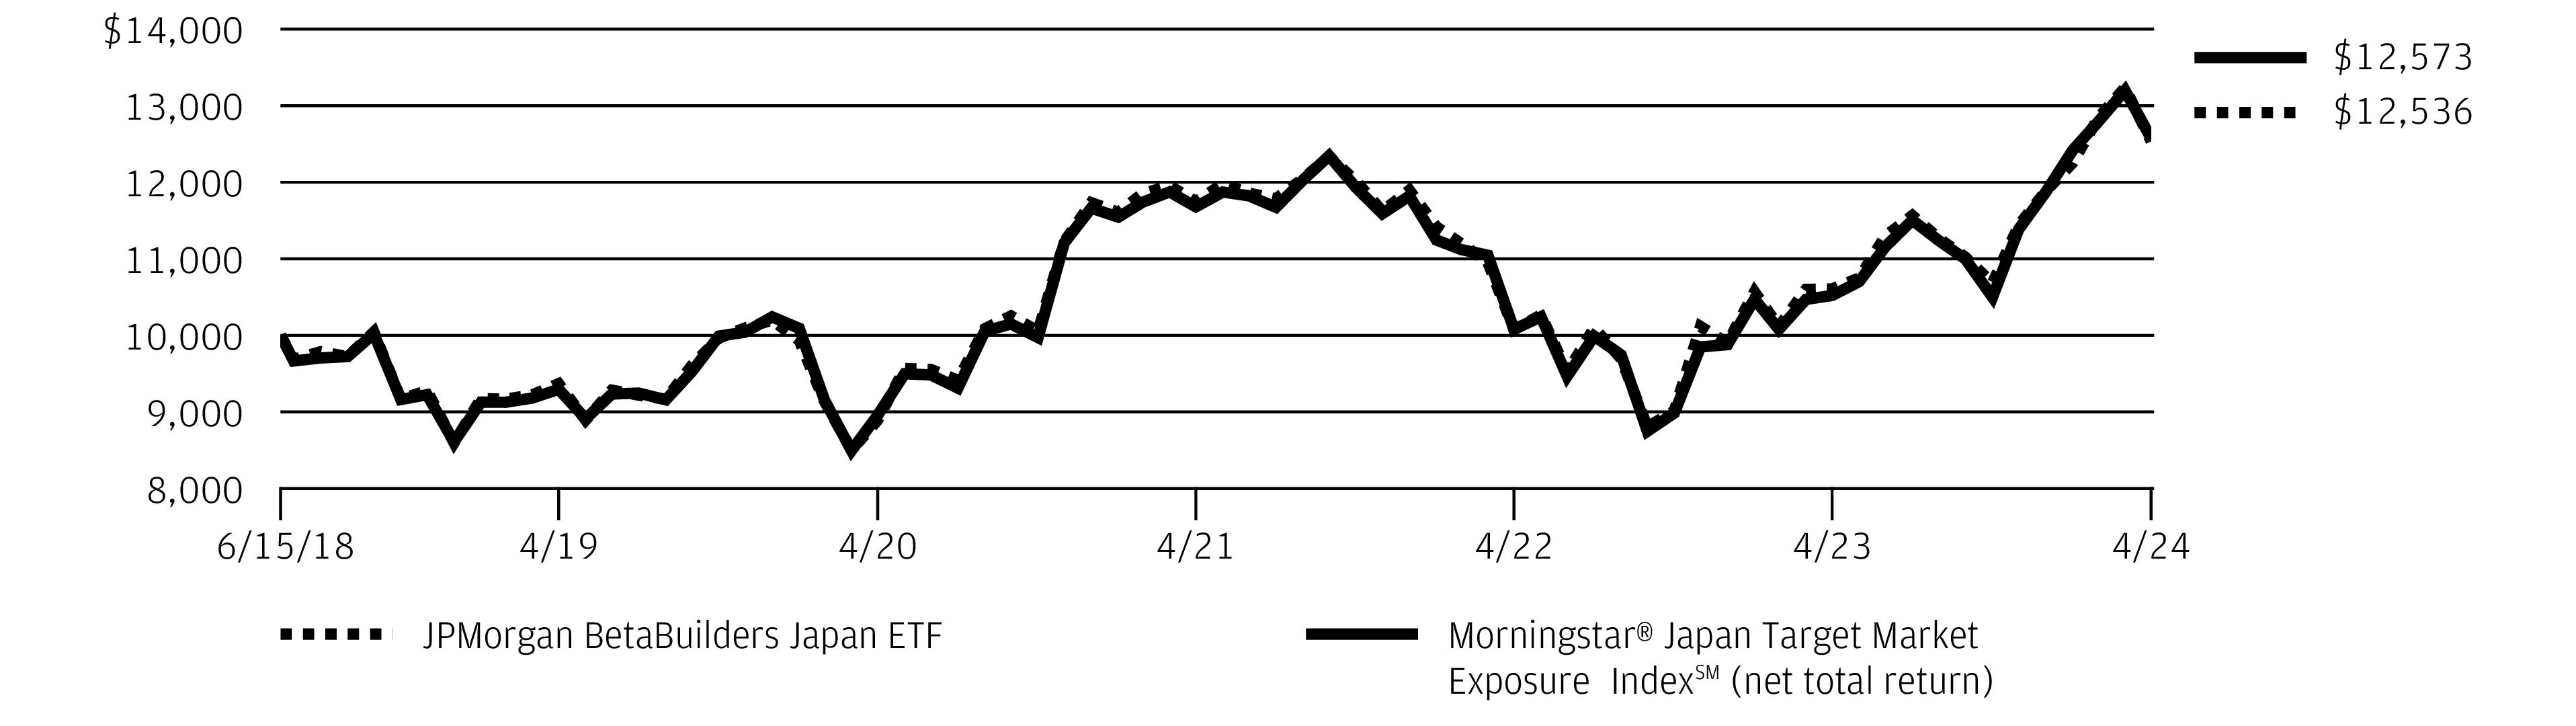
REPORTING PERIOD RETURN: | |
Net Asset Value * | 17.37% |
Market Price ** | 16.03% |
Morningstar® Japan Target Market Exposure IndexSM (net total return) | 19.75% |
Net Assets as of 4/30/2024 | $11,257,349,289 |
Fund Ticker | BBJP |
TOP TEN HOLDINGS OF THE PORTFOLIO AS OF April 30, 2024 | PERCENT OF TOTAL INVESTMENTS | |
1. | Toyota Motor Corp. (Japan) | 6.7 % |
2. | Mitsubishi UFJ Financial Group, Inc. (Japan) | 2.9 |
3. | Sony Group Corp. (Japan) | 2.5 |
4. | Tokyo Electron Ltd. (Japan) | 2.4 |
5. | Mitsubishi Corp. (Japan) | 2.3 |
6. | Hitachi Ltd. (Japan) | 2.1 |
7. | Keyence Corp. (Japan) | 2.0 |
8. | Shin-Etsu Chemical Co. Ltd. (Japan) | 1.9 |
9. | Sumitomo Mitsui Financial Group, Inc. (Japan) | 1.8 |
10. | Mitsui & Co. Ltd. (Japan) | 1.8 |
PORTFOLIO COMPOSITION BY SECTOR AS OF April 30, 2024 | PERCENT OF TOTAL INVESTMENTS |
Industrials | 24.5% |
Consumer Discretionary | 19.5 |
Financials | 13.5 |
Information Technology | 13.2 |
Health Care | 7.4 |
Communication Services | 6.0 |
Consumer Staples | 5.6 |
Materials | 4.8 |
Real Estate | 3.4 |
Utilities | 1.1 |
Others (each less than 1.0%) | 0.8 |
Short-Term Investments | 0.2 |
18 | J.P. Morgan Exchange-Traded Funds | April 30, 2024 |
April 30, 2024 | J.P. Morgan Exchange-Traded Funds | 19 |
INCEPTION DATE | SIX MONTHS* | 1 YEAR | 5 YEAR | SINCE INCEPTION | |
JPMorgan BetaBuilders Japan ETF | |||||
Net Asset Value | June 15, 2018 | 17.37 % | 18.19 % | 6.00 % | 3.92 % |
Market Price | 16.03 | 17.44 | 6.02 | 3.90 |
* | Not annualized. |
20 | J.P. Morgan Exchange-Traded Funds | April 30, 2024 |
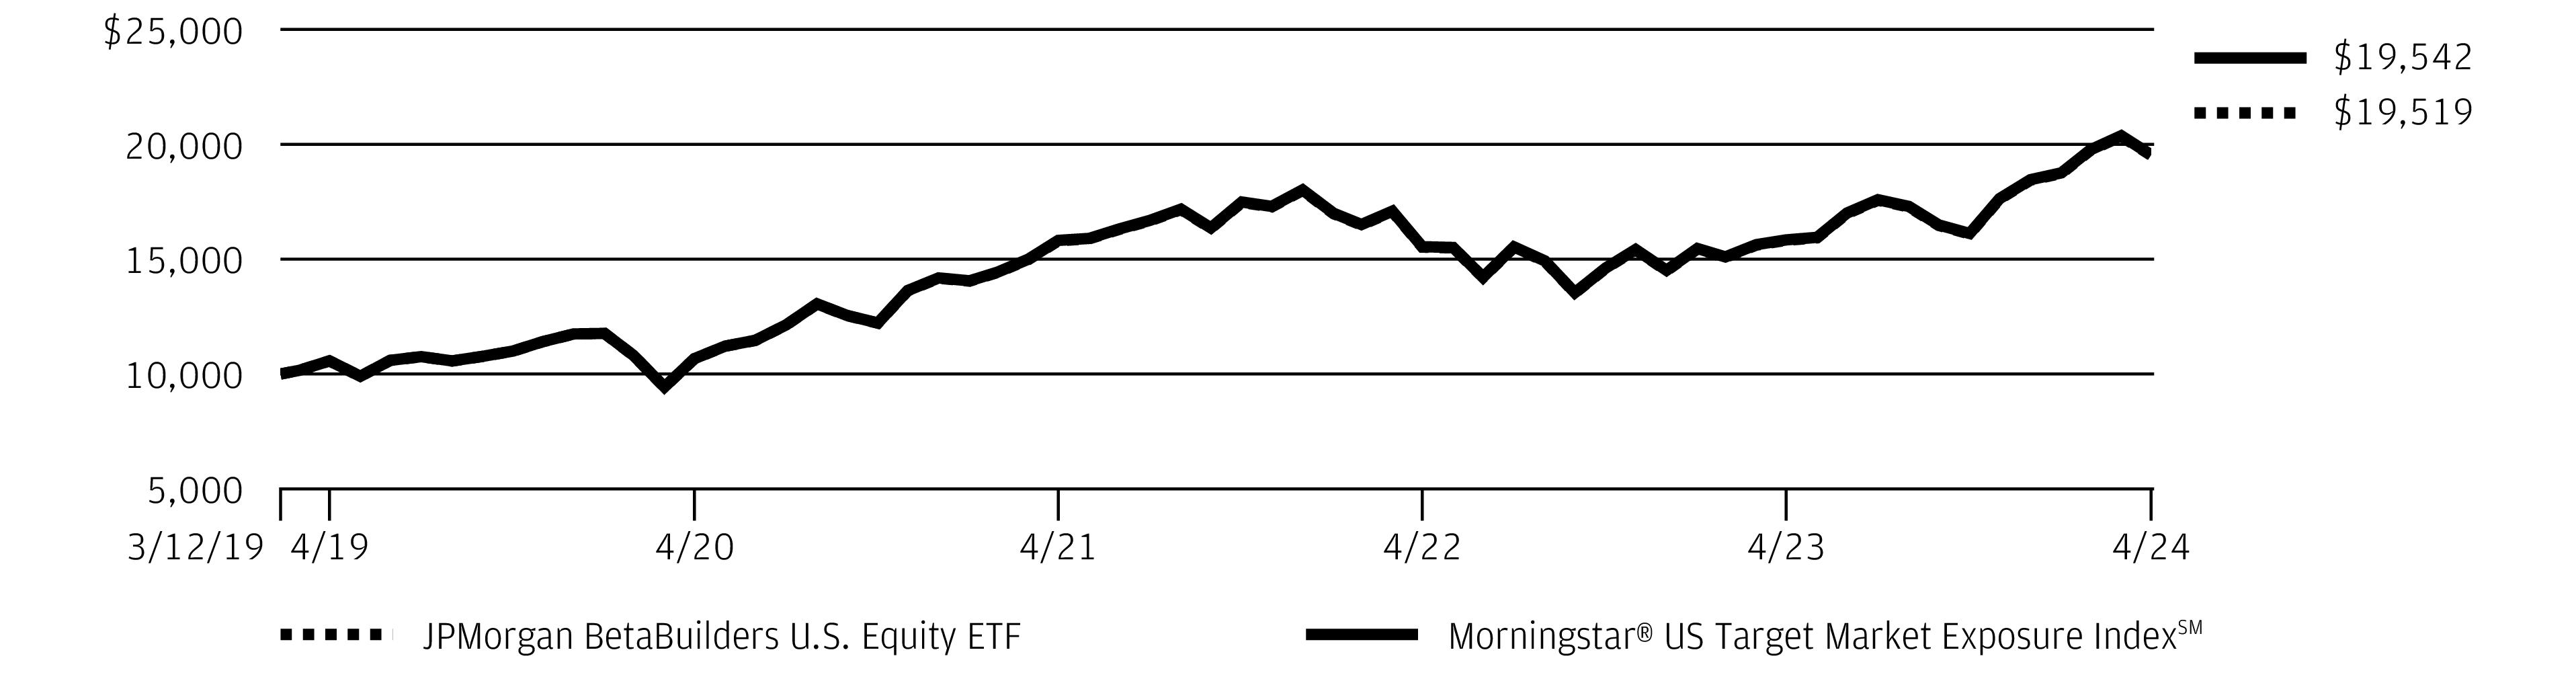
REPORTING PERIOD RETURN: | |
Net Asset Value * | 21.26% |
Market Price ** | 21.21% |
Morningstar® US Target Market Exposure IndexSM | 21.24% |
Net Assets as of 4/30/2024 | $3,091,709,462 |
Fund Ticker | BBUS |
TOP TEN HOLDINGS OF THE PORTFOLIO AS OF April 30, 2024 | PERCENT OF TOTAL INVESTMENTS | |
1. | Microsoft Corp. | 6.5 % |
2. | Apple, Inc. | 5.6 |
3. | NVIDIA Corp. | 4.7 |
4. | Amazon.com, Inc. | 3.7 |
5. | Alphabet, Inc., Class A | 2.2 |
6. | Meta Platforms, Inc., Class A | 2.2 |
7. | Alphabet, Inc., Class C | 2.0 |
8. | Berkshire Hathaway, Inc., Class B | 1.6 |
9. | Eli Lilly & Co. | 1.5 |
10. | Broadcom, Inc. | 1.4 |
PORTFOLIO COMPOSITION BY SECTOR AS OF April 30, 2024 | PERCENT OF TOTAL INVESTMENTS |
Information Technology | 28.9% |
Financials | 13.1 |
Health Care | 12.0 |
Consumer Discretionary | 10.1 |
Communication Services | 9.1 |
Industrials | 8.5 |
Consumer Staples | 5.9 |
Energy | 4.0 |
Materials | 2.3 |
Utilities | 2.3 |
Real Estate | 2.2 |
Short-Term Investments | 1.6 |
April 30, 2024 | J.P. Morgan Exchange-Traded Funds | 21 |
22 | J.P. Morgan Exchange-Traded Funds | April 30, 2024 |
INCEPTION DATE | SIX MONTHS* | 1 YEAR | 5 YEAR | SINCE INCEPTION | |
JPMorgan BetaBuilders U.S. Equity ETF | |||||
Net Asset Value | March 12, 2019 | 21.26 % | 23.38 % | 13.05 % | 13.91 % |
Market Price | 21.21 | 23.43 | 13.04 | 13.91 |
* | Not annualized. |
April 30, 2024 | J.P. Morgan Exchange-Traded Funds | 23 |
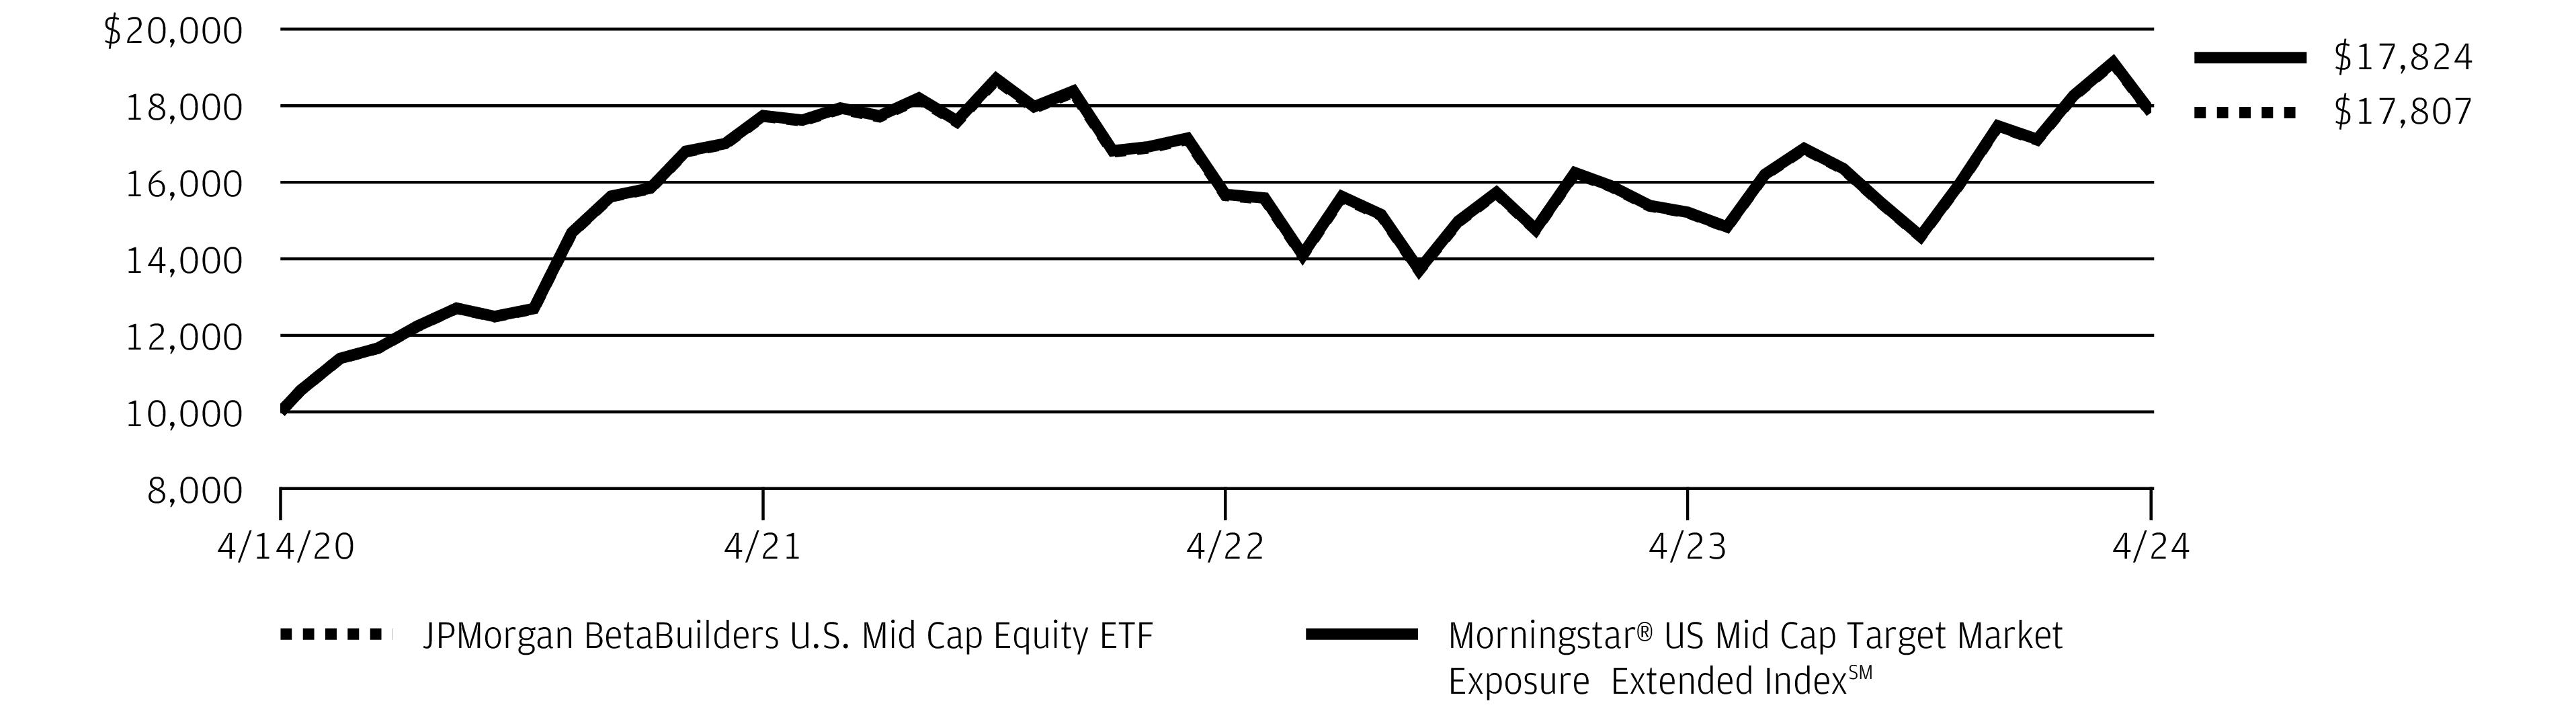
REPORTING PERIOD RETURN: | |
Net Asset Value * | 22.13% |
Market Price ** | 22.22% |
Morningstar® US Mid Cap Target Market Exposure Extended IndexSM | 22.15% |
Net Assets as of 4/30/2024 | $1,584,002,517 |
Fund Ticker | BBMC |
TOP TEN HOLDINGS OF THE PORTFOLIO AS OF April 30, 2024 | PERCENT OF TOTAL INVESTMENTS | |
1. | Super Micro Computer, Inc. | 1.2 % |
2. | Vertiv Holdings Co., Class A | 0.8 |
3. | Builders FirstSource, Inc. | 0.6 |
4. | Axon Enterprise, Inc. | 0.6 |
5. | Deckers Outdoor Corp. | 0.6 |
6. | DraftKings, Inc., Class A | 0.5 |
7. | Carlisle Cos., Inc. | 0.5 |
8. | Williams-Sonoma, Inc. | 0.5 |
9. | EMCOR Group, Inc. | 0.5 |
10. | Reliance, Inc. | 0.5 |
PORTFOLIO COMPOSITION BY SECTOR AS OF April 30, 2024 | PERCENT OF TOTAL INVESTMENTS |
Industrials | 21.8% |
Consumer Discretionary | 14.1 |
Financials | 13.4 |
Information Technology | 11.8 |
Health Care | 9.8 |
Materials | 5.9 |
Real Estate | 4.8 |
Energy | 4.6 |
Consumer Staples | 3.8 |
Utilities | 2.3 |
Communication Services | 1.9 |
Short-Term Investments | 5.8 |
24 | J.P. Morgan Exchange-Traded Funds | April 30, 2024 |
April 30, 2024 | J.P. Morgan Exchange-Traded Funds | 25 |
INCEPTION DATE | SIX MONTHS* | 1 YEAR | SINCE INCEPTION | |
JPMorgan BetaBuilders U.S. Mid Cap Equity ETF | ||||
Net Asset Value | April 14, 2020 | 22.13 % | 17.11 % | 15.34 % |
Market Price | 22.22 | 17.21 | 15.36 |
* | Not annualized. |
26 | J.P. Morgan Exchange-Traded Funds | April 30, 2024 |
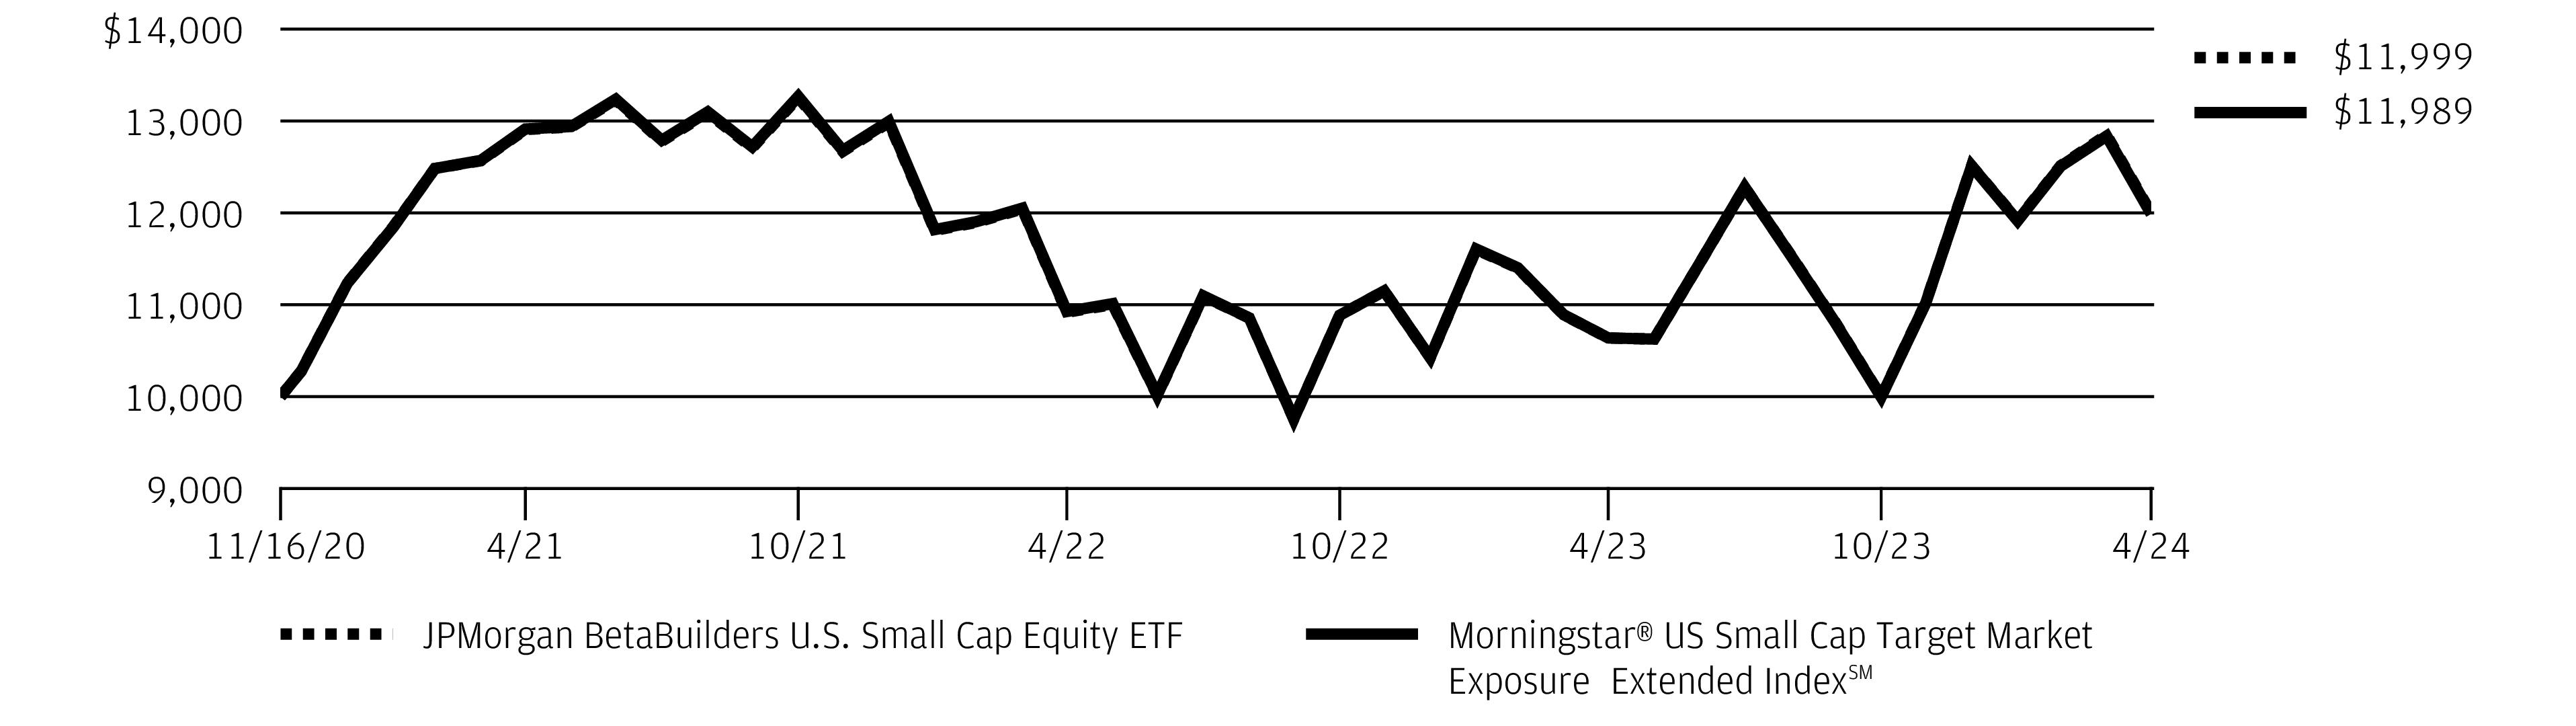
REPORTING PERIOD RETURN: | |
Net Asset Value * | 19.99% |
Market Price ** | 20.26% |
Morningstar® US Small Cap Target Market Exposure Extended IndexSM | 19.94% |
Net Assets as of 4/30/2024 | $449,661,690 |
Fund Ticker | BBSC |
TOP TEN HOLDINGS OF THE PORTFOLIO AS OF April 30, 2024 | PERCENT OF TOTAL INVESTMENTS | |
1. | Carvana Co. | 0.6 % |
2. | Viking Therapeutics, Inc. | 0.6 |
3. | Affirm Holdings, Inc. | 0.5 |
4. | FTAI Aviation Ltd. | 0.5 |
5. | Samsara, Inc., Class A | 0.4 |
6. | Equitrans Midstream Corp. | 0.4 |
7. | Abercrombie & Fitch Co., Class A | 0.4 |
8. | SPX Technologies, Inc. | 0.4 |
9. | Boise Cascade Co. | 0.4 |
10. | NEXTracker, Inc., Class A | 0.4 |
PORTFOLIO COMPOSITION BY SECTOR AS OF April 30, 2024 | PERCENT OF TOTAL INVESTMENTS |
Financials | 17.8% |
Industrials | 16.4 |
Information Technology | 12.9 |
Health Care | 12.8 |
Consumer Discretionary | 12.5 |
Real Estate | 7.1 |
Energy | 4.5 |
Materials | 3.2 |
Communication Services | 2.7 |
Consumer Staples | 2.6 |
Others (each less than 1.0%) | 0.8 |
Short-Term Investments | 6.7 |
April 30, 2024 | J.P. Morgan Exchange-Traded Funds | 27 |
28 | J.P. Morgan Exchange-Traded Funds | April 30, 2024 |
INCEPTION DATE | SIX MONTHS* | 1 YEAR | SINCE INCEPTION | |
JPMorgan BetaBuilders U.S. Small Cap Equity ETF | ||||
Net Asset Value | November 16, 2020 | 19.99 % | 12.79 % | 5.42 % |
Market Price | 20.26 | 12.95 | 5.44 |
* | Not annualized. |
April 30, 2024 | J.P. Morgan Exchange-Traded Funds | 29 |
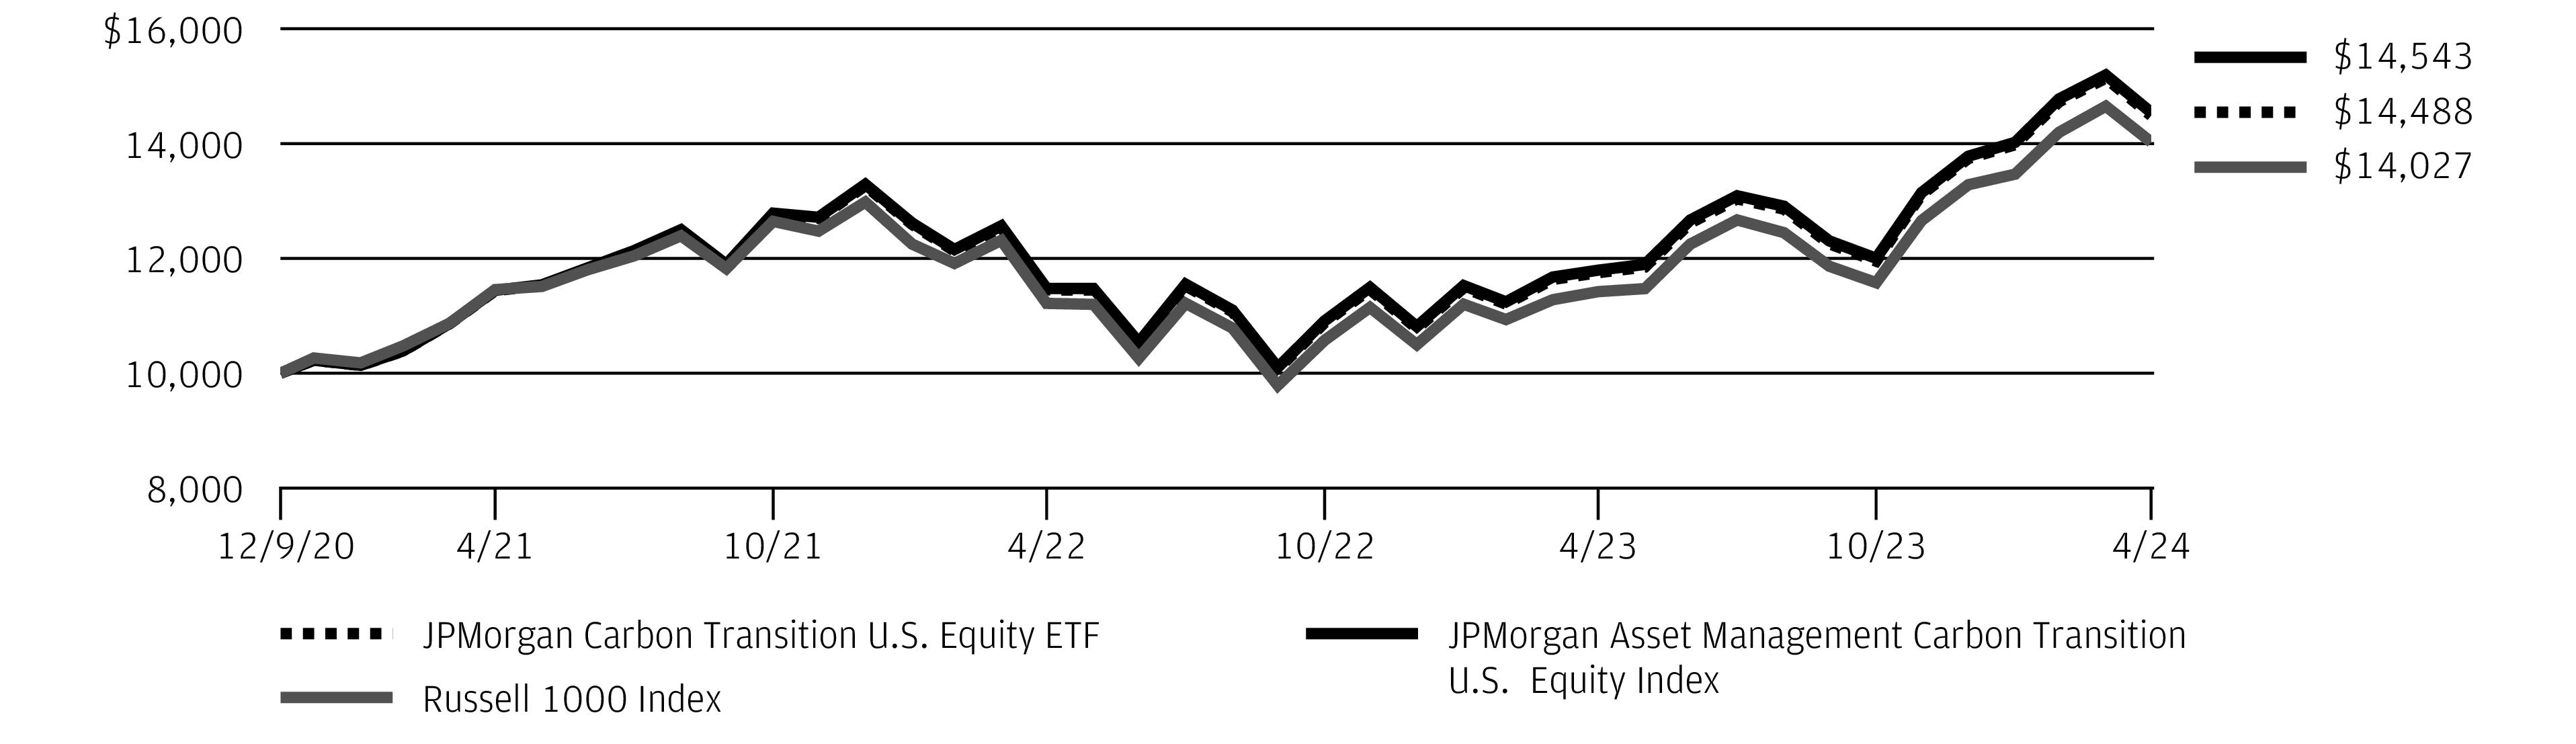
REPORTING PERIOD RETURN: | |
Net Asset Value * | 21.22% |
Market Price ** | 21.35% |
JPMorgan Asset Management Carbon Transition U.S. Equity Index | 21.17% |
Russell 1000 Index | 21.17% |
Net Assets as of 4/30/2024 | $5,093,623 |
Fund Ticker | JCTR |
TOP TEN HOLDINGS OF THE PORTFOLIO AS OF April 30, 2024 | PERCENT OF TOTAL INVESTMENTS | |
1. | Microsoft Corp. | 6.1 % |
2. | Apple, Inc. | 5.7 |
3. | NVIDIA Corp. | 4.8 |
4. | Alphabet, Inc., Class A | 3.7 |
5. | Amazon.com, Inc. | 3.3 |
6. | Meta Platforms, Inc., Class A | 1.9 |
7. | Eli Lilly & Co. | 1.8 |
8. | Broadcom, Inc. | 1.5 |
9. | Tesla, Inc. | 1.4 |
10. | Exxon Mobil Corp. | 1.4 |
PORTFOLIO COMPOSITION BY SECTOR AS OF April 30, 2024 | PERCENT OF TOTAL INVESTMENTS |
Information Technology | 29.5% |
Financials | 15.0 |
Health Care | 12.9 |
Consumer Discretionary | 10.2 |
Communication Services | 8.5 |
Industrials | 8.3 |
Consumer Staples | 4.9 |
Energy | 4.0 |
Real Estate | 2.5 |
Materials | 2.0 |
Utilities | 2.0 |
Short-Term Investments | 0.2 |
30 | J.P. Morgan Exchange-Traded Funds | April 30, 2024 |
April 30, 2024 | J.P. Morgan Exchange-Traded Funds | 31 |
INCEPTION DATE | SIX MONTHS* | 1 YEAR | SINCE INCEPTION | |
JPMorgan Carbon Transition U.S. Equity ETF | ||||
Net Asset Value | December 9, 2020 | 21.22 % | 23.29 % | 11.56 % |
Market Price | 21.35 | 23.50 | 11.60 |
* | Not annualized. |
32 | J.P. Morgan Exchange-Traded Funds | April 30, 2024 |
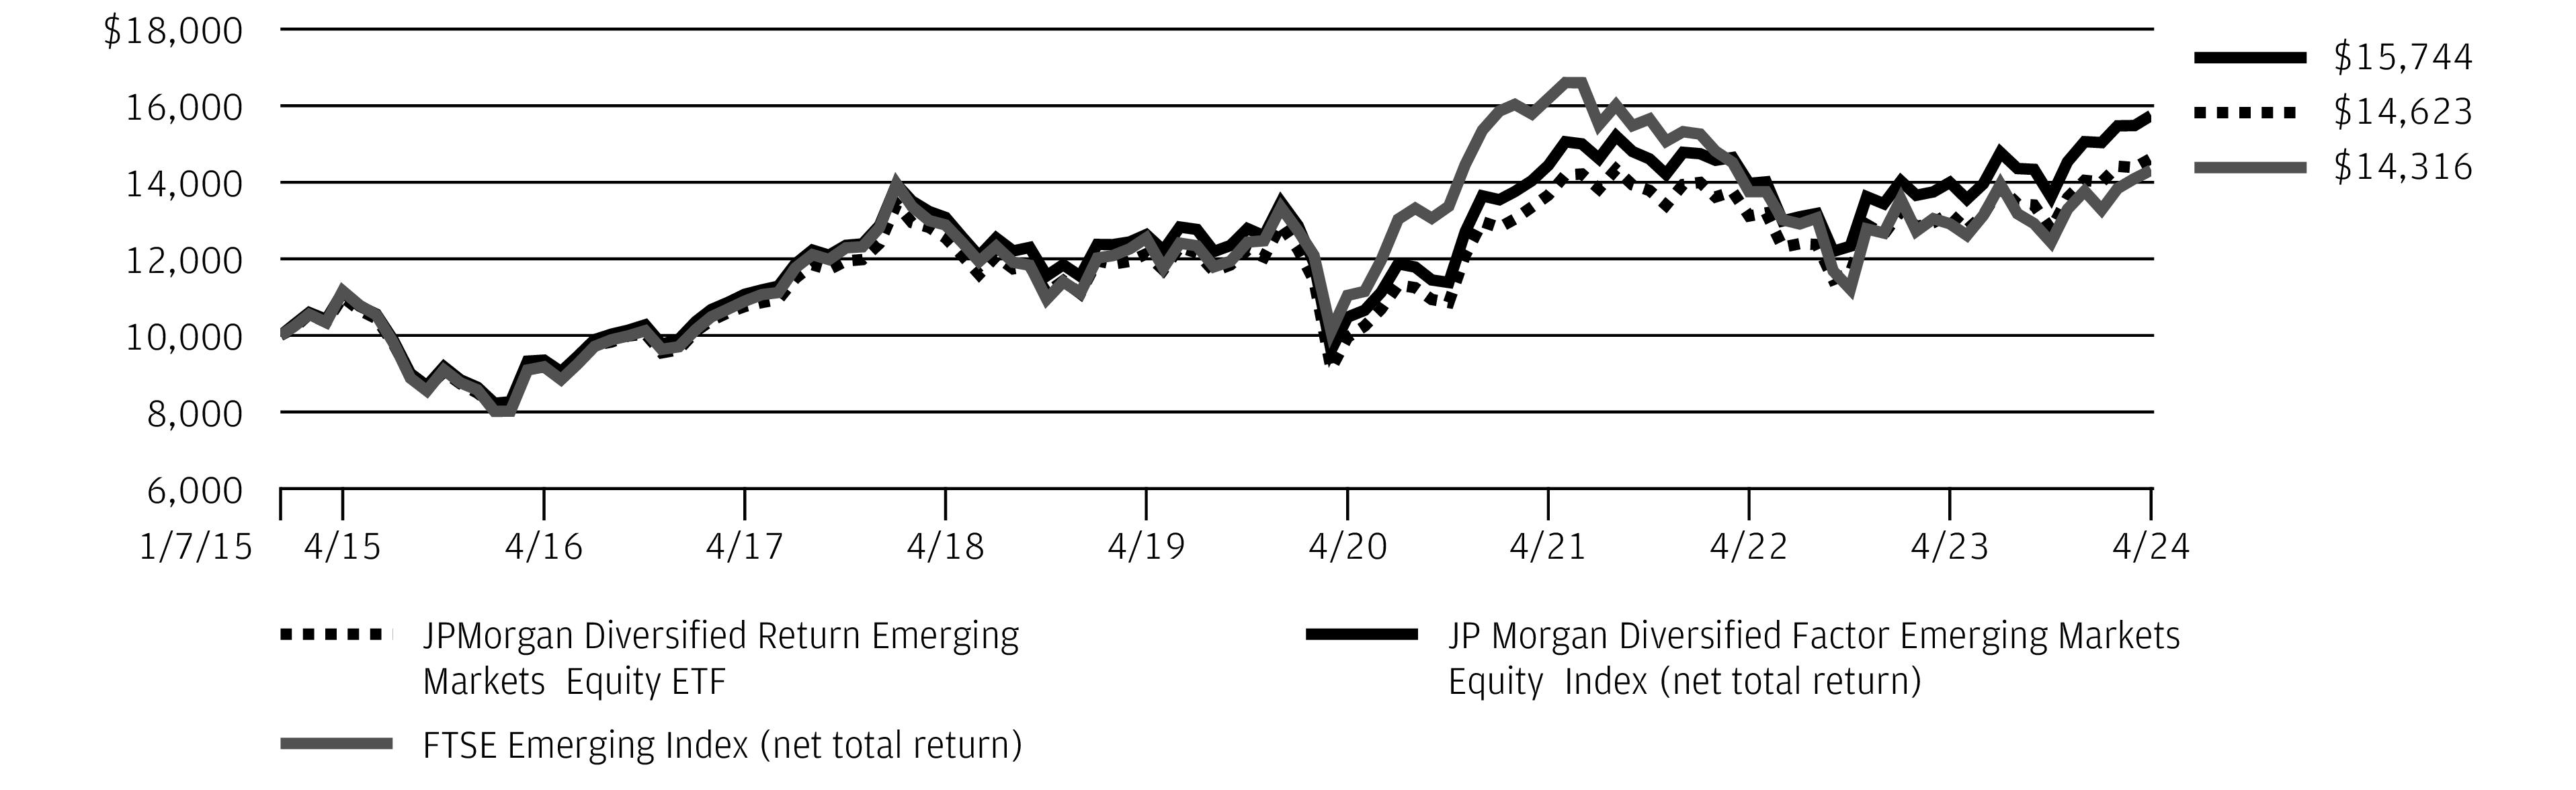
REPORTING PERIOD RETURN: | |
Net Asset Value * | 14.56% |
Market Price ** | 14.95% |
JP Morgan Diversified Factor Emerging Markets Equity Index (net total return) | 15.62% |
FTSE Emerging Index (net total return) | 15.15% |
Net Assets as of 4/30/2024 | $314,661,918 |
Fund Ticker | JPEM |
April 30, 2024 | J.P. Morgan Exchange-Traded Funds | 33 |
TOP TEN HOLDINGS OF THE PORTFOLIO AS OF April 30, 2024 | PERCENT OF TOTAL INVESTMENTS | |
1. | Taiwan Semiconductor Manufacturing Co. Ltd. (Taiwan) | 1.4 % |
2. | Infosys Ltd. (India) | 1.3 |
3. | Petroleo Brasileiro SA (Preference) (Brazil) | 1.2 |
4. | Bank of China Ltd., Class H (China) | 1.0 |
5. | Grupo Financiero Banorte SAB de CV, Class O (Mexico) | 0.9 |
6. | Vale SA (Brazil) | 0.9 |
7. | Tata Consultancy Services Ltd. (India) | 0.9 |
8. | Reliance Industries Ltd. (India) | 0.8 |
9. | Hindustan Unilever Ltd. (India) | 0.8 |
10. | Saudi Arabian Oil Co. (Saudi Arabia) | 0.7 |
PORTFOLIO COMPOSITION BY COUNTRY AS OF April 30, 2024 | PERCENT OF TOTAL INVESTMENTS |
China | 22.7% |
India | 12.3 |
Taiwan | 10.9 |
Turkey | 10.7 |
Brazil | 8.6 |
Mexico | 7.6 |
Saudi Arabia | 4.4 |
Indonesia | 3.7 |
South Africa | 3.7 |
Thailand | 2.8 |
Malaysia | 2.6 |
United Arab Emirates | 2.3 |
Greece | 2.1 |
Qatar | 1.3 |
Chile | 1.2 |
Others (each less than 1.0%) | 3.0 |
Short-Term Investments | 0.1 |
34 | J.P. Morgan Exchange-Traded Funds | April 30, 2024 |
INCEPTION DATE | SIX MONTHS* | 1 YEAR | 5 YEAR | SINCE INCEPTION | |
JPMorgan Diversified Return Emerging Markets Equity ETF | |||||
Net Asset Value | January 7, 2015 | 14.56 % | 10.88 % | 3.81 % | 4.17 % |
Market Price | 14.95 | 10.31 | 3.72 | 4.18 |
* | Not annualized. |
April 30, 2024 | J.P. Morgan Exchange-Traded Funds | 35 |
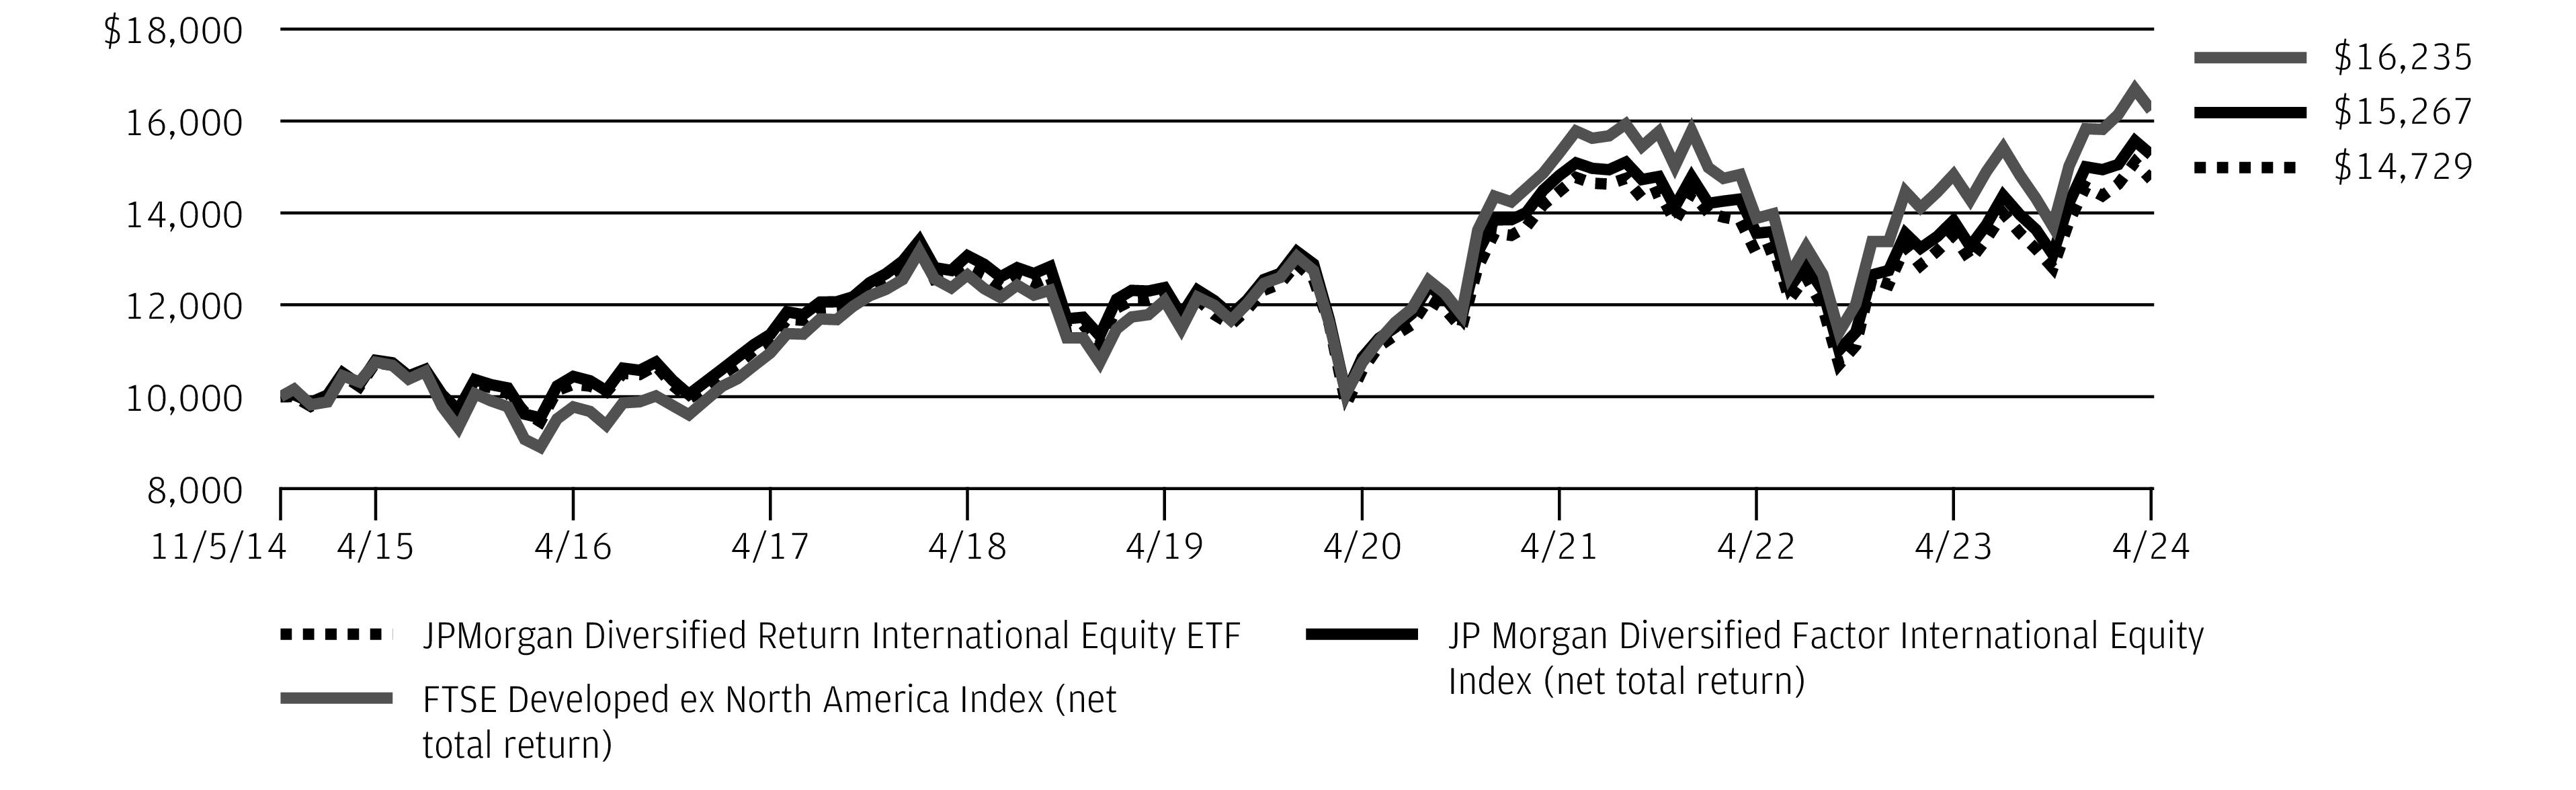
REPORTING PERIOD RETURN: | |
Net Asset Value * | 15.05% |
Market Price ** | 14.52% |
JP Morgan Diversified Factor International Equity Index (net total return) | 16.57% |
FTSE Developed ex North America Index (net total return) | 18.47% |
Net Assets as of 4/30/2024 | $362,852,941 |
Fund Ticker | JPIN |
36 | J.P. Morgan Exchange-Traded Funds | April 30, 2024 |
TOP TEN HOLDINGS OF THE PORTFOLIO AS OF April 30, 2024 | PERCENT OF TOTAL INVESTMENTS | |
1. | HSBC Holdings plc (United Kingdom) | 0.5 % |
2. | Antofagasta plc (Chile) | 0.5 |
3. | AstraZeneca plc (United Kingdom) | 0.5 |
4. | 3i Group plc (United Kingdom) | 0.5 |
5. | KB Financial Group, Inc. (South Korea) | 0.5 |
6. | Shell plc | 0.4 |
7. | UniCredit SpA (Italy) | 0.4 |
8. | Niterra Co. Ltd. (Japan) | 0.4 |
9. | Tokyu Fudosan Holdings Corp. (Japan) | 0.4 |
10. | BAE Systems plc (United Kingdom) | 0.4 |
PORTFOLIO COMPOSITION BY COUNTRY AS OF April 30, 2024 | PERCENT OF TOTAL INVESTMENTS |
Japan | 27.9% |
United Kingdom | 16.4 |
Australia | 11.6 |
South Korea | 7.4 |
France | 5.0 |
United States | 3.9 |
Singapore | 3.1 |
Hong Kong | 2.9 |
Italy | 2.7 |
Netherlands | 2.6 |
Germany | 2.5 |
Spain | 2.1 |
Sweden | 2.1 |
Switzerland | 1.3 |
Norway | 1.1 |
Others (each less than 1.0%) | 6.2 |
Short-Term Investments | 1.2 |
April 30, 2024 | J.P. Morgan Exchange-Traded Funds | 37 |
INCEPTION DATE | SIX MONTHS* | 1 YEAR | 5 YEAR | SINCE INCEPTION | |
JPMorgan Diversified Return International Equity ETF | |||||
Net Asset Value | November 5, 2014 | 15.05 % | 8.98 % | 3.84 % | 4.17 % |
Market Price | 14.52 | 8.53 | 3.79 | 4.14 |
* | Not annualized. |
38 | J.P. Morgan Exchange-Traded Funds | April 30, 2024 |
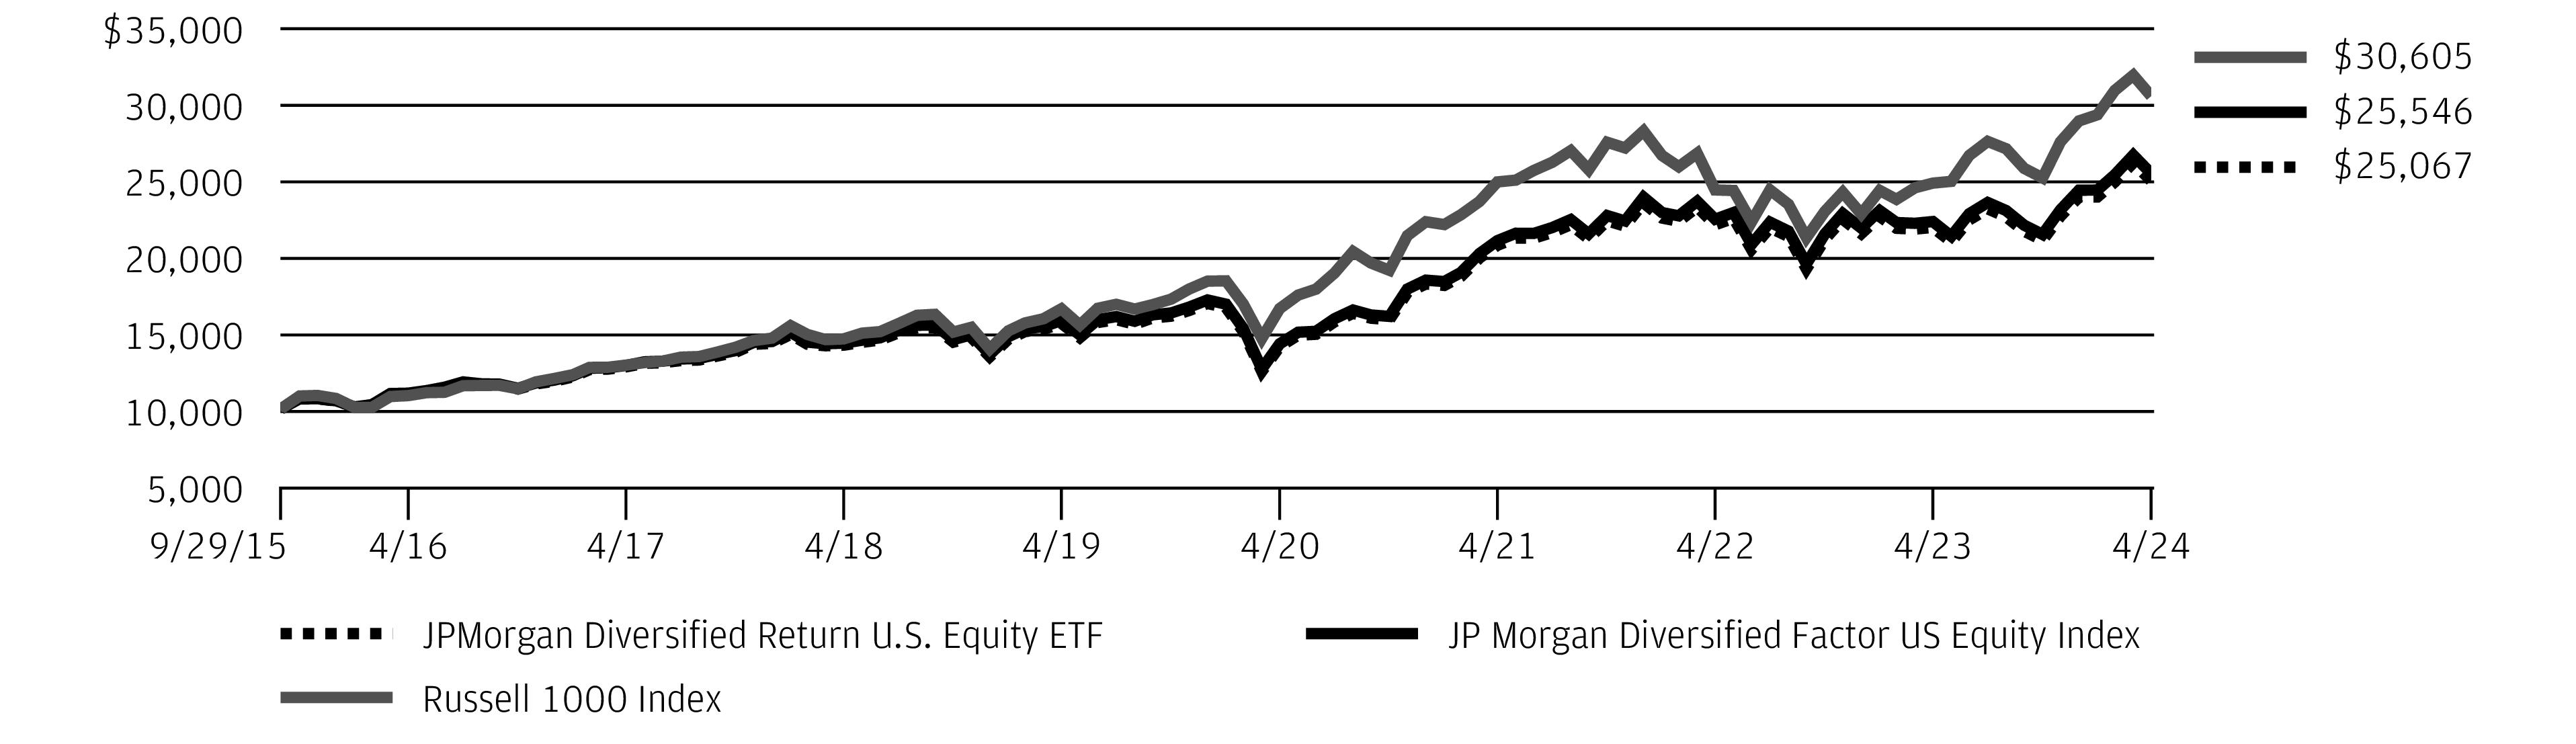
REPORTING PERIOD RETURN: | |
Net Asset Value * | 18.35% |
Market Price ** | 18.40% |
JP Morgan Diversified Factor US Equity Index | 18.45% |
Russell 1000 Index | 21.17% |
Net Assets as of 4/30/2024 | $424,872,292 |
Fund Ticker | JPUS |
TOP TEN HOLDINGS OF THE PORTFOLIO AS OF April 30, 2024 | PERCENT OF TOTAL INVESTMENTS | |
1. | Vistra Corp. | 0.6 % |
2. | Williams-Sonoma, Inc. | 0.5 |
3. | Meta Platforms, Inc., Class A | 0.5 |
4. | Southern Copper Corp. (Mexico) | 0.5 |
5. | Targa Resources Corp. | 0.5 |
6. | Kroger Co. (The) | 0.5 |
7. | Kimberly-Clark Corp. | 0.4 |
8. | Public Service Enterprise Group, Inc. | 0.4 |
9. | Dick's Sporting Goods, Inc. | 0.4 |
10. | Progressive Corp. (The) | 0.4 |
PORTFOLIO COMPOSITION BY SECTOR AS OF April 30, 2024 | PERCENT OF TOTAL INVESTMENTS |
Consumer Staples | 14.4% |
Utilities | 11.4 |
Health Care | 10.7 |
Industrials | 9.9 |
Financials | 9.1 |
Real Estate | 9.1 |
Consumer Discretionary | 8.9 |
Basic Materials | 7.6 |
Technology | 7.5 |
Energy | 6.8 |
Telecommunications | 4.4 |
Short-Term Investments | 0.2 |
April 30, 2024 | J.P. Morgan Exchange-Traded Funds | 39 |
40 | J.P. Morgan Exchange-Traded Funds | April 30, 2024 |
INCEPTION DATE | SIX MONTHS* | 1 YEAR | 5 YEAR | SINCE INCEPTION | |
JPMorgan Diversified Return U.S. Equity ETF | |||||
Net Asset Value | September 29, 2015 | 18.35 % | 13.82 % | 9.72 % | 11.30 % |
Market Price | 18.40 | 13.92 | 9.73 | 11.30 |
* | Not annualized. |
April 30, 2024 | J.P. Morgan Exchange-Traded Funds | 41 |
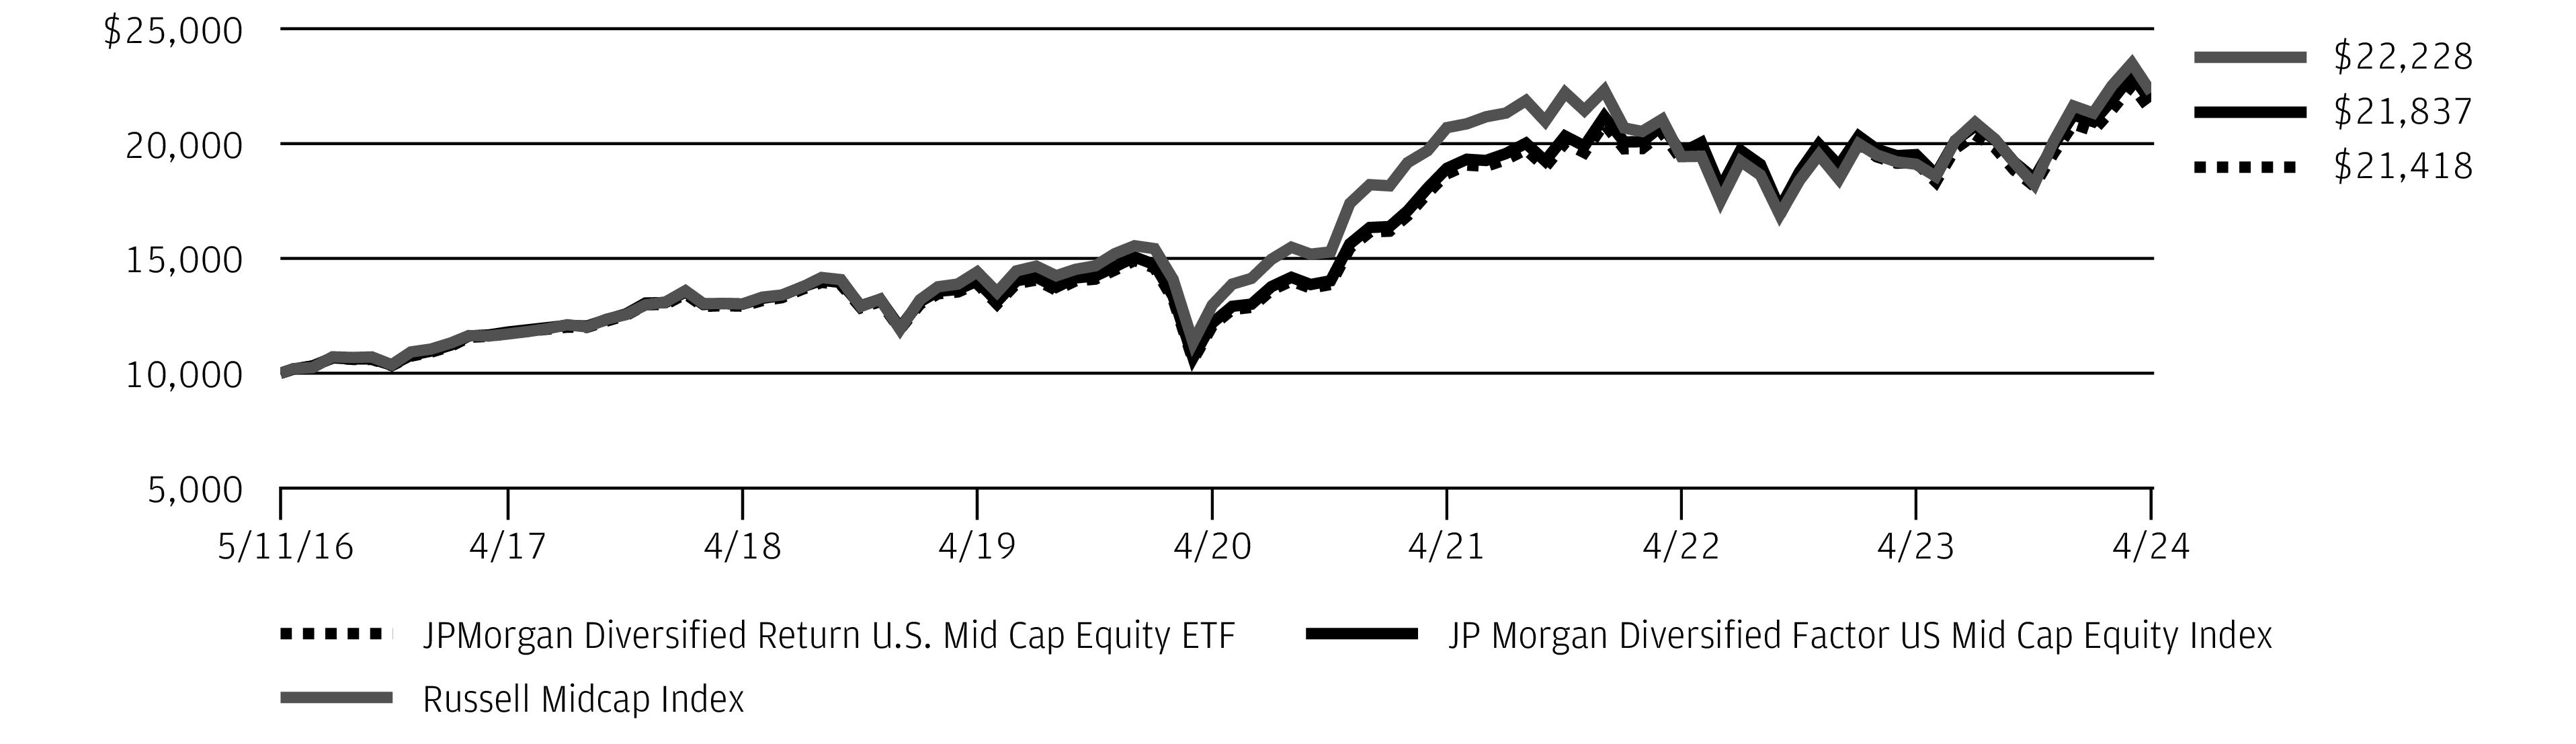
REPORTING PERIOD RETURN: | |
Net Asset Value * | 18.02% |
Market Price ** | 18.24% |
JP Morgan Diversified Factor US Mid Cap Equity Index | 18.16% |
Russell Midcap Index | 22.00% |
Net Assets as of 4/30/2024 | $360,008,122 |
Fund Ticker | JPME |
TOP TEN HOLDINGS OF THE PORTFOLIO AS OF April 30, 2024 | PERCENT OF TOTAL INVESTMENTS | |
1. | Vistra Corp. | 0.5 % |
2. | Williams-Sonoma, Inc. | 0.5 |
3. | Tenet Healthcare Corp. | 0.5 |
4. | Targa Resources Corp. | 0.5 |
5. | Kroger Co. (The) | 0.4 |
6. | Encompass Health Corp. | 0.4 |
7. | Owens Corning | 0.4 |
8. | Dick's Sporting Goods, Inc. | 0.4 |
9. | Public Service Enterprise Group, Inc. | 0.4 |
10. | Constellation Energy Corp. | 0.4 |
PORTFOLIO COMPOSITION BY SECTOR AS OF April 30, 2024 | PERCENT OF TOTAL INVESTMENTS |
Health Care | 10.8% |
Industrials | 10.7 |
Utilities | 10.7 |
Real Estate | 10.5 |
Financials | 9.9 |
Consumer Discretionary | 9.7 |
Consumer Staples | 9.1 |
Technology | 8.5 |
Basic Materials | 8.0 |
Energy | 7.4 |
Telecommunications | 2.2 |
Short-Term Investments | 2.5 |
42 | J.P. Morgan Exchange-Traded Funds | April 30, 2024 |
April 30, 2024 | J.P. Morgan Exchange-Traded Funds | 43 |
INCEPTION DATE | SIX MONTHS* | 1 YEAR | 5 YEAR | SINCE INCEPTION | |
JPMorgan Diversified Return U.S. Mid Cap Equity ETF | |||||
Net Asset Value | May 11, 2016 | 18.02 % | 11.64 % | 9.03 % | 10.03 % |
Market Price | 18.24 | 11.71 | 9.04 | 10.04 |
* | Not annualized. |
44 | J.P. Morgan Exchange-Traded Funds | April 30, 2024 |
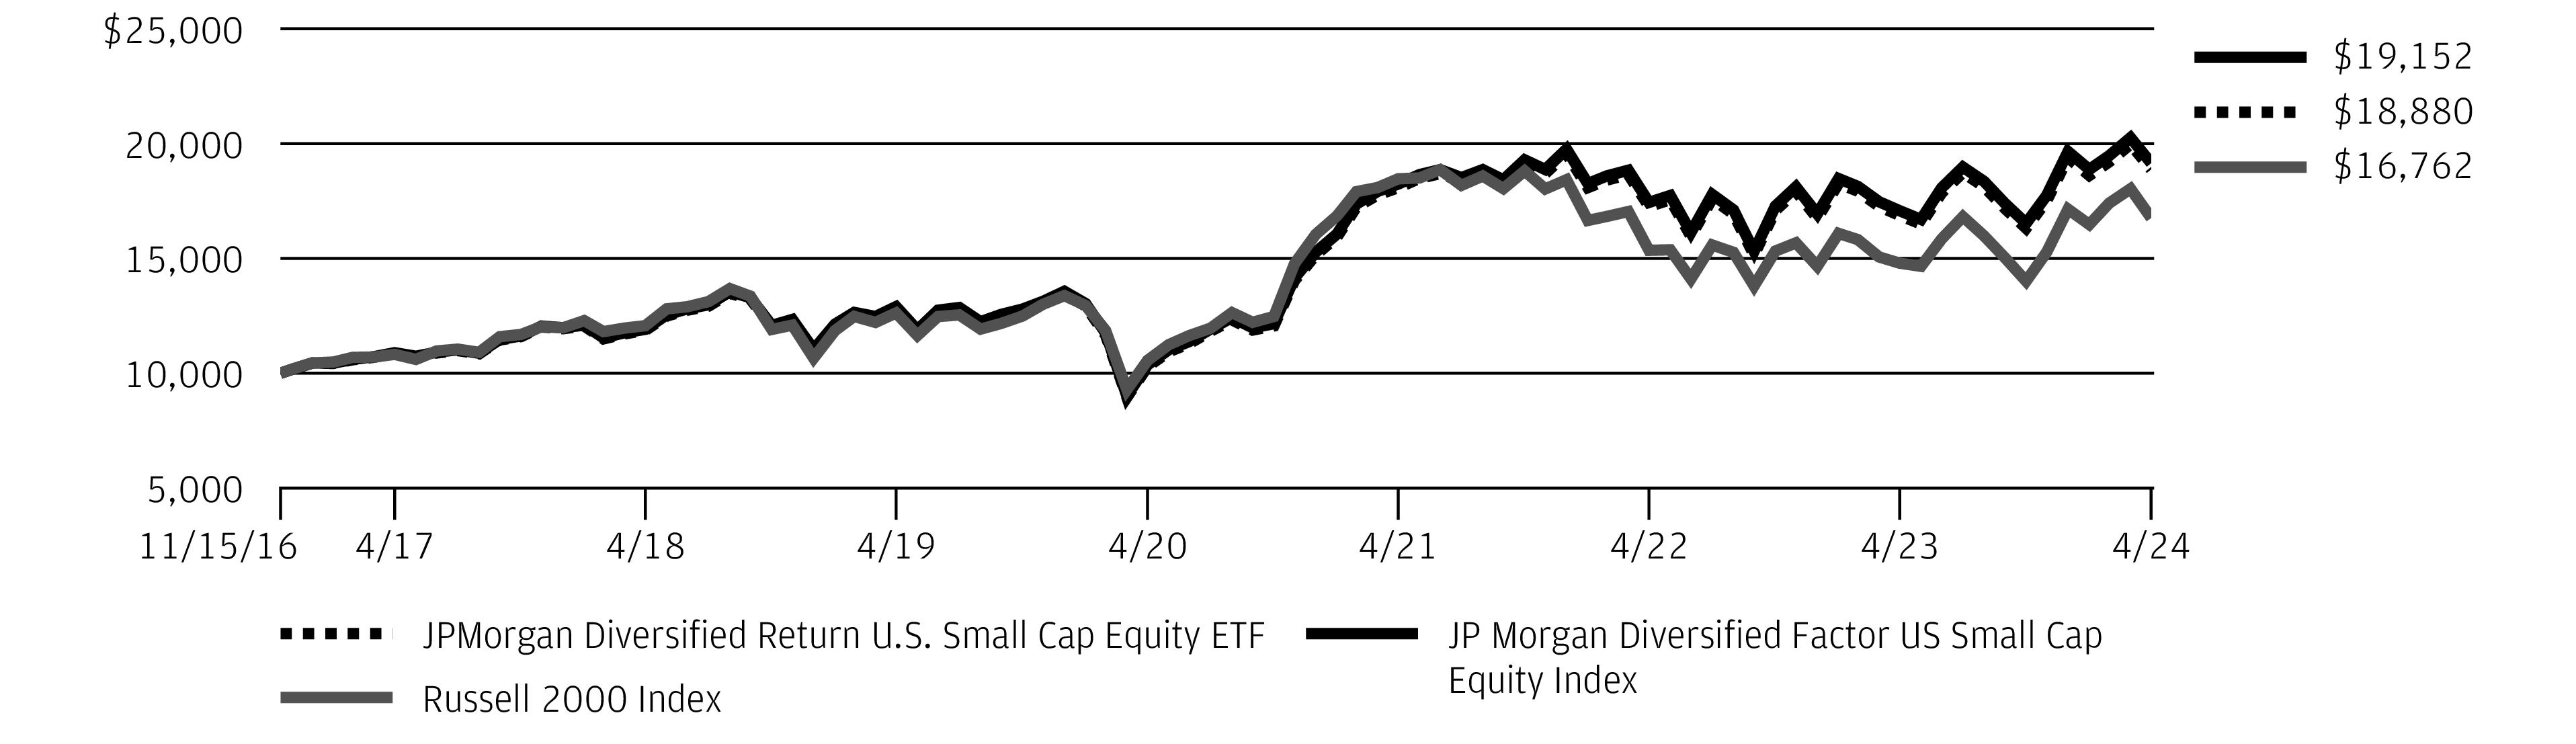
REPORTING PERIOD RETURN: | |
Net Asset Value * | 15.74% |
Market Price ** | 15.93% |
JP Morgan Diversified Factor US Small Cap Equity Index | 15.88% |
Russell 2000 Index | 19.66% |
Net Assets as of 4/30/2024 | $470,549,537 |
Fund Ticker | JPSE |
TOP TEN HOLDINGS OF THE PORTFOLIO AS OF April 30, 2024 | PERCENT OF TOTAL INVESTMENTS | |
1. | GEO Group, Inc. (The) | 0.4 % |
2. | Jackson Financial, Inc., Class A | 0.3 |
3. | EchoStar Corp., Class A | 0.4 |
4. | Primo Water Corp. | 0.3 |
5. | Encore Wire Corp. | 0.3 |
6. | Boise Cascade Co. | 0.3 |
7. | Carpenter Technology Corp. | 0.3 |
8. | Badger Meter, Inc. | 0.3 |
9. | Mueller Industries, Inc. | 0.3 |
10. | National Health Investors, Inc. | 0.3 |
PORTFOLIO COMPOSITION BY SECTOR AS OF April 30, 2024 | PERCENT OF TOTAL INVESTMENTS |
Financials | 12.2% |
Real Estate | 11.8 |
Industrials | 11.7 |
Consumer Discretionary | 9.5 |
Technology | 9.0 |
Health Care | 8.3 |
Basic Materials | 7.9 |
Energy | 6.9 |
Consumer Staples | 6.8 |
Utilities | 4.5 |
Telecommunications | 4.2 |
Short-Term Investments | 7.2 |
April 30, 2024 | J.P. Morgan Exchange-Traded Funds | 45 |
46 | J.P. Morgan Exchange-Traded Funds | April 30, 2024 |
INCEPTION DATE | SIX MONTHS* | 1 YEAR | 5 YEAR | SINCE INCEPTION | |
JPMorgan Diversified Return U.S. Small Cap Equity ETF | |||||
Net Asset Value | November 15, 2016 | 15.74 % | 11.91 % | 8.06 % | 8.90 % |
Market Price | 15.93 | 12.18 | 8.10 | 8.92 |
* | Not annualized. |
April 30, 2024 | J.P. Morgan Exchange-Traded Funds | 47 |
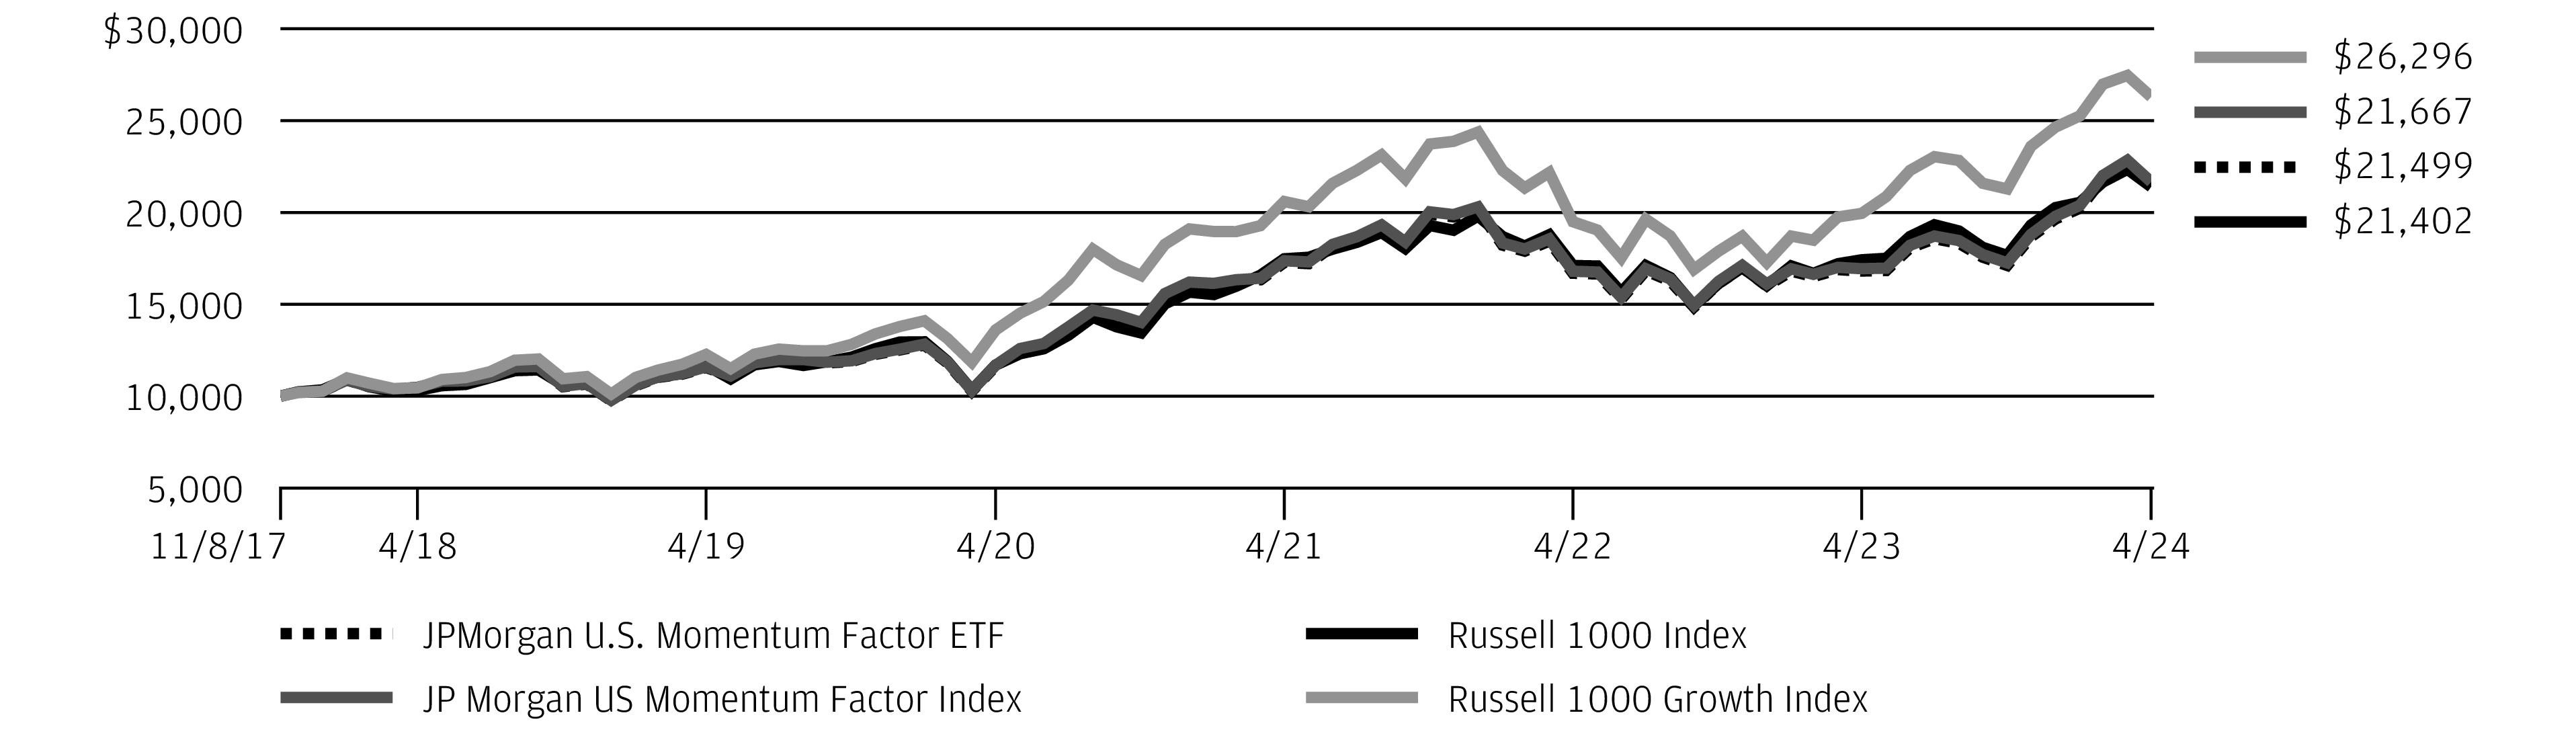
REPORTING PERIOD RETURN: | |
Net Asset Value * | 25.59% |
Market Price ** | 25.71% |
JP Morgan US Momentum Factor Index | 25.55% |
Russell 1000 Growth Index | 23.56% |
Russell 1000 Index | 21.17% |
Net Assets as of 4/30/2024 | $845,889,984 |
Fund Ticker | JMOM |
TOP TEN HOLDINGS OF THE PORTFOLIO AS OF April 30, 2024 | PERCENT OF TOTAL INVESTMENTS | |
1. | Alphabet, Inc., Class A | 2.5 % |
2. | Meta Platforms, Inc., Class A | 2.3 |
3. | NVIDIA Corp. | 2.2 |
4. | Eli Lilly & Co. | 2.1 |
5. | Berkshire Hathaway, Inc., Class B | 2.0 |
6. | Microsoft Corp. | 1.9 |
7. | Broadcom, Inc. | 1.9 |
8. | Apple, Inc. | 1.6 |
9. | Costco Wholesale Corp. | 1.5 |
10. | Home Depot, Inc. (The) | 1.4 |
PORTFOLIO COMPOSITION BY SECTOR AS OF April 30, 2024 | PERCENT OF TOTAL INVESTMENTS |
Technology | 32.1% |
Consumer Discretionary | 14.3 |
Industrials | 13.4 |
Health Care | 12.0 |
Financials | 10.3 |
Consumer Staples | 4.7 |
Energy | 4.2 |
Utilities | 2.7 |
Real Estate | 2.4 |
Telecommunications | 2.0 |
Basic Materials | 1.8 |
Short-Term Investments | 0.1 |
48 | J.P. Morgan Exchange-Traded Funds | April 30, 2024 |
April 30, 2024 | J.P. Morgan Exchange-Traded Funds | 49 |
INCEPTION DATE | SIX MONTHS* | 1 YEAR | 5 YEAR | SINCE INCEPTION | |
JPMorgan U.S. Momentum Factor ETF | |||||
Net Asset Value | November 8, 2017 | 25.59 % | 27.87 % | 13.20 % | 12.55 % |
Market Price | 25.71 | 28.10 | 13.20 | 12.57 |
* | Not annualized. |
50 | J.P. Morgan Exchange-Traded Funds | April 30, 2024 |
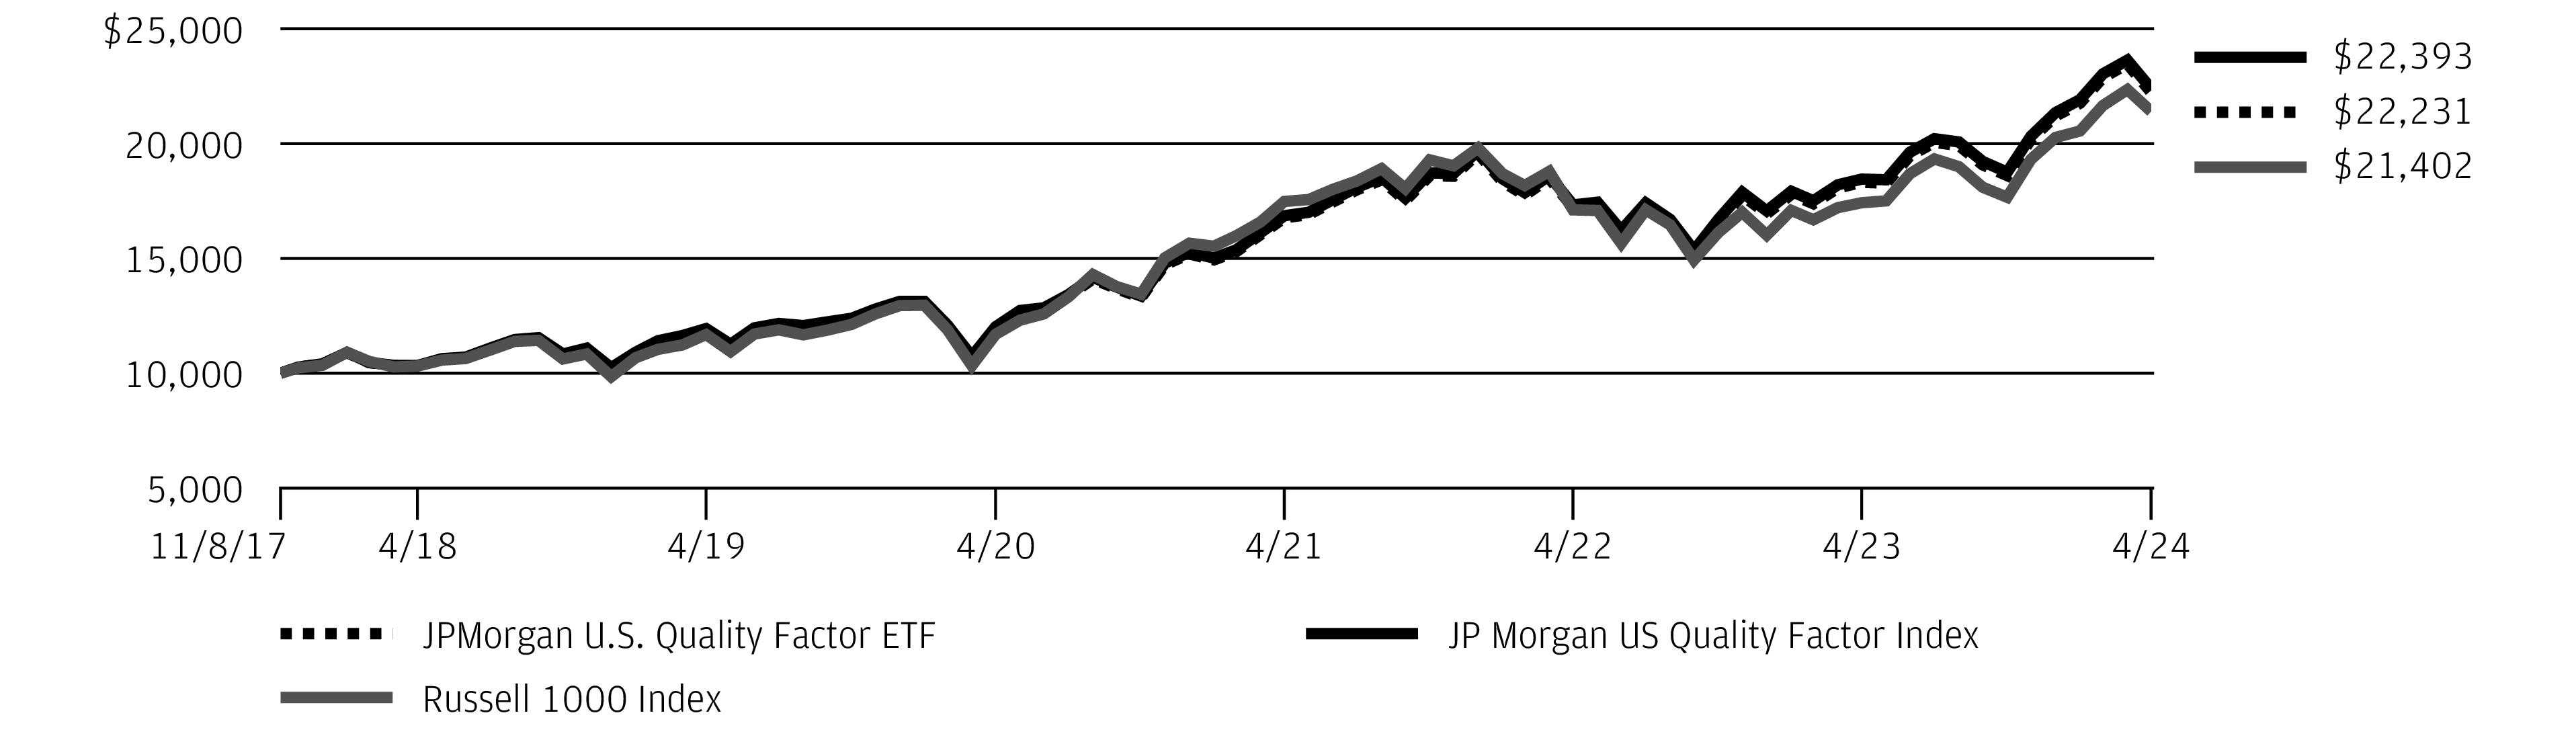
REPORTING PERIOD RETURN: | |
Net Asset Value * | 19.48% |
Market Price ** | 19.40% |
JP Morgan US Quality Factor Index | 19.41% |
Russell 1000 Index | 21.17% |
Net Assets as of 4/30/2024 | $4,018,415,214 |
Fund Ticker | JQUA |
TOP TEN HOLDINGS OF THE PORTFOLIO AS OF April 30, 2024 | PERCENT OF TOTAL INVESTMENTS | |
1. | Alphabet, Inc., Class A | 2.4 % |
2. | Meta Platforms, Inc., Class A | 2.4 |
3. | NVIDIA Corp. | 2.2 |
4. | Apple, Inc. | 1.9 |
5. | Berkshire Hathaway, Inc., Class B | 1.9 |
6. | Broadcom, Inc. | 1.9 |
7. | Microsoft Corp. | 1.9 |
8. | Visa, Inc., Class A | 1.9 |
9. | Mastercard, Inc., Class A | 1.7 |
10. | Procter & Gamble Co. (The) | 1.6 |
PORTFOLIO COMPOSITION BY SECTOR AS OF April 30, 2024 | PERCENT OF TOTAL INVESTMENTS |
Technology | 32.3% |
Consumer Discretionary | 14.1 |
Industrials | 12.5 |
Health Care | 11.5 |
Financials | 10.0 |
Consumer Staples | 4.9 |
Energy | 4.2 |
Real Estate | 2.5 |
Utilities | 2.5 |
Telecommunications | 2.0 |
Basic Materials | 1.8 |
Short-Term Investments | 1.7 |
April 30, 2024 | J.P. Morgan Exchange-Traded Funds | 51 |
52 | J.P. Morgan Exchange-Traded Funds | April 30, 2024 |
INCEPTION DATE | SIX MONTHS* | 1 YEAR | 5 YEAR | SINCE INCEPTION | |
JPMorgan U.S. Quality Factor ETF | |||||
Net Asset Value | November 8, 2017 | 19.48 % | 21.39 % | 13.31 % | 13.13 % |
Market Price | 19.40 | 21.30 | 13.30 | 13.13 |
* | Not annualized. |
April 30, 2024 | J.P. Morgan Exchange-Traded Funds | 53 |
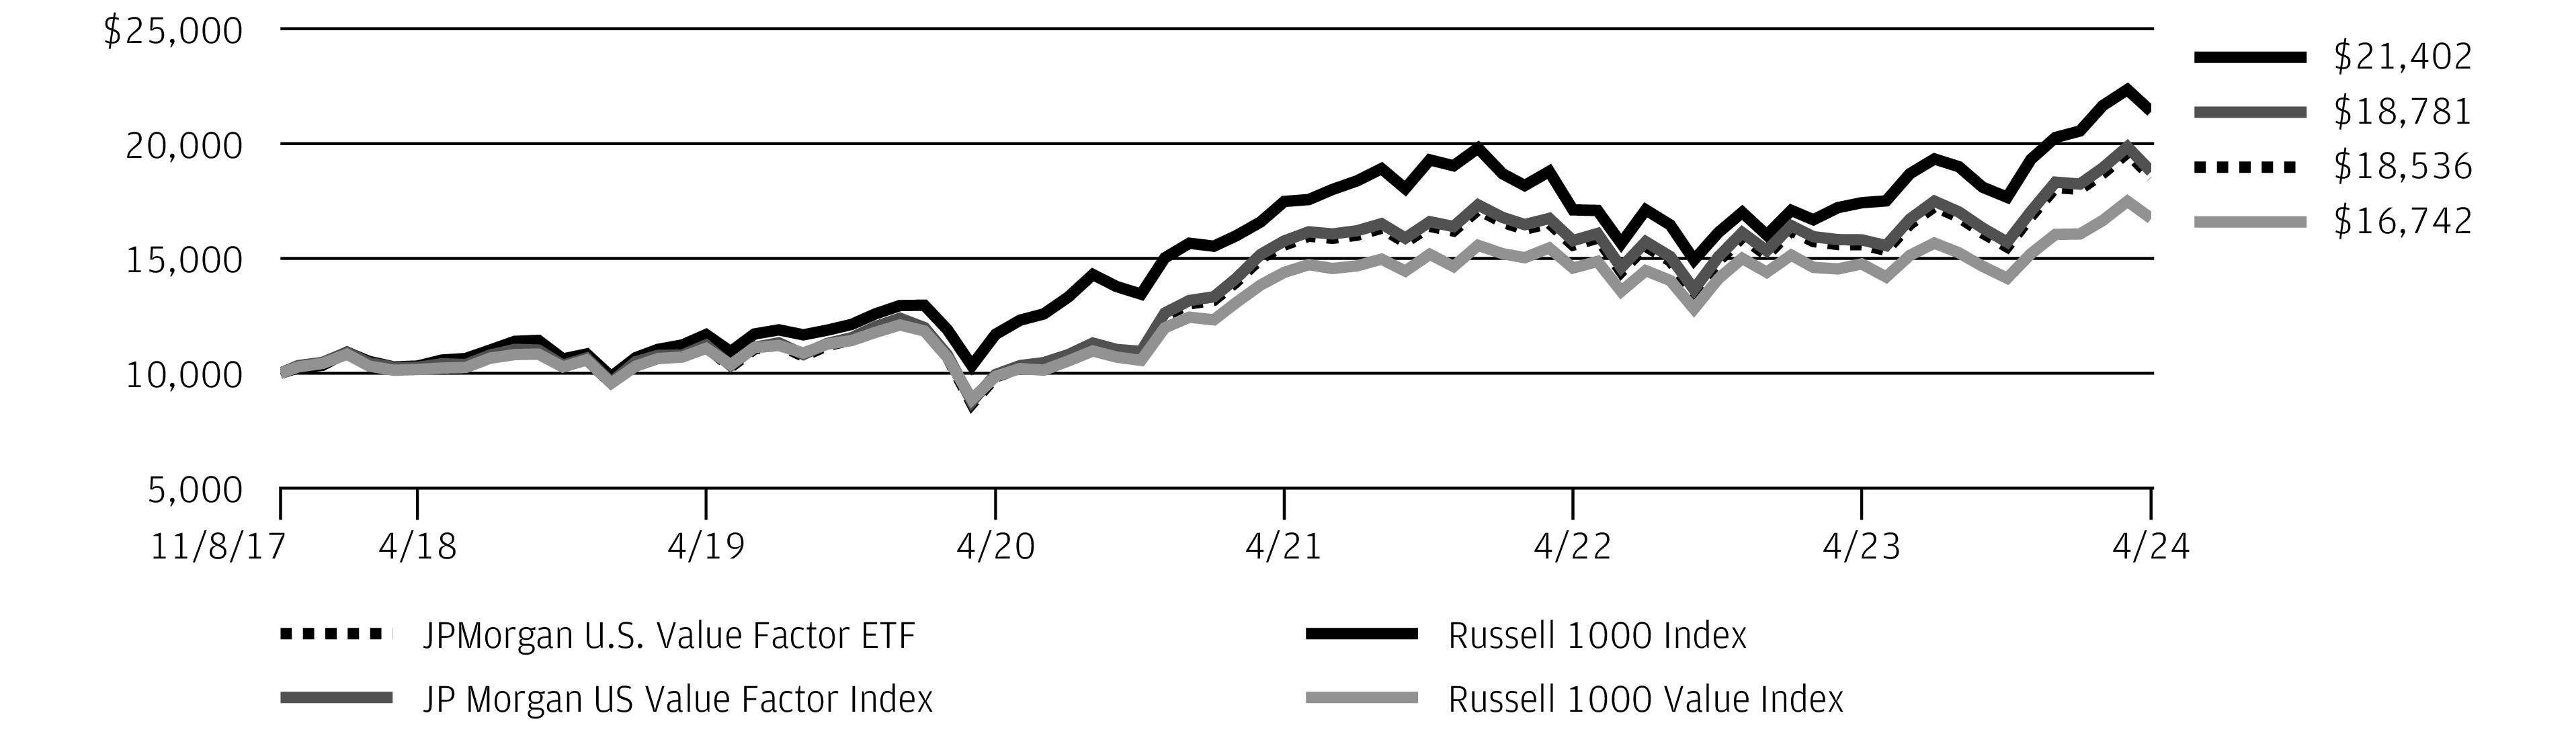
REPORTING PERIOD RETURN: | |
Net Asset Value * | 19.60% |
Market Price ** | 19.70% |
JP Morgan US Value Factor Index | 19.58% |
Russell 1000 Value Index | 18.42% |
Russell 1000 Index | 21.17% |
Net Assets as of 4/30/2024 | $784,324,102 |
Fund Ticker | JVAL |
TOP TEN HOLDINGS OF THE PORTFOLIO AS OF April 30, 2024 | PERCENT OF TOTAL INVESTMENTS | |
1. | Meta Platforms, Inc., Class A | 2.4 % |
2. | Alphabet, Inc., Class A | 2.4 |
3. | Apple, Inc. | 1.9 |
4. | Microsoft Corp. | 1.9 |
5. | Broadcom, Inc. | 1.8 |
6. | UnitedHealth Group, Inc. | 1.7 |
7. | Merck & Co., Inc. | 1.5 |
8. | Johnson & Johnson | 1.3 |
9. | QUALCOMM, Inc. | 0.9 |
10. | Salesforce, Inc. | 0.9 |
PORTFOLIO COMPOSITION BY SECTOR AS OF April 30, 2024 | PERCENT OF TOTAL INVESTMENTS |
Technology | 31.8% |
Consumer Discretionary | 13.8 |
Industrials | 12.9 |
Health Care | 11.6 |
Financials | 10.1 |
Consumer Staples | 4.7 |
Energy | 4.0 |
Real Estate | 2.5 |
Utilities | 2.5 |
Telecommunications | 1.9 |
Basic Materials | 1.7 |
Short-Term Investments | 2.5 |
54 | J.P. Morgan Exchange-Traded Funds | April 30, 2024 |
April 30, 2024 | J.P. Morgan Exchange-Traded Funds | 55 |
INCEPTION DATE | SIX MONTHS* | 1 YEAR | 5 YEAR | SINCE INCEPTION | |
JPMorgan U.S. Value Factor ETF | |||||
Net Asset Value | November 8, 2017 | 19.60 % | 18.84 % | 10.69 % | 10.00 % |
Market Price | 19.70 | 18.94 | 10.68 | 10.01 |
* | Not annualized. |
56 | J.P. Morgan Exchange-Traded Funds | April 30, 2024 |
INVESTMENTS | SHARES | VALUE($) |
Common Stocks — 99.4% | ||
Aerospace & Defense — 0.3% | ||
CAE, Inc. * | 1,161,686 | 22,412,654 |
Automobile Components — 0.7% | ||
Magna International, Inc. | 978,299 | 46,759,942 |
Banks — 22.7% | ||
Bank of Montreal | 2,615,759 | 233,654,076 |
Bank of Nova Scotia (The) | 4,431,131 | 203,298,031 |
Canadian Imperial Bank of Commerce | 3,372,625 | 157,429,181 |
National Bank of Canada | 1,234,420 | 99,119,447 |
Royal Bank of Canada | 5,133,605 | 496,672,975 |
Toronto-Dominion Bank (The) | 6,535,848 | 387,740,316 |
1,577,914,026 | ||
Broadline Retail — 1.5% | ||
Canadian Tire Corp. Ltd., Class A (a) | 190,331 | 18,386,750 |
Dollarama, Inc. | 1,029,649 | 85,893,213 |
104,279,963 | ||
Capital Markets — 4.2% | ||
Brookfield Asset Management Ltd., Class A | 1,318,269 | 50,359,762 |
Brookfield Corp. | 5,222,368 | 209,478,924 |
IGM Financial, Inc. | 294,638 | 7,364,613 |
TMX Group Ltd. | 958,445 | 25,377,053 |
292,580,352 | ||
Chemicals — 1.3% | ||
Nutrien Ltd. | 1,738,257 | 91,657,339 |
Commercial Services & Supplies — 3.2% | ||
GFL Environmental, Inc. | 637,973 | 20,358,227 |
RB Global, Inc. | 664,824 | 47,568,492 |
Waste Connections, Inc. (a) | 939,430 | 152,312,335 |
220,239,054 | ||
Construction & Engineering — 1.0% | ||
WSP Global, Inc. | 453,058 | 68,746,076 |
Consumer Staples Distribution & Retail — 4.3% | ||
Alimentation Couche-Tard, Inc. | 2,778,369 | 153,989,434 |
Empire Co. Ltd., Class A | 553,918 | 12,903,898 |
George Weston Ltd. | 211,652 | 27,853,843 |
Loblaw Cos. Ltd. | 549,650 | 60,273,246 |
Metro, Inc. | 835,321 | 42,729,310 |
297,749,731 | ||
Containers & Packaging — 0.4% | ||
CCL Industries, Inc., Class B | 538,579 | 27,503,072 |
INVESTMENTS | SHARES | VALUE($) |
Diversified Telecommunication Services — 1.1% | ||
BCE, Inc. | 1,108,779 | 36,429,066 |
Quebecor, Inc., Class B | 562,041 | 11,631,532 |
TELUS Corp. | 1,768,431 | 28,402,288 |
76,462,886 | ||
Electric Utilities — 2.0% | ||
Emera, Inc. (a) | 1,001,549 | 33,779,043 |
Fortis, Inc. | 1,782,937 | 70,014,582 |
Hydro One Ltd. (b) | 1,154,489 | 32,337,265 |
136,130,890 | ||
Food Products — 0.3% | ||
Saputo, Inc. | 900,908 | 17,322,511 |
Gas Utilities — 0.3% | ||
AltaGas Ltd. | 1,026,586 | 22,505,623 |
Ground Transportation — 7.8% | ||
Canadian National Railway Co. | 1,958,096 | 237,662,631 |
Canadian Pacific Kansas City Ltd. | 3,400,933 | 266,807,659 |
TFI International, Inc. | 284,761 | 37,084,191 |
541,554,481 | ||
Hotels, Restaurants & Leisure — 1.1% | ||
Restaurant Brands International, Inc. | 1,051,147 | 79,745,609 |
Independent Power and Renewable Electricity Producers — 0.2% | ||
Brookfield Renewable Corp. | 491,773 | 11,424,037 |
Insurance — 8.2% | ||
Fairfax Financial Holdings Ltd. | 85,667 | 93,138,165 |
Great-West Lifeco, Inc. | 999,354 | 29,552,683 |
iA Financial Corp., Inc. | 363,331 | 22,027,099 |
Intact Financial Corp. | 650,189 | 106,866,862 |
Manulife Financial Corp. | 6,627,380 | 154,581,899 |
Power Corp. of Canada | 2,015,162 | 53,692,763 |
Sun Life Financial, Inc. | 2,132,605 | 108,888,102 |
568,747,573 | ||
IT Services — 5.4% | ||
CGI, Inc. * | 751,408 | 76,136,928 |
Shopify, Inc., Class A * | 4,248,731 | 298,289,217 |
374,426,145 | ||
Metals & Mining — 8.5% | ||
Agnico Eagle Mines Ltd. | 1,808,739 | 114,543,178 |
Barrick Gold Corp. | 6,388,244 | 106,172,973 |
First Quantum Minerals Ltd. | 2,479,452 | 31,482,818 |
Franco-Nevada Corp. | 697,691 | 83,987,471 |
Ivanhoe Mines Ltd., Class A * (a) | 2,277,856 | 30,875,526 |
April 30, 2024 | J.P. Morgan Exchange-Traded Funds | 57 |
INVESTMENTS | SHARES | VALUE($) |
Common Stocks — continued | ||
Metals & Mining — continued | ||
Kinross Gold Corp. | 4,467,487 | 28,817,263 |
Lundin Mining Corp. | 2,382,488 | 27,205,689 |
Teck Resources Ltd., Class B | 1,682,889 | 82,747,798 |
Wheaton Precious Metals Corp. | 1,653,398 | 86,137,874 |
591,970,590 | ||
Multi-Utilities — 0.1% | ||
Canadian Utilities Ltd., Class A (a) | 454,328 | 10,158,149 |
Oil, Gas & Consumable Fuels — 18.3% | ||
ARC Resources Ltd. | 2,205,974 | 39,948,376 |
Cameco Corp. | 1,580,390 | 72,105,688 |
Canadian Natural Resources Ltd. | 3,885,292 | 294,420,268 |
Cenovus Energy, Inc. | 4,549,429 | 93,457,198 |
Enbridge, Inc. | 7,758,068 | 275,856,193 |
Imperial Oil Ltd. | 595,599 | 40,949,730 |
Keyera Corp. (a) | 835,548 | 21,437,225 |
Pembina Pipeline Corp. | 2,002,630 | 70,466,275 |
Suncor Energy, Inc. | 4,542,310 | 173,324,770 |
TC Energy Corp. | 3,781,115 | 135,462,603 |
Tourmaline Oil Corp. | 1,179,118 | 57,626,164 |
1,275,054,490 | ||
Paper & Forest Products — 0.2% | ||
West Fraser Timber Co. Ltd. | 200,549 | 15,360,394 |
Passenger Airlines — 0.1% | ||
Air Canada * | 641,094 | 9,462,848 |
Professional Services — 1.2% | ||
Thomson Reuters Corp. | 558,595 | 84,370,579 |
Real Estate Management & Development — 0.3% | ||
FirstService Corp. | 143,924 | 21,139,311 |
Residential REITs — 0.1% | ||
Canadian Apartment Properties (a) | 299,589 | 9,325,093 |
Retail REITs — 0.1% | ||
RioCan (a) | 537,240 | 6,805,990 |
Software — 3.3% | ||
Constellation Software, Inc. | 75,801 | 195,154,882 |
Open Text Corp. | 989,025 | 34,922,824 |
230,077,706 | ||
Textiles, Apparel & Luxury Goods — 0.3% | ||
Gildan Activewear, Inc. | 627,267 | 21,743,494 |
Trading Companies & Distributors — 0.2% | ||
Finning International, Inc. | 529,279 | 16,605,208 |
INVESTMENTS | SHARES | VALUE($) |
Wireless Telecommunication Services — 0.7% | ||
Rogers Communications, Inc., Class B | 1,342,219 | 50,280,197 |
Total Common Stocks (Cost $5,738,303,526) | 6,920,516,013 | |
NO. OF WARRANTS | VALUE ($) | |
Warrants — 0.0% ^ | ||
Software — 0.0% ^ | ||
Constellation Software, Inc., Zero Coupon, 3/31/2040 ‡ * (Cost $-) | 65,101 | — |
SHARES | VALUE($) | |
Short-Term Investments — 1.3% | ||
Investment of Cash Collateral from Securities Loaned — 1.3% | ||
JPMorgan Securities Lending Money Market Fund Agency SL Class Shares, 5.47% (c) (d) | 70,059,387 | 70,066,393 |
JPMorgan U.S. Government Money Market Fund Class IM Shares, 5.25% (c) (d) | 19,863,417 | 19,863,417 |
Total Investment of Cash Collateral from Securities Loaned (Cost $89,929,810) | 89,929,810 | |
Total Investments — 100.7% (Cost $5,828,233,336) | 7,010,445,823 | |
Liabilities in Excess of Other Assets — (0.7)% | (49,633,694 ) | |
NET ASSETS — 100.0% | 6,960,812,129 | |
Percentages indicated are based on net assets. |
Abbreviations | |
REIT | Real Estate Investment Trust |
^ | Amount rounds to less than 0.1% of net assets. | |
‡ | Value determined using significant unobservable inputs. | |
* | Non-income producing security. | |
(a) | The security or a portion of this security is on loan at April 30, 2024. The total value of securities on loan at April 30, 2024 is $81,758,457. | |
(b) | Security exempt from registration pursuant to Regulation S under the Securities Act of 1933, as amended. Regulation S applies to securities offerings that are made outside of the United States and do not involve direct selling efforts in the United States and as such may have restrictions on resale. | |
58 | J.P. Morgan Exchange-Traded Funds | April 30, 2024 |
(c) | Investment in an affiliated fund, which is registered under the Investment Company Act of 1940, as amended, and is advised by J.P. Morgan Investment Management Inc. | |
(d) | The rate shown is the current yield as of April 30, 2024. |
DESCRIPTION | NUMBER OF CONTRACTS | EXPIRATION DATE | TRADING CURRENCY | NOTIONAL AMOUNT ($) | VALUE AND UNREALIZED APPRECIATION (DEPRECIATION) ($) |
Long Contracts | |||||
S&P/TSX 60 Index | 193 | 06/20/2024 | CAD | 36,613,431 | (538,767 ) |
Abbreviations | |
CAD | Canadian Dollar |
April 30, 2024 | J.P. Morgan Exchange-Traded Funds | 59 |
INVESTMENTS | SHARES | VALUE($) |
Common Stocks — 99.5% | ||
Australia — 62.5% | ||
Ampol Ltd. | 627,882 | 14,826,676 |
ANZ Group Holdings Ltd. | 7,902,819 | 142,597,901 |
APA Group | 3,380,491 | 18,039,924 |
Aristocrat Leisure Ltd. | 1,707,203 | 43,567,796 |
ASX Ltd. | 510,082 | 20,836,922 |
Atlas Arteria Ltd. | 2,989,424 | 9,956,081 |
Aurizon Holdings Ltd. | 4,850,131 | 11,913,141 |
BHP Group Ltd. | 13,344,305 | 365,982,458 |
BlueScope Steel Ltd. | 1,178,894 | 17,206,459 |
Brambles Ltd. | 3,666,529 | 34,493,433 |
Cochlear Ltd. | 163,980 | 34,207,535 |
Coles Group Ltd. | 3,526,531 | 36,778,962 |
Commonwealth Bank of Australia | 4,412,248 | 323,283,331 |
Computershare Ltd. | 1,504,872 | 26,438,146 |
Dexus, REIT | 2,834,015 | 12,872,699 |
Endeavour Group Ltd. | 3,577,081 | 12,301,242 |
Fortescue Ltd. | 4,178,096 | 69,249,631 |
Goodman Group, REIT | 4,563,830 | 92,187,685 |
GPT Group (The), REIT | 5,042,335 | 13,561,020 |
IDP Education Ltd. | 732,649 | 7,639,255 |
IGO Ltd. | 1,783,837 | 8,884,727 |
Incitec Pivot Ltd. | 5,117,636 | 9,189,165 |
Insurance Australia Group Ltd. | 6,388,539 | 26,467,571 |
Lottery Corp. Ltd. (The) | 5,864,714 | 18,294,928 |
Macquarie Group Ltd. | 1,018,361 | 121,937,035 |
Medibank Pvt Ltd. | 7,256,565 | 16,631,033 |
Mineral Resources Ltd. | 451,545 | 20,483,136 |
Mirvac Group, REIT | 10,397,045 | 13,622,930 |
National Australia Bank Ltd. | 8,223,131 | 178,257,177 |
Northern Star Resources Ltd. | 3,028,123 | 28,702,771 |
Orica Ltd. | 1,270,022 | 14,705,247 |
Origin Energy Ltd. | 4,539,299 | 28,649,413 |
Pilbara Minerals Ltd. (a) | 7,477,710 | 19,037,528 |
Qantas Airways Ltd. * | 2,226,435 | 8,400,129 |
QBE Insurance Group Ltd. | 3,936,363 | 45,027,933 |
Ramsay Health Care Ltd. | 481,236 | 16,131,135 |
REA Group Ltd. | 134,356 | 15,400,967 |
Reece Ltd. | 912,325 | 16,184,330 |
Rio Tinto Ltd. | 978,151 | 81,405,970 |
Santos Ltd. | 8,112,630 | 39,811,658 |
Scentre Group, REIT | 13,676,248 | 27,695,095 |
SEEK Ltd. | 855,062 | 13,208,853 |
Seven Group Holdings Ltd. | 410,994 | 9,986,788 |
Sonic Healthcare Ltd. | 1,211,403 | 20,818,777 |
INVESTMENTS | SHARES | VALUE($) |
Australia — continued | ||
South32 Ltd. | 11,934,257 | 27,227,779 |
Stockland, REIT | 6,283,693 | 17,802,436 |
Suncorp Group Ltd. | 3,347,071 | 35,748,112 |
Telstra Group Ltd. | 10,655,747 | 25,175,399 |
TPG Telecom Ltd. | 1,121,935 | 3,242,665 |
Transurban Group | 8,137,320 | 65,330,154 |
Treasury Wine Estates Ltd. | 2,049,038 | 15,890,721 |
Vicinity Ltd., REIT | 9,547,950 | 11,692,122 |
Washington H Soul Pattinson & Co. Ltd. | 642,942 | 13,455,227 |
Wesfarmers Ltd. | 2,990,069 | 128,092,231 |
Westpac Banking Corp. | 9,232,333 | 153,315,297 |
WiseTech Global Ltd. | 454,942 | 26,801,793 |
Woodside Energy Group Ltd. | 5,003,078 | 89,640,191 |
Woolworths Group Ltd. | 3,057,822 | 62,737,702 |
Worley Ltd. | 968,788 | 9,351,903 |
2,792,378,325 | ||
China — 1.1% | ||
Budweiser Brewing Co. APAC Ltd. (b) | 4,464,300 | 6,210,696 |
ESR Group Ltd. (b) | 6,560,600 | 7,189,566 |
Wharf Holdings Ltd. (The) | 2,501,000 | 8,046,611 |
Wilmar International Ltd. | 4,754,600 | 11,176,037 |
Wuxi Biologics Cayman, Inc. * (b) | 9,672,000 | 16,755,162 |
49,378,072 | ||
Hong Kong — 15.6% | ||
AIA Group Ltd. | 29,827,200 | 218,465,092 |
CK Asset Holdings Ltd. | 5,343,000 | 22,790,973 |
CK Infrastructure Holdings Ltd. | 1,623,000 | 9,168,553 |
CLP Holdings Ltd. | 4,767,000 | 37,497,521 |
Hang Lung Properties Ltd. | 4,518,000 | 4,986,574 |
Hang Seng Bank Ltd. | 1,909,300 | 25,177,138 |
Henderson Land Development Co. Ltd. | 3,517,700 | 10,605,245 |
HKT Trust & HKT Ltd. | 9,412,000 | 10,390,640 |
Hong Kong & China Gas Co. Ltd. | 28,759,789 | 21,867,571 |
Hong Kong Exchanges & Clearing Ltd. | 3,140,900 | 99,800,295 |
Jardine Matheson Holdings Ltd. | 613,400 | 23,536,158 |
Link, REIT | 6,748,600 | 28,916,368 |
MTR Corp. Ltd. | 4,150,000 | 13,638,720 |
Power Assets Holdings Ltd. | 3,601,000 | 20,655,894 |
Sino Land Co. Ltd. | 8,854,000 | 9,466,694 |
Sun Hung Kai Properties Ltd. | 4,950,000 | 45,663,551 |
Swire Pacific Ltd., Class A | 1,086,000 | 9,197,018 |
Swire Pacific Ltd., Class B | 2,072,500 | 2,815,666 |
Swire Properties Ltd. | 2,771,400 | 5,731,719 |
60 | J.P. Morgan Exchange-Traded Funds | April 30, 2024 |
INVESTMENTS | SHARES | VALUE($) |
Common Stocks — continued | ||
Hong Kong — continued | ||
Techtronic Industries Co. Ltd. | 3,687,500 | 50,958,677 |
WH Group Ltd. (b) | 20,539,191 | 14,928,708 |
Wharf Real Estate Investment Co. Ltd. | 4,072,000 | 12,633,433 |
698,892,208 | ||
Macau — 0.9% | ||
Galaxy Entertainment Group Ltd. | 5,929,000 | 26,602,787 |
Sands China Ltd. * | 6,409,379 | 15,117,457 |
41,720,244 | ||
New Zealand — 1.8% | ||
Auckland International Airport Ltd. | 3,456,266 | 15,987,347 |
Contact Energy Ltd. | 2,074,942 | 10,600,459 |
Fisher & Paykel Healthcare Corp. Ltd. | 1,435,472 | 24,040,927 |
Mercury NZ Ltd. | 1,770,567 | 6,656,296 |
Meridian Energy Ltd. | 3,244,354 | 11,470,414 |
Spark New Zealand Ltd. | 4,797,230 | 13,483,682 |
82,239,125 | ||
Singapore — 10.8% | ||
CapitaLand Ascendas, REIT | 9,555,928 | 18,101,058 |
CapitaLand Integrated Commercial Trust, REIT | 12,437,332 | 17,729,363 |
CapitaLand Investment Ltd. * | 6,315,700 | 12,213,640 |
City Developments Ltd. | 1,225,700 | 5,493,506 |
DBS Group Holdings Ltd. | 5,298,900 | 134,896,260 |
Genting Singapore Ltd. | 15,010,600 | 10,017,628 |
Great Eastern Holdings Ltd. | 152,200 | 2,034,229 |
Jardine Cycle & Carriage Ltd. | 238,000 | 4,592,984 |
Keppel Ltd. | 3,640,200 | 18,207,964 |
Mapletree Pan Asia Commercial Trust, REIT | 6,347,900 | 5,817,046 |
Oversea-Chinese Banking Corp. Ltd. | 8,586,000 | 89,136,191 |
Singapore Airlines Ltd. | 3,643,900 | 17,387,310 |
Singapore Exchange Ltd. | 2,158,200 | 14,722,216 |
Singapore Technologies Engineering Ltd. | 4,111,000 | 12,075,999 |
Singapore Telecommunications Ltd. | 20,622,300 | 35,764,744 |
United Overseas Bank Ltd. | 3,532,400 | 78,386,796 |
UOL Group Ltd. | 1,383,300 | 5,906,349 |
482,483,283 | ||
United Kingdom — 0.8% | ||
CK Hutchison Holdings Ltd. | 7,013,500 | 34,062,998 |
INVESTMENTS | SHARES | VALUE($) |
United States — 6.0% | ||
CSL Ltd. | 1,272,856 | 226,156,133 |
James Hardie Industries plc, CHDI * | 1,153,480 | 39,654,282 |
265,810,415 | ||
Total Common Stocks (Cost $4,718,795,251) | 4,446,964,670 | |
Short-Term Investments — 0.1% | ||
Investment of Cash Collateral from Securities Loaned — 0.1% | ||
JPMorgan Securities Lending Money Market Fund Agency SL Class Shares, 5.47% (c) (d) | 3,998,700 | 3,999,100 |
JPMorgan U.S. Government Money Market Fund Class IM Shares, 5.25% (c) (d) | 1,875,035 | 1,875,035 |
Total Investment of Cash Collateral from Securities Loaned (Cost $5,874,935) | 5,874,135 | |
Total Investments — 99.6% (Cost $4,724,670,186) | 4,452,838,805 | |
Other Assets Less Liabilities — 0.4% | 16,920,705 | |
NET ASSETS — 100.0% | 4,469,759,510 | |
Percentages indicated are based on net assets. |
Abbreviations | |
APAC | Asia Pacific |
CHDI | Clearing House Electronic Subregister System (CHESS) Depository Interest |
REIT | Real Estate Investment Trust |
* | Non-income producing security. |
(a) | The security or a portion of this security is on loan at April 30, 2024. The total value of securities on loan at April 30, 2024 is $5,342,700. |
(b) | Security exempt from registration pursuant to Regulation S under the Securities Act of 1933, as amended. Regulation S applies to securities offerings that are made outside of the United States and do not involve direct selling efforts in the United States and as such may have restrictions on resale. |
(c) | Investment in an affiliated fund, which is registered under the Investment Company Act of 1940, as amended, and is advised by J.P. Morgan Investment Management Inc. |
(d) | The rate shown is the current yield as of April 30, 2024. |
April 30, 2024 | J.P. Morgan Exchange-Traded Funds | 61 |
INDUSTRY | PERCENT OF TOTAL INVESTMENTS |
Banks | 25.3 % |
Metals & Mining | 14.3 |
Insurance | 7.7 |
Capital Markets | 5.8 |
Biotechnology | 5.1 |
Real Estate Management & Development | 3.7 |
Oil, Gas & Consumable Fuels | 3.2 |
Broadline Retail | 2.9 |
Hotels, Restaurants & Leisure | 2.5 |
Electric Utilities | 2.5 |
Consumer Staples Distribution & Retail | 2.5 |
Industrial REITs | 2.5 |
Retail REITs | 2.1 |
Transportation Infrastructure | 2.0 |
Diversified Telecommunication Services | 2.0 |
Industrial Conglomerates | 1.8 |
Health Care Equipment & Supplies | 1.3 |
Machinery | 1.1 |
Diversified REITs | 1.0 |
Others (each less than 1.0%) | 10.6 |
Short-Term Investments | 0.1 |
DESCRIPTION | NUMBER OF CONTRACTS | EXPIRATION DATE | TRADING CURRENCY | NOTIONAL AMOUNT ($) | VALUE AND UNREALIZED APPRECIATION (DEPRECIATION) ($) |
Long Contracts | |||||
MSCI Singapore Index | 345 | 05/30/2024 | SGD | 7,584,667 | (47,629 ) |
SPI 200 Index | 115 | 06/20/2024 | AUD | 14,126,494 | (206,731 ) |
(254,360 ) |
Abbreviations | |
AUD | Australian Dollar |
MSCI | Morgan Stanley Capital International |
SGD | Singapore Dollar |
SPI | Australian Securities Exchange |
62 | J.P. Morgan Exchange-Traded Funds | April 30, 2024 |
INVESTMENTS | SHARES | VALUE($) |
Common Stocks — 99.2% | ||
Australia — 0.0% ^ | ||
Yancoal Australia Ltd. (a) | 19,600 | 70,715 |
Brazil — 4.6% | ||
Ambev SA | 329,502 | 773,529 |
Atacadao SA | 41,458 | 89,262 |
B3 SA - Brasil Bolsa Balcao | 420,450 | 870,438 |
Banco Bradesco SA | 113,747 | 270,315 |
Banco Bradesco SA (Preference) | 397,140 | 1,073,041 |
Banco BTG Pactual SA | 35,677 | 229,757 |
Banco do Brasil SA | 128,018 | 677,736 |
BB Seguridade Participacoes SA | 50,674 | 314,236 |
Braskem SA (Preference), Class A * | 15,048 | 61,814 |
Caixa Seguridade Participacoes S/A | 38,804 | 116,952 |
CCR SA | 88,350 | 209,280 |
Centrais Eletricas Brasileiras SA | 79,788 | 581,439 |
Centrais Eletricas Brasileiras SA (Preference) | 17,750 | 142,066 |
Cia de Saneamento Basico do Estado de Sao Paulo SABESP | 25,399 | 398,599 |
Cia Energetica de Minas Gerais (Preference) | 151,461 | 283,226 |
Cia Siderurgica Nacional SA | 45,471 | 122,158 |
Companhia Paranaense de Energia | 60,659 | 96,141 |
Companhia Paranaense de Energia (Preference) | 79,482 | 138,832 |
Cosan SA | 89,491 | 249,553 |
CPFL Energia SA | 14,149 | 87,386 |
CSN Mineracao SA | 45,112 | 42,917 |
Energisa SA | 21,806 | 189,857 |
Engie Brasil Energia SA | 20,064 | 158,384 |
Equatorial Energia SA | 83,638 | 494,651 |
Gerdau SA (Preference) | 106,526 | 373,988 |
Hapvida Participacoes e Investimentos SA * (a) | 395,808 | 281,272 |
Hypera SA * | 31,692 | 180,597 |
Itau Unibanco Holding SA (Preference) | 362,265 | 2,190,641 |
Itausa SA | 79,728 | 147,246 |
Itausa SA (Preference) | 417,732 | 769,079 |
Klabin SA | 66,120 | 292,871 |
Localiza Rent a Car SA | 65,935 | 623,339 |
Lojas Renner SA | 77,748 | 229,234 |
Natura & Co. Holding SA | 74,010 | 236,742 |
Neoenergia SA | 42,143 | 155,340 |
Petroleo Brasileiro SA | 276,539 | 2,360,322 |
Petroleo Brasileiro SA (Preference) | 347,865 | 2,808,323 |
PRIO SA | 60,045 | 556,670 |
Raia Drogasil SA | 96,773 | 477,845 |
Rede D'Or Sao Luiz SA (a) | 98,274 | 494,909 |
Rumo SA * | 87,440 | 339,986 |
INVESTMENTS | SHARES | VALUE($) |
Brazil — continued | ||
Sendas Distribuidora SA * | 103,641 | 262,266 |
Suzano SA | 56,146 | 632,110 |
Telefonica Brasil SA | 28,608 | 262,963 |
TIM SA | 61,136 | 208,159 |
Transmissora Alianca de Energia Eletrica S/A | 17,214 | 116,824 |
Vale SA | 270,873 | 3,299,449 |
Vibra Energia SA | 79,139 | 357,700 |
WEG SA | 119,189 | 910,800 |
26,240,244 | ||
Chile — 0.5% | ||
Banco de Chile | 3,454,713 | 383,237 |
Banco de Credito e Inversiones SA | 6,595 | 192,351 |
Banco Santander Chile | 5,244,456 | 237,627 |
Cencosud SA | 102,429 | 175,518 |
Cencosud Shopping SA | 37,578 | 58,243 |
Cia Sud Americana de Vapores SA | 1,183,662 | 92,346 |
Empresas CMPC SA | 87,438 | 172,681 |
Empresas Copec SA | 33,310 | 237,703 |
Enel Americas SA | 1,421,786 | 133,286 |
Enel Chile SA | 1,925,403 | 114,315 |
Falabella SA * | 99,790 | 267,132 |
Latam Airlines Group SA * | 14,009,071 | 189,550 |
Quinenco SA | 21,290 | 74,176 |
Sociedad Quimica y Minera de Chile SA (Preference), Class B | 11,343 | 518,088 |
2,846,253 | ||
China — 25.1% | ||
360 Security Technology, Inc., Class A * | 45,600 | 53,263 |
37 Interactive Entertainment Network Technology Group Co. Ltd. | 17,100 | 39,213 |
AAC Technologies Holdings, Inc. | 52,000 | 165,497 |
AECC Aviation Power Co. Ltd., Class A | 17,200 | 83,682 |
Agricultural Bank of China Ltd., Class A | 1,010,100 | 612,062 |
Agricultural Bank of China Ltd., Class H | 2,114,000 | 942,656 |
Airtac International Group | 11,000 | 389,464 |
Akeso, Inc. * (a) | 41,000 | 250,884 |
Alibaba Group Holding Ltd. | 1,265,500 | 11,848,958 |
Alibaba Health Information Technology Ltd. * | 382,000 | 142,593 |
Aluminum Corp. of China Ltd., Class A | 81,100 | 82,661 |
Aluminum Corp. of China Ltd., Class H | 312,000 | 206,923 |
Anhui Conch Cement Co. Ltd., Class A | 25,100 | 79,369 |
Anhui Conch Cement Co. Ltd., Class H | 93,500 | 216,926 |
Anhui Gujing Distillery Co. Ltd., Class A | 2,700 | 100,734 |
Anhui Gujing Distillery Co. Ltd., Class B | 8,200 | 134,407 |
April 30, 2024 | J.P. Morgan Exchange-Traded Funds | 63 |
INVESTMENTS | SHARES | VALUE($) |
Common Stocks — continued | ||
China — continued | ||
Anjoy Foods Group Co. Ltd., Class A | 5,900 | 74,790 |
ANTA Sports Products Ltd. | 101,400 | 1,147,949 |
Asymchem Laboratories Tianjin Co. Ltd., Class A | 5,900 | 67,017 |
Atour Lifestyle Holdings Ltd., ADR | 4,799 | 85,566 |
Autohome, Inc., Class A | 20,000 | 127,889 |
AviChina Industry & Technology Co. Ltd., Class H | 155,000 | 66,661 |
BAIC BluePark New Energy Technology Co. Ltd., Class A * | 31,300 | 29,246 |
Baidu, Inc., Class A * | 168,650 | 2,184,960 |
Baiyin Nonferrous Group Co. Ltd., Class A | 1,001,700 | 426,714 |
Bank of Beijing Co. Ltd., Class A | 133,000 | 102,208 |
Bank of China Ltd., Class H | 5,939,000 | 2,663,585 |
Bank of Communications Co. Ltd., Class A | 250,800 | 237,479 |
Bank of Communications Co. Ltd., Class H | 543,000 | 390,992 |
Bank of Jiangsu Co. Ltd., Class A | 103,100 | 114,742 |
Bank of Nanjing Co. Ltd., Class A | 65,000 | 83,466 |
Bank of Ningbo Co. Ltd., Class A | 45,600 | 143,736 |
Baoshan Iron & Steel Co. Ltd., Class A | 140,300 | 134,132 |
BeiGene Ltd. * | 61,100 | 724,805 |
Beijing Enterprises Holdings Ltd. | 57,000 | 182,488 |
Beijing Enterprises Water Group Ltd. | 312,000 | 78,690 |
Beijing Kingsoft Office Software, Inc., Class A | 3,357 | 141,948 |
Beijing Tongrentang Co. Ltd., Class A | 11,600 | 67,531 |
Beijing Wantai Biological Pharmacy Enterprise Co. Ltd., Class A | 6,000 | 56,479 |
Bilibili, Inc., Class Z * | 19,080 | 242,281 |
BOC Aviation Ltd. (a) | 17,100 | 136,009 |
BOC Hong Kong Holdings Ltd. | 267,500 | 819,912 |
BOE Technology Group Co. Ltd., Class A | 239,400 | 143,453 |
Bosideng International Holdings Ltd. | 260,000 | 150,506 |
BYD Co. Ltd., Class A | 4,700 | 140,866 |
BYD Co. Ltd., Class H | 74,000 | 2,028,531 |
BYD Electronic International Co. Ltd. | 58,000 | 195,390 |
C&D International Investment Group Ltd. | 63,000 | 124,798 |
Cambricon Technologies Corp. Ltd., Class A * | 2,827 | 65,125 |
CGN Power Co. Ltd., Class A | 91,300 | 51,679 |
CGN Power Co. Ltd., Class H (a) | 752,000 | 252,152 |
Changchun High-Tech Industry Group Co. Ltd. | 5,800 | 90,017 |
Changzhou Xingyu Automotive Lighting Systems Co. Ltd., Class A | 5,700 | 104,787 |
China CITIC Bank Corp. Ltd., Class H | 679,000 | 397,238 |
China Coal Energy Co. Ltd., Class H | 158,000 | 159,160 |
China Construction Bank Corp., Class H | 7,315,000 | 4,732,740 |
China CSSC Holdings Ltd., Class A | 28,600 | 143,460 |
China Eastern Airlines Corp. Ltd., Class A * | 161,800 | 85,455 |
INVESTMENTS | SHARES | VALUE($) |
China — continued | ||
China Everbright Bank Co. Ltd., Class A | 292,000 | 126,753 |
China Everbright Environment Group Ltd. | 277,000 | 112,320 |
China Feihe Ltd. (a) | 285,000 | 155,857 |
China First Heavy Industries Co. Ltd., Class A * | 1,053,300 | 386,900 |
China Galaxy Securities Co. Ltd., Class H | 273,500 | 148,146 |
China Gas Holdings Ltd. | 235,800 | 220,787 |
China Great Wall Securities Co. Ltd., Class A | 446,900 | 470,351 |
China Hongqiao Group Ltd. | 194,000 | 267,697 |
China International Capital Corp. Ltd., Class H (a) | 136,800 | 164,960 |
China International Marine Containers Group Co. Ltd., Class H | 64,700 | 54,731 |
China Jushi Co. Ltd., Class A | 38,500 | 63,174 |
China Lesso Group Holdings Ltd. | 78,000 | 32,697 |
China Life Insurance Co. Ltd., Class H | 556,000 | 732,209 |
China Literature Ltd. * (a) | 34,400 | 122,879 |
China Longyuan Power Group Corp. Ltd., Class A | 28,400 | 71,338 |
China Longyuan Power Group Corp. Ltd., Class H | 266,000 | 186,342 |
China Medical System Holdings Ltd. | 99,000 | 88,392 |
China Mengniu Dairy Co. Ltd. | 239,000 | 495,083 |
China Merchants Bank Co. Ltd., Class A | 136,800 | 644,355 |
China Merchants Bank Co. Ltd., Class H | 247,000 | 1,069,722 |
China Merchants Energy Shipping Co. Ltd., Class A | 51,200 | 60,209 |
China Merchants Expressway Network & Technology Holdings Co. Ltd., Class A | 29,800 | 45,519 |
China Merchants Port Holdings Co. Ltd. | 116,000 | 153,191 |
China Merchants Shekou Industrial Zone Holdings Co. Ltd., Class A | 51,300 | 59,664 |
China Minsheng Banking Corp. Ltd., Class A | 228,000 | 124,104 |
China Minsheng Banking Corp. Ltd., Class H | 513,000 | 187,697 |
China National Building Material Co. Ltd., Class H | 358,000 | 138,524 |
China National Nuclear Power Co. Ltd., Class A | 118,900 | 151,326 |
China Northern Rare Earth Group High-Tech Co. Ltd., Class A | 22,800 | 60,488 |
China Oilfield Services Ltd., Class H | 144,000 | 153,980 |
China Overseas Land & Investment Ltd. | 313,500 | 576,487 |
China Pacific Insurance Group Co. Ltd., Class A | 38,500 | 136,226 |
China Pacific Insurance Group Co. Ltd., Class H | 197,800 | 433,395 |
China Petroleum & Chemical Corp., Class A | 292,000 | 254,909 |
China Petroleum & Chemical Corp., Class H | 1,760,000 | 1,050,547 |
China Power International Development Ltd. | 390,000 | 157,379 |
China Railway Group Ltd., Class A | 131,100 | 118,211 |
China Railway Group Ltd., Class H | 286,000 | 141,129 |
China Resources Beer Holdings Co. Ltd. | 124,000 | 565,200 |
64 | J.P. Morgan Exchange-Traded Funds | April 30, 2024 |
INVESTMENTS | SHARES | VALUE($) |
Common Stocks — continued | ||
China — continued | ||
China Resources Gas Group Ltd. | 70,900 | 222,837 |
China Resources Land Ltd. | 222,500 | 800,074 |
China Resources Mixc Lifestyle Services Ltd. (a) | 57,200 | 201,331 |
China Resources Pharmaceutical Group Ltd. (a) | 148,000 | 95,706 |
China Resources Power Holdings Co. Ltd. | 140,000 | 348,160 |
China Resources Sanjiu Medical & Pharmaceutical Co. Ltd., Class A | 6,400 | 52,912 |
China Shenhua Energy Co. Ltd., Class A | 57,000 | 312,549 |
China Shenhua Energy Co. Ltd., Class H | 252,500 | 1,047,994 |
China Southern Airlines Co. Ltd., Class A * | 91,200 | 71,118 |
China Suntien Green Energy Corp. Ltd., Class A | 119,800 | 141,803 |
China Taiping Insurance Holdings Co. Ltd. | 136,800 | 125,078 |
China Three Gorges Renewables Group Co. Ltd., Class A | 182,400 | 117,742 |
China Tourism Group Duty Free Corp. Ltd., Class A | 17,100 | 175,150 |
China Tourism Group Duty Free Corp. Ltd., Class H (a) | 8,400 | 73,972 |
China Tower Corp. Ltd., Class H (a) | 3,244,000 | 379,741 |
China Vanke Co. Ltd., Class A | 62,700 | 63,712 |
China Vanke Co. Ltd., Class H | 176,700 | 103,632 |
China Yangtze Power Co. Ltd., Class A | 153,900 | 547,180 |
Chongqing Changan Automobile Co. Ltd., Class A | 57,000 | 115,084 |
Chow Tai Fook Jewellery Group Ltd. | 130,800 | 177,973 |
CITIC Ltd. | 476,000 | 450,488 |
CITIC Securities Co. Ltd., Class A | 79,800 | 207,674 |
CITIC Securities Co. Ltd., Class H | 142,500 | 226,876 |
CMOC Group Ltd., Class A | 114,000 | 139,931 |
CMOC Group Ltd., Class H | 255,000 | 239,244 |
COSCO SHIPPING Energy Transportation Co. Ltd., Class A | 22,000 | 48,315 |
COSCO SHIPPING Energy Transportation Co. Ltd., Class H | 116,000 | 136,041 |
COSCO SHIPPING Holdings Co. Ltd., Class H | 220,000 | 284,643 |
Country Garden Holdings Co. Ltd. ‡ * (b) | 148,000 | 9,176 |
Country Garden Services Holdings Co. Ltd. | 173,000 | 115,415 |
CSC Financial Co. Ltd., Class A | 26,700 | 81,821 |
CSPC Pharmaceutical Group Ltd. | 650,000 | 533,736 |
Daqin Railway Co. Ltd., Class A | 95,500 | 91,107 |
East Buy Holding Ltd. * (a) | 33,000 | 69,769 |
ENN Energy Holdings Ltd. | 59,500 | 506,963 |
ENN Natural Gas Co. Ltd., Class A | 19,400 | 48,251 |
Everdisplay Optronics Shanghai Co. Ltd., Class A * | 726,961 | 223,489 |
Far East Horizon Ltd. | 140,000 | 104,158 |
INVESTMENTS | SHARES | VALUE($) |
China — continued | ||
Flat Glass Group Co. Ltd., Class A | 11,700 | 42,744 |
Flat Glass Group Co. Ltd., Class H | 38,000 | 91,533 |
Focus Media Information Technology Co. Ltd., Class A | 107,300 | 95,881 |
Foshan Haitian Flavouring & Food Co. Ltd., Class A | 39,960 | 215,447 |
Foxconn Industrial Internet Co. Ltd., Class A | 61,000 | 201,208 |
Full Truck Alliance Co. Ltd., ADR | 51,471 | 443,165 |
Fuyao Glass Industry Group Co. Ltd., Class A | 11,300 | 77,561 |
Fuyao Glass Industry Group Co. Ltd., Class H (a) | 47,200 | 282,589 |
Ganfeng Lithium Group Co. Ltd. (a) | 34,400 | 100,877 |
Ganfeng Lithium Group Co. Ltd., Class A | 11,600 | 56,144 |
GCL Technology Holdings Ltd. | 1,576,000 | 233,426 |
GD Power Development Co. Ltd., Class A | 112,300 | 79,223 |
Geely Automobile Holdings Ltd. | 436,000 | 524,752 |
Genscript Biotech Corp. * | 70,000 | 103,227 |
GF Securities Co. Ltd., Class H | 91,200 | 90,857 |
Giant Biogene Holding Co. Ltd. * (a) | 29,800 | 181,564 |
GigaDevice Semiconductor, Inc., Class A | 5,800 | 62,457 |
GoerTek, Inc., Class A | 21,700 | 47,039 |
Great Wall Motor Co. Ltd., Class A | 19,300 | 69,492 |
Great Wall Motor Co. Ltd., Class H | 173,500 | 262,183 |
Gree Electric Appliances, Inc. of Zhuhai, Class A | 39,900 | 231,081 |
Guangdong Haid Group Co. Ltd., Class A | 10,800 | 74,185 |
Guangdong Investment Ltd. | 232,000 | 121,189 |
Guanghui Energy Co. Ltd., Class A | 41,300 | 41,912 |
Guangzhou Tinci Materials Technology Co. Ltd., Class A | 12,100 | 34,893 |
Guosen Securities Co. Ltd., Class A | 53,900 | 66,529 |
Guoyuan Securities Co. Ltd., Class A | 464,600 | 435,194 |
H World Group Ltd. | 128,000 | 476,246 |
Haidilao International Holding Ltd. (a) | 131,000 | 295,563 |
Haier Smart Home Co. Ltd., Class A | 39,900 | 165,708 |
Haier Smart Home Co. Ltd., Class H | 174,600 | 646,723 |
Hainan Airlines Holding Co. Ltd., Class A * | 269,600 | 50,770 |
Haitian International Holdings Ltd. | 79,000 | 257,291 |
Haitong Securities Co. Ltd., Class H | 196,800 | 93,996 |
Hangzhou First Applied Material Co. Ltd., Class A | 11,900 | 44,420 |
Hansoh Pharmaceutical Group Co. Ltd. (a) | 84,000 | 185,614 |
Henan Shuanghui Investment & Development Co. Ltd., Class A | 19,100 | 70,937 |
Hengan International Group Co. Ltd. | 57,500 | 193,037 |
Hengli Petrochemical Co. Ltd., Class A * | 43,400 | 92,501 |
Hisense Home Appliances Group Co. Ltd. | 28,000 | 117,117 |
April 30, 2024 | J.P. Morgan Exchange-Traded Funds | 65 |
INVESTMENTS | SHARES | VALUE($) |
Common Stocks — continued | ||
China — continued | ||
Hoyuan Green Energy Co. Ltd. | 7,906 | 23,910 |
Hua Hong Semiconductor Ltd. * (a) | 59,000 | 116,272 |
Huadian Power International Corp. Ltd., Class A | 53,000 | 49,318 |
Huadian Power International Corp. Ltd., Class H | 130,000 | 71,126 |
Huadong Medicine Co. Ltd., Class A | 11,300 | 51,242 |
Hualan Biological Engineering, Inc., Class A | 10,300 | 27,603 |
Huaneng Power International, Inc., Class A * | 74,100 | 95,455 |
Huaneng Power International, Inc., Class H * | 342,000 | 217,683 |
Huatai Securities Co. Ltd., Class A | 45,300 | 85,523 |
Huatai Securities Co. Ltd., Class H (a) | 125,400 | 148,301 |
Huaxia Bank Co. Ltd., Class A | 100,400 | 92,762 |
Huayu Automotive Systems Co. Ltd., Class A | 92,700 | 210,115 |
Huizhou Desay Sv Automotive Co. Ltd., Class A | 5,800 | 100,001 |
Hundsun Technologies, Inc., Class A | 17,100 | 48,227 |
Hygeia Healthcare Holdings Co. Ltd. (a) | 27,400 | 113,092 |
IEIT Systems Co. Ltd., Class A | 9,600 | 53,443 |
Iflytek Co. Ltd., Class A | 17,200 | 106,147 |
Industrial & Commercial Bank of China Ltd., Class A | 646,000 | 483,052 |
Industrial & Commercial Bank of China Ltd., Class H | 5,457,000 | 2,926,199 |
Industrial Bank Co. Ltd., Class A | 136,800 | 317,205 |
Inner Mongolia BaoTou Steel Union Co. Ltd., Class A * | 278,900 | 61,305 |
Inner Mongolia Yili Industrial Group Co. Ltd., Class A | 45,600 | 179,393 |
Inner Mongolia Yitai Coal Co. Ltd., Class B | 76,000 | 147,708 |
Innovent Biologics, Inc. * (a) | 96,500 | 467,153 |
iQIYI, Inc., ADR * | 35,064 | 170,060 |
JA Solar Technology Co. Ltd., Class A * | 22,800 | 44,636 |
JD Health International, Inc. * (a) | 78,550 | 267,920 |
JD Logistics, Inc. * (a) | 176,900 | 191,463 |
JD.com, Inc., Class A | 185,500 | 2,672,753 |
Jiangsu Eastern Shenghong Co. Ltd., Class A | 40,600 | 55,388 |
Jiangsu Expressway Co. Ltd., Class H | 92,000 | 90,226 |
Jiangsu Hengli Hydraulic Co. Ltd., Class A | 8,500 | 59,736 |
Jiangsu Hengrui Pharmaceuticals Co. Ltd., Class A | 45,600 | 289,071 |
Jiangsu King's Luck Brewery JSC Ltd., Class A | 8,000 | 63,156 |
Jiangsu Yanghe Distillery Co. Ltd., Class A | 11,500 | 150,279 |
Jiangsu Zhongtian Technology Co. Ltd., Class A | 21,600 | 40,232 |
Jiangxi Copper Co. Ltd., Class H | 95,000 | 193,480 |
Jinko Solar Co. Ltd., Class A | 56,090 | 58,199 |
JiuGui Liquor Co. Ltd., Class A | 5,900 | 41,402 |
Jointown Pharmaceutical Group Co. Ltd., Class A | 139,451 | 157,515 |
INVESTMENTS | SHARES | VALUE($) |
China — continued | ||
KE Holdings, Inc., Class A | 171,500 | 877,097 |
Kingboard Holdings Ltd. | 57,000 | 125,273 |
Kingdee International Software Group Co. Ltd. * | 229,000 | 241,601 |
Kingsoft Corp. Ltd. | 75,200 | 244,324 |
Kuaishou Technology * (a) | 176,100 | 1,234,586 |
Kunlun Energy Co. Ltd. | 276,000 | 267,549 |
Kweichow Moutai Co. Ltd., Class A | 7,100 | 1,661,818 |
Lenovo Group Ltd. | 542,000 | 609,620 |
Li Auto, Inc., Class A * | 77,700 | 1,018,018 |
Li Ning Co. Ltd. | 184,500 | 482,997 |
Liaoning Cheng Da Co. Ltd., Class A | 51,900 | 73,946 |
Liaoning Port Co. Ltd., Class A | 2,144,800 | 425,413 |
Longfor Group Holdings Ltd. (a) | 153,500 | 227,356 |
LONGi Green Energy Technology Co. Ltd., Class A | 51,300 | 128,236 |
Luxshare Precision Industry Co. Ltd., Class A | 45,600 | 182,470 |
Luzhou Laojiao Co. Ltd., Class A | 9,300 | 237,639 |
Meituan * (a) | 404,300 | 5,520,527 |
Microport Scientific Corp. * | 58,400 | 46,445 |
MINISO Group Holding Ltd. | 31,600 | 178,257 |
Minth Group Ltd. | 74,000 | 126,141 |
Montage Technology Co. Ltd., Class A | 7,295 | 50,577 |
Muyuan Foods Co. Ltd., Class A | 39,900 | 239,509 |
NARI Technology Co. Ltd., Class A | 54,880 | 177,195 |
NAURA Technology Group Co. Ltd., Class A | 3,700 | 161,741 |
NetEase, Inc. | 132,500 | 2,483,665 |
New China Life Insurance Co. Ltd., Class A | 13,200 | 56,984 |
New China Life Insurance Co. Ltd., Class H | 69,000 | 132,325 |
New Hope Liuhe Co. Ltd., Class A * | 391,500 | 480,500 |
New Oriental Education & Technology Group, Inc. * | 109,000 | 866,110 |
Ningbo Deye Technology Co. Ltd., Class A | 2,440 | 31,344 |
Ningbo Tuopu Group Co. Ltd., Class A | 7,100 | 60,990 |
Ningxia Baofeng Energy Group Co. Ltd., Class A | 45,100 | 102,916 |
NIO, Inc., Class A * | 112,000 | 529,148 |
Nongfu Spring Co. Ltd., Class H (a) | 134,400 | 789,589 |
PDD Holdings, Inc., ADR * | 47,779 | 5,980,975 |
People.cn Co. Ltd., Class A | 6,200 | 21,092 |
People's Insurance Co. Group of China Ltd. (The), Class H | 644,000 | 211,377 |
PetroChina Co. Ltd., Class H | 1,576,000 | 1,468,425 |
PICC Property & Casualty Co. Ltd., Class H | 516,000 | 641,070 |
Ping An Bank Co. Ltd., Class A | 125,400 | 186,063 |
Ping An Healthcare and Technology Co. Ltd. * (a) | 44,000 | 62,209 |
66 | J.P. Morgan Exchange-Traded Funds | April 30, 2024 |
INVESTMENTS | SHARES | VALUE($) |
Common Stocks — continued | ||
China — continued | ||
Ping An Insurance Group Co. of China Ltd., Class A | 71,300 | 404,605 |
Ping An Insurance Group Co. of China Ltd., Class H | 473,000 | 2,143,675 |
Poly Developments and Holdings Group Co. Ltd., Class A | 79,800 | 97,743 |
Pop Mart International Group Ltd. (a) | 48,200 | 206,269 |
Postal Savings Bank of China Co. Ltd., Class A | 249,700 | 164,963 |
Postal Savings Bank of China Co. Ltd., Class H (a) | 728,000 | 377,215 |
Power Construction Corp. of China Ltd., Class A | 114,000 | 79,630 |
Qingdao Rural Commercial Bank Corp., Class A * | 1,018,400 | 397,918 |
Qinghai Salt Lake Industry Co. Ltd., Class A * | 39,900 | 90,991 |
Remegen Co. Ltd., Class H * (a) | 13,500 | 47,623 |
Rongsheng Petrochemical Co. Ltd., Class A | 68,400 | 105,465 |
SAIC Motor Corp. Ltd., Class A | 57,300 | 117,126 |
Sanan Optoelectronics Co. Ltd., Class A | 31,200 | 53,670 |
Sany Heavy Equipment International Holdings Co. Ltd. | 82,000 | 57,620 |
Sany Heavy Industry Co. Ltd., Class A | 57,000 | 127,861 |
Seres Group Co. Ltd., Class A * | 9,800 | 121,938 |
SF Holding Co. Ltd., Class A | 34,300 | 170,799 |
Shaanxi Beiyuan Chemical Industry Group Co. Ltd., Class A | 626,100 | 383,495 |
Shaanxi Coal Industry Co. Ltd., Class A | 62,700 | 211,983 |
Shandong Gold Mining Co. Ltd., Class A | 22,800 | 89,998 |
Shandong Gold Mining Co. Ltd., Class H (a) | 51,750 | 111,822 |
Shandong Hi-Speed Holdings Group Ltd. * (b) | 142,000 | 129,244 |
Shandong Nanshan Aluminum Co. Ltd., Class A | 138,800 | 68,276 |
Shandong Weigao Group Medical Polymer Co. Ltd., Class H | 191,200 | 130,519 |
Shanghai Baosight Software Co. Ltd., Class A | 11,600 | 65,421 |
Shanghai Baosight Software Co. Ltd., Class B | 47,720 | 101,943 |
Shanghai Electric Group Co. Ltd., Class A * | 459,600 | 272,320 |
Shanghai Fosun Pharmaceutical Group Co. Ltd., Class H | 37,000 | 58,085 |
Shanghai Fudan Microelectronics Group Co. Ltd., Class H | 22,000 | 30,378 |
Shanghai International Airport Co. Ltd., Class A * | 17,300 | 89,584 |
Shanghai Jahwa United Co. Ltd., Class A | 38,900 | 111,891 |
Shanghai Pharmaceuticals Holding Co. Ltd., Class H | 60,800 | 86,400 |
Shanghai Pudong Development Bank Co. Ltd., Class A | 188,100 | 199,062 |
Shanghai Putailai New Energy Technology Co. Ltd., Class A | 12,700 | 32,249 |
INVESTMENTS | SHARES | VALUE($) |
China — continued | ||
Shanxi Coking Coal Energy Group Co. Ltd., Class A | 34,900 | 50,412 |
Shanxi Lu'an Environmental Energy Development Co. Ltd., Class A | 18,300 | 53,333 |
Shanxi Meijin Energy Co. Ltd., Class A * | 48,200 | 40,227 |
Shanxi Xinghuacun Fen Wine Factory Co. Ltd., Class A | 7,500 | 269,657 |
Shennan Circuits Co. Ltd., Class A | 2,900 | 37,133 |
Shenwan Hongyuan Group Co. Ltd., Class A | 214,400 | 138,506 |
Shenzhen Transsion Holdings Co. Ltd., Class A | 5,500 | 109,186 |
Shenzhou International Group Holdings Ltd. | 62,700 | 616,292 |
Sichuan Chuantou Energy Co. Ltd., Class A | 27,400 | 63,271 |
Sichuan Road and Bridge Group Co. Ltd., Class A | 49,000 | 48,975 |
Silergy Corp. | 26,000 | 345,309 |
Sinomach Heavy Equipment Group Co. Ltd., Class A * | 1,183,100 | 480,118 |
Sinopec Oilfield Service Corp., Class A * | 206,500 | 53,045 |
Sinopharm Group Co. Ltd., Class H | 106,400 | 268,699 |
Sinotrans Ltd., Class H | 138,000 | 66,153 |
Sinotruk Hong Kong Ltd. | 52,500 | 130,657 |
Smoore International Holdings Ltd. (a) | 171,000 | 148,926 |
StarPower Semiconductor Ltd., Class A | 5,600 | 106,971 |
Sunny Optical Technology Group Co. Ltd. | 56,800 | 274,783 |
TAL Education Group, ADR * | 36,714 | 442,037 |
TBEA Co. Ltd., Class A | 32,040 | 62,282 |
TCL Technology Group Corp., Class A * | 118,300 | 77,637 |
TCL Zhonghuan Renewable Energy Technology Co. Ltd., Class A | 30,900 | 44,272 |
Tencent Holdings Ltd. | 462,500 | 20,295,980 |
Tencent Music Entertainment Group, Class A * | 98,900 | 624,513 |
Tianqi Lithium Corp., Class A | 11,500 | 62,261 |
Tingyi Cayman Islands Holding Corp. | 150,000 | 165,555 |
Tongcheng Travel Holdings Ltd. * (a) | 90,400 | 237,922 |
Tonghua Dongbao Pharmaceutical Co. Ltd., Class A | 65,000 | 90,115 |
Tongwei Co. Ltd., Class A | 34,200 | 102,037 |
Topsports International Holdings Ltd. (a) | 228,000 | 158,340 |
Trip.com Group Ltd. * | 41,300 | 2,011,614 |
Tsingtao Brewery Co. Ltd. | 50,000 | 360,320 |
Tuhu Car, Inc. * (a) | 31,000 | 90,749 |
Unigroup Guoxin Microelectronics Co. Ltd., Class A * | 5,900 | 47,182 |
Uni-President China Holdings Ltd. | 96,000 | 73,755 |
Unisplendour Corp. Ltd., Class A * | 22,800 | 65,143 |
Vipshop Holdings Ltd., ADR | 19,878 | 298,965 |
Wanhua Chemical Group Co. Ltd., Class A | 22,900 | 280,068 |
April 30, 2024 | J.P. Morgan Exchange-Traded Funds | 67 |
INVESTMENTS | SHARES | VALUE($) |
Common Stocks — continued | ||
China — continued | ||
Want Want China Holdings Ltd. | 393,000 | 224,566 |
Weichai Power Co. Ltd., Class A | 38,100 | 91,248 |
Weichai Power Co. Ltd., Class H | 154,000 | 314,678 |
Will Semiconductor Co. Ltd., Class A | 10,200 | 142,285 |
Wingtech Technology Co. Ltd., Class A * | 7,900 | 34,094 |
Wuliangye Yibin Co. Ltd., Class A | 21,900 | 452,131 |
WUS Printed Circuit Kunshan Co. Ltd., Class A * | 12,200 | 55,389 |
WuXi AppTec Co. Ltd., Class A | 17,300 | 103,778 |
WuXi AppTec Co. Ltd., Class H (a) | 28,500 | 128,281 |
XCMG Construction Machinery Co. Ltd., Class A | 74,400 | 71,878 |
Xiamen Faratronic Co. Ltd., Class A | 5,900 | 79,966 |
Xinjiang Daqo New Energy Co. Ltd., Class A * | 11,587 | 38,984 |
Xinyi Glass Holdings Ltd. | 129,000 | 137,850 |
Xinyi Solar Holdings Ltd. | 370,000 | 254,584 |
XPeng, Inc., Class A * | 92,400 | 374,604 |
Yadea Group Holdings Ltd. (a) | 112,000 | 215,451 |
Yangzijiang Shipbuilding Holdings Ltd. | 201,100 | 258,135 |
Yankuang Energy Group Co. Ltd., Class A | 25,850 | 82,207 |
Yankuang Energy Group Co. Ltd., Class H | 170,000 | 368,793 |
Yongan Futures Co. Ltd., Class A | 194,501 | 359,920 |
Yuexiu Property Co. Ltd. | 127,000 | 75,796 |
Yum China Holdings, Inc. | 30,592 | 1,116,914 |
Yunnan Energy New Material Co. Ltd., Class A | 6,100 | 34,909 |
Zhangzhou Pientzehuang Pharmaceutical Co. Ltd., Class A | 5,700 | 186,266 |
Zhaojin Mining Industry Co. Ltd., Class H | 110,000 | 177,147 |
Zhejiang Century Huatong Group Co. Ltd., Class A * | 46,900 | 30,259 |
Zhejiang China Commodities City Group Co. Ltd., Class A | 34,600 | 41,693 |
Zhejiang Dahua Technology Co. Ltd., Class A | 21,100 | 52,010 |
Zhejiang Huayou Cobalt Co. Ltd., Class A | 10,700 | 41,780 |
Zhejiang Leapmotor Technology Co. Ltd. * (a) | 52,000 | 178,674 |
Zhejiang Sanhua Intelligent Controls Co. Ltd., Class A | 22,700 | 68,408 |
Zhejiang Zheneng Electric Power Co. Ltd., Class A * | 84,500 | 72,575 |
ZhongAn Online P&C Insurance Co. Ltd., Class H * (a) | 53,300 | 89,646 |
Zhongsheng Group Holdings Ltd. | 57,500 | 104,868 |
Zhuzhou CRRC Times Electric Co. Ltd., Class H | 41,800 | 149,812 |
Zijin Mining Group Co. Ltd., Class A | 115,700 | 278,075 |
Zijin Mining Group Co. Ltd., Class H | 400,000 | 872,589 |
ZJLD Group, Inc. * (a) | 42,000 | 56,784 |
Zoomlion Heavy Industry Science and Technology Co. Ltd., Class H | 118,400 | 89,890 |
INVESTMENTS | SHARES | VALUE($) |
China — continued | ||
ZTE Corp., Class A | 27,800 | 109,056 |
ZTE Corp., Class H * | 59,400 | 128,028 |
ZTO Express Cayman, Inc. | 31,650 | 671,923 |
144,202,895 | ||
Colombia — 0.2% | ||
Banco de Bogota SA | 8,721 | 62,912 |
Bancolombia SA | 21,888 | 188,584 |
Bancolombia SA (Preference) | 35,967 | 294,300 |
Ecopetrol SA | 354,045 | 205,767 |
Grupo Energia Bogota SA ESP | 276,812 | 171,817 |
Grupo Nutresa SA | 8,336 | 76,497 |
Interconexion Electrica SA ESP | 35,283 | 162,789 |
1,162,666 | ||
Czech Republic — 0.1% | ||
CEZ A/S | 12,081 | 445,941 |
Komercni Banka A/S * | 5,326 | 196,235 |
642,176 | ||
Egypt — 0.0% ^ | ||
Commercial International Bank - Egypt (CIB) | 181,904 | 273,331 |
Greece — 0.4% | ||
Eurobank Ergasias Services and Holdings SA * | 186,367 | 399,770 |
Hellenic Telecommunications Organization SA | 15,561 | 236,397 |
JUMBO SA | 8,458 | 263,390 |
Motor Oil Hellas Corinth Refineries SA | 4,911 | 142,346 |
Mytilineos SA | 7,493 | 303,992 |
National Bank of Greece SA * | 40,753 | 328,796 |
OPAP SA | 13,854 | 230,794 |
Public Power Corp. SA * | 15,846 | 189,145 |
2,094,630 | ||
Hong Kong — 0.1% | ||
J&T Global Express Ltd. * (b) | 409,400 | 314,009 |
Nine Dragons Paper Holdings Ltd. * | 133,000 | 58,761 |
Orient Overseas International Ltd. | 11,000 | 160,435 |
Sino Biopharmaceutical Ltd. | 798,000 | 272,676 |
805,881 | ||
Hungary — 0.2% | ||
MOL Hungarian Oil & Gas plc | 27,214 | 223,335 |
OTP Bank Nyrt. | 16,940 | 839,642 |
Richter Gedeon Nyrt. | 10,343 | 263,385 |
1,326,362 | ||
68 | J.P. Morgan Exchange-Traded Funds | April 30, 2024 |
INVESTMENTS | SHARES | VALUE($) |
Common Stocks — continued | ||
India — 20.4% | ||
ABB India Ltd. | 4,161 | 325,819 |
ACC Ltd. | 6,669 | 201,801 |
Adani Energy Solutions Ltd. * | 27,401 | 350,082 |
Adani Enterprises Ltd. | 30,599 | 1,118,094 |
Adani Green Energy Ltd. * | 29,181 | 627,060 |
Adani Ports & Special Economic Zone Ltd. | 67,830 | 1,074,565 |
Adani Power Ltd. * | 72,198 | 528,116 |
Adani Total Gas Ltd. | 21,888 | 244,169 |
Alkem Laboratories Ltd. | 4,631 | 268,141 |
Ambuja Cements Ltd. | 54,861 | 406,712 |
Apollo Hospitals Enterprise Ltd. | 8,105 | 576,469 |
Ashok Leyland Ltd. | 114,399 | 263,452 |
Asian Paints Ltd. | 55,057 | 1,893,847 |
Astral Ltd. | 8,877 | 224,670 |
AU Small Finance Bank Ltd. (a) | 25,992 | 196,933 |
Aurobindo Pharma Ltd. | 24,394 | 336,664 |
Avenue Supermarts Ltd. * (a) | 13,303 | 734,060 |
Axis Bank Ltd. | 170,554 | 2,380,609 |
Bajaj Auto Ltd. | 5,081 | 542,437 |
Bajaj Finance Ltd. | 18,899 | 1,567,714 |
Bajaj Finserv Ltd. | 28,600 | 552,478 |
Balkrishna Industries Ltd. | 6,441 | 187,151 |
Bandhan Bank Ltd. (a) | 60,249 | 135,638 |
Bank of Baroda | 77,442 | 260,385 |
Berger Paints India Ltd. | 22,366 | 136,241 |
Bharat Electronics Ltd. | 267,643 | 748,430 |
Bharat Forge Ltd. | 20,349 | 309,634 |
Bharat Petroleum Corp. Ltd. | 74,804 | 544,317 |
Bharti Airtel Ltd. | 173,925 | 2,753,005 |
Biocon Ltd. | 35,896 | 128,253 |
Bosch Ltd. | 652 | 229,231 |
Britannia Industries Ltd. * | 9,956 | 569,037 |
Canara Bank | 27,166 | 201,930 |
CG Power & Industrial Solutions Ltd. | 47,959 | 317,557 |
Cholamandalam Investment and Finance Co. Ltd. | 31,808 | 454,033 |
Cipla Ltd. | 41,513 | 694,940 |
Coal India Ltd. | 168,740 | 917,430 |
Colgate-Palmolive India Ltd. | 9,979 | 337,706 |
Container Corp. of India Ltd. | 21,774 | 267,448 |
Cummins India Ltd. | 10,155 | 397,609 |
Dabur India Ltd. | 47,988 | 291,676 |
Divi's Laboratories Ltd. | 10,137 | 485,383 |
DLF Ltd. | 61,904 | 659,563 |
Dr Reddy's Laboratories Ltd. | 9,633 | 714,842 |
INVESTMENTS | SHARES | VALUE($) |
India — continued | ||
Eicher Motors Ltd. | 11,058 | 608,783 |
Embassy Office Parks, REIT | 48,279 | 208,123 |
FSN E-Commerce Ventures Ltd. * | 89,796 | 189,570 |
GAIL India Ltd. | 209,133 | 522,439 |
Godrej Consumer Products Ltd. | 30,039 | 438,403 |
Godrej Properties Ltd. * | 9,234 | 291,854 |
Grasim Industries Ltd. | 28,806 | 830,568 |
Havells India Ltd. | 16,541 | 329,208 |
HCL Technologies Ltd. | 79,767 | 1,301,398 |
HDFC Asset Management Co. Ltd. (a) | 7,702 | 359,059 |
HDFC Bank Ltd. | 419,911 | 7,625,833 |
HDFC Life Insurance Co. Ltd. (a) | 73,312 | 511,721 |
Hero MotoCorp Ltd. | 9,864 | 535,340 |
Hindalco Industries Ltd. | 112,117 | 862,266 |
Hindustan Aeronautics Ltd. (a) | 13,916 | 656,718 |
Hindustan Petroleum Corp. Ltd. | 49,578 | 294,083 |
Hindustan Unilever Ltd. | 66,929 | 1,787,481 |
ICICI Bank Ltd. | 388,358 | 5,351,166 |
ICICI Lombard General Insurance Co. Ltd. (a) | 17,780 | 363,387 |
ICICI Prudential Life Insurance Co. Ltd. (a) | 30,894 | 211,495 |
IDFC First Bank Ltd. * | 268,728 | 263,741 |
Indian Bank | 20,171 | 132,344 |
Indian Hotels Co. Ltd. | 67,597 | 465,805 |
Indian Oil Corp. Ltd. | 281,507 | 568,471 |
Indian Railway Catering & Tourism Corp. Ltd. | 26,358 | 327,295 |
Indian Railway Finance Corp. Ltd. (a) | 132,881 | 249,366 |
Indraprastha Gas Ltd. | 27,816 | 156,058 |
Indus Towers Ltd. * | 52,659 | 222,867 |
IndusInd Bank Ltd. | 43,079 | 781,041 |
Info Edge India Ltd. | 5,993 | 433,436 |
Infosys Ltd. | 306,347 | 5,172,523 |
InterGlobe Aviation Ltd. * (a) | 10,259 | 489,190 |
ITC Ltd. | 223,808 | 1,166,988 |
Jindal Steel & Power Ltd. | 35,310 | 392,154 |
Jio Financial Services Ltd. * | 257,451 | 1,159,340 |
JSW Energy Ltd. | 42,253 | 318,676 |
JSW Steel Ltd. | 96,049 | 1,011,967 |
Jubilant Foodworks Ltd. | 30,381 | 168,313 |
Kotak Mahindra Bank Ltd. | 81,721 | 1,588,280 |
L&T Technology Services Ltd. (a) | 2,109 | 116,699 |
Larsen & Toubro Ltd. | 50,355 | 2,164,556 |
Linde India Ltd. | 1,595 | 157,453 |
LTIMindtree Ltd. (a) | 6,903 | 387,713 |
Lupin Ltd. | 19,152 | 377,104 |
April 30, 2024 | J.P. Morgan Exchange-Traded Funds | 69 |
INVESTMENTS | SHARES | VALUE($) |
Common Stocks — continued | ||
India — continued | ||
Macrotech Developers Ltd. (a) | 19,152 | 283,689 |
Mahindra & Mahindra Ltd. | 75,710 | 1,952,856 |
Mankind Pharma Ltd. * | 5,601 | 158,339 |
Marico Ltd. | 48,337 | 299,967 |
Maruti Suzuki India Ltd. | 10,203 | 1,565,337 |
Max Healthcare Institute Ltd. | 49,991 | 502,357 |
Mphasis Ltd. | 6,273 | 173,253 |
MRF Ltd. | 229 | 364,514 |
Muthoot Finance Ltd. * | 8,529 | 175,438 |
Nestle India Ltd. | 26,810 | 804,769 |
NHPC Ltd. | 217,793 | 250,715 |
NMDC Ltd. | 90,858 | 275,724 |
NTPC Ltd. | 354,508 | 1,540,669 |
Oil & Natural Gas Corp. Ltd. | 299,345 | 1,010,516 |
One 97 Communications Ltd. * | 20,450 | 91,148 |
Oracle Financial Services Software Ltd. | 1,757 | 159,497 |
Page Industries Ltd. | 457 | 190,242 |
Patanjali Foods Ltd. | 7,404 | 133,714 |
Persistent Systems Ltd. | 7,924 | 318,767 |
Petronet LNG Ltd. | 59,622 | 221,305 |
PI Industries Ltd. | 6,170 | 269,660 |
Pidilite Industries Ltd. | 19,279 | 703,188 |
Polycab India Ltd. | 4,536 | 307,816 |
Power Finance Corp. Ltd. | 98,691 | 520,225 |
Power Grid Corp. of India Ltd. | 338,638 | 1,221,392 |
Procter & Gamble Hygiene & Health Care Ltd. | 761 | 147,485 |
Punjab National Bank | 164,892 | 278,092 |
REC Ltd. | 86,623 | 524,736 |
Reliance Industries Ltd. | 306,555 | 10,761,389 |
Samvardhana Motherson International Ltd. | 197,587 | 309,443 |
SBI Cards & Payment Services Ltd. | 22,572 | 196,570 |
SBI Life Insurance Co. Ltd. (a) | 30,660 | 527,487 |
Shree Cement Ltd. | 1,206 | 353,080 |
Shriram Finance Ltd. | 21,307 | 650,079 |
Siemens Ltd. | 6,667 | 465,814 |
Solar Industries India Ltd. | 1,915 | 205,352 |
Sona Blw Precision Forgings Ltd. (a) | 31,455 | 235,124 |
SRF Ltd. | 11,150 | 349,260 |
Star Health & Allied Insurance Co. Ltd. * | 15,531 | 106,353 |
State Bank of India | 133,449 | 1,318,203 |
Steel Authority of India Ltd. | 110,956 | 217,213 |
Sun Pharmaceutical Industries Ltd. | 87,939 | 1,579,839 |
Sundaram Finance Ltd. | 7,547 | 428,547 |
Supreme Industries Ltd. | 4,521 | 273,813 |
INVESTMENTS | SHARES | VALUE($) |
India — continued | ||
Tata Communications Ltd. | 8,758 | 181,265 |
Tata Consultancy Services Ltd. | 74,928 | 3,419,723 |
Tata Consumer Products Ltd. | 45,563 | 603,357 |
Tata Elxsi Ltd. | 2,736 | 230,985 |
Tata Motors Ltd. | 134,143 | 1,617,639 |
Tata Motors Ltd., Class A | 33,962 | 277,024 |
Tata Power Co. Ltd. (The) | 131,046 | 703,292 |
Tata Steel Ltd. | 619,119 | 1,220,397 |
Tech Mahindra Ltd. | 52,465 | 790,318 |
Titan Co. Ltd. | 30,254 | 1,298,118 |
Torrent Pharmaceuticals Ltd. | 7,752 | 244,881 |
Tube Investments of India Ltd. | 9,236 | 414,314 |
TVS Motor Co. Ltd. | 17,679 | 435,300 |
UltraTech Cement Ltd. | 8,861 | 1,056,802 |
Union Bank of India Ltd. | 110,837 | 204,305 |
United Spirits Ltd. | 23,655 | 332,771 |
UPL Ltd. | 40,859 | 247,974 |
Varun Beverages Ltd. | 35,899 | 635,047 |
Vedanta Ltd. | 88,749 | 423,569 |
Vodafone Idea Ltd. * | 749,740 | 117,849 |
Voltas Ltd. | 18,126 | 319,674 |
Wipro Ltd. | 106,833 | 588,343 |
Yes Bank Ltd. * | 1,513,687 | 473,429 |
Zomato Ltd. * | 438,758 | 1,012,622 |
Zydus Lifesciences Ltd. | 18,947 | 216,409 |
117,193,989 | ||
Indonesia — 1.9% | ||
Adaro Energy Indonesia Tbk. PT | 1,117,200 | 185,676 |
Adaro Minerals Indonesia Tbk. PT * | 502,100 | 41,533 |
Amman Mineral Internasional PT * | 925,800 | 551,277 |
Aneka Tambang Tbk. | 735,200 | 73,902 |
Astra International Tbk. PT | 1,613,100 | 509,023 |
Avia Avian Tbk. PT | 1,413,600 | 44,338 |
Bank Central Asia Tbk. PT | 4,151,800 | 2,496,413 |
Bank Mandiri Persero Tbk. PT | 2,749,300 | 1,162,066 |
Bank Negara Indonesia Persero Tbk. PT | 1,185,600 | 381,452 |
Bank Rakyat Indonesia Persero Tbk. PT | 4,838,500 | 1,464,631 |
Barito Pacific Tbk. PT | 2,171,700 | 135,715 |
Bayan Resources Tbk. PT | 637,900 | 743,432 |
Bukit Asam Tbk. PT | 308,100 | 57,413 |
Capital Financial Indonesia Tbk. PT * | 1,342,000 | 42,505 |
Charoen Pokphand Indonesia Tbk. PT | 570,000 | 173,524 |
Dayamitra Telekomunikasi PT | 1,410,500 | 49,446 |
Elang Mahkota Teknologi Tbk. PT | 3,163,500 | 74,846 |
70 | J.P. Morgan Exchange-Traded Funds | April 30, 2024 |
INVESTMENTS | SHARES | VALUE($) |
Common Stocks — continued | ||
Indonesia — continued | ||
GoTo Gojek Tokopedia Tbk. PT * | 8,294,000 | 31,901 |
Indah Kiat Pulp & Paper Tbk. PT | 205,200 | 118,104 |
Indocement Tunggal Prakarsa Tbk. PT | 148,200 | 70,492 |
Indofood CBP Sukses Makmur Tbk. PT | 171,000 | 114,300 |
Indofood Sukses Makmur Tbk. PT | 353,400 | 135,840 |
Indosat Tbk. PT | 98,800 | 66,839 |
Kalbe Farma Tbk. PT | 1,511,100 | 135,218 |
Merdeka Battery Materials Tbk. PT * | 2,228,500 | 75,380 |
Merdeka Copper Gold Tbk. PT * | 1,094,400 | 176,260 |
Mitra Keluarga Karyasehat Tbk. PT (a) | 433,200 | 77,262 |
Pantai Indah Kapuk Dua Tbk. PT * | 120,400 | 36,485 |
Petrindo Jaya Kreasi Tbk. PT * | 125,300 | 57,410 |
Sarana Menara Nusantara Tbk. PT | 1,722,800 | 85,119 |
Semen Indonesia Persero Tbk. PT | 262,200 | 75,211 |
Sumber Alfaria Trijaya Tbk. PT | 1,516,200 | 273,214 |
Telkom Indonesia Persero Tbk. PT | 3,700,700 | 717,412 |
Trimegah Bangun Persada Tbk. PT | 678,100 | 40,357 |
Unilever Indonesia Tbk. PT | 450,300 | 72,520 |
United Tractors Tbk. PT | 159,200 | 242,636 |
Vale Indonesia Tbk. PT | 157,800 | 41,245 |
10,830,397 | ||
Kuwait — 0.8% | ||
Agility Public Warehousing Co. KSC ‡ * | 292,344 | 11,853 |
Agility Public Warehousing Co. KSC | 146,172 | 149,514 |
Boubyan Bank KSCP | 126,096 | 240,564 |
Gulf Bank KSCP | 294,000 | 245,614 |
Kuwait Finance House KSCP | 771,175 | 1,798,980 |
Mabanee Co. KPSC | 52,688 | 134,796 |
Mobile Telecommunications Co. KSCP | 164,483 | 259,949 |
National Bank of Kuwait SAKP | 622,522 | 1,744,637 |
4,585,907 | ||
Luxembourg — 0.0% ^ | ||
Reinet Investments SCA | 9,950 | 233,836 |
Malaysia — 1.6% | ||
AMMB Holdings Bhd. | 171,000 | 150,313 |
Axiata Group Bhd. | 356,800 | 211,272 |
CELCOMDIGI Bhd. | 296,500 | 257,368 |
CIMB Group Holdings Bhd. | 606,100 | 837,648 |
Dialog Group Bhd. | 467,400 | 235,452 |
Gamuda Bhd. | 256,500 | 285,388 |
Genting Bhd. | 162,100 | 153,214 |
Genting Malaysia Bhd. | 307,800 | 169,790 |
Hong Leong Bank Bhd. | 55,000 | 222,114 |
INVESTMENTS | SHARES | VALUE($) |
Malaysia — continued | ||
IHH Healthcare Bhd. | 245,100 | 325,088 |
IOI Corp. Bhd. | 245,100 | 208,632 |
Kuala Lumpur Kepong Bhd. | 44,300 | 213,982 |
Malayan Banking Bhd. | 546,500 | 1,113,584 |
Malaysia Airports Holdings Bhd. | 85,700 | 179,362 |
Maxis Bhd. | 221,300 | 169,978 |
MISC Bhd. | 163,600 | 272,867 |
MR DIY Group M Bhd. (a) | 444,600 | 145,328 |
Petronas Chemicals Group Bhd. | 220,700 | 313,535 |
Petronas Dagangan Bhd. | 28,600 | 130,041 |
Petronas Gas Bhd. | 74,400 | 280,608 |
PPB Group Bhd. | 56,100 | 185,021 |
Press Metal Aluminium Holdings Bhd. | 307,800 | 346,336 |
Public Bank Bhd. | 1,136,500 | 980,240 |
RHB Bank Bhd. | 288,300 | 331,863 |
Sime Darby Bhd. | 246,600 | 144,370 |
Sime Darby Plantation Bhd. | 286,600 | 267,644 |
Telekom Malaysia Bhd. | 181,100 | 234,889 |
Tenaga Nasional Bhd. | 331,500 | 830,747 |
YTL Power International Bhd. | 201,100 | 192,784 |
9,389,458 | ||
Mexico — 2.1% | ||
Arca Continental SAB de CV | 36,538 | 355,467 |
Becle SAB de CV | 35,710 | 72,563 |
Cemex SAB de CV * | 1,083,174 | 856,764 |
Coca-Cola Femsa SAB de CV | 39,268 | 388,743 |
El Puerto de Liverpool SAB de CV, Class C1 | 14,784 | 118,207 |
Fibra Uno Administracion SA de CV, REIT | 228,513 | 327,081 |
Fomento Economico Mexicano SAB de CV | 119,730 | 1,408,181 |
Gruma SAB de CV, Class B | 13,485 | 264,501 |
Grupo Aeroportuario del Pacifico SAB de CV, Class B | 28,699 | 524,299 |
Grupo Aeroportuario del Sureste SAB de CV, Class B | 13,575 | 467,457 |
Grupo Bimbo SAB de CV | 100,859 | 421,670 |
Grupo Carso SAB de CV | 37,295 | 291,729 |
Grupo Elektra SAB de CV | 3,858 | 248,856 |
Grupo Financiero Banorte SAB de CV, Class O | 215,580 | 2,138,339 |
Grupo Financiero Inbursa SAB de CV, Class O * | 133,677 | 368,396 |
Grupo Mexico SAB de CV | 234,563 | 1,449,489 |
Industrias Penoles SAB de CV * | 14,047 | 200,954 |
Kimberly-Clark de Mexico SAB de CV, Class A | 112,005 | 233,808 |
Operadora De Sites Mexicanos SAB de CV | 86,024 | 97,118 |
Orbia Advance Corp. SAB de CV | 74,054 | 121,213 |
April 30, 2024 | J.P. Morgan Exchange-Traded Funds | 71 |
INVESTMENTS | SHARES | VALUE($) |
Common Stocks — continued | ||
Mexico — continued | ||
Promotora y Operadora de Infraestructura SAB de CV | 17,344 | 173,726 |
Wal-Mart de Mexico SAB de CV | 379,282 | 1,413,666 |
11,942,227 | ||
Peru — 0.2% | ||
Credicorp Ltd. | 5,089 | 842,789 |
Enel Distribucion Peru SAA | 40,568 | 38,041 |
InRetail Peru Corp. (a) | 2,523 | 80,736 |
961,566 | ||
Philippines — 0.7% | ||
Aboitiz Equity Ventures, Inc. | 178,820 | 130,009 |
ACEN Corp. | 698,900 | 50,208 |
Ayala Corp. | 19,950 | 212,386 |
Ayala Land, Inc. | 478,800 | 237,351 |
Bank of the Philippine Islands | 157,510 | 347,638 |
BDO Unibank, Inc. | 160,480 | 411,697 |
GT Capital Holdings, Inc. | 6,440 | 71,291 |
International Container Terminal Services, Inc. | 64,410 | 369,054 |
JG Summit Holdings, Inc. | 243,000 | 141,968 |
Jollibee Foods Corp. | 35,340 | 143,695 |
Manila Electric Co. | 22,230 | 141,996 |
Metropolitan Bank & Trust Co. | 255,670 | 309,360 |
Monde Nissin Corp. (a) | 575,700 | 106,162 |
PLDT, Inc. | 6,840 | 159,292 |
SM Investments Corp. | 36,540 | 600,898 |
SM Prime Holdings, Inc. | 917,700 | 444,009 |
Universal Robina Corp. | 69,540 | 124,229 |
4,001,243 | ||
Qatar — 0.9% | ||
Commercial Bank PSQC (The) | 254,277 | 290,034 |
Dukhan Bank | 191,749 | 202,808 |
Industries Qatar QSC | 221,639 | 743,595 |
Masraf Al Rayan QSC | 513,985 | 354,609 |
Mesaieed Petrochemical Holding Co. | 324,991 | 171,304 |
Ooredoo QPSC | 87,411 | 239,834 |
Qatar Electricity & Water Co. QSC | 44,396 | 186,245 |
Qatar Fuel QSC | 59,467 | 236,169 |
Qatar Gas Transport Co. Ltd. | 264,269 | 289,692 |
Qatar International Islamic Bank QSC | 92,682 | 256,078 |
Qatar Islamic Bank SAQ | 135,007 | 677,995 |
Qatar National Bank QPSC | 332,158 | 1,264,621 |
4,912,984 | ||
INVESTMENTS | SHARES | VALUE($) |
Saudi Arabia — 3.8% | ||
ACWA Power Co. | 10,039 | 1,067,461 |
Advanced Petrochemical Co. | 10,089 | 115,026 |
Al Rajhi Bank | 146,766 | 3,121,605 |
Alinma Bank | 91,143 | 808,487 |
Almarai Co. JSC | 19,836 | 300,401 |
Arabian Drilling Co. | 2,035 | 83,015 |
Arabian Internet & Communications Services Co. | 2,052 | 189,767 |
Bank Al-Jazira * | 39,900 | 172,009 |
Banque Saudi Fransi | 46,968 | 458,310 |
Bupa Arabia for Cooperative Insurance Co. | 5,548 | 356,790 |
Dr Sulaiman Al Habib Medical Services Group Co. | 6,867 | 567,817 |
Elm Co. | 1,804 | 439,119 |
Etihad Etisalat Co. | 29,982 | 415,684 |
Jarir Marketing Co. | 46,740 | 168,476 |
Mouwasat Medical Services Co. | 7,396 | 265,030 |
Nahdi Medical Co. | 3,135 | 115,415 |
Rabigh Refining & Petrochemical Co. * | 31,232 | 62,615 |
Riyad Bank | 116,136 | 856,321 |
SABIC Agri-Nutrients Co. | 18,180 | 560,224 |
Sahara International Petrochemical Co. | 28,557 | 261,005 |
Saudi Arabian Mining Co. * | 90,673 | 1,222,298 |
Saudi Arabian Oil Co. (a) | 326,110 | 2,613,026 |
Saudi Aramco Base Oil Co. | 3,984 | 160,500 |
Saudi Awwal Bank | 74,933 | 813,166 |
Saudi Basic Industries Corp. | 67,393 | 1,518,387 |
Saudi Electricity Co. | 62,928 | 311,767 |
Saudi Industrial Investment Group | 29,412 | 181,581 |
Saudi Investment Bank (The) | 50,225 | 225,607 |
Saudi Kayan Petrochemical Co. * | 58,425 | 145,961 |
Saudi National Bank (The) | 218,097 | 2,183,252 |
Saudi Tadawul Group Holding Co. | 3,819 | 269,540 |
Saudi Telecom Co. | 135,722 | 1,361,873 |
Savola Group (The) | 23,598 | 317,101 |
Yanbu National Petrochemical Co. | 21,888 | 226,202 |
21,934,838 | ||
South Africa — 2.5% | ||
Absa Group Ltd. | 65,541 | 506,533 |
African Rainbow Minerals Ltd. | 8,984 | 92,806 |
Anglo American Platinum Ltd. | 4,243 | 147,805 |
Aspen Pharmacare Holdings Ltd. | 28,730 | 342,341 |
Bid Corp. Ltd. | 24,996 | 573,170 |
Bidvest Group Ltd. (The) | 26,118 | 341,704 |
Capitec Bank Holdings Ltd. | 7,681 | 950,623 |
72 | J.P. Morgan Exchange-Traded Funds | April 30, 2024 |
INVESTMENTS | SHARES | VALUE($) |
Common Stocks — continued | ||
South Africa — continued | ||
Clicks Group Ltd. | 17,808 | 275,835 |
Discovery Ltd. | 38,712 | 247,313 |
Exxaro Resources Ltd. | 19,152 | 183,497 |
FirstRand Ltd. | 409,586 | 1,413,953 |
Gold Fields Ltd. | 66,951 | 1,083,111 |
Growthpoint Properties Ltd., REIT | 263,338 | 153,067 |
Impala Platinum Holdings Ltd. | 67,830 | 301,949 |
Kumba Iron Ore Ltd. | 4,332 | 106,686 |
Mr Price Group Ltd. | 18,721 | 173,968 |
MTN Group Ltd. | 135,334 | 651,315 |
Naspers Ltd., Class N | 13,861 | 2,656,665 |
Nedbank Group Ltd. | 32,697 | 397,568 |
Northam Platinum Holdings Ltd. | 27,704 | 184,186 |
Old Mutual Ltd. | 360,811 | 211,258 |
OUTsurance Group Ltd. | 63,282 | 136,407 |
Pepkor Holdings Ltd. (a) | 138,742 | 130,882 |
Remgro Ltd. | 40,623 | 265,284 |
Sanlam Ltd. | 132,459 | 479,155 |
Sasol Ltd. | 44,307 | 311,271 |
Shoprite Holdings Ltd. | 35,933 | 479,429 |
Sibanye Stillwater Ltd. | 211,942 | 241,900 |
Standard Bank Group Ltd. | 99,915 | 938,278 |
Vodacom Group Ltd. | 41,674 | 200,274 |
Woolworths Holdings Ltd. | 69,061 | 220,709 |
14,398,942 | ||
South Korea — 11.6% | ||
Amorepacific Corp. | 2,337 | 284,846 |
BGF retail Co. Ltd. | 756 | 71,272 |
BNK Financial Group, Inc. | 23,153 | 139,786 |
Celltrion, Inc. | 10,975 | 1,490,234 |
CJ CheilJedang Corp. | 645 | 156,340 |
CJ Corp. | 1,169 | 107,201 |
CosmoAM&T Co. Ltd. * | 1,809 | 195,369 |
Coway Co. Ltd. | 4,275 | 171,284 |
DB Insurance Co. Ltd. | 3,343 | 234,494 |
Doosan Bobcat, Inc. | 4,156 | 155,330 |
Doosan Enerbility Co. Ltd. * | 34,419 | 415,588 |
Ecopro BM Co. Ltd. * | 3,575 | 607,695 |
Ecopro Co. Ltd. * | 7,475 | 565,031 |
F&F Co. Ltd. | 1,425 | 67,455 |
GS Holdings Corp. | 5,577 | 180,314 |
Hana Financial Group, Inc. | 21,565 | 909,543 |
Hanjin Kal Corp. | 2,816 | 120,858 |
Hankook Tire & Technology Co. Ltd. | 5,571 | 236,390 |
INVESTMENTS | SHARES | VALUE($) |
South Korea — continued | ||
Hanmi Pharm Co. Ltd. | 513 | 116,863 |
Hanmi Semiconductor Co. Ltd. | 3,964 | 377,479 |
Hanwha Aerospace Co. Ltd. | 2,622 | 398,273 |
Hanwha Ocean Co. Ltd. * | 5,153 | 118,655 |
Hanwha Solutions Corp. | 8,778 | 159,761 |
HD Hyundai Co. Ltd. | 3,629 | 175,691 |
HD Hyundai Heavy Industries Co. Ltd. * | 1,596 | 157,845 |
HD Korea Shipbuilding & Offshore Engineering Co. Ltd. * | 3,225 | 304,493 |
HLB, Inc. * | 9,229 | 737,398 |
HMM Co. Ltd. | 20,041 | 228,811 |
Hotel Shilla Co. Ltd. | 2,624 | 112,407 |
HYBE Co. Ltd. | 1,409 | 204,384 |
Hyundai Engineering & Construction Co. Ltd. | 5,700 | 145,209 |
Hyundai Glovis Co. Ltd. | 1,392 | 182,227 |
Hyundai Marine & Fire Insurance Co. Ltd. | 4,528 | 102,215 |
Hyundai Mobis Co. Ltd. | 4,582 | 749,612 |
Hyundai Motor Co. | 10,784 | 1,939,782 |
Hyundai Motor Co. (Preference) | 2,600 | 297,096 |
Hyundai Motor Co. (Preference) | 1,642 | 186,843 |
Hyundai Rotem Co. Ltd. | 5,700 | 152,822 |
Hyundai Steel Co. | 6,504 | 151,029 |
Industrial Bank of Korea | 22,800 | 229,221 |
Kakao Corp. | 22,880 | 794,597 |
KakaoBank Corp. | 26,348 | 472,573 |
Kakaopay Corp. * | 1,938 | 48,840 |
Kangwon Land, Inc. | 9,791 | 108,192 |
KB Financial Group, Inc. | 28,520 | 1,546,837 |
Kia Corp. | 18,430 | 1,561,438 |
Korea Aerospace Industries Ltd. | 5,700 | 212,240 |
Korea Electric Power Corp. * | 19,199 | 293,097 |
Korea Investment Holdings Co. Ltd. | 3,245 | 156,842 |
Korea Zinc Co. Ltd. | 932 | 310,463 |
Korean Air Lines Co. Ltd. | 14,277 | 215,300 |
Krafton, Inc. * | 2,284 | 393,092 |
KT&G Corp. | 7,725 | 497,767 |
Kum Yang Co. Ltd. * | 2,290 | 153,654 |
Kumho Petrochemical Co. Ltd. | 1,368 | 136,065 |
L&F Co. Ltd. * | 1,931 | 225,888 |
LG Chem Ltd. | 3,521 | 1,011,754 |
LG Chem Ltd. (Preference) | 570 | 109,395 |
LG Corp. | 8,281 | 472,497 |
LG Display Co. Ltd. * | 21,926 | 165,959 |
LG Electronics, Inc. | 8,073 | 537,679 |
LG Energy Solution Ltd. * | 3,185 | 886,128 |
April 30, 2024 | J.P. Morgan Exchange-Traded Funds | 73 |
INVESTMENTS | SHARES | VALUE($) |
Common Stocks — continued | ||
South Korea — continued | ||
LG H&H Co. Ltd. | 741 | 223,269 |
LG Innotek Co. Ltd. | 1,083 | 172,146 |
LG Uplus Corp. | 15,771 | 112,014 |
Lotte Chemical Corp. | 1,482 | 114,525 |
Meritz Financial Group, Inc. | 7,163 | 409,562 |
Mirae Asset Securities Co. Ltd. | 18,065 | 98,456 |
NAVER Corp. | 10,794 | 1,423,724 |
NCSoft Corp. | 1,254 | 158,443 |
Netmarble Corp. * (a) | 2,052 | 82,161 |
Orion Corp. | 1,995 | 133,513 |
Pan Ocean Co. Ltd. | 18,926 | 55,952 |
Pearl Abyss Corp. * | 2,964 | 68,108 |
Posco DX Co. Ltd. | 3,917 | 113,831 |
POSCO Future M Co. Ltd. | 2,379 | 478,602 |
POSCO Holdings, Inc. | 5,176 | 1,494,212 |
Posco International Corp. | 2,812 | 92,744 |
Samsung Biologics Co. Ltd. * (a) | 1,368 | 768,895 |
Samsung C&T Corp. | 6,536 | 704,798 |
Samsung E&A Co. Ltd. * | 12,186 | 231,038 |
Samsung Electro-Mechanics Co. Ltd. | 4,120 | 459,559 |
Samsung Electronics Co. Ltd. | 378,933 | 21,063,612 |
Samsung Electronics Co. Ltd. (Preference) | 61,522 | 2,872,531 |
Samsung Fire & Marine Insurance Co. Ltd. | 2,341 | 523,976 |
Samsung Heavy Industries Co. Ltd. * | 54,037 | 366,125 |
Samsung Life Insurance Co. Ltd. | 7,247 | 456,655 |
Samsung SDI Co. Ltd. | 3,890 | 1,203,835 |
Samsung SDS Co. Ltd. | 2,955 | 339,468 |
Samsung Securities Co. Ltd. | 4,986 | 136,397 |
Shinhan Financial Group Co. Ltd. | 36,537 | 1,227,545 |
SK Biopharmaceuticals Co. Ltd. * | 2,223 | 139,849 |
SK Bioscience Co. Ltd. * | 1,939 | 81,667 |
SK Hynix, Inc. | 40,602 | 5,010,518 |
SK IE Technology Co. Ltd. * (a) | 2,223 | 94,088 |
SK Innovation Co. Ltd. * | 4,484 | 355,722 |
SK Square Co. Ltd. * | 6,532 | 358,884 |
SK Telecom Co. Ltd. | 8,550 | 316,194 |
SK, Inc. | 2,752 | 327,935 |
SKC Co. Ltd. * | 1,596 | 126,144 |
S-Oil Corp. | 3,306 | 172,605 |
Woori Financial Group, Inc. | 47,726 | 489,083 |
Yuhan Corp. | 4,369 | 227,264 |
66,933,092 | ||
Taiwan — 16.8% | ||
Accton Technology Corp. | 40,000 | 560,376 |
INVESTMENTS | SHARES | VALUE($) |
Taiwan — continued | ||
Acer, Inc. | 239,000 | 328,853 |
Advanced Energy Solution Holding Co. Ltd. | 4,000 | 76,843 |
Advantech Co. Ltd. | 38,196 | 444,274 |
Alchip Technologies Ltd. | 6,000 | 565,890 |
ASE Technology Holding Co. Ltd. | 250,000 | 1,124,649 |
Asia Cement Corp. | 192,000 | 257,512 |
Asustek Computer, Inc. | 53,000 | 694,976 |
AUO Corp. | 531,000 | 296,914 |
Catcher Technology Co. Ltd. | 52,000 | 347,343 |
Cathay Financial Holding Co. Ltd. | 740,000 | 1,144,302 |
Chailease Holding Co. Ltd. | 123,200 | 649,789 |
Chang Hwa Commercial Bank Ltd. | 459,450 | 256,911 |
Cheng Shin Rubber Industry Co. Ltd. | 174,000 | 251,209 |
Chicony Electronics Co. Ltd. | 52,000 | 321,912 |
China Airlines Ltd. | 230,000 | 147,292 |
China Development Financial Holding Corp. * | 1,152,000 | 481,587 |
China Steel Corp. | 967,000 | 736,682 |
Chunghwa Telecom Co. Ltd. | 238,000 | 904,599 |
Compal Electronics, Inc. | 313,000 | 341,408 |
CTBC Financial Holding Co. Ltd. | 1,458,000 | 1,521,743 |
Delta Electronics, Inc. | 153,000 | 1,498,374 |
E Ink Holdings, Inc. | 66,000 | 421,953 |
E.Sun Financial Holding Co. Ltd. | 1,123,149 | 943,785 |
Eclat Textile Co. Ltd. | 16,000 | 251,746 |
Elite Material Co. Ltd. | 23,000 | 286,370 |
eMemory Technology, Inc. | 5,000 | 336,063 |
Eva Airways Corp. | 206,000 | 223,971 |
Evergreen Marine Corp. Taiwan Ltd. | 78,000 | 453,934 |
Far Eastern New Century Corp. | 259,000 | 258,363 |
Far EasTone Telecommunications Co. Ltd. | 133,000 | 329,895 |
Feng TAY Enterprise Co. Ltd. | 54,360 | 270,285 |
First Financial Holding Co. Ltd. | 808,260 | 677,583 |
Formosa Chemicals & Fibre Corp. | 309,000 | 525,189 |
Formosa Plastics Corp. | 346,000 | 726,924 |
Foxconn Technology Co. Ltd. | 90,000 | 169,630 |
Fubon Financial Holding Co. Ltd. | 621,000 | 1,313,737 |
Giant Manufacturing Co. Ltd. | 27,000 | 180,632 |
Gigabyte Technology Co. Ltd. | 44,000 | 396,810 |
Global Unichip Corp. | 7,000 | 290,721 |
Globalwafers Co. Ltd. | 17,000 | 270,116 |
Highwealth Construction Corp. | 125,600 | 170,762 |
Hiwin Technologies Corp. | 24,000 | 169,715 |
Hon Hai Precision Industry Co. Ltd. | 906,000 | 4,312,877 |
Hotai Motor Co. Ltd. | 35,520 | 674,037 |
74 | J.P. Morgan Exchange-Traded Funds | April 30, 2024 |
INVESTMENTS | SHARES | VALUE($) |
Common Stocks — continued | ||
Taiwan — continued | ||
Hua Nan Financial Holdings Co. Ltd. | 745,000 | 539,695 |
Innolux Corp. | 685,550 | 298,146 |
Inventec Corp. | 239,000 | 383,408 |
Largan Precision Co. Ltd. | 7,000 | 466,606 |
Lite-On Technology Corp. | 170,000 | 514,553 |
MediaTek, Inc. | 116,000 | 3,497,537 |
Mega Financial Holding Co. Ltd. | 837,360 | 1,026,111 |
Micro-Star International Co. Ltd. | 58,000 | 282,212 |
momo.com, Inc. | 8,500 | 114,911 |
Nan Ya Plastics Corp. | 399,000 | 692,825 |
Nan Ya Printed Circuit Board Corp. | 20,000 | 113,879 |
Nanya Technology Corp. | 93,000 | 187,715 |
Nien Made Enterprise Co. Ltd. | 16,000 | 186,982 |
Novatek Microelectronics Corp. | 45,000 | 850,285 |
Oneness Biotech Co. Ltd. | 29,163 | 141,301 |
Pegatron Corp. | 158,000 | 471,223 |
PharmaEssentia Corp. * | 26,000 | 234,353 |
Phison Electronics Corp. | 14,000 | 298,847 |
Polaris Group * | 44,000 | 91,858 |
Pou Chen Corp. | 202,000 | 223,588 |
Powerchip Semiconductor Manufacturing Corp. * | 238,000 | 166,285 |
Powertech Technology, Inc. | 53,000 | 282,245 |
President Chain Store Corp. | 43,000 | 361,614 |
Quanta Computer, Inc. | 214,000 | 1,679,524 |
Radiant Opto-Electronics Corp. | 35,000 | 213,392 |
Realtek Semiconductor Corp. | 37,000 | 583,681 |
Ruentex Development Co. Ltd. | 157,900 | 185,783 |
Ruentex Industries Ltd. | 64,000 | 118,027 |
Shanghai Commercial & Savings Bank Ltd. (The) | 361,000 | 514,141 |
Shin Kong Financial Holding Co. Ltd. * | 1,038,000 | 274,300 |
Simplo Technology Co. Ltd. | 15,000 | 200,312 |
Sino-American Silicon Products, Inc. | 44,000 | 261,965 |
SinoPac Financial Holdings Co. Ltd. | 925,740 | 622,806 |
Synnex Technology International Corp. | 102,000 | 249,314 |
Taishin Financial Holding Co. Ltd. | 891,750 | 490,971 |
Taiwan Business Bank | 493,728 | 256,338 |
Taiwan Cement Corp. | 486,000 | 477,713 |
Taiwan Cooperative Financial Holding Co. Ltd. | 746,100 | 599,587 |
Taiwan Mobile Co. Ltd. | 103,000 | 328,736 |
Taiwan Semiconductor Manufacturing Co. Ltd. | 1,811,000 | 43,362,165 |
Tatung Co. Ltd. * | 132,000 | 264,010 |
Teco Electric and Machinery Co. Ltd. | 125,000 | 212,374 |
Tripod Technology Corp. | 39,000 | 233,951 |
Unimicron Technology Corp. | 99,000 | 547,473 |
INVESTMENTS | SHARES | VALUE($) |
Taiwan — continued | ||
Uni-President Enterprises Corp. | 364,000 | 853,801 |
United Microelectronics Corp. | 894,000 | 1,373,562 |
Vanguard International Semiconductor Corp. | 69,000 | 180,814 |
Voltronic Power Technology Corp. | 6,000 | 283,903 |
Walsin Lihwa Corp. | 217,000 | 245,115 |
Wan Hai Lines Ltd. | 115,000 | 178,626 |
Win Semiconductors Corp. | 30,000 | 133,334 |
Winbond Electronics Corp. | 214,000 | 169,715 |
Wistron Corp. | 212,000 | 725,901 |
Wiwynn Corp. | 8,000 | 569,113 |
WPG Holdings Ltd. | 128,000 | 345,706 |
Yageo Corp. | 30,000 | 572,235 |
Yang Ming Marine Transport Corp. | 136,000 | 217,435 |
Yuanta Financial Holding Co. Ltd. | 916,515 | 859,725 |
Zhen Ding Technology Holding Ltd. | 57,000 | 201,756 |
96,622,019 | ||
Thailand — 1.4% | ||
Advanced Info Service PCL, NVDR | 80,700 | 428,763 |
Airports of Thailand PCL, NVDR | 320,300 | 562,355 |
B Grimm Power PCL, NVDR | 98,000 | 67,606 |
Bangkok Bank PCL, NVDR | 45,100 | 166,392 |
Bangkok Dusit Medical Services PCL, NVDR | 356,400 | 278,306 |
Bangkok Expressway & Metro PCL, NVDR | 598,500 | 133,606 |
Berli Jucker PCL, NVDR | 269,600 | 177,774 |
BTS Group Holdings PCL, NVDR | 541,700 | 92,391 |
Bumrungrad Hospital PCL, NVDR | 30,600 | 201,968 |
Carabao Group PCL, NVDR | 36,000 | 66,116 |
Central Pattana PCL, NVDR | 106,100 | 180,940 |
Central Retail Corp. PCL, NVDR | 239,400 | 221,435 |
CP ALL PCL, NVDR | 329,500 | 509,247 |
CP Axtra PCL, NVDR | 121,600 | 106,070 |
Delta Electronics Thailand PCL, NVDR | 337,600 | 629,679 |
Energy Absolute PCL, NVDR | 142,500 | 117,105 |
Global Power Synergy PCL, NVDR | 52,400 | 68,698 |
Gulf Energy Development PCL, NVDR | 408,000 | 440,720 |
Home Product Center PCL, NVDR | 313,500 | 87,510 |
Indorama Ventures PCL, NVDR | 227,600 | 146,076 |
Intouch Holdings PCL, NVDR | 90,800 | 163,544 |
Kasikornbank PCL, NVDR | 86,800 | 304,694 |
Krung Thai Bank PCL, NVDR | 273,600 | 123,739 |
Krungthai Card PCL, NVDR | 67,700 | 78,058 |
Land & Houses PCL, NVDR | 390,400 | 78,359 |
Minor International PCL, NVDR | 205,400 | 182,104 |
Osotspa PCL, NVDR | 119,700 | 69,079 |
April 30, 2024 | J.P. Morgan Exchange-Traded Funds | 75 |
INVESTMENTS | SHARES | VALUE($) |
Common Stocks — continued | ||
Thailand — continued | ||
PTT Exploration & Production PCL, NVDR | 107,600 | 450,123 |
PTT Global Chemical PCL, NVDR | 131,100 | 129,307 |
PTT Oil & Retail Business PCL, NVDR | 239,400 | 120,203 |
PTT PCL, NVDR | 640,600 | 580,559 |
SCB X PCL, NVDR | 68,400 | 195,876 |
SCG Packaging PCL, NVDR | 94,800 | 82,529 |
Siam Cement PCL (The), NVDR | 22,800 | 152,745 |
Siam Global House PCL, NVDR | 179,504 | 78,057 |
Thai Life Insurance PCL, NVDR | 237,500 | 58,624 |
Thai Oil PCL, NVDR | 66,900 | 97,477 |
Tisco Financial Group PCL, NVDR | 29,300 | 76,795 |
TMBThanachart Bank PCL, NVDR | 2,966,300 | 144,543 |
7,849,172 | ||
Turkey — 0.8% | ||
Akbank TAS | 243,960 | 449,031 |
Aselsan Elektronik Sanayi ve Ticaret A/S | 94,392 | 177,060 |
BIM Birlesik Magazalar A/S | 33,908 | 405,097 |
Borusan Birlesik Boru Fabrikalari Sanayi ve Ticaret A/S * | 2,809 | 52,171 |
Coca-Cola Icecek A/S | 5,858 | 131,137 |
Enka Insaat ve Sanayi A/S | 88,229 | 104,612 |
Eregli Demir ve Celik Fabrikalari TAS | 137,012 | 182,168 |
Ford Otomotiv Sanayi A/S | 5,529 | 190,183 |
Gubre Fabrikalari TAS * | 5,993 | 28,516 |
Haci Omer Sabanci Holding A/S * | 101,800 | 290,601 |
Hektas Ticaret TAS * | 189,154 | 88,666 |
KOC Holding A/S | 50,606 | 353,299 |
Petkim Petrokimya Holding A/S * | 97,706 | 62,510 |
Sasa Polyester Sanayi A/S * | 37,435 | 47,715 |
Tofas Turk Otomobil Fabrikasi A/S | 9,918 | 84,296 |
Turk Hava Yollari AO * | 54,023 | 543,796 |
Turkcell Iletisim Hizmetleri A/S | 94,449 | 235,639 |
Turkiye Garanti Bankasi A/S | 46,264 | 117,780 |
Turkiye Is Bankasi A/S, Class C | 671,615 | 284,313 |
Turkiye Petrol Rafinerileri A/S | 68,095 | 411,687 |
Turkiye Sise ve Cam Fabrikalari A/S | 104,709 | 162,641 |
Yapi ve Kredi Bankasi A/S | 245,037 | 245,374 |
4,648,292 | ||
United Arab Emirates — 2.4% | ||
Abu Dhabi Commercial Bank PJSC | 218,153 | 495,357 |
Abu Dhabi Islamic Bank PJSC | 115,539 | 351,062 |
Abu Dhabi National Oil Co. for Distribution PJSC | 228,684 | 217,296 |
ADNOC Drilling Co. PJSC | 132,704 | 139,464 |
ADNOC Logistics & Services | 105,098 | 114,458 |
INVESTMENTS | SHARES | VALUE($) |
United Arab Emirates — continued | ||
Aldar Properties PJSC | 287,622 | 427,569 |
Alpha Dhabi Holding PJSC * | 104,671 | 402,395 |
Americana Restaurants International plc * | 219,845 | 199,320 |
Dubai Electricity & Water Authority PJSC | 673,929 | 431,194 |
Dubai Islamic Bank PJSC | 224,734 | 340,200 |
Emaar Development PJSC * | 62,803 | 142,948 |
Emaar Properties PJSC * | 474,928 | 1,061,602 |
Emirates NBD Bank PJSC | 183,994 | 851,615 |
Emirates Telecommunications Group Co. PJSC | 260,489 | 1,205,672 |
Fertiglobe plc | 91,438 | 69,300 |
First Abu Dhabi Bank PJSC | 330,707 | 1,123,696 |
International Holding Co. PJSC * | 55,269 | 6,011,589 |
Multiply Group PJSC * | 251,209 | 157,163 |
Q Holding PJSC * | 163,533 | 131,347 |
Salik Co. PJSC | 143,925 | 135,582 |
14,008,829 | ||
United States — 0.1% | ||
JBS SA | 50,489 | 228,011 |
Parade Technologies Ltd. | 7,000 | 158,918 |
386,929 | ||
Total Common Stocks (Cost $541,250,148) | 570,498,873 | |
Short-Term Investments — 1.3% | ||
Investment Companies — 1.2% | ||
JPMorgan U.S. Government Money Market Fund Class IM Shares, 5.25% (c) (d)(Cost $6,819,830) | 6,819,830 | 6,819,830 |
Investment of Cash Collateral from Securities Loaned — 0.1% | ||
JPMorgan U.S. Government Money Market Fund Class IM Shares, 5.25% (c) (d)(Cost $526,874) | 526,874 | 526,874 |
Total Short-Term Investments (Cost $7,346,704) | 7,346,704 | |
Total Investments — 100.5% (Cost $548,596,852) | 577,845,577 | |
Liabilities in Excess of Other Assets — (0.5)% | (2,906,225 ) | |
NET ASSETS — 100.0% | 574,939,352 | |
Percentages indicated are based on net assets. |
Abbreviations | |
ADR | American Depositary Receipt |
JSC | Joint Stock Company |
76 | J.P. Morgan Exchange-Traded Funds | April 30, 2024 |
NVDR | Non-Voting Depositary Receipt |
PJSC | Public Joint Stock Company |
Preference | A special type of equity investment that shares in the earnings of the company, has limited voting rights, and may have a dividend preference. Preference shares may also have liquidation preference. |
PT | Limited liability company |
REIT | Real Estate Investment Trust |
SCA | Limited partnership with share capital |
^ | Amount rounds to less than 0.1% of net assets. | |
‡ | Value determined using significant unobservable inputs. | |
* | Non-income producing security. | |
(a) | Security exempt from registration pursuant to Regulation S under the Securities Act of 1933, as amended. Regulation S applies to securities offerings that are made outside of the United States and do not involve direct selling efforts in the United States and as such may have restrictions on resale. | |
(b) | The security or a portion of this security is on loan at April 30, 2024. The total value of securities on loan at April 30, 2024 is $152,773. | |
(c) | Investment in an affiliated fund, which is registered under the Investment Company Act of 1940, as amended, and is advised by J.P. Morgan Investment Management Inc. | |
(d) | The rate shown is the current yield as of April 30, 2024. | |
INDUSTRY April 30, 2024 | PERCENT OF TOTAL INVESTMENTS |
Banks | 17.1 % |
Semiconductors & Semiconductor Equipment | 10.7 |
Oil, Gas & Consumable Fuels | 5.9 |
Technology Hardware, Storage & Peripherals | 5.6 |
Interactive Media & Services | 4.6 |
Broadline Retail | 4.3 |
Metals & Mining | 3.6 |
Automobiles | 3.0 |
Electronic Equipment, Instruments & Components | 2.5 |
Chemicals | 2.5 |
Industrial Conglomerates | 2.4 |
Insurance | 2.3 |
IT Services | 2.3 |
Hotels, Restaurants & Leisure | 2.2 |
Food Products | 1.6 |
Beverages | 1.6 |
Pharmaceuticals | 1.4 |
Independent Power and Renewable Electricity Producers | 1.4 |
Real Estate Management & Development | 1.3 |
Electrical Equipment | 1.3 |
Wireless Telecommunication Services | 1.3 |
Electric Utilities | 1.3 |
Consumer Staples Distribution & Retail | 1.2 |
Financial Services | 1.2 |
Diversified Telecommunication Services | 1.1 |
Others (each less than 1.0%) | 15.0 |
Short-Term Investments | 1.3 |
DESCRIPTION | NUMBER OF CONTRACTS | EXPIRATION DATE | TRADING CURRENCY | NOTIONAL AMOUNT ($) | VALUE AND UNREALIZED APPRECIATION (DEPRECIATION) ($) |
Long Contracts | |||||
MSCI Emerging Markets E-Mini Index | 85 | 06/21/2024 | USD | 4,428,075 | (4,686 ) |
Abbreviations | |
MSCI | Morgan Stanley Capital International |
USD | United States Dollar |
April 30, 2024 | J.P. Morgan Exchange-Traded Funds | 77 |
INVESTMENTS | SHARES | VALUE($) |
Common Stocks — 98.6% | ||
Australia — 1.2% | ||
Glencore plc | 6,617,427 | 38,503,925 |
Rio Tinto plc | 766,215 | 51,842,703 |
90,346,628 | ||
Austria — 0.5% | ||
ANDRITZ AG | 48,580 | 2,651,667 |
BAWAG Group AG (a) | 59,013 | 3,523,713 |
Erste Group Bank AG | 253,961 | 11,843,495 |
EVN AG | 25,567 | 785,767 |
Mondi plc | 316,520 | 6,007,760 |
OMV AG | 102,274 | 4,853,042 |
Raiffeisen Bank International AG | 111,626 | 2,061,604 |
Strabag SE | 8,902 | 379,059 |
Telekom Austria AG | 98,095 | 842,730 |
Verbund AG | 47,363 | 3,618,113 |
Vienna Insurance Group AG Wiener Versicherung Gruppe | 25,670 | 799,122 |
voestalpine AG | 75,486 | 2,015,860 |
39,381,932 | ||
Belgium — 1.3% | ||
Ackermans & van Haaren NV | 15,870 | 2,727,851 |
Ageas SA | 109,577 | 5,029,753 |
Anheuser-Busch InBev SA | 652,760 | 39,017,940 |
Azelis Group NV | 67,785 | 1,628,733 |
Colruyt Group NV | 29,688 | 1,375,677 |
D'ieteren Group | 14,539 | 3,136,389 |
Elia Group SA/NV | 20,214 | 1,946,235 |
Groupe Bruxelles Lambert NV | 61,020 | 4,529,512 |
KBC Group NV | 194,870 | 14,475,755 |
Sofina SA (b) | 10,131 | 2,371,478 |
Solvay SA | 50,980 | 1,646,833 |
UCB SA | 86,250 | 11,437,628 |
Umicore SA | 134,285 | 2,974,443 |
Warehouses De Pauw CVA, REIT | 123,833 | 3,274,683 |
95,572,910 | ||
Brazil — 0.0% ^ | ||
Yara International ASA | 116,534 | 3,321,819 |
Chile — 0.1% | ||
Antofagasta plc | 248,129 | 6,806,619 |
China — 0.5% | ||
Prosus NV | 1,031,737 | 34,521,869 |
Denmark — 5.8% | ||
AP Moller - Maersk A/S, Class A | 1,913 | 2,712,994 |
INVESTMENTS | SHARES | VALUE($) |
Denmark — continued | ||
AP Moller - Maersk A/S, Class B | 2,593 | 3,757,437 |
Carlsberg A/S, Class B | 66,373 | 8,928,023 |
Coloplast A/S, Class B | 96,026 | 11,577,391 |
Danske Bank A/S | 484,674 | 13,952,315 |
Demant A/S * | 65,355 | 3,120,832 |
DSV A/S | 122,922 | 17,463,456 |
Genmab A/S * | 46,835 | 13,002,807 |
Novo Nordisk A/S, Class B | 2,427,670 | 311,330,010 |
Novonesis (Novozymes) B | 272,939 | 15,114,476 |
Orsted A/S * (a) | 135,045 | 7,421,852 |
Pandora A/S | 59,075 | 8,991,212 |
Svitzer A/S * | 9,012 | 302,833 |
Tryg A/S | 226,523 | 4,483,398 |
Vestas Wind Systems A/S * | 719,404 | 19,279,043 |
441,438,079 | ||
Finland — 1.6% | ||
Elisa OYJ | 102,932 | 4,641,137 |
Fortum OYJ | 313,333 | 4,128,914 |
Huhtamaki OYJ | 66,790 | 2,563,167 |
Kesko OYJ, Class A | 65,723 | 1,152,652 |
Kesko OYJ, Class B | 193,613 | 3,305,433 |
Kone OYJ, Class B | 254,261 | 12,394,455 |
Metso OYJ | 503,649 | 5,709,918 |
Neste OYJ | 306,822 | 6,955,382 |
Nokia OYJ | 3,730,612 | 13,562,087 |
Nordea Bank Abp | 2,392,165 | 27,807,077 |
Orion OYJ, Class A | 19,445 | 749,137 |
Orion OYJ, Class B | 76,587 | 2,925,247 |
Sampo OYJ, Class A | 335,218 | 13,604,292 |
Stora Enso OYJ, Class R | 423,313 | 5,638,797 |
UPM-Kymmene OYJ | 382,427 | 13,402,203 |
Wartsila OYJ Abp | 347,185 | 6,404,695 |
124,944,593 | ||
France — 15.0% | ||
Aeroports de Paris SA | 22,919 | 2,911,052 |
Air Liquide SA | 374,578 | 73,259,447 |
Airbus SE | 419,923 | 69,101,590 |
Amundi SA (a) | 44,619 | 3,112,817 |
AXA SA (b) | 1,264,094 | 43,676,454 |
BioMerieux | 30,747 | 3,268,528 |
BNP Paribas SA | 753,696 | 54,237,361 |
Bollore SE | 556,881 | 3,614,574 |
Bouygues SA (b) | 147,791 | 5,446,878 |
78 | J.P. Morgan Exchange-Traded Funds | April 30, 2024 |
INVESTMENTS | SHARES | VALUE($) |
Common Stocks — continued | ||
France — continued | ||
Bureau Veritas SA | 210,119 | 6,128,252 |
Capgemini SE | 113,131 | 23,777,995 |
Carrefour SA | 400,283 | 6,734,051 |
Cie de Saint-Gobain SA | 328,942 | 26,013,592 |
Cie Generale des Etablissements Michelin SCA | 491,136 | 18,868,782 |
Credit Agricole SA | 876,889 | 13,568,309 |
Danone SA (b) | 460,257 | 28,806,253 |
Dassault Aviation SA | 14,095 | 3,017,017 |
Dassault Systemes SE | 503,496 | 19,763,187 |
Edenred SE | 178,496 | 8,469,969 |
Eiffage SA | 54,224 | 5,785,616 |
Engie SA * (b) | 1,323,077 | 22,969,432 |
EssilorLuxottica SA (b) | 220,352 | 46,986,022 |
Getlink SE | 226,505 | 3,855,952 |
Hermes International SCA | 24,331 | 58,248,164 |
Ipsen SA | 25,259 | 3,072,413 |
Kering SA | 50,454 | 17,682,570 |
Legrand SA | 187,165 | 19,234,309 |
L'Oreal SA | 173,871 | 81,519,965 |
LVMH Moet Hennessy Louis Vuitton SE | 184,459 | 151,521,325 |
Orange SA | 1,260,636 | 14,031,237 |
Pernod Ricard SA | 143,160 | 21,651,815 |
Publicis Groupe SA | 162,920 | 17,977,696 |
Safran SA | 245,497 | 53,231,610 |
Sartorius Stedim Biotech | 18,418 | 3,966,630 |
Societe Generale SA | 521,949 | 14,063,941 |
Sodexo SA | 59,828 | 5,209,431 |
Thales SA | 66,630 | 11,198,331 |
TotalEnergies SE | 1,567,017 | 113,763,431 |
Veolia Environnement SA (b) | 439,745 | 13,670,654 |
Vinci SA | 338,128 | 39,620,506 |
Vivendi SE (b) | 476,849 | 4,851,313 |
1,137,888,471 | ||
Germany — 12.3% | ||
adidas AG | 113,819 | 27,428,453 |
Allianz SE (Registered) | 280,887 | 79,711,485 |
BASF SE | 639,994 | 33,533,475 |
Bayer AG (Registered) | 657,260 | 19,172,715 |
Bayerische Motoren Werke AG | 215,402 | 23,467,905 |
Bayerische Motoren Werke AG (Preference) | 43,629 | 4,482,952 |
Beiersdorf AG | 70,099 | 10,536,132 |
Brenntag SE | 91,354 | 7,290,361 |
Carl Zeiss Meditec AG | 26,231 | 2,767,707 |
INVESTMENTS | SHARES | VALUE($) |
Germany — continued | ||
Commerzbank AG | 722,126 | 10,732,338 |
Continental AG | 77,445 | 5,019,307 |
Covestro AG * (a) | 126,135 | 6,317,389 |
Daimler Truck Holding AG | 351,522 | 15,852,309 |
Deutsche Bank AG (Registered) | 1,329,852 | 21,241,072 |
Deutsche Boerse AG | 131,752 | 25,400,730 |
Deutsche Lufthansa AG (Registered) * | 429,025 | 3,070,374 |
Deutsche Post AG | 673,221 | 28,187,718 |
Deutsche Telekom AG (Registered) | 2,478,187 | 56,764,276 |
Deutsche Wohnen SE | 35,294 | 665,836 |
Dr Ing hc F Porsche AG (Preference) (a) | 79,042 | 7,036,829 |
E.ON SE | 1,587,290 | 21,018,849 |
Evonik Industries AG | 144,019 | 3,001,452 |
Fresenius SE & Co. KGaA | 294,829 | 8,797,808 |
Hannover Rueck SE | 43,065 | 10,682,015 |
Heidelberg Materials AG | 93,722 | 9,431,771 |
Henkel AG & Co. KGaA | 69,075 | 4,967,079 |
Henkel AG & Co. KGaA (Preference) | 118,464 | 9,410,988 |
Infineon Technologies AG | 934,870 | 32,442,817 |
Mercedes-Benz Group AG | 573,821 | 43,404,321 |
Merck KGaA | 92,675 | 14,726,207 |
MTU Aero Engines AG | 37,310 | 8,988,613 |
Muenchener Rueckversicherungs- Gesellschaft AG (Registered) | 97,619 | 42,933,668 |
Porsche Automobil Holding SE (Preference) | 109,800 | 5,594,475 |
Puma SE | 69,161 | 3,193,232 |
RWE AG | 484,816 | 16,888,817 |
SAP SE | 765,777 | 138,274,093 |
Sartorius AG (Preference) | 17,652 | 5,277,172 |
Siemens AG (Registered) | 507,815 | 95,130,797 |
Siemens Energy AG * (b) | 368,097 | 7,558,297 |
Siemens Healthineers AG (a) | 193,445 | 10,727,966 |
Symrise AG | 92,107 | 9,873,097 |
Talanx AG | 43,144 | 3,245,056 |
Volkswagen AG (Preference) | 147,862 | 18,113,847 |
Vonovia SE | 584,151 | 16,879,642 |
929,241,442 | ||
Hong Kong — 0.2% | ||
Prudential plc | 1,913,026 | 16,638,258 |
Ireland — 0.4% | ||
Kerry Group plc, Class A | 110,055 | 9,471,157 |
April 30, 2024 | J.P. Morgan Exchange-Traded Funds | 79 |
INVESTMENTS | SHARES | VALUE($) |
Common Stocks — continued | ||
Ireland — continued | ||
Kingspan Group plc | 111,206 | 9,891,501 |
Smurfit Kappa Group plc | 179,036 | 7,757,551 |
27,120,209 | ||
Italy — 4.0% | ||
A2A SpA | 1,114,258 | 2,197,487 |
Amplifon SpA | 93,297 | 3,114,844 |
Assicurazioni Generali SpA | 721,084 | 17,581,785 |
Banca Mediolanum SpA | 148,796 | 1,610,207 |
Banco BPM SpA | 981,993 | 6,447,410 |
Buzzi SpA | 59,605 | 2,147,587 |
Coca-Cola HBC AG | 146,458 | 4,727,477 |
Davide Campari-Milano NV | 408,241 | 4,094,169 |
DiaSorin SpA | 15,514 | 1,566,872 |
Enel SpA | 5,565,345 | 36,577,890 |
Eni SpA | 1,512,370 | 24,291,220 |
Ferrari NV | 87,154 | 35,844,235 |
FinecoBank Banca Fineco SpA | 437,795 | 6,706,918 |
Hera SpA | 646,556 | 2,334,378 |
Infrastrutture Wireless Italiane SpA (a) | 250,082 | 2,680,111 |
Intesa Sanpaolo SpA | 11,536,959 | 43,182,883 |
Leonardo SpA | 287,122 | 6,598,653 |
Mediobanca Banca di Credito Finanziario SpA | 461,828 | 6,561,700 |
Moncler SpA | 146,828 | 9,996,365 |
Nexi SpA * (a) | 408,162 | 2,374,750 |
Pirelli & C SpA (a) | 219,421 | 1,387,389 |
Poste Italiane SpA (a) | 328,833 | 4,177,206 |
Prysmian SpA | 195,539 | 10,609,626 |
Recordati Industria Chimica e Farmaceutica SpA | 69,695 | 3,708,705 |
Snam SpA | 1,538,646 | 7,039,725 |
Telecom Italia SpA * (b) | 7,226,952 | 1,713,335 |
Telecom Italia SpA * | 4,322,302 | 1,064,017 |
Terna - Rete Elettrica Nazionale | 1,008,226 | 8,077,814 |
UniCredit SpA | 1,161,055 | 42,615,784 |
UnipolSai Assicurazioni SpA | 300,189 | 859,533 |
301,890,075 | ||
Jordan — 0.0% ^ | ||
Hikma Pharmaceuticals plc | 114,140 | 2,740,566 |
Luxembourg — 0.2% | ||
ArcelorMittal SA | 387,007 | 9,668,536 |
Eurofins Scientific SE | 92,663 | 5,679,199 |
15,347,735 | ||
INVESTMENTS | SHARES | VALUE($) |
Mexico — 0.0% ^ | ||
Fresnillo plc | 132,100 | 914,896 |
Netherlands — 6.6% | ||
Adyen NV * (a) | 21,887 | 26,220,615 |
Aegon Ltd. | 1,002,656 | 6,244,385 |
Akzo Nobel NV | 118,535 | 7,821,169 |
Argenx SE * | 36,108 | 13,488,635 |
Argenx SE * | 6,255 | 2,311,669 |
ASM International NV | 31,247 | 19,655,568 |
ASML Holding NV | 282,946 | 246,449,486 |
EXOR NV | 71,257 | 7,779,519 |
HAL Trust | 24,879 | 3,286,898 |
Heineken Holding NV | 95,193 | 7,657,702 |
Heineken NV | 205,857 | 20,033,922 |
ING Groep NV | 2,368,086 | 37,440,084 |
JDE Peet's NV | 85,701 | 1,904,240 |
Koninklijke Ahold Delhaize NV | 663,684 | 20,145,581 |
Koninklijke KPN NV | 2,208,689 | 8,026,667 |
Koninklijke Philips NV * (b) | 556,983 | 14,791,345 |
NN Group NV | 196,373 | 9,058,860 |
Randstad NV | 76,279 | 3,825,464 |
Universal Music Group NV | 678,823 | 19,967,696 |
Wolters Kluwer NV | 172,765 | 25,864,027 |
501,973,532 | ||
Norway — 1.0% | ||
Aker ASA, Class A | 16,727 | 928,615 |
Aker BP ASA | 220,001 | 5,335,718 |
AutoStore Holdings Ltd. * (a) (b) | 642,655 | 910,554 |
DNB Bank ASA | 621,835 | 10,838,061 |
Equinor ASA | 677,384 | 18,024,089 |
Gjensidige Forsikring ASA | 135,154 | 2,166,964 |
Kongsberg Gruppen ASA | 62,689 | 4,425,415 |
Mowi ASA | 317,776 | 5,579,161 |
Norsk Hydro ASA | 938,372 | 5,766,657 |
Orkla ASA | 535,793 | 3,644,683 |
Salmar ASA | 50,278 | 3,163,045 |
Schibsted ASA, Class A | 50,464 | 1,443,711 |
Schibsted ASA, Class B | 67,560 | 1,892,665 |
Storebrand ASA | 310,542 | 2,981,080 |
Telenor ASA | 451,772 | 5,201,570 |
Var Energi ASA | 426,039 | 1,383,144 |
73,685,132 | ||
Poland — 0.6% | ||
Allegro.eu SA * (a) | 369,057 | 3,076,500 |
80 | J.P. Morgan Exchange-Traded Funds | April 30, 2024 |
INVESTMENTS | SHARES | VALUE($) |
Common Stocks — continued | ||
Poland — continued | ||
Bank Polska Kasa Opieki SA | 150,566 | 6,233,478 |
Dino Polska SA * (a) | 34,307 | 3,286,700 |
ING Bank Slaski SA | 23,318 | 1,824,381 |
KGHM Polska Miedz SA | 97,807 | 3,362,569 |
LPP SA | 752 | 2,897,599 |
ORLEN SA | 417,066 | 6,800,009 |
Powszechna Kasa Oszczednosci Bank Polski SA | 614,881 | 9,129,218 |
Powszechny Zaklad Ubezpieczen SA | 407,433 | 5,127,908 |
Santander Bank Polska SA | 23,888 | 3,273,444 |
45,011,806 | ||
Portugal — 0.3% | ||
EDP - Energias de Portugal SA * | 2,031,350 | 7,628,058 |
Galp Energia SGPS SA | 344,703 | 7,404,617 |
Jeronimo Martins SGPS SA | 197,374 | 4,060,327 |
19,093,002 | ||
Russia — 0.0% ^ | ||
Evraz plc ‡ * | 453,755 | 23,213 |
Singapore — 0.2% | ||
STMicroelectronics NV | 467,661 | 18,512,308 |
South Africa — 0.4% | ||
Anglo American plc | 894,865 | 29,241,932 |
South Korea — 0.0% ^ | ||
Delivery Hero SE * (a) | 131,001 | 3,665,086 |
Spain — 3.9% | ||
Acciona SA | 17,524 | 2,025,882 |
ACS Actividades de Construccion y Servicios SA | 153,282 | 6,139,011 |
Aena SME SA (a) | 52,704 | 9,604,753 |
Amadeus IT Group SA | 308,058 | 19,553,658 |
Banco Bilbao Vizcaya Argentaria SA | 4,056,395 | 43,865,733 |
Banco Santander SA (b) | 11,296,961 | 54,966,855 |
CaixaBank SA | 2,859,057 | 15,077,406 |
Cellnex Telecom SA (a) | 421,333 | 13,927,033 |
Corp. ACCIONA Energias Renovables SA | 40,516 | 822,771 |
EDP Renovaveis SA | 179,893 | 2,462,768 |
Endesa SA | 226,943 | 4,138,452 |
Iberdrola SA | 4,034,957 | 49,474,935 |
Industria de Diseno Textil SA (b) | 794,686 | 36,182,793 |
Naturgy Energy Group SA | 90,363 | 2,285,584 |
Redeia Corp. SA | 270,452 | 4,514,820 |
INVESTMENTS | SHARES | VALUE($) |
Spain — continued | ||
Repsol SA | 837,377 | 13,143,532 |
Telefonica SA | 3,764,698 | 16,864,331 |
295,050,317 | ||
Sweden — 5.2% | ||
Alfa Laval AB | 207,466 | 8,832,814 |
Assa Abloy AB, Class B (b) | 755,246 | 19,954,670 |
Atlas Copco AB, Class A | 1,814,614 | 31,784,939 |
Atlas Copco AB, Class B | 1,119,245 | 16,782,209 |
Axfood AB | 76,909 | 1,989,594 |
Beijer Ref AB (b) | 273,158 | 3,849,716 |
Boliden AB | 196,096 | 6,444,635 |
Castellum AB * | 310,132 | 3,684,979 |
Epiroc AB, Class A | 424,082 | 7,840,164 |
Epiroc AB, Class B | 279,635 | 4,635,223 |
EQT AB (b) | 482,068 | 13,005,889 |
Essity AB, Class A | 15,830 | 392,518 |
Essity AB, Class B | 434,485 | 10,840,298 |
Evolution AB (a) | 136,353 | 15,064,989 |
Fastighets AB Balder, Class B * | 468,285 | 2,951,745 |
Getinge AB, Class B | 155,818 | 3,280,347 |
H & M Hennes & Mauritz AB, Class B (b) | 430,277 | 6,839,166 |
Hexagon AB, Class B | 1,511,718 | 15,814,042 |
Holmen AB, Class B (b) | 58,307 | 2,270,899 |
Husqvarna AB, Class B | 246,152 | 1,996,591 |
Industrivarden AB, Class A | 93,740 | 3,018,760 |
Industrivarden AB, Class C (b) | 109,399 | 3,517,161 |
Indutrade AB | 191,752 | 4,411,372 |
Investment AB Latour, Class B (b) | 103,948 | 2,504,690 |
Investor AB, Class A | 407,667 | 9,929,344 |
Investor AB, Class B | 1,300,808 | 31,860,378 |
L E Lundbergforetagen AB, Class B | 53,625 | 2,643,062 |
Lifco AB, Class B (b) | 161,988 | 3,924,740 |
Nibe Industrier AB, Class B (b) | 1,231,173 | 5,680,909 |
Nordnet AB publ (b) | 107,102 | 1,904,155 |
Saab AB, Class B (b) | 65,973 | 5,223,001 |
Sagax AB, Class B | 142,194 | 3,560,833 |
Sagax AB, Class D | 78,612 | 217,987 |
Sandvik AB (b) | 775,346 | 15,455,390 |
Securitas AB, Class B (b) | 378,581 | 3,793,988 |
Skandinaviska Enskilda Banken AB, Class A | 1,159,841 | 15,189,774 |
Skandinaviska Enskilda Banken AB, Class C | 14,444 | 191,563 |
Skanska AB, Class B | 226,648 | 3,893,431 |
SKF AB, Class A | 9,960 | 205,165 |
SKF AB, Class B | 257,795 | 5,299,766 |
April 30, 2024 | J.P. Morgan Exchange-Traded Funds | 81 |
INVESTMENTS | SHARES | VALUE($) |
Common Stocks — continued | ||
Sweden — continued | ||
SSAB AB, Class A (b) | 172,940 | 971,081 |
SSAB AB, Class B (b) | 433,761 | 2,427,136 |
Svenska Cellulosa AB SCA, Class A | 13,522 | 197,056 |
Svenska Cellulosa AB SCA, Class B | 426,670 | 6,252,960 |
Svenska Handelsbanken AB, Class A | 1,057,051 | 9,064,558 |
Svenska Handelsbanken AB, Class B (b) | 25,304 | 271,467 |
Swedbank AB, Class A | 708,150 | 13,541,441 |
Swedish Orphan Biovitrum AB * | 155,299 | 4,021,844 |
Tele2 AB, Class B | 380,999 | 3,553,601 |
Telefonaktiebolaget LM Ericsson, Class A (b) | 39,279 | 200,505 |
Telefonaktiebolaget LM Ericsson, Class B | 2,036,803 | 10,336,546 |
Telia Co. AB | 1,612,792 | 3,689,224 |
Trelleborg AB, Class B | 154,931 | 5,460,145 |
Volvo AB, Class A | 136,249 | 3,588,289 |
Volvo AB, Class B | 1,082,077 | 27,542,308 |
Volvo Car AB, Class B * | 309,793 | 961,670 |
392,760,727 | ||
Switzerland — 8.6% | ||
ABB Ltd. (Registered) | 1,142,393 | 55,507,091 |
Alcon, Inc. | 337,135 | 25,850,446 |
Barry Callebaut AG (Registered) | 2,524 | 4,078,716 |
Chocoladefabriken Lindt & Spruengli AG | 723 | 8,328,212 |
Chocoladefabriken Lindt & Spruengli AG (Registered) | 73 | 8,424,400 |
Cie Financiere Richemont SA (Registered) | 382,612 | 52,887,320 |
DSM-Firmenich AG | 164,216 | 18,417,562 |
EMS-Chemie Holding AG (Registered) | 4,880 | 3,893,437 |
Geberit AG (Registered) | 24,046 | 12,835,308 |
Givaudan SA (Registered) | 6,610 | 28,269,455 |
Julius Baer Group Ltd. | 141,528 | 7,594,161 |
Kuehne + Nagel International AG (Registered) (b) | 35,768 | 9,453,358 |
Lonza Group AG (Registered) | 53,265 | 29,401,943 |
Novartis AG (Registered) | 1,464,234 | 142,114,971 |
Partners Group Holding AG | 15,454 | 19,882,592 |
Sandoz Group AG * | 282,784 | 9,610,959 |
Schindler Holding AG | 29,197 | 7,277,540 |
Schindler Holding AG (Registered) | 14,838 | 3,615,334 |
SGS SA (Registered) | 106,474 | 9,375,637 |
Sika AG (Registered) | 114,958 | 32,701,135 |
Sonova Holding AG (Registered) | 34,974 | 9,667,942 |
Straumann Holding AG (Registered) | 79,644 | 10,587,681 |
Swatch Group AG (The) (b) | 20,713 | 4,352,036 |
Swatch Group AG (The) (Registered) | 37,851 | 1,569,282 |
INVESTMENTS | SHARES | VALUE($) |
Switzerland — continued | ||
Swiss Life Holding AG (Registered) | 20,180 | 13,616,573 |
Swisscom AG (Registered) | 18,201 | 9,985,197 |
UBS Group AG (Registered) | 2,316,134 | 60,829,280 |
Zurich Insurance Group AG | 105,579 | 51,105,132 |
651,232,700 | ||
United Arab Emirates — 0.0% ^ | ||
NMC Health plc ‡ * | 23,176 | — |
United Kingdom — 16.3% | ||
3i Group plc | 697,950 | 24,935,975 |
abrdn plc | 1,334,131 | 2,432,897 |
Admiral Group plc | 172,637 | 5,876,070 |
Ashtead Group plc | 313,249 | 22,745,602 |
Associated British Foods plc | 239,297 | 7,920,176 |
AstraZeneca plc | 1,111,386 | 168,095,968 |
Auto Trader Group plc (a) | 653,250 | 5,663,338 |
Aviva plc | 1,963,740 | 11,401,774 |
B&M European Value Retail SA | 668,729 | 4,315,692 |
BAE Systems plc | 2,165,119 | 36,010,728 |
Barclays plc | 9,739,017 | 24,554,934 |
Barratt Developments plc | 698,839 | 3,948,525 |
Berkeley Group Holdings plc | 76,080 | 4,467,847 |
British American Tobacco plc | 1,603,640 | 47,076,901 |
BT Group plc | 4,520,778 | 5,781,192 |
Bunzl plc | 232,672 | 8,922,459 |
Burberry Group plc | 248,613 | 3,557,314 |
Centrica plc | 3,902,645 | 6,229,687 |
Coca-Cola Europacific Partners plc | 146,804 | 10,572,824 |
Compass Group plc | 1,225,371 | 34,082,135 |
ConvaTec Group plc (a) | 1,167,043 | 3,631,037 |
Croda International plc | 95,121 | 5,448,207 |
DCC plc | 70,824 | 4,836,619 |
Diageo plc | 1,606,460 | 55,518,741 |
DS Smith plc | 958,087 | 4,173,936 |
Entain plc | 458,046 | 4,468,794 |
Halma plc | 272,229 | 7,460,936 |
Hargreaves Lansdown plc | 253,387 | 2,560,562 |
Hiscox Ltd. | 248,906 | 3,817,189 |
Howden Joinery Group plc | 393,039 | 4,278,119 |
HSBC Holdings plc | 13,700,072 | 118,751,584 |
Imperial Brands plc | 637,458 | 14,566,015 |
Informa plc | 923,481 | 9,142,360 |
InterContinental Hotels Group plc | 118,137 | 11,522,376 |
Intermediate Capital Group plc | 208,179 | 5,425,959 |
Intertek Group plc | 115,729 | 7,122,723 |
82 | J.P. Morgan Exchange-Traded Funds | April 30, 2024 |
INVESTMENTS | SHARES | VALUE($) |
Common Stocks — continued | ||
United Kingdom — continued | ||
J Sainsbury plc | 1,214,129 | 3,982,561 |
JD Sports Fashion plc | 1,795,133 | 2,570,046 |
Kingfisher plc | 1,349,294 | 4,156,263 |
Land Securities Group plc, REIT | 496,711 | 4,014,449 |
Legal & General Group plc | 4,278,537 | 12,559,649 |
Lloyds Banking Group plc | 44,070,434 | 28,442,330 |
London Stock Exchange Group plc | 311,325 | 34,320,502 |
M&G plc | 1,625,470 | 4,069,412 |
Melrose Industries plc | 893,476 | 7,019,447 |
National Grid plc | 2,644,653 | 34,690,343 |
NatWest Group plc | 3,472,637 | 13,107,065 |
Next plc | 85,604 | 9,601,170 |
Ocado Group plc * | 519,003 | 2,272,311 |
Pearson plc | 486,435 | 5,902,325 |
Persimmon plc | 229,045 | 3,708,934 |
Phoenix Group Holdings plc | 537,182 | 3,271,820 |
Reckitt Benckiser Group plc | 513,110 | 28,686,444 |
RELX plc | 1,353,377 | 55,606,040 |
Rentokil Initial plc | 1,808,818 | 9,130,866 |
Rightmove plc | 575,692 | 3,687,771 |
Rolls-Royce Holdings plc * | 6,035,296 | 30,949,151 |
Sage Group plc (The) | 731,815 | 10,611,978 |
Schroders plc | 641,567 | 2,812,684 |
Segro plc, REIT | 900,068 | 9,467,031 |
Severn Trent plc | 189,369 | 5,837,165 |
Smith & Nephew plc | 625,654 | 7,580,208 |
Smiths Group plc | 249,206 | 5,023,986 |
Spirax-Sarco Engineering plc | 52,895 | 5,820,433 |
SSE plc | 783,614 | 16,288,513 |
St. James's Place plc | 393,384 | 2,128,717 |
Standard Chartered plc | 1,584,229 | 13,610,968 |
Taylor Wimpey plc | 2,533,021 | 4,150,669 |
Tesco plc | 4,920,584 | 18,167,145 |
Unilever plc | 1,792,954 | 92,750,956 |
United Utilities Group plc | 488,956 | 6,373,630 |
Vodafone Group plc | 15,610,548 | 13,164,407 |
Weir Group plc (The) | 186,158 | 4,750,264 |
Whitbread plc | 130,434 | 5,140,770 |
Wise plc, Class A * | 480,578 | 4,618,572 |
WPP plc | 770,726 | 7,725,113 |
1,239,089,303 | ||
United States — 12.4% | ||
BP plc | 12,239,111 | 78,888,868 |
Experian plc | 658,792 | 26,571,681 |
INVESTMENTS | SHARES | VALUE($) |
United States — continued | ||
Ferrovial SE | 354,467 | 12,748,528 |
GSK plc | 2,909,978 | 60,373,079 |
Haleon plc | 3,973,059 | 16,779,591 |
Holcim AG | 353,635 | 29,602,000 |
Nestle SA (Registered) | 1,911,281 | 191,892,991 |
QIAGEN NV * | 158,395 | 6,613,256 |
Roche Holding AG | 496,179 | 118,891,544 |
Roche Holding AG | 20,809 | 5,473,986 |
Sanofi SA (b) | 814,599 | 80,476,691 |
Schneider Electric SE | 384,734 | 87,724,472 |
Shell plc | 4,651,273 | 165,346,326 |
Stellantis NV (b) | 1,474,070 | 32,616,002 |
Swiss Re AG | 207,015 | 22,503,650 |
Tenaris SA | 332,430 | 5,520,734 |
942,023,399 | ||
Total Common Stocks (Cost $7,373,940,099) | 7,479,478,558 | |
Short-Term Investments — 3.9% | ||
Investment of Cash Collateral from Securities Loaned — 3.9% | ||
JPMorgan Securities Lending Money Market Fund Agency SL Class Shares, 5.47% (c) (d) | 261,585,920 | 261,612,078 |
JPMorgan U.S. Government Money Market Fund Class IM Shares, 5.25% (c) (d) | 29,854,614 | 29,854,614 |
Total Investment of Cash Collateral from Securities Loaned (Cost $291,473,953) | 291,466,692 | |
Total Investments — 102.5% (Cost $7,665,414,052) | 7,770,945,250 | |
Liabilities in Excess of Other Assets — (2.5)% | (187,005,984 ) | |
NET ASSETS — 100.0% | 7,583,939,266 | |
Percentages indicated are based on net assets. |
Abbreviations | |
CVA | Certificaten Van Aandelen (Dutch Certificate) |
OYJ | Public Limited Company |
Preference | A special type of equity investment that shares in the earnings of the company, has limited voting rights, and may have a dividend preference. Preference shares may also have liquidation preference. |
REIT | Real Estate Investment Trust |
April 30, 2024 | J.P. Morgan Exchange-Traded Funds | 83 |
SCA | Limited partnership with share capital |
SGPS | Holding company |
^ | Amount rounds to less than 0.1% of net assets. | |
‡ | Value determined using significant unobservable inputs. | |
* | Non-income producing security. | |
(a) | Security exempt from registration pursuant to Regulation S under the Securities Act of 1933, as amended. Regulation S applies to securities offerings that are made outside of the United States and do not involve direct selling efforts in the United States and as such may have restrictions on resale. | |
(b) | The security or a portion of this security is on loan at April 30, 2024. The total value of securities on loan at April 30, 2024 is $269,215,464. | |
(c) | Investment in an affiliated fund, which is registered under the Investment Company Act of 1940, as amended, and is advised by J.P. Morgan Investment Management Inc. | |
(d) | The rate shown is the current yield as of April 30, 2024. | |
INDUSTRY April 30, 2024 | PERCENT OF TOTAL INVESTMENTS |
Pharmaceuticals | 12.3 % |
Banks | 8.9 |
Oil, Gas & Consumable Fuels | 5.7 |
Insurance | 5.1 |
Textiles, Apparel & Luxury Goods | 4.4 |
Semiconductors & Semiconductor Equipment | 4.1 |
Food Products | 3.5 |
Chemicals | 3.2 |
Aerospace & Defense | 3.0 |
Capital Markets | 2.9 |
Personal Care Products | 2.6 |
Electrical Equipment | 2.6 |
Machinery | 2.6 |
Beverages | 2.2 |
Automobiles | 2.2 |
Software | 2.2 |
Metals & Mining | 2.0 |
Health Care Equipment & Supplies | 2.0 |
Electric Utilities | 1.9 |
Diversified Telecommunication Services | 1.9 |
Professional Services | 1.7 |
Financial Services | 1.5 |
Industrial Conglomerates | 1.4 |
Multi-Utilities | 1.3 |
Hotels, Restaurants & Leisure | 1.3 |
Construction & Engineering | 1.0 |
Building Products | 1.0 |
Others (each less than 1.0%) | 11.7 |
Short-Term Investments | 3.8 |
DESCRIPTION | NUMBER OF CONTRACTS | EXPIRATION DATE | TRADING CURRENCY | NOTIONAL AMOUNT ($) | VALUE AND UNREALIZED APPRECIATION (DEPRECIATION) ($) |
Long Contracts | |||||
EURO STOXX 50 Index | 1,352 | 06/21/2024 | EUR | 70,382,438 | (386,763 ) |
FTSE 100 Index | 338 | 06/21/2024 | GBP | 34,457,254 | 1,326,426 |
939,663 |
84 | J.P. Morgan Exchange-Traded Funds | April 30, 2024 |
Abbreviations | |
EUR | Euro |
FTSE | Financial Times and the London Stock Exchange |
GBP | British Pound |
April 30, 2024 | J.P. Morgan Exchange-Traded Funds | 85 |
INVESTMENTS | SHARES | VALUE($) |
Common Stocks — 98.6% | ||
Australia — 7.2% | ||
Ampol Ltd. | 57,538 | 1,358,691 |
ANZ Group Holdings Ltd. | 724,176 | 13,066,980 |
APA Group | 309,772 | 1,653,092 |
Aristocrat Leisure Ltd. | 156,439 | 3,992,321 |
ASX Ltd. | 46,740 | 1,909,336 |
Atlas Arteria Ltd. | 273,131 | 909,645 |
Aurizon Holdings Ltd. | 443,132 | 1,088,444 |
BHP Group Ltd. | 1,222,807 | 33,536,847 |
BlueScope Steel Ltd. | 108,026 | 1,576,685 |
Brambles Ltd. | 335,980 | 3,160,783 |
Cochlear Ltd. | 15,025 | 3,134,335 |
Coles Group Ltd. | 323,156 | 3,370,264 |
Commonwealth Bank of Australia | 404,314 | 29,623,896 |
Computershare Ltd. | 137,899 | 2,422,660 |
Dexus, REIT | 258,935 | 1,176,138 |
Endeavour Group Ltd. | 326,819 | 1,123,900 |
Fortescue Ltd. | 382,861 | 6,345,709 |
Glencore plc | 2,228,238 | 12,965,146 |
Goodman Group, REIT | 418,207 | 8,447,627 |
GPT Group (The), REIT | 460,700 | 1,239,022 |
IDP Education Ltd. | 66,937 | 697,945 |
IGO Ltd. | 162,987 | 811,787 |
Incitec Pivot Ltd. | 467,578 | 839,577 |
Insurance Australia Group Ltd. | 585,416 | 2,425,365 |
Lottery Corp. Ltd. (The) | 537,415 | 1,676,462 |
Macquarie Group Ltd. | 93,315 | 11,173,400 |
Medibank Pvt Ltd. | 664,957 | 1,523,989 |
Mineral Resources Ltd. | 41,378 | 1,877,003 |
Mirvac Group, REIT | 949,931 | 1,244,666 |
National Australia Bank Ltd. | 753,526 | 16,334,583 |
Northern Star Resources Ltd. | 277,480 | 2,630,159 |
Orica Ltd. | 116,380 | 1,347,533 |
Origin Energy Ltd. | 415,959 | 2,625,291 |
Pilbara Minerals Ltd. | 685,220 | 1,744,504 |
Qantas Airways Ltd. * | 203,421 | 767,488 |
QBE Insurance Group Ltd. | 360,708 | 4,126,127 |
Ramsay Health Care Ltd. | 44,096 | 1,478,108 |
REA Group Ltd. | 12,313 | 1,411,415 |
Reece Ltd. | 83,601 | 1,483,053 |
Rio Tinto Ltd. | 89,630 | 7,459,397 |
Rio Tinto plc | 258,002 | 17,456,616 |
Santos Ltd. | 743,402 | 3,648,147 |
Scentre Group, REIT | 1,253,223 | 2,537,840 |
SEEK Ltd. | 78,130 | 1,206,939 |
INVESTMENTS | SHARES | VALUE($) |
Australia — continued | ||
Seven Group Holdings Ltd. | 37,548 | 912,383 |
Sonic Healthcare Ltd. | 111,005 | 1,907,696 |
South32 Ltd. | 1,093,595 | 2,495,016 |
Stockland, REIT | 575,809 | 1,631,334 |
Suncorp Group Ltd. | 306,707 | 3,275,758 |
Telstra Group Ltd. | 976,440 | 2,306,949 |
TPG Telecom Ltd. | 102,502 | 296,256 |
Transurban Group | 745,663 | 5,986,526 |
Treasury Wine Estates Ltd. | 187,502 | 1,454,117 |
Vicinity Ltd., REIT | 872,354 | 1,068,258 |
Washington H Soul Pattinson & Co. Ltd. (a) | 58,917 | 1,232,991 |
Wesfarmers Ltd. | 273,994 | 11,737,690 |
Westpac Banking Corp. | 846,003 | 14,049,017 |
WiseTech Global Ltd. | 41,688 | 2,455,946 |
Woodside Energy Group Ltd. | 458,455 | 8,214,142 |
Woolworths Group Ltd. | 280,205 | 5,749,000 |
Worley Ltd. | 88,510 | 854,405 |
286,256,399 | ||
Austria — 0.3% | ||
ANDRITZ AG | 16,307 | 890,093 |
BAWAG Group AG (b) | 19,812 | 1,182,990 |
Erste Group Bank AG | 85,514 | 3,987,953 |
EVN AG | 8,563 | 263,172 |
Mondi plc | 106,580 | 2,022,959 |
OMV AG | 34,438 | 1,634,131 |
Raiffeisen Bank International AG | 37,472 | 692,065 |
Strabag SE | 2,998 | 127,659 |
Telekom Austria AG | 33,031 | 283,768 |
Verbund AG | 15,907 | 1,215,154 |
Vienna Insurance Group AG Wiener Versicherung Gruppe | 8,653 | 269,373 |
voestalpine AG | 25,344 | 676,814 |
13,246,131 | ||
Belgium — 0.8% | ||
Ackermans & van Haaren NV | 5,344 | 918,565 |
Ageas SA | 36,897 | 1,693,629 |
Anheuser-Busch InBev SA | 219,799 | 13,138,219 |
Azelis Group NV | 22,754 | 546,732 |
Colruyt Group NV | 9,969 | 461,942 |
D'ieteren Group | 4,884 | 1,053,589 |
Elia Group SA/NV | 6,776 | 652,404 |
Groupe Bruxelles Lambert NV | 20,547 | 1,525,203 |
KBC Group NV | 65,617 | 4,874,304 |
Sofina SA (a) | 3,397 | 795,174 |
86 | J.P. Morgan Exchange-Traded Funds | April 30, 2024 |
INVESTMENTS | SHARES | VALUE($) |
Common Stocks — continued | ||
Belgium — continued | ||
Solvay SA | 17,164 | 554,457 |
UCB SA | 29,043 | 3,851,397 |
Umicore SA | 45,082 | 998,577 |
Warehouses De Pauw CVA, REIT | 41,697 | 1,102,650 |
32,166,842 | ||
Brazil — 0.0% ^ | ||
Yara International ASA | 39,129 | 1,115,378 |
Chile — 0.1% | ||
Antofagasta plc | 83,550 | 2,291,925 |
China — 0.4% | ||
Budweiser Brewing Co. APAC Ltd. (b) | 409,300 | 569,415 |
ESR Group Ltd. (b) | 599,000 | 656,426 |
Prosus NV | 347,409 | 11,624,288 |
Wharf Holdings Ltd. (The) | 231,000 | 743,209 |
Wilmar International Ltd. | 435,600 | 1,023,910 |
Wuxi Biologics Cayman, Inc. * (b) | 885,000 | 1,533,118 |
16,150,366 | ||
Denmark — 3.7% | ||
AP Moller - Maersk A/S, Class A | 644 | 913,313 |
AP Moller - Maersk A/S, Class B | 874 | 1,266,487 |
Carlsberg A/S, Class B | 22,349 | 3,006,228 |
Coloplast A/S, Class B | 32,334 | 3,898,354 |
Danske Bank A/S | 163,201 | 4,698,069 |
Demant A/S * | 22,093 | 1,054,985 |
DSV A/S | 41,391 | 5,880,395 |
Genmab A/S * | 15,770 | 4,378,227 |
Novo Nordisk A/S, Class B | 817,452 | 104,831,933 |
Novonesis (Novozymes) B | 91,905 | 5,089,400 |
Orsted A/S * (b) | 45,473 | 2,499,122 |
Pandora A/S | 19,892 | 3,027,561 |
Svitzer A/S * | 3,036 | 102,020 |
Tryg A/S | 76,275 | 1,509,653 |
Vestas Wind Systems A/S * | 242,239 | 6,491,674 |
148,647,421 | ||
Finland — 1.1% | ||
Elisa OYJ | 34,659 | 1,562,752 |
Fortum OYJ | 105,506 | 1,390,295 |
Huhtamaki OYJ | 22,530 | 864,623 |
Kesko OYJ, Class A | 22,131 | 388,134 |
Kesko OYJ, Class B | 65,003 | 1,109,755 |
Kone OYJ, Class B | 85,615 | 4,173,472 |
Metso OYJ | 169,590 | 1,922,658 |
INVESTMENTS | SHARES | VALUE($) |
Finland — continued | ||
Neste OYJ | 103,314 | 2,342,036 |
Nokia OYJ | 1,256,182 | 4,566,663 |
Nordea Bank Abp | 805,496 | 9,363,271 |
Orion OYJ, Class A | 6,529 | 251,536 |
Orion OYJ, Class B | 25,715 | 982,187 |
Sampo OYJ, Class A | 112,876 | 4,580,894 |
Stora Enso OYJ, Class R | 142,539 | 1,898,710 |
UPM-Kymmene OYJ | 128,771 | 4,512,796 |
Wartsila OYJ Abp | 116,905 | 2,156,605 |
42,066,387 | ||
France — 9.6% | ||
Aeroports de Paris SA | 7,700 | 978,014 |
Air Liquide SA | 126,129 | 24,668,135 |
Airbus SE | 141,397 | 23,267,974 |
Amundi SA (b) | 14,978 | 1,044,931 |
AXA SA (a) | 425,650 | 14,706,883 |
BioMerieux | 10,325 | 1,097,589 |
BNP Paribas SA | 253,787 | 18,262,983 |
Bollore SE | 187,197 | 1,215,048 |
Bouygues SA (a) | 49,764 | 1,834,066 |
Bureau Veritas SA | 70,752 | 2,063,526 |
Capgemini SE | 38,093 | 8,006,428 |
Carrefour SA | 134,784 | 2,267,502 |
Cie de Saint-Gobain SA | 110,762 | 8,759,348 |
Cie Generale des Etablissements Michelin SCA | 165,377 | 6,353,561 |
Credit Agricole SA | 295,268 | 4,568,751 |
Danone SA (a) | 154,979 | 9,699,721 |
Dassault Aviation SA | 4,730 | 1,012,451 |
Dassault Systemes SE | 169,539 | 6,654,732 |
Edenred SE | 60,104 | 2,852,047 |
Eiffage SA | 18,258 | 1,948,100 |
Engie SA * (a) | 445,510 | 7,734,328 |
EssilorLuxottica SA (a) | 74,197 | 15,821,149 |
Getlink SE | 76,234 | 1,297,784 |
Hermes International SCA | 8,193 | 19,613,958 |
Ipsen SA | 8,478 | 1,031,233 |
Kering SA | 16,989 | 5,954,120 |
Legrand SA | 63,023 | 6,476,659 |
L'Oreal SA | 58,546 | 27,449,476 |
LVMH Moet Hennessy Louis Vuitton SE | 62,112 | 51,021,054 |
Orange SA | 424,485 | 4,724,639 |
Pernod Ricard SA | 48,205 | 7,290,624 |
Publicis Groupe SA | 54,859 | 6,053,514 |
Safran SA | 82,665 | 17,924,419 |
April 30, 2024 | J.P. Morgan Exchange-Traded Funds | 87 |
INVESTMENTS | SHARES | VALUE($) |
Common Stocks — continued | ||
France — continued | ||
Sartorius Stedim Biotech | 6,202 | 1,335,706 |
Societe Generale SA | 175,752 | 4,735,646 |
Sodexo SA | 20,145 | 1,754,095 |
Thales SA | 22,436 | 3,770,760 |
TotalEnergies SE | 527,650 | 38,306,715 |
Veolia Environnement SA (a) | 148,072 | 4,603,216 |
Vinci SA | 113,855 | 13,341,080 |
Vivendi SE | 160,565 | 1,633,538 |
383,135,503 | ||
Germany — 7.9% | ||
adidas AG | 38,325 | 9,235,677 |
Allianz SE (Registered) | 94,581 | 26,840,658 |
BASF SE | 215,500 | 11,291,456 |
Bayer AG (Registered) | 221,314 | 6,455,878 |
Bayerische Motoren Werke AG | 72,531 | 7,902,204 |
Bayerische Motoren Werke AG (Preference) | 14,691 | 1,509,525 |
Beiersdorf AG | 23,604 | 3,547,766 |
Brenntag SE | 30,761 | 2,454,833 |
Carl Zeiss Meditec AG | 8,804 | 928,935 |
Commerzbank AG | 243,156 | 3,613,819 |
Continental AG | 26,077 | 1,690,083 |
Covestro AG * (b) | 42,472 | 2,127,182 |
Daimler Truck Holding AG | 118,366 | 5,337,858 |
Deutsche Bank AG (Registered) | 447,791 | 7,152,345 |
Deutsche Boerse AG | 44,364 | 8,553,024 |
Deutsche Lufthansa AG (Registered) * | 144,040 | 1,030,841 |
Deutsche Post AG | 226,689 | 9,491,453 |
Deutsche Telekom AG (Registered) | 834,462 | 19,113,824 |
Deutsche Wohnen SE | 12,042 | 227,177 |
Dr Ing hc F Porsche AG (Preference) (b) | 26,616 | 2,369,528 |
E.ON SE | 534,477 | 7,077,529 |
Evonik Industries AG | 48,495 | 1,010,668 |
Fresenius SE & Co. KGaA | 99,276 | 2,962,433 |
Hannover Rueck SE | 14,501 | 3,596,886 |
Heidelberg Materials AG | 31,558 | 3,175,859 |
Henkel AG & Co. KGaA | 23,259 | 1,672,520 |
Henkel AG & Co. KGaA (Preference) | 39,890 | 3,168,932 |
Infineon Technologies AG | 314,792 | 10,924,234 |
Mercedes-Benz Group AG | 193,218 | 14,615,178 |
Merck KGaA | 31,205 | 4,958,525 |
MTU Aero Engines AG | 12,563 | 3,026,640 |
Muenchener Rueckversicherungs-Gesellschaft AG (Registered) | 32,871 | 14,456,946 |
Porsche Automobil Holding SE (Preference) | 36,972 | 1,883,779 |
INVESTMENTS | SHARES | VALUE($) |
Germany — continued | ||
Puma SE | 23,218 | 1,071,998 |
RWE AG | 163,248 | 5,686,829 |
SAP SE | 257,854 | 46,559,936 |
Sartorius AG (Preference) | 5,943 | 1,776,696 |
Siemens AG (Registered) | 170,993 | 32,032,729 |
Siemens Energy AG * | 123,946 | 2,545,038 |
Siemens Healthineers AG (b) | 65,137 | 3,612,332 |
Symrise AG | 31,015 | 3,324,547 |
Talanx AG | 14,489 | 1,089,783 |
Volkswagen AG (Preference) | 49,789 | 6,099,406 |
Vonovia SE | 196,697 | 5,683,761 |
312,887,250 | ||
Hong Kong — 1.8% | ||
AIA Group Ltd. | 2,733,200 | 20,018,935 |
CK Asset Holdings Ltd. | 488,500 | 2,083,734 |
CK Infrastructure Holdings Ltd. | 148,000 | 836,073 |
CLP Holdings Ltd. | 437,000 | 3,437,469 |
Hang Lung Properties Ltd. | 414,000 | 456,937 |
Hang Seng Bank Ltd. | 174,900 | 2,306,333 |
Henderson Land Development Co. Ltd. | 320,000 | 964,744 |
HKT Trust & HKT Ltd. | 858,000 | 947,213 |
Hong Kong & China Gas Co. Ltd. | 2,636,100 | 2,004,365 |
Hong Kong Exchanges & Clearing Ltd. | 288,000 | 9,151,035 |
Jardine Matheson Holdings Ltd. | 56,400 | 2,164,068 |
Link, REIT | 618,600 | 2,650,574 |
MTR Corp. Ltd. | 381,500 | 1,253,776 |
Power Assets Holdings Ltd. | 329,500 | 1,890,063 |
Prudential plc | 644,159 | 5,602,477 |
Sino Land Co. Ltd. | 816,000 | 872,467 |
Sun Hung Kai Properties Ltd. | 454,500 | 4,192,744 |
Swire Pacific Ltd., Class A | 100,000 | 846,871 |
Swire Pacific Ltd., Class B | 190,000 | 258,131 |
Swire Properties Ltd. | 252,800 | 522,833 |
Techtronic Industries Co. Ltd. | 337,500 | 4,664,014 |
WH Group Ltd. (b) | 1,877,924 | 1,364,950 |
Wharf Real Estate Investment Co. Ltd. | 374,000 | 1,160,340 |
69,650,146 | ||
Ireland — 0.2% | ||
Kerry Group plc, Class A | 37,058 | 3,189,152 |
Kingspan Group plc | 37,445 | 3,330,641 |
Smurfit Kappa Group plc | 60,285 | 2,612,123 |
9,131,916 | ||
88 | J.P. Morgan Exchange-Traded Funds | April 30, 2024 |
INVESTMENTS | SHARES | VALUE($) |
Common Stocks — continued | ||
Israel — 0.5% | ||
Azrieli Group Ltd. | 8,785 | 565,230 |
Bank Hapoalim BM | 307,064 | 2,766,165 |
Bank Leumi Le-Israel BM | 367,695 | 2,865,122 |
Bezeq The Israeli Telecommunication Corp. Ltd. | 485,578 | 603,201 |
Elbit Systems Ltd. | 5,986 | 1,218,496 |
ICL Group Ltd. | 173,839 | 815,996 |
Israel Discount Bank Ltd., Class A | 298,678 | 1,531,987 |
Mizrahi Tefahot Bank Ltd. | 36,320 | 1,322,565 |
Nice Ltd. * | 15,291 | 3,419,227 |
Teva Pharmaceutical Industries Ltd. * | 270,390 | 3,781,423 |
18,889,412 | ||
Italy — 2.6% | ||
A2A SpA | 374,093 | 737,769 |
Amplifon SpA | 31,318 | 1,045,593 |
Assicurazioni Generali SpA | 242,806 | 5,920,202 |
Banca Mediolanum SpA | 49,957 | 540,613 |
Banco BPM SpA | 330,659 | 2,170,987 |
Buzzi SpA | 20,017 | 721,219 |
Coca-Cola HBC AG | 49,316 | 1,591,858 |
Davide Campari-Milano NV | 137,464 | 1,378,599 |
DiaSorin SpA | 5,211 | 526,297 |
Enel SpA | 1,873,978 | 12,316,606 |
Eni SpA | 509,249 | 8,179,400 |
Ferrari NV | 29,347 | 12,069,678 |
FinecoBank Banca Fineco SpA | 147,416 | 2,258,379 |
Hera SpA | 217,068 | 783,720 |
Infrastrutture Wireless Italiane SpA (b) | 84,208 | 902,451 |
Intesa Sanpaolo SpA | 3,884,757 | 14,540,661 |
Leonardo SpA | 96,681 | 2,221,928 |
Mediobanca Banca di Credito Finanziario SpA | 155,508 | 2,209,474 |
Moncler SpA | 49,441 | 3,366,049 |
Nexi SpA * (b) | 137,031 | 797,268 |
Pirelli & C SpA (b) | 73,672 | 465,825 |
Poste Italiane SpA (b) | 110,726 | 1,406,566 |
Prysmian SpA | 65,842 | 3,572,479 |
Recordati Industria Chimica e Farmaceutica SpA | 23,468 | 1,248,811 |
Snam SpA | 518,097 | 2,370,435 |
Telecom Italia SpA * (a) | 2,426,331 | 575,224 |
Telecom Italia SpA * | 1,451,146 | 357,227 |
Terna - Rete Elettrica Nazionale | 339,493 | 2,719,986 |
INVESTMENTS | SHARES | VALUE($) |
Italy — continued | ||
UniCredit SpA | 390,953 | 14,349,681 |
UnipolSai Assicurazioni SpA | 101,081 | 289,426 |
101,634,411 | ||
Japan — 24.6% | ||
ABC-Mart, Inc. | 24,300 | 484,014 |
Acom Co. Ltd. | 108,400 | 279,512 |
Advantest Corp. | 171,300 | 5,361,805 |
Aeon Co. Ltd. | 205,800 | 4,302,928 |
AGC, Inc. (a) | 51,100 | 1,889,384 |
Aisin Corp. | 40,900 | 1,555,683 |
Ajinomoto Co., Inc. | 119,300 | 4,435,750 |
ANA Holdings, Inc. | 37,600 | 714,100 |
Asahi Group Holdings Ltd. | 122,400 | 4,187,180 |
Asahi Intecc Co. Ltd. | 57,000 | 835,203 |
Asahi Kasei Corp. | 334,700 | 2,333,574 |
Asics Corp. | 44,200 | 1,894,516 |
Astellas Pharma, Inc. | 433,900 | 4,164,530 |
Bandai Namco Holdings, Inc. | 159,400 | 2,978,417 |
Bridgestone Corp. | 141,600 | 6,248,385 |
Brother Industries Ltd. | 61,700 | 1,091,409 |
Canon, Inc. | 238,500 | 6,455,072 |
Capcom Co. Ltd. | 70,400 | 1,158,956 |
Central Japan Railway Co. | 215,500 | 4,928,051 |
Chiba Bank Ltd. (The) | 174,600 | 1,474,858 |
Chubu Electric Power Co., Inc. | 182,400 | 2,341,280 |
Chugai Pharmaceutical Co. Ltd. | 154,500 | 4,913,698 |
Concordia Financial Group Ltd. | 283,000 | 1,524,843 |
Cosmos Pharmaceutical Corp. | 5,500 | 507,403 |
Dai Nippon Printing Co. Ltd. | 55,800 | 1,625,238 |
Daifuku Co. Ltd. | 86,500 | 1,771,849 |
Dai-ichi Life Holdings, Inc. | 237,400 | 5,498,432 |
Daiichi Sankyo Co. Ltd. | 462,900 | 15,580,155 |
Daikin Industries Ltd. | 70,700 | 9,649,937 |
Daito Trust Construction Co. Ltd. | 15,600 | 1,672,233 |
Daiwa House Industry Co. Ltd. | 158,700 | 4,465,646 |
Daiwa House REIT Investment Corp., REIT | 538 | 903,720 |
Daiwa Securities Group, Inc. | 344,600 | 2,532,486 |
Denso Corp. | 426,700 | 7,272,300 |
Dentsu Group, Inc. (a) | 55,400 | 1,498,746 |
Disco Corp. | 22,100 | 6,295,091 |
East Japan Railway Co. | 263,400 | 4,827,851 |
Eisai Co. Ltd. | 65,500 | 2,690,023 |
ENEOS Holdings, Inc. | 727,800 | 3,362,592 |
FANUC Corp. | 218,600 | 6,474,779 |
April 30, 2024 | J.P. Morgan Exchange-Traded Funds | 89 |
INVESTMENTS | SHARES | VALUE($) |
Common Stocks — continued | ||
Japan — continued | ||
Fast Retailing Co. Ltd. | 40,300 | 10,537,203 |
Fuji Electric Co. Ltd. | 34,500 | 2,146,036 |
FUJIFILM Holdings Corp. | 290,700 | 6,183,912 |
Fujitsu Ltd. | 419,000 | 6,472,776 |
Fukuoka Financial Group, Inc. | 45,600 | 1,211,251 |
GLP J-REIT, REIT | 1,148 | 933,682 |
Hamamatsu Photonics KK | 35,300 | 1,293,451 |
Hankyu Hanshin Holdings, Inc. | 58,500 | 1,533,767 |
Haseko Corp. | 61,100 | 738,165 |
Hikari Tsushin, Inc. | 5,500 | 893,870 |
Hirose Electric Co. Ltd. | 6,900 | 732,406 |
Hitachi Construction Machinery Co. Ltd. | 25,000 | 714,057 |
Hitachi Ltd. | 223,700 | 20,638,718 |
Honda Motor Co. Ltd. | 1,176,600 | 13,386,862 |
Hoshizaki Corp. | 28,000 | 964,844 |
Hoya Corp. | 84,600 | 9,808,509 |
Hulic Co. Ltd. (a) | 132,500 | 1,220,942 |
Ibiden Co. Ltd. | 32,200 | 1,224,035 |
Idemitsu Kosan Co. Ltd. | 254,400 | 1,723,590 |
Iida Group Holdings Co. Ltd. | 35,500 | 453,190 |
Inpex Corp. | 212,700 | 3,186,204 |
Isuzu Motors Ltd. | 149,700 | 1,897,126 |
ITOCHU Corp. | 331,800 | 14,969,081 |
Japan Airlines Co. Ltd. | 34,700 | 614,841 |
Japan Airport Terminal Co. Ltd. | 18,900 | 667,911 |
Japan Exchange Group, Inc. | 125,700 | 2,943,960 |
Japan Metropolitan Fund Invest, REIT | 1,682 | 1,015,472 |
Japan Post Bank Co. Ltd. | 336,300 | 3,413,550 |
Japan Post Holdings Co. Ltd. | 492,700 | 4,731,546 |
Japan Post Insurance Co. Ltd. | 46,600 | 874,872 |
Japan Real Estate Investment Corp., REIT | 334 | 1,132,641 |
Japan Tobacco, Inc. | 267,400 | 7,193,492 |
JFE Holdings, Inc. | 146,200 | 2,182,141 |
JSR Corp. * | 48,600 | 1,333,217 |
Kajima Corp. | 112,500 | 2,155,172 |
Kansai Electric Power Co., Inc. (The) | 188,800 | 2,828,115 |
Kansai Paint Co. Ltd. | 51,900 | 675,643 |
Kao Corp. | 112,200 | 4,628,500 |
Kawasaki Heavy Industries Ltd. | 39,200 | 1,213,556 |
Kawasaki Kisen Kaisha Ltd. | 106,200 | 1,496,346 |
KDDI Corp. | 363,300 | 10,081,138 |
Keio Corp. | 28,100 | 687,530 |
Keisei Electric Railway Co. Ltd. | 39,100 | 1,456,590 |
Keyence Corp. | 45,200 | 19,877,598 |
INVESTMENTS | SHARES | VALUE($) |
Japan — continued | ||
Kikkoman Corp. | 213,000 | 2,537,982 |
Kintetsu Group Holdings Co. Ltd. | 45,900 | 1,180,024 |
Kirin Holdings Co. Ltd. | 196,000 | 2,861,129 |
Kobe Bussan Co. Ltd. | 34,100 | 736,467 |
Koei Tecmo Holdings Co. Ltd. | 28,400 | 264,159 |
Koito Manufacturing Co. Ltd. | 56,200 | 755,932 |
Komatsu Ltd. | 228,400 | 6,819,144 |
Konami Group Corp. | 23,100 | 1,393,792 |
Kose Corp. | 8,600 | 443,451 |
Kubota Corp. | 275,900 | 4,425,363 |
Kurita Water Industries Ltd. | 27,200 | 1,077,231 |
Kyocera Corp. | 326,100 | 3,974,717 |
Kyoto Financial Group, Inc. | 71,800 | 1,277,980 |
Kyowa Kirin Co. Ltd. | 60,100 | 1,009,311 |
Kyushu Railway Co. | 36,100 | 776,725 |
Lasertec Corp. | 19,300 | 4,163,115 |
Lawson, Inc. | 12,000 | 785,594 |
LY Corp. | 647,500 | 1,555,706 |
M3, Inc. | 108,200 | 1,144,559 |
Makita Corp. | 62,200 | 1,800,746 |
Marubeni Corp. | 406,400 | 7,240,570 |
MatsukiyoCocokara & Co. | 92,000 | 1,304,627 |
Mazda Motor Corp. | 144,200 | 1,632,268 |
McDonald's Holdings Co. Japan Ltd. | 20,800 | 914,965 |
Medipal Holdings Corp. | 50,900 | 798,267 |
MEIJI Holdings Co. Ltd. | 68,700 | 1,537,120 |
MINEBEA MITSUMI, Inc. | 90,300 | 1,691,351 |
MISUMI Group, Inc. | 68,000 | 1,105,534 |
Mitsubishi Chemical Group Corp. | 343,400 | 2,003,350 |
Mitsubishi Corp. | 978,600 | 22,380,172 |
Mitsubishi Electric Corp. | 506,500 | 8,828,258 |
Mitsubishi Estate Co. Ltd. | 306,100 | 5,609,195 |
Mitsubishi HC Capital, Inc. | 217,900 | 1,411,131 |
Mitsubishi Heavy Industries Ltd. | 810,000 | 7,242,305 |
Mitsubishi Motors Corp. | 164,600 | 521,591 |
Mitsubishi UFJ Financial Group, Inc. | 2,903,800 | 28,925,787 |
Mitsui & Co. Ltd. | 361,600 | 17,456,491 |
Mitsui Chemicals, Inc. | 45,900 | 1,306,448 |
Mitsui Fudosan Co. Ltd. | 676,500 | 6,884,783 |
Mitsui OSK Lines Ltd. | 87,400 | 2,774,040 |
Mizuho Financial Group, Inc. | 612,000 | 11,829,414 |
MonotaRO Co. Ltd. (a) | 60,100 | 720,291 |
MS&AD Insurance Group Holdings, Inc. | 321,300 | 5,776,667 |
Murata Manufacturing Co. Ltd. | 421,900 | 7,709,030 |
90 | J.P. Morgan Exchange-Traded Funds | April 30, 2024 |
INVESTMENTS | SHARES | VALUE($) |
Common Stocks — continued | ||
Japan — continued | ||
NEC Corp. | 61,300 | 4,438,242 |
Nexon Co. Ltd. | 107,500 | 1,676,070 |
NGK Insulators Ltd. | 73,900 | 1,006,688 |
NIDEC Corp. | 126,700 | 5,933,724 |
Nikon Corp. | 83,800 | 866,435 |
Nintendo Co. Ltd. | 255,200 | 12,445,850 |
Nippon Building Fund, Inc., REIT | 397 | 1,516,855 |
Nippon Express Holdings, Inc. | 19,500 | 997,587 |
Nippon Paint Holdings Co. Ltd. | 234,200 | 1,499,118 |
Nippon Prologis REIT, Inc., REIT | 582 | 1,005,949 |
Nippon Sanso Holdings Corp. | 47,400 | 1,407,894 |
Nippon Steel Corp. | 222,200 | 4,981,485 |
Nippon Telegraph & Telephone Corp. | 6,703,800 | 7,237,841 |
Nippon Yusen KK | 116,500 | 3,307,490 |
Nissan Chemical Corp. | 32,400 | 1,104,457 |
Nissan Motor Co. Ltd. | 532,000 | 1,946,962 |
Nisshin Seifun Group, Inc. | 65,200 | 850,526 |
Nissin Foods Holdings Co. Ltd. | 57,000 | 1,521,077 |
Niterra Co. Ltd. | 48,500 | 1,590,696 |
Nitori Holdings Co. Ltd. | 19,600 | 2,623,128 |
Nitto Denko Corp. | 34,400 | 2,844,388 |
Nomura Holdings, Inc. | 727,800 | 4,141,172 |
Nomura Real Estate Holdings, Inc. | 27,200 | 761,522 |
Nomura Real Estate Master Fund, Inc., REIT | 991 | 947,317 |
Nomura Research Institute Ltd. | 102,100 | 2,470,605 |
NTT Data Group Corp. | 143,000 | 2,236,208 |
Obayashi Corp. | 169,000 | 1,886,175 |
Obic Co. Ltd. | 15,700 | 2,016,925 |
Odakyu Electric Railway Co. Ltd. | 83,900 | 943,261 |
Oji Holdings Corp. | 231,700 | 907,573 |
Olympus Corp. | 290,800 | 4,050,763 |
Omron Corp. | 47,300 | 1,623,449 |
Ono Pharmaceutical Co. Ltd. | 107,500 | 1,548,362 |
Open House Group Co. Ltd. | 18,000 | 547,384 |
Oracle Corp. | 8,000 | 600,357 |
Oriental Land Co. Ltd. | 265,400 | 7,322,847 |
ORIX Corp. | 279,600 | 5,722,130 |
Osaka Gas Co. Ltd. | 100,300 | 2,230,259 |
Otsuka Corp. | 58,600 | 1,165,444 |
Otsuka Holdings Co. Ltd. | 109,800 | 4,694,703 |
Pan Pacific International Holdings Corp. | 128,100 | 3,008,560 |
Panasonic Holdings Corp. | 563,600 | 4,919,358 |
Persol Holdings Co. Ltd. | 448,700 | 620,691 |
Rakuten Group, Inc. * | 355,500 | 1,709,758 |
INVESTMENTS | SHARES | VALUE($) |
Japan — continued | ||
Recruit Holdings Co. Ltd. | 374,600 | 16,133,033 |
Renesas Electronics Corp. | 311,500 | 5,057,437 |
Resona Holdings, Inc. | 548,700 | 3,469,841 |
Ricoh Co. Ltd. | 146,900 | 1,267,315 |
Rohm Co. Ltd. | 78,000 | 1,121,239 |
SBI Holdings, Inc. | 65,300 | 1,589,934 |
SCSK Corp. | 37,200 | 676,266 |
Secom Co. Ltd. | 49,800 | 3,459,233 |
Sega Sammy Holdings, Inc. | 39,300 | 514,397 |
Seiko Epson Corp. | 73,800 | 1,214,009 |
Sekisui Chemical Co. Ltd. | 99,200 | 1,443,166 |
Sekisui House Ltd. | 151,500 | 3,481,524 |
Seven & i Holdings Co. Ltd. | 588,600 | 7,605,419 |
SG Holdings Co. Ltd. | 101,800 | 1,191,578 |
Sharp Corp. * | 57,200 | 300,252 |
Shimadzu Corp. | 71,000 | 1,928,932 |
Shimano, Inc. | 20,000 | 3,250,260 |
Shimizu Corp. | 147,800 | 915,541 |
Shin-Etsu Chemical Co. Ltd. | 482,000 | 18,657,709 |
Shionogi & Co. Ltd. | 70,700 | 3,301,745 |
Shiseido Co. Ltd. | 96,500 | 2,583,137 |
SMC Corp. | 13,800 | 7,250,060 |
SoftBank Corp. | 676,200 | 8,156,112 |
SoftBank Group Corp. | 232,900 | 11,454,161 |
Sojitz Corp. | 53,480 | 1,376,942 |
Sompo Holdings, Inc. | 225,600 | 4,464,654 |
Sony Group Corp. | 297,200 | 24,563,987 |
Square Enix Holdings Co. Ltd. | 18,800 | 679,566 |
Subaru Corp. | 144,700 | 3,231,005 |
SUMCO Corp. | 84,800 | 1,264,649 |
Sumitomo Chemical Co. Ltd. | 394,400 | 842,620 |
Sumitomo Corp. | 295,100 | 7,760,294 |
Sumitomo Electric Industries Ltd. | 188,300 | 2,910,425 |
Sumitomo Metal Mining Co. Ltd. | 63,700 | 2,128,131 |
Sumitomo Mitsui Financial Group, Inc. | 318,600 | 18,097,695 |
Sumitomo Mitsui Trust Holdings, Inc. | 175,300 | 3,685,653 |
Sumitomo Realty & Development Co. Ltd. | 114,500 | 3,962,149 |
Suntory Beverage & Food Ltd. | 30,200 | 982,565 |
Suzuki Motor Corp. | 442,800 | 5,156,754 |
Sysmex Corp. | 126,600 | 2,024,382 |
T&D Holdings, Inc. | 129,500 | 2,113,095 |
Taisei Corp. | 43,600 | 1,596,214 |
Takeda Pharmaceutical Co. Ltd. | 378,800 | 9,955,649 |
TDK Corp. | 91,600 | 4,086,367 |
April 30, 2024 | J.P. Morgan Exchange-Traded Funds | 91 |
INVESTMENTS | SHARES | VALUE($) |
Common Stocks — continued | ||
Japan — continued | ||
Terumo Corp. | 347,000 | 5,886,554 |
TIS, Inc. | 58,100 | 1,240,817 |
Tobu Railway Co. Ltd. | 49,900 | 990,040 |
Toho Co. Ltd. | 28,200 | 944,767 |
Tokio Marine Holdings, Inc. | 477,400 | 15,088,893 |
Tokyo Century Corp. | 40,400 | 402,115 |
Tokyo Electric Power Co. Holdings, Inc. * | 174,800 | 1,087,305 |
Tokyo Electron Ltd. | 107,800 | 23,645,490 |
Tokyo Gas Co. Ltd. | 98,800 | 2,215,814 |
Tokyu Corp. | 144,800 | 1,714,079 |
Tokyu Fudosan Holdings Corp. | 143,900 | 1,054,248 |
TOPPAN Holdings, Inc. | 77,800 | 1,845,724 |
Toray Industries, Inc. | 385,700 | 1,762,928 |
Tosoh Corp. | 76,900 | 1,060,153 |
TOTO Ltd. | 38,400 | 1,039,277 |
Toyo Suisan Kaisha Ltd. | 24,700 | 1,544,598 |
Toyota Industries Corp. | 41,500 | 3,943,615 |
Toyota Motor Corp. | 2,865,800 | 65,364,874 |
Toyota Tsusho Corp. | 57,000 | 3,624,057 |
Trend Micro, Inc. | 31,000 | 1,527,625 |
Unicharm Corp. | 98,300 | 2,920,803 |
USS Co. Ltd. | 96,800 | 739,484 |
Welcia Holdings Co. Ltd. | 24,800 | 364,630 |
West Japan Railway Co. | 117,800 | 2,236,014 |
Yakult Honsha Co. Ltd. | 65,900 | 1,288,987 |
Yamaha Corp. | 37,000 | 779,708 |
Yamaha Motor Co. Ltd. | 219,000 | 2,042,662 |
Yamato Holdings Co. Ltd. | 77,700 | 1,026,159 |
Yaskawa Electric Corp. | 61,300 | 2,525,721 |
Yokogawa Electric Corp. | 63,100 | 1,394,245 |
Zensho Holdings Co. Ltd. | 23,000 | 891,462 |
ZOZO, Inc. | 31,000 | 667,693 |
979,478,841 | ||
Jordan — 0.0% ^ | ||
Hikma Pharmaceuticals plc | 38,321 | 920,109 |
Luxembourg — 0.1% | ||
ArcelorMittal SA | 130,314 | 3,255,614 |
Eurofins Scientific SE | 31,202 | 1,912,332 |
5,167,946 | ||
Macau — 0.1% | ||
Galaxy Entertainment Group Ltd. | 544,000 | 2,440,870 |
Sands China Ltd. * | 587,600 | 1,385,940 |
3,826,810 | ||
INVESTMENTS | SHARES | VALUE($) |
Mexico — 0.0% ^ | ||
Fresnillo plc | 44,347 | 307,138 |
Netherlands — 4.2% | ||
Adyen NV * (b) | 7,369 | 8,828,058 |
Aegon Ltd. | 337,617 | 2,102,626 |
Akzo Nobel NV | 39,914 | 2,633,603 |
Argenx SE * | 10,963 | 4,095,378 |
Argenx SE * | 3,302 | 1,220,325 |
ASM International NV | 10,522 | 6,618,744 |
ASML Holding NV | 95,275 | 82,985,710 |
EXOR NV | 23,994 | 2,619,557 |
HAL Trust | 8,357 | 1,104,088 |
Heineken Holding NV | 32,054 | 2,578,551 |
Heineken NV | 69,317 | 6,745,903 |
ING Groep NV | 797,388 | 12,606,921 |
JDE Peet's NV | 28,774 | 639,346 |
Koninklijke Ahold Delhaize NV | 223,477 | 6,783,460 |
Koninklijke KPN NV | 743,716 | 2,702,762 |
Koninklijke Philips NV * (a) | 187,549 | 4,980,587 |
NN Group NV | 66,123 | 3,050,313 |
Randstad NV | 25,685 | 1,288,127 |
Universal Music Group NV (a) | 228,575 | 6,723,573 |
Wolters Kluwer NV | 58,174 | 8,709,020 |
169,016,652 | ||
New Zealand — 0.2% | ||
Auckland International Airport Ltd. | 316,713 | 1,464,992 |
Contact Energy Ltd. | 189,584 | 968,546 |
Fisher & Paykel Healthcare Corp. Ltd. | 131,539 | 2,202,982 |
Mercury NZ Ltd. | 161,770 | 608,161 |
Meridian Energy Ltd. | 296,420 | 1,047,993 |
Spark New Zealand Ltd. | 438,299 | 1,231,937 |
7,524,611 | ||
Norway — 0.6% | ||
Aker ASA, Class A | 5,632 | 312,666 |
Aker BP ASA | 74,080 | 1,796,674 |
AutoStore Holdings Ltd. * (b) | 215,760 | 305,702 |
DNB Bank ASA | 209,386 | 3,649,422 |
Equinor ASA | 228,091 | 6,069,131 |
Gjensidige Forsikring ASA | 45,372 | 727,463 |
Kongsberg Gruppen ASA | 21,109 | 1,490,151 |
Mowi ASA | 107,003 | 1,878,641 |
Norsk Hydro ASA | 315,971 | 1,941,763 |
Orkla ASA | 179,884 | 1,223,645 |
Salmar ASA | 16,929 | 1,065,022 |
92 | J.P. Morgan Exchange-Traded Funds | April 30, 2024 |
INVESTMENTS | SHARES | VALUE($) |
Common Stocks — continued | ||
Norway — continued | ||
Schibsted ASA, Class A | 16,993 | 486,148 |
Schibsted ASA, Class B | 22,748 | 637,276 |
Storebrand ASA | 104,258 | 1,000,835 |
Telenor ASA | 152,122 | 1,751,488 |
Var Energi ASA | 143,038 | 464,376 |
24,800,403 | ||
Poland — 0.4% | ||
Allegro.eu SA * (b) | 123,908 | 1,032,911 |
Bank Polska Kasa Opieki SA | 50,699 | 2,098,954 |
Dino Polska SA * (b) | 11,552 | 1,106,712 |
ING Bank Slaski SA | 7,827 | 612,378 |
KGHM Polska Miedz SA | 32,837 | 1,128,924 |
LPP SA | 253 | 974,857 |
ORLEN SA | 140,436 | 2,289,724 |
Powszechna Kasa Oszczednosci Bank Polski SA | 207,044 | 3,074,009 |
Powszechny Zaklad Ubezpieczen SA | 137,192 | 1,726,684 |
Santander Bank Polska SA | 8,025 | 1,099,690 |
15,144,843 | ||
Portugal — 0.2% | ||
EDP - Energias de Portugal SA * | 684,002 | 2,568,542 |
Galp Energia SGPS SA | 116,069 | 2,493,295 |
Jeronimo Martins SGPS SA | 66,460 | 1,367,198 |
6,429,035 | ||
Russia — 0.0% ^ | ||
Evraz plc ‡ * | 96,418 | 4,932 |
Singapore — 1.3% | ||
CapitaLand Ascendas, REIT | 874,200 | 1,655,930 |
CapitaLand Integrated Commercial Trust, REIT | 1,139,737 | 1,624,690 |
CapitaLand Investment Ltd. * | 576,900 | 1,115,640 |
City Developments Ltd. | 112,500 | 504,218 |
DBS Group Holdings Ltd. | 485,650 | 12,363,390 |
Genting Singapore Ltd. | 1,371,900 | 915,565 |
Great Eastern Holdings Ltd. | 13,800 | 184,444 |
Jardine Cycle & Carriage Ltd. | 22,000 | 424,562 |
Keppel Ltd. | 333,600 | 1,668,638 |
Mapletree Pan Asia Commercial Trust, REIT | 580,100 | 531,588 |
Oversea-Chinese Banking Corp. Ltd. | 786,700 | 8,167,184 |
Singapore Airlines Ltd. | 333,950 | 1,593,483 |
Singapore Exchange Ltd. | 198,000 | 1,350,662 |
Singapore Technologies Engineering Ltd. | 375,900 | 1,104,200 |
Singapore Telecommunications Ltd. | 1,889,600 | 3,277,087 |
STMicroelectronics NV | 157,472 | 6,233,511 |
INVESTMENTS | SHARES | VALUE($) |
Singapore — continued | ||
United Overseas Bank Ltd. | 323,900 | 7,187,601 |
UOL Group Ltd. | 126,200 | 538,843 |
50,441,236 | ||
South Africa — 0.2% | ||
Anglo American plc | 301,321 | 9,846,411 |
South Korea — 0.0% ^ | ||
Delivery Hero SE * (b) | 43,977 | 1,230,368 |
Spain — 2.5% | ||
Acciona SA | 5,886 | 680,458 |
ACS Actividades de Construccion y Servicios SA | 51,614 | 2,067,163 |
Aena SME SA (b) | 17,747 | 3,234,205 |
Amadeus IT Group SA | 103,730 | 6,584,153 |
Banco Bilbao Vizcaya Argentaria SA | 1,365,881 | 14,770,596 |
Banco Santander SA (a) | 3,803,944 | 18,508,592 |
CaixaBank SA | 962,709 | 5,076,903 |
Cellnex Telecom SA (b) | 141,873 | 4,689,569 |
Corp. ACCIONA Energias Renovables SA | 13,600 | 276,179 |
EDP Renovaveis SA | 60,392 | 826,778 |
Endesa SA | 76,417 | 1,393,513 |
Iberdrola SA | 1,358,662 | 16,659,338 |
Industria de Diseno Textil SA (a) | 267,589 | 12,183,576 |
Naturgy Energy Group SA | 30,335 | 767,274 |
Redeia Corp. SA | 91,067 | 1,520,237 |
Repsol SA | 281,963 | 4,425,712 |
Telefonica SA | 1,267,660 | 5,678,606 |
99,342,852 | ||
Sweden — 3.3% | ||
Alfa Laval AB | 69,858 | 2,974,187 |
Assa Abloy AB, Class B (a) | 254,309 | 6,719,204 |
Atlas Copco AB, Class A | 611,022 | 10,702,715 |
Atlas Copco AB, Class B | 376,875 | 5,650,948 |
Axfood AB | 25,826 | 668,105 |
Beijer Ref AB (a) | 91,979 | 1,296,294 |
Boliden AB | 66,030 | 2,170,056 |
Castellum AB * | 104,127 | 1,237,234 |
Epiroc AB, Class A | 142,798 | 2,639,961 |
Epiroc AB, Class B | 94,159 | 1,560,777 |
EQT AB (a) | 162,324 | 4,379,399 |
Essity AB, Class A | 5,311 | 131,690 |
Essity AB, Class B | 146,301 | 3,650,175 |
Evolution AB (b) | 45,913 | 5,072,707 |
Fastighets AB Balder, Class B * | 157,682 | 993,918 |
April 30, 2024 | J.P. Morgan Exchange-Traded Funds | 93 |
INVESTMENTS | SHARES | VALUE($) |
Common Stocks — continued | ||
Sweden — continued | ||
Getinge AB, Class B | 52,313 | 1,101,316 |
H & M Hennes & Mauritz AB, Class B (a) | 144,992 | 2,304,619 |
Hexagon AB, Class B | 509,030 | 5,324,949 |
Holmen AB, Class B | 19,578 | 762,510 |
Husqvarna AB, Class B | 82,885 | 672,298 |
Industrivarden AB, Class A | 31,472 | 1,013,510 |
Industrivarden AB, Class C (a) | 36,733 | 1,180,960 |
Indutrade AB | 64,567 | 1,485,403 |
Investment AB Latour, Class B (a) | 34,899 | 840,912 |
Investor AB, Class A | 137,270 | 3,343,418 |
Investor AB, Class B | 438,012 | 10,728,123 |
L E Lundbergforetagen AB, Class B | 18,000 | 887,182 |
Lifco AB, Class B (a) | 54,544 | 1,321,524 |
Nibe Industrier AB, Class B (a) | 414,564 | 1,912,891 |
Nordnet AB publ (a) | 35,959 | 639,311 |
Saab AB, Class B (a) | 22,215 | 1,758,734 |
Sagax AB, Class B | 47,735 | 1,195,383 |
Sagax AB, Class D | 26,511 | 73,514 |
Sandvik AB | 261,076 | 5,204,169 |
Securitas AB, Class B (a) | 127,099 | 1,273,736 |
Skandinaviska Enskilda Banken AB, Class A | 390,545 | 5,114,744 |
Skandinaviska Enskilda Banken AB, Class C | 4,708 | 62,440 |
Skanska AB, Class B | 76,317 | 1,310,997 |
SKF AB, Class A | 3,299 | 67,956 |
SKF AB, Class B | 86,806 | 1,784,563 |
SSAB AB, Class A (a) | 58,059 | 326,009 |
SSAB AB, Class B (a) | 145,626 | 814,859 |
Svenska Cellulosa AB SCA, Class A | 4,543 | 66,205 |
Svenska Cellulosa AB SCA, Class B | 143,670 | 2,105,521 |
Svenska Handelsbanken AB, Class A | 355,933 | 3,052,242 |
Svenska Handelsbanken AB, Class B (a) | 8,512 | 91,319 |
Swedbank AB, Class A | 238,450 | 4,559,707 |
Swedish Orphan Biovitrum AB * | 52,293 | 1,354,254 |
Tele2 AB, Class B | 127,915 | 1,193,071 |
Telefonaktiebolaget LM Ericsson, Class A (a) | 13,285 | 67,815 |
Telefonaktiebolaget LM Ericsson, Class B | 685,837 | 3,480,546 |
Telia Co. AB | 544,506 | 1,245,545 |
Trelleborg AB, Class B | 52,168 | 1,838,527 |
Volvo AB, Class A | 45,878 | 1,208,255 |
Volvo AB, Class B | 364,360 | 9,274,123 |
Volvo Car AB, Class B * | 104,009 | 322,868 |
132,213,398 | ||
Switzerland — 5.5% | ||
ABB Ltd. (Registered) | 384,670 | 18,690,514 |
INVESTMENTS | SHARES | VALUE($) |
Switzerland — continued | ||
Alcon, Inc. | 113,521 | 8,704,431 |
Barry Callebaut AG (Registered) | 849 | 1,371,961 |
Chocoladefabriken Lindt & Spruengli AG (a) | 244 | 2,810,627 |
Chocoladefabriken Lindt & Spruengli AG (Registered) | 24 | 2,769,666 |
Cie Financiere Richemont SA (Registered) | 128,834 | 17,808,341 |
DSM-Firmenich AG | 55,296 | 6,201,695 |
EMS-Chemie Holding AG (Registered) | 1,644 | 1,311,641 |
Geberit AG (Registered) | 8,097 | 4,322,028 |
Givaudan SA (Registered) | 2,225 | 9,515,815 |
Julius Baer Group Ltd. | 47,655 | 2,557,089 |
Kuehne + Nagel International AG (Registered) | 12,044 | 3,183,187 |
Lonza Group AG (Registered) | 17,935 | 9,900,007 |
Novartis AG (Registered) | 493,041 | 47,853,354 |
Partners Group Holding AG | 5,203 | 6,694,003 |
Sandoz Group AG * | 95,219 | 3,236,201 |
Schindler Holding AG | 9,831 | 2,450,440 |
Schindler Holding AG (Registered) | 4,997 | 1,217,538 |
SGS SA (Registered) | 35,852 | 3,156,971 |
Sika AG (Registered) | 38,709 | 11,011,224 |
Sonova Holding AG (Registered) | 11,776 | 3,255,266 |
Straumann Holding AG (Registered) | 26,818 | 3,565,120 |
Swatch Group AG (The) (a) | 6,958 | 1,461,955 |
Swatch Group AG (The) (Registered) | 12,710 | 526,950 |
Swiss Life Holding AG (Registered) | 6,795 | 4,584,966 |
Swisscom AG (Registered) | 6,129 | 3,362,413 |
UBS Group AG (Registered) | 779,895 | 20,482,602 |
Zurich Insurance Group AG | 35,551 | 17,208,333 |
219,214,338 | ||
United Arab Emirates — 0.0% ^ | ||
NMC Health plc ‡ * | 300 | — |
United Kingdom — 10.6% | ||
3i Group plc | 235,016 | 8,396,523 |
abrdn plc | 447,910 | 816,800 |
Admiral Group plc | 58,131 | 1,978,613 |
Ashtead Group plc | 105,478 | 7,658,957 |
Associated British Foods plc | 80,577 | 2,666,912 |
AstraZeneca plc | 374,229 | 56,601,744 |
Auto Trader Group plc (b) | 219,964 | 1,906,974 |
Aviva plc | 661,236 | 3,839,237 |
B&M European Value Retail SA | 225,176 | 1,453,190 |
BAE Systems plc | 729,045 | 12,125,634 |
Barclays plc | 3,279,349 | 8,268,206 |
Barratt Developments plc | 235,315 | 1,329,558 |
94 | J.P. Morgan Exchange-Traded Funds | April 30, 2024 |
INVESTMENTS | SHARES | VALUE($) |
Common Stocks — continued | ||
United Kingdom — continued | ||
Berkeley Group Holdings plc | 25,618 | 1,504,433 |
British American Tobacco plc | 539,982 | 15,851,861 |
BT Group plc | 1,522,249 | 1,946,659 |
Bunzl plc | 78,346 | 3,004,397 |
Burberry Group plc | 83,469 | 1,194,328 |
Centrica plc | 1,314,109 | 2,097,677 |
CK Hutchison Holdings Ltd. | 644,000 | 3,127,764 |
Coca-Cola Europacific Partners plc | 49,432 | 3,560,093 |
Compass Group plc | 412,610 | 11,476,222 |
ConvaTec Group plc (b) | 392,970 | 1,222,653 |
Croda International plc | 32,030 | 1,834,569 |
DCC plc | 23,804 | 1,625,591 |
Diageo plc | 540,932 | 18,694,436 |
DS Smith plc | 323,603 | 1,409,787 |
Entain plc | 154,234 | 1,504,739 |
Halma plc | 91,666 | 2,512,275 |
Hargreaves Lansdown plc | 85,068 | 859,641 |
Hiscox Ltd. | 83,812 | 1,285,330 |
Howden Joinery Group plc | 132,345 | 1,440,538 |
HSBC Holdings plc | 4,613,126 | 39,986,361 |
Imperial Brands plc | 214,647 | 4,904,717 |
Informa plc | 310,957 | 3,078,440 |
InterContinental Hotels Group plc | 39,779 | 3,879,806 |
Intermediate Capital Group plc | 70,099 | 1,827,054 |
Intertek Group plc | 38,969 | 2,398,408 |
J Sainsbury plc | 407,624 | 1,337,080 |
JD Sports Fashion plc | 602,690 | 862,856 |
Kingfisher plc | 452,999 | 1,395,384 |
Land Securities Group plc, REIT | 166,759 | 1,347,756 |
Legal & General Group plc | 1,440,680 | 4,229,117 |
Lloyds Banking Group plc | 14,839,517 | 9,577,179 |
London Stock Exchange Group plc | 104,830 | 11,556,471 |
M&G plc | 547,332 | 1,370,262 |
Melrose Industries plc | 300,854 | 2,363,610 |
National Grid plc | 890,515 | 11,681,030 |
NatWest Group plc | 1,169,316 | 4,413,447 |
Next plc | 28,824 | 3,232,841 |
Ocado Group plc * | 174,253 | 762,919 |
Pearson plc | 163,794 | 1,987,450 |
Persimmon plc | 76,896 | 1,245,180 |
Phoenix Group Holdings plc | 180,354 | 1,098,484 |
Reckitt Benckiser Group plc | 172,776 | 9,659,389 |
RELX plc | 455,712 | 18,723,785 |
Rentokil Initial plc | 609,070 | 3,074,569 |
INVESTMENTS | SHARES | VALUE($) |
United Kingdom — continued | ||
Rightmove plc | 194,014 | 1,242,816 |
Rolls-Royce Holdings plc * | 2,032,221 | 10,421,281 |
Sage Group plc (The) | 246,418 | 3,573,283 |
Schroders plc | 215,874 | 946,410 |
Segro plc, REIT | 303,071 | 3,187,740 |
Severn Trent plc | 63,764 | 1,965,480 |
Smith & Nephew plc | 210,672 | 2,552,429 |
Smiths Group plc | 83,913 | 1,691,684 |
Spirax-Sarco Engineering plc | 17,811 | 1,959,878 |
SSE plc | 263,860 | 5,484,699 |
St. James's Place plc | 132,074 | 714,692 |
Standard Chartered plc | 533,446 | 4,583,123 |
Taylor Wimpey plc | 852,926 | 1,397,625 |
Tesco plc | 1,656,873 | 6,117,293 |
Unilever plc | 603,728 | 31,231,336 |
United Utilities Group plc | 164,642 | 2,146,138 |
Vodafone Group plc | 5,256,427 | 4,432,756 |
Weir Group plc (The) | 62,683 | 1,599,506 |
Whitbread plc | 43,920 | 1,731,010 |
Wise plc, Class A * | 161,821 | 1,555,173 |
WPP plc | 259,521 | 2,601,222 |
420,324,510 | ||
United States — 8.6% | ||
BP plc | 4,121,187 | 26,563,676 |
CSL Ltd. | 116,637 | 20,723,611 |
Experian plc | 221,831 | 8,947,319 |
Ferrovial SE | 119,357 | 4,292,716 |
GSK plc | 979,856 | 20,328,994 |
Haleon plc | 1,337,820 | 5,650,073 |
Holcim AG | 119,077 | 9,967,671 |
James Hardie Industries plc, CHDI * | 105,701 | 3,633,784 |
Nestle SA (Registered) | 643,572 | 64,614,756 |
QIAGEN NV * | 53,335 | 2,226,825 |
Roche Holding AG | 167,074 | 40,033,306 |
Roche Holding AG | 7,006 | 1,842,989 |
Sanofi SA (a) | 274,294 | 27,098,331 |
Schneider Electric SE | 129,549 | 29,538,896 |
Shell plc | 1,566,189 | 55,675,854 |
Stellantis NV (a) | 496,353 | 10,982,552 |
Swiss Re AG | 69,707 | 7,577,528 |
Tenaris SA | 111,936 | 1,858,945 |
341,557,826 | ||
Total Common Stocks (Cost $3,451,212,546) | 3,924,061,746 | |
April 30, 2024 | J.P. Morgan Exchange-Traded Funds | 95 |
INVESTMENTS | SHARES | VALUE($) |
Short-Term Investments — 3.3% | ||
Investment Companies — 0.8% | ||
JPMorgan U.S. Government Money Market Fund Class IM Shares, 5.25% (c) (d)(Cost $31,381,914) | 31,381,914 | 31,381,914 |
Investment of Cash Collateral from Securities Loaned — 2.5% | ||
JPMorgan Securities Lending Money Market Fund Agency SL Class Shares, 5.47% (c) (d) | 88,998,626 | 89,007,526 |
JPMorgan U.S. Government Money Market Fund Class IM Shares, 5.25% (c) (d) | 10,988,807 | 10,988,807 |
Total Investment of Cash Collateral from Securities Loaned (Cost $99,998,033) | 99,996,333 | |
Total Short-Term Investments (Cost $131,379,947) | 131,378,247 | |
Total Investments — 101.9% (Cost $3,582,592,493) | 4,055,439,993 | |
Liabilities in Excess of Other Assets — (1.9)% | (74,625,822 ) | |
NET ASSETS — 100.0% | 3,980,814,171 | |
Percentages indicated are based on net assets. |
Abbreviations | |
APAC | Asia Pacific |
CHDI | Clearing House Electronic Subregister System (CHESS) Depository Interest |
CVA | Certificaten Van Aandelen (Dutch Certificate) |
OYJ | Public Limited Company |
Preference | A special type of equity investment that shares in the earnings of the company, has limited voting rights, and may have a dividend preference. Preference shares may also have liquidation preference. |
REIT | Real Estate Investment Trust |
SCA | Limited partnership with share capital |
SGPS | Holding company |
^ | Amount rounds to less than 0.1% of net assets. | |
‡ | Value determined using significant unobservable inputs. | |
* | Non-income producing security. | |
(a) | The security or a portion of this security is on loan at April 30, 2024. The total value of securities on loan at April 30, 2024 is $92,572,419. | |
(b) | Security exempt from registration pursuant to Regulation S under the Securities Act of 1933, as amended. Regulation S applies to securities offerings that are made outside of the United States and do not involve direct selling efforts in the United States and as such may have restrictions on resale. | |
(c) | Investment in an affiliated fund, which is registered under the Investment Company Act of 1940, as amended, and is advised by J.P. Morgan Investment Management Inc. | |
(d) | The rate shown is the current yield as of April 30, 2024. |
96 | J.P. Morgan Exchange-Traded Funds | April 30, 2024 |
INDUSTRY | PERCENT OF TOTAL INVESTMENTS |
Banks | 10.3 % |
Pharmaceuticals | 9.2 |
Insurance | 5.0 |
Oil, Gas & Consumable Fuels | 4.2 |
Semiconductors & Semiconductor Equipment | 3.8 |
Automobiles | 3.8 |
Chemicals | 3.0 |
Machinery | 3.0 |
Metals & Mining | 3.0 |
Textiles, Apparel & Luxury Goods | 2.9 |
Capital Markets | 2.7 |
Food Products | 2.7 |
Trading Companies & Distributors | 2.3 |
Electrical Equipment | 2.1 |
Aerospace & Defense | 2.0 |
Health Care Equipment & Supplies | 2.0 |
Personal Care Products | 1.9 |
Beverages | 1.7 |
Industrial Conglomerates | 1.6 |
Electric Utilities | 1.6 |
Diversified Telecommunication Services | 1.6 |
Software | 1.6 |
Professional Services | 1.6 |
Hotels, Restaurants & Leisure | 1.3 |
Electronic Equipment, Instruments & Components | 1.3 |
Real Estate Management & Development | 1.2 |
Consumer Staples Distribution & Retail | 1.2 |
Financial Services | 1.2 |
Household Durables | 1.1 |
Others (each less than 1.0%) | 15.9 |
Short-Term Investments | 3.2 |
DESCRIPTION | NUMBER OF CONTRACTS | EXPIRATION DATE | TRADING CURRENCY | NOTIONAL AMOUNT ($) | VALUE AND UNREALIZED APPRECIATION (DEPRECIATION) ($) |
Long Contracts | |||||
MSCI EAFE E-Mini Index | 500 | 06/21/2024 | USD | 56,650,000 | (1,368,000 ) |
April 30, 2024 | J.P. Morgan Exchange-Traded Funds | 97 |
Abbreviations | |
EAFE | Europe, Australasia and Far East |
MSCI | Morgan Stanley Capital International |
USD | United States Dollar |
98 | J.P. Morgan Exchange-Traded Funds | April 30, 2024 |
INVESTMENTS | SHARES | VALUE($) |
Common Stocks — 98.8% | ||
Air Freight & Logistics — 0.3% | ||
Nippon Express Holdings, Inc. | 220,400 | 11,275,290 |
SG Holdings Co. Ltd. | 1,161,300 | 13,593,123 |
Yamato Holdings Co. Ltd. | 881,000 | 11,635,090 |
36,503,503 | ||
Automobile Components — 2.1% | ||
Aisin Corp. | 462,500 | 17,591,768 |
Bridgestone Corp. | 1,609,500 | 71,022,425 |
Denso Corp. | 4,849,600 | 82,652,328 |
Koito Manufacturing Co. Ltd. | 637,800 | 8,578,883 |
Niterra Co. Ltd. | 552,500 | 18,120,811 |
Sumitomo Electric Industries Ltd. | 2,137,500 | 33,037,883 |
231,004,098 | ||
Automobiles — 9.6% | ||
Honda Motor Co. Ltd. | 13,371,000 | 152,129,642 |
Isuzu Motors Ltd. | 1,699,900 | 21,542,585 |
Mazda Motor Corp. | 1,640,000 | 18,563,939 |
Mitsubishi Motors Corp. | 1,877,400 | 5,949,180 |
Nissan Motor Co. Ltd. | 6,052,000 | 22,148,523 |
Subaru Corp. | 1,642,400 | 36,673,137 |
Suzuki Motor Corp. | 5,032,000 | 58,601,593 |
Toyota Motor Corp. | 32,562,900 | 742,714,022 |
Yamaha Motor Co. Ltd. | 2,491,100 | 23,235,046 |
1,081,557,667 | ||
Banks — 7.6% | ||
Chiba Bank Ltd. (The) | 1,989,500 | 16,805,440 |
Concordia Financial Group Ltd. | 3,222,000 | 17,360,577 |
Fukuoka Financial Group, Inc. | 520,600 | 13,828,449 |
Japan Post Bank Co. Ltd. | 3,822,100 | 38,795,504 |
Kyoto Financial Group, Inc. | 815,800 | 14,520,564 |
Mitsubishi UFJ Financial Group, Inc. | 32,994,300 | 328,667,989 |
Mizuho Financial Group, Inc. | 6,953,800 | 134,410,748 |
Resona Holdings, Inc. | 6,236,900 | 39,440,585 |
Sumitomo Mitsui Financial Group, Inc. | 3,621,300 | 205,703,651 |
Sumitomo Mitsui Trust Holdings, Inc. | 1,993,500 | 41,913,005 |
851,446,512 | ||
Beverages — 0.8% | ||
Asahi Group Holdings Ltd. | 1,390,800 | 47,577,855 |
Kirin Holdings Co. Ltd. | 2,227,500 | 32,516,146 |
Suntory Beverage & Food Ltd. | 344,700 | 11,214,902 |
91,308,903 | ||
INVESTMENTS | SHARES | VALUE($) |
Broadline Retail — 0.5% | ||
Pan Pacific International Holdings Corp. | 1,454,700 | 34,165,125 |
Rakuten Group, Inc. * | 4,047,100 | 19,464,307 |
53,629,432 | ||
Building Products — 1.3% | ||
AGC, Inc. (a) | 581,700 | 21,507,918 |
Daikin Industries Ltd. | 803,300 | 109,643,486 |
TOTO Ltd. | 435,800 | 11,794,708 |
142,946,112 | ||
Capital Markets — 1.1% | ||
Daiwa Securities Group, Inc. | 3,915,000 | 28,771,570 |
Japan Exchange Group, Inc. | 1,427,800 | 33,439,827 |
Nomura Holdings, Inc. | 8,272,100 | 47,068,137 |
SBI Holdings, Inc. | 743,100 | 18,093,104 |
127,372,638 | ||
Chemicals — 3.7% | ||
Asahi Kasei Corp. | 3,804,100 | 26,522,698 |
JSR Corp. * | 553,600 | 15,186,599 |
Kansai Paint Co. Ltd. | 590,500 | 7,687,233 |
Mitsubishi Chemical Group Corp. | 3,900,900 | 22,757,335 |
Mitsui Chemicals, Inc. | 523,500 | 14,900,335 |
Nippon Paint Holdings Co. Ltd. | 2,660,700 | 17,031,186 |
Nippon Sanso Holdings Corp. | 540,600 | 16,057,124 |
Nissan Chemical Corp. | 370,400 | 12,626,262 |
Nitto Denko Corp. | 391,400 | 32,363,180 |
Shin-Etsu Chemical Co. Ltd. | 5,477,800 | 212,039,831 |
Sumitomo Chemical Co. Ltd. | 4,488,200 | 9,588,865 |
Toray Industries, Inc. | 4,394,300 | 20,085,124 |
Tosoh Corp. | 872,500 | 12,028,391 |
418,874,163 | ||
Commercial Services & Supplies — 0.7% | ||
Dai Nippon Printing Co. Ltd. | 633,000 | 18,436,838 |
Secom Co. Ltd. | 566,800 | 39,371,346 |
TOPPAN Holdings, Inc. | 882,200 | 20,929,277 |
78,737,461 | ||
Construction & Engineering — 0.7% | ||
Kajima Corp. | 1,277,900 | 24,480,839 |
Obayashi Corp. | 1,918,000 | 21,406,407 |
Shimizu Corp. | 1,678,800 | 10,399,258 |
Taisei Corp. | 494,000 | 18,085,545 |
74,372,049 | ||
April 30, 2024 | J.P. Morgan Exchange-Traded Funds | 99 |
INVESTMENTS | SHARES | VALUE($) |
Common Stocks — continued | ||
Consumer Finance — 0.0% ^ | ||
Acom Co. Ltd. | 1,233,300 | 3,180,091 |
Consumer Staples Distribution & Retail — 1.6% | ||
Aeon Co. Ltd. | 2,336,200 | 48,845,966 |
Cosmos Pharmaceutical Corp. | 62,400 | 5,756,713 |
Kobe Bussan Co. Ltd. | 389,300 | 8,407,822 |
Lawson, Inc. | 138,700 | 9,080,160 |
MatsukiyoCocokara & Co. | 1,044,900 | 14,817,448 |
Seven & i Holdings Co. Ltd. | 6,688,600 | 86,424,743 |
Welcia Holdings Co. Ltd. | 279,700 | 4,112,375 |
177,445,227 | ||
Diversified REITs — 0.2% | ||
Daiwa House REIT Investment Corp. | 6,104 | 10,253,354 |
Nomura Real Estate Master Fund, Inc. | 11,325 | 10,825,800 |
21,079,154 | ||
Diversified Telecommunication Services — 0.7% | ||
Nippon Telegraph & Telephone Corp. | 76,177,200 | 82,245,660 |
Electric Utilities — 0.6% | ||
Chubu Electric Power Co., Inc. | 2,073,700 | 26,617,939 |
Kansai Electric Power Co., Inc. (The) | 2,146,900 | 32,159,320 |
Tokyo Electric Power Co. Holdings, Inc. * | 1,992,100 | 12,391,418 |
71,168,677 | ||
Electrical Equipment — 1.7% | ||
Fuji Electric Co. Ltd. | 392,200 | 24,396,383 |
Mitsubishi Electric Corp. | 5,754,000 | 100,291,798 |
NIDEC Corp. | 1,438,600 | 67,373,762 |
192,061,943 | ||
Electronic Equipment, Instruments & Components — 4.4% | ||
Hamamatsu Photonics KK | 402,000 | 14,729,952 |
Hirose Electric Co. Ltd. | 78,300 | 8,311,219 |
Ibiden Co. Ltd. | 367,100 | 13,954,760 |
Keyence Corp. | 511,500 | 224,942,283 |
Kyocera Corp. | 3,705,400 | 45,163,801 |
Murata Manufacturing Co. Ltd. | 4,796,400 | 87,640,650 |
Omron Corp. | 539,900 | 18,530,663 |
Shimadzu Corp. | 808,600 | 21,968,096 |
TDK Corp. | 1,040,100 | 46,399,896 |
Yokogawa Electric Corp. | 714,600 | 15,789,664 |
497,430,984 | ||
Entertainment — 1.9% | ||
Capcom Co. Ltd. | 800,000 | 13,169,952 |
Koei Tecmo Holdings Co. Ltd. | 325,300 | 3,025,736 |
INVESTMENTS | SHARES | VALUE($) |
Entertainment — continued | ||
Konami Group Corp. | 261,400 | 15,772,175 |
Nexon Co. Ltd. | 1,223,600 | 19,077,574 |
Nintendo Co. Ltd. | 2,899,200 | 141,391,097 |
Square Enix Holdings Co. Ltd. | 212,700 | 7,688,500 |
Toho Co. Ltd. | 322,400 | 10,801,164 |
210,926,198 | ||
Financial Services — 0.8% | ||
Mitsubishi HC Capital, Inc. | 2,478,400 | 16,050,236 |
ORIX Corp. | 3,179,100 | 65,061,605 |
Tokyo Century Corp. | 458,300 | 4,561,611 |
85,673,452 | ||
Food Products — 1.4% | ||
Ajinomoto Co., Inc. | 1,357,100 | 50,458,977 |
Kikkoman Corp. | 2,415,100 | 28,776,902 |
MEIJI Holdings Co. Ltd. | 781,200 | 17,478,864 |
Nisshin Seifun Group, Inc. | 742,300 | 9,683,217 |
Nissin Foods Holdings Co. Ltd. | 646,500 | 17,252,211 |
Toyo Suisan Kaisha Ltd. | 278,600 | 17,422,061 |
Yakult Honsha Co. Ltd. | 749,800 | 14,665,899 |
155,738,131 | ||
Gas Utilities — 0.4% | ||
Osaka Gas Co. Ltd. | 1,141,700 | 25,386,711 |
Tokyo Gas Co. Ltd. | 1,120,000 | 25,118,540 |
50,505,251 | ||
Ground Transportation — 2.1% | ||
Central Japan Railway Co. | 2,448,500 | 55,992,262 |
East Japan Railway Co. | 2,992,800 | 54,854,943 |
Hankyu Hanshin Holdings, Inc. | 663,000 | 17,382,690 |
Keio Corp. | 320,800 | 7,849,101 |
Keisei Electric Railway Co. Ltd. | 442,700 | 16,491,882 |
Kintetsu Group Holdings Co. Ltd. | 523,600 | 13,461,019 |
Kyushu Railway Co. | 411,200 | 8,847,347 |
Odakyu Electric Railway Co. Ltd. | 951,500 | 10,697,413 |
Tobu Railway Co. Ltd. | 568,000 | 11,269,391 |
Tokyu Corp. | 1,646,600 | 19,491,726 |
West Japan Railway Co. | 1,335,600 | 25,351,619 |
241,689,393 | ||
Health Care Equipment & Supplies — 2.3% | ||
Asahi Intecc Co. Ltd. (a) | 646,800 | 9,477,356 |
Hoya Corp. | 962,800 | 111,626,864 |
Olympus Corp. | 3,303,500 | 46,016,838 |
100 | J.P. Morgan Exchange-Traded Funds | April 30, 2024 |
INVESTMENTS | SHARES | VALUE($) |
Common Stocks — continued | ||
Health Care Equipment & Supplies — continued | ||
Sysmex Corp. | 1,436,600 | 22,971,774 |
Terumo Corp. | 3,945,200 | 66,926,892 |
257,019,724 | ||
Health Care Providers & Services — 0.1% | ||
Medipal Holdings Corp. | 580,000 | 9,096,171 |
Health Care Technology — 0.1% | ||
M3, Inc. | 1,231,100 | 13,022,798 |
Hotels, Restaurants & Leisure — 0.9% | ||
McDonald's Holdings Co. Japan Ltd. (a) | 235,300 | 10,350,538 |
Oriental Land Co. Ltd. | 3,016,400 | 83,227,713 |
Zensho Holdings Co. Ltd. | 260,300 | 10,089,021 |
103,667,272 | ||
Household Durables — 3.8% | ||
Haseko Corp. | 692,800 | 8,369,901 |
Iida Group Holdings Co. Ltd. | 404,700 | 5,166,366 |
Nikon Corp. | 951,200 | 9,834,767 |
Open House Group Co. Ltd. | 205,400 | 6,246,263 |
Panasonic Holdings Corp. | 6,402,400 | 55,883,065 |
Sekisui Chemical Co. Ltd. | 1,128,900 | 16,423,290 |
Sekisui House Ltd. | 1,719,300 | 39,510,127 |
Sharp Corp. * | 654,600 | 3,436,103 |
Sony Group Corp. | 3,378,600 | 279,245,917 |
424,115,799 | ||
Household Products — 0.3% | ||
Unicharm Corp. | 1,115,300 | 33,139,077 |
Industrial Conglomerates — 2.2% | ||
Hikari Tsushin, Inc. | 62,400 | 10,141,365 |
Hitachi Ltd. | 2,540,200 | 234,360,620 |
244,501,985 | ||
Industrial REITs — 0.2% | ||
GLP J-REIT | 13,028 | 10,595,831 |
Nippon Prologis REIT, Inc. | 6,602 | 11,411,122 |
22,006,953 | ||
Insurance — 3.9% | ||
Dai-ichi Life Holdings, Inc. | 2,696,800 | 62,460,700 |
Japan Post Holdings Co. Ltd. | 5,601,200 | 53,790,007 |
Japan Post Insurance Co. Ltd. | 528,800 | 9,927,734 |
MS&AD Insurance Group Holdings, Inc. | 3,651,600 | 65,652,283 |
Sompo Holdings, Inc. | 2,564,000 | 50,741,897 |
INVESTMENTS | SHARES | VALUE($) |
Insurance — continued | ||
T&D Holdings, Inc. | 1,469,900 | 23,984,847 |
Tokio Marine Holdings, Inc. | 5,426,400 | 171,508,945 |
438,066,413 | ||
Interactive Media & Services — 0.2% | ||
LY Corp. | 7,356,400 | 17,674,738 |
IT Services — 2.1% | ||
Fujitsu Ltd. | 4,749,400 | 73,369,460 |
NEC Corp. | 695,000 | 50,319,384 |
Nomura Research Institute Ltd. | 1,161,800 | 28,113,118 |
NTT Data Group Corp. | 1,627,700 | 25,453,682 |
Obic Co. Ltd. | 179,100 | 23,008,358 |
Otsuka Corp. | 668,000 | 13,285,268 |
SCSK Corp. | 423,100 | 7,691,620 |
TIS, Inc. | 658,300 | 14,059,034 |
235,299,924 | ||
Leisure Products — 0.8% | ||
Bandai Namco Holdings, Inc. | 1,811,300 | 33,844,463 |
Sega Sammy Holdings, Inc. | 445,600 | 5,832,445 |
Shimano, Inc. | 225,800 | 36,695,439 |
Yamaha Corp. | 420,200 | 8,854,955 |
85,227,302 | ||
Machinery — 5.0% | ||
Daifuku Co. Ltd. | 984,100 | 20,158,112 |
FANUC Corp. | 2,483,000 | 73,544,718 |
Hitachi Construction Machinery Co. Ltd. | 281,900 | 8,051,707 |
Hoshizaki Corp. | 319,800 | 11,019,898 |
Kawasaki Heavy Industries Ltd. | 444,500 | 13,760,860 |
Komatsu Ltd. | 2,596,300 | 77,515,517 |
Kubota Corp. | 3,132,900 | 50,250,889 |
Kurita Water Industries Ltd. | 306,200 | 12,126,773 |
Makita Corp. | 705,100 | 20,413,279 |
MINEBEA MITSUMI, Inc. | 1,025,300 | 19,204,233 |
MISUMI Group, Inc. | 773,000 | 12,567,326 |
Mitsubishi Heavy Industries Ltd. | 9,192,000 | 82,186,748 |
NGK Insulators Ltd. | 840,100 | 11,444,091 |
SMC Corp. | 158,100 | 83,060,470 |
Toyota Industries Corp. | 470,600 | 44,719,646 |
Yaskawa Electric Corp. | 694,100 | 28,598,744 |
568,623,011 | ||
Marine Transportation — 0.8% | ||
Kawasaki Kisen Kaisha Ltd. | 1,205,700 | 16,988,178 |
April 30, 2024 | J.P. Morgan Exchange-Traded Funds | 101 |
INVESTMENTS | SHARES | VALUE($) |
Common Stocks — continued | ||
Marine Transportation — continued | ||
Mitsui OSK Lines Ltd. | 993,300 | 31,526,931 |
Nippon Yusen KK | 1,322,300 | 37,540,716 |
86,055,825 | ||
Media — 0.1% | ||
Dentsu Group, Inc. (a) | 629,200 | 17,021,862 |
Metals & Mining — 0.9% | ||
JFE Holdings, Inc. | 1,661,700 | 24,802,078 |
Nippon Steel Corp. | 2,524,700 | 56,601,054 |
Sumitomo Metal Mining Co. Ltd. | 725,500 | 24,237,970 |
105,641,102 | ||
Office REITs — 0.3% | ||
Japan Real Estate Investment Corp. | 3,805 | 12,903,296 |
Nippon Building Fund, Inc. | 4,499 | 17,189,754 |
30,093,050 | ||
Oil, Gas & Consumable Fuels — 0.8% | ||
ENEOS Holdings, Inc. | 8,272,200 | 38,219,341 |
Idemitsu Kosan Co. Ltd. | 2,890,760 | 19,585,246 |
Inpex Corp. (a) | 2,417,600 | 36,215,169 |
94,019,756 | ||
Paper & Forest Products — 0.1% | ||
Oji Holdings Corp. | 2,632,700 | 10,312,329 |
Passenger Airlines — 0.1% | ||
ANA Holdings, Inc. | 425,600 | 8,083,002 |
Japan Airlines Co. Ltd. | 395,900 | 7,014,861 |
15,097,863 | ||
Personal Care Products — 0.8% | ||
Kao Corp. | 1,274,200 | 52,563,589 |
Kose Corp. | 98,000 | 5,053,281 |
Shiseido Co. Ltd. | 1,094,600 | 29,300,535 |
86,917,405 | ||
Pharmaceuticals — 4.8% | ||
Astellas Pharma, Inc. | 4,928,600 | 47,304,219 |
Chugai Pharmaceutical Co. Ltd. | 1,756,500 | 55,863,498 |
Daiichi Sankyo Co. Ltd. | 5,261,000 | 177,073,220 |
Eisai Co. Ltd. | 745,800 | 30,629,304 |
Kyowa Kirin Co. Ltd. | 681,400 | 11,443,332 |
Ono Pharmaceutical Co. Ltd. | 1,223,600 | 17,623,962 |
Otsuka Holdings Co. Ltd. | 1,247,000 | 53,317,805 |
Shionogi & Co. Ltd. | 803,800 | 37,538,081 |
Takeda Pharmaceutical Co. Ltd. | 4,303,700 | 113,110,151 |
543,903,572 | ||
INVESTMENTS | SHARES | VALUE($) |
Professional Services — 1.7% | ||
Persol Holdings Co. Ltd. | 5,112,000 | 7,071,479 |
Recruit Holdings Co. Ltd. | 4,256,600 | 183,320,523 |
190,392,002 | ||
Real Estate Management & Development — 2.6% | ||
Daito Trust Construction Co. Ltd. | 177,800 | 19,059,163 |
Daiwa House Industry Co. Ltd. | 1,803,200 | 50,740,089 |
Hulic Co. Ltd. | 1,503,800 | 13,857,000 |
Mitsubishi Estate Co. Ltd. | 3,478,300 | 63,738,855 |
Mitsui Fudosan Co. Ltd. | 7,690,300 | 78,264,668 |
Nomura Real Estate Holdings, Inc. | 306,900 | 8,592,321 |
Sumitomo Realty & Development Co. Ltd. | 1,298,700 | 44,940,113 |
Tokyu Fudosan Holdings Corp. | 1,637,200 | 11,994,544 |
291,186,753 | ||
Retail REITs — 0.1% | ||
Japan Metropolitan Fund Invest | 19,157 | 11,565,629 |
Semiconductors & Semiconductor Equipment — 4.7% | ||
Advantest Corp. | 1,948,600 | 60,992,491 |
Disco Corp. | 249,300 | 71,012,050 |
Lasertec Corp. | 218,900 | 47,217,920 |
Renesas Electronics Corp. | 3,538,500 | 57,450,208 |
Rohm Co. Ltd. | 883,700 | 12,703,058 |
SUMCO Corp. (a) | 961,900 | 14,345,120 |
Tokyo Electron Ltd. | 1,225,300 | 268,764,552 |
532,485,399 | ||
Software — 0.2% | ||
Oracle Corp. | 91,400 | 6,859,076 |
Trend Micro, Inc. | 353,700 | 17,429,703 |
24,288,779 | ||
Specialty Retail — 1.5% | ||
ABC-Mart, Inc. | 274,300 | 5,463,586 |
Fast Retailing Co. Ltd. | 457,500 | 119,622,098 |
Nitori Holdings Co. Ltd. | 221,900 | 29,697,559 |
USS Co. Ltd. | 1,103,600 | 8,430,726 |
ZOZO, Inc. | 353,500 | 7,613,852 |
170,827,821 | ||
Technology Hardware, Storage & Peripherals — 1.6% | ||
Brother Industries Ltd. | 699,300 | 12,369,896 |
Canon, Inc. | 2,708,800 | 73,314,460 |
FUJIFILM Holdings Corp. | 3,296,900 | 70,133,265 |
102 | J.P. Morgan Exchange-Traded Funds | April 30, 2024 |
INVESTMENTS | SHARES | VALUE($) |
Common Stocks — continued | ||
Technology Hardware, Storage & Peripherals — continued | ||
Ricoh Co. Ltd. | 1,670,200 | 14,408,912 |
Seiko Epson Corp. | 838,400 | 13,791,669 |
184,018,202 | ||
Textiles, Apparel & Luxury Goods — 0.2% | ||
Asics Corp. | 500,700 | 21,461,180 |
Tobacco — 0.7% | ||
Japan Tobacco, Inc. | 3,038,800 | 81,748,631 |
Trading Companies & Distributors — 7.6% | ||
ITOCHU Corp. | 3,771,600 | 170,154,876 |
Marubeni Corp. | 4,619,200 | 82,297,343 |
Mitsubishi Corp. | 11,121,100 | 254,334,903 |
Mitsui & Co. Ltd. | 4,107,200 | 198,277,934 |
MonotaRO Co. Ltd. (a) | 681,500 | 8,167,696 |
Sojitz Corp. | 607,000 | 15,628,345 |
Sumitomo Corp. | 3,350,200 | 88,100,772 |
Toyota Tsusho Corp. | 647,000 | 41,136,222 |
858,098,091 | ||
Transportation Infrastructure — 0.1% | ||
Japan Airport Terminal Co. Ltd. | 214,900 | 7,594,395 |
Wireless Telecommunication Services — 3.0% | ||
KDDI Corp. | 4,126,500 | 114,505,410 |
SoftBank Corp. | 7,683,900 | 92,680,787 |
SoftBank Group Corp. | 2,645,700 | 130,117,107 |
337,303,304 | ||
Total Common Stocks (Cost $10,355,489,844) | 11,128,390,816 | |
INVESTMENTS | SHARES | VALUE($) |
Short-Term Investments — 0.2% | ||
Investment of Cash Collateral from Securities Loaned — 0.2% | ||
JPMorgan Securities Lending Money Market Fund Agency SL Class Shares, 5.47% (b) (c) | 17,345,163 | 17,346,897 |
JPMorgan U.S. Government Money Market Fund Class IM Shares, 5.25% (b) (c) | 2,508,735 | 2,508,735 |
Total Investment of Cash Collateral from Securities Loaned (Cost $19,855,867) | 19,855,632 | |
Total Investments — 99.0% (Cost $10,375,345,711) | 11,148,246,448 | |
Other Assets Less Liabilities — 1.0% | 109,102,841 | |
NET ASSETS — 100.0% | 11,257,349,289 | |
Percentages indicated are based on net assets. |
Abbreviations | |
REIT | Real Estate Investment Trust |
^ | Amount rounds to less than 0.1% of net assets. | |
* | Non-income producing security. | |
(a) | The security or a portion of this security is on loan at April 30, 2024. The total value of securities on loan at April 30, 2024 is $18,842,417. | |
(b) | Investment in an affiliated fund, which is registered under the Investment Company Act of 1940, as amended, and is advised by J.P. Morgan Investment Management Inc. | |
(c) | The rate shown is the current yield as of April 30, 2024. | |
DESCRIPTION | NUMBER OF CONTRACTS | EXPIRATION DATE | TRADING CURRENCY | NOTIONAL AMOUNT ($) | VALUE AND UNREALIZED APPRECIATION (DEPRECIATION) ($) |
Long Contracts | |||||
TOPIX Index | 733 | 06/13/2024 | JPY | 126,740,703 | (509,454 ) |
Abbreviations | |
JPY | Japanese Yen |
TOPIX | Tokyo Stock Price Index |
April 30, 2024 | J.P. Morgan Exchange-Traded Funds | 103 |
INVESTMENTS | SHARES | VALUE($) |
Common Stocks — 99.2% | ||
Aerospace & Defense — 1.9% | ||
Boeing Co. (The) * | 42,986 | 7,214,770 |
General Dynamics Corp. | 16,903 | 4,852,682 |
General Electric Co. | 73,910 | 11,960,116 |
HEICO Corp. | 2,978 | 617,637 |
HEICO Corp., Class A | 5,349 | 887,132 |
Howmet Aerospace, Inc. | 27,408 | 1,829,484 |
Huntington Ingalls Industries, Inc. | 2,794 | 773,743 |
L3Harris Technologies, Inc. | 12,621 | 2,701,525 |
Lockheed Martin Corp. | 15,112 | 7,026,022 |
Northrop Grumman Corp. | 10,623 | 5,152,474 |
RTX Corp. | 93,575 | 9,499,734 |
Textron, Inc. | 13,804 | 1,167,680 |
TransDigm Group, Inc. | 3,715 | 4,636,432 |
58,319,431 | ||
Air Freight & Logistics — 0.4% | ||
CH Robinson Worldwide, Inc. | 8,194 | 581,774 |
Expeditors International of Washington, Inc. | 10,183 | 1,133,469 |
FedEx Corp. | 16,623 | 4,351,569 |
United Parcel Service, Inc., Class B | 51,012 | 7,523,250 |
13,590,062 | ||
Automobile Components — 0.1% | ||
Aptiv plc * | 19,905 | 1,413,255 |
BorgWarner, Inc. | 16,522 | 541,426 |
Lear Corp. | 4,104 | 516,570 |
2,471,251 | ||
Automobiles — 1.4% | ||
Ford Motor Co. | 277,028 | 3,365,890 |
General Motors Co. | 81,329 | 3,621,581 |
Lucid Group, Inc. * (a) | 60,709 | 154,808 |
Rivian Automotive, Inc., Class A * (a) | 47,418 | 422,020 |
Tesla, Inc. * | 195,396 | 35,812,179 |
43,376,478 | ||
Banks — 3.3% | ||
Bank of America Corp. | 483,871 | 17,908,029 |
Citigroup, Inc. | 134,090 | 8,223,740 |
Citizens Financial Group, Inc. | 31,432 | 1,072,145 |
East West Bancorp, Inc. | 9,907 | 737,972 |
Fifth Third Bancorp | 44,771 | 1,632,351 |
First Citizens BancShares, Inc., Class A | 829 | 1,398,324 |
Huntington Bancshares, Inc. | 97,529 | 1,313,715 |
JPMorgan Chase & Co. (b) | 202,672 | 38,860,330 |
KeyCorp | 65,970 | 955,905 |
INVESTMENTS | SHARES | VALUE($) |
Banks — continued | ||
M&T Bank Corp. | 11,689 | 1,687,775 |
PNC Financial Services Group, Inc. (The) | 28,034 | 4,296,491 |
Regions Financial Corp. | 65,525 | 1,262,667 |
Truist Financial Corp. | 93,967 | 3,528,461 |
US Bancorp | 109,595 | 4,452,845 |
Wells Fargo & Co. | 253,805 | 15,055,712 |
102,386,462 | ||
Beverages — 1.4% | ||
Brown-Forman Corp., Class A | 3,425 | 168,065 |
Brown-Forman Corp., Class B | 21,447 | 1,026,239 |
Coca-Cola Co. (The) | 276,540 | 17,081,876 |
Constellation Brands, Inc., Class A | 10,994 | 2,786,539 |
Keurig Dr Pepper, Inc. | 67,955 | 2,290,083 |
Molson Coors Beverage Co., Class B | 12,548 | 718,498 |
Monster Beverage Corp. * | 54,875 | 2,933,069 |
PepsiCo, Inc. | 96,958 | 17,055,882 |
44,060,251 | ||
Biotechnology — 1.9% | ||
AbbVie, Inc. | 124,523 | 20,252,421 |
Alnylam Pharmaceuticals, Inc. * | 8,585 | 1,235,811 |
Amgen, Inc. | 37,736 | 10,337,400 |
Biogen, Inc. * | 10,214 | 2,194,172 |
BioMarin Pharmaceutical, Inc. * | 13,248 | 1,069,908 |
Exact Sciences Corp. * | 12,749 | 756,653 |
Gilead Sciences, Inc. | 87,880 | 5,729,776 |
Incyte Corp. * | 13,021 | 677,743 |
Moderna, Inc. * | 22,637 | 2,497,087 |
Neurocrine Biosciences, Inc. * | 6,906 | 949,851 |
Regeneron Pharmaceuticals, Inc. * | 7,539 | 6,714,686 |
Vertex Pharmaceuticals, Inc. * | 18,163 | 7,134,608 |
59,550,116 | ||
Broadline Retail — 4.1% | ||
Amazon.com, Inc. * | 661,217 | 115,712,975 |
Coupang, Inc. (South Korea) * | 82,584 | 1,858,140 |
eBay, Inc. | 36,610 | 1,886,880 |
Etsy, Inc. * (a) | 8,420 | 578,201 |
MercadoLibre, Inc. (Brazil) * | 3,440 | 5,017,928 |
125,054,124 | ||
Building Products — 0.5% | ||
Allegion plc | 6,184 | 751,727 |
Carrier Global Corp. | 59,180 | 3,638,978 |
Johnson Controls International plc | 47,972 | 3,121,538 |
104 | J.P. Morgan Exchange-Traded Funds | April 30, 2024 |
INVESTMENTS | SHARES | VALUE($) |
Common Stocks — continued | ||
Building Products — continued | ||
Lennox International, Inc. | 2,273 | 1,053,354 |
Masco Corp. | 15,813 | 1,082,400 |
Owens Corning | 6,252 | 1,051,649 |
Trane Technologies plc | 16,021 | 5,084,104 |
15,783,750 | ||
Capital Markets — 3.0% | ||
Ameriprise Financial, Inc. | 7,120 | 2,931,945 |
Ares Management Corp. | 11,748 | 1,563,541 |
Bank of New York Mellon Corp. (The) | 53,437 | 3,018,656 |
BlackRock, Inc. | 10,117 | 7,634,693 |
Blackstone, Inc. | 50,675 | 5,909,212 |
Carlyle Group, Inc. (The) | 14,449 | 647,315 |
Charles Schwab Corp. (The) | 101,199 | 7,483,666 |
CME Group, Inc. | 25,359 | 5,316,261 |
Coinbase Global, Inc., Class A * | 12,088 | 2,465,106 |
FactSet Research Systems, Inc. | 2,681 | 1,117,682 |
Franklin Resources, Inc. | 20,174 | 460,774 |
Goldman Sachs Group, Inc. (The) | 22,796 | 9,727,281 |
Intercontinental Exchange, Inc. | 40,323 | 5,191,990 |
KKR & Co., Inc. | 46,737 | 4,349,813 |
LPL Financial Holdings, Inc. | 5,327 | 1,433,656 |
MarketAxess Holdings, Inc. | 2,667 | 533,640 |
Moody's Corp. | 11,156 | 4,131,401 |
Morgan Stanley | 89,361 | 8,117,553 |
MSCI, Inc. | 5,574 | 2,596,313 |
Nasdaq, Inc. | 28,191 | 1,687,231 |
Northern Trust Corp. | 14,550 | 1,198,775 |
Raymond James Financial, Inc. | 13,303 | 1,622,966 |
S&P Global, Inc. | 22,141 | 9,206,892 |
State Street Corp. | 21,723 | 1,574,700 |
T. Rowe Price Group, Inc. | 15,651 | 1,714,880 |
91,635,942 | ||
Chemicals — 1.5% | ||
Air Products and Chemicals, Inc. | 15,672 | 3,703,920 |
Albemarle Corp. | 8,257 | 993,400 |
Celanese Corp. | 7,300 | 1,121,353 |
CF Industries Holdings, Inc. | 12,523 | 988,941 |
Corteva, Inc. | 49,655 | 2,687,825 |
Dow, Inc. | 49,406 | 2,811,201 |
DuPont de Nemours, Inc. | 30,289 | 2,195,953 |
Eastman Chemical Co. | 8,336 | 787,252 |
Ecolab, Inc. | 17,522 | 3,962,600 |
International Flavors & Fragrances, Inc. | 17,995 | 1,523,277 |
INVESTMENTS | SHARES | VALUE($) |
Chemicals — continued | ||
Linde plc | 34,127 | 15,048,642 |
LyondellBasell Industries NV, Class A | 18,238 | 1,823,253 |
Mosaic Co. (The) | 23,010 | 722,284 |
PPG Industries, Inc. | 16,621 | 2,144,109 |
Sherwin-Williams Co. (The) | 16,652 | 4,989,106 |
Westlake Corp. | 2,384 | 351,306 |
45,854,422 | ||
Commercial Services & Supplies — 0.6% | ||
Cintas Corp. | 6,169 | 4,061,299 |
Copart, Inc. * | 58,646 | 3,185,064 |
Republic Services, Inc. | 14,441 | 2,768,340 |
Rollins, Inc. | 20,746 | 924,442 |
Veralto Corp. | 16,329 | 1,529,701 |
Waste Management, Inc. | 25,906 | 5,388,966 |
17,857,812 | ||
Communications Equipment — 0.8% | ||
Arista Networks, Inc. * | 17,940 | 4,602,686 |
Cisco Systems, Inc. | 286,571 | 13,463,106 |
F5, Inc. * | 4,068 | 672,481 |
Juniper Networks, Inc. | 22,445 | 781,535 |
Motorola Solutions, Inc. | 11,701 | 3,968,394 |
23,488,202 | ||
Construction & Engineering — 0.1% | ||
Quanta Services, Inc. | 10,236 | 2,646,620 |
Construction Materials — 0.2% | ||
Martin Marietta Materials, Inc. | 4,346 | 2,551,406 |
Vulcan Materials Co. | 9,046 | 2,330,521 |
4,881,927 | ||
Consumer Finance — 0.5% | ||
American Express Co. | 40,527 | 9,484,534 |
Capital One Financial Corp. | 25,919 | 3,717,562 |
Discover Financial Services | 17,621 | 2,233,109 |
Synchrony Financial | 27,760 | 1,220,885 |
16,656,090 | ||
Consumer Staples Distribution & Retail — 1.8% | ||
Albertsons Cos., Inc., Class A | 29,402 | 599,801 |
Costco Wholesale Corp. | 31,296 | 22,623,878 |
Dollar General Corp. | 15,470 | 2,153,269 |
Dollar Tree, Inc. * | 14,529 | 1,718,054 |
Kroger Co. (The) | 47,125 | 2,609,783 |
Sysco Corp. | 35,099 | 2,608,558 |
Target Corp. | 32,533 | 5,237,162 |
April 30, 2024 | J.P. Morgan Exchange-Traded Funds | 105 |
INVESTMENTS | SHARES | VALUE($) |
Common Stocks — continued | ||
Consumer Staples Distribution & Retail — continued | ||
Walgreens Boots Alliance, Inc. | 50,448 | 894,443 |
Walmart, Inc. | 306,940 | 18,216,889 |
56,661,837 | ||
Containers & Packaging — 0.2% | ||
Amcor plc | 101,824 | 910,306 |
Avery Dennison Corp. | 5,645 | 1,226,546 |
Ball Corp. | 21,211 | 1,475,649 |
Crown Holdings, Inc. | 8,482 | 696,118 |
International Paper Co. | 23,206 | 810,818 |
Packaging Corp. of America | 6,033 | 1,043,588 |
WestRock Co. | 17,319 | 830,619 |
6,993,644 | ||
Distributors — 0.1% | ||
Genuine Parts Co. | 9,867 | 1,551,191 |
LKQ Corp. | 18,825 | 811,922 |
Pool Corp. | 2,662 | 965,055 |
3,328,168 | ||
Diversified REITs — 0.0% ^ | ||
WP Carey, Inc. | 15,304 | 839,271 |
Diversified Telecommunication Services — 0.7% | ||
AT&T, Inc. | 504,245 | 8,516,698 |
Verizon Communications, Inc. | 296,499 | 11,708,746 |
20,225,444 | ||
Electric Utilities — 1.5% | ||
Alliant Energy Corp. | 17,970 | 894,906 |
American Electric Power Co., Inc. | 37,079 | 3,189,906 |
Avangrid, Inc. | 5,011 | 183,052 |
Constellation Energy Corp. | 21,630 | 4,021,882 |
Duke Energy Corp. | 54,361 | 5,341,512 |
Edison International | 27,058 | 1,922,742 |
Entergy Corp. | 14,874 | 1,586,610 |
Evergy, Inc. | 15,557 | 815,965 |
Eversource Energy | 24,633 | 1,493,252 |
Exelon Corp. | 70,204 | 2,638,266 |
FirstEnergy Corp. | 36,295 | 1,391,550 |
NextEra Energy, Inc. | 144,552 | 9,680,647 |
NRG Energy, Inc. | 15,884 | 1,154,290 |
PG&E Corp. | 149,791 | 2,562,924 |
Pinnacle West Capital Corp. | 8,003 | 589,421 |
PPL Corp. | 51,980 | 1,427,371 |
INVESTMENTS | SHARES | VALUE($) |
Electric Utilities — continued | ||
Southern Co. (The) | 73,907 | 5,432,165 |
Xcel Energy, Inc. | 38,915 | 2,090,903 |
46,417,364 | ||
Electrical Equipment — 0.6% | ||
AMETEK, Inc. | 16,248 | 2,837,876 |
Eaton Corp. plc | 28,154 | 8,960,292 |
Emerson Electric Co. | 40,168 | 4,329,307 |
Hubbell, Inc. | 3,470 | 1,285,704 |
Rockwell Automation, Inc. | 8,090 | 2,192,067 |
19,605,246 | ||
Electronic Equipment, Instruments & Components — 0.6% | ||
Amphenol Corp., Class A | 40,889 | 4,938,165 |
CDW Corp. | 9,442 | 2,283,642 |
Corning, Inc. | 54,515 | 1,819,711 |
Flex Ltd. * | 30,510 | 874,112 |
Keysight Technologies, Inc. * | 12,467 | 1,844,368 |
TE Connectivity Ltd. | 21,171 | 2,995,273 |
Teledyne Technologies, Inc. * | 3,311 | 1,263,080 |
Trimble, Inc. * | 16,849 | 1,012,119 |
Zebra Technologies Corp., Class A * | 3,598 | 1,131,787 |
18,162,257 | ||
Energy Equipment & Services — 0.3% | ||
Baker Hughes Co. | 70,963 | 2,314,813 |
Halliburton Co. | 63,050 | 2,362,484 |
Schlumberger NV | 100,650 | 4,778,862 |
9,456,159 | ||
Entertainment — 1.2% | ||
Electronic Arts, Inc. | 17,200 | 2,181,304 |
Liberty Media Corp-Liberty Formula One, Class A * | 1,614 | 100,504 |
Liberty Media Corp-Liberty Formula One, Class C * | 14,469 | 1,012,396 |
Live Nation Entertainment, Inc. * | 9,935 | 883,321 |
Netflix, Inc. * | 30,526 | 16,808,836 |
ROBLOX Corp., Class A * | 33,730 | 1,199,439 |
Take-Two Interactive Software, Inc. * | 11,147 | 1,591,903 |
Walt Disney Co. (The) | 129,077 | 14,340,455 |
38,118,158 | ||
Financial Services — 4.3% | ||
Apollo Global Management, Inc. | 28,017 | 3,036,482 |
Berkshire Hathaway, Inc., Class B * | 127,839 | 50,717,567 |
Block, Inc. * | 38,997 | 2,846,781 |
106 | J.P. Morgan Exchange-Traded Funds | April 30, 2024 |
INVESTMENTS | SHARES | VALUE($) |
Common Stocks — continued | ||
Financial Services — continued | ||
Corebridge Financial, Inc. (a) | 10,947 | 290,752 |
Corpay, Inc. * | 4,796 | 1,449,063 |
Equitable Holdings, Inc. | 22,211 | 819,808 |
Fidelity National Information Services, Inc. | 41,738 | 2,834,845 |
Fiserv, Inc. * | 38,612 | 5,894,894 |
Global Payments, Inc. | 16,882 | 2,072,603 |
Jack Henry & Associates, Inc. | 5,124 | 833,624 |
Mastercard, Inc., Class A | 58,453 | 26,373,994 |
PayPal Holdings, Inc. * | 75,951 | 5,158,592 |
Visa, Inc., Class A (a) | 111,467 | 29,941,151 |
132,270,156 | ||
Food Products — 0.8% | ||
Archer-Daniels-Midland Co. | 37,467 | 2,197,814 |
Bunge Global SA | 10,216 | 1,039,580 |
Campbell Soup Co. | 14,031 | 641,357 |
Conagra Brands, Inc. | 32,089 | 987,700 |
General Mills, Inc. | 40,018 | 2,819,668 |
Hershey Co. (The) | 10,549 | 2,045,662 |
Hormel Foods Corp. | 20,427 | 726,384 |
J M Smucker Co. (The) | 7,477 | 858,734 |
Kellanova | 18,571 | 1,074,518 |
Kraft Heinz Co. (The) | 56,406 | 2,177,836 |
Lamb Weston Holdings, Inc. | 10,201 | 850,151 |
McCormick & Co., Inc. (Non-Voting) | 17,723 | 1,348,011 |
Mondelez International, Inc., Class A | 95,983 | 6,905,017 |
Tyson Foods, Inc., Class A | 18,993 | 1,151,926 |
24,824,358 | ||
Gas Utilities — 0.0% ^ | ||
Atmos Energy Corp. | 10,445 | 1,231,466 |
Ground Transportation — 1.0% | ||
CSX Corp. | 139,358 | 4,629,473 |
JB Hunt Transport Services, Inc. | 5,561 | 904,052 |
Norfolk Southern Corp. | 15,940 | 3,671,301 |
Old Dominion Freight Line, Inc. | 13,398 | 2,434,550 |
Uber Technologies, Inc. * | 139,902 | 9,271,305 |
Union Pacific Corp. | 42,949 | 10,185,785 |
31,096,466 | ||
Health Care Equipment & Supplies — 2.4% | ||
Abbott Laboratories | 122,305 | 12,960,661 |
Align Technology, Inc. * | 5,372 | 1,516,945 |
Baxter International, Inc. | 35,734 | 1,442,582 |
Becton Dickinson & Co. | 19,507 | 4,576,342 |
Boston Scientific Corp. * | 103,207 | 7,417,487 |
INVESTMENTS | SHARES | VALUE($) |
Health Care Equipment & Supplies — continued | ||
Cooper Cos., Inc. (The) | 13,946 | 1,242,031 |
Dexcom, Inc. * | 26,855 | 3,421,059 |
Edwards Lifesciences Corp. * | 42,426 | 3,592,210 |
GE HealthCare Technologies, Inc. | 26,615 | 2,029,128 |
Hologic, Inc. * | 16,897 | 1,280,286 |
IDEXX Laboratories, Inc. * | 5,799 | 2,857,515 |
Insulet Corp. * | 4,915 | 845,085 |
Intuitive Surgical, Inc. * | 23,479 | 8,701,787 |
Medtronic plc | 93,820 | 7,528,117 |
ResMed, Inc. | 10,359 | 2,216,722 |
STERIS plc | 6,956 | 1,422,919 |
Stryker Corp. | 24,542 | 8,258,383 |
Teleflex, Inc. | 3,183 | 664,451 |
Zimmer Biomet Holdings, Inc. | 14,112 | 1,697,391 |
73,671,101 | ||
Health Care Providers & Services — 2.5% | ||
Cardinal Health, Inc. | 17,355 | 1,788,259 |
Cencora, Inc. | 11,064 | 2,644,849 |
Centene Corp. * | 37,560 | 2,744,134 |
Cigna Group (The) | 19,691 | 7,030,475 |
CVS Health Corp. | 90,669 | 6,139,198 |
Elevance Health, Inc. | 15,740 | 8,319,849 |
HCA Healthcare, Inc. | 14,035 | 4,348,324 |
Henry Schein, Inc. * | 8,529 | 590,889 |
Humana, Inc. | 8,179 | 2,470,794 |
Laboratory Corp. of America Holdings | 5,987 | 1,205,602 |
McKesson Corp. | 9,253 | 4,970,804 |
Molina Healthcare, Inc. * | 3,836 | 1,312,296 |
Quest Diagnostics, Inc. | 7,922 | 1,094,662 |
UnitedHealth Group, Inc. | 65,153 | 31,514,506 |
Universal Health Services, Inc., Class B | 4,142 | 705,921 |
76,880,562 | ||
Health Care REITs — 0.2% | ||
Healthpeak Properties, Inc. | 49,822 | 927,187 |
Ventas, Inc. | 26,997 | 1,195,427 |
Welltower, Inc. | 39,028 | 3,718,588 |
5,841,202 | ||
Health Care Technology — 0.1% | ||
Veeva Systems, Inc., Class A * | 10,286 | 2,042,388 |
Hotel & Resort REITs — 0.0% ^ | ||
Host Hotels & Resorts, Inc. | 46,920 | 885,380 |
April 30, 2024 | J.P. Morgan Exchange-Traded Funds | 107 |
INVESTMENTS | SHARES | VALUE($) |
Common Stocks — continued | ||
Hotels, Restaurants & Leisure — 2.0% | ||
Airbnb, Inc., Class A * | 28,953 | 4,591,077 |
Booking Holdings, Inc. | 2,409 | 8,315,940 |
Caesars Entertainment, Inc. * | 14,595 | 522,793 |
Carnival Corp. * | 66,945 | 992,125 |
Chipotle Mexican Grill, Inc. * | 1,772 | 5,598,811 |
Darden Restaurants, Inc. | 8,475 | 1,300,150 |
Domino's Pizza, Inc. | 2,457 | 1,300,416 |
DoorDash, Inc., Class A * | 19,489 | 2,519,148 |
Expedia Group, Inc. * | 9,380 | 1,262,830 |
Hilton Worldwide Holdings, Inc. | 16,682 | 3,291,025 |
Las Vegas Sands Corp. | 21,472 | 952,498 |
Marriott International, Inc., Class A | 17,570 | 4,148,804 |
McDonald's Corp. | 50,930 | 13,905,927 |
MGM Resorts International * | 19,638 | 774,523 |
Royal Caribbean Cruises Ltd. * | 16,564 | 2,312,831 |
Starbucks Corp. | 80,076 | 7,085,925 |
Vail Resorts, Inc. | 2,550 | 482,894 |
Wynn Resorts Ltd. | 6,780 | 621,387 |
Yum! Brands, Inc. | 19,769 | 2,792,371 |
62,771,475 | ||
Household Durables — 0.4% | ||
DR Horton, Inc. | 21,693 | 3,091,035 |
Garmin Ltd. | 10,838 | 1,565,766 |
Lennar Corp., Class A | 17,628 | 2,672,757 |
Lennar Corp., Class B | 818 | 114,839 |
NVR, Inc. * | 209 | 1,554,720 |
PulteGroup, Inc. | 15,169 | 1,690,130 |
10,689,247 | ||
Household Products — 1.3% | ||
Church & Dwight Co., Inc. | 17,365 | 1,873,510 |
Clorox Co. (The) | 8,745 | 1,293,123 |
Colgate-Palmolive Co. | 58,065 | 5,337,335 |
Kimberly-Clark Corp. | 23,788 | 3,247,775 |
Procter & Gamble Co. (The) | 165,939 | 27,081,245 |
38,832,988 | ||
Independent Power and Renewable Electricity Producers — 0.1% | ||
AES Corp. (The) | 47,129 | 843,609 |
Vistra Corp. | 23,394 | 1,774,201 |
2,617,810 | ||
INVESTMENTS | SHARES | VALUE($) |
Industrial Conglomerates — 0.4% | ||
3M Co. | 38,949 | 3,758,968 |
Honeywell International, Inc. | 46,490 | 8,960,018 |
12,718,986 | ||
Industrial REITs — 0.2% | ||
Prologis, Inc. | 65,151 | 6,648,660 |
Insurance — 2.1% | ||
Aflac, Inc. | 37,544 | 3,140,556 |
Allstate Corp. (The) | 18,436 | 3,135,226 |
American Financial Group, Inc. | 4,997 | 638,367 |
American International Group, Inc. | 47,922 | 3,609,006 |
Aon plc, Class A | 14,086 | 3,972,393 |
Arch Capital Group Ltd. * | 26,254 | 2,455,799 |
Arthur J Gallagher & Co. | 15,131 | 3,551,094 |
Brown & Brown, Inc. | 16,436 | 1,340,191 |
Chubb Ltd. | 26,782 | 6,659,076 |
Cincinnati Financial Corp. | 10,922 | 1,263,566 |
Everest Group Ltd. | 3,011 | 1,103,261 |
Fidelity National Financial, Inc. | 18,167 | 899,267 |
Globe Life, Inc. | 6,637 | 505,540 |
Hartford Financial Services Group, Inc. (The) | 19,646 | 1,903,501 |
Loews Corp. | 12,912 | 970,337 |
Markel Group, Inc. * | 841 | 1,226,514 |
Marsh & McLennan Cos., Inc. | 34,774 | 6,934,979 |
MetLife, Inc. | 43,233 | 3,073,002 |
Principal Financial Group, Inc. | 16,718 | 1,323,063 |
Progressive Corp. (The) | 41,206 | 8,581,149 |
Prudential Financial, Inc. | 25,428 | 2,809,285 |
Reinsurance Group of America, Inc. | 4,481 | 837,902 |
Travelers Cos., Inc. (The) | 16,085 | 3,412,594 |
Willis Towers Watson plc | 7,275 | 1,827,043 |
WR Berkley Corp. | 14,471 | 1,113,833 |
66,286,544 | ||
Interactive Media & Services — 6.5% | ||
Alphabet, Inc., Class A * | 415,594 | 67,650,391 |
Alphabet, Inc., Class C * | 372,759 | 61,371,042 |
Match Group, Inc. * | 18,459 | 568,906 |
Meta Platforms, Inc., Class A | 156,526 | 67,332,790 |
Pinterest, Inc., Class A * | 38,911 | 1,301,573 |
Snap, Inc., Class A * | 71,864 | 1,081,553 |
199,306,255 | ||
IT Services — 1.3% | ||
Accenture plc, Class A | 44,221 | 13,306,541 |
Akamai Technologies, Inc. * | 10,636 | 1,073,492 |
108 | J.P. Morgan Exchange-Traded Funds | April 30, 2024 |
INVESTMENTS | SHARES | VALUE($) |
Common Stocks — continued | ||
IT Services — continued | ||
Cloudflare, Inc., Class A * | 20,857 | 1,822,902 |
Cognizant Technology Solutions Corp., Class A | 35,365 | 2,322,773 |
EPAM Systems, Inc. * | 4,066 | 956,567 |
Gartner, Inc. * | 5,342 | 2,204,056 |
GoDaddy, Inc., Class A * | 9,224 | 1,128,833 |
International Business Machines Corp. | 64,388 | 10,701,286 |
MongoDB, Inc. * | 4,678 | 1,708,312 |
Okta, Inc. * | 11,040 | 1,026,499 |
Snowflake, Inc., Class A * | 21,608 | 3,353,562 |
Twilio, Inc., Class A * | 11,865 | 710,476 |
VeriSign, Inc. * | 6,240 | 1,057,555 |
41,372,854 | ||
Life Sciences Tools & Services — 1.4% | ||
Agilent Technologies, Inc. | 19,788 | 2,711,747 |
Avantor, Inc. * | 45,929 | 1,112,860 |
Bio-Rad Laboratories, Inc., Class A * | 1,497 | 403,816 |
Bio-Techne Corp. | 11,135 | 703,843 |
Charles River Laboratories International, Inc. * | 3,436 | 786,844 |
Danaher Corp. | 47,634 | 11,747,497 |
Illumina, Inc. * | 11,168 | 1,374,222 |
IQVIA Holdings, Inc. * | 12,874 | 2,983,807 |
Mettler-Toledo International, Inc. * | 1,524 | 1,874,063 |
Revvity, Inc. | 8,708 | 892,309 |
Thermo Fisher Scientific, Inc. | 27,250 | 15,497,620 |
Waters Corp. * | 4,167 | 1,287,770 |
West Pharmaceutical Services, Inc. | 5,012 | 1,791,690 |
43,168,088 | ||
Machinery — 1.7% | ||
Caterpillar, Inc. | 35,911 | 12,014,743 |
CNH Industrial NV | 66,953 | 763,264 |
Cummins, Inc. | 9,585 | 2,707,667 |
Deere & Co. | 18,155 | 7,106,049 |
Dover Corp. | 9,846 | 1,765,388 |
Fortive Corp. | 24,753 | 1,863,158 |
IDEX Corp. | 5,119 | 1,128,535 |
Illinois Tool Works, Inc. | 21,156 | 5,164,391 |
Ingersoll Rand, Inc. | 26,662 | 2,488,098 |
Otis Worldwide Corp. | 28,856 | 2,631,667 |
PACCAR, Inc. | 36,259 | 3,847,442 |
Parker-Hannifin Corp. | 8,704 | 4,742,897 |
Pentair plc | 11,644 | 920,924 |
Snap-on, Inc. | 3,701 | 991,720 |
Stanley Black & Decker, Inc. | 10,784 | 985,658 |
INVESTMENTS | SHARES | VALUE($) |
Machinery — continued | ||
Westinghouse Air Brake Technologies Corp. | 12,550 | 2,021,554 |
Xylem, Inc. | 16,987 | 2,220,201 |
53,363,356 | ||
Media — 0.6% | ||
Charter Communications, Inc., Class A * | 7,125 | 1,823,573 |
Comcast Corp., Class A | 279,454 | 10,649,992 |
Fox Corp., Class A | 17,389 | 539,233 |
Fox Corp., Class B | 9,408 | 269,821 |
Interpublic Group of Cos., Inc. (The) | 26,994 | 821,697 |
Liberty Broadband Corp., Class A * | 1,203 | 60,306 |
Liberty Broadband Corp., Class C * | 7,974 | 396,547 |
Liberty Media Corp-Liberty SiriusXM * | 11,232 | 270,242 |
Liberty Media Corp-Liberty SiriusXM, Class A * | 5,494 | 132,186 |
News Corp., Class A | 26,686 | 635,127 |
News Corp., Class B (a) | 7,371 | 180,884 |
Omnicom Group, Inc. | 13,476 | 1,251,112 |
Sirius XM Holdings, Inc. (a) | 44,399 | 130,533 |
Trade Desk, Inc. (The), Class A * | 31,408 | 2,602,153 |
19,763,406 | ||
Metals & Mining — 0.4% | ||
Freeport-McMoRan, Inc. | 101,125 | 5,050,183 |
Newmont Corp. | 78,670 | 3,197,149 |
Nucor Corp. | 17,278 | 2,911,861 |
Southern Copper Corp. (Mexico) | 6,055 | 706,437 |
Steel Dynamics, Inc. | 11,042 | 1,436,785 |
13,302,415 | ||
Mortgage Real Estate Investment Trusts (REITs) — 0.0% ^ | ||
Annaly Capital Management, Inc. | 35,207 | 659,779 |
Multi-Utilities — 0.6% | ||
Ameren Corp. | 17,513 | 1,293,685 |
CenterPoint Energy, Inc. | 44,468 | 1,295,798 |
CMS Energy Corp. | 20,533 | 1,244,505 |
Consolidated Edison, Inc. | 24,353 | 2,298,923 |
Dominion Energy, Inc. | 59,003 | 3,007,973 |
DTE Energy Co. | 14,525 | 1,602,398 |
NiSource, Inc. | 31,515 | 878,008 |
Public Service Enterprise Group, Inc. | 35,098 | 2,424,570 |
Sempra | 44,381 | 3,179,011 |
WEC Energy Group, Inc. | 22,233 | 1,837,335 |
19,062,206 | ||
April 30, 2024 | J.P. Morgan Exchange-Traded Funds | 109 |
INVESTMENTS | SHARES | VALUE($) |
Common Stocks — continued | ||
Office REITs — 0.1% | ||
Alexandria Real Estate Equities, Inc. (a) | 12,126 | 1,405,040 |
Boston Properties, Inc. | 11,042 | 683,389 |
2,088,429 | ||
Oil, Gas & Consumable Fuels — 3.8% | ||
APA Corp. | 25,990 | 817,126 |
Cheniere Energy, Inc. | 16,778 | 2,647,904 |
Chevron Corp. | 130,532 | 21,050,896 |
ConocoPhillips | 83,009 | 10,427,591 |
Coterra Energy, Inc. | 52,569 | 1,438,288 |
Devon Energy Corp. | 45,092 | 2,307,808 |
Diamondback Energy, Inc. | 12,062 | 2,426,030 |
EOG Resources, Inc. | 41,040 | 5,422,615 |
EQT Corp. | 27,100 | 1,086,439 |
Exxon Mobil Corp. | 279,769 | 33,088,280 |
Hess Corp. | 19,631 | 3,091,686 |
Kinder Morgan, Inc. | 138,572 | 2,533,096 |
Marathon Oil Corp. | 41,223 | 1,106,837 |
Marathon Petroleum Corp. | 25,927 | 4,711,454 |
Occidental Petroleum Corp. | 46,822 | 3,096,807 |
ONEOK, Inc. | 41,034 | 3,246,610 |
Phillips 66 | 30,257 | 4,333,105 |
Pioneer Natural Resources Co. | 16,435 | 4,426,274 |
Targa Resources Corp. | 15,602 | 1,779,564 |
Texas Pacific Land Corp. | 1,327 | 764,750 |
Valero Energy Corp. | 23,372 | 3,736,482 |
Williams Cos., Inc. (The) | 85,666 | 3,286,148 |
116,825,790 | ||
Passenger Airlines — 0.2% | ||
Delta Air Lines, Inc. | 45,236 | 2,264,966 |
Southwest Airlines Co. | 41,864 | 1,085,952 |
United Airlines Holdings, Inc. * | 23,045 | 1,185,896 |
4,536,814 | ||
Personal Care Products — 0.2% | ||
Estee Lauder Cos., Inc. (The), Class A | 16,351 | 2,398,855 |
Kenvue, Inc. | 122,213 | 2,300,049 |
4,698,904 | ||
Pharmaceuticals — 3.8% | ||
Bristol-Myers Squibb Co. | 143,492 | 6,305,038 |
Eli Lilly & Co. | 59,577 | 46,535,595 |
Jazz Pharmaceuticals plc * | 4,420 | 489,515 |
Johnson & Johnson | 169,774 | 24,547,623 |
Merck & Co., Inc. | 178,710 | 23,092,906 |
INVESTMENTS | SHARES | VALUE($) |
Pharmaceuticals — continued | ||
Pfizer, Inc. | 398,214 | 10,202,243 |
Royalty Pharma plc, Class A | 27,159 | 752,304 |
Viatris, Inc. | 81,138 | 938,767 |
Zoetis, Inc. | 32,368 | 5,154,280 |
118,018,271 | ||
Professional Services — 0.7% | ||
Automatic Data Processing, Inc. | 28,967 | 7,006,828 |
Booz Allen Hamilton Holding Corp. | 8,415 | 1,242,643 |
Broadridge Financial Solutions, Inc. | 7,996 | 1,546,506 |
Dayforce, Inc. * | 10,495 | 644,078 |
Equifax, Inc. | 8,687 | 1,912,791 |
Jacobs Solutions, Inc. | 8,878 | 1,274,259 |
Leidos Holdings, Inc. | 9,126 | 1,279,648 |
Paychex, Inc. | 22,816 | 2,710,769 |
Paycom Software, Inc. | 3,489 | 655,862 |
Paylocity Holding Corp. * | 3,067 | 475,876 |
SS&C Technologies Holdings, Inc. | 15,181 | 939,552 |
TransUnion | 13,136 | 958,928 |
Verisk Analytics, Inc. | 10,225 | 2,228,641 |
22,876,381 | ||
Real Estate Management & Development — 0.2% | ||
CBRE Group, Inc., Class A * | 21,422 | 1,861,358 |
CoStar Group, Inc. * | 27,357 | 2,503,986 |
Zillow Group, Inc., Class A * | 3,612 | 151,704 |
Zillow Group, Inc., Class C * | 11,178 | 475,847 |
4,992,895 | ||
Residential REITs — 0.3% | ||
AvalonBay Communities, Inc. | 9,361 | 1,774,565 |
Camden Property Trust | 7,507 | 748,298 |
Equity LifeStyle Properties, Inc. | 12,074 | 727,941 |
Equity Residential | 26,308 | 1,694,235 |
Essex Property Trust, Inc. | 4,315 | 1,062,569 |
Invitation Homes, Inc. | 41,688 | 1,425,729 |
Mid-America Apartment Communities, Inc. | 8,212 | 1,067,560 |
Sun Communities, Inc. | 8,418 | 937,092 |
UDR, Inc. | 23,085 | 879,077 |
10,317,066 | ||
Retail REITs — 0.3% | ||
Federal Realty Investment Trust | 5,685 | 592,206 |
Kimco Realty Corp. | 47,389 | 882,857 |
Realty Income Corp. | 58,642 | 3,139,693 |
110 | J.P. Morgan Exchange-Traded Funds | April 30, 2024 |
INVESTMENTS | SHARES | VALUE($) |
Common Stocks — continued | ||
Retail REITs — continued | ||
Regency Centers Corp. | 11,762 | 696,546 |
Simon Property Group, Inc. | 22,991 | 3,230,925 |
8,542,227 | ||
Semiconductors & Semiconductor Equipment — 9.9% | ||
Advanced Micro Devices, Inc. * | 113,711 | 18,009,548 |
Analog Devices, Inc. | 34,992 | 7,019,745 |
Applied Materials, Inc. | 58,623 | 11,645,459 |
Broadcom, Inc. | 33,006 | 42,916,712 |
Enphase Energy, Inc. * | 9,628 | 1,047,141 |
Entegris, Inc. | 9,994 | 1,328,403 |
First Solar, Inc. * | 7,162 | 1,262,661 |
Intel Corp. | 298,174 | 9,085,362 |
KLA Corp. | 9,585 | 6,606,845 |
Lam Research Corp. | 9,225 | 8,250,932 |
Marvell Technology, Inc. | 58,540 | 3,858,371 |
Microchip Technology, Inc. | 37,435 | 3,443,271 |
Micron Technology, Inc. | 77,774 | 8,785,351 |
Monolithic Power Systems, Inc. | 3,171 | 2,122,446 |
NVIDIA Corp. | 167,920 | 145,086,238 |
NXP Semiconductors NV (China) | 18,186 | 4,659,071 |
ON Semiconductor Corp. * | 30,334 | 2,128,234 |
Qorvo, Inc. * | 6,851 | 800,471 |
QUALCOMM, Inc. | 78,492 | 13,017,898 |
Skyworks Solutions, Inc. | 11,258 | 1,199,990 |
Teradyne, Inc. | 10,776 | 1,253,464 |
Texas Instruments, Inc. | 63,991 | 11,289,292 |
304,816,905 | ||
Software — 10.6% | ||
Adobe, Inc. * | 31,883 | 14,756,409 |
ANSYS, Inc. * | 6,127 | 1,990,540 |
Aspen Technology, Inc. * | 1,961 | 386,062 |
Atlassian Corp., Class A * | 10,074 | 1,735,750 |
Autodesk, Inc. * | 15,059 | 3,205,308 |
Bentley Systems, Inc., Class B | 15,818 | 830,920 |
Bill Holdings, Inc. * | 6,916 | 431,282 |
Cadence Design Systems, Inc. * | 19,147 | 5,277,488 |
Crowdstrike Holdings, Inc., Class A * | 15,964 | 4,670,109 |
Datadog, Inc., Class A * | 19,197 | 2,409,224 |
DocuSign, Inc. * | 14,317 | 810,342 |
Dynatrace, Inc. * | 15,656 | 709,373 |
Fair Isaac Corp. * | 1,722 | 1,951,594 |
Fortinet, Inc. * | 45,865 | 2,897,751 |
Gen Digital, Inc. | 41,616 | 838,146 |
INVESTMENTS | SHARES | VALUE($) |
Software — continued | ||
HubSpot, Inc. * | 3,404 | 2,058,977 |
Intuit, Inc. | 18,804 | 11,764,158 |
Microsoft Corp. | 524,021 | 204,017,096 |
Oracle Corp. | 112,446 | 12,790,733 |
Palantir Technologies, Inc., Class A * | 130,610 | 2,869,502 |
Palo Alto Networks, Inc. * | 22,180 | 6,451,940 |
PTC, Inc. * | 8,394 | 1,489,431 |
Roper Technologies, Inc. | 6,956 | 3,557,716 |
Salesforce, Inc. | 66,086 | 17,773,169 |
ServiceNow, Inc. * | 13,749 | 9,532,594 |
Synopsys, Inc. * | 10,375 | 5,504,871 |
Tyler Technologies, Inc. * | 2,859 | 1,319,571 |
Unity Software, Inc. * | 16,968 | 411,813 |
Workday, Inc., Class A * | 14,683 | 3,593,371 |
Zoom Video Communications, Inc., Class A * | 16,521 | 1,009,433 |
Zscaler, Inc. * | 6,403 | 1,107,335 |
328,152,008 | ||
Specialized REITs — 0.9% | ||
American Tower Corp. | 32,872 | 5,639,520 |
Crown Castle, Inc. | 30,530 | 2,863,103 |
Digital Realty Trust, Inc. | 20,865 | 2,895,645 |
Equinix, Inc. | 6,627 | 4,712,526 |
Extra Space Storage, Inc. | 14,406 | 1,934,438 |
Iron Mountain, Inc. | 20,588 | 1,595,982 |
Public Storage | 11,153 | 2,893,646 |
SBA Communications Corp. | 7,598 | 1,414,140 |
VICI Properties, Inc. | 72,629 | 2,073,558 |
Weyerhaeuser Co. | 48,295 | 1,457,060 |
27,479,618 | ||
Specialty Retail — 1.8% | ||
AutoZone, Inc. * | 1,223 | 3,615,677 |
Best Buy Co., Inc. | 13,103 | 964,905 |
Burlington Stores, Inc. * | 4,236 | 762,226 |
CarMax, Inc. * (a) | 11,138 | 757,050 |
Home Depot, Inc. (The) | 70,124 | 23,436,843 |
Lowe's Cos., Inc. | 40,542 | 9,243,170 |
O'Reilly Automotive, Inc. * | 4,133 | 4,187,804 |
Ross Stores, Inc. | 22,036 | 2,854,764 |
TJX Cos., Inc. (The) | 80,301 | 7,555,521 |
Tractor Supply Co. (a) | 7,613 | 2,078,958 |
Ulta Beauty, Inc. * | 3,356 | 1,358,643 |
56,815,561 | ||
April 30, 2024 | J.P. Morgan Exchange-Traded Funds | 111 |
INVESTMENTS | SHARES | VALUE($) |
Common Stocks — continued | ||
Technology Hardware, Storage & Peripherals — 5.9% | ||
Apple, Inc. | 1,026,119 | 174,778,849 |
Dell Technologies, Inc., Class C | 11,317 | 1,410,551 |
Hewlett Packard Enterprise Co. | 90,481 | 1,538,177 |
HP, Inc. | 61,027 | 1,714,249 |
NetApp, Inc. | 14,734 | 1,505,962 |
Seagate Technology Holdings plc | 14,667 | 1,260,042 |
Western Digital Corp. * | 21,174 | 1,499,754 |
183,707,584 | ||
Textiles, Apparel & Luxury Goods — 0.3% | ||
Lululemon Athletica, Inc. * | 7,800 | 2,812,680 |
NIKE, Inc., Class B | 83,101 | 7,666,898 |
10,479,578 | ||
Tobacco — 0.5% | ||
Altria Group, Inc. | 124,736 | 5,464,684 |
Philip Morris International, Inc. | 109,365 | 10,383,113 |
15,847,797 | ||
Trading Companies & Distributors — 0.4% | ||
Fastenal Co. | 40,271 | 2,736,012 |
Ferguson plc | 14,341 | 3,010,176 |
United Rentals, Inc. | 4,771 | 3,186,980 |
Watsco, Inc. | 2,377 | 1,064,231 |
WW Grainger, Inc. | 3,189 | 2,938,185 |
12,935,584 | ||
Water Utilities — 0.1% | ||
American Water Works Co., Inc. | 13,729 | 1,679,331 |
Wireless Telecommunication Services — 0.2% | ||
T-Mobile US, Inc. | 31,884 | 5,234,396 |
Total Common Stocks (Cost $2,620,314,508) | 3,066,772,775 | |
NO. OF RIGHTS | ||
Rights — 0.0% ^ | ||
Health Care Equipment & Supplies — 0.0% ^ | ||
ABIOMED, Inc., CVR ‡ * (Cost $1,765) | 1,730 | 1,765 |
SHARES | ||
Short-Term Investments — 1.6% | ||
Investment Companies — 0.7% | ||
JPMorgan U.S. Government Money Market Fund Class IM Shares, 5.25% (c) (d) (Cost $22,371,012) | 22,371,012 | 22,371,012 |
INVESTMENTS | SHARES | VALUE($) |
Investment of Cash Collateral from Securities Loaned — 0.9% | ||
JPMorgan Securities Lending Money Market Fund Agency SL Class Shares, 5.47% (c) (d) | 24,994,301 | 24,996,801 |
JPMorgan U.S. Government Money Market Fund Class IM Shares, 5.25% (c) (d) | 3,614,466 | 3,614,466 |
Total Investment of Cash Collateral from Securities Loaned (Cost $28,617,265) | 28,611,267 | |
Total Short-Term Investments (Cost $50,988,277) | 50,982,279 | |
Total Investments — 100.8% (Cost $2,671,304,550) | 3,117,756,819 | |
Liabilities in Excess of Other Assets — (0.8)% | (26,047,357 ) | |
NET ASSETS — 100.0% | 3,091,709,462 | |
Percentages indicated are based on net assets. |
Abbreviations | |
CVR | Contingent Value Rights |
REIT | Real Estate Investment Trust |
^ | Amount rounds to less than 0.1% of net assets. | |
‡ | Value determined using significant unobservable inputs. | |
* | Non-income producing security. | |
(a) | The security or a portion of this security is on loan at April 30, 2024. The total value of securities on loan at April 30, 2024 is $27,667,394. | |
(b) | Investment in affiliate. This security is included in an index which the Fund, as an index fund, tracks. | |
(c) | Investment in an affiliated fund, which is registered under the Investment Company Act of 1940, as amended, and is advised by J.P. Morgan Investment Management Inc. | |
(d) | The rate shown is the current yield as of April 30, 2024. | |
112 | J.P. Morgan Exchange-Traded Funds | April 30, 2024 |
DESCRIPTION | NUMBER OF CONTRACTS | EXPIRATION DATE | TRADING CURRENCY | NOTIONAL AMOUNT ($) | VALUE AND UNREALIZED APPRECIATION (DEPRECIATION) ($) |
Long Contracts | |||||
S&P 500 E-Mini Index | 98 | 06/21/2024 | USD | 24,817,275 | (662,839 ) |
Abbreviations | |
USD | United States Dollar |
April 30, 2024 | J.P. Morgan Exchange-Traded Funds | 113 |
INVESTMENTS | SHARES | VALUE($) |
Common Stocks — 99.2% | ||
Aerospace & Defense — 1.9% | ||
Axon Enterprise, Inc. * | 33,373 | 10,467,775 |
BWX Technologies, Inc. | 42,754 | 4,094,551 |
Curtiss-Wright Corp. | 17,857 | 4,525,321 |
Hexcel Corp. | 39,310 | 2,524,095 |
Leonardo DRS, Inc. * | 24,163 | 519,988 |
Parsons Corp. * | 20,340 | 1,596,893 |
Spirit AeroSystems Holdings, Inc., Class A * | 49,377 | 1,580,064 |
Woodward, Inc. | 26,143 | 4,244,577 |
29,553,264 | ||
Air Freight & Logistics — 0.2% | ||
GXO Logistics, Inc. * | 55,474 | 2,754,839 |
Automobile Components — 0.8% | ||
Adient plc * | 43,725 | 1,306,066 |
Autoliv, Inc. (Sweden) | 33,475 | 4,009,970 |
Fox Factory Holding Corp. * | 19,794 | 770,382 |
Gentex Corp. | 109,082 | 3,741,513 |
Goodyear Tire & Rubber Co. (The) * | 127,945 | 1,530,222 |
Visteon Corp. * | 12,963 | 1,434,097 |
12,792,250 | ||
Automobiles — 0.3% | ||
Harley-Davidson, Inc. | 65,103 | 2,238,892 |
Thor Industries, Inc. | 23,928 | 2,378,922 |
4,617,814 | ||
Banks — 3.9% | ||
Bank OZK | 50,272 | 2,244,645 |
BOK Financial Corp. | 11,434 | 1,014,539 |
Cadence Bank | 84,197 | 2,329,731 |
Comerica, Inc. | 61,526 | 3,086,759 |
Commerce Bancshares, Inc. | 59,364 | 3,246,024 |
Cullen/Frost Bankers, Inc. | 27,160 | 2,833,874 |
First Financial Bankshares, Inc. (a) | 66,577 | 1,968,016 |
First Horizon Corp. | 258,390 | 3,855,179 |
FNB Corp. | 161,567 | 2,155,304 |
Glacier Bancorp, Inc. (a) | 51,861 | 1,876,331 |
Hancock Whitney Corp. | 40,189 | 1,824,179 |
Home BancShares, Inc. | 90,837 | 2,151,020 |
New York Community Bancorp, Inc. (a) | 333,774 | 884,501 |
Old National Bancorp | 131,241 | 2,170,726 |
Pinnacle Financial Partners, Inc. | 35,891 | 2,752,840 |
Popular, Inc. (Puerto Rico) | 31,192 | 2,651,008 |
Prosperity Bancshares, Inc. | 43,289 | 2,682,619 |
SouthState Corp. | 33,976 | 2,571,983 |
Synovus Financial Corp. | 65,659 | 2,349,936 |
INVESTMENTS | SHARES | VALUE($) |
Banks — continued | ||
TFS Financial Corp. | 24,654 | 296,095 |
UMB Financial Corp. | 20,582 | 1,639,562 |
United Bankshares, Inc. | 62,461 | 2,027,484 |
Valley National Bancorp | 203,222 | 1,424,586 |
Webster Financial Corp. | 77,055 | 3,377,321 |
Western Alliance Bancorp | 48,527 | 2,757,789 |
Wintrust Financial Corp. | 28,570 | 2,761,005 |
Zions Bancorp NA | 69,136 | 2,819,366 |
61,752,422 | ||
Beverages — 0.5% | ||
Boston Beer Co., Inc. (The), Class A * | 4,527 | 1,260,362 |
Celsius Holdings, Inc. * | 67,857 | 4,836,168 |
Coca-Cola Consolidated, Inc. | 2,211 | 1,826,286 |
National Beverage Corp. * | 11,463 | 510,104 |
8,432,920 | ||
Biotechnology — 3.2% | ||
ACADIA Pharmaceuticals, Inc. * | 53,905 | 900,752 |
Alkermes plc * | 73,910 | 1,813,751 |
Amicus Therapeutics, Inc. * | 122,035 | 1,219,130 |
Apellis Pharmaceuticals, Inc. * | 45,838 | 2,025,581 |
Arrowhead Pharmaceuticals, Inc. * | 55,040 | 1,245,005 |
Blueprint Medicines Corp. * | 25,694 | 2,346,890 |
Cerevel Therapeutics Holdings, Inc. * (a) | 35,590 | 1,520,049 |
CRISPR Therapeutics AG (Switzerland) * (a) | 35,520 | 1,882,205 |
Cytokinetics, Inc. * (a) | 43,373 | 2,659,632 |
Denali Therapeutics, Inc. * | 51,778 | 799,452 |
Exelixis, Inc. * | 144,408 | 3,387,812 |
Halozyme Therapeutics, Inc. * | 61,703 | 2,350,884 |
Immunovant, Inc. * | 29,066 | 797,571 |
Intellia Therapeutics, Inc. * | 40,142 | 859,039 |
Ionis Pharmaceuticals, Inc. * | 66,884 | 2,759,634 |
Madrigal Pharmaceuticals, Inc. * | 6,279 | 1,281,042 |
Natera, Inc. * | 56,141 | 5,214,376 |
Roivant Sciences Ltd. * | 177,044 | 1,929,780 |
Sarepta Therapeutics, Inc. * | 42,183 | 5,342,899 |
Ultragenyx Pharmaceutical, Inc. * | 34,638 | 1,473,500 |
United Therapeutics Corp. * | 21,969 | 5,147,996 |
Vaxcyte, Inc. * | 48,012 | 2,907,127 |
49,864,107 | ||
Broadline Retail — 0.3% | ||
Dillard's, Inc., Class A (a) | 2,100 | 919,779 |
114 | J.P. Morgan Exchange-Traded Funds | April 30, 2024 |
INVESTMENTS | SHARES | VALUE($) |
Common Stocks — continued | ||
Broadline Retail — continued | ||
Macy's, Inc. | 128,032 | 2,359,630 |
Ollie's Bargain Outlet Holdings, Inc. * | 28,832 | 2,108,772 |
5,388,181 | ||
Building Products — 3.5% | ||
A O Smith Corp. | 57,438 | 4,758,164 |
AAON, Inc. | 31,486 | 2,962,518 |
Advanced Drainage Systems, Inc. | 32,195 | 5,054,615 |
Armstrong World Industries, Inc. | 20,619 | 2,368,711 |
AZEK Co., Inc. (The) * | 67,684 | 3,089,098 |
Builders FirstSource, Inc. * | 57,451 | 10,503,192 |
Carlisle Cos., Inc. | 22,762 | 8,837,346 |
Fortune Brands Innovations, Inc. | 58,844 | 4,301,496 |
Simpson Manufacturing Co., Inc. | 19,939 | 3,467,193 |
Trex Co., Inc. * | 50,673 | 4,487,094 |
UFP Industries, Inc. | 28,825 | 3,248,577 |
Zurn Elkay Water Solutions Corp. (a) | 68,189 | 2,132,952 |
55,210,956 | ||
Capital Markets — 3.0% | ||
Affiliated Managers Group, Inc. | 15,730 | 2,455,453 |
Blue Owl Capital, Inc. (a) | 170,252 | 3,216,060 |
Cohen & Steers, Inc. (a) | 11,959 | 822,540 |
Evercore, Inc., Class A | 16,575 | 3,008,363 |
Federated Hermes, Inc. | 40,108 | 1,317,548 |
Freedom Holding Corp. (Kazakhstan) * (a) | 8,060 | 548,161 |
Houlihan Lokey, Inc. | 24,127 | 3,075,951 |
Interactive Brokers Group, Inc., Class A | 49,724 | 5,724,227 |
Invesco Ltd. | 152,207 | 2,156,773 |
Janus Henderson Group plc | 62,347 | 1,946,473 |
Jefferies Financial Group, Inc. | 73,499 | 3,164,867 |
Morningstar, Inc. | 12,414 | 3,508,817 |
Robinhood Markets, Inc., Class A * | 234,276 | 3,863,211 |
SEI Investments Co. | 50,633 | 3,339,246 |
Stifel Financial Corp. | 46,821 | 3,741,934 |
Tradeweb Markets, Inc., Class A | 50,977 | 5,184,871 |
47,074,495 | ||
Chemicals — 2.5% | ||
Arcadium Lithium plc (Jersey) * (a) | 481,444 | 2,118,354 |
Ashland, Inc. | 23,935 | 2,281,723 |
Avient Corp. | 42,535 | 1,804,335 |
Axalta Coating Systems Ltd. * | 96,432 | 3,031,822 |
Balchem Corp. | 15,066 | 2,130,031 |
Cabot Corp. | 25,733 | 2,347,622 |
Chemours Co. (The) | 69,353 | 1,855,193 |
INVESTMENTS | SHARES | VALUE($) |
Chemicals — continued | ||
Element Solutions, Inc. | 105,573 | 2,441,903 |
FMC Corp. | 58,228 | 3,436,034 |
HB Fuller Co. | 25,222 | 1,884,336 |
Huntsman Corp. | 77,520 | 1,849,627 |
NewMarket Corp. | 3,549 | 1,870,039 |
Olin Corp. | 57,179 | 2,989,318 |
Quaker Chemical Corp. | 6,485 | 1,209,647 |
RPM International, Inc. | 58,006 | 6,201,421 |
Scotts Miracle-Gro Co. (The) (a) | 18,811 | 1,289,306 |
Sensient Technologies Corp. | 19,708 | 1,443,020 |
40,183,731 | ||
Commercial Services & Supplies — 1.1% | ||
Casella Waste Systems, Inc., Class A * | 26,577 | 2,402,561 |
Clean Harbors, Inc. * | 23,841 | 4,516,677 |
MSA Safety, Inc. | 17,335 | 3,127,234 |
Stericycle, Inc. * | 41,554 | 1,858,710 |
Tetra Tech, Inc. | 24,787 | 4,826,525 |
16,731,707 | ||
Communications Equipment — 0.3% | ||
Calix, Inc. * | 27,804 | 771,005 |
Ciena Corp. * | 68,735 | 3,177,619 |
Lumentum Holdings, Inc. * (a) | 31,223 | 1,366,318 |
5,314,942 | ||
Construction & Engineering — 2.4% | ||
AECOM | 63,540 | 5,868,554 |
API Group Corp. * | 100,670 | 3,882,842 |
Arcosa, Inc. | 22,655 | 1,722,233 |
Comfort Systems USA, Inc. | 16,652 | 5,152,295 |
EMCOR Group, Inc. | 21,994 | 7,855,597 |
Fluor Corp. * | 79,344 | 3,199,943 |
MasTec, Inc. * | 28,597 | 2,536,268 |
MDU Resources Group, Inc. | 92,188 | 2,277,044 |
Valmont Industries, Inc. | 9,667 | 1,979,802 |
WillScot Mobile Mini Holdings Corp. * | 84,924 | 3,138,791 |
37,613,369 | ||
Construction Materials — 0.4% | ||
Eagle Materials, Inc. | 16,287 | 4,083,314 |
Summit Materials, Inc., Class A * | 55,561 | 2,161,323 |
6,244,637 | ||
Consumer Finance — 1.0% | ||
Ally Financial, Inc. | 126,516 | 4,851,889 |
Credit Acceptance Corp. * (a) | 3,062 | 1,573,011 |
April 30, 2024 | J.P. Morgan Exchange-Traded Funds | 115 |
INVESTMENTS | SHARES | VALUE($) |
Common Stocks — continued | ||
Consumer Finance — continued | ||
FirstCash Holdings, Inc. | 18,192 | 2,055,332 |
OneMain Holdings, Inc. | 53,892 | 2,808,312 |
SLM Corp. | 105,394 | 2,233,299 |
SoFi Technologies, Inc. * (a) | 416,922 | 2,826,731 |
16,348,574 | ||
Consumer Staples Distribution & Retail — 1.5% | ||
BJ's Wholesale Club Holdings, Inc. * | 57,446 | 4,290,067 |
Casey's General Stores, Inc. | 17,394 | 5,558,775 |
Performance Food Group Co. * | 72,525 | 4,922,997 |
Sprouts Farmers Market, Inc. * | 47,414 | 3,130,746 |
US Foods Holding Corp. * | 114,165 | 5,736,791 |
23,639,376 | ||
Containers & Packaging — 1.2% | ||
AptarGroup, Inc. | 30,654 | 4,425,824 |
Berry Global Group, Inc. | 54,027 | 3,060,089 |
Graphic Packaging Holding Co. | 142,681 | 3,688,304 |
Greif, Inc., Class A | 11,832 | 725,065 |
O-I Glass, Inc. * | 72,137 | 1,079,170 |
Sealed Air Corp. | 67,316 | 2,119,108 |
Silgan Holdings, Inc. | 38,456 | 1,794,357 |
Sonoco Products Co. | 45,622 | 2,557,113 |
19,449,030 | ||
Diversified Consumer Services — 1.1% | ||
ADT, Inc. | 103,800 | 674,700 |
Bright Horizons Family Solutions, Inc. * | 24,847 | 2,576,883 |
Duolingo, Inc. * | 15,823 | 3,572,042 |
Grand Canyon Education, Inc. * | 13,114 | 1,705,082 |
H&R Block, Inc. | 67,182 | 3,173,006 |
Service Corp. International | 68,028 | 4,878,288 |
16,580,001 | ||
Diversified REITs — 0.1% | ||
Essential Properties Realty Trust, Inc. | 76,990 | 2,027,917 |
Diversified Telecommunication Services — 0.3% | ||
Cogent Communications Holdings, Inc. | 20,431 | 1,311,262 |
Frontier Communications Parent, Inc. * | 102,979 | 2,382,934 |
Iridium Communications, Inc. | 51,932 | 1,598,986 |
5,293,182 | ||
Electric Utilities — 0.8% | ||
ALLETE, Inc. | 26,868 | 1,591,123 |
IDACORP, Inc. | 23,650 | 2,241,547 |
OGE Energy Corp. | 93,669 | 3,245,631 |
Otter Tail Corp. (a) | 19,341 | 1,650,948 |
INVESTMENTS | SHARES | VALUE($) |
Electric Utilities — continued | ||
PNM Resources, Inc. | 40,118 | 1,486,773 |
Portland General Electric Co. | 47,248 | 2,042,531 |
12,258,553 | ||
Electrical Equipment — 2.8% | ||
Acuity Brands, Inc. | 14,426 | 3,581,976 |
Array Technologies, Inc. * | 66,888 | 825,398 |
Atkore, Inc. | 17,401 | 3,050,395 |
Bloom Energy Corp., Class A * (a) | 93,021 | 1,035,324 |
EnerSys | 18,817 | 1,701,998 |
Generac Holdings, Inc. * | 28,698 | 3,901,780 |
nVent Electric plc | 77,191 | 5,563,155 |
Plug Power, Inc. * (a) | 289,305 | 668,295 |
Regal Rexnord Corp. | 30,967 | 4,997,145 |
Sensata Technologies Holding plc | 70,559 | 2,703,115 |
Shoals Technologies Group, Inc., Class A * | 79,440 | 671,268 |
Sunrun, Inc. * (a) | 101,795 | 1,047,470 |
Vertiv Holdings Co., Class A | 151,614 | 14,100,102 |
43,847,421 | ||
Electronic Equipment, Instruments & Components — 2.8% | ||
Advanced Energy Industries, Inc. | 17,420 | 1,669,533 |
Arrow Electronics, Inc. * | 25,290 | 3,228,774 |
Avnet, Inc. | 40,898 | 1,998,685 |
Badger Meter, Inc. | 13,679 | 2,502,163 |
Belden, Inc. | 19,471 | 1,582,408 |
Cognex Corp. | 80,343 | 3,337,448 |
Coherent Corp. * | 60,834 | 3,323,362 |
Fabrinet (Thailand) * | 16,975 | 2,937,863 |
Insight Enterprises, Inc. * (a) | 12,995 | 2,372,497 |
IPG Photonics Corp. * | 14,279 | 1,199,151 |
Jabil, Inc. | 58,618 | 6,879,409 |
Littelfuse, Inc. | 11,625 | 2,681,190 |
Novanta, Inc. * | 16,646 | 2,605,099 |
Rogers Corp. * | 8,680 | 1,033,701 |
Sanmina Corp. * | 26,528 | 1,609,454 |
TD SYNNEX Corp. | 24,279 | 2,861,037 |
Vontier Corp. | 72,016 | 2,926,010 |
44,747,784 | ||
Energy Equipment & Services — 1.1% | ||
ChampionX Corp. | 87,440 | 2,935,361 |
Helmerich & Payne, Inc. | 46,009 | 1,809,534 |
NOV, Inc. | 183,634 | 3,395,393 |
Patterson-UTI Energy, Inc. | 175,806 | 1,902,221 |
Transocean Ltd. * (a) | 336,310 | 1,755,538 |
116 | J.P. Morgan Exchange-Traded Funds | April 30, 2024 |
INVESTMENTS | SHARES | VALUE($) |
Common Stocks — continued | ||
Energy Equipment & Services — continued | ||
Valaris Ltd. * | 27,380 | 1,781,343 |
Weatherford International plc * | 33,681 | 4,163,645 |
17,743,035 | ||
Entertainment — 0.7% | ||
Endeavor Group Holdings, Inc., Class A | 86,535 | 2,285,389 |
Madison Square Garden Sports Corp. * | 7,753 | 1,441,438 |
Playtika Holding Corp. | 24,390 | 176,827 |
Roku, Inc. * | 55,342 | 3,191,020 |
TKO Group Holdings, Inc. | 24,939 | 2,360,975 |
Warner Music Group Corp., Class A | 61,436 | 2,027,388 |
11,483,037 | ||
Financial Services — 2.1% | ||
Enact Holdings, Inc. | 13,885 | 412,801 |
Essent Group Ltd. | 49,810 | 2,638,436 |
Euronet Worldwide, Inc. * | 20,619 | 2,117,159 |
Flywire Corp. * | 42,278 | 866,699 |
Jackson Financial, Inc., Class A | 33,553 | 2,292,341 |
MGIC Investment Corp. | 129,135 | 2,618,858 |
Mr. Cooper Group, Inc. * | 29,247 | 2,257,868 |
PennyMac Financial Services, Inc. | 12,365 | 1,058,939 |
Radian Group, Inc. | 71,406 | 2,132,897 |
Remitly Global, Inc. * | 63,476 | 1,131,777 |
Shift4 Payments, Inc., Class A * (a) | 26,468 | 1,531,438 |
Toast, Inc., Class A * (a) | 180,369 | 4,262,119 |
Voya Financial, Inc. | 48,712 | 3,320,210 |
Western Union Co. (The) | 170,042 | 2,285,365 |
WEX, Inc. * | 19,970 | 4,218,862 |
33,145,769 | ||
Food Products — 1.3% | ||
Darling Ingredients, Inc. * | 74,379 | 3,151,438 |
Flowers Foods, Inc. | 88,465 | 2,206,317 |
Freshpet, Inc. * | 21,840 | 2,316,569 |
Ingredion, Inc. | 30,439 | 3,488,005 |
J & J Snack Foods Corp. | 7,037 | 966,110 |
Lancaster Colony Corp. | 9,287 | 1,772,052 |
Pilgrim's Pride Corp. * | 19,392 | 698,500 |
Post Holdings, Inc. * | 23,035 | 2,445,165 |
Seaboard Corp. | 127 | 420,384 |
Simply Good Foods Co. (The) * | 42,016 | 1,531,483 |
TreeHouse Foods, Inc. * | 22,807 | 856,403 |
19,852,426 | ||
INVESTMENTS | SHARES | VALUE($) |
Gas Utilities — 0.7% | ||
National Fuel Gas Co. | 41,361 | 2,196,269 |
New Jersey Resources Corp. | 45,645 | 1,994,230 |
ONE Gas, Inc. | 24,271 | 1,565,965 |
Southwest Gas Holdings, Inc. | 24,981 | 1,864,082 |
Spire, Inc. | 24,657 | 1,523,556 |
UGI Corp. | 97,960 | 2,503,858 |
11,647,960 | ||
Ground Transportation — 1.7% | ||
Avis Budget Group, Inc. | 8,663 | 826,883 |
Hertz Global Holdings, Inc. * (a) | 59,894 | 272,518 |
Knight-Swift Transportation Holdings, Inc. | 70,388 | 3,254,037 |
Landstar System, Inc. | 16,766 | 2,924,158 |
Lyft, Inc., Class A * | 158,174 | 2,473,841 |
Ryder System, Inc. | 20,623 | 2,512,913 |
Saia, Inc. * | 12,382 | 4,913,549 |
U-Haul Holding Co. * (a) | 3,550 | 224,467 |
U-Haul Holding Co. | 46,945 | 2,878,667 |
XPO, Inc. * | 54,160 | 5,820,034 |
26,101,067 | ||
Health Care Equipment & Supplies — 2.4% | ||
CONMED Corp. | 14,372 | 977,009 |
Dentsply Sirona, Inc. | 95,703 | 2,872,047 |
Enovis Corp. * (a) | 24,521 | 1,354,295 |
Envista Holdings Corp. * | 80,062 | 1,575,620 |
Globus Medical, Inc., Class A * | 53,902 | 2,683,781 |
Haemonetics Corp. * | 23,688 | 2,178,112 |
ICU Medical, Inc. * | 9,525 | 932,688 |
Inari Medical, Inc. * | 22,425 | 837,349 |
Inspire Medical Systems, Inc. * | 13,766 | 3,326,691 |
Integra LifeSciences Holdings Corp. * | 32,661 | 952,721 |
iRhythm Technologies, Inc. * | 14,232 | 1,559,543 |
Lantheus Holdings, Inc. * | 31,914 | 2,123,558 |
Masimo Corp. * (a) | 23,094 | 3,104,064 |
Merit Medical Systems, Inc. * | 26,963 | 1,997,958 |
Neogen Corp. * | 101,063 | 1,246,107 |
Penumbra, Inc. * | 17,006 | 3,341,169 |
QuidelOrtho Corp. * | 23,196 | 940,598 |
Shockwave Medical, Inc. * | 17,218 | 5,685,211 |
STAAR Surgical Co. * | 22,756 | 1,045,866 |
38,734,387 | ||
Health Care Providers & Services — 2.4% | ||
Acadia Healthcare Co., Inc. * | 42,691 | 3,156,572 |
agilon health, Inc. * (a) | 142,224 | 782,232 |
April 30, 2024 | J.P. Morgan Exchange-Traded Funds | 117 |
INVESTMENTS | SHARES | VALUE($) |
Common Stocks — continued | ||
Health Care Providers & Services — continued | ||
AMN Healthcare Services, Inc. * | 17,653 | 1,058,827 |
Chemed Corp. | 7,027 | 3,991,336 |
CorVel Corp. * | 4,356 | 1,040,431 |
DaVita, Inc. * | 25,758 | 3,580,619 |
Encompass Health Corp. | 46,656 | 3,890,177 |
Ensign Group, Inc. (The) | 26,364 | 3,120,443 |
HealthEquity, Inc. * | 39,974 | 3,154,348 |
LifeStance Health Group, Inc. * (a) | 45,868 | 283,464 |
Option Care Health, Inc. * | 82,721 | 2,472,531 |
Premier, Inc., Class A | 55,844 | 1,166,023 |
Privia Health Group, Inc. * (a) | 49,184 | 904,986 |
Progyny, Inc. * | 38,129 | 1,222,416 |
R1 RCM, Inc. * | 91,505 | 1,124,596 |
Select Medical Holdings Corp. | 49,154 | 1,394,499 |
Surgery Partners, Inc. * | 31,645 | 789,543 |
Tenet Healthcare Corp. * | 47,007 | 5,278,416 |
38,411,459 | ||
Health Care REITs — 0.3% | ||
Medical Properties Trust, Inc. (a) | 279,788 | 1,287,025 |
Omega Healthcare Investors, Inc. | 114,341 | 3,477,110 |
4,764,135 | ||
Health Care Technology — 0.2% | ||
Doximity, Inc., Class A * | 55,023 | 1,336,509 |
Evolent Health, Inc., Class A * | 52,480 | 1,455,795 |
Teladoc Health, Inc. * | 73,708 | 939,777 |
3,732,081 | ||
Hotel & Resort REITs — 0.3% | ||
Apple Hospitality REIT, Inc. | 105,709 | 1,560,265 |
Ryman Hospitality Properties, Inc. | 27,252 | 2,874,541 |
4,434,806 | ||
Hotels, Restaurants & Leisure — 3.5% | ||
Aramark | 115,172 | 3,629,070 |
Boyd Gaming Corp. | 33,961 | 1,817,253 |
Cava Group, Inc. * | 8,018 | 576,815 |
Choice Hotels International, Inc. (a) | 12,480 | 1,475,885 |
Churchill Downs, Inc. | 32,769 | 4,227,201 |
DraftKings, Inc., Class A * | 217,990 | 9,059,664 |
Hilton Grand Vacations, Inc. * | 36,214 | 1,507,951 |
Hyatt Hotels Corp., Class A | 18,755 | 2,790,556 |
Life Time Group Holdings, Inc. * | 27,378 | 373,983 |
Light & Wonder, Inc. * | 42,072 | 3,755,347 |
Marriott Vacations Worldwide Corp. | 15,014 | 1,442,995 |
INVESTMENTS | SHARES | VALUE($) |
Hotels, Restaurants & Leisure — continued | ||
Norwegian Cruise Line Holdings Ltd. * (a) | 198,528 | 3,756,150 |
Penn Entertainment, Inc. * | 70,631 | 1,168,237 |
Planet Fitness, Inc., Class A * | 39,923 | 2,388,992 |
Texas Roadhouse, Inc. | 31,215 | 5,018,748 |
Travel + Leisure Co. | 33,228 | 1,446,747 |
United Parks & Resorts, Inc. * | 17,019 | 864,906 |
Wendy's Co. (The) | 78,496 | 1,569,135 |
Wingstop, Inc. | 13,173 | 5,068,839 |
Wyndham Hotels & Resorts, Inc. | 38,415 | 2,823,887 |
54,762,361 | ||
Household Durables — 2.3% | ||
Installed Building Products, Inc. | 11,152 | 2,628,861 |
KB Home | 32,695 | 2,117,328 |
Leggett & Platt, Inc. | 61,713 | 1,115,154 |
Meritage Homes Corp. | 16,373 | 2,713,661 |
Mohawk Industries, Inc. * | 24,856 | 2,866,394 |
Newell Brands, Inc. | 169,855 | 1,348,649 |
Skyline Champion Corp. * | 25,345 | 1,900,621 |
Taylor Morrison Home Corp. * | 47,291 | 2,648,769 |
Tempur Sealy International, Inc. | 79,513 | 3,980,421 |
Toll Brothers, Inc. | 50,272 | 5,987,898 |
TopBuild Corp. * | 14,851 | 6,009,754 |
Whirlpool Corp. | 25,589 | 2,427,372 |
Worthington Enterprises, Inc. | 15,042 | 859,801 |
36,604,683 | ||
Household Products — 0.0% ^ | ||
Reynolds Consumer Products, Inc. | 20,728 | 593,443 |
Independent Power and Renewable Electricity Producers — 0.2% | ||
Clearway Energy, Inc. | 15,321 | 332,619 |
Clearway Energy, Inc., Class C | 38,502 | 900,177 |
Ormat Technologies, Inc. (a) | 25,004 | 1,596,005 |
2,828,801 | ||
Industrial REITs — 1.1% | ||
Americold Realty Trust, Inc. | 125,534 | 2,757,982 |
EastGroup Properties, Inc. | 21,615 | 3,358,106 |
First Industrial Realty Trust, Inc. | 56,046 | 2,545,609 |
Rexford Industrial Realty, Inc. | 91,896 | 3,934,068 |
STAG Industrial, Inc. | 84,922 | 2,920,468 |
Terreno Realty Corp. | 40,493 | 2,200,795 |
17,717,028 | ||
Insurance — 3.6% | ||
American Equity Investment Life Holding Co. | 28,518 | 1,600,145 |
118 | J.P. Morgan Exchange-Traded Funds | April 30, 2024 |
INVESTMENTS | SHARES | VALUE($) |
Common Stocks — continued | ||
Insurance — continued | ||
Assurant, Inc. | 24,585 | 4,287,624 |
Assured Guaranty Ltd. | 26,536 | 2,035,311 |
Axis Capital Holdings Ltd. | 35,231 | 2,160,717 |
Brighthouse Financial, Inc. * | 28,480 | 1,374,160 |
Enstar Group Ltd. * | 5,394 | 1,566,256 |
Erie Indemnity Co., Class A | 11,771 | 4,504,291 |
First American Financial Corp. | 47,916 | 2,566,860 |
Hanover Insurance Group, Inc. (The) | 16,640 | 2,160,205 |
Kemper Corp. | 26,365 | 1,537,343 |
Kinsale Capital Group, Inc. | 10,340 | 3,756,005 |
Lincoln National Corp. | 78,784 | 2,148,440 |
Old Republic International Corp. | 121,918 | 3,640,471 |
Primerica, Inc. | 16,359 | 3,465,818 |
RenaissanceRe Holdings Ltd. (Bermuda) | 22,622 | 4,959,873 |
RLI Corp. | 19,093 | 2,698,796 |
Ryan Specialty Holdings, Inc. | 46,357 | 2,287,254 |
Selective Insurance Group, Inc. | 28,324 | 2,879,135 |
Unum Group | 90,475 | 4,587,082 |
White Mountains Insurance Group Ltd. | 1,171 | 2,082,202 |
56,297,988 | ||
Interactive Media & Services — 0.3% | ||
IAC, Inc. * | 34,316 | 1,632,069 |
Ziff Davis, Inc. * | 20,828 | 1,043,691 |
ZoomInfo Technologies, Inc. * | 130,668 | 2,072,395 |
4,748,155 | ||
IT Services — 0.4% | ||
ASGN, Inc. * | 21,954 | 2,117,463 |
DXC Technology Co. * | 85,152 | 1,659,613 |
Kyndryl Holdings, Inc. * | 106,540 | 2,094,576 |
5,871,652 | ||
Leisure Products — 0.9% | ||
Acushnet Holdings Corp. | 14,262 | 869,697 |
Brunswick Corp. | 32,098 | 2,588,383 |
Hasbro, Inc. | 61,334 | 3,759,774 |
Mattel, Inc. * | 158,241 | 2,898,975 |
Polaris, Inc. | 23,920 | 2,037,027 |
Topgolf Callaway Brands Corp. * | 67,460 | 1,080,709 |
YETI Holdings, Inc. * | 40,579 | 1,449,482 |
14,684,047 | ||
Life Sciences Tools & Services — 0.9% | ||
10X Genomics, Inc., Class A * | 46,262 | 1,354,551 |
Azenta, Inc. * | 24,131 | 1,265,912 |
INVESTMENTS | SHARES | VALUE($) |
Life Sciences Tools & Services — continued | ||
Bruker Corp. | 43,498 | 3,393,279 |
Medpace Holdings, Inc. * | 10,988 | 4,267,190 |
Repligen Corp. * (a) | 22,708 | 3,728,654 |
Sotera Health Co. * | 49,671 | 556,315 |
14,565,901 | ||
Machinery — 4.9% | ||
AGCO Corp. | 29,226 | 3,337,317 |
Allison Transmission Holdings, Inc. | 41,794 | 3,073,949 |
Chart Industries, Inc. * (a) | 19,977 | 2,877,887 |
Crane Co. | 22,766 | 3,187,468 |
Donaldson Co., Inc. | 56,313 | 4,065,799 |
Esab Corp. | 24,908 | 2,637,259 |
Federal Signal Corp. | 28,449 | 2,312,904 |
Flowserve Corp. | 61,307 | 2,891,238 |
Franklin Electric Co., Inc. | 18,776 | 1,807,565 |
Gates Industrial Corp. plc * | 66,326 | 1,168,664 |
Graco, Inc. | 78,772 | 6,317,514 |
Hillenbrand, Inc. | 32,611 | 1,556,197 |
ITT, Inc. | 38,317 | 4,955,921 |
John Bean Technologies Corp. | 14,851 | 1,323,076 |
Lincoln Electric Holdings, Inc. | 26,735 | 5,869,134 |
Middleby Corp. (The) * | 24,023 | 3,338,476 |
Mueller Industries, Inc. | 52,977 | 2,957,176 |
Nordson Corp. | 23,925 | 6,177,196 |
Oshkosh Corp. | 28,659 | 3,217,546 |
RBC Bearings, Inc. * | 12,700 | 3,105,785 |
Terex Corp. | 31,271 | 1,752,739 |
Timken Co. (The) | 30,913 | 2,758,058 |
Toro Co. (The) | 46,066 | 4,034,921 |
Watts Water Technologies, Inc., Class A | 12,774 | 2,535,128 |
77,258,917 | ||
Marine Transportation — 0.2% | ||
Kirby Corp. * | 26,621 | 2,905,150 |
Media — 0.7% | ||
Cable One, Inc. | 2,128 | 838,113 |
New York Times Co. (The), Class A | 72,841 | 3,134,348 |
Nexstar Media Group, Inc. | 15,100 | 2,416,906 |
Paramount Global, Class B | 240,747 | 2,742,108 |
TEGNA, Inc. | 88,872 | 1,212,214 |
10,343,689 | ||
Metals & Mining — 1.9% | ||
Alcoa Corp. | 83,386 | 2,930,184 |
ATI, Inc. * (a) | 59,597 | 3,557,941 |
April 30, 2024 | J.P. Morgan Exchange-Traded Funds | 119 |
INVESTMENTS | SHARES | VALUE($) |
Common Stocks — continued | ||
Metals & Mining — continued | ||
Cleveland-Cliffs, Inc. * | 235,115 | 3,973,443 |
Commercial Metals Co. | 54,267 | 2,916,309 |
Hecla Mining Co. | 271,455 | 1,283,982 |
MP Materials Corp. * (a) | 58,569 | 937,104 |
Reliance, Inc. | 26,870 | 7,650,426 |
Royal Gold, Inc. | 30,707 | 3,688,832 |
United States Steel Corp. (a) | 104,063 | 3,798,300 |
30,736,521 | ||
Mortgage Real Estate Investment Trusts (REITs) — 0.6% | ||
AGNC Investment Corp. (a) | 312,220 | 2,856,813 |
Blackstone Mortgage Trust, Inc., Class A (a) | 76,797 | 1,354,699 |
Rithm Capital Corp. | 225,961 | 2,512,686 |
Starwood Property Trust, Inc. (a) | 138,573 | 2,628,730 |
9,352,928 | ||
Multi-Utilities — 0.3% | ||
Avista Corp. | 36,071 | 1,297,835 |
Black Hills Corp. | 31,769 | 1,744,118 |
Northwestern Energy Group, Inc. | 26,871 | 1,355,373 |
4,397,326 | ||
Office REITs — 0.2% | ||
Cousins Properties, Inc. | 65,840 | 1,510,370 |
Kilroy Realty Corp. | 52,072 | 1,760,033 |
3,270,403 | ||
Oil, Gas & Consumable Fuels — 3.7% | ||
Antero Midstream Corp. | 148,060 | 2,049,150 |
Antero Resources Corp. * | 132,681 | 4,512,481 |
California Resources Corp. | 31,434 | 1,661,601 |
Chesapeake Energy Corp. (a) | 49,147 | 4,417,332 |
Chord Energy Corp. | 19,359 | 3,426,156 |
Civitas Resources, Inc. | 32,182 | 2,315,817 |
Comstock Resources, Inc. (a) | 42,706 | 429,622 |
DT Midstream, Inc. | 45,280 | 2,816,416 |
HF Sinclair Corp. | 70,376 | 3,817,898 |
Magnolia Oil & Gas Corp., Class A (a) | 78,364 | 1,964,586 |
Matador Resources Co. | 52,743 | 3,285,889 |
Murphy Oil Corp. | 72,088 | 3,218,008 |
New Fortress Energy, Inc. (a) | 37,586 | 984,753 |
Ovintiv, Inc. | 118,676 | 6,090,452 |
PBF Energy, Inc., Class A | 50,923 | 2,712,668 |
Peabody Energy Corp. | 51,300 | 1,125,522 |
Permian Resources Corp. | 221,816 | 3,715,418 |
Range Resources Corp. | 112,060 | 4,024,075 |
INVESTMENTS | SHARES | VALUE($) |
Oil, Gas & Consumable Fuels — continued | ||
SM Energy Co. | 54,071 | 2,621,903 |
Southwestern Energy Co. * | 488,758 | 3,660,798 |
58,850,545 | ||
Paper & Forest Products — 0.1% | ||
Louisiana-Pacific Corp. | 29,967 | 2,193,285 |
Passenger Airlines — 0.4% | ||
Alaska Air Group, Inc. * | 59,896 | 2,576,726 |
American Airlines Group, Inc. * | 283,899 | 3,835,475 |
6,412,201 | ||
Personal Care Products — 0.6% | ||
BellRing Brands, Inc. * | 60,920 | 3,360,957 |
Coty, Inc., Class A * | 155,939 | 1,783,942 |
elf Beauty, Inc. * | 23,759 | 3,861,550 |
Inter Parfums, Inc. | 8,471 | 985,855 |
9,992,304 | ||
Pharmaceuticals — 1.1% | ||
Axsome Therapeutics, Inc. * | 16,928 | 1,248,609 |
Catalent, Inc. * | 84,144 | 4,699,442 |
Elanco Animal Health, Inc. * | 222,138 | 2,923,336 |
Intra-Cellular Therapies, Inc. * | 44,961 | 3,228,650 |
Organon & Co. | 119,417 | 2,222,350 |
Perrigo Co. plc | 63,302 | 2,067,443 |
Prestige Consumer Healthcare, Inc. * | 23,152 | 1,661,388 |
18,051,218 | ||
Professional Services — 2.4% | ||
Alight, Inc., Class A * | 174,444 | 1,573,485 |
CACI International, Inc., Class A * | 10,402 | 4,183,996 |
Clarivate plc * (a) | 160,798 | 1,086,994 |
Concentrix Corp. (a) | 20,049 | 1,096,079 |
Dun & Bradstreet Holdings, Inc. | 118,826 | 1,081,317 |
ExlService Holdings, Inc. * | 76,866 | 2,229,114 |
Exponent, Inc. | 23,629 | 2,171,741 |
FTI Consulting, Inc. * | 16,578 | 3,544,874 |
Genpact Ltd. | 72,375 | 2,224,808 |
Insperity, Inc. | 15,845 | 1,630,926 |
KBR, Inc. | 62,888 | 4,083,947 |
ManpowerGroup, Inc. | 22,800 | 1,720,260 |
Maximus, Inc. | 28,513 | 2,289,024 |
Paycor HCM, Inc. * (a) | 30,055 | 522,055 |
Robert Half, Inc. | 48,893 | 3,380,462 |
120 | J.P. Morgan Exchange-Traded Funds | April 30, 2024 |
INVESTMENTS | SHARES | VALUE($) |
Common Stocks — continued | ||
Professional Services — continued | ||
Science Applications International Corp. | 23,723 | 3,053,150 |
TriNet Group, Inc. | 14,639 | 1,469,316 |
37,341,548 | ||
Real Estate Management & Development — 0.3% | ||
Howard Hughes Holdings, Inc. * | 14,179 | 923,904 |
Jones Lang LaSalle, Inc. * | 22,162 | 4,004,673 |
4,928,577 | ||
Residential REITs — 0.6% | ||
American Homes 4 Rent, Class A | 150,926 | 5,403,151 |
Apartment Income REIT Corp. | 64,385 | 2,471,096 |
Independence Realty Trust, Inc. | 104,846 | 1,653,421 |
9,527,668 | ||
Retail REITs — 0.8% | ||
Agree Realty Corp. | 44,087 | 2,522,658 |
Brixmor Property Group, Inc. | 140,266 | 3,099,879 |
Kite Realty Group Trust | 102,498 | 2,234,456 |
NNN REIT, Inc. | 85,218 | 3,453,886 |
Phillips Edison & Co., Inc. | 55,867 | 1,826,851 |
13,137,730 | ||
Semiconductors & Semiconductor Equipment — 2.4% | ||
Allegro MicroSystems, Inc. (Japan) * | 35,279 | 1,047,433 |
Amkor Technology, Inc. | 53,317 | 1,724,805 |
Axcelis Technologies, Inc. * | 15,142 | 1,567,500 |
Cirrus Logic, Inc. * | 25,188 | 2,230,901 |
Diodes, Inc. * | 21,399 | 1,562,341 |
Lattice Semiconductor Corp. * | 64,302 | 4,411,117 |
MACOM Technology Solutions Holdings, Inc. * | 25,527 | 2,602,478 |
MKS Instruments, Inc. | 27,074 | 3,221,265 |
Onto Innovation, Inc. * | 22,959 | 4,258,665 |
Power Integrations, Inc. | 26,340 | 1,757,405 |
Rambus, Inc. * | 50,180 | 2,750,868 |
Silicon Laboratories, Inc. * | 14,790 | 1,796,837 |
SolarEdge Technologies, Inc. * (a) | 26,570 | 1,558,330 |
Synaptics, Inc. * | 18,249 | 1,641,680 |
Universal Display Corp. | 22,079 | 3,488,040 |
Wolfspeed, Inc. * (a) | 58,526 | 1,581,958 |
37,201,623 | ||
Software — 5.0% | ||
Altair Engineering, Inc., Class A * | 25,423 | 2,045,280 |
AppLovin Corp., Class A * | 63,713 | 4,496,226 |
Blackbaud, Inc. * | 20,519 | 1,598,840 |
BlackLine, Inc. * | 22,745 | 1,320,347 |
INVESTMENTS | SHARES | VALUE($) |
Software — continued | ||
Box, Inc., Class A * | 67,024 | 1,743,964 |
CCC Intelligent Solutions Holdings, Inc. * | 85,349 | 957,616 |
Confluent, Inc., Class A * | 95,810 | 2,694,177 |
Dolby Laboratories, Inc., Class A | 27,588 | 2,142,484 |
DoubleVerify Holdings, Inc. * | 57,306 | 1,679,066 |
Dropbox, Inc., Class A * | 115,646 | 2,678,361 |
Elastic NV * | 37,951 | 3,879,351 |
Envestnet, Inc. * | 24,632 | 1,528,908 |
Five9, Inc. * | 33,786 | 1,945,060 |
Guidewire Software, Inc. * | 38,274 | 4,225,450 |
Informatica, Inc., Class A * (a) | 18,736 | 580,254 |
Instructure Holdings, Inc. * | 9,754 | 186,594 |
Manhattan Associates, Inc. * | 28,672 | 5,908,152 |
MicroStrategy, Inc., Class A * (a) | 6,683 | 7,117,596 |
NCR Voyix Corp. * | 65,816 | 806,246 |
Nutanix, Inc., Class A * | 113,691 | 6,901,044 |
Pegasystems, Inc. | 18,980 | 1,127,792 |
PowerSchool Holdings, Inc., Class A * (a) | 33,247 | 575,838 |
Procore Technologies, Inc. * | 40,247 | 2,753,700 |
Qualys, Inc. * | 17,218 | 2,822,202 |
SentinelOne, Inc., Class A * | 112,566 | 2,378,520 |
Smartsheet, Inc., Class A * | 63,117 | 2,387,716 |
SPS Commerce, Inc. * | 17,065 | 2,967,092 |
Tenable Holdings, Inc. * | 54,694 | 2,459,589 |
Teradata Corp. * | 45,497 | 1,687,939 |
UiPath, Inc., Class A * | 199,515 | 3,784,800 |
Workiva, Inc. * | 23,421 | 1,845,575 |
79,225,779 | ||
Specialized REITs — 1.2% | ||
CubeSmart | 99,032 | 4,004,854 |
EPR Properties | 33,410 | 1,356,112 |
Gaming and Leisure Properties, Inc. | 115,494 | 4,935,059 |
Lamar Advertising Co., Class A | 40,678 | 4,712,546 |
National Storage Affiliates Trust (a) | 37,120 | 1,300,685 |
PotlatchDeltic Corp. | 36,973 | 1,479,290 |
Rayonier, Inc. | 61,563 | 1,825,958 |
19,614,504 | ||
Specialty Retail — 3.6% | ||
Academy Sports & Outdoors, Inc. | 34,316 | 2,000,623 |
Advance Auto Parts, Inc. | 26,842 | 1,958,929 |
Asbury Automotive Group, Inc. * | 9,615 | 2,021,458 |
AutoNation, Inc. * | 13,158 | 2,120,412 |
Bath & Body Works, Inc. | 102,399 | 4,650,962 |
April 30, 2024 | J.P. Morgan Exchange-Traded Funds | 121 |
INVESTMENTS | SHARES | VALUE($) |
Common Stocks — continued | ||
Specialty Retail — continued | ||
Chewy, Inc., Class A * (a) | 55,862 | 837,371 |
Dick's Sporting Goods, Inc. | 27,057 | 5,436,833 |
Five Below, Inc. * | 24,102 | 3,527,087 |
Floor & Decor Holdings, Inc., Class A * (a) | 49,663 | 5,479,319 |
GameStop Corp., Class A * (a) | 124,881 | 1,384,930 |
Gap, Inc. (The) | 100,238 | 2,056,884 |
Group 1 Automotive, Inc. | 6,231 | 1,832,039 |
Lithia Motors, Inc., Class A | 12,863 | 3,272,090 |
Murphy USA, Inc. | 9,614 | 3,978,465 |
Penske Automotive Group, Inc. | 9,254 | 1,415,029 |
RH * | 7,008 | 1,731,326 |
Signet Jewelers Ltd. | 20,567 | 2,016,183 |
Valvoline, Inc. * | 61,030 | 2,594,996 |
Williams-Sonoma, Inc. | 28,356 | 8,131,934 |
56,446,870 | ||
Technology Hardware, Storage & Peripherals — 1.7% | ||
Pure Storage, Inc., Class A * | 130,267 | 6,565,457 |
Super Micro Computer, Inc. * | 23,034 | 19,781,599 |
26,347,056 | ||
Textiles, Apparel & Luxury Goods — 2.1% | ||
Capri Holdings Ltd. * | 54,283 | 1,925,961 |
Columbia Sportswear Co. | 16,244 | 1,293,510 |
Crocs, Inc. * | 28,013 | 3,483,977 |
Deckers Outdoor Corp. * | 12,009 | 9,829,006 |
PVH Corp. | 28,273 | 3,076,102 |
Ralph Lauren Corp. | 17,482 | 2,860,755 |
Skechers U.S.A., Inc., Class A * | 62,467 | 4,125,945 |
Tapestry, Inc. | 107,041 | 4,273,077 |
Under Armour, Inc., Class A * | 88,278 | 594,111 |
Under Armour, Inc., Class C * | 75,562 | 492,664 |
VF Corp. (a) | 153,846 | 1,916,921 |
33,872,029 | ||
Trading Companies & Distributors — 1.7% | ||
Air Lease Corp. | 48,817 | 2,452,566 |
Applied Industrial Technologies, Inc. | 18,051 | 3,307,846 |
Beacon Roofing Supply, Inc. * | 24,652 | 2,428,962 |
Core & Main, Inc., Class A * | 84,594 | 4,777,023 |
GATX Corp. | 15,270 | 1,868,437 |
Herc Holdings, Inc. | 11,526 | 1,648,564 |
MSC Industrial Direct Co., Inc., Class A | 21,560 | 1,967,134 |
Rush Enterprises, Inc., Class A | 27,909 | 1,225,763 |
Rush Enterprises, Inc., Class B | 3,921 | 160,408 |
INVESTMENTS | SHARES | VALUE($) |
Trading Companies & Distributors — continued | ||
SiteOne Landscape Supply, Inc. * | 20,818 | 3,266,136 |
WESCO International, Inc. | 20,764 | 3,171,701 |
26,274,540 | ||
Water Utilities — 0.4% | ||
American States Water Co. | 17,316 | 1,226,665 |
California Water Service Group | 25,830 | 1,268,770 |
Essential Utilities, Inc. | 117,007 | 4,280,116 |
6,775,551 | ||
Total Common Stocks (Cost $1,444,442,509) | 1,570,903,655 | |
Short-Term Investments — 6.1% | ||
Investment Companies — 0.8% | ||
JPMorgan U.S. Government Money Market Fund Class IM Shares, 5.25% (b) (c) (Cost $12,042,783) | 12,042,783 | 12,042,783 |
Investment of Cash Collateral from Securities Loaned — 5.3% | ||
JPMorgan Securities Lending Money Market Fund Agency SL Class Shares, 5.47% (b) (c) | 74,467,158 | 74,474,605 |
JPMorgan U.S. Government Money Market Fund Class IM Shares, 5.25% (b) (c) | 9,815,815 | 9,815,815 |
Total Investment of Cash Collateral from Securities Loaned (Cost $84,302,162) | 84,290,420 | |
Total Short-Term Investments (Cost $96,344,945) | 96,333,203 | |
Total Investments — 105.3% (Cost $1,540,787,454) | 1,667,236,858 | |
Liabilities in Excess of Other Assets — (5.3)% | (83,234,341 ) | |
NET ASSETS — 100.0% | 1,584,002,517 | |
Percentages indicated are based on net assets. |
Abbreviations | |
REIT | Real Estate Investment Trust |
^ | Amount rounds to less than 0.1% of net assets. | |
* | Non-income producing security. | |
(a) | The security or a portion of this security is on loan at April 30, 2024. The total value of securities on loan at April 30, 2024 is $79,189,425. | |
122 | J.P. Morgan Exchange-Traded Funds | April 30, 2024 |
(b) | Investment in an affiliated fund, which is registered under the Investment Company Act of 1940, as amended, and is advised by J.P. Morgan Investment Management Inc. | |
(c) | The rate shown is the current yield as of April 30, 2024. |
DESCRIPTION | NUMBER OF CONTRACTS | EXPIRATION DATE | TRADING CURRENCY | NOTIONAL AMOUNT ($) | VALUE AND UNREALIZED APPRECIATION (DEPRECIATION) ($) |
Long Contracts | |||||
S&P MidCap 400 E-Mini Index | 45 | 06/21/2024 | USD | 12,946,950 | (298,291 ) |
Abbreviations | |
USD | United States Dollar |
April 30, 2024 | J.P. Morgan Exchange-Traded Funds | 123 |
INVESTMENTS | SHARES | VALUE($) |
Common Stocks — 98.7% | ||
Aerospace & Defense — 1.4% | ||
AAR Corp. * | 11,312 | 782,112 |
AeroVironment, Inc. * | 9,369 | 1,497,073 |
AerSale Corp. * | 8,832 | 62,972 |
Cadre Holdings, Inc. | 6,454 | 215,241 |
Eve Holding, Inc. * (a) | 9,178 | 49,469 |
Kratos Defense & Security Solutions, Inc. * | 49,681 | 885,315 |
Mercury Systems, Inc. * | 17,198 | 484,984 |
Moog, Inc., Class A | 9,650 | 1,535,025 |
Rocket Lab USA, Inc. * (a) | 89,339 | 335,915 |
V2X, Inc. * | 4,093 | 198,838 |
Virgin Galactic Holdings, Inc. * (a) | 123,256 | 107,245 |
6,154,189 | ||
Air Freight & Logistics — 0.3% | ||
Air Transport Services Group, Inc. * | 17,264 | 221,325 |
Forward Air Corp. | 10,370 | 228,347 |
Hub Group, Inc., Class A | 20,962 | 843,092 |
1,292,764 | ||
Automobile Components — 1.9% | ||
American Axle & Manufacturing Holdings, Inc. * | 39,217 | 287,853 |
Dana, Inc. | 43,826 | 544,757 |
Dorman Products, Inc. * | 8,923 | 780,316 |
Garrett Motion, Inc. (Switzerland) * | 44,328 | 423,776 |
Gentherm, Inc. * | 10,699 | 541,048 |
LCI Industries | 8,527 | 886,638 |
Luminar Technologies, Inc. * (a) | 88,454 | 130,027 |
Mobileye Global, Inc., Class A (Israel) * (a) | 26,119 | 719,579 |
Modine Manufacturing Co. * | 16,110 | 1,492,269 |
Patrick Industries, Inc. | 7,318 | 764,658 |
Phinia, Inc. | 15,466 | 603,174 |
QuantumScape Corp. * (a) | 116,116 | 629,349 |
Standard Motor Products, Inc. | 6,832 | 219,307 |
XPEL, Inc. * (b) | 7,253 | 381,145 |
8,403,896 | ||
Automobiles — 0.1% | ||
Winnebago Industries, Inc. | 9,907 | 610,073 |
Banks — 9.6% | ||
1st Source Corp. | 5,661 | 280,786 |
Amalgamated Financial Corp. | 5,517 | 135,387 |
Amerant Bancorp, Inc. | 9,650 | 209,019 |
Ameris Bancorp | 21,597 | 1,025,426 |
Associated Banc-Corp. | 50,669 | 1,067,596 |
Atlantic Union Bankshares Corp. | 25,257 | 802,415 |
Axos Financial, Inc. * | 18,290 | 925,657 |
Banc of California, Inc. | 51,586 | 706,212 |
BancFirst Corp. | 6,753 | 602,165 |
Bancorp, Inc. (The) * | 17,758 | 531,675 |
Bank of Hawaii Corp. | 13,345 | 756,528 |
BankUnited, Inc. | 24,091 | 643,952 |
Banner Corp. | 11,519 | 502,574 |
Berkshire Hills Bancorp, Inc. | 14,645 | 312,231 |
Brookline Bancorp, Inc. | 29,862 | 247,855 |
INVESTMENTS | SHARES | VALUE($) |
Banks — continued | ||
Capitol Federal Financial, Inc. | 42,468 | 202,572 |
Cathay General Bancorp | 23,724 | 817,055 |
City Holding Co. | 4,988 | 503,888 |
Columbia Financial, Inc. * | 9,591 | 159,211 |
Community Bank System, Inc. | 17,993 | 777,657 |
Community Trust Bancorp, Inc. | 5,198 | 218,368 |
Customers Bancorp, Inc. * | 9,709 | 443,410 |
CVB Financial Corp. | 44,517 | 727,408 |
Dime Community Bancshares, Inc. | 12,900 | 234,780 |
Eagle Bancorp, Inc. | 10,016 | 185,196 |
Eastern Bankshares, Inc. | 53,926 | 677,311 |
Enterprise Financial Services Corp. | 12,588 | 478,470 |
FB Financial Corp. | 12,089 | 443,062 |
First Bancorp | 13,557 | 412,268 |
First BanCorp (Puerto Rico) | 54,022 | 931,879 |
First Busey Corp. | 17,935 | 400,668 |
First Commonwealth Financial Corp. | 34,311 | 452,562 |
First Financial Bancorp | 31,996 | 707,432 |
First Hawaiian, Inc. | 42,752 | 901,640 |
First Interstate BancSystem, Inc., Class A | 30,109 | 803,910 |
First Merchants Corp. | 20,028 | 669,336 |
Fulton Financial Corp. | 52,514 | 869,107 |
German American Bancorp, Inc. | 9,647 | 306,099 |
Heartland Financial USA, Inc. | 13,831 | 582,423 |
Heritage Financial Corp. | 11,704 | 207,629 |
Hilltop Holdings, Inc. | 15,523 | 454,203 |
Hope Bancorp, Inc. | 39,224 | 393,024 |
Independent Bank Corp. | 14,202 | 713,508 |
Independent Bank Group, Inc. | 12,019 | 447,588 |
International Bancshares Corp. | 18,006 | 1,002,034 |
Lakeland Bancorp, Inc. | 21,807 | 265,827 |
Lakeland Financial Corp. | 8,546 | 502,248 |
Live Oak Bancshares, Inc. | 9,740 | 314,797 |
National Bank Holdings Corp., Class A | 12,688 | 415,278 |
NBT Bancorp, Inc. | 15,792 | 552,878 |
Nicolet Bankshares, Inc. | 4,527 | 346,451 |
Northwest Bancshares, Inc. | 41,037 | 434,992 |
OceanFirst Financial Corp. | 19,927 | 294,123 |
OFG Bancorp (Puerto Rico) | 15,797 | 570,430 |
Origin Bancorp, Inc. | 9,520 | 282,744 |
Pacific Premier Bancorp, Inc. | 29,215 | 628,123 |
Park National Corp. | 4,807 | 633,130 |
Pathward Financial, Inc. | 8,714 | 438,924 |
Preferred Bank | 4,339 | 328,419 |
Premier Financial Corp. | 11,609 | 224,982 |
Provident Financial Services, Inc. | 23,855 | 350,191 |
Renasant Corp. | 18,713 | 543,800 |
Republic Bancorp, Inc., Class A | 3,143 | 159,413 |
S&T Bancorp, Inc. | 12,436 | 374,945 |
Sandy Spring Bancorp, Inc. | 14,950 | 305,728 |
Seacoast Banking Corp. of Florida | 28,642 | 660,771 |
ServisFirst Bancshares, Inc. | 18,217 | 1,074,074 |
Simmons First National Corp., Class A | 41,849 | 715,199 |
Southside Bancshares, Inc. | 10,056 | 268,093 |
124 | J.P. Morgan Exchange-Traded Funds | April 30, 2024 |
INVESTMENTS | SHARES | VALUE($) |
Common Stocks — continued | ||
Banks — continued | ||
Stellar Bancorp, Inc. | 17,573 | 390,121 |
Stock Yards Bancorp, Inc. | 9,318 | 415,117 |
Texas Capital Bancshares, Inc. * | 15,422 | 885,223 |
Tompkins Financial Corp. | 4,458 | 196,063 |
Towne Bank | 23,448 | 606,600 |
TriCo Bancshares | 10,808 | 375,794 |
Triumph Financial, Inc. * | 7,786 | 547,823 |
Trustmark Corp. | 19,162 | 567,195 |
United Community Banks, Inc. | 40,100 | 1,011,723 |
Veritex Holdings, Inc. | 16,513 | 321,673 |
WaFd, Inc. | 21,713 | 588,205 |
WesBanco, Inc. | 19,829 | 535,383 |
Westamerica BanCorp | 8,657 | 402,983 |
WSFS Financial Corp. | 20,449 | 873,786 |
43,276,425 | ||
Beverages — 0.2% | ||
Duckhorn Portfolio, Inc. (The) * | 17,710 | 150,004 |
MGP Ingredients, Inc. | 4,991 | 391,494 |
Vita Coco Co., Inc. (The) * | 11,421 | 276,845 |
818,343 | ||
Biotechnology — 6.9% | ||
ACELYRIN, Inc. * (a) | 7,619 | 31,847 |
Agios Pharmaceuticals, Inc. * | 18,668 | 606,710 |
Akero Therapeutics, Inc. * | 18,666 | 371,267 |
Arcellx, Inc. * | 12,894 | 644,958 |
Arcus Biosciences, Inc. * | 17,386 | 264,789 |
Ardelyx, Inc. * (a) | 72,835 | 466,144 |
Aurinia Pharmaceuticals, Inc. (Canada) * (a) | 45,978 | 234,028 |
Beam Therapeutics, Inc. * (a) | 24,032 | 509,959 |
BioCryst Pharmaceuticals, Inc. * | 68,890 | 284,516 |
Biohaven Ltd. * | 23,333 | 905,320 |
Bridgebio Pharma, Inc. * | 36,389 | 932,286 |
Catalyst Pharmaceuticals, Inc. * | 34,108 | 513,325 |
Celldex Therapeutics, Inc. * | 20,631 | 772,012 |
Cogent Biosciences, Inc. * | 28,097 | 182,631 |
Crinetics Pharmaceuticals, Inc. * | 20,994 | 919,957 |
Day One Biopharmaceuticals, Inc. * | 18,706 | 319,873 |
Deciphera Pharmaceuticals, Inc. * | 17,030 | 430,348 |
Disc Medicine, Inc. * | 2,704 | 75,279 |
Dynavax Technologies Corp. * | 43,608 | 495,823 |
Editas Medicine, Inc. * | 27,500 | 143,275 |
Ideaya Biosciences, Inc. * | 21,268 | 864,544 |
ImmunityBio, Inc. * (a) | 44,377 | 354,572 |
Inhibrx, Inc. * | 9,828 | 334,545 |
Insmed, Inc. * | 44,789 | 1,107,184 |
Iovance Biotherapeutics, Inc. * | 73,495 | 865,771 |
Ironwood Pharmaceuticals, Inc. * | 45,931 | 355,965 |
Keros Therapeutics, Inc. * | 8,565 | 482,980 |
Krystal Biotech, Inc. * | 8,392 | 1,284,983 |
Kura Oncology, Inc. * | 22,828 | 447,885 |
Kymera Therapeutics, Inc. * | 14,002 | 470,747 |
Morphic Holding, Inc. * | 13,493 | 367,954 |
Myriad Genetics, Inc. * | 29,940 | 585,926 |
INVESTMENTS | SHARES | VALUE($) |
Biotechnology — continued | ||
Novavax, Inc. * (a) | 37,272 | 161,388 |
Nuvalent, Inc., Class A * | 10,575 | 728,406 |
OmniAb Operations, Inc. ‡ * | 2,112 | — |
Protagonist Therapeutics, Inc. * | 18,350 | 460,769 |
Prothena Corp. plc (Ireland) * | 13,144 | 267,349 |
PTC Therapeutics, Inc. * | 25,383 | 816,064 |
Recursion Pharmaceuticals, Inc., Class A * (a) | 52,139 | 407,727 |
REGENXBIO, Inc. * | 13,015 | 199,780 |
Relay Therapeutics, Inc. * | 28,861 | 188,174 |
Replimune Group, Inc. * | 13,370 | 84,900 |
REVOLUTION Medicines, Inc. * | 41,113 | 1,532,693 |
Rhythm Pharmaceuticals, Inc. * (a) | 16,488 | 655,563 |
Rocket Pharmaceuticals, Inc. * | 22,600 | 486,352 |
Sage Therapeutics, Inc. * | 18,127 | 252,690 |
Sana Biotechnology, Inc. * (a) | 33,719 | 303,471 |
SpringWorks Therapeutics, Inc. * (a) | 20,651 | 964,195 |
Summit Therapeutics, Inc. * | 38,778 | 152,398 |
Syndax Pharmaceuticals, Inc. * | 27,688 | 585,047 |
TG Therapeutics, Inc. * | 46,996 | 641,965 |
Twist Bioscience Corp. * | 18,233 | 569,417 |
Veracyte, Inc. * | 23,484 | 459,582 |
Vericel Corp. * | 16,086 | 737,865 |
Verve Therapeutics, Inc. * (a) | 21,056 | 126,547 |
Viking Therapeutics, Inc. * | 34,814 | 2,770,498 |
Vir Biotechnology, Inc. * | 29,318 | 248,030 |
Viridian Therapeutics, Inc. * | 15,617 | 207,081 |
Xencor, Inc. * | 19,407 | 406,383 |
Zentalis Pharmaceuticals, Inc. * | 18,478 | 204,367 |
31,246,104 | ||
Broadline Retail — 0.5% | ||
Kohl's Corp. | 33,758 | 808,166 |
Nordstrom, Inc. | 35,153 | 668,259 |
Savers Value Village, Inc. * (a) | 54,133 | 894,277 |
2,370,702 | ||
Building Products — 2.1% | ||
American Woodmark Corp. * | 5,534 | 509,571 |
Apogee Enterprises, Inc. | 7,401 | 457,234 |
AZZ, Inc. | 8,417 | 602,910 |
CSW Industrials, Inc. | 5,184 | 1,231,822 |
Gibraltar Industries, Inc. * | 10,269 | 733,823 |
Griffon Corp. | 14,501 | 950,105 |
Hayward Holdings, Inc. * | 42,537 | 577,652 |
Janus International Group, Inc. * | 38,242 | 551,067 |
JELD-WEN Holding, Inc. * | 27,456 | 562,848 |
Masonite International Corp. * | 7,361 | 975,701 |
Masterbrand, Inc. * | 42,724 | 712,209 |
Quanex Building Products Corp. | 11,073 | 367,845 |
Resideo Technologies, Inc. * | 48,941 | 955,818 |
Tecnoglass, Inc. | 7,675 | 426,346 |
9,614,951 | ||
April 30, 2024 | J.P. Morgan Exchange-Traded Funds | 125 |
INVESTMENTS | SHARES | VALUE($) |
Common Stocks — continued | ||
Capital Markets — 2.6% | ||
Artisan Partners Asset Management, Inc., Class A | 23,010 | 941,799 |
AssetMark Financial Holdings, Inc. * | 6,864 | 232,072 |
B. Riley Financial, Inc. (a) | 5,458 | 187,755 |
BGC Group, Inc., Class A | 130,233 | 1,019,724 |
Brightsphere Investment Group, Inc. | 10,882 | 242,016 |
Donnelley Financial Solutions, Inc. * | 7,993 | 501,801 |
Hamilton Lane, Inc., Class A | 12,580 | 1,405,438 |
Moelis & Co., Class A | 22,490 | 1,103,809 |
Open Lending Corp. * | 33,009 | 168,346 |
Piper Sandler Cos. | 4,928 | 964,853 |
PJT Partners, Inc., Class A | 7,776 | 734,754 |
StepStone Group, Inc., Class A | 17,920 | 646,374 |
StoneX Group, Inc. * | 9,146 | 664,000 |
TPG, Inc. | 19,890 | 857,259 |
Victory Capital Holdings, Inc., Class A | 12,978 | 660,061 |
Virtu Financial, Inc., Class A | 28,999 | 629,278 |
Virtus Investment Partners, Inc. | 2,323 | 509,480 |
WisdomTree, Inc. | 39,105 | 348,035 |
11,816,854 | ||
Chemicals — 1.3% | ||
AdvanSix, Inc. | 9,029 | 228,072 |
Ecovyst, Inc. * | 35,806 | 337,651 |
Ginkgo Bioworks Holdings, Inc. * (a) | 504,834 | 449,858 |
Ingevity Corp. * | 12,199 | 623,857 |
Innospec, Inc. | 8,363 | 1,003,560 |
LSB Industries, Inc. * | 17,683 | 164,452 |
Mativ Holdings, Inc. | 18,194 | 332,222 |
Minerals Technologies, Inc. | 10,047 | 732,326 |
Orion SA (Germany) | 18,211 | 430,872 |
PureCycle Technologies, Inc. * (a) | 32,657 | 152,508 |
Stepan Co. | 7,350 | 609,976 |
Tronox Holdings plc | 40,044 | 680,348 |
5,745,702 | ||
Commercial Services & Supplies — 2.6% | ||
ABM Industries, Inc. | 22,020 | 962,274 |
ACV Auctions, Inc., Class A * | 45,572 | 795,231 |
Brady Corp., Class A | 14,417 | 850,603 |
BrightView Holdings, Inc. * | 13,231 | 148,849 |
Brink's Co. (The) | 14,499 | 1,268,082 |
Cimpress plc (Ireland) * | 5,363 | 457,303 |
CoreCivic, Inc. * | 37,944 | 565,366 |
Deluxe Corp. | 13,753 | 271,622 |
Driven Brands Holdings, Inc. * | 21,629 | 309,943 |
GEO Group, Inc. (The) * | 40,799 | 606,273 |
Healthcare Services Group, Inc. * | 23,095 | 245,269 |
HNI Corp. | 15,667 | 657,231 |
Matthews International Corp., Class A | 10,138 | 273,523 |
MillerKnoll, Inc. | 24,742 | 629,189 |
Montrose Environmental Group, Inc. * | 9,411 | 408,626 |
OPENLANE, Inc. * | 36,187 | 621,693 |
Pitney Bowes, Inc. (a) | 53,720 | 228,847 |
SP Plus Corp. * | 6,617 | 337,864 |
INVESTMENTS | SHARES | VALUE($) |
Commercial Services & Supplies — continued | ||
Steelcase, Inc., Class A | 29,477 | 354,608 |
UniFirst Corp. | 5,087 | 814,581 |
Vestis Corp. | 43,928 | 809,154 |
11,616,131 | ||
Communications Equipment — 0.7% | ||
Digi International, Inc. * | 12,157 | 372,734 |
Extreme Networks, Inc. * | 43,685 | 489,272 |
Harmonic, Inc. * | 35,313 | 379,262 |
Infinera Corp. * (a) | 67,831 | 326,945 |
NetScout Systems, Inc. * | 23,041 | 443,770 |
Viasat, Inc. * (a) | 25,538 | 406,309 |
Viavi Solutions, Inc. * | 74,955 | 592,144 |
3,010,436 | ||
Construction & Engineering — 1.4% | ||
Ameresco, Inc., Class A * (a) | 10,822 | 226,504 |
Construction Partners, Inc., Class A * | 14,606 | 754,254 |
Dycom Industries, Inc. * | 9,531 | 1,334,531 |
Granite Construction, Inc. | 14,806 | 821,733 |
IES Holdings, Inc. * | 2,888 | 390,227 |
MYR Group, Inc. * | 5,407 | 898,914 |
Primoris Services Corp. | 17,985 | 838,101 |
Sterling Infrastructure, Inc. * | 10,404 | 1,057,046 |
6,321,310 | ||
Construction Materials — 0.1% | ||
United States Lime & Minerals, Inc. | 724 | 224,440 |
Consumer Finance — 0.9% | ||
Bread Financial Holdings, Inc. | 15,960 | 589,084 |
Encore Capital Group, Inc. * | 7,637 | 313,804 |
Enova International, Inc. * | 10,027 | 606,934 |
Green Dot Corp., Class A * | 14,936 | 130,690 |
LendingClub Corp. * | 36,142 | 271,788 |
Navient Corp. | 28,679 | 430,759 |
Nelnet, Inc., Class A | 6,340 | 597,101 |
PROG Holdings, Inc. | 15,072 | 500,993 |
Upstart Holdings, Inc. * (a) | 23,875 | 528,354 |
World Acceptance Corp. * | 1,193 | 164,121 |
4,133,628 | ||
Consumer Staples Distribution & Retail — 0.8% | ||
Andersons, Inc. (The) | 10,555 | 579,892 |
Chefs' Warehouse, Inc. (The) * | 12,043 | 398,382 |
Grocery Outlet Holding Corp. * | 31,346 | 814,055 |
Ingles Markets, Inc., Class A | 4,876 | 349,853 |
PriceSmart, Inc. | 8,457 | 681,550 |
SpartanNash Co. | 11,623 | 221,883 |
United Natural Foods, Inc. * | 19,902 | 177,725 |
Weis Markets, Inc. | 5,508 | 347,720 |
3,571,060 | ||
Containers & Packaging — 0.2% | ||
Myers Industries, Inc. | 10,439 | 228,614 |
126 | J.P. Morgan Exchange-Traded Funds | April 30, 2024 |
INVESTMENTS | SHARES | VALUE($) |
Common Stocks — continued | ||
Containers & Packaging — continued | ||
Pactiv Evergreen, Inc. | 11,680 | 178,003 |
TriMas Corp. | 13,959 | 362,795 |
769,412 | ||
Diversified Consumer Services — 1.4% | ||
Adtalem Global Education, Inc. * | 12,670 | 628,686 |
Chegg, Inc. * | 33,337 | 172,352 |
Coursera, Inc. * | 35,254 | 360,296 |
European Wax Center, Inc., Class A * | 11,299 | 132,876 |
Frontdoor, Inc. * | 26,003 | 798,032 |
Graham Holdings Co., Class B | 1,208 | 847,255 |
Laureate Education, Inc., Class A | 44,490 | 645,105 |
Mister Car Wash, Inc. * | 31,470 | 210,534 |
OneSpaWorld Holdings Ltd. (Bahamas) * | 28,246 | 359,289 |
Strategic Education, Inc. | 7,710 | 885,417 |
Stride, Inc. * | 14,213 | 948,718 |
Udemy, Inc. * | 28,813 | 288,706 |
6,277,266 | ||
Diversified REITs — 0.5% | ||
Alexander & Baldwin, Inc. | 24,447 | 402,642 |
American Assets Trust, Inc. | 16,492 | 352,104 |
Broadstone Net Lease, Inc. | 58,184 | 847,159 |
Empire State Realty Trust, Inc., Class A | 44,296 | 403,094 |
Global Net Lease, Inc. | 65,820 | 457,449 |
2,462,448 | ||
Diversified Telecommunication Services — 0.3% | ||
Globalstar, Inc. * (a) | 258,245 | 333,136 |
Liberty Latin America Ltd., Class A (Puerto Rico) * | 12,071 | 91,136 |
Liberty Latin America Ltd., Class C (Puerto Rico) * | 41,843 | 315,496 |
Lumen Technologies, Inc. * (a) | 334,589 | 398,161 |
Shenandoah Telecommunications Co. | 16,296 | 208,915 |
1,346,844 | ||
Electric Utilities — 0.3% | ||
Hawaiian Electric Industries, Inc. | 37,152 | 365,947 |
MGE Energy, Inc. | 11,407 | 893,396 |
1,259,343 | ||
Electrical Equipment — 1.0% | ||
ChargePoint Holdings, Inc. * (a) | 128,338 | 170,690 |
Encore Wire Corp. | 5,115 | 1,428,926 |
Enovix Corp. * (a) | 47,262 | 295,860 |
Fluence Energy, Inc. * (a) | 18,983 | 338,657 |
GrafTech International Ltd. | 64,979 | 111,764 |
NEXTracker, Inc., Class A * | 39,890 | 1,706,893 |
SES AI Corp. * (a) | 46,426 | 73,353 |
SunPower Corp. * (a) | 27,130 | 55,888 |
Vicor Corp. * | 7,746 | 250,815 |
4,432,846 | ||
Electronic Equipment, Instruments & Components — 2.2% | ||
Benchmark Electronics, Inc. | 11,930 | 360,405 |
INVESTMENTS | SHARES | VALUE($) |
Electronic Equipment, Instruments & Components — continued | ||
Crane NXT Co. (a) | 19,029 | 1,157,154 |
CTS Corp. | 10,469 | 478,957 |
ePlus, Inc. * | 9,013 | 692,919 |
Itron, Inc. * | 15,333 | 1,412,476 |
Knowles Corp. * | 30,359 | 480,583 |
Methode Electronics, Inc. | 11,614 | 141,575 |
Mirion Technologies, Inc. * | 63,978 | 695,441 |
Napco Security Technologies, Inc. | 11,090 | 451,363 |
OSI Systems, Inc. * | 5,622 | 738,956 |
PAR Technology Corp. * | 9,311 | 393,669 |
PC Connection, Inc. | 3,828 | 237,221 |
Plexus Corp. * | 9,202 | 929,494 |
ScanSource, Inc. * | 8,330 | 346,695 |
TTM Technologies, Inc. * | 34,253 | 511,397 |
Vishay Intertechnology, Inc. | 40,460 | 936,244 |
9,964,549 | ||
Energy Equipment & Services — 1.8% | ||
Archrock, Inc. | 48,753 | 935,570 |
Cactus, Inc., Class A | 21,091 | 1,046,957 |
Core Laboratories, Inc. | 14,909 | 235,562 |
Diamond Offshore Drilling, Inc. * | 34,245 | 419,159 |
Dril-Quip, Inc. * | 10,840 | 197,071 |
Helix Energy Solutions Group, Inc. * | 48,253 | 518,237 |
Kodiak Gas Services, Inc. | 6,110 | 166,070 |
Liberty Energy, Inc. | 53,015 | 1,166,330 |
Nabors Industries Ltd. * | 3,018 | 217,387 |
Oceaneering International, Inc. * | 33,710 | 772,296 |
ProFrac Holding Corp., Class A * (a) | 8,766 | 63,729 |
ProPetro Holding Corp. * | 26,703 | 232,850 |
RPC, Inc. | 33,046 | 221,078 |
Tidewater, Inc. * | 16,079 | 1,476,856 |
US Silica Holdings, Inc. * | 25,874 | 399,236 |
8,068,388 | ||
Entertainment — 1.0% | ||
AMC Entertainment Holdings, Inc., Class A * (a) | 83,487 | 244,618 |
Atlanta Braves Holdings, Inc., Class A * | 3,480 | 140,383 |
Atlanta Braves Holdings, Inc., Class C * | 15,618 | 584,582 |
Cinemark Holdings, Inc. * (a) | 37,171 | 637,111 |
Eventbrite, Inc., Class A * | 28,176 | 148,769 |
IMAX Corp. * | 14,886 | 238,325 |
Liberty Media Corp-Liberty Live, Class A * | 8,494 | 304,595 |
Liberty Media Corp-Liberty Live, Class C * | 19,647 | 733,226 |
Lions Gate Entertainment Corp., Class A * | 17,838 | 179,985 |
Lions Gate Entertainment Corp., Class B * | 45,075 | 425,057 |
Madison Square Garden Entertainment Corp. * | 13,548 | 530,404 |
Sphere Entertainment Co. * | 8,080 | 313,989 |
4,481,044 | ||
Financial Services — 2.2% | ||
Affirm Holdings, Inc. * | 75,388 | 2,403,369 |
AvidXchange Holdings, Inc. * | 55,788 | 650,488 |
Cannae Holdings, Inc. * | 20,779 | 404,152 |
Compass Diversified Holdings | 19,383 | 425,844 |
April 30, 2024 | J.P. Morgan Exchange-Traded Funds | 127 |
INVESTMENTS | SHARES | VALUE($) |
Common Stocks — continued | ||
Financial Services — continued | ||
EVERTEC, Inc. (Puerto Rico) | 20,777 | 779,761 |
Federal Agricultural Mortgage Corp., Class C | 3,019 | 561,926 |
International Money Express, Inc. * | 10,894 | 220,386 |
Marqeta, Inc., Class A * | 135,787 | 753,618 |
Merchants Bancorp | 5,309 | 214,112 |
NCR Atleos Corp. * | 23,725 | 472,839 |
NMI Holdings, Inc., Class A * | 25,467 | 785,912 |
Payoneer Global, Inc. * | 79,220 | 391,347 |
Repay Holdings Corp. * | 26,406 | 268,549 |
Rocket Cos., Inc., Class A * (a) | 39,918 | 490,193 |
Walker & Dunlop, Inc. | 11,241 | 1,030,013 |
9,852,509 | ||
Food Products — 0.6% | ||
B&G Foods, Inc. | 26,127 | 290,010 |
Cal-Maine Foods, Inc. | 13,773 | 762,060 |
Fresh Del Monte Produce, Inc. | 10,279 | 262,834 |
Hain Celestial Group, Inc. (The) * | 29,025 | 178,214 |
Mission Produce, Inc. * | 14,544 | 165,074 |
Tootsie Roll Industries, Inc. | 4,731 | 140,558 |
Utz Brands, Inc. | 20,339 | 366,712 |
WK Kellogg Co. | 24,111 | 562,751 |
2,728,213 | ||
Gas Utilities — 0.3% | ||
Chesapeake Utilities Corp. | 7,337 | 776,768 |
Northwest Natural Holding Co. | 12,382 | 472,373 |
1,249,141 | ||
Ground Transportation — 0.7% | ||
ArcBest Corp. | 7,943 | 880,958 |
Heartland Express, Inc. | 16,210 | 161,127 |
Marten Transport Ltd. | 19,532 | 330,482 |
RXO, Inc. * | 39,314 | 743,428 |
Schneider National, Inc., Class B | 12,606 | 260,692 |
Werner Enterprises, Inc. | 21,324 | 729,281 |
3,105,968 | ||
Health Care Equipment & Supplies — 2.5% | ||
Alphatec Holdings, Inc. * | 33,200 | 418,984 |
AtriCure, Inc. * | 15,878 | 382,977 |
Atrion Corp. | 455 | 192,597 |
Avanos Medical, Inc. * | 15,631 | 282,608 |
Axonics, Inc. * | 17,007 | 1,132,156 |
Embecta Corp. | 17,543 | 177,711 |
Establishment Labs Holdings, Inc. (Costa Rica) * | 7,958 | 397,980 |
Glaukos Corp. * | 15,855 | 1,522,080 |
Integer Holdings Corp. * | 11,233 | 1,253,940 |
LeMaitre Vascular, Inc. (a) | 6,715 | 435,132 |
LivaNova plc * | 18,174 | 1,013,201 |
Novocure Ltd. * | 35,511 | 434,655 |
Omnicell, Inc. * | 15,340 | 411,265 |
OrthoPediatrics Corp. * | 5,429 | 160,861 |
Paragon 28, Inc. * | 12,025 | 110,871 |
PROCEPT BioRobotics Corp. * | 14,396 | 762,700 |
INVESTMENTS | SHARES | VALUE($) |
Health Care Equipment & Supplies — continued | ||
Tandem Diabetes Care, Inc. * | 21,913 | 803,988 |
TransMedics Group, Inc. * | 10,586 | 996,460 |
Treace Medical Concepts, Inc. * | 14,752 | 152,978 |
Varex Imaging Corp. * | 13,637 | 221,601 |
11,264,745 | ||
Health Care Providers & Services — 2.0% | ||
AdaptHealth Corp. * | 25,537 | 251,539 |
Addus HomeCare Corp. * | 5,043 | 484,884 |
Agiliti, Inc. * | 10,601 | 107,600 |
Alignment Healthcare, Inc. * | 34,834 | 179,395 |
Amedisys, Inc. * | 10,238 | 942,408 |
Astrana Health, Inc. * | 13,607 | 505,500 |
Brookdale Senior Living, Inc. * | 58,935 | 400,169 |
Cross Country Healthcare, Inc. * | 11,111 | 195,554 |
DocGo, Inc. * | 29,935 | 101,180 |
Fulgent Genetics, Inc. * (a) | 6,698 | 136,304 |
Guardant Health, Inc. * | 37,060 | 667,080 |
Hims & Hers Health, Inc. * | 43,552 | 545,707 |
ModivCare, Inc. * | 3,761 | 88,271 |
National HealthCare Corp. | 4,932 | 448,171 |
National Research Corp. | 4,822 | 165,154 |
NeoGenomics, Inc. * | 42,874 | 596,806 |
OPKO Health, Inc. * (a) | 150,748 | 183,913 |
Owens & Minor, Inc. * | 24,002 | 593,809 |
Patterson Cos., Inc. | 29,103 | 741,253 |
Pediatrix Medical Group, Inc. * | 28,318 | 251,181 |
RadNet, Inc. * | 23,244 | 1,127,334 |
US Physical Therapy, Inc. | 4,859 | 493,237 |
9,206,449 | ||
Health Care REITs — 0.8% | ||
CareTrust REIT, Inc. | 43,285 | 1,070,005 |
LTC Properties, Inc. | 13,972 | 462,473 |
National Health Investors, Inc. | 14,031 | 884,795 |
Sabra Health Care REIT, Inc. | 70,909 | 987,054 |
3,404,327 | ||
Health Care Technology — 0.4% | ||
Certara, Inc. * | 36,778 | 629,272 |
Definitive Healthcare Corp. * | 17,111 | 118,750 |
HealthStream, Inc. | 8,347 | 215,102 |
Multiplan Corp. * (a) | 94,221 | 61,225 |
Phreesia, Inc. * | 16,745 | 347,291 |
Schrodinger, Inc. * | 18,836 | 459,222 |
1,830,862 | ||
Hotel & Resort REITs — 1.0% | ||
DiamondRock Hospitality Co. | 67,541 | 601,115 |
Park Hotels & Resorts, Inc. | 70,631 | 1,139,278 |
Pebblebrook Hotel Trust | 39,921 | 580,052 |
RLJ Lodging Trust | 52,472 | 577,192 |
Service Properties Trust | 55,814 | 342,140 |
Summit Hotel Properties, Inc. | 36,077 | 216,823 |
128 | J.P. Morgan Exchange-Traded Funds | April 30, 2024 |
INVESTMENTS | SHARES | VALUE($) |
Common Stocks — continued | ||
Hotel & Resort REITs — continued | ||
Sunstone Hotel Investors, Inc. | 63,488 | 647,577 |
Xenia Hotels & Resorts, Inc. | 35,492 | 492,274 |
4,596,451 | ||
Hotels, Restaurants & Leisure — 2.4% | ||
BJ's Restaurants, Inc. * | 7,651 | 249,346 |
Bloomin' Brands, Inc. | 26,565 | 685,111 |
Bowlero Corp., Class A (a) | 13,145 | 154,454 |
Brinker International, Inc. * | 14,852 | 796,067 |
Cheesecake Factory, Inc. (The) (a) | 16,049 | 554,012 |
Cracker Barrel Old Country Store, Inc. (a) | 7,445 | 433,225 |
Dave & Buster's Entertainment, Inc. * | 10,860 | 579,924 |
Dine Brands Global, Inc. | 4,923 | 217,104 |
Dutch Bros, Inc., Class A * (a) | 25,287 | 712,082 |
Everi Holdings, Inc. * | 28,290 | 231,129 |
First Watch Restaurant Group, Inc. * | 6,720 | 171,494 |
Golden Entertainment, Inc. | 7,522 | 241,080 |
Jack in the Box, Inc. | 6,565 | 374,665 |
Krispy Kreme, Inc. | 25,596 | 323,789 |
Monarch Casino & Resort, Inc. | 4,529 | 306,930 |
Papa John's International, Inc. | 11,029 | 680,379 |
Portillo's, Inc., Class A * | 15,748 | 193,071 |
Red Rock Resorts, Inc., Class A | 16,687 | 886,413 |
Sabre Corp. * | 121,754 | 349,434 |
Shake Shack, Inc., Class A * | 12,675 | 1,341,649 |
Six Flags Entertainment Corp. * | 24,041 | 566,887 |
Sweetgreen, Inc., Class A * | 28,372 | 637,519 |
Target Hospitality Corp. * (a) | 12,381 | 137,739 |
10,823,503 | ||
Household Durables — 1.7% | ||
Cavco Industries, Inc. * | 2,641 | 961,879 |
Century Communities, Inc. | 9,692 | 768,769 |
Green Brick Partners, Inc. * | 10,074 | 545,306 |
Helen of Troy Ltd. * | 8,002 | 741,865 |
iRobot Corp. * (a) | 9,306 | 79,659 |
La-Z-Boy, Inc. | 14,436 | 474,078 |
LGI Homes, Inc. * | 6,805 | 611,974 |
M/I Homes, Inc. * | 9,396 | 1,092,003 |
Sonos, Inc. * | 40,847 | 690,314 |
Tri Pointe Homes, Inc. * | 32,743 | 1,206,580 |
Vizio Holding Corp., Class A * | 23,231 | 246,249 |
7,418,676 | ||
Household Products — 0.7% | ||
Central Garden & Pet Co. * | 3,002 | 122,932 |
Central Garden & Pet Co., Class A * | 17,551 | 621,832 |
Energizer Holdings, Inc. | 22,434 | 644,304 |
Spectrum Brands Holdings, Inc. | 9,979 | 816,981 |
WD-40 Co. | 4,547 | 1,028,213 |
3,234,262 | ||
Independent Power and Renewable Electricity Producers — 0.1% | ||
Altus Power, Inc. * | 22,636 | 83,074 |
INVESTMENTS | SHARES | VALUE($) |
Independent Power and Renewable Electricity Producers — continued | ||
Montauk Renewables, Inc. * | 22,488 | 80,957 |
Sunnova Energy International, Inc. * (a) | 32,503 | 136,838 |
300,869 | ||
Industrial REITs — 0.4% | ||
Innovative Industrial Properties, Inc. (a) | 9,460 | 978,164 |
LXP Industrial Trust | 98,332 | 821,072 |
1,799,236 | ||
Insurance — 2.0% | ||
AMERISAFE, Inc. | 6,458 | 294,485 |
BRP Group, Inc., Class A * | 21,635 | 576,356 |
CNO Financial Group, Inc. | 37,314 | 982,478 |
Employers Holdings, Inc. | 8,668 | 369,170 |
F&G Annuities & Life, Inc. (a) | 5,801 | 219,394 |
Genworth Financial, Inc., Class A * | 152,005 | 901,390 |
Goosehead Insurance, Inc., Class A * | 8,006 | 455,621 |
Hagerty, Inc., Class A * | 8,590 | 76,881 |
Horace Mann Educators Corp. | 13,763 | 507,304 |
Lemonade, Inc. * (a) | 21,067 | 362,984 |
Mercury General Corp. | 8,985 | 469,556 |
National Western Life Group, Inc., Class A | 675 | 329,953 |
Oscar Health, Inc., Class A * | 48,540 | 843,140 |
Palomar Holdings, Inc. * | 7,985 | 628,180 |
ProAssurance Corp. * | 17,195 | 229,725 |
Safety Insurance Group, Inc. | 4,940 | 393,076 |
SiriusPoint Ltd. (Bermuda) * | 31,774 | 374,298 |
Skyward Specialty Insurance Group, Inc. * | 7,094 | 247,722 |
Stewart Information Services Corp. | 9,185 | 569,562 |
Trupanion, Inc. * (a) | 11,114 | 250,065 |
9,081,340 | ||
Interactive Media & Services — 0.8% | ||
Bumble, Inc., Class A * | 31,511 | 318,261 |
Cargurus, Inc. * | 29,198 | 655,787 |
Cars.com, Inc. * | 20,958 | 350,208 |
Shutterstock, Inc. | 8,325 | 355,561 |
TripAdvisor, Inc. * | 36,603 | 963,757 |
Yelp, Inc. * | 21,876 | 880,290 |
ZipRecruiter, Inc., Class A * | 22,057 | 226,746 |
3,750,610 | ||
IT Services — 0.6% | ||
BigCommerce Holdings, Inc. * | 22,153 | 125,386 |
DigitalOcean Holdings, Inc. * | 16,482 | 541,598 |
Fastly, Inc., Class A * | 40,599 | 513,577 |
Grid Dynamics Holdings, Inc. * | 19,381 | 189,352 |
Perficient, Inc. * | 11,579 | 547,224 |
Squarespace, Inc., Class A * | 15,073 | 525,445 |
Thoughtworks Holding, Inc. * | 26,105 | 60,564 |
2,503,146 | ||
Leisure Products — 0.4% | ||
Malibu Boats, Inc., Class A * | 6,703 | 228,036 |
Peloton Interactive, Inc., Class A * | 112,986 | 351,386 |
Smith & Wesson Brands, Inc. | 14,978 | 254,177 |
April 30, 2024 | J.P. Morgan Exchange-Traded Funds | 129 |
INVESTMENTS | SHARES | VALUE($) |
Common Stocks — continued | ||
Leisure Products — continued | ||
Sturm Ruger & Co., Inc. | 5,937 | 274,468 |
Vista Outdoor, Inc. * | 18,868 | 662,078 |
1,770,145 | ||
Life Sciences Tools & Services — 0.4% | ||
Adaptive Biotechnologies Corp. * | 37,023 | 97,000 |
Cytek Biosciences, Inc. * | 34,343 | 206,402 |
Fortrea Holdings, Inc. * | 27,592 | 1,009,591 |
Maravai LifeSciences Holdings, Inc., Class A * | 37,104 | 304,253 |
OmniAb, Inc. ‡ * | 2,112 | — |
Pacific Biosciences of California, Inc. * | 84,725 | 139,796 |
1,757,042 | ||
Machinery — 3.3% | ||
Alamo Group, Inc. | 3,380 | 657,004 |
Albany International Corp., Class A | 10,483 | 836,019 |
Astec Industries, Inc. | 7,633 | 319,059 |
Atmus Filtration Technologies, Inc. * | 5,367 | 162,566 |
Barnes Group, Inc. | 16,755 | 581,734 |
Energy Recovery, Inc. * | 18,934 | 282,117 |
Enerpac Tool Group Corp. | 18,297 | 651,922 |
Enpro, Inc. | 6,715 | 1,008,123 |
ESCO Technologies, Inc. | 8,551 | 867,499 |
Gorman-Rupp Co. (The) | 7,370 | 244,463 |
Greenbrier Cos., Inc. (The) | 10,409 | 514,100 |
Helios Technologies, Inc. | 10,236 | 461,644 |
Hillman Solutions Corp. * | 65,098 | 622,337 |
Kadant, Inc. | 3,744 | 1,025,070 |
Kennametal, Inc. | 25,648 | 603,497 |
Lindsay Corp. | 3,714 | 431,381 |
Mueller Water Products, Inc., Class A | 52,740 | 835,402 |
Omega Flex, Inc. | 1,185 | 78,518 |
Proto Labs, Inc. * | 8,213 | 250,332 |
SPX Technologies, Inc. * | 15,339 | 1,868,444 |
Standex International Corp. | 4,011 | 693,422 |
Symbotic, Inc. * (a) | 6,787 | 261,775 |
Tennant Co. | 6,290 | 732,659 |
Trinity Industries, Inc. | 27,399 | 712,922 |
Wabash National Corp. | 15,472 | 357,558 |
15,059,567 | ||
Marine Transportation — 0.3% | ||
Matson, Inc. | 11,703 | 1,261,349 |
Media — 0.5% | ||
Altice USA, Inc., Class A * | 72,161 | 139,271 |
Gray Television, Inc. | 28,204 | 162,173 |
Integral Ad Science Holding Corp. * | 16,987 | 162,905 |
John Wiley & Sons, Inc., Class A | 14,897 | 559,680 |
Magnite, Inc. * | 39,718 | 350,710 |
Scholastic Corp. | 8,548 | 304,480 |
TechTarget, Inc. * | 8,858 | 243,595 |
Thryv Holdings, Inc. * | 10,522 | 242,111 |
2,164,925 | ||
INVESTMENTS | SHARES | VALUE($) |
Metals & Mining — 1.7% | ||
Alpha Metallurgical Resources, Inc. | 3,590 | 1,174,361 |
Arch Resources, Inc. | 5,669 | 900,124 |
Carpenter Technology Corp. | 15,686 | 1,344,290 |
Century Aluminum Co. * | 17,365 | 301,283 |
Coeur Mining, Inc. * | 128,307 | 579,947 |
Compass Minerals International, Inc. | 11,482 | 142,951 |
Ivanhoe Electric, Inc. * | 25,060 | 253,106 |
Kaiser Aluminum Corp. | 5,358 | 484,845 |
Materion Corp. | 6,965 | 800,557 |
Radius Recycling, Inc. | 8,745 | 152,338 |
Ryerson Holding Corp. | 9,833 | 280,732 |
Warrior Met Coal, Inc. | 17,462 | 1,193,528 |
7,608,062 | ||
Mortgage Real Estate Investment Trusts (REITs) — 1.4% | ||
Apollo Commercial Real Estate Finance, Inc. | 42,254 | 406,906 |
Arbor Realty Trust, Inc. (a) | 60,670 | 778,396 |
ARMOUR Residential REIT, Inc. (a) | 15,919 | 289,248 |
Brightspire Capital, Inc. | 43,853 | 275,835 |
Chimera Investment Corp. | 76,427 | 314,879 |
Claros Mortgage Trust, Inc. | 39,128 | 340,414 |
Franklin BSP Realty Trust, Inc. | 27,633 | 345,136 |
Hannon Armstrong Sustainable Infrastructure Capital, Inc. (a) | 36,866 | 922,019 |
KKR Real Estate Finance Trust, Inc. | 19,527 | 183,749 |
Ladder Capital Corp. | 38,450 | 412,569 |
MFA Financial, Inc. | 34,145 | 361,593 |
New York Mortgage Trust, Inc. | 30,227 | 207,055 |
PennyMac Mortgage Investment Trust (a) | 27,617 | 382,495 |
Ready Capital Corp. | 58,013 | 494,271 |
Redwood Trust, Inc. | 39,985 | 221,117 |
Two Harbors Investment Corp. | 31,089 | 392,654 |
6,328,336 | ||
Office REITs — 1.7% | ||
Brandywine Realty Trust | 57,654 | 261,749 |
COPT Defense Properties | 37,932 | 909,230 |
Douglas Emmett, Inc. | 52,090 | 714,154 |
Easterly Government Properties, Inc. | 32,086 | 375,085 |
Equity Commonwealth * | 35,857 | 671,243 |
Highwoods Properties, Inc. | 35,586 | 932,353 |
Hudson Pacific Properties, Inc. | 47,453 | 275,228 |
JBG SMITH Properties | 29,607 | 444,401 |
Paramount Group, Inc. | 61,962 | 287,504 |
Piedmont Office Realty Trust, Inc., Class A | 41,529 | 286,135 |
SL Green Realty Corp. (a) | 21,733 | 1,082,955 |
Vornado Realty Trust | 57,211 | 1,489,202 |
7,729,239 | ||
Oil, Gas & Consumable Fuels — 3.0% | ||
Clean Energy Fuels Corp. * | 57,634 | 133,711 |
CNX Resources Corp. * | 53,433 | 1,256,744 |
CONSOL Energy, Inc. | 9,520 | 787,875 |
CVR Energy, Inc. | 11,429 | 347,213 |
Delek US Holdings, Inc. | 20,168 | 551,191 |
130 | J.P. Morgan Exchange-Traded Funds | April 30, 2024 |
INVESTMENTS | SHARES | VALUE($) |
Common Stocks — continued | ||
Oil, Gas & Consumable Fuels — continued | ||
Dorian LPG Ltd. | 11,659 | 481,750 |
Equitrans Midstream Corp. | 146,024 | 1,975,705 |
Granite Ridge Resources, Inc. | 21,582 | 140,715 |
Green Plains, Inc. * | 19,997 | 413,338 |
Gulfport Energy Corp. * | 4,115 | 653,092 |
HighPeak Energy, Inc. (a) | 7,236 | 102,824 |
International Seaways, Inc. | 11,832 | 654,191 |
Kinetik Holdings, Inc. | 5,875 | 225,248 |
Kosmos Energy Ltd. (Ghana) * | 148,870 | 844,093 |
NextDecade Corp. * (a) | 30,989 | 198,949 |
Northern Oil & Gas, Inc. | 31,193 | 1,272,362 |
Par Pacific Holdings, Inc. * | 20,329 | 626,133 |
Sitio Royalties Corp. | 27,391 | 636,567 |
Talos Energy, Inc. * | 36,487 | 480,899 |
Uranium Energy Corp. * | 120,671 | 814,529 |
Vital Energy, Inc. * | 8,037 | 426,122 |
W&T Offshore, Inc. (a) | 33,131 | 74,545 |
World Kinect Corp. | 20,269 | 476,321 |
13,574,117 | ||
Paper & Forest Products — 0.2% | ||
Sylvamo Corp. | 11,833 | 739,563 |
Passenger Airlines — 0.6% | ||
Allegiant Travel Co. | 4,793 | 261,506 |
JetBlue Airways Corp. * | 112,442 | 638,671 |
Joby Aviation, Inc. * (a) | 141,421 | 714,176 |
SkyWest, Inc. * | 13,537 | 988,607 |
Spirit Airlines, Inc. (a) | 36,683 | 129,491 |
Sun Country Airlines Holdings, Inc. * | 12,035 | 160,186 |
2,892,637 | ||
Personal Care Products — 0.3% | ||
Edgewell Personal Care Co. | 16,689 | 627,840 |
Herbalife Ltd. * (a) | 32,702 | 282,872 |
Medifast, Inc. | 3,668 | 100,980 |
Nu Skin Enterprises, Inc., Class A | 16,569 | 194,852 |
USANA Health Sciences, Inc. * | 3,775 | 156,738 |
1,363,282 | ||
Pharmaceuticals — 1.3% | ||
Amphastar Pharmaceuticals, Inc. * | 12,655 | 522,019 |
Amylyx Pharmaceuticals, Inc. * | 15,239 | 27,582 |
ANI Pharmaceuticals, Inc. * | 5,671 | 374,286 |
Arvinas, Inc. * | 16,725 | 531,353 |
Cassava Sciences, Inc. * (a) | 14,227 | 315,128 |
Corcept Therapeutics, Inc. * | 31,752 | 740,457 |
Harmony Biosciences Holdings, Inc. * (a) | 12,430 | 384,211 |
Innoviva, Inc. * | 19,026 | 287,483 |
Ligand Pharmaceuticals, Inc. * | 5,876 | 410,674 |
Neumora Therapeutics, Inc. * | 26,274 | 238,831 |
Pacira BioSciences, Inc. * | 15,573 | 408,791 |
Pliant Therapeutics, Inc. * | 15,823 | 187,028 |
Revance Therapeutics, Inc. * | 27,138 | 97,968 |
Supernus Pharmaceuticals, Inc. * | 17,750 | 534,275 |
INVESTMENTS | SHARES | VALUE($) |
Pharmaceuticals — continued | ||
Tilray Brands, Inc. (Canada) * (a) | 246,133 | 607,948 |
Ventyx Biosciences, Inc. * (a) | 15,040 | 56,250 |
5,724,284 | ||
Professional Services — 1.8% | ||
CBIZ, Inc. * | 15,907 | 1,132,260 |
Conduent, Inc. * | 57,325 | 180,574 |
CSG Systems International, Inc. | 9,939 | 469,518 |
First Advantage Corp. | 17,087 | 278,518 |
Huron Consulting Group, Inc. * | 5,932 | 553,100 |
ICF International, Inc. | 6,330 | 913,356 |
Kelly Services, Inc., Class A | 10,576 | 242,613 |
Kforce, Inc. | 6,272 | 387,359 |
Korn Ferry | 16,786 | 1,019,246 |
Legalzoom.com, Inc. * | 39,754 | 475,060 |
NV5 Global, Inc. * | 4,756 | 443,449 |
Planet Labs PBC * | 68,445 | 115,672 |
Sterling Check Corp. * | 10,402 | 157,382 |
TTEC Holdings, Inc. | 6,591 | 47,983 |
Upwork, Inc. * | 42,061 | 492,114 |
Verra Mobility Corp. * | 55,773 | 1,315,127 |
8,223,331 | ||
Real Estate Management & Development — 0.9% | ||
Compass, Inc., Class A * | 110,544 | 348,214 |
Cushman & Wakefield plc * | 51,675 | 498,664 |
DigitalBridge Group, Inc. | 49,291 | 810,344 |
eXp World Holdings, Inc. (a) | 27,084 | 269,757 |
Forestar Group, Inc. * | 6,163 | 190,991 |
Kennedy-Wilson Holdings, Inc. | 37,150 | 319,118 |
Marcus & Millichap, Inc. | 8,185 | 259,219 |
Newmark Group, Inc., Class A | 47,249 | 452,173 |
Opendoor Technologies, Inc. * | 207,741 | 413,404 |
St. Joe Co. (The) | 11,954 | 683,769 |
4,245,653 | ||
Residential REITs — 0.4% | ||
Apartment Investment and Management Co., Class A * | 42,930 | 343,440 |
Centerspace | 5,079 | 341,563 |
Elme Communities | 29,574 | 448,342 |
NexPoint Residential Trust, Inc. | 7,874 | 269,606 |
Veris Residential, Inc. | 26,975 | 388,709 |
1,791,660 | ||
Retail REITs — 1.3% | ||
Acadia Realty Trust | 34,229 | 591,477 |
Alexander's, Inc. | 716 | 151,477 |
CBL & Associates Properties, Inc. | 4,404 | 95,787 |
Getty Realty Corp. | 16,750 | 453,925 |
InvenTrust Properties Corp. | 21,896 | 554,844 |
Macerich Co. (The) | 72,613 | 999,155 |
Retail Opportunity Investments Corp. | 42,212 | 517,941 |
Saul Centers, Inc. | 4,153 | 151,211 |
SITE Centers Corp. | 63,910 | 862,146 |
April 30, 2024 | J.P. Morgan Exchange-Traded Funds | 131 |
INVESTMENTS | SHARES | VALUE($) |
Common Stocks — continued | ||
Retail REITs — continued | ||
Tanger, Inc. | 35,045 | 993,526 |
Urban Edge Properties | 39,690 | 664,014 |
6,035,503 | ||
Semiconductors & Semiconductor Equipment — 2.2% | ||
Ambarella, Inc. * | 13,334 | 612,964 |
Cohu, Inc. * | 15,883 | 481,573 |
Credo Technology Group Holding Ltd. * | 44,304 | 791,712 |
FormFactor, Inc. * | 26,210 | 1,168,704 |
Ichor Holdings Ltd. * | 9,783 | 379,385 |
Impinj, Inc. * | 7,776 | 1,239,339 |
indie Semiconductor, Inc., Class A (China) * | 48,098 | 270,311 |
Kulicke & Soffa Industries, Inc. (Singapore) | 18,159 | 840,398 |
MaxLinear, Inc. * | 25,700 | 534,303 |
Navitas Semiconductor Corp. * | 39,985 | 173,135 |
PDF Solutions, Inc. * | 9,682 | 291,235 |
Photronics, Inc. * | 19,920 | 546,007 |
Semtech Corp. * | 21,608 | 812,893 |
SiTime Corp. * | 5,879 | 523,936 |
Ultra Clean Holdings, Inc. * | 14,989 | 626,990 |
Veeco Instruments, Inc. * | 18,895 | 667,749 |
9,960,634 | ||
Software — 7.8% | ||
A10 Networks, Inc. | 23,686 | 309,339 |
ACI Worldwide, Inc. * | 36,608 | 1,248,333 |
Adeia, Inc. | 35,868 | 352,941 |
Agilysys, Inc. * | 7,743 | 643,056 |
Alarm.com Holdings, Inc. * | 16,661 | 1,107,956 |
Alkami Technology, Inc. * | 14,187 | 341,481 |
Amplitude, Inc., Class A * | 22,272 | 218,043 |
Appfolio, Inc., Class A * | 7,047 | 1,598,119 |
Appian Corp., Class A * | 10,362 | 387,953 |
Asana, Inc., Class A * (a) | 27,786 | 413,178 |
Aurora Innovation, Inc. * | 238,156 | 660,883 |
AvePoint, Inc. * | 33,584 | 260,948 |
Braze, Inc., Class A * | 15,598 | 653,556 |
C3.ai, Inc., Class A * (a) | 33,086 | 745,428 |
Cerence, Inc. * | 13,596 | 123,860 |
Clear Secure, Inc., Class A | 25,557 | 446,481 |
Clearwater Analytics Holdings, Inc., Class A * | 42,687 | 673,601 |
CommVault Systems, Inc. * | 14,744 | 1,510,818 |
E2open Parent Holdings, Inc. * | 61,090 | 296,287 |
Everbridge, Inc. * | 13,814 | 480,036 |
EverCommerce, Inc. * | 7,065 | 63,585 |
Freshworks, Inc., Class A * | 55,923 | 998,226 |
Gitlab, Inc., Class A * | 30,309 | 1,590,313 |
HashiCorp, Inc., Class A * | 38,082 | 1,236,142 |
Intapp, Inc. * | 8,389 | 259,388 |
InterDigital, Inc. | 8,247 | 814,226 |
Jamf Holding Corp. * | 16,425 | 319,795 |
JFrog Ltd. (Israel) * | 25,513 | 1,017,458 |
LiveRamp Holdings, Inc. * | 22,057 | 708,250 |
Marathon Digital Holdings, Inc. * (a) | 74,958 | 1,203,825 |
Matterport, Inc. * | 87,241 | 401,309 |
INVESTMENTS | SHARES | VALUE($) |
Software — continued | ||
MeridianLink, Inc. * | 6,369 | 106,235 |
Model N, Inc. * | 12,791 | 379,253 |
N-Able, Inc. * | 23,080 | 282,961 |
nCino, Inc. * | 20,570 | 599,821 |
PagerDuty, Inc. * | 29,843 | 595,666 |
Progress Software Corp. | 14,095 | 702,213 |
PROS Holdings, Inc. * | 14,514 | 475,334 |
Q2 Holdings, Inc. * | 19,564 | 1,005,394 |
Rapid7, Inc. * | 20,647 | 924,986 |
RingCentral, Inc., Class A * | 25,112 | 743,817 |
Riot Platforms, Inc. * (a) | 71,959 | 727,505 |
Samsara, Inc., Class A * | 56,865 | 1,986,294 |
SolarWinds Corp. | 16,002 | 176,342 |
Sprinklr, Inc., Class A * | 41,736 | 487,894 |
Sprout Social, Inc., Class A * (a) | 15,665 | 790,299 |
Varonis Systems, Inc. * | 36,390 | 1,592,062 |
Verint Systems, Inc. * | 21,597 | 653,957 |
Vertex, Inc., Class A * | 15,161 | 441,640 |
Zeta Global Holdings Corp., Class A * | 53,446 | 660,593 |
Zuora, Inc., Class A * | 44,580 | 439,559 |
34,856,639 | ||
Specialized REITs — 0.4% | ||
Four Corners Property Trust, Inc. | 30,524 | 715,788 |
Outfront Media, Inc. | 47,053 | 746,260 |
Uniti Group, Inc. | 80,441 | 462,536 |
1,924,584 | ||
Specialty Retail — 3.6% | ||
Abercrombie & Fitch Co., Class A * | 15,491 | 1,882,466 |
American Eagle Outfitters, Inc. | 61,179 | 1,484,203 |
Arko Corp. | 23,881 | 102,688 |
Beyond, Inc. * | 15,254 | 307,063 |
Boot Barn Holdings, Inc. * (a) | 10,196 | 1,085,568 |
Buckle, Inc. (The) | 10,603 | 396,446 |
Caleres, Inc. | 11,354 | 418,168 |
Camping World Holdings, Inc., Class A | 13,626 | 276,199 |
Carvana Co. * (a) | 36,047 | 2,989,016 |
Foot Locker, Inc. | 27,828 | 580,214 |
Guess?, Inc. | 9,693 | 259,579 |
Leslie's, Inc. * | 59,951 | 235,607 |
Monro, Inc. | 10,599 | 288,823 |
National Vision Holdings, Inc. * | 26,371 | 459,383 |
ODP Corp. (The) * | 12,182 | 620,186 |
Petco Health & Wellness Co., Inc. * | 30,767 | 46,150 |
Revolve Group, Inc. * | 13,346 | 265,719 |
Sally Beauty Holdings, Inc. * | 35,857 | 389,048 |
Sonic Automotive, Inc., Class A | 4,587 | 265,312 |
Upbound Group, Inc. | 16,504 | 511,789 |
Urban Outfitters, Inc. * | 19,720 | 768,291 |
Victoria's Secret & Co. * | 23,306 | 410,652 |
Warby Parker, Inc., Class A * | 25,010 | 293,617 |
132 | J.P. Morgan Exchange-Traded Funds | April 30, 2024 |
INVESTMENTS | SHARES | VALUE($) |
Common Stocks — continued | ||
Specialty Retail — continued | ||
Wayfair, Inc., Class A * (a) | 30,097 | 1,509,365 |
Winmark Corp. | 877 | 315,124 |
16,160,676 | ||
Technology Hardware, Storage & Peripherals — 0.2% | ||
Corsair Gaming, Inc. * | 15,703 | 174,303 |
IonQ, Inc. * (a) | 57,460 | 491,283 |
Xerox Holdings Corp. | 30,103 | 400,069 |
1,065,655 | ||
Textiles, Apparel & Luxury Goods — 1.3% | ||
Carter's, Inc. | 12,001 | 820,988 |
Figs, Inc., Class A * (a) | 42,834 | 218,882 |
G-III Apparel Group Ltd. * | 13,991 | 393,847 |
Hanesbrands, Inc. * | 117,741 | 536,899 |
Kontoor Brands, Inc. | 18,860 | 1,170,452 |
Levi Strauss & Co., Class A | 31,287 | 663,910 |
Oxford Industries, Inc. (a) | 5,243 | 565,090 |
Steven Madden Ltd. | 24,264 | 980,508 |
Wolverine World Wide, Inc. | 26,777 | 287,585 |
5,638,161 | ||
Tobacco — 0.2% | ||
Universal Corp. | 8,228 | 423,166 |
Vector Group Ltd. | 45,874 | 474,796 |
897,962 | ||
Trading Companies & Distributors — 1.8% | ||
Boise Cascade Co. | 13,344 | 1,765,011 |
Custom Truck One Source, Inc. * | 20,076 | 100,179 |
Distribution Solutions Group, Inc. * | 3,492 | 115,131 |
DNOW, Inc. * | 34,617 | 488,446 |
FTAI Aviation Ltd. | 33,411 | 2,345,786 |
Global Industrial Co. | 5,458 | 210,188 |
GMS, Inc. * | 13,124 | 1,214,233 |
H&E Equipment Services, Inc. | 10,969 | 529,693 |
McGrath RentCorp | 8,237 | 878,558 |
Xometry, Inc., Class A * (a) | 13,125 | 234,544 |
7,881,769 | ||
Water Utilities — 0.2% | ||
Middlesex Water Co. | 5,996 | 304,117 |
SJW Group | 9,836 | 535,570 |
839,687 | ||
Wireless Telecommunication Services — 0.2% | ||
Gogo, Inc. * | 23,342 | 211,479 |
Telephone and Data Systems, Inc. | 33,508 | 524,400 |
United States Cellular Corp. * | 4,842 | 176,055 |
911,934 | ||
Total Common Stocks (Cost $459,809,027) | 443,845,851 | |
INVESTMENTS | NO. OF RIGHTS | VALUE($) |
Rights — 0.0% ^ | ||
Biotechnology — 0.0% ^ | ||
Mirati Therapeutics, Inc., CVR ‡ * (Cost $27,613) | 39,447 | 27,613 |
INVESTMENTS | SHARES | |
Short-Term Investments — 7.2% | ||
Investment Companies — 1.2% | ||
JPMorgan U.S. Government Money Market Fund Class IM Shares, 5.25% (c) (d) (Cost $5,327,256) | 5,327,256 | 5,327,256 |
Investment of Cash Collateral from Securities Loaned — 6.0% | ||
JPMorgan Securities Lending Money Market Fund Agency SL Class Shares, 5.47% (c) (d) | 23,015,394 | 23,017,695 |
JPMorgan U.S. Government Money Market Fund Class IM Shares, 5.25% (c) (d) | 3,759,222 | 3,759,222 |
Total Investment of Cash Collateral from Securities Loaned (Cost $26,781,822) | 26,776,917 | |
Total Short-Term Investments (Cost $32,109,078) | 32,104,173 | |
Total Investments — 105.9% (Cost $491,945,718) | 475,977,637 | |
Liabilities in Excess of Other Assets — (5.9)% | (26,315,947 ) | |
NET ASSETS — 100.0% | 449,661,690 | |
Percentages indicated are based on net assets. |
Abbreviations | |
CVR | Contingent Value Rights |
REIT | Real Estate Investment Trust |
^ | Amount rounds to less than 0.1% of net assets. | |
‡ | Value determined using significant unobservable inputs. | |
* | Non-income producing security. | |
(a) | The security or a portion of this security is on loan at April 30, 2024. The total value of securities on loan at April 30, 2024 is $25,267,248. | |
(b) | Security exempt from registration pursuant to Regulation S under the Securities Act of 1933, as amended. Regulation S applies to securities offerings that are made outside of the United States and do not involve direct selling efforts in the United States and as such may have restrictions on resale. | |
(c) | Investment in an affiliated fund, which is registered under the Investment Company Act of 1940, as amended, and is advised by J.P. Morgan Investment Management Inc. | |
(d) | The rate shown is the current yield as of April 30, 2024. | |
April 30, 2024 | J.P. Morgan Exchange-Traded Funds | 133 |
DESCRIPTION | NUMBER OF CONTRACTS | EXPIRATION DATE | TRADING CURRENCY | NOTIONAL AMOUNT ($) | VALUE AND UNREALIZED APPRECIATION (DEPRECIATION) ($) |
Long Contracts | |||||
Russell 2000 E-Mini Index | 56 | 06/21/2024 | USD | 5,559,960 | (323,942 ) |
Abbreviations | |
USD | United States Dollar |
134 | J.P. Morgan Exchange-Traded Funds | April 30, 2024 |
INVESTMENTS | SHARES | VALUE($) |
Common Stocks — 99.8% | ||
Aerospace & Defense — 0.0% ^ | ||
Hexcel Corp. | 16 | 1,027 |
Air Freight & Logistics — 0.1% | ||
CH Robinson Worldwide, Inc. | 26 | 1,846 |
Expeditors International of Washington, Inc. | 32 | 3,562 |
United Parcel Service, Inc., Class B | 12 | 1,770 |
7,178 | ||
Automobile Components — 0.0% ^ | ||
Gentex Corp. | 64 | 2,195 |
Automobiles — 1.4% | ||
Tesla, Inc. * | 392 | 71,846 |
Banks — 1.1% | ||
Bank of America Corp. | 475 | 17,580 |
Citigroup, Inc. | 426 | 26,127 |
Wells Fargo & Co. | 217 | 12,872 |
56,579 | ||
Beverages — 1.4% | ||
Brown-Forman Corp., Class B | 52 | 2,488 |
Constellation Brands, Inc., Class A | 36 | 9,125 |
Keurig Dr Pepper, Inc. | 212 | 7,144 |
Monster Beverage Corp. * | 165 | 8,819 |
PepsiCo, Inc. | 248 | 43,626 |
71,202 | ||
Biotechnology — 2.6% | ||
AbbVie, Inc. | 138 | 22,444 |
Alnylam Pharmaceuticals, Inc. * | 28 | 4,031 |
Amgen, Inc. | 115 | 31,503 |
Gilead Sciences, Inc. | 278 | 18,126 |
Incyte Corp. * | 41 | 2,134 |
Ionis Pharmaceuticals, Inc. * | 25 | 1,032 |
Moderna, Inc. * | 74 | 8,163 |
Natera, Inc. * | 21 | 1,950 |
Regeneron Pharmaceuticals, Inc. * | 23 | 20,485 |
Vertex Pharmaceuticals, Inc. * | 57 | 22,390 |
132,258 | ||
Broadline Retail — 3.4% | ||
Amazon.com, Inc. * | 943 | 165,025 |
eBay, Inc. | 115 | 5,927 |
Etsy, Inc. * | 24 | 1,648 |
172,600 | ||
Building Products — 0.7% | ||
Carrier Global Corp. | 185 | 11,376 |
INVESTMENTS | SHARES | VALUE($) |
Building Products — continued | ||
Hayward Holdings, Inc. * | 37 | 502 |
Lennox International, Inc. | 8 | 3,707 |
Masco Corp. | 50 | 3,423 |
Trane Technologies plc | 50 | 15,867 |
34,875 | ||
Capital Markets — 5.1% | ||
Affiliated Managers Group, Inc. | 8 | 1,249 |
Ares Management Corp. | 37 | 4,924 |
Bank of New York Mellon Corp. (The) | 25 | 1,412 |
BlackRock, Inc. | 33 | 24,903 |
Blackstone, Inc. | 158 | 18,424 |
Cboe Global Markets, Inc. | 23 | 4,166 |
Charles Schwab Corp. (The) | 329 | 24,329 |
CME Group, Inc. | 79 | 16,562 |
FactSet Research Systems, Inc. | 8 | 3,335 |
Goldman Sachs Group, Inc. (The) | 70 | 29,870 |
Intercontinental Exchange, Inc. | 126 | 16,224 |
Jefferies Financial Group, Inc. | 37 | 1,593 |
KKR & Co., Inc. | 147 | 13,681 |
LPL Financial Holdings, Inc. | 17 | 4,575 |
MarketAxess Holdings, Inc. | 7 | 1,401 |
Moody's Corp. | 35 | 12,962 |
Morgan Stanley | 260 | 23,618 |
Morningstar, Inc. | 6 | 1,696 |
MSCI, Inc. | 17 | 7,918 |
Nasdaq, Inc. | 76 | 4,549 |
Raymond James Financial, Inc. | 42 | 5,124 |
Robinhood Markets, Inc., Class A * | 140 | 2,309 |
S&P Global, Inc. | 70 | 29,108 |
Tradeweb Markets, Inc., Class A | 25 | 2,543 |
XP, Inc., Class A (Brazil) | 72 | 1,474 |
257,949 | ||
Chemicals — 1.5% | ||
Albemarle Corp. | 24 | 2,887 |
Ashland, Inc. | 9 | 858 |
Celanese Corp. | 22 | 3,379 |
Ecolab, Inc. | 55 | 12,438 |
Element Solutions, Inc. | 38 | 879 |
FMC Corp. | 26 | 1,534 |
Huntsman Corp. | 56 | 1,336 |
International Flavors & Fragrances, Inc. | 57 | 4,825 |
Linde plc | 87 | 38,364 |
April 30, 2024 | J.P. Morgan Exchange-Traded Funds | 135 |
INVESTMENTS | SHARES | VALUE($) |
Common Stocks — continued | ||
Chemicals — continued | ||
Scotts Miracle-Gro Co. (The) | 12 | 823 |
Sherwin-Williams Co. (The) | 27 | 8,090 |
75,413 | ||
Commercial Services & Supplies — 1.2% | ||
Cintas Corp. | 19 | 12,509 |
Clean Harbors, Inc. * | 10 | 1,895 |
Copart, Inc. * | 190 | 10,319 |
MSA Safety, Inc. | 8 | 1,443 |
RB Global, Inc. (Canada) | 40 | 2,863 |
Republic Services, Inc. | 46 | 8,818 |
Stericycle, Inc. * | 17 | 760 |
Tetra Tech, Inc. | 10 | 1,947 |
Waste Management, Inc. | 90 | 18,722 |
59,276 | ||
Communications Equipment — 1.3% | ||
Arista Networks, Inc. * | 55 | 14,111 |
Ciena Corp. * | 39 | 1,803 |
Cisco Systems, Inc. | 765 | 35,940 |
F5, Inc. * | 12 | 1,984 |
Motorola Solutions, Inc. | 37 | 12,548 |
66,386 | ||
Construction & Engineering — 0.1% | ||
AECOM | 35 | 3,233 |
MasTec, Inc. * | 15 | 1,330 |
4,563 | ||
Consumer Finance — 1.1% | ||
Ally Financial, Inc. | 58 | 2,224 |
American Express Co. | 129 | 30,190 |
Capital One Financial Corp. | 84 | 12,048 |
Discover Financial Services | 55 | 6,970 |
SLM Corp. | 61 | 1,293 |
Synchrony Financial | 90 | 3,958 |
56,683 | ||
Consumer Staples Distribution & Retail — 0.9% | ||
Costco Wholesale Corp. | 36 | 26,025 |
Walmart, Inc. | 304 | 18,042 |
44,067 | ||
Containers & Packaging — 0.1% | ||
Avery Dennison Corp. | 18 | 3,911 |
INVESTMENTS | SHARES | VALUE($) |
Distributors — 0.1% | ||
Genuine Parts Co. | 27 | 4,245 |
Pool Corp. | 8 | 2,900 |
7,145 | ||
Diversified REITs — 0.0% ^ | ||
WP Carey, Inc. | 44 | 2,413 |
Diversified Telecommunication Services — 0.3% | ||
AT&T, Inc. | 196 | 3,311 |
Iridium Communications, Inc. | 39 | 1,201 |
Verizon Communications, Inc. | 213 | 8,411 |
12,923 | ||
Electric Utilities — 1.2% | ||
Avangrid, Inc. | 8 | 292 |
Edison International | 84 | 5,969 |
Eversource Energy | 82 | 4,971 |
Exelon Corp. | 221 | 8,305 |
FirstEnergy Corp. | 53 | 2,032 |
NextEra Energy, Inc. | 456 | 30,538 |
PG&E Corp. | 453 | 7,751 |
59,858 | ||
Electrical Equipment — 0.8% | ||
Acuity Brands, Inc. | 7 | 1,738 |
AMETEK, Inc. | 51 | 8,908 |
Emerson Electric Co. | 127 | 13,688 |
Generac Holdings, Inc. * | 13 | 1,767 |
Hubbell, Inc. | 12 | 4,446 |
nVent Electric plc | 37 | 2,666 |
Plug Power, Inc. * | 199 | 460 |
Rockwell Automation, Inc. | 26 | 7,045 |
Sunrun, Inc. * | 68 | 700 |
41,418 | ||
Electronic Equipment, Instruments & Components — 0.5% | ||
CDW Corp. | 30 | 7,256 |
Cognex Corp. | 48 | 1,994 |
Keysight Technologies, Inc. * | 39 | 5,769 |
Teledyne Technologies, Inc. * | 10 | 3,815 |
Trimble, Inc. * | 55 | 3,304 |
Vontier Corp. | 33 | 1,341 |
Zebra Technologies Corp., Class A * | 12 | 3,774 |
27,253 | ||
136 | J.P. Morgan Exchange-Traded Funds | April 30, 2024 |
INVESTMENTS | SHARES | VALUE($) |
Common Stocks — continued | ||
Energy Equipment & Services — 0.6% | ||
Halliburton Co. | 250 | 9,368 |
Schlumberger NV | 396 | 18,802 |
28,170 | ||
Entertainment — 2.0% | ||
Electronic Arts, Inc. | 60 | 7,609 |
Liberty Media Corp-Liberty Formula One, Class C * | 48 | 3,359 |
Netflix, Inc. * | 73 | 40,197 |
Spotify Technology SA * | 31 | 8,694 |
Take-Two Interactive Software, Inc. * | 37 | 5,284 |
Walt Disney Co. (The) | 315 | 34,996 |
100,139 | ||
Financial Services — 4.9% | ||
Affirm Holdings, Inc. * | 65 | 2,072 |
Apollo Global Management, Inc. | 115 | 12,464 |
Berkshire Hathaway, Inc., Class B * | 118 | 46,814 |
Block, Inc. * | 122 | 8,906 |
Fidelity National Information Services, Inc. | 132 | 8,965 |
Fiserv, Inc. * | 132 | 20,153 |
Global Payments, Inc. | 57 | 6,998 |
Jack Henry & Associates, Inc. | 16 | 2,603 |
Mastercard, Inc., Class A | 125 | 56,400 |
PayPal Holdings, Inc. * | 240 | 16,301 |
Toast, Inc., Class A * | 75 | 1,772 |
Visa, Inc., Class A | 235 | 63,123 |
Western Union Co. (The) | 61 | 820 |
WEX, Inc. * | 9 | 1,901 |
249,292 | ||
Food Products — 0.8% | ||
Freshpet, Inc. * | 10 | 1,061 |
General Mills, Inc. | 127 | 8,949 |
Hershey Co. (The) | 33 | 6,399 |
McCormick & Co., Inc. (Non-Voting) | 56 | 4,259 |
Mondelez International, Inc., Class A | 303 | 21,798 |
42,466 | ||
Gas Utilities — 0.0% ^ | ||
National Fuel Gas Co. | 24 | 1,274 |
UGI Corp. | 34 | 869 |
2,143 | ||
Ground Transportation — 0.7% | ||
Landstar System, Inc. | 6 | 1,047 |
Lyft, Inc., Class A * | 95 | 1,486 |
INVESTMENTS | SHARES | VALUE($) |
Ground Transportation — continued | ||
Uber Technologies, Inc. * | 412 | 27,303 |
Union Pacific Corp. | 27 | 6,403 |
36,239 | ||
Health Care Equipment & Supplies — 2.7% | ||
Abbott Laboratories | 106 | 11,233 |
Boston Scientific Corp. * | 324 | 23,286 |
Dexcom, Inc. * | 86 | 10,956 |
Edwards Lifesciences Corp. * | 133 | 11,261 |
Hologic, Inc. * | 52 | 3,940 |
IDEXX Laboratories, Inc. * | 18 | 8,870 |
Insulet Corp. * | 15 | 2,579 |
Intuitive Surgical, Inc. * | 77 | 28,538 |
Medtronic plc | 26 | 2,086 |
ResMed, Inc. | 32 | 6,848 |
Shockwave Medical, Inc. * | 8 | 2,641 |
Stryker Corp. | 79 | 26,583 |
138,821 | ||
Health Care Providers & Services — 3.2% | ||
Cencora, Inc. | 37 | 8,845 |
Cigna Group (The) | 64 | 22,851 |
CVS Health Corp. | 284 | 19,230 |
Elevance Health, Inc. | 53 | 28,015 |
McKesson Corp. | 30 | 16,116 |
Premier, Inc., Class A | 39 | 814 |
UnitedHealth Group, Inc. | 136 | 65,783 |
161,654 | ||
Health Care REITs — 0.0% ^ | ||
Medical Properties Trust, Inc. | 187 | 860 |
Omega Healthcare Investors, Inc. | 49 | 1,490 |
2,350 | ||
Health Care Technology — 0.1% | ||
Certara, Inc. * | 33 | 564 |
Veeva Systems, Inc., Class A * | 32 | 6,354 |
6,918 | ||
Hotels, Restaurants & Leisure — 2.2% | ||
Airbnb, Inc., Class A * | 92 | 14,589 |
Booking Holdings, Inc. | 8 | 27,616 |
Chipotle Mexican Grill, Inc. * | 6 | 18,958 |
Choice Hotels International, Inc. | 7 | 828 |
Expedia Group, Inc. * | 29 | 3,904 |
McDonald's Corp. | 134 | 36,587 |
April 30, 2024 | J.P. Morgan Exchange-Traded Funds | 137 |
INVESTMENTS | SHARES | VALUE($) |
Common Stocks — continued | ||
Hotels, Restaurants & Leisure — continued | ||
Starbucks Corp. | 11 | 973 |
Yum! Brands, Inc. | 62 | 8,758 |
112,213 | ||
Household Durables — 0.3% | ||
DR Horton, Inc. | 67 | 9,547 |
PulteGroup, Inc. | 47 | 5,237 |
14,784 | ||
Household Products — 1.7% | ||
Church & Dwight Co., Inc. | 54 | 5,826 |
Clorox Co. (The) | 28 | 4,140 |
Colgate-Palmolive Co. | 183 | 16,821 |
Procter & Gamble Co. (The) | 357 | 58,263 |
85,050 | ||
Industrial REITs — 0.5% | ||
Prologis, Inc. | 205 | 20,920 |
Rexford Industrial Realty, Inc. | 47 | 2,012 |
STAG Industrial, Inc. | 53 | 1,823 |
24,755 | ||
Insurance — 2.7% | ||
Aflac, Inc. | 129 | 10,791 |
Aon plc, Class A | 44 | 12,408 |
Arch Capital Group Ltd. * | 79 | 7,390 |
Arthur J Gallagher & Co. | 48 | 11,265 |
Axis Capital Holdings Ltd. | 18 | 1,104 |
Brighthouse Financial, Inc. * | 17 | 820 |
Chubb Ltd. | 90 | 22,378 |
Everest Group Ltd. | 9 | 3,298 |
Globe Life, Inc. | 18 | 1,371 |
Marsh & McLennan Cos., Inc. | 4 | 798 |
MetLife, Inc. | 139 | 9,880 |
Primerica, Inc. | 7 | 1,483 |
Progressive Corp. (The) | 130 | 27,072 |
Prudential Financial, Inc. | 80 | 8,838 |
Reinsurance Group of America, Inc. | 15 | 2,805 |
RenaissanceRe Holdings Ltd. (Bermuda) | 11 | 2,412 |
Travelers Cos., Inc. (The) | 50 | 10,608 |
WR Berkley Corp. | 44 | 3,387 |
138,108 | ||
Interactive Media & Services — 5.7% | ||
Alphabet, Inc., Class A * | 1,138 | 185,243 |
Match Group, Inc. * | 61 | 1,880 |
Meta Platforms, Inc., Class A | 223 | 95,928 |
INVESTMENTS | SHARES | VALUE($) |
Interactive Media & Services — continued | ||
Pinterest, Inc., Class A * | 126 | 4,215 |
ZoomInfo Technologies, Inc. * | 92 | 1,459 |
288,725 | ||
IT Services — 1.4% | ||
Accenture plc, Class A | 111 | 33,401 |
Cloudflare, Inc., Class A * | 65 | 5,681 |
EPAM Systems, Inc. * | 12 | 2,823 |
Gartner, Inc. * | 17 | 7,014 |
Globant SA * | 12 | 2,143 |
International Business Machines Corp. | 47 | 7,811 |
MongoDB, Inc. * | 15 | 5,478 |
Okta, Inc. * | 34 | 3,161 |
Twilio, Inc., Class A * | 36 | 2,156 |
69,668 | ||
Leisure Products — 0.1% | ||
Hasbro, Inc. | 28 | 1,716 |
YETI Holdings, Inc. * | 32 | 1,143 |
2,859 | ||
Life Sciences Tools & Services — 1.3% | ||
Agilent Technologies, Inc. | 65 | 8,908 |
Bio-Techne Corp. | 33 | 2,086 |
Danaher Corp. | 45 | 11,098 |
ICON plc * | 18 | 5,362 |
Illumina, Inc. * | 35 | 4,307 |
IQVIA Holdings, Inc. * | 40 | 9,271 |
Maravai LifeSciences Holdings, Inc., Class A * | 32 | 262 |
Mettler-Toledo International, Inc. * | 5 | 6,148 |
Repligen Corp. * | 12 | 1,970 |
Thermo Fisher Scientific, Inc. | 25 | 14,218 |
Waters Corp. * | 14 | 4,327 |
67,957 | ||
Machinery — 2.8% | ||
Caterpillar, Inc. | 103 | 34,461 |
CNH Industrial NV | 173 | 1,972 |
Deere & Co. | 57 | 22,310 |
Dover Corp. | 31 | 5,558 |
Graco, Inc. | 37 | 2,967 |
IDEX Corp. | 17 | 3,748 |
Illinois Tool Works, Inc. | 66 | 16,111 |
Ingersoll Rand, Inc. | 90 | 8,399 |
Nordson Corp. | 13 | 3,356 |
Otis Worldwide Corp. | 92 | 8,390 |
138 | J.P. Morgan Exchange-Traded Funds | April 30, 2024 |
INVESTMENTS | SHARES | VALUE($) |
Common Stocks — continued | ||
Machinery — continued | ||
PACCAR, Inc. | 114 | 12,097 |
Parker-Hannifin Corp. | 28 | 15,258 |
Snap-on, Inc. | 12 | 3,216 |
Xylem, Inc. | 53 | 6,927 |
144,770 | ||
Media — 0.7% | ||
Comcast Corp., Class A | 592 | 22,561 |
Fox Corp., Class A | 82 | 2,543 |
Interpublic Group of Cos., Inc. (The) | 86 | 2,618 |
Liberty Media Corp-Liberty SiriusXM * | 46 | 1,107 |
Omnicom Group, Inc. | 44 | 4,085 |
Sirius XM Holdings, Inc. | 195 | 573 |
33,487 | ||
Metals & Mining — 0.5% | ||
Freeport-McMoRan, Inc. | 315 | 15,731 |
Newmont Corp. | 92 | 3,739 |
Royal Gold, Inc. | 17 | 2,042 |
Southern Copper Corp. (Mexico) | 19 | 2,217 |
23,729 | ||
Mortgage Real Estate Investment Trusts (REITs) — 0.1% | ||
AGNC Investment Corp. | 181 | 1,656 |
Annaly Capital Management, Inc. | 101 | 1,893 |
Starwood Property Trust, Inc. | 66 | 1,252 |
4,801 | ||
Multi-Utilities — 0.6% | ||
CenterPoint Energy, Inc. | 140 | 4,080 |
Consolidated Edison, Inc. | 77 | 7,269 |
NiSource, Inc. | 92 | 2,563 |
Public Service Enterprise Group, Inc. | 111 | 7,668 |
Sempra | 140 | 10,028 |
31,608 | ||
Oil, Gas & Consumable Fuels — 3.4% | ||
Antero Resources Corp. * | 74 | 2,517 |
Chevron Corp. | 122 | 19,675 |
ConocoPhillips | 271 | 34,043 |
Diamondback Energy, Inc. | 52 | 10,459 |
Exxon Mobil Corp. | 596 | 70,489 |
Hess Corp. | 64 | 10,079 |
New Fortress Energy, Inc. | 19 | 498 |
ONEOK, Inc. | 129 | 10,206 |
INVESTMENTS | SHARES | VALUE($) |
Oil, Gas & Consumable Fuels — continued | ||
Targa Resources Corp. | 25 | 2,852 |
Williams Cos., Inc. (The) | 337 | 12,927 |
173,745 | ||
Personal Care Products — 0.2% | ||
Coty, Inc., Class A * | 113 | 1,293 |
Estee Lauder Cos., Inc. (The), Class A | 51 | 7,482 |
8,775 | ||
Pharmaceuticals — 3.0% | ||
Bristol-Myers Squibb Co. | 28 | 1,230 |
Eli Lilly & Co. | 114 | 89,045 |
Johnson & Johnson | 203 | 29,352 |
Merck & Co., Inc. | 198 | 25,586 |
Pfizer, Inc. | 233 | 5,969 |
151,182 | ||
Professional Services — 1.2% | ||
Automatic Data Processing, Inc. | 92 | 22,254 |
Booz Allen Hamilton Holding Corp. | 28 | 4,135 |
Dayforce, Inc. * | 31 | 1,902 |
Dun & Bradstreet Holdings, Inc. | 92 | 837 |
Equifax, Inc. | 27 | 5,945 |
FTI Consulting, Inc. * | 7 | 1,497 |
Genpact Ltd. | 31 | 953 |
ManpowerGroup, Inc. | 15 | 1,132 |
Paychex, Inc. | 72 | 8,554 |
Paycom Software, Inc. | 10 | 1,880 |
Paylocity Holding Corp. * | 12 | 1,862 |
Robert Half, Inc. | 23 | 1,590 |
TransUnion | 43 | 3,139 |
Verisk Analytics, Inc. | 32 | 6,975 |
62,655 | ||
Real Estate Management & Development — 0.4% | ||
CBRE Group, Inc., Class A * | 67 | 5,822 |
CoStar Group, Inc. * | 89 | 8,146 |
Jones Lang LaSalle, Inc. * | 11 | 1,988 |
Zillow Group, Inc., Class C * | 46 | 1,958 |
17,914 | ||
Residential REITs — 0.3% | ||
American Homes 4 Rent, Class A | 70 | 2,506 |
AvalonBay Communities, Inc. | 32 | 6,066 |
Equity LifeStyle Properties, Inc. | 22 | 1,326 |
April 30, 2024 | J.P. Morgan Exchange-Traded Funds | 139 |
INVESTMENTS | SHARES | VALUE($) |
Common Stocks — continued | ||
Residential REITs — continued | ||
Essex Property Trust, Inc. | 14 | 3,448 |
UDR, Inc. | 73 | 2,780 |
16,126 | ||
Retail REITs — 0.6% | ||
Brixmor Property Group, Inc. | 88 | 1,945 |
Federal Realty Investment Trust | 18 | 1,875 |
Kimco Realty Corp. | 157 | 2,925 |
Realty Income Corp. | 185 | 9,905 |
Regency Centers Corp. | 40 | 2,369 |
Simon Property Group, Inc. | 72 | 10,118 |
29,137 | ||
Semiconductors & Semiconductor Equipment — 9.1% | ||
Advanced Micro Devices, Inc. * | 253 | 40,070 |
Analog Devices, Inc. | 1 | 201 |
Applied Materials, Inc. | 167 | 33,174 |
Broadcom, Inc. | 60 | 78,016 |
Enphase Energy, Inc. * | 37 | 4,024 |
First Solar, Inc. * | 31 | 5,465 |
Intel Corp. | 231 | 7,039 |
KLA Corp. | 30 | 20,679 |
Lam Research Corp. | 4 | 3,578 |
Lattice Semiconductor Corp. * | 29 | 1,989 |
Marvell Technology, Inc. | 51 | 3,361 |
Micron Technology, Inc. | 13 | 1,468 |
MKS Instruments, Inc. | 19 | 2,261 |
NVIDIA Corp. | 283 | 244,518 |
QUALCOMM, Inc. | 60 | 9,951 |
Texas Instruments, Inc. | 40 | 7,057 |
Universal Display Corp. | 11 | 1,738 |
464,589 | ||
Software — 11.3% | ||
Adobe, Inc. * | 78 | 36,101 |
ANSYS, Inc. * | 19 | 6,173 |
Atlassian Corp., Class A * | 34 | 5,858 |
Autodesk, Inc. * | 48 | 10,217 |
Bentley Systems, Inc., Class B | 42 | 2,206 |
Cadence Design Systems, Inc. * | 60 | 16,538 |
Confluent, Inc., Class A * | 51 | 1,434 |
Datadog, Inc., Class A * | 62 | 7,781 |
DoubleVerify Holdings, Inc. * | 32 | 938 |
Fortinet, Inc. * | 143 | 9,035 |
Guidewire Software, Inc. * | 18 | 1,987 |
HubSpot, Inc. * | 10 | 6,049 |
INVESTMENTS | SHARES | VALUE($) |
Software — continued | ||
Intuit, Inc. | 54 | 33,783 |
Microsoft Corp. | 802 | 312,244 |
Oracle Corp. | 78 | 8,872 |
Palantir Technologies, Inc., Class A * | 426 | 9,359 |
Palo Alto Networks, Inc. * | 69 | 20,071 |
Pegasystems, Inc. | 13 | 772 |
PTC, Inc. * | 25 | 4,436 |
Roper Technologies, Inc. | 23 | 11,764 |
Salesforce, Inc. | 69 | 18,557 |
ServiceNow, Inc. * | 43 | 29,813 |
Synopsys, Inc. * | 34 | 18,040 |
Tyler Technologies, Inc. * | 9 | 4,154 |
Unity Software, Inc. * | 56 | 1,359 |
577,541 | ||
Specialized REITs — 0.6% | ||
American Tower Corp. | 2 | 343 |
Crown Castle, Inc. | 96 | 9,003 |
CubeSmart | 49 | 1,981 |
Extra Space Storage, Inc. | 45 | 6,043 |
Public Storage | 35 | 9,081 |
Rayonier, Inc. | 41 | 1,216 |
SBA Communications Corp. | 24 | 4,467 |
32,134 | ||
Specialty Retail — 1.7% | ||
Bath & Body Works, Inc. | 49 | 2,226 |
CarMax, Inc. * | 41 | 2,787 |
Floor & Decor Holdings, Inc., Class A * | 23 | 2,538 |
Home Depot, Inc. (The) | 152 | 50,801 |
Lithia Motors, Inc., Class A | 7 | 1,781 |
Lowe's Cos., Inc. | 21 | 4,788 |
Penske Automotive Group, Inc. | 7 | 1,070 |
Ross Stores, Inc. | 26 | 3,368 |
TJX Cos., Inc. (The) | 20 | 1,882 |
Tractor Supply Co. | 24 | 6,554 |
Ulta Beauty, Inc. * | 11 | 4,453 |
Valvoline, Inc. * | 26 | 1,105 |
Wayfair, Inc., Class A * | 25 | 1,254 |
Williams-Sonoma, Inc. | 14 | 4,015 |
88,622 | ||
Technology Hardware, Storage & Peripherals — 5.8% | ||
Apple, Inc. | 1,714 | 291,946 |
Pure Storage, Inc., Class A * | 64 | 3,225 |
295,171 | ||
140 | J.P. Morgan Exchange-Traded Funds | April 30, 2024 |
INVESTMENTS | SHARES | VALUE($) |
Common Stocks — continued | ||
Textiles, Apparel & Luxury Goods — 0.9% | ||
Capri Holdings Ltd. * | 21 | 745 |
Columbia Sportswear Co. | 13 | 1,035 |
Crocs, Inc. * | 16 | 1,990 |
Deckers Outdoor Corp. * | 6 | 4,911 |
Lululemon Athletica, Inc. * | 25 | 9,015 |
NIKE, Inc., Class B | 261 | 24,080 |
Ralph Lauren Corp. | 9 | 1,472 |
Tapestry, Inc. | 51 | 2,036 |
VF Corp. | 113 | 1,408 |
46,692 | ||
Trading Companies & Distributors — 0.6% | ||
Air Lease Corp. | 17 | 854 |
Ferguson plc | 45 | 9,445 |
United Rentals, Inc. | 15 | 10,020 |
WESCO International, Inc. | 10 | 1,528 |
WW Grainger, Inc. | 10 | 9,213 |
31,060 | ||
Water Utilities — 0.2% | ||
American Water Works Co., Inc. | 43 | 5,260 |
Essential Utilities, Inc. | 69 | 2,524 |
7,784 | ||
Total Common Stocks (Cost $4,752,336) | 5,082,851 | |
INVESTMENTS | SHARES | VALUE($) |
Short-Term Investments — 0.2% | ||
Investment Companies — 0.2% | ||
JPMorgan U.S. Government Money Market Fund Class IM Shares, 5.25% (a) (b) (Cost $8,574) | 8,574 | 8,574 |
Total Investments — 100.0% (Cost $4,760,910) | 5,091,425 | |
Other Assets Less Liabilities — 0.0% ^ | 2,198 | |
NET ASSETS — 100.0% | 5,093,623 | |
Percentages indicated are based on net assets. |
Abbreviations | |
REIT | Real Estate Investment Trust |
^ | Amount rounds to less than 0.1% of net assets. | |
* | Non-income producing security. | |
(a) | Investment in an affiliated fund, which is registered under the Investment Company Act of 1940, as amended, and is advised by J.P. Morgan Investment Management Inc. | |
(b) | The rate shown is the current yield as of April 30, 2024. | |
April 30, 2024 | J.P. Morgan Exchange-Traded Funds | 141 |
INVESTMENTS | SHARES | VALUE($) |
Common Stocks — 99.9% | ||
Brazil — 8.6% | ||
Alupar Investimento SA | 55,206 | 295,667 |
Ambev SA | 491,084 | 1,152,855 |
Auren Energia SA | 146,718 | 327,195 |
Banco do Brasil SA | 248,460 | 1,315,365 |
BB Seguridade Participacoes SA | 146,849 | 910,630 |
Bradespar SA (Preference) | 109,461 | 422,236 |
Caixa Seguridade Participacoes S/A | 181,916 | 548,277 |
CCR SA | 302,881 | 717,451 |
Centrais Eletricas Brasileiras SA | 26,926 | 196,218 |
Cia de Saneamento Basico do Estado de Sao Paulo SABESP | 58,059 | 911,148 |
Cia Energetica de Minas Gerais (Preference) | 439,159 | 821,212 |
Cielo SA | 587,800 | 632,785 |
Companhia Paranaense de Energia (Preference) | 415,169 | 725,182 |
CPFL Energia SA | 78,730 | 486,244 |
CSN Mineracao SA | 343,632 | 326,916 |
CTEEP-Cia de Transmissao de Energia Eletrica Paulista (Preference) | 131,055 | 630,718 |
Dexco SA | 121,408 | 168,811 |
Embraer SA * | 180,879 | 1,156,489 |
Energisa SA | 21,802 | 189,822 |
Engie Brasil Energia SA | 51,557 | 406,987 |
Gerdau SA (Preference) | 4,609 | 16,181 |
GPS Participacoes e Empreendimentos SA (a) | 137,859 | 496,469 |
Itau Unibanco Holding SA (Preference) | 209,488 | 1,266,788 |
Itausa SA (Preference) | 750,243 | 1,381,259 |
M Dias Branco SA | 22,518 | 147,313 |
Metalurgica Gerdau SA (Preference) | 198,688 | 401,769 |
Neoenergia SA | 89,382 | 329,463 |
Petroleo Brasileiro SA (Preference) | 477,066 | 3,851,367 |
Rumo SA * | 150,961 | 586,970 |
Sao Martinho SA | 76,962 | 423,746 |
Telefonica Brasil SA | 91,400 | 840,142 |
TIM SA | 236,499 | 805,242 |
TOTVS SA | 119,647 | 637,798 |
Transmissora Alianca de Energia Eletrica S/A | 82,314 | 558,631 |
Usinas Siderurgicas de Minas Gerais S (Preference) | 174,370 | 267,636 |
Vale SA | 231,663 | 2,821,840 |
27,174,822 | ||
Chile — 1.2% | ||
Banco de Chile | 6,095,225 | 676,154 |
Banco Santander Chile | 6,070,057 | 275,035 |
Cencosud SA | 390,709 | 669,502 |
INVESTMENTS | SHARES | VALUE($) |
Chile — continued | ||
Cia Cervecerias Unidas SA | 30,279 | 185,765 |
Cia Sud Americana de Vapores SA | 6,827,946 | 532,694 |
Colbun SA | 2,833,677 | 363,902 |
Embotelladora Andina SA (Preference), Class B | 122,078 | 345,234 |
Empresas CMPC SA | 14,414 | 28,466 |
Enel Americas SA | 2,641,461 | 247,624 |
Enel Chile SA | 5,950,894 | 353,316 |
3,677,692 | ||
China — 22.7% | ||
3SBio, Inc. (b) | 284,500 | 227,418 |
Agricultural Bank of China Ltd., Class A | 1,618,400 | 980,657 |
An Hui Wenergy Co. Ltd., Class A | 327,300 | 375,243 |
Angang Steel Co. Ltd., Class H | 27,800 | 4,578 |
Anhui Conch Cement Co. Ltd., Class H | 500 | 1,160 |
Anhui Expressway Co. Ltd., Class A | 279,600 | 503,794 |
ANTA Sports Products Ltd. | 18,400 | 208,306 |
BAIC Motor Corp. Ltd., Class H (b) | 1,196,500 | 339,327 |
Bank of Beijing Co. Ltd., Class A | 589,600 | 453,096 |
Bank of Changsha Co. Ltd., Class A | 280,300 | 314,824 |
Bank of China Ltd., Class H | 7,009,000 | 3,143,470 |
Bank of Communications Co. Ltd., Class A | 945,700 | 895,471 |
Bank of Shanghai Co. Ltd., Class A | 430,800 | 433,281 |
Baoshan Iron & Steel Co. Ltd., Class A | 437,100 | 417,884 |
Beijing Enterprises Holdings Ltd. | 83,500 | 267,330 |
Bosideng International Holdings Ltd. | 752,000 | 435,309 |
BYD Electronic International Co. Ltd. | 115,000 | 387,410 |
CGN Power Co. Ltd., Class H (b) | 2,852,000 | 956,299 |
China CITIC Bank Corp. Ltd., Class H | 1,869,000 | 1,093,428 |
China Coal Energy Co. Ltd., Class H | 467,000 | 470,428 |
China Communications Services Corp. Ltd., Class H | 802,000 | 383,394 |
China Construction Bank Corp., Class H | 3,223,000 | 2,085,252 |
China Everbright Bank Co. Ltd., Class H | 527,000 | 159,658 |
China Feihe Ltd. (b) | 417,000 | 228,043 |
China International Marine Containers Group Co. Ltd., Class A | 321,700 | 401,749 |
China Lesso Group Holdings Ltd. | 90,000 | 37,727 |
China Medical System Holdings Ltd. | 365,000 | 325,890 |
China Merchants Energy Shipping Co. Ltd., Class A | 332,200 | 390,651 |
China Merchants Port Group Co. Ltd., Class A | 75,400 | 195,261 |
China Merchants Port Holdings Co. Ltd. | 308,000 | 406,749 |
China Minsheng Banking Corp. Ltd., Class H | 820,800 | 300,315 |
142 | J.P. Morgan Exchange-Traded Funds | April 30, 2024 |
INVESTMENTS | SHARES | VALUE($) |
Common Stocks — continued | ||
China — continued | ||
China National Accord Medicines Corp. Ltd., Class A | 47,800 | 231,093 |
China National Chemical Engineering Co. Ltd., Class A | 137,900 | 130,729 |
China National Medicines Corp. Ltd., Class A | 67,700 | 323,869 |
China Petroleum & Chemical Corp., Class H | 1,650,000 | 984,888 |
China Resources Pharmaceutical Group Ltd. (b) | 468,500 | 302,961 |
China Resources Power Holdings Co. Ltd. | 306,000 | 760,978 |
China Resources Sanjiu Medical & Pharmaceutical Co. Ltd., Class A | 71,200 | 588,646 |
China Shenhua Energy Co. Ltd., Class H | 440,000 | 1,826,207 |
China South Publishing & Media Group Co. Ltd., Class A | 325,500 | 542,024 |
China United Network Communications Ltd., Class A | 739,100 | 475,841 |
China Yangtze Power Co. Ltd., Class A | 127,400 | 452,961 |
Chinese Universe Publishing and Media Group Co. Ltd., Class A | 251,700 | 508,050 |
Chongqing Changan Automobile Co. Ltd., Class A | 233,930 | 472,310 |
Chongqing Rural Commercial Bank Co. Ltd., Class H | 754,000 | 322,737 |
CITIC Ltd. | 765,000 | 723,998 |
COSCO SHIPPING Energy Transportation Co. Ltd., Class H | 114,000 | 133,695 |
COSCO SHIPPING Holdings Co. Ltd., Class H | 588,350 | 761,227 |
COSCO SHIPPING Ports Ltd. | 368,000 | 225,827 |
CSPC Pharmaceutical Group Ltd. | 272,000 | 223,348 |
Daqin Railway Co. Ltd., Class A | 396,200 | 377,973 |
Datang International Power Generation Co. Ltd., Class H | 440,000 | 86,592 |
Dong-E-E-Jiao Co. Ltd., Class A | 46,100 | 435,723 |
Dongfeng Motor Group Co. Ltd., Class H | 256,000 | 92,837 |
Dongguan Development Holdings Co. Ltd., Class A | 189,200 | 263,702 |
ENN Energy Holdings Ltd. | 100,200 | 853,743 |
Foxconn Industrial Internet Co. Ltd., Class A | 155,700 | 513,574 |
G-bits Network Technology Xiamen Co. Ltd., Class A | 5,400 | 144,968 |
GD Power Development Co. Ltd., Class A | 875,400 | 617,561 |
Great Wall Motor Co. Ltd., Class H | 468,500 | 707,970 |
Gree Electric Appliances, Inc. of Zhuhai, Class A | 77,200 | 447,104 |
Guangdong Baolihua New Energy Stock Co. Ltd., Class A | 526,300 | 407,147 |
INVESTMENTS | SHARES | VALUE($) |
China — continued | ||
Guangxi Guiguan Electric Power Co. Ltd., Class A | 418,600 | 363,599 |
Guangzhou Baiyunshan Pharmaceutical Holdings Co. Ltd., Class H | 70,000 | 186,206 |
Haitian International Holdings Ltd. | 160,000 | 521,096 |
Heilongjiang Agriculture Co. Ltd., Class A | 259,500 | 467,428 |
Henan Shuanghui Investment & Development Co. Ltd., Class A | 17,100 | 63,509 |
Hengan International Group Co. Ltd. | 78,000 | 261,859 |
HLA Group Corp. Ltd. | 301,000 | 378,029 |
Huabao Flavours & Fragrances Co. Ltd., Class A | 17,300 | 44,575 |
Huadian Power International Corp. Ltd., Class H | 1,048,000 | 573,388 |
Huaibei Mining Holdings Co. Ltd., Class A | 153,100 | 406,574 |
Huapont Life Sciences Co. Ltd., Class A | 433,900 | 277,291 |
Huaxia Bank Co. Ltd., Class A | 469,700 | 433,969 |
Huaxin Cement Co. Ltd., Class H | 197,200 | 175,957 |
Huayu Automotive Systems Co. Ltd., Class A | 96,600 | 218,955 |
Hubei Jumpcan Pharmaceutical Co. Ltd., Class A | 101,300 | 574,532 |
Hunan Valin Steel Co. Ltd., Class A | 319,200 | 229,280 |
Industrial & Commercial Bank of China Ltd., Class H | 4,219,000 | 2,262,348 |
Inner Mongolia Dian Tou Energy Corp. Ltd., Class A | 240,016 | 696,342 |
Inner Mongolia ERDOS Resources Co. Ltd., Class A | 182,080 | 309,253 |
Inner Mongolia Yitai Coal Co. Ltd., Class B | 391,200 | 760,306 |
Jiangling Motors Corp. Ltd., Class A | 111,700 | 400,711 |
Jiangsu Expressway Co. Ltd., Class A | 204,700 | 313,301 |
Jiangsu Financial Leasing Co. Ltd., Class A | 484,900 | 343,043 |
Jiangsu Hengli Hydraulic Co. Ltd., Class A | 9,656 | 67,860 |
Jiangsu Phoenix Publishing & Media Corp. Ltd., Class A | 231,000 | 323,926 |
Jiangsu Yuyue Medical Equipment & Supply Co. Ltd., Class A | 79,700 | 424,277 |
Jiangsu Zhongtian Technology Co. Ltd., Class A | 174,200 | 324,467 |
Joincare Pharmaceutical Group Industry Co. Ltd., Class A | 174,700 | 292,179 |
Jointown Pharmaceutical Group Co. Ltd., Class A | 328,400 | 370,940 |
JOYY, Inc., ADR | 6,629 | 216,238 |
Kingboard Holdings Ltd. | 125,500 | 275,821 |
KingClean Electric Co. Ltd., Class A | 86,018 | 311,829 |
Kunlun Energy Co. Ltd. | 436,000 | 422,649 |
Kweichow Moutai Co. Ltd., Class A | 8,500 | 1,989,501 |
April 30, 2024 | J.P. Morgan Exchange-Traded Funds | 143 |
INVESTMENTS | SHARES | VALUE($) |
Common Stocks — continued | ||
China — continued | ||
Lao Feng Xiang Co. Ltd., Class A | 34,300 | 364,336 |
Li Ning Co. Ltd. | 88,000 | 230,372 |
Livzon Pharmaceutical Group, Inc., Class A | 56,200 | 310,308 |
Maanshan Iron & Steel Co. Ltd., Class H | 104,000 | 15,212 |
Meihua Holdings Group Co. Ltd., Class A | 224,100 | 342,598 |
Metallurgical Corp. of China Ltd., Class A | 509,300 | 228,999 |
Nanjing Iron & Steel Co. Ltd., Class A | 642,900 | 482,151 |
New China Life Insurance Co. Ltd., Class A | 9,800 | 42,307 |
Ningbo Sanxing Medical Electric Co. Ltd., Class A | 150,400 | 698,744 |
Offshore Oil Engineering Co. Ltd., Class A | 273,500 | 239,265 |
PetroChina Co. Ltd., Class A | 416,800 | 587,019 |
Postal Savings Bank of China Co. Ltd., Class A | 560,200 | 370,094 |
Qingdao Port International Co. Ltd., Class A | 382,000 | 426,234 |
Qinhuangdao Port Co. Ltd., Class A | 750,200 | 340,262 |
Shaanxi Coal Industry Co. Ltd., Class A | 229,300 | 775,244 |
Shandong Buchang Pharmaceuticals Co. Ltd., Class A | 66,700 | 150,643 |
Shandong Publishing & Media Co. Ltd., Class A | 428,100 | 602,575 |
Shandong Weigao Group Medical Polymer Co. Ltd., Class H | 335,200 | 228,817 |
Shanghai International Port Group Co. Ltd., Class A | 437,000 | 337,905 |
Shanghai Mechanical and Electrical Industry Co. Ltd., Class A | 143,300 | 253,874 |
Shanghai Pharmaceuticals Holding Co. Ltd., Class H | 30,400 | 43,200 |
Shanghai Rural Commercial Bank Co. Ltd., Class A | 395,000 | 367,811 |
Shanghai Tunnel Engineering Co. Ltd., Class A | 387,400 | 357,965 |
Shanxi Coal International Energy Group Co. Ltd., Class A | 121,500 | 239,496 |
Shanxi Coking Coal Energy Group Co. Ltd., Class A | 172,900 | 249,748 |
Shanxi Lu'an Environmental Energy Development Co. Ltd., Class A | 136,100 | 396,646 |
Shenzhen Aisidi Co. Ltd., Class A | 244,340 | 405,221 |
Shenzhen Jinjia Group Co. Ltd., Class A | 89,300 | 57,369 |
Shenzhen Mindray Bio-Medical Electronics Co. Ltd., Class A | 14,600 | 611,986 |
Shenzhen Salubris Pharmaceuticals Co. Ltd., Class A | 64,300 | 281,988 |
Shenzhen Transsion Holdings Co. Ltd., Class A | 17,967 | 356,680 |
Sichuan Kelun Pharmaceutical Co. Ltd., Class A | 90,500 | 423,049 |
Sinoma International Engineering Co., Class A | 127,500 | 222,624 |
Sinopharm Group Co. Ltd., Class H | 146,000 | 368,703 |
INVESTMENTS | SHARES | VALUE($) |
China — continued | ||
Sinotrans Ltd., Class A | 406,300 | 328,795 |
Sinotruk Hong Kong Ltd. | 248,000 | 617,200 |
Skyworth Digital Co. Ltd., Class A | 108,600 | 156,483 |
TangShan Port Group Co. Ltd., Class A | 1,080,900 | 658,640 |
Tasly Pharmaceutical Group Co. Ltd., Class A | 157,200 | 334,426 |
Tian Di Science & Technology Co. Ltd., Class A | 562,900 | 574,541 |
Tianhe Chemicals Group Ltd. ‡ * | 20,000 | — |
Triangle Tyre Co. Ltd., Class A | 145,300 | 343,622 |
Wanxiang Qianchao Co. Ltd., Class A ‡ | 762,900 | 540,994 |
Weichai Power Co. Ltd., Class A | 232,956 | 557,922 |
Wuliangye Yibin Co. Ltd., Class A | 34,600 | 714,325 |
Xiamen C & D, Inc., Class A | 193,500 | 264,803 |
Xinhua Winshare Publishing and Media Co. Ltd., Class A | 242,600 | 474,250 |
Yangzijiang Shipbuilding Holdings Ltd. | 675,500 | 867,080 |
Yankuang Energy Group Co. Ltd., Class H | 442,000 | 958,862 |
Yintai Gold Co. Ltd., Class A * | 223,320 | 565,560 |
Youngor Fashion Co. Ltd., Class A | 384,600 | 414,096 |
Yunnan Baiyao Group Co. Ltd., Class A | 31,560 | 248,578 |
Yutong Bus Co. Ltd., Class A | 261,800 | 922,698 |
Zhejiang Conba Pharmaceutical Co. Ltd., Class A | 419,700 | 285,075 |
Zhejiang Expressway Co. Ltd., Class H | 474,000 | 309,916 |
Zhejiang Sanhua Intelligent Controls Co. Ltd., Class A | 153,980 | 464,031 |
Zhejiang Semir Garment Co. Ltd., Class A | 594,600 | 532,604 |
Zhejiang Weixing New Building Materials Co. Ltd., Class A | 101,997 | 246,505 |
Zhengzhou Coal Mining Machinery Group Co. Ltd., Class A | 242,700 | 583,856 |
Zhongjin Gold Corp. Ltd., Class A | 197,700 | 355,309 |
Zhongsheng Group Holdings Ltd. | 87,500 | 159,581 |
Zoomlion Heavy Industry Science and Technology Co. Ltd., Class H | 550,800 | 418,170 |
71,352,290 | ||
Colombia — 0.2% | ||
Bancolombia SA (Preference) | 64,508 | 527,838 |
Czech Republic — 0.4% | ||
CEZ A/S | 26,742 | 987,116 |
Moneta Money Bank A/S (b) | 64,394 | 259,611 |
1,246,727 | ||
Egypt — 0.1% | ||
Commercial International Bank - Egypt (CIB) | 246,288 | 370,075 |
144 | J.P. Morgan Exchange-Traded Funds | April 30, 2024 |
INVESTMENTS | SHARES | VALUE($) |
Common Stocks — continued | ||
Greece — 2.1% | ||
Eurobank Ergasias Services and Holdings SA * | 227,312 | 487,601 |
Hellenic Telecommunications Organization SA | 55,580 | 844,352 |
HELLENiQ ENERGY Holdings S.A. | 22,797 | 204,365 |
JUMBO SA | 30,434 | 947,742 |
Motor Oil Hellas Corinth Refineries SA | 17,141 | 496,834 |
Mytilineos SA | 24,446 | 991,777 |
National Bank of Greece SA * | 77,360 | 624,143 |
OPAP SA | 49,747 | 828,735 |
Piraeus Financial Holdings SA * | 202,160 | 809,843 |
Public Power Corp. SA * | 20,738 | 247,538 |
6,482,930 | ||
Hungary — 0.6% | ||
Magyar Telekom Telecommunications plc | 147,112 | 371,016 |
MOL Hungarian Oil & Gas plc | 68,563 | 562,670 |
Richter Gedeon Nyrt. | 33,641 | 856,669 |
1,790,355 | ||
India — 12.3% | ||
Adani Power Ltd. * | 139,021 | 1,016,914 |
Aurobindo Pharma Ltd. | 23,986 | 331,033 |
Bajaj Auto Ltd. | 13,087 | 1,397,140 |
Bajaj Holdings & Investment Ltd. | 1,385 | 134,539 |
Bank of Baroda | 49,664 | 166,986 |
Bharat Petroleum Corp. Ltd. | 83,954 | 610,898 |
Canara Bank | 24,880 | 184,938 |
Castrol India Ltd. | 21,195 | 53,384 |
Cipla Ltd. | 57,096 | 955,804 |
Coal India Ltd. | 31,971 | 173,825 |
Colgate-Palmolive India Ltd. | 8,603 | 291,139 |
Dabur India Ltd. | 70,462 | 428,275 |
Divi's Laboratories Ltd. | 11,601 | 555,482 |
Dr Reddy's Laboratories Ltd. | 11,648 | 864,371 |
GAIL India Ltd. | 105,464 | 263,462 |
Glenmark Pharmaceuticals Ltd. | 11,429 | 144,627 |
HCL Technologies Ltd. | 75,966 | 1,239,385 |
Hindalco Industries Ltd. | 28,920 | 222,417 |
Hindustan Petroleum Corp. Ltd. | 56,930 | 337,693 |
Hindustan Unilever Ltd. | 93,103 | 2,486,514 |
Hindustan Zinc Ltd. | 20,666 | 105,438 |
ICICI Lombard General Insurance Co. Ltd. (b) | 4,558 | 93,156 |
Indian Oil Corp. Ltd. | 423,809 | 855,833 |
Indus Towers Ltd. * | 107,375 | 454,440 |
Infosys Ltd. | 241,986 | 4,085,818 |
ITC Ltd. | 345,809 | 1,803,130 |
INVESTMENTS | SHARES | VALUE($) |
India — continued | ||
Jindal Steel & Power Ltd. | 26,745 | 297,031 |
JSW Steel Ltd. | 42,327 | 445,955 |
Mphasis Ltd. | 1,337 | 36,926 |
Nestle India Ltd. | 34,359 | 1,031,372 |
NHPC Ltd. | 345,699 | 397,955 |
NMDC Ltd. | 217,510 | 660,072 |
NTPC Ltd. | 271,977 | 1,181,995 |
Oil & Natural Gas Corp. Ltd. | 227,226 | 767,060 |
Oil India Ltd. | 22,788 | 168,490 |
Petronet LNG Ltd. | 86,810 | 322,222 |
Piramal Enterprises Ltd. | 7,599 | 83,942 |
Power Grid Corp. of India Ltd. | 232,093 | 837,108 |
REC Ltd. | 134,878 | 817,050 |
Reliance Industries Ltd. | 75,625 | 2,654,760 |
Steel Authority of India Ltd. | 93,874 | 183,772 |
Sun Pharmaceutical Industries Ltd. | 51,478 | 924,811 |
Tata Consultancy Services Ltd. | 60,975 | 2,782,906 |
Tata Motors Ltd. | 82,411 | 993,799 |
Tata Power Co. Ltd. (The) | 258,033 | 1,384,801 |
Tata Steel Ltd. | 558,854 | 1,101,604 |
Titan Co. Ltd. | 16,781 | 720,028 |
Torrent Power Ltd. | 16,773 | 302,384 |
Union Bank of India Ltd. | 112,368 | 207,127 |
United Breweries Ltd. | 3,516 | 85,724 |
UPL Ltd. | 20,349 | 123,498 |
Vedanta Ltd. | 151,675 | 723,894 |
Zydus Lifesciences Ltd. | 19,822 | 226,403 |
38,719,330 | ||
Indonesia — 3.7% | ||
Adaro Energy Indonesia Tbk. PT | 4,110,100 | 683,089 |
Astra International Tbk. PT | 3,559,500 | 1,123,220 |
Bank Central Asia Tbk. PT | 3,294,700 | 1,981,052 |
Bank Mandiri Persero Tbk. PT | 3,484,300 | 1,472,734 |
Bank Rakyat Indonesia Persero Tbk. PT | 2,342,300 | 709,023 |
Bukit Asam Tbk. PT | 2,626,100 | 489,365 |
Gudang Garam Tbk. PT | 185,700 | 207,873 |
Hanjaya Mandala Sampoerna Tbk. PT | 6,430,000 | 338,109 |
Indofood CBP Sukses Makmur Tbk. PT | 809,500 | 541,085 |
Indofood Sukses Makmur Tbk. PT | 1,589,700 | 611,047 |
Kalbe Farma Tbk. PT | 1,910,500 | 170,958 |
Perusahaan Gas Negara Tbk. PT | 5,286,000 | 477,340 |
Sarana Menara Nusantara Tbk. PT | 5,264,200 | 260,090 |
Sumber Alfaria Trijaya Tbk. PT | 1,855,200 | 334,301 |
Telkom Indonesia Persero Tbk. PT | 5,891,900 | 1,142,195 |
April 30, 2024 | J.P. Morgan Exchange-Traded Funds | 145 |
INVESTMENTS | SHARES | VALUE($) |
Common Stocks — continued | ||
Indonesia — continued | ||
Unilever Indonesia Tbk. PT | 1,559,700 | 251,186 |
United Tractors Tbk. PT | 300,500 | 457,991 |
Vale Indonesia Tbk. PT | 463,800 | 121,227 |
XL Axiata Tbk. PT | 2,496,100 | 379,174 |
11,751,059 | ||
Kuwait — 0.7% | ||
Agility Public Warehousing Co. KSC ‡ * | 229,828 | 9,318 |
Agility Public Warehousing Co. KSC | 114,914 | 117,542 |
Mobile Telecommunications Co. KSCP | 510,845 | 807,340 |
National Bank of Kuwait SAKP | 466,017 | 1,306,027 |
2,240,227 | ||
Malaysia — 2.6% | ||
Axiata Group Bhd. | 245,100 | 145,131 |
CELCOMDIGI Bhd. | 546,600 | 474,460 |
Hong Leong Financial Group Bhd. | 16,400 | 57,456 |
IHH Healthcare Bhd. | 108,400 | 143,776 |
Kuala Lumpur Kepong Bhd. | 41,500 | 200,457 |
Malayan Banking Bhd. | 516,108 | 1,051,655 |
Maxis Bhd. | 651,000 | 500,025 |
Nestle Malaysia Bhd. | 2,700 | 71,879 |
Petronas Chemicals Group Bhd. | 306,800 | 435,852 |
Petronas Gas Bhd. | 195,200 | 736,218 |
PPB Group Bhd. | 180,860 | 596,487 |
RHB Bank Bhd. | 181,700 | 209,156 |
Sime Darby Bhd. | 794,500 | 465,135 |
Telekom Malaysia Bhd. | 446,400 | 578,987 |
Tenaga Nasional Bhd. | 455,300 | 1,140,993 |
YTL Corp. Bhd. | 1,030,600 | 666,330 |
YTL Power International Bhd. | 787,600 | 755,031 |
8,229,028 | ||
Mexico — 7.6% | ||
Alfa SAB de CV, Class A | 1,096,813 | 802,886 |
Alsea SAB de CV * | 49,934 | 208,996 |
America Movil SAB de CV | 2,342,068 | 2,231,224 |
Arca Continental SAB de CV | 94,308 | 917,495 |
Banco del Bajio SA (b) | 28,533 | 105,466 |
Cemex SAB de CV * | 2,045,711 | 1,618,107 |
Coca-Cola Femsa SAB de CV | 108,446 | 1,073,587 |
El Puerto de Liverpool SAB de CV, Class C1 | 63,253 | 505,743 |
Fibra Uno Administracion SA de CV, REIT | 585,018 | 837,362 |
Fomento Economico Mexicano SAB de CV | 133,796 | 1,573,616 |
Gruma SAB de CV, Class B | 48,312 | 947,613 |
INVESTMENTS | SHARES | VALUE($) |
Mexico — continued | ||
Grupo Aeroportuario del Centro Norte SAB de CV | 87,139 | 962,709 |
Grupo Aeroportuario del Sureste SAB de CV, Class B | 38,348 | 1,320,519 |
Grupo Bimbo SAB de CV | 215,314 | 900,182 |
Grupo Carso SAB de CV | 70,831 | 554,054 |
Grupo Financiero Banorte SAB de CV, Class O | 298,913 | 2,964,920 |
Grupo Mexico SAB de CV | 229,848 | 1,420,353 |
Kimberly-Clark de Mexico SAB de CV, Class A | 316,041 | 659,727 |
Megacable Holdings SAB de CV | 136,897 | 399,565 |
Orbia Advance Corp. SAB de CV | 326,628 | 534,632 |
Promotora y Operadora de Infraestructura SAB de CV | 63,423 | 635,276 |
Qualitas Controladora SAB de CV | 44,664 | 584,022 |
Wal-Mart de Mexico SAB de CV | 582,676 | 2,171,759 |
23,929,813 | ||
Pakistan — 0.1% | ||
Oil & Gas Development Co. Ltd. | 1,001,350 | 480,748 |
Philippines — 0.3% | ||
Globe Telecom, Inc. | 2,518 | 77,325 |
Manila Electric Co. | 67,930 | 433,907 |
PLDT, Inc. | 12,615 | 293,782 |
Puregold Price Club, Inc. | 40,100 | 16,452 |
821,466 | ||
Qatar — 1.3% | ||
Commercial Bank PSQC (The) | 62,807 | 71,639 |
Industries Qatar QSC | 253,212 | 849,522 |
Mesaieed Petrochemical Holding Co. | 354,185 | 186,693 |
Ooredoo QPSC | 268,625 | 737,040 |
Qatar Electricity & Water Co. QSC | 129,735 | 544,249 |
Qatar Fuel QSC | 65,980 | 262,035 |
Qatar Gas Transport Co. Ltd. | 769,294 | 843,302 |
Qatar International Islamic Bank QSC | 53,327 | 147,341 |
Qatar Islamic Bank SAQ | 8,661 | 43,495 |
Qatar Navigation QSC | 151,457 | 439,365 |
4,124,681 | ||
Romania — 0.3% | ||
NEPI Rockcastle NV | 135,021 | 911,080 |
Russia — 0.0% ^ | ||
Alrosa PJSC ‡ | 200,448 | 4,122 |
Federal Grid Co. - Rosseti PJSC ‡ * | 170,798,392 | 3,619 |
GMK Norilskiy Nickel PAO ‡ | 308,700 | 14,762 |
Inter RAO UES PJSC ‡ | 6,142,220 | 4,185 |
146 | J.P. Morgan Exchange-Traded Funds | April 30, 2024 |
INVESTMENTS | SHARES | VALUE($) |
Common Stocks — continued | ||
Russia — continued | ||
LUKOIL PJSC ‡ | 17,853 | 21,998 |
M.Video PJSC ‡ * | 8,526 | 539 |
Magnit PJSC ‡ | 7,858 | 5,824 |
Magnitogorsk Iron & Steel Works PJSC ‡ * | 334,440 | 3,866 |
Mobile TeleSystems PJSC ‡ | 120,496 | 6,770 |
Novolipetsk Steel PJSC ‡ * | 155,019 | 6,950 |
PhosAgro PJSC ‡ | 1,940 | 2,387 |
Rostelecom PJSC ‡ | 157,186 | 2,668 |
RusHydro PJSC ‡ | 35,715,691 | 5,977 |
Sberbank of Russia PJSC ‡ | 537,391 | 16,767 |
Severstal PAO ‡ * | 20,498 | 6,910 |
Sistema AFK PAO ‡ | 308,352 | 918 |
Surgutneftegas PJSC (Preference) ‡ | 655,737 | 4,970 |
Tatneft PJSC ‡ | 17,275 | 1,549 |
Unipro PJSC ‡ * | 4,941,067 | 1,948 |
116,729 | ||
Saudi Arabia — 4.4% | ||
Abdullah Al Othaim Markets Co. | 115,463 | 382,824 |
Arab National Bank | 30,786 | 253,041 |
Arabian Internet & Communications Services Co. | 8,379 | 774,882 |
Catrion Catering Holding Co. | 20,761 | 698,572 |
Cenomi Centers | 25,869 | 172,550 |
Dr Sulaiman Al Habib Medical Services Group Co. | 14,009 | 1,158,372 |
Elm Co. | 4,353 | 1,059,583 |
Etihad Etisalat Co. | 73,953 | 1,025,318 |
Leejam Sports Co. JSC | 6,538 | 364,954 |
Mouwasat Medical Services Co. | 853 | 30,567 |
Riyad Bank | 12,674 | 93,451 |
Riyadh Cables Group Co. | 8,428 | 211,740 |
SABIC Agri-Nutrients Co. | 27,196 | 838,056 |
Sahara International Petrochemical Co. | 61,305 | 560,314 |
Saudi Arabian Mining Co. * | 9,987 | 134,628 |
Saudi Arabian Oil Co. (b) | 290,713 | 2,329,400 |
Saudi Aramco Base Oil Co. | 18,033 | 726,478 |
Saudi Cement Co. | 34,096 | 417,268 |
Saudi Electricity Co. | 34,296 | 169,914 |
Saudi Investment Bank (The) | 63,466 | 285,085 |
Saudi Telecom Co. | 203,552 | 2,042,499 |
Savola Group (The) | 17,398 | 233,788 |
13,963,284 | ||
South Africa — 3.7% | ||
African Rainbow Minerals Ltd. | 40,880 | 422,296 |
INVESTMENTS | SHARES | VALUE($) |
South Africa — continued | ||
Aspen Pharmacare Holdings Ltd. | 19,364 | 230,737 |
Bid Corp. Ltd. | 38,878 | 891,491 |
Bidvest Group Ltd. (The) | 66,167 | 865,668 |
Exxaro Resources Ltd. | 75,485 | 723,228 |
Foschini Group Ltd. (The) | 74,457 | 393,939 |
Harmony Gold Mining Co. Ltd. | 94,983 | 822,194 |
Impala Platinum Holdings Ltd. | 106,921 | 475,965 |
Investec Ltd. | 89,678 | 571,576 |
Kumba Iron Ore Ltd. | 19,546 | 481,369 |
MTN Group Ltd. | 217,411 | 1,046,322 |
MultiChoice Group * | 27,095 | 173,385 |
Naspers Ltd., Class N | 6,754 | 1,294,504 |
Nedbank Group Ltd. | 67,195 | 817,035 |
Shoprite Holdings Ltd. | 38,630 | 515,414 |
Sibanye Stillwater Ltd. | 251,223 | 286,733 |
Tiger Brands Ltd. | 40,125 | 436,465 |
Vodacom Group Ltd. | 116,025 | 557,586 |
Woolworths Holdings Ltd. | 223,843 | 715,370 |
11,721,277 | ||
Taiwan — 10.9% | ||
Accton Technology Corp. | 81,000 | 1,134,762 |
Asia Cement Corp. | 68,000 | 91,202 |
Capital Securities Corp. | 777,000 | 591,973 |
Catcher Technology Co. Ltd. | 90,000 | 601,171 |
Cheng Shin Rubber Industry Co. Ltd. | 553,000 | 798,383 |
Chicony Electronics Co. Ltd. | 58,551 | 362,466 |
China Airlines Ltd. | 1,243,000 | 796,016 |
China Motor Corp. | 181,000 | 792,826 |
Chunghwa Telecom Co. Ltd. | 465,000 | 1,767,389 |
CTBC Financial Holding Co. Ltd. | 2,186,395 | 2,281,982 |
E.Sun Financial Holding Co. Ltd. | 789,244 | 663,204 |
Eclat Textile Co. Ltd. | 47,000 | 739,505 |
Eva Airways Corp. | 862,000 | 937,199 |
Evergreen Marine Corp. Taiwan Ltd. | 155,800 | 906,704 |
Far Eastern New Century Corp. | 92,000 | 91,774 |
Far EasTone Telecommunications Co. Ltd. | 303,000 | 751,565 |
Feng TAY Enterprise Co. Ltd. | 108,960 | 541,763 |
First Financial Holding Co. Ltd. | 1,356,087 | 1,136,838 |
Formosa Chemicals & Fibre Corp. | 116,000 | 197,159 |
Formosa Taffeta Co. Ltd. | 304,000 | 213,220 |
Fubon Financial Holding Co. Ltd. | 297,444 | 629,248 |
Largan Precision Co. Ltd. | 1,000 | 66,658 |
Lite-On Technology Corp. | 309,000 | 935,275 |
Mega Financial Holding Co. Ltd. | 1,411,101 | 1,729,180 |
April 30, 2024 | J.P. Morgan Exchange-Traded Funds | 147 |
INVESTMENTS | SHARES | VALUE($) |
Common Stocks — continued | ||
Taiwan — continued | ||
Nan Ya Plastics Corp. | 535,000 | 928,976 |
Nien Made Enterprise Co. Ltd. | 64,000 | 747,927 |
Novatek Microelectronics Corp. | 17,000 | 321,219 |
Pou Chen Corp. | 825,000 | 913,168 |
President Chain Store Corp. | 115,000 | 967,107 |
SinoPac Financial Holdings Co. Ltd. | 1,936,500 | 1,302,810 |
Taiwan Cooperative Financial Holding Co. Ltd. | 1,283,609 | 1,031,544 |
Taiwan Fertilizer Co. Ltd. | 336,000 | 673,253 |
Taiwan Mobile Co. Ltd. | 318,000 | 1,014,932 |
Taiwan Semiconductor Manufacturing Co. Ltd. | 182,000 | 4,357,766 |
Uni-President Enterprises Corp. | 658,000 | 1,543,410 |
Yuanta Financial Holding Co. Ltd. | 1,730,746 | 1,623,503 |
34,183,077 | ||
Thailand — 2.8% | ||
Advanced Info Service PCL | 178,200 | 946,785 |
Bangkok Bank PCL | 116,800 | 430,923 |
Banpu PCL | 1,994,100 | 297,501 |
Bumrungrad Hospital PCL | 85,300 | 563,001 |
CP ALL PCL, NVDR | 210,200 | 324,867 |
CP Axtra PCL, NVDR | 148,000 | 129,098 |
Digital Telecommunications Infrastructure Fund, Class F | 1,409,700 | 296,699 |
Electricity Generating PCL | 115,200 | 348,479 |
Intouch Holdings PCL, NVDR | 259,400 | 467,218 |
Krung Thai Bank PCL | 1,536,500 | 694,899 |
Minor International PCL, NVDR | 609,700 | 540,548 |
Osotspa PCL, NVDR | 328,200 | 189,405 |
PTT Exploration & Production PCL | 248,800 | 1,050,653 |
PTT PCL, NVDR | 1,301,600 | 1,179,605 |
Ratch Group PCL | 199,500 | 154,387 |
Thai Oil PCL | 279,500 | 407,246 |
Thai Union Group PCL, Class F | 433,900 | 173,886 |
TMBThanachart Bank PCL, NVDR | 9,865,600 | 480,736 |
8,675,936 | ||
Turkey — 10.7% | ||
AG Anadolu Grubu Holding A/S | 86,451 | 866,879 |
Ahlatci Dogal Gaz Dagitim Enerji ve Yatirim A/S * | 508,677 | 208,269 |
Akbank TAS | 739,191 | 1,360,549 |
Akcansa Cimento A/S | 128,562 | 599,417 |
Aksa Enerji Uretim A/S | 285,834 | 339,440 |
Alarko Holding A/S | 164,692 | 592,939 |
Alfa Solar Enerji Sanayi ve Ticaret A/S | 109,922 | 304,790 |
Anadolu Efes Biracilik ve Malt Sanayii A/S | 145,134 | 817,846 |
INVESTMENTS | SHARES | VALUE($) |
Turkey — continued | ||
Aselsan Elektronik Sanayi ve Ticaret A/S | 431,330 | 809,087 |
Astor Transformator Enerji Turizm Insaat ve Petrol Sanayi Ticaret A/S | 127,315 | 368,248 |
Aygaz A/S | 123,964 | 749,841 |
BIM Birlesik Magazalar A/S | 88,128 | 1,052,861 |
Borusan Birlesik Boru Fabrikalari Sanayi ve Ticaret A/S * | 14,387 | 267,205 |
Cimsa Cimento Sanayi ve Ticaret A/S | 532,227 | 524,893 |
Coca-Cola Icecek A/S | 37,250 | 833,880 |
Dogan Sirketler Grubu Holding A/S | 1,491,417 | 671,883 |
Dogus Otomotiv Servis ve Ticaret A/S | 80,741 | 707,407 |
EGE Endustri ve Ticaret A/S * | 756 | 408,507 |
EIS Eczacibasi Ilac ve Sinai ve Finansal Yatirimlar Sanayi ve Ticaret A/S * | 371,804 | 596,976 |
Emlak Konut Gayrimenkul Yatirim Ortakligi A/S, REIT * | 956,898 | 287,562 |
Enerjisa Enerji A/S * (b) | 333,785 | 699,704 |
Enka Insaat ve Sanayi A/S | 499,623 | 592,397 |
Ford Otomotiv Sanayi A/S | 24,806 | 853,260 |
Haci Omer Sabanci Holding A/S * | 363,289 | 1,037,056 |
Is Gayrimenkul Yatirim Ortakligi A/S, REIT * | 482,017 | 232,627 |
Is Yatirim Menkul Degerler A/S | 563,458 | 650,339 |
KOC Holding A/S | 188,992 | 1,319,421 |
Kontrolmatik Enerji ve Muhendislik A/S | 8,811 | 64,206 |
Konya Cimento Sanayii A/S * | 989 | 350,373 |
Mavi Giyim Sanayi ve Ticaret A/S, Class B (b) | 299,718 | 856,040 |
MIA Teknoloji A/S * | 136,206 | 236,359 |
Migros Ticaret A/S | 47,041 | 642,005 |
MLP Saglik Hizmetleri A/S * (b) | 117,480 | 848,827 |
Nuh Cimento Sanayi A/S | 47,206 | 444,202 |
ODAS Elektrik Uretim ve Sanayi Ticaret A/S * | 1,133,951 | 334,728 |
Otokar Otomotiv ve Savunma Sanayi AS | 7,297 | 118,083 |
Oyak Cimento Fabrikalari A/S * | 270,402 | 505,967 |
Pegasus Hava Tasimaciligi A/S * | 21,188 | 674,542 |
Sok Marketler Ticaret A/S | 321,387 | 576,276 |
Tekfen Holding A/S | 252,520 | 403,502 |
Tofas Turk Otomobil Fabrikasi A/S | 83,508 | 709,755 |
Torunlar Gayrimenkul Yatirim Ortakligi A/S, REIT | 364,749 | 507,820 |
Turk Hava Yollari AO * | 116,664 | 1,174,340 |
Turk Telekomunikasyon A/S * | 665,334 | 829,555 |
Turk Traktor ve Ziraat Makineleri A/S | 24,694 | 701,104 |
Turkcell Iletisim Hizmetleri A/S | 391,982 | 977,950 |
Turkiye Is Bankasi A/S, Class C | 2,486,417 | 1,052,569 |
Turkiye Petrol Rafinerileri A/S | 192,344 | 1,162,869 |
148 | J.P. Morgan Exchange-Traded Funds | April 30, 2024 |
INVESTMENTS | SHARES | VALUE($) |
Common Stocks — continued | ||
Turkey — continued | ||
Turkiye Sise ve Cam Fabrikalari A/S | 372,314 | 578,301 |
Ulker Biskuvi Sanayi A/S * | 197,340 | 696,467 |
Yapi ve Kredi Bankasi A/S | 1,138,721 | 1,140,285 |
Zorlu Enerji Elektrik Uretim A/S * | 1,298,546 | 265,032 |
33,604,440 | ||
United Arab Emirates — 2.3% | ||
Abu Dhabi Commercial Bank PJSC | 428,119 | 972,123 |
Abu Dhabi Islamic Bank PJSC | 224,011 | 680,651 |
Abu Dhabi Ports Co. PJSC * | 177,754 | 281,181 |
Air Arabia PJSC | 726,413 | 528,906 |
Aldar Properties PJSC | 615,162 | 914,478 |
Americana Restaurants International plc * | 119,563 | 108,401 |
Dubai Electricity & Water Authority PJSC | 221,622 | 141,798 |
Dubai Islamic Bank PJSC | 448,455 | 678,867 |
Emaar Development PJSC * | 250,875 | 571,024 |
Emaar Properties PJSC * | 304,079 | 679,705 |
Emirates NBD Bank PJSC | 90,168 | 417,342 |
Emirates Telecommunications Group Co. PJSC | 59,314 | 274,535 |
National Marine Dredging Co. | 69,781 | 506,510 |
Salik Co. PJSC | 482,154 | 454,206 |
7,209,727 | ||
United States — 0.3% | ||
GCC SAB de CV | 27,877 | 313,973 |
JBS SA | 177,662 | 802,329 |
1,116,302 | ||
Total Common Stocks (Cost $277,752,218) | 314,420,933 | |
Short-Term Investments — 0.2% | ||
Investment Companies — 0.2% | ||
JPMorgan U.S. Government Money Market Fund Class IM Shares, 5.25% (c) (d)(Cost $401,232) | 401,232 | 401,232 |
Total Investments — 100.1% (Cost $278,153,450) | 314,822,165 | |
Liabilities in Excess of Other Assets — (0.1)% | (160,247 ) | |
NET ASSETS — 100.0% | 314,661,918 | |
Percentages indicated are based on net assets. |
Abbreviations | |
ADR | American Depositary Receipt |
JSC | Joint Stock Company |
NVDR | Non-Voting Depositary Receipt |
PJSC | Public Joint Stock Company |
Preference | A special type of equity investment that shares in the earnings of the company, has limited voting rights, and may have a dividend preference. Preference shares may also have liquidation preference. |
PT | Limited liability company |
REIT | Real Estate Investment Trust |
^ | Amount rounds to less than 0.1% of net assets. | |
‡ | Value determined using significant unobservable inputs. | |
* | Non-income producing security. | |
(a) | Securities exempt from registration under Rule 144A or section 4(a)(2), of the Securities Act of 1933, as amended. | |
(b) | Security exempt from registration pursuant to Regulation S under the Securities Act of 1933, as amended. Regulation S applies to securities offerings that are made outside of the United States and do not involve direct selling efforts in the United States and as such may have restrictions on resale. | |
(c) | Investment in an affiliated fund, which is registered under the Investment Company Act of 1940, as amended, and is advised by J.P. Morgan Investment Management Inc. | |
(d) | The rate shown is the current yield as of April 30, 2024. | |
April 30, 2024 | J.P. Morgan Exchange-Traded Funds | 149 |
INDUSTRY | PERCENT OF TOTAL INVESTMENTS |
Banks | 16.1 % |
Oil, Gas & Consumable Fuels | 9.4 |
Metals & Mining | 4.8 |
Wireless Telecommunication Services | 4.1 |
Electric Utilities | 3.6 |
Food Products | 3.3 |
Diversified Telecommunication Services | 3.2 |
IT Services | 3.2 |
Beverages | 3.1 |
Industrial Conglomerates | 3.1 |
Pharmaceuticals | 3.0 |
Independent Power and Renewable Electricity Producers | 3.0 |
Consumer Staples Distribution & Retail | 2.8 |
Transportation Infrastructure | 2.7 |
Machinery | 2.2 |
Automobiles | 2.1 |
Textiles, Apparel & Luxury Goods | 1.8 |
Chemicals | 1.8 |
Construction Materials | 1.6 |
Semiconductors & Semiconductor Equipment | 1.6 |
Health Care Providers & Services | 1.4 |
Passenger Airlines | 1.3 |
Personal Care Products | 1.3 |
Gas Utilities | 1.3 |
Real Estate Management & Development | 1.2 |
Financial Services | 1.2 |
Specialty Retail | 1.0 |
Media | 1.0 |
Others (each less than 1.0%) | 13.7 |
Short-Term Investments | 0.1 |
DESCRIPTION | NUMBER OF CONTRACTS | EXPIRATION DATE | TRADING CURRENCY | NOTIONAL AMOUNT ($) | VALUE AND UNREALIZED APPRECIATION (DEPRECIATION) ($) |
Long Contracts | |||||
MSCI Emerging Markets E-Mini Index | 5 | 06/21/2024 | USD | 260,475 | 6,920 |
150 | J.P. Morgan Exchange-Traded Funds | April 30, 2024 |
Abbreviations | |
MSCI | Morgan Stanley Capital International |
USD | United States Dollar |
April 30, 2024 | J.P. Morgan Exchange-Traded Funds | 151 |
INVESTMENTS | SHARES | VALUE($) |
Common Stocks — 99.1% | ||
Australia — 11.6% | ||
AGL Energy Ltd. | 240,113 | 1,462,424 |
Altium Ltd. | 23,617 | 997,815 |
Alumina Ltd. * | 435,257 | 447,151 |
Ampol Ltd. | 54,877 | 1,295,854 |
Ansell Ltd. | 48,925 | 804,381 |
ANZ Group Holdings Ltd. | 22,802 | 411,438 |
APA Group | 100,585 | 536,770 |
Aurizon Holdings Ltd. | 113,653 | 279,160 |
BHP Group Ltd. | 40,511 | 1,111,059 |
BlueScope Steel Ltd. | 28,444 | 415,152 |
CAR Group Ltd. | 19,562 | 424,173 |
Charter Hall Group, REIT | 34,430 | 261,469 |
Cochlear Ltd. | 6,264 | 1,306,720 |
Coles Group Ltd. | 129,780 | 1,353,504 |
CSR Ltd. | 235,658 | 1,344,143 |
Dexus, REIT | 204,287 | 927,915 |
EBOS Group Ltd. | 8,101 | 167,359 |
Fortescue Ltd. | 71,007 | 1,176,902 |
Glencore plc | 248,633 | 1,446,687 |
Goodman Group, REIT | 75,137 | 1,517,740 |
GPT Group (The), REIT | 376,723 | 1,013,171 |
Harvey Norman Holdings Ltd. | 229,635 | 674,395 |
Iluka Resources Ltd. | 29,838 | 145,091 |
Incitec Pivot Ltd. | 233,855 | 419,907 |
JB Hi-Fi Ltd. | 35,060 | 1,368,115 |
Lottery Corp. Ltd. (The) | 218,551 | 681,768 |
Metcash Ltd. | 314,530 | 797,612 |
New Hope Corp. Ltd. | 185,523 | 539,690 |
Origin Energy Ltd. | 184,472 | 1,164,280 |
Pilbara Minerals Ltd. (a) | 99,385 | 253,025 |
Ramsay Health Care Ltd. | 10,409 | 348,912 |
REA Group Ltd. | 3,716 | 425,958 |
Rio Tinto Ltd. | 14,000 | 1,165,141 |
Rio Tinto plc | 22,234 | 1,504,370 |
Santos Ltd. | 231,389 | 1,135,511 |
Seven Group Holdings Ltd. | 12,779 | 310,518 |
Sonic Healthcare Ltd. | 50,189 | 862,532 |
South32 Ltd. | 308,276 | 703,326 |
Stockland, REIT | 482,708 | 1,367,568 |
Tabcorp Holdings Ltd. | 387,287 | 181,722 |
Telstra Group Ltd. | 526,919 | 1,244,905 |
Treasury Wine Estates Ltd. | 72,801 | 564,587 |
Vicinity Ltd., REIT | 787,126 | 963,890 |
Wesfarmers Ltd. | 33,705 | 1,443,896 |
INVESTMENTS | SHARES | VALUE($) |
Australia — continued | ||
Whitehaven Coal Ltd. | 282,707 | 1,398,407 |
WiseTech Global Ltd. | 17,588 | 1,036,154 |
Woodside Energy Group Ltd. | 53,857 | 964,956 |
Woolworths Group Ltd. | 61,695 | 1,265,804 |
Yancoal Australia Ltd. | 144,499 | 515,852 |
42,148,879 | ||
Austria — 0.5% | ||
Mondi plc | 61,704 | 1,171,183 |
OMV AG | 13,884 | 658,815 |
1,829,998 | ||
Belgium — 0.3% | ||
Anheuser-Busch InBev SA | 4,682 | 279,861 |
Solvay SA | 12,515 | 404,278 |
Syensqo SA * | 4,356 | 403,765 |
1,087,904 | ||
Brazil — 0.2% | ||
Yara International ASA | 26,032 | 742,046 |
Burkina Faso — 0.2% | ||
Endeavour Mining plc | 31,253 | 661,724 |
Cambodia — 0.0% ^ | ||
NagaCorp Ltd. * | 64,945 | 34,036 |
Chile — 0.5% | ||
Antofagasta plc | 63,070 | 1,730,122 |
China — 0.9% | ||
Budweiser Brewing Co. APAC Ltd. (b) | 418,206 | 581,805 |
Chow Tai Fook Jewellery Group Ltd. | 111,757 | 152,062 |
Lenovo Group Ltd. | 1,070,000 | 1,203,493 |
SITC International Holdings Co. Ltd. | 98,917 | 214,511 |
Wilmar International Ltd. | 423,000 | 994,292 |
Xinyi Glass Holdings Ltd. | 150,000 | 160,291 |
3,306,454 | ||
Denmark — 0.8% | ||
Carlsberg A/S, Class B | 10,592 | 1,424,760 |
Novo Nordisk A/S, Class B | 11,662 | 1,495,562 |
2,920,322 | ||
Finland — 0.7% | ||
Elisa OYJ | 16,388 | 738,924 |
Kesko OYJ, Class B | 33,880 | 578,412 |
152 | J.P. Morgan Exchange-Traded Funds | April 30, 2024 |
INVESTMENTS | SHARES | VALUE($) |
Common Stocks — continued | ||
Finland — continued | ||
Orion OYJ, Class B | 6,708 | 256,213 |
UPM-Kymmene OYJ | 25,380 | 889,445 |
2,462,994 | ||
France — 5.0% | ||
Air Liquide SA | 2,248 | 439,661 |
Arkema SA | 8,033 | 828,899 |
Capgemini SE | 5,916 | 1,243,431 |
Carrefour SA | 76,522 | 1,287,347 |
Covivio SA, REIT | 8,995 | 447,736 |
Credit Agricole SA | 61,459 | 950,970 |
Danone SA (a) | 22,669 | 1,418,792 |
Eiffage SA | 12,444 | 1,327,755 |
Engie SA * (a) | 67,938 | 1,179,446 |
EssilorLuxottica SA | 2,466 | 525,829 |
Gecina SA, REIT | 9,485 | 968,435 |
Klepierre SA, REIT | 49,537 | 1,330,188 |
Orange SA | 100,343 | 1,116,846 |
Pernod Ricard SA | 1,409 | 213,100 |
Publicis Groupe SA | 13,352 | 1,473,350 |
TotalEnergies SE | 20,158 | 1,463,445 |
Unibail-Rodamco-Westfield, REIT * | 6,852 | 570,997 |
Vinci SA | 10,029 | 1,175,159 |
Vivendi SE | 16,669 | 169,585 |
18,130,971 | ||
Germany — 2.5% | ||
Bayerische Motoren Werke AG | 10,076 | 1,097,774 |
Beiersdorf AG | 2,882 | 433,175 |
Brenntag SE | 8,616 | 687,586 |
Covestro AG * (b) | 5,459 | 273,410 |
Deutsche Telekom AG (Registered) | 58,515 | 1,340,319 |
E.ON SE | 23,358 | 309,306 |
Fresenius Medical Care AG | 21,542 | 906,977 |
Hannover Rueck SE | 1,545 | 383,228 |
Heidelberg Materials AG | 3,275 | 329,582 |
Mercedes-Benz Group AG | 17,007 | 1,286,424 |
Merck KGaA | 3,806 | 604,780 |
SAP SE | 7,679 | 1,386,574 |
9,039,135 | ||
Hong Kong — 2.9% | ||
ASMPT Ltd. | 53,200 | 661,153 |
CK Asset Holdings Ltd. | 9,266 | 39,525 |
CK Infrastructure Holdings Ltd. | 226,500 | 1,279,530 |
CLP Holdings Ltd. | 139,500 | 1,097,316 |
INVESTMENTS | SHARES | VALUE($) |
Hong Kong — continued | ||
Hong Kong & China Gas Co. Ltd. | 894,393 | 680,054 |
Hutchison Port Holdings Trust | 1,299,200 | 166,138 |
Orient Overseas International Ltd. | 67,500 | 984,489 |
PCCW Ltd. | 1,414,000 | 706,992 |
Power Assets Holdings Ltd. | 235,500 | 1,350,864 |
Sun Hung Kai Properties Ltd. | 82,000 | 756,447 |
Swire Pacific Ltd., Class A | 111,500 | 944,261 |
United Energy Group Ltd. | 4,762,001 | 339,685 |
WH Group Ltd. (b) | 1,694,743 | 1,231,807 |
Yue Yuen Industrial Holdings Ltd. | 157,000 | 277,977 |
10,516,238 | ||
Indonesia — 0.0% ^ | ||
First Pacific Co. Ltd. | 266,000 | 124,402 |
Ireland — 0.1% | ||
Smurfit Kappa Group plc | 11,250 | 487,458 |
Italy — 2.8% | ||
A2A SpA | 546,876 | 1,078,523 |
Assicurazioni Generali SpA | 23,225 | 566,282 |
Banca Mediolanum SpA | 30,026 | 324,929 |
Coca-Cola HBC AG | 46,453 | 1,499,444 |
Enel SpA | 59,570 | 391,520 |
Eni SpA | 64,599 | 1,037,569 |
Infrastrutture Wireless Italiane SpA (b) | 24,191 | 259,253 |
Italgas SpA | 158,102 | 876,383 |
Poste Italiane SpA (b) | 72,398 | 919,681 |
Recordati Industria Chimica e Farmaceutica SpA | 14,030 | 746,584 |
Terna - Rete Elettrica Nazionale | 86,655 | 694,272 |
UniCredit SpA | 42,947 | 1,576,342 |
9,970,782 | ||
Japan — 28.0% | ||
Activia Properties, Inc., REIT | 194 | 481,498 |
Advance Residence Investment Corp., REIT | 127 | 274,576 |
Advantest Corp. | 10,400 | 325,527 |
Aeon Mall Co. Ltd. | 31,300 | 357,850 |
AEON REIT Investment Corp., REIT | 361 | 315,703 |
Ajinomoto Co., Inc. | 32,500 | 1,208,398 |
Alfresa Holdings Corp. | 43,100 | 638,720 |
Anritsu Corp. | 55,900 | 426,190 |
Asahi Group Holdings Ltd. | 25,400 | 868,908 |
Astellas Pharma, Inc. | 88,100 | 845,575 |
Canon Marketing Japan, Inc. | 26,500 | 728,150 |
Canon, Inc. | 49,300 | 1,334,319 |
Capcom Co. Ltd. | 63,400 | 1,043,719 |
April 30, 2024 | J.P. Morgan Exchange-Traded Funds | 153 |
INVESTMENTS | SHARES | VALUE($) |
Common Stocks — continued | ||
Japan — continued | ||
Chubu Electric Power Co., Inc. | 99,700 | 1,279,746 |
Chugai Pharmaceutical Co. Ltd. | 35,500 | 1,129,037 |
COMSYS Holdings Corp. | 34,300 | 802,879 |
Cosmo Energy Holdings Co. Ltd. | 32,300 | 1,544,117 |
Daito Trust Construction Co. Ltd. | 12,200 | 1,307,772 |
Daiwa House REIT Investment Corp., REIT | 129 | 216,691 |
Daiwa Securities Group, Inc. | 163,200 | 1,199,367 |
Dowa Holdings Co. Ltd. | 10,200 | 381,959 |
Electric Power Development Co. Ltd. | 82,300 | 1,398,030 |
ENEOS Holdings, Inc. | 291,200 | 1,345,407 |
Fuji Media Holdings, Inc. | 6,700 | 79,632 |
FUJIFILM Holdings Corp. | 56,100 | 1,193,387 |
Hachijuni Bank Ltd. (The) | 65,100 | 434,278 |
Hikari Tsushin, Inc. | 5,700 | 926,375 |
Hoya Corp. | 1,500 | 173,910 |
Hulic Co. Ltd. | 107,600 | 991,497 |
Idemitsu Kosan Co. Ltd. | 51,185 | 346,785 |
Inpex Corp. (a) | 94,800 | 1,420,085 |
Invincible Investment Corp., REIT | 1,046 | 468,651 |
ITOCHU Corp. | 32,800 | 1,479,765 |
Iwatani Corp. | 9,200 | 522,399 |
Japan Metropolitan Fund Invest, REIT | 1,086 | 655,649 |
Japan Post Holdings Co. Ltd. | 125,000 | 1,200,413 |
Japan Post Insurance Co. Ltd. | 38,500 | 722,802 |
Japan Real Estate Investment Corp., REIT | 9 | 30,520 |
Japan Tobacco, Inc. | 54,200 | 1,458,068 |
JFE Holdings, Inc. | 68,500 | 1,022,412 |
Kajima Corp. | 14,700 | 281,609 |
Kaneka Corp. | 1,600 | 41,443 |
Kansai Electric Power Co., Inc. (The) | 93,300 | 1,397,580 |
Kawasaki Kisen Kaisha Ltd. | 60,000 | 845,393 |
KDDI Corp. | 44,200 | 1,226,497 |
Kinden Corp. | 18,000 | 343,460 |
Kobe Steel Ltd. | 104,100 | 1,270,597 |
K's Holdings Corp. | 57,700 | 553,876 |
Kuraray Co. Ltd. | 36,200 | 401,064 |
Kyowa Kirin Co. Ltd. | 44,100 | 740,609 |
Kyushu Electric Power Co., Inc. | 102,900 | 954,592 |
Lawson, Inc. | 21,500 | 1,407,523 |
Mani, Inc. | 14,400 | 166,825 |
Marubeni Corp. | 79,200 | 1,411,056 |
MatsukiyoCocokara & Co. | 62,700 | 889,132 |
Mebuki Financial Group, Inc. | 77,200 | 273,105 |
Medipal Holdings Corp. | 45,300 | 710,442 |
INVESTMENTS | SHARES | VALUE($) |
Japan — continued | ||
MEIJI Holdings Co. Ltd. | 39,500 | 883,788 |
Mitsubishi Chemical Group Corp. | 108,400 | 632,391 |
Mitsubishi Corp. | 56,600 | 1,294,418 |
Mitsubishi Gas Chemical Co., Inc. | 21,000 | 371,579 |
Mitsubishi HC Capital, Inc. | 206,900 | 1,339,894 |
Mitsubishi UFJ Financial Group, Inc. | 111,300 | 1,108,699 |
Mitsui & Co. Ltd. | 32,200 | 1,554,477 |
Mitsui Fudosan Co. Ltd. | 138,000 | 1,404,435 |
Mitsui Mining & Smelting Co. Ltd. | 26,400 | 827,822 |
Morinaga Milk Industry Co. Ltd. | 8,700 | 170,480 |
MS&AD Insurance Group Holdings, Inc. | 48,100 | 864,792 |
NH Foods Ltd. | 7,100 | 233,563 |
Nifco, Inc. | 3,700 | 89,442 |
Nintendo Co. Ltd. | 25,300 | 1,233,856 |
Nippon Shinyaku Co. Ltd. | 4,200 | 116,215 |
Nippon Shokubai Co. Ltd. | 26,200 | 249,033 |
Nippon Steel Corp. | 56,700 | 1,271,153 |
Nippon Telegraph & Telephone Corp. | 1,223,400 | 1,320,859 |
Nippon Yusen KK | 32,000 | 908,495 |
Nisshin Seifun Group, Inc. | 6,000 | 78,269 |
Nissin Foods Holdings Co. Ltd. | 31,300 | 835,258 |
Niterra Co. Ltd. | 47,800 | 1,567,737 |
Nitto Denko Corp. | 15,600 | 1,289,897 |
NOF Corp. | 20,700 | 277,710 |
Nomura Real Estate Holdings, Inc. | 52,700 | 1,475,449 |
Nomura Real Estate Master Fund, Inc., REIT | 775 | 740,838 |
Obayashi Corp. | 24,100 | 268,975 |
Ono Pharmaceutical Co. Ltd. | 49,300 | 710,086 |
Open House Group Co. Ltd. | 4,900 | 149,010 |
ORIX Corp. | 23,100 | 472,751 |
Osaka Gas Co. Ltd. | 60,500 | 1,345,271 |
Otsuka Holdings Co. Ltd. | 36,100 | 1,543,523 |
Rohto Pharmaceutical Co. Ltd. | 23,000 | 448,740 |
Sankyo Co. Ltd. | 80,400 | 873,306 |
Santen Pharmaceutical Co. Ltd. | 74,600 | 720,568 |
Sapporo Holdings Ltd. | 3,500 | 126,510 |
Sawai Group Holdings Co. Ltd. | 11,700 | 436,006 |
SCREEN Holdings Co. Ltd. | 11,100 | 1,145,266 |
SCSK Corp. | 25,300 | 459,934 |
Seiko Epson Corp. | 31,200 | 513,240 |
Sekisui Chemical Co. Ltd. | 23,600 | 343,334 |
Sekisui House Ltd. | 37,200 | 854,869 |
Sekisui House REIT, Inc., REIT | 874 | 447,837 |
Shimamura Co. Ltd. | 7,200 | 354,937 |
154 | J.P. Morgan Exchange-Traded Funds | April 30, 2024 |
INVESTMENTS | SHARES | VALUE($) |
Common Stocks — continued | ||
Japan — continued | ||
Shionogi & Co. Ltd. | 21,900 | 1,022,747 |
Ship Healthcare Holdings, Inc. | 6,100 | 90,755 |
Skylark Holdings Co. Ltd. | 29,600 | 421,820 |
SoftBank Corp. | 111,600 | 1,346,084 |
SoftBank Group Corp. | 11,200 | 550,823 |
Sojitz Corp. | 56,120 | 1,444,914 |
Sugi Holdings Co. Ltd. | 19,800 | 290,511 |
SUMCO Corp. (a) | 25,200 | 375,816 |
Sumitomo Mitsui Financial Group, Inc. | 25,600 | 1,454,178 |
Suntory Beverage & Food Ltd. | 21,000 | 683,240 |
Suzuken Co. Ltd. | 11,000 | 324,871 |
Takeda Pharmaceutical Co. Ltd. | 44,000 | 1,156,411 |
Teijin Ltd. | 300 | 2,927 |
TIS, Inc. | 3,300 | 70,477 |
Toho Gas Co. Ltd. | 12,700 | 326,142 |
Tohoku Electric Power Co., Inc. | 137,400 | 1,060,736 |
Tokyo Electron Ltd. | 5,600 | 1,228,337 |
Tokyo Gas Co. Ltd. | 58,400 | 1,309,752 |
Tokyo Tatemono Co. Ltd. | 69,200 | 1,151,487 |
Tokyu Fudosan Holdings Corp. | 213,900 | 1,567,086 |
Tosoh Corp. | 20,400 | 281,237 |
Toyo Suisan Kaisha Ltd. | 19,500 | 1,219,419 |
Toyota Boshoku Corp. | 13,500 | 199,643 |
Trend Micro, Inc. | 8,900 | 438,576 |
Tsumura & Co. | 19,100 | 460,247 |
UBE Corp. | 36,100 | 659,969 |
United Urban Investment Corp., REIT | 428 | 410,107 |
USS Co. Ltd. | 84,800 | 647,812 |
Yakult Honsha Co. Ltd. | 21,900 | 428,358 |
Yamada Holdings Co. Ltd. | 72,800 | 208,396 |
Yamaguchi Financial Group, Inc. | 3,200 | 32,325 |
Yamaha Motor Co. Ltd. | 122,900 | 1,146,316 |
Yokohama Rubber Co. Ltd. (The) | 30,700 | 803,548 |
101,665,348 | ||
Jordan — 0.3% | ||
Hikma Pharmaceuticals plc | 50,462 | 1,211,621 |
Luxembourg — 0.1% | ||
L'Occitane International SA | 49,000 | 202,321 |
RTL Group SA | 10,299 | 317,465 |
519,786 | ||
Mexico — 0.1% | ||
Fresnillo plc | 40,912 | 283,348 |
INVESTMENTS | SHARES | VALUE($) |
Netherlands — 2.6% | ||
ABN AMRO Bank NV, CVA (b) | 49,301 | 789,731 |
ASML Holding NV | 1,110 | 966,824 |
ASR Nederland NV | 18,484 | 924,930 |
BE Semiconductor Industries NV | 7,910 | 1,049,452 |
Heineken Holding NV | 11,938 | 960,340 |
Koninklijke Ahold Delhaize NV | 49,071 | 1,489,510 |
Koninklijke KPN NV | 396,965 | 1,442,623 |
NN Group NV | 7,612 | 351,148 |
OCI NV | 1,602 | 43,088 |
Wolters Kluwer NV | 9,165 | 1,372,059 |
9,389,705 | ||
New Zealand — 0.5% | ||
Fisher & Paykel Healthcare Corp. Ltd. | 53,090 | 889,138 |
Spark New Zealand Ltd. | 314,591 | 884,228 |
1,773,366 | ||
Norway — 1.1% | ||
Aker BP ASA | 92 | 2,231 |
DNB Bank ASA | 16,793 | 292,688 |
Equinor ASA | 32,500 | 864,772 |
Mowi ASA | 31,090 | 545,844 |
Norsk Hydro ASA | 150,920 | 927,462 |
Orkla ASA | 67,681 | 460,394 |
Telenor ASA | 77,385 | 890,988 |
3,984,379 | ||
Poland — 0.1% | ||
ORLEN SA | 29,088 | 474,262 |
Portugal — 0.5% | ||
Galp Energia SGPS SA | 45,026 | 967,210 |
Jeronimo Martins SGPS SA | 45,828 | 942,762 |
1,909,972 | ||
Russia — 0.0% ^ | ||
Evraz plc ‡ * | 393,430 | 20,126 |
Singapore — 3.1% | ||
CapitaLand Ascendas, REIT | 667,542 | 1,264,473 |
CapitaLand Integrated Commercial Trust, REIT | 883,408 | 1,259,294 |
ComfortDelGro Corp. Ltd. | 304,900 | 331,645 |
DBS Group Holdings Ltd. | 24,500 | 623,707 |
Genting Singapore Ltd. | 386,400 | 257,872 |
Jardine Cycle & Carriage Ltd. | 15,600 | 301,053 |
Keppel Ltd. | 213,900 | 1,069,909 |
Mapletree Logistics Trust, REIT | 206,700 | 202,835 |
Mapletree Pan Asia Commercial Trust, REIT | 5,900 | 5,407 |
April 30, 2024 | J.P. Morgan Exchange-Traded Funds | 155 |
INVESTMENTS | SHARES | VALUE($) |
Common Stocks — continued | ||
Singapore — continued | ||
Oversea-Chinese Banking Corp. Ltd. | 115,100 | 1,194,919 |
Sembcorp Industries Ltd. | 343,300 | 1,341,642 |
Singapore Airlines Ltd. | 253,100 | 1,207,697 |
Singapore Telecommunications Ltd. | 55,200 | 95,732 |
STMicroelectronics NV | 8,422 | 333,384 |
Suntec, REIT | 885,800 | 698,351 |
Venture Corp. Ltd. | 92,400 | 979,001 |
11,166,921 | ||
South Africa — 0.4% | ||
Anglo American plc | 39,059 | 1,276,350 |
South Korea — 7.4% | ||
CJ Logistics Corp. | 1,959 | 172,815 |
DB Insurance Co. Ltd. | 5,833 | 409,155 |
DL Holdings Co. Ltd. | 1,377 | 52,840 |
Doosan Bobcat, Inc. | 18,395 | 687,512 |
F&F Co. Ltd. | 768 | 36,355 |
GS Holdings Corp. | 5,071 | 163,954 |
GS Retail Co. Ltd. | 18,916 | 271,156 |
Hana Financial Group, Inc. | 34,038 | 1,435,614 |
Hankook Tire & Technology Co. Ltd. | 5,773 | 244,962 |
Hanmi Pharm Co. Ltd. | 1,766 | 402,300 |
Hanwha Aerospace Co. Ltd. | 10,257 | 1,558,004 |
Hanwha Corp. | 8,436 | 165,550 |
HD Hyundai Co. Ltd. | 3,595 | 174,045 |
HD Hyundai Infracore Co. Ltd. | 50,253 | 298,968 |
HD Korea Shipbuilding & Offshore Engineering Co. Ltd. * | 3,682 | 347,641 |
Hite Jinro Co. Ltd. | 2,933 | 44,469 |
Hyundai Mobis Co. Ltd. | 2,842 | 464,949 |
Industrial Bank of Korea | 85,364 | 858,210 |
KB Financial Group, Inc. | 30,397 | 1,648,640 |
Kia Corp. | 15,523 | 1,315,149 |
Korea Electric Power Corp. * | 43,670 | 666,678 |
Korea Gas Corp. * | 3,914 | 77,869 |
Korea Investment Holdings Co. Ltd. | 2,533 | 122,429 |
Korean Air Lines Co. Ltd. | 22,240 | 335,383 |
KT&G Corp. | 20,242 | 1,304,309 |
LG Corp. | 17,738 | 1,012,094 |
LG H&H Co. Ltd. | 2,621 | 789,728 |
LG Innotek Co. Ltd. | 4,919 | 781,889 |
LG Uplus Corp. | 70,267 | 499,072 |
Mirae Asset Securities Co. Ltd. | 5,309 | 28,935 |
NAVER Corp. | 840 | 110,796 |
NH Investment & Securities Co. Ltd. | 25,506 | 229,263 |
INVESTMENTS | SHARES | VALUE($) |
South Korea — continued | ||
NongShim Co. Ltd. | 1,649 | 473,493 |
Orion Corp. | 10,197 | 682,422 |
POSCO Holdings, Inc. | 3,414 | 985,557 |
Posco International Corp. | 21,178 | 698,483 |
Samsung E&A Co. Ltd. * | 6,431 | 121,928 |
Samsung Electronics Co. Ltd. | 26,886 | 1,494,502 |
Samsung Fire & Marine Insurance Co. Ltd. | 3,389 | 758,545 |
Samsung SDS Co. Ltd. | 1,853 | 212,871 |
Samsung Securities Co. Ltd. | 15,106 | 413,238 |
Seegene, Inc. | 11,275 | 179,945 |
SK Hynix, Inc. | 7,728 | 953,679 |
SK Networks Co. Ltd. | 41,894 | 152,076 |
S-Oil Corp. | 8,251 | 430,781 |
Woori Financial Group, Inc. | 129,163 | 1,323,628 |
Yuhan Corp. | 26,866 | 1,397,500 |
26,989,381 | ||
Spain — 2.1% | ||
Enagas SA | 35,240 | 516,830 |
Endesa SA | 61,723 | 1,125,559 |
Iberdrola SA | 116,097 | 1,423,532 |
Industria de Diseno Textil SA | 16,329 | 743,475 |
Merlin Properties Socimi SA, REIT | 43,719 | 491,802 |
Naturgy Energy Group SA | 47,556 | 1,202,851 |
Redeia Corp. SA | 20,401 | 340,566 |
Repsol SA | 45,104 | 707,956 |
Telefonica SA | 261,230 | 1,170,205 |
7,722,776 | ||
Sweden — 2.1% | ||
Castellum AB * | 88,652 | 1,053,360 |
Fastighets AB Balder, Class B * | 24,050 | 151,595 |
Getinge AB, Class B | 16,781 | 353,281 |
H & M Hennes & Mauritz AB, Class B (a) | 30,017 | 477,114 |
Investor AB, Class B | 16,102 | 394,382 |
Sagax AB, Class B | 11,989 | 300,229 |
Securitas AB, Class B (a) | 74,064 | 742,240 |
SSAB AB, Class B | 186,876 | 1,045,676 |
Tele2 AB, Class B | 128,599 | 1,199,451 |
Telefonaktiebolaget LM Ericsson, Class B | 47,061 | 238,829 |
Telia Co. AB | 177,985 | 407,137 |
Trelleborg AB, Class B | 32,264 | 1,137,062 |
7,500,356 | ||
Switzerland — 1.3% | ||
Kuehne + Nagel International AG (Registered) (a) | 2,067 | 546,301 |
156 | J.P. Morgan Exchange-Traded Funds | April 30, 2024 |
INVESTMENTS | SHARES | VALUE($) |
Common Stocks — continued | ||
Switzerland — continued | ||
Novartis AG (Registered) | 14,124 | 1,370,841 |
PSP Swiss Property AG (Registered) | 3,077 | 380,383 |
Sandoz Group AG * | 2,735 | 92,954 |
Sonova Holding AG (Registered) | 1,664 | 459,983 |
Swiss Prime Site AG (Registered) | 8,245 | 761,284 |
Swisscom AG (Registered) | 2,180 | 1,195,964 |
4,807,710 | ||
United Kingdom — 16.5% | ||
3i Group plc | 46,391 | 1,657,432 |
abrdn plc | 271,144 | 494,453 |
Admiral Group plc | 38,558 | 1,312,404 |
Associated British Foods plc | 47,220 | 1,562,873 |
AstraZeneca plc | 11,345 | 1,715,919 |
Auto Trader Group plc (b) | 77,748 | 674,035 |
Aviva plc | 197,101 | 1,144,399 |
B&M European Value Retail SA | 182,220 | 1,175,970 |
BAE Systems plc | 94,144 | 1,565,823 |
Barratt Developments plc | 179,642 | 1,014,999 |
British American Tobacco plc | 45,639 | 1,339,791 |
British Land Co. plc (The), REIT | 220,319 | 1,062,411 |
BT Group plc | 823,074 | 1,052,551 |
Bunzl plc | 30,546 | 1,171,372 |
Burberry Group plc | 36,889 | 527,831 |
Centrica plc | 737,842 | 1,177,797 |
CK Hutchison Holdings Ltd. | 27,256 | 132,376 |
Compass Group plc | 15,293 | 425,355 |
ConvaTec Group plc (b) | 318,766 | 991,781 |
Croda International plc | 17,592 | 1,007,610 |
DS Smith plc | 134,047 | 583,980 |
Hiscox Ltd. | 14,794 | 226,879 |
HSBC Holdings plc | 204,528 | 1,772,839 |
IMI plc | 45,549 | 992,181 |
Imperial Brands plc | 60,549 | 1,383,554 |
Informa plc | 114,699 | 1,135,507 |
InterContinental Hotels Group plc | 13,801 | 1,346,067 |
Intermediate Capital Group plc | 19,112 | 498,134 |
International Consolidated Airlines Group SA * | 221,029 | 481,700 |
Intertek Group plc | 10,653 | 655,656 |
J Sainsbury plc | 386,202 | 1,266,812 |
Johnson Matthey plc | 29,401 | 645,120 |
Land Securities Group plc, REIT | 154,225 | 1,246,456 |
Legal & General Group plc | 428,607 | 1,258,176 |
M&G plc | 298,137 | 746,395 |
Marks & Spencer Group plc | 208,118 | 663,052 |
INVESTMENTS | SHARES | VALUE($) |
United Kingdom — continued | ||
National Grid plc | 86,205 | 1,130,765 |
NatWest Group plc | 305,218 | 1,152,010 |
Next plc | 13,653 | 1,531,293 |
Pearson plc | 79,574 | 965,538 |
Phoenix Group Holdings plc | 4,403 | 26,817 |
Reckitt Benckiser Group plc | 17,315 | 968,030 |
RELX plc | 23,830 | 979,100 |
Rightmove plc | 198,751 | 1,273,160 |
Rolls-Royce Holdings plc * | 236,220 | 1,211,342 |
Sage Group plc (The) | 94,231 | 1,366,435 |
Segro plc, REIT | 52,078 | 547,763 |
Smiths Group plc | 62,272 | 1,255,402 |
SSE plc | 59,878 | 1,244,648 |
Standard Chartered plc | 146,076 | 1,255,018 |
Taylor Wimpey plc | 617,027 | 1,011,075 |
Tesco plc | 401,676 | 1,483,016 |
Unilever plc | 30,189 | 1,561,701 |
UNITE Group plc (The), REIT | 65,087 | 752,441 |
United Utilities Group plc | 102,620 | 1,337,670 |
Vodafone Group plc | 1,234,600 | 1,041,141 |
Wise plc, Class A * | 48,502 | 466,126 |
WPP plc | 99,751 | 999,821 |
59,670,002 | ||
United States — 3.9% | ||
BP plc | 173,761 | 1,120,000 |
CRH plc | 17,940 | 1,389,289 |
CSL Ltd. | 6,812 | 1,210,330 |
Ferguson plc | 6,841 | 1,442,465 |
GSK plc | 72,490 | 1,503,944 |
Haleon plc | 339,273 | 1,432,866 |
Holcim AG | 17,368 | 1,453,837 |
Roche Holding AG | 3,728 | 893,282 |
Sanofi SA (a) | 6,062 | 598,883 |
Schneider Electric SE | 3,257 | 742,639 |
Shell plc | 45,042 | 1,601,181 |
Sims Ltd. | 48,162 | 369,127 |
Tenaris SA | 18,289 | 303,729 |
14,061,572 | ||
Total Common Stocks (Cost $354,747,316) | 359,620,446 | |
April 30, 2024 | J.P. Morgan Exchange-Traded Funds | 157 |
INVESTMENTS | SHARES | VALUE($) |
Short-Term Investments — 1.2% | ||
Investment of Cash Collateral from Securities Loaned — 1.2% | ||
JPMorgan Securities Lending Money Market Fund Agency SL Class Shares, 5.47% (c) (d) | 3,158,665 | 3,158,982 |
JPMorgan U.S. Government Money Market Fund Class IM Shares, 5.25% (c) (d) | 1,099,786 | 1,099,786 |
Total Investment of Cash Collateral from Securities Loaned (Cost $4,258,883) | 4,258,768 | |
Total Investments — 100.3% (Cost $359,006,199) | 363,879,214 | |
Liabilities in Excess of Other Assets — (0.3)% | (1,026,273 ) | |
NET ASSETS — 100.0% | 362,852,941 | |
Percentages indicated are based on net assets. |
Abbreviations | |
APAC | Asia Pacific |
CVA | Certificaten Van Aandelen (Dutch Certificate) |
OYJ | Public Limited Company |
REIT | Real Estate Investment Trust |
SGPS | Holding company |
^ | Amount rounds to less than 0.1% of net assets. | |
‡ | Value determined using significant unobservable inputs. | |
* | Non-income producing security. | |
(a) | The security or a portion of this security is on loan at April 30, 2024. The total value of securities on loan at April 30, 2024 is $4,017,022. | |
(b) | Security exempt from registration pursuant to Regulation S under the Securities Act of 1933, as amended. Regulation S applies to securities offerings that are made outside of the United States and do not involve direct selling efforts in the United States and as such may have restrictions on resale. | |
(c) | Investment in an affiliated fund, which is registered under the Investment Company Act of 1940, as amended, and is advised by J.P. Morgan Investment Management Inc. | |
(d) | The rate shown is the current yield as of April 30, 2024. | |
INDUSTRY | PERCENT OF TOTAL INVESTMENTS |
Pharmaceuticals | 5.8 % |
Oil, Gas & Consumable Fuels | 5.7 |
Metals & Mining | 5.6 |
Banks | 5.1 |
Electric Utilities | 4.3 |
Diversified Telecommunication Services | 4.0 |
Consumer Staples Distribution & Retail | 3.8 |
Real Estate Management & Development | 3.5 |
Food Products | 3.5 |
Trading Companies & Distributors | 3.2 |
Insurance | 3.0 |
Chemicals | 2.6 |
Diversified REITs | 2.4 |
Multi-Utilities | 2.1 |
Beverages | 2.0 |
Semiconductors & Semiconductor Equipment | 1.9 |
Gas Utilities | 1.9 |
Technology Hardware, Storage & Peripherals | 1.6 |
Health Care Equipment & Supplies | 1.6 |
Tobacco | 1.5 |
Wireless Telecommunication Services | 1.5 |
Software | 1.4 |
Retail REITs | 1.4 |
Industrial Conglomerates | 1.4 |
Personal Care Products | 1.3 |
Automobiles | 1.3 |
Broadline Retail | 1.3 |
Capital Markets | 1.3 |
Construction Materials | 1.2 |
Specialty Retail | 1.2 |
Aerospace & Defense | 1.2 |
Construction & Engineering | 1.2 |
Media | 1.2 |
Health Care Providers & Services | 1.1 |
Financial Services | 1.0 |
Industrial REITs | 1.0 |
Marine Transportation | 1.0 |
Machinery | 1.0 |
Others (each less than 1.0%) | 11.7 |
Short-Term Investments | 1.2 |
158 | J.P. Morgan Exchange-Traded Funds | April 30, 2024 |
DESCRIPTION | NUMBER OF CONTRACTS | EXPIRATION DATE | TRADING CURRENCY | NOTIONAL AMOUNT ($) | VALUE AND UNREALIZED APPRECIATION (DEPRECIATION) ($) |
Long Contracts | |||||
MSCI EAFE E-Mini Index | 21 | 06/21/2024 | USD | 2,379,300 | (72,803 ) |
Abbreviations | |
EAFE | Europe, Australasia and Far East |
MSCI | Morgan Stanley Capital International |
USD | United States Dollar |
April 30, 2024 | J.P. Morgan Exchange-Traded Funds | 159 |
INVESTMENTS | SHARES | VALUE ($) |
Common Stocks — 99.7% | ||
Aerospace & Defense — 0.8% | ||
General Dynamics Corp. | 6,253 | 1,795,174 |
Lockheed Martin Corp. | 3,361 | 1,562,629 |
3,357,803 | ||
Automobiles & Parts — 0.6% | ||
Ford Motor Co. | 74,292 | 902,648 |
Gentex Corp. | 43,173 | 1,480,834 |
2,383,482 | ||
Banks — 2.0% | ||
Bank of America Corp. | 31,396 | 1,161,966 |
Citizens Financial Group, Inc. | 6,753 | 230,345 |
Discover Financial Services | 6,352 | 804,989 |
Fifth Third Bancorp | 29,687 | 1,082,388 |
First Citizens BancShares, Inc., Class A | 1,090 | 1,838,568 |
Huntington Bancshares, Inc. | 80,638 | 1,086,194 |
KeyCorp | 13,677 | 198,180 |
New York Community Bancorp, Inc. | 158,767 | 420,732 |
Popular, Inc. (Puerto Rico) | 9,734 | 827,293 |
Regions Financial Corp. | 16,984 | 327,282 |
US Bancorp | 9,786 | 397,605 |
8,375,542 | ||
Beverages — 2.4% | ||
Boston Beer Co., Inc. (The), Class A * | 1,407 | 391,723 |
Celsius Holdings, Inc. * | 21,449 | 1,528,670 |
Coca-Cola Co. (The) | 28,560 | 1,764,151 |
Constellation Brands, Inc., Class A | 6,800 | 1,723,528 |
Molson Coors Beverage Co., Class B | 27,366 | 1,566,977 |
Monster Beverage Corp. * | 28,910 | 1,545,240 |
PepsiCo, Inc. | 10,330 | 1,817,150 |
10,337,439 | ||
Chemicals — 4.2% | ||
Ashland, Inc. | 5,646 | 538,233 |
Celanese Corp. | 8,365 | 1,284,948 |
CF Industries Holdings, Inc. | 16,455 | 1,299,451 |
Chemours Co. (The) | 13,336 | 356,738 |
Dow, Inc. | 26,451 | 1,505,062 |
Eastman Chemical Co. | 12,970 | 1,224,887 |
Ecolab, Inc. | 3,237 | 732,048 |
Element Solutions, Inc. | 54,493 | 1,260,423 |
Huntsman Corp. | 50,997 | 1,216,788 |
Linde plc | 2,838 | 1,251,445 |
LyondellBasell Industries NV, Class A | 16,757 | 1,675,197 |
Mosaic Co. (The) | 24,844 | 779,853 |
INVESTMENTS | SHARES | VALUE ($) |
Chemicals — continued | ||
NewMarket Corp. | 1,525 | 803,553 |
Olin Corp. | 26,892 | 1,405,914 |
Valvoline, Inc. * | 21,844 | 928,807 |
Westlake Corp. | 11,762 | 1,733,248 |
17,996,595 | ||
Construction & Materials — 2.2% | ||
A O Smith Corp. | 18,383 | 1,522,848 |
Builders FirstSource, Inc. * | 8,503 | 1,554,519 |
Carrier Global Corp. | 5,812 | 357,380 |
Eagle Materials, Inc. | 3,047 | 763,913 |
Fortune Brands Innovations, Inc. | 7,353 | 537,504 |
Louisiana-Pacific Corp. | 3,533 | 258,580 |
Masco Corp. | 17,761 | 1,215,740 |
Owens Corning | 6,766 | 1,138,109 |
Quanta Services, Inc. | 7,059 | 1,825,175 |
9,173,768 | ||
Consumer Services — 0.6% | ||
Grand Canyon Education, Inc. * | 2,328 | 302,687 |
H&R Block, Inc. | 35,158 | 1,660,512 |
Service Corp. International | 10,694 | 766,867 |
2,730,066 | ||
Electricity — 7.2% | ||
Brookfield Renewable Corp. | 8,662 | 201,305 |
Clearway Energy, Inc., Class C | 8,502 | 198,777 |
CMS Energy Corp. | 19,429 | 1,177,592 |
Consolidated Edison, Inc. | 17,432 | 1,645,581 |
Constellation Energy Corp. | 10,001 | 1,859,586 |
Dominion Energy, Inc. | 28,470 | 1,451,401 |
DTE Energy Co. | 11,795 | 1,301,224 |
Edison International | 24,038 | 1,708,140 |
Entergy Corp. | 15,578 | 1,661,705 |
Evergy, Inc. | 26,670 | 1,398,842 |
Exelon Corp. | 39,072 | 1,468,326 |
FirstEnergy Corp. | 40,209 | 1,541,613 |
Hawaiian Electric Industries, Inc. | 80,332 | 791,270 |
IDACORP, Inc. | 6,937 | 657,489 |
OGE Energy Corp. | 41,835 | 1,449,583 |
PG&E Corp. | 90,540 | 1,549,139 |
Pinnacle West Capital Corp. | 21,310 | 1,569,482 |
PPL Corp. | 58,203 | 1,598,254 |
Public Service Enterprise Group, Inc. | 27,317 | 1,887,058 |
Southern Co. (The) | 22,350 | 1,642,725 |
160 | J.P. Morgan Exchange-Traded Funds | April 30, 2024 |
INVESTMENTS | SHARES | VALUE ($) |
Common Stocks — continued | ||
Electricity — continued | ||
Vistra Corp. | 31,198 | 2,366,056 |
Xcel Energy, Inc. | 26,084 | 1,401,493 |
30,526,641 | ||
Electronic & Electrical Equipment — 0.6% | ||
AMETEK, Inc. | 6,274 | 1,095,817 |
Hubbell, Inc. | 3,491 | 1,293,485 |
Veralto Corp. | 1,835 | 171,903 |
2,561,205 | ||
Finance & Credit Services — 0.9% | ||
Ally Financial, Inc. | 29,795 | 1,142,638 |
MGIC Investment Corp. | 66,155 | 1,341,624 |
OneMain Holdings, Inc. | 17,674 | 920,992 |
SLM Corp. | 18,232 | 386,336 |
3,791,590 | ||
Food Producers — 5.2% | ||
Bunge Global SA | 18,260 | 1,858,138 |
Campbell Soup Co. | 39,270 | 1,795,032 |
Conagra Brands, Inc. | 46,757 | 1,439,181 |
Flowers Foods, Inc. | 36,695 | 915,173 |
General Mills, Inc. | 24,372 | 1,717,251 |
Hormel Foods Corp. | 38,663 | 1,374,856 |
Ingredion, Inc. | 14,516 | 1,663,388 |
J M Smucker Co. (The) | 10,941 | 1,256,574 |
Kellanova | 31,009 | 1,794,181 |
Kraft Heinz Co. (The) | 48,399 | 1,868,685 |
Lamb Weston Holdings, Inc. | 15,803 | 1,317,022 |
Mondelez International, Inc., Class A | 23,493 | 1,690,086 |
Pilgrim's Pride Corp. * | 4,113 | 148,150 |
Post Holdings, Inc. * | 16,304 | 1,730,670 |
US Foods Holding Corp. * | 33,609 | 1,688,852 |
22,257,239 | ||
Gas, Water & Multi-utilities — 3.0% | ||
Ameren Corp. | 16,884 | 1,247,221 |
Atmos Energy Corp. | 14,866 | 1,752,701 |
CenterPoint Energy, Inc. | 52,686 | 1,535,270 |
Duke Energy Corp. | 14,035 | 1,379,079 |
National Fuel Gas Co. | 23,530 | 1,249,443 |
NiSource, Inc. | 56,437 | 1,572,335 |
Sempra | 20,096 | 1,439,477 |
UGI Corp. | 42,008 | 1,073,724 |
WEC Energy Group, Inc. | 17,356 | 1,434,300 |
12,683,550 | ||
INVESTMENTS | SHARES | VALUE ($) |
General Industrials — 2.0% | ||
Carlisle Cos., Inc. | 1,656 | 642,942 |
Eaton Corp. plc | 5,790 | 1,842,725 |
Illinois Tool Works, Inc. | 5,782 | 1,411,444 |
ITT, Inc. | 6,874 | 889,083 |
Packaging Corp. of America | 6,030 | 1,043,069 |
Parker-Hannifin Corp. | 2,514 | 1,369,904 |
RPM International, Inc. | 10,204 | 1,090,910 |
Sonoco Products Co. | 882 | 49,436 |
8,339,513 | ||
Health Care Providers — 2.6% | ||
Chemed Corp. | 1,359 | 771,912 |
Cigna Group (The) | 4,888 | 1,745,211 |
DaVita, Inc. * | 11,495 | 1,597,920 |
Elevance Health, Inc. | 3,098 | 1,637,541 |
HCA Healthcare, Inc. | 5,450 | 1,688,519 |
Humana, Inc. | 613 | 185,181 |
Molina Healthcare, Inc. * | 2,088 | 714,305 |
UnitedHealth Group, Inc. | 2,928 | 1,416,274 |
Universal Health Services, Inc., Class B | 8,680 | 1,479,332 |
11,236,195 | ||
Household Goods & Home Construction — 2.0% | ||
DR Horton, Inc. | 11,114 | 1,583,634 |
Leggett & Platt, Inc. | 12,808 | 231,440 |
Lennar Corp., Class A | 10,529 | 1,596,407 |
NVR, Inc. * | 222 | 1,651,425 |
PulteGroup, Inc. | 15,288 | 1,703,389 |
Toll Brothers, Inc. | 14,543 | 1,732,217 |
8,498,512 | ||
Industrial Engineering — 0.7% | ||
Caterpillar, Inc. | 3,092 | 1,034,490 |
Cummins, Inc. | 5,203 | 1,469,796 |
Otis Worldwide Corp. | 3,188 | 290,746 |
2,795,032 | ||
Industrial Materials — 0.2% | ||
International Paper Co. | 27,277 | 953,058 |
Industrial Metals & Mining — 2.9% | ||
Cleveland-Cliffs, Inc. * | 53,197 | 899,029 |
Fastenal Co. | 21,850 | 1,484,489 |
Freeport-McMoRan, Inc. | 23,112 | 1,154,213 |
Nucor Corp. | 8,515 | 1,435,033 |
Reliance, Inc. | 5,311 | 1,512,148 |
Southern Copper Corp. (Mexico) | 16,757 | 1,955,039 |
April 30, 2024 | J.P. Morgan Exchange-Traded Funds | 161 |
INVESTMENTS | SHARES | VALUE ($) |
Common Stocks — continued | ||
Industrial Metals & Mining — continued | ||
Steel Dynamics, Inc. | 11,603 | 1,509,783 |
Timken Co. (The) | 11,023 | 983,472 |
United States Steel Corp. | 35,869 | 1,309,219 |
12,242,425 | ||
Industrial Support Services — 2.6% | ||
Accenture plc, Class A | 4,463 | 1,342,961 |
Booz Allen Hamilton Holding Corp. | 9,786 | 1,445,099 |
Capital One Financial Corp. | 11,419 | 1,637,827 |
Core & Main, Inc., Class A * | 17,261 | 974,729 |
MSC Industrial Direct Co., Inc., Class A | 12,328 | 1,124,807 |
Robert Half, Inc. | 12,962 | 896,193 |
Synchrony Financial | 35,729 | 1,571,361 |
Western Union Co. (The) | 49,023 | 658,869 |
WW Grainger, Inc. | 1,733 | 1,596,699 |
11,248,545 | ||
Industrial Transportation — 1.1% | ||
Allison Transmission Holdings, Inc. | 15,670 | 1,152,528 |
CSX Corp. | 17,102 | 568,128 |
Landstar System, Inc. | 1,082 | 188,712 |
Norfolk Southern Corp. | 3,081 | 709,616 |
PACCAR, Inc. | 2,318 | 245,963 |
Ryder System, Inc. | 4,642 | 565,628 |
Schneider National, Inc., Class B | 88 | 1,820 |
Union Pacific Corp. | 5,340 | 1,266,434 |
4,698,829 | ||
Investment Banking & Brokerage Services — 1.7% | ||
Ameriprise Financial, Inc. | 2,371 | 976,354 |
Apollo Global Management, Inc. | 6,474 | 701,652 |
Berkshire Hathaway, Inc., Class B * | 4,177 | 1,657,141 |
Cboe Global Markets, Inc. | 6,350 | 1,150,303 |
Jefferies Financial Group, Inc. | 18,510 | 797,041 |
State Street Corp. | 6,016 | 436,100 |
Virtu Financial, Inc., Class A | 19,369 | 420,307 |
XP, Inc., Class A (Brazil) | 43,915 | 898,940 |
7,037,838 | ||
Leisure Goods — 0.5% | ||
Electronic Arts, Inc. | 5,433 | 689,013 |
Garmin Ltd. | 9,927 | 1,434,154 |
Harley-Davidson, Inc. | 3,452 | 118,714 |
2,241,881 | ||
Life Insurance — 1.0% | ||
Aflac, Inc. | 17,046 | 1,425,898 |
INVESTMENTS | SHARES | VALUE ($) |
Life Insurance — continued | ||
Globe Life, Inc. | 4,152 | 316,258 |
Principal Financial Group, Inc. | 5,380 | 425,773 |
Prudential Financial, Inc. | 3,278 | 362,153 |
Unum Group | 31,253 | 1,584,527 |
4,114,609 | ||
Media — 0.5% | ||
Interpublic Group of Cos., Inc. (The) | 22,035 | 670,745 |
Nexstar Media Group, Inc. | 9,161 | 1,466,310 |
2,137,055 | ||
Medical Equipment & Services — 3.6% | ||
Abbott Laboratories | 13,956 | 1,478,917 |
Becton Dickinson & Co. | 4,032 | 945,907 |
Danaher Corp. | 5,651 | 1,393,650 |
GE HealthCare Technologies, Inc. | 12,775 | 973,966 |
Hologic, Inc. * | 17,656 | 1,337,795 |
Laboratory Corp. of America Holdings | 5,776 | 1,163,113 |
Medtronic plc | 13,484 | 1,081,956 |
Quest Diagnostics, Inc. | 10,721 | 1,481,428 |
QuidelOrtho Corp. * | 637 | 25,830 |
Revvity, Inc. | 9,221 | 944,876 |
STERIS plc | 5,517 | 1,128,558 |
Stryker Corp. | 3,663 | 1,232,600 |
Thermo Fisher Scientific, Inc. | 1,420 | 807,582 |
West Pharmaceutical Services, Inc. | 3,835 | 1,370,936 |
15,367,114 | ||
Mortgage Real Estate Investment Trusts — 0.5% | ||
Rithm Capital Corp. | 136,202 | 1,514,566 |
Starwood Property Trust, Inc. | 42,508 | 806,377 |
2,320,943 | ||
Non-life Insurance — 3.1% | ||
American Financial Group, Inc. | 1,969 | 251,540 |
Arch Capital Group Ltd. * | 14,373 | 1,344,450 |
Assured Guaranty Ltd. | 2,373 | 182,009 |
Chubb Ltd. | 4,593 | 1,142,004 |
Everest Group Ltd. | 3,535 | 1,295,259 |
Fidelity National Financial, Inc. | 27,179 | 1,345,360 |
Hartford Financial Services Group, Inc. (The) | 18,001 | 1,744,117 |
Marsh & McLennan Cos., Inc. | 7,720 | 1,539,600 |
Old Republic International Corp. | 36,743 | 1,097,146 |
Progressive Corp. (The) | 9,051 | 1,884,871 |
162 | J.P. Morgan Exchange-Traded Funds | April 30, 2024 |
INVESTMENTS | SHARES | VALUE ($) |
Common Stocks — continued | ||
Non-life Insurance — continued | ||
Reinsurance Group of America, Inc. | 3,470 | 648,855 |
WR Berkley Corp. | 6,308 | 485,527 |
12,960,738 | ||
Non-Renewable Energy — 6.8% | ||
Antero Midstream Corp. | 117,012 | 1,619,446 |
Cheniere Energy, Inc. | 7,688 | 1,213,320 |
Chesapeake Energy Corp. | 5,566 | 500,272 |
Chevron Corp. | 9,640 | 1,554,643 |
ConocoPhillips | 10,939 | 1,374,157 |
Coterra Energy, Inc. | 60,001 | 1,641,627 |
Diamondback Energy, Inc. | 7,624 | 1,533,415 |
DT Midstream, Inc. | 1,171 | 72,836 |
EOG Resources, Inc. | 10,076 | 1,331,342 |
EQT Corp. | 35,863 | 1,437,748 |
Exxon Mobil Corp. | 13,823 | 1,634,846 |
HF Sinclair Corp. | 23,461 | 1,272,759 |
Kinder Morgan, Inc. | 73,035 | 1,335,080 |
Marathon Oil Corp. | 48,266 | 1,295,942 |
Marathon Petroleum Corp. | 9,816 | 1,783,764 |
Occidental Petroleum Corp. | 8,180 | 541,025 |
Phillips 66 | 11,791 | 1,688,589 |
Pioneer Natural Resources Co. | 6,608 | 1,779,667 |
Range Resources Corp. | 7,461 | 267,924 |
Targa Resources Corp. | 17,115 | 1,952,137 |
Valero Energy Corp. | 10,511 | 1,680,394 |
Williams Cos., Inc. (The) | 35,033 | 1,343,866 |
28,854,799 | ||
Personal Care, Drug & Grocery Stores — 5.9% | ||
Albertsons Cos., Inc., Class A | 73,455 | 1,498,482 |
Casey's General Stores, Inc. | 5,540 | 1,770,473 |
Cencora, Inc. | 7,173 | 1,714,706 |
Church & Dwight Co., Inc. | 16,954 | 1,829,167 |
Clorox Co. (The) | 11,295 | 1,670,192 |
Colgate-Palmolive Co. | 19,657 | 1,806,871 |
CVS Health Corp. | 17,386 | 1,177,206 |
GCI Liberty Inc. ‡ * | 2,678 | — |
Grocery Outlet Holding Corp. * | 19,250 | 499,922 |
Kenvue, Inc. | 77,436 | 1,457,345 |
Kimberly-Clark Corp. | 13,834 | 1,888,756 |
Kroger Co. (The) | 34,586 | 1,915,373 |
McKesson Corp. | 3,234 | 1,737,337 |
Olaplex Holdings, Inc. * | 49,548 | 68,872 |
Performance Food Group Co. * | 22,144 | 1,503,135 |
INVESTMENTS | SHARES | VALUE ($) |
Personal Care, Drug & Grocery Stores — continued | ||
Procter & Gamble Co. (The) | 10,704 | 1,746,893 |
Spectrum Brands Holdings, Inc. | 12,925 | 1,058,170 |
Sysco Corp. | 21,263 | 1,580,266 |
24,923,166 | ||
Personal Goods — 0.1% | ||
Carter's, Inc. | 2,063 | 141,130 |
NIKE, Inc., Class B | 3,849 | 355,109 |
496,239 | ||
Pharmaceuticals, Biotechnology & Marijuana Producers — 4.4% | ||
AbbVie, Inc. | 9,503 | 1,545,568 |
Amgen, Inc. | 5,689 | 1,558,445 |
Bristol-Myers Squibb Co. | 20,689 | 909,075 |
Cardinal Health, Inc. | 14,636 | 1,508,094 |
Eli Lilly & Co. | 2,173 | 1,697,330 |
Fortrea Holdings, Inc. * | 5,653 | 206,843 |
Gilead Sciences, Inc. | 18,902 | 1,232,410 |
Medpace Holdings, Inc. * | 2,750 | 1,067,963 |
Merck & Co., Inc. | 13,392 | 1,730,514 |
Pfizer, Inc. | 34,589 | 886,170 |
Regeneron Pharmaceuticals, Inc. * | 1,730 | 1,540,842 |
United Therapeutics Corp. * | 5,249 | 1,229,998 |
Vertex Pharmaceuticals, Inc. * | 3,928 | 1,542,958 |
Viatris, Inc. | 83,411 | 965,065 |
Zoetis, Inc. | 7,968 | 1,268,824 |
18,890,099 | ||
Precious Metals & Mining — 0.2% | ||
Newmont Corp. | 20,225 | 821,944 |
Real Estate Investment & Services — 1.0% | ||
CBRE Group, Inc., Class A * | 1,844 | 160,225 |
CoStar Group, Inc. * | 18,385 | 1,682,779 |
Jones Lang LaSalle, Inc. * | 6,647 | 1,201,113 |
Zillow Group, Inc., Class C * | 23,564 | 1,003,120 |
4,047,237 | ||
Real Estate Investment Trusts — 8.1% | ||
AvalonBay Communities, Inc. | 7,158 | 1,356,942 |
Brixmor Property Group, Inc. | 59,570 | 1,316,497 |
Camden Property Trust | 7,248 | 722,481 |
Crown Castle, Inc. | 7,685 | 720,699 |
CubeSmart | 38,950 | 1,575,138 |
EastGroup Properties, Inc. | 1,759 | 273,278 |
EPR Properties | 15,430 | 626,304 |
Equinix, Inc. | 1,799 | 1,279,287 |
April 30, 2024 | J.P. Morgan Exchange-Traded Funds | 163 |
INVESTMENTS | SHARES | VALUE ($) |
Common Stocks — continued | ||
Real Estate Investment Trusts — continued | ||
Essex Property Trust, Inc. | 3,926 | 966,777 |
First Industrial Realty Trust, Inc. | 14,655 | 665,630 |
Gaming and Leisure Properties, Inc. | 33,530 | 1,432,737 |
Highwoods Properties, Inc. | 16,000 | 419,200 |
Host Hotels & Resorts, Inc. | 81,157 | 1,531,433 |
Iron Mountain, Inc. | 20,983 | 1,626,602 |
Kilroy Realty Corp. | 10,720 | 362,336 |
Kimco Realty Corp. | 64,632 | 1,204,094 |
Lamar Advertising Co., Class A | 15,113 | 1,750,841 |
Mid-America Apartment Communities, Inc. | 6,715 | 872,950 |
NET Lease Office Properties | 1,284 | 29,352 |
NNN REIT, Inc. | 20,061 | 813,072 |
Omega Healthcare Investors, Inc. | 49,822 | 1,515,087 |
Park Hotels & Resorts, Inc. | 47,533 | 766,707 |
Prologis, Inc. | 12,323 | 1,257,562 |
Public Storage | 5,286 | 1,371,453 |
Regency Centers Corp. | 18,258 | 1,081,239 |
Simon Property Group, Inc. | 11,302 | 1,588,270 |
STAG Industrial, Inc. | 30,807 | 1,059,453 |
Ventas, Inc. | 19,451 | 861,290 |
VICI Properties, Inc. | 51,358 | 1,466,271 |
Welltower, Inc. | 15,420 | 1,469,218 |
Weyerhaeuser Co. | 48,704 | 1,469,400 |
WP Carey, Inc. | 19,022 | 1,043,166 |
34,494,766 | ||
Retailers — 4.1% | ||
AutoZone, Inc. * | 562 | 1,661,497 |
Best Buy Co., Inc. | 12,799 | 942,519 |
Dick's Sporting Goods, Inc. | 9,381 | 1,885,018 |
Kohl's Corp. | 1,996 | 47,784 |
Lowe's Cos., Inc. | 6,599 | 1,504,506 |
Macy's, Inc. | 51,169 | 943,045 |
O'Reilly Automotive, Inc. * | 1,566 | 1,586,765 |
Penske Automotive Group, Inc. | 9,020 | 1,379,248 |
Ross Stores, Inc. | 8,526 | 1,104,543 |
Target Corp. | 6,788 | 1,092,732 |
TJX Cos., Inc. (The) | 14,850 | 1,397,237 |
Tractor Supply Co. | 6,695 | 1,828,271 |
Williams-Sonoma, Inc. | 7,185 | 2,060,514 |
17,433,679 | ||
Software & Computer Services — 3.7% | ||
Adobe, Inc. * | 532 | 246,225 |
Alphabet, Inc., Class A * | 3,059 | 497,944 |
INVESTMENTS | SHARES | VALUE ($) |
Software & Computer Services — continued | ||
Amdocs Ltd. | 12,932 | 1,086,159 |
CACI International, Inc., Class A * | 1,314 | 528,530 |
Cadence Design Systems, Inc. * | 5,393 | 1,486,473 |
Cognizant Technology Solutions Corp., Class A | 21,629 | 1,420,593 |
Dolby Laboratories, Inc., Class A | 3,744 | 290,759 |
Gartner, Inc. * | 3,003 | 1,239,008 |
Hewlett Packard Enterprise Co. | 79,549 | 1,352,333 |
International Business Machines Corp. | 2,504 | 416,165 |
Intuit, Inc. | 2,551 | 1,595,957 |
Meta Platforms, Inc., Class A | 4,767 | 2,050,620 |
Microsoft Corp. | 4,091 | 1,592,749 |
Oracle Corp. | 12,908 | 1,468,285 |
Science Applications International Corp. | 2,736 | 352,123 |
SS&C Technologies Holdings, Inc. | 2,671 | 165,308 |
15,789,231 | ||
Technology Hardware & Equipment — 3.7% | ||
Amphenol Corp., Class A | 15,345 | 1,853,216 |
Analog Devices, Inc. | 8,341 | 1,673,288 |
Apple, Inc. | 8,399 | 1,430,602 |
Applied Materials, Inc. | 8,086 | 1,606,284 |
Broadcom, Inc. | 1,214 | 1,578,528 |
KLA Corp. | 2,369 | 1,632,928 |
Lam Research Corp. | 1,732 | 1,549,118 |
NetApp, Inc. | 12,902 | 1,318,713 |
NVIDIA Corp. | 2,066 | 1,785,065 |
Skyworks Solutions, Inc. | 8,454 | 901,112 |
TD SYNNEX Corp. | 4,230 | 498,463 |
15,827,317 | ||
Telecommunications Equipment — 1.7% | ||
Arista Networks, Inc. * | 5,909 | 1,516,013 |
Ciena Corp. * | 19,854 | 917,850 |
Cisco Systems, Inc. | 32,924 | 1,546,769 |
Juniper Networks, Inc. | 45,497 | 1,584,206 |
Motorola Solutions, Inc. | 4,826 | 1,636,738 |
Ubiquiti, Inc. | 1,663 | 178,906 |
7,380,482 | ||
Telecommunications Service Providers — 2.7% | ||
AT&T, Inc. | 88,199 | 1,489,681 |
Cable One, Inc. | 1,944 | 765,644 |
Charter Communications, Inc., Class A * | 4,063 | 1,039,884 |
Comcast Corp., Class A | 39,595 | 1,508,966 |
Frontier Communications Parent, Inc. * | 62,749 | 1,452,012 |
Iridium Communications, Inc. | 10,423 | 320,924 |
164 | J.P. Morgan Exchange-Traded Funds | April 30, 2024 |
INVESTMENTS | SHARES | VALUE ($) |
Common Stocks — continued | ||
Telecommunications Service Providers — continued | ||
Liberty Broadband Corp., Class C * | 11,890 | 591,290 |
Roku, Inc. * | 15,150 | 873,549 |
T-Mobile US, Inc. | 10,475 | 1,719,681 |
Verizon Communications, Inc. | 41,343 | 1,632,635 |
11,394,266 | ||
Tobacco — 0.9% | ||
Altria Group, Inc. | 41,611 | 1,822,978 |
Philip Morris International, Inc. | 18,928 | 1,797,024 |
3,620,002 | ||
Travel & Leisure — 0.5% | ||
Booking Holdings, Inc. | 172 | 593,749 |
Darden Restaurants, Inc. | 6,956 | 1,067,120 |
Travel + Leisure Co. | 5,555 | 241,865 |
1,902,734 | ||
Waste & Disposal Services — 1.2% | ||
Clean Harbors, Inc. * | 9,239 | 1,750,329 |
Republic Services, Inc. | 9,259 | 1,774,950 |
Waste Management, Inc. | 8,262 | 1,718,661 |
5,243,940 | ||
Total Common Stocks (Cost $366,431,680) | 423,487,108 | |
INVESTMENTS | SHARES | VALUE ($) |
Short-Term Investments — 0.2% | ||
Investment Companies — 0.2% | ||
JPMorgan U.S. Government Money Market Fund Class IM Shares, 5.25% (a) (b)(Cost $905,882) | 905,882 | 905,882 |
Total Investments — 99.9% (Cost $367,337,562) | 424,392,990 | |
Assets in Excess of Other Liabilities — 0.1% | 479,302 | |
NET ASSETS — 100.0% | 424,872,292 | |
Percentages indicated are based on net assets. |
‡ | Value determined using significant unobservable inputs. |
* | Non-income producing security. |
(a) | Investment in an affiliated fund, which is registered under the Investment Company Act of 1940, as amended, and is advised by J.P. Morgan Investment Management Inc. |
(b) | The rate shown is the current yield as of April 30, 2024. |
DESCRIPTION | NUMBER OF CONTRACTS | EXPIRATION DATE | TRADING CURRENCY | NOTIONAL AMOUNT ($) | VALUE AND UNREALIZED APPRECIATION (DEPRECIATION) ($) |
Long Contracts | |||||
S&P 500 E-Mini Index | 4 | 06/21/2024 | USD | 1,012,950 | (17,759 ) |
Abbreviations | |
USD | United States Dollar |
April 30, 2024 | J.P. Morgan Exchange-Traded Funds | 165 |
INVESTMENTS | SHARES | VALUE ($) |
Common Stocks — 99.7% | ||
Aerospace & Defense — 0.1% | ||
Textron, Inc. | 6,036 | 510,585 |
Automobiles & Parts — 0.6% | ||
BorgWarner, Inc. | 14,426 | 472,740 |
Gentex Corp. | 39,748 | 1,363,357 |
LKQ Corp. | 4,403 | 189,901 |
Phinia, Inc. | 2,878 | 112,242 |
2,138,240 | ||
Banks — 2.3% | ||
Citizens Financial Group, Inc. | 8,943 | 305,046 |
Comerica, Inc. | 3,986 | 199,978 |
Discover Financial Services | 7,344 | 930,705 |
Fifth Third Bancorp | 15,134 | 551,786 |
First Citizens BancShares, Inc., Class A | 924 | 1,558,566 |
FNB Corp. | 15,874 | 211,759 |
Huntington Bancshares, Inc. | 84,321 | 1,135,804 |
KeyCorp | 18,591 | 269,384 |
M&T Bank Corp. | 5,621 | 811,616 |
New York Community Bancorp, Inc. (a) | 184,594 | 489,174 |
Popular, Inc. (Puerto Rico) | 11,970 | 1,017,330 |
Prosperity Bancshares, Inc. | 3,111 | 192,789 |
Regions Financial Corp. | 24,539 | 472,866 |
Zions Bancorp NA | 5,821 | 237,380 |
8,384,183 | ||
Beverages — 0.8% | ||
Boston Beer Co., Inc. (The), Class A * | 1,185 | 329,916 |
Celsius Holdings, Inc. * | 18,262 | 1,301,533 |
Molson Coors Beverage Co., Class B | 23,317 | 1,335,131 |
2,966,580 | ||
Chemicals — 4.6% | ||
Ashland, Inc. | 7,330 | 698,769 |
Celanese Corp. | 9,433 | 1,449,003 |
CF Industries Holdings, Inc. | 17,554 | 1,386,239 |
Chemours Co. (The) | 16,121 | 431,237 |
Eastman Chemical Co. | 16,629 | 1,570,443 |
Element Solutions, Inc. | 64,012 | 1,480,598 |
Huntsman Corp. | 45,464 | 1,084,771 |
LyondellBasell Industries NV, Class A | 14,563 | 1,455,863 |
Mosaic Co. (The) | 34,344 | 1,078,058 |
NewMarket Corp. | 2,201 | 1,159,751 |
Olin Corp. | 25,803 | 1,348,981 |
Scotts Miracle-Gro Co. (The) (a) | 3,812 | 261,275 |
INVESTMENTS | SHARES | VALUE ($) |
Chemicals — continued | ||
Valvoline, Inc. * | 33,839 | 1,438,834 |
Westlake Corp. | 10,540 | 1,553,174 |
16,396,996 | ||
Construction & Materials — 2.6% | ||
A O Smith Corp. | 15,137 | 1,253,949 |
Builders FirstSource, Inc. * | 7,246 | 1,324,714 |
Eagle Materials, Inc. | 2,639 | 661,624 |
Fortune Brands Innovations, Inc. | 17,367 | 1,269,528 |
Louisiana-Pacific Corp. | 5,600 | 409,864 |
Masco Corp. | 16,325 | 1,117,446 |
Owens Corning | 9,627 | 1,619,357 |
Quanta Services, Inc. | 6,011 | 1,554,204 |
9,210,686 | ||
Consumer Services — 0.5% | ||
H&R Block, Inc. | 24,167 | 1,141,408 |
Service Corp. International | 7,530 | 539,976 |
1,681,384 | ||
Electricity — 7.3% | ||
Alliant Energy Corp. | 19,416 | 966,917 |
Brookfield Renewable Corp. | 26,597 | 618,114 |
Clearway Energy, Inc., Class C | 12,265 | 286,756 |
CMS Energy Corp. | 22,535 | 1,365,846 |
Consolidated Edison, Inc. | 15,096 | 1,425,062 |
Constellation Energy Corp. | 8,589 | 1,597,039 |
DTE Energy Co. | 10,719 | 1,182,520 |
Edison International | 20,586 | 1,462,841 |
Entergy Corp. | 14,416 | 1,537,755 |
Evergy, Inc. | 26,443 | 1,386,935 |
FirstEnergy Corp. | 35,421 | 1,358,041 |
Hawaiian Electric Industries, Inc. | 107,146 | 1,055,388 |
IDACORP, Inc. | 8,750 | 829,325 |
NRG Energy, Inc. | 12,630 | 917,822 |
OGE Energy Corp. | 38,335 | 1,328,308 |
PG&E Corp. | 78,350 | 1,340,568 |
Pinnacle West Capital Corp. (a) | 18,158 | 1,337,337 |
PPL Corp. | 51,760 | 1,421,330 |
Public Service Enterprise Group, Inc. | 23,271 | 1,607,561 |
Vistra Corp. | 26,755 | 2,029,099 |
Xcel Energy, Inc. | 21,785 | 1,170,508 |
26,225,072 | ||
Electronic & Electrical Equipment — 1.3% | ||
AMETEK, Inc. | 8,018 | 1,400,424 |
166 | J.P. Morgan Exchange-Traded Funds | April 30, 2024 |
INVESTMENTS | SHARES | VALUE ($) |
Common Stocks — continued | ||
Electronic & Electrical Equipment — continued | ||
Crane Co. | 1,082 | 151,491 |
Crane NXT Co. | 6,839 | 415,880 |
Hubbell, Inc. | 3,762 | 1,393,896 |
IDEX Corp. | 735 | 162,038 |
Keysight Technologies, Inc. * | 4,216 | 623,715 |
nVent Electric plc | 9,278 | 668,665 |
4,816,109 | ||
Finance & Credit Services — 1.1% | ||
Ally Financial, Inc. | 12,391 | 475,195 |
MGIC Investment Corp. | 73,072 | 1,481,900 |
OneMain Holdings, Inc. | 30,371 | 1,582,633 |
SLM Corp. | 26,275 | 556,767 |
4,096,495 | ||
Food Producers — 4.8% | ||
Bunge Global SA | 15,554 | 1,582,775 |
Campbell Soup Co. | 33,264 | 1,520,497 |
Conagra Brands, Inc. | 48,087 | 1,480,118 |
Flowers Foods, Inc. | 37,488 | 934,951 |
Hormel Foods Corp. | 34,673 | 1,232,972 |
Ingredion, Inc. | 12,358 | 1,416,103 |
J M Smucker Co. (The) | 11,820 | 1,357,527 |
Kellanova | 26,414 | 1,528,314 |
Lamb Weston Holdings, Inc. | 13,191 | 1,099,338 |
McCormick & Co., Inc. (Non-Voting) | 15,685 | 1,193,001 |
Pilgrim's Pride Corp. * | 22,039 | 793,845 |
Post Holdings, Inc. * | 13,881 | 1,473,468 |
US Foods Holding Corp. * | 28,862 | 1,450,315 |
WK Kellogg Co. | 6,190 | 144,475 |
17,207,699 | ||
Gas, Water & Multi-utilities — 2.5% | ||
Ameren Corp. | 17,175 | 1,268,717 |
Atmos Energy Corp. | 12,848 | 1,514,779 |
CenterPoint Energy, Inc. | 47,291 | 1,378,060 |
National Fuel Gas Co. | 24,014 | 1,275,143 |
NiSource, Inc. | 51,659 | 1,439,220 |
UGI Corp. (a) | 40,456 | 1,034,055 |
WEC Energy Group, Inc. | 15,193 | 1,255,550 |
9,165,524 | ||
General Industrials — 1.8% | ||
AptarGroup, Inc. | 258 | 37,250 |
Carlisle Cos., Inc. | 1,287 | 499,678 |
ITT, Inc. | 4,209 | 544,392 |
INVESTMENTS | SHARES | VALUE ($) |
General Industrials — continued | ||
Packaging Corp. of America | 7,275 | 1,258,429 |
Parker-Hannifin Corp. | 2,696 | 1,469,077 |
RPM International, Inc. | 12,727 | 1,360,644 |
Silgan Holdings, Inc. | 7,097 | 331,146 |
Sonoco Products Co. | 10,614 | 594,915 |
WestRock Co. | 6,119 | 293,467 |
6,388,998 | ||
Health Care Providers — 3.6% | ||
Acadia Healthcare Co., Inc. * | 16,652 | 1,231,249 |
Chemed Corp. | 2,379 | 1,351,272 |
DaVita, Inc. * | 11,209 | 1,558,163 |
Encompass Health Corp. | 19,534 | 1,628,745 |
IQVIA Holdings, Inc. * | 5,503 | 1,275,430 |
Molina Healthcare, Inc. * | 3,741 | 1,279,796 |
Premier, Inc., Class A (a) | 25,347 | 529,245 |
Tenet Healthcare Corp. * | 15,485 | 1,738,811 |
Universal Health Services, Inc., Class B | 8,296 | 1,413,887 |
Veeva Systems, Inc., Class A * | 5,453 | 1,082,748 |
13,089,346 | ||
Household Goods & Home Construction — 1.9% | ||
DR Horton, Inc. | 8,540 | 1,216,865 |
Leggett & Platt, Inc. | 12,686 | 229,236 |
Lennar Corp., Class A | 8,968 | 1,359,728 |
NVR, Inc. * | 168 | 1,249,727 |
PulteGroup, Inc. | 13,127 | 1,462,610 |
Toll Brothers, Inc. | 12,385 | 1,475,177 |
6,993,343 | ||
Industrial Engineering — 1.5% | ||
Cummins, Inc. | 4,918 | 1,389,286 |
Graco, Inc. | 15,860 | 1,271,972 |
Lincoln Electric Holdings, Inc. | 5,208 | 1,143,312 |
Nordson Corp. | 907 | 234,178 |
Snap-on, Inc. | 4,825 | 1,292,907 |
5,331,655 | ||
Industrial Materials — 0.8% | ||
Avery Dennison Corp. | 6,190 | 1,344,963 |
Hexcel Corp. | 3,075 | 197,446 |
International Paper Co. | 41,322 | 1,443,791 |
2,986,200 | ||
Industrial Metals & Mining — 2.6% | ||
Cleveland-Cliffs, Inc. * | 69,009 | 1,166,252 |
Fastenal Co. | 19,873 | 1,350,172 |
April 30, 2024 | J.P. Morgan Exchange-Traded Funds | 167 |
INVESTMENTS | SHARES | VALUE ($) |
Common Stocks — continued | ||
Industrial Metals & Mining — continued | ||
Nucor Corp. | 7,595 | 1,279,985 |
RBC Bearings, Inc. * | 1,493 | 365,113 |
Reliance, Inc. | 4,521 | 1,287,219 |
Steel Dynamics, Inc. | 10,827 | 1,408,809 |
Timken Co. (The) | 17,121 | 1,527,536 |
United States Steel Corp. | 30,537 | 1,114,601 |
9,499,687 | ||
Industrial Support Services — 2.0% | ||
ADT, Inc. | 14,393 | 93,555 |
Booz Allen Hamilton Holding Corp. | 3,728 | 550,514 |
Core & Main, Inc., Class A * | 24,258 | 1,369,849 |
MSC Industrial Direct Co., Inc., Class A | 13,835 | 1,262,305 |
Paychex, Inc. | 7,784 | 924,817 |
Robert Half, Inc. | 3,827 | 264,599 |
Synchrony Financial | 27,188 | 1,195,728 |
Western Union Co. (The) | 12,773 | 171,669 |
WW Grainger, Inc. | 1,478 | 1,361,755 |
7,194,791 | ||
Industrial Transportation — 1.6% | ||
Allison Transmission Holdings, Inc. | 19,201 | 1,412,234 |
Expeditors International of Washington, Inc. | 7,808 | 869,109 |
Landstar System, Inc. | 6,713 | 1,170,814 |
Old Dominion Freight Line, Inc. | 6,196 | 1,125,875 |
PACCAR, Inc. | 5,268 | 558,987 |
Ryder System, Inc. | 6,298 | 767,411 |
5,904,430 | ||
Investment Banking & Brokerage Services — 1.7% | ||
Ameriprise Financial, Inc. | 3,531 | 1,454,030 |
Apollo Global Management, Inc. | 2,665 | 288,833 |
Cboe Global Markets, Inc. | 7,743 | 1,402,644 |
Jefferies Financial Group, Inc. | 34,926 | 1,503,914 |
Virtu Financial, Inc., Class A | 5,666 | 122,952 |
XP, Inc., Class A (Brazil) | 60,574 | 1,239,950 |
6,012,323 | ||
Leisure Goods — 0.8% | ||
Garmin Ltd. | 9,011 | 1,301,819 |
Harley-Davidson, Inc. | 2,361 | 81,195 |
Polaris, Inc. | 4,521 | 385,008 |
Pool Corp. | 1,381 | 500,654 |
Thor Industries, Inc. | 4,607 | 458,028 |
2,726,704 | ||
INVESTMENTS | SHARES | VALUE ($) |
Life Insurance — 1.0% | ||
Aflac, Inc. | 16,528 | 1,382,567 |
Primerica, Inc. | 3,021 | 640,029 |
Principal Financial Group, Inc. | 2,133 | 168,806 |
Unum Group | 28,524 | 1,446,167 |
3,637,569 | ||
Media — 0.8% | ||
Interpublic Group of Cos., Inc. (The) | 3,228 | 98,260 |
Liberty Media Corp-Liberty Live, Class A * | 3,443 | 123,466 |
Liberty Media Corp-Liberty SiriusXM, Class A * | 13,503 | 324,882 |
Nexstar Media Group, Inc. | 7,910 | 1,266,075 |
Omnicom Group, Inc. | 10,807 | 1,003,322 |
2,816,005 | ||
Medical Equipment & Services — 4.7% | ||
Agilent Technologies, Inc. | 8,973 | 1,229,660 |
Bio-Techne Corp. | 3,238 | 204,674 |
Bruker Corp. | 14,965 | 1,167,420 |
Cooper Cos., Inc. (The) | 8,931 | 795,395 |
Dentsply Sirona, Inc. | 19,959 | 598,969 |
Envista Holdings Corp. * | 8,645 | 170,134 |
Henry Schein, Inc. * | 17,440 | 1,208,243 |
Hologic, Inc. * | 17,564 | 1,330,824 |
ICON plc * | 3,730 | 1,111,092 |
Integra LifeSciences Holdings Corp. * | 5,029 | 146,696 |
Laboratory Corp. of America Holdings | 5,259 | 1,059,005 |
QIAGEN NV * | 24,209 | 1,024,763 |
Quest Diagnostics, Inc. | 9,993 | 1,380,833 |
QuidelOrtho Corp. * | 11,078 | 449,213 |
ResMed, Inc. | 5,440 | 1,164,106 |
Revvity, Inc. | 8,771 | 898,764 |
STERIS plc | 5,985 | 1,224,292 |
Teleflex, Inc. | 1,896 | 395,790 |
West Pharmaceutical Services, Inc. | 3,420 | 1,222,582 |
16,782,455 | ||
Mortgage Real Estate Investment Trusts — 0.7% | ||
Annaly Capital Management, Inc. | 11,159 | 209,119 |
Rithm Capital Corp. | 131,906 | 1,466,795 |
Starwood Property Trust, Inc. (a) | 46,641 | 884,780 |
2,560,694 | ||
Non-life Insurance — 3.3% | ||
American Financial Group, Inc. | 5,425 | 693,044 |
Arch Capital Group Ltd. * | 4,054 | 379,211 |
Arthur J Gallagher & Co. | 5,499 | 1,290,560 |
168 | J.P. Morgan Exchange-Traded Funds | April 30, 2024 |
INVESTMENTS | SHARES | VALUE ($) |
Common Stocks — continued | ||
Non-life Insurance — continued | ||
Assured Guaranty Ltd. | 10,674 | 818,696 |
Axis Capital Holdings Ltd. | 6,799 | 416,983 |
Brown & Brown, Inc. | 6,523 | 531,885 |
CNA Financial Corp. | 224 | 9,843 |
Everest Group Ltd. | 3,321 | 1,216,848 |
Fidelity National Financial, Inc. | 11,818 | 584,991 |
First American Financial Corp. | 6,353 | 340,330 |
Hartford Financial Services Group, Inc. (The) | 15,456 | 1,497,532 |
Loews Corp. | 12,234 | 919,385 |
Old Republic International Corp. | 45,863 | 1,369,469 |
Reinsurance Group of America, Inc. | 7,076 | 1,323,141 |
White Mountains Insurance Group Ltd. | 275 | 488,988 |
11,880,906 | ||
Non-Renewable Energy — 7.6% | ||
Antero Midstream Corp. | 101,505 | 1,404,829 |
Antero Resources Corp. * | 37,531 | 1,276,429 |
APA Corp. | 20,852 | 655,587 |
Baker Hughes Co. | 16,048 | 523,486 |
Cheniere Energy, Inc. | 6,816 | 1,075,701 |
Chesapeake Energy Corp. (a) | 13,116 | 1,178,866 |
Coterra Energy, Inc. | 48,992 | 1,340,421 |
Devon Energy Corp. | 19,988 | 1,022,986 |
Diamondback Energy, Inc. | 7,818 | 1,572,434 |
DT Midstream, Inc. | 13,629 | 847,724 |
EQT Corp. | 31,523 | 1,263,757 |
Halliburton Co. | 29,913 | 1,120,840 |
Hess Corp. | 7,288 | 1,147,787 |
HF Sinclair Corp. | 23,646 | 1,282,796 |
Marathon Oil Corp. | 42,177 | 1,132,453 |
ONEOK, Inc. | 19,434 | 1,537,618 |
Ovintiv, Inc. | 21,552 | 1,106,049 |
Phillips 66 | 10,120 | 1,449,285 |
Range Resources Corp. | 33,797 | 1,213,650 |
Southwestern Energy Co. * | 155,622 | 1,165,609 |
Targa Resources Corp. | 14,695 | 1,676,112 |
Texas Pacific Land Corp. | 1,527 | 880,010 |
Williams Cos., Inc. (The) | 36,361 | 1,394,808 |
27,269,237 | ||
Personal Care, Drug & Grocery Stores — 3.7% | ||
Albertsons Cos., Inc., Class A | 61,836 | 1,261,454 |
Casey's General Stores, Inc. | 4,718 | 1,507,778 |
Cencora, Inc. | 6,112 | 1,461,074 |
Church & Dwight Co., Inc. | 14,566 | 1,571,526 |
INVESTMENTS | SHARES | VALUE ($) |
Personal Care, Drug & Grocery Stores — continued | ||
Clorox Co. (The) | 9,525 | 1,408,462 |
GCI Liberty Inc. ‡ * | 7,824 | — |
Grocery Outlet Holding Corp. * | 34,562 | 897,575 |
Kroger Co. (The) | 29,460 | 1,631,495 |
Olaplex Holdings, Inc. * | 90,459 | 125,738 |
Performance Food Group Co. * | 18,856 | 1,279,945 |
Reynolds Consumer Products, Inc. | 24,506 | 701,607 |
Spectrum Brands Holdings, Inc. | 18,237 | 1,493,063 |
13,339,717 | ||
Personal Goods — 1.0% | ||
Carter's, Inc. | 2,931 | 200,509 |
Crocs, Inc. * | 8,335 | 1,036,624 |
Deckers Outdoor Corp. * | 1,289 | 1,055,008 |
Tapestry, Inc. | 29,764 | 1,188,179 |
3,480,320 | ||
Pharmaceuticals, Biotechnology & Marijuana Producers — 2.8% | ||
Biogen, Inc. * | 1,065 | 228,783 |
Cardinal Health, Inc. | 12,640 | 1,302,426 |
Exelixis, Inc. * | 45,968 | 1,078,409 |
Fortrea Holdings, Inc. * | 5,323 | 194,769 |
Incyte Corp. * | 14,969 | 779,136 |
Jazz Pharmaceuticals plc * | 9,093 | 1,007,050 |
Maravai LifeSciences Holdings, Inc., Class A * | 19,891 | 163,106 |
Medpace Holdings, Inc. * | 2,677 | 1,039,613 |
Neurocrine Biosciences, Inc. * | 5,408 | 743,816 |
Royalty Pharma plc, Class A | 33,978 | 941,191 |
United Therapeutics Corp. * | 5,219 | 1,222,968 |
Viatris, Inc. | 115,037 | 1,330,978 |
10,032,245 | ||
Precious Metals & Mining — 0.2% | ||
Royal Gold, Inc. | 4,064 | 488,208 |
SSR Mining, Inc. (Canada) | 46,739 | 250,521 |
738,729 | ||
Real Estate Investment & Services — 1.3% | ||
CBRE Group, Inc., Class A * | 15,557 | 1,351,748 |
CoStar Group, Inc. * | 15,720 | 1,438,851 |
Jones Lang LaSalle, Inc. * | 6,074 | 1,097,572 |
Zillow Group, Inc., Class C * | 22,973 | 977,961 |
4,866,132 | ||
Real Estate Investment Trusts — 9.4% | ||
American Homes 4 Rent, Class A | 29,526 | 1,057,031 |
AvalonBay Communities, Inc. | 8,131 | 1,541,394 |
April 30, 2024 | J.P. Morgan Exchange-Traded Funds | 169 |
INVESTMENTS | SHARES | VALUE ($) |
Common Stocks — continued | ||
Real Estate Investment Trusts — continued | ||
Brixmor Property Group, Inc. | 63,495 | 1,403,240 |
Camden Property Trust | 7,176 | 715,304 |
Cousins Properties, Inc. | 15,583 | 357,474 |
CubeSmart | 32,737 | 1,323,884 |
EastGroup Properties, Inc. | 5,836 | 906,681 |
EPR Properties | 31,465 | 1,277,164 |
Equity Residential | 9,388 | 604,587 |
Essex Property Trust, Inc. | 4,636 | 1,141,615 |
First Industrial Realty Trust, Inc. | 19,143 | 869,475 |
Gaming and Leisure Properties, Inc. | 28,535 | 1,219,301 |
Highwoods Properties, Inc. | 32,769 | 858,548 |
Host Hotels & Resorts, Inc. | 69,132 | 1,304,521 |
Iron Mountain, Inc. | 18,030 | 1,397,686 |
Kilroy Realty Corp. | 15,449 | 522,176 |
Kimco Realty Corp. | 60,252 | 1,122,495 |
Lamar Advertising Co., Class A | 13,005 | 1,506,629 |
Mid-America Apartment Communities, Inc. | 6,857 | 891,410 |
NET Lease Office Properties | 1,276 | 29,169 |
NNN REIT, Inc. | 23,159 | 938,634 |
Omega Healthcare Investors, Inc. (a) | 46,722 | 1,420,816 |
Park Hotels & Resorts, Inc. | 84,437 | 1,361,969 |
Rayonier, Inc. | 20,920 | 620,487 |
Regency Centers Corp. | 21,302 | 1,261,505 |
Rexford Industrial Realty, Inc. | 17,768 | 760,648 |
Simon Property Group, Inc. | 9,625 | 1,352,601 |
STAG Industrial, Inc. | 32,460 | 1,116,299 |
VICI Properties, Inc. | 44,785 | 1,278,612 |
Welltower, Inc. | 15,108 | 1,439,490 |
Weyerhaeuser Co. | 41,488 | 1,251,693 |
WP Carey, Inc. | 17,229 | 944,838 |
33,797,376 | ||
Retailers — 2.9% | ||
AutoNation, Inc. * | 8,272 | 1,333,033 |
Bath & Body Works, Inc. | 3,378 | 153,429 |
Best Buy Co., Inc. | 13,882 | 1,022,270 |
Dick's Sporting Goods, Inc. | 8,048 | 1,617,165 |
Kohl's Corp. | 1,487 | 35,599 |
Macy's, Inc. | 34,707 | 639,650 |
Penske Automotive Group, Inc. (a) | 8,078 | 1,235,207 |
Ross Stores, Inc. | 9,676 | 1,253,526 |
Tractor Supply Co. (a) | 5,739 | 1,567,206 |
Williams-Sonoma, Inc. | 6,160 | 1,766,565 |
10,623,650 | ||
INVESTMENTS | SHARES | VALUE ($) |
Software & Computer Services — 4.4% | ||
Akamai Technologies, Inc. * | 5,439 | 548,958 |
Amdocs Ltd. | 14,080 | 1,182,579 |
ANSYS, Inc. * | 4,108 | 1,334,607 |
AppLovin Corp., Class A * | 17,447 | 1,231,235 |
CACI International, Inc., Class A * | 3,843 | 1,545,770 |
Concentrix Corp. | 5,696 | 311,400 |
Dolby Laboratories, Inc., Class A | 11,646 | 904,428 |
Gartner, Inc. * | 3,042 | 1,255,099 |
Gen Digital, Inc. | 14,925 | 300,590 |
Hewlett Packard Enterprise Co. | 64,715 | 1,100,155 |
Leidos Holdings, Inc. | 10,029 | 1,406,266 |
Manhattan Associates, Inc. * | 5,643 | 1,162,797 |
Paycom Software, Inc. | 627 | 117,864 |
Science Applications International Corp. | 7,867 | 1,012,483 |
SS&C Technologies Holdings, Inc. | 19,178 | 1,186,926 |
Tyler Technologies, Inc. * | 2,621 | 1,209,723 |
15,810,880 | ||
Technology Hardware & Equipment — 4.3% | ||
Amphenol Corp., Class A | 13,181 | 1,591,869 |
CDW Corp. | 5,855 | 1,416,090 |
Cirrus Logic, Inc. * | 11,138 | 986,493 |
Corning, Inc. | 15,362 | 512,784 |
HP, Inc. | 28,585 | 802,953 |
Jabil, Inc. | 9,841 | 1,154,940 |
Microchip Technology, Inc. | 10,587 | 973,792 |
Monolithic Power Systems, Inc. | 1,948 | 1,303,855 |
NetApp, Inc. | 12,575 | 1,285,291 |
ON Semiconductor Corp. * | 13,179 | 924,639 |
Qorvo, Inc. * | 8,223 | 960,775 |
Skyworks Solutions, Inc. | 12,157 | 1,295,815 |
TD SYNNEX Corp. | 8,499 | 1,001,522 |
Teradyne, Inc. | 10,136 | 1,179,019 |
15,389,837 | ||
Telecommunications Equipment — 1.1% | ||
Ciena Corp. * | 23,432 | 1,083,261 |
Juniper Networks, Inc. | 39,031 | 1,359,059 |
Lumentum Holdings, Inc. * (a) | 19,727 | 863,254 |
Ubiquiti, Inc. (a) | 1,189 | 127,913 |
Viasat, Inc. * (a) | 29,168 | 464,063 |
3,897,550 | ||
Telecommunications Service Providers — 1.2% | ||
Cable One, Inc. | 1,989 | 783,368 |
Frontier Communications Parent, Inc. * | 58,925 | 1,363,524 |
170 | J.P. Morgan Exchange-Traded Funds | April 30, 2024 |
INVESTMENTS | SHARES | VALUE ($) |
Common Stocks — continued | ||
Telecommunications Service Providers — continued | ||
Iridium Communications, Inc. | 22,681 | 698,348 |
Liberty Broadband Corp., Class C * | 13,972 | 694,827 |
Roku, Inc. * | 12,101 | 697,744 |
4,237,811 | ||
Travel & Leisure — 1.4% | ||
Boyd Gaming Corp. | 15,957 | 853,859 |
Darden Restaurants, Inc. | 6,578 | 1,009,131 |
MGM Resorts International * | 23,923 | 943,523 |
Texas Roadhouse, Inc. | 9,235 | 1,484,803 |
Travel + Leisure Co. | 5,273 | 229,587 |
Wendy's Co. (The) | 28,801 | 575,732 |
5,096,635 | ||
Waste & Disposal Services — 1.1% | ||
Clean Harbors, Inc. * | 7,933 | 1,502,907 |
Republic Services, Inc. | 7,954 | 1,524,782 |
Stericycle, Inc. * | 17,945 | 802,680 |
3,830,369 | ||
Total Common Stocks (Cost $332,793,444) | 359,015,147 | |
Short-Term Investments — 2.6% | ||
Investment Companies — 0.2% | ||
JPMorgan U.S. Government Money Market Fund Class IM Shares, 5.25% (b) (c)(Cost $701,532) | 701,532 | 701,532 |
INVESTMENTS | SHARES | VALUE ($) |
Investment of Cash Collateral from Securities Loaned — 2.4% | ||
JPMorgan Securities Lending Money Market Fund Class Agency SL Shares, 5.47% (b) (c) | 7,101,459 | 7,102,169 |
JPMorgan U.S. Government Money Market Fund Class IM Shares, 5.25% (b) (c) | 1,470,731 | 1,470,731 |
Total Investment of Cash Collateral from Securities Loaned (Cost $8,574,030) | 8,572,900 | |
Total Short-Term Investments (Cost $9,275,562) | 9,274,432 | |
Total Investments — 102.3% (Cost $342,069,006) | 368,289,579 | |
Liabilities in Excess of Other Assets — (2.3)% | (8,281,457 ) | |
NET ASSETS — 100.0% | 360,008,122 | |
Percentages indicated are based on net assets. |
‡ | Value determined using significant unobservable inputs. |
* | Non-income producing security. |
(a) | The security or a portion of this security is on loan at April 30, 2024. The total value of securities on loan at April 30, 2024 is $8,192,524. |
(b) | Investment in an affiliated fund, which is registered under the Investment Company Act of 1940, as amended, and is advised by J.P. Morgan Investment Management Inc. |
(c) | The rate shown is the current yield as of April 30, 2024. |
DESCRIPTION | NUMBER OF CONTRACTS | EXPIRATION DATE | TRADING CURRENCY | NOTIONAL AMOUNT ($) | VALUE AND UNREALIZED APPRECIATION (DEPRECIATION) ($) |
Long Contracts | |||||
S&P MidCap 400 E-Mini Index | 3 | 06/21/2024 | USD | 863,130 | (27,576 ) |
Abbreviations | |
USD | United States Dollar |
April 30, 2024 | J.P. Morgan Exchange-Traded Funds | 171 |
INVESTMENTS | SHARES | VALUE ($) |
Common Stocks — 99.8% | ||
Aerospace & Defense — 0.2% | ||
Moog, Inc., Class A | 2,935 | 466,870 |
National Presto Industries, Inc. | 3,301 | 270,649 |
737,519 | ||
Automobiles & Parts — 0.1% | ||
Dorman Products, Inc. * | 3,039 | 265,761 |
Gentherm, Inc. * | 8,469 | 428,277 |
694,038 | ||
Banks — 4.9% | ||
1st Source Corp. | 5,714 | 283,414 |
Ameris Bancorp | 21,905 | 1,040,049 |
Atlantic Union Bankshares Corp. | 13,791 | 438,140 |
Axos Financial, Inc. * | 16,690 | 844,681 |
BancFirst Corp. | 5,889 | 525,122 |
Bancorp, Inc. (The) * | 12,717 | 380,747 |
Bank of NT Butterfield & Son Ltd. (The) (Bermuda) | 31,880 | 1,083,920 |
Brookline Bancorp, Inc. | 2,226 | 18,476 |
Capital City Bank Group, Inc. | 2,090 | 55,427 |
Cathay General Bancorp | 21,134 | 727,855 |
City Holding Co. (a) | 2,653 | 268,006 |
Community Trust Bancorp, Inc. | 5,633 | 236,642 |
Enterprise Financial Services Corp. | 1,589 | 60,398 |
First BanCorp (Puerto Rico) | 39,495 | 681,289 |
First Busey Corp. | 10,992 | 245,561 |
First Commonwealth Financial Corp. | 20,980 | 276,726 |
First Financial Bancorp | 21,405 | 473,265 |
First Financial Corp. | 3,048 | 110,978 |
First Merchants Corp. | 7,132 | 238,352 |
Fulton Financial Corp. | 38,072 | 630,092 |
Hancock Whitney Corp. | 13,728 | 623,114 |
Hilltop Holdings, Inc. | 41,939 | 1,227,135 |
Home BancShares, Inc. | 40,188 | 951,652 |
Hope Bancorp, Inc. | 65,220 | 653,504 |
International Bancshares Corp. | 13,962 | 776,985 |
NBT Bancorp, Inc. | 17,330 | 606,723 |
Northwest Bancshares, Inc. | 62,454 | 662,012 |
OceanFirst Financial Corp. | 37,037 | 546,666 |
OFG Bancorp (Puerto Rico) | 28,966 | 1,045,962 |
Old National Bancorp | 74,416 | 1,230,841 |
Pathward Financial, Inc. | 6,281 | 316,374 |
Renasant Corp. | 18,179 | 528,282 |
Republic Bancorp, Inc., Class A | 4,090 | 207,445 |
Simmons First National Corp., Class A | 33,523 | 572,908 |
TrustCo Bank Corp. | 10,835 | 288,428 |
INVESTMENTS | SHARES | VALUE ($) |
Banks — continued | ||
Trustmark Corp. | 11,501 | 340,430 |
UMB Financial Corp. | 4,576 | 364,524 |
United Bankshares, Inc. | 35,242 | 1,143,955 |
Valley National Bancorp | 112,525 | 788,800 |
WaFd, Inc. | 30,128 | 816,168 |
WesBanco, Inc. | 20,245 | 546,615 |
22,857,663 | ||
Beverages — 1.4% | ||
Coca-Cola Consolidated, Inc. | 1,773 | 1,464,498 |
MGP Ingredients, Inc. (a) | 7,062 | 553,943 |
National Beverage Corp. * (a) | 28,479 | 1,267,316 |
Primo Water Corp. | 90,843 | 1,714,207 |
Vita Coco Co., Inc. (The) * | 55,977 | 1,356,883 |
6,356,847 | ||
Chemicals — 3.2% | ||
AdvanSix, Inc. | 19,707 | 497,799 |
American Vanguard Corp. | 11,405 | 129,903 |
Arcadium Lithium plc (Jersey) * (a) | 153,962 | 677,433 |
Avient Corp. | 31,080 | 1,318,413 |
Balchem Corp. | 9,389 | 1,327,417 |
Cabot Corp. | 17,199 | 1,569,065 |
Ecovyst, Inc. * | 92,355 | 870,907 |
Ingevity Corp. * | 8,143 | 416,433 |
Innospec, Inc. | 11,730 | 1,407,600 |
Intrepid Potash, Inc. * | 11,661 | 234,619 |
LSB Industries, Inc. * | 92,580 | 860,994 |
Orion SA (Germany) | 53,938 | 1,276,173 |
Quaker Chemical Corp. | 5,443 | 1,015,283 |
Rayonier Advanced Materials, Inc. * | 92,469 | 344,909 |
Sensient Technologies Corp. | 15,635 | 1,144,795 |
Stepan Co. | 11,503 | 954,634 |
Tronox Holdings plc | 72,218 | 1,226,984 |
15,273,361 | ||
Construction & Materials — 2.8% | ||
American Woodmark Corp. * | 3,152 | 290,236 |
Atkore, Inc. | 8,517 | 1,493,030 |
BlueLinx Holdings, Inc. * | 3,921 | 430,016 |
Comfort Systems USA, Inc. | 4,736 | 1,465,366 |
Exponent, Inc. | 5,719 | 525,633 |
GMS, Inc. * | 13,865 | 1,282,790 |
Griffon Corp. | 12,179 | 797,968 |
Installed Building Products, Inc. | 6,098 | 1,437,482 |
Masonite International Corp. * | 6,421 | 851,104 |
172 | J.P. Morgan Exchange-Traded Funds | April 30, 2024 |
INVESTMENTS | SHARES | VALUE ($) |
Common Stocks — continued | ||
Construction & Materials — continued | ||
Masterbrand, Inc. * | 27,971 | 466,277 |
Mueller Water Products, Inc., Class A | 10,426 | 165,148 |
Patrick Industries, Inc. | 12,008 | 1,254,716 |
Quanex Building Products Corp. | 8,255 | 274,231 |
Simpson Manufacturing Co., Inc. | 7,087 | 1,232,358 |
Sterling Infrastructure, Inc. * | 13,244 | 1,345,590 |
13,311,945 | ||
Consumer Services — 1.2% | ||
Carriage Services, Inc. | 4,625 | 118,308 |
Cars.com, Inc. * | 15,672 | 261,879 |
Laureate Education, Inc., Class A | 102,270 | 1,482,915 |
Perdoceo Education Corp. | 67,317 | 1,231,901 |
PROG Holdings, Inc. | 12,779 | 424,774 |
Strategic Education, Inc. | 10,011 | 1,149,663 |
Upbound Group, Inc. | 27,110 | 840,681 |
5,510,121 | ||
Electricity — 1.2% | ||
ALLETE, Inc. | 24,952 | 1,477,657 |
Altus Power, Inc. * (a) | 43,289 | 158,871 |
MGE Energy, Inc. | 12,802 | 1,002,653 |
Northwestern Energy Group, Inc. | 26,971 | 1,360,417 |
NuScale Power Corp. * (a) | 21,472 | 124,538 |
Portland General Electric Co. | 33,092 | 1,430,567 |
5,554,703 | ||
Electronic & Electrical Equipment — 1.4% | ||
AZZ, Inc. | 9,959 | 713,363 |
Badger Meter, Inc. | 8,753 | 1,601,099 |
Belden, Inc. | 9,515 | 773,284 |
Encore Wire Corp. | 6,089 | 1,701,023 |
EnerSys | 5,946 | 537,816 |
Watts Water Technologies, Inc., Class A | 7,054 | 1,399,937 |
6,726,522 | ||
Finance & Credit Services — 2.0% | ||
Enact Holdings, Inc. | 19,782 | 588,119 |
Encore Capital Group, Inc. * | 5,460 | 224,351 |
Enova International, Inc. * | 18,171 | 1,099,891 |
Federal Agricultural Mortgage Corp., Class C | 3,830 | 712,878 |
FirstCash Holdings, Inc. | 5,535 | 625,344 |
Mr. Cooper Group, Inc. * | 20,551 | 1,586,537 |
Navient Corp. | 76,555 | 1,149,856 |
Nelnet, Inc., Class A | 3,724 | 350,726 |
INVESTMENTS | SHARES | VALUE ($) |
Finance & Credit Services — continued | ||
PennyMac Financial Services, Inc. | 17,205 | 1,473,436 |
Radian Group, Inc. | 51,065 | 1,525,312 |
9,336,450 | ||
Food Producers — 3.3% | ||
Andersons, Inc. (The) | 26,367 | 1,448,603 |
B&G Foods, Inc. | 94,249 | 1,046,164 |
BellRing Brands, Inc. * | 24,781 | 1,367,168 |
Cal-Maine Foods, Inc. | 26,291 | 1,454,681 |
Fresh Del Monte Produce, Inc. | 41,061 | 1,049,930 |
GrowGeneration Corp. * | 99,539 | 297,622 |
Herbalife Ltd. * (a) | 70,285 | 607,965 |
J & J Snack Foods Corp. | 8,442 | 1,159,002 |
John B Sanfilippo & Son, Inc. | 11,653 | 1,161,804 |
Lancaster Colony Corp. | 7,133 | 1,361,048 |
Medifast, Inc. | 17,387 | 478,664 |
Nature's Sunshine Products, Inc. * | 12,449 | 242,133 |
Simply Good Foods Co. (The) * | 36,010 | 1,312,564 |
SunOpta, Inc. (Canada) * | 9,562 | 62,631 |
TreeHouse Foods, Inc. * | 12,896 | 484,245 |
USANA Health Sciences, Inc. * | 12,676 | 526,308 |
Utz Brands, Inc. | 75,106 | 1,354,161 |
15,414,693 | ||
Gas, Water & Multi-utilities — 3.4% | ||
American States Water Co. | 8,848 | 626,792 |
Aris Water Solutions, Inc., Class A | 33,140 | 464,954 |
Avista Corp. | 39,522 | 1,422,002 |
Black Hills Corp. | 26,340 | 1,446,066 |
Brookfield Infrastructure Corp., Class A (Canada) | 35,077 | 1,068,796 |
California Water Service Group | 19,049 | 935,687 |
Chesapeake Utilities Corp. | 13,899 | 1,471,487 |
Consolidated Water Co. Ltd., Class D | 7,141 | 181,739 |
Excelerate Energy, Inc., Class A | 29,186 | 492,076 |
Middlesex Water Co. | 7,094 | 359,808 |
New Jersey Resources Corp. | 32,326 | 1,412,323 |
Northwest Natural Holding Co. | 31,860 | 1,215,459 |
ONE Gas, Inc. (a) | 23,097 | 1,490,218 |
SJW Group | 14,642 | 797,257 |
Southwest Gas Holdings, Inc. | 14,941 | 1,114,897 |
Spire, Inc. | 22,390 | 1,383,478 |
15,883,039 | ||
General Industrials — 1.5% | ||
Apogee Enterprises, Inc. | 10,468 | 646,713 |
April 30, 2024 | J.P. Morgan Exchange-Traded Funds | 173 |
INVESTMENTS | SHARES | VALUE ($) |
Common Stocks — continued | ||
General Industrials — continued | ||
Barnes Group, Inc. | 6,292 | 218,458 |
CSW Industrials, Inc. | 3,802 | 903,431 |
Greif, Inc., Class A | 14,106 | 864,416 |
HB Fuller Co. | 18,133 | 1,354,716 |
Kronos Worldwide, Inc. | 22,366 | 256,091 |
Myers Industries, Inc. | 12,667 | 277,407 |
Otter Tail Corp. (a) | 16,407 | 1,400,502 |
Standex International Corp. | 6,207 | 1,073,066 |
TriMas Corp. | 4,596 | 119,450 |
7,114,250 | ||
Health Care Providers — 2.6% | ||
Addus HomeCare Corp. * | 9,495 | 912,944 |
Astrana Health, Inc. * (a) | 25,536 | 948,662 |
CorVel Corp. * | 6,118 | 1,461,284 |
Ensign Group, Inc. (The) | 12,114 | 1,433,813 |
Healthcare Services Group, Inc. * | 19,763 | 209,883 |
HealthEquity, Inc. * | 14,506 | 1,144,669 |
National HealthCare Corp. | 2,921 | 265,431 |
Omnicell, Inc. * | 9,896 | 265,312 |
Option Care Health, Inc. * | 42,933 | 1,283,267 |
Pennant Group, Inc. (The) * | 14,772 | 308,883 |
RadNet, Inc. * | 17,081 | 828,429 |
Select Medical Holdings Corp. | 49,045 | 1,391,407 |
Surgery Partners, Inc. * | 32,317 | 806,309 |
TruBridge, Inc. * | 12,846 | 101,483 |
US Physical Therapy, Inc. (a) | 10,115 | 1,026,774 |
12,388,550 | ||
Household Goods & Home Construction — 3.5% | ||
Beazer Homes USA, Inc. * | 17,768 | 498,037 |
Central Garden & Pet Co., Class A * | 22,729 | 805,288 |
Century Communities, Inc. | 6,420 | 509,234 |
CompX International, Inc. | 3,519 | 110,813 |
Ethan Allen Interiors, Inc. (a) | 42,173 | 1,190,966 |
Green Brick Partners, Inc. * | 16,994 | 919,885 |
HNI Corp. | 23,317 | 978,148 |
Hovnanian Enterprises, Inc., Class A * | 3,138 | 463,891 |
Interface, Inc. | 46,948 | 717,835 |
KB Home | 18,772 | 1,215,675 |
La-Z-Boy, Inc. | 37,932 | 1,245,687 |
M/I Homes, Inc. * | 11,206 | 1,302,361 |
Meritage Homes Corp. | 7,212 | 1,195,317 |
MillerKnoll, Inc. | 24,586 | 625,222 |
Steelcase, Inc., Class A | 61,404 | 738,690 |
INVESTMENTS | SHARES | VALUE ($) |
Household Goods & Home Construction — continued | ||
Taylor Morrison Home Corp. * | 25,583 | 1,432,904 |
Tri Pointe Homes, Inc. * | 28,962 | 1,067,250 |
Worthington Enterprises, Inc. | 23,281 | 1,330,742 |
16,347,945 | ||
Industrial Engineering — 1.0% | ||
Albany International Corp., Class A | 6,938 | 553,305 |
Columbus McKinnon Corp. | 11,932 | 492,433 |
Enpro, Inc. | 7,275 | 1,092,196 |
Franklin Electric Co., Inc. | 14,173 | 1,364,435 |
Hillenbrand, Inc. | 25,369 | 1,210,609 |
Tennant Co. | 462 | 53,814 |
4,766,792 | ||
Industrial Materials — 2.3% | ||
Boise Cascade Co. | 12,140 | 1,605,758 |
Clearwater Paper Corp. * | 24,907 | 1,121,811 |
Koppers Holdings, Inc. | 25,961 | 1,331,280 |
Materion Corp. | 10,838 | 1,245,720 |
Mativ Holdings, Inc. | 59,329 | 1,083,348 |
Minerals Technologies, Inc. | 19,873 | 1,448,543 |
Sylvamo Corp. | 23,595 | 1,474,687 |
Tredegar Corp. | 14,982 | 95,585 |
UFP Industries, Inc. | 12,312 | 1,387,562 |
10,794,294 | ||
Industrial Metals & Mining — 2.9% | ||
Carpenter Technology Corp. | 18,688 | 1,601,562 |
Commercial Metals Co. | 27,557 | 1,480,913 |
Constellium SE * | 75,494 | 1,486,477 |
GrafTech International Ltd. (a) | 316,932 | 545,123 |
Haynes International, Inc. | 14,192 | 853,649 |
Kaiser Aluminum Corp. | 9,176 | 830,336 |
Metallus, Inc. * | 55,121 | 1,133,288 |
Mueller Industries, Inc. | 28,683 | 1,601,085 |
Olympic Steel, Inc. | 13,130 | 834,674 |
Piedmont Lithium, Inc. * (a) | 16,886 | 206,853 |
Radius Recycling, Inc. | 24,173 | 421,094 |
Ryerson Holding Corp. | 43,344 | 1,237,471 |
Uranium Energy Corp. * | 59,692 | 402,921 |
US Silica Holdings, Inc. * | 80,444 | 1,241,251 |
13,876,697 | ||
Industrial Support Services — 2.4% | ||
ABM Industries, Inc. | 19,342 | 845,245 |
Applied Industrial Technologies, Inc. | 7,684 | 1,408,093 |
174 | J.P. Morgan Exchange-Traded Funds | April 30, 2024 |
INVESTMENTS | SHARES | VALUE ($) |
Common Stocks — continued | ||
Industrial Support Services — continued | ||
ASGN, Inc. * | 8,443 | 814,327 |
CoreCivic, Inc., REIT * | 72,617 | 1,081,993 |
CRA International, Inc. | 6,789 | 985,016 |
Cross Country Healthcare, Inc. * | 17,557 | 309,003 |
Donnelley Financial Solutions, Inc. * | 5,755 | 361,299 |
DXP Enterprises, Inc. * | 1,960 | 95,570 |
EVERTEC, Inc. (Puerto Rico) | 16,222 | 608,812 |
Heidrick & Struggles International, Inc. | 8,642 | 254,766 |
Insperity, Inc. | 6,986 | 719,069 |
Korn Ferry | 10,418 | 632,581 |
Maximus, Inc. | 16,396 | 1,316,271 |
Pitney Bowes, Inc. (a) | 67,102 | 285,855 |
Resources Connection, Inc. | 9,215 | 101,826 |
Target Hospitality Corp. * (a) | 18,109 | 201,463 |
TriNet Group, Inc. | 10,344 | 1,038,227 |
TrueBlue, Inc. * | 6,349 | 66,157 |
UniFirst Corp. | 173 | 27,702 |
11,153,275 | ||
Industrial Transportation — 3.3% | ||
ArcBest Corp. | 10,373 | 1,150,469 |
Ardmore Shipping Corp. (Ireland) | 42,469 | 711,356 |
Costamare, Inc. (Monaco) | 30,432 | 364,575 |
DHT Holdings, Inc. | 122,337 | 1,397,089 |
Dorian LPG Ltd. (a) | 27,088 | 1,119,276 |
Federal Signal Corp. | 12,886 | 1,047,632 |
FLEX LNG Ltd. (Norway) | 13,010 | 338,390 |
Forward Air Corp. | 9,719 | 214,012 |
GATX Corp. | 8,056 | 985,732 |
Genco Shipping & Trading Ltd. | 29,058 | 620,098 |
Hub Group, Inc., Class A | 6,901 | 277,558 |
International Seaways, Inc. | 20,683 | 1,143,563 |
Matson, Inc. | 13,343 | 1,438,108 |
McGrath RentCorp (a) | 7,083 | 755,473 |
Nordic American Tankers Ltd. | 73,423 | 286,350 |
Scorpio Tankers, Inc. (Monaco) | 21,485 | 1,511,685 |
Teekay Tankers Ltd., Class A (Canada) | 26,870 | 1,565,715 |
Tingo Group, Inc. * (a) | 827,098 | 16,459 |
Wabash National Corp. | 24,554 | 567,443 |
15,510,983 | ||
Investment Banking & Brokerage Services — 1.2% | ||
Artisan Partners Asset Management, Inc., Class A (a) | 32,693 | 1,338,124 |
Brightsphere Investment Group, Inc. | 27,704 | 616,137 |
Cannae Holdings, Inc. * | 2,929 | 56,969 |
INVESTMENTS | SHARES | VALUE ($) |
Investment Banking & Brokerage Services — continued | ||
Cohen & Steers, Inc. | 4,307 | 296,235 |
Hamilton Lane, Inc., Class A | 7,112 | 794,553 |
Moelis & Co., Class A (a) | 20,638 | 1,012,913 |
StoneX Group, Inc. * | 5,197 | 377,302 |
Victory Capital Holdings, Inc., Class A | 11,512 | 585,500 |
Virtus Investment Partners, Inc. | 1,743 | 382,275 |
WisdomTree, Inc. (a) | 44,694 | 397,777 |
5,857,785 | ||
Leisure Goods — 0.8% | ||
Camping World Holdings, Inc., Class A (a) | 5,748 | 116,512 |
LCI Industries | 6,022 | 626,167 |
Smith & Wesson Brands, Inc. | 84,378 | 1,431,895 |
Sturm Ruger & Co., Inc. | 19,075 | 881,837 |
Winnebago Industries, Inc. | 13,900 | 855,962 |
3,912,373 | ||
Life Insurance — 1.4% | ||
American Equity Investment Life Holding Co. | 25,082 | 1,407,351 |
CNO Financial Group, Inc. | 51,177 | 1,347,491 |
Genworth Financial, Inc., Class A * | 231,086 | 1,370,340 |
Jackson Financial, Inc., Class A | 25,995 | 1,775,978 |
National Western Life Group, Inc., Class A | 1,087 | 531,347 |
6,432,507 | ||
Media — 0.4% | ||
Gray Television, Inc. | 34,671 | 199,358 |
Scholastic Corp. | 7,364 | 262,306 |
TEGNA, Inc. | 87,065 | 1,187,567 |
1,649,231 | ||
Medical Equipment & Services — 2.8% | ||
AdaptHealth Corp. * | 39,954 | 393,547 |
Anika Therapeutics, Inc. * | 4,253 | 110,110 |
AtriCure, Inc. * | 17,565 | 423,668 |
Atrion Corp. | 425 | 179,898 |
Avanos Medical, Inc. * | 13,565 | 245,255 |
CONMED Corp. | 11,061 | 751,927 |
Fulgent Genetics, Inc. * (a) | 24,243 | 493,345 |
Haemonetics Corp. * | 12,837 | 1,180,362 |
Integer Holdings Corp. * | 13,190 | 1,472,400 |
Lantheus Holdings, Inc. * | 17,263 | 1,148,680 |
Merit Medical Systems, Inc. * | 17,319 | 1,283,338 |
NeoGenomics, Inc. * (a) | 45,587 | 634,571 |
OraSure Technologies, Inc. * | 107,615 | 569,283 |
Owens & Minor, Inc. * | 42,904 | 1,061,445 |
April 30, 2024 | J.P. Morgan Exchange-Traded Funds | 175 |
INVESTMENTS | SHARES | VALUE ($) |
Common Stocks — continued | ||
Medical Equipment & Services — continued | ||
Patterson Cos., Inc. | 26,181 | 666,830 |
STAAR Surgical Co. * | 5,549 | 255,032 |
Surmodics, Inc. * | 2,944 | 75,631 |
UFP Technologies, Inc. * | 5,485 | 1,129,581 |
Varex Imaging Corp. * | 40,142 | 652,308 |
Zynex, Inc. * (a) | 29,585 | 324,548 |
13,051,759 | ||
Mortgage Real Estate Investment Trusts — 2.0% | ||
Apollo Commercial Real Estate Finance, Inc. (a) | 88,841 | 855,539 |
Arbor Realty Trust, Inc. (a) | 66,323 | 850,924 |
Blackstone Mortgage Trust, Inc., Class A (a) | 48,329 | 852,524 |
Dynex Capital, Inc. | 52,012 | 606,980 |
Ellington Financial, Inc. (a) | 105,493 | 1,206,840 |
KKR Real Estate Finance Trust, Inc. | 33,133 | 311,781 |
Ladder Capital Corp. | 80,472 | 863,464 |
MFA Financial, Inc. | 98,051 | 1,038,360 |
New York Mortgage Trust, Inc. | 34,055 | 233,277 |
PennyMac Mortgage Investment Trust (a) | 68,327 | 946,329 |
Ready Capital Corp. (a) | 84,623 | 720,988 |
Redwood Trust, Inc. | 78,580 | 434,547 |
TPG RE Finance Trust, Inc. | 17,366 | 127,293 |
Two Harbors Investment Corp. | 40,246 | 508,307 |
9,557,153 | ||
Nonequity Investment Instruments — 0.0% ^ | ||
OmniAb, Inc. * (a) | 10,865 | 48,241 |
OmniAb, Inc. ‡ * | 1,382 | — |
48,241 | ||
Non-life Insurance — 1.6% | ||
Employers Holdings, Inc. | 18,178 | 774,201 |
Enstar Group Ltd. * | 3,450 | 1,001,777 |
Essent Group Ltd. | 27,293 | 1,445,710 |
Horace Mann Educators Corp. | 5,266 | 194,105 |
NMI Holdings, Inc., Class A * | 32,740 | 1,010,356 |
Safety Insurance Group, Inc. | 4,674 | 371,910 |
Selective Insurance Group, Inc. | 12,815 | 1,302,645 |
Stewart Information Services Corp. | 23,199 | 1,438,570 |
7,539,274 | ||
Non-Renewable Energy — 7.0% | ||
Alpha Metallurgical Resources, Inc. (a) | 3,826 | 1,251,561 |
Arch Resources, Inc. | 6,017 | 955,379 |
Archrock, Inc. | 79,962 | 1,534,471 |
Berry Corp. | 64,870 | 550,746 |
INVESTMENTS | SHARES | VALUE ($) |
Non-Renewable Energy — continued | ||
Cactus, Inc., Class A | 21,612 | 1,072,820 |
California Resources Corp. | 18,292 | 966,915 |
ChampionX Corp. | 33,996 | 1,141,246 |
Chord Energy Corp. | 7,145 | 1,264,522 |
Civitas Resources, Inc. | 17,330 | 1,247,067 |
CNX Resources Corp. * | 60,153 | 1,414,799 |
Comstock Resources, Inc. (a) | 73,301 | 737,408 |
CONSOL Energy, Inc. | 11,928 | 987,161 |
CVR Energy, Inc. (a) | 25,794 | 783,622 |
DMC Global, Inc. * | 8,618 | 136,595 |
DNOW, Inc. * | 23,446 | 330,823 |
Equitrans Midstream Corp. | 92,275 | 1,248,481 |
Gulfport Energy Corp. * | 5,391 | 855,606 |
Helix Energy Solutions Group, Inc. * | 110,078 | 1,182,238 |
Liberty Energy, Inc. | 45,167 | 993,674 |
Magnolia Oil & Gas Corp., Class A (a) | 48,570 | 1,217,650 |
Matador Resources Co. | 19,977 | 1,244,567 |
MRC Global, Inc. * | 16,627 | 186,721 |
Newpark Resources, Inc. * | 5,912 | 41,029 |
Northern Oil & Gas, Inc. | 16,629 | 678,297 |
Par Pacific Holdings, Inc. * | 33,153 | 1,021,112 |
Patterson-UTI Energy, Inc. | 67,930 | 735,003 |
PBF Energy, Inc., Class A | 27,196 | 1,448,731 |
Permian Resources Corp. | 92,030 | 1,541,502 |
RPC, Inc. | 32,626 | 218,268 |
SandRidge Energy, Inc. | 39,829 | 545,657 |
Select Water Solutions, Inc. | 37,219 | 343,904 |
SM Energy Co. | 27,255 | 1,321,595 |
Solaris Oilfield Infrastructure, Inc., Class A | 59,294 | 522,380 |
SunCoke Energy, Inc. | 106,289 | 1,095,840 |
Warrior Met Coal, Inc. | 23,263 | 1,590,026 |
World Kinect Corp. | 21,579 | 507,106 |
32,914,522 | ||
Personal Care, Drug & Grocery Stores — 2.0% | ||
ACCO Brands Corp. | 102,737 | 495,192 |
Edgewell Personal Care Co. | 37,404 | 1,407,138 |
Energizer Holdings, Inc. (a) | 44,140 | 1,267,701 |
Ingles Markets, Inc., Class A | 14,654 | 1,051,425 |
Nu Skin Enterprises, Inc., Class A | 6,335 | 74,500 |
PetMed Express, Inc. (a) | 60,897 | 240,543 |
SpartanNash Co. | 42,087 | 803,441 |
Sprouts Farmers Market, Inc. * | 23,305 | 1,538,829 |
United Natural Foods, Inc. * | 53,897 | 481,300 |
176 | J.P. Morgan Exchange-Traded Funds | April 30, 2024 |
INVESTMENTS | SHARES | VALUE ($) |
Common Stocks — continued | ||
Personal Care, Drug & Grocery Stores — continued | ||
WD-40 Co. | 5,480 | 1,239,192 |
Weis Markets, Inc. | 12,538 | 791,524 |
9,390,785 | ||
Personal Goods — 1.1% | ||
elf Beauty, Inc. * | 6,864 | 1,115,606 |
Inter Parfums, Inc. | 4,556 | 530,227 |
Movado Group, Inc. | 21,073 | 536,729 |
Oxford Industries, Inc. (a) | 6,247 | 673,302 |
Signet Jewelers Ltd. | 14,500 | 1,421,435 |
Steven Madden Ltd. | 22,602 | 913,347 |
5,190,646 | ||
Pharmaceuticals, Biotechnology & Marijuana Producers — 3.5% | ||
Alkermes plc * | 32,833 | 805,722 |
Amphastar Pharmaceuticals, Inc. * | 24,122 | 995,032 |
ANI Pharmaceuticals, Inc. * | 16,274 | 1,074,084 |
Arcellx, Inc. * | 21,878 | 1,094,338 |
Arcturus Therapeutics Holdings, Inc. * | 30,388 | 777,021 |
Castle Biosciences, Inc. * | 15,430 | 325,419 |
Catalyst Pharmaceuticals, Inc. * | 86,271 | 1,298,378 |
Collegium Pharmaceutical, Inc. * | 39,372 | 1,454,008 |
Corcept Therapeutics, Inc. * | 42,643 | 994,435 |
Dynavax Technologies Corp. * | 84,351 | 959,071 |
Eagle Pharmaceuticals, Inc. * (a) | 2,367 | 9,681 |
Harmony Biosciences Holdings, Inc. * (a) | 16,097 | 497,558 |
Innoviva, Inc. * (a) | 82,887 | 1,252,423 |
Ironwood Pharmaceuticals, Inc. * | 120,573 | 934,441 |
Ligand Pharmaceuticals, Inc. * | 13,858 | 968,536 |
Mural Oncology plc * | 1,765 | 6,530 |
Myriad Genetics, Inc. * | 18,674 | 365,450 |
OmniAb Operations, Inc. ‡ * | 1,382 | — |
Pacira BioSciences, Inc. * | 6,489 | 170,336 |
PDL BioPharma, Inc. ‡ * | 22,361 | 32,423 |
Prestige Consumer Healthcare, Inc. * | 20,967 | 1,504,592 |
Supernus Pharmaceuticals, Inc. * | 32,836 | 988,364 |
Vanda Pharmaceuticals, Inc. * | 36,890 | 175,596 |
16,683,438 | ||
Precious Metals & Mining — 0.0% ^ | ||
Hecla Mining Co. | 3,938 | 18,627 |
Real Estate Investment & Services — 1.2% | ||
Anywhere Real Estate, Inc. * | 905 | 4,398 |
Douglas Elliman, Inc. * | 15,443 | 21,002 |
eXp World Holdings, Inc. (a) | 76,836 | 765,287 |
Marcus & Millichap, Inc. | 2,410 | 76,325 |
INVESTMENTS | SHARES | VALUE ($) |
Real Estate Investment & Services — continued | ||
Newmark Group, Inc., Class A | 136,248 | 1,303,893 |
Opendoor Technologies, Inc. * (a) | 470,499 | 936,293 |
Redfin Corp. * (a) | 182,057 | 1,021,340 |
St. Joe Co. (The) | 27,093 | 1,549,720 |
5,678,258 | ||
Real Estate Investment Trusts — 11.5% | ||
Acadia Realty Trust | 85,383 | 1,475,418 |
Alexander & Baldwin, Inc. | 41,788 | 688,248 |
American Assets Trust, Inc. | 43,387 | 926,312 |
Apartment Investment and Management Co., Class A * | 15,008 | 120,064 |
Apple Hospitality REIT, Inc. | 80,885 | 1,193,863 |
Ares Commercial Real Estate Corp. | 124,347 | 844,316 |
Brandywine Realty Trust | 227,889 | 1,034,616 |
Broadstone Net Lease, Inc. | 83,238 | 1,211,945 |
CareTrust REIT, Inc. | 64,125 | 1,585,170 |
Community Healthcare Trust, Inc. | 14,868 | 394,448 |
COPT Defense Properties | 53,075 | 1,272,208 |
DiamondRock Hospitality Co. | 118,767 | 1,057,026 |
DigitalBridge Group, Inc. | 78,845 | 1,296,212 |
Douglas Emmett, Inc. (a) | 73,307 | 1,005,039 |
Easterly Government Properties, Inc. (a) | 82,206 | 960,988 |
Empire State Realty Trust, Inc., Class A | 148,796 | 1,354,044 |
Equity Commonwealth * | 51,894 | 971,456 |
Essential Properties Realty Trust, Inc. | 55,462 | 1,460,869 |
Four Corners Property Trust, Inc. | 52,305 | 1,226,552 |
GEO Group, Inc. (The) * | 121,167 | 1,800,541 |
Getty Realty Corp. | 27,553 | 746,686 |
Hannon Armstrong Sustainable Infrastructure Capital, Inc. (a) | 36,952 | 924,170 |
Hudson Pacific Properties, Inc. | 98,047 | 568,673 |
Independence Realty Trust, Inc. | 63,783 | 1,005,858 |
Innovative Industrial Properties, Inc. (a) | 14,957 | 1,546,554 |
InvenTrust Properties Corp. | 11,957 | 302,990 |
Kite Realty Group Trust | 63,932 | 1,393,718 |
LTC Properties, Inc. | 41,679 | 1,379,575 |
LXP Industrial Trust | 112,664 | 940,744 |
Macerich Co. (The) | 89,022 | 1,224,943 |
National Health Investors, Inc. | 25,342 | 1,598,066 |
Paramount Group, Inc. | 100,010 | 464,046 |
Pebblebrook Hotel Trust | 64,363 | 935,194 |
Phillips Edison & Co., Inc. | 39,063 | 1,277,360 |
Piedmont Office Realty Trust, Inc., Class A | 145,838 | 1,004,824 |
PotlatchDeltic Corp. | 29,824 | 1,193,258 |
April 30, 2024 | J.P. Morgan Exchange-Traded Funds | 177 |
INVESTMENTS | SHARES | VALUE ($) |
Common Stocks — continued | ||
Real Estate Investment Trusts — continued | ||
Retail Opportunity Investments Corp. | 75,958 | 932,005 |
RLJ Lodging Trust | 120,474 | 1,325,214 |
Ryman Hospitality Properties, Inc. | 12,398 | 1,307,741 |
Sabra Health Care REIT, Inc. | 104,511 | 1,454,793 |
Service Properties Trust | 98,747 | 605,319 |
SITE Centers Corp. | 102,955 | 1,388,863 |
SL Green Realty Corp. (a) | 23,138 | 1,152,967 |
Star Holdings * | 3,491 | 41,508 |
Summit Hotel Properties, Inc. | 71,816 | 431,614 |
Sunstone Hotel Investors, Inc. | 129,918 | 1,325,164 |
Tanger, Inc. (a) | 50,779 | 1,439,585 |
Terreno Realty Corp. | 22,521 | 1,224,016 |
Uniti Group, Inc. | 67,673 | 389,120 |
Urban Edge Properties | 85,688 | 1,433,560 |
Whitestone | 50,981 | 586,281 |
Xenia Hotels & Resorts, Inc. | 54,771 | 759,674 |
54,183,418 | ||
Renewable Energy — 0.5% | ||
Arcosa, Inc. | 17,639 | 1,340,917 |
REX American Resources Corp. * | 15,719 | 869,732 |
2,210,649 | ||
Retailers — 2.7% | ||
Abercrombie & Fitch Co., Class A * | 1,223 | 148,619 |
Academy Sports & Outdoors, Inc. | 18,300 | 1,066,890 |
American Eagle Outfitters, Inc. | 22,328 | 541,677 |
Asbury Automotive Group, Inc. * | 2,272 | 477,665 |
Big 5 Sporting Goods Corp. (a) | 55,669 | 197,068 |
Buckle, Inc. (The) | 34,925 | 1,305,846 |
Caleres, Inc. (a) | 3,363 | 123,859 |
Dillard's, Inc., Class A (a) | 3,559 | 1,558,807 |
Global Industrial Co. | 2,710 | 104,362 |
Group 1 Automotive, Inc. | 4,765 | 1,401,005 |
Haverty Furniture Cos., Inc. (a) | 29,587 | 911,280 |
Hibbett, Inc. | 12,391 | 1,068,600 |
ODP Corp. (The) * | 22,564 | 1,148,733 |
PriceSmart, Inc. | 3,675 | 296,168 |
Shoe Carnival, Inc. | 38,218 | 1,278,010 |
Urban Outfitters, Inc. * | 25,370 | 988,415 |
Zumiez, Inc. * | 15,313 | 263,384 |
12,880,388 | ||
Software & Computer Services — 3.2% | ||
A10 Networks, Inc. | 26,215 | 342,368 |
Agilysys, Inc. * | 14,073 | 1,168,763 |
INVESTMENTS | SHARES | VALUE ($) |
Software & Computer Services — continued | ||
Appfolio, Inc., Class A * | 4,463 | 1,012,119 |
Blackbaud, Inc. * | 5,905 | 460,118 |
Cargurus, Inc. * | 40,612 | 912,145 |
CommVault Systems, Inc. * | 5,710 | 585,104 |
Consensus Cloud Solutions, Inc. * | 2,903 | 33,791 |
CSG Systems International, Inc. | 14,495 | 684,744 |
ePlus, Inc. * | 7,306 | 561,685 |
Mitek Systems, Inc. * | 23,151 | 292,397 |
NetScout Systems, Inc. * | 33,050 | 636,543 |
OneSpan, Inc. * | 8,305 | 89,860 |
Perficient, Inc. * | 6,351 | 300,148 |
Progress Software Corp. | 23,941 | 1,192,741 |
Qualys, Inc. * | 7,657 | 1,255,059 |
Shutterstock, Inc. | 17,484 | 746,742 |
Simulations Plus, Inc. (a) | 15,473 | 701,701 |
SPS Commerce, Inc. * | 7,773 | 1,351,491 |
Verint Systems, Inc. * | 10,122 | 306,494 |
Workiva, Inc. * | 13,249 | 1,044,021 |
Yelp, Inc. * | 38,056 | 1,531,373 |
15,209,407 | ||
Technology Hardware & Equipment — 6.4% | ||
Adeia, Inc. | 81,214 | 799,146 |
Advanced Energy Industries, Inc. | 12,239 | 1,172,986 |
Alpha & Omega Semiconductor Ltd. * | 1,650 | 36,085 |
Amkor Technology, Inc. | 44,487 | 1,439,154 |
Axcelis Technologies, Inc. * | 7,451 | 771,327 |
Benchmark Electronics, Inc. | 27,379 | 827,120 |
Cohu, Inc. * | 37,306 | 1,131,118 |
CTS Corp. | 20,783 | 950,822 |
Diodes, Inc. * | 15,118 | 1,103,765 |
Fabrinet (Thailand) * | 6,777 | 1,172,895 |
FormFactor, Inc. * | 32,986 | 1,470,846 |
Ichor Holdings Ltd. * | 14,292 | 554,244 |
Insight Enterprises, Inc. * | 7,825 | 1,428,610 |
Kulicke & Soffa Industries, Inc. (Singapore) | 25,847 | 1,196,199 |
MaxLinear, Inc. * | 9,752 | 202,744 |
Methode Electronics, Inc. | 21,846 | 266,303 |
Novanta, Inc. * | 8,439 | 1,320,703 |
Onto Innovation, Inc. * | 7,704 | 1,429,015 |
PC Connection, Inc. | 12,080 | 748,598 |
Photronics, Inc. * | 49,412 | 1,354,383 |
Plexus Corp. * | 11,857 | 1,197,676 |
Power Integrations, Inc. | 15,290 | 1,020,149 |
Rambus, Inc. * | 18,833 | 1,032,425 |
178 | J.P. Morgan Exchange-Traded Funds | April 30, 2024 |
INVESTMENTS | SHARES | VALUE ($) |
Common Stocks — continued | ||
Technology Hardware & Equipment — continued | ||
Sanmina Corp. * | 15,509 | 940,931 |
ScanSource, Inc. * | 15,666 | 652,019 |
Super Micro Computer, Inc. * | 1,729 | 1,484,865 |
Synaptics, Inc. * | 2,631 | 236,685 |
TTM Technologies, Inc. * | 65,669 | 980,438 |
Ultra Clean Holdings, Inc. * | 32,714 | 1,368,427 |
Vishay Intertechnology, Inc. | 51,063 | 1,181,598 |
Xerox Holdings Corp. | 46,061 | 612,151 |
30,083,427 | ||
Telecommunications Equipment — 2.3% | ||
Aviat Networks, Inc. * | 18,425 | 616,316 |
Cambium Networks Corp. * | 19,429 | 65,864 |
Clearfield, Inc. * (a) | 31,790 | 957,515 |
CommScope Holding Co., Inc. * | 142,259 | 127,180 |
Comtech Telecommunications Corp. * | 41,009 | 77,097 |
Digi International, Inc. * | 36,812 | 1,128,656 |
EchoStar Corp., Class A * | 110,861 | 1,772,667 |
Extreme Networks, Inc. * | 85,956 | 962,707 |
Harmonic, Inc. * (a) | 109,633 | 1,177,458 |
Infinera Corp. * (a) | 190,414 | 917,795 |
InterDigital, Inc. | 13,690 | 1,351,614 |
Lightwave Logic, Inc. * (a) | 64,758 | 247,376 |
NETGEAR, Inc. * | 38,041 | 562,246 |
Ribbon Communications, Inc. * | 1,005 | 3,186 |
Viavi Solutions, Inc. * | 108,874 | 860,105 |
10,827,782 | ||
Telecommunications Service Providers — 2.2% | ||
8x8, Inc. * | 245,491 | 542,535 |
Cogent Communications Holdings, Inc. | 18,748 | 1,203,247 |
Consolidated Communications Holdings, Inc. * | 120,373 | 520,011 |
fuboTV, Inc. * (a) | 457,851 | 650,149 |
Globalstar, Inc. * (a) | 862,046 | 1,112,039 |
Gogo, Inc. * | 86,447 | 783,210 |
IDT Corp., Class B | 44,526 | 1,582,454 |
Liberty Latin America Ltd., Class C (Puerto Rico) * | 133,473 | 1,006,387 |
Lumen Technologies, Inc. * (a) | 620,402 | 738,278 |
Shenandoah Telecommunications Co. | 47,009 | 602,655 |
Telephone and Data Systems, Inc. | 71,180 | 1,113,967 |
WideOpenWest, Inc. * | 22,427 | 80,064 |
Xperi, Inc. * | 55,852 | 587,005 |
10,522,001 | ||
INVESTMENTS | SHARES | VALUE ($) |
Tobacco — 0.7% | ||
Turning Point Brands, Inc. | 33,723 | 972,572 |
Universal Corp. | 20,933 | 1,076,584 |
Vector Group Ltd. | 110,175 | 1,140,311 |
3,189,467 | ||
Travel & Leisure — 0.4% | ||
Biglari Holdings, Inc., Class B * | 211 | 41,590 |
Bloomin' Brands, Inc. | 38,446 | 991,523 |
Chuy's Holdings, Inc. * | 618 | 18,206 |
International Game Technology plc | 31,258 | 617,033 |
1,668,352 | ||
Waste & Disposal Services — 0.3% | ||
Casella Waste Systems, Inc., Class A * | 16,177 | 1,462,401 |
Total Common Stocks (Cost $453,374,656) | 469,771,578 | |
Short-Term Investments — 7.7% | ||
Investment Companies — 0.1% | ||
JPMorgan U.S. Government Money Market Fund Class IM Shares, 5.25% (b) (c)(Cost $446,703) | 446,703 | 446,703 |
Investment of Cash Collateral from Securities Loaned — 7.6% | ||
JPMorgan Securities Lending Money Market Fund Class Agency SL Shares, 5.47% (b) (c) | 31,643,631 | 31,646,796 |
JPMorgan U.S. Government Money Market Fund Class IM Shares, 5.25% (b) (c) | 4,159,653 | 4,159,653 |
Total Investment of Cash Collateral from Securities Loaned (Cost $35,813,377) | 35,806,449 | |
Total Short-Term Investments (Cost $36,260,080) | 36,253,152 | |
Total Investments — 107.5% (Cost $489,634,736) | 506,024,730 | |
Liabilities in Excess of Other Assets — (7.5)% | (35,475,193 ) | |
NET ASSETS — 100.0% | 470,549,537 | |
Percentages indicated are based on net assets. |
Abbreviations | |
REIT | Real Estate Investment Trust |
^ | Amount rounds to less than 0.1% of net assets. | |
‡ | Value determined using significant unobservable inputs. | |
* | Non-income producing security. | |
April 30, 2024 | J.P. Morgan Exchange-Traded Funds | 179 |
(a) | The security or a portion of this security is on loan at April 30, 2024. The total value of securities on loan at April 30, 2024 is $33,126,060. | |
(b) | Investment in an affiliated fund, which is registered under the Investment Company Act of 1940, as amended, and is advised by J.P. Morgan Investment Management Inc. | |
(c) | The rate shown is the current yield as of April 30, 2024. |
DESCRIPTION | NUMBER OF CONTRACTS | EXPIRATION DATE | TRADING CURRENCY | NOTIONAL AMOUNT ($) | VALUE AND UNREALIZED APPRECIATION (DEPRECIATION) ($) |
Long Contracts | |||||
Russell 2000 E-Mini Index | 5 | 06/21/2024 | USD | 496,425 | 6,019 |
Abbreviations | |
USD | United States Dollar |
180 | J.P. Morgan Exchange-Traded Funds | April 30, 2024 |
INVESTMENTS | SHARES | VALUE ($) |
Common Stocks — 99.8% | ||
Aerospace & Defense — 3.2% | ||
Axon Enterprise, Inc. * | 7,932 | 2,487,951 |
BWX Technologies, Inc. | 17,004 | 1,628,473 |
Curtiss-Wright Corp. | 5,056 | 1,281,292 |
General Dynamics Corp. | 13,831 | 3,970,742 |
General Electric Co. | 47,421 | 7,673,666 |
HEICO Corp. | 4,514 | 936,204 |
Howmet Aerospace, Inc. | 38,809 | 2,590,501 |
Huntington Ingalls Industries, Inc. | 3,495 | 967,870 |
Textron, Inc. | 20,155 | 1,704,911 |
TransDigm Group, Inc. | 3,260 | 4,068,578 |
27,310,188 | ||
Automobiles & Parts — 0.1% | ||
Gentex Corp. | 10,584 | 363,031 |
Phinia, Inc. | 6,438 | 251,082 |
614,113 | ||
Banks — 0.3% | ||
First Citizens BancShares, Inc., Class A | 1,369 | 2,309,174 |
Beverages — 1.3% | ||
Celsius Holdings, Inc. * | 26,928 | 1,919,158 |
Coca-Cola Co. (The) | 27,490 | 1,698,057 |
Constellation Brands, Inc., Class A | 6,658 | 1,687,537 |
Molson Coors Beverage Co., Class B | 25,691 | 1,471,067 |
Monster Beverage Corp. * | 51,833 | 2,770,474 |
PepsiCo, Inc. | 6,898 | 1,213,427 |
10,759,720 | ||
Chemicals — 0.7% | ||
Ecolab, Inc. | 4,309 | 974,480 |
Linde plc | 3,560 | 1,569,818 |
Valvoline, Inc. * | 40,679 | 1,729,671 |
Westlake Corp. | 11,183 | 1,647,927 |
5,921,896 | ||
Construction & Materials — 2.4% | ||
Acuity Brands, Inc. | 262 | 65,055 |
AECOM | 7,625 | 704,245 |
AZEK Co., Inc. (The) * | 32,079 | 1,464,085 |
Builders FirstSource, Inc. * | 12,813 | 2,342,473 |
Eagle Materials, Inc. | 7,980 | 2,000,666 |
EMCOR Group, Inc. | 7,010 | 2,503,762 |
Lennox International, Inc. | 4,768 | 2,209,586 |
Louisiana-Pacific Corp. | 10,097 | 738,999 |
Owens Corning | 13,624 | 2,291,693 |
Quanta Services, Inc. | 11,824 | 3,057,213 |
INVESTMENTS | SHARES | VALUE ($) |
Construction & Materials — continued | ||
TopBuild Corp. * | 3,971 | 1,606,945 |
Watsco, Inc. | 3,536 | 1,583,138 |
20,567,860 | ||
Consumer Services — 1.4% | ||
Copart, Inc. * | 57,674 | 3,132,275 |
Grand Canyon Education, Inc. * | 7,906 | 1,027,938 |
H&R Block, Inc. | 17,659 | 834,035 |
Rollins, Inc. | 32,149 | 1,432,559 |
Uber Technologies, Inc. * | 87,641 | 5,807,969 |
12,234,776 | ||
Electricity — 1.3% | ||
Consolidated Edison, Inc. | 26,863 | 2,535,867 |
Constellation Energy Corp. | 12,131 | 2,255,638 |
FirstEnergy Corp. | 24,622 | 944,008 |
Southern Co. (The) | 22,276 | 1,637,286 |
Vistra Corp. | 43,968 | 3,334,533 |
10,707,332 | ||
Electronic & Electrical Equipment — 0.8% | ||
Crane NXT Co. | 12,402 | 754,166 |
Hubbell, Inc. | 6,272 | 2,323,901 |
nVent Electric plc | 30,913 | 2,227,900 |
Pentair plc | 5,733 | 453,423 |
Veralto Corp. | 8,934 | 836,937 |
6,596,327 | ||
Finance & Credit Services — 0.4% | ||
MGIC Investment Corp. | 38,515 | 781,085 |
Morningstar, Inc. | 48 | 13,567 |
NU Holdings Ltd. * | 233,541 | 2,536,255 |
SLM Corp. | 13,016 | 275,809 |
3,606,716 | ||
Food Producers — 1.5% | ||
Bunge Global SA | 494 | 50,269 |
Freshpet, Inc. * | 10,412 | 1,104,401 |
Ingredion, Inc. | 13,616 | 1,560,257 |
Lamb Weston Holdings, Inc. | 19,800 | 1,650,132 |
Mondelez International, Inc., Class A | 66,249 | 4,765,953 |
Post Holdings, Inc. * | 17,544 | 1,862,296 |
US Foods Holding Corp. * | 33,690 | 1,692,923 |
12,686,231 | ||
Gas, Water & Multi-utilities — 0.5% | ||
CenterPoint Energy, Inc. | 65,177 | 1,899,258 |
April 30, 2024 | J.P. Morgan Exchange-Traded Funds | 181 |
INVESTMENTS | SHARES | VALUE ($) |
Common Stocks — continued | ||
Gas, Water & Multi-utilities — continued | ||
NiSource, Inc. | 60,192 | 1,676,949 |
Sempra | 8,006 | 573,470 |
4,149,677 | ||
General Industrials — 1.5% | ||
Eaton Corp. plc | 19,159 | 6,097,543 |
GE Vernova, Inc. * | 11,850 | 1,821,463 |
Parker-Hannifin Corp. | 7,536 | 4,106,442 |
RPM International, Inc. | 9,315 | 995,867 |
13,021,315 | ||
Health Care Providers — 2.6% | ||
Acadia Healthcare Co., Inc. * | 1,344 | 99,375 |
Encompass Health Corp. | 12,474 | 1,040,082 |
HCA Healthcare, Inc. | 5,772 | 1,788,281 |
IQVIA Holdings, Inc. * | 11,700 | 2,711,709 |
Molina Healthcare, Inc. * | 6,440 | 2,203,124 |
Tenet Healthcare Corp. * | 21,920 | 2,461,397 |
UnitedHealth Group, Inc. | 23,585 | 11,408,065 |
21,712,033 | ||
Household Goods & Home Construction — 0.9% | ||
DR Horton, Inc. | 10,162 | 1,447,983 |
PulteGroup, Inc. | 22,930 | 2,554,861 |
Tempur Sealy International, Inc. | 35,694 | 1,786,842 |
Toll Brothers, Inc. | 18,428 | 2,194,959 |
7,984,645 | ||
Industrial Engineering — 1.0% | ||
Caterpillar, Inc. | 20,670 | 6,915,562 |
Lincoln Electric Holdings, Inc. | 5,755 | 1,263,395 |
8,178,957 | ||
Industrial Materials — 0.1% | ||
Hexcel Corp. | 7,746 | 497,371 |
Industrial Metals & Mining — 1.1% | ||
Nucor Corp. | 15,716 | 2,648,618 |
Reliance, Inc. | 7,220 | 2,055,678 |
Southern Copper Corp. (Mexico) | 17,464 | 2,037,525 |
Steel Dynamics, Inc. | 15,246 | 1,983,810 |
Timken Co. (The) | 4,497 | 401,222 |
9,126,853 | ||
Industrial Support Services — 2.3% | ||
American Express Co. | 14,564 | 3,408,413 |
Booz Allen Hamilton Holding Corp. | 15,960 | 2,356,813 |
Cintas Corp. | 5,531 | 3,641,279 |
INVESTMENTS | SHARES | VALUE ($) |
Industrial Support Services — continued | ||
Core & Main, Inc., Class A * | 41,515 | 2,344,352 |
Fair Isaac Corp. * | 2,158 | 2,445,726 |
FTI Consulting, Inc. * | 1,230 | 263,011 |
Verisk Analytics, Inc. | 3,661 | 797,952 |
Vestis Corp. | 19,129 | 352,356 |
Vontier Corp. | 11,705 | 475,574 |
WW Grainger, Inc. | 3,269 | 3,011,893 |
19,097,369 | ||
Industrial Transportation — 2.2% | ||
Allison Transmission Holdings, Inc. | 21,534 | 1,583,826 |
FedEx Corp. | 13,407 | 3,509,684 |
Old Dominion Freight Line, Inc. | 12,908 | 2,345,513 |
PACCAR, Inc. | 32,646 | 3,464,067 |
Ryder System, Inc. | 11,287 | 1,375,321 |
Saia, Inc. * | 3,915 | 1,553,589 |
United Rentals, Inc. | 4,307 | 2,877,033 |
XPO, Inc. * | 18,318 | 1,968,452 |
18,677,485 | ||
Investment Banking & Brokerage Services — 5.5% | ||
Ameriprise Financial, Inc. | 7,299 | 3,005,655 |
Apollo Global Management, Inc. | 33,253 | 3,603,960 |
Ares Management Corp. | 18,759 | 2,496,635 |
Berkshire Hathaway, Inc., Class B * | 42,929 | 17,031,222 |
Broadridge Financial Solutions, Inc. | 10,985 | 2,124,609 |
Cboe Global Markets, Inc. | 12,896 | 2,336,110 |
Coinbase Global, Inc., Class A * | 14,242 | 2,904,371 |
Evercore, Inc., Class A | 3,878 | 703,857 |
Interactive Brokers Group, Inc., Class A | 13,131 | 1,511,641 |
Intercontinental Exchange, Inc. | 19,190 | 2,470,905 |
Jefferies Financial Group, Inc. | 41,983 | 1,807,788 |
KKR & Co., Inc. | 39,937 | 3,716,937 |
Tradeweb Markets, Inc., Class A | 10,340 | 1,051,681 |
XP, Inc., Class A (Brazil) | 83,974 | 1,718,948 |
46,484,319 | ||
Life Insurance — 0.8% | ||
Aflac, Inc. | 32,459 | 2,715,196 |
Globe Life, Inc. | 3,025 | 230,414 |
Primerica, Inc. | 7,350 | 1,557,171 |
Unum Group | 37,356 | 1,893,949 |
6,396,730 | ||
Media — 1.6% | ||
Liberty Media Corp-Liberty Formula One, Class C * | 24,537 | 1,716,854 |
182 | J.P. Morgan Exchange-Traded Funds | April 30, 2024 |
INVESTMENTS | SHARES | VALUE ($) |
Common Stocks — continued | ||
Media — continued | ||
Netflix, Inc. * | 10,430 | 5,743,175 |
Spotify Technology SA * | 11,338 | 3,179,628 |
Trade Desk, Inc. (The), Class A * | 32,855 | 2,722,037 |
13,361,694 | ||
Medical Equipment & Services — 4.4% | ||
Boston Scientific Corp. * | 75,145 | 5,400,671 |
Danaher Corp. | 26,488 | 6,532,471 |
Dexcom, Inc. * | 19,846 | 2,528,182 |
Intuitive Surgical, Inc. * | 16,125 | 5,976,247 |
Penumbra, Inc. * | 838 | 164,642 |
Repligen Corp. * | 807 | 132,509 |
Stryker Corp. | 16,879 | 5,679,784 |
Thermo Fisher Scientific, Inc. | 15,335 | 8,721,321 |
West Pharmaceutical Services, Inc. | 6,714 | 2,400,121 |
37,535,948 | ||
Non-life Insurance — 3.4% | ||
Arch Capital Group Ltd. * | 30,133 | 2,818,641 |
Arthur J Gallagher & Co. | 13,013 | 3,054,021 |
Assured Guaranty Ltd. | 7,260 | 556,842 |
Brown & Brown, Inc. | 28,834 | 2,351,124 |
Chubb Ltd. | 19,904 | 4,948,930 |
Marsh & McLennan Cos., Inc. | 23,799 | 4,746,235 |
Old Republic International Corp. | 33,388 | 996,966 |
Progressive Corp. (The) | 28,587 | 5,953,243 |
Reinsurance Group of America, Inc. | 11,485 | 2,147,580 |
Ryan Specialty Holdings, Inc. | 17,639 | 870,308 |
28,443,890 | ||
Non-Renewable Energy — 4.2% | ||
Antero Midstream Corp. | 87,573 | 1,212,010 |
ConocoPhillips | 48,517 | 6,094,706 |
Diamondback Energy, Inc. | 15,432 | 3,103,838 |
DT Midstream, Inc. | 12,372 | 769,538 |
Hess Corp. | 15,075 | 2,374,162 |
HF Sinclair Corp. | 27,028 | 1,466,269 |
Marathon Petroleum Corp. | 22,436 | 4,077,070 |
Phillips 66 | 26,888 | 3,850,631 |
Pioneer Natural Resources Co. | 5,032 | 1,355,218 |
Targa Resources Corp. | 25,015 | 2,853,211 |
TechnipFMC plc (United Kingdom) | 92,009 | 2,357,271 |
Valero Energy Corp. | 15,097 | 2,413,557 |
Williams Cos., Inc. (The) | 88,893 | 3,409,935 |
35,337,416 | ||
INVESTMENTS | SHARES | VALUE ($) |
Personal Care, Drug & Grocery Stores — 1.9% | ||
Casey's General Stores, Inc. | 3,173 | 1,014,027 |
Cencora, Inc. | 12,613 | 3,015,138 |
Church & Dwight Co., Inc. | 23,807 | 2,568,537 |
GCI Liberty Inc. ‡ * | 3,962 | — |
Kroger Co. (The) | 43,106 | 2,387,210 |
McKesson Corp. | 7,600 | 4,082,796 |
Procter & Gamble Co. (The) | 12,540 | 2,046,528 |
Spectrum Brands Holdings, Inc. | 12,279 | 1,005,282 |
16,119,518 | ||
Personal Goods — 0.4% | ||
Deckers Outdoor Corp. * | 2,790 | 2,283,531 |
Tapestry, Inc. | 37,370 | 1,491,811 |
3,775,342 | ||
Pharmaceuticals, Biotechnology & Marijuana Producers — 5.0% | ||
AbbVie, Inc. | 66,662 | 10,841,908 |
Cardinal Health, Inc. | 23,697 | 2,441,739 |
Eli Lilly & Co. | 22,351 | 17,458,366 |
Medpace Holdings, Inc. * | 5,095 | 1,978,643 |
Merck & Co., Inc. | 19,077 | 2,465,130 |
Roivant Sciences Ltd. * | 161,070 | 1,755,663 |
Vertex Pharmaceuticals, Inc. * | 12,696 | 4,987,116 |
41,928,565 | ||
Real Estate Investment & Services — 0.4% | ||
CBRE Group, Inc., Class A * | 25,347 | 2,202,401 |
Zillow Group, Inc., Class C * | 31,821 | 1,354,620 |
3,557,021 | ||
Real Estate Investment Trusts — 1.9% | ||
Digital Realty Trust, Inc. | 20,864 | 2,895,506 |
Equinix, Inc. | 2,251 | 1,600,709 |
Invitation Homes, Inc. | 44,814 | 1,532,639 |
Iron Mountain, Inc. | 31,285 | 2,425,213 |
NET Lease Office Properties | 274 | 6,264 |
Prologis, Inc. | 37,070 | 3,782,993 |
STAG Industrial, Inc. | 17,251 | 593,262 |
Welltower, Inc. | 17,566 | 1,673,688 |
Weyerhaeuser Co. | 62,015 | 1,870,993 |
16,381,267 | ||
Retailers — 6.3% | ||
Amazon.com, Inc. * | 31,314 | 5,479,950 |
AutoNation, Inc. * | 9,997 | 1,611,017 |
AutoZone, Inc. * | 1,143 | 3,379,165 |
Costco Wholesale Corp. | 17,199 | 12,433,157 |
April 30, 2024 | J.P. Morgan Exchange-Traded Funds | 183 |
INVESTMENTS | SHARES | VALUE ($) |
Common Stocks — continued | ||
Retailers — continued | ||
Dick's Sporting Goods, Inc. | 11,227 | 2,255,953 |
Home Depot, Inc. (The) | 35,913 | 12,002,843 |
Lowe's Cos., Inc. | 13,049 | 2,975,042 |
O'Reilly Automotive, Inc. * | 3,471 | 3,517,025 |
Penske Automotive Group, Inc. | 9,492 | 1,451,422 |
TJX Cos., Inc. (The) | 54,371 | 5,115,767 |
Tractor Supply Co. | 5,447 | 1,487,467 |
Ulta Beauty, Inc. * | 3,991 | 1,615,716 |
53,324,524 | ||
Software & Computer Services — 20.1% | ||
Adobe, Inc. * | 18,225 | 8,435,077 |
Akamai Technologies, Inc. * | 20,877 | 2,107,116 |
Alphabet, Inc., Class A * | 127,456 | 20,747,288 |
AppLovin Corp., Class A * | 34,867 | 2,460,564 |
Bentley Systems, Inc., Class B | 27,973 | 1,469,422 |
CACI International, Inc., Class A * | 5,312 | 2,136,646 |
Cadence Design Systems, Inc. * | 14,624 | 4,030,813 |
Cloudflare, Inc., Class A * | 27,348 | 2,390,215 |
Crowdstrike Holdings, Inc., Class A * | 12,725 | 3,722,571 |
Dolby Laboratories, Inc., Class A | 1,321 | 102,589 |
DoorDash, Inc., Class A * | 24,125 | 3,118,397 |
DoubleVerify Holdings, Inc. * | 23,462 | 687,437 |
Dynatrace, Inc. * | 35,420 | 1,604,880 |
Elastic NV * | 17,657 | 1,804,899 |
Gartner, Inc. * | 6,005 | 2,477,603 |
GoDaddy, Inc., Class A * | 20,098 | 2,459,593 |
Guidewire Software, Inc. * | 17,027 | 1,879,781 |
HubSpot, Inc. * | 4,305 | 2,603,965 |
Informatica, Inc., Class A * | 22,773 | 705,280 |
International Business Machines Corp. | 39,798 | 6,614,428 |
Intuit, Inc. | 11,785 | 7,372,932 |
Kyndryl Holdings, Inc. * | 31,486 | 619,015 |
Manhattan Associates, Inc. * | 8,875 | 1,828,782 |
Meta Platforms, Inc., Class A | 45,596 | 19,614,031 |
Microsoft Corp. | 42,069 | 16,378,724 |
MongoDB, Inc. * | 6,267 | 2,288,583 |
Nutanix, Inc., Class A * | 41,043 | 2,491,310 |
Oracle Corp. | 61,908 | 7,042,035 |
Palantir Technologies, Inc., Class A * | 134,728 | 2,959,974 |
Palo Alto Networks, Inc. * | 15,486 | 4,504,723 |
Pinterest, Inc., Class A * | 15,025 | 502,586 |
PTC, Inc. * | 13,144 | 2,332,271 |
Roper Technologies, Inc. | 6,739 | 3,446,729 |
Salesforce, Inc. | 36,946 | 9,936,257 |
INVESTMENTS | SHARES | VALUE ($) |
Software & Computer Services — continued | ||
Science Applications International Corp. | 14,111 | 1,816,086 |
ServiceNow, Inc. * | 9,086 | 6,299,596 |
Synopsys, Inc. * | 8,059 | 4,276,025 |
Workday, Inc., Class A * | 12,731 | 3,115,658 |
Zscaler, Inc. * | 10,943 | 1,892,482 |
170,276,363 | ||
Technology Hardware & Equipment — 11.9% | ||
Advanced Micro Devices, Inc. * | 29,130 | 4,613,609 |
Amphenol Corp., Class A | 35,341 | 4,268,133 |
Apple, Inc. | 79,858 | 13,602,213 |
Applied Materials, Inc. | 36,371 | 7,225,099 |
Avnet, Inc. | 21,531 | 1,052,220 |
Broadcom, Inc. | 12,483 | 16,231,271 |
CDW Corp. | 11,480 | 2,776,553 |
Cirrus Logic, Inc. * | 6,609 | 585,359 |
Intel Corp. | 181,575 | 5,532,590 |
Jabil, Inc. | 16,081 | 1,887,266 |
KLA Corp. | 6,969 | 4,803,662 |
Lam Research Corp. | 6,196 | 5,541,764 |
Marvell Technology, Inc. | 51,210 | 3,375,251 |
Monolithic Power Systems, Inc. | 3,898 | 2,609,048 |
NetApp, Inc. | 19,869 | 2,030,811 |
NVIDIA Corp. | 21,237 | 18,349,193 |
Pure Storage, Inc., Class A * | 46,051 | 2,320,970 |
Universal Display Corp. | 4,843 | 765,097 |
Vertiv Holdings Co., Class A | 36,326 | 3,378,318 |
100,948,427 | ||
Telecommunications Equipment — 1.7% | ||
Arista Networks, Inc. * | 14,483 | 3,715,758 |
Cisco Systems, Inc. | 119,107 | 5,595,647 |
Juniper Networks, Inc. | 54,606 | 1,901,381 |
Motorola Solutions, Inc. | 9,882 | 3,351,480 |
14,564,266 | ||
Telecommunications Service Providers — 0.3% | ||
AT&T, Inc. | 71,236 | 1,203,176 |
T-Mobile US, Inc. | 7,103 | 1,166,099 |
2,369,275 | ||
Travel & Leisure — 3.5% | ||
Aramark | 38,056 | 1,199,144 |
Booking Holdings, Inc. | 1,473 | 5,084,840 |
Boyd Gaming Corp. | 8,736 | 467,463 |
Chipotle Mexican Grill, Inc. * | 1,565 | 4,944,774 |
184 | J.P. Morgan Exchange-Traded Funds | April 30, 2024 |
INVESTMENTS | SHARES | VALUE ($) |
Common Stocks — continued | ||
Travel & Leisure — continued | ||
DraftKings, Inc., Class A * | 52,239 | 2,171,053 |
Hilton Worldwide Holdings, Inc. | 16,930 | 3,339,950 |
Hyatt Hotels Corp., Class A | 10,216 | 1,520,039 |
McDonald's Corp. | 22,490 | 6,140,670 |
Royal Caribbean Cruises Ltd. * | 21,147 | 2,952,756 |
Wingstop, Inc. | 5,749 | 2,212,158 |
30,032,847 | ||
Waste & Disposal Services — 0.9% | ||
Republic Services, Inc. | 15,969 | 3,061,257 |
Waste Management, Inc. | 21,922 | 4,560,215 |
7,621,472 | ||
Total Common Stocks (Cost $782,651,197) | 844,218,922 | |
Short-Term Investments — 0.1% | ||
Investment Companies — 0.1% | ||
JPMorgan U.S. Government Money Market Fund Class IM Shares, 5.25% (a) (b)(Cost $1,213,737) | 1,213,737 | 1,213,737 |
Total Investments — 99.9% (Cost $783,864,934) | 845,432,659 | |
Assets in Excess of Other Liabilities — 0.1% | 457,325 | |
NET ASSETS — 100.0% | 845,889,984 | |
Percentages indicated are based on net assets. |
‡ | Value determined using significant unobservable inputs. |
* | Non-income producing security. |
(a) | Investment in an affiliated fund, which is registered under the Investment Company Act of 1940, as amended, and is advised by J.P. Morgan Investment Management Inc. |
(b) | The rate shown is the current yield as of April 30, 2024. |
DESCRIPTION | NUMBER OF CONTRACTS | EXPIRATION DATE | TRADING CURRENCY | NOTIONAL AMOUNT ($) | VALUE AND UNREALIZED APPRECIATION (DEPRECIATION) ($) |
Long Contracts | |||||
S&P 500 Micro E-Mini Index | 56 | 06/21/2024 | USD | 1,418,060 | (38,300 ) |
Abbreviations | |
USD | United States Dollar |
April 30, 2024 | J.P. Morgan Exchange-Traded Funds | 185 |
INVESTMENTS | SHARES | VALUE ($) |
Common Stocks — 99.9% | ||
Aerospace & Defense — 0.6% | ||
Lockheed Martin Corp. | 50,110 | 23,297,642 |
Automobiles & Parts — 0.2% | ||
Gentex Corp. | 63,355 | 2,173,077 |
LKQ Corp. | 120,310 | 5,188,970 |
7,362,047 | ||
Banks — 0.2% | ||
Commerce Bancshares, Inc. | 116,272 | 6,357,761 |
Beverages — 0.9% | ||
Coca-Cola Co. (The) | 563,943 | 34,834,759 |
Chemicals — 1.3% | ||
CF Industries Holdings, Inc. | 95,175 | 7,515,970 |
Linde plc | 88,542 | 39,043,480 |
Olin Corp. | 103,583 | 5,415,319 |
51,974,769 | ||
Construction & Materials — 1.2% | ||
A O Smith Corp. | 67,325 | 5,577,203 |
Acuity Brands, Inc. | 17,112 | 4,248,910 |
Advanced Drainage Systems, Inc. | 48,193 | 7,566,301 |
Builders FirstSource, Inc. * | 45,277 | 8,277,541 |
Eagle Materials, Inc. | 22,732 | 5,699,140 |
Fortune Brands Innovations, Inc. | 82,675 | 6,043,542 |
Watsco, Inc. (a) | 22,337 | 10,000,722 |
47,413,359 | ||
Consumer Services — 1.3% | ||
Copart, Inc. * | 283,727 | 15,409,213 |
eBay, Inc. | 257,550 | 13,274,127 |
Grand Canyon Education, Inc. * | 59,026 | 7,674,561 |
H&R Block, Inc. | 187,723 | 8,866,157 |
Rollins, Inc. | 208,765 | 9,302,569 |
54,526,627 | ||
Electricity — 0.7% | ||
Consolidated Edison, Inc. | 102,519 | 9,677,794 |
Evergy, Inc. | 102,309 | 5,366,107 |
Hawaiian Electric Industries, Inc. | 152,911 | 1,506,173 |
OGE Energy Corp. | 231,286 | 8,014,060 |
Public Service Enterprise Group, Inc. | 63,968 | 4,418,909 |
28,983,043 | ||
Electronic & Electrical Equipment — 0.9% | ||
Donaldson Co., Inc. | 94,771 | 6,842,466 |
IDEX Corp. | 38,662 | 8,523,425 |
INVESTMENTS | SHARES | VALUE ($) |
Electronic & Electrical Equipment — continued | ||
Keysight Technologies, Inc. * | 66,764 | 9,877,066 |
Mettler-Toledo International, Inc. * | 7,946 | 9,771,196 |
35,014,153 | ||
Finance & Credit Services — 1.3% | ||
FactSet Research Systems, Inc. | 22,624 | 9,431,720 |
Moody's Corp. | 45,113 | 16,706,697 |
S&P Global, Inc. | 68,211 | 28,364,180 |
54,502,597 | ||
Food Producers — 0.2% | ||
General Mills, Inc. | 6,041 | 425,649 |
Hershey Co. (The) | 43,911 | 8,515,221 |
8,940,870 | ||
Gas, Water & Multi-utilities — 0.7% | ||
Atmos Energy Corp. | 89,317 | 10,530,474 |
National Fuel Gas Co. | 125,515 | 6,664,847 |
WEC Energy Group, Inc. | 113,783 | 9,403,027 |
26,598,348 | ||
General Industrials — 0.9% | ||
3M Co. | 117,372 | 11,327,572 |
Carlisle Cos., Inc. | 19,180 | 7,446,635 |
Illinois Tool Works, Inc. | 72,308 | 17,651,106 |
36,425,313 | ||
Health Care Providers — 1.0% | ||
Centene Corp. * | 193,067 | 14,105,475 |
Chemed Corp. | 15,977 | 9,074,936 |
DaVita, Inc. * | 58,050 | 8,069,530 |
Molina Healthcare, Inc. * | 22,965 | 7,856,327 |
Premier, Inc., Class A (a) | 45,619 | 952,525 |
40,058,793 | ||
Household Goods & Home Construction — 0.6% | ||
Lennar Corp., Class A | 63,163 | 9,576,774 |
NVR, Inc. * | 1,558 | 11,589,728 |
PulteGroup, Inc. | 22,573 | 2,515,084 |
23,681,586 | ||
Industrial Engineering — 0.6% | ||
Graco, Inc. | 105,723 | 8,478,985 |
Lincoln Electric Holdings, Inc. | 41,825 | 9,181,842 |
Nordson Corp. | 18,397 | 4,749,921 |
22,410,748 | ||
186 | J.P. Morgan Exchange-Traded Funds | April 30, 2024 |
INVESTMENTS | SHARES | VALUE ($) |
Common Stocks — continued | ||
Industrial Metals & Mining — 0.6% | ||
Fastenal Co. | 47,651 | 3,237,409 |
Reliance, Inc. | 33,608 | 9,568,870 |
Southern Copper Corp. (Mexico) (a) | 87,847 | 10,249,109 |
23,055,388 | ||
Industrial Support Services — 7.0% | ||
Accenture plc, Class A | 114,617 | 34,489,401 |
Automatic Data Processing, Inc. | 87,617 | 21,193,676 |
Cintas Corp. | 27,229 | 17,925,940 |
Core & Main, Inc., Class A * | 106,121 | 5,992,653 |
Jack Henry & Associates, Inc. | 37,121 | 6,039,216 |
Mastercard, Inc., Class A | 150,132 | 67,739,558 |
MSC Industrial Direct Co., Inc., Class A | 60,835 | 5,550,585 |
Paychex, Inc. | 112,150 | 13,324,542 |
Verisk Analytics, Inc. | 53,613 | 11,685,489 |
Visa, Inc., Class A (a) | 283,543 | 76,162,485 |
Western Union Co. (The) | 529,240 | 7,112,986 |
WW Grainger, Inc. | 15,536 | 14,314,094 |
281,530,625 | ||
Industrial Transportation — 1.6% | ||
Allison Transmission Holdings, Inc. | 91,306 | 6,715,556 |
CH Robinson Worldwide, Inc. | 93,098 | 6,609,958 |
Expeditors International of Washington, Inc. | 84,885 | 9,448,549 |
Landstar System, Inc. | 49,004 | 8,546,788 |
Union Pacific Corp. | 126,657 | 30,037,974 |
United Parcel Service, Inc., Class B | 13,268 | 1,956,765 |
63,315,590 | ||
Investment Banking & Brokerage Services — 4.2% | ||
Ameriprise Financial, Inc. | 29,792 | 12,268,048 |
Berkshire Hathaway, Inc., Class B * | 198,912 | 78,914,358 |
BlackRock, Inc. | 27,615 | 20,839,384 |
Broadridge Financial Solutions, Inc. | 56,903 | 11,005,609 |
Cboe Global Markets, Inc. | 48,972 | 8,871,278 |
Intercontinental Exchange, Inc. | 111,417 | 14,346,053 |
MarketAxess Holdings, Inc. | 10,874 | 2,175,779 |
Nasdaq, Inc. | 171,991 | 10,293,661 |
SEI Investments Co. | 139,371 | 9,191,517 |
Virtu Financial, Inc., Class A | 89,642 | 1,945,231 |
169,850,918 | ||
Leisure Goods — 0.6% | ||
Electronic Arts, Inc. | 96,573 | 12,247,388 |
INVESTMENTS | SHARES | VALUE ($) |
Leisure Goods — continued | ||
Pool Corp. | 26,593 | 9,640,760 |
YETI Holdings, Inc. * | 115,222 | 4,115,730 |
26,003,878 | ||
Life Insurance — 0.6% | ||
Aflac, Inc. | 185,371 | 15,506,284 |
Globe Life, Inc. | 67,609 | 5,149,778 |
Primerica, Inc. | 12,171 | 2,578,548 |
23,234,610 | ||
Media — 0.1% | ||
Sirius XM Holdings, Inc. (a) | 1,162,973 | 3,419,141 |
Medical Equipment & Services — 2.3% | ||
Abbott Laboratories | 221,696 | 23,493,125 |
Agilent Technologies, Inc. | 107,149 | 14,683,699 |
Bio-Techne Corp. | 21,139 | 1,336,196 |
Edwards Lifesciences Corp. * | 164,280 | 13,909,588 |
Hologic, Inc. * | 150,914 | 11,434,754 |
IDEXX Laboratories, Inc. * | 27,732 | 13,665,220 |
ResMed, Inc. | 65,794 | 14,079,258 |
Solventum Corp. * | 29,269 | 1,902,778 |
94,504,618 | ||
Non-life Insurance — 3.9% | ||
American Financial Group, Inc. | 43,426 | 5,547,672 |
Aon plc, Class A | 54,829 | 15,462,326 |
Arch Capital Group Ltd. * | 148,238 | 13,866,183 |
Arthur J Gallagher & Co. | 64,060 | 15,034,241 |
Brown & Brown, Inc. | 138,123 | 11,262,549 |
Chubb Ltd. | 76,521 | 19,026,181 |
Fidelity National Financial, Inc. | 139,662 | 6,913,269 |
Hartford Financial Services Group, Inc. (The) | 84,394 | 8,176,935 |
Marsh & McLennan Cos., Inc. | 119,188 | 23,769,663 |
Progressive Corp. (The) | 41,299 | 8,600,517 |
RLI Corp. | 17,867 | 2,525,500 |
Travelers Cos., Inc. (The) | 73,169 | 15,523,535 |
WR Berkley Corp. | 131,140 | 10,093,846 |
155,802,417 | ||
Non-Renewable Energy — 4.3% | ||
Antero Midstream Corp. | 96,358 | 1,333,595 |
APA Corp. | 160,469 | 5,045,145 |
Chevron Corp. | 259,319 | 41,820,375 |
ConocoPhillips | 148,021 | 18,594,398 |
Coterra Energy, Inc. | 382,116 | 10,454,694 |
EOG Resources, Inc. | 117,224 | 15,488,807 |
April 30, 2024 | J.P. Morgan Exchange-Traded Funds | 187 |
INVESTMENTS | SHARES | VALUE ($) |
Common Stocks — continued | ||
Non-Renewable Energy — continued | ||
Exxon Mobil Corp. | 477,181 | 56,436,197 |
Marathon Petroleum Corp. | 22,850 | 4,152,302 |
Pioneer Natural Resources Co. | 51,913 | 13,981,209 |
Texas Pacific Land Corp. | 9,081 | 5,233,380 |
172,540,102 | ||
Personal Care, Drug & Grocery Stores — 3.3% | ||
Church & Dwight Co., Inc. | 64,267 | 6,933,767 |
Clorox Co. (The) | 68,459 | 10,123,032 |
Colgate-Palmolive Co. | 211,441 | 19,435,657 |
Kimberly-Clark Corp. | 111,363 | 15,204,390 |
McKesson Corp. | 33,762 | 18,137,284 |
Procter & Gamble Co. (The) | 397,322 | 64,842,951 |
134,677,081 | ||
Personal Goods — 0.9% | ||
Carter's, Inc. | 108,334 | 7,411,129 |
Deckers Outdoor Corp. * | 13,370 | 10,942,944 |
NIKE, Inc., Class B | 60,317 | 5,564,846 |
Skechers U.S.A., Inc., Class A * | 82,023 | 5,417,619 |
Tapestry, Inc. | 175,001 | 6,986,040 |
36,322,578 | ||
Pharmaceuticals, Biotechnology & Marijuana Producers — 8.3% | ||
AbbVie, Inc. | 330,387 | 53,734,142 |
Amgen, Inc. | 107,177 | 29,360,067 |
Bristol-Myers Squibb Co. | 491,649 | 21,603,057 |
Gilead Sciences, Inc. | 316,589 | 20,641,603 |
Incyte Corp. * | 144,506 | 7,521,537 |
Jazz Pharmaceuticals plc * | 37,692 | 4,174,389 |
Johnson & Johnson | 438,956 | 63,468,648 |
Medpace Holdings, Inc. * | 24,459 | 9,498,653 |
Merck & Co., Inc. | 474,149 | 61,269,534 |
Regeneron Pharmaceuticals, Inc. * | 24,985 | 22,253,140 |
Vertex Pharmaceuticals, Inc. * | 60,288 | 23,681,729 |
Zoetis, Inc. | 104,696 | 16,671,791 |
333,878,290 | ||
Real Estate Investment & Services — 0.2% | ||
CoStar Group, Inc. * | 104,641 | 9,577,791 |
Real Estate Investment Trusts — 2.3% | ||
Camden Property Trust | 40,304 | 4,017,503 |
Crown Castle, Inc. | 54,689 | 5,128,734 |
CubeSmart | 52,440 | 2,120,674 |
Equity LifeStyle Properties, Inc. | 91,825 | 5,536,129 |
Equity Residential | 54,113 | 3,484,877 |
INVESTMENTS | SHARES | VALUE ($) |
Real Estate Investment Trusts — continued | ||
Extra Space Storage, Inc. | 70,723 | 9,496,684 |
Gaming and Leisure Properties, Inc. | 61,038 | 2,608,154 |
Host Hotels & Resorts, Inc. | 511,017 | 9,642,891 |
Lamar Advertising Co., Class A | 84,833 | 9,827,903 |
Mid-America Apartment Communities, Inc. | 63,802 | 8,294,260 |
Public Storage | 53,229 | 13,810,264 |
Simon Property Group, Inc. | 74,132 | 10,417,770 |
Weyerhaeuser Co. | 317,745 | 9,586,367 |
93,972,210 | ||
Retailers — 6.0% | ||
AutoZone, Inc. * | 5,528 | 16,342,979 |
Best Buy Co., Inc. | 78,872 | 5,808,134 |
Costco Wholesale Corp. | 82,371 | 59,545,996 |
Dick's Sporting Goods, Inc. | 38,658 | 7,767,939 |
Home Depot, Inc. (The) | 181,384 | 60,622,160 |
O'Reilly Automotive, Inc. * | 17,097 | 17,323,706 |
Ross Stores, Inc. | 109,051 | 14,127,557 |
TJX Cos., Inc. (The) | 268,139 | 25,229,199 |
Tractor Supply Co. (a) | 18,881 | 5,156,023 |
Ulta Beauty, Inc. * | 18,718 | 7,577,795 |
Walmart, Inc. | 120,528 | 7,153,337 |
Williams-Sonoma, Inc. (a) | 45,591 | 13,074,587 |
239,729,412 | ||
Software & Computer Services — 20.0% | ||
Adobe, Inc. * | 87,222 | 40,368,958 |
Akamai Technologies, Inc. * | 88,653 | 8,947,747 |
Alphabet, Inc., Class A * | 609,155 | 99,158,251 |
Amdocs Ltd. | 106,019 | 8,904,536 |
ANSYS, Inc. * | 25,119 | 8,160,661 |
AppLovin Corp., Class A * | 166,774 | 11,769,241 |
Aspen Technology, Inc. * | 3,167 | 623,487 |
Atlassian Corp., Class A * | 62,558 | 10,778,743 |
Autodesk, Inc. * | 66,130 | 14,075,771 |
Bentley Systems, Inc., Class B | 101,764 | 5,345,663 |
Cadence Design Systems, Inc. * | 69,980 | 19,288,587 |
Cognizant Technology Solutions Corp., Class A | 186,414 | 12,243,672 |
Crowdstrike Holdings, Inc., Class A * | 60,884 | 17,811,005 |
Datadog, Inc., Class A * | 107,616 | 13,505,808 |
DocuSign, Inc. * | 185,585 | 10,504,111 |
Dolby Laboratories, Inc., Class A | 93,658 | 7,273,480 |
DoorDash, Inc., Class A * | 115,484 | 14,927,462 |
DoubleVerify Holdings, Inc. * | 129,905 | 3,806,217 |
Dropbox, Inc., Class A * | 387,234 | 8,968,339 |
188 | J.P. Morgan Exchange-Traded Funds | April 30, 2024 |
INVESTMENTS | SHARES | VALUE ($) |
Common Stocks — continued | ||
Software & Computer Services — continued | ||
DXC Technology Co. * | 221,719 | 4,321,303 |
Dynatrace, Inc. * | 176,328 | 7,989,422 |
EPAM Systems, Inc. * | 24,620 | 5,792,101 |
F5, Inc. * | 51,997 | 8,595,624 |
Fortinet, Inc. * | 222,152 | 14,035,563 |
Gartner, Inc. * | 29,874 | 12,325,714 |
International Business Machines Corp. | 22,741 | 3,779,554 |
Intuit, Inc. | 56,355 | 35,256,815 |
Manhattan Associates, Inc. * | 41,975 | 8,649,369 |
Meta Platforms, Inc., Class A | 224,333 | 96,501,327 |
Microsoft Corp. | 198,507 | 77,284,730 |
Palantir Technologies, Inc., Class A * | 512,083 | 11,250,464 |
Palo Alto Networks, Inc. * | 76,160 | 22,154,182 |
Paycom Software, Inc. | 47,818 | 8,988,828 |
Pegasystems, Inc. | 45,222 | 2,687,091 |
Pinterest, Inc., Class A * | 230,768 | 7,719,190 |
RingCentral, Inc., Class A * | 236,591 | 7,007,825 |
Salesforce, Inc. | 175,421 | 47,177,724 |
Science Applications International Corp. | 57,715 | 7,427,921 |
ServiceNow, Inc. * | 43,222 | 29,967,109 |
Smartsheet, Inc., Class A * | 100,833 | 3,814,512 |
Synopsys, Inc. * | 36,822 | 19,537,385 |
Teradata Corp. * | 232,450 | 8,623,895 |
UiPath, Inc., Class A * | 233,517 | 4,429,817 |
VeriSign, Inc. * | 57,145 | 9,684,935 |
Workday, Inc., Class A * | 43,897 | 10,742,913 |
ZoomInfo Technologies, Inc. * | 292,701 | 4,642,238 |
Zscaler, Inc. * | 32,144 | 5,558,983 |
802,408,273 | ||
Technology Hardware & Equipment — 12.8% | ||
Amphenol Corp., Class A | 169,180 | 20,431,869 |
Analog Devices, Inc. | 117,717 | 23,615,207 |
Apple, Inc. | 465,727 | 79,327,280 |
Applied Materials, Inc. | 174,086 | 34,582,184 |
Broadcom, Inc. | 59,801 | 77,757,446 |
CDW Corp. | 39,703 | 9,602,568 |
Cirrus Logic, Inc. * | 50,446 | 4,468,002 |
IPG Photonics Corp. * | 52,207 | 4,384,344 |
Jabil, Inc. | 53,921 | 6,328,168 |
KLA Corp. | 33,394 | 23,018,150 |
Lam Research Corp. | 29,674 | 26,540,722 |
Lattice Semiconductor Corp. * (a) | 128,721 | 8,830,261 |
Microchip Technology, Inc. | 181,512 | 16,695,474 |
NetApp, Inc. | 70,074 | 7,162,263 |
INVESTMENTS | SHARES | VALUE ($) |
Technology Hardware & Equipment — continued | ||
NVIDIA Corp. | 101,693 | 87,864,786 |
Pure Storage, Inc., Class A * | 257,674 | 12,986,770 |
Qorvo, Inc. * | 77,448 | 9,049,024 |
QUALCOMM, Inc. | 230,607 | 38,246,171 |
Skyworks Solutions, Inc. | 104,037 | 11,089,304 |
Teradyne, Inc. (a) | 101,977 | 11,861,965 |
513,841,958 | ||
Telecommunications Equipment — 1.1% | ||
Cisco Systems, Inc. | 801,666 | 37,662,269 |
Motorola Solutions, Inc. | 24,590 | 8,339,698 |
46,001,967 | ||
Telecommunications Service Providers — 0.9% | ||
AT&T, Inc. | 651,758 | 11,008,193 |
Verizon Communications, Inc. | 658,978 | 26,023,041 |
37,031,234 | ||
Tobacco — 0.5% | ||
Altria Group, Inc. | 453,462 | 19,866,170 |
Travel & Leisure — 4.6% | ||
Airbnb, Inc., Class A * | 99,603 | 15,794,048 |
Booking Holdings, Inc. | 7,995 | 27,598,980 |
Boyd Gaming Corp. | 68,637 | 3,672,766 |
Choice Hotels International, Inc. (a) | 57,536 | 6,804,207 |
Darden Restaurants, Inc. | 61,455 | 9,427,812 |
Expedia Group, Inc. * | 73,917 | 9,951,446 |
Live Nation Entertainment, Inc. * | 91,128 | 8,102,190 |
Madison Square Garden Sports Corp. * | 40,346 | 7,501,128 |
Marriott International, Inc., Class A | 72,027 | 17,007,736 |
McDonald's Corp. | 140,605 | 38,390,789 |
Starbucks Corp. | 254,889 | 22,555,128 |
Wyndham Hotels & Resorts, Inc. | 48,544 | 3,568,469 |
Yum! Brands, Inc. | 95,378 | 13,472,142 |
183,846,841 | ||
Waste & Disposal Services — 1.2% | ||
Clean Harbors, Inc. * | 52,302 | 9,908,614 |
Republic Services, Inc. | 78,554 | 15,058,802 |
Waste Management, Inc. | 106,012 | 22,052,616 |
47,020,032 | ||
Total Common Stocks (Cost $3,716,542,859) | 4,013,813,539 | |
April 30, 2024 | J.P. Morgan Exchange-Traded Funds | 189 |
INVESTMENTS | SHARES | VALUE ($) |
Short-Term Investments — 1.7% | ||
Investment Companies — 0.2% | ||
JPMorgan U.S. Government Money Market Fund Class IM Shares, 5.25% (b) (c)(Cost $8,565,577) | 8,565,577 | 8,565,577 |
Investment of Cash Collateral from Securities Loaned — 1.5% | ||
JPMorgan Securities Lending Money Market Fund Class Agency SL Shares, 5.47% (b) (c) | 52,400,457 | 52,405,697 |
JPMorgan U.S. Government Money Market Fund Class IM Shares, 5.25% (b) (c) | 6,857,694 | 6,857,694 |
Total Investment of Cash Collateral from Securities Loaned (Cost $59,272,213) | 59,263,391 | |
Total Short-Term Investments (Cost $67,837,790) | 67,828,968 | |
Total Investments — 101.6% (Cost $3,784,380,649) | 4,081,642,507 | |
Liabilities in Excess of Other Assets — (1.6)% | (63,227,293 ) | |
NET ASSETS — 100.0% | 4,018,415,214 | |
Percentages indicated are based on net assets. |
* | Non-income producing security. |
(a) | The security or a portion of this security is on loan at April 30, 2024. The total value of securities on loan at April 30, 2024 is $56,687,542. |
(b) | Investment in an affiliated fund, which is registered under the Investment Company Act of 1940, as amended, and is advised by J.P. Morgan Investment Management Inc. |
(c) | The rate shown is the current yield as of April 30, 2024. |
DESCRIPTION | NUMBER OF CONTRACTS | EXPIRATION DATE | TRADING CURRENCY | NOTIONAL AMOUNT ($) | VALUE AND UNREALIZED APPRECIATION (DEPRECIATION) ($) |
Long Contracts | |||||
S&P 500 E-Mini Index | 11 | 06/21/2024 | USD | 2,785,613 | (41,736 ) |
Abbreviations | |
USD | United States Dollar |
190 | J.P. Morgan Exchange-Traded Funds | April 30, 2024 |
INVESTMENTS | SHARES | VALUE ($) |
Common Stocks — 99.7% | ||
Aerospace & Defense — 1.5% | ||
General Dynamics Corp. | 10,825 | 3,107,749 |
Huntington Ingalls Industries, Inc. | 6,627 | 1,835,215 |
L3Harris Technologies, Inc. | 10,351 | 2,215,631 |
RTX Corp. | 33,563 | 3,407,316 |
Textron, Inc. | 18,196 | 1,539,200 |
12,105,111 | ||
Automobiles & Parts — 2.1% | ||
Aptiv plc * | 16,537 | 1,174,127 |
BorgWarner, Inc. | 35,883 | 1,175,886 |
Ford Motor Co. | 247,528 | 3,007,465 |
General Motors Co. | 74,489 | 3,316,995 |
Gentex Corp. | 50,398 | 1,728,652 |
Genuine Parts Co. | 12,662 | 1,990,593 |
Lear Corp. | 10,937 | 1,376,640 |
LKQ Corp. | 35,190 | 1,517,745 |
Phinia, Inc. | 22,984 | 896,376 |
16,184,479 | ||
Banks — 5.2% | ||
Bank of America Corp. | 79,393 | 2,938,335 |
Bank OZK | 21,313 | 951,625 |
BOK Financial Corp. | 6,866 | 609,220 |
Citigroup, Inc. | 87,382 | 5,359,138 |
Citizens Financial Group, Inc. | 64,464 | 2,198,867 |
Columbia Banking System, Inc. | 50,308 | 946,293 |
Comerica, Inc. | 26,299 | 1,319,421 |
Fifth Third Bancorp | 55,658 | 2,029,291 |
First Hawaiian, Inc. | 41,002 | 864,732 |
First Horizon Corp. | 72,828 | 1,086,594 |
FNB Corp. | 102,895 | 1,372,619 |
Huntington Bancshares, Inc. | 135,082 | 1,819,555 |
KeyCorp | 93,187 | 1,350,280 |
M&T Bank Corp. | 10,655 | 1,538,475 |
New York Community Bancorp, Inc. (a) | 469,619 | 1,244,490 |
PNC Financial Services Group, Inc. (The) | 5,108 | 782,852 |
Popular, Inc. (Puerto Rico) | 20,898 | 1,776,121 |
Prosperity Bancshares, Inc. | 15,346 | 950,992 |
Regions Financial Corp. | 86,090 | 1,658,954 |
Synovus Financial Corp. | 32,804 | 1,174,055 |
Truist Financial Corp. | 84,673 | 3,179,471 |
US Bancorp | 68,676 | 2,790,306 |
Webster Financial Corp. | 21,607 | 947,035 |
INVESTMENTS | SHARES | VALUE ($) |
Banks — continued | ||
Western Alliance Bancorp | 20,102 | 1,142,397 |
Zions Bancorp NA | 25,292 | 1,031,408 |
41,062,526 | ||
Beverages — 0.3% | ||
Keurig Dr Pepper, Inc. | 31,060 | 1,046,722 |
Molson Coors Beverage Co., Class B | 27,351 | 1,566,118 |
2,612,840 | ||
Chemicals — 0.9% | ||
CF Industries Holdings, Inc. | 5,211 | 411,512 |
Dow, Inc. | 41,671 | 2,371,080 |
Huntsman Corp. | 12,159 | 290,114 |
LyondellBasell Industries NV, Class A | 23,885 | 2,387,783 |
Mosaic Co. (The) | 60,212 | 1,890,055 |
7,350,544 | ||
Construction & Materials — 1.0% | ||
Acuity Brands, Inc. | 5,213 | 1,294,388 |
Builders FirstSource, Inc. * | 11,657 | 2,131,133 |
Fortune Brands Innovations, Inc. | 13,780 | 1,007,318 |
MDU Resources Group, Inc. | 61,084 | 1,508,775 |
Owens Corning | 13,187 | 2,218,185 |
8,159,799 | ||
Consumer Services — 0.8% | ||
eBay, Inc. | 46,328 | 2,387,745 |
Grand Canyon Education, Inc. * | 157 | 20,413 |
H&R Block, Inc. (a) | 36,746 | 1,735,514 |
Service Corp. International | 26,239 | 1,881,599 |
U-Haul Holding Co. * (a) | 5,393 | 340,999 |
6,366,270 | ||
Electricity — 2.1% | ||
Avangrid, Inc. | 18,955 | 692,426 |
Brookfield Renewable Corp. | 15,682 | 364,450 |
Clearway Energy, Inc., Class C | 28,535 | 667,148 |
Consolidated Edison, Inc. | 26,841 | 2,533,790 |
Dominion Energy, Inc. | 13,705 | 698,681 |
Entergy Corp. | 22,295 | 2,378,208 |
Evergy, Inc. | 39,171 | 2,054,519 |
Hawaiian Electric Industries, Inc. | 131,570 | 1,295,965 |
OGE Energy Corp. | 54,516 | 1,888,979 |
Pinnacle West Capital Corp. (a) | 23,085 | 1,700,210 |
PPL Corp. | 73,814 | 2,026,933 |
16,301,309 | ||
April 30, 2024 | J.P. Morgan Exchange-Traded Funds | 191 |
INVESTMENTS | SHARES | VALUE ($) |
Common Stocks — continued | ||
Electronic & Electrical Equipment — 1.6% | ||
Crane Co. | 3,210 | 449,432 |
Crane NXT Co. | 20,179 | 1,227,085 |
Johnson Controls International plc | 47,206 | 3,071,694 |
nVent Electric plc | 28,442 | 2,049,815 |
Pentair plc | 25,298 | 2,000,819 |
Sensata Technologies Holding plc | 48,302 | 1,850,450 |
WESCO International, Inc. | 11,800 | 1,802,450 |
12,451,745 | ||
Finance & Credit Services — 0.7% | ||
Ally Financial, Inc. | 50,845 | 1,949,906 |
MGIC Investment Corp. | 89,600 | 1,817,088 |
OneMain Holdings, Inc. | 31,613 | 1,647,353 |
5,414,347 | ||
Food Producers — 2.4% | ||
Archer-Daniels-Midland Co. | 34,510 | 2,024,357 |
Bunge Global SA | 10,463 | 1,064,715 |
Campbell Soup Co. | 37,343 | 1,706,949 |
Conagra Brands, Inc. | 66,685 | 2,052,564 |
General Mills, Inc. | 37,071 | 2,612,023 |
Ingredion, Inc. | 9,404 | 1,077,604 |
J M Smucker Co. (The) | 12,423 | 1,426,782 |
Kellanova | 19,449 | 1,125,319 |
Kraft Heinz Co. (The) | 66,507 | 2,567,835 |
Post Holdings, Inc. * | 9,936 | 1,054,706 |
Tyson Foods, Inc., Class A | 27,880 | 1,690,922 |
18,403,776 | ||
Gas, Water & Multi-utilities — 0.4% | ||
National Fuel Gas Co. | 28,495 | 1,513,084 |
UGI Corp. | 70,796 | 1,809,546 |
3,322,630 | ||
General Industrials — 3.1% | ||
3M Co. | 23,180 | 2,237,102 |
Amcor plc | 197,140 | 1,762,432 |
Berry Global Group, Inc. | 25,430 | 1,440,355 |
Crown Holdings, Inc. | 24,077 | 1,976,000 |
Dover Corp. | 12,234 | 2,193,556 |
DuPont de Nemours, Inc. | 33,326 | 2,416,135 |
Graphic Packaging Holding Co. | 72,439 | 1,872,548 |
Packaging Corp. of America | 11,523 | 1,993,249 |
Parker-Hannifin Corp. | 6,865 | 3,740,807 |
Silgan Holdings, Inc. | 36,299 | 1,693,711 |
INVESTMENTS | SHARES | VALUE ($) |
General Industrials — continued | ||
Sonoco Products Co. | 20,302 | 1,137,927 |
WestRock Co. | 43,521 | 2,087,267 |
24,551,089 | ||
Health Care Providers — 4.2% | ||
Centene Corp. * | 27,864 | 2,035,744 |
Cigna Group (The) | 13,629 | 4,866,098 |
Elevance Health, Inc. | 10,477 | 5,537,933 |
Encompass Health Corp. | 13,473 | 1,123,379 |
Humana, Inc. | 6,361 | 1,921,594 |
Premier, Inc., Class A (a) | 36,540 | 762,955 |
Tenet Healthcare Corp. * | 11,258 | 1,264,161 |
UnitedHealth Group, Inc. | 27,695 | 13,396,071 |
Universal Health Services, Inc., Class B | 11,086 | 1,889,387 |
32,797,322 | ||
Household Goods & Home Construction — 1.9% | ||
DR Horton, Inc. | 19,640 | 2,798,504 |
Leggett & Platt, Inc. | 64,592 | 1,167,177 |
Lennar Corp., Class A | 17,245 | 2,614,687 |
Newell Brands, Inc. | 115,941 | 920,572 |
NVR, Inc. * | 208 | 1,547,281 |
PulteGroup, Inc. | 20,840 | 2,321,993 |
Toll Brothers, Inc. | 16,768 | 1,997,236 |
Whirlpool Corp. | 15,325 | 1,453,729 |
14,821,179 | ||
Industrial Engineering — 2.2% | ||
AGCO Corp. | 16,303 | 1,861,640 |
Brunswick Corp. | 20,179 | 1,627,234 |
Caterpillar, Inc. | 18,484 | 6,184,192 |
CNH Industrial NV | 159,578 | 1,819,189 |
Cummins, Inc. | 10,206 | 2,883,093 |
Snap-on, Inc. | 7,328 | 1,963,611 |
Stanley Black & Decker, Inc. | 11,946 | 1,091,864 |
17,430,823 | ||
Industrial Materials — 0.2% | ||
International Paper Co. | 41,486 | 1,449,521 |
Industrial Metals & Mining — 0.6% | ||
Cleveland-Cliffs, Inc. * | 11,014 | 186,137 |
Nucor Corp. | 15,833 | 2,668,335 |
Reliance, Inc. | 6,706 | 1,909,332 |
4,763,804 | ||
Industrial Support Services — 2.0% | ||
ADT, Inc. | 88,325 | 574,113 |
192 | J.P. Morgan Exchange-Traded Funds | April 30, 2024 |
INVESTMENTS | SHARES | VALUE ($) |
Common Stocks — continued | ||
Industrial Support Services — continued | ||
Capital One Financial Corp. | 23,359 | 3,350,381 |
Fidelity National Information Services, Inc. | 12,435 | 844,585 |
Gates Industrial Corp. plc * | 37,312 | 657,437 |
Genpact Ltd. | 24,253 | 745,537 |
ManpowerGroup, Inc. | 23,168 | 1,748,026 |
MSC Industrial Direct Co., Inc., Class A | 17,349 | 1,582,923 |
NCR Atleos Corp. * | 27,461 | 547,298 |
Robert Half, Inc. | 22,844 | 1,579,434 |
Synchrony Financial | 51,102 | 2,247,466 |
Western Union Co. (The) | 128,976 | 1,733,437 |
15,610,637 | ||
Industrial Transportation — 1.7% | ||
Allison Transmission Holdings, Inc. | 23,808 | 1,751,078 |
FedEx Corp. | 13,616 | 3,564,397 |
Oshkosh Corp. | 15,673 | 1,759,608 |
PACCAR, Inc. | 29,867 | 3,169,187 |
Ryder System, Inc. | 14,997 | 1,827,385 |
Schneider National, Inc., Class B | 29,658 | 613,327 |
Union Pacific Corp. | 2,027 | 480,723 |
13,165,705 | ||
Investment Banking & Brokerage Services — 1.3% | ||
Bank of New York Mellon Corp. (The) | 49,955 | 2,821,958 |
Franklin Resources, Inc. | 53,496 | 1,221,849 |
Invesco Ltd. | 81,945 | 1,161,161 |
Janus Henderson Group plc | 38,090 | 1,189,170 |
Jefferies Financial Group, Inc. | 42,867 | 1,845,853 |
State Street Corp. | 25,989 | 1,883,942 |
10,123,933 | ||
Leisure Goods — 0.9% | ||
Garmin Ltd. | 16,247 | 2,347,204 |
Harley-Davidson, Inc. | 47,606 | 1,637,170 |
Polaris, Inc. | 10,016 | 852,963 |
Pool Corp. | 3,168 | 1,148,495 |
Thor Industries, Inc. | 13,884 | 1,380,347 |
7,366,179 | ||
Life Insurance — 1.0% | ||
Corebridge Financial, Inc. (a) | 47,645 | 1,265,451 |
Principal Financial Group, Inc. | 23,509 | 1,860,503 |
Prudential Financial, Inc. | 25,706 | 2,839,999 |
Unum Group | 36,476 | 1,849,333 |
7,815,286 | ||
INVESTMENTS | SHARES | VALUE ($) |
Media — 1.4% | ||
Fox Corp., Class A | 52,546 | 1,629,451 |
Interpublic Group of Cos., Inc. (The) | 47,976 | 1,460,389 |
Liberty Media Corp-Liberty SiriusXM * | 39,794 | 957,444 |
News Corp., Class A | 72,003 | 1,713,671 |
Nexstar Media Group, Inc. | 10,696 | 1,712,002 |
Omnicom Group, Inc. | 21,397 | 1,986,498 |
Paramount Global, Class B | 83,574 | 951,908 |
Sirius XM Holdings, Inc. (a) | 202,122 | 594,239 |
11,005,602 | ||
Medical Equipment & Services — 1.7% | ||
Baxter International, Inc. | 33,533 | 1,353,727 |
Becton Dickinson & Co. | 2,361 | 553,891 |
Henry Schein, Inc. * | 8,197 | 567,888 |
Laboratory Corp. of America Holdings | 6,106 | 1,229,565 |
Medtronic plc | 55,136 | 4,424,113 |
Quest Diagnostics, Inc. | 14,024 | 1,937,836 |
QuidelOrtho Corp. * | 345 | 13,990 |
Revvity, Inc. | 10,070 | 1,031,873 |
Solventum Corp. * | 5,819 | 378,293 |
Teleflex, Inc. | 3,276 | 683,865 |
Zimmer Biomet Holdings, Inc. | 12,311 | 1,480,767 |
13,655,808 | ||
Mortgage Real Estate Investment Trusts — 0.7% | ||
AGNC Investment Corp. (a) | 109,009 | 997,432 |
Annaly Capital Management, Inc. | 82,286 | 1,542,040 |
Rithm Capital Corp. | 160,039 | 1,779,634 |
Starwood Property Trust, Inc. (a) | 75,633 | 1,434,758 |
5,753,864 | ||
Non-life Insurance — 1.4% | ||
American International Group, Inc. | 43,577 | 3,281,784 |
Assured Guaranty Ltd. | 18,987 | 1,456,303 |
Axis Capital Holdings Ltd. | 15,390 | 943,869 |
Fidelity National Financial, Inc. | 14,932 | 739,134 |
First American Financial Corp. | 26,341 | 1,411,087 |
Old Republic International Corp. | 57,632 | 1,720,891 |
Reinsurance Group of America, Inc. | 8,285 | 1,549,212 |
11,102,280 | ||
Non-Renewable Energy — 4.1% | ||
Chesapeake Energy Corp. (a) | 22,030 | 1,980,056 |
Chevron Corp. | 38,381 | 6,189,704 |
Coterra Energy, Inc. | 76,211 | 2,085,133 |
Diamondback Energy, Inc. | 2,703 | 543,654 |
April 30, 2024 | J.P. Morgan Exchange-Traded Funds | 193 |
INVESTMENTS | SHARES | VALUE ($) |
Common Stocks — continued | ||
Non-Renewable Energy — continued | ||
HF Sinclair Corp. | 31,232 | 1,694,336 |
Kinder Morgan, Inc. | 135,499 | 2,476,922 |
Marathon Oil Corp. | 71,502 | 1,919,829 |
Marathon Petroleum Corp. | 20,519 | 3,728,713 |
Ovintiv, Inc. | 34,700 | 1,780,804 |
Phillips 66 | 24,570 | 3,518,670 |
Pioneer Natural Resources Co. | 13,539 | 3,646,323 |
Valero Energy Corp. | 13,879 | 2,218,836 |
31,782,980 | ||
Personal Care, Drug & Grocery Stores — 1.2% | ||
Albertsons Cos., Inc., Class A | 75,253 | 1,535,161 |
CVS Health Corp. | 60,949 | 4,126,857 |
Kroger Co. (The) | 47,302 | 2,619,585 |
Spectrum Brands Holdings, Inc. | 9,890 | 809,694 |
9,091,297 | ||
Personal Goods — 1.1% | ||
Carter's, Inc. | 20,879 | 1,428,332 |
Columbia Sportswear Co. (a) | 10,741 | 855,306 |
Crocs, Inc. * | 8,975 | 1,116,221 |
PVH Corp. | 13,352 | 1,452,698 |
Ralph Lauren Corp. | 9,788 | 1,601,708 |
Tapestry, Inc. | 40,663 | 1,623,267 |
VF Corp. | 38,367 | 478,053 |
8,555,585 | ||
Pharmaceuticals, Biotechnology & Marijuana Producers — 6.0% | ||
Amgen, Inc. | 18,835 | 5,159,660 |
Bristol-Myers Squibb Co. | 79,537 | 3,494,856 |
Fortrea Holdings, Inc. * | 24,784 | 906,847 |
Gilead Sciences, Inc. | 52,507 | 3,423,456 |
Jazz Pharmaceuticals plc * | 7,152 | 792,084 |
Johnson & Johnson | 72,533 | 10,487,546 |
Maravai LifeSciences Holdings, Inc., Class A * | 49,044 | 402,161 |
Merck & Co., Inc. | 90,287 | 11,666,886 |
Organon & Co. | 28,889 | 537,624 |
Perrigo Co. plc | 33,971 | 1,109,493 |
Pfizer, Inc. | 219,449 | 5,622,283 |
United Therapeutics Corp. * | 5,917 | 1,386,531 |
Viatris, Inc. | 156,457 | 1,810,208 |
46,799,635 | ||
Real Estate Investment Trusts — 2.6% | ||
Brixmor Property Group, Inc. | 2,410 | 53,261 |
Cousins Properties, Inc. | 34,055 | 781,222 |
INVESTMENTS | SHARES | VALUE ($) |
Real Estate Investment Trusts — continued | ||
EPR Properties | 40,344 | 1,637,563 |
Equity Residential | 18,688 | 1,203,507 |
Gaming and Leisure Properties, Inc. | 19,241 | 822,168 |
Highwoods Properties, Inc. (a) | 66,983 | 1,754,954 |
Host Hotels & Resorts, Inc. | 38,409 | 724,778 |
Kilroy Realty Corp. | 31,139 | 1,052,498 |
Kimco Realty Corp. | 81,959 | 1,526,896 |
Medical Properties Trust, Inc. (a) | 130,266 | 599,224 |
NET Lease Office Properties | 5,902 | 134,920 |
NNN REIT, Inc. | 22,001 | 891,700 |
Omega Healthcare Investors, Inc. (a) | 51,636 | 1,570,251 |
Park Hotels & Resorts, Inc. | 74,248 | 1,197,620 |
Regency Centers Corp. | 15,691 | 929,221 |
Simon Property Group, Inc. | 16,117 | 2,264,922 |
VICI Properties, Inc. | 81,149 | 2,316,804 |
WP Carey, Inc. | 13,238 | 725,972 |
20,187,481 | ||
Retailers — 3.9% | ||
Advance Auto Parts, Inc. | 14,827 | 1,082,074 |
AutoNation, Inc. * | 9,729 | 1,567,828 |
Bath & Body Works, Inc. | 28,116 | 1,277,029 |
Best Buy Co., Inc. | 24,865 | 1,831,059 |
Capri Holdings Ltd. * | 22,975 | 815,153 |
Dick's Sporting Goods, Inc. | 10,587 | 2,127,352 |
Gap, Inc. (The) | 75,076 | 1,540,560 |
Home Depot, Inc. (The) | 18,965 | 6,338,482 |
Kohl's Corp. (a) | 46,855 | 1,121,709 |
Lithia Motors, Inc., Class A | 5,366 | 1,365,003 |
Macy's, Inc. | 90,751 | 1,672,541 |
Murphy USA, Inc. | 3,065 | 1,268,358 |
Nordstrom, Inc. (a) | 60,891 | 1,157,538 |
Penske Automotive Group, Inc. (a) | 9,235 | 1,412,124 |
Target Corp. | 18,314 | 2,948,188 |
Victoria's Secret & Co. * | 38,394 | 676,502 |
Williams-Sonoma, Inc. (a) | 8,730 | 2,503,589 |
30,705,089 | ||
Software & Computer Services — 17.6% | ||
Akamai Technologies, Inc. * | 18,976 | 1,915,248 |
Alphabet, Inc., Class A * | 116,160 | 18,908,525 |
Amdocs Ltd. | 20,944 | 1,759,087 |
ANSYS, Inc. * | 4,881 | 1,585,739 |
AppLovin Corp., Class A * | 31,648 | 2,233,399 |
Bentley Systems, Inc., Class B | 13,779 | 723,811 |
194 | J.P. Morgan Exchange-Traded Funds | April 30, 2024 |
INVESTMENTS | SHARES | VALUE ($) |
Common Stocks — continued | ||
Software & Computer Services — continued | ||
CACI International, Inc., Class A * | 4,980 | 2,003,105 |
Clarivate plc * (a) | 221,733 | 1,498,915 |
Cognizant Technology Solutions Corp., Class A | 35,554 | 2,335,187 |
Concentrix Corp. (a) | 22,747 | 1,243,578 |
DocuSign, Inc. * | 20,220 | 1,144,452 |
Dolby Laboratories, Inc., Class A | 21,089 | 1,637,772 |
Dropbox, Inc., Class A * | 73,653 | 1,705,803 |
Dun & Bradstreet Holdings, Inc. | 158,309 | 1,440,612 |
DXC Technology Co. * | 79,200 | 1,543,608 |
EPAM Systems, Inc. * | 6,883 | 1,619,295 |
F5, Inc. * | 10,169 | 1,681,037 |
Gen Digital, Inc. | 89,747 | 1,807,505 |
GoDaddy, Inc., Class A * | 18,278 | 2,236,862 |
Hewlett Packard Enterprise Co. | 141,793 | 2,410,481 |
IAC, Inc. * | 7,424 | 353,085 |
International Business Machines Corp. | 36,330 | 6,038,046 |
Intuit, Inc. | 10,767 | 6,736,051 |
KBR, Inc. | 30,622 | 1,988,593 |
Leidos Holdings, Inc. | 16,639 | 2,333,121 |
Maplebear, Inc. * | 17,287 | 590,005 |
Match Group, Inc. * | 52,555 | 1,619,745 |
Meta Platforms, Inc., Class A | 43,958 | 18,909,413 |
Microsoft Corp. | 38,347 | 14,929,637 |
NCR Voyix Corp. * | 135,118 | 1,655,195 |
Okta, Inc. * | 14,146 | 1,315,295 |
Oracle Corp. | 61,206 | 6,962,182 |
Paycom Software, Inc. | 10,176 | 1,912,884 |
Pegasystems, Inc. | 8,623 | 512,379 |
Roper Technologies, Inc. | 6,135 | 3,137,807 |
Salesforce, Inc. | 27,032 | 7,269,986 |
Science Applications International Corp. | 12,878 | 1,657,399 |
SS&C Technologies Holdings, Inc. | 31,416 | 1,944,336 |
Teradata Corp. * | 35,270 | 1,308,517 |
Twilio, Inc., Class A * | 31,492 | 1,885,741 |
Zoom Video Communications, Inc., Class A * | 30,388 | 1,856,707 |
ZoomInfo Technologies, Inc. * | 103,430 | 1,640,400 |
137,990,545 | ||
Technology Hardware & Equipment — 14.9% | ||
Allegro MicroSystems, Inc. (Japan) * | 26,569 | 788,834 |
Amphenol Corp., Class A | 32,330 | 3,904,494 |
Analog Devices, Inc. | 23,337 | 4,681,636 |
Apple, Inc. | 88,649 | 15,099,584 |
Applied Materials, Inc. | 33,173 | 6,589,816 |
Arrow Electronics, Inc. * | 14,879 | 1,899,602 |
INVESTMENTS | SHARES | VALUE ($) |
Technology Hardware & Equipment — continued | ||
Avnet, Inc. | 36,196 | 1,768,899 |
Broadcom, Inc. | 11,379 | 14,795,772 |
CDW Corp. | 10,562 | 2,554,525 |
Cirrus Logic, Inc. * | 18,697 | 1,655,993 |
Coherent Corp. * | 29,011 | 1,584,871 |
Corning, Inc. | 72,222 | 2,410,770 |
GLOBALFOUNDRIES, Inc. * (a) | 30,956 | 1,513,129 |
HP, Inc. | 80,653 | 2,265,543 |
Intel Corp. | 165,719 | 5,049,458 |
IPG Photonics Corp. * | 15,485 | 1,300,430 |
Jabil, Inc. | 14,603 | 1,713,808 |
KLA Corp. | 6,378 | 4,396,292 |
Lam Research Corp. | 5,653 | 5,056,100 |
Marvell Technology, Inc. | 46,577 | 3,069,890 |
Microchip Technology, Inc. | 34,487 | 3,172,114 |
NetApp, Inc. | 21,380 | 2,185,250 |
ON Semiconductor Corp. * | 32,762 | 2,298,582 |
Qorvo, Inc. * | 16,277 | 1,901,805 |
QUALCOMM, Inc. | 43,929 | 7,285,625 |
Skyworks Solutions, Inc. | 19,786 | 2,108,990 |
TD SYNNEX Corp. | 16,872 | 1,988,196 |
Teradyne, Inc. | 19,721 | 2,293,947 |
Texas Instruments, Inc. | 37,164 | 6,556,473 |
Universal Display Corp. | 10,534 | 1,664,161 |
Vertiv Holdings Co., Class A | 33,265 | 3,093,645 |
116,648,234 | ||
Telecommunications Equipment — 0.8% | ||
Cisco Systems, Inc. | 131,067 | 6,157,528 |
Telecommunications Service Providers — 1.2% | ||
AT&T, Inc. | 279,487 | 4,720,536 |
Comcast Corp., Class A | 96,830 | 3,690,191 |
Verizon Communications, Inc. | 22,690 | 896,028 |
9,306,755 | ||
Tobacco — 1.0% | ||
Altria Group, Inc. | 90,791 | 3,977,554 |
Philip Morris International, Inc. | 39,965 | 3,794,277 |
7,771,831 | ||
Travel & Leisure — 2.0% | ||
Aramark | 32,079 | 1,010,809 |
Boyd Gaming Corp. | 22,668 | 1,212,965 |
Caesars Entertainment, Inc. * | 21,761 | 779,479 |
Darden Restaurants, Inc. | 12,418 | 1,905,045 |
Delta Air Lines, Inc. | 37,664 | 1,885,836 |
April 30, 2024 | J.P. Morgan Exchange-Traded Funds | 195 |
INVESTMENTS | SHARES | VALUE ($) |
Common Stocks — continued | ||
Travel & Leisure — continued | ||
Marriott Vacations Worldwide Corp. | 17,996 | 1,729,596 |
MGM Resorts International * | 40,418 | 1,594,086 |
Travel + Leisure Co. | 30,862 | 1,343,731 |
United Airlines Holdings, Inc. * | 27,903 | 1,435,888 |
Vail Resorts, Inc. | 4,057 | 768,274 |
Wendy's Co. (The) | 66,850 | 1,336,332 |
Wyndham Hotels & Resorts, Inc. | 12,562 | 923,433 |
15,925,474 | ||
Total Common Stocks (Cost $756,480,348) | 782,070,842 | |
Short-Term Investments — 2.6% | ||
Investment Companies — 0.2% | ||
JPMorgan U.S. Government Money Market Fund Class IM Shares, 5.25% (b) (c)(Cost $1,515,338) | 1,515,338 | 1,515,338 |
Investment of Cash Collateral from Securities Loaned — 2.4% | ||
JPMorgan Securities Lending Money Market Fund Class Agency SL Shares, 5.47% (b) (c) | 16,289,275 | 16,290,904 |
JPMorgan U.S. Government Money Market Fund Class IM Shares, 5.25% (b) (c) | 2,305,678 | 2,305,678 |
Total Investment of Cash Collateral from Securities Loaned (Cost $18,598,240) | 18,596,582 | |
Total Short-Term Investments (Cost $20,113,578) | 20,111,920 | |
Total Investments — 102.3% (Cost $776,593,926) | 802,182,762 | |
Liabilities in Excess of Other Assets — (2.3)% | (17,858,660 ) | |
NET ASSETS — 100.0% | 784,324,102 | |
Percentages indicated are based on net assets. |
* | Non-income producing security. |
(a) | The security or a portion of this security is on loan at April 30, 2024. The total value of securities on loan at April 30, 2024 is $17,697,964. |
(b) | Investment in an affiliated fund, which is registered under the Investment Company Act of 1940, as amended, and is advised by J.P. Morgan Investment Management Inc. |
(c) | The rate shown is the current yield as of April 30, 2024. |
DESCRIPTION | NUMBER OF CONTRACTS | EXPIRATION DATE | TRADING CURRENCY | NOTIONAL AMOUNT ($) | VALUE AND UNREALIZED APPRECIATION (DEPRECIATION) ($) |
Long Contracts | |||||
S&P 500 E-Mini Index | 7 | 06/21/2024 | USD | 1,772,663 | (47,027 ) |
196 | J.P. Morgan Exchange-Traded Funds | April 30, 2024 |
Abbreviations | |
USD | United States Dollar |
April 30, 2024 | J.P. Morgan Exchange-Traded Funds | 197 |
JPMorgan BetaBuilders Canada ETF | JPMorgan BetaBuilders Developed Asia Pacific ex-Japan ETF | JPMorgan BetaBuilders Emerging Markets Equity ETF | JPMorgan BetaBuilders Europe ETF | |
ASSETS: | ||||
Investments in non-affiliates, at value | $6,920,516,013 | $4,446,964,670 | $570,498,873 | $7,479,478,558 |
Investments in affiliates, at value | — | — | 6,819,830 | — |
Investments of cash collateral received from securities loaned, at value (See Note 2.C.) | 89,929,810 | 5,874,135 | 526,874 | 291,466,692 |
Cash | — | 11,955 | 914,699 | 172,953 |
Foreign currency, at value | 20,559,454 | 16,985,844 | 120,667 | 44,380,073 |
Deposits at broker for futures contracts | 1,888,022 | 1,482,410 | 204,125 | 6,271,078 |
Segregated cash balance with Authorized Participant for deposit securities | 2,899,869 | — | — | — |
Receivables: | ||||
Investment securities sold | — | 61 | — | — |
Dividends from non-affiliates | 19,079,411 | 5,013,531 | 715,300 | 23,759,782 |
Dividends from affiliates | — | — | 981 | — |
Tax reclaims | — | 92,427 | 36,392 | 31,464,028 |
Securities lending income (See Note 2.C.) | 313,580 | 2,987 | 6,206 | 145,171 |
Total Assets | 7,055,186,159 | 4,476,428,020 | 579,843,947 | 7,877,138,335 |
LIABILITIES: | ||||
Payables: | ||||
Due to custodian | 3,880 | — | — | — |
Investment securities purchased | — | — | 2 | — |
Collateral received on securities loaned (See Note 2.C.) | 89,929,810 | 5,874,135 | 526,874 | 291,466,692 |
Variation margin on futures contracts | 430,035 | 79,852 | 61,200 | 1,122,821 |
Collateral upon return of deposit securities | 2,899,869 | — | — | — |
Accrued liabilities: | ||||
Management fees (See Note 3.A.) | 1,110,436 | 714,523 | 69,908 | 609,556 |
Deferred foreign capital gains tax | — | — | 4,246,611 | — |
Total Liabilities | 94,374,030 | 6,668,510 | 4,904,595 | 293,199,069 |
Net Assets | $6,960,812,129 | $4,469,759,510 | $574,939,352 | $7,583,939,266 |
NET ASSETS: | ||||
Paid-in-Capital | $5,975,430,626 | $5,112,913,270 | $550,183,764 | $7,804,444,409 |
Total distributable earnings (loss) | 985,381,503 | (643,153,760 ) | 24,755,588 | (220,505,143 ) |
Total Net Assets | $6,960,812,129 | $4,469,759,510 | $574,939,352 | $7,583,939,266 |
Outstanding number of shares (unlimited number of shares authorized - par value $0.0001) | 108,248,911 | 95,598,641 | 11,400,000 | 131,049,596 |
Net asset value, per share | $64.30 | $46.76 | $50.43 | $57.87 |
Cost of investments in non-affiliates | $5,738,303,526 | $4,718,795,251 | $541,250,148 | $7,373,940,099 |
Cost of investments in affiliates | — | — | 6,819,830 | — |
Cost of foreign currency | 20,681,906 | 16,866,878 | 119,373 | 44,359,183 |
Investment securities on loan, at value (See Note 2.C.) | 81,758,457 | 5,342,700 | 152,773 | 269,215,464 |
Cost of investment of cash collateral (See Note 2.C.) | 89,929,810 | 5,874,935 | 526,874 | 291,473,953 |
198 | J.P. Morgan Exchange-Traded Funds | April 30, 2024 |
JPMorgan BetaBuilders International Equity ETF | JPMorgan BetaBuilders Japan ETF | JPMorgan BetaBuilders U.S. Equity ETF | JPMorgan BetaBuilders U.S. Mid Cap Equity ETF | |
ASSETS: | ||||
Investments in non-affiliates, at value | $3,924,061,746 | $11,128,390,816 | $3,027,914,210 | $1,570,903,655 |
Investments in affiliates, at value | 31,381,914 | — | 61,231,342 | 12,042,783 |
Investments of cash collateral received from securities loaned, at value (See Note 2.C.) | 99,996,333 | 19,855,632 | 28,611,267 | 84,290,420 |
Cash | 187,720 | 58,239 | 87,351 | 44,033 |
Foreign currency, at value | 301,994 | 27,938,009 | — | — |
Deposits at broker for futures contracts | 1,736,975 | 6,507,931 | 1,096,000 | 691,000 |
Receivables: | ||||
Investment securities sold | — | 219,420 | — | — |
Interest from non-affiliates | — | — | 5,123 | — |
Dividends from non-affiliates | 16,890,452 | 94,305,219 | 1,792,091 | 613,113 |
Dividends from affiliates | 4,516 | — | 3,220 | 1,733 |
Tax reclaims | 7,217,294 | — | — | — |
Securities lending income (See Note 2.C.) | 46,476 | 15,568 | 7,142 | 23,785 |
Variation margin on futures contracts | — | 1,713,004 | — | — |
Total Assets | 4,081,825,420 | 11,279,003,838 | 3,120,747,746 | 1,668,610,522 |
LIABILITIES: | ||||
Payables: | ||||
Collateral received on securities loaned (See Note 2.C.) | 99,996,333 | 19,855,632 | 28,611,267 | 84,290,420 |
Variation margin on futures contracts | 791,917 | — | 378,962 | 227,194 |
Accrued liabilities: | ||||
Management fees (See Note 3.A.) | 222,999 | 1,798,917 | 48,055 | 90,391 |
Total Liabilities | 101,011,249 | 21,654,549 | 29,038,284 | 84,608,005 |
Net Assets | $3,980,814,171 | $11,257,349,289 | $3,091,709,462 | $1,584,002,517 |
NET ASSETS: | ||||
Paid-in-Capital | $3,543,693,869 | $10,892,435,225 | $2,674,869,485 | $1,689,466,963 |
Total distributable earnings (loss) | 437,120,302 | 364,914,064 | 416,839,977 | (105,464,446 ) |
Total Net Assets | $3,980,814,171 | $11,257,349,289 | $3,091,709,462 | $1,584,002,517 |
Outstanding number of shares (unlimited number of shares authorized - par value $0.0001) | 68,400,000 | 203,197,548 | 34,100,000 | 18,375,000 |
Net asset value, per share | $58.20 | $55.40 | $90.67 | $86.20 |
Cost of investments in non-affiliates | $3,451,212,546 | $10,355,489,844 | $2,591,230,236 | $1,444,442,509 |
Cost of investments in affiliates | 31,381,914 | — | 51,457,049 | 12,042,783 |
Cost of foreign currency | 304,690 | 28,564,974 | — | — |
Investment securities on loan, at value (See Note 2.C.) | 92,572,419 | 18,842,417 | 27,667,394 | 79,189,425 |
Cost of investment of cash collateral (See Note 2.C.) | 99,998,033 | 19,855,867 | 28,617,265 | 84,302,162 |
April 30, 2024 | J.P. Morgan Exchange-Traded Funds | 199 |
JPMorgan BetaBuilders U.S. Small Cap Equity ETF | JPMorgan Carbon Transition U.S. Equity ETF | JPMorgan Diversified Return Emerging Markets Equity ETF | JPMorgan Diversified Return International Equity ETF | |
ASSETS: | ||||
Investments in non-affiliates, at value | $443,873,464 | $5,082,851 | $314,420,933 | $359,620,446 |
Investments in affiliates, at value | 5,327,256 | 8,574 | 401,232 | — |
Investments of cash collateral received from securities loaned, at value (See Note 2.C.) | 26,776,917 | — | — | 4,258,768 |
Cash | 21,128 | 36 | 936,688 | 357,057 |
Foreign currency, at value | — | — | 107,508 | — |
Deposits at broker for futures contracts | 374,000 | — | 21,389 | 90,180 |
Receivables: | ||||
Investment securities sold | — | — | 6 | — |
Interest from non-affiliates | — | 68 | — | — |
Dividends from non-affiliates | 174,218 | 2,730 | 713,353 | 2,146,814 |
Dividends from affiliates | 767 | 1 | 58 | — |
Tax reclaims | — | — | 35,281 | 810,005 |
Securities lending income (See Note 2.C.) | 39,780 | — | — | 3,553 |
Total Assets | 476,587,530 | 5,094,260 | 316,636,448 | 367,286,823 |
LIABILITIES: | ||||
Payables: | ||||
Foreign currency due to custodian, at value | — | — | — | 26,833 |
Investment securities purchased | — | — | 415,938 | — |
Collateral received on securities loaned (See Note 2.C.) | 26,776,917 | — | — | 4,258,768 |
Variation margin on futures contracts | 115,881 | — | 3,600 | 34,335 |
Accrued liabilities: | ||||
Management fees (See Note 3.A.) | 33,042 | 637 | 112,968 | 113,946 |
Deferred foreign capital gains tax | — | — | 1,442,024 | — |
Total Liabilities | 26,925,840 | 637 | 1,974,530 | 4,433,882 |
Net Assets | $449,661,690 | $5,093,623 | $314,661,918 | $362,852,941 |
NET ASSETS: | ||||
Paid-in-Capital | $545,537,678 | $7,024,000 | $323,552,767 | $526,871,060 |
Total distributable earnings (loss) | (95,875,988 ) | (1,930,377 ) | (8,890,849 ) | (164,018,119 ) |
Total Net Assets | $449,661,690 | $5,093,623 | $314,661,918 | $362,852,941 |
Outstanding number of shares (unlimited number of shares authorized - par value $0.0001) | 7,650,000 | 75,000 | 5,800,000 | 6,600,000 |
Net asset value, per share | $58.78 | $67.91 | $54.25 | $54.98 |
Cost of investments in non-affiliates | $459,836,640 | $4,752,336 | $277,752,218 | $354,747,316 |
Cost of investments in affiliates | 5,327,256 | 8,574 | 401,232 | — |
Cost of foreign currency | — | — | 106,717 | — |
Investment securities on loan, at value (See Note 2.C.) | 25,267,248 | — | — | 4,017,022 |
Cost of investment of cash collateral (See Note 2.C.) | 26,781,822 | — | — | 4,258,883 |
200 | J.P. Morgan Exchange-Traded Funds | April 30, 2024 |
JPMorgan Diversified Return U.S. Equity ETF | JPMorgan Diversified Return U.S. Mid Cap Equity ETF | JPMorgan Diversified Return U.S. Small Cap Equity ETF | JPMorgan U.S. Momentum Factor ETF | |
ASSETS: | ||||
Investments in non-affiliates, at value | $423,487,108 | $359,015,147 | $469,771,578 | $844,218,922 |
Investments in affiliates, at value | 905,882 | 701,532 | 446,703 | 1,213,737 |
Investments of cash collateral received from securities loaned, at value (See Note 2.C.) | — | 8,572,900 | 35,806,449 | — |
Cash | — | 2,227 | — | 4,125 |
Deposits at broker for futures contracts | 117,000 | 86,300 | 233,000 | 225,140 |
Receivables: | ||||
Interest from non-affiliates | 10,633 | 9,299 | — | — |
Dividends from non-affiliates | 444,729 | 278,799 | 213,694 | 335,415 |
Dividends from affiliates | 130 | 101 | 64 | 175 |
Securities lending income (See Note 2.C.) | 137 | 1,190 | 17,468 | 1 |
Total Assets | 424,965,619 | 368,667,495 | 506,488,956 | 845,997,515 |
LIABILITIES: | ||||
Payables: | ||||
Due to custodian | 12,798 | — | 10,415 | — |
Collateral received on securities loaned (See Note 2.C.) | — | 8,572,900 | 35,806,449 | — |
Variation margin on futures contracts | 16,465 | 14,031 | 10,372 | 23,071 |
Accrued liabilities: | ||||
Management fees (See Note 3.A.) | 64,064 | 72,442 | 112,183 | 84,460 |
Total Liabilities | 93,327 | 8,659,373 | 35,939,419 | 107,531 |
Net Assets | $424,872,292 | $360,008,122 | $470,549,537 | $845,889,984 |
NET ASSETS: | ||||
Paid-in-Capital | $409,460,570 | $357,038,010 | $498,532,293 | $801,698,183 |
Total distributable earnings (loss) | 15,411,722 | 2,970,112 | (27,982,756 ) | 44,191,801 |
Total Net Assets | $424,872,292 | $360,008,122 | $470,549,537 | $845,889,984 |
Outstanding number of shares (unlimited number of shares authorized - par value $0.0001) | 3,975,000 | 3,825,000 | 11,000,000 | 16,925,000 |
Net asset value, per share | $106.89 | $94.12 | $42.78 | $49.98 |
Cost of investments in non-affiliates | $366,431,680 | $332,793,444 | $453,374,656 | $782,651,197 |
Cost of investments in affiliates | 905,882 | 701,532 | 446,703 | 1,213,737 |
Investment securities on loan, at value (See Note 2.C.) | — | 8,192,524 | 33,126,060 | — |
Cost of investment of cash collateral (See Note 2.C.) | — | 8,574,030 | 35,813,377 | — |
April 30, 2024 | J.P. Morgan Exchange-Traded Funds | 201 |
JPMorgan U.S. Quality Factor ETF | JPMorgan U.S. Value Factor ETF | |
ASSETS: | ||
Investments in non-affiliates, at value | $4,013,813,539 | $782,070,842 |
Investments in affiliates, at value | 8,565,577 | 1,515,338 |
Investments of cash collateral received from securities loaned, at value (See Note 2.C.) | 59,263,391 | 18,596,582 |
Cash | 16,609 | 4,811 |
Deposits at broker for futures contracts | 330,400 | 222,800 |
Receivables: | ||
Fund shares sold | 24,180 | — |
Interest from non-affiliates | — | 11,142 |
Dividends from non-affiliates | 2,931,453 | 593,382 |
Dividends from affiliates | 1,233 | 218 |
Securities lending income (See Note 2.C.) | 53,262 | 13,774 |
Total Assets | 4,084,999,644 | 803,028,889 |
LIABILITIES: | ||
Payables: | ||
Investment securities purchased | 6,881,499 | — |
Collateral received on securities loaned (See Note 2.C.) | 59,263,391 | 18,596,582 |
Variation margin on futures contracts | 45,223 | 28,800 |
Accrued liabilities: | ||
Management fees (See Note 3.A.) | 394,317 | 79,405 |
Total Liabilities | 66,584,430 | 18,704,787 |
Net Assets | $4,018,415,214 | $784,324,102 |
NET ASSETS: | ||
Paid-in-Capital | $3,627,486,171 | $808,140,799 |
Total distributable earnings (loss) | 390,929,043 | (23,816,697 ) |
Total Net Assets | $4,018,415,214 | $784,324,102 |
Outstanding number of shares (unlimited number of shares authorized - par value $0.0001) | 80,250,000 | 19,900,000 |
Net asset value, per share | $50.07 | $39.41 |
Cost of investments in non-affiliates | $3,716,542,859 | $756,480,348 |
Cost of investments in affiliates | 8,565,577 | 1,515,338 |
Investment securities on loan, at value (See Note 2.C.) | 56,687,542 | 17,697,964 |
Cost of investment of cash collateral (See Note 2.C.) | 59,272,213 | 18,598,240 |
202 | J.P. Morgan Exchange-Traded Funds | April 30, 2024 |
JPMorgan BetaBuilders Canada ETF | JPMorgan BetaBuilders Developed Asia Pacific ex-Japan ETF | JPMorgan BetaBuilders Emerging Markets Equity ETF | JPMorgan BetaBuilders Europe ETF | |
INVESTMENT INCOME: | ||||
Interest income from non-affiliates | $52,953 | $42,239 | $4,610 | $55,244 |
Interest income from affiliates | 4,537 | 71,320 | 5,211 | 102,444 |
Dividend income from non-affiliates | 105,734,649 | 79,173,713 | 6,021,305 | 128,822,386 |
Dividend income from affiliates | — | — | 134,819 | — |
Income from securities lending (net) (See Note 2.C.) | 2,120,782 | 57,950 | 11,751 | 435,520 |
Foreign taxes withheld (net) | (15,207,152 ) | (821,102 ) | (691,074 ) | (14,017,804 ) |
Total investment income | 92,705,769 | 78,524,120 | 5,486,622 | 115,397,790 |
EXPENSES: | ||||
Management fees (See Note 3.A.) | 6,254,380 | 4,017,987 | 406,315 | 2,975,476 |
Interest expense to non-affiliates | — | 1,190 | 247 | 3,423 |
Interest expense to affiliates | 331 | 3,456 | 1,197 | 1,486 |
Total expenses | 6,254,711 | 4,022,633 | 407,759 | 2,980,385 |
Net investment income (loss) | 86,451,058 | 74,501,487 | 5,078,863 | 112,417,405 |
REALIZED/UNREALIZED GAINS (LOSSES): | ||||
Net realized gain (loss) on transactions from: | ||||
Investments in non-affiliates | (36,877,196 ) | (44,540,469 ) | (697,660 )(a) | (68,036,799 ) |
In-kind redemptions of investments in non-affiliates (See Note 4) | 9,513,888 | 8,465,630 | — | — |
Futures contracts | 5,737,248 | 3,454,542 | 259,623 | 7,575,650 |
Foreign currency transactions | 409,590 | 1,355,968 | (44,391 ) | 785,386 |
Net realized gain (loss) | (21,216,470 ) | (31,264,329 ) | (482,428 ) | (59,675,763 ) |
Change in net unrealized appreciation/depreciation on: | ||||
Investments in non-affiliates | 956,127,068 | 323,706,573 | 62,114,939 (b) | 930,542,112 |
Investments in affiliates | — | (800 ) | — | (7,261 ) |
Futures contracts | 418,301 | (242,635 ) | 237,526 | 3,210,580 |
Foreign currency translations | (7,204 ) | 13,151 | (11,530 ) | (341,368 ) |
Change in net unrealized appreciation/depreciation | 956,538,165 | 323,476,289 | 62,340,935 | 933,404,063 |
Net realized/unrealized gains (losses) | 935,321,695 | 292,211,960 | 61,858,507 | 873,728,300 |
Change in net assets resulting from operations | $1,021,772,753 | $366,713,447 | $66,937,370 | $986,145,705 |
April 30, 2024 | J.P. Morgan Exchange-Traded Funds | 203 |
JPMorgan BetaBuilders International Equity ETF | JPMorgan BetaBuilders Japan ETF | JPMorgan BetaBuilders U.S. Equity ETF | JPMorgan BetaBuilders U.S. Mid Cap Equity ETF | |
INVESTMENT INCOME: | ||||
Interest income from non-affiliates | $9,307 | $— | $29,736 | $20,119 |
Interest income from affiliates | 3,761 | 424 | 482 | 380 |
Dividend income from non-affiliates | 64,775,251 | 125,577,112 | 20,469,829 | 10,362,604 |
Dividend income from affiliates | 670,934 | — | 880,005 | 286,899 |
Income from securities lending (net) (See Note 2.C.) | 168,288 | 170,380 | 77,509 | 277,059 |
Foreign taxes withheld (net) | (6,171,484 ) | (12,553,087 ) | — | — |
Total investment income | 59,456,057 | 113,194,829 | 21,457,561 | 10,947,061 |
EXPENSES: | ||||
Management fees (See Note 3.A.) | 1,361,715 | 9,883,847 | 266,213 | 547,663 |
Interest expense to non-affiliates | — | 8,821 | 928 | 1,119 |
Interest expense to affiliates | 1,637 | 81,092 | — | 1,855 |
Total expenses | 1,363,352 | 9,973,760 | 267,141 | 550,637 |
Net investment income (loss) | 58,092,705 | 103,221,069 | 21,190,420 | 10,396,424 |
REALIZED/UNREALIZED GAINS (LOSSES): | ||||
Net realized gain (loss) on transactions from: | ||||
Investments in non-affiliates | (29,677,428 ) | (113,037,642 ) | (4,750,726 ) | (16,110,431 ) |
Investments in affiliates | — | — | 2,103 | — |
In-kind redemptions of investments in non-affiliates (See Note 4) | 73,864,698 | 72,305,296 | 12,139,887 | 71,942,420 |
In-kind redemptions of investments in affiliates (See Note 4) | — | — | 154,275 | — |
Futures contracts | 5,088,453 | 5,401,608 | 2,812,173 | 2,877,389 |
Foreign currency transactions | 95,109 | 933,017 | — | — |
Net realized gain (loss) | 49,370,832 | (34,397,721 ) | 10,357,712 | 58,709,378 |
Change in net unrealized appreciation/depreciation on: | ||||
Investments in non-affiliates | 493,938,704 | 1,458,902,054 | 438,402,734 | 240,121,895 |
Investments in affiliates | (1,700 ) | (235 ) | 9,486,098 | (9,243 ) |
Futures contracts | 776,748 | 1,633,676 | 274,926 | 833,671 |
Foreign currency translations | (329,972 ) | (2,718,782 ) | — | — |
Change in net unrealized appreciation/depreciation | 494,383,780 | 1,457,816,713 | 448,163,758 | 240,946,323 |
Net realized/unrealized gains (losses) | 543,754,612 | 1,423,418,992 | 458,521,470 | 299,655,701 |
Change in net assets resulting from operations | $601,847,317 | $1,526,640,061 | $479,711,890 | $310,052,125 |
204 | J.P. Morgan Exchange-Traded Funds | April 30, 2024 |
JPMorgan BetaBuilders U.S. Small Cap Equity ETF | JPMorgan Carbon Transition U.S. Equity ETF | JPMorgan Diversified Return Emerging Markets Equity ETF | JPMorgan Diversified Return International Equity ETF | |
INVESTMENT INCOME: | ||||
Interest income from non-affiliates | $13,214 | $296 | $427 | $4,697 |
Interest income from affiliates | 242 | 2 | 3,949 | 1,434 |
Dividend income from non-affiliates | 3,718,342 | 34,960 | 4,981,195 | 6,917,055 |
Dividend income from affiliates | 162,672 | 343 | 13,530 | 17,320 |
Income from securities lending (net) (See Note 2.C.) | 480,953 | — | — | 19,357 |
Foreign taxes withheld (net) | — | — | (409,817 ) | (559,120 ) |
Total investment income | 4,375,423 | 35,601 | 4,589,284 | 6,400,743 |
EXPENSES: | ||||
Management fees (See Note 3.A.) | 291,851 | 3,802 | 654,137 | 684,851 |
Interest expense to non-affiliates | 387 | 1 | — | — |
Interest expense to affiliates | 1,211 | — | 1,347 | 153 |
Total expenses | 293,449 | 3,803 | 655,484 | 685,004 |
Net investment income (loss) | 4,081,974 | 31,798 | 3,933,800 | 5,715,739 |
REALIZED/UNREALIZED GAINS (LOSSES): | ||||
Net realized gain (loss) on transactions from: | ||||
Investments in non-affiliates | (84,100,770 ) | (69,135 ) | (2,166,091 )(a) | (1,461,975 ) |
Investments in affiliates | — | — | — | 1,031 |
In-kind redemptions of investments in non-affiliates (See Note 4) | 84,315,932 | 486,778 | — | 2,097,616 |
Futures contracts | 1,168,131 | 3,337 | 30,624 | 229,845 |
Foreign currency transactions | — | — | (113,888 ) | (21,483 ) |
Forward foreign currency exchange contracts | — | — | (1,176 ) | — |
Net realized gain (loss) | 1,383,293 | 420,980 | (2,250,531 ) | 845,034 |
Change in net unrealized appreciation/depreciation on: | ||||
Investments in non-affiliates | 131,225,291 | 539,809 | 37,922,327 (b) | 44,788,303 |
Investments in affiliates | (4,205 ) | — | — | (146 ) |
Futures contracts | 58,288 | 743 | 31,425 | 22,758 |
Foreign currency translations | — | — | 24,301 | (29,444 ) |
Change in net unrealized appreciation/depreciation | 131,279,374 | 540,552 | 37,978,053 | 44,781,471 |
Net realized/unrealized gains (losses) | 132,662,667 | 961,532 | 35,727,522 | 45,626,505 |
Change in net assets resulting from operations | $136,744,641 | $993,330 | $39,661,322 | $51,342,244 |
April 30, 2024 | J.P. Morgan Exchange-Traded Funds | 205 |
JPMorgan Diversified Return U.S. Equity ETF | JPMorgan Diversified Return U.S. Mid Cap Equity ETF | JPMorgan Diversified Return U.S. Small Cap Equity ETF | JPMorgan U.S. Momentum Factor ETF | |
INVESTMENT INCOME: | ||||
Interest income from non-affiliates | $12,055 | $10,589 | $3,419 | $1,478 |
Interest income from affiliates | 176 | 253 | 129 | 249 |
Dividend income from non-affiliates | 5,240,062 | 3,950,290 | 4,646,959 | 2,979,157 |
Dividend income from affiliates | 22,640 | 16,891 | 33,877 | 26,395 |
Income from securities lending (net) (See Note 2.C.) | 12,685 | 22,113 | 142,573 | 479 |
Total investment income | 5,287,618 | 4,000,136 | 4,826,957 | 3,007,758 |
EXPENSES: | ||||
Management fees (See Note 3.A.) | 390,550 | 428,610 | 652,484 | 322,212 |
Interest expense to affiliates | 112 | 1,942 | 1,182 | 975 |
Total expenses | 390,662 | 430,552 | 653,666 | 323,187 |
Net investment income (loss) | 4,896,956 | 3,569,584 | 4,173,291 | 2,684,571 |
REALIZED/UNREALIZED GAINS (LOSSES): | ||||
Net realized gain (loss) on transactions from: | ||||
Investments in non-affiliates | 1,660,185 | (6,511,805 ) | (3,921,399 ) | (3,980,882 ) |
In-kind redemptions of investments in non-affiliates (See Note 4) | 15,064,577 | 14,789,974 | 11,438,938 | 30,209,374 |
Futures contracts | 216,256 | 208,564 | 576,956 | 201,251 |
Net realized gain (loss) | 16,941,018 | 8,486,733 | 8,094,495 | 26,429,743 |
Change in net unrealized appreciation/depreciation on: | ||||
Investments in non-affiliates | 51,439,456 | 44,773,302 | 49,093,873 | 48,177,703 |
Investments in affiliates | 200 | (931 ) | (6,028 ) | — |
Futures contracts | (18,267 ) | (31,334 ) | 28,143 | (36,350 ) |
Change in net unrealized appreciation/depreciation | 51,421,389 | 44,741,037 | 49,115,988 | 48,141,353 |
Net realized/unrealized gains (losses) | 68,362,407 | 53,227,770 | 57,210,483 | 74,571,096 |
Change in net assets resulting from operations | $73,259,363 | $56,797,354 | $61,383,774 | $77,255,667 |
206 | J.P. Morgan Exchange-Traded Funds | April 30, 2024 |
JPMorgan U.S. Quality Factor ETF | JPMorgan U.S. Value Factor ETF | |
INVESTMENT INCOME: | ||
Interest income from non-affiliates | $8,358 | $14,089 |
Interest income from affiliates | 762 | 174 |
Dividend income from non-affiliates | 27,100,957 | 9,633,979 |
Dividend income from affiliates | 177,817 | 45,733 |
Non-cash dividend income from non-affiliates | — | 629,000 |
Income from securities lending (net) (See Note 2.C.) | 786,025 | 186,995 |
Total investment income | 28,073,919 | 10,509,970 |
EXPENSES: | ||
Management fees (See Note 3.A.) | 2,050,658 | 465,019 |
Interest expense to affiliates | 362 | 534 |
Total expenses | 2,051,020 | 465,553 |
Net investment income (loss) | 26,022,899 | 10,044,417 |
REALIZED/UNREALIZED GAINS (LOSSES): | ||
Net realized gain (loss) on transactions from: | ||
Investments in non-affiliates | (15,100,496 ) | (10,918,956 ) |
In-kind redemptions of investments in non-affiliates (See Note 4) | 176,888,910 | 44,293,702 |
Futures contracts | 1,288,412 | 461,827 |
Net realized gain (loss) | 163,076,826 | 33,836,573 |
Change in net unrealized appreciation/depreciation on: | ||
Investments in non-affiliates | 306,353,698 | 89,155,343 |
Investments in affiliates | (5,023 ) | (1,458 ) |
Futures contracts | 16,640 | (34,456 ) |
Change in net unrealized appreciation/depreciation | 306,365,315 | 89,119,429 |
Net realized/unrealized gains (losses) | 469,442,141 | 122,956,002 |
Change in net assets resulting from operations | $495,465,040 | $133,000,419 |
April 30, 2024 | J.P. Morgan Exchange-Traded Funds | 207 |
JPMorgan BetaBuilders Canada ETF | JPMorgan BetaBuilders Developed Asia Pacific ex-Japan ETF | |||
Six Months Ended April 30, 2024 (Unaudited) | Year Ended October 31, 2023 | Six Months Ended April 30, 2024 (Unaudited) | Year Ended October 31, 2023 | |
CHANGE IN NET ASSETS RESULTING FROM OPERATIONS: | ||||
Net investment income (loss) | $86,451,058 | $162,247,128 | $74,501,487 | $173,601,115 |
Net realized gain (loss) | (21,216,470 ) | 117,082,989 | (31,264,329 ) | (47,836,361 ) |
Change in net unrealized appreciation/depreciation | 956,538,165 | (344,168,709 ) | 323,476,289 | 7,518,922 |
Change in net assets resulting from operations | 1,021,772,753 | (64,838,592 ) | 366,713,447 | 133,283,676 |
DISTRIBUTIONS TO SHAREHOLDERS: | ||||
Total distributions to shareholders | (82,502,893 ) | (154,798,545 ) | (90,505,593 ) | (149,063,924 ) |
CAPITAL TRANSACTIONS: | ||||
Change in net assets resulting from capital transactions | 334,567,557 | 262,338,554 | 383,649,140 | 413,671,860 |
NET ASSETS: | ||||
Change in net assets | 1,273,837,417 | 42,701,417 | 659,856,994 | 397,891,612 |
Beginning of period | 5,686,974,712 | 5,644,273,295 | 3,809,902,516 | 3,412,010,904 |
End of period | $6,960,812,129 | $5,686,974,712 | $4,469,759,510 | $3,809,902,516 |
CAPITAL TRANSACTIONS: | ||||
Proceeds from shares issued | $364,949,824 | $729,964,543 | $426,995,331 | $599,967,907 |
Cost of shares redeemed | (30,382,267 ) | (467,625,989 ) | (43,346,191 ) | (186,296,047 ) |
Total change in net assets resulting from capital transactions | $334,567,557 | $262,338,554 | $383,649,140 | $413,671,860 |
SHARE TRANSACTIONS: | ||||
Issued | 5,650,000 | 12,300,000 | 9,050,000 | 11,550,000 |
Redeemed | (500,000 ) | (7,700,000 ) | (900,000 ) | (3,900,000 ) |
Net increase (decrease) in shares from share transactions | 5,150,000 | 4,600,000 | 8,150,000 | 7,650,000 |
208 | J.P. Morgan Exchange-Traded Funds | April 30, 2024 |
JPMorgan BetaBuilders Emerging Markets Equity ETF | JPMorgan BetaBuilders Europe ETF | |||
Six Months Ended April 30, 2024 (Unaudited) | Period Ended October 31, 2023 (a) | Six Months Ended April 30, 2024 (Unaudited) | Year Ended October 31, 2023 | |
CHANGE IN NET ASSETS RESULTING FROM OPERATIONS: | ||||
Net investment income (loss) | $5,078,863 | $7,160,694 | $112,417,405 | $240,438,252 |
Net realized gain (loss) | (482,428 ) | (1,025,916 ) | (59,675,763 ) | 307,603,821 |
Change in net unrealized appreciation/depreciation | 62,340,935 | (37,361,086 ) | 933,404,063 | 67,083,048 |
Change in net assets resulting from operations | 66,937,370 | (31,226,308 ) | 986,145,705 | 615,125,121 |
DISTRIBUTIONS TO SHAREHOLDERS: | ||||
Total distributions to shareholders | (4,360,472 ) | (6,595,002 ) | (54,906,374 ) | (236,546,537 ) |
CAPITAL TRANSACTIONS: | ||||
Change in net assets resulting from capital transactions | 28,956,840 | 521,226,924 | 1,509,339,360 | 1,237,094,232 |
NET ASSETS: | ||||
Change in net assets | 91,533,738 | 483,405,614 | 2,440,578,691 | 1,615,672,816 |
Beginning of period | 483,405,614 | — | 5,143,360,575 | 3,527,687,759 |
End of period | $574,939,352 | $483,405,614 | $7,583,939,266 | $5,143,360,575 |
CAPITAL TRANSACTIONS: | ||||
Proceeds from shares issued | $28,956,840 | $521,696,199 | $1,509,339,360 | $5,755,955,092 |
Cost of shares redeemed | — | (469,275 ) | — | (4,518,860,860 ) |
Total change in net assets resulting from capital transactions | $28,956,840 | $521,226,924 | $1,509,339,360 | $1,237,094,232 |
SHARE TRANSACTIONS: | ||||
Issued | 600,000 | 10,800,000 | 26,850,000 | 109,050,000 |
Redeemed | — | — | — | (85,750,000 ) |
Net increase (decrease) in shares from share transactions | 600,000 | 10,800,000 | 26,850,000 | 23,300,000 |
April 30, 2024 | J.P. Morgan Exchange-Traded Funds | 209 |
JPMorgan BetaBuilders International Equity ETF | JPMorgan BetaBuilders Japan ETF | |||
Six Months Ended April 30, 2024 (Unaudited) | Year Ended October 31, 2023 | Six Months Ended April 30, 2024 (Unaudited) | Year Ended October 31, 2023 | |
CHANGE IN NET ASSETS RESULTING FROM OPERATIONS: | ||||
Net investment income (loss) | $58,092,705 | $102,334,948 | $103,221,069 | $164,453,628 |
Net realized gain (loss) | 49,370,832 | 24,661,242 | (34,397,721 ) | (25,682,690 ) |
Change in net unrealized appreciation/depreciation | 494,383,780 | 261,606,407 | 1,457,816,713 | 946,314,427 |
Change in net assets resulting from operations | 601,847,317 | 388,602,597 | 1,526,640,061 | 1,085,085,365 |
DISTRIBUTIONS TO SHAREHOLDERS: | ||||
Total distributions to shareholders | (57,531,144 ) | (88,690,220 ) | (294,824,859 ) | (102,173,384 ) |
CAPITAL TRANSACTIONS: | ||||
Change in net assets resulting from capital transactions | (123,798,679 ) | 550,286,782 | 1,228,224,153 | 1,603,160,390 |
NET ASSETS: | ||||
Change in net assets | 420,517,494 | 850,199,159 | 2,460,039,355 | 2,586,072,371 |
Beginning of period | 3,560,296,677 | 2,710,097,518 | 8,797,309,934 | 6,211,237,563 |
End of period | $3,980,814,171 | $3,560,296,677 | $11,257,349,289 | $8,797,309,934 |
CAPITAL TRANSACTIONS: | ||||
Proceeds from shares issued | $138,890,184 | $829,640,586 | $1,473,071,436 | $1,810,441,192 |
Cost of shares redeemed | (262,688,863 ) | (279,353,804 ) | (244,847,283 ) | (207,280,802 ) |
Total change in net assets resulting from capital transactions | $(123,798,679 ) | $550,286,782 | $1,228,224,153 | $1,603,160,390 |
SHARE TRANSACTIONS: | ||||
Issued | 2,400,000 | 15,400,000 | 26,900,000 | 36,000,000 |
Redeemed | (4,600,000 ) | (5,400,000 ) | (4,400,000 ) | (4,300,000 ) |
Net increase (decrease) in shares from share transactions | (2,200,000 ) | 10,000,000 | 22,500,000 | 31,700,000 |
210 | J.P. Morgan Exchange-Traded Funds | April 30, 2024 |
JPMorgan BetaBuilders U.S. Equity ETF | JPMorgan BetaBuilders U.S. Mid Cap Equity ETF | |||
Six Months Ended April 30, 2024 (Unaudited) | Year Ended October 31, 2023 | Six Months Ended April 30, 2024 (Unaudited) | Year Ended October 31, 2023 | |
CHANGE IN NET ASSETS RESULTING FROM OPERATIONS: | ||||
Net investment income (loss) | $21,190,420 | $26,495,941 | $10,396,424 | $22,537,760 |
Net realized gain (loss) | 10,357,712 | 24,298,633 | 58,709,378 | (28,126,236 ) |
Change in net unrealized appreciation/depreciation | 448,163,758 | 63,499,407 | 240,946,323 | (33,375,136 ) |
Change in net assets resulting from operations | 479,711,890 | 114,293,981 | 310,052,125 | (38,963,612 ) |
DISTRIBUTIONS TO SHAREHOLDERS: | ||||
Total distributions to shareholders | (20,476,522 ) | (24,912,196 ) | (11,212,570 ) | (22,224,476 ) |
CAPITAL TRANSACTIONS: | ||||
Change in net assets resulting from capital transactions | 459,435,595 | 807,133,106 | (128,999,529 ) | 84,786,233 |
NET ASSETS: | ||||
Change in net assets | 918,670,963 | 896,514,891 | 169,840,026 | 23,598,145 |
Beginning of period | 2,173,038,499 | 1,276,523,608 | 1,414,162,491 | 1,390,564,346 |
End of period | $3,091,709,462 | $2,173,038,499 | $1,584,002,517 | $1,414,162,491 |
CAPITAL TRANSACTIONS: | ||||
Proceeds from shares issued | $491,185,069 | $995,179,712 | $133,692,042 | $549,541,390 |
Cost of shares redeemed | (31,749,474 ) | (188,046,606 ) | (262,691,571 ) | (464,755,157 ) |
Total change in net assets resulting from capital transactions | $459,435,595 | $807,133,106 | $(128,999,529 ) | $84,786,233 |
SHARE TRANSACTIONS: | ||||
Issued | 5,600,000 | 13,050,000 | 1,600,000 | 7,175,000 |
Redeemed | (350,000 ) | (2,600,000 ) | (3,125,000 ) | (6,050,000 ) |
Net increase (decrease) in shares from share transactions | 5,250,000 | 10,450,000 | (1,525,000 ) | 1,125,000 |
April 30, 2024 | J.P. Morgan Exchange-Traded Funds | 211 |
JPMorgan BetaBuilders U.S. Small Cap Equity ETF | JPMorgan Carbon Transition U.S. Equity ETF | |||
Six Months Ended April 30, 2024 (Unaudited) | Year Ended October 31, 2023 | Six Months Ended April 30, 2024 (Unaudited) | Year Ended October 31, 2023 | |
CHANGE IN NET ASSETS RESULTING FROM OPERATIONS: | ||||
Net investment income (loss) | $4,081,974 | $11,065,965 | $31,798 | $303,381 |
Net realized gain (loss) | 1,383,293 | 16,660,435 | 420,980 | 2,054,177 |
Change in net unrealized appreciation/depreciation | 131,279,374 | (89,898,651 ) | 540,552 | (163,996 ) |
Change in net assets resulting from operations | 136,744,641 | (62,172,251 ) | 993,330 | 2,193,562 |
DISTRIBUTIONS TO SHAREHOLDERS: | ||||
Total distributions to shareholders | (6,264,310 ) | (10,398,310 ) | (62,006 ) | (313,724 ) |
CAPITAL TRANSACTIONS: | ||||
Change in net assets resulting from capital transactions | (304,541,528 ) | 201,531,188 | (1,510,840 ) | (17,154,380 ) |
NET ASSETS: | ||||
Change in net assets | (174,061,197 ) | 128,960,627 | (579,516 ) | (15,274,542 ) |
Beginning of period | 623,722,887 | 494,762,260 | 5,673,139 | 20,947,681 |
End of period | $449,661,690 | $623,722,887 | $5,093,623 | $5,673,139 |
CAPITAL TRANSACTIONS: | ||||
Proceeds from shares issued | $182,756,627 | $478,587,958 | $1,749,948 | $4,177,902 |
Cost of shares redeemed | (487,298,155 ) | (277,056,770 ) | (3,260,788 ) | (21,332,282 ) |
Total change in net assets resulting from capital transactions | $(304,541,528 ) | $201,531,188 | $(1,510,840 ) | $(17,154,380 ) |
SHARE TRANSACTIONS: | ||||
Issued | 3,200,000 | 8,625,000 | 25,000 | 75,000 |
Redeemed | (8,175,000 ) | (5,050,000 ) | (50,000 ) | (375,000 ) |
Net increase (decrease) in shares from share transactions | (4,975,000 ) | 3,575,000 | (25,000 ) | (300,000 ) |
212 | J.P. Morgan Exchange-Traded Funds | April 30, 2024 |
JPMorgan Diversified Return Emerging Markets Equity ETF | JPMorgan Diversified Return International Equity ETF | |||
Six Months Ended April 30, 2024 (Unaudited) | Year Ended October 31, 2023 | Six Months Ended April 30, 2024 (Unaudited) | Year Ended October 31, 2023 | |
CHANGE IN NET ASSETS RESULTING FROM OPERATIONS: | ||||
Net investment income (loss) | $3,933,800 | $11,177,230 | $5,715,739 | $22,166,755 |
Net realized gain (loss) | (2,250,531 ) | (4,876,927 ) | 845,034 | (2,043,729 ) |
Change in net unrealized appreciation/depreciation | 37,978,053 | 9,574,548 | 44,781,471 | 99,573,852 |
Change in net assets resulting from operations | 39,661,322 | 15,874,851 | 51,342,244 | 119,696,878 |
DISTRIBUTIONS TO SHAREHOLDERS: | ||||
Total distributions to shareholders | (4,685,104 ) | (10,712,059 ) | (9,856,428 ) | (21,332,208 ) |
CAPITAL TRANSACTIONS: | ||||
Change in net assets resulting from capital transactions | 10,186,798 | 100,409,884 | (31,808,254 ) | (416,251,431 ) |
NET ASSETS: | ||||
Change in net assets | 45,163,016 | 105,572,676 | 9,677,562 | (317,886,761 ) |
Beginning of period | 269,498,902 | 163,926,226 | 353,175,379 | 671,062,140 |
End of period | $314,661,918 | $269,498,902 | $362,852,941 | $353,175,379 |
CAPITAL TRANSACTIONS: | ||||
Proceeds from shares issued | $10,186,798 | $119,933,807 | $— | $35,996,019 |
Cost of shares redeemed | — | (19,523,923 ) | (31,808,254 ) | (452,247,450 ) |
Total change in net assets resulting from capital transactions | $10,186,798 | $100,409,884 | $(31,808,254 ) | $(416,251,431 ) |
SHARE TRANSACTIONS: | ||||
Issued | 200,000 | 2,400,000 | — | 700,000 |
Redeemed | — | (400,000 ) | (600,000 ) | (8,600,000 ) |
Net increase (decrease) in shares from share transactions | 200,000 | 2,000,000 | (600,000 ) | (7,900,000 ) |
April 30, 2024 | J.P. Morgan Exchange-Traded Funds | 213 |
JPMorgan Diversified Return U.S. Equity ETF | JPMorgan Diversified Return U.S. Mid Cap Equity ETF | |||
Six Months Ended April 30, 2024 (Unaudited) | Year Ended October 31, 2023 | Six Months Ended April 30, 2024 (Unaudited) | Year Ended October 31, 2023 | |
CHANGE IN NET ASSETS RESULTING FROM OPERATIONS: | ||||
Net investment income (loss) | $4,896,956 | $11,334,670 | $3,569,584 | $6,090,886 |
Net realized gain (loss) | 16,941,018 | 19,512,453 | 8,486,733 | 13,390,937 |
Change in net unrealized appreciation/depreciation | 51,421,389 | (30,077,329 ) | 44,741,037 | (28,014,797 ) |
Change in net assets resulting from operations | 73,259,363 | 769,794 | 56,797,354 | (8,532,974 ) |
DISTRIBUTIONS TO SHAREHOLDERS: | ||||
Total distributions to shareholders | (5,070,782 ) | (11,826,601 ) | (3,587,083 ) | (5,959,752 ) |
CAPITAL TRANSACTIONS: | ||||
Change in net assets resulting from capital transactions | (63,482,330 ) | (76,059,605 ) | (3,266,096 ) | 57,036,143 |
NET ASSETS: | ||||
Change in net assets | 4,706,251 | (87,116,412 ) | 49,944,175 | 42,543,417 |
Beginning of period | 420,166,041 | 507,282,453 | 310,063,947 | 267,520,530 |
End of period | $424,872,292 | $420,166,041 | $360,008,122 | $310,063,947 |
CAPITAL TRANSACTIONS: | ||||
Proceeds from shares issued | $4,980,673 | $88,108,412 | $46,375,415 | $179,548,242 |
Cost of shares redeemed | (68,463,003 ) | (164,168,017 ) | (49,641,511 ) | (122,512,099 ) |
Total change in net assets resulting from capital transactions | $(63,482,330 ) | $(76,059,605 ) | $(3,266,096 ) | $57,036,143 |
SHARE TRANSACTIONS: | ||||
Issued | 50,000 | 925,000 | 500,000 | 2,100,000 |
Redeemed | (675,000 ) | (1,725,000 ) | (525,000 ) | (1,450,000 ) |
Net increase (decrease) in shares from share transactions | (625,000 ) | (800,000 ) | (25,000 ) | 650,000 |
214 | J.P. Morgan Exchange-Traded Funds | April 30, 2024 |
JPMorgan Diversified Return U.S. Small Cap Equity ETF | JPMorgan U.S. Momentum Factor ETF | |||
Six Months Ended April 30, 2024 (Unaudited) | Year Ended October 31, 2023 | Six Months Ended April 30, 2024 (Unaudited) | Year Ended October 31, 2023 | |
CHANGE IN NET ASSETS RESULTING FROM OPERATIONS: | ||||
Net investment income (loss) | $4,173,291 | $7,393,908 | $2,684,571 | $3,480,550 |
Net realized gain (loss) | 8,094,495 | (163,118 ) | 26,429,743 | (18,056,194 ) |
Change in net unrealized appreciation/depreciation | 49,115,988 | (28,884,944 ) | 48,141,353 | 25,907,183 |
Change in net assets resulting from operations | 61,383,774 | (21,654,154 ) | 77,255,667 | 11,331,539 |
DISTRIBUTIONS TO SHAREHOLDERS: | ||||
Total distributions to shareholders | (4,331,534 ) | (6,840,045 ) | (2,216,275 ) | (3,468,175 ) |
CAPITAL TRANSACTIONS: | ||||
Change in net assets resulting from capital transactions | 27,288,991 | 127,769,508 | 468,924,006 | 64,740,104 |
NET ASSETS: | ||||
Change in net assets | 84,341,231 | 99,275,309 | 543,963,398 | 72,603,468 |
Beginning of period | 386,208,306 | 286,932,997 | 301,926,586 | 229,323,118 |
End of period | $470,549,537 | $386,208,306 | $845,889,984 | $301,926,586 |
CAPITAL TRANSACTIONS: | ||||
Proceeds from shares issued | $71,495,173 | $264,275,154 | $556,029,017 | $72,582,485 |
Cost of shares redeemed | (44,206,182 ) | (136,505,646 ) | (87,105,011 ) | (7,842,381 ) |
Total change in net assets resulting from capital transactions | $27,288,991 | $127,769,508 | $468,924,006 | $64,740,104 |
SHARE TRANSACTIONS: | ||||
Issued | 1,675,000 | 6,600,000 | 11,075,000 | 1,750,000 |
Redeemed | (1,025,000 ) | (3,450,000 ) | (1,700,000 ) | (200,000 ) |
Net increase (decrease) in shares from share transactions | 650,000 | 3,150,000 | 9,375,000 | 1,550,000 |
April 30, 2024 | J.P. Morgan Exchange-Traded Funds | 215 |
JPMorgan U.S. Quality Factor ETF | JPMorgan U.S. Value Factor ETF | |||
Six Months Ended April 30, 2024 (Unaudited) | Year Ended October 31, 2023 | Six Months Ended April 30, 2024 (Unaudited) | Year Ended October 31, 2023 | |
CHANGE IN NET ASSETS RESULTING FROM OPERATIONS: | ||||
Net investment income (loss) | $26,022,899 | $20,412,132 | $10,044,417 | $15,715,710 |
Net realized gain (loss) | 163,076,826 | 36,070,927 | 33,836,573 | 2,098,503 |
Change in net unrealized appreciation/depreciation | 306,365,315 | 7,321,870 | 89,119,429 | (16,775,755 ) |
Change in net assets resulting from operations | 495,465,040 | 63,804,929 | 133,000,419 | 1,038,458 |
DISTRIBUTIONS TO SHAREHOLDERS: | ||||
Total distributions to shareholders | (22,797,819 ) | (17,505,540 ) | (9,849,537 ) | (15,133,809 ) |
CAPITAL TRANSACTIONS: | ||||
Change in net assets resulting from capital transactions | 1,143,524,387 | 1,776,196,110 | (22,472,401 ) | 253,657,252 |
NET ASSETS: | ||||
Change in net assets | 1,616,191,608 | 1,822,495,499 | 100,678,481 | 239,561,901 |
Beginning of period | 2,402,223,606 | 579,728,107 | 683,645,621 | 444,083,720 |
End of period | $4,018,415,214 | $2,402,223,606 | $784,324,102 | $683,645,621 |
CAPITAL TRANSACTIONS: | ||||
Proceeds from shares issued | $1,779,913,226 | $2,091,392,700 | $184,084,976 | $686,426,951 |
Cost of shares redeemed | (636,388,839 ) | (315,196,590 ) | (206,557,377 ) | (432,769,699 ) |
Total change in net assets resulting from capital transactions | $1,143,524,387 | $1,776,196,110 | $(22,472,401 ) | $253,657,252 |
SHARE TRANSACTIONS: | ||||
Issued | 36,200,000 | 49,250,000 | 4,700,000 | 19,700,000 |
Redeemed | (12,900,000 ) | (7,500,000 ) | (5,300,000 ) | (12,700,000 ) |
Net increase (decrease) in shares from share transactions | 23,300,000 | 41,750,000 | (600,000 ) | 7,000,000 |
216 | J.P. Morgan Exchange-Traded Funds | April 30, 2024 |
Per share operating performance | |||||
Investment operations | Distributions | ||||
Net asset value, beginning of period | Net investment income (loss) (b) | Net realized and unrealized gains (losses) on investments | Total from investment operations | Net investment income | |
JPMorgan BetaBuilders Canada ETF | |||||
Six Months Ended April 30, 2024 (Unaudited) | $55.16 | $0.83 | $9.11 | $9.94 | $(0.80 ) |
Year Ended October 31, 2023 | 57.30 | 1.63 | (2.21 ) | (0.58 ) | (1.56 ) |
Year Ended October 31, 2022 | 67.80 | 1.59 | (10.53 ) | (8.94 ) | (1.56 ) |
Year Ended October 31, 2021 (f) | 45.99 | 1.38 | 21.78 | 23.16 | (1.35 ) |
Year Ended October 31, 2020 (f) | 49.78 | 1.29 | (3.82 ) | (2.53 ) | (1.26 ) |
Year Ended October 31, 2019 (f) | 45.19 | 1.31 | 4.47 | 5.78 | (1.19 ) |
JPMorgan BetaBuilders Developed Asia Pacific ex-Japan ETF | |||||
Six Months Ended April 30, 2024 (Unaudited) | 43.57 | 0.83 | 3.38 | 4.21 | (1.02 ) |
Year Ended October 31, 2023 | 42.76 | 2.00 | 0.51 | 2.51 | (1.70 ) |
Year Ended October 31, 2022 | 56.89 | 2.12 | (12.86 ) | (10.74 ) | (3.39 ) |
Year Ended October 31, 2021 (f) | 44.97 | 2.44 | 11.48 | 13.92 | (2.00 ) |
Year Ended October 31, 2020 (f) | 50.63 | 1.58 | (5.65 ) | (4.07 ) | (1.59 ) |
Year Ended October 31, 2019 (f) | 45.36 | 2.10 | 5.17 | 7.27 | (2.00 ) |
JPMorgan BetaBuilders Emerging Markets Equity ETF | |||||
Six Months Ended April 30, 2024 (Unaudited) | 44.76 | 0.45 | 5.61 | 6.06 | (0.39 ) |
May 10, 2023 (h) through October 31, 2023 | 47.67 | 0.80 | (3.09 ) | (2.29 ) | (0.62 ) |
JPMorgan BetaBuilders Europe ETF | |||||
Six Months Ended April 30, 2024 (Unaudited) | 49.36 | 0.95 | 8.02 | 8.97 | (0.46 ) |
Year Ended October 31, 2023 | 43.61 | 1.92 | 5.46 | 7.38 | (1.63 ) |
Year Ended October 31, 2022 | 59.74 | 1.78 | (15.31 ) | (13.53 ) | (2.60 ) |
Year Ended October 31, 2021 (f) | 43.29 | 1.67 | 16.19 | 17.86 | (1.41 ) |
Year Ended October 31, 2020 (f) | 48.71 | 1.08 | (5.43 ) | (4.35 ) | (1.07 ) |
Year Ended October 31, 2019 (f) | 45.19 | 1.79 | 3.28 | 5.07 | (1.55 ) |
(a) | Annualized for periods less than one year, unless otherwise noted. |
(b) | Calculated based upon average shares outstanding. |
(c) | Not annualized for periods less than one year. |
(d) | Includes adjustments in accordance with accounting principles generally accepted in the United States of America and as such, the net asset values for financial reporting purposes and the returns based upon those net asset values may differ from the net asset values and returns for shareholder transactions. |
(e) | Prior to December 9, 2019, the market price return was calculated assuming an initial investment made at the market price at the beginning of the reporting period, reinvestment of all dividends and distributions at the market price during the period, and sale at the market price on the last day of the period. The price used to calculate the market price return was the midpoint of the bid/ask spread at the close of business on the listing exchange of the Fund. Effective December 9, 2019, the closing price was used to calculate the market price return; however, any prices used in the calculation for the market price return prior to December 9, 2019, would have used the midpoint of the bid/ask spread at the close of business on the exchange. |
(f) | Per share amounts reflects a 1:2 reverse stock split that occurred on April 12, 2021. |
(g) | Prior to November 1, 2019, the Fund may have waived fees if expenses exceeded the expense cap. On November 1, 2019, the Fund adopted a unitary fee structure where a management fee is accrued by the Fund based on prior day net assets and other expenses are paid by the Advisor. |
(h) | Commencement of operations. |
218 | J.P. Morgan Exchange-Traded Funds | April 30, 2024 |
Ratios/Supplemental data | ||||||||
Ratios to average net assets (a) | ||||||||
Net asset value, end of period | Market price, end of period | Total return (c)(d) | Market price total return (c)(e) | Net assets, end of period | Net expenses | Net investment income (loss) | Expenses without waivers and reimbursements | Portfolio turnover rate (c) |
$64.30 | $64.36 | 18.03 % | 18.11 % | $6,960,812,129 | 0.19 % | 2.62 % | 0.19 % | 2 % |
55.16 | 55.17 | (1.15 ) | (1.22 ) | 5,686,974,712 | 0.19 | 2.73 | 0.19 | 3 |
57.30 | 57.35 | (13.34 ) | (13.49 ) | 5,644,273,295 | 0.19 | 2.51 | 0.19 | 5 |
67.80 | 67.98 | 50.77 | 50.84 | 6,071,268,619 | 0.19 | 2.28 | 0.19 | 2 |
45.99 | 46.10 | (4.98 ) | (4.81 ) | 3,640,211,260 | 0.19 | 2.74 | 0.19 | 4 |
49.78 | 49.80 | 13.08 | 12.97 | 3,800,754,020 | 0.19 | 2.73 | 0.34 (g) | 7 |
46.76 | 46.73 | 9.60 | 9.56 | 4,469,759,510 | 0.19 | 3.52 | 0.19 | 3 |
43.57 | 43.56 | 5.55 | 5.45 | 3,809,902,516 | 0.19 | 4.14 | 0.19 | 6 |
42.76 | 42.79 | (19.60 ) | (19.87 ) | 3,412,010,904 | 0.20 | 4.17 | 0.20 | 14 |
56.89 | 57.12 | 31.14 | 31.26 | 4,113,118,547 | 0.19 | 4.26 | 0.19 | 6 |
44.97 | 45.10 | (7.87 ) | (7.45 ) | 1,465,970,894 | 0.19 | 3.40 | 0.19 | 6 |
50.63 | 50.54 | 16.18 | 15.94 | 1,442,853,830 | 0.19 | 4.22 | 0.39 (g) | 7 |
50.43 | 50.25 | 13.57 | 12.91 | 574,939,352 | 0.15 | 1.86 | 0.15 | 6 |
44.76 | 44.86 | (4.88 ) | (4.67 ) | 483,405,614 | 0.15 | 3.47 | 0.15 | 14 |
57.87 | 57.98 | 18.18 | 18.31 | 7,583,939,266 | 0.09 | 3.39 | 0.09 | 3 |
49.36 | 49.40 | 16.74 | 16.81 | 5,143,360,575 | 0.09 | 3.64 | 0.09 | 6 |
43.61 | 43.62 | (23.01 ) | (23.22 ) | 3,527,687,759 | 0.10 | 3.36 | 0.10 | 7 |
59.74 | 59.92 | 41.54 | 41.77 | 9,427,453,378 | 0.09 | 2.92 | 0.09 | 6 |
43.29 | 43.34 | (8.92 ) | (8.90 ) | 3,701,005,509 | 0.09 | 2.33 | 0.09 | 5 |
48.71 | 48.78 | 11.43 | 11.32 | 3,853,145,624 | 0.09 | 3.83 | 0.25 (g) | 7 |
April 30, 2024 | J.P. Morgan Exchange-Traded Funds | 219 |
Per share operating performance | |||||
Investment operations | Distributions | ||||
Net asset value, beginning of period | Net investment income (loss) (b) | Net realized and unrealized gains (losses) on investments | Total from investment operations | Net investment income | |
JPMorgan BetaBuilders International Equity ETF | |||||
Six Months Ended April 30, 2024 (Unaudited) | $50.43 | $0.83 | $7.76 | $8.59 | $(0.82 ) |
Year Ended October 31, 2023 | 44.72 | 1.60 | 5.49 | 7.09 | (1.38 ) |
Year Ended October 31, 2022 | 60.53 | 1.51 | (15.16 ) | (13.65 ) | (2.16 ) |
Year Ended October 31, 2021 | 46.20 | 1.67 | 14.10 | 15.77 | (1.44 ) |
December 3, 2019 (f) through October 31, 2020 | 49.79 | 1.05 | (4.26 )(g) | (3.21 ) | (0.38 ) |
JPMorgan BetaBuilders Japan ETF | |||||
Six Months Ended April 30, 2024 (Unaudited) | 48.69 | 0.54 | 7.77 | 8.31 | (1.60 ) |
Year Ended October 31, 2023 | 41.69 | 1.03 | 6.65 | 7.68 | (0.68 ) |
Year Ended October 31, 2022 | 57.16 | 1.03 | (14.91 ) | (13.88 ) | (1.59 ) |
Year Ended October 31, 2021 (i) | 48.39 | 1.04 | 8.36 | 9.40 | (0.63 ) |
Year Ended October 31, 2020 (i) | 49.07 | 0.84 | (0.39 ) | 0.45 | (1.13 ) |
Year Ended October 31, 2019 (i) | 45.45 | 0.97 | 2.93 | 3.90 | (0.28 ) |
JPMorgan BetaBuilders U.S. Equity ETF | |||||
Six Months Ended April 30, 2024 (Unaudited) | 75.32 | 0.67 | 15.33 | 16.00 | (0.65 ) |
Year Ended October 31, 2023 | 69.38 | 1.19 | 5.89 | 7.08 | (1.14 ) |
Year Ended October 31, 2022 | 84.15 | 1.11 | (14.86 ) | (13.75 ) | (1.02 ) |
Year Ended October 31, 2021 | 59.59 | 1.02 | 24.48 | 25.50 | (0.94 ) |
Year Ended October 31, 2020 | 54.60 | 1.14 | 4.83 | 5.97 | (0.98 ) |
March 12, 2019 (f) through October 31, 2019 | 50.14 | 0.68 | 4.29 | 4.97 | (0.51 ) |
JPMorgan BetaBuilders U.S. Mid Cap Equity ETF | |||||
Six Months Ended April 30, 2024 (Unaudited) | 71.06 | 0.55 | 15.17 | 15.72 | (0.58 ) |
Year Ended October 31, 2023 | 74.06 | 1.14 | (3.00 ) | (1.86 ) | (1.14 ) |
Year Ended October 31, 2022 | 93.59 | 1.03 | (19.57 ) | (18.54 ) | (0.99 ) |
Year Ended October 31, 2021 | 64.16 | 0.90 | 29.27 | 30.17 | (0.74 ) |
April 14, 2020 (f) through October 31, 2020 | 50.78 | 0.33 | 13.32 (g) | 13.65 | (0.27 ) |
(a) | Annualized for periods less than one year, unless otherwise noted. |
(b) | Calculated based upon average shares outstanding. |
(c) | Not annualized for periods less than one year. |
(d) | Includes adjustments in accordance with accounting principles generally accepted in the United States of America and as such, the net asset values for financial reporting purposes and the returns based upon those net asset values may differ from the net asset values and returns for shareholder transactions. |
(e) | Prior to December 9, 2019, the market price return was calculated assuming an initial investment made at the market price at the beginning of the reporting period, reinvestment of all dividends and distributions at the market price during the period, and sale at the market price on the last day of the period. The price used to calculate the market price return was the midpoint of the bid/ask spread at the close of business on the listing exchange of the Fund. Effective December 9, 2019, the closing price was used to calculate the market price return; however, any prices used in the calculation for the market price return prior to December 9, 2019, would have used the midpoint of the bid/ask spread at the close of business on the exchange. |
(f) | Commencement of operations. |
(g) | Calculation of the net realized and unrealized gains (losses) per share does not correlate with the Fund’s net realized and unrealized gains (losses) presented in the Statements of Operations due to the timing of capital transactions in relation to the fluctuating market values of the Fund’s investments. |
(h) | Since the shares of the Fund did not trade in the secondary market until the day after the Fund’s inception, for the period from the inception to the first day of secondary market trading, the net asset value is used as a proxy for the secondary market trading price to calculate the market returns. |
(i) | Per share amounts reflects a 1:2 reverse stock split that occurred on April 12, 2021. |
(j) | Prior to November 1, 2019, the Fund may have waived fees if expenses exceeded the expense cap. On November 1, 2019, the Fund adopted a unitary fee structure where a management fee is accrued by the Fund based on prior day net assets and other expenses are paid by the Advisor. |
220 | J.P. Morgan Exchange-Traded Funds | April 30, 2024 |
Ratios/Supplemental data | ||||||||
Ratios to average net assets (a) | ||||||||
Net asset value, end of period | Market price, end of period | Total return (c)(d) | Market price total return (c)(e) | Net assets, end of period | Net expenses | Net investment income (loss) | Expenses without waivers and reimbursements | Portfolio turnover rate (c) |
$58.20 | $58.16 | 17.08 % | 16.56 % | $3,980,814,171 | 0.07 % | 2.95 % | 0.07 % | 3 % |
50.43 | 50.62 | 15.69 | 16.04 | 3,560,296,677 | 0.07 | 3.02 | 0.07 | 5 |
44.72 | 44.75 | (23.02 ) | (23.11 ) | 2,710,097,518 | 0.07 | 2.88 | 0.07 | 6 |
60.53 | 60.64 | 34.26 | 34.24 | 3,680,140,678 | 0.07 | 2.85 | 0.07 | 5 |
46.20 | 46.29 | (6.45 ) | (6.27 )(h) | 1,866,670,302 | 0.07 | 2.40 | 0.07 | 8 |
55.40 | 55.34 | 17.34 | 16.03 | 11,257,349,289 | 0.19 | 1.98 | 0.19 | 2 |
48.69 | 49.19 | 18.54 | 19.65 | 8,797,309,934 | 0.19 | 2.11 | 0.19 | 3 |
41.69 | 41.73 | (24.96 ) | (24.95 ) | 6,211,237,563 | 0.19 | 2.10 | 0.19 | 4 |
57.16 | 57.21 | 19.47 | 18.98 | 7,864,537,853 | 0.19 | 1.83 | 0.19 | 3 |
48.39 | 48.64 | 0.87 | 1.24 | 5,323,035,447 | 0.19 | 1.77 | 0.19 | 5 |
49.07 | 49.14 | 8.74 | 9.07 | 4,318,521,919 | 0.19 | 2.14 | 0.33 (j) | 4 |
90.67 | 90.64 | 21.26 | 21.21 | 3,091,709,462 | 0.02 | 1.53 | 0.02 | 2 |
75.32 | 75.33 | 10.25 | 10.20 | 2,173,038,499 | 0.02 | 1.58 | 0.02 | 3 |
69.38 | 69.42 | (16.42 ) | (16.33 ) | 1,276,523,608 | 0.02 | 1.47 | 0.02 | 4 |
84.15 | 84.11 | 43.02 | 42.97 | 782,605,972 | 0.02 | 1.34 | 0.02 | 4 |
59.59 | 59.58 | 11.09 | 11.05 | 238,372,575 | 0.02 | 1.99 | 0.02 | 4 |
54.60 | 54.61 | 9.95 | 9.97 (h) | 46,409,125 | 0.02 | 2.01 | 0.02 | 3 |
86.20 | 86.26 | 22.13 | 22.22 | 1,584,002,517 | 0.07 | 1.31 | 0.07 | 5 |
71.06 | 71.06 | (2.57 ) | (2.39 ) | 1,414,162,491 | 0.07 | 1.49 | 0.07 | 25 |
74.06 | 73.92 | (19.87 ) | (20.10 ) | 1,390,564,346 | 0.07 | 1.29 | 0.07 | 30 |
93.59 | 93.68 | 47.15 | 47.52 | 1,698,624,114 | 0.07 | 1.05 | 0.07 | 27 |
64.16 | 64.06 | 26.91 | 26.71 (h) | 988,131,953 | 0.07 | 0.91 | 0.07 | 7 |
April 30, 2024 | J.P. Morgan Exchange-Traded Funds | 221 |
Per share operating performance | |||||
Investment operations | Distributions | ||||
Net asset value, beginning of period | Net investment income (loss) (b) | Net realized and unrealized gains (losses) on investments | Total from investment operations | Net investment income | |
JPMorgan BetaBuilders U.S. Small Cap Equity ETF | |||||
Six Months Ended April 30, 2024 (Unaudited) | $49.40 | $0.36 | $9.53 | $9.89 | $(0.51 ) |
Year Ended October 31, 2023 | 54.67 | 0.92 | (5.30 ) | (4.38 ) | (0.89 ) |
Year Ended October 31, 2022 | 67.49 | 0.77 | (12.79 ) | (12.02 ) | (0.80 ) |
November 16, 2020 (f) through October 31, 2021 | 51.27 | 0.62 | 16.04 | 16.66 | (0.44 ) |
JPMorgan Carbon Transition U.S. Equity ETF | |||||
Six Months Ended April 30, 2024 (Unaudited) | 56.73 | 0.41 | 11.60 | 12.01 | (0.83 ) |
Year Ended October 31, 2023 | 52.37 | 0.77 | 4.37 | 5.14 | (0.78 ) |
Year Ended October 31, 2022 | 62.33 | 0.77 | (9.94 ) | (9.17 ) | (0.79 ) |
December 9, 2020 (f) through October 31, 2021 | 49.29 | 0.63 | 12.95 | 13.58 | (0.54 ) |
JPMorgan Diversified Return Emerging Markets Equity ETF | |||||
Six Months Ended April 30, 2024 (Unaudited) | 48.12 | 0.69 | 6.27 | 6.96 | (0.83 ) |
Year Ended October 31, 2023 | 45.54 | 2.11 | 2.38 | 4.49 | (1.91 ) |
Year Ended October 31, 2022 | 56.99 | 2.21 | (10.86 ) | (8.65 ) | (2.80 ) |
Year Ended October 31, 2021 | 46.47 | 1.81 | 10.70 | 12.51 | (1.99 ) |
Year Ended October 31, 2020 | 54.43 | 1.46 | (7.48 ) | (6.02 ) | (1.94 ) |
Year Ended October 31, 2019 | 50.91 | 2.07 | 2.97 | 5.04 | (1.52 ) |
JPMorgan Diversified Return International Equity ETF | |||||
Six Months Ended April 30, 2024 (Unaudited) | 49.05 | 0.83 | 6.51 | 7.34 | (1.41 ) |
Year Ended October 31, 2023 | 44.44 | 1.84 | 5.02 | 6.86 | (2.25 ) |
Year Ended October 31, 2022 | 61.02 | 1.91 | (15.62 ) | (13.71 ) | (2.87 ) |
Year Ended October 31, 2021 | 49.84 | 1.91 | 11.03 | 12.94 | (1.76 ) |
Year Ended October 31, 2020 | 55.06 | 1.35 | (5.01 ) | (3.66 ) | (1.56 ) |
Year Ended October 31, 2019 | 53.10 | 1.77 | 1.90 | 3.67 | (1.71 ) |
(a) | Annualized for periods less than one year, unless otherwise noted. |
(b) | Calculated based upon average shares outstanding. |
(c) | Not annualized for periods less than one year. |
(d) | Includes adjustments in accordance with accounting principles generally accepted in the United States of America and as such, the net asset values for financial reporting purposes and the returns based upon those net asset values may differ from the net asset values and returns for shareholder transactions. |
(e) | Prior to December 9, 2019, the market price return was calculated assuming an initial investment made at the market price at the beginning of the reporting period, reinvestment of all dividends and distributions at the market price during the period, and sale at the market price on the last day of the period. The price used to calculate the market price return was the midpoint of the bid/ask spread at the close of business on the listing exchange of the Fund. Effective December 9, 2019, the closing price was used to calculate the market price return; however, any prices used in the calculation for the market price return prior to December 9, 2019, would have used the midpoint of the bid/ask spread at the close of business on the exchange. |
(f) | Commencement of operations. |
(g) | Since the shares of the Fund did not trade in the secondary market until the day after the Fund’s inception, for the period from the inception to the first day of secondary market trading, the net asset value is used as a proxy for the secondary market trading price to calculate the market returns. |
(h) | Prior to November 1, 2019, the Fund may have waived fees if expenses exceeded the expense cap. On November 1, 2019, the Fund adopted a unitary fee structure where a management fee is accrued by the Fund based on prior day net assets and other expenses are paid by the Advisor. |
222 | J.P. Morgan Exchange-Traded Funds | April 30, 2024 |
Ratios/Supplemental data | ||||||||
Ratios to average net assets (a) | ||||||||
Net asset value, end of period | Market price, end of period | Total return (c)(d) | Market price total return (c)(e) | Net assets, end of period | Net expenses | Net investment income (loss) | Expenses without waivers and reimbursements | Portfolio turnover rate (c) |
$58.78 | $58.82 | 19.99 % | 20.26 % | $449,661,690 | 0.09 % | 1.24 % | 0.09 % | 10 % |
49.40 | 49.32 | (8.15 ) | (7.81 ) | 623,722,887 | 0.09 | 1.67 | 0.09 | 41 |
54.67 | 54.38 | (17.87 ) | (18.39 ) | 494,762,260 | 0.09 | 1.35 | 0.09 | 30 |
67.49 | 67.56 | 32.56 | 32.70 (g) | 442,061,490 | 0.09 | 0.98 | 0.09 | 27 |
67.91 | 67.99 | 21.22 | 21.35 | 5,093,623 | 0.15 | 1.25 | 0.15 | 11 |
56.73 | 56.74 | 9.85 | 9.85 | 5,673,139 | 0.15 | 1.36 | 0.15 | 20 |
52.37 | 52.38 | (14.79 ) | (14.79 ) | 20,947,681 | 0.15 | 1.35 | 0.15 | 16 |
62.33 | 62.34 | 27.68 | 27.70 (g) | 24,933,394 | 0.15 | 1.26 | 0.15 | 27 |
54.25 | 54.29 | 14.56 | 14.95 | 314,661,918 | 0.44 | 2.64 | 0.44 | 11 |
48.12 | 47.99 | 9.72 | 8.78 | 269,498,902 | 0.44 | 4.17 | 0.44 | 33 |
45.54 | 45.81 | (15.61 ) | (15.20 ) | 163,926,226 | 0.44 | 4.19 | 0.44 | 33 |
56.99 | 57.05 | 26.93 | 27.80 | 153,882,748 | 0.44 | 3.18 | 0.44 | 29 |
46.47 | 46.21 | (11.20 ) | (11.80 ) | 213,760,142 | 0.44 | 2.97 | 0.44 | 26 |
54.43 | 54.50 | 10.00 | 10.31 | 353,795,416 | 0.45 | 3.87 | 0.87 (h) | 51 |
54.98 | 54.86 | 15.05 | 14.52 | 362,852,941 | 0.37 | 3.09 | 0.37 | 11 |
49.05 | 49.17 | 15.22 | 15.26 | 353,175,379 | 0.37 | 3.57 | 0.37 | 26 |
44.44 | 44.54 | (23.25 ) | (23.15 ) | 671,062,140 | 0.37 | 3.59 | 0.37 | 28 |
61.02 | 61.08 | 26.00 | 26.08 | 842,016,222 | 0.37 | 3.14 | 0.37 | 35 |
49.84 | 49.86 | (6.72 ) | (6.62 ) | 867,200,124 | 0.37 | 2.61 | 0.37 | 23 |
55.06 | 55.02 | 7.05 | 7.23 | 1,282,867,303 | 0.38 | 3.27 | 0.41 (h) | 25 |
April 30, 2024 | J.P. Morgan Exchange-Traded Funds | 223 |
Per share operating performance | |||||
Investment operations | Distributions | ||||
Net asset value, beginning of period | Net investment income (loss) (b) | Net realized and unrealized gains (losses) on investments | Total from investment operations | Net investment income | |
JPMorgan Diversified Return U.S. Equity ETF | |||||
Six Months Ended April 30, 2024 (Unaudited) | $91.34 | $1.16 | $15.57 | $16.73 | $(1.18 ) |
Year Ended October 31, 2023 | 93.94 | 2.24 | (2.49 ) | (0.25 ) | (2.35 ) |
Year Ended October 31, 2022 | 101.43 | 2.16 | (7.56 ) | (5.40 ) | (2.09 ) |
Year Ended October 31, 2021 | 73.52 | 1.71 | 27.76 | 29.47 | (1.56 ) |
Year Ended October 31, 2020 | 76.44 | 1.65 | (2.82 ) | (1.17 ) | (1.75 ) |
Year Ended October 31, 2019 | 69.92 | 1.66 | 6.34 | 8.00 | (1.48 ) |
JPMorgan Diversified Return U.S. Mid Cap Equity ETF | |||||
Six Months Ended April 30, 2024 (Unaudited) | 80.54 | 0.91 | 13.59 | 14.50 | (0.92 ) |
Year Ended October 31, 2023 | 83.60 | 1.62 | (3.04 ) | (1.42 ) | (1.64 ) |
Year Ended October 31, 2022 | 92.23 | 1.60 | (8.73 ) | (7.13 ) | (1.50 ) |
Year Ended October 31, 2021 | 64.77 | 1.30 | 27.36 | 28.66 | (1.20 ) |
Year Ended October 31, 2020 | 67.13 | 1.18 | (2.38 ) | (1.20 ) | (1.16 ) |
Year Ended October 31, 2019 | 62.24 | 1.18 | 4.78 | 5.96 | (1.07 ) |
JPMorgan Diversified Return U.S. Small Cap Equity ETF | |||||
Six Months Ended April 30, 2024 (Unaudited) | 37.31 | 0.39 | 5.49 | 5.88 | (0.41 ) |
Year Ended October 31, 2023 | 39.85 | 0.81 | (2.59 ) | (1.78 ) | (0.76 ) |
Year Ended October 31, 2022 | 45.20 | 0.64 | (5.41 ) | (4.77 ) | (0.58 ) |
Year Ended October 31, 2021 | 28.87 | 0.46 | 16.35 | 16.81 | (0.48 ) |
Year Ended October 31, 2020 | 30.84 | 0.44 | (2.01 ) | (1.57 ) | (0.40 ) |
Year Ended October 31, 2019 | 29.58 | 0.42 | 1.22 | 1.64 | (0.38 ) |
(a) | Annualized for periods less than one year, unless otherwise noted. |
(b) | Calculated based upon average shares outstanding. |
(c) | Not annualized for periods less than one year. |
(d) | Includes adjustments in accordance with accounting principles generally accepted in the United States of America and as such, the net asset values for financial reporting purposes and the returns based upon those net asset values may differ from the net asset values and returns for shareholder transactions. |
(e) | Prior to December 9, 2019, the market price return was calculated assuming an initial investment made at the market price at the beginning of the reporting period, reinvestment of all dividends and distributions at the market price during the period, and sale at the market price on the last day of the period. The price used to calculate the market price return was the midpoint of the bid/ask spread at the close of business on the listing exchange of the Fund. Effective December 9, 2019, the closing price was used to calculate the market price return; however, any prices used in the calculation for the market price return prior to December 9, 2019, would have used the midpoint of the bid/ask spread at the close of business on the exchange. |
(f) | Prior to November 1, 2019, the Fund may have waived fees if expenses exceeded the expense cap. On November 1, 2019, the Fund adopted a unitary fee structure where a management fee is accrued by the Fund based on prior day net assets and other expenses are paid by the Advisor. |
224 | J.P. Morgan Exchange-Traded Funds | April 30, 2024 |
Ratios/Supplemental data | ||||||||
Ratios to average net assets (a) | ||||||||
Net asset value, end of period | Market price, end of period | Total return (c)(d) | Market price total return (c)(e) | Net assets, end of period | Net expenses | Net investment income (loss) | Expenses without waivers and reimbursements | Portfolio turnover rate (c) |
$106.89 | $106.94 | 18.35 % | 18.40 % | $424,872,292 | 0.18 % | 2.25 % | 0.18 % | 12 % |
91.34 | 91.34 | (0.34 ) | (0.45 ) | 420,166,041 | 0.18 | 2.33 | 0.18 | 28 |
93.94 | 94.05 | (5.36 ) | (5.28 ) | 507,282,453 | 0.18 | 2.18 | 0.18 | 22 |
101.43 | 101.46 | 40.36 | 40.44 | 710,012,574 | 0.18 | 1.86 | 0.18 | 33 |
73.52 | 73.50 | (1.40 ) | (1.44 ) | 536,709,641 | 0.18 | 2.26 | 0.18 | 21 |
76.44 | 76.45 | 11.65 | 11.65 | 802,625,997 | 0.19 | 2.27 | 0.37 (f) | 24 |
94.12 | 94.18 | 18.02 | 18.24 | 360,008,122 | 0.24 | 2.00 | 0.24 | 11 |
80.54 | 80.44 | (1.78 ) | (1.85 ) | 310,063,947 | 0.24 | 1.89 | 0.24 | 24 |
83.60 | 83.55 | (7.78 ) | (7.90 ) | 267,520,530 | 0.24 | 1.82 | 0.24 | 24 |
92.23 | 92.30 | 44.51 | 44.73 | 239,808,712 | 0.24 | 1.57 | 0.24 | 34 |
64.77 | 64.72 | (1.66 ) | (1.79 ) | 220,207,846 | 0.24 | 1.86 | 0.24 | 28 |
67.13 | 67.17 | 9.73 | 9.78 | 187,973,791 | 0.24 | 1.82 | 0.43 (f) | 25 |
42.78 | 42.84 | 15.74 | 15.93 | 470,549,537 | 0.29 | 1.85 | 0.29 | 12 |
37.31 | 37.30 | (4.55 ) | (4.77 ) | 386,208,306 | 0.29 | 2.01 | 0.29 | 28 |
39.85 | 39.93 | (10.59 ) | (10.49 ) | 286,932,997 | 0.29 | 1.55 | 0.29 | 26 |
45.20 | 45.24 | 58.49 | 58.25 | 176,262,186 | 0.29 | 1.13 | 0.29 | 37 |
28.87 | 28.94 | (4.99 ) | (4.85 ) | 148,672,825 | 0.29 | 1.54 | 0.29 | 30 |
30.84 | 30.87 | 5.64 | 5.75 | 140,343,327 | 0.29 | 1.40 | 0.54 (f) | 43 |
April 30, 2024 | J.P. Morgan Exchange-Traded Funds | 225 |
Per share operating performance | |||||
Investment operations | Distributions | ||||
Net asset value, beginning of period | Net investment income (loss) (b) | Net realized and unrealized gains (losses) on investments | Total from investment operations | Net investment income | |
JPMorgan U.S. Momentum Factor ETF | |||||
Six Months Ended April 30, 2024 (Unaudited) | $39.99 | $0.24 | $9.98 | $10.22 | $(0.23 ) |
Year Ended October 31, 2023 | 38.22 | 0.55 | 1.77 | 2.32 | (0.55 ) |
Year Ended October 31, 2022 | 47.71 | 0.50 | (9.53 ) | (9.03 ) | (0.46 ) |
Year Ended October 31, 2021 | 33.68 | 0.34 | 14.00 | 14.34 | (0.31 ) |
Year Ended October 31, 2020 | 29.04 | 0.35 | 4.63 | 4.98 | (0.34 ) |
Year Ended October 31, 2019 | 25.98 | 0.37 | 2.99 | 3.36 | (0.30 ) |
JPMorgan U.S. Quality Factor ETF | |||||
Six Months Ended April 30, 2024 (Unaudited) | 42.18 | 0.37 | 7.84 | 8.21 | (0.32 ) |
Year Ended October 31, 2023 | 38.14 | 0.65 | 3.97 | 4.62 | (0.58 ) |
Year Ended October 31, 2022 | 43.45 | 0.66 | (5.34 ) | (4.68 ) | (0.63 ) |
Year Ended October 31, 2021 | 31.53 | 0.60 | 11.91 | 12.51 | (0.59 ) |
Year Ended October 31, 2020 | 29.74 | 0.56 | 1.70 | 2.26 | (0.47 ) |
Year Ended October 31, 2019 | 26.56 | 0.58 | 3.11 | 3.69 | (0.51 ) |
JPMorgan U.S. Value Factor ETF | |||||
Six Months Ended April 30, 2024 (Unaudited) | 33.35 | 0.50 | 6.03 | 6.53 | (0.47 ) |
Year Ended October 31, 2023 | 32.90 | 0.87 | 0.49 | 1.36 | (0.91 ) |
Year Ended October 31, 2022 | 37.09 | 0.80 | (4.19 ) | (3.39 ) | (0.80 ) |
Year Ended October 31, 2021 | 24.99 | 0.72 | 12.03 | 12.75 | (0.65 ) |
Year Ended October 31, 2020 | 27.29 | 0.77 | (2.29 ) | (1.52 ) | (0.78 ) |
Year Ended October 31, 2019 | 25.21 | 0.75 | 1.97 | 2.72 | (0.64 ) |
(a) | Annualized for periods less than one year, unless otherwise noted. |
(b) | Calculated based upon average shares outstanding. |
(c) | Not annualized for periods less than one year. |
(d) | Includes adjustments in accordance with accounting principles generally accepted in the United States of America and as such, the net asset values for financial reporting purposes and the returns based upon those net asset values may differ from the net asset values and returns for shareholder transactions. |
(e) | Prior to December 9, 2019, the market price return was calculated assuming an initial investment made at the market price at the beginning of the reporting period, reinvestment of all dividends and distributions at the market price during the period, and sale at the market price on the last day of the period. The price used to calculate the market price return was the midpoint of the bid/ask spread at the close of business on the listing exchange of the Fund. Effective December 9, 2019, the closing price was used to calculate the market price return; however, any prices used in the calculation for the market price return prior to December 9, 2019, would have used the midpoint of the bid/ask spread at the close of business on the exchange. |
(f) | Prior to November 1, 2019, the Fund may have waived fees if expenses exceeded the expense cap. On November 1, 2019, the Fund adopted a unitary fee structure where a management fee is accrued by the Fund based on prior day net assets and other expenses are paid by the Advisor. |
226 | J.P. Morgan Exchange-Traded Funds | April 30, 2024 |
Ratios/Supplemental data | ||||||||
Ratios to average net assets (a) | ||||||||
Net asset value, end of period | Market price, end of period | Total return (c)(d) | Market price total return (c)(e) | Net assets, end of period | Net expenses | Net investment income (loss) | Expenses without waivers and reimbursements | Portfolio turnover rate (c) |
$49.98 | $50.03 | 25.59 % | 25.71 % | $845,889,984 | 0.12 % | 1.00 % | 0.12 % | 22 % |
39.99 | 39.99 | 6.10 | 6.02 | 301,926,586 | 0.12 | 1.36 | 0.12 | 43 |
38.22 | 38.25 | (18.97 ) | (18.86 ) | 229,323,118 | 0.12 | 1.20 | 0.12 | 43 |
47.71 | 47.68 | 42.72 | 42.38 | 221,858,171 | 0.12 | 0.80 | 0.12 | 44 |
33.68 | 33.74 | 17.33 | 17.50 | 134,743,086 | 0.12 | 1.11 | 0.12 | 39 |
29.04 | 29.05 | 13.06 | 13.06 | 56,620,589 | 0.12 | 1.35 | 0.55 (f) | 52 |
50.07 | 50.06 | 19.48 | 19.40 | 4,018,415,214 | 0.12 | 1.52 | 0.12 | 10 |
42.18 | 42.20 | 12.15 | 12.14 | 2,402,223,606 | 0.12 | 1.54 | 0.12 | 21 |
38.14 | 38.16 | (10.84 ) | (10.85 ) | 579,728,107 | 0.12 | 1.64 | 0.12 | 18 |
43.45 | 43.48 | 39.97 | 40.02 | 393,204,091 | 0.12 | 1.56 | 0.12 | 21 |
31.53 | 31.54 | 7.72 | 7.68 | 384,671,209 | 0.12 | 1.81 | 0.12 | 20 |
29.74 | 29.76 | 14.10 | 14.18 | 107,067,872 | 0.12 | 2.05 | 0.50 (f) | 21 |
39.41 | 39.42 | 19.60 | 19.70 | 784,324,102 | 0.12 | 2.59 | 0.12 | 10 |
33.35 | 33.33 | 4.11 | 4.11 | 683,645,621 | 0.12 | 2.53 | 0.12 | 26 |
32.90 | 32.88 | (9.21 ) | (9.24 ) | 444,083,720 | 0.12 | 2.28 | 0.12 | 21 |
37.09 | 37.08 | 51.38 | 51.88 | 400,579,487 | 0.12 | 2.01 | 0.12 | 34 |
24.99 | 24.90 | (5.39 ) | (5.76 ) | 62,468,155 | 0.12 | 2.99 | 0.12 | 25 |
27.29 | 27.30 | 11.01 | 11.05 | 66,849,642 | 0.12 | 2.90 | 0.52 (f) | 22 |
April 30, 2024 | J.P. Morgan Exchange-Traded Funds | 227 |
Diversification Classification | |
JPMorgan BetaBuilders Canada ETF | Diversified |
JPMorgan BetaBuilders Developed Asia Pacific ex-Japan ETF | Diversified |
JPMorgan BetaBuilders Emerging Markets Equity ETF | Diversified |
JPMorgan BetaBuilders Europe ETF | Diversified |
JPMorgan BetaBuilders International Equity ETF | Diversified |
JPMorgan BetaBuilders Japan ETF | Diversified |
JPMorgan BetaBuilders U.S. Equity ETF | Diversified |
JPMorgan BetaBuilders U.S. Mid Cap Equity ETF | Diversified |
JPMorgan BetaBuilders U.S. Small Cap Equity ETF | Diversified |
JPMorgan Carbon Transition U.S. Equity ETF | Diversified |
JPMorgan Diversified Return Emerging Markets Equity ETF | Diversified |
JPMorgan Diversified Return International Equity ETF | Diversified |
JPMorgan Diversified Return U.S. Equity ETF | Diversified |
JPMorgan Diversified Return U.S. Mid Cap Equity ETF | Diversified |
JPMorgan Diversified Return U.S. Small Cap Equity ETF | Diversified |
JPMorgan U.S. Momentum Factor ETF | Diversified |
JPMorgan U.S. Quality Factor ETF | Diversified |
JPMorgan U.S. Value Factor ETF | Diversified |
228 | J.P. Morgan Exchange-Traded Funds | April 30, 2024 |
Listing Exchange | |
BetaBuilders Canada ETF | Cboe BZX Exchange, Inc. |
BetaBuilders Developed Asia Pacific ex-Japan ETF | Cboe BZX Exchange, Inc. |
BetaBuilders Emerging Markets Equity ETF | Cboe BZX Exchange, Inc. |
BetaBuilders Europe ETF | Cboe BZX Exchange, Inc. |
BetaBuilders International Equity ETF | Cboe BZX Exchange, Inc. |
BetaBuilders Japan ETF | Cboe BZX Exchange, Inc. |
BetaBuilders U.S. Equity ETF | Cboe BZX Exchange, Inc. |
BetaBuilders U.S. Mid Cap Equity ETF | NYSE Arca, Inc. |
BetaBuilders U.S. Small Cap Equity ETF | NYSE Arca, Inc. |
Carbon Transition U.S. Equity ETF | NYSE Arca, Inc. |
Emerging Markets Equity ETF | NYSE Arca, Inc. |
International Equity ETF | NYSE Arca, Inc. |
U.S. Equity ETF | NYSE Arca, Inc. |
U.S. Mid Cap Equity ETF | NYSE Arca, Inc. |
U.S. Small Cap Equity ETF | NYSE Arca, Inc. |
U.S. Momentum Factor ETF | NYSE Arca, Inc. |
U.S. Quality Factor ETF | NYSE Arca, Inc. |
U.S. Value Factor ETF | NYSE Arca, Inc. |
April 30, 2024 | J.P. Morgan Exchange-Traded Funds | 229 |
230 | J.P. Morgan Exchange-Traded Funds | April 30, 2024 |
BetaBuilders Canada ETF | ||||
Level 1 Quoted prices | Level 2 Other significant observable inputs | Level 3 Significant unobservable inputs | Total | |
Investments in Securities | ||||
Common Stocks | $6,920,516,013 | $— | $— | $6,920,516,013 |
Warrants | — | — | — (a) | — (a) |
Short-Term Investments | ||||
Investment of Cash Collateral from Securities Loaned | 89,929,810 | — | — | 89,929,810 |
Total Investments in Securities | $7,010,445,823 | $— | $— (a) | $7,010,445,823 |
Depreciation in Other Financial Instruments | ||||
Futures Contracts | $(538,767 ) | $— | $— | $(538,767 ) |
(a) | Amount rounds to less than one thousand. |
BetaBuilders Developed Asia Pacific ex-Japan ETF | ||||
Level 1 Quoted prices | Level 2 Other significant observable inputs | Level 3 Significant unobservable inputs | Total | |
Investments in Securities | ||||
Common Stocks | ||||
Australia | $— | $2,792,378,325 | $— | $2,792,378,325 |
China | — | 49,378,072 | — | 49,378,072 |
Hong Kong | 23,536,158 | 675,356,050 | — | 698,892,208 |
Macau | — | 41,720,244 | — | 41,720,244 |
New Zealand | 58,198,198 | 24,040,927 | — | 82,239,125 |
Singapore | — | 482,483,283 | — | 482,483,283 |
United Kingdom | — | 34,062,998 | — | 34,062,998 |
United States | — | 265,810,415 | — | 265,810,415 |
Total Common Stocks | 81,734,356 | 4,365,230,314 | — | 4,446,964,670 |
Short-Term Investments | ||||
Investment of Cash Collateral from Securities Loaned | 5,874,135 | — | — | 5,874,135 |
Total Investments in Securities | $87,608,491 | $4,365,230,314 | $— | $4,452,838,805 |
Depreciation in Other Financial Instruments | ||||
Futures Contracts | $(254,360 ) | $— | $— | $(254,360 ) |
BetaBuilders Emerging Markets Equity ETF | ||||
Level 1 Quoted prices | Level 2 Other significant observable inputs | Level 3 Significant unobservable inputs | Total | |
Investments in Securities | ||||
Common Stocks | ||||
Australia | $— | $70,715 | $— | $70,715 |
Brazil | 26,240,244 | — | — | 26,240,244 |
Chile | 2,846,253 | — | — | 2,846,253 |
China | 11,467,046 | 132,726,673 | 9,176 | 144,202,895 |
Colombia | 1,162,666 | — | — | 1,162,666 |
Czech Republic | 445,941 | 196,235 | — | 642,176 |
April 30, 2024 | J.P. Morgan Exchange-Traded Funds | 231 |
BetaBuilders Emerging Markets Equity ETF (continued) | ||||
Level 1 Quoted prices | Level 2 Other significant observable inputs | Level 3 Significant unobservable inputs | Total | |
Egypt | $273,331 | $— | $— | $273,331 |
Greece | 1,365,096 | 729,534 | — | 2,094,630 |
Hong Kong | 314,009 | 491,872 | — | 805,881 |
Hungary | 486,720 | 839,642 | — | 1,326,362 |
India | 355,608 | 116,838,381 | — | 117,193,989 |
Indonesia | 2,014,599 | 8,815,798 | — | 10,830,397 |
Kuwait | — | 4,574,054 | 11,853 | 4,585,907 |
Luxembourg | 233,836 | — | — | 233,836 |
Malaysia | 3,349,848 | 6,039,610 | — | 9,389,458 |
Mexico | 11,942,227 | — | — | 11,942,227 |
Peru | 961,566 | — | — | 961,566 |
Philippines | 3,045,383 | 955,860 | — | 4,001,243 |
Qatar | 1,579,532 | 3,333,452 | — | 4,912,984 |
Saudi Arabia | 1,566,881 | 20,367,957 | — | 21,934,838 |
South Africa | 7,246,715 | 7,152,227 | — | 14,398,942 |
South Korea | — | 66,933,092 | — | 66,933,092 |
Taiwan | 688,287 | 95,933,732 | — | 96,622,019 |
Thailand | — | 7,849,172 | — | 7,849,172 |
Turkey | 2,922,586 | 1,725,706 | — | 4,648,292 |
United Arab Emirates | 13,287,009 | 721,820 | — | 14,008,829 |
United States | 228,011 | 158,918 | — | 386,929 |
Total Common Stocks | 94,023,394 | 476,454,450 | 21,029 | 570,498,873 |
Short-Term Investments | ||||
Investment Companies | 6,819,830 | — | — | 6,819,830 |
Investment of Cash Collateral from Securities Loaned | 526,874 | — | — | 526,874 |
Total Short-Term Investments | 7,346,704 | — | — | 7,346,704 |
Total Investments in Securities | $101,370,098 | $476,454,450 | $21,029 | $577,845,577 |
Depreciation in Other Financial Instruments | ||||
Futures Contracts | $(4,686 ) | $— | $— | $(4,686 ) |
BetaBuilders Europe ETF | ||||
Level 1 Quoted prices | Level 2 Other significant observable inputs | Level 3 Significant unobservable inputs | Total | |
Investments in Securities | ||||
Common Stocks | ||||
Australia | $— | $90,346,628 | $— | $90,346,628 |
Austria | 7,229,549 | 32,152,383 | — | 39,381,932 |
Belgium | 1,375,677 | 94,197,233 | — | 95,572,910 |
Brazil | — | 3,321,819 | — | 3,321,819 |
Chile | — | 6,806,619 | — | 6,806,619 |
China | — | 34,521,869 | — | 34,521,869 |
Denmark | 302,833 | 441,135,246 | — | 441,438,079 |
Finland | 6,237,551 | 118,707,042 | — | 124,944,593 |
France | — | 1,137,888,471 | — | 1,137,888,471 |
Germany | — | 929,241,442 | — | 929,241,442 |
232 | J.P. Morgan Exchange-Traded Funds | April 30, 2024 |
BetaBuilders Europe ETF (continued) | ||||
Level 1 Quoted prices | Level 2 Other significant observable inputs | Level 3 Significant unobservable inputs | Total | |
Hong Kong | $— | $16,638,258 | $— | $16,638,258 |
Ireland | — | 27,120,209 | — | 27,120,209 |
Italy | — | 301,890,075 | — | 301,890,075 |
Jordan | — | 2,740,566 | — | 2,740,566 |
Luxembourg | — | 15,347,735 | — | 15,347,735 |
Mexico | — | 914,896 | — | 914,896 |
Netherlands | 2,311,669 | 499,661,863 | — | 501,973,532 |
Norway | 8,537,946 | 65,147,186 | — | 73,685,132 |
Poland | — | 45,011,806 | — | 45,011,806 |
Portugal | — | 19,093,002 | — | 19,093,002 |
Russia | — | — | 23,213 | 23,213 |
Singapore | — | 18,512,308 | — | 18,512,308 |
South Africa | — | 29,241,932 | — | 29,241,932 |
South Korea | — | 3,665,086 | — | 3,665,086 |
Spain | — | 295,050,317 | — | 295,050,317 |
Sweden | 4,218,900 | 388,541,827 | — | 392,760,727 |
Switzerland | — | 651,232,700 | — | 651,232,700 |
United Arab Emirates | — | — | — (a) | — (a) |
United Kingdom | 10,572,824 | 1,228,516,479 | — | 1,239,089,303 |
United States | — | 942,023,399 | — | 942,023,399 |
Total Common Stocks | 40,786,949 | 7,438,668,396 | 23,213 | 7,479,478,558 |
Short-Term Investments | ||||
Investment of Cash Collateral from Securities Loaned | 291,466,692 | — | — | 291,466,692 |
Total Investments in Securities | $332,253,641 | $7,438,668,396 | $23,213 | $7,770,945,250 |
Appreciation in Other Financial Instruments | ||||
Futures Contracts | $1,326,426 | $— | $— | $1,326,426 |
Depreciation in Other Financial Instruments | ||||
Futures Contracts | (386,763 ) | — | — | (386,763 ) |
Total Net Appreciation/ Depreciation in Other Financial Instruments | $939,663 | $— | $— | $939,663 |
(a) | Value is zero. |
BetaBuilders International Equity ETF | ||||
Level 1 Quoted prices | Level 2 Other significant observable inputs | Level 3 Significant unobservable inputs | Total | |
Investments in Securities | ||||
Common Stocks | ||||
Australia | $— | $286,256,399 | $— | $286,256,399 |
Austria | 2,434,386 | 10,811,745 | — | 13,246,131 |
Belgium | 461,942 | 31,704,900 | — | 32,166,842 |
Brazil | — | 1,115,378 | — | 1,115,378 |
Chile | — | 2,291,925 | — | 2,291,925 |
China | — | 16,150,366 | — | 16,150,366 |
Denmark | 102,020 | 148,545,401 | — | 148,647,421 |
April 30, 2024 | J.P. Morgan Exchange-Traded Funds | 233 |
BetaBuilders International Equity ETF (continued) | ||||
Level 1 Quoted prices | Level 2 Other significant observable inputs | Level 3 Significant unobservable inputs | Total | |
Finland | $2,098,346 | $39,968,041 | $— | $42,066,387 |
France | — | 383,135,503 | — | 383,135,503 |
Germany | — | 312,887,250 | — | 312,887,250 |
Hong Kong | 2,164,068 | 67,486,078 | — | 69,650,146 |
Ireland | — | 9,131,916 | — | 9,131,916 |
Israel | 603,201 | 18,286,211 | — | 18,889,412 |
Italy | — | 101,634,411 | — | 101,634,411 |
Japan | 2,298,946 | 977,179,895 | — | 979,478,841 |
Jordan | — | 920,109 | — | 920,109 |
Luxembourg | — | 5,167,946 | — | 5,167,946 |
Macau | — | 3,826,810 | — | 3,826,810 |
Mexico | — | 307,138 | — | 307,138 |
Netherlands | 1,220,325 | 167,796,327 | — | 169,016,652 |
New Zealand | 5,321,629 | 2,202,982 | — | 7,524,611 |
Norway | 2,874,912 | 21,925,491 | — | 24,800,403 |
Poland | — | 15,144,843 | — | 15,144,843 |
Portugal | — | 6,429,035 | — | 6,429,035 |
Russia | — | — | 4,932 | 4,932 |
Singapore | — | 50,441,236 | — | 50,441,236 |
South Africa | — | 9,846,411 | — | 9,846,411 |
South Korea | — | 1,230,368 | — | 1,230,368 |
Spain | — | 99,342,852 | — | 99,342,852 |
Sweden | 1,420,459 | 130,792,939 | — | 132,213,398 |
Switzerland | — | 219,214,338 | — | 219,214,338 |
United Arab Emirates | — | — | — (a) | — (a) |
United Kingdom | 3,560,093 | 416,764,417 | — | 420,324,510 |
United States | — | 341,557,826 | — | 341,557,826 |
Total Common Stocks | 24,560,327 | 3,899,496,487 | 4,932 | 3,924,061,746 |
Short-Term Investments | ||||
Investment Companies | 31,381,914 | — | — | 31,381,914 |
Investment of Cash Collateral from Securities Loaned | 99,996,333 | — | — | 99,996,333 |
Total Short-Term Investments | 131,378,247 | — | — | 131,378,247 |
Total Investments in Securities | $155,938,574 | $3,899,496,487 | $4,932 | $4,055,439,993 |
Depreciation in Other Financial Instruments | ||||
Futures Contracts | $(1,368,000 ) | $— | $— | $(1,368,000 ) |
(a) | Value is zero. |
BetaBuilders Japan ETF | ||||
Level 1 Quoted prices | Level 2 Other significant observable inputs | Level 3 Significant unobservable inputs | Total | |
Investments in Securities | ||||
Common Stocks | ||||
Air Freight & Logistics | $— | $36,503,503 | $— | $36,503,503 |
Automobile Components | — | 231,004,098 | — | 231,004,098 |
234 | J.P. Morgan Exchange-Traded Funds | April 30, 2024 |
BetaBuilders Japan ETF (continued) | ||||
Level 1 Quoted prices | Level 2 Other significant observable inputs | Level 3 Significant unobservable inputs | Total | |
Automobiles | $— | $1,081,557,667 | $— | $1,081,557,667 |
Banks | — | 851,446,512 | — | 851,446,512 |
Beverages | — | 91,308,903 | — | 91,308,903 |
Broadline Retail | — | 53,629,432 | — | 53,629,432 |
Building Products | — | 142,946,112 | — | 142,946,112 |
Capital Markets | — | 127,372,638 | — | 127,372,638 |
Chemicals | — | 418,874,163 | — | 418,874,163 |
Commercial Services & Supplies | — | 78,737,461 | — | 78,737,461 |
Construction & Engineering | — | 74,372,049 | — | 74,372,049 |
Consumer Finance | — | 3,180,091 | — | 3,180,091 |
Consumer Staples Distribution & Retail | 14,836,873 | 162,608,354 | — | 177,445,227 |
Diversified REITs | — | 21,079,154 | — | 21,079,154 |
Diversified Telecommunication Services | — | 82,245,660 | — | 82,245,660 |
Electric Utilities | — | 71,168,677 | — | 71,168,677 |
Electrical Equipment | — | 192,061,943 | — | 192,061,943 |
Electronic Equipment, Instruments & Components | — | 497,430,984 | — | 497,430,984 |
Entertainment | — | 210,926,198 | — | 210,926,198 |
Financial Services | — | 85,673,452 | — | 85,673,452 |
Food Products | — | 155,738,131 | — | 155,738,131 |
Gas Utilities | — | 50,505,251 | — | 50,505,251 |
Ground Transportation | — | 241,689,393 | — | 241,689,393 |
Health Care Equipment & Supplies | — | 257,019,724 | — | 257,019,724 |
Health Care Providers & Services | — | 9,096,171 | — | 9,096,171 |
Health Care Technology | — | 13,022,798 | — | 13,022,798 |
Hotels, Restaurants & Leisure | — | 103,667,272 | — | 103,667,272 |
Household Durables | — | 424,115,799 | — | 424,115,799 |
Household Products | — | 33,139,077 | — | 33,139,077 |
Industrial Conglomerates | — | 244,501,985 | — | 244,501,985 |
Industrial REITs | 11,411,122 | 10,595,831 | — | 22,006,953 |
Insurance | — | 438,066,413 | — | 438,066,413 |
Interactive Media & Services | — | 17,674,738 | — | 17,674,738 |
IT Services | — | 235,299,924 | — | 235,299,924 |
Leisure Products | — | 85,227,302 | — | 85,227,302 |
Machinery | — | 568,623,011 | — | 568,623,011 |
Marine Transportation | — | 86,055,825 | — | 86,055,825 |
Media | — | 17,021,862 | — | 17,021,862 |
Metals & Mining | — | 105,641,102 | — | 105,641,102 |
Office REITs | — | 30,093,050 | — | 30,093,050 |
Oil, Gas & Consumable Fuels | — | 94,019,756 | — | 94,019,756 |
Paper & Forest Products | — | 10,312,329 | — | 10,312,329 |
Passenger Airlines | — | 15,097,863 | — | 15,097,863 |
Personal Care Products | — | 86,917,405 | — | 86,917,405 |
Pharmaceuticals | — | 543,903,572 | — | 543,903,572 |
Professional Services | — | 190,392,002 | — | 190,392,002 |
Real Estate Management & Development | — | 291,186,753 | — | 291,186,753 |
Retail REITs | — | 11,565,629 | — | 11,565,629 |
Semiconductors & Semiconductor Equipment | — | 532,485,399 | — | 532,485,399 |
Software | — | 24,288,779 | — | 24,288,779 |
April 30, 2024 | J.P. Morgan Exchange-Traded Funds | 235 |
BetaBuilders Japan ETF (continued) | ||||
Level 1 Quoted prices | Level 2 Other significant observable inputs | Level 3 Significant unobservable inputs | Total | |
Specialty Retail | $— | $170,827,821 | $— | $170,827,821 |
Technology Hardware, Storage & Peripherals | — | 184,018,202 | — | 184,018,202 |
Textiles, Apparel & Luxury Goods | — | 21,461,180 | — | 21,461,180 |
Tobacco | — | 81,748,631 | — | 81,748,631 |
Trading Companies & Distributors | — | 858,098,091 | — | 858,098,091 |
Transportation Infrastructure | — | 7,594,395 | — | 7,594,395 |
Wireless Telecommunication Services | — | 337,303,304 | — | 337,303,304 |
Total Common Stocks | 26,247,995 | 11,102,142,821 | — | 11,128,390,816 |
Short-Term Investments | ||||
Investment of Cash Collateral from Securities Loaned | 19,855,632 | — | — | 19,855,632 |
Total Investments in Securities | $46,103,627 | $11,102,142,821 | $— | $11,148,246,448 |
Depreciation in Other Financial Instruments | ||||
Futures Contracts | $(509,454 ) | $— | $— | $(509,454 ) |
BetaBuilders U.S. Equity ETF | ||||
Level 1 Quoted prices | Level 2 Other significant observable inputs | Level 3 Significant unobservable inputs | Total | |
Investments in Securities | ||||
Common Stocks | $3,066,772,775 | $— | $— | $3,066,772,775 |
Rights | — | — | 1,765 | 1,765 |
Short-Term Investments | ||||
Investment Companies | 22,371,012 | — | — | 22,371,012 |
Investment of Cash Collateral from Securities Loaned | 28,611,267 | — | — | 28,611,267 |
Total Short-Term Investments | 50,982,279 | — | — | 50,982,279 |
Total Investments in Securities | $3,117,755,054 | $— | $1,765 | $3,117,756,819 |
Depreciation in Other Financial Instruments | ||||
Futures Contracts | $(662,839 ) | $— | $— | $(662,839 ) |
BetaBuilders U.S. Mid Cap Equity ETF | ||||
Level 1 Quoted prices | Level 2 Other significant observable inputs | Level 3 Significant unobservable inputs | Total | |
Total Investments in Securities (a) | $1,667,236,858 | $— | $— | $1,667,236,858 |
Depreciation in Other Financial Instruments | ||||
Futures Contracts (a) | $(298,291 ) | $— | $— | $(298,291 ) |
(a) | Please refer to the SOI for specifics of portfolio holdings. |
236 | J.P. Morgan Exchange-Traded Funds | April 30, 2024 |
BetaBuilders U.S. Small Cap Equity ETF | ||||
Level 1 Quoted prices | Level 2 Other significant observable inputs | Level 3 Significant unobservable inputs | Total | |
Investments in Securities | ||||
Common Stocks | ||||
Aerospace & Defense | $6,154,189 | $— | $— | $6,154,189 |
Air Freight & Logistics | 1,292,764 | — | — | 1,292,764 |
Automobile Components | 8,403,896 | — | — | 8,403,896 |
Automobiles | 610,073 | — | — | 610,073 |
Banks | 43,276,425 | — | — | 43,276,425 |
Beverages | 818,343 | — | — | 818,343 |
Biotechnology | 31,246,104 | — | — (a) | 31,246,104 |
Broadline Retail | 2,370,702 | — | — | 2,370,702 |
Building Products | 9,614,951 | — | — | 9,614,951 |
Capital Markets | 11,816,854 | — | — | 11,816,854 |
Chemicals | 5,745,702 | — | — | 5,745,702 |
Commercial Services & Supplies | 11,616,131 | — | — | 11,616,131 |
Communications Equipment | 3,010,436 | — | — | 3,010,436 |
Construction & Engineering | 6,321,310 | — | — | 6,321,310 |
Construction Materials | 224,440 | — | — | 224,440 |
Consumer Finance | 4,133,628 | — | — | 4,133,628 |
Consumer Staples Distribution & Retail | 3,571,060 | — | — | 3,571,060 |
Containers & Packaging | 769,412 | — | — | 769,412 |
Diversified Consumer Services | 6,277,266 | — | — | 6,277,266 |
Diversified REITs | 2,462,448 | — | — | 2,462,448 |
Diversified Telecommunication Services | 1,346,844 | — | — | 1,346,844 |
Electric Utilities | 1,259,343 | — | — | 1,259,343 |
Electrical Equipment | 4,432,846 | — | — | 4,432,846 |
Electronic Equipment, Instruments & Components | 9,964,549 | — | — | 9,964,549 |
Energy Equipment & Services | 8,068,388 | — | — | 8,068,388 |
Entertainment | 4,481,044 | — | — | 4,481,044 |
Financial Services | 9,852,509 | — | — | 9,852,509 |
Food Products | 2,728,213 | — | — | 2,728,213 |
Gas Utilities | 1,249,141 | — | — | 1,249,141 |
Ground Transportation | 3,105,968 | — | — | 3,105,968 |
Health Care Equipment & Supplies | 11,264,745 | — | — | 11,264,745 |
Health Care Providers & Services | 9,206,449 | — | — | 9,206,449 |
Health Care REITs | 3,404,327 | — | — | 3,404,327 |
Health Care Technology | 1,830,862 | — | — | 1,830,862 |
Hotel & Resort REITs | 4,596,451 | — | — | 4,596,451 |
Hotels, Restaurants & Leisure | 10,823,503 | — | — | 10,823,503 |
Household Durables | 7,418,676 | — | — | 7,418,676 |
Household Products | 3,234,262 | — | — | 3,234,262 |
Independent Power and Renewable Electricity Producers | 300,869 | — | — | 300,869 |
Industrial REITs | 1,799,236 | — | — | 1,799,236 |
Insurance | 9,081,340 | — | — | 9,081,340 |
Interactive Media & Services | 3,750,610 | — | — | 3,750,610 |
IT Services | 2,503,146 | — | — | 2,503,146 |
Leisure Products | 1,770,145 | — | — | 1,770,145 |
Life Sciences Tools & Services | 1,757,042 | — | — (a) | 1,757,042 |
Machinery | 15,059,567 | — | — | 15,059,567 |
April 30, 2024 | J.P. Morgan Exchange-Traded Funds | 237 |
BetaBuilders U.S. Small Cap Equity ETF (continued) | ||||
Level 1 Quoted prices | Level 2 Other significant observable inputs | Level 3 Significant unobservable inputs | Total | |
Marine Transportation | $1,261,349 | $— | $— | $1,261,349 |
Media | 2,164,925 | — | — | 2,164,925 |
Metals & Mining | 7,608,062 | — | — | 7,608,062 |
Mortgage Real Estate Investment Trusts (REITs) | 6,328,336 | — | — | 6,328,336 |
Office REITs | 7,729,239 | — | — | 7,729,239 |
Oil, Gas & Consumable Fuels | 13,574,117 | — | — | 13,574,117 |
Paper & Forest Products | 739,563 | — | — | 739,563 |
Passenger Airlines | 2,892,637 | — | — | 2,892,637 |
Personal Care Products | 1,363,282 | — | — | 1,363,282 |
Pharmaceuticals | 5,724,284 | — | — | 5,724,284 |
Professional Services | 8,223,331 | — | — | 8,223,331 |
Real Estate Management & Development | 4,245,653 | — | — | 4,245,653 |
Residential REITs | 1,791,660 | — | — | 1,791,660 |
Retail REITs | 6,035,503 | — | — | 6,035,503 |
Semiconductors & Semiconductor Equipment | 9,960,634 | — | — | 9,960,634 |
Software | 34,856,639 | — | — | 34,856,639 |
Specialized REITs | 1,924,584 | — | — | 1,924,584 |
Specialty Retail | 16,160,676 | — | — | 16,160,676 |
Technology Hardware, Storage & Peripherals | 1,065,655 | — | — | 1,065,655 |
Textiles, Apparel & Luxury Goods | 5,638,161 | — | — | 5,638,161 |
Tobacco | 897,962 | — | — | 897,962 |
Trading Companies & Distributors | 7,881,769 | — | — | 7,881,769 |
Water Utilities | 839,687 | — | — | 839,687 |
Wireless Telecommunication Services | 911,934 | — | — | 911,934 |
Total Common Stocks | 443,845,851 | — | — (a) | 443,845,851 |
Rights | — | — | 27,613 | 27,613 |
Short-Term Investments | ||||
Investment Companies | 5,327,256 | — | — | 5,327,256 |
Investment of Cash Collateral from Securities Loaned | 26,776,917 | — | — | 26,776,917 |
Total Short-Term Investments | 32,104,173 | — | — | 32,104,173 |
Total Investments in Securities | $475,950,024 | $— | $27,613 | $475,977,637 |
Depreciation in Other Financial Instruments | ||||
Futures Contracts | $(323,942 ) | $— | $— | $(323,942 ) |
(a) | Value is zero. |
Carbon Transition U.S. Equity ETF | ||||
Level 1 Quoted prices | Level 2 Other significant observable inputs | Level 3 Significant unobservable inputs | Total | |
Total Investments in Securities (a) | $5,091,425 | $— | $— | $5,091,425 |
(a) | Please refer to the SOI for specifics of portfolio holdings. |
238 | J.P. Morgan Exchange-Traded Funds | April 30, 2024 |
Emerging Markets Equity ETF | ||||
Level 1 Quoted prices | Level 2 Other significant observable inputs | Level 3 Significant unobservable inputs | Total | |
Investments in Securities | ||||
Common Stocks | ||||
Brazil | $27,174,822 | $— | $— | $27,174,822 |
Chile | 3,677,692 | — | — | 3,677,692 |
China | 10,536,089 | 60,275,207 | 540,994 | 71,352,290 |
Colombia | 527,838 | — | — | 527,838 |
Czech Republic | 987,116 | 259,611 | — | 1,246,727 |
Egypt | 370,075 | — | — | 370,075 |
Greece | 3,385,055 | 3,097,875 | — | 6,482,930 |
Hungary | 1,419,339 | 371,016 | — | 1,790,355 |
India | — | 38,719,330 | — | 38,719,330 |
Indonesia | 2,444,181 | 9,306,878 | — | 11,751,059 |
Kuwait | — | 2,230,909 | 9,318 | 2,240,227 |
Malaysia | 3,689,769 | 4,539,259 | — | 8,229,028 |
Mexico | 23,929,813 | — | — | 23,929,813 |
Pakistan | — | 480,748 | — | 480,748 |
Philippines | 527,684 | 293,782 | — | 821,466 |
Qatar | 1,218,055 | 2,906,626 | — | 4,124,681 |
Romania | 911,080 | — | — | 911,080 |
Russia | — | — | 116,729 | 116,729 |
Saudi Arabia | 1,473,153 | 12,490,131 | — | 13,963,284 |
South Africa | 7,221,947 | 4,499,330 | — | 11,721,277 |
Taiwan | 906,704 | 33,276,373 | — | 34,183,077 |
Thailand | 1,347,352 | 7,328,584 | — | 8,675,936 |
Turkey | 24,143,025 | 9,461,415 | — | 33,604,440 |
United Arab Emirates | 5,708,698 | 1,501,029 | — | 7,209,727 |
United States | 1,116,302 | — | — | 1,116,302 |
Total Common Stocks | 122,715,789 | 191,038,103 | 667,041 | 314,420,933 |
Short-Term Investments | ||||
Investment Companies | 401,232 | — | — | 401,232 |
Total Investments in Securities | $123,117,021 | $191,038,103 | $667,041 | $314,822,165 |
Appreciation in Other Financial Instruments | ||||
Futures Contracts | $6,920 | $— | $— | $6,920 |
International Equity ETF | ||||
Level 1 Quoted prices | Level 2 Other significant observable inputs | Level 3 Significant unobservable inputs | Total | |
Investments in Securities | ||||
Common Stocks | ||||
Australia | $167,359 | $41,981,520 | $— | $42,148,879 |
Austria | 1,171,183 | 658,815 | — | 1,829,998 |
Belgium | — | 1,087,904 | — | 1,087,904 |
Brazil | — | 742,046 | — | 742,046 |
Burkina Faso | — | 661,724 | — | 661,724 |
Cambodia | — | 34,036 | — | 34,036 |
April 30, 2024 | J.P. Morgan Exchange-Traded Funds | 239 |
International Equity ETF (continued) | ||||
Level 1 Quoted prices | Level 2 Other significant observable inputs | Level 3 Significant unobservable inputs | Total | |
Chile | $— | $1,730,122 | $— | $1,730,122 |
China | — | 3,306,454 | — | 3,306,454 |
Denmark | — | 2,920,322 | — | 2,920,322 |
Finland | 256,213 | 2,206,781 | — | 2,462,994 |
France | — | 18,130,971 | — | 18,130,971 |
Germany | — | 9,039,135 | — | 9,039,135 |
Hong Kong | — | 10,516,238 | — | 10,516,238 |
Indonesia | — | 124,402 | — | 124,402 |
Ireland | — | 487,458 | — | 487,458 |
Italy | — | 9,970,782 | — | 9,970,782 |
Japan | 1,407,523 | 100,257,825 | — | 101,665,348 |
Jordan | — | 1,211,621 | — | 1,211,621 |
Luxembourg | 202,321 | 317,465 | — | 519,786 |
Mexico | — | 283,348 | — | 283,348 |
Netherlands | — | 9,389,705 | — | 9,389,705 |
New Zealand | 884,228 | 889,138 | — | 1,773,366 |
Norway | 890,988 | 3,093,391 | — | 3,984,379 |
Poland | — | 474,262 | — | 474,262 |
Portugal | — | 1,909,972 | — | 1,909,972 |
Russia | — | — | 20,126 | 20,126 |
Singapore | — | 11,166,921 | — | 11,166,921 |
South Africa | — | 1,276,350 | — | 1,276,350 |
South Korea | — | 26,989,381 | — | 26,989,381 |
Spain | — | 7,722,776 | — | 7,722,776 |
Sweden | — | 7,500,356 | — | 7,500,356 |
Switzerland | — | 4,807,710 | — | 4,807,710 |
United Kingdom | 645,120 | 59,024,882 | — | 59,670,002 |
United States | — | 14,061,572 | — | 14,061,572 |
Total Common Stocks | 5,624,935 | 353,975,385 | 20,126 | 359,620,446 |
Short-Term Investments | ||||
Investment of Cash Collateral from Securities Loaned | 4,258,768 | — | — | 4,258,768 |
Total Investments in Securities | $9,883,703 | $353,975,385 | $20,126 | $363,879,214 |
Depreciation in Other Financial Instruments | ||||
Futures Contracts | $(72,803 ) | $— | $— | $(72,803 ) |
U.S. Equity ETF | ||||
Level 1 Quoted prices | Level 2 Other significant observable inputs | Level 3 Significant unobservable inputs | Total | |
Total Investments in Securities (a) | $424,392,990 | $— | $— (b) | $424,392,990 |
Depreciation in Other Financial Instruments | ||||
Futures Contracts (a) | $(17,759 ) | $— | $— | $(17,759 ) |
(a) | Please refer to the SOI for specifics of portfolio holdings. |
(b) | Value is zero. |
240 | J.P. Morgan Exchange-Traded Funds | April 30, 2024 |
U.S. Mid Cap Equity ETF | ||||
Level 1 Quoted prices | Level 2 Other significant observable inputs | Level 3 Significant unobservable inputs | Total | |
Total Investments in Securities (a) | $368,289,579 | $— | $— (b) | $368,289,579 |
Depreciation in Other Financial Instruments | ||||
Futures Contracts (a) | $(27,576 ) | $— | $— | $(27,576 ) |
(a) | Please refer to the SOI for specifics of portfolio holdings. |
(b) | Value is zero. |
U.S. Small Cap Equity ETF | ||||
Level 1 Quoted prices | Level 2 Other significant observable inputs | Level 3 Significant unobservable inputs | Total | |
Investments in Securities | ||||
Common Stocks | ||||
Aerospace & Defense | $737,519 | $— | $— | $737,519 |
Automobiles & Parts | 694,038 | — | — | 694,038 |
Banks | 22,857,663 | — | — | 22,857,663 |
Beverages | 6,356,847 | — | — | 6,356,847 |
Chemicals | 15,273,361 | — | — | 15,273,361 |
Construction & Materials | 13,311,945 | — | — | 13,311,945 |
Consumer Services | 5,510,121 | — | — | 5,510,121 |
Electricity | 5,554,703 | — | — | 5,554,703 |
Electronic & Electrical Equipment | 6,726,522 | — | — | 6,726,522 |
Finance & Credit Services | 9,336,450 | — | — | 9,336,450 |
Food Producers | 15,414,693 | — | — | 15,414,693 |
Gas, Water & Multi-utilities | 15,883,039 | — | — | 15,883,039 |
General Industrials | 7,114,250 | — | — | 7,114,250 |
Health Care Providers | 12,388,550 | — | — | 12,388,550 |
Household Goods & Home Construction | 16,347,945 | — | — | 16,347,945 |
Industrial Engineering | 4,766,792 | — | — | 4,766,792 |
Industrial Materials | 10,794,294 | — | — | 10,794,294 |
Industrial Metals & Mining | 13,876,697 | — | — | 13,876,697 |
Industrial Support Services | 11,153,275 | — | — | 11,153,275 |
Industrial Transportation | 15,510,983 | — | — | 15,510,983 |
Investment Banking & Brokerage Services | 5,857,785 | — | — | 5,857,785 |
Leisure Goods | 3,912,373 | — | — | 3,912,373 |
Life Insurance | 6,432,507 | — | — | 6,432,507 |
Media | 1,649,231 | — | — | 1,649,231 |
Medical Equipment & Services | 13,051,759 | — | — | 13,051,759 |
Mortgage Real Estate Investment Trusts | 9,557,153 | — | — | 9,557,153 |
Nonequity Investment Instruments | 48,241 | — | — (a) | 48,241 |
Non-life Insurance | 7,539,274 | — | — | 7,539,274 |
Non-Renewable Energy | 32,914,522 | — | — | 32,914,522 |
Personal Care, Drug & Grocery Stores | 9,390,785 | — | — | 9,390,785 |
Personal Goods | 5,190,646 | — | — | 5,190,646 |
Pharmaceuticals, Biotechnology & Marijuana Producers | 16,651,015 | — | 32,423 | 16,683,438 |
Precious Metals & Mining | 18,627 | — | — | 18,627 |
Real Estate Investment & Services | 5,678,258 | — | — | 5,678,258 |
April 30, 2024 | J.P. Morgan Exchange-Traded Funds | 241 |
U.S. Small Cap Equity ETF (continued) | ||||
Level 1 Quoted prices | Level 2 Other significant observable inputs | Level 3 Significant unobservable inputs | Total | |
Real Estate Investment Trusts | $54,183,418 | $— | $— | $54,183,418 |
Renewable Energy | 2,210,649 | — | — | 2,210,649 |
Retailers | 12,880,388 | — | — | 12,880,388 |
Software & Computer Services | 15,209,407 | — | — | 15,209,407 |
Technology Hardware & Equipment | 30,083,427 | — | — | 30,083,427 |
Telecommunications Equipment | 10,827,782 | — | — | 10,827,782 |
Telecommunications Service Providers | 10,522,001 | — | — | 10,522,001 |
Tobacco | 3,189,467 | — | — | 3,189,467 |
Travel & Leisure | 1,668,352 | — | — | 1,668,352 |
Waste & Disposal Services | 1,462,401 | — | — | 1,462,401 |
Total Common Stocks | 469,739,155 | — | 32,423 | 469,771,578 |
Short-Term Investments | ||||
Investment Companies | 446,703 | — | — | 446,703 |
Investment of Cash Collateral from Securities Loaned | 35,806,449 | — | — | 35,806,449 |
Total Short-Term Investments | 36,253,152 | — | — | 36,253,152 |
Total Investments in Securities | $505,992,307 | $— | $32,423 | $506,024,730 |
Appreciation in Other Financial Instruments | ||||
Futures Contracts | $6,019 | $— | $— | $6,019 |
(a) | Value is zero. |
U.S. Momentum Factor ETF | ||||
Level 1 Quoted prices | Level 2 Other significant observable inputs | Level 3 Significant unobservable inputs | Total | |
Total Investments in Securities (a) | $845,432,659 | $— | $— (b) | $845,432,659 |
Depreciation in Other Financial Instruments | ||||
Futures Contracts (a) | $(38,300 ) | $— | $— | $(38,300 ) |
(a) | Please refer to the SOI for specifics of portfolio holdings. |
(b) | Value is zero. |
U.S. Quality Factor ETF | ||||
Level 1 Quoted prices | Level 2 Other significant observable inputs | Level 3 Significant unobservable inputs | Total | |
Total Investments in Securities (a) | $4,081,642,507 | $— | $— | $4,081,642,507 |
Depreciation in Other Financial Instruments | ||||
Futures Contracts (a) | $(41,736 ) | $— | $— | $(41,736 ) |
(a) | Please refer to the SOI for specifics of portfolio holdings. |
U.S. Value Factor ETF | ||||
Level 1 Quoted prices | Level 2 Other significant observable inputs | Level 3 Significant unobservable inputs | Total | |
Total Investments in Securities (a) | $802,182,762 | $— | $— | $802,182,762 |
242 | J.P. Morgan Exchange-Traded Funds | April 30, 2024 |
U.S. Value Factor ETF (continued) | ||||
Level 1 Quoted prices | Level 2 Other significant observable inputs | Level 3 Significant unobservable inputs | Total | |
Depreciation in Other Financial Instruments | ||||
Futures Contracts (a) | $(47,027 ) | $— | $— | $(47,027 ) |
(a) | Please refer to the SOI for specifics of portfolio holdings. |
Investment Securities on Loan, at value, Presented on the Statements of Assets and Liabilities | Cash Collateral Posted by Borrower* | Net Amount Due to Counterparty (not less than zero) | |
BetaBuilders Canada ETF | $81,758,457 | $(81,758,457 ) | $— |
BetaBuilders Developed Asia Pacific ex-Japan ETF | 5,342,700 | (5,342,700 ) | — |
BetaBuilders Emerging Markets Equity ETF | 152,773 | (152,773 ) | — |
BetaBuilders Europe ETF | 269,215,464 | (269,215,464 ) | — |
BetaBuilders International Equity ETF | 92,572,419 | (92,572,419 ) | — |
BetaBuilders Japan ETF | 18,842,417 | (18,842,417 ) | — |
April 30, 2024 | J.P. Morgan Exchange-Traded Funds | 243 |
Investment Securities on Loan, at value, Presented on the Statements of Assets and Liabilities | Cash Collateral Posted by Borrower* | Net Amount Due to Counterparty (not less than zero) | |
BetaBuilders U.S. Equity ETF | $27,667,394 | $(27,667,394 ) | $— |
BetaBuilders U.S. Mid Cap Equity ETF | 79,189,425 | (79,189,425 ) | — |
BetaBuilders U.S. Small Cap Equity ETF | 25,267,248 | (25,267,248 ) | — |
International Equity ETF | 4,017,022 | (4,017,022 ) | — |
U.S. Mid Cap Equity ETF | 8,192,524 | (8,192,524 ) | — |
U.S. Small Cap Equity ETF | 33,126,060 | (33,126,060 ) | — |
U.S. Quality Factor ETF | 56,687,542 | (56,687,542 ) | — |
U.S. Value Factor ETF | 17,697,964 | (17,697,964 ) | — |
* | Collateral posted reflects the value of securities on loan and does not include any additional amounts received from the borrower. |
BetaBuilders Canada ETF | $58,348 |
BetaBuilders Developed Asia Pacific ex-Japan ETF | 892 |
BetaBuilders Emerging Markets Equity ETF | 40 |
BetaBuilders Europe ETF | 1,743 |
BetaBuilders International Equity ETF | 1,038 |
BetaBuilders Japan ETF | 1,989 |
BetaBuilders U.S. Equity ETF | 2,555 |
BetaBuilders U.S. Mid Cap Equity ETF | 5,165 |
BetaBuilders U.S. Small Cap Equity ETF | 3,454 |
International Equity ETF | 340 |
U.S. Equity ETF | 667 |
U.S. Mid Cap Equity ETF | 927 |
U.S. Small Cap Equity ETF | 1,996 |
U.S. Momentum Factor ETF | 70 |
U.S. Quality Factor ETF | 3,471 |
U.S. Value Factor ETF | 1,163 |
244 | J.P. Morgan Exchange-Traded Funds | April 30, 2024 |
BetaBuilders Canada ETF | |||||||||
For the six months ended April 30, 2024 | |||||||||
Security Description | Value at October 31, 2023 | Purchases at Cost | Proceeds from Sales | Net Realized Gain (Loss) | Change in Unrealized Appreciation/ (Depreciation) | Value at April 30, 2024 | Shares at April 30, 2024 | Dividend Income | Capital Gain Distributions |
JPMorgan Securities Lending Money Market Fund Agency SL Class Shares, 5.47% (a) (b) | $104,289,023 | $1,856,144,648 | $1,890,342,916 | $(24,362 )* | $— | $70,066,393 | 70,059,387 | $3,096,346 * | $— |
JPMorgan U.S. Government Money Market Fund Class IM Shares, 5.25% (a) (b) | 80,082,808 | 4,460,441,216 | 4,520,660,607 | — | — | 19,863,417 | 19,863,417 | 4,880,370 * | — |
Total | $184,371,831 | $6,316,585,864 | $6,411,003,523 | $(24,362 ) | $— | $89,929,810 | $7,976,716 | $— | |
(a) | Investment in an affiliated fund, which is registered under the Investment Company Act of 1940, as amended, and is advised by J.P. Morgan Investment Management Inc. |
(b) | The rate shown is the current yield as of April 30, 2024. |
* | Amount is included on the Statements of Operations as Income from securities lending (net) (after payments of rebates and Citibank’s fee). |
BetaBuilders Developed Asia Pacific ex-Japan ETF | |||||||||
For the six months ended April 30, 2024 | |||||||||
Security Description | Value at October 31, 2023 | Purchases at Cost | Proceeds from Sales | Net Realized Gain (Loss) | Change in Unrealized Appreciation/ (Depreciation) | Value at April 30, 2024 | Shares at April 30, 2024 | Dividend Income | Capital Gain Distributions |
JPMorgan Securities Lending Money Market Fund Agency SL Class Shares, 5.47% (a) (b) | $— | $64,000,000 | $60,000,000 | $(100 )* | $(800 ) | $3,999,100 | 3,998,700 | $383,958 * | $— |
JPMorgan U.S. Government Money Market Fund Class IM Shares, 5.25% (a) (b) | 11,792,130 | 35,045,613 | 44,962,708 | — | — | 1,875,035 | 1,875,035 | 70,008 * | — |
Total | $11,792,130 | $99,045,613 | $104,962,708 | $(100 ) | $(800 ) | $5,874,135 | $453,966 | $— | |
(a) | Investment in an affiliated fund, which is registered under the Investment Company Act of 1940, as amended, and is advised by J.P. Morgan Investment Management Inc. |
(b) | The rate shown is the current yield as of April 30, 2024. |
* | Amount is included on the Statements of Operations as Income from securities lending (net) (after payments of rebates and Citibank’s fee). |
April 30, 2024 | J.P. Morgan Exchange-Traded Funds | 245 |
BetaBuilders Emerging Markets Equity ETF | |||||||||
For the six months ended April 30, 2024 | |||||||||
Security Description | Value at October 31, 2023 | Purchases at Cost | Proceeds from Sales | Net Realized Gain (Loss) | Change in Unrealized Appreciation/ (Depreciation) | Value at April 30, 2024 | Shares at April 30, 2024 | Dividend Income | Capital Gain Distributions |
JPMorgan U.S. Government Money Market Fund Class IM Shares, 5.25% (a) (b) | $— | $3,483,921 | $2,957,047 | $— | $— | $526,874 | 526,874 | $5,793 * | $— |
JPMorgan U.S. Government Money Market Fund Class IM Shares, 5.25% (a) (b) | 4,440,195 | 31,930,219 | 29,550,584 | — | — | 6,819,830 | 6,819,830 | 134,819 | — |
Total | $4,440,195 | $35,414,140 | $32,507,631 | $— | $— | $7,346,704 | $140,612 | $— | |
(a) | Investment in an affiliated fund, which is registered under the Investment Company Act of 1940, as amended, and is advised by J.P. Morgan Investment Management Inc. |
(b) | The rate shown is the current yield as of April 30, 2024. |
* | Amount is included on the Statements of Operations as Income from securities lending (net) (after payments of rebates and Citibank’s fee). |
BetaBuilders Europe ETF | |||||||||
For the six months ended April 30, 2024 | |||||||||
Security Description | Value at October 31, 2023 | Purchases at Cost | Proceeds from Sales | Net Realized Gain (Loss) | Change in Unrealized Appreciation/ (Depreciation) | Value at April 30, 2024 | Shares at April 30, 2024 | Dividend Income | Capital Gain Distributions |
JPMorgan Securities Lending Money Market Fund Agency SL Class Shares, 5.47% (a) (b) | $38,622,839 | $454,000,000 | $231,000,000 | $(3,500 )* | $(7,261 ) | $261,612,078 | 261,585,920 | $1,312,774 * | $— |
JPMorgan U.S. Government Money Market Fund Class IM Shares, 5.25% (a) (b) | 4,769,550 | 155,037,140 | 129,952,076 | — | — | 29,854,614 | 29,854,614 | 203,026 * | — |
Total | $43,392,389 | $609,037,140 | $360,952,076 | $(3,500 ) | $(7,261 ) | $291,466,692 | $1,515,800 | $— | |
(a) | Investment in an affiliated fund, which is registered under the Investment Company Act of 1940, as amended, and is advised by J.P. Morgan Investment Management Inc. |
(b) | The rate shown is the current yield as of April 30, 2024. |
* | Amount is included on the Statements of Operations as Income from securities lending (net) (after payments of rebates and Citibank’s fee). |
BetaBuilders International Equity ETF | |||||||||
For the six months ended April 30, 2024 | |||||||||
Security Description | Value at October 31, 2023 | Purchases at Cost | Proceeds from Sales | Net Realized Gain (Loss) | Change in Unrealized Appreciation/ (Depreciation) | Value at April 30, 2024 | Shares at April 30, 2024 | Dividend Income | Capital Gain Distributions |
JPMorgan Securities Lending Money Market Fund Agency SL Class Shares, 5.47% (a) (b) | $11,011,226 | $182,000,000 | $104,000,000 | $(2,000 )* | $(1,700 ) | $89,007,526 | 88,998,626 | $576,362 * | $— |
246 | J.P. Morgan Exchange-Traded Funds | April 30, 2024 |
BetaBuilders International Equity ETF (continued) | |||||||||
For the six months ended April 30, 2024 | |||||||||
Security Description | Value at October 31, 2023 | Purchases at Cost | Proceeds from Sales | Net Realized Gain (Loss) | Change in Unrealized Appreciation/ (Depreciation) | Value at April 30, 2024 | Shares at April 30, 2024 | Dividend Income | Capital Gain Distributions |
JPMorgan U.S. Government Money Market Fund Class IM Shares, 5.25% (a) (b) | $2,270,425 | $70,179,233 | $61,460,851 | $— | $— | $10,988,807 | 10,988,807 | $100,919 * | $— |
JPMorgan U.S. Government Money Market Fund Class IM Shares, 5.25% (a) (b) | 26,299,048 | 83,221,498 | 78,138,632 | — | — | 31,381,914 | 31,381,914 | 670,934 | — |
Total | $39,580,699 | $335,400,731 | $243,599,483 | $(2,000 ) | $(1,700 ) | $131,378,247 | $1,348,215 | $— | |
(a) | Investment in an affiliated fund, which is registered under the Investment Company Act of 1940, as amended, and is advised by J.P. Morgan Investment Management Inc. |
(b) | The rate shown is the current yield as of April 30, 2024. |
* | Amount is included on the Statements of Operations as Income from securities lending (net) (after payments of rebates and Citibank’s fee). |
BetaBuilders Japan ETF | |||||||||
For the six months ended April 30, 2024 | |||||||||
Security Description | Value at October 31, 2023 | Purchases at Cost | Proceeds from Sales | Net Realized Gain (Loss) | Change in Unrealized Appreciation/ (Depreciation) | Value at April 30, 2024 | Shares at April 30, 2024 | Dividend Income | Capital Gain Distributions |
JPMorgan Securities Lending Money Market Fund Agency SL Class Shares, 5.47% (a) (b) | $7,351,631 | $341,000,000 | $331,000,000 | $(4,499 )* | $(235 ) | $17,346,897 | 17,345,163 | $1,096,448 * | $— |
JPMorgan U.S. Government Money Market Fund Class IM Shares, 5.25% (a) (b) | 1,317,980 | 130,826,151 | 129,635,396 | — | — | 2,508,735 | 2,508,735 | 168,777 * | — |
Total | $8,669,611 | $471,826,151 | $460,635,396 | $(4,499 ) | $(235 ) | $19,855,632 | $1,265,225 | $— | |
(a) | Investment in an affiliated fund, which is registered under the Investment Company Act of 1940, as amended, and is advised by J.P. Morgan Investment Management Inc. |
(b) | The rate shown is the current yield as of April 30, 2024. |
* | Amount is included on the Statements of Operations as Income from securities lending (net) (after payments of rebates and Citibank’s fee). |
BetaBuilders U.S. Equity ETF | |||||||||
For the six months ended April 30, 2024 | |||||||||
Security Description | Value at October 31, 2023 | Purchases at Cost | Proceeds from Sales | Net Realized Gain (Loss) | Change in Unrealized Appreciation/ (Depreciation) | Value at April 30, 2024 | Shares at April 30, 2024 | Dividend Income | Capital Gain Distributions |
JPMorgan Chase & Co. (a) | $23,749,501 | $6,021,663 | $558,008 | $156,378 | $9,490,796 | $38,860,330 | 202,672 | $422,052 | $— |
JPMorgan Securities Lending Money Market Fund Agency SL Class Shares, 5.47% (b) (c) | 39,998,200 | 35,000,000 | 50,000,000 | 3,299 * | (4,698 ) | 24,996,801 | 24,994,301 | 921,084 * | — |
April 30, 2024 | J.P. Morgan Exchange-Traded Funds | 247 |
BetaBuilders U.S. Equity ETF (continued) | |||||||||
For the six months ended April 30, 2024 | |||||||||
Security Description | Value at October 31, 2023 | Purchases at Cost | Proceeds from Sales | Net Realized Gain (Loss) | Change in Unrealized Appreciation/ (Depreciation) | Value at April 30, 2024 | Shares at April 30, 2024 | Dividend Income | Capital Gain Distributions |
JPMorgan U.S. Government Money Market Fund Class IM Shares, 5.25% (b) (c) | $4,560,264 | $48,070,794 | $49,016,592 | $— | $— | $3,614,466 | 3,614,466 | $125,261 * | $— |
JPMorgan U.S. Government Money Market Fund Class IM Shares, 5.25% (b) (c) | 15,413,521 | 34,781,941 | 27,824,450 | — | — | 22,371,012 | 22,371,012 | 457,953 | — |
Total | $83,721,486 | $123,874,398 | $127,399,050 | $159,677 | $9,486,098 | $89,842,609 | $1,926,350 | $— | |
(a) | Investment in affiliate. This security is included in an index which the Fund, as an index fund, tracks. |
(b) | Investment in an affiliated fund, which is registered under the Investment Company Act of 1940, as amended, and is advised by J.P. Morgan Investment Management Inc. |
(c) | The rate shown is the current yield as of April 30, 2024. |
* | Amount is included on the Statements of Operations as Income from securities lending (net) (after payments of rebates and Citibank’s fee). |
BetaBuilders U.S. Mid Cap Equity ETF | |||||||||
For the six months ended April 30, 2024 | |||||||||
Security Description | Value at October 31, 2023 | Purchases at Cost | Proceeds from Sales | Net Realized Gain (Loss) | Change in Unrealized Appreciation/ (Depreciation) | Value at April 30, 2024 | Shares at April 30, 2024 | Dividend Income | Capital Gain Distributions |
JPMorgan Securities Lending Money Market Fund Agency SL Class Shares, 5.47% (a) (b) | $139,472,056 | $155,000,000 | $220,000,000 | $11,792 * | $(9,243 ) | $74,474,605 | 74,467,158 | $3,204,549 * | $— |
JPMorgan U.S. Government Money Market Fund Class IM Shares, 5.25% (a) (b) | 15,819,380 | 122,489,171 | 128,492,736 | — | — | 9,815,815 | 9,815,815 | 405,250 * | — |
JPMorgan U.S. Government Money Market Fund Class IM Shares, 5.25% (a) (b) | 14,241,062 | 35,848,585 | 38,046,864 | — | — | 12,042,783 | 12,042,783 | 286,899 | — |
Total | $169,532,498 | $313,337,756 | $386,539,600 | $11,792 | $(9,243 ) | $96,333,203 | $3,896,698 | $— | |
(a) | Investment in an affiliated fund, which is registered under the Investment Company Act of 1940, as amended, and is advised by J.P. Morgan Investment Management Inc. |
(b) | The rate shown is the current yield as of April 30, 2024. |
* | Amount is included on the Statements of Operations as Income from securities lending (net) (after payments of rebates and Citibank’s fee). |
BetaBuilders U.S. Small Cap Equity ETF | |||||||||
For the six months ended April 30, 2024 | |||||||||
Security Description | Value at October 31, 2023 | Purchases at Cost | Proceeds from Sales | Net Realized Gain (Loss) | Change in Unrealized Appreciation/ (Depreciation) | Value at April 30, 2024 | Shares at April 30, 2024 | Dividend Income | Capital Gain Distributions |
JPMorgan Securities Lending Money Market Fund Agency SL Class Shares, 5.47% (a) (b) | $93,001,004 | $115,000,000 | $185,000,000 | $20,896 * | $(4,205 ) | $23,017,695 | 23,015,394 | $1,931,098 * | $— |
248 | J.P. Morgan Exchange-Traded Funds | April 30, 2024 |
BetaBuilders U.S. Small Cap Equity ETF (continued) | |||||||||
For the six months ended April 30, 2024 | |||||||||
Security Description | Value at October 31, 2023 | Purchases at Cost | Proceeds from Sales | Net Realized Gain (Loss) | Change in Unrealized Appreciation/ (Depreciation) | Value at April 30, 2024 | Shares at April 30, 2024 | Dividend Income | Capital Gain Distributions |
JPMorgan U.S. Government Money Market Fund Class IM Shares, 5.25% (a) (b) | $11,142,566 | $92,902,600 | $100,285,944 | $— | $— | $3,759,222 | 3,759,222 | $261,461 * | $— |
JPMorgan U.S. Government Money Market Fund Class IM Shares, 5.25% (a) (b) | 3,209,614 | 60,352,014 | 58,234,372 | — | — | 5,327,256 | 5,327,256 | 162,672 | — |
Total | $107,353,184 | $268,254,614 | $343,520,316 | $20,896 | $(4,205 ) | $32,104,173 | $2,355,231 | $— | |
(a) | Investment in an affiliated fund, which is registered under the Investment Company Act of 1940, as amended, and is advised by J.P. Morgan Investment Management Inc. |
(b) | The rate shown is the current yield as of April 30, 2024. |
* | Amount is included on the Statements of Operations as Income from securities lending (net) (after payments of rebates and Citibank’s fee). |
Carbon Transition U.S. Equity ETF | |||||||||
For the six months ended April 30, 2024 | |||||||||
Security Description | Value at October 31, 2023 | Purchases at Cost | Proceeds from Sales | Net Realized Gain (Loss) | Change in Unrealized Appreciation/ (Depreciation) | Value at April 30, 2024 | Shares at April 30, 2024 | Dividend Income | Capital Gain Distributions |
JPMorgan U.S. Government Money Market Fund Class IM Shares, 5.25% (a) (b) | $10,503 | $124,786 | $126,715 | $— | $— | $8,574 | 8,574 | $343 | $— |
(a) | Investment in an affiliated fund, which is registered under the Investment Company Act of 1940, as amended, and is advised by J.P. Morgan Investment Management Inc. |
(b) | The rate shown is the current yield as of April 30, 2024. |
Emerging Markets Equity ETF | |||||||||
For the six months ended April 30, 2024 | |||||||||
Security Description | Value at October 31, 2023 | Purchases at Cost | Proceeds from Sales | Net Realized Gain (Loss) | Change in Unrealized Appreciation/ (Depreciation) | Value at April 30, 2024 | Shares at April 30, 2024 | Dividend Income | Capital Gain Distributions |
JPMorgan U.S. Government Money Market Fund Class IM Shares, 5.25% (a) (b) | $— | $10,055,135 | $9,653,903 | $— | $— | $401,232 | 401,232 | $13,530 | $— |
(a) | Investment in an affiliated fund, which is registered under the Investment Company Act of 1940, as amended, and is advised by J.P. Morgan Investment Management Inc. |
(b) | The rate shown is the current yield as of April 30, 2024. |
International Equity ETF | |||||||||
For the six months ended April 30, 2024 | |||||||||
Security Description | Value at October 31, 2023 | Purchases at Cost | Proceeds from Sales | Net Realized Gain (Loss) | Change in Unrealized Appreciation/ (Depreciation) | Value at April 30, 2024 | Shares at April 30, 2024 | Dividend Income | Capital Gain Distributions |
JPMorgan Prime Money Market Fund Class IM Shares, 5.41% (a) (b) | $424,062 | $14,476,350 | $14,901,412 | $1,031 | $(31 ) | $— | — | $17,320 | $— |
April 30, 2024 | J.P. Morgan Exchange-Traded Funds | 249 |
International Equity ETF (continued) | |||||||||
For the six months ended April 30, 2024 | |||||||||
Security Description | Value at October 31, 2023 | Purchases at Cost | Proceeds from Sales | Net Realized Gain (Loss) | Change in Unrealized Appreciation/ (Depreciation) | Value at April 30, 2024 | Shares at April 30, 2024 | Dividend Income | Capital Gain Distributions |
JPMorgan Securities Lending Money Market Fund Agency SL Class Shares, 5.47% (a) (b) | $1,259,077 | $12,000,000 | $10,100,000 | $20 * | $(115 ) | $3,158,982 | 3,158,665 | $43,853 * | $— |
JPMorgan U.S. Government Money Market Fund Class IM Shares, 5.25% (a) (b) | 865,085 | 20,419,040 | 20,184,339 | — | — | 1,099,786 | 1,099,786 | 29,733 * | — |
Total | $2,548,224 | $46,895,390 | $45,185,751 | $1,051 | $(146 ) | $4,258,768 | $90,906 | $— | |
(a) | Investment in an affiliated fund, which is registered under the Investment Company Act of 1940, as amended, and is advised by J.P. Morgan Investment Management Inc. |
(b) | The rate shown is the current yield as of April 30, 2024. |
* | Amount is included on the Statements of Operations as Income from securities lending (net) (after payments of rebates and Citibank’s fee). |
U.S. Equity ETF | |||||||||
For the six months ended April 30, 2024 | |||||||||
Security Description | Value at October 31, 2023 | Purchases at Cost | Proceeds from Sales | Net Realized Gain (Loss) | Change in Unrealized Appreciation/ (Depreciation) | Value at April 30, 2024 | Shares at April 30, 2024 | Dividend Income | Capital Gain Distributions |
JPMorgan Securities Lending Money Market Fund Agency SL Class Shares, 5.47% (a) (b) | $16,999,600 | $25,000,000 | $42,003,848 | $4,048 * | $200 | $— | — | $242,788 * | $— |
JPMorgan U.S. Government Money Market Fund Class IM Shares, 5.25% (a) (b) | 3,440,270 | 23,012,539 | 26,452,809 | — | — | — | — | 45,333 * | — |
JPMorgan U.S. Government Money Market Fund Class IM Shares, 5.25% (a) (b) | 306,480 | 9,700,440 | 9,101,038 | — | — | 905,882 | 905,882 | 22,640 | — |
Total | $20,746,350 | $57,712,979 | $77,557,695 | $4,048 | $200 | $905,882 | $310,761 | $— | |
(a) | Investment in an affiliated fund, which is registered under the Investment Company Act of 1940, as amended, and is advised by J.P. Morgan Investment Management Inc. |
(b) | The rate shown is the current yield as of April 30, 2024. |
* | Amount is included on the Statements of Operations as Income from securities lending (net) (after payments of rebates and Citibank’s fee). |
U.S. Mid Cap Equity ETF | |||||||||
For the six months ended April 30, 2024 | |||||||||
Security Description | Value at October 31, 2023 | Purchases at Cost | Proceeds from Sales | Net Realized Gain (Loss) | Change in Unrealized Appreciation/ (Depreciation) | Value at April 30, 2024 | Shares at April 30, 2024 | Dividend Income | Capital Gain Distributions |
JPMorgan Securities Lending Money Market Fund Agency SL Class Shares, 5.47% (a) (b) | $22,000,000 | $21,000,000 | $35,899,999 | $3,099 * | $(931 ) | $7,102,169 | 7,101,459 | $429,930 * | $— |
250 | J.P. Morgan Exchange-Traded Funds | April 30, 2024 |
U.S. Mid Cap Equity ETF (continued) | |||||||||
For the six months ended April 30, 2024 | |||||||||
Security Description | Value at October 31, 2023 | Purchases at Cost | Proceeds from Sales | Net Realized Gain (Loss) | Change in Unrealized Appreciation/ (Depreciation) | Value at April 30, 2024 | Shares at April 30, 2024 | Dividend Income | Capital Gain Distributions |
JPMorgan U.S. Government Money Market Fund Class IM Shares, 5.25% (a) (b) | $4,283,512 | $26,470,772 | $29,283,553 | $— | $— | $1,470,731 | 1,470,731 | $70,928 * | $— |
JPMorgan U.S. Government Money Market Fund Class IM Shares, 5.25% (a) (b) | 280,906 | 9,444,890 | 9,024,264 | — | — | 701,532 | 701,532 | 16,891 | — |
Total | $26,564,418 | $56,915,662 | $74,207,816 | $3,099 | $(931 ) | $9,274,432 | $517,749 | $— | |
(a) | Investment in an affiliated fund, which is registered under the Investment Company Act of 1940, as amended, and is advised by J.P. Morgan Investment Management Inc. |
(b) | The rate shown is the current yield as of April 30, 2024. |
* | Amount is included on the Statements of Operations as Income from securities lending (net) (after payments of rebates and Citibank’s fee). |
U.S. Small Cap Equity ETF | |||||||||
For the six months ended April 30, 2024 | |||||||||
Security Description | Value at October 31, 2023 | Purchases at Cost | Proceeds from Sales | Net Realized Gain (Loss) | Change in Unrealized Appreciation/ (Depreciation) | Value at April 30, 2024 | Shares at April 30, 2024 | Dividend Income | Capital Gain Distributions |
JPMorgan Securities Lending Money Market Fund Agency SL Class Shares, 5.47% (a) (b) | $43,647,261 | $48,000,000 | $60,000,000 | $5,563 * | $(6,028 ) | $31,646,796 | 31,643,631 | $1,266,396 * | $— |
JPMorgan U.S. Government Money Market Fund Class IM Shares, 5.25% (a) (b) | 5,628,021 | 46,455,258 | 47,923,626 | — | — | 4,159,653 | 4,159,653 | 165,611 * | — |
JPMorgan U.S. Government Money Market Fund Class IM Shares, 5.25% (a) (b) | 365,657 | 15,886,329 | 15,805,283 | — | — | 446,703 | 446,703 | 33,877 | — |
Total | $49,640,939 | $110,341,587 | $123,728,909 | $5,563 | $(6,028 ) | $36,253,152 | $1,465,884 | $— | |
(a) | Investment in an affiliated fund, which is registered under the Investment Company Act of 1940, as amended, and is advised by J.P. Morgan Investment Management Inc. |
(b) | The rate shown is the current yield as of April 30, 2024. |
* | Amount is included on the Statements of Operations as Income from securities lending (net) (after payments of rebates and Citibank’s fee). |
U.S. Momentum Factor ETF | |||||||||
For the six months ended April 30, 2024 | |||||||||
Security Description | Value at October 31, 2023 | Purchases at Cost | Proceeds from Sales | Net Realized Gain (Loss) | Change in Unrealized Appreciation/ (Depreciation) | Value at April 30, 2024 | Shares at April 30, 2024 | Dividend Income | Capital Gain Distributions |
JPMorgan U.S. Government Money Market Fund Class IM Shares, 5.25% (a) (b) | $571,988 | $1,501,191 | $2,073,179 | $— | $— | $— | — | $3,188 * | $— |
JPMorgan U.S. Government Money Market Fund Class IM Shares, 5.25% (a) (b) | 154,302 | 10,543,365 | 9,483,930 | — | — | 1,213,737 | 1,213,737 | 26,395 | — |
Total | $726,290 | $12,044,556 | $11,557,109 | $— | $— | $1,213,737 | $29,583 | $— | |
(a) | Investment in an affiliated fund, which is registered under the Investment Company Act of 1940, as amended, and is advised by J.P. Morgan Investment Management Inc. |
April 30, 2024 | J.P. Morgan Exchange-Traded Funds | 251 |
(b) | The rate shown is the current yield as of April 30, 2024. |
* | Amount is included on the Statements of Operations as Income from securities lending (net) (after payments of rebates and Citibank’s fee). |
U.S. Quality Factor ETF | |||||||||
For the six months ended April 30, 2024 | |||||||||
Security Description | Value at October 31, 2023 | Purchases at Cost | Proceeds from Sales | Net Realized Gain (Loss) | Change in Unrealized Appreciation/ (Depreciation) | Value at April 30, 2024 | Shares at April 30, 2024 | Dividend Income | Capital Gain Distributions |
JPMorgan Securities Lending Money Market Fund Agency SL Class Shares, 5.47% (a) (b) | $84,512,218 | $127,000,000 | $159,093,602 | $(7,896 )* | $(5,023 ) | $52,405,697 | 52,400,457 | $2,358,422 * | $— |
JPMorgan U.S. Government Money Market Fund Class IM Shares, 5.25% (a) (b) | 10,755,358 | 86,660,246 | 90,557,910 | — | — | 6,857,694 | 6,857,694 | 294,548 * | — |
JPMorgan U.S. Government Money Market Fund Class IM Shares, 5.25% (a) (b) | 1,995,808 | 45,820,370 | 39,250,601 | — | — | 8,565,577 | 8,565,577 | 177,817 | — |
Total | $97,263,384 | $259,480,616 | $288,902,113 | $(7,896 ) | $(5,023 ) | $67,828,968 | $2,830,787 | $— | |
(a) | Investment in an affiliated fund, which is registered under the Investment Company Act of 1940, as amended, and is advised by J.P. Morgan Investment Management Inc. |
(b) | The rate shown is the current yield as of April 30, 2024. |
* | Amount is included on the Statements of Operations as Income from securities lending (net) (after payments of rebates and Citibank’s fee). |
U.S. Value Factor ETF | |||||||||
For the six months ended April 30, 2024 | |||||||||
Security Description | Value at October 31, 2023 | Purchases at Cost | Proceeds from Sales | Net Realized Gain (Loss) | Change in Unrealized Appreciation/ (Depreciation) | Value at April 30, 2024 | Shares at April 30, 2024 | Dividend Income | Capital Gain Distributions |
JPMorgan Securities Lending Money Market Fund Agency SL Class Shares, 5.47% (a) (b) | $30,290,534 | $47,000,000 | $61,000,000 | $1,828 * | $(1,458 ) | $16,290,904 | 16,289,275 | $615,389 * | $— |
JPMorgan U.S. Government Money Market Fund Class IM Shares, 5.25% (a) (b) | 3,962,851 | 45,328,008 | 46,985,181 | — | — | 2,305,678 | 2,305,678 | 91,196 * | — |
JPMorgan U.S. Government Money Market Fund Class IM Shares, 5.25% (a) (b) | 841,596 | 16,344,259 | 15,670,517 | — | — | 1,515,338 | 1,515,338 | 45,733 | — |
Total | $35,094,981 | $108,672,267 | $123,655,698 | $1,828 | $(1,458 ) | $20,111,920 | $752,318 | $— | |
(a) | Investment in an affiliated fund, which is registered under the Investment Company Act of 1940, as amended, and is advised by J.P. Morgan Investment Management Inc. |
(b) | The rate shown is the current yield as of April 30, 2024. |
* | Amount is included on the Statements of Operations as Income from securities lending (net) (after payments of rebates and Citibank’s fee). |
252 | J.P. Morgan Exchange-Traded Funds | April 30, 2024 |
BetaBuilders Canada ETF | BetaBuilders Developed Asia Pacific ex-Japan ETF | BetaBuilders Emerging Markets Equity ETF | BetaBuilders Europe ETF | BetaBuilders International Equity ETF | BetaBuilders Japan ETF | |
Futures Contracts: | ||||||
Average Notional Balance Long | $38,769,385 | $26,770,065 | $3,863,009 | $70,882,515 | $40,218,452 | $79,143,524 |
Ending Notional Balance Long | 36,613,431 | 21,711,161 | 4,428,075 | 104,839,692 | 56,650,000 | 126,740,703 |
BetaBuilders U.S. Equity ETF | BetaBuilders U.S. Mid Cap Equity ETF | BetaBuilders U.S. Small Cap Equity ETF | Carbon Transition U.S. Equity ETF | Emerging Markets Equity ETF | International Equity ETF | |
Futures Contracts: | ||||||
Average Notional Balance Long | $19,368,543 | $11,937,670 | $6,138,879 | $9,542 | $301,271 | $1,900,005 |
Ending Notional Balance Long | 24,817,275 | 12,946,950 | 5,559,960 | — | 260,475 | 2,379,300 |
Forward Foreign Currency Exchange Contracts: | ||||||
Average Settlement Value Purchased | — | — | — | — | (369,979 ) | — |
U.S. Equity ETF | U.S. Mid Cap Equity ETF | U.S. Small Cap Equity ETF | U.S. Momentum Factor ETF | U.S. Quality Factor ETF | U.S. Value Factor ETF | |
Futures Contracts: | ||||||
Average Notional Balance Long | $909,093 | $682,476 | $1,139,021 | $851,202 | $4,887,021 | $1,814,811 |
Ending Notional Balance Long | 1,012,950 | 863,130 | 496,425 | 1,418,060 | 2,785,613 | 1,772,663 |
April 30, 2024 | J.P. Morgan Exchange-Traded Funds | 253 |
BetaBuilders Canada ETF | BetaBuilders Developed Asia Pacific ex-Japan ETF | BetaBuilders Emerging Markets Equity ETF | BetaBuilders Europe ETF | BetaBuilders International Equity ETF | BetaBuilders Japan ETF | |
Equity Risk Exposure: | ||||||
Unrealized Appreciation on Futures Contracts * | $— | $— | $— | $1,326,426 | $— | $— |
Unrealized Depreciation on Futures Contracts * | (538,767 ) | (254,360 ) | (4,686 ) | (386,763 ) | (1,368,000 ) | (509,454 ) |
Net Fair Value of Derivative Contracts: | ||||||
Unrealized Appreciation (Depreciation) on Futures Contracts * | (538,767 ) | (254,360 ) | (4,686 ) | 939,663 | (1,368,000 ) | (509,454 ) |
BetaBuilders U.S. Equity ETF | BetaBuilders U.S. Mid Cap Equity ETF | BetaBuilders U.S. Small Cap Equity ETF | Emerging Markets Equity ETF | International Equity ETF | |
Equity Risk Exposure: | |||||
Unrealized Appreciation on Futures Contracts * | $— | $— | $— | $6,920 | $— |
Unrealized Depreciation on Futures Contracts * | (662,839 ) | (298,291 ) | (323,942 ) | — | (72,803 ) |
Net Fair Value of Derivative Contracts: | |||||
Unrealized Appreciation (Depreciation) on Futures Contracts * | (662,839 ) | (298,291 ) | (323,942 ) | 6,920 | (72,803 ) |
U.S. Equity ETF | U.S. Mid Cap Equity ETF | U.S. Small Cap Equity ETF | U.S. Momentum Factor ETF | U.S. Quality Factor ETF | U.S. Value Factor ETF | |
Equity Risk Exposure: | ||||||
Unrealized Appreciation on Futures Contracts * | $— | $— | $6,019 | $— | $— | $— |
Unrealized Depreciation on Futures Contracts * | (17,759 ) | (27,576 ) | — | (38,300 ) | (41,736 ) | (47,027 ) |
Net Fair Value of Derivative Contracts: | ||||||
Unrealized Appreciation (Depreciation) on Futures Contracts * | (17,759 ) | (27,576 ) | 6,019 | (38,300 ) | (41,736 ) | (47,027 ) |
* | Includes cumulative appreciation/(depreciation) on futures contracts, if any, as reported on the SOIs. Only current day’s variation margin is reported within the Statements of Assets and Liabilities. |
BetaBuilders Canada ETF | BetaBuilders Developed Asia Pacific ex-Japan ETF | BetaBuilders Emerging Markets Equity ETF | BetaBuilders Europe ETF | BetaBuilders International Equity ETF | BetaBuilders Japan ETF | |
Realized Gain (Loss) on Derivatives Recognized as a Result From Operations: | ||||||
Equity Risk Exposure: | ||||||
Futures Contracts | $5,737,248 | $3,454,542 | $259,623 | $7,575,650 | $5,088,453 | $5,401,608 |
Net Change in Unrealized Appreciation (Depreciation) on Derivatives Recognized as a Result of Operations: | ||||||
Equity Risk Exposure: | ||||||
Futures Contracts | 418,301 | (242,635 ) | 237,526 | 3,210,580 | 776,748 | 1,633,676 |
254 | J.P. Morgan Exchange-Traded Funds | April 30, 2024 |
BetaBuilders U.S. Equity ETF | BetaBuilders U.S. Mid Cap Equity ETF | BetaBuilders U.S. Small Cap Equity ETF | Carbon Transition U.S. Equity ETF | Emerging Markets Equity ETF | International Equity ETF | |
Realized Gain (Loss) on Derivatives Recognized as a Result From Operations: | ||||||
Equity Risk Exposure: | ||||||
Futures Contracts | $2,812,173 | $2,877,389 | $1,168,131 | $3,337 | $30,624 | $229,845 |
Foreign Exchange Rate Risk Exposure: | ||||||
Forward Foreign Currency Exchange Contracts | — | — | — | — | (1,176 ) | — |
Net Change in Unrealized Appreciation (Depreciation) on Derivatives Recognized as a Result of Operations: | ||||||
Equity Risk Exposure: | ||||||
Futures Contracts | 274,926 | 833,671 | 58,288 | 743 | 31,425 | 22,758 |
U.S. Equity ETF | U.S. Mid Cap Equity ETF | U.S. Small Cap Equity ETF | U.S. Momentum Factor ETF | U.S. Quality Factor ETF | U.S. Value Factor ETF | |
Realized Gain (Loss) on Derivatives Recognized as a Result From Operations: | ||||||
Equity Risk Exposure: | ||||||
Futures Contracts | $216,256 | $208,564 | $576,956 | $201,251 | $1,288,412 | $461,827 |
Net Change in Unrealized Appreciation (Depreciation) on Derivatives Recognized as a Result of Operations: | ||||||
Equity Risk Exposure: | ||||||
Futures Contracts | (18,267 ) | (31,334 ) | 28,143 | (36,350 ) | 16,640 | (34,456 ) |
April 30, 2024 | J.P. Morgan Exchange-Traded Funds | 255 |
BetaBuilders Canada ETF | 0.19 % |
BetaBuilders Developed Asia Pacific ex-Japan ETF | 0.19 |
BetaBuilders Emerging Markets Equity ETF | 0.15 |
BetaBuilders Europe ETF | 0.09 |
BetaBuilders International Equity ETF | 0.07 |
BetaBuilders Japan ETF | 0.19 |
BetaBuilders U.S. Equity ETF | 0.02 |
BetaBuilders U.S. Mid Cap Equity ETF | 0.07 |
BetaBuilders U.S. Small Cap Equity ETF | 0.09 |
Carbon Transition U.S. Equity ETF | 0.15 |
Emerging Markets Equity ETF | 0.44 |
International Equity ETF | 0.37 |
U.S. Equity ETF | 0.18 |
U.S. Mid Cap Equity ETF | 0.24 |
U.S. Small Cap Equity ETF | 0.29 |
U.S. Momentum Factor ETF | 0.12 |
U.S. Quality Factor ETF | 0.12 |
U.S. Value Factor ETF | 0.12 |
256 | J.P. Morgan Exchange-Traded Funds | April 30, 2024 |
Purchases (excluding U.S. Government) | Sales (excluding U.S. Government) | |
BetaBuilders Canada ETF | $114,649,412 | $111,910,138 |
BetaBuilders Developed Asia Pacific ex-Japan ETF | 165,883,615 | 116,062,034 |
BetaBuilders Emerging Markets Equity ETF | 54,851,468 | 33,314,426 |
BetaBuilders Europe ETF | 232,050,730 | 183,972,273 |
BetaBuilders International Equity ETF | 111,506,579 | 117,380,568 |
BetaBuilders Japan ETF | 187,995,665 | 349,714,023 |
BetaBuilders U.S. Equity ETF | 46,530,738 | 42,908,524 |
BetaBuilders U.S. Mid Cap Equity ETF | 91,459,874 | 83,790,340 |
BetaBuilders U.S. Small Cap Equity ETF | 62,076,100 | 149,925,867 |
Carbon Transition U.S. Equity ETF | 533,633 | 938,813 |
Emerging Markets Equity ETF | 39,908,758 | 34,175,941 |
International Equity ETF | 41,153,906 | 48,081,821 |
U.S. Equity ETF | 51,709,259 | 52,995,932 |
U.S. Mid Cap Equity ETF | 37,426,072 | 38,526,621 |
U.S. Small Cap Equity ETF | 53,119,236 | 52,464,443 |
U.S. Momentum Factor ETF | 120,313,709 | 121,236,461 |
U.S. Quality Factor ETF | 349,309,211 | 347,705,747 |
U.S. Value Factor ETF | 79,477,388 | 82,040,229 |
April 30, 2024 | J.P. Morgan Exchange-Traded Funds | 257 |
In-Kind Purchases | In-Kind Sales | |
BetaBuilders Canada ETF | $362,879,871 | $30,131,414 |
BetaBuilders Developed Asia Pacific ex-Japan ETF | 349,405,808 | 34,473,185 |
BetaBuilders Emerging Markets Equity ETF | 5,056,838 | — |
BetaBuilders Europe ETF | 1,486,288,872 | — |
BetaBuilders International Equity ETF | 134,831,849 | 258,901,807 |
BetaBuilders Japan ETF | 1,445,708,685 | 240,171,405 |
BetaBuilders U.S. Equity ETF | 483,663,661 | 31,245,588 |
BetaBuilders U.S. Mid Cap Equity ETF | 131,659,101 | 260,020,983 |
BetaBuilders U.S. Small Cap Equity ETF | 180,445,169 | 397,935,274 |
Carbon Transition U.S. Equity ETF | 1,725,598 | 2,831,352 |
Emerging Markets Equity ETF | 3,060,095 | — |
International Equity ETF | — | 29,325,759 |
U.S. Equity ETF | 4,926,417 | 67,424,779 |
U.S. Mid Cap Equity ETF | 45,688,529 | 47,854,923 |
U.S. Small Cap Equity ETF | 70,724,889 | 43,138,551 |
U.S. Momentum Factor ETF | 552,372,324 | 83,149,496 |
U.S. Quality Factor ETF | 1,769,354,389 | 623,417,139 |
U.S. Value Factor ETF | 180,353,831 | 200,875,958 |
Aggregate Cost | Gross Unrealized Appreciation | Gross Unrealized Depreciation | Net Unrealized Appreciation (Depreciation) | |
BetaBuilders Canada ETF | $5,828,233,336 | $1,392,059,516 | $210,385,796 | $1,181,673,720 |
BetaBuilders Developed Asia Pacific ex-Japan ETF | 4,724,670,186 | 316,749,529 | 588,835,270 | (272,085,741 ) |
BetaBuilders Emerging Markets Equity ETF | 548,596,852 | 68,800,119 | 39,556,080 | 29,244,039 |
BetaBuilders Europe ETF | 7,665,414,052 | 714,231,884 | 607,761,023 | 106,470,861 |
BetaBuilders International Equity ETF | 3,582,592,493 | 764,491,971 | 293,012,471 | 471,479,500 |
BetaBuilders Japan ETF | 10,375,345,711 | 1,789,923,496 | 1,017,532,213 | 772,391,283 |
BetaBuilders U.S. Equity ETF | 2,671,304,550 | 548,211,077 | 102,421,647 | 445,789,430 |
BetaBuilders U.S. Mid Cap Equity ETF | 1,540,787,454 | 278,958,197 | 152,807,084 | 126,151,113 |
BetaBuilders U.S. Small Cap Equity ETF | 491,945,718 | 44,823,445 | 61,115,468 | (16,292,023 ) |
Carbon Transition U.S. Equity ETF | 4,760,910 | 513,753 | 183,238 | 330,515 |
Emerging Markets Equity ETF | 278,153,450 | 60,847,312 | 24,171,677 | 36,675,635 |
International Equity ETF | 359,006,199 | 50,517,910 | 45,717,698 | 4,800,212 |
U.S. Equity ETF | 367,337,562 | 75,416,062 | 18,378,393 | 57,037,669 |
U.S. Mid Cap Equity ETF | 342,069,006 | 42,630,786 | 16,437,789 | 26,192,997 |
U.S. Small Cap Equity ETF | 489,634,736 | 54,634,783 | 38,238,770 | 16,396,013 |
U.S. Momentum Factor ETF | 783,864,934 | 74,639,425 | 13,110,000 | 61,529,425 |
U.S. Quality Factor ETF | 3,784,380,649 | 380,471,816 | 83,251,694 | 297,220,122 |
U.S. Value Factor ETF | 776,593,926 | 72,591,365 | 47,049,556 | 25,541,809 |
258 | J.P. Morgan Exchange-Traded Funds | April 30, 2024 |
Capital Loss Carryforward Character | ||
Short-Term | Long-Term | |
BetaBuilders Canada ETF | $64,270,716 | $137,634,986 |
BetaBuilders Developed Asia Pacific ex-Japan ETF | 103,133,156 | 135,762,083 |
BetaBuilders Emerging Markets Equity ETF | 535,185 | 312,990 |
BetaBuilders Europe ETF | 123,586,788 | 207,235,489 |
BetaBuilders International Equity ETF | 29,397,394 | 54,939,789 |
BetaBuilders Japan ETF | 65,782,769 | 230,823,357 |
BetaBuilders U.S. Equity ETF | 30,535,955 | 11,801,665 |
BetaBuilders U.S. Mid Cap Equity ETF | 157,391,651 | 133,598,467 |
BetaBuilders U.S. Small Cap Equity ETF | 50,557,459 | 29,835,755 |
Carbon Transition U.S. Equity ETF | 1,455,965 * | 1,205,586 * |
Emerging Markets Equity ETF | 27,541,488 | 9,070,037 |
International Equity ETF | 53,684,631 | 111,916,925 |
U.S. Equity ETF | 34,559,356 | 22,862,408 |
U.S. Mid Cap Equity ETF | 21,279,323 | 10,918,611 |
U.S. Small Cap Equity ETF | 30,381,878 | 21,790,847 |
U.S. Momentum Factor ETF | 31,055,612 | 13,263,139 |
U.S. Quality Factor ETF | 52,310,857 | 22,883,195 |
U.S. Value Factor ETF | 53,754,581 | 28,161,447 |
* | Amount includes capital loss carryforwards which are limited in future years under Internal Revenue Code sections 381-384. |
Capital Loss Utilized | |
Short-Term | |
BetaBuilders Japan ETF | $13,529,258 |
April 30, 2024 | J.P. Morgan Exchange-Traded Funds | 259 |
JPMorgan SmartRetirement Funds | JPMorgan SmartRetirement Blend Funds | |
BetaBuilders Emerging Markets Equity ETF | — % | 96.0 % |
BetaBuilders International Equity ETF | — | 72.5 |
BetaBuilders U.S. Mid Cap Equity ETF | 51.8 | 41.7 |
BetaBuilders U.S. Small Cap Equity ETF | — | 72.2 |
260 | J.P. Morgan Exchange-Traded Funds | April 30, 2024 |
BetaBuilders Canada ETF | BetaBuilders Developed Asia Pacific ex-Japan ETF | BetaBuilders Emerging Markets Equity ETF | BetaBuilders Europe ETF | BetaBuilders International Equity ETF | BetaBuilders Japan ETF | Emerging Markets Equity ETF | International Equity ETF | |
Australia | — % | 62.8 % | — % | — % | — % | — % | — % | 11.7 % |
Canada | 95.2 | — | — | — | — | — | — | — |
China | — | — | 25.0 | — | — | — | 22.7 | — |
France | — | — | — | 15.2 | — | — | — | — |
Germany | — | — | — | 12.4 | — | — | — | — |
Hong Kong | — | 15.7 | — | — | — | — | — | — |
India | — | — | 20.3 | — | — | — | 12.3 | — |
Japan | — | — | — | — | 24.8 | 100.0 | — | 28.3 |
Singapore | — | 10.8 | — | — | — | — | — | — |
South Korea | — | — | 11.6 | — | — | — | — | — |
Taiwan | — | — | 16.7 | — | — | — | 10.9 | — |
Turkey | — | — | — | — | — | — | 10.7 | — |
United Kingdom | — | — | — | 16.6 | 10.6 | — | — | 16.6 |
April 30, 2024 | J.P. Morgan Exchange-Traded Funds | 261 |
262 | J.P. Morgan Exchange-Traded Funds | April 30, 2024 |
Beginning Account Value November 1, 2023 | Ending Account Value April 30, 2024 | Expenses Paid During the Period* | Annualized Expense Ratio | |
JPMorgan BetaBuilders Canada ETF | ||||
Actual | $1,000.00 | $1,180.30 | $1.03 | 0.19 % |
Hypothetical | 1,000.00 | 1,023.92 | 0.96 | 0.19 |
JPMorgan BetaBuilders Developed Asia Pacific ex-Japan ETF | ||||
Actual | 1,000.00 | 1,096.00 | 0.99 | 0.19 |
Hypothetical | 1,000.00 | 1,023.92 | 0.96 | 0.19 |
JPMorgan BetaBuilders Emerging Markets Equity ETF | ||||
Actual | 1,000.00 | 1,135.70 | 0.80 | 0.15 |
Hypothetical | 1,000.00 | 1,024.12 | 0.75 | 0.15 |
JPMorgan BetaBuilders Europe ETF | ||||
Actual | 1,000.00 | 1,181.80 | 0.49 | 0.09 |
Hypothetical | 1,000.00 | 1,024.42 | 0.45 | 0.09 |
JPMorgan BetaBuilders International Equity ETF | ||||
Actual | 1,000.00 | 1,170.80 | 0.38 | 0.07 |
Hypothetical | 1,000.00 | 1,024.51 | 0.35 | 0.07 |
JPMorgan BetaBuilders Japan ETF | ||||
Actual | 1,000.00 | 1,173.40 | 1.03 | 0.19 |
Hypothetical | 1,000.00 | 1,023.92 | 0.96 | 0.19 |
JPMorgan BetaBuilders U.S. Equity ETF | ||||
Actual | 1,000.00 | 1,212.60 | 0.11 | 0.02 |
Hypothetical | 1,000.00 | 1,024.76 | 0.10 | 0.02 |
JPMorgan BetaBuilders U.S. Mid Cap Equity ETF | ||||
Actual | 1,000.00 | 1,221.30 | 0.39 | 0.07 |
Hypothetical | 1,000.00 | 1,024.51 | 0.35 | 0.07 |
JPMorgan BetaBuilders U.S. Small Cap Equity ETF | ||||
Actual | 1,000.00 | 1,199.90 | 0.49 | 0.09 |
Hypothetical | 1,000.00 | 1,024.42 | 0.45 | 0.09 |
April 30, 2024 | J.P. Morgan Exchange-Traded Funds | 263 |
Beginning Account Value November 1, 2023 | Ending Account Value April 30, 2024 | Expenses Paid During the Period* | Annualized Expense Ratio | |
JPMorgan Carbon Transition U.S. Equity ETF | ||||
Actual | $1,000.00 | $1,212.20 | $0.83 | 0.15 % |
Hypothetical | 1,000.00 | 1,024.12 | 0.75 | 0.15 |
JPMorgan Diversified Return Emerging Markets Equity ETF | ||||
Actual | 1,000.00 | 1,145.60 | 2.35 | 0.44 |
Hypothetical | 1,000.00 | 1,022.68 | 2.21 | 0.44 |
JPMorgan Diversified Return International Equity ETF | ||||
Actual | 1,000.00 | 1,150.50 | 1.98 | 0.37 |
Hypothetical | 1,000.00 | 1,023.02 | 1.86 | 0.37 |
JPMorgan Diversified Return U.S. Equity ETF | ||||
Actual | 1,000.00 | 1,183.50 | 0.98 | 0.18 |
Hypothetical | 1,000.00 | 1,023.97 | 0.91 | 0.18 |
JPMorgan Diversified Return U.S. Mid Cap Equity ETF | ||||
Actual | 1,000.00 | 1,180.20 | 1.30 | 0.24 |
Hypothetical | 1,000.00 | 1,023.67 | 1.21 | 0.24 |
JPMorgan Diversified Return U.S. Small Cap Equity ETF | ||||
Actual | 1,000.00 | 1,157.40 | 1.56 | 0.29 |
Hypothetical | 1,000.00 | 1,023.42 | 1.46 | 0.29 |
JPMorgan U.S. Momentum Factor ETF | ||||
Actual | 1,000.00 | 1,255.90 | 0.67 | 0.12 |
Hypothetical | 1,000.00 | 1,024.27 | 0.60 | 0.12 |
JPMorgan U.S. Quality Factor ETF | ||||
Actual | 1,000.00 | 1,194.80 | 0.65 | 0.12 |
Hypothetical | 1,000.00 | 1,024.27 | 0.60 | 0.12 |
JPMorgan U.S. Value Factor ETF | ||||
Actual | 1,000.00 | 1,196.00 | 0.66 | 0.12 |
Hypothetical | 1,000.00 | 1,024.27 | 0.60 | 0.12 |
* | Expenses are equal to each Fund's annualized net expense ratio, multiplied by the average account value over the period, multiplied by 182/366 (to reflect the one-half year period). |
264 | J.P. Morgan Exchange-Traded Funds | April 30, 2024 |
April 30, 2024 | J.P. Morgan Exchange-Traded Funds | 265 |


Fund | Ticker | Listing Exchange |
JPMorgan Active China ETF | JCHI | NYSE Arca, Inc. |
JPMorgan ActiveBuilders Emerging Markets Equity ETF | JEMA | Cboe BZX Exchange, Inc. |
JPMorgan Global Select Equity ETF | JGLO | The NASDAQ Stock Market® LLC |
JPMorgan Healthcare Leaders ETF | JDOC | The NASDAQ Stock Market® LLC |
JPMorgan Hedged Equity Laddered Overlay ETF | HELO | NYSE Arca, Inc. |
JPMorgan International Growth ETF | JIG | NYSE Arca, Inc. |
JPMorgan International Value ETF | JIVE | The NASDAQ Stock Market® LLC |
1 | |
2 | |
3 | |
6 | |
9 | |
12 | |
14 | |
17 | |
20 | |
23 | |
51 | |
60 | |
62 | |
80 | |
81 | |
82 |
 | “The U.S. economic expansion has entered its fifth year, led by consumer spending, an increase in immigrant workers and receding inflation.” — Brian S. Shlissel |

President, J.P. Morgan Exchange-Traded Funds
J.P. Morgan Asset Management
1-844-4JPM-ETF or jpmorgan.com/etfs for more information
April 30, 2024 | J.P. Morgan Exchange-Traded Funds | 1 |
2 | J.P. Morgan Exchange-Traded Funds | April 30, 2024 |
REPORTING PERIOD RETURN: | |
Net Asset Value * | 3.74% |
Market Price ** | 3.50% |
MSCI China All Shares Index (net total return) | 3.64% |
Net Assets as of 4/30/2024 | $10,718,574 |
Fund Ticker | JCHI |
April 30, 2024 | J.P. Morgan Exchange-Traded Funds | 3 |
TOP TEN HOLDINGS OF THE PORTFOLIO AS OF April 30, 2024 | PERCENT OF TOTAL INVESTMENTS | |
1. | Tencent Holdings Ltd. (China) | 12.2 % |
2. | Alibaba Group Holding Ltd. (China) | 5.6 |
3. | China Merchants Bank Co. Ltd., Class H (China) | 4.3 |
4. | China Construction Bank Corp., Class H (China) | 4.2 |
5. | Kweichow Moutai Co. Ltd., Class A (China) | 4.1 |
6. | Meituan (China) | 3.2 |
7. | Haier Smart Home Co. Ltd., Class H (China) | 3.2 |
8. | China Yangtze Power Co. Ltd., Class A (China) | 2.8 |
9. | Foxconn Industrial Internet Co. Ltd., Class A (China) | 2.7 |
10. | NetEase, Inc. (China) | 2.4 |
PORTFOLIO COMPOSITION BY SECTOR AS OF April 30, 2024 | PERCENT OF TOTAL INVESTMENTS |
Consumer Discretionary | 18.9% |
Communication Services | 18.8 |
Information Technology | 15.2 |
Financials | 15.1 |
Consumer Staples | 10.8 |
Utilities | 4.9 |
Energy | 4.3 |
Health Care | 4.2 |
Industrials | 3.5 |
Real Estate | 2.3 |
Materials | 1.9 |
Short-Term Investments | 0.1 |
4 | J.P. Morgan Exchange-Traded Funds | April 30, 2024 |
INCEPTION DATE | SIX MONTHS* | 1 YEAR | SINCE INCEPTION | |
JPMorgan Active China ETF | ||||
Net Asset Value | March 15, 2023 | 3.74 % | (11.72 )% | (10.94 )% |
Market Price | 3.50 | (11.74 ) | (10.81 ) |
* | Not annualized. |
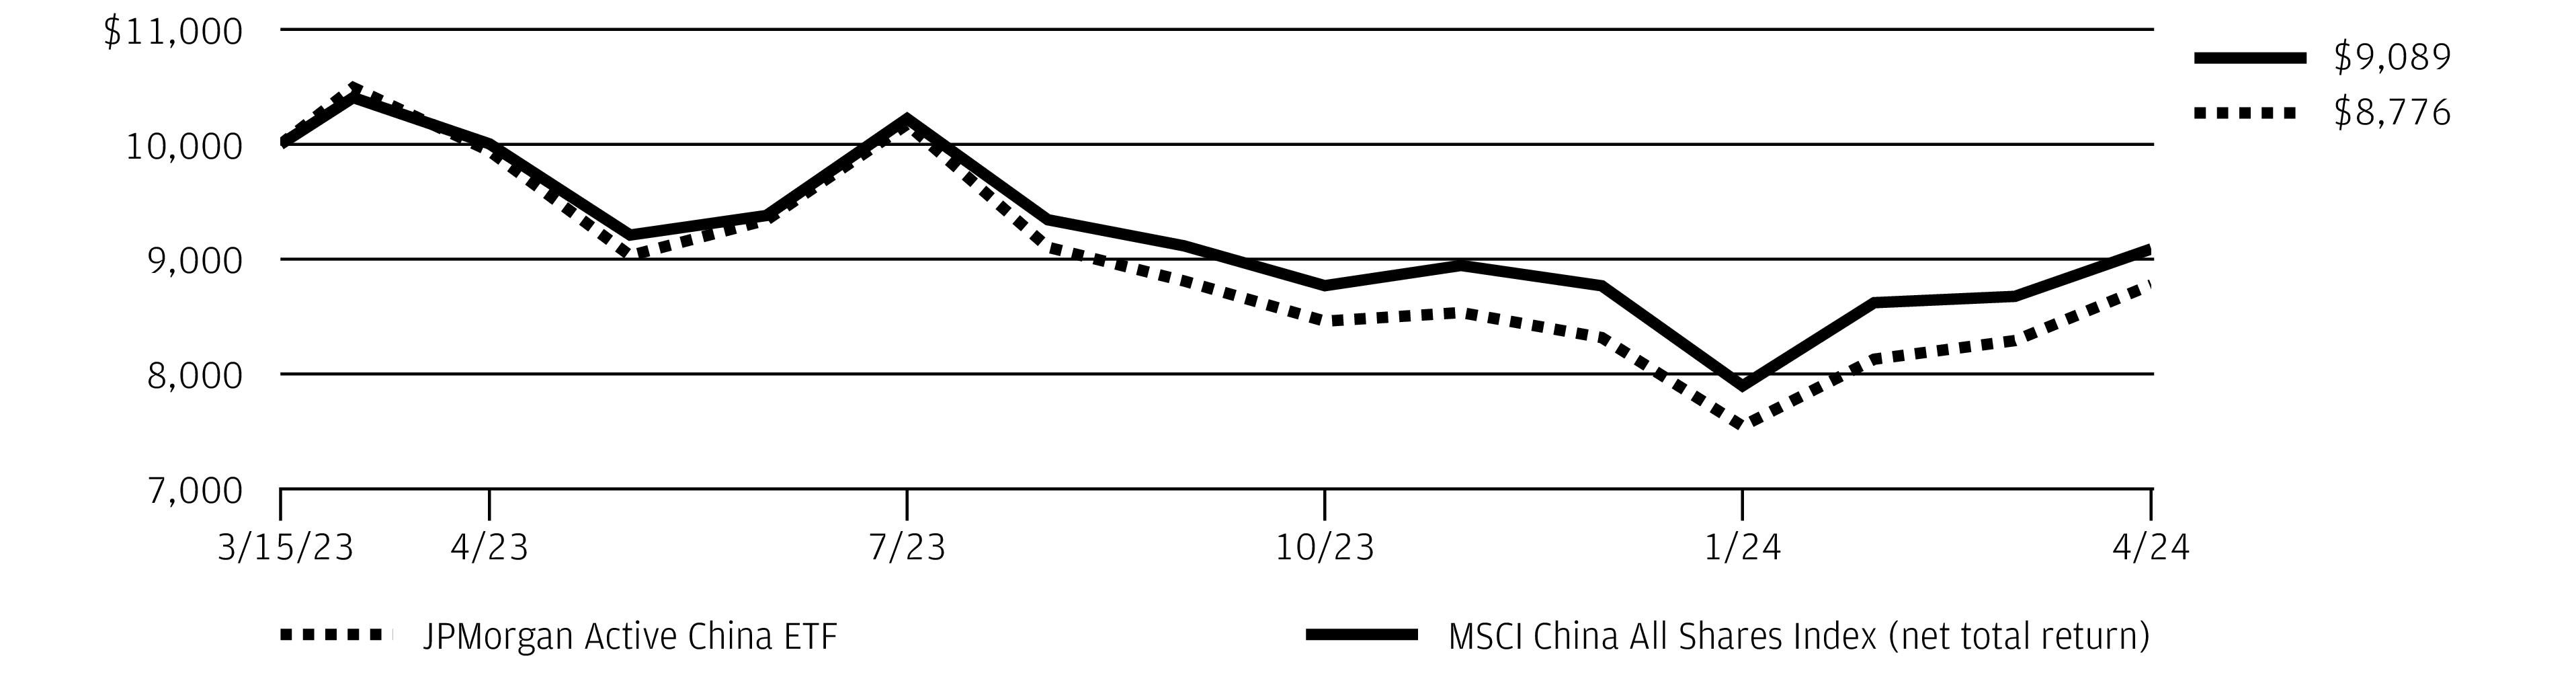
April 30, 2024 | J.P. Morgan Exchange-Traded Funds | 5 |
REPORTING PERIOD RETURN: | |
Net Asset Value * | 12.33% |
Market Price ** | 12.55% |
MSCI Emerging Markets Index (net total return) | 15.40% |
Net Assets as of 4/30/2024 | $1,014,555,181 |
Fund Ticker | JEMA |
TOP TEN HOLDINGS OF THE PORTFOLIO AS OF April 30, 2024 | PERCENT OF TOTAL INVESTMENTS | |
1. | Taiwan Semiconductor Manufacturing Co. Ltd. (Taiwan) | 8.3 % |
2. | Samsung Electronics Co. Ltd. (South Korea) | 4.6 |
3. | Tencent Holdings Ltd. (China) | 4.4 |
4. | Alibaba Group Holding Ltd. (China) | 1.7 |
5. | Infosys Ltd. (India) | 1.6 |
6. | Tata Consultancy Services Ltd. (India) | 1.3 |
7. | NetEase, Inc. (China) | 1.1 |
8. | ICICI Bank Ltd. (India) | 1.1 |
9. | Reliance Industries Ltd. (India) | 1.0 |
10. | China Merchants Bank Co. Ltd., Class H (China) | 1.0 |
PORTFOLIO COMPOSITION BY COUNTRY AS OF April 30, 2024 | PERCENT OF TOTAL INVESTMENTS |
China | 26.6% |
Taiwan | 17.7 |
India | 16.4 |
South Korea | 13.1 |
Brazil | 5.1 |
Mexico | 3.5 |
South Africa | 3.2 |
Saudi Arabia | 2.9 |
Indonesia | 2.0 |
Thailand | 1.4 |
Hong Kong | 1.2 |
Others (each less than 1.0%) | 6.3 |
Short-Term Investments | 0.6 |
6 | J.P. Morgan Exchange-Traded Funds | April 30, 2024 |
April 30, 2024 | J.P. Morgan Exchange-Traded Funds | 7 |
INCEPTION DATE | SIX MONTHS* | 1 YEAR | SINCE INCEPTION | |
JPMorgan ActiveBuilders Emerging Markets Equity ETF | ||||
Net Asset Value | March 10, 2021 | 12.33 % | 5.66 % | (6.24 )% |
Market Price | 12.55 | 5.22 | (6.20 ) |
* | Not annualized. |
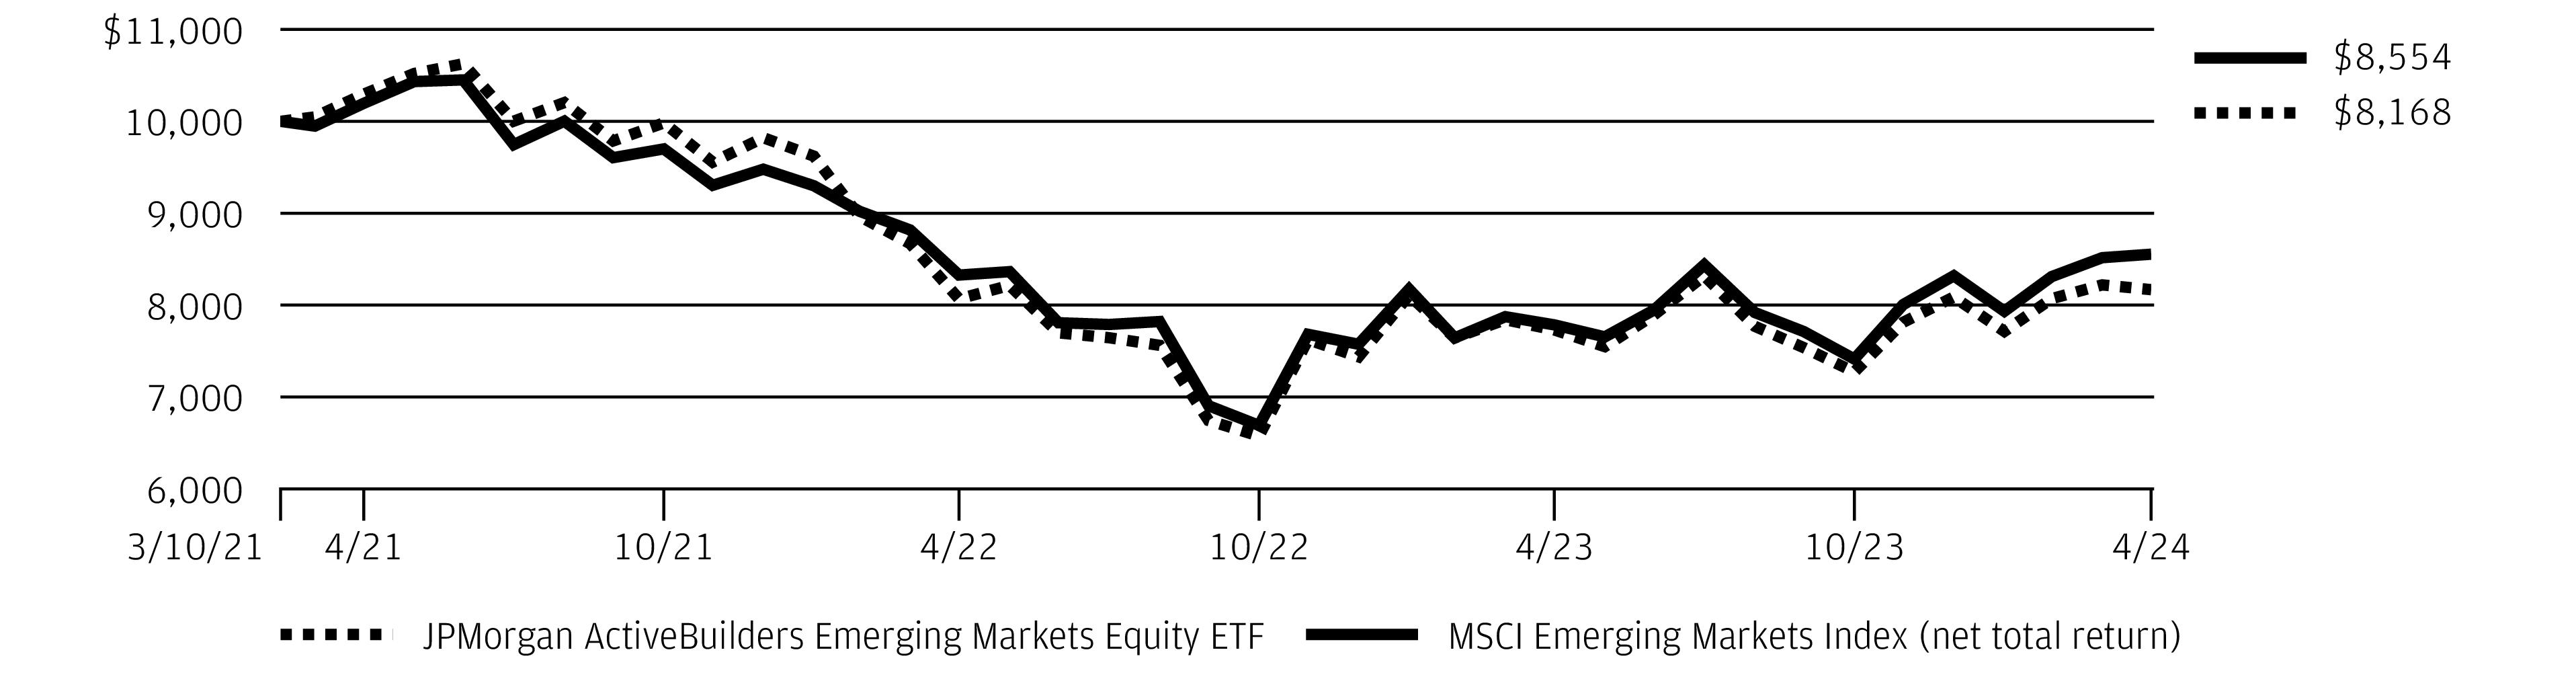
8 | J.P. Morgan Exchange-Traded Funds | April 30, 2024 |
REPORTING PERIOD RETURN: | |
Net Asset Value * | 20.76% |
Market Price ** | 20.79% |
MSCI World Index (net total return) | 20.29% |
Net Assets as of 4/30/2024 | $2,827,199,415 |
Fund Ticker | JGLO |
TOP TEN HOLDINGS OF THE PORTFOLIO AS OF April 30, 2024 | PERCENT OF TOTAL INVESTMENTS | |
1. | Microsoft Corp. | 7.2 % |
2. | Amazon.com, Inc. | 5.6 |
3. | Apple, Inc. | 4.9 |
4. | NVIDIA Corp. | 4.9 |
5. | UnitedHealth Group, Inc. | 3.5 |
6. | Mastercard, Inc., Class A | 3.4 |
7. | CME Group, Inc. | 2.9 |
8. | Meta Platforms, Inc., Class A | 2.9 |
9. | LVMH Moet Hennessy Louis Vuitton SE (France) | 2.6 |
10. | Exxon Mobil Corp. | 2.0 |
PORTFOLIO COMPOSITION BY COUNTRY AS OF April 30, 2024 | PERCENT OF TOTAL INVESTMENTS |
United States | 72.7% |
France | 7.2 |
United Kingdom | 3.1 |
Taiwan | 2.9 |
Japan | 2.2 |
South Korea | 2.1 |
Denmark | 1.9 |
Germany | 1.6 |
Netherlands | 1.5 |
Others (each less than 1.0%) | 3.3 |
Short-Term Investments | 1.5 |
April 30, 2024 | J.P. Morgan Exchange-Traded Funds | 9 |
10 | J.P. Morgan Exchange-Traded Funds | April 30, 2024 |
INCEPTION DATE | SIX MONTHS* | CUMULATIVE SINCE INCEPTION | |
JPMorgan Global Select Equity ETF | |||
Net Asset Value | September 13, 2023 | 20.76 % | 15.88 % |
Market Price | 20.79 | 16.09 |
* | Not annualized. |
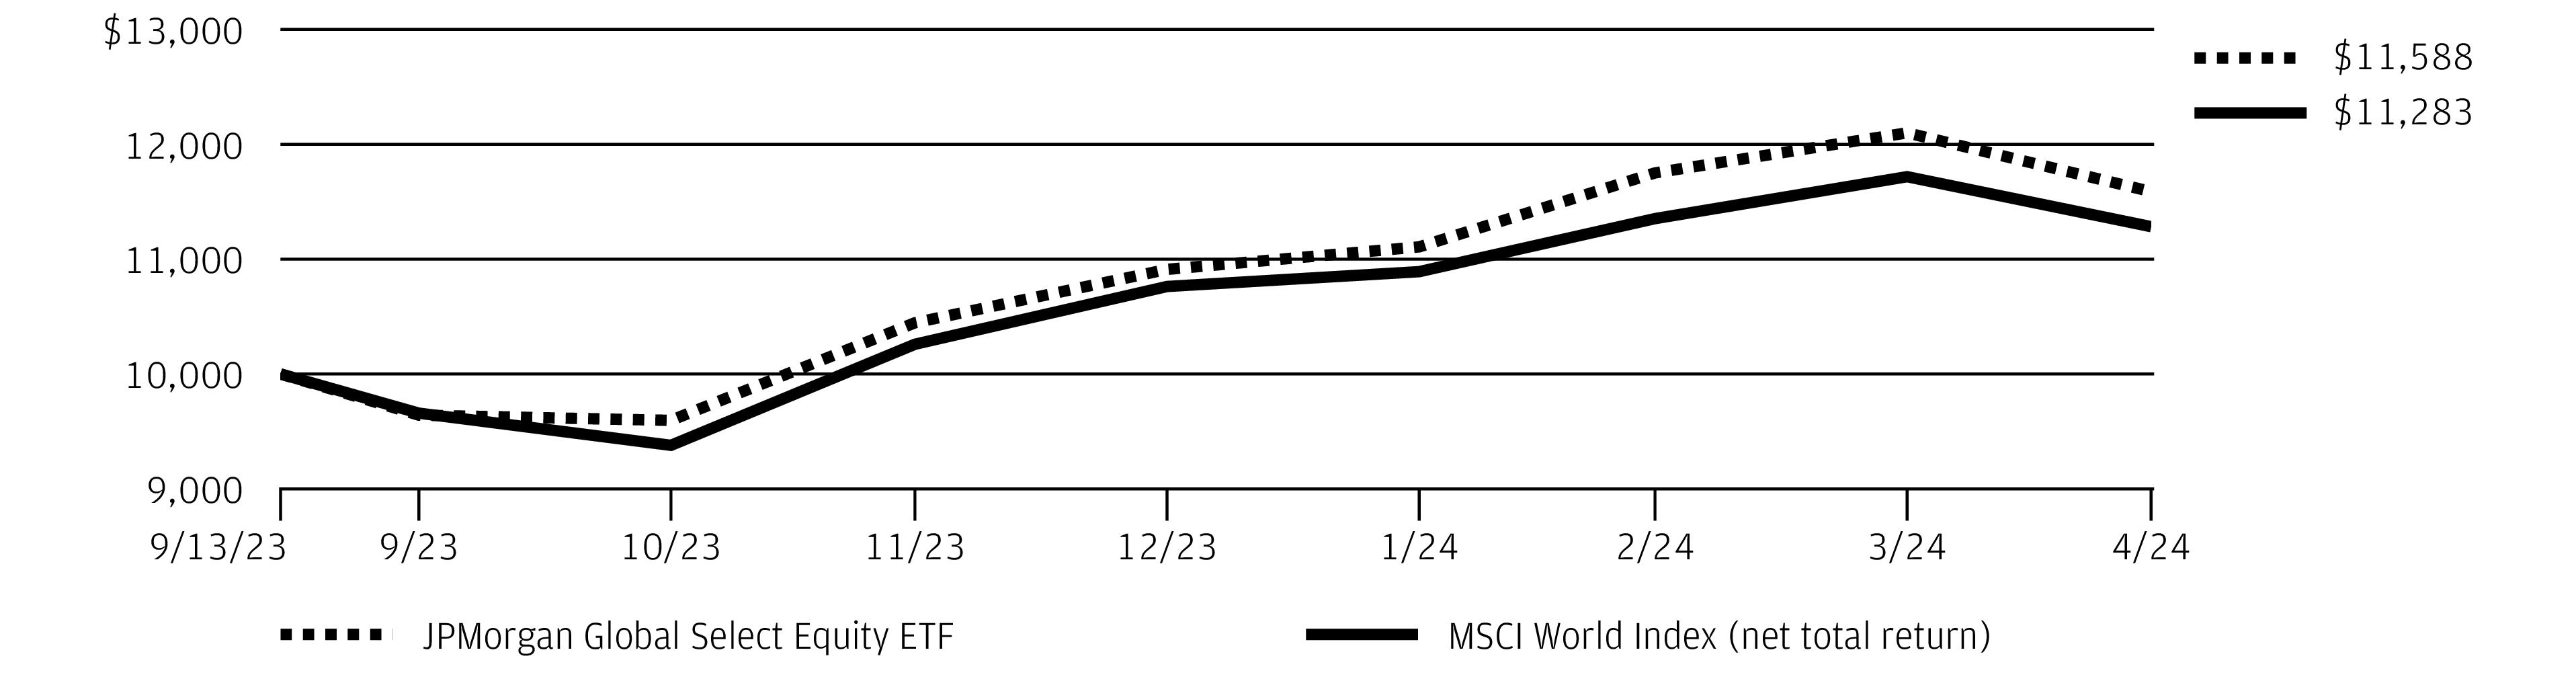
April 30, 2024 | J.P. Morgan Exchange-Traded Funds | 11 |
REPORTING PERIOD RETURN: | |
Net Asset Value * | 17.47% |
Market Price ** | 17.51% |
MSCI World Healthcare Index (net total return) | 13.41% |
MSCI World Index (net total return) | 19.05% |
Net Assets as of 4/30/2024 | $7,037,375 |
Fund Ticker | JDOC |
TOP TEN HOLDINGS OF THE PORTFOLIO AS OF April 30, 2024 | PERCENT OF TOTAL INVESTMENTS | |
1. | Eli Lilly & Co. | 9.5 % |
2. | UnitedHealth Group, Inc. | 7.8 |
3. | Novo Nordisk A/S, Class B (Denmark) | 5.9 |
4. | AstraZeneca plc (United Kingdom) | 5.0 |
5. | AbbVie, Inc. | 4.6 |
6. | Regeneron Pharmaceuticals, Inc. | 4.4 |
7. | Danaher Corp. | 3.4 |
8. | Cigna Group (The) | 3.0 |
9. | Johnson & Johnson | 2.9 |
10. | Stryker Corp. | 2.8 |
PORTFOLIO COMPOSITION BY COUNTRY AS OF April 30, 2024 | PERCENT OF TOTAL INVESTMENTS |
United States | 81.5% |
Denmark | 6.3 |
United Kingdom | 5.0 |
Switzerland | 3.3 |
Japan | 1.6 |
Others (each less than 1.0%) | 1.4 |
Short-Term Investments | 0.9 |
12 | J.P. Morgan Exchange-Traded Funds | April 30, 2024 |
INCEPTION DATE | CUMULATIVE SINCE INCEPTION | |
JPMorgan Healthcare Leaders ETF | ||
Net Asset Value | November 1, 2023 | 17.47 % |
Market Price | 17.51 |
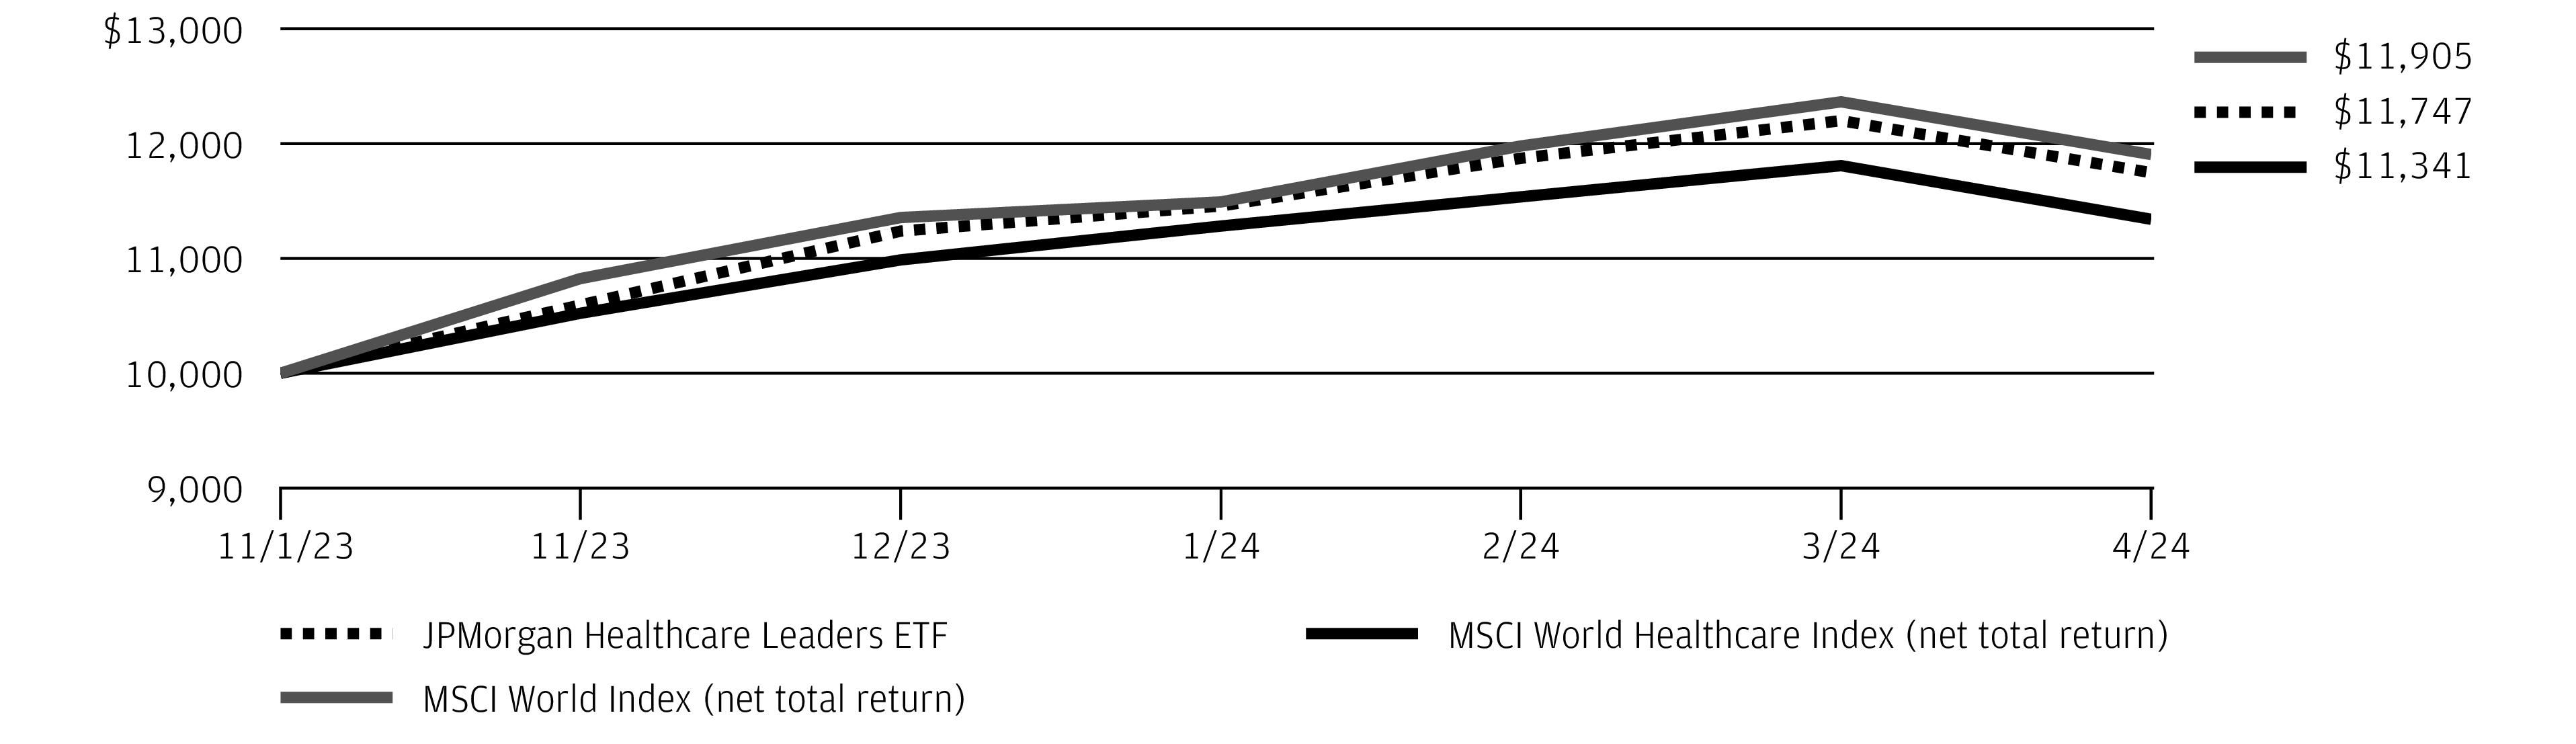
April 30, 2024 | J.P. Morgan Exchange-Traded Funds | 13 |
REPORTING PERIOD RETURN: | |
Net Asset Value * | 11.81% |
Market Price ** | 11.95% |
S&P 500 Index | 20.98% |
ICE BofA 3-Month US Treasury Bill Index | 2.66% |
Net Assets as of 4/30/2024 | $528,702,504 |
Fund Ticker | HELO |
TOP TEN HOLDINGS OF THE PORTFOLIO AS OF April 30, 2024 | PERCENT OF TOTAL INVESTMENTS | |
1. | Microsoft Corp. | 7.5 % |
2. | Apple, Inc. | 5.9 |
3. | NVIDIA Corp. | 5.5 |
4. | Amazon.com, Inc. | 4.3 |
5. | Meta Platforms, Inc., Class A | 2.5 |
6. | Alphabet, Inc., Class A | 2.3 |
7. | Exxon Mobil Corp. | 1.8 |
8. | Alphabet, Inc., Class C | 1.7 |
9. | Mastercard, Inc., Class A | 1.6 |
10. | Berkshire Hathaway, Inc., Class B | 1.4 |
PORTFOLIO COMPOSITION BY SECTOR AS OF April 30, 2024 | PERCENT OF TOTAL INVESTMENTS |
Information Technology | 28.7% |
Financials | 13.2 |
Health Care | 12.2 |
Consumer Discretionary | 11.6 |
Industrials | 9.1 |
Communication Services | 8.3 |
Consumer Staples | 5.2 |
Energy | 4.1 |
Utilities | 2.3 |
Materials | 2.2 |
Real Estate | 1.9 |
Other **** | 1.0 |
Short-Term Investments | 0.2 |
14 | J.P. Morgan Exchange-Traded Funds | April 30, 2024 |
April 30, 2024 | J.P. Morgan Exchange-Traded Funds | 15 |
INCEPTION DATE | SIX MONTHS* | CUMULATIVE SINCE INCEPTION | |
JPMorgan Hedged Equity Laddered Overlay ETF | |||
Net Asset Value | September 28, 2023 | 11.81 % | 10.20 % |
Market Price | 11.95 | 10.34 |
* | Not annualized. |
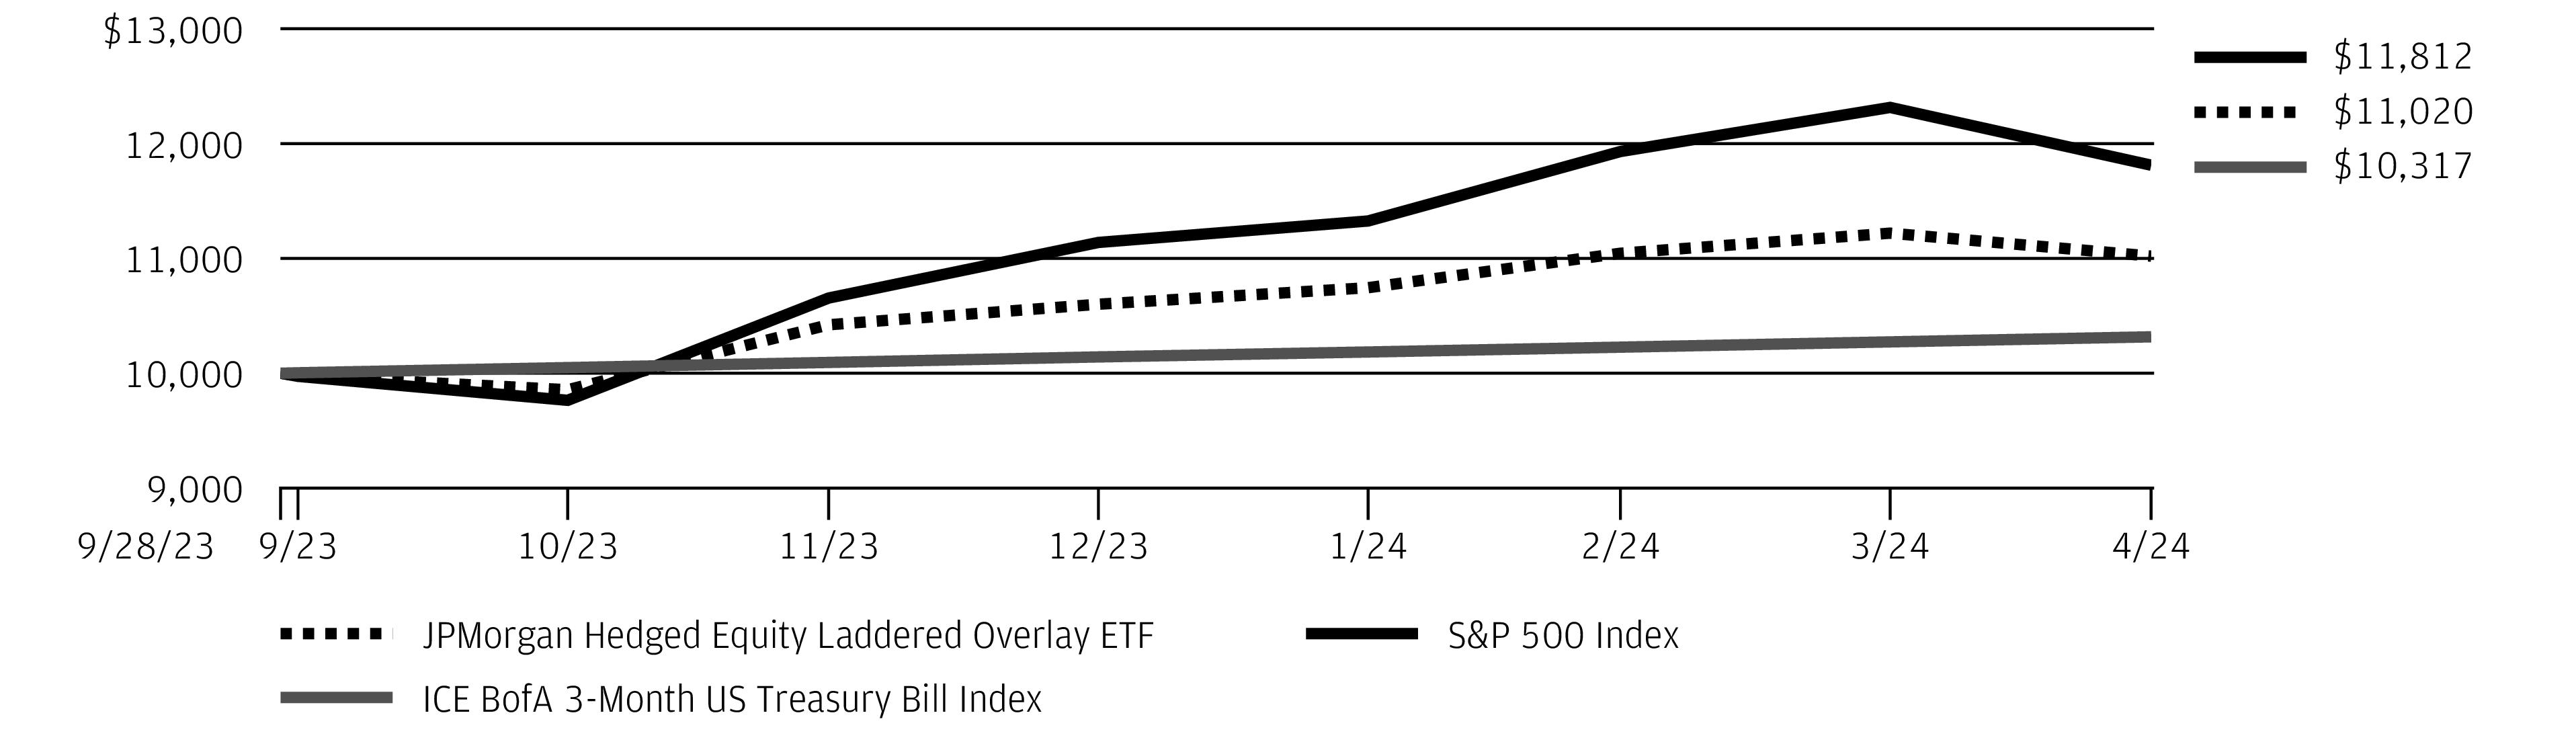
16 | J.P. Morgan Exchange-Traded Funds | April 30, 2024 |
REPORTING PERIOD RETURN: | |
Net Asset Value * | 17.97% |
Market Price ** | 18.08% |
MSCI ACWI ex USA Growth Index (net total return) | 19.07% |
Net Assets as of 4/30/2024 | $86,166,714 |
Fund Ticker | JIG |
April 30, 2024 | J.P. Morgan Exchange-Traded Funds | 17 |
TOP TEN HOLDINGS OF THE PORTFOLIO AS OF April 30, 2024 | PERCENT OF TOTAL INVESTMENTS | |
1. | ASML Holding NV (Netherlands) | 4.4 % |
2. | Tencent Holdings Ltd. (China) | 3.9 |
3. | Taiwan Semiconductor Manufacturing Co. Ltd. (Taiwan) | 3.7 |
4. | Novo Nordisk A/S, Class B (Denmark) | 3.6 |
5. | Taiwan Semiconductor Manufacturing Co. Ltd., ADR (Taiwan) | 3.5 |
6. | Nestle SA (Registered) | 2.9 |
7. | Safran SA (France) | 2.6 |
8. | 3i Group plc (United Kingdom) | 2.4 |
9. | LVMH Moet Hennessy Louis Vuitton SE (France) | 2.3 |
10. | Air Liquide SA (France) | 2.2 |
PORTFOLIO COMPOSITION BY COUNTRY AS OF April 30, 2024 | PERCENT OF TOTAL INVESTMENTS |
Japan | 15.9% |
France | 11.4 |
United Kingdom | 9.7 |
China | 8.0 |
United States | 7.9 |
Taiwan | 7.2 |
Netherlands | 7.1 |
Canada | 6.1 |
Denmark | 4.2 |
South Korea | 2.9 |
Sweden | 2.8 |
Indonesia | 1.9 |
Switzerland | 1.8 |
Mexico | 1.6 |
Spain | 1.5 |
Germany | 1.3 |
Singapore | 1.1 |
Italy | 1.0 |
Brazil | 1.0 |
Others (each less than 1.0%) | 0.7 |
Short-Term Investments | 4.9 |
18 | J.P. Morgan Exchange-Traded Funds | April 30, 2024 |
INCEPTION DATE | SIX MONTHS* | 1 YEAR | SINCE INCEPTION | |
JPMorgan International Growth ETF | ||||
Net Asset Value | May 20, 2020 | 17.97 % | 5.27 % | 5.05 % |
Market Price | 18.08 | 5.07 | 5.06 |
* | Not annualized. |
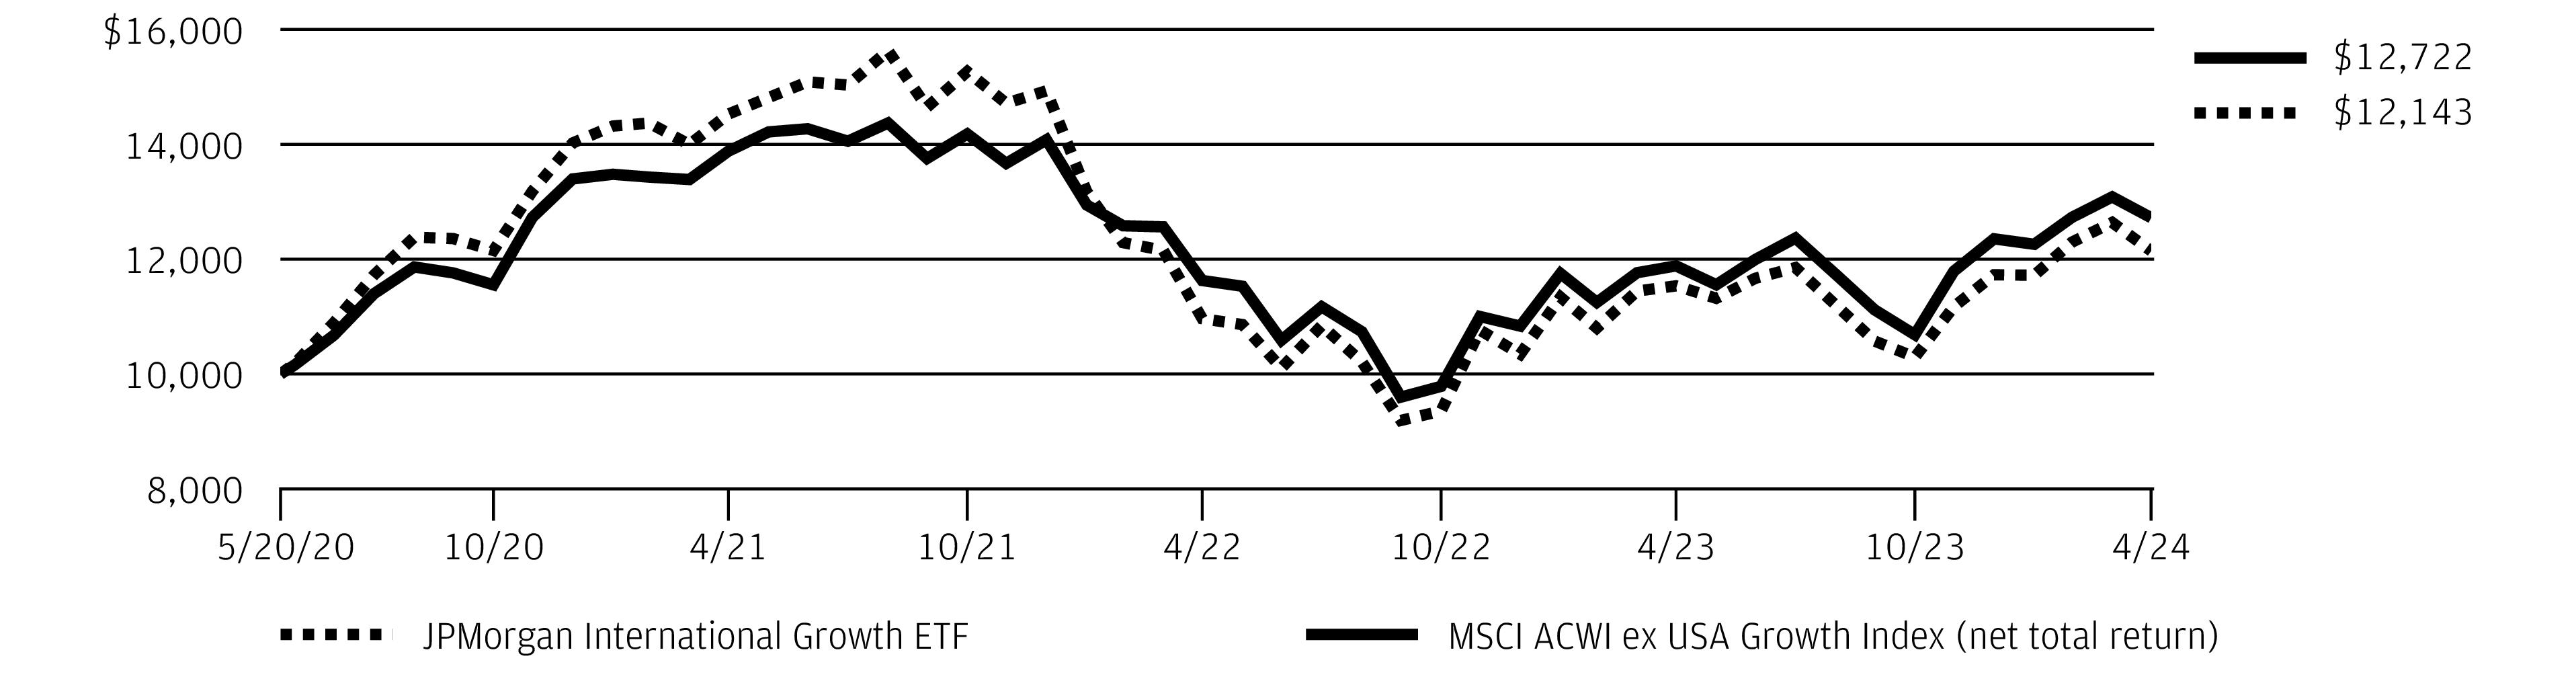
April 30, 2024 | J.P. Morgan Exchange-Traded Funds | 19 |
REPORTING PERIOD RETURN: | |
Net Asset Value * | 18.58% |
Market Price ** | 18.22% |
MSCI ACWI ex USA Index (net total return) | 17.69% |
MSCI ACWI ex USA Value Index (net total return) | 16.35% |
Net Assets as of 4/30/2024 | $13,537,548 |
Fund Ticker | JIVE |
20 | J.P. Morgan Exchange-Traded Funds | April 30, 2024 |
TOP TEN HOLDINGS OF THE PORTFOLIO AS OF April 30, 2024 | PERCENT OF TOTAL INVESTMENTS | |
1. | Shell plc | 2.0 % |
2. | Novartis AG (Registered) (Switzerland) | 1.8 |
3. | TotalEnergies SE (France) | 1.4 |
4. | Samsung Electronics Co. Ltd. (South Korea) | 1.3 |
5. | Alibaba Group Holding Ltd. (China) | 1.3 |
6. | Toyota Motor Corp. (Japan) | 1.1 |
7. | HSBC Holdings plc (United Kingdom) | 1.0 |
8. | Rio Tinto plc (Australia) | 1.0 |
9. | BP plc | 1.0 |
10. | Allianz SE (Registered) (Germany) | 1.0 |
PORTFOLIO COMPOSITION BY COUNTRY AS OF April 30, 2024 | PERCENT OF TOTAL INVESTMENTS |
Japan | 16.9% |
China | 8.5 |
United Kingdom | 6.5 |
France | 6.2 |
South Korea | 6.1 |
Germany | 5.9 |
United States | 5.4 |
Italy | 4.7 |
Australia | 4.3 |
Canada | 4.2 |
Switzerland | 2.9 |
Spain | 2.7 |
Taiwan | 2.4 |
India | 2.4 |
Brazil | 2.0 |
South Africa | 1.9 |
Netherlands | 1.8 |
Sweden | 1.7 |
Finland | 1.6 |
Austria | 1.2 |
Singapore | 1.2 |
Hong Kong | 1.2 |
Norway | 1.2 |
Denmark | 1.0 |
Others (each less than 1.0%) | 4.9 |
Short-Term Investments | 1.2 |
April 30, 2024 | J.P. Morgan Exchange-Traded Funds | 21 |
INCEPTION DATE | SIX MONTHS* | CUMULATIVE SINCE INCEPTION | |
JPMorgan International Value ETF | |||
Net Asset Value | September 13, 2023 | 18.58 % | 13.67 % |
Market Price | 18.22 | 13.83 |
* | Not annualized. |
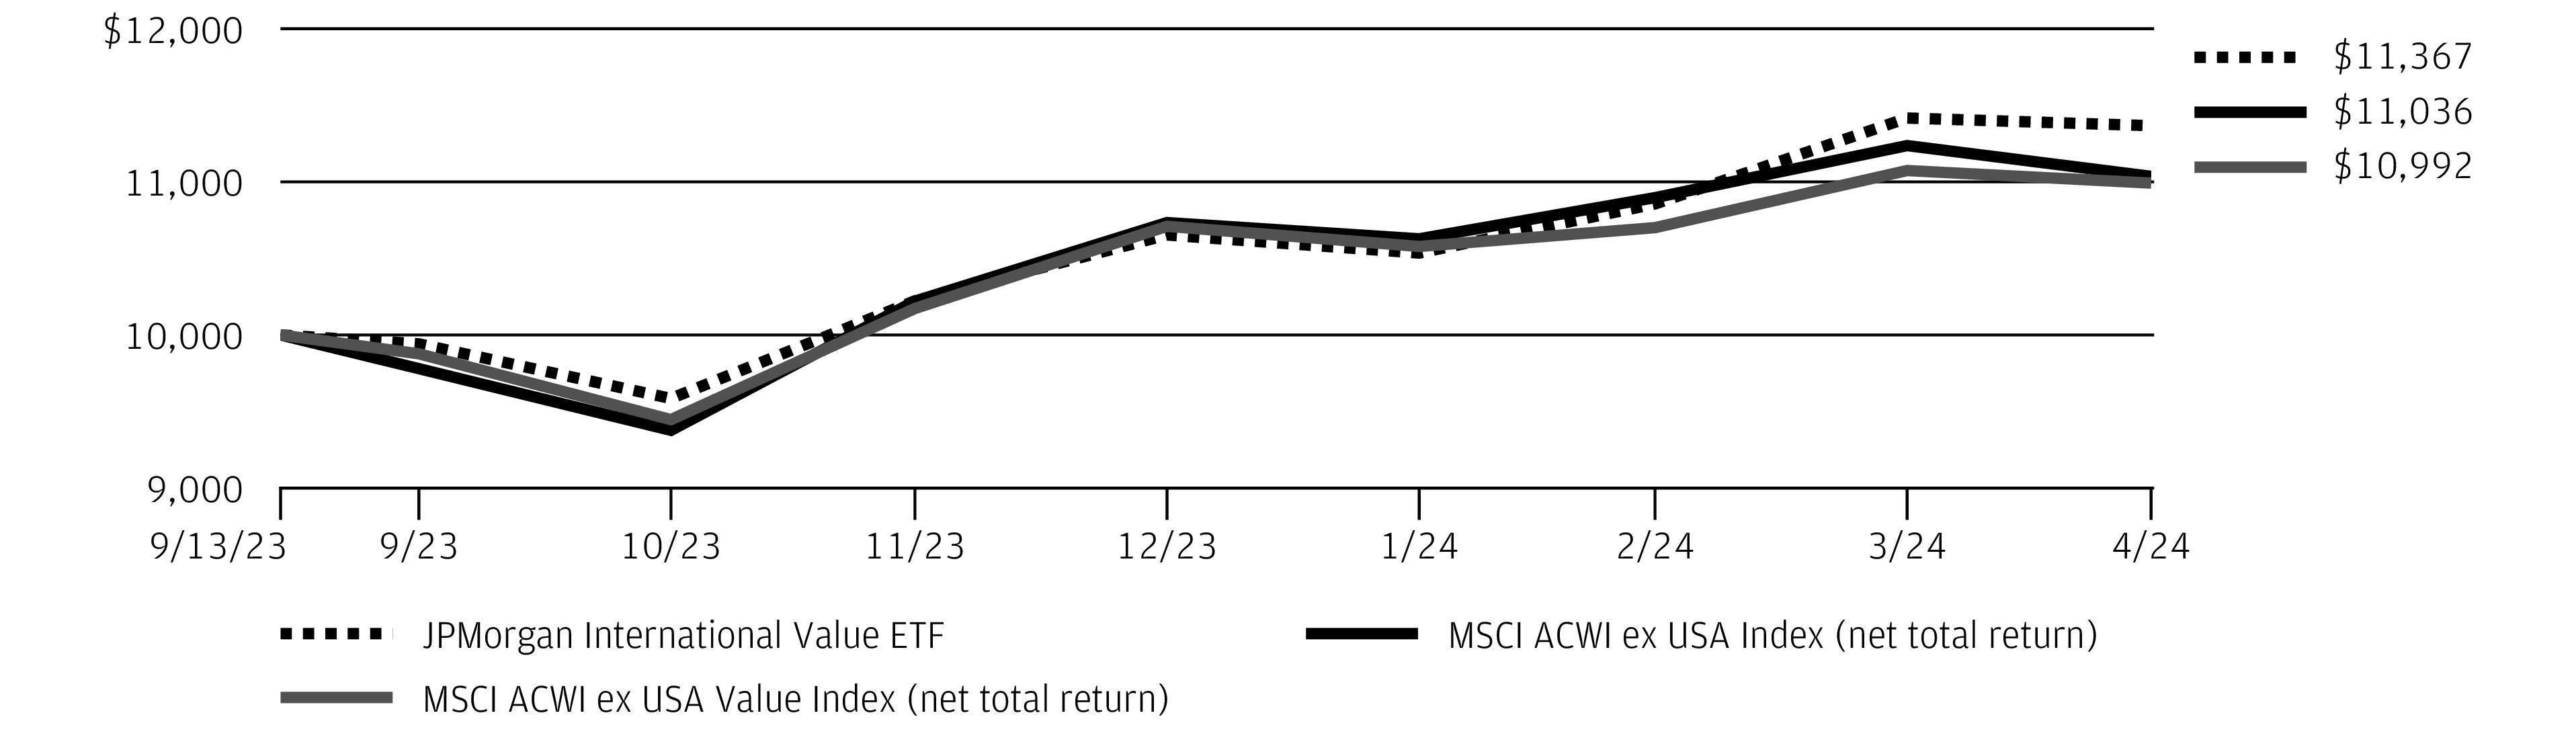
22 | J.P. Morgan Exchange-Traded Funds | April 30, 2024 |
INVESTMENTS | SHARES | VALUE($) |
Common Stocks — 100.0% | ||
Automobile Components — 2.2% | ||
Fuyao Glass Industry Group Co. Ltd., Class A | 34,900 | 239,548 |
Banks — 10.0% | ||
Agricultural Bank of China Ltd., Class H | 366,000 | 163,203 |
China Construction Bank Corp., Class H | 692,000 | 447,718 |
China Merchants Bank Co. Ltd., Class H | 107,000 | 463,402 |
1,074,323 | ||
Beverages — 5.9% | ||
Chongqing Brewery Co. Ltd., Class A | 19,600 | 189,618 |
Kweichow Moutai Co. Ltd., Class A | 1,900 | 444,712 |
634,330 | ||
Broadline Retail — 5.6% | ||
Alibaba Group Holding Ltd. | 64,000 | 599,236 |
Chemicals — 1.9% | ||
Wanhua Chemical Group Co. Ltd., Class A | 16,600 | 203,019 |
Consumer Staples Distribution & Retail — 1.7% | ||
Yifeng Pharmacy Chain Co. Ltd., Class A | 30,400 | 183,565 |
Electrical Equipment — 1.0% | ||
Hongfa Technology Co. Ltd., Class A | 27,700 | 108,747 |
Electronic Equipment, Instruments & Components — 8.5% | ||
BOE Technology Group Co. Ltd., Class A | 408,500 | 244,782 |
Foxconn Industrial Internet Co. Ltd., Class A | 86,331 | 284,762 |
Luxshare Precision Industry Co. Ltd., Class A | 44,000 | 176,068 |
Sunny Optical Technology Group Co. Ltd. | 24,400 | 118,040 |
Xiamen Faratronic Co. Ltd., Class A | 6,600 | 89,453 |
913,105 | ||
Entertainment — 3.5% | ||
iQIYI, Inc., ADR * | 25,034 | 121,415 |
NetEase, Inc. | 13,400 | 251,178 |
372,593 | ||
Food Products — 3.2% | ||
Angel Yeast Co. Ltd., Class A | 24,400 | 100,009 |
Anjoy Foods Group Co. Ltd., Class A | 5,700 | 72,255 |
Inner Mongolia Yili Industrial Group Co. Ltd., Class A | 44,300 | 174,278 |
346,542 | ||
Gas Utilities — 2.1% | ||
ENN Energy Holdings Ltd. | 26,600 | 226,643 |
Health Care Equipment & Supplies — 1.3% | ||
Shenzhen Mindray Bio-Medical Electronics Co. Ltd., Class A | 3,200 | 134,134 |
INVESTMENTS | SHARES | VALUE($) |
Health Care Providers & Services — 0.8% | ||
Guangzhou Kingmed Diagnostics Group Co. Ltd., Class A | 15,800 | 83,334 |
Hotels, Restaurants & Leisure — 4.6% | ||
H World Group Ltd., ADR | 4,021 | 147,611 |
Meituan * (a) | 25,700 | 350,921 |
498,532 | ||
Household Durables — 4.9% | ||
Haier Smart Home Co. Ltd., Class H | 93,200 | 345,215 |
Jason Furniture Hangzhou Co. Ltd., Class A | 24,100 | 110,749 |
Oppein Home Group, Inc., Class A | 8,500 | 72,864 |
528,828 | ||
Independent Power and Renewable Electricity Producers — 2.8% | ||
China Yangtze Power Co. Ltd., Class A | 83,900 | 298,300 |
Insurance — 5.1% | ||
China Pacific Insurance Group Co. Ltd., Class H | 85,400 | 187,118 |
PICC Property & Casualty Co. Ltd., Class H | 106,000 | 131,693 |
Ping An Insurance Group Co. of China Ltd., Class H | 49,500 | 224,338 |
543,149 | ||
Interactive Media & Services — 14.1% | ||
Kanzhun Ltd., ADR | 10,057 | 199,028 |
Tencent Holdings Ltd. | 29,800 | 1,307,719 |
1,506,747 | ||
Machinery — 2.5% | ||
Jiangsu Hengli Hydraulic Co. Ltd., Class A | 13,200 | 92,766 |
Zhuzhou CRRC Times Electric Co. Ltd., Class A | 4,141 | 27,162 |
Zhuzhou CRRC Times Electric Co. Ltd., Class H | 40,400 | 144,794 |
264,722 | ||
Media — 1.2% | ||
Focus Media Information Technology Co. Ltd., Class A | 149,500 | 133,590 |
Oil, Gas & Consumable Fuels — 4.4% | ||
China Petroleum & Chemical Corp., Class H | 386,000 | 230,404 |
PetroChina Co. Ltd., Class H | 254,000 | 236,663 |
467,067 | ||
Pharmaceuticals — 2.2% | ||
Asymchem Laboratories Tianjin Co. Ltd., Class A | 7,700 | 87,463 |
China Resources Sanjiu Medical & Pharmaceutical Co. Ltd., Class A | 18,300 | 151,295 |
238,758 | ||
Real Estate Management & Development — 2.3% | ||
KE Holdings, Inc., ADR | 16,143 | 244,082 |
April 30, 2024 | J.P. Morgan Exchange-Traded Funds | 23 |
INVESTMENTS | SHARES | VALUE($) |
Common Stocks — continued | ||
Semiconductors & Semiconductor Equipment — 3.8% | ||
Flat Glass Group Co. Ltd., Class H | 65,000 | 156,570 |
Hangzhou First Applied Material Co. Ltd., Class A | 16,420 | 61,292 |
Montage Technology Co. Ltd., Class A | 27,124 | 188,055 |
405,917 | ||
Software — 1.1% | ||
Kingdee International Software Group Co. Ltd. * | 110,000 | 116,053 |
Technology Hardware, Storage & Peripherals — 1.8% | ||
Lenovo Group Ltd. | 170,000 | 191,209 |
Textiles, Apparel & Luxury Goods — 1.5% | ||
Shenzhou International Group Holdings Ltd. | 16,000 | 157,267 |
Total Common Stocks (Cost $11,639,725) | 10,713,340 | |
Short-Term Investments — 0.1% | ||
Investment Companies — 0.1% | ||
JPMorgan Prime Money Market Fund Class IM, 5.41% (b) (c)(Cost $10,610) | 10,608 | 10,610 |
Total Investments — 100.1% (Cost $11,650,335) | 10,723,950 | |
Liabilities in Excess of Other Assets — (0.1)% | (5,376 ) | |
NET ASSETS — 100.0% | 10,718,574 | |
Percentages indicated are based on net assets. |
Abbreviations | |
ADR | American Depositary Receipt |
* | Non-income producing security. |
(a) | Security exempt from registration pursuant to Regulation S under the Securities Act of 1933, as amended. Regulation S applies to securities offerings that are made outside of the United States and do not involve direct selling efforts in the United States and as such may have restrictions on resale. |
(b) | Investment in an affiliated fund, which is registered under the Investment Company Act of 1940, as amended, and is advised by J.P. Morgan Investment Management Inc. |
(c) | The rate shown is the current yield as of April 30, 2024. |
24 | J.P. Morgan Exchange-Traded Funds | April 30, 2024 |
INVESTMENTS | SHARES | VALUE($) |
Common Stocks — 99.7% | ||
Australia — 0.1% | ||
Rio Tinto plc | 9,009 | 609,556 |
Austria — 0.1% | ||
Erste Group Bank AG | 9,343 | 435,712 |
Raiffeisen Bank International AG | 14,354 | 265,102 |
700,814 | ||
Brazil — 5.1% | ||
Ambev SA | 366,965 | 861,477 |
Arcos Dorados Holdings, Inc., Class A | 80,077 | 863,230 |
Atacadao SA | 516,931 | 1,112,985 |
B3 SA - Brasil Bolsa Balcao | 1,524,372 | 3,155,837 |
Banco BTG Pactual SA | 97,264 | 626,374 |
Banco do Brasil SA | 953,924 | 5,050,143 |
BB Seguridade Participacoes SA | 183,832 | 1,139,967 |
CCR SA | 109,145 | 258,538 |
Cury Construtora e Incorporadora SA | 103,394 | 389,076 |
Itau Unibanco Holding SA (Preference) | 851,066 | 5,146,453 |
Itausa SA (Preference) | 744,469 | 1,370,628 |
Localiza Rent a Car SA | 225,883 | 2,135,461 |
Lojas Renner SA | 722,929 | 2,131,503 |
MercadoLibre, Inc. * | 3,458 | 5,044,185 |
Natura & Co. Holding SA | 109,450 | 350,107 |
NU Holdings Ltd., Class A * | 210,261 | 2,283,434 |
Petroleo Brasileiro SA, ADR | 442,618 | 7,511,227 |
Porto Seguro SA | 133,138 | 769,198 |
Raia Drogasil SA | 431,109 | 2,128,728 |
Rumo SA * | 118,965 | 462,563 |
Suzano SA | 64,478 | 725,915 |
Telefonica Brasil SA | 61,643 | 566,618 |
TIM SA | 785,914 | 2,675,916 |
TOTVS SA | 49,726 | 265,073 |
Transmissora Alianca de Energia Eletrica S/A | 108,195 | 734,274 |
Vale SA, ADR | 152,660 | 1,857,872 |
Vibra Energia SA | 102,769 | 464,505 |
WEG SA | 274,709 | 2,099,228 |
52,180,515 | ||
Chile — 0.3% | ||
Banco de Chile | 3,253,341 | 360,899 |
Banco Santander Chile | 69,316,051 | 3,140,720 |
3,501,619 | ||
China — 26.7% | ||
Agricultural Bank of China Ltd., Class H | 624,000 | 278,248 |
Airtac International Group | 30,562 | 1,082,074 |
Alibaba Group Holding Ltd. | 1,897,586 | 17,767,220 |
INVESTMENTS | SHARES | VALUE($) |
China — continued | ||
Angel Yeast Co. Ltd., Class A | 203,209 | 832,897 |
Anhui Heli Co. Ltd., Class A | 115,900 | 383,247 |
Anjoy Foods Group Co. Ltd., Class A | 79,900 | 1,012,839 |
Anker Innovations Technology Co. Ltd., Class A | 33,200 | 393,747 |
Asymchem Laboratories Tianjin Co. Ltd., Class H (a) | 39,000 | 317,252 |
Avary Holding Shenzhen Co. Ltd., Class A | 105,500 | 349,391 |
Baidu, Inc., Class A * | 157,300 | 2,037,914 |
Bank of China Ltd., Class H | 624,000 | 279,858 |
Beijing Kingsoft Office Software, Inc., Class A | 31,204 | 1,319,432 |
BOE Technology Group Co. Ltd., Class A | 1,296,300 | 776,770 |
Budweiser Brewing Co. APAC Ltd. (a) | 1,091,828 | 1,518,942 |
BYD Electronic International Co. Ltd. | 112,500 | 378,988 |
Chacha Food Co. Ltd., Class A | 142,900 | 736,705 |
China CITIC Bank Corp. Ltd., Class H | 830,000 | 485,578 |
China Construction Bank Corp., Class H | 9,524,000 | 6,161,943 |
China Merchants Bank Co. Ltd., Class H | 2,344,500 | 10,153,696 |
China Merchants Energy Shipping Co. Ltd., Class A | 334,300 | 393,121 |
China Oilfield Services Ltd., Class H | 294,000 | 314,376 |
China Overseas Land & Investment Ltd. | 1,066,500 | 1,961,158 |
China Pacific Insurance Group Co. Ltd., Class H | 1,214,400 | 2,660,846 |
China Petroleum & Chemical Corp., Class H | 3,710,000 | 2,214,506 |
China Resources Gas Group Ltd. | 634,300 | 1,993,588 |
China Resources Land Ltd. | 240,000 | 863,001 |
China Resources Mixc Lifestyle Services Ltd. (a) | 243,082 | 855,591 |
China Resources Sanjiu Medical & Pharmaceutical Co. Ltd., Class A | 121,700 | 1,006,155 |
China Shenhua Energy Co. Ltd., Class H | 133,500 | 554,088 |
China Yangtze Power Co. Ltd., Class A | 1,260,775 | 4,482,593 |
Chongqing Brewery Co. Ltd., Class A | 184,600 | 1,785,895 |
Chongqing Changan Automobile Co. Ltd., Class A | 87,100 | 175,857 |
CITIC Securities Co. Ltd., Class H | 651,500 | 1,037,263 |
CMOC Group Ltd., Class H | 639,000 | 599,516 |
Contemporary Amperex Technology Co. Ltd., Class A | 47,200 | 1,317,900 |
CSPC Pharmaceutical Group Ltd. | 998,000 | 819,490 |
DaShenLin Pharmaceutical Group Co. Ltd., Class A | 111,112 | 332,727 |
ENN Energy Holdings Ltd. | 67,500 | 575,127 |
Flat Glass Group Co. Ltd., Class H | 269,000 | 647,960 |
April 30, 2024 | J.P. Morgan Exchange-Traded Funds | 25 |
INVESTMENTS | SHARES | VALUE($) |
Common Stocks — continued | ||
China — continued | ||
Focus Media Information Technology Co. Ltd., Class A | 1,973,600 | 1,763,563 |
Foshan Haitian Flavouring & Food Co. Ltd., Class A | 128,430 | 692,440 |
Foxconn Industrial Internet Co. Ltd., Class A | 865,300 | 2,854,178 |
Fuyao Glass Industry Group Co. Ltd., Class H (a) | 964,000 | 5,771,529 |
Ganfeng Lithium Group Co. Ltd. (a) | 161,200 | 472,716 |
GF Securities Co. Ltd., Class H | 351,800 | 350,478 |
Great Wall Motor Co. Ltd., Class H | 281,000 | 424,631 |
Gree Electric Appliances, Inc. of Zhuhai, Class A | 116,500 | 674,710 |
Guangdong Dongpeng Holdings Co. Ltd., Class A | 272,700 | 256,057 |
Guangdong Investment Ltd. | 64,000 | 33,431 |
Guangzhou Kingmed Diagnostics Group Co. Ltd., Class A | 66,100 | 348,630 |
H World Group Ltd. | 936,686 | 3,485,103 |
Haier Smart Home Co. Ltd., Class H | 2,436,800 | 9,025,967 |
Haitian International Holdings Ltd. | 91,000 | 296,373 |
Hangzhou First Applied Material Co. Ltd., Class A | 94,460 | 352,594 |
Hefei Meiya Optoelectronic Technology, Inc., Class A | 387,121 | 952,390 |
Hisense Home Appliances Group Co. Ltd. | 133,000 | 556,306 |
HLA Group Corp. Ltd. | 314,800 | 395,361 |
Hongfa Technology Co. Ltd., Class A | 218,900 | 859,373 |
Huayu Automotive Systems Co. Ltd., Class A | 575,446 | 1,304,315 |
Industrial & Commercial Bank of China Ltd., Class H | 523,000 | 280,448 |
Inner Mongolia Yili Industrial Group Co. Ltd., Class A | 1,668,413 | 6,563,621 |
iQIYI, Inc., ADR * | 128,379 | 622,638 |
JA Solar Technology Co. Ltd., Class A * | 143,500 | 280,934 |
Jason Furniture Hangzhou Co. Ltd., Class A | 111,636 | 513,010 |
JD Health International, Inc. * (a) | 273,420 | 932,588 |
JD.com, Inc., Class A | 238,152 | 3,431,383 |
Jiangsu Hengli Hydraulic Co. Ltd., Class A | 151,400 | 1,063,998 |
Jiangxi Copper Co. Ltd., Class H | 132,000 | 268,835 |
Jiayou International Logistics Co. Ltd., Class A | 150,400 | 527,301 |
Kanzhun Ltd., ADR | 103,642 | 2,051,075 |
KE Holdings, Inc., Class A | 131,268 | 671,340 |
Kingdee International Software Group Co. Ltd. * | 1,052,000 | 1,109,887 |
Kweichow Moutai Co. Ltd., Class A | 31,400 | 7,349,450 |
INVESTMENTS | SHARES | VALUE($) |
China — continued | ||
Lenovo Group Ltd. | 1,412,000 | 1,588,161 |
Lens Technology Co. Ltd., Class A | 232,100 | 455,454 |
Li Auto, Inc., Class A * | 12,400 | 162,464 |
Lingyi iTech Guangdong Co., Class A | 369,900 | 264,070 |
Livzon Pharmaceutical Group, Inc., Class H | 57,800 | 198,757 |
Luxshare Precision Industry Co. Ltd., Class A | 178,000 | 712,275 |
Luzhou Laojiao Co. Ltd., Class A | 48,000 | 1,226,522 |
Meituan * (a) | 489,228 | 6,680,179 |
Midea Group Co. Ltd., Class A | 779,012 | 7,479,338 |
Montage Technology Co. Ltd., Class A | 78,677 | 545,480 |
NARI Technology Co. Ltd., Class A | 201,148 | 649,460 |
NetEase, Inc. | 590,148 | 11,062,112 |
Ningbo Tuopu Group Co. Ltd., Class A | 53,700 | 461,290 |
Oppein Home Group, Inc., Class A | 57,184 | 490,194 |
PDD Holdings, Inc., ADR * | 51,538 | 6,451,527 |
PetroChina Co. Ltd., Class H | 2,766,000 | 2,577,197 |
PICC Property & Casualty Co. Ltd., Class H | 1,564,000 | 1,943,087 |
Ping An Insurance Group Co. of China Ltd., Class H | 1,693,000 | 7,672,817 |
Qingdao Haier Biomedical Co. Ltd., Class A | 51,720 | 264,845 |
Sailun Group Co. Ltd., Class A | 105,000 | 239,564 |
Shanghai Baosight Software Co. Ltd., Class A | 282,251 | 1,591,827 |
Shenzhen Inovance Technology Co. Ltd., Class A | 65,500 | 537,278 |
Shenzhen Mindray Bio-Medical Electronics Co. Ltd., Class A | 58,100 | 2,435,371 |
Shenzhen Transsion Holdings Co. Ltd., Class A | 21,598 | 428,762 |
Shenzhou International Group Holdings Ltd. | 399,400 | 3,925,787 |
Sichuan Swellfun Co. Ltd., Class A | 81,600 | 505,139 |
Silergy Corp. | 200,414 | 2,661,724 |
Sinopharm Group Co. Ltd., Class H | 162,000 | 409,109 |
Sinotrans Ltd., Class H | 942,000 | 451,564 |
Sinotruk Hong Kong Ltd. | 184,500 | 459,167 |
SITC International Holdings Co. Ltd. | 193,000 | 418,539 |
Sunny Optical Technology Group Co. Ltd. | 52,488 | 253,922 |
Sunresin New Materials Co. Ltd., Class A | 94,000 | 603,578 |
SUPCON Technology Co. Ltd., Class A | 133,321 | 872,397 |
Tencent Holdings Ltd. | 1,027,500 | 45,089,988 |
Tianqi Lithium Corp., Class H | 43,000 | 165,586 |
Tingyi Cayman Islands Holding Corp. | 1,568,000 | 1,730,597 |
Tongwei Co. Ltd., Class A | 201,700 | 601,781 |
Topsports International Holdings Ltd. (a) | 1,578,652 | 1,096,334 |
Trip.com Group Ltd. * | 59,868 | 2,916,012 |
Venustech Group, Inc., Class A | 192,500 | 519,764 |
26 | J.P. Morgan Exchange-Traded Funds | April 30, 2024 |
INVESTMENTS | SHARES | VALUE($) |
Common Stocks — continued | ||
China — continued | ||
Vipshop Holdings Ltd., ADR | 26,371 | 396,620 |
Wanhua Chemical Group Co. Ltd., Class A | 198,500 | 2,427,663 |
Warom Technology, Inc. Co., Class A | 94,300 | 282,756 |
Weichai Power Co. Ltd., Class H | 387,000 | 790,781 |
Wuliangye Yibin Co. Ltd., Class A | 158,100 | 3,264,011 |
Wuxi Biologics Cayman, Inc. * (a) | 788,318 | 1,365,632 |
XGD, Inc., Class A | 105,500 | 316,098 |
Xiamen Faratronic Co. Ltd., Class A | 38,800 | 525,876 |
Xiaomi Corp., Class B * (a) | 480,000 | 1,046,365 |
Xinyi Solar Holdings Ltd. | 372,000 | 255,961 |
Yifeng Pharmacy Chain Co. Ltd., Class A | 108,180 | 653,227 |
Yum China Holdings, Inc. | 92,279 | 3,369,106 |
Yutong Bus Co. Ltd., Class A | 186,800 | 658,365 |
Zhejiang Dingli Machinery Co. Ltd., Class A | 40,500 | 365,291 |
Zhejiang Jingsheng Mechanical & Electrical Co. Ltd., Class A | 102,100 | 475,640 |
Zhejiang Sanhua Intelligent Controls Co. Ltd., Class A | 240,624 | 725,140 |
Zhejiang Supor Co. Ltd., Class A | 193,873 | 1,574,248 |
Zhongji Innolight Co. Ltd., Class A | 48,900 | 1,230,485 |
Zhuzhou CRRC Times Electric Co. Ltd., Class H | 242,400 | 868,766 |
Zijin Mining Group Co. Ltd., Class H | 982,000 | 2,142,205 |
ZTO Express Cayman, Inc. | 82,056 | 1,742,033 |
270,669,440 | ||
Colombia — 0.1% | ||
Bancolombia SA (Preference) | 31,235 | 255,581 |
Ecopetrol SA | 603,650 | 350,834 |
606,415 | ||
Czech Republic — 0.0% ^ | ||
Komercni Banka A/S * | 12,274 | 452,233 |
Georgia — 0.0% ^ | ||
Bank of Georgia Group plc | 7,773 | 520,473 |
Greece — 0.5% | ||
Alpha Services and Holdings SA * | 253,335 | 427,786 |
Eurobank Ergasias Services and Holdings SA * | 306,391 | 657,231 |
Hellenic Telecommunications Organization SA | 51,280 | 779,028 |
JUMBO SA | 18,431 | 573,958 |
Motor Oil Hellas Corinth Refineries SA | 13,395 | 388,256 |
Mytilineos SA | 13,648 | 553,701 |
National Bank of Greece SA * | 87,206 | 703,581 |
INVESTMENTS | SHARES | VALUE($) |
Greece — continued | ||
OPAP SA | 51,063 | 850,658 |
Piraeus Financial Holdings SA * | 120,911 | 484,363 |
5,418,562 | ||
Hong Kong — 1.2% | ||
AIA Group Ltd. | 657,600 | 4,816,498 |
ASMPT Ltd. | 38,600 | 479,708 |
Cathay Pacific Airways Ltd. | 360,000 | 387,557 |
Hong Kong Exchanges & Clearing Ltd. | 95,500 | 3,034,458 |
Techtronic Industries Co. Ltd. | 258,500 | 3,572,290 |
12,290,511 | ||
Hungary — 0.4% | ||
MOL Hungarian Oil & Gas plc | 57,013 | 467,883 |
OTP Bank Nyrt. | 59,617 | 2,954,957 |
Richter Gedeon Nyrt. | 21,802 | 555,189 |
3,978,029 | ||
India — 16.5% | ||
Apollo Tyres Ltd. | 69,028 | 420,738 |
Asian Paints Ltd. | 15,233 | 523,984 |
Axis Bank Ltd. | 15,722 | 219,449 |
Bajaj Auto Ltd. | 44,501 | 4,750,830 |
Bajaj Finance Ltd. | 7,134 | 591,781 |
Bajaj Finserv Ltd. | 112,398 | 2,171,239 |
Bank of Baroda | 175,104 | 588,755 |
Bharti Airtel Ltd. | 24,093 | 381,361 |
Biocon Ltd. | 90,303 | 322,644 |
Britannia Industries Ltd. * | 61,438 | 3,511,502 |
Canara Bank | 70,332 | 522,791 |
Cholamandalam Investment and Finance Co. Ltd. | 164,696 | 2,350,898 |
Coal India Ltd. | 80,391 | 437,082 |
Coforge Ltd. | 35,210 | 2,144,087 |
Colgate-Palmolive India Ltd. | 78,509 | 2,656,872 |
Computer Age Management Services Ltd. | 31,401 | 1,203,544 |
CRISIL Ltd. | 19,432 | 1,013,650 |
Cummins India Ltd. | 39,484 | 1,545,955 |
Delhivery Ltd. * | 336,543 | 1,809,279 |
Dr Lal PathLabs Ltd. (a) | 8,126 | 230,689 |
Dr Reddy's Laboratories Ltd. | 16,328 | 1,211,662 |
Eicher Motors Ltd. | 34,172 | 1,881,293 |
Endurance Technologies Ltd. (a) | 31,399 | 742,962 |
Havells India Ltd. | 99,166 | 1,973,657 |
HCL Technologies Ltd. | 153,128 | 2,498,282 |
HDFC Asset Management Co. Ltd. (a) | 20,828 | 970,980 |
April 30, 2024 | J.P. Morgan Exchange-Traded Funds | 27 |
INVESTMENTS | SHARES | VALUE($) |
Common Stocks — continued | ||
India — continued | ||
HDFC Bank Ltd., ADR | 170,142 | 9,800,179 |
HDFC Bank Ltd. | 509,532 | 9,253,403 |
HDFC Life Insurance Co. Ltd. (a) | 712,987 | 4,976,684 |
Hindustan Unilever Ltd. | 206,843 | 5,524,183 |
ICICI Bank Ltd. | 783,370 | 10,794,017 |
Indian Oil Corp. Ltd. | 183,844 | 371,252 |
Info Edge India Ltd. | 32,760 | 2,369,325 |
Infosys Ltd. | 947,059 | 15,990,640 |
InterGlobe Aviation Ltd. * (a) | 13,099 | 624,612 |
ITC Ltd. | 462,844 | 2,413,378 |
Kajaria Ceramics Ltd. | 29,857 | 430,317 |
Kotak Mahindra Bank Ltd. | 447,443 | 8,696,232 |
Larsen & Toubro Ltd. | 5,383 | 231,393 |
Mahanagar Gas Ltd. (a) | 22,238 | 384,371 |
Mahindra & Mahindra Ltd. | 284,907 | 7,348,862 |
Manappuram Finance Ltd. | 194,805 | 465,111 |
Maruti Suzuki India Ltd. | 24,973 | 3,831,341 |
Metropolis Healthcare Ltd. (a) | 25,547 | 555,121 |
Multi Commodity Exchange of India Ltd. | 21,400 | 1,051,466 |
Natco Pharma Ltd. | 36,894 | 448,435 |
NCC Ltd. | 258,332 | 747,291 |
NMDC Ltd. | 137,558 | 417,444 |
Oil & Natural Gas Corp. Ltd. | 447,091 | 1,509,270 |
Oil India Ltd. | 130,405 | 964,189 |
Reliance Industries Ltd. | 292,808 | 10,278,810 |
Shriram Finance Ltd. | 108,466 | 3,309,310 |
State Bank of India | 87,599 | 865,299 |
Sun TV Network Ltd. | 60,662 | 475,797 |
Supreme Industries Ltd. | 14,714 | 891,150 |
Syngene International Ltd. (a) | 37,462 | 308,894 |
Tata Consultancy Services Ltd. | 288,243 | 13,155,446 |
Tata Motors Ltd. | 56,080 | 676,272 |
Triveni Turbine Ltd. | 86,229 | 554,947 |
Tube Investments of India Ltd. | 50,046 | 2,244,995 |
UltraTech Cement Ltd. | 32,813 | 3,913,424 |
United Spirits Ltd. | 169,061 | 2,378,298 |
Vedanta Ltd. | 87,456 | 417,398 |
WNS Holdings Ltd. * | 35,835 | 1,501,845 |
Zensar Technologies Ltd. | 60,265 | 441,446 |
167,287,813 | ||
Indonesia — 2.0% | ||
Adaro Energy Indonesia Tbk. PT | 1,472,000 | 244,643 |
Astra International Tbk. PT | 1,075,900 | 339,506 |
Bank Central Asia Tbk. PT | 10,625,900 | 6,389,190 |
INVESTMENTS | SHARES | VALUE($) |
Indonesia — continued | ||
Bank Mandiri Persero Tbk. PT | 5,557,900 | 2,349,197 |
Bank Negara Indonesia Persero Tbk. PT | 1,667,900 | 536,625 |
Bank Rakyat Indonesia Persero Tbk. PT | 21,813,170 | 6,602,925 |
GoTo Gojek Tokopedia Tbk. PT * | 47,754,700 | 183,678 |
Indah Kiat Pulp & Paper Tbk. PT | 348,400 | 200,524 |
Indofood CBP Sukses Makmur Tbk. PT | 380,100 | 254,066 |
Sumber Alfaria Trijaya Tbk. PT | 1,507,600 | 271,665 |
Telkom Indonesia Persero Tbk. PT | 12,543,000 | 2,431,567 |
United Tractors Tbk. PT | 177,500 | 270,527 |
20,074,113 | ||
Kazakhstan — 0.1% | ||
NAC Kazatomprom JSC, GDR (a) | 20,728 | 833,990 |
Macau — 0.1% | ||
Sands China Ltd. * | 313,112 | 738,520 |
Malaysia — 0.4% | ||
CIMB Group Holdings Bhd. | 365,400 | 504,994 |
Gamuda Bhd. | 179,600 | 199,827 |
Hong Leong Bank Bhd. | 77,600 | 313,383 |
Malayan Banking Bhd. | 231,400 | 471,516 |
Petronas Chemicals Group Bhd. | 205,200 | 291,515 |
Press Metal Aluminium Holdings Bhd. | 230,500 | 259,358 |
Public Bank Bhd. | 1,622,100 | 1,399,074 |
Tenaga Nasional Bhd. | 204,900 | 513,484 |
YTL Power International Bhd. | 243,200 | 233,143 |
4,186,294 | ||
Mexico — 3.5% | ||
America Movil SAB de CV | 815,553 | 776,955 |
Arca Continental SAB de CV | 95,674 | 930,784 |
Banco del Bajio SA (a) | 102,284 | 378,070 |
Bolsa Mexicana de Valores SAB de CV | 367,830 | 689,248 |
Cemex SAB de CV * | 606,282 | 479,554 |
Coca-Cola Femsa SAB de CV | 41,765 | 413,463 |
Corp. Inmobiliaria Vesta SAB de CV | 236,755 | 838,488 |
Fomento Economico Mexicano SAB de CV | 165,185 | 1,942,791 |
Gentera SAB de CV | 590,017 | 946,466 |
Grupo Aeroportuario del Pacifico SAB de CV, Class B | 132,173 | 2,414,656 |
Grupo Aeroportuario del Sureste SAB de CV, Class B | 72,887 | 2,509,875 |
Grupo Comercial Chedraui SA de CV | 38,479 | 283,335 |
Grupo Financiero Banorte SAB de CV, Class O | 752,597 | 7,465,014 |
Grupo Mexico SAB de CV | 62,371 | 385,424 |
Kimberly-Clark de Mexico SAB de CV, Class A | 1,344,703 | 2,807,033 |
28 | J.P. Morgan Exchange-Traded Funds | April 30, 2024 |
INVESTMENTS | SHARES | VALUE($) |
Common Stocks — continued | ||
Mexico — continued | ||
Qualitas Controladora SAB de CV | 51,623 | 675,017 |
Regional SAB de CV | 117,116 | 1,053,246 |
Southern Copper Corp. | 14,842 | 1,731,616 |
Wal-Mart de Mexico SAB de CV | 2,311,799 | 8,616,573 |
35,337,608 | ||
Panama — 0.1% | ||
Copa Holdings SA, Class A | 5,623 | 536,996 |
Peru — 0.5% | ||
Credicorp Ltd. | 28,409 | 4,704,814 |
Poland — 0.7% | ||
Bank Polska Kasa Opieki SA | 31,656 | 1,310,568 |
Dino Polska SA * (a) | 10,902 | 1,044,440 |
InPost SA * | 19,779 | 317,547 |
KRUK SA | 3,862 | 438,997 |
LPP SA | 183 | 705,134 |
Powszechna Kasa Oszczednosci Bank Polski SA | 65,673 | 975,056 |
Powszechny Zaklad Ubezpieczen SA | 212,026 | 2,668,536 |
7,460,278 | ||
Portugal — 0.2% | ||
Jeronimo Martins SGPS SA | 91,721 | 1,886,861 |
Qatar — 0.3% | ||
Ooredoo QPSC | 182,033 | 499,454 |
Qatar Gas Transport Co. Ltd. | 618,539 | 678,044 |
Qatar National Bank QPSC | 404,994 | 1,541,928 |
2,719,426 | ||
Romania — 0.0% ^ | ||
Banca Transilvania SA | 81,420 | 495,867 |
Russia — 0.0% ^ | ||
Gazprom PJSC, ADR ‡ * | 12,780 | 1,426 |
Gazprom PJSC ‡ * | 1,135,066 | 57,816 |
GMK Norilskiy Nickel PAO, ADR ‡ * | 2,018 | 969 |
GMK Norilskiy Nickel PAO ‡ | 203,600 | 8,715 |
Magnitogorsk Iron & Steel Works PJSC, GDR ‡ * (a) | 12,378 | 1,869 |
Moscow Exchange MICEX-RTS PJSC ‡ | 571,670 | 13,582 |
Rosneft Oil Co. PJSC ‡ | 141,777 | 9,346 |
Sberbank of Russia PJSC ‡ | 629,236 | 17,574 |
Severstal PAO, GDR ‡ * (a) | 98,048 | 31,375 |
VTB Bank PJSC ‡ * | 168,450,798 | 795 |
X5 Retail Group NV, GDR ‡ * (a) | 1,062 | 256 |
143,723 | ||
INVESTMENTS | SHARES | VALUE($) |
Saudi Arabia — 2.9% | ||
Ades Holding Co. * | 103,113 | 549,298 |
Al Rajhi Bank | 193,545 | 4,116,559 |
Al-Dawaa Medical Services Co. | 14,484 | 368,907 |
Aldrees Petroleum and Transport Services Co. | 14,702 | 656,282 |
Alinma Bank | 197,683 | 1,753,553 |
Arabian Contracting Services Co. | 14,142 | 823,731 |
Bupa Arabia for Cooperative Insurance Co. | 10,031 | 645,091 |
Catrion Catering Holding Co. | 18,439 | 620,440 |
Cenomi Centers | 64,604 | 430,919 |
Elm Co. | 5,003 | 1,217,802 |
Etihad Etisalat Co. | 51,212 | 710,026 |
Jarir Marketing Co. | 78,173 | 281,778 |
Leejam Sports Co. JSC | 15,937 | 889,611 |
Lumi Rental Co. * | 15,874 | 372,656 |
Mouwasat Medical Services Co. | 13,259 | 475,127 |
Riyad Bank | 117,581 | 866,975 |
Riyadh Cables Group Co. | 44,181 | 1,109,976 |
Saudi Arabian Oil Co. (a) | 288,180 | 2,309,104 |
Saudi Awwal Bank | 79,054 | 857,887 |
Saudi Basic Industries Corp. | 22,610 | 509,411 |
Saudi National Bank (The) | 590,457 | 5,910,748 |
Saudi Telecom Co. | 149,603 | 1,501,159 |
Saudia Dairy & Foodstuff Co. | 9,187 | 894,058 |
United International Transportation Co. | 53,193 | 1,183,849 |
29,054,947 | ||
South Africa — 3.2% | ||
Absa Group Ltd. (b) | 56,474 | 436,459 |
AVI Ltd. (b) | 280,803 | 1,296,502 |
Bid Corp. Ltd. | 119,971 | 2,750,991 |
Bidvest Group Ltd. (The) | 158,287 | 2,070,882 |
Capitec Bank Holdings Ltd. | 36,552 | 4,523,782 |
Clicks Group Ltd. | 164,145 | 2,542,509 |
Exxaro Resources Ltd. | 29,519 | 282,824 |
FirstRand Ltd. | 1,793,146 | 6,190,213 |
Gold Fields Ltd. | 109,747 | 1,775,451 |
Harmony Gold Mining Co. Ltd. | 88,657 | 767,435 |
Mr Price Group Ltd. | 42,810 | 397,820 |
Sanlam Ltd. | 614,577 | 2,223,160 |
Shoprite Holdings Ltd. | 194,462 | 2,594,573 |
Standard Bank Group Ltd. (b) | 265,442 | 2,492,703 |
Truworths International Ltd. | 72,316 | 289,094 |
Vodacom Group Ltd. | 349,692 | 1,680,528 |
32,314,926 | ||
April 30, 2024 | J.P. Morgan Exchange-Traded Funds | 29 |
INVESTMENTS | SHARES | VALUE($) |
Common Stocks — continued | ||
South Korea — 13.1% | ||
APR Corp. * | 3,173 | 652,002 |
APRILBIO Co. Ltd. * | 44,325 | 478,334 |
BGF retail Co. Ltd. | 12,822 | 1,208,803 |
CJ CheilJedang Corp. | 3,904 | 946,279 |
Coupang, Inc. * | 31,033 | 698,243 |
Coway Co. Ltd. | 14,768 | 591,701 |
Daeduck Electronics Co. Ltd. | 29,494 | 489,391 |
DB Insurance Co. Ltd. | 5,614 | 393,793 |
Eugene Technology Co. Ltd. | 28,099 | 1,068,860 |
HAESUNG DS Co. Ltd. | 7,172 | 256,586 |
Hana Financial Group, Inc. | 85,879 | 3,622,102 |
Hankook Tire & Technology Co. Ltd. | 48,352 | 2,051,687 |
Hansol Chemical Co. Ltd. | 2,874 | 398,636 |
Hanwha Engine * | 51,616 | 473,696 |
HK inno N Corp. | 16,327 | 456,078 |
HMM Co. Ltd. | 25,969 | 296,491 |
Hugel, Inc. * | 13,675 | 2,090,738 |
Hyundai Glovis Co. Ltd. | 7,030 | 920,299 |
Hyundai Marine & Fire Insurance Co. Ltd. | 30,480 | 688,057 |
Hyundai Mobis Co. Ltd. | 8,699 | 1,423,150 |
Hyundai Motor Co. | 25,096 | 4,514,167 |
Industrial Bank of Korea | 86,529 | 869,922 |
Kakao Corp. | 12,162 | 422,373 |
KakaoBank Corp. | 13,064 | 234,314 |
KB Financial Group, Inc. | 73,106 | 3,965,046 |
Kia Corp. | 78,755 | 6,672,330 |
KIWOOM Securities Co. Ltd. | 13,895 | 1,319,517 |
Korea Investment Holdings Co. Ltd. | 18,579 | 897,989 |
Korean Air Lines Co. Ltd. | 37,313 | 562,687 |
Kumho Petrochemical Co. Ltd. | 5,008 | 498,108 |
LG Chem Ltd. | 15,793 | 4,538,093 |
LG Energy Solution Ltd. * | 4,424 | 1,230,841 |
LG H&H Co. Ltd. | 5,258 | 1,584,278 |
NAVER Corp. | 27,046 | 3,567,355 |
NCSoft Corp. | 2,446 | 309,053 |
NHN KCP Corp. | 51,091 | 428,155 |
Orion Corp. | 4,471 | 299,217 |
Park Systems Corp. | 2,998 | 318,843 |
Samsung Biologics Co. Ltd. * (a) | 4,008 | 2,252,727 |
Samsung C&T Corp. | 19,804 | 2,135,531 |
Samsung Electro-Mechanics Co. Ltd. | 28,412 | 3,169,174 |
Samsung Electronics Co. Ltd. | 837,551 | 46,556,644 |
Samsung Fire & Marine Insurance Co. Ltd. | 6,904 | 1,545,293 |
Samsung Heavy Industries Co. Ltd. * | 107,408 | 727,738 |
INVESTMENTS | SHARES | VALUE($) |
South Korea — continued | ||
Samsung Life Insurance Co. Ltd. | 11,867 | 747,774 |
Samsung SDI Co. Ltd. | 2,700 | 835,567 |
Samsung SDS Co. Ltd. | 3,140 | 360,721 |
Samsung Securities Co. Ltd. | 7,269 | 198,850 |
Shinhan Financial Group Co. Ltd. | 109,082 | 3,664,861 |
SK Hynix, Inc. | 70,903 | 8,749,833 |
SK IE Technology Co. Ltd. * (a) | 22,803 | 965,136 |
SK Telecom Co. Ltd. | 30,247 | 1,118,589 |
SK, Inc. | 13,336 | 1,589,151 |
SKC Co. Ltd. * | 16,497 | 1,303,883 |
SM Entertainment Co. Ltd. | 6,477 | 368,809 |
S-Oil Corp. | 35,057 | 1,830,311 |
SOLUM Co. Ltd. * | 36,429 | 686,307 |
SOOP Co. Ltd. | 10,761 | 871,013 |
Soulbrain Co. Ltd. | 1,933 | 417,301 |
ST Pharm Co. Ltd. | 5,519 | 371,818 |
Tokai Carbon Korea Co. Ltd. | 4,045 | 354,590 |
WONIK IPS Co. Ltd. * | 18,627 | 496,086 |
YG Entertainment, Inc. | 8,679 | 264,251 |
133,019,172 | ||
Spain — 0.4% | ||
Banco Bilbao Vizcaya Argentaria SA | 373,408 | 4,038,023 |
Taiwan — 17.8% | ||
Accton Technology Corp. | 223,000 | 3,124,097 |
Advantech Co. Ltd. | 281,629 | 3,275,745 |
Allis Electric Co. Ltd. | 188,000 | 838,406 |
Arcadyan Technology Corp. | 60,000 | 316,321 |
ASE Technology Holding Co. Ltd. | 1,051,000 | 4,728,026 |
ASPEED Technology, Inc. | 13,500 | 1,264,073 |
AUO Corp. | 871,000 | 487,028 |
Chailease Holding Co. Ltd. | 499,974 | 2,636,994 |
China Steel Corp. | 2,617,000 | 1,993,688 |
Chunghwa Telecom Co. Ltd. | 313,000 | 1,189,662 |
CTBC Financial Holding Co. Ltd. | 3,130,000 | 3,266,841 |
Delta Electronics, Inc. | 494,000 | 4,837,888 |
E.Sun Financial Holding Co. Ltd. | 3,367,013 | 2,829,309 |
Elan Microelectronics Corp. | 60,000 | 301,994 |
Elite Material Co. Ltd. | 31,000 | 385,977 |
eMemory Technology, Inc. | 27,000 | 1,814,739 |
Evergreen Marine Corp. Taiwan Ltd. | 238,000 | 1,385,081 |
Faraday Technology Corp. | 148,000 | 1,316,371 |
Fubon Financial Holding Co. Ltd. | 322,930 | 683,164 |
Global Unichip Corp. | 44,000 | 1,827,388 |
Hon Hai Precision Industry Co. Ltd. | 890,000 | 4,236,712 |
30 | J.P. Morgan Exchange-Traded Funds | April 30, 2024 |
INVESTMENTS | SHARES | VALUE($) |
Common Stocks — continued | ||
Taiwan — continued | ||
Jentech Precision Industrial Co. Ltd. | 20,000 | 595,048 |
Kinsus Interconnect Technology Corp. | 94,000 | 273,828 |
Largan Precision Co. Ltd. | 38,000 | 2,533,003 |
Lite-On Technology Corp. | 263,000 | 796,043 |
Lotes Co. Ltd. | 19,000 | 832,278 |
Makalot Industrial Co. Ltd. | 69,000 | 826,134 |
Materials Analysis Technology, Inc. | 74,000 | 660,877 |
MediaTek, Inc. | 177,000 | 5,336,759 |
Mega Financial Holding Co. Ltd. | 1,480,750 | 1,814,529 |
Nan Ya Plastics Corp. | 588,000 | 1,021,006 |
Nien Made Enterprise Co. Ltd. | 87,000 | 1,016,713 |
Novatek Microelectronics Corp. | 206,000 | 3,892,415 |
Powertech Technology, Inc. | 93,000 | 495,259 |
Poya International Co. Ltd. | 36,000 | 551,536 |
President Chain Store Corp. | 407,000 | 3,422,719 |
Quanta Computer, Inc. | 916,000 | 7,188,991 |
Raydium Semiconductor Corp. | 22,000 | 286,790 |
Realtek Semiconductor Corp. | 334,000 | 5,268,903 |
Shiny Chemical Industrial Co. Ltd. | 87,000 | 462,750 |
Taiwan Cement Corp. | 536,961 | 527,805 |
Taiwan Semiconductor Manufacturing Co. Ltd. | 3,511,000 | 84,066,573 |
Tong Yang Industry Co. Ltd. | 217,000 | 789,926 |
Unimicron Technology Corp. | 288,000 | 1,592,648 |
United Microelectronics Corp. | 931,000 | 1,430,410 |
Vanguard International Semiconductor Corp. | 1,042,000 | 2,730,558 |
Wistron Corp. | 593,000 | 2,030,468 |
Wiwynn Corp. | 53,000 | 3,770,371 |
Yageo Corp. | 68,000 | 1,297,066 |
Yuanta Financial Holding Co. Ltd. | 2,008,000 | 1,883,577 |
ZillTek Technology Corp. | 21,000 | 241,186 |
180,375,673 | ||
Thailand — 1.4% | ||
Advanced Info Service PCL | 130,600 | 693,884 |
Airports of Thailand PCL | 524,300 | 923,113 |
Bangchak Corp. PCL, NVDR | 342,400 | 385,673 |
Bangkok Dusit Medical Services PCL, Class F | 807,600 | 632,098 |
Bumrungrad Hospital PCL, NVDR | 40,000 | 264,010 |
Central Pattana PCL, NVDR | 205,100 | 349,772 |
Central Retail Corp. PCL, NVDR | 175,500 | 162,330 |
CP ALL PCL | 392,500 | 606,614 |
Delta Electronics Thailand PCL, NVDR | 202,400 | 377,509 |
Gulf Energy Development PCL | 257,600 | 278,259 |
Intouch Holdings PCL, NVDR | 130,700 | 235,410 |
INVESTMENTS | SHARES | VALUE($) |
Thailand — continued | ||
Krung Thai Bank PCL, NVDR | 1,365,700 | 617,653 |
Minor International PCL, NVDR | 229,400 | 203,382 |
PTT Exploration & Production PCL | 578,500 | 2,442,937 |
PTT Global Chemical PCL | 178,900 | 176,453 |
PTT PCL | 729,200 | 664,072 |
SCB X PCL | 927,400 | 2,665,086 |
Siam Cement PCL (The) (Registered) | 231,300 | 1,554,697 |
Thai Oil PCL | 364,963 | 531,770 |
True Corp. PCL, NVDR * | 1,735,300 | 357,840 |
14,122,562 | ||
Turkey — 0.4% | ||
Akbank TAS | 230,372 | 424,021 |
BIM Birlesik Magazalar A/S | 55,598 | 664,227 |
Ford Otomotiv Sanayi A/S | 12,431 | 427,593 |
Turk Hava Yollari AO * | 78,213 | 787,292 |
Turkiye Petrol Rafinerileri A/S | 84,514 | 510,953 |
Turkiye Sigorta A/S | 263,062 | 538,125 |
Yapi ve Kredi Bankasi A/S | 416,645 | 417,217 |
3,769,428 | ||
United Arab Emirates — 0.8% | ||
Abu Dhabi Commercial Bank PJSC | 99,916 | 226,878 |
Abu Dhabi Islamic Bank PJSC | 253,433 | 770,049 |
ADNOC Drilling Co. PJSC | 394,181 | 414,261 |
Adnoc Gas plc | 378,710 | 308,850 |
Aldar Properties PJSC | 676,163 | 1,005,159 |
Dubai Electricity & Water Authority PJSC | 1,967,139 | 1,258,618 |
Dubai Islamic Bank PJSC | 174,145 | 263,619 |
Emaar Properties PJSC * | 732,747 | 1,637,903 |
Emirates NBD Bank PJSC | 172,040 | 796,286 |
First Abu Dhabi Bank PJSC | 393,857 | 1,338,271 |
Salik Co. PJSC | 410,427 | 386,636 |
8,406,530 | ||
United Kingdom — 0.1% | ||
Anglogold Ashanti plc | 17,282 | 397,462 |
HSBC Holdings plc | 130,800 | 1,124,325 |
1,521,787 | ||
United States — 0.7% | ||
EPAM Systems, Inc. * | 6,443 | 1,515,780 |
ExlService Holdings, Inc. * | 80,631 | 2,338,299 |
April 30, 2024 | J.P. Morgan Exchange-Traded Funds | 31 |
INVESTMENTS | SHARES | VALUE($) |
Common Stocks — continued | ||
United States — continued | ||
Globant SA * | 11,503 | 2,054,321 |
Parade Technologies Ltd. | 53,400 | 1,212,318 |
7,120,718 | ||
Total Common Stocks (Cost $995,274,079) | 1,011,078,236 | |
Short-Term Investments — 0.6% | ||
Investment Companies — 0.2% | ||
JPMorgan Prime Money Market Fund Class IM Shares, 5.41% (c) (d)(Cost $2,267,205) | 2,266,752 | 2,267,205 |
Investment of Cash Collateral from Securities Loaned — 0.4% | ||
JPMorgan U.S. Government Money Market Fund Class IM Shares, 5.25% (c) (d)(Cost $4,030,602) | 4,030,602 | 4,030,602 |
Total Short-Term Investments (Cost $6,297,807) | 6,297,807 | |
Total Investments — 100.3% (Cost $1,001,571,886) | 1,017,376,043 | |
Liabilities in Excess of Other Assets — (0.3)% | (2,820,862 ) | |
NET ASSETS — 100.0% | 1,014,555,181 | |
Percentages indicated are based on net assets. |
Abbreviations | |
ADR | American Depositary Receipt |
APAC | Asia Pacific |
GDR | Global Depositary Receipt |
JSC | Joint Stock Company |
NVDR | Non-Voting Depositary Receipt |
PJSC | Public Joint Stock Company |
Preference | A special type of equity investment that shares in the earnings of the company, has limited voting rights, and may have a dividend preference. Preference shares may also have liquidation preference. |
PT | Limited liability company |
RTS | Russian Trading System |
SGPS | Holding company |
^ | Amount rounds to less than 0.1% of net assets. | |
‡ | Value determined using significant unobservable inputs. | |
* | Non-income producing security. | |
(a) | Security exempt from registration pursuant to Regulation S under the Securities Act of 1933, as amended. Regulation S applies to securities offerings that are made outside of the United States and do not involve direct selling efforts in the United States and as such may have restrictions on resale. | |
(b) | The security or a portion of this security is on loan at April 30, 2024. The total value of securities on loan at April 30, 2024 is $2,943,659. | |
(c) | Investment in an affiliated fund, which is registered under the Investment Company Act of 1940, as amended, and is advised by J.P. Morgan Investment Management Inc. | |
(d) | The rate shown is the current yield as of April 30, 2024. |
INDUSTRY | PERCENT OF TOTAL INVESTMENTS |
Banks | 17.0 % |
Semiconductors & Semiconductor Equipment | 13.3 |
Technology Hardware, Storage & Peripherals | 6.6 |
Interactive Media & Services | 5.5 |
Oil, Gas & Consumable Fuels | 3.9 |
IT Services | 3.9 |
Insurance | 3.4 |
Broadline Retail | 3.4 |
Consumer Staples Distribution & Retail | 3.1 |
Automobiles | 3.0 |
Electronic Equipment, Instruments & Components | 2.9 |
Household Durables | 2.2 |
Beverages | 2.2 |
Hotels, Restaurants & Leisure | 2.0 |
Food Products | 1.8 |
Automobile Components | 1.5 |
Chemicals | 1.4 |
Machinery | 1.4 |
Capital Markets | 1.4 |
Metals & Mining | 1.3 |
Financial Services | 1.3 |
Entertainment | 1.2 |
Electrical Equipment | 1.2 |
Personal Care Products | 1.1 |
Others (each less than 1.0%) | 13.4 |
Short-Term Investments | 0.6 |
32 | J.P. Morgan Exchange-Traded Funds | April 30, 2024 |
INVESTMENTS | SHARES | VALUE($) |
Common Stocks — 98.4% | ||
Denmark — 1.9% | ||
Novo Nordisk A/S, Class B | 426,329 | 54,673,416 |
France — 7.2% | ||
Dassault Systemes SE | 365,768 | 14,357,098 |
Legrand SA | 349,074 | 35,873,144 |
LVMH Moet Hennessy Louis Vuitton SE | 88,672 | 72,838,403 |
Safran SA | 156,750 | 33,988,419 |
Vinci SA | 386,242 | 45,258,315 |
202,315,379 | ||
Germany — 1.6% | ||
Muenchener Rueckversicherungs-Gesellschaft AG (Registered) | 100,547 | 44,221,427 |
Hong Kong — 0.9% | ||
AIA Group Ltd. | 1,523,800 | 11,160,857 |
Hong Kong Exchanges & Clearing Ltd. | 471,100 | 14,968,932 |
26,129,789 | ||
India — 0.5% | ||
HDFC Bank Ltd., ADR | 226,391 | 13,040,122 |
Japan — 2.2% | ||
Japan Exchange Group, Inc. | 264,000 | 6,183,019 |
Shin-Etsu Chemical Co. Ltd. | 1,112,800 | 43,075,308 |
Tokio Marine Holdings, Inc. | 394,200 | 12,459,241 |
61,717,568 | ||
Mexico — 0.5% | ||
Wal-Mart de Mexico SAB de CV | 3,631,662 | 13,535,988 |
Netherlands — 1.5% | ||
ASML Holding NV | 24,258 | 21,129,020 |
Heineken NV | 233,944 | 22,767,338 |
43,896,358 | ||
Singapore — 0.5% | ||
DBS Group Holdings Ltd. | 579,620 | 14,755,623 |
South Korea — 2.1% | ||
Samsung Electronics Co. Ltd. | 594,754 | 33,060,375 |
SK Hynix, Inc. | 214,816 | 26,509,515 |
59,569,890 | ||
Switzerland — 0.9% | ||
UBS Group AG (Registered) | 928,224 | 24,378,208 |
INVESTMENTS | SHARES | VALUE($) |
Taiwan — 2.9% | ||
Taiwan Semiconductor Manufacturing Co. Ltd., ADR | 395,743 | 54,351,344 |
Taiwan Semiconductor Manufacturing Co. Ltd. | 1,203,000 | 28,804,354 |
83,155,698 | ||
United Kingdom — 3.1% | ||
AstraZeneca plc | 199,919 | 30,237,539 |
Diageo plc | 628,304 | 21,713,984 |
RELX plc | 436,464 | 17,932,945 |
SSE plc | 832,084 | 17,296,030 |
87,180,498 | ||
United States — 72.6% | ||
AbbVie, Inc. | 199,989 | 32,526,211 |
Advanced Micro Devices, Inc. * | 105,821 | 16,759,930 |
Amazon.com, Inc. * | 894,896 | 156,606,800 |
Analog Devices, Inc. | 109,006 | 21,867,694 |
Apple, Inc. | 813,482 | 138,560,389 |
AutoZone, Inc. * | 7,997 | 23,642,331 |
Bank of America Corp. | 1,026,889 | 38,005,162 |
Boston Scientific Corp. * | 181,561 | 13,048,789 |
Charles Schwab Corp. (The) | 167,101 | 12,357,119 |
Chevron Corp. | 213,983 | 34,509,038 |
CME Group, Inc. | 391,716 | 82,119,342 |
Coca-Cola Co. (The) | 682,080 | 42,132,082 |
ConocoPhillips | 74,873 | 9,405,546 |
Deere & Co. | 84,658 | 33,135,988 |
Digital Realty Trust, Inc., REIT | 74,949 | 10,401,422 |
Dominion Energy, Inc. | 292,766 | 14,925,211 |
Dow, Inc. | 312,691 | 17,792,118 |
EOG Resources, Inc. | 161,161 | 21,294,203 |
Exxon Mobil Corp. | 484,287 | 57,276,624 |
Fidelity National Information Services, Inc. | 183,745 | 12,479,960 |
Fiserv, Inc. * | 120,068 | 18,330,782 |
Hilton Worldwide Holdings, Inc. | 203,847 | 40,214,936 |
Honeywell International, Inc. | 195,796 | 37,735,763 |
Johnson & Johnson | 216,289 | 31,273,227 |
Mastercard, Inc., Class A | 212,035 | 95,670,192 |
Meta Platforms, Inc., Class A | 189,954 | 81,712,512 |
Micron Technology, Inc. | 103,169 | 11,653,970 |
Microsoft Corp. | 525,048 | 204,416,938 |
Mondelez International, Inc., Class A | 267,113 | 19,216,109 |
Nestle SA (Registered) | 534,117 | 53,625,453 |
NextEra Energy, Inc. | 468,935 | 31,404,577 |
NVIDIA Corp. | 160,366 | 138,559,431 |
O'Reilly Automotive, Inc. * | 20,916 | 21,193,346 |
April 30, 2024 | J.P. Morgan Exchange-Traded Funds | 33 |
INVESTMENTS | SHARES | VALUE($) |
Common Stocks — continued | ||
United States — continued | ||
Progressive Corp. (The) | 56,117 | 11,686,365 |
Prologis, Inc., REIT | 426,360 | 43,510,038 |
Public Service Enterprise Group, Inc. | 351,041 | 24,249,912 |
Regeneron Pharmaceuticals, Inc. * | 49,861 | 44,409,198 |
Ross Stores, Inc. | 143,746 | 18,622,294 |
Salesforce, Inc. | 140,348 | 37,745,191 |
Shell plc | 816,654 | 29,030,921 |
Southern Co. (The) | 466,819 | 34,311,197 |
Stryker Corp. | 52,914 | 17,805,561 |
TJX Cos., Inc. (The) | 209,656 | 19,726,533 |
Uber Technologies, Inc. * | 364,324 | 24,143,751 |
UnitedHealth Group, Inc. | 201,508 | 97,469,420 |
Wells Fargo & Co. | 330,670 | 19,615,344 |
Welltower, Inc., REIT | 107,525 | 10,244,982 |
Yum! Brands, Inc. | 326,553 | 46,125,611 |
2,052,549,513 | ||
Total Common Stocks (Cost $2,660,631,935) | 2,781,119,477 | |
Short-Term Investments — 1.4% | ||
Investment Companies — 1.4% | ||
JPMorgan Prime Money Market Fund Class IM Shares, 5.41% (a) (b)(Cost $41,448,250) | 41,437,193 | 41,445,480 |
Total Investments — 99.8% (Cost $2,702,080,185) | 2,822,564,957 | |
Other Assets Less Liabilities — 0.2% | 4,634,458 | |
NET ASSETS — 100.0% | 2,827,199,415 | |
Percentages indicated are based on net assets. |
Abbreviations | |
ADR | American Depositary Receipt |
REIT | Real Estate Investment Trust |
* | Non-income producing security. |
(a) | Investment in an affiliated fund, which is registered under the Investment Company Act of 1940, as amended, and is advised by J.P. Morgan Investment Management Inc. |
(b) | The rate shown is the current yield as of April 30, 2024. |
INDUSTRY | PERCENT OF TOTAL INVESTMENTS |
Semiconductors & Semiconductor Equipment | 11.3 % |
Software | 9.1 |
Technology Hardware, Storage & Peripherals | 6.1 |
Broadline Retail | 5.5 |
Oil, Gas & Consumable Fuels | 5.4 |
Capital Markets | 5.0 |
Financial Services | 4.5 |
Pharmaceuticals | 4.1 |
Health Care Providers & Services | 3.4 |
Beverages | 3.1 |
Hotels, Restaurants & Leisure | 3.1 |
Banks | 3.0 |
Specialty Retail | 2.9 |
Electric Utilities | 2.9 |
Interactive Media & Services | 2.9 |
Insurance | 2.8 |
Biotechnology | 2.7 |
Food Products | 2.6 |
Textiles, Apparel & Luxury Goods | 2.6 |
Chemicals | 2.2 |
Construction & Engineering | 1.6 |
Industrial REITs | 1.5 |
Multi-Utilities | 1.4 |
Industrial Conglomerates | 1.3 |
Electrical Equipment | 1.3 |
Aerospace & Defense | 1.2 |
Machinery | 1.2 |
Health Care Equipment & Supplies | 1.1 |
Others (each less than 1.0%) | 2.7 |
Short-Term Investments | 1.5 |
34 | J.P. Morgan Exchange-Traded Funds | April 30, 2024 |
INVESTMENTS | SHARES | VALUE($) |
Common Stocks — 98.2% | ||
Denmark — 6.2% | ||
Novo Nordisk A/S, Class B | 3,176 | 407,298 |
Zealand Pharma A/S * | 334 | 29,975 |
437,273 | ||
Germany — 0.6% | ||
Sartorius AG (Preference) | 136 | 40,658 |
Japan — 1.6% | ||
Daiichi Sankyo Co. Ltd. | 3,300 | 111,070 |
Netherlands — 0.8% | ||
Argenx SE * | 155 | 57,284 |
Switzerland — 3.2% | ||
Lonza Group AG (Registered) | 149 | 82,247 |
Novartis AG (Registered) | 1,044 | 101,328 |
Sonova Holding AG (Registered) | 165 | 45,611 |
229,186 | ||
United Kingdom — 5.0% | ||
AstraZeneca plc | 2,309 | 349,234 |
United States — 80.8% | ||
Abbott Laboratories | 574 | 60,827 |
AbbVie, Inc. | 1,988 | 323,328 |
Acadia Healthcare Co., Inc. * | 819 | 60,557 |
Accolade, Inc. * | 2,554 | 19,487 |
Agios Pharmaceuticals, Inc. * | 1,133 | 36,823 |
Align Technology, Inc. * | 208 | 58,735 |
Alnylam Pharmaceuticals, Inc. * | 134 | 19,289 |
Amgen, Inc. | 238 | 65,198 |
Amicus Therapeutics, Inc. * | 3,119 | 31,159 |
Apellis Pharmaceuticals, Inc. * | 740 | 32,701 |
Arvinas, Inc. * | 809 | 25,702 |
Becton Dickinson & Co. | 638 | 149,675 |
Biogen, Inc. * | 97 | 20,838 |
Biohaven Ltd. * | 363 | 14,084 |
BioMarin Pharmaceutical, Inc. * | 459 | 37,069 |
Blueprint Medicines Corp. * | 472 | 43,112 |
Boston Scientific Corp. * | 2,463 | 177,016 |
Bristol-Myers Squibb Co. | 2,825 | 124,131 |
Centene Corp. * | 633 | 46,247 |
Cigna Group (The) | 579 | 206,726 |
Danaher Corp. | 962 | 237,248 |
Dexcom, Inc. * | 474 | 60,383 |
Edwards Lifesciences Corp. * | 1,517 | 128,444 |
Eli Lilly & Co. | 845 | 660,029 |
Evolent Health, Inc., Class A * | 2,093 | 58,060 |
INVESTMENTS | SHARES | VALUE($) |
United States — continued | ||
Exact Sciences Corp. * | 1,184 | 70,270 |
GSK plc | 6,693 | 138,859 |
Halozyme Therapeutics, Inc. * | 953 | 36,309 |
HCA Healthcare, Inc. | 510 | 158,008 |
IDEXX Laboratories, Inc. * | 49 | 24,145 |
Inspire Medical Systems, Inc. * | 234 | 56,548 |
Intra-Cellular Therapies, Inc. * | 626 | 44,953 |
Intuitive Surgical, Inc. * | 237 | 87,837 |
IQVIA Holdings, Inc. * | 402 | 93,172 |
iRhythm Technologies, Inc. * | 388 | 42,517 |
Johnson & Johnson | 1,398 | 202,137 |
McKesson Corp. | 241 | 129,468 |
Merck & Co., Inc. | 1,143 | 147,698 |
Natera, Inc. * | 715 | 66,409 |
Neurocrine Biosciences, Inc. * | 333 | 45,801 |
Regeneron Pharmaceuticals, Inc. * | 348 | 309,950 |
REGENXBIO, Inc. * | 1,540 | 23,639 |
REVOLUTION Medicines, Inc. * | 960 | 35,789 |
Sanofi SA | 1,908 | 188,497 |
Sarepta Therapeutics, Inc. * | 286 | 36,225 |
Shockwave Medical, Inc. * | 207 | 68,349 |
Stryker Corp. | 573 | 192,815 |
Thermo Fisher Scientific, Inc. | 260 | 147,867 |
Twist Bioscience Corp. * | 1,300 | 40,599 |
UnitedHealth Group, Inc. | 1,126 | 544,646 |
West Pharmaceutical Services, Inc. | 164 | 58,627 |
5,688,002 | ||
Total Common Stocks (Cost $6,127,375) | 6,912,707 | |
Short-Term Investments — 0.9% | ||
Investment Companies — 0.9% | ||
JPMorgan U.S. Government Money Market Fund Class IM Shares, 5.25% (a) (b)(Cost $61,610) | 61,610 | 61,610 |
Total Investments — 99.1% (Cost $6,188,985) | 6,974,317 | |
Other Assets Less Liabilities — 0.9% | 63,058 | |
NET ASSETS — 100.0% | 7,037,375 | |
Percentages indicated are based on net assets. |
April 30, 2024 | J.P. Morgan Exchange-Traded Funds | 35 |
Abbreviations | |
Preference | A special type of equity investment that shares in the earnings of the company, has limited voting rights, and may have a dividend preference. Preference shares may also have liquidation preference. |
* | Non-income producing security. |
(a) | Investment in an affiliated fund, which is registered under the Investment Company Act of 1940, as amended, and is advised by J.P. Morgan Investment Management Inc. |
(b) | The rate shown is the current yield as of April 30, 2024. |
INDUSTRY | PERCENT OF TOTAL INVESTMENTS |
Pharmaceuticals | 35.9 % |
Biotechnology | 19.7 |
Health Care Providers & Services | 16.7 |
Health Care Equipment & Supplies | 16.5 |
Life Sciences Tools & Services | 9.5 |
Health Care Technology | 0.8 |
Short-Term Investments | 0.9 |
36 | J.P. Morgan Exchange-Traded Funds | April 30, 2024 |
INVESTMENTS | SHARES | VALUE($) |
Common Stocks — 99.2% | ||
Aerospace & Defense — 1.3% | ||
Howmet Aerospace, Inc. | 29,983 | 2,001,365 |
Northrop Grumman Corp. | 1,708 | 828,431 |
RTX Corp. | 12,455 | 1,264,432 |
Textron, Inc. | 24,220 | 2,048,770 |
TransDigm Group, Inc. | 704 | 878,613 |
7,021,611 | ||
Air Freight & Logistics — 1.0% | ||
FedEx Corp. | 7,099 | 1,858,376 |
United Parcel Service, Inc., Class B | 24,775 | 3,653,817 |
5,512,193 | ||
Automobile Components — 0.2% | ||
Aptiv plc * | 10,912 | 774,752 |
Automobiles — 1.0% | ||
Tesla, Inc. * (a) | 28,601 | 5,241,991 |
Banks — 3.6% | ||
Bank of America Corp. (a) | 163,544 | 6,052,764 |
Citigroup, Inc. | 16,183 | 992,503 |
Fifth Third Bancorp | 61,979 | 2,259,754 |
Truist Financial Corp. | 73,999 | 2,778,663 |
US Bancorp | 63,961 | 2,598,735 |
Wells Fargo & Co. (a) | 72,736 | 4,314,700 |
18,997,119 | ||
Beverages — 2.0% | ||
Coca-Cola Co. (The) (a) | 71,796 | 4,434,839 |
Monster Beverage Corp. * | 26,295 | 1,405,468 |
PepsiCo, Inc. (a) | 27,323 | 4,806,389 |
10,646,696 | ||
Biotechnology — 2.7% | ||
AbbVie, Inc. (a) | 38,851 | 6,318,727 |
Biogen, Inc. * | 4,517 | 970,342 |
BioMarin Pharmaceutical, Inc. * | 2,838 | 229,197 |
Neurocrine Biosciences, Inc. * | 3,781 | 520,039 |
Regeneron Pharmaceuticals, Inc. * | 3,481 | 3,100,387 |
Sarepta Therapeutics, Inc. * | 1,852 | 234,574 |
Vertex Pharmaceuticals, Inc. * | 7,752 | 3,045,063 |
14,418,329 | ||
Broadline Retail — 4.3% | ||
Amazon.com, Inc. * (a) | 129,699 | 22,697,325 |
Building Products — 1.6% | ||
Carrier Global Corp. | 36,992 | 2,274,638 |
INVESTMENTS | SHARES | VALUE($) |
Building Products — continued | ||
Masco Corp. | 18,998 | 1,300,413 |
Trane Technologies plc | 14,696 | 4,663,629 |
8,238,680 | ||
Capital Markets — 2.4% | ||
Ameriprise Financial, Inc. | 1,664 | 685,219 |
Blackstone, Inc. | 3,586 | 418,163 |
Charles Schwab Corp. (The) | 30,457 | 2,252,295 |
CME Group, Inc. | 8,130 | 1,704,373 |
Goldman Sachs Group, Inc. (The) | 7,880 | 3,362,475 |
Intercontinental Exchange, Inc. | 20,793 | 2,677,307 |
State Street Corp. | 23,898 | 1,732,366 |
12,832,198 | ||
Chemicals — 2.0% | ||
Dow, Inc. | 46,617 | 2,652,507 |
Eastman Chemical Co. | 14,173 | 1,338,498 |
Linde plc | 10,760 | 4,744,730 |
LyondellBasell Industries NV, Class A | 13,769 | 1,376,487 |
PPG Industries, Inc. | 5,016 | 647,064 |
10,759,286 | ||
Commercial Services & Supplies — 0.1% | ||
Cintas Corp. | 1,084 | 713,641 |
Communications Equipment — 0.2% | ||
Motorola Solutions, Inc. | 2,789 | 945,889 |
Consumer Finance — 0.0% ^ | ||
Capital One Financial Corp. | 271 | 38,869 |
Consumer Staples Distribution & Retail — 1.1% | ||
Costco Wholesale Corp. (a) | 7,216 | 5,216,447 |
Dollar Tree, Inc. * | 4,529 | 535,554 |
5,752,001 | ||
Distributors — 0.1% | ||
LKQ Corp. | 8,571 | 369,667 |
Electric Utilities — 2.1% | ||
Constellation Energy Corp. | 3,954 | 735,207 |
NextEra Energy, Inc. (a) | 53,173 | 3,560,996 |
NRG Energy, Inc. | 1,509 | 109,659 |
PG&E Corp. | 153,658 | 2,629,088 |
Southern Co. (The) | 54,703 | 4,020,670 |
11,055,620 | ||
April 30, 2024 | J.P. Morgan Exchange-Traded Funds | 37 |
INVESTMENTS | SHARES | VALUE($) |
Common Stocks — continued | ||
Electrical Equipment — 0.7% | ||
AMETEK, Inc. | 2,071 | 361,721 |
Eaton Corp. plc | 10,915 | 3,473,808 |
3,835,529 | ||
Electronic Equipment, Instruments & Components — 0.2% | ||
Corning, Inc. | 12,165 | 406,068 |
Keysight Technologies, Inc. * | 1,157 | 171,166 |
TE Connectivity Ltd. | 3,795 | 536,917 |
1,114,151 | ||
Energy Equipment & Services — 0.1% | ||
Baker Hughes Co. | 21,715 | 708,343 |
Entertainment — 0.5% | ||
Netflix, Inc. * | 3,462 | 1,906,316 |
Warner Music Group Corp., Class A | 20,820 | 687,060 |
2,593,376 | ||
Financial Services — 5.0% | ||
Berkshire Hathaway, Inc., Class B * (a) | 18,439 | 7,315,304 |
Block, Inc. * | 3,184 | 232,432 |
Corpay, Inc. * | 6,804 | 2,055,761 |
Fidelity National Information Services, Inc. | 7,585 | 515,173 |
Fiserv, Inc. * | 11,505 | 1,756,468 |
Mastercard, Inc., Class A (a) | 18,586 | 8,386,003 |
Visa, Inc., Class A (a) | 23,396 | 6,284,400 |
26,545,541 | ||
Food Products — 0.9% | ||
Mondelez International, Inc., Class A (a) | 64,671 | 4,652,432 |
Ground Transportation — 1.1% | ||
CSX Corp. | 51,989 | 1,727,075 |
Norfolk Southern Corp. | 829 | 190,935 |
Uber Technologies, Inc. * | 35,792 | 2,371,936 |
Union Pacific Corp. | 5,851 | 1,387,623 |
5,677,569 | ||
Health Care Equipment & Supplies — 2.4% | ||
Baxter International, Inc. | 19,230 | 776,315 |
Becton Dickinson & Co. | 3,471 | 814,297 |
Boston Scientific Corp. * (a) | 56,654 | 4,071,723 |
Dexcom, Inc. * | 4,716 | 600,771 |
Intuitive Surgical, Inc. * | 2,172 | 804,987 |
Medtronic plc | 32,459 | 2,604,510 |
Stryker Corp. | 9,099 | 3,061,813 |
12,734,416 | ||
INVESTMENTS | SHARES | VALUE($) |
Health Care Providers & Services — 2.6% | ||
Centene Corp. * | 21,145 | 1,544,854 |
CVS Health Corp. | 9,173 | 621,104 |
Elevance Health, Inc. | 4,608 | 2,435,697 |
HCA Healthcare, Inc. | 1,619 | 501,598 |
Humana, Inc. | 2,655 | 802,049 |
McKesson Corp. | 1,600 | 859,536 |
UnitedHealth Group, Inc. (a) | 14,786 | 7,151,988 |
13,916,826 | ||
Health Care REITs — 0.5% | ||
Ventas, Inc. | 35,498 | 1,571,852 |
Welltower, Inc. | 11,133 | 1,060,752 |
2,632,604 | ||
Hotels, Restaurants & Leisure — 3.0% | ||
Booking Holdings, Inc. | 920 | 3,175,868 |
Chipotle Mexican Grill, Inc. * | 917 | 2,897,353 |
Expedia Group, Inc. * | 15,769 | 2,122,981 |
Marriott International, Inc., Class A | 5,118 | 1,208,513 |
McDonald's Corp. | 8,212 | 2,242,205 |
Royal Caribbean Cruises Ltd. * | 13,042 | 1,821,054 |
Yum! Brands, Inc. | 18,228 | 2,574,705 |
16,042,679 | ||
Household Durables — 0.3% | ||
Lennar Corp., Class A | 4,984 | 755,674 |
Toll Brothers, Inc. | 5,740 | 683,691 |
1,439,365 | ||
Household Products — 0.6% | ||
Church & Dwight Co., Inc. | 6,340 | 684,023 |
Procter & Gamble Co. (The) | 15,183 | 2,477,865 |
3,161,888 | ||
Industrial Conglomerates — 0.9% | ||
Honeywell International, Inc. (a) | 25,515 | 4,917,506 |
Industrial REITs — 0.6% | ||
Prologis, Inc. | 28,383 | 2,896,485 |
Insurance — 2.2% | ||
Aflac, Inc. | 10,217 | 854,652 |
Chubb Ltd. | 4,796 | 1,192,477 |
MetLife, Inc. | 25,283 | 1,797,116 |
Principal Financial Group, Inc. | 9,619 | 761,248 |
Progressive Corp. (The) | 17,164 | 3,574,403 |
Travelers Cos., Inc. (The) | 15,291 | 3,244,138 |
11,424,034 | ||
38 | J.P. Morgan Exchange-Traded Funds | April 30, 2024 |
INVESTMENTS | SHARES | VALUE($) |
Common Stocks — continued | ||
Interactive Media & Services — 6.6% | ||
Alphabet, Inc., Class A * (a) | 74,195 | 12,077,462 |
Alphabet, Inc., Class C * (a) | 55,052 | 9,063,761 |
Meta Platforms, Inc., Class A (a) | 31,308 | 13,467,763 |
34,608,986 | ||
IT Services — 0.9% | ||
Accenture plc, Class A | 9,557 | 2,875,797 |
Cognizant Technology Solutions Corp., Class A | 31,816 | 2,089,675 |
4,965,472 | ||
Life Sciences Tools & Services — 1.3% | ||
Danaher Corp. | 13,485 | 3,325,671 |
Thermo Fisher Scientific, Inc. | 6,218 | 3,536,301 |
6,861,972 | ||
Machinery — 1.7% | ||
Deere & Co. (a) | 10,789 | 4,222,923 |
Dover Corp. | 5,013 | 898,831 |
Ingersoll Rand, Inc. | 8,639 | 806,191 |
Otis Worldwide Corp. | 30,699 | 2,799,749 |
8,727,694 | ||
Media — 1.0% | ||
Charter Communications, Inc., Class A * | 3,829 | 979,994 |
Comcast Corp., Class A (a) | 103,597 | 3,948,082 |
Liberty Media Corp-Liberty SiriusXM, Class A * | 18,398 | 442,656 |
5,370,732 | ||
Metals & Mining — 0.2% | ||
Nucor Corp. | 4,513 | 760,576 |
Multi-Utilities — 0.3% | ||
CMS Energy Corp. | 22,758 | 1,379,362 |
Oil, Gas & Consumable Fuels — 4.0% | ||
Chevron Corp. | 7,829 | 1,262,583 |
ConocoPhillips (a) | 28,916 | 3,632,428 |
Diamondback Energy, Inc. | 12,570 | 2,528,204 |
EOG Resources, Inc. (a) | 27,697 | 3,659,604 |
Exxon Mobil Corp. (a) | 78,644 | 9,301,226 |
Pioneer Natural Resources Co. | 2,956 | 796,110 |
21,180,155 | ||
Passenger Airlines — 0.2% | ||
Delta Air Lines, Inc. | 17,798 | 891,146 |
Personal Care Products — 0.2% | ||
Kenvue, Inc. | 61,651 | 1,160,272 |
INVESTMENTS | SHARES | VALUE($) |
Pharmaceuticals — 3.1% | ||
Bristol-Myers Squibb Co. | 69,991 | 3,075,404 |
Eli Lilly & Co. (a) | 8,829 | 6,896,332 |
Johnson & Johnson (a) | 22,066 | 3,190,523 |
Merck & Co., Inc. | 26,598 | 3,436,994 |
16,599,253 | ||
Professional Services — 0.3% | ||
Leidos Holdings, Inc. | 12,183 | 1,708,300 |
Residential REITs — 0.2% | ||
Equity LifeStyle Properties, Inc. | 12,300 | 741,567 |
Sun Communities, Inc. | 4,341 | 483,240 |
1,224,807 | ||
Semiconductors & Semiconductor Equipment — 10.8% | ||
Advanced Micro Devices, Inc. * (a) | 27,320 | 4,326,941 |
Analog Devices, Inc. (a) | 21,047 | 4,222,239 |
Broadcom, Inc. | 3,182 | 4,137,459 |
Lam Research Corp. (a) | 2,230 | 1,994,534 |
Micron Technology, Inc. | 23,981 | 2,708,894 |
NVIDIA Corp. (a) | 33,582 | 29,015,520 |
NXP Semiconductors NV (China) (a) | 18,916 | 4,846,090 |
Qorvo, Inc. * | 6,033 | 704,896 |
Texas Instruments, Inc. (a) | 27,790 | 4,902,712 |
56,859,285 | ||
Software — 10.0% | ||
Adobe, Inc. * (a) | 2,760 | 1,277,411 |
Cadence Design Systems, Inc. * | 3,397 | 936,315 |
Intuit, Inc. | 5,929 | 3,709,301 |
Microsoft Corp. (a) | 102,449 | 39,886,469 |
Salesforce, Inc. | 11,973 | 3,220,019 |
ServiceNow, Inc. * | 5,720 | 3,965,847 |
52,995,362 | ||
Specialized REITs — 0.6% | ||
Digital Realty Trust, Inc. | 13,207 | 1,832,867 |
SBA Communications Corp. | 8,247 | 1,534,932 |
3,367,799 | ||
Specialty Retail — 2.9% | ||
AutoNation, Inc. * | 755 | 121,668 |
AutoZone, Inc. * | 1,348 | 3,985,227 |
Best Buy Co., Inc. | 19,718 | 1,452,034 |
Burlington Stores, Inc. * | 5,331 | 959,260 |
Lowe's Cos., Inc. (a) | 23,475 | 5,352,065 |
O'Reilly Automotive, Inc. * | 940 | 952,465 |
April 30, 2024 | J.P. Morgan Exchange-Traded Funds | 39 |
INVESTMENTS | SHARES | VALUE($) |
Common Stocks — continued | ||
Specialty Retail — continued | ||
Ross Stores, Inc. | 6,455 | 836,245 |
TJX Cos., Inc. (The) | 15,187 | 1,428,945 |
15,087,909 | ||
Technology Hardware, Storage & Peripherals — 6.7% | ||
Apple, Inc. (a) | 185,008 | 31,512,413 |
Hewlett Packard Enterprise Co. | 57,057 | 969,969 |
Seagate Technology Holdings plc | 27,639 | 2,374,466 |
Western Digital Corp. * | 7,048 | 499,210 |
35,356,058 | ||
Tobacco — 0.4% | ||
Altria Group, Inc. | 16,735 | 733,160 |
Philip Morris International, Inc. | 14,133 | 1,341,787 |
2,074,947 | ||
Trading Companies & Distributors — 0.2% | ||
United Rentals, Inc. | 1,562 | 1,043,400 |
Wireless Telecommunication Services — 0.3% | ||
T-Mobile US, Inc. | 9,888 | 1,623,313 |
Total Common Stocks (Cost $499,827,553) | 524,155,411 | |
NO. OF CONTRACTS | ||
Options Purchased — 1.0% | ||
Put Options Purchased — 1.0% | ||
SPDR S&P 500 ETF Trust | ||
5/31/2024 at USD 481.00, American Style | ||
Notional Amount: USD 171,074,784 | ||
Counterparty: Exchange-Traded * | 3,408 | 732,720 |
6/28/2024 at USD 495.00, American Style | ||
Notional Amount: USD 180,261,018 | ||
Counterparty: Exchange-Traded * | 3,591 | 2,707,614 |
7/31/2024 at USD 476.00, American Style | ||
INVESTMENTS | NO. OF CONTRACTS | VALUE($) |
Put Options Purchased — continued | ||
Notional Amount: USD 172,179,140 | ||
Counterparty: Exchange-Traded * | 3,430 | 1,800,750 |
Total Put Options Purchased (Cost $4,703,327) | 5,241,084 | |
SHARES | ||
Short-Term Investments — 0.2% | ||
Investment Companies — 0.2% | ||
JPMorgan U.S. Government Money Market Fund Class IM Shares, 5.25% (b) (c) (Cost $1,240,933) | 1,240,933 | 1,240,933 |
Total Investments — 100.4% (Cost $505,771,813) | 530,637,428 | |
Liabilities in Excess of Other Assets — (0.4)% | (1,934,924 ) | |
NET ASSETS — 100.0% | 528,702,504 | |
Percentages indicated are based on net assets. |
Abbreviations | |
ETF | Exchange Traded Fund |
REIT | Real Estate Investment Trust |
SPDR | Standard & Poor's Depositary Receipt |
USD | United States Dollar |
^ | Amount rounds to less than 0.1% of net assets. | |
* | Non-income producing security. | |
(a) | All or a portion of the security is segregated for options written. | |
(b) | Investment in an affiliated fund, which is registered under the Investment Company Act of 1940, as amended, and is advised by J.P. Morgan Investment Management Inc. | |
(c) | The rate shown is the current yield as of April 30, 2024. | |
DESCRIPTION | NUMBER OF CONTRACTS | EXPIRATION DATE | TRADING CURRENCY | NOTIONAL AMOUNT ($) | VALUE AND UNREALIZED APPRECIATION (DEPRECIATION) ($) |
Long Contracts | |||||
S&P 500 E-Mini Index | 6 | 06/21/2024 | USD | 1,519,425 | (47,398 ) |
40 | J.P. Morgan Exchange-Traded Funds | April 30, 2024 |
Abbreviations | |
USD | United States Dollar |
Written Call Options Contracts as of April 30, 2024 | ||||||
DESCRIPTION | COUNTERPARTY | NUMBER OF CONTRACTS | NOTIONAL AMOUNT | EXERCISE PRICE | EXPIRATION DATE | VALUE ($) |
SPDR S&P 500 ETF Trust | Exchange-Traded | 3,408 | USD 171,074,784 | USD 538.00 | 5/31/2024 | (68,160 ) |
SPDR S&P 500 ETF Trust | Exchange-Traded | 3,591 | USD 180,261,018 | USD 554.00 | 6/28/2024 | (68,229 ) |
SPDR S&P 500 ETF Trust | Exchange-Traded | 3,430 | USD 172,179,140 | USD 532.00 | 7/31/2024 | (1,325,695 ) |
(1,462,084 ) | ||||||
Written Put Options Contracts as of April 30, 2024 | ||||||
DESCRIPTION | COUNTERPARTY | NUMBER OF CONTRACTS | NOTIONAL AMOUNT | EXERCISE PRICE | EXPIRATION DATE | VALUE ($) |
SPDR S&P 500 ETF Trust | Exchange-Traded | 3,408 | USD 171,074,784 | USD 405.00 | 5/31/2024 | (57,936 ) |
SPDR S&P 500 ETF Trust | Exchange-Traded | 3,591 | USD 180,261,018 | USD 417.00 | 6/28/2024 | (213,665 ) |
SPDR S&P 500 ETF Trust | Exchange-Traded | 3,430 | USD 172,179,140 | USD 400.00 | 7/31/2024 | (293,265 ) |
(564,866 ) | ||||||
Total Written Options Contracts (Premiums Received $4,144,366) | (2,026,950 ) | |||||
Abbreviations | |
ETF | Exchange Traded Fund |
SPDR | Standard & Poor's Depositary Receipt |
USD | United States Dollar |
April 30, 2024 | J.P. Morgan Exchange-Traded Funds | 41 |
INVESTMENTS | SHARES | VALUE($) |
Common Stocks — 95.3% | ||
Australia — 0.7% | ||
Goodman Group, REIT | 28,074 | 567,084 |
Brazil — 1.0% | ||
MercadoLibre, Inc. * | 294 | 428,858 |
NU Holdings Ltd., Class A * | 42,134 | 457,575 |
886,433 | ||
Canada — 6.1% | ||
Alimentation Couche-Tard, Inc. | 25,233 | 1,398,524 |
Canadian National Railway Co. | 11,913 | 1,445,933 |
Canadian Pacific Kansas City Ltd. | 19,808 | 1,553,964 |
Intact Financial Corp. | 5,388 | 885,586 |
5,284,007 | ||
China — 8.0% | ||
ANTA Sports Products Ltd. | 43,600 | 493,595 |
Fuyao Glass Industry Group Co. Ltd., Class H (a) | 87,200 | 522,072 |
JD.com, Inc., ADR | 16,664 | 481,423 |
PDD Holdings, Inc., ADR * | 5,029 | 629,530 |
Shenzhen Mindray Bio-Medical Electronics Co. Ltd., Class A | 14,300 | 599,412 |
Tencent Holdings Ltd. | 77,700 | 3,409,725 |
Yum China Holdings, Inc. | 20,500 | 767,427 |
6,903,184 | ||
Denmark — 4.2% | ||
Coloplast A/S, Class B | 4,271 | 514,934 |
Novo Nordisk A/S, Class B | 24,078 | 3,087,818 |
3,602,752 | ||
France — 11.4% | ||
Air Liquide SA | 9,819 | 1,920,386 |
Airbus SE | 9,098 | 1,497,147 |
Dassault Systemes SE | 22,190 | 871,000 |
Legrand SA | 4,181 | 429,667 |
LVMH Moet Hennessy Louis Vuitton SE | 2,431 | 1,996,912 |
Safran SA | 10,480 | 2,272,400 |
Vinci SA | 7,003 | 820,584 |
9,808,096 | ||
Germany — 1.3% | ||
Muenchener Rueckversicherungs-Gesellschaft AG (Registered) | 1,913 | 841,354 |
Zalando SE * (a) | 10,338 | 270,496 |
1,111,850 | ||
INVESTMENTS | SHARES | VALUE($) |
Indonesia — 1.9% | ||
Bank Central Asia Tbk. PT | 1,788,100 | 1,075,157 |
Bank Rakyat Indonesia Persero Tbk. PT | 1,849,499 | 559,850 |
1,635,007 | ||
Italy — 1.0% | ||
Ferrari NV | 468 | 192,476 |
Ryanair Holdings plc, ADR | 5,139 | 699,932 |
892,408 | ||
Japan — 15.9% | ||
Advantest Corp. | 5,800 | 181,544 |
Daikin Industries Ltd. | 6,100 | 832,597 |
Denso Corp. | 23,100 | 393,696 |
Hitachi Ltd. | 12,900 | 1,190,163 |
Hoya Corp. | 11,200 | 1,298,526 |
Keyence Corp. | 4,000 | 1,759,079 |
Otsuka Corp. | 37,600 | 747,794 |
Rakuten Bank Ltd. * | 38,200 | 774,164 |
Recruit Holdings Co. Ltd. | 32,600 | 1,403,996 |
Shimano, Inc. | 5,400 | 877,570 |
Shin-Etsu Chemical Co. Ltd. | 29,100 | 1,126,430 |
Sony Group Corp. | 16,200 | 1,338,952 |
Terumo Corp. | 61,400 | 1,041,598 |
Tokio Marine Holdings, Inc. | 22,900 | 723,787 |
13,689,896 | ||
Mexico — 1.6% | ||
Grupo Financiero Banorte SAB de CV, Class O | 43,561 | 432,082 |
Wal-Mart de Mexico SAB de CV | 250,284 | 932,862 |
1,364,944 | ||
Netherlands — 7.1% | ||
Adyen NV * (a) | 142 | 170,116 |
Argenx SE * | 1,417 | 529,340 |
Argenx SE * | 302 | 111,611 |
ASML Holding NV | 4,353 | 3,791,517 |
Heineken NV | 8,119 | 790,138 |
Wolters Kluwer NV | 4,809 | 719,938 |
6,112,660 | ||
Singapore — 1.1% | ||
DBS Group Holdings Ltd. | 36,850 | 938,105 |
South Korea — 2.9% | ||
Delivery Hero SE * (a) | 9,239 | 258,484 |
Kia Corp. | 5,017 | 425,053 |
42 | J.P. Morgan Exchange-Traded Funds | April 30, 2024 |
INVESTMENTS | SHARES | VALUE($) |
Common Stocks — continued | ||
South Korea — continued | ||
Samsung Electronics Co. Ltd., GDR (a) | 1,059 | 1,477,788 |
SK Hynix, Inc. | 2,923 | 360,715 |
2,522,040 | ||
Spain — 1.5% | ||
Industria de Diseno Textil SA | 29,239 | 1,331,279 |
Sweden — 2.8% | ||
Atlas Copco AB, Class A | 101,532 | 1,778,444 |
Volvo AB, Class B | 25,323 | 644,551 |
2,422,995 | ||
Switzerland — 1.8% | ||
Cie Financiere Richemont SA (Registered) | 11,110 | 1,535,702 |
Taiwan — 7.2% | ||
Taiwan Semiconductor Manufacturing Co. Ltd., ADR | 21,988 | 3,019,832 |
Taiwan Semiconductor Manufacturing Co. Ltd. | 134,000 | 3,208,465 |
6,228,297 | ||
United Kingdom — 9.8% | ||
3i Group plc | 58,575 | 2,092,736 |
InterContinental Hotels Group plc | 18,787 | 1,832,372 |
London Stock Exchange Group plc | 14,371 | 1,584,261 |
Next plc | 3,193 | 358,120 |
RELX plc | 41,631 | 1,712,056 |
Sage Group plc (The) | 22,440 | 325,400 |
SSE plc | 24,834 | 516,209 |
8,421,154 | ||
United States — 8.0% | ||
Cadence Design Systems, Inc. * | 2,255 | 621,546 |
Ferrovial SE | 13,449 | 483,698 |
Las Vegas Sands Corp. | 18,351 | 814,050 |
Linde plc | 3,752 | 1,654,494 |
Nestle SA (Registered) | 24,780 | 2,487,917 |
Sanofi SA (b) | 7,967 | 787,084 |
6,848,789 | ||
Total Common Stocks (Cost $71,935,550) | 82,106,682 | |
Short-Term Investments — 4.9% | ||
Investment Companies — 4.2% | ||
JPMorgan Prime Money Market Fund Class IM Shares, 5.41% (c) (d)(Cost $3,656,590) | 3,655,323 | 3,656,054 |
INVESTMENTS | SHARES | VALUE($) |
Investment of Cash Collateral from Securities Loaned — 0.7% | ||
JPMorgan U.S. Government Money Market Fund Class IM Shares, 5.25% (c) (d)(Cost $576,057) | 576,057 | 576,057 |
Total Short-Term Investments (Cost $4,232,647) | 4,232,111 | |
Total Investments — 100.2% (Cost $76,168,197) | 86,338,793 | |
Liabilities in Excess of Other Assets — (0.2)% | (172,079 ) | |
NET ASSETS — 100.0% | 86,166,714 | |
Percentages indicated are based on net assets. |
Abbreviations | |
ADR | American Depositary Receipt |
GDR | Global Depositary Receipt |
PT | Limited liability company |
REIT | Real Estate Investment Trust |
* | Non-income producing security. |
(a) | Security exempt from registration pursuant to Regulation S under the Securities Act of 1933, as amended. Regulation S applies to securities offerings that are made outside of the United States and do not involve direct selling efforts in the United States and as such may have restrictions on resale. |
(b) | The security or a portion of this security is on loan at April 30, 2024. The total value of securities on loan at April 30, 2024 is $550,870. |
(c) | Investment in an affiliated fund, which is registered under the Investment Company Act of 1940, as amended, and is advised by J.P. Morgan Investment Management Inc. |
(d) | The rate shown is the current yield as of April 30, 2024. |
April 30, 2024 | J.P. Morgan Exchange-Traded Funds | 43 |
INDUSTRY | PERCENT OF TOTAL INVESTMENTS |
Semiconductors & Semiconductor Equipment | 12.2 % |
Chemicals | 5.4 |
Banks | 4.9 |
Textiles, Apparel & Luxury Goods | 4.7 |
Pharmaceuticals | 4.5 |
Professional Services | 4.4 |
Aerospace & Defense | 4.4 |
Capital Markets | 4.3 |
Hotels, Restaurants & Leisure | 4.3 |
Health Care Equipment & Supplies | 4.0 |
Interactive Media & Services | 3.9 |
Ground Transportation | 3.5 |
Food Products | 2.9 |
Insurance | 2.8 |
Machinery | 2.8 |
Consumer Staples Distribution & Retail | 2.7 |
Broadline Retail | 2.2 |
Software | 2.1 |
Electronic Equipment, Instruments & Components | 2.0 |
Specialty Retail | 1.9 |
Technology Hardware, Storage & Peripherals | 1.7 |
Household Durables | 1.5 |
Construction & Engineering | 1.5 |
Industrial Conglomerates | 1.4 |
Automobile Components | 1.1 |
Leisure Products | 1.0 |
Building Products | 1.0 |
Others (each less than 1.0%) | 6.0 |
Short-Term Investments | 4.9 |
DESCRIPTION | NUMBER OF CONTRACTS | EXPIRATION DATE | TRADING CURRENCY | NOTIONAL AMOUNT ($) | VALUE AND UNREALIZED APPRECIATION (DEPRECIATION) ($) |
Long Contracts | |||||
IFSC NIFTY 50 Index | 57 | 05/30/2024 | USD | 2,583,297 | 20,692 |
Abbreviations | |
IFSC | International Financial Service Centre |
USD | United States Dollar |
44 | J.P. Morgan Exchange-Traded Funds | April 30, 2024 |
INVESTMENTS | SHARES | VALUE($) |
Common Stocks — 97.8% | ||
Australia — 4.2% | ||
BHP Group Ltd. | 4,077 | 111,816 |
BlueScope Steel Ltd. | 2,663 | 38,868 |
Fortescue Ltd. | 2,675 | 44,337 |
Glencore plc | 13,517 | 78,650 |
JB Hi-Fi Ltd. | 870 | 33,949 |
Perseus Mining Ltd. | 26,669 | 39,009 |
QBE Insurance Group Ltd. | 1,829 | 20,922 |
Rio Tinto plc | 1,969 | 133,224 |
Ventia Services Group Pty. Ltd. | 14,173 | 32,985 |
Whitehaven Coal Ltd. | 7,042 | 34,833 |
568,593 | ||
Austria — 1.2% | ||
ANDRITZ AG | 293 | 15,993 |
Erste Group Bank AG | 1,033 | 48,174 |
OMV AG | 769 | 36,490 |
Telekom Austria AG | 3,822 | 32,835 |
Vienna Insurance Group AG Wiener Versicherung Gruppe | 987 | 30,726 |
164,218 | ||
Belgium — 0.7% | ||
Ageas SA | 870 | 39,934 |
KBC Group NV | 531 | 39,445 |
Proximus SADP | 1,918 | 14,154 |
93,533 | ||
Brazil — 2.0% | ||
Banco do Brasil SA | 7,824 | 41,421 |
Cia de Saneamento de Minas Gerais Copasa MG | 7,944 | 29,955 |
Gerdau SA (Preference) | 6,633 | 23,287 |
Petroleo Brasileiro SA (Preference) | 12,754 | 102,963 |
TIM SA | 6,375 | 21,706 |
Vale SA | 3,864 | 47,066 |
266,398 | ||
Canada — 4.2% | ||
Air Canada * | 1,448 | 21,373 |
ARC Resources Ltd. | 1,543 | 27,943 |
Canadian Natural Resources Ltd. | 288 | 21,824 |
CI Financial Corp. | 2,408 | 28,442 |
Dundee Precious Metals, Inc. | 5,192 | 39,299 |
EQB, Inc. | 527 | 31,816 |
Fairfax Financial Holdings Ltd. | 43 | 46,750 |
First Capital REIT, REIT | 1,621 | 17,403 |
Manulife Financial Corp. | 3,148 | 73,426 |
NuVista Energy Ltd. * | 3,561 | 32,179 |
INVESTMENTS | SHARES | VALUE($) |
Canada — continued | ||
Precision Drilling Corp. * | 279 | 19,561 |
Quebecor, Inc., Class B | 1,369 | 28,332 |
Russel Metals, Inc. | 1,072 | 30,190 |
Suncor Energy, Inc. | 1,979 | 75,514 |
Teck Resources Ltd., Class B | 800 | 39,336 |
Whitecap Resources, Inc. | 4,016 | 30,456 |
563,844 | ||
China — 8.4% | ||
Agricultural Bank of China Ltd., Class H | 122,000 | 54,401 |
Alibaba Group Holding Ltd. | 18,200 | 170,408 |
BOC Hong Kong Holdings Ltd. | 11,000 | 33,716 |
China CITIC Bank Corp. Ltd., Class H | 49,000 | 28,667 |
China Construction Bank Corp., Class H | 143,999 | 93,167 |
China Feihe Ltd. (a) | 59,000 | 32,265 |
China Merchants Bank Co. Ltd., Class H | 10,000 | 43,309 |
China Pacific Insurance Group Co. Ltd., Class H | 17,000 | 37,248 |
China Resources Pharmaceutical Group Ltd. (a) | 33,500 | 21,663 |
CSPC Pharmaceutical Group Ltd. | 48,000 | 39,414 |
Geely Automobile Holdings Ltd. | 29,000 | 34,903 |
Industrial & Commercial Bank of China Ltd., Class H | 108,000 | 57,913 |
JD.com, Inc., Class A | 2,000 | 28,817 |
Jiangxi Copper Co. Ltd., Class H | 20,000 | 40,733 |
Kunlun Energy Co. Ltd. | 44,000 | 42,653 |
Lenovo Group Ltd. | 28,000 | 31,493 |
Livzon Pharmaceutical Group, Inc., Class H | 10,300 | 35,419 |
People's Insurance Co. Group of China Ltd. (The), Class H | 105,000 | 34,464 |
PetroChina Co. Ltd., Class H | 66,000 | 61,495 |
PICC Property & Casualty Co. Ltd., Class H | 24,000 | 29,817 |
Ping An Insurance Group Co. of China Ltd., Class H | 11,000 | 49,853 |
Sinotruk Hong Kong Ltd. | 14,500 | 36,086 |
TI Fluid Systems plc (a) | 14,952 | 25,725 |
Vipshop Holdings Ltd., ADR | 1,314 | 19,762 |
Weichai Power Co. Ltd., Class H | 15,000 | 30,650 |
Yangzijiang Shipbuilding Holdings Ltd. | 16,000 | 20,538 |
1,134,579 | ||
Denmark — 1.0% | ||
D/S Norden A/S | 677 | 28,546 |
Danske Bank A/S | 1,676 | 48,247 |
Jyske Bank A/S (Registered) | 393 | 31,797 |
Sydbank A/S | 607 | 30,866 |
139,456 | ||
April 30, 2024 | J.P. Morgan Exchange-Traded Funds | 45 |
INVESTMENTS | SHARES | VALUE($) |
Common Stocks — continued | ||
Finland — 1.5% | ||
Fortum OYJ | 2,611 | 34,406 |
Konecranes OYJ | 429 | 22,546 |
Nokia OYJ | 11,534 | 41,930 |
Nordea Bank Abp | 5,811 | 67,549 |
UPM-Kymmene OYJ | 1,192 | 41,774 |
208,205 | ||
France — 6.1% | ||
AXA SA | 2,320 | 80,160 |
BNP Paribas SA | 1,344 | 96,717 |
Cie de Saint-Gobain SA | 667 | 52,748 |
Cie Generale des Etablissements Michelin SCA | 1,240 | 47,639 |
Credit Agricole SA | 2,182 | 33,763 |
Eiffage SA | 347 | 37,024 |
Engie SA * (b) | 3,422 | 59,408 |
Eurazeo SE * | 268 | 24,141 |
Orange SA | 3,309 | 36,830 |
Renault SA | 598 | 29,621 |
Rubis SCA | 547 | 18,930 |
SCOR SE | 938 | 30,605 |
Sodexo SA | 236 | 20,549 |
TotalEnergies SE | 2,491 | 180,843 |
Trigano SA | 121 | 18,394 |
Vallourec SA * | 1,941 | 33,418 |
Vicat SACA | 815 | 30,088 |
830,878 | ||
Georgia — 0.2% | ||
Bank of Georgia Group plc | 384 | 25,712 |
Germany — 5.9% | ||
Allianz SE (Registered) | 463 | 131,392 |
Bayerische Motoren Werke AG | 580 | 63,191 |
Commerzbank AG | 3,510 | 52,166 |
Deutsche Bank AG (Registered) | 4,041 | 64,545 |
Deutsche Telekom AG (Registered) | 4,068 | 93,180 |
E.ON SE | 4,253 | 56,318 |
Fresenius SE & Co. KGaA | 1,353 | 40,374 |
Heidelberg Materials AG | 328 | 33,009 |
Hornbach Holding AG & Co. KGaA | 256 | 20,088 |
KION Group AG | 410 | 18,896 |
Mercedes-Benz Group AG | 1,033 | 78,137 |
SAF-Holland SE | 1,129 | 21,750 |
Schaeffler AG (Preference) | 4,302 | 25,174 |
Traton SE | 733 | 26,032 |
INVESTMENTS | SHARES | VALUE($) |
Germany — continued | ||
TUI AG * | 3,378 | 23,817 |
Volkswagen AG (Preference) | 380 | 46,552 |
794,621 | ||
Greece — 0.5% | ||
Hellenic Telecommunications Organization SA | 2,405 | 36,536 |
National Bank of Greece SA * | 3,391 | 27,359 |
63,895 | ||
Hong Kong — 1.2% | ||
Bank of East Asia Ltd. (The) | 25,200 | 31,729 |
Cathay Pacific Airways Ltd. | 20,000 | 21,531 |
Link, REIT | 7,200 | 30,850 |
Pacific Basin Shipping Ltd. | 108,000 | 37,396 |
United Laboratories International Holdings Ltd. (The) | 32,000 | 37,757 |
159,263 | ||
Hungary — 0.3% | ||
OTP Bank Nyrt. | 850 | 42,131 |
India — 2.4% | ||
Bank of Baroda | 11,607 | 39,026 |
Bharat Petroleum Corp. Ltd. | 3,469 | 25,242 |
Coal India Ltd. | 6,788 | 36,906 |
Indian Oil Corp. Ltd. | 12,172 | 24,580 |
Natco Pharma Ltd. | 3,160 | 38,409 |
NMDC Ltd. | 7,898 | 23,968 |
Oil & Natural Gas Corp. Ltd. | 11,365 | 38,366 |
State Bank of India, GDR (a) | 567 | 55,623 |
Sun TV Network Ltd. | 4,820 | 37,805 |
319,925 | ||
Indonesia — 0.2% | ||
United Tractors Tbk. PT | 20,700 | 31,549 |
Ireland — 0.8% | ||
AerCap Holdings NV * | 414 | 34,979 |
AIB Group plc | 3,562 | 18,438 |
Cairn Homes plc | 12,817 | 21,589 |
Glenveagh Properties plc * (a) | 14,476 | 19,713 |
Greencore Group plc * | 11,697 | 19,134 |
113,853 | ||
Italy — 4.6% | ||
Assicurazioni Generali SpA | 2,215 | 54,007 |
Banco BPM SpA | 4,057 | 26,637 |
BFF Bank SpA (a) | 1,712 | 21,969 |
BPER Banca SpA | 7,310 | 37,962 |
46 | J.P. Morgan Exchange-Traded Funds | April 30, 2024 |
INVESTMENTS | SHARES | VALUE($) |
Common Stocks — continued | ||
Italy — continued | ||
Buzzi SpA | 530 | 19,096 |
Danieli & C Officine Meccaniche SpA | 847 | 29,287 |
Eni SpA | 3,815 | 61,275 |
Intesa Sanpaolo SpA | 23,921 | 89,536 |
Iveco Group NV | 1,382 | 17,328 |
Mediobanca Banca di Credito Finanziario SpA | 1,975 | 28,061 |
MFE-MediaForEurope NV, Class B | 9,092 | 36,600 |
Pirelli & C SpA (a) | 3,600 | 22,763 |
Saipem SpA * | 11,504 | 26,399 |
Saras SpA | 10,169 | 19,096 |
UniCredit SpA | 1,880 | 69,004 |
Unipol Gruppo SpA | 3,860 | 34,604 |
Webuild SpA | 14,286 | 35,859 |
629,483 | ||
Japan — 16.7% | ||
ANA Holdings, Inc. | 1,100 | 20,891 |
Cosmo Energy Holdings Co. Ltd. | 800 | 38,244 |
Credit Saison Co. Ltd. | 1,000 | 18,459 |
ENEOS Holdings, Inc. | 7,400 | 34,190 |
Fujikura Ltd. | 1,200 | 20,621 |
Gunma Bank Ltd. (The) | 6,200 | 37,734 |
Hitachi Ltd. | 900 | 83,035 |
Hitachi Zosen Corp. | 4,200 | 32,508 |
Honda Motor Co. Ltd. | 6,600 | 75,092 |
Inpex Corp. | 3,000 | 44,939 |
Isuzu Motors Ltd. | 3,000 | 38,019 |
ITOCHU Corp. | 1,500 | 67,672 |
Japan Airlines Co. Ltd. | 1,100 | 19,491 |
Japan Petroleum Exploration Co. Ltd. | 800 | 33,747 |
JFE Holdings, Inc. | 2,400 | 35,822 |
Kandenko Co. Ltd. | 1,700 | 18,963 |
Marubeni Corp. | 3,100 | 55,231 |
Mazda Motor Corp. | 3,300 | 37,354 |
Mitsubishi Chemical Group Corp. | 6,200 | 36,170 |
Mitsubishi Corp. | 4,600 | 105,200 |
Mitsubishi UFJ Financial Group, Inc. | 12,800 | 127,505 |
Mitsui & Co. Ltd. | 1,200 | 57,931 |
Mitsui Fudosan Co. Ltd. | 4,400 | 44,779 |
Mizuho Financial Group, Inc. | 3,700 | 71,518 |
MS&AD Insurance Group Holdings, Inc. | 2,600 | 46,746 |
Nippon Steel Corp. | 1,900 | 42,596 |
Niterra Co. Ltd. | 1,100 | 36,078 |
ORIX Corp. | 2,500 | 51,164 |
Sankyo Co. Ltd. | 2,800 | 30,414 |
INVESTMENTS | SHARES | VALUE($) |
Japan — continued | ||
SBI Holdings, Inc. | 1,500 | 36,522 |
SBI Sumishin Net Bank Ltd. | 1,600 | 23,926 |
Sekisui House Ltd. | 1,200 | 27,576 |
Shimamura Co. Ltd. | 400 | 19,719 |
SKY Perfect JSAT Holdings, Inc. | 6,000 | 35,308 |
Sojitz Corp. | 1,300 | 33,471 |
Sompo Holdings, Inc. | 2,100 | 41,559 |
Subaru Corp. | 2,100 | 46,891 |
Sumitomo Corp. | 2,300 | 60,483 |
Sumitomo Electric Industries Ltd. | 2,000 | 30,913 |
Sumitomo Mitsui Financial Group, Inc. | 1,600 | 90,886 |
Sumitomo Realty & Development Co. Ltd. | 1,300 | 44,985 |
Suzuki Motor Corp. | 3,200 | 37,266 |
Toho Gas Co. Ltd. | 800 | 20,544 |
Tokyo Gas Co. Ltd. | 1,300 | 29,155 |
Tokyo Steel Manufacturing Co. Ltd. | 2,700 | 28,641 |
Tokyo Tatemono Co. Ltd. | 1,200 | 19,968 |
Toyota Boshoku Corp. | 1,600 | 23,661 |
Toyota Motor Corp. | 6,200 | 141,413 |
Toyota Tsusho Corp. | 700 | 44,506 |
Tsubakimoto Chain Co. | 1,100 | 37,871 |
Yokohama Rubber Co. Ltd. (The) | 800 | 20,939 |
2,258,316 | ||
Mexico — 0.3% | ||
Grupo Mexico SAB de CV | 7,297 | 45,092 |
Netherlands — 1.8% | ||
ABN AMRO Bank NV, CVA (a) | 1,659 | 26,575 |
Aegon Ltd. | 4,751 | 29,588 |
ASR Nederland NV | 549 | 27,472 |
ING Groep NV | 4,383 | 69,296 |
Koninklijke Heijmans N.V., CVA * | 1,373 | 25,768 |
NN Group NV | 971 | 44,793 |
OCI NV | 765 | 20,576 |
244,068 | ||
Norway — 1.2% | ||
Aker Solutions ASA | 7,954 | 29,981 |
DNB Bank ASA | 1,590 | 27,712 |
Frontline plc | 857 | 20,307 |
Hoegh Autoliners ASA | 3,196 | 33,546 |
Norwegian Air Shuttle ASA * | 18,967 | 24,634 |
Wallenius Wilhelmsen ASA | 2,030 | 20,447 |
156,627 | ||
April 30, 2024 | J.P. Morgan Exchange-Traded Funds | 47 |
INVESTMENTS | SHARES | VALUE($) |
Common Stocks — continued | ||
Poland — 0.3% | ||
ORLEN SA | 2,783 | 45,375 |
Singapore — 1.2% | ||
DBS Group Holdings Ltd. | 1,430 | 36,404 |
Hafnia Ltd. | 4,011 | 30,242 |
Oversea-Chinese Banking Corp. Ltd. | 4,900 | 50,870 |
United Overseas Bank Ltd. | 2,000 | 44,381 |
161,897 | ||
South Africa — 1.9% | ||
Absa Group Ltd. | 4,176 | 32,274 |
Anglo American plc | 2,127 | 69,505 |
Kumba Iron Ore Ltd. | 999 | 24,603 |
Mr Price Group Ltd. | 4,364 | 40,553 |
MTN Group Ltd. | 6,976 | 33,573 |
Nedbank Group Ltd. | 3,342 | 40,636 |
Sibanye Stillwater Ltd. | 16,324 | 18,632 |
259,776 | ||
South Korea — 6.1% | ||
BGF retail Co. Ltd. | 223 | 21,023 |
DB Insurance Co. Ltd. | 352 | 24,691 |
Doosan Bobcat, Inc. | 861 | 32,180 |
GS Holdings Corp. | 604 | 19,528 |
Hana Financial Group, Inc. | 1,198 | 50,528 |
Hankook Tire & Technology Co. Ltd. | 1,008 | 42,772 |
Hyundai Glovis Co. Ltd. | 260 | 34,037 |
Hyundai Marine & Fire Insurance Co. Ltd. | 1,390 | 31,378 |
Hyundai Mobis Co. Ltd. | 185 | 30,266 |
Hyundai Motor Co. | 294 | 52,884 |
KB Financial Group, Inc. | 1,102 | 59,769 |
Kia Corp. | 692 | 58,628 |
Korean Air Lines Co. Ltd. | 2,136 | 32,211 |
KT Corp. | 797 | 19,927 |
Kumho Petrochemical Co. Ltd. | 347 | 34,513 |
Samsung Electronics Co. Ltd. | 3,158 | 175,543 |
Samsung Fire & Marine Insurance Co. Ltd. | 198 | 44,317 |
Samsung Life Insurance Co. Ltd. | 335 | 21,109 |
SK Telecom Co. Ltd. | 913 | 33,764 |
819,068 | ||
Spain — 2.7% | ||
Banco Bilbao Vizcaya Argentaria SA | 8,652 | 93,562 |
Banco de Sabadell SA | 22,179 | 42,366 |
Banco Santander SA | 21,568 | 104,942 |
CaixaBank SA | 7,606 | 40,111 |
INVESTMENTS | SHARES | VALUE($) |
Spain — continued | ||
Grupo Catalana Occidente SA | 856 | 33,148 |
Repsol SA | 2,910 | 45,676 |
359,805 | ||
Sweden — 1.7% | ||
Ambea AB (a) | 3,474 | 20,002 |
Betsson AB, Class B * | 2,471 | 27,313 |
NCC AB, Class B | 1,510 | 18,365 |
Skandinaviska Enskilda Banken AB, Class A | 3,519 | 46,086 |
Svenska Handelsbanken AB, Class A | 2,961 | 25,392 |
Swedbank AB, Class A | 2,173 | 41,553 |
Tele2 AB, Class B | 2,988 | 27,869 |
Volvo Car AB * | 7,660 | 1,564 |
Volvo Car AB, Class B * | 7,660 | 23,778 |
231,922 | ||
Switzerland — 2.9% | ||
Aryzta AG * | 8,883 | 16,818 |
Novartis AG (Registered) | 2,458 | 238,567 |
UBS Group AG (Registered) | 1,715 | 45,042 |
Zurich Insurance Group AG | 180 | 87,128 |
387,555 | ||
Taiwan — 2.4% | ||
ASE Technology Holding Co. Ltd. | 11,000 | 49,485 |
Compeq Manufacturing Co. Ltd. * | 14,000 | 32,982 |
Globalwafers Co. Ltd. | 1,000 | 15,889 |
Hon Hai Precision Industry Co. Ltd. | 20,000 | 95,207 |
Pegatron Corp. | 15,000 | 44,736 |
Sercomm Corp. | 9,000 | 34,050 |
United Microelectronics Corp. | 32,000 | 49,166 |
321,515 | ||
Thailand — 0.6% | ||
Bangchak Corp. PCL, NVDR | 20,600 | 23,204 |
Krung Thai Bank PCL, NVDR | 71,500 | 32,337 |
PTT Exploration & Production PCL, NVDR | 6,500 | 27,191 |
82,732 | ||
Turkey — 0.5% | ||
KOC Holding A/S | 2,940 | 20,525 |
Tofas Turk Otomobil Fabrikasi A/S | 3,166 | 26,909 |
Turkiye Garanti Bankasi A/S | 8,552 | 21,772 |
69,206 | ||
48 | J.P. Morgan Exchange-Traded Funds | April 30, 2024 |
INVESTMENTS | SHARES | VALUE($) |
Common Stocks — continued | ||
United Arab Emirates — 0.3% | ||
Dubai Islamic Bank PJSC | 14,273 | 21,606 |
Emirates NBD Bank PJSC | 5,517 | 25,536 |
47,142 | ||
United Kingdom — 6.5% | ||
3i Group plc | 1,885 | 67,346 |
Balfour Beatty plc | 4,584 | 20,788 |
Barclays plc | 24,460 | 61,671 |
Beazley plc | 2,620 | 21,677 |
Centrica plc | 19,004 | 30,336 |
Currys plc * | 31,452 | 24,267 |
Direct Line Insurance Group plc | 8,296 | 19,261 |
Harbour Energy plc | 4,995 | 17,850 |
Hiscox Ltd. | 1,282 | 19,661 |
HSBC Holdings plc | 16,009 | 138,765 |
Inchcape plc | 2,213 | 22,057 |
Indivior plc * | 1,125 | 20,195 |
International Consolidated Airlines Group SA * | 8,865 | 19,320 |
Investec plc | 4,626 | 29,302 |
ITV plc | 25,507 | 22,379 |
JD Sports Fashion plc | 9,363 | 13,405 |
JET2 plc | 1,129 | 20,190 |
Kier Group plc | 13,230 | 22,133 |
Lloyds Banking Group plc | 110,869 | 71,553 |
Marks & Spencer Group plc | 5,608 | 17,867 |
NatWest Group plc | 11,662 | 44,017 |
Paragon Banking Group plc | 2,962 | 26,415 |
Shaftesbury Capital plc, REIT | 12,503 | 20,929 |
Standard Chartered plc | 4,352 | 37,390 |
Tesco plc | 12,733 | 47,011 |
TP ICAP Group plc | 7,799 | 20,189 |
875,974 | ||
United States — 5.3% | ||
BP plc | 20,487 | 132,052 |
GSK plc | 4,906 | 101,784 |
Holcim AG | 867 | 72,575 |
Roche Holding AG | 221 | 52,955 |
Shell plc | 7,404 | 263,202 |
Stellantis NV | 3,243 | 71,756 |
Tenaris SA | 1,659 | 27,551 |
721,875 | ||
Total Common Stocks (Cost $12,041,814) | 13,238,081 | |
INVESTMENTS | SHARES | VALUE($) |
Short-Term Investments — 1.2% | ||
Investment Companies — 0.9% | ||
JPMorgan Prime Money Market Fund Class IM Shares, 5.41% (c) (d)(Cost $117,227) | 117,192 | 117,215 |
Investment of Cash Collateral from Securities Loaned — 0.3% | ||
JPMorgan U.S. Government Money Market Fund Class IM Shares, 5.25% (c) (d)(Cost $43,829) | 43,829 | 43,829 |
Total Short-Term Investments (Cost $161,056) | 161,044 | |
Total Investments — 99.0% (Cost $12,202,870) | 13,399,125 | |
Other Assets Less Liabilities — 1.0% | 138,423 | |
NET ASSETS — 100.0% | 13,537,548 | |
Percentages indicated are based on net assets. |
Abbreviations | |
ADR | American Depositary Receipt |
CVA | Certificaten Van Aandelen (Dutch Certificate) |
GDR | Global Depositary Receipt |
NVDR | Non-Voting Depositary Receipt |
OYJ | Public Limited Company |
PJSC | Public Joint Stock Company |
Preference | A special type of equity investment that shares in the earnings of the company, has limited voting rights, and may have a dividend preference. Preference shares may also have liquidation preference. |
PT | Limited liability company |
REIT | Real Estate Investment Trust |
SCA | Limited partnership with share capital |
* | Non-income producing security. |
(a) | Security exempt from registration pursuant to Regulation S under the Securities Act of 1933, as amended. Regulation S applies to securities offerings that are made outside of the United States and do not involve direct selling efforts in the United States and as such may have restrictions on resale. |
(b) | The security or a portion of this security is on loan at April 30, 2024. The total value of securities on loan at April 30, 2024 is $41,579. |
(c) | Investment in an affiliated fund, which is registered under the Investment Company Act of 1940, as amended, and is advised by J.P. Morgan Investment Management Inc. |
(d) | The rate shown is the current yield as of April 30, 2024. |
April 30, 2024 | J.P. Morgan Exchange-Traded Funds | 49 |
INDUSTRY | PERCENT OF TOTAL INVESTMENTS |
Banks | 22.1 % |
Oil, Gas & Consumable Fuels | 11.9 |
Insurance | 8.9 |
Metals & Mining | 6.9 |
Automobiles | 6.6 |
Pharmaceuticals | 4.4 |
Trading Companies & Distributors | 3.7 |
Automobile Components | 2.4 |
Machinery | 2.4 |
Capital Markets | 2.2 |
Diversified Telecommunication Services | 1.9 |
Technology Hardware, Storage & Peripherals | 1.9 |
Broadline Retail | 1.6 |
Construction & Engineering | 1.6 |
Passenger Airlines | 1.3 |
Construction Materials | 1.2 |
Specialty Retail | 1.1 |
Multi-Utilities | 1.1 |
Energy Equipment & Services | 1.0 |
Media | 1.0 |
Electronic Equipment, Instruments & Components | 1.0 |
Others (each less than 1.0%) | 12.6 |
Short-Term Investments | 1.2 |
DESCRIPTION | NUMBER OF CONTRACTS | EXPIRATION DATE | TRADING CURRENCY | NOTIONAL AMOUNT ($) | VALUE AND UNREALIZED APPRECIATION (DEPRECIATION) ($) |
Long Contracts | |||||
EURO STOXX 50 Index | 3 | 06/21/2024 | EUR | 156,174 | (3,762 ) |
FTSE 100 Index | 1 | 06/21/2024 | GBP | 101,945 | 2,526 |
(1,236 ) |
Abbreviations | |
EUR | Euro |
FTSE | Financial Times and the London Stock Exchange |
GBP | British Pound |
50 | J.P. Morgan Exchange-Traded Funds | April 30, 2024 |
JPMorgan Active China ETF | JPMorgan ActiveBuilders Emerging Markets Equity ETF | JPMorgan Global Select Equity ETF | JPMorgan Healthcare Leaders ETF | |
ASSETS: | ||||
Investments in non-affiliates, at value | $10,713,340 | $1,011,078,236 | $2,781,119,477 | $6,912,707 |
Investments in affiliates, at value | 10,610 | 2,267,205 | 41,445,480 | 61,610 |
Investments of cash collateral received from securities loaned, at value (See Note 2.C.) | — | 4,030,602 | — | — |
Cash | 113 | 2,100,887 | 608,901 | 63,968 |
Foreign currency, at value | — | 246,814 | 2,807,367 | 4 |
Segregated cash balance with Authorized Participant for deposit securities | — | — | 4,768,127 | — |
Receivables: | ||||
Investment securities sold | — | — | 5,718,104 | — |
Fund shares sold | — | — | 487,398 | — |
Dividends from non-affiliates | — | 1,463,299 | 1,842,246 | 6,771 |
Dividends from affiliates | 1 | 336 | 6,148 | 9 |
Tax reclaims | — | 39,874 | 1,223,258 | 1,604 |
Securities lending income (See Note 2.C.) | — | 8,436 | — | — |
Total Assets | 10,724,064 | 1,021,235,689 | 2,840,026,506 | 7,046,673 |
LIABILITIES: | ||||
Payables: | ||||
Investment securities purchased | — | — | 7,055,810 | 5,176 |
Collateral received on securities loaned (See Note 2.C.) | — | 4,030,602 | — | — |
Collateral upon return of deposit securities | — | — | 4,768,127 | — |
Accrued liabilities: | ||||
Management fees (See Note 3.A.) | 5,490 | 272,748 | 1,003,154 | 4,122 |
Deferred foreign capital gains tax | — | 2,375,785 | — | — |
Other | — | 1,373 | — | — |
Total Liabilities | 5,490 | 6,680,508 | 12,827,091 | 9,298 |
Net Assets | $10,718,574 | $1,014,555,181 | $2,827,199,415 | $7,037,375 |
NET ASSETS: | ||||
Paid-in-Capital | $12,694,661 | $1,193,050,653 | $2,652,089,520 | $5,324,424 |
Total distributable earnings (loss) | (1,976,087 ) | (178,495,472 ) | 175,109,895 | 1,712,951 |
Total Net Assets | $10,718,574 | $1,014,555,181 | $2,827,199,415 | $7,037,375 |
Outstanding number of shares (unlimited number of shares authorized - par value $0.0001) | 260,000 | 27,800,000 | 51,000,000 | 125,000 |
Net asset value, per share | $41.23 | $36.49 | $55.44 | $56.30 |
Cost of investments in non-affiliates | $11,639,725 | $995,274,079 | $2,660,631,935 | $6,127,375 |
Cost of investments in affiliates | 10,610 | 2,267,205 | 41,448,250 | 61,610 |
Cost of foreign currency | — | 246,125 | 2,810,398 | 4 |
Investment securities on loan, at value (See Note 2.C.) | — | 2,943,659 | — | — |
Cost of investment of cash collateral (See Note 2.C.) | — | 4,030,602 | — | — |
April 30, 2024 | J.P. Morgan Exchange-Traded Funds | 51 |
JPMorgan Hedged Equity Laddered Overlay ETF | JPMorgan International Growth ETF | JPMorgan International Value ETF | |
ASSETS: | |||
Investments in non-affiliates, at value | $524,155,411 | $82,106,682 | $13,238,081 |
Investments in affiliates, at value | 1,240,933 | 3,656,054 | 117,215 |
Investments of cash collateral received from securities loaned, at value (See Note 2.C.) | — | 576,057 | 43,829 |
Options purchased, at value | 5,241,084 | — | — |
Cash | — | 86,169 | 79,037 |
Foreign currency, at value | — | — | 18,730 |
Deposits at broker for futures contracts | 259,000 | 129,420 | 27,653 |
Receivables: | |||
Investment securities sold | 3,211,252 | — | 11,592 |
Fund shares sold | 85,236 | — | — |
Dividends from non-affiliates | 180,619 | 125,852 | 70,455 |
Dividends from affiliates | 179 | 542 | 17 |
Tax reclaims | — | 115,867 | 11,018 |
Securities lending income (See Note 2.C.) | — | 2 | 6 |
Total Assets | 534,373,714 | 86,796,645 | 13,617,633 |
LIABILITIES: | |||
Payables: | |||
Due to custodian | 16,283 | — | — |
Foreign currency due to custodian, at value | — | 2,910 | — |
Investment securities purchased | 3,414,123 | — | 25,178 |
Collateral received on securities loaned (See Note 2.C.) | — | 576,057 | 43,829 |
Variation margin on futures contracts | 24,696 | 11,862 | 2,612 |
Outstanding options written, at fair value | 2,026,950 | — | — |
Accrued liabilities: | |||
Management fees (See Note 3.A.) | 189,158 | 39,102 | 5,793 |
Deferred foreign capital gains tax | — | — | 2,673 |
Total Liabilities | 5,671,210 | 629,931 | 80,085 |
Net Assets | $528,702,504 | $86,166,714 | $13,537,548 |
NET ASSETS: | |||
Paid-in-Capital | $514,113,992 | $89,208,259 | $12,049,097 |
Total distributable earnings (loss) | 14,588,512 | (3,041,545 ) | 1,488,451 |
Total Net Assets | $528,702,504 | $86,166,714 | $13,537,548 |
Outstanding number of shares (unlimited number of shares authorized - par value $0.0001) | 9,625,000 | 1,425,000 | 250,000 |
Net asset value, per share | $54.93 | $60.47 | $54.15 |
Cost of investments in non-affiliates | $499,827,553 | $71,935,550 | $12,041,814 |
Cost of investments in affiliates | 1,240,933 | 3,656,590 | 117,227 |
Cost of options purchased | 4,703,327 | — | — |
Cost of foreign currency | — | — | 18,736 |
Investment securities on loan, at value (See Note 2.C.) | — | 550,870 | 41,579 |
Cost of investment of cash collateral (See Note 2.C.) | — | 576,057 | 43,829 |
Premiums received from options written | 4,144,366 | — | — |
52 | J.P. Morgan Exchange-Traded Funds | April 30, 2024 |
JPMorgan Active China ETF | JPMorgan ActiveBuilders Emerging Markets Equity ETF | JPMorgan Global Select Equity ETF | JPMorgan Healthcare Leaders ETF (a) | |
INVESTMENT INCOME: | ||||
Interest income from non-affiliates | $— | $— | $3,605 | $5 |
Interest income from affiliates | — | 9,042 | 9,488 | 522 |
Dividend income from non-affiliates | 37,564 | 10,846,784 | 18,799,981 | 60,584 |
Dividend income from affiliates | 765 | 100,995 | 504,090 | 4,046 |
Income from securities lending (net) (See Note 2.C.) | — | 15,378 | — | — |
Foreign taxes withheld (net) | (1,642 ) | (1,212,826 ) | (1,200,609 ) | (1,601 ) |
Total investment income | 36,687 | 9,759,373 | 18,116,555 | 63,556 |
EXPENSES: | ||||
Management fees (See Note 3.A.) | 32,711 | 1,528,957 | 3,693,217 | 32,186 |
Interest expense to affiliates | — | 28,189 | 2,601 | — |
Total expenses | 32,711 | 1,557,146 | 3,695,818 | 32,186 |
Net investment income (loss) | 3,976 | 8,202,227 | 14,420,737 | 31,370 |
REALIZED/UNREALIZED GAINS (LOSSES): | ||||
Net realized gain (loss) on transactions from: | ||||
Investments in non-affiliates | (798,672 ) | (44,643,482 )(b) | 27,027,539 | 261,950 |
Investments in affiliates | (17 ) | (772 ) | (7,374 ) | — |
In-kind redemptions of investments in non-affiliates (See Note 4) | — | 2,373,659 | 17,287,539 | 650,138 |
Foreign currency transactions | 161 | (145,703 ) | 275,435 | 180 |
Net realized gain (loss) | (798,528 ) | (42,416,298 ) | 44,583,139 | 912,268 |
Change in net unrealized appreciation/depreciation on: | ||||
Investments in non-affiliates | 1,170,809 | 142,452,724 (c) | 123,693,095 | 785,332 |
Investments in affiliates | (1 ) | (463 ) | (2,946 ) | — |
Foreign currency translations | 4 | (21,694 ) | (86,852 ) | (89 ) |
Change in net unrealized appreciation/depreciation | 1,170,812 | 142,430,567 | 123,603,297 | 785,243 |
Net realized/unrealized gains (losses) | 372,284 | 100,014,269 | 168,186,436 | 1,697,511 |
Change in net assets resulting from operations | $376,260 | $108,216,496 | $182,607,173 | $1,728,881 |
April 30, 2024 | J.P. Morgan Exchange-Traded Funds | 53 |
JPMorgan Hedged Equity Laddered Overlay ETF | JPMorgan International Growth ETF | JPMorgan International Value ETF | |
INVESTMENT INCOME: | |||
Interest income from non-affiliates | $1,909 | $701 | $90 |
Interest income from affiliates | 405 | 935 | 559 |
Dividend income from non-affiliates | 1,763,274 | 776,663 | 289,535 |
Dividend income from affiliates | 26,501 | 55,694 | 2,605 |
Income from securities lending (net) (See Note 2.C.) | — | 367 | 379 |
Foreign taxes withheld (net) | — | (88,971 ) | (35,640 ) |
Total investment income | 1,792,089 | 745,389 | 257,528 |
EXPENSES: | |||
Management fees (See Note 3.A.) | 687,720 | 224,394 | 34,397 |
Interest expense to non-affiliates | 59 | — | — |
Interest expense to affiliates | — | 79 | 29 |
Total expenses | 687,779 | 224,473 | 34,426 |
Net investment income (loss) | 1,104,310 | 520,916 | 223,102 |
REALIZED/UNREALIZED GAINS (LOSSES): | |||
Net realized gain (loss) on transactions from: | |||
Investments in non-affiliates | (340,780 ) | (62,894 ) | 192,597 (a) |
Investments in affiliates | — | (793 ) | (47 ) |
In-kind redemptions of investments in non-affiliates (See Note 4) | 3,636,948 | 1,770,090 | — |
In-kind redemptions of options purchased (See Note 4) | (177,767 ) | — | — |
Options purchased | (3,271,979 ) | — | — |
Futures contracts | 171,095 | 15,259 | 1,029 |
Foreign currency transactions | — | (19,808 ) | (2,330 ) |
Options written | (12,599,920 ) | — | — |
Net realized gain (loss) | (12,582,403 ) | 1,701,854 | 191,249 |
Change in net unrealized appreciation/depreciation on: | |||
Investments in non-affiliates | 25,316,578 | 10,724,753 | 1,717,267 (b) |
Investments in affiliates | — | (536 ) | (12 ) |
Options purchased | 573,021 | — | — |
Futures contracts | (47,377 ) | 20,692 | (1,236 ) |
Foreign currency translations | — | (1,592 ) | (1,440 ) |
Options written | 1,629,025 | — | — |
Change in net unrealized appreciation/depreciation | 27,471,247 | 10,743,317 | 1,714,579 |
Net realized/unrealized gains (losses) | 14,888,844 | 12,445,171 | 1,905,828 |
Change in net assets resulting from operations | $15,993,154 | $12,966,087 | $2,128,930 |
54 | J.P. Morgan Exchange-Traded Funds | April 30, 2024 |
JPMorgan Active China ETF | JPMorgan ActiveBuilders Emerging Markets Equity ETF | |||
Six Months Ended April 30, 2024 (Unaudited) | Period Ended October 31, 2023 (a) | Six Months Ended April 30, 2024 (Unaudited) | Year Ended October 31, 2023 | |
CHANGE IN NET ASSETS RESULTING FROM OPERATIONS: | ||||
Net investment income (loss) | $3,976 | $193,269 | $8,202,227 | $23,574,423 |
Net realized gain (loss) | (798,528 ) | (231,764 ) | (42,416,298 ) | (76,213,731 ) |
Change in net unrealized appreciation/depreciation | 1,170,812 | (2,097,197 ) | 142,430,567 | 160,619,200 |
Change in net assets resulting from operations | 376,260 | (2,135,692 ) | 108,216,496 | 107,979,892 |
DISTRIBUTIONS TO SHAREHOLDERS: | ||||
Total distributions to shareholders | (216,655 ) | — | (25,156,045 ) | (26,488,020 ) |
CAPITAL TRANSACTIONS: | ||||
Change in net assets resulting from capital transactions | — | 12,694,661 | 34,544,755 | (91,696,023 ) |
NET ASSETS: | ||||
Change in net assets | 159,605 | 10,558,969 | 117,605,206 | (10,204,151 ) |
Beginning of period | 10,558,969 | — | 896,949,975 | 907,154,126 |
End of period | $10,718,574 | $10,558,969 | $1,014,555,181 | $896,949,975 |
CAPITAL TRANSACTIONS: | ||||
Proceeds from shares issued | $— | $12,694,661 | $177,593,389 | $183,119,158 |
Cost of shares redeemed | — | — | (143,048,634 ) | (274,815,181 ) |
Total change in net assets resulting from capital transactions | $— | $12,694,661 | $34,544,755 | $(91,696,023 ) |
SHARE TRANSACTIONS: | ||||
Issued | — | 260,000 | 5,000,000 | 5,200,000 |
Redeemed | — | — | (4,000,000 ) | (7,600,000 ) |
Net increase (decrease) in shares from share transactions | — | 260,000 | 1,000,000 | (2,400,000 ) |
April 30, 2024 | J.P. Morgan Exchange-Traded Funds | 55 |
JPMorgan Global Select Equity ETF | JPMorgan Healthcare Leaders ETF | ||
Six Months Ended April 30, 2024 (Unaudited) | Period Ended October 31, 2023 (a) | Period Ended April 30, 2024 (Unaudited)(b) | |
CHANGE IN NET ASSETS RESULTING FROM OPERATIONS: | |||
Net investment income (loss) | $14,420,737 | $50,691 | $31,370 |
Net realized gain (loss) | 44,583,139 | (1,156,083 ) | 912,268 |
Change in net unrealized appreciation/depreciation | 123,603,297 | (3,203,890 ) | 785,243 |
Change in net assets resulting from operations | 182,607,173 | (4,309,282 ) | 1,728,881 |
DISTRIBUTIONS TO SHAREHOLDERS: | |||
Total distributions to shareholders | (3,187,996 ) | — | (15,930 ) |
CAPITAL TRANSACTIONS: | |||
Change in net assets resulting from capital transactions | 1,806,104,205 | 845,985,315 | 5,324,424 |
NET ASSETS: | |||
Change in net assets | 1,985,523,382 | 841,676,033 | 7,037,375 |
Beginning of period | 841,676,033 | — | — |
End of period | $2,827,199,415 | $841,676,033 | $7,037,375 |
CAPITAL TRANSACTIONS: | |||
Proceeds from shares issued | $1,925,035,501 | $846,035,530 | $9,600,000 |
Cost of shares redeemed | (118,931,296 ) | (50,215 ) | (4,275,576 ) |
Total change in net assets resulting from capital transactions | $1,806,104,205 | $845,985,315 | $5,324,424 |
SHARE TRANSACTIONS: | |||
Issued | 34,925,000 | 18,275,000 | 200,000 |
Redeemed | (2,200,000 ) | — | (75,000 ) |
Net increase in shares from transactions | 32,725,000 | 18,275,000 | 125,000 |
56 | J.P. Morgan Exchange-Traded Funds | April 30, 2024 |
JPMorgan Hedged Equity Laddered Overlay ETF | JPMorgan International Growth ETF | |||
Six Months Ended April 30, 2024 (Unaudited) | Period Ended October 31, 2023 (a) | Six Months Ended April 30, 2024 (Unaudited) | Year Ended October 31, 2023 | |
CHANGE IN NET ASSETS RESULTING FROM OPERATIONS: | ||||
Net investment income (loss) | $1,104,310 | $28,799 | $520,916 | $991,055 |
Net realized gain (loss) | (12,582,403 ) | (151,743 ) | 1,701,854 | (4,993,820 ) |
Change in net unrealized appreciation/depreciation | 27,471,247 | (535,614 ) | 10,743,317 | 8,154,392 |
Change in net assets resulting from operations | 15,993,154 | (658,558 ) | 12,966,087 | 4,151,627 |
DISTRIBUTIONS TO SHAREHOLDERS: | ||||
Total distributions to shareholders | (746,084 ) | — | (1,328,751 ) | (548,251 ) |
CAPITAL TRANSACTIONS: | ||||
Change in net assets resulting from capital transactions | 451,861,619 | 62,252,373 | (7,575,649 ) | 23,519,546 |
NET ASSETS: | ||||
Change in net assets | 467,108,689 | 61,593,815 | 4,061,687 | 27,122,922 |
Beginning of period | 61,593,815 | — | 82,105,027 | 54,982,105 |
End of period | $528,702,504 | $61,593,815 | $86,166,714 | $82,105,027 |
CAPITAL TRANSACTIONS: | ||||
Proceeds from shares issued | $469,842,579 | $62,252,373 | $4,464,251 | $23,520,679 |
Cost of shares redeemed | (17,980,960 ) | — | (12,039,900 ) | (1,133 ) |
Total change in net assets resulting from capital transactions | $451,861,619 | $62,252,373 | $(7,575,649 ) | $23,519,546 |
SHARE TRANSACTIONS: | ||||
Issued | 8,700,000 | 1,250,000 | 75,000 | 425,000 |
Redeemed | (325,000 ) | — | (225,000 ) | — |
Net increase (decrease) in shares from share transactions | 8,375,000 | 1,250,000 | (150,000 ) | 425,000 |
April 30, 2024 | J.P. Morgan Exchange-Traded Funds | 57 |
JPMorgan International Value ETF | ||
Six Months Ended April 30, 2024 (Unaudited) | Period Ended October 31, 2023 (a) | |
CHANGE IN NET ASSETS RESULTING FROM OPERATIONS: | ||
Net investment income (loss) | $223,102 | $36,994 |
Net realized gain (loss) | 191,249 | (59,564 ) |
Change in net unrealized appreciation/depreciation | 1,714,579 | (523,962 ) |
Change in net assets resulting from operations | 2,128,930 | (546,532 ) |
DISTRIBUTIONS TO SHAREHOLDERS: | ||
Total distributions to shareholders | (93,947 ) | — |
CAPITAL TRANSACTIONS: | ||
Change in net assets resulting from capital transactions | — | 12,049,097 |
NET ASSETS: | ||
Change in net assets | 2,034,983 | 11,502,565 |
Beginning of period | 11,502,565 | — |
End of period | $13,537,548 | $11,502,565 |
CAPITAL TRANSACTIONS: | ||
Proceeds from shares issued | $— | $12,049,097 |
Total change in net assets resulting from capital transactions | $— | $12,049,097 |
SHARE TRANSACTIONS: | ||
Issued | — | 250,000 |
Net increase in shares from transactions | — | 250,000 |
58 | J.P. Morgan Exchange-Traded Funds | April 30, 2024 |
Per share operating performance | |||||||
Investment operations | Distributions | ||||||
Net asset value, beginning of period | Net investment income (loss) (b) | Net realized and unrealized gains (losses) on investments | Total from investment operations | Net investment income | Net realized gain | Total distributions | |
JPMorgan Active China ETF | |||||||
Six Months Ended April 30, 2024 (Unaudited) | $40.61 | $0.02 | $1.43 | $1.45 | $(0.83 ) | $— | $(0.83 ) |
March 15, 2023 (g) through October 31, 2023 | 48.00 | 0.75 | (8.14 ) | (7.39 ) | — | — | — |
JPMorgan ActiveBuilders Emerging Markets Equity ETF | |||||||
Six Months Ended April 30, 2024 (Unaudited) | 33.47 | 0.31 | 3.78 | 4.09 | (1.07 ) | — | (1.07 ) |
Year Ended October 31, 2023 | 31.07 | 0.86 | 2.45 | 3.31 | (0.91 ) | — | (0.91 ) |
Year Ended October 31, 2022 | 47.92 | 1.14 | (17.27 ) | (16.13 ) | (0.63 ) | (0.09 ) | (0.72 ) |
March 10, 2021 (g) through October 31, 2021 | 48.00 | 0.66 | (0.74 ) | (0.08 ) | — | — | — |
JPMorgan Global Select Equity ETF | |||||||
Six Months Ended April 30, 2024 (Unaudited) | 46.06 | 0.49 | 9.06 | 9.55 | (0.17 ) | — | (0.17 ) |
September 13, 2023 (g) through October 31, 2023 | 48.00 | 0.00 (j) | (1.94 ) | (1.94 ) | — | — | — |
JPMorgan Healthcare Leaders ETF | |||||||
November 1, 2023 (g) through April 30, 2024 (Unaudited) | 48.00 | 0.17 | 8.21 | 8.38 | (0.08 ) | — | (0.08 ) |
JPMorgan Hedged Equity Laddered Overlay ETF | |||||||
Six Months Ended April 30, 2024 (Unaudited) | 49.28 | 0.22 | 5.59 | 5.81 | (0.16 ) | — | (0.16 ) |
September 28, 2023 (g) through October 31, 2023 | 50.00 | 0.03 | (0.75 ) | (0.72 ) | — | — | — |
JPMorgan International Growth ETF | |||||||
Six Months Ended April 30, 2024 (Unaudited) | 52.13 | 0.37 | 8.95 | 9.32 | (0.98 ) | — | (0.98 ) |
Year Ended October 31, 2023 | 47.81 | 0.68 | 4.12 | 4.80 | (0.48 ) | — | (0.48 ) |
Year Ended October 31, 2022 | 79.09 | 0.44 | (30.69 ) | (30.25 ) | (0.49 ) | (0.54 ) | (1.03 ) |
Year Ended October 31, 2021 | 62.98 | 0.19 | 15.95 | 16.14 | (0.03 ) | — | (0.03 ) |
May 20, 2020 (g) through October 31, 2020 | 51.83 | 0.05 | 11.10 | 11.15 | — | — | — |
JPMorgan International Value ETF | |||||||
Six Months Ended April 30, 2024 (Unaudited) | 46.01 | 0.89 | 7.63 | 8.52 | (0.38 ) | — | (0.38 ) |
September 13, 2023 (g) through October 31, 2023 | 48.00 | 0.15 | (2.14 ) | (1.99 ) | — | — | — |
(a) | Annualized for periods less than one year, unless otherwise noted. |
(b) | Calculated based upon average shares outstanding. |
(c) | Not annualized for periods less than one year. |
(d) | Includes adjustments in accordance with accounting principles generally accepted in the United States of America and as such, the net asset values for financial reporting purposes and the returns based upon those net asset values may differ from the net asset values and returns for shareholder transactions. |
(e) | Market price return was calculated assuming an initial investment made at the market price at the beginning of the reporting period, reinvestment of all dividends and distributions at the market price during the period, and sale at the market price on the last day of the period. The price used to calculate the market price return was the closing price on the listing exchange of the Fund. |
(f) | Includes interest expense, if applicable, which is less than 0.005% unless otherwise noted. |
(g) | Commencement of operations. |
(h) | Since the shares of the Fund did not trade in the secondary market until the day after the Fund’s inception, for the period from the inception to the first day of secondary market trading, the net asset value is used as a proxy for the secondary market trading price to calculate the market returns. |
(i) | Does not include expenses of unaffiliated Underlying Funds. |
(j) | Amount rounds to less than $0.005. |
60 | J.P. Morgan Exchange-Traded Funds | April 30, 2024 |
Ratios/Supplemental data | ||||||||
Ratios to average net assets (a) | ||||||||
Net asset value, end of period | Market price, end of period | Total return (c)(d) | Market price total return (c)(e) | Net assets, end of period | Net expenses(f) | Net investment income (loss) | Expenses without waivers and reimbursements | Portfolio turnover rate (c) |
$41.23 | $41.30 | 3.74 % | 3.50 % | $10,718,574 | 0.65 % | 0.08 % | 0.65 % | 15 % |
40.61 | 40.77 | (15.40 ) | (15.06 )(h) | 10,558,969 | 0.65 | 2.64 | 0.65 | 17 |
36.49 | 36.55 | 12.33 | 12.55 | 1,014,555,181 | 0.34 | 1.77 | 0.34 | 30 |
33.47 | 33.45 | 10.61 | 10.27 | 896,949,975 | 0.33 | 2.41 | 0.33 | 46 |
31.07 | 31.15 | (34.15 ) | (34.32 ) | 907,154,126 | 0.33 | 3.05 | 0.33 | 28 |
47.92 | 48.17 | (0.17 ) | 0.35 (h) | 325,863,960 | 0.30 (i) | 2.11 | 0.33 (i) | 40 |
55.44 | 55.54 | 20.76 | 20.79 | 2,827,199,415 | 0.47 | 1.82 | 0.47 | 43 |
46.06 | 46.13 | (4.04 ) | (3.90 )(h) | 841,676,033 | 0.47 | 0.07 | 0.47 | 8 |
56.30 | 56.32 | 17.47 | 17.51 (h) | 7,037,375 | 0.65 | 0.63 | 0.65 | 29 |
54.93 | 55.01 | 11.79 | 11.95 | 528,702,504 | 0.50 | 0.80 | 0.50 | 19 |
49.28 | 49.28 | (1.44 ) | (1.44 )(h) | 61,593,815 | 0.50 | 0.70 | 0.50 | 4 |
60.47 | 60.50 | 17.97 | 18.08 | 86,166,714 | 0.55 | 1.27 | 0.55 | 30 |
52.13 | 52.11 | 10.03 | 10.01 | 82,105,027 | 0.55 | 1.21 | 0.55 | 53 |
47.81 | 47.80 | (38.72 ) | (38.97 ) | 54,982,105 | 0.55 | 0.75 | 0.55 | 32 |
79.09 | 79.40 | 25.63 | 25.85 | 61,291,950 | 0.55 | 0.25 | 0.55 | 37 |
62.98 | 63.12 | 21.51 | 21.78 (h) | 37,787,658 | 0.55 | 0.16 | 0.55 | 12 |
54.15 | 54.23 | 18.58 | 18.22 | 13,537,548 | 0.54 | 3.52 | 0.54 | 33 |
46.01 | 46.22 | (4.15 ) | (3.71 )(h) | 11,502,565 | 0.55 | 2.46 | 0.55 | 4 |
April 30, 2024 | J.P. Morgan Exchange-Traded Funds | 61 |
Diversification Classification | |
JPMorgan Active China ETF | Non-Diversified |
JPMorgan ActiveBuilders Emerging Markets Equity ETF | Diversified |
JPMorgan Global Select Equity ETF | Diversified |
JPMorgan Healthcare Leaders ETF(1) | Diversified |
JPMorgan Hedged Equity Laddered Overlay ETF | Diversified |
JPMorgan International Growth ETF | Diversified |
JPMorgan International Value ETF | Diversified |
(1) | Commencement of operations was November 1, 2023. |
Listing Exchange | |
Active China ETF | NYSE Arca, Inc. |
ActiveBuilders Emerging Markets Equity ETF | Cboe BZX Exchange, Inc. |
Global Select Equity ETF | The NASDAQ Stock Market® LLC |
Healthcare Leaders ETF | The NASDAQ Stock Market® LLC |
Hedged Equity Laddered Overlay ETF | NYSE Arca, Inc. |
International Growth ETF | NYSE Arca, Inc. |
International Value ETF | The NASDAQ Stock Market® LLC |
62 | J.P. Morgan Exchange-Traded Funds | April 30, 2024 |
Active China ETF | ||||
Level 1 Quoted prices | Level 2 Other significant observable inputs | Level 3 Significant unobservable inputs | Total | |
Investments in Securities | ||||
Common Stocks | ||||
Automobile Components | $— | $239,548 | $— | $239,548 |
Banks | — | 1,074,323 | — | 1,074,323 |
Beverages | — | 634,330 | — | 634,330 |
April 30, 2024 | J.P. Morgan Exchange-Traded Funds | 63 |
Active China ETF (continued) | ||||
Level 1 Quoted prices | Level 2 Other significant observable inputs | Level 3 Significant unobservable inputs | Total | |
Broadline Retail | $— | $599,236 | $— | $599,236 |
Chemicals | — | 203,019 | — | 203,019 |
Consumer Staples Distribution & Retail | — | 183,565 | — | 183,565 |
Electrical Equipment | — | 108,747 | — | 108,747 |
Electronic Equipment, Instruments & Components | — | 913,105 | — | 913,105 |
Entertainment | 121,415 | 251,178 | — | 372,593 |
Food Products | — | 346,542 | — | 346,542 |
Gas Utilities | — | 226,643 | — | 226,643 |
Health Care Equipment & Supplies | — | 134,134 | — | 134,134 |
Health Care Providers & Services | — | 83,334 | — | 83,334 |
Hotels, Restaurants & Leisure | 147,611 | 350,921 | — | 498,532 |
Household Durables | — | 528,828 | — | 528,828 |
Independent Power and Renewable Electricity Producers | 298,300 | — | — | 298,300 |
Insurance | — | 543,149 | — | 543,149 |
Interactive Media & Services | 199,028 | 1,307,719 | — | 1,506,747 |
Machinery | — | 264,722 | — | 264,722 |
Media | — | 133,590 | — | 133,590 |
Oil, Gas & Consumable Fuels | — | 467,067 | — | 467,067 |
Pharmaceuticals | 151,295 | 87,463 | — | 238,758 |
Real Estate Management & Development | 244,082 | — | — | 244,082 |
Semiconductors & Semiconductor Equipment | — | 405,917 | — | 405,917 |
Software | — | 116,053 | — | 116,053 |
Technology Hardware, Storage & Peripherals | — | 191,209 | — | 191,209 |
Textiles, Apparel & Luxury Goods | — | 157,267 | — | 157,267 |
Total Common Stocks | 1,161,731 | 9,551,609 | — | 10,713,340 |
Short-Term Investments | ||||
Investment Companies | 10,610 | — | — | 10,610 |
Total Investments in Securities | $1,172,341 | $9,551,609 | $— | $10,723,950 |
ActiveBuilders Emerging Markets Equity ETF | ||||
Level 1 Quoted prices | Level 2 Other significant observable inputs | Level 3 Significant unobservable inputs | Total | |
Investments in Securities | ||||
Common Stocks | ||||
Australia | $— | $609,556 | $— | $609,556 |
Austria | — | 700,814 | — | 700,814 |
Brazil | 52,180,515 | — | — | 52,180,515 |
Chile | 3,501,619 | — | — | 3,501,619 |
China | 22,189,997 | 248,479,443 | — | 270,669,440 |
Colombia | 606,415 | — | — | 606,415 |
Czech Republic | — | 452,233 | — | 452,233 |
Georgia | — | 520,473 | — | 520,473 |
Greece | 3,173,684 | 2,244,878 | — | 5,418,562 |
Hong Kong | — | 12,290,511 | — | 12,290,511 |
Hungary | 1,023,072 | 2,954,957 | — | 3,978,029 |
India | 11,302,024 | 155,985,789 | — | 167,287,813 |
Indonesia | 271,665 | 19,802,448 | — | 20,074,113 |
64 | J.P. Morgan Exchange-Traded Funds | April 30, 2024 |
ActiveBuilders Emerging Markets Equity ETF (continued) | ||||
Level 1 Quoted prices | Level 2 Other significant observable inputs | Level 3 Significant unobservable inputs | Total | |
Kazakhstan | $— | $833,990 | $— | $833,990 |
Macau | — | 738,520 | — | 738,520 |
Malaysia | 1,264,184 | 2,922,110 | — | 4,186,294 |
Mexico | 35,337,608 | — | — | 35,337,608 |
Panama | 536,996 | — | — | 536,996 |
Peru | 4,704,814 | — | — | 4,704,814 |
Poland | — | 7,460,278 | — | 7,460,278 |
Portugal | — | 1,886,861 | — | 1,886,861 |
Qatar | 499,454 | 2,219,972 | — | 2,719,426 |
Romania | 495,867 | — | — | 495,867 |
Russia | — | — | 143,723 | 143,723 |
Saudi Arabia | 3,273,600 | 25,781,347 | — | 29,054,947 |
South Africa | 11,175,691 | 21,139,235 | — | 32,314,926 |
South Korea | 1,350,245 | 131,668,927 | — | 133,019,172 |
Spain | — | 4,038,023 | — | 4,038,023 |
Taiwan | 1,385,081 | 178,990,592 | — | 180,375,673 |
Thailand | 6,695,208 | 7,427,354 | — | 14,122,562 |
Turkey | 2,263,963 | 1,505,465 | — | 3,769,428 |
United Arab Emirates | 7,870,802 | 535,728 | — | 8,406,530 |
United Kingdom | — | 1,521,787 | — | 1,521,787 |
United States | 5,908,400 | 1,212,318 | — | 7,120,718 |
Total Common Stocks | 177,010,904 | 833,923,609 | 143,723 | 1,011,078,236 |
Short-Term Investments | ||||
Investment Companies | 2,267,205 | — | — | 2,267,205 |
Investment of Cash Collateral from Securities Loaned | 4,030,602 | — | — | 4,030,602 |
Total Short-Term Investments | 6,297,807 | — | — | 6,297,807 |
Total Investments in Securities | $183,308,711 | $833,923,609 | $143,723 | $1,017,376,043 |
Global Select Equity ETF | ||||
Level 1 Quoted prices | Level 2 Other significant observable inputs | Level 3 Significant unobservable inputs | Total | |
Investments in Securities | ||||
Common Stocks | ||||
Denmark | $— | $54,673,416 | $— | $54,673,416 |
France | — | 202,315,379 | — | 202,315,379 |
Germany | — | 44,221,427 | — | 44,221,427 |
Hong Kong | — | 26,129,789 | — | 26,129,789 |
India | 13,040,122 | — | — | 13,040,122 |
Japan | — | 61,717,568 | — | 61,717,568 |
Mexico | 13,535,988 | — | — | 13,535,988 |
Netherlands | — | 43,896,358 | — | 43,896,358 |
Singapore | — | 14,755,623 | — | 14,755,623 |
South Korea | — | 59,569,890 | — | 59,569,890 |
Switzerland | — | 24,378,208 | — | 24,378,208 |
Taiwan | 54,351,344 | 28,804,354 | — | 83,155,698 |
United Kingdom | — | 87,180,498 | — | 87,180,498 |
April 30, 2024 | J.P. Morgan Exchange-Traded Funds | 65 |
Global Select Equity ETF (continued) | ||||
Level 1 Quoted prices | Level 2 Other significant observable inputs | Level 3 Significant unobservable inputs | Total | |
United States | $1,969,893,139 | $82,656,374 | $— | $2,052,549,513 |
Total Common Stocks | 2,050,820,593 | 730,298,884 | — | 2,781,119,477 |
Short-Term Investments | ||||
Investment Companies | 41,445,480 | — | — | 41,445,480 |
Total Investments in Securities | $2,092,266,073 | $730,298,884 | $— | $2,822,564,957 |
Healthcare Leaders ETF | ||||
Level 1 Quoted prices | Level 2 Other significant observable inputs | Level 3 Significant unobservable inputs | Total | |
Investments in Securities | ||||
Common Stocks | ||||
Denmark | $— | $437,273 | $— | $437,273 |
Germany | — | 40,658 | — | 40,658 |
Japan | — | 111,070 | — | 111,070 |
Netherlands | 57,284 | — | — | 57,284 |
Switzerland | — | 229,186 | — | 229,186 |
United Kingdom | — | 349,234 | — | 349,234 |
United States | 5,360,646 | 327,356 | — | 5,688,002 |
Total Common Stocks | 5,417,930 | 1,494,777 | — | 6,912,707 |
Short-Term Investments | ||||
Investment Companies | 61,610 | — | — | 61,610 |
Total Investments in Securities | $5,479,540 | $1,494,777 | $— | $6,974,317 |
Hedged Equity Laddered Overlay ETF | ||||
Level 1 Quoted prices | Level 2 Other significant observable inputs | Level 3 Significant unobservable inputs | Total | |
Total Investments in Securities (a) | $530,637,428 | $— | $— | $530,637,428 |
Depreciation in Other Financial Instruments | ||||
Futures Contracts (a) | $(47,398 ) | $— | $— | $(47,398 ) |
Options Written (a) | ||||
Call Options Written | (1,462,084 ) | — | — | (1,462,084 ) |
Put Options Written | (564,866 ) | — | — | (564,866 ) |
Total Depreciation in Other Financial Instruments | $(2,074,348 ) | $— | $— | $(2,074,348 ) |
(a) | Please refer to the SOI for specifics of portfolio holdings. |
International Growth ETF | ||||
Level 1 Quoted prices | Level 2 Other significant observable inputs | Level 3 Significant unobservable inputs | Total | |
Investments in Securities | ||||
Common Stocks | ||||
Australia | $— | $567,084 | $— | $567,084 |
Brazil | 886,433 | — | — | 886,433 |
Canada | 5,284,007 | — | — | 5,284,007 |
66 | J.P. Morgan Exchange-Traded Funds | April 30, 2024 |
International Growth ETF (continued) | ||||
Level 1 Quoted prices | Level 2 Other significant observable inputs | Level 3 Significant unobservable inputs | Total | |
China | $1,110,953 | $5,792,231 | $— | $6,903,184 |
Denmark | — | 3,602,752 | — | 3,602,752 |
France | — | 9,808,096 | — | 9,808,096 |
Germany | — | 1,111,850 | — | 1,111,850 |
Indonesia | — | 1,635,007 | — | 1,635,007 |
Italy | 699,932 | 192,476 | — | 892,408 |
Japan | — | 13,689,896 | — | 13,689,896 |
Mexico | 1,364,944 | — | — | 1,364,944 |
Netherlands | 111,611 | 6,001,049 | — | 6,112,660 |
Singapore | — | 938,105 | — | 938,105 |
South Korea | — | 2,522,040 | — | 2,522,040 |
Spain | — | 1,331,279 | — | 1,331,279 |
Sweden | — | 2,422,995 | — | 2,422,995 |
Switzerland | — | 1,535,702 | — | 1,535,702 |
Taiwan | 3,019,832 | 3,208,465 | — | 6,228,297 |
United Kingdom | — | 8,421,154 | — | 8,421,154 |
United States | 1,435,596 | 5,413,193 | — | 6,848,789 |
Total Common Stocks | 13,913,308 | 68,193,374 | — | 82,106,682 |
Short-Term Investments | ||||
Investment Companies | 3,656,054 | — | — | 3,656,054 |
Investment of Cash Collateral from Securities Loaned | 576,057 | — | — | 576,057 |
Total Short-Term Investments | 4,232,111 | — | — | 4,232,111 |
Total Investments in Securities | $18,145,419 | $68,193,374 | $— | $86,338,793 |
Appreciation in Other Financial Instruments | ||||
Futures Contracts | $20,692 | $— | $— | $20,692 |
International Value ETF | ||||
Level 1 Quoted prices | Level 2 Other significant observable inputs | Level 3 Significant unobservable inputs | Total | |
Investments in Securities | ||||
Common Stocks | ||||
Australia | $— | $568,593 | $— | $568,593 |
Austria | 32,835 | 131,383 | — | 164,218 |
Belgium | 14,154 | 79,379 | — | 93,533 |
Brazil | 266,398 | — | — | 266,398 |
Canada | 563,844 | — | — | 563,844 |
China | 55,181 | 1,079,398 | — | 1,134,579 |
Denmark | — | 139,456 | — | 139,456 |
Finland | — | 208,205 | — | 208,205 |
France | — | 830,878 | — | 830,878 |
Georgia | — | 25,712 | — | 25,712 |
Germany | — | 794,621 | — | 794,621 |
Greece | 27,359 | 36,536 | — | 63,895 |
Hong Kong | 37,757 | 121,506 | — | 159,263 |
Hungary | — | 42,131 | — | 42,131 |
India | 55,623 | 264,302 | — | 319,925 |
April 30, 2024 | J.P. Morgan Exchange-Traded Funds | 67 |
International Value ETF (continued) | ||||
Level 1 Quoted prices | Level 2 Other significant observable inputs | Level 3 Significant unobservable inputs | Total | |
Indonesia | $— | $31,549 | $— | $31,549 |
Ireland | 54,692 | 59,161 | — | 113,853 |
Italy | 65,887 | 563,596 | — | 629,483 |
Japan | — | 2,258,316 | — | 2,258,316 |
Mexico | 45,092 | — | — | 45,092 |
Netherlands | — | 244,068 | — | 244,068 |
Norway | — | 156,627 | — | 156,627 |
Poland | — | 45,375 | — | 45,375 |
Singapore | — | 161,897 | — | 161,897 |
South Africa | 131,003 | 128,773 | — | 259,776 |
South Korea | — | 819,068 | — | 819,068 |
Spain | — | 359,805 | — | 359,805 |
Sweden | 21,566 | 210,356 | — | 231,922 |
Switzerland | — | 387,555 | — | 387,555 |
Taiwan | — | 321,515 | — | 321,515 |
Thailand | — | 82,732 | — | 82,732 |
Turkey | 42,297 | 26,909 | — | 69,206 |
United Arab Emirates | 47,142 | — | — | 47,142 |
United Kingdom | — | 875,974 | — | 875,974 |
United States | — | 721,875 | — | 721,875 |
Total Common Stocks | 1,460,830 | 11,777,251 | — | 13,238,081 |
Short-Term Investments | ||||
Investment Companies | 117,215 | — | — | 117,215 |
Investment of Cash Collateral from Securities Loaned | 43,829 | — | — | 43,829 |
Total Short-Term Investments | 161,044 | — | — | 161,044 |
Total Investments in Securities | $1,621,874 | $11,777,251 | $— | $13,399,125 |
Appreciation in Other Financial Instruments | ||||
Futures Contracts | $2,526 | $— | $— | $2,526 |
Depreciation in Other Financial Instruments | ||||
Futures Contracts | (3,762 ) | — | — | (3,762 ) |
Total Net Appreciation/ Depreciation in Other Financial Instruments | $(1,236 ) | $— | $— | $(1,236 ) |
68 | J.P. Morgan Exchange-Traded Funds | April 30, 2024 |
Investment Securities on Loan, at value, Presented on the Statements of Assets and Liabilities | Cash Collateral Posted by Borrower* | Net Amount Due to Counterparty (not less than zero) | |
ActiveBuilders Emerging Markets Equity ETF | $2,943,659 | $(2,943,659 ) | $— |
International Growth ETF | 550,870 | (550,870 ) | — |
International Value ETF | 41,579 | (41,579 ) | — |
* | Collateral posted reflects the value of securities on loan and does not include any additional amounts received from the borrower. |
ActiveBuilders Emerging Markets Equity ETF | $163 |
International Growth ETF | 44 |
International Value ETF | 10 |
April 30, 2024 | J.P. Morgan Exchange-Traded Funds | 69 |
Active China ETF | |||||||||
For the six months ended April 30, 2024 | |||||||||
Security Description | Value at October 31, 2023 | Purchases at Cost | Proceeds from Sales | Net Realized Gain (Loss) | Change in Unrealized Appreciation/ (Depreciation) | Value at April 30, 2024 | Shares at April 30, 2024 | Dividend Income | Capital Gain Distributions |
JPMorgan Prime Money Market Fund Class IM Shares, 5.41% (a) (b) | $10,004 | $754,719 | $754,095 | $(17 ) | $(1 ) | $10,610 | 10,608 | $765 | $— |
(a) | Investment in an affiliated fund, which is registered under the Investment Company Act of 1940, as amended, and is advised by J.P. Morgan Investment Management Inc. |
(b) | The rate shown is the current yield as of April 30, 2024. |
ActiveBuilders Emerging Markets Equity ETF | |||||||||
For the six months ended April 30, 2024 | |||||||||
Security Description | Value at October 31, 2023 | Purchases at Cost | Proceeds from Sales | Net Realized Gain (Loss) | Change in Unrealized Appreciation/ (Depreciation) | Value at April 30, 2024 | Shares at April 30, 2024 | Dividend Income | Capital Gain Distributions |
JPMorgan Prime Money Market Fund Class IM Shares, 5.41% (a) (b) | $4,916,639 | $110,695,017 | $113,343,216 | $(772 ) | $(463 ) | $2,267,205 | 2,266,752 | $100,995 | $— |
JPMorgan Securities Lending Money Market Fund Agency SL Class Shares, 5.47% (a) (b) | — | 500,000 | 500,050 | 50 * | — | — | — | 76 * | — |
JPMorgan U.S. Government Money Market Fund Class IM Shares, 5.25% (a) (b) | — | 13,354,991 | 9,324,389 | — | — | 4,030,602 | 4,030,602 | 33,901 * | — |
Total | $4,916,639 | $124,550,008 | $123,167,655 | $(722 ) | $(463 ) | $6,297,807 | $134,972 | $— | |
(a) | Investment in an affiliated fund, which is registered under the Investment Company Act of 1940, as amended, and is advised by J.P. Morgan Investment Management Inc. |
(b) | The rate shown is the current yield as of April 30, 2024. |
* | Amount is included on the Statements of Operations as Income from securities lending (net) (after payments of rebates and Citibank’s fee). |
Global Select Equity ETF | |||||||||
For the six months ended April 30, 2024 | |||||||||
Security Description | Value at October 31, 2023 | Purchases at Cost | Proceeds from Sales | Net Realized Gain (Loss) | Change in Unrealized Appreciation/ (Depreciation) | Value at April 30, 2024 | Shares at April 30, 2024 | Dividend Income | Capital Gain Distributions |
JPMorgan Prime Money Market Fund Class IM Shares, 5.41% (a) (b) | $10,930,514 | $225,131,547 | $194,606,261 | $(7,374 ) | $(2,946 ) | $41,445,480 | 41,437,193 | $504,090 | $— |
(a) | Investment in an affiliated fund, which is registered under the Investment Company Act of 1940, as amended, and is advised by J.P. Morgan Investment Management Inc. |
(b) | The rate shown is the current yield as of April 30, 2024. |
70 | J.P. Morgan Exchange-Traded Funds | April 30, 2024 |
Healthcare Leaders ETF | |||||||||
For the period ended April 30, 2024 | |||||||||
Security Description | Value at November 1, 2023(a) | Purchases at Cost | Proceeds from Sales | Net Realized Gain (Loss) | Change in Unrealized Appreciation/ (Depreciation) | Value at April 30, 2024 | Shares at April 30, 2024 | Dividend Income | Capital Gain Distributions |
JPMorgan U.S. Government Money Market Fund Class IM Shares, 5.25% (b) (c) | $— | $9,812,065 | $9,750,455 | $— | $— | $61,610 | 61,610 | $4,046 | $— |
(a) | Commencement of operations was November 1, 2023. |
(b) | Investment in an affiliated fund, which is registered under the Investment Company Act of 1940, as amended, and is advised by J.P. Morgan Investment Management Inc. |
(c) | The rate shown is the current yield as of April 30, 2024. |
Hedged Equity Laddered Overlay ETF | |||||||||
For the six months ended April 30, 2024 | |||||||||
Security Description | Value at October 31, 2023 | Purchases at Cost | Proceeds from Sales | Net Realized Gain (Loss) | Change in Unrealized Appreciation/ (Depreciation) | Value at April 30, 2024 | Shares at April 30, 2024 | Dividend Income | Capital Gain Distributions |
JPMorgan U.S. Government Money Market Fund Class IM Shares, 5.25% (a) (b) | $451,185 | $8,739,468 | $7,949,720 | $— | $— | $1,240,933 | 1,240,933 | $26,501 | $— |
(a) | Investment in an affiliated fund, which is registered under the Investment Company Act of 1940, as amended, and is advised by J.P. Morgan Investment Management Inc. |
(b) | The rate shown is the current yield as of April 30, 2024. |
International Growth ETF | |||||||||
For the six months ended April 30, 2024 | |||||||||
Security Description | Value at October 31, 2023 | Purchases at Cost | Proceeds from Sales | Net Realized Gain (Loss) | Change in Unrealized Appreciation/ (Depreciation) | Value at April 30, 2024 | Shares at April 30, 2024 | Dividend Income | Capital Gain Distributions |
JPMorgan Prime Money Market Fund Class IM Shares, 5.41% (a) (b) | $— | $7,771,873 | $4,114,490 | $(793 ) | $(536 ) | $3,656,054 | 3,655,323 | $41,750 | $— |
JPMorgan U.S. Government Money Market Fund Class IM Shares, 5.25% (a) (b) | — | 1,681,681 | 1,105,624 | — | — | 576,057 | 576,057 | 3,754 * | — |
JPMorgan U.S. Government Money Market Fund Class IM Shares, 5.25% (a) (b) | 1,033,189 | 6,833,671 | 7,866,860 | — | — | — | — | 13,944 | — |
Total | $1,033,189 | $16,287,225 | $13,086,974 | $(793 ) | $(536 ) | $4,232,111 | $59,448 | $— | |
(a) | Investment in an affiliated fund, which is registered under the Investment Company Act of 1940, as amended, and is advised by J.P. Morgan Investment Management Inc. |
(b) | The rate shown is the current yield as of April 30, 2024. |
* | Amount is included on the Statements of Operations as Income from securities lending (net) (after payments of rebates and Citibank’s fee). |
International Value ETF | |||||||||
For the six months ended April 30, 2024 | |||||||||
Security Description | Value at October 31, 2023 | Purchases at Cost | Proceeds from Sales | Net Realized Gain (Loss) | Change in Unrealized Appreciation/ (Depreciation) | Value at April 30, 2024 | Shares at April 30, 2024 | Dividend Income | Capital Gain Distributions |
JPMorgan Prime Money Market Fund Class IM Shares, 5.41% (a) (b) | $— | $907,994 | $790,720 | $(47 ) | $(12 ) | $117,215 | 117,192 | $1,633 | $— |
April 30, 2024 | J.P. Morgan Exchange-Traded Funds | 71 |
International Value ETF (continued) | |||||||||
For the six months ended April 30, 2024 | |||||||||
Security Description | Value at October 31, 2023 | Purchases at Cost | Proceeds from Sales | Net Realized Gain (Loss) | Change in Unrealized Appreciation/ (Depreciation) | Value at April 30, 2024 | Shares at April 30, 2024 | Dividend Income | Capital Gain Distributions |
JPMorgan U.S. Government Money Market Fund Class IM Shares, 5.25% (a) (b) | $— | $259,851 | $216,022 | $— | $— | $43,829 | 43,829 | $844 * | $— |
JPMorgan U.S. Government Money Market Fund Class IM Shares, 5.25% (a) (b) | 336,217 | 369,766 | 705,983 | — | — | — | — | 972 | — |
Total | $336,217 | $1,537,611 | $1,712,725 | $(47 ) | $(12 ) | $161,044 | $3,449 | $— | |
(a) | Investment in an affiliated fund, which is registered under the Investment Company Act of 1940, as amended, and is advised by J.P. Morgan Investment Management Inc. |
(b) | The rate shown is the current yield as of April 30, 2024. |
* | Amount is included on the Statements of Operations as Income from securities lending (net) (after payments of rebates and Citibank’s fee). |
72 | J.P. Morgan Exchange-Traded Funds | April 30, 2024 |
Hedged Equity Laddered Overlay ETF | International Growth ETF | International Value ETF | |
Futures Contracts: | |||
Average Notional Balance Long | $2,050,729 | $1,162,703 | $74,432 |
Ending Notional Balance Long | 1,519,425 | 2,583,297 | 258,119 |
Exchange-Traded Options: | |||
Average Number of Contracts Purchased | 5,893 | — | — |
Average Number of Contracts Written | (10,808 ) | — | — |
Ending Number of Contracts Purchased | 10,429 | — | — |
Ending Number of Contracts Written | (20,858 ) | — | — |
April 30, 2024 | J.P. Morgan Exchange-Traded Funds | 73 |
Active China ETF | 0.65 % |
ActiveBuilders Emerging Markets Equity ETF | 0.33 |
Global Select Equity ETF | 0.47 |
Healthcare Leaders ETF | 0.65 |
Hedged Equity Laddered Overlay ETF | 0.50 |
International Growth ETF | 0.55 |
International Value ETF | 0.55 |
74 | J.P. Morgan Exchange-Traded Funds | April 30, 2024 |
Purchases (excluding U.S. Government) | Sales (excluding U.S. Government) | |
Active China ETF | $1,553,012 | $1,759,447 |
ActiveBuilders Emerging Markets Equity ETF | 288,103,468 | 277,846,068 |
Global Select Equity ETF | 758,927,576 | 702,746,099 |
Healthcare Leaders ETF | 12,206,397 | 2,809,782 |
Hedged Equity Laddered Overlay ETF | 55,455,488 | 68,530,628 |
International Growth ETF | 24,003,735 | 28,251,396 |
International Value ETF | 4,400,658 | 4,180,833 |
In-Kind Purchases | In-Kind Sales | |
ActiveBuilders Emerging Markets Equity ETF | $32,972,355 | $25,934,369 |
Global Select Equity ETF | 1,840,154,502 | 114,544,773 |
Healthcare Leaders ETF | — | 4,181,328 |
Hedged Equity Laddered Overlay ETF | 465,875,995 | 16,608,822 |
April 30, 2024 | J.P. Morgan Exchange-Traded Funds | 75 |
In-Kind Purchases | In-Kind Sales | |
International Growth ETF | $4,097,979 | $11,127,231 |
Aggregate Cost | Gross Unrealized Appreciation | Gross Unrealized Depreciation | Net Unrealized Appreciation (Depreciation) | |
Active China ETF | $11,650,335 | $416,031 | $1,342,416 | $(926,385 ) |
ActiveBuilders Emerging Markets Equity ETF | 1,001,571,886 | 103,811,544 | 88,007,387 | 15,804,157 |
Global Select Equity ETF | 2,702,080,185 | 163,074,906 | 42,590,134 | 120,484,772 |
Healthcare Leaders ETF | 6,188,985 | 953,906 | 168,574 | 785,332 |
Hedged Equity Laddered Overlay ETF | 501,627,447 | 35,543,708 | 8,608,075 | 26,935,633 |
International Growth ETF | 76,168,197 | 13,111,460 | 2,920,172 | 10,191,288 |
International Value ETF | 12,202,870 | 1,439,404 | 244,385 | 1,195,019 |
Capital Loss Carryforward Character | ||
Short-Term | Long-Term | |
Active China ETF | $236,737 | $— |
ActiveBuilders Emerging Markets Equity ETF | 80,921,269 | 49,650,872 |
Global Select Equity ETF | 1,001,211 | — |
Hedged Equity Laddered Overlay ETF | 147,186 | — |
International Growth ETF | 8,005,243 | 6,587,616 |
International Value ETF | 52,875 | — |
76 | J.P. Morgan Exchange-Traded Funds | April 30, 2024 |
Average Borrowings | Average Interest Rate Paid | Number of Days Outstanding | Interest Paid | |
ActiveBuilders Emerging Markets Equity ETF | $6,932,057 | 6.06 % | 3 | $3,501 |
JPMorgan SmartRetirement Funds | |
ActiveBuilders Emerging Markets Equity ETF | 59.7 % |
Global Select Equity ETF | 58.4 |
April 30, 2024 | J.P. Morgan Exchange-Traded Funds | 77 |
% of Ownership | |
Active China ETF | 77 % |
Healthcare Leaders ETF | 40 |
International Value ETF | 80 |
Active China ETF | ActiveBuilders Emerging Markets Equity ETF | International Growth ETF | International Value ETF | |
China | 99.9 % | 26.7 % | — % | — % |
France | — | — | 11.4 | — |
India | — | 16.5 | — | — |
Japan | — | — | 16.0 | 16.9 |
South Korea | — | 13.1 | — | — |
Taiwan | — | 17.8 | — | — |
78 | J.P. Morgan Exchange-Traded Funds | April 30, 2024 |
countries typically have less established market economies than developed countries and may face greater social, economic, regulatory and political uncertainties. In addition, emerging markets typically present greater illiquidity and price volatility concerns due to smaller or limited local capital markets and greater difficulty in determining market valuations of securities due to limited public information on issuers. Certain emerging market countries may be subject to less stringent requirements regarding accounting, auditing, financial reporting and record keeping and therefore, material information related to an investment may not be available or reliable.
a Fund's volatility, negatively impact a Fund’s arbitrage and pricing mechanisms, exacerbate other pre-existing political, social and economic risks to the Funds and negatively impact broad segments of businesses and populations. In addition, governments, their regulatory agencies, or self-regulatory organizations have taken or may take actions in response to a pandemic or other global event that affect the instruments in which the
Funds invest, or the issuers of such instruments, in ways that could have a significant negative impact on a Fund’s investment performance. The ultimate impact of any pandemic or other global event and the extent to which the associated conditions and governmental responses impact a Fund will also depend on future developments, which are highly uncertain, difficult to accurately predict and subject to frequent changes.
April 30, 2024 | J.P. Morgan Exchange-Traded Funds | 79 |
Beginning Account Value November 1, 2023 | Ending Account Value April 30, 2024 | Expenses Paid During the Period | Annualized Expense Ratio | |
JPMorgan Active China ETF | ||||
Actual * | $1,000.00 | $1,037.40 | $3.29 | 0.65 % |
Hypothetical * | 1,000.00 | 1,021.63 | 3.27 | 0.65 |
JPMorgan ActiveBuilders Emerging Markets Equity ETF | ||||
Actual * | 1,000.00 | 1,123.30 | 1.79 | 0.34 |
Hypothetical * | 1,000.00 | 1,023.17 | 1.71 | 0.34 |
JPMorgan Global Select Equity ETF | ||||
Actual * | 1,000.00 | 1,207.60 | 2.58 | 0.47 |
Hypothetical * | 1,000.00 | 1,022.53 | 2.36 | 0.47 |
JPMorgan Healthcare Leaders ETF | ||||
Actual ** | 1,000.00 | 1,174.70 | 3.50 | 0.65 |
Hypothetical * | 1,000.00 | 1,021.63 | 3.27 | 0.65 |
JPMorgan Hedged Equity Laddered Overlay ETF | ||||
Actual * | 1,000.00 | 1,117.90 | 2.63 | 0.50 |
Hypothetical * | 1,000.00 | 1,022.38 | 2.51 | 0.50 |
JPMorgan International Growth ETF | ||||
Actual * | 1,000.00 | 1,179.70 | 2.98 | 0.55 |
Hypothetical * | 1,000.00 | 1,022.13 | 2.77 | 0.55 |
JPMorgan International Value ETF | ||||
Actual * | 1,000.00 | 1,185.80 | 2.93 | 0.54 |
Hypothetical * | 1,000.00 | 1,022.18 | 2.72 | 0.54 |
* | Expenses are equal to each Fund's annualized net expense ratio, multiplied by the average account value over the period, multiplied by 182/366 (to reflect the one-half year period). |
** | Expenses are equal to the Fund’s annualized net expense ratio, multiplied by the average account value over the period, multiplied by 181/366 (to reflect the actual period). The Fund commenced operations on November 1, 2023. |
80 | J.P. Morgan Exchange-Traded Funds | April 30, 2024 |
April 30, 2024 | J.P. Morgan Exchange-Traded Funds | 81 |
82 | J.P. Morgan Exchange-Traded Funds | April 30, 2024 |
April 30, 2024 | J.P. Morgan Exchange-Traded Funds | 83 |


Fund | Ticker | Listing Exchange |
JPMorgan Climate Change Solutions ETF | TEMP | NYSE Arca, Inc. |
JPMorgan Sustainable Infrastructure ETF | BLLD | The NASDAQ Stock Market® LLC |

1 | |
2 | |
3 | |
6 | |
9 | |
13 | |
16 | |
18 | |
27 | |
28 |
 | “The U.S. economic expansion has entered its fifth year, led by consumer spending, an increase in immigrant workers and receding inflation.” — Brian S. Shlissel |

President, J.P. Morgan Exchange-Traded Funds
J.P. Morgan Asset Management
1-844-4JPM-ETF or jpmorgan.com/etfs for more information
April 30, 2024 | J.P. Morgan Exchange-Traded Funds | 1 |
2 | J.P. Morgan Exchange-Traded Funds | April 30, 2024 |
REPORTING PERIOD RETURN: | |
Net Asset Value * | 26.40% |
Market Price ** | 26.75% |
MSCI ACWI Index (net total return) | 19.77% |
Net Assets as of 4/30/2024 | $23,519,624 |
Fund Ticker | TEMP |
TOP TEN HOLDINGS OF THE PORTFOLIO AS OF April 30, 2024 | PERCENT OF TOTAL INVESTMENTS | |
1. | Trane Technologies plc | 4.4 % |
2. | Prysmian SpA (Italy) | 4.1 |
3. | Hitachi Ltd. (Japan) | 4.1 |
4. | Quanta Services, Inc. | 4.0 |
5. | Schneider Electric SE | 4.0 |
6. | Xylem, Inc. | 3.6 |
7. | Iberdrola SA (Spain) | 3.4 |
8. | NextEra Energy, Inc. | 3.2 |
9. | Keyence Corp. (Japan) | 3.2 |
10. | Atlas Copco AB, Class A (Sweden) | 3.1 |
April 30, 2024 | J.P. Morgan Exchange-Traded Funds | 3 |
PORTFOLIO COMPOSITION BY COUNTRY AS OF April 30, 2024 | PERCENT OF TOTAL INVESTMENTS |
United States | 49.3% |
Japan | 7.8 |
France | 6.7 |
Switzerland | 4.3 |
Germany | 4.2 |
Italy | 4.1 |
Sweden | 4.0 |
Spain | 3.4 |
Ireland | 2.9 |
China | 2.1 |
Netherlands | 2.0 |
United Kingdom | 1.5 |
Australia | 1.5 |
Canada | 1.4 |
Denmark | 1.2 |
Taiwan | 1.0 |
Others (each less than 1.0%) | 2.2 |
Short-Term Investments | 0.4 |
4 | J.P. Morgan Exchange-Traded Funds | April 30, 2024 |
INCEPTION DATE | SIX MONTHS* | 1 YEAR | SINCE INCEPTION | |
JPMorgan Climate Change Solutions ETF | ||||
Net Asset Value | December 13, 2021 | 26.40 % | 10.28 % | (3.84 )% |
Market Price | 26.75 | 10.41 | (3.67 ) |
* | Not annualized. |
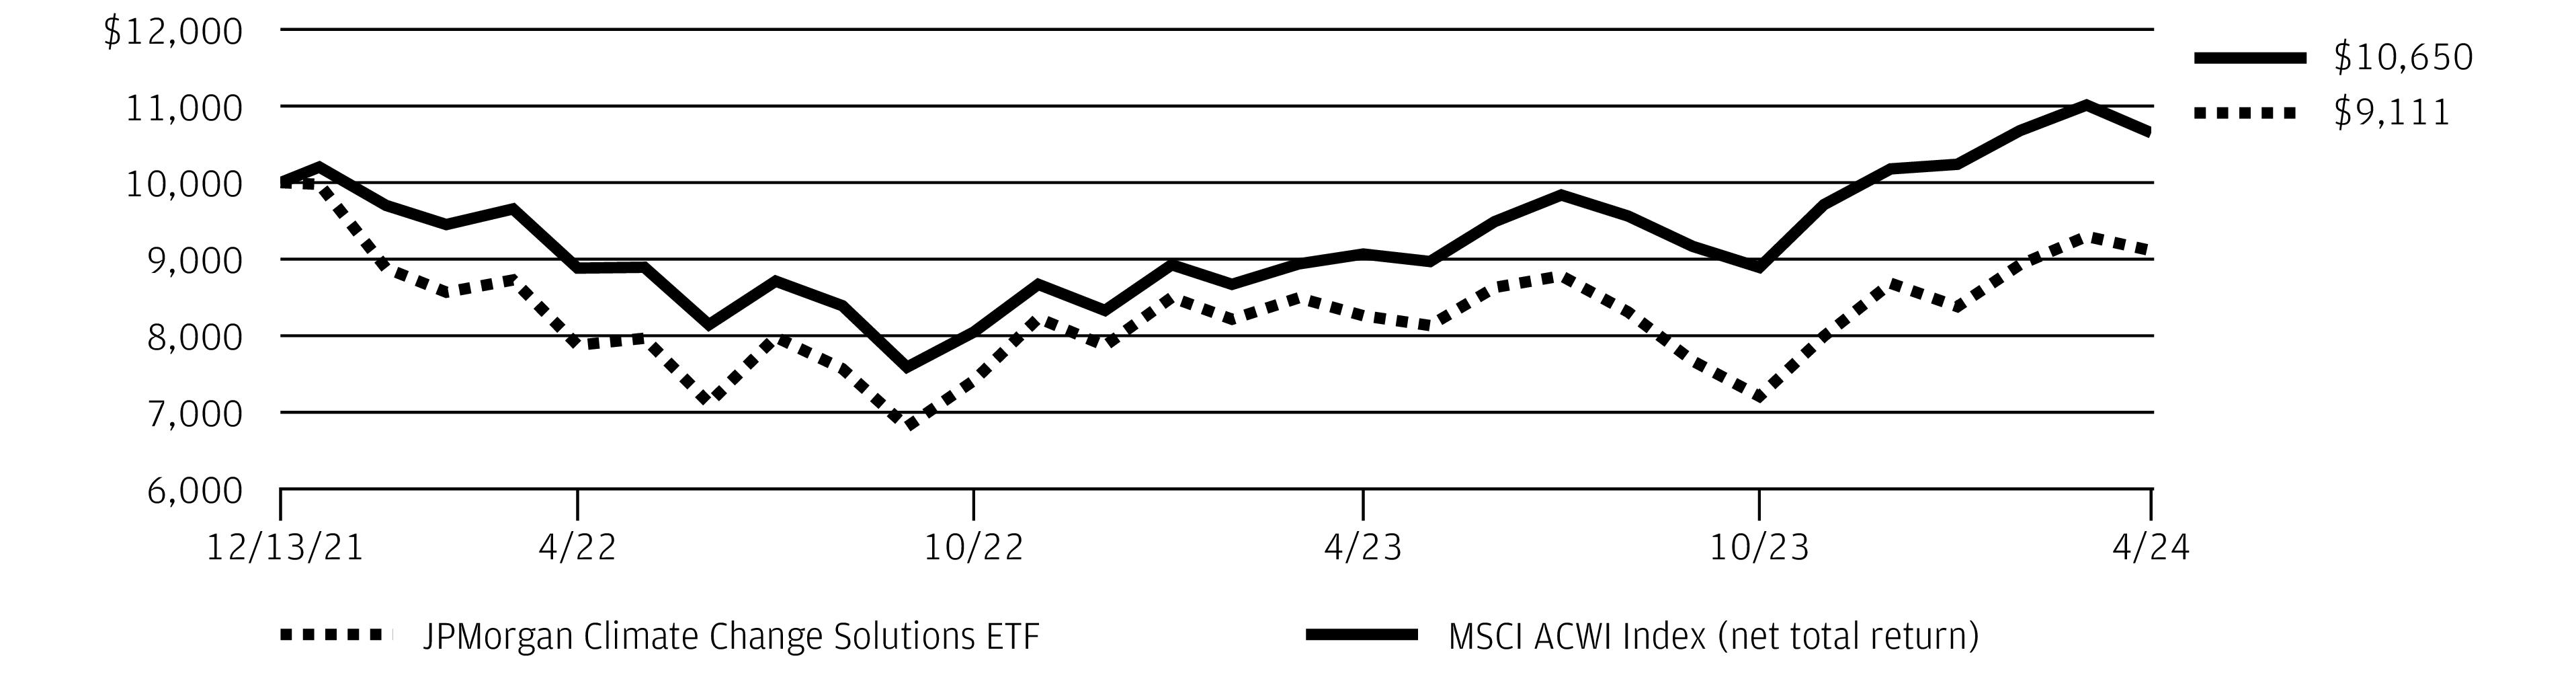
April 30, 2024 | J.P. Morgan Exchange-Traded Funds | 5 |
REPORTING PERIOD RETURN: | |
Net Asset Value * | 9.38% |
Market Price ** | 9.41% |
MSCI ACWI Index (net total return) | 19.77% |
Net Assets as of 4/30/2024 | $23,943,301 |
Fund Ticker | BLLD |
6 | J.P. Morgan Exchange-Traded Funds | April 30, 2024 |
TOP TEN HOLDINGS OF THE PORTFOLIO AS OF April 30, 2024 | PERCENT OF TOTAL INVESTMENTS | |
1. | Engie SA (France) | 4.3 % |
2. | SSE plc (United Kingdom) | 4.0 |
3. | National Grid plc (United Kingdom) | 3.6 |
4. | E.ON SE (Germany) | 3.4 |
5. | Digital Realty Trust, Inc. | 3.4 |
6. | NARI Technology Co. Ltd., Class A (China) | 3.3 |
7. | NextEra Energy, Inc. | 3.2 |
8. | American Tower Corp. | 3.1 |
9. | Union Pacific Corp. | 3.1 |
10. | Xylem, Inc. | 2.9 |
PORTFOLIO COMPOSITION BY COUNTRY AS OF April 30, 2024 | PERCENT OF TOTAL INVESTMENTS |
United States | 43.2% |
United Kingdom | 15.7 |
France | 9.0 |
Germany | 6.0 |
China | 5.0 |
Spain | 4.0 |
Italy | 3.7 |
Canada | 2.7 |
Belgium | 2.5 |
Japan | 2.2 |
Brazil | 1.8 |
Australia | 1.4 |
Others (each less than 1.0%) | 1.8 |
Short-Term Investments | 1.0 |
April 30, 2024 | J.P. Morgan Exchange-Traded Funds | 7 |
INCEPTION DATE | SIX MONTHS* | 1 YEAR | SINCE INCEPTION | |
JPMorgan Sustainable Infrastructure ETF | ||||
Net Asset Value | September 7, 2022 | 9.38 % | (2.96 )% | (1.64 )% |
Market Price | 9.41 | (3.06 ) | (1.54 ) |
* | Not annualized. |
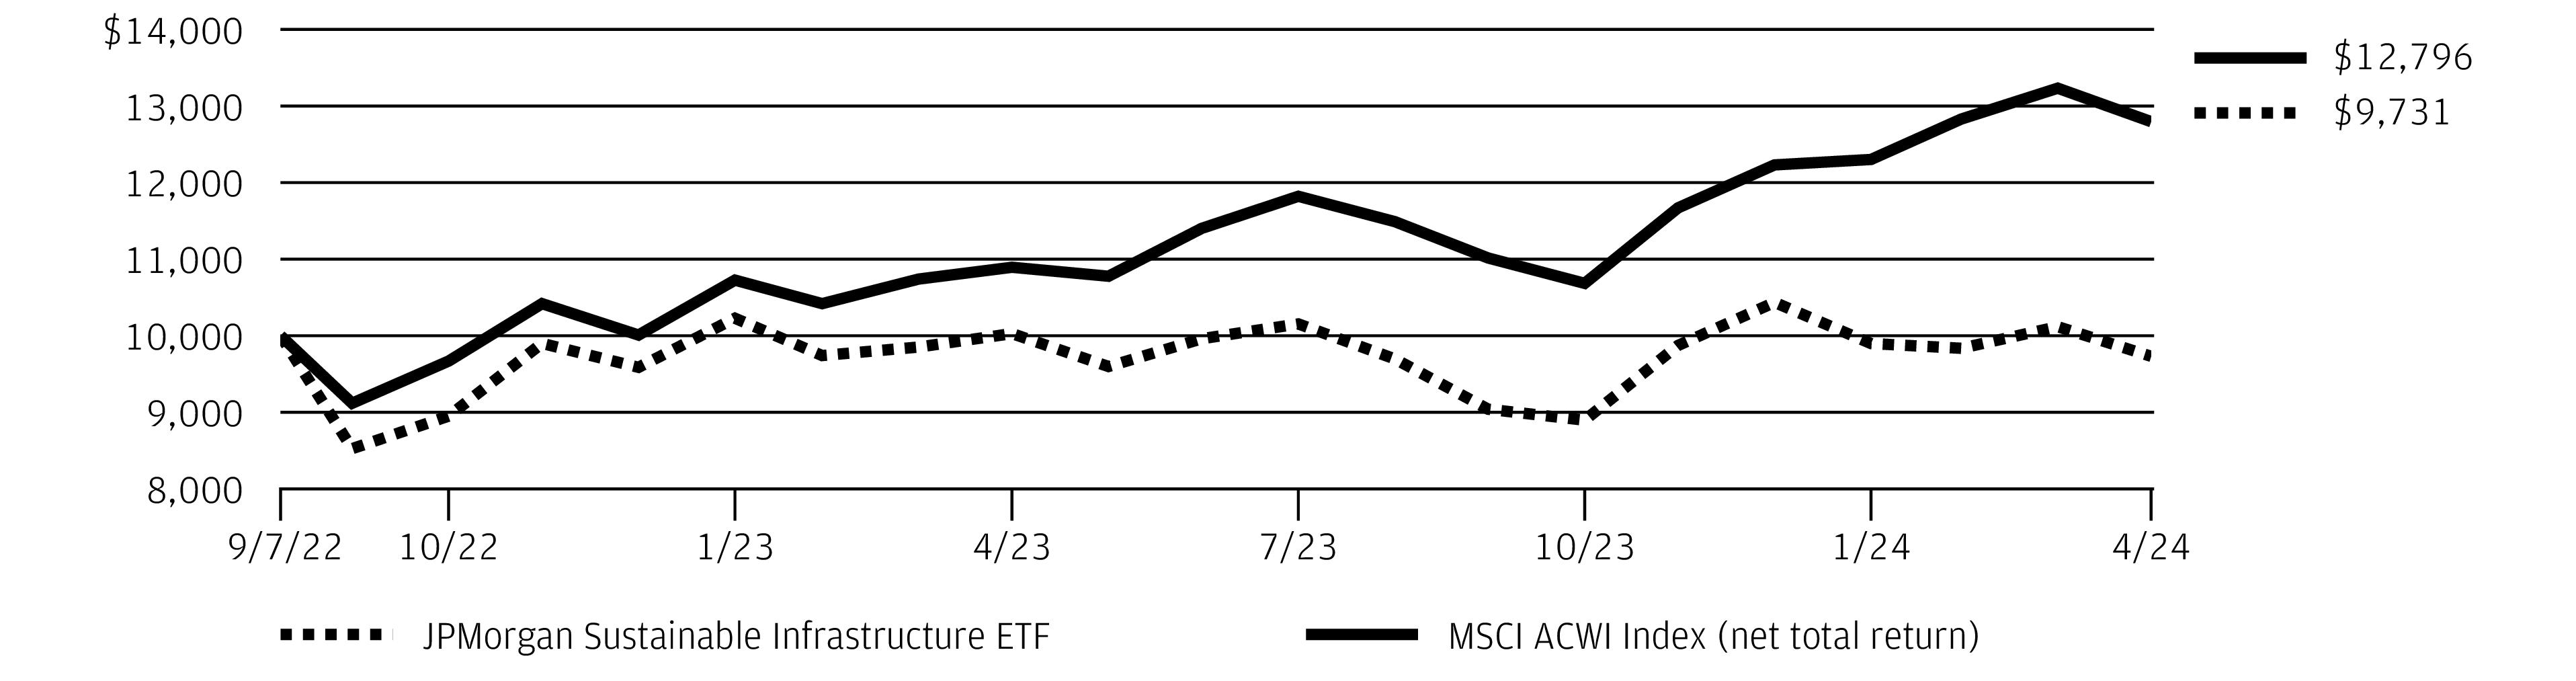
8 | J.P. Morgan Exchange-Traded Funds | April 30, 2024 |
INVESTMENTS | SHARES | VALUE($) |
Common Stocks — 98.7% | ||
Australia — 1.5% | ||
Brambles Ltd. | 36,130 | 339,898 |
Austria — 0.2% | ||
ANDRITZ AG | 865 | 47,215 |
Canada — 1.3% | ||
West Fraser Timber Co. Ltd. | 4,127 | 316,094 |
China — 2.0% | ||
Contemporary Amperex Technology Co. Ltd., Class A | 9,120 | 254,645 |
NARI Technology Co. Ltd., Class A | 69,920 | 225,755 |
480,400 | ||
Denmark — 1.2% | ||
NKT A/S * | 1,404 | 116,468 |
Orsted A/S * (a) | 3,120 | 171,470 |
287,938 | ||
Finland — 0.9% | ||
UPM-Kymmene OYJ | 6,102 | 213,845 |
France — 6.7% | ||
Dassault Systemes SE | 17,799 | 698,645 |
Neoen SA (a) | 3,606 | 110,362 |
Nexans SA | 3,750 | 399,363 |
SPIE SA | 9,972 | 362,588 |
1,570,958 | ||
Germany — 4.1% | ||
Infineon Technologies AG | 2,782 | 96,544 |
Mercedes-Benz Group AG | 3,191 | 241,370 |
Siemens AG (Registered) | 3,359 | 629,253 |
967,167 | ||
Ireland — 2.9% | ||
Kingspan Group plc | 7,709 | 685,697 |
Italy — 4.1% | ||
Prysmian SpA | 17,797 | 965,636 |
Japan — 7.8% | ||
Hitachi Ltd. | 10,300 | 950,285 |
Keyence Corp. | 1,700 | 747,609 |
Kurita Water Industries Ltd. | 3,200 | 126,733 |
1,824,627 | ||
Netherlands — 2.0% | ||
Arcadis NV | 7,663 | 473,259 |
South Africa — 0.6% | ||
Scatec ASA * (a) | 18,240 | 133,118 |
INVESTMENTS | SHARES | VALUE($) |
South Korea — 0.5% | ||
Samsung SDI Co. Ltd. | 350 | 108,314 |
Spain — 3.4% | ||
Iberdrola SA | 65,239 | 799,933 |
Sweden — 4.0% | ||
Atlas Copco AB, Class A | 41,005 | 718,247 |
Volvo AB, Class B | 8,788 | 223,683 |
941,930 | ||
Switzerland — 4.2% | ||
ABB Ltd. (Registered) | 13,944 | 677,517 |
DSM-Firmenich AG | 815 | 91,406 |
SIG Group AG | 5,460 | 109,109 |
Sika AG (Registered) | 397 | 112,932 |
990,964 | ||
Taiwan — 1.0% | ||
Taiwan Semiconductor Manufacturing Co. Ltd., ADR | 1,714 | 235,401 |
United Kingdom — 1.5% | ||
Spirax-Sarco Engineering plc | 383 | 42,144 |
SSE plc | 14,580 | 303,066 |
345,210 | ||
United States — 48.8% | ||
AGCO Corp. | 2,020 | 230,664 |
Autodesk, Inc. * | 1,903 | 405,054 |
Carrier Global Corp. | 9,557 | 587,660 |
CNH Industrial NV | 24,078 | 274,489 |
Cognex Corp. | 2,863 | 118,929 |
Deere & Co. | 1,204 | 471,258 |
Eaton Corp. plc | 389 | 123,803 |
Enphase Energy, Inc. * | 1,080 | 117,461 |
First Solar, Inc. * | 1,459 | 257,222 |
Hubbell, Inc. | 1,312 | 486,122 |
Linde plc | 1,288 | 567,956 |
NextEra Energy, Inc. | 11,235 | 752,408 |
NVIDIA Corp. | 347 | 299,815 |
ON Semiconductor Corp. * | 1,100 | 77,176 |
Owens Corning | 742 | 124,812 |
Quanta Services, Inc. | 3,645 | 942,451 |
Rayonier, Inc., REIT | 8,551 | 253,623 |
Schneider Electric SE | 4,033 | 919,578 |
TE Connectivity Ltd. | 1,560 | 220,709 |
Tetra Tech, Inc. | 3,610 | 702,939 |
Trane Technologies plc | 3,196 | 1,014,219 |
Trex Co., Inc. * | 5,418 | 479,764 |
April 30, 2024 | J.P. Morgan Exchange-Traded Funds | 9 |
INVESTMENTS | SHARES | VALUE($) |
Common Stocks — continued | ||
United States — continued | ||
Trimble, Inc. * | 792 | 47,575 |
Veralto Corp. | 5,461 | 511,586 |
Watts Water Technologies, Inc., Class A | 287 | 56,958 |
Weyerhaeuser Co., REIT | 20,063 | 605,301 |
Xylem, Inc. | 6,385 | 834,519 |
11,484,051 | ||
Total Common Stocks (Cost $20,692,542) | 23,211,655 | |
Short-Term Investments — 0.4% | ||
Investment Companies — 0.4% | ||
JPMorgan Prime Money Market Fund Class IM Shares, 5.41% (b) (c)(Cost $94,397) | 94,358 | 94,377 |
Total Investments — 99.1% (Cost $20,786,939) | 23,306,032 | |
Other Assets Less Liabilities — 0.9% | 213,592 | |
NET ASSETS — 100.0% | 23,519,624 | |
Percentages indicated are based on net assets. |
Abbreviations | |
ADR | American Depositary Receipt |
OYJ | Public Limited Company |
REIT | Real Estate Investment Trust |
* | Non-income producing security. |
(a) | Security exempt from registration pursuant to Regulation S under the Securities Act of 1933, as amended. Regulation S applies to securities offerings that are made outside of the United States and do not involve direct selling efforts in the United States and as such may have restrictions on resale. |
(b) | Investment in an affiliated fund, which is registered under the Investment Company Act of 1940, as amended, and is advised by J.P. Morgan Investment Management Inc. |
(c) | The rate shown is the current yield as of April 30, 2024. |
INDUSTRY | PERCENT OF TOTAL INVESTMENTS |
Electrical Equipment | 17.9 % |
Machinery | 13.0 |
Building Products | 12.4 |
Electric Utilities | 8.7 |
Commercial Services & Supplies | 8.2 |
Industrial Conglomerates | 6.8 |
Electronic Equipment, Instruments & Components | 5.3 |
Software | 4.7 |
Semiconductors & Semiconductor Equipment | 4.7 |
Construction & Engineering | 4.0 |
Specialized REITs | 3.7 |
Chemicals | 3.3 |
Paper & Forest Products | 2.3 |
Professional Services | 2.0 |
Independent Power and Renewable Electricity Producers | 1.1 |
Automobiles | 1.0 |
Containers & Packaging | 0.5 |
Short-Term Investments | 0.4 |
10 | J.P. Morgan Exchange-Traded Funds | April 30, 2024 |
INVESTMENTS | SHARES | VALUE($) |
Common Stocks — 98.4% | ||
Australia — 1.4% | ||
Goodman Group, REIT | 6,096 | 123,137 |
NEXTDC Ltd. * | 10,869 | 115,380 |
Ramsay Health Care Ltd. | 2,849 | 95,499 |
334,016 | ||
Belgium — 2.5% | ||
Elia Group SA/NV | 3,602 | 346,806 |
Warehouses De Pauw CVA, REIT | 9,391 | 248,339 |
595,145 | ||
Brazil — 1.8% | ||
Transmissora Alianca de Energia Eletrica S/A | 63,726 | 432,482 |
Canada — 2.6% | ||
Canadian National Railway Co. | 5,221 | 634,038 |
China — 5.0% | ||
China Longyuan Power Group Corp. Ltd., Class H | 408,000 | 285,817 |
Contemporary Amperex Technology Co. Ltd., Class A | 4,020 | 112,245 |
NARI Technology Co. Ltd., Class A | 247,140 | 797,957 |
1,196,019 | ||
Denmark — 0.2% | ||
Orsted A/S * (a) | 1,095 | 60,179 |
France — 8.9% | ||
Engie SA * | 59,340 | 1,030,179 |
Getlink SE | 29,740 | 506,285 |
Neoen SA (a) | 3,434 | 105,098 |
Veolia Environnement SA | 15,901 | 494,325 |
2,135,887 | ||
Germany — 6.0% | ||
E.ON SE | 61,533 | 814,818 |
Vonovia SE | 21,274 | 614,734 |
1,429,552 | ||
Italy — 3.7% | ||
Enel SpA | 44,040 | 289,450 |
Infrastrutture Wireless Italiane SpA (a) | 21,159 | 226,760 |
Terna - Rete Elettrica Nazionale | 46,553 | 372,978 |
889,188 | ||
Japan — 2.2% | ||
Kurita Water Industries Ltd. | 4,700 | 186,139 |
Kyushu Railway Co. | 15,600 | 335,649 |
521,788 | ||
Portugal — 0.4% | ||
EDP - Energias de Portugal SA * | 24,857 | 93,342 |
INVESTMENTS | SHARES | VALUE($) |
Singapore — 0.7% | ||
Parkway Life, REIT | 60,500 | 158,808 |
South Korea — 0.4% | ||
Samsung SDI Co. Ltd. | 294 | 90,984 |
Spain — 4.0% | ||
Cellnex Telecom SA (a) | 10,832 | 358,048 |
Corp. ACCIONA Energias Renovables SA | 4,759 | 96,643 |
EDP Renovaveis SA | 14,557 | 199,288 |
Iberdrola SA | 25,007 | 306,625 |
960,604 | ||
United Kingdom — 15.6% | ||
Assura plc, REIT | 829,553 | 424,707 |
Grainger plc | 76,831 | 246,251 |
LondonMetric Property plc, REIT | 189,586 | 462,763 |
National Grid plc | 65,672 | 861,430 |
Severn Trent plc | 7,860 | 242,279 |
SSE plc | 45,418 | 944,077 |
UNITE Group plc (The), REIT | 26,614 | 307,672 |
United Utilities Group plc | 18,952 | 247,043 |
3,736,222 | ||
United States — 43.0% | ||
Alexandria Real Estate Equities, Inc., REIT | 3,164 | 366,613 |
American Tower Corp., REIT | 4,279 | 734,105 |
Americold Realty Trust, Inc., REIT | 23,870 | 524,424 |
CMS Energy Corp. | 9,603 | 582,038 |
Crown Castle, Inc., REIT | 567 | 53,173 |
Digital Realty Trust, Inc., REIT | 5,832 | 809,365 |
Equinix, Inc., REIT | 373 | 265,244 |
Ferrovial SE | 10,027 | 360,625 |
Hannon Armstrong Sustainable Infrastructure Capital, Inc., REIT | 10,763 | 269,183 |
HCA Healthcare, Inc. | 945 | 292,780 |
Healthpeak Properties, Inc., REIT | 22,421 | 417,255 |
Itron, Inc. * | 2,153 | 198,334 |
NextEra Energy, Inc. | 11,335 | 759,105 |
PG&E Corp. | 24,248 | 414,883 |
Prologis, Inc., REIT | 1,766 | 180,220 |
Public Service Enterprise Group, Inc. | 3,996 | 276,044 |
Rexford Industrial Realty, Inc., REIT | 2,361 | 101,074 |
Sabra Health Care REIT, Inc., REIT | 37,352 | 519,940 |
SBA Communications Corp., REIT | 1,100 | 204,732 |
Union Pacific Corp. | 3,089 | 732,587 |
Ventas, Inc., REIT | 11,098 | 491,419 |
Welltower, Inc., REIT | 7,165 | 682,681 |
April 30, 2024 | J.P. Morgan Exchange-Traded Funds | 11 |
INVESTMENTS | SHARES | VALUE($) |
Common Stocks — continued | ||
United States — continued | ||
Weyerhaeuser Co., REIT | 11,721 | 353,623 |
Xylem, Inc. | 5,362 | 700,813 |
10,290,260 | ||
Total Common Stocks (Cost $22,989,334) | 23,558,514 | |
NO. OF RIGHTS | ||
Rights — 0.0% ^ | ||
Australia — 0.0% ^ | ||
NEXTDC Ltd., expiring 5/2/2024*(Cost $—) | 1,811 | 1,158 |
SHARES | ||
Short-Term Investments — 1.0% | ||
Investment Companies — 1.0% | ||
JPMorgan Prime Money Market Fund Class IM Shares, 5.41% (b) (c)(Cost $231,260) | 231,206 | 231,253 |
Total Investments — 99.4% (Cost $23,220,594) | 23,790,925 | |
Other Assets Less Liabilities — 0.6% | 152,376 | |
NET ASSETS — 100.0% | 23,943,301 | |
Percentages indicated are based on net assets. |
Abbreviations | |
CVA | Certificaten Van Aandelen (Dutch Certificate) |
REIT | Real Estate Investment Trust |
^ | Amount rounds to less than 0.1% of net assets. | |
* | Non-income producing security. | |
(a) | Security exempt from registration pursuant to Regulation S under the Securities Act of 1933, as amended. Regulation S applies to securities offerings that are made outside of the United States and do not involve direct selling efforts in the United States and as such may have restrictions on resale. | |
(b) | Investment in an affiliated fund, which is registered under the Investment Company Act of 1940, as amended, and is advised by J.P. Morgan Investment Management Inc. | |
(c) | The rate shown is the current yield as of April 30, 2024. |
INDUSTRY | PERCENT OF TOTAL INVESTMENTS |
Multi-Utilities | 17.1 % |
Electric Utilities | 16.9 |
Health Care REITs | 11.3 |
Specialized REITs | 10.2 |
Ground Transportation | 7.2 |
Industrial REITs | 5.0 |
Electrical Equipment | 3.8 |
Machinery | 3.7 |
Real Estate Management & Development | 3.6 |
Independent Power and Renewable Electricity Producers | 2.9 |
Diversified Telecommunication Services | 2.5 |
Transportation Infrastructure | 2.1 |
Water Utilities | 2.1 |
Diversified REITs | 1.9 |
Health Care Providers & Services | 1.6 |
Office REITs | 1.5 |
Construction & Engineering | 1.5 |
Residential REITs | 1.3 |
Electronic Equipment, Instruments & Components | 1.2 |
Mortgage Real Estate Investment Trusts (REITs) | 1.1 |
IT Services | 0.5 |
Short-Term Investments | 1.0 |
12 | J.P. Morgan Exchange-Traded Funds | April 30, 2024 |
JPMorgan Climate Change Solutions ETF | JPMorgan Sustainable Infrastructure ETF | |
ASSETS: | ||
Investments in non-affiliates, at value | $23,211,655 | $23,559,672 |
Investments in affiliates, at value | 94,377 | 231,253 |
Cash | 178,176 | 132,621 |
Foreign currency, at value | 4,678 | 4,404 |
Receivables: | ||
Dividends from non-affiliates | 17,687 | 15,262 |
Dividends from affiliates | 14 | 34 |
Tax reclaims | 22,473 | 9,708 |
Total Assets | 23,529,060 | 23,952,954 |
LIABILITIES: | ||
Accrued liabilities: | ||
Management fees (See Note 3.A.) | 9,436 | 9,653 |
Total Liabilities | 9,436 | 9,653 |
Net Assets | $23,519,624 | $23,943,301 |
NET ASSETS: | ||
Paid-in-Capital | $26,388,065 | $24,627,196 |
Total distributable earnings (loss) | (2,868,441 ) | (683,895 ) |
Total Net Assets | $23,519,624 | $23,943,301 |
Outstanding number of shares (unlimited number of shares authorized - par value $0.0001) | 550,000 | 525,000 |
Net asset value, per share | $42.76 | $45.61 |
Cost of investments in non-affiliates | $20,692,542 | $22,989,334 |
Cost of investments in affiliates | 94,397 | 231,260 |
Cost of foreign currency | 4,675 | 4,441 |
April 30, 2024 | J.P. Morgan Exchange-Traded Funds | 13 |
JPMorgan Climate Change Solutions ETF | JPMorgan Sustainable Infrastructure ETF | |
INVESTMENT INCOME: | ||
Interest income from non-affiliates | $2 | $2 |
Interest income from affiliates | 1,664 | 586 |
Dividend income from non-affiliates | 141,312 | 287,097 |
Dividend income from affiliates | 1,957 | 6,621 |
Non-cash dividend income from non-affiliates | 18,309 | — |
Foreign taxes withheld (net) | (12,527 ) | (15,703 ) |
Total investment income | 150,717 | 278,603 |
EXPENSES: | ||
Management fees (See Note 3.A.) | 54,071 | 59,542 |
Total expenses | 54,071 | 59,542 |
Net investment income (loss) | 96,646 | 219,061 |
REALIZED/UNREALIZED GAINS (LOSSES): | ||
Net realized gain (loss) on transactions from: | ||
Investments in non-affiliates | (218,253 ) | (57,068 ) |
Investments in affiliates | 32 | 20 |
Foreign currency transactions | (5,243 ) | (3,256 ) |
Net realized gain (loss) | (223,464 ) | (60,304 ) |
Change in net unrealized appreciation/depreciation on: | ||
Investments in non-affiliates | 5,082,499 | 1,953,272 |
Investments in affiliates | (40 ) | (59 ) |
Foreign currency translations | 1,176 | (41 ) |
Change in net unrealized appreciation/depreciation | 5,083,635 | 1,953,172 |
Net realized/unrealized gains (losses) | 4,860,171 | 1,892,868 |
Change in net assets resulting from operations | $4,956,817 | $2,111,929 |
14 | J.P. Morgan Exchange-Traded Funds | April 30, 2024 |
JPMorgan Climate Change Solutions ETF | JPMorgan Sustainable Infrastructure ETF | |||
Six Months Ended April 30, 2024 (Unaudited) | Year Ended October 31, 2023 | Six Months Ended April 30, 2024 (Unaudited) | Year Ended October 31, 2023 | |
CHANGE IN NET ASSETS RESULTING FROM OPERATIONS: | ||||
Net investment income (loss) | $96,646 | $240,022 | $219,061 | $323,751 |
Net realized gain (loss) | (223,464 ) | (2,097,113 ) | (60,304 ) | (1,276,519 ) |
Change in net unrealized appreciation/depreciation | 5,083,635 | 1,330,155 | 1,953,172 | (385,984 ) |
Change in net assets resulting from operations | 4,956,817 | (526,936 ) | 2,111,929 | (1,338,752 ) |
DISTRIBUTIONS TO SHAREHOLDERS: | ||||
Total distributions to shareholders | (249,706 ) | (221,237 ) | (421,749 ) | (76,216 ) |
CAPITAL TRANSACTIONS: | ||||
Change in net assets resulting from capital transactions | — | — | — | 14,003,003 |
NET ASSETS: | ||||
Change in net assets | 4,707,111 | (748,173 ) | 1,690,180 | 12,588,035 |
Beginning of period | 18,812,513 | 19,560,686 | 22,253,121 | 9,665,086 |
End of period | $23,519,624 | $18,812,513 | $23,943,301 | $22,253,121 |
CAPITAL TRANSACTIONS: | ||||
Proceeds from shares issued | $— | $— | $— | $14,003,003 |
Total change in net assets resulting from capital transactions | $— | $— | $— | $14,003,003 |
SHARE TRANSACTIONS: | ||||
Issued | — | — | — | 300,000 |
Net increase in shares from transactions | — | — | — | 300,000 |
April 30, 2024 | J.P. Morgan Exchange-Traded Funds | 15 |
Per share operating performance | |||||
Investment operations | Distributions | ||||
Net asset value, beginning of period | Net investment income (loss) (b) | Net realized and unrealized gains (losses) on investments | Total from investment operations | Net investment income | |
JPMorgan Climate Change Solutions ETF | |||||
Six Months Ended April 30, 2024 (Unaudited) | $34.20 | $0.18 | $8.83 | $9.01 | $(0.45 ) |
Year Ended October 31, 2023 | 35.56 | 0.44 | (1.40 ) | (0.96 ) | (0.40 ) |
December 13, 2021 (f) through October 31, 2022 | 48.00 | 0.43 | (12.84 ) | (12.41 ) | (0.03 ) |
JPMorgan Sustainable Infrastructure ETF | |||||
Six Months Ended April 30, 2024 (Unaudited) | 42.39 | 0.42 | 3.60 | 4.02 | (0.80 ) |
Year Ended October 31, 2023 | 42.96 | 0.97 | (1.20 ) | (0.23 ) | (0.34 ) |
September 7, 2022 (f) through October 31, 2022 | 48.00 | 0.04 | (5.08 ) | (5.04 ) | — |
(a) | Annualized for periods less than one year, unless otherwise noted. |
(b) | Calculated based upon average shares outstanding. |
(c) | Not annualized for periods less than one year. |
(d) | Includes adjustments in accordance with accounting principles generally accepted in the United States of America and as such, the net asset values for financial reporting purposes and the returns based upon those net asset values may differ from the net asset values and returns for shareholder transactions. |
(e) | Market price return was calculated assuming an initial investment made at the market price at the beginning of the reporting period, reinvestment of all dividends and distributions at the market price during the period, and sale at the market price on the last day of the period. The closing price was used to calculate the market price return. |
(f) | Commencement of operations. |
(g) | Since the shares of the Fund did not trade in the secondary market until the day after the Fund’s inception, for the period from the inception to the first day of secondary market trading, the net asset value is used as a proxy for the secondary market trading price to calculate the market returns. |
16 | J.P. Morgan Exchange-Traded Funds | April 30, 2024 |
Ratios/Supplemental data | |||||||
Ratios to average net assets (a) | |||||||
Net asset value, end of period | Market price, end of period | Total return (c)(d) | Market price total return (c)(e) | Net assets, end of period | Net expenses | Net investment income (loss) | Portfolio turnover rate (c) |
$42.76 | $42.94 | 26.44 % | 26.75 % | $23,519,624 | 0.49 % | 0.87 % | 25 % |
34.20 | 34.26 | (2.80 ) | (3.04 ) | 18,812,513 | 0.49 | 1.12 | 43 |
35.56 | 35.71 | (25.87 ) | (25.56 )(g) | 19,560,686 | 0.49 | 1.26 | 32 |
45.61 | 45.69 | 9.38 | 9.41 | 23,943,301 | 0.49 | 1.80 | 26 |
42.39 | 42.45 | (0.59 ) | (0.68 ) | 22,253,121 | 0.49 | 2.11 | 75 |
42.96 | 43.06 | (10.50 ) | (10.29 )(g) | 9,665,086 | 0.49 | 0.64 | — |
April 30, 2024 | J.P. Morgan Exchange-Traded Funds | 17 |
Diversification Classification | |
JPMorgan Climate Change Solutions ETF | Non-Diversified |
JPMorgan Sustainable Infrastructure ETF | Non-Diversified |
Listing Exchange | |
Climate Change Solutions ETF | NYSE Arca, Inc. |
Sustainable Infrastructure ETF | The NASDAQ Stock Market® LLC |
18 | J.P. Morgan Exchange-Traded Funds | April 30, 2024 |
Climate Change Solutions ETF | ||||
Level 1 Quoted prices | Level 2 Other significant observable inputs | Level 3 Significant unobservable inputs | Total | |
Investments in Securities | ||||
Common Stocks | ||||
Australia | $— | $339,898 | $— | $339,898 |
Austria | — | 47,215 | — | 47,215 |
Canada | 316,094 | — | — | 316,094 |
China | — | 480,400 | — | 480,400 |
Denmark | — | 287,938 | — | 287,938 |
Finland | — | 213,845 | — | 213,845 |
France | — | 1,570,958 | — | 1,570,958 |
Germany | — | 967,167 | — | 967,167 |
Ireland | — | 685,697 | — | 685,697 |
Italy | — | 965,636 | — | 965,636 |
Japan | — | 1,824,627 | — | 1,824,627 |
Netherlands | — | 473,259 | — | 473,259 |
South Africa | — | 133,118 | — | 133,118 |
South Korea | — | 108,314 | — | 108,314 |
Spain | — | 799,933 | — | 799,933 |
Sweden | — | 941,930 | — | 941,930 |
Switzerland | — | 990,964 | — | 990,964 |
Taiwan | 235,401 | — | — | 235,401 |
United Kingdom | — | 345,210 | — | 345,210 |
United States | 10,564,473 | 919,578 | — | 11,484,051 |
Total Common Stocks | 11,115,968 | 12,095,687 | — | 23,211,655 |
Short-Term Investments | ||||
Investment Companies | 94,377 | — | — | 94,377 |
April 30, 2024 | J.P. Morgan Exchange-Traded Funds | 19 |
Climate Change Solutions ETF (continued) | ||||
Level 1 Quoted prices | Level 2 Other significant observable inputs | Level 3 Significant unobservable inputs | Total | |
Total Investments in Securities | $11,210,345 | $12,095,687 | $— | $23,306,032 |
Sustainable Infrastructure ETF | ||||
Level 1 Quoted prices | Level 2 Other significant observable inputs | Level 3 Significant unobservable inputs | Total | |
Investments in Securities | ||||
Common Stocks | ||||
Australia | $— | $334,016 | $— | $334,016 |
Belgium | — | 595,145 | — | 595,145 |
Brazil | 432,482 | — | — | 432,482 |
Canada | 634,038 | — | — | 634,038 |
China | — | 1,196,019 | — | 1,196,019 |
Denmark | — | 60,179 | — | 60,179 |
France | — | 2,135,887 | — | 2,135,887 |
Germany | — | 1,429,552 | — | 1,429,552 |
Italy | — | 889,188 | — | 889,188 |
Japan | — | 521,788 | — | 521,788 |
Portugal | — | 93,342 | — | 93,342 |
Singapore | — | 158,808 | — | 158,808 |
South Korea | — | 90,984 | — | 90,984 |
Spain | — | 960,604 | — | 960,604 |
United Kingdom | 246,251 | 3,489,971 | — | 3,736,222 |
United States | 9,929,635 | 360,625 | — | 10,290,260 |
Total Common Stocks | 11,242,406 | 12,316,108 | — | 23,558,514 |
Rights | — | 1,158 | — | 1,158 |
Short-Term Investments | ||||
Investment Companies | 231,253 | — | — | 231,253 |
Total Investments in Securities | $11,473,659 | $12,317,266 | $— | $23,790,925 |
20 | J.P. Morgan Exchange-Traded Funds | April 30, 2024 |
Climate Change Solutions ETF | |||||||||
For the six months ended April 30, 2024 | |||||||||
Security Description | Value at October 31, 2023 | Purchases at Cost | Proceeds from Sales | Net Realized Gain (Loss) | Change in Unrealized Appreciation/ (Depreciation) | Value at April 30, 2024 | Shares at April 30, 2024 | Dividend Income | Capital Gain Distributions |
JPMorgan Prime Money Market Fund Class IM Shares, 5.41% (a) (b) | $195,583 | $81,553 | $182,751 | $32 | $(40 ) | $94,377 | 94,358 | $1,957 | $— |
(a) | Investment in an affiliated fund, which is registered under the Investment Company Act of 1940, as amended, and is advised by J.P. Morgan Investment Management Inc. |
(b) | The rate shown is the current yield as of April 30, 2024. |
Sustainable Infrastructure ETF | |||||||||
For the six months ended April 30, 2024 | |||||||||
Security Description | Value at October 31, 2023 | Purchases at Cost | Proceeds from Sales | Net Realized Gain (Loss) | Change in Unrealized Appreciation/ (Depreciation) | Value at April 30, 2024 | Shares at April 30, 2024 | Dividend Income | Capital Gain Distributions |
JPMorgan Prime Money Market Fund Class IM Shares, 5.41% (a) (b) | $522,146 | $2,005,812 | $2,296,666 | $20 | $(59 ) | $231,253 | 231,206 | $6,621 | $— |
(a) | Investment in an affiliated fund, which is registered under the Investment Company Act of 1940, as amended, and is advised by J.P. Morgan Investment Management Inc. |
(b) | The rate shown is the current yield as of April 30, 2024. |
April 30, 2024 | J.P. Morgan Exchange-Traded Funds | 21 |
Climate Change Solutions ETF | 0.49 % |
Sustainable Infrastructure ETF | 0.49 |
22 | J.P. Morgan Exchange-Traded Funds | April 30, 2024 |
Purchases (excluding U.S. Government) | Sales (excluding U.S. Government) | |
Climate Change Solutions ETF | $5,481,423 | $5,456,205 |
Sustainable Infrastructure ETF | 6,205,175 | 6,168,903 |
Aggregate Cost | Gross Unrealized Appreciation | Gross Unrealized Depreciation | Net Unrealized Appreciation (Depreciation) | |
Climate Change Solutions ETF | $20,786,939 | $3,451,116 | $932,023 | $2,519,093 |
Sustainable Infrastructure ETF | 23,220,594 | 1,626,350 | 1,056,019 | 570,331 |
Capital Loss Carryforward Character | ||
Short-Term | Long-Term | |
Climate Change Solutions ETF | $3,953,712 | $1,266,146 |
Sustainable Infrastructure ETF | 966,654 | 294,709 |
April 30, 2024 | J.P. Morgan Exchange-Traded Funds | 23 |
24 | J.P. Morgan Exchange-Traded Funds | April 30, 2024 |
% of Ownership | |
Climate Change Solutions ETF | 82 % |
Sustainable Infrastructure ETF | 36 |
Sustainable Infrastructure ETF | |
United Kingdom | 15.7 % |
April 30, 2024 | J.P. Morgan Exchange-Traded Funds | 25 |
26 | J.P. Morgan Exchange-Traded Funds | April 30, 2024 |
Beginning Account Value November 1, 2023 | Ending Account Value April 30, 2024 | Expenses Paid During the Period* | Annualized Expense Ratio | |
JPMorgan Climate Change Solutions ETF | ||||
Actual | $1,000.00 | $1,264.40 | $2.76 | 0.49 % |
Hypothetical | 1,000.00 | 1,022.43 | 2.46 | 0.49 |
JPMorgan Sustainable Infrastructure ETF | ||||
Actual | 1,000.00 | 1,093.80 | 2.55 | 0.49 |
Hypothetical | 1,000.00 | 1,022.43 | 2.46 | 0.49 |
* | Expenses are equal to each Fund's annualized net expense ratio, multiplied by the average account value over the period, multiplied by 182/366 (to reflect the one-half year period). |
April 30, 2024 | J.P. Morgan Exchange-Traded Funds | 27 |
28 | J.P. Morgan Exchange-Traded Funds | April 30, 2024 |


Fund | Ticker | Listing Exchange |
JPMorgan International Research Enhanced Equity ETF | JIRE | NYSE Arca, Inc. |

1 | |
2 | |
5 | |
10 | |
14 | |
16 | |
25 | |
26 |
 | “The U.S. economic expansion has entered its fifth year, led by consumer spending, an increase in immigrant workers and receding inflation.” — Brian S. Shlissel |

President, J.P. Morgan Exchange-Traded Funds
J.P. Morgan Asset Management
1-844-4JPM-ETF or jpmorgan.com/etfs for more information
April 30, 2024 | J.P. Morgan Exchange-Traded Funds | 1 |
REPORTING PERIOD RETURN: | |
Net Asset Value * | 18.19% |
Market Price ** | 17.98% |
MSCI EAFE Index (net total return) | 18.63% |
Net Assets as of 4/30/2024 | $6,040,459,200 |
Fund Ticker | JIRE |
As a result, investor demand for equities and bonds surged in
2 | J.P. Morgan Exchange-Traded Funds | April 30, 2024 |
TOP TEN HOLDINGS OF THE PORTFOLIO AS OF April 30, 2024 | PERCENT OF TOTAL INVESTMENTS | |
1. | Novo Nordisk A/S, Class B (Denmark) | 3.1 % |
2. | ASML Holding NV (Netherlands) | 2.6 |
3. | Nestle SA (Registered) | 2.3 |
4. | Shell plc | 2.0 |
5. | LVMH Moet Hennessy Louis Vuitton SE (France) | 2.0 |
6. | AstraZeneca plc (United Kingdom) | 1.9 |
7. | Toyota Motor Corp. (Japan) | 1.6 |
8. | Roche Holding AG | 1.5 |
9. | BP plc | 1.4 |
10. | Allianz SE (Registered) (Germany) | 1.4 |
PORTFOLIO COMPOSITION BY COUNTRY AS OF April 30, 2024 | PERCENT OF TOTAL INVESTMENTS |
Japan | 22.4% |
France | 12.7 |
United Kingdom | 11.9 |
United States | 11.1 |
Germany | 7.8 |
Australia | 6.1 |
Netherlands | 4.8 |
Switzerland | 4.7 |
Denmark | 3.6 |
Sweden | 2.4 |
Spain | 2.0 |
Hong Kong | 1.4 |
Italy | 1.3 |
Singapore | 1.1 |
Others (each less than 1.0%) | 2.7 |
Short-Term Investments | 4.0 |
April 30, 2024 | J.P. Morgan Exchange-Traded Funds | 3 |
INCEPTION DATE | SIX MONTHS* | 1 YEAR | 5 YEAR | 10 YEAR | |
JPMorgan International Research Enhanced Equity ETF | |||||
Net Asset Value | October 28, 1992** | 18.19 % | 9.91 % | 6.56 % | 4.51 % |
Market Price | 17.98 | 10.07 | 6.60 | 4.53 |
* | Not annualized. |
** | Inception date for Class R6 Shares of the Predecessor Fund (as defined below). |
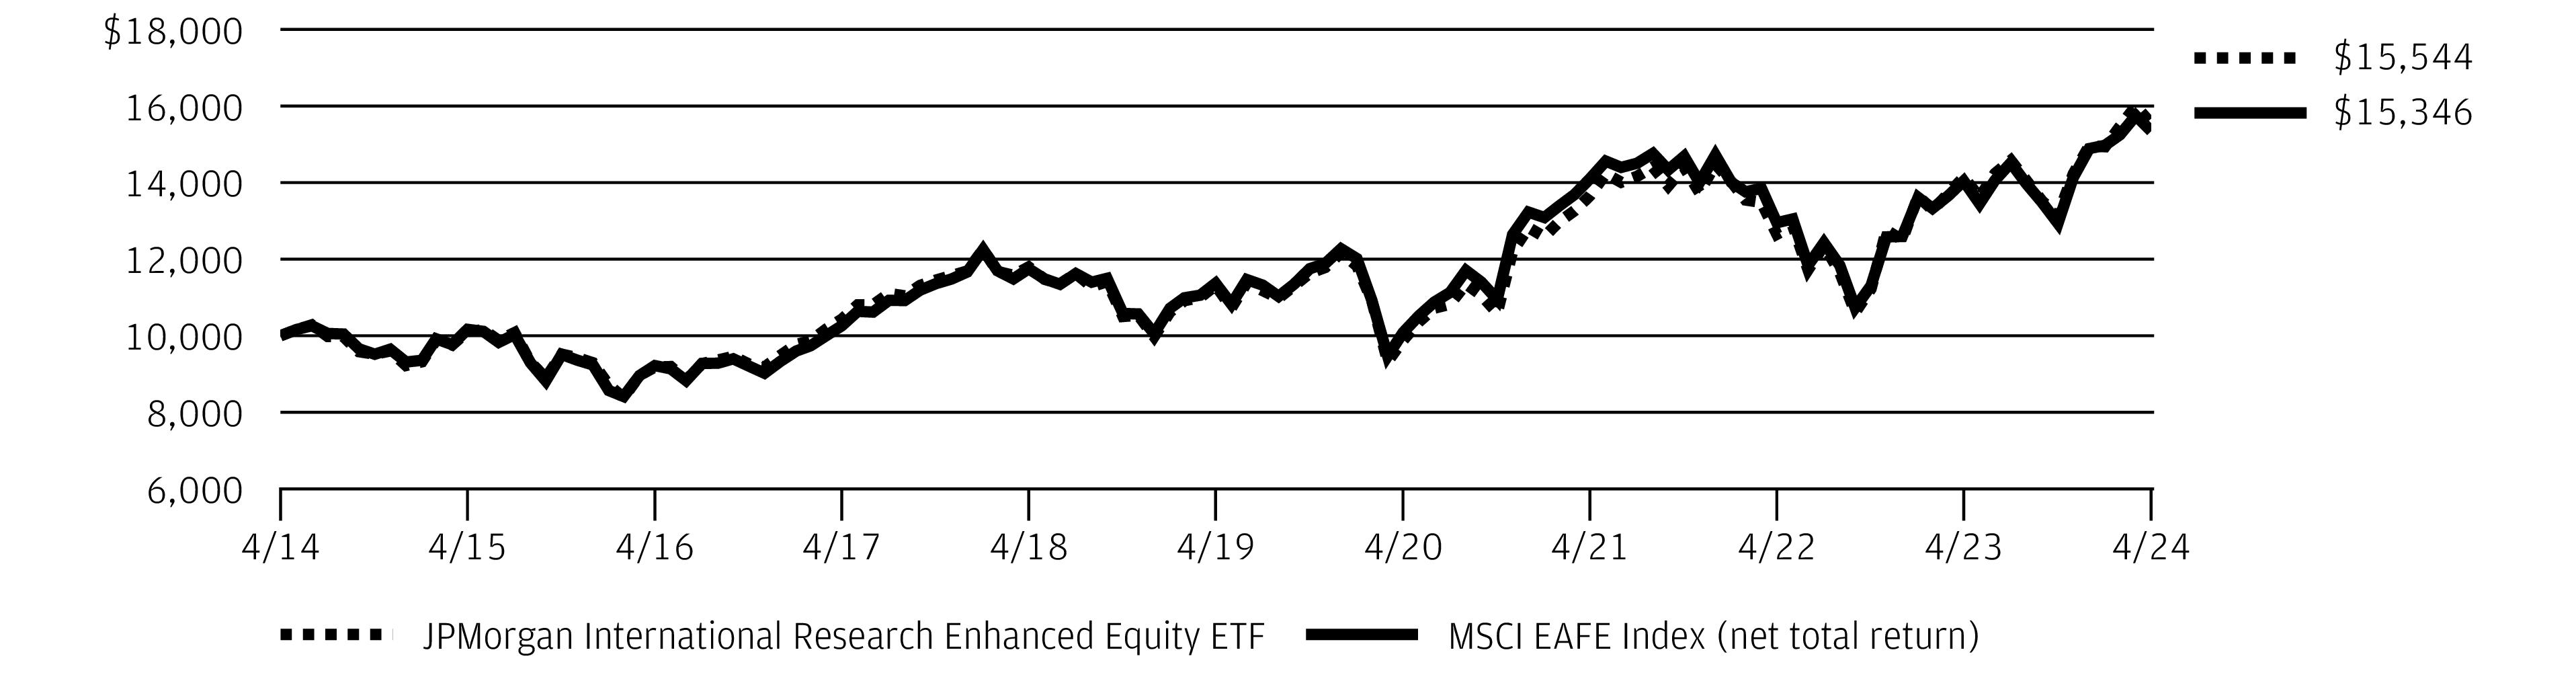
4 | J.P. Morgan Exchange-Traded Funds | April 30, 2024 |
INVESTMENTS | SHARES | VALUE($) |
Common Stocks — 97.5% | ||
Australia — 6.2% | ||
ANZ Group Holdings Ltd. | 869,547 | 15,690,044 |
Aurizon Holdings Ltd. | 996,880 | 2,448,588 |
BHP Group Ltd. | 2,094,893 | 57,454,779 |
Brambles Ltd. | 591,290 | 5,562,651 |
Commonwealth Bank of Australia | 410,638 | 30,087,253 |
Dexus, REIT | 819,609 | 3,722,838 |
Glencore plc | 883,319 | 5,139,648 |
Goodman Group, REIT | 1,460,435 | 29,500,249 |
GPT Group (The), REIT | 1,423,513 | 3,828,442 |
Insurance Australia Group Ltd. | 2,287,809 | 9,478,340 |
Macquarie Group Ltd. | 138,636 | 16,600,069 |
Medibank Pvt Ltd. | 4,067,874 | 9,322,999 |
Mirvac Group, REIT | 4,630,509 | 6,067,214 |
National Australia Bank Ltd. | 998,438 | 21,643,671 |
QBE Insurance Group Ltd. | 1,480,517 | 16,935,587 |
Rio Tinto Ltd. | 612,115 | 50,942,866 |
Rio Tinto plc | 324,665 | 21,967,087 |
Santos Ltd. | 3,265,312 | 16,024,087 |
Wesfarmers Ltd. | 267,725 | 11,469,131 |
Westpac Banking Corp. | 1,044,587 | 17,346,771 |
Woodside Energy Group Ltd. | 245,737 | 4,402,872 |
Woolworths Group Ltd. | 959,442 | 19,684,987 |
375,320,173 | ||
Austria — 0.2% | ||
Erste Group Bank AG | 272,153 | 12,691,881 |
Belgium — 0.5% | ||
Anheuser-Busch InBev SA | 230,380 | 13,770,686 |
KBC Group NV | 223,153 | 16,576,734 |
30,347,420 | ||
China — 0.5% | ||
BOC Hong Kong Holdings Ltd. | 3,677,000 | 11,270,348 |
Prosus NV | 650,668 | 21,771,319 |
33,041,667 | ||
Denmark — 3.7% | ||
Carlsberg A/S, Class B | 220,212 | 29,621,347 |
Novo Nordisk A/S, Class B | 1,490,072 | 191,090,276 |
220,711,623 | ||
Finland — 0.8% | ||
Nokia OYJ | 1,253,151 | 4,555,645 |
Nordea Bank Abp | 3,687,523 | 42,864,617 |
47,420,262 | ||
INVESTMENTS | SHARES | VALUE($) |
France — 12.9% | ||
Air Liquide SA | 381,306 | 74,575,300 |
Airbus SE | 250,863 | 41,281,454 |
AXA SA (a) | 276,998 | 9,570,721 |
BNP Paribas SA | 710,808 | 51,151,062 |
Capgemini SE | 255,357 | 53,671,208 |
Cie Generale des Etablissements Michelin SCA | 633,171 | 24,325,574 |
Dassault Systemes SE | 304,762 | 11,962,495 |
Engie SA * (a) | 2,812,279 | 48,822,897 |
Kering SA | 28,139 | 9,861,851 |
Legrand SA | 477,944 | 49,116,675 |
L'Oreal SA | 71,039 | 33,306,858 |
LVMH Moet Hennessy Louis Vuitton SE | 148,865 | 122,283,120 |
Orange SA | 2,385,991 | 26,556,757 |
Pernod Ricard SA | 189,438 | 28,650,996 |
Safran SA | 269,162 | 58,362,940 |
Societe Generale SA | 1,100,251 | 29,646,317 |
TotalEnergies SE | 593,410 | 43,080,808 |
Vinci SA (a) | 519,364 | 60,857,026 |
777,084,059 | ||
Germany — 7.9% | ||
adidas AG | 77,873 | 18,766,076 |
Allianz SE (Registered) | 299,055 | 84,867,289 |
BASF SE | 67,331 | 3,527,912 |
Bayer AG (Registered) | 269,015 | 7,847,348 |
Brenntag SE | 84,727 | 6,761,503 |
Deutsche Post AG | 811,263 | 33,967,527 |
Deutsche Telekom AG (Registered) | 2,090,668 | 47,887,934 |
E.ON SE | 1,415,890 | 18,749,175 |
Infineon Technologies AG | 1,195,269 | 41,479,449 |
Mercedes-Benz Group AG | 148,914 | 11,263,985 |
Merck KGaA | 50,396 | 8,008,006 |
Muenchener Rueckversicherungs- Gesellschaft AG (Registered) | 88,321 | 38,844,328 |
RWE AG | 807,889 | 28,143,233 |
SAP SE | 376,131 | 67,916,865 |
Siemens AG (Registered) | 273,401 | 51,217,185 |
Symrise AG | 28,389 | 3,043,062 |
Zalando SE * (b) | 242,855 | 6,354,364 |
478,645,241 | ||
Hong Kong — 1.5% | ||
AIA Group Ltd. | 4,407,800 | 32,284,305 |
CK Asset Holdings Ltd. | 1,616,844 | 6,896,771 |
CLP Holdings Ltd. | 350,000 | 2,753,122 |
April 30, 2024 | J.P. Morgan Exchange-Traded Funds | 5 |
INVESTMENTS | SHARES | VALUE($) |
Common Stocks — continued | ||
Hong Kong — continued | ||
Hong Kong Exchanges & Clearing Ltd. | 492,700 | 15,655,260 |
Link, REIT | 632,800 | 2,711,418 |
Prudential plc | 1,476,809 | 12,844,325 |
Sun Hung Kai Properties Ltd. | 684,000 | 6,309,873 |
Techtronic Industries Co. Ltd. | 621,000 | 8,581,787 |
88,036,861 | ||
Ireland — 0.5% | ||
Kingspan Group plc | 360,397 | 32,056,431 |
Italy — 1.3% | ||
Enel SpA | 1,073,163 | 7,053,298 |
FinecoBank Banca Fineco SpA | 1,636,891 | 25,076,790 |
UniCredit SpA | 1,305,507 | 47,917,803 |
80,047,891 | ||
Japan — 22.7% | ||
AGC, Inc. | 199,500 | 7,376,362 |
Ajinomoto Co., Inc. | 742,600 | 27,610,962 |
Asahi Group Holdings Ltd. | 737,700 | 25,235,967 |
Asahi Kasei Corp. | 1,115,700 | 7,778,811 |
Bridgestone Corp. | 715,000 | 31,550,813 |
Central Japan Railway Co. | 1,138,000 | 26,023,767 |
Daiichi Sankyo Co. Ltd. | 1,306,100 | 43,960,337 |
Daikin Industries Ltd. | 175,783 | 23,992,856 |
Daiwa House Industry Co. Ltd. | 299,900 | 8,438,860 |
Denso Corp. | 1,722,100 | 29,349,962 |
Dentsu Group, Inc. | 827,200 | 22,378,392 |
Fuji Electric Co. Ltd. | 167,000 | 10,388,057 |
Hitachi Ltd. | 658,100 | 60,716,764 |
Honda Motor Co. Ltd. | 522,716 | 5,947,244 |
Hoya Corp. | 322,300 | 37,367,406 |
ITOCHU Corp. | 1,026,200 | 46,296,779 |
Keyence Corp. | 112,500 | 49,474,109 |
Komatsu Ltd. | 100,300 | 2,994,572 |
Konami Group Corp. | 239,600 | 14,456,822 |
Kyowa Kirin Co. Ltd. | 947,800 | 15,917,215 |
Mitsubishi Corp. | 2,559,900 | 58,543,842 |
Mitsubishi UFJ Financial Group, Inc. | 2,300,050 | 22,911,618 |
Mitsui Fudosan Co. Ltd. | 3,450,700 | 35,117,991 |
Murata Manufacturing Co. Ltd. | 1,562,800 | 28,555,752 |
NIDEC Corp. | 101,500 | 4,753,536 |
Nintendo Co. Ltd. | 240,900 | 11,748,453 |
Nippon Paint Holdings Co. Ltd. | 477,700 | 3,057,766 |
Nippon Steel Corp. | 187,800 | 4,210,274 |
Nippon Telegraph & Telephone Corp. | 29,885,400 | 32,266,143 |
INVESTMENTS | SHARES | VALUE($) |
Japan — continued | ||
Nomura Research Institute Ltd. | 567,500 | 13,732,307 |
ORIX Corp. | 1,217,200 | 24,910,505 |
Osaka Gas Co. Ltd. | 481,400 | 10,704,356 |
Otsuka Corp. | 1,020,800 | 20,301,799 |
Pan Pacific International Holdings Corp. | 282,500 | 6,634,803 |
Recruit Holdings Co. Ltd. | 420,100 | 18,092,598 |
Renesas Electronics Corp. | 824,800 | 13,391,248 |
Shimadzu Corp. | 250,100 | 6,794,733 |
Shimano, Inc. | 92,900 | 15,097,459 |
Shin-Etsu Chemical Co. Ltd. | 1,313,300 | 50,836,451 |
Shionogi & Co. Ltd. | 442,200 | 20,651,081 |
Shiseido Co. Ltd. | 138,900 | 3,718,111 |
SoftBank Group Corp. | 163,500 | 8,041,028 |
Sony Group Corp. | 625,815 | 51,724,467 |
Sumitomo Electric Industries Ltd. | 1,691,100 | 26,138,182 |
Sumitomo Metal Mining Co. Ltd. | 539,300 | 18,017,281 |
Sumitomo Mitsui Financial Group, Inc. | 992,500 | 56,377,785 |
Suzuki Motor Corp. | 2,633,000 | 30,663,353 |
T&D Holdings, Inc. | 1,529,400 | 24,955,728 |
Takeda Pharmaceutical Co. Ltd. | 135,200 | 3,553,336 |
Terumo Corp. | 1,926,000 | 32,672,917 |
Tokio Marine Holdings, Inc. | 1,488,500 | 47,046,120 |
Tokyo Electron Ltd. | 281,500 | 61,745,875 |
Toyota Motor Corp. | 4,213,000 | 96,092,614 |
Yamato Holdings Co. Ltd. | 910,100 | 12,019,404 |
1,372,334,973 | ||
Macau — 0.1% | ||
Sands China Ltd. * | 2,284,400 | 5,388,091 |
Netherlands — 4.8% | ||
Adyen NV * (b) | 8,919 | 10,684,957 |
ASML Holding NV | 182,854 | 159,268,109 |
Heineken NV | 126,756 | 12,335,844 |
Koninklijke Ahold Delhaize NV | 539,610 | 16,379,417 |
Koninklijke KPN NV | 8,388,160 | 30,483,678 |
NN Group NV | 823,589 | 37,992,890 |
Wolters Kluwer NV | 166,087 | 24,864,288 |
292,009,183 | ||
Singapore — 1.1% | ||
DBS Group Holdings Ltd. | 1,457,031 | 37,092,233 |
Oversea-Chinese Banking Corp. Ltd. | 734,400 | 7,624,228 |
Sea Ltd., ADR * | 129,327 | 8,172,173 |
United Overseas Bank Ltd. | 626,700 | 13,906,977 |
66,795,611 | ||
6 | J.P. Morgan Exchange-Traded Funds | April 30, 2024 |
INVESTMENTS | SHARES | VALUE($) |
Common Stocks — continued | ||
South Korea — 0.1% | ||
Delivery Hero SE * (a) (b) | 120,314 | 3,366,090 |
Spain — 2.0% | ||
Banco Bilbao Vizcaya Argentaria SA | 1,487,940 | 16,090,538 |
Banco Santander SA | 11,903,742 | 57,919,228 |
Iberdrola SA | 1,531,411 | 18,777,514 |
Industria de Diseno Textil SA (a) | 677,645 | 30,853,807 |
123,641,087 | ||
Sweden — 2.5% | ||
Atlas Copco AB, Class A | 3,866,172 | 67,720,209 |
Sandvik AB | 909,333 | 18,126,225 |
Skandinaviska Enskilda Banken AB, Class A | 463,111 | 6,065,100 |
Volvo AB, Class B | 2,278,315 | 57,990,378 |
149,901,912 | ||
Switzerland — 4.8% | ||
Cie Financiere Richemont SA (Registered) | 271,464 | 37,523,662 |
Givaudan SA (Registered) | 1,974 | 8,442,346 |
Julius Baer Group Ltd. | 172,582 | 9,260,468 |
Lonza Group AG (Registered) | 91,186 | 50,334,095 |
Novartis AG (Registered) | 737,708 | 71,600,134 |
Sandoz Group AG * | 721,679 | 24,527,650 |
SGS SA (Registered) | 254,495 | 22,409,722 |
Sika AG (Registered) | 26,625 | 7,573,790 |
UBS Group AG (Registered) | 795,911 | 20,903,235 |
Zurich Insurance Group AG | 80,253 | 38,846,173 |
291,421,275 | ||
United Kingdom — 12.1% | ||
3i Group plc | 1,698,545 | 60,684,684 |
AstraZeneca plc | 775,439 | 117,284,336 |
Barclays plc | 15,830,866 | 39,914,283 |
Berkeley Group Holdings plc | 509,337 | 29,911,141 |
British American Tobacco plc | 617,583 | 18,129,938 |
Centrica plc | 20,181,033 | 32,214,437 |
DCC plc | 150,459 | 10,274,947 |
Diageo plc | 1,123,882 | 38,841,000 |
HSBC Holdings plc | 5,820,859 | 50,454,934 |
InterContinental Hotels Group plc | 388,986 | 37,939,366 |
Intertek Group plc | 71,943 | 4,427,845 |
Lloyds Banking Group plc | 58,065,627 | 37,474,596 |
London Stock Exchange Group plc | 161,755 | 17,831,889 |
National Grid plc | 695,180 | 9,118,789 |
Next plc | 56,547 | 6,342,196 |
Reckitt Benckiser Group plc | 396,537 | 22,169,197 |
RELX plc | 1,763,950 | 72,475,204 |
INVESTMENTS | SHARES | VALUE($) |
United Kingdom — continued | ||
SSE plc | 1,509,601 | 31,379,169 |
Standard Chartered plc | 2,488,581 | 21,380,745 |
Taylor Wimpey plc | 5,122,697 | 8,394,175 |
Tesco plc | 8,608,058 | 31,781,561 |
Unilever plc | 649,131 | 33,578,366 |
732,002,798 | ||
United States — 11.3% | ||
BP plc | 13,397,063 | 86,352,606 |
CSL Ltd. | 169,648 | 30,142,401 |
GSK plc | 2,605,209 | 54,050,062 |
Nestle SA (Registered) | 1,375,036 | 138,053,887 |
Roche Holding AG | 380,847 | 91,256,357 |
Sanofi SA (a) | 189,966 | 18,767,314 |
Schneider Electric SE | 357,191 | 81,444,301 |
Shell plc | 3,465,519 | 123,194,410 |
Stellantis NV (a) | 2,557,078 | 56,579,172 |
679,840,510 | ||
Total Common Stocks (Cost $4,972,123,080) | 5,892,105,039 | |
Short-Term Investments — 4.1% | ||
Investment Companies — 1.6% | ||
JPMorgan Prime Money Market Fund Class IM Shares, 5.41% (c) (d)(Cost $96,920,379) | 96,887,706 | 96,907,084 |
Investment of Cash Collateral from Securities Loaned — 2.5% | ||
JPMorgan Securities Lending Money Market Fund Agency SL Class Shares, 5.47% (c) (d) | 134,985,002 | 134,998,500 |
JPMorgan U.S. Government Money Market Fund Class IM Shares, 5.25% (c) (d) | 15,285,787 | 15,285,787 |
Total Investment of Cash Collateral from Securities Loaned (Cost $150,284,887) | 150,284,287 | |
Total Short-Term Investments (Cost $247,205,266) | 247,191,371 | |
Total Investments — 101.6% (Cost $5,219,328,346) | 6,139,296,410 | |
Liabilities in Excess of Other Assets — (1.6)% | (98,837,210 ) | |
NET ASSETS — 100.0% | 6,040,459,200 | |
Percentages indicated are based on net assets. |
April 30, 2024 | J.P. Morgan Exchange-Traded Funds | 7 |
Abbreviations | |
ADR | American Depositary Receipt |
OYJ | Public Limited Company |
REIT | Real Estate Investment Trust |
SCA | Limited partnership with share capital |
* | Non-income producing security. |
(a) | The security or a portion of this security is on loan at April 30, 2024. The total value of securities on loan at April 30, 2024 is $136,756,447. |
(b) | Security exempt from registration pursuant to Regulation S under the Securities Act of 1933, as amended. Regulation S applies to securities offerings that are made outside of the United States and do not involve direct selling efforts in the United States and as such may have restrictions on resale. |
(c) | Investment in an affiliated fund, which is registered under the Investment Company Act of 1940, as amended, and is advised by J.P. Morgan Investment Management Inc. |
(d) | The rate shown is the current yield as of April 30, 2024. |
INDUSTRY April 30, 2024 | PERCENT OF TOTAL INVESTMENTS |
Banks | 11.2 % |
Pharmaceuticals | 10.9 |
Insurance | 5.9 |
Semiconductors & Semiconductor Equipment | 4.5 |
Oil, Gas & Consumable Fuels | 4.4 |
Automobiles | 3.3 |
Textiles, Apparel & Luxury Goods | 3.1 |
Food Products | 2.7 |
Chemicals | 2.6 |
Metals & Mining | 2.6 |
Machinery | 2.5 |
Beverages | 2.4 |
Electrical Equipment | 2.4 |
Professional Services | 2.3 |
Capital Markets | 2.3 |
Diversified Telecommunication Services | 2.2 |
Industrial Conglomerates | 2.0 |
Trading Companies & Distributors | 1.8 |
Automobile Components | 1.8 |
Multi-Utilities | 1.8 |
Aerospace & Defense | 1.6 |
Household Durables | 1.5 |
IT Services | 1.4 |
Electronic Equipment, Instruments & Components | 1.4 |
Software | 1.3 |
Personal Care Products | 1.1 |
Health Care Equipment & Supplies | 1.1 |
Consumer Staples Distribution & Retail | 1.1 |
Building Products | 1.0 |
Construction & Engineering | 1.0 |
Electric Utilities | 1.0 |
Others (each less than 1.0%) | 9.8 |
Short-Term Investments | 4.0 |
8 | J.P. Morgan Exchange-Traded Funds | April 30, 2024 |
DESCRIPTION | NUMBER OF CONTRACTS | EXPIRATION DATE | TRADING CURRENCY | NOTIONAL AMOUNT ($) | VALUE AND UNREALIZED APPRECIATION (DEPRECIATION) ($) |
Long Contracts | |||||
SPI 200 Index | 550 | 06/20/2024 | AUD | 67,561,491 | (1,816,234 ) |
Abbreviations | |
AUD | Australian Dollar |
SPI | Australian Securities Exchange |
April 30, 2024 | J.P. Morgan Exchange-Traded Funds | 9 |
JPMorgan International Research Enhanced Equity ETF | |
ASSETS: | |
Investments in non-affiliates, at value | $5,892,105,039 |
Investments in affiliates, at value | 96,907,084 |
Investments of cash collateral received from securities loaned, at value (See Note 2.C.) | 150,284,287 |
Cash | 466,939 |
Foreign currency, at value | 3,769,838 |
Deposits at broker for futures contracts | 5,450,709 |
Segregated cash balance with Authorized Participant for deposit securities | 313,529 |
Receivables: | |
Investment securities sold | 17,233 |
Fund shares sold | 1,600,464 |
Dividends from non-affiliates | 20,602,138 |
Dividends from affiliates | 14,376 |
Tax reclaims | 20,697,525 |
Securities lending income (See Note 2.C.) | 57,523 |
Variation margin on futures contracts | 16,398 |
Due from adviser | 8,603 |
Total Assets | 6,192,311,685 |
LIABILITIES: | |
Payables: | |
Collateral received on securities loaned (See Note 2.C.) | 150,284,287 |
Collateral upon return of deposit securities | 313,529 |
Accrued liabilities: | |
Investment advisory fees | 689,189 |
Administration fees | 366,106 |
Printing and mailing costs | 21,500 |
Custodian and accounting fees | 139,562 |
Other | 38,312 |
Total Liabilities | 151,852,485 |
Net Assets | $6,040,459,200 |
NET ASSETS: | |
Paid-in-Capital | $5,354,518,499 |
Total distributable earnings (loss) | 685,940,701 |
Total Net Assets | $6,040,459,200 |
Outstanding number of shares (unlimited number of shares authorized - par value $0.0001) | 99,427,892 |
Net asset value, per share | $60.75 |
Cost of investments in non-affiliates | $4,972,123,080 |
Cost of investments in affiliates | 96,920,379 |
Cost of foreign currency | 3,761,930 |
Investment securities on loan, at value (See Note 2.C.) | 136,756,447 |
Cost of investment of cash collateral (See Note 2.C.) | 150,284,887 |
10 | J.P. Morgan Exchange-Traded Funds | April 30, 2024 |
JPMorgan International Research Enhanced Equity ETF | |
INVESTMENT INCOME: | |
Interest income from non-affiliates | $232,252 |
Interest income from affiliates | 18,912 |
Dividend income from non-affiliates | 93,855,659 |
Dividend income from affiliates | 3,188,136 |
Income from securities lending (net) (See Note 2.C.) | 190,514 |
Foreign taxes withheld (net) | (8,917,854 ) |
Total investment income | 88,567,619 |
EXPENSES: | |
Investment advisory fees | 5,838,205 |
Administration fees | 2,189,330 |
Custodian and accounting fees | 309,634 |
Interest expense to non-affiliates | 5,524 |
Interest expense to affiliates | 1,218 |
Professional fees | 76,513 |
Trustees’ and Chief Compliance Officer’s fees | 20,166 |
Printing and mailing costs | 61,527 |
Registration and filing fees | 7,047 |
Other | 21,900 |
Total expenses | 8,531,064 |
Less fees waived | (83,058 ) |
Less expense reimbursements | (1,518,070 ) |
Net expenses | 6,929,936 |
Net investment income (loss) | 81,637,683 |
REALIZED/UNREALIZED GAINS (LOSSES): | |
Net realized gain (loss) on transactions from: | |
Investments in non-affiliates | (27,403,687 ) |
Investments in affiliates | 41,998 |
In-kind redemptions of investments in non-affiliates (See Note 4) | 219,762,132 |
Futures contracts | 4,978,366 |
Foreign currency transactions | (329,327 ) |
Net realized gain (loss) | 197,049,482 |
Change in net unrealized appreciation/depreciation on: | |
Investments in non-affiliates | 652,958,343 |
Investments in affiliates | (48,515 ) |
Futures contracts | 7,377,186 |
Foreign currency translations | (414,775 ) |
Change in net unrealized appreciation/depreciation | 659,872,239 |
Net realized/unrealized gains (losses) | 856,921,721 |
Change in net assets resulting from operations | $938,559,404 |
April 30, 2024 | J.P. Morgan Exchange-Traded Funds | 11 |
JPMorgan International Research Enhanced Equity ETF | ||
Six Months Ended April 30, 2024 (Unaudited) | Year Ended October 31, 2023 | |
CHANGE IN NET ASSETS RESULTING FROM OPERATIONS: | ||
Net investment income (loss) | $81,637,683 | $151,466,238 |
Net realized gain (loss) | 197,049,482 | 272,228,534 |
Change in net unrealized appreciation/depreciation | 659,872,239 | 398,728,777 |
Change in net assets resulting from operations | 938,559,404 | 822,423,549 |
DISTRIBUTIONS TO SHAREHOLDERS: | ||
Total distributions to shareholders | (167,953,253 ) | (129,393,763 ) |
CAPITAL TRANSACTIONS: | ||
Change in net assets resulting from capital transactions | 183,316,010 | (632,681,089 ) |
NET ASSETS: | ||
Change in net assets | 953,922,161 | 60,348,697 |
Beginning of period | 5,086,537,039 | 5,026,188,342 |
End of period | $6,040,459,200 | $5,086,537,039 |
CAPITAL TRANSACTIONS: | ||
Proceeds from shares issued | $888,851,479 | $626,324,597 |
Cost of shares redeemed | (705,535,469 ) | (1,259,005,686 ) |
Total change in net assets resulting from capital transactions | $183,316,010 | $(632,681,089 ) |
SHARE TRANSACTIONS: | ||
Issued | 15,250,000 | 11,400,000 |
Redeemed | (12,100,000 ) | (23,750,000 ) |
Net increase (decrease) in shares from share transactions | 3,150,000 | (12,350,000 ) |
12 | J.P. Morgan Exchange-Traded Funds | April 30, 2024 |
Per share operating performance (a) | |||||
Investment operations | Distributions | ||||
Net asset value, beginning of period | Net investment income (loss) (c) | Net realized and unrealized gains (losses) on investments | Total from investment operations | Net investment income | |
JPMorgan International Research Enhanced Equity ETF (g) | |||||
Six Months Ended April 30, 2024 (Unaudited) | $52.83 | $0.82 | $8.70 | $9.52 | $(1.60 ) |
Year Ended October 31, 2023 | 46.27 | 1.54 | 6.33 | 7.87 | (1.31 ) |
Year Ended October 31, 2022 | 61.89 | 1.39 | (14.54 ) | (13.15 ) | (2.47 ) |
Year Ended October 31, 2021 | 46.43 | 1.42 (h) | 15.11 | 16.53 | (1.07 ) |
Year Ended October 31, 2020 | 52.55 | 1.13 | (5.63 ) | (4.50 ) | (1.62 ) |
Year Ended October 31, 2019 | 49.24 | 1.65 | 3.37 | 5.02 | (1.71 ) |
(a) | Per share amounts reflect the conversion of the Predecessor Fund into the Fund as of the close of business on June 10, 2022. See Note 1. |
(b) | Annualized for periods less than one year, unless otherwise noted. |
(c) | Calculated based upon average shares outstanding. |
(d) | Not annualized for periods less than one year. |
(e) | Includes adjustments in accordance with accounting principles generally accepted in the United States of America and as such, the net asset values for financial reporting purposes and the returns based upon those net asset values may differ from the net asset values and returns for shareholder transactions. |
(f) | JPMorgan International Research Enhanced Equity ETF acquired all of the assets and liabilities of the JPMorgan International Research Enhanced Equity Fund (“Predecessor Fund”) in a reorganization that occurred as of the close of business on June 10, 2022. Market price returns are calculated using the official closing price of the JPMorgan International Research Enhanced Equity ETF on the listing exchange as of the time that the JPMorgan International Research Enhanced Equity ETF's NAV is calculated. Prior to the JPMorgan International Research Enhanced Equity ETF's listing on June 13, 2022, the NAV performance of the Class R6 Shares of the Predecessor Fund are used as proxy market price returns. |
(g) | JPMorgan International Research Enhanced Equity ETF (the “Fund”) acquired all of the assets and liabilities of the JPMorgan International Research Enhanced Equity Fund (“Predecessor Fund”) in a reorganization that occurred as of the close of business on June 10, 2022. Performance and financial history of the Predecessor Fund’s Class R6 Shares have been adopted by the Fund and will be used going forward. As a result, the financial highlight information reflects that of the Predecessor Fund’s Class R6 Shares for the period November 1, 2018 up through the reorganization. |
(h) | Reflects income from foreign withholding tax claims, including related interest income. Had the Fund not received these proceeds, the net investment income (loss) per share would have remained the same and the net investment income (loss) ratio would have been 2.44%. |
14 | J.P. Morgan Exchange-Traded Funds | April 30, 2024 |
Ratios/Supplemental data | ||||||||
Ratios to average net assets (b) | ||||||||
Net asset value, end of period | Market price, end of period | Total return (d)(e) | Market price total return (d)(f) | Net assets, end of period | Net expenses | Net investment income (loss) | Expenses without waivers and reimbursements | Portfolio turnover rate (d) |
$60.75 | $60.85 | 18.19 % | 17.98 % | $6,040,459,200 | 0.24 % | 2.79 % | 0.29 % | 11 % |
52.83 | 53.01 | 17.17 | 17.54 | 5,086,537,039 | 0.24 | 2.82 | 0.29 | 16 |
46.27 | 46.28 | (22.04 ) | (22.03 ) | 5,026,188,342 | 0.24 | 2.66 | 0.30 | 16 |
61.89 | 61.89 | 35.93 | 35.93 | 4,562,266,369 | 0.25 | 2.46 (h) | 0.31 | 20 |
46.43 | 46.43 | (8.96 ) | (8.96 ) | 4,337,775,495 | 0.24 | 2.35 | 0.30 | 52 |
52.55 | 52.55 | 10.78 | 10.78 | 4,435,538,473 | 0.25 | 3.37 | 0.31 | 22 |
April 30, 2024 | J.P. Morgan Exchange-Traded Funds | 15 |
16 | J.P. Morgan Exchange-Traded Funds | April 30, 2024 |
Level 1 Quoted prices | Level 2 Other significant observable inputs | Level 3 Significant unobservable inputs | Total | |
Investments in Securities | ||||
Common Stocks | ||||
Australia | $— | $375,320,173 | $— | $375,320,173 |
Austria | — | 12,691,881 | — | 12,691,881 |
Belgium | — | 30,347,420 | — | 30,347,420 |
China | — | 33,041,667 | — | 33,041,667 |
Denmark | — | 220,711,623 | — | 220,711,623 |
Finland | — | 47,420,262 | — | 47,420,262 |
France | — | 777,084,059 | — | 777,084,059 |
Germany | — | 478,645,241 | — | 478,645,241 |
Hong Kong | — | 88,036,861 | — | 88,036,861 |
Ireland | — | 32,056,431 | — | 32,056,431 |
Italy | — | 80,047,891 | — | 80,047,891 |
Japan | — | 1,372,334,973 | — | 1,372,334,973 |
April 30, 2024 | J.P. Morgan Exchange-Traded Funds | 17 |
(continued) | ||||
Level 1 Quoted prices | Level 2 Other significant observable inputs | Level 3 Significant unobservable inputs | Total | |
Macau | $— | $5,388,091 | $— | $5,388,091 |
Netherlands | — | 292,009,183 | — | 292,009,183 |
Singapore | 8,172,173 | 58,623,438 | — | 66,795,611 |
South Korea | — | 3,366,090 | — | 3,366,090 |
Spain | — | 123,641,087 | — | 123,641,087 |
Sweden | — | 149,901,912 | — | 149,901,912 |
Switzerland | — | 291,421,275 | — | 291,421,275 |
United Kingdom | — | 732,002,798 | — | 732,002,798 |
United States | — | 679,840,510 | — | 679,840,510 |
Total Common Stocks | 8,172,173 | 5,883,932,866 | — | 5,892,105,039 |
Short-Term Investments | ||||
Investment Companies | 96,907,084 | — | — | 96,907,084 |
Investment of Cash Collateral from Securities Loaned | 150,284,287 | — | — | 150,284,287 |
Total Short-Term Investments | 247,191,371 | — | — | 247,191,371 |
Total Investments in Securities | $255,363,544 | $5,883,932,866 | $— | $6,139,296,410 |
Depreciation in Other Financial Instruments | ||||
Futures Contracts | $(1,816,234 ) | $— | $— | $(1,816,234 ) |
18 | J.P. Morgan Exchange-Traded Funds | April 30, 2024 |
Investment Securities on Loan, at value, Presented on the Statement of Assets and Liabilities | Cash Collateral Posted by Borrower* | Net Amount Due to Counterparty (not less than zero) | |
$136,756,447 | $(136,756,447 ) | $— |
* | Collateral posted reflects the value of securities on loan and does not include any additional amounts received from the borrower. |
For the six months ended April 30, 2024 | |||||||||
Security Description | Value at October 31, 2023 | Purchases at Cost | Proceeds from Sales | Net Realized Gain (Loss) | Change in Unrealized Appreciation/ (Depreciation) | Value at April 30, 2024 | Shares at April 30, 2024 | Dividend Income | Capital Gain Distributions |
JPMorgan Prime Money Market Fund Class IM Shares, 5.41% (a) (b) | $182,533,672 | $410,001,528 | $495,622,199 | $41,998 | $(47,915 ) | $96,907,084 | 96,887,706 | $3,188,136 | $— |
JPMorgan Securities Lending Money Market Fund Agency SL Class Shares, 5.47% (a) (b) | 12,000,000 | 222,500,000 | 99,506,799 | 5,899 * | (600 ) | 134,998,500 | 134,985,002 | 505,885 * | — |
JPMorgan U.S. Government Money Market Fund Class IM Shares, 5.25% (a) (b) | 1,828,971 | 82,301,392 | 68,844,576 | — | — | 15,285,787 | 15,285,787 | 87,512 * | — |
Total | $196,362,643 | $714,802,920 | $663,973,574 | $47,897 | $(48,515 ) | $247,191,371 | $3,781,533 | $— | |
(a) | Investment in an affiliated fund, which is registered under the Investment Company Act of 1940, as amended, and is advised by J.P. Morgan Investment Management Inc. |
(b) | The rate shown is the current yield as of April 30, 2024. |
* | Amount is included on the Statement of Operations as Income from securities lending (net) (after payments of rebates and Citibank’s fee). |
April 30, 2024 | J.P. Morgan Exchange-Traded Funds | 19 |
Futures Contracts: | |
Average Notional Balance Long | $102,542,511 |
Ending Notional Balance Long | 67,561,491 |
20 | J.P. Morgan Exchange-Traded Funds | April 30, 2024 |
April 30, 2024 | J.P. Morgan Exchange-Traded Funds | 21 |
Contractual Reimbursements | |
$1,517,690 |
Purchases (excluding U.S. Government) | Sales (excluding U.S. Government) | |
$620,605,428 | $615,402,468 |
In-Kind Purchases | In-Kind Sales | |
$852,859,967 | $676,215,840 |
22 | J.P. Morgan Exchange-Traded Funds | April 30, 2024 |
Aggregate Cost | Gross Unrealized Appreciation | Gross Unrealized Depreciation | Net Unrealized Appreciation (Depreciation) | |
$5,219,328,346 | $1,129,741,970 | $211,590,140 | $918,151,830 |
Capital Loss Carryforward Character | ||
Short-Term | Long-Term | |
$66,324,084 | $354,799,332 | |
April 30, 2024 | J.P. Morgan Exchange-Traded Funds | 23 |
J.P. Morgan Investor Funds | JPMorgan SmartRetirement Funds | |
18.2 % | 39.8 % |
of cash collateral from securities loaned) as follows:
France | 13.0 % |
Japan | 22.9 |
United Kingdom | 12.2 |
24 | J.P. Morgan Exchange-Traded Funds | April 30, 2024 |
Beginning Account Value November 1, 2023 | Ending Account Value April 30, 2024 | Expenses Paid During the Period* | Annualized Expense Ratio | |
JPMorgan International Research Enhanced Equity ETF | ||||
Actual | $1,000.00 | $1,181.90 | $1.30 | 0.24 % |
Hypothetical | 1,000.00 | 1,023.67 | 1.21 | 0.24 |
* | Expenses are equal to the Fund’s annualized net expense ratio, multiplied by the average account value over the period, multiplied by 182/366 (to reflect the one-half year period). |
April 30, 2024 | J.P. Morgan Exchange-Traded Funds | 25 |
26 | J.P. Morgan Exchange-Traded Funds | April 30, 2024 |


ITEM 2. CODE OF ETHICS.
Not applicable to a semi-annual report.
ITEM 3. AUDIT COMMITTEE FINANCIAL EXPERT.
Not applicable to a semi-annual report.
ITEM 4. PRINCIPAL ACCOUNTANT FEES AND SERVICES.
Not applicable to a semi-annual report.
ITEM 5. AUDIT COMMITTEE OF LISTED REGISTRANTS.
Not applicable to a semi-annual report.
ITEM 6. SCHEDULE OF INVESTMENTS.
File Schedule I – Investments in securities of unaffiliated issuers as of the close of the reporting period as set forth in Section 210.12-12 of Regulation S-X, unless the schedule is included as part of the report to shareholders filed under Item 1 of this Form.
Included in Item 1.
ITEM 7. DISCLOSURE OF PROXY VOTING POLICIES AND PROCEDURES FOR CLOSED-END MANAGEMENT INVESTMENT COMPANIES.
Not applicable.
ITEM 8. PORTFOLIO MANAGERS OF CLOSED-END MANAGEMENT INVESTMENT COMPANIES.
Not applicable.
ITEM 9. PURCHASE OF EQUITY SECURITIES BY CLOSED-END MANAGEMENT INVESTMENT COMPANY AND AFFILIATED PURCHASERS.
Not applicable.
ITEM 10. SUBMISSION OF MATTERS TO A VOTE OF SECURITY HOLDERS.
Describe any material changes to the procedures by which shareholders may recommend nominees to the registrant`s board of directors, where those changes were implemented after the registrant last provided disclosure in response to the requirements of Item 7(d)(2)(ii)(G) of Schedule 14A (17 CFR 240.14a-101), or this Item.
No material changes to report.
ITEM 11. CONTROLS AND PROCEDURES.
(a) Disclose the conclusions of the registrant’s principal executive and principal financial officers, or persons performing similar functions, regarding the effectiveness of the registrant’s disclosure controls and procedures (as defined in Rule 30a-3(c) under the Act (17 CFR 270.30a-3(c))) as of a date within 90 days of the filing date of the report that includes the disclosure required by this paragraph, based on the evaluation of these controls and procedures required by Rule 30a-3(b) under the Act (17 CFR 270.30a-3(b))and Rules 13a-15(b) or 15d-15(b) under the Exchange Act (17 CFR 240.13a-15(b) or 240.15d-15(b)).
The Registrant’s principal executive and principal financial officers have concluded, based on their evaluation of the Registrant’s disclosure controls and procedures as of a date within 90 days of the filing date of this report, that the Registrant’s disclosure controls and procedures are reasonably designed to ensure that information required to be disclosed by the Registrant on Form N-CSR is recorded, processed, summarized and reported within the required time periods and that information required to be disclosed by the Registrant in the reports that it files or submits on Form N-CSR is accumulated and communicated to the Registrant’s management, including its principal executive and principal financial officers, as appropriate to allow timely decisions regarding required disclosure.
(b) Disclose any change in the registrant’s internal control over financial reporting (as defined in Rule 30a-3(d) under the Act (17 CFR 270.30a-3(d)) that occurred during the period covered by this report that has materially affected, or is reasonably likely to materially affect, the registrant’s internal control over financial reporting.
There were no changes in the Registrant’s internal control over financial reporting that occurred during the last fiscal quarter covered by this report that have materially affected, or are reasonably likely to materially affect, the Registrant’s internal control over financial reporting.
ITEM 12. DISCLOSURE OF SECURITIES LENDING ACTIVITIES FOR CLOSED-END MANAGEMENT INVESTMENT COMPANIES.
Not applicable.
ITEM 13. EXHIBITS.
| (a) | File the exhibits listed below as part of this Form. Letter or number the exhibits in the sequence indicated. |
(1) Any code of ethics, or amendment thereto, that is the subject of the disclosure required by Item 2, to the extent that the registrant intends to satisfy the Item 2 requirements through filing of an exhibit.
Not applicable.
(2) A separate certification for each principal executive officer and principal financial officer of the registrant as required by Rule 30a-2(a) under the Act (17 CFR 270.30a-2), exactly as set forth below:
(1) Any written solicitation to purchase securities under Rule 23c-1 under the Act (17 CFR 270.23c-1) sent or given during the period covered by the report by or on behalf of the registrant to 10 or more persons.
Not applicable.
(2) Change in the registrant’s independent public accountant. Provide the information called for by Item 4 of Form 8-K under the Exchange Act (17 CFR 249.308). Unless otherwise specified by Item 4, or related to and necessary for a complete understanding of information not previously disclosed, the information should relate to events occurring during the reporting period.
Not applicable.
| (b) | A separate or combined certification for each principal executive officer and principal officer of the registrant as required by Rule 30a-2(b) under the Act of 1940. |
SIGNATURES
Pursuant to the requirements of the Securities Exchange Act of 1934 and the Investment Company Act of 1940, the registrant has duly caused this report to be signed on its behalf by the undersigned, thereunto duly authorized.
| J.P. Morgan Exchange-Traded Fund Trust | ||
| By: | /s/ Brian S. Shlissel | |
| Brian S. Shlissel | ||
| President and Principal Executive Officer | ||
| July 2, 2024 | ||
Pursuant to the requirements of the Securities Exchange Act of 1934 and the Investment Company Act of 1940, this report has been signed below by the following persons on behalf of the registrant and in the capacities and on the dates indicated.
| By: | /s/ Brian S. Shlissel | |
| Brian S. Shlissel | ||
| President and Principal Executive Officer | ||
| July 2, 2024 | ||
| By: | /s/ Timothy J. Clemens | |
| Timothy J. Clemens | ||
| Treasurer and Principal Financial Officer | ||
| July 2, 2024 | ||