October 2018 Analyst DayOctober 15, 2018 Customers Bancorp, Inc.
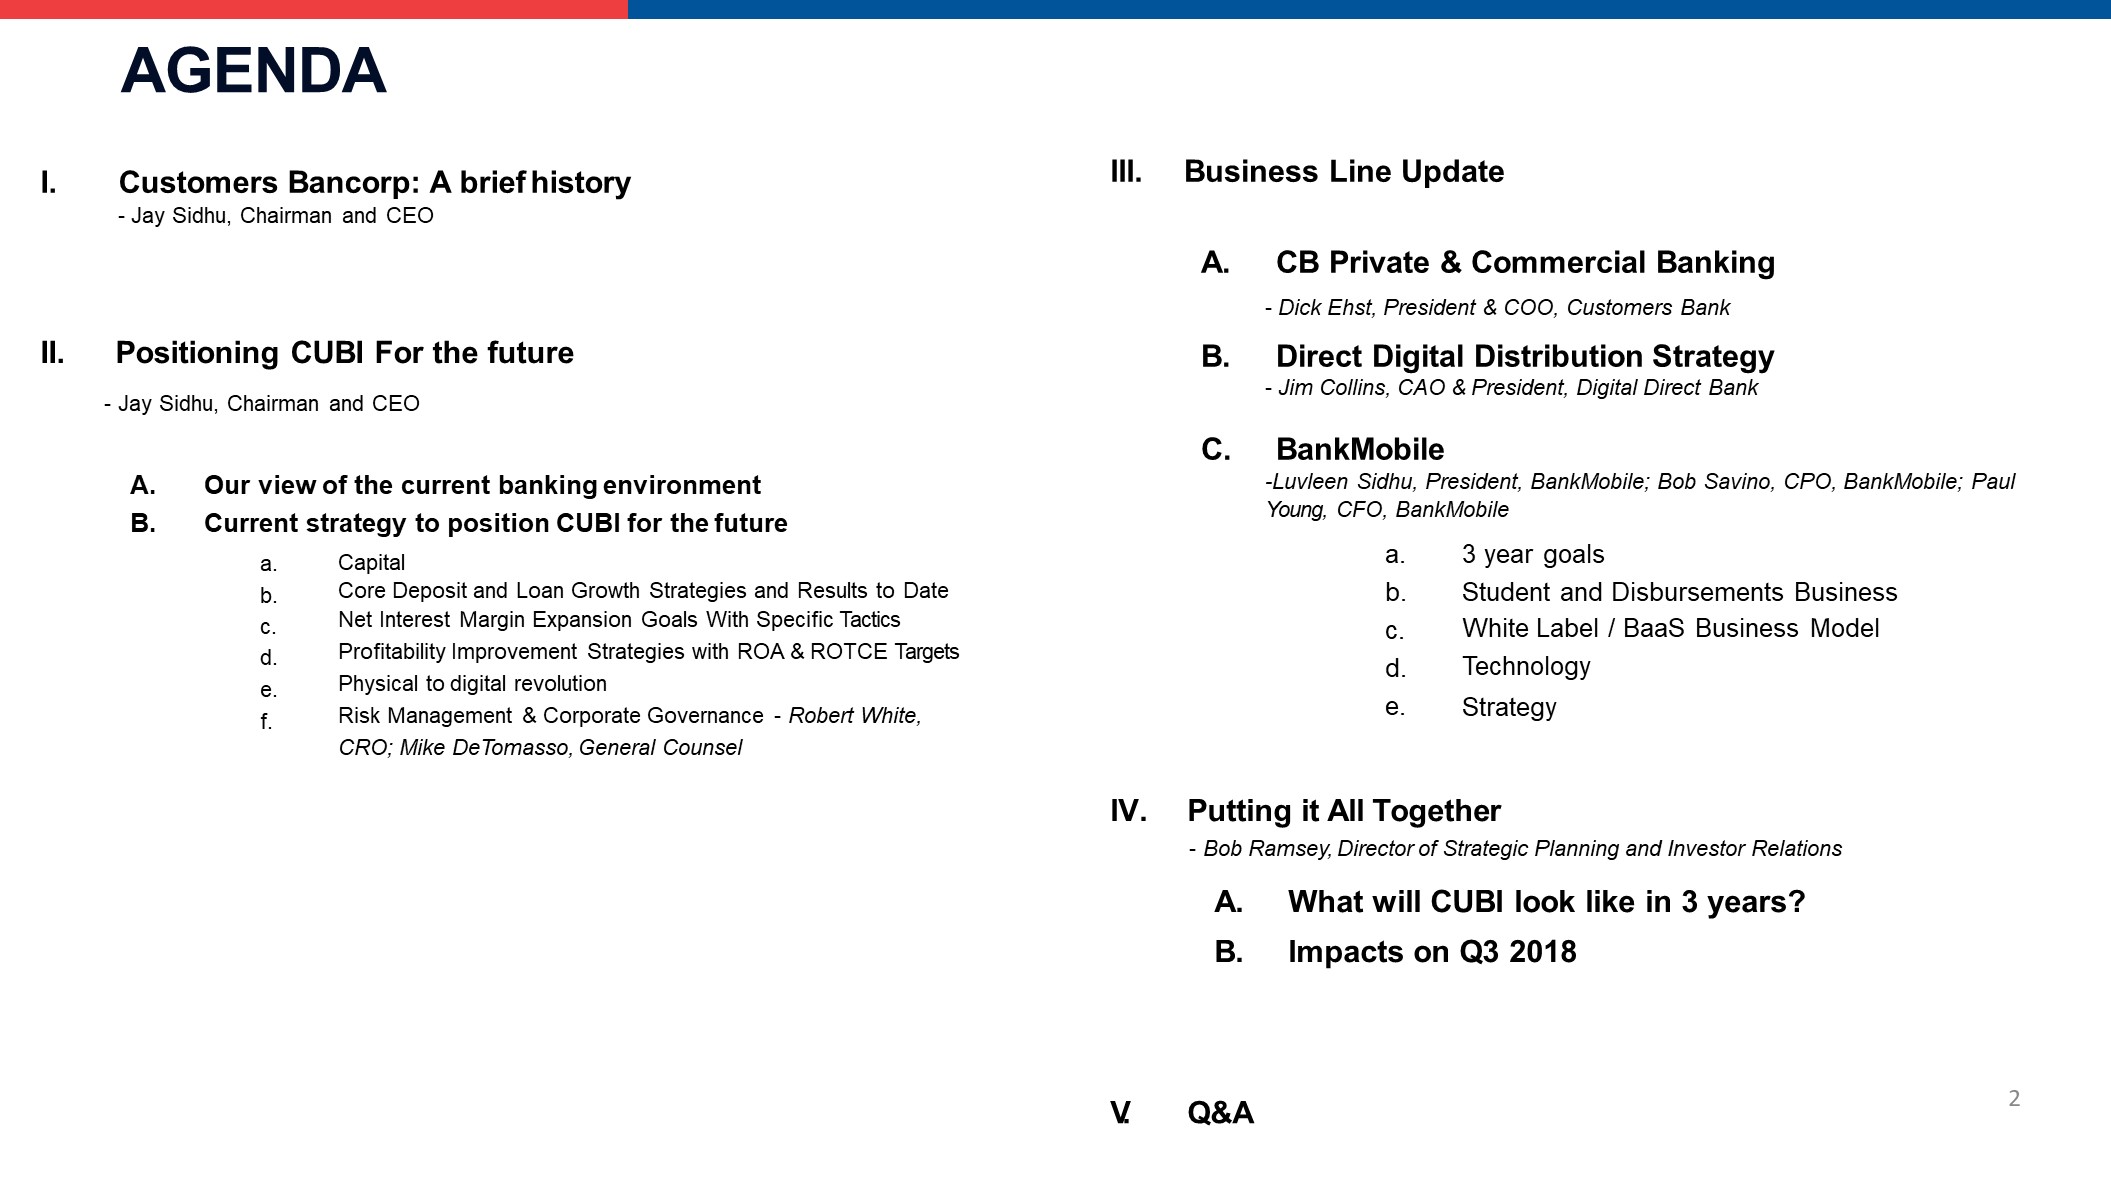
I. Customers Bancorp: A brief history- Jay Sidhu, Chairman and CEO Positioning CUBI For the futureJay Sidhu, Chairman and CEOOur view of the current banking environmentCurrent strategy to position CUBI for the future a.b.c.d.e.f. CapitalCore Deposit and Loan Growth Strategies and Results to DateNet Interest Margin Expansion Goals With Specific Tactics Profitability Improvement Strategies with ROA & ROTCE Targets Physical to digital revolutionRisk Management & Corporate Governance - Robert White, CRO; Mike DeTomasso, General Counsel AGENDA III. Business Line UpdateCB Private & Commercial BankingDick Ehst, President & COO, Customers BankDirect Digital Distribution StrategyJim Collins, CAO & President, Digital Direct BankBankMobile-Luvleen Sidhu, President, BankMobile; Bob Savino, CPO, BankMobile; Paul Young, CFO, BankMobile a.b.c.d.e. 3 year goalsStudent and Disbursements BusinessWhite Label / BaaS Business Model TechnologyStrategy Putting it All TogetherBob Ramsey, Director of Strategic Planning and Investor RelationsWhat will CUBI look like in 3 years?Impacts on Q3 2018 V. Q&A 2
A Brief History of Customers Bancorp Jay Sidhu, Chairman & CEO October 2018
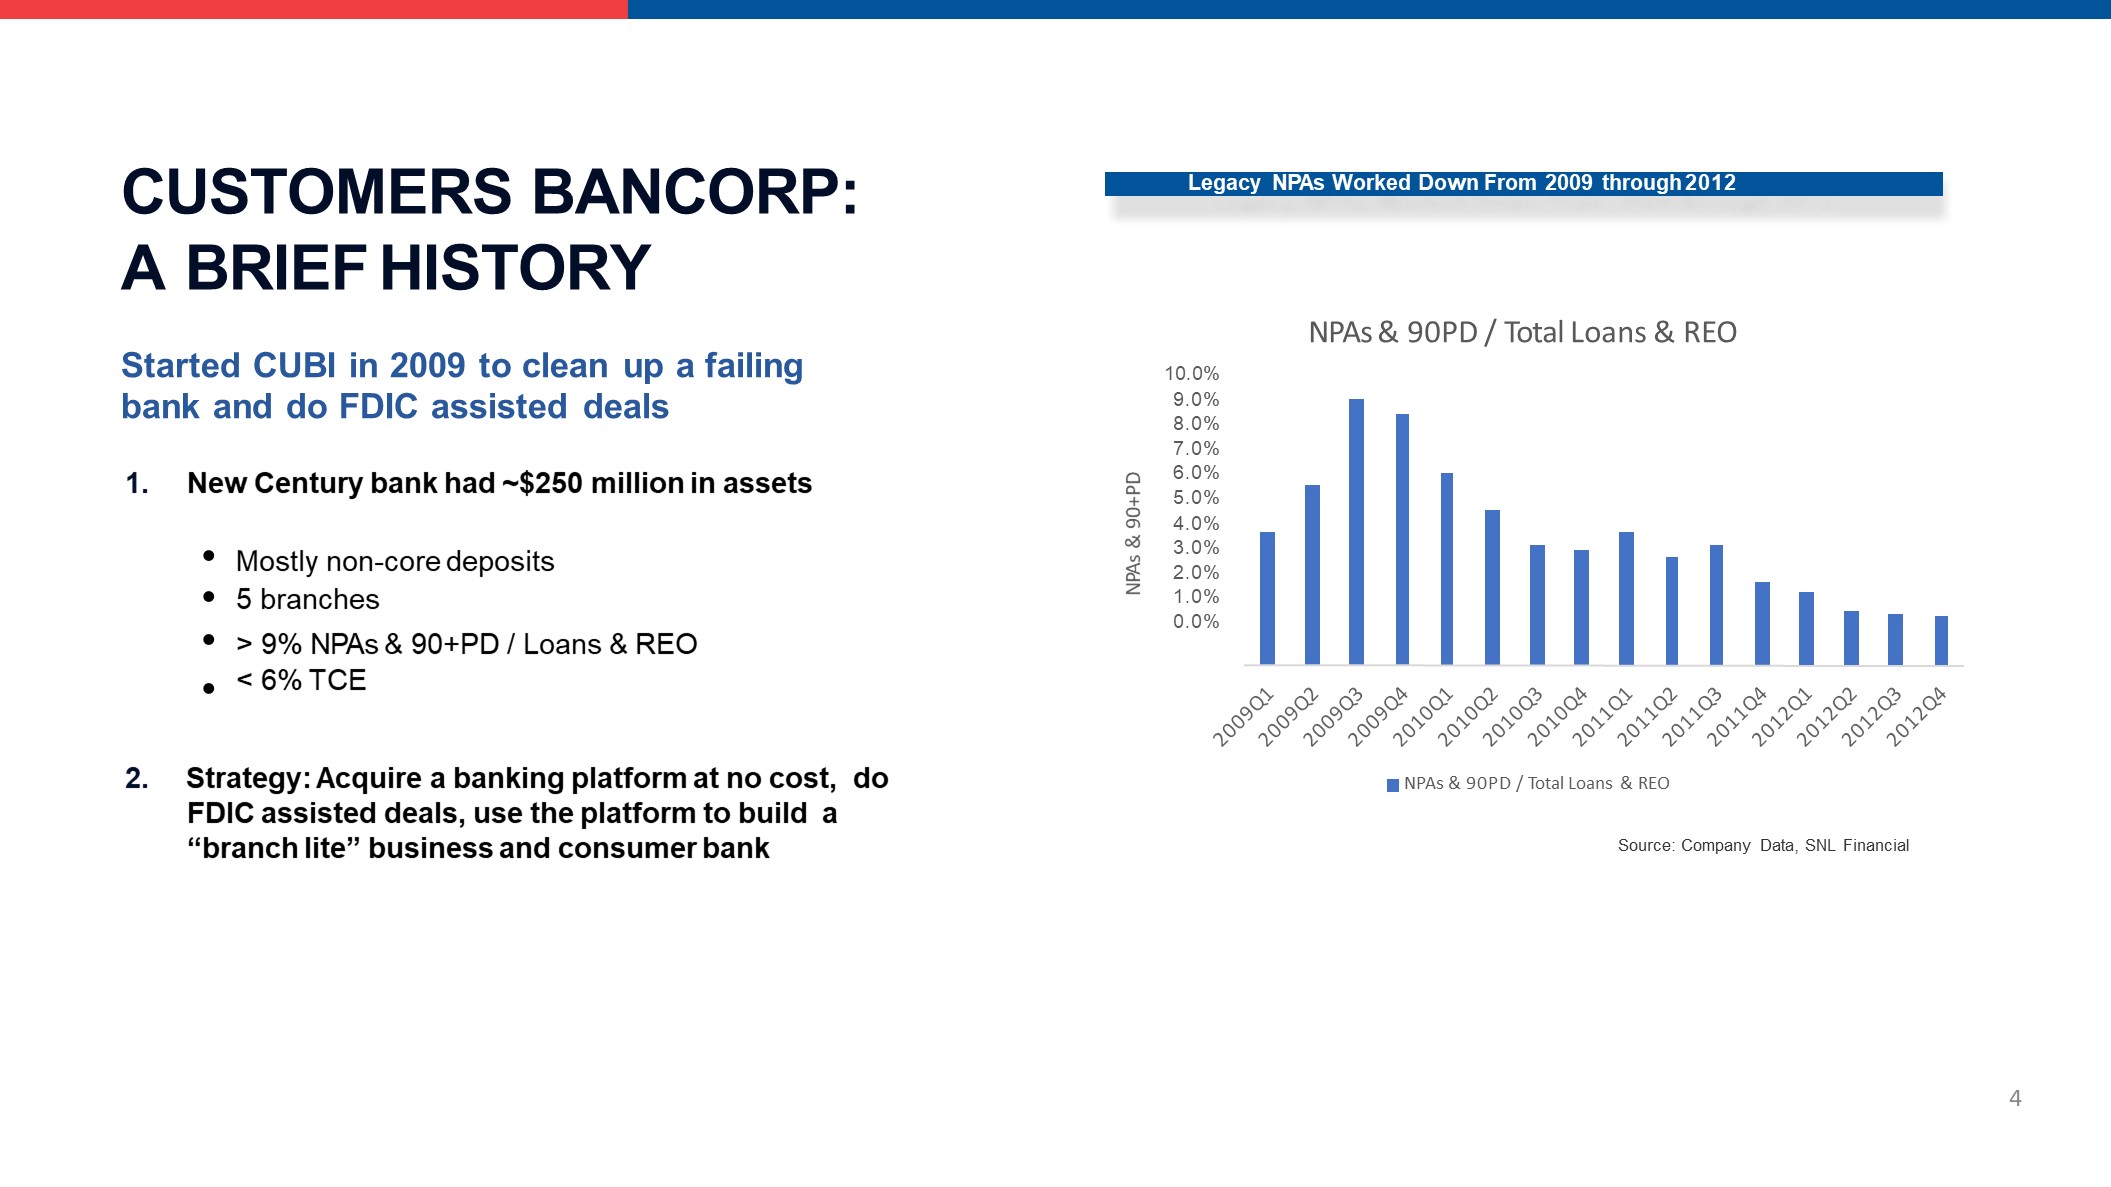
CUSTOMERS BANCORP: A BRIEF HISTORY Started CUBI in 2009 to clean up a failing bank and do FDIC assisted deals1. New Century bank had ~$250 million in assets •••• Mostly non-core deposits 5 branches> 9% NPAs & 90+PD / Loans & REO< 6% TCE 2. Strategy: Acquire a banking platform at no cost, do FDIC assisted deals, use the platform to build a “branch lite” business and consumer bank Legacy NPAs Worked Down From 2009 through 2012 Source: Company Data, SNL Financial 10.0%9.0%8.0%7.0%6.0%5.0%4.0%3.0%2.0%1.0%0.0% NPAs & 90+PD NPAs & 90PD / Total Loans & REO NPAs & 90PD / Total Loans & REO 4
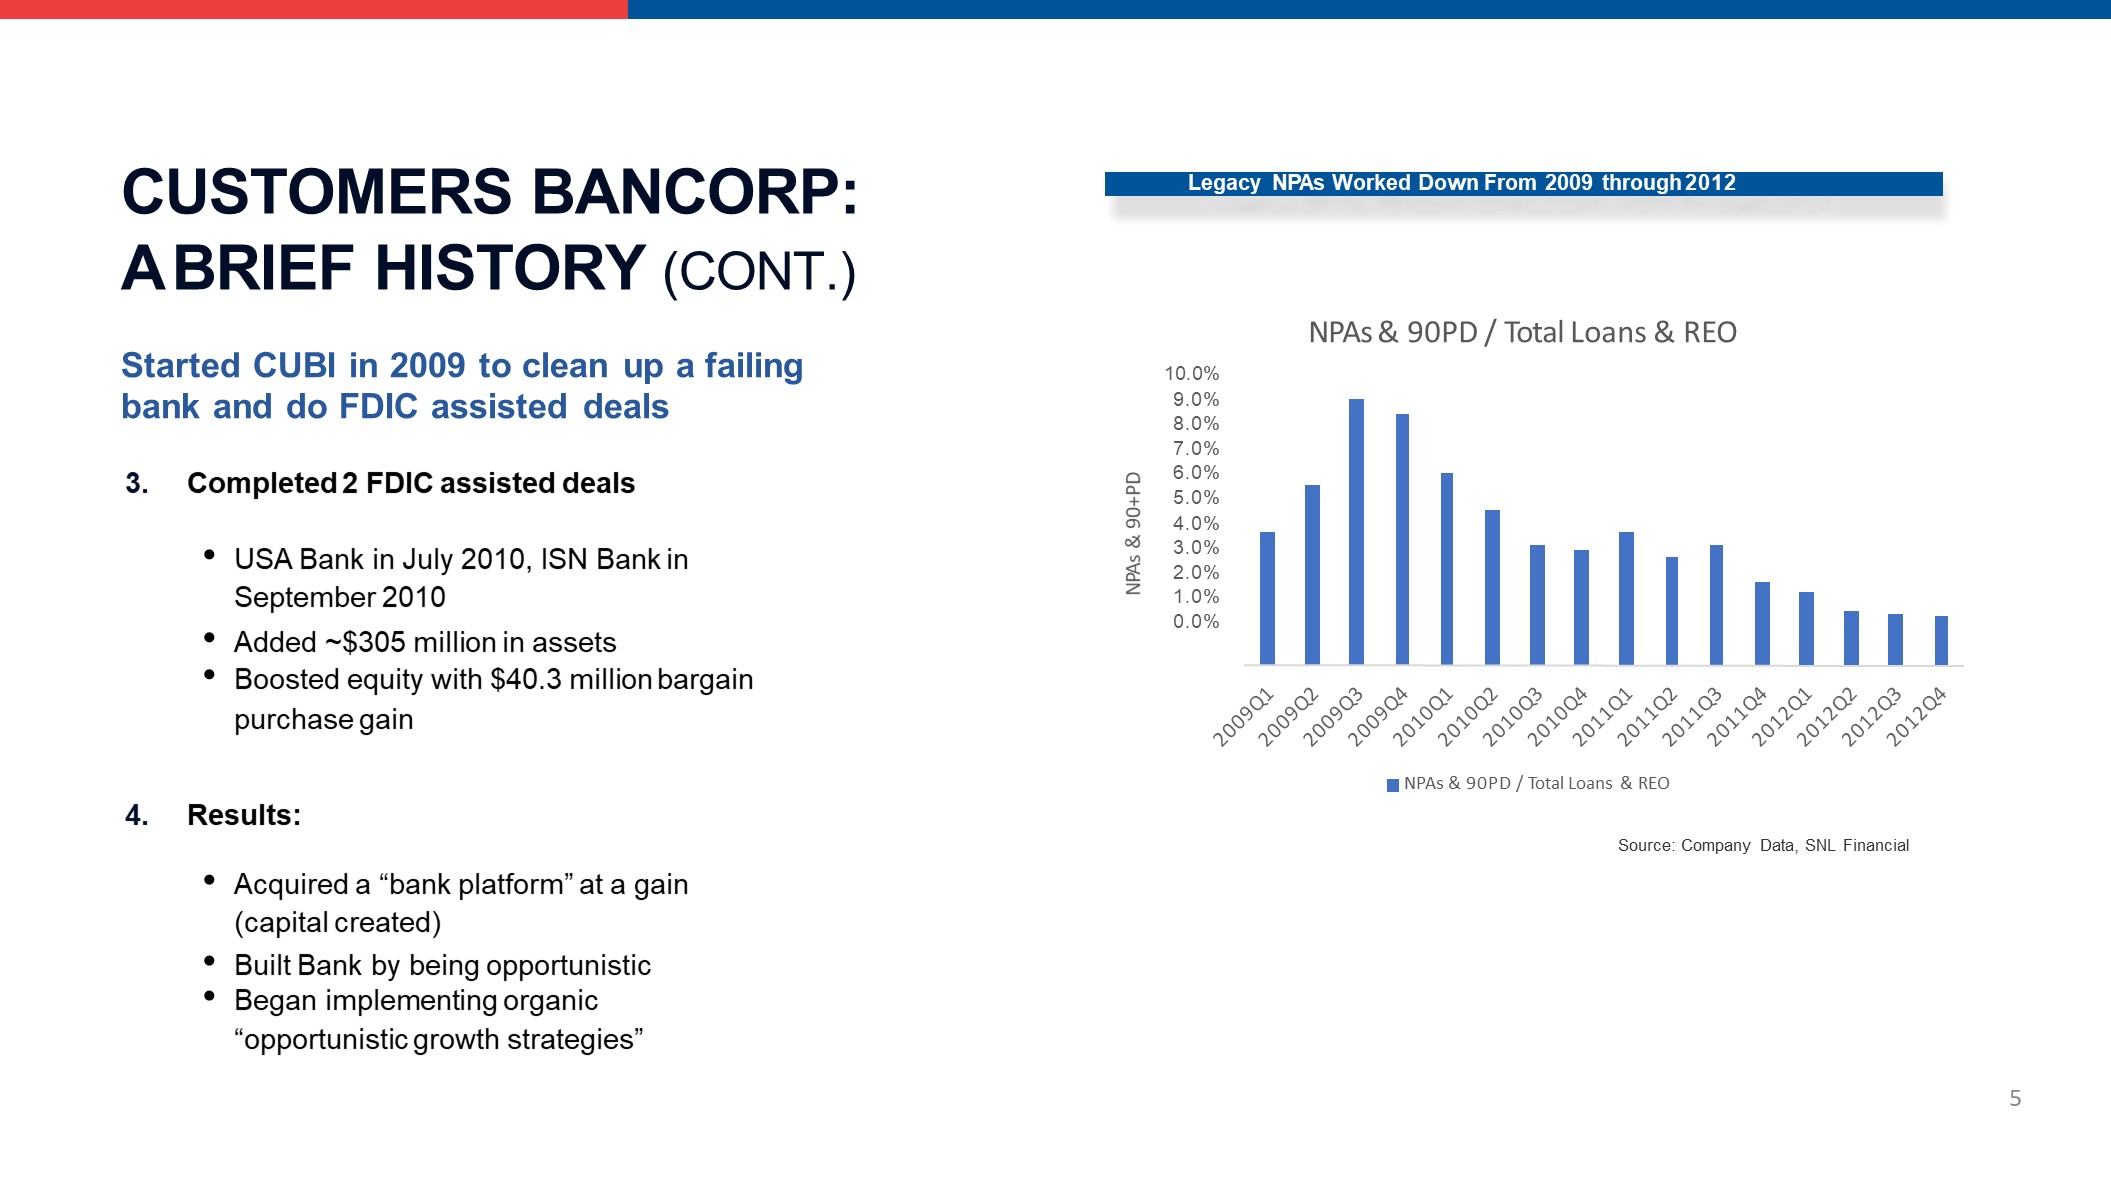
CUSTOMERS BANCORP: A BRIEF HISTORY (CONT.) Started CUBI in 2009 to clean up a failing bank and do FDIC assisted deals3. Completed 2 FDIC assisted deals USA Bank in July 2010, ISN Bank in September 2010Added ~$305 million in assetsBoosted equity with $40.3 million bargain purchase gain 4. Results: Acquired a “bank platform” at a gain (capital created)Built Bank by being opportunisticBegan implementing organic“opportunistic growth strategies” Legacy NPAs Worked Down From 2009 through 2012 Source: Company Data, SNL Financial 10.0%9.0%8.0%7.0%6.0%5.0%4.0%3.0%2.0%1.0%0.0% NPAs & 90+PD NPAs & 90PD / Total Loans & REO NPAs & 90PD / Total Loans & REO 5
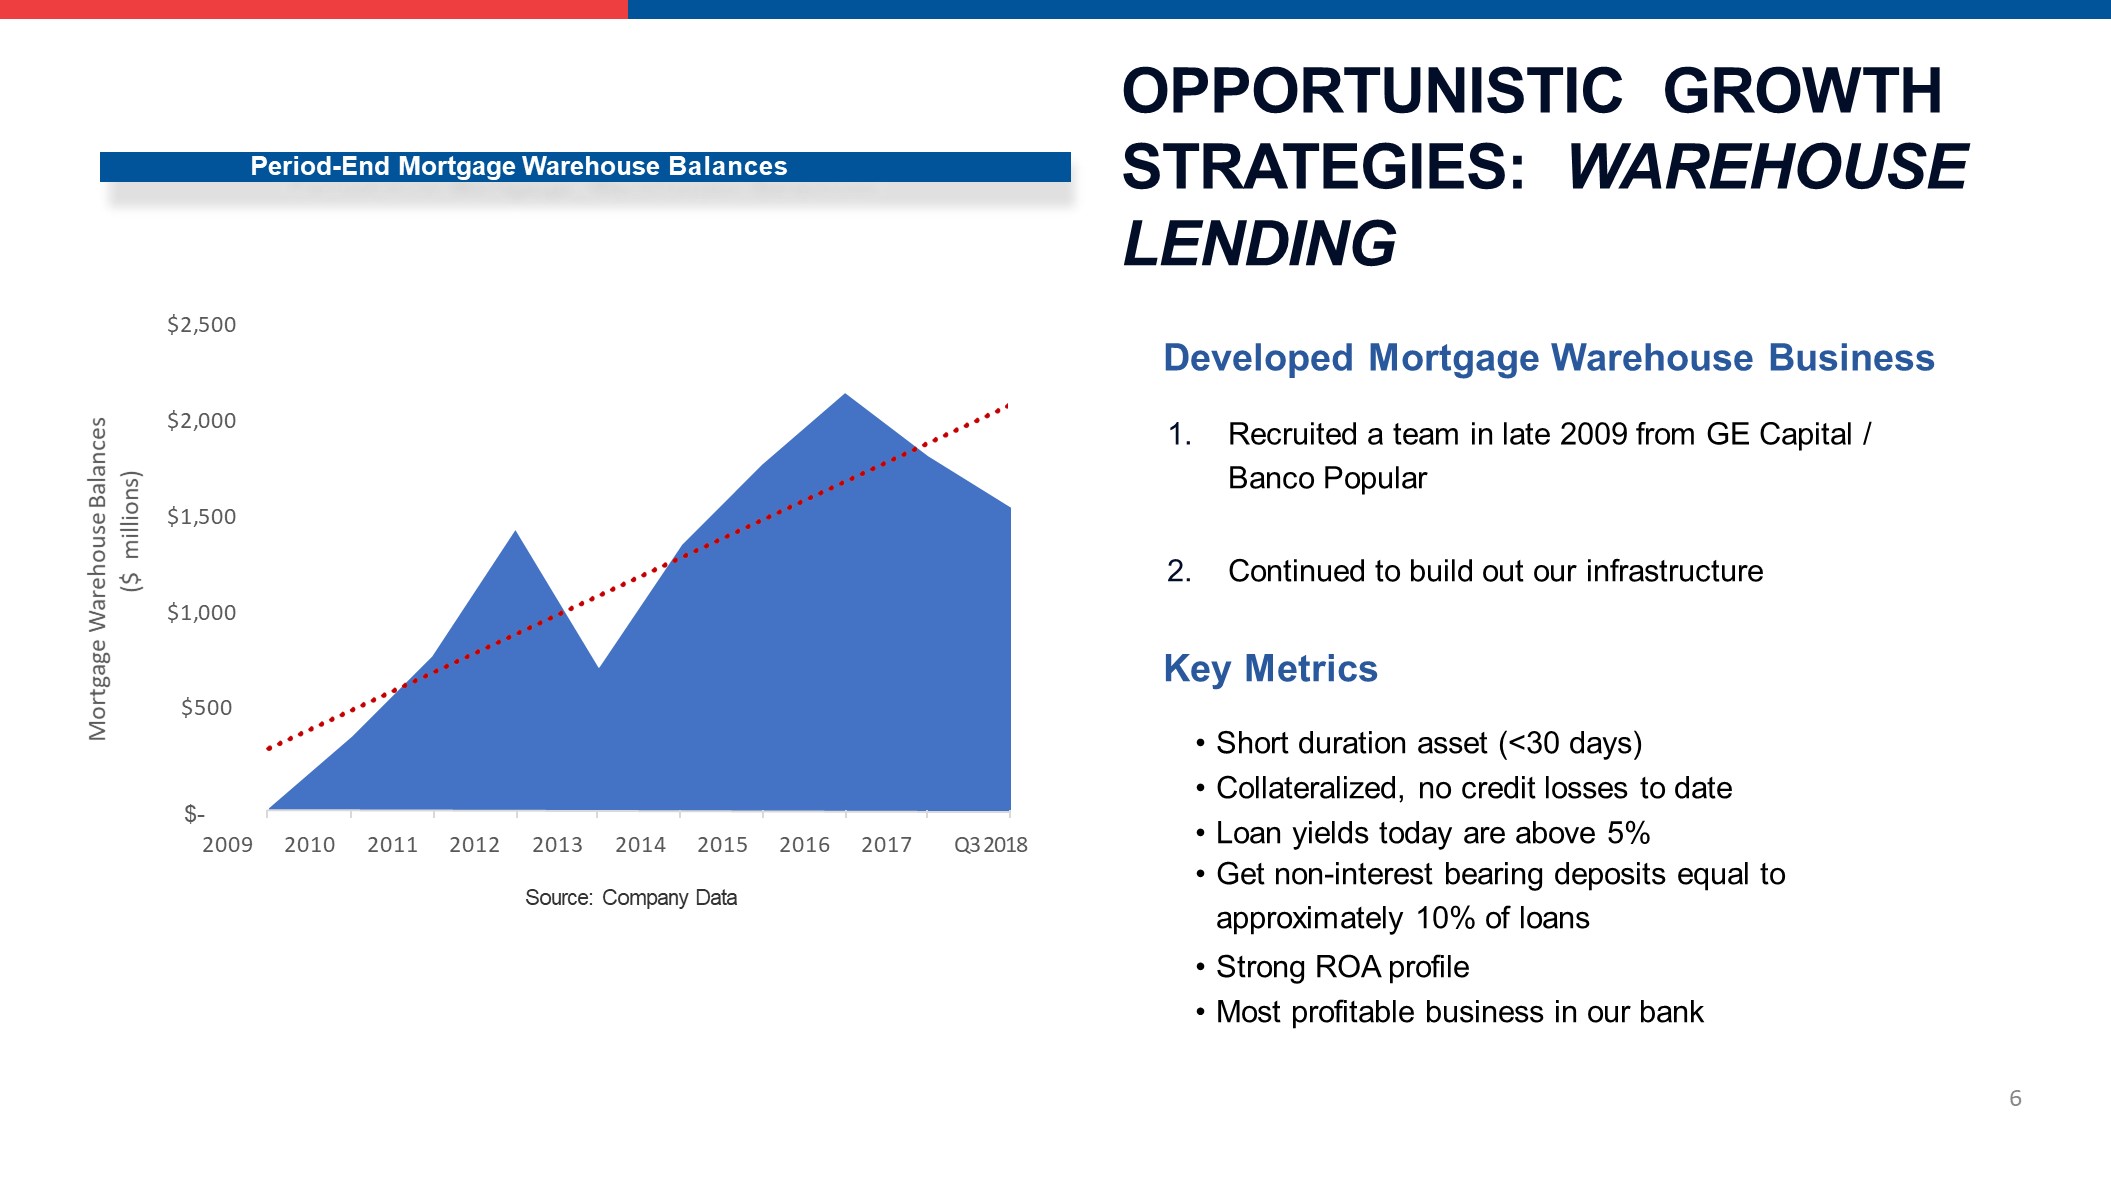
OPPORTUNISTIC GROWTH STRATEGIES: WAREHOUSE LENDING Developed Mortgage Warehouse BusinessRecruited a team in late 2009 from GE Capital / Banco PopularContinued to build out our infrastructureKey MetricsShort duration asset (<30 days)Collateralized, no credit losses to dateLoan yields today are above 5%Get non-interest bearing deposits equal to approximately 10% of loansStrong ROA profileMost profitable business in our bank Period-End Mortgage Warehouse Balances $2,500$2,000$1,500$1,000$500 6 $-2009 2010 2011 2012 2013 2014 2015 2016 2017 Q3 2018Source: Company Data Mortgage Warehouse Balances($ millions)
OPPORTUNISTIC GROWTH STRATEGIES: BUILDOUT C&I BUSINESS Started buildout of commercial lendingFocused on Single Point of Contact (“SPOC”) model“Branch Lite”Recruit teams who bring long-established client relationshipsWe have recruited 20+ teamsAccelerated with 2013 acquisition of New England team and loan portfolio from Flagstar BancorpOpened a few select denovo branches and 3 loan production offices to build a strong and unique presence in New York, New England, Pennsylvania/ New Jersey, Chicago and Washington, DC 7
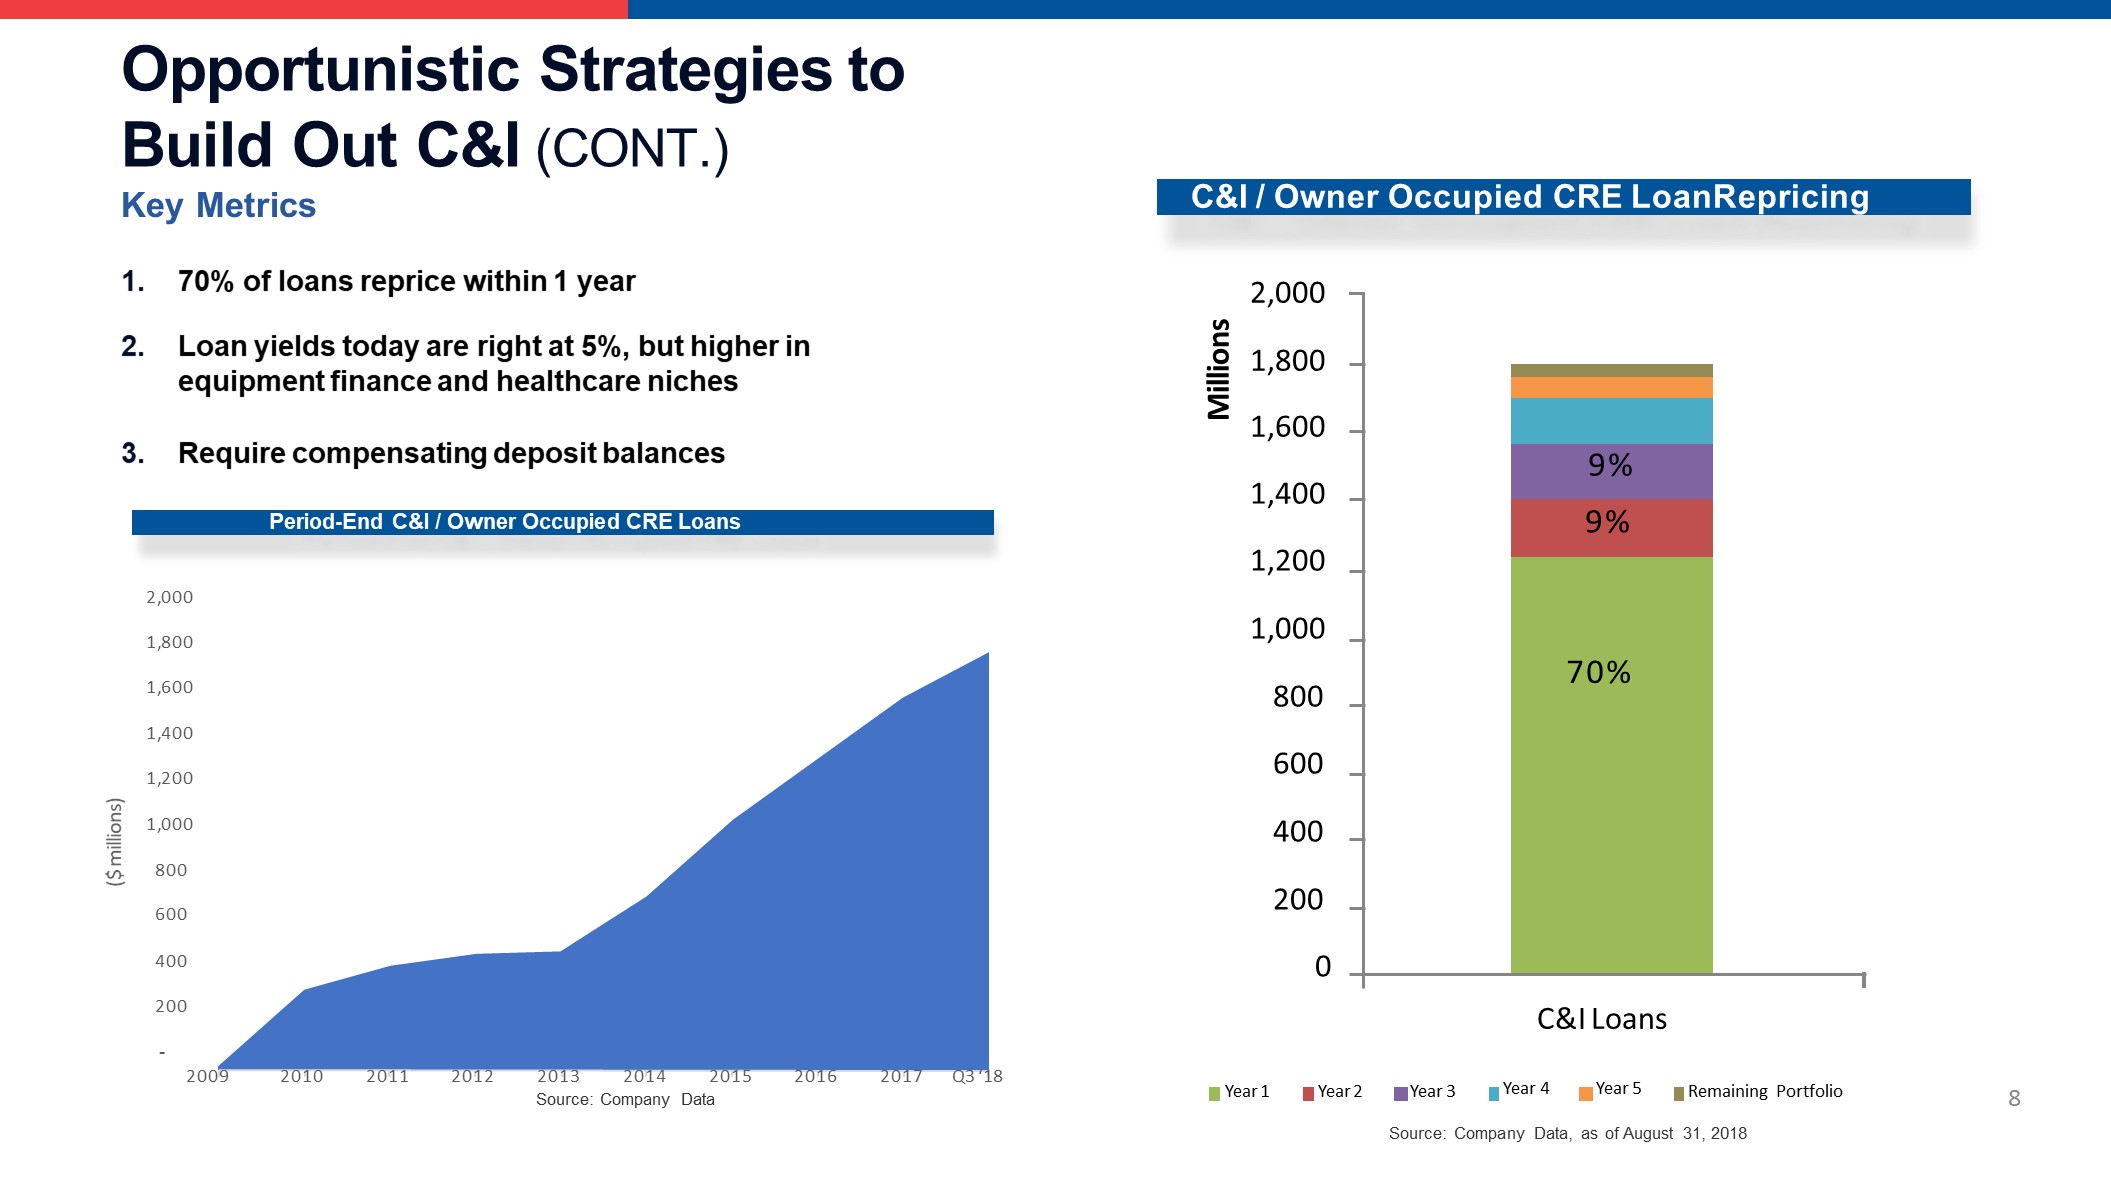
Opportunistic Strategies to Build Out C&I (CONT.) Key Metrics1. 70% of loans reprice within 1 year 2. Loan yields today are right at 5%, but higher in equipment finance and healthcare niches 3. Require compensating deposit balances ($ millions) Period-End C&I / Owner Occupied CRE Loans 2,000 1,800 1,600 1,400 1,200 1,000800 600 400 200 - 2009 2010 2011 2012 2016 2017 Q3 ‘18 2013 2014 2015Source: Company Data C&I / Owner Occupied CRE LoanRepricing 2,0001,8001,6001,4001,2001,0008006004002000 Millions Year 1 Year 2 C&I Loans Year 4 Year 5 Year 3 Remaining Portfolio 9% 9% 70% 8 Source: Company Data, as of August 31, 2018
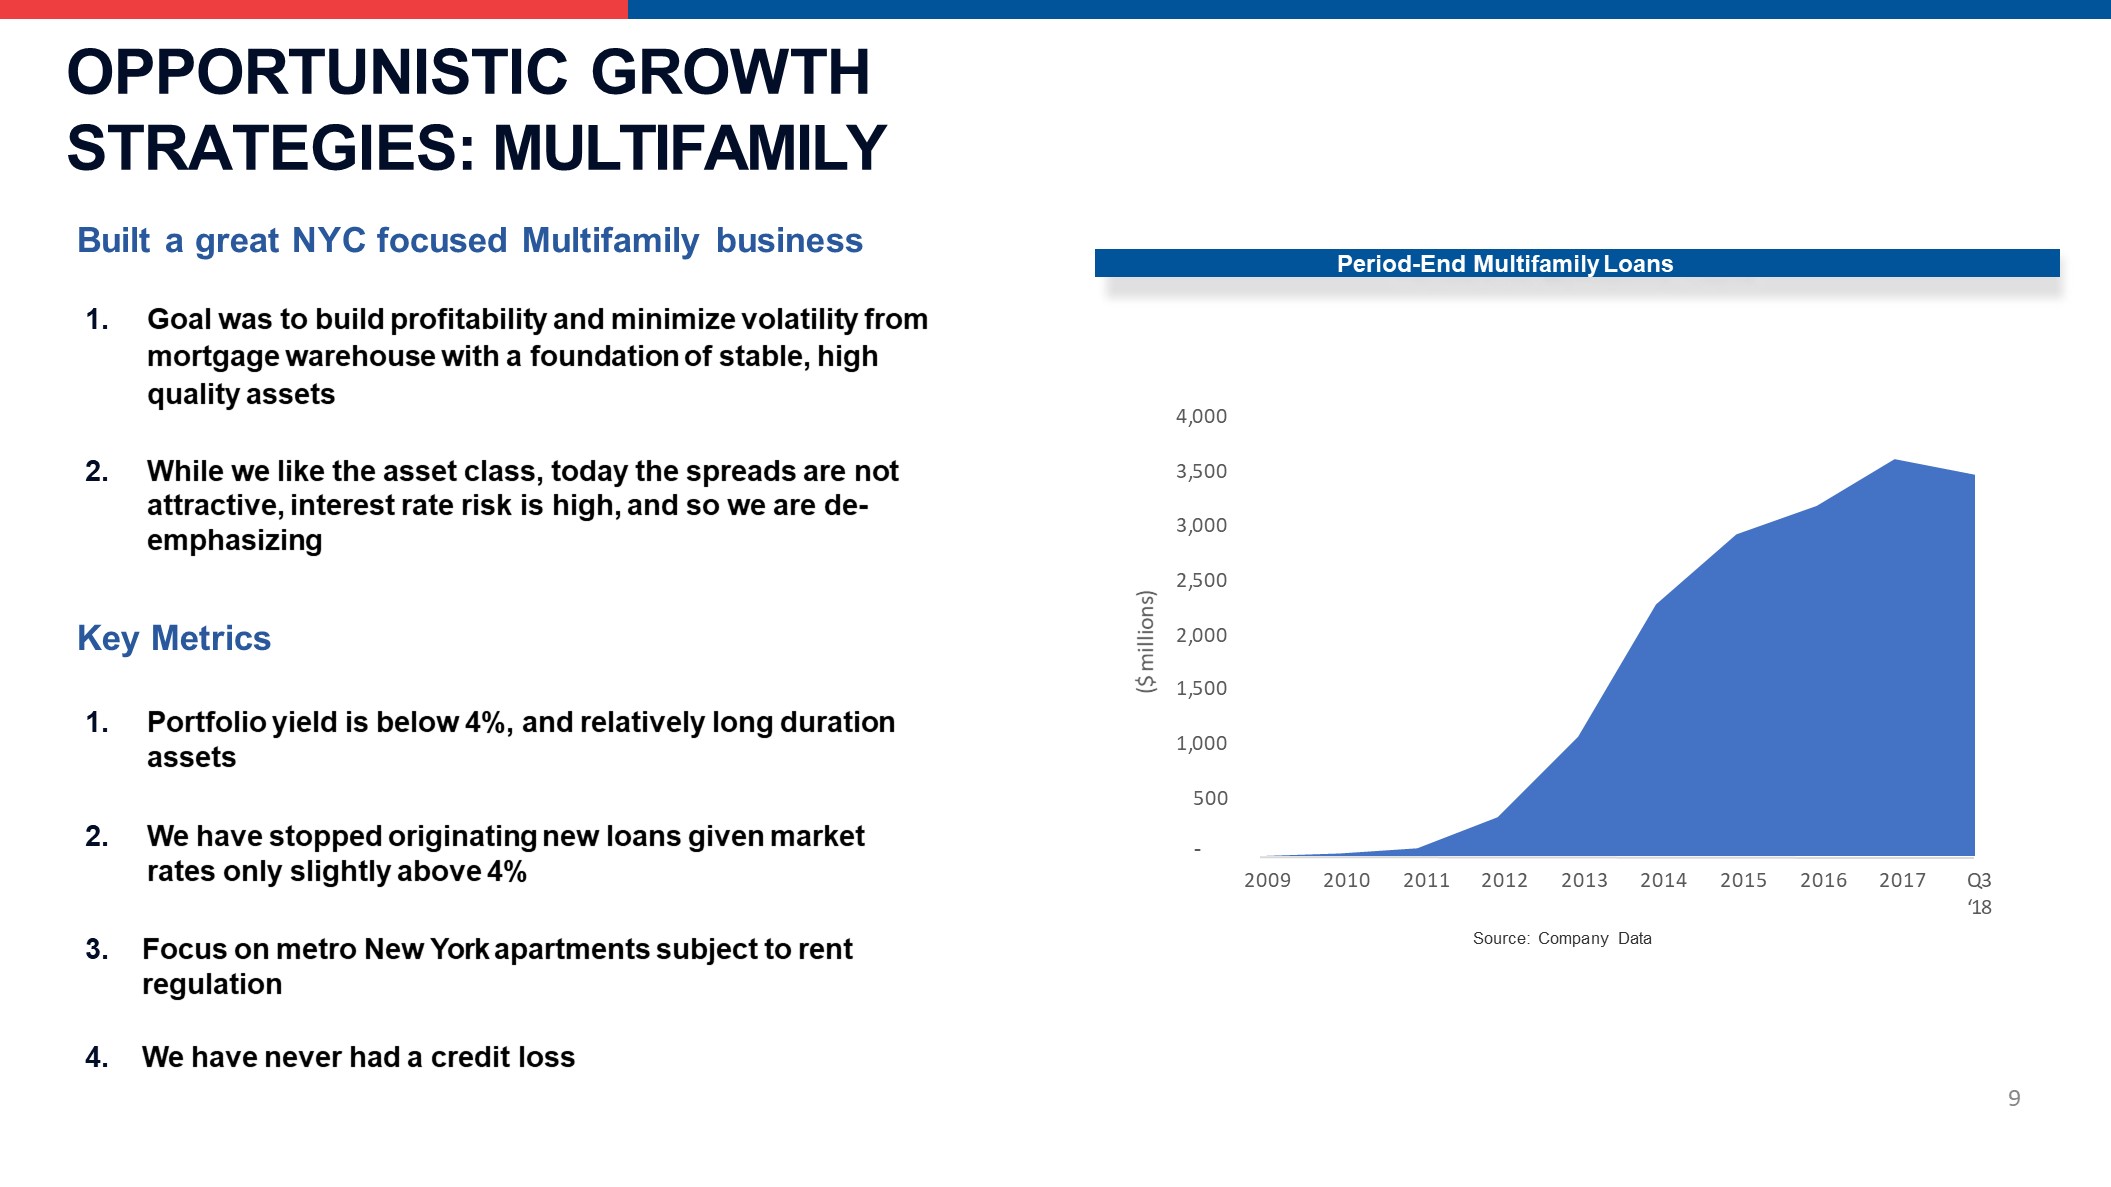
OPPORTUNISTIC GROWTH STRATEGIES: MULTIFAMILY Built a great NYC focused Multifamily businessGoal was to build profitability and minimize volatility from mortgage warehouse with a foundation of stable, high quality assetsWhile we like the asset class, today the spreads are not attractive, interest rate risk is high, and so we are de- emphasizingKey MetricsPortfolio yield is below 4%, and relatively long duration assetsWe have stopped originating new loans given market rates only slightly above 4%Focus on metro New York apartments subject to rent regulationWe have never had a credit loss Period-End Multifamily Loans 500 - 1,000 1,500 2,000 2,500 3,000 3,500 4,000 ($ millions) 9 2009 2010 2011 2012 2013 2014 2015 2016 2017 Q3‘18Source: Company Data
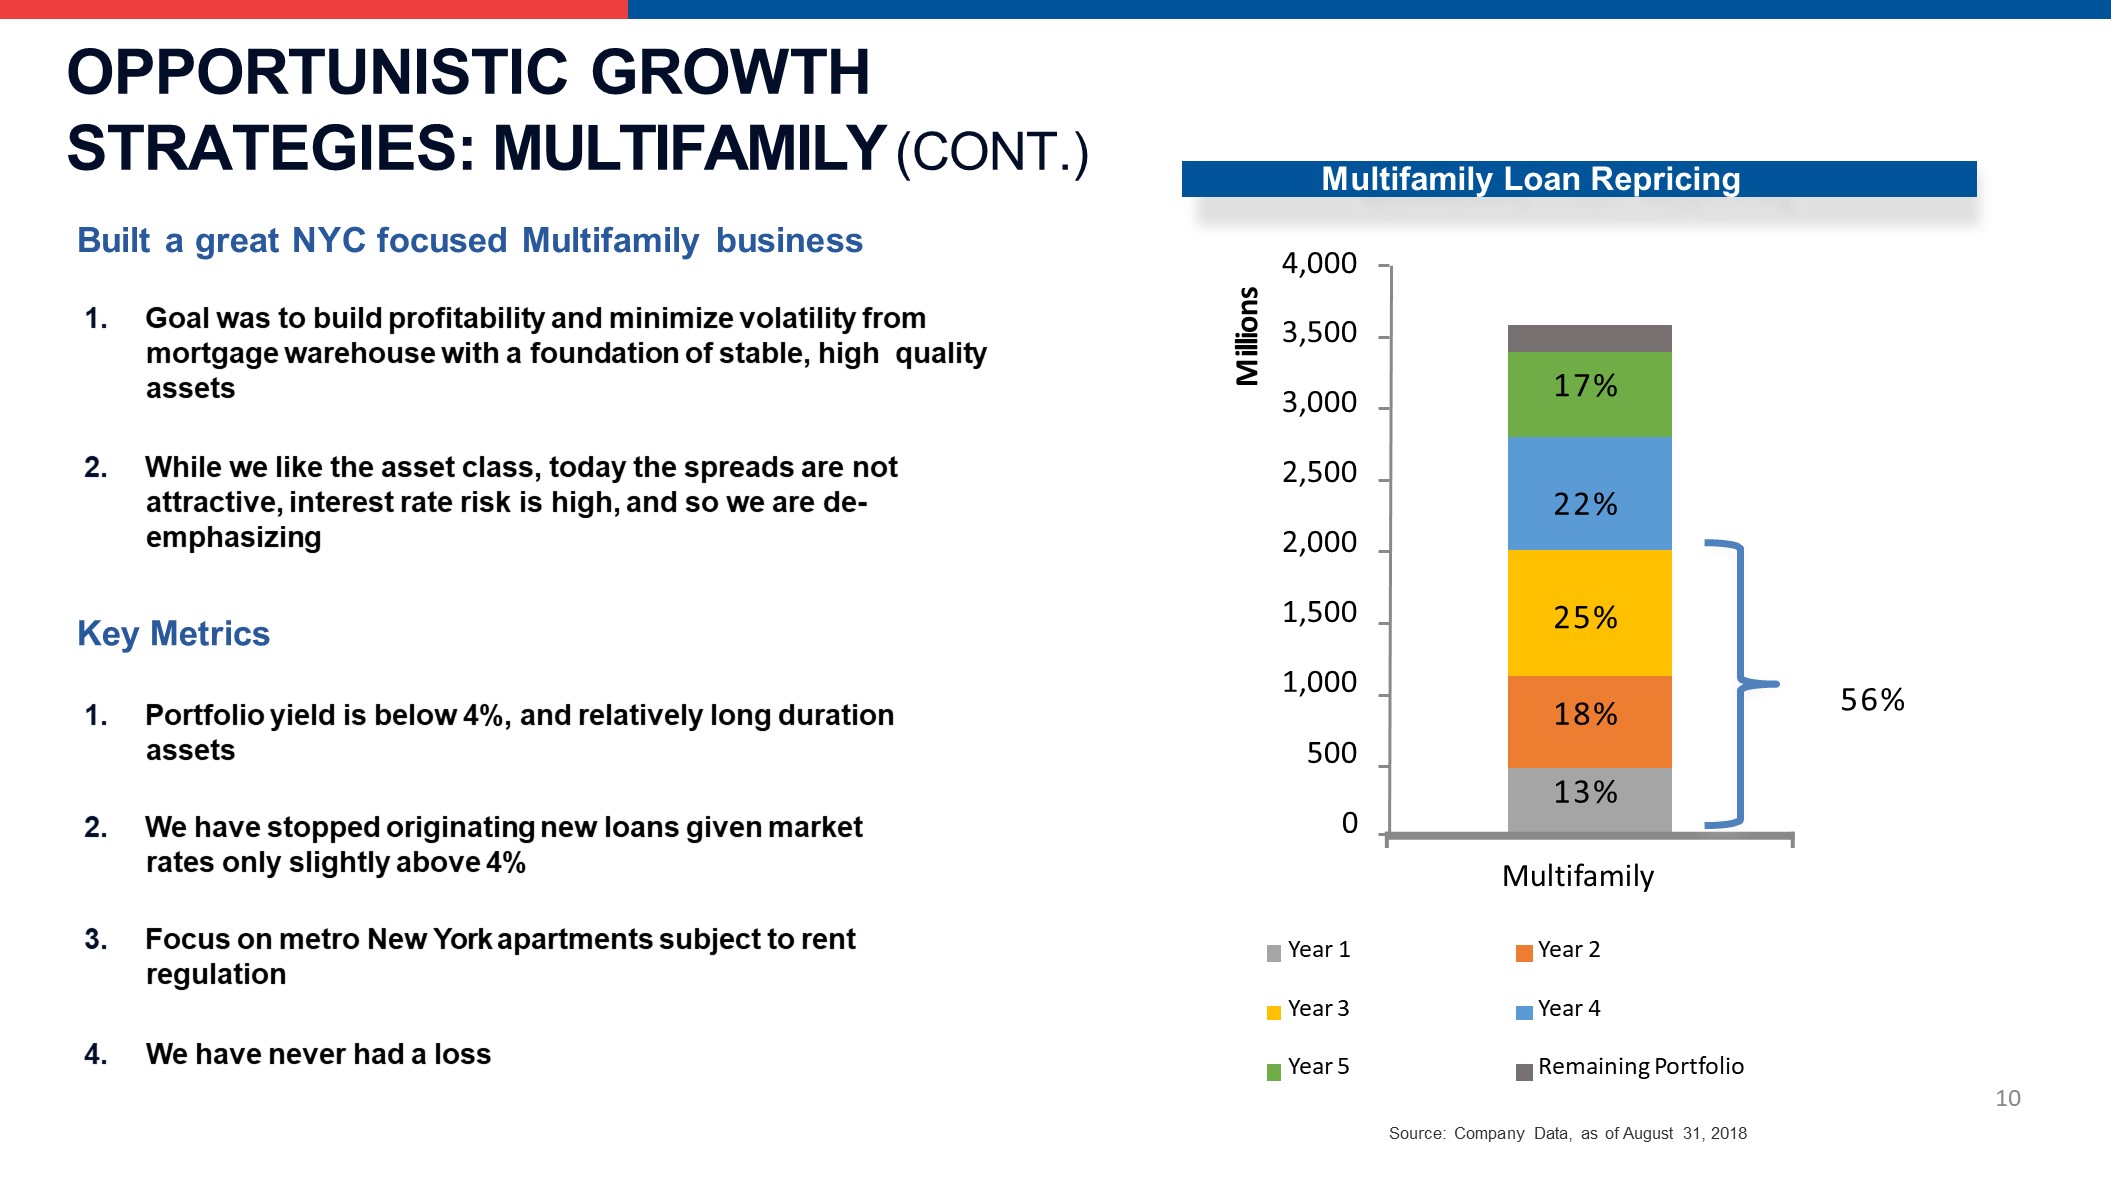
OPPORTUNISTIC GROWTH STRATEGIES: MULTIFAMILY (CONT.) Built a great NYC focused Multifamily business 1. Goal was to build profitability and minimize volatility from mortgage warehouse with a foundation of stable, high quality assets 2. While we like the asset class, today the spreads are not attractive, interest rate risk is high, and so we are de- emphasizing Key Metrics 1. Portfolio yield is below 4%, and relatively long duration assets 2. We have stopped originating new loans given market rates only slightly above 4% 3. Focus on metro New York apartments subject to rent regulation 4. We have never had a loss Multifamily Loan Repricing 4,0003,5003,0002,5002,0001,5001,0005000 Multifamily Millions Year 1 Year 3Year 5 Year 2 Year 4Remaining Portfolio 17% 22% 25% 18% 13% 56% 10 Source: Company Data, as of August 31, 2018
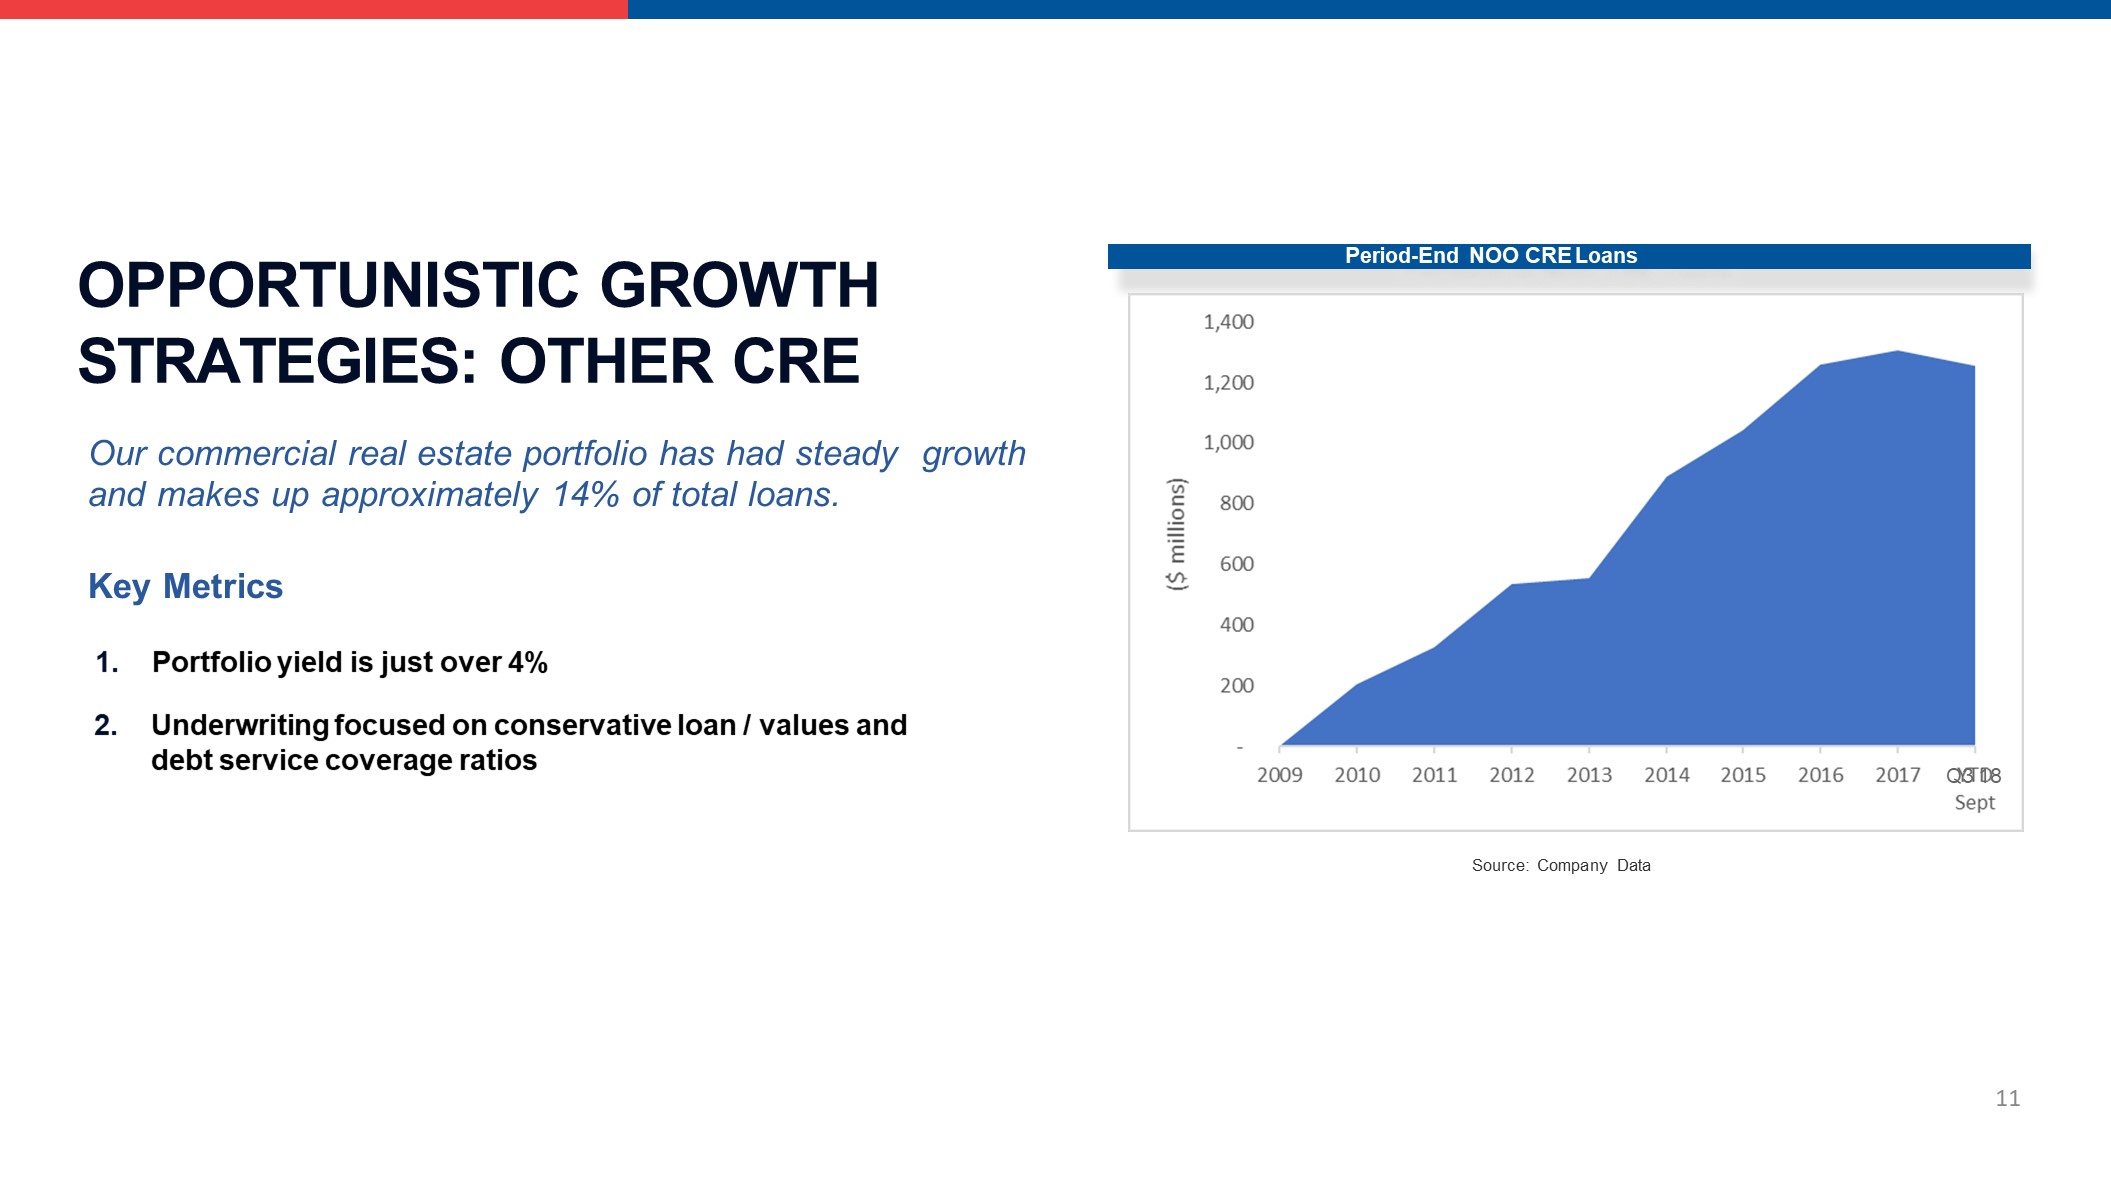
OPPORTUNISTIC GROWTH STRATEGIES: OTHER CRE Our commercial real estate portfolio has had steady growth and makes up approximately 14% of total loans.Key Metrics1. Portfolio yield is just over 4% 2. Underwriting focused on conservative loan / values and debt service coverage ratios Period-End NOO CRE Loans 11 Q3 18 Source: Company Data
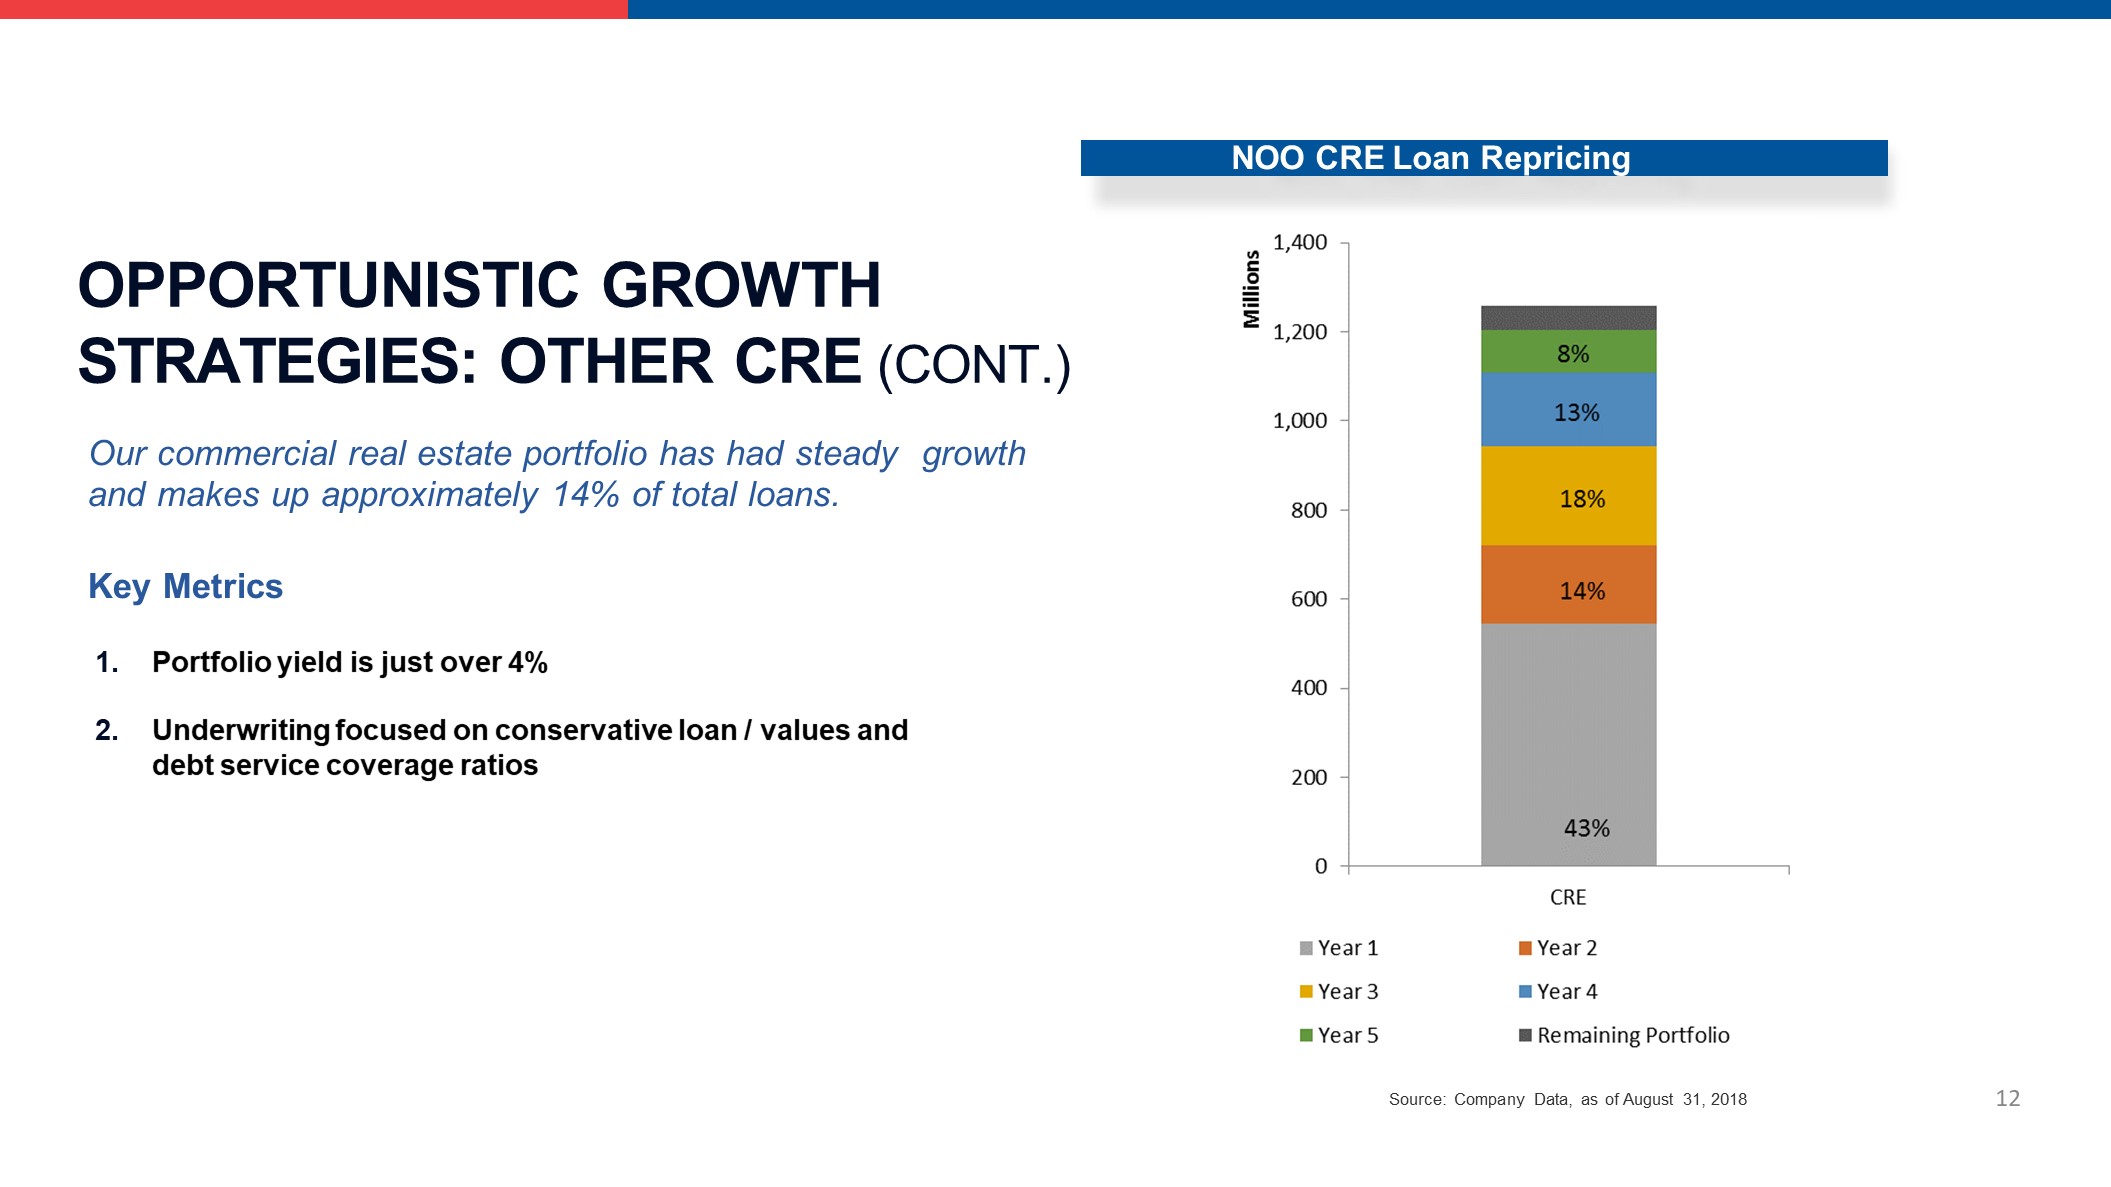
OPPORTUNISTIC GROWTH STRATEGIES: OTHER CRE (CONT.) Our commercial real estate portfolio has had steady growth and makes up approximately 14% of total loans.Key MetricsPortfolio yield is just over 4%Underwriting focused on conservative loan / values and debt service coverage ratios NOO CRE Loan Repricing 12 Source: Company Data, as of August 31, 2018
OPPORTUNISTIC GROWTH STRATEGIES: BANKMOBILE Recognizing the changing consumer behavior and advent of mobile technology, we launched BankMobile in 2016.Today BankMobile has:1.0 million active customers726 campuses serviced$31 million YTD (9/30/18) non-interest revenues$732 million (9/30/18) of demand depositsWe will launch our first White Label partnership in Q4 2018 13
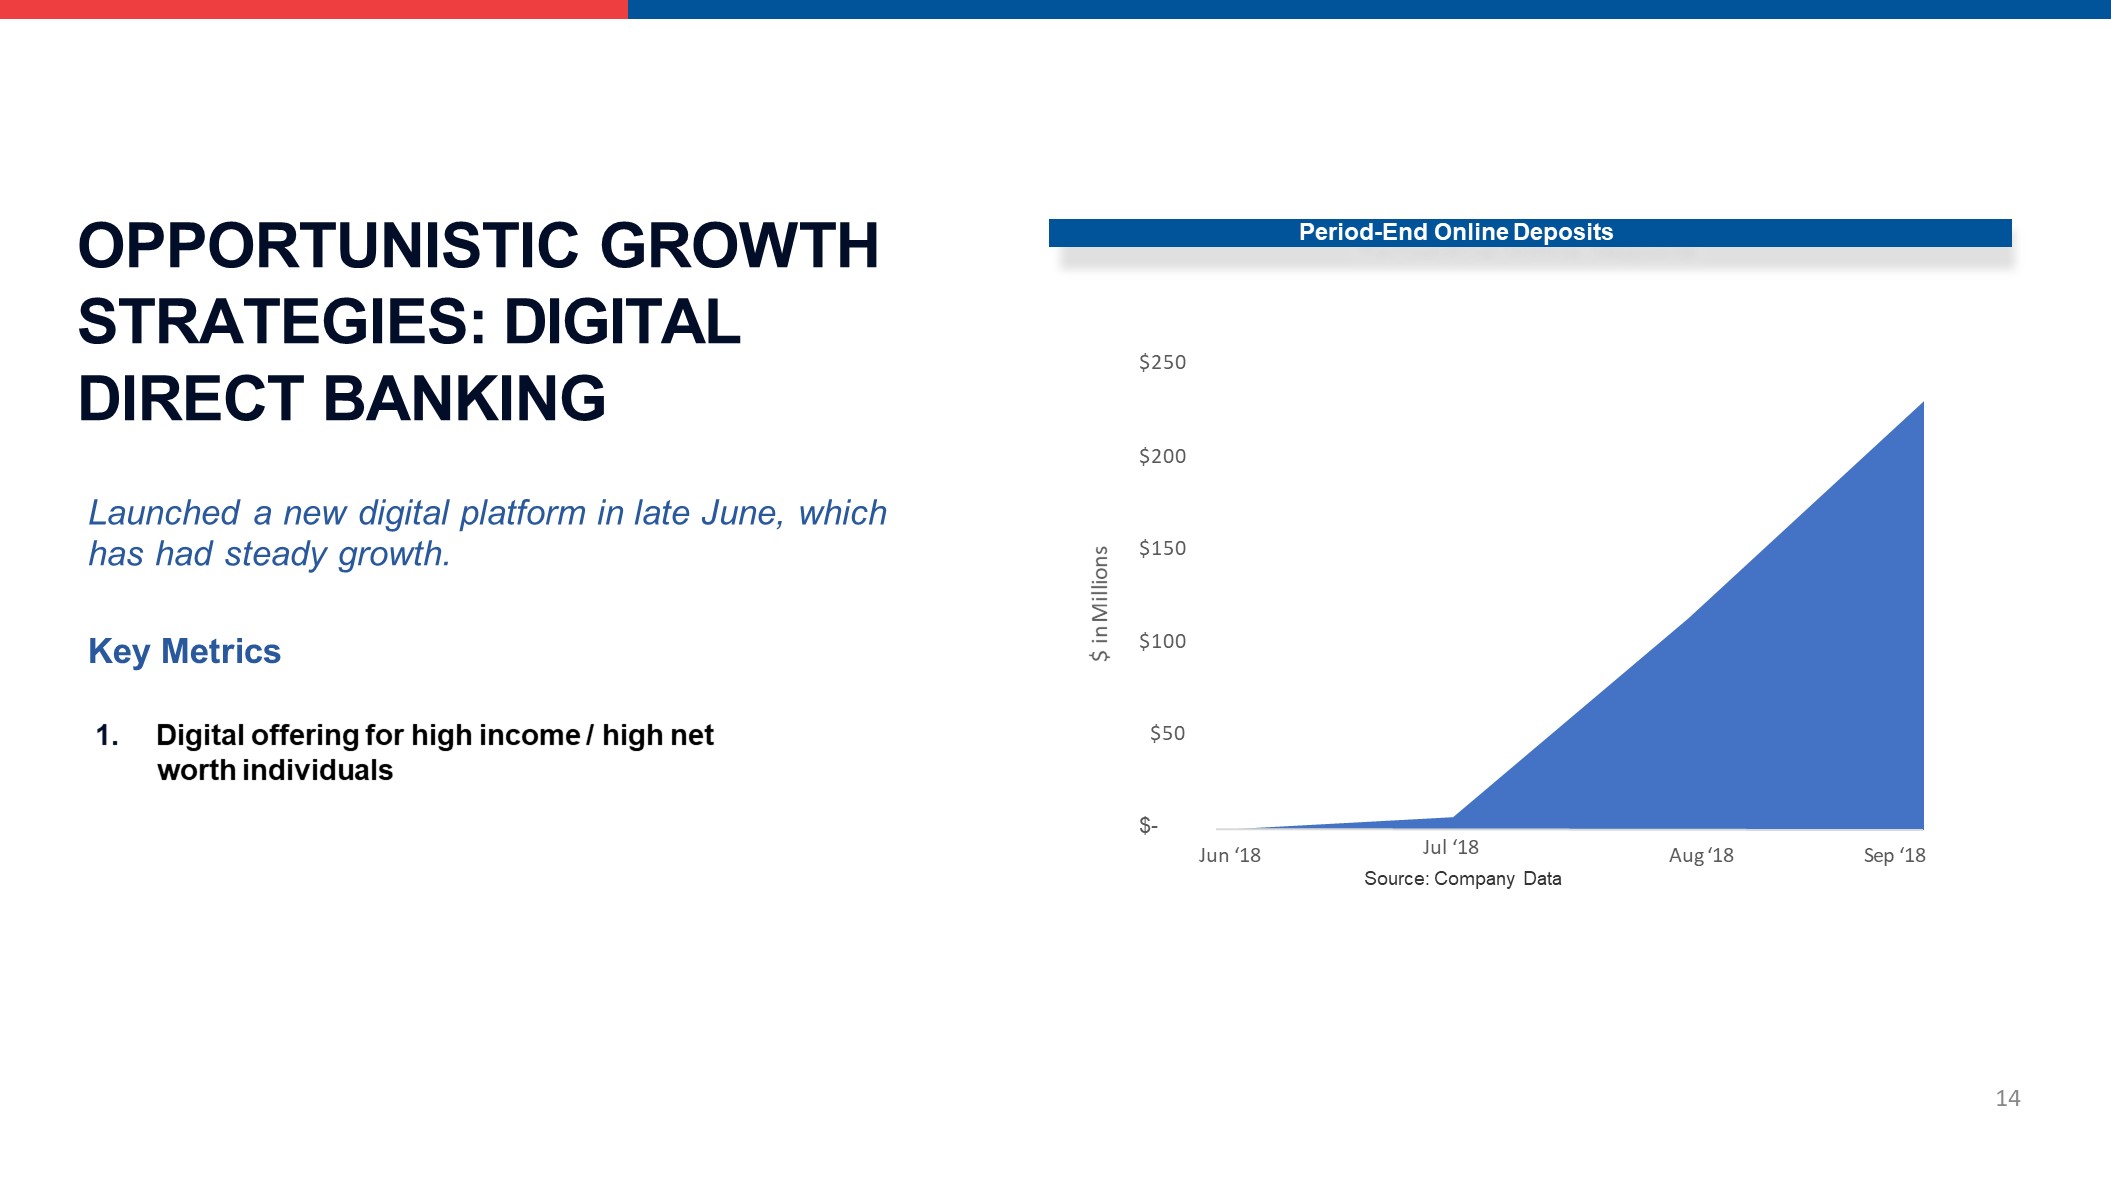
OPPORTUNISTIC GROWTH STRATEGIES: DIGITAL DIRECT BANKING Launched a new digital platform in late June, which has had steady growth. Key Metrics 1. Digital offering for high income / high net worth individuals Period-End Online Deposits $- 14 $50 $100 $150 $200 $250 Jun ‘18 Jul ‘18Source: Company Data Aug ‘18 Sep ‘18 $ in Millions
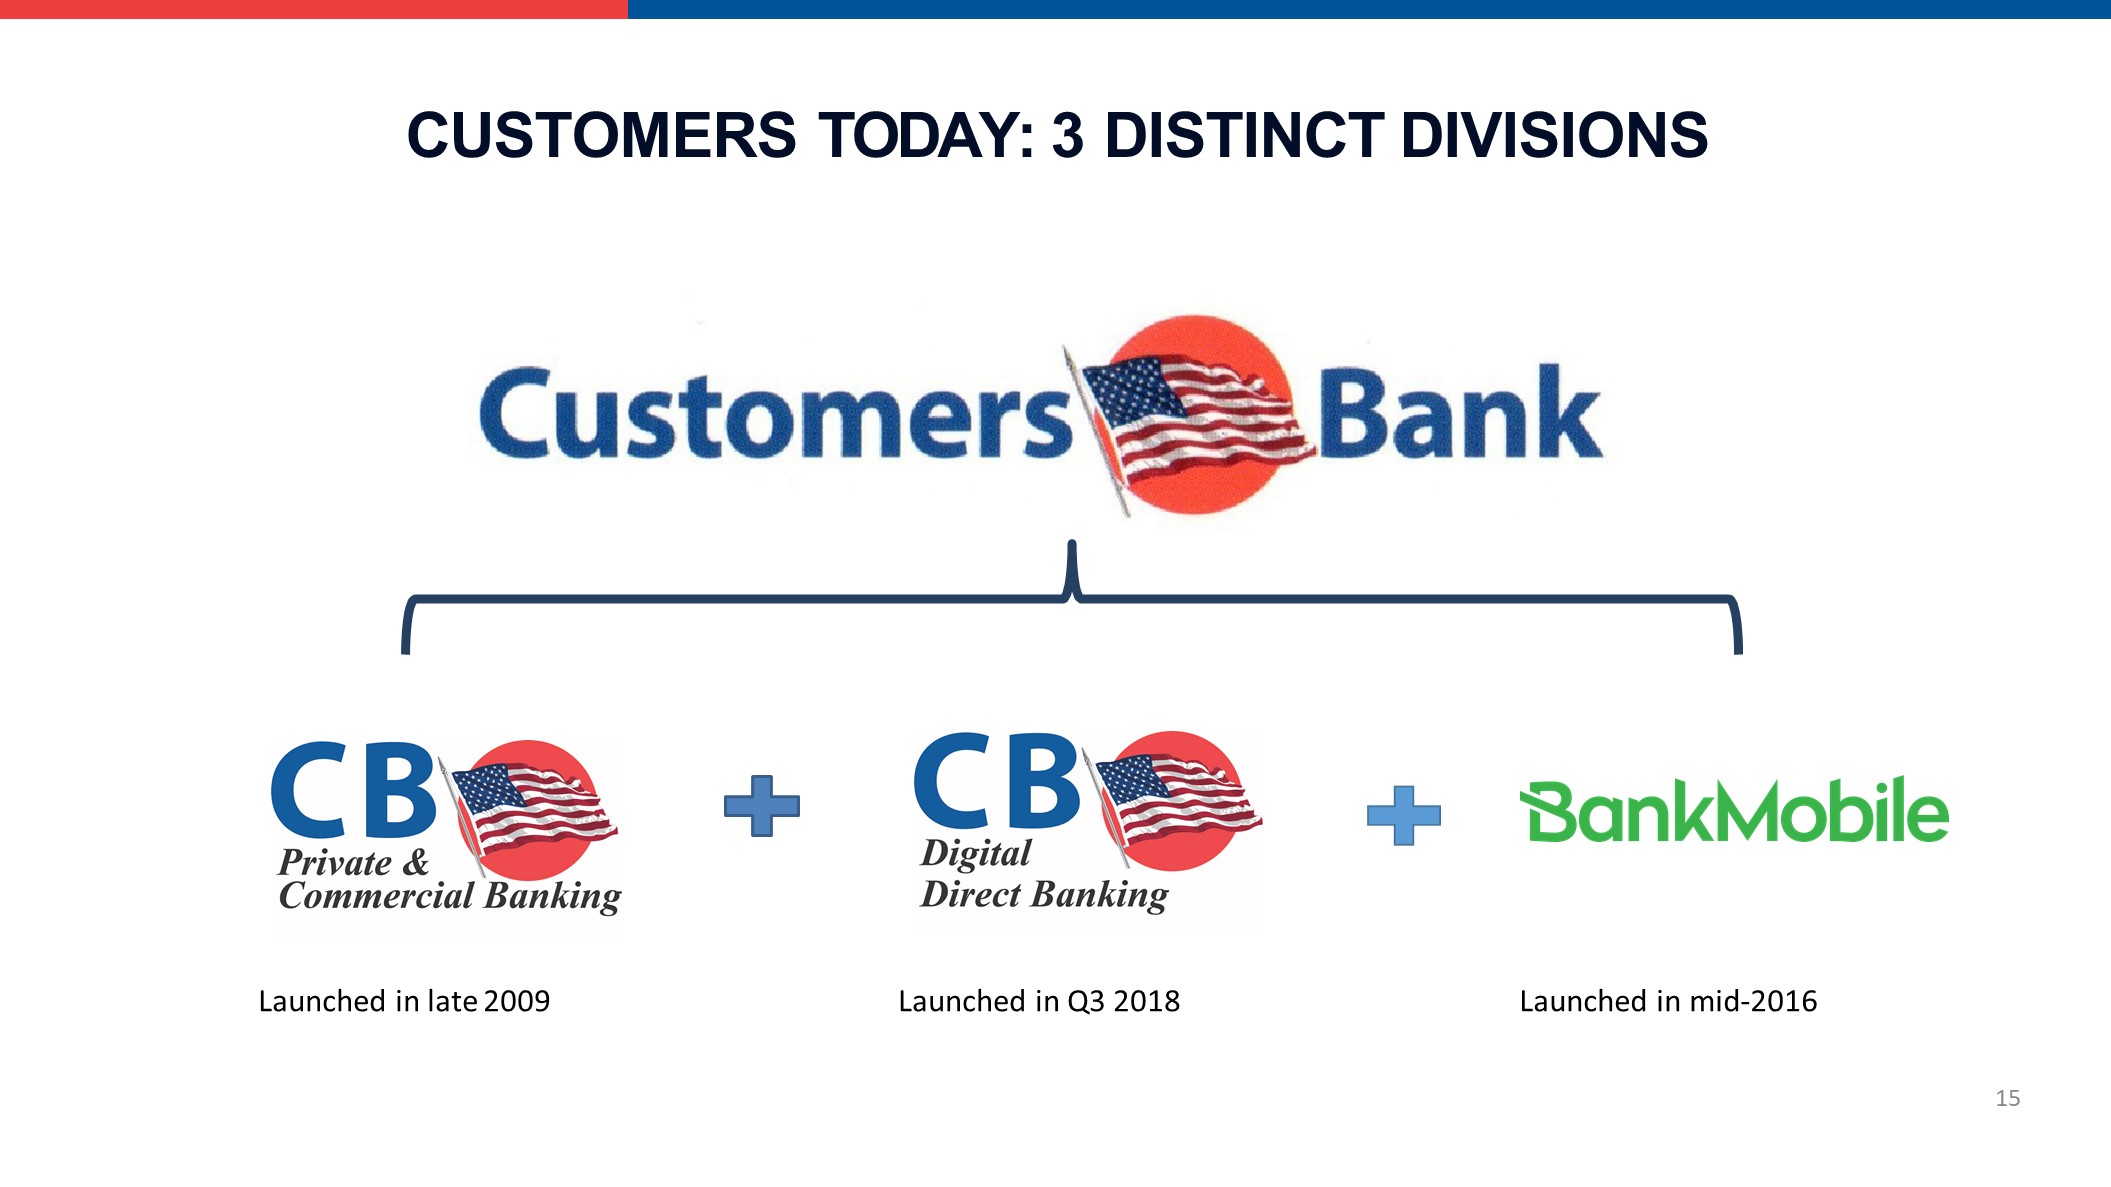
Launched in late 2009 15 Launched in Q3 2018 Launched in mid-2016 CUSTOMERS TODAY: 3 DISTINCT DIVISIONS
Our View of the Current Banking Environment October 2018
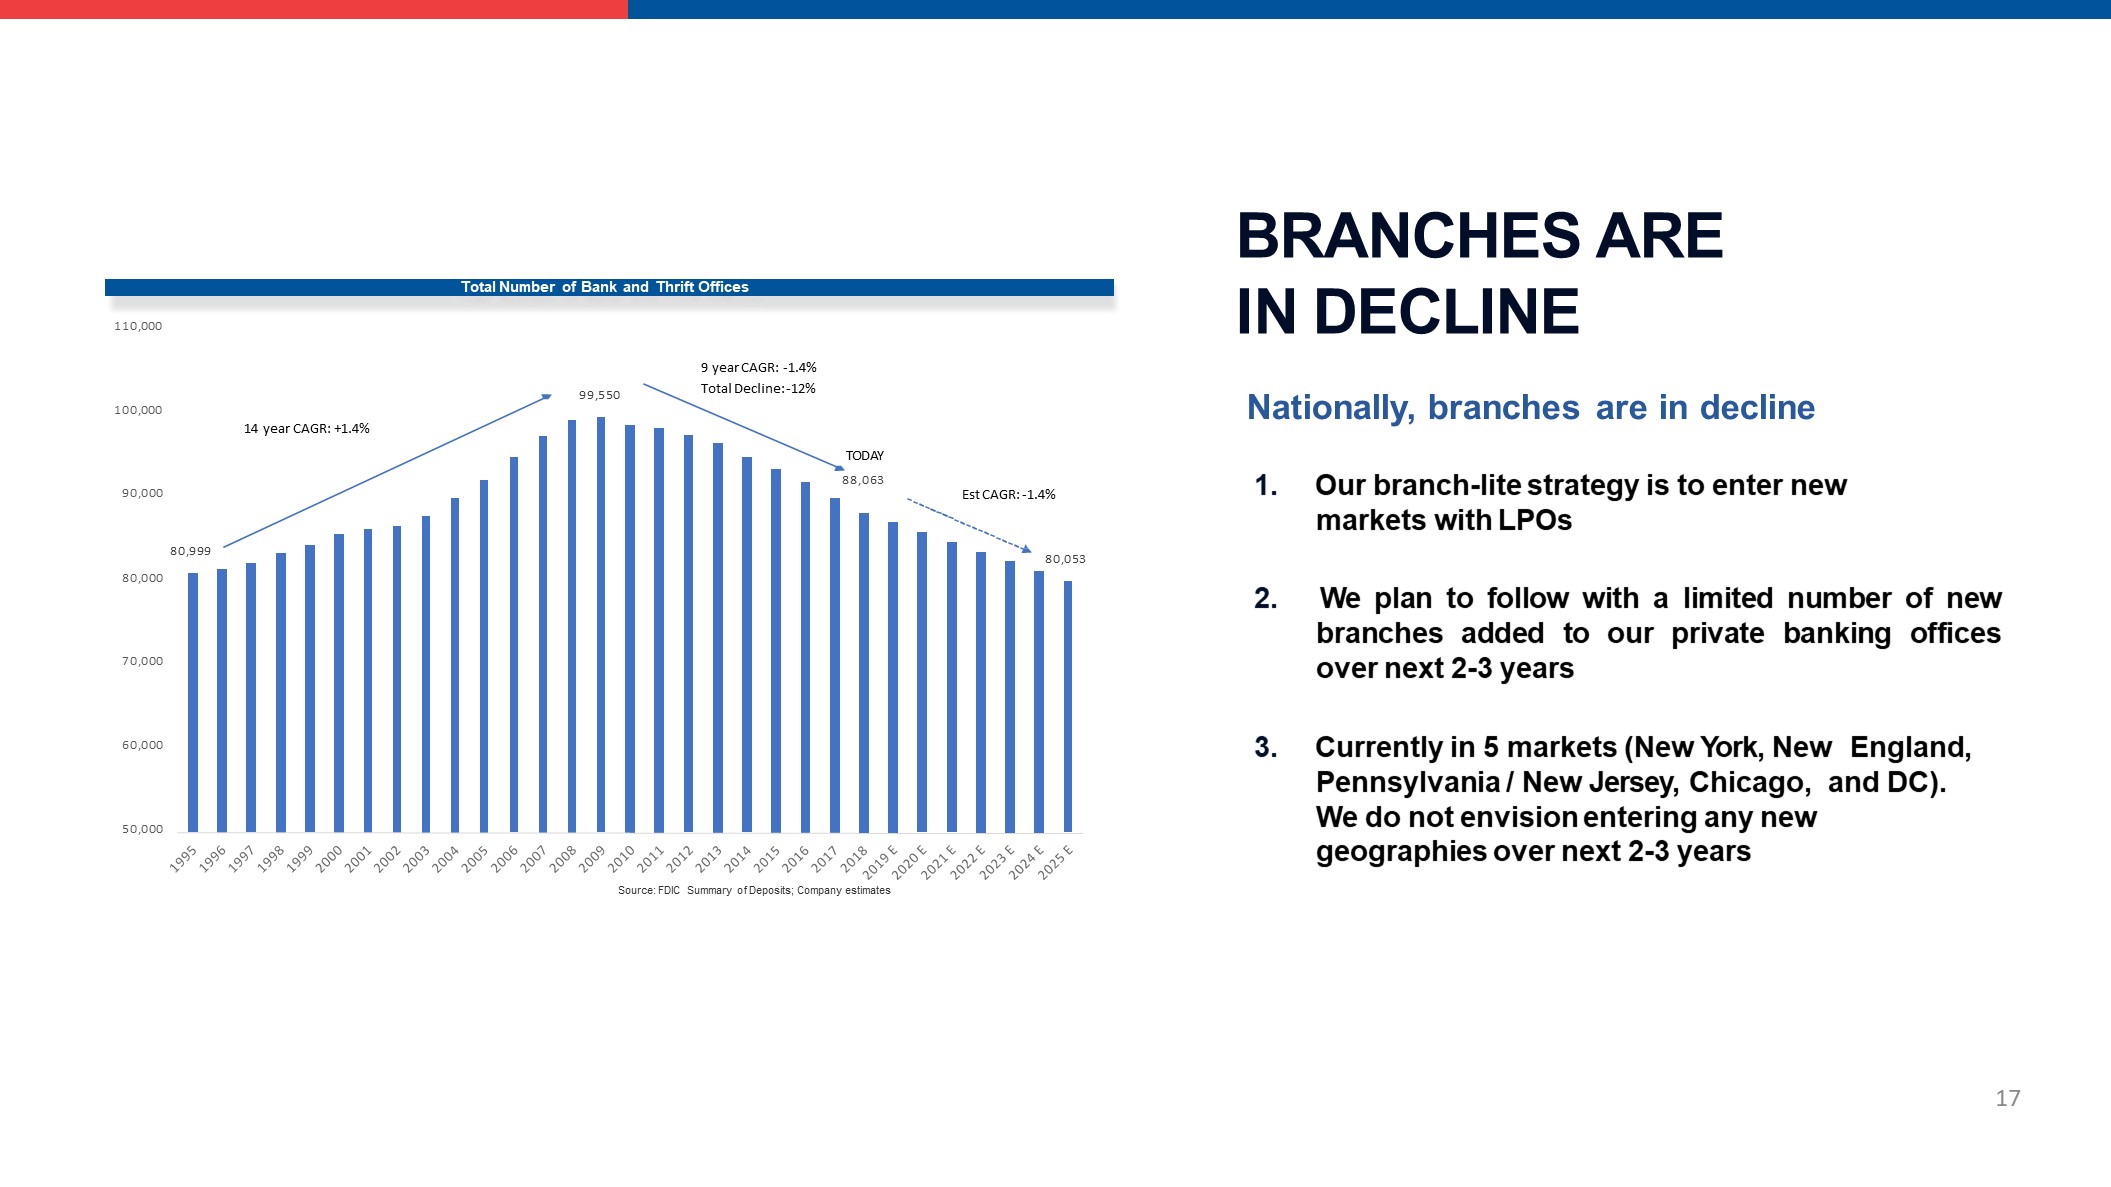
BRANCHES ARE IN DECLINE Nationally, branches are in decline 1. Our branch-lite strategy is to enter new markets with LPOs 2. We plan to follow with a limited number of new branches added to our private banking offices over next 2-3 years 3. Currently in 5 markets (New York, New England, Pennsylvania / New Jersey, Chicago, and DC). We do not envision entering any new geographies over next 2-3 years 80,999 99,550 80,053 50,000 60,000 70,000 80,000 90,000 100,000 110,000 14 year CAGR: +1.4% 9 year CAGR: -1.4%Total Decline: -12% TODAY88,063 Est CAGR: -1.4% Total Number of Bank and Thrift Offices 17 Source: FDIC Summary of Deposits; Company estimates

RATES ARE ON THE RISE The Fed has raised short-term rates 200 bps since late 2015. The consensus view is for another increase this year (4 total) and 2-3 more increases in 2019, but the Federal Reserve’s Dot Plot suggests it could be more. 2.2502.0001.7501.500 2.500 2.750 3.000 3.250 3.500 Market Expectations FOMC Projections Fed Funds Expectations 18
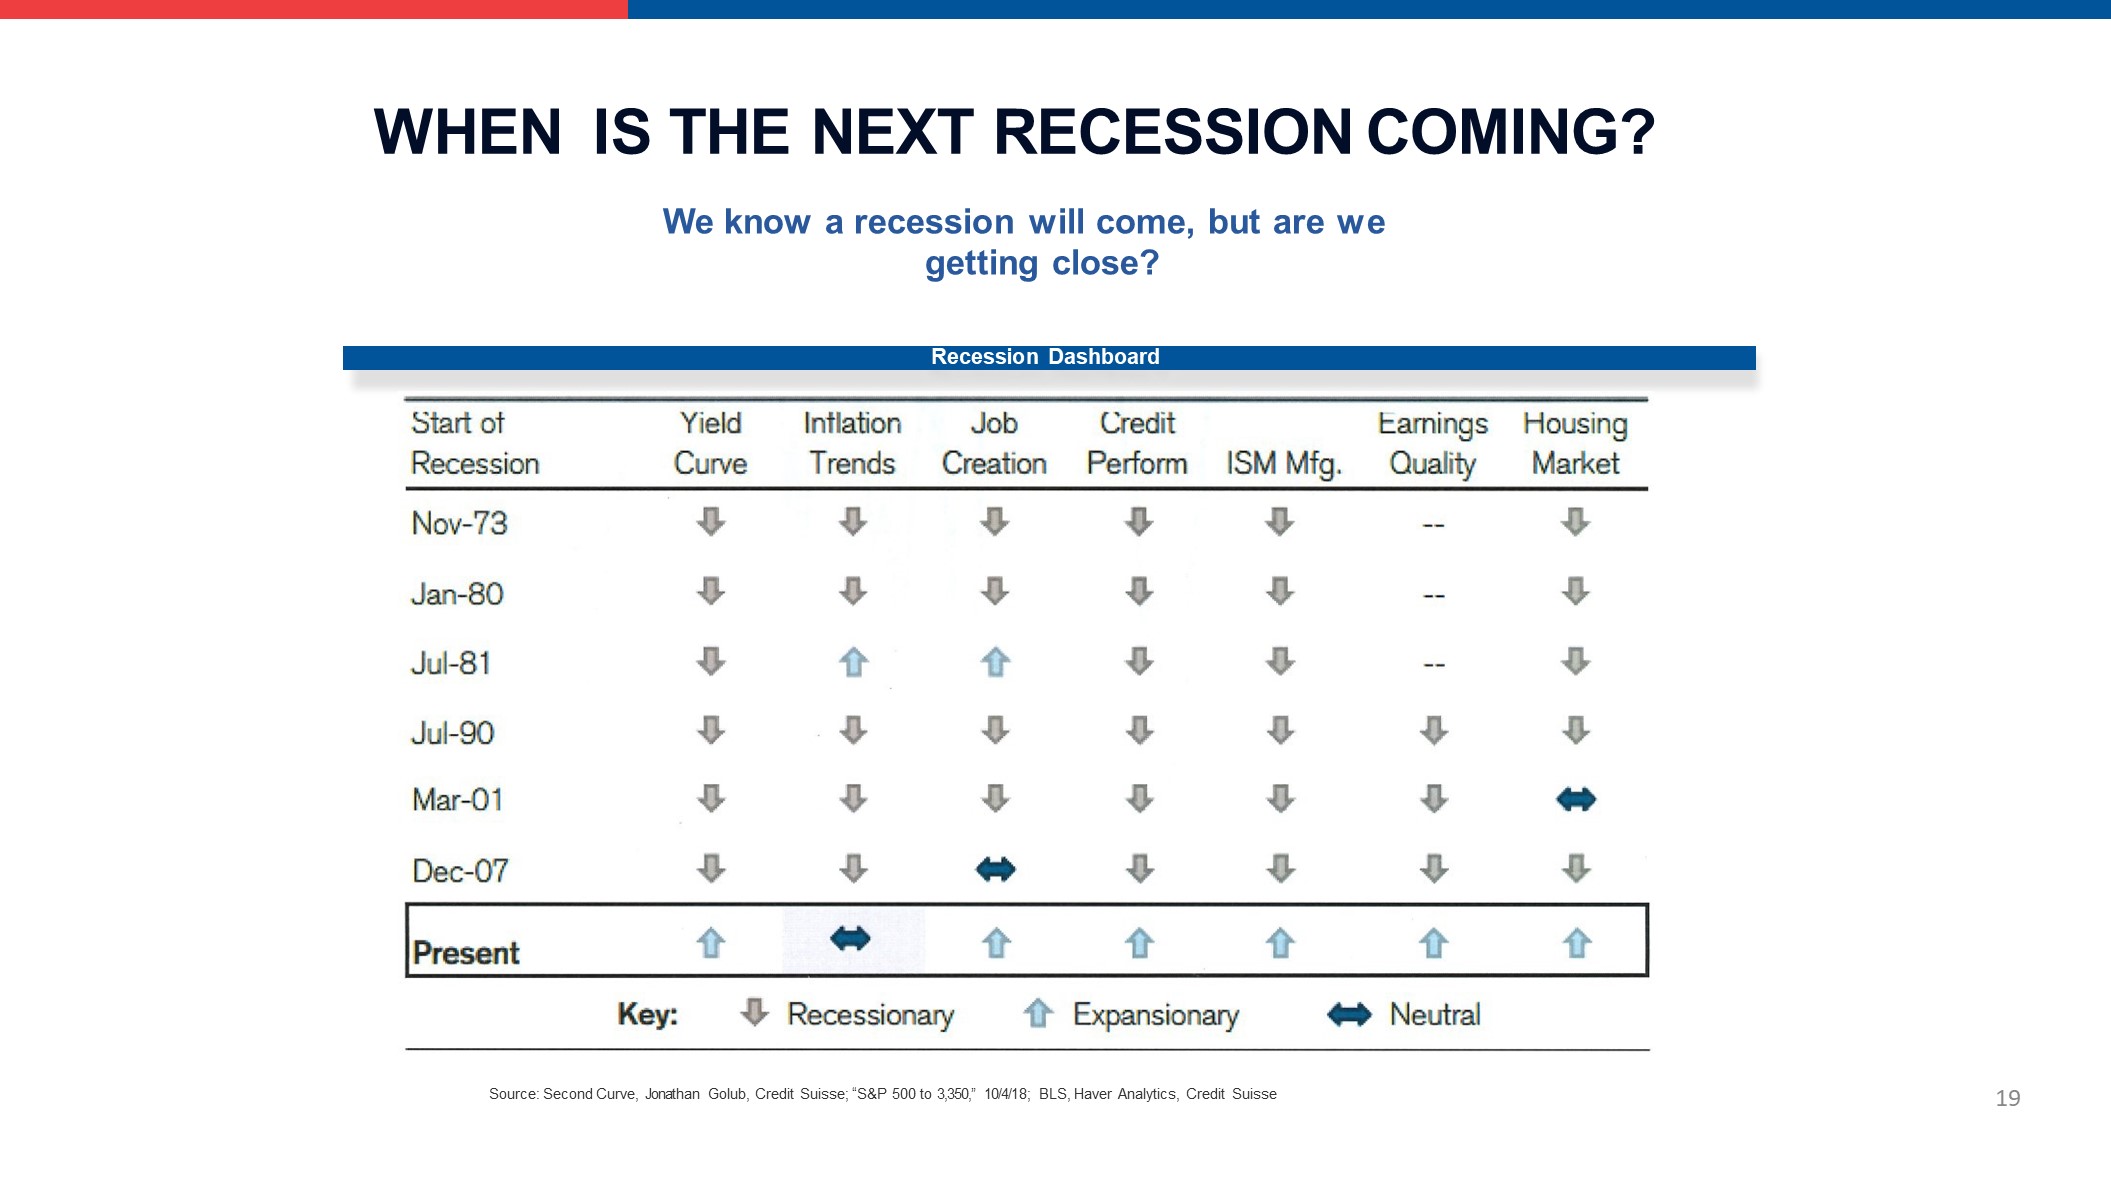
Recession Dashboard Source: Second Curve, Jonathan Golub, Credit Suisse; “S&P 500 to 3,350,” 10/4/18; BLS, Haver Analytics, Credit Suisse WHEN IS THE NEXT RECESSION COMING? We know a recession will come, but are wegetting close? 19
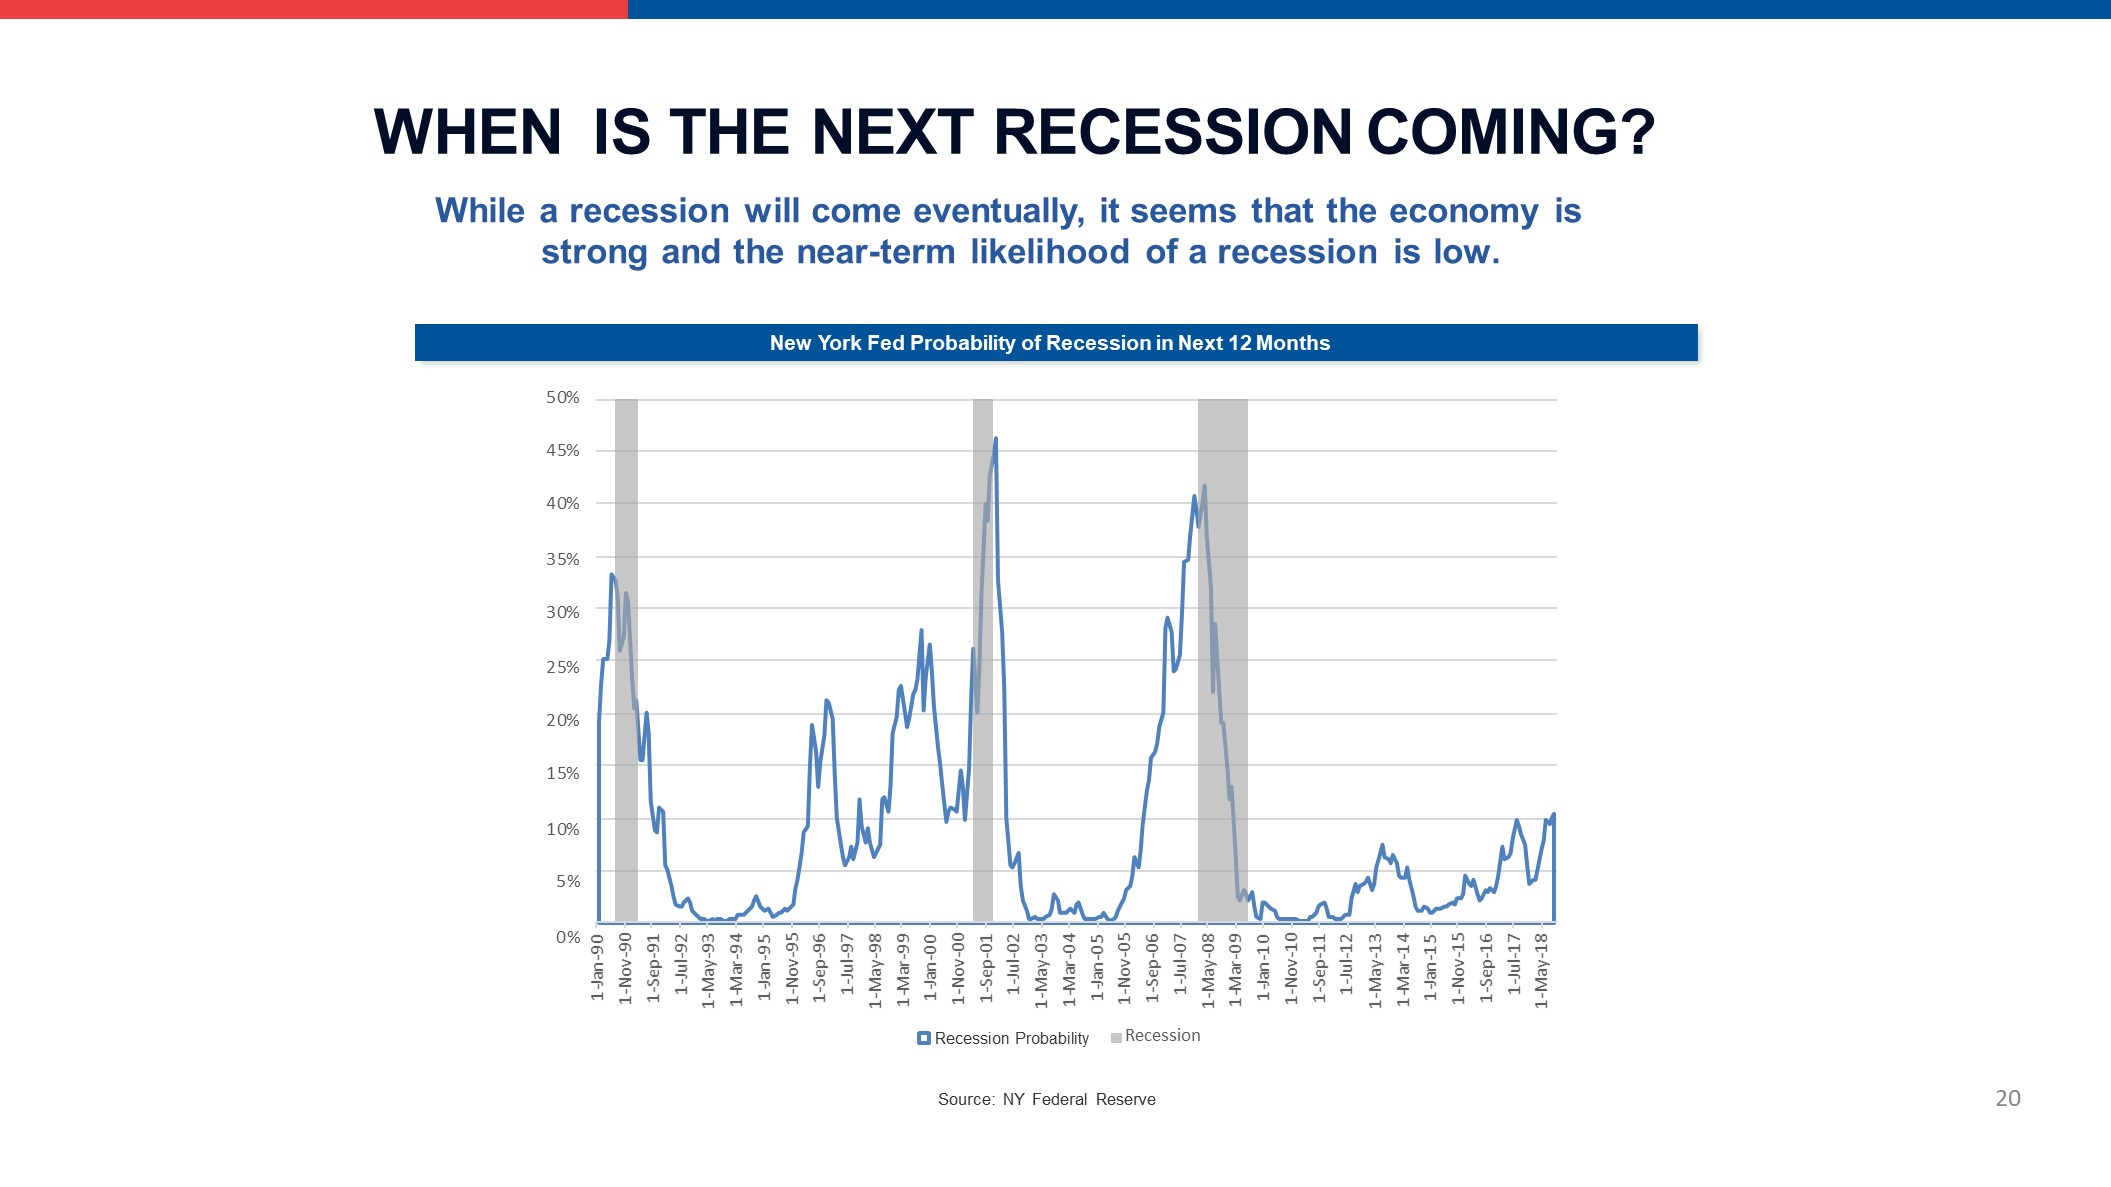
WHEN IS THE NEXT RECESSION COMING? While a recession will come eventually, it seems that the economy is strong and the near-term likelihood of a recession is low. 20 Source: NY Federal Reserve New York Fed Probability of Recession in Next 12 Months 50%45%40%35%30%25%20%15%10%5%0% 1-Jan-901-Nov-901-Sep-911-Jul-921-May-931-Mar-941-Jan-951-Nov-951-Sep-961-Jul-971-May-981-Mar-991-Jan-001-Nov-001-Sep-011-Jul-021-May-031-Mar-041-Jan-051-Nov-051-Sep-061-Jul-071-May-081-Mar-091-Jan-101-Nov-101-Sep-111-Jul-121-May-131-Mar-141-Jan-151-Nov-151-Sep-161-Jul-171-May-18 Reession Probability Recession Recession Probability
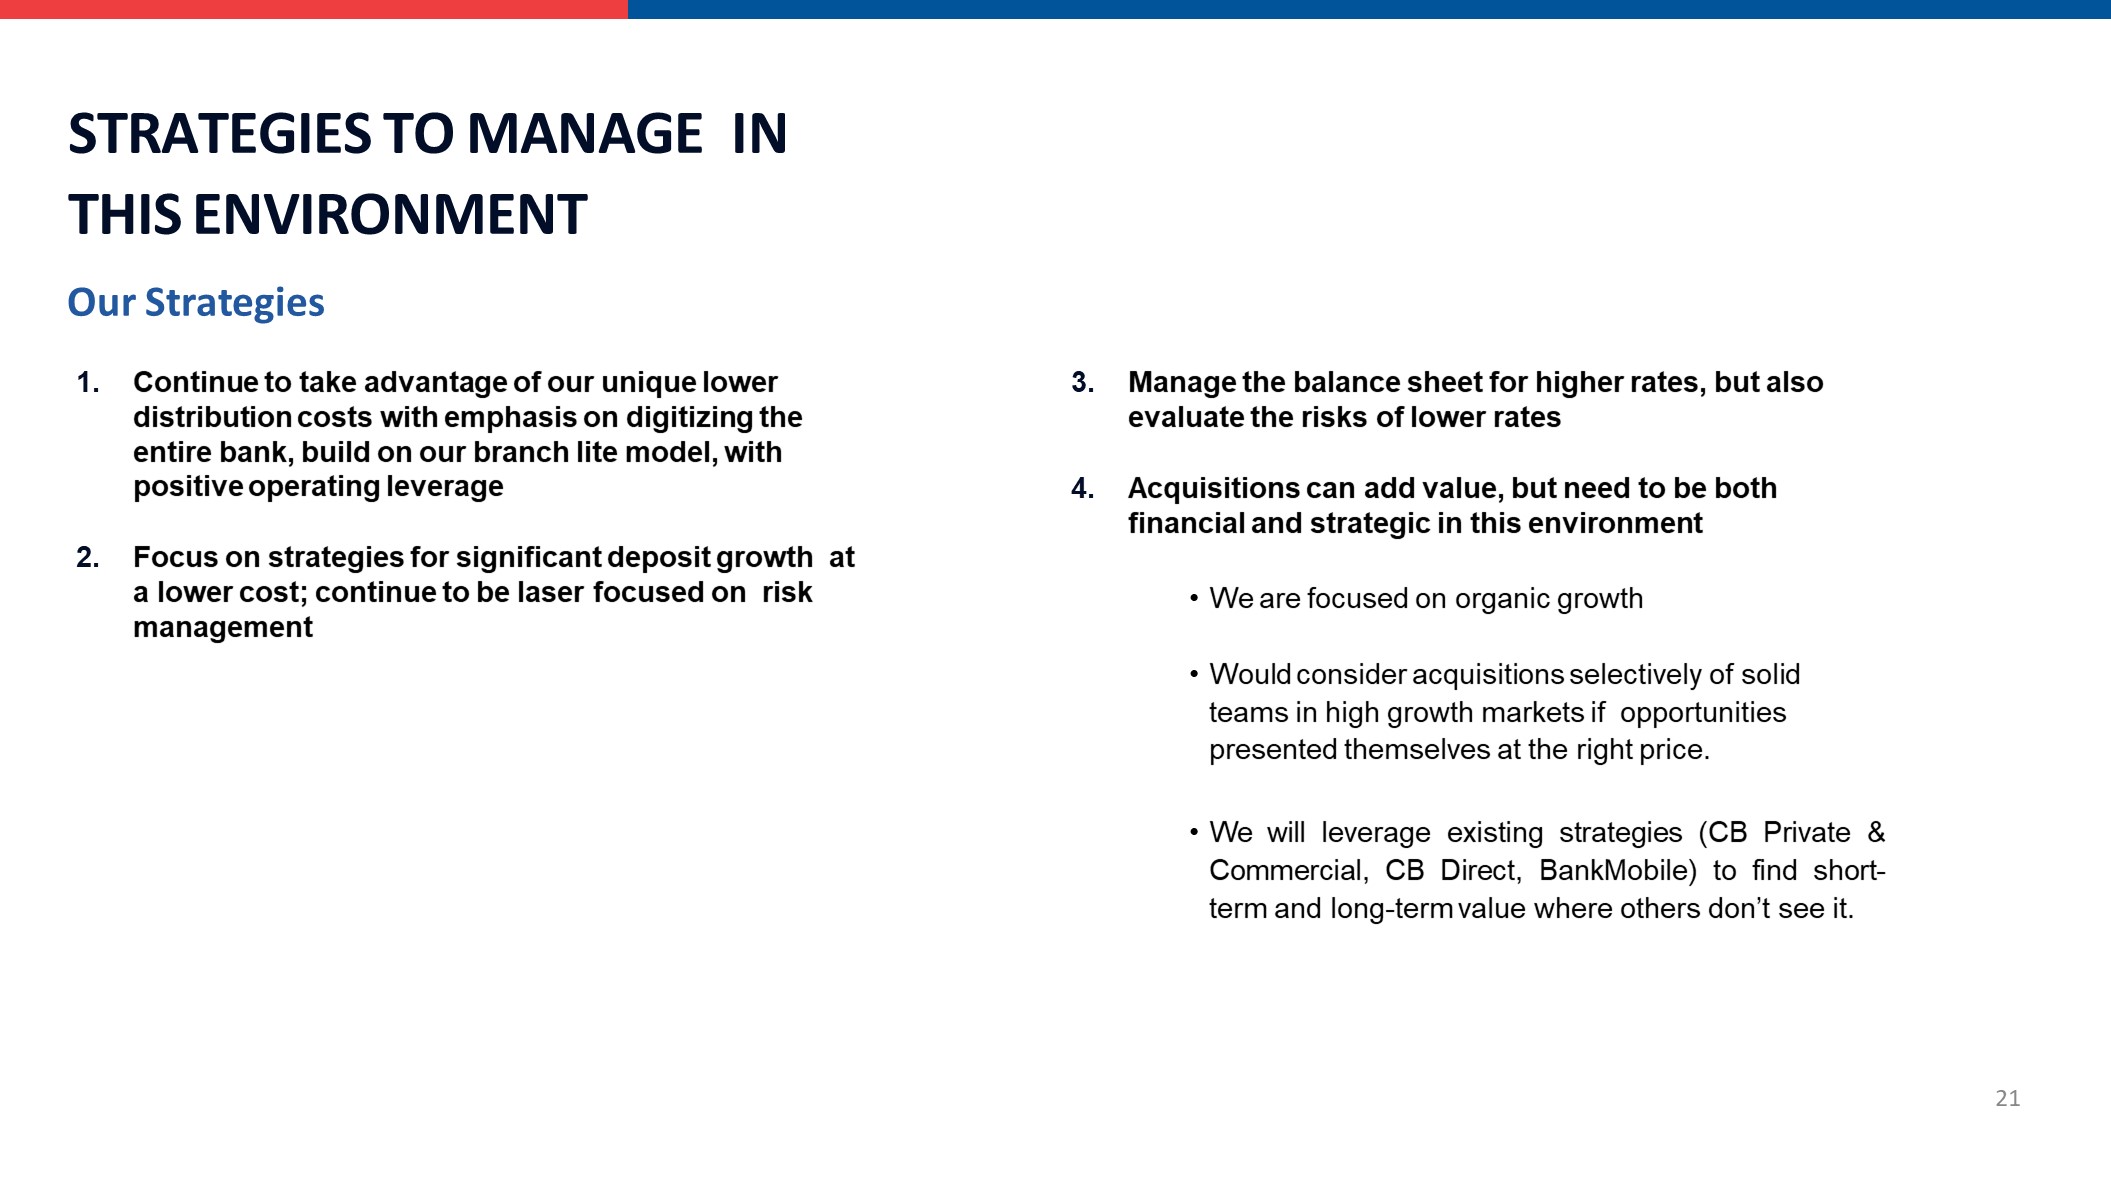
STRATEGIES TO MANAGE IN THIS ENVIRONMENT Our Strategies Continue to take advantage of our unique lower distribution costs with emphasis on digitizing the entire bank, build on our branch lite model, with positive operating leverageFocus on strategies for significant deposit growth at a lower cost; continue to be laser focused on risk management Manage the balance sheet for higher rates, but also evaluate the risks of lower ratesAcquisitions can add value, but need to be both financial and strategic in this environmentWe are focused on organic growthWould consider acquisitions selectively of solid teams in high growth markets if opportunities presented themselves at the right price.We will leverage existing strategies (CB Private & Commercial, CB Direct, BankMobile) to find short- term and long-term value where others don’t see it. 21
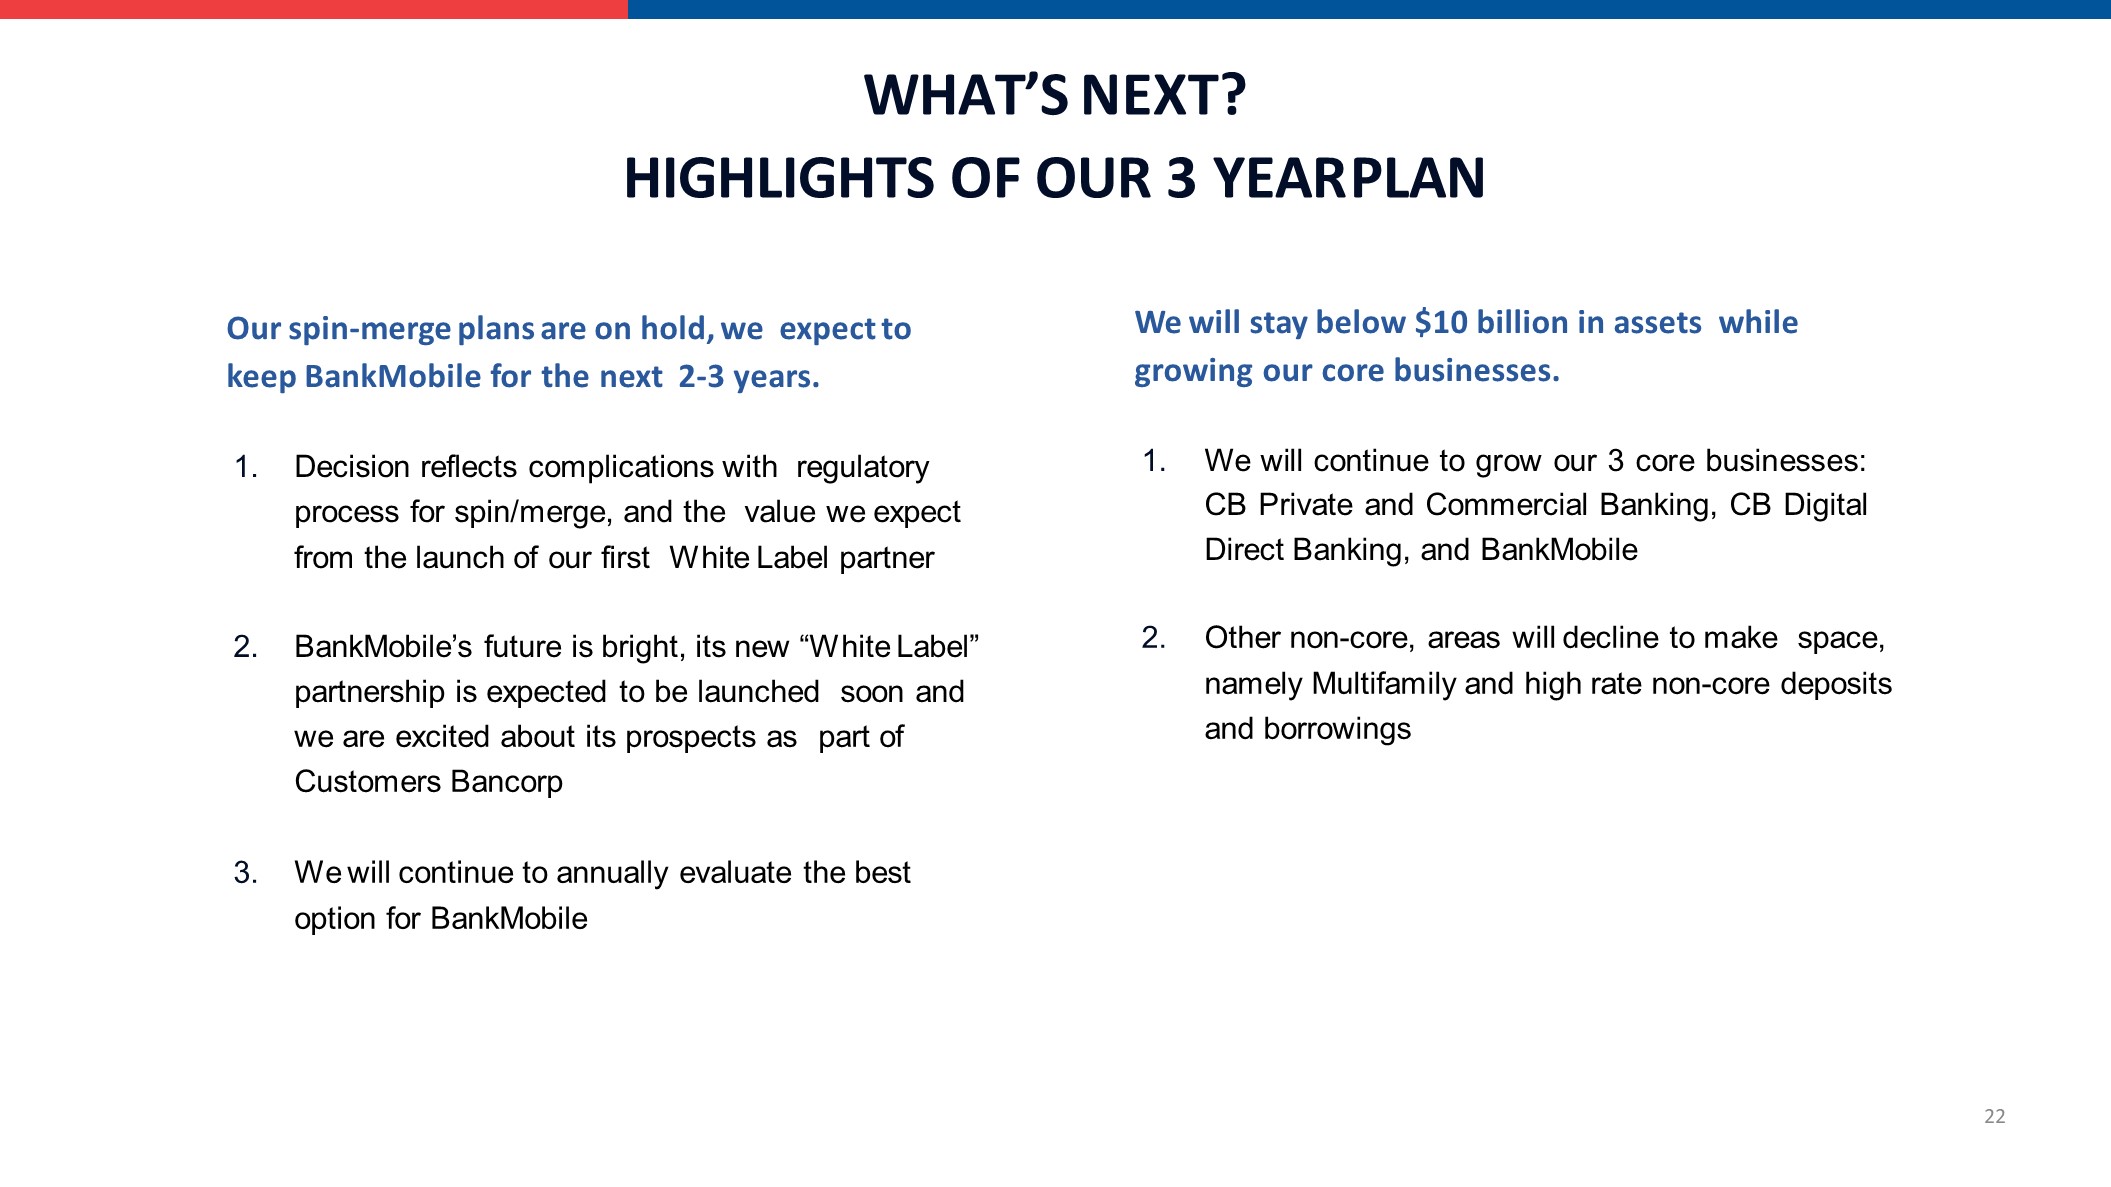
WHAT’S NEXT?HIGHLIGHTS OF OUR 3 YEAR PLAN 22 Our spin-merge plans are on hold, we expect to keep BankMobile for the next 2-3 years.Decision reflects complications with regulatory process for spin/merge, and the value we expect from the launch of our first White Label partnerBankMobile’s future is bright, its new “White Label” partnership is expected to be launched soon and we are excited about its prospects as part of Customers BancorpWe will continue to annually evaluate the best option for BankMobile We will stay below $10 billion in assets while growing our core businesses.We will continue to grow our 3 core businesses: CB Private and Commercial Banking, CB Digital Direct Banking, and BankMobileOther non-core, areas will decline to make space, namely Multifamily and high rate non-core deposits and borrowings
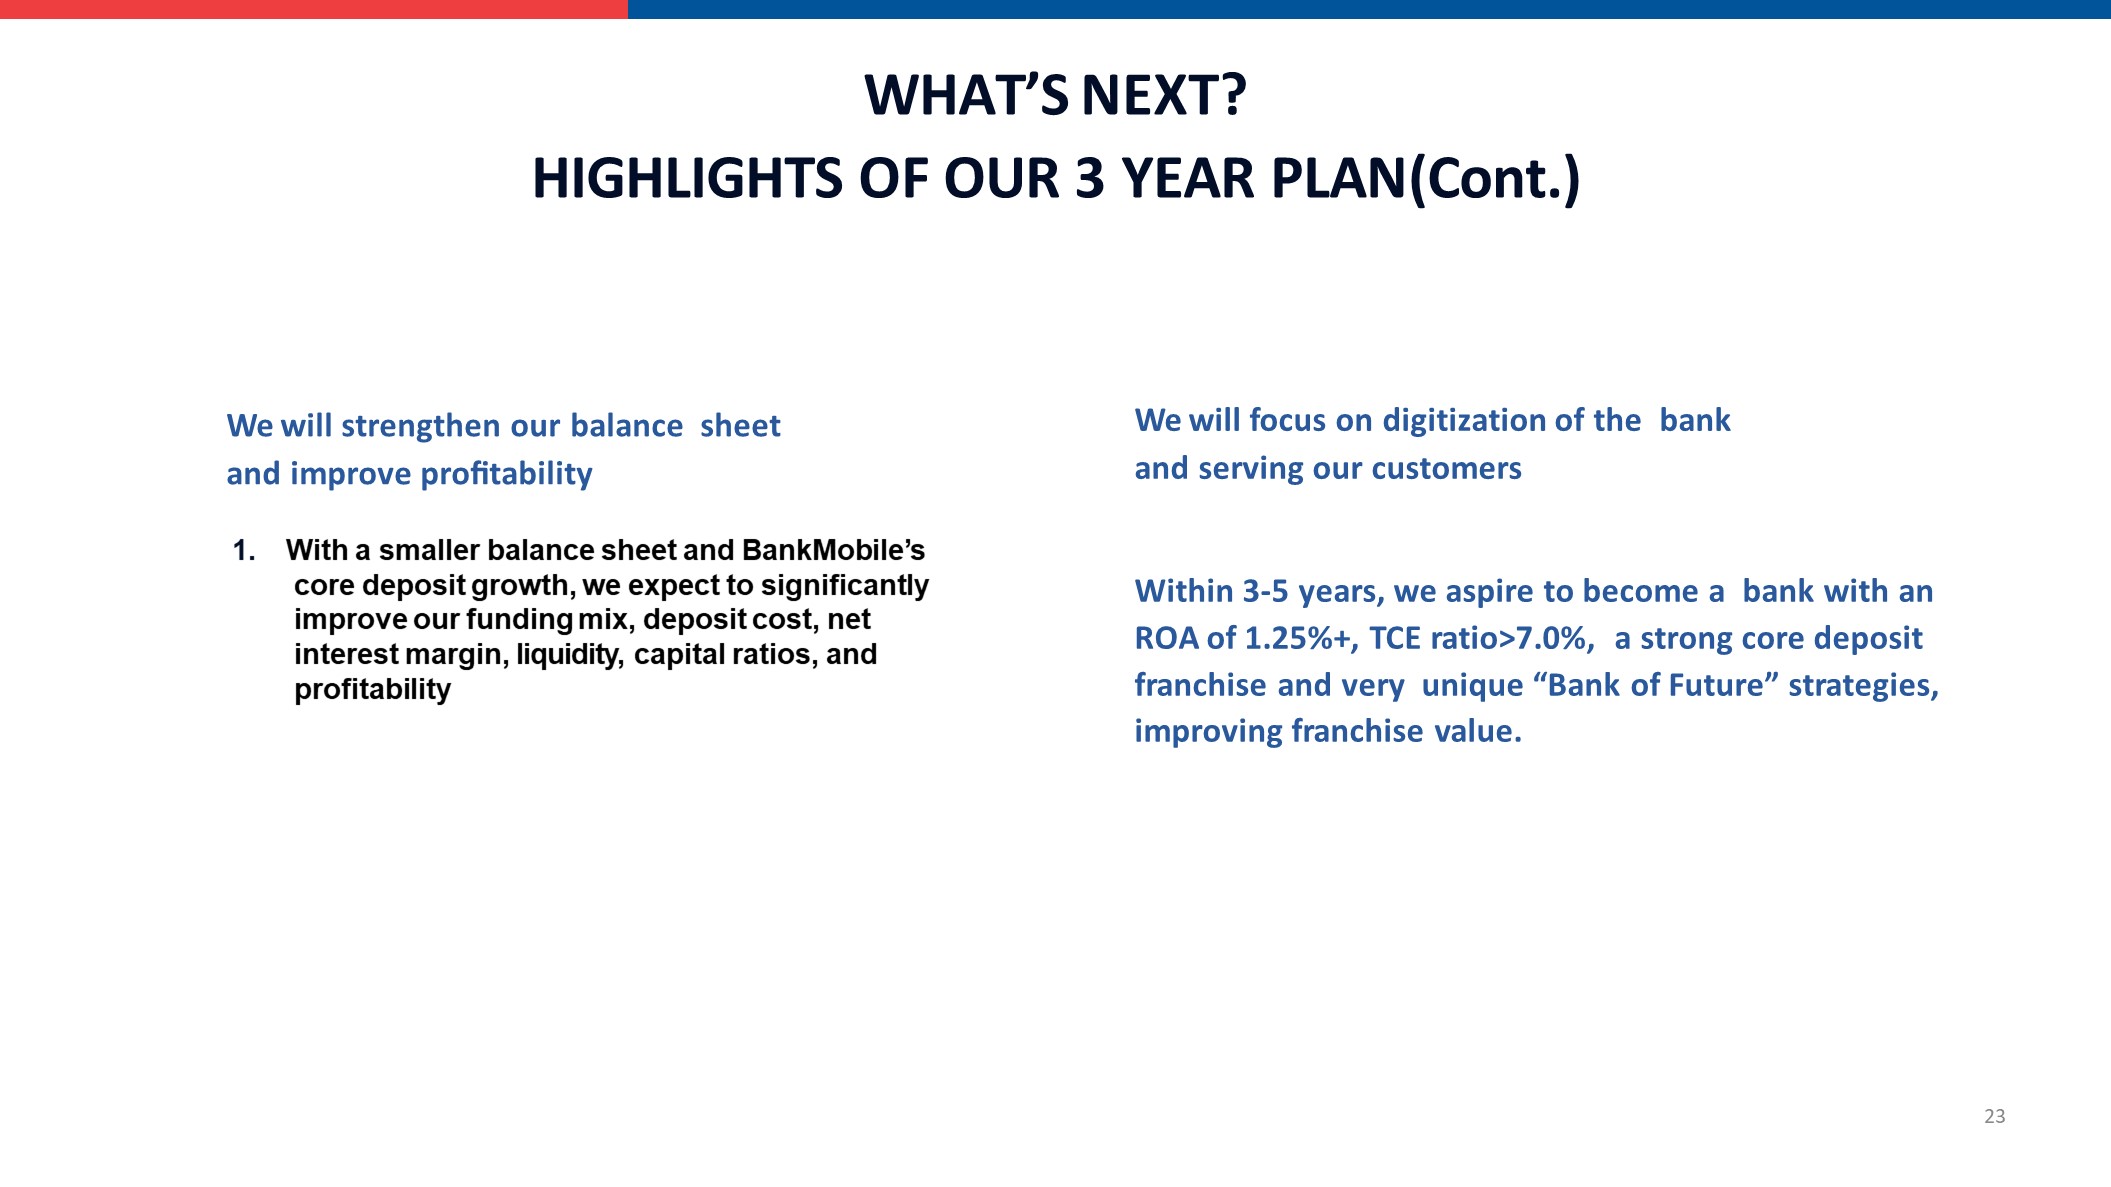
WHAT’S NEXT?HIGHLIGHTS OF OUR 3 YEAR PLAN (Cont.) 23 We will strengthen our balance sheet and improve profitability1. With a smaller balance sheet and BankMobile’s core deposit growth, we expect to significantly improve our funding mix, deposit cost, net interest margin, liquidity, capital ratios, and profitability We will focus on digitization of the bank and serving our customersWithin 3-5 years, we aspire to become a bank with an ROA of 1.25%+, TCE ratio>7.0%, a strong core deposit franchise and very unique “Bank of Future” strategies, improving franchise value.
Our Strategy to Position CUBI for the Future October 2018
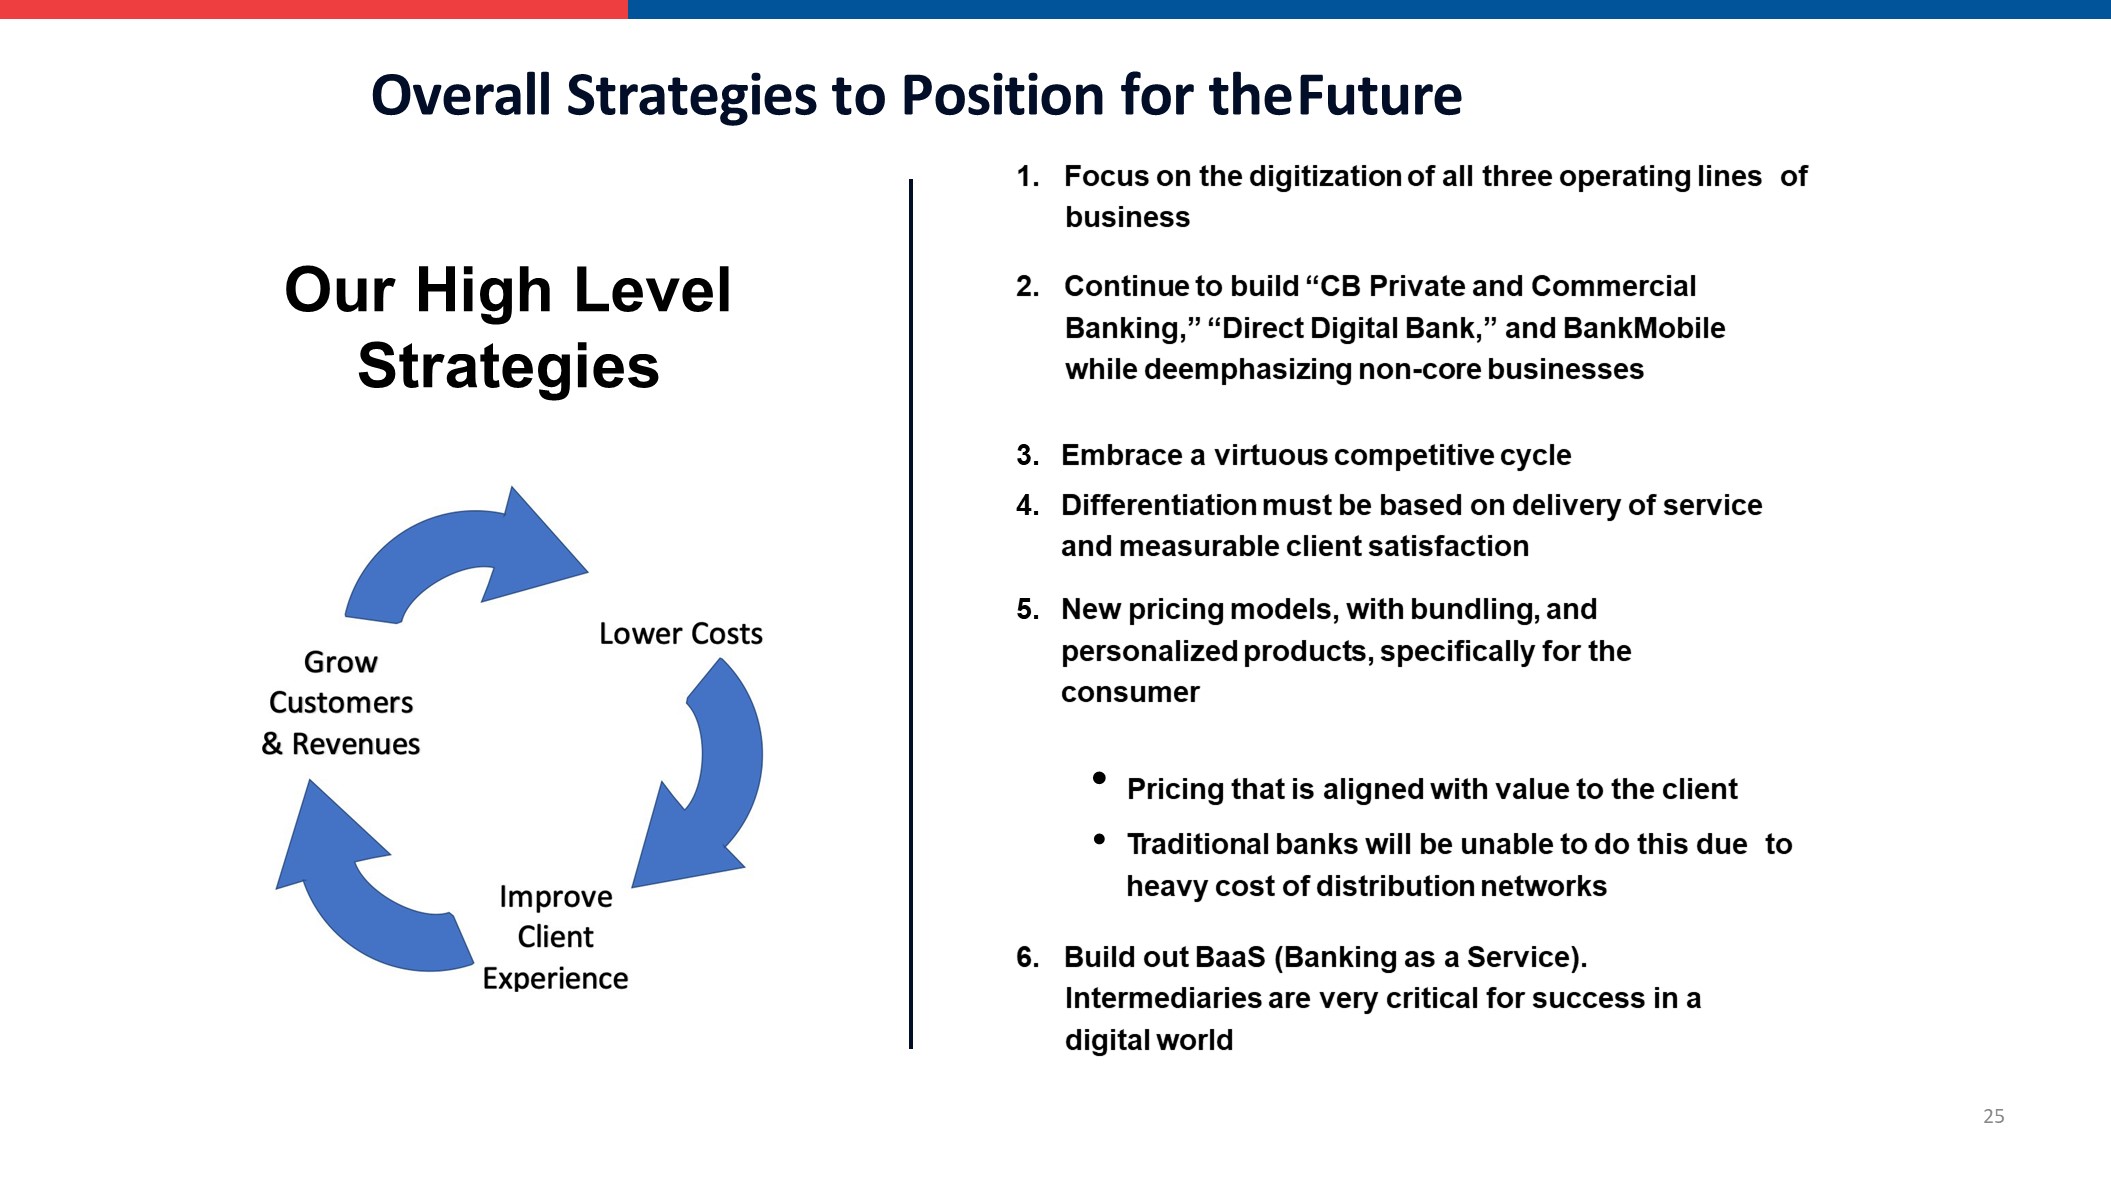
1. Focus on the digitization of all three operating lines of business 2. Continue to build “CB Private and Commercial Banking,” “Direct Digital Bank,” and BankMobile while deemphasizing non-core businesses Embrace a virtuous competitive cycleDifferentiation must be based on delivery of service and measurable client satisfactionNew pricing models, with bundling, and personalized products, specifically for the consumer Pricing that is aligned with value to the client •Traditional banks will be unable to do this due to heavy cost of distribution networks 6. Build out BaaS (Banking as a Service). Intermediaries are very critical for success in a digital world 25 Overall Strategies to Position for the Future Our High Level Strategies
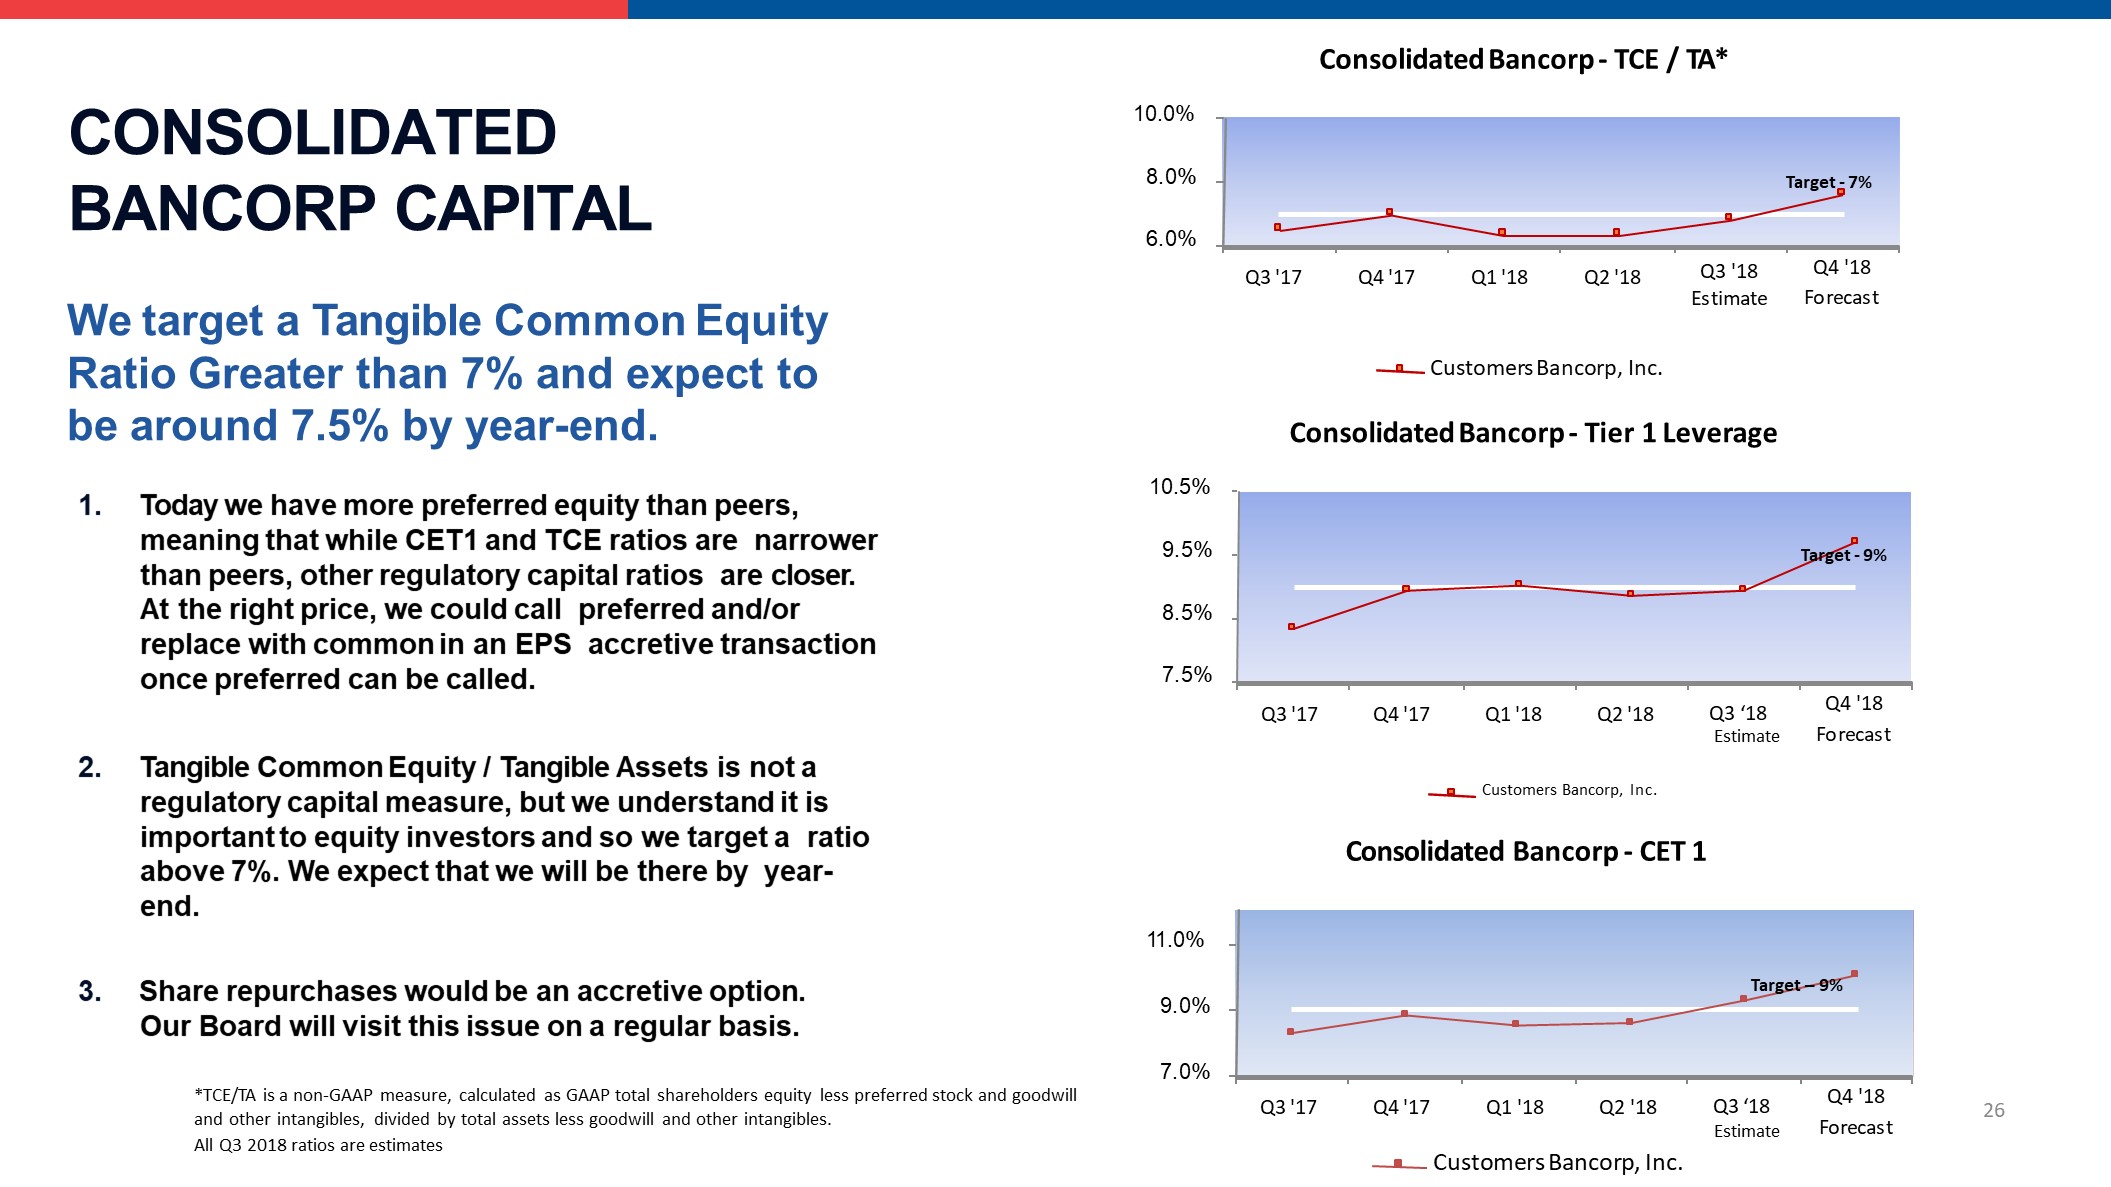
CONSOLIDATED BANCORP CAPITAL We target a Tangible Common Equity Ratio Greater than 7% and expect to be around 7.5% by year-end. 1. Today we have more preferred equity than peers, meaning that while CET1 and TCE ratios are narrower than peers, other regulatory capital ratios are closer. At the right price, we could call preferred and/or replace with common in an EPS accretive transaction once preferred can be called. 2. Tangible Common Equity / Tangible Assets is not a regulatory capital measure, but we understand it is important to equity investors and so we target a ratio above 7%. We expect that we will be there by year- end. 3. Share repurchases would be an accretive option. Our Board will visit this issue on a regular basis. 26 10.5% 9.5% 8.5% 7.5% Q3 '17 Q4 '17 Q1 '18 Q2 '18 Q4 '18Forecast Consolidated Bancorp - Tier 1 Leverage Customers Bancorp, Inc. Target - 9% 11.0% 9.0% 7.0% Q3 '17 Q4 '17 Q1 '18 Q2 '18Customers Bancorp, Inc. Q4 '18Forecast Consolidated Bancorp - CET 1 Target – 9% 10.0% 8.0% 6.0% Q3 '17 Q4 '17 Q1 '18 Q2 '18 Q3 '18Estimate Q4 '18Forecast Consolidated Bancorp - TCE / TA* Customers Bancorp, Inc. Target - 7% *TCE/TA is a non-GAAP measure, calculated as GAAP total shareholders equity less preferred stock and goodwill and other intangibles, divided by total assets less goodwill and other intangibles.All Q3 2018 ratios are estimates Q3 ‘18Estimate Q3 ‘18Estimate
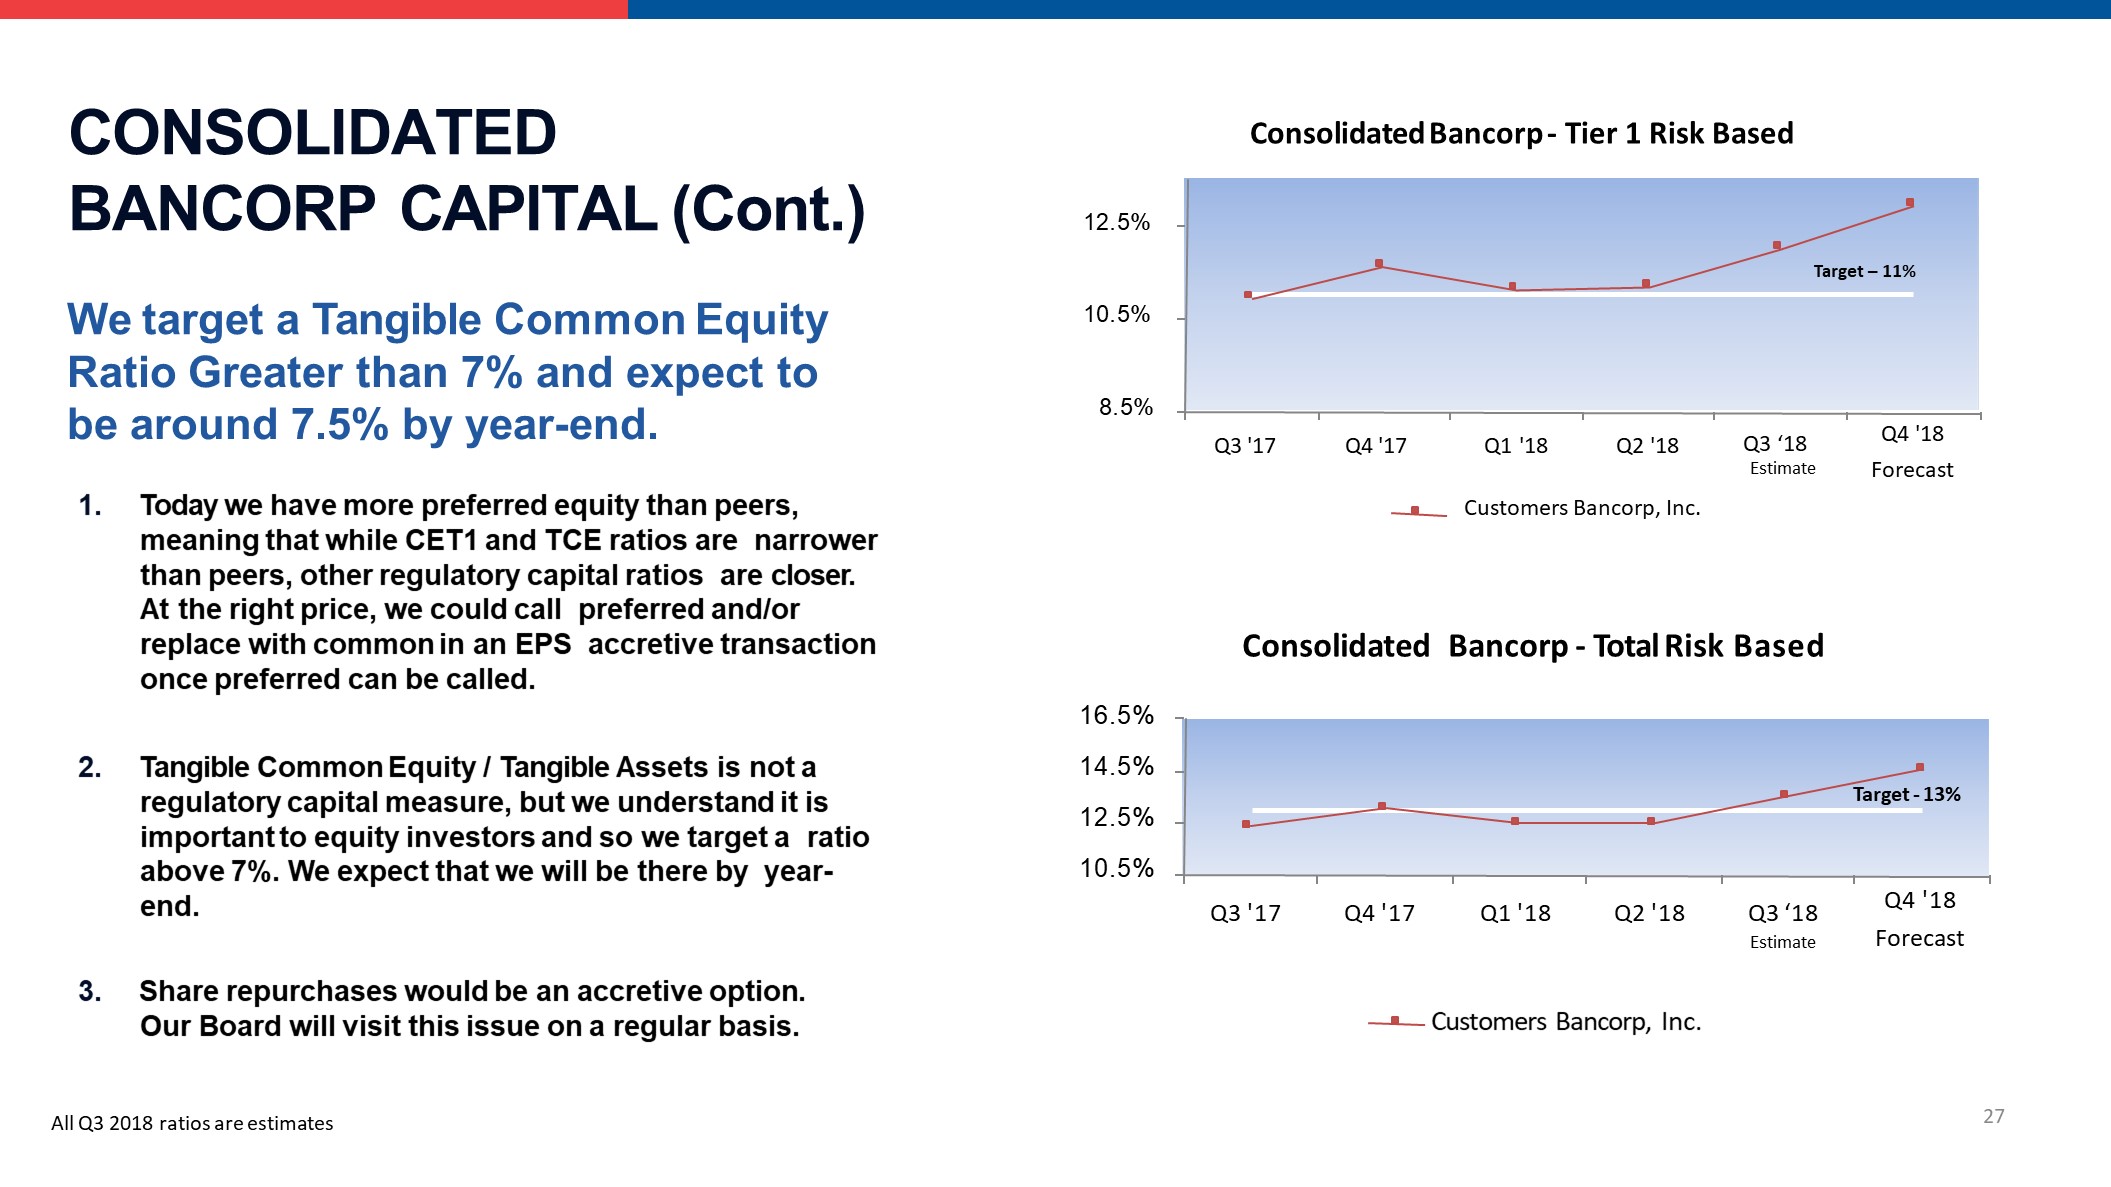
We target a Tangible Common Equity Ratio Greater than 7% and expect to be around 7.5% by year-end. 1. Today we have more preferred equity than peers, meaning that while CET1 and TCE ratios are narrower than peers, other regulatory capital ratios are closer. At the right price, we could call preferred and/or replace with common in an EPS accretive transaction once preferred can be called. 2. Tangible Common Equity / Tangible Assets is not a regulatory capital measure, but we understand it is important to equity investors and so we target a ratio above 7%. We expect that we will be there by year- end. 3. Share repurchases would be an accretive option. Our Board will visit this issue on a regular basis. 8.5% 10.5% 12.5% Q3 '17 Q4 '17 Q4 '18Forecast Consolidated Bancorp - Tier 1 Risk Based Q1 '18 Q2 '18Customers Bancorp, Inc. 16.5% 14.5%12.5%10.5% Q3 '17 Q4 '17 Q1 '18 Q2 '18 Q4 '18Forecast Consolidated Bancorp - Total Risk Based Customers Bancorp, Inc. Target - 13% 27 Target – 11% All Q3 2018 ratios are estimates Q3 ‘18Estimate Q3 ‘18Estimate CONSOLIDATED BANCORP CAPITAL (Cont.)
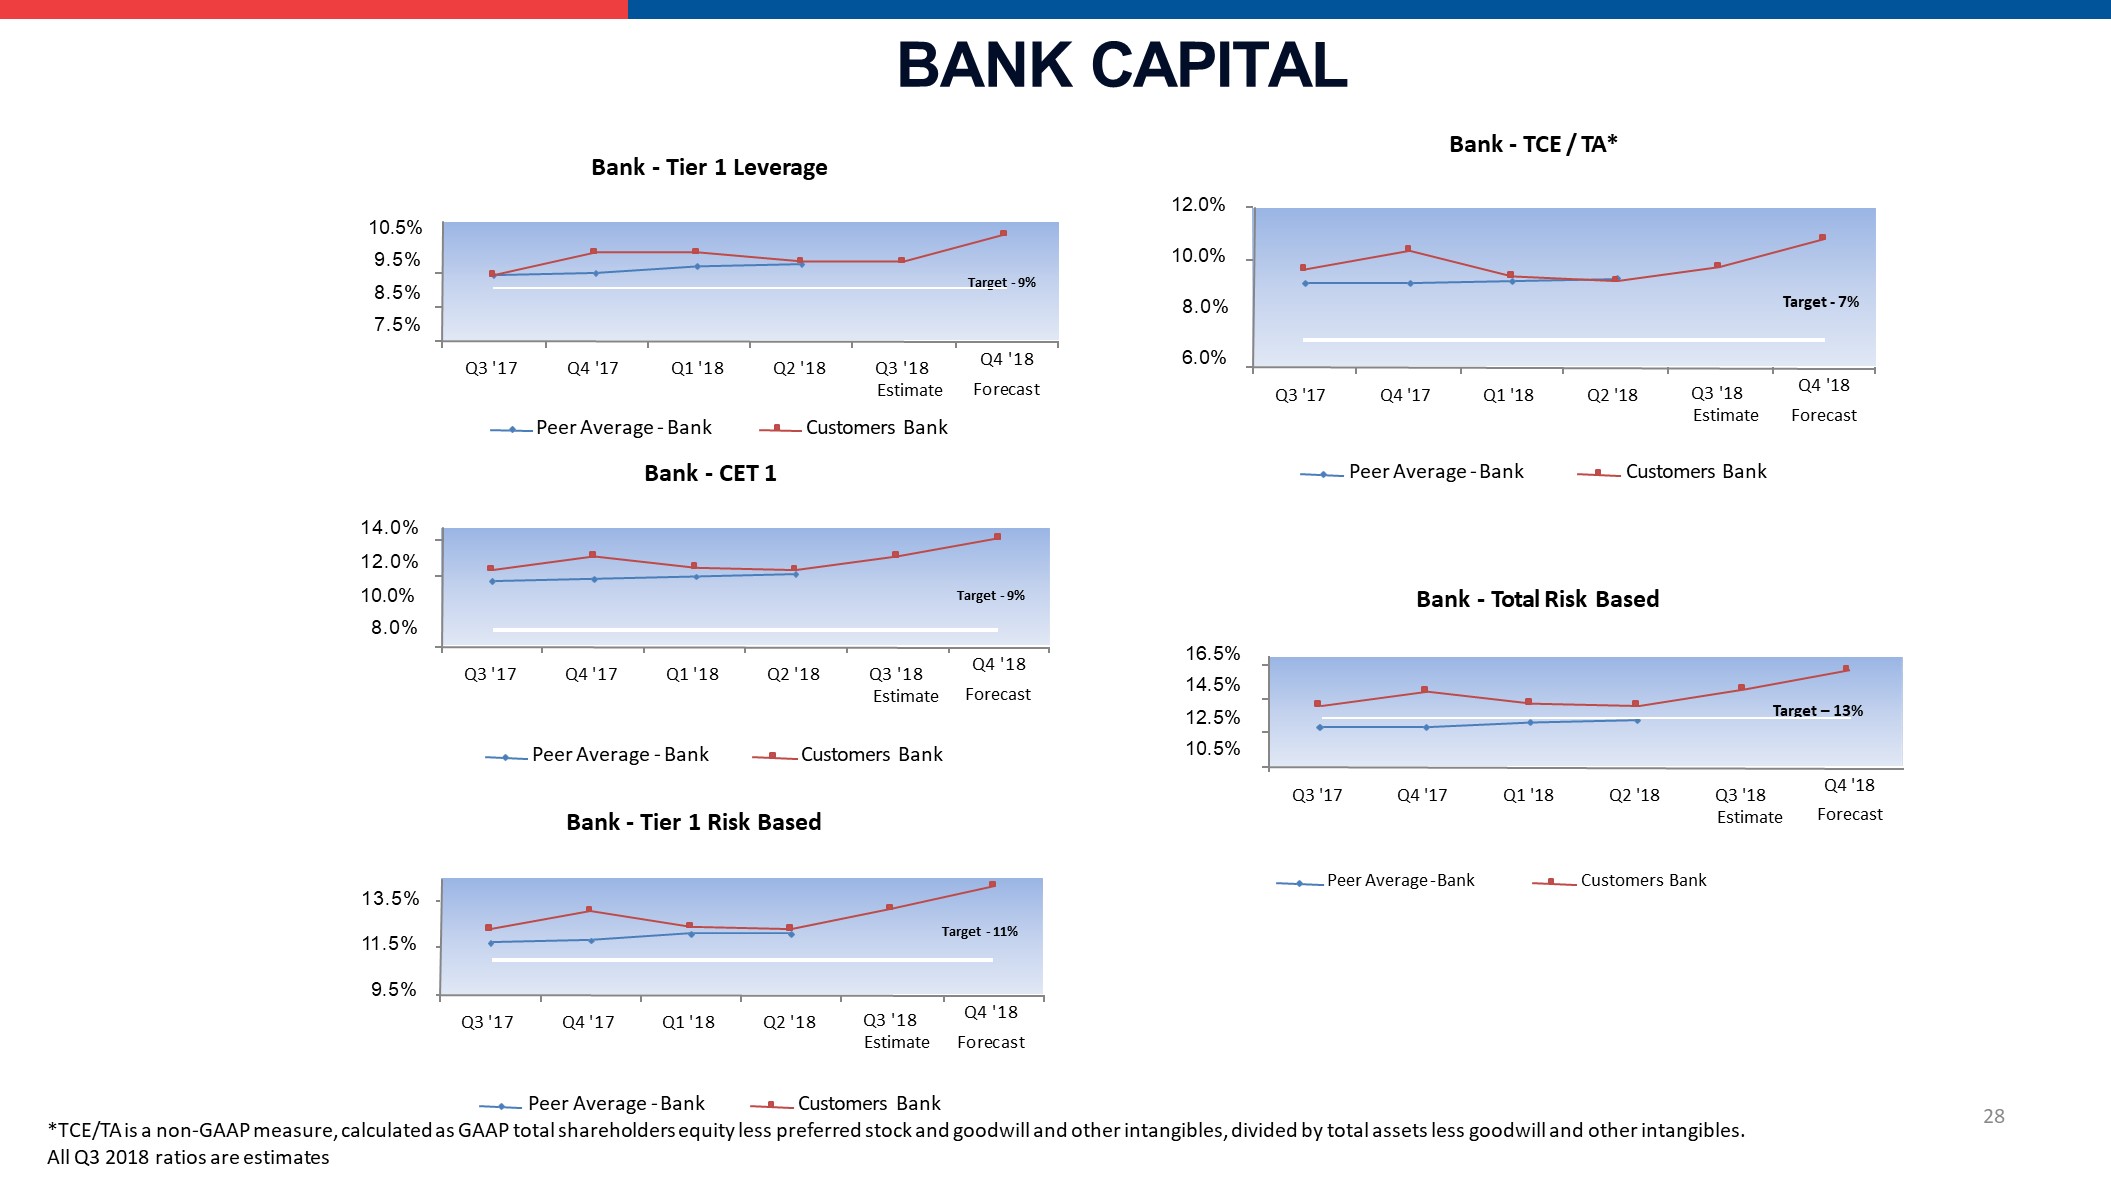
BANK CAPITAL 10.5% 9.5%8.5%7.5% Q3 '17 Q4 '17 Q1 '18 Q2 '18 Q4 '18Forecast Bank - Tier 1 Leverage Customers Bank Target - 9% 14.0%12.0%10.0% 8.0% Q3 '17 Q4 '17 Q1 '18 Q2 '18 Q4 '18Forecast Peer Average - BankBank - CET 1 Target - 9% 13.5% 11.5% 9.5% Q3 '17 Q4 '17 Q1 '18 Q2 '18 Q4 '18Forecast Peer Average - Bank Customers BankBank - Tier 1 Risk Based Target - 11% 16.5%14.5%12.5%10.5% Q3 '17 Q4 '17 Q1 '18 Q2 '18 Q4 '18Forecast Bank - Total Risk Based Peer Average - Bank Customers Bank Target – 13% 12.0% 10.0% 8.0% 6.0% Q3 '17 Q4 '17 Q1 '18 Q2 '18 Q4 '18Forecast Bank - TCE / TA* Peer Average - Bank Customers Bank Target - 7% 28 Peer Average - Bank Customers Bank*TCE/TA is a non-GAAP measure, calculated as GAAP total shareholders equity less preferred stock and goodwill and other intangibles, divided by total assets less goodwill and other intangibles. All Q3 2018 ratios are estimates Q3 '18Estimate Q3 '18Estimate Q3 '18Estimate Q3 '18Estimate Q3 '18Estimate
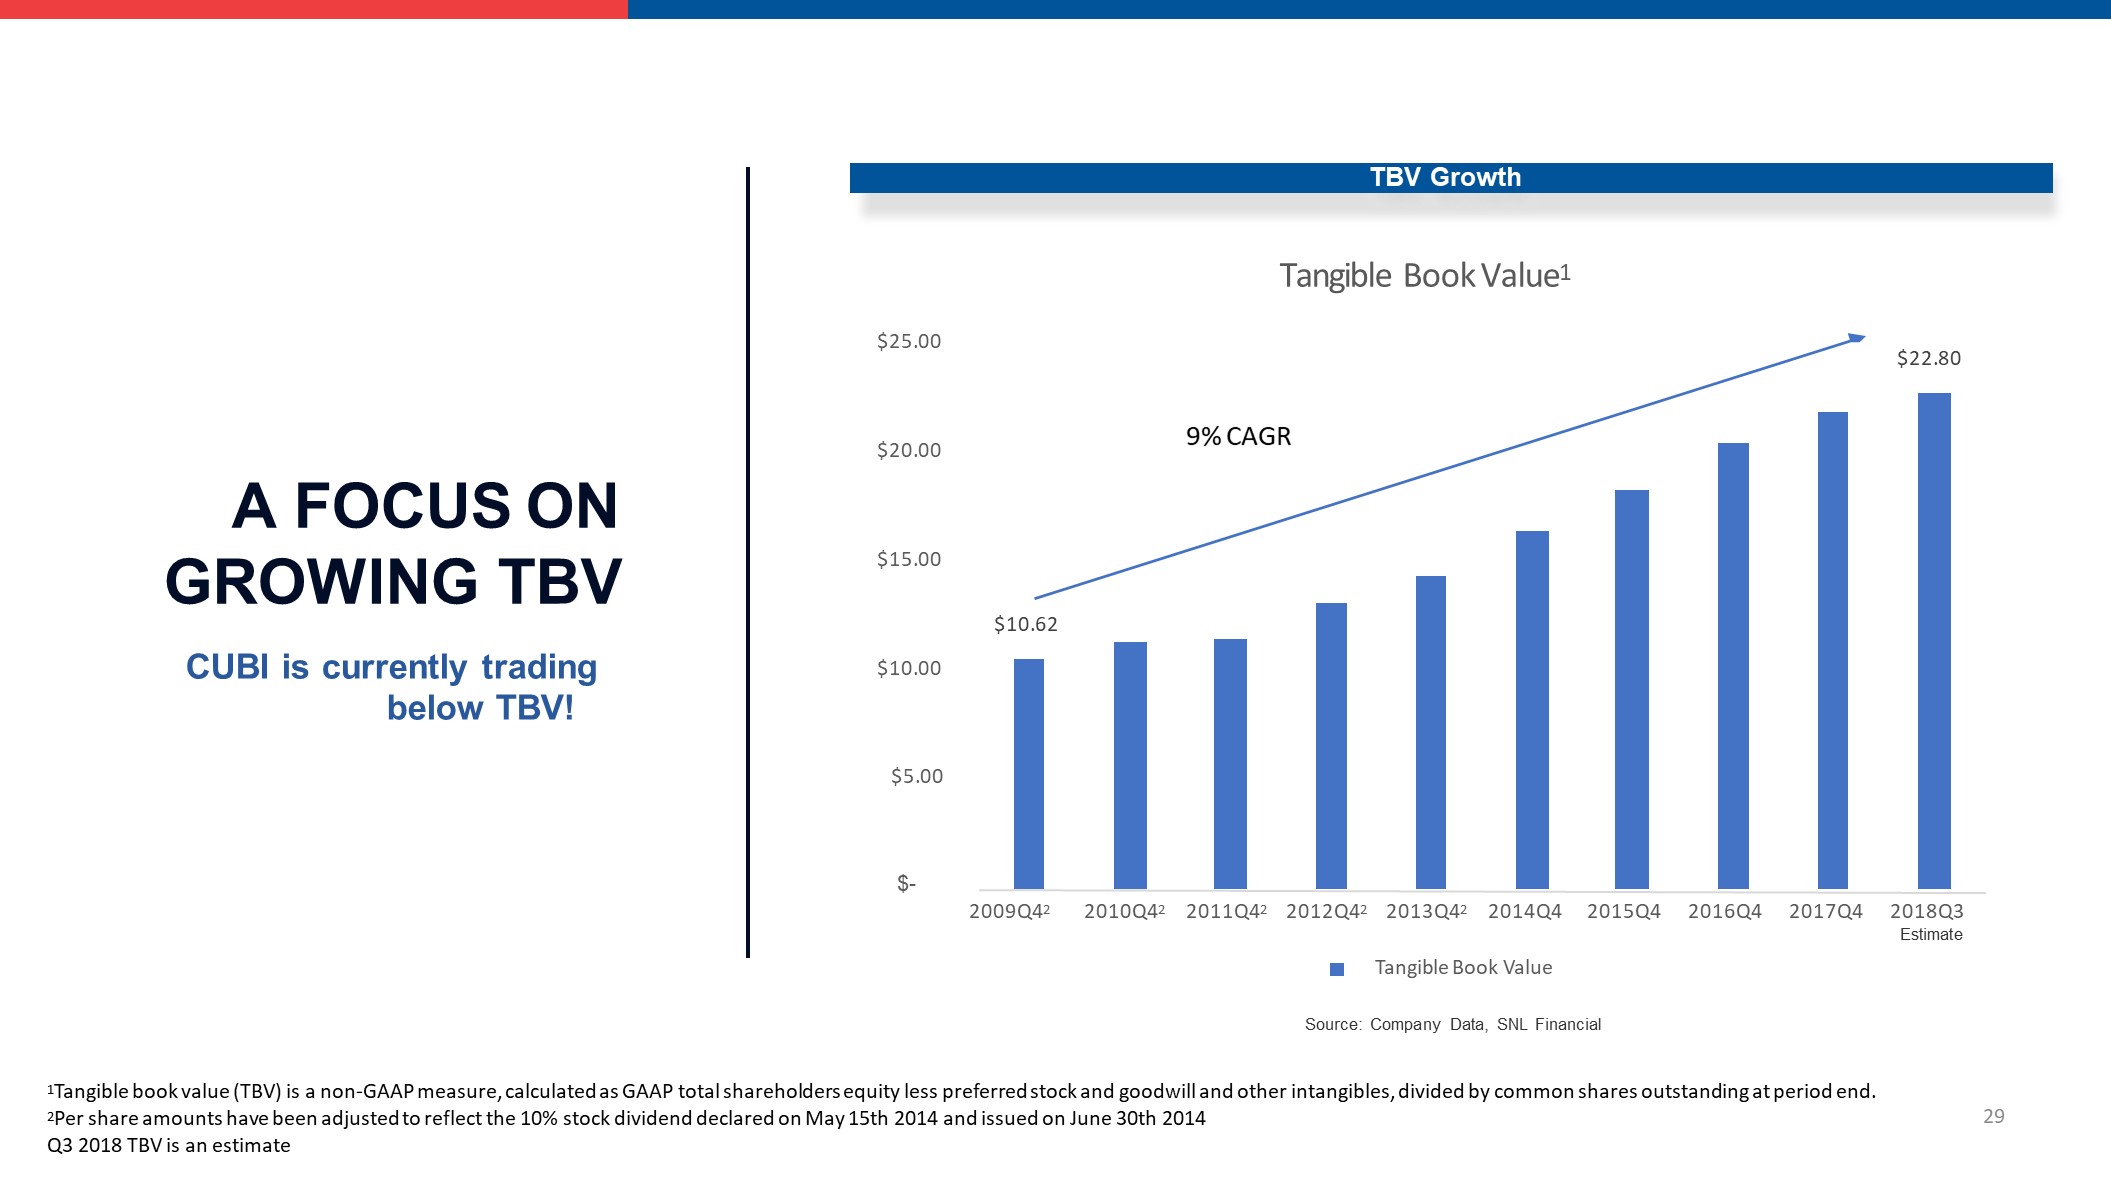
$10.62 $22.80 $5.00 $10.00 $15.00 $20.00 $25.00 Tangible Book Value1 $- 2009Q42 2010Q42 2011Q42 2012Q42 2015Q4 2016Q4 2017Q4 2013Q42 2014Q4Tangible Book Value 9% CAGR TBV Growth A FOCUS ON GROWING TBVCUBI is currently tradingbelow TBV! 29 1Tangible book value (TBV) is a non-GAAP measure, calculated as GAAP total shareholders equity less preferred stock and goodwill and other intangibles, divided by common shares outstanding at period end.2Per share amounts have been adjusted to reflect the 10% stock dividend declared on May 15th 2014 and issued on June 30th 2014 Q3 2018 TBV is an estimate Source: Company Data, SNL Financial 2018Q3Estimate
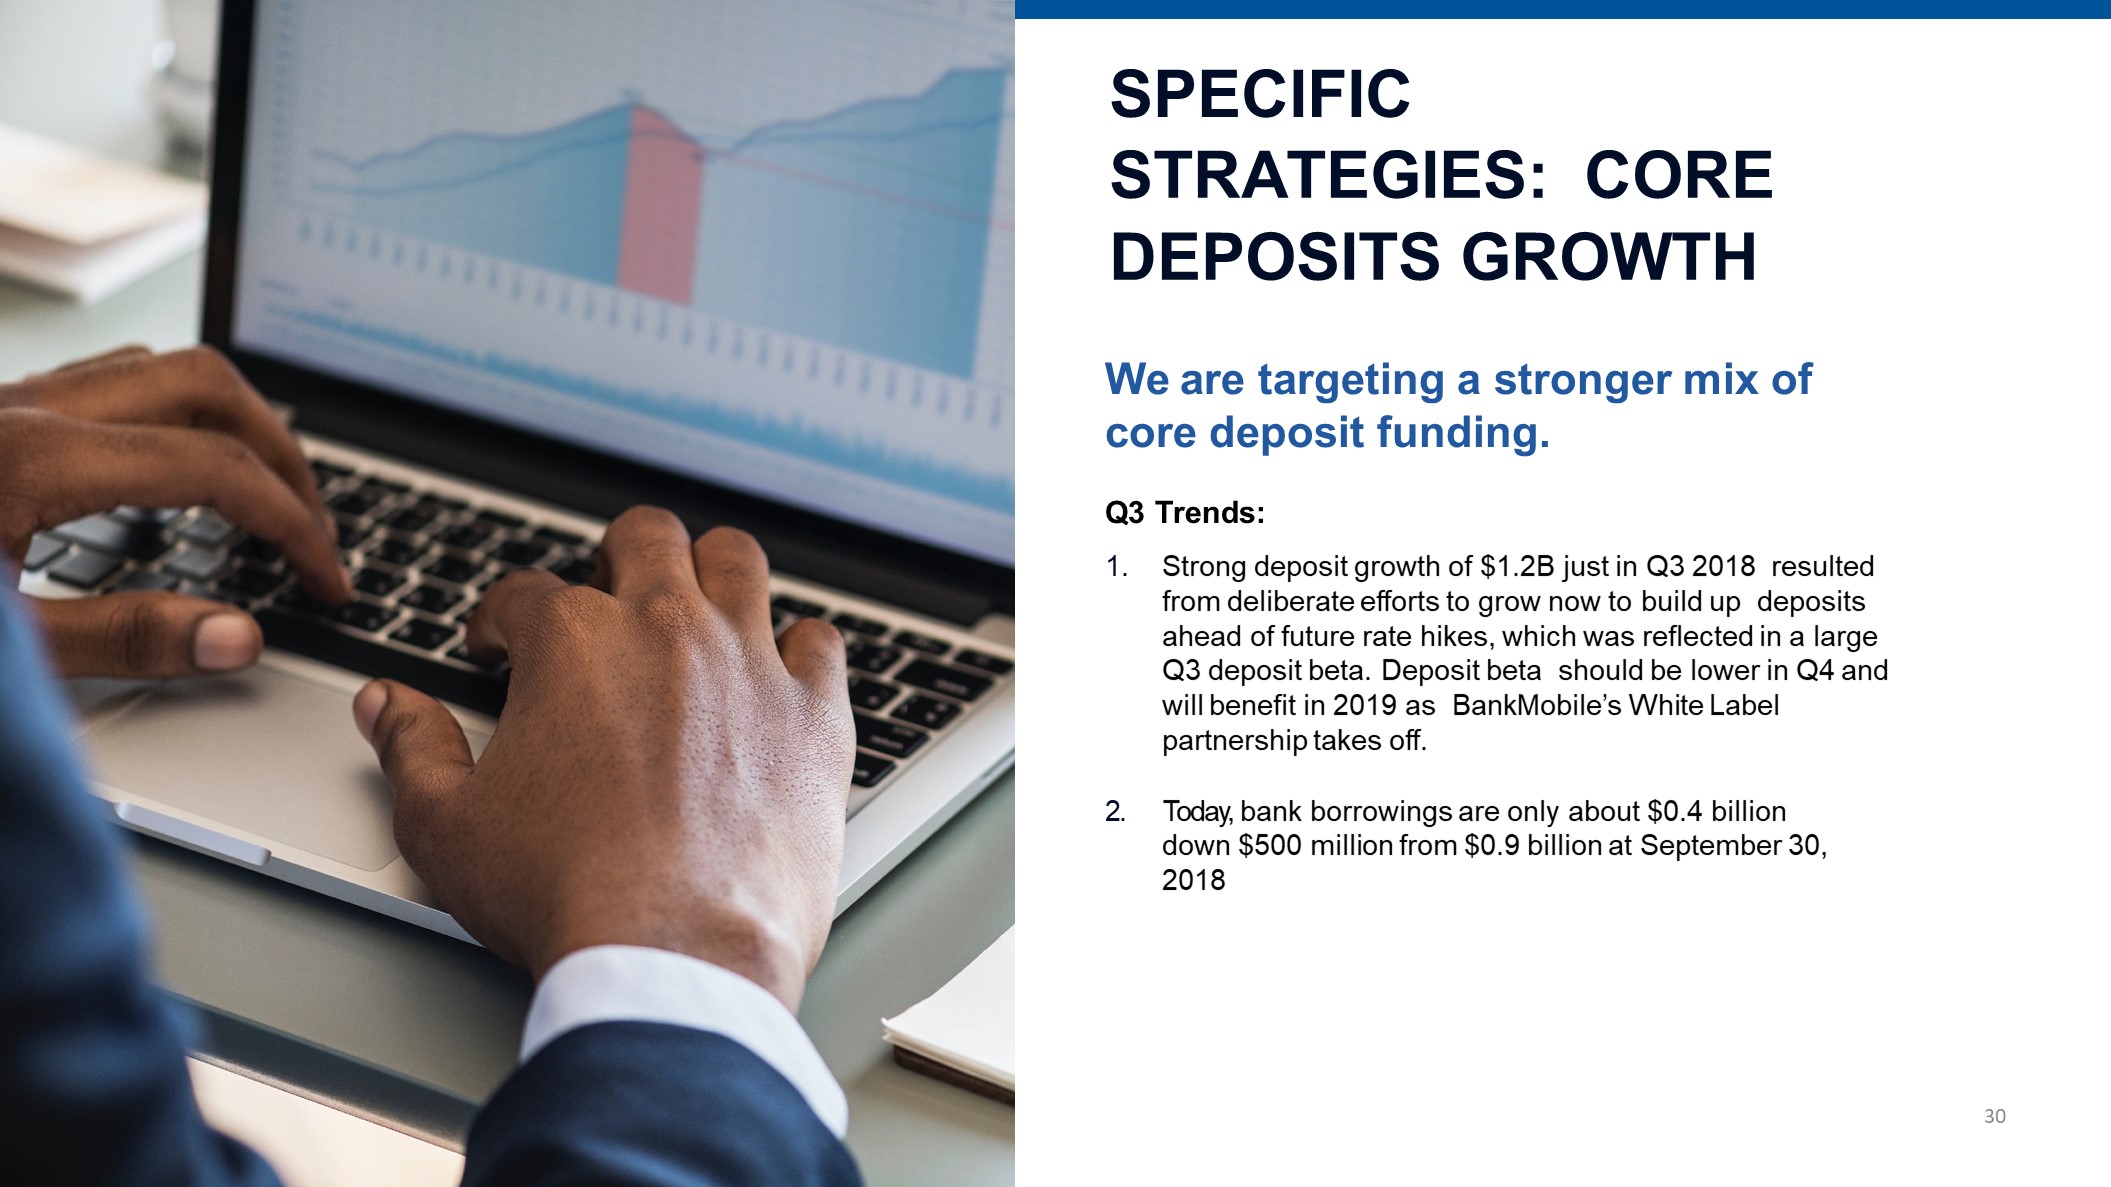
SPECIFIC STRATEGIES: CORE DEPOSITS GROWTH We are targeting a stronger mix of core deposit funding.Q3 Trends:Strong deposit growth of $1.2B just in Q3 2018 resulted from deliberate efforts to grow now to build up deposits ahead of future rate hikes, which was reflected in a large Q3 deposit beta. Deposit beta should be lower in Q4 and will benefit in 2019 as BankMobile’s White Label partnership takes off.Today, bank borrowings are only about $0.4 billion down $500 million from $0.9 billion at September 30, 2018 30
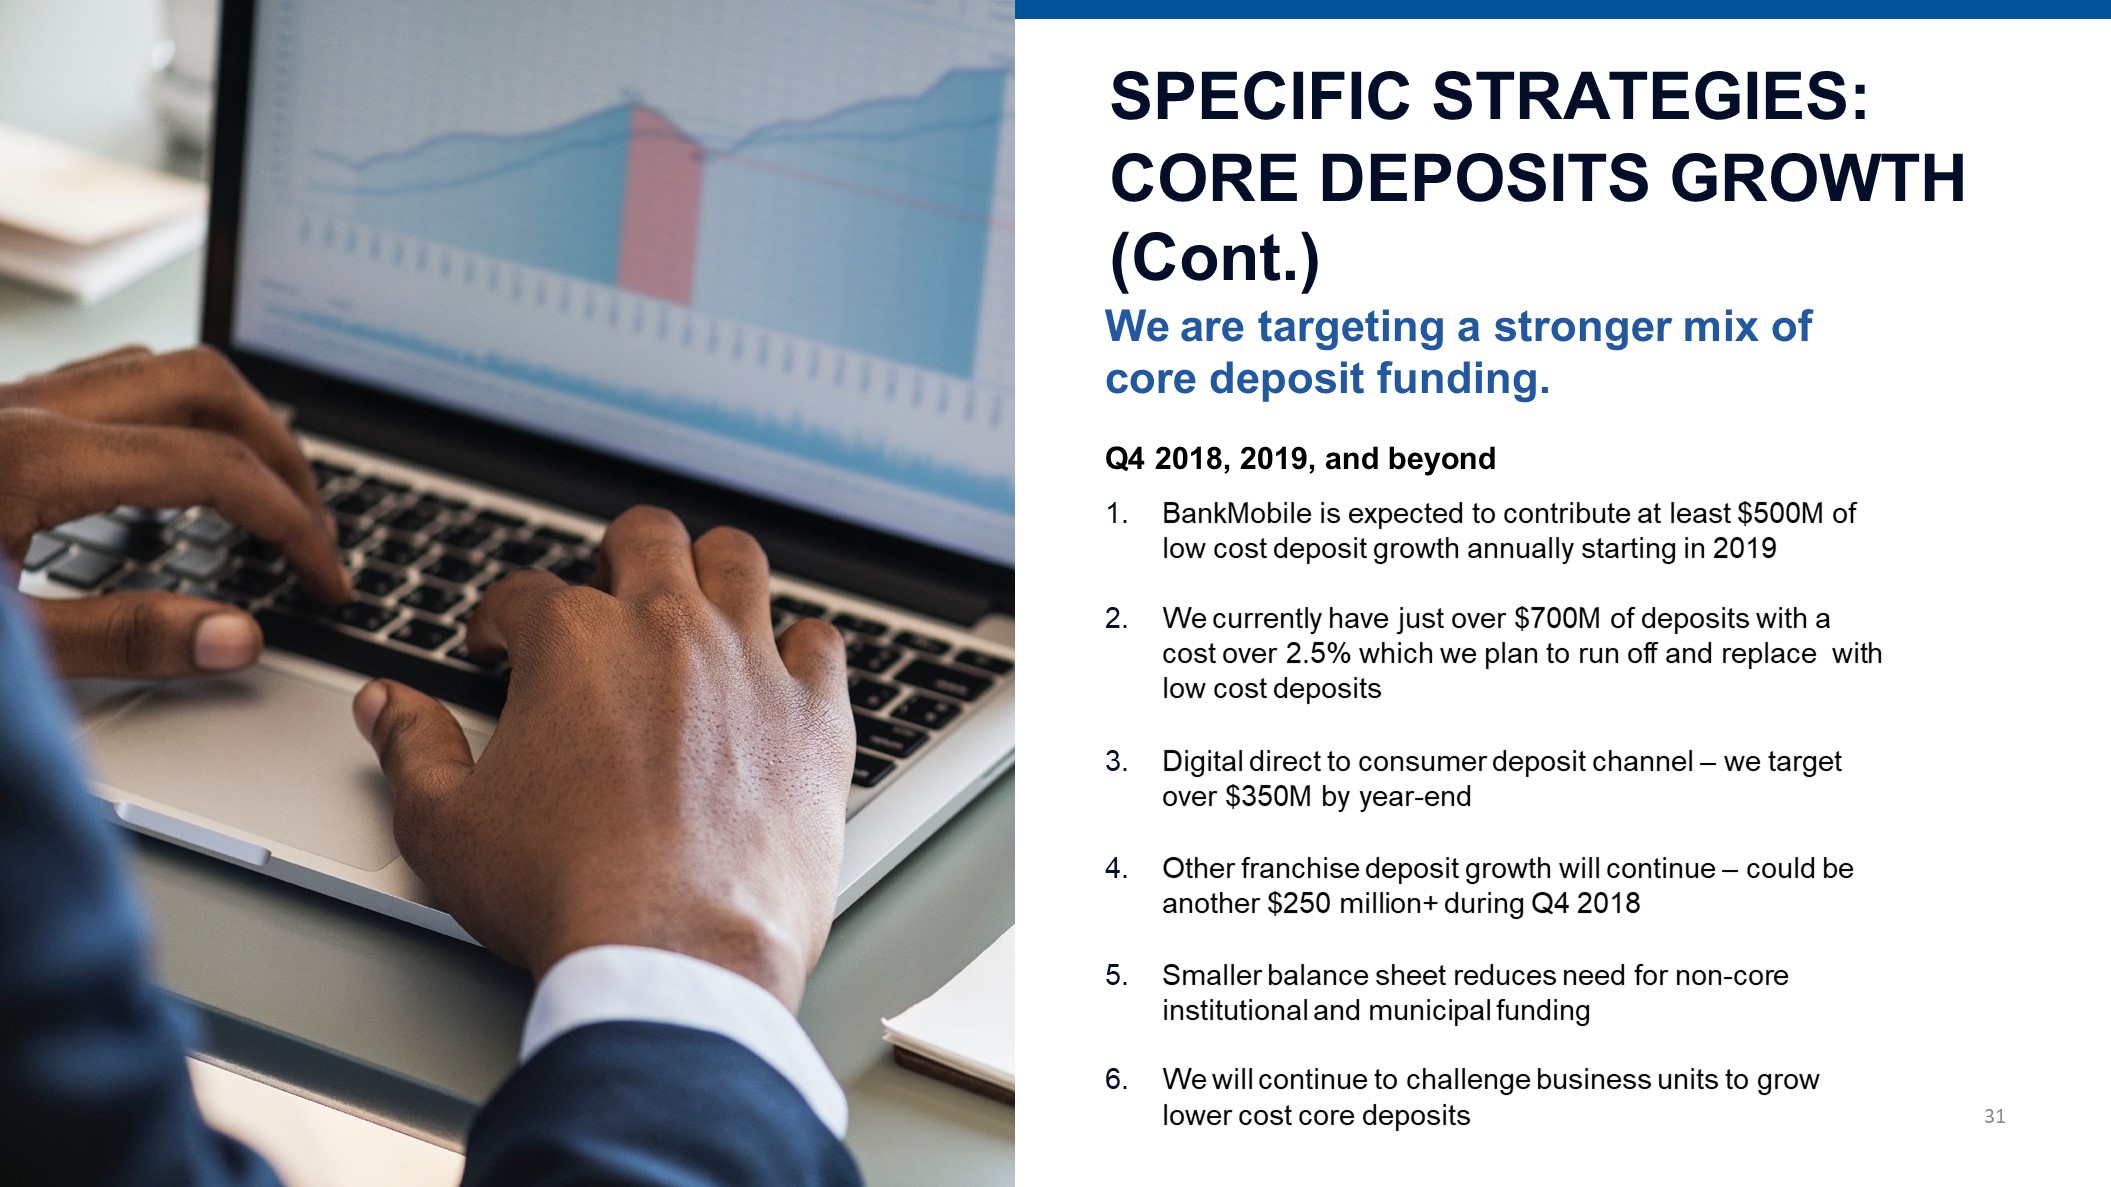
We are targeting a stronger mix of core deposit funding.Q4 2018, 2019, and beyondBankMobile is expected to contribute at least $500M of low cost deposit growth annually starting in 2019We currently have just over $700M of deposits with a cost over 2.5% which we plan to run off and replace with low cost depositsDigital direct to consumer deposit channel – we target over $350M by year-endOther franchise deposit growth will continue – could be another $250 million+ during Q4 2018Smaller balance sheet reduces need for non-core institutional and municipal fundingWe will continue to challenge business units to grow lower cost core deposits SPECIFIC STRATEGIES:CORE DEPOSITS GROWTH (Cont.) 31
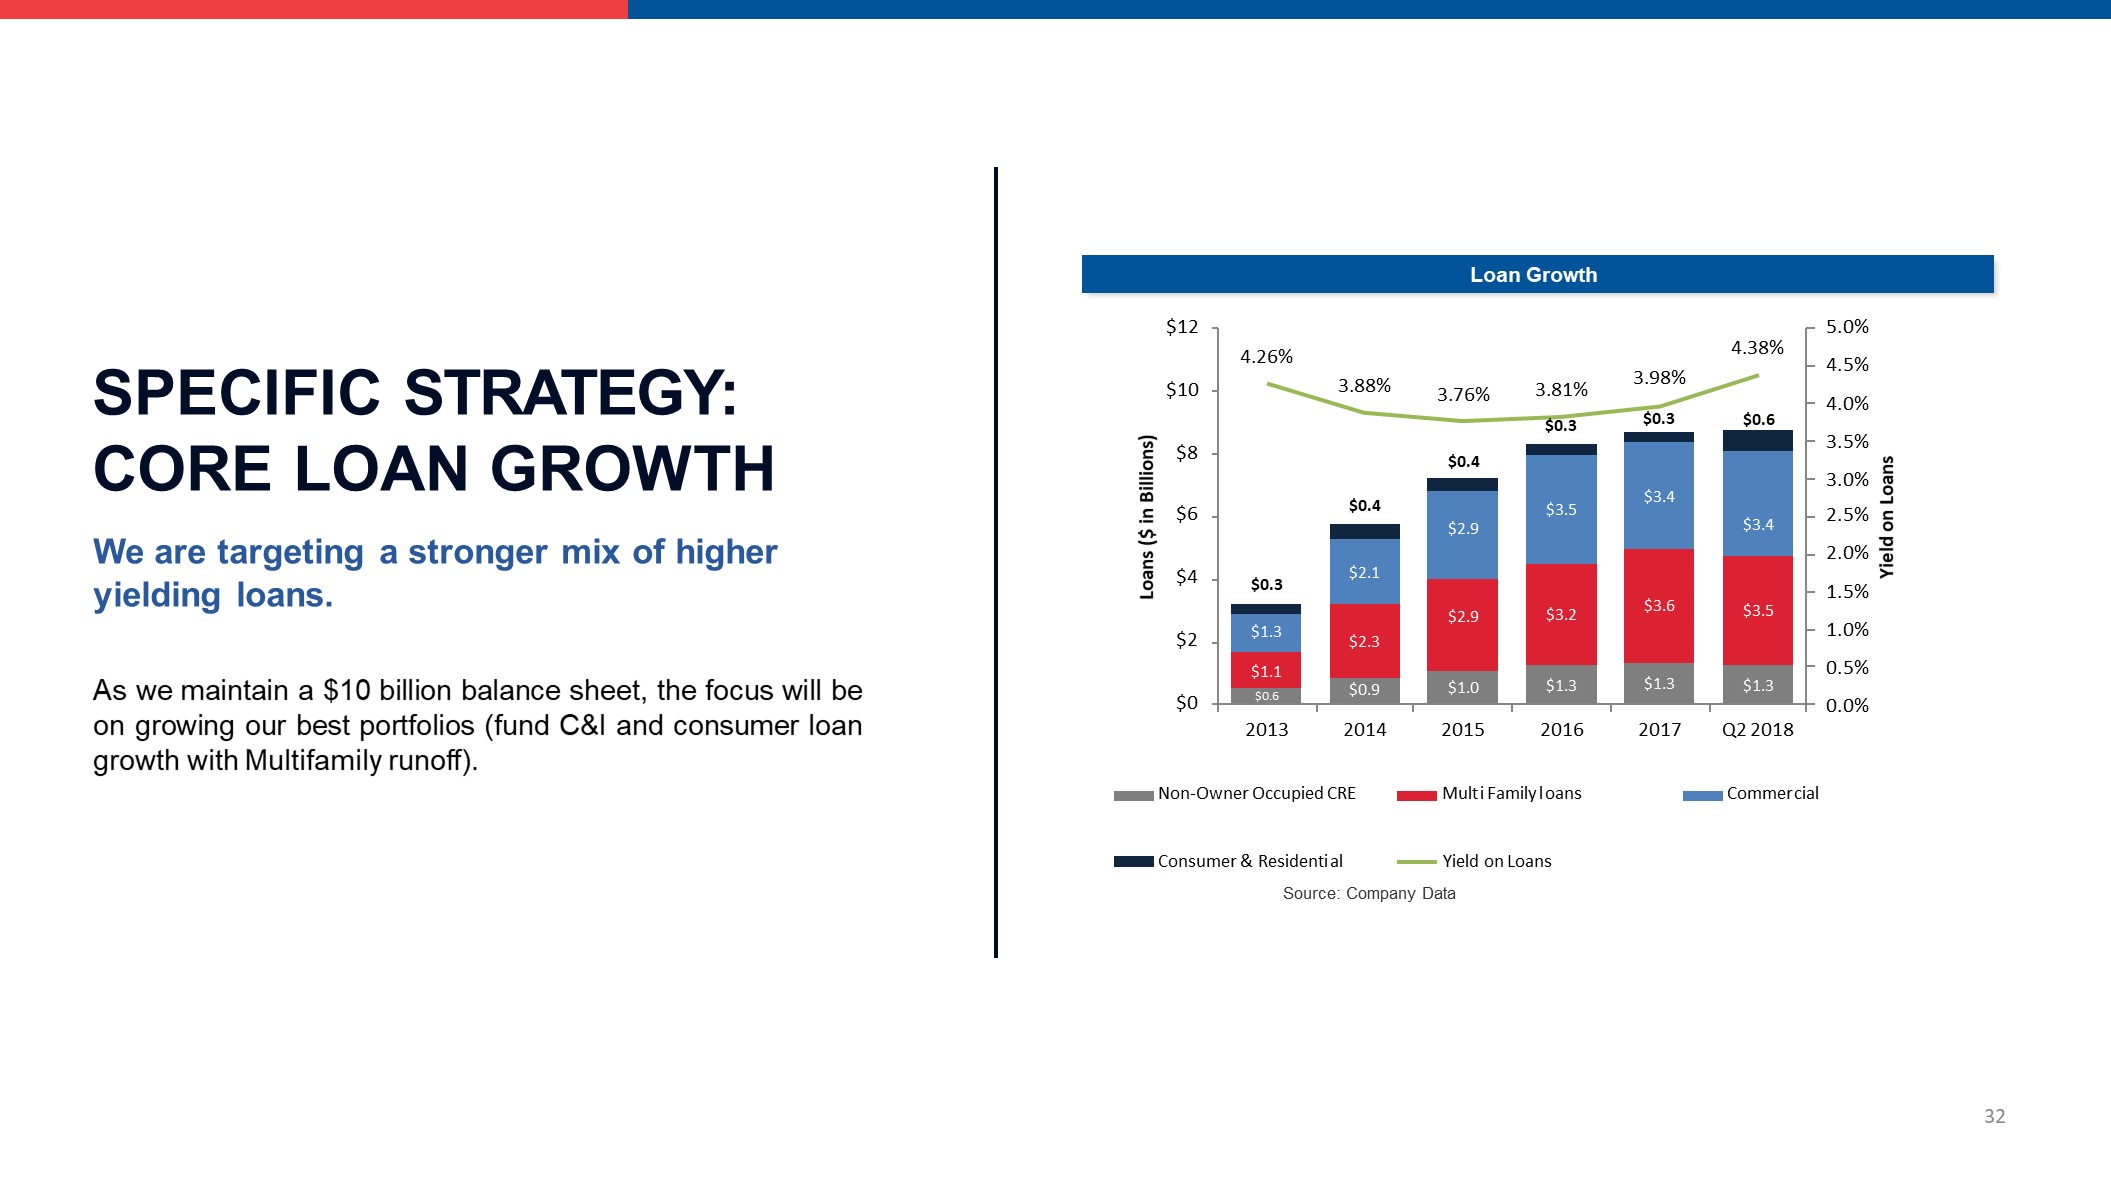
SPECIFIC STRATEGY: CORE LOAN GROWTHWe are targeting a stronger mix of higher yielding loans. As we maintain a $10 billion balance sheet, the focus will be on growing our best portfolios (fund C&I and consumer loan growth with Multifamily runoff). $0.6 $0.9 $1.0 $1.3 $1.3 $1.3 $1.1 $2.3 $2.9 $3.2 $3.6 $3.5 $1.3 $2.1 $2.9 $3.5 $3.4 $3.4 $0.3 $0.4 $0.4 $0.6 4.26% 3.88% 3.76% 3.81%$0.3 3.98%$0.3 4.38% 5.0%4.5%4.0%3.5%3.0%2.5%2.0%1.5%1.0%0.5%0.0% $0 $2 $4 $6 $8 $10 $12 2013 2014 2015 2016 2017 Q2 2018 Yield on Loans Loans ($ in Billions) Non-Owner Occupied CRE Mult i Family l oans Commer cial Consumer & Residenti al Yield on LoansSource: Company Data Loan Growth 32
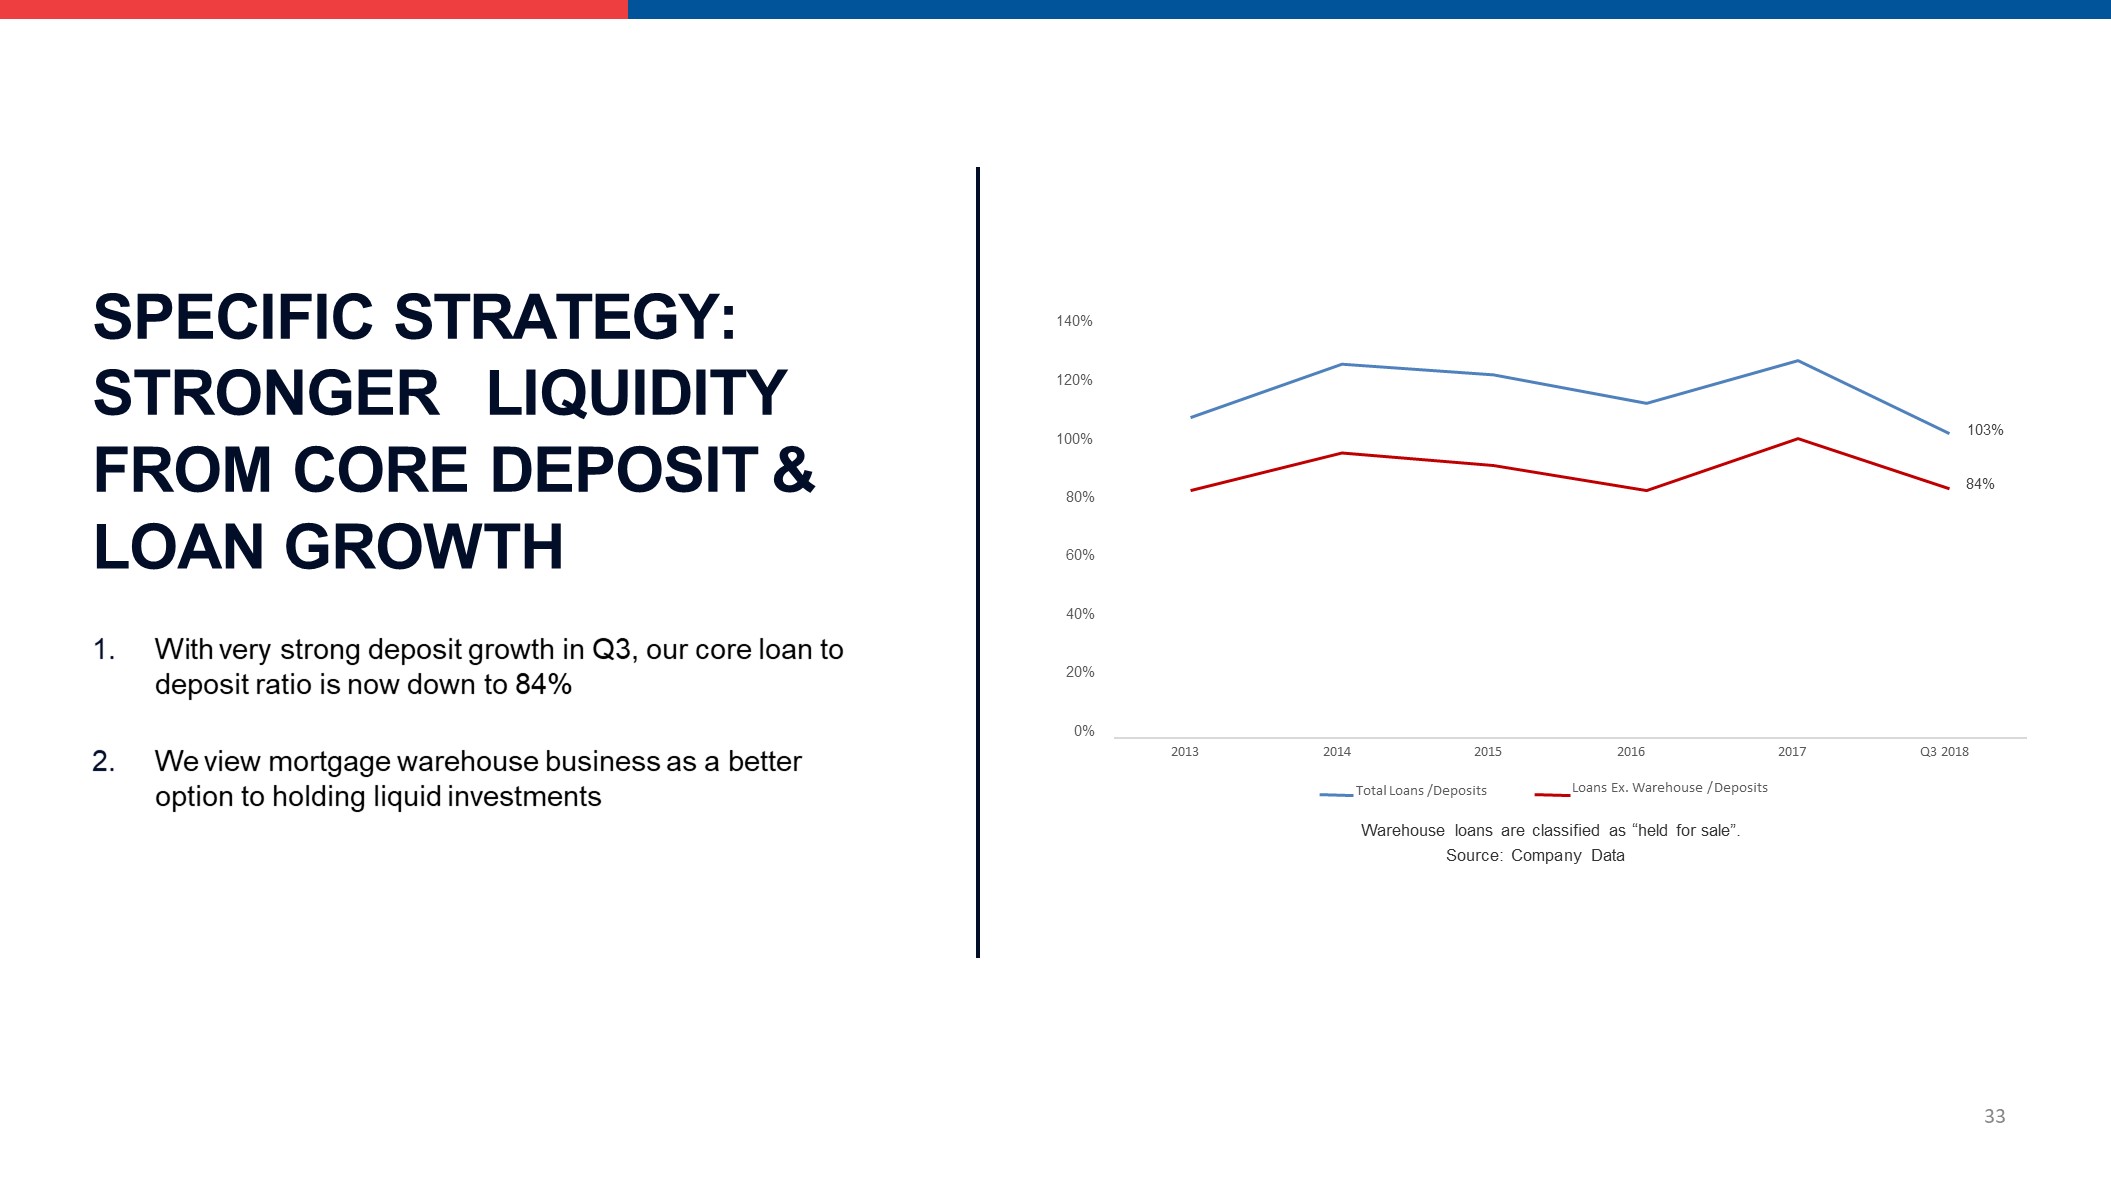
SPECIFIC STRATEGY: STRONGER LIQUIDITY FROM CORE DEPOSIT & LOAN GROWTH 1. With very strong deposit growth in Q3, our core loan to deposit ratio is now down to 84% 2. We view mortgage warehouse business as a better option to holding liquid investments 103% 84% 20% 40% 60% 80% 100% 120% 140% Total Loans /Deposits 0% 2013 2014 2015 2016 2017 Q3 2018 33 Loans Ex. Warehouse / Deposits Warehouse loans are classified as “held for sale”.Source: Company Data
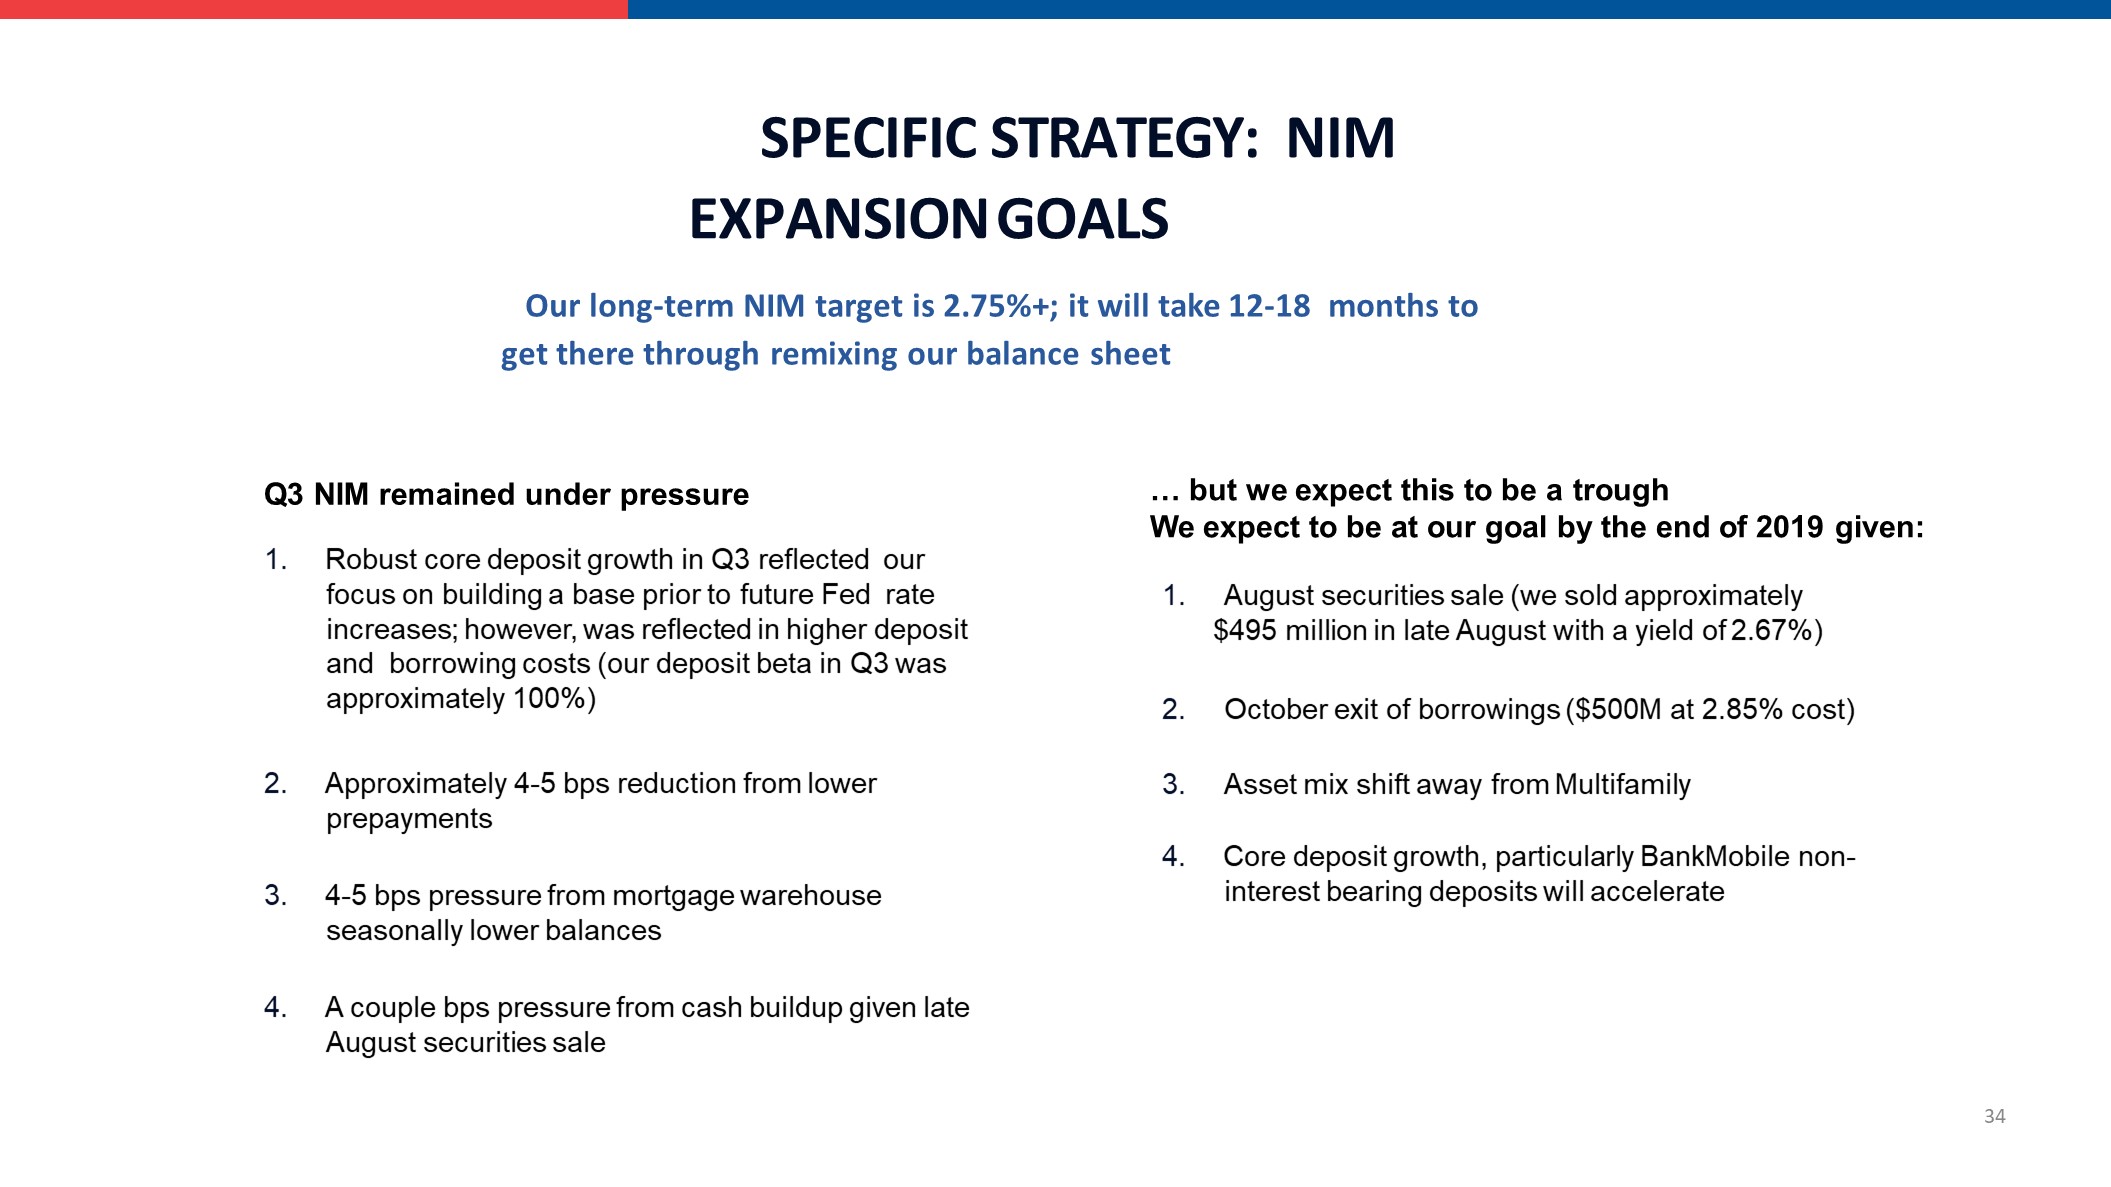
Our long-term NIM target is 2.75%+; it will take 12-18 months to get there through remixing our balance sheet 34 SPECIFIC STRATEGY: NIM EXPANSION GOALS 1. Robust core deposit growth in Q3 reflected our focus on building a base prior to future Fed rate increases; however, was reflected in higher deposit and borrowing costs (our deposit beta in Q3 was approximately 100%) 2. Approximately 4-5 bps reduction from lower prepayments 3. 4-5 bps pressure from mortgage warehouse seasonally lower balances 4. A couple bps pressure from cash buildup given late August securities sale Q3 NIM remained under pressure 1. August securities sale (we sold approximately$495 million in late August with a yield of 2.67%) 2. October exit of borrowings ($500M at 2.85% cost) 3. Asset mix shift away from Multifamily 4. Core deposit growth, particularly BankMobile non- interest bearing deposits will accelerate … but we expect this to be a troughWe expect to be at our goal by the end of 2019 given:

Our long-term NIM target is 2.75%+. It will take12-18 months to get there through remixing our balance sheet 35 NIM EXPANSION STRATEGIES We like the asset class, but not the spreads today. We expect to always maintain around $1 billion or 10% of assets We have been incentivizing loans to refinance off our balance sheet Will explore opportunities to securitize in the future – it would make sense to monetize our relationships and experience to generate fee income. It will likely take us 6-12 months to evaluate this option. We are reducing our exposure to lower yielding assets while emphasizing C&I lending Multifamily lendingExpect Multifamily loan balances to end 2018 around$3.3B, and to continue to trend lower over time. We will limit consumer loans to 15% to 20% of our total balance sheet – our goal is to remain predominantly a small business bank We will not do subprime lending We are also increasing our exposure to higher yielding assets and diversifying our loan portfolio Consumer lendingWe will add high quality consumer loans to our balance sheet
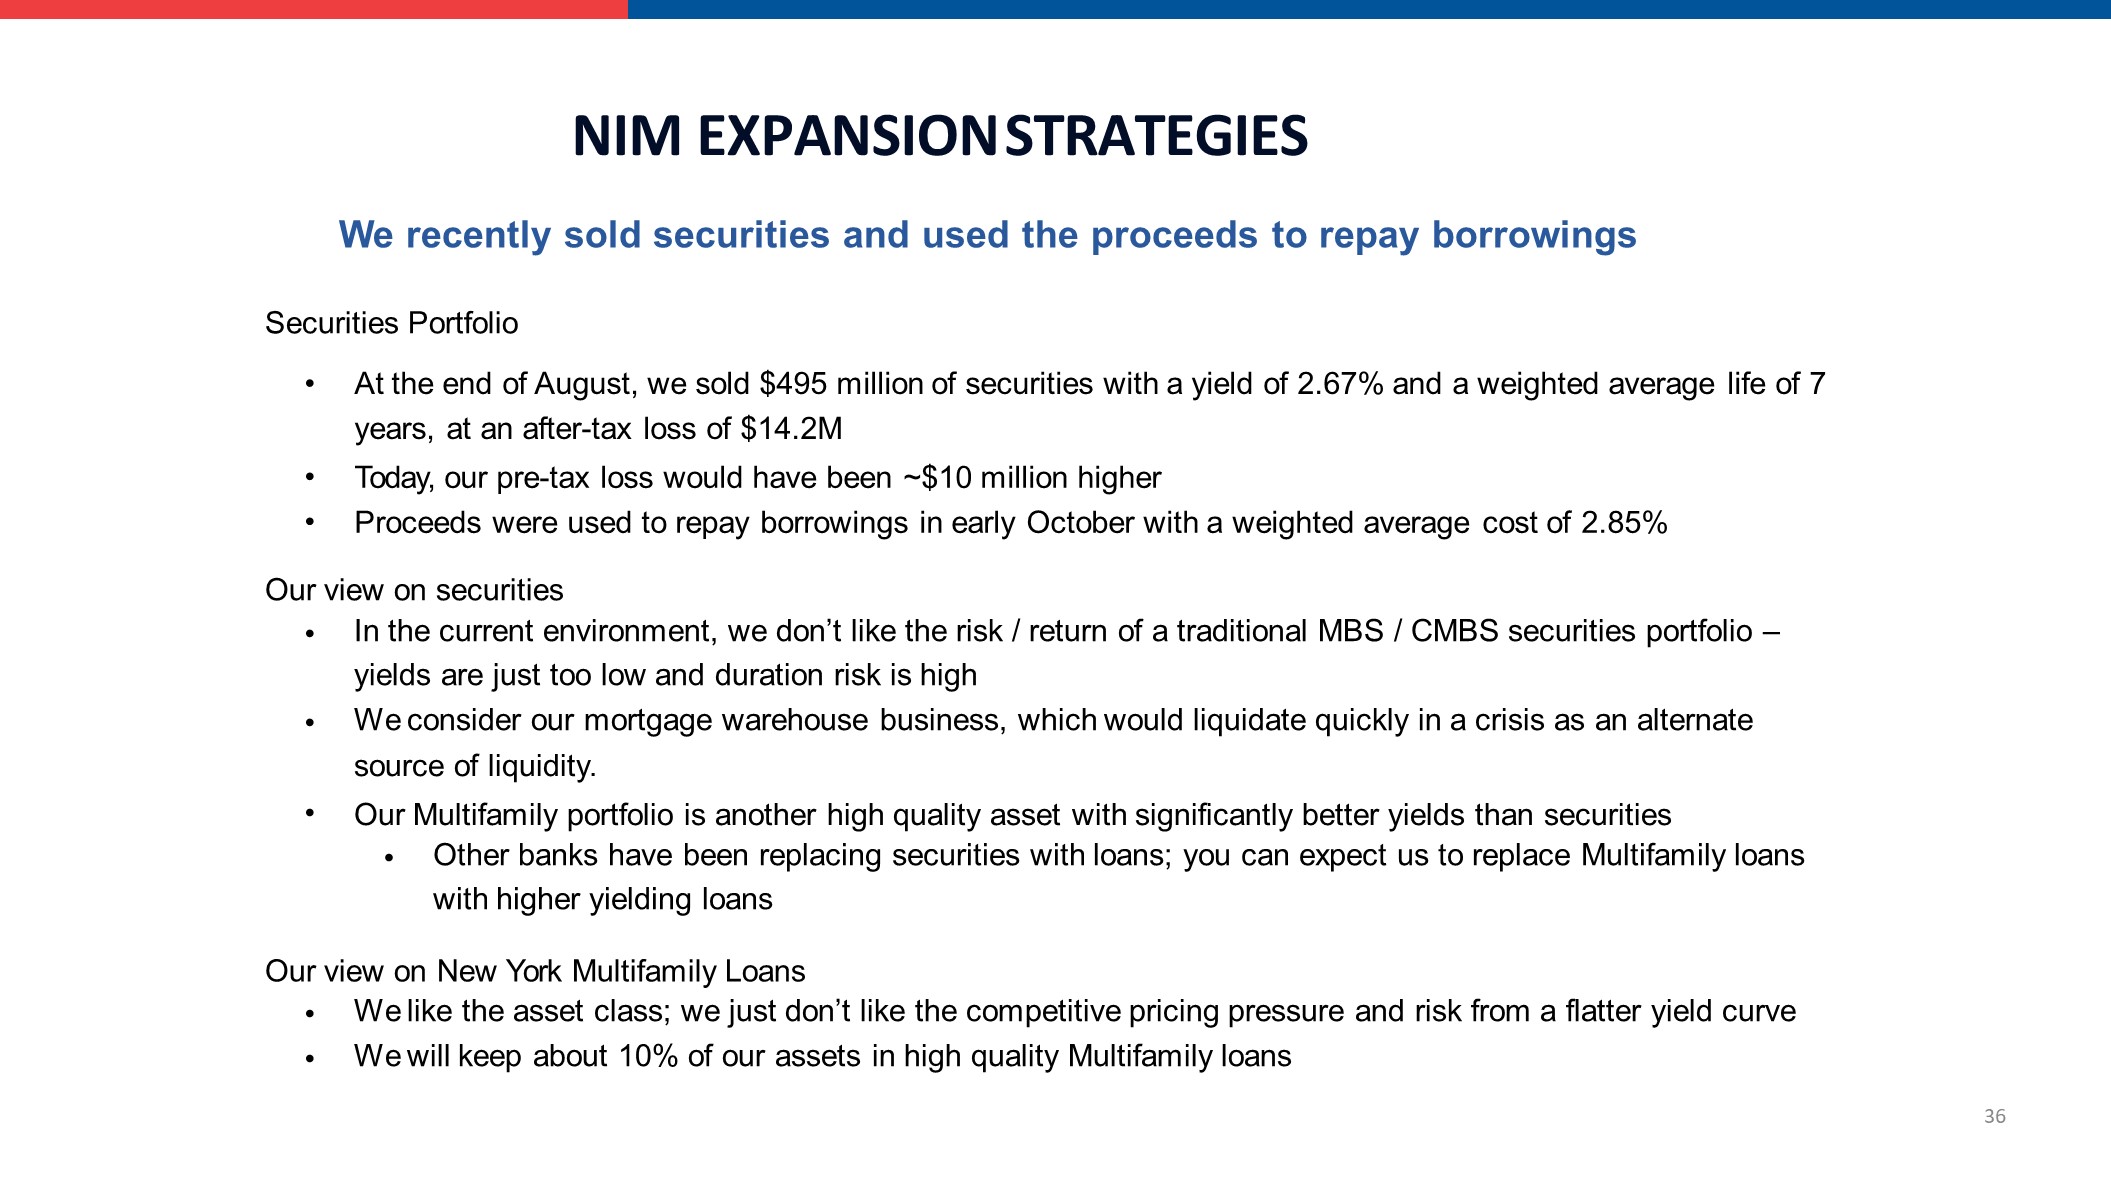
NIM EXPANSION STRATEGIES 36 We recently sold securities and used the proceeds to repay borrowingsSecurities Portfolio •• At the end of August, we sold $495 million of securities with a yield of 2.67% and a weighted average life of 7 years, at an after-tax loss of $14.2MToday, our pre-tax loss would have been ~$10 million higherProceeds were used to repay borrowings in early October with a weighted average cost of 2.85% Our view on securities • • • In the current environment, we don’t like the risk / return of a traditional MBS / CMBS securities portfolio – yields are just too low and duration risk is highWe consider our mortgage warehouse business, which would liquidate quickly in a crisis as an alternate source of liquidity.Our Multifamily portfolio is another high quality asset with significantly better yields than securities • Other banks have been replacing securities with loans; you can expect us to replace Multifamily loans with higher yielding loans Our view on New York Multifamily Loans •• We like the asset class; we just don’t like the competitive pricing pressure and risk from a flatter yield curve We will keep about 10% of our assets in high quality Multifamily loans
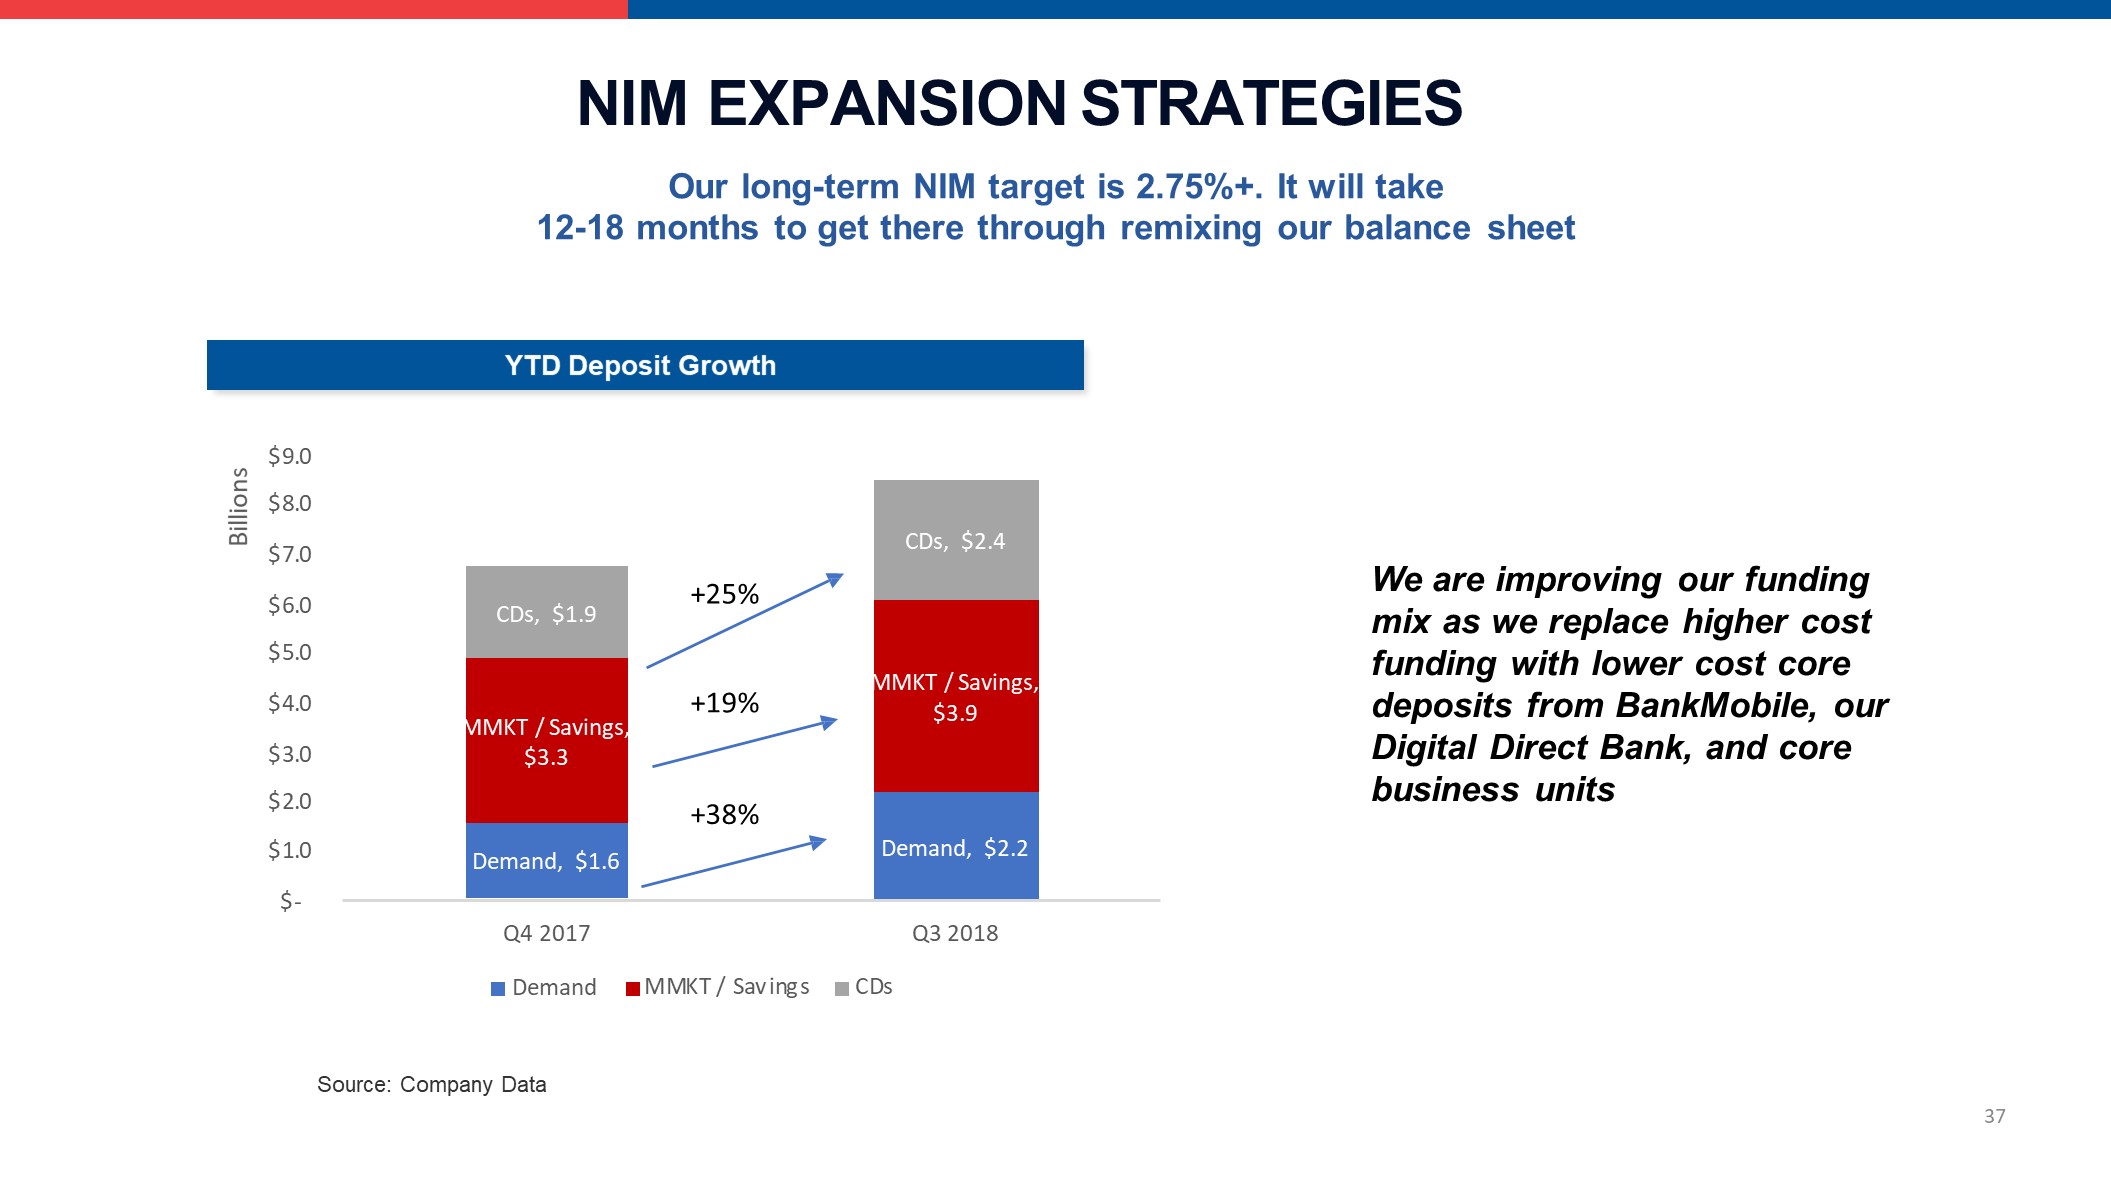
Our long-term NIM target is 2.75%+. It will take12-18 months to get there through remixing our balance sheet NIM EXPANSION STRATEGIES We are improving our funding mix as we replace higher cost funding with lower cost core deposits from BankMobile, our Digital Direct Bank, and core business units Demand, $1.6 Demand, $2.2 MMKT / Savings, $3.3 MMKT / Savings, $3.9 CDs, $1.9 CDs, $2.4 $9.0$8.0$7.0$6.0$5.0$4.0$3.0$2.0$1.0$- Q3 2018 Billions Q4 2017Demand MMKT / Savings CDs +25% +19% +38% YTD Deposit Growth 37 Source: Company Data
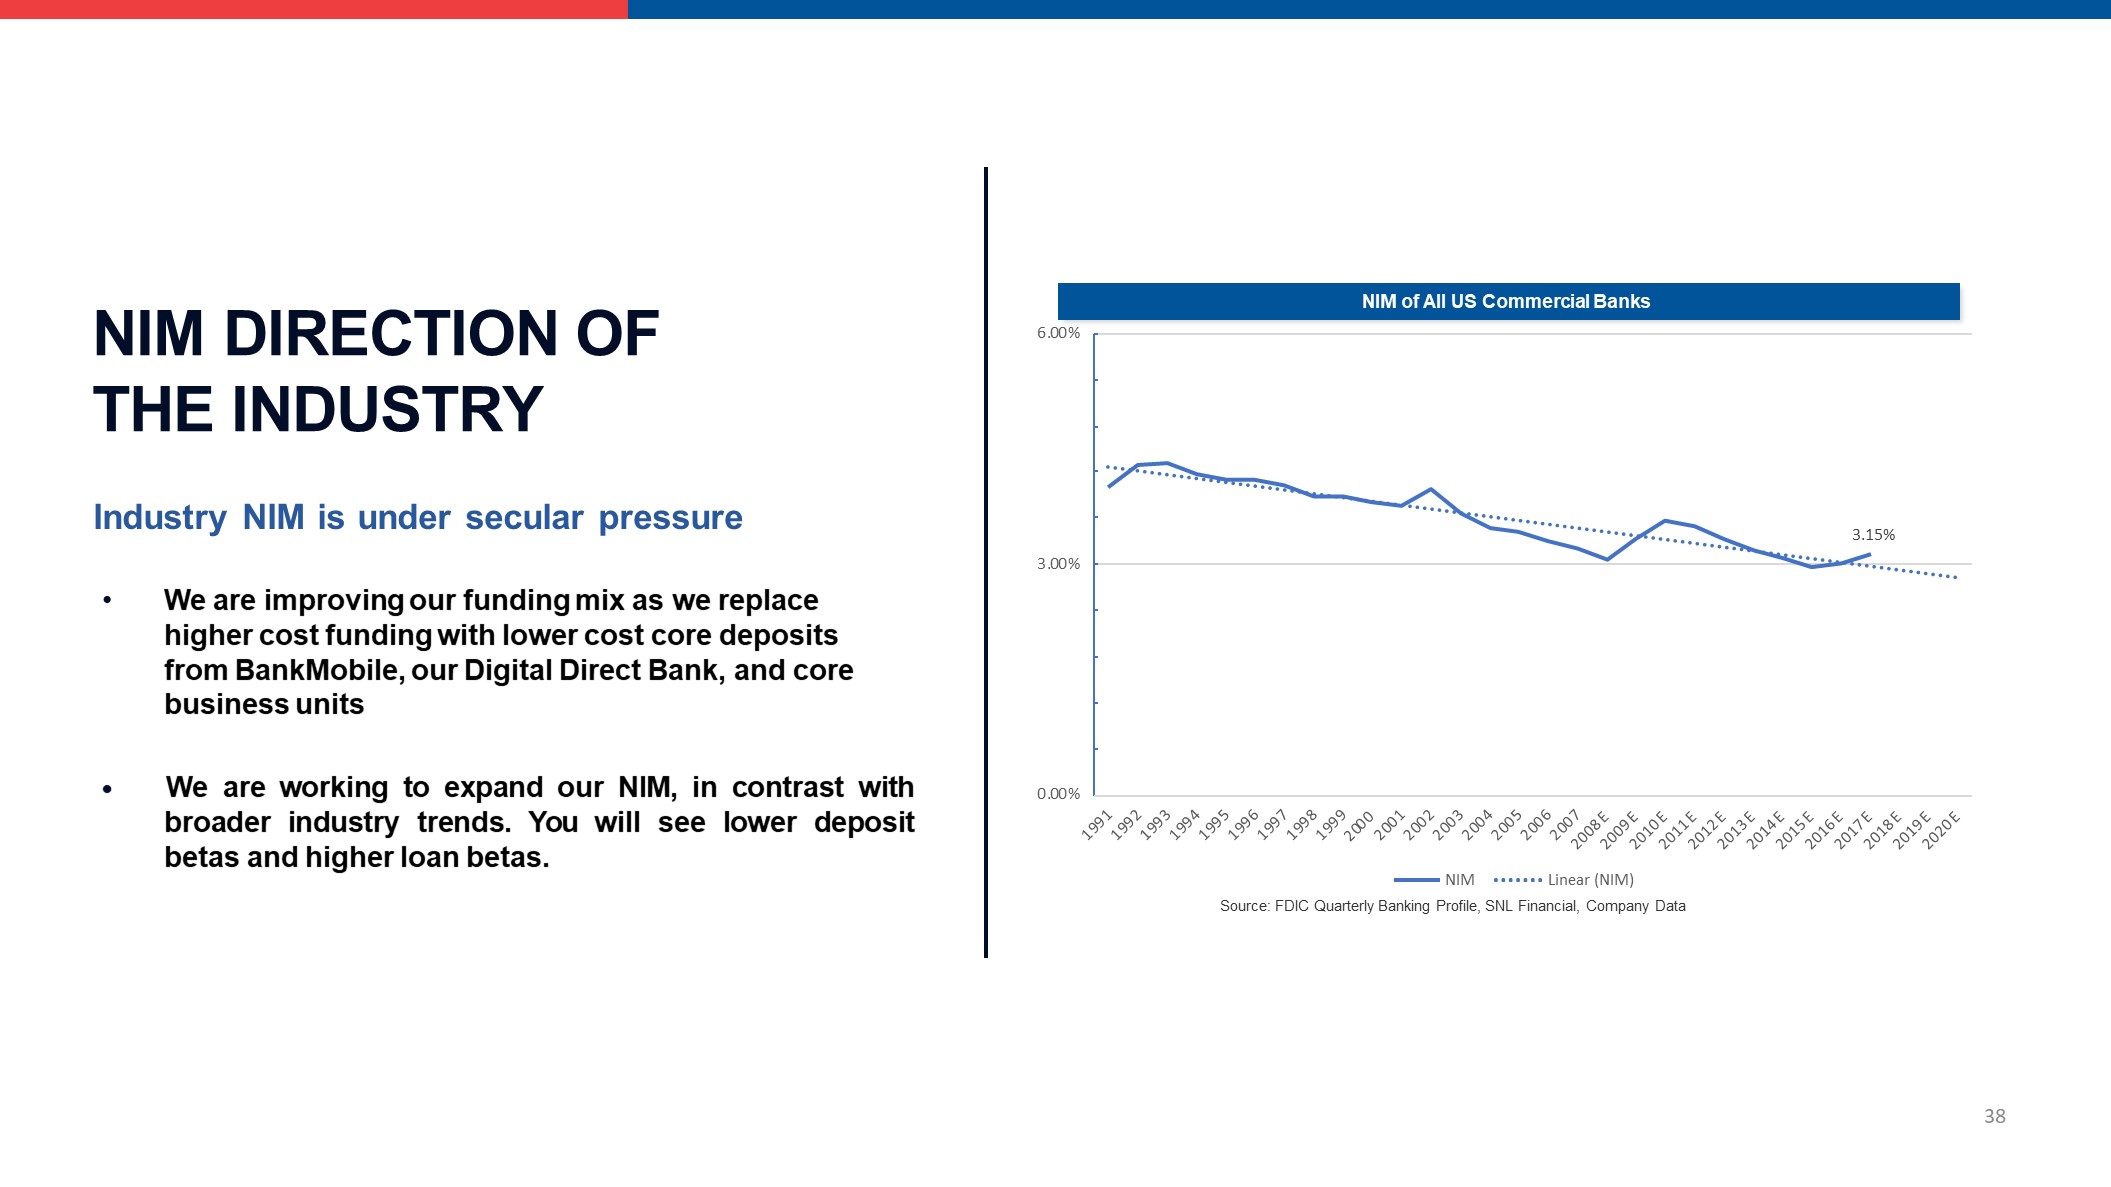
NIM DIRECTION OF THE INDUSTRY Industry NIM is under secular pressure We are improving our funding mix as we replace higher cost funding with lower cost core deposits from BankMobile, our Digital Direct Bank, and core business units • We are working to expand our NIM, in contrast with broader industry trends. You will see lower deposit betas and higher loan betas. NIM of All US Commercial Banks 3.15% 0.00% 3.00% 6.00% 1991 1992 1993 1994 1995 1996 1997 1998 1999 20 00 2001 2002 2003 2004 2005 2006 2007 2008 E 2009 E 2010 E 2011 E 2012 E 2013 E 2014 E 2015 E 2016 E 2017 E 2018 E 2019 E 2020 E NIM Linear (NIM)Source: FDIC Quarterly Banking Profile, SNL Financial, Company Data 38
OUR STRATEGY: IMPROVE PROFITABILITY 39 We target an ROAA of 1.25% + over a 3-5 year period Target top quartile of peer group – today that equates to 1.17%, but we know it is headed higherWe expect that the shift in asset and funding mix will drive a wider NIM at the core banking operationsAs BankMobile’s growth accelerates, it has ROA potential that is greater than Customers Bank, given significant non- interest bearing deposit balances and fee income. The shift from BankMobile as a drag to BankMobile as a lift, which is expected to begin in mid-2019, should raise consolidated profitability We will remained focused on expense control and positive operating leverageWe will also look for opportunities to grow fee income. Expect to enter wealth management by 12/31/19All these factors should push consolidated ROAA and ROTCE higher and efficiency lowerOur ROAA target and capital targets equate to a double digit ROTCEWe will consider capital deployment through share repurchases and redeeming preferred stock
OUR STRATEGY: IMPROVE PROFITABILITY 40 With a cap on balance sheet size, we are looking very closely at costsWe expect to have deminimus growth in CB Private and Commercial banking expenseGrowth in costs at the digital bank and BankMobile will be tied to their growing contributionConsolidated efficiency should move lower as our first White Label partner comes online and BankMobile begins to have a more meaningful contribution to the overall business
OUR STRATEGY: DIGITAL FOCUS We will continue to be a leader in the industry’s shift to digital There is a major initiative throughout the company to digitize not only the front end but the entire operation that supports the front endWe hold quarterly discussions with our tech partners at FIS to see how to partner with them to achieve our goalsConsistent with our view of a virtuous cycle, of improving costs, customer experience and revenues, all simultaneouslyWe want to be in the business of providing customized customer experiences, but we are not there yetUse of machine learning and artificial intelligencewill help us to make intelligent, and quicker decisionsWe will partner with FinTech companies where we can to be sure we can have the same capabilities as bigger banks without their technology budgets 41
RISK MANAGEMENT IS ALWAYS A FOCUS CUBI has been focused from the very beginning on risk management and corporate governanceWe consider risk management a critical functionOver 90 full time employees are dedicated to risk managementThe Board is actively engaged with top management in setting risk focused culture and detailed oversightBoard level risk committee meeting each monthWe hold two annual offsite risk summitsWe learned from fair lending issues and HigherOne’s mistakes 42
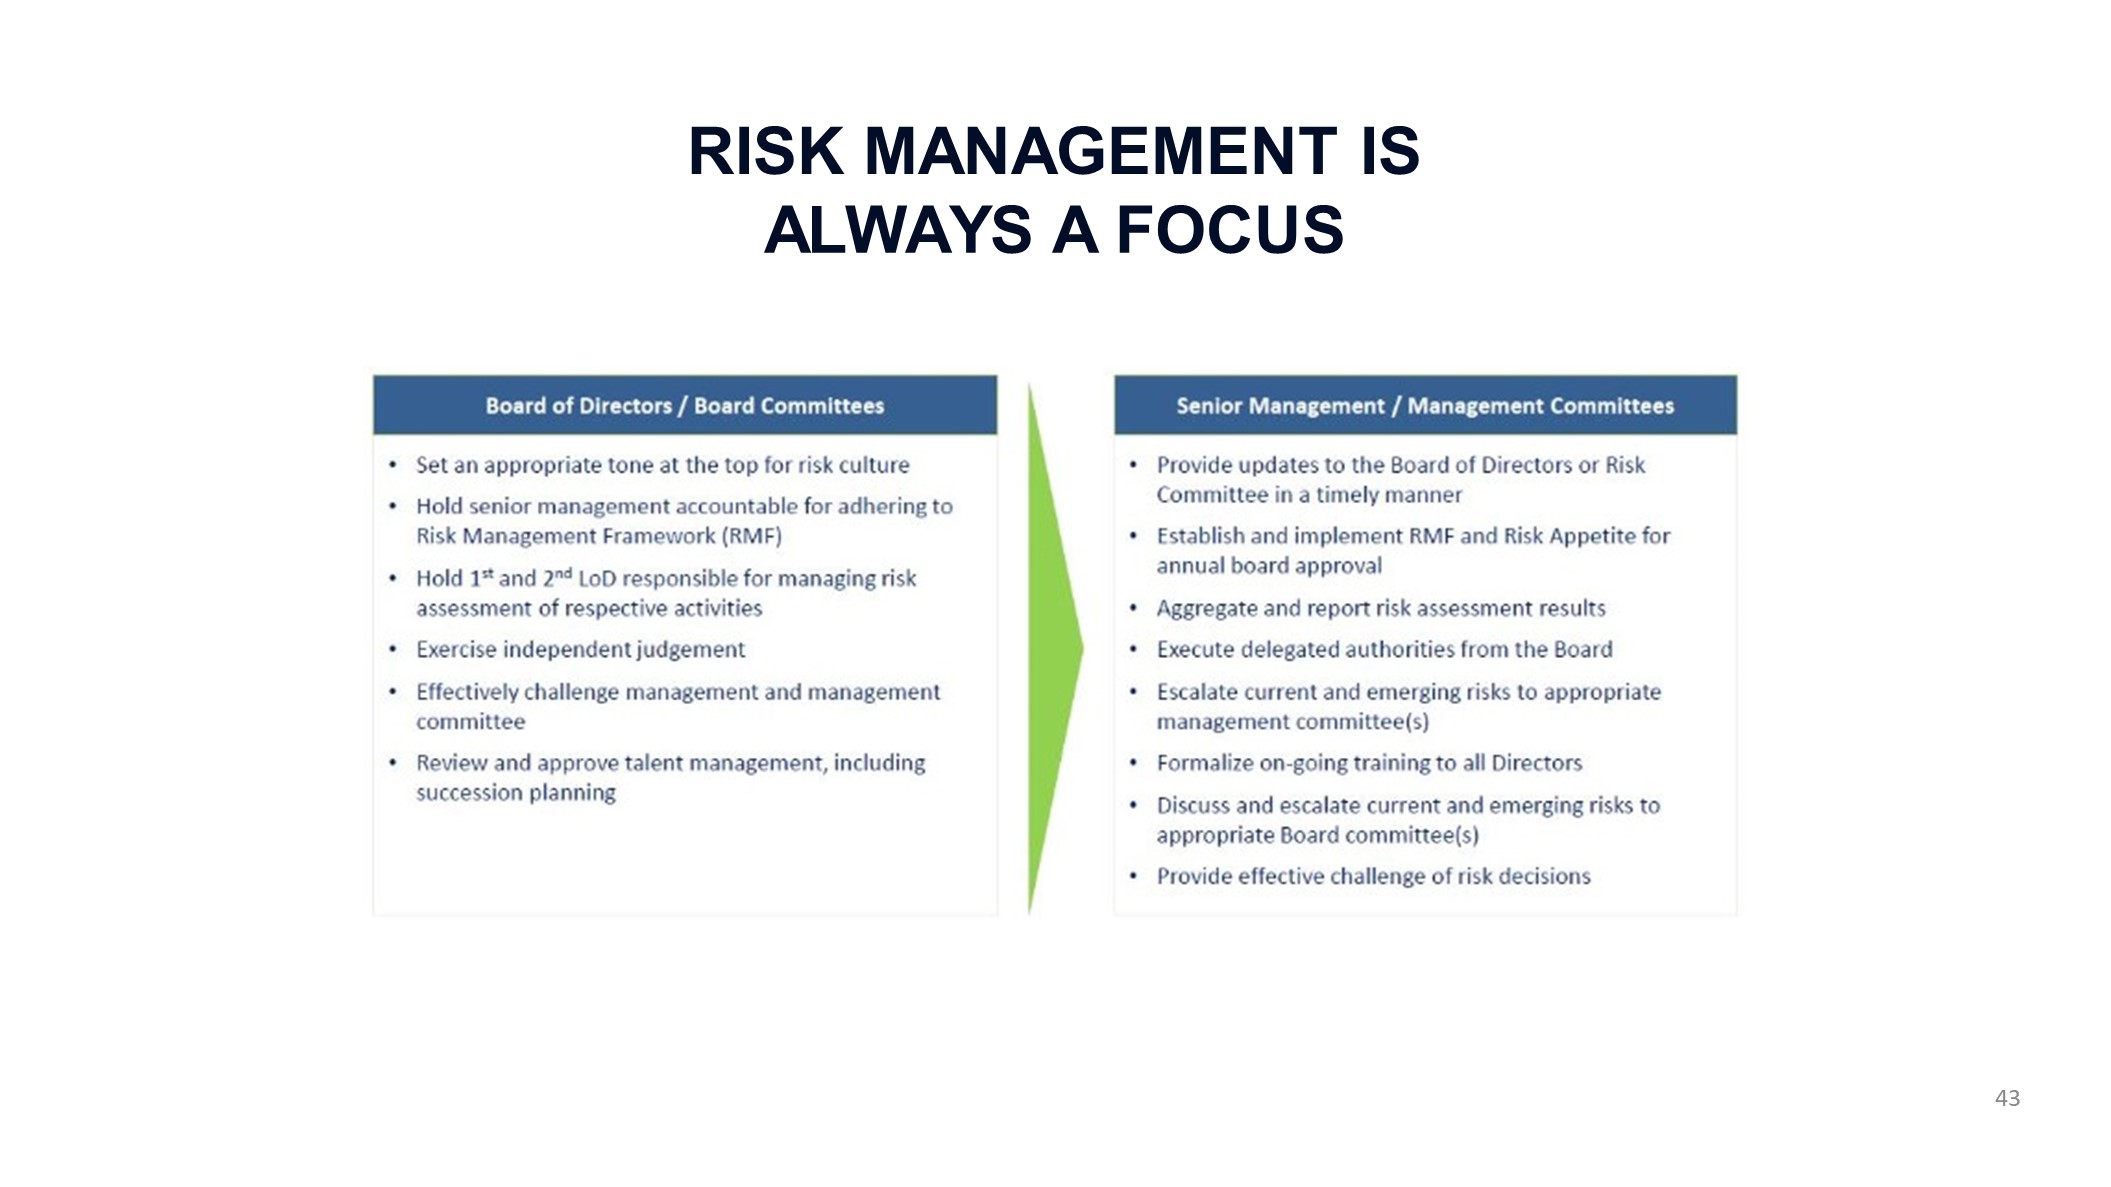
RISK MANAGEMENT IS ALWAYS A FOCUS 43
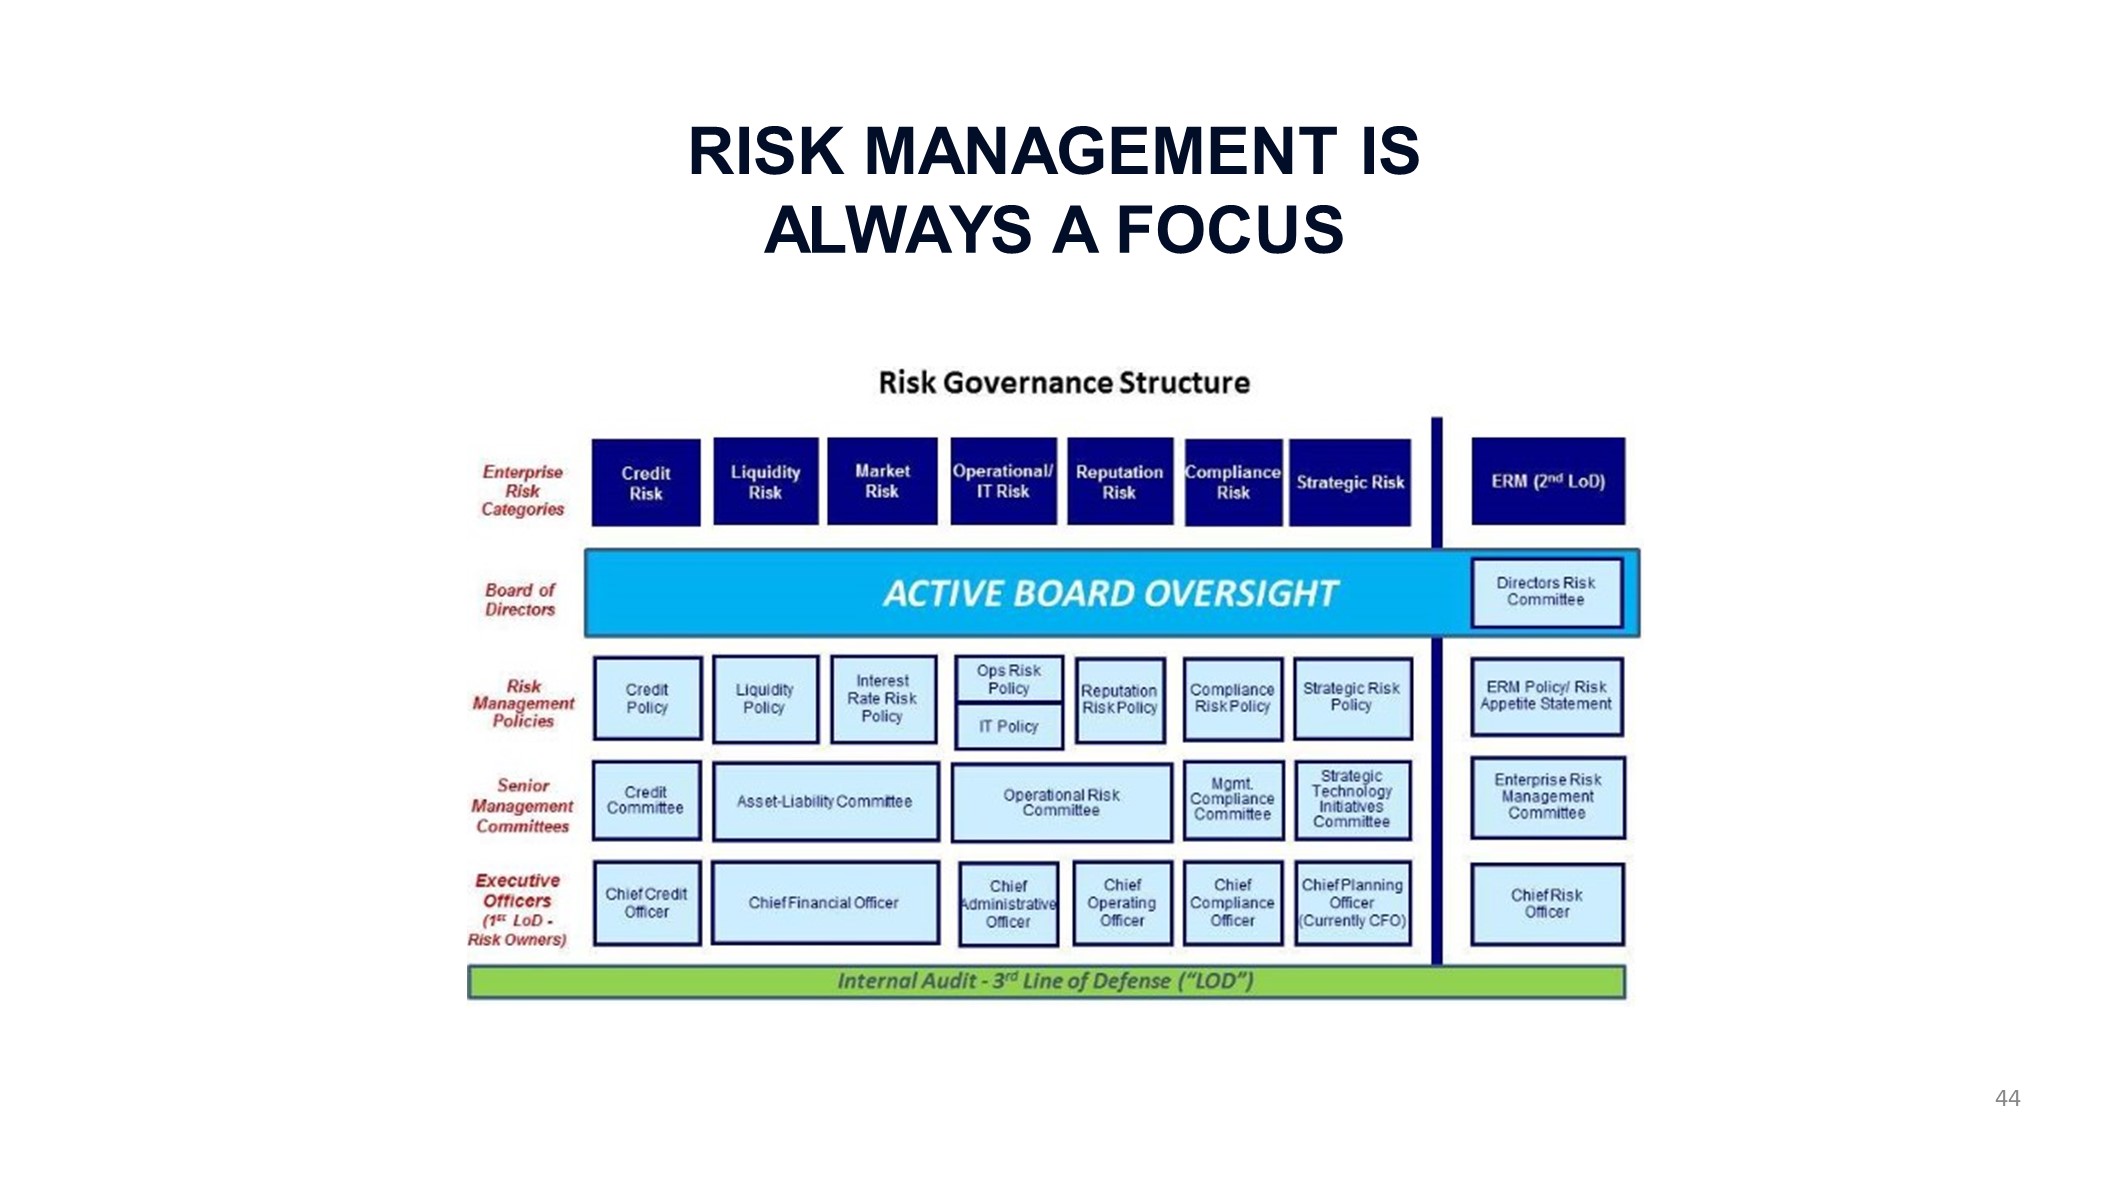
RISK MANAGEMENT IS ALWAYS A FOCUS 44
Business Line Update Dick Ehst, President & COO October 2018
46

OUR STRATEGY: IMPROVE PROFITABILITY 47 Single point of contact“We are a bank of 25 teams of highly-experienced and well-compensated professionals who own the customer experience for both loans and deposits, and are devoted to delivering the entire bank to the customer, with certainty of execution.”
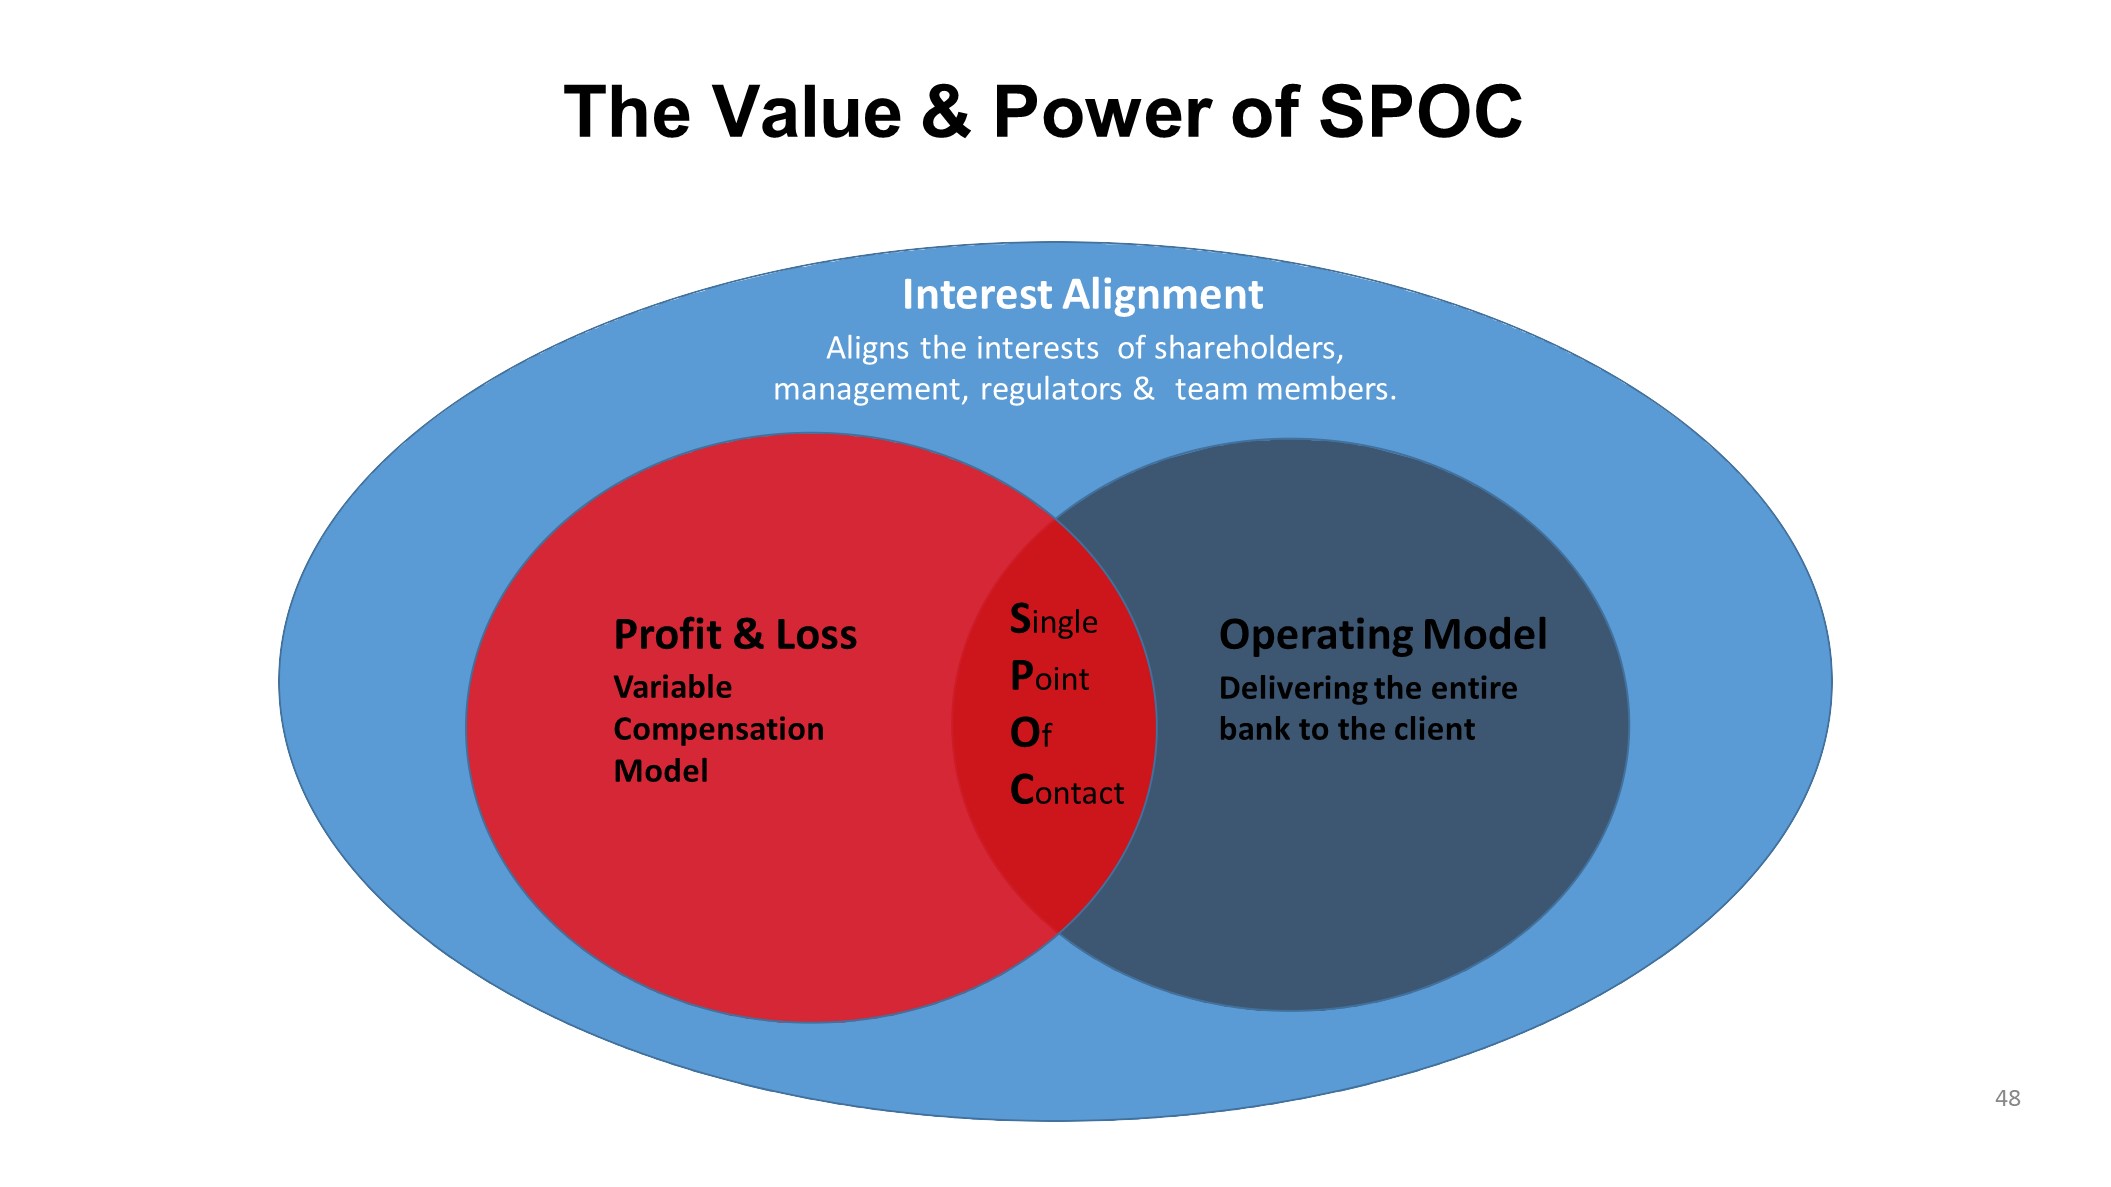
Profit & LossVariable Compensation Model 48 Operating ModelDelivering the entire bank to the client Single Point Of Contact Interest AlignmentAligns the interests of shareholders, management, regulators & team members. The Value & Power of SPOC
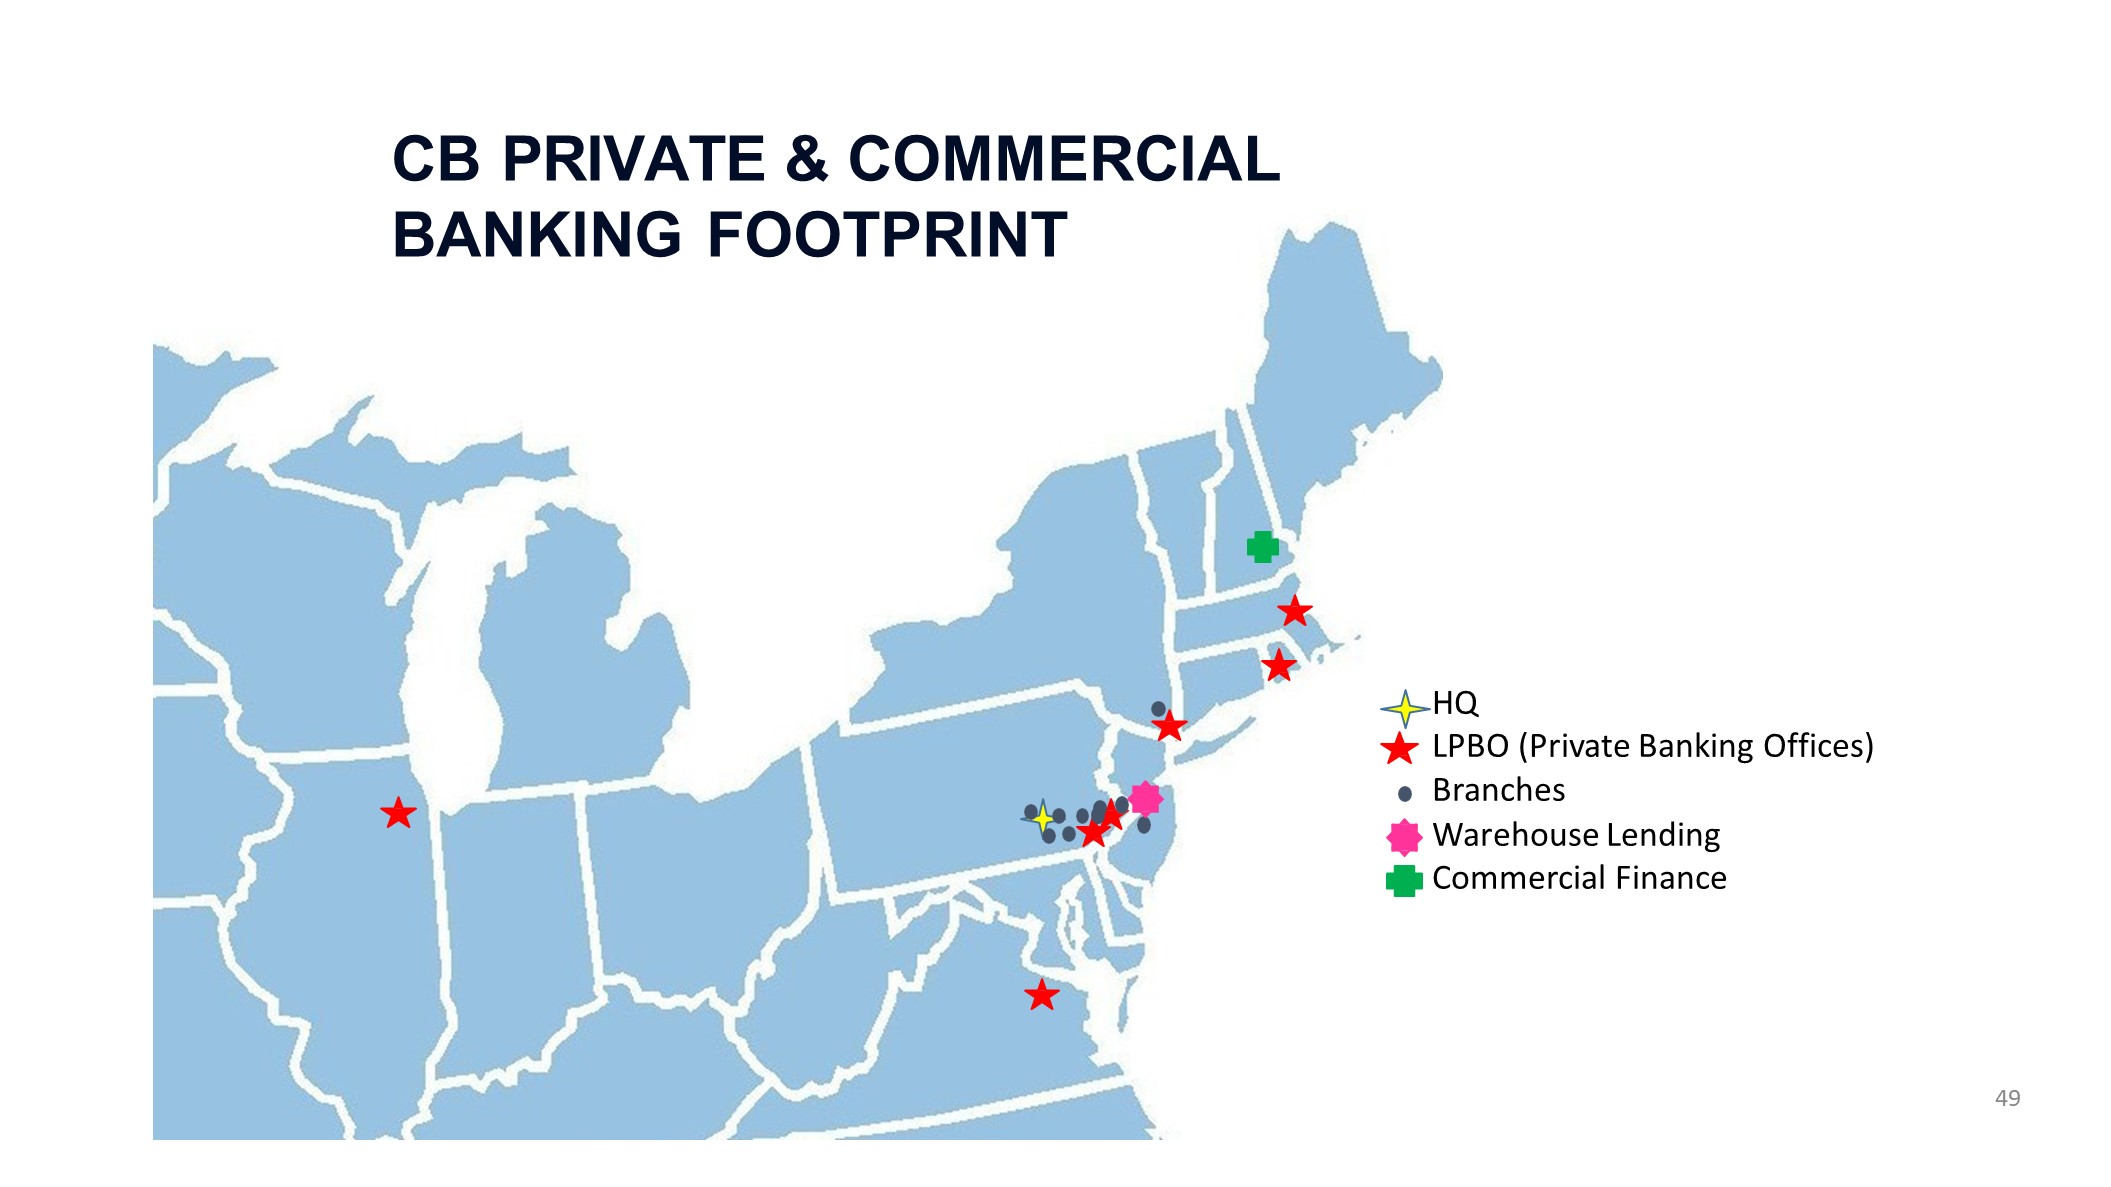
HQLPBO (Private Banking Offices) BranchesWarehouse Lending Commercial Finance CB PRIVATE & COMMERCIAL BANKING FOOTPRINT 49
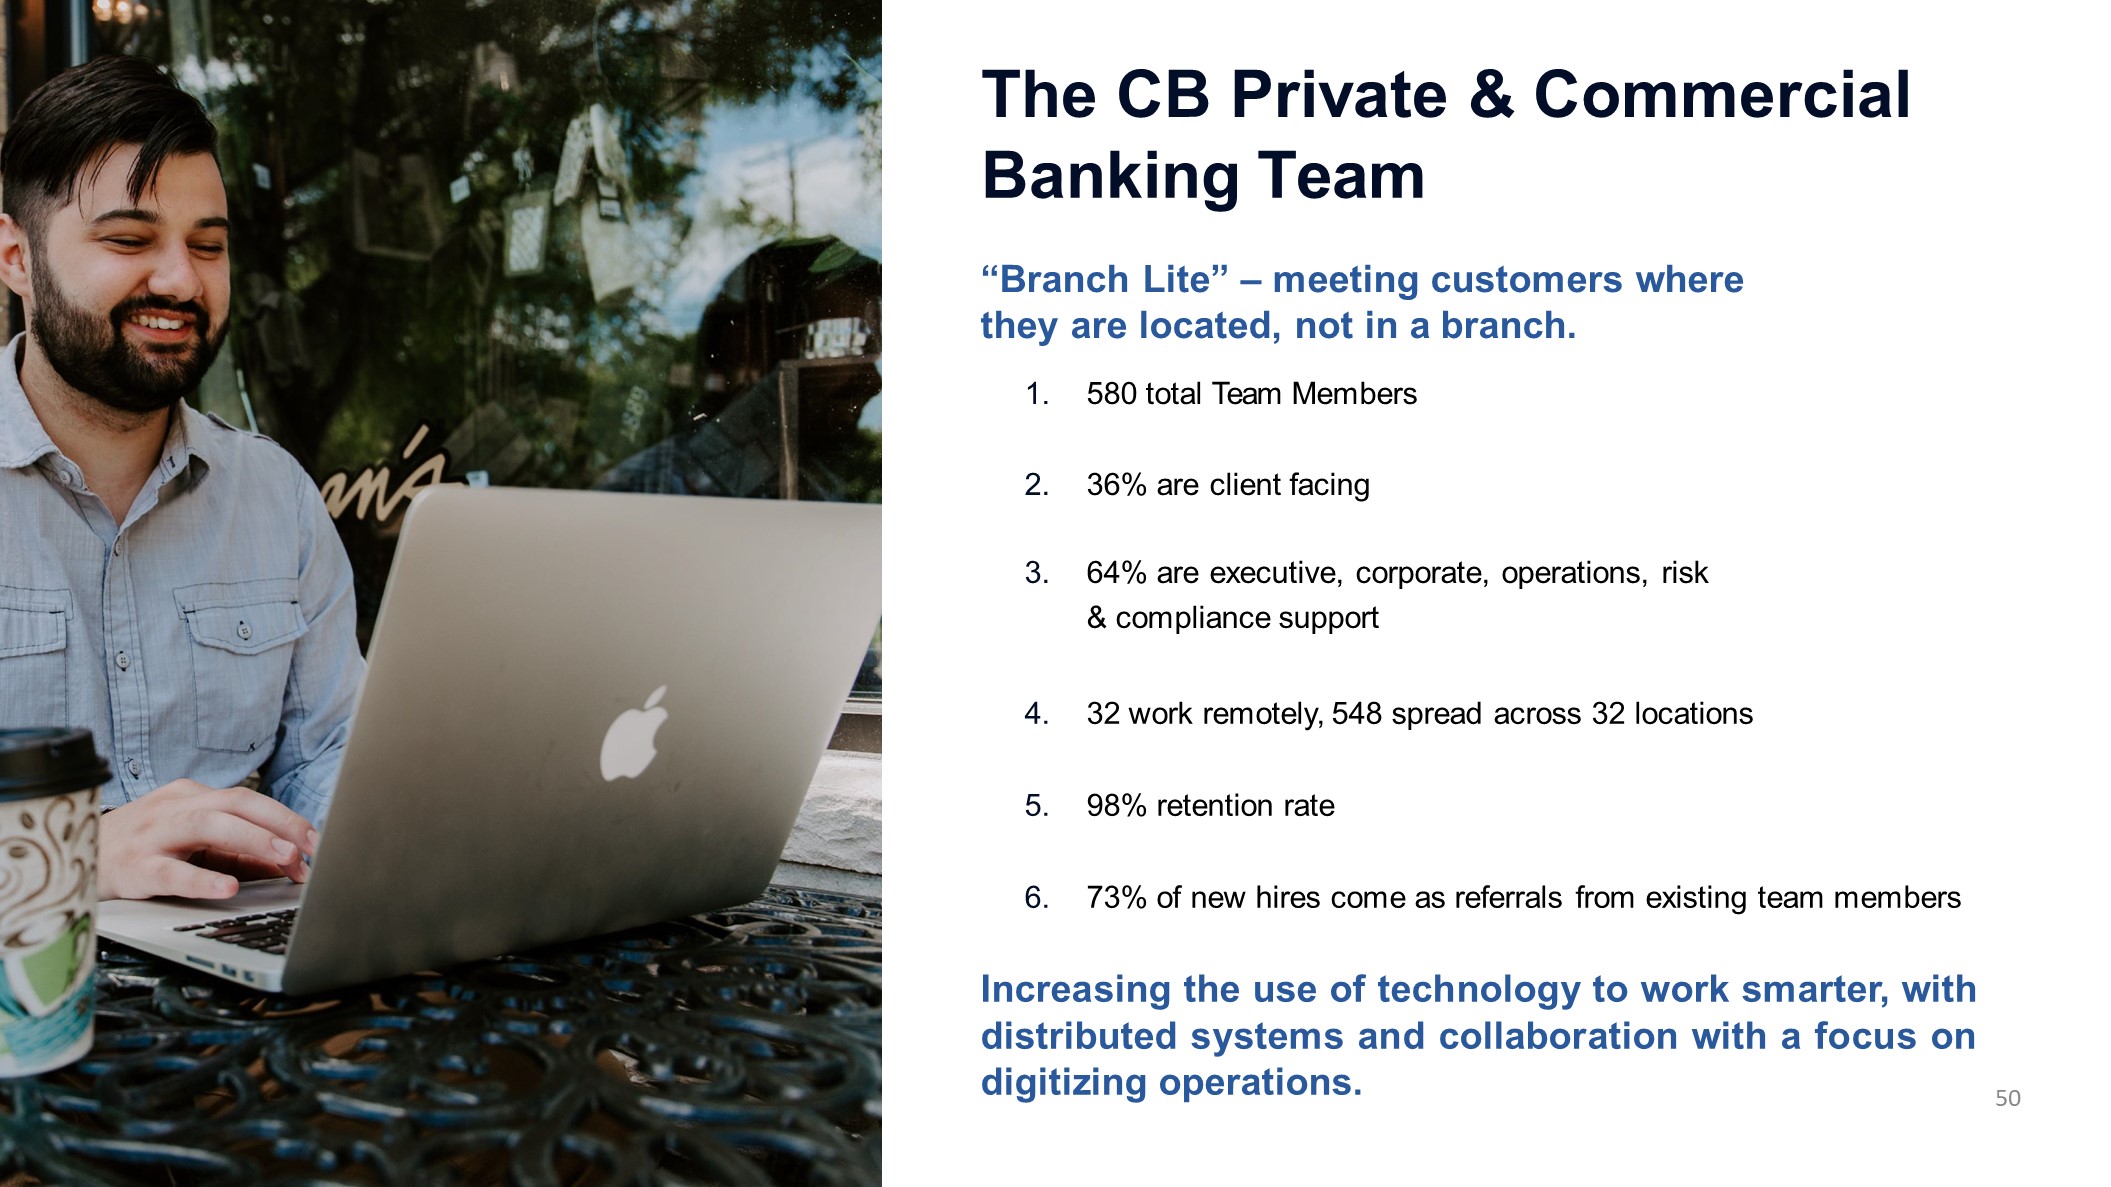
The CB Private & Commercial Banking Team 50 “Branch Lite” – meeting customers where they are located, not in a branch.580 total Team Members36% are client facing64% are executive, corporate, operations, risk & compliance support32 work remotely, 548 spread across 32 locations98% retention rate73% of new hires come as referrals from existing team membersIncreasing the use of technology to work smarter, with distributed systems and collaboration with a focus on digitizing operations.
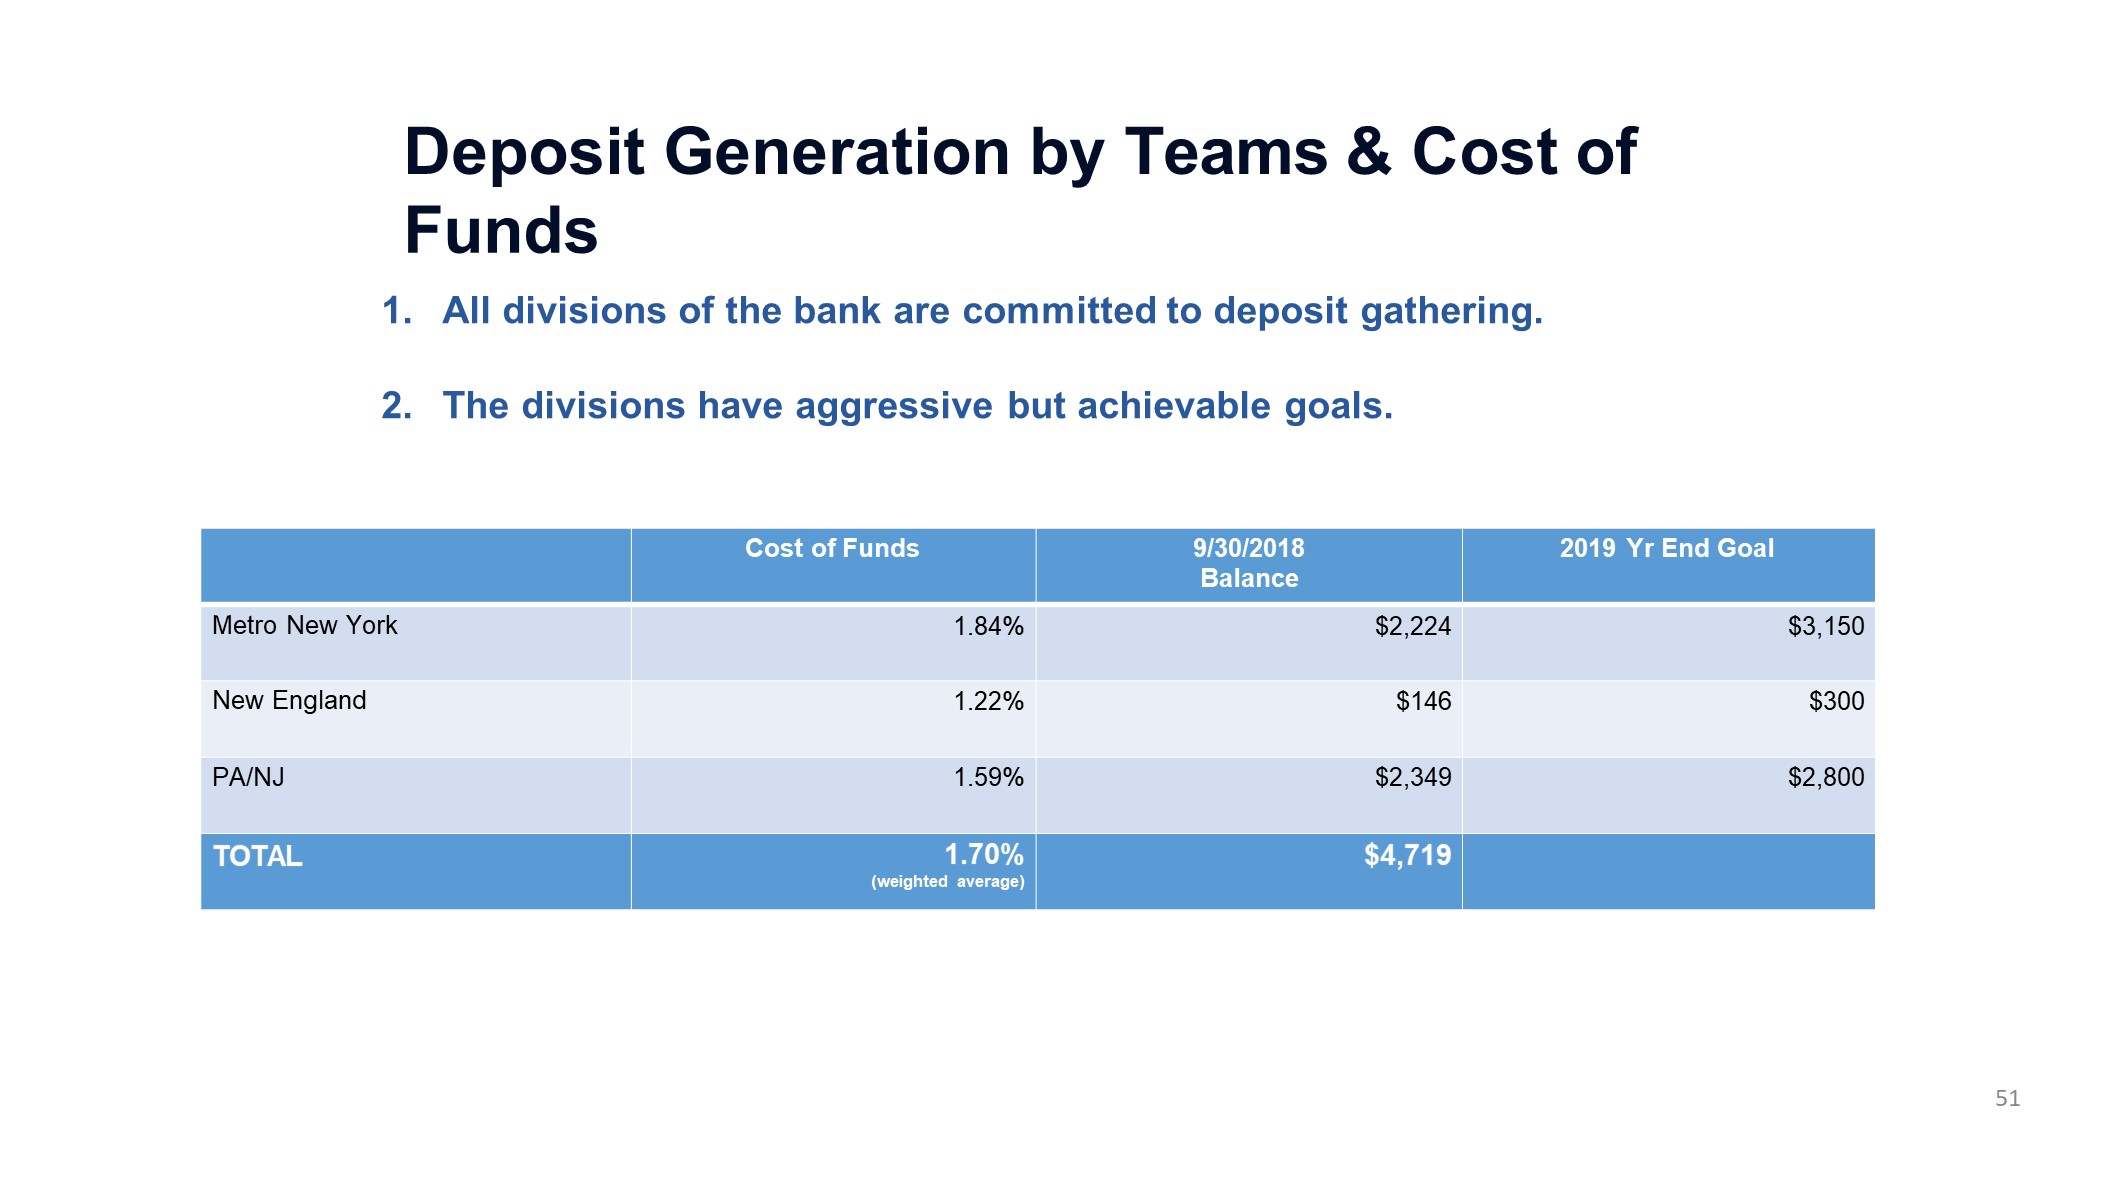
51 Cost of Funds 9/30/2018Balance 2019 Yr End Goal Metro New York 1.84% $2,224 $3,150 New England 1.22% $146 $300 PA/NJ 1.59% $2,349 $2,800 TOTAL 1.70%(weighted average) $4,719 Deposit Generation by Teams & Cost of Funds All divisions of the bank are committed to deposit gathering.The divisions have aggressive but achievable goals.
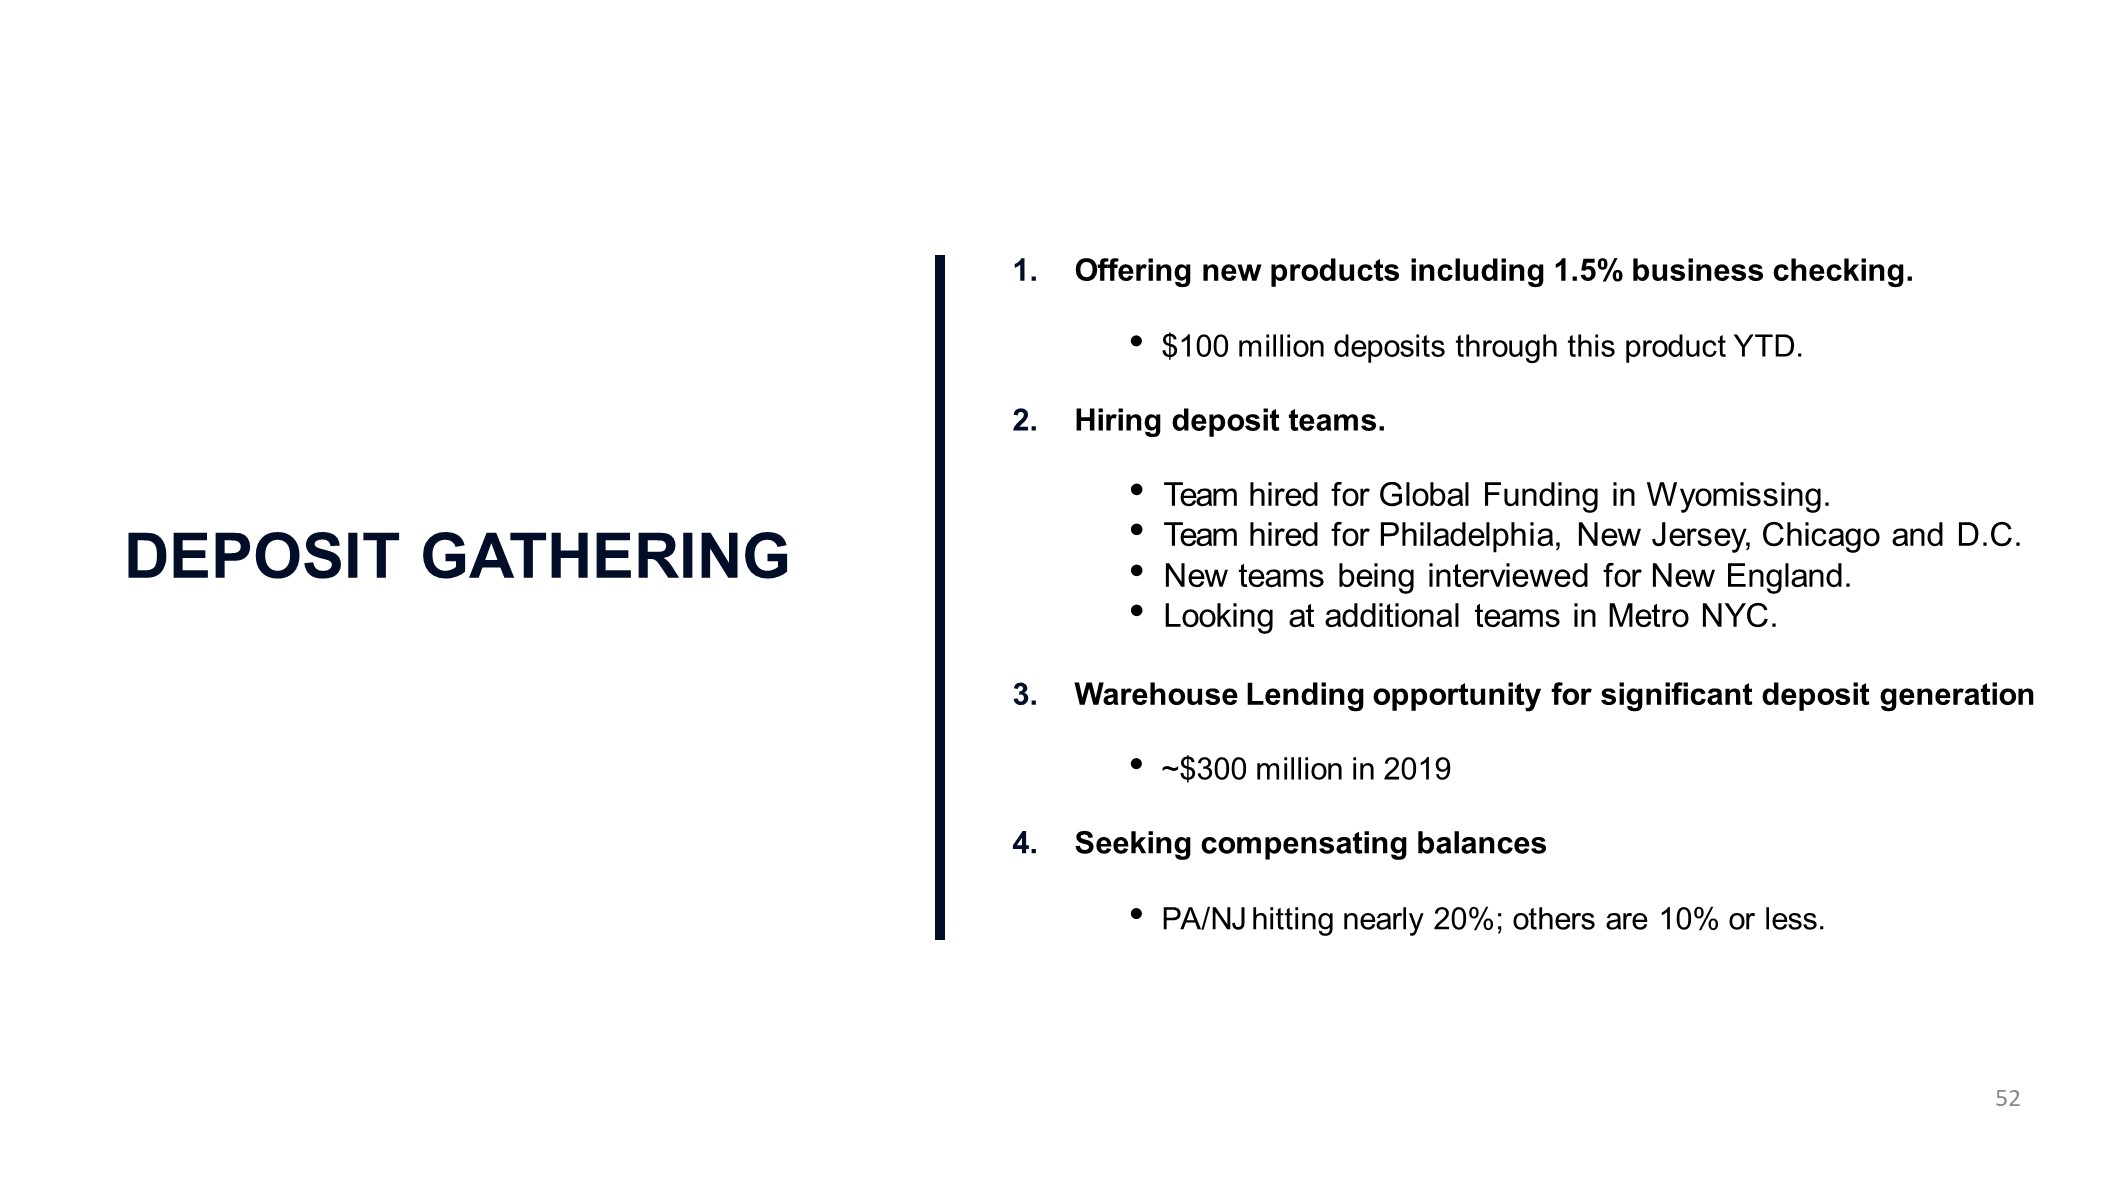
DEPOSIT GATHERING Offering new products including 1.5% business checking.$100 million deposits through this product YTD.Hiring deposit teams. 52 Team hired for Global Funding in Wyomissing.Team hired for Philadelphia, New Jersey, Chicago and D.C.New teams being interviewed for New England.Looking at additional teams in Metro NYC.3. Warehouse Lending opportunity for significant deposit generation ~$300 million in 2019Seeking compensating balancesPA/NJ hitting nearly 20%; others are 10% or less.
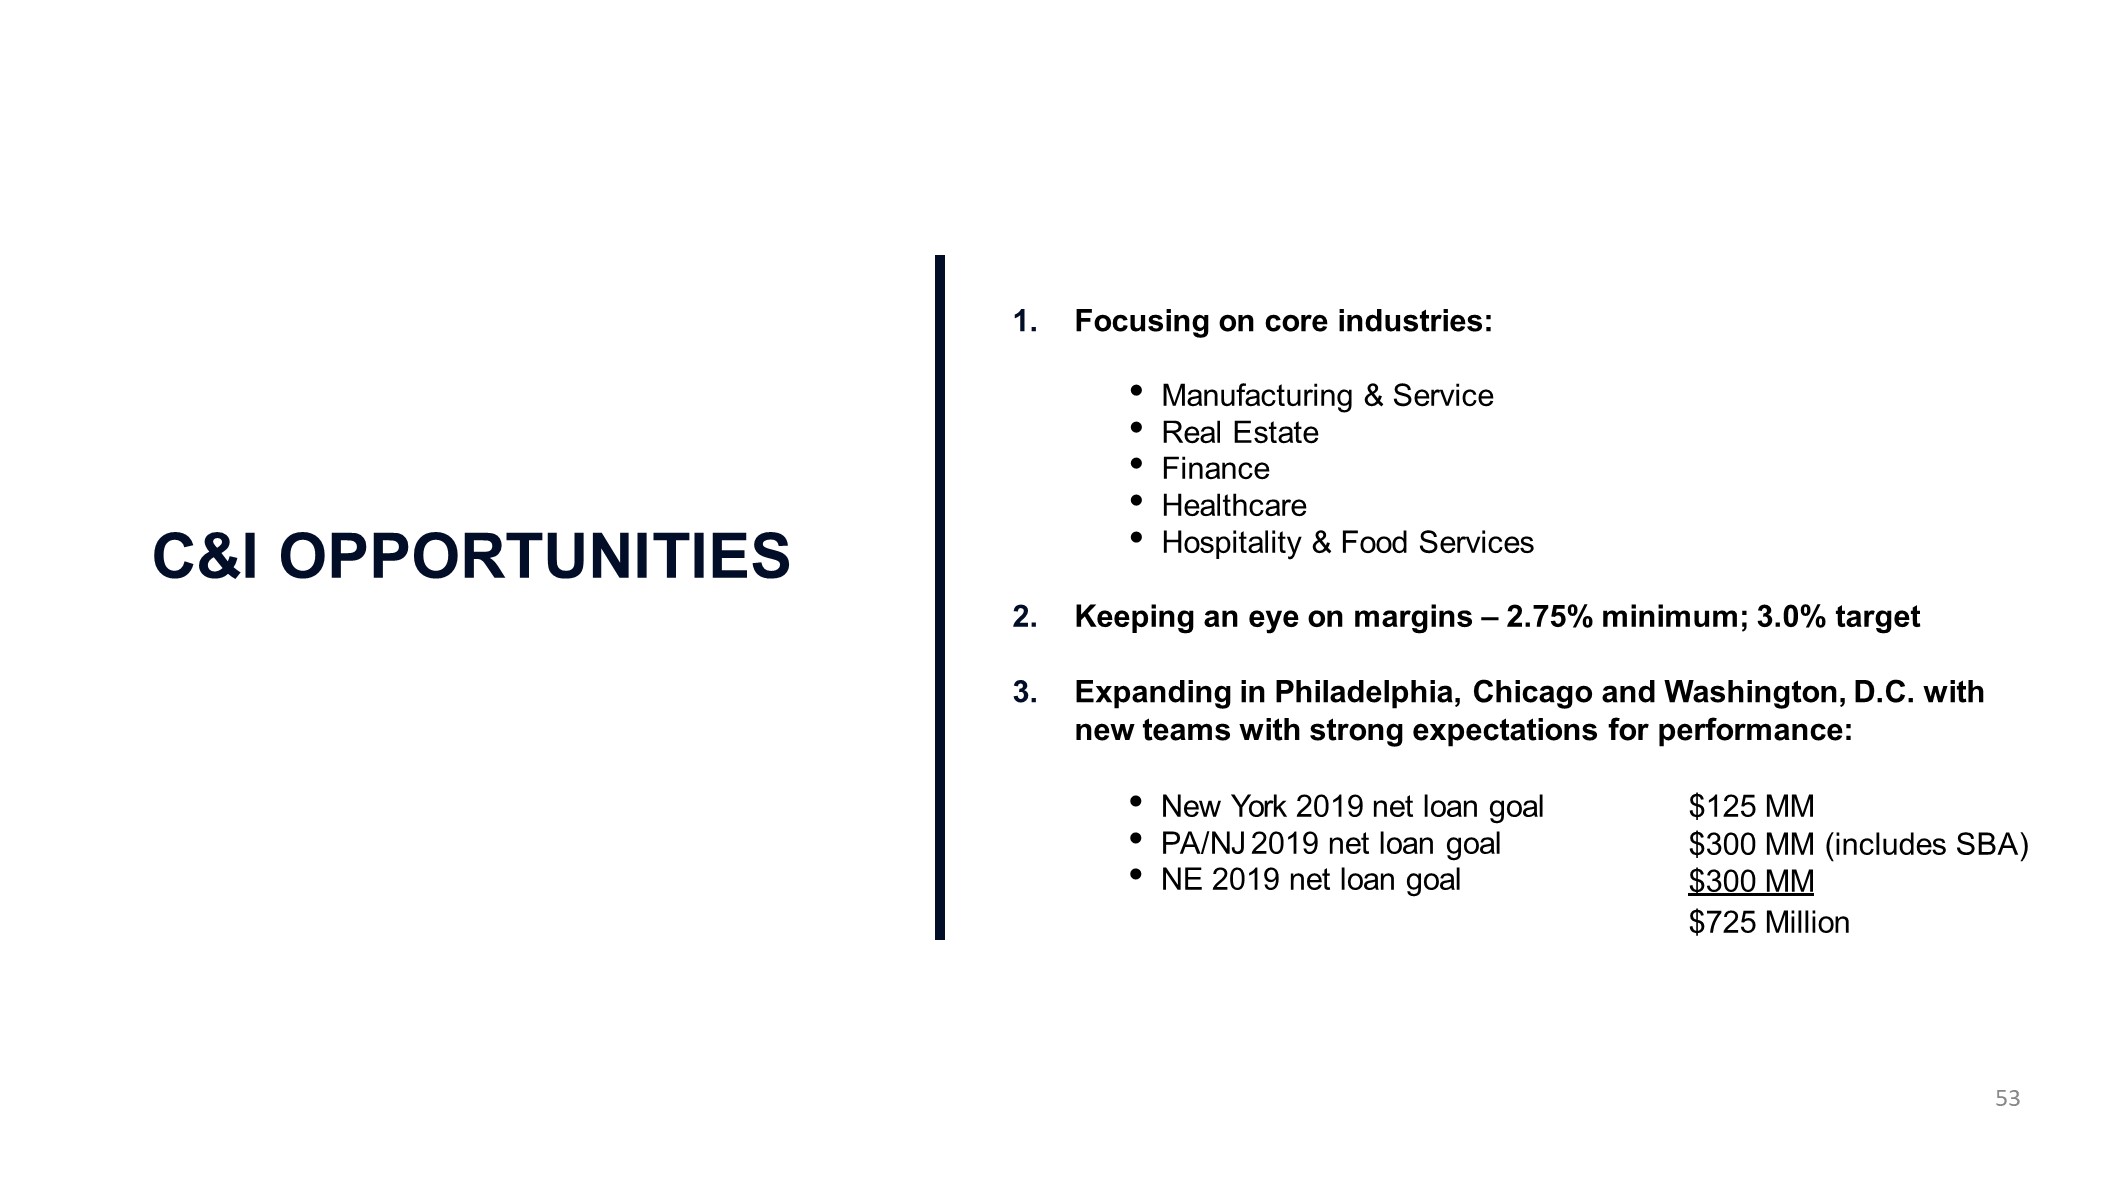
C&I OPPORTUNITIES 1. Focusing on core industries: 53 Manufacturing & ServiceReal EstateFinanceHealthcareHospitality & Food Services2. Keeping an eye on margins – 2.75% minimum; 3.0% target 3. Expanding in Philadelphia, Chicago and Washington, D.C. with new teams with strong expectations for performance: New York 2019 net loan goalPA/NJ 2019 net loan goalNE 2019 net loan goal $125 MM$300 MM (includes SBA)$300 MM$725 Million
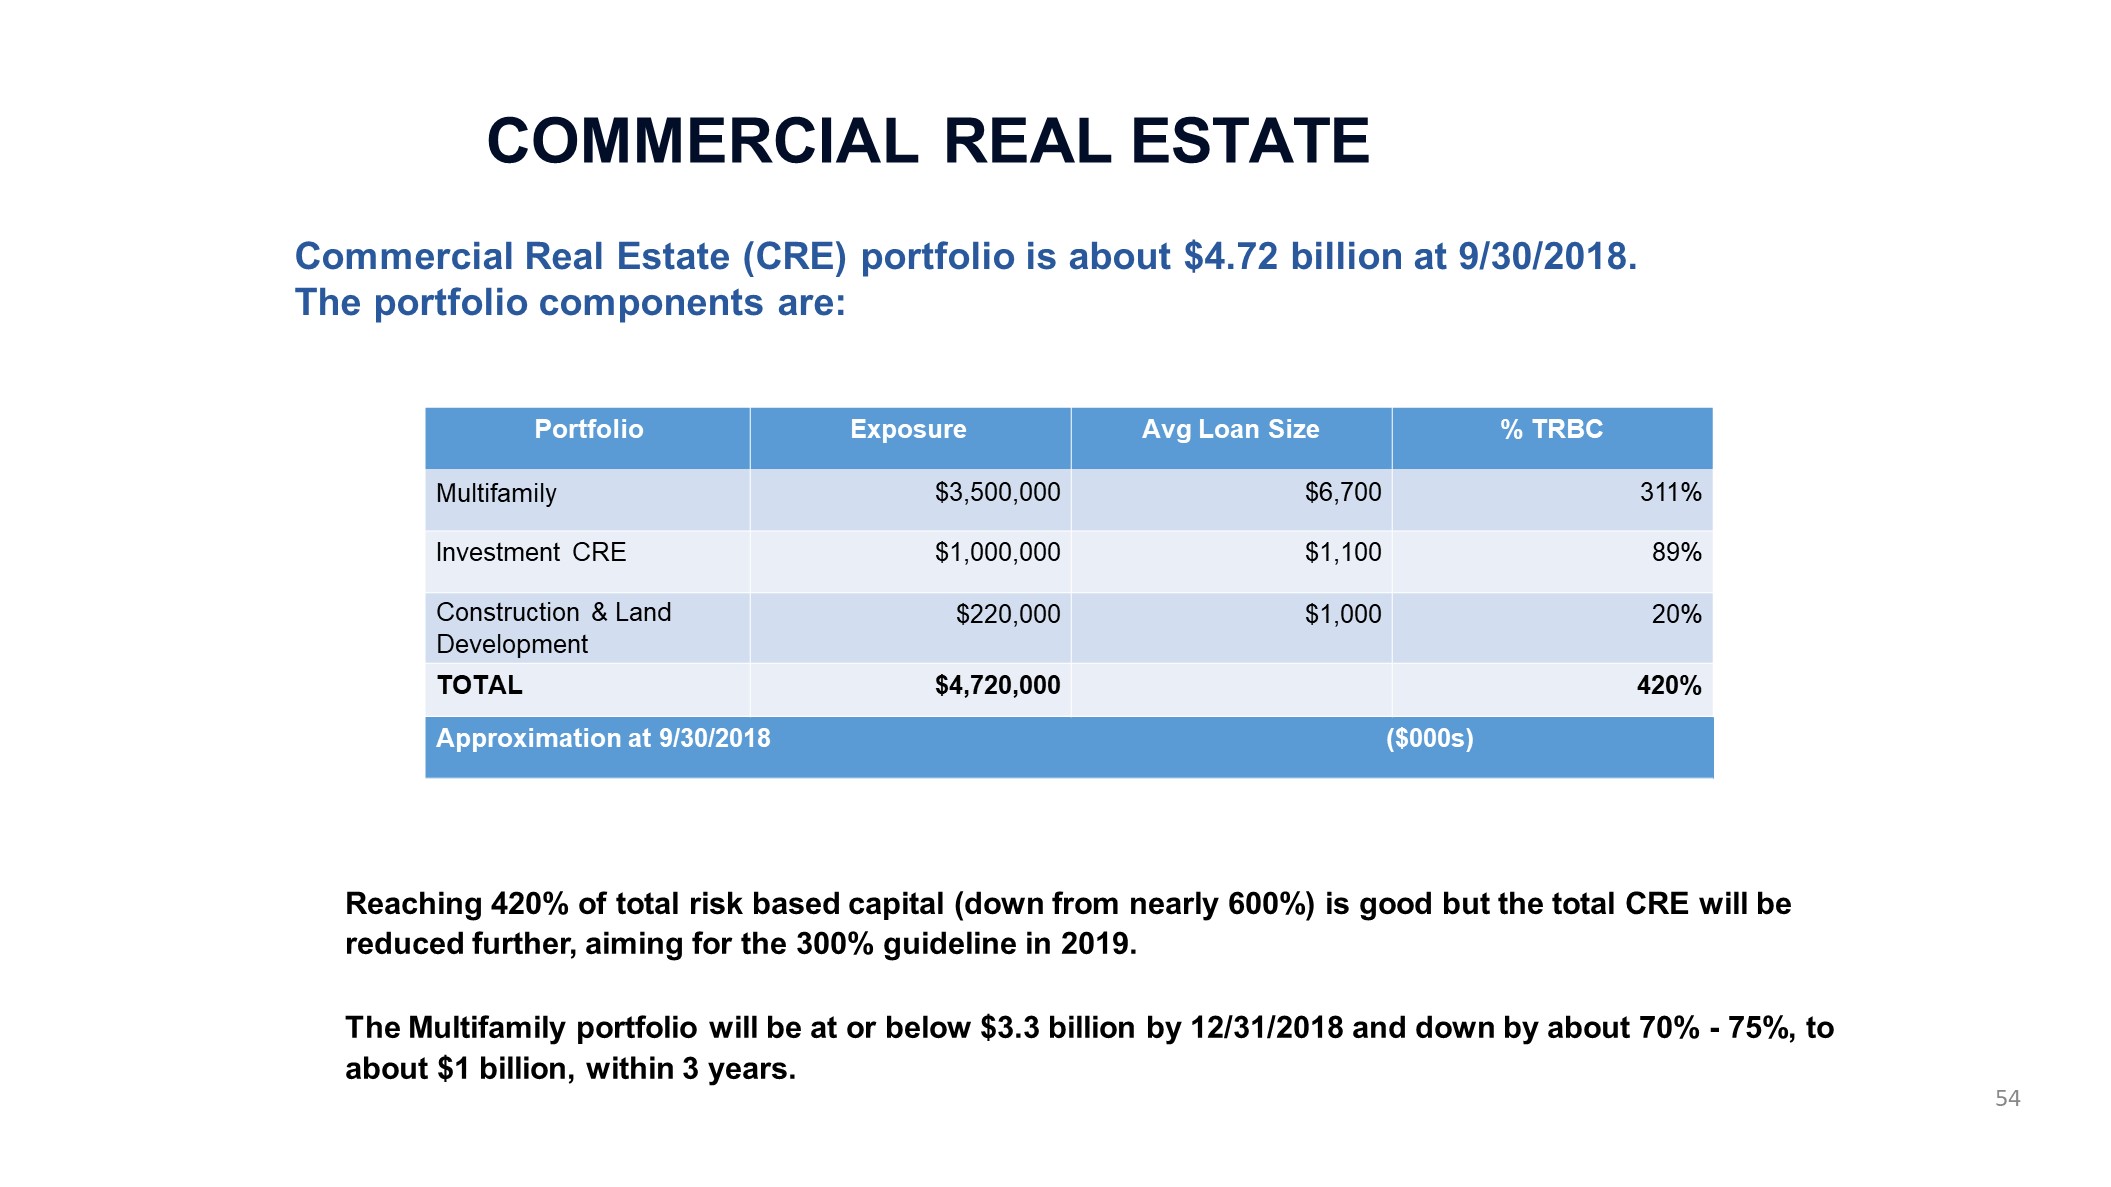
COMMERCIAL REAL ESTATE Reaching 420% of total risk based capital (down from nearly 600%) is good but the total CRE will be reduced further, aiming for the 300% guideline in 2019.The Multifamily portfolio will be at or below $3.3 billion by 12/31/2018 and down by about 70% - 75%, to about $1 billion, within 3 years. Portfolio Exposure Avg Loan Size % TRBC Multifamily $3,500,000 $6,700 311% Investment CRE $1,000,000 $1,100 89% Construction & Land Development $220,000 $1,000 20% TOTAL $4,720,000 420% Approximation at 9/30/2018 ($000s) 54 Commercial Real Estate (CRE) portfolio is about $4.72 billion at 9/30/2018. The portfolio components are:
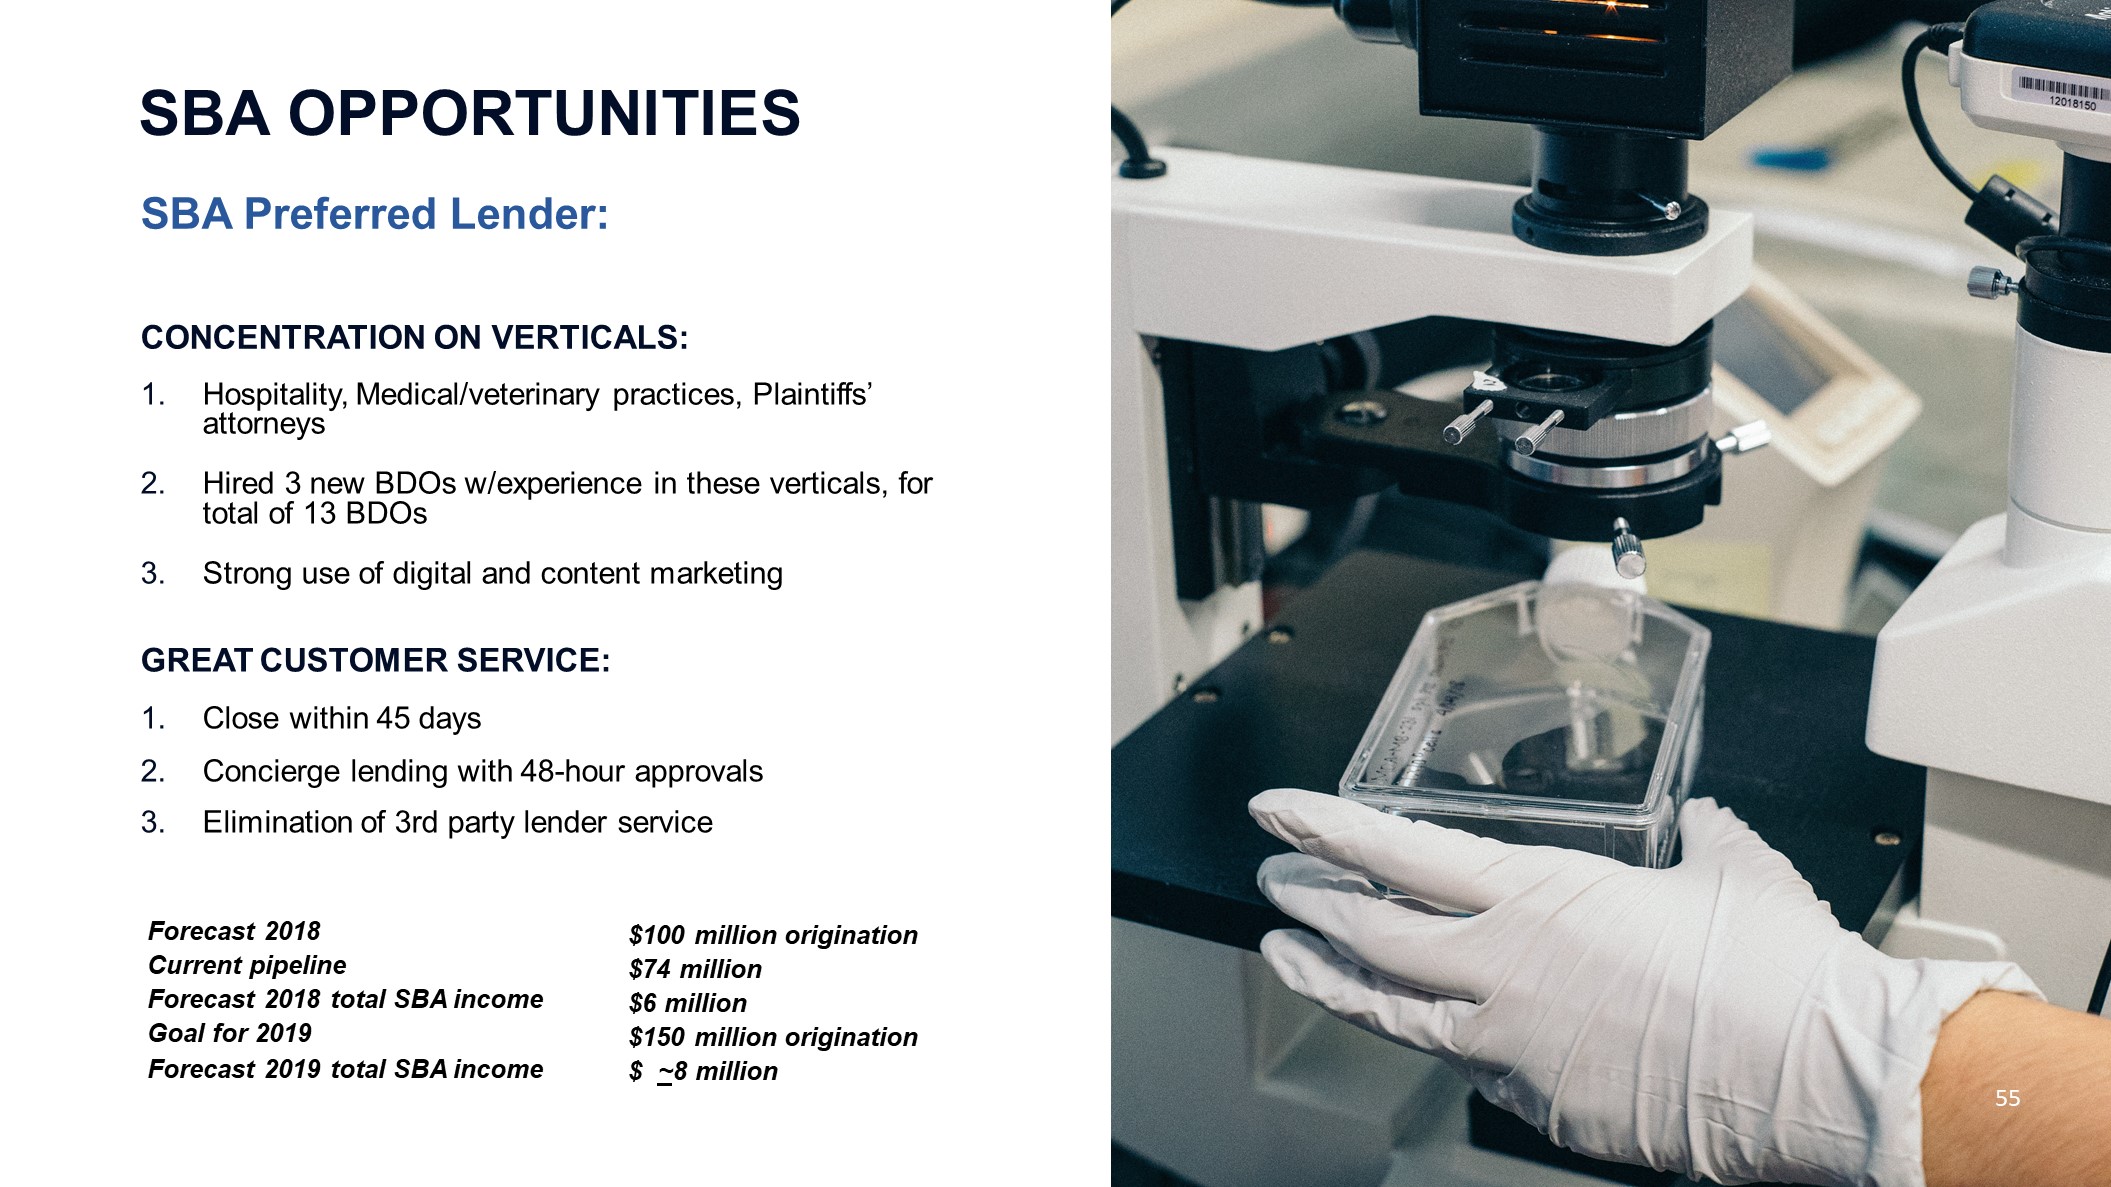
SBA OPPORTUNITIES Forecast 2018 Current pipelineForecast 2018 total SBA income Goal for 2019Forecast 2019 total SBA income $100 million origination$74 million$6 million$150 million origination$ ~8 million SBA Preferred Lender:CONCENTRATION ON VERTICALS:Hospitality, Medical/veterinary practices, Plaintiffs’ attorneysHired 3 new BDOs w/experience in these verticals, for total of 13 BDOsStrong use of digital and content marketingGREAT CUSTOMER SERVICE:Close within 45 daysConcierge lending with 48-hour approvalsElimination of 3rd party lender service 55
COMMERCIAL LEASING OPPORTUNITIES 1. National footprint 56 Did business in 24 states in 20182. YTD September 2018 volume of $120 million through 119 contracts 3. $90 million of contracts are concentrated in four industry sectors: Transportation – primarily truck fleetsConstruction equipmentMotor coach equipmentPackaging & plastics equipment
BANKING MORTGAGECOMPANIES (WAREHOUSE LENDING) 1. Year-end 2018 balance is forecasted to be between $1.3 billion and $1.5 billion 57 2. YTD September 2018 mortgage warehouse volume was $20.6 billion 3. We serve 62 mortgage banking clients 4. Looking ahead, CB Private & Commercial Bank for mortgage companies typically trends with national volume forecast. Mortgage Bankers Association Future Volume Forecast (9/19/2018) •••• 2017 actual volume: $1.71 trillion 2018 forecasted: $1.606 trillion 2019 forecasted: $1.592 trillion 2020 forecasted: $1.63 trillion
1 NEW PRODUCT INTRODUCTIONS Nationwide LockboxA highly portable, flexible and scalable approach to retail and wholesale lockbox processing.Electronic Bill Presentment and Payment with Debit / Credit CardsGives commercial clients the ability to quickly and easily present summary statements online and allow their consumers to make payments electronically with Debit or Credit Cards.Electronic Bill Presentment and Payment with ACH Direct DebitGives commercial clients the ability to quickly and easily present summary statements online and allow their consumers to make payments electronically via ACH Debit. 58
NEW PRODUCT INTRODUCTIONS REMOTE PAYMENT CONCENTRATIONAn automated eLockbox solution for collecting bill payments made by consumers at online bill payment sites. 59 REMOTE CAPTURE WITH LOCKBOXAllows commercial clients to use a web-connected PC and desktop scanner to capture payments and transmit them into a lockbox.HEALTHCARE LOCKBOXStreamlines healthcare receivable using a lockbox specifically designed for the industry, converting paper EOBs to ANSI 835 files for direct posting into the billing system.TAX ESCROWHelps the bank maintain control of escrowed funds while eliminating the time spent coordinating these efforts.
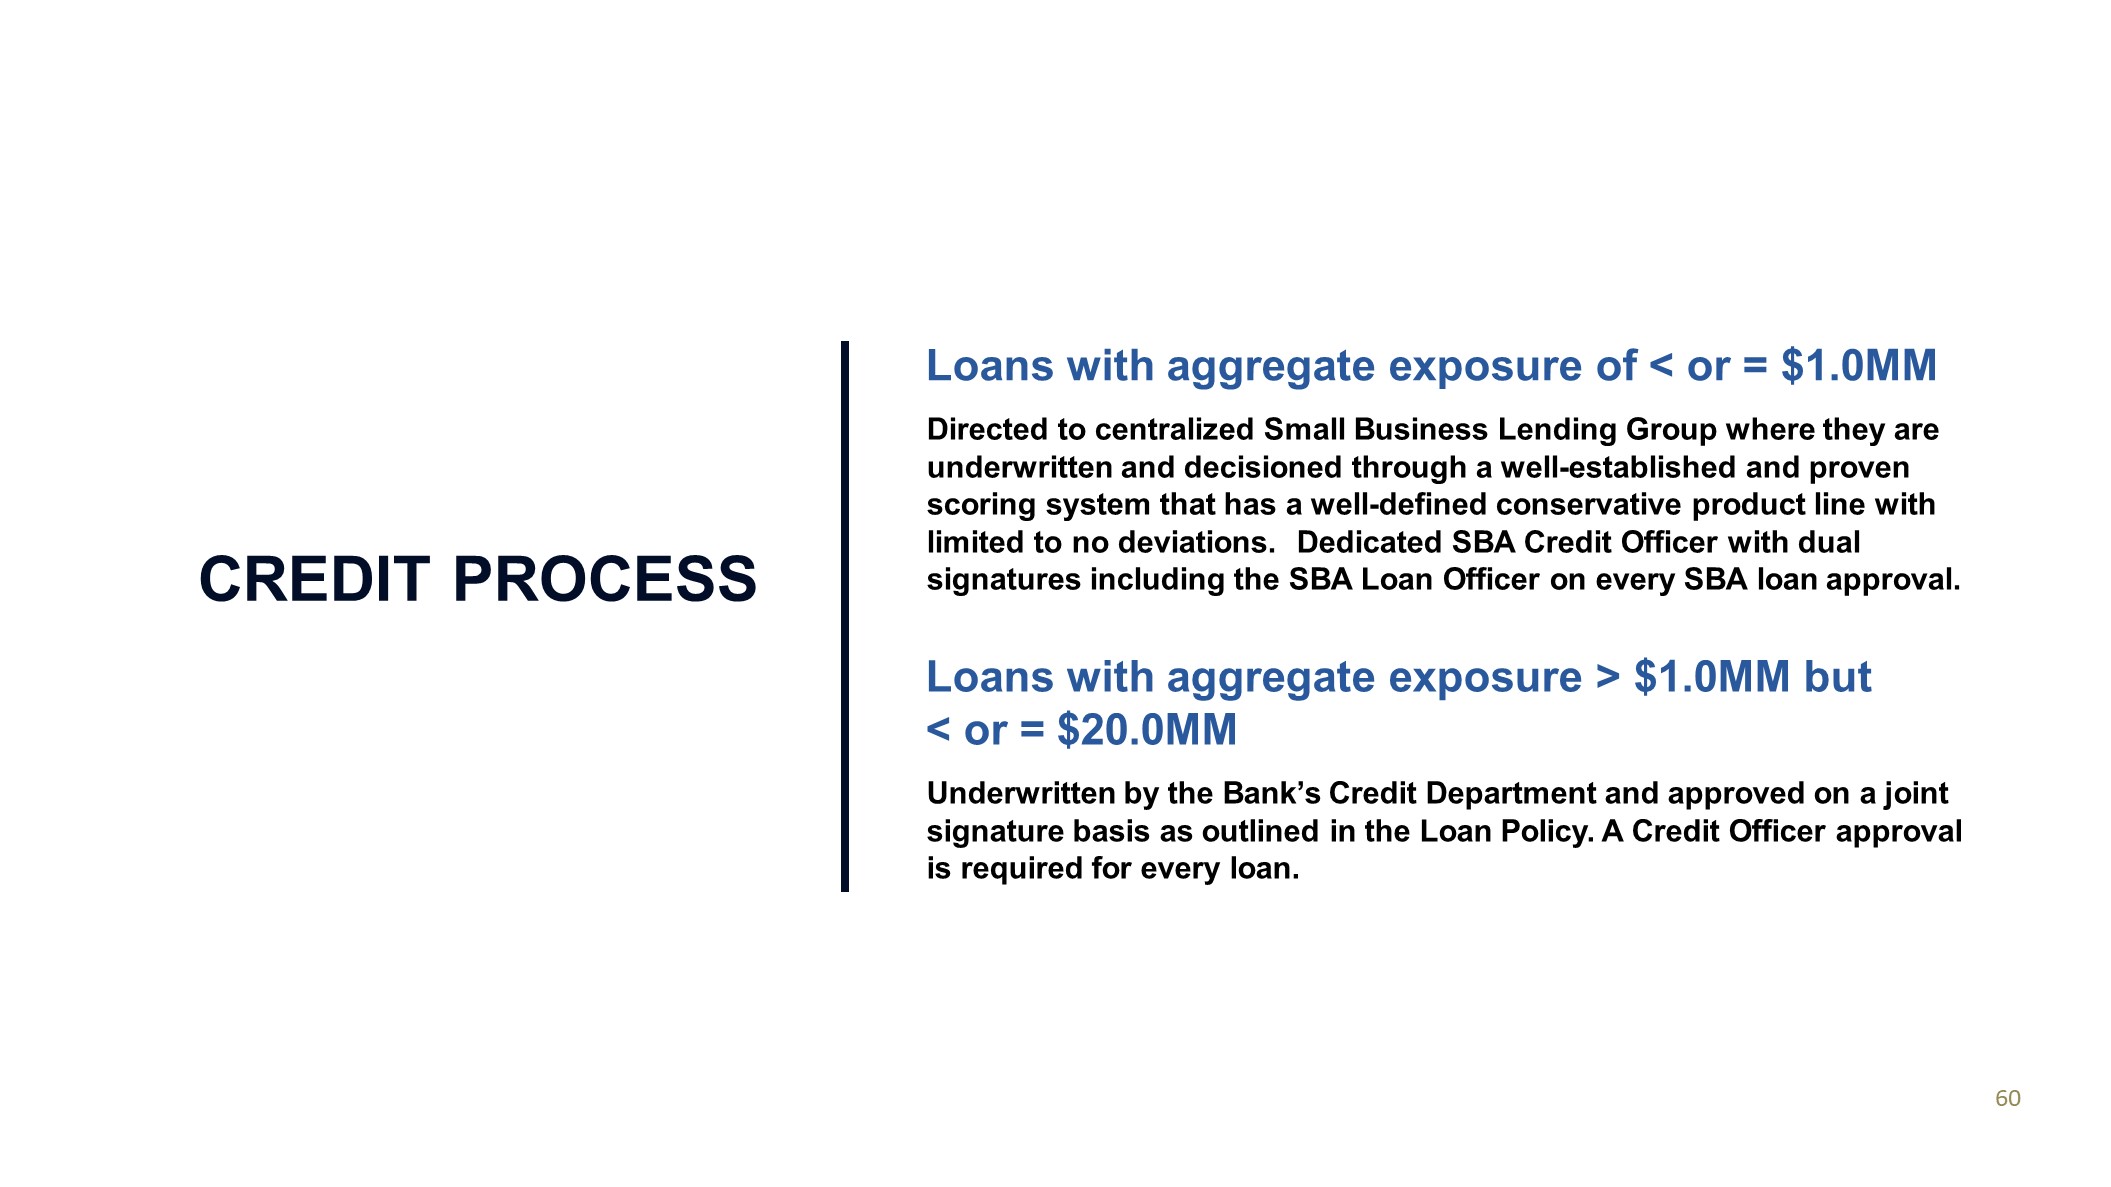
CREDIT PROCESS Loans with aggregate exposure of < or = $1.0MM Directed to centralized Small Business Lending Group where they are underwritten and decisioned through a well-established and proven scoring system that has a well-defined conservative product line with limited to no deviations. Dedicated SBA Credit Officer with dual signatures including the SBA Loan Officer on every SBA loan approval. 60 Loans with aggregate exposure > $1.0MM but< or = $20.0MMUnderwritten by the Bank’s Credit Department and approved on a joint signature basis as outlined in the Loan Policy. A Credit Officer approval is required for every loan.
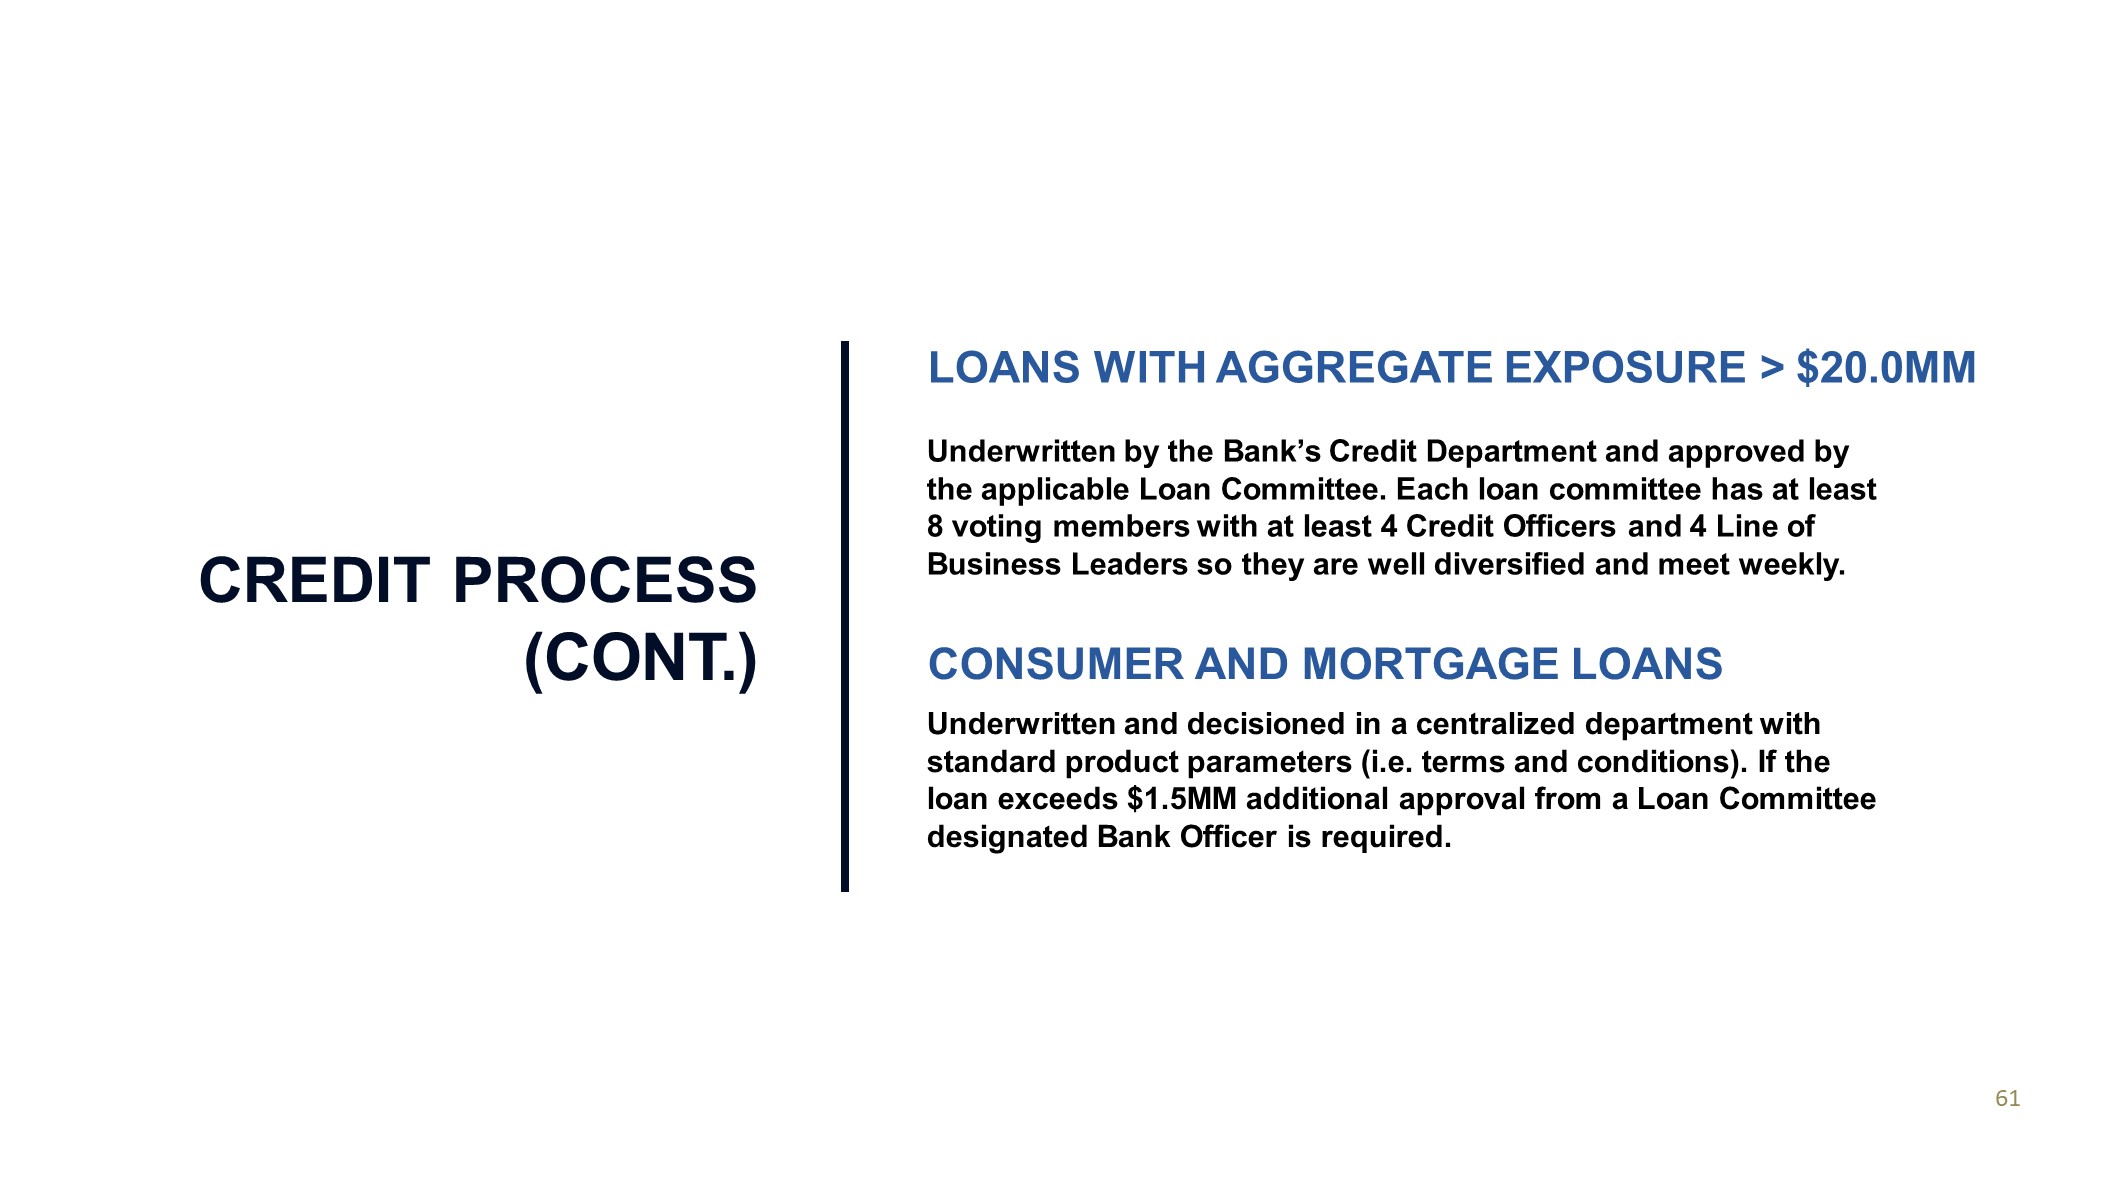
LOANS WITH AGGREGATE EXPOSURE > $20.0MM Underwritten by the Bank’s Credit Department and approved by the applicable Loan Committee. Each loan committee has at least 8 voting members with at least 4 Credit Officers and 4 Line of Business Leaders so they are well diversified and meet weekly. CONSUMER AND MORTGAGE LOANSUnderwritten and decisioned in a centralized department with standard product parameters (i.e. terms and conditions). If the loan exceeds $1.5MM additional approval from a Loan Committee designated Bank Officer is required. CREDIT PROCESS(CONT.) 61

Business Line Update Direct Digital Distribution Channel Jim Collins, Chief Administrative Officer October 2018
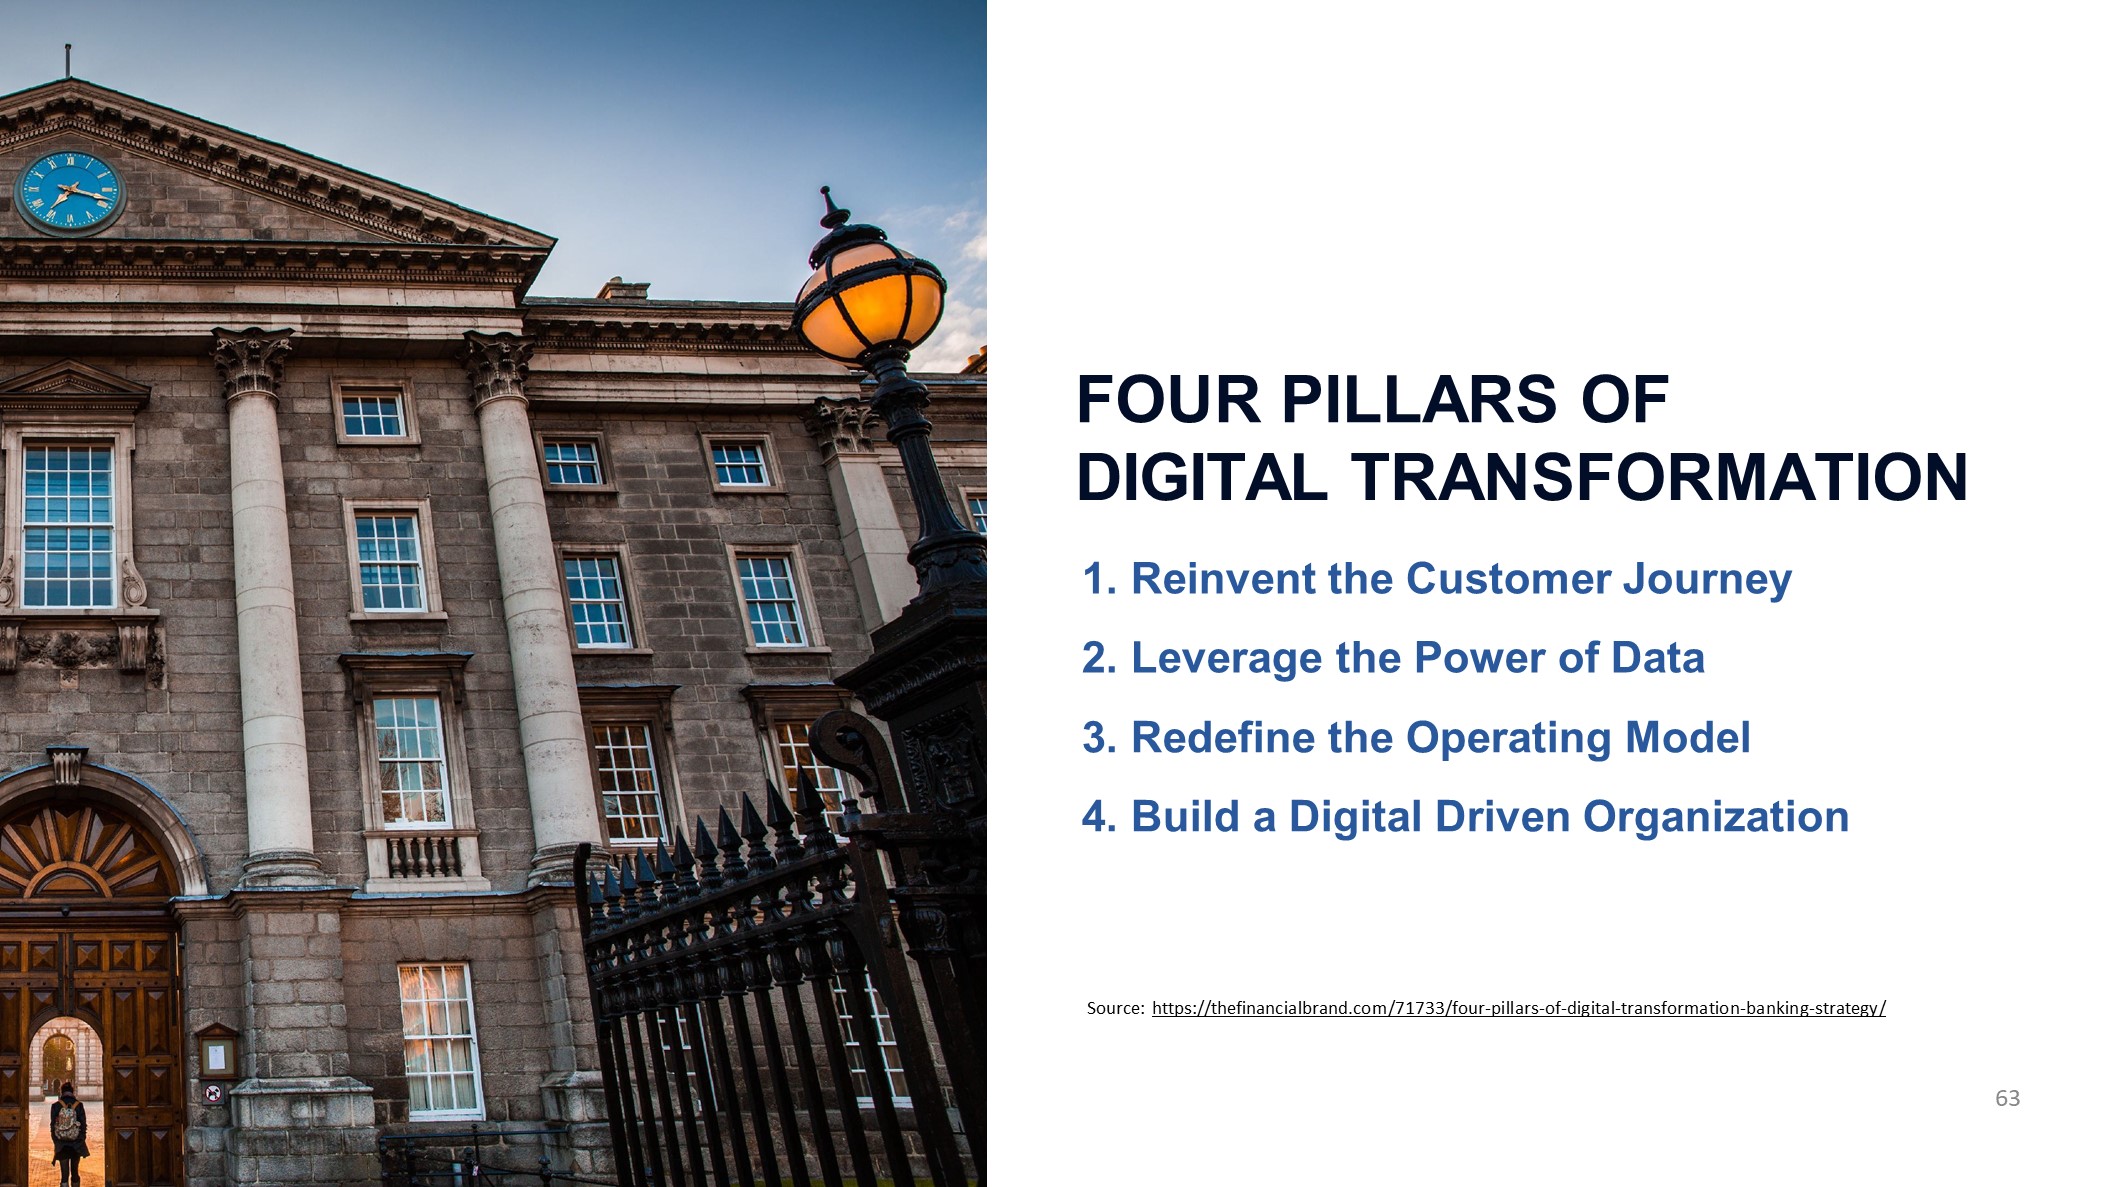
Reinvent the Customer JourneyLeverage the Power of DataRedefine the Operating ModelBuild a Digital Driven Organization 63 FOUR PILLARS OFDIGITAL TRANSFORMATION Source: https://thefinancialbrand.com/71733/four-pillars-of-digital-transformation-banking-strategy/
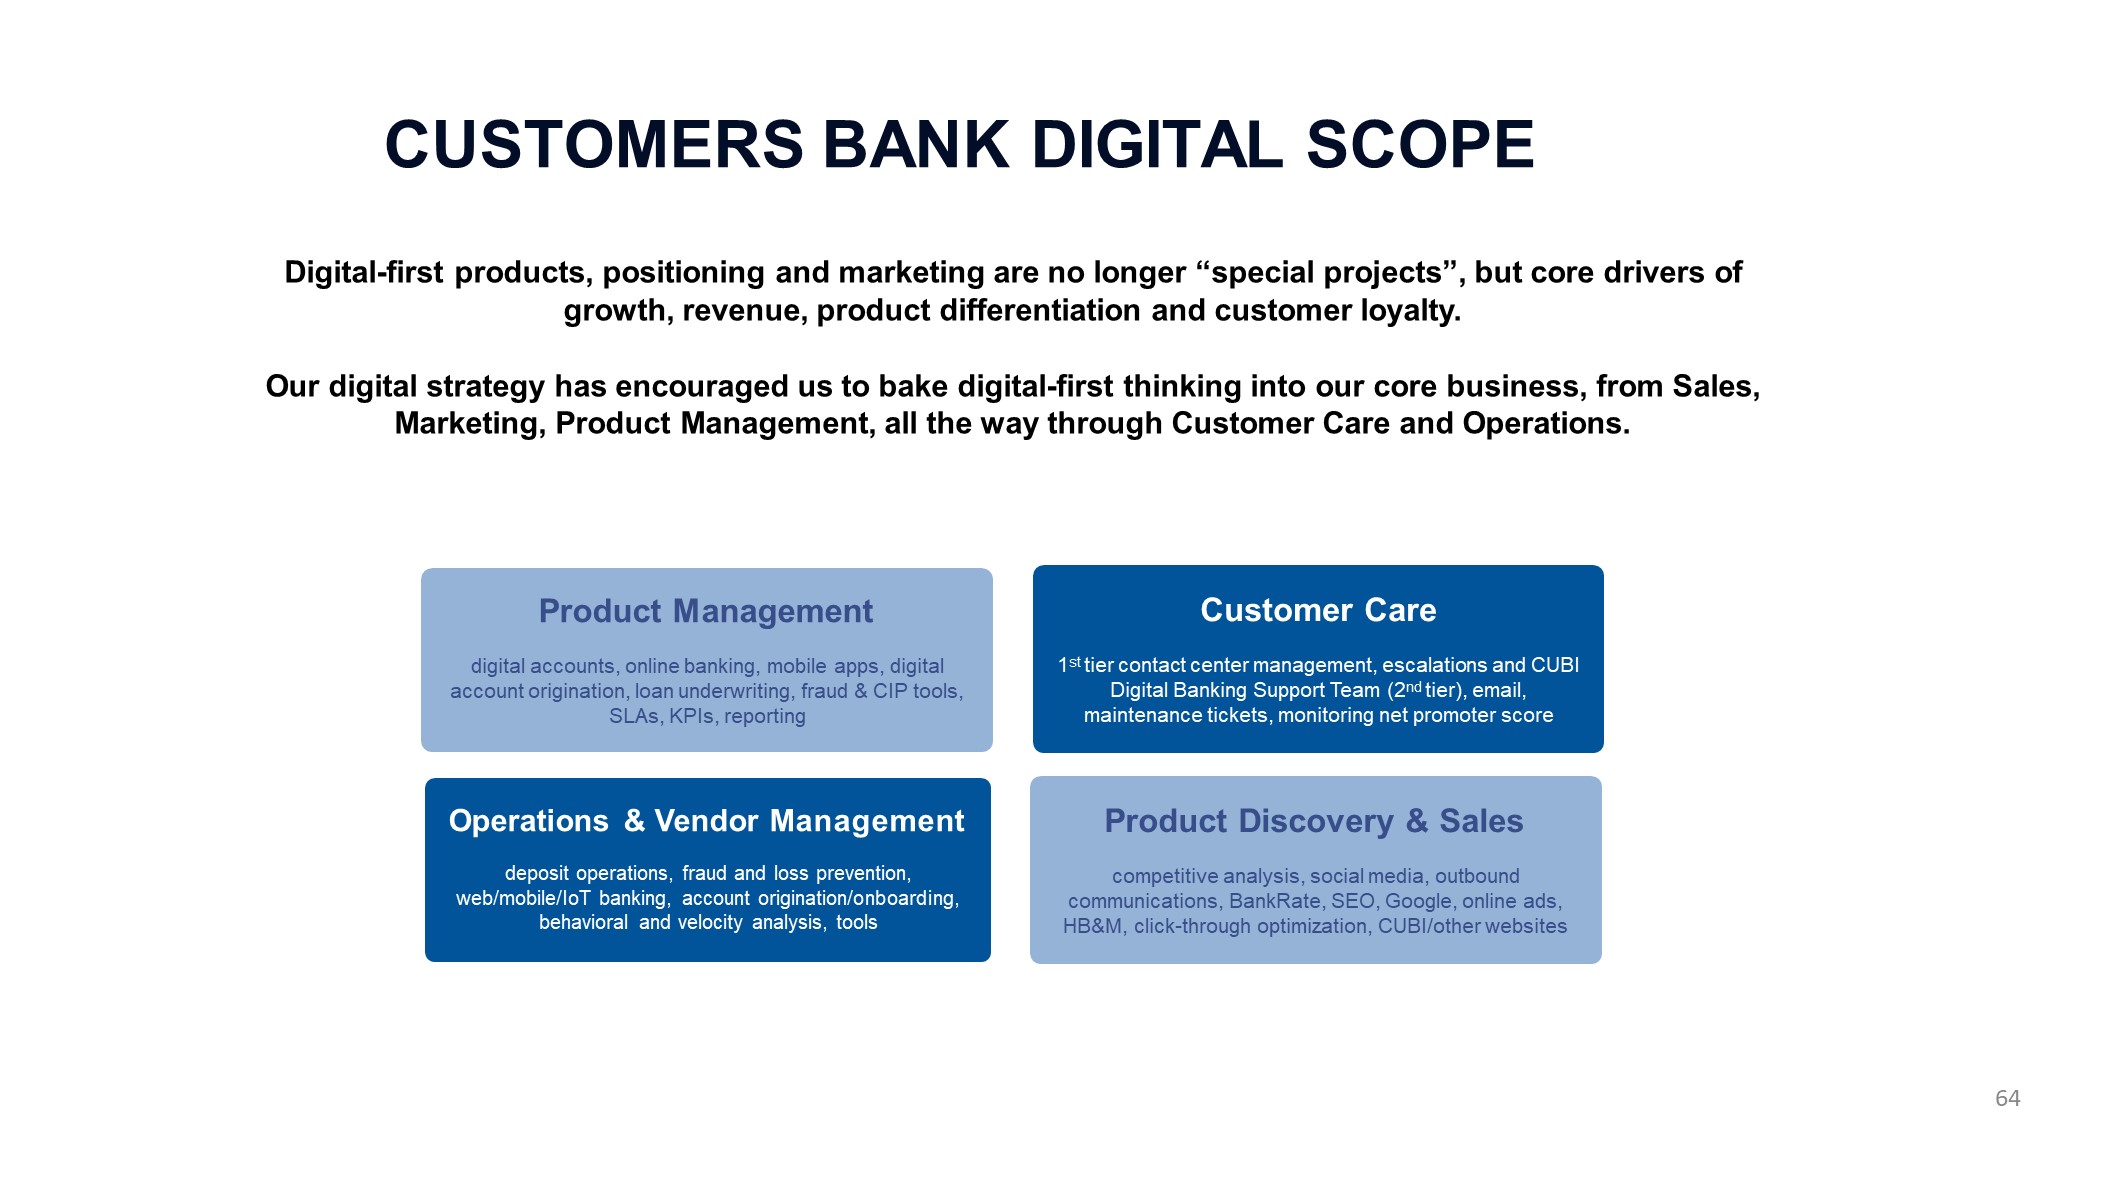
Product Managementdigital accounts, online banking, mobile apps, digital account origination, loan underwriting, fraud & CIP tools, SLAs, KPIs, reporting Customer Care1st tier contact center management, escalations and CUBI Digital Banking Support Team (2nd tier), email, maintenance tickets, monitoring net promoter score Operations & Vendor Managementdeposit operations, fraud and loss prevention, web/mobile/IoT banking, account origination/onboarding, behavioral and velocity analysis, tools Product Discovery & Salescompetitive analysis, social media, outbound communications, BankRate, SEO, Google, online ads, HB&M, click-through optimization, CUBI/other websites 64 Digital-first products, positioning and marketing are no longer “special projects”, but core drivers of growth, revenue, product differentiation and customer loyalty.Our digital strategy has encouraged us to bake digital-first thinking into our core business, from Sales, Marketing, Product Management, all the way through Customer Care and Operations. CUSTOMERS BANK DIGITAL SCOPE

EXAMPLE OF LEADING TECHNOLOGYADOPTION Digital Account Creation (FIS IBS)Sales Pipeline Management (Salesforce Sales Cloud)Campaign Management and Customer Email Journeys (Salesforce Marketing Cloud) 4. Case Management (Salesforce Service Cloud) 5. AI Experimentation (Salesforce Einstein) 6. Custom Developed Solutions (Salesforce Platform) Commercial Loan Origination (nCino bank operating system)Vendor Solutions (Salesforce AppExchange)Digital Workforce (Microsoft O365 suite of products)Data Analytics & Reporting (Data Warehouse & Qlikview) 65
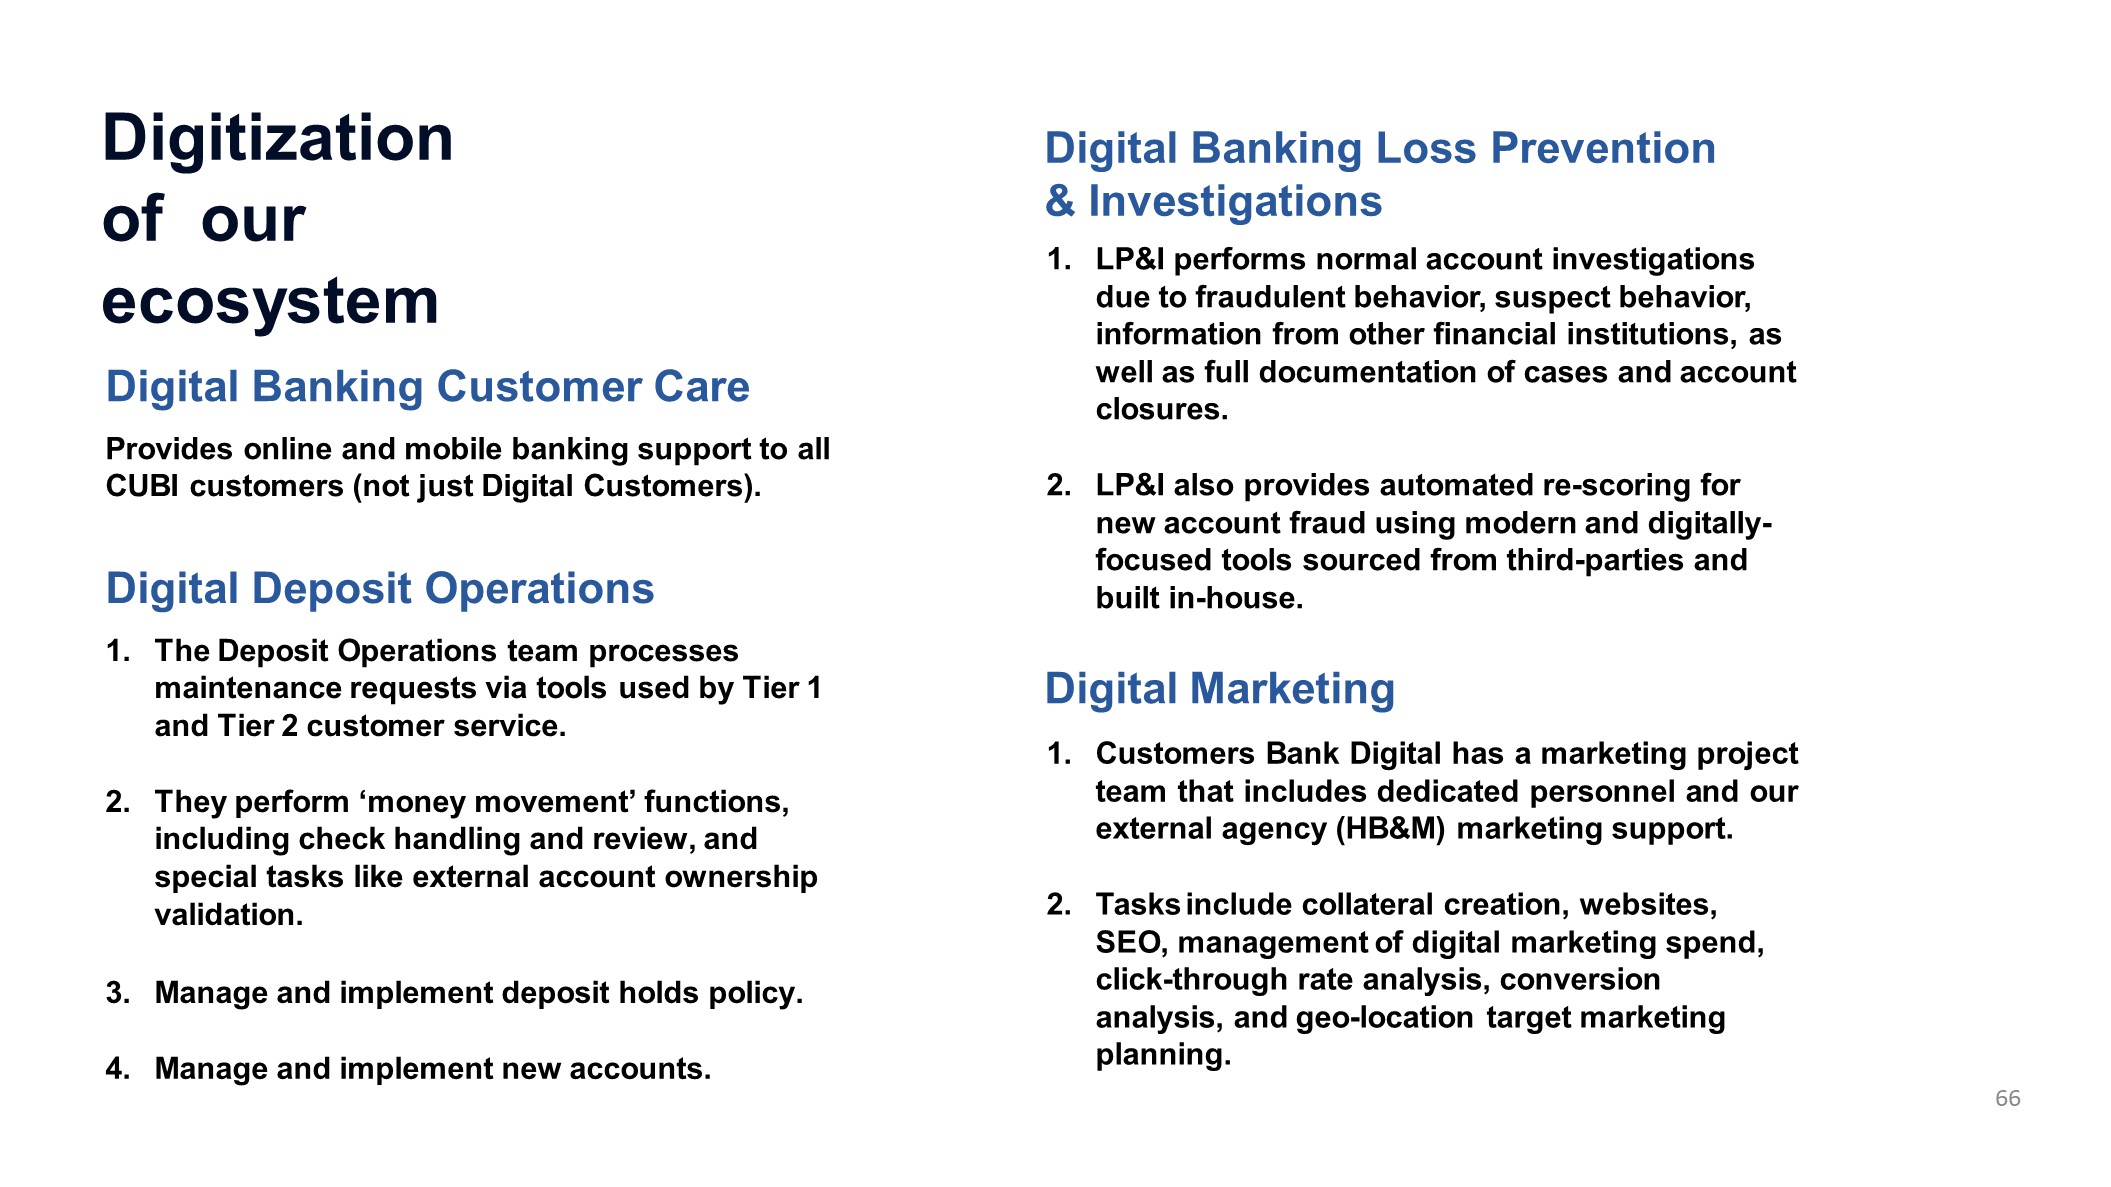
66 Digitization of our ecosystem Digital Banking Customer CareProvides online and mobile banking support to all CUBI customers (not just Digital Customers).Digital Deposit OperationsThe Deposit Operations team processes maintenance requests via tools used by Tier 1 and Tier 2 customer service.They perform ‘money movement’ functions, including check handling and review, and special tasks like external account ownership validation.Manage and implement deposit holds policy.Manage and implement new accounts. Digital Banking Loss Prevention & Investigations LP&I performs normal account investigations due to fraudulent behavior, suspect behavior, information from other financial institutions, as well as full documentation of cases and account closures.LP&I also provides automated re-scoring for new account fraud using modern and digitally- focused tools sourced from third-parties and built in-house. Digital Marketing Customers Bank Digital has a marketing project team that includes dedicated personnel and our external agency (HB&M) marketing support.Tasks include collateral creation, websites, SEO, management of digital marketing spend, click-through rate analysis, conversion analysis, and geo-location target marketing planning.
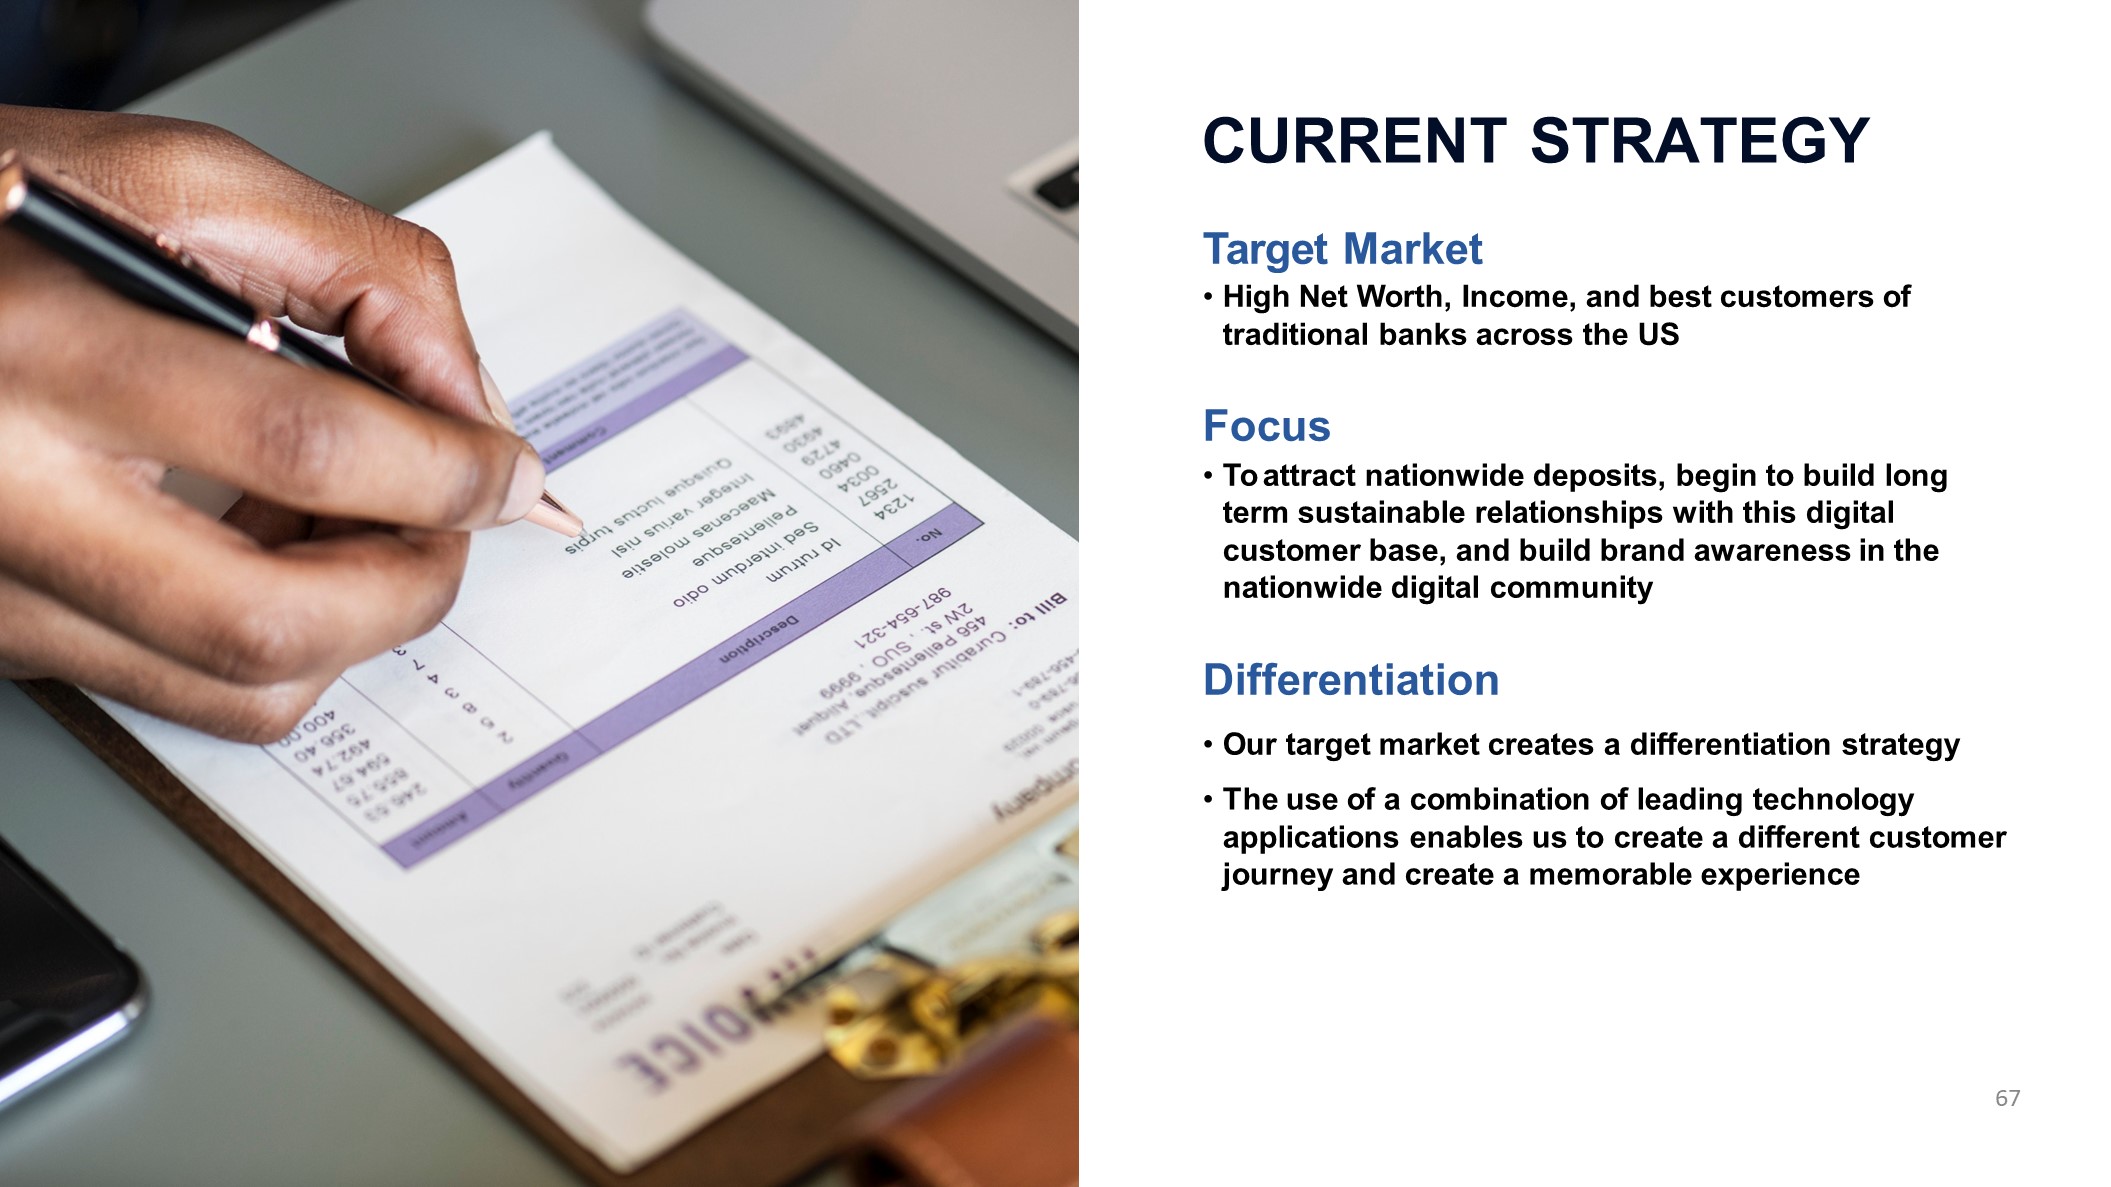
CURRENT STRATEGY Target MarketHigh Net Worth, Income, and best customers of traditional banks across the USFocusTo attract nationwide deposits, begin to build long term sustainable relationships with this digital customer base, and build brand awareness in the nationwide digital communityDifferentiationOur target market creates a differentiation strategyThe use of a combination of leading technology applications enables us to create a different customer journey and create a memorable experience 67
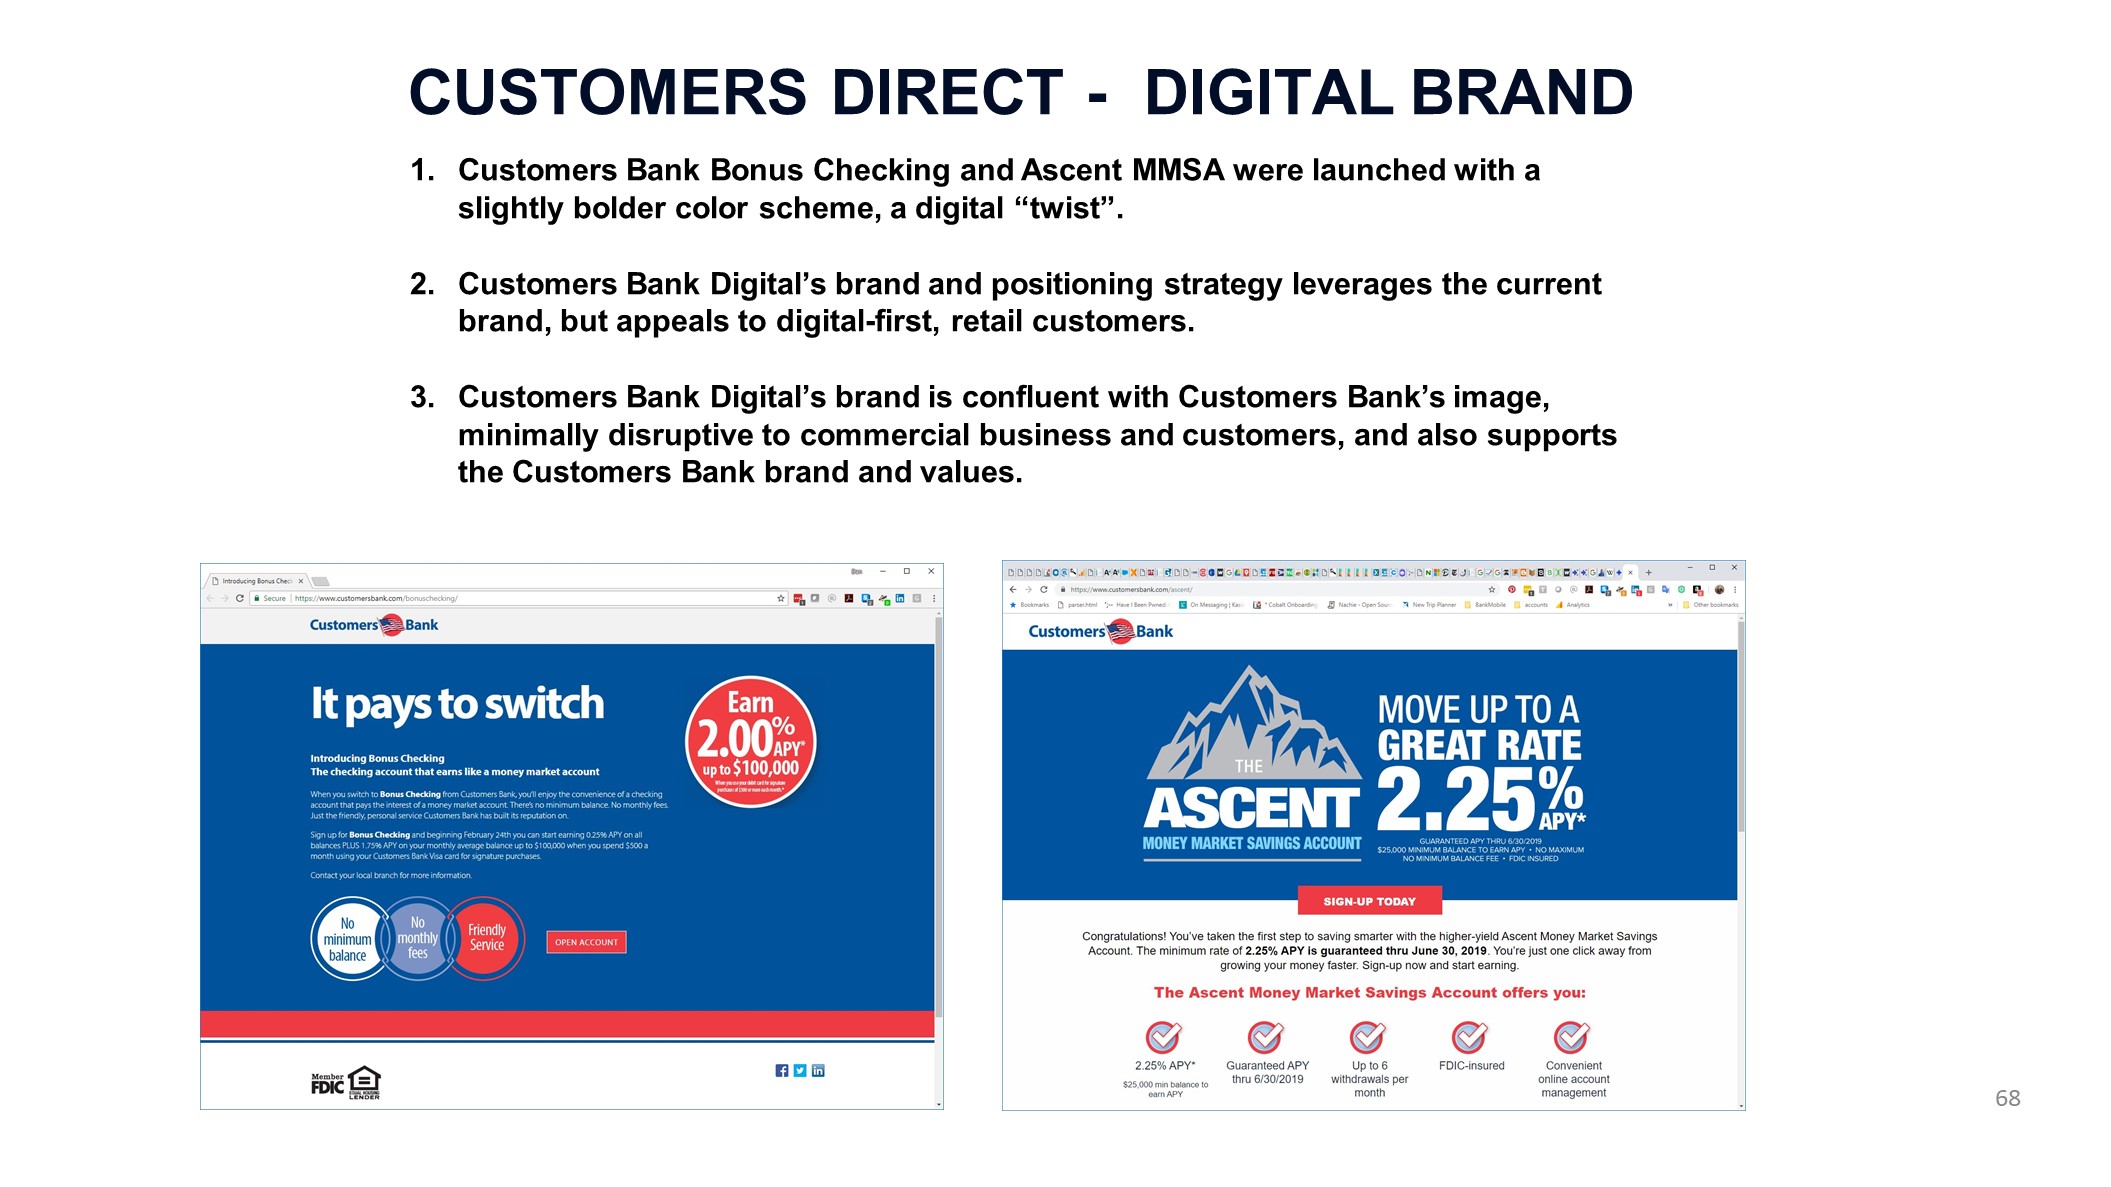
CUSTOMERS DIRECT - DIGITAL BRAND Customers Bank Bonus Checking and Ascent MMSA were launched with a slightly bolder color scheme, a digital “twist”.Customers Bank Digital’s brand and positioning strategy leverages the current brand, but appeals to digital-first, retail customers.Customers Bank Digital’s brand is confluent with Customers Bank’s image, minimally disruptive to commercial business and customers, and also supports the Customers Bank brand and values. 68
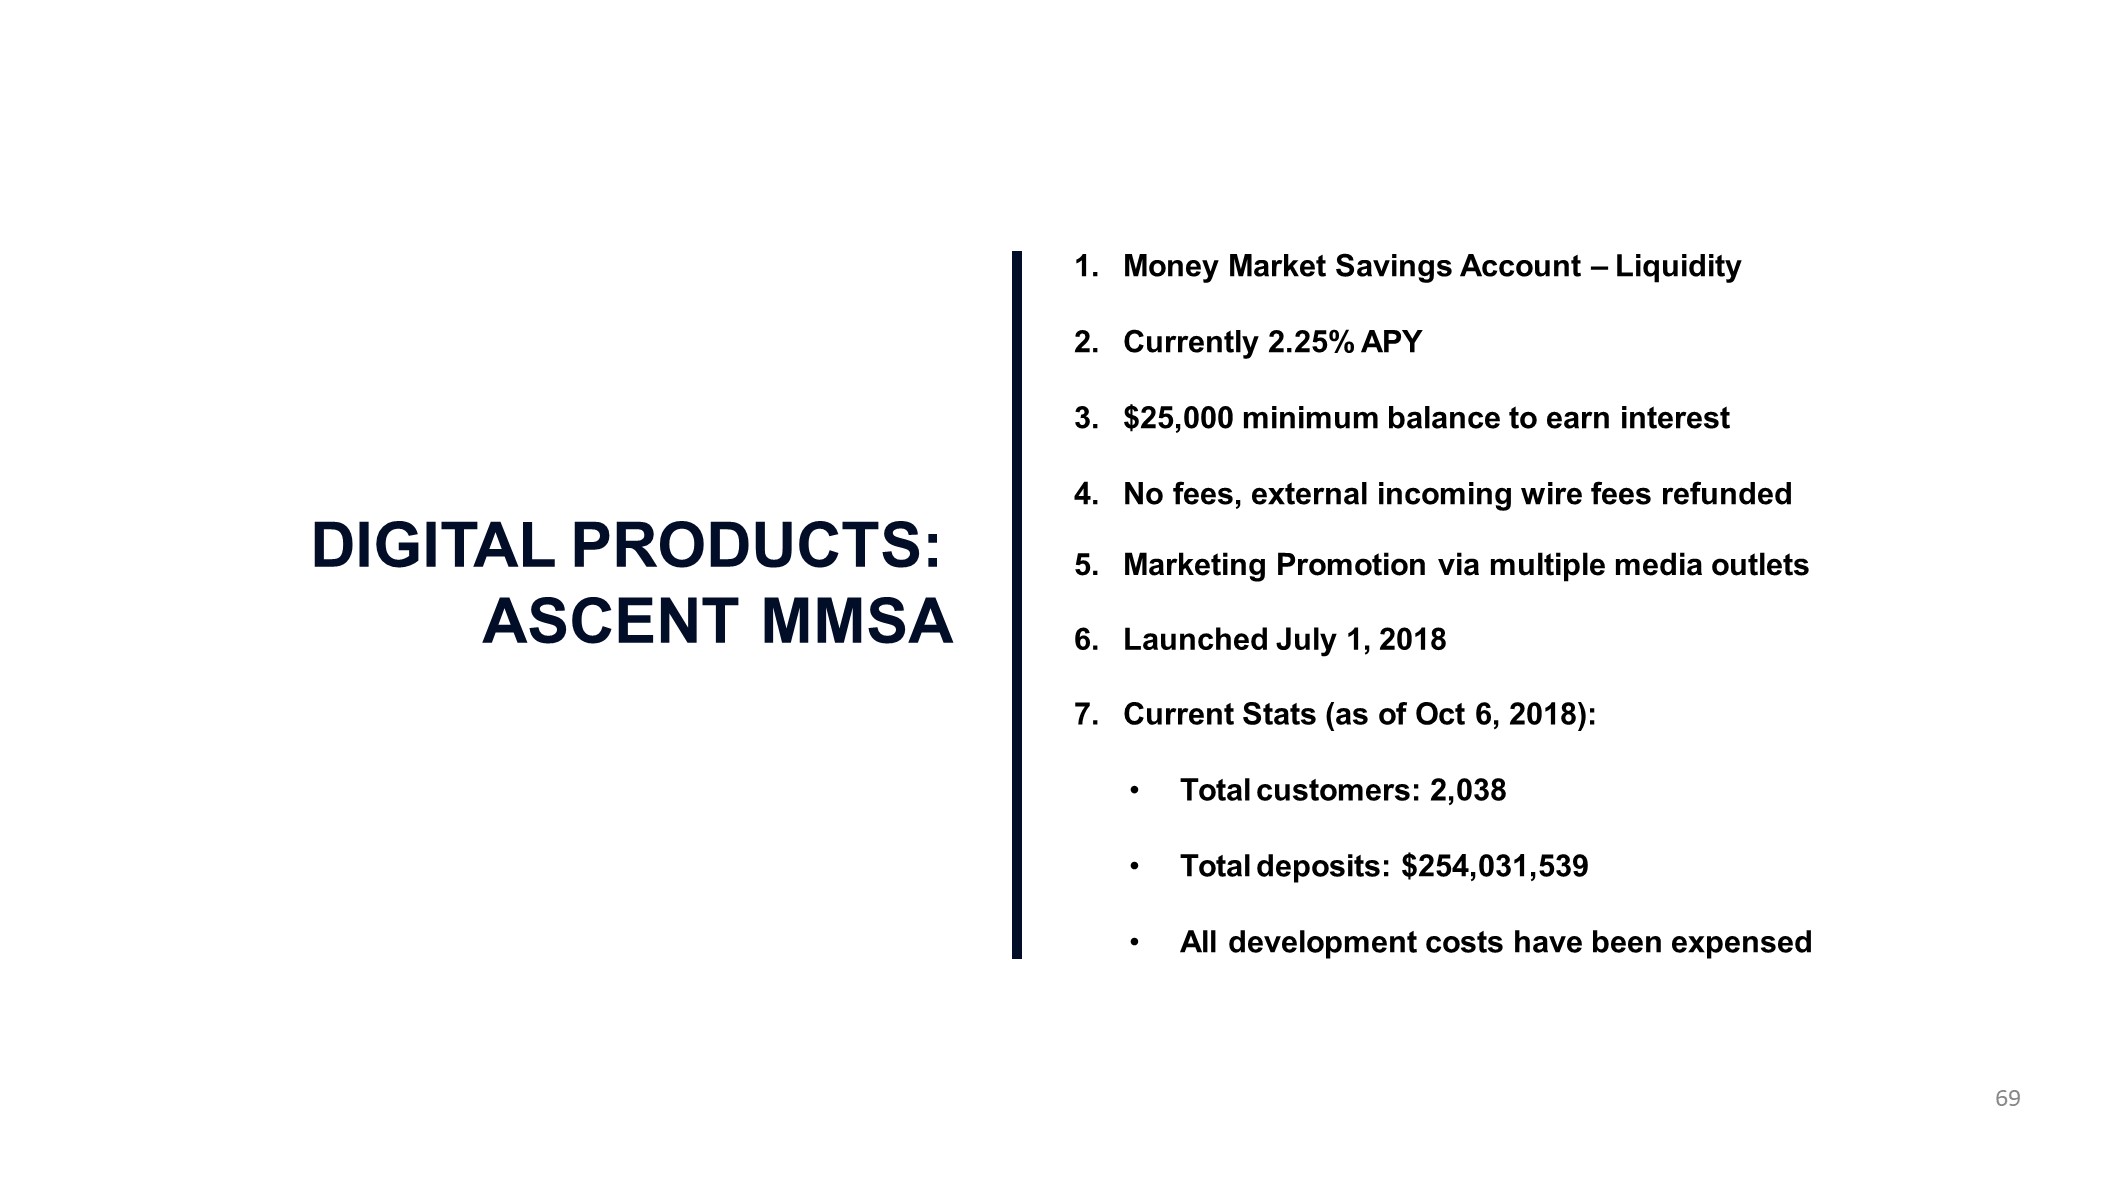
DIGITAL PRODUCTS: ASCENT MMSA Money Market Savings Account – LiquidityCurrently 2.25% APY$25,000 minimum balance to earn interestNo fees, external incoming wire fees refunded 5. Marketing Promotion via multiple media outlets 6. Launched July 1, 2018 Current Stats (as of Oct 6, 2018):Total customers: 2,038Total deposits: $254,031,539All development costs have been expensed 69
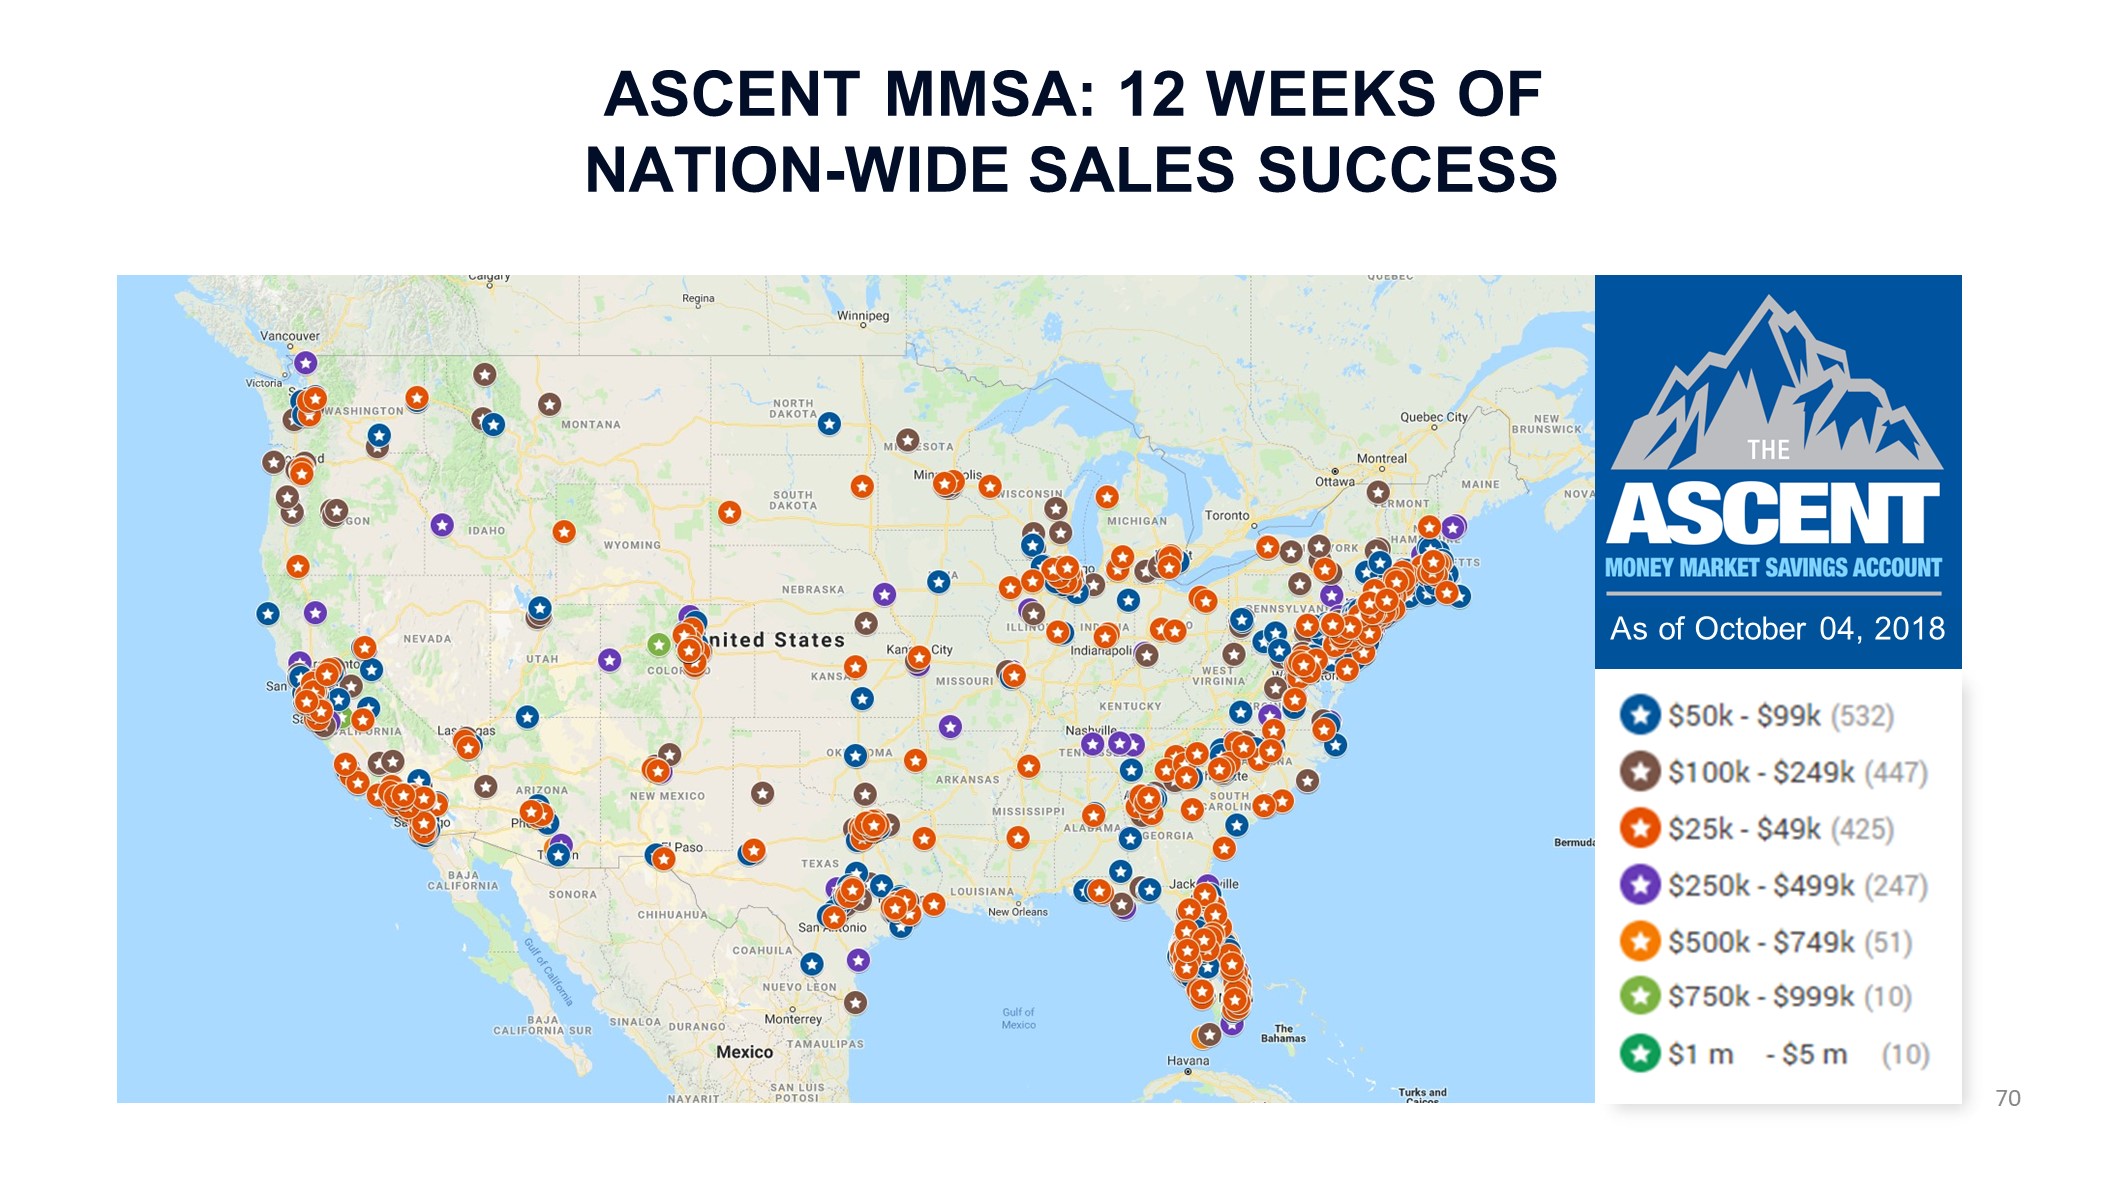
ASCENT MMSA: 12 WEEKS OF NATION-WIDE SALES SUCCESS As of October 04, 2018 70
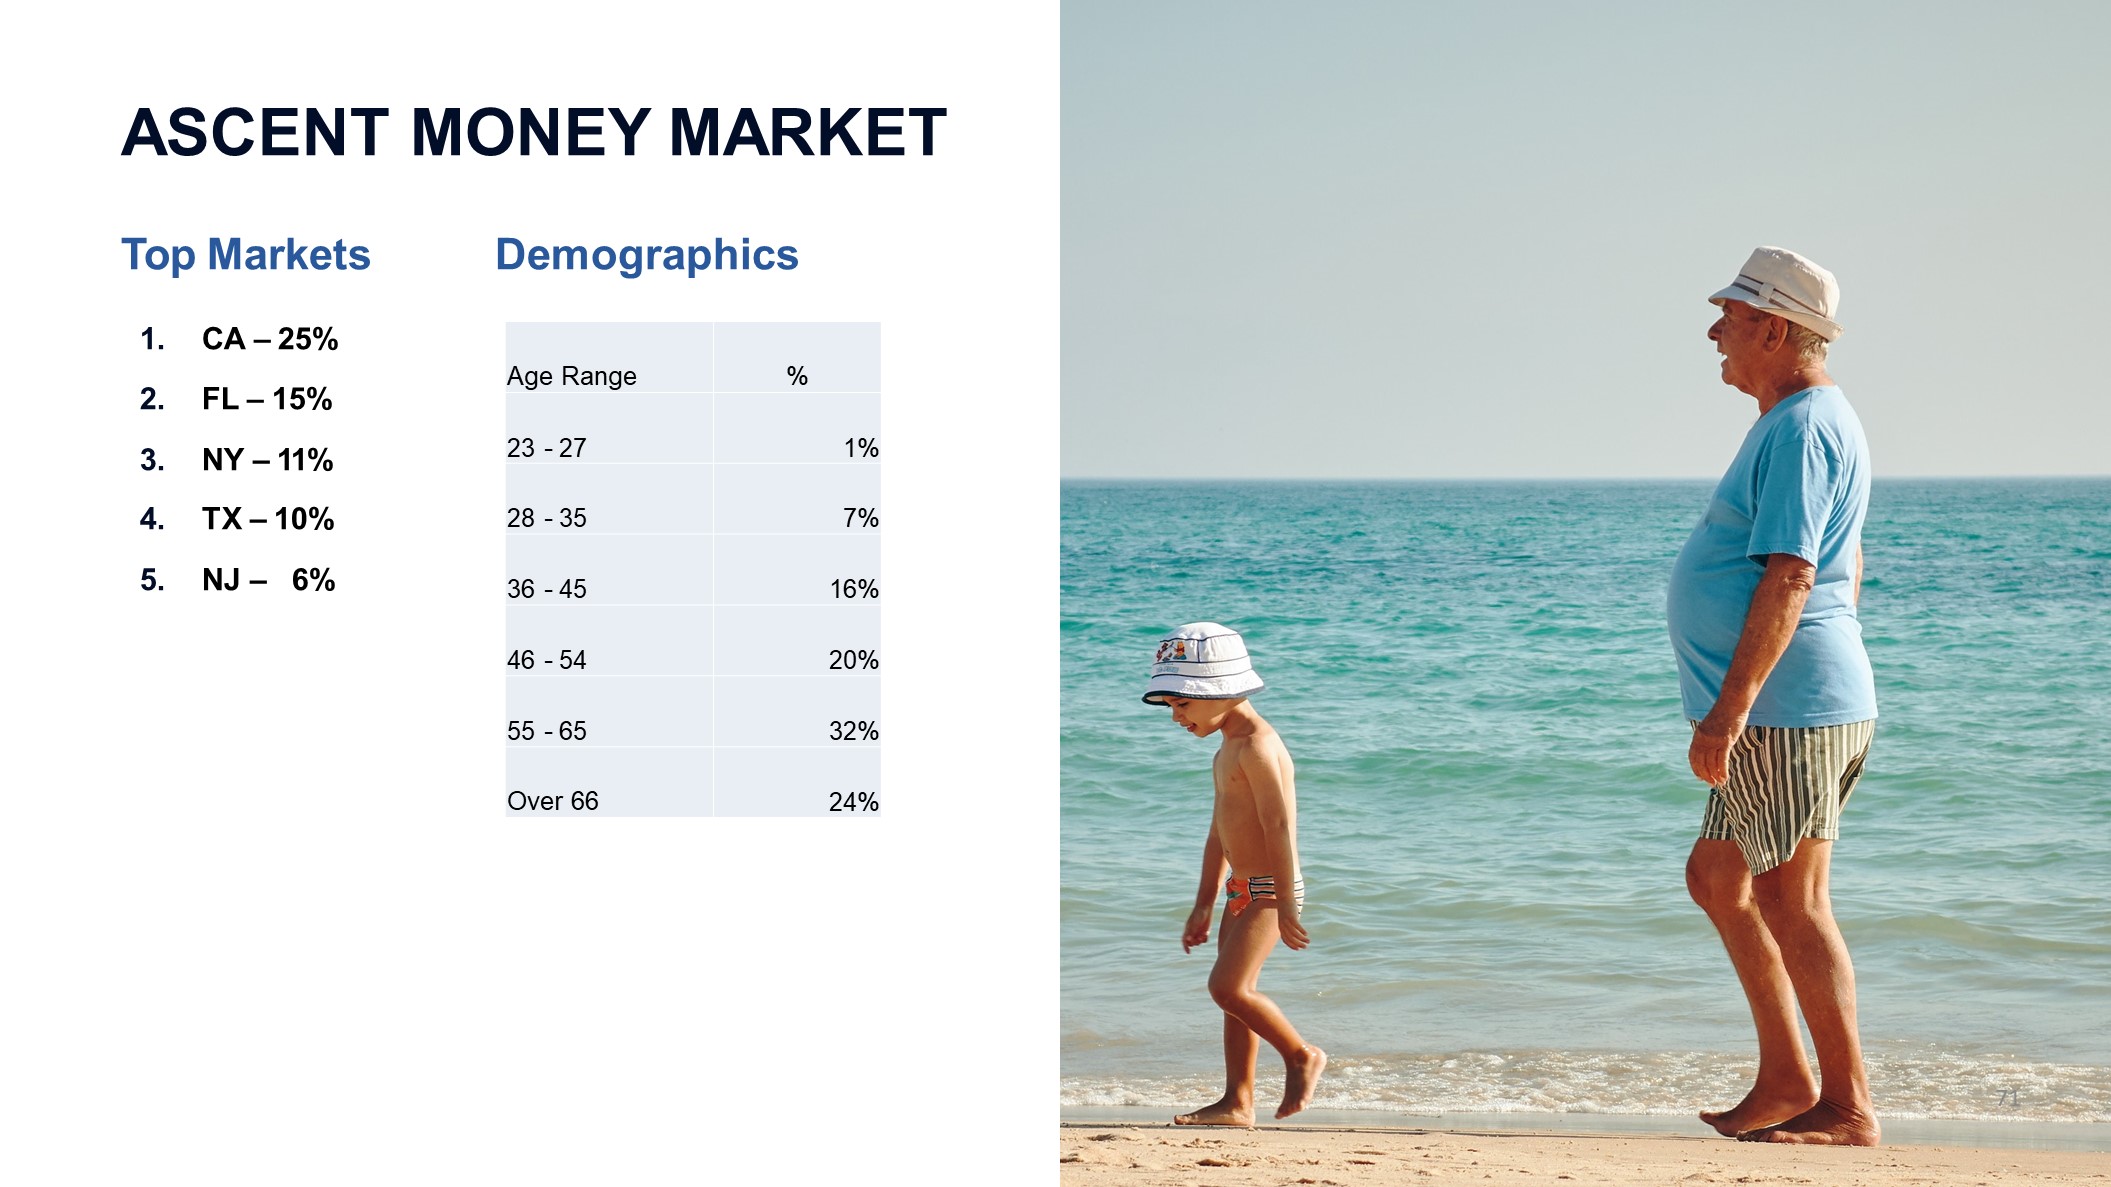
Age Range % 23 - 27 1% 28 - 35 7% 36 - 45 16% 46 - 54 20% 55 - 65 32% Over 66 24% ASCENT MONEY MARKET Top Markets Demographics1. CA – 25%2. FL – 15%3. NY – 11%4. TX – 10%5. NJ – 6% 71

ON THE ROADMAP 72 Customers Bank Convenience CheckingDigital re-launch, targeted at Ascent MMSA customers and new customersNo minimum balanceNo ATM fees with an average total balance of $5,000Checks, debit cards, web/mobile banking with Apple and Samsung pay digital walletsMRDC, bill-pay, text alerts, FIS People Pay, stop checkCustomers Bank Online CDsHighly attractive rates via digital-only sales channelsCurrent plan is for 4 CD time-based and rate variations, to meet varying consumer needs
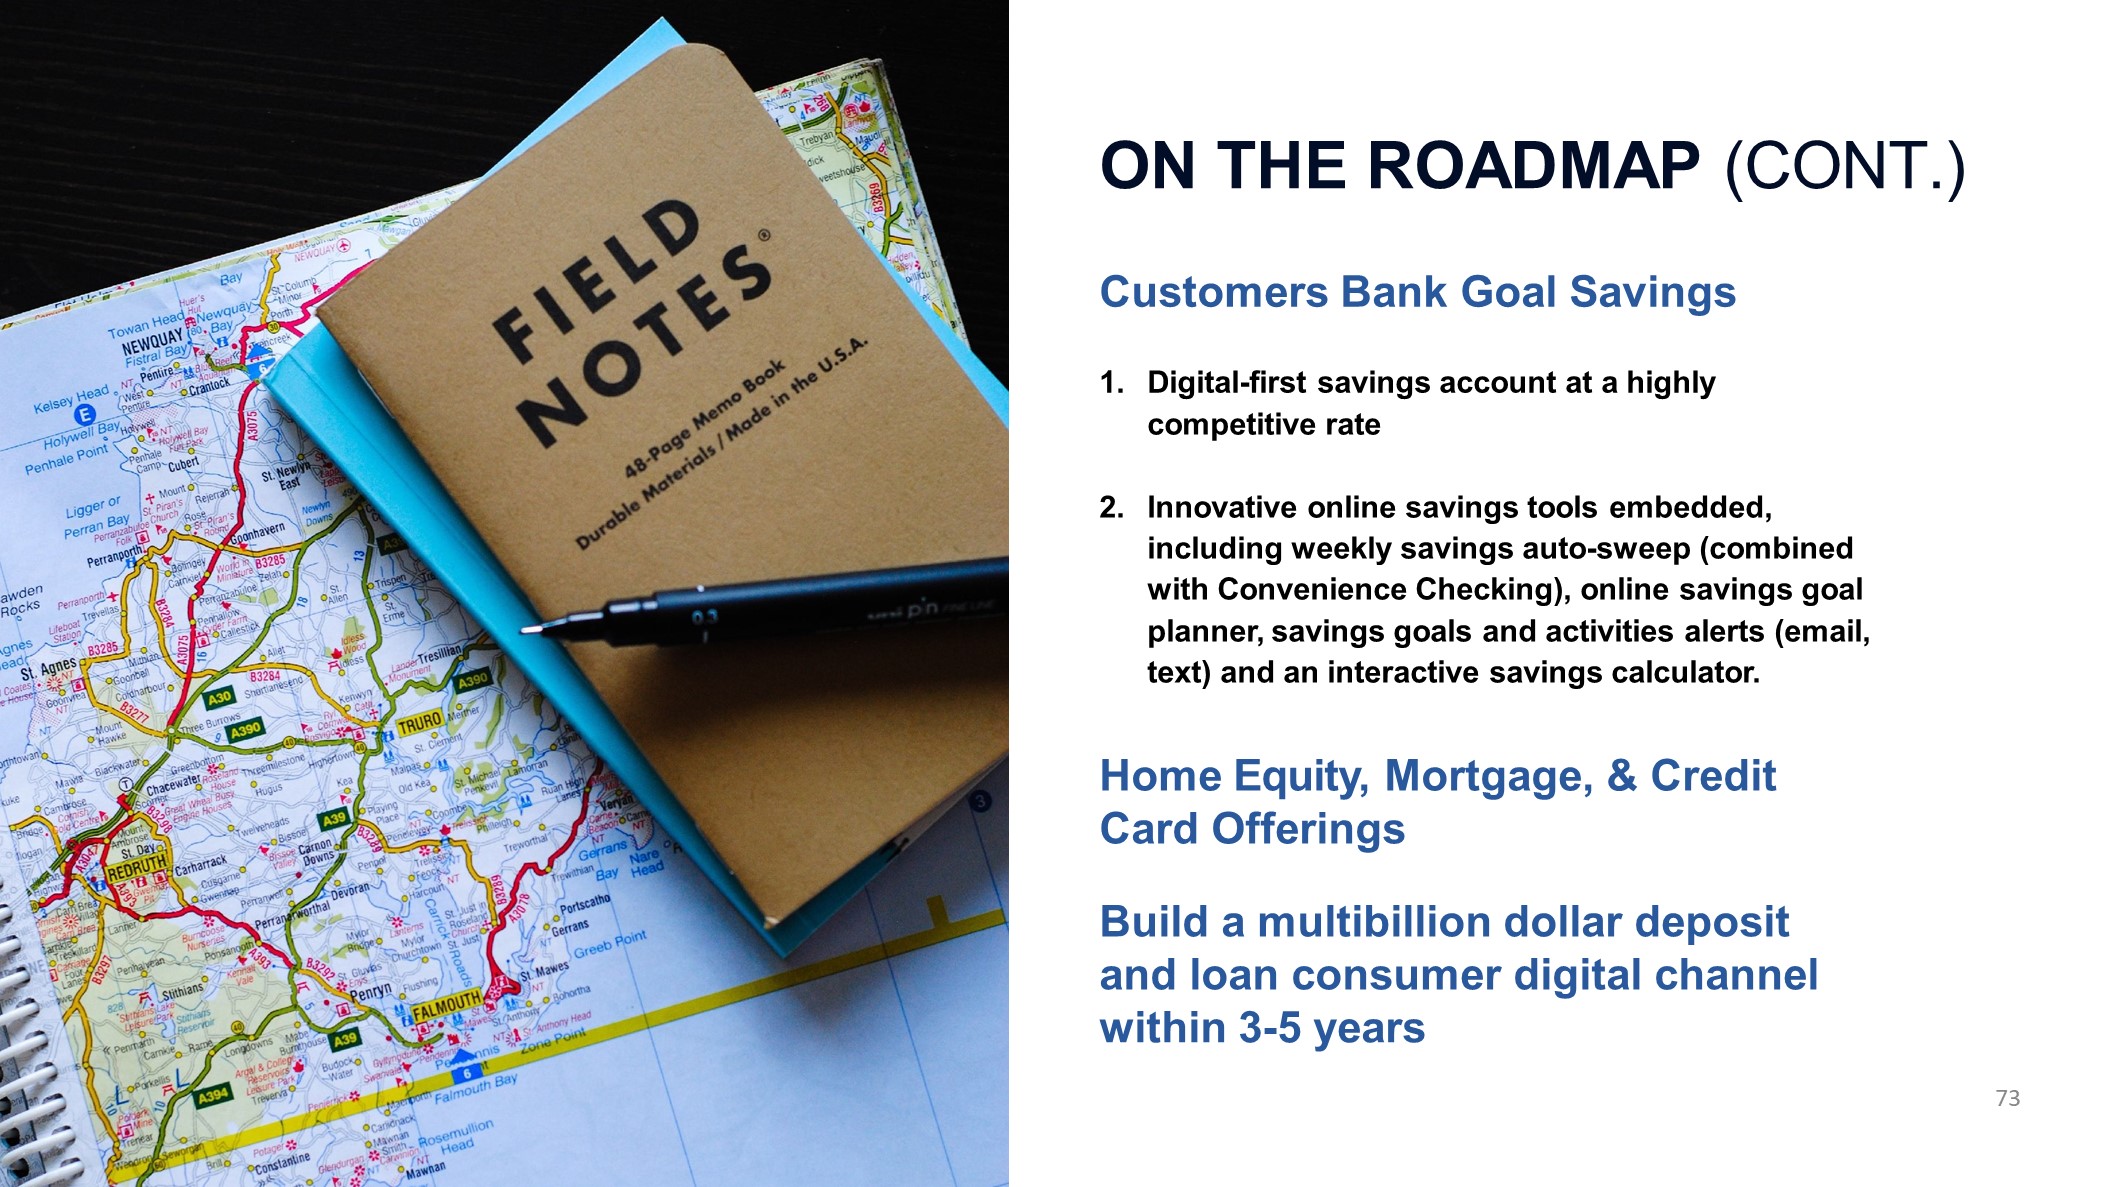
ON THE ROADMAP (CONT.) 73 Customers Bank Goal SavingsDigital-first savings account at a highly competitive rateInnovative online savings tools embedded, including weekly savings auto-sweep (combined with Convenience Checking), online savings goal planner, savings goals and activities alerts (email, text) and an interactive savings calculator.Home Equity, Mortgage, & Credit Card OfferingsBuild a multibillion dollar deposit and loan consumer digital channel within 3-5 years
Business Line Update: BankMobile Jay Sidhu, Customers Chairman & CEO Luvleen Sidhu, BankMobile PresidentBob Savino, BankMobile Chief Product Officer Bob Diegel, BankMobile COOPaul Young, BankMobile CFO October 2018
75 OUR B2B2C (BUSINESS TO BUSINESS TO CONSUMER) BUSINESS As you have heard, we are putting our spin-merge plans on hold. Keeping BankMobile for the next 2-3 years is aligned with our strategy to focus on balance sheet mix, capital, and profitability with a balance sheet below $10 billionWe intend to benefit from 2-3 years of growth from our first White Label PartnerOur first White Label partnership has taken a long time to develop - over 2 yearsWe are very excited about disrupting the banking industry
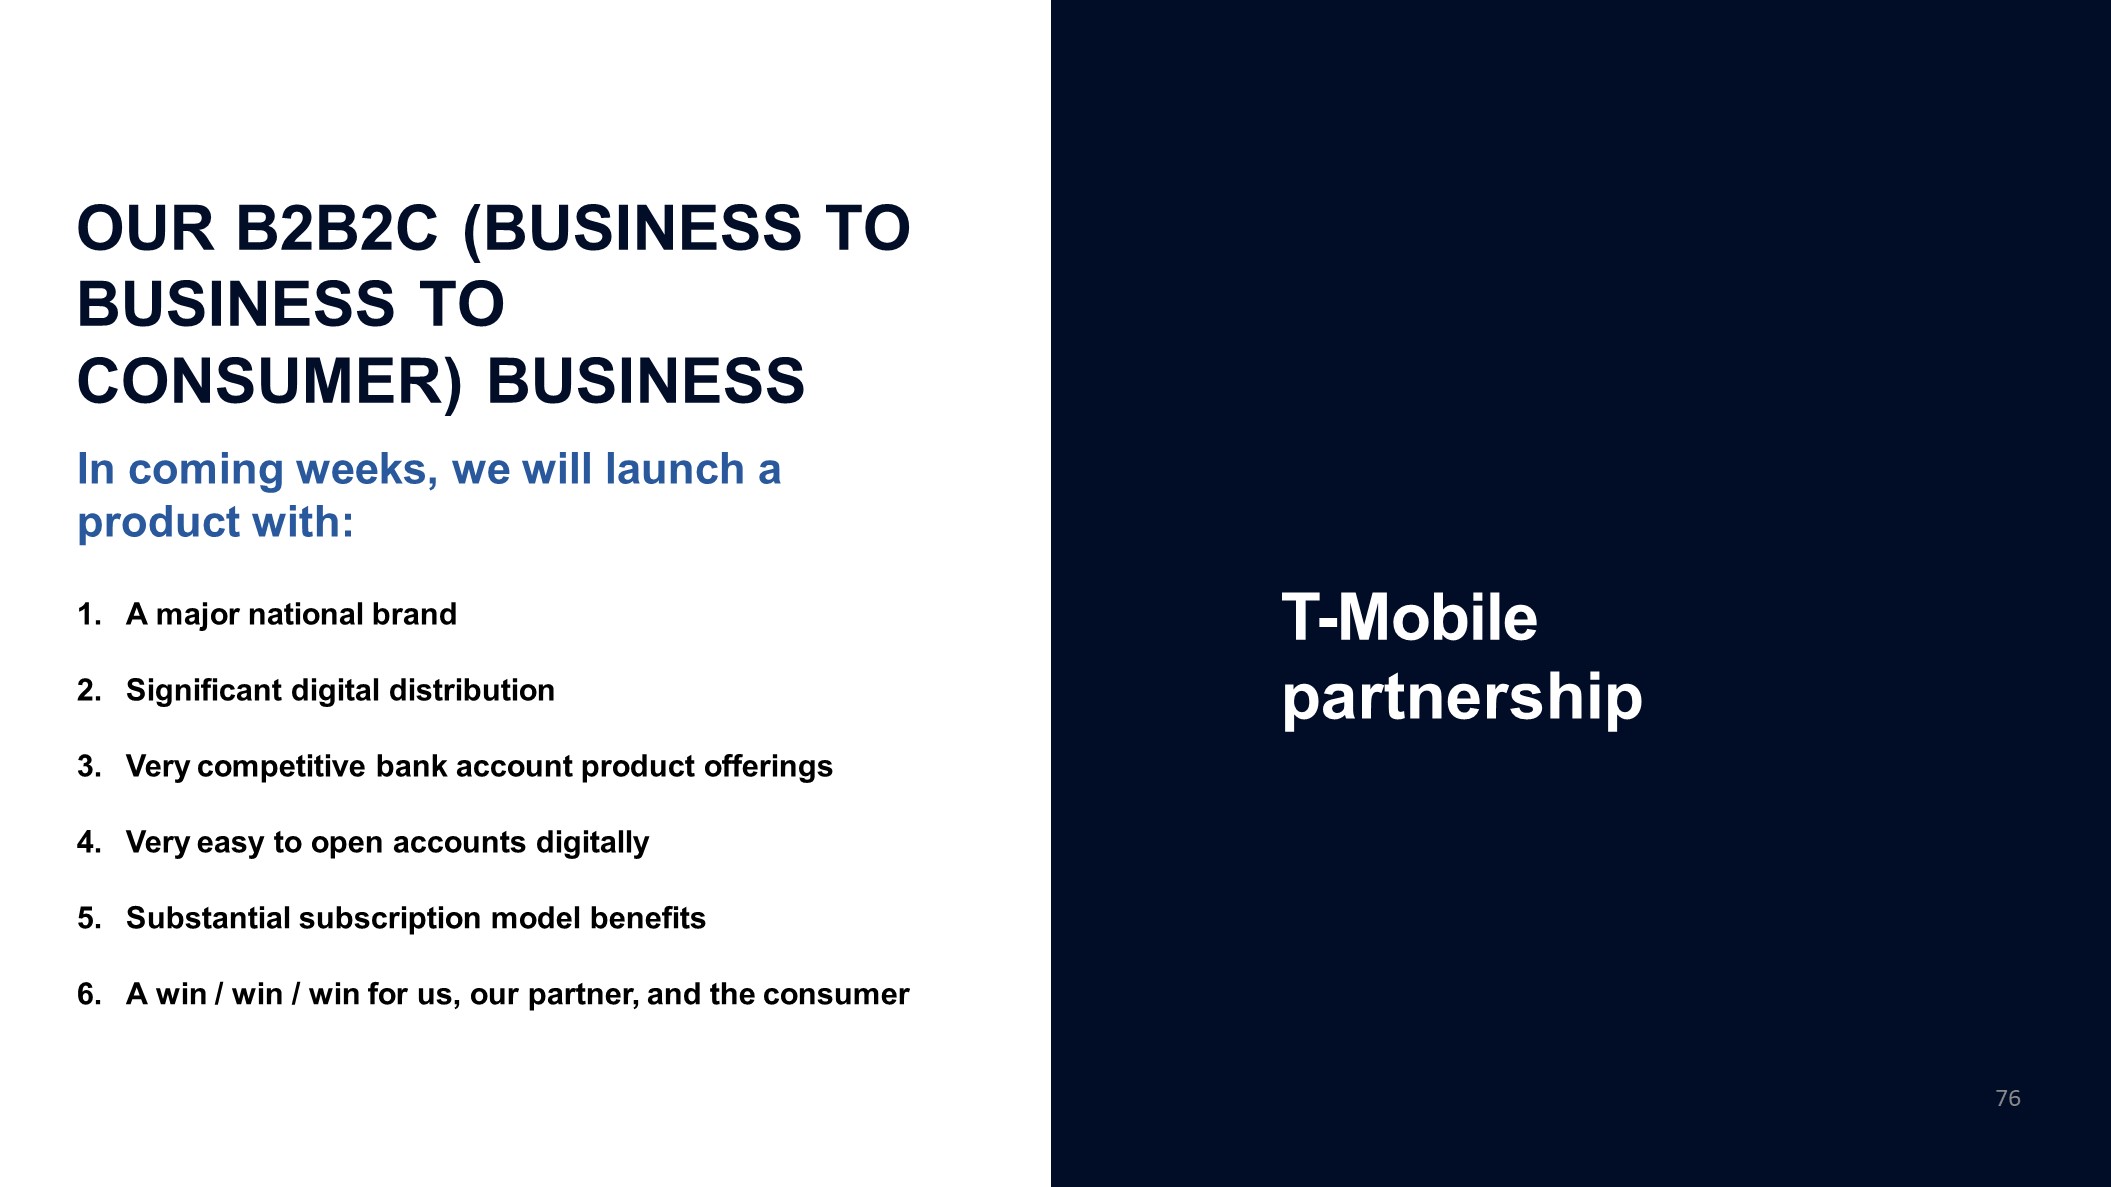
OUR B2B2C (BUSINESS TO BUSINESS TO CONSUMER) BUSINESS 76 In coming weeks, we will launch a product with:A major national brandSignificant digital distributionVery competitive bank account product offeringsVery easy to open accounts digitallySubstantial subscription model benefitsA win / win / win for us, our partner, and the consumer T-Mobile partnership
BankMobile Update Luvleen Sidhu, President Bob Savino, CTO & CPOBob Diegel, BankMobile COO Paul Young, CFO October 2018
What we will be covering today 1. How changing trends are creating unique opportunities for a mobile first digital distribution strategy 2. What is BankMobile’s strategy? Why is it unique and cannot be easily copied? 3. Critical success factors for BankMobile 4. Status of the student business “Bank as a Service” Model an our unique technology3 year growth goalsWhere are we heading?78
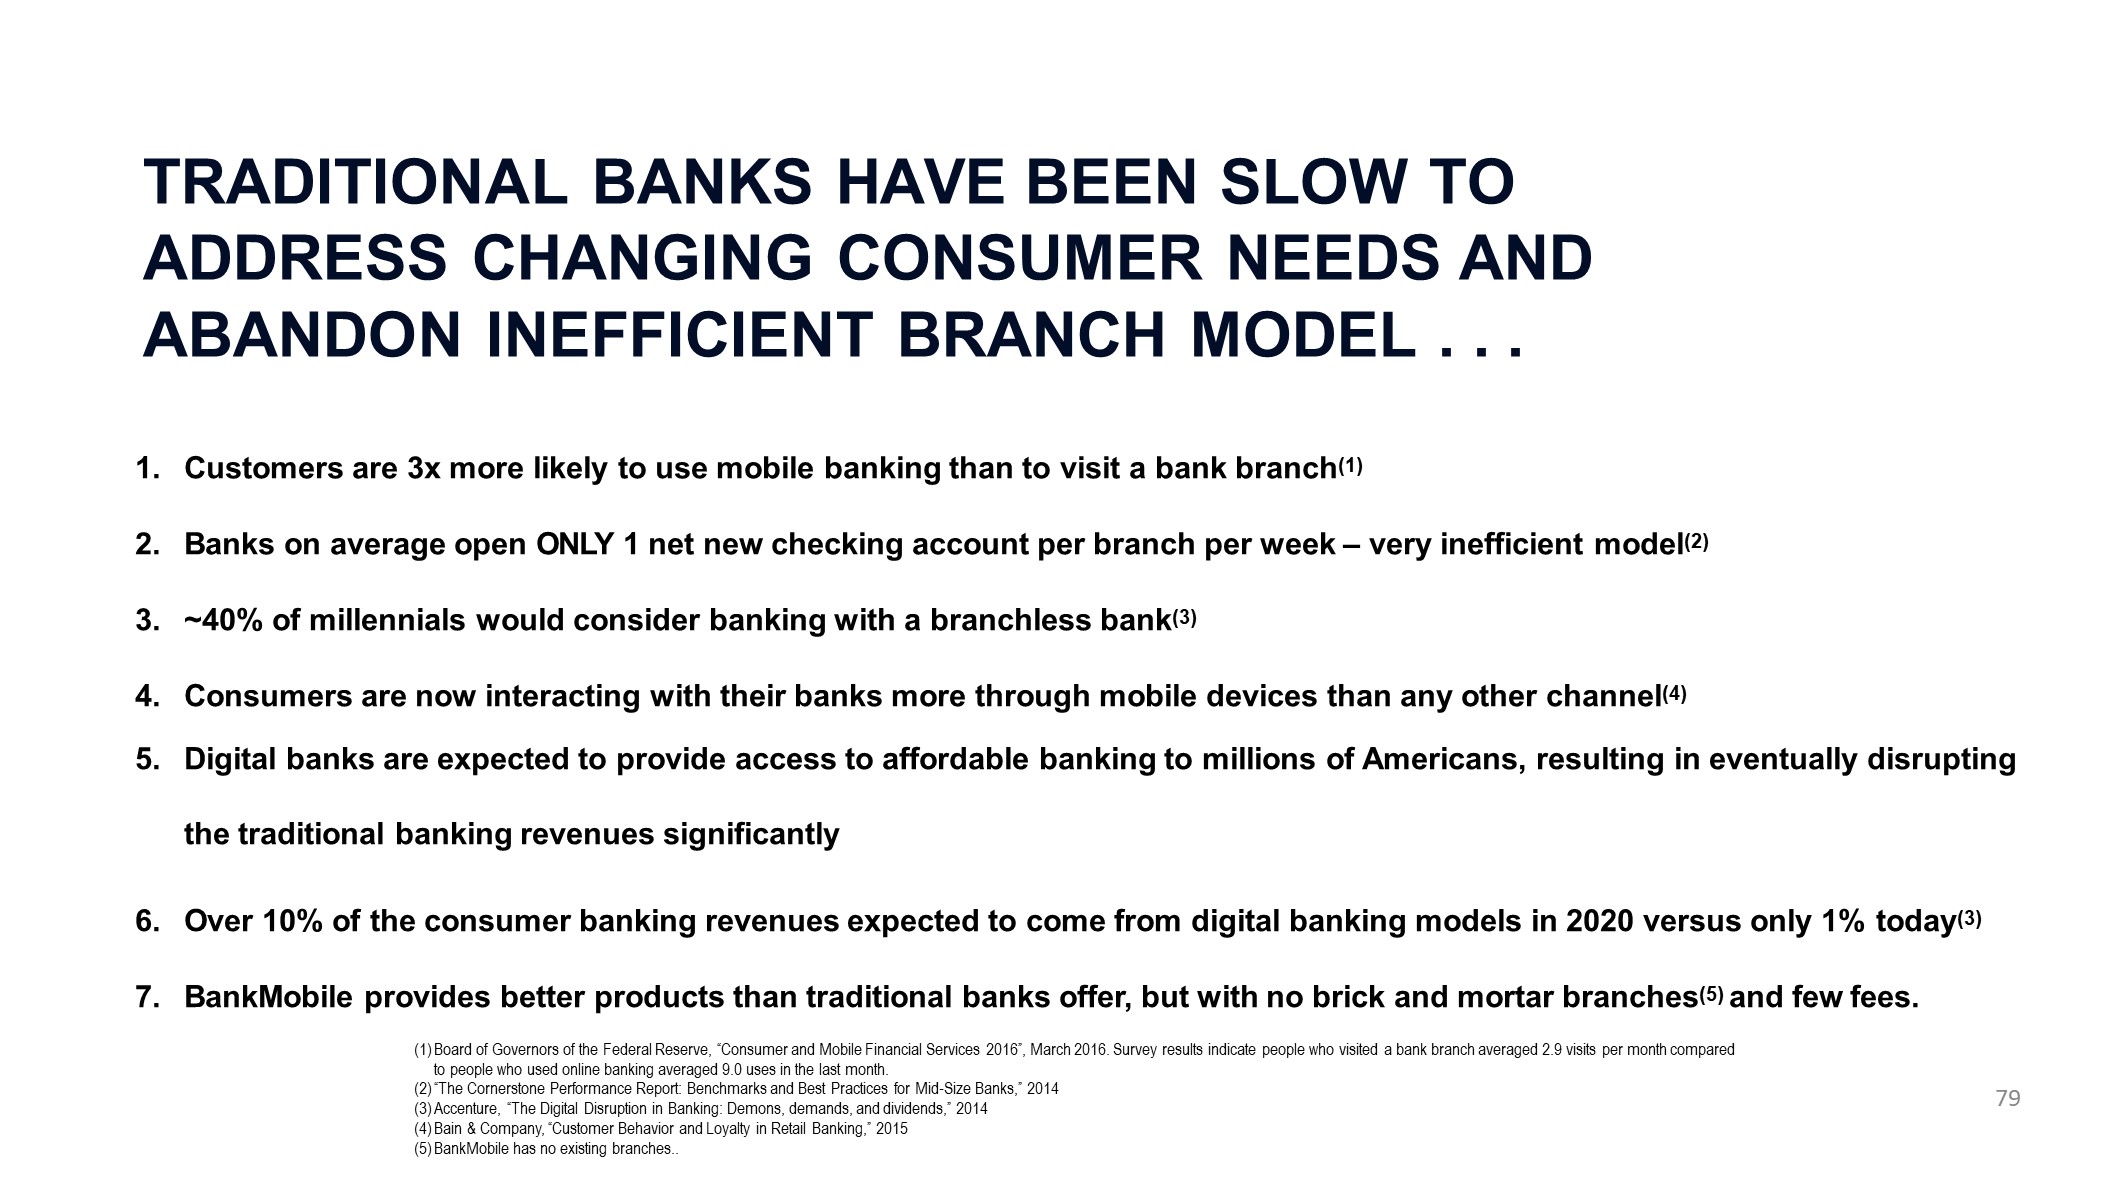
TRADITIONAL BANKS HAVE BEEN SLOW TO ADDRESS CHANGING CONSUMER NEEDS AND ABANDON INEFFICIENT BRANCH MODEL . . . Customers are 3x more likely to use mobile banking than to visit a bank branch(1)Banks on average open ONLY 1 net new checking account per branch per week – very inefficient model(2)~40% of millennials would consider banking with a branchless bank(3)Consumers are now interacting with their banks more through mobile devices than any other channel(4)Digital banks are expected to provide access to affordable banking to millions of Americans, resulting in eventually disrupting the traditional banking revenues significantlyOver 10% of the consumer banking revenues expected to come from digital banking models in 2020 versus only 1% today(3)BankMobile provides better products than traditional banks offer, but with no brick and mortar branches(5) and few fees. Board of Governors of the Federal Reserve, “Consumer and Mobile Financial Services 2016”, March 2016. Survey results indicate people who visited a bank branch averaged 2.9 visits per month compared to people who used online banking averaged 9.0 uses in the last month.“The Cornerstone Performance Report: Benchmarks and Best Practices for Mid-Size Banks,” 2014Accenture, “The Digital Disruption in Banking: Demons, demands, and dividends,” 2014Bain & Company, “Customer Behavior and Loyalty in Retail Banking,” 2015BankMobile has no existing branches.. 79
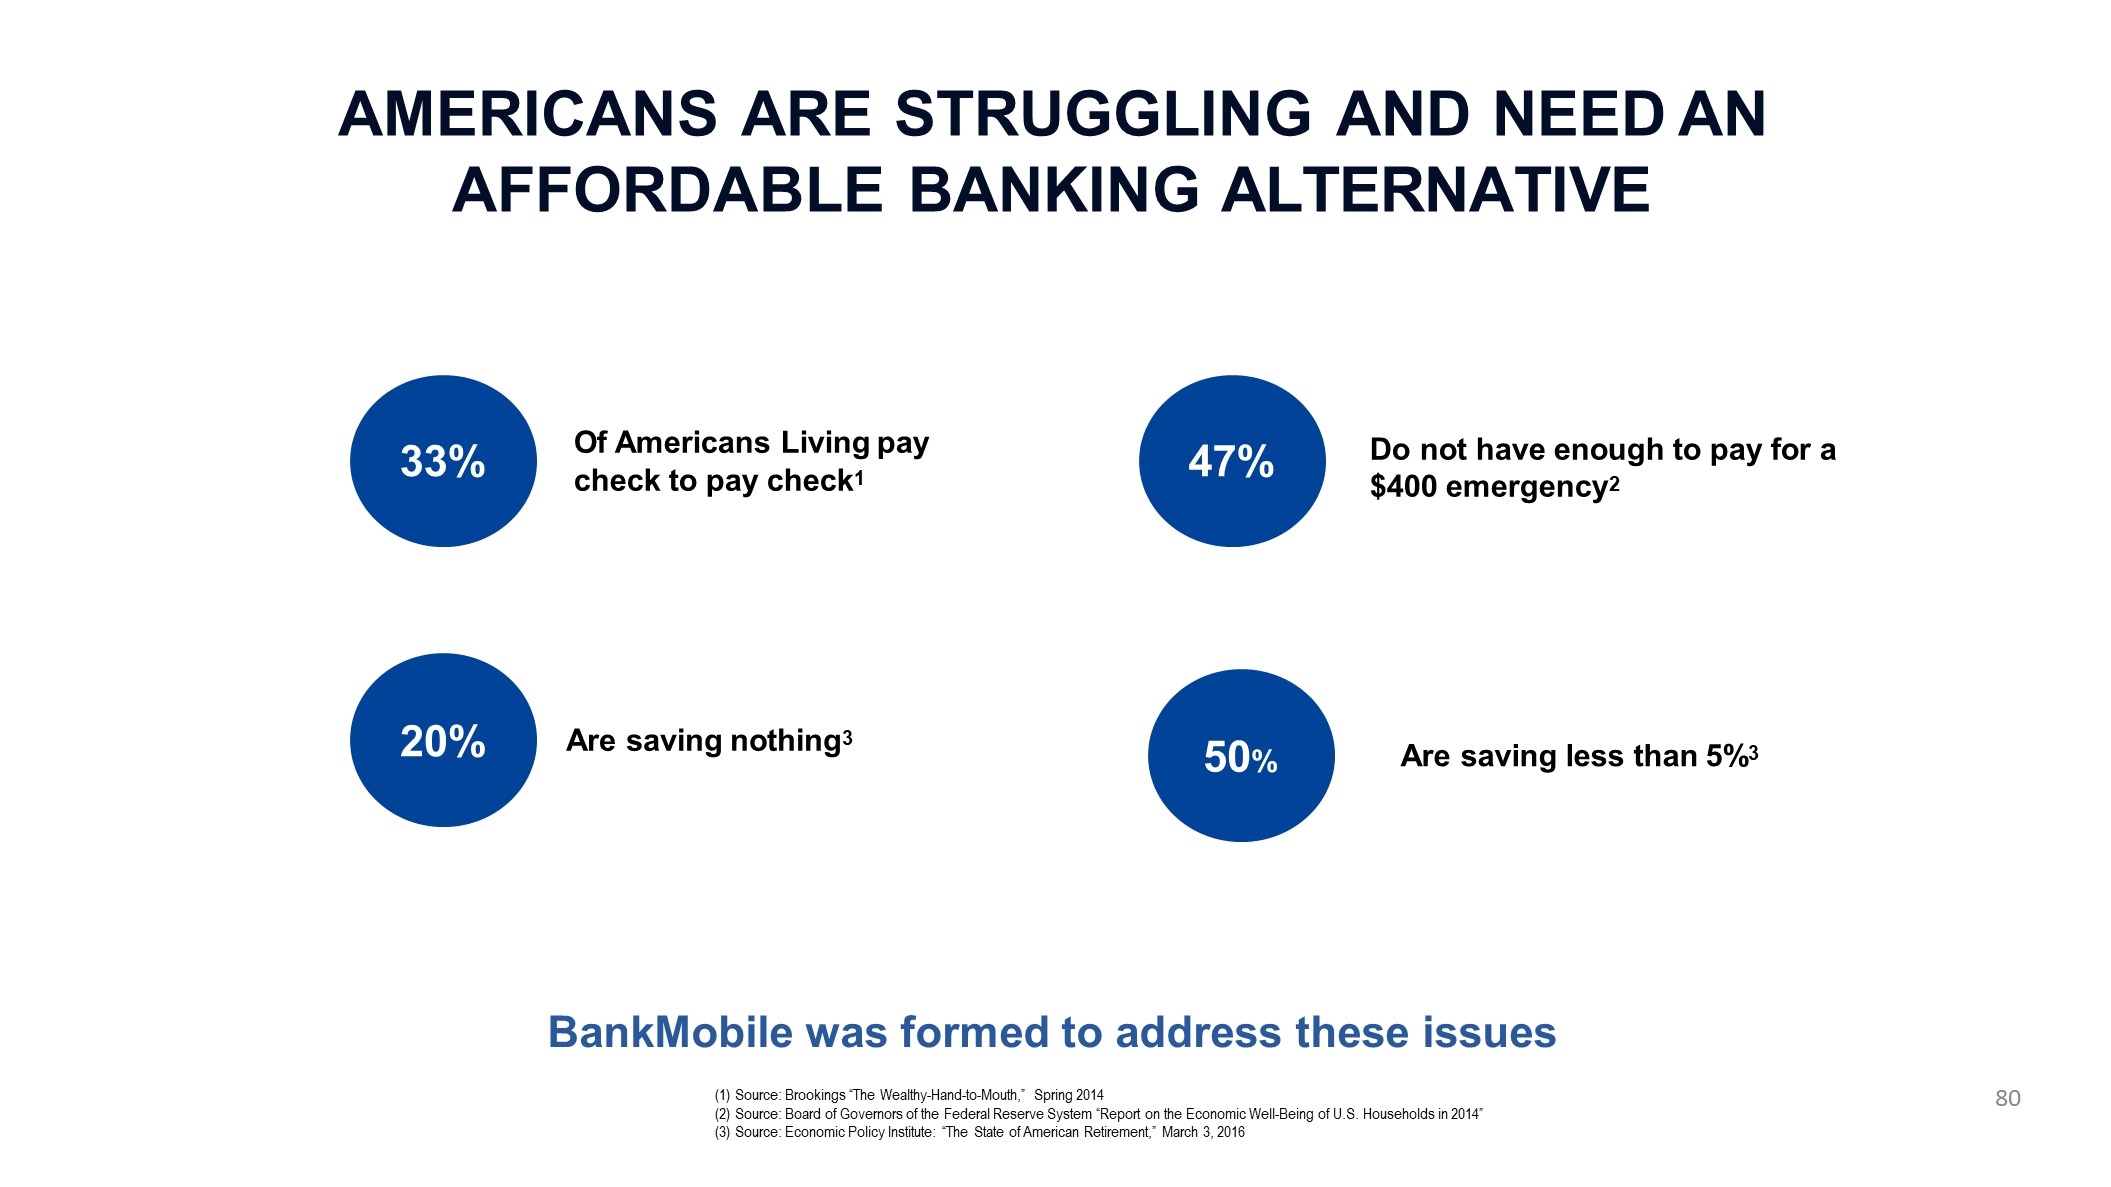
AMERICANS ARE STRUGGLING AND NEED AN AFFORDABLE BANKING ALTERNATIVE 33% 47% 50% 20% Of Americans Living pay check to pay check1 Are saving nothing3 Do not have enough to pay for a$400 emergency2 Are saving less than 5%3 BankMobile was formed to address these issuesSource: Brookings “The Wealthy-Hand-to-Mouth,” Spring 2014Source: Board of Governors of the Federal Reserve System “Report on the Economic Well-Being of U.S. Households in 2014”Source: Economic Policy Institute: “The State of American Retirement,” March 3, 2016 80
Untapped exponential technologies ready to be used Internet of everythingSensorsArtificial intelligenceMachine learningMobile internetPersonal devicesBlockchainData analyticsRoboticsBiometrics 81
Critical success factors 1. Unique and exponentially better customer acquisition strategy 82 2. Customer engagement and customer for life profitability strategy 3. Unique technology, contractual relationships, and Durbin create barriers to entry 4. Long-term profitability better than traditional banks
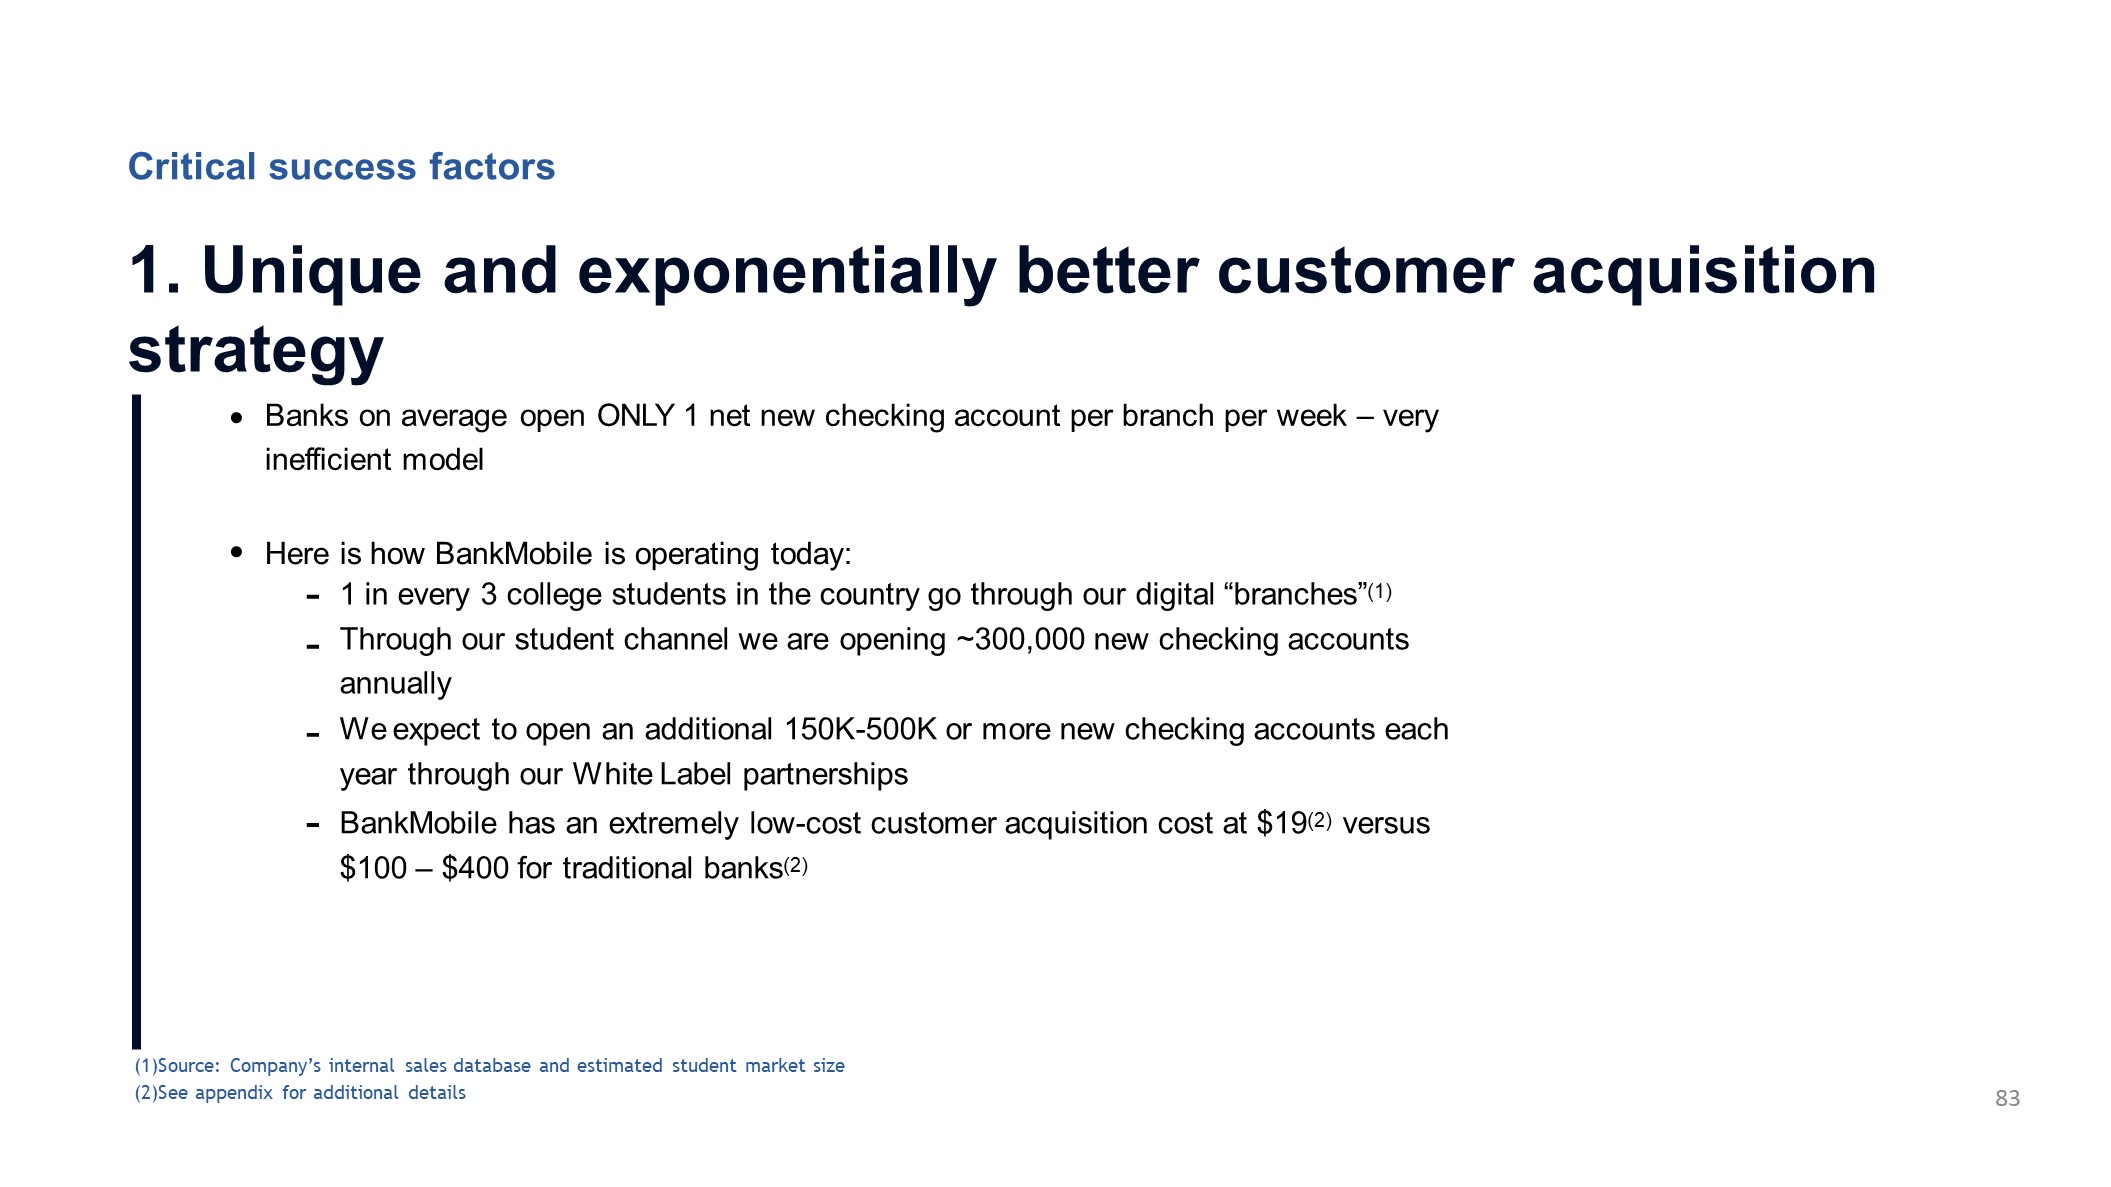
1. Unique and exponentially better customer acquisition strategy • Banks on average open ONLY 1 net new checking account per branch per week – very inefficient model • Here is how BankMobile is operating today: -- - - 1 in every 3 college students in the country go through our digital “branches”(1) Through our student channel we are opening ~300,000 new checking accounts annuallyWe expect to open an additional 150K-500K or more new checking accounts each year through our White Label partnershipsBankMobile has an extremely low-cost customer acquisition cost at $19(2) versus$100 – $400 for traditional banks(2) (1)Source: Company’s internal sales database and estimated student market size (2)See appendix for additional details Critical success factors 83
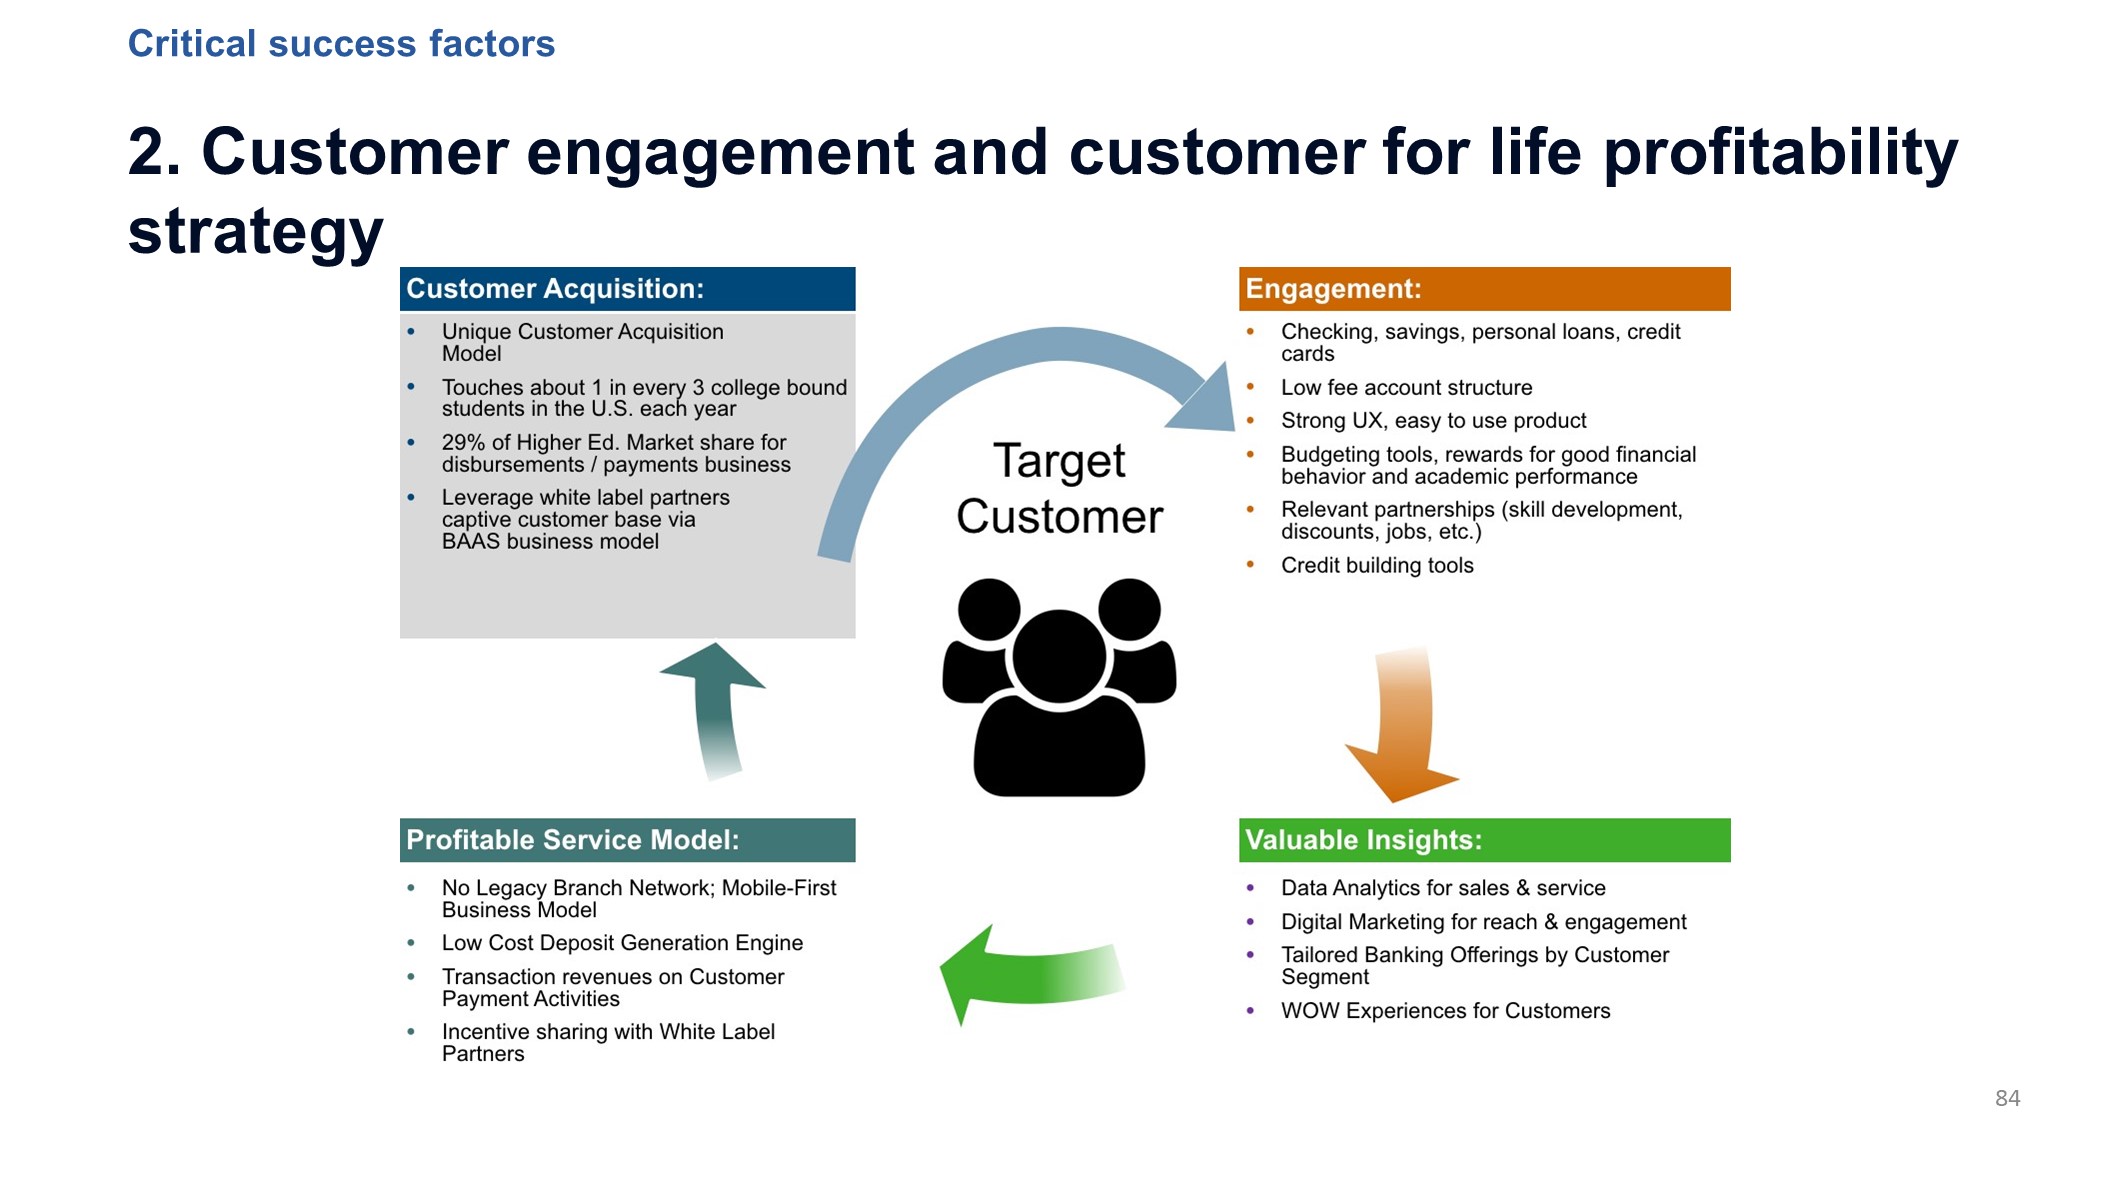
2. Customer engagement and customer for life profitability strategy Critical success factors 84
Recent focus in the student / disbursement business Recovering from Department of Education Ban - - - Proactive carding ban dropped adoption rate to historical low of ~19%; this took away ~$20 million in non-interest revenues from BankMobile.Through brand awareness, marketing campaigns, and product suite enhancements we have driven adoption up to 25% todayWe plan to make the student business profitable by the end of 2019 • Record Sales Year in 2018 – Best year in the history of the company --- Sold 56 new schools bringing in 570,793 new SSEs YTD Expecting another ~120K by year endThis builds higher sales and higher revenues going forward • Expanded Product Offering -- Introduced savings account, interest bearing checking account, personal loans in Q2 and Q3 2018 Since May 2018, we have opened 85,663 savings accounts •• Eliminated over $100 million in bank fees for our student customers since we took over the business in 2016 Product offering is easy to use, transparent, affordable, and creates an emotional connection Critical success factors 85
Spent significantly in R&D, technology and product development for White LabelExpected to be a very customer friendly product offeringWe will have more to share later this year 86 Banking as a ServiceBesides student disbursements, our biggest focus over the last two years has been the development of “Banking as a Service” model BaaS and T-Mobile Critical success factors
3. Unique technology, contractual relationships, & Durbin create barriers to entry Today, BankMobile has relationships with approximately 726 campuses that have approximately 5.7 million studentsOur patented disbursement process designed for higher ed; saving colleges millions of dollarsDisbursing ~$10 billion each year of which over $3 billion go into Vibe Checking AccountsRelationship with T-Mobile first signed LOI in Sept 2016Building technology and product since that timeIn addition, we have built proprietary technology to support the roll out of a full service bank for our partners (“Bank as a Service”) with speed and cost efficiencyDurbin makes is practically impossible for banks greater than $10 billion in assets to compete with us Critical success factors 87
4. Long-term profitability better than traditional banks •••• 2% or higher ROA which is significantly better than traditional banksUniqueness of Durbin – a significant competitive advantage that benefits our partners and our customersHigh volume and Low cost customer acquisition - $19 for BankMobile student business versus $100 – $400 for traditional banks A very unique offering to potentially attract millions of consumers for primary checking accounts and building potentially billions of no to very low cost stable deposits Critical success factors 88
STUDENT SEGMENT UPDATE October 2018
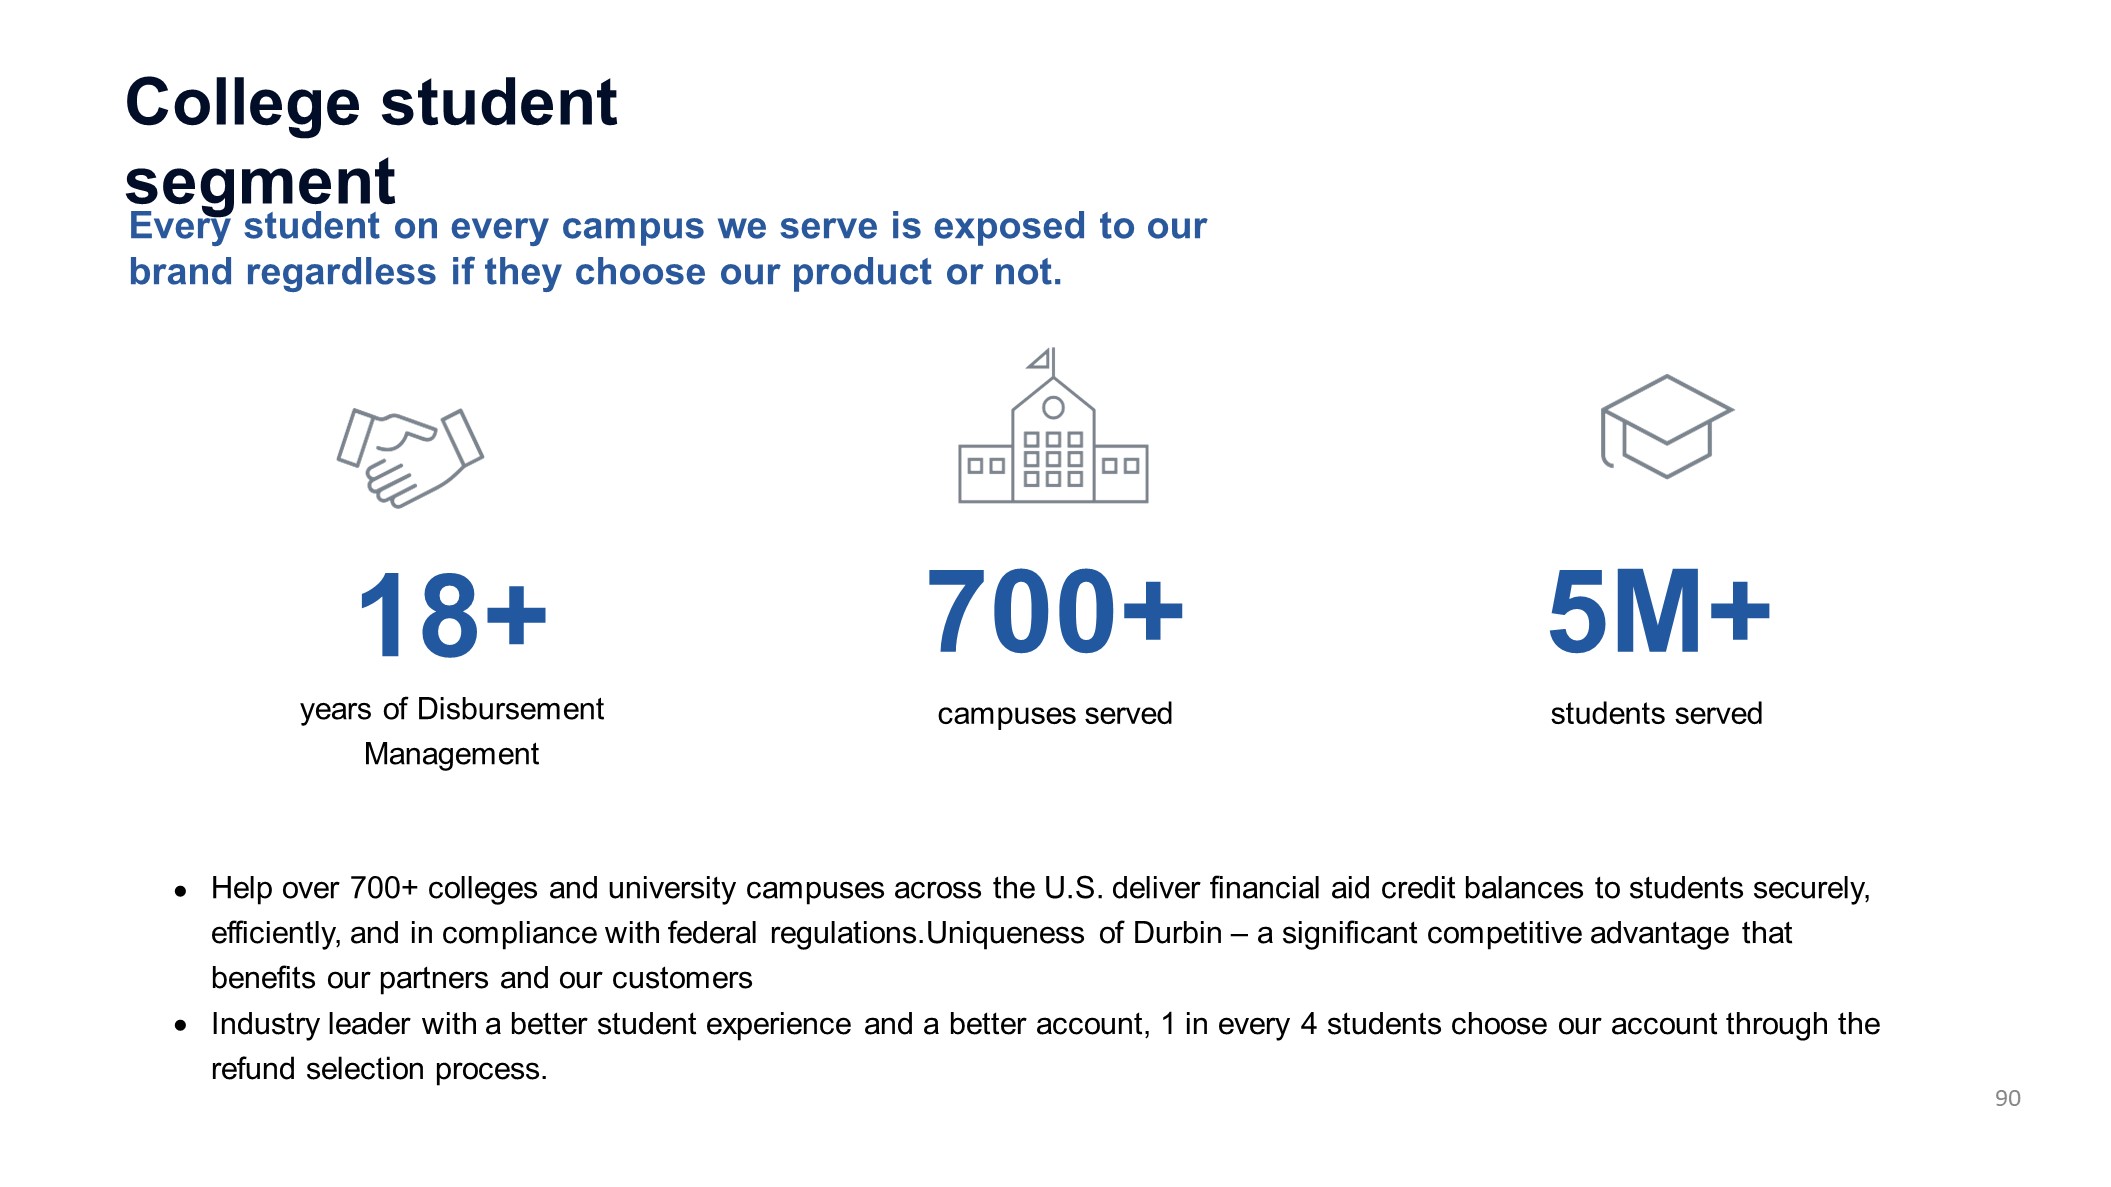
Every student on every campus we serve is exposed to our brand regardless if they choose our product or not. 18+years of Disbursement Management College student segment 700+campuses served 5M+students served • • Help over 700+ colleges and university campuses across the U.S. deliver financial aid credit balances to students securely, efficiently, and in compliance with federal regulations.Uniqueness of Durbin – a significant competitive advantage that benefits our partners and our customersIndustry leader with a better student experience and a better account, 1 in every 4 students choose our account through the refund selection process. 90
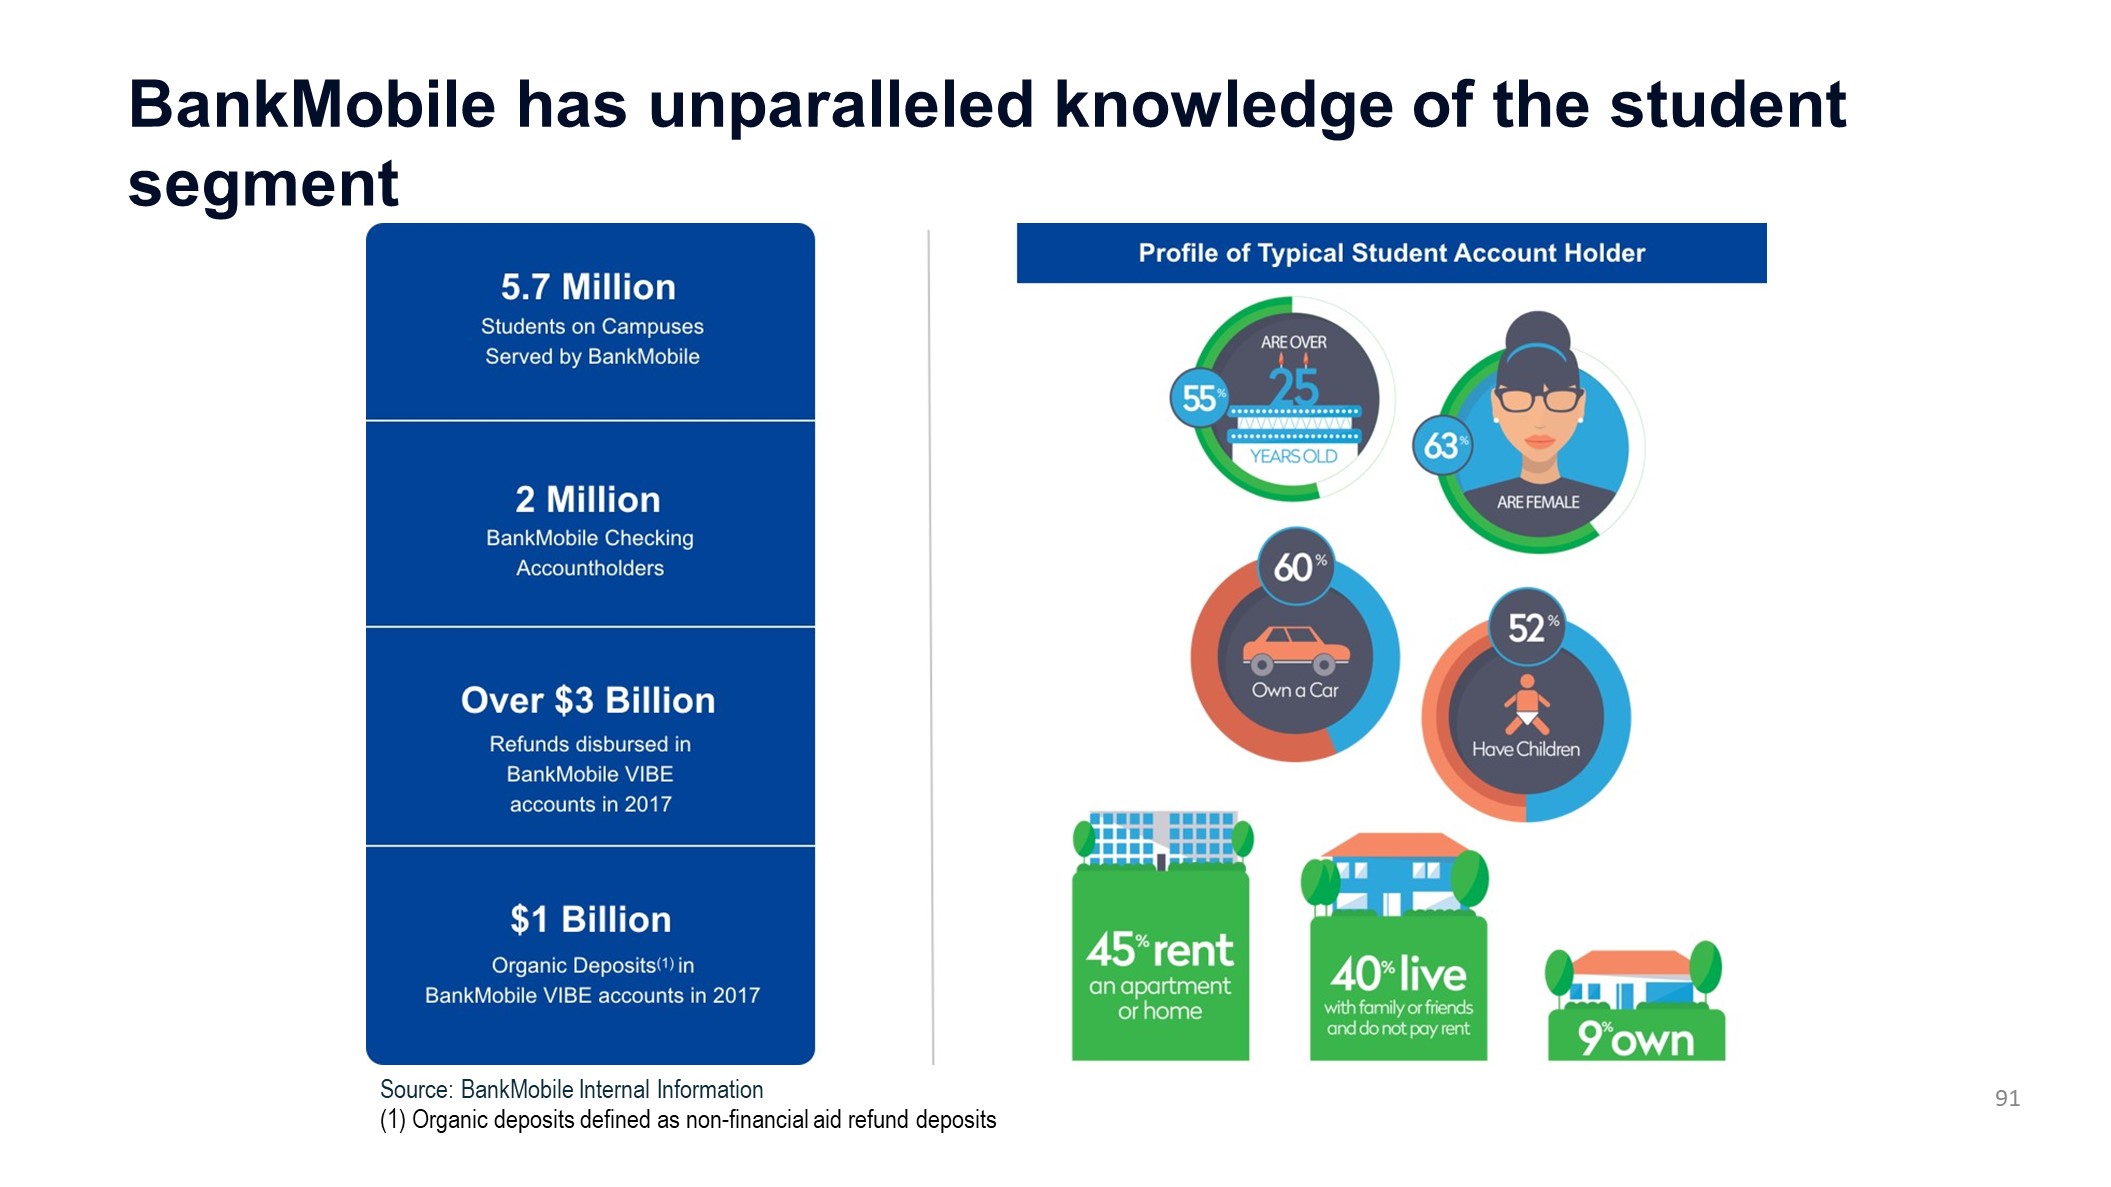
BankMobile has unparalleled knowledge of the student segment 91 Source: BankMobile Internal Information(1) Organic deposits defined as non-financial aid refund deposits
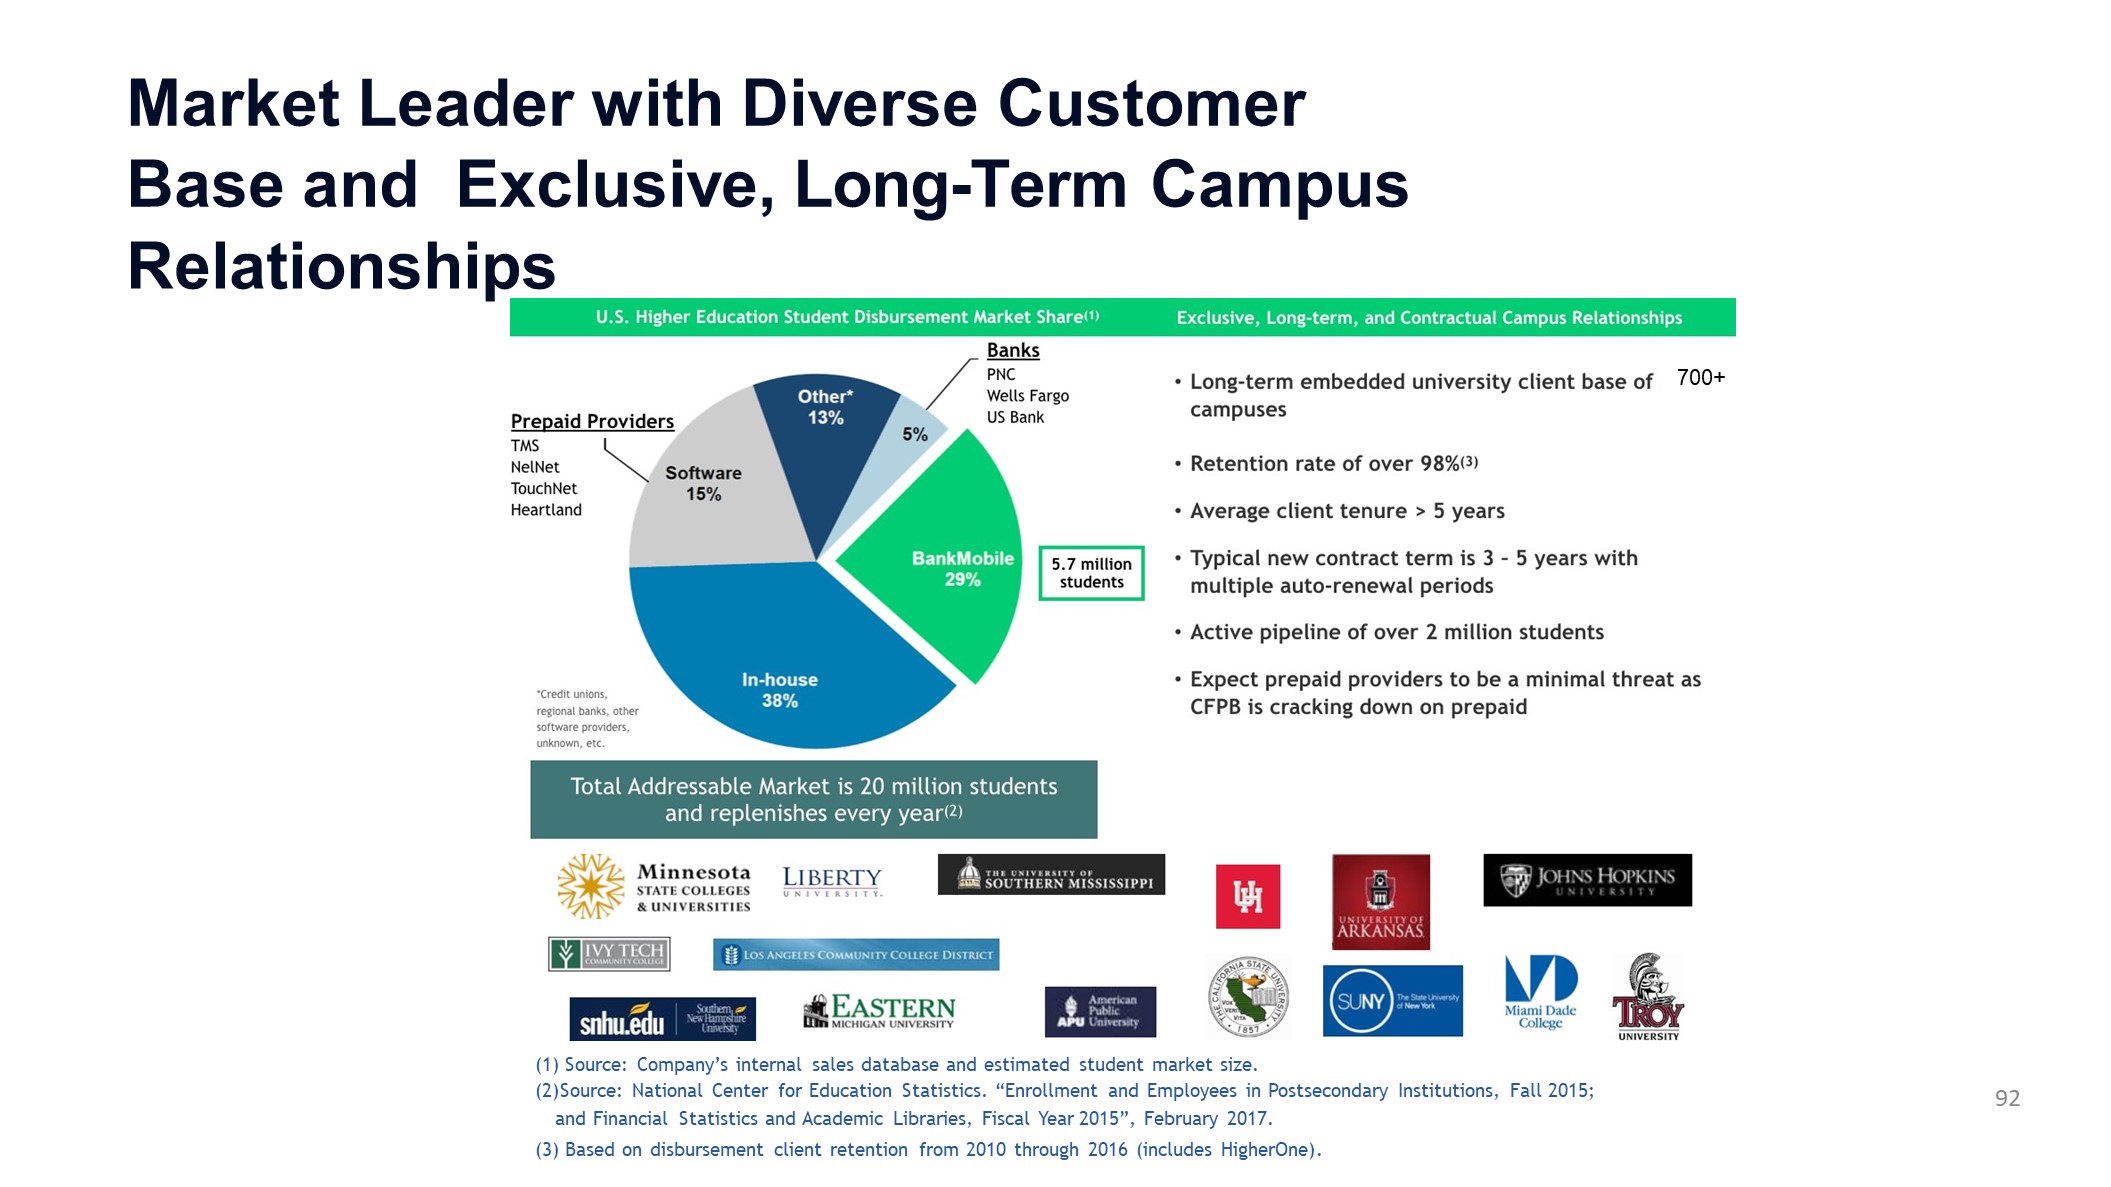
Market Leader with Diverse Customer Base and Exclusive, Long-Term Campus Relationships Source: Company’s internal sales database and estimated student market size.Source: National Center for Education Statistics. “Enrollment and Employees in Postsecondary Institutions, Fall 2015; and Financial Statistics and Academic Libraries, Fiscal Year 2015”, February 2017.Based on disbursement client retention from 2010 through 2016 (includes HigherOne). 700+ 92

Revenue Generating transaction trends $489.57 $962.56 $0 $200 $400 $600 $800 $1,000 $1,200 01/01/2016 to09/30/2016 01/01/2018 to09/30/2018 Organic Deposits Per Transacting Account 97% increase $1,332.05 $1,368.81 $1,310 $1,320 $1,330 $1,340 $1,350 $1,360 $1,370 $1,380 01/01/2016 to09/30/2016 01/01/2018 to09/30/2018 Spending Per New Account (POS) Organic deposits per transacting account has increased by 97% in 2018 when compared to same period in 2016. Point of sale spending among newer accounts shows a 3% increase in 2018 when compared to same time period in 2016. 3% increase 93

76% of Existing Student Customers Surveyed Likely to Use BankMobile VIBE Post-Graduation 94
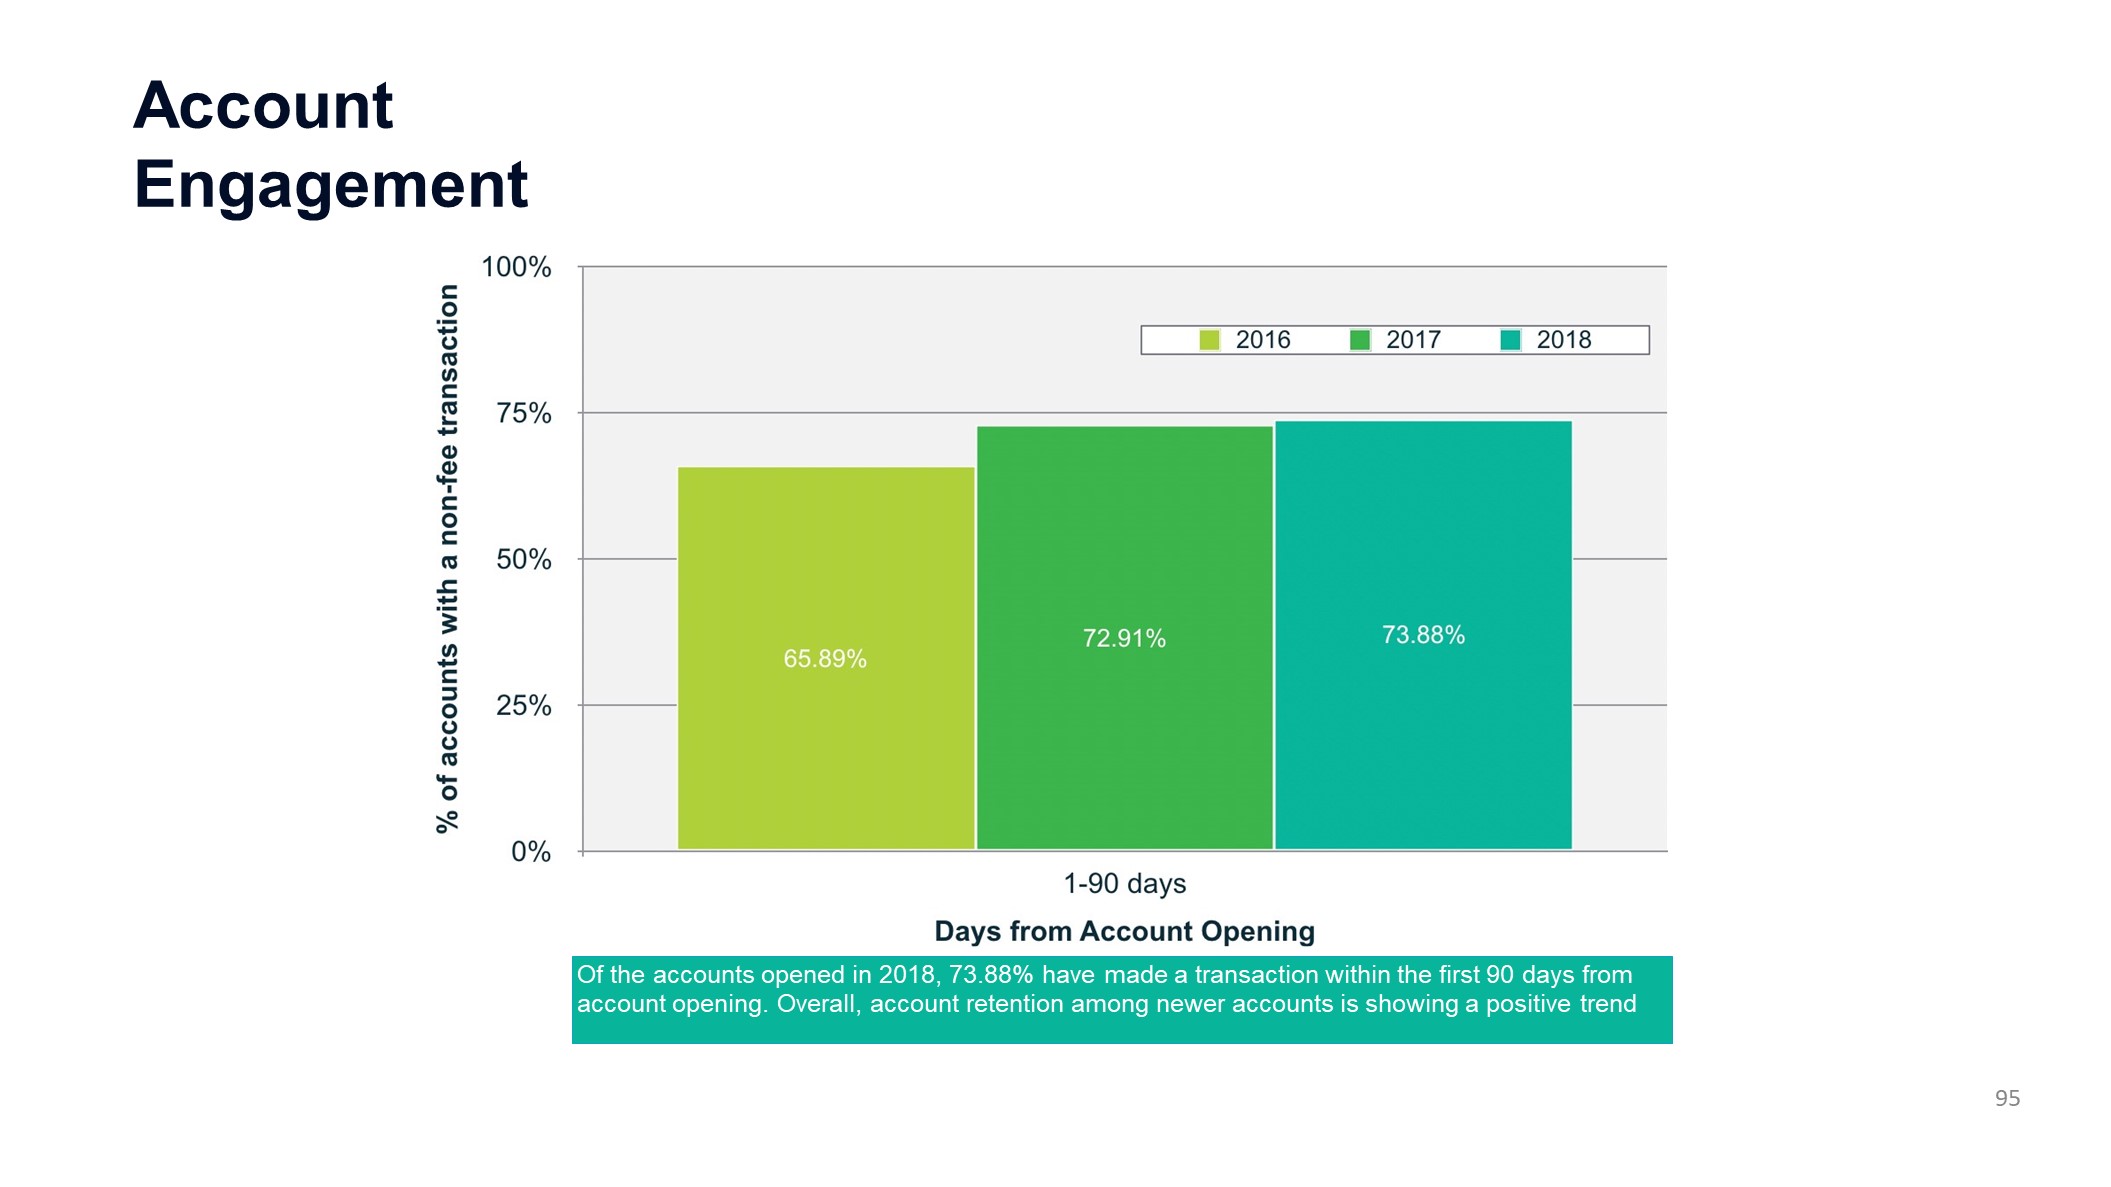
Account Engagement Of the accounts opened in 2018, 73.88% have made a transaction within the first 90 days from account opening. Overall, account retention among newer accounts is showing a positive trend 95
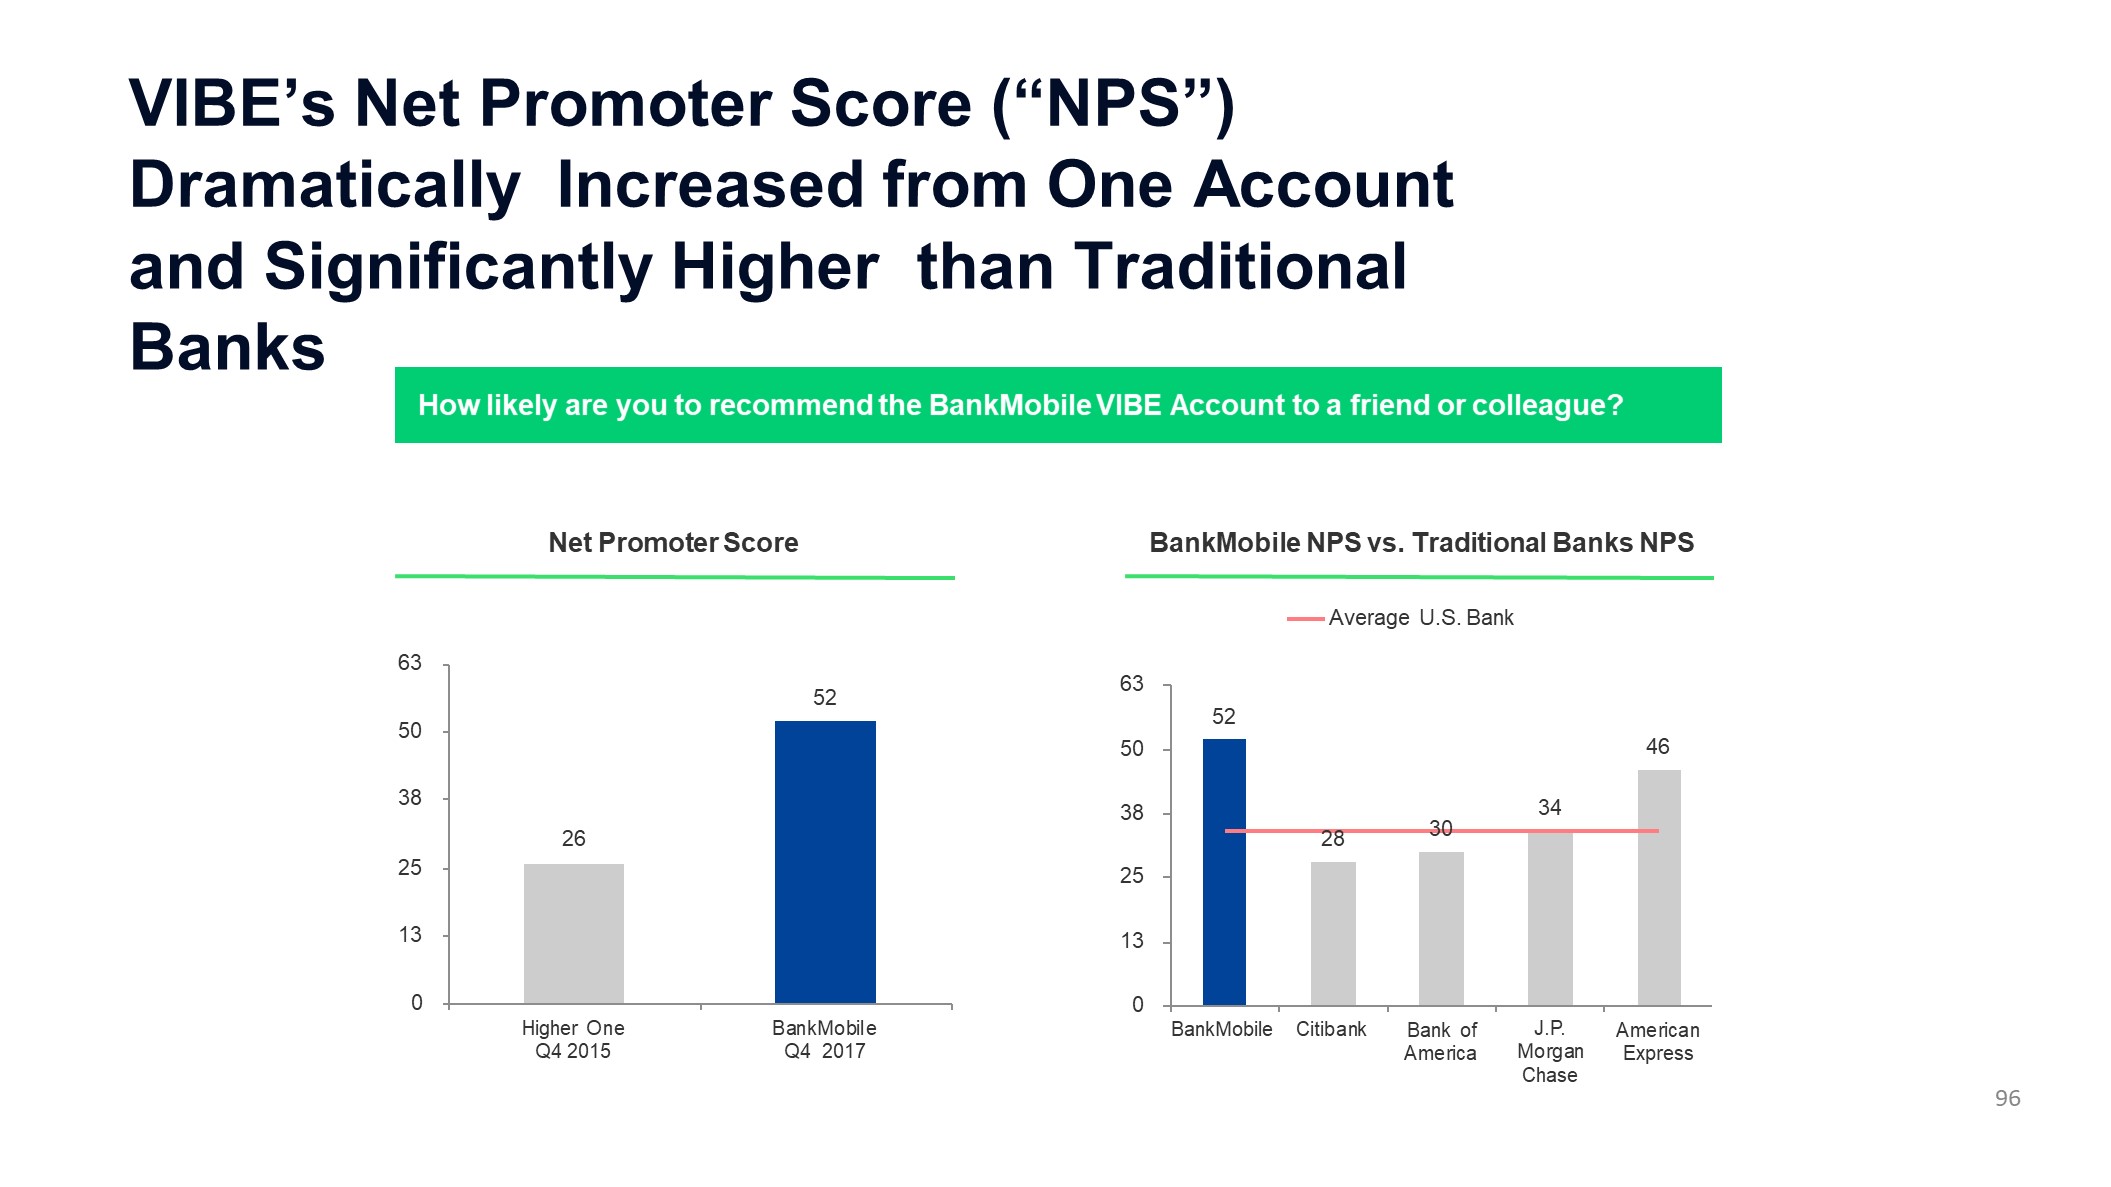
VIBE’s Net Promoter Score (“NPS”) Dramatically Increased from One Account and Significantly Higher than Traditional Banks How likely are you to recommend the BankMobile VIBE Account to a friend or colleague? 26 52 0 13 25 38 50 63 Higher One Q4 2015 BankMobile Q4 2017 52 28 30 34 46 0 13 25 38 50 63 BankMobile Citibank Bank of America J.P.MorganChase American Express Average U.S. Bank Net Promoter Score BankMobile NPS vs. Traditional Banks NPS 96
“Bank as a Service” Model and our unique technology October 2018
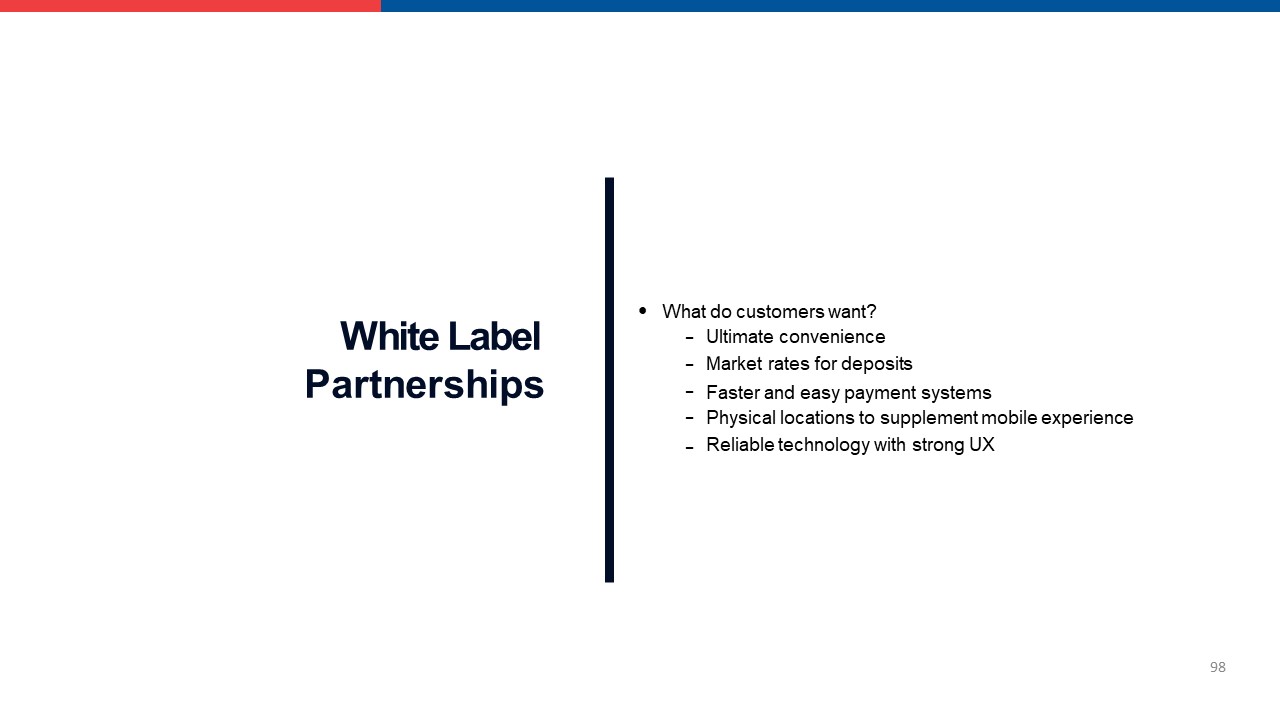
White Label Partnerships • What do customers want? ----- Ultimate convenience Market rates for depositsFaster and easy payment systemsPhysical locations to supplement mobile experience Reliable technology with strong UX 98
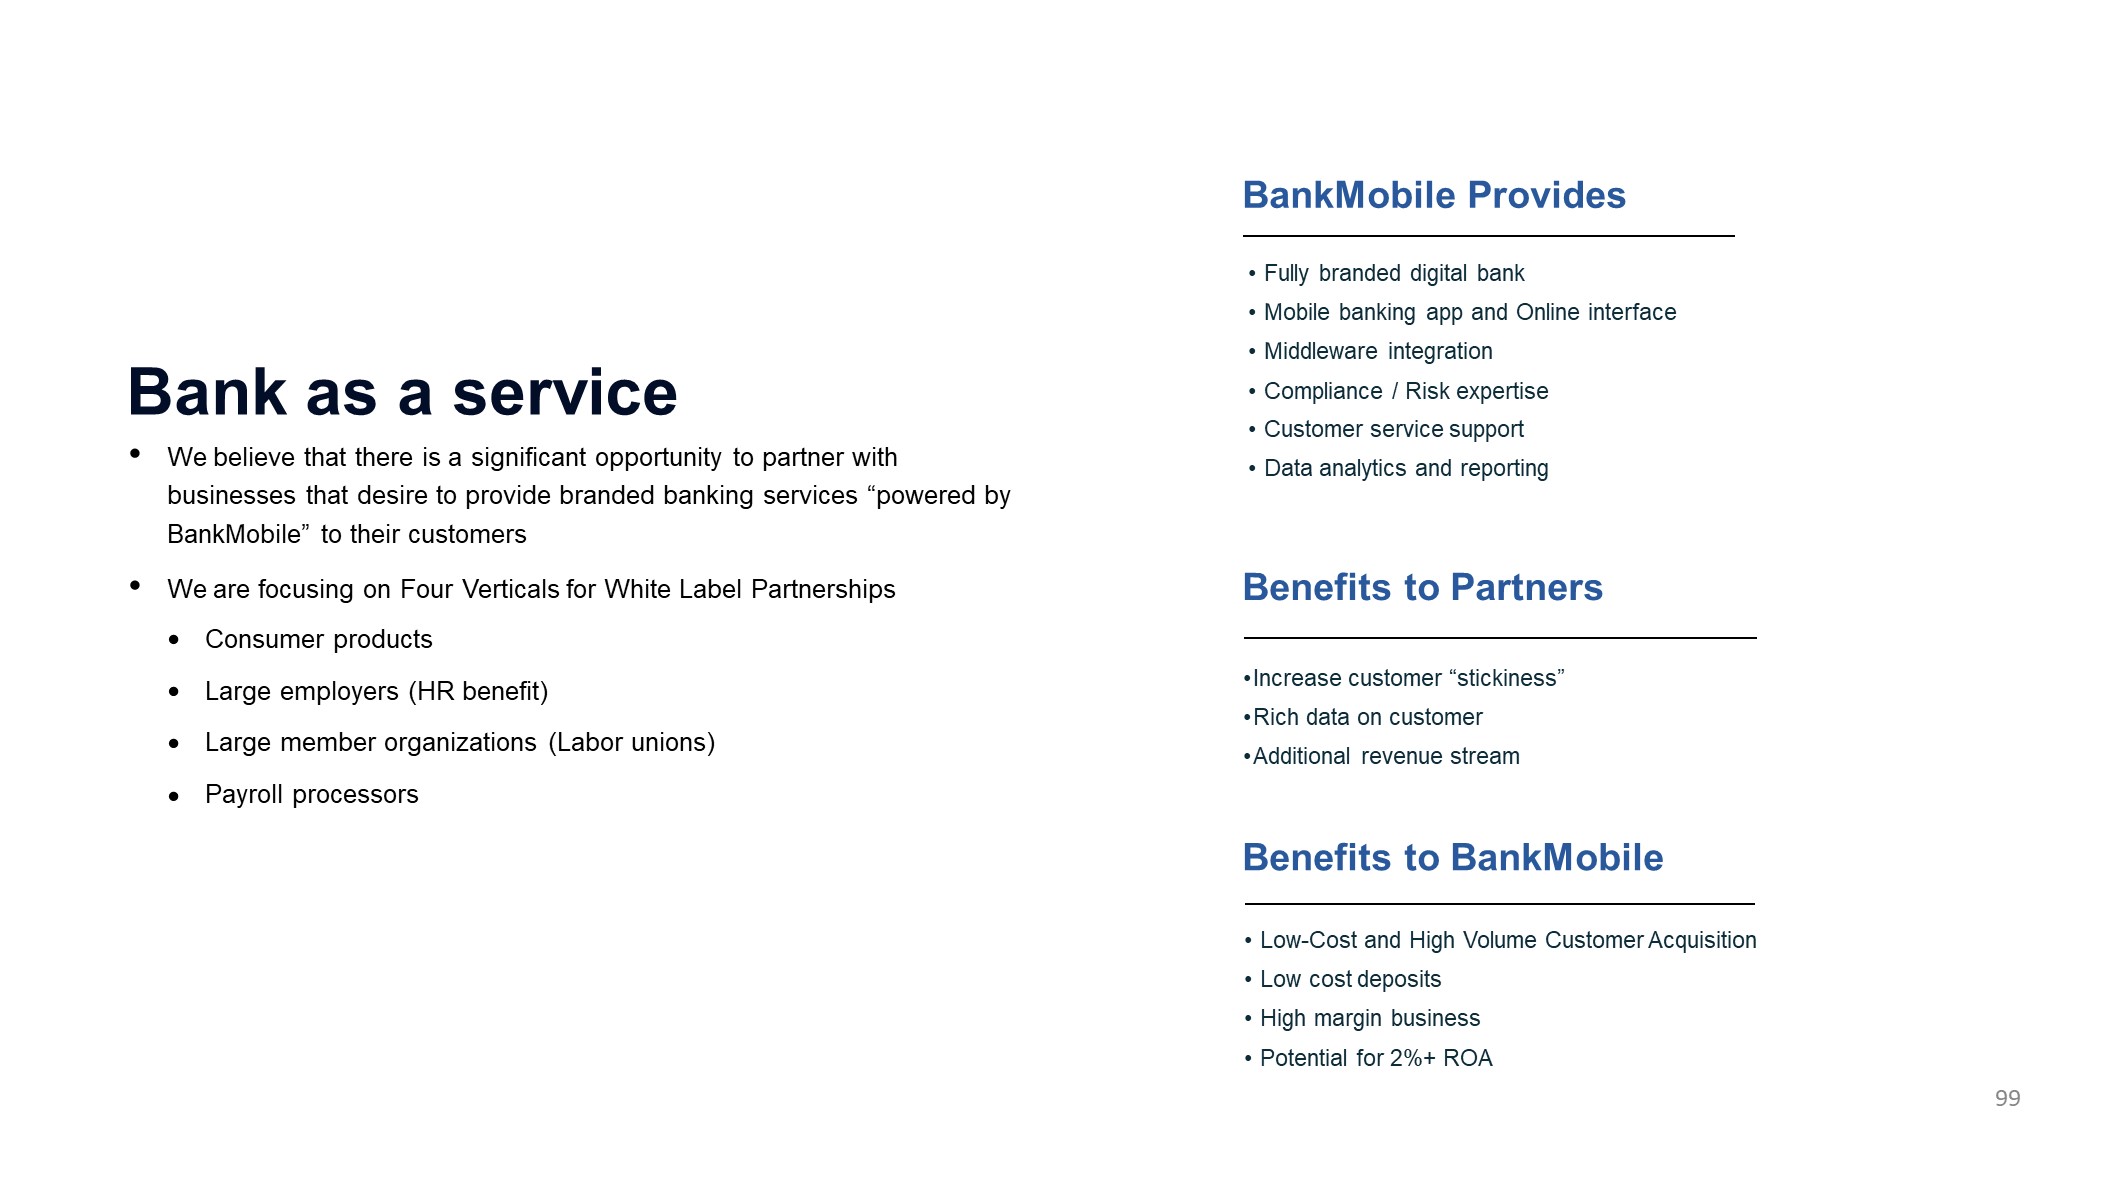
Bank as a serviceWe believe that there is a significant opportunity to partner with businesses that desire to provide branded banking services “powered by BankMobile” to their customersWe are focusing on Four Verticals for White Label Partnerships Consumer products Large employers (HR benefit) Large member organizations (Labor unions) •••• Payroll processors Fully branded digital bankMobile banking app and Online interfaceMiddleware integrationCompliance / Risk expertiseCustomer service supportData analytics and reporting Increase customer “stickiness”Rich data on customerAdditional revenue stream BankMobile Provides Low-Cost and High Volume Customer AcquisitionLow cost depositsHigh margin businessPotential for 2%+ ROA 99 Benefits to Partners Benefits to BankMobile
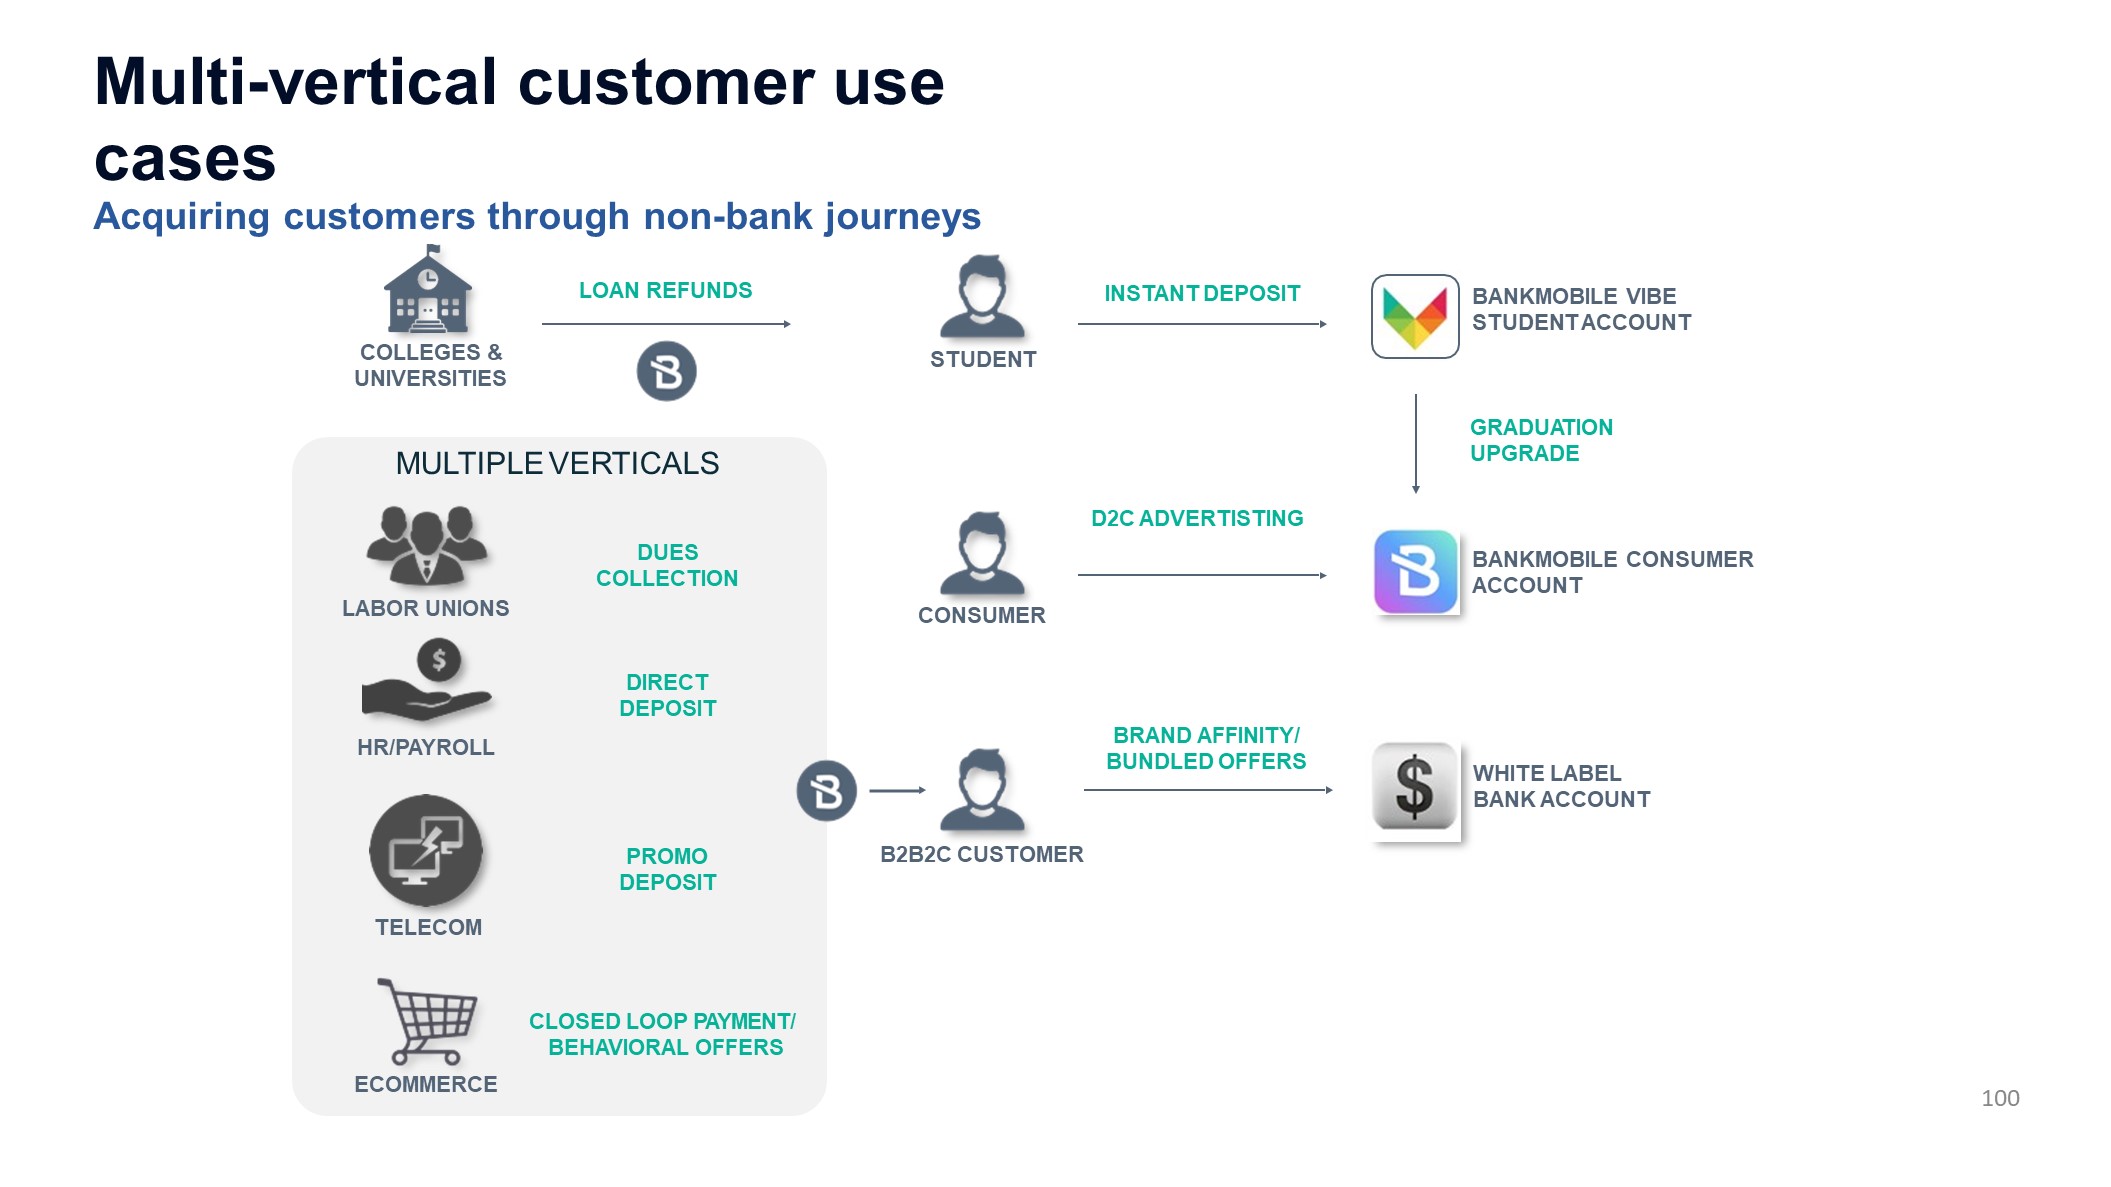
MULTIPLE VERTICALS COLLEGES & UNIVERSITIES STUDENT LOAN REFUNDS BANKMOBILE VIBE STUDENT ACCOUNT BANKMOBILE CONSUMER ACCOUNT GRADUATION UPGRADE CONSUMER D2C ADVERTISTING LABOR UNIONS B2B2C CUSTOMER DUES COLLECTION HR/PAYROLL INSTANT DEPOSIT TELECOM WHITE LABEL BANK ACCOUNT BRAND AFFINITY/ BUNDLED OFFERS DIRECT DEPOSIT ECOMMERCE PROMO DEPOSIT CLOSED LOOP PAYMENT/ BEHAVIORAL OFFERS Multi-vertical customer use casesAcquiring customers through non-bank journeys 100
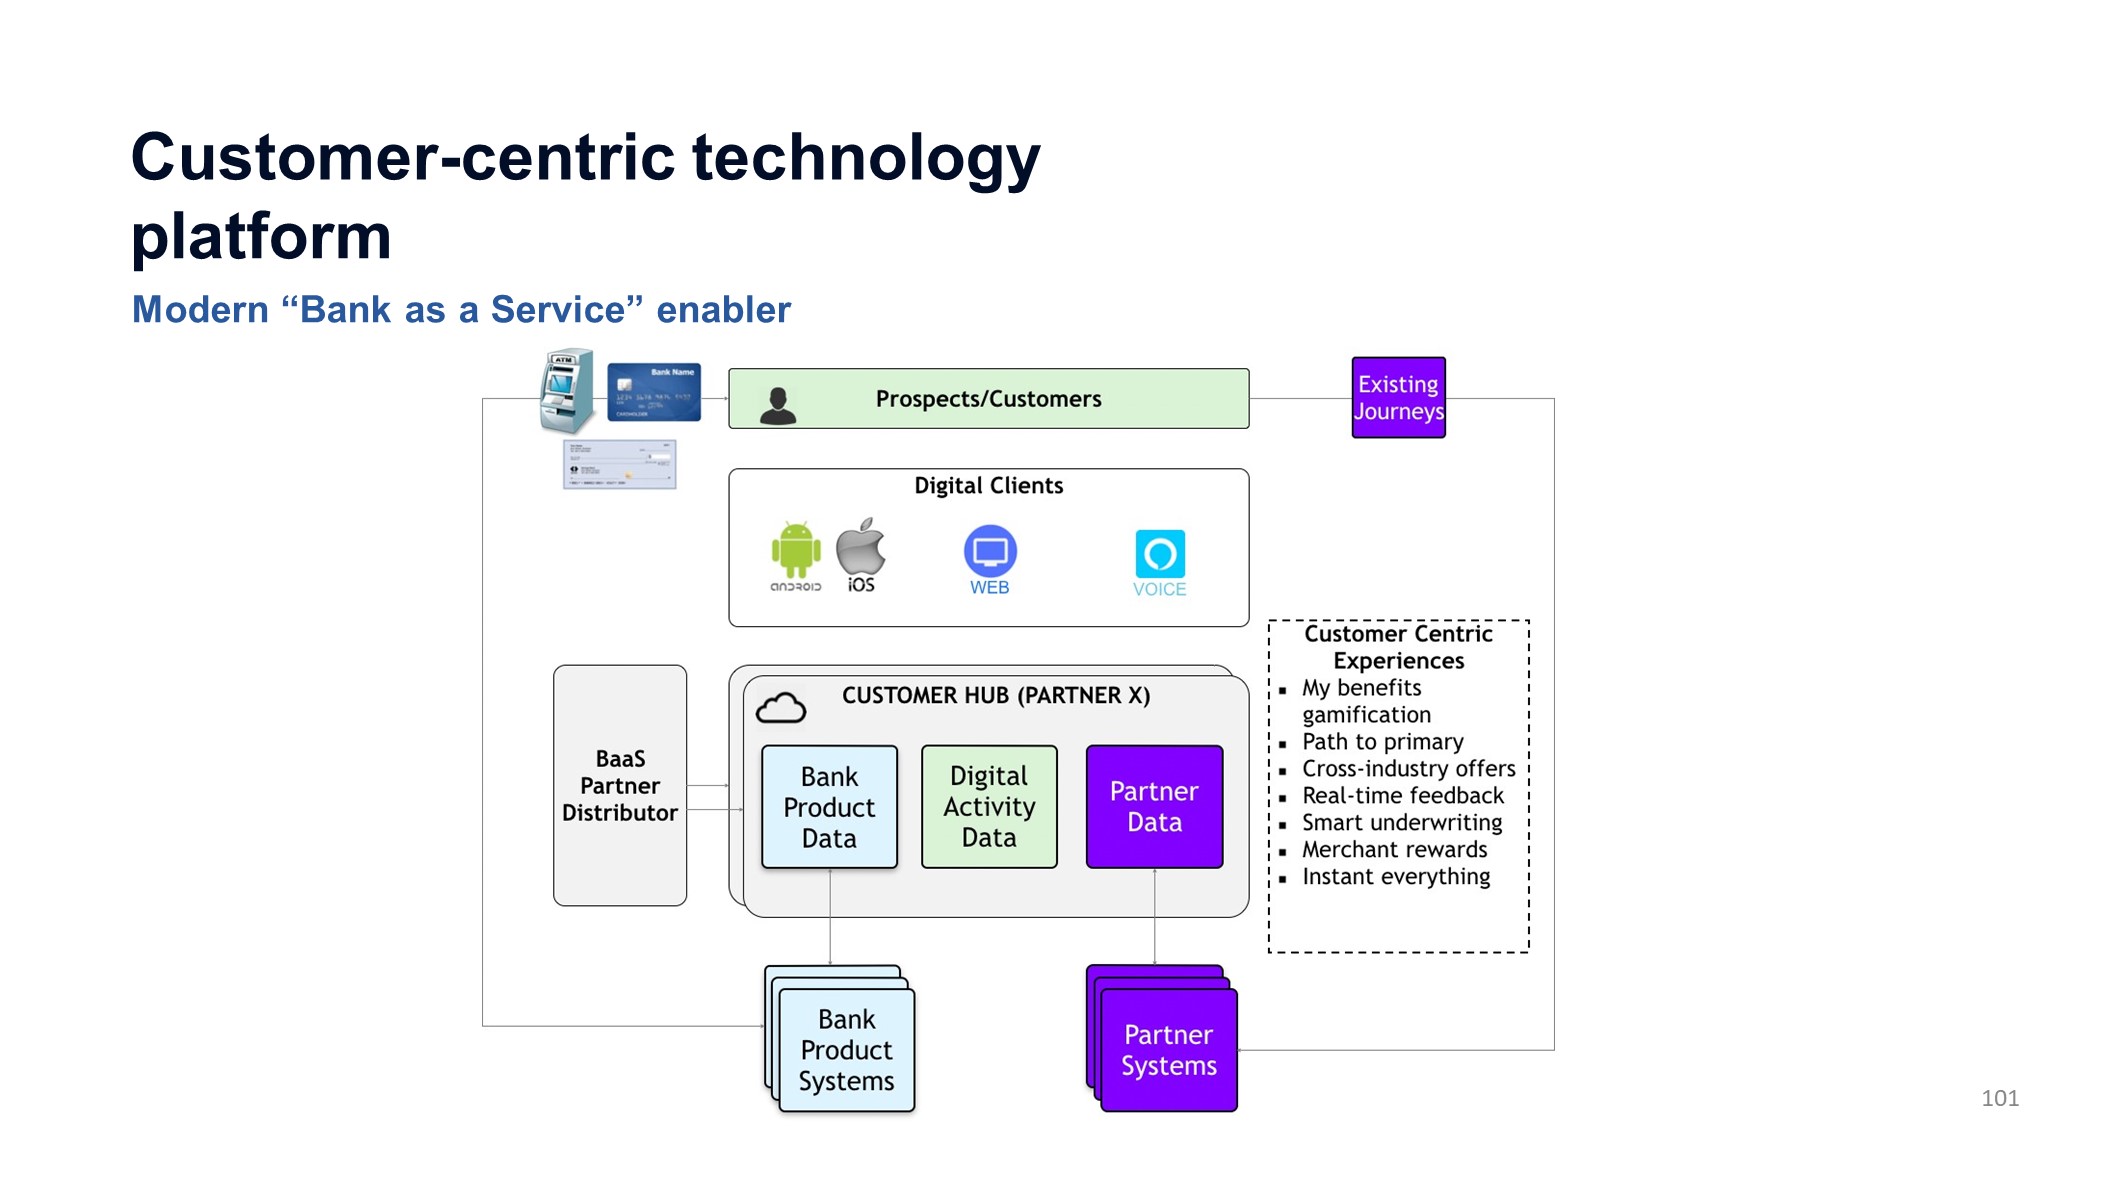
Customer-centric technology platformModern “Bank as a Service” enabler 101

3 Year Growth Goals October 2018
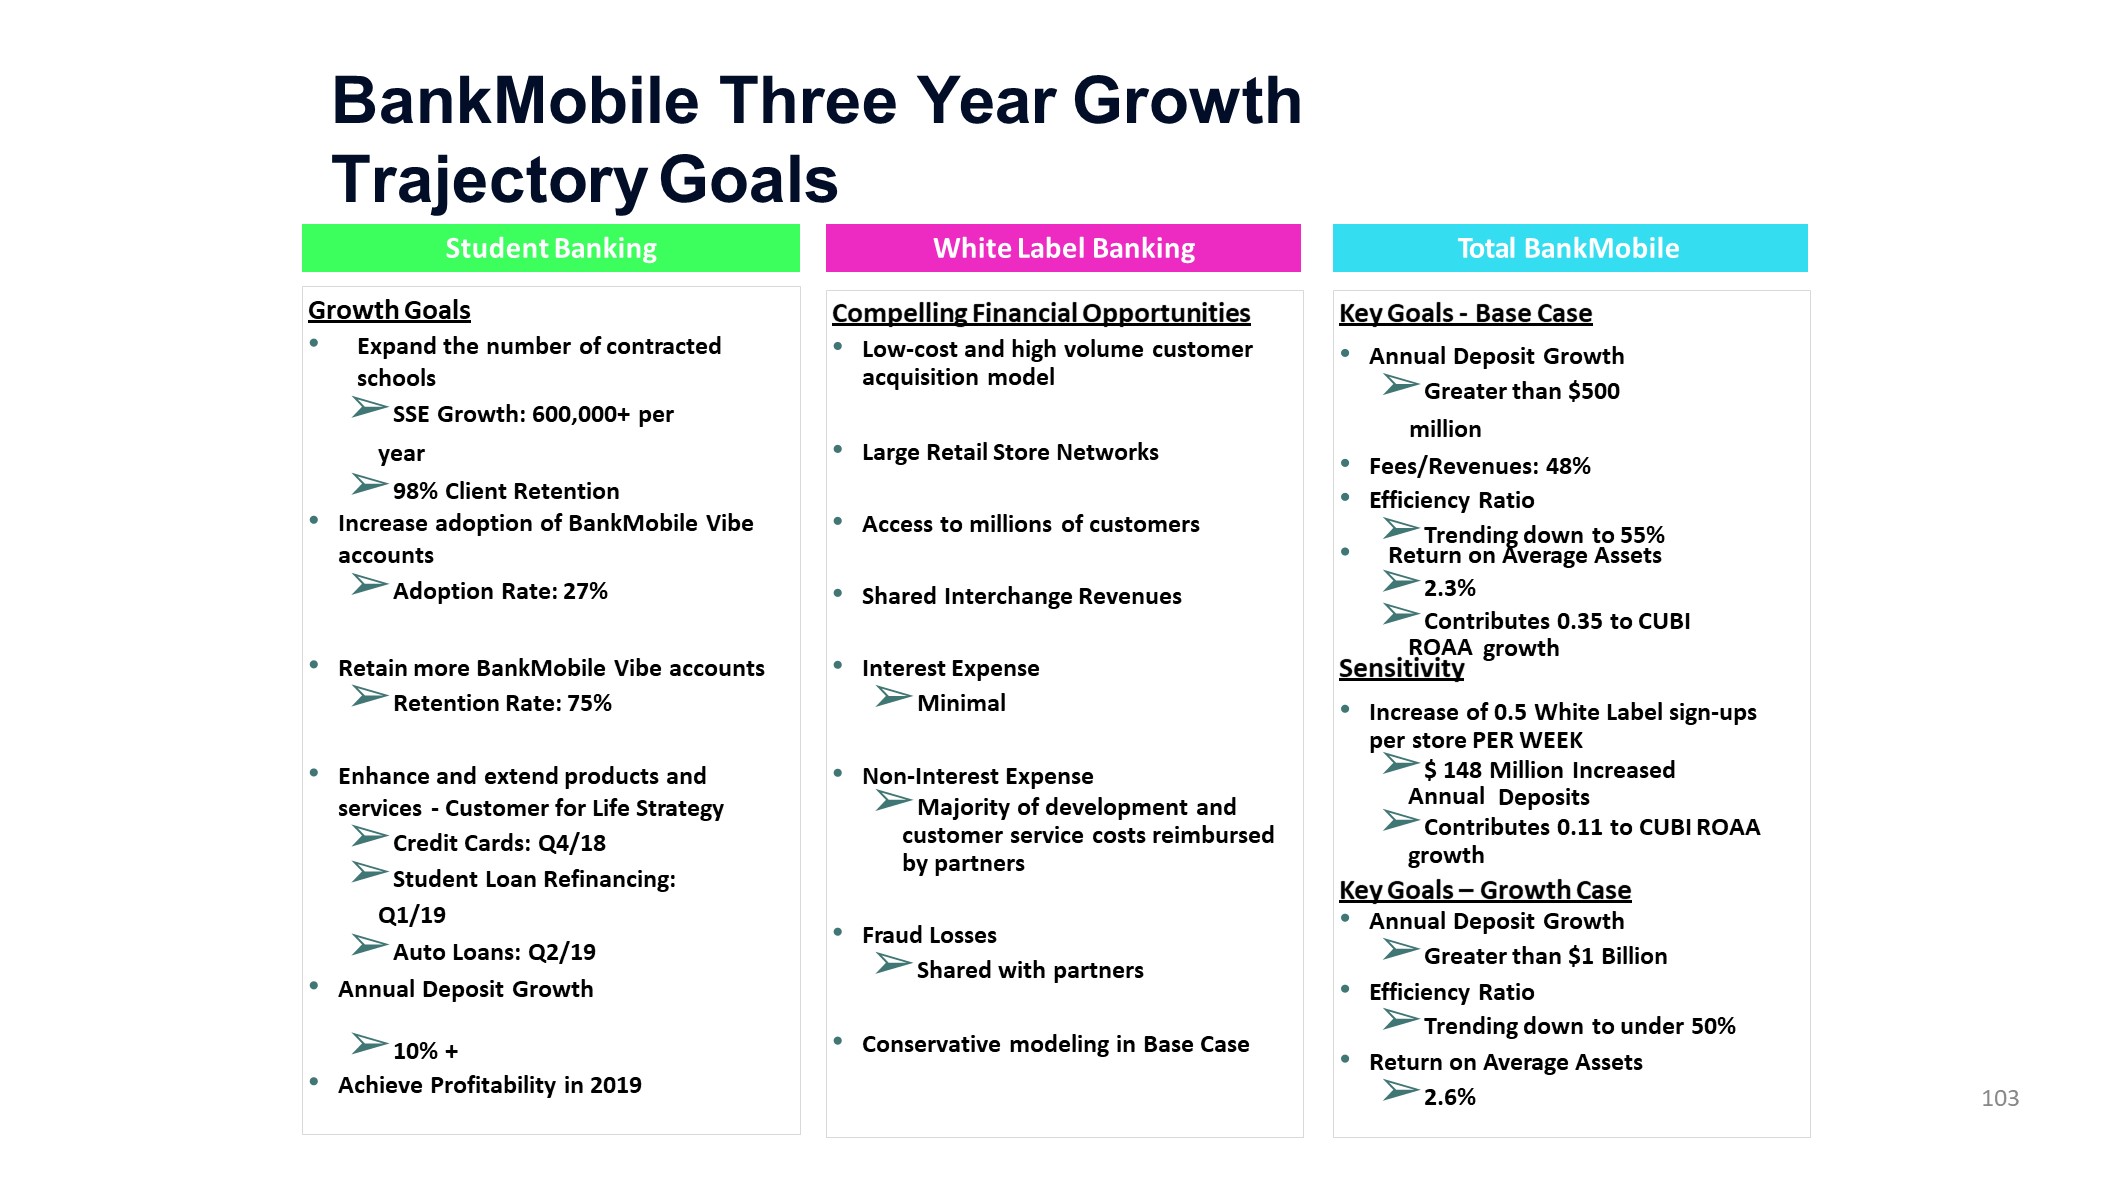
BankMobile Three Year Growth Trajectory Goals Student Banking White Label Banking Total BankMobile Growth GoalsExpand the number of contracted schoolsSSE Growth: 600,000+ per year98% Client Retention Increase adoption of BankMobile Vibe accountsAdoption Rate: 27% Retain more BankMobile Vibe accountsRetention Rate: 75% Enhance and extend products and services - Customer for Life StrategyCredit Cards: Q4/18Student Loan Refinancing: Q1/19Auto Loans: Q2/19Annual Deposit Growth10% +Achieve Profitability in 2019 Compelling Financial OpportunitiesLow-cost and high volume customer acquisition modelLarge Retail Store NetworksAccess to millions of customersShared Interchange RevenuesInterest ExpenseMinimalNon-Interest ExpenseMajority of development and customer service costs reimbursed by partnersFraud LossesShared with partnersConservative modeling in Base Case Key Goals - Base CaseAnnual Deposit GrowthGreater than $500 millionFees/Revenues: 48%Efficiency RatioTrending down to 55% Return on Average Assets2.3%Contributes 0.35 to CUBI ROAA growth SensitivityIncrease of 0.5 White Label sign-ups per store PER WEEK$ 148 Million Increased Annual DepositsContributes 0.11 to CUBI ROAA growthKey Goals – Growth CaseAnnual Deposit GrowthGreater than $1 BillionEfficiency RatioTrending down to under 50%Return on Average Assets2.6% 103
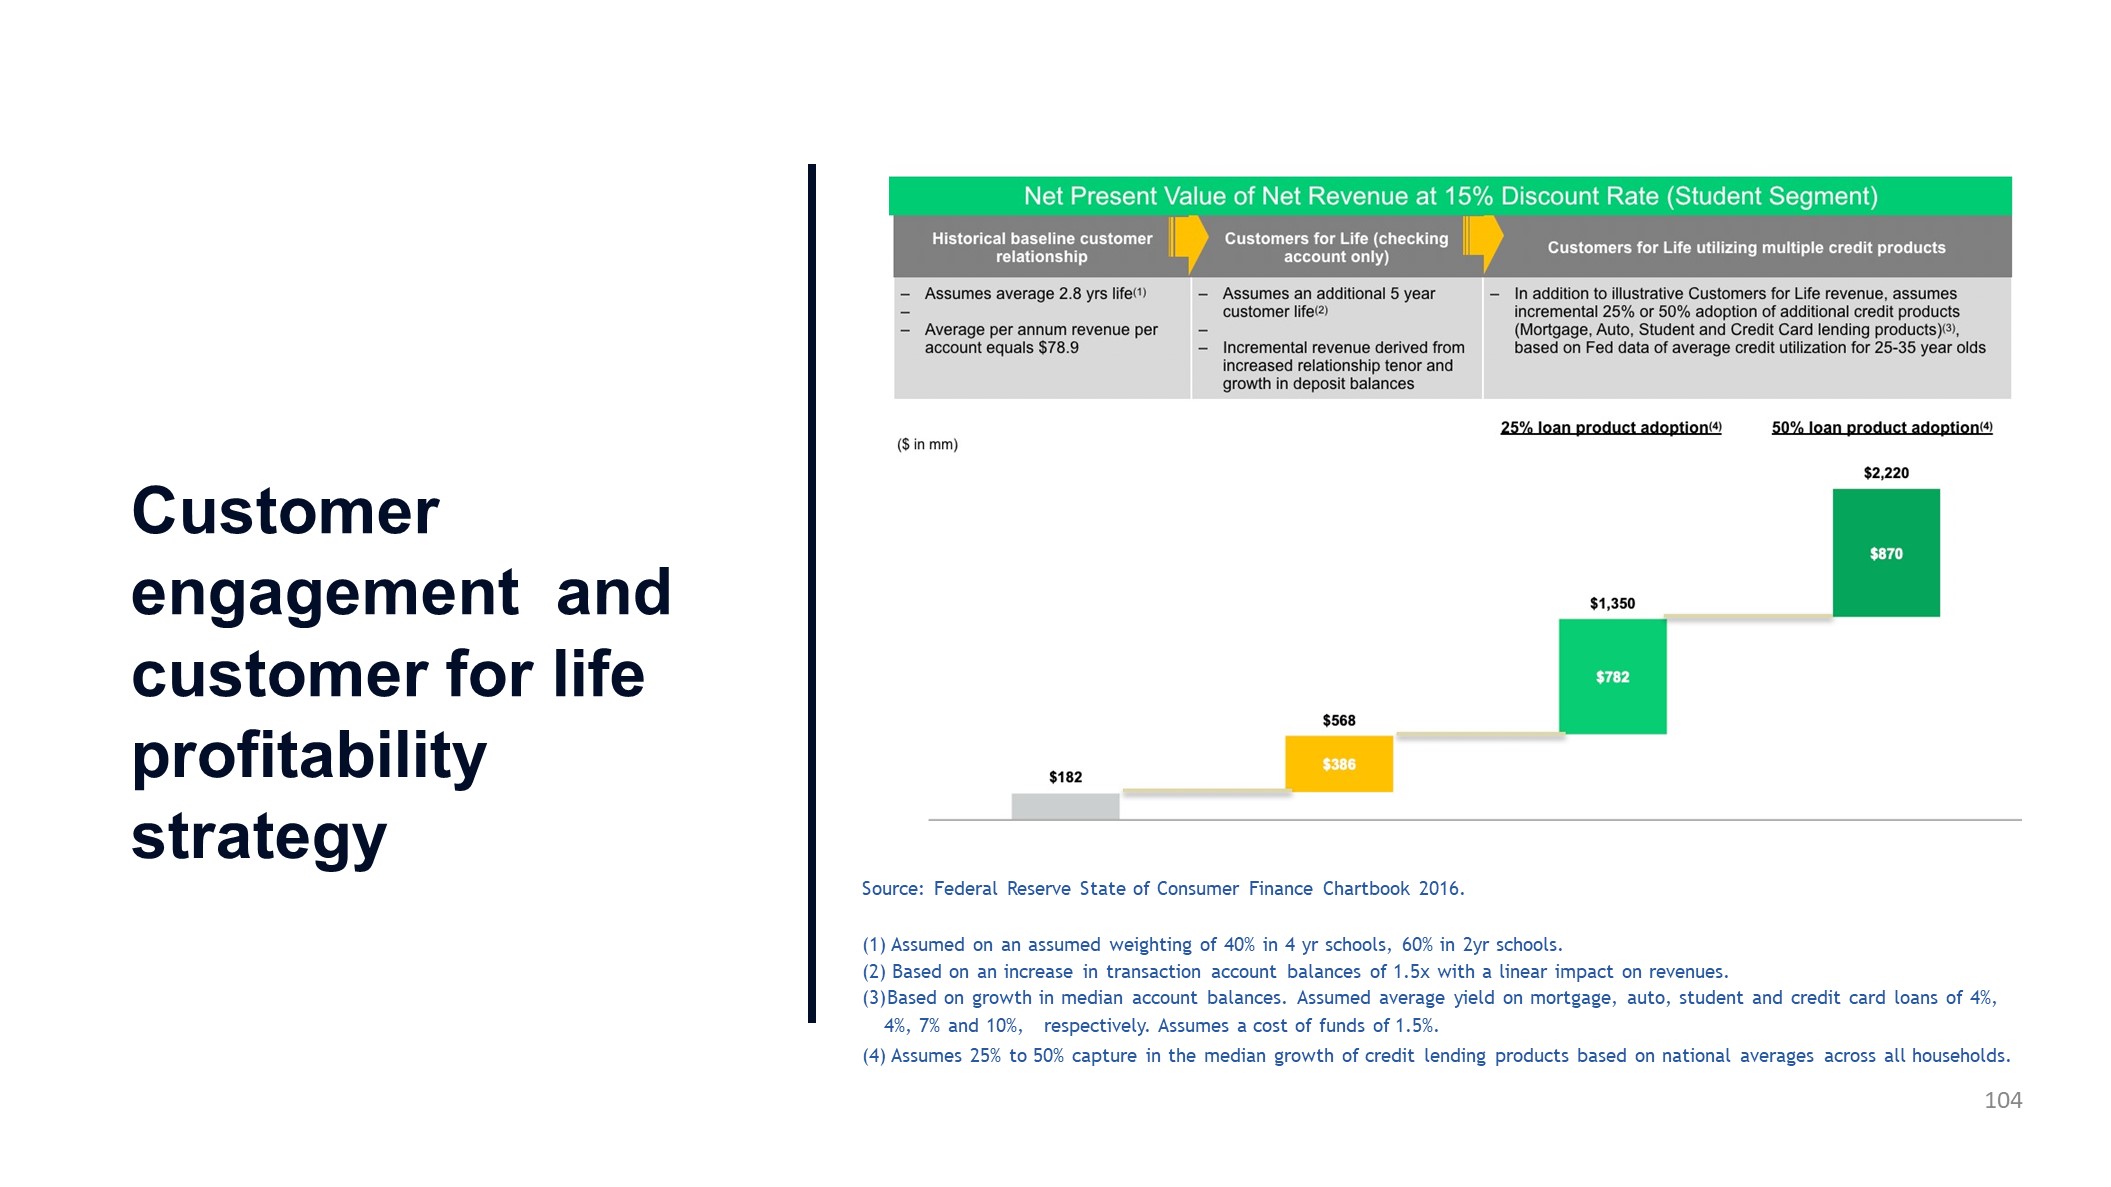
Customer engagement and customer for life profitability strategy Source: Federal Reserve State of Consumer Finance Chartbook 2016.Assumed on an assumed weighting of 40% in 4 yr schools, 60% in 2yr schools.Based on an increase in transaction account balances of 1.5x with a linear impact on revenues.Based on growth in median account balances. Assumed average yield on mortgage, auto, student and credit card loans of 4%, 4%, 7% and 10%, respectively. Assumes a cost of funds of 1.5%.Assumes 25% to 50% capture in the median growth of credit lending products based on national averages across all households.104

Where are we heading? October 2018
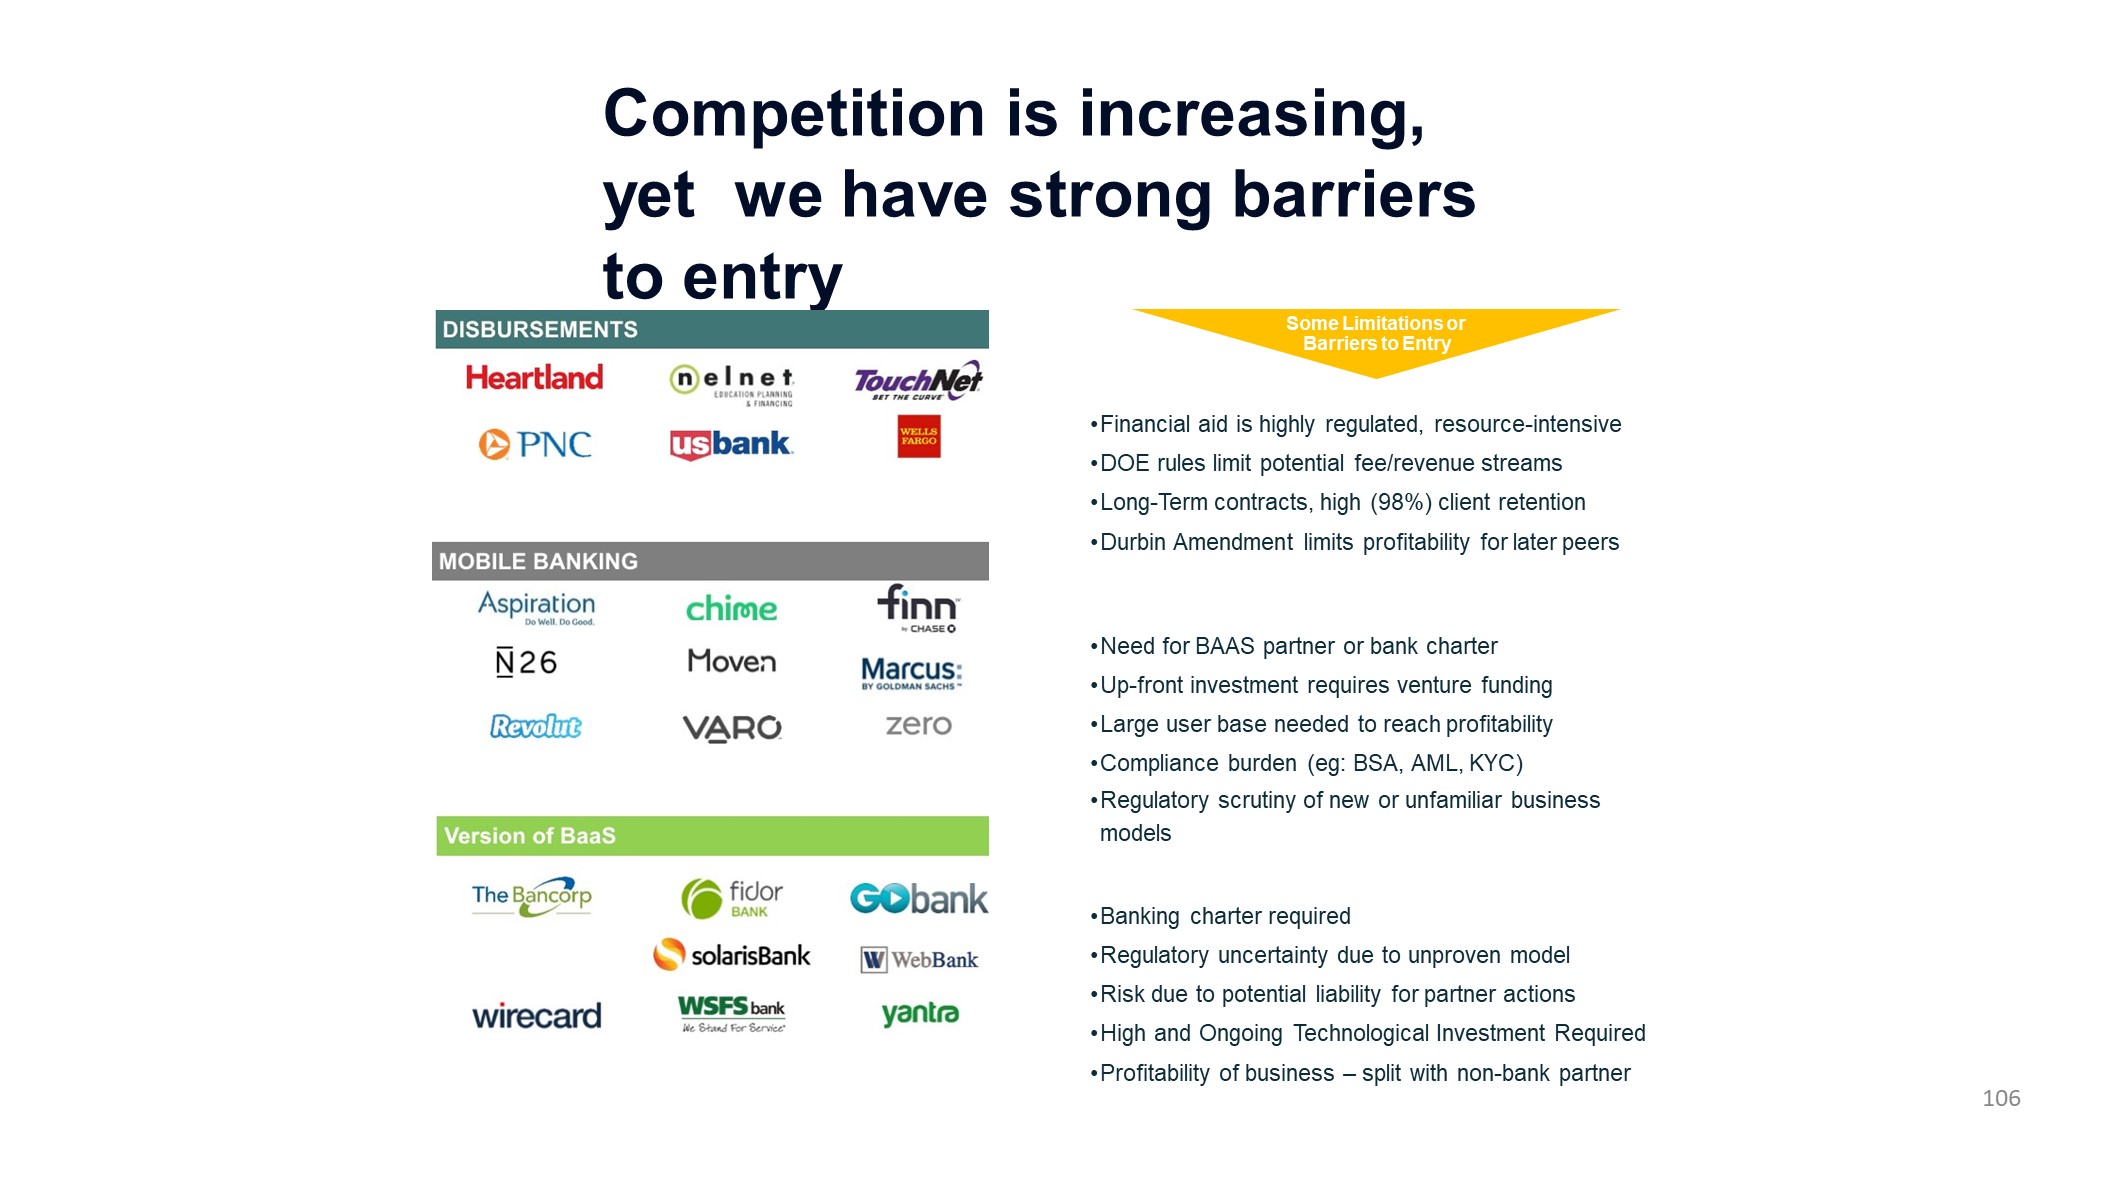
Competition is increasing, yet we have strong barriers to entry Financial aid is highly regulated, resource-intensiveDOE rules limit potential fee/revenue streamsLong-Term contracts, high (98%) client retentionDurbin Amendment limits profitability for later peersNeed for BAAS partner or bank charterUp-front investment requires venture fundingLarge user base needed to reach profitabilityCompliance burden (eg: BSA, AML, KYC)Regulatory scrutiny of new or unfamiliar business modelsBanking charter requiredRegulatory uncertainty due to unproven modelRisk due to potential liability for partner actionsHigh and Ongoing Technological Investment RequiredProfitability of business – split with non-bank partner Some Limitations or Barriers to Entry 106
Goals for the Next 2-3 Years •••• 107 Attracting over a million checking accounts per yearTop 5 bank in the country in terms of # of checking accounts Strong brand presence and perceived as a world-class digital bank Standalone ROAA in 2% range


Appendix October 2018
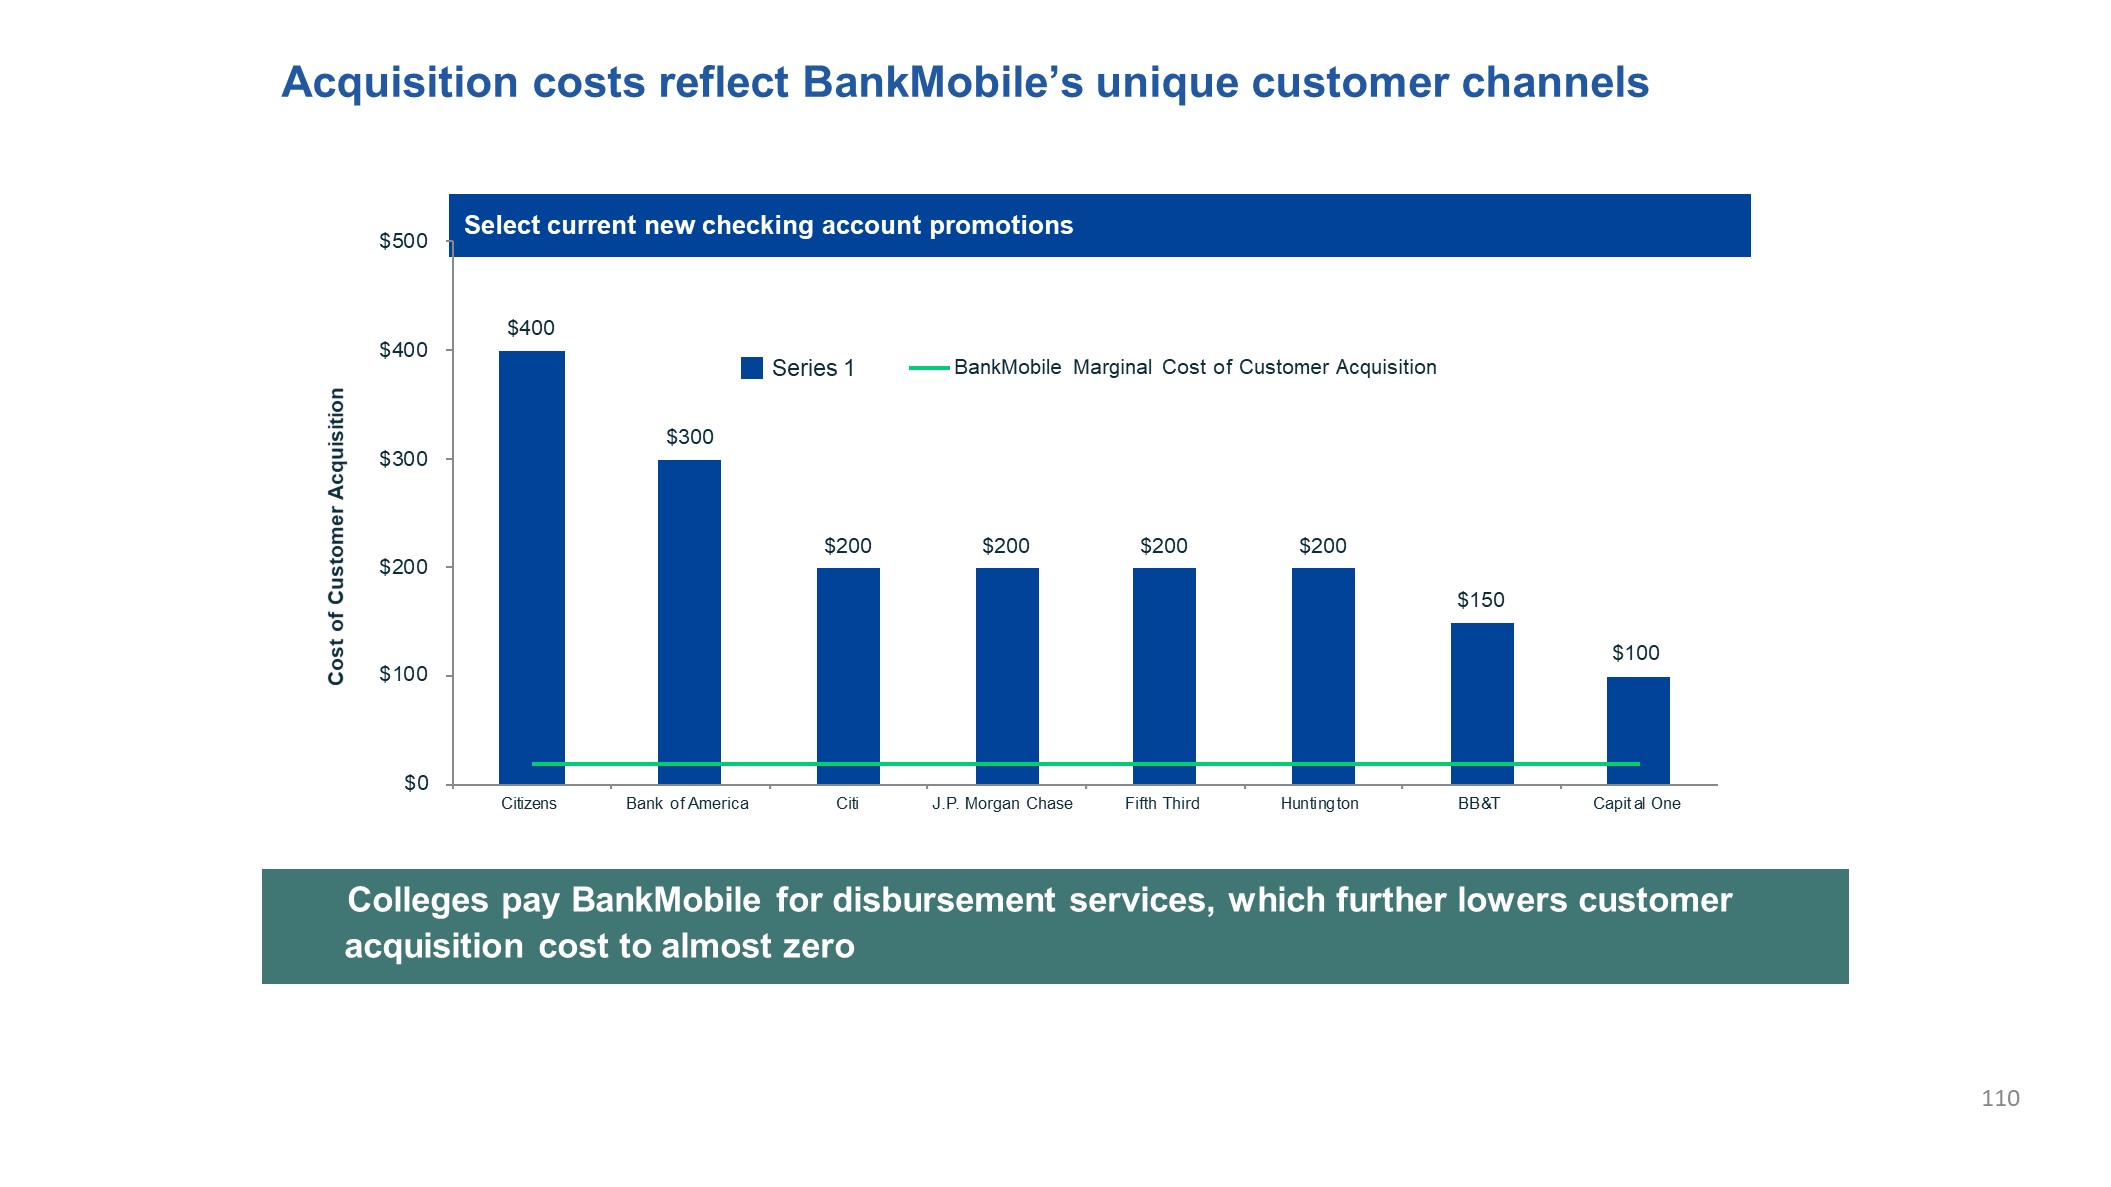
Acquisition costs reflect BankMobile’s unique customer channels 110 Select current new checking account promotions Colleges pay BankMobile for disbursement services, which further lowers customer acquisition cost to almost zero $400 $300 $200 $200 $200 $200 $150$100 $0 $100 $200 $300 $400 $500 Citizens Bank of America Citi J.P. Morgan Chase Fifth Third Huntington BB &T Capit al One Cost of Customer Acquisition BankMobile Marginal Cost of Customer Acquisition Series 1
Putting it all togetherBob Ramsey, Director of Investor Relations and Strategic Planning October 2018
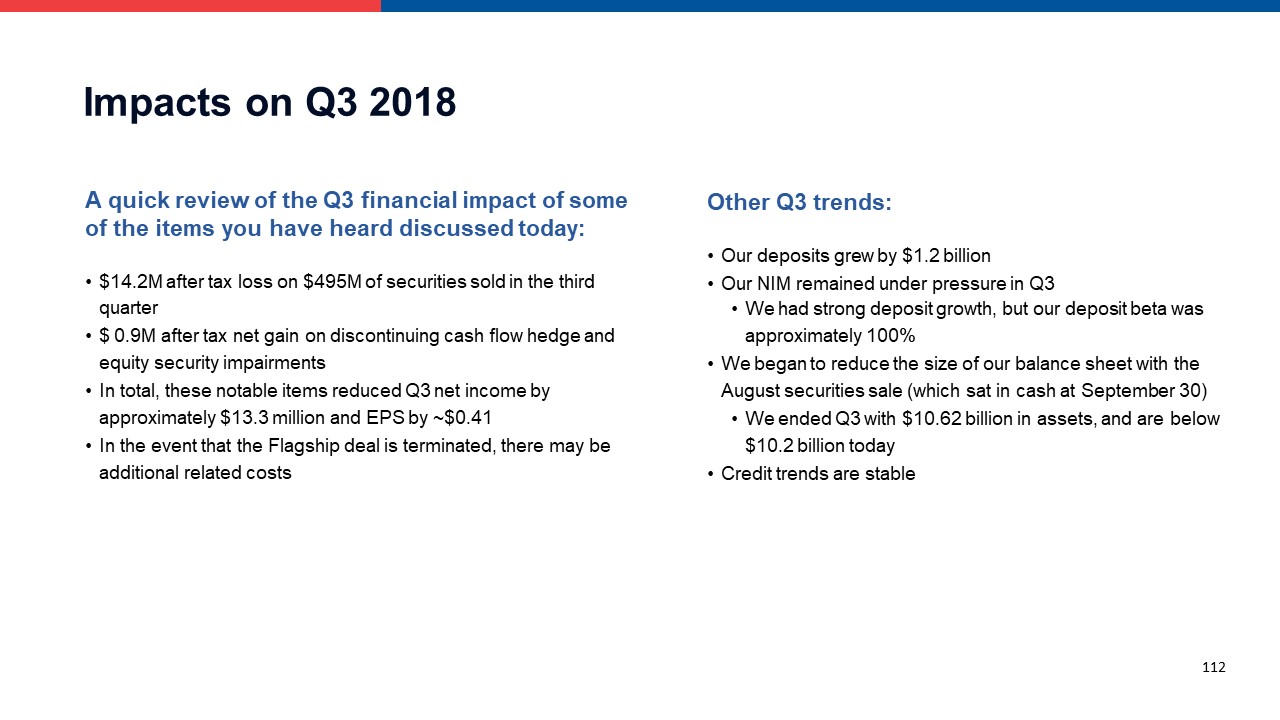
112 Impacts on Q3 2018 A quick review of the Q3 financial impact of some of the items you have heard discussed today:$14.2M after tax loss on $495M of securities sold in the third quarter$ 0.9M after tax net gain on discontinuing cash flow hedge and equity security impairmentsIn total, these notable items reduced Q3 net income by approximately $13.3 million and EPS by ~$0.41In the event that the Flagship deal is terminated, there may be additional related costs Other Q3 trends:Our deposits grew by $1.2 billionOur NIM remained under pressure in Q3We had strong deposit growth, but our deposit beta was approximately 100%We began to reduce the size of our balance sheet with the August securities sale (which sat in cash at September 30)We ended Q3 with $10.62 billion in assets, and are below$10.2 billion todayCredit trends are stable
113 What will CUBI Look Like in 3 Years? Balance Sheet StatementWe plan to stay under $10 billion in assetsWe are adding higher yielding consumer loans but will remain a business bankOur business mix will be ~15% consumer / 85% businessMultifamily will end this year at or below $3.3 billion and trend lowerWe are focused on improving our balance sheet mixReduce higher cost institutional and municipal deposits and FHLB borrowings.Increase core deposit fundingBankMobile expects to generate at least $500M per year in new core deposits
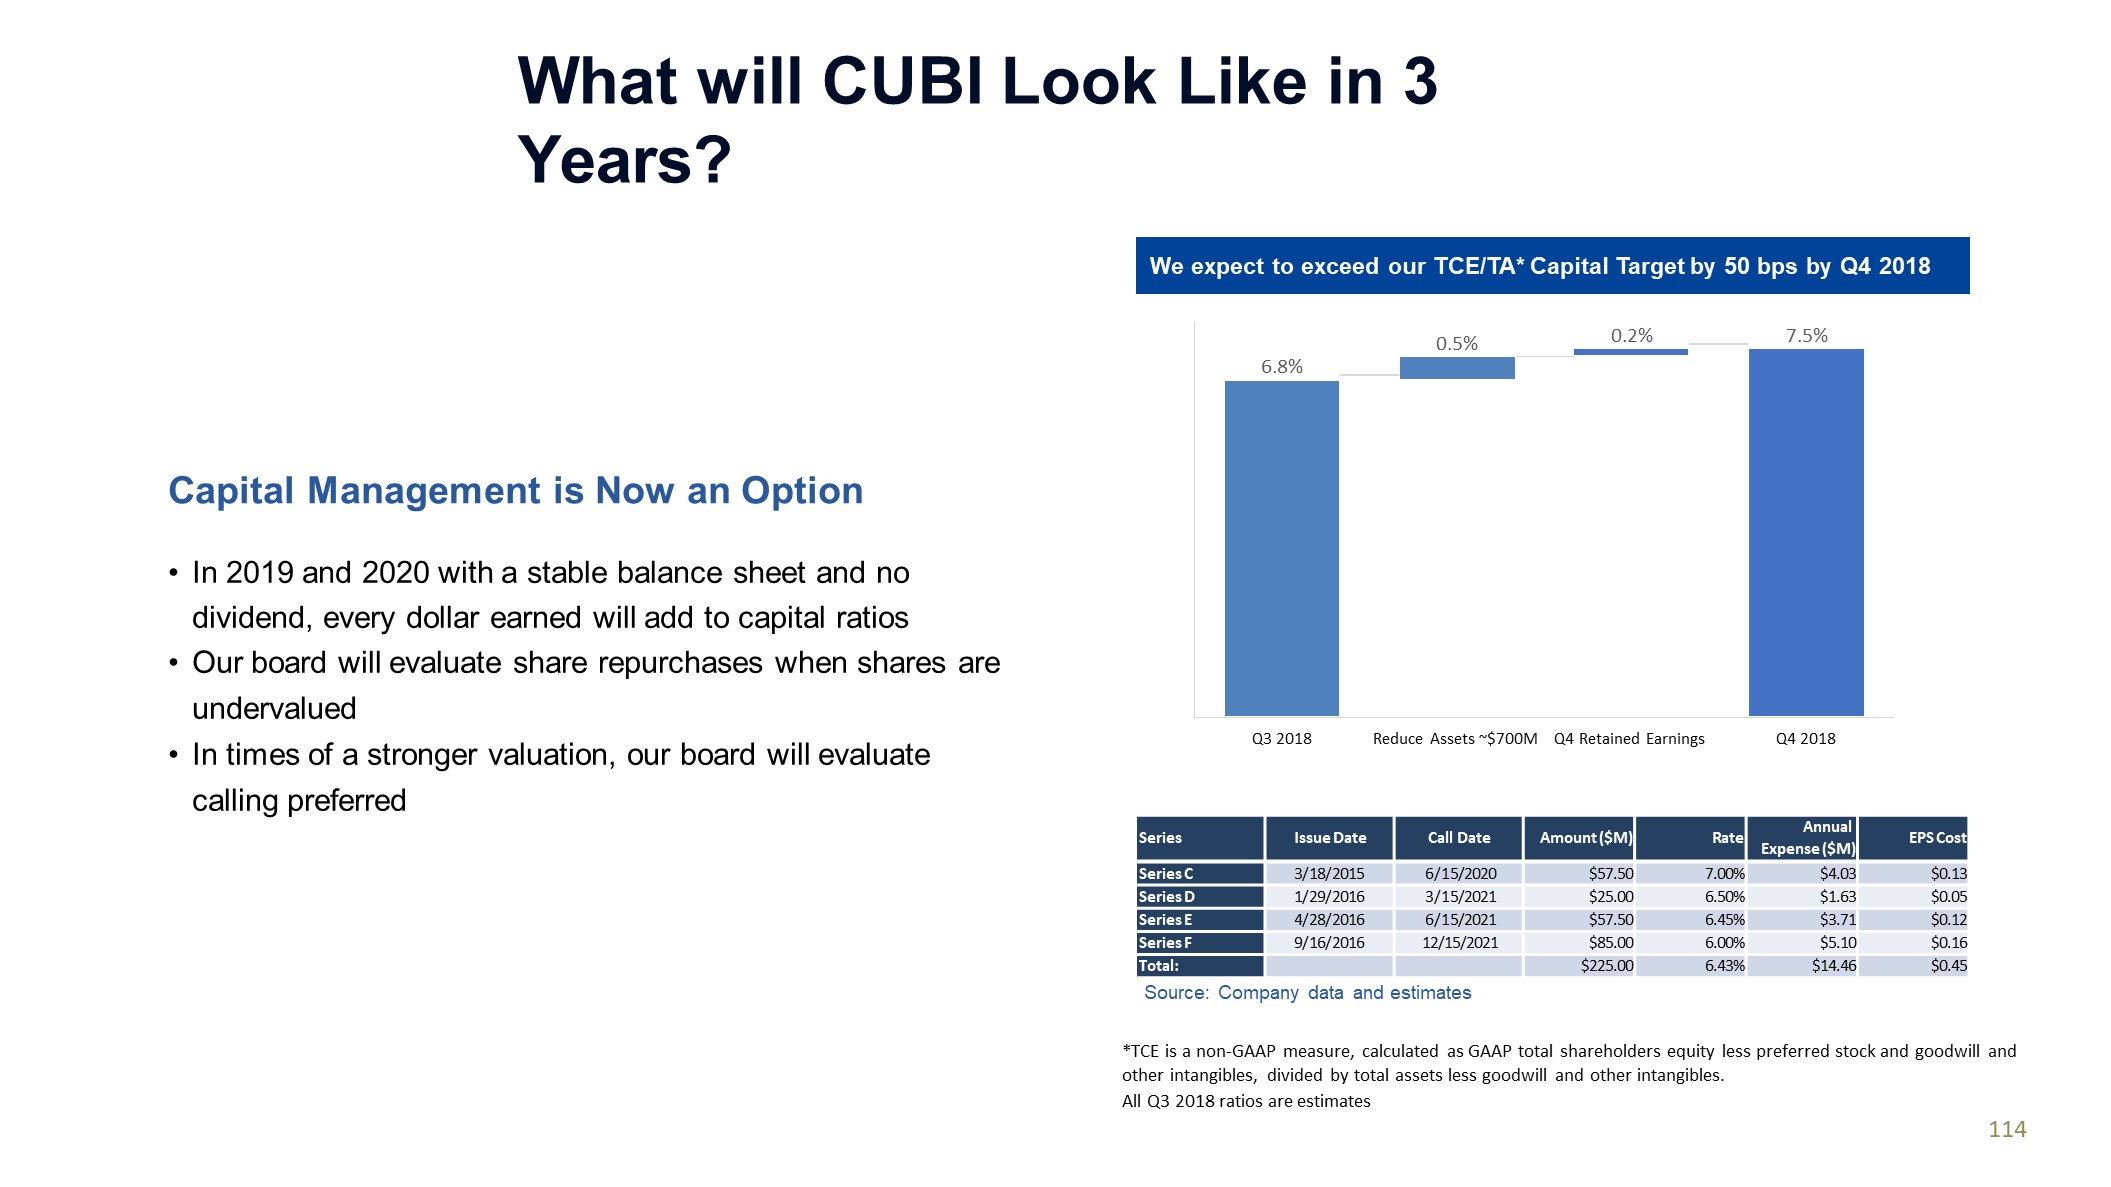
What will CUBI Look Like in 3 Years? Capital Management is Now an Option In 2019 and 2020 with a stable balance sheet and no dividend, every dollar earned will add to capital ratiosOur board will evaluate share repurchases when shares are undervaluedIn times of a stronger valuation, our board will evaluate calling preferred Source: Company data and estimates Series Issue Date Call Date Amount ($M) Rate AnnualExpense ($M) EPS Cost Series C 3/18/2015 6/15/2020 $57.50 7.00% $4.03 $0.13 Series D 1/29/2016 3/15/2021 $25.00 6.50% $1.63 $0.05 Series E 4/28/2016 6/15/2021 $57.50 6.45% $3.71 $0.12 Series F 9/16/2016 12/15/2021 $85.00 6.00% $5.10 $0.16 Total: $225.00 6.43% $14.46 $0.45 *TCE is a non-GAAP measure, calculated as GAAP total shareholders equity less preferred stock and goodwill and other intangibles, divided by total assets less goodwill and other intangibles.All Q3 2018 ratios are estimates114 6.8% 0.5% 0.2% 7.5% Q3 2018 Reduce Assets ~$700M Q4 Retained Earnings Q4 2018 We expect to exceed our TCE/TA* Capital Target by 50 bps by Q4 2018
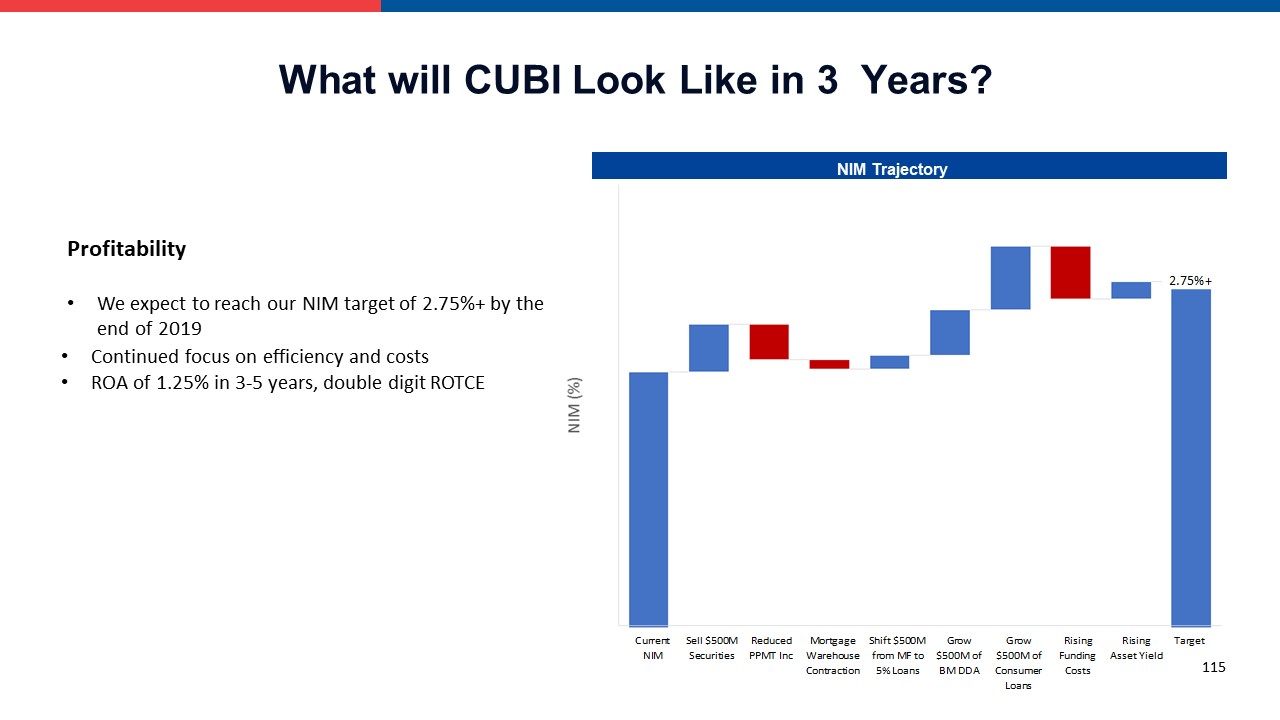
ProfitabilityWe expect to reach our NIM target of 2.75%+ by the end of 2019 Continued focus on efficiency and costsROA of 1.25% in 3-5 years, double digit ROTCE NIM Trajectory What will CUBI Look Like in 3 Years? 115

Q&ASenior executive management OCTOBER 2018
117 Reconciliation of Non-GAAP Measures - Unaudited Customers believes that the non-GAAP measurements disclosed within this document are useful for investors, regulators, management and others to evaluate our results of operations and financial condition relative to other financial institutions. These non-GAAP financial measures exclude from corresponding GAAP measures the impact of certain elements that we do not believe are representative of our financial results, which we believe enhance an overall understanding of our performance. Investors should consider our performance and financial condition as reported under GAAP and all other relevant information when assessing our performance or financial condition. Although non-GAAP financial measures are frequently used in the evaluation of a company, they have limitations as analytical tools and should not be considered in isolation or as a substitute for analysis of our results of operations or financial condition as reported under GAAP.The following tables present reconciliations of GAAP to Non-GAAP measures disclosed within this document.
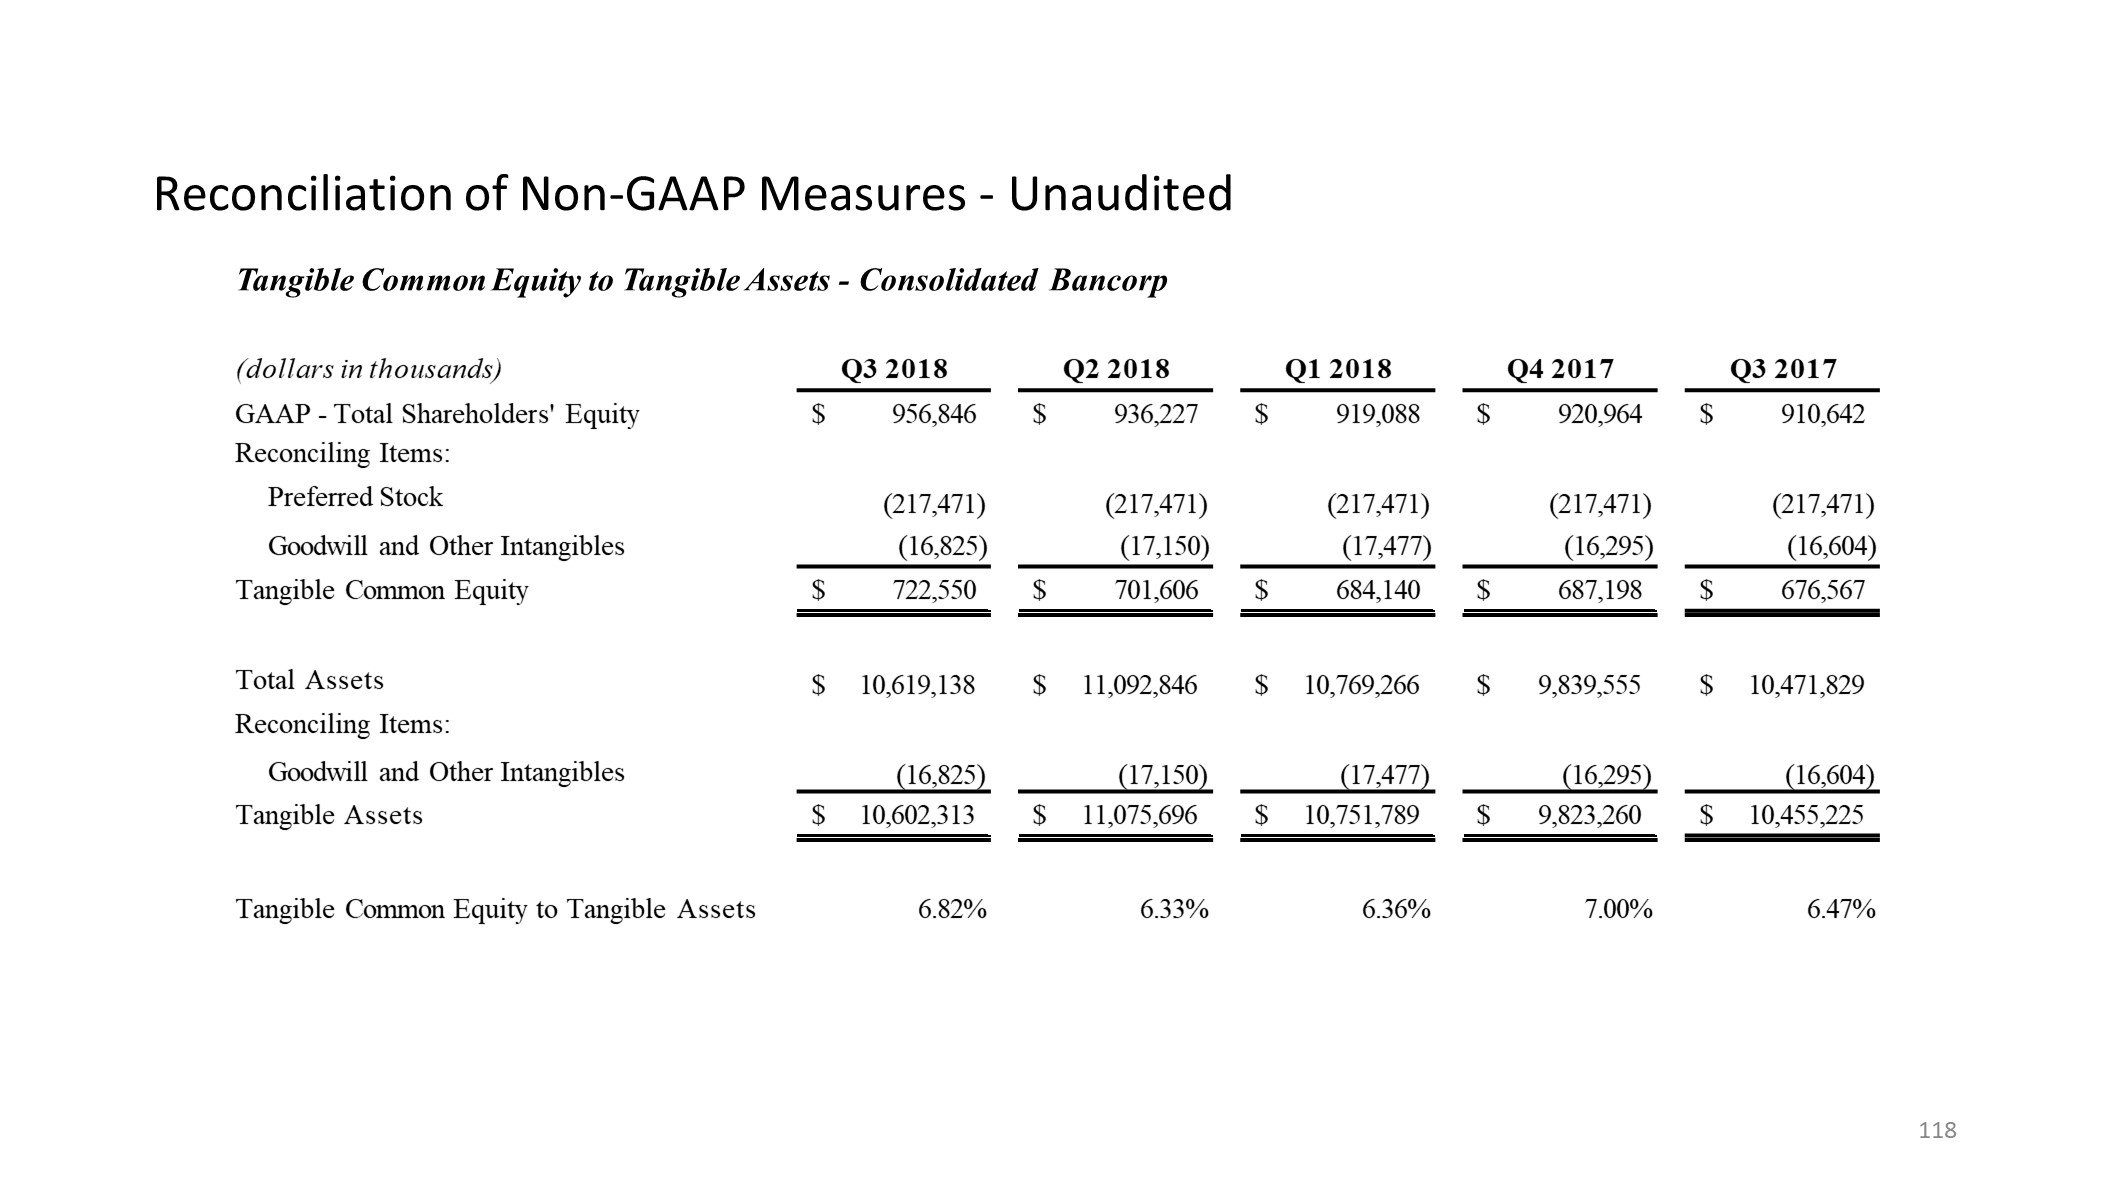
Reconciliation of Non-GAAP Measures - Unaudited Tangible Common Equity to Tangible Assets - Consolidated Bancorp (dollars in thousands) Q3 2018 Q2 2018 Q1 2018 Q4 2017 Q3 2017 GAAP - Total Shareholders' EquityReconciling Items: Preferred Stock $ 956,846(217,471) $ 936,227(217,471) $ 919,088(217,471) $ 920,964(217,471) $ 910,642(217,471) Goodwill and Other Intangibles (16,825) (17,150) (17,477) (16,295) (16,604) Tangible Common Equity $ 722,550 $ 701,606 $ 684,140 $ 687,198 $ 676,567 Total Assets Reconciling Items:Goodwill and Other Intangibles $ 10,619,138(16,825) $ 11,092,846(17,150) $ 10,769,266(17,477) $ 9,839,555(16,295) $ 10,471,829(16,604) Tangible Assets $ 10,602,313 $ 11,075,696 $ 10,751,789 $ 9,823,260 $ 10,455,225 Tangible Common Equity to Tangible Assets 6.82% 6.33% 6.36% 7.00% 6.47% 118
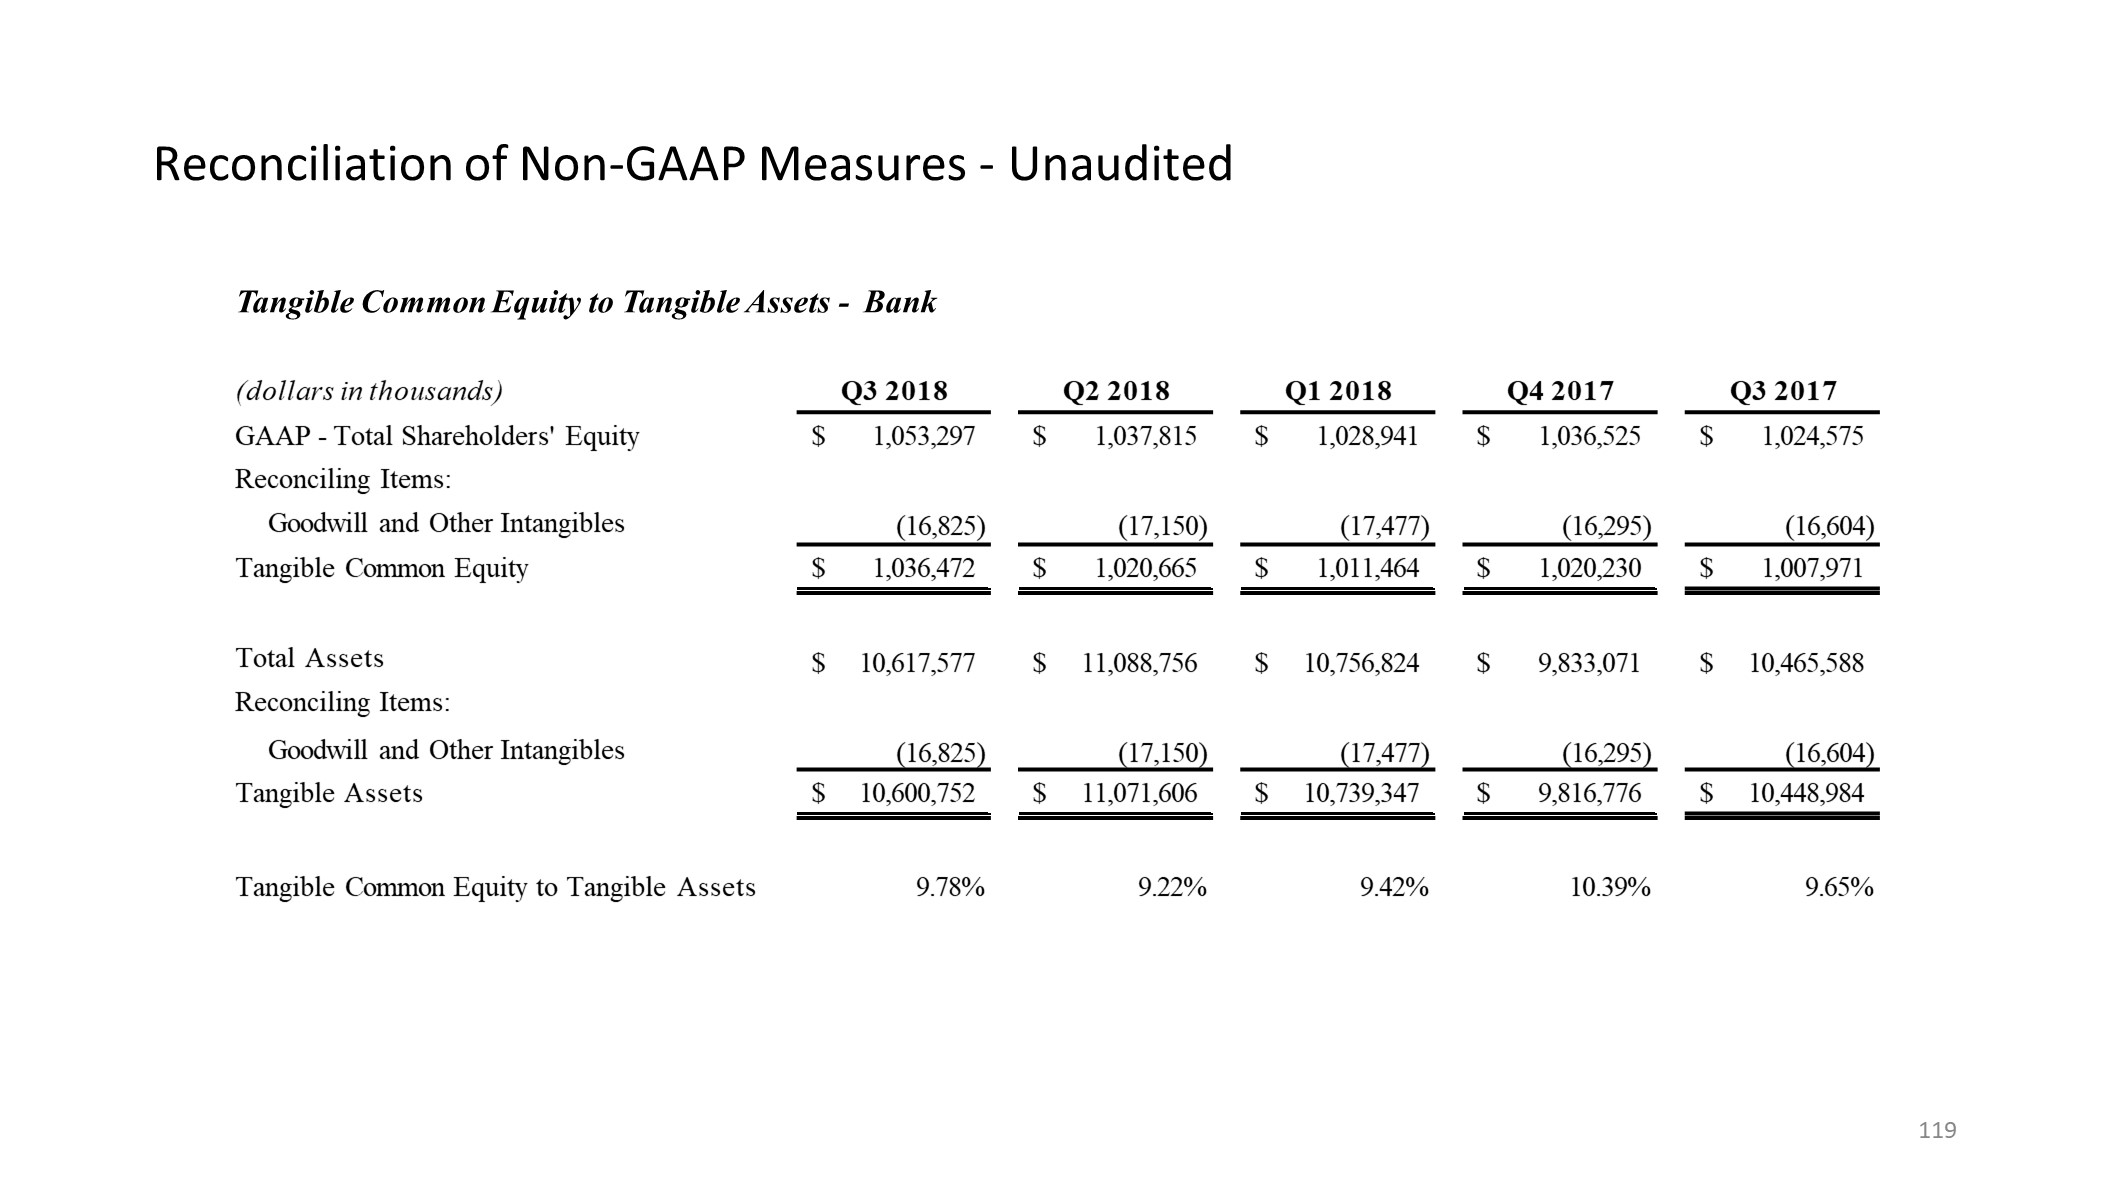
Reconciliation of Non-GAAP Measures - Unaudited Tangible Common Equity to Tangible Assets - Bank (dollars in thousands) Q3 2018 Q2 2018 Q1 2018 Q4 2017 Q3 2017 GAAP - Total Shareholders' EquityReconciling Items:Goodwill and Other Intangibles $ 1,053,297(16,825) $ 1,037,815(17,150) $ 1,028,941(17,477) $ 1,036,525(16,295) $ 1,024,575(16,604) Tangible Common Equity $ 1,036,472 $ 1,020,665�� $ 1,011,464 $ 1,020,230 $ 1,007,971 Total Assets Reconciling Items:Goodwill and Other Intangibles $ 10,617,577(16,825) $ 11,088,756(17,150) $ 10,756,824(17,477) $ 9,833,071(16,295) $ 10,465,588(16,604) Tangible Assets $ 10,600,752 $ 11,071,606 $ 10,739,347 $ 9,816,776 $ 10,448,984 Tangible Common Equity to Tangible Assets 9.78% 9.22% 9.42% 10.39% 9.65% 119
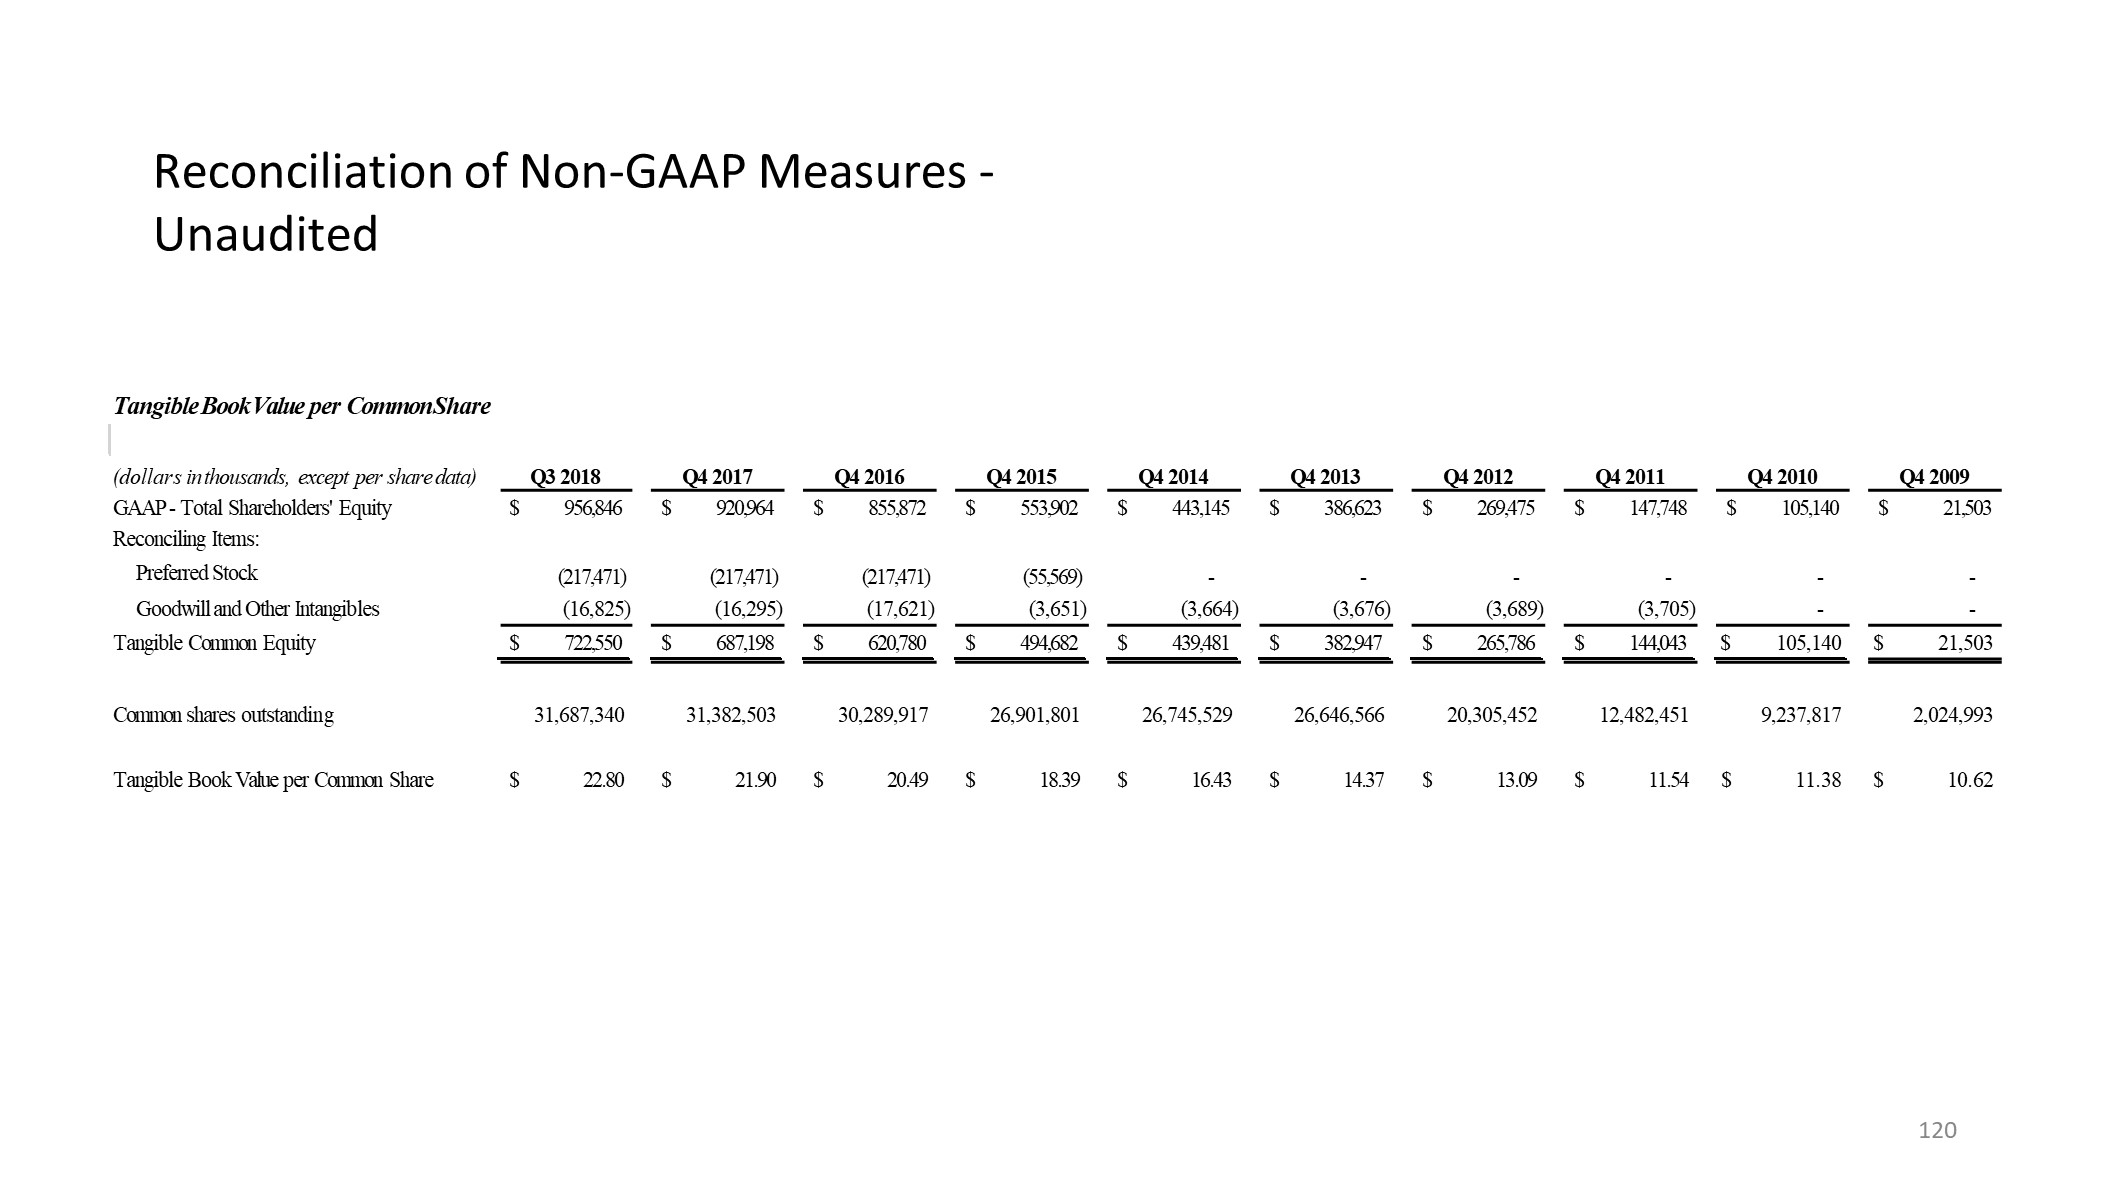
Reconciliation of Non-GAAP Measures - Unaudited Tangible Book Value per Common Share(dollars in thousands, except per share data) Q3 2018 Q4 2017 Q4 2016 Q4 2015 Q4 2014 Q4 2013 Q4 2012 Q4 2011 Q4 2010 Q4 2009 GAAP - Total Shareholders' EquityReconciling Items: Preferred Stock $ 956,846(217,471) $ 920,964(217,471) $ 855,872(217,471) $ 553,902(55,569) $ 443,145- $ 386,623- $ 269,475- $ 147,748- $ 105,140- $ 21,503- Goodwill and Other Intangibles (16,825) (16,295) (17,621) (3,651) (3,664) (3,676) (3,689) (3,705) - - Tangible Common Equity $ 722,550 $ 687,198 $ 620,780 $ 494,682 $ 439,481 $ 382,947 $ 265,786 $ 144,043 $ 105,140 $ 21,503 Common shares outstanding 31,687,340 31,382,503 30,289,917 26,901,801 26,745,529 26,646,566 20,305,452 12,482,451 9,237,817 2,024,993 Tangible Book Value per Common Share $ 22.80 $ 21.90 $ 20.49 $ 18.39 $ 16.43 $ 14.37 $ 13.09 $ 11.54 $ 11.38 $ 10.62 120

Forward-Looking Statements 121 This presentation, as well as other written or oral communications made from time to time by us, contains forward-looking information within the meaning of the safe harbor provisions of the U.S. Private Securities Litigation Reform Act of 1995. These statements relate to future events or future predictions, including events or predictions relating to future financial performance, and are generally identifiable by the use of forward-looking terminology such as “believe,” “expect,” “may,” “will,” “should,” “plan,” “intend,” or “anticipate” or the negative thereof or comparable terminology. Forward- looking statements in this presentation include, among other matters, guidance for our financial performance, and our financial performance targets. Forward-looking statements reflect numerous assumptions, estimates and forecasts as to future events. No assurance can be given that the assumptions, estimates and forecasts underlying such forward-looking statements will accurately reflect future conditions, or that any guidance, goals, targets or projected results will be realized. The assumptions, estimates and forecasts underlying such forward-looking statements involve judgments with respect to, among other things, future economic, competitive, regulatory and financial market conditions and future business decisions, which may not be realized and which are inherently subject to significant business, economic, competitive and regulatory uncertainties and known and unknown risks, including the risks described under “Risk Factors” in our Annual Report on Form 10-K for the year ended December 31, 2017 and subsequent Quarterly Reports on Form 10-Q, as such factors may be updated from time to time in our filings with the SEC. Our actual results may differ materially from those reflected in the forward-looking statements.This presentation provides certain preliminary estimated financial information for the three- and nine-month period ended September 30, 2018. This information reflects management’s estimates based upon information available to it as of the date of this presentation and is not a comprehensive statement of our financial results for the three- and nine-month period ended September 30, 2018. Our financial closing procedures for September 30, 2018 are not yet complete, and the information included in this presentation should not be considered a substitute for full unaudited financial statements for the three- and nine-month period ended September 30, 2018, once they become available and should not be regarded as a representation by us or our management as to our actual financial results. The preliminary estimated financial information included in this presentation is subject to change, and our actual financial results may differ from such preliminary estimates and such differences could be material. Accordingly, you should not place undue reliance upon these preliminary estimates.In addition to the risks described under “Risk Factors” in our filings with the SEC, important factors to consider and evaluate with respect to our forward-looking statements include: changes in external competitive market factors that might impact our results of operations;changes in laws and regulations, including without limitation changes in capital requirements under Basel III;changes in our business strategy or an inability to execute our strategy due to the occurrence of unanticipated events;our ability to identify potential candidates for, and consummate, acquisition or investment transactions;the timing of acquisition, investment or disposition transactions;constraints on our ability to consummate an attractive acquisition or investment transaction because of significant competition for these opportunities;local, regional and national economic conditions and events and the impact they may have on us and our customers;costs and effects of regulatory and legal developments, including the results of regulatory examinations and the outcome of regulatory or other governmental inquiries and proceedings, such as fines or restrictions on our business activities;our ability to attract deposits and other sources of liquidity;changes in the financial performance and/or condition of our borrowers;changes in the level of non-performing and classified assets and charge-offs;changes in estimates of future loan loss reserve requirements based upon the periodic review thereof under relevant regulatory and accounting requirements;inflation, interest rate, securities market and monetary fluctuations;
Forward-Looking Statements (Cont.) 122 timely development and acceptance of new banking products and services and perceived overall value of these products and services by users, including the products and services being developed and introduced to the market by the BankMobile division of Customers Bank;changes in consumer spending, borrowing and saving habits;technological changes;our ability to increase market share and control expenses;continued volatility in the credit and equity markets and its effect on the general economy;effects of changes in accounting policies and practices, as may be adopted by the regulatory agencies, as well as the Public Company Accounting Oversight Board, the Financial Accounting Standards Board and other accounting standard setters;the businesses of Customers Bank and any acquisition targets or merger partners and subsidiaries not integrating successfully or such integration being more difficult, time-consuming or costly than expected;material differences in the actual financial results of merger and acquisition activities compared with our expectations, such as with respect to the full realization of anticipated cost savings and revenue enhancements within the expected time frame;our ability to successfully implement our growth strategy, control expenses and maintain liquidity;Customers Bank's ability to pay dividends to Customers Bancorp;risks related to our proposed spin-off of BankMobile and merger of BankMobile into Flagship Community Bank, including:the possibility the transaction is terminated;uncertainty of timing of a spin/merge transaction if it is not terminated;our ability to successfully complete the transactions;the ability of Customers and Flagship Community Bank to meet all of the conditions to completion of the proposed transactions; • The ability of Customers to maintain the planned tax-free of the transaction while also complying with federal and state bank laws, regulations and requirements;the impact of an announcement of the proposed spin-off and merger on the value of our securities, our business and our relationship with employees and customers;risks relating to BankMobile, including: our ability to maintain interchange income with the small issuer exemption to the Durbin amendment;our ability to manage our balance sheet under $10 billion by December 31, 2018 and thereafter;our ability to execute on our White Label strategy to grow demand deposits through strategic partnerships;material variances in the adoption rate of BankMobile's services by new studentsthe usage rate of BankMobile's services by current student customers compared to our expectations;
Forward-Looking Statements (Cont.) 123 the levels of usage of other BankMobile student customers following graduation of additional product and service offerings of BankMobile or Customers Bank, including mortgages and consumer loans, and the mix of products and services used;our ability to implement changes to BankMobile's product and service offerings under current and future regulations and governmental policies; • our ability to effectively manage revenue and expense fluctuations that may occur with respect to BankMobile's student-oriented business activities, which result from seasonal factors related to the higher-education academic year;our ability to implement our strategy regarding BankMobile, including with respect to our intent to spin-off and merge or otherwise dispose of the BankMobile business in the future, depending upon market conditions and opportunities; andBankMobile's ability to successfully implement its growth strategy and control expenses. risks related to planned changes in our balance sheet, including: our ability to reduce the size of our Multifamily loan portfolio;our ability to execute our digital distribution strategy; andour ability to manage the risk of change in our loan mix to include a greater proportion of consumer loans.You are cautioned not to place undue reliance on any forward-looking statements we make, which speak only as of the date they are made. We do not undertake any obligation to release publicly or otherwise provide any revisions to any forward-looking statements we may make, including any forward-looking financial information, to reflect events or circumstances occurring after the date hereof or to reflect the occurrence of unanticipated events, except as may be required under applicable law.This presentation shall not constitute an offer to sell or the solicitation of an offer to sell or the solicitation of an offer to buy any securities, nor shall there be any sale of securities in any jurisdiction in which such offer, solicitation or sale would be unlawful prior to registration or qualification under the securities laws of any such jurisdiction.