Exhibit 99.1

SMART Technologies Inc. 2011 Annual Report
We built our company on an idea. Today, our technology solutions have a profound impact on learning and collaboration around the world.
It has been a year of milestones for SMART. We completed our IPO and celebrated the 20th anniversary of the SMART Board interactive whiteboard. Those 20 years have been rich with progress and growth. Recently, we installed our two millionth SMART Board interactive whiteboard.
When we introduced the SMART Board interactive whiteboard in 1991, no one knew about interactive whiteboards, much less why they might want or need one. Educators were among the first to recognize the depth of its potential, and soon students began learning in more visual, hands-on ways. Teachers noticed that even the most reticent children were up at the interactive whiteboard, presenting to peers and solving problems. Administrators noticed upward trends in achievement. Students found that learning was simply more interesting and engaging.
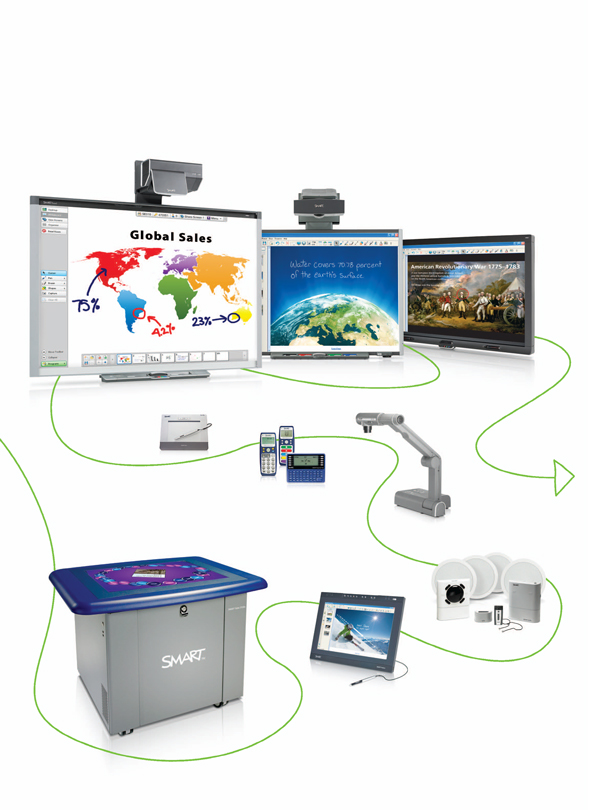
Today, the SMART Board interactive whiteboard remains the world’s most popular brand. We now offer solutions for businesses to help their teams collaborate in interactive and visual ways. All of these advances and milestones demonstrate our ongoing commitment to innovation. We acknowledge and thank the thousands of educators and business professionals who have worked with us through the years, helping us develop solutions that improve the way the world works and learns.
Our Evolution
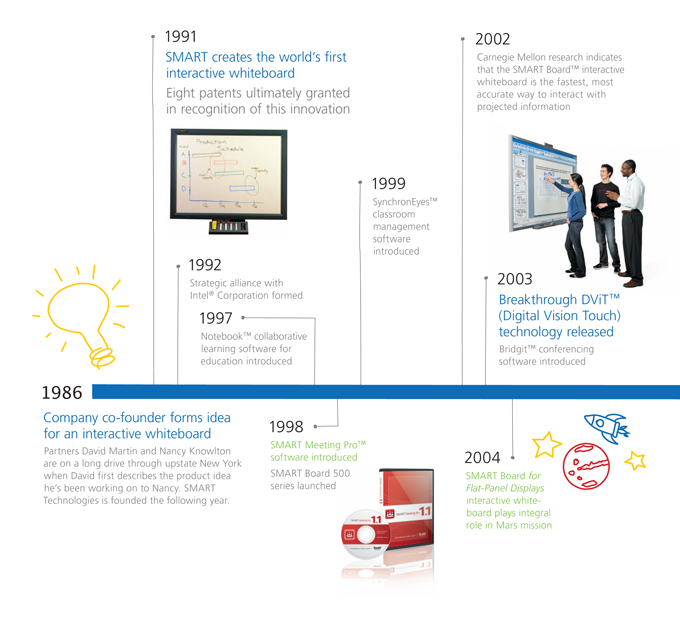
1991
SMART creates the world’s first interactive whiteboard Eight patents ultimately granted in recognition of this innovation
1992
Strategic alliance with Intel® Corporation formed
1997
Notebook™ collaborative learning software for education introduced
1999
SynchronEyes™ classroom management software introduced
2002
Carnegie Mellon research indicates that the SMART Board™ interactive whiteboard is the fastest, most accurate way to interact with projected information
2003
Breakthrough DViT™ (Digital Vision Touch) technology released
Bridgit™ conferencing software introduced
Company co-founder forms idea for an interactive whiteboard
Partners David Martin and Nancy Knowlton are on a long drive through upstate New York when David first describes the product idea he’s been working on to Nancy. SMART Technologies is founded the following year.
1998
SMART Meeting Pro™ software introduced SMART Board 500 series launched
2004
SMART Board for Flat-Panel Displays interactive white-board plays integral role in Mars mission
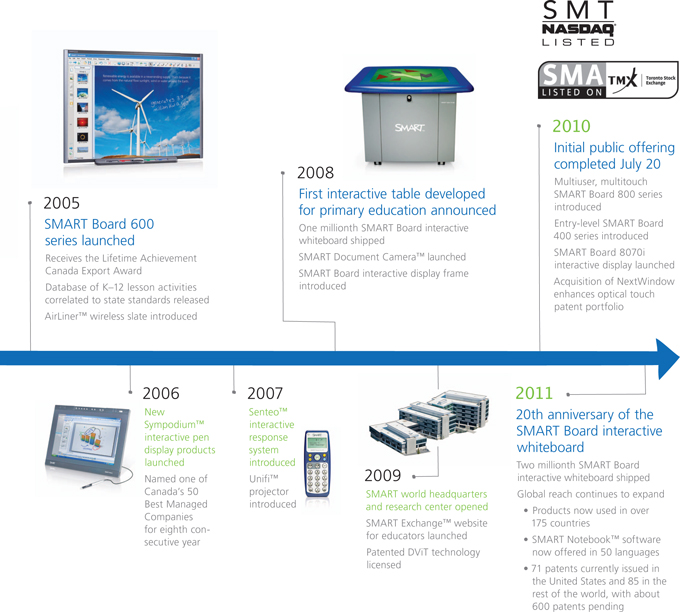
2005
SMART Board 600 series launched
Receives the Lifetime Achievement Canada Export Award Database of K–12 lesson activities correlated to state standards released AirLiner™ wireless slate introduced
2008
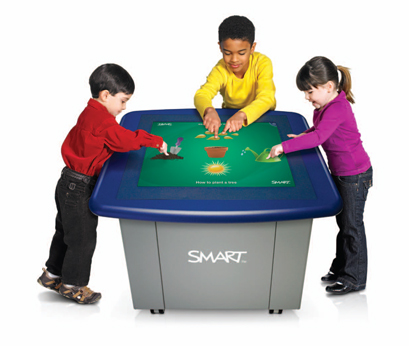
First interactive table developed for primary education announced
One millionth SMART Board interactive whiteboard shipped SMART Document Camera™ launched SMART Board interactive display frame introduced
2010
Initial public offering completed July 20
Multiuser, multitouch SMART Board 800 series introduced Entry-level SMART Board 400 series introduced SMART Board 8070i interactive display launched Acquisition of NextWindow enhances optical touch patent portfolio
2006
New
Sympodium™ interactive pen display products launched Named one of Canada’s 50 Best Managed Companies for eighth consecutive year
2007
Senteo™ interactive response
system introduced Unifi™ projector introduced
2009
SMART world headquarters and research center opened SMART Exchange™ website for educators launched Patented DViT technology licensed
2011
20th anniversary of the SMART Board interactive whiteboard
Two millionth SMART Board interactive whiteboard shipped Global reach continues to expand
• Products now used in over 175 countries
• SMART Notebook™ software now offered in 50 languages
• 71 patents currently issued in the United States and 85 in the rest of the world, with about 600 patents pending
SMART Technologies Inc. 2011 Annual Report
Message from the CEO and Chairman

David Martin, Executive Chairman
Nancy Knowlton, President and Chief Executive Officer
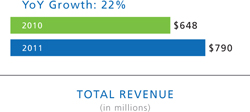
Total revenue increased 22% year over year despite a challenging second half.
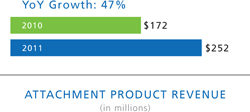
Revenue from attachment products increased 47% year over year.
Fiscal 2011 was an exciting year for SMART. We are very pleased with the company’s financial performance, particularly in light of the challenging environment that developed as the year progressed. As the category creator and market share leader for interactive , SMART’s recognized brand and easy-to-use collaboration solutions have made it the standard in education and the emerging business and government sectors.
Our solid execution enabled us to grow revenues by 22% over fiscal 2010 and ship record unit volumes despite the strong head winds in education spending that emerged in the second half of the year. In addition, the completion of our initial public offering in July 2010 was a significant milestone for our company as it led to greater brand awareness and provided access to further resources to execute our strategy. We look forward to leveraging the strong foundation we have built over the past 20 years as we execute our growth plan and take SMART to the next level as a public company.
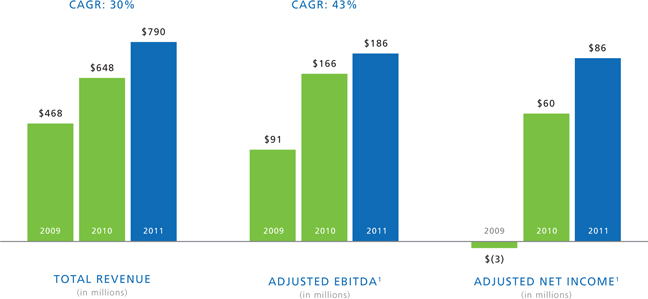
Fiscal 2011 Financial Highlights
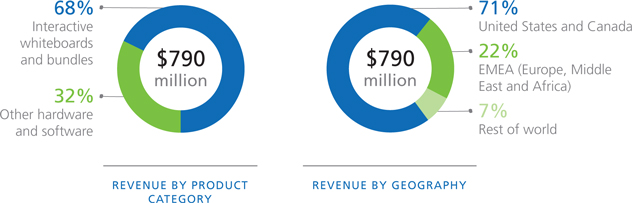
Total revenues increased 22% to $790 million due to the combination of 10% unit growth of interactive whiteboards, 47% growth of attachment product revenue and strength in our business and government markets. We are very pleased with our ability to maintain growth in North America and EMEA (Europe, Middle East and Africa) despite education funding challenges that increased as the year progressed. We continued to deliver best-in-class profitability levels, achieving Adjusted EBITDA of $186 million and Adjusted Net Income of $86 million, up 12% and 44% respectively compared to fiscal 2010. At the same time, we generated $85 million in cash flow from operations and ended the year in a strong financial position with $119 million of cash. Our strong performance demonstrates our ability to adapt to changing market conditions and execute our plan in a difficult operating environment.
2
SMART Technologies Inc. 2011 Annual Report
We help educators achieve better results with technology products that support student- centered learning. We help businesses become more productive with easy-to-use solutions that facilitate collaboration.
Strategy Execution
The market environment changed rapidly during the year, with strong year-over-year revenue growth of 31% in the first half followed by growth of only 12% in the second half of the year. This was due to education funding issues at the state and local level in the United States and austerity measures in other countries around the world. Despite these challenges, SMART outperformed its competitors and increased the company’s interactive whiteboard category share in its key markets of the United States and EMEA.
First, we increased sales of our core products into the education market, where classroom interactive whiteboard penetration in the United States increased from 28% to 36%, and in EMEA increased from 8% to 10%. Nearly half of the approximately 895,000 interactive whiteboards sold globally in calendar 2010 were SMART Board interactive whiteboards. We continued our global expansion during the year, with SMART products now used in over 175 countries.
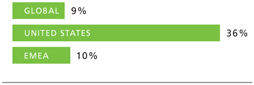
PENETRATION RATES1
Second, we executed our strategy of selling attachment products to our existing installed base as customers are recognizing the value of the fully integrated SMART solution. These products represented 32% of our total revenue for the year, and sales of these products increased 47% over fiscal 2010.
Third, we continued to accelerate adoption in the business and government sectors, which represented approximately 15% of our revenue in fiscal 2011.
Finally, we continued to further develop our leadership in interactive touch technologies with the acquisition of NextWindow in April 2010. This acquisition enhanced our optical touch patent portfolio, which we are leveraging in a number of recently announced SMART products and in the all-in-one computer segment.
The above four strategies remain our focus in the year ahead.
| 1 | Futuresource Consulting Ltd., May 2011 (data as of December 31, 2010) |
3
SMART Technologies Inc. 2011 Annual Report

Market Dynamics
Since SMART introduced the world’s first interactive white-board in 1991, we have shipped more than two million interactive whiteboards, establishing our company as the clear leader in this product category. In education, we now estimate that at least 40 million students and teachers currently use SMART Board interactive whiteboards and other SMART products worldwide. The growth has been driven primarily by our broad, integrated suite of collaboration solutions, ease of use and the value for both students and teachers. Third-party research suggests that interactive whiteboards in the classroom can have a positive effect on student engagement and motivation, while accommodating a variety of learning styles (including those of students with special needs). As a result, these collaboration products have become a high priority for teachers, administrators and parents.
An October 2010 survey indicated that interactive whiteboards were the #2 education technology spending priority next to a classroom computer with Internet access.
The survey also indicated that 30% of U.S. districts were aiming for 100% adoption of interactive whiteboards in their classrooms over the next 3–5 years.
Despite current challenges with education funding, we remain optimistic about the long-term growth prospects of our business. Customer interest in our products is as high as ever. In fact, in the fall of 2010, we commissioned a third-party survey of approximately 375 of the largest school districts in the United States, which indicated that interactive whiteboards with short-throw projectors and document cameras remain high-priority future purchases. Furthermore, during the next five years, over half of these districts have plans to move to interactive whiteboard adoption levels in excess of 75%, including 30% of districts aiming for 100% adoption.
Of an estimated 35 million teaching spaces globally, only 9% currently have an interactive whiteboard.
According to Futuresource Consulting, global classroom penetration of interactive whiteboards was only 9% as of December 31, 2010. In combination with our other products for the classroom, this leaves significant runway in the education market alone.
In addition, although we are still in the early stages of penetrating the business and government sectors, we believe that SMART is well positioned to benefit from the significant long-term growth opportunity in unified communications as businesses continue to realize the benefits of technology for collaboration and quick decision making.
4
SMART Technologies Inc. 2011 Annual Report
Innovation
Innovation remains a cornerstone of our strategy, and our significant investment in research and development and focus on customer needs have enabled us to maintain our competitive edge. At the heart of our advantage is our touch technology and portfolio of integrated solutions, including SMART Notebook and SMART Meeting Pro software, which have not only differentiated the company in the marketplace, but allowed us to increase penetration in our core education market and in the business sector. A relentless focus on ease of use and the customer experience has been at SMART’s core from the beginning.
In fiscal 2011, we launched a significant number of new products and product upgrades that have expanded and enhanced our collaboration solutions portfolio. In October, we launched the SMART Board 800 series interactive whiteboard, which offers true collaboration through multiuser writing and common multitouch gestures. Shortly after, we introduced the SMART Board 400 series interactive whiteboard, a cost-effective, entry-level interactive whiteboard system that leveraged NextWindow’s optical touch technology and components.
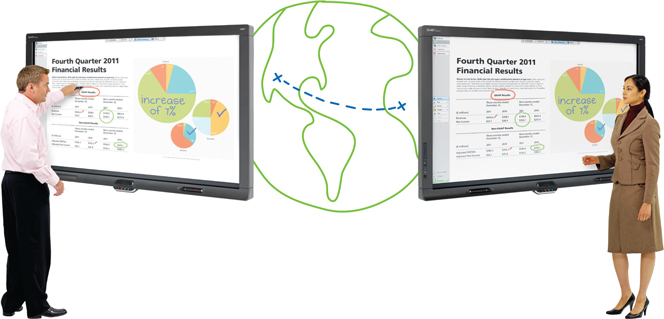
In addition, we launched two new interactive products designed specifically for business users – the SMART Board 885ix interactive whiteboard system and the SMART Board 8070i interactive display. When used in conjunction with SMART Bridgit™ conferencing software and SMART Meeting Pro Premium software, meeting participants can connect and collaborate from anywhere in the world to share and interact with digital information, minimizing the cost and hassle of travel.
Since the company’s inception, we have invested over $185 million in R&D, resulting in over 150 issued patents and approximately 600 patents pending. We remain committed to investing in the company to support future growth in an effort to strengthen our technology and product leadership position in our core education sector and to build our presence in the business and government sectors.
Conclusion
We are proud of SMART’s strong execution during fiscal 2011, and we remain excited about the opportunity ahead. Despite the near-term challenges in the education marketplace, we are confident in our ability to grow and increase shareholder value over the long term. We plan to strengthen our leadership position through continued innovation and a strong focus on improving collaboration in the classroom and meeting room.
We are honored to work with our staff worldwide, who continue to have an unwavering commitment to excellence. We would also like to extend our sincere appreciation to our customers, resellers, suppliers and shareholders for their ongoing support of SMART.
Sincerely,
| | |
 | |  |
| |
| NANCY KNOWLTON | | DAVID MARTIN |
| President and Chief Executive Officer | | Executive Chairman |
5
SMART Technologies Inc. 2011 Annual Report
Financial Highlights
| 1 | Adjusted EBITDA and Adjusted Net Income are non-GAAP measures and are not substitutes for GAAP equivalents. For a full reconciliation of Adjusted EBITDA and Adjusted Net Income to their most comparable GAAP measures, please refer later in this document to Management’s Discussion and Analysis for the year ended March 31, 2011. |
6
SMART Technologies Inc. 2011 Annual Report
In fiscal 2011, we increased our interactive whiteboard category share in our key markets in the United States and EMEA. We continue to make investments in areas we believe are large future growth opportunities, such as emerging international markets and the business sector.
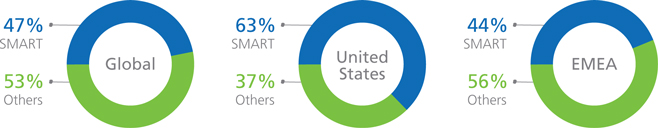
INTERACTIVE WHITEBOARD CATEGORY SHARE2
| 2 | Futuresource Consulting Ltd., May 2011 (trailing 12-month data to March 31, 2011) |
7
SMART Technologies Inc. 2011 Annual Report
Education Solutions

When SMART created the world’s first interactive white-board in 1991, educators were among the first to recognize its potential. Since then, the education community has made SMART the global leader in the interactive whiteboard product category – over 40 million teachers and students in over 1.7 million K–12 classrooms around the world use a SMART Board interactive whiteboard. Educators trust SMART solutions because they help them achieve an immediate and lasting impact on learning.
Helping Education Evolve
Schools are changing. Classrooms today are increasingly interactive, student-centered, technology-rich environments. This shift demands new pedagogical strategies and versatile technology products. Educators around the world are choosing SMART solutions to help give students the skills they need to succeed in a knowledge-based society.
Integrated Products for Flexible Teaching
SMART solutions are designed to facilitate the dynamic learning environments preferred by today’s educators. SMART products are designed to work together, so they help teachers move easily between a variety of activities and learning environments.
Using SMART Notebook collaborative learning software, teachers can create compelling multimedia lessons that engage students of all learning styles. Once they’ve taught the lesson to the whole class on the SMART Board interactive whiteboard, teachers can reinforce the concept for small groups with the SMART Table™ interactive learning center. To assess knowledge, teachers can take a quick poll right from SMART Notebook software, with the SMART Response™ interactive response system.
Comprehensive Solutions for Long-Term Success
SMART solutions begin with innovative products. We have more than 300 researchers and developers who ensure that teachers find our products relevant and simple to use. This commitment to innovation has paid off. Our products have been proven around the world to create enthusiasm for teaching and learning.
To help educators realize the full potential of SMART products, we provide the support needed to ensure our products will be used, and used well. SMART solutions include the following three key elements that help educators improve student learning outcomes.
8
SMART Technologies Inc. 2011 Annual Report
Professional development and training – We offer programs and sites that help teachers gain the confidence to make SMART products part of everyday curriculum.
High-quality digital resources– Through the SMART Exchange website, we offer extensive collections of subject-specific, curriculum-correlated resources to help teachers find content that’s right for them. We also link teachers to a vast online community, providing them with access to advice, product information, support and ideas from around the world.
Strong support – Administrators can access consultative services to plan and execute the implementation of SMART products. Along with our extensive network of resellers, we provide excellent technical support.
Comprehensive SMART solutions help ensure that teachers adopt our products enthusiastically, knowing the right resources and services are at their fingertips. When teachers become passionate leaders of technology adoptions, administrators achieve their two main goals – improved student achievement and an excellent return on their investment.
“Twenty-first century learning skills are necessary for the success of our students and the economic prosperity of our nation. These skills begin with installing a SMART Board in every classroom.”
Anthony Mullen
2009 National Teacher of the Year
United States
“Teachers who had 35 years’ experience but very little technology skill are now doing integrated technology lessons in their classrooms with SMART Board interactive whiteboards.”
David C. Harding
Superintendent
Willington Public Schools, United States
“The growing interest shown by the teachers in our school and their widespread use of the SMART Board inside classrooms confirms the great education value of the SMART Board interactive whiteboard. It gives students the opportunity to mature, consolidate and express the multiple and simultaneous skills required for communication.”
Alma Perucca
Teacher
Croce-Morelli Public Middle School, Italy
9
SMART Technologies Inc. 2011 Annual Report
Business Solutions

For 20 years, SMART has been designing products that change the way people share and work with digital information, turning workplaces into interactive collaboration spaces where teamwork can thrive. True collaboration – when people share their ideas, skills, experiences and inspiration to work toward common goals – can help virtually any business reach its objectives. And it can strengthen the relationships with colleagues, customers and suppliers upon which businesses are built.
A New Way to Collaborate
In a SMART-equipped workspace, every meeting becomes an opportunity to share information, brainstorm ideas, capture feedback and clearly document next steps. Our interactive whiteboards and displays, software, services and support all work together so that people can share information and ideas in visual and interactive ways. Teams can easily access their digital resources – files, applications, websites and multimedia – and open them on a SMART Board interactive whiteboard or display. They can write notes in digital ink, save them into their files and share them instantly via e-mail. They can switch from writing notes to navigating applications and back to writing with a simple touch. And they can share screens instantly with remote participants, so everyone can see and contribute to the work in real time – regardless of location.
Collaboration Solutions for Any Business
Because our products are designed to streamline the exchange of information and make meetings more productive, they can benefit virtually any organization. SMART solutions have been implemented by businesses in various industries, from architecture to manufacturing to telecommunications. We’ve helped our customers find innovative ways to work together across distances, accelerate decision making, enhance cross-functional collaboration, engage clients and stakeholders, train personnel and respond to emergency situations – all by making it easier to share information and communicate ideas.
“We now have the ability to give the client a collaborative experience with us, and we don’t have to get on an airplane to do it. SMART business solutions have eliminated the competitive disadvantage of being remote from our clients.”
Johnny Anderson
Vice President, Business Development
Bulldog Solutions
10
SMART Technologies Inc. 2011 Annual Report
Why Businesses Choose SMART Products
We understand the needs of business today and deliver solutions that help our customers deliver exceptional results. We recognize that business people don’t have time to focus on technology when they have urgent challenges and opportunities. Our business solutions offer the following five key benefits.
Ease of use – SMART products are designed with the user in mind. They are highly intuitive and easy to use, so teams can quickly incorporate them into collaborative work sessions.
Interactivity – Team members can control applications with a simple touch and write over applications in digital ink, so collaboration is highly visual and interactive.
Distance collaboration – You can share content on your desktops or displays and write notes in digital ink for everyone to see, regardless of location.
Integration with everyday software – Our products integrate easily with a growing list of preferred software applications, allowing users to save notes and markups directly into their original files.
Support – SMART solutions include world-class customer service and technical support. Our extensive global network of resellers also offers excellent support.
“Our new SMART collaboration capability enables people to meet, regardless of where they are in the world, and interact as if they were in the same room. This has had a massive impact on travel costs and reduced our carbon footprint significantly.”
Bola Oshisanwo
Director, Agile Development Centre
BT
“With the SMART Board interactive whiteboard, we can very easily demonstrate what works and what doesn’t. The evolution of a plan can take place right there, when normally it would take three meetings.”
Helma Gansen
President
Gansen Lindsay Design Consultants Inc.
11
Looking Ahead
When we think of the future, we envision classrooms and meeting rooms where images, applications and information are literally at people’s fingertips. We envision students around the world, experiencing the rewards of learning, whether they learn best by seeing, hearing or doing. We envision teams collaborating simultaneously around the world, at home and in offices, developing ideas on SMART Board interactive whiteboards, making decisions quickly and minimizing the barrier of distance.
We are passionate about our vision. Our motivation comes from educators and business professionals who tell us they can’t imagine working without SMART solutions. Students who once struggled have found their stride, teachers have rediscovered their love for learning and business teams have found new ways to collaborate and become more productive.
That’s what drives SMART staff around the world to invest their energy in innovation. Our teams are united in their desire to create intuitive products that help educators and business people achieve their goals.
2011 marks the 20th anniversary of the SMART Board interactive whiteboard – a milestone that reminds us of the long-lasting and profound impact our solutions have had on our customers. Over the next 20 years, we’re committed to further innovation to deliver on our vision of changing the way the world works and learns.

SMART Technologies Inc. 2011 Annual Report
13
SMART Technologies Inc. 2011 Annual Report
Management’s Discussion and Analysis of Financial Condition and Results of Operations
The following annual management’s discussion and analysis (“MD&A”) should be read in conjunction with our audited consolidated financial statements and the accompanying notes of SMART Technologies Inc. (the “Company”) for the fiscal year ended March 31, 2011. The consolidated financial statements have been presented in United States (“U.S.”) dollars and have been prepared in accordance with accounting principles generally accepted in the United States of America (“GAAP”). Unless the context otherwise requires, any reference to the “Company”, “SMART Technologies”, “we”, “our”, “us” or similar terms refers to SMART Technologies Inc. and its subsidiaries. Because our fiscal year ends on March 31, references to a fiscal year refer to the fiscal year ended March 31 of the same calendar year. For example, when we refer to fiscal 2011, we mean our fiscal year ended March 31, 2011. Unless otherwise indicated, all references to “$” and “dollars” in this discussion and analysis mean U.S. dollars. The following table sets forth the period end and period average exchange rates for U.S. dollars expressed in Canadian dollars that are used in the preparation of our audited consolidated financial statements and this MD&A. These rates are based on the closing rates published by the Bank of Canada.
| | | | |
| | | Period End Rate | | Period Average Rate |
Year ended March 31, 2011 | | 0.9696 | | 1.0167 |
Year ended March 31, 2010 | | 1.0158 | | 1.0906 |
Year ended March 31, 2009 | | 1.2613 | | 1.1260 |
This MD&A includes forward-looking statements which reflect our current views with respect to future events and financial performance. These statements include forward-looking statements both with respect to us specifically and the technology product industry and business, demographic and other matters in general. Statements which include the words “expect”, “intend”, “plan”, “believe”, “project”, “estimate”, “anticipate”, “may”, “will”, “continue”, “further”, “seek”, and similar words or statements of a future or forward-looking nature identify forward-looking statements for purposes of the applicable securities laws or otherwise. In particular and without limitation, this MD&A contains forward-looking statements pertaining to general market conditions, our future growth strategy and prospects, including growth of the education, business and government markets for our products, our plans and objectives for future operations, our future financial performance and financial condition, the addition of new products to our portfolio and enhancements to current products, our industry, opportunities in the business and government markets and licensing opportunities, working capital requirements, integration of our acquisition of NextWindow, our acquisition strategy, regulation, exchange rates and income tax considerations.
All forward-looking statements address matters that involve risks, uncertainties and assumptions. Accordingly, there are or will be important factors and assumptions that could cause our actual results and other circumstances and events to differ materially from those indicated in these statements, as discussed more fully in the sections “Risks Related to Our Business” and “Capital Structure Risks”. These risk factors and assumptions include, but are not limited to, the following:
| | • | | competition in our industry; |
| | • | | our ability to successfully obtain patents or registration for other intellectual property rights or protect, maintain and enforce such rights; |
| | • | | our ability to manage our growth; |
| | • | | third-party claims of infringement or violation of, or other conflicts with, intellectual property rights by us; |
| | • | | our ability to enhance current products and develop and introduce new products; |
| | • | | the development of the market for interactive learning and collaboration products; |
| | • | | reduced spending by our customers due to changes in the spending policies or budget priorities for government funding; |
| | • | | our ability to grow our sales in foreign markets; |
| | • | | our ability to manage risks inherent in foreign operations; |
| | • | | our ability to protect our brand; |
| | • | | our ability to obtain components and products from suppliers on a timely basis and on favorable terms; |
| | • | | our ability to manage our component and product assembly and logistical services successfully; |
| | • | | the reliability of component supply and product assembly and logistical services provided by third parties; |
| | • | | possible changes in the demand for our products; |
| | • | | our ability to successfully execute our strategy to grow in the business and government markets; |
14
SMART Technologies Inc. 2011 Annual Report
| | • | | our ability to integrate the operations of the various businesses we acquire; |
| | • | | our ability to establish new relationships and to build on our existing relationships with our dealers and distribu- tors; and |
| | • | | our ability to manage cash flow, foreign exchange risk and working capital. |
Overview
We design, develop and sell interactive technology products and integrated solutions that enhance learning and enable people to collaborate in innovative and effective ways. We are the global leader in the interactive whiteboard product category, which is the core of our collaboration solutions. We introduced the world’s first commercial interactive whiteboard in 1991 and as of March 31, 2011, we have shipped over 1.9 million of our SMART Board™ interactive whiteboards worldwide.
SMART Board interactive whiteboards combine the simplicity of a whiteboard and the power of a computer. By touching the surface of a SMART Board interactive whiteboard, the user can control computer applications, access the Internet, write in digital ink and save and share work. Our interactive whiteboards are designed to serve as the focal point of a broad technology platform in classrooms and meeting rooms.
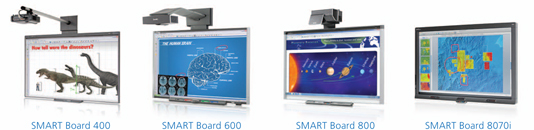
We complement our interactive whiteboards with a comprehensive range of modular and integrated interactive technology products for easy-to-use, touch- and gesture-enabled solutions that facilitate effective learning and collaboration. Our line of interactive whiteboards currently ranges from the 400 series, our latest entry-level product, to the 600 series, our most popular product in education, to the 800 series, our feature- and functionality-rich multi-user interactive whiteboard. We also have a line of SMART Board interactive displays and the SMART Table™ interactive learning center, as well as a variety of related attachment products and services.
We generate our revenue from the sale of these interactive technology products and integrated solutions, including hardware, software and services. Our global expansion has led to our products being used in more than 175 countries worldwide through our distributor and dealer network to the education, business and government markets. Although we do not sell to them directly, we consider these end-users to be our customers. We estimate that approximately 85% of our sales are to customers in the education market and the other 15% to customers in the business and government markets.
Our company operates in a very competitive global environment with products based on rapidly changing technologies. As we continue to focus on expanding our markets and further developing our portfolio of collaboration solutions, we plan to build on our position as the global leader in the interactive whiteboard product category.
We believe the interactive whiteboard market is in the early stages of adoption and that significant opportunities exist beyond the traditional education markets we have penetrated. Our strategy includes acquiring new customers in the education market, specifically in markets we are developing such as Europe, Middle East and Africa (“EMEA”), that have seen recent growth. We have expanded operations in continental Europe, Asia and in other countries where we believe average penetration rates are currently lower than in the United Kingdom, U.S., Mexico and Canada. We have broadened our geographical focus to support our distribution channel by opening offices in additional countries, by continuing to hire additional personnel in our current global locations and by increasing our global distribution network.
We have been successful at penetrating the education market by providing integrated solutions that enhance the interactive whiteboard experience with improved collaboration. Our portfolio of products has expanded to include related attachment products that provide this collaboration solution, including SMART Response™, SMART Slate™, SMART Document Camera™, SMART Table, SMART Audio™ and SMART Classroom Suite™. We have also increased the depth and quality of the digital content offered by us and third parties for use on our interactive whiteboards through a combination of both free and premium content.
Our company plans to accelerate the adoption of our products in the business and government markets, leveraging on our existing distribution network and other strategic relationships to penetrate these markets. Our growth strategy focuses on the simplicity and ease of use of our products, while fully integrating them with critical business processes and products for a superior collaborative business solution. We have expanded our staffing and research and development team in these areas to develop new solutions and improve existing solutions for these markets.
15
SMART Technologies Inc. 2011 Annual Report
Management’s Discussion and Analysis of Financial Condition and Results of Operations(continued)
We have supported our focus of expanding globally and further penetrating the education, business and government markets by developing different series of collaboration solutions designed to meet the specific requirements of our target markets. Our 400 series is a cost-effective, entry-level product recently introduced to respond to the growing needs of markets such as EMEA, Asia Pacific and Latin America. Our 600 series is our leading product and continues to evolve to meet changing market needs. The 800 series was recently introduced as a premium solution for next-generation classrooms and corporate meeting rooms requiring enhanced collaboration, using our DViT™ (Digital Vision Touch) technology to enable many of the enhanced features of this interactive whiteboard.
Significant 2011 Financial Transactions
During fiscal 2011, we completed several significant transactions, including the acquisition of Next Holdings Limited (“NextWindow”), a reorganization of the capital of the company that we refer to as the “2010 Reorganization”, our initial public offering (“IPO”), and significant repayments of our debt. The details of each of these transactions are as follows.
As part of our strategy to expand our market position in optical touch technology, we acquired NextWindow on April 21, 2010. NextWindow designs and manufactures components for optical touch screens for integration into electronic displays, including PC displays. We are integrating NextWindow’s technologies within our products to accelerate the introduction of new products, including the new SMART Board 400 series interactive whiteboard. The acquisition consideration for NextWindow consisted of $82.0 million funded from our available cash, net of $8.0 million of cash held by NextWindow at the date of acquisition.
On May 13, 2010, in preparation for our IPO, our Board of Directors approved a reorganization of the capital of the Company. Through a series of transactions, the 2010 Reorganization resulted in the repayment of $8.0 million of the shareholder note payable and the effective conversion of the remaining shareholder note payable and cumulative preferred shares, together with all accrued interest and accumulated dividends thereon, as well as all our other outstanding shares into Class B Shares, Class A Subordinate Voting Shares and Class A Preferred Shares. The 2010 Reorganization was completed prior to and in conjunction with the closing of our IPO on July 20, 2010. At this time, the newly created Class A Preferred Shares were converted into Class B Shares and Class A Subordinate Voting Shares and are therefore no longer outstanding.
Upon the completion of our IPO on July 20, 2010, we issued 8,800,000 Class A Subordinate Voting Shares resulting in proceeds received of $134.3 million, net of underwriting commissions and other offering expenses. Concurrently, existing shareholders sold an aggregate of 30,030,000 Class A Subordinate Voting Shares in the offering. In July 2010, we repaid $19.2 million of our term construction facility and $40.0 million of our unsecured term loan with proceeds from the offering. In conjunction with our IPO, we implemented an Equity Incentive Plan which provides for the grant of options, restricted share units and deferred share units to directors, officers, employees, consultants and service providers of our Company and its subsidiaries. During the year ended March 31, 2011, we granted 1,444,500 stock options to purchase the Company’s Class A Subordinate Voting Shares at a weighted average exercise price of $16.22. Of these options, 1,140,000 were granted on July 15, 2010 in conjunction with the IPO at an exercise price of $17.00.
In September 2010, the remaining balances of the unsecured term loan, the term construction facility and the construction loan of $42.4 million, $29.8 million and $1.4 million, respectively, were repaid in full. During the remainder of fiscal 2011, $55.0 million of the Second lien facility was repaid. Using interest rates and the debt level at March 31, 2011, we expect that future interest expense will be approximately $16.3 million annually.
Sources of Revenue and Expenses
Revenue
We generate our revenue from the sale of interactive technology products and solutions, including hardware, software and services. Our distribution and sales channel includes dealers in North America and distributors in Europe, the Middle East and Africa, Caribbean and Latin America and the Asia Pacific regions. We complement and support our sales channel with sales and support staff who work either directly with prospective customers or in coordination with our sales channel to promote and provide products and solutions that address the needs of the end-user. Revenue is recognized at the time we transfer the risks and rewards to our sales channel according to contractual terms. Our practice with end-users usually involves multiple elements including post-contract technical support, software
16
SMART Technologies Inc. 2011 Annual Report
upgrades and updates, although we are not contractually required to do so. Revenue from product sales is allocated to each element based on relative fair values with any discount allocated proportionately. Revenue attributable to undelivered elements is deferred and recognized ratably over the estimated term of provision of these elements.
Cost of Sales
Our cost of sales is primarily comprised of the cost of materials and components purchased from our suppliers, assembly labor and overhead costs, inventory provisions and write offs, warranty costs, product transportation costs and other supply chain management costs. Our standard warranty period on interactive whiteboards extends up to five years and on other hardware products from one to three years. At the time product revenue is recognized, an accrual for estimated warranty costs is recorded as a component of cost of sales based on prior claims experience. Depreciation of assembly equipment is included in cost of sales. To the extent that our sales increase, we expect our cost of sales to also increase in absolute dollars.
Selling, Marketing and Administration Expenses
Our selling and marketing expenses consist primarily of costs relating to our sales and marketing activities, including salaries and related expenses, customer order management activities, customer support, advertising, trade shows and other promotional activities. We offer various cooperative marketing programs to assist our sales channel to market and sell our products which are included as part of selling and marketing expenses. Our administration expenses consist of costs relating to people services, information systems, legal and finance functions, professional fees, insurance, stock-based compensation and other corporate expenses. During fiscal 2011, our selling, marketing and administration expenses increased in absolute dollars as a result of hiring additional personnel, expanding internationally and becoming a public company. We do not expect these expenses to change materially from prior years as a percentage of revenue.
Research and Development Expenses
Research and development expenses consist primarily of salaries and related expenses for software and hardware engineering and technical personnel as well as materials and consumables used in product development. We incur most of our research and development expenses in Canada and New Zealand, and are eligible to receive Scientific Research and Experimental Development investment tax credits for certain eligible expenditures. Investment tax credits are netted against our provision for income taxes for financial statement presentation purposes. We expect research and development expenses to continue to grow in absolute dollars as we focus on enhancing and expanding our product offerings, although we do not expect these expenses to change materially from prior years as a percentage of revenue.
Interest Expense
In August 2007, shareholders of our predecessor company (SMART Technologies (Holdings) Inc.) signed an agreement with Apax Partners to effect a corporate reorganization, pursuant to which the shareholders of our predecessor company reduced their combined ownership interest to 50.1% and Apax Partners acquired a 49.9% interest in the Company. As part of this corporate reorganization, we issued $465.0 million of term bank debt and CDN$338.9 million (equivalent to $319.2 million when issued) of related party debt, consisting of the shareholder note payable and cumulative preferred shares. Our increased interest expense from this 2007 corporate reorganization was one of the principal reasons for our net loss in fiscal 2009. Interest expense has declined significantly in fiscal 2011 as a result of the 2010 Reorganization described under “Significant 2011 Financial Transactions” above, which resulted in the conversion of the shareholder note payable and cumulative preferred shares into equity during the first quarter of fiscal 2011. Interest expense has also declined due to the significant debt repayments made in the last three quarters of 2011.
Foreign Exchange Gains & Losses
We report our financial results in U.S. dollars allowing us to assess our business performance in comparison to the financial results of other companies in the technology industry. Our Canadian operations and marketing support subsidiaries around the world have the Canadian dollar as their functional currency. Our U.S. and New Zealand operating subsidiaries have the U.S. dollar as their functional currency, our German operating subsidiary has the Euro as its functional currency, and our Japanese operating subsidiary has the Japanese Yen as its functional currency. The financial results of these operating subsidiaries are converted to Canadian dollars for consolidation purposes and then the Canadian consolidated financial results are converted from Canadian dollars to U.S. dollars
17
SMART Technologies Inc. 2011 Annual Report
Management’s Discussion and Analysis of Financial Condition and Results of Operations(continued)
for reporting purposes. During the first quarter of fiscal 2012, our Germany operating subsidiary will discontinue its distribution activities and become a marketing support subsidiary for EMEA, at which point the Canadian dollar will become its functional currency.
Our foreign exchange exposure is primarily between the Canadian dollar and both the U.S. dollar and the Euro. This exposure relates to our U.S. dollar-denominated assets and liabilities, including our external debt, the sale of our products to customers globally and purchases of goods and services in foreign currencies. Gains and losses on our U.S. dollar-denominated debt prior to its maturity or redemption are non-cash in nature.
Results of Operations
The following table sets forth certain consolidated statement of operations data and other data for the periods indicated in millions of dollars, except for percentages, shares, per share amounts, units and average selling prices.
| | | | | | | | | | | | |
Fiscal Year Ended March 31, | | 2011 | | | 2010 | | | 2009 | |
Consolidated Statement of Operations | | | | | | | | | | | | |
Revenue | | $ | 790.1 | | | $ | 648.0 | | | $ | 468.2 | |
Cost of sales | | | 399.2 | | | | 326.5 | | | | 268.2 | |
| | | | | | | | | | | | |
Gross margin | | | 390.9 | | | | 321.5 | | | | 200.0 | |
Operating expenses | | | | | | | | | | | | |
Selling, marketing and administration | | | 180.8 | | | | 138.8 | | | | 99.7 | |
Research and development | | | 53.0 | | | | 33.6 | | | | 25.0 | |
Depreciation and amortization | | | 31.8 | | | | 15.9 | | | | 5.8 | |
| | | | | | | | | | | | |
Operating income | | | 125.3 | | | | 133.2 | | | | 69.5 | |
Non-operating expenses | | | | | | | | | | | | |
Other income, net | | | (0.5 | ) | | | (0.2 | ) | | | (0.8 | ) |
Interest | | | 31.6 | | | | 64.9 | | | | 78.6 | |
Foreign exchange (gain) loss | | | (10.5 | ) | | | (91.8 | ) | | | 94.0 | |
| | | | | | | | | | | | |
Income (loss) before income taxes | | | 104.7 | | | | 160.3 | | | | (102.3 | ) |
Income tax expense | | | 35.3 | | | | 18.3 | | | | 4.3 | |
| | | | | | | | | | | | |
Net income (loss) | | $ | 69.4 | | | $ | 142.0 | | | $ | (106.6 | ) |
| | | | | | | | | | | | |
Earnings (loss) per share | | | | | | | | | | | | |
Basic and diluted earnings (loss) per share | | $ | 0.53 | | | $ | 0.81 | | | $ | (0.63 | ) |
Weighted average number of shares outstanding | | | 130,775,288 | | | | 176,322,584 | | | | 170,096,497 | |
Period end number of shares outstanding | | | 123,772,791 | | | | 181,053,688 | | | | 170,096,497 | |
| | | | | | | | | | | | |
Selected Data | | | | | | | | | | | | |
Revenue by geographic location | | | | | | | | | | | | |
North America | | $ | 558.4 | | | $ | 457.3 | | | $ | 314.3 | |
Europe, Middle East and Africa | | | 175.5 | | | | 149.9 | | | | 131.5 | |
Rest of World | | | 56.2 | | | | 40.8 | | | | 22.4 | |
| | | | | | | | | | | | |
| | $ | 790.1 | | | $ | 648.0 | | | $ | 468.2 | |
| | | | | | | | | | | | |
Revenue growth(1) | | | 21.9 | % | | | 38.4 | % | | | 23.7 | % |
As a percent of revenue | | | | | | | | | | | | |
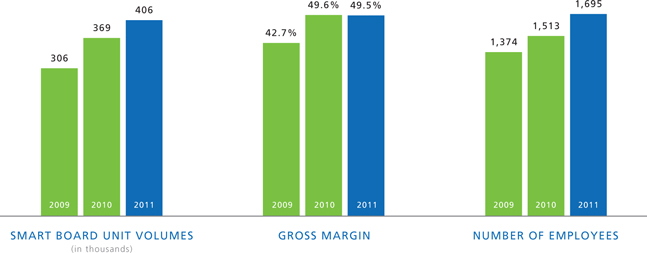
Gross margin | | | 49.5 | % | | | 49.6 | % | | | 42.7 | % |
Selling, marketing and administration | | | 22.9 | % | | | 21.4 | % | | | 21.3 | % |
Research and development | | | 6.7 | % | | | 5.2 | % | | | 5.3 | % |
Adjusted EBITDA(2) | | $ | 185.8 | | | $ | 166.3 | | | $ | 90.9 | |
Adjusted EBITDA as a percentage of revenue(2)(3) | | | 23.1 | % | | | 25.1 | % | | | 19.4 | % |
Adjusted Net Income(4) | | $ | 85.5 | | | $ | 59.5 | | | $ | (2.5 | ) |
Adjusted Net Income per share(4)(5) | | $ | 0.65 | | | $ | 0.34 | | | $ | (0.01 | ) |
Total number of SMART Board interactive whiteboards sold | | | 406,314 | | | | 369,489 | | | | 306,234 | |
Average selling price of SMART Board interactive whiteboards sold(6) | | $ | 1,324 | | | $ | 1,289 | | | $ | 1,146 | |
18
SMART Technologies Inc. 2011 Annual Report
| (1) | Revenue growth is calculated as a percentage by comparing the increase in revenue in the period to revenue during the same period in the immediately preceding fiscal year. |
| (2) | Adjusted EBITDA is a non-GAAP measure that is described and reconciled to net income in the next section and is not a substitute for the GAAP equivalent. |
| (3) | Adjusted EBITDA as a percentage of revenue is calculated by dividing Adjusted EBITDA by revenue after adding back the net change in deferred revenue. |
| (4) | Adjusted Net Income is a non-GAAP measure that is described and reconciled to net income in the next section and is not a substitute for the GAAP equivalent. |
| (5) | Adjusted Net Income per share is calculated by dividing Adjusted Net Income by the average number of basic shares outstanding during the period. |
| (6) | Average selling price is calculated by dividing the total revenue from the sale of SMART Board interactive whiteboards and SMART Board interactive whiteboards with integrated projectors by the total number of units sold. |
Non-GAAP Measures
We define Adjusted EBITDA as net income before interest, income taxes, depreciation and amortization, as well as adjusting for the following items: foreign exchange gains or losses, net change in deferred revenue, stock-based compensation, acquisition costs and other income. We define Adjusted Net Income as net income before stock-based compensation, acquisition costs, foreign exchange gains or losses, net change in deferred revenue and amortization of intangible assets, all net of tax.
Adjusted EBITDA and Adjusted Net Income are non-GAAP measures and should not be considered as an alternative to net income or any other measure of financial performance calculated and presented in accordance with GAAP. Adjusted EBITDA, Adjusted Net Income and other non-GAAP measures have inherent limitations and therefore, you should not place undue reliance on them.
We use Adjusted EBITDA as a key measure to assess the core operating performance of our business removing the effects of our leveraged capital structure and the volatility associated with the foreign exchange on our U.S. dollar-denominated debt. We also use Adjusted Net Income to assess the performance of the business removing the after-tax impact of stock-based compensation, acquisition costs, foreign exchange gains and losses, revenue deferral and amortization of intangible assets. We use both of these measures to assess business performance when we evaluate our results in comparison to budgets, forecasts, prior-year financial results and other companies in our industry. Many of these companies use similar non-GAAP measures to supplement their GAAP disclosures but such measures may not be directly comparable. In addition to its use by management in the assessment of business performance, Adjusted EBITDA is used by our Board of Directors and by our lenders in assessing management’s performance and is a key metric in the determination of incentive plan payments. We believe Adjusted EBITDA and Adjusted Net Income may be useful to investors in evaluating our operating performance because securities analysts use metrics similar to Adjusted EBITDA and Adjusted Net Income as supplemental measures to evaluate the overall operating performance of companies.
Some of the limitations of Adjusted EBITDA are that it does not reflect:
| | • | | depreciation and amortization; |
| | • | | foreign exchange gains or losses; |
| | • | | changes in deferred revenue which, in accordance with our revenue recognition policy described under “Critical Accounting Policies and Estimates – Revenue Recognition” below, represents the portion of our sales that we do not recognize in the period less amounts recognized from prior periods; |
| | • | | stock-based compensation expense; |
| | • | | other income, including interest income and gains or losses related to the sale of property and equipment. |
Adjusted Net Income has the same limitations as Adjusted EBITDA discussed above, with the exception that it does reflect income taxes, depreciation and amortization of property and equipment, interest expense and other income.
We compensate for the inherent limitations associated with using Adjusted EBITDA and Adjusted Net Income through disclosure of such limitations, presentation of our financial statements in accordance with GAAP and reconciliation of Adjusted EBITDA and Adjusted Net Income to the most directly comparable GAAP measure, net income (loss).
19
SMART Technologies Inc. 2011 Annual Report
Management’s Discussion and Analysis of Financial Condition and Results of Operations(continued)
The following table sets forth the reconciliation of net income to Adjusted EBITDA in millions of dollars.
| | | | | | | | | | | | |
Fiscal Year Ended March 31, | | 2011 | | | 2010 | | | 2009 | |
Adjusted EBITDA | | | | | | | | | | | | |
Net income (loss) | | $ | 69.4 | | | $ | 142.0 | | | $ | (106.6 | ) |
Income tax expense | | | 35.3 | | | | 18.3 | | | | 4.3 | |
Depreciation in cost of sales | | | 4.1 | | | | 2.0 | | | | 3.9 | |
Depreciation and amortization | | | 31.8 | | | | 15.9 | | | | 5.8 | |
Interest expense | | | 31.6 | | | | 64.9 | | | | 78.6 | |
Foreign exchange (gain) loss | | | (10.5 | ) | | | (91.8 | ) | | | 94.0 | |
Change in deferred revenue(1) | | | 14.8 | | | | 13.4 | | | | 11.7 | |
Stock-based compensation | | | 8.7 | | | | — | | | | — | |
Acquisition costs | | | 1.1 | | | | 1.8 | | | | — | |
Other income, net | | | (0.5 | ) | | | (0.2 | ) | | | (0.8 | ) |
| | | | | | | | | | | | |
Adjusted EBITDA | | $ | 185.8 | | | $ | 166.3 | | | $ | 90.9 | |
| | | | | | | | | | | | |
| (1) | Change in deferred revenue is calculated as the difference between deferred revenue and deferred revenue recognized. In accordance with our revenue recognition policy, deferred revenue represents the portion of our sales that we do not recognize in the period. Deferred revenue recognized represents the portion of our revenue deferred in a prior period that we recognized in the current period. We deferred revenue of $44.2 million, $36.9 million and $31.1 million in the years ended March 31, 2011, 2010 and 2009, respectively. |
The following table sets forth the reconciliation of net income to Adjusted Net Income and basic and diluted earnings per share to Adjusted Net Income per share in millions of dollars, except per share amounts.
| | | | | | | | | | | | |
Fiscal Year Ended March 31, | | 2011 | | | 2010 | | | 2009 | |
Adjusted Net Income | | | | | | | | | | | | |
Net income (loss) | | $ | 69.4 | | | $ | 142.0 | | | $ | (106.6 | ) |
Adjustments to net income (loss) | | | | | | | | | | | | |
Amortization of intangible assets | | | 9.0 | | | | — | | | | — | |
Foreign exchange (gain) loss | | | (10.5 | ) | | | (91.8 | ) | | | 94.0 | |
Change in deferred revenue | | | 14.8 | | | | 13.4 | | | | 11.7 | |
Stock-based compensation | | | 8.7 | | | | — | | | | — | |
Acquisition costs | | | 1.1 | | | | 1.8 | | | | — | |
| | | | | | | | | | | | |
| | | 23.1 | | | | (76.6 | ) | | | 105.7 | |
Tax impact on adjustments(1) | | | 7.0 | | | | 5.9 | | | | (1.6 | ) |
| | | | | | | | | | | | |
Adjustments to net income (loss), net of tax | | | 16.1 | | | | (82.5 | ) | | | 104.1 | |
| | | | | | | | | | | | |
Adjusted Net Income | | $ | 85.5 | | | $ | 59.5 | | | $ | (2.5 | ) |
| | | | | | | | | | | | |
Adjusted Net Income per share | | | | | | | | | | | | |
Basic and diluted earnings (loss) per share | | $ | 0.53 | | | $ | 0.81 | | | $ | (0.63 | ) |
Adjustments to net income (loss), net of tax, per share | | | 0.12 | | | | (0.47 | ) | | | 0.62 | |
| | | | | | | | | | | | |
Adjusted Net Income per share | | $ | 0.65 | | | $ | 0.34 | | | $ | (0.01 | ) |
| | | | | | | | | | | | |
| (1) | Reflects the tax impact on the adjustments to net income (loss). A key driver of our foreign exchange (gain) loss is the conversion of our U.S. dollar-denominated debt that was originally incurred at an average rate of 1.05. When the unrealized foreign exchange amount on U.S. dollar-denominated debt is in a net gain position as measured against the original exchange rate, the gain is tax-effected at current rates. When the unrealized foreign exchange amount on the U.S. dollar-denominated debt is in a net loss position as measured against the original exchange rate, a valuation allowance is taken against it and as a result no net tax effect is recorded. |
20
SMART Technologies Inc. 2011 Annual Report
Results of Operations – Fiscal 2011 Compared to Fiscal 2010
Revenue
Revenue increased by $142.1 million, or 21.9%, from $648.0 million in fiscal 2010 to $790.1 million in fiscal 2011. Sales volumes for SMART Board interactive whiteboards for fiscal 2011 were 406,314 units, an increase of 36,825 units, or 10.0%, from 369,489 units in fiscal 2010. The majority of this growth was driven by market demand in the education sector in both North America and EMEA. In North America, revenue increased by $101.1 million as a result of continued adoption of interactive whiteboards in the education market, and increased sales of related attachment products. In EMEA, revenue increased by $25.6 million as a result of our expansion in this region during fiscal 2011.
Gross Margin
Gross margin increased by $69.4 million from $321.5 million in fiscal 2010 to $390.9 million in fiscal 2011. The gross margin percentage in fiscal 2011 was 49.5%, compared to 49.6% in fiscal 2010. Although we continue to focus on lowering assembly costs of certain key components in our product offering as well as logistics and transportation costs, improvements were offset by higher warranty provisions on certain attachment products. The increase in gross margin was partially offset by a negative foreign exchange impact of approximately $6.1 million as a result of the year-over-year weakening of the Euro relative to the U.S. dollar, which impacted our revenue, and the strengthening of the Canadian dollar relative to the U.S. dollar, which impacted our cost of sales.
Operating Expenses
Selling, Marketing and Administration Expenses
Selling, marketing and administration expenses increased by $42.0 million, or 30.3%, from $138.8 million in fiscal 2010 to $180.8 million in fiscal 2011. Approximately $9.0 million of the increase is related to growth in North American employee levels and $8.1 million is related to stock-based compensation expense from the Participant Equity Loan Plan and the Equity Incentive Plan. Approximately $7.4 million of the increase related to increased consulting fees and other costs primarily related to our information systems, the acquisition of NextWindow and the additional costs related to being a public company. Internationally, our expansion in Europe, as part of our global strategy, accounted for approximately $4.3 million of the increase and selling, marketing and administration expenses of NextWindow accounted for approximately $5.7 million of the increase. Lastly, the strengthening in the value of the Canadian dollar compared to the U.S. dollar contributed approximately $8.8 million of the increase.
Research and Development Expenses
Our research and development expenses increased by $19.4 million, or 57.7%, from $33.6 million in fiscal 2010 to $53.0 million in fiscal 2011. These increases reflect our continued commitment to innovation and investment in product development for the education and business markets, including an increase in the number of software developers, engineers and technicians required to support this development, as well as the acquisition of NextWindow. Also, the strengthening in the value of the Canadian dollar compared to the U.S. dollar contributed approximately $3.1 million of the increase.
Depreciation and Amortization
Depreciation and amortization of property and equipment increased by $6.9 million from $15.9 million in fiscal 2010 to $22.8 million in fiscal 2011. This reflects higher depreciation from our continued investment in systems to support our business growth.
Amortization of intangible assets reflects amortization of $8.6 million on $50.1 million of intangible assets recorded upon the acquisition of NextWindow on April 21, 2010. The weighted average amortization period for the intangible assets is 5.6 years.
21
SMART Technologies Inc. 2011 Annual Report
Management’s Discussion and Analysis of Financial Condition and Results of Operations(continued)
Non-Operating Expenses
Interest Expense
Interest expense declined by $33.3 million, or 51.3%, from $64.9 million in fiscal 2010 to $31.6 million in fiscal 2011. Interest expense declined as a result of the 2010 Reorganization described under “Significant 2011 Financial Transactions” above, which resulted in the conversion of the shareholder note payable and cumulative preferred shares into equity during the first quarter of fiscal 2011, as well as the debt repayments made in the last three quarters of fiscal 2011. Using interest rates and the debt level at March 31, 2011, we expect that future interest expense will be approximately $16.3 million annually.
Foreign Exchange Gains
Foreign exchange gains decreased by $81.3 million, from $91.8 million in fiscal 2010 to $10.5 million in fiscal 2011. In prior years, foreign exchange gains and losses have primarily resulted from the conversion of our U.S. dollar-denominated long-term debt into our functional currency of Canadian dollars. From March 31, 2010 to March 31, 2011, the U.S. dollar weakened by approximately 4.5% against the Canadian dollar from CDN$1.0158 to CDN$0.9696, resulting in an unrealized foreign exchange gain on our U.S. dollar-denominated debt of $10.4 million in the year. This compares to a $105.7 million gain reported in fiscal 2010 when the U.S. dollar weakened by approximately 19.5% compared to the Canadian dollar. Although U.S. dollar-denominated debt will continue to be a key driver of foreign exchange gains and losses, the debt repayments during fiscal 2011 and the year-over-year increase in U.S. dollar-denominated cash and accounts receivable have significantly offset the impact of the revaluation of U.S. dollar-denominated debt.
Provision for Income Taxes
Income tax expense increased by $17.0 million from $18.3 million in fiscal 2010 to $35.3 million in fiscal 2011. Our tax provision is weighted towards Canadian income tax rates as substantially all our taxable income is Canadian-based. In calculating the tax provision we adjust income before income taxes by the unrealized foreign exchange (gain) loss from the revaluation of the U.S. dollar-denominated debt. This is treated as a capital item for income tax purposes. We take a valuation allowance if the conversion of U.S. dollar-denominated debt is in a net foreign exchange loss position due to the uncertainty that we will be able to utilize the capital loss in the future. The increase in income tax expense in fiscal 2011 compared to fiscal 2010 was due to a reduction in the valuation allowance against unrealized capital losses on U.S. dollar-denominated debt and utilization of non-capital losses occurring in fiscal 2010. The tax provision also includes investment tax credits for fiscal 2011 and fiscal 2010 of $4.4 million and $4.6 million, respectively.
Net Income (Loss)
Net income decreased by $72.6 million from $142.0 million in fiscal 2010 to $69.4 million in fiscal 2011. This change is due to the increase in gross margin of $69.4 million and decrease in interest expense of $33.3 million, offset by an increase in operating expenses of $77.3 million, income taxes of $17.0 million and the impact of the volatility of the U.S. dollar relative to the Canadian dollar on our U.S. dollar-denominated debt, which resulted in an $81.3 million decrease in year-over-year foreign exchange gains.
Adjusted EBITDA
Adjusted EBITDA increased by $19.5 million, or 11.7%, from $166.3 million in fiscal 2010 to $185.8 million in fiscal 2011 due to continued revenue growth in the adoption of SMART Board interactive whiteboards and related attachment products. This was offset by a negative foreign exchange impact of approximately $17.7 million as a result of the year-over-year strengthening of the Canadian dollar relative to the U.S. dollar.
22
SMART Technologies Inc. 2011 Annual Report
Equity Incentive Plan
In June 2010, we implemented an Equity Incentive Plan which provides for the grant of options, restricted share units and deferred share units to directors, officers, employees, consultants and service providers of the Company and its subsidiaries. During fiscal 2011, we granted 1,444,500 stock options to purchase an equivalent number of the Company’s Class A Subordinate Voting Shares at a weighted average exercise price of $16.22. Of these options, 1,140,000 were granted on July 15, 2010, in conjunction with our IPO, at an exercise price of $17.00. These options will vest over various periods ranging between three and four years. We expect stock-based compensation in selling, marketing and administration and research and development expenses to be approximately $1.7 million in fiscal 2012 as a result of these issuances.
Participant Equity Loan Plan
In August 2010, the Board of Directors approved a change to the Participant Equity Loan Plan (the “Plan”) whereby 40% of performance-based Class A Subordinate Voting Shares that did not become unrestricted as part of the IPO transaction on July 20, 2010, representing 24% of total shares under the Plan, will become unrestricted in two equal installments on each of the next two anniversary dates of the IPO. This has been treated as a change in the Plan for accounting purposes and we expect stock-based compensation in selling, marketing and administration and research and development expenses will be approximately $5.8 million for fiscal 2012 as a result of this change.
Results of Operations – Fiscal 2010 Compared to Fiscal 2009
Revenue
Revenue for fiscal 2010 increased by $179.8 million, or 38.4%, from $468.2 million in fiscal 2009 to $648.0 million in fiscal 2010. This was due primarily to higher product sales volumes in North America driven by the continued adoption of interactive whiteboard technology and related products in the U.S. education market. Demand for our core products increased as a result of a general expansion of the market for interactive whiteboards and related attachment products. In addition, the education market, which represents an estimated 85% of our revenue base, was aided by various government economic stimulus programs in fiscal 2010 as governments undertook spending initiatives to improve public infrastructure and to help alleviate the effects of the global recession.
Gross Margin
Gross margin for fiscal 2010 increased by $121.5 million from $200.0 million in fiscal 2009 to $321.5 million in fiscal 2010. The gross margin percentage in fiscal 2010 was 49.6% compared to 42.7% in fiscal 2009. The improvement in gross margin as a percentage of revenue reflects the redesign and lower assembly cost of certain key components in our product offering, including interactive whiteboards and integrated projectors, and a general focus on cost reduction in other areas, including logistics and transportation. The increase in gross margin was partially offset by a negative foreign exchange impact of approximately $5.0 million as a result of the year-over-year weakening of the Euro relative to the U.S. dollar, which impacted our revenue, and the strengthening of the Canadian dollar relative to the U.S. dollar, which impacted our cost of sales.
Operating Expenses
Selling, Marketing and Administration Expenses
Selling, marketing and administration expenses increased by $39.1 million, or 39.2%, from $99.7 million in fiscal 2009 to $138.8 million in fiscal 2010. Approximately $12.1 million of the increase related to our expansion into Europe as part of our overall global strategy. Growth in North American employee levels accounted for approximately $4.5 million of the increase. Approximately $5.8 million related to sales and marketing expenses to support additional product offerings and our growing revenue profile and the remaining expenses related to remediation efforts for our enterprise resource planning, or ERP, system and increased expenses for administrative support in finance, information systems and legal required to meet the business growth.
23
SMART Technologies Inc. 2011 Annual Report
Management’s Discussion and Analysis of Financial Condition and Results of Operations(continued)
Research and Development Expenses
Research and development expenses increased by $8.6 million, or 34.4%, from $25.0 million in fiscal 2009 to $33.6 million in fiscal 2010. The increase reflects our continued focus on investing in product development for the education and business markets, including an increase in the number of software developers, engineers and technicians required to support this development.
Depreciation and Amortization
Depreciation and amortization expense increased by $10.1 million, or 174.1%, from $5.8 million in fiscal 2009 to $15.9 million in fiscal 2010. The increase relates to the first full year of depreciation recorded on our new headquarters building which was substantially completed on January 1, 2009, amortization for the information technology infrastructure which was put into place in the new building and amortization of the implemented components of our new ERP system. Because the building was under construction in fiscal 2009, depreciation was recorded only for the fourth quarter of fiscal 2009.
Non-Operating Expenses
Interest Expense
Interest expense declined by $13.7 million, or 17.4%, from $78.6 million in fiscal 2009 to $64.9 million in fiscal 2010. The decrease corresponds with the year-over-year decrease in the U.S. LIBOR rate, which is the rate on which our floating rate term bank debt is based. For example, three-month LIBOR declined from an average of 2.4% in fiscal 2009 to an average of 0.4% in fiscal 2010.
Foreign Exchange Loss (Gain)
Foreign exchange loss (gain) for fiscal 2010 changed by $185.8 million, from a loss of $94.0 million in fiscal 2009 to a gain of $91.8 million in fiscal 2010. These foreign exchange gains and losses primarily resulted from the conversion of our U.S. dollar denominated long-term debt into our functional currency of Canadian dollars. From the end of fiscal 2009 to the end of fiscal 2010, the U.S. dollar weakened by approximately 19.5% against the Canadian dollar from CDN$1.2613 to CDN$1.0158, resulting in an unrealized foreign exchange gain on our U.S. dollar denominated debt of $105.7 million. This gain reversed the loss reported in the same period in 2009 when the U.S. dollar strengthened by approximately 22.9% compared to the Canadian dollar.
Provision for Income Taxes
Income tax expense increased by $14.0 million, from $4.3 million in fiscal 2009 to $18.3 million in fiscal 2010. This was primarily due to an increase in taxable income. Our tax provision is weighted towards Canadian income tax rates as substantially all our taxable income is Canadian-based. In calculating the tax provision we add back the unrealized foreign exchange loss (gain) from the revaluation of the U.S. dollar denominated debt to net income (loss) before income taxes. This is treated as a capital item for income tax purposes. The tax provision also includes investment tax credits for fiscal 2010 and fiscal 2009 of $4.6 million and $3.5 million, respectively.
Net Income (Loss)
Net income increased by $248.6 million from a net loss of $106.6 million in fiscal 2009 to a net income of $142.0 million in fiscal 2010. The primary factors driving the change in net income (loss) were the impact of the volatility of the U.S. dollar relative to the Canadian dollar on our U.S. dollar denominated debt, which resulted in an unrealized foreign exchange gain of $91.8 million in fiscal 2010 compared to a loss of $94.0 million in fiscal 2009. This accounted for $185.8 million of the increase, and continued growth in Adjusted EBITDA accounted for the remainder.
Adjusted EBITDA
Adjusted EBITDA increased by $75.4 million, or 82.9%, from $90.9 million in fiscal 2009 to $166.3 million in fiscal 2010. This was due to continued growth in the adoption of SMART Board interactive whiteboards and related attachment products and the improvement in gross margin.
24
SMART Technologies Inc. 2011 Annual Report
Selected Quarterly Financial Data
The following tables set forth the Company’s unaudited quarterly consolidated results of operations, reconciliation of net income to Adjusted EBITDA and reconciliation to Adjusted Net Income for each of the eight most recent quarters. The information in the table below has been derived from our unaudited interim consolidated financial statements. Our quarterly operating results have varied substantially in the past and may vary substantially in the future. Accordingly, the information below is not necessarily indicative of future results. Data for the periods are indicated in millions of dollars, except for shares, per share amounts, units and average selling prices.
| | | | | | | | | | | | | | | | | | | | | | | | | | | | | | | | |
| | | Fiscal Year 2011 | | | Fiscal Year 2010 | |
| | | Fourth
Quarter | | | Third
Quarter | | | Second
Quarter | | | First
Quarter | | | Fourth
Quarter | | | Third
Quarter | | | Second
Quarter | | | First
Quarter | |
Consolidated Statement of Operations | | | | | | | | | | | | | | | | | | | | | | | | | | | | | | | | |
Revenue | | $ | 167.3 | | | $ | 180.9 | | | $ | 222.7 | | | $ | 219.2 | | | $ | 155.6 | | | $ | 156.1 | | | $ | 177.8 | | | $ | 158.5 | |
Cost of sales | | | 89.6 | | | | 94.5 | | | | 106.6 | | | | 108.5 | | | | 75.9 | | | | 79.5 | | | | 92.7 | | | | 78.4 | |
| | | | | | | | | | | | | | | | | | | | | | | | | | | | | | | | |
Gross margin | | | 77.7 | | | | 86.4 | | | | 116.1 | | | | 110.7 | | | | 79.7 | | | | 76.6 | | | | 85.1 | | | | 80.1 | |
Operating expenses | | | | | | | | | | | | | | | | | | | | | | | | | | | | | | | | |
Selling, marketing and administration expenses | | | 52.1 | | | | 45.5 | | | | 41.4 | | | | 41.8 | | | | 41.9 | | | | 35.7 | | | | 33.4 | | | | 27.9 | |
Research and development expenses | | | 14.7 | | | | 13.8 | | | | 12.7 | | | | 11.8 | | | | 9.9 | | | | 9.0 | | | | 7.5 | | | | 7.1 | |
Depreciation and amortization | | | 7.9 | | | | 7.2 | | | | 8.1 | | | | 8.6 | | | | 6.7 | | | | 3.9 | | | | 3.0 | | | | 2.3 | |
| | | | | | | | | | | | | | | | | | | | | | | | | | | | | | | | |
Operating income | | | 3.0 | | | | 19.9 | | | | 53.9 | | | | 48.5 | | | | 21.2 | | | | 28.0 | | | | 41.2 | | | | 42.8 | |
Non-operating expenses | | | | | | | | | | | | | | | | | | | | | | | | | | | | | | | | |
Other (income) loss, net | | | (0.1 | ) | | | (0.1 | ) | | | (0.1 | ) | | | (0.2 | ) | | | (0.2 | ) | | | (0.2 | ) | | | — | | | | 0.2 | |
Interest expense | | | 4.8 | | | | 5.3 | | | | 8.0 | | | | 13.5 | | | | 17.8 | | | | 16.2 | | | | 16.0 | | | | 14.9 | |
Foreign exchange (gain) loss | | | (13.6 | ) | | | (3.2 | ) | | | (14.7 | ) | | | 21.0 | | | | (8.2 | ) | | | (8.7 | ) | | | (38.9 | ) | | | (36.0 | ) |
| | | | | | | | | | | | | | | | | | | | | | | | | | | | | | | | |
Income before income taxes | | | 11.9 | | | | 17.9 | | | | 60.7 | | | | 14.2 | | | | 11.8 | | | | 20.7 | | | | 64.1 | | | | 63.7 | |
Income tax expense | | | 4.3 | | | | 5.4 | | | | 16.4 | | | | 9.2 | | | | 1.3 | | | | 0.8 | | | | 7.4 | | | | 8.8 | |
| | | | | | | | | | | | | | | | | | | | | | | | | | | | | | | | |
Net income | | $ | 7.6 | | | $ | 12.5 | | | $ | 44.3 | | | $ | 5.0 | | | $ | 10.5 | | | $ | 19.9 | | | $ | 56.7 | | | $ | 54.9 | |
| | | | | | | | | | | | | | | | | | | | | | | | | | | | | | | | |
Certain reclassifications have been made to prior periods’ figures to conform to the current period’s presentation.
| | | | | | | | | | | | | | | | | | | | | | | | | | | | | | | | |
| | | Fiscal Year 2011 | | | Fiscal Year 2010 | |
| | | Fourth
Quarter | | | Third
Quarter | | | Second
Quarter | | | First
Quarter | | | Fourth
Quarter | | | Third
Quarter | | | Second
Quarter | | | First
Quarter | |
Adjusted EBITDA | | | | | | | | | | | | | | | | | | | | | | | | | | | | | | | | |
Net income | | $ | 7.6 | | | $ | 12.5 | | | $ | 44.3 | | | $ | 5.0 | | | $ | 10.5 | | | $ | 19.9 | | | $ | 56.7 | | | $ | 54.9 | |
Income tax expense | | | 4.3 | | | | 5.4 | | | | 16.4 | | | | 9.2 | | | | 1.3 | | | | 0.8 | | | | 7.4 | | | | 8.8 | |
Depreciation in cost of sales | | | 0.9 | | | | 0.9 | | | | 0.5 | | | | 1.8 | | | | (1.0 | ) | | | 1.1 | | | | 1.0 | | | | 0.9 | |
Depreciation and amortization | | | 7.9 | | | | 7.2 | | | | 8.1 | | | | 8.6 | | | | 6.7 | | | | 3.9 | | | | 3.0 | | | | 2.3 | |
Interest expense | | | 4.8 | | | | 5.3 | | | | 8.0 | | | | 13.5 | | | | 17.8 | | | | 16.2 | | | | 16.0 | | | | 14.9 | |
Foreign exchange (gain) loss | | | (13.6 | ) | | | (3.2 | ) | | | (14.7 | ) | | | 21.0 | | | | (8.2 | ) | | | (8.7 | ) | | | (38.9 | ) | | | (36.0 | ) |
Change in deferred revenue(1) | | | 1.5 | | | | 2.2 | | | | 5.4 | | | | 5.7 | | | | 2.6 | | | | 2.5 | | | | 3.7 | | | | 4.6 | |
Stock-based compensation | | | 3.1 | | | | 3.8 | | | | 1.8 | | | | — | | | | — | | | | — | | | | — | | | | — | |
Acquisition costs | | | — | | | | — | | | | 0.1 | | | | 1.0 | | | | 1.8 | | | | — | | | | — | | | | — | |
Other income, net | | | (0.1 | ) | | | (0.1 | ) | | | (0.1 | ) | | | (0.2 | ) | | | (0.2 | ) | | | (0.2 | ) | | | — | | | | 0.2 | |
| | | | | | | | | | | | | | | | | | | | | | | | | | | | | | | | |
Adjusted EBITDA | | $ | 16.4 | | | $ | 34.0 | | | $ | 69.8 | | | $ | 65.6 | | | $ | 31.3 | | | $ | 35.5 | | | $ | 48.9 | | | $ | 50.6 | |
| | | | | | | | | | | | | | | | | | | | | | | | | | | | | | | | |
| (1) | Change in deferred revenue is calculated as the difference between deferred revenue and deferred revenue recognized. In accordance with our revenue recognition policy, deferred revenue represents the portion of our sales that we do not recognize in the period. Deferred revenue recognized represents the portion of our revenue deferred in a prior period that we recognized in the current period. |
25
SMART Technologies Inc. 2011 Annual Report
Management’s Discussion and Analysis of Financial Condition and Results of Operations(continued)
| | | | | | | | | | | | | | | | | | | | | | | | | | | | | | | | |
| | | Fiscal Year 2011 | | | Fiscal Year 2010 | |
| | | Fourth
Quarter | | | Third
Quarter | | | Second
Quarter | | | First
Quarter | | | Fourth
Quarter | | | Third
Quarter | | | Second
Quarter | | | First
Quarter | |
Adjusted Net Income | | | | | | | | | | | | | | | | | | | | | | | | | | | | | | | | |
Net income | | $ | 7.6 | | | $ | 12.5 | | | $ | 44.3 | | | $ | 5.0 | | | $ | 10.5 | | | $ | 19.9 | | | $ | 56.7 | | | $ | 54.9 | |
Adjustments to net income | | | | | | | | | | | | | | | | | | | | | | | | | | | | | | | | |
Amortization of intangible assets | | | 2.4 | | | | 2.4 | | | | 2.4 | | | | 1.8 | | | | — | | | | — | | | | — | | | | — | |
Foreign exchange (gain) loss | | | (13.6 | ) | | | (3.2 | ) | | | (14.7 | ) | | | 21.0 | | | | (8.2 | ) | | | (8.7 | ) | | | (38.9 | ) | | | (36.0 | ) |
Change in deferred revenue | | | 1.5 | | | | 2.2 | | | | 5.4 | | | | 5.7 | | | | 2.6 | | | | 2.5 | | | | 3.7 | | | | 4.6 | |
Stock-based compensation | | | 3.1 | | | | 3.8 | | | | 1.8 | | | | — | | | | — | | | | — | | | | — | | | | — | |
Acquisition costs | | | — | | | | — | | | | 0.1 | | | | 1.0 | | | | 1.8 | | | | — | | | | — | | | | — | |
| | | | | | | | | | | | | | | | | | | | | | | | | | | | | | | | |
| | | (6.6 | ) | | | 5.2 | | | | (5.0 | ) | | | 29.5 | | | | (3.8 | ) | | | (6.2 | ) | | | (35.2 | ) | | | (31.4 | ) |
Tax impact on adjustments(1) | | | 0.2 | | | | 1.8 | | | | 0.6 | | | | 4.4 | | | | 1.0 | | | | 1.1 | | | | 1.3 | | | | 2.5 | |
| | | | | | | | | | | | | | | | | | | | | | | | | | | | | | | | |
Adjustments to net income, net of tax | | | (6.8 | ) | | | 3.4 | | | | (5.6 | ) | | | 25.1 | | | | (4.8 | ) | | | (7.3 | ) | | | (36.5 | ) | | | (33.9 | ) |
| | | | | | | | | | | | | | | | | | | | | | | | | | | | | | | | |
Adjusted Net Income(2) | | $ | 0.8 | | | $ | 15.9 | | | $ | 38.7 | | | $ | 30.1 | | | $ | 5.7 | | | $ | 12.6 | | | $ | 20.2 | | | $ | 21.0 | |
| | | | | | | | | | | | | | | | | | | | | | | | | | | | | | | | |
Adjusted Net Income per share | | | | | | | | | | | | | | | | | | | | | | | | | | | | | | | | |
Weighted average number of shares outstanding | | | 123,772,791 | | | | 123,772,791 | | | | 116,544,684 | | | | 159,167,268 | | | | 180,769,238 | | | | 180,508,997 | | | | 173,986,882 | | | | 170,096,497 | |
Basic and diluted earnings per share | | $ | 0.06 | | | $ | 0.10 | | | $ | 0.38 | | | $ | 0.03 | | | $ | 0.06 | | | $ | 0.11 | | | $ | 0.33 | | | $ | 0.32 | |
Adjustments to net income, net of tax, per share | | | (0.05 | ) | | | 0.03 | | | | (0.05 | ) | | | 0.15 | | | | (0.03 | ) | | | (0.04 | ) | | | (0.21 | ) | | | (0.20 | ) |
| | | | | | | | | | | | | | | | | | | | | | | | | | | | | | | | |
Adjusted Net Income per share | | $ | 0.01 | | | $ | 0.13 | | | $ | 0.33 | | | $ | 0.18 | | | $ | 0.03 | | | $ | 0.07 | | | $ | 0.12 | | | $ | 0.12 | |
| | | | | | | | | | | | | | | | | | | | | | | | | | | | | | | | |
Total number of SMART Board interactive whiteboards sold | | | 82,964 | | | | 89,705 | | | | 117,723 | | | | 115,922 | | | | 82,331 | | | | 93,958 | | | | 101,204 | | | | 91,996 | |
Average selling price of SMART Board interactive whiteboards sold | | $ | 1,301 | | | $ | 1,370 | | | $ | 1,315 | | | $ | 1,315 | | | $ | 1,313 | | | $ | 1,261 | | | $ | 1,355 | | | $ | 1,226 | |
| | | | | | | | | | | | | | | | | | | | | | | | | | | | | | | | |
| (1) | Reflects the tax impact on the adjustments to net income. A key driver of our foreign exchange (gain) loss is the conversion of our U.S. dollar-denominated debt that was originally incurred at an average rate of 1.05. When the unrealized foreign exchange amount on U.S. dollar-denominated debt is in a net gain position as measured against the original exchange rate, the gain is tax-effected at current rates. When the unrealized foreign exchange amount on the U.S. dollar-denominated debt is in a net loss position as measured against the original exchange rate, a valuation allowance is taken against it and as a result no net tax effect is recorded. |
| (2) | Adjusted Net Income is a non-GAAP measure and is not a substitute for the GAAP equivalent. |
26
SMART Technologies Inc. 2011 Annual Report
Liquidity and Capital Resources
As of March 31, 2011, we held cash and cash equivalents of $119.0 million. Our primary source of cash flow is generated from sales of interactive whiteboards and related attachment products. We believe that ongoing operations and associated cash flow in addition to our cash resources and revolving credit facilities provide sufficient liquidity to support our business operations for at least the next 12 months.
During fiscal 2011, the Company completed several significant transactions affecting capital resources, including the 2010 Reorganization, our IPO and repayments of debt. The details of each of these transactions are as follows:
| | • | | On May 13, 2010, the Company’s board of directors approved the 2010 Reorganization of the capital of the Company. Through a series of transactions, the reorganization resulted in the repayment of $8.0 million of the shareholder note payable and the effective conversion of the remaining shareholder note payable and cumula- tive preferred shares, together with all accrued interest and accumulated dividends thereon, as well as all our other outstanding shares into Class B Shares, Class A Subordinate Voting Shares and Class A Preferred Shares. The 2010 Reorganization was completed prior to and in conjunction with the closing of our IPO on July 20, 2010. At this time, the newly created Class A Preferred Shares were converted into Class B Shares and Class A Subordinate Voting Shares and are therefore no longer outstanding. |
| | • | | Using the proceeds of our IPO on July 20, 2010, we repaid $19.2 million of our term construction facility on July 22, 2010 and we repaid $40.0 million of our unsecured term loan on July 30, 2010. |
| | • | | In September 2010, the remaining balances of the unsecured term loan, the term construction facility and the construction loan of $42.4 million, $29.8 million and $1.4 million, respectively, were repaid in full. |
| | • | | During the remainder of fiscal 2011, $55.0 million of the Second lien facility was repaid. |
In addition to our First lien term loan, we have two revolving credit facilities totaling $100.0 million that form part of the First lien facility: a $45.0 million facility that bears interest at LIBOR plus 2.0%, and a $55.0 million facility put into place in conjunction with our IPO that bears interest at LIBOR plus 3.75%. Both credit facilities mature on August 28, 2013 and were undrawn as of March 31, 2011.
As of March 31, 2011, our outstanding debt balances were as follows.
| | | | | | | | | | | | | | | | |
| | | Issue Date | | | Maturity Date | | | Interest Rate | | | Amount
Outstanding | |
First lien facility | | | Aug 28, 2007 | | | | Aug 28, 2014 | | | | LIBOR + 2.75 | % | | $ | 294.3 million | |
Second lien facility | | | Aug 28, 2007 | | | | Aug 28, 2015 | | | | LIBOR + 7.00 | % | | $ | 45.0 million | |
All debt facilities are denominated in U.S. dollars.
Below is a summary of our cash flows provided by operating activities, financing activities and investing activities for the periods indicated.
Net Cash Provided by (Used in) Operating Activities
Net cash provided by operating activities decreased by $74.5 million from $159.5 million in fiscal 2010 to $85.0 million in fiscal 2011. The majority of this change is due to increases in year-over-year non-cash working capital balances of $76.3 million reflecting higher revenue and the related growth in accounts receivable and inventory, as well as reductions in accounts payable, accrued and other liabilities for fiscal 2011 compared to fiscal 2010.
Net cash provided by operating activities increased by $165.8 million to $159.5 million for fiscal 2010 compared to a net use of cash of $6.3 million in fiscal 2009. Approximately $60.3 million of this increase came from operations and business growth and the remainder from improvements in non-cash working capital. Our working capital management improved significantly in fiscal 2010. During fiscal 2009 we were impacted by the implementation on April 1, 2008 of our new ERP system, which adversely affected our ability to manage our working capital levels during that period.
27
SMART Technologies Inc. 2011 Annual Report
Management’s Discussion and Analysis of Financial Condition and Results of Operations (continued)
Net Cash Used in Investing Activities
Net cash used in investing activities increased by $77.0 million from $25.0 million in fiscal 2010 to $102.0 million in fiscal 2011. This increase primarily relates to the acquisition of NextWindow on April 21, 2010 for $82.0 million in cash, which included $8.0 million in cash held by NextWindow at the date of acquisition.
Net cash used in investing activities decreased by $7.5 million from $32.5 million in fiscal 2009 to $25.0 million in fiscal 2010. Net cash used in investing activities in fiscal 2010 and 2009 consisted primarily of capital expenditures associated with the construction of our new headquarters building. The capital expenditures for the building were $5.0 million and $30.9 million for fiscal 2010 and 2009, respectively. These expenditures were higher in fiscal 2009 when the new headquarters was constructed. The remaining expenditures relate to purchases of assembly equipment, leasehold improvements, furniture and fixtures, tradeshow equipment, data network infrastructure for our new headquarters and certain capitalized information systems expenditures.
Net Cash Used in (Provided by) Financing Activities
Net cash used in financing activities increased by $144.9 million from net cash provided of $46.8 million in fiscal 2010 to net cash used of $98.1 million in fiscal 2011. The cash used in financing activities for fiscal 2011 relates to the $40.0 million repayment on our revolving credit facility, an $8.0 million repayment on our shareholder note payable as part of the 2010 Reorganization, as well as significant debt repayments made in fiscal 2011. Specifically, the debt repayments included repayments in July 2010 of $19.2 million (CDN$20.0 million) of our term construction facility and $40.0 million of our unsecured term loan. In September 2010, the remaining balances of $42.4 million of the unsecured term loan, $29.8 million (CDN$30.6 million) of the term construction facility and $1.4 million (CDN$1.5 million) of the construction loan were repaid in full. During the remainder of fiscal 2011, $55.0 million of the Second lien facility was repaid. Cash used in financing activities was offset by net cash proceeds of $134.3 million from the IPO.
Net cash provided by financing activities increased by $10.9 million from $35.9 million in fiscal 2009 to $46.8 million in fiscal 2010. This is primarily due to $40.0 million drawn on our revolving credit facility near the end of fiscal 2010, offset by a decrease of $30.8 million in fiscal 2010 compared to fiscal 2009 in debt issued to complete the construction of our new headquarters building.
Contractual Obligations, Commitments, Guarantees and Contingencies
Contractual Obligations and Commitments
We have certain fixed contractual obligations and commitments that include future estimated payments for general operating purposes. Changes in our business needs, contractual cancellation provisions, fluctuating foreign exchange and interest rates, and other factors may result in actual payments differing from estimates. The following table summarizes our outstanding contractual obligations in millions of dollars as of March 31, 2011.
| | | | | | | | | | | | | | | | | | | | | | | | | | | | |
| | | Fiscal Year Ending March 31, | |
| | | 2012 | | | 2013 | | | 2014 | | | 2015 | | | 2016 | | | 2017
and
Thereafter | | | Total | |
Operating leases | | $ | 7.8 | | | $ | 6.0 | | | $ | 5.6 | | | $ | 5.5 | | | $ | 5.1 | | | $ | 17.7 | | | $ | 47.7 | |
Derivative contracts | | | 1.8 | | | | — | | | | — | | | | — | | | | — | | | | — | | | | 1.8 | |
Long-term debt repayments | | | | | | | | | | | | | | | | | | | | | | | | | | | | |
Long-term debt | | | 3.1 | | | | 3.1 | | | | 3.1 | | | | 285.0 | | | | 45.0 | | | | — | | | | 339.3 | |
Future interest obligations on long-term debt | | | 12.4 | | | | 12.3 | | | | 12.2 | | | | 7.0 | | | | 1.4 | | | | — | | | | 45.3 | |
Purchase commitments | | | 88.5 | | | | 2.0 | | | | 1.2 | | | | — | | | | — | | | | — | | | | 91.7 | |
| | | | | | | | | | | | | | | | | | | | | | | | | | | | |
Total | | $ | 113.6 | | | $ | 23.4 | | | $ | 22.1 | | | $ | 297.5 | | | $ | 51.5 | | | $ | 17.7 | | | $ | 525.8 | |
| | | | | | | | | | | | | | | | | | | | | | | | | | | | |
The operating lease obligations relate primarily to office, warehouse and assembly facilities and represent the minimum commitments under these agreements.
28
SMART Technologies Inc. 2011 Annual Report
The derivative contracts represent minimum commitments under foreign exchange and interest rate contracts based on the forward strip for each instrument through the contract term.
Long-term debt obligations represent the minimum principal repayments required under our long-term debt facilities.
Purchase commitments represent our commitments for raw materials used in the assembly of the SMART Board interactive whiteboards and commitments for finished goods from contract manufacturers, as well as certain information systems and licensing costs.
Commitments have been calculated using foreign exchange rates and interest rates in effect at March 31, 2011. Fluctuations in these rates may result in actual payments differing from those in the above table.
Guarantees and Contingencies
Indemnities and Guarantees
In the normal course of business, we enter into guarantees that provide indemnifications and guarantees to counter-parties to secure sales agreements or purchase commitments. Should we be required to act under such agreements, we expect that we would not incur any material loss.
As a result of the U.S. and Canadian class action IPO litigations, as described in the “Litigation” section below, SMART may be required, subject to certain limitations, to indemnify the following parties: the underwriters pursuant to the underwriting agreement entered into in connection with the IPO; Intel Corporation, Apax Partners and IFF Holdings Inc. (“IFF”), pursuant to a registration rights agreement entered into in 2007 and amended and restated in connection with the IPO; and the directors and officers of SMART Technologies Inc. pursuant to indemnification agreements entered into by SMART and each director and officer on or about the time of their appointment to their respective office.
Litigation
Since December 2010, several class action complaints have been filed in the U.S. District Courts in New York and Illinois on behalf of the purchasers of the Class A Subordinate Voting Shares against the Company and other parties alleging certain violations of federal securities laws relative to the IPO. The New York actions have been dismissed voluntarily and the Illinois action is pending. Pursuant to the provisions governing class action litigation as set out in thePrivate Securities Litigation Reform Act of 1995, it is expected that the various complaints will be consolidated into one action going forward. Several individuals and entities have applied to the Courts to be appointed Lead Plaintiff and those applications remain pending.
In February 2011, a class proceeding was commenced in the Ontario Superior Court of Justice on behalf of purchasers of the Class A Subordinate Voting Shares issued in conjunction with the IPO.
The proceedings relative to the above litigation are currently pending and as such the likelihood of damages or recoveries and the ultimate amounts, if any, relative to the above litigation (or any associated litigation) are not determinable. Accordingly, no amount has been recorded in the financial statements at March 31, 2011.
General
We are subject to claims and contingencies related to lawsuits and other matters arising in the normal course of operations. We believe that the ultimate liability, if any, arising from such claims and contingencies is not likely to have a material effect on our consolidated results of operations or financial condition.
Off-Balance Sheet Arrangements
As of March 31, 2011, we had no off-balance sheet arrangements that have, or are reasonably likely to have, a current or future material effect on our consolidated financial condition, results of operations, liquidity, capital expenditures or capital resources.
29
SMART Technologies Inc. 2011 Annual Report
Management’s Discussion and Analysis of Financial Condition and Results of Operations(continued)
Disclosure Controls and Procedures
As of March 31, 2011, the Company carried out an evaluation, under the supervision and with the participation of the Company’s management, including the Company’s Chief Executive Officer and Chief Financial Officer, of the effectiveness of the design and operations of the Company’s disclosure controls and procedures as defined in Rules 13(a)-15(e) and 15(d)-15(e) under the U.S. Securities Exchange Act (the “Exchange Act”). Based on that evaluation, the Chief Executive Officer and Chief Financial Officer have concluded that, as of such date, the Company’s disclosure controls and procedures were effective to give reasonable assurance that the information required to be disclosed by the Company in reports that it files or submits under the U.S. Securities Exchange Act is recorded, processed, summarized and reported within the time periods specified in the SEC’s rules and forms.
Disclosure controls and procedures include, without limitation, controls and procedures designed to ensure that information required to be disclosed by the Company in the reports that it files or submits under the Exchange Act is accumulated and communicated to management, including its principal executive and financial officers, or persons performing similar functions, as appropriate to allow for timely decisions regarding required disclosure.
Quantitative and Qualitative Disclosures about Market and Other Financial Risks
In the normal course of our business, we engage in operating and financing activities that generate risks in the following primary areas.
Foreign Currency Risk
Foreign currency risk is the risk that fluctuations in foreign exchange rates could impact our results from operations. We are exposed to foreign exchange risk primarily between the Canadian dollar and both the U.S. dollar and the Euro. This exposure relates to our U.S. dollar denominated debt, the sale of our products to customers globally and purchases of goods and services in foreign currencies. A large portion of our revenue and purchases of materials and components are denominated in U.S. dollars. However, a substantial portion of our revenue is denominated in other foreign currencies, primarily the Canadian dollar and the Euro. If the value of any of these currencies depreciates relative to the U.S. dollar, our foreign currency revenue will decrease when translated to U.S. dollars for financial reporting purposes. In addition, a significant portion of our cost of goods sold, operating costs and capital expenditures are incurred in other currencies, primarily the Canadian dollar and the Euro. If the value of either of these currencies appreciates relative to the U.S. dollar, our expenses will increase when translated to U.S. dollars for financial reporting purposes.
We continually monitor foreign exchange rates and periodically enter into forward contracts and other derivative contracts to convert a portion of our forecasted foreign currency denominated cash flows into Canadian dollars for the purpose of paying our Canadian dollar denominated operating costs. We target to cover between 25% and 75% of our expected Canadian dollar cash needs for the next 12 months through the use of forward contracts and other derivatives with the actual percentage determined by management based on the changing exchange rate environment. We do not use derivative financial instruments for speculative purposes. We have also entered into and continue to look for opportunities within our supply chain to match our cost structures to our foreign currency revenues.
These programs reduce, but do not entirely eliminate, the impact of currency exchange movements. Our current practice is to use foreign currency derivatives without hedge accounting designation. The maturity of these instruments generally occurs within 12 months. Gains or losses resulting from the fair valuing of these instruments are reported in foreign exchange (gain) loss on the consolidated statements of operations.
For fiscal 2011, our net income would have decreased with a 10% depreciation in the average value of the Canadian dollar compared to the U.S. dollar by approximately $12.2 million, primarily as a result of our U.S. dollar-denominated debt. Our net income would have decreased with a 10% depreciation in the average value of the Euro compared to the U.S. dollar by approximately $6.1 million primarily as a result of revenue denominated in the Euro.
30
SMART Technologies Inc. 2011 Annual Report
Interest Rate Risk
Interest rate risk is the risk that the value of a financial instrument will be affected by changes in market interest rates. Our financing includes long-term debt and revolving credit facilities that bear interest based on floating market rates. Changes in these rates result in fluctuations in the required cash flows to service this debt. We partially mitigate this risk by periodically entering into interest rate swap agreements to fix the interest rate on certain long-term variable-rate debt. Using interest rates and the debt level at March 31, 2011, our future interest expense would increase by approximately $1.9 million annually for each 1% increase in interest rates. Our current practice is to use interest rate derivatives without hedge accounting designation. Changes in the fair value of these interest rate derivatives are included in interest expense in our consolidated statement of operations.
Credit Risk
Credit risk is the risk that the counterparty to a financial instrument fails to meet its contractual obligations, resulting in a financial loss to us.
We sell to a diverse customer base over a global geographic area. We evaluate collectability of specific customer receivables based on a variety of factors including currency risk, geopolitical risk, payment history, customer stability and other economic factors. Collectability of receivables is reviewed on an ongoing basis by management and the allowance for doubtful receivables is adjusted as required. Account balances are charged against the allowance for doubtful receivables when we determine that it is probable that the receivable will not be recovered. We believe that the geographic diversity of the customer base, combined with our established credit approval practices and ongoing monitoring of customer balances, mitigates this counterparty risk.
We may also be exposed to certain losses in the event that counterparties to the derivative financial instruments are unable to meet the terms of the contracts. Our credit exposure is limited to those counterparties holding derivative contracts with positive fair values at the reporting date. We manage this counterparty credit risk by entering into contracts with large established counterparties.
Liquidity Risk
Liquidity risk is the risk that we will not be able to meet our financial obligations as they come due. We continually monitor our actual and projected cash flows and believe that our internally generated cash flows, combined with our revolving credit facilities, will provide us with sufficient funding to meet all working capital and financing needs for at least the next 12 months.
Critical Accounting Policies and Estimates
The preparation of financial statements and related disclosures in conformity with GAAP requires us to make judgments, assumptions and estimates that affect the amounts reported in our consolidated financial statements and accompanying notes. Note 1, “Basis of presentation and significant accounting policies”, to our consolidated financial statements describes the significant accounting policies and methods used in the preparation of our consolidated financial statements. We base our estimates on historical experience and various other assumptions we believe to be reasonable under the circumstances, the results of which form the basis for making judgments about the carrying values of assets and liabilities. Actual results may differ from these estimates and such differences may be material.
We believe our critical accounting policies and estimates are those related to revenue recognition, inventory valuation and inventory purchase commitments, warranty costs, income taxes, business combinations, and legal and other contingencies. We consider these policies critical because they are both important to the portrayal of our financial condition and operating results, and they require us to make judgments and estimates about inherently uncertain matters. Our company’s critical accounting policies and estimates used in the preparation of our financial statements are reviewed regularly by management.
31
SMART Technologies Inc. 2011 Annual Report
Management’s Discussion and Analysis of Financial Condition and Results of Operations(continued)
Revenue Recognition
Revenue consists primarily of the sale of hardware and software. We recognize revenue when persuasive evidence of an arrangement exists, shipping has occurred, the sales price is fixed or determinable and collection is reasonably assured. Product is considered shipped to the customer once it has left our shipping facilities and title and risk of loss have been transferred. For most of our product sales, these criteria are met at the time the product is shipped. In the case of integrated hardware and software products, we recognize revenue from the sale of (i) hardware products (e.g. SMART Board interactive whiteboards and related attachment products), (ii) software bundled with hardware that is essential to the functionality of the hardware, and (iii) post-contract customer support which includes technical support for the life of the product and when-and-if-available upgrades. We recognize revenue in accordance with industry specific software accounting guidance for the following types of sales transactions: (i) stand-alone sales of software products and post-contract customer support, and (ii) sales of software bundled with hardware not essential to the functionality of the hardware.
For multiple-element arrangements that include tangible products containing software essential to the tangible product’s functionality and undelivered software elements relating to the tangible product’s essential software, we allocate revenue to all deliverables based on their relative selling prices. In such circumstances, accounting principles establish a hierarchy to determine the selling price to be used for allocating revenue to deliverables as follows: (i) vendor-specific objective evidence of fair value, or VSOE, (ii) third-party evidence of selling price, or TPE, and (iii) estimate of the selling price, or ESP.
For the SMART Board interactive whiteboard and the SMART Notebook™ software which is essential to its operation we may from time to time provide future unspecified software upgrades and features free of charge to customers. We have identified three deliverables generally contained in arrangements involving the sale of the SMART Board interactive whiteboard. The first deliverable is the hardware. The second deliverable is the software license essential to the functionality of the hardware device delivered at the time of sale. The third deliverable is post-contract customer support, which includes the customer of the SMART Board interactive whiteboard receiving, on a when-and-if-available basis, future unspecified software upgrades and features relating to the product’s essential software and unlimited customer support for both the hardware and software. Because we have neither VSOE nor TPE for the three deliverables, the allocation of revenue has been based on ESP. Amounts allocated to the delivered hardware and the related essential software are recognized at the time of sale, provided the other conditions for revenue recognition have been met. Amounts allocated to the unspecified software upgrades and hardware and software support are deferred and recognized on a straight-line basis over the seven-year estimated life of the related hardware. All product cost of sales, including estimated warranty costs, are generally recognized at the time of sale. Costs for product development and sales and marketing are expensed as incurred. If the estimated life of the hardware product should change, the future rate of amortization of the deferred revenue allocated to post-customer support will also change.
Our process for determining the ESP for deliverables without VSOE or TPE involves management’s judgment. Our process considers multiple factors that may vary depending upon the unique facts and circumstances related to each deliverable. This view is primarily based on the fact that we are not obligated to provide upgrades at a particular time or at all, and do not specify to customers which upgrades or features will be delivered in the future. Therefore, we have concluded that if we were to sell upgrades on a stand-alone basis, such as those included with the SMART Notebook software, the selling price would be relatively low. Key factors considered in developing the ESP for SMART Notebook software include our historical pricing practices, the nature of the upgrades (i.e. unspecified and when-and-if-available), and the relative ESP of the upgrades as compared to the total selling price of the product. If the facts and circumstances underlying the factors considered change or should future facts and circumstances lead us to consider additional factors, our ESP for software upgrades, updates and customer support related to future SMART Board interactive whiteboard sales could change in future periods.
We record reductions to revenue for estimated commitments related to dealer and distributor incentive programs, including sales programs and volume-based incentives. For dealer and distributor incentive programs, the estimated cost of these programs is recognized at the date the product is sold. Additionally, certain dealer and distributor incentive programs are based on annual sales targets and require management to estimate the expected sales levels based on market conditions. Our estimates are based on experience and the specific terms and conditions of particular incentive programs. If a dealer or distributor misses its sales target significantly in relation to our estimate we would be required to record a change to the estimate, which would favorably impact our revenue and results of operations.
32
SMART Technologies Inc. 2011 Annual Report
Inventory Valuation and Inventory Purchase Commitments
We must order components and finished goods for our products and build inventory in advance of product shipments. We record a write-down for inventories of components and products which have become obsolete or are in excess of anticipated demand or net realizable value. We perform detailed reviews of inventory that consider multiple factors including demand forecasts, product life cycle status, product development plans, current sales levels and component cost trends. If the future demand or market conditions for our products are less favorable than forecasted or if unforeseen technological changes negatively impact the utility of component inventory, we may be required to record additional write-downs, which would negatively affect our results of operations in the period when the write-downs are recorded.
Consistent with industry practice, we acquire components and finished goods through a combination of purchase orders, supplier contracts and open orders based on projected demand information. These commitments typically cover our requirements for periods ranging from 30 to 150 days. If there were an abrupt and substantial decline in demand for one or more of our products, or an unanticipated change in technological requirements for any of our products, we may be required to record additional accruals for cancellation fees that would negatively affect the results of operations in the period when the cancellation fees are identified and recorded.
Warranty Costs
We provide for the estimated cost of hardware warranties at the time the related revenue is recognized based on historical and projected warranty claim rates, historical and projected cost-per-claim, and knowledge of specific product failures that are outside of our typical experience. Each quarter, we evaluate our estimates to assess the adequacy of our recorded warranty liabilities considering the size of the installed base of products subject to warranty protection and adjust the amounts if necessary. If actual product failure rates or repair costs differ significantly from our estimates, revisions to the estimated warranty liability would be required and could negatively affect our results of operations.
Income Taxes
We record a tax provision for the anticipated tax effect of the reported results of operations. In accordance with GAAP, the provision for income taxes is computed using the asset and liability method, under which deferred tax assets and liabilities are recognized for the expected future tax consequences of temporary differences between the financial reporting and tax bases of assets and liabilities, and for operating losses and tax credit carry-forwards. Deferred tax assets and liabilities are measured using the currently enacted tax rates that apply to taxable income in effect for the years in which those tax assets are expected to be realized or settled. We record a valuation allowance to reduce deferred tax assets to the amount that is believed more likely than not to be realized.
We recognize and measure uncertain tax positions in accordance with GAAP, whereby we only recognize the tax benefit from an uncertain tax position if it is more likely than not that the tax position will be sustained on examination by the taxing authorities based on the technical merits of the position. The tax benefits recognized in the financial statements from such positions are then measured based on the largest benefit that has a greater than 50% likelihood of being realized upon ultimate settlement.
We use the flow-through method to account for investment tax credits earned on eligible scientific research and experimental development expenditures. We apply judgment in determining which expenditures are eligible to be claimed. Under this method, investment tax credits are recognized as a reduction to income tax expense.
We enter into transactions and arrangements in the ordinary course of business in which the tax treatment is not entirely certain. In particular, certain countries in which we operate could seek to tax a greater share of income than has been provided for. The final outcome of any audits by taxation authorities may differ from estimates and assumptions used in determining our consolidated tax provision and accruals for interest and penalties associated with the resolution of these audits. These may have a material effect on the consolidated income tax provision and the net income for the period in which such determinations are made.
33
SMART Technologies Inc. 2011 Annual Report
Management’s Discussion and Analysis of Financial Condition and Results of Operations(continued)
We believe it is more likely than not that forecasted income, including income that may be generated as a result of certain tax planning strategies, together with the tax effects of the deferred tax liabilities, will be sufficient to fully recover the deferred tax assets. In the event that we determine all or part of the net deferred tax assets are not realizable in the future, we will make an adjustment to the valuation allowance that would be charged to earnings in the period such determination is made. In addition, the calculation of tax liabilities involves significant judgment in estimating the impact of uncertainties in the application of GAAP and complex tax laws in multiple jurisdictions. Resolution of these uncertainties in a manner inconsistent with our expectations could have a material impact on our financial condition and operating results.
Business Combinations
In December 2007, the Financial Accounting Standards Board (“FASB”), issued a new accounting standard for business combinations, which established principles and requirements for how an acquirer is to recognize and measure in its financial statements the identifiable assets acquired, the liabilities assumed, and any non-controlling interest in the acquiree in a business combination. This new accounting standard also established principles regarding how goodwill acquired in a business combination or gain from a bargain purchase should be recognized and measured, as well as providing guidelines on the disclosure requirements. In April 2009, FASB amended this new accounting standard to require the assets acquired and liabilities assumed in a business combination that arise from contingencies be recognized at fair value, if the fair value can be determined during the measurement period. We adopted the new business combinations accounting standard in the first quarter of fiscal 2011 and applied these principles to our acquisition of NextWindow on April 21, 2010.
Legal and Other Contingencies
We are subject to various legal proceedings and claims that arise in the ordinary course of business. In accordance with GAAP, we record a liability when it is probable that a loss has been incurred and the amount is reasonably estimable. There is significant judgment required in both the probability determination and as to whether an exposure can be reasonably estimated. We believe we have no potential liability related to any current legal proceedings and claims that would individually or in the aggregate materially adversely affect our financial condition or operating results. However, the outcomes of legal proceedings and claims brought against us are subject to significant uncertainty. Should we fail to prevail in any of these legal matters or should several legal matters be resolved against us in the same reporting period, the operating results of a particular reporting period could be materially adversely affected.
Recent Accounting Pronouncements
In January 2010, the FASB issued revised guidance intended to improve disclosures related to fair value measurements. This guidance requires new disclosures as well as clarifies certain existing disclosure requirements. New disclosures under this guidance require separate information about significant transfers in and out of Level 1 and Level 2 and the reason for such transfers, and also require purchases, sales, issuances, and settlements information for Level 3 measurement to be included in the roll-forward activity on a gross basis. The guidance also clarifies the requirement to determine the level of disaggregation for fair value measurement disclosures and the requirement to disclose valuation techniques and inputs used for both recurring and nonrecurring fair value measurements in either Level 2 or Level 3. This accounting guidance was effective for our financial statements beginning in the first quarter of fiscal 2011, except for the roll-forward of activity on a gross basis for Level 3 fair value measurement, which will be effective for our financial statements in the first quarter of fiscal 2012. The adoption of the remaining guidance in the first quarter of 2012 is not expected to have a material impact on our results of operations, financial condition and disclosures.
Risks Related to Our Business
We operate in a highly competitive industry.
We are engaged in an industry that is highly competitive. Because our industry is evolving and characterized by technological change, it is difficult for us to predict whether, when and by whom new competing technologies may be introduced or when new competitors may enter the market. We face increased competition from companies with strong positions in certain markets we currently serve and in new markets and regions we may enter. We compete with other interactive whiteboard developers such as Promethean World Plc, currently our principal competitor, Hitachi, Ltd., Panasonic Corporation and Samsung Electronics Co. We also compete with interactive projector developers such as Seiko Epson Corp. and Dell Inc. Additionally, makers of personal computer technologies, television screens,
34
SMART Technologies Inc. 2011 Annual Report
mobile phones and other technology companies such as Apple Inc., Cisco Systems, Inc., Dell Inc., Hewlett-Packard Company, LG Electronics, Inc., Microsoft Corporation and Polycom, Inc. may seek to provide integrated solutions that include interactive learning and collaboration features substantially similar to those offered by our products. Many of our current and potential future competitors have significantly greater financial and other resources than we do and may spend significant amounts of resources to try to enter the market. We cannot assure that we will be able to compete effectively against current and future competitors. In addition, increased competition or other competitive pressures may result in price reductions, reduced margins or loss of market share, any of which could have a material adverse effect on our business, financial condition or results of operations.
Some of our customers are required to purchase equipment by soliciting proposals from a number of sources and, in some cases, are required to purchase from the lowest bidder. While we attempt to price our products competitively based upon the relative features they offer, our competitors’ prices and other factors, we are often not the lowest bidder and may lose sales to lower bidders. When we are the successful bidder, it is most often as a result of our products being perceived as providing better value to the customer. Our ability to provide better value to the customer depends on continually enhancing our current products and developing new products at competitive prices and in a timely manner.
We cannot assure that we will be able to continue to maintain our value advantage and be competitive. See also, “If we are unable continually to enhance our current products and to develop, introduce and sell new products at competitive prices and in a timely manner, our business would be harmed” below.
Competitors may be able to respond to new or emerging technologies and changes in customer requirements more effectively than we can, or devote greater resources to the development, promotion and sale of products than we can. Current and potential competitors may establish cooperative relationships among themselves or with third parties, including through mergers or acquisitions, to increase the ability of their products to address the needs of our current or prospective customers. If these competitors were to acquire significantly increased market share, it could have a material adverse effect on our business, financial condition or results of operations.
We may not be able to obtain patents or other intellectual property rights necessary to protect our proprietary technology and business.
Our commercial success depends to a significant degree upon our ability to develop new or improved technologies and products, and to obtain patents or other intellectual property rights or statutory protection for these technologies and products in Canada, the U.S. and other countries. We seek to patent concepts, components, processes, designs and methods, and other inventions and technologies that we consider to have commercial value or that will likely give us a technological advantage. We own rights in patents and patent applications for technologies relating to interactive whiteboards and other complementary products in Canada, the U.S. and other countries. Despite devoting resources to the research and development of proprietary technology, we may not be able to develop technology that is patentable or protectable. Patents may not be issued in connection with our pending patent applications and claims allowed may not be sufficient to allow us to use the inventions that we create exclusively. Furthermore, any patents issued to us could be challenged, held invalid or unenforceable or circumvented and may not provide us with sufficient protection or a competitive advantage. In addition, despite our efforts to protect and maintain our patents, competitors and other third parties may be able to design around our patents or develop products similar to our products that are not within the scope of our patents. Finally, patents provide certain statutory protection only for a limited period of time that varies depending on the jurisdiction and type of patent. The statutory protection term of certain of our material patents may expire soon and, thereafter, the underlying technology of such patents can be used by any third party including our competitors.
A number of our competitors and other third parties have been issued patents, or may have filed patent applications, or may obtain additional patents or other intellectual property rights for technologies similar to those that we have developed, used or commercialized, or may develop, use or commercialize, in the future. As certain patent applications in the U.S. and other countries are maintained in secrecy for a period of time after filing, and as publication or public awareness of new technologies often lags behind actual discoveries, we cannot be certain that we were the first to develop the technology covered by our pending patent applications or issued patents or that we were the first to file patent applications for the technology covered by our issued patents and patent pending applications. In addition, the disclosure in our patent applications, including in respect of the utility of our claimed inventions, may not be sufficient
35
SMART Technologies Inc. 2011 Annual Report
Management’s Discussion and Analysis of Financial Condition and Results of Operations(continued)
to meet the statutory requirements for patentability in all cases. As a result, we cannot assure that our patent applications will result in valid or enforceable patents or that we will be able to protect or maintain our patents.
Prosecution and protection of the rights sought in patent applications and patents can be costly and uncertain, often involve complex legal and factual issues and consume significant time and resources. In addition, the breadth of claims allowed in our patents, their enforceability and our ability to protect and maintain them cannot be predicted with any certainty. The laws of certain countries may not protect intellectual property rights to the same extent as the laws of Canada or the U.S. Even if our patents are held to be valid and enforceable in a certain jurisdiction, any legal proceedings that we may initiate against third parties to enforce such patents will likely be expensive, take significant time and divert management’s attention from other business matters. We cannot assure that any of our issued patents or pending patent applications will provide any protectable, maintainable or enforceable rights or competitive advantages to us.
In addition to patents, we rely on a combination of copyrights, trademarks, trade secrets and other related laws and confidentiality procedures and contractual provisions to protect, maintain and enforce our proprietary technology and intellectual property rights in the U.S., Canada and other countries. However, our ability to protect our brand by registering certain trademarks may be limited. See “We may not be able to protect our brand, and any failure to protect our brand would likely harm our business” below. In addition, while we generally enter into confidentiality and nondisclosure agreements with our employees, consultants, contract manufacturers, distributors and dealers and with others to attempt to limit access to and distribution of our proprietary and confidential information, it is possible that:
| | • | | misappropriation of our proprietary and confidential information, including technology, will nevertheless occur; |
| | • | | our confidentiality agreements will not be honored or may be rendered unenforceable; |
| | • | | third parties will independently develop equivalent, superior or competitive technology or products; |
| | • | | disputes will arise with our current or future strategic licensees, customers or others concerning the ownership, validity, enforceability, use, patentability or registrability of intellectual property; or |
| | • | | unauthorized disclosure of our know-how, trade secrets or other proprietary or confidential information will occur. |
We cannot assure that we will be successful in protecting, maintaining or enforcing our intellectual property rights. If we are not successful in protecting, maintaining or enforcing our intellectual property rights, then our business, operating results and financial condition could be materially adversely affected.
We may not be able to manage our growth.
In recent years we have substantially expanded our headcount, facilities and infrastructure. Our total number of employees increased from 824 as of December 31, 2005 to 1,753 as of March 31, 2011. In addition, several of our executive officers and other officers joined us in the last three years. As a result, certain members of our management team lack the institutional knowledge about our Company that is typically required to manage a business of our size and in our stage of development. Our expansion has placed, and we expect it will continue to place, a significant strain on our management, operational and financial resources. We cannot assure that we will be able to better integrate any additional management systems we may require in the future.
Our current and planned personnel, systems, procedures and controls may not be adequate to support our future operations. We must continue to effectively hire, train and manage new employees. If our new hires perform poorly, if we are unsuccessful in hiring, training, managing and integrating these new employees, or if we are not successful in retaining our existing employees, our business may be harmed. To manage any significant growth of our operations and personnel we will need to improve our operational and financial systems, procedures and controls and may need to obtain additional systems.
Our growth also creates difficulties in budgeting expenses and forecasting demand for our products, which can lead to delays in managing the production and shipment of our products and to difficulties in managing cash flows. These difficulties could be exacerbated by our expansion into foreign markets, see “We face significant challenges growing our sales in foreign markets” below. If we are unable to manage our growth rate, our business could be harmed and our results of operations and financial condition could be materially adversely affected.
36
SMART Technologies Inc. 2011 Annual Report
We may infringe on or violate the intellectual property rights of others.
Our commercial success depends, in part, upon our not infringing or violating intellectual property rights owned by others. The industry in which we compete has many participants that own, or claim to own, intellectual property. We cannot determine with certainty whether any existing third-party patents, or the issuance of any new third-party patents, would require us to alter our technologies or products, obtain licenses or cease certain activities, including the sale of certain products.
We have received, and we may in the future receive, claims from third parties asserting infringement and other related claims. Litigation has been and may continue to be necessary to determine the scope, enforceability and validity of third-party intellectual property rights or to protect, maintain and enforce our intellectual property rights. Some of our competitors have, or are affiliated with companies having, substantially greater resources than we have, and these competitors may be able to sustain the costs of complex intellectual property litigation to a greater degree and for longer periods of time than we can. Regardless of whether claims that we are infringing or violating patents or other intellectual property rights have any merit, those claims could:
| | • | | adversely affect our relationships with current or future distributors and dealers of our products; |
| | • | | adversely affect our reputation with customers; |
| | • | | be time-consuming and expensive to evaluate and defend; |
| | • | | cause product shipment delays or stoppages; |
| | • | | divert management’s attention and resources; |
| | • | | subject us to significant liabilities and damages; |
| | • | | require us to enter into royalty or licensing agreements; or |
| | • | | require us to cease certain activities, including the sale of products. |
If it is determined that we have infringed, violated or are infringing or violating a patent or other intellectual property right of any other person or if we are found liable in respect of any other related claim, then, in addition to being liable for potentially substantial damages, we may be prohibited from developing, using, distributing, selling or commercializing certain of our technologies and products unless we obtain a license from the holder of the patent or other intellectual property right. We cannot assure that we will be able to obtain any such license on a timely basis or on commercially favorable terms, or that any such licenses will be available, or that workarounds will be feasible and cost-efficient. If we do not obtain such a license or find a cost-efficient workaround, our business, operating results and financial condition could be materially adversely affected and we could be required to cease related business operations in some markets and restructure our business to focus on our continuing operations in other markets.
If we are unable continually to enhance our current products and to develop, introduce and sell new products at competitive prices and in a timely manner, our business would be harmed.
The market for interactive learning and collaboration solutions is still emerging. It is characterized by rapid technological change and frequent new product introductions. Accordingly, our future success depends upon our ability to enhance our current products and to develop, introduce and sell new products offering enhanced performance and functionality at competitive prices. The development of new technologies and products involves time, substantial costs and risks. Our ability to successfully develop new technologies depends in large measure on our ability to maintain a technically skilled research and development staff and to adapt to technological changes and advances in the industry. The success of new product introductions depends on a number of factors including timely and successful product development, market acceptance, the effective management of purchase commitments and inventory levels in line with anticipated product demand, the availability of components in appropriate quantities and costs to meet anticipated demand, the risk that new products may have quality or other defects in the early stages of introduction and our ability to manage distribution and production issues related to new product introductions. If we are unable, for any reason, to enhance, develop, introduce and sell new products in a timely manner, or at all, in response to changing market conditions or customer requirements or otherwise, our business would be harmed.
37
SMART Technologies Inc. 2011 Annual Report
Management’s Discussion and Analysis of Financial Condition and Results of Operations(continued)
The emerging market for interactive learning and collaboration products may not develop as we expect.
The market for interactive learning and collaboration products has begun to develop only recently, is evolving rapidly and is characterized by an increasing number of market entrants. As is typical of a new and rapidly evolving industry, the demand for and market acceptance of these products are uncertain. The adoption of these products may not become widespread. If the market for these products fails to develop or develops more slowly than we anticipate, we may fail to achieve our anticipated growth.
If there are decreases in spending or changes in the spending policies or budget priorities for government funding of schools, colleges, universities, other education providers or government agencies, we could lose revenue.
Our customers include primary and secondary schools, colleges, universities, other education providers, and, to a lesser extent, government agencies, each of which depends heavily on government funding. The recent worldwide recession has resulted in substantial declines in the tax revenues of many national, federal, state, provincial and local governments. Many of those governments could react to the decreases in revenue by cutting funding to those institutions, and if our products are not a high enough priority expenditure for those institutions, we could lose revenue.
Any general decrease, delay or change in national, federal, state, provincial or local funding for primary and secondary schools, colleges, universities, or other education providers or for government agencies that use our products could cause our current and prospective customers to reduce their purchases of our products, which could cause us to lose revenue. In addition, a specific reduction in governmental funding support for products such as ours could also cause us to lose revenue.
We believe that we have been an indirect but perhaps substantial beneficiary of the American Recovery and Reinvestment Act of 2009, or the ARRA. The ARRA was intended to provide a stimulus to the U.S. economy in the wake of the recent economic downturn. Among other things, the ARRA provided state and local governments with substantial additional funds for education. We believe that some of our sales since the enactment of the ARRA in February 2009 resulted from state and local governments’ obtaining funds under the ARRA for technology purchases. If state and local governments are unable to secure an alternative source of funds upon the depletion of the funds provided under the ARRA, we could experience a slowdown of revenue growth as a result of that lack of funding.
We face significant challenges growing our sales in foreign markets.
As the market for interactive learning and collaboration products and solutions in the U.S. and the United Kingdom becomes more saturated, the growth rate of our revenue in those countries will decrease and, as a result, our revenue growth will become more dependent on sales in other foreign markets. In order for our products to gain broad acceptance in foreign markets, we may need to develop customized solutions specifically designed for each country in which we seek to grow our sales and to sell those solutions at prices that are competitive in that country. For example, while our hardware requires only minimal modification to be usable in other countries, our software and content requires significant customization and modification to adapt to the needs of foreign customers. Specifically, our software will need to be adapted to work in a user-friendly way in several languages and alphabets, and content that fits the specific needs of foreign customers (such as, for example, classroom lessons adapted to specific foreign curricula) will need to be developed. If we are not able to develop customized products and solutions for use in a particular country, we may be unable to compete successfully in that country and our sales growth in that country will be adversely affected. We cannot assure that we will be able to successfully develop customized solutions for each foreign country in which we seek to grow our sales or that our solutions, when developed, will be competitive in the relevant country.
Growth in many foreign countries will require us to price our products at prices that are competitive in the context of those countries. In certain developing countries, we may be required to sell our products at prices below those that we are currently charging in developed countries. Such pricing pressures could reduce our gross margins and decrease the growth rate of our revenue.
Our customers’ experience with our products is directly affected by the availability and quality of our customers’ Internet access. We are unable to control broadband penetration rates and to the extent that broadband growth in emerging markets slows, our growth in international markets could be hindered.
38
SMART Technologies Inc. 2011 Annual Report
In addition, we face lengthy and unpredictable sales cycles in foreign markets, particularly in countries with centralized decision making. In these countries, particularly in connection with significant technology product purchases, we have experienced recurrent requests for proposals, significant delays in the decision making process and, in some cases, indefinite deferrals of purchases or cancellations of requests for proposals. If we are unable to overcome these challenges, the growth of our sales in these markets would be adversely affected.
We are subject to risks inherent in foreign operations.
Sales outside the U.S. and Canada represented approximately 29% of our consolidated sales based on our most recent fiscal year ended March 31, 2011. We intend to continue to pursue international market growth opportunities, which could result in those international sales accounting for a more significant portion of our revenue. We have committed, and may continue to commit, significant resources to our international operations and sales and marketing activities. In addition to our offices in the U.S. and Canada, we maintain offices in Brazil, China, France, Germany, Japan, New Zealand, Singapore, the United Arab Emirates and the United Kingdom. We have limited experience conducting business outside of the U.S. and Canada, and we may not be aware of all the factors that may affect our business in foreign jurisdictions. We are subject to a number of risks associated with international business activities that may increase costs, lengthen sales cycles and require significant management attention. International operations carry certain risks and associated costs, such as the complexities and expense of administering a business abroad, complications in compliance with, and unexpected changes in regulatory requirements, foreign laws, international import and export legislation, trading and investment policies, exchange controls, tariffs and other trade barriers, difficulties in collecting accounts receivable, potential adverse tax consequences, uncertainties of laws, difficulties in protecting, maintaining or enforcing intellectual property rights, difficulty in managing a geographically dispersed workforce in compliance with diverse local laws and customs, and other factors, depending upon the country involved. Moreover, local laws and customs in many countries differ significantly and compliance with the laws of multiple jurisdictions can be complex, difficult and costly. For example, we recently amended our distributorship agreements to bring them into compliance with certain restrictions contained in the competition laws of the European Union. We cannot assure that risks inherent in our foreign operations will not have a material adverse effect on our business. See also, “We face significant challenges growing our sales in foreign markets” above.
If we are unable to implement effective procedures to ensure compliance with export control laws, our business could be harmed.
Our extensive foreign operations and sales are subject to far reaching and complex export control laws and regulations in the U.S., Canada and elsewhere. Violations of those laws and regulations could have material negative consequences for us including large fines, criminal sanctions, prohibitions on participating in certain transactions and government contracts, sanctions on other companies if they continue to do business with us and adverse publicity. In January 2010, we retained a third party consultant to assess our operations from an export compliance perspective, resulting in the identification of a number of deficiencies in our policies, procedures and controls. We have since implemented appropriate controls for export compliance in response to those recommendations from the consultant.
We may not be able to protect our brand, and any failure to protect our brand would likely harm our business.
We regard our SMART brand as one of our most valuable assets. We believe that continuing to strengthen our brand will be critical to achieving widespread acceptance of our products, and will require a continued focus on active marketing efforts. We will need to continue to spend substantial amounts of money on, and devote substantial resources to, advertising, marketing and other efforts to create and maintain brand recognition and loyalty among end-users. However, brand promotion activities may not yield increased revenue, and even if they do, any increased revenue may not offset the expenses incurred in building our brand. If we fail to promote, protect and maintain our brand, or if we incur substantial expenses in an unsuccessful attempt to promote, protect and maintain our brand, our business would be harmed.
The unlicensed use of our trademarks by third parties could harm our reputation, impair such trademarks and adversely affect the strength and value of our brand in the marketplace and the associated goodwill. We use the term “SMART” in the branding of many of our products, such as the SMART Board interactive whiteboard, the SMART Response interactive response system and our SMART Notebook software. Because it is generally not possible to obtain trademark protection for a term that is descriptive, we may be unable to obtain, or may be unable to enforce, trademark rights for certain of our product brands such as “smart board” in certain jurisdictions. If we are unable to obtain or enforce such rights under applicable law, our ability to prevent our competitors and potential competitors from
39
SMART Technologies Inc. 2011 Annual Report
Management’s Discussion and Analysis of Financial Condition and Results of Operations(continued)
referring to their products using terms or trademarks that are confusingly similar to those of our products will be adversely affected. We are aware of situations in which our competitors have described their product generally as a “smart board.” While we seek to defend against such dilution of our trademarks, we cannot assure that we will be successful in protecting our trademarks.
In addition, trademark protection is territorial and our ability to expand our business, including, for example, by offering different products or services or by selling our products in new jurisdictions, may be limited by prior use, common law rights or prior applications or registrations of certain trademarks by third parties in such jurisdiction.
Under applicable trademark law in certain jurisdictions, if a trademark becomes generic, rights in the mark may no longer be enforceable. To the extent that people refer generally to interactive whiteboards as “smart boards” or if the “SMART” name were otherwise to become a generic term, we may be unable to prevent competitors and others from using our name for their products which could adversely affect our ability to leverage our brand and could harm our reputation if third-party products of lesser quality are mistaken for our products.
Our suppliers and contract manufacturers may not be able to supply components or products to us on a timely basis or on favorable terms.
Assembly of our products depends on obtaining adequate supplies of components on a timely basis. Some of those components, as well as certain complete products that we sell, are provided to us by only one supplier or contract manufacturer. We are subject to risks that disruptions in the operations of our sole or limited suppliers or contract manufacturers may cause them to decrease or stop production of these components and products. Alternative sources are not always available. Many of our components are manufactured overseas and have long lead times. We have from time to time experienced shortages of several of our products and components that we obtain from third parties. Because of the current economic climate, many suppliers and contract manufacturers have generally lowered their manufacturing capacity which increases lead times for our products or components. Because of the global reach of our supply chain, world events such as local disruptions, natural disasters or political conflict may cause unexpected interruptions to the supply of our products or components. We have also experienced unexpected demand for certain of our products. As a result of these factors, we have had, and may have in the future, delays in delivering the number of products ordered by our customers. We cannot predict if or when our suppliers and contract manufacturers will resume production at full capacity and we cannot ensure that product or component shortages will not occur in the future. If we cannot supply products due to a lack of components, or are unable to redesign products with other components in a timely manner, our business will be significantly harmed.
We do not have written agreements with many of our suppliers. Although we are endeavoring to enter into written agreements with certain of our suppliers, we cannot assure that our efforts will be successful. Even where we do have a written agreement for the supply of a component, there is no guarantee that we will be able to extend or renew that agreement on similar favorable terms, or at all, upon expiration or otherwise obtain favorable pricing in the future.
We depend on component and product assembly and logistical services provided by third parties, some of which are sole source and many of which are located outside of Canada and the U.S.
Most of our components are manufactured, and certain of our complete products are assembled, in whole or in part by a few third parties. Many of these third parties are located outside of Canada and the U.S. For example, we rely on one contract manufacturer based in China for the production of all our short-throw projectors used in our interactive whiteboard solution and on contract manufacturers based in Hungary and Mexico for the final production of a significant portion of our completed interactive whiteboards. We have also contracted with a third party to manage much of our transportation and logistics requirements. While these arrangements may lower costs, they also reduce our direct control over production and shipments. It is uncertain what effect such diminished control will have on the quality or quantity of our products or on our flexibility to respond to changing conditions. Our failure to manage production and supply of our products adequately, or the failure of products to meet quality requirements, could materially adversely affect our business.
40
SMART Technologies Inc. 2011 Annual Report
Although arrangements with our suppliers and contract manufacturers may contain provisions for warranty expense reimbursement, it may be difficult or impossible for us to recover from suppliers and contract manufacturers, and we may remain responsible to the customer for warranty service in the event of product defects. Any unanticipated product defect or warranty liability, whether pursuant to arrangements with suppliers, contract manufacturers or otherwise, could materially adversely affect our reputation and business.
Final assembly of our interactive whiteboard products is currently performed in our assembly facility in Ottawa, Canada and by contract manufacturers in Hungary and Mexico. If assembly or logistics in these locations is disrupted for any reason, including natural disasters, information technology failures, breaches of systems security, military or terrorist actions or economic, business, labor, environmental, public health, or political issues, our business, financial condition and operating results could be materially adversely affected.
Any current or future financial problems of suppliers or contract manufacturers could adversely affect us by increasing costs or exposing us to credit risks of these suppliers or contract manufacturers or as the result of a complete cessation of supply. In addition, if suppliers or contract manufacturers or other third parties experience insolvency or bankruptcy, we may lose the benefit of any warranties and indemnities. If we are unable to obtain the necessary components for our products in a timely manner, we may not be able to produce a sufficient supply of products, which could lead to reduced revenue, and our business, financial condition and results of operations could be harmed.
Our future success depends on our co-founders, the loss of either of whom could adversely impact our business.
We depend in a large part upon the continued service of key members of our senior management team. In particular, our co-founders David A. Martin and Nancy L. Knowlton are critical to the overall management of our company as well as the development of our technology, our culture and our strategic direction. We do not maintain any key-person life insurance policies. The loss of any of our management or key personnel could seriously harm our business.
We generate a substantial majority of our revenue from the sale of our interactive whiteboards, and any significant reduction in sales of that product would materially harm our business.
We generated approximately 68% of our revenue from sales of our interactive whiteboards and integrated projectors based on our most recent fiscal year ended March 31, 2011. A decrease in demand for our interactive whiteboards would significantly reduce our revenue. If any of our competitors introduces attractive alternatives to our interactive whiteboards, we could experience a significant decrease in sales as customers migrate to those alternative products.
We may not be successful in our strategy to grow in the business and government markets.
To date, a substantial majority of our revenue has been derived from sales to the education market. Because we sell our products through dealers and distributors, we are unable to precisely quantify the portion of our revenue that is derived from any particular market. However, we estimate that based on our most recent fiscal year ended March 31, 2011, approximately 85% of our revenue was derived from the education market. Our business strategy contemplates expanding our sales to the business and government markets. However, there has not been widespread adoption of interactive whiteboard solutions in the business and government markets and these solutions may fail to achieve wide acceptance in these markets. We believe that the primary reason interactive whiteboards have had slower acceptance rates by business and government users is that they still may be too difficult for the average business and government user to use without training. While most educators who use our products do so on a regular and recurring basis (e.g., teachers may use SMART Board interactive whiteboards in their classrooms daily) and gain a certain proficiency with frequent use, most business and government end-users are occasional users for whom the training required to use our interactive whiteboards may be too significant of a time investment. As a result, our ability to grow our sales in the business and government markets will largely depend on our ability to introduce products that are easier to use intuitively with relatively minimal or no training. We may not be successful in achieving penetration in those markets for other reasons as well. For example, expanding into the business and government markets may require us to develop new distributor and dealer relationships and we may not be successful in developing those relationships. In addition, our brand is less recognized in the business and government markets than it is in the education market.
41
SMART Technologies Inc. 2011 Annual Report
Management’s Discussion and Analysis of Financial Condition and Results of Operations(continued)
Acquisitions and joint ventures could result in operating difficulties, dilution and other harmful consequences.
We expect to evaluate and consider a wide array of potential strategic transactions, including joint ventures, business combinations, acquisitions and dispositions of businesses, technologies, services, products and other assets. At any given time we may be engaged in discussions or negotiations with respect to one or more of these types of transactions. Any of these transactions could be material to our financial condition and results of operations. The process of integrating any acquired business may create unforeseen operating difficulties and expenditures and is itself risky. The areas where we may face difficulties include:
| | • | | diversion of management time, as well as a shift of focus from operating the businesses to issues related to integration and administration; |
| | • | | declining employee morale and retention issues resulting from changes in, or acceleration of, compensation, or changes in management, reporting relationships, future prospects or the direction or culture of the business; |
| | • | | the need to integrate each company’s accounting, management, information, human resource and other administrative systems to permit effective management, and the lack of control if such integration is delayed or not implemented; |
| | • | | the need to implement controls, procedures and policies appropriate for a larger public company at companies that prior to acquisition had lacked such controls, procedures and policies; |
| | • | | in the case of foreign acquisitions, the need to integrate operations across different cultures and languages and to address the particular economic, currency, political, and regulatory risks associated with specific countries; |
| | • | | in some cases, the need to transition operations, end-users, and customers onto our existing platforms; and |
| | • | | liability for activities of the acquired company before the acquisition, including violations of laws, rules and regulations, commercial disputes, tax liabilities and other known and unknown liabilities. |
Moreover, we may not realize the anticipated benefits of any or all of our acquisitions, or may not realize them in the time frame expected. For example, in April 2010 we acquired NextWindow, and we are integrating its operations and technologies with our business. However, we cannot assure that we will be able to integrate those operations and technologies without encountering difficulties, including, but not limited to, the loss of key employees, the disruption of our respective ongoing businesses, the inability to retain business relationships with NextWindow’s customers or possible inconsistencies in standards, controls, procedures and policies. Future acquisitions or mergers may require us to issue additional equity securities, spend our cash, or incur debt, liabilities, and amortization expenses related to intangible assets or write-offs of goodwill, any of which could adversely affect our results of operations.
Our ability to sell our products is dependent upon us establishing and maintaining good relationships with dealers and distributors that promote and sell our products.
Substantially all our sales are made through dealers and distributors and accordingly, we depend on our ability to establish and develop new relationships and to build on existing relationships with dealers and distributors. Our dealers and most of our distributors are not contractually required to sell our products exclusively and may offer competing interactive whiteboard products. We cannot assure that our dealers and distributors will act in a manner that will promote the success of our products. Factors that are largely within the control of those dealers and distributors but are important to the success of our products include:
| | • | | the degree to which our dealers and distributors actively promote our products; |
| | • | | the extent to which our dealers and distributors offer and promote competitive products; and |
| | • | | the quality of installation, training and other support services offered by our dealers and distributors. |
In addition, if some of our competitors offer their products to dealers and distributors on more favorable terms or have more products available to meet their needs, there may be pressure on us to reduce the price of our products or those dealers and distributors may stop carrying our products or de-emphasize the sale of our products in favor of the products of these competitors. If we do not maintain and continue to build relationships with dealers and distributors our business will be harmed.
42
SMART Technologies Inc. 2011 Annual Report
If we are unable to ship and transport components and final products efficiently and economically across long distances and borders our business would be harmed.
We transport significant volumes of components and finished products across long-distances and international borders. Any increases in our transportation costs, as a result of increases in the price of oil or otherwise, would increase our costs and the final prices of our products to our customers. In addition, any increases in customs or tariffs, as a result of changes to existing trade agreements between countries or otherwise, could increase our costs or the final cost of our products to our customers or decrease our margins. Such increases could harm our competitive position and could have a material adverse effect on our business. The laws governing customs and tariffs in many countries are complex, subject to many interpretations and often include substantial penalties for non-compliance. We have an ongoing dispute with the U.S. Customs and Border Protection Agency with respect to the classification of certain of our products and similar disputes may arise in the future. Such similar disputes, if they arise, could subject us to material liabilities and have a material adverse effect on our business.
If we are unable to integrate our products with certain third-party operating system software and other products, the functionality of our products would be adversely affected.
The functionality of our products depends on our ability to integrate our products with the operating system software and related products of providers such as Microsoft Corporation, Apple Inc., and the main distributors of Linux, among other providers. If integration with the products of those companies becomes more difficult, our products would likely be more difficult to use. Any increase in the difficulty of using our products would likely harm our reputation and the utility and desirability of our products, and, as a result, would likely have a material adverse effect on our business. Integrating our products with those of the main software platform providers is particularly critical to increasing our sales to the business and government markets, as discussed above under “We may not be successful in our strategy to grow in the business and government markets”.
Our use of open source and third-party software could impose limitations on our ability to distribute or commercialize our software products. We incorporate open source software into our software products. Although we monitor our use of open source software, the terms of many open source licenses have not been interpreted by Canadian, U.S. and other courts, and there is a risk that such licenses could be construed in a manner that could impose unanticipated conditions or restrictions on our ability to distribute or commercialize our products. In such event, we could be required to seek licenses from, or pay royalties to, third parties in order to continue offering our products, to re-engineer our products or to discontinue the sale of our products in the event re-engineering cannot be accomplished on a timely or efficient basis. If we are required to take any of the foregoing action, this could adversely affect our business, operating results and financial condition.
We also incorporate certain third-party technologies and proprietary rights into our software products and may need to utilize additional third-party technologies or proprietary rights in the future. Although we are not currently reliant in any material respect on any technology license agreement from a single third-party, if software suppliers or other third-party licensors terminate their relationships with us, we could face delays in product releases until equivalent technology can be identified, licensed or developed and integrated into our current software products. These delays, if they occur, could materially adversely affect our business, operating results and financial condition. If we are unable to redesign our software products to function without this third-party technology or to obtain or internally develop similar technology, we might be forced to limit the features available in our current or future software products.
Defects in our products can be difficult to detect before shipment. If defects occur, they could have a material adverse effect on our business.
Our products are highly complex and sophisticated and, from time to time, may contain design defects or software “bugs” or failures that are difficult to detect and correct. Errors or defects may be found in new products after commercial shipments and we may be unable successfully to correct such errors or defects in a timely manner or at all. The occurrence of errors and defects in our products could result in loss of, or delay in, market acceptance of our products, and correcting such errors and failures in our products could require significant expenditure of capital by us. We typically provide warranties on interactive whiteboards for between two and five years, and the failure of our products to operate as described could give rise to warranty claims. The consequences of such errors, failures and other defects and claims could have a material adverse effect on our business, financial condition and results of operations.
43
SMART Technologies Inc. 2011 Annual Report
Management’s Discussion and Analysis of Financial Condition and Results of Operations(continued)
We are exposed to fluctuations in foreign currencies that may materially adversely affect our results of operations.
We are exposed to foreign exchange risk as a result of transactions in currencies other than our functional currency of the Canadian dollar. For example, all of our long-term debt is denominated in U.S. dollars. If the Canadian dollar depreciates relative to the U.S. dollar, the outstanding amount of that debt when translated to our Canadian dollar functional currency will increase. Although we report our results in U.S. dollars, a foreign exchange loss will result from the increase in the outstanding amount and that loss could materially adversely affect our results of operations.
In addition, we are exposed to fluctuations in foreign currencies as a result of transactions in currencies other than our reporting currency of the U.S. dollar. A large portion of our revenue and purchases of materials and components are denominated in U.S. dollars. However, a substantial portion of our revenue is denominated in other foreign currencies, primarily the Canadian dollar and the Euro. If the value of any of these currencies depreciates relative to the U.S. dollar, our foreign currency revenue will decrease when translated to U.S. dollars for financial reporting purposes. In addition, a significant portion of our cost of goods sold, operating costs and capital expenditures are incurred in other currencies, primarily the Canadian dollar and the Euro. If the value of either of these currencies appreciates relative to the U.S. dollar, our expenses will increase when translated to U.S. dollars for financial reporting purposes.
We monitor our foreign exchange exposures and, in certain circumstances, maintain net monetary asset and/or liability balances in foreign currencies and enter into forward contracts and other derivative contracts to convert a portion of our foreign currency denominated cash flows into Canadian dollars. These activities mitigate, but do not eliminate, our exposure to exchange rate fluctuations. As a result, exchange rate fluctuations may materially adversely affect our operating results in future periods.
The level of our current and future debt could have an adverse impact on our business.
We have substantial debt outstanding and we may incur additional indebtedness in the future. As of March 31, 2011, we had $339.3 million of outstanding indebtedness.
The high level of our indebtedness, among other things, could:
| | • | | make it difficult for us to make payments on our debt; |
| | • | | increase our vulnerability to general adverse economic and industry conditions; |
| | • | | require us to dedicate a substantial portion of our cash flow from operations to payments on our indebtedness, thereby reducing the availability of our cash flow to fund working capital, capital expenditures, acquisitions and investments and other general corporate purposes; |
| | • | | limit our flexibility in planning for, or reacting to, changes in our business and the markets in which we operate; |
| | • | | place us at a competitive disadvantage compared to our competitors that have less debt; and |
| | • | | limit our ability to borrow additional funds. |
If additional debt financing is not available when required or is not available on acceptable terms, we may be unable to grow our business, take advantage of business opportunities, respond to competitive pressures or refinance maturing debt, any of which could have a material adverse effect on our operating results and financial condition.
A substantial portion of our debt bears interest at floating rates and we are therefore exposed to fluctuations in interest rates. In order to mitigate the effects of increases in interest rates on our cash flows, from time to time we enter into derivative instruments, including interest rate swaps. These hedging activities mitigate but do not eliminate our exposure to interest rate fluctuations and, as a result, interest rate fluctuations may materially adversely affect our operating results in future periods.
Our working capital requirements and cash flows are subject to fluctuation which could have an adverse effect on our financial condition.
Our working capital requirements and cash flows have historically been, and are expected to continue to be, subject to quarterly and yearly fluctuations, depending on a number of factors. Factors which could result in cash flow fluctuations include:
| | • | | the level of sales and the related margins on those sales; |
| | • | | the collection of receivables; |
| | • | | the timing and size of purchases of inventory and related components; and |
| | • | | the timing of payment on payables and accrued liabilities. |
44
SMART Technologies Inc. 2011 Annual Report
If we are unable to manage fluctuations in cash flow, our business, operating results and financial condition may be materially adversely affected. For example, if we are unable to effectively manage fluctuations in our cash flows, we may be unable to make required interest payments on our indebtedness.
We may need to raise additional funds to pursue our growth strategy or continue our operations, and we may be unable to raise capital when needed.
We believe that our existing working capital, expected cash flow from operations and other available cash resources will enable us to meet our working capital requirements for at least the next 12 months. However, the development and marketing of new products and the expansion of distribution channels require a significant commitment of resources. From time to time, we may seek additional equity or debt financing to finance working capital requirements, continue our expansion, develop new products or make acquisitions or other investments. In addition, if our business plans change; general economic, financial or political conditions in our industry change; or other circumstances arise that have a material effect on our cash flow, the anticipated cash needs of our business, as well as our conclusions as to the adequacy of our available sources of capital, could change significantly. Any of these events or circumstances could result in significant additional funding needs, requiring us to raise additional capital. To the extent that we raise additional capital through the sale of equity or convertible debt securities, the issuance of such securities would result in dilution of the shares held by existing shareholders. If additional funds are raised through the issuance of preferred shares or debt securities, such securities may provide the holders certain rights, preferences, and privileges senior to those of the holders of our Class A Subordinate Voting Shares, and the terms of such securities could impose restrictions on our operations. If financing is not available on satisfactory terms, or at all, we may be unable to expand our business or to develop new business at the rate desired and our results of operations may suffer.
We rely on highly skilled personnel and, if we are unable to attract, retain or motivate qualified personnel, we may not be able to grow effectively.
Our success is largely dependent on our ability to attract and retain skilled employees. Competition for highly skilled management, technical, research and development and other employees is intense in the high-technology industry and we may not be able to attract or retain highly qualified personnel in the future. In making employment decisions, particularly in the high-technology industry, job candidates often consider the value of the equity awards they would receive in connection with their employment. Although our Participant Equity Loan Plan described under note 10(b) of the Company’s audited consolidated financial statements provided certain employees with an opportunity to invest in us, prior to the adoption of our 2010 Equity Incentive Plan, which is described under note 11 of the Company’s audited consolidated financial statements and which we have adopted in connection with our IPO, none of our employee incentive plans provided employees with grants of equity awards.
Our worldwide operations subject us to income taxes in many jurisdictions, and we must exercise significant judgment in order to determine our worldwide financial provision for income taxes. That determination is ultimately an estimate and, accordingly, we cannot assure that our historical income tax provisions and accruals will be adequate.
We are subject to income taxes in Canada, the U.S. and numerous other jurisdictions. Significant judgment is required in determining our worldwide provision for income taxes. In the ordinary course of our business, there are many transactions and calculations where the ultimate tax determination is uncertain. Although we believe our tax estimates are reasonable, we cannot assure that the final determination of any tax audits and litigation will not be materially different from that which is reflected in our historical income tax provisions and accruals. Should additional taxes be assessed against us as a result of an audit or litigation, there could be a material adverse effect on our current and future results and financial condition.
Certain of our subsidiaries provide products to, and may from time to time undertake certain significant transactions with, us and our other subsidiaries in different jurisdictions. In general, cross border transactions between related parties and, in particular, related party financing transactions, are subject to close review by tax authorities. Moreover, several jurisdictions in which we operate have tax laws with detailed transfer pricing rules that require all transactions with nonresident related parties to be priced using arm’s-length pricing principles and require the existence of contemporaneous documentation to support such pricing. A tax authority in one or more jurisdictions could challenge the validity of our related party transfer pricing policies. Because such a challenge generally involves a complex area of taxation and because a significant degree of judgment by management is required to be exercised in setting related party transfer pricing policies, the resolution of such challenges often results in adjustments in favor of the taxing authority. If in the future any taxation authorities are successful in challenging our financing or transfer pricing policies,
45
SMART Technologies Inc. 2011 Annual Report
Management’s Discussion and Analysis of Financial Condition and Results of Operations(continued)
our income tax expense may be adversely affected and we could become subject to interest and penalty charges, which may harm our business, financial condition and operating results.
If our products fail to comply with consumer product or environmental laws, it could materially affect our financial performance.
Because we sell products used by children in classrooms and because our products are subject to environmental regulations in some jurisdictions in which we do business, we must comply with a variety of product safety, product testing and environmental regulations, including compliance with applicable laws and standards with respect to lead content and other child safety and environmental issues. If our products do not meet applicable safety or regulatory standards, we could experience lost sales, diverted resources and increased costs, which could have a material adverse effect on our financial condition and results of operations. Events that give rise to actual, potential or perceived product safety or environmental concerns could expose us to government enforcement action or private litigation and result in product recalls and other liabilities. In addition, negative consumer perceptions regarding the safety of our products could cause negative publicity and harm our reputation.
A successful unionization drive could have a material adverse effect on our business.
Currently, none of our employees are unionized. However, our assembly facility in Ottawa, Canada was the subject of two labor union organizing efforts in the past and any of our current or future facilities may become subject to labor union organizing efforts. Any union organizing efforts, if successful, could result in an increased risk of strikes, work stoppages and resulting product shortages or delays and higher labor costs.
We may have assumed or incurred additional liabilities in connection with the 2010 Reorganization.
While we believe that there will be no material adverse tax consequences to us from the 2010 Reorganization, no advance tax ruling has been obtained from the Canada Revenue Agency and we cannot provide any assurances in this regard. In addition, as a result of the 2010 Reorganization, a number of companies controlled by certain of our shareholders were amalgamated with us. Consequently, we have assumed all liabilities (including tax liabilities and contingent liabilities) of such companies. We will not be indemnified for any of these assumed liabilities. Based upon our due diligence investigations related to the 2010 Reorganization, we believe that we have not assumed any additional material liabilities, although we cannot provide any assurances in this regard. In addition, there may be liabilities that are neither probable nor estimable at this time, which may become probable and estimable in the future. Any such assumption of liabilities as a result of such amalgamation or any adverse tax consequences as a result of the 2010 Reorganization could have a material adverse effect on our results of operations.
We may have difficulty finding an additional independent director and could suffer regulatory consequences as a result.
One of the directors who currently serves on our audit committee is not an independent director. Under the rules of the NASDAQ and of the Canadian provincial securities regulators, all the members of our audit committee must be independent directors by the first anniversary of the date of our IPO. Any failure to comply with these requirements by this deadline would allow the NASDAQ to de-list our Class A Subordinate Voting Shares and the Canadian provincial securities regulators to issue a cease trade order respecting trading of our Class A Subordinate Voting Shares on the TSX.
If our internal controls and accounting processes are insufficient, we may not detect in a timely manner misstatements that could occur in our financial statements in amounts that could be material.
As a new public company, we are devoting substantial efforts to the reporting obligations and internal controls required of a public company in the U.S. and Canada, which will result in substantial costs. A failure to properly meet these obligations could cause investors to lose confidence in us and have a negative impact on the market price of our Class A Subordinate Voting Shares. We are devoting significant resources to the documentation and testing of our operational and financial systems for the foreseeable future. We will need to make continued efforts with respect to the documentation of our internal controls in order to meet the requirements of being a public company in the U.S. and Canada, including the rules under Section 404 of Sarbanes-Oxley in the U.S. These improvements and efforts with respect to our accounting processes that we will need to continue to make may not be sufficient to ensure that we maintain adequate controls over our financial processes and reporting in the future. Any failure to implement required, new or improved controls, or difficulties encountered in their implementation, could cause us to fail to meet our reporting obligations in the U.S. or Canada or result in misstatements in our financial statements in amounts that
46
SMART Technologies Inc. 2011 Annual Report
could be material. Insufficient internal controls could also cause investors to lose confidence in our reported financial information, which could have a negative effect on the trading price of our shares and may expose us to litigation risk.
As a public company, we are now required to document and test our internal control procedures in order to satisfy the requirements of Section 404 of Sarbanes-Oxley, which will, beginning in fiscal 2012, require annual management assessments of the effectiveness of our internal control over financial reporting and a report by our independent registered public accounting firm that addresses the effectiveness of our internal control over financial reporting. During the course of our testing, we may identify deficiencies which we may not be able to remediate in time to meet our deadline for compliance with Section 404. We may not be able to conclude on an ongoing basis that we have effective internal control over financial reporting in accordance with Section 404 or our independent registered public accounting firm may not be able or willing to issue an unqualified report on the effectiveness of our internal control over financial reporting. If we are unable to conclude that we have effective internal control over financial reporting or our independent auditors are unable to provide us with an unqualified report as required by Section 404, then investors could lose confidence in our reported financial information, which could have a negative effect on the trading price of our shares.
Capital Structure Risks
The concentration of voting power and control with our co-founders, Intel and Apax Partners will limit shareholders’ ability to influence corporate matters, including takeovers.
Our Class B Shares have 10 votes per share and our Class A Subordinate Voting Shares have one vote per share. Our Class B Shares constitute approximately 64% of our total share capital outstanding, but carry approximately 95% of the total outstanding voting power of all our outstanding share capital. As of March 31, 2011, our co-founders, David A. Martin and Nancy L. Knowlton, beneficially own approximately 34% of our outstanding Class B Shares, representing approximately 32% of the voting power of all our outstanding share capital, while Intel and Apax Partners beneficially own approximately 22% and 44% of our outstanding Class B Shares, representing approximately 21% and 42% of the voting power of all our outstanding share capital, respectively. As a result, our co-founders, Intel and Apax Partners have significant influence over our management and affairs and over all matters requiring shareholder approval, including the election of directors and significant corporate transactions, such as a business combination or other sale of our company or its assets, for the foreseeable future. In addition, we and the holders of our Class B Shares have entered into a security holders agreement pursuant to which the holders of our Class B Shares agree to exercise their voting power so as to ensure that our Board of Directors will be comprised of seven members, including two directors nominated by IFF and one director nominated by each of Apax Partners and Intel.
This concentrated control may provide our current shareholders with the ability to prevent and deter takeover proposals from third parties. In particular, because under Alberta law and/or our articles of incorporation most amalgamations and certain other business combination transactions, including a sale of all or substantially all our assets, would require approval by a majority of not less than two-thirds of the votes cast by the holders of the Class B Shares voting as a separate class, and because each of IFF and Apax Partners owns more than one-third of the Class B Shares, each of IFF and Apax Partners will have the ability to prevent such transactions. The concentration of voting power limits shareholders’ ability to influence corporate matters and, as a result, we may take actions that shareholders do not view as beneficial, including rejecting takeover proposals at a premium to the then prevailing market price of the Class A Subordinate Voting Shares. As a result, the market price of our Class A Subordinate Voting Shares could be adversely affected.
Some of our directors have interests that are different than our interests.
We may do business with certain companies that are related parties. Pursuant to the security holders agreement mentioned above, we expect to have one or more directors affiliated with Apax Partners, Intel and IFF for the foreseeable future. Although our directors owe fiduciary duties, including the duties of loyalty and confidentiality, to us, our directors that serve as directors, officers, partners or employees of companies that we do business with also owe fiduciary duties or other obligations to such other companies or to the investors in their funds. The duties owed to us could conflict with the duties such directors owe to these other companies or investors.
47
SMART Technologies Inc. 2011 Annual Report
Management’s Discussion and Analysis of Financial Condition and Results of Operations(continued)
Our share price may be volatile and the market price of our shares may decline.
The stock market in general, and the market for equities of some high-technology companies in particular, have been highly volatile. As a result, the market price of our Class A Subordinate Voting Shares is likely to be similarly volatile, and investors in our Class A Subordinate Voting Shares may experience a decrease, which could be substantial, in the value of their shares, including decreases unrelated to our operating performance or prospects, or a complete loss of their investment. The price of our Class A Subordinate Voting Shares could be subject to wide fluctuations in response to a number of factors, including those listed elsewhere in this “Business Risks” section and others such as:
| | • | | variations in our operating performance and the performance of our competitors; |
| | • | | actual or anticipated fluctuations in our quarterly or annual operating results which may be the result of many factors including: |
| | • | | the timing and amount of sales of our products or the cancellation or rescheduling of significant orders; |
| | • | | the length and variability of the sales cycle for our products; |
| | • | | the timing of implementation and acceptance of new products by our customers and by our distributors and dealers; |
| | • | | the timing and success of new product introductions; |
| | • | | increases in the prices or decreases in the availability of the components we purchase; |
| | • | | price and product competition; |
| | • | | our ability to execute on our operating plan and strategy; |
| | • | | the timing and level of research and development expenses; |
| | • | | the mix of products sold; |
| | • | | changes in the distribution channels through which we sell our products and the loss of distributors or dealers; |
| | • | | our ability to maintain appropriate inventory levels and purchase commitments; |
| | • | | fluctuations in our gross margins and the factors that contribute to such fluctuations; |
| | • | | the ability of our customers, distributors and dealers to obtain financing to purchase our products, especially during a period of global credit market disruption or in the event of customer, distributor, dealer, contract manufacturer or supplier financial problems; |
| | • | | uncertainty regarding our ability to realize benefits anticipated from our investments in research and develop- ment, sales and assembly activities; |
| | • | | delays in government requests for proposals for significant technology purchases; |
| | • | | changes in foreign exchange rates or interest rates; |
| | • | | changes in our financing and capital structures; and |
| | • | | the uncertainties inherent in our accounting estimates and assumptions and the impact of changes in account- ing principles; |
| | • | | changes in estimates of our revenue, income or other operating results published by securities analysts or changes in recommendations by securities analysts; |
| | • | | publication of research reports by securities analysts about us, our competitors or our industry; |
| | • | | our failure or the failure of our competitors to meet analysts’ projections or guidance that we or our competitors may give to the market; |
| | • | | additions and departures of key personnel; |
| | • | | strategic decisions by us or our competitors, such as acquisitions, divestitures, spin-offs, joint ventures, strategic investments or changes in business strategy; |
| | • | | the passage of legislation or other regulatory developments affecting us; |
| | • | | speculation in the press or investment community; |
| | • | | changes in accounting principles; |
| | • | | terrorist acts, acts of war or periods of widespread civil unrest; and |
| | • | | changes in general market and economic conditions as well as those specific to the industry in which we operate. |
48
SMART Technologies Inc. 2011 Annual Report
In the past, securities class action litigation has often been initiated against companies following periods of volatility in their share price. This type of litigation could result in substantial costs and divert our management’s attention and resources, and could also require us to make substantial payments to satisfy judgments or to settle litigation.
Because we are an Alberta corporation and the majority of our directors and officers are resident in Canada, it may be difficult for investors in the U.S. to enforce civil liabilities against us based solely upon the federal securities laws of the U.S.
We are an Alberta corporation with our principal place of business in Canada. A majority of our directors and officers and the auditors named herein are residents of Canada and all or a substantial portion of our assets and those of such persons are located outside the U.S. Consequently, it may be difficult for U.S. investors to effect service of process within the U.S. upon us or our directors or officers or such auditors who are not residents of the U.S., or to realize in the U.S. upon judgments of courts of the U.S. predicated upon civil liabilities under the U.S. Securities Act of 1933. Investors should not assume that Canadian courts: (1) would enforce judgments of U.S. courts obtained in actions against us or such persons predicated upon the civil liability provisions of the U.S. federal securities laws or the securities or “blue sky” laws of any state within the U.S. or (2) would enforce, in original actions, liabilities against us or such persons predicated upon the U.S. federal securities laws or any such state securities or blue sky laws.
As a foreign private issuer, we are not subject to certain U.S. securities law disclosure requirements that apply to a domestic U.S. issuer, which may limit the information publicly available to our shareholders.
As a foreign private issuer we are not required to comply with all the periodic disclosure requirements of the Exchange Act and therefore there may be less publicly available information about us than if we were a U.S. domestic issuer. For example, we are not subject to the proxy rules in the U.S. and disclosure with respect to our annual meetings will be governed by Canadian requirements. Section 132 of the ABCA provides that the directors of a corporation must call an annual meeting of shareholders not later than 15 months after holding the last preceding annual meeting. Prior to our IPO, our shareholders passed written resolutions having the same effect as the holding of an annual shareholders’ meeting. Therefore, our first annual meeting of shareholders will not be required to occur until late 2011. In addition, our officers, directors and principal shareholders are exempt from the reporting and “short-swing” profit recovery provisions of Section 16 of the Securities Exchange Act of 1934 and the rules thereunder. Therefore, our shareholders may not know on a timely basis when our officers, directors and principal shareholders purchase or sell our shares.
We currently do not intend to pay dividends on our Class A Subordinate Voting Shares.
We have never declared or paid any cash dividend on our Class A Subordinate Voting Shares. Our ability to pay dividends is restricted by covenants in our outstanding credit facilities and may be further restricted by covenants in any instruments and agreements that we may enter into in the future. We currently intend to retain any future earnings and do not expect to pay any dividends in the foreseeable future. Investors seeking cash dividends should not purchase our Class A Subordinate Voting Shares.
Our share price may decline because of the ability of our co-founders, Apax Partners, Intel and others to sell our shares.
Sales of substantial amounts of our Class A Subordinate Voting Shares after our IPO, or the perception that those sales may occur, could adversely affect the market price of our Class A Subordinate Voting Shares and impede our ability to raise capital through the issuance of equity securities. Our co-founders, Apax Partners and Intel are party to a registration rights agreement with us (which was amended and restated in connection with our IPO) that may require us to register their shares for resale or include shares owned by such shareholders in future offerings by us.
Significant sales of our Class A Subordinate Voting Shares pursuant to our 2010 Equity Incentive Plan or Participant Equity Loan Plan could also adversely affect the prevailing market price for our Class A Subordinate Voting Shares.
49
SMART Technologies Inc. 2011 Annual Report
Management’s Discussion and Analysis of Financial Condition and Results of Operations(continued)
Future sales or issuances of our Class A Subordinate Voting Shares could lower our share price and dilute shareholders’ voting power and may reduce our earnings per share.
We may issue and sell additional Class A Subordinate Voting Shares in subsequent offerings. We may also issue additional Class A Subordinate Voting Shares to finance future acquisitions. We cannot predict the size of future issuances of our Class A Subordinate Voting Shares or the effect, if any, that future issuances and sales of our Class A Subordinate Voting Shares will have on the market price of our Class A Subordinate Voting Shares. Sales or issuances of substantial amounts of Class A Subordinate Voting Shares, or the perception that such sales could occur, may adversely affect prevailing market prices for our Class A Subordinate Voting Shares. With any additional sale or issuance of Class A Subordinate Voting Shares, shareholders will suffer dilution to their voting power and may experience dilution in our earnings per share.
If securities or industry analysts do not publish research or reports about us, if they adversely change their recommendations regarding our shares or if our operating results do not meet their expectations, our share price could decline.
The market price of our Class A Subordinate Voting Shares will be influenced by the research and reports that industry or securities analysts publish about us. If one or more of these analysts ceases coverage of our company or fail to publish reports on us regularly, we could lose visibility in the financial markets, which in turn could cause our share price or trading volume to decline. Moreover, if one or more of the analysts who cover us downgrades our Class A Subordinate Voting Shares or if our operating results or prospects do not meet their expectations, our share price could decline.
There could be adverse tax consequence for our shareholders in the U.S. if we are a passive foreign investment company.
Under U.S. federal income tax laws, if a company is, or for any past period was, a passive foreign investment company (“PFIC”), it could have adverse U.S. federal income tax consequences to U.S. shareholders even if the company is no longer a PFIC. The determination of whether we are a PFIC is a factual determination made annually based on all the facts and circumstances and thus is subject to change, and the principles and methodology used in determining whether a company is a PFIC are subject to interpretation. While we do not believe that we currently are or have been a PFIC, we cannot assure that we will not be a PFIC in the future. U.S. investors in our Class A Subordinate Voting Shares are urged to consult their tax advisors concerning U.S. federal income tax consequences of holding our Class A Subordinate Voting Shares if we are considered to be a PFIC.
50
SMART Technologies Inc. 2011 Annual Report
Independent Auditors’ Report
To the Board of Directors and Stockholders of SMART Technologies Inc.
We have audited the accompanying consolidated balance sheets of SMART Technologies Inc. (the “Company”) and its subsidiaries as of March 31, 2011 and 2010, and the related consolidated statements of operations, shareholders’ deficit, and cash flows for each of the years in the three year period ended March 31, 2011. These consolidated financial statements are the responsibility of the Company’s management. Our responsibility is to express an opinion on these consolidated financial statements based on our audits.
We conducted our audits in accordance with the auditing standards of the Public Company Accounting Oversight Board (United States). Those standards require that we plan and perform the audit to obtain reasonable assurance about whether the financial statements are free of material misstatement. An audit includes examining, on a test basis, evidence supporting the amounts and disclosures in the financial statements. An audit also includes assessing the accounting principles used and significant estimates made by management, as well as evaluating the overall financial statement presentation. We believe that our audits provide a reasonable basis for our opinion.
In our opinion, the consolidated financial statements referred to above present fairly, in all material respects, the financial position of SMART Technologies Inc. as of March 31, 2011 and 2010, and the results of its operations and its cash flows for each of the years in the three year period ended March 31, 2011 in conformity with U.S. generally accepted accounting principles.

Chartered Accountants
Calgary, Canada
May 18, 2011
51
SMART Technologies Inc. 2011 Annual Report
SMART Technologies Inc.
Consolidated Statements of Operations
(thousands of U.S. dollars, except per share amounts)
| | | | | | | | | | | | |
| | | For the Years Ended | |
| | | March 31,
2011 | | | March 31,
2010 | | | March 31,
2009 | |
Revenue | | $ | 790,055 | | | $ | 647,975 | | | $ | 468,156 | |
Cost of sales | | | 399,176 | | | | 326,457 | | | | 268,153 | |
| | | | | | | | | | | | |
Gross margin | | | 390,879 | | | | 321,518 | | | | 200,003 | |
| | | |
Expenses | | | | | | | | | | | | |
Selling, marketing and administration | | | 180,803 | | | | 138,810 | | | | 99,751 | |
Research and development | | | 53,029 | | | | 33,581 | | | | 25,011 | |
Depreciation and amortization of property and equipment | | | 22,796 | | | | 15,930 | | | | 5,817 | |
Amortization of intangible assets | | | 8,986 | | | | 21 | | | | — | |
Interest expense | | | 26,321 | | | | 30,222 | | | | 44,683 | |
Interest expense on related party debt | | | 5,297 | | | | 34,626 | | | | 33,877 | |
Foreign exchange (gain) loss | | | (10,534 | ) | | | (91,814 | ) | | | 93,999 | |
| | | | | | | | | | | | |
| | | 286,698 | | | | 161,376 | | | | 303,138 | |
Other income, net | | | 486 | | | | 204 | | | | 752 | |
| | | | | | | | | | | | |
Income (loss) before income taxes | | | 104,667 | | | | 160,346 | | | | (102,383 | ) |
Income tax expense (recovery) (note 12) | | | | | | | | | | | | |
Current | | | 35,652 | | | | 12,504 | | | | (2,041 | ) |
Deferred | | | (340 | ) | | | 5,810 | | | | 6,315 | |
| | | | | | | | | | | | |
| | | 35,312 | | | | 18,314 | | | | 4,274 | |
| | | | | | | | | | | | |
Net income (loss) | | $ | 69,355 | | | $ | 142,032 | | | $ | (106,657 | ) |
| | | | | | | | | | | | |
| | | |
Earnings (loss) per share amounts (note 14) Basic and diluted earnings (loss) per share | | $ | 0.53 | | | $ | 0.81 | �� | | $ | (0.63 | ) |
| | | | | | | | | | | | |
See accompanying notes to consolidated financial statements.
52
SMART Technologies Inc. 2011 Annual Report
SMART Technologies Inc.
Consolidated Balance Sheets
(thousands of U.S. dollars)
| | | | | | | | |
| | | March 31,
2011 | | | March 31,
2010 | |
Assets | | | | | | | | |
Current assets | | | | | | | | |
Cash and cash equivalents | | $ | 119,025 | | | $ | 230,169 | |
Trade receivables (note 5) | | | 106,389 | | | | 81,901 | |
Other current assets | | | 7,915 | | | | 11,972 | |
Inventory (note 6) | | | 81,816 | | | | 58,743 | |
Deferred income taxes (note 12) | | | 12,200 | | | | 11,683 | |
| | | | | | | | |
| | | 327,345 | | | | 394,468 | |
Property and equipment (note 7) | | | 117,173 | | | | 107,999 | |
Goodwill (note 2) | | | 34,173 | | | | — | |
Intangible assets (note 8) | | | 42,140 | | | | 506 | |
Deferred income taxes (note 12) | | | 17,177 | | | | 14,962 | |
Deferred financing fees (note 9) | | | 8,215 | | | | 9,652 | |
Other long-term assets (note 18) | | | — | | | | 507 | |
| | | | | | | | |
| | $ | 546,223 | | | $ | 528,094 | |
| | | | | | | | |
Liabilities and Shareholders’ Deficit | | | | | | | | |
Current liabilities | | | | | | | | |
Accounts payable | | $ | 36,579 | | | $ | 38,861 | |
Accrued and other current liabilities | | | 79,541 | | | | 81,123 | |
Deferred revenue | | | 31,516 | | | | 24,697 | |
Income taxes payable | | | 2,949 | | | | 5,523 | |
Current portion of long-term debt (note 9) | | | 3,050 | | | | 92,790 | |
Current portion of related party long-term debt (note 9) | | | — | | | | 1,421 | |
| | | | | | | | |
| | | 153,635 | | | | 244,415 | |
Long-term debt (note 9) | | | 336,275 | | | | 473,732 | |
Related party long-term debt (note 9) | | | — | | | | 429,855 | |
Deferred revenue | | | 87,992 | | | | 74,407 | |
Deferred income taxes (note 12) | | | 11,594 | | | | — | |
| | | | | | | | |
| | | 589,496 | | | | 1,222,409 | |
Shareholders’ deficit | | | | | | | | |
Share capital (note 10) | | | | | | | | |
Class B Shares – no par value | | | | | | | | |
Authorized – unlimited | | | | | | | | |
Issued and outstanding – 79,464,195 shares as of March 31, 2011 and zero shares as of March 31, 2010 | | | 238,407 | | | | — | |
Class A Subordinate Voting Shares – no par value | | | | | | | | |
Authorized – unlimited | | | | | | | | |
Issued and outstanding – 44,308,596 shares as of March 31, 2011 and zero shares as of March 31, 2010 | | | 483,412 | | | | — | |
Voting Common Shares – no par value | | | | | | | | |
Authorized – unlimited | | | | | | | | |
Issued and outstanding – zero shares as of March 31, 2011 and 53,563,844 shares as of March 31, 2010 | | | — | | | | 41,166 | |
Voting Preferred Shares – no par value | | | | | | | | |
Authorized – unlimited | | | | | | | | |
Issued and outstanding – zero shares as of March 31, 2011 and 127,483,148 shares as of March 31, 2010 | | | — | | | | — | |
Non-voting Common Shares – no par value | | | | | | | | |
Authorized – unlimited | | | | | | | | |
Issued and outstanding – zero shares as of March 31, 2011 and 127,489,844 shares as of March 31, 2010 | | | — | | | | 120,108 | |
Accumulated other comprehensive loss (note 4) | | | (11,894 | ) | | | (24,364 | ) |
Additional paid-in capital (notes 10 and 11) | | | 8,672 | | | | — | |
Deficit | | | (761,870 | ) | | | (831,225 | ) |
| | | | | | | | |
| | | (43,273 | ) | | | (694,315 | ) |
| | | | | | | | |
| | $ | 546,223 | | | $ | 528,094 | |
| | | | | | | | |
|
See accompanying notes to consolidated financial statements. | |
53
SMART Technologies Inc. 2011 Annual Report
SMART Technologies Inc.
Consolidated Statements of Shareholders’ Deficit
(thousands of U.S. dollars)
For the Years Ended March 31, 2011, 2010 and 2009
| | | | | | | | | | | | | | | | | | | | |
| | | Share Capital
Stated Amount | | | Deficit | | | Accumulated
Other
Comprehensive
(Loss) Income | | | Additional
Paid-in
Capital | | | Total | |
Balance as of March 31, 2008 | | $ | 160,247 | | | $ | (866,600 | ) | | $ | (19,163 | ) | | $ | — | | | $ | (725,516 | ) |
Net loss | | | — | | | | (106,657 | ) | | | — | | | | — | | | | (106,657 | ) |
Foreign currency translation | | | — | | | | — | | | | 149,840 | | | | — | | | | 149,840 | |
| | | | | | | | | | | | | | | | | | | | |
Balance as of March 31, 2009 | | $ | 160,247 | | | $ | (973,257 | ) | | $ | 130,677 | | | $ | — | | | $ | (682,333 | ) |
Net income | | | — | | | | 142,032 | | | | — | | | | — | | | | 142,032 | |
Participant Equity Loan Plan (note 10) | | | 1,027 | | | | — | | | | — | | | | — | | | | 1,027 | |
Foreign currency translation | | | — | | | | — | | | | (155,041 | ) | | | — | | | | (155,041 | ) |
| | | | | | | | | | | | | | | | | | | | |
Balance as of March 31, 2010 | | $ | 161,274 | | | $ | (831,225 | ) | | $ | (24,364 | ) | | $ | — | | | $ | (694,315 | ) |
Net income | | | — | | | | 69,355 | | | | — | | | | — | | | | 69,355 | |
Participant Equity Loan Plan (note 10) | | | 8,331 | | | | — | | | | — | | | | — | | | | 8,331 | |
2010 Reorganization (notes 3 and 10) | | | 413,618 | | | | — | | | | — | | | | — | | | | 413,618 | |
Initial public offering | | | 138,596 | | | | — | | | | — | | | | — | | | | 138,596 | |
Foreign currency translation | | | — | | | | — | | | | 12,470 | | | | — | | | | 12,470 | |
Stock-based compensation | | | — | | | | — | | | | — | | | | 8,672 | | | | 8,672 | |
| | | | | | | | | | | | | | | | | | | | |
Balance as of March 31, 2011 | | $ | 721,819 | | | $ | (761,870 | ) | | $ | (11,894 | ) | | $ | 8,672 | | | $ | (43,273 | ) |
| | | | | | | | | | | | | | | | | | | | |
See accompanying notes to consolidated financial statements.
54
SMART Technologies Inc. 2011 Annual Report
SMART Technologies Inc.
Consolidated Statements of Cash Flows
(thousands of U.S. dollars)
| | | | | | | | | | | | |
| | | For the Years Ended | |
| | | March 31,
2011 | | | March 31,
2010 | | | March 31,
2009 | |
Cash provided by (used in) | | | | | | | | | | | | |
| | | |
Operations | | | | | | | | | | | | |
Net income (loss) | | $ | 69,355 | | | $ | 142,032 | | | $ | (106,657 | ) |
Adjustments to reconcile net income (loss) to net cash provided by (used in) operating activities | | | | | | | | | | | | |
Depreciation and amortization of property and equipment | | | 26,914 | | | | 17,956 | | | | 9,730 | |
Amortization of intangible assets | | | 8,986 | | | | 21 | | | | — | |
Amortization of deferred financing fees | | | 3,270 | | | | 1,927 | | | | 1,864 | |
Non-cash interest (recovery) expense on long-term debt | | | (967 | ) | | | (1,082 | ) | | | 7,891 | |
Non-cash interest expense on related party long-term debt | | | 5,297 | | | | 34,626 | | | | 33,877 | |
Stock-based compensation | | | 8,672 | | | | — | | | | — | |
(Gain) loss on foreign exchange | | | (11,483 | ) | | | (93,447 | ) | | | 94,336 | |
Deferred income tax (recovery) expense | | | (340 | ) | | | 5,810 | | | | 6,315 | |
Loss on disposal of property and equipment | | | 86 | | | | 220 | | | | 392 | |
Trade receivables | | | (11,048 | ) | | | 2,452 | | | | (18,653 | ) |
Other current assets | | | 6,400 | | | | (3,745 | ) | | | (131 | ) |
Inventory | | | (16,689 | ) | | | 14,237 | | | | (36,448 | ) |
Income taxes recoverable and payable | | | (5,556 | ) | | | 7,872 | | | | (7,296 | ) |
Accounts payable, accrued and other current liabilities | | | (12,739 | ) | | | 17,251 | | | | (3,203 | ) |
Deferred revenue | | | 14,810 | | | | 13,379 | | | | 11,715 | |
| | | | | | | | | | | | |
Cash provided by (used in) operating activities | | | 84,968 | | | | 159,509 | | | | (6,268 | ) |
| | | |
Investing | | | | | | | | | | | | |
Business acquisition | | | (82,000 | ) | | | — | | | | — | |
Cash of subsidiary at date of acquisition | | | 7,974 | | | | — | | | | — | |
Capital expenditures | | | (27,498 | ) | | | (24,565 | ) | | | (59,375 | ) |
Proceeds from the sale of property and equipment | | | 14 | | | | 18 | | | | — | |
Intangible assets | | | (502 | ) | | | (484 | ) | | | — | |
Restricted cash | | | — | | | | — | | | | 26,859 | |
| | | | | | | | | | | | |
Cash used in investing activities | | | (102,012 | ) | | | (25,049 | ) | | | (32,516 | ) |
| | | |
Financing | | | | | | | | | | | | |
Proceeds from issuance of debt | | | — | | | | 47,910 | | | | 37,521 | |
Proceeds from issuance of related party debt | | | — | | | | — | | | | 1,225 | |
Proceeds from IPO, net | | | 134,314 | | | | — | | | | — | |
Repayment of debt | | | (239,307 | ) | | | (3,006 | ) | | | (3,126 | ) |
Financing fees (paid) recovered | | | (1,396 | ) | | | — | | | | 313 | |
Participant equity loan plan, net | | | 8,251 | | | | (10,210 | ) | | | — | |
Common shares issued | | | — | | | | 12,136 | | | | — | |
| | | | | | | | | | | | |
Cash (used in) provided by financing activities | | | (98,138 | ) | | | 46,848 | | | | 35,933 | |
Effect of exchange rate changes on cash and cash equivalents | | | 4,038 | | | | 11,806 | | | | (8,717 | ) |
| | | | | | | | | | | | |
Net (decrease) increase in cash and cash equivalents | | | (111,144 | ) | | | 193,114 | | | | (11,568 | ) |
Cash and cash equivalents, beginning of year | | | 230,169 | | | | 37,055 | | | | 48,623 | |
| | | | | | | | | | | | |
Cash and cash equivalents, end of year | | $ | 119,025 | | | $ | 230,169 | | | $ | 37,055 | |
| | | | | | | | | | | | |
Cash and cash equivalents are comprised as follows | | $ | 10,662 | | | $ | 7,080 | | | $ | 26,761 | |
Cash | | | 108,363 | | | | 223,089 | | | | 10,294 | |
| | | | | | | | | | | | |
Short-term investments | | $ | 119,025 | | | $ | 230,169 | | | $ | 37,055 | |
| | | | | | | | | | | | |
Supplemental cash flow disclosures | | | | | | | | | | | | |
Interest paid | | $ | 29,721 | | | $ | 26,328 | | | $ | 36,347 | |
Interest received | | | 574 | | | | 169 | | | | 1,144 | |
Income taxes paid | | | 38,674 | | | | 4,334 | | | | 4,978 | |
Amount of non-cash capital additions in accounts payable, accrued and other current liabilities | | | 4,368 | | | | 2,793 | | | | 4,041 | |
| | | | | | | | | | | | |
See accompanying notes to consolidated financial statements.
55
SMART Technologies Inc. 2011 Annual Report
Notes to Consolidated Financial Statements
(thousands of U.S. dollars, except per share amounts, and except as otherwise indicated)
For the Years Ended March 31, 2011, 2010 and 2009
Nature of Business
SMART Technologies Inc. (the “Company”), formerly SMART Technologies (Holdings) Inc., was incorporated on June 11, 2007 under the Business Corporations Act (Alberta). On August 28, 2007 the shareholders of a related company which was then named SMART Technologies Inc. (“STI”), transferred 100% of the issued shares of STI to the Company. Prior to August 28, 2007 the principal operating company was STI. On August 28, 2007, SMART Technologies ULC was formed with the amalgamation of STI and a numbered company. On February 26, 2010 the Company changed its name to SMART Technologies Inc.
Through its wholly owned subsidiary, SMART Technologies ULC (“ULC”), and its subsidiaries, the Company designs, develops and sells interactive technology products and integrated solutions that enhance learning and enable people to collaborate with each other in innovative and effective ways. The Company is the global leader in the interactive whiteboard product category, which is the core of its collaboration solutions. It generates revenue from the sale of interactive technology products and integrated solutions, including hardware, software and services.
1. Basis of Presentation and Significant Accounting Policies
The consolidated financial statements of the Company have been prepared by management in accordance with accounting principles generally accepted in the United States of America (“GAAP”), applied on a basis consistent for all periods. All normal recurring adjustments considered necessary for fair presentation have been included in the financial statements. The significant accounting policies used in these GAAP consolidated financial statements are as follows.
(a) Principles of Consolidation
These consolidated financial statements include the accounts of the Company and its subsidiaries, all of which are wholly owned. All intercompany balances and transactions have been appropriately eliminated on consolidation.
(b) Use of Estimates
The preparation of the consolidated financial statements requires management to make estimates and assumptions that affect the reported amounts of assets and liabilities and disclosures of contingent assets and liabilities at the date of the financial statements and reported amounts of revenues and expenses during the reporting period. Significant areas requiring the use of management estimates relate to the determination of provisions for various litigation claims, deferred revenue, allowance for doubtful receivables, inventory valuation, warranty provisions, sales incentive provisions, fair value of assets acquired and liabilities assumed in business combinations, deferred income taxes, valuation of derivative financial instruments and impairment assessments of property and equipment, intangible assets and goodwill. Actual results could differ from these estimates.
(c) Foreign Currency Translation
The Company’s Canadian operations and its foreign subsidiaries, which solely provide sales and marketing support, use the Canadian dollar (“CDN”) as their functional currency. For these entities, monetary assets and liabilities denominated in foreign currencies are translated using exchange rates in effect at the balance sheet date and non-monetary assets and liabilities denominated in foreign currencies are translated at historic rates. Gains and losses on remeasurement are recorded in the Company’s Statements of Operations as part of foreign exchange gain (loss). The Company’s United States (“U.S.”) and New Zealand operating subsidiaries have the U.S. dollar as their functional currency, its German operating subsidiary has the Euro as its functional currency and its Japanese operating subsidiary has the Japanese Yen as its functional currency. The financial statements of these subsidiaries are translated into Canadian dollars using the current rate method of translation whereby assets and liabilities are translated using exchange rates in effect at the balance sheet date and revenues and expenses are translated using average rates for the period. Exchange gains or losses from the translation of these foreign subsidiaries financial results are credited or charged to foreign currency translation included in other comprehensive income (loss) for the period and accumulated other comprehensive (loss) income as part of shareholders’ deficit.
56
SMART Technologies Inc. 2011 Annual Report
The Company uses the U.S. dollar as its reporting currency. The Canadian functional currency consolidated financial statements are translated into the U.S. dollar reporting currency using the current rate method of translation. Exchange gains or losses are included as part of other comprehensive income (loss) for the period and accumulated other comprehensive (loss) income as part of shareholders’ deficit.
(d) Cash and Cash Equivalents
Cash equivalents consist primarily of short-term investments with an original maturity of three months or less and are carried on the consolidated balance sheet at cost which approximates fair value.
(e) Trade Receivables
Trade receivables reflect invoiced and accrued revenue and are presented net of an allowance for doubtful receivables.
The Company evaluates the collectability of its trade receivables based on a combination of factors on a periodic basis. The Company considers historical experience, the age of the trade receivable balances, credit quality of the Company’s distributors and dealers, current economic conditions, and other factors that may affect the distributors’ and dealers’ ability to pay.
(f) Inventory
Raw materials and finished goods inventory is stated at the lower of cost and market value. Cost includes the cost of materials, direct labor and the applicable share of production overhead. Cost is determined on a first-in, first-out basis.
(g) Property and Equipment
Property and equipment are recorded at cost and depreciated and amortized to their net residual value over their estimated useful lives using the straight-line method. Depreciation and amortization is calculated using the following rates.
| | | | |
Building | | | 25 years | |
Information systems, hardware and software | | | 2-4 years | |
Assembly equipment, furniture, fixtures and other | | | 2-4 years | |
Depreciation charges related to equipment used in assembly operations are included in cost of sales.
Property and equipment are reviewed for impairment whenever events or changes in circumstances indicate that the carrying value may not be recoverable. In reviewing for impairment, the carrying value of such assets is compared to the estimated undiscounted future cash flows expected from the use of the assets and their eventual disposition. Any impairment charge is recognized to reduce the carrying value of the assets to its estimated fair value in the period in which it is identified.
(h) Intangible Assets
Intangible assets are stated at cost less accumulated amortization and are comprised of acquired technology, customer relationships and other intellectual property.
Intangible assets are amortized as follows.
| | | | |
Acquired technology | | | 5-10 years | |
Customer relationships | | | 5 years | |
Other intellectual property | | | 5-10 years | |
Intangibles with determinable lives are amortized using the straight-line method based on the estimated useful lives of the respective assets. When there is a change in the estimated useful life of a finite-lived intangible asset, amortization is adjusted prospectively. Intangible assets with finite lives are tested for impairment if events or conditions have occurred that indicate that their carrying value may not be recoverable. Any impairment charge is recognized to reduce the carrying value of the intangible asset to its estimated fair value in the period in which such determination is made.
57
SMART Technologies Inc. 2011 Annual Report
Notes to Consolidated Financial Statements(continued)
(thousands of U.S. dollars, except per share amounts, and except as otherwise indicated)
For the Years Ended March 31, 2011, 2010 and 2009
(i) Goodwill
Goodwill is the residual amount that results when the purchase price of an acquired business exceeds the sum of the amounts allocated to the assets acquired, less liabilities assumed, based on their fair values.
Goodwill is not amortized, but is tested for impairment annually or more frequently if events or changes in circumstances indicate that the asset might be impaired. The impairment test is carried out in two steps. In the first step, the carrying amount of each identified reporting unit is compared with its fair value. When the fair value exceeds its carrying amount, goodwill is considered not to be impaired and the second step of the impairment test is unnecessary. The second step is carried out when the carrying amount exceeds its fair value, in which case the implied fair value of the goodwill is compared with its carrying amount to measure the amount of the impairment loss, if any. The implied fair value of goodwill is determined in a similar manner as the value of goodwill is determined in a business combination, using the fair value as if it was the purchase price. When the carrying amount of the goodwill exceeds the implied fair value of the goodwill, an impairment loss is recognized in an amount equal to the excess.
(j) Business Combinations
In December 2007, the Financial Accounting Standards Board (“FASB”), issued a new accounting standard for business combinations, which established principles and requirements for how an acquirer is to recognize and measure in its financial statements the identifiable assets acquired, the liabilities assumed, and any non-controlling interest in the acquiree in a business combination. This new accounting standard also established principles regarding how goodwill acquired in a business combination or gain from a bargain purchase should be recognized and measured, as well as providing guidelines on the disclosure requirements. In April 2009, FASB amended this new accounting standard to require the assets acquired and liabilities assumed in a business combination that arise from contingencies be recognized at fair value, if the fair value can be determined during the measurement period. The Company adopted the new business combinations accounting standard in the first quarter of fiscal 2011 and applied these principles to its acquisition on April 21, 2010 of Next Holdings Limited (note 2).
(k) Deferred Financing Fees
Deferred financing fees included in other assets represent the direct costs of entering into the Company’s long-term debt and credit facilities. For non-revolving credit facilities, costs are amortized as interest expense using the effective interest method. For revolving credit facilities, costs are amortized as interest expense using the straight-line method. The deferred financing fees are being amortized over the term of the debt or credit facilities.
(l) Revenue Recognition
The Company recognizes revenue when persuasive evidence of an arrangement exists, shipping occurs or services are rendered, the sales price is fixed or determinable and collection is reasonably assured. Revenue consists primarily of consideration from the bundled sale of hardware, software that is essential to the functionality of the hardware and technical support for the life of the product, which includes future unspecified software upgrades and features relating to the product’s essential software to be received, on a when-and-if-available basis.
Revenue from the bundled sale of hardware, software and technical support is recognized in accordance with general revenue recognition accounting guidance and revenue from separate sales of software products and technical support is recognized in accordance with industry specific software revenue recognition accounting guidance. Amounts invoiced and cash received in advance of meeting these revenue recognition criteria are recognized as deferred revenue.
The Company offers certain incentives to customers based on purchase levels. These incentives are recorded as a reduction of related revenues when this revenue is recognized. Revenue is recorded net of taxes collected from customers that are remitted to government authorities with the collected taxes recorded as current liabilities until remitted to the relevant government authority. The Company’s arrangements do not include any provisions for refunds.
58
SMART Technologies Inc. 2011 Annual Report
Revenue Recognition for Arrangements with Multiple Deliverables
For multi-element arrangements that include tangible products containing software essential to the product’s functionality and undelivered elements relating to the tangible product and its essential software, the Company allocates revenue to the multiple deliverables based on their relative selling prices. To determine the relative selling price the following hierarchy is used.
| | (i) | vendor-specific objective evidence of fair value (“VSOE”); |
| | (ii) | third-party evidence (“TPE”); and |
| | (iii) | estimate of the selling price (“ESP”). |
VSOE is established as the price charged for a deliverable when the same deliverable is sold separately by the Company. TPE of selling price is established by evaluating largely similar and interchangeable competitor products or services in stand-alone sales to similarly situated customers. The ESP is established considering internal factors such as internal costs, margin objectives, pricing practices and controls, customer and market conditions such as competitor pricing strategies for similar products, and industry data.
Substantially all the Company’s revenue is made up of the sales of interactive whiteboards and accessories. The interactive whiteboards consist of hardware products and software essential to the functionality of the hardware product that is delivered at the time of sale, and technical support. The Company has allocated revenue between these deliverables using the relative selling price method.
The Company assesses incentives and discounts provided to customers in determining the relative selling prices of the deliverables in its arrangements to determine the most appropriate method of allocating such incentives and discounts to such deliverables. In general, the Company has concluded that allocating such incentives and discounts ratably to the deliverables based on the proportion of arrangement consideration allocated to each is appropriate based upon the way the Company currently sells its product.
The Company is unable to determine VSOE for its deliverables as they are not sold on a separate, stand-alone basis. The Company’s go-to-market strategy is the same or similar to that of its peers for these deliverables, in that product offerings are made in multiple deliverable bundles, such that the TPE of selling price of stand-alone deliverables cannot be obtained. Consequently, the Company is unable to establish selling price using VSOE or TPE and therefore uses ESP in its allocation of revenue.
Amounts allocated to the delivered hardware and the related essential software is recognized at the time of sale provided all the conditions for revenue recognition have been met. Amounts allocated to the technical support services and unspecified software upgrades are deferred and recognized using the straight-line method over the estimated life of the related hardware of seven years. All product cost of sales, including estimated warranty costs, are recognized at the time of sale. Costs for research and development, sales and marketing are expensed as incurred.
Revenue Recognition for Software
The Company also sells software, technical support and unspecified software upgrade rights altogether separate from hardware. For software arrangements involving multiple elements, revenue is allocated to each element based on the relative fair value only if VSOE evidence of fair values, which is based on prices charged when the element is sold separately, is available. The Company does not have VSOE for the undelivered elements in its software sales and, accordingly, the entire arrangement consideration is deferred and amortized over three years, the estimated period that such items are delivered or that services are provided.
(m) Comprehensive Income (Loss)
Comprehensive income (loss) is comprised of net income (loss) and other comprehensive income (loss) (“OCI”).
OCI refers to revenues, expenses, gains and losses that under GAAP are recorded as an element of comprehensive income but are excluded from net income (loss). OCI consists of foreign currency translation adjustments for the period which arise from the conversion of the Canadian dollar functional currency consolidated financial statements to the U.S. dollar reporting currency consolidated financial statements. OCI also includes foreign currency translation adjustments from those foreign subsidiaries that have a local currency as their functional currency and arising on translation of the Company’s consolidated financial statement into their reporting currency.
59
SMART Technologies Inc. 2011 Annual Report
Notes to Consolidated Financial Statements(continued)
(thousands of U.S. dollars, except per share amounts, and except as otherwise indicated)
For the Years Ended March 31, 2011, 2010 and 2009
(n) Financial Instruments
Derivative financial instruments are used by the Company to manage its exposure to interest and foreign exchange rate fluctuations. To manage interest rate exposure, the Company enters into interest rate swap contracts and to manage foreign exchange exposure, the Company enters into forward and foreign exchange collar contracts. The Company does not use derivative financial instruments for speculative purposes.
FASB ASC 815 -Accounting for Derivative Instruments requires all derivative financial instruments to be recognized at fair value on the consolidated balance sheet and outlines the criteria to be met in order to designate a derivative instrument as a hedge and the methods for evaluating hedge effectiveness. The fair value is calculated based on quoted market prices.
Derivative contracts that do not qualify as hedges under ASC 815, or where hedge accounting is not applied, are recorded at fair value in the consolidated balance sheet unless exempted from derivative treatment as meeting normal purchase and sale criteria. Any changes in the fair value of these derivative contracts are recorded in net income (loss) when those changes occur. The Company does not currently apply hedge accounting as defined by ASC 815 to any of its financial instruments.
(o) Income Taxes
In accordance with FASB ASC 740 -Accounting for Income Taxes, the Company uses the liability method of accounting for income taxes. Under the liability method, current income taxes are recognized for the estimated income taxes payable for the current year and deferred income taxes are recognized for temporary differences between the tax and accounting bases of assets and liabilities and the benefit of losses and other deductions carried forward for tax purposes that are likely to be realized. A valuation allowance is recorded against net deferred income tax assets if it is more likely than not that the asset will not be realized. Deferred income tax assets and liabilities are measured using enacted tax rates expected to apply to taxable income in the years in which the temporary differences are scheduled to be recovered or settled. The effect on the deferred income tax assets and liabilities from a change in tax rates is recognized in net income (loss) in the period that the change is enacted.
The Company follows ASC 740 in assessing its uncertain tax positions and provisions for income taxes which clarifies the accounting for uncertainty in income taxes recognized in an enterprise’s financial statements, prescribes a recognition threshold of more likely than not to be sustained upon examination and provides guidance on derecognition measurement classification, interest and penalties, accounting in interim periods, disclosure and transitions.
(p) Investment Tax Credits
The Company uses the flow-through method to account for investment tax credits (“ITCs”), earned on eligible Scientific Research and Experimental Development (“SR&ED”) expenditures. Under this method, the ITCs are recognized as a reduction to income tax expense (recovery).
ITCs are subject to technical and financial review by Canadian tax authorities on a project-by-project basis and therefore amounts received may vary significantly from the amounts recorded. Any such differences are recorded as an adjustment to the recognized amount in the year the SR&ED review is completed and the results are made known to the Company.
(q) Research and Product Development Costs
Research costs are expensed as incurred. Development costs for products and licensed software to be sold, leased or otherwise marketed are subject to capitalization beginning when a product’s technological feasibility has been established and ending when a product is available for general release to customers. In most instances, the Company’s products are released soon after technological feasibility has been established. Costs incurred subsequent to achievement of technological feasibility are usually not significant, and therefore most product development costs are expensed as incurred.
60
SMART Technologies Inc. 2011 Annual Report
(r) Earnings Per Share
Per share amounts are based on the weighted average number of common shares outstanding during the period. Diluted earnings per share are calculated using the treasury stock method.
(s) Warranty Provision
The Company provides for the estimated costs of product warranties at the time revenue is recognized. Interactive whiteboards and other hardware products are generally covered by a time-limited warranty for varying periods of time. The Company’s warranty obligation is affected by product failure rates, warranty periods, freight, material usage and other related repair or replacement costs. The Company assesses the adequacy of its warranty liability and adjusts the amount as necessary based on actual experience and changes in future estimated costs.
(t) Stock-Based Compensation
Stock-based compensation expense for stock options is estimated at the grant date based on each option’s fair value as calculated by the Black-Scholes-Merton (“BSM”) option-pricing model. The Company generally recognizes stock-based compensation expense ratably using the straight-line method over the requisite service period with an offset to additional paid-in capital.
(u) Participant Equity Loan Plan
The Company has a Participant Equity Loan Plan (the “Plan”), under which the Company loaned funds to certain employees for the purpose of allowing these employees the opportunity to purchase common shares of the Company at fair value. Common shares issued under the Plan are subject to voting and transferability restrictions that lapse based on certain events.
Shares purchased under the Plan are reported as share capital at their fair value on the date of issue. The outstanding related employee loans and accrued interest are reported as a deduction from share capital. When there is an amendment in the terms of the Plan, the difference between the fair value at the date of the amendment and the fair value at the original date of purchase is recognized as stock-based compensation ratably on a graded basis over the period that restrictions on the shares lapse.
(v) Recent Accounting Policies Adopted
In January 2010, the FASB issued revised guidance intended to improve disclosures related to fair value measurements. This guidance requires new disclosures as well as clarifies certain existing disclosure requirements. New disclosures under this guidance require separate information about significant transfers in and out of Level 1 and Level 2 and the reason for such transfers, and also require purchases, sales, issuances, and settlements information for Level 3 measurement to be included in the roll-forward activity on a gross basis. The guidance also clarifies the requirement to determine the level of disaggregation for fair value measurement disclosures and the requirement to disclose valuation techniques and inputs used for both recurring and nonrecurring fair value measurements in either Level 2 or Level 3. This accounting guidance was effective for the Company beginning in the first quarter of fiscal 2011, except for the roll-forward of activity on a gross basis for Level 3 fair value measurement, which will be effective for the Company in the first quarter of fiscal 2012. The adoption of the remaining guidance in the first quarter of 2012 is not expected to have a material impact on the Company’s results of operations, financial condition and the Company’s disclosures.
2. Acquisition
On April 21, 2010 the Company acquired 100% of the issued and outstanding shares of Next Holdings Limited (“NextWindow”), a privately held New Zealand company, for $82,000 in cash. NextWindow designs components for optical touch screens for integration into electronic displays including PC displays. This acquisition provided the Company with innovative technology and research and development expertise which is being integrated into the Company’s products.
61
SMART Technologies Inc. 2011 Annual Report
Notes to Consolidated Financial Statements(continued)
(thousands of U.S. dollars, except per share amounts, and except as otherwise indicated)
For the Years Ended March 31, 2011, 2010 and 2009
The acquisition was accounted for using the acquisition method whereby identifiable assets acquired and liabilities assumed were measured at their fair values as of the date of acquisition. The excess of the acquisition price over such fair value was recorded as goodwill on acquisition. Fair values were determined based on information available at the date of acquisition. The Company has included the operating results of NextWindow in the consolidated financial statements from the date of acquisition. Revenue and net loss from NextWindow reported in the Company’s results for the year ended March 31, 2011 amounted to $24,674 and $17,122, respectively. The net loss for the year ended March 31, 2011 included amortization of intangible assets of $8,903 resulting from the acquisition.
The following table summarizes the allocation of the total consideration to the assets acquired and liabilities assumed based on fair values.
| | | | |
Assets purchased | | | | |
Current assets | | $ | 12,513 | |
Property and equipment | | | 2,177 | |
Intangible assets (note 8) | | | 50,061 | |
Goodwill | | | 34,173 | |
| | | | |
| | $ | 98,924 | |
| | | | |
Liabilities assumed | | | | |
Current liabilities | | $ | 9,868 | |
Deferred income tax liability | | | 15,030 | |
| | | | |
| | $ | 24,898 | |
| | | | |
Net non-cash assets acquired | | $ | 74,026 | |
Cash acquired | | | 7,974 | |
| | | | |
Consideration paid – cash | | $ | 82,000 | |
| | | | |
The goodwill associated with the acquisition is primarily attributable to broader exposure to international markets, enhancing the Company’s work force with skilled researchers and engineers, and expected incremental revenue from new technologies and customers generated from the existing base of intangible assets. The goodwill is not expected to be deductible for income tax purposes.
The Company expensed $1,143 of acquisition-related costs included in selling, marketing and administration in the year ended March 31, 2011.
The weighted average amortization period of the total intangible assets related to the business acquisition is approximately 5.6 years at the date of acquisition.
Pro forma results of operations have not been presented because the effects of NextWindow’s operations are not considered material to the Company’s consolidated results.
3. 2010 Reorganization
On May 13, 2010, the Company’s board of directors approved a reorganization (the “2010 Reorganization”), of the capital of the Company. Through a series of transactions including a payment on May 25, 2010 of $8,016 on the shareholder note payable, the 2010 Reorganization resulted in the shareholder note payable and the cumulative preferred shares, together with all accrued interest and accumulated dividends thereon, as well as the Company’s existing share capital being effectively converted into new share capital. At the completion of the 2010 Reorganization, the Company’s share capital consisted of 433,676,686 Class A Preferred Shares, 170,089,800 Class B Shares and 10,957,191 Class A Subordinate Voting Shares. As part of the 2010 Reorganization, the Company amalgamated with
62
SMART Technologies Inc. 2011 Annual Report
a successor corporation to School 3 ULC, a corporation that, prior to giving effect to the 2010 Reorganization, held all of the outstanding non-voting common shares. This series of transactions was completed on June 8, 2010. On June 24, 2010, the Company effected a one-for-two reverse stock split for both the Class A Subordinate Voting Shares and the Class B Shares. In July 2010, in connection with the Company’s initial public offering (“IPO”) transaction, all the issued and outstanding Class A Preferred Shares were converted into Class B or Class A Subordinate Voting Shares and the Class A Preferred Shares were removed from the authorized share capital of the Company. Also refer to notes 9 and 10 which describe the impact of the 2010 Reorganization on the Company’s financial position in greater detail.
4. Accumulated Other Comprehensive (Loss) Income and Comprehensive Income (Loss)
| | | | | | | | | | | | |
| | | Year Ended March 31, | |
| | | 2011 | | | 2010 | | | 2009 | |
Accumulated other comprehensive (loss) income | | | | | | | | | | | | |
Balance at beginning of year | | $ | (24,364 | ) | | $ | 130,677 | | | $ | (19,163 | ) |
Unrealized gains (losses) on translation of consolidated financial statements to U.S. dollar reporting currency | | | 14,696 | | | | (152,577 | ) | | | 147,246 | |
Unrealized gains (losses) on translation of foreign subsidiaries to Canadian dollar functional currency | | | (2,226 | ) | | | (2,464 | ) | | | 2,594 | |
| | | | | | | | | | | | |
Other comprehensive income (loss) | | | 12,470 | | | | (155,041 | ) | | | 149,840 | |
| | | | | | | | | | | | |
Balance at end of year | | $ | (11,894 | ) | | $ | (24,364 | ) | | $ | 130,677 | |
| | | | | | | | | | | | |
| | | | | | | | | | | | |
| | | Year Ended March 31, | |
| | | 2011 | | | 2010 | | | 2009 | |
Comprehensive income (loss) | | | | | | | | | | | | |
Net income | | $ | 69,355 | | | $ | 142,032 | | | $ | (106,657 | ) |
Foreign currency translation | | | 12,470 | | | | (155,041 | ) | | | 149,840 | |
| | | | | | | | | | | | |
Comprehensive income (loss) | | $ | 81,825 | | | $ | (13,009 | ) | | $ | 43,183 | |
| | | | | | | | | | | | |
5. Trade Receivables
| | | | | | | | |
| | | March 31,
2011 | | | March 31,
2010 | |
Trade receivables | | $ | 109,992 | | | $ | 85,769 | |
Allowance for doubtful receivables | | | (3,603 | ) | | | (3,868 | ) |
| | | | | | | | |
| | $ | 106,389 | | | $ | 81,901 | |
| | | | | | | | |
The following table summarizes the activity in the allowance for doubtful receivables.
| | | | | | | | | | | | |
| | | Year Ended March 31, | |
| | | 2011 | | | 2010 | | | 2009 | |
Balance at beginning of year | | $ | 3,868 | | | $ | 878 | | | $ | 957 | |
Charge to bad debts expense | | | 17 | | | | 2,954 | | | | 328 | |
Reduction to provision | | | (635 | ) | | | (260 | ) | | | (209 | ) |
Foreign exchange loss (gain) | | | 353 | | | | 296 | | | | (198 | ) |
| | | | | | | | | | | | |
Balance at end of year | | $ | 3,603 | | | $ | 3,868 | | | $ | 878 | |
| | | | | | | | | | | | |
63
SMART Technologies Inc. 2011 Annual Report
Notes to Consolidated Financial Statements(continued)
(thousands of U.S. dollars, except per share amounts, and except as otherwise indicated)
For the Years Ended March 31, 2011, 2010 and 2009
6. Inventory
| | | | | | | | |
| | | March 31,
2011 | | | March 31,
2010 | |
Raw materials | | $ | 19,939 | | | $ | 11,061 | |
Finished goods | | | 65,018 | | | | 51,408 | |
Provision for obsolescence | | | (3,141 | ) | | | (3,726 | ) |
| | | | | | | | |
| | $ | 81,816 | | | $ | 58,743 | |
| | | | | | | | |
The provision for obsolescence is related to finished goods inventory.
7. Property and Equipment
| | | | | | | | |
| | | March 31,
2011 | | | March 31,
2010 | |
Cost | | | | | | | | |
Building | | $ | 75,745 | | | $ | 72,180 | |
Information systems, hardware and software | | | 49,020 | | | | 45,607 | |
Assembly equipment, furniture, fixtures and other | | | 43,497 | | | | 40,852 | |
Construction in progress | | | 11,837 | | | | 3,107 | |
| | | | | | | | |
| | $ | 180,099 | | | $ | 161,746 | |
| | | | | | | | |
Accumulated depreciation and amortization | | | | | | | | |
Building | | $ | 6,638 | | | $ | 3,167 | |
Information systems, hardware and software | | | 27,090 | | | | 21,434 | |
Assembly equipment, furniture, fixtures and other | | | 29,198 | | | | 29,146 | |
| | | | | | | | |
| | $ | 62,926 | | | $ | 53,747 | |
| | | | | | | | |
Net book value | | | | | | | | |
Building | | $ | 69,107 | | | $ | 69,013 | |
Information systems, hardware and software | | | 21,930 | | | | 24,173 | |
Assembly equipment, furniture, fixtures and other | | | 14,299 | | | | 11,706 | |
Construction in progress | | | 11,837 | | | | 3,107 | |
| | | | | | | | |
| | $ | 117,173 | | | $ | 107,999 | |
| | | | | | | | |
Depreciation and amortization expense incurred is as follows.
| | | | | | | | | | | | |
| | | Year Ended March 31, | |
| | | 2011 | | | 2010 | | | 2009 | |
Building | | $ | 3,159 | | | $ | 2,630 | | | $ | 315 | |
Information systems, hardware and software | | | 14,780 | | | | 9,715 | | | | 3,999 | |
Assembly equipment, furniture, fixtures and other | | | 8,975 | | | | 5,611 | | | | 5,416 | |
| | | | | | | | | | | | |
| | $ | 26,914 | | | $ | 17,956 | | | $ | 9,730 | |
| | | | | | | | | | | | |
The building is the Company’s global headquarters located in Calgary, Alberta which was substantially complete in 2009, at which point the Company commenced depreciation. The cost of the building includes $548 of capitalized interest. Included in accrued and other current liabilities is an accrual for capital expenditures of $4,368 at March 31, 2011 ($2,793 at March 31, 2010).
The amount of depreciation expense included in cost of sales amounted to $4,118, $2,026 and $3,913 for the years ended March 31, 2011, 2010 and 2009, respectively.
64
SMART Technologies Inc. 2011 Annual Report
8. Intangible Assets
| | | | | | | | |
| | | March 31,
2011 | | | March 31,
2010 | |
Cost | | | | | | | | |
Acquired technology | | $ | 29,600 | | | $ | — | |
Customer relationships | | | 17,500 | | | | — | |
Other intellectual property | | | 4,047 | | | | 527 | |
| | | | | | | | |
| | $ | 51,147 | | | $ | 527 | |
Accumulated amortization | | | | | | | | |
Acquired technology | | $ | 5,039 | | | $ | — | |
Customer relationships | | | 3,296 | | | | — | |
Other intellectual property | | | 672 | | | | 21 | |
| | | | | | | | |
| | $ | 9,007 | | | $ | 21 | |
Net book value | | | | | | | | |
Acquired technology | | $ | 24,561 | | | $ | — | |
Customer relationships | | | 14,204 | | | | — | |
Other intellectual property | | | 3,375 | | | | 506 | |
| | | | | | | | |
| | $ | 42,140 | | | $ | 506 | |
| | | | | | | | |
The increase in intangible assets in the year ended March 31, 2011 relates to the acquisition of NextWindow (note 2).
Amortization expense of finite-lived intangibles for the year ended March 31, 2011 was $8,986 (2010 – $21). Based on the carrying value of the identified intangible assets as at March 31, 2011 and assuming no subsequent impairment of the underlying assets, the annual amortization expense for the next five years is expected to be as follows.
| | | | | | | | | | | | | | | | | | | | |
Fiscal Year Ending March 31, | | 2012 | | | 2013 | | | 2014 | | | 2015 | | | 2016 | |
Amortization expense | | $ | 9,542 | | | $ | 9,542 | | | $ | 9,542 | | | $ | 9,542 | | | $ | 1,180 | |
| | | | | | | | | | | | | | | | | | | | |
9. Long-Term Debt and Credit Facilities
| | | | | | | | |
| | | March 31,
2011 | | | March 31,
2010 | |
Long-term debt | | | | | | | | |
First lien facility | | $ | 294,325 | | | $ | 337,375 | |
Second lien facility | | | 45,000 | | | | 100,000 | |
Unsecured term loan | | | — | | | | 79,407 | |
Term construction facility | | | — | | | | 49,740 | |
| | | | | | | | |
| | | 339,325 | | | | 566,522 | |
Current portion of long-term debt | | | (3,050 | ) | | | (92,790 | ) |
| | | | | | | | |
| | $ | 336,275 | | | $ | 473,732 | |
| | | | | | | | |
| | |
| | | March 31,
2011 | | | March 31,
2010 | |
Related party long-term debt | | | | | | | | |
Construction loan | | $ | — | | | $ | 1,421 | |
Shareholder note payable | | | — | | | | 327,864 | |
Cumulative preferred shares | | | — | | | | 101,991 | |
| | | | | | | | |
| | | — | | | | 431,276 | |
Current portion of related party long-term debt | | | — | | | | (1,421 | ) |
| | | | | | | | |
| | $ | — | | | $ | 429,855 | |
| | | | | | | | |
65
SMART Technologies Inc. 2011 Annual Report
Notes to Consolidated Financial Statements(continued)
(thousands of U.S. dollars, except per share amounts, and except as otherwise indicated)
For the Years Ended March 31, 2011, 2010 and 2009
(a) Credit Facilities
(i) First Lien Facility
In August 2007, the Company entered into a seven-year, $305,000 term loan with a six-year, $45,000 revolving credit facility (the “First lien facility”). The full amount of the term loan was drawn upon closing. At March 31, 2010, $40,000 was drawn on the revolving portion of the First lien facility, which was subsequently repaid in April 2010. As part of the Company’s IPO transaction which closed on July 20, 2010, the Company put into place an additional $55,000 revolving credit facility under the First lien facility maturing August 28, 2013, which increased the total revolving credit capacity to $100,000 and which remains undrawn as of March 31, 2011. The First lien facility is secured by a first priority interest over all assets of the Company and certain subsidiaries.
The Company may repay all or a portion of the First lien facility at any time without incurring early repayment premiums. The term-loan portion of the First lien facility requires mandatory annual repayments totaling $3,050. In addition, beginning with the year ended March 31, 2009, the Company is required to repay amounts under the facility ranging between zero and 50% of annual excess cash flow, contingent upon the Company’s leverage ratio at the time. As of March 31, 2011, the leverage ratio was below the level required to trigger a repayment.
Borrowings under the term loan bear interest at floating rates, based on LIBOR, the U.S. federal funds rate or the Canadian base rate of the administrative agent. Borrowings under the revolving credit facility bear interest at floating rates based on the banker’s acceptance rate, LIBOR, the U.S. federal funds rate, the Canadian base rate of the administrative agent or the Canadian prime rate. The Company has discretion with respect to the basis upon which interest rates are set. The interest rate on borrowings under the First lien facility term loan was 3.1% at March 31, 2011 and 3.0% at March 31, 2010.
The Company had outstanding letters of credit totaling $1,371 at March 31, 2011 and, $2,190 at March 31, 2010. These letters of credit have not been drawn, however, they reduce the amount available to the Company under the revolving portion of the First lien facility.
The Company was in compliance with all financial covenants with respect to this facility calculated in accordance with U.S. GAAP at March 31, 2011. The facility has two financial covenants: a total leverage ratio test and an interest coverage ratio test. Compliance is tested quarterly and the Company has been in compliance with all covenants during all reporting periods since the inception of the loan. Prior to March 31, 2010, these covenants were calculated in accordance with Canadian GAAP.
(ii) Second Lien Facility
In August 2007, the Company entered into an eight-year, $100,000 term loan (the “Second lien facility”), which was fully drawn upon closing. The Second lien facility is secured by a second priority interest over all the assets of the Company and certain subsidiaries. The Company may repay all or a portion of the facility at any time without repayment premiums.
Borrowings under the Second lien facility bear interest at floating rates based on LIBOR, the U.S. federal funds rate or the Canadian base rate of the administrative agent. The Company has discretion with respect to the basis upon which interest rates are set. The interest rate on borrowing under the Second lien facility was 7.2% at March 31, 2011 and 7.3% at March 31, 2010.
In fiscal 2011, repayments of $55,000 were made on the Second lien facility. There were no repayment premiums charged.
66
SMART Technologies Inc. 2011 Annual Report
The Company incurred fees of $13,090 in closing the First lien facility and the Second lien facility which have been recorded as deferred financing fees. These fees are shown as an asset and amortized over the loans’ terms based on the effective interest rate method. The Company also incurred fees of $1,385 in closing the new revolving facility on July 20, 2010 under the First lien facility. These fees are shown as an asset and amortized over the term of the facility using the straight-line method. Repayments of the term loans also result in releases of these fees, which are then recorded as amortization expense. The Company recorded amortization of these fees of $3,270, $1,525 and $1,445 for the years ended March 31, 2011, 2010 and 2009, respectively.
(b) Unsecured Term Loan
In August 2007, the Company closed an eight-year, $60,000 unsecured term loan. The full amount of the loan was drawn upon closing.
Borrowings under the term loan bore interest at floating rates, based on LIBOR, the U.S. federal funds rate or the Canadian base rate of the administrative agent. The Company had discretion with respect to the basis upon which interest rates were set. Interest on the loan was deferred for the first four years and paid in cash thereafter, with the deferred interest added to the principal on a quarterly basis. At March 31, 2010, accrued interest on the loan was $19,407 and the interest rate on borrowings under the term loan was 8.8%.
As part of the 2010 Reorganization (note 3), the Company repaid $40,000 of the unsecured term loan from the IPO proceeds. In September 2010, the remaining balance of $42,389 was repaid in full. A premium of $424 was charged on this repayment.
(c) Term Construction Facility
In May 2008, the Company closed a 21-month term construction facility to finance, in part, the construction costs of the Company’s global headquarters. In January 2010, the facility was extended for a further nine months. The available borrowings under this facility were comprised of loans and banker’s acceptances for terms of 30, 60, 90 and 180 days, with outstanding borrowings subject to a maximum of the lesser of CDN$52,000 and 75% of project costs as set forth in the project budget as at the closing date of the loan. The facility was primarily secured by a first priority interest of CDN$55,000 over the building and a joint and several undertaking from the Company and the guarantor, IFF Holdings Inc., a shareholder, to fund any cost overruns and complete the project.
The Company incurred fees of $887 in closing this facility which were recorded as deferred financing fees. These fees were shown as an asset and amortized over the loan’s term based on the effective interest rate method. The fees were fully amortized by the end of the original facility term in February 2010. The Company recorded amortization of these fees of $402 for the year ended March 31, 2010 and $419 for the year ended March 31, 2009.
Borrowings in the form of banker’s acceptances bore interest at floating rates based on the Canadian banker’s acceptance rate and CDOR borrowings in the form of prime loans bore interest at floating rates based on the Canadian prime rate. The Company had discretion with respect to the basis upon which interest rates are set. The interest rate on the outstanding banker’s acceptances ranged from 4.8% to 4.9% at March 31, 2010.
As part of the 2010 Reorganization (note 3), the Company repaid $19,244 of the term construction facility from the IPO proceeds. In September 2010, the remaining balance of $29,836 was repaid in full.
(d) Construction Loan
In May 2008, as part of the undertaking for the term construction facility, the Company entered into a 21-month loan agreement with a shareholder to fund completion of the construction of the Company’s global headquarters including any cost overruns. In January 2010, the facility was extended for a further nine months. This loan was secured by a second priority interest over the building. The Company could repay all or a portion of the loan prior to maturity without incurring repayment premiums.
67
SMART Technologies Inc. 2011 Annual Report
Notes to Consolidated Financial Statements(continued)
(thousands of U.S. dollars, except per share amounts, and except as otherwise indicated)
For the Years Ended March 31, 2011, 2010 and 2009
Borrowings under the loan bore interest at floating rates based on the Canadian prime rate, payable at maturity, with the accrued interest added to the principal on a monthly basis. At March 31, 2010, accrued interest on the loan was $78 and the interest rate on the loan was 4.3%.
In September 2010, the remaining balance of $1,438 was repaid in full.
(e) Shareholder Note Payable
As part of the Corporate Reorganization in August 2007, the Company issued a ten-year, CDN$253,972 note (with two possible five-year extensions at the Company’s election), payable to a shareholder. The note was an unsecured obligation of the Company, subordinate to the First lien facility, Second lien facility and the unsecured term loan. Subject to restrictions under these loans, the Company could repay all or a portion of the note prior to maturity without incurring repayment premiums.
Borrowings under the note bore interest at a rate of 12.0% non-compounding and payable at maturity. Accrued interest on the note was $77,842 at March 31, 2010.
On May 22, 2010, the Company made a payment of $8,016 on the shareholder note payable, and the balance of CDN$253,972 plus accrued interest of CDN$75,074 were effectively converted to Class A Preferred Shares and Class B Shares as part of the 2010 Reorganization (notes 3 and 10).
(f) Cumulative Preferred Shares
As part of the Corporate Reorganization in August 2007, the Company issued 84,883,191 cumulative preferred shares for consideration of CDN$84,883. The holders of the shareholder note payable and the cumulative preferred shares participated ratably with respect to payments made against the shareholder note payable. In the event a payment was made with respect to the shareholder note payable, the Company was obligated to make payments to the holder of the cumulative preferred shares, concurrently, first towards the discharge of any accrued dividends and secondly to the redemption of the cumulative preferred shares. As such, the cumulative preferred shares were classified as long-term debt.
The cumulative preferred shares did not allow the holder to vote at shareholder meetings but the holder was entitled to receive a fixed cumulative annual dividend at the rate of 8.5%. The dividends accrued from the date of issue, and were subject to and would be payable if and when declared by the Board of Directors. The dividends were recorded as interest expense and were added to the outstanding amount of the cumulative preferred shares. The accrued dividends on the cumulative preferred shares were $18,428 at March 31, 2010.
On May 22, 2010, the cumulative preferred shares of CDN$84,883 plus accrued dividends of CDN$19,748 were converted to Class A Preferred Shares as part of the 2010 Reorganization (notes 3 and 10).
10. Share Capital
(a) Share Capital
(i) Authorized
The Company’s authorized share capital consists of an unlimited number of Class A Subordinate Voting Shares, an unlimited number of Class B Shares, 433,676,686 Class A Preferred Shares and an unlimited number of Preferred Shares issuable in series.
Each holder of Class B Shares and each holder of Class A Subordinate Voting Shares is entitled to receive notice of and attend all meetings of the Company’s shareholders, except meetings at which only holders of another particular class or series have the right to vote. At each such meeting, each Class B Share entitles its holder to 10 votes and each Class A Subordinate Voting Share entitles its holder to one vote, voting together as a single class, except as otherwise set forth in the Company’s articles of amalgamation or prescribed by applicable laws.
68
SMART Technologies Inc. 2011 Annual Report
| | | | | | | | | | | | | | | | | | | | | | | | | | | | |
(ii) Issued and Outstanding | | | | | | | | | | | | | | | | |
| | | March 31,
2008 and
2009 | | | Participant
Equity Loan
Plan | | | March 31,
2010 | | | Participant
Equity Loan
Plan | | | 2010
Reorganization | | | Initial Public
Offering | | | March 31,
2011 | |
Voting Common Shares | | | | | | | | | | | | | | | | | | | | | | | | | | | | |
Shares | | | 42,606,653 | | | | 10,957,191 | | | | 53,563,844 | | | | — | | | | (53,563,844 | ) | | | — | | | | — | |
Stated amount | | $ | 40,139 | | | $ | 1,027 | | | $ | 41,166 | | | $ | 2,122 | | | $ | (43,288 | ) | | $ | — | | | $ | — | |
Non-voting | | | | | | | | | | | | | | | | | | | | | | | | | | | | |
Common Shares | | | | | | | | | | | | | | | | | | | | | | | | | | | | |
Shares | | | 127,489,844 | | | | — | | | | 127,489,844 | | | | — | | | | (127,489,844 | ) | | | — | | | | — | |
Stated amount | | $ | 120,108 | | | $ | — | | | $ | 120,108 | | | $ | — | | | $ | (120,108 | ) | | $ | — | | | $ | — | |
Voting Preferred Shares | | | | | | | | | | | | | | | | | | | | | | | | | | | | |
Shares | | | 127,483,148 | | | | — | | | | 127,483,148 | | | | — | | | | (127,483,148 | ) | | | — | | | | — | |
Stated amount | | $ | — | | | $ | — | | | $ | — | | | $ | — | | | $ | — | | | $ | — | | | $ | — | |
Class A Subordinate | | | | | | | | | | | | | | | | | | | | | | | | | | | | |
Voting Shares | | | | | | | | | | | | | | | | | | | | | | | | | | | | |
Shares | | | — | | | | — | | | | — | | | | — | | | | 5,478,596 | | | | 38,830,000 | | | | 44,308,596 | |
Stated amount | | $ | — | | | $ | — | | | $ | — | | | $ | 6,209 | | | $ | 3,156 | | | $ | 474,047 | | | $ | 483,412 | |
Class B Shares | | | | | | | | | | | | | | | | | | | | | | | | | | | | |
Shares | | | — | | | | — | | | | — | | | | — | | | | 85,044,901 | | | | (5,580,706 | ) | | | 79,464,195 | |
Stated amount | | $ | — | | | $ | — | | | $ | — | | | $ | — | | | $ | 160,242 | | | $ | 78,165 | | | $ | 238,407 | |
Class A Preferred Shares | | | | | | | | | | | | | | | | | | | | | | | | | | | | |
Shares | | | — | | | | — | | | | — | | | | — | | | | 433,676,686 | | | | (433,676,686 | ) | | | — | |
Stated amount | | $ | — | | | $ | — | | | $ | — | | | $ | — | | | $ | 413,616 | | | $ | (413,616 | ) | | $ | — | |
| | | | | | | | | | | | | | | | | | | | | | | | | | | | |
Total share capital | | | | | | | | | | | | | | | | | | | | | | | | | | | | |
Shares | | | 297,579,645 | | | | 10,957,191 | | | | 308,536,836 | | | | — | | | | 215,663,347 | | | | (400,427,392 | ) | | | 123,772,791 | |
Stated amount | | $ | 160,247 | | | $ | 1,027 | | | $ | 161,274 | | | $ | 8,331 | | | $ | 413,618 | | | $ | 138,596 | | | $ | 721,819 | |
| | | | | | | | | | | | | | | | | | | | | | | | | | | | |
The 2010 Reorganization completed on June 8, 2010 effectively resulted in the conversion of the Company’s Voting Common Shares, Voting Preferred Shares, cumulative preferred shares including accrued interest (note 9) and shareholder note payable (note 9) into 10,957,191 Class A Subordinate Voting Shares, 170,089,800 Class B Shares and 433,676,686 Class A Preferred Shares. The Company’s Non-voting Common Shares were cancelled as part of the 2010 Reorganization.
On June 24, 2010, the Company effected a one-for-two reverse split of the Class A Subordinate Voting Shares and the Class B Shares.
As part of the Company’s IPO on July 20, 2010, the 433,676,686 Class A Preferred Shares were converted to 5,898,744 Class B Shares and 18,550,550 Class A Subordinate Voting Shares and then 11,479,450 Class B Shares were converted to 11,479,450 Class A Subordinate Voting Shares. New Class A Subordinate Voting Shares issued by the Company to the public pursuant to the IPO totaled 8,800,000 at an issue price of $17.00. Proceeds from the IPO were $138,596, net of underwriting commissions of $7,854 and other offering expenses of $7,429, net of tax of $4,279. Other offering expenses were also recorded as a reduction of IPO proceeds effective the date of the IPO. Concurrent with this transaction, 30,030,000 Class A Subordinate Voting Shares were sold to the public by existing shareholders at an issue price of $17.00.
69
SMART Technologies Inc. 2011 Annual Report
Notes to Consolidated Financial Statements(continued)
(thousands of U.S. dollars, except per share amounts, and except as otherwise indicated)
For the Years Ended March 31, 2011, 2010 and 2009
(b) Participant Equity Loan Plan
In 2009, the Company implemented a Participant Equity Loan Plan (the “Plan”) under which the Company loaned funds to certain employees for the purpose of allowing them to purchase common shares of the Company at fair market value as determined by a third party valuation.
Shares granted under the Plan are reported as share capital in shareholders’ equity at their value on the date of issue. The outstanding related loans and accrued interest are reported as a reduction of share capital.
In August 2009 and February 2010 the Company made loans to employees totaling CDN$12,960 and issued 10,957,191 common shares at a weighted average price of CDN$1.18.
Share capital increased by $8,331 in the year ended March 31, 2011 as a result of Plan activity which consisted of loan principal and interest repayments totaling $8,404, interest accrued during the year of $204 and foreign exchange adjustments of $131. Also, during the year ended March 31, 2011, 26,250 shares of employees who left the Company were repurchased and related loans and accrued interest amounting to $93 were repaid. During 2010, loan principal and interest repayments totaled $1,918. Total loans and accrued interest amounted to $2,624 at March 31, 2011 ($10,965 at March 31, 2010).
Shares issued under the Plan were initially subject to restrictions that lapse as follows: 40% of the Plan shares were subject to restrictions that lapse based on passage of time and 60% were subject to restrictions that lapse based on performance of the Company. The restrictions on performance-based shares lapsed upon a liquidity event that provided a return on invested capital earned by the principal shareholders of the Company above certain valuation thresholds. At the time of the IPO, 789,176 time-vesting shares were unrestricted and as a result of the Company’s IPO, 1,951,594 performance-based shares became unrestricted, causing employee loans of $6,537 to become immediately repayable.
In August 2010, the Plan was amended such that the 40% of shares with performance-based restrictions that did not become unrestricted as part of the IPO transaction, representing 24% of the total shares under the Plan, would become unrestricted in two equal installments on each of the next two anniversary dates of the IPO. As a result of this amendment, the difference between the fair value of the affected shares at the date of the amendment and the fair value at the initial issuance of the shares is being recognized as stock-based compensation ratably on a graded basis over the period the restrictions lapse. The expense is included in selling, marketing, and administration and research and development, with an offsetting credit to additional paid-in capital. The total number of shares affected by this amendment was 1,301,063 Class A Subordinate Voting Shares. The weighted average grant date price was $2.36 and the fair value at the date of the amendment was $13.38. The total amount of compensation cost is adjusted to reflect expected forfeitures based on Company historical data. Changes in the forfeiture rate will result in changes in the amount of compensation cost recognized over the amortization period. The total value to be expensed over two years is $13,714, of which $7,567 was expensed in the year ended March 31, 2011.
11. Stock-Based Compensation
On June 3, 2010 the Company approved the 2010 Equity Incentive Plan (“2010 Plan”) which provides for the grant of options, restricted share units and deferred share units to the directors, officers, employees, consultants and service providers of the Company and its subsidiaries. Under the 2010 Plan, the Company has reserved for issuance Class A Subordinate Voting Shares representing up to 10% of the total outstanding Class A Subordinate Voting Shares and Class B Shares. At March 31, 2011 there were 10,961,279 stock-based awards available for future grant.
During the year ended March 31, 2011 the Company granted 1,444,500 stock options to purchase an equivalent number of the Company’s Class A Subordinate Voting Shares at a weighted average exercise price of $16.22. Of these options 1,140,000 were granted on July 15, 2010, the date of the Company’s IPO, at an exercise price of $17.00. These options vest over various periods ranging between three and four years.
70
SMART Technologies Inc. 2011 Annual Report
A summary of the status of the Company’s stock options at March 31, 2011, 2010 and 2009 and changes during the year ended on those dates is as follows.
| | | | | | | | | | | | | | | | |
| | | Options Outstanding | |
| | | Number of
Options | | | Weighted
Average Exercise
Price Per Option | | | Average Remaining
Contractual Life
in Years | | | Aggregate
Intrinsic
Value | |
Balance at March 31, 2008, 2009 and 2010 | | | — | | | $ | — | | | | — | | | $ | — | |
Granted | | | 1,444,500 | | | | 16.22 | | | | — | | | | — | |
Exercised | | | — | | | | — | | | | — | | | | — | |
Forfeited | | | (28,500 | ) | | | 15.61 | | | | — | | | | — | |
| | | | | | | | | | | | | | | | |
Balance at March 31, 2011 | | | 1,416,000 | | | $ | 16.24 | | | | 4.37 | | | $ | 152 | |
| | | | | | | | | | | | | | | | |
Exercisable at March 31, 2011 | | | — | | | $ | — | | | | — | | | $ | — | |
| | | | | | | | | | | | | | | | |
The aggregate intrinsic value in the table above represents the total intrinsic value (the aggregate difference between the closing stock price of the Company’s Class A Subordinate Voting Shares on March 31, 2011 and the exercise price of in-the-money options) that would have been received by the option holders if all in-the-money options had been exercised on March 31, 2011.
The fair value of each stock-based award is estimated at the date of grant using the BSM option-pricing model and the assumptions noted in the table below. The amounts computed according to the model may not be indicative of the actual values realized upon the exercise of the options by the holders. The weighted average fair value of options granted in the year ended March 31, 2011 was $16.24. No options were granted in the year ended March 31, 2010.
Stock-based compensation expense related to these options included in selling, marketing and administration expense and research and development expense for the year ended March 31, 2011 was $1,105 (zero for the year ended March 31, 2010). As at March 31, 2011, the total compensation cost not yet recognized related to stock options was $5,425. This amount is expected to be recognized over the next four years on a weighted average basis.
The weighted average fair value of the stock options granted in 2011 was calculated using the BSM option-pricing model with the following assumptions.
| | | | |
| | | Year Ended
March 31, 2011 | |
Fair value of stock options granted during the year | | $ | 5.59 | |
Assumptions | | | | |
Risk-free interest rate | | | 0.96%–1.49 | % |
Expected life in years | | | 4.0 | |
Expected dividend yield | | | 0.0 | % |
Volatility | | | 45.0 | % |
| | | | |
The assumed volatility used in the stock option valuation for options granted for the year ended March 31, 2011 is the Company’s estimate of the future volatility of the share price based on a review of the volatility of comparable public companies. The assumed dividend yield reflects the Company’s intention to not pay cash dividends in the foreseeable future. The assumed expected life is the Company’s estimated expected exercise pattern of the options. The assumed risk-free interest rate is based on the yield of a U.S. government zero coupon Treasury bill issued at the date of grant with a remaining life approximately equal to the expected term of the option.
The Company estimates forfeitures at the time of grant based on the Company’s historical data and revises these estimates in subsequent periods if actual forfeitures differ from those estimates. The estimated forfeiture rate used was 5.0% for the year ended March 31, 2011.
71
SMART Technologies Inc. 2011 Annual Report
Notes to Consolidated Financial Statements(continued)
(thousands of U.S. dollars, except per share amounts, and except as otherwise indicated)
For the Years Ended March 31, 2011, 2010 and 2009
12. Income Taxes
Income tax expense differs from the amount that would be computed by applying the combined Canadian federal and provincial statutory income tax rates to income before income taxes.
The reasons for these differences are as follows.
| | | | | | | | | | | | |
| | | Year Ended March 31, | |
| | | 2011 | | | 2010 | | | 2009 | |
Income (loss) before income taxes | | | | | | | | | | | | |
Domestic | | $ | 114,480 | | | $ | 157,548 | | | $ | (109,274 | ) |
Foreign | | | (9,813 | ) | | | 2,798 | | | | 6,891 | |
| | | | | | | | | | | | |
| | $ | 104,667 | | | $ | 160,346 | | | $ | (102,383 | ) |
Combined tax rate | | | 27.89 | % | | | 29.15 | % | | | 29.40 | % |
Expected income tax expense (recovery) | | | 29,192 | | | | 46,741 | | | | (30,101 | ) |
Adjustments | | | | | | | | | | | | |
Non-deductible, non-taxable items | | | 2,744 | | | | (12,511 | ) | | | 19,703 | |
Variation in foreign tax rates | | | 830 | | | | 709 | | | | 571 | |
Deferred income tax rate differences | | | 464 | | | | (1,741 | ) | | | 6,768 | |
Change in valuation allowance | | | 3,107 | | | | (11,263 | ) | | | 10,722 | |
Investment tax credits | | | (4,285 | ) | | | (3,248 | ) | | | (2,451 | ) |
Other | | | 3,260 | | | | (373 | ) | | | (938 | ) |
| | | | | | | | | | | | |
Income tax expense | | $ | 35,312 | | | $ | 18,314 | | | $ | 4,274 | |
| | | | | | | | | | | | |
The tax effects of temporary differences that give rise to significant portions of the deferred income tax assets and liabilities are presented below.
| | | | | | | | |
| | | March 31,
2011 | | | March 31,
2010 | |
Deferred income tax assets | | | | | | | | |
Inventory | | $ | 350 | | | $ | 668 | |
Non-capital losses | | | — | | | | 453 | |
Foreign non-capital losses | | | 4,140 | | | | 2,549 | |
Property and equipment | | | — | | | | 614 | |
Derivative contracts | | | 341 | | | | 1,386 | |
Deferred revenue | | | 30,823 | | | | 26,164 | |
Warranty accrual | | | 2,979 | | | | 2,809 | |
Other | | | 833 | | | | 374 | |
Valuation allowance | | | (4,564 | ) | | | (2,548 | ) |
| | | | | | | | |
| | | 34,902 | | | | 32,469 | |
Deferred income tax liabilities | | | | | | | | |
Intangible assets | | | 8,690 | | | | 33 | |
Property and equipment | | | 49 | | | | — | |
Long-term debt | | | 5,121 | | | | 2,223 | |
Investment tax credits | | | 2,249 | | | | 2,873 | |
Long-term debt financing costs | | | 1,010 | | | | 695 | |
| | | | | | | | |
| | | 17,119 | | | | 5,824 | |
| | | | | | | | |
Net deferred income tax asset | | $ | 17,783 | | | $ | 26,645 | |
| | | | | | | | |
Deferred income tax asset – current | | $ | 12,200 | | | $ | 11,683 | |
Deferred income tax asset – long-term | | | 17,177 | | | | 14,962 | |
Deferred income tax liability – long-term | | | (11,594 | ) | | | — | |
| | | | | | | | |
| | $ | 17,783 | | | $ | 26,645 | |
| | | | | | | | |
72
SMART Technologies Inc. 2011 Annual Report
The Company had consolidated non-capital losses for income tax purposes of $13,589 at March 31, 2011 and $9,486 at March 31, 2010, which will expire at various times through to 2029.
In assessing the realization of deferred tax assets, management considers whether it is more likely than not that some portion of or all of the deferred tax assets will be realized. Management considers the scheduled reversal of deferred tax liabilities, projected future taxable income and tax planning strategies in making this assessment. To the extent that any portion of the deferred tax assets is not more likely than not to be realized, a valuation allowance has been provided.
As at March 31, 2011 and 2010, the Company did not have unrecognized tax benefits. The Company files federal and provincial income tax returns in Canada, its U.S. subsidiary files federal and state income tax returns in the U.S. and its other foreign subsidiaries file income tax returns in their respective foreign jurisdictions. The Company and its subsidiaries are generally no longer subject to income tax examinations by tax authorities for years before March 31, 2008. The Canada Revenue Agency (the “CRA”), is conducting an examination of the Company’s Canadian income tax returns of taxation years ending in the 2008 and 2009 fiscal years. The German Tax Authority has commenced an examination of the Company’s German income tax returns of taxation years ending in the 2006 to 2009 fiscal years which is in its preliminary stages. Notwithstanding management’s belief in the merit of the Company’s tax filing position, it is possible that the final outcome of any audits by taxation authorities may differ from estimates and assumptions used in determining the Company’s consolidated tax provision and accruals, which could result in a material effect on the consolidated income tax provision and the net income for the period in which such determinations are made.
Notwithstanding management’s belief in the merit of the Company’s tax filing positions, it is reasonably possible that the Company’s unrecognized tax benefits, if any, could significantly increase or decrease within the next twelve months, although this change is not likely to have a material impact on the Company’s effective tax rate. Future changes in management’s assessment of the sustainability of tax filing positions may impact the Company’s income tax liability.
The Company recognizes interest related to income taxes in interest expense and penalties related to income taxes in selling, marketing and administration expense in the consolidated statement of operations. The amount of gross interest and penalties accrued was zero at March 31, 2011 and zero at March 31, 2010. The Company recognized interest and penalty expense related to tax matters of $86, $173 and $727 for the years ended March 31, 2011, 2010 and 2009, respectively.
13. Product Warranty
The Company estimates its warranty costs at the time of revenue recognition based on historical warranty claims experience and records the expense in cost of sales. The accrued warranty obligation is reviewed quarterly to establish that it reflects the remaining obligation based on the anticipated future expenditures over the balance of the obligation period. Adjustments are made when the actual warranty claim experience differs from the estimates. The accrued warranty obligation is included in accrued and other current liabilities.
The change in the Company’s warranty expense and actual warranty experience from April 1, 2008 to March 31, 2011 as well as the accrued warranty obligation as at March 31, 2011 are set forth in the following table.
| | | | | | | | | | | | |
Year Ended March 31, | | 2011 | | | 2010 | | | 2009 | |
Accrued warranty obligation at beginning of year | | $ | 10,840 | | | $ | 6,132 | | | $ | 6,639 | |
Actual warranty experience | | | (14,041 | ) | | | (10,845 | ) | | | (3,860 | ) |
Warranty provision | | | 13,494 | | | | 13,842 | | | | 4,676 | |
Adjustments for changes in estimate | | | 725 | | | | — | | | | — | |
Foreign exchange (gain) loss | | | 525 | | | | 1,711 | | | | (1,323 | ) |
| | | | | | | | | | | | |
Accrued warranty obligation at end of year | | $ | 11,543 | | | $ | 10,840 | | | $ | 6,132 | |
| | | | | | | | | | | | |
73
SMART Technologies Inc. 2011 Annual Report
Notes to Consolidated Financial Statements(continued)
(thousands of U.S. dollars, except per share amounts, and except as otherwise indicated)
For the Years Ended March 31, 2011, 2010 and 2009
14. Earnings Per Share Amounts
| | | | | | | | | | | | |
| | | Year Ended March 31, | |
| | | 2011 | | | 2010 | | | 2009 | |
Net income (loss) for basic and diluted earnings (loss) per share available to common shareholders | | $ | 69,355 | | | $ | 142,032 | | | $ | (106,657 | ) |
Weighted average number of shares outstanding – basic and diluted | | | 130,775,288 | | | | 176,332,584 | | | | 170,096,497 | |
Basic and diluted earnings (loss) per share | | $ | 0.53 | | | $ | 0.81 | | | $ | (0.63 | ) |
| | | | | | | | | | | | |
The weighted average number of shares outstanding for the year ended March 31, 2011 reflects voting common shares and non-voting shares outstanding on a pro-rata basis from April 1, 2010 to June 8, 2010, the date of the 2010 Reorganization and Class A Subordinate Voting Shares and Class B Shares outstanding on a pro-rata basis from June 9, 2010 to March 31, 2011, after giving retroactive effect to the one-for-two reverse share split effected June 24, 2010 for the Class A Subordinate Voting Shares and the Class B Shares. Options to purchase 1,416,000 Class A Subordinate Voting Shares were outstanding at March 31, 2011 of which 137,000 options had an exercise price lower than the weighted average trading price of underlying Class A Subordinate Voting Shares during the year ended March 31, 2011. These options were excluded from the calculation of diluted earnings per share because the combined exercise price and unamortized fair value is greater than the average trading price of the Class A Subordinate Voting shares for the year ended March 31, 2011 and therefore their inclusion would have been anti-dilutive. All other options were excluded from the computation of diluted earnings per share because their exercise prices exceeded the trading price of the underlying Class A Subordinate Voting Shares during the year ended March 31, 2011.
The weighted number of shares outstanding for the years ended March 31, 2010 and 2009 reflects voting and non-voting common shares.
15. Commitments
| | | | | | | | | | | | | | | | | | | | |
| | | Fiscal Year Ending March 31, | |
| | | 2012 | | | 2013 | | | 2014 | | | 2015 | | | 2016
and
Thereafter | |
Operating leases | | $ | 7,795 | | | $ | 6,010 | | | $ | 5,559 | | | $ | 5,485 | | | $ | 22,793 | |
Derivative contracts | | | 1,846 | | | | — | | | | — | | | | — | | | | — | |
Long-term debt repayments | | | | | | | | | | | | | | | | | | | | |
Long-term debt | | | 3,050 | | | | 3,050 | | | | 3,050 | | | | 285,175 | | | | 45,000 | |
Future interest obligations on long-term debt | | | 12,441 | | | | 12,313 | | | | 12,218 | | | | 6,956 | | | | 1,369 | |
Purchase commitments | | | 88,488 | | | | 1,985 | | | | 1,201 | | | | — | | | | — | |
| | | | | | | | | | | | | | | | | | | | |
Total | | $ | 113,620 | | | $ | 23,358 | | | $ | 22,028 | | | $ | 297,616 | | | $ | 69,162 | |
| | | | | | | | | | | | | | | | | | | | |
The operating lease commitments relate primarily to office, warehouse and assembly facilities and represent the minimum commitments under these agreements. The Company incurred rental expense of $5,175, $4,373 and $9,332 for the years ended March 31, 2011, 2010 and 2009, respectively.
The derivative contracts represent minimum commitments under foreign exchange and interest rate contracts based on the forward strip for each instrument through the contract term.
74
SMART Technologies Inc. 2011 Annual Report
Long-term debt commitments represent the minimum principal repayments required under the long-term debt facilities.
Purchase commitments represent commitments for raw materials to be used in the assembly of the Company’s products and commitments for finished goods to be purchased from contract manufacturers, as well as certain information systems and licensing costs.
Commitments have been calculated using foreign exchange and interest rates in effect at March 31, 2011. Fluctuations in these rates may result in actual payments differing from those reported in the above table.
16. Guarantees and Contingencies
(a) Indemnities and Guarantees
In the normal course of business, the Company enters into guarantees that provide indemnification and guarantees to counterparties to secure sales agreements and purchase commitments. Should the Company be required to act under such agreements, it is expected that no material loss would result.
As a result of the U.S. and Canadian class action IPO litigations, as described in the “Litigation” section below, SMART may be required, subject to certain limitations, to indemnify the following parties: the underwriters pursuant to the underwriting agreement entered into in connection with the IPO; Intel Corporation, Apax Partners and IFF Holdings Inc. (“IFF”), pursuant to a registration rights agreement entered into in 2007 and amended and restated in connection with the IPO; and the directors and officers of SMART Technologies Inc. pursuant to indemnification agreements entered into by SMART and each director and officer on or about the time of their appointment to their respective office.
(b) Litigation
Since December 2010, several class action complaints have been filed in the U.S. District Courts in New York and Illinois on behalf of the purchasers of the Class A Subordinate Voting Shares against the Company and other parties alleging certain violations of federal securities laws relative to the IPO. The New York actions have been dismissed voluntarily and the Illinois action is pending. Pursuant to the provisions governing class action litigation as set out in thePrivate Securities Litigation Reform Act of 1995, it is expected that the various complaints will be consolidated into one action going forward. Several individuals and entities have applied to the Courts to be appointed Lead Plaintiff and those applications remain pending.
In February 2011, a class proceeding was commenced in the Ontario Superior Court of Justice on behalf of purchasers of the Class A Subordinate Voting Shares issued in conjunction with the IPO.
The proceedings relative to the above litigation are currently pending and as such the likelihood of damages or recoveries and the ultimate amounts, if any, relative to the above litigation (or any associated litigation) are not determinable. Accordingly, no amount has been recorded in these financial statements as at March 31, 2011.
(c) General
The Company is subject to claims and contingencies related to lawsuits and other matters arising in the normal course of operations. Management believes the ultimate liability, if any, arising from such claims and contingencies, is not likely to have a material effect on the consolidated results of operations or financial condition of the Company.
75
SMART Technologies Inc. 2011 Annual Report
Notes to Consolidated Financial Statements(continued)
(thousands of U.S. dollars, except per share amounts, and except as otherwise indicated)
For the Years Ended March 31, 2011, 2010 and 2009
17. Segmented Disclosure
The Company reports segmented information based upon the manner in which related information is organized and managed as a single reportable business segment. The Company’s operations are substantially related to the design, development, assembly and sale of hardware and software of interactive whiteboards and related products that enable group collaboration and learning.
The Company conducts business globally. Revenue information relating to the geographic locations that the Company sells products in is as follows.
| | | | | | | | | | | | |
| | | Year Ended March 31, | |
| | | 2011 | | | 2010 | | | 2009 | |
Revenue | | | | | | | | | | | | |
United States | | $ | 497,726 | | | $ | 409,527 | | | $ | 277,926 | |
Canada | | | 60,669 | | | | 47,722 | | | | 36,317 | |
Europe, Middle East and Africa | | | 175,472 | | | | 149,905 | | | | 131,474 | |
Rest of World | | | 56,188 | | | | 40,821 | | | | 22,439 | |
| | | | | | | | | | | | |
| | $ | 790,055 | | | $ | 647,975 | | | $ | 468,156 | |
| | | | | | | | | | | | |
For the years ended March 31, 2011, 2010 and 2009, no single customer accounted for more than 10% of revenues.
Most of the Company’s assets are held in Canada. As a result of the acquisition of NextWindow on April 21, 2010 (note 2), one country outside Canada, New Zealand, has more than 10% of the Company’s total consolidated long-lived assets at March 31, 2011. Total long-lived assets in New Zealand amounted to $78,228 and total long-lived assets outside of Canada amounted to $79,207 at March 31, 2011.
18. Financial Instruments
The Company’s financial instruments consist of foreign exchange and interest rate derivative instruments and other financial instruments including cash and cash equivalents, trade receivables, accounts payable, accrued and other current liabilities, and long-term debt.
The Company uses derivatives to partially offset its exposure to foreign exchange risk and interest rate risk. The Company enters into derivative transactions with high credit quality counterparties and, by policy, seeks to limit the amount of credit exposure to any one counterparty based on an analysis of the counterparty’s relative credit standing. The Company does not use derivative financial instruments for trading or speculative purposes.
(a) Foreign Exchange Rate Risk
Foreign exchange risk is the risk that fluctuations in foreign exchange rates could impact the Company. The Company operates globally and is exposed to significant foreign exchange risk, primarily between the Canadian dollar and both the U.S. dollar (“USD”), and the Euro (“EUR”). This exposure relates to our USD denominated debt, the sale of our products to customers globally and purchases of goods and services in foreign currencies. The Company seeks to manage its foreign exchange risk by monitoring foreign exchange rates, forecasting its net foreign currency cash flows and periodically entering into forward contracts and other derivative contracts to convert a portion of our forecasted foreign currency denominated cash flows into Canadian dollars for the purpose of paying Canadian dollar denominated operating costs.
These programs reduce, but do not entirely eliminate, the impact of currency exchange movements. The Company currently does not apply hedge accounting to its currency derivatives. The maturity of these instruments generally occurs within 12 months. Gains or losses resulting from the fair valuing of these instruments are reported in foreign exchange (gain) loss on the Consolidated Statement of Operations.
(b) Interest Rate Risk
Interest rate risk is the risk that the value of a financial instrument will be affected by changes in market interest rates. The Company’s financing includes long-term debt and revolving credit facilities that bear interest based on floating market rates. Changes in these rates result in fluctuations in the required cash flows to service this debt. The Company
76
SMART Technologies Inc. 2011 Annual Report
partially mitigates this risk by periodically entering into interest rate swap agreements to fix the interest rate on certain long-term variable-rate debt. The Company currently does not apply hedge accounting to its interest rate derivatives. Changes in the fair value of these interest rate derivatives are included in interest expense in our Consolidated Statement of Operations.
(c) Credit Risk
Credit risk is the risk that the counterparty to a financial instrument fails to meet its contractual obligations, resulting in a financial loss to the Company.
The Company sells hardware and software that enables group collaboration and learning to a diverse customer base over a global geographic area. The Company evaluates collectability of specific customer receivables based on a variety of factors including currency risk, geopolitical risk, payment history, customer stability and other economic factors. Collectability of receivables is reviewed on an ongoing basis by management and receivables accounts are adjusted as required. Receivables balances are charged against the allowance when the Company determines that it is probable that the receivable will not be recovered. The geographic diversity of the customer base, combined with the Company’s established credit approval practices and ongoing monitoring of customer balances, mitigates this counterparty risk (note 5).
Fair Value Measurements
ASC 820 defines fair value as the price that would be received to sell an asset or paid to transfer a liability in an orderly transaction between market participants at the measurement date and establishes a three-tier value hierarchy, which prioritizes the inputs in the valuation methodologies in measuring fair value:
Level 1 – Unadjusted quoted prices at the measurement date for identical assets or liabilities in active markets.
Level 2 – Observable inputs other than quoted market prices included in level 1, such as quoted prices for similar assets and liabilities in active markets, quoted prices for identical or similar assets in markets that are not active; or inputs that are observable or can be corroborated by observable market data.
Level 3 – Significant unobservable inputs which are supported by little or no market activity and typically reflect management’s estimates of assumptions that market participants would use in pricing the asset or liability.
The fair value hierarchy also requires an entity to maximize the use of observable inputs and minimize the use of unobservable inputs when measuring fair value.
The following table presents the Company’s assets and liabilities that are measured at fair value on a recurring basis.
| | | | | | | | | | | | | | | | |
| | | March 31, 2011 | |
| | | Level 1 | | | Level 2 | | | Level 3 | | | Total | |
Assets | | | | | | | | | | | | | | | | |
Money market funds | | $ | 108,363 | | | $ | — | | | $ | — | | | $ | 108,363 | |
Derivative instruments | | | — | | | | 1,340 | | | | — | | | | 1,340 | |
| | | | | | | | | | | | | | | | |
Total assets | | $ | 108,363 | | | $ | 1,340 | | | $ | — | | | $ | 109,703 | |
| | | | | | | | | | | | | | | | |
Liabilities | | | | | | | | | | | | | | | | |
Derivative instruments | | $ | — | | | $ | 1,846 | | | $ | — | | | $ | 1,846 | |
| | | | | | | | | | | | | | | | |
Total liabilities | | $ | — | | | $ | 1,846 | | | $ | — | | | $ | 1,846 | |
| | | | | | | | | | | | | | | | |
| |
| | | March 31, 2010 | |
| | | Level 1 | | | Level 2 | | | Level 3 | | | Total | |
Assets | | | | | | | | | | | | | | | | |
Money market funds | | $ | 223,089 | | | $ | — | | | $ | — | | | $ | 223,089 | |
Derivative instruments | | | — | | | | 4,422 | | | | — | | | | 4,422 | |
| | | | | | | | | | | | | | | | |
Total assets | | $ | 223,089 | | | $ | 4,422 | | | $ | — | | | $ | 227,511 | |
| | | | | | | | | | | | | | | | |
Liabilities | | | | | | | | | | | | | | | | |
Derivative instruments | | $ | — | | | $ | 5,758 | | | $ | — | | | $ | 5,758 | |
| | | | | | | | | | | | | | | | |
Total liabilities | | $ | — | | | $ | 5,758 | | | $ | — | | | $ | 5,758 | |
| | | | | | | | | | | | | | | | |
77
SMART Technologies Inc. 2011 Annual Report
Notes to Consolidated Financial Statements(continued)
(thousands of U.S. dollars, except per share amounts, and except as otherwise indicated)
For the Years Ended March 31, 2011, 2010 and 2009
(a) Fair Value of Derivative Contracts
| | | | | | | | | | | | |
March 31, 2011 | | Fair Value | | | Contract Expiry | | Rates | | | Notional Amounts of Quantity |
Foreign exchange forward derivative contracts | | $ | 832 | | | Apr 2011 to Sep 2011 | | | 1.0311–1.0460 | | | USD 13,000 |
| | | (426 | ) | | Apr 2011 to Jan 2012 | | | 1.2970–1.4069 | | | EUR 17,500 |
| | | 408 | | | Apr 2011 to Jan 2012 | | | 1.5081–1.6027 | | | GBP 11,500 |
| | | | | | | | | | | | |
| | | 814 | | | | | | | | | |
| | | | | | | | | | | | |
Interest rate derivative contracts | | $ | (1,320 | ) | | Dec 2011 | | | 1.253% | | | 60% of the outstanding principal on the first and second lien term loans over the contract term |
| | | | |
March 31, 2010 | | Fair Value | | | Contract Expiry | | Rates | | | Notional Amounts of Quantity |
Foreign exchange derivative contracts | | $ | 331 | | | Apr 2010 to Sep 2010 | | | 1.0140–1.0800 | | | USD 31,000 |
| | | 1,927 | | | Apr 2010 to Dec 2010 | | | 1.4945–1.5882 | | | EUR 13,500 |
| | | 1,657 | | | Apr 2010 to Jan 2011 | | | 1.7171–1.7778 | | | GBP 9,150 |
| | | | | | | | | | | | |
| | | 3,915 | | | | | | | | | |
| | | | | | | | | | | | |
Interest rate derivative contracts | | | (4,299 | ) | | Sep 2010 | | | 4.756% | | | 80% declining to 50% of the outstanding principal on the first and second lien term loans over the contract term |
| | | (952 | ) | | Dec 2011 | | | 1.253% | | | 50% of the outstanding principal on the first and second lien term loans over the contract term |
| | | | | | | | | | | | |
| | $ | (5,251 | ) | | | | | | | | |
| | | | | | | | | | | | |
The fair value of the foreign exchange derivative contracts of $1,340 is included in other current assets at March 31, 2011 ($3,915 at March 31, 2010). The fair value of foreign exchange derivative contracts of $526 is included in accrued and other current liabilities at March 31, 2011 (zero at March 31, 2010).
The fair value of interest rate derivative contracts included in accrued and other current liabilities is $1,320 at March 31, 2011 ($5,758 at March 31, 2010). The fair value of interest rate derivative contracts included in other long-term assets is zero at March 31, 2011 ($507 at March 31, 2010).
(b) Long-Term Debt
The estimated fair value of the Company’s long-term debt has been determined based on current market conditions by discounting future cash flows under current financing arrangements at borrowing rates believed to be available to the Company for debt with similar terms and remaining maturities. The carrying value and fair value of the Company’s long-term debt as at March 31, 2011 and March 31, 2010, are as follows.
| | | | | | | | | | | | | | | | |
| | | March 31, 2011 | | | March 31, 2010 | |
| | | Carrying
Amount | | | Fair
Value | | | Carrying
Amount | | | Fair
Value | |
Variable-rate long-term debt | | $ | 339,325 | | | $ | 328,869 | | | $ | 567,943 | | | $ | 518,131 | |
Fixed-rate long-term debt | | | — | | | | — | | | | 429,855 | | | | 229,549 | |
| | | | | | | | | | | | | | | | |
Total | | $ | 339,325 | | | $ | 328,869 | | | $ | 997,798 | | | $ | 747,680 | |
| | | | | | | | | | | | | | | | |
(c) Other Financial Assets and Liabilities
The fair values of cash and cash equivalents, trade receivables and accounts payable, accrued and other current liabilities approximate their carrying amounts due to the short-term maturity of these instruments. A portion of these items are denominated in foreign currencies including the USD, EUR and British pound sterling (“GBP”) and are translated at the exchange rate in effect at the balance sheet date.
19. Related Party Transactions
All transactions with related parties were nominal for the years ended March 31, 2011, 2010 and 2009, with the exception of those disclosed in notes 9 and 10.
20. Comparative Figures
Certain reclassifications have been made to prior periods’ figures to conform to the current period’s presentation.
78
Corporate Information
Executive Officers
David Martin
Executive Chairman1,2
Nancy Knowlton
President and Chief Executive Officer1
Chief Executive Officer2
Tom Hodson
Vice President1
President and Chief Operating Officer2
Drew Fitch
Vice President, Finance and
Chief Financial Officer1,2
Jeff Losch
Vice President, Legal and
General Counsel1,2
Mike Battistel
Vice President, Information Systems2
Bill Ciprick
Vice President, Strategy and Alliances2
Sandra Coates
Vice President, Services2
Vaughn Keenan
Senior Vice President,
Product Development2
Keith Lantz
Vice President, SMART Labs2
Patrick Lelorieux
Vice President and General Manager,
EMEA2
Brian McGurk
Vice President, People Services2
Al Monro
Vice President, Asia Pacific2
Patric Nagel
Vice President, Sales – Americas2
Dan Rodrigue
Vice President, Operations2
Linda Thomas
Vice President, Products2
Board of Directors
David Martin
Executive Chairman
Nancy Knowlton
President and Chief Executive Officer
Salim Nathoo
Partner, Apax Partners
Arvind Sodhani
Executive Vice President, Intel Corporation
Michael Mueller3,4,5
Corporate Director
Robert Hagerty3,4,5,6
Corporate Director
David Sutcliffe3,4,5
Corporate Director
| 1 | Position held within SMART Technologies Inc. |
| 2 | Position held within SMART Technologies ULC, the company’s major operating subsidiary |
| 3 | Member of Audit Committee |
| 4 | Member of Compensation Committee |
| 5 | Member of Corporate Governance and Nominating Committee |
Annual Meeting of Shareholders
Wednesday, August 10, 2011, 9:00 a.m.
Sheraton Suites Calgary Eau Claire
255 Barclay Parade SW
Calgary, Alberta T2P 5C2 Canada
Shareholder Inquiries
Investor Contact
Seth Potter, ICR
1.877.320.2241
ir@smarttech.com
investor.smarttech.com
Stock Exchange Listings
NASDAQ Global Select Market Symbol: SMT
Toronto Stock Exchange Symbol: SMA
Independent Auditor
KPMG LLP
Suite 2700, Bow Valley Square II
205, 5th Avenue SW
Calgary, Alberta T2P 4B9 Canada
1.403.691.8000
Transfer Agent
Computershare Trust Company N.A.
350 Indiana Street, Suite 800
Golden, Colorado 80401 USA
1.800.736.3001
1.781.575.3100
Computershare Trust Company of Canada
100 University Avenue, 9th Floor
Toronto, Ontario M5J 2Y1 Canada
1.416.263.9200
Corporate Office
SMART Technologies Inc.
3636 Research Road NW
Calgary, Alberta T2L 1Y1 Canada
1.403.245.0333
Corporate Website
smarttech.com
© 2011 SMART Technologies. All rights reserved. Notebook, SynchronEyes, DViT, Bridgit, SMART Board, SMART Meeting Pro, AirLiner, SMART Document Camera, Sympodium, Senteo, Unifi, SMART Exchange, SMART Notebook, SMART Bridgit, SMART Table, SMART Response, SMART Slate, SMART Audio, SMART Classroom Suite, smarttech, the SMART logo and all SMART taglines and product logos are trademarks or registered trademarks of SMART Technologies in the U.S. and/or other countries. Intel is a trademark or registered trademark of Intel Corporation or its subsidiaries in the U.S. and other countries. All third-party product and company names are for identification purposes only and may be trademarks of their respective owners.

smarttech.com
Annual Report Design by Curran & Connors, Inc. / www.curran-connors.com