MANAGEMENT’S DISCUSSION AND ANALYSIS
For the three months ended March 31, 2013
Tables are expressed in USD $000’s except share and per share amounts
The following provides management’s discussion and analysis (‘‘MD&A’’) of IMRIS Inc.’s consolidated results of operations and financial condition for the three months ended March 31, 2013. In this MD&A, “IMRIS”, the “Company”, “we”, “our” and “us” are used to refer to IMRIS Inc.
This MD&A is dated as of May 02, 2013 and should be read in conjunction with the interim unaudited consolidated financial statements and the notes thereto for the three months ended March 31, 2013 and with the audited consolidated financial statements and notes thereto for the year ending December 31, 2012.
This MD&A contains forward-looking statements about future events or future performance and reflects management’s expectations and assumptions regarding our growth, results of operations, performance and business prospects and opportunities. Such forward-looking statements reflect management’s current beliefs and are based on information currently available to us. In some cases, forward-looking statements can be identified by terminology such as “may”, “would”, “could”, “will”, “should”, “expect”, “plan”, “intend”, “anticipate”, “believe”, “estimate”, “predict”, “potential”, “continue” or the negative of these terms or other similar expressions concerning matters that are not historical facts. In particular, statements regarding our future operating results, economic performance and product development efforts are or involve forward-looking statements.
A number of factors could cause actual events, performance or results, including those in respect of the foregoing items, to differ materially from the events, performance and results discussed in the forward-looking statements. Factors which could cause future outcomes to differ materially from those set forth in the forward-looking statements include, but are not limited to: [i] timing and amount of revenue recognition of order backlog and the Company’s expectation of sales and margin growth [ii] obtaining sufficient and suitable financing to support operations and commercialization of products, [iii] adequately protecting proprietary information and technology from competitors, [iv] obtaining regulatory approvals and successfully completing new product launches, [v] successfully competing in the targeted markets, and [vi] maintaining third party relationships, including key personnel, and key suppliers. In evaluating these forward-looking statements, readers should specifically consider various factors, including the risks outlined under “Risks and Uncertainties”, which may cause actual events, performance or results to differ materially from any forward-looking statement.
Readers are cautioned that our expectation, beliefs, projections and assumptions used in preparation of such information, although considered reasonable at the time of preparation, may prove to be wrong, and as such, undue reliance should not be placed on forward-looking statements. By their nature, forward-looking statements are subject to numerous known and unknown risks and uncertainties so as a result, we can give no assurance that any of the actual events, performance, results, or expectations will occur or be realized. These forward-looking statements are expressly qualified by this cautionary statement as of the date of this MD&A and we do not intend, and do not assume any obligation, to update or revise them to reflect new or future events or circumstances.
IMRIS Inc.
Management's Discussion and Analysis – May 2, 2013
Page 1 of 25 |
OVERVIEW
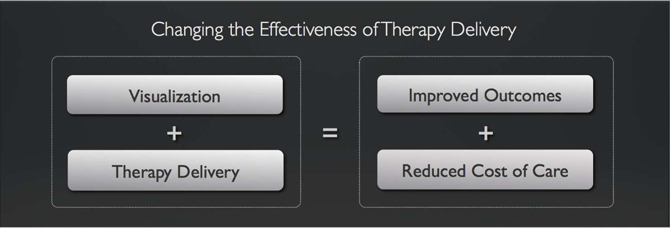
IMRIS designs, manufactures and marketsImage Guided Therapy Systems that enhance the effectiveness of therapy delivery. Our Image Guided Therapy Systems are a combination of real time visualization products and therapy delivery products that are designed to improve patient outcomes and reduce the cost of patient care. We accomplish this by combining our visualization technology products with therapy delivery products in a single integrated system that has the ability to provide timely information to clinicians to properly assess the treatment plan at the point of therapy delivery. We believe this approach to patient care not only improves patient outcomes, but also contributes to reduced cost of care for those patients. Our goal is to continuously deliver products that improve therapy delivery for an increasing number of medical procedures while at the same time are supported by peer reviewed published measurement of improved outcomes and reduced cost of care.
Visualization and Therapy Delivery
In 2005 at the founding of the company, we created a visualization platform based on a single Magnetic Resonance (MR) Imaging product. Since then we have introduced a variety of next generation imaging capabilities into our visualization products. These include multiple field strength MR systems, X-Ray Fluoroscopy (AX) systems, and Computed Tomography (CT) systems, all designed to provide imaging capabilities for different therapy delivery products. All of these imaging capabilities are marketed as theVISIUS Surgical Theatre.
Our goal is to design visualization products that have the ability to be used in a large number of surgical and interventional procedures and to become a foundational investment in every hospital. To do this the system must be flexible enough to meet current and evolving procedural requirements while at the same time improving patient care and reducing costs to the hospital. The VISIUS Surgical Theatre can incorporate multiple configurations and imaging modalities while reducing patient risk and delivering real-time information to clinicians while preserving optimal surgical access and techniques.
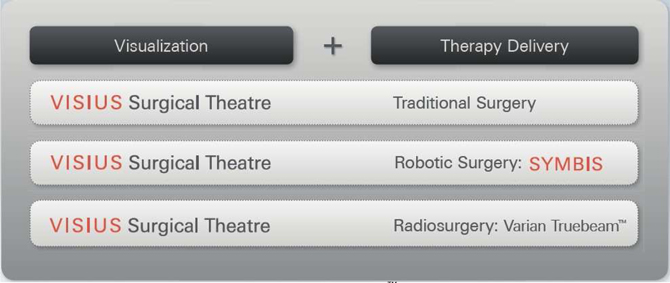
Our visualization product, the VISIUS Surgical Theatre, is used in combination with multiple therapy delivery systems including traditional surgery, Surgeon directed robotic surgery, and Radio-surgery. It is our goal to provide a means for clinicians to improve therapy delivery by moving towards a minimally invasive surgical (MIS) procedure whenever possible. The transition to an MIS procedure is expected to contribute to improved outcomes and reduced costs of care versus traditional surgical methods.
We sell our VISIUS Surgical Theatre globally to hospitals that deliver clinical services to patients in the neurosurgical, cerebrovascular, and cardiovascular markets. Historically our products have enabled therapy delivery through traditional surgical techniques, primarily for neurosurgical applications. We believe that the VISIUS Surgical Theatre, in combination with therapy delivery, has the ability to continue to expand across a large number of clinical procedures. As we continue to work with clinicians to promote and identify potential new areas of clinical application, new high value procedures are expected, resulting in increased utilization and further adoption of the products.
IMRIS Inc.
Management's Discussion and Analysis – May 2, 2013
Page 2 of 25 |
Value Proposition
We believe that the combination of the VISIUS Surgical Theatre with therapy delivery benefits patients, physicians and hospitals:
Patients
| · | Improved Outcomes: Peer reviewed published research has shown significant improvements in patient outcomes when the intraoperative MRI available in the VISIUS Surgical Theatre is used in a procedure. |
| · | Risk Reduction: The risk of requiring a repeat operation because of incomplete procedures is significantly reduced due to improved levels of complete resection in the case of brain tumors as a result of the intraoperative visualization. |
Clinicians
| · | Enhanced Efficiency and Effectiveness for Clinicians: High resolution imaging information is captured rapidly and presented in a manner designed to enhance clinician efficiency and effectiveness. |
| · | Enhanced Workflow for Clinicians: The patient can be maintained in the optimal surgical position throughout the procedure and the MRI or CT imaging system is removed from the surgical or interventional theatre when not required resulting in unrestricted access to the patient by the surgical team. |
Hospitals
| · | Greater Utilization of the VISIUS Surgical Theatre:The VISIUS Surgical Theatre permits greater utilization of the imaging equipment as the MR or CT scanner can be shared by multiple operating rooms and a diagnostic imaging suite allowing for a single asset to be used by numerous clinicians. |
| · | Increased Patient Volumes: Improved patient outcomes may result in higher patient volumes and revenue for hospitals. |
| · | Technology Attracts Clinicians: Access to technologies such as the VISIUS Surgical Theatre can assist in both the recruitment and retention of clinicians. |
PRODUCT PORTFOLIO
The VISIUS Surgical Theatre is the foundational technology of our Company and continues to evolve in its utilization across numerous surgical and interventional applications. We have invested in research and development to further broaden our product portfolio by introducing new procedures into the VISIUS Surgical Theatre as well as combining it with new therapy products.
Our product portfolio consists of three therapy delivery systems made up of the VISIUS Surgical Theatre in combination with:
| 1: | Traditional surgical techniques, |
| 2: | The SYMBIS Surgical System, a surgeon controlled surgical robot, and |
| 3: | The TrueBeamTM radiation therapy product from Varian Medical Systems, Inc. (Varian). |
IMRIS Inc.
Management's Discussion and Analysis – May 2, 2013
Page 3 of 25 |
(The SYMBIS surgical system and the Radiosurgery product with the TrueBeamTM system are both works in progress and not available for commercial sale)
All of these Image Guided Therapy systems include our proprietary VISIUS Surgical Theatre in combination with therapy delivery systems that are integrated with multiple proprietary supporting products and technologies. These include patient handling systems, data management and information presentation systems, surgical devices, imaging and system control software platforms, and safety and remote management products. These are proprietary products that underlay the VISIUS Surgical Theatre’s ability to be integrated with each therapy delivery product.
| I. | VISIUS Surgical Theatre and Traditional Surgical Procedures |
The VISIUS Surgical Theatrecan be configured to support the delivery of a wide rangeof neurosurgical, cardiovascular and cerebrovascular procedures using traditional surgical techniques. The VISIUS Surgical Theatre can be equipped with intraoperative imaging utilizing MRI, x-ray angiography and computed tomography, alone or in multimodality combinations.
The VISIUS Surgical Theatre provides a fully integrated surgical environment with the availability of high-resolution images for use in a number of surgical procedures. These procedures include neurological tumor resection, epilepsy foci resection, arteriovenous malformation, aneurysm, upper C-spine and frame-based stereotaxy. Due to the invasive nature of brain surgery and the importance of minimizing disturbance to healthy brain tissue, neurosurgical procedures may particularly benefit from an MRI's unique ability to distinguish between diseased and healthy brain tissue. The VISIUS Surgical Theatre provides visualization information to allow clinicians to make adjustments to the procedure while the procedure is in progress, which may lead to improved patient outcomes and reduce the likelihood that repeat surgeries will be needed.
When equipped with an MR scanner and integrated x-ray angiography system, the VISIUS Surgical Theatre provides clinicians with timely and accurate images for visualizing the patient anatomy before, during and after interventions for the treatment of a wide variety of cardiovascular and cerebrovascular conditions, such as atrial fibrillation, certain structural heart disorders and stroke. With seamless transitions between MR and x-ray angiography systems, the VISIUS Surgical Theatre enables surgical and catheter-based treatments and real-time assessment of therapy in a single integrated suite. The single integrated system in a VISIUS Surgical Theatre eliminates patient transport between imaging modalities and streamlines workflow. After MR scanning, the patient can be transitioned to image-guided intervention on the angiography system without moving the patient from the table. During and immediately after the procedure, new MR images can be taken to assess treatment and to determine if further intervention is required.
IMRIS Inc.
Management's Discussion and Analysis – May 2, 2013
Page 4 of 25 |
In certain cranial and spinal procedures, the VISIUS Surgical Theatre can also be equipped with a multi-slice floor mounted CT which moves over top of a stationary patient, to provide intraoperative images of diagnostic quality, without the additional risk of moving the patient. The VISIUS Surgical Theatre with CT imaging delivers real-time information to clinicians while preserving optimal surgical access and techniques.
We are currently developing a ceiling mounted CT based version of the VISIUS Surgical Theatre leveraging our know-how from our existing VISIUS Surgical Theatre offering in MR systems. This system will have the ability to move between multiple operating rooms and offer significant benefits over the current floor mounted system. This product is expected to be submitted to the FDA with an anticipated regulatory clearance in the first half of 2013.
| II. | VISIUS Surgical Theatre and the SYMBIS Surgical System |
In February 2010, we acquired NeuroArm Surgical Ltd and all of its intellectual property. Since then we have been developing the SYMBIS Surgical System, a surgeon controlled surgical robot designed to enable minimally invasive procedures that are currently performed in a more invasive manner. This system consists of a MR compatible robot and surgical control console integrated together with the VISIUS Surgical Theatre. We believe that the combination of optical and MR imaging integrated with a surgical robot may have the ability to transform a number of surgical procedures to MIS procedures. The robot has been designed to operate in the bore of a high field MR system that can provide unprecedented visualization of the surgical site by providing both optical and MR views of the surgical target. The SYMBIS Surgical System is a micro-surgical system that has all of the traditional attributes of a robotic system such as accuracy, repeatability, and control, but also has integrated MR and optical imaging, along with haptic feedback to the clinician. The haptic feedback or “sense of touch” may enable surgeons to complete procedures in a way never before possible. The SYMBIS Surgical System is designed to be installed in both existing VISIUS Surgical Theatre systems, and in new installations.
We are developing surgical instruments for the SYMBIS that are procedure specific and are designed to enable greater precision and flexibility for the surgeon. We believe that the SYMBIS Surgical System will be applicable for a large number of high volume surgical procedures with the potential to be clinically meaningful and thereby further adoption of the system.
Our SYMBIS Surgical System is currently in a single site clinical trial with a planned cohort of 120 neurosurgical patients. It is expected that the initial outcomes will be published in peer reviewed journals over the next 6 months.
The SYMBIS Surgical System was submitted to the FDA in August 2012 and is pending clearance.s
| III. | VISIUS Surgical Theatre and the TrueBeamTMSystem for Radiosurgery |
On October 5, 2010 we announced our agreement with Varian to integrate the capabilities of the VISIUS Surgical Theatre together with the therapy capability of Varian’s TrueBeamTM radiotherapy system. This product has the potential to provide a number of high value capabilities to radiation oncology centres that are hospital based or standalone clinics. This system is designed to provide a radiation oncology centre with the ability to deliver MR guided radiation therapy, MR simulation, and MR guided brachytherapy from a single integrated system. The system consists of three connected rooms that provide radiosurgery, simulation, and brachytherapy all with a common MR imaging platform.
MR simulation is a planning and imaging procedure that is done in conjunction with a patient’s preparation for radiation therapy delivery. Our system allows for a high field MR to be used in a diagnostic simulation suite and then, on demand, be available for use in MR guided radiosurgery, or MR guided brachy therapy. This may provide a significant economic advantage over other means of completing the same procedure.
For MR guided radiation therapy, the patient is located in the radiation therapy bunker and a high field MR moves into the bunker over top of a stationary patient. The MR image is acquired, the MR moves out of the room, and the therapy treatment plan is developed and delivered to the TrueBeamTMradiosurgery system which executes the treatment. The ability to image soft tissue lesions with MR, immediately before the application of radiation therapy may allow for more accurate targeting of the lesion, resulting in a reduction in the radiation delivered to adjacent healthy tissue. This improved targeting may also result in the ability to increase the energy delivered at a treatment session, which may result in fewer treatment sessions for the patient. This new approach to treatment delivery is expected to provide improved patient outcomes versus existing radiosurgery technology systems and have the opportunity to reduce the cost of care.
IMRIS Inc.
Management's Discussion and Analysis – May 2, 2013
Page 5 of 25 |
We believe that the ability to deliver MR guided brachytherapy in a single suite may have compelling advantages over other means of delivering brachytherapy to patients. Brachytherapy is the deposition of high dose radiation seeds into target tissue for the delivery of radiation. It requires the ability to image, target, and deliver the seeds with precision and confidence. Our system is designed to enhance the workflow and provide improved procedural outcomes. This product is currently under development with regulatory clearance anticipated in 2013.
Technology and Product Development
Underlying all of our image guided therapy solutions is advanced proprietary technology and intellectual property that we have developed as part of our unique solutions. The protection of these products, our processes and know-how is integral to our business. We currently have 49 patents either issued or pending. As we develop our technologies, we will continue to seek patent protection to contribute to our competitive advantage. We have patents in place in the United States, Canada and other countries, where available, to protect our core patent family and we have filed a number of additional patent applications that are directed to specific aspects of our technology.
Innovation and the creation of high value novel products is a cornerstone of IMRIS’s development activities. To grow the Company and remain competitive, we are continuously engaged in new product development and enhancement and each year we invest significantly in research and development to drive continuing innovations that support our competitive position.
As we move forward our product development efforts will be focused on enhancing the capabilities of the VISIUS Surgical Theatre so that we are increasing the number and quantity of traditional procedures that can be completed in our theatres. Following commercialization of our products that combine robotics and radiosurgery with the VISIUS Surgical Theatre, we expect to continue to expand the capabilities of these systems to continue to grow their value proposition.
Regulatory
IMRIS is a global company serving global markets. We have registered our core MR VISIUS Surgical Theatre in the United States, Canada, European Union, Australia, Japan, China, Singapore and South Korea. We continue to maintain our facility and product registrations to serve these global markets. We successfully completed re-certification to ISO-13485 in September 2012, which is a requirement for many of our global markets. During this period, IMRIS cleared the Oncology Package for the VISIUS Surgical Theatre with the FDA, providing a suite of tools to enable radiation therapy planning using the VISIUS Surgical Theatre MR system.
IMRIS currently has two 510(k)s pending with the United States FDA involving innovative products and industry firsts: the SYMBIS Surgical Robot (the first microsurgical robot for neurosurgery) and the VISIUS Surgical Theatre utilizing a ceiling mounted CT.
IMRIS maintains a proven network of global regulatory partners and will seek product registrations based on market demand and product launch strategy as the new planned therapy products and technologies are developed.
Market and Sales Cycle
We sell our VISIUS Surgical Theatres globally to hospitals that deliver clinical services to patients in the neurosurgical, cerebrovascular and cardiovascular markets. We believe that the primary market for our current product portfolio is comprised of those hospitals having relatively large neurosurgical, cerebrovascular or cardiovascular practices. Clinical appreciation for the benefits of VISIUS Surgical Theatres for neurosurgical applications is growing supported by repeat purchases from hospitals and market penetration within regions in which our product is being sold.
We have a direct sales force in the United States, Canada, China, Singapore, Japan and Europe, excluding Italy and Eastern European countries. Our recent investment in sales management in Singapore during 2013 is the result of the market opportunies we foresee in the Asia Pacific region, In all other markets where we have a presence, we utilize distributors.
IMRIS Inc.
Management's Discussion and Analysis – May 2, 2013
Page 6 of 25 |
Our sales force is focusing its efforts on hospitals with the greatest ability to benefit from neurosurgical applications. They are aggressively working our sales pipeline and we are increasing our marketing efforts. As a result, we expect that market interest will develop for new applications of the product and the new products being developed, which can be utilized within our Theatres.
The purchase and installation of a VISIUS Surgical Theatre for traditional surgical procedures represents a significant capital project for our customers that can range in price from approximately $4 million to $12 million depending on the product solution, the configuration of the VISIUS Surgical Theatre layout and system options selected. In addition to the capital equipment sale, most of our customers enter into equipment service contracts that are generally 4-5 years in duration. These contracts begin after the typical one-year warranty period and are on average equal to approximately 5% of the original equipment purchase price per year in revenues. In addition to our equipment and services, customers may require further capital expenditures for construction and ancillary equipment. The sales cycle for our VISIUS Surgical Theatres is both complex and lengthy and can be more than 12 months from initial customer engagement to receipt of a purchase order.
Following the receipt of a customer purchase order, the delivery and installation cycle for one of our VISIUS Surgical Theatres typically ranges from 8 months to 18 months or more depending on the configuration of our system and the amount of additional construction work that may be required to be completed by the customer. We invoice customers for a VISIUS Surgical Theatre in installments spread over a number of milestones, which typically include a deposit at the time of order and a percentage of the remaining total price upon delivery of the equipment, completion of installation and final acceptance. Due to the project nature of our VISIUS Surgical Theatre sales, we recognize revenues and related cost of sales on a percentage-of-completion basis as the VISIUS Surgical Theatre is installed.
As our newer products are commercialized, we believe we can leverage our significant customer relationships to accelerate new product introductions. Moreover, our VISIUS Surgical Theatres equipped with CT or the SYMBIS Surgical System are being designed to have shorter installation timeframes. These factors together are expected to result in significantly shorter sales and installation cycles for our Company.
IMRIS Inc.
Management's Discussion and Analysis – May 2, 2013
Page 7 of 25 |
Overall Performance
Highlights from the first quarter of 2013 include:
| Ø | Quarterly revenues increase by 131% to $8.1 million |
| Ø | Strengthened our working capital position with the completion of $20.1 million public offering of common shares |
| Ø | VISIUS® iCT exhibited at American Association of Neurological Surgeons Annual Scientific Meeting |
SUMMARY OF SELECTED FINANCIAL INFORMATION
Quarterly Results
The following table sets forth selected financial information for the dates and periods indicated:
Selected Financial Information
(Thousands of US dollars, except per share amounts)
(Unaudited)
| | | Three months ended | | | | |
| | | March 31 | | | % | |
| | | 2013 | | | 2012 | | | Change | |
| | | | | | | | | | |
| Sales | | $ | 8,066 | | | $ | 3,493 | | | | 130.9 | % |
| Gross profit | | $ | 3,020 | | | $ | 1,394 | | | | 116.6 | % |
| Gross profit % | | | 37.4 | % | | | 39.9 | % | | | | |
| | | | | | | | | | | | | |
| Operating expenses | | $ | 10,794 | | | $ | 9,939 | | | | 8.6 | % |
| Operating loss | | $ | (7,774 | ) | | $ | (8,545 | ) | | | -9.0 | % |
| | | | | | | | | | | | | |
| Income taxes | | $ | 16 | | | $ | 18 | | | | -11.1 | % |
| | | | | | | | | | | | | |
| Net loss | | $ | (8,378 | ) | | $ | (8,350 | ) | | | 0.3 | % |
| | | | | | | | | | | | | |
| Basic and diluted loss per share | | $ | (0.18 | ) | | $ | (0.18 | ) | | | 0.0 | % |
| Balance Sheet Data | | As of
March 31,
2013 | | | As of
December 31,
2012 | |
| | | | | | | |
| Cash | | $ | 27,089 | | | $ | 19,060 | |
| Total assets | | | 88,616 | | | | 81,985 | |
| Deferred revenue | | | 10,545 | | | | 10,182 | |
| Total liabilities | | | 27,127 | | | | 31,398 | |
| Shareholders' equity | | | 61,489 | | | | 50,587 | |
IMRIS Inc.
Management's Discussion and Analysis – May 2, 2013
Page 8 of 25 |
Revenues
Revenues by sales classification
| (Thousands of US dollars) | | Three months ended | | | | |
| | | March 31 | | | % | |
| | | 2013 | | | 2012 | | | Change | |
| | | | | | | | | | |
| VISIUS Surgical Theatres | | $ | 6,264 | | | $ | 2,439 | | | | 156.8 | % |
| Extended maintenance contracts | | | 1,802 | | | | 1,054 | | | | 71.0 | % |
| Total revenues | | $ | 8,066 | | | $ | 3,493 | | | | 130.9 | % |
| | | | | | | | | | | | | |
| VISIUS Surgical Theatres as a percentage of total revenues | | | 78.0 | % | | | 70.0 | % | | | | |
| Extended maintenance contracts as a percentage of total revenues | | | 22.0 | % | | | 30.0 | % | | | | |
Revenues by region
| (Thousands of US dollars) | | Three months ended | | | | |
| | | March 31 | | | % | |
| | | 2013 | | | 2012 | | | Change | |
| North America | | $ | 5,001 | | | $ | 3,022 | | | | 65.5 | % |
| Europe and Middle East | | | 2,933 | | | | 166 | | | | 1666.9 | % |
| Asia Pacfic | | | 132 | | | | 305 | | | | -56.7 | % |
| | | $ | 8,066 | | | $ | 3,493 | | | | 130.9 | % |
Revenues for the three months ended March 31, 2013 increased $4.6 million, or 130.9 percent, compared with the same period last year. Revenue from VISIUS Surgical Theaters was $3.8 million higher during the three months ended March 31, 2013 compared with the same period in last year because of additional projects in the period at varying stages of installation. Extended maintenance contract revenue was $0.7 million higher during the three months ended March 31, 2013 compared with the same period last year due to additional extended maintenance contracts as a result of a higher installation base of VISIUS Surgical Theatres which have transitioned off warranty to chargeable service programs.
Revenues for the three months ended March 31, 2013 were higher in the North America and Europe and Middle East regions compared with the same period last year due to increased VISIUS Surgical Theatre system deliveries and increased service revenue. Revenues from the North America region for the three months ended March 31, 2013 increased compared with the same period last year due to increased project activity and services revenue in the United States. Revenues from the Europe and Middle East region for the three months ended March 31, 2013 increased compared with the same period last year due to VISIUS Surgical system installation activities in Qatar.
Gross Profit
| (Thousands of US dollars) | | Three months ended | | | | |
| | | March 31 | | | % | |
| | | 2013 | | | 2012 | | | Change | |
| | | | | | | | | | |
| Gross profit | | $ | 3,020 | | | $ | 1,394 | | | | 117 | % |
| As a percentage of sales | | | 37.4 | % | | | 39.9 | % | | | | |
Gross profit for the three months ended March 31, 2013 increased $1.6 million, or 117 percent over the same period last year due to the additional installation activities in 2013. Gross profit as a percentage of sales was 37.4 percent for the three months ended March 31, 2013, down from 39.9 percent during the same period last year.
Gross profit as a percentage of sales from VISIUS Theatres for the three months ended March 31, 2013 was lower than the same period last year primarily due to cost reductions and recoveries on a number of projects in the prior year period. Gross profit as a percentage of sales from extended maintenance contracts for the three months ended March 31, 2013 was lower than during the same period last year due to higher than anticipated service parts replacement costs on several maintenance contracts.
IMRIS Inc.
Management's Discussion and Analysis – May 2, 2013
Page 9 of 25 |
Operating Expenses
| (Thousands of US dollars) | | Three months ended | | | | |
| | | March 31 | | | % | |
| | | 2013 | | | 2012 | | | Change | |
| | | | | | | | | | | | | |
| Operating expenses | | $ | 10,794 | | | $ | 9,939 | | | | 9 | % |
Operating expenses for the three months ended March 31, 2013 were $10.8 million, an increase of $0.9 million or 9% over the same period last year. The increase is primarily due to additional one-time costs related to the relocation of the Company to Minnesota of $0.8 million, additional employee related costs of $0.9 million, offset by lower expense of $0.9 million in research and development costs for robotics, MR-guided radiation therapy and other ancillary research projects. The relocation costs consist of recruiting of $0.3 million, retention and severance costs of $0.2 million, and travel, professional fees and other expenses of $0.3 million. The increased employee related costs from the prior year period includes the addition of new customer support staff and the addition of three senior executives in Operations, Customer Service and the Company’s Chief Operating Officer.
Administrative
| (Thousands of US dollars) | | Three months ended | | | | |
| | | March 31 | | | % | |
| | | 2013 | | | 2012 | | | Change | |
| | | | | | | | | | | | | |
| Administrative | | $ | 2,410 | | | $ | 1,673 | | | | 44 | % |
Administrative expense for the three months ended March 31, 2013 increased $0.7 million compared with the same period last year. The increase is primarily related to relocation related costs of $0.4 million and increased headcount. The relocation costs consist of recruiting expenses of $0.1 million, staff retention and severance costs of $0.1 million and travel, professional services fees and other expenses of $0.2 million. The increased salaries, benefits and stock option expense of $0.3 million is due primarily to the addition of the Company’s Chief Operating Officer and other new hires.
Sales and marketing
| (Thousands of US dollars) | | Three months ended | | | | |
| | | March 31 | | | % | |
| | | 2013 | | | 2012 | | | Change | |
| | | | | | | | | | | | | |
| Sales and marketing | | $ | 2,259 | | | $ | 2,051 | | | | 10 | % |
Sales and marketing expense or the three months ended March 31, 2013 increased $0.2 million compared with the same period last year. The increase is primarily related to increased commissions of $0.1 million as a result of the higher project installation activity and higher travel and other general expenses of $0.1 million primarily related to customer activities.
IMRIS Inc.
Management's Discussion and Analysis – May 2, 2013
Page 10 of 25 |
Customer support and operations
| (Thousands of US dollars) | | Three months ended | | | | |
| | | March 31 | | | % | |
| | | 2013 | | | 2012 | | | Change | |
| | | | | | | | | | | | | |
| Customer support and operations | | $ | 2,436 | | | $ | 1,670 | | | | 46 | % |
Customer support and operations expense for the three months ended March 31, 2013 increased $0.8 million compared with the same period last year. The increase is primarily related to increased headcount within customer support including the appointment of two senior executives in Operations and Customer Service, resulting in higher salaries and benefits and stock option expense of $0.5 million. The increase is also a result of relocation related costs of $0.2 million consisting of recruiting expenses of $0.1 million and staff retention and severance expenses of $0.1 million.
Research and development
| (Thousands of US dollars) | | Three months ended | | | | |
| | | March 31 | | | % | |
| | | 2013 | | | 2012 | | | Change | |
| | | | | | | | | | | | | |
| Research and development | | $ | 2,739 | | | $ | 3,576 | | | | -23 | % |
Research and development expense for the three months ended March 31, 2013 decreased $0.8 million compared with the same period last year. The decrease is primarily related to reduced spending on technical development associated with image-guided surgical robotics, MR guided radiation therapy development, and other ongoing development projects, as well as lower equipment maintenance costs as a result of periodic repairs to capital equipment. This decrease was partially offset by relocation related costs of $0.2 million, consisting of staff recruiting costs of $0.1 million and staff retention and legal costs of $0.1 million.
Amortization
| (Thousands of US dollars) | | Three months ended | | | | |
| | | March 31 | | | % | |
| | | 2013 | | | 2012 | | | Change | |
| | | | | | | | | | | | | |
| Amortization | | $ | 950 | | | $ | 969 | | | | -2 | % |
Amortization expense for the three months ended March 31, 2013 remained relatively flat compared with the same period last year.
Foreign exchange
| (Thousands of US dollars) | | Three months ended | | | | |
| | | March 31 | | | % | |
| | | 2013 | | | 2012 | | | Change | |
| | | | | | | | | | | | | |
| Foreign exchange (loss) gain | | $ | (555 | ) | | $ | 196 | | | | -383 | % |
Foreign exchange for the three months ended March 31, 2013 decreased $0.8 million resulting in a loss of $0.6 million compared with the same period last year. The decrease is due to a strengthening of the U.S. dollar against the Company’s higher net foreign denominated monetary assets compared to the same period in 2012, which resulted in higher losses on revaluation.
IMRIS Inc.
Management's Discussion and Analysis – May 2, 2013
Page 11 of 25 |
Income taxes
| (Thousands of US dollars) | | Three months ended | | | | |
| | | March 31 | | | % | |
| | | 2013 | | | 2012 | | | Change | |
| | | | | | | | | | | | | |
| Income taxes | | $ | 16 | | | $ | 18 | | | | -11 | % |
Income taxes for the three months ended March 31, 2013 was flat compared with the same period last year. The Company generates taxable income in several of its foreign subsidiaries due to transfer pricing policies used in those foreign jurisdictions. As a result of activities in these foreign subsidiaries, the Company has recognized tax expense during the three months ended March 31, 2013. The change in income tax expense compared with the same period last year is primarily due to lower taxable income in those foreign jurisdictions.
Operating Loss and Net Loss
| (Thousands of US dollars) | | Three months ended | | | | |
| | | March 31 | | | % | |
| | | 2013 | | | 2012 | | | Change | |
| | | | | | | | | | | | | |
| Operating loss | | $ | (7,774 | ) | | $ | (8,545 | ) | | | -9 | % |
| | | | | | | | | | | | | |
| Net loss | | $ | (8,378 | ) | | $ | (8,350 | ) | | | 0 | % |
Operating loss for the three months ended March 31, 2013 decreased $0.8 million compared with the same period last year. The decrease in the loss is primarily due to higher gross profit of $1.6 million, partially offset by higher operating expenses of $0.9 million, including one-time relocation costs of $0.8 million. The relocation costs were recorded within the affected functional area, including administrative ($0.4 million), customer support and operations ($0.2 million) and research and development ($0.2 million). Additional employee related costs in administration and customer support and operations was largely offset by lower research and development cost of $0.8 million, each as described above.
Net loss for the three months ended March 31, 2013 was flat compared with the same period last year. While operating loss decreased $0.8 million, this was offset as other loss increased $0.8 million primarily due to foreign exchange losses recorded in the period.
Adjusted EBITDA
| (Thousands of US dollars) | | Three months ended | | | | |
| | | March 31 | | | % | |
| | | 2013 | | | 2012 | | | Change | |
| | | | | | | | | | | | | |
| Adjusted EBITDA | | $ | (6,372 | ) | | $ | (7,222 | ) | | | -12 | % |
The Company uses the non-GAAP measure Adjusted EBITDA to measure aspects of our financial performance (see “Non-GAAP Financial Measures” for a reconciliation of adjusted EBITDA to GAAP measures). The Company defines Adjusted EBITDA as earnings (loss) before stock based compensation, interest income (expense), foreign exchange gain (loss), embedded derivatives gain (loss), income taxes and amortization.
IMRIS Inc.
Management's Discussion and Analysis – May 2, 2013
Page 12 of 25 |
Adjusted EBITDA for the three months ended March 31, 2013 was negative $6.4 million, compared with negative $7.2 million for the same period last year. The decrease in negative Adjusted EBITDA was primarily due to higher gross profit, partially offset by higher operating expenses as described above.
SUMMARY OF QUARTERLY RESULTS
The following table is a summary of our financial results for the past eight quarters:
| (Thousands of US dollars) | | Q1 | | | Q4 | | | Q3 | | | Q2 | | | Q1 | | | Q4 | | | Q3 | | | Q2 | |
| | | 2013 | | | 2102 | | | 2012 | | | 2012 | | | 2012 | | | 2011 | | | 2011 | | | 2011 | |
| | | | | | | | | | | | | | | | | | | | | | | | | |
| Sales | | $ | 8,066 | | | $ | 20,095 | | | $ | 11,569 | | | $ | 17,235 | | | $ | 3,493 | | | $ | 14,677 | | | $ | 7,182 | | | $ | 18,881 | |
| Cost of sales | | | 5,046 | | | | 13,100 | | | | 8,818 | | | | 10,577 | | | | 2,099 | | | | 9,855 | | | | 5,104 | | | | 12,560 | |
| Gross profit | | | 3,020 | | | | 6,995 | | | | 2,751 | | | | 6,658 | | | | 1,394 | | | | 4,822 | | | | 2,078 | | | | 6,321 | |
| As a percentage of sales | | | 37.4 | % | | | 34.8 | % | | | 23.8 | % | | | 38.6 | % | | | 39.9 | % | | | 32.9 | % | | | 28.9 | % | | | 33.5 | % |
| | | | | | | | | | | | | | | | | | | | | | | | | | | | | | | | | |
| Operating expenses | | | | | | | | | | | | | | | | | | | | | | | | | | | | | | | | |
| Administration | | | 2,410 | | | | 2,664 | | | | 2,000 | | | | 1,887 | | | | 1,673 | | | | 2,037 | | | | 2,026 | | | | 2,095 | |
| Sales and marketing | | | 2,259 | | | | 2,785 | | | | 2,427 | | | | 2,536 | | | | 2,051 | | | | 2,941 | | | | 2,204 | | | | 2,547 | |
| Customer support and operations | | | 2,436 | | | | 3,062 | | | | 2,007 | | | | 1,907 | | | | 1,670 | | | | 1,805 | | | | 1,580 | | | | 1,759 | |
| Research and development | | | 2,739 | | | | 3,729 | | | | 3,840 | | | | 3,411 | | | | 3,576 | | | | 2,433 | | | | 2,541 | | | | 2,141 | |
| Amortization | | | 950 | | | | 1,071 | | | | 1,067 | | | | 990 | | | | 969 | | | | 908 | | | | 884 | | | | 871 | |
| | | | 10,794 | | | | 13,311 | | | | 11,341 | | | | 10,731 | | | | 9,939 | | | | 10,124 | | | | 9,235 | | | | 9,413 | |
| | | | | | | | | | | | | | | | | | | | | | | | | | | | | | | | | |
| Operating loss before the following: | | | (7,774 | ) | | | (6,316 | ) | | | (8,590 | ) | | | (4,073 | ) | | | (8,545 | ) | | | (5,302 | ) | | | (7,157 | ) | | | (3,092 | ) |
| Foreign exchange | | | (555 | ) | | | (232 | ) | | | 118 | | | | (207 | ) | | | 196 | | | | 710 | | | | (1,351 | ) | | | 210 | |
| Interest | | | (33 | ) | | | (55 | ) | | | - | | | | (2 | ) | | | 17 | | | | (1 | ) | | | 3 | | | | 9 | |
| Gain on sale of asset disposal | | | - | | | | 19 | | | | | | | | | | | | | | | | | | | | | | | | | |
| Loss before taxes | | $ | (8,362 | ) | | $ | (6,584 | ) | | $ | (8,472 | ) | | $ | (4,282 | ) | | $ | (8,332 | ) | | $ | (4,593 | ) | | $ | (8,505 | ) | | $ | (2,873 | ) |
| | | | | | | | | | | | | | | | | | | | | | | | | | | | | | | | | |
| Income taxes | | | 16 | | | | 20 | | | | 48 | | | | - | | | | 18 | | | | 366 | | | | - | | | | - | |
| | | | | | | | | | | | | | | | | | | | | | | | | | | | | | | | | |
| Net loss for the quarter | | $ | (8,378 | ) | | $ | (6,604 | ) | | $ | (8,520 | ) | | $ | (4,282 | ) | | $ | (8,350 | ) | | $ | (4,959 | ) | | $ | (8,505 | ) | | $ | (2,873 | ) |
| | | | | | | | | | | | | | | | | | | | | | | | | | | | | | | | | |
| Loss per share | | | | | | | | | | | | | | | | | | | | | | | | | | | | | | | | |
| Basic | | $ | (0.18 | ) | | $ | (0.14 | ) | | $ | (0.19 | ) | | $ | (0.09 | ) | | $ | (0.18 | ) | | $ | (0.11 | ) | | $ | (0.19 | ) | | $ | (0.06 | ) |
| Diluted | | $ | (0.18 | ) | | $ | (0.14 | ) | | $ | (0.19 | ) | | $ | (0.09 | ) | | $ | (0.18 | ) | | $ | (0.11 | ) | | $ | (0.19 | ) | | $ | (0.06 | ) |
The financial results for the eight most recent quarters reflect the progression of an early stage Company with a limited operating history. Factors that have caused our results to vary are described below.
| Ø | As a result of the limited number of VISIUS Surgical Theatres sold and installed to date and the high dollar value associated with each sale, our revenues recorded from quarter to quarter have varied depending on the number and stage of active projects in any given quarter. |
| Ø | Gross margins for the VISIUS Surgical Theatre are largely dependent on whether a particular product application has achieved acceptance amongst clinical thought leaders. Given the maturity and clinical data surrounding the neurosurgical application of the VISIUS Surgical Theatre, margins for these products have generally been stronger than other newer clinical applications. |
| Ø | The decrease in gross profit percentage in the latter stages of 2011 is primarily tied to market penetration pricing for the introduction of the VISIUS Surgical Theatre for cerebrovascular and cardiovascular applications, as well as the provision of certain equipment for research purposes to a third party customer. The decrease in gross margins in 2012 is mainly due to higher installation costs with third quarter margins being further impacted by the provision of certain equipment for research purposes and lower margins for the Company’s first customer installation in Japan. |
IMRIS Inc.
Management's Discussion and Analysis – May 2, 2013
Page 13 of 25 |
| Ø | Net losses generally vary depending on the timing of when specific projects were installed and the pricing associated with the respective projects. Net losses in 2013, 2012 and 2011 have largely been the result of lower product installations and planned increases in research and development activity for the Company’s MR guided radiation therapy program and the image-guided robotics program. |
| Ø | Operating expenses began to increase in 2011 because of planned research and development activities for robotics, MR-guided radiation therapy and other ancillary research projects, increased employee costs, and professional fees as a result of additional reporting requirements as a NASDAQ registrant. Operating expenses during the first part of 2012, in areas outside of research and development, are lower as a result of cost management measures undertaken by management. Increases in the second half of 2012 and the first three months of 2013 reflect additional efforts to recruit qualified personnel and severance and retention costs recorded in the fourth quarter of 2012 and the first quarter of 2013 related to the relocation of operations from Winnipeg, Canada to Minnesota, U.S.A. |
| Ø | Although the majority of the Company’s sales are denominated in U.S. dollars, the Company sells its VISIUS Surgical Theatres in a variety of foreign currencies. As well, a significant portion of the Company’s operating costs are in Canadian dollars. This gives rise to foreign exchange gains or losses each quarter depending on the change in value of the U.S. dollar versus the Canadian dollar and other currencies in each quarter. |
| Ø | The Company generated taxable income in several of its foreign subsidiaries in 2013, 2012 and 2011 because of our transfer pricing methodology. As a result, the Company began recognizing tax expense in the 4th quarter of 2011 related to these subsidiaries. |
Backlog
In the first quarter of 2013, total order bookings were $1.0 million, consisting of one new service contract of $0.8 million and miscellaneous product bookings $0.2 million. We converted $8.1 million of backlog into revenues and changes in foreign exchange were insignificant in the period. We evaluate our backlog and individual order conversion on a regular basis and our experience is that orders typically convert into revenues over 12 to 18 months on average. Based on our review, we are reasonably confident that we will convert our present order backlog to recognized revenue.
The table below provides the Company’s backlog on a segmented basis, as of March 31, 2013 and its comparable periods for each of the last three years as of December 31:
| | | December 31, 2010 | | | December 31, 2011 | | | December 31, 2012 | | | March 31, 2013 | |
| | | (Thousands of U.S. dollars) | |
| VISIUS Surgical Theatres | | $ | 86,505 | | | $ | 58,583 | | | $ | 69,213 | | | $ | 63,141 | |
| Service contracts | | | 30,619 | | | | 36,430 | | | | 53,326 | | | | 52,337 | |
| Total backlog | | $ | 117,124 | | | $ | 95,013 | | | $ | 122,539 | | | $ | 115,478 | |
To March 31, 2013, we have sold 58 systems, of which 45 are installed and 13 are in the delivery phase. Of the 58 sold, 38 are in the United States, 7 are in Canada, 9 are in Asia Pacific and 4 are in Europe and the Middle East.
We use the non-GAAP measure “backlog” to measure aspects of our financial performance. Backlog is defined as the unrecognized portion of (i) revenues anticipated to be recorded from VISIUS Surgical Theatre orders, including confirmed orders and orders subject to the completion of formal documentation and (ii) service contracts with a term of four to five years and which commence at the conclusion of the warranty period on our VISIUS Surgical Theatres. The term of our service contracts generally ranges from 4 to 5 years commencing at the conclusion of the warranty period on our VISIUS Surgical Theatres, which are typically 1 year in length. Service contract revenue is recognized ratably over the term of the contract.
IMRIS Inc.
Management's Discussion and Analysis – May 2, 2013
Page 14 of 25 |
OUTLOOK
In 2013 we expect to deliver continued growth in order bookings. When we assess the opportunity today for our existing products, we have a significant numbers of customers in the mid-to-later stages of the sales funnel. This does not take into account the potential that exists for our Symbis Surgical System, our MR guided Radiation Therapy System, and only includes a modest projection for Visius CT. Our sales funnel has increased substantially from a year ago, and while not all of these customers move to purchase order we believe that most will convert over time, and it is on this basis that we believe we will deliver strong order bookings performance in 2013.
In 2013, we anticipate that the U.S. will continue to be a strong contributor to overall bookings performance, with approximately half of all system bookings coming from this region. We are also well positioned in China. We have a solid position from which to continue to expand our installed base and have a substantial funnel of customers. Asia Pacific, and specifically Japan, are also areas of focus for our company. We believe that the Japanese market potential is substantial and we are positioning ourselves to serve that market. In Europe we will be focused on advancing a select number of opportunities this year. While the market is not robust across all of Europe, there are many centers who are proceeding with the procurement of systems, and we intend to be a part of that.
New Product Development
As planned, our VISIUS Surgical Theatre equipped with a ceiling mounted CT scanner has been submitted to the FDA, and we anticipate receiving regulatory clearance in the first half of 2013. This product addresses the demand for radiological quality imaging during spinal and other procedures and we believe that the combination of enhanced work flow, ceiling mounted technology and radiological quality imaging will be a compelling value for many centers.
Completion of our MR Guided Radiation Therapy system is also scheduled for 2013. This innovative new product is designed to deliver MR guided radiation therapy, MR simulation, and MR guided brachytherapy from a single integrated system. We believe that our MR guided brachy therapy solution has the ability to improve workflow and also reduce the cost of care. The MR Guided radiotherapy portion of the system is expected to be completed in the second quarter and soon after begin acceptance testing with the goal of completion by summer. Final submissions for regulatory clearance of this new product offering are expected by the end of the second quarter.
Our third major product development initiative is the SYMBIS Surgical System — the world's first commercialized MR compatible surgical robot. Version 1 of the system is currently in a single site clinical trial with a cohort of 120 neurosurgical patients and from that we submitted a 510(k) clearance application for the SYMBIS Surgical System in August 2012. The 510(k) process is underway and we continue to work with the FDA to address any concerns. We believe that we will be required to provide more clinical trial data for evaluation in addition to what we have already submitted. We are working with the FDA to determine the scope and size of the additional patient data that will satisfy the needs of the evaluators and provide us with clarity and a timeline to completion.
Financial Outlook
Revenues
Our ability to complete installations and recognize revenue on a timely basis is directly influenced by the circumstances of each hospital and schedules can shift because of unique customer specific requirements. The delivery cycle and installation process for a VISIUS Surgical Theatre is lengthy and installation times can be further lengthened depending on additional site-specific construction work that may be required to be completed by the customer.
In 2013 revenues are expected to be in the range of $65 million and include revenues from the conversion of both system and service backlog. Included in this forecast are revenues associated with our new VISIUS Surgical Theatre equipped with a ceiling mounted CT. We anticipate this product will receive FDA regulatory clearance in the first half of 2013. Relative to MR-equipped VISIUS Surgical Theatres, our new CT product is expected to have a lower price point as well as quicker sales and significantly reduced installation cycles. As a result, we have included the sale and installation of our new CT-equipped VISIUS Surgical Theatres as a component in our 2013 revenue expectations.
IMRIS Inc.
Management's Discussion and Analysis – May 2, 2013
Page 15 of 25 |
IMRIS’s quarterly revenue profile varies depending on the underlying system installations in each period. We anticipate that Q2 2013 revenues will be in the $9 million to $10 million range, and similar to prior years, the strongest quarterly revenue performance will once again occur in the second half of 2013.
Gross Profit
Strong increases in gross profit are expected in 2013, including significantly higher gross profit as a percentage of sales, which is forecast to be in the range of 40% for the year. Quarterly gross profit as a percentage of sales will vary depending on the underlying system installations in the respective quarters.
Operating Expenses
Carefully managing expenses is a priority for our Company and in 2013 we expect our departmental cash operating expenses to decrease approximately $4 million from 2012 levels to approximately $34 million. Not included in this amount are one-time cash costs of $4 million associated with the relocation of the Company’s facility from Winnipeg to Minneapolis and a charge of approximately $7 million to research and development costs which is described further below. The total cost of the Company’s relocation is forecast to be $5.4 million including $1.4 million incurred in 2012 and $4.0 million in 2013.
Total research and development expenses are anticipated to be approximately $17 million, including an exceptional research and development charge of $7 million arising from the completion of the collaborative arrangement we entered into with Princess Margaret Hospital in October 2011 for their clinical MR-guided radiation therapy system. The MR-guided radiation therapy system will be used to conduct research at the hospital in order to clinically validate the system and develop a commercially viable version of the platform. The $7 million charge includes $5 million of deferred costs incurred in prior year periods as part of the development of the clinical site and has been recorded in prepaid expenses and other assets. These costs will be deferred until the installation is complete and then charged as research and development when clinical validation can begin.
Research and development will continue to be a priority in 2013 in support of commercializing our MR-guided radiation therapy system and SYMBIS Surgical System as well as enhancements for the VISIUS Surgical Theatre and traditional surgical procedures, including the addition of a ceiling mounted CT to the VISIUS Surgical Theatre.
Taken together, total cash and non-cash operating expenses in 2013 are expected to be approximately $51 million, as summarized in the table below:
| 2013 Forecast | | $ Millions | |
| Cash operating expenses | | | 34.0 | |
| Minneapolis relocation costs | | | 4.0 | |
| R&D Development charge | | | 2.0 | |
| Total | | | 40.0 | |
| Research & Development charge (non-cash) | | | 5.0 | |
| Depreciation (non-cash) | | | 4.0 | |
| Stock Based Compensation (non-cash) | | | 2.0 | |
| Total operating expenses | | | 51.0 | |
Liquidity and Capital Resources
With cash and accounts receivable at March 31, 2013 of $30.8 million and order backlog of $115.5 million, we have a solid base from which to continue to build the business.
IMRIS Inc.
Management's Discussion and Analysis – May 2, 2013
Page 16 of 25 |
Our cash requirements in 2013 include funding for operations, capital investments related to robotics, iCT and MRgRT test labs, the costs related to the U.S. relocation and prepaid development costs associated with our collaborative arrangements. Our total capital expenditures for the year are expected to be in the range of $6 million to $8 million this year.
LIQUIDITY AND CAPITAL RESOURCES
Our principal capital needs are for funding scientific research and development programs, supporting our sales and marketing activities and funding capital expenditures and working capital. The Company has financed its cash requirements primarily through issuances of securities and advanced customer deposits from new orders.
We had cash of $27.1 million as of March 31, 2013, an increase of $8.0 million from December 31, 2012. The increase primarily resulted from financing activities which included proceeds from the issuance of share capital during the three months ended March 31, 2013 of $18.6 million, partially offset by cash used in operating activities, which included an operating loss (excluding non-cash related items) of $6.8 million and cash used for working capital of $3.2 million. Cash used in investing activities of $0.9 million included capital spending of $2.8 million partially offset by the reduction of restricted cash of $1.9 million. These uses of cash were offset by a foreign exchange translation adjustment of $0.3 million.
The following table sets forth the summary statement of cash flows for the dates and periods indicated:
| | | Three months ended | |
| | | March 31, | |
| | | 2013 | | | 2012 | | | Change | |
| Cash flows: | | | | | | | | | | | | |
| Used in Operating Activities | | $ | (9,937 | ) | | $ | (5,175 | ) | | $ | (4,762 | ) |
| From Financing Activities | | | 18,577 | | | | 1,796 | | | | 16,781 | |
| Used in Investing Activities | | | (868 | ) | | | (1,958 | ) | | | 1,090 | |
| Foreign exchange translation adjustment | | | 257 | | | | 287 | | | | (30 | ) |
| Net increase (decrease) | | | 8,029 | | | | (5,050 | ) | | | 13,079 | |
| | | | | | | | | | | | | |
| Cash and cash equivalents, opening | | | 19,060 | | | | 40,425 | | | | | |
| Cash and cash equivalents, closing | | $ | 27,089 | | | $ | 35,375 | | | $ | (8,286 | ) |
Operating Activities
The cash used in operating activities for the three months ended March 31, 2013 was $9.9 million. The cash used in operating activities was comprised of an operating loss (excluding non-cash related items) of $6.8 million and cash used for working capital of $3.2 million. The $3.2 million in cash used for working capital consists of a decrease in accounts receivable of $7.5 million and an increase in deferred revenue of $0.3 million, partially offset by a decrease in accounts payable and accrued liabilities of $4.7 million, an increase of inventory and prepaids of $2.2 million and an increase in unbilled receivables of $4.1 million.
Financing Activities
The cash provided by financing activities for the three months ended March 31, 2013 was $18.6 million compared to $1.8 million in the same period last year. The cash generated in financing activities included net proceeds from the issuance of share capital during the three months ended March 31, 2013 of $18.5 million along with cash from employee share options being exercised of $0.1 million.
IMRIS Inc.
Management's Discussion and Analysis – May 2, 2013
Page 17 of 25 |
Investing Activities
The cash used in investing activities for the three months ended March 31, 2013 was $0.9 million compared to $2.0 million in the same period last year. Investing activities include acquisition of tangible and intangible capital assets of $2.8 million, offset by a reduction of restricted cash of $1.9 million. The $2.8 million in capital asset consists mainly of additions to our test labs, including the new labs for robotics, MR and iCT.
Liquidity and Capital Resources Summary
Our cash as of March 31, 2013 totaled $27.1 million. This cash position is expected to provide sufficient liquidity to meet the anticipated needs of current operations and existing projects and budgeted capital asset expenditures.
OUTSTANDING SHARE DATA
The following table sets forth our outstanding share data as at the dates given:
| | | Authorized | | | May 2, 2013 | | | December 31, 2012 | |
| | | | | | | | | | |
| Common shares | | | unlimited | | | $ | 166,451,000 | | | $ | 147,819,000 | |
| | | | | | | | (51,865,549 common shares) | | | | (46,061,211 common shares) | |
| Preferred shares | | | unlimited | | | | Nil | | | | Nil | |
| | | | | | | | | | | | | |
| Additional paid-in capital | | | | | | $ | 5,258,000 | | | $ | 4,861,000 | |
As at May 2, 2013, a total of 5,103,842 stock options were outstanding under the Company’s stock option plan.
NON-GAAP FINANCIAL MEASURES
In this MD&A, we use the non-GAAP measure “Backlog” and "Adjusted EBITDA". We define backlog as the unrecognized portion of the revenues anticipated to be recorded from VISIUS Surgical Theatre orders, including confirmed orders and orders subject to completion of formal documentation and the unrecognized portion of service contracts which have a term of 4-5 years commencing at the conclusion of the warranty period on our theatres, which is typically one year in length. In view of the long sales cycle, high unit price and limited quarterly installations that are characteristic of our business, we believe that our backlog provides a better measure at any particular point in time of the long-term performance prospects of our business than our quarterly operating results. Backlog does not have any standardized meaning prescribed by U.S GAAP and is, therefore, unlikely to be comparable to similar measures presented by other companies.
The Company defines Adjusted EBITDA as earnings before stock based compensation, interest income (expense), foreign exchange gain (loss), embedded derivative gain (loss), income taxes, and amortization. We have begun reporting Adjusted EBITDA because we believe investors use it as another measure of our operating performance. Adjusted EBITDA does not have a standardized meaning as prescribed by U.S. GAAP and it is not necessarily comparable to similarly titled measures used by other companies.
Reconciliation to the most comparable U.S. GAAP measure for Adjusted EBITDA for the three months ended March 31, 2013 and 2012 is as follows:
IMRIS Inc.
Management's Discussion and Analysis – May 2, 2013
Page 18 of 25 |
| (Thousands of US dollars) | | Three months ended | |
| (Unaudited) | | March 31 | |
| | | 2013 | | | 2012 | |
| Loss for the year | | $ | (8,378 | ) | | $ | (8,350 | ) |
| Stock based compensation | | | 452 | | | | 354 | |
| Foreign exchange loss (gain) | | | 555 | | | | (196 | ) |
| Interest expense (income) | | | 33 | | | | (17 | ) |
| Amortization | | | 950 | | | | 969 | |
| Income taxes | | | 16 | | | | 18 | |
| Adjusted EBITDA | | $ | (6,372 | ) | | $ | (7,222 | ) |
FINANCIAL INSTRUMENTS
Our financial instruments consist of cash, cash equivalents, accounts receivables, unbilled receivables, and accounts payable and accrued liabilities.
We are subject to credit risk with respect to our accounts receivable and unbilled receivables to the extent debtors do not meet their obligations and we are subject to foreign exchange risk with respect to financial instruments denominated in a currency other than the U.S. dollar.
Our accounts receivable at March 31, 2013 were $3.7 million, of which $3.6 million is considered current (less than 60 days old). Accounts receivable includes $0.1 million denominated in a currency other than the U.S. dollar.
RELATED PARTY TRANSACTIONS
We lease air travel time from a corporation that is controlled by the Chairman of IMRIS Inc. The amount charged to travel expenses during the three-month period ended March 31, 2013 and 2012 with respect to transactions with this related party totaled $55 and $84, respectively. On March 31, 2013, there was no receivable or payable balance owing to this corporation ($Nil as of December 31, 2012) and on March 31, 2012, there was no receivable or payable balance owing.
CRITICAL ACCOUNTING POLICIES AND ESTIMATES
Use of Estimates
The preparation of financial statements in accordance with U.S. GAAP requires us to make estimates and assumptions that affect the reported amounts of assets and liabilities and disclosures of contingent assets and liabilities at the date of the financial statements and the reported amounts of revenues and expenses during the year. Among the accounting estimates described in the notes to the financial statements, we consider the accounting estimates used in the determination of recognized revenues, the value of goodwill and the valuation of stock options to be critical. Our results as determined by actual events could differ materially from the previously mentioned estimates.
Revenue Recognition
We recognize revenues for our VISIUS Surgical Theatre sales on a percentage-of-completion basis as the theatre is installed. The percentage-of-completion is determined by the ratio of actual costs incurred to date to the estimated cost of completion for the project. Actual costs include only those costs that are directly attributable to contract performance with respect to the revenue recognized. In the event that the actual costs of completion differ from the estimated cost we have used in determining the percentage-of-completion, recognized revenues may be over or under-estimated until all costs have been incurred and the project is complete. Funds received from our customers in advance of meeting the criteria for recognition of revenues are recorded as deferred revenue until the revenue is recognized. Revenues recognized in advance of the criteria for invoicing to our customer are recorded as unbilled receivables. Accordingly, the reported amounts shown on the balance sheet under deferred revenue or unbilled receivables may be over or understated.
IMRIS Inc.
Management's Discussion and Analysis – May 2, 2013
Page 19 of 25 |
Value of Goodwill
We recorded goodwill on the purchase of the assets of a predecessor company. The value of goodwill is tested for impairment annually or more frequently, if an event or circumstance occurs which we feel may result in an impairment of the value of goodwill.
Stock Based Compensation Plan
From time to time we issue stock options to employees, directors, officers or consultants. The Company measures compensation expense at the date of granting stock options to employees and recognizes the expense based on their fair values determined in accordance with the U.S. GAAP codification Accounting Standards Codification 718. The fair value of options is determined using the Black-Scholes option-pricing model. The fair value amount is amortized to earnings over the vesting period, with the related credit recorded as additional paid-in capital. Amortization takes into consideration estimated forfeitures, determined on a historic basis, at the time of grant to determine the number of awards that will ultimately vest. Upon exercise of these stock options, amounts previously credited to additional paid-in capital are reversed and credited to share capital.
FUTURE ACCOUNTING STANDARDS
In October 2012, the Financial Accounting Standards Board, or FASB, issued Accounting Standards Update, or ASU, No. 2012-04, Technical Corrections and Improvements, which was meant to correct minor technical errors in the codification and to conform terminology and clarify certain guidance in various topics of the codification to fully reflect the fair value measurement and disclosure requirements of Topic 820. This guidance is effective for interim and annual periods beginning after December 15, 2012. This guidance did not have an impact on the results of operations or financial position of the Company.
On February 5, 2013, the FASB issued authoritative guidance (ASU 2013-02), which further revises the manner in which entities present comprehensive income in their financial statements. The new guidance requires entities to report the effect of significant reclassifications out of accumulated other comprehensive income on the respective line items in the net income if the amount being reclassified is required under U.S. GAAP to be classified in its entirety to net income. For other amounts that are not required under U.S. GAAP to be reclassified in their entirety to net income in the same reporting period, entities are required to cross-reference other disclosures required under U.S. GAAP that provide additional detail about those amounts. This guidance is effective for interim and annual periods beginning after December 15, 2012. The guidance affects presentation only and did not have an impact on the results of operations or financial condition of the Company.
In March 2013, the FASB issued ASU No. 2013-05, “Foreign Currency Matters (Topic 830): Parent’s Accounting for the Cumulative Translation Adjustment upon Derecognition of Certain subsidiaries or Groups of Assets within a Foreign Entity or of an Investment in a Foreign Entity” (“ASU 2013-05”). The purpose of ASU 2013-05 is to resolve the diversity in practice in relation to the treatment of the release of cumulative translation adjustments (“CTA”) upon sale (in full or part) of a foreign investment. It applies to the release of the CTA into net income when a parent either sells a part of all of its investment in a foreign entity or no longer holds a controlling financial interest in a subsidiary or group of assets that is a nonprofit activity or a business within a foreign entity. For public entities, the amendments are effective for fiscal years and interim reporting periods beginning after December 15, 2013. Early adoption by public entities is permitted. This guidance is not expected to have an impact on the results of operations or financial position of the Company.
DISCLOSURE AND INTERNAL CONTROLS
We have established and maintain disclosure controls and procedures in order to provide reasonable assurance that material information relating to IMRIS is made known in a timely manner. We have evaluated the effectiveness of our disclosure controls and procedures as at the date of our 2012 Financial Statements and are not aware of any material changes that are required to be made to these controls and procedures; we believe them to be effective in providing such reasonable assurance.
IMRIS Inc.
Management's Discussion and Analysis – May 2, 2013
Page 20 of 25 |
We are also responsible for the design of our internal controls over financial reporting (ICFR) in order to provide reasonable assurance regarding the reliability of financial reporting and the preparation of financial statements for external purposes in accordance with U.S. GAAP. Management used the framework issued by the Committee of Sponsoring Organizations of the Treadway Commission (COSO) to evaluate the effectiveness of internal controls in fiscal 2012, based on this evaluation management concluded that our internal control over financial reporting was effective as of December 31, 2012. The Company’s independent registered public accounting firm, Deloitte LLP, has issued an unqualified opinion on the Company’s internal controls over financial reporting as of December 31, 2012.
As of the date of this report, there have been no changes to the Company’s internal controls over financial reporting that materially affect, or are reasonably likely to materially affect, its internal controls over financial reporting.
In compliance with rules of the Canadian Securities Administration and the U.S. Securities and Exchange Commission, we have filed certificates signed by our Chief Executive Officer (‘‘CEO’’) and Chief Financial Officer (‘‘CFO’’) regarding the effectiveness of our disclosure controls and our internal controls over financial reporting. It should be noted however, that while the Company’s CEO and CFO believe the organizations disclosure controls and internal controls over financial reporting are effective any system of internal control has inherent limitations and cannot prevent all errors or fraud. Even systems determined to be effective can provide only reasonable assurance of the reliability of financial statement preparation and presentation.
RISKS AND UNCERTAINTIES
The operating results, business prospects and financial position of the Company are subject to a number of risks and uncertainties.Risks relating to our business include: our long sales cycle; high unit price and limited quarterly installations; our limited operating history and accumulated deficit; our lack of product diversity; our dependence on our suppliers; the development of VISIUS Surgical Theatres for cardiovascular and cerebrovascular procedures; our reliance on key personnel; the lack of supporting clinical data; market competition and technological advances; patent protection and trade secrets; intellectual property litigation; our ability to shift from research and development to commercialization; our ability to manage growth; foreign exchange fluctuations; additional financing requirements; and regulatory matters.If any of the events described as risks or uncertainties actually occurs, our business, prospects, financial condition and operating results would likely suffer, possibly materially. We have discussed several of the more significant risks and uncertainties that may affect the business below; however, for a more comprehensive list of the risks and uncertainties affecting the business, readers are advised to refer to our 2012 Annual Information Form (AIF) and our Base Shelf Prospectus (Base Shelf) filed October 2, 2012. Both the AIF and Base Shelf are available atwww.sedar.com and on theUnited States Securities and Exchange Commission (SEC) website atwww.sec.gov. The AIF is locatedin the Company’s Annual Report on Form 40-F.
Financial Risks
The Company is exposed to a variety of financial risks by virtue of its activities. These risks include market risk (including currency risk; fair value interest rate risk; cash flow interest rate risk); credit risk and liquidity risk. The Company’s overall risk management efforts focus on the unpredictability of financial markets and seek to minimize potential adverse effects on financial performance. Management identifies and evaluates financial risks in close cooperation and direction from the Board of Directors. Management is charged with the responsibility of establishing controls and procedures to ensure that financial risks are mitigated.
IMRIS Inc.
Management's Discussion and Analysis – May 2, 2013
Page 21 of 25 |
The following is a brief overview of the Company’s financial risk management for each of the risks identified above:
Market Risks
Currency risk
The Company operates internationally and is exposed to foreign exchange risk from various currencies. Foreign exchange risk arises from future sales and purchase transactions as well as recognized financial assets and liabilities denominated in foreign currencies. The Company’s main objective in managing its foreign exchange risk is to preserve gross margins and reduce variations in performance. The Company prices a significant portion of its VISIUS Surgical Theatre sales in USD. To offset these revenues, the Company sources a major portion of the components it delivers in U.S. dollars. In addition, the Company incurs nearly all of its sales expenses in U.S. dollars.
Cash flow and fair value interest rate risk
Interest rate risk is the risk that the fair value or future cash flows of a financial instrument will fluctuate because of changes in market interest rates. Financial assets and financial liabilities with variable interest rates expose the Company to cash flow interest rate risk. The Company’s restricted cash includes short-term highly liquid investments that earn interest at market rates. Financial assets and financial liabilities that bear interest at fixed rates are subject to fair value interest rate risk. The Company’s restricted cash is the only financial asset bearing fixed interest rates. The Company manages its interest rate risk by minimizing financing costs on its borrowings and maximizing the interest income earned on excess funds while maintaining the liquidity necessary to conduct operations on a day-to-day basis. The Company’s investment policy limits the investing of excess funds to Bankers Acceptances, Canadian Chartered bank term deposits, and short-term highly liquid money market mutual funds sponsored by Canadian Chartered banks.
Credit Risk
Credit risk is the risk of financial loss to the Company if a customer or counterparty to a financial instrument fails to meet its contractual obligation. The maximum exposure to credit risk of the Company at quarter end is the carrying value of its financial assets. The Company manages its credit risk on financial assets by dealing solely with reputable banks and financial institutions. The Company’s North American customers are large credit worthy medical hospitals and thus there is very little exposure to credit risk. When selling internationally, the Company uses irrevocable letters of credit to reduce its exposure to credit risk. The Company reviews the collectability of its accounts receivable and would record an allowance for doubtful accounts receivable if accounts were determined to be uncollectible. The loss would be recognized in the income statement within ‘Administrative expense’. Significant financial difficulties of the debtor, probability that the debtor will enter bankruptcy or financial reorganization, and default or delinquency in payments are considered indicators that the account receivable is uncollectible.
Liquidity Risk
Liquidity risk is the risk that the Company will not be able to meet its obligations as they fall due. The Company manages its liquidity risk by forecasting cash flows from operations and anticipated investing and financing activities. The Board of Directors reviews and approves the Company’s operating and capital budgets as well as any material transactions that are not in the ordinary course of business.
Long Sales Cycle, High Unit Price and Limited Installations
The long sales cycle, as well as the high unit price of the VISIUS Surgical Theatre, among other factors, may contribute to substantial fluctuations in our quarterly operating results. Because of the high unit price of VISIUS Surgical Theatres and the fact that we have installed only 45 units over the Company’s history, each installation currently represents a significant component of our revenue for a particular quarter. VISIUS Surgical Theatres represent a significant capital expenditure for our customers and adverse global economic and business conditions could result in a loss of consumer confidence, which could decrease capital spending or increase the length of time and effort our customers require to gain approval for capital spending. If we lose a single customer order or if customers defer installation of a VISIUS Surgical Theatre for even a short period of time, recognition of a significant amount of revenue may be lost or deferred to a subsequent period. Given that our operating costs are relatively fixed, our inability to recognize revenue in a particular quarter may adversely affect our profitability in that quarter.
IMRIS Inc.
Management's Discussion and Analysis – May 2, 2013
Page 22 of 25 |
We expect that revenues from a limited number of new customers will account for a large percentage of total revenues in future quarters. Our ability to attract new customers will depend on a variety of internal factors, including the capability, safety, efficacy, ease of use, price, quality and reliability of our products and effective sales support, training and service. In addition, if we are unable to fulfill our current purchase orders and other commitments on a timely basis or at all, market acceptance of our products could be adversely affected and hospitals may instead purchase our competitors’ products. The loss or delay of individual orders, failure to add new customers or worsening macroeconomic conditions could have a significant impact on future revenues and operating results.
Limited Operating History and Accumulated Deficit
We have a limited operating history from which investors can evaluate our business and prospects.We have a large accumulated deficit and we may not achieve profitability. We have incurred substantial losses since inception and may incur additional operating losses in the near term. If the time required to generate significant revenues and consistently achieve profitability is longer than anticipated, we may not be able to continue our operations without additional capital.Our prospects must be considered in light of the risks and uncertainties encountered by an early-stage company in the continuously evolving surgical imaging market. If we cannot successfully address these risks, our business and financial condition would suffer.
Actual Bookings May Vary from Forecast
We periodically forecast information about the rate we will be able to convert potential customers in our order pipeline into actual bookings we expect to achieve in future periods. The actual bookings we achieve in a period may vary from the bookings we forecast in public disclosure documents, presentations or other public information and these variations could be material and adverse. Our forecasts reflect numerous assumptions concerning our expected performance, as well as other factors, which may not be accurate. Actual bookings rely on the occurrence of numerous factors beyond our control such as a customer’s capital budget, their patient requirements and timing. Although we believe that the assumptions underlying our guidance and other forward looking statements were reasonable at the time such statements were made, actual results could be materially different. If actual bookings vary from our announced guidance, the price of our Common Shares may decline, and such a decline could be substantial. Except as required under applicable securities legislation, we do not undertake to update any guidance or other forward-looking information we may provide, whether as a result of new information, future events or otherwise.
Backlog may not Result in Future Net Sales
Our backlog at any particular date may not be indicative of recognized revenues in our financial statements in subsequent periods. We evaluate each customer order to determine qualification for inclusion in backlog; however, there can be no assurance that amounts included in backlog will ultimately result in recognition of revenue or occur in a financial reporting period. In addition, in any given period management can reduce backlog due to factors such as a cancellation of an order, lack of confidence in the customer proceeding with the order, changes in the financial condition at a customer, changes in government or third party funding for customers, and changes in installation schedules. Changes to backlog during any particular period, or the failure of our backlog to result in future sales, could harm our business, financial condition, results of operations and cash flows.
Lack of Product Diversity
Currently, our commercially available products include the VISIUS Surgical Theatre for neurosurgical, cardiovascular and cerebrovascular applications. Although we expect sales of our VISIUS Surgical Theatres to increase with market acceptance of the theatres for cardiovascular and cerebrovascular applications, we currently generate substantially all of our revenue from sales of VISIUS Surgical Theatres for neurosurgical applications and multiyear service plans for the theatres. If we are unable to sustain or grow sales of the VISIUS Surgical Theatre for use in multiple applications beyond neurosurgery, we may not generate sufficient revenue to support our business. Accordingly, we are currently dependent on our ability to market and sell the VISIUS Surgical Theatre for neurosurgical applications. Any factor materially and/or adversely affecting our ability to market and sell the VISIUS Surgical Theatre for neurosurgical applications or pricing and demand for the theatre may have a material and adverse effect on our financial condition and results of operations.
IMRIS Inc.
Management's Discussion and Analysis – May 2, 2013
Page 23 of 25 |
Foreign Exchange Fluctuations
We currently generate a significant portion of our sales in U.S. dollars but many of our expenses are denominated in Canadian dollars. To date, we have not used forward exchange contracts to hedge exposures denominated in foreign currencies or any other derivative instrument for trading, hedging or speculative purposes. As such, we are exposed to fluctuations in the exchange rate between certain foreign currencies, including Canadian, Euros and Australian dollars, versus the U.S. dollar as a result of the translation into U.S. dollars of our balance sheet and income statement items denominated in those foreign currencies.
Regulatory Matters
Products intended for diagnostic and therapeutic use for humans are governed by a wide array of regulatory authorities in various jurisdictions throughout the world. For most of these products in most jurisdictions, applicable statutes and regulations require testing and government review and approval prior to marketing the product. This procedure can take a number of years and involves the expenditure of substantial resources. Any failure or delay by us to obtain regulatory approvals or clearances could adversely affect the marketing of any products developed by us and our ability to receive product revenue. There is no assurance that any of our planned products will be approved by any regulatory authority on a timely basis, or at all. Also, in the event that a regulatory authority revokes any approvals granted in respect of our products, or a recall of our products is required in the event of material deficiencies or defects, our business, financial condition and results of operations could be adversely affected.
Dependence on Suppliers
We depend on Siemens to supply the MR scanner, CT scanner and angiography systems for our VISIUS Surgical Theatres. Our current agreement with Siemens was entered into as of November 2009 for a five-year term with automatic renewal provisions thereafter, subject to six months' advance written notice of termination by either party. The agreement may be terminated earlier in the event of default or in the event of insolvency or equivalent proceedings against either party or in the event of a change of control or similar sale transaction affecting IMRIS where the buyer or controlling shareholder is a direct competitor to Siemens. If for any reason, we could not obtain MR scanners, CT scanners and angiography systems from Siemens there is no certainty that we could find another vendor willing to supply this equipment for the VISIUS Surgical Theatre and a change would require a redesign of the VISIUS Surgical Theatre, which could take a year or more to implement. We are dependent on Siemens to provide support and maintenance services to our customers under contract to IMRIS; if Siemens' services became unavailable, any resulting service issues could disrupt our customer relationships and cause damage to our reputation.
We purchase certain other components of our VISIUS Surgical Theatre from outside vendors, including radio-frequency shielding systems, certain hardware components for our surgical information management system and operating room booms and lights. For the majority of our theatre components, we do not have long-term supply contracts with the suppliers; however, we attempt to establish dual sourcing for most of these other components of our theatre and we believe that we would be able to establish alternative sources for these components, subject to any regulatory qualifications, as may be required. It is possible that a disruption of the supply of these components could result in increased costs and delays in deliveries of VISIUS Surgical Theatre, which could adversely affect our reputation and results of operations.Additionally,any transition to alternate manufacturers or suppliers would likely result in operational problems and increased expenses and could delay the shipment of, or limit our ability to provide our products.
We purchase all significant components for development of our image guided surgical robotics program from MacDonald, Dettwiler and Associates Ltd. (MDA). We do not have a formal long-term supply contracts with MDA; however, IMRIS and MDA have signed a collaborative development agreement for development of the surgical robotics program. It is possible that a disruption of the supply of these components could result in increased costs and delays in the development of our image guided surgical robotics program, which could adversely affect our reputation and results of operations. Additionally, any transition to alternate manufacturers or suppliers would likely result in operational problems and increased expenses, which could also delay the development of our image guided surgical robotics program.
IMRIS Inc.
Management's Discussion and Analysis – May 2, 2013
Page 24 of 25 |
Competition and Technological Advances
The surgical imaging industry is subject to intense and increasing competition and rapidly evolving technologies. Many government, academic and business entities are investing substantial resources in research and development of treatments and new products that may render surgical imaging obsolete, including radiation treatment, new drug treatments and gene therapy. Successful developments that result in new approaches for treatments could reduce the attractiveness of our products or render them obsolete. MRI competes with other surgical imaging technologies such as CT, fluoroscopy and ultrasound for market share in the overall surgical imaging market.
The market for surgical imaging is highly competitive, with a number of companies providing competing surgical imaging systems. Many of these competitors are large medical system suppliers which have considerably greater resources at their disposal to advance the development of their systems. These competitors or other companies may at any time develop new or improved surgical imaging solutions. Alternatively, these competitors may choose to increase their respective market share by changing their pricing model or by lowering the price of their surgical imaging solutions or ancillary supplies. If we are unable to address these competitor tactics by either continuing to enhance and improve our current product(s) or we are unable to maintain or increase our selling price in the face of competition, there can be no assurance that the Company will be able to maintain its desired market share or achieve its financial objectives.
Changes to Financial Accounting Standards
A change in accounting standards or practices can have a significant effect on our reported results and may even affect our reporting of transactions completed before the change is effective. New accounting pronouncements and varying interpretations of accounting pronouncements have occurred and may occur in the future. Changes to existing standards or the questioning of current practices may adversely affect our reported financial results or the way we conduct our business.
Relocating our Operations to the United States
On November 9, 2012, we announced that we plan to relocate our research and development, customer service, manufacturing and administration functions currently located in our Winnipeg facility to Minneapolis Minnesota in order to gainaccess to a larger pool of talented personnel and access to a qualified ecosystem of suppliers. The move will be completed by the end of the third quarter of 2013. If we are not able to timely recruit individuals with the requisite skills, or timely gain access to a qualified ecosystem of suppliers, the delay could materially and adversely affect our financial condition, results of operations, and cash flows.
ADDITIONAL INFORMATION
Additional information about IMRIS, including our annual information form, can be found on the SEDAR website at www.sedar.com or the United States Securities and Exchange Commission (SEC) website at www.sec.gov.
IMRIS Inc.
Management's Discussion and Analysis – May 2, 2013
Page 25 of 25 |