SUPPLEMENTAL INFORMATION
FOR THE THREE AND TWELVE MONTHS ENDED DECEMBER 31, 2014
GENERAL INFORMATION
Unless the context indicates otherwise, references in the accompanying financial information (the "Supplemental") to the "Corporation" refer to General Growth Properties, Inc. and references to "GGP" or the "Company" refer to the Corporation, its direct and indirect subsidiaries, and consolidated and unconsolidated entities. Additionally, where reference is made to "GAAP", this refers to accounting principles generally accepted in the United States of America.
PROPERTY INFORMATION
The Company has presented information on its consolidated and unconsolidated properties ("Proportionate" or "at share") in certain schedules included within this Supplemental. This form of presentation offers insights into the financial performance and condition of the Company as a whole, given the significance of the Company's unconsolidated property operations that are owned through investments accounted for under the equity method.
NON-GAAP MEASURES
This Supplemental makes reference to net operating income (“NOI”), earnings before interest, taxes, depreciation and amortization ("EBITDA"), and funds from operations (“FFO”). NOI is defined as income from property operations after operating expenses have been deducted, but prior to deducting financing, administrative and income tax expenses. EBITDA is defined as NOI less certain property management and administrative expenses, net of management fees and other operational items. FFO is defined as net income (loss) attributable to common stockholders in accordance with GAAP, excluding impairment write-downs on depreciable real estate, gains (or losses) from cumulative effects of accounting changes, extraordinary items and sales of properties, less preferred unit distributions and preferred stock dividends, plus real estate related depreciation and amortization including adjustments for unconsolidated entities. NOI, EBITDA and FFO are presented in the Supplemental on a Proportionate basis, which includes GGP’s share of consolidated and unconsolidated properties. As GGP conducts substantially all of its business through GGP Operating Partnership, LP, and through GGP Limited Partnership and GGP Nimbus, LP (collectively the “Operating Partnerships”, which are 99% owned by GGP) and since the limited common units of the Operating Partnerships are included in total diluted weighted average FFO per share amounts, all FFO amounts in this Supplemental reflect the FFO of the Operating Partnerships.
In order to present GGP's operations in a manner most relevant to its operations, Company NOI, Company EBITDA, and Company FFO have been presented to exclude certain non-cash and non-recurring revenue and expenses. Same Store Company NOI is presented to exclude the periodic effects of acquisitions of new properties, reductions in ownership as a result of sales or other transactions, and certain redevelopments and other properties. Company NOI, EBITDA, FFO and derivations thereof, are not alternatives to GAAP operating income (loss) or net income (loss) attributable to common stockholders. For reference, as an aid in understanding management's computation of Company NOI, EBITDA, and FFO, a reconciliation of Company NOI to consolidated operating income, Company EBITDA, and Company FFO to net income (loss) in accordance with GAAP has been included in the "Reconciliation of Non-GAAP to GAAP Financial Measures" schedule.
|
| | | |
| | Page | | Page |
| Financial Overview | | Asset Transactions: | |
| GAAP Financial Statements: | | Summary of Transactions | 15 |
| Consolidated Balance Sheets | 1 | Discontinued Operations | 16 |
| Consolidated Statements of Operations | 2 | | |
| | | Portfolio Operating Metrics: | |
| Proportionate Financial Statements: | | Key Operating Performance Indicators | 17 |
| Proportionate Balance Sheets | 3 | Signed Leases All Less Anchors | 18 |
| Overview | 4 | Lease Expiration Schedule and Top Ten Tenants | 19 |
| Company NOI, EBITDA, and FFO | 5-6 | Property Schedule | 20-26 |
| Reconciliation of Non-GAAP to GAAP Financial Measures | 7-8 | | |
| | | Miscellaneous: | |
| Debt: | | Capital Information | 27 |
| Debt Summary, at Share | 9 | Change in Total Common and Equivalent Shares | 28 |
| Maturity Schedule | 10 | Development Summary | 29-30 |
| Debt Detail, at Share | 11-14 | Capital Expenditures | 31 |
| | | Corporate Information | 32 |
| | | Glossary of Terms | 33 |
This presentation contains forward-looking statements. Actual results may differ materially from the results suggested by these forward-looking statements for a number of reasons. Readers are referred to the documents filed by General Growth Properties, Inc. with the Securities and Exchange Commission, which further identify the important risk factors which could cause actual results to differ materially from the forward-looking statements in this Supplemental. The Company disclaims any obligation to update any forward-looking statements.
|
| |
| SELECT SCHEDULE DEFINITIONS | |
|
| | |
| Page | Schedule | Description |
| Proportionate Financial Schedules: | |
| 3 | Proportionate Balance Sheet | The proportionate balance sheet adjusts GGP's GAAP balance sheet for noncontrolling interests and adds the Company's proportionate share of assets and liabilities related to investments accounted for under the equity method. |
| 4 | Overview | Summary of Company NOI, Same Store NOI, Company EBITDA and Company FFO on a proportionate basis. |
| 5-6 | Company NOI, EBITDA and FFO | Proportionate Results and FFO for the three and twelve months ended December 31, 2014 and 2013 adjusts GGP's consolidated results and FFO for noncontrolling interests and adds the Company's proportionate share of certain revenues and expenses included in NOI, EBITDA and FFO as defined in the Basis of Presentation. Company NOI, EBITDA and FFO exclude certain non-cash and non-recurring revenues and expenses that may not be indicative of future operations. |
| Portfolio Operating Metrics: | |
| 17 | Key Operating Performance Indicators | Certain retail properties operating measures presented on a comparable basis.
See Glossary of Terms for detailed descriptions. |
| 20-26 | Property Schedule | By Property, gross leasable area detail, including: Anchor tenant listing Ownership percentage Gross leasable area by space type (mall, anchor, strip center, office) Occupancy percentage
See Glossary of Terms for detailed descriptions. |
|
|
| GAAP Financial Statements |
|
| |
FINANCIAL OVERVIEW
Consolidated Balance Sheets (In thousands) | |
|
| | | | | | | |
| | December 31, 2014 | | December 31, 2013 |
| | | | |
| Assets: | | | |
| Investment in real estate: | | | |
| Land | $ | 4,244,607 |
| | $ | 4,320,597 |
|
| Buildings and equipment | 18,028,844 |
| | 18,270,748 |
|
| Less accumulated depreciation | (2,280,845 | ) | | (1,884,861 | ) |
| Construction in progress | 703,859 |
| | 406,930 |
|
| Net property and equipment | 20,696,465 |
| | 21,113,414 |
|
| Investment in and loans to/from Unconsolidated Real Estate Affiliates | 2,604,762 |
| | 2,407,698 |
|
| Net investment in real estate | 23,301,227 |
| | 23,521,112 |
|
| Cash and cash equivalents | 372,471 |
| | 577,271 |
|
| Accounts and notes receivable, net | 663,768 |
| | 478,899 |
|
| Deferred expenses, net | 184,491 |
| | 189,452 |
|
| Prepaid expenses and other assets | 813,777 |
| | 995,569 |
|
| Total assets | $ | 25,335,734 |
| | $ | 25,762,303 |
|
| Liabilities: | | | |
| Mortgages, notes and loans payable | $ | 15,998,289 |
| | $ | 15,672,437 |
|
| Investment in and loans to/from Unconsolidated Real Estate Affiliates | 35,598 |
| | 17,405 |
|
| Accounts payable and accrued expenses | 934,897 |
| | 970,995 |
|
| Dividend payable | 154,694 |
| | 134,476 |
|
| Deferred tax liabilities | 21,240 |
| | 24,667 |
|
| Tax indemnification liability | — |
| | 321,958 |
|
| Junior Subordinated Notes | 206,200 |
| | 206,200 |
|
| Total liabilities | 17,350,918 |
| | 17,348,138 |
|
| Redeemable noncontrolling interests: | | | |
| Preferred | 164,031 |
| | 131,881 |
|
| Common | 135,265 |
| | 97,021 |
|
| Total redeemable noncontrolling interests | 299,296 |
| | 228,902 |
|
| Equity: | | | |
| Preferred stock | 242,042 |
| | 242,042 |
|
| Stockholders' equity | 7,363,877 |
| | 7,861,079 |
|
| Noncontrolling interests in consolidated real estate affiliates | 79,601 |
| | 82,142 |
|
| Total equity | 7,685,520 |
| | 8,185,263 |
|
| Total liabilities, redeemable noncontrolling interests and equity | $ | 25,335,734 |
| | $ | 25,762,303 |
|
|
| |
FINANCIAL OVERVIEW
Consolidated Statements of Operations (In thousands, except per share) | |
|
| | | | | | | | | | | | | | | |
| | Three Months Ended | | Twelve Months Ended |
| | December 31, 2014 | | December 31, 2013 | | December 31, 2014 | | December 31, 2013 |
| Revenues: | | | | | | | |
| Minimum rents | $ | 413,147 |
| | $ | 405,625 |
| | $ | 1,583,695 |
| | $ | 1,553,941 |
|
| Tenant recoveries | 186,815 |
| | 183,024 |
| | 739,411 |
| | 716,932 |
|
| Overage rents | 27,126 |
| | 28,610 |
| | 51,611 |
| | 55,998 |
|
| Management fees and other corporate revenues | 19,128 |
| | 18,218 |
| | 70,887 |
| | 68,792 |
|
| Other | 26,806 |
| | 35,188 |
| | 89,955 |
| | 90,354 |
|
| Total revenues | 673,022 |
| | 670,665 |
| | 2,535,559 |
| | 2,486,017 |
|
| Expenses: |
| | | | | | |
| Real estate taxes | 55,306 |
| | 63,227 |
| | 227,992 |
| | 239,807 |
|
| Property maintenance costs | 17,944 |
| | 18,560 |
| | 66,897 |
| | 69,411 |
|
| Marketing | 8,346 |
| | 8,171 |
| | 23,455 |
| | 26,232 |
|
| Other property operating costs | 82,356 |
| | 82,332 |
| | 334,819 |
| | 342,815 |
|
| Provision for doubtful accounts | 2,844 |
| | 635 |
| | 8,055 |
| | 3,920 |
|
| Property management and other costs | 35,702 |
| | 41,378 |
| | 155,093 |
| | 164,457 |
|
| General and administrative | 11,441 |
| | 14,658 |
| | 64,051 |
| | 49,237 |
|
| Provisions for impairment | 5,278 |
| | — |
| | 5,278 |
| | — |
|
| Depreciation and amortization | 179,478 |
| | 188,860 |
| | 708,406 |
| | 749,722 |
|
| Total expenses | 398,695 |
| | 417,821 |
| | 1,594,046 |
| | 1,645,601 |
|
| Operating income | 274,327 |
| | 252,844 |
| | 941,513 |
| | 840,416 |
|
| Interest and dividend income | 8,812 |
| | 6,423 |
| | 28,613 |
| | 7,699 |
|
| Interest expense | (171,012 | ) | | (173,595 | ) | | (699,285 | ) | | (723,152 | ) |
| Loss on Foreign Currency | (11,031 | ) | | (7,312 | ) | | (18,048 | ) | | (7,312 | ) |
| Warrant liability adjustment | — |
| | — |
| | — |
| | (40,546 | ) |
| Gain from change in control of investment properties | 91,193 |
| | — |
| | 91,193 |
| | 219,784 |
|
| Loss on extinguishment of debt | — |
| | — |
| | — |
| | (36,479 | ) |
| Income before income taxes, equity in income of Unconsolidated Real Estate Affiliates, discontinued operations, noncontrolling interests and preferred stock dividends | 192,289 |
| | 78,360 |
| | 343,986 |
| | 260,410 |
|
| (Provision for) benefit from income taxes | (4,417 | ) | | 891 |
| | (7,253 | ) | | (345 | ) |
| Equity in income of Unconsolidated Real Estate Affiliates | 27,410 |
| | 26,943 |
| | 61,278 |
| | 68,756 |
|
| Income from continuing operations | 215,282 |
| | 106,194 |
| | 398,011 |
| | 328,821 |
|
| Discontinued operations: | | | | | | | |
| Income (loss) from discontinued operations, including gains (losses) on dispositions | 1,021 |
| | (25,033 | ) | | 137,989 |
| | (37,516 | ) |
| Gain on extinguishment of liability | 77,215 |
| | — |
| | 77,215 |
| | — |
|
| Gain on extinguishment of debt | — |
| | — |
| | 66,679 |
| | 25,894 |
|
| Discontinued operations, net | 78,236 |
| | (25,033 | ) | | 281,883 |
| | (11,622 | ) |
| Net income | 293,518 |
| | 81,161 |
| | 679,894 |
| | 317,199 |
|
| Allocation to noncontrolling interests | (4,036 | ) | | (3,964 | ) | | (14,044 | ) | | (14,671 | ) |
| Net income attributable to GGP | 289,482 |
| | 77,197 |
| | 665,850 |
| | 302,528 |
|
| Preferred stock dividends | (3,984 | ) | | (3,984 | ) | | (15,936 | ) | | (14,078 | ) |
| Net income attributable to common stockholders | $ | 285,498 |
| | $ | 73,213 |
| | $ | 649,914 |
| | $ | 288,450 |
|
| Basic Income Per Share: | | | | | | | |
| Continuing operations | $ | 0.23 |
| | $ | 0.11 |
| | $ | 0.42 |
| | $ | 0.32 |
|
| Discontinued operations | 0.09 |
| | (0.03 | ) | | 0.32 |
| | (0.01 | ) |
| Total basic income per share | $ | 0.32 |
| | $ | 0.08 |
| | $ | 0.74 |
| | $ | 0.31 |
|
| Diluted Income Per Share: | | | | | | | |
| Continuing operations | $ | 0.22 |
| | $ | 0.10 |
| | $ | 0.39 |
| | $ | 0.32 |
|
| Discontinued operations | 0.08 |
| | (0.03 | ) | | 0.30 |
| | (0.01 | ) |
| Total diluted income per share | $ | 0.30 |
| | $ | 0.07 |
| | $ | 0.69 |
| | $ | 0.31 |
|
|
|
| Proportionate Financial Statements |
|
| |
PROPORTIONATE FINANCIAL STATEMENTS
Proportionate Balance Sheets (In thousands) | |
|
| | | | | | | | | | | | | | | | | | | | |
| | | As of December 31, 2014 | | As of December 31, 2013 |
| | | GAAP | | Noncontrolling Interests | | GGP Share of Unconsolidated Real Estate Affiliates | | GGP Total Share | | GGP Total Share |
| | | | | | | | | | | |
| Assets: | | | | | | | | | | |
| Investment in real estate: | | | | | | | | | | |
| Land | | $ | 4,244,607 |
| | $ | (31,466 | ) | | $ | 756,028 |
| | $ | 4,969,169 |
| | $ | 4,990,338 |
|
| Buildings and equipment | | 18,028,844 |
| | (169,207 | ) | | 6,204,746 |
| | 24,064,383 |
| | 23,645,676 |
|
| Less accumulated depreciation | | (2,280,845 | ) | | 25,731 |
| | (1,128,831 | ) | | (3,383,945 | ) | | (2,819,385 | ) |
| Construction in progress | | 703,859 |
| | (4 | ) | | 65,506 |
| | 769,361 |
| | 429,553 |
|
| Net property and equipment | | 20,696,465 |
| | (174,946 | ) | | 5,897,449 |
| | 26,418,968 |
| | 26,246,182 |
|
| Investment in and loans to/from Unconsolidated Real Estate Affiliates | | 2,604,762 |
| | — |
| | (2,604,762 | ) | | — |
| | — |
|
| Net investment in real estate | | 23,301,227 |
| | (174,946 | ) | | 3,292,687 |
| | 26,418,968 |
| | 26,246,182 |
|
| Cash and cash equivalents | | 372,471 |
| | (3,733 | ) | | 143,979 |
| | 512,717 |
| | 697,536 |
|
| Accounts and notes receivable, net | | 663,768 |
| | (2,726 | ) | | 85,791 |
| | 746,833 |
| | 549,021 |
|
| Deferred expenses, net | | 184,491 |
| | (1,097 | ) | | 150,877 |
| | 334,271 |
| | 314,860 |
|
| Prepaid expenses and other assets | | 813,777 |
| | (13,580 | ) | | 451,697 |
| | 1,251,894 |
| | 1,169,423 |
|
| Total assets | | $ | 25,335,734 |
| | $ | (196,082 | ) | | $ | 4,125,031 |
| | $ | 29,264,683 |
| | $ | 28,977,022 |
|
| Liabilities: | | | | | | | | | | |
| Mortgages, notes and loans payable | | $ | 15,998,289 |
| | $ | (107,783 | ) | | $ | 3,920,304 |
| | $ | 19,810,810 |
| | $ | 18,788,230 |
|
| Investment in and loans to/from Unconsolidated Real Estate Affiliates | | 35,598 |
| | — |
| | (35,598 | ) | | — |
| | — |
|
| Accounts payable and accrued expenses | | 934,897 |
| | (8,698 | ) | | 240,227 |
| | 1,166,426 |
| | 1,169,438 |
|
| Dividend payable | | 154,694 |
| | — |
| | — |
| | 154,694 |
| | 134,476 |
|
| Deferred tax liabilities | | 21,240 |
| | — |
| | 98 |
| | 21,338 |
| | 24,697 |
|
| Tax indemnification liability | | — |
| | — |
| | — |
| | — |
| | 321,958 |
|
| Junior Subordinated Notes | | 206,200 |
| | — |
| | — |
| | 206,200 |
| | 206,200 |
|
| Total liabilities | | 17,350,918 |
| | (116,481 | ) | | 4,125,031 |
| | 21,359,468 |
| | 20,644,999 |
|
| Redeemable noncontrolling interests: | | | | | | | | | | |
| Preferred | | 164,031 |
| | — |
| | — |
| | 164,031 |
| | 131,881 |
|
| Common | | 135,265 |
| | — |
| | — |
| | 135,265 |
| | 97,021 |
|
| Total redeemable noncontrolling interests | | 299,296 |
| | — |
| | — |
| | 299,296 |
| | 228,902 |
|
| | | | | | | | | | | |
| Equity: | | | | | | | | | | |
| Preferred stock | | 242,042 |
| | — |
| | — |
| | 242,042 |
| | 242,042 |
|
| Stockholders' equity | | 7,363,877 |
| | — |
| | — |
| | 7,363,877 |
| | 7,861,079 |
|
| Noncontrolling interests in consolidated real estate affiliates | | 79,601 |
| | (79,601 | ) | | — |
| | — |
| | — |
|
| Total equity | | 7,685,520 |
| | (79,601 | ) | | — |
| | 7,605,919 |
| | 8,103,121 |
|
| Total liabilities, redeemable noncontrolling interests and equity | | $ | 25,335,734 |
| | $ | (196,082 | ) | | $ | 4,125,031 |
| | $ | 29,264,683 |
| | $ | 28,977,022 |
|
|
| |
PROPORTIONATE FINANCIAL STATEMENTS
Overview (In thousands, except per share) | |
|
| | | | | | | | | | | | | | | | | | |
| | | Three Months Ended | | Twelve Months Ended |
| | | December 31, 2014 | December 31, 2013 | Percentage Change | | December 31, 2014 | December 31, 2013 | Percentage Change |
| | | | | | | | | |
Same Store NOI 1 | | $ | 596,186 |
| $ | 582,313 |
| 2.4 | % | | $ | 2,206,900 |
| $ | 2,110,929 |
| 4.5 | % |
Non-Same Store 2 | | 12,246 |
| 12,606 |
| n/a |
| | 43,609 |
| 50,908 |
| n/a |
|
Company NOI 3 | | 608,432 |
| 594,919 |
| 2.3 | % | | 2,250,509 |
| 2,161,837 |
| 4.1 | % |
| | | | | | | | | |
Company EBITDA 3 | | 572,296 |
| 550,011 |
| 4.1 | % | | 2,087,912 |
| 1,990,687 |
| 4.9 | % |
| | | | | | | | | |
Company FFO 3 | | 357,427 |
| 345,665 |
| 3.4 | % | | 1,255,651 |
| 1,148,233 |
| 9.4 | % |
| Company FFO per diluted share | | $ | 0.38 |
| $ | 0.36 |
| 5.1 | % | | $ | 1.32 |
| $ | 1.16 |
| 13.7 | % |
| | | | | | | | | |
| Weighted average diluted common shares outstanding | | 951,920 |
| 967,096 |
| | | 949,554 |
| 987,226 |
| |
| | | | | | | | | |
| |
| 1. | Total termination fees were $2.4 million and $0.8 million for the three months ended December 31, 2014 and 2013, respectively. Total termination fees were $13.6 million and $14.3 million for the twelve months ended December 31, 2014 and 2013, respectively. |
| |
| 2. | Non-Same Store includes the periodic effects of acquisitions of new properties, reductions in ownership as a result of sales or other transactions, and certain redevelopment and other properties. See Summary of Transactions on page 15 and Property Schedule on pages 20-26 for individual property details. |
3.Refer to pages 5-6 (Company NOI, EBITDA and FFO).
|
| |
PROPORTIONATE FINANCIAL STATEMENTS
Company NOI, EBITDA and FFO For the Three Months Ended December 31, 2014 and 2013 (In thousands) | |
|
| | | | | | | | | | | | | | | | | | | | | | | | | | | | | | | | | | | | | | |
| | | Three Months Ended December 31, 2014 | | Three Months Ended December 31, 2013 |
| | | Consolidated Properties | Noncontrolling Interests | Unconsolidated Properties | Proportionate | Adjustments 1 | Company | | Consolidated Properties | Noncontrolling Interests | Unconsolidated Properties | Proportionate | Adjustments | Company |
| Property revenues: | | | | | | | | | | | | | | |
Minimum rents 2 | | $ | 413,147 |
| $ | (4,267 | ) | $ | 106,464 |
| $ | 515,344 |
| $ | 3,163 |
| $ | 518,507 |
| | $ | 405,625 |
| $ | (3,463 | ) | $ | 97,145 |
| $ | 499,307 |
| $ | 5,702 |
| $ | 505,009 |
|
| Tenant recoveries | | 186,815 |
| (1,728 | ) | 43,898 |
| 228,985 |
| — |
| 228,985 |
| | 183,024 |
| (1,254 | ) | 40,595 |
| 222,365 |
| — |
| 222,365 |
|
| Overage rents | | 27,126 |
| (309 | ) | 7,484 |
| 34,301 |
| — |
| 34,301 |
| | 28,610 |
| (241 | ) | 8,369 |
| 36,738 |
| — |
| 36,738 |
|
| Other revenue | | 26,806 |
| (323 | ) | 5,984 |
| 32,467 |
| — |
| 32,467 |
| | 35,189 |
| (148 | ) | 5,253 |
| 40,294 |
| — |
| 40,294 |
|
| Total property revenues | | 653,894 |
| (6,627 | ) | 163,830 |
| 811,097 |
| 3,163 |
| 814,260 |
| | 652,448 |
| (5,106 | ) | 151,362 |
| 798,704 |
| 5,702 |
| 804,406 |
|
| Property operating expenses: | | | | | | | | | | | | | | |
| Real estate taxes | | 55,306 |
| (864 | ) | 14,019 |
| 68,461 |
| (1,490 | ) | 66,971 |
| | 63,227 |
| (531 | ) | 12,768 |
| 75,464 |
| (1,578 | ) | 73,886 |
|
| Property maintenance costs | | 17,944 |
| (139 | ) | 5,246 |
| 23,051 |
| — |
| 23,051 |
| | 18,560 |
| (128 | ) | 5,052 |
| 23,484 |
| — |
| 23,484 |
|
| Marketing | | 8,346 |
| (72 | ) | 2,439 |
| 10,713 |
| — |
| 10,713 |
| | 8,171 |
| (91 | ) | 2,782 |
| 10,862 |
| — |
| 10,862 |
|
| Other property operating costs | | 82,356 |
| (763 | ) | 21,541 |
| 103,134 |
| (1,267 | ) | 101,867 |
| | 82,332 |
| (425 | ) | 20,246 |
| 102,153 |
| (1,344 | ) | 100,809 |
|
| Provision for doubtful accounts | | 2,844 |
| 2 |
| 380 |
| 3,226 |
| — |
| 3,226 |
| | 635 |
| 7 |
| (196 | ) | 446 |
| — |
| 446 |
|
| Total property operating expenses | | 166,796 |
| (1,836 | ) | 43,625 |
| 208,585 |
| (2,757 | ) | 205,828 |
| | 172,925 |
| (1,168 | ) | 40,652 |
| 212,409 |
| (2,922 | ) | 209,487 |
|
| NOI | | $ | 487,098 |
| $ | (4,791 | ) | $ | 120,205 |
| $ | 602,512 |
| $ | 5,920 |
| $ | 608,432 |
| | $ | 479,523 |
| $ | (3,938 | ) | $ | 110,710 |
| $ | 586,295 |
| $ | 8,624 |
| $ | 594,919 |
|
| Management fees and other corporate revenues | | 19,128 |
| — |
| — |
| 19,128 |
| — |
| 19,128 |
| | 18,218 |
| — |
| — |
| 18,218 |
| — |
| 18,218 |
|
Property management and other costs 3 | | (35,702 | ) | 180 |
| (7,800 | ) | (43,322 | ) | — |
| (43,322 | ) | | (41,378 | ) | 172 |
| (7,020 | ) | (48,226 | ) | — |
| (48,226 | ) |
| General and administrative | | (11,441 | ) | — |
| (501 | ) | (11,942 | ) | — |
| (11,942 | ) | | (14,658 | ) | — |
| (242 | ) | (14,900 | ) | — |
| (14,900 | ) |
| EBITDA | | $ | 459,083 |
| $ | (4,611 | ) | $ | 111,904 |
| $ | 566,376 |
| $ | 5,920 |
| $ | 572,296 |
| | $ | 441,705 |
| $ | (3,766 | ) | $ | 103,448 |
| $ | 541,387 |
| $ | 8,624 |
| $ | 550,011 |
|
| Depreciation on non-income producing assets | | (2,751 | ) | — |
| — |
| (2,751 | ) | — |
| (2,751 | ) | | (3,192 | ) | — |
| — |
| (3,192 | ) | — |
| (3,192 | ) |
| Interest and dividend income | | 8,812 |
| 386 |
| 587 |
| 9,785 |
| (205 | ) | 9,580 |
| | 6,423 |
| — |
| 184 |
| 6,607 |
| — |
| 6,607 |
|
| Preferred unit distributions | | (2,268 | ) | — |
| — |
| (2,268 | ) | — |
| (2,268 | ) | | (2,280 | ) | — |
| — |
| (2,280 | ) | — |
| (2,280 | ) |
| Preferred stock dividends | | (3,984 | ) | — |
| — |
| (3,984 | ) | — |
| (3,984 | ) | | (3,984 | ) | — |
| — |
| (3,984 | ) | — |
| (3,984 | ) |
| Interest expense: | | | | | | | | | | | | | | |
| Mark-to-market adjustments on debt | | (410 | ) | (100 | ) | 386 |
| (124 | ) | 124 |
| — |
| | (1,025 | ) | (95 | ) | 365 |
| (755 | ) | 755 |
| — |
|
| Write-off of mark-to-market adjustments on extinguished debt | | — |
| — |
| — |
| — |
| — |
| — |
| | (274 | ) | — |
| (3,924 | ) | (4,198 | ) | 4,198 |
| — |
|
| Interest on existing debt | | (170,602 | ) | 1,479 |
| (41,640 | ) | (210,763 | ) | — |
| (210,763 | ) | | (172,296 | ) | 1,111 |
| (35,782 | ) | (206,967 | ) | — |
| (206,967 | ) |
| Loss on foreign currency | | (11,031 | ) | — |
| — |
| (11,031 | ) | 11,031 |
| — |
| | (7,312 | ) | — |
| — |
| (7,312 | ) | 7,312 |
| — |
|
| (Provision for) benefit from income taxes | | (4,417 | ) | 20 |
| (339 | ) | (4,736 | ) | (2,186 | ) | (6,922 | ) | �� | 891 |
| 19 |
| 8 |
| 918 |
| (2,892 | ) | (1,974 | ) |
FFO from discontinued operations 4 | | 79,227 |
| — |
| 127 |
| 79,354 |
| (77,115 | ) | 2,239 |
| | 5,460 |
| — |
| 257 |
| 5,717 |
| 1,727 |
| 7,444 |
|
| | | 351,659 |
| (2,826 | ) | 71,025 |
| 419,858 |
| (62,431 | ) | 357,427 |
| | 264,116 |
| (2,731 | ) | 64,556 |
| 325,941 |
| 19,724 |
| 345,665 |
|
| Equity in FFO of Unconsolidated Properties and Noncontrolling Interests | | 68,199 |
| 2,826 |
| (71,025 | ) | — |
| — |
| — |
| | 61,825 |
| 2,731 |
| (64,556 | ) | — |
| — |
| — |
|
FFO 5 | | $ | 419,858 |
| $ | — |
| $ | — |
| $ | 419,858 |
| $ | (62,431 | ) | $ | 357,427 |
| | $ | 325,941 |
| $ | — |
| $ | — |
| $ | 325,941 |
| $ | 19,724 |
| $ | 345,665 |
|
| | | | | | | | | | | | | | | |
| Company FFO per diluted share | | | | | | | $ | 0.38 |
| | | | | | | $ | 0.36 |
|
| | | | | | | | | | | | | | | |
| |
| 1. | Adjustments primarily relate to the following: straight-line rent, above/below market lease amortization, amortization of real estate tax stabilization agreement, loss on foreign currency and the related benefit from income taxes, and other non-comparable items. |
| |
| 2. | Adjustments include amounts for straight-line rent of ($13,999) and ($15,413) and above/below market lease amortization of $17,162 and $21,115 for the three months ended December 31, 2014 and 2013, respectively. |
| |
| 3. | Unconsolidated amounts include our share of management fees paid by these properties. Revenues associated with these fees are included in consolidated management fees and other corporate revenues. |
| |
| 4. | Company FFO includes FFO from discontinued operations. Adjustments include a gain on extinguishment of liability of $77,215 for the three months ended December 31, 2014. |
| |
| 5. | Proportionate FFO reflects FFO as defined by NAREIT. |
|
| |
PROPORTIONATE FINANCIAL STATEMENTS
Company NOI, EBITDA and FFO For the Twelve Months Ended December 31, 2014 and 2013 (In thousands) | |
|
| | | | | | | | | | | | | | | | | | | | | | | | | | | | | | | | | | | | | | |
| | | Twelve Months Ended December 31, 2014 | | Twelve Months Ended December 31, 2013 |
| | | Consolidated Properties | Noncontrolling Interests | Unconsolidated Properties | Proportionate | Adjustments 1 | Company | | Consolidated Properties | Noncontrolling Interests | Unconsolidated Properties | Proportionate | Adjustments | Company |
| Property revenues: | | | | | | | | | | | | | | |
Minimum rents 2 | | $ | 1,583,695 |
| $ | (16,609 | ) | $ | 391,255 |
| $ | 1,958,341 |
| $ | 25,504 |
| $ | 1,983,845 |
| | $ | 1,553,941 |
| $ | (14,143 | ) | $ | 361,997 |
| $ | 1,901,795 |
| $ | 27,914 |
| $ | 1,929,709 |
|
| Tenant recoveries | | 739,411 |
| (6,743 | ) | 172,255 |
| 904,923 |
| — |
| 904,923 |
| | 716,932 |
| (4,841 | ) | 159,220 |
| 871,311 |
| — |
| 871,311 |
|
| Overage rents | | 51,611 |
| (528 | ) | 14,897 |
| 65,980 |
| — |
| 65,980 |
| | 55,998 |
| (486 | ) | 15,829 |
| 71,341 |
| — |
| 71,341 |
|
| Other revenue | | 89,999 |
| (1,146 | ) | 16,036 |
| 104,889 |
| — |
| 104,889 |
| | 90,353 |
| (442 | ) | 15,958 |
| 105,869 |
| — |
| 105,869 |
|
| Total property revenues | | 2,464,716 |
| (25,026 | ) | 594,443 |
| 3,034,133 |
| 25,504 |
| 3,059,637 |
| | 2,417,224 |
| (19,912 | ) | 553,004 |
| 2,950,316 |
| 27,914 |
| 2,978,230 |
|
| Property operating expenses: | | | | | | | | | | | | | | |
| Real estate taxes | | 227,992 |
| (2,853 | ) | 54,130 |
| 279,269 |
| (5,958 | ) | 273,311 |
| | 239,807 |
| (2,126 | ) | 51,450 |
| 289,131 |
| (6,312 | ) | 282,819 |
|
| Property maintenance costs | | 66,897 |
| (448 | ) | 18,886 |
| 85,335 |
| — |
| 85,335 |
| | 69,411 |
| (406 | ) | 16,890 |
| 85,895 |
| — |
| 85,895 |
|
| Marketing | | 23,455 |
| (229 | ) | 7,159 |
| 30,385 |
| — |
| 30,385 |
| | 26,232 |
| (263 | ) | 7,840 |
| 33,809 |
| — |
| 33,809 |
|
| Other property operating costs | | 334,819 |
| (3,026 | ) | 84,096 |
| 415,889 |
| (5,162 | ) | 410,727 |
| | 342,815 |
| (2,068 | ) | 78,695 |
| 419,442 |
| (10,108 | ) | 409,334 |
|
| Provision for doubtful accounts | | 8,055 |
| (58 | ) | 1,373 |
| 9,370 |
| — |
| 9,370 |
| | 3,920 |
| (29 | ) | 645 |
| 4,536 |
| — |
| 4,536 |
|
| Total property operating expenses | | 661,218 |
| (6,614 | ) | 165,644 |
| 820,248 |
| (11,120 | ) | 809,128 |
| | 682,185 |
| (4,892 | ) | 155,520 |
| 832,813 |
| (16,420 | ) | 816,393 |
|
| NOI | | $ | 1,803,498 |
| $ | (18,412 | ) | $ | 428,799 |
| $ | 2,213,885 |
| $ | 36,624 |
| $ | 2,250,509 |
| | $ | 1,735,039 |
| $ | (15,020 | ) | $ | 397,484 |
| $ | 2,117,503 |
| $ | 44,334 |
| $ | 2,161,837 |
|
| Management fees and other corporate revenues | | 70,887 |
| — |
| — |
| 70,887 |
| — |
| 70,887 |
| | 68,792 |
| — |
| — |
| 68,792 |
| — |
| 68,792 |
|
Property management and other costs 3 | | (155,093 | ) | 670 |
| (28,477 | ) | (182,900 | ) | — |
| (182,900 | ) | | (164,457 | ) | 638 |
| (25,895 | ) | (189,714 | ) | — |
| (189,714 | ) |
| General and administrative | | (64,051 | ) | 2 |
| (4,389 | ) | (68,438 | ) | 17,854 |
| (50,584 | ) | | (49,237 | ) | — |
| (991 | ) | (50,228 | ) | — |
| (50,228 | ) |
| EBITDA | | $ | 1,655,241 |
| $ | (17,740 | ) | $ | 395,933 |
| $ | 2,033,434 |
| $ | 54,478 |
| $ | 2,087,912 |
| | $ | 1,590,137 |
| $ | (14,382 | ) | $ | 370,598 |
| $ | 1,946,353 |
| $ | 44,334 |
| $ | 1,990,687 |
|
| Depreciation on non-income producing assets | | (11,806 | ) | — |
| — |
| (11,806 | ) | — |
| (11,806 | ) | | (12,232 | ) | — |
| — |
| (12,232 | ) | — |
| (12,232 | ) |
| Interest and dividend income | | 28,613 |
| 1,546 |
| 2,155 |
| 32,314 |
| (484 | ) | 31,830 |
| | 7,699 |
| (1 | ) | 533 |
| 8,231 |
| — |
| 8,231 |
|
| Preferred unit distributions | | (8,965 | ) | — |
| — |
| (8,965 | ) | — |
| (8,965 | ) | | (9,287 | ) | — |
| — |
| (9,287 | ) | — |
| (9,287 | ) |
| Preferred stock dividends | | (15,936 | ) | — |
| — |
| (15,936 | ) | — |
| (15,936 | ) | | (14,078 | ) | — |
| — |
| (14,078 | ) | — |
| (14,078 | ) |
| Interest expense: | | | | | | | | | | | | | | |
| Default interest | | — |
| — |
| — |
| — |
| — |
| — |
| | (1,306 | ) | — |
| — |
| (1,306 | ) | 1,306 |
| — |
|
| Mark-to-market adjustments on debt | | (3,014 | ) | (391 | ) | 1,512 |
| (1,893 | ) | 1,893 |
| — |
| | (9,329 | ) | (373 | ) | (583 | ) | (10,285 | ) | 10,285 |
| — |
|
| Write-off of mark-to-market adjustments on extinguished debt | | (9,831 | ) | — |
| — |
| (9,831 | ) | 9,831 |
| — |
| | 6,801 |
| — |
| (3,513 | ) | 3,288 |
| (3,288 | ) | — |
|
| Interest on existing debt | | (686,440 | ) | 5,982 |
| (152,794 | ) | (833,252 | ) | — |
| (833,252 | ) | | (719,318 | ) | 4,478 |
| (138,545 | ) | (853,385 | ) | — |
| (853,385 | ) |
| Loss on foreign currency | | (18,048 | ) | — |
| — |
| (18,048 | ) | 18,048 |
| — |
| | (7,312 | ) | — |
| — |
| (7,312 | ) | 7,312 |
| — |
|
| Warrant liability adjustment | | — |
| — |
| — |
| — |
| — |
| — |
| | (40,546 | ) | — |
| — |
| (40,546 | ) | 40,546 |
| — |
|
Loss on extinguishment of debt 4 | | — |
| — |
| — |
| — |
| — |
| — |
| | (36,479 | ) | — |
| — |
| (36,479 | ) | 36,479 |
| — |
|
| (Provision for) benefit from income taxes | | (7,253 | ) | 74 |
| (633 | ) | (7,812 | ) | (4,961 | ) | (12,773 | ) | | (345 | ) | 72 |
| (202 | ) | (475 | ) | (2,892 | ) | (3,367 | ) |
FFO from discontinued operations 5 | | 161,126 |
| — |
| 865 |
| 161,991 |
| (143,350 | ) | 18,641 |
| | 43,658 |
| — |
| 14,707 |
| 58,365 |
| (16,701 | ) | 41,664 |
|
| | | 1,083,687 |
| (10,529 | ) | 247,038 |
| 1,320,196 |
| (64,545 | ) | 1,255,651 |
| | 798,063 |
| (10,206 | ) | 242,995 |
| 1,030,852 |
| 117,381 |
| 1,148,233 |
|
| Equity in FFO of Unconsolidated Properties and Noncontrolling Interests | | 236,509 |
| 10,529 |
| (247,038 | ) | — |
| — |
| — |
| | 232,789 |
| 10,206 |
| (242,995 | ) | — |
| — |
| — |
|
FFO 6 | | $ | 1,320,196 |
| $ | — |
| $ | — |
| $ | 1,320,196 |
| $ | (64,545 | ) | $ | 1,255,651 |
| | $ | 1,030,852 |
| $ | — |
| $ | — |
| $ | 1,030,852 |
| $ | 117,381 |
| $ | 1,148,233 |
|
| | | | | | | | | | | | | | | |
| Company FFO per diluted share | | | | | | | $ | 1.32 |
| | | | | | | $ | 1.16 |
|
| |
| 1. | Adjustments primarily relate to the following: straight-line rent, above/below market lease amortization, amortization of real estate tax stabilization agreement, amounts resulting from Urban litigation settlement, loss on foreign currency and the related benefit from income taxes, and other non-comparable items. |
| |
| 2. | Adjustments include amounts for straight-line rent of ($57,339) and ($60,925) and above/below market lease amortization of $82,843 and $88,839 for the twelve months ended December 31, 2014 and 2013, respectively. |
| |
| 3. | Unconsolidated amounts include our share of management fees paid by these properties. Revenues associated with these fees are included in consolidated management fees and other corporate revenues. |
| |
| 4. | For the twelve months ended December 31, 2013, adjustments include $24.0 million in prepayment fees to retire unsecured notes, a $5.8 million prepayment penalty on a secured mortgage note and $6.6 million in fees related to the refinancing of the secured corporate loan. |
| |
| 5. | Company FFO includes FFO from discontinued operations. Adjustments include gains on extinguishment of debt of $66,680 and $25,894 for the twelve months ended December 31, 2014 and 2013, respectively and gain on extinguishment of liability of $77,215 for the twelve months ended December 31, 2014. |
| |
| 6. | Proportionate FFO reflects FFO as defined by NAREIT. |
|
| |
PROPORTIONATE FINANCIAL STATEMENTS
Reconciliation of Non-GAAP to GAAP Financial Measures (In thousands) | |
|
| | | | | | | | | | | | | | |
| | | Three Months Ended | | Twelve Months Ended |
| | | December 31, 2014 | December 31, 2013 | | December 31, 2014 | December 31, 2013 |
| | | | | | | |
| Reconciliation of Company NOI to GAAP Operating Income | | | | | | |
| Company NOI | | $ | 608,432 |
| $ | 594,919 |
| | $ | 2,250,509 |
| $ | 2,161,837 |
|
Adjustments for minimum rents, real estate taxes and other property operating costs 1 | | (5,920 | ) | (8,624 | ) | | (36,624 | ) | (44,334 | ) |
| Proportionate NOI | | 602,512 |
| 586,295 |
| | 2,213,885 |
| 2,117,503 |
|
| Unconsolidated Properties | | (120,205 | ) | (110,710 | ) | | (428,799 | ) | (397,484 | ) |
| Consolidated Properties | | 482,307 |
| 475,585 |
| | 1,785,086 |
| 1,720,019 |
|
| Management fees and other corporate revenues | | 19,128 |
| 18,218 |
| | 70,887 |
| 68,792 |
|
| Property management and other costs | | (35,702 | ) | (41,378 | ) | | (155,093 | ) | (164,457 | ) |
| General and administrative | | (11,441 | ) | (14,658 | ) | | (64,051 | ) | (49,237 | ) |
| Provisions for impairment | | (5,278 | ) | — |
| | (5,278 | ) | — |
|
| Depreciation and amortization | | (179,478 | ) | (188,860 | ) | | (708,406 | ) | (749,722 | ) |
| Loss on sales of investment properties | | — |
| — |
| | (44 | ) | — |
|
| Noncontrolling interest in operating income of Consolidated Properties and other | | 4,791 |
| 3,937 |
| | 18,412 |
| 15,021 |
|
| Operating income | | $ | 274,327 |
| $ | 252,844 |
| | $ | 941,513 |
| $ | 840,416 |
|
| | | | | | | |
| Reconciliation of Company EBITDA to GAAP Net Income Attributable to GGP | | | | | | |
| Company EBITDA | | $ | 572,296 |
| $ | 550,011 |
| | $ | 2,087,912 |
| $ | 1,990,687 |
|
Adjustments for minimum rents, real estate taxes, other property operating costs, and general and administrative 1 | | (5,920 | ) | (8,624 | ) | | (54,478 | ) | (44,334 | ) |
| Proportionate EBITDA | | 566,376 |
| 541,387 |
| | 2,033,434 |
| 1,946,353 |
|
| Unconsolidated Properties | | (111,904 | ) | (103,448 | ) | | (395,933 | ) | (370,598 | ) |
| Consolidated Properties | | 454,472 |
| 437,939 |
| | 1,637,501 |
| 1,575,755 |
|
| Depreciation and amortization | | (179,478 | ) | (188,860 | ) | | (708,406 | ) | (749,722 | ) |
| Noncontrolling interest in NOI of Consolidated Properties and other | | 4,791 |
| 3,937 |
| | 18,412 |
| 15,021 |
|
| Interest income | | 8,812 |
| 6,423 |
| | 28,613 |
| 7,699 |
|
| Interest expense | | (171,012 | ) | (173,595 | ) | | (699,285 | ) | (723,152 | ) |
| Loss on foreign currency | | (11,031 | ) | (7,312 | ) | | (18,048 | ) | (7,312 | ) |
| Warrant liability adjustment | | — |
| — |
| | — |
| (40,546 | ) |
| (Provision for) benefit from income taxes | | (4,417 | ) | 891 |
| | (7,253 | ) | (345 | ) |
| Provision for impairment excluded from FFO | | (5,278 | ) | — |
| | (5,278 | ) | — |
|
| Equity in income of Unconsolidated Real Estate Affiliates | | 27,410 |
| 26,943 |
| | 61,278 |
| 68,756 |
|
| Discontinued operations | | 78,236 |
| (25,033 | ) | | 281,883 |
| (11,622 | ) |
| Gains from changes in control of investment properties | | 91,193 |
| — |
| | 91,193 |
| 219,784 |
|
| Loss on extinguishment of debt | | — |
| — |
| | — |
| (36,479 | ) |
| Loss on sales of investment properties | | — |
| — |
| | (44 | ) | — |
|
| Allocation to noncontrolling interests | | (4,216 | ) | (4,136 | ) | | (14,716 | ) | (15,309 | ) |
| Net income attributable to GGP | | $ | 289,482 |
| $ | 77,197 |
| | $ | 665,850 |
| $ | 302,528 |
|
1.Refer to Pages 5-6 (Company NOI, EBITDA and FFO).
|
| |
PROPORTIONATE FINANCIAL STATEMENTS
Reconciliation of Non-GAAP to GAAP Financial Measures (In thousands) | |
|
| | | | | | | | | | | | | | |
| | | Three Months Ended | | Twelve Months Ended |
| | | December 31, 2014 | December 31, 2013 | | December 31, 2014 | December 31, 2013 |
| | | | | | | |
| Reconciliation of Company FFO to GAAP Net Income Attributable to GGP | | | | | | |
| Company FFO | | $ | 357,427 |
| $ | 345,665 |
| | $ | 1,255,651 |
| $ | 1,148,233 |
|
Adjustments for minimum rents, property operating expenses, market rate adjustments, debt extinguishment, income taxes and FFO from discontinued operations1 | | 62,431 |
| (19,724 | ) | | 64,545 |
| (117,381 | ) |
| Proportionate FFO | | 419,858 |
| 325,941 |
| | 1,320,196 |
| 1,030,852 |
|
| Depreciation and amortization of capitalized real estate costs | | (229,982 | ) | (232,408 | ) | | (893,418 | ) | (915,282 | ) |
| Gain from change in control of investment properties | | 91,193 |
| — |
| | 91,193 |
| 219,784 |
|
| Preferred stock dividends | | 3,984 |
| 3,984 |
| | 15,936 |
| 14,078 |
|
| Gains (losses) on sales of investment properties | | 10,368 |
| 9,216 |
| | 141,687 |
| 9,026 |
|
| Noncontrolling interests in depreciation of Consolidated Properties | | 2,246 |
| 1,788 |
| | 8,731 |
| 7,151 |
|
| Provision for impairment excluded from FFO | | (5,278 | ) | — |
| | (5,278 | ) | — |
|
| Provision for impairment excluded from FFO of discontinued operations | | — |
| (25,961 | ) | | — |
| (30,935 | ) |
| Redeemable noncontrolling interests | | (1,179 | ) | (726 | ) | | (3,228 | ) | (2,289 | ) |
| Depreciation and amortization of discontinued operations | | (1,728 | ) | (4,637 | ) | | (9,969 | ) | (29,857 | ) |
| Net income attributable to GGP | | $ | 289,482 |
| $ | 77,197 |
| | $ | 665,850 |
| $ | 302,528 |
|
| | | | | | | |
| Reconciliation of Equity in NOI of Unconsolidated Properties to GAAP Equity in Income of Unconsolidated Real Estate Affiliates | | | | | | |
| Equity in Unconsolidated Properties: | | | | | | |
| NOI | | $ | 120,205 |
| $ | 110,710 |
| | $ | 428,799 |
| $ | 397,484 |
|
| Net property management fees and costs | | (7,800 | ) | (7,020 | ) | | (28,477 | ) | (25,895 | ) |
| General and administrative and provisions for impairment | | (501 | ) | (242 | ) | | (4,389 | ) | (991 | ) |
| EBITDA | | 111,904 |
| 103,448 |
| | 395,933 |
| 370,598 |
|
| Net interest expense | | (40,667 | ) | (39,157 | ) | | (149,127 | ) | (142,108 | ) |
| Provision for income taxes | | (339 | ) | 8 |
| | (633 | ) | (202 | ) |
| FFO of discontinued Unconsolidated Properties | | 127 |
| 257 |
| | 865 |
| 14,707 |
|
| FFO of Unconsolidated Properties | | 71,025 |
| 64,556 |
| | 247,038 |
| 242,995 |
|
| Depreciation and amortization of capitalized real estate costs | | (53,334 | ) | (46,817 | ) | | (197,129 | ) | (184,115 | ) |
| Other, including gain on sales of investment properties | | 9,719 |
| 9,204 |
| | 11,369 |
| 9,876 |
|
| Equity in income of Unconsolidated Real Estate Affiliates | | $ | 27,410 |
| $ | 26,943 |
| | $ | 61,278 |
| $ | 68,756 |
|
| | | | | | | |
1.Refer to Page 5-6 (Company NOI, EBITDA and FFO).
|
| |
Debt
SUMMARY, AT SHARE As of December 31, 2014 (In thousands) | |
|
| | | | | | | | | | | | | | | | | | | | | | | | | | | | | | |
| | | | | | | Maturities | | |
| | | Coupon Rate | Proportionate Balance | Average Remaining Term (Years) | | 2015 | 2016 | 2017 | 2018 | 2019 | Subsequent | | Total |
| Fixed Rate | | | | | | | | | | | | | |
| Property Level Consolidated | | 4.52% | $ | 13,466,048 |
| 7.0 |
| | $ | 360,301 |
| $ | 522,404 |
| $ | 701,824 |
| $ | 118,892 |
| $ | 493,457 |
| $ | 10,107,361 |
| | $ | 12,304,239 |
|
| Property Level Unconsolidated | | 4.37% | 3,463,130 |
| 6.7 |
| | 120,409 |
| 2,944 |
| 172,773 |
| 186,862 |
| 607,145 |
| 2,138,735 |
| | 3,228,868 |
|
| Corporate Consolidated | | 4.41% | 6,735 |
| 0.9 |
| | 573 |
| — |
| — |
| — |
| — |
| — |
| | 573 |
|
| Total Fixed Rate | | 4.49% | $ | 16,935,913 |
| 6.9 |
| | $ | 481,283 |
| $ | 525,348 |
| $ | 874,597 |
| $ | 305,754 |
| $ | 1,100,602 |
| $ | 12,246,096 |
| | $ | 15,533,680 |
|
| | | | | | | | | | | | | | |
| Variable Rate | | | | | | | | | | | | | |
Property Level Consolidated 1 | | 2.00% | $ | 2,291,352 |
| 3.7 |
| | $ | — |
| $ | — |
| $ | — |
| $ | 1,571,973 |
| $ | 691,407 |
| $ | — |
| | $ | 2,263,380 |
|
| Property Level Unconsolidated | | 3.22% | 477,160 |
| 3.9 |
| | — |
| 44,582 |
| 110,500 |
| 16,250 |
| 178,328 |
| 127,500 |
| | 477,160 |
|
| Junior Subordinated Notes Due 2036 | | 1.68% | 206,200 |
| 21.3 |
| | — |
| — |
| — |
| — |
| — |
| 206,200 |
| | 206,200 |
|
| Total Variable Rate | | 2.18% | $ | 2,974,712 |
| 5.0 |
| | $ | — |
| $ | 44,582 |
| $ | 110,500 |
| $ | 1,588,223 |
| $ | 869,735 |
| $ | 333,700 |
| | $ | 2,946,740 |
|
| | | | | | | | | | | | | | |
| Total | | 4.14% | $ | 19,910,625 |
| 6.6 |
| | $ | 481,283 |
| $ | 569,930 |
| $ | 985,097 |
| $ | 1,893,977 |
| $ | 1,970,337 |
| $ | 12,579,796 |
| | $ | 18,480,420 |
|
| | | | | | | | | | | | | | |
| | | | Total Amortization | | | $ | 169,445 |
| $ | 192,220 |
| $ | 184,411 |
| $ | 171,000 |
| $ | 169,430 |
| $ | 543,699 |
| | $ | 1,430,205 |
|
| | | | | | | | | | | | | | |
| | | | | | | | | Total Maturities and Amortization 2, 3 | | | $ | 19,910,625 |
|
1. Properties provide mortgage collateral as guarantors. The $1.4 billion corporate loan is cross collateralized.
2. Reconciliation to GGP Proportionate Mortgages, Notes, and Loans Payable:
|
| | | |
| Total Mortgages, Notes, and Other Payables, from above | $ | 19,910,625 |
|
| Market rate adjustments, net | 20,784 |
|
| Junior Subordinated Notes Due 2036 | (206,200 | ) |
| Corporate Revolver | 100,000 |
|
| Other | (14,399 | ) |
| Total | $ | 19,810,810 |
|
3. Reflects maturities and amortization for periods subsequent to December 31, 2014.
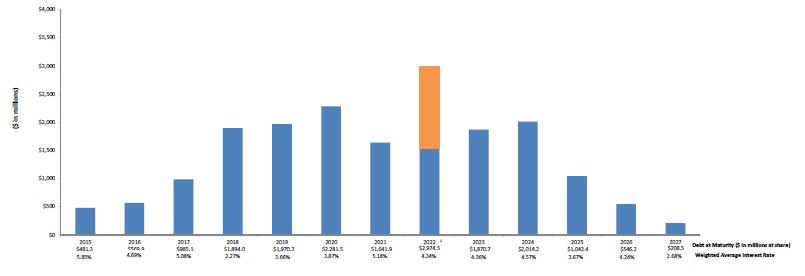
1. Net present value of debt is $11.1 billion at 8% discount rate.
2. Maturities in 2022 include $1.4 billion for Ala Moana (presented with separate color).
|
| |
DEBT
DETAIL, AT SHARE1 As of December 31, 2014 (In thousands) | |
|
| | | | | | | | | | | | | | | | | | | | | | | | | | | | | | |
| | | | | | | | | | Amortization |
| Property | | Own% | Proportionate Balance | Maturity Year 2 | Balloon Pmt at Maturity | Coupon Rate | Parent Recourse as of 12/31/2014 3 | | 2015 | 2016 | 2017 | 2018 | 2019 | Subsequent |
| Fixed Rate | | | | | | | | | | | | | | |
| | | | | | | | | | | | | | | |
| Consolidated Property Level | | | | | | | | | | | | | | |
| Boise Towne Plaza | | 100% | $ | 8,965 |
| 2015 | $ | 8,765 |
| 4.70% | No | | $ | 200 |
| $ | — |
| $ | — |
| $ | — |
| $ | — |
| $ | — |
|
| Paramus Park | | 100% | 92,095 |
| 2015 | 90,242 |
| 4.86% | No | | 1,853 |
| — |
| — |
| — |
| — |
| — |
|
| Peachtree Mall | | 100% | 78,226 |
| 2015 | 77,085 |
| 5.08% | No | | 1,141 |
| — |
| — |
| — |
| — |
| — |
|
| Quail Springs Mall | | 100% | 67,517 |
| 2015 | 66,864 |
| 6.74% | No | | 653 |
| — |
| — |
| — |
| — |
| — |
|
| The Shops at La Cantera | | 75% | 118,345 |
| 2015 | 117,345 |
| 5.95% | No | | 1,000 |
| — |
| — |
| — |
| — |
| — |
|
| Brass Mill Center | | 100% | 99,814 |
| 2016 | 93,347 |
| 4.55% | No | | 4,885 |
| 1,582 |
| — |
| — |
| — |
| — |
|
| Glenbrook Square | | 100% | 154,352 |
| 2016 | 141,325 |
| 4.91% | No | | 5,511 |
| 7,516 |
| — |
| — |
| — |
| — |
|
| Lakeside Mall | | 100% | 154,011 |
| 2016 | 144,451 |
| 4.28% | No | | 6,155 |
| 3,405 |
| — |
| — |
| — |
| — |
|
| Ridgedale Center | | 100% | 154,646 |
| 2016 | 143,281 |
| 4.86% | No | | 5,649 |
| 5,716 |
| — |
| — |
| — |
| — |
|
| Apache Mall | | 100% | 96,151 |
| 2017 | 91,402 |
| 4.32% | No | | 1,776 |
| 1,843 |
| 1,130 |
| — |
| — |
| — |
|
| Beachwood Place | | 100% | 213,432 |
| 2017 | 190,177 |
| 5.60% | No | | 6,655 |
| 9,274 |
| 7,326 |
| — |
| — |
| — |
|
| Eastridge (CA) | | 100% | 142,933 |
| 2017 | 127,418 |
| 5.79% | Yes - Partial | | 4,617 |
| 6,398 |
| 4,500 |
| — |
| — |
| — |
|
| Four Seasons Town Centre | | 100% | 82,915 |
| 2017 | 72,532 |
| 5.60% | No | | 3,722 |
| 4,940 |
| 1,721 |
| — |
| — |
| — |
|
| Mall of Louisiana | | 100% | 211,522 |
| 2017 | 191,409 |
| 5.82% | No | | 5,647 |
| 8,074 |
| 6,392 |
| — |
| — |
| — |
|
Provo Towne Center 4 | | 75% | 30,246 |
| 2017 | 28,886 |
| 4.53% | No | | 545 |
| 566 |
| 249 |
| — |
| — |
| — |
|
| Hulen Mall | | 100% | 127,529 |
| 2018 | 118,702 |
| 4.25% | No | | 2,220 |
| 2,304 |
| 2,421 |
| 1,882 |
| — |
| — |
|
| The Gallery at Harborplace - Other | | 100% | 7,210 |
| 2018 | 190 |
| 6.05% | No | | 1,906 |
| 2,026 |
| 2,152 |
| 936 |
| — |
| — |
|
| Coronado Center | | 100% | 197,534 |
| 2019 | 180,278 |
| 3.50% | No | | 3,830 |
| 3,948 |
| 4,110 |
| 4,258 |
| 1,110 |
| — |
|
| Governor's Square | | 100% | 70,506 |
| 2019 | 66,488 |
| 6.69% | No | | 907 |
| 969 |
| 1,035 |
| 1,107 |
| — |
| — |
|
| Oak View Mall | | 100% | 78,966 |
| 2019 | 74,467 |
| 6.69% | No | | 1,014 |
| 1,085 |
| 1,160 |
| 1,240 |
| — |
| — |
|
| Park City Center | | 100% | 187,362 |
| 2019 | 172,224 |
| 5.34% | No | | 3,120 |
| 3,264 |
| 3,473 |
| 3,666 |
| 1,615 |
| — |
|
| Fashion Place | | 100% | 226,730 |
| 2020 | 226,730 |
| 3.64% | No | | — |
| — |
| — |
| — |
| — |
| — |
|
| Mall St. Matthews | | 100% | 186,662 |
| 2020 | 170,305 |
| 2.72% | No | | — |
| 1,985 |
| 4,067 |
| 4,181 |
| 4,297 |
| 1,827 |
|
| Newgate Mall | | 100% | 58,000 |
| 2020 | 58,000 |
| 3.69% | No | | — |
| — |
| — |
| — |
| — |
| — |
|
| The Mall In Columbia | | 100% | 350,000 |
| 2020 | 316,928 |
| 3.95% | No | | 1,532 |
| 6,279 |
| 6,531 |
| 6,794 |
| 7,067 |
| 4,869 |
|
| Town East Mall | | 100% | 160,270 |
| 2020 | 160,270 |
| 3.57% | No | | — |
| — |
| — |
| — |
| — |
| — |
|
| Tucson Mall | | 100% | 246,000 |
| 2020 | 246,000 |
| 4.01% | No | | — |
| — |
| — |
| — |
| — |
| — |
|
| Tysons Galleria | | 100% | 318,100 |
| 2020 | 282,081 |
| 4.06% | No | | 5,774 |
| 5,979 |
| 6,266 |
| 6,528 |
| 6,802 |
| 4,670 |
|
| Visalia Mall | | 100% | 74,000 |
| 2020 | 74,000 |
| 3.71% | No | | — |
| — |
| — |
| — |
| — |
| — |
|
| Deerbrook Mall | | 100% | 145,934 |
| 2021 | 127,934 |
| 5.25% | No | | 2,497 |
| 2,612 |
| 2,776 |
| 2,928 |
| 3,087 |
| 4,100 |
|
| Fashion Show - Other | | 100% | 4,570 |
| 2021 | 1,577 |
| 6.06% | Yes - Full | | 364 |
| 386 |
| 411 |
| 437 |
| 465 |
| 930 |
|
| Fox River Mall | | 100% | 178,063 |
| 2021 | 156,373 |
| 5.46% | No | | 2,899 |
| 3,038 |
| 3,238 |
| 3,422 |
| 3,616 |
| 5,477 |
|
| Northridge Fashion Center | | 100% | 237,466 |
| 2021 | 207,503 |
| 5.10% | No | | 4,175 |
| 4,362 |
| 4,627 |
| 4,871 |
| 5,129 |
| 6,799 |
|
| Oxmoor Center | | 94% | 85,318 |
| 2021 | 74,781 |
| 5.37% | No | | 1,412 |
| 1,479 |
| 1,574 |
| 1,662 |
| 1,755 |
| 2,655 |
|
| Park Place | | 100% | 189,665 |
| 2021 | 165,815 |
| 5.18% | No | | 3,266 |
| 3,414 |
| 3,626 |
| 3,821 |
| 4,026 |
| 5,697 |
|
| Providence Place | | 94% | 342,702 |
| 2021 | 302,577 |
| 5.65% | No | | 5,424 |
| 5,687 |
| 6,077 |
| 6,434 |
| 6,813 |
| 9,690 |
|
| Rivertown Crossings | | 100% | 160,861 |
| 2021 | 141,356 |
| 5.52% | No | | 2,604 |
| 2,728 |
| 2,910 |
| 3,077 |
| 3,254 |
| 4,932 |
|
| Westlake Center - Land | | 100% | 2,437 |
| 2021 | 2,437 |
| 12.90% | Yes - Full | | — |
| — |
| — |
| — |
| — |
| — |
|
| White Marsh Mall | | 100% | 190,000 |
| 2021 | 190,000 |
| 3.66% | No | | — |
| — |
| — |
| — |
| — |
| — |
|
| Ala Moana Center | | 100% | 1,400,000 |
| 2022 | 1,400,000 |
| 4.23% | No | | — |
| — |
| — |
| — |
| — |
| — |
|
| Bellis Fair | | 100% | 89,778 |
| 2022 | 77,060 |
| 5.23% | No | | 1,523 |
| 1,594 |
| 1,694 |
| 1,786 |
| 1,883 |
| 4,238 |
|
| Coastland Center | | 100% | 125,063 |
| 2022 | 102,621 |
| 3.76% | No | | 2,510 |
| 2,594 |
| 2,707 |
| 2,812 |
| 2,922 |
| 8,897 |
|
| Coral Ridge Mall | | 100% | 110,155 |
| 2022 | 98,394 |
| 5.71% | No | | 349 |
| 1,448 |
| 1,533 |
| 1,623 |
| 1,718 |
| 5,090 |
|
| Greenwood Mall | | 100% | 63,000 |
| 2022 | 57,469 |
| 4.19% | No | | (1 | ) | — |
| 420 |
| 1,054 |
| 1,100 |
| 2,958 |
|
| North Star Mall | | 100% | 325,946 |
| 2022 | 270,113 |
| 3.93% | No | | 6,439 |
| 6,666 |
| 6,973 |
| 7,256 |
| 7,551 |
| 20,948 |
|
| Rogue Valley Mall | | 100% | 55,000 |
| 2022 | 48,245 |
| 4.5% | No | | 138 |
| 852 |
| 899 |
| 941 |
| 984 |
| 2,941 |
|
Spokane Valley Mall 4 | | 75% | 45,410 |
| 2022 | 38,484 |
| 4.65% | No | | 799 |
| 833 |
| 879 |
| 921 |
| 965 |
| 2,529 |
|
| The Gallery at Harborplace | | 100% | 79,055 |
| 2022 | 68,096 |
| 5.24% | No | | 1,258 |
| 1,315 |
| 1,398 |
| 1,474 |
| 1,555 |
| 3,959 |
|
|
| |
DEBT
DETAIL, AT SHARE1 As of December 31, 2014 (In thousands) | |
|
| | | | | | | | | | | | | | | | | | | | | | | | | | | | | | |
| | | | | | | | | | Amortization |
| Property | | Own% | Proportionate Balance | Maturity Year 2 | Balloon Pmt at Maturity | Coupon Rate | Parent Recourse as of 12/31/2014 3 | | 2015 | 2016 | 2017 | 2018 | 2019 | Subsequent |
| | | | | | | | | | | | | | | |
| The Oaks Mall | | 100% | 134,253 |
| 2022 | 112,842 |
| 4.55% | No | | 2,359 |
| 2,451 |
| 2,584 |
| 2,706 |
| 2,833 |
| 8,478 |
|
| The Shoppes at Buckland Hills | | 100% | 124,961 |
| 2022 | 107,820 |
| 5.19% | No | | 2,030 |
| 2,121 |
| 2,253 |
| 2,375 |
| 2,503 |
| 5,859 |
|
| The Streets at Southpoint | | 94% | 243,094 |
| 2022 | 207,909 |
| 4.36% | No | | 4,161 |
| 4,348 |
| 4,542 |
| 4,744 |
| 4,955 |
| 12,435 |
|
| Westroads Mall | | 100% | 151,638 |
| 2022 | 127,455 |
| 4.55% | No | | 2,663 |
| 2,769 |
| 2,919 |
| 3,056 |
| 3,200 |
| 9,576 |
|
| Augusta Mall | | 100% | 170,000 |
| 2023 | 170,000 |
| 4.36% | No | | — |
| — |
| — |
| — |
| — |
| — |
|
| Boise Towne Square | | 100% | 132,841 |
| 2023 | 106,372 |
| 4.79% | No | | 2,496 |
| 2,618 |
| 2,746 |
| 2,880 |
| 3,021 |
| 12,708 |
|
| Crossroads Center (MN) | | 100% | 103,785 |
| 2023 | 83,026 |
| 3.25% | No | | 2,227 |
| 2,293 |
| 2,379 |
| 2,459 |
| 2,541 |
| 8,860 |
|
| Cumberland Mall | | 100% | 160,000 |
| 2023 | 160,000 |
| 3.67% | No | | — |
| — |
| — |
| — |
| — |
| — |
|
| Meadows Mall | | 100% | 159,032 |
| 2023 | 118,726 |
| 3.96% | No | | 4,064 |
| 4,212 |
| 4,402 |
| 4,582 |
| 4,770 |
| 18,276 |
|
| Oglethorpe Mall | | 100% | 150,000 |
| 2023 | 136,166 |
| 3.90% | No | | — |
| — |
| — |
| 1,058 |
| 2,648 |
| 10,128 |
|
| Pecanland Mall | | 100% | 90,000 |
| 2023 | 75,750 |
| 3.88% | No | | 1,159 |
| 1,607 |
| 1,682 |
| 1,749 |
| 1,819 |
| 6,234 |
|
| Prince Kuhio Plaza | | 100% | 43,930 |
| 2023 | 35,974 |
| 4.10% | No | | 798 |
| 827 |
| 867 |
| 903 |
| 942 |
| 3,619 |
|
| Staten Island Mall | | 100% | 258,187 |
| 2023 | 206,942 |
| 4.77% | No | | 4,893 |
| 5,131 |
| 5,381 |
| 5,643 |
| 5,918 |
| 24,279 |
|
| Stonestown Galleria | | 100% | 180,000 |
| 2023 | 164,720 |
| 4.39% | No | | — |
| — |
| — |
| 462 |
| 2,871 |
| 11,947 |
|
| The Crossroads (MI) | | 100% | 98,427 |
| 2023 | 80,833 |
| 4.42% | No | | 1,645 |
| 1,708 |
| 1,799 |
| 1,881 |
| 1,967 |
| 8,594 |
|
| The Woodlands | | 100% | 255,242 |
| 2023 | 207,057 |
| 5.04% | No | | 4,717 |
| 4,959 |
| 5,215 |
| 5,484 |
| 5,767 |
| 22,043 |
|
| Baybrook Mall | | 100% | 250,000 |
| 2024 | 212,423 |
| 5.52% | No | | 821 |
| 3,402 |
| 3,595 |
| 3,798 |
| 4,013 |
| 21,948 |
|
| Fashion Show | | 100% | 835,000 |
| 2024 | 835,000 |
| 4.03% | No | | — |
| — |
| — |
| — |
| — |
| — |
|
| Jordan Creek Town Center | | 100% | 216,782 |
| 2024 | 177,448 |
| 4.37% | No | | 3,644 |
| 3,783 |
| 3,980 |
| 4,160 |
| 4,348 |
| 19,419 |
|
| The Maine Mall | | 100% | 235,000 |
| 2024 | 235,000 |
| 4.66% | No | | — |
| — |
| — |
| — |
| — |
| — |
|
| The Parks At Arlington | | 100% | 250,000 |
| 2024 | 212,687 |
| 5.57% | No | | 814 |
| 3,371 |
| 3,564 |
| 3,767 |
| 3,983 |
| 21,814 |
|
| Woodbridge Center | | 100% | 250,000 |
| 2024 | 220,726 |
| 4.80% | No | | — |
| — |
| 2,395 |
| 3,777 |
| 3,964 |
| 19,138 |
|
| Pembroke Lakes Mall | | 100% | 260,000 |
| 2025 | 260,000 |
| 3.56% | No | | — |
| — |
| — |
| — |
| — |
| — |
|
| Valley Plaza Mall | | 100% | 240,000 |
| 2025 | 206,847 |
| 3.75% | No | | — |
| — |
| — |
| 3,168 |
| 4,410 |
| 25,575 |
|
| Willowbrook Mall | | 100% | 360,000 |
| 2025 | 360,000 |
| 3.55% | No | | — |
| — |
| — |
| — |
| — |
| — |
|
| North Point Mall | | 100% | 250,000 |
| 2026 | 218,205 |
| 4.54% | No | | — |
| — |
| — |
| — |
| 984 |
| 30,811 |
|
| Providence Place - Other | | 94% | 37,165 |
| 2028 | 2,247 |
| 7.75% | No | | 2,394 |
| 1,757 |
| 1,897 |
| 1,825 |
| 1,740 |
| 25,305 |
|
| Provo Towne Center Land | | 75% | 2,249 |
| 2095 | 37 |
| 10.00% | Yes - Full | | — |
| — |
| — |
| — |
| — |
| 2,212 |
|
| Consolidated Property Level | | | $ | 13,466,048 |
| | $ | 12,304,239 |
| 4.52% | | | $ | 146,853 |
| $ | 163,518 |
| $ | 146,475 |
| $ | 135,588 |
| $ | 136,911 |
| $ | 432,464 |
|
| | | | | | | | | | | | | | | |
| Unconsolidated Property Level | | | | | | | | | | | | | | |
| Alderwood | | 50% | $ | 121,717 |
| 2015 | $ | 120,409 |
| 6.65% | No | | $ | 1,308 |
| $ | — |
| $ | — |
| $ | — |
| $ | — |
| $ | — |
|
| Shane Plaza | | 50% | 3,006 |
| 2016 | 2,944 |
| 5.56% | No | | 62 |
| — |
| — |
| — |
| — |
| — |
|
Riverchase Galleria 5 | | 50% | 152,500 |
| 2017 | 152,500 |
| 3.86% | No | | — |
| — |
| — |
| — |
| — |
| — |
|
| The Shops at Bravern | | 40% | 21,298 |
| 2017 | 20,273 |
| 3.86% | No | | 444 |
| 460 |
| 121 |
| — |
| — |
| — |
|
| Plaza Frontenac | | 55% | 28,600 |
| 2018 | 28,600 |
| 3.04% | No | | — |
| — |
| — |
| — |
| — |
| — |
|
| Saint Louis Galleria | | 74% | 158,262 |
| 2018 | 158,262 |
| 3.44% | No | | — |
| — |
| — |
| — |
| — |
| — |
|
| First Colony Mall | | 50% | 92,256 |
| 2019 | 84,321 |
| 4.50% | No | | 1,503 |
| 1,573 |
| 1,645 |
| 1,720 |
| 1,494 |
| — |
|
| Natick Mall | | 50% | 225,000 |
| 2019 | 209,699 |
| 4.60% | No | | 584 |
| 3,593 |
| 3,762 |
| 3,939 |
| 3,423 |
| — |
|
| The Grand Canal Shoppes | | 50% | 313,125 |
| 2019 | 313,125 |
| 4.24% | No | | — |
| — |
| — |
| — |
| — |
| — |
|
| Christiana Mall | | 50% | 117,495 |
| 2020 | 108,697 |
| 5.10% | No | | 402 |
| 1,622 |
| 1,725 |
| 1,816 |
| 1,913 |
| 1,320 |
|
| Kenwood Towne Centre | | 70% | 155,198 |
| 2020 | 137,191 |
| 5.37% | No | | 2,659 |
| 2,784 |
| 2,964 |
| 3,131 |
| 3,306 |
| 3,163 |
|
| Oakbrook Center | | 48% | 202,725 |
| 2020 | 202,725 |
| 3.66% | No | | — |
| — |
| — |
| — |
| — |
| — |
|
| Water Tower Place | | 47% | 182,353 |
| 2020 | 171,026 |
| 4.36% | No | | 1,752 |
| 1,837 |
| 1,928 |
| 2,024 |
| 2,124 |
| 1,662 |
|
| Northbrook Court | | 50% | 65,410 |
| 2021 | 56,811 |
| 4.25% | No | | 1,108 |
| 1,156 |
| 1,206 |
| 1,259 |
| 1,313 |
| 2,557 |
|
| Village of Merrick Park | | 55% | 96,900 |
| 2021 | 85,797 |
| 5.73% | No | | 1,520 |
| 1,595 |
| 1,706 |
| 1,808 |
| 1,916 |
| 2,558 |
|
| Whaler's Village | | 50% | 40,000 |
| 2021 | 40,000 |
| 5.42% | No | | — |
| — |
| — |
| — |
| — |
| — |
|
| Willowbrook Mall (TX) | | 50% | 101,740 |
| 2021 | 88,965 |
| 5.13% | No | | 1,779 |
| 1,858 |
| 1,972 |
| 2,077 |
| 2,188 |
| 2,901 |
|
| Bridgewater Commons | | 35% | 105,000 |
| 2022 | 105,000 |
| 3.34% | No | | — |
| — |
| — |
| — |
| — |
| — |
|
| Clackamas Town Center | | 50% | 108,000 |
| 2022 | 108,000 |
| 4.18% | No | | — |
| — |
| — |
| — |
| — |
| — |
|
|
| |
DEBT
DETAIL, AT SHARE1 As of December 31, 2014 (In thousands) | |
|
| | | | | | | | | | | | | | | | | | | | | | | | | | | | | | |
| | | | | | | | | | Amortization |
| Property | | Own% | Proportionate Balance | Maturity Year 2 | Balloon Pmt at Maturity | Coupon Rate | Parent Recourse as of 12/31/2014 3 | | 2015 | 2016 | 2017 | 2018 | 2019 | Subsequent |
| Florence Mall | | 50% | 45,000 |
| 2022 | 45,000 |
| 4.15% | No | | — |
| — |
| — |
| — |
| — |
| — |
|
| Carolina Place | | 50% | 87,500 |
| 2023 | 75,542 |
| 3.84% | No | | — |
| 757 |
| 1,567 |
| 1,630 |
| 1,694 |
| 6,310 |
|
| Galleria at Tyler | | 50% | 95,245 |
| 2023 | 76,716 |
| 5.05% | No | | 1,709 |
| 1,796 |
| 1,889 |
| 1,987 |
| 2,089 |
| 9,059 |
|
| Lake Mead and Buffalo | | 50% | 2,069 |
| 2023 | 27 |
| 7.20% | No | | 181 |
| 194 |
| 209 |
| 224 |
| 241 |
| 993 |
|
| Park Meadows | | 35% | 126,000 |
| 2023 | 112,734 |
| 4.60% | No | | — |
| — |
| — |
| 1,997 |
| 2,090 |
| 9,179 |
|
| The Shoppes at River Crossing | | 50% | 38,675 |
| 2023 | 35,026 |
| 3.75% | No | | — |
| — |
| — |
| 511 |
| 710 |
| 2,428 |
|
| The Trails Village Center | | 50% | 5,795 |
| 2023 | 78 |
| 8.21% | No | | 485 |
| 527 |
| 571 |
| 620 |
| 673 |
| 2,841 |
|
| Union Square Portfolio | | 50% | 25,000 |
| 2023 | 25,000 |
| 5.12% | No | | — |
| — |
| — |
| — |
| — |
| — |
|
| Stonebriar Centre | | 50% | 140,000 |
| 2024 | 120,886 |
| 4.05% | No | | — |
| — |
| 805 |
| 2,477 |
| 2,579 |
| 13,253 |
|
| Pinnacle Hills Promenade | | 50% | 61,000 |
| 2025 | 48,805 |
| 4.13% | No | | 934 |
| 1,048 |
| 1,099 |
| 1,146 |
| 1,195 |
| 6,773 |
|
| Altamonte Mall | | 50% | 80,000 |
| 2025 | 69,045 |
| 3.72% | No | | — |
| — |
| — |
| 1,062 |
| 1,478 |
| 8,415 |
|
| Towson Town Center | | 35% | 113,761 |
| 2025 | 97,713 |
| 3.82% | No | | — |
| — |
| — |
| 681 |
| 2,093 |
| 13,274 |
|
| Glendale Galleria | | 50% | 215,000 |
| 2026 | 190,451 |
| 4.06% | No | | — |
| — |
| — |
| — |
| — |
| 24,549 |
|
| Perimeter Mall | | 50% | 137,500 |
| 2,026 | 137,500 |
| 3.96% | No | | — |
| — |
| — |
| — |
| — |
| — |
|
| Unconsolidated Property Level | | | $ | 3,463,130 |
| | $ | 3,228,868 |
| 4.37% | | | $ | 16,430 |
| $ | 20,800 |
| $ | 23,169 |
| $ | 30,109 |
| $ | 32,519 |
| $ | 111,235 |
|
| | | | | | | | | | | | | | | |
| Total Fixed - Property Level | | | $ | 16,929,178 |
| | $ | 15,533,107 |
| 4.49% | | | $ | 163,283 |
| $ | 184,318 |
| $ | 169,644 |
| $ | 165,697 |
| $ | 169,430 |
| $ | 543,699 |
|
| | | | | | | | | | | | | | | |
| Consolidated Corporate | | | | | | | | | | | | | | |
| Arizona Two (HHC) | | 100% | $ | 6,735 |
| 2015 | $ | 573 |
| 4.41% | Yes - Full | | $ | 6,162 |
| $ | — |
| $ | — |
| $ | — |
| $ | — |
| $ | — |
|
| Consolidated Corporate | | | $ | 6,735 |
| | $ | 573 |
| 4.41% | | | $ | 6,162 |
| $ | — |
| $ | — |
| $ | — |
| $ | — |
| $ | — |
|
| | | | | | | | | | | | | | | |
| Total Fixed Rate Debt | | | $ | 16,935,913 |
| | $ | 15,533,680 |
| 4.49% | | | $ | 169,445 |
| $ | 184,318 |
| $ | 169,644 |
| $ | 165,697 |
| $ | 169,430 |
| $ | 543,699 |
|
| | | | | | | | | | | | | | | |
| Variable Rate | | | | | | | | | | | | | | |
| | | | | | | | | | | | | | | |
| Consolidated Property Level | | | | | | | | | | | | | | |
| Columbia Mall | | 100% | $ | 100,000 |
| 2018 | $ | 100,000 |
| Libor + 175 bps | Yes - Full | | $ | — |
| $ | — |
| $ | — |
| $ | — |
| $ | — |
| $ | — |
|
Columbiana Centre 6 | | 100% | 130,816 |
| 2018 | 128,177 |
| Libor + 175 bps | Yes - Full | | — |
| 746 |
| 1,393 |
| 500 |
| — |
| — |
|
Eastridge (WY) 6 | | 100% | 48,228 |
| 2018 | 47,255 |
| Libor + 175 bps | Yes - Full | | — |
| 275 |
| 514 |
| 184 |
| — |
| — |
|
Grand Teton Mall 6 | | 100% | 48,859 |
| 2018 | 47,873 |
| Libor + 175 bps | Yes - Full | | — |
| 279 |
| 520 |
| 187 |
| — |
| — |
|
| Market Place Shopping Center | | 100% | 113,425 |
| 2018 | 113,425 |
| Libor + 240 bps | No | | — |
| — |
| — |
| — |
| — |
| — |
|
Mayfair 6 | | 100% | 347,813 |
| 2018 | 340,796 |
| Libor + 175 bps | Yes - Full | | — |
| 1,983 |
| 3,704 |
| 1,330 |
| — |
| — |
|
Mondawmin Mall 6 | | 100% | 81,011 |
| 2018 | 79,377 |
| Libor + 175 bps | Yes - Full | | — |
| 461 |
| 863 |
| 310 |
| — |
| — |
|
North Town Mall 6 | | 100% | 89,207 |
| 2018 | 87,407 |
| Libor + 175 bps | Yes - Full | | — |
| 509 |
| 950 |
| 341 |
| — |
| — |
|
Oakwood 6 | | 100% | 76,913 |
| 2018 | 75,362 |
| Libor + 175 bps | Yes - Full | | — |
| 438 |
| 819 |
| 294 |
| — |
| — |
|
Oakwood Center 6 | | 100% | 91,413 |
| 2018 | 89,569 |
| Libor + 175 bps | Yes - Full | | — |
| 520 |
| 974 |
| 350 |
| — |
| — |
|
Pioneer Place 6 | | 100% | 188,185 |
| 2018 | 184,389 |
| Libor + 175 bps | Yes - Full | | — |
| 1,072 |
| 2,004 |
| 720 |
| — |
| — |
|
Red Cliffs Mall 6 | | 100% | 30,261 |
| 2018 | 29,650 |
| Libor + 175 bps | Yes - Full | | — |
| 173 |
| 322 |
| 116 |
| — |
| — |
|
River Hills Mall 6 | | 100% | 76,283 |
| 2018 | 74,744 |
| Libor + 175 bps | Yes - Full | | — |
| 435 |
| 812 |
| 292 |
| — |
| — |
|
Sooner Mall 6 | | 100% | 78,931 |
| 2018 | 77,338 |
| Libor + 175 bps | Yes - Full | | — |
| 450 |
| 841 |
| 302 |
| — |
| — |
|
Southwest Plaza 6 | | 100% | 73,383 |
| 2018 | 71,902 |
| Libor + 175 bps | Yes - Full | | — |
| 418 |
| 782 |
| 281 |
| — |
| — |
|
The Shops at Fallen Timbers 6 | | 100% | 25,217 |
| 2018 | 24,709 |
| Libor + 175 bps | Yes - Full | | — |
| 143 |
| 269 |
| 96 |
| — |
| — |
|
| 200 Lafayette | | 100% | 100,000 |
| 2019 | 100,000 |
| Libor + 250 bps | No | | — |
| — |
| — |
| — |
| — |
| — |
|
| 830 North Michigan | | 100% | 85,000 |
| 2019 | 85,000 |
| Libor + 160 bps | No | | — |
| — |
| — |
| — |
| — |
| — |
|
Ala Moana Construction Loan 7 | | 100% | 228,907 |
| 2019 | 228,907 |
| Libor + 190 bps | Yes - Partial | | — |
| — |
| — |
| — |
| — |
| — |
|
| Lynnhaven Mall | | 100% | 235,000 |
| 2019 | 235,000 |
| Libor + 185 bps | No | | — |
| — |
| — |
| — |
| — |
| — |
|
| Westlake Center | | 100% | 42,500 |
| 2019 | 42,500 |
| Libor + 230 bps | No | | — |
| — |
| — |
| — |
| — |
| — |
|
| Consolidated Property Level | | | $ | 2,291,352 |
| | $ | 2,263,380 |
| 2.00% | | | $ | — |
| $ | 7,902 |
| $ | 14,767 |
| $ | 5,303 |
| $ | — |
| $ | — |
|
| | | | | | | | | | | | | | | |
|
| |
DEBT
DETAIL, AT SHARE1 As of December 31, 2014 (In thousands) | |
|
| | | | | | | | | | | | | | | | | | | | | | | | | | | | | | |
| | | | | | | | | | Amortization |
| Property | | Own% | Proportionate Balance | Maturity Year 2 | Balloon Pmt at Maturity | Coupon Rate | Parent Recourse as of 12/31/2014 3 | | 2015 | 2016 | 2017 | 2018 | 2019 | Subsequent |
| Unconsolidated Property Level | | | | | | | | | | | | | | |
Miami Design District 8 | | 13% | $ | 44,582 |
| 2016 | $ | 44,582 |
| Libor + 487 bps | No | | $ | — |
| $ | — |
| $ | — |
| $ | — |
| $ | — |
| $ | — |
|
| 530 Fifth Avenue Mezz Note | | 50% | 15,500 |
| 2017 | 15,500 |
| Libor + 788 bps | No | | — |
| — |
| — |
| — |
| — |
| — |
|
| 530 Fifth Avenue | | 50% | 95,000 |
| 2017 | 95,000 |
| Libor + 325 bps | No | | — |
| — |
| — |
| — |
| — |
| — |
|
| Union Square Portfolio | | 50% | 16,250 |
| 2018 | 16,250 |
| Libor + 400 bps | No | | — |
| — |
| — |
| — |
| — |
| — |
|
| 522 Fifth Avenue | | 10% | 8,328 |
| 2019 | 8,328 |
| Libor + 200 bps | No | | — |
| — |
| — |
| — |
| — |
| — |
|
| 685 Fifth Avenue | | 50% | 170,000 |
| 2019 | 170,000 |
| Libor + 275 bps | No | | — |
| — |
| — |
| — |
| — |
| — |
|
| Bayside Marketplace | | 51% | 127,500 |
| 2020 | 127,500 |
| Libor + 205 bps | No | | — |
| — |
| — |
| — |
| — |
| — |
|
| Unconsolidated Property Level | | | $ | 477,160 |
| | $ | 477,160 |
| 3.22% | | | $ | — |
| $ | — |
| $ | — |
| $ | — |
| $ | — |
| $ | — |
|
| | | | | | | | | | | | | | | |
| | | | | | | | | | | | | | | |
| Consolidated Corporate | | | | | | | | | | | | | | |
| Junior Subordinated Notes Due 2036 | | 100% | $ | 206,200 |
| 2036 | $ | 206,200 |
| Libor + 145 bps | Yes - Full | | $ | — |
| $ | — |
| $ | — |
| $ | — |
| $ | — |
| $ | — |
|
| Consolidated Corporate | | | $ | 206,200 |
| | $ | 206,200 |
| 1.68% | | | $ | — |
| $ | — |
| $ | — |
| $ | — |
| $ | — |
| $ | — |
|
| | | | | | | | | | | | | | | |
| Total Variable Rate Debt | | | $ | 2,974,712 |
| | $ | 2,946,740 |
| 2.18% | | | $ | — |
| $ | 7,902 |
| $ | 14,767 |
| $ | 5,303 |
| $ | — |
| $ | — |
|
| | | | | | | | | | | | | | | |
Total 9, 10 | | | $ | 19,910,625 |
| | $ | 18,480,420 |
| 4.14% | | | $ | 169,445 |
| $ | 192,220 |
| $ | 184,411 |
| $ | 171,000 |
| $ | 169,430 |
| $ | 543,699 |
|
| |
| 1. | Proportionate share for Consolidated Properties presented exclusive of non-controlling interests. |
| |
| 2. | Assumes that all maturity extensions are exercised. |
| |
| 3. | Total recourse to GGP or its subsidiaries of approximately $1.9 billion, excluding the corporate revolver. |
| |
| 4. | Loan is cross-collateralized with other properties. |
| |
| 5. | $45.0 million B-note is subordinate to return of GGP's additional contributed equity. |
| |
| 6. | Properties provide mortgage collateral as guarantors for $1.4 billion corporate borrowing and are cross collateralized. |
| |
| 7. | Reflects the amount drawn as of December 31, 2014 on the $450.0 construction loan. |
| |
| 8. | Investment is considered cost method for reporting purposes and is reflected in prepaid and other assets in our proportionate balance sheet. |
| |
| 9. | Excludes the $1.0 billion corporate revolver. As of December 31, 2014 the corporate revolver was undrawn. |
| |
| 10. | Reflects amortization for the period subsequent to December 31, 2014. |
|
| |
ASSET TRANSACTIONS
Summary of Transactions For the Twelve Months Ended December 31, 2014 (In thousands, except GLA)
| |
|
| | | | | | | | | | | | | | |
| Closing Date | Property Name | Property Location | GGP Ownership % | Total GLA | Gross Proceeds at Share | Debt at Share | Net Proceeds at Share 1 |
| | | | | | | ($ in thousands) | |
| Dispositions | | | | | | | |
| February 2014 | Regency Square Mall | Jacksonville, FL | 100.0% | 539,636 |
| $ | 13,000 |
| $ | 78,964 |
| $ | — |
|
| June 2014 | Fallbrook Center | West Hills (Los Angeles), CA | 100.0% | 875,642 |
| 210,000 |
| 100,870 |
| 102,900 |
|
| September 2014 | Lincolnshire Commons | Lincolnshire (Chicago), IL | 100.0% | 118,562 |
| 40,300 |
| 26,100 |
| 13,200 |
|
| September 2014 | Stonestown Medical Office Building | San Francisco, CA | 100.0% | 54,059 |
| 28,300 |
| — |
| 27,100 |
|
| December 2014 | Center Point Plaza | Las Vegas, NV | 50.0% | 144,691 |
| 21,300 |
| 5,962 |
| 15,400 |
|
| December 2014 | Columbia Office Portfolio (6 properties) 3 | Columbia, MD | 100.0% | 716,854 |
| 130,000 |
| — |
| — |
|
| | | | | | | | |
| | Total | | | 2,449,444 |
| $ | 442,900 |
| $ | 211,896 |
| $ | 158,600 |
|
| | | | | | | | |
| Joint Venture Interest | | | | | | | |
| December 2014 | Bayside Marketplace | Miami, FL | Sold 49%, Retained 51% | 217,523 |
| $ | 196,000 |
| $ | 122,500 |
| $ | 71,900 |
|
| | | | | | | | |
| | Total | | | 217,523 |
| $ | 196,000 |
| $ | 122,500 |
| $ | 71,900 |
|
|
| | | | | | | | | | | | | | |
| Closing Date | Property Name | Property Location | GGP Ownership % | Total GLA 2 | Gross Purchase Price at Share | Debt at Share | Net Equity at Share 1 |
| | | | | | | ($ in thousands) | |
| Acquisitions | | | | | | | |
| June 2014 | 685 Fifth Avenue | New York, NY | 50.0% | 140,051 |
| $ | 260,700 |
| $ | 170,000 |
| $ | 106,600 |
|
| September 2014 | 522 Fifth Avenue | New York, NY | 10.0% | 26,500 |
| 16,500 |
| 8,330 |
| 8,300 |
|
| September 2014 | The Shops at the Bravern | Bellevue, WA | 40.0% | 309,000 |
| 88,000 |
| 21,400 |
| 66,600 |
|
| September 2014 | Miami Design District 4 | Miami, FL | 12.5% | 785,000 |
| 175,000 |
| — |
| 175,000 |
|
| October 2014 | 530 Fifth Avenue | New York, NY | 50.0% | 58,000 |
| 150,000 |
| 110,500 |
| 49,000 |
|
| | | | | | | | |
| | Total | | | 1,318,551 |
| $ | 690,200 |
| $ | 310,230 |
| $ | 405,500 |
|
| |
| 1. | Includes closing costs. |
| |
| 2. | Represents total GLA at the property, including development spaces. |
| |
| 3. | Columbia office properties transferred to Howard Hughes Corporation as part of the Company's extinguishment of its tax indemnification liability. |
| |
| 4. | Investment is considered cost method for reporting purposes. The $175.0 million is net of $44.6 million of existing debt at share at the property level and is reflected in prepaid and other assets in our proportionate balance sheet. |
|
| |
ASSET TRANSACTIONS
Discontinued Operations
| |
|
| | |
| | | |
| 2014 Dispositions | Month of Disposition |
| Stand Alone Strip Centers, Office & Other Retail | | |
| Center Point Plaza | | December 2014 |
| Columbia Office Portfolio | | December 2014 |
| Lincolnshire Commons | | September 2014 |
| Stonestown Medical Office Building | | September 2014 |
| Fallbrook Center | | June 2014 |
| Regency Square Mall | | February 2014 |
| | | |
| 2013 Dispositions | | |
| Retail Properties | | |
| Pine Ridge Mall | | December 2013 |
| Burlington Town Center | | December 2013 |
| Eden Prairie Center | | October 2013 |
| Mall of the Bluffs | | February 2013 |
| | | |
| International Properties | | |
| Aliansce Shopping Centers S.A. (Brazil) | | September 2013 |
| | | |
| Stand Alone Strip Centers & Other Retail | | |
| Senate Plaza | | December 2013 |
| Plaza 800 | | May 2013 |
| Southlake Mall | | February 2013 |
|
|
| Portfolio Operating Metrics |
|
| |
PORTFOLIO OPERATING METRICS
Key Operating Performance Indicators As of and for the Twelve Months Ended December 31, 2014 (GLA in thousands)
| |
|
| | | | | | | | | | | | | | | | | | | | | | | | | | | | | |
GLA Summary (in thousands) 1, 2 |
| | Number of Properties | | Mall and Freestanding GLA | | Anchor GLA (GGP Owned) | | Anchor GLA (Tenant Owned) | | Total Retail Property | | Strip Center GLA | | Office GLA | | Total GLA | | Total GLA at Share 3 | | % Leased |
| Consolidated Retail Properties | 87 |
| | 38,006 |
| | 13,087 |
| | 36,008 |
| | 87,101 |
| | 1,113 |
| | 1,444 |
| | 89,658 |
| | 53,072 |
| | 97.2 | % |
| Unconsolidated Retail Properties | 32 |
| | 15,651 |
| | 3,200 |
| | 14,597 |
| | 33,448 |
| | 630 |
| | 918 |
| | 34,996 |
| | 9,979 |
| | 97.4 | % |
| Same Store Retail Properties | 119 |
| | 53,657 |
| | 16,287 |
| | 50,605 |
| | 120,549 |
| | 1,743 |
| | 2,362 |
| | 124,654 |
| | 63,051 |
| | 97.2 | % |
| Non-Same Store Retail Properties | 9 |
| | 1,412 |
| | 218 |
| | 542 |
| | 2,172 |
| | — |
| | 349 |
| | 2,521 |
| | 1,190 |
| | |
| Total Retail Properties | 128 |
| | 55,069 |
| | 16,505 |
| | 51,147 |
| | 122,721 |
| | 1,743 |
| | 2,711 |
| | 127,175 |
| | 64,241 |
| | |
| | | | | | | | | | | | | | | | | | | | |
| Non-Same Store Office, Strip, Urban & Other Retail | 5 |
| | 752 |
| | 340 |
| | 307 |
| | 1,399 |
| | 270 |
| | — |
| | 1,669 |
| | 656 |
| | 69.5 | % |
| Total Real Estate | 133 |
| | 55,821 |
| | 16,845 |
| | 51,454 |
| | 124,120 |
| | 2,013 |
| | 2,711 |
| | 128,844 |
| | 64,897 |
| | 96.2 | % |
|
| | | | | | | | | | | | | | | | | | | | | | | | | | |
| Same Store Operating Metrics |
| | | | | | | | | | | | | | | | |
| | | | | | In-Place Rent | | Tenant Sales 4 | | | | |
December 31, 2014 1 | % Leased | | % Occupied | | <10K SF | | All Less Anchors | | <10K SF | | All Less Anchors | | Occupancy Cost | | |
| Consolidated Retail Properties | 97.2 | % | | 96.6 | % | | $ | 67.41 |
| | $ | 55.35 |
| | $ | 507 |
| | $ | 13,059 |
| | 14.3 | % | | |
| Unconsolidated Retail Properties | 97.4 | % | | 96.9 | % | | 80.31 |
| | 66.74 |
| | 722 |
| | 7,459 |
| | 11.8 | % | | |
| Same Store Retail Properties | 97.2 | % | | 96.7 | % | | $ | 71.24 |
| | $ | 58.79 |
| | $ | 570 |
| | $ | 20,518 |
| | 13.4 | % | | |
| | | | | | | | | | | | | | | | |
| | | | | | In-Place Rent | | Tenant Sales 4 | | | | |
| December 31, 2013 | % Leased | | % Occupied | | <10K SF | | All Less Anchors | | <10K SF | | All Less Anchors | | Occupancy Cost | | |
| | | | | | | | | | | | | | | | |
| Consolidated Retail Properties | 96.9 | % | | 96.4 | % | | $ | 67.61 |
| | $ | 54.13 |
| | $ | 520 |
| | $ | 13,032 |
| | 13.4 | % | | |
| Unconsolidated Retail Properties | 97.6 | % | | 96.4 | % | | 80.42 |
| | 66.75 |
| | 677 |
| | 6,925 |
| | 12.2 | % | | |
| Same Store Retail Properties | 97.1 | % | | 96.4 | % | | $ | 71.29 |
| | $ | 57.75 |
| | $ | 564 |
| | $ | 19,957 |
| | 13.0 | % | | |
| |
| 1. | Same Store metrics exclude one asset that is being de-leased for redevelopment. |
| |
| 2. | See Property Schedule on pages 20-26 for individual property details. |
| |
| 3. | Total GLA at Share includes assets at GGP ownership percentages and excludes tenant owned area. |
| |
| 4. | In 2013, In-Place Rent included base minimum rents, common area costs, and real estate taxes. Adjusting to the current method (see page 33), the <10K SF of $71.29 becomes $70.14, and the All Less Anchors of $57.75 becomes $57.42. |
| |
| 5. | Tenant Sales <10K SF is presented as Sales per square foot in dollars, and Tenant Sales All Less Anchors is presented as total sales volume in millions of dollars. |
|
| |
PORTFOLIO OPERATING METRICS
Signed Leases All Less Anchors As of December 31, 2014
| |
|
| | | | | | | | | | | |
| | All Leases - Lease Spread 1 |
| | | | | | |
| | Commencement 2014 |
| | # of Leases | SF | Term (in years) | Initial Rent PSF | Average Rent PSF |
| | | | | | |
| New and Renewal Leases | 2,189 |
| 7,578,928 |
| 7.1 | $ | 55.40 |
| $ | 61.03 |
|
| Percent in Lieu/Gross | 418 |
| 1,755,352 |
| 5.0 | N/A |
| N/A |
|
| Total Leases | 2,607 |
| 9,334,280 |
| 6.7 | $ | 55.40 |
| $ | 61.03 |
|
| | | | | | |
| | Commencement 2015 |
| | # of Leases | SF | Term (in years) | Initial Rent PSF | Average Rent PSF |
| New and Renewal Leases | 1,395 |
| 5,277,778 |
| 7.4 | $ | 61.62 |
| $ | 68.65 |
|
| Percent in Lieu/Gross | 127 |
| 967,099 |
| 6.5 | N/A |
| N/A |
|
| Total Leases | 1,522 |
| 6,244,877 |
| 7.2 | $ | 61.62 |
| $ | 68.65 |
|
|
| | | | | | | | | | | | | | | | | | | | | | | | | |
| | SUITE TO SUITE - Lease Spread 2 |
| | | | | | | | | | | | |
| | New and Renewal Leases 3 |
| | # of Leases | SF | Term (in years) | Initial Rent PSF | Average Rent PSF | Expiring Rent PSF | Initial Rent Spread | | Average Rent Spread |
| Commencement 2014 | 1,668 |
| 4,822,093 |
| 6.7 | $ | 62.26 |
| $ | 69.19 |
| $ | 52.63 |
| $ | 9.63 |
| 18.3 | % | | $ | 16.56 |
| 31.5 | % |
| Commencement 2015 | 477 |
| 1,562,471 |
| 6.4 | $ | 67.87 |
| $ | 74.97 |
| $ | 61.28 |
| $ | 6.59 |
| 10.8 | % | | $ | 13.69 |
| 22.3 | % |
| Total 2014/2015 | 2,145 |
| 6,384,564 |
| 6.6 | $ | 63.63 |
| $ | 70.60 |
| $ | 54.76 |
| $ | 8.87 |
| 16.2 | % | | $ | 15.84 |
| 28.9 | % |
1. Represents signed leases that are scheduled to commence in the respective period.
2. Represents signed leases that are scheduled to commence in the respective period compared to expiring rent for the prior tenant in the same suite. New suites are within 10,000 square feet of the expiring suites.
3. Represents leases where downtime between the new and previous tenant was less than 24 months.
|
| |
PORTFOLIO OPERATING METRICS
Lease Expiration Schedule and Top Ten Tenants | |
|
| | | | | | | | | | | | | | | | |
| Year | | Number of Expiring Leases | | Expiring GLA at 100% (in thousands) | | Percent of Total | | Expiring Rent (in thousands) | | Expiring Rent ($psf) |
| | | | | | | | | | | |
| Specialty Leasing | | 1,027 |
| | 2,014 |
| | 3.9% | | $ | 46,641 |
| | $ | 23.92 |
|
| 2015 | | 2,019 |
| | 6,393 |
| | 12.3% | | 350,621 |
| | 57.55 |
|
| 2016 | | 1,734 |
| | 5,440 |
| | 10.4% | | 323,733 |
| | 61.03 |
|
| 2017 | | 1,700 |
| | 5,511 |
| | 10.6% | | 318,647 |
| | 59.43 |
|
| 2018 | | 1,410 |
| | 5,083 |
| | 9.7% | | 330,422 |
| | 66.22 |
|
| 2019 | | 1,226 |
| | 5,470 |
| | 10.5% | | 320,424 |
| | 59.22 |
|
| 2020 | | 747 |
| | 2,949 |
| | 5.7% | | 197,317 |
| | 67.22 |
|
| 2021 | | 815 |
| | 3,039 |
| | 5.8% | | 207,936 |
| | 69.25 |
|
| 2022 | | 853 |
| | 3,445 |
| | 6.6% | | 231,636 |
| | 67.42 |
|
| 2023 | | 948 |
| | 3,914 |
| | 7.5% | | 282,250 |
| | 73.46 |
|
| 2024 | | 880 |
| | 4,219 |
| | 8.1% | | 309,282 |
| | 73.81 |
|
| Subsequent | | 434 |
| | 4,691 |
| | 8.9% | | 206,779 |
| | 45.29 |
|
| Total | | 13,793 |
| | 52,168 |
| | 100.0% | | $ | 3,125,688 |
| | $ | 61.19 |
|
|
| | | | |
| Top Ten Largest Tenants | | Primary DBA | | Percent of Minimum Rents, Tenant Recoveries and Other |
| | | | | |
| Limited Brands, Inc. | | Victoria's Secret, Bath & Body Works, PINK | | 3.6% |
| The Gap, Inc. | | Gap, Banana Republic, Old Navy | | 3.0% |
| Foot Locker, Inc. | | Footlocker, Champs Sports, Footaction USA | | 2.8% |
| Forever 21, Inc. | | Forever 21 | | 2.3% |
| Abercrombie & Fitch Stores, Inc. | | Abercrombie, Abercrombie & Fitch, Hollister, Gilly Hicks | | 2.2% |
| Signet Jewelers Limited | | Zales, Gordon's, Kay, Jared | | 1.7% |
| American Eagle Outfitters, Inc. | | American Eagle, Aerie, Martin + Osa | | 1.6% |
| Express, Inc. | | Express, Express Men | | 1.6% |
| Genesco Inc. | | Journeys, Lids, Underground Station, Johnston & Murphy | | 1.5% |
| LVMH | | Louis Vuitton, Sephora | | 1.5% |
| Totals | | | | 21.8% |
|
| |
PORTFOLIO OPERATING METRICS
Property Schedule As of December 31, 2014
| |
|
| | | | | | | | | | | | | | | | | | | | | | | | | | |
| Property Name | Anchors | GGP Own % | | Location | | Mall and Freestanding GLA | | Anchor GLA (GGP Owned) | | Anchor GLA (Tenant Owned) | | Strip Center GLA | | Office GLA | | Total GLA | | Retail Percentage Leased |
| Consolidated Regional Malls | | | | | | | | | | | | | | | | | | |
| Ala Moana Center | Macy's, Neiman Marcus, Nordstrom, Bloomingdale's | 100 | % | | Honolulu, HI | | 955,642 |
| | 849,915 |
| | — |
| | 14,042 |
| | 362,718 |
| | 2,182,317 |
| | 99.3 | % |
| Apache Mall | Herberger's, JCPenney, Macy's, Scheel's | 100 | % | | Rochester, MN | | 264,960 |
| | 350,326 |
| | 162,790 |
| | — |
| | — |
| | 778,076 |
| | 98.6 | % |
| Augusta Mall | Dillard's, JCPenney, Macy's, Sears | 100 | % | | Augusta, GA | | 503,947 |
| | — |
| | 597,223 |
| | — |
| | — |
| | 1,101,170 |
| | 97.8 | % |
| Baybrook Mall | Dillard's, JCPenney, Macy's, Sears | 100 | % | | Friendswood (Houston), TX | | 443,458 |
| | 96,605 |
| | 720,931 |
| | — |
| | — |
| | 1,260,994 |
| | 99.3 | % |
| Beachwood Place | Dillard's, Nordstrom, Saks Fifth Avenue | 100 | % | | Beachwood, OH | | 344,780 |
| | 317,347 |
| | 247,000 |
| | — |
| | — |
| | 909,127 |
| | 97.1 | % |
| Bellis Fair | JCPenney, Kohl's, Macy's, Target | 100 | % | | Bellingham (Seattle), WA | | 422,657 |
| | 100,400 |
| | 237,910 |
| | — |
| | — |
| | 760,967 |
| | 98.2 | % |
| Boise Towne Square | Dillard's, JCPenney, Macy's, Sears, Kohl's | 100 | % | | Boise, ID | | 422,466 |
| | 425,556 |
| | 247,714 |
| | 114,687 |
| | — |
| | 1,210,423 |
| | 96.2 | % |
| Brass Mill Center | Burlington Coat Factory, JCPenney, Macy's, Sears | 100 | % | | Waterbury, CT | | 444,588 |
| | 218,339 |
| | 319,391 |
| | 197,087 |
| | — |
| | 1,179,405 |
| | 97.0 | % |
| Coastland Center | Dillard's, JCPenney, Macy's, Sears | 100 | % | | Naples, FL | | 337,684 |
| | 123,921 |
| | 466,469 |
| | — |
| | — |
| | 928,074 |
| | 98.0 | % |
| Columbia Mall | Dillard's, JCPenney, Sears, Target | 100 | % | | Columbia, MO | | 314,628 |
| | 85,972 |
| | 335,088 |
| | — |
| | — |
| | 735,688 |
| | 91.5 | % |
| Columbiana Centre | Belk, Dillard's, JCPenney | 100 | % | | Columbia, SC | | 268,995 |
| | 190,911 |
| | 360,643 |
| | — |
| | — |
| | 820,549 |
| | 98.1 | % |
| Coral Ridge Mall | Dillard's, JCPenney, Target, Younkers | 100 | % | | Coralville (Iowa City), IA | | 521,542 |
| | 98,596 |
| | 442,365 |
| | — |
| | — |
| | 1,062,503 |
| | 99.4 | % |
| Coronado Center | JCPenney, Kohl's, Macy's, Sears | 100 | % | | Albuquerque, NM | | 505,866 |
| | 118,272 |
| | 468,375 |
| | — |
| | — |
| | 1,092,513 |
| | 99.9 | % |
| Crossroads Center | JCPenney, Macy's, Sears, Target | 100 | % | | St. Cloud, MN | | 368,291 |
| | 294,167 |
| | 229,275 |
| | — |
| | — |
| | 891,733 |
| | 97.4 | % |
| Cumberland Mall | Costco, Macy's, Sears | 100 | % | | Atlanta, GA | | 380,239 |
| | 147,409 |
| | 500,575 |
| | — |
| | — |
| | 1,028,223 |
| | 99.3 | % |
| Deerbrook Mall | Dillard's, JCPenney, Macy's, Sears | 100 | % | | Humble (Houston), TX | | 557,387 |
| | — |
| | 653,540 |
| | — |
| | — |
| | 1,210,927 |
| | 98.3 | % |
| Eastridge Mall WY | JCPenney, Macy's, Sears, Target | 100 | % | | Casper, WY | | 275,132 |
| | 213,913 |
| | 75,883 |
| | — |
| | — |
| | 564,928 |
| | 95.7 | % |
| Eastridge Mall CA | JCPenney, Macy's, Sears | 100 | % | | San Jose, CA | | 558,857 |
| | 246,261 |
| | 426,000 |
| | — |
| | — |
| | 1,231,118 |
| | 98.8 | % |
| Fashion Place | Dillard's, Nordstrom | 100 | % | | Murray, UT | | 442,293 |
| | 281,175 |
| | 319,603 |
| | — |
| | — |
| | 1,043,071 |
| | 97.6 | % |
| Fashion Show | Dillard's, Macy's, Macy's Mens, Neiman Marcus, Nordstrom, Saks Fifth Avenue | 100 | % | | Las Vegas, NV | | 709,084 |
| | 371,635 |
| | 761,653 |
| | — |
| | — |
| | 1,842,372 |
| | 99.0 | % |
|
| |
PORTFOLIO OPERATING METRICS
Property Schedule As of December 31, 2014
| |
|
| | | | | | | | | | | | | | | | | | | | | | | | | | |
| Property Name | Anchors | GGP Own % | | Location | | Mall and Freestanding GLA | | Anchor GLA (GGP Owned) | | Anchor GLA (Tenant Owned) | | Strip Center GLA | | Office GLA | | Total GLA | | Retail Percentage Leased |
| Four Seasons Town Centre | Belk, Dillard's, JCPenney | 100 | % | | Greensboro, NC | | 436,083 |
| | 429,969 |
| | 212,047 |
| | — |
| | — |
| | 1,078,099 |
| | 95.7 | % |
| Fox River Mall | JCPenney, Macy's, Sears, Target, Younkers | 100 | % | | Appleton, WI | | 596,865 |
| | 30,000 |
| | 564,914 |
| | — |
| | — |
| | 1,191,779 |
| | 98.4 | % |
| Glenbrook Square | JCPenney, Macy's, Sears, Carson's | 100 | % | | Fort Wayne, IN | | 448,494 |
| | 555,870 |
| | 221,000 |
| | — |
| | — |
| | 1,225,364 |
| | 95.9 | % |
| Governor's Square | Dillard's, JCPenney, Macy's, Sears | 100 | % | | Tallahassee, FL | | 342,865 |
| | — |
| | 691,605 |
| | — |
| | — |
| | 1,034,470 |
| | 97.4 | % |
| Grand Teton Mall | Dillard's, JCPenney, Macy's, Sears | 100 | % | | Idaho Falls, ID | | 209,933 |
| | 323,925 |
| | — |
| | 93,274 |
| | — |
| | 627,132 |
| | 93.8 | % |
| Greenwood Mall | Dillard's, JCPenney, Macy's, Sears | 100 | % | | Bowling Green, KY | | 421,383 |
| | 156,096 |
| | 272,957 |
| | — |
| | — |
| | 850,436 |
| | 97.7 | % |
| Hulen Mall | Dillard's, Macy's, Sears | 100 | % | | Ft. Worth, TX | | 397,885 |
| | — |
| | 596,570 |
| | — |
| | — |
| | 994,455 |
| | 94.8 | % |
| Jordan Creek Town Center | Dillard's, Younkers | 100 | % | | West Des Moines, IA | | 748,175 |
| | — |
| | 349,760 |
| | 253,080 |
| | — |
| | 1,351,015 |
| | 99.1 | % |
| Lakeside Mall | JCPenney, Lord & Taylor, Macy's, Macy's Mens & Home, Sears | 100 | % | | Sterling Heights, MI | | 480,226 |
| | 115,300 |
| | 905,418 |
| | — |
| | — |
| | 1,500,944 |
| | 87.4 | % |
| Lynnhaven Mall | Dillard's, JCPenney, Macy's | 100 | % | | Virginia Beach, VA | | 600,301 |
| | 150,434 |
| | 380,958 |
| | — |
| | — |
| | 1,131,693 |
| | 98.9 | % |
| Mall Of Louisiana | Dillard's, Dillard's Men's & Home, JCPenney, Macy's, Sears | 100 | % | | Baton Rouge, LA | | 623,436 |
| | — |
| | 805,630 |
| | 143,634 |
| | — |
| | 1,572,700 |
| | 98.7 | % |
| Mall St. Matthews | Dillard's, Dillard's Men's & Home, JCPenney | 100 | % | | Louisville, KY | | 506,136 |
| | — |
| | 514,135 |
| | — |
| | — |
| | 1,020,271 |
| | 97.9 | % |
| Market Place Shopping Center | Bergner's, JCPenney, Macy's, | 100 | % | | Champaign, IL | | 411,953 |
| | 234,834 |
| | 300,912 |
| | — |
| | — |
| | 947,699 |
| | 97.8 | % |
| Mayfair | Boston Store, Macy's, Nordstrom | 100 | % | | Wauwatosa (Milwaukee), WI | | 574,959 |
| | 288,596 |
| | 348,714 |
| | — |
| | 314,991 |
| | 1,527,260 |
| | 97.3 | % |
| Meadows Mall | Dillard's, JCPenney, Macy's, Sears | 100 | % | | Las Vegas, NV | | 307,720 |
| | — |
| | 636,853 |
| | — |
| | — |
| | 944,573 |
| | 97.2 | % |
| Mondawmin Mall | | 100 | % | | Baltimore, MD | | 384,726 |
| | — |
| | — |
| | — |
| | 65,352 |
| | 450,078 |
| | 99.8 | % |
| Newgate Mall | Dillard's, Sears, Burlington Coat Factory | 100 | % | | Ogden (Salt Lake City), UT | | 331,729 |
| | 218,874 |
| | 118,919 |
| | — |
| | — |
| | 669,522 |
| | 95.9 | % |
| North Point Mall | Dillard's, JCPenney, Macy's, Sears, Von Maur | 100 | % | | Alpharetta (Atlanta), GA | | 427,215 |
| | 539,850 |
| | 363,151 |
| | — |
| | — |
| | 1,330,216 |
| | 90.4 | % |
| North Star Mall | Dillard's, JCPenney, Macy's, Saks Fifth Avenue | 100 | % | | San Antonio, TX | | 550,635 |
| | 173,198 |
| | 522,126 |
| | — |
| | — |
| | 1,245,959 |
| | 99.7 | % |
| Northridge Fashion Center | JCPenney, Macy's, Sears | 100 | % | | Northridge (Los Angeles), CA | | 636,176 |
| | — |
| | 824,443 |
| | — |
| | — |
| | 1,460,619 |
| | 98.5 | % |
| Northtown Mall | JCPenney, Kohl's, Macy's, Sears | 100 | % | | Spokane, WA | | 395,592 |
| | 276,488 |
| | 242,392 |
| | — |
| | — |
| | 914,472 |
| | 91.9 | % |
|
| |
PORTFOLIO OPERATING METRICS
Property Schedule As of December 31, 2014
| |
|
| | | | | | | | | | | | | | | | | | | | | | | | | | |
| Property Name | Anchors | GGP Own % | | Location | | Mall and Freestanding GLA | | Anchor GLA (GGP Owned) | | Anchor GLA (Tenant Owned) | | Strip Center GLA | | Office GLA | | Total GLA | | Retail Percentage Leased |
| Oak View Mall | Dillard's, JCPenney, Sears, Younkers | 100 | % | | Omaha, NE | | 255,930 |
| | 149,326 |
| | 454,860 |
| | — |
| | — |
| | 860,116 |
| | 93.9 | % |
| Oakwood Center | Dillard's, JCPenney, Sears | 100 | % | | Gretna, LA | | 397,192 |
| | — |
| | 514,028 |
| | — |
| | — |
| | 911,220 |
| | 97.8 | % |
| Oakwood Mall | JCPenney, Macy's, Sears, Younkers | 100 | % | | Eau Claire, WI | | 403,703 |
| | 116,620 |
| | 298,224 |
| | — |
| | — |
| | 818,547 |
| | 96.5 | % |
| Oglethorpe Mall | Belk, JCPenney, Macy's, Sears | 100 | % | | Savannah, GA | | 406,358 |
| | 220,824 |
| | 315,760 |
| | — |
| | — |
| | 942,942 |
| | 97.1 | % |
| Oxmoor Center | Macy's, Sears, Von Maur | 94 | % | | Louisville, KY | | 351,584 |
| | 156,000 |
| | 411,210 |
| | — |
| | — |
| | 918,794 |
| | 98.4 | % |
| Paramus Park | Macy's, Sears | 100 | % | | Paramus, NJ | | 306,593 |
| | — |
| | 459,057 |
| | — |
| | — |
| | 765,650 |
| | 96.6 | % |
| Park City Center | The Bon Ton, Boscov's, JCPenney, Kohl's, Sears | 100 | % | | Lancaster (Philadelphia), PA | | 541,430 |
| | 514,917 |
| | 384,980 |
| | — |
| | 3,268 |
| | 1,444,595 |
| | 96.0 | % |
| Park Place | Dillard's, Macy's, Sears | 100 | % | | Tucson, AZ | | 469,587 |
| | — |
| | 581,457 |
| | — |
| | — |
| | 1,051,044 |
| | 98.3 | % |
| Peachtree Mall | Dillard's, JCPenney, Macy's | 100 | % | | Columbus, GA | | 290,633 |
| | 221,539 |
| | 201,076 |
| | — |
| | 12,600 |
| | 725,848 |
| | 94.8 | % |
| Pecanland Mall | Belk, Burlington Coat Factory, Dillard's, JCPenney, Sears | 100 | % | | Monroe, LA | | 349,205 |
| | 19,962 |
| | 595,474 |
| | — |
| | — |
| | 964,641 |
| | 97.6 | % |
| Pembroke Lakes Mall | Dillard's, Dillard's Men's & Home, JCPenney, Macy's, Macy's Home Store, Sears | 100 | % | | Pembroke Pines (Fort Lauderdale), FL | | 353,425 |
| | 395,219 |
| | 386,056 |
| | — |
| | — |
| | 1,134,700 |
| | 99.9 | % |
| Pioneer Place | | 100 | % | | Portland, OR | | 348,235 |
| | — |
| | — |
| | — |
| | 287,625 |
| | 635,860 |
| | 90.3 | % |
| Prince Kuhio Plaza | Macy's, Sears | 100 | % | | Hilo, HI | | 320,700 |
| | 124,547 |
| | 61,873 |
| | — |
| | — |
| | 507,120 |
| | 96.6 | % |
| Providence Place | JCPenney, Macy's, Nordstrom | 94 | % | | Providence, RI | | 734,231 |
| | — |
| | 513,816 |
| | — |
| | 4,304 |
| | 1,252,351 |
| | 99.8 | % |
| Provo Towne Centre | Dillard's, JCPenney, Sears | 75 | % | | Provo, UT | | 300,337 |
| | 285,479 |
| | 206,240 |
| | — |
| | — |
| | 792,056 |
| | 86.9 | % |
| Quail Springs Mall | Dillard's, JCPenney, Macy's, Von Maur | 100 | % | | Oklahoma City, OK | | 450,457 |
| | 160,000 |
| | 505,596 |
| | — |
| | — |
| | 1,116,053 |
| | 95.4 | % |
| Red Cliffs Mall | Dillard's, JCPenney, Sears | 100 | % | | St. George, UT | | 150,019 |
| | 235,031 |
| | — |
| | 57,304 |
| | — |
| | 442,354 |
| | 99.7 | % |
| Ridgedale Center | JCPenney, Sears, Macy's, Nordstrom | 100 | % | | Minnetonka, MN | | 305,715 |
| | — |
| | 924,603 |
| | — |
| | — |
| | 1,230,318 |
| | 93.8 | % |
| River Hills Mall | Herberger's, JCPenney, Sears, Target | 100 | % | | Mankato, MN | | 353,589 |
| | 189,559 |
| | 174,383 |
| | — |
| | — |
| | 717,531 |
| | 92.4 | % |
| Rivertown Crossings | JCPenney, Kohl's, Macy's, Sears, Younkers | 100 | % | | Grandville (Grand Rapids), MI | | 631,904 |
| | — |
| | 635,625 |
| | — |
| | — |
| | 1,267,529 |
| | 97.5 | % |
| Rogue Valley Mall | JCPenney, Kohl's, Macy's, Macy's Home Store | 100 | % | | Medford (Portland), OR | | 279,866 |
| | 170,625 |
| | 186,359 |
| | — |
| | — |
| | 636,850 |
| | 85.2 | % |
|
| |
PORTFOLIO OPERATING METRICS
Property Schedule As of December 31, 2014
| |
|
| | | | | | | | | | | | | | | | | | | | | | | | | | |
| Property Name | Anchors | GGP Own % | | Location | | Mall and Freestanding GLA | | Anchor GLA (GGP Owned) | | Anchor GLA (Tenant Owned) | | Strip Center GLA | | Office GLA | | Total GLA | | Retail Percentage Leased |
| Sooner Mall | Dillard's, JCPenney, Sears | 100 | % | | Norman, OK | | 220,869 |
| | 129,823 |
| | 137,082 |
| | — |
| | — |
| | 487,774 |
| | 99.5 | % |
| Spokane Valley Mall | JCPenney, Macy's, Sears | 75 | % | | Spokane, WA | | 350,585 |
| | 126,243 |
| | 251,366 |
| | 138,002 |
| | — |
| | 866,196 |
| | 95.2 | % |
| Staten Island Mall | Macy's, Sears, JCPenney | 100 | % | | Staten Island, NY | | 529,664 |
| | — |
| | 657,363 |
| | 74,318 |
| | — |
| | 1,261,345 |
| | 97.9 | % |
| Stonestown Galleria | Macy's, Nordstrom | 100 | % | | San Francisco, CA | | 407,342 |
| | 160,505 |
| | 267,788 |
| | — |
| | — |
| | 835,635 |
| | 99.8 | % |
| The Crossroads | Burlington Coat Factory, JCPenney, Macy's, Sears | 100 | % | | Portage (Kalamazoo), MI | | 266,301 |
| | — |
| | 502,961 |
| | — |
| | — |
| | 769,262 |
| | 95.5 | % |
| The Gallery At Harborplace | | 100 | % | | Baltimore, MD | | 131,467 |
| | — |
| | — |
| | — |
| | 283,321 |
| | 414,788 |
| | 89.1 | % |
| The Maine Mall | The Bon Ton, JCPenney, Macy's, Sears | 100 | % | | South Portland, ME | | 506,311 |
| | 120,844 |
| | 377,662 |
| | — |
| | 600 |
| | 1,005,417 |
| | 99.3 | % |
| The Mall In Columbia | JCPenney, Lord & Taylor, Macy's, Nordstrom, Sears | 100 | % | | Columbia, MD | | 634,373 |
| | 212,847 |
| | 587,321 |
| | — |
| | — |
| | 1,434,541 |
| | 98.9 | % |
| The Oaks Mall | Belk, Dillard's, JCPenney, Macy's, Sears | 100 | % | | Gainesville, FL | | 344,673 |
| | 233,367 |
| | 324,500 |
| | — |
| | — |
| | 902,540 |
| | 94.1 | % |
| The Parks At Arlington | Dillard's, JCPenney, Macy's, Sears | 100 | % | | Arlington (Dallas), TX | | 761,440 |
| | — |
| | 748,945 |
| | — |
| | — |
| | 1,510,385 |
| | 98.8 | % |
| The Shoppes At Buckland Hills | JCPenney, Macy's, Macy's Mens & Home, Sears | 100 | % | | Manchester, CT | | 551,529 |
| | — |
| | 512,611 |
| | — |
| | — |
| | 1,064,140 |
| | 93.8 | % |
| The Shops At Fallen Timbers | Dillard's, JCPenney | 100 | % | | Maumee, OH | | 344,554 |
| | — |
| | 261,502 |
| | — |
| | — |
| | 606,056 |
| | 96.1 | % |
| The Shops at La Cantera | Dillard's, Macy's, Neiman Marcus, Nordstrom | 75 | % | | San Antonio, TX | | 617,702 |
| | — |
| | 627,597 |
| | — |
| | 70,178 |
| | 1,315,477 |
| | 97.7 | % |
| The Streets At Southpoint | Hudson Belk, JCPenney, Macy's, Nordstrom, Sears | 94 | % | | Durham, NC | | 608,363 |
| | — |
| | 726,347 |
| | — |
| | — |
| | 1,334,710 |
| | 99.2 | % |
| The Woodlands Mall | Dillard's, JCPenney, Macy's, Nordstrom | 100 | % | | Woodlands (Houston), TX | | 624,839 |
| | — |
| | 713,438 |
| | — |
| | 39,471 |
| | 1,377,748 |
| | 99.5 | % |
| Town East Mall | Dillard's, JCPenney, Macy's, Sears | 100 | % | | Mesquite (Dallas), TX | | 413,406 |
| | — |
| | 809,386 |
| | — |
| | — |
| | 1,222,792 |
| | 98.6 | % |
| Tucson Mall | Dillard's, JCPenney, Macy's, Sears | 100 | % | | Tucson, AZ | | 609,467 |
| | — |
| | 641,458 |
| | 27,305 |
| | — |
| | 1,278,230 |
| | 96.8 | % |
| Tysons Galleria | Macy's, Neiman Marcus, Saks Fifth Avenue | 100 | % | | McLean (Washington, D.C.), VA | | 308,276 |
| | — |
| | 511,933 |
| | — |
| | — |
| | 820,209 |
| | 96.3 | % |
| Valley Plaza Mall | JCPenney, Macy's, Sears, Target | 100 | % | | Bakersfield, CA | | 520,494 |
| | 147,792 |
| | 509,176 |
| | — |
| | — |
| | 1,177,462 |
| | 99.3 | % |
| Visalia Mall | JCPenney, Macy's | 100 | % | | Visalia, CA | | 172,679 |
| | 257,000 |
| | — |
| | — |
| | — |
| | 429,679 |
| | 96.2 | % |
| Westlake Center | | 100 | % | | Seattle, WA | | 108,937 |
| | — |
| | — |
| | — |
| | — |
| | 108,937 |
| | 97.3 | % |
|
| |
PORTFOLIO OPERATING METRICS
Property Schedule As of December 31, 2014
| |
|
| | | | | | | | | | | | | | | | | | | | | | | | | | |
| Property Name | Anchors | GGP Own % | | Location | | Mall and Freestanding GLA | | Anchor GLA (GGP Owned) | | Anchor GLA (Tenant Owned) | | Strip Center GLA | | Office GLA | | Total GLA | | Retail Percentage Leased |
| Westroads Mall | JCPenney, Von Maur, Younkers | 100 | % | | Omaha, NE | | 517,826 |
| | — |
| | 529,036 |
| | — |
| | — |
| | 1,046,862 |
| | 98.3 | % |
| White Marsh Mall | JCPenney, Macy's, Macy's Home Store, Sears, Boscov's | 100 | % | | Baltimore, MD | | 438,090 |
| | 257,345 |
| | 466,009 |
| | — |
| | — |
| | 1,161,444 |
| | 97.9 | % |
| Willowbrook | Bloomingdale's, Lord & Taylor, Macy's, Sears | 100 | % | | Wayne, NJ | | 490,346 |
| | 2,060 |
| | 1,028,000 |
| | — |
| | — |
| | 1,520,406 |
| | 100.0 | % |
| Woodbridge Center | Boscov's, JCPenney, Lord & Taylor, Macy's, Sears | 100 | % | | Woodbridge, NJ | | 650,462 |
| | 455,739 |
| | 560,935 |
| | — |
| | — |
| | 1,667,136 |
| | 96.6 | % |
| Total Consolidated Retail Properties | | | Count: 87 | | 38,005,671 |
| | 13,087,367 |
| | 36,008,025 |
| | 1,112,733 |
| | 1,444,428 |
| | 89,658,224 |
| | 97.2 | % |
| | | | | | | | | | | | | | | | | | | |
| | | | | | | | | | | | | | | | | | | |
| Unconsolidated Retail Properties | | | | | | | | | | | | | | | | | |
| Alderwood | JCPenney, Macy's, Nordstrom, Sears | 50 | % | | Lynnwood (Seattle), WA | | 576,934 |
| | — |
| | 705,898 |
| | 39,096 |
| | — |
| | 1,321,928 |
| | 97.4 | % |
| Altamonte Mall | Dillard's, JCPenney, Macy's, Sears | 50 | % | | Altamonte Springs (Orlando), FL | | 481,787 |
| | 158,658 |
| | 519,890 |
| | — |
| | — |
| | 1,160,335 |
| | 95.8 | % |
| Bayside Marketplace | | 51 | % | | Miami, FL | | 216,420 |
| | — |
| | — |
| | — |
| | 1,103 |
| | 217,523 |
| | 98.5 | % |
| Bridgewater Commons | Bloomingdale's, Lord & Taylor, Macy's | 35 | % | | Bridgewater, NJ | | 396,017 |
| | 150,525 |
| | 352,351 |
| | 88,784 |
| | — |
| | 987,677 |
| | 98.4 | % |
| Carolina Place | Belk, Dillard's, JCPenney, Macy's, Sears | 50 | % | | Pineville (Charlotte), NC | | 386,390 |
| | 277,404 |
| | 496,098 |
| | — |
| | — |
| | 1,159,892 |
| | 96.9 | % |
| Christiana Mall | JCPenney, Macy's, Nordstrom, Target | 50 | % | | Newark, DE | | 625,697 |
| | — |
| | 641,312 |
| | — |
| | — |
| | 1,267,009 |
| | 99.0 | % |
| Clackamas Town Center | JCPenney, Macy's, Macy's Home Store, Nordstrom, Sears | 50 | % | | Happy Valley, OR | | 629,952 |
| | — |
| | 774,842 |
| | — |
| | — |
| | 1,404,794 |
| | 96.8 | % |
| First Colony Mall | Dillard's, Dillard's Men's & Home, JCPenney, Macy's | 50 | % | | Sugar Land, TX | | 506,271 |
| | — |
| | 619,048 |
| | — |
| | — |
| | 1,125,319 |
| | 97.6 | % |
| Florence Mall | JCPenney, Macy's, Macy's Home Store, Sears | 50 | % | | Florence (Cincinnati, OH), KY | | 388,700 |
| | — |
| | 552,407 |
| | — |
| | — |
| | 941,107 |
| | 92.4 | % |
| Galleria At Tyler | JCPenney, Macy's, Nordstrom | 50 | % | | Riverside, CA | | 544,741 |
| | — |
| | 468,208 |
| | — |
| | — |
| | 1,012,949 |
| | 99.8 | % |
| Glendale Galleria | JCPenney, Macy's, Target, Bloomingdale's | 50 | % | | Glendale, CA | | 504,149 |
| | 305,000 |
| | 385,000 |
| | — |
| | 136,588 |
| | 1,330,737 |
| | 98.6 | % |
Kenwood Towne Centre 1 | Dillard's, Macy's, Nordstrom | 50 | % | | Cincinnati, OH | | 520,156 |
| | 240,656 |
| | 400,665 |
| | — |
| | — |
| | 1,161,477 |
| | 100.0 | % |
| Mizner Park | Lord & Taylor | 47 | % | | Boca Raton, FL | | 177,615 |
| | 79,822 |
| | — |
| | — |
| | 264,199 |
| | 521,636 |
| | 94.4 | % |
| Natick Mall | JCPenney, Lord & Taylor, Macy's, Sears, Neiman Marcus, Nordstrom | 50 | % | | Natick (Boston), MA | | 747,509 |
| | 194,558 |
| | 753,092 |
| | — |
| | — |
| | 1,695,159 |
| | 97.0 | % |
|
| |
PORTFOLIO OPERATING METRICS
Property Schedule As of December 31, 2014
| |
|
| | | | | | | | | | | | | | | | | | | | | | | | | | |
| Property Name | Anchors | GGP Own % | | Location | | Mall and Freestanding GLA | | Anchor GLA (GGP Owned) | | Anchor GLA (Tenant Owned) | | Strip Center GLA | | Office GLA | | Total GLA | | Retail Percentage Leased |
| Neshaminy Mall | Boscov's, Macy's, Sears | 50 | % | | Bensalem, PA | | 410,526 |
| | 188,394 |
| | 418,595 |
| | — |
| | — |
| | 1,017,515 |
| | 96.8 | % |
| Northbrook Court | Lord & Taylor, Macy's, Neiman Marcus | 50 | % | | Northbrook (Chicago), IL | | 477,701 |
| | 126,000 |
| | 410,277 |
| | — |
| | — |
| | 1,013,978 |
| | 95.7 | % |
| Oakbrook Center | Lord & Taylor, Macy's, Neiman Marcus, Nordstrom, Sears | 48 | % | | Oak Brook (Chicago), IL | | 874,571 |
| | 322,033 |
| | 751,911 |
| | — |
| | 239,292 |
| | 2,187,807 |
| | 98.0 | % |
| Otay Ranch Town Center | Macy's | 50 | % | | Chula Vista (San Diego), CA | | 498,200 |
| | — |
| | 140,000 |
| | — |
| | — |
| | 638,200 |
| | 96.0 | % |
| Park Meadows | Dillard's, JCPenney, Macy's, Nordstrom | 35 | % | | Lone Tree, CO | | 757,041 |
| | — |
| | 823,000 |
| | — |
| | — |
| | 1,580,041 |
| | 98.6 | % |
| Perimeter Mall | Dillard's, Macy's, Nordstrom, Von Maur | 50 | % | | Atlanta, GA | | 504,560 |
| | 222,056 |
| | 831,218 |
| | — |
| | — |
| | 1,557,834 |
| | 99.0 | % |
| Pinnacle Hills Promenade | Dillard's, JCPenney | 50 | % | | Rogers, AR | | 359,092 |
| | 98,540 |
| | 162,140 |
| | 501,852 |
| | 51,903 |
| | 1,173,527 |
| | 94.0 | % |
| Plaza Frontenac | Neiman Marcus, Saks Fifth Avenue | 55 | % | | St. Louis, MO | | 224,158 |
| | 125,669 |
| | 135,044 |
| | — |
| | — |
| | 484,871 |
| | 98.2 | % |
| Riverchase Galleria | Belk, JCPenney, Macy's, Sears, Von Maur | 50 | % | | Hoover (Birmingham), AL | | 562,576 |
| | 330,032 |
| | 610,026 |
| | — |
| | — |
| | 1,502,634 |
| | 96.2 | % |
Saint Louis Galleria 2 | Dillard's, Macy's, Nordstrom | 74 | % | | St. Louis, MO | | 447,018 |
| | — |
| | 714,052 |
| | — |
| | — |
| | 1,161,070 |
| | 97.2 | % |
| Stonebriar Centre | Dillard's, JCPenney, Macy's, Nordstrom, Sears | 50 | % | | Frisco (Dallas), TX | | 845,497 |
| | — |
| | 865,192 |
| | — |
| | — |
| | 1,710,689 |
| | 98.7 | % |
| The Grand Canal Shoppes | Barneys New York | 50 | % | | Las Vegas, NV | | 626,475 |
| | 84,743 |
| | — |
| | — |
| | 34,414 |
| | 745,632 |
| | 99.1 | % |
| The Shoppes At River Crossing | Belk, Dillard's | 50 | % | | Macon, GA | | 377,533 |
| | — |
| | 333,219 |
| | — |
| | — |
| | 710,752 |
| | 97.1 | % |
| Towson Town Center | Macy's, Nordstrom | 35 | % | | Towson, MD | | 603,735 |
| | — |
| | 419,129 |
| | — |
| | — |
| | 1,022,864 |
| | 95.6 | % |
| Village Of Merrick Park | Neiman Marcus, Nordstrom | 55 | % | | Coral Gables, FL | | 409,263 |
| | — |
| | 330,000 |
| | — |
| | 101,263 |
| | 840,526 |
| | 95.7 | % |
| Water Tower Place | Macy's | 47 | % | | Chicago, IL | | 406,848 |
| | 296,128 |
| | — |
| | — |
| | 88,809 |
| | 791,785 |
| | 97.9 | % |
| Whaler's Village | | 50 | % | | Lahaina, HI | | 103,959 |
| | — |
| | — |
| | — |
| | — |
| | 103,959 |
| | 96.5 | % |
| Willowbrook Mall | Dillard's, JCPenney, Macy's, Macy's Mens, Sears | 50 | % | | Houston, TX | | 459,789 |
| | — |
| | 984,372 |
| | — |
| | — |
| | 1,444,161 |
| | 97.7 | % |
| Total Unconsolidated Retail Properties | | | Count: 32 | | 15,650,880 |
| | 3,200,218 |
| | 14,596,986 |
| | 629,732 |
| | 917,571 |
| | 34,995,387 |
| | 97.4 | % |
Total Same Store Retail Properties 3 | | | Count: 119 | | 53,656,551 |
| | 16,287,585 |
| | 50,605,011 |
| | 1,742,465 |
| | 2,361,999 |
| | 124,653,611 |
| | 97.2 | % |
| | | | | | | | | | | | | | | | | | | |
|
| |
PORTFOLIO OPERATING METRICS
Property Schedule As of December 31, 2014
| |
|
| | | | | | | | | | | | | | | | | | | | | | | | | | |
| Property Name | Anchors | GGP Own % | | Location | | Mall and Freestanding GLA | | Anchor GLA (GGP Owned) | | Anchor GLA (Tenant Owned) | | Strip Center GLA | | Office GLA | | Total GLA | | Retail Percentage Leased |
| Non-Same Store Retail Properties | | | | | | | | | | | | | | | | | |
Southwest Plaza 4 | Dillard's, JCPenney, Macy's, Sears | 100 | % | | Littleton, CO | | 503,977 |
| | 93,630 |
| | 541,851 |
| | — |
| | 64,817 |
| | 1,204,275 |
| | 89.1 | % |
| The Shops at Bravern | Neiman Marcus | 40 | % | | Bellevue, WA | | 120,232 |
| | 124,637 |
| | — |
| | — |
| | — |
| | 244,869 |
| | 91.2 | % |
| 200 Lafayette | | 100 | % | | New York, NY | | 31,328 |
| | — |
| | — |
| | — |
| | 83,776 |
| | 115,104 |
| | 100.0 | % |
| 522 Fifth Avenue | | 10 | % | | New York, NY | | 7,978 |
| | — |
| | — |
| | — |
| | — |
| | 7,978 |
| | 100.0 | % |
| 530 Fifth Avenue | | 50 | % | | New York, NY | | 57,720 |
| | — |
| | — |
| | — |
| | — |
| | 57,720 |
| | 54.1 | % |
| 685 Fifth Avenue | | 50 | % | | New York, NY | | 26,311 |
| | — |
| | — |
| | — |
| | 94,812 |
| | 121,123 |
| | 100.0 | % |
| 830 N. Michigan Ave. | | 100 | % | | Chicago, IL | | 121,637 |
| | — |
| | — |
| | — |
| | — |
| | 121,637 |
| | 100.0 | % |
Miami Design District 5 | | 13 | % | | Miami, FL | | 503,455 |
| | — |
| | — |
| | — |
| | 86,032 |
| | 589,487 |
| | 52.0 | % |
| Union Square | | 50 | % | | San Francisco, CA | | 39,479 |
| | — |
| | — |
| | — |
| | 19,507 |
| | 58,986 |
| | 100.0 | % |
| Total Retail Properties | | | | Count: 128 | | 55,068,668 |
| | 16,505,852 |
| | 51,146,862 |
| | 1,742,465 |
| | 2,710,943 |
| | 127,174,790 |
| | 96.7 | % |
| | | | | | | | | | | | | | | | | | | |
| Non-Same Store Strip Centers & Other Retail | | | | | | | | | | | | | | | | | |
Lake Mead & Buffalo 6 | | 50 | % | | Las Vegas, NV | | 64,991 |
| | — |
| | — |
| | 85,957 |
| | — |
| | 150,948 |
| | 95.8 | % |
| Lockport Mall | | 100 | % | | Lockport, NY | | — |
| | — |
| | — |
| | 9,114 |
| | — |
| | 9,114 |
| | 100.0 | % |
The Trails Village Center 6 | | 50 | % | | Las Vegas, NV | | — |
| | — |
| | — |
| | 174,644 |
| | — |
| | 174,644 |
| | 95.7 | % |
Shopping Leblon 7 | | 35 | % | | Rio de Janeiro, Brazil | | 249,343 |
| | — |
| | — |
| | — |
| | — |
| | 249,343 |
| | 96.6 | % |
Owings Mills Mall 8 | JCPenney, Macy's | 51 | % | | Owings Mills, MD | | 438,017 |
| | 340,000 |
| | 307,037 |
| | — |
| | — |
| | 1,085,054 |
| | 34.0 | % |
| Total Non-Same Store Strip Centers & Other Retail: | | Count: 5 | | 752,351 |
| | 340,000 |
| | 307,037 |
| | 269,715 |
| | — |
| | 1,669,103 |
| | 69.5 | % |
1. Ownership percentage includes retained debt of $91.8 million.
2. Ownership of the St. Louis Galleria is more than 50% but management decisions are decided by the joint venture and the entity is unconsolidated for reporting purposes.
3. Refer to page 17 (Key Operating Performance Indicators).
4. Southwest Plaza is currently under redevelopment.
5. Investment is considered cost method for reporting purposes and is reflected in prepaid and other assets in our proportionate balance sheet.
6. Third party managed strip center.
7. GGP's investment in Brazil is through an ownership interest in Leblon. For this property, only Mall and Freestanding GLA is presented.
8. The Owings Mills Mall space is currently de-leased in preparation for future opportunities.
|
| |
MISCELLANEOUS
Capital Information (In thousands, except per share amounts) | |
|
| | | |
| | December 31, 2014 |
| | |
| Closing common stock price per share | $ | 28.13 |
|
52 Week High 1 | 28.88 |
|
52 Week Low 1 | 19.38 |
|
| | |
| Portfolio Net Debt, At Share | |
| Portfolio Debt | |
| Fixed | $ | 16,955,913 |
|
| Variable | 3,040,313 |
|
| Total Portfolio Debt | 19,996,226 |
|
| Less: Cash and Cash Equivalents | (512,717 | ) |
| Portfolio Net Debt | $ | 19,483,509 |
|
| | |
| Portfolio Capitalization Data | |
| Portfolio Net Debt | $ | 19,483,509 |
|
| Preferred Securities: | |
| Convertible Preferred Units at 6.50% | 26,637 |
|
| Convertible Preferred Units at 7.00% | 25,133 |
|
| Convertible Preferred Units at 8.50% | 112,260 |
|
| Preferred Stock at 6.375% | 250,000 |
|
| Other Preferred Stock | 360 |
|
| Total Preferred Securities | $ | 414,390 |
|
| | |
Common stock and Operating Partnership units outstanding at end of period 2 | $ | 25,027,852 |
|
| Total Market Capitalization at end of period | $ | 44,925,751 |
|
| |
| 1. | 52-week pricing information includes the intra-day highs and lows. |
| |
| 2. | Amount calculated as outstanding shares at the end of the period multiplied by the closing share price plus outstanding partnership units multiplied by a conversion rate of 1.0397624 multiplied by the closing share price. |
|
| |
MISCELLANEOUS
Change in Total Common and Equivalent Shares | |
|
| | | | | | | | |
| Rollforward of Shares to December 31, 2014 | Operating Partnership Units | | Company Common Shares | | Total Common Shares & Operating Partnership Units |
| | | | (In thousands) | | |
| Common Shares and Operating Partnership Units ("OP Units") Outstanding at December 31, 2013 | 4,649 |
| | 911,195 |
| | 915,844 |
|
| Common Unit Cash Conversion | (24 | ) | | — |
| | (24 | ) |
| DRIP | — |
| | 22 |
| | 22 |
|
| Issuance of stock for restricted stock grants, net of forfeitures and stock options exercised | — |
| | 1,181 |
| | 1,181 |
|
| Issuance of stock for employee stock purchase program | — |
| | 138 |
| | 138 |
|
| Buyback of common stock | — |
| | (27,624 | ) | | (27,624 | ) |
| Common Shares and OP Units Outstanding at December 31, 2014 | 4,625 |
| | 884,912 |
| | 889,537 |
|
| | | | | | |
Common Shares issuable assuming exercise of warrants 1 | | | 59,066 |
| | |
Common Shares issuable assuming exercise of in-the-money stock options 2 | | | 7,562 |
| | |
| Common Shares issuable assuming exchange of OP Units | | | 4,809 |
| | |
| Diluted Common Shares and OP Units Outstanding at December 31, 2014 | | | 956,349 |
| | |
|
| | | | | | | | | | | | |
| | | Three Months Ended | | Twelve Months Ended |
| | | December 31, 2014 | | December 31, 2013 | | December 31, 2014 | | December 31, 2013 |
| | | (In thousands) | | (In thousands) |
| Weighted average number of company shares outstanding | | 884,370 |
| | 911,185 |
| | 887,031 |
| | 930,643 |
|
Weighted average number of stock options 3 | | 6,753 |
| | 3,474 |
| | 5,547 |
| | 3,425 |
|
Weighted average number of GAAP dilutive warrants 4 | | 55,967 |
| | 46,106 |
| | 52,143 |
| | — |
|
| Diluted weighted average number of Company shares outstanding - GAAP EPS | | 947,090 |
| | 960,765 |
| | 944,721 |
| | 934,068 |
|
| | | | | | | | | |
| Weighted average number of common units | | 4,830 |
| | 6,331 |
| | 4,833 |
| | 6,434 |
|
Weighted average number of warrants 4 | | — |
| | — |
| | — |
| | 46,724 |
|
| Diluted weighted average number of Company shares outstanding - FFO/Company FFO | | 951,920 |
| | 967,096 |
| | 949,554 |
| | 987,226 |
|
| |
| 1 | GGP has 73.9 million warrants outstanding convertible to 1.1816 Common Shares with a weighted average exercise price of $9.1094, with a scheduled expiration of November 9, 2017. 16.4 million warrants must be satisfied through net share settlement, with the remainder through either a net or full share settlement feature at the option of the holder. |
Pursuant to the Plan, warrants to purchase equity were issued to the Plan Sponsors on the Effective Date. The warrants are fully vested and the exercise prices will be subject to adjustment for future dividends, stock dividends, splits or reverse splits of our common stock or certain other events as are customary with such instruments at declaration.
|
| | | | | |
| Warrants | Weighted Average Exercise Price | Expiration Date | Impact of Dividend issued to stockholders of record as of December 15, 2014 5 | Impact of settling warrants via net share settlement 6 |
| 57,500,000 | $9.1567 | November 9, 2017 | Reduces exercise price to $9.1567 | Increases number of Common shares per warrant to 1.1816 | Net share: 67,942,000 x [28.13 - 9.1567] /28.13 = 45,825,949 shares delivered |
| 16,428,571 | $8.9437 | November 9, 2017 | Reduces exercise price to $8.9437 | Increases number of Common shares per warrant to 1.1816 | Net share: 19,411,999 x [28.13 - 8.9437] /28.13 = 13,240,115 shares delivered |
| 73,928,571 | $9.1094 | | | | 59,066,064 shares delivered |
| |
| 2 | The options are included at net share settlement. |
| |
| 3 | The impact of the stock options are dilutive under GAAP and FFO in 2014 and 2013. |
| |
| 4 | The impact of the warrants are dilutive under GAAP and FFO in 2014 and for the three months ended December 31, 2013. The impact of the warrants are anti-dilutive under GAAP, but dilutive for FFO for the twelve months ended December 31, 2013. |
| |
| 5 | Based on dividend of $0.17 per share issued to stockholders of record on December 15, 2014. |
| |
| 6 | Based on stock price of $28.13 on December 31, 2014. |
|
| |
MISCELLANEOUS
Development Summary | |
|
| | | | | | | | | | | | | | | |
| Property | Description | | Ownership % | | GGP's Total Projected Share of Cost | | GGP's Investment to Date 1 | | Expected Return on Investment 2 | | Expected Project Opening |
| Major Development Summary (in millions, at share unless otherwise noted) | | | | | | | | | | |
| | | | | | | | | | | | |
| Open | | | | | | | | | | | |
| Northridge | The Sports Authority, Yardhouse and Plaza | | 100% | | $ | 12.2 |
| | $ | 11.3 |
| | 14% | | Open |
| Northridge, CA | | | | | | | | | | | |
| | | | | | | | | | | | |
| Fashion Show | Addition of Macy's Men's and inline | | 100% | | 34.4 |
| | 33.3 |
| | 22% | | Open |
| Las Vegas, NV | | | | | | | | | | | |
| | | | | | | | | | | | |
| Oakwood Center | West wing redevelopment and Dick's Sporting Goods | | 100% | | 19.0 |
| | 16.6 |
| | 9% | | Open |
| Gretna, LA | | | | | | | | | | | |
| | | | | | | | | | | | |
Glendale Galleria 3 | Addition of Bloomingdale's, remerchandising, business | | 50% | | 52.6 |
| | 51.0 |
| | 12% | | Open |
| Glendale, CA | development and renovation | | | | | | | | | | |
| | | | | | | | | | | | |
| The Mall in Columbia | Lifestyle expansion | | 100% | | 23.0 |
| | 21.2 |
| | 13% | | Open |
| Columbia, MD | | | | | | | | | | | |
| | | | | | | | | | | | |
| Oakbrook Center | Conversion of former anchor space into Container Store, Pirch and | | 48% | | 13.8 |
| | 13.4 |
| | 11% | | Open |
| Oakbrook, IL | inline | | | | | | | | | | |
| | | | | | | | | | | | |
The Woodlands 3 | Addition of Nordstrom in former Sears box | | 100% | | 44.0 |
| | 41.0 |
| | 9% | | Open |
| Woodlands, TX | | | | | | | | | | | |
| | | | | | | | | | | | |
| Other Projects | Redevelopment projects at various malls | | N/A | | 218.8 |
| | $ | 196.5 |
| | 11% | | Open |
| Various Malls | | | | | | | | | | | |
| | | | | | | | | | | | |
| | Total Open Projects | | | | $ | 417.8 |
| | $ | 384.3 |
| | 12% | | |
| | | | | | | | | | | | |
| Under Construction | | | | | | | | | | | |
Mayfair Mall 3 | Nordstrom | | 100% | | $ | 72.3 |
| | $ | 34.4 |
| | 6-8% | | Q4 2015 |
| Wauwatosa, WI | | | | | | | | | | | |
| | | | | | | | | | | | |
Ridgedale Center 3 | Nordstrom, Macy's Expansion, New Inline GLA and renovation | | 100% | | 106.2 |
| | 49.3 |
| | 8-9% | | Q4 2015 |
| Minnetonka, MN | | | | | | | | | | | |
| | | | | | | | | | | | |
| Southwest Plaza | Redevelopment | | 100% | | 72.6 |
| | 22.1 |
| | 9-10% | | Q4 2015 |
| Littleton, CO | | | | | | | | | | | |
| | | | | | | | | | | | |
Ala Moana Center 3 | Demolish existing Sears store and expand mall, adding anchor, | | 100% | | 573.2 |
| | 391.5 |
| | 9-10% | | Q4 2015 |
| Honolulu, HI | box and inline tenants, reconfigure center court | | | | | | | | | | |
| | | | | | | | | | | | |
| Baybrook Mall | Expansion | | 53% | | 90.5 |
| | 26.3 |
| | 9-10% | | Q4 2015 |
| Friendswood, TX | | | | | | | | | | | |
| | | | | | | | | | | | |
| Other Projects | Redevelopment projects at various malls | | N/A | | 236.2 |
| | 65.8 |
| | 8-9% | | Various |
| Various Malls | | | | | | | | | | | |
| | | | | | | | | | | | |
| | Total Projects Under Construction | | | | $ | 1,151.0 |
| | $ | 589.4 |
| | 8-10% | | |
|
| | | | | | | | | | | | | | | |
| Property | Description | | Ownership % | | GGP's Total Projected Share of Cost | | GGP's Investment to Date 1 | | Expected Return on Investment 2 | | Expected Project Opening |
| Major Development Summary (in millions, at share unless otherwise noted) | | | | | | | | | | |
| | | | | | | | | | | | |
| Projects in Pipeline | | | | | | | | | | | |
| Staten Island Mall | Expansion | | 100% | | $ | 180.0 |
| | $ | 4.8 |
| | 8-9% | | TBD |
| Staten Island, NY | | | | | | | | | | | |
| | | | | | | | | | | | |
| New Mall Development | Ground up mall development | | 100% | | 285.0 |
| | 38.1 |
| | 8-10% | | TBD |
| Norwalk, CT | | | | | | | | | | | |
| | | | | | | | | | | | |
| Ala Moana Center | Nordstrom box repositioning | | 100% | | 85.0 |
| | — |
| | 9-10% | | TBD |
| Honolulu, HI | | | | | | | | | | | |
| | | | | | | | | | | | |
| Other Projects | Redevelopment projects at various malls | | N/A | | 274.5 |
| | 6.5 |
| | 8-9% | | TBD |
| Various Malls | | | | | | | | | | | |
| | | | | | | | | | | | |
| | Total Projects in Pipeline | | | | $ | 824.5 |
| | $ | 49.4 |
| | 8-10% | | |
| | | | | | | | | | | | |
| | Total Development Summary | | | | $ | 2,393.3 |
| | $ | 1,023.1 |
| | 9-11% | | |
1. Projected costs and investments to date exclude capitalized interest and overhead.
2. Return on investment represents first year stabilized cash on cost return, based upon budgeted assumptions. Actual costs may vary.
3. Project ROI includes income related to uplift on existing space.
|
| |
MISCELLANEOUS
Capital Expenditures | |
|
| | | | | | | | |
| Expenditures ($ in thousands) |
| | | | | |
| | | Twelve Months Ended | | Twelve Months Ended |
| | | December 31, 2014 | | December 31, 2013 |
| | | | | |
Capital expenditures 1 | | $ | 177,255 |
| | $ | 146,315 |
|
Tenant allowances and capitalized leasing costs 2 | | 132,242 |
| | 131,802 |
|
| Total | | $ | 309,497 |
| | $ | 278,117 |
|
1. Reflects only non-tenant operating capital expenditures.
2. Reflects tenant allowances on current operating properties.
|
| |
MISCELLANEOUS
Corporate Information | |
|
| | | | |
| Reporting Calendar |
| Results for year end will be announced according to the following approximate schedule: | | |
| | Quarter | Earnings Release Date | Earnings Call Date | |
| | Q1 2015 | April 27, 2015 | April 28, 2015 | |
|
| | | | |
| Stock Information | | | | |
| Common Stock | | | | |
| NYSE: GGP | | | | |
| | | | | |
| 6.375% Series A Cumulative Redeemable Perpetual Preferred Stock (Series A Preferred Stock) |
| NYSE: GGP PrA | | | | |
|
| | | | | |
| Security | Quarter | Declaration Date | Record Date | Date Payable or Paid | Dividend per Share |
| Common Stock | Q4 2014 | November 14, 2014 | December 15, 2014 | January 2, 2015 | $0.1700 |
| Common Stock | Q3 2014 | August 12, 2014 | October 15, 2014 | October 31, 2014 | $0.1600 |
| Common Stock | Q2 2014 | May 15, 2014 | July 15, 2014 | July 31, 2014 | $0.1500 |
| Common Stock | Q1 2014 | February 26, 2014 | April 15, 2014 | April 30, 2014 | $0.1500 |
| Common Stock | Q4 2013 | October 28, 2013 | December 13, 2013 | January 2, 2014 | $0.1400 |
| Common Stock | Q3 2013 | July 29, 2013 | October 15, 2013 | October 29, 2013 | $0.1300 |
| Common Stock | Q2 2013 | May 10, 2013 | July 16, 2013 | July 30, 2013 | $0.1200 |
| Common Stock | Q1 2013 | February 4, 2013 | April 16, 2013 | April 30, 2013 | $0.1200 |
| Series A Preferred Stock | Q4 2014 | November 14, 2014 | December 15, 2014 | January 2, 2015 | $0.3984 |
| Series A Preferred Stock | Q3 2014 | August 12, 2014 | September 15, 2014 | October 1, 2014 | $0.3984 |
| Series A Preferred Stock | Q2 2014 | May 15, 2014 | June 16, 2014 | July 1, 2014 | $0.3984 |
| Series A Preferred Stock | Q1 2014 | February 26, 2014 | March 17, 2014 | April 1, 2014 | $0.3984 |
| Series A Preferred Stock | Q4 2013 | October 28, 2013 | December 13, 2013 | January 2, 2014 | $0.3984 |
| Series A Preferred Stock | Q3 2013 | July 29, 2013 | September 13, 2013 | October 1, 2013 | $0.3984 |
| Series A Preferred Stock | Q2 2013 | May 10, 2013 | June 14, 2013 | July 1, 2013 | $0.3984 |
| Series A Preferred Stock | Q1 2013 | March 5, 2013 | March 15, 2013 | April 1, 2013 | $0.2125 |
|
| | | | |
| Investor Relations | | | | Transfer Agent |
| | | | | |
| Kevin Berry | | | | American Stock Transfer & Trust Company, LLC |
| Vice President, Investor Relations | | | | 6201 15th Avenue |
| Phone (312) 960-5529 | | | | Brooklyn, NY 11219 |
| kevin.berry@ggp.com | | | | Phone: (866) 627-2643 |
| | | | | Foreign Investor Line: |
| | | | | +1 718 921-8124 |
|
| |
MISCELLANEOUS
Glossary of Terms | |
|
| | |
| Terms | | Description |
| Gross Leasable Area (GLA) | | Total gross leasable space at 100%. |
| Mall and Freestanding | | Inline mall shop and outparcel retail locations (locations that are not attached to the primary complex of buildings that comprise a shopping center). Excludes anchor stores and development space. |
| Anchor/Traditional Anchor | | Department stores whose merchandise appeals to a broad range of shoppers. Anchors either own their stores, the land under them and adjacent parking areas, or enter into long-term leases at rates that are generally lower than the rents charged to mall store tenants. |
| Strip Center | | An attached row of stores or service outlets managed as a coherent retail entity, with on-site parking usually located in front of the stores. Open canopies may connect the storefronts, but a strip center does not have enclosed walkways linking the stores. |
| Office | | Leasable office space, either peripheral to a retail center or a stand-alone office building without a retail component. |
| Specialty Leasing | | Temporary tenants on license agreements (as opposed to leases) with terms in excess of twelve months. License agreements are cancellable by the Company with 60 days notice. |
| Same Store NOI | | Company NOI that excludes the periodic effects of acquisitions of new properties, reductions in ownership as a result of sales or other transactions, and certain redevelopments and other properties. |
| Non-Same Store | | Includes the periodic effects of acquisitions of new properties, reductions in ownership as a result of sales or other transactions, and certain redevelopment and other properties. |
|
| | |
| Operating Metrics | | Description |
| Leased | | Leased area represents the sum of: (1) tenant occupied space under lease, (2) all leases signed for currently vacant space, and (3) tenants no longer occupying space, but still paying rent for all inline mall shop and outparcel retail locations, excluding anchors (Leased Area). Leased percentage is the Leased Area over the Mall and Freestanding Area. |
| Occupied | | Occupied area represents the sum of: (1) tenant occupied space under lease, (2) tenants no longer occupying space, but still paying rent, and (3) tenants with a signed lease paying rent, but not yet opened for all inline mall shop and outparcel retail locations, excluding anchors (Occupied Area). Occupied percentage is the Occupied Area over the Mall and Freestanding Area. |
| Tenant Sales | | Comparative rolling twelve month sales. |
| Occupancy Cost | | Ratio of total tenant charges to comparative sales for inline mall tenants that opened at less than 10,000 square feet. |
| In-Place Rent | | Weighted average rental rate of mall stores as of a point in time. Rent is presented on a cash basis and consists of base minimum rent and common area costs. |
| Expiring Rent | | Represents rent at the end of the lease consisting of base minimum rent and common area costs. |
| Initial Rent | | Represents initial rent at the time of rent commencement consisting of base minimum rent and common area costs. |
| Average Rent | | Represents average rent over the term consisting of base minimum rent and common area costs. |
| Initial Rent Spread | | Dollar spread between Initial Rent and Expiring Rent. |
| Average Rent Spread | | Dollar spread between Average Rent and Expiring Rent. |