The past twelve months have been transformative for the Company, and our accomplishments to date have defined what it means to be a ‘first mover’ in the new light oil resource sector in California.
The Zodiac vision is to be an industry leader in unlocking massive new resource potential by applying the highest technical and operating standards. This vision is but only a starting point towards success.
A strong investor base, robust financial capability, technical excellence, the willingness and ability to overcome an array of challenges, and most importantly, an unyielding commitment to work for the collective benefit of all stakeholders, are the essential elements that must be in place in order to succeed in California.
During the past year, we successfully completed a TSX-V public listing while raising $50 million in new capital from a first class institutional shareholder base. Later in the year our shareholder base and capital position were further strengthened with the exercise of warrants totaling $34 million. This brought the total funds raised during the year to $84 million, an exceptional achievement given the early stage nature of the project.
Much of what we are doing is ‘pioneering’ in California. The reservoir targets are deep and over pressured and the wells are costly, but the prize is enormous.
The first step in unlocking this potential was to design and execute a systematic and highly focused data collection program, and this has been the primary focus of our activities over the past year. Early stage projects such as ours by necessity require an aggressive approach in this regard, and the term ‘science well’ should not be taken lightly.
Our past experience has proven that investing substantial upfront capital to capture and analyze high quality data provides the technical framework necessary to create robust project economics as a project matures.
As the first operator to embark on new play concepts in this realm, we faced many unknowns. During the past year we have met and overcome many operational, logistical and technical challenges. We successfully drilled over 34,000 feet of vertical and horizontal section in two wells, and we have collected the first comprehensive dataset over many new, and potentially important, light oil resource plays. For a junior E&P company, this is a remarkable achievement.
The spudding of the 4-9 test well on December 25, 2010 triggered a series of technical ‘firsts’ for the company, and for this area of California. This well, which reached a TD of 14,950 feet, was the first deep test in Kings County in which over 400 feet of core was cut over 6 geological horizons and a full suite of modern well logs were run. In most instances, this data represents the ‘first look’ at several new light oil resource play types. Our analysis indicated over 1,000 feet of gross potential pay, and further confirmed the presence of several oil generating source rock intervals and the presence of extensive oil bearing natural fractures in many horizons.
Both the Upper Kreyenhagen and Whepley intervals tested oil at rates that indicate commerciality can be achieved with further optimization of drilling and completion methods, and the application of new technologies.
The 1-10 well was spud in June, 2010 and reached a vertical depth of 16,950 feet. The well intersected the entire Kreyenhagen formation and we cored over 110 feet in the uppermost section. Significantly, in the deeper section we identified a potentially large conventional-style target and another active oil generating source rock system in the Cretaceous. This further expands the portfolio of opportunities on our acreage.
The 1-10 wellbore was subsequently plugged back and we then drilled a 2,648 foot horizontal wellbore at an average vertical depth of 14,550 feet in the Upper Kreyenhagen. This is the first horizontal wellbore in this formation and at these depths ever drilled in California. While this zone comprises less than 10% of the entire Kreyenhagen formation, our internal Company estimates indicate potential in excess of 1.6 billion boe. It is also important to understand that this horizontal well is the first step in unlocking the potential of the entire Kreyenhagen formation.
The horizontal wellbore is expected to be completed by the end of calendar 2011.
The Company is now embarking on the next phase of its evolution, as we are actively seeking a joint venture partner to bring additional capital and expertise to assist in unlocking the vast resource potential under our acreage.
I am extremely proud of what we have accomplished to date, as we have demonstrated all the attributes that comprise a true ‘first mover’.
In closing, I wish to thank the management team, the Board of Directors, and our shareholders for their terrific efforts and support over the past twelve months. Most importantly, I wish to acknowledge the tremendous efforts of our talented and dedicated staff without whom these accomplishments would not have occurred.
This message to shareholders should be read in conjunction with the audited financial statements of Zodiac Exploration Inc. along with Management’s Discussion and Analysis for the year and period ended September 30, 2011 and 2010. All numbers expressed in Canadian $ 000’s unless otherwise noted.
The following is Management’s Discussion and Analysis (“MD&A”) of the performance, financial condition and future prospects of Zodiac Exploration Inc. (“Zodiac” or “the Company”). This document should be read in conjunction with the audited annual consolidated financial statements of the Company for the year ended September 30, 2011 and September 30, 2010, and notes thereto. With its head office based in Calgary, Alberta, Canada, Zodiac is primarily engaged in the exploration for, and development of, oil and gas interests in California, USA. Common shares of the Company are listed on the TSX-Venture under the symbol “ZEX”.
The financial information in this MD&A is derived from the Company’s audited consolidated financial statements. All amounts are expressed in Canadian $ 000’s unless otherwise indicated and prepared in accordance with Canadian generally accepted accounting principles (“Canadian GAAP”).
Certain information contained herein may constitute forward-looking statements under applicable securities laws. Forward-looking statements look into the future and provide an opinion as to the effect of certain events and trends on the business. Forward-looking statements are based on the estimates and opinions of the Company’s management at the time the statements were made. Readers are cautioned not to place undue reliance on these statements as the Company’s actual results, performance or achievements may differ materially from any future results, performance or achievements expressed or implied by such forward-looking statements if known or unknown risks, uncertainties or other factors affect the Company’s business, or if the Company’s estimates or assumptions prove inaccurate. Therefore, the Company cannot provide any assurance that forward-looking statements will materialize.
The Company assumes no obligation to update forward-looking statements should circumstances or management’s estimates change.
The material assumptions that were applied in making the forward-looking statements in this MD&A include: execution of the Company’s existing plans for each of its projects, which may change due to changes in the views of the Company or if new information arises which makes it prudent to change such plans; and execution of the Company’s plans to seek out additional opportunities in the natural resource sector, which are dependent in part on global economic conditions and upon the prices of commodities and natural resources.
Summary of Operations
4-9 Well
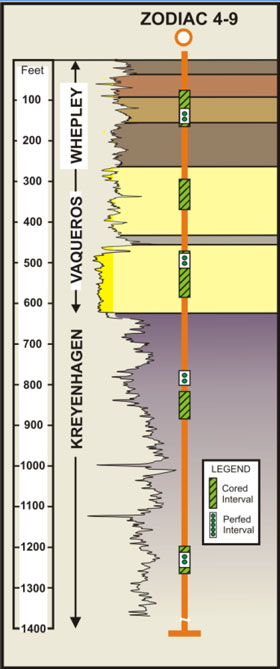
On December 25, 2010, the Company spud its initial evaluation well – the 4-9 well - in the Jaguar prospect area. The well reached a total depth of 14,950 feet in the Kreyenhagen formation and a 7 inch production liner was set on March 18, 2011.
This is the first deep well in the Kings County area in the past 25 years and it provided the Company with a comprehensive data set over several prospective light oil targets within the Monterey, Allison/Whepley, Vaqueros and Tumey/Kreyenhagen Formations. The drilling operations included the collection of 417 feet of core and an extensive suite of modern well logs over these prospective geological horizons.
Kreyenhagen Formation
The Kreyenhagen formation is one of the primary source rocks in the San Joaquin Basin and these source rocks have been estimated by the United States Geological Service (“USGS”) to have generated over 100 Billion barrels of crude oil.1 USGS PP 1713
The 4-9 well reached total depth after intersecting 650 feet of Kreyenhagen silts and organic source shales. In the area of the wellbore, the Kreyenhagen formation is approximately 800 feet thick and reaches thicknesses exceeding 1,500 feet further south on Zodiac acreage.
Zodiac completed and tested a 30 foot silty interval in the upper part of the Kreyenhagen. The upper Kreyenhagen interval flowed 29° API oil at an average rate of 24 barrels per day (“bbls/day”) over a nine day flow test period. The pressure transient analysis (“PTA”) indicated significant formation damage with a positive skin factor of 13 (“S=+13”). The Inflow Performance Relationship (“IPR”) derived from the well test analysis demonstrated that a rate of 120 bbls per day could be achieved by removing the formation damage (“S=0”) and decreasing the pressure drawdown to 60 % (from 45 %). The extrapolated reservoir pressure from the PTA was 12,900 pound per square inch (“psia”) which equates to a pressure gradient of approximately 0.9 psi per foot. The reservoir permeability calculated from the PTA was 0.85 mD.
The Company believes the formation damage observed in the 4-9 well can be addressed by optimizing completion procedures in future wells. Porosity and permeability values derived from the well log and core analyses indicated effective siltstone porosity ranging between 10% and 13%, with permeability ranging between 0.4 and 3.0 millidarcies.
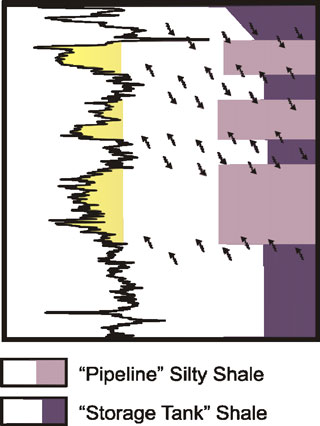
Fig: 1 “Bakken-like” Model
The production testing, the coring and the log analyses have shown that the Kreyenhagen formation has similarities to the Bakken in that organic rich shales are feeding oil into siltier units.
The major difference between the Bakken and the Kreyenhagen interval is the thickness. The Kreyenhagen is approximately 800 to 1,500 feet thick across Zodiac’s land base while the Bakken ranges from 40 to 100 feet.
The 1-10 horizontal well was drilled into this same interval, and it is anticipated that testing will commence prior to end of December 2011.
Lower Vaqueros Formation
The Company performed a completion over a 30 foot interval in the Lower Vaqueros formation. Following this operation, the zone flowed water at an average rate of 57 bbls/day over a 19 day period. The chemistry and the salinities of the water recovered during the flow period do not match regional Vaqueros water properties. The Company believes the water could have originated from interference from the 1-9 offset well which was injected with 5,000 bbls of kill fluid during well control operations.
Given the proximity of the 4-9 wellbore to the 1-9 wellbore and the fractured nature of the rock, there is more than one possible source for the water produced during the production test over the Lower Vaqueros.
This test does not negate the Vaqueros formation as a target. The entire Vaqueros formation is over 650 feet thick, with the first test comprising 30 feet within the lowermost 200 feet of the Vaqueros formation. Oil-bearing sandstones above the tested zone have been identified in core and on well logs in both the 4-9 and 1-10 wells but down-hole equipment limitations did not allow the Company to test these zones in the 4-9 well. Further testing will be required to fully evaluate this formation.
Fig 2: Core and testing zones
Allison/Whepley Formation
A 30 foot interval was completed in the Allison/Whepley formation. This zone flowed 33° API oil at a stabilized an average rate of 13 bbls/day over a 9 day flow period. The well was then shut-in and the pressure transient analysis indicated significant formation damage with a positive skin factor or of 7 (S=+7). A reservoir pressure of 11,100 psia was extrapolated from the PTA and this equates to a gradient of 0.8 psi per foot. The IPR curve derived from the well test analysis demonstrated that a rate of 30 bbls per day could be achieved with the removal of the formation damage (S=0).
The test results achieved in the Allison/Whepley formation were very encouraging to the Company, particularly as the interval completed was mostly shale rather than a siltstone or sandstone sequence inter-bedded in the shale. Over 50 feet of potential siltstone reservoir remains to be adequately tested in future operations. The Company is confident it can reduce the skin factor and by optimizing its completion procedures in future wells
Jaguar Prospect Earning Obligation
The Company has now completed its earning obligation on the Jaguar prospect as required under the Zodiac/Bayswater farm-in agreement effective May 27, 2009.
1-10 Well
The Company’s second well was drilled one mile east of the 4-9 location and was spud on June 16, 2011. The 1-10 well consisted of a vertical pilot hole with a lateral section drilled in the Upper Kreyenhagen zone which tested oil in the 4-9 well.
The vertical pilot hole reached total depth of 16,950 feet, on August 28, 2011, in the Cretaceous Moreno formation. The lower section was successfully logged and plugged back to the Whepley formation. A 2,647 foot horizontal wellbore was then drilled into the Upper Kreyenhagen at an average depth approximately 14,550 feet. This operation was completed in October 2011.
The Upper Kreyenhagen zone was cored in the 1-10 well with a total of 110 feet recovered. Thorough analysis of the logging and coring data gathered to date in the 1-10 and 4-9 wells over this horizon indicates the presence of significant oil stained natural fractures (observed in magnetic resonance images and confirmed visually in core and detailed petrographic analysis), high silica content and high brittleness. The Company believes these recent findings will help in optimizing the upcoming completion results of the 1-10 well.
The Company has now demonstrated that a horizontal wellbore can be drilled successfully at these depths and pressures in the San Joaquin Basin, which had been an uncertainty from the outset. In addition, the horizontal operation is a key first step in proving the potential of the Upper Kreyenhagen formation, which is only one of the several primary plays identified on the Company’s acreage to date.
Detailed geologic mapping indicates that this zone is present on at least 100 net sections of Zodiac acreage. Based on preliminary internal estimates from petrophysical logs and core data, management's best estimate is that the prospective resources for the Upper Kreyenhagen formation amounts to 16 million barrels of petroleum initially-in-place per section. This could comprise a significant resource addition to Zodiac’s portfolio as the Kreyenhagen formation was not included in the resource assessment conducted by Sproule (US) Limited (a summary is available within the September 1, 2010 Management Information Circular on SEDAR). This estimate represents less than 10% of the Kreyenhagen formation, which has a thickness of approximately 800 feet in this location. Several prospective lower zones in the Kreyenhagen have been identified and have not yet been tested. The total thickness of the Kreyenhagen formation ranges from approximately 800 to 1,500 feet throughout Zodiac’s acreage. The Company anticipates that with continued wellbore design refinements, horizontal drilling should have widespread application in the Kreyenhagen and in the development of other plays that comprise Zodiac’s portfolio.
Deeper Potential
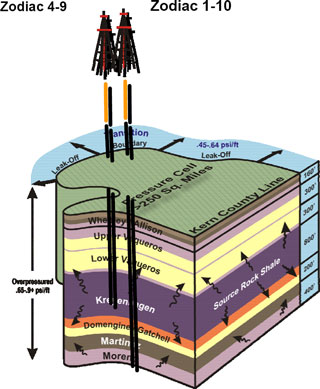
The 1-10 well, originally targeted to a total vertical depth of 15,240 feet, was deepened to test additional zones of interest including the Cretaceous Moreno formation, a significant source rock interval in this area, according to the USGS. The well reached total depth at 16,950 feet on August 28, 2011, after intersecting sandstone, siltstone, and shale sections below the Kreyenhagen formation with high background gas readings and associated increases in C1-C5 on mud logs, and oil shows. The Company encountered significant hydrocarbon response and pressures that exceeded 14,000 psi in the lowermost 250 feet of the wellbore, which required mud weight to be increased to 16.4 ppg prior to stopping drilling. Subsequent analysis conducted by the Company has confirmed that the Moreno formation in this area is in an oil generation phase. Fig 4: Overpressure cell
Core Analysis
The Company continues to conduct analysis and interpretation of the core and the suite of modern wireline well logs that were obtained from the 4-9 and 1-10 wells. These data, combined with the existing 3‐D seismic data, are expected to enable Zodiac to systematically identify and rank all potential reservoir targets and to further refine and implement a testing and appraisal program which will continue in 2012.
Well Costs
Well costs were higher than anticipated due primarily to the significant changes in scope such as additional coring and logging intervals, increase in the number of intervals completed and tested, the deepening of the 1-10 pilot hole. Other factors contributing to the cost over runs are equipment failures and inexperienced crews. The drilling and completion costs for the 4-9 well were approximately $23 million while gross drilling and completion costs for the 1-10 well are estimated to be approximately $27 million.
These costs are in line with those faced by ‘first movers’ in the early stages of operations in new plays of this complexity in other areas of North America. The Company expects to reduce these costs by 50 percent once in development mode.
Some examples of substantial cost reductions are
| - | Reduce casing size (13 3/8” Conductor, 9 5/8” Surface and 7” Intermediate, all with standard connections instead of premium connections) |
| - | Reduced logging and coring |
| - | Increase crew and rig efficiency |
| - | Minimize equipment useage from outside California requiring support personnel from outside California |
Land Holdings
The Company continued to add to its land base in a significant manner in 2011, bringing its total land base to approximately 89,000 net acres by year-end.
Our single largest land transaction during the year closed on January 31, 2011. On that date, the Company closed a transaction whereon Zodiac acquired, through farm-in, a 75% working interest in approximately 21,500 acres (the "Assets") located in Kings and Kern Counties in California (the "Panther prospect"). The transaction included the payment of US$5.6 million in cash, the issuance of 2,700,018 shares with a deemed value of US$1.9 million and provision of a work credit in respect of future cash calls made by Zodiac of US$0.9 million for a total transaction cost of US$8.4 million. Going forward Zodiac is required to pay 92 % of the drilling costs of two wells to test Monterey and Kreyenhagen formations. These lands carry, on average, a 19.5% gross royalty interest burden.
| Land Holdings | | Acres | | | Sections | |
| Gross | | | 112,000 | | | | 175 | |
| Net | | | 89,000 | | | | 139 | |
| Net Revenue Interest | | | 70,000 | | | | 109 | |
Note: Net Revenue Interest is shown after payout and includes all overriding royalty interests
Net lands include lands associated with earning requirements in Hawk and Panther.
Strategy and Outlook
Zodiac plans to commence completion operations on the horizontal section of the 1-10 well in Kings County during the last week of December, 2011. Results of the test on the horizontal well are expected within 30 days of completion of the operation.
In September, Zodiac began a process to identify a joint venture (“JV”) partner to assist the Company in assessing and ultimately exploiting the potential within its acquired land base. That process is currently on-going and the Company anticipates a deal will be announced by the end of first quarter of calendar 2012.
Once a JV approach is established, the Company will finalize its plans for the current fiscal year, 2012. The Company expects to develop a systematic plan to both achieve commerciality and further appraise the array of resource and conventional plays on its land base. The pace at which this is executed will depend on the resources that the Company has at its disposal.
Corporate History and Background
Zodiac is in the pre-production stages of its oil and gas exploration and development program on its land holdings in California, USA (San Joaquin Valley, California). The Company holds varying working interests in approximately 89,000 net acres in the San Joaquin Basin in California. The primary target formations in the Jaguar prospect area are characterized as naturally fractured, low permeability sandstone, siltstone and shale contained in the Whepley, Vaqueros and Kreyenhagen formations. Management believes that this acreage position contains a major accumulation of light oil and further believes that through the application of established oilfield drilling, completion and production technologies and methodologies that Zodiac will be able to ultimately prove the commercial productivity of these lands.
On August 19, 2010, Zodiac Exploration Corp. (“Old Zodiac”) entered into an Arrangement Agreement with Peninsula Resources Ltd. (“Peninsula”), and a wholly-owned subsidiary of Peninsula, 1543081 Alberta Ltd., to effect a reverse takeover transaction (“RTO”). Under the Agreement, Old Zodiac amalgamated with 1543081 Alberta Ltd (the continuing corporate entity post-amalgamation was named Zodiac Exploration Corp.). Peninsula was renamed Zodiac Exploration Inc. (TSX-V:ZEX). This transaction was successfully completed on September 28, 2010 and shares of ZEX began trading on October 6, 2010.
Upon completion of the RTO, Old Zodiac shareholders exchanged their shares in Old Zodiac for shares in Zodiac Exploration Inc. on a 1:1.45 basis. Pre-existing warrants, performance warrants and stock options of Old Zodiac remain outstanding until they are exercised, expired, forfeited, or cancelled. Upon exercise of the warrants, performance warrants, or options they will be exchanged at the 1:1.45 ratio for Zodiac Exploration Inc. shares.
SELECTED ANNUAL FINANCIAL INFORMATION
At September 30, 2011, the Company has not yet achieved profitable operations, has accumulated a deficit of $18,410 (nine months ended September 30, 2010 - $4,609 and twelve months ended December 31, 2009 - $2,028) since inception and expects to incur further losses in the development of its business, which is typical of an oil and gas exploration company in the early stages of development. As at September 30, 2011, the Company’s cash balance was $40,532 (September 30, 2010 - $58,445) primarily resulting from warrant exercises during the year ended September 30, 2011 and financings completed in the nine month period ended September 30, 2010.
To date, the Company has no oil and gas revenues and is considered to be in the development stage as defined by the Canadian Institute of Chartered Accountants (“CICA”) Accounting Guideline 11.
| | | FINANCIAL HIGHLIGHTS | |
| | | September 30,
2011 $ | | | September 30,
2010 $ | | | December 31,
2009 $ | |
| Interest income | | | 215 | | | | 42 | | | | 21 | |
| Total assets | | | 109,184 | | | | 80,143 | | | | 17,202 | |
| Cash flows used in operating activities | | | (3,786 | ) | | | (1,673 | ) | | | (1,536 | ) |
| Per share (basic and diluted) | | | (0.01 | ) | | | (0.01 | ) | | | (0.02 | ) |
| Net loss | | | (13,801 | ) | | | (2,581 | ) | | | (1,766 | ) |
| Per share (basic and diluted) | | | (0.04 | ) | | | (0.02 | ) | | | (0.02 | ) |
| Capital expenditures | | | 46,402 | | | | 5,320 | | | | 7,241 | |
| General & administrative expenses | | | 3,825 | | | | 1,878 | | | | 1,546 | |
Interest income was generated from interest received on cash held in bank deposits and term deposits obtained throughout the period. During the twelve months ended September 30, 2011, interest revenue increased when compared to the nine month period ended September 30, 2010 and twelve month period ended December 31, 2009, primarily due to higher cash deposits held during the year.
Total assets at September 30, 2011 were $109,184 (September 30, 2010 - $80,143). The significant increase in assets was primarily the result of warrant and option exercises which occurred during the twelve months ended September 30, 2011. Assets are comprised mainly of cash of $40,532 and property, plant and equipment of $64,463.
During the twelve months ended September 30, 2011, cash flows used in operating activities increased to $3,786, from usage of $1,673 during the nine months ended September 30, 2010 and $1,536 during the twelve months ended December 31, 2009. This increase is due to the increase in G&A expense resulting from the growth of the Company.
Net loss for the twelve months ended September 30, 2011 was $13,801 or $(0.04) per share, compared to a loss of $2,581 or $(0.02) per share for the nine months ended September 30, 2010, and a loss of $1,766 or $(0.02) during the twelve months ended December 31, 2009. Weighted average share calculations have been restated for comparative periods in accordance with reverse takeover accounting guidance. For the year ended September 30, 2011, Zodiac expensed $3,825 in general and administrative expenses (nine months ended September 30, 2010 - $1,878 and twelve months ended December 31, 2009 – $1,546), net of capitalized G&A of $1,496 (September 30, 2010 - $772). The amounts capitalized are directly related to the Company’s drilling, geological and geophysical capital programs, which increased due to activity related to the beginning of physical operations in December 2010. Additionally, G&A expenses increased throughout 2011 primarily as a result of the expanding activities of the Company and consequent increases of technical and financial personnel to undertake and oversee those activities.
Zodiac uses the Canadian dollar as its functional and reporting currency. The Company’s US operations are considered integrated. Accordingly, the Company uses the temporal method of accounting for the foreign currency transactions of its US subsidiaries. It is anticipated that, as US operations comprise a progressively larger proportion of the Company’s balance sheet and operations, adoption of the US dollar as its reporting currency may occur.
ANNUAL RESULTS OF OPERATIONS
| | | | | | RESULTS OF OPERATIONS | |
| | | September 30, 2011 $ | | | September 30, 2010 $ | | | December 31, 2009 $ | |
| Interest income | | | 215 | | | | 42 | | | | 21 | |
| General and administrative expenses | | | 3,825 | | | | 1,878 | | | | 1,546 | |
| Foreign exchange (gain)/loss | | | 62 | | | | (115 | ) | | | 36 | |
| Stock based compensation | | | 1,587 | | | | 802 | | | | 183 | |
| Depreciation and accretion | | | 45 | | | | 33 | | | | 22 | |
| Impairment of assets | | | 8,497 | | | | 25 | | | | - | |
| Net loss | | | 13,801 | | | | 2,581 | | | | 1,766 | |
During the year, the Company recognized $265 (nine months ended September 30, 2010 - $489 and twelve months ended December 31, 2009 - $nil) of performance warrant compensation expense (included in stock-based compensation) resulting from the issuance of 10,150,000 performance warrants to officers of the Company. As at December 31, 2010, all performance warrants had vested.
Stock based compensation expense recognized for the fiscal period ended September 30, 2011 also included $1,605 (nine months ended September 30, 2010 - $404 and twelve months ended December 31, 2009 - $236). Of the total compensation expense for the fiscal period ended September 30, 2011, $1,322 (nine months ended September 30, 2010 - $312 and twelve months ended December 31, 2009 - $183) has been recorded as a stock-based compensation expense related to options issuances and $283 (nine months ended September 30, 2010 - $92 and twelve months ended December 31, 2009 - $52) has been capitalized for options issued to employees and consultants directly involved in exploration activities.
Depreciation and accretion expenses during the twelve months ended September 30, 2011, nine months ended September 30, 2010 and twelve months ended December 31, 2009 were $45, $33 and $22, respectively, related to depreciation on fixed assets and accretion on the asset retirement obligation (“ARO”). As the Company’s petroleum and natural gas assets have not yet commenced production no depletion has been recorded.
SELECTED QUARTERLY FINANCIAL INFORMATION
| | | For the three months ended | | | | |
| | | September 30, 2011 $ | | | June 30,
2011 $ | | | March 31,
2011 $ | | | December 31,
2010 $ | | | September 30,
2010 $ | | | June 30,
2010 $ | | | March 31,
2010 $ | | | December 31,
2009 $ | |
| Interest income | | | 100 | | | | 29 | | | | 34 | | | | 52 | | | | 37 | | | | 5 | | | | - | | | | 1 | |
| Total assets | | | 109,184 | | | | 108,033 | | | | 72,558 | | | | 80,031 | | | | 80,143 | | | | 32,575 | | | | 27,496 | | | | 17,202 | |
| Cash flow used in operating activities | | | (2,930 | ) | | | 1,077 | | | | (992 | ) | | | (942 | ) | | | (474 | ) | | | (937 | ) | | | (261 | ) | | | (678 | ) |
| Per share (basic and diluted) | | | (0.01 | ) | | | (0.00 | ) | | | (0.00 | ) | | | (0.00 | ) | | | (0.00 | ) | | | (0.01 | ) | | | (0.00 | ) | | | (0.01 | ) |
| Net loss | | | (246 | ) | | | (1,833 | ) | | | (10,450 | ) | | | (1,272 | ) | | | (1,150 | ) | | | (907 | ) | | | (523 | ) | | | (652 | ) |
| Per share (basic and diluted) | | | (0.00 | ) | | | (0.01 | ) | | | (0.03 | ) | | | (0.00 | ) | | | (0.01 | ) | | | (0.01 | ) | | | (0.00 | ) | | | (0.01 | ) |
| Capital expenditures | | | 10,164 | | | | 10,487 | | | | 20, 983 | | | | 4,769 | | | | 2,892 | | | | 1,811 | | | | 617 | | | | 2,113 | |
| General & administrative expenses | | | 972 | | | | 1,021 | | | | 1,018 | | | | 814 | | | | 697 | | | | 796 | | | | 385 | | | | 521 | |
| | | For the three months ended | | | | |
| | | September 30, 2011 $ | | | June 30,
2011 $ | | | March 31, 2011 $ | | | December 31, 2010 $ | | | September 30, 2010 $ | | | June 30, 2010 $ | | | March 31, 2010 $ | | | December 31, 2009 $ | |
| Interest income | | | 100 | | | | 29 | | | | 34 | | | | 52 | | | | 37 | | | | 5 | | | | - | | | | 1 | |
| General and administrative expenses | | | 972 | | | | 1,021 | | | | 1,018 | | | | 814 | | | | 697 | | | | 796 | | | | 385 | | | | 521 | |
| Foreign exchange (gain) loss | | | (980 | ) | | | (74 | ) | | | 828 | | | | 289 | | | | 162 | | | | (368 | ) | | | 92 | | | | 38 | |
| Stock based compensation | | | 315 | | | | 905 | | | | 156 | | | | 211 | | | | 317 | | | | 449 | | | | 36 | | | | 89 | |
| Impairment of oil and gas properties | | | - | | | | - | | | | 8,472 | | | | - | | | | - | | | | - | | | | - | | | | - | |
| Impairment of investment in KOS Energy Ltd. | | | 25 | | | | - | | | | - | | | | - | | | | - | | | | 25 | | | | - | | | | - | |
| Depletion, depreciation and accretion | | | 14 | | | | 11 | | | | 10 | | | | 10 | | | | 12 | | | | 11 | | | | 11 | | | | 6 | |
| Net loss | | | (246 | ) | | | (1,833 | ) | | | (10,450 | ) | | | (1,272 | ) | | | (1,150 | ) | | | (907 | ) | | | (523 | ) | | | (652 | ) |
QUARTERLY RESULTS OF OPERATIONS
Foreign exchange (gain)/loss during the three months ended September 30, 2011 and September 30, 2010 was $(980) and $162, respectively. The foreign exchange (gain)/loss is due to the business activities in the United States and holding of US cash deposits. During the three months ended September 30, 2011, there was a foreign exchange gain as a result of the strengthening of the US dollar which impacted US cash balances and purchases of US assets in the period.
General and administrative expenses (“G&A”) during the three months ended September 30, 2011 were $972, compared to $1,021 during the three months ended June 30, 2011. The G&A expenses during the quarter were largely due to staffing costs and office expenses. The company capitalized a portion of G&A expense for the three months ended September 30, 2011 consistent with the prior year. G&A expenses are comprised mainly of salaries, management fees, consulting services, legal fees, travel expenditures and office expenses.
Stock-based compensation during the three months ended September 30, 2011 and September 30, 2010 was $315 and $317, respectively. The Company continued to issue options to employees, directors and consultants in the year, with share price fluctuations impacting option valuations at grant date, and amortized over the vesting life of each tranche.
CAPITAL EXPENDITURES
The Company’s intention is to fund the acquisition of mineral and surface rights, the initiation of exploration activities including acquisition of seismic data, and the drilling, completion and tie-in of oil and gas wells through equity issues, operating cash flow and eventually borrowing base loans. A summary of the Company’s Property, Plant and Equipment additions to date are summarized below:
| | | September
30, 2011 $ | | | September 30, 2010 $ | |
| Beginning asset balance | | | 21,121 | | | | 15,722 | |
| Land and lease rentals additions | | | 13,342 | | | | 1,846 | |
| Geology and seismic additions | | | 1,584 | | | | 1,332 | |
| Drilling and completions additions | | | 28,296 | | | | 2,221 | |
| Asset retirement obligation additions | | | 163 | | | | (12 | ) |
| Other fixed assets additions | | | 36 | | | | 12 | |
| Accumulated depreciation | | | (78 | ) | | | (49 | ) |
| Total | | | 64,463 | | | | 21,072 | |
Since its inception, the Company’s Property, Plant and Equipment additions have been $64,463, net of depreciation and impairment (September 30, 2010 - $21,072).
During the quarter the Company’s operational focus continued to be on the drilling of the horizontal 1-10 well in the San Joaquin Basin and planning the completion program thereof. Throughout the year additional areas of capital expenditure were the acquisition of the Panther prospect (discussed above) and additional lands in the Company’s operational area of focus in the San Joaquin basin, lease rental costs to maintain our rights in our land holdings, and acquisition of additional 3-D seismic data.
The Company’s initial entry into California occurred on June 8, 2009, when the Company acquired the rights, through farm-in, to drill for petroleum and natural gas on approximately 19,700 gross acres (15,750 net) (the “Jaguar Prospect”), of principally contiguous land in the San Joaquin Basin in California (“California Transaction”). The Company paid US$2,500 (CDN $2,800), issued 2 million Zodiac common shares, committed to pay 100% of a seismic program and drill the initial well on the Jaguar prospect, and agreed to pay 100% of the land lease rentals until the initial well is drilled to earn an 80% interest in these lands. The California Transaction also has a secondary component, the Hawk prospect, which is characterized as a conventional prospect. The Company received an option to drill and pay for 100% of the first exploratory well on the Hawk prospect (to be spud by May 31, 2013) to earn an 80% interest in an approximate additional 4,800 gross acres (3,860 net). All of the lands are entirely freehold lands and have varying royalty requirements, which average approximately 20%. These lands are also subject to an overriding royalty interest on production of 2.5% before payout and 4% after payout.
With the completion of the drilling of the 4-9 well on the Jaguar prospect the Company has satisfied its earning requirements on the Jaguar prospect.
During the year ended September 30, 2011, the Company had minimal activities in the Windsor Basin in Nova Scotia. The Company took a full impairment charge on its Nova Scotia assets upon assessing certain factors including (among others): intent to drill by the operator of the Windsor Basin project; remaining lease term; geological and geophysical evaluations; and drilling results. Given that the operator was no longer allocating meaningful resources to continued evaluation, lack of proved reserves attributable to the property and no success to date in finding a joint venture partner to fund a drilling program the Company felt that a full impairment charge was both reasonable and warranted.
LIQUIDITY & CAPITAL RESOURCES
As of September 30, 2011 the Company had positive working capital of $37,731 (September 30, 2010 - $56,912). The Company had $40,532 in cash, generated through equity financings in 2010 and warrant exercises in 2011. Management believes that through existing cash it will have adequate funding to support the Company’s planned capital expenditure programs to the end of calendar 2011. Zodiac’s revenue is comprised entirely of interest earned on cash and cash equivalent balances and short-term investments. Zodiac invests the short-term investments with a major Canadian financial institution. Zodiac has no outstanding bank debt or other interest-bearing indebtedness as at September 30, 2011.
In connection with the RTO of Peninsula, escrow conditions were imposed on the shareholders of Old Zodiac. To date, 100% of the restricted shares have now been released from escrow. The final escrow release date occurred on October 6, 2011.
The Company spud its initial evaluation well on December 25, 2010 and as of the date of this MD&A has completed and tested it. This well has satisfied the Company’s obligations to earn its interest in the Jaguar prospect as previously described above. In order for the Company to earn its working interest in the Hawk and Panther prospects, it will need to spud a well on the Hawk prospect by May 31, 2013; in addition to one well in Panther by January 1, 2013 and a second well in Panther by January 1, 2014.
The Company currently holds an operating lease agreement for office space in Calgary, Alberta which commenced on May 1, 2010 and ends on February 29, 2012. The annual basic rent obligation is $38, payable in monthly instalments of $3. In addition to the basic rent, additional rent is payable monthly, and includes the Company’s proportionate share of all operating costs and taxes.
The Company currently holds an operating lease agreement for the lease of office space in Bakersfield, California for two years which commenced July 1, 2010 and ends on June 30, 2012. The annual basic rent obligation is US$37 per annum, payable in monthly instalments of US$3. In addition to the basic rent, additional rent is payable monthly, and includes the Company’s proportionate share of all operating costs and taxes.
Zodiac assesses its financing requirements and its ability to access equity or debt markets on an ongoing basis. This assessment considers: the stage and success of the Company’s evaluation activities to date; the continued participation of the Company’s partners in evaluation activities; and financial market conditions.
The Company’s intent is to fund the acquisition of mineral and surface rights, the initiation of exploration activities including acquisition of seismic data, and the drilling, completion and tie-in of oil and gas wells through equity issues and potentially farm-out agreements and eventually operating cash flow and borrowing base loans.
Zodiac will continue to maintain financial flexibility and monitor its financing requirements along with its ability to access the equity markets. It is possible that future economic events and global conditions may result in further volatility in the financial markets which could negatively impact Zodiac’s ability to access equity or debt markets in the future. Any inability to access equity or debt markets for sufficient capital, at acceptable terms, and within required timeframes, could have a material adverse effect on Zodiac’s financial condition, results of operations and prospects. Further discussion of these risks may be found in the “Business Risks and Uncertainties” section of this MD&A.
On June 9, 2011, the Company filed a form 40-F registration statement with the SEC.
TRANSACTIONS WITH RELATED PARTIES
Related party transactions during the period ended September 30, 2011 not disclosed elsewhere in this Management’s Discussion and Analysis are as follows:
| | a) | Aggregate management fees of $nil (nine months ended September 30, 2010 - $220 and twelve months ended December 31, 2009 – $581) were paid to officers of the Company and recorded in the consolidated statement of loss and deficit. All officers of the Company became employees on May 1, 2010. |
| | b) | Included in accounts payable as at September 30, 2011 was $nil (September 30, 2010 - $nil) payable to directors and officers of the Company. |
Transactions with related parties are recorded at the exchange amount, being the price agreed to between the parties.
RECENT ACCOUNTING PRONOUNCEMENTS
Accounting Standards Change
The Company successfully completed efforts to raise additional equity capital in conjunction with the plan to combine with Peninsula (note 4). Post RTO, U.S. based investors form a substantial minority of the Company’s shareholder base. Should trading of the Company’s shares shift the balance to majority ownership by U.S. investors, it is anticipated, given the Company’s focus on the properties located in California, that the Company will eventually become a Domestic Issuer from a Securities Exchange Commission ("SEC") perspective. As a result, the Company would then be obligated to prepare and file U.S. GAAP based financial statements and regulatory filings to comply with U.S. regulations and the Company could avail itself of the option to use its U.S. GAAP statements for all financial disclosure requirements both in Canada and the U.S. Alternatively, should shareholdings shift towards a greater allocation to Canadian and international investors or stay static, International Financial Reporting Standards (“IFRS”) would need to be adopted for the fiscal year beginning October 1, 2011. In order to eliminate the uncertainty regarding an inevitable accounting conversion, to either IFRS or U.S. GAAP, the Company filed a form 40 F registration statement with the SEC during the year. The Company intends to list its securities on a U.S. exchange and file U.S. GAAP statements with the SEC within the next 12 months. Further the Company intends to avail itself of the option to use its U.S. GAAP statements for all financial disclosure requirements both in Canada and the U.S. beginning in fiscal 2012. The Company has determined that a conversion to U.S. GAAP will have an insignificant impact on its financial statements.
APPLICATION OF ACCOUNTING ESTIMATES
Estimates by management represent an integral component of the consolidated financial statements prepared under Canadian GAAP. The estimates made in the consolidated financial statements reflect management’s judgments based on past experiences, present conditions, and expectations of future events. Where estimates were made, the reported amounts for assets, liabilities, revenues and expenses may differ from the amounts that would otherwise be reflected if the ultimate outcome of all uncertainties and future events were known at the time the consolidated financial statements were prepared. By their nature, these estimates are subject to measurement uncertainty, and the impact of differences between actual and estimated amounts on the consolidated financial statements of future periods could be material.
The Company views the following estimates as critical:
Income Tax
Income taxes are accounted for using the liability method of income tax allocation. Under the liability method, future income tax assets and liabilities are recorded to recognize future income tax inflows and outflows arising from the settlement or recovery of assets and liabilities at their carrying values. Future income tax assets are also recognized for the benefits from tax losses and deductions that cannot be identified with particular assets or liabilities, provided those benefits are more likely than not to be realized. Future income tax assets and liabilities are determined based on the substantively enacted tax laws and rates that are anticipated to apply in the period of realization.
Oil and Gas Properties
The Company follows the full cost method of accounting whereby all costs related to the acquisition are initially capitalized. Costs capitalized include land acquisition costs, geological and geophysical expenditures, lease rentals on undeveloped properties, costs of drilling productive and non-productive wells, together with overhead and interest directly related to exploration and development activities, and lease and well equipment.
Costs capitalized are intended to be depleted and amortized on a cost centre basis using the unit-of-production method based on estimated proved petroleum and natural gas reserves before royalties as determined by independent engineers. In determining its depletion base, the Corporation includes estimated future capital costs to be incurred in developing proved reserves and excludes the cost of significant unproved properties until it is determined whether proved reserves are attributable to the unproved properties or impairment has occurred. Unproved properties are evaluated separately for impairment based on management’s assessment of future drilling and exploration activities. During the period there has been nil production, and a depletion expense was not recognized.
Costs capitalized are periodically assessed for impairment after considering geological data and other information. A loss is recognized at the time of impairment by providing an impairment allowance.
As at September 30, 2011, the Company had oil and gas properties with a net book value of $64,392 (September 30, 2010 of $21,008) included in Property, Plant and Equipment on the balance sheet. During the year ended September 30, 2011, management considered whether events occurred or conditions existed, as at period end, that would indicate that net carrying amounts would not be recoverable from estimated future cash flows. Management has determined that there was no asset impairment as at September 30, 2011, other than as already claimed in the year.
Asset Retirement Obligation (“ARO”)
The Company recognizes the fair value of an ARO in the period in which a well or related asset is drilled, constructed or acquired and when a reasonable estimate of the fair value can be made. The fair value of the estimated ARO is recorded as a long-term liability, and equals the present value of estimated future cash flows, discounted using a risk-free interest rate adjusted for the Company’s credit standing. The liability accretes until the date of expected settlement of the retirement obligations or the asset is sold and is recorded as an accretion expense. Asset retirement costs are capitalized as part of the carrying value of the related assets. The capitalized amount will be amortized to earnings on a basis consistent with depreciation and depletion of the underlying assets. Actual restoration expenditures are charged to the accumulated obligation as incurred. Any settlements are charged to income in the period of settlement.
Revenue Recognition
Revenue from the sale of petroleum and natural gas is recorded on a gross basis when title passes to an external party and is recognized based on volumes delivered to customers at contractual delivery points and when the significant risks and rewards of ownership have been transferred to the buyer and collectability is reasonably assured.
As at September 30, 2011, the Company has not recognized revenue from the sale of petroleum and natural gas as production has not yet occurred, other than incidental production from testing net against capital costs.
Financial Instruments, Recognition, Measurement, Disclosure and Presentation
Under Section 3855 of the CICA Handbook, all financial instruments are classified into one of the following five categories: held-for-trading; held-to-maturity investments; loans and receivables; available for sale financial assets; or other financial liabilities. All financial instruments and derivatives are measured on the balance sheet date at fair value upon initial recognition. Subsequent measurement depends on the initial classification of the instrument. Held-for-trading financial assets are measured at fair value, with changes in fair value recognized in net earnings (loss). Available for sale financial instruments are measured at fair value, with changes in fair value recorded in Other Comprehensive Income until the instrument is de-recognized or impaired. Loans and receivables, held-to-maturity investments and other financial liabilities are measured at amortized cost.
All derivative instruments, including embedded derivatives, are recorded in the balance sheet at fair value unless they qualify for the normal sales and purchases exemption. Changes in the fair value of derivatives that are not exempt are recorded in net earnings (loss). Derivatives that qualify as hedging instruments must be designated as either a “cash flow hedge,” when the hedged item is a future cash flow, or a “fair value hedge,” when the hedged item is a recognized asset or liability. The unrealized gains and losses of the effective portion related to a cash flow hedge are included in other comprehensive income. For a fair value hedge, both the derivative and the hedged risk of the hedged item are recorded at fair value in the balance sheet and the unrealized gains and losses from both items are recorded in net earnings (loss). Any derivative instrument that does not qualify for hedge accounting is marked-to-market at each reporting date and the gains or losses are included in income.
Upon adoption of these standards, the Company has designated its cash and cash equivalents as held for trading, which are measured at fair value. Accounts receivable are classified as loans and receivables, which are measured at amortized cost. Accounts payable and accrued liabilities are classified as other financial liabilities, which are measured at amortized cost.
OFF BALANCE SHEET ARRANGEMENTS
The Company has not entered into any off-balance sheet arrangements such as guarantee contracts, contingent interests in assets transferred to unconsolidated entities, derivative financial obligations, or with respect to any obligation under a variable interest equity arrangement.
FINANCIAL INSTRUMENTS
The Company’s financial instruments consist of cash and cash equivalents, accounts receivable, and accounts payable and accrued liabilities. The fair values of these financial instruments approximate their carrying value due to their short-term nature.
Effective December 31, 2009, the Company adopted the amendments to CICA Section 3862 “Financial Instruments – Disclosures”. These amendments require the Company to present information about financial instruments measured at fair value in accordance with a three level hierarchy. The hierarchy groups financial assets and liabilities into three levels based on the significance of inputs used in measuring the fair values of the financial assets and liabilities. The fair value hierarchy has the following levels:
| | (i) | Level 1: quoted prices (unadjusted) in active markets for identical assets or liabilities; |
| | (ii) | Level 2: inputs other than quoted prices included within Level 1 that are observable for the asset or liability either directly (i.e. as prices) or indirectly (i.e. derived from prices); and |
| | (iii) | Level 3: inputs for the asset or liability that are not based on observable market data (unobservable inputs). |
The level within which the financial asset or liability is classified is determined based on the lowest level of significant input to the fair value measurement.
| | Credit risk is the risk of loss if a customer or party to a financial instrument fails to meet its commercial obligations. The Company’s maximum credit risk exposure is limited to the carrying value of its accounts receivable and cash and cash equivalents. At September 30, 2011, the Company had accounts receivable of $3,875, which consisted primarily of joint interest billings receivable from partners. The Company’s cash and cash equivalents of $40,532 at September 30, 2011 consisted of balances with a Canadian Chartered Bank and a US Chartered Bank. Management believes that the credit risk with respect to accounts receivables and cash and cash equivalents is not material. | |
| | The Company’s operations are expected to eventually result in exposure to fluctuations in prices of commodities including oil, natural gas and natural gas liquids. At this time, the Company does not have any production and therefore there is no need for the Company to engage in commodity price risk management. However, management continuously monitors commodity prices and will utilize instruments to manage exposure to these risks when it deems necessary. | |
The Company has $nil short or long term interest bearing debt and therefore is only exposed to interest rate risk through its cash holdings. The Company manages its exposure to interest rate risk by entering into term deposits with fixed interest rates.
The Company is exposed to the financial risk related to the fluctuation of foreign exchange rates. The Company operates in Canada and the United States and a growing portion of its expenses is incurred in US dollars. The Company does not hedge its exposure to fluctuations in the exchange rate. Changes in exchange rates could have a material effect on the Company’s business including its intended capital plans, its financial condition and results of operations.
Certain of the Company’s financial instruments are exposed to fluctuations in the US dollar, including cash and cash equivalents, accounts receivable and accounts payable and accrued liabilities. A hypothetical change of 10% to the foreign exchange rate between the US dollar and the Canadian dollar applied to the average level of US denominated cash and cash equivalents during the twelve months ended September 30, 2011 would have had approximately a $2,200 impact on the Company’s earnings for the period.
OUTSTANDING SHARE DATA
Authorized capital:
Unlimited number of common shares with voting rights.
Unlimited number of preferred shares, issuable in series.
Issued and outstanding:
| - | 359,248,741 common shares as at December 22, 2011. |
Warrants outstanding:
| - | 14,500,000 with an exercise price of $1.034. Expiry dates are between February 8th and February 10th, 2012. |
| - | 24,445,706 with an exercise price of $0.414. 12,325,008 expire on March 17, 2015, 11,088,539 expire on April 1, 2015 and 1,032,159 expire on April 9, 2015. |
| - | Subsequent to year end 1,630,000 options were issued to directors, officers, employees and consultants of the Company. |
BUSINESS RISKS AND UNCERTAINTIES
The Company is subject to various risks and uncertainties, including, but not limited to, those listed below:
Oil and Gas Exploration and Development
The oil and gas industry is extremely competitive in all aspects including the acquisition of oil and gas interests, the marketing of oil and natural gas, and acquiring or gaining access to necessary drilling equipment, services and supplies. Zodiac competes with numerous other companies in the search for and acquisition of prospective oil and gas plays.
Zodiac is subject to all risks and hazards inherent in the business involved in the exploration for, and the acquisition, development, production and marketing of oil and natural gas. Many of these inherent risks cannot be compensated for, even with the combination of experience, knowledge and careful planning of an experienced technical team. The risks and hazards typically associated with oil and gas operations include equipment failure, fire, explosion, blowouts, sour gas releases, pipeline ruptures and oil spills, each of which could result in substantial damage to oil and gas wells, production facilities, other property, the environment or personal injury.
Capital Requirements
To finance future operations, Zodiac may require financing from external sources including, but not limited to, issuance of common or preferred shares, issuance of debt or implementation of working interest farm-out agreements. There can be no assurance that such financing will be offered on acceptable terms or that it will be available at all to the Company. If additional financing is raised through the issuance of equity or convertible debt securities, control of the Company may change and the interests of shareholders in the net assets of Zodiac may be diluted. If unable to secure financing on acceptable terms, Zodiac may have to cancel or postpone certain of its planned exploration and development activities which may ultimately lead to Zodiac’s inability to fulfill the minimum work obligations under various farm-in agreements and potentially to the forfeiture of existing land holdings. Availability of capital will also directly impact the Company’s ability to take advantage of additional farm-in and acquisition opportunities.
Operations
Zodiac’s largest land position relates to the oil and gas projects located in Kings County, California, USA, which is currently its primary focus. Uncertainties include, but are not limited to: a change in the general regulatory environment; a change in environmental protection policies; or a change in taxation policies. These uncertainties, all of which are beyond the Company’s control, could have a material adverse effect on Zodiac’s business, prospects and results of operations. Zodiac will require licenses or permits from various governmental authorities to carry out future exploration, development and production activities. There can be no assurance that Zodiac will be able to obtain all necessary licenses and permits when required.
Uncertainty of Title
Although Zodiac conducts a thorough title review prior to acquiring additional acreage in its areas of interest, such reviews do not guarantee that an unforeseen defect in the chain of title will not arise that may call into question Zodiac’s interest in its land holdings. Any uncertainty with respect to one or more of Zodiac’s leasehold interests could have a material adverse effect on the Company’s business, prospects and results of operations.
Foreign Operations
Zodiac operates in the United States and consequently, if legal disputes arise related to oil and gas leases acquired by Zodiac, these disputes would likely be subject to the jurisdiction of courts other than those of Canada.
Operational Uncertainties
In carrying out its planned exploration program, Zodiac is subject to various risks including, but not limited to: the availability of equipment, manpower and supplies; the effects of weather on drilling and production; and operating in an environmentally responsible fashion.
The Company mitigates these business risks by: working with qualified operators and/or operating the majority of properties to control the amount and timing of capital expenditures; restricting operations to areas where locations are accessible, operating and capital costs are reasonable and on-stream times are shorter; drilling wells in areas with multiple high deliverability zone potential; striving to maintain cost-effective operations; using current technology to maximize production and recoveries and reduce operating costs and environmental impacts; and maintaining memberships in industry organizations.
Dependence on Management
The Company strongly depends on the technical and business expertise of its management team and there is little possibility that this dependence will decrease in the near term. The unexpected loss of any member of the management team may have a material adverse impact on the operations of the Company.
MANAGEMENT’S REPORT ON INTERNAL CONTROL OVER FINANCIAL REPORTING
In connection with National Instrument 52-109 – Certification of Disclosure in Issuer’s Annual and Interim Filings (“NI 52-109”) adopted in December 2008 by each of the securities commissions across Canada, the Chief Executive Officer and Chief Financial Officer of the Company will file a Venture Issuer Basic Certificate with respect to the financial information contained in the unaudited interim financial statements and the audited annual financial statements and accompanying Management’s Discussion and Analysis.
The Venture Issuer Basic Certification does not include representations relating to the establishment and maintenance of disclosure controls and procedures and internal control over financial reporting; as defined in NI 52-109, as there are inherent limitations on the ability of certifying officers of a venture issuer to design and implement the above-mentioned controls on a cost effective basis.
During the past year the Company completed the initial assessment and documentation of its internal control over financial reporting. In the current year, management intends to continue refining existing procedures and implementing additional such controls over financial reporting as will enhance effectiveness over reliability of reporting and preparation of the financial statements.
DATE
This MD&A is dated December 22, 2011
(a Development Stage Company)
Consolidated Financial Statements
Year Ended September 30, 2011
(expressed in Canadian dollars)
Management's Responsibility For Financial Reporting
The accompanying financial statements of Zodiac Exploration Inc. (the “Company”) have been prepared by and are the responsibility of the management of the Company. The financial statements are prepared in accordance with Canadian generally accepted accounting principles and reflect management’s best estimates and judgment based on currently available information.
The Audit Committee of the Board of Directors meets periodically with management and the independent auditors to review the scope and results of the annual audit, and to review the financial statements and related financial reporting matters prior to submitting the financial statements to the Board for approval.
The Company’s independent auditors, PricewaterhouseCoopers LLP, who are appointed by the shareholders, conducted an audit in accordance with Canadian generally accepted auditing standards. Their report outlines the scope of their audit and gives their opinion on the financial statements.
Management has developed and maintains a system of internal controls to provide reasonable assurance that the Company’s assets are safeguarded, transactions are authorized and financial information is accurate and reliable.
| (Signed) “Murray Rodgers” | | (Signed) “Randy Neely” |
| President and Chief Executive Officer | | Chief Financial Officer |
December 22, 2011
Calgary, Alberta
Independent Auditor's Report
December 22, 2011
Independent Auditor’s Report
To the Shareholders of Zodiac Exploration Inc.
We have audited the accompanying consolidated financial statements of Zodiac Exploration Inc., which comprise the consolidated balance sheets as at September 30, 2011 and September 30, 2010 and the consolidated statements of loss and deficit and cash flows for the 12 month periods ended September 30, 2011 and December 31, 2009 and the nine month period ended September 30, 2010, and the related notes, which comprise a summary of significant accounting policies and other explanatory information.
Management’s responsibility for the consolidated financial statements
Management is responsible for the preparation and fair presentation of these consolidated financial statements in accordance with Canadian generally accepted accounting principles, and for such internal control as management determines is necessary to enable the preparation of consolidated financial statements that are free from material misstatement, whether due to fraud or error.
Auditor’s responsibility
Our responsibility is to express an opinion on these consolidated financial statements based on our audits. We conducted our audits in accordance with Canadian generally accepted auditing standards. Those standards require that we comply with ethical requirements and plan and perform the audit to obtain reasonable assurance about whether the consolidated financial statements are free from material misstatement.
An audit involves performing procedures to obtain audit evidence about the amounts and disclosures in the consolidated financial statements. The procedures selected depend on the auditor’s judgment, including the assessment of the risks of material misstatement of the consolidated financial statements, whether due to fraud or error. In making those risk assessments, the auditor considers internal control relevant to the entity’s preparation and fair presentation of the consolidated financial statements in order to design audit procedures that are appropriate in the circumstances, but not for the purpose of expressing an opinion on the effectiveness of the entity’s internal control. An audit also includes evaluating the appropriateness of accounting policies used and the reasonableness of accounting estimates made by management, as well as evaluating the overall presentation of the consolidated financial statements.
We believe that the audit evidence we have obtained in our audits is sufficient and appropriate to provide a basis for our audit opinion.
Opinion
In our opinion, the consolidated financial statements present fairly, in all material respects, the consolidated balance sheets of Zodiac Exploration Inc. as at September 30, 2011 and September 30, 2010 and the results of its operations and its cash flows for the periods ended September 30, 2011, September 30, 2010 and December 31, 2009 in accordance with Canadian generally accepted accounting principles.
PricewaterhouseCoopers LLP
Chartered Accountants
Zodiac Exploration Inc.
(a Development Stage Company)
Consolidated Balance Sheet
As at September 30, 2011 and September 30, 2010
(Expressed in Canadian $ 000's)
| | Note | | 2011 | | | 2010 | |
| Assets | | | | | | | |
| Current Assets | | | | | | | |
| Cash | | | $ | 40,532 | | | $ | 58,445 | |
| Accounts receivable | | | | 3,875 | | | | 63 | |
| Prepaid expenditures | | | | 314 | | | | 538 | |
| | | | | 44,721 | | | | 59,046 | |
| | | | | | | | | | |
| Investment in KOS Energy Ltd. | | | | - | | | | 25 | |
| Property, plant and equipment | 5. | | | 64,463 | | | | 21,072 | |
| | | | $ | 109,184 | | | $ | 80,143 | |
| Liabilities | | | | | | |
| Current Liabilities | | | | | | |
| Accounts payable and accrued liabilities | | $ | 6,990 | | | $ | 2,134 | |
| | | | 6,990 | | | | 2,134 | |
| | | | | | | | | |
| Asset retirement obligation | 6. | | 385 | | | | 206 | |
| | | | 7,375 | | | | 2,340 | |
| Shareholders' Equity | | | | | | | | |
| Share capital | 8. | | 114,424 | | | | 74,742 | |
| Warrants | 8. | | 2,833 | | | | 6,547 | |
| Contributed surplus | | | 2,962 | | | | 1,123 | |
| Deficit | | | (18,410 | ) | | | (4,609 | ) |
| | | | 101,809 | | | | 77,803 | |
| | | $ | 109,184 | | | $ | 80,143 | |
| Nature of operations | 1. | | | | | | | |
| Commitments | 11. | | | | | | | |
The accompanying notes are an integral part of these financial statements.
Zodiac Exploration Inc.
(a Development Stage Company)
Consolidated Statement of Loss and Deficit
For the year ended September 30, 2011, 9 months ended September 30, 2010 and the year ended December 31, 2009
(Expressed in Canadian $ 000's except per share amounts)
| | | 12 months ended September 30, 2011 | | | 9 months ended September 30, 2010 | | | 12 months ended December 31, 2009 | |
| Income | | | | | | | | | |
| Interest income | | $ | 215 | | | $ | 42 | | | $ | 21 | |
| Operating expenses | | | | | | | | | | | | |
| General and administrative | | | 3,825 | | | | 1,878 | | | | 1,546 | |
| Stock based compensation | | | 1,587 | | | | 802 | | | | 183 | |
| Depreciation and accretion | | | 45 | | | | 33 | | | | 22 | |
| Impairment of oil & gas properties | | | 8,472 | | | | - | | | | - | |
| Writedown of KOS investment | | | 25 | | | | 25 | | | | - | |
| Foreign exchange (gain) loss | | | 62 | | | | (115 | ) | | | 36 | |
| | | | 14,016 | | | | 2,623 | | | | 1,787 | |
| Net loss before income taxes | | | (13,801 | ) | | | (2,581 | ) | | | (1,766 | ) |
| Income taxes | | | | | | | | | | | | |
| Net loss | | | (13,801 | ) | | | (2,581 | ) | | | (1,766 | ) |
| Deficit, beginning of period | | | (4,609 | ) | | | (2,028 | ) | | | (262 | ) |
| Deficit, end of period | | $ | (18,410 | ) | | $ | (4,609 | ) | | $ | (2,028 | ) |
| Basic and diluted loss per share: | | | | | | | | | | | | |
| | | $ | (0.04 | ) | | $ | (0.02 | ) | | $ | (0.02 | ) |
| Weighted average shares outstanding during the period | | | 333,580,968 | | | | 163,810,884 | | | | 81,820,932 | |
The accompanying notes are an integral part of these financial statements.
Zodiac Exploration Inc.
(a Development Stage Company)
Consolidated Statement of Cash Flows
For the year ended September 30, 2011, 9 months ended September 30, 2010 and year ended December 31, 2009
(Expressed in Canadian $ 000's)
| | | 12 Months ended September 30, 2011 | | | 9 Months ended September 30, 2010 | | | 12 Months ended December 31, 2009 | |
| CASH FLOWS FROM OPERATING ACTIVITIES: | | | | | | | | | |
| Net loss for the period | | $ | (13,801 | ) | | $ | (2,581 | ) | | $ | (1,766 | ) |
| Depreciation and amortization | | | 45 | | | | 33 | | | | 22 | |
| Stock based compensation | | | 1,587 | | | | 802 | | | | 183 | |
| Asset impairment charges | | | 8,497 | | | | 25 | | | | - | |
| Foreign exchange gains (losses) | | | 62 | | | | (120 | ) | | | 35 | |
| | | | (3,611 | ) | | | (1,840 | ) | | | (1,525 | ) |
| Changes in non cash working capital | | | | | | | | | | | | |
| Change in accounts receivable | | | 21 | | | | 48 | | | | (92 | ) |
| Change in prepaids | | | (35 | ) | | | (107 | ) | | | (56 | ) |
| Change in accounts payable and accrued liabilities | | | (162 | ) | | | 227 | | | | 138 | |
| TOTAL CASH FLOWS FROM OPERATING ACTIVITIES | | | (3,786 | ) | | | (1,673 | ) | | | (1,536 | ) |
| CASH FLOWS FROM INVESTING ACTIVITIES: | | | | | | | | | | | | |
| Purchase of property and equipment | | | (46,402 | ) | | | (5,320 | ) | | | (7,241 | ) |
| Investment in KOS Energy Ltd. | | | - | | | | - | | | | (50 | ) |
| Change in accounts receivable | | | (3,833 | ) | | | 17 | | | | 757 | |
| Change in prepaids | | | 258 | | | | (369 | ) | | | - | |
| Change in accounts payable and accrued liabilities | | | 4,028 | | | | 1,272 | | | | 418 | |
| Working capital acquired in reverse takeover transaction | | | - | | | | 24 | | | | - | |
| Proceeds from sale of property and equipment | | | - | | | | - | | | | 159 | |
| NET CASH USED BY INVESTING ACTIVITIES | | | (45,949 | ) | | | (4,376 | ) | | | (5,957 | ) |
| CASH FLOWS FROM FINANCING ACTIVITIES: | | | | | | | | | | | | |
| Proceeds from issuance of common stock | | | - | | | | 61,783 | | | | - | |
| Proceeds from issuance of warrants | | | 33,946 | | | | 1,296 | | | | - | |
| Proceeds from stock options exercised | | | 101 | | | | 25 | | | | - | |
| NET CASH USED BY FINANCING ACTIVITIES | | | 34,047 | | | | 63,104 | | | | - | |
| OTHER ACTIVITIES: | | | | | | | | | | | | |
| Effect of exchange rate on cash and cash equivalents | | | (2,225 | ) | | | 121 | | | | (34 | ) |
| Net cash increase (decreases) in cash and cash equivalents | | | (17,913 | ) | | | 57,176 | | | | (7,527 | ) |
| Cash and cash equivalents at beginning of period | | | 58,445 | | | | 1,269 | | | | 8,796 | |
| Cash and cash equivalents at end of period | | $ | 40,532 | | | $ | 58,445 | | | $ | 1,269 | |
| Interest received | | | 215 | | | | 42 | | | | 21 | |
The accompanying notes are an integral part of these financial statements.
Zodiac Exploration Inc.
(a Development Stage Company)
Notes to the Financial Statements
For the year ended September 30, 2011, nine months ended September 30, 2010 and year ended December 31, 2009
(Expressed in Canadian $ 000's except per share amounts)
Zodiac Exploration Inc. (“Zodiac” or “the Company”) was formed as a result of the Reverse Takeover (“RTO”) as structured under a Plan of Arrangement completed on September 28, 2010, in which Peninsula Resources Ltd. (“Peninsula”) acquired all of the outstanding shares of Zodiac Exploration Corp. in a share for share exchange (the “Transaction”) (note 4). The Transaction entailed the amalgamation of Zodiac Exploration Corp. with 1543081 Alberta Ltd. (subsequently named Zodiac Exploration Corp.), a wholly-owned subsidiary of Peninsula. Upon completion of the Transaction, Peninsula changed its name to Zodiac Exploration Inc. For financial reporting purposes, the Transaction was accounted for as a RTO that did not constitute a business combination, with Zodiac Exploration Corp. identified as the RTO acquirer and Peninsula the reverse takeover acquiree. These consolidated financial statements are those of Zodiac with the RTO accounted for as a capital transaction. The comparative information presented, including all information presented prior to September 28, 2010, is that of Zodiac Exploration Corp. as it has been deemed the continuing entity post-RTO. Zodiac is principally engaged in the acquisition, exploration and development of oil and gas properties in the San Joaquin Basin in California. To date, the Company has had only incidental oil and gas revenues included as an offset to capital expenditures and is still considered to be in the development stage as defined by the Canadian Institute of Chartered Accountants (“CICA”) Accounting Guideline 11.
The Company has consolidated in its accounts the accounts of: Zodiac Exploration Corp.; Peninsula Resources (Barbados) Limited; and Zodiac USA Corp. (“Zodiac USA”), including Zodiac Kentucky LLC (“Zodiac Kentucky”) and Zodiac Energy LLC (“Zodiac Energy”). Peninsula Resources (Barbados) Limited was established by Peninsula Resources Ltd. prior to the RTO and is inactive. Zodiac Exploration Corp. (formerly 1543081 Alberta Ltd.) was the amalgamation vehicle for the RTO. Zodiac Kentucky and Zodiac Energy were established to carry on oil and gas exploration and development activities in the states of Kentucky and California, respectively. Both Zodiac Kentucky and Zodiac Energy are limited liability corporations, established under the laws of the state of Nevada, wholly-owned by Zodiac USA to act as operating companies. Zodiac Kentucky LLC is inactive.
At September 30, 2011, the Company has not yet achieved profitable operations, has accumulated a deficit of $18,410 (nine months ended September 30, 2010 - $4,609 and twelve months ended December 31, 2009 - $2,028) since its inception, and expects to incur further losses in the development of its business, which is typical of an oil and gas exploration company in the early stages of development. As at September 30, 2011, the Company’s cash balance was $40,532 (2010 - $58,445) primarily from financings completed in the twelve month period ended September 30, 2011 and the nine months ended September 30, 2010.
The Company changed its fiscal year from December 31 to September 30, effective September 30, 2010. As a result, the figures in the consolidated statement of earnings and comprehensive income and consolidated cash statement of cash flows are for the twelve months ended September 30, 2011, nine months ended September 30, 2010 and twelve months ended December 31, 2009.
Zodiac Exploration Inc.
(a Development Stage Company)
Notes to the Financial Statements
For the year ended September 30, 2011, nine months ended September 30, 2010 and year ended December 31, 2009
(Expressed in Canadian $ 000's except per share amounts)
| 2. | Significant Accounting Policies |
The financial statements have been prepared in accordance with pre-IFRS (International Financial Reporting Standards) Canadian generally accepted accounting principles ("Canadian GAAP") and reflect the following significant accounting policies:
Principles of consolidation |
The consolidated financial statements include the assets, liabilities and results of operations, after the elimination of intercompany transactions and balances, of the Company and its subsidiaries, all of which are wholly-owned.
Estimates by management represent an integral component of these financial statements prepared in accordance with Canadian GAAP. The estimates made in these financial statements reflect management's judgments based on past experiences, present conditions, and expectations of future events. Where estimates were made, the reported amounts for assets, liabilities, revenues and expenses may differ from the amounts that would otherwise be reflected if the ultimate outcome of all uncertainties and future events were known at the time these financial statements were prepared.
The Company uses estimates to calculate depreciation, depletion and accretion expense, to assess impairments of long-lived assets, to estimate asset retirement obligations, to estimate fair market value of investments, to calculate the fair value of warrants and stock options, and to estimate current tax expense.
The Company calculated depreciation and accretion expense using estimates of oil and gas reserves remaining in oil and gas properties, commodity prices and capital costs required to develop those reserves. Estimates of volumes and the related future cash flows are subject to measurement uncertainty. Such reserve estimates are subject to change as additional information becomes available.
Numerous assumptions and judgments are required in the fair value calculation of the asset retirement obligation including the ultimate settlement amounts, inflation factors, credit adjusted discount rates, and timing of settlement. To the extent future revisions to these assumptions impact the fair value of any existing asset retirement obligation (“ARO”) liability, a corresponding adjustment is made to the oil and gas property.
Impairment tests are carried out by the Company based upon the technical expertise of its personnel and are subject to measurement uncertainty. The assumptions underlying the impairment tests are subject to change as circumstances dictate and additional information becomes available.
The assumptions used in the determination of the fair value of warrants and stock options issued are based on the use of the Black-Scholes pricing model, which includes estimates of the future volatility of the Company’s stock price, expected lives of the warrants and stock options, expected dividends and risk-free rate.
By their nature, these estimates are subject to measurement uncertainty, and the impact of differences between actual and estimated amounts on the financial statements of future periods could be material.
Cash and cash equivalents |
Cash and cash equivalents include cash and highly liquid investments held in the form of bankers’ acceptances, money market investments and certificates of deposit with investment terms that are less than three months at the time of acquisition. These investments are stated at fair value, which approximates cost plus accrued interest.
Foreign currency translation |
The Company's reporting currency is Canadian ("CAD") dollars. Monetary assets and liabilities denominated in foreign currencies are translated into CAD dollars at exchange rates prevailing at the balance sheet date and non-monetary assets and liabilities are translated at rates in effect on the date of the transaction. Revenues and expenses are translated at the average rate of exchange in effect during the period other than depreciation which is translated at historical rates. Exchange gains or losses arising from translation are included in operating expenses.
Property, plant and equipment |
| | i. | Petroleum and natural gas properties |
The Company follows the full cost method of accounting whereby all costs related to the acquisition are initially capitalized on a country by country cost centre basis. Costs capitalized include land acquisition costs, geological and geophysical expenditures, lease rentals on undeveloped properties, costs of drilling productive and non-productive wells, together with overhead and interest directly related to exploration and development activities, and lease and well equipment.
Gains or losses are not recognized upon disposition of petroleum and natural gas properties unless such a disposition would alter the rate of depletion and depreciation by more than 20%.
ii. Depletion
Costs capitalized are depleted and amortized on a cost centre basis using the unit-of-production method based on estimated proved petroleum and natural gas reserves before royalties as determined by independent engineers. For purposes of this calculation, petroleum and natural gas reserves before royalties are converted to a common unit of measure on the basis of their relative energy content where one barrel of oil or liquids equals six thousand cubic feet of gas.
In determining its depletion base, the Company includes estimated future capital costs to be incurred in developing proved reserves and excludes the cost of significant unproved properties until it is determined whether proved reserves are attributable to the unproved properties or impairment has occurred. Unproved properties are evaluated separately for impairment based on management’s assessment of future drilling.
During the period there has been no commercial production, and a depletion expense was not recognized.
Zodiac Exploration Inc.
(a Development Stage Company)
Notes to the Financial Statements
For the year ended September 30, 2011, nine months ended September 30, 2010 and year ended December 31, 2009
(Expressed in Canadian $ 000's except per share amounts)
iii. Ceiling test
Under the full cost method of accounting, a limit is placed on the carrying amount of petroleum and natural gas properties. A ceiling test is performed on a cost centre basis to recognize and measure impairment, if any.
Impairment is recognized if the carrying amount of petroleum and natural gas properties, less the cost of unproved properties not subject to depletion (the “adjusted carrying amount”), exceeds the estimated undiscounted future cash flows from the Company’s proved reserves. The future cash flows are based on forecast prices and costs, as provided by an independent third party. If recognized, the magnitude of the impairment is measured by comparing the adjusted carrying amount to the estimated discounted future cash flows of the Company’s proved plus probable reserves. Any recognized impairment is recorded as additional depletion and amortization expense.
iv. Other assets
Other assets are carried at cost and amortized over the estimated useful lives of the assets at various rates per annum calculated on a declining balance basis
.
Asset retirement obligations |
The Company recognizes the fair value of an asset retirement obligation in the period in which a well or related asset is drilled, constructed or acquired and when a reasonable estimate of the fair value can be made. The fair value of the estimated ARO is recorded as a long-term liability, and equals the present value of estimated future cash flows, discounted using a risk-free interest rate adjusted for the Company’s credit standing. The liability accretes until the date of expected settlement of the retirement obligations or the asset is sold and is recorded as an accretion expense. The associated asset retirement costs are capitalized as part of the carrying value of the related assets. The capitalized amount will be amortized to earnings on a basis consistent with depreciation and depletion of the underlying assets. Actual restoration expenditures are charged to the accumulated obligation as incurred. Any settlements are charged to income in the period of settlement.
Income taxes are accounted for using the liability method of income tax allocation. Under the liability method, future income tax assets and liabilities are recorded to recognize future income tax inflows and outflows arising from the settlement or recovery of assets and liabilities at their carrying values. Future income tax assets are also recognized for the benefits from tax losses and deductions that cannot be identified with particular assets or liabilities, provided those benefits are more likely than not to be realized. Future income tax assets and liabilities are determined based on the substantively enacted tax laws and rates that are anticipated to apply in the period of realization.
The Company evaluates such tax reporting methods on a periodic basis to determine if any uncertain tax positions exist that would require the establishment of a loss contingency. A loss contingency would be recognized if it were probable that a liability had been incurred as of the date of the financial statements and the amount of the loss could be reasonably estimated.
Amounts recognized are subject to estimate and judgment regarding the likely outcome of each uncertain tax position. The amount that is ultimately incurred for an individual tax position or for all uncertain tax positions in the aggregate could differ from the amount recognized. The Company has determined that no significant uncertain tax positions exist as of September 30, 2011 and September 30, 2010 as a full valuation allowance has been taken in the year then ended.
Zodiac Exploration Inc.
(a Development Stage Company)
Notes to the Financial Statements
For the year ended September 30, 2011, nine months ended September 30, 2010 and year ended December 31, 2009
(Expressed in Canadian $ 000's except per share amounts)
The financial statements have been prepared in accordance with CICA Handbook Section 1530: Comprehensive Income, CICA Handbook Section 3251: Equity, CICA Handbook Section 3855: Financial Instruments – Recognition and Measurement, CICA Handbook Section 3862: Financial Instruments – Disclosures, CICA Handbook Section 3863: Financial Instruments – Presentation, and CICA Handbook Section 3865: Hedges. These Sections provide comprehensive requirements for the recognition and measurement of financial instruments, as well as standards on when and how hedge accounting may be applied. CICA Handbook Section 1530 also establishes standards for reporting and displaying comprehensive income. Comprehensive income is defined as the change in equity from transactions and other events from non-owner sources. Other comprehensive income (“OCI”) refers to items recognized in comprehensive income but that are excluded from net income calculated in accordance with generally accepted accounting principles.
Under CICA Handbook Section 3855, all financial instruments are classified into one of the following five categories: held-for-trading, held-to-maturity investments, loans and receivables, available for sale financial assets or other financial liabilities. All financial instruments and derivatives are measured on the balance sheet date at fair value upon initial recognition. Subsequent measurement depends on the initial classification of the instrument. Held-for-trading financial assets are measured at fair value, with changes in fair value recognized in net earnings (loss). Available for sale financial instruments are measured at fair value, with changes in fair value recorded in OCI until the instrument is derecognized or impaired. Loans and receivables, held-to-maturity investments and other financial liabilities are measured at amortized cost.
The Company has designated its cash and cash equivalents as held for trading, which are measured at fair value. Accounts receivable are classified as loans and receivables, which are measured at amortized cost. Accounts payable and accrued liabilities are classified as other financial liabilities, which are measured at amortized cost.
General standards of financial statement preparation |
CICA Handbook Section 1400, General Standards of Financial Statement Preparation, was amended to include requirements to assess and disclose an entity's ability to continue as a going concern. Realization values may be substantially different from carrying values as shown and these financial statements do not give effect to adjustments that would be necessary to the carrying values and classification of assets and liabilities should the Company be unable to continue as a going concern. As at September 30, 2011, the Company has not yet achieved profitable operations, has accumulated a deficit since inception, and expects to incur further losses in the development of its business. The Company is operating as a going concern based on the positive working capital generated through equity capital raised.
Stock-based compensation cost for options is estimated at the grant date based on the award's fair value as calculated by the Black-Scholes option-pricing model and is recognized as expense over the estimated requisite service period. The Black-Scholes model requires various highly judgmental assumptions including volatility and expected option life. If any of the assumptions used in the Black-Scholes model change significantly, stock-based compensation expense for future grants may differ materially from that recorded in the current period.
Zodiac Exploration Inc.
(a Development Stage Company)
Notes to the Financial Statements
For the year ended September 30, 2011, nine months ended September 30, 2010 and year ended December 31, 2009
(Expressed in Canadian $ 000's except per share amounts)
| 3. | Future Accounting and Reporting Changes |
The Company successfully completed efforts to raise additional equity capital in conjunction with the plan to combine with Peninsula (note 4). Post RTO, U.S. based investors form a substantial minority of the Company’s shareholder base. Should trading of the Company’s shares shift the balance to majority ownership by U.S. investors, it is anticipated, given the Company’s focus on the properties located in California, that the Company will eventually become a Domestic Issuer from a Securities Exchange Commission ("SEC") perspective. As a result, the Company would then be obligated to prepare and file U.S. GAAP based financial statements and regulatory filings to comply with U.S. regulations. Alternatively, should shareholdings shift towards a greater allocation to Canadian and international investors or stay static, International Financial Reporting Standards (“IFRS”) would need to be adopted for the fiscal year beginning October 1, 2011. In order to eliminate the uncertainty regarding an inevitable accounting conversion, to either IFRS or U.S. GAAP, the Company filed a form 40 F registration statement with the SEC during the quarter ended June 30, 2011. The Company intends to list its securities on a U.S. exchange and file U.S. GAAP statements with the SEC within the next 12 months. Further the Company intends to avail itself of the option to use its U.S. GAAP statements for all financial disclosure requirements both in Canada and the U.S. beginning in fiscal 2012. The Company has determined that a conversion to U.S. GAAP will have an insignificant impact on its financial statements.
On August 19, 2010, Zodiac Exploration Corp. entered into an Arrangement Agreement with Peninsula, and a wholly owned subsidiary of Peninsula named 1543081 Alberta Ltd., to effect a reverse takeover transaction. Under the Agreement, Zodiac Exploration Corp. amalgamated with 1543081 Alberta Ltd (the continuing corporate entity post amalgamation was named Zodiac Exploration Corp.); Peninsula was renamed Zodiac Exploration Inc. This transaction was successfully completed on September 28, 2010 (“the Closing Date”) with the shares of the Company subsequently listed on the TSX Venture Exchange. As a result of the transaction mechanics as of the Closing Date, the shareholders of Zodiac Exploration Corp. held 308,721,985 post consolidation shares (97.21%) of the Company, and the shareholders of Peninsula held 8,861,626 post-consolidation shares (2.79%).
Immediately prior to the reverse takeover the book value of Peninsula’s net assets was as follows:
| Cash | 198 |
| Prepaid Expenses | 1 |
| Accounts receivable | 24 |
| Accounts payables and accrued liabilities | (1) |
| Book value of net assets | 222 |
Although Peninsula was the legal acquirer of Zodiac, as the shareholders of Zodiac Exploration Corp. held approximately 97.2% of the Company post RTO, Zodiac Exploration Corp. was treated as the acquirer under Canadian GAAP. Consequently Zodiac Exploration Inc. was deemed a continuation of Zodiac Exploration Corp. and the book value of Peninsula’s net assets was accounted for as an increase in share capital of $222 as Peninsula was deemed not to meet the definition of a business under Canadian GAAP (necessitating treatment as a capital transaction). RTO transaction costs, to the extent of cash received from Peninsula, were charged to share capital in the amount of $198, resulting in a net increase to share capital of $16 and warrants of $8 (note 8b, 8c).
Zodiac Exploration Inc.
(a Development Stage Company)
Notes to the Financial Statements
For the year ended September 30, 2011, nine months ended September 30, 2010 and year ended December 31, 2009
(Expressed in Canadian $ 000's except per share amounts)
| 5. | Property, plant and equipment |
| | | September 30, 2011 | |
| | | Cost $ | | | Accumulated depletion & depreciation $ | | | Net book value $ | |
| Oil and gas properties | | | 64,392 | | | | - | | | | 64,392 | |
| Other | | | 149 | | | | (78 | ) | | | 71 | |
| | | | 64,541 | | | | (78 | ) | | | 64,463 | |
| | | September 30, 2010 | |
| | | Cost $ | | | Accumulated depletion & depreciation $ | | | Net book value $ | |
| Oil and gas properties | | | 21,008 | | | | - | | | | 21,008 | |
| Other | | | 113 | | | | (49 | ) | | | 64 | |
| | | | 21,121 | | | | (49 | ) | | | 21,072 | |
On January 31, 2011, Zodiac acquired, through farm-in, a 75% working interest in approximately 21,500 acres located in Kings and Kern Counties in California for total proceeds of US$8,422. The transaction included the payment of US$5,614 in cash, the issuance of 2,700,018 shares with a deemed value of US$1,871 and provision of a work credit in respect of future cash calls made by Zodiac of US$936. In addition, Zodiac is required to pay approximately 92% of the costs to drill two wells to evaluate the Monterey and Kreyenhagen formations within this area.
During the year ended September 30, 2011, the Company capitalized $1,496 (nine months ended September 30, 2010 - $772 and twelve months ended December 31, 2009 - $522) of general and administrative expenditures and stock based compensation costs attributable to employees and consultants directly engaged in exploration activities.
At September 30, 2011, the balance of the oil and gas properties related to unproven properties, and the Company has not commenced principal operations; accordingly there has been no depletion or depreciation recorded against the oil and gas properties.
During the twelve months ended September 30, 2011, the Company had minimal activities in the Windsor Basin in Nova Scotia.
During the year ended September 30, 2011 the Company recognized a full impairment charge of $8,472 on its Nova Scotia assets. In determining the impairment charge for these assets, the Company considered (among others) the following factors: intent to drill by the operator of the Windsor Basin project; remaining lease term; geological and geophysical evaluations; and drilling results. Given that the operator was no longer allocating meaningful resources to continued evaluation, the lack of proved reserves attributable to the property and no success to date in finding a joint venture partner to fund a drilling program, the Company deemed a full impairment charge in the period was both reasonable and warranted.
Zodiac Exploration Inc.
(a Development Stage Company)
Notes to the Financial Statements
For the year ended September 30, 2011, nine months ended September 30, 2010 and year ended December 31, 2009
(Expressed in Canadian $ 000's except per share amounts)
| 6. | Asset Retirement Obligation |
As at September 30, 2011, the Company has estimated the net present value of its total ARO to be $385 based upon a total future undiscounted liability of $1,080 (September 30, 2010 - $331), where the liability settlement period has been estimated to occur over 9 to 25 years. The Company calculated the net present value of ARO using a discount rate of 8% and an inflation rate of 2% to 3%.
| | | September 30, 2011 $ | | | September 30, 2010 $ | |
| Balance, beginning of period | | | 206 | | | | 206 | |
| Liabilities incurred | | | 179 | | | | - | |
| Balance, end of period | | | 385 | | | | 206 | |
| | a) | The significant components of the Company's future tax assets and liabilities are as follows: |
| | | September 30, 2011 $ | | | September 30, 2010 $ | |
| Property and equipment | | | 2,397 | | | | (72 | ) |
| Non-capital loss carryforward | | | 2,482 | | | | 1,275 | |
| Share issuance costs | | | 752 | | | | 930 | |
| Asset retirement obligation | | | 60 | | | | 60 | |
| Valuation allowance | | | (5,691 | ) | | | (2,193 | ) |
| | | | - | | | | - | |
| | b) | The Company has estimated tax pools totaling $83,661 as follows: |
| | | Rate of claim | | | September 30, 2011 $ | |
| U.S. tax pools | | | 100 | % | | | 61,299 | |
| Canadian tax pools | | Various | | | | 22,362 | |
| | | | - | | | | 83,661 | |
| | c) | FIT Rate Reconciliation |
| | | Zodiac Exploration Corp | | | Zodiac USA Corp | | | Total | |
| Expected (income) loss | | | 9,581 | | | | 4,220 | | | | 13,801 | |
| US Federal & State tax rate | | | - | | | | 43.4 | % | | | - | |
| Adjustment on consolidation | | | - | | | | (43.4 | )% | | | - | |
| Consolidated tax rate | | | 29 | % | | | 34 | % | | | - | |
| | | | 2,778 | | | | 1,435 | | | | 4,213 | |
| Future tax differences | | | 5,830 | | | | - | | | | 5,830 | |
| Non-deductible | | | (2,918 | ) | | | - | | | | (2,918 | ) |
| Change in tax rates | | | - | | | | - | | | | - | |
| Valuation | | | (5,691 | ) | | | (1,435 | ) | | | (7,126 | ) |
| | | | - | | | | - | | | | - | |
Zodiac Exploration Inc.
(a Development Stage Company)
Notes to the Financial Statements
For the year ended September 30, 2011, nine months ended September 30, 2010 and year ended December 31, 2009
(Expressed in Canadian $ 000's except per share amounts)
Unlimited number of common shares with voting rights.
Unlimited number of preferred shares, issuable in series.
| | | Number of Common Shares | | | Amount $ | |
| Outstanding, December 31, 2009 | | | 83,302,515 | | | | 12,913 | |
| Common shares issued (i) | | | 29,000,000 | | | | 5,176 | |
| Common shares issued through private placement (ii) | | | 54,190,127 | | | | 9,915 | |
| Common shares issued upon exercise of stock options | | | 72,503 | | | | 25 | |
| Contributed surplus effect on exercise of options (000's) | | | - | | | | 6 | |
| Common shares issued (iii) | | | 142,156,840 | | | | 50,000 | |
| Share issue costs (000's) (ii, iii) | | | - | | | | (3,309 | ) |
| Shares held by Peninsula shareholders pursuant to the RTO (iv) | | | 8,861,626 | | | | 16 | |
| Outstanding, September 30, 2010 | | | 317,583,611 | | | | 74,742 | |
| Common shares issued to acquire property (note 5) | | | 2,700,018 | | | | 1,890 | |
| Common shares issued upon exercise of options and warrants (v) | | | 38,965,112 | | | | 34,047 | |
| Equity effect on exercise of options and warrants (000's) | | | - | | | | 3,745 | |
| Outstanding, September 30, 2011 | | | 359,248,741 | | | | 114,424 | |
| | (i) | On January 7, 2010, the Company issued 29,000,000 common shares ($0.179 per share) for total gross cash proceeds of $5,176. |
| | (ii) | During the fiscal year ended September 30, 2010, the Company issued 54,190,127 Units, respectively, of the Company for total gross proceeds of $11,212 ($0.207/Unit). Each Unit consisted of one common share and one half of one share purchase warrant with an exercise price of $0.414/share (note 8(c)(ii)), $1,296 was allocated to warrant proceeds. In addition, the Company incurred $29 in share issue costs related to the placement, which were recorded as a charge against capital raised. |
| | (iii) | On September 2, 2010, the Company issued 142,156,840 common shares ($0.352 per share) for total gross cash proceeds of $50,000. The Company incurred $3,280 in share issue costs related to the placement, which were recorded as a charge against capital raised. |
| | (iv) | Pursuant to the reverse takeover transaction that occurred on September 28, 2010 (note 4), all existing Zodiac Exploration Corp. shares were exchanged on a 1:1.45 ratio for Zodiac Exploration Inc. shares. The figures shown in note 8b are presented on a post-converted basis. At the time of the RTO, Peninsula shareholders held 8,861,626 shares and another 4,800,000 full share purchase warrants exercisable at $0.125/share of the Company. |
| | (v) | During the quarter ended June 30, 2011, the Company received a notice of exercise in respect of 31,175,000 of its outstanding warrants. Each warrant was exercised at an exercise price of approximately $1.034 per warrant and entitled the holder thereof to acquire 1.0 common share of Zodiac for each warrant held. The Company received total proceeds of $32,250 upon the exercise of these warrants. |
Zodiac Exploration Inc.
(a Development Stage Company)
Notes to the Financial Statements
For the year ended September 30, 2011, nine months ended September 30, 2010 and year ended December 31, 2009
(Expressed in Canadian $ 000's except per share amounts)
| 8. | Share Capital (Continued) |
| | | Outstanding September 30, 2010 (i) | | | Exercised | | | Outstanding September 30, 2011 | | | Weighted Average Exercise Price $ | | | Deemed Value $ | |
| Warrants issued on private placement | | | 45,675,000 | | | | (31,175,000 | ) | | | 14,500,000 | | | | 1.034 | | | | 1,664 | |
| Warrants issued on private placement (ii) | | | 27,095,068 | | | | (2,649,362 | ) | | | 24,445,706 | | | | 0.414 | | | | 1,168 | |
| Peninsula Warrants pursuant to RTO (iii) | | | 4,800,000 | | | | (4,800,000 | ) | | | - | | | | 0.125 | | | | - | |
| Outstanding, end of year | | | 77,570,068 | | | | (38,624,362 | ) | | | 38,945,706 | | | | 0.645 | | | | 2,832 | |
| | (i) | Zodiac Exploration Corp. warrant and option holders will continue to hold the original equity instruments until exercise, expiry, cancellation or forfeiture. Upon exercise the warrants/options will be exchanged at the 1:1.45 ratio for Zodiac Exploration Inc. shares, with the corresponding ratio applied to the exercise price. The figures shown in note 8(c) are shown on a post conversion basis (i.e. original issue x 1.45 (as applicable)). |
| | (ii) | In conjunction with the units issued, noted in note 8(b)(ii), the Company issued 27,095,068 common share purchase warrants during the fiscal year ended September 30, 2010. Each whole warrant has an exercise price of $0.414/share and expires five years after the grant date. As of September 30, 2011, there are 24,445,706 common share purchase warrants outstanding. |
| | The fair values of the warrants issued were estimated as at the grant date using the Black-Scholes option pricing model. The weighted average assumptions used in the calculations are noted below: |
| | 2010 |
| Risk-free interest rate | 1.95% |
| Expected life | 3.1 years |
| Expected volatility | 71.3% |
| Fair value per whole warrant | $0.048 |
The remaining fair value of the warrants issued is $1,168 (September 30, 2010 - $1,296), which was allocated from the gross proceeds received on the private placement.
| | (iii) | As of September 30, 2011 all common share purchase warrants outstanding that had previously been issued by Peninsula (the “Peninsula Warrants”) have been exercised. Each warrant had an exercise price of $0.125/share and expired April 20, 2011. |
The valuation assigned to the Peninsula Warrants was determined using the original value proportion attributed to the warrants from the original equity raise, using the Black-Scholes option pricing model. The assumptions used in the calculation were as noted below:
| | 2010 |
| Risk-free interest rate | 1.62% |
| Expected life | 1 years |
| Expected volatility | 168.2% |
| Fair value per whole warrant | $0.002 |
Zodiac Exploration Inc.
(a Development Stage Company)
Notes to the Financial Statements
For the year ended September 30, 2011, nine months ended September 30, 2010 and year ended December 31, 2009
(Expressed in Canadian $ 000's except per share amounts)
| 8. | Share Capital (Continued) |
On April 6, 2010, the Company issued the equivalent of 10,150,000 performance warrants to officers of the Company. These performance warrants have an equivalent exercise price of $0.207/share, a term of five years, are exercisable into one common share per performance warrant and vest in four equal increments with the initial increment occurring on a liquidity event for the Company. The RTO was the initial liquidity event for the Performance Warrants, and the initial liquidity price was equal to $0.352, the Zodiac Exploration Inc. equivalent price ($0.51/1.45) of the subscription receipt financing (note 8(b)(iii)). The remaining warrants became exercisable in increments of 25% with each increase in the market price of the common shares of 33% from the original liquidity price, with 100% of the performance warrants being exercisable upon the achievement of a common share price equal to two times the initial liquidity price. As of December 31, 2010, all performance warrants had vested.
The fair value of the performance warrants issued was estimated as at the grant date using the Black Scholes option pricing model. The compensation expense is being recognized over the then expected vesting term. The estimate of this expense is adjusted for subsequent changes in the expected or actual outcome of the vesting requirements and any changes to this expense are recorded in the period of the change. The assumptions used in the calculation are noted below:
| Risk-free interest rate | 1.75% |
| Expected life | 2.6 years |
| Expected volatility | 75.4% |
| Fair value per whole warrant | $0.097 |
Compensation expense recognized for the year ended September 30, 2011 was $265 (nine months ended September 30, 2010 - $489 and twelve months ended December 31, 2009 - $nil) and has been recorded as a non-cash compensation expense. The total amount has been recorded with an offsetting credit to contributed surplus. Since issuance, approximately 86% of the originally estimated fair value of the performance warrants has been recognized as compensation expense.
| | e) | Stock options outstanding |
Zodiac Exploration Corp. warrant and option holders will continue to hold the original equity instruments until exercise, expiry, cancellation or forfeiture. Upon exercise the warrants/options will be exchanged at the 1:1.45 ratio for Zodiac Exploration Inc. shares, with the corresponding ratio applied to the exercise price, figures shown herein are on a post-conversion basis.
Under the share option plan of the Company (the “Plan”), established on September 28, 2010, the number of common shares to be reserved and authorized for issuance pursuant to options granted under the Plan cannot exceed 10% of the total number of issued and outstanding shares of the Company. The 10% limit includes shares reserved for issuance upon the exercise of the performance warrants (Note 8 (d)). All currently issued options have terms of five years and vest over two to three years; the term, the vesting period and the price are determined at the discretion of the Board of Directors. However, the maximum option term shall not exceed five years.
Zodiac Exploration Inc.
(a Development Stage Company)
Notes to the Financial Statements
For the year ended September 30, 2011, nine months ended September 30, 2010 and year ended December 31, 2009
(Expressed in Canadian $ 000's except per share amounts)
| 8. | Share Capital (Continued) |
The following table summarizes information about the Company’s stock options outstanding at September 30, 2011, and for changes that occurred during the twelve month period then ended:
| | | | September 30, 2011 | |
| | | Number of Options | | | Weighted Average Exercise Price $ | | | Weighted Average Remaining Contractual Life (years) | |
| Balance, beginning of year | | | 9,748,834 | | | | 0.273 | | | | 3.19 | |
| Granted | | | 6,410,000 | | | | 0.861 | | | | 4.52 | |
| Forfeited | | | (1,100,834 | ) | | | 0.370 | | | | - | |
| Exercised | | | (340,750 | ) | | | 0.295 | | | | - | |
| Balance, end of year | | | 14,717,250 | | | | 0.534 | | | | 3.74 | |
As at September 30, 2011, the Company had 6,535,070 options granted but not yet vested.
The following table summarizes information about the Company’s stock options outstanding at September 30, 2010, and for changes that occurred during the nine month period then ended:
| | | September 30, 2010 | |
| | | Equivalent Number of Options | | | Weighted Average Exercise Price $ | | | Weighted Average Remaining Contractual Life (years) | |
| Balance, beginning of period | | | 4,756,000 | | | | 0.345 | | | | 3.77 | |
| Granted | | | 5,524,500 | | | | 0.213 | | | | 4.55 | |
| Forfeited | | | (459,163 | ) | | | 0.280 | | | | - | |
| Exercised | | | (72,503 | ) | | | 0.345 | | | | - | |
| Balance, end of period | | | 9,748,834 | | | | 0.273 | | | | 4.18 | |
Zodiac Exploration Inc.
(a Development Stage Company)
Notes to the Financial Statements
For the year ended September 30, 2011, nine months ended September 30, 2010 and year ended December 31, 2009
(Expressed in Canadian $ 000's except per share amounts)
| | f) | Stock-based compensation |
During the fiscal year ended September 30, 2011, the Company granted 6,410,000 options to officers, directors, employees and consultants (nine months ended September 30, 2010 - 5,524,500 and twelve months ended December 31, 2009 - 4,770,500). The terms of the grant are consistent with the Plan and options are exercisable at a weighted average price of $0.534 per option and expire five years after the grant date. The fair value of the options granted is estimated as at the grant date using the Black-Scholes option pricing model. The weighted average assumptions used in the calculation are noted below:
| | 2011 | 2010 |
| Risk-free interest rate | 1.86% | 1.64% |
| Expected life | 3.0 years | 2.6 years |
| Expected volatility | 71.11% | 75.19% |
| Fair value per option | $0.412 | $0.097 |
Compensation expense recognized for the fiscal period ended September 30, 2011 was $1,605 (nine months ended September 30, 2010 - $404 and twelve months ended December 31, 2009 - $236). Of the total compensation expense for the fiscal period ended September 30, 2011, $1,322 (nine months ended September 30, 2010 - $312 and twelve months ended December 31, 2009 - $183) has been recorded as a stock-based compensation expense related to options issuances and $283 (nine months ended September 30, 2010 - $92 and twelve months ended December 31, 2009 - $52) has been capitalized for options issued to employees and consultants directly involved in exploration activities. The total amount has been recorded with an offsetting credit to contributed surplus.
Basic earnings per share are calculated based on the weighted average number of shares outstanding during the year ended September 30, 2011 of 333,580,968 (nine months ended September 30, 2010 - 163,810,884 and twelve months ended December 31, 2009 - 81,820,932). Weighted average number of shares and calculation of diluted loss per share have been restated for the prior year in accordance with reverse takeover accounting guidance. The treasury stock method is used for the calculation of diluted loss per share. Under this method, it is assumed that proceeds from the exercise of dilutive securities are used by the Company to repurchase Company shares at the average price during the period. During the period, the Company did not have any dilutive securities outstanding. The issued and outstanding warrants, performance warrants and vested stock options of 38,945,706, 10,150,000 and 8,182,180, respectively, were not dilutive due to the Company’s loss position.
The Company’s objective when managing capital is to safeguard the entity’s ability to continue as a going concern, so that it can ultimately provide returns for shareholders and benefits for other stakeholders. The Company manages its common shares and warrants as capital. As the Company is still in the development stage its principal source of funds is from the issuance of common shares and warrants. The Company’s ability to raise future capital through equity is subject to uncertainty and the inability to raise such capital may have an adverse impact over the Company’s ability to continue as a going concern.
As part of the capital management program the Company monitors its working capital ratio. The Company’s objective is to maintain a working capital ratio of greater than 1:1 defined as the ratio of currents assets divided by current liabilities. At September 30, 2011, the working capital ratio was 6.4:1 (2010 – 27.7:1). The Board of Directors has not established quantitative return on capital criteria for management, but rather promotes prudent capital management.
Zodiac Exploration Inc.
(a Development Stage Company)
Notes to the Financial Statements
For the year ended September 30, 2011, nine months ended September 30, 2010 and year ended December 31, 2009
(Expressed in Canadian $ 000's except per share amounts)
Related party transactions during the fiscal year ended September 30, 2011 are as follows:
| | a) Aggregate management fees of $nil (nine months ended September 30, 2010 - $220 and twelve months ended December 31, 2009 - $581) were paid to officers of the Company and recorded in the consolidated statement of loss and deficit. All officers of the Company became employees on May 1, 2010. |
| | b) Included in accounts payable as at September 30, 2011 was $nil (2010 - $nil) payable to directors and officers of the Company. |
Transactions with related parties are recorded at the exchange amount, being the price agreed to between the parties.
10. Financial Instruments |
| a) Fair value measurement |
The Company’s financial instruments consist of cash and cash equivalents, accounts receivable, and accounts payable and accrued liabilities. The fair values of these financial instruments approximate their carrying values due to their short term nature.
The Company is required to present information about financial instruments measured at fair value in accordance with a three level hierarchy. The hierarchy groups financial assets and liabilities at a fair value into three levels based on the significance of inputs used in measuring the fair values of the financial assets and liabilities. The fair value hierarchy has the following levels:
| | Level 1 - Quoted prices (unadjusted) in active markets for identical assets or liabilities; |
| | Level 2 - Inputs other than quoted prices included within Level 1 that are observable for the asset or liability either directly (i.e. as prices) or indirectly (i.e. derived from prices); and |
| | Level 3 - Inputs for the asset or liability that are not based on observable market data (unobservable inputs). |
The level within which the financial asset or liability is classified is determined based on the lowest level of significant input to the fair value measurement.
Credit risk arises if a customer or third party to a financial instrument fails to meet its commercial obligations, which could reduce the amount of future cash inflows from financial assets as at the balance sheet date. The Company’s maximum credit risk exposure is limited to the carrying value of its accounts receivable and cash and cash equivalents. At September 30, 2011, the Company had accounts receivable of $3,875 (September 30, 2010 - $63), which consisted primarily of joint interest billings receivable from partners. The Company’s cash and cash equivalents of $40,532 (September 30, 2010 - $58,445) consist of balances with a Canadian Chartered Bank and a US Chartered Bank. Management believes that the credit risk with respect to accounts receivables and cash and cash equivalents is not material.
Zodiac Exploration Inc.
(a Development Stage Company)
Notes to the Financial Statements
For the year ended September 30, 2011, nine months ended September 30, 2010 and year ended December 31, 2009
(Expressed in Canadian $ 000's except per share amounts)
The Company’s operations are expected to eventually result in exposure to fluctuations in the prices of commodities including oil, natural gas and natural gas liquids. At this time the Company does not have commercial levels of production and therefore there is no need for the Company to engage in commodity price risk management. However, on commercial levels of production management will continuously monitor commodity prices and will utilize or employ instruments to manage exposure to these risks when it deems necessary.
The Company has $nil short or long term interest bearing debt and therefore is only exposed to interest rate risk through its cash holdings. The Company manages its exposure to interest rate risk by entering into term deposits with fixed interest rates.
The Company is exposed to the financial risk related to the fluctuation of foreign exchange rates. The Company is based in Canada with its operations primarily in the United States. Therefore a significant portion of its expenses are incurred in US dollars. The Company does not hedge its exposure to fluctuations in the exchange rate. Changes in exchange rates could have a material effect on the Company’s business including its intended capital plans, its financial condition and results of operations.
Certain of the Company’s financial instruments are exposed to fluctuations in the US dollar, including cash and cash equivalents, accounts receivable and accounts payable and accrued liabilities. A hypothetical change of 10% to the foreign exchange rate between the US dollar and the Canadian dollar applied to the average level of US denominated cash and cash equivalents during the year ended September 30, 2011 would have had approximately a $2,200 impact on the Company’s after tax earnings for the period.
| | a) | The Company holds an operating lease agreement for office space in Calgary, Alberta commencing on May 1, 2010 and ending on February 29, 2012. The annual basic rent obligation is $38, payable in monthly instalments of $3. In addition to the basic rent, additional rent is payable monthly, and includes the Company’s proportionate share of all operating costs and taxes. |
| | b) | The Company holds an operating lease agreement for the lease of office space in Bakersfield, California commencing July 1, 2010 and ending on June 30, 2012. The annual basic rent obligation is US$37 per annum, payable in monthly instalments of US$3. In addition to the basic rent, additional rent is payable monthly, and includes the Company’s proportionate share of all operating costs and taxes. |
Zodiac Exploration Inc.
(a Development Stage Company)
Notes to the Financial Statements
For the year ended September 30, 2011, nine months ended September 30, 2010 and year ended December 31, 2009
(Expressed in Canadian $ 000's except per share amounts)
The Company’s primary operations are limited to a single industry being the acquisition, exploration for, and development of petroleum and natural gas. Geographical segmentation is as follows:
| | | Twelve months ended September 30, 2011 ($) | |
| | | Canada | | | United States | | | Total | |
| Interest income | | | 215 | | | | - | | | | 215 | |
| Depreciation and accretion | | | 43 | | | | 2 | | | | 45 | |
| Net loss | | | (12,113 | ) | | | (1,688 | ) | | | (13,801 | ) |
| Property and equipment | | | 2,945 | | | | 61,518 | | | | 64,463 | |
| Total assets | | | 41,560 | | | | 67,624 | | | | 109,184 | |
| | | Nine months ended September 30, 2010 ($) | |
| | | Canada | | | United States | | | Total | |
| Interest income | | | 42 | | | | - | | | | 42 | |
| Depreciation and accretion | | | 32 | | | | 1 | | | | 33 | |
| Net loss | | | (2,452 | ) | | | (129 | ) | | | (2,581 | ) |
| Property and equipment | | | 9,952 | | | | 11,120 | | | | 21,072 | |
| Total assets | | | 68,419 | | | | 11,724 | | | | 80,143 | |
| | | Twelve months ended December 31, 2009 ($) | |
| | | Canada | | | United States | | | Total | |
| Interest income | | | 21 | | | | - | | | | 21 | |
| Depreciation and accretion | | | 22 | | | | - | | | | 22 | |
| Net loss | | | (1,673 | ) | | | (93 | ) | | | (1,766 | ) |
| Property and equipment | | | 9,286 | | | | 6,408 | | | | 15,694 | |
| Total assets | | | 10,657 | | | | 6,544 | | | | 17,201 | |
Certain of the comparative figures were reclassified from statements previously presented to conform to the current period presentation.