UNITED STATES
SECURITIES AND EXCHANGE COMMISSION
Washington, D.C. 20549
FORMN-CSR
CERTIFIED SHAREHOLDER REPORT OF REGISTERED
MANAGEMENT INVESTMENT COMPANIES
Investment Company Act file number811-22487
DBX ETF Trust
(Exact name of registrant as specified in charter)
345 Park Avenue
New York, New York 10154
(Address of principal executive offices) (Zip code)
Freddi Klassen
DBX ETF Trust
345 Park Avenue
New York, New York 10154
(Name and address of agent for service)
Registrant’s telephone number, including area code: (212)250-4352
Date of fiscal year end: August 31
Date of reporting period: August 31, 2019
FormN-CSR is to be used by management investment companies to file reports with the Commission not later than 10 days after the transmission to stockholders of any report that is required to be transmitted to stockholders under Rule30e-1 under the Investment Company Act of 1940 (17 CFR270.30e-1). The Commission may use the information provided on FormN-CSR in its regulatory, disclosure review, inspection, and policymaking roles.
A registrant is required to disclose the information specified by FormN-CSR, and the Commission will make this information public. A registrant is not required to respond to the collection of information contained in FormN-CSR unless the Form displays a currently valid Office of Management and Budget (“OMB”) control number. Please direct comments concerning the accuracy of the information collection burden estimate and any suggestions for reducing the burden to Secretary, Securities and Exchange Commission, 450 Fifth Street, NW, Washington, DC 20549-0609. The OMB has reviewed this collection of information under the clearance requirements of 44 U.S.C. § 3507.
| Item 1. | Reports to Stockholders. |
The Report to Shareholders is attached herewith.

August 31, 2019
Annual Report
DBX ETF Trust
Xtrackers FTSE Developed ex US Comprehensive Factor ETF (DEEF)
Xtrackers FTSE Emerging Comprehensive Factor ETF (DEMG)
Xtrackers Russell 1000 Comprehensive Factor ETF (DEUS)
Xtrackers Russell 1000 US Quality at a Reasonable Price ETF (QARP)
(Formerly known as Xtrackers Russell 1000 US QARP ETF)
Xtrackers Russell 2000 Comprehensive Factor ETF (DESC)

DBX ETF Trust
| Page | ||||
| 1 | ||||
| 3 | ||||
Performance Summary | ||||
| 6 | ||||
| 8 | ||||
| 10 | ||||
| 12 | ||||
| 14 | ||||
| 16 | ||||
Schedule of Investments | ||||
| 17 | ||||
| 31 | ||||
| 42 | ||||
| 52 | ||||
| 57 | ||||
| 74 | ||||
| 76 | ||||
| 78 | ||||
| 81 | ||||
| 84 | ||||
| 95 | ||||
| 96 | ||||
| 98 | ||||
| 99 | ||||
To our Shareholders:(Unaudited)
Dear Shareholder,
We are pleased to provide this annual report for our five comprehensive factor equity ETFs for the period ended August 31, 2019.
Global economies continued to grow, albeit at a slower pace, as trade and geopolitical tensions among large economies resulted in a lackluster economic backdrop. Labor markets and a growing service sector were the building blocks that aided in continued positive gross domestic product (GDP) readings of developed economies. Lower unemployment rates spurred domestic consumption in these economies, which offset the negative impact of ade-levered external trade void. Shielding from the harsh impact of tariffs1, accommodative backing continued from all major central banks, including the Federal Reserve Board (FRB), which took a temporary detour from its gradual tightening mandate.
In the U.S., despite equity markets facing a slump in the initial period, higher reported retail sales and heavy weight stocks anchored the index in recovering to itsall-time-high position. Inflation hovered around targets and unemployment rates sustained at record lows, as they were tail winded by earlier thrusts from a pleasant business sentiment and increased consumer spending. However, as trade partners started retaliating with their set of tariffs against the U.S., business sentiment was affected, weighing on overall economic expansion. The FRB took note and responded with a minor cut to the federal funds rate of .25 percent. It also stated that the rate cut was aimed at countering only current hurdles and it was confident of the overall state of the economy.
Economic acceleration slowed in the export-driven Eurozone, as its powerhouse, Germany, lost steam owing to a lower geared auto sector. In addition, political ruffles within Italy and the U.K. burdened the scope of the Euro region and were the main areas of focus of investors and administrators. Despite consumer spending being on the rise, inflation numbers were far below their target levels compared to 2018. The European Central Bank continued to hold ground and initiate support, but with the uncertainty over a consolidated reserve from the Eurozone, the planning committee may have to come to a solid consensus to make ends meet in the future.
Among emerging economies, China’s growth was drawn down as it was the direct target of the trade war and mountingoff-balance-sheet borrowings by state-owned enterprises. The Japanese economy, on the other hand, expanded during the review period, riding on higher public investment. Nevertheless, a reduction in capital expenditure made the Bank of Japan continue with its negative interest rate policy. Among other developing economies, India’s abated GDP came as a shock, weighed by cash-strapped manufacturing and automobile sectors, which suffered from increasing public finance,non-performing assets and a lack of consumer demand.
Geopolitical tensions continue to command the attention of financial markets. Trade frictions between the U.S. and China and ano-deal Brexit2 are a few examples. At this point, emerging economies can rise to the occasion if they plan their infrastructure in such a manner that they can supply to global markets substitutes of products that nations directly impacted by tariffs currently provide. However, whether markets remain relatively calm, or we do in fact witness some episodic volatility, our view is that retaining a diversified factor approach is right. It takes advantage of the relatively uncorrelated nature of their excess returns, and mitigates the need to try and time a particular market cycle.
1
Our team appreciates your trust and looks forward to continue serving your investment needs through innovative index-driven strategies.
Sincerely,
/s/ Freddi Klassen
Freddi Klassen
President and Chief Executive Officer
1 Tariffs are used to restrict imports by increasing the price of goods and services purchased from overseas and making them less attractive to consumers. A specific tariff is levied as a fixed fee based on the type of item.
2Brexit is a combination of the words “Britain” and “Exit” and describes the exit of the United Kingdom from the European Union.
Assumptions, estimates and opinions contained in this document constitute our judgment as of the date of the document and are subject to change without notice. Any projections are based on a number of assumptions as to market conditions and there can be no guarantee that any projected results will be achieved. Past performance is not a guarantee of future results.
2
DBX ETF Trust
Xtrackers FTSE Developedex-US Comprehensive Factor ETF
The Xtrackers FTSE Developedex-US Comprehensive Factor ETF (DEEF) seeks investment results that correspond generally to the performance, before fees and expenses, of the FTSE Developed ex US Comprehensive Factor Index (the DEEF Index). The DEEF Index is designed to provide exposure to developed international equities (except the United States) based on five factors — value, momentum, quality, low volatility and size. For the12-month period ended August 31, 2019, DEEF shares returned-4.51%, compared to the DEEF Index return of-4.23%.
The Materials and Consumer Discretionary were primary negative contributors to performance, while the Real Estate Sector was the major positive contributor to performance. From a geographical perspective, Japan and United Kingdom were the major negative contributors, while Australia and China contributed positively to performance.
Xtrackers FTSE Emerging Comprehensive Factor ETF
The Xtrackers FTSE Emerging Comprehensive Factor ETF (DEMG) seeks investment results that correspond generally to the performance, before fees and expenses, of the FTSE Emerging Comprehensive Factor Index (the DEMG Index). The DEMG Index is designed to provide exposure to emerging market equities based on five factors — value, momentum, quality, low volatility, and size. For the12-month period ended August 31, 2019, DEMG shares returned-4.69%, compared to the DEMG Index return of-3.99%.
The majority of sectors contributed negatively to performance during the period with Energy and Materials sectors detracting the most from performance. Financials, Utilities and Communication services were the positive contributors to performance. From a geographical perspective, China, South Africa and Mexico were the major negative contributors, while Brazil contributed positively to performance.
Xtrackers Russell 1000 Comprehensive Factor ETF
The Xtrackers Russell 1000 Comprehensive Factor ETF (DEUS) seeks investment results that correspond generally to the performance, before fees and expenses, of the Russell 1000 Comprehensive Factor Index (the DEUS Index). The DEUS Index is designed to provide exposure tolarge-cap United States equities based on five factors — value, momentum, quality, low volatility and size. For the12-month period ended August 31, 2019, DEUS shares returned 1.53%, compared to the DEUS Index return of 1.66%.
The Utilities, Information Technology and Real Estate sectors were the primary positive contributors to performance, while Energy and Industrials sectors were major negative contributors to performance.
Xtrackers Russell 1000 US Quality at a Reasonable Price ETF
The Xtrackers Russell 1000 US Quality at a Reasonable Price ETF (QARP) seeks investment results that correspond generally to the performance, before fees and expenses, of the Russell 1000 2Qual/Val 5% Capped Factor Index (the QARP Index). The QARP Index is a multifactor index designed to capture exposure tolarge-cap U.S. equities that exhibit strong quality and value factor characteristics. For the12-month period ended August 31, 2019, QARP shares returned 1.03%, compared to the QARP Index return of 1.21%.
The Consumer Staples, Information Technology and Consumer Discretionary sectors were the primary positive contributors to performance, while Energy and Health Care sectors were major negative contributors to performance.
Xtrackers Russell 2000 Comprehensive Factor ETF
The Xtrackers Russell 2000 Comprehensive Factor ETF (DESC) seeks investment results that correspond generally to the performance, before fees and expenses, of the Russell 2000 Comprehensive Factor Index (the DESC Index). The DESC Index is designed to provide exposure tosmall-cap United States equities based on five factors — value, momentum, quality, low volatility and size. For the12-month period ended August 31, 2019, DESC shares returned-14.11%, compared to the DESC Index return of-14.01%.
3
DBX ETF Trust
Management’s Discussion of Fund Performance(Unaudited) (Continued)
The majority of sectors contributed negatively to performance during the period with Financials, Consumer Discretionary and Industrials detracting the most from performance. Utilities and Real Estate sectors were the only positive contributors to performance.
*************************
Performance data quoted represents past performance and does not guarantee future results. Investment returns and principal value of an investment will fluctuate so that an investor’s shares, when sold or redeemed, may be worth more or less than their original cost. Current performance may be lower or higher than the performance data quoted. To obtain the most recentmonth-end performance data visit www.Xtrackers.com. Returns assume that dividends and capital gains distributions have been reinvested. See pages6-15 of this report for additional performance information, including performance data based on market value.
The views expressed in this report reflect those of the portfolio management team only through the end of the period of the report as stated on the cover. The management team’s views are subject to change at any time based on market and other conditions and should not be construed as a recommendation. Current and future portfolio holdings are subject to risk.
4
This Page is Intentionally Left Blank
5
DBX ETF Trust
Performance Summary(Unaudited)
Xtrackers FTSE Developed ex US Comprehensive Factor ETF (DEEF)
The Xtrackers FTSE Developed ex US Comprehensive Factor ETF (the “Fund”), using a “passive” or indexing investment approach, seeks investment results that correspond generally to the performance, before fees and expenses, of the FTSE Developed ex US Comprehensive Factor Index (the “Underlying Index”). The Underlying Index is designed to track the equity market performance of companies in developed countries (except the United States) selected on the investment style criteria (“factors”) of value, momentum, quality, low volatility and size. The companies eligible for the Underlying Index are derived from its starting universe, the FTSE Developed ex US Index, which is comprised of large- andmid-capitalization equity securities from developed markets (except the United States). It is not possible to invest directly into an index.
| Performance as of August 31, 2019 |
| Average Annual Total Returns | ||||||||
| Net Asset Value | Market Value | FTSE Developed ex US Comprehensive Factor Index | FTSE Developed ex US Net Tax (US RIC) Index | |||||
One Year | -4.51% | -4.58% | -4.23% | -3.73% | ||||
Since Inception1 | 4.84% | 4.79% | 5.50% | 4.89% | ||||
| Cumulative Total Returns | ||||||||
| Net Asset Value | Market Value | FTSE Developed ex US Comprehensive Factor Index | FTSE Developed ex US Net Tax (US RIC) Index | |||||
One Year | -4.51% | -4.58% | -4.23% | -3.73% | ||||
Since Inception1 | 19.53% | 19.29% | 22.39% | 19.72% | ||||
1 Total returns are calculated based on the commencement of operations, November 24, 2015 (“Inception”).
Past performance is no guarantee of future results. Current performance may be lower or higher than the performance data quoted. Performance data current to the most recentmonth-end is available at www.Xtrackers.com. Performance results assume reinvestment of all dividends and capital gain distributions and do not reflect the deduction of taxes that a shareholder would pay on fund distributions or on the sale of fund shares or redemption of fund creation units. The investment return and principal value of shares will vary with changes in market conditions. Shares may be worth more or less than their original cost when they are sold in the market or redeemed. Performance for certain funds may reflect a waiver of a portion of investment management fees. Without such waiver, performance would have been lower. The estimated operating expense ratio as disclosed in the most recent prospectus dated December 28, 2018, as supplemented March 5, 2019, was 0.35%, and may differ from the expense ratio disclosed in the Financial Highlights table in this report.
The Fund’s net asset value or “NAV” is calculated by dividing the value of the Fund’s total assets less total liabilities by the number of shares outstanding. The price used to calculate market return (“Market Price”) is determined by using the midpoint between the highest bid and the lowest offer on the primary stock exchange on which shares of a fund are listed for trading, as of the time that such fund’s NAV is calculated. Since shares of a fund may not have traded in the secondary market until after the fund’s inception, for the period from inception to the first day of secondary trading, the NAV of the fund is used as a proxy for the Market Price to calculate market returns. Market and NAV returns assume that dividends and capital gain distributions have been reinvested at Market Price and NAV, respectively.
An index is a statistical composite that tracks a specified financial market or sector. Unlike a fund, an index does not actually hold a portfolio of securities and therefore does not incur the expenses incurred by a fund. These expenses negatively impact fund performance. Also, market returns do not include brokerage commissions that may be payable on secondary market transactions. If brokerage commissions were included, market returns would be lower.
6
DBX ETF Trust
Performance Summary(Unaudited)
Xtrackers FTSE Developed ex US Comprehensive Factor ETF (DEEF)(Continued)
| Growth of an Assumed $10,000 Investment |
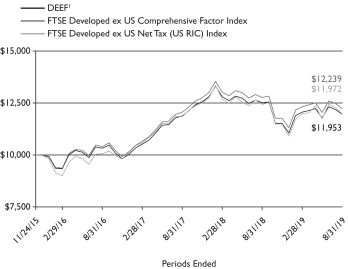 |
1 Based on Net Asset Value from commencement of operations, November 24, 2015.
| Sector Diversification* as of August 31, 2019 |
Industrials | 22.8% | |||
Real Estate | 16.0% | |||
Consumer Staples | 10.2% | |||
Consumer Discretionary | 9.4% | |||
Utilities | 9.1% | |||
Materials | 7.9% | |||
Financials | 6.4% | |||
Communication Services | 5.4% | |||
Health Care | 4.6% | |||
Information Technology | 4.1% | |||
Energy | 4.1% | |||
|
| |||
Total | 100.0% |
| Ten Largest Equity Holdings as of August 31, 2019 (8.2% of Net Assets) |
| Description | % of Net Assets | |||
Link (Hong Kong) | 1.2% | |||
Dexus (Australia) | 1.0% | |||
GPT Group (Australia) | 1.0% | |||
Mirvac Group (Australia) | 0.9% | |||
Koninklijke Ahold Delhaize NV (Netherlands) | 0.8% | |||
Segro PLC (United Kingdom) | 0.8% | |||
Castellum AB (Sweden) | 0.7% | |||
LEG Immobilien AG (Germany) | 0.6% | |||
3i Group PLC (United Kingdom) | 0.6% | |||
Ferguson PLC (United Kingdom) | 0.6% | |||
| Country Diversification* as of August 31, 2019 |
Japan | 22.9% | |||
United Kingdom | 13.7% | |||
Australia | 11.5% | |||
Canada | 6.7% | |||
France | 4.6% | |||
Sweden | 4.5% | |||
Hong Kong | 4.2% | |||
Germany | 4.0% | |||
Singapore | 3.6% | |||
Switzerland | 2.9% | |||
Spain | 2.8% | |||
South Korea | 2.7% | |||
Netherlands | 2.6% | |||
Israel | 2.1% | |||
Other | 11.2% | |||
|
| |||
Total | 100.0% |
* As a percent of total investments excluding securities lending collateral and cash equivalents.
Portfolio holdings and characteristics are subject to change. For more complete details about the Fund’s investment portfolio see page 17.
7
DBX ETF Trust
Performance Summary(Unaudited)
Xtrackers FTSE Emerging Comprehensive Factor ETF (DEMG)
Xtrackers FTSE Emerging Comprehensive Factor ETF (the “Fund”), using a “passive” or indexing investment approach, seeks investment results that correspond generally to the performance, before fees and expenses, of the FTSE Emerging Comprehensive Factor Index (the “Underlying Index”). The Underlying Index is designed to track the equity market performance of companies in emerging market countries selected on the investment style criteria (“factors”) of value, momentum, quality, low volatility and size. The companies eligible for the Underlying Index are derived from its starting universe, the FTSE Emerging Index, which is comprised of large- andmid-cap equity securities from emerging markets. It is not possible to invest directly into an index.
| Performance as of August 31, 2019 |
| Average Annual Total Returns | ||||||||
| Net Asset Value | Market Value | FTSE Emerging Comprehensive Factor Index | FTSE Emerging Net Tax (US RIC) Index | |||||
One Year | -4.69% | -4.65% | -3.99% | -0.94% | ||||
Since Inception1 | 2.27% | 2.28% | 3.59% | 7.69% | ||||
| Cumulative Total Returns | ||||||||
| Net Asset Value | Market Value | FTSE Emerging Comprehensive Factor Index | FTSE Emerging Net Tax (US RIC) Index | |||||
One Year | -4.69% | -4.65% | -3.99% | -0.94% | ||||
Since Inception1 | 7.85% | 7.90% | 12.63% | 28.37% | ||||
1 Total returns are calculated based on the commencement of operations, April 19, 2016 (“Inception”).
Past performance is no guarantee of future results. Current performance may be lower or higher than the performance data quoted. Performance data current to the most recentmonth-end is available at www.Xtrackers.com. Performance results assume reinvestment of all dividends and capital gain distributions and do not reflect the deduction of taxes that a shareholder would pay on fund distributions or on the sale of fund shares or redemption of fund creation units. The investment return and principal value of shares will vary with changes in market conditions. Shares may be worth more or less than their original cost when they are sold in the market or redeemed. Performance for certain funds may reflect a waiver of a portion of investment management fees. Without such waiver, performance would have been lower. The estimated operating expense ratio as disclosed in the most recent prospectus dated December 28, 2018, was 0.50%, and may differ from the expense ratio disclosed in the Financial Highlights table in this report.
The Fund’s net asset value or “NAV” is calculated by dividing the value of the Fund’s total assets less total liabilities by the number of shares outstanding. The price used to calculate market return (“Market Price”) is determined by using the midpoint between the highest bid and the lowest offer on the primary stock exchange on which shares of a fund are listed for trading, as of the time that such fund’s NAV is calculated. Since shares of a fund may not have traded in the secondary market until after the fund’s inception, for the period from inception to the first day of secondary trading, the NAV of the fund is used as a proxy for the Market Price to calculate market returns. Market and NAV returns assume that dividends and capital gain distributions have been reinvested at Market Price and NAV, respectively.
An index is a statistical composite that tracks a specified financial market or sector. Unlike a fund, an index does not actually hold a portfolio of securities and therefore does not incur the expenses incurred by a fund. These expenses negatively impact fund performance. Also, market returns do not include brokerage commissions that may be payable on secondary market transactions. If brokerage commissions were included, market returns would be lower.
8
DBX ETF Trust
Performance Summary(Unaudited)
Xtrackers FTSE Emerging Comprehensive Factor ETF (DEMG)(Continued)
| Growth of an Assumed $10,000 Investment |

1 Based on Net Asset Value from commencement of operations, April 19, 2016.
| Sector Diversification* as of August 31, 2019 |
Industrials | 12.6% | |||
Financials | 12.0% | |||
Energy | 11.6% | |||
Consumer Staples | 11.1% | |||
Information Technology | 10.0% | |||
Utilities | 9.3% | |||
Materials | 9.1% | |||
Consumer Discretionary | 7.2% | |||
Real Estate | 7.1% | |||
Communication Services | 7.0% | |||
Health Care | 3.0% | |||
|
| |||
Total | 100.0% |
| Ten Largest Equity Holdings as of August 31, 2019 (9.8% of Net Assets) |
| Description | % of Net Assets | |||
China Petroleum & Chemical Corp. (China) | 1.3% | |||
Qatar Fuel QSC (Qatar) | 1.1% | |||
Fibra Uno Administracion SA de CV (Mexico) | 1.1% | |||
China Shenhua Energy Co. Ltd. (China) | 1.1% | |||
PetroChina Co. Ltd. (China) | 1.0% | |||
MOL Hungarian Oil & Gas PLC (Hungary) | 1.0% | |||
Novatek Microelectronics Corp. (Taiwan) | 0.9% | |||
Intouch Holdings PCL, NVDR (Thailand) | 0.8% | |||
Chicony Electronics Co. Ltd. (Taiwan) | 0.8% | |||
Electricity Generating PCL, NVDR (Thailand) | 0.7% | |||
| Country Diversification* as of August 31, 2019 |
China | 17.5% | |||
Taiwan | 15.4% | |||
Brazil | 8.9% | |||
India | 7.5% | |||
South Africa | 6.9% | |||
Mexico | 6.3% | |||
Thailand | 5.9% | |||
Russia | 4.7% | |||
Malaysia | 4.6% | |||
Hong Kong | 3.6% | |||
Qatar | 3.0% | |||
Chile | 2.6% | |||
Turkey | 2.5% | |||
Philippines | 2.2% | |||
Indonesia | 2.0% | |||
Other | 6.4% | |||
|
| |||
Total | 100.0% |
* As a percent of total investments excluding exchange-traded funds, securities lending collateral and cash equivalents.
Portfolio holdings and characteristics are subject to change. For more complete details about the Fund’s investment portfolio see page 31.
9
DBX ETF Trust
Performance Summary(Unaudited)
Xtrackers Russell 1000 Comprehensive Factor ETF (DEUS)
Xtrackers Russell 1000 Comprehensive Factor ETF (the “Fund”), using a “passive” or indexing investment approach, seeks investment results that correspond generally to the performance, before fees and expenses, of the Russell 1000 Comprehensive Factor Index (the “Underlying Index”). The Underlying Index is designed to track the equity market performance of companies in the United States selected on the investment style criteria (“factors”) of value, momentum, quality, low volatility and size. The companies eligible for the Underlying Index are derived from its starting universe, the Russell 1000 Index, which is comprised oflarge-cap equity securities from issuers in the United States. It is not possible to invest directly into an index.
| Performance as of August 31, 2019 |
| Average Annual Total Returns | ||||||||
| Net Asset Value | Market Value | Russell 1000 Comprehensive Factor Index | Russell 1000 Index Total Return | |||||
One Year | 1.53% | 1.47% | 1.66% | 2.49% | ||||
Since Inception1 | 10.29% | 10.28% | 10.51% | 11.50% | ||||
| Cumulative Total Returns | ||||||||
| Net Asset Value | Market Value | Russell 1000 Comprehensive Factor Index | Russell 1000 Index Total Return | |||||
One Year | 1.53% | 1.47% | 1.66% | 2.49% | ||||
Since Inception1 | 44.69% | 44.64% | 45.78% | 50.79% | ||||
1 Total returns are calculated based on the commencement of operations, November 24, 2015 (“Inception”).
Past performance is no guarantee of future results. Current performance may be lower or higher than the performance data quoted. Performance data current to the most recentmonth-end is available at www.Xtrackers.com. Performance results assume reinvestment of all dividends and capital gain distributions and do not reflect the deduction of taxes that a shareholder would pay on fund distributions or on the sale of fund shares or redemption of fund creation units. The investment return and principal value of shares will vary with changes in market conditions. Shares may be worth more or less than their original cost when they are sold in the market or redeemed. Performance for certain funds may reflect a waiver of a portion of investment management fees. Without such waiver, performance would have been lower. The estimated operating expense ratio as disclosed in the most recent prospectus dated December 28, 2018, was 0.17%, and may differ from the expense ratio disclosed in the Financial Highlights table in this report.
The Fund’s net asset value or “NAV” is calculated by dividing the value of the Fund’s total assets less total liabilities by the number of shares outstanding. The price used to calculate market return (“Market Price”) is determined by using the midpoint between the highest bid and the lowest offer on the primary stock exchange on which shares of a fund are listed for trading, as of the time that such fund’s NAV is calculated. Since shares of a fund may not have traded in the secondary market until after the fund’s inception, for the period from inception to the first day of secondary trading, the NAV of the fund is used as a proxy for the Market Price to calculate market returns. Market and NAV returns assume that dividends and capital gain distributions have been reinvested at Market Price and NAV, respectively.
An index is a statistical composite that tracks a specified financial market or sector. Unlike a fund, an index does not actually hold a portfolio of securities and therefore does not incur the expenses incurred by a fund. These expenses negatively impact fund performance. Also, market returns do not include brokerage commissions that may be payable on secondary market transactions. If brokerage commissions were included, market returns would be lower.
10
DBX ETF Trust
Performance Summary(Unaudited)
Xtrackers Russell 1000 Comprehensive Factor ETF (DEUS)(Continued)
| Growth of an Assumed $10,000 Investment |

1 Based on Net Asset Value from commencement of operations, November 24, 2015.
| Sector Diversification* as of August 31, 2019 |
Industrials | 16.9% | |||
Information Technology | 14.9% | |||
Consumer Discretionary | 13.8% | |||
Financials | 12.3% | |||
Utilities | 9.4% | |||
Real Estate | 8.6% | |||
Health Care | 7.9% | |||
Consumer Staples | 6.7% | |||
Materials | 5.1% | |||
Communication Services | 3.1% | |||
Energy | 1.3% | |||
|
| |||
Total | 100.0% |
| Ten Largest Equity Holdings as of August 31, 2019 (5.7% of Net Assets) |
| Description | % of Net Assets | |||
CDW Corp. | 0.7% | |||
Lam Research Corp. | 0.7% | |||
Cummins, Inc. | 0.6% | |||
Dollar General Corp. | 0.6% | |||
Darden Restaurants, Inc. | 0.6% | |||
Apartment Investment & Management Co. | 0.5% | |||
Medical Properties Trust, Inc. | 0.5% | |||
Starbucks Corp. | 0.5% | |||
Synopsys, Inc. | 0.5% | |||
Progressive Corp. | 0.5% | |||
* As a percent of total investments excluding securities lending collateral and cash equivalents.
Portfolio holdings and characteristics are subject to change. For more complete details about the Fund’s investment portfolio see page 42.
11
DBX ETF Trust
Performance Summary(Unaudited)
Xtrackers Russell 1000 US Quality at a Reasonable Price ETF (QARP)
Xtrackers Russell 1000 US Quality at a Reasonable Price ETF (the “Fund”), using a “passive” or indexing investment approach, seeks investment results that correspond generally to the performance, before fees and expenses, of the Russell 1000 2Qual/Val 5% Capped Factor Index (the “Underlying Index”). The Underlying Index is designed to track the equity market performance of companies in the United States selected on the investment style criteria (“factors”) of quality and value. The companies eligible for the Underlying Index are derived from its starting universe, the Russell 1000 Index, which is comprised oflarge-cap equity securities from issuers in the United States. It is not possible to invest directly into an index.
| Performance as of August 31, 2019 | ||||||||
| Average Annual Total Returns | ||||||||
| Net Asset Value | Market Value | Russell 1000 2Qual/Val 5% Capped Factor Index | Russell 1000 Index Total Return | |||||
One Year | 1.03% | 0.88% | 1.21% | 2.49% | ||||
Since Inception1 | 7.45% | 7.36% | 7.67% | 9.39% | ||||
| Cumulative Total Returns | ||||||||
| Net Asset Value | Market Value | Russell 1000 2Qual/Val 5% Capped Factor Index | Russell 1000 Index Total Return | |||||
One Year | 1.03% | 0.88% | 1.21% | 2.49% | ||||
Since Inception1 | 10.64% | 10.52% | 10.97% | 13.47% | ||||
1 Total returns are calculated based on the commencement of operations, April 5, 2018 (“Inception”).
Past performance is no guarantee of future results. Current performance may be lower or higher than the performance data quoted. Performance data current to the most recentmonth-end is available at www.Xtrackers.com. Performance results assume reinvestment of all dividends and capital gain distributions and do not reflect the deduction of taxes that a shareholder would pay on fund distributions or on the sale of fund shares or redemption of fund creation units. The investment return and principal value of shares will vary with changes in market conditions. Shares may be worth more or less than their original cost when they are sold in the market or redeemed. Performance for certain funds may reflect a waiver of a portion of investment management fees. Without such waiver, performance would have been lower. The estimated operating expense ratio as disclosed in the most recent prospectus dated December 28, 2018, was 0.19%, and may differ from the expense ratio disclosed in the Financial Highlights table in this report.
The Fund’s net asset value or “NAV” is calculated by dividing the value of the Fund’s total assets less total liabilities by the number of shares outstanding. The price used to calculate market return (“Market Price”) is determined by using the midpoint between the highest bid and the lowest offer on the primary stock exchange on which shares of a fund are listed for trading, as of the time that such fund’s NAV is calculated. Since shares of a fund may not have traded in the secondary market until after the fund’s inception, for the period from inception to the first day of secondary trading, the NAV of the fund is used as a proxy for the Market Price to calculate market returns. Market and NAV returns assume that dividends and capital gain distributions have been reinvested at Market Price and NAV, respectively.
An index is a statistical composite that tracks a specified financial market or sector. Unlike a fund, an index does not actually hold a portfolio of securities and therefore does not incur the expenses incurred by a fund. These expenses negatively impact fund performance. Also, market returns do not include brokerage commissions that may be payable on secondary market transactions. If brokerage commissions were included, market returns would be lower.
12
DBX ETF Trust
Performance Summary(Unaudited)
Xtrackers Russell 1000 US Quality at a Reasonable Price ETF (QARP)(Continued)
| Growth of an Assumed $10,000 Investment |
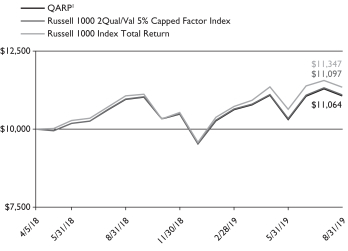
1 Based on Net Asset Value from commencement of operations, April 5, 2018.
| Sector Diversification* as of August 31, 2019 |
Information Technology | 24.0% | |||
Consumer Discretionary | 14.1% | |||
Industrials | 12.2% | |||
Health Care | 12.0% | |||
Communication Services | 11.0% | |||
Energy | 9.4% | |||
Consumer Staples | 8.1% | |||
Financials | 4.1% | |||
Materials | 2.3% | |||
Real Estate | 2.0% | |||
Utilities | 0.8% | |||
|
| |||
Total | 100.0% |
| Ten Largest Equity Holdings as of August 31, 2019 (31.3% of Net Assets) |
| Description | % of Net Assets | |||
Apple, Inc. | 5.1% | |||
Alphabet, Inc. | 4.4% | |||
Exxon Mobil Corp. | 3.4% | |||
Intel Corp. | 3.3% | |||
Facebook, Inc. | 2.9% | |||
Home Depot, Inc. | 2.8% | |||
Visa, Inc. | 2.6% | |||
Johnson & Johnson | 2.5% | |||
Chevron Corp. | 2.3% | |||
Mastercard, Inc. | 2.0% | |||
* As a percent of total investments excluding securities lending collateral and cash equivalents.
Portfolio holdings and characteristics are subject to change. For more complete details about the Fund’s investment portfolio see page 52.
13
DBX ETF Trust
Performance Summary(Unaudited)
Xtrackers Russell 2000 Comprehensive Factor ETF (DESC)
Xtrackers Russell 2000 Comprehensive Factor ETF (the “Fund”), using a “passive” or indexing investment approach, seeks investment results that correspond generally to the performance, before fees and expenses, of the Russell 2000 Comprehensive Factor Index (the “Underlying Index”). The Underlying Index is designed to track the equity market performance of companies in the United States selected on the investment style criteria (“factors”) of value, momentum, quality, low volatility and size. The companies eligible for the Underlying Index are derived from its starting universe, the Russell 2000 Index, which is comprised ofsmall-cap equity securities from issuers in the United States. It is not possible to invest directly into an index.
| Performance as of August 31, 2019 |
| Average Annual Total Returns | ||||||||
| Net Asset Value | Market Value | Russell 2000 Comprehensive Factor Index | Russell 2000 Index Total Return | |||||
One Year | -14.11% | -14.26% | -14.01% | -12.89% | ||||
Since Inception1 | 10.14% | 10.06% | 10.42% | 11.98% | ||||
| Cumulative Total Returns | ||||||||
| Net Asset Value | Market Value | Russell 2000 Comprehensive Factor Index | Russell 2000 Index Total Return | |||||
One Year | -14.11% | -14.26% | -14.01% | -12.89% | ||||
Since Inception1 | 35.94% | 35.60% | 37.01% | 43.27% | ||||
1 Total returns are calculated based on the commencement of operations, June 28, 2016 (“Inception”).
Past performance is no guarantee of future results. Current performance may be lower or higher than the performance data quoted. Performance data current to the most recentmonth-end is available at www.Xtrackers.com. Performance results assume reinvestment of all dividends and capital gain distributions and do not reflect the deduction of taxes that a shareholder would pay on fund distributions or on the sale of fund shares or redemption of fund creation units. The investment return and principal value of shares will vary with changes in market conditions. Shares may be worth more or less than their original cost when they are sold in the market or redeemed. Performance for certain funds may reflect a waiver of a portion of investment management fees. Without such waiver, performance would have been lower. The estimated operating expense ratio as disclosed in the most recent prospectus dated December 28, 2018, was 0.30%, and may differ from the expense ratio disclosed in the Financial Highlights table in this report.
The Fund’s net asset value or “NAV” is calculated by dividing the value of the Fund’s total assets less total liabilities by the number of shares outstanding. The price used to calculate market return (“Market Price”) is determined by using the midpoint between the highest bid and the lowest offer on the primary stock exchange on which shares of a fund are listed for trading, as of the time that such fund’s NAV is calculated. Since shares of a fund may not have traded in the secondary market until after the fund’s inception, for the period from inception to the first day of secondary trading, the NAV of the fund is used as a proxy for the Market Price to calculate market returns. Market and NAV returns assume that dividends and capital gain distributions have been reinvested at Market Price and NAV, respectively.
An index is a statistical composite that tracks a specified financial market or sector. Unlike a fund, an index does not actually hold a portfolio of securities and therefore does not incur the expenses incurred by a fund. These expenses negatively impact fund performance. Also, market returns do not include brokerage commissions that may be payable on secondary market transactions. If brokerage commissions were included, market returns would be lower.
14
DBX ETF Trust
Performance Summary(Unaudited)
Xtrackers Russell 2000 Comprehensive Factor ETF (DESC)(Continued)
| Growth of an Assumed $10,000 Investment |
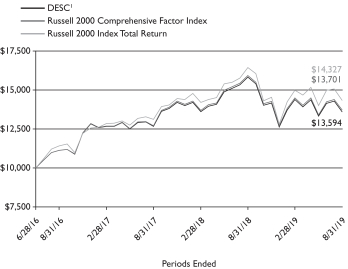
1 Based on Net Asset Value from commencement of operations, June 28, 2016.
| Sector Diversification* as of August 31, 2019 |
Financials | 27.4% | |||
Industrials | 17.4% | |||
Consumer Discretionary | 12.6% | |||
Information Technology | 9.4% | |||
Real Estate | 8.8% | |||
Health Care | 8.5% | |||
Materials | 3.8% | |||
Consumer Staples | 3.1% | |||
Utilities | 3.1% | |||
Energy | 3.0% | |||
Communication Services | 2.9% | |||
|
| |||
Total | 100.0% |
| Ten Largest Equity Holdings as of August 31, 2019 (3.1% of Net Assets) |
| Description | % of Net Assets | |||
National HealthCare Corp. | 0.4% | |||
Kelly Services, Inc. | 0.3% | |||
World Fuel Services Corp. | 0.3% | |||
US Physical Therapy, Inc. | 0.3% | |||
Core-Mark Holding Co., Inc. | 0.3% | |||
Atkore International Group, Inc. | 0.3% | |||
Murphy USA, Inc. | 0.3% | |||
Warrior Met Coal, Inc. | 0.3% | |||
BMC Stock Holdings, Inc. | 0.3% | |||
Miller Industries, Inc. | 0.3% | |||
* As a percent of total investments excluding exchange-traded funds, securities lending collateral and cash equivalents.
Portfolio holdings and characteristics are subject to change. For more complete details about the Fund’s investment portfolio see page 57.
15
DBX ETF Trust
As a shareholder of one or more of the Funds, you incur two types of costs: (1) transaction costs, including brokerage commissions paid on purchases and sales of fund shares, and (2) ongoing costs, including management fees and other Fund expenses. In the most recentsix-month period the Funds limited these expenses; had they not done so, expenses would have been higher. The expense examples below are intended to help you understand your ongoing costs (in dollars) of investing in the Funds and to compare these costs with the ongoing costs of investing in other funds.
The examples in the table are based on an investment of $1,000 invested at the beginning of thesix-month period and held for the entire period (March 1, 2019 to August 31, 2019).
Actual expenses
The first line in the following tables provides information about actual account values and actual expenses. You may use the information in this line, together with the amount you invested, to estimate the expenses that you paid over the period. Simply divide your account value by $1,000 (for example, an $8,600 account value divided by $1,000 = 8.6), then multiply the result by the number in the first line under the heading “Expenses Paid During the Period” to estimate the expenses you paid on your account during this period.
Hypothetical example for comparison purposes
The second line in the following tables provides information about hypothetical account values and hypothetical expenses based on the Funds’ actual expense ratios and an assumed rate of return of 5% per year before expenses (which is not the Funds’ actual return). The hypothetical account values and expenses may not be used to estimate the actual ending account balance or expenses you paid for the period. You may use this information to compare the ongoing costs of investing in the Fund and other funds. To do so, compare this 5% hypothetical example with the 5% hypothetical examples that appear in the shareholder reports of the other funds.
Please note that the expenses shown in the tables are meant to highlight your ongoing costs only, and do not reflect any transactional costs. Therefore the second line in the table is useful in comparing ongoing costs only, and will not help you determine the relative total costs of owning different funds. In addition, if these transactional costs were included, your costs would have been higher.
| Beginning Account Value March 1, 2019 | Ending Account Value August 31, 2019 | Annualized Expense Ratio | Expenses Paid During the Period Per $1,000(1) | |||||||||||||
| Xtrackers FTSE Developed ex US Comprehensive Factor ETF |
| |||||||||||||||
Actual | $ | 1,000.00 | $ | 991.20 | 0.24 | % | $ | 1.20 | ||||||||
Hypothetical (5% return before expenses) | $ | 1,000.00 | $ | 1,024.00 | 0.24 | % | $ | 1.22 | ||||||||
| Xtrackers FTSE Emerging Comprehensive Factor ETF |
| |||||||||||||||
Actual | $ | 1,000.00 | $ | 953.40 | 0.50 | % | $ | 2.46 | ||||||||
Hypothetical (5% return before expenses) | $ | 1,000.00 | $ | 1,022.68 | 0.50 | % | $ | 2.55 | ||||||||
| Xtrackers Russell 1000 Comprehensive Factor ETF |
| |||||||||||||||
Actual | $ | 1,000.00 | $ | 1,055.70 | 0.17 | % | $ | 0.88 | ||||||||
Hypothetical (5% return before expenses) | $ | 1,000.00 | $ | 1,024.35 | 0.17 | % | $ | 0.87 | ||||||||
| Xtrackers Russell 1000 US Quality at a Reasonable Price ETF |
| |||||||||||||||
Actual | $ | 1,000.00 | $ | 1,041.00 | 0.19 | % | $ | 0.98 | ||||||||
Hypothetical (5% return before expenses) | $ | 1,000.00 | $ | 1,024.25 | 0.19 | % | $ | 0.97 | ||||||||
| Xtrackers Russell 2000 Comprehensive Factor ETF |
| |||||||||||||||
Actual | $ | 1,000.00 | $ | 944.90 | 0.30 | % | $ | 1.47 | ||||||||
Hypothetical (5% return before expenses) | $ | 1,000.00 | $ | 1,023.69 | 0.30 | % | $ | 1.53 | ||||||||
(1) Expenses are equal to each Fund’s annualized expense ratio, multiplied by the average account value over the period, multiplied by 184 (the number of days in the most recentsix-month period), then divided by 365.
16
DBX ETF Trust
Schedule of Investments
Xtrackers FTSE Developed ex US Comprehensive Factor ETF
August 31, 2019
Number | Value | |||||||
| COMMON STOCKS — 99.0% |
| |||||||
| Australia — 11.4% | ||||||||
Adelaide Brighton Ltd. | 6,844 | $ | 14,248 | |||||
AGL Energy Ltd. | 25,798 | 329,552 | ||||||
ALS Ltd. | 1,329 | 6,868 | ||||||
Alumina Ltd. | 96,700 | 141,379 | ||||||
Ansell Ltd. | 1,079 | 19,810 | ||||||
APA Group (a) | 14,052 | 104,238 | ||||||
Aristocrat Leisure Ltd. | 1,885 | 37,783 | ||||||
ASX Ltd. | 1,341 | 77,981 | ||||||
Atlas Arteria Ltd. (a) | 17,116 | 98,021 | ||||||
Aurizon Holdings Ltd. | 60,863 | 242,348 | ||||||
AusNet Services | 48,154 | 58,399 | ||||||
Australia & New Zealand Banking Group Ltd. | 795 | 14,323 | ||||||
Bank of Queensland Ltd. (b) | 1,773 | 10,954 | ||||||
Bendigo & Adelaide Bank Ltd. | 1,077 | 8,113 | ||||||
BHP Group Ltd. | 1,322 | 32,323 | ||||||
BHP Group PLC | 1,563 | 33,749 | ||||||
BlueScope Steel Ltd. | 1,452 | 12,219 | ||||||
Boral Ltd. | 5,894 | 16,877 | ||||||
Brambles Ltd. | 31,071 | 236,555 | ||||||
Caltex Australia Ltd. | 8,417 | 135,876 | ||||||
CIMIC Group Ltd. | 2,242 | 46,827 | ||||||
Coca-Cola Amatil Ltd. | 11,921 | 87,305 | ||||||
Cochlear Ltd. | 952 | 139,827 | ||||||
Coles Group Ltd. | 15,231 | 142,025 | ||||||
Commonwealth Bank of Australia | 100 | 5,326 | ||||||
Computershare Ltd. | 9,670 | 100,203 | ||||||
Crown Resorts Ltd. | 5,553 | 44,933 | ||||||
CSL Ltd. | 278 | 45,116 | ||||||
CSR Ltd. | 4,630 | 12,166 | ||||||
Dexus REIT | 83,354 | 724,461 | ||||||
Domino’s Pizza Enterprises Ltd. (b) | 305 | 8,789 | ||||||
Downer EDI Ltd. | 30,456 | 158,207 | ||||||
Flight Centre Travel Group Ltd. | 315 | 9,871 | ||||||
Goodman Group REIT | 32,097 | 314,000 | ||||||
GPT Group REIT | 161,975 | 697,345 | ||||||
Harvey Norman Holdings Ltd. (b) | 20,835 | 61,485 | ||||||
Iluka Resources Ltd. | 2,011 | 9,688 | ||||||
Incitec Pivot Ltd. | 5,944 | 12,855 | ||||||
Insurance Australia Group Ltd. | 18,351 | 99,654 | ||||||
Lendlease Group (a) | 7,744 | 89,011 | ||||||
Macquarie Group Ltd. | 283 | 23,613 | ||||||
Magellan Financial Group Ltd. | 2,478 | 84,713 | ||||||
Medibank Pvt Ltd. | 87,427 | 214,410 | ||||||
Metcash Ltd. | 5,870 | 11,469 | ||||||
Mirvac Group REIT | 293,801 | 631,456 | ||||||
Newcrest Mining Ltd. | 1,139 | 28,394 | ||||||
Oil Search Ltd. | 7,601 | 34,005 | ||||||
Orica Ltd. | 1,393 | 20,207 | ||||||
Origin Energy Ltd. | 1,364 | 7,012 | ||||||
Orora Ltd. | 54,469 | 102,389 | ||||||
OZ Minerals Ltd. | 1,668 | 10,283 | ||||||
Perpetual Ltd. (b) | 612 | 14,659 | ||||||
Platinum Asset Management Ltd. | 1,909 | 4,926 | ||||||
Qantas Airways Ltd. | 14,064 | 57,896 | ||||||
Qube Holdings Ltd. | 31,444 | 68,005 | ||||||
Number | Value | |||||||
| Australia (Continued) | ||||||||
Ramsay Health Care Ltd. | 1,156 | $ | 51,124 | |||||
REA Group Ltd. (b) | 564 | 39,713 | ||||||
Scentre Group REIT | 98,122 | 267,083 | ||||||
SEEK Ltd. | 1,937 | 26,532 | ||||||
Shopping Centres Australasia Property Group REIT | 62,104 | 110,046 | ||||||
Sonic Healthcare Ltd. | 6,713 | 133,199 | ||||||
South32 Ltd. | 6,317 | 11,236 | ||||||
Star Entertainment Group Ltd. | 6,141 | 17,005 | ||||||
Stockland REIT | 82,348 | 250,779 | ||||||
Suncorp Group Ltd. | 1,316 | 12,245 | ||||||
Sydney Airport (a) | 9,310 | 52,878 | ||||||
Telstra Corp. Ltd. | 37,661 | 94,392 | ||||||
TPG Telecom Ltd. | 2,309 | 10,361 | ||||||
Transurban Group (a) | 5,779 | 58,209 | ||||||
Treasury Wine Estates Ltd. | 2,091 | 26,401 | ||||||
Vicinity Centres REIT | 193,672 | 337,960 | ||||||
Washington H Soul Pattinson & Co. Ltd. | 2,591 | 36,467 | ||||||
Wesfarmers Ltd. | 14,162 | 373,079 | ||||||
Westpac Banking Corp. | 599 | 11,389 | ||||||
Woodside Petroleum Ltd. | 8,912 | 192,923 | ||||||
Woolworths Group Ltd. | 14,176 | 360,744 | ||||||
|
| |||||||
| 8,227,912 | ||||||||
|
| |||||||
| Austria — 0.2% | ||||||||
ANDRITZ AG | 790 | 27,874 | ||||||
OMV AG | 1,412 | 72,166 | ||||||
Telekom Austria AG* | 2,035 | 15,620 | ||||||
Verbund AG | 197 | 11,748 | ||||||
voestalpine AG (b) | 285 | 6,575 | ||||||
|
| |||||||
| 133,983 | ||||||||
|
| |||||||
| Belgium — 0.7% | ||||||||
Ackermans & van Haaren NV | 154 | 22,318 | ||||||
Ageas | 445 | 23,866 | ||||||
Colruyt SA | 1,775 | 91,031 | ||||||
Groupe Bruxelles Lambert SA | 256 | 23,952 | ||||||
KBC Group NV | 55 | 3,188 | ||||||
Proximus SADP | 3,005 | 88,986 | ||||||
Sofina SA | 697 | 134,786 | ||||||
Solvay SA | 432 | 43,635 | ||||||
Telenet Group Holding NV | 264 | 13,182 | ||||||
UCB SA | 1,092 | 81,702 | ||||||
Umicore SA | 119 | 3,797 | ||||||
|
| |||||||
| 530,443 | ||||||||
|
| |||||||
| Bermuda (c) — 0.0% | ||||||||
Hiscox Ltd. | 920 | 17,367 | ||||||
|
| |||||||
| Cambodia — 0.0% | ||||||||
NagaCorp Ltd. | 25,279 | 35,489 | ||||||
|
| |||||||
| Canada — 6.6% | ||||||||
Alimentation Couche-Tard, Inc., Class B | 969 | 61,109 | ||||||
Bank of Montreal | 445 | 30,562 | ||||||
Bank of Nova Scotia | 515 | 27,440 | ||||||
BCE, Inc. | 1,112 | 52,721 | ||||||
Brookfield Asset Management, Inc., Class A | 1,294 | 66,862 | ||||||
| See Notes to Financial Statements. | 17 |
DBX ETF Trust
Schedule of Investments
Xtrackers FTSE Developed ex US Comprehensive Factor ETF(Continued)
August 31, 2019
Number | Value | |||||||
| Canada (Continued) | ||||||||
Canadian Imperial Bank of Commerce | 694 | $ | 53,862 | |||||
Canadian National Railway Co. | 1,135 | 104,719 | ||||||
Canadian Natural Resources Ltd. | 908 | 21,737 | ||||||
Canadian Pacific Railway Ltd. | 672 | 162,118 | ||||||
Canadian Tire Corp. Ltd., Class A | 690 | 69,831 | ||||||
Canadian Utilities Ltd., Class A | 2,346 | 67,884 | ||||||
Cenovus Energy, Inc. | 645 | 5,640 | ||||||
CGI, Inc.* | 4,539 | 356,685 | ||||||
Constellation Software, Inc. | 142 | 138,571 | ||||||
Dollarama, Inc. | 675 | 25,881 | ||||||
Enbridge, Inc. | 836 | 28,016 | ||||||
Fairfax Financial Holdings Ltd. | 339 | 151,348 | ||||||
Fortis, Inc. | 4,227 | 174,863 | ||||||
Franco-Nevada Corp. | 707 | 69,200 | ||||||
George Weston Ltd. | 738 | 60,076 | ||||||
Great-West Lifeco, Inc. | 745 | 15,911 | ||||||
Husky Energy, Inc. | 4,391 | 29,377 | ||||||
Hydro One Ltd., 144A | 6,274 | 116,528 | ||||||
IGM Financial, Inc. | 2,165 | 58,589 | ||||||
Imperial Oil Ltd. | 4,703 | 115,628 | ||||||
Intact Financial Corp. | 1,775 | 173,813 | ||||||
Inter Pipeline Ltd. (b) | 6,375 | 116,485 | ||||||
Loblaw Cos. Ltd. | 3,967 | 217,546 | ||||||
Magna International, Inc. | 6,018 | 301,896 | ||||||
Manulife Financial Corp. | 2,949 | 49,024 | ||||||
Metro, Inc. | 3,724 | 158,315 | ||||||
National Bank of Canada | 774 | 36,417 | ||||||
Nutrien Ltd. | 520 | 26,239 | ||||||
Pembina Pipeline Corp. | 5,602 | 205,480 | ||||||
Power Corp. of Canada | 4,092 | 86,441 | ||||||
Power Financial Corp. | 1,349 | 28,822 | ||||||
Restaurant Brands International, Inc. | 1,202 | 94,447 | ||||||
RioCan Real Estate Investment Trust REIT | 9,599 | 191,287 | ||||||
Rogers Communications, Inc., Class B | 3,910 | 193,940 | ||||||
Royal Bank of Canada | 179 | 13,414 | ||||||
Saputo, Inc. | 4,371 | 131,643 | ||||||
Shaw Communications, Inc., Class B | 5,099 | 97,084 | ||||||
Sun Life Financial, Inc. | 1,724 | 70,800 | ||||||
Suncor Energy, Inc. | 3,238 | 94,888 | ||||||
TC Energy Corp. | 1,762 | 90,460 | ||||||
TELUS Corp. | 1,670 | 60,614 | ||||||
Thomson Reuters Corp. | 3,755 | 258,538 | ||||||
Toronto-Dominion Bank | 92 | 4,999 | ||||||
Wheaton Precious Metals Corp. | 872 | 25,698 | ||||||
|
| |||||||
| 4,793,448 | ||||||||
|
| |||||||
| Chile — 0.0% | ||||||||
Antofagasta PLC | 1,346 | 14,196 | ||||||
|
| |||||||
| China (c) — 0.1% | ||||||||
Uni-President China Holdings Ltd. | 15,416 | 17,137 | ||||||
Want Want China Holdings Ltd. | 52,256 | 40,749 | ||||||
|
| |||||||
| 57,886 | ||||||||
|
| |||||||
| Denmark — 1.7% | ||||||||
A.P. Moller — Maersk A/S, Class A | 19 | 18,956 | ||||||
A.P. Moller — Maersk A/S, Class B | 21 | 22,388 | ||||||
Carlsberg A/S, Class B | 1,529 | 226,168 | ||||||
Number | Value | |||||||
| Denmark (Continued) | ||||||||
Chr Hansen Holding A/S | 699 | $ | 58,847 | |||||
Coloplast A/S, Class B | 1,052 | 125,545 | ||||||
Demant A/S* | 664 | 20,154 | ||||||
Drilling Co. of 1972 A/S* | 80 | 4,407 | ||||||
DSV A/S | 3,101 | 307,966 | ||||||
GN Store Nord A/S | 1,509 | 63,297 | ||||||
H Lundbeck A/S | 168 | 6,129 | ||||||
ISS A/S | 2,472 | 62,853 | ||||||
Novo Nordisk A/S, Class B | 717 | 37,308 | ||||||
Novozymes A/S, Class B | 1,368 | 58,453 | ||||||
Orsted A/S, 144A | 772 | 73,864 | ||||||
Rockwool International A/S, Class B | 174 | 34,000 | ||||||
Tryg A/S | 1,299 | 38,909 | ||||||
Vestas Wind Systems A/S | 1,029 | 75,762 | ||||||
|
| |||||||
| 1,235,006 | ||||||||
|
| |||||||
| Finland — 1.6% | ||||||||
Elisa OYJ | 3,422 | 172,446 | ||||||
Fortum OYJ | 1,150 | 25,341 | ||||||
Huhtamaki OYJ | 1,352 | 52,290 | ||||||
Kesko OYJ, Class B | 3,698 | 233,187 | ||||||
Kone OYJ, Class B | 3,265 | 189,128 | ||||||
Metso OYJ | 1,088 | 40,833 | ||||||
Neste OYJ | 2,799 | 88,280 | ||||||
Nokia OYJ | 2,033 | 10,074 | ||||||
Nokian Renkaat OYJ | 1,865 | 51,140 | ||||||
Orion OYJ, Class B | 3,093 | 115,026 | ||||||
Sampo OYJ, Class A | 841 | 33,471 | ||||||
Stora Enso OYJ, Class R | 2,658 | 29,769 | ||||||
UPM-Kymmene OYJ | 4,577 | 123,591 | ||||||
Wartsila OYJ Abp | 1,881 | 23,107 | ||||||
|
| |||||||
| 1,187,683 | ||||||||
|
| |||||||
| France — 4.6% | ||||||||
Accor SA | 2,667 | 115,308 | ||||||
Aeroports de Paris | 92 | 15,917 | ||||||
AirFrance-KLM* | 403 | 4,547 | ||||||
Air Liquide SA | 460 | 64,158 | ||||||
Airbus SE | 57 | 7,868 | ||||||
ALD SA, 144A | 287 | 4,305 | ||||||
Alstom SA | 1,887 | 80,774 | ||||||
Amundi SA, 144A | 167 | 10,694 | ||||||
Arkema SA | 357 | 31,357 | ||||||
BioMerieux | 304 | 24,757 | ||||||
Bollore SA | 1,116 | 4,746 | ||||||
Bouygues SA | 965 | 36,717 | ||||||
Bureau Veritas SA | 1,908 | 45,722 | ||||||
Capgemini SE | 803 | 96,522 | ||||||
Carrefour SA | 5,801 | 99,019 | ||||||
Casino Guichard Perrachon SA (b) | 687 | 28,976 | ||||||
Cie de Saint-Gobain | 758 | 27,396 | ||||||
Cie Generale des Etablissements Michelin SCA | 398 | 41,901 | ||||||
CNP Assurances | 275 | 5,003 | ||||||
Covivio REIT | 846 | 90,184 | ||||||
Danone SA | 607 | 54,453 | ||||||
Dassault Aviation SA | 15 | 21,375 | ||||||
| See Notes to Financial Statements. | 18 |
DBX ETF Trust
Schedule of Investments
Xtrackers FTSE Developed ex US Comprehensive Factor ETF(Continued)
August 31, 2019
Number | Value | |||||||
| France (Continued) | ||||||||
Dassault Systemes SE | 203 | $ | 28,648 | |||||
Edenred | 2,279 | 111,182 | ||||||
Eiffage SA | 803 | 83,337 | ||||||
Electricite de France SA | 703 | 8,566 | ||||||
Engie SA | 8,845 | 134,663 | ||||||
EssilorLuxottica SA | 155 | 22,916 | ||||||
Eurazeo SE | 395 | 26,165 | ||||||
Eutelsat Communications SA (b) | 2,786 | 48,537 | ||||||
Gecina SA REIT | 511 | 81,147 | ||||||
Getlink SE | 1,964 | 27,685 | ||||||
Hermes International | 21 | 14,361 | ||||||
ICADE REIT | 82 | 7,265 | ||||||
Imerys SA | 138 | 5,638 | ||||||
Ingenico Group SA | 175 | 17,383 | ||||||
Ipsen SA | 289 | 30,426 | ||||||
JCDecaux SA | 394 | 10,552 | ||||||
Kering SA | 65 | 31,524 | ||||||
Klepierre SA REIT | 2,243 | 68,570 | ||||||
Lagardere SCA | 3,985 | 85,005 | ||||||
Legrand SA | 994 | 70,298 | ||||||
L’Oreal SA | 44 | 12,046 | ||||||
LVMH Moet Hennessy Louis Vuitton SE | 10 | 3,991 | ||||||
Orange SA | 4,921 | 74,786 | ||||||
Orpea | 93 | 11,757 | ||||||
Pernod Ricard SA | 170 | 32,519 | ||||||
Peugeot SA | 3,446 | 77,151 | ||||||
Publicis Groupe SA | 1,218 | 58,509 | ||||||
Remy Cointreau SA* | 164 | 24,815 | ||||||
Rexel SA | 2,389 | 25,388 | ||||||
Rubis SCA | 856 | 49,584 | ||||||
Safran SA | 344 | 50,062 | ||||||
Sanofi | 329 | 28,304 | ||||||
Sartorius Stedim Biotech | 159 | 24,654 | ||||||
Schneider Electric SE | 702 | 58,878 | ||||||
SCOR SE | 885 | 35,368 | ||||||
SEB SA | 282 | 43,943 | ||||||
Societe BIC SA | 833 | 53,298 | ||||||
Sodexo SA | 426 | 48,368 | ||||||
Suez | 8,058 | 125,344 | ||||||
Teleperformance | 1,077 | 235,549 | ||||||
Thales SA | 488 | 56,509 | ||||||
TOTAL SA | 490 | 24,493 | ||||||
Ubisoft Entertainment SA* | 116 | 9,371 | ||||||
Unibail-Rodamco-Westfield REIT | 49 | 6,427 | ||||||
Veolia Environnement SA | 7,379 | 176,743 | ||||||
Vinci SA | 791 | 86,673 | ||||||
Vivendi SA | 795 | 22,264 | ||||||
Wendel SA | 80 | 11,233 | ||||||
|
| |||||||
| 3,293,594 | ||||||||
|
| |||||||
| Germany — 3.9% | ||||||||
adidas AG | 202 | 59,996 | ||||||
Allianz SE | 52 | 11,482 | ||||||
Axel Springer SE | 260 | 17,895 | ||||||
BASF SE | 574 | 38,041 | ||||||
Bayerische Motoren Werke AG | 204 | 13,661 | ||||||
Beiersdorf AG | 551 | 69,477 | ||||||
Number | Value | |||||||
| Germany (Continued) | ||||||||
Brenntag AG | 2,445 | $ | 118,015 | |||||
Carl Zeiss Meditec AG | 428 | 49,443 | ||||||
Continental AG | 56 | 6,769 | ||||||
Covestro AG, 144A | 318 | 14,425 | ||||||
Daimler AG | 164 | 7,713 | ||||||
Deutsche Boerse AG | 56 | 8,248 | ||||||
Deutsche Lufthansa AG | 1,621 | 24,956 | ||||||
Deutsche Post AG | 1,201 | 39,546 | ||||||
Deutsche Telekom AG | 2,652 | 44,322 | ||||||
Deutsche Wohnen SE | 7,954 | 282,577 | ||||||
E.ON SE | 3,268 | 30,429 | ||||||
Evonik Industries AG | 784 | 20,013 | ||||||
Fielmann AG | 206 | 14,689 | ||||||
Fraport AG Frankfurt Airport Services Worldwide | 204 | 17,069 | ||||||
Fresenius Medical Care AG & Co. KGaA | 240 | 16,175 | ||||||
Fresenius SE & Co. KGaA | 124 | 6,030 | ||||||
FUCHS PETROLUB SE | 564 | 19,410 | ||||||
GEA Group AG | 387 | 10,454 | ||||||
GRENKE AG | 62 | 5,032 | ||||||
Hannover Rueck SE | 217 | 34,603 | ||||||
HeidelbergCement AG | 644 | 44,708 | ||||||
Hella GmbH & Co. KGaA | 202 | 8,427 | ||||||
Henkel AG & Co. KGaA | 85 | 7,868 | ||||||
HOCHTIEF AG | 346 | 37,703 | ||||||
HUGO BOSS AG | 491 | 27,403 | ||||||
Infineon Technologies AG | 1,245 | 21,591 | ||||||
Innogy SE, 144A | 551 | 27,482 | ||||||
KION Group AG | 182 | 8,817 | ||||||
Knorr-Bremse AG | 211 | 19,749 | ||||||
LANXESS AG | 903 | 54,395 | ||||||
LEG Immobilien AG | 3,906 | 459,399 | ||||||
Merck KGaA | 1,420 | 152,093 | ||||||
METRO AG | 107 | 1,659 | ||||||
MTU Aero Engines AG | 657 | 179,650 | ||||||
Muenchener Rueckversicherungs-Gesellschaft AG in Muenchen | 81 | 19,437 | ||||||
ProSiebenSat.1 Media SE | 757 | 9,983 | ||||||
Puma SE | 846 | 64,331 | ||||||
Rational AG | 22 | 15,360 | ||||||
Rheinmetall AG | 548 | 64,754 | ||||||
RWE AG | 845 | 24,111 | ||||||
SAP SE | 110 | 13,156 | ||||||
Scout24 AG, 144A* | 268 | 15,878 | ||||||
Siemens AG | 177 | 17,728 | ||||||
Siemens Healthineers AG, 144A | 101 | 3,972 | ||||||
Suedzucker AG | 436 | 7,202 | ||||||
Symrise AG | 867 | 81,080 | ||||||
Talanx AG | 120 | 4,979 | ||||||
Uniper SE | 5,993 | 181,956 | ||||||
Vonovia SE | 4,505 | 224,739 | ||||||
Wacker Chemie AG | 69 | 5,381 | ||||||
Wirecard AG | 39 | 6,232 | ||||||
|
| |||||||
| 2,791,693 | ||||||||
|
| |||||||
| Hong Kong — 4.2% | ||||||||
AIA Group Ltd. | 1,218 | 11,853 | ||||||
| See Notes to Financial Statements. | 19 |
DBX ETF Trust
Schedule of Investments
Xtrackers FTSE Developed ex US Comprehensive Factor ETF(Continued)
August 31, 2019
Number | Value | |||||||
| Hong Kong (Continued) | ||||||||
ASM Pacific Technology Ltd. | 522 | $ | 5,986 | |||||
Bank of East Asia Ltd. | 1,291 | 3,266 | ||||||
Cafe de Coral Holdings Ltd. | 17,512 | 55,875 | ||||||
Champion REIT | 183,008 | 123,323 | ||||||
China Mengniu Dairy Co. Ltd.* | 4,814 | 19,108 | ||||||
CK Asset Holdings Ltd. | 11,209 | 76,178 | ||||||
CK Hutchison Holdings Ltd. | 2,996 | 26,116 | ||||||
CK Infrastructure Holdings Ltd. | 2,392 | 16,134 | ||||||
CLP Holdings Ltd. | 8,562 | 88,239 | ||||||
Dairy Farm International Holdings Ltd. | 3,865 | 27,673 | ||||||
First Pacific Co. Ltd. | 14,081 | 5,769 | ||||||
Great Eagle Holdings Ltd. | 4,759 | 17,614 | ||||||
Hang Lung Group Ltd. | 9,287 | 23,089 | ||||||
Hang Lung Properties Ltd. | 22,923 | 51,841 | ||||||
Hang Seng Bank Ltd. | 201 | 4,197 | ||||||
Henderson Land Development Co. Ltd. | 12,110 | 56,413 | ||||||
Hong Kong & China Gas Co. Ltd. | 17,146 | 33,131 | ||||||
Hong Kong Exchanges & Clearing Ltd. (b) | 219 | 6,708 | ||||||
Hongkong Land Holdings Ltd. | 45,500 | 248,430 | ||||||
Hutchison Port Holdings Trust, Class U | 23,800 | 3,737 | ||||||
Hysan Development Co. Ltd. | 11,685 | 47,349 | ||||||
Jardine Matheson Holdings Ltd. | 500 | 27,185 | ||||||
Jardine Strategic Holdings Ltd. | 300 | 9,480 | ||||||
Kerry Logistics Network Ltd. | 35,345 | 54,763 | ||||||
Kerry Properties Ltd. | 22,907 | 77,328 | ||||||
Lifestyle International Holdings Ltd. | 17,894 | 20,028 | ||||||
Link REIT | 75,016 | 842,516 | ||||||
MTR Corp. Ltd. | 2,864 | 16,595 | ||||||
New World Development Co. Ltd. | 95,562 | 119,279 | ||||||
NWS Holdings Ltd. | 65,183 | 112,308 | ||||||
PCCW Ltd. | 60,577 | 32,858 | ||||||
Power Assets Holdings Ltd. | 7,045 | 46,935 | ||||||
Shun Tak Holdings Ltd. | 28,694 | 10,254 | ||||||
Sino Land Co. Ltd. | 60,194 | 86,042 | ||||||
Sun Art Retail Group Ltd. | 5,291 | 5,152 | ||||||
Sun Hung Kai Properties Ltd. | 4,266 | 60,489 | ||||||
Swire Pacific Ltd., Class A | 13,447 | 131,718 | ||||||
Swire Pacific Ltd., Class B | 18,611 | 28,503 | ||||||
Swire Properties Ltd. | 25,258 | 83,008 | ||||||
Techtronic Industries Co. Ltd. | 8,852 | 61,232 | ||||||
Towngas China Co. Ltd.* | 11,961 | 8,274 | ||||||
Vitasoy International Holdings Ltd. (b) | 14,821 | 69,042 | ||||||
VTech Holdings Ltd. | 1,650 | 13,056 | ||||||
WH Group Ltd., 144A | 10,213 | 8,225 | ||||||
Wharf Holdings Ltd. | 22,070 | 48,335 | ||||||
Wharf Real Estate Investment Co. Ltd. | 8,463 | 45,850 | ||||||
Wheelock & Co. Ltd. | 5,627 | 32,712 | ||||||
Yue Yuen Industrial Holdings Ltd. | 9,288 | 23,767 | ||||||
|
| |||||||
| 3,026,963 | ||||||||
|
| |||||||
| Ireland — 0.9% | ||||||||
CRH PLC | 2,575 | 85,831 | ||||||
DCC PLC | 2,040 | 173,512 | ||||||
Experian PLC | 6,182 | 189,574 | ||||||
Flutter Entertainment PLC | 390 | 32,136 | ||||||
Glanbia PLC | 1,479 | 16,247 | ||||||
James Hardie Industries PLC CDI | 1,976 | 30,021 | ||||||
Number | Value | |||||||
| Ireland (Continued) | ||||||||
Kerry Group PLC, Class A | 516 | $ | 61,541 | |||||
Kingspan Group PLC | 1,299 | 59,424 | ||||||
Smurfit Kappa Group PLC | 165 | 5,096 | ||||||
|
| |||||||
| 653,382 | ||||||||
|
| |||||||
| Isle of Man — 0.0% | ||||||||
GVC Holdings PLC | 434 | 3,325 | ||||||
|
| |||||||
| Israel — 2.1% | ||||||||
Airport City Ltd.* | 4,998 | 95,720 | ||||||
Alony Hetz Properties & Investments Ltd. | 5,185 | 74,586 | ||||||
Amot Investments Ltd. | 4,334 | 30,491 | ||||||
Azrieli Group Ltd. | 923 | 68,857 | ||||||
Bank Hapoalim BM* | 10,486 | 76,921 | ||||||
Bank LeumiLe-Israel BM | 16,126 | 109,981 | ||||||
Bezeq The Israeli Telecommunication Corp. Ltd. | 24,526 | 15,421 | ||||||
Delek Group Ltd. | 97 | 13,627 | ||||||
Elbit Systems Ltd. | 406 | 62,704 | ||||||
First International Bank of Israel Ltd. | 1,068 | 27,677 | ||||||
Gazit-Globe Ltd. | 728 | 7,194 | ||||||
Harel Insurance Investments & Financial Services Ltd. | 2,128 | 16,568 | ||||||
Israel Chemicals Ltd. | 45,519 | 205,501 | ||||||
Israel Corp. Ltd.* | 217 | 41,928 | ||||||
Israel Discount Bank Ltd., Class A | 34,550 | 143,944 | ||||||
Melisron Ltd. | 567 | 35,121 | ||||||
Mizrahi Tefahot Bank Ltd. | 1,427 | 32,859 | ||||||
Nice Ltd.* | 1,098 | 168,086 | ||||||
Oil Refineries Ltd.* | 142,061 | 70,452 | ||||||
Paz Oil Co. Ltd. | 952 | 126,457 | ||||||
Phoenix Holdings Ltd. | 2,558 | 15,511 | ||||||
Shufersal Ltd. | 4,653 | 31,497 | ||||||
Strauss Group Ltd. | 1,698 | 50,352 | ||||||
|
| |||||||
| 1,521,455 | ||||||||
|
| |||||||
| Italy — 1.4% | ||||||||
A2A SpA | 57,702 | 101,607 | ||||||
Assicurazioni Generali SpA | 1,287 | 23,343 | ||||||
Atlantia SpA | 1,115 | 27,222 | ||||||
Buzzi Unicem SpA | 374 | 7,861 | ||||||
Buzzi UnicemSpA-RSP | 692 | 9,907 | ||||||
Davide Campari-Milano SpA | 3,320 | 31,169 | ||||||
DiaSorin SpA | 362 | 42,935 | ||||||
Enel SpA | 8,369 | 60,773 | ||||||
Eni SpA | 5,680 | 85,570 | ||||||
Ferrari NV | 132 | 20,816 | ||||||
FinecoBank Banca Fineco SpA | 458 | 4,730 | ||||||
Hera SpA | 37,028 | 147,939 | ||||||
Italgas SpA | 14,499 | 94,206 | ||||||
Leonardo SpA | 1,809 | 22,173 | ||||||
Moncler SpA | 1,187 | 44,562 | ||||||
Pirelli & C SpA, 144A | 833 | 4,334 | ||||||
Poste Italiane SpA, 144A | 1,714 | 18,445 | ||||||
Prysmian SpA | 977 | 21,416 | ||||||
Recordati SpA | 928 | 40,735 | ||||||
Salvatore Ferragamo SpA (b) | 510 | 9,756 | ||||||
Snam SpA | 5,743 | 29,086 | ||||||
| See Notes to Financial Statements. | 20 |
DBX ETF Trust
Schedule of Investments
Xtrackers FTSE Developed ex US Comprehensive Factor ETF(Continued)
August 31, 2019
Number | Value | |||||||
| Italy (Continued) | ||||||||
Terna Rete Elettrica Nazionale SpA | 21,054 | $ | 132,391 | |||||
UnipolSai Assicurazioni SpA | 2,596 | 6,587 | ||||||
|
| |||||||
| 987,563 | ||||||||
|
| |||||||
| Japan — 22.7% | ||||||||
ABC-Mart, Inc. | 400 | 25,588 | ||||||
Advantest Corp. | 800 | 32,898 | ||||||
Aeon Co. Ltd. (b) | 7,700 | 136,670 | ||||||
Aeon Mall Co. Ltd. | 900 | 14,168 | ||||||
AGC, Inc. | 2,800 | 80,852 | ||||||
Aica Kogyo Co. Ltd. | 1,500 | 42,889 | ||||||
Ain Holdings, Inc. | 300 | 16,223 | ||||||
Air Water, Inc. | 3,200 | 54,416 | ||||||
Aisin Seiki Co. Ltd. | 1,000 | 29,676 | ||||||
Ajinomoto Co., Inc. | 1,900 | 34,672 | ||||||
Alfresa Holdings Corp. | 5,700 | 129,149 | ||||||
Alps Alpine Co. Ltd. | 800 | 13,981 | ||||||
Amada Holdings Co. Ltd. | 2,600 | 27,116 | ||||||
ANA Holdings, Inc. | 2,100 | 71,856 | ||||||
Aoyama Trading Co. Ltd. | 200 | 3,542 | ||||||
Aozora Bank Ltd. | 300 | 6,939 | ||||||
Asahi Group Holdings Ltd. | 1,000 | 46,691 | ||||||
Asahi Intecc Co. Ltd. | 600 | 13,419 | ||||||
Asahi Kasei Corp. | 7,209 | 65,281 | ||||||
Astellas Pharma, Inc. | 6,900 | 95,688 | ||||||
Autobacs Seven Co. Ltd. | 2,200 | 36,893 | ||||||
Azbil Corp. | 3,100 | 79,146 | ||||||
Bandai Namco Holdings, Inc. | 2,100 | 123,652 | ||||||
Benesse Holdings, Inc. | 600 | 15,364 | ||||||
Bic Camera, Inc. | 1,200 | 11,904 | ||||||
Bridgestone Corp. | 2,100 | 80,186 | ||||||
Brother Industries Ltd. | 1,100 | 19,068 | ||||||
Calbee, Inc. | 500 | 15,262 | ||||||
Canon Marketing Japan, Inc. | 500 | 10,194 | ||||||
Canon, Inc. | 2,400 | 62,428 | ||||||
Capcom Co. Ltd. | 1,054 | 27,476 | ||||||
Casio Computer Co. Ltd. | 700 | 9,780 | ||||||
Central Japan Railway Co. | 510 | 100,972 | ||||||
Chubu Electric Power Co., Inc. | 18,200 | 268,598 | ||||||
Chugai Pharmaceutical Co. Ltd. | 200 | 14,320 | ||||||
Chugoku Electric Power Co., Inc. | 17,500 | 223,727 | ||||||
Citizen Watch Co. Ltd. | 3,200 | 14,591 | ||||||
Coca-Cola Bottlers Japan Holdings, Inc. (b) | 175 | 3,808 | ||||||
COMSYS Holdings Corp. | 4,000 | 113,241 | ||||||
Cosmos Pharmaceutical Corp. | 129 | 26,348 | ||||||
Dai Nippon Printing Co. Ltd. | 5,000 | 108,295 | ||||||
Daicel Corp. | 7,200 | 55,690 | ||||||
Daido Steel Co. Ltd. | 100 | 3,754 | ||||||
Dai-ichi Life Holdings, Inc. | 500 | 6,821 | ||||||
Daiichi Sankyo Co. Ltd. | 229 | 15,141 | ||||||
Daiichikosho Co. Ltd. | 855 | 38,584 | ||||||
Daikin Industries Ltd. | 500 | 61,967 | ||||||
Daito Trust Construction Co. Ltd. | 1,343 | 173,086 | ||||||
Daiwa House Industry Co. Ltd. | 1,300 | 40,808 | ||||||
Denka Co. Ltd. | 2,000 | 52,212 | ||||||
Denso Corp. | 688 | 28,895 | ||||||
Number | Value | |||||||
| Japan (Continued) | ||||||||
Dentsu, Inc. | 1,634 | $ | 55,880 | |||||
DIC Corp. | 1,500 | 39,682 | ||||||
Disco Corp. | 11 | 2,000 | ||||||
Dowa Holdings Co. Ltd. | 200 | 6,406 | ||||||
East Japan Railway Co. | 1,000 | 95,294 | ||||||
Ebara Corp. | 600 | 14,262 | ||||||
Eisai Co. Ltd. | 300 | 15,347 | ||||||
Electric Power Development Co. Ltd. | 6,000 | 139,168 | ||||||
Exedy Corp. | 700 | 13,137 | ||||||
Ezaki Glico Co. Ltd. | 300 | 13,029 | ||||||
FamilyMart UNY Holdings Co. Ltd. (b) | 1,944 | 44,871 | ||||||
Fancl Corp. | 400 | 9,723 | ||||||
FANUC Corp. | 100 | 17,387 | ||||||
Fast Retailing Co. Ltd. (b) | 11 | 6,450 | ||||||
FP Corp. | 100 | 6,585 | ||||||
Fuji Electric Co. Ltd. | 954 | 27,233 | ||||||
Fuji Media Holdings, Inc. | 800 | 10,386 | ||||||
Fuji Oil Holdings, Inc. | 800 | 22,287 | ||||||
Fuji Seal International, Inc. | 500 | 13,604 | ||||||
FUJIFILM Holdings Corp. | 2,700 | 115,712 | ||||||
Fujitsu Ltd. | 777 | 60,047 | ||||||
Fukuyama Transporting Co. Ltd. | 700 | 24,269 | ||||||
Glory Ltd. | 200 | 5,498 | ||||||
GS Yuasa Corp. | 400 | 6,708 | ||||||
H2O Retailing Corp. | 700 | 7,353 | ||||||
Hakuhodo DY Holdings, Inc. | 7,700 | 113,819 | ||||||
Hamamatsu Photonics KK | 1,100 | 38,033 | ||||||
Hankyu Hanshin Holdings, Inc. | 2,400 | 91,008 | ||||||
Haseko Corp. | 2,100 | 22,574 | ||||||
Heiwa Corp. | 200 | 4,034 | ||||||
Hikari Tsushin, Inc. | 100 | 23,458 | ||||||
Hino Motors Ltd. | 1,600 | 12,602 | ||||||
Hirose Electric Co. Ltd. | 205 | 23,311 | ||||||
HIS Co. Ltd. | 600 | 14,674 | ||||||
Hisamitsu Pharmaceutical Co., Inc. | 100 | 4,051 | ||||||
Hitachi Chemical Co. Ltd. | 700 | 21,895 | ||||||
Hitachi Construction Machinery Co. Ltd. | 300 | 6,416 | ||||||
Hitachi High-Technologies Corp. | 400 | 21,631 | ||||||
Hitachi Ltd. | 2,400 | 82,054 | ||||||
Hitachi Metals Ltd. | 1,100 | 11,855 | ||||||
Hitachi Transport System Ltd. | 1,200 | 37,647 | ||||||
Hokkaido Electric Power Co., Inc. | 6,500 | 33,007 | ||||||
Hokuriku Electric Power Co.* | 7,000 | 44,053 | ||||||
Honda Motor Co. Ltd. | 1,000 | 23,774 | ||||||
Horiba Ltd. | 200 | 10,288 | ||||||
Hoshizaki Corp. | 200 | 14,395 | ||||||
House Foods Group, Inc. | 1,200 | 45,786 | ||||||
Hoya Corp. | 1,300 | 105,928 | ||||||
Hulic Co. Ltd. | 2,000 | 19,106 | ||||||
Ibiden Co. Ltd. | 400 | 7,774 | ||||||
Idemitsu Kosan Co. Ltd. | 3,101 | 83,408 | ||||||
IHI Corp. | 900 | 17,543 | ||||||
Iida Group Holdings Co. Ltd. | 400 | 6,233 | ||||||
Inpex Corp. | 1,500 | 12,987 | ||||||
Isetan Mitsukoshi Holdings Ltd. | 4,100 | 31,094 | ||||||
Isuzu Motors Ltd. | 5,800 | 62,456 | ||||||
Ito En Ltd. | 600 | 27,444 | ||||||
| See Notes to Financial Statements. | 21 |
DBX ETF Trust
Schedule of Investments
Xtrackers FTSE Developed ex US Comprehensive Factor ETF(Continued)
August 31, 2019
Number | Value | |||||||
| Japan (Continued) | ||||||||
ITOCHU Corp. | 6,000 | $ | 119,751 | |||||
Itochu Techno-Solutions Corp. | 500 | 13,792 | ||||||
Izumi Co. Ltd. | 280 | 10,670 | ||||||
Japan Airlines Co. Ltd. | 2,400 | 75,045 | ||||||
Japan Airport Terminal Co. Ltd. | 100 | 3,990 | ||||||
Japan Tobacco, Inc. | 1,400 | 29,683 | ||||||
JFE Holdings, Inc. | 2,400 | 28,116 | ||||||
JSR Corp. | 1,600 | 26,198 | ||||||
JTEKT Corp. | 500 | 5,427 | ||||||
JXTG Holdings, Inc. | 33,850 | 140,030 | ||||||
Kagome Co. Ltd. | 400 | 10,107 | ||||||
Kajima Corp. | 4,200 | 51,162 | ||||||
Kakaku.com, Inc. | 486 | 12,184 | ||||||
Kaken Pharmaceutical Co. Ltd. | 200 | 9,591 | ||||||
Kamigumi Co. Ltd. | 5,200 | 121,935 | ||||||
Kandenko Co. Ltd. | 2,200 | 18,882 | ||||||
Kaneka Corp. | 1,322 | 39,668 | ||||||
Kansai Electric Power Co., Inc. | 11,300 | 137,597 | ||||||
Kansai Mirai Financial Group, Inc. | 4,500 | 29,295 | ||||||
Kansai Paint Co. Ltd. | 288 | 5,999 | ||||||
Kao Corp. | 800 | 57,838 | ||||||
Kawasaki Heavy Industries Ltd. | 500 | 9,812 | ||||||
KDDI Corp. | 3,200 | 85,468 | ||||||
Keihan Holdings Co. Ltd. | 2,100 | 88,040 | ||||||
Keikyu Corp. | 1,800 | 33,034 | ||||||
Keio Corp. | 1,300 | 81,323 | ||||||
Keisei Electric Railway Co. Ltd. | 1,400 | 55,132 | ||||||
Kewpie Corp. | 1,200 | 28,094 | ||||||
Kikkoman Corp. | 1,200 | 54,039 | ||||||
Kinden Corp. | 5,900 | 86,434 | ||||||
Kintetsu Group Holdings Co. Ltd. | 2,100 | 104,659 | ||||||
Kirin Holdings Co. Ltd. | 2,700 | 53,379 | ||||||
Kissei Pharmaceutical Co. Ltd. | 300 | 6,871 | ||||||
Kobayashi Pharmaceutical Co. Ltd. | 600 | 44,995 | ||||||
Koei Tecmo Holdings Co. Ltd. | 240 | 5,013 | ||||||
Koito Manufacturing Co. Ltd. | 700 | 32,908 | ||||||
Kokuyo Co. Ltd. | 2,000 | 26,718 | ||||||
Komatsu Ltd. | 791 | 16,819 | ||||||
Komeri Co. Ltd. | 900 | 18,459 | ||||||
Konami Holdings Corp. | 500 | 22,681 | ||||||
Konica Minolta, Inc. | 2,000 | 14,245 | ||||||
Kose Corp. | 69 | 11,864 | ||||||
K’s Holdings Corp. | 1,200 | 12,877 | ||||||
Kubota Corp. | 1,800 | 25,861 | ||||||
Kuraray Co. Ltd. | 5,000 | 57,092 | ||||||
Kurita Water Industries Ltd. | 1,800 | 46,855 | ||||||
Kyocera Corp. | 1,700 | 101,140 | ||||||
KYORIN Holdings, Inc. | 1,000 | 16,713 | ||||||
Kyoritsu Maintenance Co. Ltd. | 200 | 7,914 | ||||||
Kyowa Exeo Corp. | 3,300 | 79,589 | ||||||
Kyowa Kirin Co. Ltd. | 800 | 14,659 | ||||||
Kyudenko Corp. | 100 | 3,104 | ||||||
Kyushu Electric Power Co., Inc. | 14,700 | 145,276 | ||||||
Kyushu Railway Co. | 9,026 | 270,835 | ||||||
Lawson, Inc. (b) | 1,100 | 54,614 | ||||||
Lintec Corp. | 1,500 | 29,139 | ||||||
Lion Corp. | 2,106 | 40,971 | ||||||
Number | Value | |||||||
| Japan (Continued) | ||||||||
LIXIL Group Corp. | 600 | $ | 9,841 | |||||
Mabuchi Motor Co. Ltd. | 200 | 7,094 | ||||||
Maeda Corp. | 3,800 | 30,716 | ||||||
Maeda Road Construction Co. Ltd. | 2,600 | 57,636 | ||||||
Makita Corp. | 500 | 14,720 | ||||||
Marubeni Corp. | 27,700 | 176,960 | ||||||
Maruha Nichiro Corp. | 1,000 | 25,842 | ||||||
Maruichi Steel Tube Ltd. | 2,050 | 49,905 | ||||||
Matsumotokiyoshi Holdings Co. Ltd. | 500 | 18,560 | ||||||
Mazda Motor Corp. | 1,700 | 14,289 | ||||||
Medipal Holdings Corp. | 5,400 | 114,822 | ||||||
Megmilk Snow Brand Co. Ltd. | 200 | 4,607 | ||||||
MEIJI Holdings Co. Ltd. | 1,200 | 83,433 | ||||||
MINEBEA MITSUMI, Inc. | 651 | 10,064 | ||||||
Miraca Holdings, Inc. | 400 | 8,829 | ||||||
MISUMI Group, Inc. | 800 | 18,149 | ||||||
Mitsubishi Chemical Holdings Corp. | 6,300 | 43,280 | ||||||
Mitsubishi Corp. | 2,900 | 70,625 | ||||||
Mitsubishi Electric Corp. | 4,100 | 49,577 | ||||||
Mitsubishi Estate Co. Ltd. | 1,800 | 34,492 | ||||||
Mitsubishi Gas Chemical Co., Inc. | 1,700 | 20,468 | ||||||
Mitsubishi Heavy Industries Ltd. | 3,521 | 132,421 | ||||||
Mitsubishi Logistics Corp. | 900 | 22,088 | ||||||
Mitsubishi Materials Corp. | 1,700 | 41,241 | ||||||
Mitsubishi Motors Corp. | 2,800 | 11,712 | ||||||
Mitsubishi Shokuhin Co. Ltd. | 400 | 9,854 | ||||||
Mitsubishi Tanabe Pharma Corp. | 900 | 9,954 | ||||||
Mitsubishi UFJ Lease & Finance Co. Ltd. | 900 | 4,867 | ||||||
Mitsui & Co. Ltd. | 7,400 | 115,938 | ||||||
Mitsui Chemicals, Inc. | 1,500 | 32,093 | ||||||
Mitsui Fudosan Co. Ltd. | 1,000 | 23,986 | ||||||
Mitsui OSK Lines Ltd. | 700 | 16,500 | ||||||
Miura Co. Ltd. | 353 | 9,747 | ||||||
Mizuho Financial Group, Inc. | 4,100 | 5,976 | ||||||
Mochida Pharmaceutical Co. Ltd. | 700 | 27,368 | ||||||
Morinaga & Co. Ltd. | 300 | 14,838 | ||||||
MS&AD Insurance Group Holdings, Inc. | 900 | 28,633 | ||||||
Murata Manufacturing Co. Ltd. | 417 | 17,518 | ||||||
Nabtesco Corp. | 200 | 5,756 | ||||||
Nagase & Co. Ltd. | 3,600 | 48,839 | ||||||
Nagoya Railroad Co. Ltd. | 3,000 | 89,453 | ||||||
Nankai Electric Railway Co. Ltd. | 1,800 | 46,109 | ||||||
NEC Corp. | 1,800 | 77,159 | ||||||
NGK Insulators Ltd. | 1,600 | 21,495 | ||||||
NGK Spark Plug Co. Ltd. | 900 | 15,550 | ||||||
NH Foods Ltd. | 2,200 | 84,564 | ||||||
NHK Spring Co. Ltd. | 7,000 | 49,790 | ||||||
Nichirei Corp. | 700 | 16,091 | ||||||
Nidec Corp. | 136 | 17,752 | ||||||
Nifco, Inc. | 300 | 6,902 | ||||||
Nihon Kohden Corp. | 1,100 | 30,551 | ||||||
Nihon Unisys Ltd. | 1,300 | 42,070 | ||||||
Nikon Corp. | 4,600 | 56,988 | ||||||
Nippo Corp. | 2,000 | 35,574 | ||||||
Nippon Electric Glass Co. Ltd. | 700 | 14,541 | ||||||
Nippon Express Co. Ltd. | 1,300 | 67,238 | ||||||
Nippon Kayaku Co. Ltd. | 4,100 | 44,691 | ||||||
| See Notes to Financial Statements. | 22 |
DBX ETF Trust
Schedule of Investments
Xtrackers FTSE Developed ex US Comprehensive Factor ETF(Continued)
August 31, 2019
Number | Value | |||||||
| Japan (Continued) | ||||||||
Nippon Paper Industries Co. Ltd. | 2,200 | $ | 36,561 | |||||
Nippon Shokubai Co. Ltd. | 1,400 | 81,115 | ||||||
Nippon Steel Corp. | 5,213 | 72,981 | ||||||
Nippon Telegraph & Telephone Corp. | 500 | 24,005 | ||||||
Nippon Television Holdings, Inc. | 1,000 | 13,199 | ||||||
Nippon Yusen KK | 1,900 | 28,389 | ||||||
Nipro Corp. | 400 | 4,209 | ||||||
Nishi-Nippon Railroad Co. Ltd. (b) | 1,500 | 34,481 | ||||||
Nissan Chemical Corp. | 1,883 | 79,741 | ||||||
Nissan Motor Co. Ltd. | 1,900 | 11,750 | ||||||
Nissan Shatai Co. Ltd. | 800 | 7,100 | ||||||
Nisshin Seifun Group, Inc. | 4,300 | 80,940 | ||||||
Nissin Foods Holdings Co. Ltd. | 784 | 54,436 | ||||||
Nitori Holdings Co. Ltd. | 43 | 6,208 | ||||||
Nitto Denko Corp. | 500 | 23,298 | ||||||
NOF Corp. | 2,500 | 81,139 | ||||||
NOK Corp. | 800 | 11,087 | ||||||
Nomura Real Estate Holdings, Inc. | 800 | 16,973 | ||||||
Nomura Research Institute Ltd. | 1,430 | 28,467 | ||||||
NS Solutions Corp. | 200 | 6,689 | ||||||
NSK Ltd. | 500 | 4,013 | ||||||
NTT Data Corp. | 4,600 | 59,415 | ||||||
NTT DOCOMO, Inc. | 1,100 | 27,794 | ||||||
Obayashi Corp. | 10,200 | 94,077 | ||||||
Obic Co. Ltd. | 300 | 34,340 | ||||||
Odakyu Electric Railway Co. Ltd. | 1,800 | 40,869 | ||||||
Oji Holdings Corp. | 12,900 | 60,158 | ||||||
OKUMA Corp. | 200 | 9,798 | ||||||
Olympus Corp. | 1,956 | 22,924 | ||||||
Omron Corp. | 500 | 24,777 | ||||||
Oracle Corp. | 300 | 25,861 | ||||||
Oriental Land Co. Ltd. | 300 | 43,723 | ||||||
ORIX Corp. | 2,800 | 41,389 | ||||||
Osaka Gas Co. Ltd. | 10,900 | 195,316 | ||||||
OSG Corp. | 1,900 | 35,997 | ||||||
Otsuka Corp. | 500 | 18,583 | ||||||
Otsuka Holdings Co. Ltd. | 300 | 12,348 | ||||||
PALTAC CORPORATION | 1,000 | 49,461 | ||||||
Pan Pacific International Holdings Corp. | 1,200 | 18,778 | ||||||
Panasonic Corp. | 800 | 6,181 | ||||||
Park24 Co. Ltd. | 1,800 | 36,951 | ||||||
Pigeon Corp. | 300 | 10,910 | ||||||
Pilot Corp. | 200 | 7,019 | ||||||
Rakuten, Inc. | 1,500 | 14,146 | ||||||
Recruit Holdings Co. Ltd. | 1,385 | 42,002 | ||||||
Relo Group, Inc. | 700 | 17,747 | ||||||
Rengo Co. Ltd. | 3,000 | 21,508 | ||||||
Resona Holdings, Inc. | 1,100 | 4,321 | ||||||
Ricoh Co. Ltd. | 600 | 5,557 | ||||||
Rinnai Corp. | 300 | 18,852 | ||||||
Rohto Pharmaceutical Co. Ltd. | 700 | 17,384 | ||||||
Ryohin Keikaku Co. Ltd. | 940 | 16,215 | ||||||
Sankyo Co. Ltd. | 800 | 27,698 | ||||||
Sankyu, Inc. | 1,000 | 50,685 | ||||||
Sanrio Co. Ltd. | 200 | 3,817 | ||||||
Santen Pharmaceutical Co. Ltd. | 900 | 15,779 | ||||||
Sanwa Holdings Corp. | 3,400 | 37,861 | ||||||
Number | Value | |||||||
| Japan (Continued) | ||||||||
SCSK Corp. | 900 | $ | 44,430 | |||||
Secom Co. Ltd. | 1,900 | 162,246 | ||||||
Sega Sammy Holdings, Inc. | 500 | 6,859 | ||||||
Seibu Holdings, Inc. | 2,200 | 37,370 | ||||||
Seiko Epson Corp. | 1,000 | 13,312 | ||||||
Seino Holdings Co. Ltd. | 1,900 | 24,487 | ||||||
Sekisui Chemical Co. Ltd. | 6,700 | 96,639 | ||||||
Sekisui House Ltd. | 4,300 | 76,383 | ||||||
Seven & i Holdings Co. Ltd. | 2,300 | 81,408 | ||||||
Seven Bank Ltd. | 2,200 | 5,762 | ||||||
SG Holdings Co. Ltd. | 1,900 | 50,890 | ||||||
Shikoku Electric Power Co., Inc. | 6,700 | 64,131 | ||||||
Shimachu Co. Ltd. | 1,118 | 26,374 | ||||||
Shimadzu Corp. | 1,700 | 42,314 | ||||||
Shimamura Co. Ltd. | 100 | 7,820 | ||||||
Shimano, Inc. | 366 | 52,653 | ||||||
Shimizu Corp. | 8,000 | 66,777 | ||||||
Shin-Etsu Chemical Co. Ltd. | 600 | 60,568 | ||||||
Shionogi & Co. Ltd. | 1,200 | 64,384 | ||||||
Shiseido Co. Ltd. | 300 | 24,561 | ||||||
SHO-BOND Holdings Co. Ltd. | 800 | 28,188 | ||||||
Showa Denko KK | 1,243 | 32,110 | ||||||
SKY Perfect JSAT Holdings, Inc. | 2,600 | 10,459 | ||||||
Skylark Holdings Co. Ltd. | 3,300 | 56,490 | ||||||
SMC Corp. | 84 | 31,766 | ||||||
Softbank Corp. | 900 | 12,638 | ||||||
Sohgo Security Services Co. Ltd. | 500 | 25,248 | ||||||
Sojitz Corp. | 38,900 | 118,739 | ||||||
Sompo Holdings, Inc. | 800 | 31,986 | ||||||
Sony Corp. | 800 | 45,538 | ||||||
Sony Financial Holdings, Inc. | 400 | 9,248 | ||||||
Sotetsu Holdings, Inc. | 1,800 | 48,008 | ||||||
Stanley Electric Co. Ltd. | 1,400 | 34,833 | ||||||
Subaru Corp. (b) | 1,700 | 45,581 | ||||||
Sugi Holdings Co. Ltd. | 600 | 31,485 | ||||||
Sumitomo Bakelite Co. Ltd. | 700 | 25,027 | ||||||
Sumitomo Chemical Co. Ltd. | 16,900 | 74,036 | ||||||
Sumitomo Corp. | 9,500 | 142,529 | ||||||
Sumitomo Dainippon Pharma Co. Ltd. | 1,100 | 19,234 | ||||||
Sumitomo Electric Industries Ltd. | 7,000 | 82,500 | ||||||
Sumitomo Forestry Co. Ltd. | 600 | 7,354 | ||||||
Sumitomo Heavy Industries Ltd. | 1,509 | 43,431 | ||||||
Sumitomo Metal Mining Co. Ltd. | 293 | 8,258 | ||||||
Sumitomo Mitsui Financial Group, Inc. | 100 | 3,282 | ||||||
Sumitomo Mitsui Trust Holdings, Inc. | 100 | 3,271 | ||||||
Sumitomo Osaka Cement Co. Ltd. | 1,400 | 58,495 | ||||||
Sumitomo Realty & Development Co. Ltd. | 571 | 21,491 | ||||||
Sumitomo Rubber Industries Ltd. | 900 | 10,166 | ||||||
Sundrug Co. Ltd. | 300 | 9,341 | ||||||
Suntory Beverage & Food Ltd. | 800 | 34,519 | ||||||
Suzuken Co. Ltd. | 3,900 | 209,798 | ||||||
Suzuki Motor Corp. | 2,000 | 77,215 | ||||||
Sysmex Corp. | 100 | 6,389 | ||||||
T&D Holdings, Inc. | 700 | 6,822 | ||||||
Taiheiyo Cement Corp. | 2,000 | 50,535 | ||||||
Taisei Corp. | 5,934 | 210,202 | ||||||
Taisho Pharmaceutical Holdings Co. Ltd. | 300 | 20,915 | ||||||
| See Notes to Financial Statements. | 23 |
DBX ETF Trust
Schedule of Investments
Xtrackers FTSE Developed ex US Comprehensive Factor ETF(Continued)
August 31, 2019
Number | Value | |||||||
| Japan (Continued) | ||||||||
Taiyo Nippon Sanso Corp. | 800 | $ | 15,873 | |||||
Takara Holdings, Inc. | 800 | 7,793 | ||||||
Takashimaya Co. Ltd. | 1,100 | 12,332 | ||||||
TDK Corp. | 100 | 7,970 | ||||||
TechnoPro Holdings, Inc. | 200 | 11,626 | ||||||
Teijin Ltd. | 5,200 | 93,570 | ||||||
Terumo Corp. | 1,316 | 38,273 | ||||||
TIS, Inc. | 1,000 | 58,693 | ||||||
Tobu Railway Co. Ltd. | 1,900 | 58,354 | ||||||
Toda Corp. | 1,000 | 5,568 | ||||||
Toho Co. Ltd. | 2,000 | 84,884 | ||||||
Toho Gas Co. Ltd. | 2,500 | 97,155 | ||||||
Tohoku Electric Power Co., Inc. | 14,700 | 147,076 | ||||||
Tokai Carbon Co. Ltd. | 600 | 5,749 | ||||||
Tokai Rika Co. Ltd. | 1,200 | 18,970 | ||||||
Tokio Marine Holdings, Inc. | 700 | 36,087 | ||||||
Tokyo Broadcasting System Holdings, Inc. | 300 | 4,802 | ||||||
Tokyo Electric Power Co. Holdings, Inc.* | 18,800 | 89,621 | ||||||
Tokyo Electron Ltd. | 86 | 15,398 | ||||||
Tokyo Gas Co. Ltd. | 9,500 | 240,353 | ||||||
Tokyo Tatemono Co. Ltd. | 300 | 3,914 | ||||||
Tokyu Corp. | 5,200 | 93,031 | ||||||
Tokyu Fudosan Holdings Corp. | 1,500 | 9,313 | ||||||
Toppan Printing Co. Ltd. | 4,300 | 68,584 | ||||||
Toray Industries, Inc. | 6,200 | 44,252 | ||||||
Toshiba Plant Systems & Services Corp. | 1,100 | 17,887 | ||||||
Tosoh Corp. | 1,600 | 20,561 | ||||||
TOTO Ltd. | 480 | 17,388 | ||||||
Toyo Seikan Group Holdings Ltd. | 1,500 | 21,876 | ||||||
Toyo Suisan Kaisha Ltd. | 1,800 | 73,343 | ||||||
Toyobo Co. Ltd. | 500 | 6,373 | ||||||
Toyoda Gosei Co. Ltd. | 1,500 | 27,938 | ||||||
Toyota Boshoku Corp. | 900 | 12,142 | ||||||
Toyota Industries Corp. | 200 | 11,004 | ||||||
Toyota Motor Corp. | 100 | 6,557 | ||||||
Toyota Tsusho Corp. | 2,700 | 83,815 | ||||||
Trend Micro, Inc. | 400 | 19,407 | ||||||
TS Tech Co. Ltd. | 1,200 | 33,011 | ||||||
Tsumura & Co. | 100 | 2,746 | ||||||
Tsuruha Holdings, Inc. | 100 | 10,910 | ||||||
TV Asahi Holdings Corp. | 300 | 4,751 | ||||||
Ube Industries Ltd. | 2,000 | 38,325 | ||||||
Unicharm Corp. | 1,377 | 42,356 | ||||||
Ushio, Inc. | 1,200 | 15,409 | ||||||
USS Co. Ltd. | 1,500 | 28,376 | ||||||
Wacoal Holdings Corp. | 1,800 | 42,073 | ||||||
Welcia Holdings Co. Ltd. (b) | 500 | 26,143 | ||||||
West Japan Railway Co. | 2,200 | 185,501 | ||||||
Yakult Honsha Co. Ltd. | 200 | 11,531 | ||||||
Yamada Denki Co. Ltd. | 10,500 | 49,461 | ||||||
Yamaha Corp. | 1,181 | 51,014 | ||||||
Yamato Holdings Co. Ltd. | 1,700 | 29,453 | ||||||
Yamato Kogyo Co. Ltd. | 700 | 17,140 | ||||||
Yamazaki Baking Co. Ltd. | 1,000 | 17,391 | ||||||
Yaoko Co. Ltd. | 400 | 17,787 | ||||||
Yokogawa Electric Corp. | 1,800 | 32,729 | ||||||
Number | Value | |||||||
| Japan (Continued) | ||||||||
Yokohama Rubber Co. Ltd. | 900 | $ | 17,323 | |||||
Zenkoku Hosho Co. Ltd. | 600 | 22,865 | ||||||
Zensho Holdings Co. Ltd. | 1,700 | 38,566 | ||||||
Zeon Corp. | 900 | 10,497 | ||||||
|
| |||||||
| 16,430,330 | ||||||||
|
| |||||||
| Jordan — 0.0% | ||||||||
Hikma Pharmaceuticals PLC | 67 | 1,646 | ||||||
|
| |||||||
| Luxembourg (c) — 0.6% | ||||||||
Aroundtown SA | 40,716 | 339,248 | ||||||
L’Occitane International SA | 8,802 | 17,075 | ||||||
RTL Group SA (b) | 266 | 12,415 | ||||||
SES SA | 1,870 | 30,180 | ||||||
Tenaris SA | 774 | 8,450 | ||||||
|
| |||||||
| 407,368 | ||||||||
|
| |||||||
| Netherlands — 2.6% | ||||||||
Aalberts NV | 760 | 28,758 | ||||||
ABN AMRO Bank NV, 144A | 393 | 7,005 | ||||||
Adyen NV, 144A* | 8 | 5,804 | ||||||
Aegon NV | 913 | 3,482 | ||||||
Akzo Nobel NV | 2,201 | 197,471 | ||||||
ASML Holding NV | 108 | 24,055 | ||||||
ASR Nederland NV | 1,869 | 65,472 | ||||||
Boskalis Westminster (b) | 339 | 6,755 | ||||||
EXOR NV | 147 | 9,956 | ||||||
GrandVision NV, 144A | 1,257 | 38,040 | ||||||
Heineken Holding NV | 370 | 36,651 | ||||||
Heineken NV | 110 | 11,721 | ||||||
Koninklijke Ahold Delhaize NV | 25,717 | 602,810 | ||||||
Koninklijke DSM NV | 2,148 | 267,536 | ||||||
Koninklijke KPN NV | 33,372 | 105,843 | ||||||
Koninklijke Philips NV | 1,826 | 86,237 | ||||||
Koninklijke Vopak NV | 626 | 29,892 | ||||||
NN Group NV | 792 | 26,567 | ||||||
QIAGEN NV* | 951 | 33,105 | ||||||
Randstad NV | 1,346 | 62,923 | ||||||
Royal Dutch Shell PLC, Class A | 798 | 22,114 | ||||||
Royal Dutch Shell PLC, Class B | 589 | 16,247 | ||||||
Signify NV, 144A (b) | 1,417 | 41,524 | ||||||
VEON Ltd. | 5,738 | 14,786 | ||||||
Wolters Kluwer NV | 1,925 | 138,896 | ||||||
|
| |||||||
| 1,883,650 | ||||||||
|
| |||||||
| New Zealand — 1.5% | ||||||||
Air New Zealand Ltd. | 11,834 | 21,384 | ||||||
Auckland International Airport Ltd. | 11,628 | 70,551 | ||||||
Contact Energy Ltd. | 24,174 | 127,766 | ||||||
Fisher & Paykel Healthcare Corp. Ltd. | 10,926 | 114,736 | ||||||
Fletcher Building Ltd. | 2,682 | 7,510 | ||||||
Kiwi Property Group Ltd. | 40,899 | 42,046 | ||||||
Mercury NZ Ltd. | 22,644 | 74,050 | ||||||
Meridian Energy Ltd. | 23,174 | 72,787 | ||||||
Ryman Healthcare Ltd. (b) | 15,476 | 127,084 | ||||||
SKYCITY Entertainment Group Ltd. | 26,244 | 63,229 | ||||||
Spark New Zealand Ltd. | 132,022 | 368,037 | ||||||
| See Notes to Financial Statements. | 24 |
DBX ETF Trust
Schedule of Investments
Xtrackers FTSE Developed ex US Comprehensive Factor ETF(Continued)
August 31, 2019
Number | Value | |||||||
| New Zealand (Continued) | ||||||||
Xero Ltd.* | 596 | $ | 25,487 | |||||
|
| |||||||
| 1,114,667 | ||||||||
|
| |||||||
| Norway — 0.8% | ||||||||
Adevinta ASA, Class A* | 175 | 2,195 | ||||||
Adevinta ASA, Class B* | 262 | 3,268 | ||||||
Aker ASA, Class A | 67 | 3,436 | ||||||
Aker BP ASA | 167 | 4,434 | ||||||
DNB ASA | 812 | 13,099 | ||||||
Equinor ASA (b) | 1,748 | 29,907 | ||||||
Gjensidige Forsikring ASA | 656 | 12,675 | ||||||
Leroy Seafood Group ASA | 8,555 | 56,142 | ||||||
Mowi ASA | 6,664 | 159,534 | ||||||
Norsk Hydro ASA | 6,042 | 19,135 | ||||||
Orkla ASA | 7,722 | 70,824 | ||||||
Salmar ASA | 1,482 | 70,404 | ||||||
Schibsted ASA, Class A | 175 | 5,335 | ||||||
Schibsted ASA, Class B | 262 | 7,596 | ||||||
Telenor ASA | 3,854 | 79,186 | ||||||
Yara International ASA | 870 | 37,766 | ||||||
|
| |||||||
| 574,936 | ||||||||
|
| |||||||
| Poland — 0.9% | ||||||||
Bank Polska Kasa Opieki SA | 394 | 9,656 | ||||||
CD Projekt SA | 167 | 10,637 | ||||||
Cyfrowy Polsat SA | 1,932 | 14,155 | ||||||
Dino Polska SA, 144A* | 192 | 7,435 | ||||||
Grupa Lotos SA | 5,453 | 118,232 | ||||||
KGHM Polska Miedz SA* | 728 | 14,355 | ||||||
LPP SA | 3 | 5,612 | ||||||
PGE Polska Grupa Energetyczna SA* | 25,223 | 48,935 | ||||||
Polski Koncern Naftowy ORLEN SA | 12,749 | 290,932 | ||||||
Polskie Gornictwo Naftowe i Gazownictwo SA | 53,044 | 63,301 | ||||||
Powszechna Kasa Oszczednosci Bank Polski SA | 1,612 | 15,889 | ||||||
Powszechny Zaklad Ubezpieczen SA | 3,787 | 35,649 | ||||||
|
| |||||||
| 634,788 | ||||||||
|
| |||||||
| Portugal — 0.4% | ||||||||
EDP — Energias de Portugal SA | 47,929 | 181,464 | ||||||
Galp Energia SGPS SA | 6,600 | 94,923 | ||||||
Jeronimo Martins SGPS SA | 2,083 | 34,432 | ||||||
|
| |||||||
| 310,819 | ||||||||
|
| |||||||
| Russia — 0.0% | ||||||||
Polymetal International PLC | 1,508 | 21,726 | ||||||
|
| |||||||
| Singapore — 3.5% | ||||||||
Ascendas Real Estate Investment Trust REIT | 48,400 | 107,463 | ||||||
BOC Aviation Ltd., 144A | 8,228 | 71,513 | ||||||
CapitaLand Commercial Trust REIT | 70,595 | 108,396 | ||||||
CapitaLand Ltd. | 17,000 | 42,525 | ||||||
CapitaLand Mall Trust REIT | 97,300 | 185,874 | ||||||
ComfortDelGro Corp. Ltd. | 161,700 | 285,586 | ||||||
DBS Group Holdings Ltd. | 700 | 12,378 | ||||||
Frasers Property Ltd. | 4,100 | 5,172 | ||||||
Number | Value | |||||||
| Singapore (Continued) | ||||||||
Genting Singapore Ltd. | 73,100 | $ | 46,900 | |||||
Golden Agri-Resources Ltd. | 36,200 | 6,915 | ||||||
Jardine Cycle & Carriage Ltd. | 1,893 | 42,030 | ||||||
Keppel REIT | 11,600 | 10,285 | ||||||
Keppel Corp. Ltd. | 9,800 | 41,257 | ||||||
Mapletree Commercial Trust REIT | 171,900 | 282,535 | ||||||
Mapletree Industrial Trust REIT | 76,551 | 127,475 | ||||||
Mapletree Logistics Trust REIT | 176,900 | 200,211 | ||||||
Mapletree North Asia Commercial Trust REIT | 188,500 | 179,369 | ||||||
Olam International Ltd. | 17,700 | 23,988 | ||||||
Oversea-Chinese Banking Corp. Ltd. | 1,680 | 12,898 | ||||||
SATS Ltd. | 22,200 | 76,817 | ||||||
Sembcorp Industries Ltd. | 13,700 | 20,443 | ||||||
SIA Engineering Co. Ltd. | 2,300 | 4,029 | ||||||
Singapore Airlines Ltd. | 13,300 | 84,659 | ||||||
Singapore Exchange Ltd. | 28,600 | 169,060 | ||||||
Singapore Post Ltd. | 13,700 | 9,086 | ||||||
Singapore Press Holdings Ltd. | 36,700 | 52,648 | ||||||
Singapore Technologies Engineering Ltd. | 49,100 | 139,456 | ||||||
Singapore Telecommunications Ltd. | 30,000 | 68,555 | ||||||
StarHub Ltd. | 4,500 | 4,282 | ||||||
Suntec Real Estate Investment Trust REIT | 24,100 | 33,530 | ||||||
United Overseas Bank Ltd. | 900 | 16,194 | ||||||
Venture Corp. Ltd. | 600 | 6,566 | ||||||
Wilmar International Ltd. | 17,000 | 46,691 | ||||||
Wing Tai Holdings Ltd. | 20,600 | 30,591 | ||||||
|
| |||||||
| 2,555,377 | ||||||||
|
| |||||||
| South Africa (c) — 0.0% | ||||||||
Investec PLC | 1,612 | 8,292 | ||||||
|
| |||||||
| South Korea — 2.6% | ||||||||
Cheil Worldwide, Inc. | 1,562 | 34,045 | ||||||
CJ CheilJedang Corp. | 232 | 43,766 | ||||||
CJ Corp. | 47 | 3,162 | ||||||
CJ ENM Co. Ltd. | 37 | 4,915 | ||||||
CJ Logistics Corp.* | 115 | 13,577 | ||||||
Daelim Industrial Co. Ltd. | 1,197 | 96,551 | ||||||
Daewoo Engineering & Construction Co. Ltd.* | 1,939 | 6,691 | ||||||
DB Insurance Co. Ltd. | 424 | 16,767 | ||||||
Doosan Bobcat, Inc. | 273 | 8,080 | ||||||
Doosan Corp. | 98 | 8,131 | ||||||
E-MART, Inc. | 56 | 5,363 | ||||||
Fila Korea Ltd. | 179 | 8,453 | ||||||
GS Engineering & Construction Corp. | 163 | 4,360 | ||||||
GS Holdings Corp. | 1,120 | 44,384 | ||||||
GS Retail Co. Ltd. | 324 | 10,352 | ||||||
Hana Financial Group, Inc. | 262 | 7,030 | ||||||
Hankook Tire & Technology Co. Ltd. | 606 | 14,584 | ||||||
Hanon Systems | 896 | 8,581 | ||||||
Hanwha Corp. | 402 | 8,131 | ||||||
HDC Hyundai DevelopmentCo-Engineering & Construction, Class E | 682 | 20,186 | ||||||
Hite Jinro Co. Ltd. | 514 | 9,336 | ||||||
Hyosung TNC Co. Ltd. | 87 | 11,277 | ||||||
Hyundai Department Store Co. Ltd. | 514 | 33,100 | ||||||
| See Notes to Financial Statements. | 25 |
DBX ETF Trust
Schedule of Investments
Xtrackers FTSE Developed ex US Comprehensive Factor ETF(Continued)
August 31, 2019
Number | Value | |||||||
| South Korea (Continued) | ||||||||
Hyundai Engineering & Construction Co. Ltd. | 243 | $ | 8,296 | |||||
Hyundai Glovis Co. Ltd. | 340 | 44,912 | ||||||
Hyundai Heavy Industries Holdings Co. Ltd. | 17 | 4,653 | ||||||
Hyundai Marine & Fire Insurance Co. Ltd. | 583 | 11,504 | ||||||
Hyundai Mobis Co. Ltd. | 279 | 57,240 | ||||||
Hyundai Motor Co. | 118 | 12,518 | ||||||
Hyundai Steel Co. | 601 | 18,508 | ||||||
Industrial Bank of Korea | 1,202 | 12,305 | ||||||
Kangwon Land, Inc. | 2,575 | 60,057 | ||||||
KB Financial Group, Inc. | 284 | 9,308 | ||||||
KCC Corp. | 42 | 7,819 | ||||||
Kia Motors Corp. | 4,198 | 151,457 | ||||||
Korea Electric Power Corp.* | 2,511 | 52,967 | ||||||
Korea Gas Corp. | 921 | 29,693 | ||||||
Korea Zinc Co. Ltd. | 129 | 46,328 | ||||||
Korean Air Lines Co. Ltd. | 552 | 10,117 | ||||||
KT&G Corp. | 1,815 | 152,842 | ||||||
Kumho Petrochemical Co. Ltd. | 110 | 6,384 | ||||||
LG Chem Ltd. | 48 | 13,097 | ||||||
LG Corp. | 1,409 | 82,824 | ||||||
LG Display Co. Ltd.* | 616 | 7,095 | ||||||
LG Electronics, Inc. | 220 | 11,134 | ||||||
LG Household & Health Care Ltd. | 7 | 6,814 | ||||||
LG Uplus Corp. | 11,925 | 129,957 | ||||||
Lotte Chilsung Beverage Co. Ltd. | 116 | 12,450 | ||||||
Lotte Shopping Co. Ltd. | 86 | 9,656 | ||||||
NAVER Corp. | 63 | 7,620 | ||||||
NCSoft Corp. | 52 | 23,054 | ||||||
NongShim Co. Ltd. | 72 | 14,266 | ||||||
Ottogi Corp. | 15 | 7,071 | ||||||
POSCO | 120 | 20,904 | ||||||
Posco International Corp. | 283 | 4,287 | ||||||
S-1 Corp. | 297 | 24,765 | ||||||
Samsung C&T Corp. | 62 | 4,423 | ||||||
Samsung Electro-Mechanics Co. Ltd. | 99 | 7,282 | ||||||
Samsung Electronics Co. Ltd. | 185 | 6,720 | ||||||
Samsung Fire & Marine Insurance Co. Ltd. | 196 | 37,056 | ||||||
Samsung SDI Co. Ltd. | 18 | 3,708 | ||||||
Shinhan Financial Group Co. Ltd. | 877 | 29,505 | ||||||
SK Holdings Co. Ltd. | 53 | 8,751 | ||||||
SK Hynix, Inc. | 443 | 28,308 | ||||||
SK Innovation Co. Ltd. | 567 | 77,238 | ||||||
SK Telecom Co. Ltd. | 479 | 94,713 | ||||||
SKC Co. Ltd. | 115 | 4,367 | ||||||
S-Oil Corp. | 552 | 44,069 | ||||||
Woongjin Coway Co. Ltd. | 751 | 52,206 | ||||||
Yuhan Corp. | 52 | 9,853 | ||||||
|
| |||||||
| 1,900,923 | ||||||||
|
| |||||||
| Spain — 2.8% | ||||||||
Acciona SA | 653 | 70,186 | ||||||
Acerinox SA* | 2,236 | 18,542 | ||||||
ACS Actividades de Construccion y Servicios SA | 6,168 | 233,459 | ||||||
Number | Value | |||||||
| Spain (Continued) | ||||||||
Aena SME SA, 144A | 163 | $ | 29,439 | |||||
Amadeus IT Group SA | 1,422 | 106,111 | ||||||
Banco Bilbao Vizcaya Argentaria SA | 1,565 | 7,426 | ||||||
Bankinter SA | 1,667 | 9,726 | ||||||
Cellnex Telecom SA, 144A* | 1,088 | 43,613 | ||||||
Corp. Financiera Alba SA | 1,386 | 70,288 | ||||||
EDP Renovaveis SA | 1,447 | 15,967 | ||||||
Enagas SA | 8,236 | 180,083 | ||||||
Endesa SA (b) | 2,596 | 66,811 | ||||||
Ferrovial SA | 5,052 | 143,928 | ||||||
Fomento de Construcciones y Contratas SA | 828 | 10,304 | ||||||
Grifols SA | 927 | 29,401 | ||||||
Iberdrola SA (b) | 12,094 | 124,555 | ||||||
Industria de Diseno Textil SA | 253 | 7,835 | ||||||
Inmobiliaria Colonial Socimi SA REIT | 8,249 | 95,384 | ||||||
Mapfre SA | 1,490 | 3,886 | ||||||
Merlin Properties Socimi SA REIT | 21,610 | 289,384 | ||||||
Naturgy Energy Group SA | 508 | 13,314 | ||||||
Red Electrica Corp. SA | 7,744 | 154,571 | ||||||
Repsol SA | 12,694 | 184,806 | ||||||
Siemens Gamesa Renewable Energy SA | 254 | 3,464 | ||||||
Telefonica SA | 10,189 | 70,701 | ||||||
Zardoya Otis SA | 2,221 | 15,311 | ||||||
|
| |||||||
| 1,998,495 | ||||||||
|
| |||||||
| Sweden — 4.5% | ||||||||
Alfa Laval AB | 4,384 | 80,780 | ||||||
Assa Abloy AB, Class B | 3,054 | 63,809 | ||||||
Atlas Copco AB, Class A | 1,793 | 53,588 | ||||||
Atlas Copco AB, Class B | 1,669 | 44,504 | ||||||
Boliden AB | 2,665 | 58,970 | ||||||
Castellum AB | 24,565 | 524,775 | ||||||
Electrolux AB, Series B | 2,947 | 65,961 | ||||||
Elekta AB, Class B | 2,728 | 34,814 | ||||||
Epiroc AB, Class A | 4,205 | 43,607 | ||||||
Epiroc AB, Class B | 2,678 | 26,559 | ||||||
Essity AB, Class B | 4,439 | 138,555 | ||||||
Fastighets AB Balder, Class B* | 8,693 | 327,800 | ||||||
Hennes & Mauritz AB, Class B (b) | 6,785 | 130,057 | ||||||
Hexagon AB, Class B | 828 | 36,812 | ||||||
Husqvarna AB, Class B | 1,847 | 14,333 | ||||||
ICA Gruppen AB (b) | 3,641 | 178,694 | ||||||
Investment AB Latour, Class B | 2,247 | 30,016 | ||||||
L E Lundbergforetagen AB, Class B | 637 | 23,877 | ||||||
Lundin Petroleum AB | 1,351 | 41,081 | ||||||
Nibe Industrier AB, Class B | 4,002 | 50,113 | ||||||
Saab AB, Class B | 140 | 3,920 | ||||||
Sandvik AB | 7,592 | 108,963 | ||||||
Securitas AB, Class B | 8,221 | 123,188 | ||||||
Skandinaviska Enskilda Banken AB, Class A | 2,052 | 17,652 | ||||||
Skanska AB, Class B | 19,304 | 361,994 | ||||||
SKF AB, Class B | 6,371 | 102,872 | ||||||
Svenska Cellulosa AB SCA, Class A | 738 | 6,750 | ||||||
Svenska Cellulosa AB SCA, Class B | 8,109 | 70,003 | ||||||
Svenska Handelsbanken AB, Class A | 812 | 7,152 | ||||||
| See Notes to Financial Statements. | 26 |
DBX ETF Trust
Schedule of Investments
Xtrackers FTSE Developed ex US Comprehensive Factor ETF(Continued)
August 31, 2019
Number | Value | |||||||
| Sweden (Continued) | ||||||||
Swedbank AB, Class A | 2,521 | $ | 32,416 | |||||
Swedish Match AB | 4,650 | 182,552 | ||||||
Swedish Orphan Biovitrum AB* | 1,318 | 21,826 | ||||||
Tele2 AB, Class B (b) | 434 | 6,127 | ||||||
Telefonaktiebolaget LM Ericsson, Class B | 3,112 | 24,263 | ||||||
Telia Co. AB | 22,873 | 100,198 | ||||||
Trelleborg AB, Class B | 2,154 | 29,432 | ||||||
Volvo AB, Class B | 6,408 | 88,539 | ||||||
|
| |||||||
| 3,256,552 | ||||||||
|
| |||||||
| Switzerland — 2.9% | ||||||||
ABB Ltd. | 2,465 | 46,712 | ||||||
Adecco Group AG | 1,827 | 96,128 | ||||||
Alcon, Inc.* | 30 | 1,828 | ||||||
Baloise Holding AG | 196 | 33,418 | ||||||
Banque Cantonale Vaudoise | 8 | 6,153 | ||||||
Barry Callebaut AG | 12 | 24,547 | ||||||
Chocoladefabriken Lindt & Spruengli AG Participation Certificates | 8 | 59,225 | ||||||
Cie Financiere Richemont SA | 266 | 20,647 | ||||||
Clariant AG* | 2,064 | 38,007 | ||||||
Coca-Cola HBC AG* | 1,645 | 54,692 | ||||||
DKSH Holding AG | 426 | 20,761 | ||||||
Dufry AG* | 44 | 3,568 | ||||||
EMS-Chemie Holding AG | 47 | 27,954 | ||||||
Flughafen Zurich AG | 269 | 49,371 | ||||||
Geberit AG | 247 | 112,360 | ||||||
Georg Fischer AG | 29 | 23,755 | ||||||
Givaudan SA | 27 | 73,022 | ||||||
Helvetia Holding AG | 194 | 25,293 | ||||||
Kuehne + Nagel International AG | 894 | 130,154 | ||||||
LafargeHolcim Ltd.* | 228 | 10,777 | ||||||
Logitech International SA | 1,485 | 60,198 | ||||||
Lonza Group AG* | 188 | 66,464 | ||||||
Nestle SA | 159 | 17,837 | ||||||
Novartis AG | 170 | 15,293 | ||||||
OC Oerlikon Corp. AG | 1,477 | 13,689 | ||||||
Pargesa Holding SA | 218 | 15,941 | ||||||
Partners Group Holding AG | 106 | 85,983 | ||||||
PSP Swiss Property AG | 856 | 113,764 | ||||||
Roche Holding AG | 79 | 21,605 | ||||||
Schindler Holding AG | 153 | 34,699 | ||||||
Schindler Holding AG Participation Certificates | 286 | 65,325 | ||||||
SGS SA | 41 | 100,692 | ||||||
Sika AG | 650 | 93,350 | ||||||
Sonova Holding AG | 570 | 132,325 | ||||||
STMicroelectronics NV | 232 | 4,120 | ||||||
Straumann Holding AG | 71 | 55,655 | ||||||
Sulzer AG | 141 | 13,395 | ||||||
Swatch Group AG — Bearer | 34 | 9,213 | ||||||
Swatch Group AG — Registered | 115 | 5,875 | ||||||
Swiss Life Holding AG | 100 | 47,430 | ||||||
Swiss Prime Site AG* | 477 | 47,486 | ||||||
Swiss Re AG | 98 | 9,425 | ||||||
Swisscom AG | 183 | 91,384 | ||||||
Temenos AG* | 354 | 59,319 | ||||||
Number | Value | |||||||
| Switzerland (Continued) | ||||||||
Zurich Insurance Group AG | 73 | $ | 25,985 | |||||
|
| |||||||
| 2,064,824 | ||||||||
|
| |||||||
| United Kingdom — 13.6% | ||||||||
3i Group PLC | 33,234 | 443,798 | ||||||
Admiral Group PLC | 7,530 | 196,889 | ||||||
Amcor PLC, Class CDI | 16,750 | 163,186 | ||||||
Ashmore Group PLC | 7,103 | 39,031 | ||||||
Ashtead Group PLC | 2,282 | 63,114 | ||||||
Associated British Foods PLC | 1,742 | 48,179 | ||||||
AstraZeneca PLC | 131 | 11,675 | ||||||
Auto Trader Group PLC, 144A | 9,960 | 64,482 | ||||||
Aviva PLC | 3,320 | 14,317 | ||||||
B&M European Value Retail SA | 4,065 | 17,713 | ||||||
Babcock International Group PLC | 5,497 | 33,580 | ||||||
BAE Systems PLC | 14,624 | 97,171 | ||||||
Barratt Developments PLC | 25,307 | 194,907 | ||||||
Bellway PLC | 3,017 | 106,590 | ||||||
Berkeley Group Holdings PLC | 3,908 | 186,424 | ||||||
BP PLC | 4,971 | 30,282 | ||||||
British Land Co. PLC REIT | 8,931 | 55,449 | ||||||
BT Group PLC | 64,257 | 129,622 | ||||||
Bunzl PLC | 7,087 | 173,740 | ||||||
Burberry Group PLC | 7,167 | 188,881 | ||||||
Centrica PLC | 156,082 | 132,489 | ||||||
Cineworld Group PLC | 6,690 | 17,794 | ||||||
CNH Industrial NV | 2,911 | 29,974 | ||||||
Cobham PLC* | 10,905 | 21,448 | ||||||
Compass Group PLC | 2,221 | 56,342 | ||||||
Croda International PLC | 1,674 | 95,859 | ||||||
Derwent London PLC REIT | 1,314 | 50,952 | ||||||
Diageo PLC | 748 | 31,915 | ||||||
Direct Line Insurance Group PLC | 41,312 | 142,433 | ||||||
DS Smith PLC | 2,193 | 9,081 | ||||||
easyJet PLC | 1,107 | 12,988 | ||||||
Ferguson PLC | 5,887 | 433,324 | ||||||
G4S PLC | 25,791 | 54,621 | ||||||
GlaxoSmithKline PLC | 2,415 | 50,340 | ||||||
Halma PLC | 7,578 | 181,163 | ||||||
Hargreaves Lansdown PLC | 1,277 | 29,207 | ||||||
Howden Joinery Group PLC | 17,535 | 114,933 | ||||||
IMI PLC | 5,082 | 62,201 | ||||||
Imperial Brands PLC | 3,058 | 79,120 | ||||||
Inchcape PLC | 18,817 | 132,456 | ||||||
Informa PLC | 6,003 | 63,604 | ||||||
InterContinental Hotels Group PLC | 2,302 | 143,679 | ||||||
International Consolidated Airlines Group SA | 9,044 | 46,447 | ||||||
Intertek Group PLC | 2,419 | 159,908 | ||||||
ITV PLC | 50,471 | 71,270 | ||||||
J Sainsbury PLC | 48,340 | 115,446 | ||||||
JD Sports Fashion PLC | 5,399 | 40,569 | ||||||
Johnson Matthey PLC | 6,142 | 217,669 | ||||||
Kingfisher PLC | 12,228 | 28,957 | ||||||
Legal & General Group PLC | 7,856 | 21,010 | ||||||
London Stock Exchange Group PLC | 63 | 5,335 | ||||||
Marks & Spencer Group PLC | 47,151 | 110,396 | ||||||
| See Notes to Financial Statements. | 27 |
DBX ETF Trust
Schedule of Investments
Xtrackers FTSE Developed ex US Comprehensive Factor ETF(Continued)
August 31, 2019
Number | Value | |||||||
| United Kingdom (Continued) | ||||||||
Meggitt PLC | 16,727 | $ | 126,096 | |||||
Merlin Entertainments PLC, 144A | 7,848 | 43,172 | ||||||
Micro Focus International PLC | 491 | 6,630 | ||||||
Mondi PLC | 9,849 | 191,554 | ||||||
National Grid PLC | 19,382 | 202,644 | ||||||
Next PLC | 1,933 | 139,740 | ||||||
Pearson PLC | 11,703 | 118,495 | ||||||
Pennon Group PLC | 11,969 | 110,081 | ||||||
Persimmon PLC | 5,474 | 126,831 | ||||||
Phoenix Group Holdings PLC | 1,504 | 11,851 | ||||||
Prudential PLC | 509 | 8,480 | ||||||
Quilter PLC, 144A | 5,532 | 8,415 | ||||||
Reckitt Benckiser Group PLC | 468 | 36,471 | ||||||
RELX PLC | 1,532 | 36,690 | ||||||
Renishaw PLC | 292 | 12,624 | ||||||
Rentokil Initial PLC | 67,010 | 367,400 | ||||||
Rightmove PLC | 11,960 | 77,998 | ||||||
Rio Tinto Ltd. | 4,016 | 236,972 | ||||||
Rio Tinto PLC | 1,634 | 82,574 | ||||||
Rolls-Royce Holdings PLC* | 11,865 | 111,437 | ||||||
Royal Mail PLC | 6,968 | 17,490 | ||||||
RSA Insurance Group PLC | 2,357 | 15,024 | ||||||
Sage Group PLC | 10,384 | 88,599 | ||||||
Schroders PLC | 387 | 12,867 | ||||||
Segro PLC REIT | 56,944 | 544,392 | ||||||
Severn Trent PLC | 4,364 | 110,068 | ||||||
Smith & Nephew PLC | 6,511 | 155,813 | ||||||
Smiths Group PLC | 3,299 | 67,075 | ||||||
Spirax-Sarco Engineering PLC | 540 | 52,776 | ||||||
SSE PLC | 19,530 | 273,761 | ||||||
Subsea 7 SA | 963 | 9,325 | ||||||
Tate & Lyle PLC | 30,177 | 264,387 | ||||||
Taylor Wimpey PLC | 51,659 | 91,821 | ||||||
Tesco PLC | 19,143 | 51,103 | ||||||
Travis Perkins PLC | 4,057 | 61,785 | ||||||
Unilever NV | 2,337 | 145,255 | ||||||
Unilever PLC | 2,539 | 160,667 | ||||||
United Utilities Group PLC | 18,557 | 183,961 | ||||||
Vodafone Group PLC | 27,106 | 51,246 | ||||||
Whitbread PLC | 2,707 | 144,166 | ||||||
Wm Morrison Supermarkets PLC | 81,298 | 180,790 | ||||||
WPP PLC | 3,928 | 46,412 | ||||||
|
| |||||||
| 9,806,898 | ||||||||
|
| |||||||
| United States (c) — 0.2% | ||||||||
Carnival PLC | 1,518 | 63,743 | ||||||
Samsonite International SA, 144A | 6,328 | 11,969 | ||||||
Sims Metal Management Ltd. | 642 | 4,970 | ||||||
Waste Connections, Inc. | 976 | 89,829 | ||||||
|
| |||||||
| 170,511 | ||||||||
|
| |||||||
TOTAL COMMON STOCKS | 71,653,190 | |||||||
|
| |||||||
| PREFERRED STOCKS — 0.2% |
| |||||||
| Germany — 0.1% | ||||||||
FUCHS PETROLUB SE | 785 | 27,473 | ||||||
Henkel AG & Co. KGaA | 94 | 9,431 | ||||||
Number | Value | |||||||
| Germany (Continued) | ||||||||
Porsche Automobil Holding SE | 500 | $ | 31,419 | |||||
Sartorius AG | 58 | 11,618 | ||||||
|
| |||||||
| 79,941 | ||||||||
|
| |||||||
| South Korea — 0.1% | ||||||||
Hanwha Corp. | 1,241 | 14,395 | ||||||
Hyundai Motor Co. — 2nd Preferred | 55 | 3,923 | ||||||
|
| |||||||
| 18,318 | ||||||||
|
| |||||||
| Spain — 0.0% | ||||||||
Grifols SA, Class B | 706 | 14,959 | ||||||
|
| |||||||
TOTAL PREFERRED STOCKS | 113,218 | |||||||
|
| |||||||
| SECURITIES LENDING COLLATERAL — 1.3% | ||||||||
DWS Government & Agency Securities Portfolio “DWS Government Cash Institutional Shares”, 2.04% (d)(e) | 906,421 | 906,421 | ||||||
|
| |||||||
| CASH EQUIVALENTS — 0.0% | ||||||||
DWS Government Money Market Series “Institutional Shares”, 2.09% (d) | 27,889 | 27,889 | ||||||
|
| |||||||
TOTAL INVESTMENTS — 100.5% (Cost $74,340,743) | $ | 72,700,718 | ||||||
Other assets and liabilities, net — (0.5%) | (346,859 | ) | ||||||
|
| |||||||
NET ASSETS — 100.0% | $ | 72,353,859 | ||||||
|
| |||||||
| See Notes to Financial Statements. | 28 |
DBX ETF Trust
Schedule of Investments
Xtrackers FTSE Developed ex US Comprehensive Factor ETF(Continued)
August 31, 2019
A summary of the Fund’s transactions with affiliated investments during the year ended August 31, 2019 is as follows:
| Value ($) at 8/31/2018 | Purchases Cost ($) | Sales Proceeds ($) | Net Realized Gain/ (Loss) ($) | Net Change in Unrealized Appreciation (Depreciation) ($) | Income ($) | Capital Gain Distributions ($) | Number of Shares at 8/31/2019 | Value ($) at 8/31/2019 | ||||||||||||||||||||||||||||||
COMMON STOCKS —0.0% | ||||||||||||||||||||||||||||||||||||||
Germany —0.0% | ||||||||||||||||||||||||||||||||||||||
DWS Group GmbH & Co. KGaA, 144A* (f) | ||||||||||||||||||||||||||||||||||||||
| — | 16,544 | (20,067 | ) | 3,523 | — | — | — | — | — | |||||||||||||||||||||||||||||
SECURITIES LENDING COLLATERAL —1.3% | ||||||||||||||||||||||||||||||||||||||
DWS Government & Agency Securities Portfolio “DWS Government Cash Institutional Shares”, 2.04% (d)(e) | ||||||||||||||||||||||||||||||||||||||
| 227,652 | 678,769 | (g) | — | — | — | 15,775 | — | 906,421 | 906,421 | |||||||||||||||||||||||||||||
CASH EQUIVALENTS —0.0% | ||||||||||||||||||||||||||||||||||||||
DWS Government Money Market Series “Institutional Shares”, 2.09% (d) | ||||||||||||||||||||||||||||||||||||||
| — | 4,021,585 | (3,993,696 | ) | — | — | 1,653 | — | 27,889 | 27,889 | |||||||||||||||||||||||||||||
|
|
|
|
|
|
|
|
|
|
|
|
|
|
|
|
|
| |||||||||||||||||||||
| 227,652 | 4,716,898 | (4,013,763 | ) | 3,523 | — | 17,428 | — | 934,310 | 934,310 | |||||||||||||||||||||||||||||
|
|
|
|
|
|
|
|
|
|
|
|
|
|
|
|
|
| |||||||||||||||||||||
| * | Non-income producing security. |
| (a) | Stapled Security — A security contractually bound to one or more other securities to form a single saleable unit which cannot be sold separately. |
| (b) | All or a portion of these securities were on loan. In addition, “Other assets and liabilities, net” may include pending sales that are also on loan. The value of securities loaned at August 31, 2019 amounted to $942,895, which is 1.3% of net assets. |
| (c) | Securities are listed in country of domicile and trade on exchanges within the FTSE Developed ex US Comprehensive Factor Index. |
| (d) | Affiliated fund managed by DWS Investment Management Americas, Inc. The rate shown is the annualizedseven-day yield at period end. |
| (e) | Represents cash collateral held in connection with securities lending. Income earned by the Fund is net of borrower rebates. In addition, the Fund heldnon-cash U.S. Treasury securities collateral having a value of $398,185. |
| (f) | Affiliated issuer. The security is owned in proportion with its representation in the index. |
| (g) | Represents the net increase (purchase cost) or decrease (sales proceeds) in the amount invested in cash collateral for the period ended August 31, 2019. |
| CDI: | Chess Depositary Interest |
| REIT: | Real Estate Investment Trust |
| RSP: | Risparmio (Convertible Savings Shares) |
| 144A: | Security exempt from registration under Rule 144A of the Securities Act of 1933. These securities may be resold in transactions exempt from registration, normally to qualified institutional buyers. |
At August 31, 2019, open futures contracts purchased were as follows:
Contract Description | Currency | Number of Contracts | Notional Amount | Contract Value | Expiration Date | Unrealized Depreciation | ||||||||||||
MSCI EAFE Futures | USD | 6 | $ | 573,390 | $553,170 | 9/20/2019 | $ | (20,220 | ) | |||||||||
For information on the Fund’s policy and additional disclosures regarding open futures contracts, please refer to the Derivatives section of Note 2 in the accompanying Notes to Financial Statements.
Currency Abbreviations
| USD | U.S. Dollar |
| See Notes to Financial Statements. | 29 |
DBX ETF Trust
Schedule of Investments
Xtrackers FTSE Developed ex US Comprehensive Factor ETF(Continued)
August 31, 2019
Fair Value Measurements
Various inputs are used in determining the value of the Fund’s investments. These inputs are summarized in three broad levels. Level 1 includes quoted prices in active markets for identical securities. Level 2 includes other significant observable inputs (including quoted prices for similar securities, interest rates, prepayment speeds and credit risk). Level 3 includes significant unobservable inputs (including the Fund’s own assumptions in determining the fair value of investments). The level assigned to the securities valuations may not be an indication of the risk or liquidity associated with investing in those securities.
The following is a summary of the inputs used as of August 31, 2019 in valuing the Fund’s investments. For information on the Fund’s policy regarding the valuation of investments, please refer to the Security Valuation section of Note 2 in the accompanying Notes to Financial Statements.
Assets | Level 1 | Level 2 | Level 3 | Total | ||||||||||||
Common Stocks (h) | $ | 71,653,190 | $ | — | $ | — | $ | 71,653,190 | ||||||||
Preferred Stocks (h) | 113,218 | — | — | 113,218 | ||||||||||||
Short-Term Investments (h) | 934,310 | — | — | 934,310 | ||||||||||||
|
|
|
|
|
|
|
| |||||||||
TOTAL | $ | 72,700,718 | $ | — | $ | — | $ | 72,700,718 | ||||||||
|
|
|
|
|
|
|
| |||||||||
Liabilities | Level 1 | Level 2 | Level 3 | Total | ||||||||||||
Derivatives (i) | ||||||||||||||||
Futures Contracts | $ | (20,220 | ) | $ | — | $ | — | $ | (20,220 | ) | ||||||
|
|
|
|
|
|
|
| |||||||||
TOTAL | $ | (20,220 | ) | $ | — | $ | — | $ | (20,220 | ) | ||||||
|
|
|
|
|
|
|
| |||||||||
| (h) | See Schedule of Investments for additional detailed categorizations. |
| (i) | Derivatives include unrealized appreciation (depreciation) on open futures contracts. |
During the year ended August 31, 2019, the amount of transfers between Level 3 and Level 1 was $40,835. The investment was transferred from Level 3 to Level 1 due to the availability of a pricing source supported by observable inputs.
| See Notes to Financial Statements. | 30 |
DBX ETF Trust
Schedule of Investments
Xtrackers FTSE Emerging Comprehensive Factor ETF
August 31, 2019
Number | Value | |||||||
| COMMON STOCKS — 93.4% |
| |||||||
| Bahrain — 0.3% | ||||||||
Ahli United Bank BSC | 10,684 | $ | 9,841 | |||||
|
| |||||||
| Brazil — 6.5% | ||||||||
Ambev SA | 46 | 208 | ||||||
Atacadao SA | 1,131 | 6,104 | ||||||
B3 SA — Brasil Bolsa Balcao | 882 | 9,562 | ||||||
Banco BTG Pactual SA | 211 | 2,991 | ||||||
Banco Santander Brasil SA | 38 | 392 | ||||||
BB Seguridade Participacoes SA | 968 | 7,653 | ||||||
BRF SA* | 230 | 2,123 | ||||||
CCR SA | 507 | 1,994 | ||||||
Cia de Saneamento Basico do Estado de Sao Paulo | 462 | 5,780 | ||||||
Cia Paranaense de Energia | 73 | 995 | ||||||
Cielo SA | 169 | 317 | ||||||
Cosan SA | 562 | 6,799 | ||||||
CVC Brasil Operadora e Agencia de Viagens SA | 87 | 1,117 | ||||||
EDP — Energias do Brasil SA | 3,078 | 14,972 | ||||||
Embraer SA | 718 | 3,119 | ||||||
Energisa SA | 524 | 6,022 | ||||||
Engie Brasil Energia SA | 525 | 5,715 | ||||||
Equatorial Energia SA | 490 | 11,356 | ||||||
Fleury SA | 137 | 796 | ||||||
Grendene SA | 1,863 | 3,629 | ||||||
Guararapes Confeccoes SA | 128 | 654 | ||||||
Hapvida Participacoes e Investimentos SA, 144A | 132 | 1,652 | ||||||
Hypera SA | 414 | 3,223 | ||||||
IRB Brasil Resseguros SA | 817 | 21,452 | ||||||
JBS SA | 242 | 1,736 | ||||||
Klabin SA | 1,434 | 5,226 | ||||||
Kroton Educacional SA | 402 | 981 | ||||||
Localiza Rent a Car SA | 561 | 6,386 | ||||||
Lojas Americanas SA | 121 | 422 | ||||||
Lojas Renner SA | 1,090 | 13,334 | ||||||
M Dias Branco SA | 261 | 2,286 | ||||||
Multiplan Empreendimentos Imobiliarios SA | 945 | 5,944 | ||||||
Natura Cosmeticos SA | 163 | 2,603 | ||||||
Odontoprev SA | 779 | 3,209 | ||||||
Petrobras Distribuidora SA | 971 | 6,768 | ||||||
Porto Seguro SA | 501 | 6,790 | ||||||
Raia Drogasil SA | 178 | 3,965 | ||||||
Sao Martinho SA | 1,441 | 6,221 | ||||||
Sul America SA | 1,381 | 16,192 | ||||||
Suzano SA | 60 | 422 | ||||||
TIM Participacoes SA | 1,639 | 4,879 | ||||||
Transmissora Alianca de Energia Eletrica SA | 1,723 | 11,717 | ||||||
Ultrapar Participacoes SA | 1,424 | 5,659 | ||||||
Vale SA* | 40 | 441 | ||||||
WEG SA | 531 | 2,891 | ||||||
YDUQS Part | 69 | 525 | ||||||
|
| |||||||
| 227,222 | ||||||||
|
| |||||||
Number | Value | |||||||
| Chile — 2.4% | ||||||||
AES Gener SA | 22,868 | $ | 4,907 | |||||
Aguas Andinas SA, Class A | 11,063 | 6,104 | ||||||
Banco de Chile | 13,967 | 1,995 | ||||||
Banco de Credito e Inversiones SA | 39 | 2,466 | ||||||
Banco Santander Chile | 23,288 | 1,668 | ||||||
Cencosud SA | 1,992 | 2,990 | ||||||
Cia Cervecerias Unidas SA | 817 | 9,300 | ||||||
Colbun SA | 21,775 | 3,889 | ||||||
Empresa Nacional de Telecomunicaciones SA* | 200 | 1,747 | ||||||
Empresas CMPC SA | 1,631 | 3,774 | ||||||
Empresas COPEC SA | 520 | 4,698 | ||||||
Enel Americas SA | 61,848 | 10,160 | ||||||
Enel Chile SA | 78,196 | 6,762 | ||||||
Engie Energia Chile SA | 1,813 | 3,107 | ||||||
Itau CorpBanca | 182,445 | 1,420 | ||||||
Latam Airlines Group SA | 428 | 3,605 | ||||||
Parque Arauco SA | 4,106 | 11,516 | ||||||
Plaza SA | 212 | 516 | ||||||
SACI Falabella | 282 | 1,587 | ||||||
|
| |||||||
| 82,211 | ||||||||
|
| |||||||
| China — 16.9% | ||||||||
3SBio, Inc., 144A* | 257 | 396 | ||||||
51job, Inc., ADR* (a) | 9 | 647 | ||||||
Agile Group Holdings Ltd. | 959 | 1,226 | ||||||
Agricultural Bank of China Ltd., Class H | 14,414 | 5,556 | ||||||
Air China Ltd., Class H | 434 | 376 | ||||||
Alibaba Group Holding Ltd., ADR* | 2 | 350 | ||||||
Aluminum Corp. of China Ltd., Class H* | 1,563 | 459 | ||||||
Angang Steel Co. Ltd., Class H | 3,056 | 1,061 | ||||||
Anhui Conch Cement Co. Ltd., Class H | 2,486 | 14,008 | ||||||
Anhui Expressway Co. Ltd., Class H | 3,280 | 1,854 | ||||||
Anhui Gujing Distillery Co. Ltd., Class B | 1,016 | 9,077 | ||||||
ANTA Sports Products Ltd. | 525 | 4,355 | ||||||
Baidu, Inc., ADR* | 8 | 836 | ||||||
Bank of China Ltd., Class H | 7,294 | 2,783 | ||||||
Bank of Communications Co. Ltd., Class H | 2,193 | 1,436 | ||||||
Beijing Capital International Airport Co. Ltd., Class H | 497 | 417 | ||||||
Beijing Jingneng Clean Energy Co. Ltd., Class H | 3,517 | 570 | ||||||
Bengang Steel Plates Co. Ltd., Class B | 3,300 | 851 | ||||||
BOE Technology Group Co. Ltd., Class B | 769 | 273 | ||||||
CAR, Inc.* | 1,480 | 1,050 | ||||||
CGN Power Co. Ltd., Class H, 144A | 3,576 | 945 | ||||||
China BlueChemical Ltd., Class H | 5,118 | 1,359 | ||||||
China CITIC Bank Corp. Ltd., Class H | 9,308 | 4,871 | ||||||
China Coal Energy Co. Ltd., Class H | 17,013 | 6,753 | ||||||
China Communications Construction Co. Ltd., Class H | 13,964 | 10,836 | ||||||
China Communications Services Corp. Ltd., Class H | 15,351 | 8,601 | ||||||
China Conch Venture Holdings Ltd. | 3,521 | 11,729 | ||||||
China Construction Bank Corp., Class H | 482 | 358 | ||||||
China Dongxiang Group Co. Ltd. | 6,316 | 677 | ||||||
China Eastern Airlines Corp. Ltd., Class H* | 684 | 322 | ||||||
| See Notes to Financial Statements. | 31 |
DBX ETF Trust
Schedule of Investments
Xtrackers FTSE Emerging Comprehensive Factor ETF(Continued)
August 31, 2019
Number | Value | |||||||
| China (Continued) | ||||||||
China Everbright Bank Co. Ltd., Class H | 5,955 | $ | 2,485 | |||||
China International Marine Containers Group Co. Ltd., Class H | 433 | 397 | ||||||
China Life Insurance Co. Ltd., Class H | 1,696 | 3,970 | ||||||
China Longyuan Power Group Corp. Ltd., Class H | 3,751 | 2,063 | ||||||
China Machinery Engineering Corp., Class H | 847 | 332 | ||||||
China Medical System Holdings Ltd. | 454 | 567 | ||||||
China Merchants Bank Co. Ltd., Class H | 603 | 2,747 | ||||||
China Merchants Securities Co. Ltd., Class H, 144A (a) | 399 | 448 | ||||||
China Minsheng Banking Corp. Ltd., Class H | 8,566 | 5,641 | ||||||
China National Accord Medicines Corp. Ltd., Class B | 236 | 864 | ||||||
China National Building Material Co. Ltd., Class H | 726 | 623 | ||||||
China Oilfield Services Ltd., Class H | 1,184 | 1,466 | ||||||
China Pacific Insurance Group Co. Ltd., Class H | 851 | 3,410 | ||||||
China Petroleum & Chemical Corp., Class H | 76,332 | 44,716 | ||||||
China Railway Construction Corp. Ltd., Class H | 11,411 | 12,321 | ||||||
China Railway Group Ltd., Class H | 22,287 | 14,592 | ||||||
China Railway Signal & Communication Corp. Ltd., Class H, 144A | 545 | 327 | ||||||
China Reinsurance Group Corp., Class H | 6,710 | 1,096 | ||||||
China Resources Pharmaceutical Group Ltd., 144A | 4,277 | 4,421 | ||||||
China Shenhua Energy Co. Ltd., Class H | 18,816 | 36,790 | ||||||
China Telecom Corp. Ltd., Class H | 2,997 | 1,343 | ||||||
China Vanke Co. Ltd., Class H | 2,013 | 6,962 | ||||||
China Zhongwang Holdings Ltd. | 4,355 | 1,790 | ||||||
Chongqing Changan Automobile Co. Ltd., Class B | 413 | 176 | ||||||
Chongqing Rural Commercial Bank Co. Ltd., Class H | 109 | 53 | ||||||
CIFI Holdings Group Co. Ltd. | 1,485 | 800 | ||||||
CNOOC Ltd. | 1,079 | 1,611 | ||||||
COSCO SHIPPING Development Co. Ltd., Class H | 2,590 | 288 | ||||||
COSCO SHIPPING Energy Transportation Co., Ltd., Class H | 6,475 | 3,669 | ||||||
COSCO SHIPPING Holdings Co. Ltd., Class H* | 1,689 | 604 | ||||||
Country Garden Holdings Co. Ltd. | 413 | 514 | ||||||
Country Garden Services Holdings Co. Ltd. | 3,187 | 9,233 | ||||||
CRRC Corp. Ltd., Class H | 4,894 | 3,367 | ||||||
CSG Holding Co. Ltd., Class B | 3,408 | 1,009 | ||||||
CSPC Pharmaceutical Group Ltd. | 721 | 1,443 | ||||||
Dali Foods Group Co. Ltd., 144A | 1,604 | 1,069 | ||||||
Datang International Power Generation Co. Ltd., Class H | 12,453 | 2,734 | ||||||
Dazhong Transportation Group Co. Ltd., Class B | 1,510 | 676 | ||||||
Number | Value | |||||||
| China (Continued) | ||||||||
Dongfang Electric Corp. Ltd., Class H | 1,212 | $ | 670 | |||||
Dongfeng Motor Group Co. Ltd., Class H | 4,908 | 4,560 | ||||||
ENN Energy Holdings Ltd. | 908 | 10,372 | ||||||
Fosun International Ltd. | 751 | 966 | ||||||
Fuyao Glass Industry Group Co. Ltd., Class H, 144A | 1,567 | 4,470 | ||||||
GF Securities Co. Ltd., Class H* | 540 | 555 | ||||||
GOME Retail Holdings Ltd.* (a) | 5,222 | 473 | ||||||
Guangdong Electric Power Development Co. Ltd., Class B | 8,300 | 2,542 | ||||||
Guangshen Railway Co. Ltd., Class H | 3,495 | 1,071 | ||||||
Guangzhou Automobile Group Co. Ltd., Class H | 9,537 | 9,616 | ||||||
Guangzhou Baiyunshan Pharmaceutical Holdings Co. Ltd., Class H | 1,336 | 5,004 | ||||||
Guangzhou R&F Properties Co. Ltd., Class H | 1,454 | 2,342 | ||||||
Guotai Junan Securities Co. Ltd., Class H, 144A | 407 | 581 | ||||||
Haidilao International Holding Ltd., 144A | 200 | 932 | ||||||
Haitian International Holdings Ltd. | 609 | 1,147 | ||||||
Haitong Securities Co. Ltd., Class H | 719 | 685 | ||||||
Hengan International Group Co. Ltd. | 471 | 3,102 | ||||||
Huadian Fuxin Energy Corp. Ltd., Class H | 2,712 | 453 | ||||||
Huadian Power International Corp. Ltd., Class H | 16,104 | 6,289 | ||||||
Huaneng Power International, Inc., Class H | 30,802 | 16,943 | ||||||
Huaneng Renewables Corp. Ltd., Class H (b) | 4,151 | 1,150 | ||||||
Huatai Securities Co. Ltd., Class H, 144A | 631 | 920 | ||||||
Huaxin Cement Co. Ltd., Class B | 4,892 | 8,874 | ||||||
Huazhu Group Ltd., ADR (a) | 13 | 429 | ||||||
Industrial & Commercial Bank of China Ltd., Class H | 2,541 | 1,605 | ||||||
Inner Mongolia Yitai Coal Co. Ltd., Class B | 6,600 | 5,874 | ||||||
JD.com, Inc., ADR* | 8 | 244 | ||||||
Jiangsu Expressway Co. Ltd., Class H | 7,501 | 9,956 | ||||||
Jiangxi Copper Co. Ltd., Class H | 3,210 | 3,613 | ||||||
Lao Feng Xiang Co. Ltd., Class B | 3,300 | 11,246 | ||||||
Li Ning Co. Ltd. | 1,927 | 5,693 | ||||||
Livzon Pharmaceutical Group, Inc., Class H | 161 | 443 | ||||||
Logan Property Holdings Co. Ltd. | 1,846 | 2,606 | ||||||
Longfor Group Holdings Ltd., 144A | 2,357 | 8,408 | ||||||
Luye Pharma Group Ltd., 144A (a) | 2,421 | 1,882 | ||||||
Maanshan Iron & Steel Co. Ltd., Class H (a) | 5,474 | 2,054 | ||||||
Metallurgical Corp. of China Ltd., Class H | 12,756 | 2,849 | ||||||
Midea Group Co. Ltd., Class A | 324 | 2,389 | ||||||
NetEase, Inc., ADR (a) | 6 | 1,530 | ||||||
New China Life Insurance Co. Ltd., Class H | 189 | 747 | ||||||
New Oriental Education & Technology Group, Inc., ADR* | 38 | 4,309 | ||||||
People’s Insurance Co. Group of China Ltd., Class H | 11,388 | 4,462 | ||||||
PetroChina Co. Ltd., Class H | 70,933 | 35,216 | ||||||
PICC Property & Casualty Co. Ltd., Class H | 2,391 | 2,743 | ||||||
Pinduoduo, Inc., ADR* (a) | 31 | 1,016 | ||||||
| See Notes to Financial Statements. | 32 |
DBX ETF Trust
Schedule of Investments
Xtrackers FTSE Emerging Comprehensive Factor ETF(Continued)
August 31, 2019
Number | Value | |||||||
| China (Continued) | ||||||||
Ping An Healthcare and Technology Co. Ltd., 144A* (a) | 69 | $ | 409 | |||||
Ping An Insurance Group Co. of China Ltd., Class H | 55 | 631 | ||||||
Qingdao Port International Co. Ltd., Class H, 144A | 1,834 | 1,088 | ||||||
Red Star Macalline Group Corp. Ltd., Class H, 144A | 3,169 | 2,508 | ||||||
Shandong Chenming Paper Holdings Ltd., Class B | 970 | 381 | ||||||
Shandong Weigao Group Medical Polymer Co. Ltd., Class H | 3,884 | 4,010 | ||||||
Shanghai Bailian Group Co. Ltd., Class B | 1,223 | 1,109 | ||||||
Shanghai Baosight Software Co. Ltd., Class B | 2,990 | 5,561 | ||||||
Shanghai Chlor-Alkali Chemical Co. Ltd., Class B | 4,000 | 2,444 | ||||||
Shanghai Huayi Group Co. Ltd., Class B | 1,184 | 811 | ||||||
Shanghai Jinjiang International Hotels Co. Ltd., Class B | 500 | 927 | ||||||
Shanghai Jinjiang International Industrial Investment Co. Ltd., Class B | 500 | 467 | ||||||
Shanghai Jinqiao Export Processing Zone Development Co. Ltd., Class B | 800 | 841 | ||||||
Shanghai Lujiazui Finance & Trade Zone Development Co. Ltd., Class B | 1,465 | 1,642 | ||||||
Shanghai Mechanical and Electrical Industry Co. Ltd., Class B | 2,162 | 3,567 | ||||||
Shanghai Pharmaceuticals Holding Co. Ltd., Class H | 2,768 | 5,228 | ||||||
Shanghai Waigaoqiao Free Trade Zone Group Co. Ltd., Class B | 1,006 | 1,390 | ||||||
Shanghai Zhenhua Heavy Industries Co. Ltd., Class B | 2,620 | 891 | ||||||
Shenzhen Expressway Co. Ltd., Class H | 4,219 | 5,169 | ||||||
Shenzhou International Group Holdings Ltd. | 551 | 7,489 | ||||||
Sichuan Expressway Co. Ltd., Class H | 5,494 | 1,592 | ||||||
Sihuan Pharmaceutical Holdings Group Ltd. | 728 | 130 | ||||||
SINA Corp.* | 7 | 288 | ||||||
Sino-Ocean Group Holding Ltd. | 1,521 | 544 | ||||||
Sinopec Engineering Group Co. Ltd., Class H | 2,849 | 1,862 | ||||||
Sinopec Shanghai Petrochemical Co. Ltd., Class H | 9,691 | 2,795 | ||||||
Sinopharm Group Co. Ltd., Class H | 666 | 2,410 | ||||||
Sinotrans Ltd., Class H | 2,654 | 857 | ||||||
Sinotruk Hong Kong Ltd. | 1,517 | 2,343 | ||||||
SOHO China Ltd. | 4,983 | 1,463 | ||||||
TAL Education Group, ADR* (a) | 27 | 962 | ||||||
Tencent Holdings Ltd. | 14 | 580 | ||||||
TravelSky Technology Ltd., Class H | 159 | 319 | ||||||
Tsingtao Brewery Co. Ltd., Class H | 1,444 | 9,758 | ||||||
Weichai Power Co. Ltd., Class H | 14,438 | 22,112 | ||||||
Weifu High-Technology Group Co. Ltd., Class B | 2,378 | 3,885 | ||||||
Number | Value | |||||||
| China (Continued) | ||||||||
Xinhua Winshare Publishing and Media Co. Ltd., Class H | 5,735 | $ | 4,011 | |||||
Yangzijiang Shipbuilding Holdings Ltd. | 10,274 | 6,740 | ||||||
Yantai Changyu Pioneer Wine Co. Ltd., Class B | 1,557 | 3,209 | ||||||
Yanzhou Coal Mining Co. Ltd., Class H | 698 | 605 | ||||||
YY, Inc., ADR* (a) | 5 | 286 | ||||||
Zhaojin Mining Industry Co. Ltd., Class H | 576 | 754 | ||||||
Zhejiang Expressway Co. Ltd., Class H | 489 | 409 | ||||||
Zhongsheng Group Holdings Ltd. | 183 | 572 | ||||||
Zhuzhou CRRC Times Electric Co. Ltd., Class H | 575 | 2,290 | ||||||
Zijin Mining Group Co. Ltd., Class H | 9,885 | 3,696 | ||||||
ZTO Express Cayman, Inc., ADR | 235 | 4,820 | ||||||
|
| |||||||
| 589,535 | ||||||||
|
| |||||||
| Colombia — 0.4% | ||||||||
Almacenes Exito SA | 1,372 | 7,042 | ||||||
Bancolombia SA | 135 | 1,560 | ||||||
Corp. Financiera Colombiana SA* | 145 | 1,113 | ||||||
Ecopetrol SA | 360 | 288 | ||||||
Grupo de Inversiones Suramericana SA | 180 | 1,761 | ||||||
Interconexion Electrica SA ESP | 704 | 3,737 | ||||||
|
| |||||||
| 15,501 | ||||||||
|
| |||||||
| Czech Republic — 0.4% | ||||||||
CEZ AS | 216 | 4,764 | ||||||
Komercni banka AS | 42 | 1,493 | ||||||
Moneta Money Bank AS, 144A | 942 | 3,051 | ||||||
O2 Czech Republic AS | 33 | 298 | ||||||
Philip Morris CR AS | 5 | 2,876 | ||||||
|
| |||||||
| 12,482 | ||||||||
|
| |||||||
| Egypt — 0.7% | ||||||||
Abou Kir Fertilizers & Chemical Industries | 622 | 820 | ||||||
Commercial International Bank Egypt SAE, GDR | 2,149 | 9,993 | ||||||
Eastern Co. SAE | 953 | 883 | ||||||
Egypt Kuwait Holding Co. SAE | 7,026 | 9,822 | ||||||
ElSewedy Electric Co. | 1,118 | 956 | ||||||
Talaat Moustafa Group | 734 | 513 | ||||||
Telecom Egypt Co. | 1,533 | 1,248 | ||||||
|
| |||||||
| 24,235 | ||||||||
|
| |||||||
| Greece — 0.7% | ||||||||
FF Group* (b) | 144 | 761 | ||||||
Hellenic Petroleum SA | 96 | 988 | ||||||
Hellenic Telecommunications Organization SA | 169 | 2,259 | ||||||
JUMBO SA | 167 | 3,215 | ||||||
Motor Oil Hellas Corinth Refineries SA | 480 | 11,756 | ||||||
Mytilineos SA | 254 | 2,825 | ||||||
OPAP SA | 146 | 1,542 | ||||||
|
| |||||||
| 23,346 | ||||||||
|
| |||||||
| Hong Kong — 3.5% | ||||||||
Beijing Enterprises Holdings Ltd. | 1,711 | 8,156 | ||||||
Beijing Enterprises Water Group Ltd.* | 1,314 | 691 | ||||||
| See Notes to Financial Statements. | 33 |
DBX ETF Trust
Schedule of Investments
Xtrackers FTSE Emerging Comprehensive Factor ETF(Continued)
August 31, 2019
Number | Value | |||||||
| Hong Kong (Continued) | ||||||||
Bosideng International Holdings Ltd. | 4,889 | $ | 1,678 | |||||
China Agri-Industries Holdings Ltd. | 5,696 | 1,607 | ||||||
China Everbright International Ltd. | 486 | 381 | ||||||
China Everbright Ltd. | 1,699 | 1,941 | ||||||
China Gas Holdings Ltd. | 455 | 1,881 | ||||||
China Merchants Port Holdings Co. Ltd. | 1,171 | 1,829 | ||||||
China Mobile Ltd. | 265 | 2,197 | ||||||
China Overseas Land & Investment Ltd. | 936 | 2,963 | ||||||
China Power International Development Ltd. | 17,325 | 3,759 | ||||||
China Resources Beer Holdings Co. Ltd. | 369 | 2,096 | ||||||
China Resources Cement Holdings Ltd. | 5,230 | 4,639 | ||||||
China Resources Gas Group Ltd. | 1,527 | 7,552 | ||||||
China Resources Land Ltd. | 975 | 3,969 | ||||||
China Resources Power Holdings Co. Ltd. | 6,836 | 9,039 | ||||||
China South City Holdings Ltd.* | 3,220 | 399 | ||||||
China State Construction International Holdings Ltd. | 628 | 567 | ||||||
China Taiping Insurance Holdings Co. Ltd. | 111 | 250 | ||||||
China Traditional Chinese Medicine Holdings Co. Ltd. | 3,711 | 1,743 | ||||||
China Unicom Hong Kong Ltd. | 2,525 | 2,517 | ||||||
CIMC Enric Holdings Ltd. | 631 | 365 | ||||||
CITIC Ltd. | 1,729 | 2,050 | ||||||
COSCO SHIPPING Ports Ltd. | 11,001 | 9,646 | ||||||
Far East Horizon Ltd. | 478 | 428 | ||||||
Geely Automobile Holdings Ltd. | 181 | 280 | ||||||
Guangdong Investment Ltd. | 5,910 | 12,461 | ||||||
Haier Electronics Group Co. Ltd. | 941 | 2,450 | ||||||
Hopson Development Holdings Ltd. | 1,258 | 1,238 | ||||||
Jiayuan International Group Ltd. | 6,700 | 2,676 | ||||||
Kingboard Holdings Ltd. | 596 | 1,396 | ||||||
Kingboard Laminates Holdings Ltd. | 731 | 577 | ||||||
Kunlun Energy Co. Ltd. | 8,189 | 7,138 | ||||||
Lee & Man Paper Manufacturing Ltd. | 7,718 | 4,088 | ||||||
Nine Dragons Paper Holdings Ltd. | 814 | 617 | ||||||
Poly Property Group Co. Ltd. | 2,562 | 899 | ||||||
Shanghai Industrial Holdings Ltd. | 1,639 | 3,196 | ||||||
Shenzhen International Holdings Ltd. | 2,039 | 3,862 | ||||||
Shenzhen Investment Ltd. | 9,367 | 3,551 | ||||||
Shimao Property Holdings Ltd. | 844 | 2,391 | ||||||
Sino Biopharmaceutical Ltd. | 484 | 720 | ||||||
Yuexiu Property Co. Ltd. | 4,754 | 1,025 | ||||||
|
| |||||||
| 120,908 | ||||||||
|
| |||||||
| Hungary — 1.5% | ||||||||
Magyar Telekom Telecommunications PLC | 6,181 | 8,697 | ||||||
MOL Hungarian Oil & Gas PLC | 3,409 | 33,431 | ||||||
OTP Bank Nyrt | 62 | 2,477 | ||||||
Richter Gedeon Nyrt | 512 | 8,559 | ||||||
|
| |||||||
| 53,164 | ||||||||
|
| |||||||
| India — 7.2% | ||||||||
3M India Ltd.* | 2 | 567 | ||||||
ABB India Ltd. | 51 | 956 | ||||||
ACC Ltd. | 129 | 2,746 | ||||||
Adani Ports & Special Economic Zone Ltd. | 245 | 1,255 | ||||||
Number | Value | |||||||
| India (Continued) | ||||||||
Alkem Laboratories Ltd. | 30 | $ | 764 | |||||
Ambuja Cements Ltd. | 1,279 | 3,624 | ||||||
Asian Paints Ltd. | 138 | 3,123 | ||||||
Aurobindo Pharma Ltd. | 414 | 3,483 | ||||||
Avenue Supermarts Ltd., 144A* | 34 | 748 | ||||||
Axis Bank Ltd. | 70 | 651 | ||||||
Bajaj Auto Ltd. | 105 | 4,100 | ||||||
Bajaj Finance Ltd. | 19 | 887 | ||||||
Bajaj Holdings & Investment Ltd. | 207 | 9,427 | ||||||
Berger Paints India Ltd. | 355 | 1,835 | ||||||
Bharat Forge Ltd. | 59 | 318 | ||||||
Bharat Heavy Electricals Ltd. | 354 | 251 | ||||||
Bharat Petroleum Corp. Ltd. | 669 | 3,328 | ||||||
Bharti Airtel Ltd. | 163 | 792 | ||||||
Bharti Infratel Ltd. | 923 | 3,237 | ||||||
Biocon Ltd. | 138 | 455 | ||||||
Bosch Ltd. | 7 | 1,419 | ||||||
Britannia Industries Ltd. | 48 | 1,816 | ||||||
Cadila Healthcare Ltd. | 111 | 350 | ||||||
Castrol India Ltd. | 695 | 1,196 | ||||||
Cipla Ltd. | 311 | 2,058 | ||||||
Coal India Ltd. | 707 | 1,829 | ||||||
Colgate-Palmolive India Ltd. | 198 | 3,534 | ||||||
Container Corp. Of India Ltd. | 434 | 3,089 | ||||||
Cummins India Ltd. | 140 | 1,127 | ||||||
Dabur India Ltd. | 624 | 3,922 | ||||||
Divi’s Laboratories Ltd. | 89 | 2,026 | ||||||
DLF Ltd. | 164 | 386 | ||||||
Dr Reddy’s Laboratories Ltd. | 107 | 3,832 | ||||||
Eicher Motors Ltd. | 4 | 911 | ||||||
Emami Ltd. | 74 | 308 | ||||||
Exide Industries Ltd. | 812 | 2,030 | ||||||
Federal Bank Ltd. | 534 | 620 | ||||||
GAIL India Ltd. | 1,678 | 3,050 | ||||||
Gillette India Ltd. | 11 | 1,124 | ||||||
GlaxoSmithKline Consumer Healthcare Ltd. | 36 | 4,085 | ||||||
Glenmark Pharmaceuticals Ltd. | 348 | 1,873 | ||||||
Godrej Consumer Products Ltd. | 141 | 1,202 | ||||||
Godrej Industries Ltd. | 63 | 371 | ||||||
Havells India Ltd. | 346 | 3,290 | ||||||
HCL Technologies Ltd. | 726 | 11,187 | ||||||
HDFC Asset Management Co. Ltd., 144A | 47 | 1,680 | ||||||
Hero MotoCorp Ltd. | 141 | 5,079 | ||||||
Hindalco Industries Ltd. | 898 | 2,320 | ||||||
Hindustan Petroleum Corp. Ltd. | 380 | 1,384 | ||||||
Hindustan Unilever Ltd. | 83 | 2,187 | ||||||
Hindustan Zinc Ltd. | 112 | 340 | ||||||
Housing Development Finance Corp. Ltd. | 53 | 1,608 | ||||||
ICICI Lombard General Insurance Co. Ltd., 144A | 175 | 3,083 | ||||||
ICICI Prudential Life Insurance Co. Ltd., 144A | 147 | 874 | ||||||
Indian Oil Corp. Ltd. | 736 | 1,262 | ||||||
Infosys Ltd. | 1,946 | 22,208 | ||||||
InterGlobe Aviation Ltd., 144A | 60 | 1,420 | ||||||
ITC Ltd. | 277 | 953 | ||||||
| See Notes to Financial Statements. | 34 |
DBX ETF Trust
Schedule of Investments
Xtrackers FTSE Emerging Comprehensive Factor ETF(Continued)
August 31, 2019
Number | Value | |||||||
| India (Continued) | ||||||||
JSW Energy Ltd. | 424 | $ | 396 | |||||
JSW Steel Ltd. | 1,798 | 5,475 | ||||||
Kansai Nerolac Paints Ltd. | 168 | 1,084 | ||||||
Larsen & Toubro Infotech Ltd., 144A | 133 | 3,029 | ||||||
Larsen & Toubro Ltd. | 30 | 558 | ||||||
Lupin Ltd. | 199 | 2,065 | ||||||
Mahindra & Mahindra Ltd. | 263 | 1,948 | ||||||
Marico Ltd. | 965 | 5,285 | ||||||
Maruti Suzuki India Ltd. | 17 | 1,458 | ||||||
Motherson Sumi Systems Ltd. | 198 | 272 | ||||||
Mphasis Ltd. | 898 | 12,271 | ||||||
MRF Ltd. | 1 | 820 | ||||||
Muthoot Finance Ltd. | 268 | 2,279 | ||||||
Nestle India Ltd. | 18 | 3,245 | ||||||
NHPC Ltd. | 5,349 | 1,742 | ||||||
NMDC Ltd. | 1,284 | 1,495 | ||||||
NTPC Ltd. | 862 | 1,469 | ||||||
Oil & Natural Gas Corp. Ltd. | 1,124 | 1,908 | ||||||
Oil India Ltd. | 832 | 1,724 | ||||||
Oracle Financial Services Software Ltd.* | 79 | 3,409 | ||||||
Page Industries Ltd. | 8 | 2,091 | ||||||
Petronet LNG Ltd. | 1,845 | 6,895 | ||||||
Pidilite Industries Ltd. | 196 | 3,782 | ||||||
Power Finance Corp. Ltd.* | 300 | 440 | ||||||
Power Grid Corp. of India Ltd. | 584 | 1,640 | ||||||
RBL Bank Ltd., 144A | 178 | 816 | ||||||
Reliance Industries Ltd. | 35 | 612 | ||||||
SBI Life Insurance Co. Ltd., 144A | 61 | 716 | ||||||
Shree Cement Ltd. | 4 | 1,040 | ||||||
Siemens Ltd. | 74 | 1,246 | ||||||
Sun Pharmaceutical Industries Ltd. | 79 | 498 | ||||||
Tata Communications Ltd. | 63 | 380 | ||||||
Tata Consultancy Services Ltd. | 50 | 1,582 | ||||||
Tata Power Co. Ltd. | 2,347 | 1,865 | ||||||
Tata Steel Ltd. | 145 | 700 | ||||||
Tech Mahindra Ltd. | 1,243 | 12,074 | ||||||
Titan Co. Ltd. | 111 | 1,718 | ||||||
Torrent Pharmaceuticals Ltd. | 24 | 574 | ||||||
Torrent Power Ltd. | 60 | 234 | ||||||
UltraTech Cement Ltd. | 12 | 681 | ||||||
United Breweries Ltd. | 134 | 2,575 | ||||||
UPL Ltd. | 660 | 5,205 | ||||||
Vedanta Ltd. | 114 | 222 | ||||||
Voltas Ltd. | 86 | 771 | ||||||
Wipro Ltd. | 2,011 | 7,164 | ||||||
Yes Bank Ltd. | 118 | 99 | ||||||
Zee Entertainment Enterprises Ltd. | 208 | 1,087 | ||||||
|
| |||||||
| 252,219 | ||||||||
|
| |||||||
| Indonesia — 1.9% | ||||||||
PT Adaro Energy Tbk | 4,362 | 346 | ||||||
PT Astra Agro Lestari Tbk | 1,217 | 901 | ||||||
PT Astra International Tbk | 10,029 | 4,719 | ||||||
PT Bank Central Asia Tbk | 671 | 1,443 | ||||||
PT Bank Danamon Indonesia Tbk | 2,126 | 721 | ||||||
PT Bank Mandiri Persero Tbk | 3,341 | 1,708 | ||||||
PT Bank Negara Indonesia Persero Tbk | 1,148 | 623 | ||||||
Number | Value | |||||||
| Indonesia (Continued) | ||||||||
PT Bank Rakyat Indonesia Persero Tbk | 5,796 | $ | 1,745 | |||||
PT Bukit Asam Tbk | 9,584 | 1,669 | ||||||
PT Bumi Serpong Damai Tbk* | 32,579 | 3,100 | ||||||
PT Charoen Pokphand Indonesia Tbk | 2,600 | 921 | ||||||
PT Gudang Garam Tbk | 492 | 2,410 | ||||||
PT Hanjaya Mandala Sampoerna Tbk | 1,955 | 371 | ||||||
PT Indah Kiat Pulp & Paper Corp. Tbk | 1,478 | 714 | ||||||
PT Indocement Tunggal Prakarsa Tbk | 1,147 | 1,757 | ||||||
PT Indofood CBP Sukses Makmur Tbk | 5,978 | 5,078 | ||||||
PT Indofood Sukses Makmur Tbk | 13,862 | 7,744 | ||||||
PT Jasa Marga Persero Tbk | 10,073 | 3,977 | ||||||
PT Kalbe Farma Tbk | 59,665 | 7,108 | ||||||
PT Media Nusantara Citra Tbk | 5,723 | 500 | ||||||
PT Perusahaan Gas Negara Tbk | 14,825 | 2,007 | ||||||
PT Semen Indonesia Persero Tbk | 3,348 | 3,127 | ||||||
PT Surya Citra Media Tbk | 2,818 | 245 | ||||||
PT Telekomunikasi Indonesia Persero Tbk | 32,890 | 10,318 | ||||||
PT Tower Bersama Infrastructure Tbk | 2,951 | 1,243 | ||||||
PT Unilever Indonesia Tbk | 297 | 1,023 | ||||||
PT United Tractors Tbk | 1,435 | 2,117 | ||||||
|
| |||||||
| 67,635 | ||||||||
|
| |||||||
| Isle of Man — 0.0% | ||||||||
MAS Real Estate, Inc. | 411 | 432 | ||||||
|
| |||||||
| Kuwait — 1.1% | ||||||||
Agility Public Warehousing Co. KSC | 3,016 | 7,490 | ||||||
Boubyan Bank KSCP | 864 | 1,623 | ||||||
Boubyan Petrochemicals Co. KSCP | 1,083 | 2,765 | ||||||
Gulf Bank KSCP | 3,256 | 3,202 | ||||||
Kuwait Finance House KSCP | 1,153 | 2,837 | ||||||
Mobile Telecommunications Co. KSC | 7,132 | 13,255 | ||||||
National Bank of Kuwait SAKP | 2,040 | 6,657 | ||||||
|
| |||||||
| 37,829 | ||||||||
|
| |||||||
| Malaysia — 4.5% | ||||||||
AirAsia Group Bhd | 5,301 | 2,256 | ||||||
Alliance Bank Malaysia Bhd | 2,248 | 1,604 | ||||||
AMMB Holdings Bhd | 1,661 | 1,659 | ||||||
Astro Malaysia Holdings Bhd | 3,257 | 1,022 | ||||||
Axiata Group Bhd | 589 | 707 | ||||||
British American Tobacco Malaysia Bhd | 834 | 3,911 | ||||||
CIMB Group Holdings Bhd | 1,462 | 1,759 | ||||||
Dialog Group Bhd | 5,700 | 4,717 | ||||||
DiGi.Com Bhd | 11,141 | 13,299 | ||||||
Fraser & Neave Holdings Bhd | 600 | 5,036 | ||||||
Gamuda Bhd | 562 | 481 | ||||||
Genting Bhd | 3,419 | 4,878 | ||||||
Genting Malaysia Bhd | 1,436 | 1,072 | ||||||
HAP Seng Consolidated Bhd | 732 | 1,727 | ||||||
Hartalega Holdings Bhd | 2,400 | 2,928 | ||||||
Hong Leong Bank Bhd | 383 | 1,512 | ||||||
Hong Leong Financial Group Bhd | 418 | 1,676 | ||||||
IHH Healthcare Bhd | 979 | 1,348 | ||||||
IJM Corp. Bhd | 3,078 | 1,669 | ||||||
IOI Corp. Bhd | 1,387 | 1,454 | ||||||
IOI Properties Group Bhd | 4,700 | 1,330 | ||||||
KLCCP Stapled Group (c) | 1,800 | 3,493 | ||||||
| See Notes to Financial Statements. | 35 |
DBX ETF Trust
Schedule of Investments
Xtrackers FTSE Emerging Comprehensive Factor ETF(Continued)
August 31, 2019
Number | Value | |||||||
| Malaysia (Continued) | ||||||||
Kuala Lumpur Kepong Bhd | 525 | $ | 2,994 | |||||
Malayan Banking Bhd | 658 | 1,360 | ||||||
Malaysia Airports Holdings Bhd | 1,365 | 2,671 | ||||||
Maxis Bhd | 4,716 | 6,246 | ||||||
MISC Bhd | 2,189 | 3,779 | ||||||
Nestle Malaysia Bhd | 169 | 5,927 | ||||||
Petronas Chemicals Group Bhd | 4,529 | 7,463 | ||||||
Petronas Dagangan Bhd | 1,619 | 8,808 | ||||||
Petronas Gas Bhd | 1,977 | 7,559 | ||||||
PPB Group Bhd | 1,660 | 7,365 | ||||||
Press Metal Aluminium Holdings Bhd | 486 | �� | 569 | |||||
Public Bank Bhd | 735 | 3,551 | ||||||
QL Resources Bhd | 2,700 | 4,456 | ||||||
RHB Bank Bhd* (b) | 400 | 0 | ||||||
RHB Bank Bhd | 1,431 | 1,939 | ||||||
Sime Darby Bhd | 22,147 | 12,060 | ||||||
Sime Darby Plantation Bhd | 3,815 | 4,518 | ||||||
Sime Darby Property Bhd | 3,943 | 825 | ||||||
Telekom Malaysia Bhd | 615 | 548 | ||||||
Tenaga Nasional Bhd | 1,501 | 4,982 | ||||||
Top Glove Corp. Bhd | 600 | 678 | ||||||
Westports Holdings Bhd | 3,396 | 3,391 | ||||||
YTL Corp. Bhd | 9,128 | 2,170 | ||||||
YTL Power International Bhd | 13,988 | 2,461 | ||||||
|
| |||||||
| 155,858 | ||||||||
|
| |||||||
| Mexico — 6.0% | ||||||||
Alfa SAB de CV, Class A | 10,777 | 9,194 | ||||||
Alpek SAB de CV | 3,203 | 3,512 | ||||||
Alsea SAB de CV* | 406 | 865 | ||||||
America Movil SAB de CV, Series L | 6,505 | 4,752 | ||||||
Arca Continental SAB de CV | 368 | 1,926 | ||||||
Banco del Bajio SA, 144A | 2,625 | 4,382 | ||||||
Banco Santander Mexico SA Institucion de Banca Multiple Grupo Financiero Santand | 3,844 | 4,879 | ||||||
Cemex SAB de CV, Series CPO | 6,990 | 2,602 | ||||||
Coca-Cola Femsa SAB de CV | 2,385 | 14,091 | ||||||
Concentradora Fibra Danhos SA de CV REIT | 1,835 | 2,433 | ||||||
El Puerto de Liverpool SAB de CV, Class C1 | 1,053 | 5,456 | ||||||
Fibra Uno Administracion SA de CV REIT | 27,576 | 38,051 | ||||||
Fomento Economico Mexicano SAB de CV | 2,031 | 18,525 | ||||||
Gruma SAB de CV, Class B | 809 | 7,525 | ||||||
Grupo Aeroportuario del Centro Norte SAB de CV | 1,964 | 11,524 | ||||||
Grupo Aeroportuario del Pacifico SAB de CV, Class B | 588 | 5,602 | ||||||
Grupo Aeroportuario del Sureste SAB de CV, Class B | 297 | 4,364 | ||||||
Grupo Bimbo SAB de CV, Series A | 2,718 | 4,750 | ||||||
Grupo Carso SAB de CV, Series A1 | 652 | 1,873 | ||||||
Grupo Comercial Chedraui SA de CV | 3,274 | 4,580 | ||||||
Grupo Elektra SAB DE CV | 13 | 899 | ||||||
Grupo Financiero Banorte SAB de CV, Class O | 850 | 4,567 | ||||||
Grupo Financiero Inbursa SAB de CV, Class O | 2,210 | 2,728 | ||||||
Number | Value | |||||||
| Mexico (Continued) | ||||||||
Grupo Lala SAB de CV | 1,614 | $ | 1,684 | |||||
Grupo Mexico SAB de CV, Series B | 816 | 1,877 | ||||||
Grupo Televisa SAB, Series CPO | 1,689 | 2,983 | ||||||
Industrias Bachoco SAB de CV, Series B | 721 | 3,293 | ||||||
Industrias Penoles SAB de CV | 33 | 396 | ||||||
Infraestructura Energetica Nova SAB de CV* | 344 | 1,445 | ||||||
Kimberly-Clark de Mexico SAB de CV, Class A* | 2,804 | 5,726 | ||||||
Megacable Holdings SAB de CV, Series CPO | 1,512 | 6,165 | ||||||
Mexichem SAB de CV | 6,191 | 11,338 | ||||||
Nemak SAB de CV, 144A | 7,078 | 3,284 | ||||||
Promotora y Operadora de Infraestructura SAB de CV | 829 | 6,931 | ||||||
Regional SAB de CV | 522 | 2,362 | ||||||
Telesites SAB de CV* | 669 | 417 | ||||||
Wal-Mart de Mexico SAB de CV | 1,305 | 3,689 | ||||||
|
| |||||||
| 210,670 | ||||||||
|
| |||||||
| Peru — 0.0% | ||||||||
Cia de Minas Buenaventura SAA, ADR | 85 | 1,295 | ||||||
|
| |||||||
| Philippines — 2.2% | ||||||||
Aboitiz Power Corp. | 3,880 | 2,832 | ||||||
Alliance Global Group, Inc. | 9,109 | 2,222 | ||||||
Ayala Corp. | 172 | 3,056 | ||||||
Ayala Land, Inc. | 6,862 | 6,235 | ||||||
Bank of the Philippine Islands | 759 | 1,282 | ||||||
BDO Unibank, Inc. | 481 | 1,377 | ||||||
DMCI Holdings, Inc. | 24,533 | 4,265 | ||||||
Energy Development Corp.* (b) | 8,122 | 1,072 | ||||||
Globe Telecom, Inc. | 110 | 4,290 | ||||||
GT Capital Holdings, Inc. | 221 | 3,855 | ||||||
International Container Terminal Services, Inc. | 1,439 | 3,754 | ||||||
JG Summit Holdings, Inc. | 2,240 | 3,096 | ||||||
Jollibee Foods Corp. | 864 | 3,947 | ||||||
LT Group, Inc. | 1,663 | 472 | ||||||
Manila Electric Co. | 953 | 6,682 | ||||||
Megaworld Corp. | 33,188 | 3,271 | ||||||
Metro Pacific Investments Corp. | 35,500 | 3,376 | ||||||
Metropolitan Bank & Trust Co. | 620 | 844 | ||||||
PLDT, Inc. | 153 | 3,465 | ||||||
San Miguel Corp. | 1,100 | 3,803 | ||||||
San Miguel Food and Beverage, Inc. | 210 | 363 | ||||||
Semirara Mining & Power Corp. | 5,574 | 2,484 | ||||||
SM Investments Corp. | 133 | 2,621 | ||||||
SM Prime Holdings, Inc. | 4,115 | 2,790 | ||||||
Universal Robina Corp. | 1,250 | 4,154 | ||||||
|
| |||||||
| 75,608 | ||||||||
|
| |||||||
| Qatar — 2.9% | ||||||||
Al Meera Consumer Goods Co. QSC | 460 | 1,882 | ||||||
Barwa Real Estate Co. | 8,380 | 7,824 | ||||||
Commercial Bank PSQC | 3,120 | 4,078 | ||||||
Doha Bank QPSC | 1,140 | 814 | ||||||
Industries Qatar QSC | 1,450 | 4,332 | ||||||
| See Notes to Financial Statements. | 36 |
DBX ETF Trust
Schedule of Investments
Xtrackers FTSE Emerging Comprehensive Factor ETF(Continued)
August 31, 2019
Number | Value | |||||||
| Qatar (Continued) | ||||||||
Masraf Al Rayan QSC | 3,020 | $ | 3,010 | |||||
Mesaieed Petrochemical Holding Co. | 12,210 | 9,522 | ||||||
Ooredoo QPSC | 1,320 | 2,537 | ||||||
Qatar Aluminum Manufacturing Co. | 3,760 | 795 | ||||||
Qatar Electricity & Water Co. QSC | 1,080 | 4,478 | ||||||
Qatar Fuel QSC | 6,510 | 38,612 | ||||||
Qatar Gas Transport Co. Ltd. | 8,130 | 5,313 | ||||||
Qatar Insurance Co. SAQ | 2,220 | 1,908 | ||||||
Qatar International Islamic Bank QSC | 930 | 1,977 | ||||||
Qatar Islamic Bank SAQ | 1,000 | 4,339 | ||||||
Qatar National Bank QPSC | 290 | 1,525 | ||||||
Qatar Navigation QSC | 1,930 | 3,206 | ||||||
United Development Co. QSC | 6,810 | 2,562 | ||||||
Vodafone Qatar QSC | 4,100 | 1,385 | ||||||
|
| |||||||
| 100,099 | ||||||||
|
| |||||||
| Romania — 0.1% | ||||||||
NEPI Rockcastle PLC | 285 | 2,524 | ||||||
|
| |||||||
| Russia — 3.6% | ||||||||
Aeroflot PJSC | 1,328 | 2,188 | ||||||
Alrosa PJSC | 270 | 301 | ||||||
Federal Grid Co Unified Energy System PJSC | 417,752 | 1,113 | ||||||
Gazprom PJSC | 1,471 | 5,127 | ||||||
Inter RAO UES PJSC | 200,702 | 12,926 | ||||||
LUKOIL PJSC | 124 | 10,014 | ||||||
Magnit PJSC | 85 | 4,709 | ||||||
Magnitogorsk Iron & Steel Works PJSC | 7,339 | 4,610 | ||||||
MMC Norilsk Nickel PJSC | 25 | 6,038 | ||||||
Mobile TeleSystems PJSC | 3,040 | 12,156 | ||||||
Mosenergo PJSC | 30,081 | 1,009 | ||||||
Novatek PJSC | 119 | 2,301 | ||||||
Novolipetsk Steel PJSC | 2,698 | 6,029 | ||||||
PhosAgro PJSC | 28 | 1,071 | ||||||
Rosneft Oil Co. PJSC | 151 | 922 | ||||||
ROSSETI PJSC | 70,408 | 1,240 | ||||||
Rostelecom PJSC | 13,024 | 15,839 | ||||||
RusHydro PJSC | 89,895 | 741 | ||||||
RussNeft PJSC* | 167 | 1,438 | ||||||
Sberbank of Russia PJSC | 124 | 417 | ||||||
Severstal PJSC | 891 | 13,414 | ||||||
Surgutneftegas PJSC | 14,014 | 5,775 | ||||||
Tatneft PJSC | 854 | 9,527 | ||||||
Unipro PJSC | 141,864 | 5,793 | ||||||
VTB Bank PJSC | 794,667 | 461 | ||||||
|
| |||||||
| 125,159 | ||||||||
|
| |||||||
| Singapore — 0.1% | ||||||||
Yanlord Land Group Ltd. | 2,798 | 2,219 | ||||||
|
| |||||||
| South Africa — 6.7% | ||||||||
Absa Group Ltd. (a) | 156 | 1,579 | ||||||
African Rainbow Minerals Ltd. | 59 | 644 | ||||||
Anglo American Platinum Ltd. | 12 | 736 | ||||||
AngloGold Ashanti Ltd. | 60 | 1,368 | ||||||
Aspen Pharmacare Holdings Ltd. | 59 | 306 | ||||||
Attacq Ltd. REIT | 8,810 | 6,382 | ||||||
AVI Ltd. | 1,186 | 6,480 | ||||||
Number | Value | |||||||
| South Africa (Continued) | ||||||||
Barloworld Ltd. | 280 | $ | 2,044 | |||||
Bid Corp. Ltd. | 140 | 2,997 | ||||||
Bidvest Group Ltd. | 425 | 5,002 | ||||||
Capitec Bank Holdings Ltd. | 59 | 4,255 | ||||||
Clicks Group Ltd. | 576 | 7,549 | ||||||
Discovery Ltd. | 233 | 1,767 | ||||||
Distell Group Holdings Ltd. | 114 | 976 | ||||||
Exxaro Resources Ltd. | 150 | 1,345 | ||||||
FirstRand Ltd. | 185 | 731 | ||||||
Foschini Group Ltd. | 79 | 783 | ||||||
Growthpoint Properties Ltd. REIT | 6,868 | 10,403 | ||||||
Hyprop Investments Ltd. REIT | 1,404 | 6,085 | ||||||
Imperial Logistics Ltd. | 202 | 732 | ||||||
Investec Ltd. | 339 | 1,788 | ||||||
JSE Ltd. | 92 | 782 | ||||||
KAP Industrial Holdings Ltd. | 7,801 | 2,692 | ||||||
Liberty Holdings Ltd. | 132 | 953 | ||||||
Life Healthcare Group Holdings Ltd. | 3,816 | 5,733 | ||||||
Massmart Holdings Ltd. | 71 | 210 | ||||||
Momentum Metropolitan Holdings | 553 | 599 | ||||||
Motus Holdings Ltd. | 1,907 | 9,420 | ||||||
Mr Price Group Ltd. | 167 | 1,888 | ||||||
MTN Group Ltd. (a) | 463 | 3,128 | ||||||
MultiChoice Group Ltd.* | 132 | 1,157 | ||||||
Naspers Ltd., Class N | 9 | 2,047 | ||||||
Nedbank Group Ltd. | 156 | 2,322 | ||||||
Netcare Ltd. | 9,040 | 9,705 | ||||||
Old Mutual Ltd. (a) | 3,495 | 4,187 | ||||||
Pick n Pay Stores Ltd. | 3,536 | 13,461 | ||||||
Pioneer Foods Group Ltd. | 147 | 1,021 | ||||||
PSG Group Ltd. | 91 | 1,202 | ||||||
Rand Merchant Investment Holdings Ltd. | 2,254 | 4,397 | ||||||
Redefine Properties Ltd. REIT | 33,962 | 17,558 | ||||||
Remgro Ltd. | 195 | 2,205 | ||||||
Reunert Ltd. | 1,537 | 6,529 | ||||||
RMB Holdings Ltd. | 1,860 | 8,753 | ||||||
Sanlam Ltd. | 321 | 1,538 | ||||||
Santam Ltd. | 204 | 3,829 | ||||||
Sappi Ltd. | 1,101 | 3,279 | ||||||
Sasol Ltd. (a) | 94 | 1,783 | ||||||
Shoprite Holdings Ltd. (a) | 222 | 1,652 | ||||||
SPAR Group Ltd. | 1,034 | 11,838 | ||||||
Standard Bank Group Ltd. | 79 | 922 | ||||||
Super Group Ltd.* | 2,748 | 5,176 | ||||||
Telkom SA SOC Ltd. | 3,069 | 16,091 | ||||||
Tiger Brands Ltd. | 149 | 2,050 | ||||||
Truworths International Ltd. | 530 | 1,839 | ||||||
Tsogo Sun Gaming Ltd. | 1,256 | 1,143 | ||||||
Tsogo Sun Hotels Ltd.* | 1,256 | 322 | ||||||
Vodacom Group Ltd. | 47 | 357 | ||||||
Vukile Property Fund Ltd. REIT | 12,473 | 15,378 | ||||||
Woolworths Holdings Ltd. (a) | 686 | 2,493 | ||||||
|
| |||||||
| 233,591 | ||||||||
|
| |||||||
| Taiwan — 14.9% | ||||||||
Acer, Inc. | 1,083 | 593 | ||||||
Advantech Co. Ltd. | 1,569 | 13,337 | ||||||
| See Notes to Financial Statements. | 37 |
DBX ETF Trust
Schedule of Investments
Xtrackers FTSE Emerging Comprehensive Factor ETF(Continued)
August 31, 2019
Number | Value | |||||||
| Taiwan (Continued) | ||||||||
ASE Technology Holding Co. Ltd. | 3,305 | $ | 7,513 | |||||
Asia Cement Corp. | 4,181 | 5,724 | ||||||
Asustek Computer, Inc. | 1,192 | 7,742 | ||||||
AU Optronics Corp. | 67,493 | 17,577 | ||||||
Capital Securities Corp. | 2,072 | 577 | ||||||
Catcher Technology Co. Ltd. | 307 | 2,155 | ||||||
Cathay Financial Holding Co. Ltd. | 1,028 | 1,314 | ||||||
Chailease Holding Co. Ltd. | 1,595 | 6,322 | ||||||
Chang Hwa Commercial Bank Ltd. | 3,173 | 2,041 | ||||||
Cheng Shin Rubber Industry Co. Ltd. | 1,770 | 2,479 | ||||||
Chicony Electronics Co. Ltd. | 9,606 | 26,974 | ||||||
China Airlines Ltd. | 13,897 | 4,088 | ||||||
China Development Financial Holding Corp. | 16,270 | 4,709 | ||||||
China Life Insurance Co. Ltd.* | 4,848 | 3,797 | ||||||
China Motor Corp. | 6,840 | 5,444 | ||||||
China Steel Corp. | 16,614 | 12,245 | ||||||
Chunghwa Telecom Co. Ltd. | 1,546 | 5,365 | ||||||
Compal Electronics, Inc. | 24,788 | 14,166 | ||||||
CTBC Financial Holding Co. Ltd. | 8,861 | 5,741 | ||||||
Delta Electronics, Inc. | 2,424 | 11,306 | ||||||
E.Sun Financial Holding Co. Ltd. | 3,312 | 2,662 | ||||||
Eclat Textile Co. Ltd. | 158 | 1,932 | ||||||
Epistar Corp.* | 655 | 481 | ||||||
Eternal Materials Co. Ltd. | 4,420 | 3,476 | ||||||
Eva Airways Corp. | 14,167 | 6,382 | ||||||
Evergreen Marine Corp. Taiwan Ltd.* | 7,392 | 3,024 | ||||||
Far Eastern International Bank | 4,027 | 1,487 | ||||||
Far Eastern New Century Corp. | 9,481 | 8,603 | ||||||
Far EasTone Telecommunications Co. Ltd. | 3,116 | 7,262 | ||||||
Feng Hsin Steel Co. Ltd. | 5,296 | 9,206 | ||||||
Feng TAY Enterprise Co. Ltd. | 1,067 | 6,947 | ||||||
First Financial Holding Co. Ltd. | 3,900 | 2,670 | ||||||
Formosa Chemicals & Fibre Corp. | 3,213 | 9,012 | ||||||
Formosa Petrochemical Corp. | 322 | 996 | ||||||
Formosa Plastics Corp. | 3,123 | 9,356 | ||||||
Formosa Taffeta Co. Ltd. | 5,245 | 5,686 | ||||||
Foxconn Technology Co. Ltd. | 3,153 | 6,364 | ||||||
Fubon Financial Holding Co. Ltd. | 1,349 | 1,875 | ||||||
Giant Manufacturing Co. Ltd. | 252 | 1,753 | ||||||
Globalwafers Co. Ltd. | 40 | 367 | ||||||
Hon Hai Precision Industry Co. Ltd. | 168 | 397 | ||||||
Hotai Motor Co. Ltd. | 277 | 3,902 | ||||||
Hua Nan Financial Holdings Co. Ltd. | 3,745 | 2,379 | ||||||
Innolux Corp. | 22,756 | 5,086 | ||||||
Inventec Corp. | 9,230 | 6,318 | ||||||
Largan Precision Co. Ltd. | 15 | 1,858 | ||||||
Lite-On Technology Corp. | 15,111 | 24,054 | ||||||
MediaTek, Inc. | 123 | 1,439 | ||||||
Mega Financial Holding Co. Ltd. | 3,733 | 3,417 | ||||||
Nan Ya Plastics Corp. | 3,910 | 8,564 | ||||||
Nanya Technology Corp. | 307 | 688 | ||||||
Novatek Microelectronics Corp. | 5,554 | 32,889 | ||||||
Oriental Union Chemical Corp. | 5,827 | 3,951 | ||||||
Pegatron Corp. | 2,766 | 4,614 | ||||||
Pou Chen Corp. | 12,298 | 15,348 | ||||||
President Chain Store Corp. | 1,212 | 11,267 | ||||||
Number | Value | |||||||
| Taiwan (Continued) | ||||||||
Quanta Computer, Inc. | 7,268 | $ | 13,074 | |||||
Realtek Semiconductor Corp. | 131 | 897 | ||||||
Shin Kong Financial Holding Co. Ltd. | 4,489 | 1,315 | ||||||
SinoPac Financial Holdings Co. Ltd. | 8,299 | 3,131 | ||||||
Synnex Technology International Corp. | 3,393 | 3,997 | ||||||
Taishin Financial Holding Co. Ltd. | 2,771 | 1,182 | ||||||
Taiwan Business Bank | 3,770 | 1,476 | ||||||
Taiwan Cement Corp. | 5,472 | 6,698 | ||||||
Taiwan Cooperative Financial Holding Co. Ltd. | 3,928 | 2,501 | ||||||
Taiwan Fertilizer Co. Ltd. | 5,432 | 7,851 | ||||||
Taiwan Glass Industry Corp. | 1,737 | 644 | ||||||
Taiwan High Speed Rail Corp. | 3,308 | 3,992 | ||||||
Taiwan Mobile Co. Ltd. | 2,140 | 7,631 | ||||||
Taiwan Secom Co. Ltd. | 1,523 | 4,170 | ||||||
Taiwan Semiconductor Manufacturing Co. Ltd. | 286 | 2,358 | ||||||
Teco Electric and Machinery Co. Ltd. | 4,939 | 3,915 | ||||||
Transcend Information, Inc. | 3,663 | 7,685 | ||||||
U-Ming Marine Transport Corp. | 477 | 525 | ||||||
Unimicron Technology Corp. | 3,036 | 3,774 | ||||||
Uni-President Enterprises Corp. | 5,294 | 12,911 | ||||||
United Microelectronics Corp. | 51,383 | 22,003 | ||||||
Vanguard International Semiconductor Corp. | 2,531 | 5,157 | ||||||
Walsin Lihwa Corp. | 18,904 | 8,306 | ||||||
Wan Hai Lines Ltd. | 3,930 | 2,377 | ||||||
Wistron Corp. | 9,933 | 7,874 | ||||||
Yuanta Financial Holding Co. Ltd. | 12,129 | 6,970 | ||||||
Yulon Nissan Motor Co. Ltd. | 144 | 1,132 | ||||||
|
| |||||||
| 520,467 | ||||||||
|
| |||||||
| Thailand — 5.8% | ||||||||
Advanced Info Service PCL, NVDR | 846 | 6,420 | ||||||
Airports of Thailand PCL, NVDR | 710 | 1,672 | ||||||
Bangkok Bank PCL | 180 | 1,007 | ||||||
Bangkok Dusit Medical Services PCL, NVDR | 6,566 | 5,068 | ||||||
Bangkok Expressway & Metro PCL, NVDR | 9,400 | 3,444 | ||||||
Bangkok Life Assurance PCL, NVDR | 903 | 605 | ||||||
Banpu PCL, NVDR | 7,635 | 3,172 | ||||||
Berli Jucker PCL, NVDR | 700 | 1,242 | ||||||
BTS Group Holdings PCL, NVDR | 9,663 | 4,267 | ||||||
Bumrungrad Hospital PCL, NVDR | 641 | 2,904 | ||||||
Central Pattana PCL, NVDR | 3,416 | 7,514 | ||||||
Charoen Pokphand Foods PCL, NVDR | 7,736 | 7,465 | ||||||
CP ALL PCL, NVDR | 1,232 | 3,385 | ||||||
Delta Electronics Thailand PCL, NVDR | 1,800 | 2,870 | ||||||
Electricity Generating PCL, NVDR | 2,197 | 24,146 | ||||||
Energy Absolute PCL, NVDR | 700 | 1,082 | ||||||
Global Power Synergy PCL, NVDR | 600 | 1,423 | ||||||
Gulf Energy Development PCL, NVDR | 700 | 3,320 | ||||||
Home Product Center PCL, NVDR | 11,677 | 6,875 | ||||||
Indorama Ventures PCL, NVDR | 928 | 1,070 | ||||||
Intouch Holdings PCL, NVDR | 13,112 | 27,448 | ||||||
IRPC PCL, NVDR | 39,505 | 5,117 | ||||||
Kasikornbank PCL | 154 | 806 | ||||||
| See Notes to Financial Statements. | 38 |
DBX ETF Trust
Schedule of Investments
Xtrackers FTSE Emerging Comprehensive Factor ETF(Continued)
August 31, 2019
Number | Value | |||||||
| Thailand (Continued) | ||||||||
Kasikornbank PCL, NVDR | 158 | $ | 827 | |||||
Krung Thai Bank PCL, NVDR | 4,398 | 2,474 | ||||||
Land & Houses PCL, NVDR | 52,721 | 18,624 | ||||||
Minor International PCL, NVDR | 702 | 873 | ||||||
Muangthai Capital PCL, NVDR | 1,200 | 2,159 | ||||||
PTT Exploration & Production PCL, NVDR | 1,679 | 6,837 | ||||||
PTT Global Chemical PCL, NVDR | 2,202 | 3,835 | ||||||
PTT PCL, NVDR | 2,640 | 3,821 | ||||||
Ratch Group PCL, NVDR | 4,746 | 11,410 | ||||||
Siam Cement PCL | 196 | 2,667 | ||||||
Siam Cement PCL, NVDR | 500 | 6,803 | ||||||
Siam City Cement PCL, NVDR | 317 | 2,395 | ||||||
Siam Commercial Bank PCL, NVDR | 1,040 | 4,201 | ||||||
Thai Oil PCL, NVDR | 1,870 | 4,144 | ||||||
Thai Union Group PCL, NVDR | 9,239 | 5,258 | ||||||
TMB Bank PCL, NVDR | 26,077 | 1,331 | ||||||
Total Access Communication PCL, NVDR | 146 | 294 | ||||||
|
| |||||||
| 200,275 | ||||||||
|
| |||||||
| Turkey — 2.4% | ||||||||
Akbank T.A.S.* | 578 | 688 | ||||||
Anadolu Efes Biracilik Ve Malt Sanayii AS | 230 | 1,010 | ||||||
Arcelik AS* | 698 | 2,047 | ||||||
BIM Birlesik Magazalar AS | 1,490 | 12,025 | ||||||
Coca-Cola Icecek AS | 272 | 1,609 | ||||||
Emlak Konut Gayrimenkul Yatirim Ortakligi AS REIT | 2,692 | 545 | ||||||
Enerjisa Enerji AS, 144A | 1,055 | 1,066 | ||||||
Enka Insaat ve Sanayi AS | 2,171 | 2,161 | ||||||
Eregli Demir ve Celik Fabrikalari TAS | 925 | 1,018 | ||||||
Ford Otomotiv Sanayi AS | 355 | 3,580 | ||||||
Haci Omer Sabanci Holding AS | 183 | 275 | ||||||
KOC Holding AS | 2,391 | 7,178 | ||||||
Petkim Petrokimya Holding AS* | 3,425 | 2,016 | ||||||
Soda Sanayii AS | 4,896 | 4,639 | ||||||
TAV Havalimanlari Holding AS | 605 | 2,451 | ||||||
Tekfen Holding AS | 2,275 | 8,091 | ||||||
Tofas Turk Otomobil Fabrikasi AS | 432 | 1,310 | ||||||
Tupras Turkiye Petrol Rafinerileri AS | 782 | 16,912 | ||||||
Turk Hava Yollari AO* | 769 | 1,491 | ||||||
Turkcell Iletisim Hizmetleri AS | 3,215 | 7,135 | ||||||
Turkiye Garanti Bankasi AS* | 1,145 | 1,749 | ||||||
Turkiye Is Bankasi AS, Class C* | 502 | 475 | ||||||
Turkiye Sise ve Cam Fabrikalari AS | 3,823 | 2,841 | ||||||
Ulker Biskuvi Sanayi AS | 237 | 729 | ||||||
|
| |||||||
| 83,041 | ||||||||
|
| |||||||
| United Arab Emirates — 0.7% | ||||||||
Abu Dhabi Commercial Bank PJSC | 858 | 2,030 | ||||||
Abu Dhabi Islamic Bank PJSC | 2,431 | 3,342 | ||||||
Abu Dhabi National Oil Co. for Distribution PJSC | 3,415 | 2,445 | ||||||
Air Arabia PJSC* | 2,852 | 932 | ||||||
Aldar Properties PJSC | 4,791 | 2,922 | ||||||
Dana Gas PJSC | 2,522 | 674 | ||||||
DP World PLC | 19 | 266 | ||||||
Dubai Islamic Bank PJSC | 1,150 | 1,603 | ||||||
Number | Value | |||||||
| United Arab Emirates (Continued) | ||||||||
Emaar Development PJSC | 3,607 | $ | 4,036 | |||||
Emaar Malls PJSC | 3,526 | 1,862 | ||||||
Emaar Properties PJSC | 1,471 | 1,982 | ||||||
Emirates Telecommunications Group Co. PJSC | 519 | 2,388 | ||||||
First Abu Dhabi Bank PJSC | 122 | 507 | ||||||
|
| |||||||
| 24,989 | ||||||||
|
| |||||||
TOTAL COMMON STOCKS | 3,252,355 | |||||||
|
| |||||||
| PREFERRED STOCKS — 3.4% |
| |||||||
| Brazil — 2.1% | ||||||||
Alpargatas SA* | 449 | 2,693 | ||||||
Azul SA* | 109 | 1,242 | ||||||
Banco Bradesco SA | 37 | 295 | ||||||
Banco do Estado do Rio Grande do Sul SA, Class B | 289 | 1,583 | ||||||
Bradespar SA | 161 | 1,108 | ||||||
Braskem SA, Class A* | 279 | 1,905 | ||||||
Cia Brasileira de Distribuicao | 1,108 | 23,478 | ||||||
Cia de Transmissao de Energia Eletrica Paulista | 428 | 2,569 | ||||||
Cia Energetica de Minas Gerais | 306 | 1,093 | ||||||
Cia Paranaense de Energia, Class B | 333 | 4,198 | ||||||
Gerdau SA | 253 | 788 | ||||||
Itau Unibanco Holding SA | 242 | 1,988 | ||||||
Itausa — Investimentos Itau SA | 4,617 | 13,732 | ||||||
Lojas Americanas SA | 82 | 372 | ||||||
Telefonica Brasil SA | 1,247 | 16,196 | ||||||
|
| |||||||
| 73,240 | ||||||||
|
| |||||||
| Chile — 0.2% | ||||||||
Embotelladora Andina SA, Class B | 818 | 2,535 | ||||||
Sociedad Quimica y Minera de Chile SA, Class B | 161 | 3,983 | ||||||
|
| |||||||
| 6,518 | ||||||||
|
| |||||||
| Colombia — 0.2% | ||||||||
Bancolombia SA | 240 | 2,995 | ||||||
Grupo Aval Acciones y Valores SA | 10,008 | 3,755 | ||||||
Grupo de Inversiones Suramericana SA | 56 | 505 | ||||||
|
| |||||||
| 7,255 | ||||||||
|
| |||||||
| Russia — 0.9% | ||||||||
Bashneft PJSC | 315 | 7,420 | ||||||
Surgutneftegas PJSC | 30,856 | 14,937 | ||||||
Tatneft PJSC | 193 | 1,840 | ||||||
Transneft PJSC | 4 | 9,031 | ||||||
|
| |||||||
| 33,228 | ||||||||
|
| |||||||
TOTAL PREFERRED STOCKS | 120,241 | |||||||
|
| |||||||
| See Notes to Financial Statements. | 39 |
DBX ETF Trust
Schedule of Investments
Xtrackers FTSE Emerging Comprehensive Factor ETF(Continued)
August 31, 2019
| Principal | Value | ||||||||||
| CORPORATE BONDS — 0.0% |
| |||||||||||
| India — 0.0% | ||||||||||||
Britannia Industries Ltd. | INR | $ | 1,440 | $ | 0 | |||||||
|
| |||||||||||
Number | ||||||||||||
| WARRANTS — 0.0% | ||||||||||||
| Thailand — 0.0% | ||||||||||||
Minor International PCL*, expires 9/30/21 | 35 | 5 | ||||||||||
|
| |||||||||||
| EXCHANGE-TRADED FUNDS — 1.7% | ||||||||||||
Global X MSCI Pakistan ETF | 1,989 | 11,178 | ||||||||||
iShares Core MSCI Emerging Markets ETF | 361 | 17,426 | ||||||||||
iShares MSCI Emerging Markets ETF (a) | 400 | 16,076 | ||||||||||
Number | Value | |||||||||||
| EXCHANGE-TRADED FUNDS (Continued) | ||||||||||||
Vanguard FTSE Emerging Markets ETF | 380 | $ | 15,352 | |||||||||
|
| |||||||||||
TOTAL EXCHANGE-TRADED FUNDS | 60,032 | |||||||||||
|
| |||||||||||
| SECURITIES LENDING COLLATERAL — 0.6% | ||||||||||||
DWS Government & Agency Securities Portfolio “DWS Government Cash Institutional Shares”, 2.04% (d)(e) | 18,715 | 18,715 | ||||||||||
|
| |||||||||||
| CASH EQUIVALENTS — 0.4% | ||||||||||||
DWS Government Money Market Series “Institutional Shares”, 2.09% (d) (Cost $15,468) | 15,468 | 15,468 | ||||||||||
|
| |||||||||||
TOTAL INVESTMENTS — 99.5% (Cost $3,535,793) | $ | 3,466,816 | ||||||||||
Other assets and liabilities, net — 0.5% | 16,938 | |||||||||||
|
| |||||||||||
NET ASSETS — 100.0% | $ | 3,483,754 | ||||||||||
|
| |||||||||||
A summary of the Fund’s transactions with affiliated investments during the year ended August 31, 2019 is as follows:
| Value ($) at 8/31/2018 | Purchases Cost ($) | Sales Proceeds ($) | Net Realized Gain/(Loss) ($) | Net Change in Unrealized Appreciation (Depreciation) ($) | Income ($) | Capital Gain Distributions ($) | Number of Shares at 8/31/2019 | Value ($) at 8/31/2019 | ||||||||||||||||||||||||||||||
SECURITIES LENDING COLLATERAL —0.6% | ||||||||||||||||||||||||||||||||||||||
DWS Government & Agency Securities Portfolio “DWS Government Cash Institutional Shares”, 2.04% (d)(e) | ||||||||||||||||||||||||||||||||||||||
| 90,527 | — | (71,812 | )(f) | — | — | 429 | — | 18,715 | 18,715 | |||||||||||||||||||||||||||||
CASH EQUIVALENTS —0.4% | ||||||||||||||||||||||||||||||||||||||
DWS Government Money Market Series “Institutional Shares”, 2.09% (d) | ||||||||||||||||||||||||||||||||||||||
| — | 319,204 | (303,736 | ) | — | — | 119 | — | 15,468 | 15,468 | |||||||||||||||||||||||||||||
|
|
|
|
|
|
|
|
|
|
|
|
|
|
|
|
|
| |||||||||||||||||||||
| 90,527 | 319,204 | (375,548 | ) | — | — | 548 | — | 34,183 | 34,183 | |||||||||||||||||||||||||||||
|
|
|
|
|
|
|
|
|
|
|
|
|
|
|
|
|
| |||||||||||||||||||||
| * | Non-income producing security. |
| (a) | All or a portion of these securities were on loan. In addition, “Other assets and liabilities, net” may include pending sales that are also on loan. The value of securities loaned at August 31, 2019 amounted to $37,898, which is 1.1% of net assets. |
| (b) | Investment was valued using significant unobservable inputs. |
| (c) | Stapled Security — A security contractually bound to one or more other securities to form a single saleable unit which cannot be sold separately. |
| (d) | Affiliated fund managed by DWS Investment Management Americas, Inc. The rate shown is the annualizedseven-day yield at period end. |
| (e) | Represents cash collateral held in connection with securities lending. Income earned by the Fund is net of borrower rebates. In addition, the Fund heldnon-cash U.S. Treasury securities collateral having a value of $22,420. |
| (f) | Represents the net increase (purchase cost) or decrease (sales proceeds) in the amount invested in cash collateral for the period ended August 31, 2019. |
| ADR: | American Depositary Receipt |
| CPO: | Ordinary Participation Certificates |
| GDR: | Global Depositary Receipt |
| KSC: | Kuwait Shareholding Company |
| KSCP: | Kuwait Shareholding Company Public |
| NVDR: | Non Voting Depositary Receipt |
| PJSC: | Public Joint Stock Company |
| PSQC: | Public Shareholders Qatari Company |
| QPSC: | Qatari Public Shareholders Company |
| See Notes to Financial Statements. | 40 |
DBX ETF Trust
Schedule of Investments
Xtrackers FTSE Emerging Comprehensive Factor ETF(Continued)
August 31, 2019
| QSC: | Qatari Shareholders Company |
| REIT: | Real Estate Investment Trust |
| SAE: | Societe Anonyme Egyptienne |
| SAQ: | Societe Anonyme Qatar |
| 144A: | Security exempt from registration under Rule 144A of the Securities Act of 1933. These securities may be resold in transactions exempt from registration, normally to qualified institutional buyers. |
At August 31, 2019, open futures contracts purchased were as follows:
Contract Description | Currency | Number of Contracts | Notional Amount | Contract Value | Expiration Date | Unrealized Depreciation | ||||||||||||
MSCI Emerging Markets Index Futures | USD | 1 | $ | 50,370 | $ | 49,200 | 9/20/2019 | $ | (1,170 | ) | ||||||||
For information on the Fund’s policy and additional disclosures regarding open futures contracts, please refer to the Derivatives section of Note 2 in the accompanying Notes to Financial Statements.
Currency Abbreviations
| USD | U.S. Dollar |
Fair Value Measurements
Various inputs are used in determining the value of the Fund’s investments. These inputs are summarized in three broad levels. Level 1 includes quoted prices in active markets for identical securities. Level 2 includes other significant observable inputs (including quoted prices for similar securities, interest rates, prepayment speeds and credit risk). Level 3 includes significant unobservable inputs (including the Fund’s own assumptions in determining the fair value of investments). The level assigned to the securities valuations may not be an indication of the risk or liquidity associated with investing in those securities.
The following is a summary of the inputs used as of August 31, 2019 in valuing the Fund’s investments. For information on the Fund’s policy regarding the valuation of investments, please refer to the Security Valuation section of Note 2 in the accompanying Notes to Financial Statements.
Assets | Level 1 | Level 2 | Level 3 | Total | ||||||||||||
Common Stocks (g) | $ | 3,249,372 | $ | — | $ | 2,983 | $ | 3,252,355 | ||||||||
Preferred Stocks (g) | 120,241 | — | — | 120,241 | ||||||||||||
Corporate Bonds | — | — | 0 | 0 | ||||||||||||
Warrants | 5 | — | — | 5 | ||||||||||||
Exchange-Traded Funds | 60,032 | — | — | 60,032 | ||||||||||||
Short-Term Investments (g) | 34,183 | — | — | 34,183 | ||||||||||||
|
|
|
|
|
|
|
| |||||||||
TOTAL | $ | 3,463,833 | $ | — | $ | 2,983 | $ | 3,466,816 | ||||||||
|
|
|
|
|
|
|
| |||||||||
Liabilities | Level 1 | Level 2 | Level 3 | Total | ||||||||||||
Derivatives (h) | ||||||||||||||||
Futures Contracts | $ | (1,170 | ) | $ | — | $ | — | $ | (1,170 | ) | ||||||
|
|
|
|
|
|
|
| |||||||||
TOTAL | $ | (1,170 | ) | $ | — | $ | — | $ | (1,170 | ) | ||||||
|
|
|
|
|
|
|
| |||||||||
| (g) | See Schedule of Investments for additional detailed categorizations. |
| (h) | Derivatives include unrealized appreciation (depreciation) on open futures contracts. |
During the year ended August 31, 2019, the amount of transfers between Level 1 and Level 3 was $2,198. The investments were transferred from Level 1 to Level 3 due to the lack of observable market data due to a decrease in market activity.
| See Notes to Financial Statements. | 41 |
DBX ETF Trust
Schedule of Investments
Xtrackers Russell 1000 Comprehensive Factor ETF
August 31, 2019
Number | Value | |||||||
| COMMON STOCKS — 99.1% |
| |||||||
| Communication Services — 3.0% | ||||||||
Activision Blizzard, Inc. | 345 | $ | 17,457 | |||||
Alphabet, Inc., Class A* | 33 | 39,288 | ||||||
Alphabet, Inc., Class C* | 50 | 59,405 | ||||||
Altice USA, Inc., Class A* | 2,036 | 58,800 | ||||||
AMC Networks, Inc., Class A* (a) | 1,223 | 59,316 | ||||||
AT&T, Inc. | 2,358 | 83,143 | ||||||
Cable One, Inc. (a) | 261 | 338,679 | ||||||
CBS Corp., Class B | 3,976 | 167,231 | ||||||
CenturyLink, Inc. (a) | 4,050 | 46,089 | ||||||
Charter Communications, Inc., Class A* | 346 | 141,718 | ||||||
Cinemark Holdings, Inc. (a) | 8,758 | 334,205 | ||||||
Comcast Corp., Class A | 2,771 | 122,644 | ||||||
Discovery, Inc., Class A* (a) | 349 | 9,632 | ||||||
Discovery, Inc., Class C* | 1,027 | 26,733 | ||||||
DISH Network Corp., Class A* | 3,658 | 122,763 | ||||||
Electronic Arts, Inc.* | 265 | 24,825 | ||||||
Facebook, Inc., Class A* | 177 | 32,864 | ||||||
Fox Corp., Class A | 11,848 | 392,998 | ||||||
Fox Corp., Class B | 6,794 | 222,843 | ||||||
IAC/InterActiveCorp* | 1,746 | 444,601 | ||||||
Interpublic Group of Cos., Inc. | 11,469 | 228,004 | ||||||
John Wiley & Sons, Inc., Class A | 1,290 | 57,405 | ||||||
Liberty Broadband Corp., Class C* | 157 | 16,554 | ||||||
Liberty Media Corp.-Liberty Formula One, Class C* | 595 | 24,835 | ||||||
Liberty Media Corp-Liberty SiriusXM, Class A* | 1,098 | 44,458 | ||||||
Liberty Media Corp-Liberty SiriusXM, Class C* | 2,117 | 86,395 | ||||||
Live Nation Entertainment, Inc.* | 3,296 | 229,105 | ||||||
Madison Square Garden Co., Class A* | 643 | 162,248 | ||||||
Match Group, Inc. (a) | 318 | 26,966 | ||||||
New York Times Co., Class A (a) | 7,213 | 210,620 | ||||||
News Corp., Class A | 944 | 12,980 | ||||||
Nexstar Media Group, Inc., Class A | 2,148 | 212,416 | ||||||
Omnicom Group, Inc. (a) | 10,420 | 792,545 | ||||||
Sinclair Broadcast Group, Inc., Class A | 1,211 | 53,974 | ||||||
Sirius XM Holdings, Inc. (a) | 7,197 | 44,406 | ||||||
Take-Two Interactive Software, Inc.* | 806 | 106,368 | ||||||
Telephone & Data Systems, Inc. | 9,753 | 245,776 | ||||||
T-Mobile US, Inc.* | 1,440 | 112,392 | ||||||
Tribune Media Co., Class A | 3,785 | 176,305 | ||||||
United States Cellular Corp.* (a) | 1,258 | 45,275 | ||||||
Verizon Communications, Inc. | 2,939 | 170,932 | ||||||
Viacom, Inc., Class B | 3,681 | 91,951 | ||||||
Walt Disney Co. | 762 | 104,592 | ||||||
Zayo Group Holdings, Inc.* | 2,150 | 72,369 | ||||||
Zynga, Inc., Class A* | 10,920 | 62,353 | ||||||
|
| |||||||
| 6,136,458 | ||||||||
|
| |||||||
| Consumer Discretionary — 13.7% | ||||||||
Advance Auto Parts, Inc. | 3,019 | 416,471 | ||||||
Amazon.com, Inc.* | 16 | 28,421 | ||||||
Aptiv PLC | 1,585 | 131,824 | ||||||
Aramark | 1,833 | 74,896 | ||||||
AutoNation, Inc.* (a) | 477 | 22,638 | ||||||
Number | Value | |||||||
| Consumer Discretionary (Continued) | ||||||||
AutoZone, Inc.* | 931 | $ | 1,025,673 | |||||
Best Buy Co., Inc. | 6,923 | 440,649 | ||||||
Booking Holdings, Inc.* | 66 | 129,783 | ||||||
BorgWarner, Inc. | 3,555 | 116,000 | ||||||
Bright Horizons Family Solutions, Inc.* | 2,049 | 338,187 | ||||||
Brunswick Corp. | 531 | 24,745 | ||||||
Burlington Stores, Inc.* | 1,714 | 347,068 | ||||||
CarMax, Inc.* (a) | 2,183 | 181,800 | ||||||
Carnival Corp. | 5,082 | 224,015 | ||||||
Carter’s, Inc. (a) | 2,238 | 204,732 | ||||||
Chipotle Mexican Grill, Inc.* | 289 | 242,303 | ||||||
Choice Hotels International, Inc. | 921 | 83,793 | ||||||
Columbia Sportswear Co. (a) | 1,037 | 97,260 | ||||||
D.R. Horton, Inc. | 7,425 | 367,315 | ||||||
Darden Restaurants, Inc. | 9,710 | 1,174,716 | ||||||
Dick’s Sporting Goods, Inc. (a) | 3,761 | 128,024 | ||||||
Dollar General Corp. | 7,989 | 1,247,003 | ||||||
Dollar Tree, Inc.* | 2,222 | 225,600 | ||||||
Domino’s Pizza, Inc. (a) | 1,087 | 246,575 | ||||||
Dunkin’ Brands Group, Inc. | 2,954 | 243,528 | ||||||
eBay, Inc. | 9,256 | 372,924 | ||||||
Expedia Group, Inc. | 1,573 | 204,647 | ||||||
Extended Stay America, Inc. | 2,750 | 38,638 | ||||||
Five Below, Inc.* | 494 | 60,698 | ||||||
Foot Locker, Inc. (a) | 5,212 | 188,622 | ||||||
Ford Motor Co. | 25,770 | 236,311 | ||||||
frontdoor, Inc.* | 4,367 | 224,202 | ||||||
Gap, Inc. (a) | 2,414 | 38,117 | ||||||
Garmin Ltd. | 8,585 | 700,278 | ||||||
General Motors Co. | 4,340 | 160,971 | ||||||
Gentex Corp. | 15,377 | 409,028 | ||||||
Genuine Parts Co. | 10,323 | 932,064 | ||||||
Goodyear Tire & Rubber Co. | 1,252 | 14,360 | ||||||
Graham Holdings Co., Class B | 619 | 435,813 | ||||||
Grand Canyon Education, Inc.* | 1,363 | 171,193 | ||||||
H&R Block, Inc. (a) | 23,663 | 573,118 | ||||||
Hanesbrands, Inc. (a) | 5,104 | 69,721 | ||||||
Harley-Davidson, Inc. (a) | 2,986 | 95,253 | ||||||
Hasbro, Inc. | 1,810 | 199,951 | ||||||
Hilton Worldwide Holdings, Inc. | 2,425 | 223,997 | ||||||
Home Depot, Inc. | 551 | 125,578 | ||||||
Hyatt Hotels Corp., Class A (a) | 1,420 | 102,453 | ||||||
Kohl’s Corp. (a) | 3,147 | 148,727 | ||||||
L Brands, Inc. (a) | 817 | 13,489 | ||||||
Las Vegas Sands Corp. | 629 | 34,891 | ||||||
Lear Corp. | 1,130 | 126,854 | ||||||
Leggett & Platt, Inc. (a) | 7,412 | 275,652 | ||||||
Lennar Corp., Class A | 3,629 | 185,079 | ||||||
LKQ Corp.* | 4,459 | 117,138 | ||||||
Lowe’s Cos., Inc. | 5,063 | 568,069 | ||||||
Lululemon Athletica, Inc.* | 851 | 157,154 | ||||||
Marriott International, Inc., Class A | 1,109 | 139,801 | ||||||
McDonald’s Corp. | 708 | 154,323 | ||||||
MGM Resorts International | 1,673 | 46,944 | ||||||
Mohawk Industries, Inc.* | 432 | 51,361 | ||||||
NIKE, Inc., Class B | 3,545 | 299,553 | ||||||
Nordstrom, Inc. (a) | 1,731 | 50,147 | ||||||
| See Notes to Financial Statements. | 42 |
DBX ETF Trust
Schedule of Investments
Xtrackers Russell 1000 Comprehensive Factor ETF(Continued)
August 31, 2019
Number | Value | |||||||
| Consumer Discretionary (Continued) | ||||||||
Norwegian Cruise Line Holdings Ltd.* | 5,855 | $ | 297,141 | |||||
NVR, Inc.* | 243 | 874,557 | ||||||
Ollie’s Bargain Outlet Holdings, Inc.* (a) | 1,006 | 55,783 | ||||||
O’Reilly Automotive, Inc.* | 1,878 | 720,701 | ||||||
Penske Automotive Group, Inc. (a) | 1,066 | 45,603 | ||||||
Planet Fitness, Inc., Class A* | 1,528 | 107,892 | ||||||
Polaris, Inc. | 144 | 11,811 | ||||||
Pool Corp. | 1,659 | 325,794 | ||||||
PulteGroup, Inc. | 28,718 | 970,668 | ||||||
PVH Corp. | 565 | 42,827 | ||||||
Qurate Retail, Inc., Series A* | 2,323 | 24,879 | ||||||
Ralph Lauren Corp. | 848 | 74,912 | ||||||
Ross Stores, Inc. | 8,187 | 867,904 | ||||||
Royal Caribbean Cruises Ltd. | 2,107 | 219,718 | ||||||
Service Corp. International | 7,584 | 351,139 | ||||||
ServiceMaster Global Holdings, Inc.* | 513 | 29,262 | ||||||
Six Flags Entertainment Corp. | 1,074 | 63,549 | ||||||
Starbucks Corp. | 11,089 | 1,070,754 | ||||||
Tapestry, Inc. | 2,422 | 50,014 | ||||||
Target Corp. | 5,990 | 641,170 | ||||||
Tempur Sealy International, Inc.* (a) | 348 | 26,838 | ||||||
Thor Industries, Inc. (a) | 335 | 15,380 | ||||||
Tiffany & Co. (a) | 759 | 64,416 | ||||||
TJX Cos., Inc. | 16,157 | 888,150 | ||||||
Toll Brothers, Inc. | 9,721 | 351,803 | ||||||
Tractor Supply Co. | 8,875 | 904,185 | ||||||
Ulta Beauty, Inc.* | 1,467 | 348,750 | ||||||
Vail Resorts, Inc. | 398 | 94,039 | ||||||
VF Corp. | 4,616 | 378,281 | ||||||
Wendy’s Co. (a) | 12,123 | 266,706 | ||||||
Whirlpool Corp. | 1,929 | 268,305 | ||||||
Williams-Sonoma, Inc. (a) | 4,170 | 274,386 | ||||||
Wyndham Destinations, Inc. | 4,225 | 187,337 | ||||||
Wyndham Hotels & Resorts, Inc. | 464 | 23,840 | ||||||
Yum China Holdings, Inc. | 6,624 | 300,928 | ||||||
Yum! Brands, Inc. | 7,015 | 819,212 | ||||||
|
| |||||||
| 27,768,772 | ||||||||
|
| |||||||
| Consumer Staples — 6.6% | ||||||||
Altria Group, Inc. | 3,953 | 172,904 | ||||||
Archer-Daniels-Midland Co. | 1,325 | 50,416 | ||||||
Brown-Forman Corp., Class A | 590 | 33,966 | ||||||
Brown-Forman Corp., Class B (a) | 1,808 | 106,654 | ||||||
Bunge Ltd. | 282 | 15,062 | ||||||
Campbell Soup Co. | 1,445 | 65,025 | ||||||
Casey’s General Stores, Inc. (a) | 4,506 | 756,332 | ||||||
Church & Dwight Co., Inc. | 8,758 | 698,713 | ||||||
Clorox Co. | 3,461 | 547,392 | ||||||
Coca-Cola Co. | 820 | 45,133 | ||||||
Colgate-Palmolive Co. | 6,989 | 518,234 | ||||||
Conagra Brands, Inc. | 3,666 | 103,968 | ||||||
Constellation Brands, Inc., Class A | 833 | 170,224 | ||||||
Costco Wholesale Corp. | 2,136 | 629,607 | ||||||
Estee Lauder Cos., Inc., Class A | 2,651 | 524,872 | ||||||
Flowers Foods, Inc. (a) | 9,238 | 210,626 | ||||||
General Mills, Inc. | 5,547 | 298,429 | ||||||
Herbalife Nutrition Ltd.* (a) | 968 | 33,328 | ||||||
Number | Value | |||||||
| Consumer Staples (Continued) | ||||||||
Hershey Co. | 3,483 | $ | 551,986 | |||||
Hormel Foods Corp. (a) | 10,327 | 440,033 | ||||||
Ingredion, Inc. | 2,105 | 162,653 | ||||||
JM Smucker Co. (a) | 4,008 | 421,481 | ||||||
Kellogg Co. (a) | 3,517 | 220,868 | ||||||
Kimberly-Clark Corp. | 6,252 | 882,220 | ||||||
Kroger Co. | 13,443 | 318,330 | ||||||
Lamb Weston Holdings, Inc. | 4,088 | 287,754 | ||||||
McCormick & Co., Inc. (a) | 2,756 | 448,870 | ||||||
Molson Coors Brewing Co., Class B | 4,533 | 232,815 | ||||||
Mondelez International, Inc., Class A | 6,483 | 357,991 | ||||||
Monster Beverage Corp.* | 2,727 | 159,993 | ||||||
PepsiCo, Inc. | 1,645 | 224,921 | ||||||
Philip Morris International, Inc. | 3,510 | 253,036 | ||||||
Pilgrim’s Pride Corp.* | 2,480 | 77,277 | ||||||
Post Holdings, Inc.* | 1,603 | 159,803 | ||||||
Procter & Gamble Co. | 975 | 117,224 | ||||||
Seaboard Corp. | 9 | 37,172 | ||||||
Spectrum Brands Holdings, Inc. (a) | 1,387 | 77,492 | ||||||
Sprouts Farmers Market, Inc.* (a) | 8,829 | 158,481 | ||||||
Sysco Corp. | 13,882 | 1,031,849 | ||||||
TreeHouse Foods, Inc.* (a) | 1,411 | 71,467 | ||||||
Tyson Foods, Inc., Class A | 10,873 | 1,011,624 | ||||||
US Foods Holding Corp.* | 10,887 | 440,379 | ||||||
Walgreens Boots Alliance, Inc. | 6,352 | 325,159 | ||||||
Walmart, Inc. | 503 | 57,473 | ||||||
|
| |||||||
| 13,509,236 | ||||||||
|
| |||||||
| Energy — 1.3% | ||||||||
Apache Corp. | 1,142 | 24,633 | ||||||
Apergy Corp.* | 548 | 14,237 | ||||||
Baker Hughes a GE Co. (a) | 1,192 | 25,854 | ||||||
Cabot Oil & Gas Corp. | 12,642 | 216,431 | ||||||
Cheniere Energy, Inc.* | 1,105 | 65,980 | ||||||
Chevron Corp. | 1,265 | 148,916 | ||||||
Cimarex Energy Co. (a) | 2,380 | 101,816 | ||||||
Concho Resources, Inc. | 590 | 43,159 | ||||||
ConocoPhillips | 6,043 | 315,324 | ||||||
Devon Energy Corp. | 1,324 | 29,115 | ||||||
Diamondback Energy, Inc. (a) | 182 | 17,851 | ||||||
EOG Resources, Inc. | 2,554 | 189,481 | ||||||
EQT Corp. (a) | 1,616 | 16,435 | ||||||
Equitrans Midstream Corp. (a) | 7,075 | 95,442 | ||||||
Exxon Mobil Corp. | 1,250 | 85,600 | ||||||
Halliburton Co. | 749 | 14,111 | ||||||
Helmerich & Payne, Inc. (a) | 665 | 24,997 | ||||||
Hess Corp. | 519 | 32,671 | ||||||
HollyFrontier Corp. | 726 | 32,205 | ||||||
Kinder Morgan, Inc. | 6,044 | 122,512 | ||||||
Murphy Oil Corp. | 397 | 7,237 | ||||||
Noble Energy, Inc. (a) | 569 | 12,848 | ||||||
Occidental Petroleum Corp. | 2,795 | 121,527 | ||||||
ONEOK, Inc. | 951 | 67,787 | ||||||
Phillips 66 | 3,770 | 371,835 | ||||||
Pioneer Natural Resources Co. | 1,008 | 124,407 | ||||||
Schlumberger Ltd. | 961 | 31,165 | ||||||
| See Notes to Financial Statements. | 43 |
DBX ETF Trust
Schedule of Investments
Xtrackers Russell 1000 Comprehensive Factor ETF(Continued)
August 31, 2019
Number | Value | |||||||
| Energy (Continued) | ||||||||
Valero Energy Corp. | 3,289 | $ | 247,596 | |||||
|
| |||||||
| 2,601,172 | ||||||||
|
| |||||||
| Financials — 12.2% | ||||||||
Affiliated Managers Group, Inc. | 161 | 12,337 | ||||||
Aflac, Inc. | 8,917 | 447,455 | ||||||
AGNC Investment Corp. REIT | 4,921 | 73,175 | ||||||
Alleghany Corp.* | 125 | 93,664 | ||||||
Allstate Corp. | 4,091 | 418,877 | ||||||
Ally Financial, Inc. | 9,786 | 306,791 | ||||||
American Express Co. | 1,786 | 214,981 | ||||||
American Financial Group, Inc. | 1,520 | 153,474 | ||||||
American International Group, Inc. | 747 | 38,874 | ||||||
American National Insurance Co. | 311 | 35,476 | ||||||
Ameriprise Financial, Inc. | 1,431 | 184,570 | ||||||
Annaly Capital Management, Inc. REIT | 11,289 | 93,699 | ||||||
Aon PLC | 1,767 | 344,300 | ||||||
Arch Capital Group Ltd.* | 12,000 | 474,000 | ||||||
Arthur J Gallagher & Co. | 7,120 | 645,855 | ||||||
Associated Banc-Corp. | 1,649 | 31,727 | ||||||
Assurant, Inc. | 1,209 | 148,707 | ||||||
Assured Guaranty Ltd. | 7,127 | 303,254 | ||||||
Athene Holding, Ltd., Class A* | 3,117 | 121,127 | ||||||
AXA Equitable Holdings, Inc. | 4,354 | 90,433 | ||||||
Axis Capital Holdings Ltd. | 724 | 44,446 | ||||||
Bank of America Corp. | 647 | 17,799 | ||||||
Bank of Hawaii Corp. (a) | 712 | 58,868 | ||||||
Bank of New York Mellon Corp. | 1,815 | 76,339 | ||||||
BankUnited, Inc. | 1,375 | 43,670 | ||||||
BB&T Corp. (a) | 3,268 | 155,720 | ||||||
Berkshire Hathaway, Inc., Class B* | 82 | 16,680 | ||||||
BlackRock, Inc. | 92 | 38,876 | ||||||
Brighthouse Financial, Inc.* | 463 | 16,325 | ||||||
Brown & Brown, Inc. | 11,268 | 415,677 | ||||||
Capital One Financial Corp. | 2,459 | 212,999 | ||||||
Cboe Global Markets, Inc. | 3,314 | 394,896 | ||||||
Charles Schwab Corp. | 783 | 29,965 | ||||||
Chimera Investment Corp. REIT (a) | 9,448 | 180,173 | ||||||
Chubb Ltd. | 1,512 | 236,295 | ||||||
Cincinnati Financial Corp. | 2,118 | 238,254 | ||||||
CIT Group, Inc. | 2,414 | 102,812 | ||||||
Citigroup, Inc. | 889 | 57,207 | ||||||
Citizens Financial Group, Inc. | 2,466 | 83,203 | ||||||
CME Group, Inc. | 480 | 104,299 | ||||||
CNA Financial Corp. | 621 | 29,268 | ||||||
Comerica, Inc. | 1,111 | 68,493 | ||||||
Commerce Bancshares, Inc. (a) | 1,653 | 94,337 | ||||||
Credit Acceptance Corp.* | 317 | 143,490 | ||||||
Cullen/Frost Bankers, Inc. (a) | 546 | 45,323 | ||||||
Discover Financial Services | 6,455 | 516,206 | ||||||
E*TRADE Financial Corp. | 1,025 | 42,783 | ||||||
East West Bancorp, Inc. | 863 | 35,495 | ||||||
Eaton Vance Corp. | 2,159 | 93,096 | ||||||
Erie Indemnity Co., Class A (a) | 1,923 | 421,733 | ||||||
Evercore, Inc., Class A (a) | 1,808 | 144,206 | ||||||
Everest Re Group Ltd. | 430 | 101,428 | ||||||
FactSet Research Systems, Inc. (a) | 2,107 | 573,294 | ||||||
Number | Value | |||||||
| Financials (Continued) | ||||||||
Fidelity National Financial, Inc. | 17,490 | $ | 768,511 | |||||
Fifth Third Bancorp | 5,387 | 142,486 | ||||||
First American Financial Corp. | 10,583 | 618,576 | ||||||
First Citizens BancShares, Inc., Class A | 174 | 77,360 | ||||||
First Hawaiian, Inc. | 1,443 | 37,085 | ||||||
First Horizon National Corp. | 1,931 | 30,568 | ||||||
First Republic Bank | 919 | 82,453 | ||||||
FNB Corp. (a) | 5,020 | 53,965 | ||||||
Franklin Resources, Inc. (a) | 18,002 | 473,093 | ||||||
Globe Life, Inc. | 4,502 | 401,849 | ||||||
Goldman Sachs Group, Inc. | 409 | 83,399 | ||||||
Hanover Insurance Group, Inc. | 2,577 | 343,128 | ||||||
Hartford Financial Services Group, Inc. | 5,539 | 322,813 | ||||||
Huntington Bancshares, Inc. | 8,851 | 117,276 | ||||||
Interactive Brokers Group, Inc., Class A (a) | 314 | 14,821 | ||||||
Intercontinental Exchange, Inc. | 1,756 | 164,151 | ||||||
Invesco Ltd. (a) | 3,786 | 59,440 | ||||||
Janus Henderson Group PLC (a) | 2,340 | 44,717 | ||||||
Jefferies Financial Group, Inc. | 3,178 | 59,238 | ||||||
JPMorgan Chase & Co. | 147 | 16,149 | ||||||
Kemper Corp. | 1,311 | 91,744 | ||||||
KeyCorp | 5,944 | 98,670 | ||||||
Lazard Ltd., Class A (a) | 2,408 | 82,691 | ||||||
Legg Mason, Inc. | 904 | 33,258 | ||||||
Lincoln National Corp. | 1,894 | 100,155 | ||||||
Loews Corp. | 4,981 | 239,437 | ||||||
LPL Financial Holdings, Inc. | 3,736 | 280,013 | ||||||
M&T Bank Corp. | 1,030 | 150,596 | ||||||
Markel Corp.* | 37 | 42,294 | ||||||
MarketAxess Holdings, Inc. (a) | 1,084 | 431,020 | ||||||
Marsh & McLennan Cos., Inc. | 5,909 | 590,250 | ||||||
Mercury General Corp. | 538 | 28,783 | ||||||
MetLife, Inc. | 3,643 | 161,385 | ||||||
MFA Financial, Inc. REIT | 17,183 | 123,202 | ||||||
MGIC Investment Corp. | 52,232 | 660,735 | ||||||
Moody’s Corp. | 2,107 | 454,227 | ||||||
Morgan Stanley | 1,067 | 44,270 | ||||||
Morningstar, Inc. | 1,079 | 174,345 | ||||||
MSCI, Inc. | 2,778 | 651,802 | ||||||
Nasdaq, Inc. | 2,208 | 220,447 | ||||||
Navient Corp. (a) | 2,486 | 31,672 | ||||||
New Residential Investment Corp. REIT (a) | 8,541 | 120,172 | ||||||
New York Community Bancorp, Inc. (a) | 7,730 | 89,204 | ||||||
Northern Trust Corp. | 975 | 85,732 | ||||||
Old Republic International Corp. | 11,634 | 271,770 | ||||||
PacWest Bancorp | 809 | 27,571 | ||||||
People’s United Financial, Inc. (a) | 4,722 | 67,855 | ||||||
Pinnacle Financial Partners, Inc. (a) | 834 | 43,927 | ||||||
PNC Financial Services Group, Inc. | 904 | 116,553 | ||||||
Popular, Inc. | 3,700 | 194,509 | ||||||
Primerica, Inc. | 1,583 | 188,646 | ||||||
Principal Financial Group, Inc. | 3,930 | 209,155 | ||||||
Progressive Corp. | 14,026 | 1,063,171 | ||||||
Prosperity Bancshares, Inc. (a) | 871 | 56,545 | ||||||
Prudential Financial, Inc. | 2,058 | 164,825 | ||||||
| See Notes to Financial Statements. | 44 |
DBX ETF Trust
Schedule of Investments
Xtrackers Russell 1000 Comprehensive Factor ETF(Continued)
August 31, 2019
Number | Value | |||||||
| Financials (Continued) | ||||||||
Raymond James Financial, Inc. | 1,880 | $ | 147,599 | |||||
Regions Financial Corp. | 4,605 | 67,325 | ||||||
Reinsurance Group of America, Inc. | 1,957 | 301,319 | ||||||
RenaissanceRe Holdings Ltd. | 1,516 | 273,714 | ||||||
S&P Global, Inc. | 1,574 | 409,539 | ||||||
Santander Consumer USA Holdings, Inc. | 1,161 | 30,314 | ||||||
SEI Investments Co. | 3,055 | 175,693 | ||||||
Signature Bank | 575 | 67,074 | ||||||
SLM Corp. | 1,405 | 11,858 | ||||||
Starwood Property Trust, Inc. REIT | 5,897 | 138,167 | ||||||
State Street Corp. | 502 | 25,758 | ||||||
Sterling Bancorp | 2,247 | 42,850 | ||||||
SunTrust Banks, Inc. | 1,921 | 118,161 | ||||||
SVB Financial Group* | 48 | 9,342 | ||||||
Synchrony Financial | 10,982 | 351,973 | ||||||
Synovus Financial Corp. | 623 | 22,141 | ||||||
T. Rowe Price Group, Inc. | 3,782 | 418,365 | ||||||
TCF Financial Corp. | 1,071 | 41,298 | ||||||
TD Ameritrade Holding Corp. | 1,125 | 49,961 | ||||||
Travelers Cos., Inc. | 3,104 | 456,164 | ||||||
Two Harbors Investment Corp. REIT (a) | 2,327 | 29,390 | ||||||
Umpqua Holdings Corp. | 2,373 | 37,280 | ||||||
Unum Group | 3,079 | 78,237 | ||||||
US Bancorp | 2,500 | 131,725 | ||||||
Voya Financial, Inc. | 2,626 | 129,514 | ||||||
W.R. Berkley Corp. | 5,381 | 383,396 | ||||||
Webster Financial Corp. | 592 | 26,498 | ||||||
Wells Fargo & Co. | 198 | 9,221 | ||||||
Western Alliance Bancorp | 369 | 16,022 | ||||||
Willis Towers Watson PLC | 1,767 | 349,813 | ||||||
Wintrust Financial Corp. | 433 | 27,205 | ||||||
Zions Bancorp NA (a) | 1,465 | 60,197 | ||||||
|
| |||||||
| 24,805,253 | ||||||||
|
| |||||||
| Health Care — 7.9% | ||||||||
Abbott Laboratories | 1,290 | 110,063 | ||||||
AbbVie, Inc. | 1,030 | 67,712 | ||||||
Agilent Technologies, Inc. | 5,105 | 363,017 | ||||||
Alexion Pharmaceuticals, Inc.* | 246 | 24,787 | ||||||
Align Technology, Inc.* | 174 | 31,861 | ||||||
Allergan PLC | 93 | 14,854 | ||||||
AmerisourceBergen Corp. | 2,843 | 233,894 | ||||||
Amgen, Inc. | 1,426 | 297,492 | ||||||
Anthem, Inc. | 959 | 250,798 | ||||||
Baxter International, Inc. | 5,552 | 488,298 | ||||||
Becton Dickinson and Co. | 82 | 20,821 | ||||||
Biogen, Inc.* | 373 | 81,967 | ||||||
Bio-Rad Laboratories, Inc., Class A* | 340 | 114,821 | ||||||
Bio-Techne Corp. | 954 | 182,758 | ||||||
Boston Scientific Corp.* | 2,223 | 94,989 | ||||||
Bristol-Myers Squibb Co. | 4,099 | 197,039 | ||||||
Bruker Corp. | 3,557 | 153,556 | ||||||
Cantel Medical Corp. (a) | 156 | 14,341 | ||||||
Cardinal Health, Inc. | 6,367 | 274,609 | ||||||
Catalent, Inc.* (a) | 929 | 48,995 | ||||||
Celgene Corp.* | 1,465 | 141,812 | ||||||
Centene Corp.* | 661 | 30,816 | ||||||
Number | Value | |||||||
| Health Care (Continued) | ||||||||
Cerner Corp. | 11,887 | $ | 819,133 | |||||
Charles River Laboratories International, Inc.* | 1,218 | 159,802 | ||||||
Chemed Corp. | 1,100 | 472,373 | ||||||
Cooper Cos., Inc. | 991 | 306,962 | ||||||
Covetrus, Inc.* (a) | 14,078 | 187,097 | ||||||
Danaher Corp. | 1,171 | 166,387 | ||||||
DaVita, Inc.* | 859 | 48,422 | ||||||
DENTSPLY SIRONA, Inc. | 1,107 | 57,730 | ||||||
Edwards Lifesciences Corp.* | 1,244 | 275,969 | ||||||
Elanco Animal Health, Inc.* | 4,877 | 126,900 | ||||||
Eli Lilly & Co. | 1,935 | 218,597 | ||||||
Encompass Health Corp. | 2,931 | 178,176 | ||||||
Gilead Sciences, Inc. | 3,107 | 197,419 | ||||||
HCA Healthcare, Inc. | 3,751 | 450,870 | ||||||
Henry Schein, Inc.* (a) | 12,258 | 755,338 | ||||||
Hill-Rom Holdings, Inc. | 1,880 | 202,438 | ||||||
Hologic, Inc.* | 2,066 | 101,998 | ||||||
Humana, Inc. | 1,183 | 335,037 | ||||||
ICU Medical, Inc.* | 119 | 19,248 | ||||||
IDEXX Laboratories, Inc.* | 869 | 251,784 | ||||||
Illumina, Inc.* | 106 | 29,822 | ||||||
Incyte Corp.* | 185 | 15,137 | ||||||
Integra LifeSciences Holdings Corp.* | 248 | 14,885 | ||||||
Intuitive Surgical, Inc.* | 248 | 126,812 | ||||||
IQVIA Holdings, Inc.* | 1,628 | 252,584 | ||||||
Jazz Pharmaceuticals PLC* | 568 | 72,789 | ||||||
Johnson & Johnson | 509 | 65,335 | ||||||
Laboratory Corp. of America Holdings* | 1,620 | 271,447 | ||||||
Masimo Corp.* | 2,191 | 335,771 | ||||||
McKesson Corp. | 2,893 | 400,015 | ||||||
Medidata Solutions, Inc.* | 597 | 54,673 | ||||||
MEDNAX, Inc.* | 517 | 10,898 | ||||||
Medtronic PLC | 1,127 | 121,592 | ||||||
Merck & Co., Inc. | 1,405 | 121,490 | ||||||
Mettler-Toledo International, Inc.* | 612 | 401,956 | ||||||
Molina Healthcare, Inc.* | 575 | 74,911 | ||||||
PerkinElmer, Inc. (a) | 1,585 | 131,080 | ||||||
Perrigo Co. PLC (a) | 274 | 12,818 | ||||||
Pfizer, Inc. | 1,896 | 67,403 | ||||||
PRA Health Sciences, Inc.* | 683 | 67,508 | ||||||
Premier, Inc., Class A* | 7,681 | 270,832 | ||||||
QIAGEN NV* | 1,339 | 46,450 | ||||||
Quest Diagnostics, Inc. | 2,527 | 258,689 | ||||||
Regeneron Pharmaceuticals, Inc.* | 362 | 104,998 | ||||||
ResMed, Inc. | 2,668 | 371,652 | ||||||
STERIS PLC | 3,609 | 557,230 | ||||||
Stryker Corp. | 802 | 176,969 | ||||||
Teleflex, Inc. | 467 | 169,951 | ||||||
Thermo Fisher Scientific, Inc. | 513 | 147,262 | ||||||
United Therapeutics Corp.* (a) | 921 | 76,038 | ||||||
UnitedHealth Group, Inc. | 274 | 64,116 | ||||||
Universal Health Services, Inc., Class B | 4,404 | 636,730 | ||||||
Varian Medical Systems, Inc.* | 3,659 | 387,598 | ||||||
Veeva Systems, Inc., Class A* | 830 | 133,115 | ||||||
Vertex Pharmaceuticals, Inc.* | 167 | 30,063 | ||||||
Waters Corp.* | 1,810 | 383,521 | ||||||
| See Notes to Financial Statements. | 45 |
DBX ETF Trust
Schedule of Investments
Xtrackers Russell 1000 Comprehensive Factor ETF(Continued)
August 31, 2019
Number | Value | |||||||
| Health Care (Continued) | ||||||||
WellCare Health Plans, Inc.* | 103 | $ | 27,886 | |||||
West Pharmaceutical Services, Inc. | 3,491 | 507,801 | ||||||
Zimmer Biomet Holdings, Inc. | 1,125 | 156,600 | ||||||
Zoetis, Inc. | 2,033 | 257,012 | ||||||
|
| |||||||
| 15,984,419 | ||||||||
|
| |||||||
| Industrials — 16.7% | ||||||||
3M Co. | 682 | 110,293 | ||||||
Acuity Brands, Inc. | 1,709 | 214,326 | ||||||
AECOM* | 5,270 | 186,980 | ||||||
AGCO Corp. | 6,609 | 456,814 | ||||||
Air Lease Corp. | 1,393 | 57,865 | ||||||
Alaska Air Group, Inc. | 5,785 | 345,480 | ||||||
Allegion PLC | 3,683 | 354,562 | ||||||
Allison Transmission Holdings, Inc. | 10,846 | 481,888 | ||||||
AMERCO (a) | 365 | 128,341 | ||||||
American Airlines Group, Inc. (a) | 526 | 13,839 | ||||||
AMETEK, Inc. | 4,108 | 353,000 | ||||||
AO Smith Corp. | 2,315 | 107,694 | ||||||
Arconic, Inc. | 2,094 | 54,109 | ||||||
Armstrong World Industries, Inc. | 2,431 | 232,088 | ||||||
Boeing Co. | 233 | 84,833 | ||||||
BWX Technologies, Inc. (a) | 691 | 40,907 | ||||||
C.H. Robinson Worldwide, Inc. (a) | 8,126 | 686,566 | ||||||
Carlisle Cos., Inc. | 4,803 | 696,243 | ||||||
Caterpillar, Inc. | 774 | 92,106 | ||||||
Cintas Corp. | 1,413 | 372,749 | ||||||
Clean Harbors, Inc.* | 2,927 | 215,281 | ||||||
Colfax Corp.* (a) | 723 | 19,666 | ||||||
Copa Holdings SA, Class A | 228 | 23,525 | ||||||
Copart, Inc.* | 4,701 | 354,408 | ||||||
CoStar Group, Inc.* | 465 | 285,915 | ||||||
Crane Co. | 2,674 | 203,866 | ||||||
CSX Corp. | 2,868 | 192,213 | ||||||
Cummins, Inc. | 8,390 | 1,252,375 | ||||||
Curtiss-Wright Corp. | 1,336 | 163,847 | ||||||
Deere & Co. | 698 | 108,127 | ||||||
Delta Air Lines, Inc. | 11,797 | 682,574 | ||||||
Donaldson Co., Inc. (a) | 5,370 | 259,693 | ||||||
Dover Corp. | 6,263 | 587,094 | ||||||
Eaton Corp. PLC | 6,361 | 513,460 | ||||||
Emerson Electric Co. | 4,753 | 283,231 | ||||||
Equifax, Inc. | 1,021 | 149,454 | ||||||
Expeditors International of Washington, Inc. | 7,992 | 568,231 | ||||||
Fastenal Co. (a) | 17,629 | 539,800 | ||||||
FedEx Corp. | 314 | 49,804 | ||||||
Flowserve Corp. | 2,209 | 94,280 | ||||||
Fluor Corp. | 383 | 6,768 | ||||||
Fortive Corp. | 4,272 | 302,885 | ||||||
Fortune Brands Home & Security, Inc. | 5,488 | 280,217 | ||||||
Gardner Denver Holdings, Inc.* | 571 | 16,376 | ||||||
General Dynamics Corp. | 725 | 138,671 | ||||||
Genesee & Wyoming, Inc., Class A* | 1,115 | 123,631 | ||||||
Graco, Inc. | 7,425 | 338,357 | ||||||
HD Supply Holdings, Inc.* | 6,475 | 251,942 | ||||||
HEICO Corp. (a) | 839 | 121,378 | ||||||
Number | Value | |||||||
| Industrials (Continued) | ||||||||
HEICO Corp., Class A | 1,428 | $ | 157,594 | |||||
Hexcel Corp. | 3,582 | 301,425 | ||||||
Honeywell International, Inc. | 1,755 | 288,908 | ||||||
Hubbell, Inc. | 1,881 | 246,674 | ||||||
Huntington Ingalls Industries, Inc. | 2,715 | 567,435 | ||||||
IAA, Inc.* | 6,047 | 295,396 | ||||||
IDEX Corp. | 2,243 | 369,445 | ||||||
IHS Markit Ltd.* | 2,588 | 169,799 | ||||||
Illinois Tool Works, Inc. | 3,009 | 450,929 | ||||||
Ingersoll-Rand PLC | 4,025 | 487,387 | ||||||
ITT, Inc. | 5,339 | 303,896 | ||||||
Jacobs Engineering Group, Inc. | 1,310 | 116,407 | ||||||
JB Hunt Transport Services, Inc. | 1,862 | 201,170 | ||||||
JetBlue Airways Corp.* | 14,277 | 247,278 | ||||||
Johnson Controls International PLC | 12,497 | 533,497 | ||||||
Kansas City Southern | 2,797 | 351,863 | ||||||
KAR Auction Services, Inc. (a) | 6,127 | 162,733 | ||||||
Kirby Corp.* (a) | 961 | 70,720 | ||||||
Knight-Swift Transportation Holdings, Inc. (a) | 2,295 | 78,351 | ||||||
L3Harris Technologies, Inc. | 4,000 | 845,640 | ||||||
Landstar System, Inc. | 3,447 | 384,409 | ||||||
Lennox International, Inc. (a) | 2,300 | 583,694 | ||||||
Lincoln Electric Holdings, Inc. (a) | 2,135 | 176,266 | ||||||
Lockheed Martin Corp. | 513 | 197,048 | ||||||
Macquarie Infrastructure Corp. | 3,003 | 113,573 | ||||||
ManpowerGroup, Inc. | 4,625 | 378,048 | ||||||
Masco Corp. | 13,009 | 529,857 | ||||||
Middleby Corp.* (a) | 1,093 | 119,858 | ||||||
MSC Industrial Direct Co., Inc., Class A | 1,569 | 106,096 | ||||||
Nielsen Holdings PLC | 704 | 14,615 | ||||||
Nordson Corp. | 1,531 | 208,155 | ||||||
Norfolk Southern Corp. | 1,805 | 314,160 | ||||||
Northrop Grumman Corp. | 386 | 141,998 | ||||||
nVent Electric PLC | 2,461 | 49,860 | ||||||
Old Dominion Freight Line, Inc. (a) | 1,648 | 269,876 | ||||||
Oshkosh Corp. | 3,372 | 236,950 | ||||||
Owens Corning | 1,107 | 63,498 | ||||||
PACCAR, Inc. | 14,800 | 970,288 | ||||||
Parker-Hannifin Corp. | 2,748 | 455,536 | ||||||
Pentair PLC | 4,736 | 170,117 | ||||||
Quanta Services, Inc. | 5,746 | 194,789 | ||||||
Raytheon Co. | 1,567 | 290,396 | ||||||
Regal Beloit Corp. | 1,855 | 131,520 | ||||||
Republic Services, Inc. | 3,851 | 343,702 | ||||||
Resideo Technologies, Inc.* | 11,947 | 164,630 | ||||||
Robert Half International, Inc. | 3,795 | 202,919 | ||||||
Rockwell Automation, Inc. | 2,577 | 393,740 | ||||||
Rollins, Inc. (a) | 4,016 | 131,765 | ||||||
Roper Technologies, Inc. | 678 | 248,663 | ||||||
Ryder System, Inc. | 968 | 46,629 | ||||||
Schneider National, Inc., Class B | 1,057 | 20,548 | ||||||
Sensata Technologies Holding PLC* | 2,070 | 94,351 | ||||||
Snap-on, Inc. (a) | 3,661 | 544,317 | ||||||
Southwest Airlines Co. | 14,819 | 775,330 | ||||||
Spirit AeroSystems Holdings, Inc., Class A | 4,165 | 335,699 | ||||||
| See Notes to Financial Statements. | 46 |
DBX ETF Trust
Schedule of Investments
Xtrackers Russell 1000 Comprehensive Factor ETF(Continued)
August 31, 2019
Number | Value | |||||||
| Industrials (Continued) | ||||||||
Stanley Black & Decker, Inc. | 2,175 | $ | 288,971 | |||||
Teledyne Technologies, Inc.* | 1,722 | 531,392 | ||||||
Textron, Inc. | 2,856 | 128,520 | ||||||
Timken Co. | 1,993 | 80,079 | ||||||
Toro Co. | 8,736 | 629,079 | ||||||
TransDigm Group, Inc. (a) | 398 | 214,251 | ||||||
TransUnion | 734 | 61,399 | ||||||
Union Pacific Corp. | 1,130 | 183,015 | ||||||
United Airlines Holdings, Inc.* | 4,358 | 367,423 | ||||||
United Parcel Service, Inc., Class B | 2,971 | 352,539 | ||||||
United Rentals, Inc.* | 129 | 14,520 | ||||||
United Technologies Corp. | 434 | 56,524 | ||||||
Univar, Inc.* (a) | 1,685 | 32,605 | ||||||
Valmont Industries, Inc. | 344 | 46,612 | ||||||
Verisk Analytics, Inc. | 2,520 | 407,081 | ||||||
W.W. Grainger, Inc. | 628 | 171,852 | ||||||
WABCO Holdings, Inc.* | 3,650 | 487,312 | ||||||
Wabtec Corp. (a) | 169 | 11,696 | ||||||
Waste Management, Inc. | 4,572 | 545,668 | ||||||
Watsco, Inc. | 1,088 | 177,942 | ||||||
WESCO International, Inc.* | 1,022 | 46,072 | ||||||
Woodward, Inc. | 976 | 105,262 | ||||||
Xylem, Inc. | 3,313 | 253,809 | ||||||
|
| |||||||
| 34,040,822 | ||||||||
|
| |||||||
| Information Technology — 14.8% | ||||||||
Accenture PLC, Class A | 1,302 | 258,017 | ||||||
Adobe, Inc.* | 487 | 138,556 | ||||||
Akamai Technologies, Inc.* | 2,646 | 235,838 | ||||||
Alliance Data Systems Corp. | 153 | 18,811 | ||||||
Amdocs Ltd. | 8,582 | 555,599 | ||||||
Amphenol Corp., Class A | 3,846 | 336,679 | ||||||
Analog Devices, Inc. | 3,305 | 362,988 | ||||||
ANSYS, Inc.* | 2,681 | 553,787 | ||||||
Apple, Inc. | 1,273 | 265,726 | ||||||
Applied Materials, Inc. | 10,954 | 526,011 | ||||||
Arista Networks, Inc.* | 55 | 12,464 | ||||||
Arrow Electronics, Inc.* | 1,649 | 114,111 | ||||||
Aspen Technology, Inc.* | 3,786 | 504,295 | ||||||
Atlassian Corp. PLC, Class A* | 142 | 19,100 | ||||||
Autodesk, Inc.* | 170 | 24,279 | ||||||
Automatic Data Processing, Inc. | 1,716 | 291,445 | ||||||
Avalara, Inc.* | 249 | 21,001 | ||||||
Avnet, Inc. | 6,008 | 251,675 | ||||||
Black Knight, Inc.* | 3,292 | 204,927 | ||||||
Booz Allen Hamilton Holding Corp. | 7,942 | 599,700 | ||||||
Broadcom, Inc. | 603 | 170,432 | ||||||
Broadridge Financial Solutions, Inc. | 3,115 | 403,206 | ||||||
CACI International, Inc., Class A* | 1,311 | 291,422 | ||||||
Cadence Design Systems, Inc.* | 11,985 | 820,733 | ||||||
CDK Global, Inc. | 2,307 | 99,570 | ||||||
CDW Corp. | 11,687 | 1,349,849 | ||||||
Ciena Corp.* | 3,961 | 162,124 | ||||||
Cisco Systems, Inc. | 3,285 | 153,771 | ||||||
Citrix Systems, Inc. | 3,744 | 348,117 | ||||||
Cognex Corp. (a) | 1,378 | 62,120 | ||||||
Cognizant Technology Solutions Corp., Class A | 3,324 | 204,060 | ||||||
Number | Value | |||||||
| Information Technology (Continued) | ||||||||
CoreLogic, Inc.* | 722 | $ | 34,945 | |||||
Corning, Inc. | 21,438 | 597,048 | ||||||
Cypress Semiconductor Corp. | 5,585 | 128,511 | ||||||
Dell Technologies, Inc., Class C* | 7,323 | 377,354 | ||||||
Dolby Laboratories, Inc., Class A | 2,596 | 159,810 | ||||||
DXC Technology Co. | 811 | 26,941 | ||||||
EchoStar Corp., Class A* | 513 | 21,674 | ||||||
Entegris, Inc. (a) | 2,613 | 111,915 | ||||||
EPAM Systems, Inc.* | 3,145 | 601,733 | ||||||
Euronet Worldwide, Inc.* | 1,794 | 274,733 | ||||||
F5 Networks, Inc.* | 1,672 | 215,237 | ||||||
Fair Isaac Corp.* | 846 | 298,401 | ||||||
Fidelity National Information Services, Inc. | 1,501 | 204,466 | ||||||
Fiserv, Inc.* | 4,272 | 456,848 | ||||||
FleetCor Technologies, Inc.* | 863 | 257,519 | ||||||
FLIR Systems, Inc. | 3,831 | 188,753 | ||||||
Fortinet, Inc.* | 5,167 | 409,123 | ||||||
Gartner, Inc.* | 1,600 | 213,872 | ||||||
Genpact Ltd. | 8,138 | 333,332 | ||||||
Global Payments, Inc. | 791 | 131,290 | ||||||
GoDaddy, Inc., Class A* | 820 | 51,939 | ||||||
Guidewire Software, Inc.* (a) | 221 | 21,256 | ||||||
Hewlett Packard Enterprise Co. | 22,430 | 309,983 | ||||||
HP, Inc. | 30,116 | 550,822 | ||||||
Intel Corp. | 2,626 | 124,499 | ||||||
International Business Machines Corp. | 2,451 | 332,184 | ||||||
Intuit, Inc. | 1,614 | 465,413 | ||||||
Jabil, Inc. | 11,072 | 318,984 | ||||||
Jack Henry & Associates, Inc. | 2,365 | 342,830 | ||||||
Juniper Networks, Inc. | 13,840 | 320,534 | ||||||
Keysight Technologies, Inc.* | 2,054 | 198,950 | ||||||
KLA Corp. | 5,051 | 747,043 | ||||||
Lam Research Corp. | 6,383 | 1,343,685 | ||||||
Leidos Holdings, Inc. | 9,449 | 825,465 | ||||||
Littelfuse, Inc. (a) | 148 | 23,098 | ||||||
LogMeIn, Inc. | 309 | 20,654 | ||||||
Manhattan Associates, Inc.* | 2,911 | 240,536 | ||||||
Mastercard, Inc., Class A | 236 | 66,403 | ||||||
Maxim Integrated Products, Inc. | 5,145 | 280,608 | ||||||
Microchip Technology, Inc. (a) | 148 | 12,777 | ||||||
Microsoft Corp. | 1,298 | 178,942 | ||||||
MKS Instruments, Inc. (a) | 1,660 | 129,961 | ||||||
Monolithic Power Systems, Inc. | 870 | 130,987 | ||||||
Motorola Solutions, Inc. | 2,700 | 488,457 | ||||||
National Instruments Corp. | 3,420 | 143,640 | ||||||
NCR Corp.* | 1,515 | 47,738 | ||||||
NetApp, Inc. | 7,906 | 379,962 | ||||||
Nuance Communications, Inc.* | 3,166 | 53,220 | ||||||
ON Semiconductor Corp.* | 2,075 | 36,935 | ||||||
Oracle Corp. | 2,316 | 120,571 | ||||||
Palo Alto Networks, Inc.* | 272 | 55,385 | ||||||
Paychex, Inc. | 5,693 | 465,118 | ||||||
Paycom Software, Inc.* (a) | 166 | 41,520 | ||||||
PayPal Holdings, Inc.* | 813 | 88,658 | ||||||
Pegasystems, Inc. | 251 | 17,608 | ||||||
Proofpoint, Inc.* | 139 | 15,792 | ||||||
| See Notes to Financial Statements. | 47 |
DBX ETF Trust
Schedule of Investments
Xtrackers Russell 1000 Comprehensive Factor ETF(Continued)
August 31, 2019
Number | Value | |||||||
| Information Technology (Continued) | ||||||||
PTC, Inc.* | 711 | $ | 46,549 | |||||
Qorvo, Inc.* | 427 | 30,501 | ||||||
QUALCOMM, Inc. | 704 | 54,750 | ||||||
RealPage, Inc.* | 311 | 19,801 | ||||||
Sabre Corp. | 3,387 | 80,069 | ||||||
salesforce.com, Inc.* | 657 | 102,538 | ||||||
ServiceNow, Inc.* | 315 | 82,480 | ||||||
Skyworks Solutions, Inc. | 1,704 | 128,260 | ||||||
SS&C Technologies Holdings, Inc. | 500 | 23,305 | ||||||
Symantec Corp. | 4,567 | 106,183 | ||||||
Synopsys, Inc.* | 7,534 | 1,068,397 | ||||||
Teradata Corp.* (a) | 2,029 | 62,635 | ||||||
Teradyne, Inc. | 14,052 | 744,334 | ||||||
Texas Instruments, Inc. | 2,978 | 368,528 | ||||||
Total System Services, Inc. | 822 | 110,329 | ||||||
Trimble, Inc.* | 2,003 | 75,153 | ||||||
Tyler Technologies, Inc.* | 730 | 187,274 | ||||||
Ubiquiti, Inc. | 115 | 12,709 | ||||||
VeriSign, Inc.* | 3,766 | 767,699 | ||||||
Versum Materials, Inc. | 1,900 | 98,800 | ||||||
ViaSat, Inc.* (a) | 1,426 | 113,125 | ||||||
Visa, Inc., Class A | 364 | 65,819 | ||||||
VMware, Inc., Class A (a) | 2,690 | 380,474 | ||||||
Western Union Co. (a) | 39,955 | 883,805 | ||||||
WEX, Inc.* | 333 | 68,115 | ||||||
Workday, Inc., Class A* | 142 | 25,174 | ||||||
Xerox Holdings Corp. | 9,209 | 266,969 | ||||||
Xilinx, Inc. | 4,968 | 516,970 | ||||||
Zebra Technologies Corp., Class A* | 756 | 155,003 | ||||||
|
| |||||||
| 30,041,823 | ||||||||
|
| |||||||
| Materials — 5.1% | ||||||||
Air Products & Chemicals, Inc. | 3,026 | 683,634 | ||||||
Albemarle Corp. (a) | 769 | 47,470 | ||||||
AptarGroup, Inc. | 1,499 | 183,208 | ||||||
Ardagh Group SA | 1,021 | 17,081 | ||||||
Ashland Global Holdings, Inc. | 1,602 | 117,330 | ||||||
Avery Dennison Corp. | 4,038 | 466,672 | ||||||
Axalta Coating Systems Ltd.* | 2,969 | 85,745 | ||||||
Ball Corp. | 9,509 | 764,619 | ||||||
Berry Global Group, Inc.* | 5,712 | 223,568 | ||||||
Cabot Corp. | 782 | 31,280 | ||||||
Celanese Corp. | 4,755 | 539,074 | ||||||
CF Industries Holdings, Inc. | 1,976 | 95,223 | ||||||
Corteva, Inc. | 663 | 19,439 | ||||||
Crown Holdings, Inc.* | 4,702 | 309,580 | ||||||
Domtar Corp. | 5,825 | 191,934 | ||||||
Dow, Inc. | 11,689 | 498,302 | ||||||
DuPont de Nemours, Inc. | 1,103 | 74,927 | ||||||
Eagle Materials, Inc. | 391 | 32,918 | ||||||
Eastman Chemical Co. | 1,427 | 93,283 | ||||||
Ecolab, Inc. | 1,792 | 369,708 | ||||||
FMC Corp. | 1,830 | 157,984 | ||||||
Graphic Packaging Holding Co. | 1,107 | 15,288 | ||||||
International Paper Co. | 7,933 | 310,180 | ||||||
LyondellBasell Industries NV, Class A | 1,825 | 141,219 | ||||||
Martin Marietta Materials, Inc. | 256 | 64,965 | ||||||
Number | Value | |||||||
| Materials (Continued) | ||||||||
Mosaic Co. | 2,959 | $ | 54,416 | |||||
NewMarket Corp. | 536 | 254,466 | ||||||
Newmont Goldcorp Corp. | 833 | 33,228 | ||||||
Nucor Corp. | 7,397 | 362,305 | ||||||
Olin Corp. (a) | 1,796 | 30,496 | ||||||
Owens-Illinois, Inc. | 4,834 | 49,162 | ||||||
Packaging Corp. of America (a) | 2,228 | 224,092 | ||||||
PPG Industries, Inc. | 6,012 | 666,069 | ||||||
Reliance Steel & Aluminum Co. | 5,502 | 534,959 | ||||||
Royal Gold, Inc. (a) | 141 | 18,807 | ||||||
RPM International, Inc. | 6,623 | 448,178 | ||||||
ScottsMiracle-Gro Co. | 768 | 81,654 | ||||||
Sealed Air Corp. | 4,436 | 176,642 | ||||||
Sherwin-Williams Co. | 647 | 340,807 | ||||||
Silgan Holdings, Inc. | 9,370 | 278,851 | ||||||
Sonoco Products Co. | 11,308 | 646,818 | ||||||
Steel Dynamics, Inc. | 1,766 | 47,682 | ||||||
Valvoline, Inc. | 11,247 | 254,182 | ||||||
Vulcan Materials Co. | 948 | 133,905 | ||||||
W.R. Grace & Co. | 1,517 | 102,716 | ||||||
Westrock Co. | �� | 1,226 | 41,905 | |||||
|
| |||||||
| 10,315,971 | ||||||||
|
| |||||||
| Real Estate — 8.5% | ||||||||
Alexandria Real Estate Equities, Inc. REIT | 1,054 | 157,931 | ||||||
American Campus Communities, Inc. REIT | 1,813 | 84,268 | ||||||
American Homes 4 Rent, Class A REIT | 2,626 | 67,173 | ||||||
American Tower Corp. REIT | 604 | 139,035 | ||||||
Americold Realty Trust REIT | 3,844 | 139,998 | ||||||
Apartment Investment & Management Co., Class A REIT | 21,405 | 1,091,655 | ||||||
Apple Hospitality REIT, Inc. REIT (a) | 9,639 | 153,549 | ||||||
AvalonBay Communities, Inc. REIT | 2,026 | 430,647 | ||||||
Boston Properties, Inc. REIT | 1,598 | 205,215 | ||||||
Brandywine Realty Trust REIT | 4,956 | 71,119 | ||||||
Brixmor Property Group, Inc. REIT | 17,091 | 314,987 | ||||||
Brookfield Property REIT, Inc., Class A REIT | 13,868 | 260,996 | ||||||
Camden Property Trust REIT | 1,303 | 141,050 | ||||||
CBRE Group, Inc., Class A* | 14,462 | 755,929 | ||||||
Columbia Property Trust, Inc. REIT | 1,057 | 22,609 | ||||||
CoreSite Realty Corp. REIT | 1,030 | 119,665 | ||||||
Corporate Office Properties Trust REIT | 1,855 | 53,591 | ||||||
Cousins Properties, Inc. REIT | 3,789 | 131,478 | ||||||
Crown Castle International Corp. REIT | 858 | 124,556 | ||||||
CubeSmart REIT | 4,898 | 175,789 | ||||||
CyrusOne, Inc. REIT | 424 | 31,147 | ||||||
Digital Realty Trust, Inc. REIT (a) | 804 | 99,399 | ||||||
Douglas Emmett, Inc. REIT | 1,729 | 72,964 | ||||||
Duke Realty Corp. REIT | 9,156 | 304,620 | ||||||
Empire State Realty Trust, Inc., Class A REIT | 2,515 | 35,361 | ||||||
EPR Properties REIT | 4,309 | 337,179 | ||||||
Equinix, Inc. REIT | 196 | 109,031 | ||||||
Equity Commonwealth REIT | 8,812 | 296,612 | ||||||
Equity LifeStyle Properties, Inc. REIT | 2,732 | 368,055 | ||||||
| See Notes to Financial Statements. | 48 |
DBX ETF Trust
Schedule of Investments
Xtrackers Russell 1000 Comprehensive Factor ETF(Continued)
August 31, 2019
Number | Value | |||||||
| Real Estate (Continued) | ||||||||
Equity Residential REIT | 3,017 | $ | 255,721 | |||||
Essex Property Trust, Inc. REIT | 768 | 246,728 | ||||||
Extra Space Storage, Inc. REIT | 2,649 | 322,966 | ||||||
Federal Realty Investment Trust REIT | 1,455 | 188,001 | ||||||
Gaming and Leisure Properties, Inc. REIT | 8,565 | 335,063 | ||||||
HCP, Inc. REIT | 26,444 | 917,871 | ||||||
Healthcare Trust of America, Inc., Class A REIT | 5,917 | 167,806 | ||||||
Highwoods Properties, Inc. REIT | 2,302 | 99,469 | ||||||
Hospitality Properties Trust REIT (a) | 5,497 | 132,698 | ||||||
Host Hotels & Resorts, Inc. REIT | 30,435 | 488,177 | ||||||
Howard Hughes Corp.* (a) | 190 | 23,991 | ||||||
Hudson Pacific Properties, Inc. REIT | 1,417 | 48,178 | ||||||
Invitation Homes, Inc. REIT | 1,600 | 46,016 | ||||||
Iron Mountain, Inc. REIT (a) | 6,981 | 222,345 | ||||||
JBG SMITH Properties REIT | 827 | 31,641 | ||||||
Jones Lang LaSalle, Inc. | 1,363 | 182,710 | ||||||
Kilroy Realty Corp. REIT | 1,821 | 141,783 | ||||||
Kimco Realty Corp. REIT | 7,933 | 145,809 | ||||||
Lamar Advertising Co., Class A REIT | 6,245 | 478,679 | ||||||
Liberty Property Trust REIT | 2,835 | 147,760 | ||||||
Life Storage, Inc. REIT | 2,063 | 218,595 | ||||||
Macerich Co. REIT (a) | 585 | 16,690 | ||||||
Medical Properties Trust, Inc. REIT | 57,706 | 1,072,755 | ||||||
Mid-America Apartment Communities, Inc. REIT | 1,410 | 178,619 | ||||||
National Retail Properties, Inc. REIT | 5,358 | 300,852 | ||||||
Omega Healthcare Investors, Inc. REIT | 5,530 | 224,960 | ||||||
Outfront Media, Inc. REIT | 5,102 | 140,203 | ||||||
Paramount Group, Inc. REIT | 2,013 | 26,531 | ||||||
Park Hotels & Resorts, Inc. REIT | 15,310 | 360,551 | ||||||
Prologis, Inc. REIT | 4,045 | 338,243 | ||||||
Public Storage REIT | 1,890 | 500,359 | ||||||
Rayonier, Inc. REIT | 1,800 | 48,240 | ||||||
Realty Income Corp. REIT | 2,505 | 184,894 | ||||||
Regency Centers Corp. REIT | 2,173 | 140,180 | ||||||
Retail Properties of America, Inc., Class A REIT | 4,752 | 53,983 | ||||||
SBA Communications Corp. REIT | 300 | 78,729 | ||||||
Simon Property Group, Inc. REIT | 2,937 | 437,437 | ||||||
SL Green Realty Corp. REIT | 588 | 47,169 | ||||||
Spirit Realty Capital, Inc. REIT (a) | 1,999 | 95,832 | ||||||
STORE Capital Corp. REIT | 3,940 | 148,774 | ||||||
Sun Communities, Inc. REIT | 942 | 139,228 | ||||||
Taubman Centers, Inc. REIT (a) | 399 | 15,581 | ||||||
UDR, Inc. REIT | 3,759 | 181,109 | ||||||
Ventas, Inc. REIT | 2,055 | 150,816 | ||||||
VEREIT, Inc. REIT | 3,444 | 33,579 | ||||||
VICI Properties, Inc. REIT (a) | 17,776 | 393,916 | ||||||
Vornado Realty Trust REIT | 1,513 | 91,491 | ||||||
Weingarten Realty Investors REIT | 13,429 | 355,734 | ||||||
Welltower, Inc. REIT | 1,445 | 129,414 | ||||||
Weyerhaeuser Co. REIT | 1,773 | 46,648 | ||||||
WP Carey, Inc. REIT (a) | 3,181 | 285,654 | ||||||
|
| |||||||
| 17,355,786 | ||||||||
|
| |||||||
Number | Value | |||||||
| Utilities — 9.3% | ||||||||
AES Corp. | 57,580 | $ | 882,701 | |||||
Alliant Energy Corp. | 7,418 | 389,074 | ||||||
Ameren Corp. | 11,256 | 868,400 | ||||||
American Electric Power Co., Inc. | 7,991 | 728,380 | ||||||
American Water Works Co., Inc. | 3,920 | 499,094 | ||||||
Aqua America, Inc. (a) | 5,130 | 227,208 | ||||||
Atmos Energy Corp. | 5,268 | 580,692 | ||||||
Avangrid, Inc. | 1,515 | 76,568 | ||||||
CenterPoint Energy, Inc. | 29,214 | 808,936 | ||||||
CMS Energy Corp. | 11,515 | 726,021 | ||||||
Consolidated Edison, Inc. | 6,192 | 550,469 | ||||||
Dominion Energy, Inc. | 3,637 | 282,340 | ||||||
DTE Energy Co. | 7,554 | 979,452 | ||||||
Duke Energy Corp. | 4,418 | 409,725 | ||||||
Edison International | 5,026 | 363,229 | ||||||
Entergy Corp. | 7,672 | 865,709 | ||||||
Evergy, Inc. | 2,718 | 176,670 | ||||||
Eversource Energy | 7,848 | 628,860 | ||||||
Exelon Corp. | 16,991 | 802,995 | ||||||
FirstEnergy Corp. | 6,474 | 297,804 | ||||||
Hawaiian Electric Industries, Inc. | 11,941 | 530,180 | ||||||
IDACORP, Inc. | 4,007 | 440,009 | ||||||
MDU Resources Group, Inc. | 5,206 | 139,989 | ||||||
National Fuel Gas Co. (a) | 6,018 | 281,281 | ||||||
NextEra Energy, Inc. | 1,199 | 262,677 | ||||||
NiSource, Inc. | 5,943 | 175,616 | ||||||
NRG Energy, Inc. | 2,683 | 97,661 | ||||||
OGE Energy Corp. | 12,398 | 531,502 | ||||||
Pinnacle West Capital Corp. | 7,826 | 745,896 | ||||||
PPL Corp. | 23,407 | 691,677 | ||||||
Public Service Enterprise Group, Inc. | 9,113 | 551,063 | ||||||
Sempra Energy | 2,447 | 346,569 | ||||||
Southern Co. | 8,409 | 489,908 | ||||||
UGI Corp. | 15,602 | 759,349 | ||||||
Vistra Energy Corp. | 4,839 | 120,733 | ||||||
WEC Energy Group, Inc. | 8,258 | 790,869 | ||||||
Xcel Energy, Inc. | 11,840 | 760,365 | ||||||
|
| |||||||
| 18,859,671 | ||||||||
|
| |||||||
TOTAL COMMON STOCKS | 201,419,383 | |||||||
|
| |||||||
| SECURITIES LENDING COLLATERAL — 0.0% | ||||||||
DWS Government & Agency Securities Portfolio “DWS Government Cash Institutional Shares”, 2.04% (b)(c) (Cost $35,815) | 35,815 | 35,815 | ||||||
|
| |||||||
| CASH EQUIVALENTS — 0.7% | ||||||||
DWS Government Money Market Series “Institutional Shares”, 2.09% (b) (Cost $1,501,074) | 1,501,074 | 1,501,074 | ||||||
|
| |||||||
TOTAL INVESTMENTS — 99.8% (Cost $183,453,818) | $ | 202,956,272 | ||||||
Other assets and liabilities, net — 0.2% | 346,604 | |||||||
|
| |||||||
NET ASSETS — 100.0% | $ | 203,302,876 | ||||||
|
| |||||||
| See Notes to Financial Statements. | 49 |
DBX ETF Trust
Schedule of Investments
Xtrackers Russell 1000 Comprehensive Factor ETF(Continued)
August 31, 2019
A summary of the Fund’s transactions with affiliated investments during the year ended August 31, 2019 is as follows:
| Value ($) at 8/31/2018 | Purchases Cost ($) | Sales Proceeds ($) | Net Realized Gain/(Loss) ($) | Net Change in Unrealized Appreciation (Depreciation) ($) | Income ($) | Capital Gain Distributions ($) | Number of Shares at 8/31/2019 | Value ($) at 8/31/2019 | ||||||||||||||||||||||||||||||
SECURITIES LENDING COLLATERAL —0.0% | ||||||||||||||||||||||||||||||||||||||
DWS Government & Agency Securities Portfolio “DWS Government Cash Institutional Shares”, 2.04% (b)(c) | ||||||||||||||||||||||||||||||||||||||
| 64,770 | — | (28,955 | )(d) | — | — | 4,168 | — | 35,815 | 35,815 | |||||||||||||||||||||||||||||
CASH EQUIVALENTS —0.7% | ||||||||||||||||||||||||||||||||||||||
DWS Government Money Market Series “Institutional Shares”, 2.09% (b) | ||||||||||||||||||||||||||||||||||||||
| — | 8,071,566 | (6,570,492 | ) | — | — | 20,679 | — | 1,501,074 | 1,501,074 | |||||||||||||||||||||||||||||
|
|
|
|
|
|
|
|
|
|
|
|
|
|
|
|
|
| |||||||||||||||||||||
| 64,770 | 8,071,566 | (6,599,447 | ) | — | — | 24,847 | — | 1,536,889 | 1,536,889 | |||||||||||||||||||||||||||||
|
|
|
|
|
|
|
|
|
|
|
|
|
|
|
|
|
| |||||||||||||||||||||
| * | Non-income producing security. |
| (a) | All or a portion of these securities were on loan. In addition, “Other assets and liabilities, net” may include pending sales that are also on loan. The value of securities loaned at August 31, 2019 amounted to $17,780,697, which is 8.7% of net assets. |
| (b) | Affiliated fund managed by DWS Investment Management Americas, Inc. The rate shown is the annualizedseven-day yield at period end. |
| (c) | Represents cash collateral held in connection with securities lending. Income earned by the Fund is net of borrower rebates. In addition, the Fund heldnon-cash U.S. Treasury securities collateral having a value of $18,047,753. |
| (d) | Represents the net increase (purchase cost) or decrease (sales proceeds) in the amount invested in cash collateral for the period ended August 31, 2019. |
| REIT: | Real Estate Investment Trust |
At August 31, 2019, open futures contracts purchased were as follows:
Contract Description | Currency | Number of Contracts | Notional Amount | Contract Value | Expiration Date | Unrealized Appreciation (Depreciation) | ||||||||||||
E-Mini S&P 500 Futures | USD | 5 | $ | 726,250 | $ | 731,200 | 9/20/2019 | $ | 4,950 | |||||||||
E-Mini S&P MidCap 400 Futures | USD | 5 | 950,295 | 940,700 | 9/20/2019 | (9,595 | ) | |||||||||||
|
| |||||||||||||||||
Total net unrealized depreciation | $ | (4,645 | ) | |||||||||||||||
|
| |||||||||||||||||
For information on the Fund’s policy and additional disclosures regarding open futures contracts, please refer to the Derivatives section of Note 2 in the accompanying Notes to Financial Statements.
Currency Abbreviations
| USD | U.S. Dollar |
| See Notes to Financial Statements. | 50 |
DBX ETF Trust
Schedule of Investments
Xtrackers Russell 1000 Comprehensive Factor ETF(Continued)
August 31, 2019
Fair Value Measurements
Various inputs are used in determining the value of the Fund’s investments. These inputs are summarized in three broad levels. Level 1 includes quoted prices in active markets for identical securities. Level 2 includes other significant observable inputs (including quoted prices for similar securities, interest rates, prepayment speeds and credit risk). Level 3 includes significant unobservable inputs (including the Fund’s own assumptions in determining the fair value of investments). The level assigned to the securities valuations may not be an indication of the risk or liquidity associated with investing in those securities.
The following is a summary of the inputs used as of August 31, 2019 in valuing the Fund’s investments. For information on the Fund’s policy regarding the valuation of investments, please refer to the Security Valuation section of Note 2 in the accompanying Notes to Financial Statements.
Assets | Level 1 | Level 2 | Level 3 | Total | ||||||||||||
Common Stocks (e) | $ | 201,419,383 | $ | — | $ | — | $ | 201,419,383 | ||||||||
Short-Term Investments (e) | 1,536,889 | — | — | 1,536,889 | ||||||||||||
Derivatives (f) | ||||||||||||||||
Futures Contracts | 4,950 | — | — | 4,950 | ||||||||||||
|
|
|
|
|
|
|
| |||||||||
TOTAL | $ | 202,961,222 | $ | — | $ | — | $ | 202,961,222 | ||||||||
|
|
|
|
|
|
|
| |||||||||
Liabilities | Level 1 | Level 2 | Level 3 | Total | ||||||||||||
Derivatives (f) | ||||||||||||||||
Futures Contracts | $ | (9,595 | ) | $ | — | $ | — | $ | (9,595 | ) | ||||||
|
|
|
|
|
|
|
| |||||||||
TOTAL | $ | (9,595 | ) | $ | — | $ | — | $ | (9,595 | ) | ||||||
|
|
|
|
|
|
|
| |||||||||
| (e) | See Schedule of Investments for additional detailed categorizations. |
| (f) | Derivatives include unrealized appreciation (depreciation) on open futures contracts. |
| See Notes to Financial Statements. | 51 |
DBX ETF Trust
Schedule of Investments
Xtrackers Russell 1000 US Quality at a Reasonable Price ETF
August 31, 2019
Number | Value | |||||||
| COMMON STOCKS — 96.3% |
| |||||||
| Communication Services — 10.6% | ||||||||
Activision Blizzard, Inc. | 3,235 | $ | 163,691 | |||||
Alphabet, Inc., Class A* | 2,010 | 2,392,965 | ||||||
Alphabet, Inc., Class C* | 2,052 | 2,437,981 | ||||||
AT&T, Inc. | 2,961 | 104,405 | ||||||
CenturyLink, Inc. (a) | 5,370 | 61,111 | ||||||
Charter Communications, Inc., Class A* | 132 | 54,066 | ||||||
Comcast Corp., Class A | 3,887 | 172,039 | ||||||
Electronic Arts, Inc.* | 2,002 | 187,548 | ||||||
Facebook, Inc., Class A* | 17,058 | 3,167,159 | ||||||
Fox Corp., Class A | 1,502 | 49,821 | ||||||
Liberty Broadband Corp., Class C* | 480 | 50,611 | ||||||
Omnicom Group, Inc. (a) | 1,319 | 100,323 | ||||||
Sirius XM Holdings, Inc. (a) | 5,695 | 35,138 | ||||||
Take-Two Interactive Software, Inc.* | 737 | 97,262 | ||||||
Verizon Communications, Inc. | 20,123 | 1,170,354 | ||||||
Walt Disney Co. | 11,205 | 1,537,998 | ||||||
|
| |||||||
| 11,782,472 | ||||||||
|
| |||||||
| Consumer Discretionary — 13.6% | ||||||||
Advance Auto Parts, Inc. | 375 | 51,731 | ||||||
Aptiv PLC | 1,862 | 154,863 | ||||||
AutoZone, Inc.* | 164 | 180,677 | ||||||
Best Buy Co., Inc. | 6,666 | 424,291 | ||||||
Booking Holdings, Inc.* | 409 | 804,262 | ||||||
BorgWarner, Inc. | 2,237 | 72,993 | ||||||
Burlington Stores, Inc.* | 563 | 114,002 | ||||||
Carnival Corp. | 3,515 | 154,941 | ||||||
Carter’s, Inc. (a) | 568 | 51,961 | ||||||
Chipotle Mexican Grill, Inc.* | 39 | 32,698 | ||||||
Darden Restaurants, Inc. | 1,390 | 168,162 | ||||||
Dick’s Sporting Goods, Inc. (a) | 1,054 | 35,878 | ||||||
Dollar General Corp. | 3,097 | 483,411 | ||||||
Dollar Tree, Inc.* | 302 | 30,662 | ||||||
Domino’s Pizza, Inc. | 38 | 8,620 | ||||||
eBay, Inc. | 7,617 | 306,889 | ||||||
Expedia Group, Inc. | 775 | 100,828 | ||||||
Foot Locker, Inc. (a) | 2,170 | 78,532 | ||||||
frontdoor, Inc.* | 616 | 31,626 | ||||||
Gap, Inc. (a) | 3,496 | 55,202 | ||||||
Garmin Ltd. | 1,278 | 104,247 | ||||||
Gentex Corp. | 4,569 | 121,535 | ||||||
Genuine Parts Co. | 1,455 | 131,372 | ||||||
H&R Block, Inc. (a) | 2,823 | 68,373 | ||||||
Hasbro, Inc. | 251 | 27,728 | ||||||
Home Depot, Inc. | 13,458 | 3,067,213 | ||||||
Kohl’s Corp. | 2,765 | 130,674 | ||||||
Las Vegas Sands Corp. | 2,524 | 140,006 | ||||||
Lear Corp. | 1,517 | 170,298 | ||||||
Lowe’s Cos., Inc. | 7,164 | 803,801 | ||||||
Lululemon Athletica, Inc.* | 730 | 134,809 | ||||||
McDonald’s Corp. | 266 | 57,980 | ||||||
NIKE, Inc., Class B | 10,892 | 920,374 | ||||||
Nordstrom, Inc. (a) | 958 | 27,753 | ||||||
Norwegian Cruise Line Holdings Ltd.* | 979 | 49,684 | ||||||
NVR, Inc.* | 46 | 165,554 | ||||||
O’Reilly Automotive, Inc.* | 619 | 237,547 | ||||||
Number | Value | |||||||
| Consumer Discretionary (Continued) | ||||||||
PulteGroup, Inc. | 4,072 | $ | 137,634 | |||||
Qurate Retail, Inc., Series A* | 4,161 | 44,564 | ||||||
Ralph Lauren Corp. | 458 | 40,460 | ||||||
Ross Stores, Inc. | 4,413 | 467,822 | ||||||
Royal Caribbean Cruises Ltd. | 198 | 20,647 | ||||||
Skechers U.S.A., Inc., Class A* | 1,252 | 39,638 | ||||||
Starbucks Corp. | 17,465 | 1,686,420 | ||||||
Target Corp. | 6,465 | 692,014 | ||||||
Thor Industries, Inc. (a) | 716 | 32,872 | ||||||
Tiffany & Co. (a) | 519 | 44,048 | ||||||
TJX Cos., Inc. | 17,904 | 984,183 | ||||||
Toll Brothers, Inc. | 1,218 | 44,079 | ||||||
Tractor Supply Co. | 1,598 | 162,804 | ||||||
Ulta Beauty, Inc.* | 537 | 127,661 | ||||||
VF Corp. | 2,404 | 197,008 | ||||||
Whirlpool Corp. | 495 | 68,850 | ||||||
Williams-Sonoma, Inc. (a) | 1,809 | 119,032 | ||||||
Yum China Holdings, Inc. | 4,788 | 217,519 | ||||||
Yum! Brands, Inc. | 2,383 | 278,287 | ||||||
|
| |||||||
| 15,106,719 | ||||||||
|
| |||||||
| Consumer Staples — 7.8% | ||||||||
Altria Group, Inc. | 9,671 | 423,010 | ||||||
Clorox Co. | 153 | 24,198 | ||||||
Colgate-Palmolive Co. | 5,851 | 433,852 | ||||||
Costco Wholesale Corp. | 5,278 | 1,555,743 | ||||||
Estee Lauder Cos., Inc., Class A | 1,219 | 241,350 | ||||||
General Mills, Inc. | 699 | 37,606 | ||||||
Hershey Co. | 209 | 33,122 | ||||||
Hormel Foods Corp. (a) | 2,451 | 104,437 | ||||||
Ingredion, Inc. | 437 | 33,767 | ||||||
Kimberly-Clark Corp. | 2,423 | 341,910 | ||||||
Kroger Co. | 1,553 | 36,775 | ||||||
Monster Beverage Corp.* | 2,371 | 139,107 | ||||||
PepsiCo, Inc. | 8,959 | 1,224,964 | ||||||
Philip Morris International, Inc. | 12,824 | 924,482 | ||||||
Procter & Gamble Co. | 5,374 | 646,116 | ||||||
Sprouts Farmers Market, Inc.* (a) | 949 | 17,035 | ||||||
Sysco Corp. | 3,630 | 269,818 | ||||||
Tyson Foods, Inc., Class A | 1,417 | 131,838 | ||||||
Walgreens Boots Alliance, Inc. | 13,808 | 706,831 | ||||||
Walmart, Inc. | 11,417 | 1,304,506 | ||||||
|
| |||||||
| 8,630,467 | ||||||||
|
| |||||||
| Energy — 9.0% | ||||||||
Apache Corp. | 404 | 8,714 | ||||||
Cabot Oil & Gas Corp. | 1,074 | 18,387 | ||||||
Chevron Corp. | 22,106 | 2,602,318 | ||||||
Cimarex Energy Co. (a) | 781 | 33,411 | ||||||
ConocoPhillips | 14,046 | 732,920 | ||||||
Devon Energy Corp. | 4,915 | 108,081 | ||||||
EOG Resources, Inc. | 6,447 | 478,303 | ||||||
Exxon Mobil Corp. | 55,355 | 3,790,710 | ||||||
Halliburton Co. | 2,953 | 55,635 | ||||||
HollyFrontier Corp. | 2,861 | 126,914 | ||||||
Marathon Oil Corp. | 5,904 | 69,903 | ||||||
Marathon Petroleum Corp. | 932 | 45,864 | ||||||
| See Notes to Financial Statements. | 52 |
DBX ETF Trust
Schedule of Investments
Xtrackers Russell 1000 US Quality at a Reasonable Price ETF(Continued)
August 31, 2019
Number | Value | |||||||
| Energy (Continued) | ||||||||
Occidental Petroleum Corp. | 9,818 | $ | 426,887 | |||||
Phillips 66 | 7,814 | 770,695 | ||||||
Pioneer Natural Resources Co. | 1,322 | 163,161 | ||||||
Valero Energy Corp. | 7,620 | 573,634 | ||||||
|
| |||||||
| 10,005,537 | ||||||||
|
| |||||||
| Financials — 3.9% | ||||||||
Credit Acceptance Corp.* | 211 | 95,509 | ||||||
Eaton Vance Corp. | 1,797 | 77,487 | ||||||
Erie Indemnity Co., Class A (a) | 293 | 64,258 | ||||||
Evercore, Inc., Class A | 1,599 | 127,536 | ||||||
FactSet Research Systems, Inc. (a) | 159 | 43,262 | ||||||
Fidelity National Financial, Inc. | 3,398 | 149,308 | ||||||
First American Financial Corp. | 726 | 42,435 | ||||||
Franklin Resources, Inc. (a) | 9,041 | 237,598 | ||||||
Globe Life, Inc. | 932 | 83,190 | ||||||
Janus Henderson Group PLC | 2,009 | 38,392 | ||||||
Lazard Ltd., Class A | 4,471 | 153,534 | ||||||
LPL Financial Holdings, Inc. | 867 | 64,982 | ||||||
Marsh & McLennan Cos., Inc. | 5,598 | 559,184 | ||||||
MGIC Investment Corp. | 9,693 | 122,616 | ||||||
Moody’s Corp. | 1,828 | 394,080 | ||||||
MSCI, Inc. | 831 | 194,978 | ||||||
Progressive Corp. | 5,524 | 418,719 | ||||||
S&P Global, Inc. | 3,089 | 803,727 | ||||||
SEI Investments Co. | 2,594 | 149,181 | ||||||
T. Rowe Price Group, Inc. | 4,786 | 529,427 | ||||||
|
| |||||||
| 4,349,403 | ||||||||
|
| |||||||
| Health Care — 11.5% | ||||||||
AbbVie, Inc. | 14,690 | 965,721 | ||||||
Agilent Technologies, Inc. | 1,507 | 107,163 | ||||||
Align Technology, Inc.* | 149 | 27,283 | ||||||
AmerisourceBergen Corp. | 1,149 | 94,528 | ||||||
Amgen, Inc. | 7,337 | 1,530,645 | ||||||
Anthem, Inc. | 92 | 24,060 | ||||||
Baxter International, Inc. | 3,454 | 303,779 | ||||||
Biogen, Inc.* | 3,822 | 839,885 | ||||||
Bristol-Myers Squibb Co. | 18,782 | 902,851 | ||||||
Cardinal Health, Inc. | 1,081 | 46,624 | ||||||
Celgene Corp.* | 1,303 | 126,130 | ||||||
Centene Corp.* | 182 | 8,485 | ||||||
Cerner Corp. | 2,139 | 147,399 | ||||||
Chemed Corp. | 130 | 55,826 | ||||||
Cigna Corp. | 1,028 | 158,281 | ||||||
Covetrus, Inc.* | 2 | 27 | ||||||
CVS Health Corp. | 2,321 | 141,395 | ||||||
Edwards Lifesciences Corp.* | 1,104 | 244,911 | ||||||
Eli Lilly & Co. | 225 | 25,418 | ||||||
Exelixis, Inc.* | 3,658 | 72,611 | ||||||
Gilead Sciences, Inc. | 10,185 | 647,155 | ||||||
HCA Healthcare, Inc. | 340 | 40,868 | ||||||
Humana, Inc. | 2,237 | 633,541 | ||||||
Jazz Pharmaceuticals PLC* | 267 | 34,216 | ||||||
Johnson & Johnson | 21,234 | 2,725,596 | ||||||
Masimo Corp.* | 205 | 31,416 | ||||||
McKesson Corp. | 2,904 | 401,536 | ||||||
Number | Value | |||||||
| Health Care (Continued) | ||||||||
Mettler-Toledo International, Inc.* | 127 | $ | 83,412 | |||||
Pfizer, Inc. | 1,439 | 51,156 | ||||||
Regeneron Pharmaceuticals, Inc.* | 790 | 229,140 | ||||||
ResMed, Inc. | 643 | 89,570 | ||||||
United Therapeutics Corp.* (a) | 491 | 40,537 | ||||||
UnitedHealth Group, Inc. | 7,185 | 1,681,290 | ||||||
Universal Health Services, Inc., Class B | 514 | 74,314 | ||||||
Varian Medical Systems, Inc.* | 460 | 48,728 | ||||||
Waters Corp.* | 446 | 94,503 | ||||||
West Pharmaceutical Services, Inc. | 490 | 71,275 | ||||||
|
| |||||||
| 12,801,275 | ||||||||
|
| |||||||
| Industrials — 11.8% | ||||||||
3M Co. | 4,668 | 754,909 | ||||||
Acuity Brands, Inc. | 658 | 82,520 | ||||||
AGCO Corp. | 215 | 14,861 | ||||||
Alaska Air Group, Inc. | 1,418 | 84,683 | ||||||
Allison Transmission Holdings, Inc. | 1,235 | 54,871 | ||||||
AO Smith Corp. | 1,569 | 72,990 | ||||||
Boeing Co. | 5,853 | 2,131,019 | ||||||
C.H. Robinson Worldwide, Inc. (a) | 2,313 | 195,425 | ||||||
Carlisle Cos., Inc. | 305 | 44,213 | ||||||
Caterpillar, Inc. | 2,788 | 331,772 | ||||||
Copa Holdings SA, Class A | 259 | 26,724 | ||||||
Copart, Inc.* | 1,129 | 85,115 | ||||||
Cummins, Inc. | 3,378 | 504,234 | ||||||
Curtiss-Wright Corp. | 167 | 20,481 | ||||||
Delta Air Lines, Inc. | 9,398 | 543,768 | ||||||
Donaldson Co., Inc. (a) | 919 | 44,443 | ||||||
Dover Corp. | 827 | 77,523 | ||||||
Eaton Corp. PLC | 3,070 | 247,810 | ||||||
Emerson Electric Co. | 4,365 | 260,110 | ||||||
Equifax, Inc. | 323 | 47,281 | ||||||
Expeditors International of Washington, Inc. | 2,334 | 165,947 | ||||||
Fastenal Co. (a) | 5,273 | 161,459 | ||||||
FedEx Corp. | 453 | 71,850 | ||||||
Fortune Brands Home & Security, Inc. | 811 | 41,410 | ||||||
General Dynamics Corp. | 652 | 124,708 | ||||||
Graco, Inc. | 1,379 | 62,841 | ||||||
HD Supply Holdings, Inc.* | 1,326 | 51,595 | ||||||
Hexcel Corp. | 430 | 36,184 | ||||||
Honeywell International, Inc. | 4,545 | 748,198 | ||||||
Huntington Ingalls Industries, Inc. | 775 | 161,975 | ||||||
Illinois Tool Works, Inc. | 2,583 | 387,088 | ||||||
Ingersoll-Rand PLC | 499 | 60,424 | ||||||
ITT, Inc. | 1,319 | 75,077 | ||||||
Jacobs Engineering Group, Inc. | 412 | 36,610 | ||||||
JB Hunt Transport Services, Inc. | 1,440 | 155,578 | ||||||
JetBlue Airways Corp.* | 5,221 | 90,428 | ||||||
Knight-Swift Transportation Holdings, Inc. (a) | 2,731 | 93,236 | ||||||
Landstar System, Inc. | 730 | 81,410 | ||||||
Lennox International, Inc. (a) | 245 | 62,176 | ||||||
Lincoln Electric Holdings, Inc. (a) | 590 | 48,710 | ||||||
Lockheed Martin Corp. | 582 | 223,552 | ||||||
ManpowerGroup, Inc. | 811 | 66,291 | ||||||
| See Notes to Financial Statements. | 53 |
DBX ETF Trust
Schedule of Investments
Xtrackers Russell 1000 US Quality at a Reasonable Price ETF(Continued)
August 31, 2019
Number | Value | |||||||
| Industrials (Continued) | ||||||||
Masco Corp. | 2,387 | $ | 97,223 | |||||
Old Dominion Freight Line, Inc. | 781 | 127,897 | ||||||
Oshkosh Corp. | 444 | 31,200 | ||||||
PACCAR, Inc. | 3,443 | 225,723 | ||||||
Parker-Hannifin Corp. | 948 | 157,150 | ||||||
Pentair PLC | 2,202 | 79,096 | ||||||
Quanta Services, Inc. | 1,669 | 56,579 | ||||||
Raytheon Co. | 2,481 | 459,779 | ||||||
Resideo Technologies, Inc.* | 4 | 55 | ||||||
Robert Half International, Inc. | 2,329 | 124,532 | ||||||
Rockwell Automation, Inc. | 1,352 | 206,572 | ||||||
Snap-on, Inc. (a) | 566 | 84,153 | ||||||
Southwest Airlines Co. | 11,271 | 589,699 | ||||||
Spirit AeroSystems Holdings, Inc., Class A | 1,314 | 105,908 | ||||||
Teledyne Technologies, Inc.* | 159 | 49,066 | ||||||
Textron, Inc. | 1,198 | 53,910 | ||||||
Toro Co. | 1,106 | 79,643 | ||||||
Union Pacific Corp. | 3,479 | 563,459 | ||||||
United Airlines Holdings, Inc.* | 2,136 | 180,086 | ||||||
United Parcel Service, Inc., Class B | 6,486 | 769,629 | ||||||
W.W. Grainger, Inc. | 494 | 135,183 | ||||||
WABCO Holdings, Inc.* | 530 | 70,760 | ||||||
Waste Management, Inc. | 717 | 85,574 | ||||||
Watsco, Inc. | 93 | 15,210 | ||||||
XPO Logistics, Inc.* (a) | 952 | 67,459 | ||||||
|
| |||||||
| 13,047,044 | ||||||||
|
| |||||||
| Information Technology — 23.2% | ||||||||
Accenture PLC, Class A | 6,145 | 1,217,755 | ||||||
Amdocs Ltd. | 1,222 | 79,112 | ||||||
Apple, Inc. | 27,042 | 5,644,747 | ||||||
Applied Materials, Inc. | 18,802 | 902,872 | ||||||
Automatic Data Processing, Inc. | 2,501 | 424,770 | ||||||
Broadridge Financial Solutions, Inc. | 666 | 86,207 | ||||||
Cisco Systems, Inc. | 24,312 | 1,138,045 | ||||||
Citrix Systems, Inc. | 835 | 77,638 | ||||||
Cognex Corp. | 835 | 37,642 | ||||||
Cognizant Technology Solutions Corp., Class A | 5,981 | 367,174 | ||||||
Coherent, Inc.* (a) | 278 | 40,299 | ||||||
Corning, Inc. | 878 | 24,452 | ||||||
Cypress Semiconductor Corp. | 1,563 | 35,965 | ||||||
Dolby Laboratories, Inc., Class A | 479 | 29,487 | ||||||
EPAM Systems, Inc.* | 245 | 46,876 | ||||||
Euronet Worldwide, Inc.* | 320 | 49,005 | ||||||
F5 Networks, Inc.* | 525 | 67,583 | ||||||
FLIR Systems, Inc. | 20 | 985 | ||||||
Fortinet, Inc.* | 736 | 58,276 | ||||||
HP, Inc. | 27,203 | 497,543 | ||||||
Intel Corp. | 77,542 | 3,676,266 | ||||||
International Business Machines Corp. | 862 | 116,827 | ||||||
Intuit, Inc. | 282 | 81,318 | ||||||
Jabil, Inc. | 2,130 | 61,365 | ||||||
Jack Henry & Associates, Inc. | 512 | 74,219 | ||||||
KLA Corp. | 1,255 | 185,614 | ||||||
Lam Research Corp. | 2,836 | 597,006 | ||||||
Manhattan Associates, Inc.* | 594 | 49,082 | ||||||
Number | Value | |||||||
| Information Technology (Continued) | ||||||||
Mastercard, Inc., Class A | 7,954 | $ | 2,238,017 | |||||
Micron Technology, Inc.* | 26,822 | 1,214,232 | ||||||
Microsoft Corp. | 616 | 84,922 | ||||||
MKS Instruments, Inc. (a) | 882 | 69,052 | ||||||
NetApp, Inc. | 3,117 | 149,803 | ||||||
NVIDIA Corp. | 2,710 | 453,952 | ||||||
Paychex, Inc. | 2,011 | 164,299 | ||||||
PayPal Holdings, Inc.* | 5,444 | 593,668 | ||||||
Qorvo, Inc.* | 644 | 46,001 | ||||||
QUALCOMM, Inc. | 571 | 44,407 | ||||||
Skyworks Solutions, Inc. | 2,676 | 201,423 | ||||||
Teradyne, Inc. | 2,191 | 116,057 | ||||||
Texas Instruments, Inc. | 10,523 | 1,302,221 | ||||||
Visa, Inc., Class A (a) | 16,162 | 2,922,413 | ||||||
VMware, Inc., Class A (a) | 368 | 52,050 | ||||||
Western Digital Corp. | 1,543 | 88,368 | ||||||
Western Union Co. (a) | 9,046 | 200,098 | ||||||
Xilinx, Inc. | 385 | 40,063 | ||||||
Zebra Technologies Corp., Class A* | 269 | 55,153 | ||||||
|
| |||||||
| 25,704,329 | ||||||||
|
| |||||||
| Materials — 2.2% | ||||||||
Air Products & Chemicals, Inc. | 963 | 217,561 | ||||||
Avery Dennison Corp. | 570 | 65,875 | ||||||
Celanese Corp. | 1,598 | 181,165 | ||||||
CF Industries Holdings, Inc. | 1,082 | 52,142 | ||||||
Dow, Inc. | 4,861 | 207,224 | ||||||
DuPont de Nemours, Inc. | 3,865 | 262,550 | ||||||
Eastman Chemical Co. | 446 | 29,155 | ||||||
Huntsman Corp. | 5,110 | 101,791 | ||||||
International Paper Co. | 2,646 | 103,459 | ||||||
LyondellBasell Industries NV, Class A | 5,271 | 407,870 | ||||||
Newmont Goldcorp Corp. | 897 | 35,781 | ||||||
Nucor Corp. | 5,987 | 293,243 | ||||||
Packaging Corp. of America (a) | 922 | 92,735 | ||||||
PPG Industries, Inc. | 1,405 | 155,660 | ||||||
Reliance Steel & Aluminum Co. | 895 | 87,021 | ||||||
Steel Dynamics, Inc. | 3,656 | 98,712 | ||||||
Valvoline, Inc. | 1,627 | 36,770 | ||||||
Westrock Co. | 941 | 32,163 | ||||||
|
| |||||||
| 2,460,877 | ||||||||
|
| |||||||
| Real Estate — 2.0% | ||||||||
Apartment Investment & Management Co., Class A REIT | 2,183 | 111,333 | ||||||
Brookfield Property REIT, Inc., Class A REIT | 3,753 | 70,631 | ||||||
CBRE Group, Inc., Class A* | 7,815 | 408,490 | ||||||
Equity Residential REIT | 617 | 52,297 | ||||||
HCP, Inc. REIT | 4,135 | 143,526 | ||||||
Host Hotels & Resorts, Inc. REIT | 12,274 | 196,875 | ||||||
Jones Lang LaSalle, Inc. | 478 | 64,076 | ||||||
Medical Properties Trust, Inc. REIT | 8,920 | 165,823 | ||||||
Public Storage REIT | 1,852 | 490,298 | ||||||
Simon Property Group, Inc. REIT | 2,771 | 412,713 | ||||||
Weingarten Realty Investors REIT | 2,008 | 53,192 | ||||||
|
| |||||||
| 2,169,254 | ||||||||
|
| |||||||
| See Notes to Financial Statements. | 54 |
DBX ETF Trust
Schedule of Investments
Xtrackers Russell 1000 US Quality at a Reasonable Price ETF(Continued)
August 31, 2019
Number | Value | |||||||
| Utilities — 0.7% | ||||||||
AES Corp. | 2,640 | $ | 40,471 | |||||
American Electric Power Co., Inc. | 386 | 35,184 | ||||||
CenterPoint Energy, Inc. | 3,094 | 85,673 | ||||||
Consolidated Edison, Inc. | 726 | 64,541 | ||||||
DTE Energy Co. | 189 | 24,506 | ||||||
Edison International | 521 | 37,653 | ||||||
Exelon Corp. | 5,552 | 262,387 | ||||||
NRG Energy, Inc. | 4,706 | 171,298 | ||||||
Sempra Energy | 206 | 29,176 | ||||||
UGI Corp. | 595 | 28,959 | ||||||
Xcel Energy, Inc. | 401 | 25,752 | ||||||
|
| |||||||
| 805,600 | ||||||||
|
| |||||||
TOTAL COMMON STOCKS | 106,862,977 | |||||||
|
| |||||||
Number | Value | |||||||
| CASH EQUIVALENTS — 3.3% | ||||||||
DWS Government Money Market Series “Institutional Shares”, 2.09% (b) | 3,716,009 | $ | 3,716,009 | |||||
|
| |||||||
TOTAL INVESTMENTS — 99.6% (Cost $106,791,081) | $ | 110,578,986 | ||||||
Other assets and liabilities, net — 0.4% | 438,777 | |||||||
|
| |||||||
NET ASSETS — 100.0% | $ | 111,017,763 | ||||||
|
| |||||||
A summary of the Fund’s transactions with affiliated investments during the year ended August 31, 2019 is as follows:
| Value ($) at 8/31/2018 | Purchases Cost ($) | Sales Proceeds ($) | Net Realized Gain/(Loss) ($) | Net Change in Unrealized Appreciation (Depreciation) ($) | Income ($) | Capital Gain Distributions ($) | Number of Shares at 8/31/2019 | Value ($) at 8/31/2019 | ||||||||||||||||||||||||||
SECURITIES LENDING COLLATERAL —0.0% | ||||||||||||||||||||||||||||||||||
DWS Government & Agency Securities Portfolio “DWS Government Cash Institutional Shares”, 2.04% (b)(c) | ||||||||||||||||||||||||||||||||||
| — | 0 | (d) | — | — | — | 1,697 | — | — | — | |||||||||||||||||||||||||
CASH EQUIVALENTS —3.3% | ||||||||||||||||||||||||||||||||||
DWS Government Money Market Series “Institutional Shares”, 2.09% (b) | ||||||||||||||||||||||||||||||||||
| — | 5,836,060 | (2,120,051 | ) | — | — | 4,886 | — | 3,716,009 | 3,716,009 | |||||||||||||||||||||||||
|
|
|
|
|
|
|
|
|
|
|
|
|
|
|
|
| ||||||||||||||||||
| — | 5,836,060 | (2,120,051 | ) | — | — | 6,583 | — | 3,716,009 | 3,716,009 | |||||||||||||||||||||||||
|
|
|
|
|
|
|
|
|
|
|
|
|
|
|
|
| ||||||||||||||||||
| * | Non-income producing security. |
| (a) | All or a portion of these securities were on loan. In addition, “Other assets and liabilities, net” may include pending sales that are also on loan. The value of securities loaned at August 31, 2019 amounted to $4,865,473, which is 4.4% of net assets. The Fund heldnon-cash U.S. Treasury securities collateral having a value of $4,961,428. |
| (b) | Affiliated fund managed by DWS Investment Management Americas, Inc. The rate shown is the annualizedseven-day yield at period end. |
| (c) | Represents cash collateral held in connection with securities lending. Income earned by the Fund is net of borrower rebates. |
| (d) | Represents the net increase (purchase cost) or decrease (sales proceeds) in the amount invested in cash collateral for the period ended August 31, 2019. |
| REIT: | Real Estate Investment Trust |
At August 31, 2019, open futures contracts purchased were as follows:
Contract Description | Currency | Number of Contracts | Notional Amount | Contract Value | Expiration Date | Unrealized Appreciation | ||||||||||||
E-Mini S&P 500 Futures | USD | 28 | $ | 4,032,412 | $4,094,720 | 9/20/2019 | $ | 62,308 | ||||||||||
For information on the Fund’s policy and additional disclosures regarding open futures contracts, please refer to the Derivatives section of Note 2 in the accompanying Notes to Financial Statements.
Currency Abbreviations
| USD | U.S. Dollar |
| See Notes to Financial Statements. | 55 |
DBX ETF Trust
Schedule of Investments
Xtrackers Russell 1000 US Quality at a Reasonable Price ETF(Continued)
August 31, 2019
Fair Value Measurements
Various inputs are used in determining the value of the Fund’s investments. These inputs are summarized in three broad levels. Level 1 includes quoted prices in active markets for identical securities. Level 2 includes other significant observable inputs (including quoted prices for similar securities, interest rates, prepayment speeds and credit risk). Level 3 includes significant unobservable inputs (including the Fund’s own assumptions in determining the fair value of investments). The level assigned to the securities valuations may not be an indication of the risk or liquidity associated with investing in those securities.
The following is a summary of the inputs used as of August 31, 2019 in valuing the Fund’s investments. For information on the Fund’s policy regarding the valuation of investments, please refer to the Security Valuation section of Note 2 in the accompanying Notes to Financial Statements.
Assets | Level 1 | Level 2 | Level 3 | Total | ||||||||||||
Common Stocks (e) | $ | 106,862,977 | $ | — | $ | — | $ | 106,862,977 | ||||||||
Short-Term Investments (e) | 3,716,009 | — | — | 3,716,009 | ||||||||||||
Derivatives (f) | ||||||||||||||||
Futures Contracts | 62,308 | — | — | 62,308 | ||||||||||||
|
|
|
|
|
|
|
| |||||||||
TOTAL | $ | 110,641,294 | $ | — | $ | — | $ | 110,641,294 | ||||||||
|
|
|
|
|
|
|
| |||||||||
| (e) | See Schedule of Investments for additional detailed categorizations. |
| (f) | Derivatives include unrealized appreciation (depreciation) on open futures contracts. |
| See Notes to Financial Statements. | 56 |
DBX ETF Trust
Schedule of Investments
Xtrackers Russell 2000 Comprehensive Factor ETF
August 31, 2019
Number | Value | |||||||
| COMMON STOCKS — 98.6% |
| |||||||
| Communication Services — 2.8% | ||||||||
AMC Entertainment Holdings, Inc., Class A (a) | 1,097 | $ | 12,188 | |||||
Anterix, Inc.* | 42 | 1,627 | ||||||
ATN International, Inc. | 196 | 11,137 | ||||||
Bandwidth, Inc., Class A* (a) | 102 | 8,893 | ||||||
Boingo Wireless, Inc.* | 168 | 2,162 | ||||||
Care.com, Inc.* | 189 | 1,869 | ||||||
Cargurus, Inc., Class A* (a) | 78 | 2,544 | ||||||
Cars.com, Inc.* (a) | 215 | 1,916 | ||||||
Central European Media Enterprises Ltd., Class A* | 1,034 | 4,798 | ||||||
Cincinnati Bell, Inc.* (a) | 227 | 1,233 | ||||||
Cogent Communications Holdings, Inc. | 85 | 5,176 | ||||||
Consolidated Communications Holdings, Inc. | 350 | 1,410 | ||||||
Daily Journal Corp.* (a) | 6 | 1,203 | ||||||
DHI Group, Inc.* | 998 | 3,623 | ||||||
Emerald Expositions Events, Inc. | 96 | 918 | ||||||
Entercom Communications Corp., Class A | 388 | 1,381 | ||||||
EW Scripps Co., Class A (a) | 782 | 9,666 | ||||||
Gannett Co., Inc. (a) | 1,101 | 11,582 | ||||||
Glu Mobile, Inc.* (a) | 537 | 2,384 | ||||||
Gray Television, Inc.* (a) | 690 | 10,557 | ||||||
Hemisphere Media Group, Inc.* | 399 | 4,736 | ||||||
IDT Corp., Class B* | 1,014 | 8,943 | ||||||
IMAX Corp.* | 434 | 9,079 | ||||||
Iridium Communications, Inc.* (a) | 258 | 6,238 | ||||||
Lee Enterprises, Inc.* | 1,418 | 2,524 | ||||||
Liberty Latin America Ltd., Class A* | 198 | 3,251 | ||||||
Liberty Latin America Ltd., Class C* | 85 | 1,402 | ||||||
Liberty Media Corp.-Liberty Braves, Class A* | 54 | 1,483 | ||||||
Liberty Media Corp.-Liberty Braves, Class C* | 237 | 6,508 | ||||||
Liberty TripAdvisor Holdings, Inc., Class A* | 443 | 3,872 | ||||||
Loral Space & Communications, Inc.* | 146 | 5,401 | ||||||
Marchex, Inc., Class B* | 579 | 1,969 | ||||||
Marcus Corp. (a) | 512 | 17,183 | ||||||
Meet Group, Inc.* | 586 | 2,022 | ||||||
Meredith Corp. | 70 | 3,065 | ||||||
MSG Networks, Inc., Class A* (a) | 689 | 11,300 | ||||||
National CineMedia, Inc. (a) | 1,637 | 13,423 | ||||||
New Media Investment Group, Inc. | 470 | 4,127 | ||||||
Ooma, Inc.* | 267 | 3,337 | ||||||
ORBCOMM, Inc.* | 222 | 1,023 | ||||||
QuinStreet, Inc.* (a) | 482 | 5,519 | ||||||
Reading International, Inc., Class A* | 393 | 4,873 | ||||||
Rosetta Stone, Inc.* | 250 | 4,562 | ||||||
Saga Communications, Inc., Class A | 107 | 3,054 | ||||||
Scholastic Corp. | 338 | 11,854 | ||||||
Shenandoah Telecommunications Co. | 263 | 8,295 | ||||||
Spok Holdings, Inc. | 617 | 7,250 | ||||||
TechTarget, Inc.* | 189 | 4,487 | ||||||
TEGNA, Inc. (a) | 684 | 9,788 | ||||||
Travelzoo* | 39 | 463 | ||||||
TrueCar, Inc.* | 145 | 574 | ||||||
Number | Value | |||||||
| Communication Services (Continued) | ||||||||
Vonage Holdings Corp.* | 83 | $ | 1,097 | |||||
WideOpenWest, Inc.* | 143 | 804 | ||||||
Yelp, Inc.* (a) | 56 | 1,877 | ||||||
|
| |||||||
| 271,650 | ||||||||
|
| |||||||
| Consumer Discretionary — 12.4% | ||||||||
1-800-Flowers.com, Inc., Class A* | 421 | 6,197 | ||||||
Aaron’s, Inc. | 171 | 10,963 | ||||||
Abercrombie & Fitch Co., Class A (a) | 685 | 10,015 | ||||||
Acushnet Holdings Corp. (a) | 236 | 6,129 | ||||||
Adient PLC (a) | 63 | 1,271 | ||||||
Adtalem Global Education, Inc.* | 124 | 5,297 | ||||||
American Axle & Manufacturing Holdings, Inc.* (a) | 680 | 4,311 | ||||||
American Eagle Outfitters, Inc. (a) | 415 | 6,980 | ||||||
American Outdoor Brands Corp.* | 204 | 1,226 | ||||||
American Public Education, Inc.* | 105 | 2,544 | ||||||
America’sCar-Mart, Inc.* | 153 | 13,124 | ||||||
Asbury Automotive Group, Inc.* (a) | 150 | 14,145 | ||||||
Barnes & Noble Education, Inc.* | 83 | 324 | ||||||
Bassett Furniture Industries, Inc. | 201 | 2,448 | ||||||
BBX Capital Corp. | 648 | 2,689 | ||||||
Beazer Homes USA, Inc.* | 281 | 3,521 | ||||||
Bed Bath & Beyond, Inc. (a) | 763 | 7,378 | ||||||
Big Lots, Inc. (a) | 108 | 2,457 | ||||||
Biglari Holdings, Inc., Class B* | 13 | 1,140 | ||||||
BJ’s Restaurants, Inc. (a) | 316 | 11,515 | ||||||
Bloomin’ Brands, Inc. (a) | 657 | 11,852 | ||||||
Boot Barn Holdings, Inc.* (a) | 140 | 4,795 | ||||||
Boyd Gaming Corp. (a) | 64 | 1,539 | ||||||
Brinker International, Inc. | 384 | 14,592 | ||||||
Buckle, Inc. (a) | 443 | 8,683 | ||||||
Caleres, Inc. (a) | 159 | 3,204 | ||||||
Callaway Golf Co. (a) | 629 | 11,171 | ||||||
Camping World Holdings, Inc., Class A (a) | 128 | 973 | ||||||
Career Education Corp.* | 313 | 6,420 | ||||||
Carriage Services, Inc. | 260 | 5,530 | ||||||
Carrols Restaurant Group, Inc.* | 453 | 3,307 | ||||||
Cato Corp., Class A | 269 | 4,608 | ||||||
Cavco Industries, Inc.* | 19 | 3,486 | ||||||
Century Casinos, Inc.* | 624 | 4,792 | ||||||
Century Communities, Inc.* (a) | 176 | 4,960 | ||||||
Cheesecake Factory, Inc. (a) | 282 | 10,713 | ||||||
Chegg, Inc.* (a) | 57 | 2,259 | ||||||
Chico’s FAS, Inc. (a) | 790 | 2,465 | ||||||
Children’s Place, Inc. (a) | 128 | 11,168 | ||||||
Churchill Downs, Inc. (a) | 39 | 4,807 | ||||||
Chuy’s Holdings, Inc.* | 233 | 5,911 | ||||||
Citi Trends, Inc. | 283 | 4,757 | ||||||
Clarus Corp. | 657 | 7,234 | ||||||
Collectors Universe, Inc. | 260 | 6,739 | ||||||
Container Store Group, Inc.* | 46 | 206 | ||||||
Cooper Tire & Rubber Co. (a) | 769 | 18,064 | ||||||
Cooper-Standard Holdings, Inc.* | 29 | 1,086 | ||||||
Core-Mark Holding Co., Inc. | 972 | 31,483 | ||||||
Cracker Barrel Old Country Store, Inc. (a) | 45 | 7,443 | ||||||
Crocs, Inc.* (a) | 576 | 12,845 | ||||||
| See Notes to Financial Statements. | 57 |
DBX ETF Trust
Schedule of Investments
Xtrackers Russell 2000 Comprehensive Factor ETF(Continued)
August 31, 2019
Number | Value | |||||||
| Consumer Discretionary (Continued) | ||||||||
Culp, Inc. | 170 | $ | 2,387 | |||||
Dana, Inc. | 503 | 6,403 | ||||||
Dave & Buster’s Entertainment, Inc. (a) | 250 | 10,762 | ||||||
Deckers Outdoor Corp.* (a) | 41 | 6,045 | ||||||
Del Taco Restaurants, Inc.* | 618 | 6,909 | ||||||
Delta Apparel, Inc.* | 247 | 5,543 | ||||||
Denny’s Corp.* | 1,066 | 25,147 | ||||||
Designer Brands, Inc., Class A (a) | 615 | 10,141 | ||||||
Dillard’s, Inc., Class A (a) | 54 | 3,160 | ||||||
Dine Brands Global, Inc. (a) | 124 | 8,748 | ||||||
Dorman Products, Inc.* (a) | 94 | 6,682 | ||||||
Drive Shack, Inc.* (a) | 77 | 363 | ||||||
Duluth Holdings, Inc., Class B* (a) | 70 | 643 | ||||||
El Pollo Loco Holdings, Inc.* (a) | 385 | 3,931 | ||||||
Eldorado Resorts, Inc.* (a) | 49 | 1,887 | ||||||
Escalade, Inc. (a) | 336 | 3,471 | ||||||
Ethan Allen Interiors, Inc. | 802 | 13,794 | ||||||
Everi Holdings, Inc.* | 331 | 2,959 | ||||||
Express, Inc.* (a) | 265 | 562 | ||||||
Fiesta Restaurant Group, Inc.* (a) | 133 | 1,149 | ||||||
Flexsteel Industries, Inc. | 59 | 893 | ||||||
Fox Factory Holding Corp.* | 169 | 12,175 | ||||||
Funko, Inc., Class A* (a) | 180 | 4,318 | ||||||
GameStop Corp., Class A (a) | 984 | 3,906 | ||||||
Genesco, Inc.* (a) | 378 | 13,487 | ||||||
Gentherm, Inc.* (a) | 454 | 16,662 | ||||||
G-III Apparel Group Ltd.* (a) | 105 | 2,154 | ||||||
Golden Entertainment, Inc.* | 108 | 1,531 | ||||||
GoPro, Inc., Class A* (a) | 256 | 991 | ||||||
Group 1 Automotive, Inc. (a) | 243 | 18,157 | ||||||
Groupon, Inc.* | 217 | 538 | ||||||
Guess?, Inc. (a) | 397 | 7,174 | ||||||
Habit Restaurants, Inc., Class A* (a) | 1,082 | 9,478 | ||||||
Hamilton Beach Brands Holding Co., Class A | 9 | 128 | ||||||
Haverty Furniture Cos., Inc. | 881 | 16,871 | ||||||
Helen of Troy Ltd.* | 72 | 11,053 | ||||||
Hibbett Sports, Inc.* (a) | 340 | 5,624 | ||||||
Hooker Furniture Corp. | 101 | 1,804 | ||||||
Houghton Mifflin Harcourt Co.* | 781 | 4,647 | ||||||
Hudson Ltd., Class A* | 288 | 3,125 | ||||||
Inspired Entertainment, Inc.* | 258 | 1,803 | ||||||
Installed Building Products, Inc.* | 94 | 5,350 | ||||||
International Speedway Corp., Class A | 308 | 13,866 | ||||||
iRobot Corp.* (a) | 84 | 5,192 | ||||||
J Alexander’s Holdings, Inc.* | 525 | 6,195 | ||||||
Jack in the Box, Inc. (a) | 81 | 6,911 | ||||||
Johnson Outdoors, Inc., Class A | 107 | 5,992 | ||||||
K12, Inc.* | 403 | 10,619 | ||||||
KB Home | 289 | 8,118 | ||||||
Kontoor Brands, Inc.* (a) | 54 | 1,849 | ||||||
Laureate Education, Inc., Class A* | 427 | 7,814 | ||||||
La-Z-Boy, Inc. | 464 | 14,788 | ||||||
LCI Industries | 70 | 5,932 | ||||||
LGI Homes, Inc.* (a) | 52 | 4,239 | ||||||
Lindblad Expeditions Holdings, Inc.* | 447 | 8,341 | ||||||
Liquidity Services, Inc.* | 193 | 1,461 | ||||||
Number | Value | |||||||
| Consumer Discretionary (Continued) | ||||||||
Lithia Motors, Inc., Class A (a) | 123 | $ | 16,122 | |||||
M/I Homes, Inc.* | 545 | 19,696 | ||||||
Malibu Boats, Inc., Class A* | 85 | 2,365 | ||||||
Marine Products Corp. | 95 | 1,437 | ||||||
MarineMax, Inc.* | 295 | 4,266 | ||||||
MasterCraft Boat Holdings, Inc.* | 108 | 1,636 | ||||||
MDC Holdings, Inc. | 332 | 12,838 | ||||||
Meritage Homes Corp.* | 300 | 19,602 | ||||||
Michaels Cos., Inc.* (a) | 295 | 1,673 | ||||||
Modine Manufacturing Co.* | 472 | 4,819 | ||||||
Monarch Casino & Resort, Inc.* | 122 | 5,414 | ||||||
Monro, Inc. (a) | 117 | 9,093 | ||||||
Motorcar Parts of America, Inc.* (a) | 174 | 2,528 | ||||||
Movado Group, Inc. (a) | 170 | 3,658 | ||||||
Murphy USA, Inc.* | 349 | 31,201 | ||||||
Nathan’s Famous, Inc. | 27 | 1,798 | ||||||
National Vision Holdings, Inc.* | 96 | 2,723 | ||||||
Noodles & Co.* (a) | 186 | 1,073 | ||||||
Office Depot, Inc. | 2,545 | 3,308 | ||||||
OneSpaWorld Holdings Ltd.* | 1,545 | 24,257 | ||||||
Oxford Industries, Inc. (a) | 151 | 10,537 | ||||||
Papa John’s International, Inc. | 57 | 2,836 | ||||||
Party City Holdco, Inc.* (a) | 114 | 536 | ||||||
Penn National Gaming, Inc.* (a) | 47 | 901 | ||||||
PetMed Express, Inc. (a) | 133 | 2,101 | ||||||
PlayAGS, Inc.* | 89 | 867 | ||||||
Potbelly Corp.* | 189 | 875 | ||||||
Quotient Technology, Inc.* | 26 | 191 | ||||||
RCI Hospitality Holdings, Inc. | 152 | 2,706 | ||||||
Red Lion Hotels Corp.* | 47 | 246 | ||||||
Red Robin Gourmet Burgers, Inc.* | 163 | 5,459 | ||||||
Red Rock Resorts, Inc., Class A (a) | 165 | 3,440 | ||||||
Regis Corp.* (a) | 254 | 4,107 | ||||||
Rent-A-Center, Inc.* | 634 | 16,186 | ||||||
RH* | 12 | 1,719 | ||||||
Rocky Brands, Inc. | 161 | 4,692 | ||||||
Ruth’s Hospitality Group, Inc. | 656 | 12,759 | ||||||
Sally Beauty Holdings, Inc.* (a) | 1,122 | 13,722 | ||||||
SeaWorld Entertainment, Inc.* (a) | 122 | 3,539 | ||||||
Select Interior Concepts, Inc., Class A* | 310 | 3,847 | ||||||
Shake Shack, Inc., Class A* | 66 | 6,545 | ||||||
Shoe Carnival, Inc. (a) | 325 | 9,990 | ||||||
Shutterfly, Inc.* (a) | 35 | 1,781 | ||||||
Shutterstock, Inc.* (a) | 78 | 2,739 | ||||||
Signet Jewelers Ltd. (a) | 83 | 1,016 | ||||||
Sleep Number Corp.* | 608 | 25,439 | ||||||
Sonic Automotive, Inc., Class A (a) | 498 | 13,401 | ||||||
Sotheby’s* | 30 | 1,733 | ||||||
Speedway Motorsports, Inc. | 223 | 4,404 | ||||||
Sportsman’s Warehouse Holdings, Inc.* | 384 | 1,620 | ||||||
Standard Motor Products, Inc. | 325 | 14,401 | ||||||
Steven Madden Ltd. | 269 | 8,936 | ||||||
Stoneridge, Inc.* | 416 | 12,775 | ||||||
Strategic Education, Inc. | 3 | 508 | ||||||
Sturm Ruger & Co., Inc. | 138 | 5,659 | ||||||
Superior Group of Cos., Inc. | 81 | 1,149 | ||||||
Target Hospitality Corp.* | 319 | 1,946 | ||||||
| See Notes to Financial Statements. | 58 |
DBX ETF Trust
Schedule of Investments
Xtrackers Russell 2000 Comprehensive Factor ETF(Continued)
August 31, 2019
Number | Value | |||||||
| Consumer Discretionary (Continued) | ||||||||
Taylor Morrison Home Corp.* | 308 | $ | 7,349 | |||||
Texas Roadhouse, Inc. (a) | 90 | 4,631 | ||||||
Tile Shop Holdings, Inc. (a) | 353 | 950 | ||||||
Tilly’s, Inc., Class A | 496 | 5,312 | ||||||
TopBuild Corp.* | 51 | 4,724 | ||||||
Tower International, Inc. | 138 | 4,268 | ||||||
TRI Pointe Group, Inc.* | 744 | 10,416 | ||||||
Tupperware Brands Corp. | 215 | 2,797 | ||||||
Twin River Worldwide Holdings, Inc. | 86 | 1,948 | ||||||
Unifi, Inc.* | 143 | 2,751 | ||||||
Universal Electronics, Inc.* | 294 | 13,274 | ||||||
Vera Bradley, Inc.* (a) | 191 | 2,023 | ||||||
Vista Outdoor, Inc.* | 258 | 1,442 | ||||||
Visteon Corp.* (a) | 45 | 3,104 | ||||||
Waitr Holdings, Inc.* (a) | 310 | 536 | ||||||
Weyco Group, Inc. | 201 | 4,931 | ||||||
William Lyon Homes, Class A* | 87 | 1,537 | ||||||
Wingstop, Inc. | 141 | 14,124 | ||||||
Winmark Corp. | 88 | 14,300 | ||||||
Winnebago Industries, Inc. (a) | 282 | 9,030 | ||||||
Wolverine World Wide, Inc. (a) | 149 | 3,867 | ||||||
YETI Holdings, Inc.* (a) | 93 | 2,627 | ||||||
Zumiez, Inc.* (a) | 357 | 9,275 | ||||||
|
| |||||||
| 1,194,669 | ||||||||
|
| |||||||
| Consumer Staples — 3.0% | ||||||||
Alico, Inc. | 63 | 1,881 | ||||||
Andersons, Inc. (a) | 80 | 1,834 | ||||||
B&G Foods, Inc. (a) | 329 | 5,570 | ||||||
BJ’s Wholesale Club Holdings, Inc.* (a) | 139 | 3,650 | ||||||
Boston Beer Co, Inc., Class A* (a) | 27 | 11,837 | ||||||
Bridgford Foods Corp.* | 51 | 1,708 | ||||||
Calavo Growers, Inc. (a) | 112 | 9,929 | ||||||
Cal-Maine Foods, Inc. (a) | 232 | 9,405 | ||||||
Central Garden & Pet Co., Class A* | 37 | 890 | ||||||
Chefs’ Warehouse, Inc.* | 278 | 10,725 | ||||||
Coca-Cola Consolidated, Inc. | 32 | 10,771 | ||||||
Craft Brew Alliance, Inc.* | 76 | 764 | ||||||
Darling Ingredients, Inc.* | 305 | 5,673 | ||||||
Edgewell Personal Care Co.* | 161 | 4,482 | ||||||
elf Beauty, Inc.* | 106 | 1,730 | ||||||
Farmer Brothers Co.* | 28 | 340 | ||||||
Fresh Del Monte Produce, Inc. | 123 | 3,203 | ||||||
Freshpet, Inc.* | 136 | 6,675 | ||||||
HF Foods Group, Inc.* | 330 | 6,395 | ||||||
Hostess Brands, Inc.* | 631 | 8,847 | ||||||
Ingles Markets, Inc., Class A | 433 | 16,835 | ||||||
Inter Parfums, Inc. | 121 | 7,779 | ||||||
J&J Snack Foods Corp. (a) | 39 | 7,529 | ||||||
John B Sanfilippo & Son, Inc. | 222 | 20,557 | ||||||
Lancaster Colony Corp. | 30 | 4,377 | ||||||
Landec Corp.* | 207 | 2,275 | ||||||
Lifevantage Corp.* | 130 | 1,581 | ||||||
Limoneira Co. | 103 | 1,870 | ||||||
Medifast, Inc. (a) | 60 | 5,998 | ||||||
MGP Ingredients, Inc. | 35 | 1,686 | ||||||
Natural Grocers by Vitamin Cottage, Inc.* | 230 | 2,171 | ||||||
Number | Value | |||||||
| Consumer Staples (Continued) | ||||||||
Nature’s Sunshine Products, Inc.* | 293 | $ | 2,757 | |||||
Oil-Dri Corp. of America | 112 | 3,445 | ||||||
Performance Food Group Co.* | 207 | 9,686 | ||||||
PriceSmart, Inc. (a) | 96 | 5,801 | ||||||
Primo Water Corp.* (a) | 127 | 1,553 | ||||||
Sanderson Farms, Inc. (a) | 74 | 11,072 | ||||||
Seneca Foods Corp., Class A* | 123 | 3,380 | ||||||
Simply Good Foods Co.* | 479 | 14,193 | ||||||
SpartanNash Co. | 331 | 3,565 | ||||||
Tootsie Roll Industries, Inc. (a) | 204 | 7,483 | ||||||
Turning Point Brands, Inc. (a) | 42 | 1,506 | ||||||
United Natural Foods, Inc.* (a) | 158 | 1,270 | ||||||
Universal Corp. | 196 | 9,812 | ||||||
USANA Health Sciences, Inc.* (a) | 24 | 1,631 | ||||||
Vector Group Ltd. (a) | 326 | 3,808 | ||||||
Village Super Market, Inc., Class A | 468 | 11,686 | ||||||
WD-40 Co. (a) | 82 | 14,949 | ||||||
Weis Markets, Inc. | 130 | 4,970 | ||||||
|
| |||||||
| 291,534 | ||||||||
|
| |||||||
| Energy — 3.0% | ||||||||
Amplify Energy Corp.* | 79 | 471 | ||||||
Archrock, Inc. | 397 | 3,855 | ||||||
Ardmore Shipping Corp.* | 308 | 1,922 | ||||||
Brigham Minerals, Inc., Class A | 134 | 2,679 | ||||||
C&J Energy Services, Inc.* | 528 | 5,048 | ||||||
Cactus, Inc., Class A* | 114 | 2,904 | ||||||
Callon Petroleum Co.* (a) | 464 | 1,907 | ||||||
Carrizo Oil & Gas, Inc.* | 55 | 456 | ||||||
Clean Energy Fuels Corp.* | 199 | 396 | ||||||
CNX Resources Corp.* | 203 | 1,618 | ||||||
CONSOL Energy, Inc.* (a) | 108 | 1,810 | ||||||
CVR Energy, Inc. (a) | 70 | 2,785 | ||||||
Delek US Holdings, Inc. (a) | 250 | 8,187 | ||||||
DHT Holdings, Inc. (a) | 698 | 3,923 | ||||||
Diamond S Shipping, Inc.* | 125 | 1,362 | ||||||
DMC Global, Inc. (a) | 107 | 4,647 | ||||||
Dorian LPG Ltd.* | 92 | 956 | ||||||
Dril-Quip, Inc.* (a) | 105 | 4,814 | ||||||
Earthstone Energy, Inc., Class A* | 257 | 884 | ||||||
Era Group, Inc.* | 172 | 1,631 | ||||||
Evolution Petroleum Corp. | 349 | 2,066 | ||||||
Exterran Corp.* | 129 | 1,361 | ||||||
Falcon Minerals Corp. | 1,790 | 10,489 | ||||||
GasLog Ltd. | 211 | 2,595 | ||||||
Geospace Technologies Corp.* | 110 | 1,346 | ||||||
Green Plains, Inc. (a) | 640 | 5,254 | ||||||
Gulfport Energy Corp.* (a) | 778 | 1,867 | ||||||
Hallador Energy Co. | 303 | 1,203 | ||||||
Helix Energy Solutions Group, Inc.* | 740 | 5,358 | ||||||
Isramco, Inc.* | 16 | 1,925 | ||||||
Jagged Peak Energy, Inc.* | 393 | 2,712 | ||||||
Keane Group, Inc.* | 398 | 2,109 | ||||||
KLX Energy Services Holdings, Inc.* | 114 | 1,143 | ||||||
Liberty Oilfield Services, Inc., Class A (a) | 509 | 5,482 | ||||||
Magnolia Oil & Gas Corp., Class A* | 899 | 9,179 | ||||||
Matador Resources Co.* (a) | 152 | 2,379 | ||||||
| See Notes to Financial Statements. | 59 |
DBX ETF Trust
Schedule of Investments
Xtrackers Russell 2000 Comprehensive Factor ETF(Continued)
August 31, 2019
Number | Value | |||||||
| Energy (Continued) | ||||||||
Matrix Service Co.* | 575 | $ | 11,425 | |||||
Nabors Industries Ltd. (a) | 503 | 845 | ||||||
NACCO Industries, Inc., Class A | 211 | 10,504 | ||||||
National Energy Services Reunited Corp* (a) | 171 | 1,310 | ||||||
Natural Gas Services Group, Inc.* | 146 | 1,574 | ||||||
Newpark Resources, Inc.* (a) | 744 | 4,918 | ||||||
Oceaneering International, Inc.* | 133 | 1,724 | ||||||
Oil States International, Inc.* | 79 | 1,089 | ||||||
Panhandle Oil and Gas, Inc., Class A | 142 | 1,623 | ||||||
Par Pacific Holdings, Inc.* | 1,137 | 24,718 | ||||||
PDC Energy, Inc.* (a) | 78 | 2,484 | ||||||
PrimeEnergy Resources Corp.* | 14 | 1,575 | ||||||
ProPetro Holding Corp.* | 517 | 5,506 | ||||||
QEP Resources, Inc. (a) | 230 | 819 | ||||||
Renewable Energy Group, Inc.* (a) | 1,060 | 12,900 | ||||||
REX American Resources Corp.* | 248 | 17,033 | ||||||
RPC, Inc. (a) | 201 | 1,067 | ||||||
Scorpio Tankers, Inc. | 57 | 1,499 | ||||||
SEACOR Holdings, Inc.* | 208 | 9,770 | ||||||
Select Energy Services, Inc., Class A* (a) | 659 | 5,377 | ||||||
SemGroup Corp., Class A (a) | 121 | 1,070 | ||||||
Ship Finance International Ltd. (a) | 509 | 7,162 | ||||||
SilverBow Resources, Inc.* | 98 | 851 | ||||||
Solaris Oilfield Infrastructure, Inc., Class A (a) | 557 | 7,659 | ||||||
Southwestern Energy Co.* (a) | 1,185 | 1,872 | ||||||
SRC Energy, Inc.* | 461 | 2,314 | ||||||
Teekay Tankers Ltd., Class A* | 2,768 | 3,072 | ||||||
US Silica Holdings, Inc. (a) | 109 | 1,108 | ||||||
US Well Services, Inc.* | 493 | 1,479 | ||||||
W&T Offshore, Inc.* | 183 | 802 | ||||||
World Fuel Services Corp. | 850 | 32,640 | ||||||
|
| |||||||
| 286,512 | ||||||||
|
| |||||||
| Financials — 27.0% | ||||||||
1st Constitution Bancorp | 181 | 3,151 | ||||||
1st Source Corp. | 120 | 5,324 | ||||||
ACNB Corp. | 330 | 11,114 | ||||||
AG Mortgage Investment Trust, Inc. REIT | 623 | 9,339 | ||||||
Allegiance Bancshares, Inc.* | 157 | 5,088 | ||||||
Amalgamated Bank, Class A | 259 | 4,157 | ||||||
Ambac Financial Group, Inc.* | 193 | 3,482 | ||||||
Amerant Bancorp, Inc., Class A* | 160 | 2,650 | ||||||
American Equity Investment Life Holding Co. | 174 | 3,750 | ||||||
American National Bankshares, Inc. | 207 | 7,079 | ||||||
Ameris Bancorp (a) | 485 | 17,067 | ||||||
AMERISAFE, Inc. | 272 | 18,686 | ||||||
Ames National Corp. | 214 | 5,665 | ||||||
Anworth Mortgage Asset Corp. REIT | 2,111 | 6,544 | ||||||
Apollo Commercial Real Estate Finance, Inc. REIT (a) | 633 | 11,742 | ||||||
Ares Commercial Real Estate Corp. REIT (a) | 1,084 | 16,249 | ||||||
Argo Group International Holdings Ltd. | 173 | 11,370 | ||||||
Arlington Asset Investment Corp., Class A (a) | 210 | 1,037 | ||||||
Number | Value | |||||||
| Financials (Continued) | ||||||||
ARMOUR Residential REIT, Inc. REIT (a) | 227 | $ | 3,727 | |||||
Arrow Financial Corp. | 285 | 9,166 | ||||||
Artisan Partners Asset Management, Inc., Class A | 573 | 15,265 | ||||||
Atlantic Capital Bancshares, Inc.* | 603 | 9,829 | ||||||
Atlantic Union Bankshares Corp. | 178 | 6,428 | ||||||
Axos Financial, Inc.* | 117 | 3,031 | ||||||
B. Riley Financial, Inc. | 94 | 1,989 | ||||||
Banc of California, Inc. | 372 | 5,420 | ||||||
BancFirst Corp. | 100 | 5,377 | ||||||
Banco Latinoamericano de Comercio Exterior SA, Class E | 315 | 5,711 | ||||||
Bancorp, Inc.* | 214 | 1,954 | ||||||
BancorpSouth Bank (a) | 159 | 4,387 | ||||||
Bank First Corp. (a) | 197 | 10,723 | ||||||
Bank of Commerce Holdings | 455 | 4,550 | ||||||
Bank of Marin Bancorp | 315 | 12,792 | ||||||
Bank of NT Butterfield & Son Ltd. | 192 | 5,292 | ||||||
Bank of Princeton | 110 | 2,937 | ||||||
Bank7 Corp.* | 80 | 1,439 | ||||||
BankFinancial Corp. | 381 | 4,442 | ||||||
Bankwell Financial Group, Inc. | 202 | 5,315 | ||||||
Banner Corp. | 148 | 7,979 | ||||||
Bar Harbor Bankshares | 335 | 7,393 | ||||||
Baycom Corp.* (a) | 267 | 5,901 | ||||||
BCB Bancorp, Inc. | 471 | 5,822 | ||||||
Berkshire Hills Bancorp, Inc. | 221 | 6,482 | ||||||
Blackstone Mortgage Trust, Inc., Class A REIT | 164 | 5,707 | ||||||
Blucora, Inc.* | 109 | 2,461 | ||||||
Boston Private Financial Holdings, Inc. | 586 | 6,223 | ||||||
Bridge Bancorp, Inc. | 245 | 6,593 | ||||||
Bridgewater Bancshares, Inc.* (a) | 466 | 5,187 | ||||||
Brightsphere Investment Group, Inc. | 994 | 9,035 | ||||||
Brookline Bancorp, Inc. | 641 | 9,000 | ||||||
Bryn Mawr Bank Corp. | 243 | 8,286 | ||||||
Business First Bancshares, Inc. | 293 | 6,921 | ||||||
Byline Bancorp, Inc.* | 285 | 4,902 | ||||||
C&F Financial Corp. | 122 | 5,783 | ||||||
Cadence BanCorp | 182 | 2,797 | ||||||
Cambridge Bancorp | 99 | 7,320 | ||||||
Camden National Corp. | 306 | 12,687 | ||||||
Cannae Holdings, Inc.* | 414 | 11,517 | ||||||
Capital Bancorp, Inc.* | 134 | 1,621 | ||||||
Capital City Bank Group, Inc. | 285 | 6,948 | ||||||
Capitol Federal Financial, Inc. | 746 | 10,049 | ||||||
Capstar Financial Holdings, Inc. | 219 | 3,386 | ||||||
Capstead Mortgage Corp. REIT | 1,974 | 14,351 | ||||||
Carolina Financial Corp. | 237 | 8,094 | ||||||
Carter Bank & Trust* | 565 | 10,673 | ||||||
Cathay General Bancorp | 193 | 6,406 | ||||||
CBTX, Inc. | 227 | 6,113 | ||||||
CenterState Banks Corp. | 165 | 3,732 | ||||||
Central Pacific Financial Corp. | 475 | 13,214 | ||||||
Central Valley Community Bancorp | 335 | 6,559 | ||||||
Century Bancorp, Inc., Class A | 103 | 8,343 | ||||||
Chemung Financial Corp. | 116 | 4,662 | ||||||
| See Notes to Financial Statements. | 60 |
DBX ETF Trust
Schedule of Investments
Xtrackers Russell 2000 Comprehensive Factor ETF(Continued)
August 31, 2019
Number | Value | |||||||
| Financials (Continued) | ||||||||
Cherry Hill Mortgage Investment Corp. REIT | 875 | $ | 10,526 | |||||
Citizens & Northern Corp. | 391 | 9,275 | ||||||
Citizens, Inc.* (a) | 654 | 4,107 | ||||||
City Holding Co. (a) | 155 | 11,524 | ||||||
Civista Bancshares, Inc. | 332 | 6,783 | ||||||
CNB Financial Corp. | 316 | 8,355 | ||||||
CNO Financial Group, Inc. | 329 | 4,764 | ||||||
Coastal Financial Corp.* | 102 | 1,507 | ||||||
Codorus Valley Bancorp, Inc. | 193 | 4,315 | ||||||
Cohen & Steers, Inc. (a) | 130 | 7,011 | ||||||
Colony Bankcorp, Inc. (a) | 274 | 4,373 | ||||||
Colony Credit Real Estate, Inc. REIT (a) | 125 | 1,566 | ||||||
Columbia Banking System, Inc. | 168 | 5,798 | ||||||
Columbia Financial, Inc.* | 138 | 2,092 | ||||||
Community Bank System, Inc. (a) | 103 | 6,282 | ||||||
Community Bankers Trust Corp. | 619 | 4,803 | ||||||
Community Financial Corp. | 108 | 3,394 | ||||||
Community Trust Bancorp, Inc. | 225 | 8,752 | ||||||
ConnectOne Bancorp, Inc. | 441 | 9,032 | ||||||
Cowen, Inc., Class A* (a) | 1,032 | 16,110 | ||||||
Crawford & Co., Class A | 871 | 8,405 | ||||||
Customers Bancorp, Inc.* | 254 | 4,798 | ||||||
CVB Financial Corp. | 267 | 5,492 | ||||||
Diamond Hill Investment Group, Inc. | 56 | 7,554 | ||||||
Dime Community Bancshares, Inc. | 574 | 11,382 | ||||||
DNB Financial Corp. | 146 | 6,009 | ||||||
Donegal Group, Inc., Class A | 343 | 4,949 | ||||||
Donnelley Financial Solutions, Inc.* (a) | 482 | 5,124 | ||||||
Dynex Capital, Inc. REIT (a) | 942 | 13,301 | ||||||
Eagle Bancorp, Inc. | 135 | 5,500 | ||||||
eHealth, Inc.* | 26 | 2,166 | ||||||
Elevate Credit, Inc.* | 89 | 384 | ||||||
Ellington Financial, Inc. | 168 | 2,935 | ||||||
EMC Insurance Group, Inc. | 194 | 6,972 | ||||||
Employers Holdings, Inc. | 416 | 17,942 | ||||||
Encore Capital Group, Inc.* (a) | 305 | 11,255 | ||||||
Enova International, Inc.* | 200 | 4,780 | ||||||
Enstar Group Ltd.* | 4 | 714 | ||||||
Entegra Financial Corp.* | 221 | 6,639 | ||||||
Enterprise Bancorp, Inc. | 159 | 4,600 | ||||||
Enterprise Financial Services Corp. | 174 | 6,859 | ||||||
Equity Bancshares, Inc., Class A* | 133 | 3,365 | ||||||
Esquire Financial Holdings, Inc.* | 154 | 3,619 | ||||||
ESSA Bancorp, Inc. | 334 | 5,110 | ||||||
Essent Group Ltd.* | 175 | 8,488 | ||||||
Evans Bancorp, Inc. | 116 | 3,957 | ||||||
Exantas Capital Corp. REIT | 1,038 | 11,636 | ||||||
EZCORP, Inc., Class A* (a) | 657 | 5,171 | ||||||
Farmers & Merchants Bancorp, Inc. (a) | 77 | 1,970 | ||||||
Farmers National Banc Corp. | 571 | 7,709 | ||||||
FB Financial Corp. | 153 | 5,488 | ||||||
FBL Financial Group, Inc., Class A | 57 | 3,091 | ||||||
Federal Agricultural Mortgage Corp., Class C | 138 | 11,364 | ||||||
Federated Investors, Inc., Class B (a) | 434 | 13,905 | ||||||
FedNat Holding Co. | 214 | 2,617 | ||||||
Number | Value | |||||||
| Financials (Continued) | ||||||||
FGL Holdings | 1,342 | $ | 10,709 | |||||
Fidelity D&D Bancorp, Inc. | 77 | 4,236 | ||||||
Financial Institutions, Inc. | 352 | 10,229 | ||||||
First BanCorp | 1,036 | 9,925 | ||||||
First Bancorp, Inc. | 309 | 7,849 | ||||||
First Bancorp/Southern Pines NC | 253 | 8,911 | ||||||
First Bancshares, Inc. | 241 | 7,601 | ||||||
First Bank | 439 | 4,636 | ||||||
First Busey Corp. | 350 | 8,575 | ||||||
First Business Financial Services, Inc. | 265 | 5,976 | ||||||
First Capital, Inc. (a) | 134 | 7,584 | ||||||
First Choice Bancorp | 82 | 1,717 | ||||||
First Commonwealth Financial Corp. | 739 | 9,141 | ||||||
First Community Bancshares, Inc. | 366 | 11,642 | ||||||
First Defiance Financial Corp. | 391 | 10,225 | ||||||
First Financial Bancorp | 245 | 5,738 | ||||||
First Financial Bankshares, Inc. (a) | 161 | 4,930 | ||||||
First Financial Corp. | 285 | 11,571 | ||||||
First Financial Northwest, Inc. | 213 | 2,922 | ||||||
First Foundation, Inc. (a) | 390 | 5,444 | ||||||
First Guaranty Bancshares, Inc. | 89 | 1,689 | ||||||
First Internet Bancorp | 90 | 1,820 | ||||||
First Interstate BancSystem, Inc., Class A | 232 | 9,048 | ||||||
First Merchants Corp. | 218 | 7,787 | ||||||
First Mid Bancshares, Inc. | 201 | 6,450 | ||||||
First Midwest Bancorp, Inc. | 285 | 5,472 | ||||||
First Northwest Bancorp | 220 | 3,516 | ||||||
First of Long Island Corp. | 423 | 9,204 | ||||||
FirstCash, Inc. | 59 | 5,825 | ||||||
Flagstar Bancorp, Inc. (a) | 23 | 836 | ||||||
Flushing Financial Corp. | 410 | 7,909 | ||||||
FNCB Bancorp, Inc. (a) | 389 | 2,863 | ||||||
Focus Financial Partners, Inc., Class A* | 106 | 2,175 | ||||||
Franklin Financial Network, Inc. | 169 | 4,889 | ||||||
Franklin Financial Services Corp. | 125 | 3,948 | ||||||
FS Bancorp, Inc. | 115 | 5,566 | ||||||
Fulton Financial Corp. (a) | 533 | 8,501 | ||||||
FVCBankcorp, Inc.* | 225 | 3,724 | ||||||
GAMCO Investors, Inc., Class A | 256 | 4,524 | ||||||
Genworth Financial, Inc., Class A* (a) | 1,059 | 4,691 | ||||||
German American Bancorp, Inc. (a) | 255 | 7,785 | ||||||
Glacier Bancorp, Inc. (a) | 150 | 5,954 | ||||||
Global Indemnity Ltd. | 95 | 2,446 | ||||||
Goosehead Insurance, Inc., Class A | 66 | 3,052 | ||||||
Granite Point Mortgage Trust, Inc. REIT (a) | 909 | 16,626 | ||||||
Great Ajax Corp. REIT | 716 | 10,439 | ||||||
Great Southern Bancorp, Inc. | 208 | 11,719 | ||||||
Great Western Bancorp, Inc. | 228 | 6,801 | ||||||
Green Dot Corp., Class A* | 41 | 1,254 | ||||||
Greene County Bancorp, Inc. | 70 | 1,883 | ||||||
Greenhill & Co., Inc. (a) | 234 | 3,285 | ||||||
Guaranty Bancshares, Inc. | 207 | 6,239 | ||||||
Hallmark Financial Services, Inc.* | 432 | 7,595 | ||||||
Hamilton Lane, Inc., Class A | 222 | 13,795 | ||||||
Hancock Whitney Corp. | 105 | 3,687 | ||||||
Hanmi Financial Corp. | 342 | 6,125 | ||||||
HarborOne Bancorp, Inc.* | 484 | 4,821 | ||||||
| See Notes to Financial Statements. | 61 |
DBX ETF Trust
Schedule of Investments
Xtrackers Russell 2000 Comprehensive Factor ETF(Continued)
August 31, 2019
Number | Value | |||||||
| Financials (Continued) | ||||||||
Hawthorn Bancshares, Inc. | 268 | $ | 5,923 | |||||
HCI Group, Inc. (a) | 136 | 5,300 | ||||||
Heartland Financial USA, Inc. | 186 | 8,134 | ||||||
Heritage Commerce Corp. | 445 | 5,158 | ||||||
Heritage Financial Corp. (a) | 350 | 9,163 | ||||||
Heritage Insurance Holdings, Inc. | 657 | 8,613 | ||||||
Hilltop Holdings, Inc. | 335 | 7,956 | ||||||
Hingham Institution for Savings | 29 | 5,223 | ||||||
Home Bancorp, Inc. | 143 | 5,331 | ||||||
Home BancShares, Inc. (a) | 265 | 4,696 | ||||||
HomeStreet, Inc.* | 572 | 15,084 | ||||||
HomeTrust Bancshares, Inc. | 322 | 8,121 | ||||||
Hope Bancorp, Inc. | 566 | 7,590 | ||||||
Horace Mann Educators Corp. | 213 | 9,344 | ||||||
Horizon Bancorp, Inc. | 456 | 7,415 | ||||||
Houlihan Lokey, Inc. | 229 | 10,117 | ||||||
Howard Bancorp, Inc.* | 132 | 1,952 | ||||||
IBERIABANK Corp. | 77 | 5,312 | ||||||
Independence Holding Co. | 133 | 4,924 | ||||||
Independent Bank Corp. | 409 | 7,947 | ||||||
Independent Bank Corp./Rockland MA | 99 | 6,693 | ||||||
Independent Bank Group, Inc. | 64 | 3,130 | ||||||
International Bancshares Corp. | 187 | 6,655 | ||||||
INTL. FCStone, Inc.* | 216 | 8,469 | ||||||
Invesco Mortgage Capital, Inc. REIT | 583 | 8,762 | ||||||
Investar Holding Corp. | 215 | 4,992 | ||||||
Investors Bancorp, Inc. | 393 | 4,362 | ||||||
Investors Title Co. | 46 | 6,771 | ||||||
James River Group Holdings Ltd. | 444 | 21,880 | ||||||
Kearny Financial Corp. (a) | 620 | 7,800 | ||||||
Kinsale Capital Group, Inc. | 165 | 16,208 | ||||||
KKR Real Estate Finance Trust, Inc. REIT | 336 | 6,354 | ||||||
Ladder Capital Corp. REIT | 938 | 15,740 | ||||||
Ladenburg Thalmann Financial Services, Inc. | 2,665 | 5,223 | ||||||
Lakeland Bancorp, Inc. | 534 | 7,946 | ||||||
Lakeland Financial Corp. (a) | 255 | 10,794 | ||||||
LCNB Corp. | 296 | 4,964 | ||||||
LegacyTexas Financial Group, Inc. | 239 | 9,656 | ||||||
Level One Bancorp, Inc. | 148 | 3,477 | ||||||
Live Oak Bancshares, Inc. (a) | 49 | 879 | ||||||
Luther Burbank Corp. | 232 | 2,427 | ||||||
Macatawa Bank Corp. | 552 | 5,459 | ||||||
Mackinac Financial Corp. (a) | 283 | 4,002 | ||||||
MainStreet Bancshares, Inc.* (a) | 235 | 5,008 | ||||||
Malvern Bancorp, Inc.* | 92 | 1,946 | ||||||
Marlin Business Services Corp. | 234 | 5,061 | ||||||
MBT Financial Corp. | 549 | 5,402 | ||||||
Medallion Financial Corp.* (a) | 352 | 1,672 | ||||||
Mercantile Bank Corp. | 330 | 10,154 | ||||||
Merchants Bancorp | 163 | 2,585 | ||||||
Meridian Bancorp, Inc. | 482 | 8,425 | ||||||
Meta Financial Group, Inc. | 212 | 6,553 | ||||||
Metropolitan Bank Holding Corp.* | 94 | 3,403 | ||||||
Mid Penn Bancorp, Inc. | 81 | 1,964 | ||||||
Midland States Bancorp, Inc. | 258 | 6,649 | ||||||
MidSouth Bancorp, Inc. | 165 | 1,708 | ||||||
Number | Value | |||||||
| Financials (Continued) | ||||||||
MidWestOne Financial Group, Inc. | 197 | $ | 5,707 | |||||
MMA Capital Holdings, Inc.* | 484 | 14,326 | ||||||
Moelis & Co., Class A (a) | 137 | 4,594 | ||||||
Mr Cooper Group, Inc.* (a) | 296 | 2,608 | ||||||
MutualFirst Financial, Inc. | 142 | 4,284 | ||||||
MVB Financial Corp. | 170 | 3,203 | ||||||
National Bank Holdings Corp., Class A (a) | 287 | 9,368 | ||||||
National Bankshares, Inc. | 131 | 4,389 | ||||||
National General Holdings Corp. | 253 | 5,966 | ||||||
National Western Life Group, Inc., Class A | 40 | 10,313 | ||||||
NBT Bancorp, Inc. | 311 | 10,876 | ||||||
Nelnet, Inc., Class A | 139 | 9,320 | ||||||
New York Mortgage Trust, Inc. REIT (a) | 2,147 | 13,204 | ||||||
NI Holdings, Inc.* | 378 | 6,350 | ||||||
Nicolet Bankshares, Inc.* | 210 | 13,310 | ||||||
NMI Holdings, Inc., Class A* | 592 | 16,777 | ||||||
Northeast Bank | 238 | 4,996 | ||||||
Northfield Bancorp, Inc. | 590 | 9,157 | ||||||
Northrim BanCorp, Inc. | 196 | 7,095 | ||||||
Northwest Bancshares, Inc. (a) | 623 | 9,850 | ||||||
Norwood Financial Corp. | 197 | 6,052 | ||||||
Oak Valley Bancorp | 164 | 2,649 | ||||||
OceanFirst Financial Corp. | 354 | 7,441 | ||||||
OFG Bancorp | 747 | 15,328 | ||||||
Ohio Valley Banc Corp. | 57 | 1,836 | ||||||
Old Line Bancshares, Inc. | 200 | 5,284 | ||||||
Old National Bancorp (a) | 377 | 6,334 | ||||||
Old Second Bancorp, Inc. | 605 | 7,133 | ||||||
On Deck Capital, Inc.* | 307 | 998 | ||||||
OP Bancorp | 430 | 4,085 | ||||||
Oppenheimer Holdings, Inc., Class A | 376 | 10,438 | ||||||
Opus Bank | 122 | 2,533 | ||||||
Orchid Island Capital, Inc. REIT (a) | 1,131 | 6,141 | ||||||
Origin Bancorp, Inc. (a) | 183 | 5,863 | ||||||
Oritani Financial Corp. (a) | 814 | 13,944 | ||||||
Orrstown Financial Services, Inc. | 200 | 4,268 | ||||||
Pacific Mercantile Bancorp* | 506 | 3,846 | ||||||
Pacific Premier Bancorp, Inc. | 194 | 5,715 | ||||||
Palomar Holdings, Inc.* | 63 | 2,144 | ||||||
Park National Corp. (a) | 70 | 6,306 | ||||||
Parke Bancorp, Inc. | 297 | 6,763 | ||||||
PCB Bancorp | 424 | 6,983 | ||||||
PCSB Financial Corp. | 294 | 5,795 | ||||||
PDL Community Bancorp* | 137 | 1,917 | ||||||
Peapack Gladstone Financial Corp. | 278 | 7,820 | ||||||
Penns Woods Bancorp, Inc. | 159 | 6,565 | ||||||
PennyMac Financial Services, Inc.* | 320 | 9,469 | ||||||
PennyMac Mortgage Investment Trust REIT | 221 | 4,809 | ||||||
Peoples Bancorp of North Carolina, Inc. | 133 | 3,707 | ||||||
Peoples Bancorp, Inc. | 304 | 9,336 | ||||||
Peoples Financial Services Corp. | 151 | 6,760 | ||||||
People’s Utah Bancorp | 268 | 7,102 | ||||||
Piper Jaffray Cos. | 280 | 20,373 | ||||||
PJT Partners, Inc., Class A (a) | 153 | 6,366 | ||||||
PRA Group, Inc.* (a) | 139 | 4,745 | ||||||
Preferred Bank (a) | 129 | 6,445 | ||||||
| See Notes to Financial Statements. | 62 |
DBX ETF Trust
Schedule of Investments
Xtrackers Russell 2000 Comprehensive Factor ETF(Continued)
August 31, 2019
Number | Value | |||||||
| Financials (Continued) | ||||||||
Premier Financial Bancorp, Inc. | 366 | $ | 5,673 | |||||
ProAssurance Corp. | 285 | 11,135 | ||||||
Protective Insurance Corp., Class B | 152 | 2,462 | ||||||
Provident Bancorp, Inc.* | 85 | 2,152 | ||||||
Provident Financial Holdings, Inc. | 306 | 6,178 | ||||||
Provident Financial Services, Inc. | 353 | 8,405 | ||||||
Prudential Bancorp, Inc. | 247 | 3,996 | ||||||
Pzena Investment Management, Inc., Class A | 800 | 6,504 | ||||||
QCR Holdings, Inc. | 169 | 5,967 | ||||||
Radian Group, Inc. | 406 | 9,155 | ||||||
RBB Bancorp | 61 | 1,124 | ||||||
Ready Capital Corp. REIT | 905 | 13,285 | ||||||
Redwood Trust, Inc. REIT | 116 | 1,926 | ||||||
Regional Management Corp.* | 171 | 4,403 | ||||||
Reliant Bancorp, Inc. (a) | 197 | 4,513 | ||||||
Renasant Corp. | 126 | 4,132 | ||||||
Republic Bancorp, Inc., Class A | 198 | 8,405 | ||||||
Republic First Bancorp, Inc.* | 235 | 951 | ||||||
Riverview Bancorp, Inc. | 561 | 3,955 | ||||||
RLI Corp. | 65 | 5,952 | ||||||
S&T Bancorp, Inc. (a) | 269 | 9,205 | ||||||
Safety Insurance Group, Inc. | 186 | 17,938 | ||||||
Sandy Spring Bancorp, Inc. | 299 | 10,011 | ||||||
SB One Bancorp | 162 | 3,616 | ||||||
Sculptor Capital Management, Inc., Class A* | 124 | 2,790 | ||||||
Seacoast Banking Corp. of Florida* | 303 | 7,072 | ||||||
Select Bancorp, Inc.* | 279 | 3,041 | ||||||
Selective Insurance Group, Inc. | 102 | 8,122 | ||||||
ServisFirst Bancshares, Inc. (a) | 160 | 4,864 | ||||||
Shore Bancshares, Inc. | 325 | 4,992 | ||||||
Sierra Bancorp | 321 | 7,909 | ||||||
Silvercrest Asset Management Group, Inc., Class A | 317 | 4,143 | ||||||
Simmons First National Corp., Class A | 205 | 4,920 | ||||||
SmartFinancial, Inc.* | 237 | 4,593 | ||||||
South Plains Financial, Inc. | 87 | 1,423 | ||||||
South State Corp. (a) | 92 | 6,769 | ||||||
Southern First Bancshares, Inc.* | 154 | 5,878 | ||||||
Southern Missouri Bancorp, Inc. | 186 | 6,212 | ||||||
Southern National Bancorp of Virginia, Inc. | 483 | 7,061 | ||||||
Southside Bancshares, Inc. (a) | 372 | 12,250 | ||||||
Spirit of Texas Bancshares, Inc.* | 308 | 6,345 | ||||||
State Auto Financial Corp. | 118 | 3,772 | ||||||
Sterling Bancorp, Inc. | 188 | 1,754 | ||||||
Stewart Information Services Corp. | 489 | 17,516 | ||||||
Stifel Financial Corp. | 114 | 6,090 | ||||||
Stock Yards Bancorp, Inc. | 265 | 9,620 | ||||||
Summit Financial Group, Inc. | 316 | 7,783 | ||||||
Territorial Bancorp, Inc. | 237 | 6,482 | ||||||
Timberland Bancorp, Inc. | 145 | 3,708 | ||||||
Tiptree, Inc. | 1,041 | 7,225 | ||||||
Tompkins Financial Corp. (a) | 127 | 10,046 | ||||||
Towne Bank | 277 | 7,277 | ||||||
TPG RE Finance Trust, Inc. REIT | 472 | 9,162 | ||||||
TriCo Bancshares | 292 | 10,325 | ||||||
Number | Value | |||||||
| Financials (Continued) | ||||||||
TriState Capital Holdings, Inc.* | 323 | $ | 6,379 | |||||
Triumph Bancorp, Inc.* | 181 | 5,428 | ||||||
TrustCo Bank Corp. | 1,352 | 10,370 | ||||||
Trustmark Corp. (a) | 343 | 11,209 | ||||||
UMB Financial Corp. | 69 | 4,300 | ||||||
Union Bankshares, Inc. | 60 | 1,646 | ||||||
United Bankshares, Inc. (a) | 157 | 5,790 | ||||||
United Community Banks, Inc. | 269 | 7,104 | ||||||
United Community Financial Corp. | 943 | 9,100 | ||||||
United Financial Bancorp, Inc. | 731 | 9,138 | ||||||
United Fire Group, Inc. | 169 | 7,632 | ||||||
United Insurance Holdings Corp. | 84 | 984 | ||||||
United Security Bancshares | 460 | 4,775 | ||||||
Unity Bancorp, Inc. | 228 | 4,476 | ||||||
Universal Insurance Holdings, Inc. | 346 | 8,650 | ||||||
Univest Financial Corp. | 454 | 11,491 | ||||||
Valley National Bancorp (a) | 562 | 5,907 | ||||||
Veritex Holdings, Inc. | 190 | 4,484 | ||||||
Virtus Investment Partners, Inc. | 63 | 6,721 | ||||||
Waddell & Reed Financial, Inc., Class A (a) | 1,267 | 20,487 | ||||||
Walker & Dunlop, Inc. | 187 | 10,446 | ||||||
Washington Federal, Inc. (a) | 267 | 9,505 | ||||||
Washington Trust Bancorp, Inc. | 195 | 9,048 | ||||||
Waterstone Financial, Inc. | 755 | 12,525 | ||||||
Watford Holdings Ltd.* (a) | 246 | 5,707 | ||||||
WesBanco, Inc. | 213 | 7,289 | ||||||
West Bancorporation, Inc. | 305 | 6,356 | ||||||
Westamerica Bancorporation (a) | 170 | 10,474 | ||||||
Western Asset Mortgage Capital Corp. REIT | 1,657 | 15,576 | ||||||
Western New England Bancorp, Inc. | 565 | 5,023 | ||||||
Westwood Holdings Group, Inc. | 64 | 1,757 | ||||||
WisdomTree Investments, Inc. | 310 | 1,491 | ||||||
World Acceptance Corp.* | 43 | 5,715 | ||||||
WSFS Financial Corp. | 122 | 5,029 | ||||||
|
| |||||||
| 2,602,199 | ||||||||
|
| |||||||
| Health Care — 8.4% | ||||||||
Acceleron Pharma, Inc.* (a) | 69 | 3,099 | ||||||
Accuray, Inc.* (a) | 2,510 | 6,727 | ||||||
Addus HomeCare Corp.* | 176 | 15,485 | ||||||
Adverum Biotechnologies, Inc.* | 134 | 1,384 | ||||||
Albireo Pharma, Inc.* (a) | 46 | 1,125 | ||||||
Alector, Inc.* | 88 | 1,448 | ||||||
Allscripts Healthcare Solutions, Inc.* (a) | 915 | 8,308 | ||||||
AMAG Pharmaceuticals, Inc.* | 156 | 1,704 | ||||||
Amedisys, Inc.* | 140 | 18,019 | ||||||
AMN Healthcare Services, Inc.* | 89 | 5,198 | ||||||
Amphastar Pharmaceuticals, Inc.* | 834 | 18,732 | ||||||
AngioDynamics, Inc.* | 736 | 13,520 | ||||||
ANI Pharmaceuticals, Inc.* | 106 | 6,943 | ||||||
Anika Therapeutics, Inc.* | 236 | 13,395 | ||||||
Assertio Therapeutics, Inc.* | 437 | 629 | ||||||
AtriCure, Inc.* | 99 | 2,712 | ||||||
Atrion Corp. | 27 | 20,983 | ||||||
Audentes Therapeutics, Inc.* | 39 | 1,213 | ||||||
Avanos Medical, Inc.* (a) | 45 | 1,493 | ||||||
| See Notes to Financial Statements. | 63 |
DBX ETF Trust
Schedule of Investments
Xtrackers Russell 2000 Comprehensive Factor ETF(Continued)
August 31, 2019
Number | Value | |||||||
| Health Care (Continued) | ||||||||
BioSpecifics Technologies Corp.* | 304 | $ | 16,744 | |||||
BioTelemetry, Inc.* (a) | 217 | 8,604 | ||||||
Brookdale Senior Living, Inc.* | 1,016 | 8,311 | ||||||
Cambrex Corp.* | 109 | 6,532 | ||||||
Cardiovascular Systems, Inc.* | 215 | 10,412 | ||||||
Community Health Systems, Inc.* | 508 | 1,265 | ||||||
Computer Programs & Systems, Inc. | 97 | 2,052 | ||||||
CONMED Corp. | 152 | 15,317 | ||||||
Corcept Therapeutics, Inc.* (a) | 259 | 3,266 | ||||||
Cortexyme, Inc.* (a) | 37 | 734 | ||||||
CorVel Corp.* | 229 | 19,289 | ||||||
Cross Country Healthcare, Inc.* | 160 | 1,640 | ||||||
CryoLife, Inc.* | 380 | 10,184 | ||||||
Denali Therapeutics, Inc.* (a) | 74 | 1,332 | ||||||
Eagle Pharmaceuticals, Inc.* | 35 | 1,974 | ||||||
Eidos Therapeutics, Inc.* (a) | 28 | 1,171 | ||||||
Emergent BioSolutions, Inc.* | 83 | 3,635 | ||||||
Enanta Pharmaceuticals, Inc.* | 52 | 3,669 | ||||||
Endo International PLC* | 237 | 562 | ||||||
Ensign Group, Inc. | 393 | 19,611 | ||||||
Fluidigm Corp.* | 121 | 675 | ||||||
Genomic Health, Inc.* | 100 | 7,666 | ||||||
Glaukos Corp.* (a) | 65 | 4,180 | ||||||
Globus Medical, Inc., Class A* | 145 | 7,405 | ||||||
Gossamer Bio, Inc.* (a) | 69 | 1,446 | ||||||
Haemonetics Corp.* | 58 | 7,745 | ||||||
Hanger, Inc.* | 513 | 9,685 | ||||||
Harpoon Therapeutics, Inc.* | 117 | 1,694 | ||||||
HealthEquity, Inc.* | 51 | 3,027 | ||||||
HealthStream, Inc.* | 550 | 13,899 | ||||||
Heska Corp.* | 62 | 4,352 | ||||||
HMS Holdings Corp.* | 324 | 11,836 | ||||||
Innoviva, Inc.* | 877 | 10,164 | ||||||
Inogen, Inc.* (a) | 10 | 464 | ||||||
Inovalon Holdings, Inc., Class A* (a) | 208 | 3,519 | ||||||
Integer Holdings Corp.* | 93 | 6,733 | ||||||
Intersect ENT, Inc.* | 74 | 1,212 | ||||||
iRadimed Corp.* (a) | 123 | 2,359 | ||||||
iRhythm Technologies, Inc.* (a) | 42 | 3,197 | ||||||
Ironwood Pharmaceuticals, Inc.* | 196 | 1,825 | ||||||
Joint Corp.* | 434 | 7,283 | ||||||
Krystal Biotech, Inc.* | 44 | 1,980 | ||||||
Lantheus Holdings, Inc.* | 61 | 1,327 | ||||||
LeMaitre Vascular, Inc. (a) | 227 | 7,187 | ||||||
LHC Group, Inc.* | 9 | 1,067 | ||||||
Ligand Pharmaceuticals, Inc.* (a) | 32 | 2,909 | ||||||
LivaNova PLC* | 29 | 2,251 | ||||||
Luminex Corp. | 314 | 6,437 | ||||||
Magellan Health, Inc.* | 268 | 16,887 | ||||||
Mallinckrodt PLC* (a) | 656 | 1,699 | ||||||
MediciNova, Inc.* (a) | 441 | 3,819 | ||||||
Medpace Holdings, Inc.* (a) | 271 | 21,927 | ||||||
Meridian Bioscience, Inc. | 765 | 7,061 | ||||||
Merit Medical Systems, Inc.* (a) | 94 | 3,269 | ||||||
Mesa Laboratories, Inc. (a) | 42 | 9,292 | ||||||
Misonix, Inc.* | 221 | 4,327 | ||||||
Myriad Genetics, Inc.* (a) | 178 | 4,188 | ||||||
Number | Value | |||||||
| Health Care (Continued) | ||||||||
National HealthCare Corp. | 454 | $ | 36,683 | |||||
National Research Corp. | 172 | 11,013 | ||||||
Natus Medical, Inc.* | 277 | 7,667 | ||||||
Neogen Corp.* | 77 | 5,430 | ||||||
NeoGenomics, Inc.* (a) | 159 | 3,972 | ||||||
Nevro Corp.* (a) | 19 | 1,591 | ||||||
NextGen Healthcare, Inc.* | 342 | 4,860 | ||||||
NGM Biopharmaceuticals, Inc.* (a) | 99 | 1,755 | ||||||
NuVasive, Inc.* | 162 | 10,290 | ||||||
Omnicell, Inc.* | 152 | 10,914 | ||||||
OraSure Technologies, Inc.* | 353 | 2,330 | ||||||
Orthofix Medical, Inc.* | 234 | 11,897 | ||||||
Pacira BioSciences, Inc.* | 126 | 4,692 | ||||||
Palatin Technologies, Inc.* | 2,905 | 2,618 | ||||||
Patterson Cos., Inc. (a) | 945 | 15,800 | ||||||
PDL BioPharma, Inc.* | 753 | 1,762 | ||||||
Phibro Animal Health Corp., Class A | 89 | 1,838 | ||||||
Prestige Consumer Healthcare, Inc.* (a) | 294 | 9,373 | ||||||
Principia Biopharma, Inc.* (a) | 100 | 3,970 | ||||||
Providence Service Corp.* | �� | 140 | 7,869 | |||||
Quidel Corp.* | 139 | 8,764 | ||||||
Ra Pharmaceuticals, Inc.* | 53 | 1,442 | ||||||
RadNet, Inc.* | 584 | 8,123 | ||||||
REGENXBIO, Inc.* (a) | 37 | 1,276 | ||||||
Repligen Corp.* | 93 | 8,631 | ||||||
Replimune Group, Inc.* | 110 | 1,142 | ||||||
RTI Surgical Holdings, Inc.* | 1,288 | 4,096 | ||||||
SeaSpine Holdings Corp.* | 101 | 1,110 | ||||||
Select Medical Holdings Corp.* | 689 | 11,176 | ||||||
SIGA Technologies, Inc.* | 269 | 1,350 | ||||||
Silk Road Medical, Inc.* | 31 | 1,336 | ||||||
Simulations Plus, Inc. | 272 | 9,822 | ||||||
STAAR Surgical Co.* (a) | 79 | 2,379 | ||||||
Supernus Pharmaceuticals, Inc.* (a) | 46 | 1,243 | ||||||
Surgery Partners, Inc.* | 185 | 1,191 | ||||||
Surmodics, Inc.* (a) | 161 | 7,577 | ||||||
Syneos Health, Inc.* | 51 | 2,679 | ||||||
Tabula Rasa HealthCare, Inc.* (a) | 31 | 1,761 | ||||||
Tactile Systems Technology, Inc.* (a) | 137 | 6,910 | ||||||
Tenet Healthcare Corp.* (a) | 125 | 2,706 | ||||||
Tivity Health, Inc.* (a) | 328 | 5,989 | ||||||
TransMedics Group, Inc.* (a) | 52 | 1,245 | ||||||
Triple-S Management Corp., Class B* | 376 | 7,716 | ||||||
Turning Point Therapeutics, Inc.* | 51 | 2,781 | ||||||
Twist Bioscience Corp.* | 53 | 1,539 | ||||||
US Physical Therapy, Inc. (a) | 237 | 31,644 | ||||||
Utah Medical Products, Inc. | 114 | 11,208 | ||||||
Vanda Pharmaceuticals, Inc.* | 230 | 3,241 | ||||||
Varex Imaging Corp.* | 313 | 8,248 | ||||||
Vocera Communications, Inc.* (a) | 38 | 872 | ||||||
Wright Medical Group NV* | 40 | 834 | ||||||
Xencor, Inc.* (a) | 30 | 1,118 | ||||||
Y-mAbs Therapeutics, Inc.* | 93 | 2,471 | ||||||
ZIOPHARM Oncology, Inc.* (a) | 264 | 1,317 | ||||||
|
| |||||||
| 805,675 | ||||||||
|
| |||||||
| See Notes to Financial Statements. | 64 |
DBX ETF Trust
Schedule of Investments
Xtrackers Russell 2000 Comprehensive Factor ETF(Continued)
August 31, 2019
Number | Value | |||||||
| Industrials — 17.2% | ||||||||
AAON, Inc. (a) | 198 | $ | 9,498 | |||||
AAR Corp. | 131 | 5,628 | ||||||
ABM Industries, Inc. | 704 | 26,231 | ||||||
ACCO Brands Corp. | 538 | 4,987 | ||||||
Actuant Corp., Class A | 307 | 6,818 | ||||||
Advanced Disposal Services, Inc.* | 217 | 7,035 | ||||||
Advanced Drainage Systems, Inc. | 207 | 6,498 | ||||||
Aegion Corp.* | 223 | 4,402 | ||||||
Aerojet Rocketdyne Holdings, Inc.* (a) | 148 | 7,730 | ||||||
AeroVironment, Inc.* (a) | 122 | 6,287 | ||||||
Air Transport Services Group, Inc.* | 209 | 4,222 | ||||||
Aircastle Ltd. | 477 | 10,422 | ||||||
Alamo Group, Inc. | 79 | 9,020 | ||||||
Albany International Corp., Class A | 147 | 12,086 | ||||||
Allegiant Travel Co. | 43 | 6,106 | ||||||
Allied Motion Technologies, Inc. | 23 | 741 | ||||||
Ameresco, Inc., Class A* | 211 | 3,038 | ||||||
American Superconductor Corp.* | 205 | 1,572 | ||||||
American Woodmark Corp.* | 156 | 12,850 | ||||||
Apogee Enterprises, Inc. | 313 | 11,559 | ||||||
Applied Industrial Technologies, Inc. | 28 | 1,495 | ||||||
ArcBest Corp. | 147 | 4,353 | ||||||
Arcosa, Inc. | 109 | 3,541 | ||||||
Argan, Inc. | 151 | 6,238 | ||||||
Armstrong Flooring, Inc.* | 535 | 3,622 | ||||||
ASGN, Inc.* | 35 | 2,186 | ||||||
Astec Industries, Inc. | 24 | 662 | ||||||
Astronics Corp.* | 296 | 8,143 | ||||||
Atkore International Group, Inc.* | 1,080 | 31,331 | ||||||
Atlas Air Worldwide Holdings, Inc.* | 78 | 2,016 | ||||||
Avis Budget Group, Inc.* | 116 | 2,873 | ||||||
Axon Enterprise, Inc.* | 16 | 960 | ||||||
AZZ, Inc. | 344 | 14,197 | ||||||
Barnes Group, Inc. | 92 | 4,126 | ||||||
Barrett Business Services, Inc. | 76 | 6,622 | ||||||
Beacon Roofing Supply, Inc.* (a) | 105 | 3,347 | ||||||
BG Staffing, Inc. | 561 | 10,513 | ||||||
Blue Bird Corp.* (a) | 240 | 4,378 | ||||||
BMC Stock Holdings, Inc.* | 1,052 | 26,752 | ||||||
Brady Corp., Class A | 296 | 13,974 | ||||||
Briggs & Stratton Corp. (a) | 331 | 1,430 | ||||||
BrightView Holdings, Inc.* (a) | 55 | 1,008 | ||||||
Brink’s Co. | 41 | 3,085 | ||||||
Builders FirstSource, Inc.* | 290 | 5,640 | ||||||
Caesarstone Ltd. | 289 | 4,332 | ||||||
CAI International, Inc.* (a) | 173 | 3,664 | ||||||
Casella Waste Systems, Inc., Class A* | 210 | 9,555 | ||||||
CBIZ, Inc.* | 660 | 14,744 | ||||||
CECO Environmental Corp.* | 691 | 4,802 | ||||||
Chart Industries, Inc.* (a) | 51 | 3,205 | ||||||
Cimpress NV* | 15 | 1,720 | ||||||
CIRCOR International, Inc.* (a) | 96 | 3,300 | ||||||
Columbus McKinnon Corp. | 204 | 6,603 | ||||||
Comfort Systems USA, Inc. | 329 | 12,719 | ||||||
Commercial Vehicle Group, Inc.* | 608 | 3,861 | ||||||
CompX International, Inc. | 101 | 1,530 | ||||||
Construction Partners, Inc., Class A* | 346 | 5,706 | ||||||
Number | Value | |||||||
| Industrials (Continued) | ||||||||
Continental Building Products, Inc.* | 387 | $ | 9,729 | |||||
Costamare, Inc. | 317 | 1,835 | ||||||
Covanta Holding Corp. (a) | 619 | 10,647 | ||||||
Covenant Transportation Group, Inc., Class A* | 132 | 1,898 | ||||||
CRA International, Inc. | 203 | 7,895 | ||||||
CSW Industrials, Inc. | 309 | 21,077 | ||||||
Cubic Corp. (a) | 54 | 3,741 | ||||||
Daseke, Inc.* (a) | 602 | 1,060 | ||||||
Deluxe Corp. | 105 | 4,838 | ||||||
Douglas Dynamics, Inc. | 167 | 6,974 | ||||||
Ducommun, Inc.* | 225 | 9,265 | ||||||
DXP Enterprises, Inc.* | 105 | 3,407 | ||||||
Dycom Industries, Inc.* | 25 | 1,113 | ||||||
Eastern Co. | 202 | 4,456 | ||||||
Echo Global Logistics, Inc.* | 430 | 8,617 | ||||||
EMCOR Group, Inc. | 96 | 8,394 | ||||||
Encore Wire Corp. | 381 | 20,570 | ||||||
EnerSys | 48 | 2,688 | ||||||
Ennis, Inc. | 1,022 | 20,552 | ||||||
EnPro Industries, Inc. | 193 | 12,020 | ||||||
ESCO Technologies, Inc. | 174 | 13,247 | ||||||
Evoqua Water Technologies Corp.* | 110 | 1,701 | ||||||
Exponent, Inc. | 161 | 11,413 | ||||||
Federal Signal Corp. | 612 | 18,183 | ||||||
Forrester Research, Inc. | 225 | 7,846 | ||||||
Forward Air Corp. | 306 | 19,064 | ||||||
Foundation Building Materials, Inc.* | 226 | 3,871 | ||||||
Franklin Covey Co.* | 155 | 5,702 | ||||||
Franklin Electric Co., Inc. | 234 | 10,729 | ||||||
FTI Consulting, Inc.* | 132 | 14,274 | ||||||
GATX Corp. (a) | 126 | 9,352 | ||||||
Gencor Industries, Inc.* | 197 | 2,254 | ||||||
Generac Holdings, Inc.* | 104 | 8,111 | ||||||
General Finance Corp.* | 153 | 1,265 | ||||||
Gibraltar Industries, Inc.* | 272 | 10,953 | ||||||
GMS, Inc.* | 212 | 6,246 | ||||||
Gorman-Rupp Co. | 344 | 10,275 | ||||||
GP Strategies Corp.* | 160 | 2,061 | ||||||
Graham Corp. | 204 | 3,756 | ||||||
Granite Construction, Inc. (a) | 40 | 1,138 | ||||||
Great Lakes Dredge & Dock Corp.* | 1,352 | 14,656 | ||||||
Greenbrier Cos., Inc. | 153 | 3,563 | ||||||
Griffon Corp. (a) | 636 | 11,098 | ||||||
H&E Equipment Services, Inc. | 134 | 3,255 | ||||||
Harsco Corp.* | 160 | 2,864 | ||||||
Hawaiian Holdings, Inc. (a) | 299 | 7,299 | ||||||
Healthcare Services Group, Inc. (a) | 451 | 10,170 | ||||||
Heartland Express, Inc. | 462 | 9,503 | ||||||
Heidrick & Struggles International, Inc. | 339 | 9,000 | ||||||
Helios Technologies, Inc. | 30 | 1,284 | ||||||
Herc Holdings, Inc.* | 94 | 3,880 | ||||||
Heritage-Crystal Clean, Inc.* | 349 | 8,551 | ||||||
Herman Miller, Inc. | 330 | 13,952 | ||||||
Hertz Global Holdings, Inc.* | 138 | 1,671 | ||||||
Hillenbrand, Inc. | 238 | 6,531 | ||||||
HNI Corp. | 462 | 14,410 | ||||||
| See Notes to Financial Statements. | 65 |
DBX ETF Trust
Schedule of Investments
Xtrackers Russell 2000 Comprehensive Factor ETF(Continued)
August 31, 2019
Number | Value | |||||||
| Industrials (Continued) | ||||||||
Hub Group, Inc., Class A* | 104 | $ | 4,478 | |||||
Hurco Cos., Inc. | 254 | 8,105 | ||||||
Huron Consulting Group, Inc.* | 252 | 15,425 | ||||||
Hyster-Yale Materials Handling, Inc. (a) | 124 | 6,764 | ||||||
ICF International, Inc. | 168 | 14,223 | ||||||
IES Holdings, Inc.* | 242 | 4,567 | ||||||
Insperity, Inc. | 47 | 4,656 | ||||||
Insteel Industries, Inc. (a) | 202 | 3,777 | ||||||
Interface, Inc. | 151 | 1,669 | ||||||
JELD-WEN Holding, Inc.* | 154 | �� | 2,658 | |||||
John Bean Technologies Corp. (a) | 80 | 8,186 | ||||||
Kadant, Inc. (a) | 162 | 13,331 | ||||||
Kaman Corp. | 181 | 10,569 | ||||||
Kelly Services, Inc., Class A | 1,355 | 32,805 | ||||||
Kennametal, Inc. | 210 | 6,277 | ||||||
Kforce, Inc. | 491 | 15,977 | ||||||
Kimball International, Inc., Class B | 932 | 16,357 | ||||||
Knoll, Inc. | 448 | 10,331 | ||||||
Korn Ferry | 100 | 3,908 | ||||||
Kratos Defense & Security Solutions, Inc.* | 125 | 2,496 | ||||||
Lawson Products, Inc.* | 174 | 6,342 | ||||||
LB Foster Co., Class A* | 116 | 2,310 | ||||||
Lindsay Corp. (a) | 84 | 7,414 | ||||||
LSC Communications, Inc. | 68 | 88 | ||||||
Luxfer Holdings PLC | 904 | 14,202 | ||||||
Lydall, Inc.* | 25 | 503 | ||||||
Marten Transport Ltd. | 497 | 9,776 | ||||||
Masonite International Corp.* | 151 | 8,062 | ||||||
MasTec, Inc.* | 51 | 3,206 | ||||||
Matson, Inc. | 420 | 14,923 | ||||||
Matthews International Corp., Class A (a) | 131 | 3,840 | ||||||
McGrath RentCorp | 199 | 12,742 | ||||||
Mercury Systems, Inc.* | 42 | 3,596 | ||||||
Meritor, Inc.* | 757 | 12,733 | ||||||
Mesa Air Group, Inc.* | 460 | 2,972 | ||||||
Milacron Holdings Corp.* | 324 | 5,135 | ||||||
Miller Industries, Inc. | 853 | 26,690 | ||||||
Mistras Group, Inc.* | 128 | 1,869 | ||||||
Mobile Mini, Inc. | 120 | 3,751 | ||||||
Moog, Inc., Class A | 73 | 5,931 | ||||||
MRC Global, Inc.* | 430 | 5,405 | ||||||
MSA Safety, Inc. | 61 | 6,443 | ||||||
Mueller Industries, Inc. | 496 | 13,075 | ||||||
Mueller Water Products, Inc., Class A | 701 | 7,332 | ||||||
MYR Group, Inc.* | 296 | 8,486 | ||||||
National Presto Industries, Inc. (a) | 83 | 7,114 | ||||||
Navigant Consulting, Inc. | 719 | 20,039 | ||||||
NOW, Inc.* (a) | 965 | 11,474 | ||||||
NRC Group Holdings Corp* | 132 | 1,550 | ||||||
NV5 Global, Inc.* (a) | 48 | 2,963 | ||||||
Omega Flex, Inc. | 29 | 2,442 | ||||||
PAM Transportation Services, Inc.* | 79 | 4,558 | ||||||
Park Aerospace Corp. | 1,162 | 19,638 | ||||||
Park-Ohio Holdings Corp. | 185 | 5,030 | ||||||
Parsons Corp.* | 40 | 1,361 | ||||||
Patrick Industries, Inc.* (a) | 141 | 5,096 | ||||||
PGT Innovations, Inc.* | 101 | 1,616 | ||||||
Number | Value | |||||||
| Industrials (Continued) | ||||||||
PICO Holdings, Inc.* | 221 | $ | 2,128 | |||||
Pitney Bowes, Inc. (a) | 1,073 | 3,820 | ||||||
Preformed Line Products Co. | 50 | 2,563 | ||||||
Primoris Services Corp. | 358 | 6,995 | ||||||
Proto Labs, Inc.* | 43 | 4,074 | ||||||
Quad/Graphics, Inc. (a) | 90 | 809 | ||||||
Quanex Building Products Corp. | 769 | 13,242 | ||||||
Radiant Logistics, Inc.* | 1,190 | 5,807 | ||||||
Raven Industries, Inc. | 285 | 8,313 | ||||||
RBC Bearings, Inc.* | 39 | 6,222 | ||||||
Resources Connection, Inc. | 393 | 6,504 | ||||||
REV Group, Inc. | 120 | 1,547 | ||||||
Rexnord Corp.* | 192 | 5,027 | ||||||
RR Donnelley & Sons Co. (a) | 170 | 411 | ||||||
Rush Enterprises, Inc., Class A | 270 | 9,750 | ||||||
Rush Enterprises, Inc., Class B | 38 | 1,413 | ||||||
Saia, Inc.* | 130 | 11,120 | ||||||
Simpson Manufacturing Co., Inc. (a) | 159 | 10,208 | ||||||
SiteOne Landscape Supply, Inc.* (a) | 18 | 1,408 | ||||||
SkyWest, Inc. | 108 | 6,184 | ||||||
SP Plus Corp.* | 88 | 3,037 | ||||||
Spartan Motors, Inc. | 170 | 2,144 | ||||||
Spirit Airlines, Inc.* (a) | 151 | 5,669 | ||||||
SPX Corp.* | 188 | 7,135 | ||||||
SPX FLOW, Inc.* | 103 | 3,472 | ||||||
Standex International Corp. | 83 | 5,706 | ||||||
Steelcase, Inc., Class A | 929 | 14,427 | ||||||
Sterling Construction Co., Inc.* | 429 | 4,801 | ||||||
Sunrun, Inc.* (a) | 98 | 1,502 | ||||||
Team, Inc.* | 228 | 3,757 | ||||||
Tennant Co. (a) | 144 | 9,848 | ||||||
Terex Corp. | 126 | 3,129 | ||||||
Tetra Tech, Inc. | 107 | 8,680 | ||||||
Thermon Group Holdings, Inc.* | 254 | 5,525 | ||||||
Titan Machinery, Inc.* | 246 | 3,705 | ||||||
TPI Composites, Inc.* (a) | 107 | 1,887 | ||||||
Transcat, Inc.* | 294 | 6,830 | ||||||
Trex Co., Inc.* (a) | 57 | 4,875 | ||||||
TriMas Corp.* | 403 | 11,840 | ||||||
TriNet Group, Inc.* | 33 | 2,215 | ||||||
Triton International Ltd/Bermuda | 113 | 3,633 | ||||||
Triumph Group, Inc. (a) | 153 | 3,179 | ||||||
TrueBlue, Inc.* | 565 | 10,967 | ||||||
Tutor Perini Corp.* (a) | 292 | 2,917 | ||||||
Twin Disc, Inc.* | 127 | 1,284 | ||||||
UniFirst Corp. | 53 | 10,383 | ||||||
Universal Forest Products, Inc. | 366 | 14,311 | ||||||
Universal Logistics Holdings, Inc. | 84 | 1,760 | ||||||
US Ecology, Inc. | 120 | 7,268 | ||||||
US Xpress Enterprises, Inc., Class A* (a) | 487 | 2,045 | ||||||
Vectrus, Inc.* | 288 | 11,652 | ||||||
Veritiv Corp.* | 63 | 1,043 | ||||||
Viad Corp. | 242 | 15,640 | ||||||
Vicor Corp.* | 37 | 1,128 | ||||||
VSE Corp. (a) | 30 | 955 | ||||||
Wabash National Corp. (a) | 820 | 11,185 | ||||||
Watts Water Technologies, Inc., Class A | 125 | 11,454 | ||||||
| See Notes to Financial Statements. | 66 |
DBX ETF Trust
Schedule of Investments
Xtrackers Russell 2000 Comprehensive Factor ETF(Continued)
August 31, 2019
Number | Value | |||||||
| Industrials (Continued) | ||||||||
Welbilt, Inc.* (a) | 93 | $ | 1,464 | |||||
Werner Enterprises, Inc. (a) | 315 | 10,294 | ||||||
Wesco Aircraft Holdings, Inc.* | 320 | 3,520 | ||||||
Willis Lease Finance Corp.* | 219 | 13,528 | ||||||
WillScot Corp, Class A* | 208 | 2,902 | ||||||
|
| |||||||
| 1,655,374 | ||||||||
|
| |||||||
| Information Technology — 9.3% | ||||||||
8x8, Inc.* (a) | 78 | 1,896 | ||||||
A10 Networks, Inc.* | 220 | 1,527 | ||||||
Acacia Communications, Inc.* | 31 | 1,955 | ||||||
ACI Worldwide, Inc.* | 101 | 3,008 | ||||||
ADTRAN, Inc. | 698 | 7,168 | ||||||
Advanced Energy Industries, Inc.* (a) | 143 | 7,385 | ||||||
Agilysys, Inc.* | 386 | 10,519 | ||||||
Alarm.com Holdings, Inc.* (a) | 70 | 3,332 | ||||||
Altair Engineering, Inc., Class A* (a) | 37 | 1,271 | ||||||
Ambarella, Inc* | 86 | 4,805 | ||||||
American Software, Inc., Class A | 597 | 9,409 | ||||||
Amkor Technology, Inc.* | 435 | 3,806 | ||||||
Anixter International, Inc.* | 149 | 8,936 | ||||||
Appfolio, Inc., Class A* (a) | 98 | 9,679 | ||||||
Appian Corp., Class A* (a) | 42 | 2,498 | ||||||
Aquantia Corp.* | 112 | 1,476 | ||||||
AstroNova, Inc. | 289 | 4,748 | ||||||
Avaya Holdings Corp.* (a) | 12 | 169 | ||||||
AVX Corp. (a) | 256 | 3,469 | ||||||
Axcelis Technologies, Inc.* | 424 | 6,491 | ||||||
AXT, Inc.* (a) | 313 | 1,061 | ||||||
Badger Meter, Inc. (a) | 258 | 13,308 | ||||||
Bel Fuse, Inc., Class B | 282 | 3,102 | ||||||
Belden, Inc. | 137 | 6,249 | ||||||
Benchmark Electronics, Inc. | 711 | 18,827 | ||||||
Blackbaud, Inc. (a) | 15 | 1,365 | ||||||
Blackline, Inc.* (a) | 56 | 2,852 | ||||||
Bottomline Technologies DE, Inc.* | 92 | 3,794 | ||||||
Box, Inc., Class A* (a) | 22 | 322 | ||||||
Brightcove, Inc.* | 315 | 3,884 | ||||||
Brooks Automation, Inc. (a) | 65 | 2,166 | ||||||
Cabot Microelectronics Corp. | 71 | 8,850 | ||||||
CalAmp Corp.* | 227 | 2,179 | ||||||
Carbonite, Inc.* (a) | 34 | 410 | ||||||
Cardtronics PLC, Class A* (a) | 361 | 10,693 | ||||||
Cass Information Systems, Inc. | 108 | 5,465 | ||||||
CEVA, Inc.* | 79 | 2,481 | ||||||
Cirrus Logic, Inc.* | 192 | 10,299 | ||||||
Cision Ltd.* | 188 | 1,301 | ||||||
Clearfield, Inc.* | 282 | 3,015 | ||||||
CommVault Systems, Inc.* | 51 | 2,212 | ||||||
Comtech Telecommunications Corp. | 122 | 3,264 | ||||||
Cornerstone OnDemand, Inc.* | 41 | 2,139 | ||||||
Cray, Inc.* | 224 | 7,824 | ||||||
CSG Systems International, Inc. | 227 | 12,231 | ||||||
CTS Corp. | 371 | 10,585 | ||||||
Daktronics, Inc. | 986 | 7,129 | ||||||
Diebold Nixdorf, Inc.* (a) | 167 | 1,872 | ||||||
Digi International, Inc.* | 574 | 7,336 | ||||||
Number | Value | |||||||
| Information Technology (Continued) | ||||||||
Digimarc Corp.* | 35 | $ | 1,384 | |||||
Digital Turbine, Inc.* | 408 | 3,105 | ||||||
Diodes, Inc.* (a) | 294 | 10,746 | ||||||
DSP Group, Inc.* | 566 | 7,833 | ||||||
Ebix, Inc. (a) | 33 | 1,169 | ||||||
Envestnet, Inc.* (a) | 30 | 1,716 | ||||||
ePlus, Inc.* | 131 | 10,705 | ||||||
Everbridge, Inc.* (a) | 34 | 2,931 | ||||||
EVERTEC, Inc. | 322 | 11,225 | ||||||
Evo Payments, Inc., Class A* | 299 | 8,874 | ||||||
ExlService Holdings, Inc.* | 116 | 7,853 | ||||||
Extreme Networks, Inc.* | 239 | 1,597 | ||||||
Fabrinet* | 311 | 15,702 | ||||||
FARO Technologies, Inc.* | 90 | 4,432 | ||||||
Finisar Corp.* | 167 | 3,776 | ||||||
Fitbit, Inc., Class A* (a) | 171 | 528 | ||||||
ForeScout Technologies, Inc.* | 45 | 1,612 | ||||||
FormFactor, Inc.* | 722 | 12,339 | ||||||
GSI Technology, Inc.* | 236 | 1,982 | ||||||
GTY Technology Holdings, Inc.* | 239 | 1,496 | ||||||
Hackett Group, Inc. | 597 | 9,630 | ||||||
Harmonic, Inc.* | 837 | 5,516 | ||||||
Ichor Holdings Ltd.* (a) | 355 | 7,547 | ||||||
II-VI, Inc.* (a) | 71 | 2,663 | ||||||
Immersion Corp.* | 137 | 1,125 | ||||||
Information Services Group, Inc.* | 1,032 | 2,745 | ||||||
Inphi Corp.* | 56 | 3,427 | ||||||
Insight Enterprises, Inc.* | 385 | 18,503 | ||||||
Instructure, Inc.* (a) | 14 | 579 | ||||||
Intelligent Systems Corp.* (a) | 118 | 6,241 | ||||||
InterDigital, Inc. | 58 | 2,852 | ||||||
International Money Express, Inc.* | 210 | 2,738 | ||||||
Iteris, Inc.* | 437 | 2,377 | ||||||
Itron, Inc.* | 60 | 4,167 | ||||||
j2 Global, Inc. (a) | 37 | 3,130 | ||||||
KBR, Inc. | 222 | 5,665 | ||||||
KEMET Corp. (a) | 138 | 2,312 | ||||||
Kimball Electronics, Inc.* | 871 | 11,506 | ||||||
Knowles Corp.* (a) | 525 | 10,647 | ||||||
KVH Industries, Inc.* | 170 | 1,581 | ||||||
Lattice Semiconductor Corp.* | 318 | 6,261 | ||||||
Limelight Networks, Inc.* | 468 | 1,137 | ||||||
LivePerson, Inc.* (a) | 142 | 5,643 | ||||||
LiveRamp Holdings, Inc.* | 203 | 8,599 | ||||||
Lumentum Holdings, Inc.* (a) | 54 | 3,011 | ||||||
ManTech International Corp., Class A | 297 | 20,873 | ||||||
MAXIMUS, Inc. | 71 | 5,463 | ||||||
MaxLinear, Inc.* | 271 | 5,371 | ||||||
Methode Electronics, Inc. | 161 | 5,110 | ||||||
MicroStrategy, Inc., Class A* | 54 | 7,738 | ||||||
Mitek Systems, Inc.* | 48 | 487 | ||||||
MobileIron, Inc.* | 363 | 2,505 | ||||||
Model N, Inc.* | 203 | 5,812 | ||||||
Monotype Imaging Holdings, Inc. | 189 | 3,733 | ||||||
MTS Systems Corp. | 193 | 10,976 | ||||||
Nanometrics, Inc.* | 286 | 7,805 | ||||||
Napco Security Technologies, Inc.* (a) | 300 | 10,344 | ||||||
| See Notes to Financial Statements. | 67 |
DBX ETF Trust
Schedule of Investments
Xtrackers Russell 2000 Comprehensive Factor ETF(Continued)
August 31, 2019
Number | Value | |||||||
| Information Technology (Continued) | ||||||||
NETGEAR, Inc.* | 114 | $ | 3,958 | |||||
NetScout Systems, Inc.* | 119 | 2,636 | ||||||
NIC, Inc. | 825 | 17,177 | ||||||
Novanta, Inc.* | 72 | 5,400 | ||||||
NVE Corp. | 52 | 3,338 | ||||||
OneSpan, Inc.* | 109 | 1,472 | ||||||
OSI Systems, Inc.* | 99 | 10,396 | ||||||
PC Connection, Inc. | 168 | 5,919 | ||||||
PCM, Inc.* | 348 | 12,180 | ||||||
PDF Solutions, Inc.* | 233 | 2,728 | ||||||
Perficient, Inc.* | 425 | 15,657 | ||||||
Perspecta, Inc. | 137 | 3,555 | ||||||
Photronics, Inc.* | 2,388 | 25,790 | ||||||
Plexus Corp.* | 279 | 15,962 | ||||||
Power Integrations, Inc. | 103 | 9,169 | ||||||
Presidio, Inc. | 439 | 7,033 | ||||||
PRGX Global, Inc.* | 314 | 1,692 | ||||||
Progress Software Corp. | 323 | 12,203 | ||||||
PROS Holdings, Inc.* | 24 | 1,704 | ||||||
QAD, Inc., Class A | 123 | 4,984 | ||||||
Qualys, Inc.* (a) | 26 | 2,070 | ||||||
Rapid7, Inc.* | 13 | 698 | ||||||
Rogers Corp.* | 33 | 4,370 | ||||||
Rudolph Technologies, Inc.* | 264 | 5,805 | ||||||
SailPoint Technologies Holding, Inc.* | 58 | 1,307 | ||||||
Sanmina Corp.* | 340 | 9,826 | ||||||
ScanSource, Inc.* | 183 | 5,172 | ||||||
SecureWorks Corp., Class A* (a) | 128 | 1,545 | ||||||
Semtech Corp.* | 121 | 5,078 | ||||||
Silicon Laboratories, Inc.* | 22 | 2,398 | ||||||
SPS Commerce, Inc.* | 184 | 9,299 | ||||||
StarTek, Inc.* | 363 | 2,261 | ||||||
Stratasys Ltd.* (a) | 271 | 6,455 | ||||||
Sykes Enterprises, Inc.* | 589 | 17,081 | ||||||
Synaptics, Inc.* (a) | 35 | 1,121 | ||||||
Tech Data Corp.* | 83 | 7,697 | ||||||
Telaria, Inc.* | 230 | 2,295 | ||||||
TTEC Holdings, Inc. | 100 | 4,691 | ||||||
TTM Technologies, Inc.* (a) | 231 | 2,462 | ||||||
Tucows, Inc., Class A* (a) | 100 | 5,046 | ||||||
Ultra Clean Holdings, Inc.* (a) | 22 | 263 | ||||||
Unisys Corp.* | 419 | 2,740 | ||||||
Upland Software, Inc.* (a) | 83 | 3,154 | ||||||
Varonis Systems, Inc.* (a) | 34 | 2,323 | ||||||
Verint Systems, Inc.* (a) | 76 | 4,050 | ||||||
Verra Mobility Corp., Class A* | 309 | 4,301 | ||||||
Viavi Solutions, Inc.* | 240 | 3,334 | ||||||
Virtusa Corp.* | 152 | 5,493 | ||||||
Vishay Intertechnology, Inc. | 452 | 7,155 | ||||||
Vishay Precision Group, Inc.* | 330 | 10,313 | ||||||
Workiva, Inc.* | 32 | 1,540 | ||||||
Xperi Corp. | 310 | 5,679 | ||||||
Yext, Inc.* (a) | 131 | 2,066 | ||||||
Zix Corp.* | 847 | 6,225 | ||||||
|
| |||||||
| 894,852 | ||||||||
|
| |||||||
Number | Value | |||||||
| Materials — 3.8% | ||||||||
Advanced Emissions Solutions, Inc. (a) | 81 | $ | 1,022 | |||||
AdvanSix, Inc.* | 271 | 6,054 | ||||||
AK Steel Holding Corp.* (a) | 527 | 1,138 | ||||||
Allegheny Technologies, Inc.* (a) | 98 | 1,942 | ||||||
American Vanguard Corp. | 178 | 2,522 | ||||||
Balchem Corp. | 63 | 5,594 | ||||||
Boise Cascade Co. | 288 | 9,043 | ||||||
Carpenter Technology Corp. (a) | 153 | 7,442 | ||||||
Chase Corp. (a) | 55 | 5,512 | ||||||
Clearwater Paper Corp.* (a) | 214 | 3,428 | ||||||
Commercial Metals Co. (a) | 309 | 4,842 | ||||||
Compass Minerals International, Inc. (a) | 160 | 7,957 | ||||||
Ferro Corp.* | 501 | 5,105 | ||||||
FutureFuel Corp. | 563 | 6,069 | ||||||
GCP Applied Technologies, Inc.* | 79 | 1,386 | ||||||
Greif, Inc., Class A | 89 | 3,132 | ||||||
Greif, Inc., Class B | 16 | 666 | ||||||
Hawkins, Inc. | 396 | 17,563 | ||||||
HB Fuller Co. (a) | 234 | 9,971 | ||||||
Ingevity Corp.* | 41 | 3,123 | ||||||
Innophos Holdings, Inc. | 170 | 4,775 | ||||||
Innospec, Inc. | 153 | 12,727 | ||||||
Kaiser Aluminum Corp. | 125 | 11,054 | ||||||
Koppers Holdings, Inc.* | 139 | 3,685 | ||||||
Kraton Corp.* | 115 | 3,156 | ||||||
Livent Corp.* | 1,737 | 10,683 | ||||||
Louisiana-Pacific Corp. (a) | 403 | 9,688 | ||||||
Materion Corp. | 262 | 15,416 | ||||||
Minerals Technologies, Inc. | 110 | 5,302 | ||||||
Myers Industries, Inc. | 551 | 9,273 | ||||||
Neenah, Inc. | 144 | 9,184 | ||||||
Novagold Resources, Inc.* | 1,882 | 14,002 | ||||||
OMNOVA Solutions, Inc.* | 414 | 4,161 | ||||||
Orion Engineered Carbons SA | 213 | 2,963 | ||||||
PH Glatfelter Co. | 425 | 6,112 | ||||||
PolyOne Corp. | 178 | 5,698 | ||||||
PQ Group Holdings, Inc.* | 96 | 1,372 | ||||||
Quaker Chemical Corp. (a) | 64 | 10,167 | ||||||
Rayonier Advanced Materials, Inc. (a) | 67 | 235 | ||||||
Schnitzer Steel Industries, Inc., Class A | 410 | 9,077 | ||||||
Schweitzer-Mauduit International, Inc. | 282 | 9,458 | ||||||
Sensient Technologies Corp. (a) | 92 | 6,009 | ||||||
Stepan Co. | 181 | 17,266 | ||||||
Summit Materials, Inc., Class A* (a) | 176 | 3,693 | ||||||
SunCoke Energy, Inc.* | 175 | 1,092 | ||||||
Synalloy Corp. | 107 | 1,716 | ||||||
Trecora Resources* | 164 | 1,484 | ||||||
Tredegar Corp. | 433 | 7,487 | ||||||
Trinseo SA | 87 | 3,053 | ||||||
UFP Technologies, Inc.* | 257 | 10,737 | ||||||
United States Lime & Minerals, Inc. | 53 | 4,090 | ||||||
US Concrete, Inc.* | 111 | 4,498 | ||||||
Verso Corp., Class A* (a) | 549 | 5,605 | ||||||
Warrior Met Coal, Inc. | 1,417 | 29,615 | ||||||
Worthington Industries, Inc. | 151 | 5,240 | ||||||
|
| |||||||
| 363,284 | ||||||||
|
| |||||||
| See Notes to Financial Statements. | 68 |
DBX ETF Trust
Schedule of Investments
Xtrackers Russell 2000 Comprehensive Factor ETF(Continued)
August 31, 2019
Number | Value | |||||||
| Real Estate — 8.7% | ||||||||
Acadia Realty Trust REIT | 256 | $ | 7,002 | |||||
Agree Realty Corp. REIT (a) | 146 | 10,905 | ||||||
Alexander & Baldwin, Inc. REIT | 348 | 7,966 | ||||||
Alexander’s, Inc. REIT | 11 | 4,153 | ||||||
American Assets Trust, Inc. REIT | 154 | 7,216 | ||||||
American Finance Trust, Inc. REIT (a) | 353 | 4,225 | ||||||
Armada Hoffler Properties, Inc. REIT | 922 | 15,988 | ||||||
Ashford Hospitality Trust, Inc. REIT | 982 | 2,750 | ||||||
Bluerock Residential Growth REIT, Inc. REIT | 742 | 9,179 | ||||||
Braemar Hotels & Resorts, Inc. REIT | 1,031 | 9,454 | ||||||
BRT Apartments Corp. REIT | 619 | 8,963 | ||||||
CareTrust REIT, Inc. REIT | 427 | 10,158 | ||||||
Cedar Realty Trust, Inc. REIT | 913 | 2,164 | ||||||
Chatham Lodging Trust REIT (a) | 710 | 11,779 | ||||||
Chesapeake Lodging Trust REIT | 434 | 11,176 | ||||||
City Office REIT, Inc. REIT | 1,262 | 17,087 | ||||||
Clipper Realty, Inc. REIT | 484 | 5,295 | ||||||
Community Healthcare Trust, Inc. REIT | 321 | 13,687 | ||||||
Consolidated-Tomoka Land Co. | 243 | 15,513 | ||||||
CoreCivic, Inc. REIT | 444 | 7,526 | ||||||
CorEnergy Infrastructure Trust, Inc. REIT | 383 | 17,277 | ||||||
Cushman & Wakefield PLC* (a) | 85 | 1,431 | ||||||
DiamondRock Hospitality Co. REIT | 926 | 8,769 | ||||||
Easterly Government Properties, Inc. REIT | 445 | 9,145 | ||||||
EastGroup Properties, Inc. REIT | 55 | 6,849 | ||||||
Essential Properties Realty Trust, Inc. REIT | 201 | 4,565 | ||||||
Farmland Partners, Inc. REIT (a) | 238 | 1,435 | ||||||
First Industrial Realty Trust, Inc. REIT | 151 | 5,881 | ||||||
Forestar Group, Inc.* | 64 | 1,220 | ||||||
Four Corners Property Trust, Inc. REIT | 509 | 14,501 | ||||||
Franklin Street Properties Corp. REIT | 1,492 | 11,294 | ||||||
Front Yard Residential Corp. REIT | 124 | 1,375 | ||||||
FRP Holdings, Inc.* | 148 | 7,280 | ||||||
GEO Group, Inc. REIT | 325 | 5,577 | ||||||
Getty Realty Corp. REIT | 446 | 14,165 | ||||||
Gladstone Commercial Corp. REIT | 638 | 14,463 | ||||||
Gladstone Land Corp. REIT | 366 | 4,213 | ||||||
Global Medical REIT, Inc. REIT | 870 | 9,509 | ||||||
Global Net Lease, Inc. REIT (a) | 488 | 9,360 | ||||||
Hannon Armstrong Sustainable Infrastructure Capital, Inc. REIT (a) | 480 | 13,262 | ||||||
Healthcare Realty Trust, Inc. REIT | 171 | 5,682 | ||||||
Hersha Hospitality Trust REIT (a) | 568 | 7,895 | ||||||
Independence Realty Trust, Inc. REIT | 1,292 | 17,972 | ||||||
Industrial Logistics Properties Trust REIT | 612 | 13,091 | ||||||
Innovative Industrial Properties, Inc. REIT (a) | 108 | 9,629 | ||||||
Investors Real Estate Trust REIT (a) | 94 | 6,510 | ||||||
iStar, Inc. REIT (a) | 388 | 4,966 | ||||||
Jernigan Capital, Inc. REIT (a) | 609 | 11,760 | ||||||
Kennedy-Wilson Holdings, Inc. (a) | 292 | 6,126 | ||||||
Kite Realty Group Trust REIT | 567 | 8,102 | ||||||
Lexington Realty Trust REIT | 1,787 | 18,567 | ||||||
LTC Properties, Inc. REIT (a) | 397 | 19,374 | ||||||
Mack-Cali Realty Corp. REIT | 521 | 10,613 | ||||||
Marcus & Millichap, Inc.* (a) | 234 | 8,443 | ||||||
Number | Value | |||||||
| Real Estate (Continued) | ||||||||
Maui Land & Pineapple Co., Inc.* | 122 | $ | 1,283 | |||||
Monmouth Real Estate Investment Corp. REIT | 706 | 9,263 | ||||||
National Health Investors, Inc. REIT | 100 | 8,296 | ||||||
National Storage Affiliates Trust REIT | 311 | 10,406 | ||||||
New Senior Investment Group, Inc. REIT | 338 | 2,113 | ||||||
Newmark Group, Inc., Class A (a) | 246 | 2,135 | ||||||
NexPoint Residential Trust, Inc. REIT | 252 | 11,693 | ||||||
NorthStar Realty Europe Corp. REIT | 1,466 | 24,819 | ||||||
Office Properties Income Trust REIT (a) | 62 | 1,681 | ||||||
One Liberty Properties, Inc. REIT | 409 | 10,953 | ||||||
Pebblebrook Hotel Trust REIT (a) | 51 | 1,375 | ||||||
Pennsylvania Real Estate Investment Trust REIT (a) | 206 | 1,059 | ||||||
Physicians Realty Trust REIT | 366 | 6,339 | ||||||
Piedmont Office Realty Trust, Inc., Class A REIT (a) | 529 | 10,442 | ||||||
PotlatchDeltic Corp. REIT | 229 | 8,812 | ||||||
Preferred Apartment Communities, Inc., Class A REIT (a) | 1,096 | 14,752 | ||||||
PS Business Parks, Inc. REIT | 36 | 6,466 | ||||||
QTS Realty Trust, Inc., Class A REIT (a) | 145 | 7,114 | ||||||
RE/MAX Holdings, Inc., Class A | 187 | 4,800 | ||||||
Realogy Holdings Corp. (a) | 213 | 1,018 | ||||||
Retail Opportunity Investments Corp. REIT | 473 | 8,282 | ||||||
Retail Value, Inc. REIT | 43 | 1,591 | ||||||
Rexford Industrial Realty, Inc. REIT | 142 | 6,275 | ||||||
RLJ Lodging Trust REIT | 386 | 6,257 | ||||||
RMR Group, Inc., Class A | 67 | 3,122 | ||||||
RPT Realty REIT (a) | 1,009 | 12,007 | ||||||
Ryman Hospitality Properties, Inc. REIT | 79 | 6,293 | ||||||
Sabra Health Care REIT, Inc. REIT | 307 | 6,637 | ||||||
Safehold, Inc. REIT | 201 | 5,889 | ||||||
Saul Centers, Inc. REIT | 146 | 7,334 | ||||||
Senior Housing Properties Trust REIT | 383 | 3,252 | ||||||
Seritage Growth Properties, Class A REIT | 88 | 3,440 | ||||||
Spirit MTA REIT | 114 | 958 | ||||||
St Joe Co.* (a) | 344 | 6,185 | ||||||
STAG Industrial, Inc. REIT | 178 | 5,176 | ||||||
Stratus Properties, Inc.* | 17 | 447 | ||||||
Summit Hotel Properties, Inc. REIT (a) | 1,096 | 12,231 | ||||||
Sunstone Hotel Investors, Inc. REIT | 544 | 7,148 | ||||||
Tanger Factory Outlet Centers, Inc. REIT (a) | 507 | 7,169 | ||||||
Tejon Ranch Co.* | 103 | 1,724 | ||||||
Terreno Realty Corp. REIT | 186 | 9,404 | ||||||
UMH Properties, Inc. REIT | 258 | 3,318 | ||||||
Uniti Group, Inc. REIT (a) | 158 | 1,168 | ||||||
Universal Health Realty Income Trust REIT | 182 | 17,598 | ||||||
Urban Edge Properties REIT | 356 | 6,234 | ||||||
Urstadt Biddle Properties, Inc., Class A REIT | 644 | 13,518 | ||||||
Washington Prime Group, Inc. REIT (a) | 1,912 | 6,176 | ||||||
Washington Real Estate Investment Trust REIT (a) | 239 | 6,331 | ||||||
Whitestone REIT (a) | 997 | 12,383 | ||||||
Xenia Hotels & Resorts, Inc. REIT (a) | 508 | 10,267 | ||||||
|
| |||||||
| 835,120 | ||||||||
|
| |||||||
| See Notes to Financial Statements. | 69 |
DBX ETF Trust
Schedule of Investments
Xtrackers Russell 2000 Comprehensive Factor ETF(Continued)
August 31, 2019
Number | Value | |||||||
| Utilities — 3.0% | ||||||||
ALLETE, Inc. | 64 | $ | 5,487 | |||||
American States Water Co. (a) | 118 | 10,918 | ||||||
AquaVenture Holdings, Ltd* | 90 | 1,591 | ||||||
Artesian Resources Corp., Class A | 204 | 7,426 | ||||||
Atlantic Power Corp.* | 4,104 | 9,398 | ||||||
Avista Corp. | 109 | 5,112 | ||||||
Black Hills Corp. | 70 | 5,370 | ||||||
California Water Service Group (a) | 244 | 13,771 | ||||||
Chesapeake Utilities Corp. | 158 | 14,944 | ||||||
Clearway Energy, Inc., Class A | 590 | 9,888 | ||||||
Clearway Energy, Inc., Class C (a) | 523 | 9,257 | ||||||
Connecticut Water Service, Inc. | 142 | 9,960 | ||||||
Consolidated Water Co. Ltd. | 516 | 7,565 | ||||||
El Paso Electric Co. | 154 | 10,272 | ||||||
Genie Energy Ltd., Class B | 534 | 3,823 | ||||||
Global Water Resources, Inc. | 305 | 3,632 | ||||||
MGE Energy, Inc. | 156 | 11,833 | ||||||
Middlesex Water Co. | 217 | 13,246 | ||||||
New Jersey Resources Corp. | 150 | 6,861 | ||||||
Northwest Natural Holding Co. | 154 | 10,989 | ||||||
NorthWestern Corp. | 109 | 7,896 | ||||||
ONE Gas, Inc. | 70 | 6,413 | ||||||
Ormat Technologies, Inc. (a) | 98 | 7,278 | ||||||
Otter Tail Corp. | 218 | 11,035 | ||||||
Pattern Energy Group, Inc., Class A (a) | 427 | 11,593 | ||||||
PNM Resources, Inc. | 140 | 7,141 | ||||||
Portland General Electric Co. | 112 | 6,372 | ||||||
Pure Cycle Corp.* | 425 | 4,611 | ||||||
RGC Resources, Inc. | 126 | 3,576 | ||||||
SJW Group | 61 | 4,168 | ||||||
South Jersey Industries, Inc. | 159 | 5,142 | ||||||
Southwest Gas Holdings, Inc. | 56 | 5,109 | ||||||
Spark Energy, Inc., Class A (a) | 531 | 5,023 | ||||||
Spire, Inc. | 72 | 6,113 | ||||||
TerraForm Power, Inc., Class A | 102 | 1,730 | ||||||
Unitil Corp. | 288 | 17,387 | ||||||
York Water Co. | 249 | 9,298 | ||||||
|
| |||||||
| 291,228 | ||||||||
|
| |||||||
TOTAL COMMON STOCKS | 9,492,097 | |||||||
|
| |||||||
| RIGHTS — 0.0% |
| |||||||
| Financials — 0.0% | ||||||||
New Star Financial, Inc. CVR* (b) | 509 | 275 | ||||||
|
| |||||||
| Materials — 0.0% | ||||||||
A Schulman, Inc. CVR* (b) | 392 | 170 | ||||||
|
| |||||||
TOTAL RIGHTS | 445 | |||||||
|
| |||||||
Number | Value | |||||||
| EXCHANGE-TRADED FUNDS — 0.6% | ||||||||
iShares Core S&PSmall-Cap ETF | 250 | $ | 18,895 | |||||
iShares Edge MSCI Multifactor USASmall-Cap ETF | 355 | 13,889 | ||||||
VanguardSmall-Cap ETF | 160 | 24,360 | ||||||
|
| |||||||
TOTAL EXCHANGE-TRADED FUNDS | 57,144 | |||||||
|
| |||||||
| SECURITIES LENDING COLLATERAL — 2.1% | ||||||||
DWS Government & Agency Securities Portfolio “DWS Government Cash Institutional Shares”, 2.04% (c)(d) | 204,000 | 204,000 | ||||||
|
| |||||||
| CASH EQUIVALENTS — 0.9% | ||||||||
DWS Government Money Market Series “Institutional Shares”, 2.09% (c) | 86,452 | 86,452 | ||||||
|
| |||||||
TOTAL INVESTMENTS — 102.2% (Cost $9,492,721) | $ | 9,840,138 | ||||||
Other assets and liabilities, net — (2.2%) | (212,580 | ) | ||||||
|
| |||||||
NET ASSETS — 100.0% | $ | 9,627,558 | ||||||
|
| |||||||
| See Notes to Financial Statements. | 70 |
DBX ETF Trust
Schedule of Investments
Xtrackers Russell 2000 Comprehensive Factor ETF(Continued)
August 31, 2019
A summary of the Fund’s transactions with affiliated investments during the year ended August 31, 2019 is as follows:
| Value ($) at 8/31/2018 | Purchases Cost ($) | Sales Proceeds ($) | Net Realized Gain/(Loss) ($) | Net Change in Unrealized Appreciation (Depreciation) ($) | Income ($) | Capital Gain Distributions ($) | Number of Shares at 8/31/2019 | Value ($) at 8/31/2019 | ||||||||||||||||||||||||||||
SECURITIES LENDING COLLATERAL —2.1% | ||||||||||||||||||||||||||||||||||||
DWS Government & Agency Securities Portfolio “DWS Government Cash Institutional Shares”, 2.04% (c)(d) | ||||||||||||||||||||||||||||||||||||
| 311,072 | — | (107,072 | )(e) | — | — | 4,940 | — | 204,000 | 204,000 | |||||||||||||||||||||||||||
CASH EQUIVALENTS —0.9% | ||||||||||||||||||||||||||||||||||||
DWS Government Money Market Series “Institutional Shares”, 2.09% (c) | ||||||||||||||||||||||||||||||||||||
| — | 882,964 | (796,512 | ) | — | — | 1,465 | — | 86,452 | 86,452 | |||||||||||||||||||||||||||
|
|
|
|
|
|
|
|
|
|
|
|
|
|
|
|
|
| |||||||||||||||||||
| 311,072 | 882,964 | (903,584 | ) | — | — | 6,405 | — | 290,452 | 290,452 | |||||||||||||||||||||||||||
|
|
|
|
|
|
|
|
|
|
|
|
|
|
|
|
|
| |||||||||||||||||||
| * | Non-income producing security. |
| (a) | All or a portion of these securities were on loan. In addition, “Other assets and liabilities, net” may include pending sales that are also on loan. The value of securities loaned at August 31, 2019 amounted to $2,035,472, which is 21.1% of net assets. |
| (b) | Investment was valued using significant unobservable inputs. |
| (c) | Affiliated fund managed by DWS Investment Management Americas, Inc. The rate shown is the annualizedseven-day yield at period end. |
| (d) | Represents cash collateral held in connection with securities lending. Income earned by the Fund is net of borrower rebates. In addition, the Fund heldnon-cash U.S. Treasury securities collateral having a value of $1,878,900. |
| (e) | Represents the net increase (purchase cost) or decrease (sales proceeds) in the amount invested in cash collateral for the period ended August 31, 2019. |
| CVR: | Contingent Value Rights |
| REIT: | Real Estate Investment Trust |
At August 31, 2019, open futures contracts purchased were as follows:
Contract Description | Currency | Number of Contracts | Notional Amount | Contract Value | Expiration Date | Unrealized Depreciation | ||||||||||||
E-Mini Russell 2000 Futures | USD | 1 | $ | 79,110 | $74,710 | 9/20/2019 | $ | (4,400 | ) | |||||||||
For information on the Fund’s policy and additional disclosures regarding open futures contracts, please refer to the Derivatives section of Note 2 in the accompanying Notes to Financial Statements.
Currency Abbreviations
| USD | U.S. Dollar |
| See Notes to Financial Statements. | 71 |
DBX ETF Trust
Schedule of Investments
Xtrackers Russell 2000 Comprehensive Factor ETF(Continued)
August 31, 2019
Fair Value Measurements
Various inputs are used in determining the value of the Fund’s investments. These inputs are summarized in three broad levels. Level 1 includes quoted prices in active markets for identical securities. Level 2 includes other significant observable inputs (including quoted prices for similar securities, interest rates, prepayment speeds and credit risk). Level 3 includes significant unobservable inputs (including the Fund’s own assumptions in determining the fair value of investments). The level assigned to the securities valuations may not be an indication of the risk or liquidity associated with investing in those securities.
The following is a summary of the inputs used as of August 31, 2019 in valuing the Fund’s investments. For information on the Fund’s policy regarding the valuation of investments, please refer to the Security Valuation section of Note 2 in the accompanying Notes to Financial Statements.
Assets | Level 1 | Level 2 | Level 3 | Total | ||||||||||||
Common Stocks (f) | $ | 9,492,097 | $ | — | $ | — | $ | 9,492,097 | ||||||||
Rights (f) | — | — | 445 | 445 | ||||||||||||
Exchange-Traded Funds | 57,144 | — | — | 57,144 | ||||||||||||
Short-Term Investments (f) | 290,452 | — | — | 290,452 | ||||||||||||
|
|
|
|
|
|
|
| |||||||||
TOTAL | $ | 9,839,693 | $ | — | $ | 445 | $ | 9,840,138 | ||||||||
|
|
|
|
|
|
|
| |||||||||
Liabilities | Level 1 | Level 2 | Level 3 | Total | ||||||||||||
Derivatives (g) | ||||||||||||||||
Futures Contracts | $ | (4,400 | ) | $ | — | $ | — | $ | (4,400 | ) | ||||||
|
|
|
|
|
|
|
| |||||||||
TOTAL | $ | (4,400 | ) | $ | — | $ | — | $ | (4,400 | ) | ||||||
|
|
|
|
|
|
|
| |||||||||
| (f) | See Schedule of Investments for additional detailed categorizations. |
| (g) | Derivatives include unrealized appreciation (depreciation) on open futures contracts. |
| See Notes to Financial Statements. | 72 |
This Page is Intentionally Left Blank
73
DBX ETF Trust
August 31, 2019
| Xtrackers FTSE Developed ex US Comprehensive Factor ETF | Xtrackers FTSE Emerging Comprehensive Factor ETF | Xtrackers Russell 1000 Comprehensive Factor ETF | Xtrackers Russell 1000 US Quality at a Reasonable Price ETF | |||||||||||||
Assets | ||||||||||||||||
Investment innon-affiliated securities at value | $ | 71,766,408 | $ | 3,432,633 | $ | 201,419,383 | $ | 106,862,977 | ||||||||
Investment in DWS Government Money Market Series | 27,889 | 15,468 | 1,501,074 | 3,716,009 | ||||||||||||
Investment in DWS Government & Agency Securities Portfolio* | 906,421 | 18,715 | 35,815 | — | ||||||||||||
Foreign currency at value | 339,960 | 26,166 | — | — | ||||||||||||
Deposit with broker for futures contracts | 27,000 | 2,600 | 70,000 | 176,400 | ||||||||||||
| Receivables: | ||||||||||||||||
Variation margin on futures contracts | 2,520 | 400 | 1,475 | — | ||||||||||||
Dividends | 185,827 | 7,935 | 338,604 | 282,430 | ||||||||||||
Securities lending income | 731 | 25 | 1,722 | 527 | ||||||||||||
Foreign tax reclaim | 18,698 | — | — | — | ||||||||||||
|
|
|
|
|
|
|
| |||||||||
Total assets | $ | 73,275,454 | $ | 3,503,942 | $ | 203,368,073 | $ | 111,038,343 | ||||||||
|
|
|
|
|
|
|
| |||||||||
Liabilities | ||||||||||||||||
Due to custodian | $ | 25 | $ | 2 | $ | 27 | $ | — | ||||||||
Payable upon return of securities loaned | 906,421 | 18,715 | 35,815 | — | ||||||||||||
| Payables: | ||||||||||||||||
Investment advisory fees | 15,149 | 1,471 | 29,355 | 17,920 | ||||||||||||
Variation margin on futures contracts | — | — | — | 2,660 | ||||||||||||
|
|
|
|
|
|
|
| |||||||||
Total liabilities | 921,595 | 20,188 | 65,197 | 20,580 | ||||||||||||
|
|
|
|
|
|
|
| |||||||||
Net Assets, at value | $ | 72,353,859 | $ | 3,483,754 | $ | 203,302,876 | $ | 111,017,763 | ||||||||
|
|
|
|
|
|
|
| |||||||||
Net Assets Consist of | ||||||||||||||||
Paid-in capital | $ | 77,743,248 | $ | 3,973,668 | $ | 196,251,986 | $ | 107,216,798 | ||||||||
Distributable earnings (loss) | (5,389,389 | ) | (489,914 | ) | 7,050,890 | 3,800,965 | ||||||||||
|
|
|
|
|
|
|
| |||||||||
Net Assets, at value | $ | 72,353,859 | $ | 3,483,754 | $ | 203,302,876 | $ | 111,017,763 | ||||||||
|
|
|
|
|
|
|
| |||||||||
Number of Common Shares outstanding | 2,700,001 | 150,001 | 6,000,001 | 4,100,001 | ||||||||||||
|
|
|
|
|
|
|
| |||||||||
Net Asset Value | $ | 26.80 | $ | 23.22 | $ | 33.88 | $ | 27.08 | ||||||||
|
|
|
|
|
|
|
| |||||||||
Investment innon-affiliated securities at cost | $ | 73,406,433 | $ | 3,501,610 | $ | 181,916,929 | $ | 103,075,072 | ||||||||
|
|
|
|
|
|
|
| |||||||||
Value of securities loaned | $ | 942,895 | $ | 37,898 | $ | 17,780,697 | $ | 4,865,473 | ||||||||
|
|
|
|
|
|
|
| |||||||||
Investment in DWS Government Money Market Series at cost | $ | 27,889 | $ | 15,468 | $ | 1,501,074 | $ | 3,716,009 | ||||||||
|
|
|
|
|
|
|
| |||||||||
Investment in DWS Government & Agency Securities Portfolio at cost* | $ | 906,421 | $ | 18,715 | $ | 35,815 | $ | — | ||||||||
|
|
|
|
|
|
|
| |||||||||
Non-cash collateral for securities on loan | $ | 398,185 | $ | 22,420 | $ | 18,047,753 | $ | 4,961,428 | ||||||||
|
|
|
|
|
|
|
| |||||||||
Foreign currency at cost | $ | 342,363 | $ | 26,463 | $ | — | $ | — | ||||||||
|
|
|
|
|
|
|
| |||||||||
| * | Represents collateral on securities loaned. |
| See Notes to Financial Statements. | 74 |
DBX ETF Trust
Statements of Assets and Liabilities(Continued)
August 31, 2019
| Xtrackers Russell 2000 Comprehensive Factor ETF | ||||
Assets | ||||
Investment innon-affiliated securities at value | $ | 9,549,686 | ||
Investment in DWS Government Money Market Series | 86,452 | |||
Investment in DWS Government & Agency Securities Portfolio* | 204,000 | |||
Deposit with broker for futures contracts | 3,250 | |||
| Receivables: | ||||
Dividends | 9,077 | |||
Securities lending income | 655 | |||
|
| |||
Total assets | $ | 9,853,120 | ||
|
| |||
Liabilities | ||||
Payable upon return of securities loaned | $ | 204,000 | ||
| Payables: | ||||
Investment securities purchased | 18,932 | |||
Investment advisory fees | 2,465 | |||
Variation margin on futures contracts | 165 | |||
|
| |||
Total liabilities | 225,562 | |||
|
| |||
Net Assets, at value | $ | 9,627,558 | ||
|
| |||
Net Assets Consist of | ||||
Paid-in capital | $ | 10,216,042 | ||
Distributable earnings (loss) | (588,484 | ) | ||
|
| |||
Net Assets, at value | $ | 9,627,558 | ||
|
| |||
Number of Common Shares outstanding | 300,001 | |||
|
| |||
Net Asset Value | $ | 32.09 | ||
|
| |||
Investment innon-affiliated securities at cost | $ | 9,202,269 | ||
|
| |||
Value of securities loaned | $ | 2,035,472 | ||
|
| |||
Investment in DWS Government Money Market Series at cost | $ | 86,452 | ||
|
| |||
Investment in DWS Government & Agency Securities Portfolio at cost* | $ | 204,000 | ||
|
| |||
Non-cash collateral for securities on loan | $ | 1,878,900 | ||
|
| |||
| * | Represents collateral on securities loaned. |
| See Notes to Financial Statements. | 75 |
DBX ETF Trust
For the Year Ended August 31, 2019
| Xtrackers FTSE Developed ex US Comprehensive Factor ETF | Xtrackers FTSE Emerging Comprehensive Factor ETF | Xtrackers Russell 1000 Comprehensive Factor ETF | Xtrackers Russell 1000 US Quality at a Reasonable Price ETF | |||||||||||||
Investment Income | ||||||||||||||||
Unaffiliated dividend income* | $ | 2,422,668 | $ | 185,343 | $ | 3,560,954 | $ | 2,162,200 | ||||||||
Income distributions from affiliated funds | 1,653 | 119 | 20,679 | 4,886 | ||||||||||||
Affiliated securities lending income | 15,775 | 429 | 4,168 | 1,697 | ||||||||||||
Unaffiliated securities lending income, net of borrower rebates | 2,009 | — | 15,974 | 3,670 | ||||||||||||
|
|
|
|
|
|
|
| |||||||||
Total investment income | 2,442,105 | 185,891 | 3,601,775 | 2,172,453 | ||||||||||||
|
|
|
|
|
|
|
| |||||||||
Expenses | ||||||||||||||||
Investment advisory fees | 256,315 | 25,852 | 315,797 | 194,377 | ||||||||||||
Other expenses | 57 | 57 | 57 | 30 | ||||||||||||
|
|
|
|
|
|
|
| |||||||||
Total expenses | 256,372 | 25,909 | 315,854 | 194,407 | ||||||||||||
|
|
|
|
|
|
|
| |||||||||
Less fees waived (see note 3): | ||||||||||||||||
Waiver | (45,593 | ) | (3 | ) | (665 | ) | (119 | ) | ||||||||
|
|
|
|
|
|
|
| |||||||||
Net expenses | 210,779 | 25,906 | 315,189 | 194,288 | ||||||||||||
|
|
|
|
|
|
|
| |||||||||
Net investment income (loss) | 2,231,326 | 159,985 | 3,286,586 | 1,978,165 | ||||||||||||
|
|
|
|
|
|
|
| |||||||||
Realized and Unrealized Gain (Loss) | ||||||||||||||||
Net realized gain (loss) from: | ||||||||||||||||
Investments | (4,010,708 | ) | (447,211 | ) | (8,940,762 | ) | (221,919 | ) | ||||||||
Investments in affiliates | 3,523 | — | — | — | ||||||||||||
In-kind redemptions | 1,259,444 | 57,713 | 8,225,047 | 4,474,786 | ||||||||||||
Futures contracts | (18,219 | ) | (4,285 | ) | (52,097 | ) | 33,248 | |||||||||
Foreign currency transactions | (16,504 | ) | (6,878 | ) | — | — | ||||||||||
|
|
|
|
|
|
|
| |||||||||
Net realized gain (loss) | (2,782,464 | ) | (400,661 | ) | (767,812 | ) | 4,286,115 | |||||||||
Net change in unrealized appreciation (depreciation) on: | ||||||||||||||||
Investments** | (1,862,238 | ) | 81,782 | 2,718,678 | (181,318 | ) | ||||||||||
Futures contracts | (18,075 | ) | 2,650 | (57,748 | ) | 62,308 | ||||||||||
Foreign currency translations | (2,965 | ) | 1,624 | — | — | |||||||||||
|
|
|
|
|
|
|
| |||||||||
Net change in unrealized appreciation (depreciation) | (1,883,278 | ) | 86,056 | 2,660,930 | (119,010 | ) | ||||||||||
|
|
|
|
|
|
|
| |||||||||
Net realized and unrealized gain (loss) on investments, futures and foreign currency transactions | (4,665,742 | ) | (314,605 | ) | 1,893,118 | 4,167,105 | ||||||||||
|
|
|
|
|
|
|
| |||||||||
Net Increase (Decrease) in Net Assets Resulting from Operations | $ | (2,434,416 | ) | $ | (154,620 | ) | $ | 5,179,704 | $ | 6,145,270 | ||||||
|
|
|
|
|
|
|
| |||||||||
* Unaffiliated foreign tax withheld | $ | 237,185 | $ | 20,489 | $ | 344 | $ | — | ||||||||
** Net of change in deferred foreign taxes | $ | — | $ | (3,551 | ) | $ | — | $ | — | |||||||
| See Notes to Financial Statements. | 76 |
DBX ETF Trust
Statements of Operations(Continued)
For the Year Ended August 31, 2019
| Xtrackers Russell 2000 Comprehensive Factor ETF | ||||
Investment Income | ||||
Unaffiliated dividend income* | $ | 185,890 | ||
Income distributions from affiliated funds | 1,465 | |||
Affiliated securities lending income | 4,940 | |||
Unaffiliated securities lending income, net of borrower rebates | 804 | |||
|
| |||
Total investment income | 193,099 | |||
|
| |||
Expenses | ||||
Investment advisory fees | 30,067 | |||
Other expenses | 57 | |||
|
| |||
Total expenses | 30,124 | |||
|
| |||
Less fees waived (see note 3): | ||||
Waiver | (44 | ) | ||
|
| |||
Net expenses | 30,080 | |||
|
| |||
Net investment income (loss) | 163,019 | |||
|
| |||
Realized and Unrealized Gain (Loss) | ||||
Net realized gain (loss) from: | ||||
Investments | (537,552 | ) | ||
Futures contracts | (5,427 | ) | ||
Foreign currency transactions | (3 | ) | ||
|
| |||
Net realized gain (loss) | (542,982 | ) | ||
Net change in unrealized appreciation (depreciation) on: | ||||
Investments | (1,219,551 | ) | ||
Futures contracts | (7,345 | ) | ||
Foreign currency translations | 24 | |||
|
| |||
Net change in unrealized appreciation (depreciation) | (1,226,872 | ) | ||
|
| |||
Net realized and unrealized gain (loss) on investments, futures and foreign currency transactions | (1,769,854 | ) | ||
|
| |||
Net Increase (Decrease) in Net Assets Resulting from Operations | $ | (1,606,835 | ) | |
|
| |||
* Unaffiliated foreign tax withheld | $ | 27 | ||
| See Notes to Financial Statements. | 77 |
DBX ETF Trust
| Xtrackers FTSE Developed ex US Comprehensive Factor ETF | Xtrackers FTSE Emerging Comprehensive Factor ETF | |||||||||||||||
| Year Ended August 31, 2019 | Year Ended August 31, 2018 | Year Ended August 31, 2019 | Year Ended August 31, 2018 | |||||||||||||
Increase (Decrease) in Net Assets from Operations | ||||||||||||||||
Net investment income (loss) | $ | 2,231,326 | $ | 1,186,134 | $ | 159,985 | $ | 228,551 | ||||||||
Net realized gain (loss) | (2,782,464 | ) | 96,967 | (400,661 | ) | 837,875 | ||||||||||
Net change in net unrealized appreciation (depreciation) | (1,883,278 | ) | (463,370 | ) | 86,056 | (1,468,661 | ) | |||||||||
|
|
|
|
|
|
|
| |||||||||
Net increase (decrease) in net assets resulting from operations | (2,434,416 | ) | 819,731 | (154,620 | ) | (402,235 | ) | |||||||||
|
|
|
|
|
|
|
| |||||||||
Distributions to Shareholders | (2,029,470 | ) | (1,119,637 | )* | (288,043 | ) | (534,323 | )** | ||||||||
|
|
|
|
|
|
|
| |||||||||
Fund Shares Transactions | ||||||||||||||||
Proceeds from shares sold | 34,949,614 | 45,367,454 | — | — | ||||||||||||
Value of shares redeemed | (17,258,305 | ) | (1,436,896 | ) | (2,490,064 | ) | (5,735,711 | ) | ||||||||
|
|
|
|
|
|
|
| |||||||||
Net increase (decrease) in net assets resulting from fund share transactions | 17,691,309 | 43,930,558 | (2,490,064 | ) | (5,735,711 | ) | ||||||||||
|
|
|
|
|
|
|
| |||||||||
Total net increase (decrease) in Net Assets | 13,227,423 | 43,630,652 | (2,932,727 | ) | (6,672,269 | ) | ||||||||||
Net Assets | ||||||||||||||||
Beginning of year | 59,126,436 | 15,495,784 | 6,416,481 | 13,088,750 | ||||||||||||
|
|
|
|
|
|
|
| |||||||||
End of year | $ | 72,353,859 | $ | 59,126,436 | *** | $ | 3,483,754 | $ | 6,416,481 | *** | ||||||
|
|
|
|
|
|
|
| |||||||||
Changes in Shares Outstanding | ||||||||||||||||
Shares outstanding, beginning of year | 2,050,001 | 550,001 | 250,001 | 450,001 | ||||||||||||
Shares sold | 1,300,000 | 1,550,000 | — | — | ||||||||||||
Shares redeemed | (650,000 | ) | (50,000 | ) | (100,000 | ) | (200,000 | ) | ||||||||
|
|
|
|
|
|
|
| |||||||||
Shares outstanding, end of year | 2,700,001 | 2,050,001 | 150,001 | 250,001 | ||||||||||||
|
|
|
|
|
|
|
| |||||||||
| * | Includes distributions from net investment income. |
| ** | Includes distributions from net investment income of $342,332 and net realized gains of $191,991. |
| *** | Includes undistributed net investment income of $434,377 and $72,089 respectively. |
| See Notes to Financial Statements. | 78 |
DBX ETF Trust
Statements of Changes in Net Assets(Continued)
| Xtrackers Russell 1000 Comprehensive Factor ETF | Xtrackers Russell 1000 US Quality at a Reasonable Price ETF | |||||||||||||||
| Year Ended August 31, 2019 | Year Ended August 31, 2018 | Year Ended August 31, 2019 | For the Period April 5, 2018(1) to August 31, 2018 | |||||||||||||
Increase (Decrease) in Net Assets from Operations | ||||||||||||||||
Net investment income (loss) | $ | 3,286,586 | $ | 2,300,079 | $ | 1,978,165 | $ | 415,425 | ||||||||
Net realized gain (loss) | (767,812 | ) | 7,060,292 | 4,286,115 | 27,083 | |||||||||||
Net change in net unrealized appreciation (depreciation) | 2,660,930 | 12,374,293 | (119,010 | ) | 3,969,223 | |||||||||||
|
|
|
|
|
|
|
| |||||||||
Net increase (decrease) in net assets resulting from operations | 5,179,704 | 21,734,664 | 6,145,270 | 4,411,731 | ||||||||||||
|
|
|
|
|
|
|
| |||||||||
Distributions to Shareholders | (3,011,382 | ) | (2,163,877 | )* | (1,746,917 | ) | (177,934 | )* | ||||||||
|
|
|
|
|
|
|
| |||||||||
Fund Shares Transactions | ||||||||||||||||
Proceeds from shares sold | 73,507,056 | 104,881,632 | 82,359,575 | 64,987,902 | ||||||||||||
Value of shares redeemed | (43,711,180 | ) | (53,325,864 | ) | (37,153,935 | ) | (7,807,954 | ) | ||||||||
|
|
|
|
|
|
|
| |||||||||
Net increase (decrease) in net assets resulting from fund share transactions | 29,795,876 | 51,555,768 | 45,205,640 | 57,179,948 | ||||||||||||
|
|
|
|
|
|
|
| |||||||||
Total net increase (decrease) in Net Assets | 31,964,198 | 71,126,555 | 49,603,993 | 61,413,745 | ||||||||||||
Net Assets | ||||||||||||||||
Beginning of period | 171,338,678 | 100,212,123 | 61,413,770 | 25 | ||||||||||||
|
|
|
|
|
|
|
| |||||||||
End of period | $ | 203,302,876 | $ | 171,338,678 | ** | $ | 111,017,763 | $ | 61,413,770 | ** | ||||||
|
|
|
|
|
|
|
| |||||||||
Changes in Shares Outstanding | ||||||||||||||||
Shares outstanding, beginning of period | 5,050,001 | 3,400,001 | 2,250,001 | 1 | ||||||||||||
Shares sold | 2,300,000 | 3,300,000 | 3,250,000 | 2,550,000 | ||||||||||||
Shares redeemed | (1,350,000 | ) | (1,650,000 | ) | (1,400,000 | ) | (300,000 | ) | ||||||||
|
|
|
|
|
|
|
| |||||||||
Shares outstanding, end of period | 6,000,001 | 5,050,001 | 4,100,001 | 2,250,001 | ||||||||||||
|
|
|
|
|
|
|
| |||||||||
| (1) | Commencement of Operations. |
| * | Includes distributions from net investment income. |
| ** | Includes undistributed net investment income of $471,966 and $237,491 respectively. |
| See Notes to Financial Statements. | 79 |
DBX ETF Trust
Statements of Changes in Net Assets(Continued)
| Xtrackers Russell 2000 Comprehensive Factor ETF | ||||||||
| Year Ended August 31, 2019 | Year Ended August 31, 2018 | |||||||
Increase (Decrease) in Net Assets from Operations | ||||||||
Net investment income (loss) | $ | 163,019 | $ | 136,931 | ||||
Net realized gain (loss) | (542,982 | ) | 684,775 | |||||
Net change in net unrealized appreciation (depreciation) | (1,226,872 | ) | 1,083,245 | |||||
|
|
|
| |||||
Net increase (decrease) in net assets resulting from operations | (1,606,835 | ) | 1,904,951 | |||||
|
|
|
| |||||
Distributions to Shareholders | (186,042 | ) | (222,095 | )* | ||||
|
|
|
| |||||
Fund Shares Transactions | ||||||||
Proceeds from shares sold | — | 10,288,658 | ||||||
Value of shares redeemed | — | (5,225,663 | ) | |||||
|
|
|
| |||||
Net increase (decrease) in net assets resulting from fund share transactions | — | 5,062,995 | ||||||
|
|
|
| |||||
Total net increase (decrease) in Net Assets | (1,792,877 | ) | 6,745,851 | |||||
Net Assets | ||||||||
Beginning of year | 11,420,435 | 4,674,584 | ||||||
|
|
|
| |||||
End of year | $ | 9,627,558 | $ | 11,420,435 | ** | |||
|
|
|
| |||||
Changes in Shares Outstanding | ||||||||
Shares outstanding, beginning of year | 300,001 | 150,001 | ||||||
Shares sold | — | 300,000 | ||||||
Shares redeemed | — | (150,000 | ) | |||||
|
|
|
| |||||
Shares outstanding, end of year | 300,001 | 300,001 | ||||||
|
|
|
| |||||
| * | Includes distributions from net investment income of 115,343 and net realized gains of 106,752. |
| ** | Includes undistributed net investment income of $34,581. |
| See Notes to Financial Statements. | 80 |
DBX ETF Trust
| Xtrackers FTSE Developed ex US Comprehensive Factor ETF Selected Per Share Data | Years Ended August 31, | Period Ended 8/31/2016(a) | ||||||||||||||
| 2019 | 2018 | 2017 | ||||||||||||||
Net Asset Value, beginning of period | $ | 28.84 | $ | 28.17 | $ | 25.41 | $ | 25.00 | ||||||||
|
|
|
|
|
|
|
| |||||||||
| Income (loss) from investment operations: | ||||||||||||||||
Net investment income (loss)(c) | 0.83 | 0.77 | 0.54 | 0.52 | ||||||||||||
Net realized and unrealized gain (loss) | (2.11 | ) | 0.72 | (d) | 3.19 | (d) | 0.27 | |||||||||
|
|
|
|
|
|
|
| |||||||||
Total from investment operations | (1.28 | ) | 1.49 | 3.73 | 0.79 | |||||||||||
|
|
|
|
|
|
|
| |||||||||
| Less distributions from: |
| |||||||||||||||
Net investment income | (0.76 | ) | (0.82 | ) | (0.97 | ) | (0.38 | ) | ||||||||
|
|
|
|
|
|
|
| |||||||||
Total distributions | (0.76 | ) | (0.82 | ) | (0.97 | ) | (0.38 | ) | ||||||||
|
|
|
|
|
|
|
| |||||||||
Net Asset Value, end of period | $ | 26.80 | $ | 28.84 | $ | 28.17 | $ | 25.41 | ||||||||
|
|
|
|
|
|
|
| |||||||||
Total Return (%) | (4.51 | )(e) | 5.32 | 15.16 | 3.21 | ** | ||||||||||
Ratios to Average Net Assets and Supplemental Data | ||||||||||||||||
Net Assets, end of period ($ millions) | 72 | 59 | 15 | 3 | ||||||||||||
Ratio of expenses before fee waiver (%) | 0.35 | 0.35 | 0.35 | 0.36 | * | |||||||||||
Ratio of expenses after fee waiver (%) | 0.29 | 0.35 | 0.35 | 0.36 | * | |||||||||||
Ratio of net investment income (loss) (%) | 3.05 | 2.62 | 2.10 | 2.77 | * | |||||||||||
Portfolio turnover rate (%)(f) | 51 | 45 | 45 | 35 | ** | |||||||||||
| Xtrackers FTSE Emerging Comprehensive Factor ETF Selected Per Share Data | Years Ended August 31, | Period Ended 8/31/2016(b) | ||||||||||||||
| 2019 | 2018 | 2017 | ||||||||||||||
Net Asset Value, beginning of period | $ | 25.67 | $ | 29.09 | $ | 25.73 | $ | 25.00 | ||||||||
|
|
|
|
|
|
|
| |||||||||
| Income (loss) from investment operations: | ||||||||||||||||
Net investment income (loss)(c) | 0.75 | 0.82 | 0.88 | 0.38 | ||||||||||||
Net realized and unrealized gain (loss) | (1.92 | ) | (2.46 | ) | 3.27 | 0.41 | ||||||||||
|
|
|
|
|
|
|
| |||||||||
Total from investment operations | (1.17 | ) | (1.64 | ) | 4.15 | 0.79 | ||||||||||
|
|
|
|
|
|
|
| |||||||||
| Less distributions from: |
| |||||||||||||||
Net investment income | (0.84 | ) | (1.01 | ) | (0.61 | ) | (0.06 | ) | ||||||||
Net realized gains | (0.44 | ) | (0.77 | ) | (0.18 | ) | — | |||||||||
|
|
|
|
|
|
|
| |||||||||
Total distributions | (1.28 | ) | (1.78 | ) | (0.79 | ) | (0.06 | ) | ||||||||
|
|
|
|
|
|
|
| |||||||||
Net Asset Value, end of period | $ | 23.22 | $ | 25.67 | $ | 29.09 | $ | 25.73 | ||||||||
|
|
|
|
|
|
|
| |||||||||
Total Return (%) | (4.69 | )(e) | (5.89 | ) | 16.56 | 3.16 | ** | |||||||||
Ratios to Average Net Assets and Supplemental Data | ||||||||||||||||
Net Assets, end of period ($ millions) | 3 | 6 | 13 | 3 | ||||||||||||
Ratio of expenses before fee waiver (%) | 0.50 | 0.50 | 0.50 | 0.50 | * | |||||||||||
Ratio of expenses after fee waiver (%) | 0.50 | 0.50 | 0.50 | 0.50 | * | |||||||||||
Ratio of net investment income (loss) (%) | 3.09 | 2.90 | 3.28 | 4.14 | * | |||||||||||
Portfolio turnover rate (%)(f) | 64 | 74 | 48 | 1 | ** | |||||||||||
| (a) | For the period November 24, 2015 (commencement of operations) through August 31, 2016. |
| (b) | For the period April 19, 2016 (commencement of operations) through August 31, 2016. |
| (c) | Based on average shares outstanding during the period. |
| (d) | Because of the timing of subscriptions and redemptions in relation to fluctuating markets at value, the amount shown may not agree with the change in aggregate gains and losses. |
| (e) | Total Return would have been lower if certain expenses had not been reimbursed by the Advisor. |
| (f) | Portfolio turnover rate does not include securities received or delivered from processing creations or redemptions. |
| * | Annualized. |
| ** | Not Annualized. |
| See Notes to Financial Statements. | 81 |
DBX ETF Trust
Financial Highlights(Continued)
| Xtrackers Russell 1000 Comprehensive Factor ETF Selected Per Share Data | Years Ended August 31, | Period Ended 8/31/2016(a) | ||||||||||||||
| 2019 | 2018 | 2017 | ||||||||||||||
Net Asset Value, beginning of period | $ | 33.93 | $ | 29.47 | $ | 26.76 | $ | 25.00 | ||||||||
|
|
|
|
|
|
|
| |||||||||
| Income (loss) from investment operations: | ||||||||||||||||
Net investment income (loss)(c) | 0.57 | 0.52 | 0.51 | 0.40 | ||||||||||||
Net realized and unrealized gain (loss) | (0.09 | )(d) | 4.44 | 2.85 | 1.60 | |||||||||||
|
|
|
|
|
|
|
| |||||||||
Total from investment operations | 0.48 | 4.96 | 3.36 | 2.00 | ||||||||||||
|
|
|
|
|
|
|
| |||||||||
| Less distributions from: |
| |||||||||||||||
Net investment income | (0.53 | ) | (0.50 | ) | (0.65 | ) | (0.24 | ) | ||||||||
|
|
|
|
|
|
|
| |||||||||
Total distributions | (0.53 | ) | (0.50 | ) | (0.65 | ) | (0.24 | ) | ||||||||
|
|
|
|
|
|
|
| |||||||||
Net Asset Value, end of period | $ | 33.88 | $ | 33.93 | $ | 29.47 | $ | 26.76 | ||||||||
|
|
|
|
|
|
|
| |||||||||
Total Return (%) | 1.53 | (e) | 16.97 | (e) | 12.75 | (e) | 8.06 | ** | ||||||||
Ratios to Average Net Assets and Supplemental Data | ||||||||||||||||
Net Assets, end of period ($ millions) | 203 | 171 | 100 | 21 | ||||||||||||
Ratio of expenses before fee waiver (%) | 0.17 | 0.19 | 0.23 | 0.25 | * | |||||||||||
Ratio of expenses after fee waiver (%) | 0.17 | 0.18 | 0.21 | 0.25 | * | |||||||||||
Ratio of net investment income (loss) (%) | 1.77 | 1.62 | 1.83 | 2.01 | * | |||||||||||
Portfolio turnover rate (%)(f) | 48 | 45 | 67 | 64 | ** | |||||||||||
| Xtrackers Russell 1000 US Quality at a Reasonable Price ETF Selected Per Share Data | Year Ended 8/31/2019 | Period Ended 8/31/2018(b) | ||||||
Net Asset Value, beginning of period | $ | 27.29 | $ | 25.00 | ||||
|
|
|
| |||||
| Income (loss) from investment operations: | ||||||||
Net investment income (loss)(c) | 0.51 | 0.21 | ||||||
Net realized and unrealized gain (loss) | (0.25 | )(d) | 2.16 | |||||
|
|
|
| |||||
Total from investment operations | 0.26 | 2.37 | ||||||
|
|
|
| |||||
| Less distributions from: |
| |||||||
Net investment income | (0.47 | ) | (0.08 | ) | ||||
|
|
|
| |||||
Total distributions | (0.47 | ) | (0.08 | ) | ||||
|
|
|
| |||||
Net Asset Value, end of period | $ | 27.08 | $ | 27.29 | ||||
|
|
|
| |||||
Total Return (%) | 1.03 | (e) | 9.52 | ** | ||||
Ratios to Average Net Assets and Supplemental Data | ||||||||
Net Assets, end of period ($ millions) | 111 | 61 | ||||||
Ratio of expenses before fee waiver (%) | 0.19 | 0.19 | * | |||||
Ratio of expenses after fee waiver (%) | 0.19 | 0.19 | * | |||||
Ratio of net investment income (loss) (%) | 1.93 | 2.00 | * | |||||
Portfolio turnover rate (%)(f) | 31 | 26 | ** | |||||
| (a) | For the period November 24, 2015 (commencement of operations) through August 31, 2016. |
| (b) | For the period April 5, 2018 (commencement of operations) through August 31, 2018. |
| (c) | Based on average shares outstanding during the period. |
| (d) | Because of the timing of subscriptions and redemptions in relation to fluctuating markets at value, the amount shown may not agree with the change in aggregate gains and losses. |
| (e) | Total Return would have been lower if certain expenses had not been reimbursed by the Advisor. |
| (f) | Portfolio turnover rate does not include securities received or delivered from processing creations or redemptions. |
| * | Annualized. |
| ** | Not Annualized. |
| See Notes to Financial Statements. | 82 |
DBX ETF Trust
Financial Highlights(Continued)
| Xtrackers Russell 2000 Comprehensive Factor ETF Selected Per Share Data | Years Ended August 31, | Period Ended 8/31/2016(a) | ||||||||||||||
| 2019 | 2018 | 2017 | ||||||||||||||
Net Asset Value, beginning of period | $ | 38.07 | $ | 31.16 | $ | 27.82 | $ | 25.00 | ||||||||
|
|
|
|
|
|
|
| |||||||||
| Income (loss) from investment operations: | ||||||||||||||||
Net investment income (loss)(b) | 0.54 | 0.49 | 0.46 | 0.09 | ||||||||||||
Net realized and unrealized gain (loss) | (5.90 | ) | 7.23 | 3.35 | 2.73 | |||||||||||
|
|
|
|
|
|
|
| |||||||||
Total from investment operations | (5.36 | ) | 7.72 | 3.81 | 2.82 | |||||||||||
|
|
|
|
|
|
|
| |||||||||
| Less distributions from: |
| |||||||||||||||
Net investment income | (0.62 | ) | (0.45 | ) | (0.46 | ) | — | |||||||||
Net realized gains | — | (0.36 | ) | (0.01 | ) | — | ||||||||||
|
|
|
|
|
|
|
| |||||||||
Total distributions | (0.62 | ) | (0.81 | ) | (0.47 | ) | — | |||||||||
|
|
|
|
|
|
|
| |||||||||
Net Asset Value, end of period | $ | 32.09 | $ | 38.07 | $ | 31.16 | $ | 27.82 | ||||||||
|
|
|
|
|
|
|
| |||||||||
Total Return (%) | (14.11 | )(c) | 25.08 | 13.72 | 11.28 | ** | ||||||||||
Ratios to Average Net Assets and Supplemental Data | ||||||||||||||||
Net Assets, end of period ($ millions) | 10 | 11 | 5 | 3 | ||||||||||||
Ratio of expenses before fee waiver (%) | 0.30 | 0.30 | 0.30 | 0.30 | * | |||||||||||
Ratio of expenses after fee waiver (%) | 0.30 | 0.30 | 0.30 | 0.30 | * | |||||||||||
Ratio of net investment income (loss) (%) | 1.63 | 1.42 | 1.51 | 1.79 | * | |||||||||||
Portfolio turnover rate (%)(d) | 47 | 60 | 53 | 2 | ** | |||||||||||
| (a) | For the period June 28, 2016 (commencement of operations) through August 31, 2016. |
| (b) | Based on average shares outstanding during the period. |
| (c) | Total Return would have been lower if certain expenses had not been reimbursed by the Advisor. |
| (d) | Portfolio turnover rate does not include securities received or delivered from processing creations or redemptions. |
| * | Annualized. |
| ** | Not Annualized. |
| See Notes to Financial Statements. | 83 |
DBX ETF Trust
1. Organization
DBX ETF Trust (the “Trust”) is registered under the Investment Company Act of 1940, as amended (the “Act”), as anopen-end registered management investment company organized as a Delaware statutory trust.
As of August 31, 2019, the Trust consists of thirty-eight investment series of exchange-traded funds (“ETFs”) (each a “Fund” and collectively, the “Funds”) in operation and trading. These financial statements report on the Funds listed below:
| Xtrackers FTSE Developed ex US Comprehensive Factor ETF |
| Xtrackers FTSE Emerging Comprehensive Factor ETF |
| Xtrackers Russell 1000 Comprehensive Factor ETF |
| Xtrackers Russell 1000 US Quality at a Reasonable Price ETF* |
| Xtrackers Russell 2000 Comprehensive Factor ETF |
DBX Advisors LLC (“DBX” or the “Advisor”), an indirect, wholly-owned subsidiary of DWS Group Gmbh & Co. KGaA (“DWS Group”), serves as investment advisor to the Funds and has overall responsibility for the general management and administration of the Funds, subject to the supervision of the Funds’ Board of Trustees (“Board”).
Each Fund offers shares that are listed and traded on the NYSE Arca, Inc. (“NYSE Arca”). Unlike conventional mutual funds, each Fund issues and redeems shares on a continuous basis, at net asset value (“NAV”), only in large specified lots consisting of 50,000 shares, each called a “Creation Unit”, to authorized participants who have entered into agreements with the Funds’ distributor. Shares are not individually redeemable securities of the Funds, and owners of the shares may acquire those shares from the Funds, or tender such shares for redemption to the Funds, in Creation Units only.
The investment objective of each Fund is to track the performance, before fees and expenses, of a particular index (the “Underlying Index”). The underlying indices for the Funds are:
Fund | Underlying Index | |
| Xtrackers FTSE Developed ex US Comprehensive Factor ETF | FTSE Developed ex US Comprehensive Factor Index | |
| Xtrackers FTSE Emerging Comprehensive Factor ETF | FTSE Emerging Comprehensive Factor Index | |
| Xtrackers Russell 1000 Comprehensive Factor ETF | Russell 1000 Comprehensive Factor Index | |
| Xtrackers Russell 1000 US Quality at a Reasonable Price ETF* | Russell 1000 2Qual/Val 5% Capped Factor Index | |
| Xtrackers Russell 2000 Comprehensive Factor ETF | Russell 2000 Comprehensive Factor Index |
| * | On May 14, 2019, the Fund changed its name from Xtrackers Russell 1000 US QARP ETF to Xtrackers Russell 1000 US Quality at a Reasonable Price ETF. |
The FTSE Developed ex US Comprehensive Factor Index is designed to track the equity market performance of companies in developed countries (except the United States) selected on the investment style criteria (“factors”) of value, momentum, quality, low volatility and size. The companies eligible for the Underlying Index are derived from its starting universe, the FTSE Developed ex US Index, which is comprised of large- andmid-capitalization equity securities from developed markets (except the United States). The Underlying Index is rebalanced semiannually in March and September after the close of business on the third Friday of the review month.
The FTSE Emerging Comprehensive Factor Index is designed to track the equity market performance of companies in emerging market countries selected on the investment style criteria (“factors”) of value, momentum, quality, low volatility and size. The companies eligible for the Underlying Index are derived from its starting universe, the FTSE Emerging Index, which is comprised of large- andmid-cap equity securities from emerging markets. The Underlying Index is rebalanced semiannually in March and September after the close of business on the third Friday of the review month.
The Russell 1000 Comprehensive Factor Index is designed to track the equity market performance of companies in the United States selected on the investment style criteria (“factors”) of value, momentum, quality, low volatility and size. The companies eligible for the Underlying Index are derived from its starting universe, the Russell 1000 Index, which is comprised oflarge-cap equity securities from issuers in the United States. The Underlying Index is rebalanced semiannually in June and December after the close of business on the third Friday of the review month.
84
DBX ETF Trust
Notes to Financial Statements(Continued)
The Russell 1000 2Qual/Val 5% Capped Factor Index is designed to track the equity market performance of companies in the United States selected on the investment style criteria (“factors”) of quality and value. The companies eligible for the Underlying Index are derived from its starting universe, the Russell 1000 Index, which is comprised oflarge-cap equity securities from issuers in the United States. The Underlying Index is rebalanced annually in June after the close of business on the third Friday of the review month. Upon a rebalancing, no issuer in the Underlying Index may represent more than 5% of the Underlying Index. In the event an issuer represents more than 5% of the Underlying Index at a rebalancing, such amount in excess of 5% shall be reallocatedpro-rata to the other issuers in the Underlying Index.
The Russell 2000 Comprehensive Factor Index is designed to track the equity market performance of companies in the United States selected on the investment style criteria (“factors”) of value, momentum, quality, low volatility and size. The companies eligible for the Underlying Index are derived from its starting universe, the Russell 2000 Index, which is comprised ofsmall-cap equity securities from issuers in the United States. The Underlying Index is rebalanced semiannually in June and December after the close of business on the third Friday of the review month.
Each Fund is entitled to use its respective Underlying Index pursuant to a licensing agreement between the Index Provider and DBX. There is no charge to the Funds in connection with these licensing agreements.
Each Fund, except Xtrackers Russell 1000 US Quality at a Reasonable Price ETF is diversified. Xtrackers Russell 1000 US Quality at a Reasonable Price ETF isnon-diversified and is not limited by the Act with regard to the percentage of its assets that may be invested in the securities of a single issuer. This means the securities of a particular issuer (or securities of issuers in particular industries) may dominate the Underlying Index of the Fund and, consequently, the Fund’s investment portfolio. This may adversely affect the Fund’s performance or subject the Fund’s shares to greater price volatility than that experienced by more diversified investment companies. As of September 26, 2019, each Fund may change its diversification status over time and then change it back again, without shareholder approval, solely as a result of a change in relative market capitalization or index weighting of one or more constituents of the index each Fund tracks.
Pursuant to the Trust’s organizational documents, the Trust’s officers and trustees are indemnified against certain liabilities that may arise out of the performance of their duties to the Funds. Additionally, in the normal course of business the Trust enters into contracts that contain a variety of representations that provide indemnification for certain liabilities. The Trust’s maximum exposure under these arrangements is unknown, as this would involve future claims that may be made against the Funds that have not yet occurred. However, the Trust expects the risk of loss to be remote.
2. Significant Accounting Policies
The financial statements have been prepared in conformity with U.S. generally accepted accounting principles (“U.S. GAAP”), which require management to make certain estimates and assumptions that affect the reported amounts and disclosures in the financial statements. Actual results could differ from those estimates. Each Fund qualifies as an investment company under Topic 946 of the Accounting Standards Codification of U.S. GAAP. The following is a summary of significant accounting policies followed by the Funds.
In October 2018, the Securities and Exchange Commission adopted amendments to certain disclosure requirements in Securities Act ReleaseNo. 33-10532, Disclosure Update and Simplification, which is intended to facilitate the disclosure of information to investors and simplify compliance without significantly altering the total mix of information provided to investors. Effective with the current reporting period, the Funds adopted the amendments with the impacts being that the Funds are no longer required to present components of distributable earnings on the Statement of Assets and Liabilities or the sources of distributable earnings and the amount of undistributed net investment income on the Statements of Changes in Net Assets.
Security Valuation The NAV of each Fund’s shares is calculated each business day as of the close of regular trading on the New York Stock Exchange, generally 4:00 p.m. Eastern Time. NAV per share is calculated by dividing a Fund’s net assets by the number of Fund shares outstanding.
Various inputs are used in determining the value of the Funds’ investments. These inputs are summarized in three broad levels. Level 1 includes quoted prices in active markets for identical securities. Level 2 includes other significant observable inputs (including quoted prices for similar securities, interest rates, prepayment speeds,
85
DBX ETF Trust
Notes to Financial Statements(Continued)
and credit risk). Level 3 includes significant unobservable inputs (including the Funds’ own assumptions in determining the fair value of investments). The level assigned to the securities valuations may not be an indication of the risk or liquidity associated with investing in those securities.
Equity securities and ETFs are valued at the most recent sale price or official closing price reported on the exchange (U.S. or foreign) orover-the-counter market on which they trade. Securities or ETFs for which no sales are reported are valued at the calculated mean between the most recent bid and asked quotations on the relevant market or, if a mean cannot be determined, at the most recent bid quotation. Equity securities and ETFs are generally categorized as Level 1.
Corporate and sovereign debt securities are valued at prices supplied by independent pricing services approved by the Funds’ Board. Such services may use various pricing techniques which take into account appropriate factors such as yield, quality, coupon rate, maturity, type of issue, trading characteristics and other data, as well as broker quotes. If the pricing services are unable to provide valuations, securities are valued at the mean between the bid and ask quotations or evaluated prices, as applicable, obtained from broker dealers. These securities are generally categorized as Level 2.
Investments inopen-end investment companies are valued at their NAV each business day and are categorized as Level 1.
Futures contracts are generally valued at the settlement prices established each day on the exchange on which they are traded and are categorized as Level 1.
Securities and other assets for which market quotations are not readily available or for which the above valuation procedures are deemed not to reflect fair value are valued in a manner that is intended to reflect their fair value as determined in accordance with procedures approved by the Board and are generally categorized as Level 3. In accordance with the Funds’ valuation procedures, factors considered in determining value may include, but are not limited to, the type of the security; the size of the holding; the initial cost of the security; the existence of any contractual restrictions on the security’s disposition; the price and extent of public trading in similar securities of the issuer or of comparable companies; quotations or evaluated prices from broker-dealers and/or pricing services; information obtained from the issuer, analysts, and/or the appropriate stock exchange (for exchange-traded securities); an analysis of the company’s or issuer’s financial statements; an evaluation of the forces that influence the issuer and the market(s) in which the security is purchased and sold; and with respect to debt securities, the maturity, coupon, creditworthiness, currency denomination and the movement of the market in which the security is normally traded. The value determined under these procedures may differ from published values for the same securities.
Fair value pricing could result in a difference between the prices used to calculate a Fund’s NAV and the prices used by the Fund’s Underlying Index, which in turn could result in a difference between the Fund’s performance and the performance of the Fund’s Underlying Index.
Disclosure about the classification of the fair value measurements is included in a table following the Fund’s Schedule of Investments.
Cash Cash consists of cash held at banks and is on deposit with major financial institutions.
Investment Transactions and Investment Income Investment transactions are recorded as of the date that the securities are purchased or sold (trade date). Realized gains and losses from the sale or disposition of securities are calculated on the identified cost-method. Dividend income is net of any foreign taxes withheld at source. Certain dividends from foreign securities may be recorded subsequent to theex-dividend date as soon as the Fund is informed of such dividends. Interest income is recorded on the accrual basis. Distributions received from foreign domiciled corporations, generally determined to be passive foreign investment companies for tax reporting purposes, are included in dividend income.
Tax Information and Dividends and Distributions to Shareholders It is each Fund’s policy to comply with all requirements of the Internal Revenue Code of 1986, as amended (“the Code”). Each Fund intends to qualify for and to elect treatment as a separate Regulated Investment Company (“RIC”) under Subchapter M of the Code. It is the policy of each Fund to pay out dividends from its net investment income, if any, to investors quarterly. Taxable net realized gains from investment transactions, reduced by capital loss carryforwards, if any, are
86
DBX ETF Trust
Notes to Financial Statements(Continued)
declared and distributed to shareholders at least annually. The capital loss carryforward amount, if any, is available to offset future net capital gains. The Funds may occasionally be required to make supplemental distributions at some other time during the year. The Funds reserve the right to declare special distributions if, in their reasonable discretion, such action is necessary or advisable to preserve the status of each Fund as a RIC or to avoid imposition of income or excise taxes on undistributed income. Dividends and distributions to shareholders, if any, are recorded on theex-dividend date. The amount of dividends and distributions from net investment income and net realized capital gains are determined in accordance with Federal income tax regulations which may differ from U.S. GAAP. These “book/tax” differences are either considered temporary or permanent in nature. To the extent these differences are permanent in nature, such amounts are reclassified at the end of the year within the components of net assets based on their federal tax treatment; temporary differences do not require reclassification. Dividends and distributions, which exceed earnings and profits for the full year for tax purposes, are reported as a tax return of capital.
In accordance with U.S. GAAP requirements regarding accounting for uncertainties in income taxes, management has analyzed the Funds’ tax positions taken or expected to be taken on foreign, federal and state income tax returns for all open tax years and has concluded that no provision for income tax is required in the Funds’ financial statements.
The Funds recognize interest and penalties, if any, related to uncertain tax positions as income tax expense on the Statements of Operations. For the year ended August 31, 2019, the Funds did not incur any interest or penalties.
As of August 31, 2019, the components of accumulated earnings (losses) on a tax basis were as follows:
| Undistributed Ordinary Income* | Capital and Other Gains (Losses) | Unrealized Appreciation (Depreciation) | Total Accumulated Earnings (Losses) | |||||||||||||
Xtrackers FTSE Developed ex US Comprehensive Factor ETF | $ | 1,086,124 | $ | (3,901,642 | ) | $ | (2,573,871 | ) | $ | (5,389,389 | ) | |||||
Xtrackers FTSE Emerging Comprehensive Factor ETF | 54,947 | (461,709 | ) | (83,152 | ) | (489,914 | ) | |||||||||
Xtrackers Russell 1000 Comprehensive Factor ETF | 751,565 | (11,322,098 | ) | 17,621,423 | 7,050,890 | |||||||||||
Xtrackers Russell 1000 US Quality at a Reasonable Price ETF | 511,569 | (386,888 | ) | 3,676,284 | 3,800,965 | |||||||||||
Xtrackers Russell 2000 Comprehensive Factor ETF | 12,190 | (891,434 | ) | 290,760 | (588,484 | ) | ||||||||||
The tax character of dividends and distributions declared for the years ended August 31, 2019 and August 31, 2018 were as follows:
| Year Ended August 31, 2019 | ||||||||
| Ordinary Income* | Long Term Capital Gains | |||||||
Xtrackers FTSE Developed ex US Comprehensive Factor ETF | $ | 2,029,470 | $ | — | ||||
Xtrackers FTSE Emerging Comprehensive Factor ETF | 258,551 | 29,492 | ||||||
Xtrackers Russell 1000 Comprehensive Factor ETF | 3,011,382 | — | ||||||
Xtrackers Russell 1000 US Quality at a Reasonable Price ETF | 1,746,917 | — | ||||||
Xtrackers Russell 2000 Comprehensive Factor ETF | 186,042 | — | ||||||
| Year Ended August 31, 2018 | ||||||||
| Ordinary Income* | Long Term Capital Gains | |||||||
Xtrackers FTSE Developed ex US Comprehensive Factor ETF | $ | 1,119,637 | $ | — | ||||
Xtrackers FTSE Emerging Comprehensive Factor ETF | 531,525 | 2,798 | ||||||
Xtrackers Russell 1000 Comprehensive Factor ETF | 2,163,877 | — | ||||||
Xtrackers Russell 1000 US Quality at a Reasonable Price ETF | 177,934 | — | ||||||
Xtrackers Russell 2000 Comprehensive Factor ETF | 217,731 | 4,364 | ||||||
| * | For tax purposes short-term capital gain distributions are considered ordinary income distributions. |
87
DBX ETF Trust
Notes to Financial Statements(Continued)
At August 31, 2019, for Federal income tax purposes, the Funds have capital loss carryforwards available as shown in the table below, to the extent provided by regulations, to offset future capital gains for an unlimited period. To the extent that these loss carryforwards are used to offset future capital gains, it is probable that the capital gains so offset will not be distributed to shareholders.
| Short-Term | Long-Term | Total Amount | ||||||||||
Xtrackers FTSE Developed ex US Comprehensive Factor ETF | $ | 2,979,340 | $ | 922,302 | $ | 3,901,642 | ||||||
Xtrackers FTSE Emerging Comprehensive Factor ETF | 313,810 | 147,899 | 461,709 | |||||||||
Xtrackers Russell 1000 Comprehensive Factor ETF | 6,533,390 | 4,788,708 | 11,322,098 | |||||||||
Xtrackers Russell 1000 US Quality at a Reasonable Price ETF | — | 386,888 | 386,888 | |||||||||
Xtrackers Russell 2000 Comprehensive Factor ETF | 585,181 | 306,253 | 891,434 | |||||||||
For the fiscal year ended August 31, 2019, the effect of permanent “book/tax” reclassifications to the components of net assets are included below. These differences are primarily due to recognition of certain foreign currency gains (losses) as ordinary income (loss), passive foreign investment companies (“PFICs”),redemptions-in-kind, partnership investments, and accrued foreign capital gain taxes.
| Distributable earnings (loss) | Paid-In Capital | |||||||
Xtrackers FTSE Developed ex US Comprehensive Factor ETF | $ | (943,493 | ) | $ | 943,493 | |||
Xtrackers FTSE Emerging Comprehensive Factor ETF | (56,083 | ) | 56,083 | |||||
Xtrackers Russell 1000 Comprehensive Factor ETF | (7,280,780 | ) | 7,280,780 | |||||
Xtrackers Russell 1000 US Quality at a Reasonable Price ETF | (4,317,494 | ) | 4,317,494 | |||||
As of August 31, 2019, the aggregate cost of investments for federal income tax purposes, the net unrealized appreciation or (depreciation) and the aggregated gross unrealized appreciation (depreciation) on investments were as follows:
| Aggregate Tax Cost | Net Unrealized Appreciation (Depreciation) | Aggregate Gross Unrealized Appreciation | Aggregate Gross Unrealized (Depreciation) | |||||||||||||
Xtrackers FTSE Developed ex US Comprehensive Factor ETF | $ | 75,271,128 | $ | (2,570,410 | ) | $ | 3,938,464 | $ | (6,508,874 | ) | ||||||
Xtrackers FTSE Emerging Comprehensive Factor ETF | 3,549,507 | (82,691 | ) | 366,263 | (448,954 | ) | ||||||||||
Xtrackers Russell 1000 Comprehensive Factor ETF | 185,334,849 | 17,621,423 | 25,559,136 | (7,937,713 | ) | |||||||||||
Xtrackers Russell 1000 US Quality at a Reasonable Price ETF | 106,902,702 | 3,676,284 | 9,202,383 | (5,526,099 | ) | |||||||||||
Xtrackers Russell 2000 Comprehensive Factor ETF | 9,549,378 | 290,760 | 1,130,430 | (839,670 | ) | |||||||||||
Foreign Taxes The Funds may be subject to foreign taxes (a portion of which may be reclaimable) on income, capital gains on investments, certain foreign currency transactions or other corporate events. All foreign taxes are recorded in accordance with the applicable foreign tax regulations and rates that exist in the foreign jurisdictions in which the Funds invest. These foreign taxes, if any, are paid by the Funds and are reflected in their Statements of Operations as follows: foreign taxes withheld at source are presented as a reduction of income, foreign taxes on capital gains from sales of investments and foreign currency transactions are included in their respective net realized gain (loss) categories, and deferred foreign taxes on unrealized gains are included in net change in unrealized appreciation (depreciation). Foreign taxes payable as of August 31, 2019, if any, are disclosed in the Funds’ Statements of Assets and Liabilities.
Foreign Currency Translations The books and records of the Funds are maintained in U.S. dollars. Investment securities and other assets and liabilities denominated in a foreign currency are translated into U.S. dollars at the prevailing exchange rates at year end. Purchases and sales of investment securities, income and expenses are translated into U.S. dollars at the prevailing exchange rates on the respective dates of the transactions.
88
DBX ETF Trust
Notes to Financial Statements(Continued)
Net realized and unrealized gains and losses on foreign currency transactions represent net gains and losses between trade and settlement dates on securities transactions, the acquisition and disposition of foreign currencies, and the difference between the amount of net investment income accrued and the U.S. dollar amount actually received. The portion of both realized and unrealized gains and losses on investments that results from fluctuations in foreign currency exchange rates is not separately disclosed, but is included with net realized and unrealized gain/appreciation and loss/depreciation on investments.
Securities Lending The Funds may lend securities to certain financial institutions under the terms of their securities lending agreement. During the term of the loans, the Funds continue to receive interest and dividends generated by the securities and to participate in any changes in their market value. The Funds require the borrowers of the securities to maintain collateral with the Funds consisting of cash and/or securities issued or guaranteed by the U.S. Government, its agencies or instrumentalities having a value at least equal to the value of the securities loaned. When the collateral falls below specified amounts, the lending agent will use its best effort to obtain additional collateral on the next business day to meet required amounts under the securities lending agreement. During the year ended August 31, 2019, the Funds invested the cash collateral into a joint trading account in DWS Government & Agency Securities Portfolio, an affiliated money market fund managed by DWS Investment Management Americas, Inc. DWS Investment Management Americas, Inc. receives a management/administration fee (0.11% annualized effective rate as of August 31, 2019) on the cash collateral invested in DWS Government & Agency Securities Portfolio. The Funds receive compensation for lending its securities either in the form of fees or by earning interest on invested cash collateral net of borrower rebates and fees paid to a lending agent. Either the Fund or the borrower may terminate the loan at any time and the borrower, after notice, is required to return borrowed securities within a standard time period. There may be risks of delay and costs in recovery of securities or even loss of rights in the collateral should the borrower of the securities fail financially. If the Funds are not able to recover securities lent, the Funds may sell the collateral and purchase a replacement investment in the market, incurring the risk that the value of the replacement security is greater than the value of the collateral. The Funds are also subject to all investment risks associated with the reinvestment of any cash collateral received, including, but not limited to, interest rate, credit and liquidity risk associated with such investments.
As of August 31, 2019, the Funds listed below had securities on loan, which were classified as Common Stocks in the Schedule of Investments. The value of the related collateral exceeded the value of the securities loaned at year end.
Remaining Contractual Maturity of the Agreements, as of August 31, 2019 | ||||||||||||||||||||
| Securities Lending Transactions | Overnight and Continuous | <30 Days | Between 30 & 90 days | >90 days | Total | |||||||||||||||
Xtrackers FTSE Developed ex US Comprehensive Factor ETF |
| |||||||||||||||||||
Common Stocks | $ | 906,421 | $ | 10,372 | $ | 5,905 | $ | 381,908 | $ | 1,304,606 | ||||||||||
|
|
|
|
|
|
|
|
|
| |||||||||||
Gross amount of recognized liabilities and non-cash collateral for securities lending transactions |
| $ | 1,304,606 | |||||||||||||||||
Xtrackers FTSE Emerging Comprehensive Factor ETF |
| |||||||||||||||||||
Common Stocks | $ | 18,715 | $ | 155 | $ | 543 | $ | 21,722 | $ | 41,135 | ||||||||||
|
|
|
|
|
|
|
|
|
| |||||||||||
Gross amount of recognized liabilities and non-cash collateral for securities lending transactions |
| $ | 41,135 | |||||||||||||||||
Xtrackers Russell 1000 Comprehensive Factor ETF |
| |||||||||||||||||||
Common Stocks | $ | 35,815 | $ | 143,818 | $ | 263,245 | $ | 17,640,690 | $ | 18,083,568 | ||||||||||
|
|
|
|
|
|
|
|
|
| |||||||||||
Gross amount of recognized liabilities and non-cash collateral for securities lending transactions |
| $ | 18,083,568 | |||||||||||||||||
Xtrackers Russell 1000 US Quality at a Reasonable Price ETF |
| |||||||||||||||||||
Common Stocks | $ | — | $ | 102,458 | $ | 101,763 | $ | 4,757,207 | $ | 4,961,428 | ||||||||||
|
|
|
|
|
|
|
|
|
| |||||||||||
Gross amount of recognized liabilities and non-cash collateral for securities lending transactions |
| $ | 4,961,428 | |||||||||||||||||
Xtrackers Russell 2000 Comprehensive Factor ETF |
| |||||||||||||||||||
Common Stocks | $ | 204,000 | $ | 25,036 | $ | 44,567 | $ | 1,809,297 | $ | 2,082,900 | ||||||||||
|
|
|
|
|
|
|
|
|
| |||||||||||
Gross amount of recognized liabilities and non-cash collateral for securities lending transactions |
| $ | 2,082,900 | |||||||||||||||||
89
DBX ETF Trust
Notes to Financial Statements(Continued)
Derivatives
Futures Contracts Each Fund may enter into futures contracts. These futures contracts will be used to simulate investment in the respective Underlying Index, to facilitate trading or to reduce transaction costs. Each Fund will enter into futures contracts that are traded on a U.S. ornon-U.S. exchange. No Fund will use futures for speculative purposes. Futures contracts provide for the future sale by one party and purchase by another party of a specified amount of a specific instrument or index at a specified future time and at a specified price. For the year ended August 31, 2019, Xtrackers FTSE Developed ex US Comprehensive Factor ETF, Xtrackers FTSE Emerging Comprehensive Factor ETF, Xtrackers Russell 1000 Comprehensive Factor ETF, Xtrackers Russell 1000 US Quality at a Reasonable Price ETF and Xtrackers Russell 2000 Comprehensive Factor ETF utilized futures in order to simulate investment in the Underlying Index. To the extent required by law, liquid assets committed to futures contracts will be maintained.
At the time each Fund enters into a futures contract, each Fund deposits and maintains as collateral an initial margin with the broker, as required by the exchange on which the transaction is affected. Pursuant to the contract, each Fund agrees to receive from or pay to the broker an amount of cash equal to the daily fluctuation in the value of the contract. Such receipts or payments are known as variation margin and are recorded by each Fund as unrealized gains or losses. Risks may arise from the potential inability of a counterparty to meet the terms of the contract. The credit/counterparty risk for exchange-traded futures contracts is generally less than privately negotiated futures contracts, since the clearinghouse, which is the issuer or counterparty to each exchange-traded future, provides a guarantee of performance. The guarantee is supported by a daily payment system (i.e., margin requirements).
Use of long futures contracts subjects each Fund to risk of loss in excess of the amounts shown on the Statement of Assets and Liabilities, up to the notional value of the futures contracts. Use of short futures contracts subjects each Fund to unlimited risk of loss. Under some circumstances, futures exchanges may establish daily limits on the amount that the price of a futures contract can vary from the previous day’s settlement price, which could effectively prevent liquidation of unfavorable positions.
A summary of the open futures contracts as of August 31, 2019 is included in a table following the Funds’ Schedule of Investments.
The following tables summarize the value of the Funds’ derivative instruments held as of August 31, 2019 and the related location in the accompanying Statement of Assets and Liabilities, presented by primary underlying risk exposure:
Asset Derivatives | Liability Derivatives | |||||||||||||
| Xtrackers FTSE Developed ex US Comprehensive Factor ETF | ||||||||||||||
| Equity contracts | Unrealized appreciation on futures contracts* | $ | — | Unrealized depreciation on futures contracts* | $ | 20,220 | ||||||||
| Xtrackers FTSE Emerging Comprehensive Factor ETF | ||||||||||||||
| Equity contracts | Unrealized appreciation on futures contracts* | $ | — | Unrealized depreciation on futures contracts* | $ | 1,170 | ||||||||
| Xtrackers Russell 1000 Comprehensive Factor ETF | ||||||||||||||
| Equity contracts | Unrealized appreciation on futures contracts* | $ | 4,950 | Unrealized depreciation on futures contracts* | $ | 9,595 | ||||||||
| Xtrackers Russell 1000 US Quality at a Reasonable Price ETF | ||||||||||||||
| Equity contracts | Unrealized appreciation on futures contracts* | $ | 62,308 | Unrealized depreciation on futures contracts* | $ | — | ||||||||
| Xtrackers Russell 2000 Comprehensive Factor ETF | ||||||||||||||
| Equity contracts | Unrealized appreciation on futures contracts* | $ | — | Unrealized depreciation on futures contracts* | $ | 4,400 | ||||||||
| * | Includes cumulative appreciation or cumulative depreciation of futures contracts as disclosed in the Schedule of Investments. Unsettled variation margin is disclosed separately within the Statement of Assets and Liabilities. |
90
DBX ETF Trust
Notes to Financial Statements(Continued)
Additionally, the amount of realized and unrealized gains and losses on derivative instruments recognized in the Funds’ earnings during the year ended August 31, 2019 and the related location in the accompanying Statement of Operations is summarized in the following tables by primary underlying risk exposure:
Net Realized Gain (Loss) from: | ||||
| Futures Contracts — Equity Contracts | ||||
Xtrackers FTSE Developed ex US Comprehensive Factor ETF | $ | (18,219 | ) | |
Xtrackers FTSE Emerging Comprehensive Factor ETF | (4,285 | ) | ||
Xtrackers Russell 1000 Comprehensive Factor ETF | (52,097 | ) | ||
Xtrackers Russell 1000 US Quality at a Reasonable Price ETF | 33,248 | |||
Xtrackers Russell 2000 Comprehensive Factor ETF | (5,427 | ) | ||
Net Change in Unrealized Appreciation (Depreciation) on: | ||||
| Futures Contracts — Equity Contracts | ||||
Xtrackers FTSE Developed ex US Comprehensive Factor ETF | $ | (18,075 | ) | |
Xtrackers FTSE Emerging Comprehensive Factor ETF | 2,650 | |||
Xtrackers Russell 1000 Comprehensive Factor ETF | (57,748 | ) | ||
Xtrackers Russell 1000 US Quality at a Reasonable Price ETF | 62,308 | |||
Xtrackers Russell 2000 Comprehensive Factor ETF | (7,345 | ) | ||
For the year ended August 31, 2019 the average monthly volume of derivatives was as follows:
| Futures Contracts (Contract Value) | ||||
Xtrackers FTSE Developed ex US Comprehensive Factor ETF | $ | 411,410 | ||
Xtrackers FTSE Emerging Comprehensive Factor ETF | 15,838 | |||
Xtrackers Russell 1000 Comprehensive Factor ETF | 1,082,257 | |||
Xtrackers Russell 1000 US Quality at a Reasonable Price ETF | 501,691 | |||
Xtrackers Russell 2000 Comprehensive Factor ETF | 83,547 | |||
Affiliated Cash Management Vehicles The Funds may invest uninvested cash balances in DWS Government Money Market Series and DWS ESG Liquidity Fund, affiliated money market funds which are managed by DWS Investment Management Americas, Inc. (“DIMA”), also an indirect, wholly owned subsidiary of DWS Group GmbH & Co. KGaA. Each affiliated money market fund is managed in accordance with Rule2a-7 under the 1940 Act, which governs the quality, maturity, diversity and liquidity of instruments in which a money market fund may invest. DWS Government Money Market Series seeks to maintain a stable NAV, and DWS ESG Liquidity Fund maintains a floating NAV. The Funds indirectly bear their proportionate share of the expenses of each affiliated money market fund in which they invest. The Advisor will waive an amount of the unitary management fee payable to the Advisor by the Funds equal to such acquired fund’s fees and expenses on the Funds’ assets invested in the affiliated money market funds.
3. Investment Advisory and Other Agreements
The Advisor has overall responsibility for the general management and administration of the Funds, subject to the supervision of the Funds’ Board of Trustees. Under an investment advisory agreement between the Trust, on behalf of the Funds, and the Advisor (the “Investment Advisory Agreement”), the Advisor is responsible for arrangingsub-advisory, transfer agency, custody, fund administration, and all othernon-distribution related services for the Funds to operate.
91
DBX ETF Trust
Notes to Financial Statements(Continued)
For its investment advisory services to the Funds below, the Advisor is entitled to receive a unitary management fee from each Fund based on each Fund’s average daily net assets, computed and accrued daily and payable monthly, at an annual rate equal to:
| Unitary Management Fee | ||||
Xtrackers FTSE Developed ex US Comprehensive Factor ETF | 0.35 | % | ||
Xtrackers FTSE Emerging Comprehensive Factor ETF | 0.50 | % | ||
Xtrackers Russell 1000 Comprehensive Factor ETF | 0.17 | % | ||
Xtrackers Russell 1000 US Quality at a Reasonable Price ETF | 0.19 | % | ||
Xtrackers Russell 2000 Comprehensive Factor ETF | 0.30 | % | ||
Effective March 5, 2019, the Advisor for Xtrackers FTSE Developed ex US Comprehensive Factor ETF has contractually agreed, until March 5, 2020, to waive a portion of its management fees to the extent necessary to prevent the operating expenses of the Fund from exceeding 0.24% of the Fund’s average daily net assets. For the period from March 5, 2019 through August 31, 2019, the Advisor waived $45,550 of expenses to the Fund.
The Advisor for the Funds below has contractually agreed to waive a portion of its management fees in an amount equal to the acquired fund’s fees and expenses attributable to the Funds’ investments in affiliated cash management vehicles. For the year ended August 31, 2019, the Advisor waived expenses of the Funds as follows:
| Expenses Waived | ||||
Xtrackers FTSE Developed ex US Comprehensive Factor ETF | $ | 43 | ||
Xtrackers FTSE Emerging Comprehensive Factor ETF | 3 | |||
Xtrackers Russell 1000 Comprehensive Factor ETF | 665 | |||
Xtrackers Russell 1000 US Quality at a Reasonable Price ETF | 119 | |||
Xtrackers Russell 2000 Comprehensive Factor ETF | 44 | |||
Out of the unitary management fee, the Advisor pays substantially all expenses of each Fund, including the cost of transfer agency, custody, fund administration, legal, audit and other services, and expenses of the Independent Trustees. Each Fund is responsible for the payment of interest expense, taxes, brokerage expenses, distribution fees or expenses, if any, litigation expenses and extraordinary expenses.
The Bank of New York Mellon, a wholly-owned subsidiary of The Bank of New York Mellon Corporation, serves as Administrator, Custodian, Accounting Agent, Lending Agent and Transfer Agent for each Fund.
ALPS Distributors, Inc. (the “Distributor”) serves as the distributor of Creation Units for each Fund on an agency basis. The Distributor does not maintain a secondary market in shares of the Funds.
The Board of Trustees is currently comprised of four Trustees, including three Independent Trustees. The Advisor paid retainer fees and attendance fees to each Independent Trustee; retainer fees to the Chairman of the Board of Trustees and Chairman of the Audit Committee; and attendance fees to each member of the Audit Committee (which is comprised of all of the Funds’ Independent Trustees).
4. Investment Portfolio Transactions
For the year ended August 31, 2019, the cost of investments purchased and proceeds from sale of investments (excludingin-kind transactions and short-term investments) were as follows:
| Purchases | Sales | |||||||
Xtrackers FTSE Developed ex US Comprehensive Factor ETF | $ | 37,867,477 | $ | 36,923,695 | ||||
Xtrackers FTSE Emerging Comprehensive Factor ETF | 3,297,862 | 5,041,191 | ||||||
Xtrackers Russell 1000 Comprehensive Factor ETF | 88,905,612 | 88,406,249 | ||||||
Xtrackers Russell 1000 US Quality at a Reasonable Price ETF | 31,550,608 | 35,204,953 | ||||||
Xtrackers Russell 2000 Comprehensive Factor ETF | 4,741,198 | 4,725,273 | ||||||
92
DBX ETF Trust
Notes to Financial Statements(Continued)
For the year ended August 31, 2019, the cost ofin-kind purchases and proceeds fromin-kind sales were as follows:
| Purchases | Sales | |||||||
Xtrackers FTSE Developed ex US Comprehensive Factor ETF | $ | 33,201,729 | $ | 16,684,170 | ||||
Xtrackers FTSE Emerging Comprehensive Factor ETF | — | 869,945 | ||||||
Xtrackers Russell 1000 Comprehensive Factor ETF | 73,452,719 | 43,586,558 | ||||||
Xtrackers Russell 1000 US Quality at a Reasonable Price ETF | 82,351,464 | 37,151,774 | ||||||
5. Fund Share Transactions
As of August 31, 2019, there were unlimited Fund shares, no par value, authorized by the Trust. Fund shares are issued and redeemed by each Fund only in Creation Units or multiples thereof. Except when aggregated in Creation Units, shares of each Fund are not redeemable. Transactions in capital shares for each Fund are disclosed in detail in the Statements of Changes in Net Assets. The consideration for the purchase of Creation Units of a Fund generally consists of thein-kind contribution of a designated portfolio of securities constituting a portfolio sampling representation of the securities included in the respective Fund’s Underlying Index and an amount of cash, which under certain circumstances may include cash in lieu of portfolio securities. Investors purchasing and redeeming Creation Units pay a purchase transaction fee and a redemption transaction fee to offset transfer and other transaction costs associated with the issuance and redemption of Creation Units.
6. Concentration of Ownership
From time to time, the Funds may have a concentration of several shareholder accounts holding a significant percentage of shares outstanding. Investment activities of these shareholders could have a material impact on the Fund. At August 31, 2019, there was one affiliated shareholder account for each of the funds listed below holding a significant percentage of the shares outstanding:
| Approximate Percent of Outstanding Shares Held | ||||
Xtrackers FTSE Emerging Comprehensive Factor ETF | 15 | % | ||
7. Investing in Emerging Markets
The securities of issuers located in emerging markets tend to be more volatile and less liquid than securities of issuers located in more mature economies, and emerging markets generally have less diverse and less mature economic structures and less stable political systems than those of developed countries. The securities of issuers located or doing substantial business in emerging markets are often subject to rapid and large changes in price.
8. Line of Credit
The Trust has entered into a senior unsecured credit facility with a syndication of banks which allows the Xtrackers FTSE Emerging Comprehensive Factor ETF and certain other funds managed by the Advisor to borrow up to $105 million. The Fund may borrow money under this credit facility to the extent necessary for temporary or emergency purposes, including the funding of shareholder redemption requests, trade settlements, and as necessary to distribute to shareholders any income necessary to maintain the Fund’s status as a regulated investment company. Borrowings are charged an interest rate of 1.25% per annum plus the greater of the Federal Funds Effective Rate or theone-month LIBOR Rate. The Fund may borrow up to the lesser of apro-rata share of the credit facility at the amount listed below or 33 percent of its net assets as permitted by the Act. The Fund had no outstanding loans at August 31, 2019.
| Pro-rata Share | ||||
Xtrackers FTSE Emerging Comprehensive Factor ETF | $ | 525,000 | ||
9. Fund Liquidation
On October 24, 2019, the Board of Trustees unanimously voted to close and liquidate Xtrackers Emerging Comprehensive Factor ETF and Xtrackers Russell 2000 Comprehensive Factor ETF. After the close of business on November 12, 2019, the Funds will no longer accept creation orders and the final day of trading on the exchange will be November 12, 2019. Proceeds of the liquidation will be sent to shareholders on or about November 21, 2019.
93
DBX ETF Trust
To the Shareholders
of Xtrackers FTSE Developed ex US Comprehensive Factor ETF, Xtrackers FTSE Emerging Comprehensive Factor ETF, Xtrackers Russell 1000 Comprehensive Factor ETF, Xtrackers Russell 1000 US Quality at a Reasonable Price ETF (formerly, Xtrackers Russell 1000 US QARP ETF), Xtrackers Russell 2000 Comprehensive Factor ETF, and the Board of Trustees of DBX ETF Trust:
Opinion on the Financial Statements
We have audited the accompanying statements of assets and liabilities of Xtrackers FTSE Developed ex US Comprehensive Factor ETF, Xtrackers FTSE Emerging Comprehensive Factor ETF, Xtrackers Russell 1000 Comprehensive Factor ETF, Xtrackers Russell 1000 US Quality at a Reasonable Price ETF, and Xtrackers Russell 2000 Comprehensive Factor ETF (collectively referred to as the “Funds”), (five of the funds constituting DBX ETF Trust (the “Trust”)), including the schedules of investments, as of August 31, 2019, and the related statements of operations and changes in net assets, and the financial highlights for each of the periods indicated in the table below and the related notes (collectively referred to as the “financial statements”). In our opinion, the financial statements present fairly, in all material respects, the financial position of each of the Funds (five of the funds constituting DBX ETF Trust) at August 31, 2019, and the results of their operations, changes in net assets and financial highlights for each of the periods indicated in the table below, in conformity with U.S. generally accepted accounting principles.
| Individual fund constituting the DBX ETF Trust | Statement of operations | Statements of changes in net assets | Financial highlights | |||
Xtrackers FTSE Developed ex US Comprehensive Factor ETF
Xtrackers Russell 1000 Comprehensive Factor ETF | For the year ended August 31, 2019 | For each of the two years in the period ended August 31, 2019 | For each of the three years in the period ended August 31, 2019 and the period from November 24, 2015 (commencement of operations) through August 31, 2016 | |||
| Xtrackers FTSE Emerging Comprehensive Factor ETF | For the year ended August 31, 2019 | For each of the two years in the period ended August 31, 2019 | For each of the three years in the period ended August 31, 2019 and the period from April 19, 2016 (commencement of operations) through August 31, 2016 | |||
| Xtrackers Russell 2000 Comprehensive Factor ETF | For the year ended August 31, 2019 | For each of the two years in the period ended August 31, 2019 | For each of the three years in the period ended August 31, 2019 and the period from June 28, 2016 (commencement of operations) through August 31, 2016 | |||
| Xtrackers Russell 1000 US Quality at a Reasonable Price ETF | For the year ended August 31, 2019 | For the year ended August 31, 2019 and the period from April 5, 2018 (commencement of operations) through August 31, 2018 | ||||
Basis for Opinion
These financial statements are the responsibility of the Trust’s management. Our responsibility is to express an opinion on each of the Funds’ financial statements based on our audits. We are a public accounting firm registered with the Public Company Accounting Oversight Board (United States) (“PCAOB”) and are required to be independent with respect to the Trust in accordance with the U.S. federal securities laws and the applicable rules and regulations of the Securities and Exchange Commission and the PCAOB.
94
DBX ETF Trust
We conducted our audits in accordance with the standards of the PCAOB. Those standards require that we plan and perform the audit to obtain reasonable assurance about whether the financial statements are free of material misstatement, whether due to error or fraud. The Trust is not required to have, nor were we engaged to perform, an audit of the Trust’s internal control over financial reporting. As part of our audits we are required to obtain an understanding of internal control over financial reporting but not for the purpose of expressing an opinion on the effectiveness of the Trust’s internal control over financial reporting. Accordingly, we express no such opinion.
Our audits included performing procedures to assess the risks of material misstatement of the financial statements, whether due to error or fraud, and performing procedures that respond to those risks. Such procedures included examining, on a test basis, evidence regarding the amounts and disclosures in the financial statements. Our procedures included confirmation of securities owned as of August 31, 2019, by correspondence with the custodians and brokers or by other appropriate auditing procedures where replies from brokers were not received. Our audits also included evaluating the accounting principles used and significant estimates made by management, as well as evaluating the overall presentation of the financial statements. We believe that our audits provide a reasonable basis for our opinion.

We have served as the auditor of one or more investment companies in the DWS family of funds since at least 1979, but we are unable to determine the specific year.
New York, New York
October 25, 2019
95
DBX ETF Trust
Name, Year of Birth, Position with the Trust and Length of Time Served(1) | Business Experience and Directorships During the Past 5 Years | Number of Portfolios in Fund Complex Overseen | Other Directorships Held by Board Member | |||
Independent Board Members | ||||||
Stephen R. Byers (1953) Chairman since 2016, and Board Member since 2011 (formerly, Lead Independent Board Member, 2015-2016) | Independent Director (2011- present); Independent Consultant (2014-present); Director of Investment Management, the Dreyfus Corporation (2000-2006) and Vice Chairman and Chief Investment Officer, the Dreyfus Corporation (2002-2006). | 38 | The Arbitrage Funds, Sierra Income Corporation, Mutual Fund Directors Forum | |||
George O. Elston (1964) Board Member since 2011, Chairman of the Audit Committee since 2015 | Chief Financial Officer, Enzyvant (2018-present); Chief Executive Officer, 2X Oncology, Inc.(2017-2018); Senior Vice President and Chief Financial Officer, Juniper Pharmaceuticals, Inc. (2014-2016); Senior Vice President and Chief Financial Officer, KBI BioPharma Inc. (2013-2014); Managing Partner, Chatham Street Partners (2010-2013). | 38 | — | |||
J. David Officer (1948) Board Member since 2011, Chairman of the Nominating Committee since 2015 | Independent Director (2010-present); Vice Chairman, the Dreyfus Corporation (2006-2009); President, The Dreyfus Family of Funds, Inc. (2006-2009). | 38 | (Chairman of) Ilex Management Ltd,; Old Westbury Funds | |||
Name, Year of Birth, Position with the Trust and Length of Time Served(1) | Business Experience and Directorships During the Past 5 Years | Number of Portfolios in Fund Complex Overseen | Other Directorships Held by Board Member | |||
Interested Board Member(2) | ||||||
Michael Gilligan(2) (1966) Board Member since 2016, and Treasurer, Chief Financial Officer and Controller since 2010 | Director(3) in DWS Finance Division (2008-Present); Manager, Treasurer and Chief Financial Officer of the Advisor (2010-present); Chief Financial Officer of Global Passive Asset Management Platform(2012-2018); Global Finance Director, Alternative Investments (2018-present); Chief Financial Officer of RREEF America LLC (2018-present). | 38 | The Advisor, DBX Strategic Advisors LLC and DB Commodity Services LLC | |||
96
DBX ETF Trust
Board Members and Officers(Unaudited) (Continued)
Name, Year of Birth, Position with the Trust and Length of Time Served(4) | Business Experience and Directorships During the Past 5 Years | |||||
Officers(2) | ||||||
Freddi Klassen(5) (1975) President and Chief Executive Officer, 2016-present | Director(3) in DWS and Chief Operating Officer in the Americas for the Traditional Asset Classes Department (2014–present); Manager and Chief Operating Officer of DWS Investment Management Americas, Inc. (2018–present) and the Advisor (2016–present); Global Chief Operating Officer for Equities Technology in the Investment Bank Division at Deutsche Bank AG (2013-2014); Chief Operating Officer for Exchange Traded Funds and Systematic Funds in Europe (2008-2013). | |||||
Luke Oliver(5) (1980) Chief Operating Officer, 2019-present | Managing Director(3) in DWS (2017-present); Director(3) in DWS(2009-2017); Head of Passive Americas Asset Management Platform (2019-present); Manager, Chief Executive Officer and Chief Investment Officer of the Advisor (2019-present); Head of ETF Capital Markets, Americas (2012-2018); Lead Portfolio Manager of PowerShares DB ETFs (2009-2012). | |||||
Frank Gecsedi(5) (1967) Chief Compliance Officer, 2010-present | Director(3) in DWS Compliance Department (2016-present), Vice President in the Deutsche Asset Management Compliance Department at Deutsche Bank AG (2013-2016) and Chief Compliance Officer of the Advisor (2010-present); Vice President in Deutsche Bank’s Global Markets Legal, Risk and Capital Division (2010-2012). | |||||
Bryan Richards(5) (1978) Vice President, 2016-present | Managing Director(3) in DWS (2018-present); Director(3) in DWS(2014-2018); Portfolio Manager in the Passive Asset Management Department at DWS (2011-present); Primary Portfolio Manager for the PowerShares DB Commodity ETFs (2011-2015). | |||||
Leslie Lowenbraun(5) (1953) Secretary, 2016-present | Director(3) in DWS US Retail Legal (2018-present) and Chief Legal Officer of the Advisor (2017-present); Vice President in DWS US Retail Legal (2014-2018); Counsel at Skadden, Arps, Slate, Meagher & Flom LLP (2005-2014). | |||||
John Millette(6) (1962) Assistant Secretary, 2019-present | Director(3) in DWS US Retail Legal (2003-present); Vice President and Secretary of DWS US registered investment companies advised by DWS Investment Management Americas, Inc. (1999-present); Chief Legal Officer, DWS Investment Management Americas, Inc.(2015-present); and Director and Vice President of DWS Trust Company (2016-present); formerly: Secretary of Deutsche Investment Management Americas Inc. (2015-2017). | |||||
Kevin Teevan(5) (1973) Assistant Treasurer, 2018-present | Vice President in Finance for US Traditional Asset Classes of DWS (2018-present); Vice President in Chief Operating Office for Global Transaction Banking at Deutsche Bank AG (2014-2017); Vice President in Finance for US Passive Asset Management Platform at Deutsche Bank AG (2011-2014). | |||||
Christina A. Morse(7) (1964) Assistant Secretary, 2017-present | Vice President at BNY Mellon-Asset Servicing (2014-present); Vice President and Counsel at Lord Abbett & Co. LLC (2013- 2014). | |||||
| (1) | The length of time served is represented by the year in which the Board Member joined the Board. |
| (2) | As a result of their respective positions held with the Advisor and its affiliates, these individuals are considered “interested persons” of the Advisor within the meaning of the 1940 Act. Interested persons receive no compensation from the fund. |
| (3) | Executive title, not a board directorship. |
| (4) | The length of time served is represented by the year in which the officer was first elected to the Trust in such capacity. |
| (5) | Address: 345 Park Avenue, New York, New York 10154. |
| (6) | Address: One International Place, Boston, Massachusetts 02110. |
| (7) | Address: BNY Mellon Asset Servicing, Atlantic Terminal Office Tower, 2 Hanson Place, Brooklyn, NY 11217. |
Each Board Member serves until his or her successor is duly elected or appointed and qualified. Each officer serves until he or she resigns, is removed, dies, retires or becomes disqualified.
The Funds’ Statement of Additional Information (“SAI”) includes additional information about the Funds’ Board Members. The SAI is available by calling855-329-3837, or on the Company’s website at www.Xtrackers.com.
97
DBX ETF Trust
Proxy Voting Policies and Procedures
The Funds’ policies and procedures for voting proxies for portfolio securities and information about how each Fund voted proxies related to its portfolio securities during the most recent12-month period ended June 30 are available on our Web site — www.Xtrackers.com (click on “Resources” and “Proxy Voting” at the top of the page) — or on the SEC’s Web site — www.sec.gov. To obtain a written copy of the Funds’ policies and procedures without charge, upon request, call us toll free at (855)329-3837.
Portfolio Holdings Information
The Funds are required to file their complete schedule of portfolio holdings with the SEC for their first and third fiscal quarters on FormN-Q or FormN-PORT (available for filings after March 31, 2019). Copies of the filings are available without charge, upon request on the SEC’s website at www.sec.gov and are available by calling the Trust at855-329-3837.
Information about each Fund’s portfolio holdings is available daily at www.Xtrackers.com.
Discount & Premium Information
Information regarding how often shares of each Fund traded on NYSE Arca at a price above (i.e., at a premium) or below (i.e., at a discount) the NAV of the Fund can be found at www.Xtrackers.com.
Tax Information
Form1099-DIV and otheryear-end tax information provide shareholders with actual calendar year amounts that should be included in their tax returns. Shareholders should consult their tax advisors.
Each Fund designates the following amounts or, if subsequently determined to be different, the maximum allowable for its year ended August 31, 2019.
| Qualified Dividend Income* | Dividends Received Deduction* | |||||||
Xtrackers FTSE Developed ex US Comprehensive Factor ETF | 79% | 0% | ||||||
Xtrackers FTSE Emerging Comprehensive Factor ETF | 53% | 0% | ||||||
Xtrackers Russell 1000 Comprehensive Factor ETF | 93% | 87% | ||||||
Xtrackers Russell 1000 US Quality at a Reasonable Price ETF | 100% | 96% | ||||||
Xtrackers Russell 2000 Comprehensive Factor ETF | 72% | 69% | ||||||
* The above percentage is based on ordinary income dividends paid to shareholders during each Fund’s fiscal year.
Each Fund intends to elect to pass through to shareholders the credit for taxes paid to foreign countries. The gross foreign source income and foreign taxes paid are as follows:
| Gross Foreign Income | Foreign Taxes Income | |||||||
Xtrackers FTSE Developed ex US Comprehensive Factor ETF | $2,657,456 | $185,363 | ||||||
Xtrackers FTSE Emerging Comprehensive Factor ETF | 203,942 | 19,404 | ||||||
98
DBX ETF Trust
DBX Advisors LLC (“Advisors”) collectsnon-public information about you from the following sources: (i) information received from you on applications or other forms; and (ii) information about your transactions with the Advisors, Advisors’ affiliates and third-party service providers and vendors. Advisors does not disclose anynon-public personal information about you to anyone, other than as set forth below, as permitted by applicable law and regulation. Advisors may disclosenon-public personal information about you to the funds in which you invest, to Advisors’ affiliates, and tonon-affiliated companies that work with Advisors to service your account(s), or to provide services or process transactions that you have requested. Advisors may disclosenon-public personal information in situations that may include, but are not limited to, in response to legal and/or regulatory inquiries and the proposed or actual sale, assignment merger or other transfer of all or a portion of Advisors’ business to another business entity. Advisors may also disclosenon-public personal information about you to parties representing you, such as your investment representative, your accountant, your tax advisor, or to other third parties at your direction/consent. Advisors will not sell, rent, license or trade your personal and financial information to or with third parties for their own direct marketing use unless you give us general or specific consent to do so. If you decide to close your account(s) or become an inactive customer, Advisors will adhere to the privacy policies and practices as described in this notice. Advisors restricts access to your personal and account information to those employees who need to know that information to provide products and services to you. Advisors maintains reasonable and customary physical, electronic and procedural safeguards to guard yournon-public personal information.
Advisors reserves the right, at their discretion, to change, modify, add, or remove portions of this Privacy Policy Notice, and any of the policies described herein, at any time. Advisors will indicate any such changes to the Privacy Policy Notice at the privacy link which can be found at www.Xtrackers.com. At all times, you are bound by the then-current version of the Privacy Policy and all applicable laws. Advisors highly recommends that you review this Privacy Policy Notice from time to time to ensure that you are familiar with the most recent version. The examples contained in this Privacy Policy Notice are illustrations; they are not intended to be exclusive.
99
DBX ETF Trust
This report is intended for the shareholders of the DBX ETF Trust.
This report must be preceded or accompanied by a prospectus.
Investing involves risk, including the possible loss of principal. Stocks may decline in value. With respect to DEEF, DEMG and DESC, foreign investing involves greater and different risks than investing in U.S. companies, including currency fluctuations, less liquidity, less developed or less efficient trading markets, lack of comprehensive company information, political instability and differing auditing and legal standards. Further, with respect to DEMG only, emerging markets tend to be more volatile and less liquid than the markets of more mature economies, and generally have less diverse and less mature economic structures and less stable political systems than those of developed countries. Funds concentrating in a single industry (or groups of industries), country or in a limited geographic region to the extent the Underlying Indexes are so concentrated, generally are more volatile than more diversified funds. Additionally, with respect to DESC only, small company stocks tend to be more volatile and less liquid thanmedium-sized or large company stocks. Because the Funds seek to provide exposure to stocks based on the following multifactors — value, momentum, quality, low volatility and size — it is expected, exposure to such investment factors will detract from performance in some market environments, as more fully explained in the Funds’ prospectus. QARP is currentlynon-diversified and can take larger positions in fewer issues, increasing their potential risk. Performance of a Fund may diverge from that of its Underlying Index due to operating expenses, transaction costs, cash flows, use of sampling strategies or operational inefficiencies. An investment in any Fund should be considered only as a supplement to a complete investment program for those investors willing to accept the risks associated with that Fund. Please read the prospectus for more information.
Shares of the Funds are bought and sold at market price (not NAV) throughout the day on the NYSE Arca, Inc. Transactions in Fund shares may result in brokerage commissions and may generate tax consequences. There can be no assurance that an active trading market for shares of a Fund will develop or be maintained.
DBX ETF Trust Funds are distributed by ALPS Distributors, Inc. (“ALPS”). The Funds are managed by DBX Advisors LLC which is not affiliated with ALPS.
The brand DWS represents DWS Group GmbH & Co. KGaA and any of its subsidiaries such as DWS Distributors, Inc. which offers investment products or Deutsche Investment Management Americas Inc. and RREEF America L.L.C. which offer advisory services.
The Funds (the “Funds”) have been developed solely by DBX Advisors LLC. The Funds are not in any way connected to or sponsored, endorsed, sold or promoted by the London Stock Exchange Group plc and its group undertakings (collectively, the “LSE Group”). FTSE Russell is a trading name of certain of the LSE Group companies.
All rights in the FTSE Developed ex US Comprehensive Factor Index, FTSE Emerging Comprehensive Factor Index, Russell 1000 Comprehensive Factor Index, Russell 1000 2Qual/Val 5% Capped Factor Index and the Russell 2000 Comprehensive Factor Index vest in the relevant LSE Group company which owns the Indexes. “FTSE®” “Russell®” and “FTSE Russell®” are a trademarks of the relevant LSE Group company and are used by any other LSE Group company under license.
The Index is calculated by or on behalf of FTSE International Limited or its affiliate, agent or partner. The LSE Group does not accept any liability whatsoever to any person arising out of (a) the use of, reliance on or any error in the Index or (b) investment in or operation of the Funds. The LSE Group makes no claim, prediction, warranty or representation either as to the results to be obtained from the Funds or the suitability of the Indexes for the purpose to which it is being put by DBX Advisors LLC.
Copyright © 2019 DWS Group. All rights reserved. XtrackersTM is a trademark of DWS Investment GmbH. All other trademarks, servicemarks or registered trademarks are the property of their respective owners.
Not FDIC Insured | No Bank Guarantee | May Lose Value
DBX ETF Trust
Investment advisor DBX Advisors LLC 345 Park Avenue New York, NY 10154 | Administrator, custodian, fund accounting agent, lending agent & transfer agent The Bank of New York Mellon 240 Greenwich Street New York, NY 10286 | Distributor ALPS Distributors, Inc. 1290 Broadway Suite 1100 Denver, CO 80203 | ||
Independent registered public accounting firm Ernst & Young LLP 5 Times Square New York, NY 10036 | Legal counsel Dechert LLP 1095 Avenue of the Americas New York, NY 10036 | |||
R-47731-4 (10/19) DBX004117 (10/20)
August 31, 2019
Annual Report
DBX ETF Trust
Xtrackers Barclays International Corporate Bond Hedged ETF (IFIX)
Xtrackers Barclays International Treasury Bond Hedged ETF (IGVT)
Xtrackers High Beta High Yield Bond ETF (HYUP)
Xtrackers Low Beta High Yield Bond ETF (HYDW)
Xtrackers Short Duration High Yield Bond ETF (SHYL)
Xtrackers USD High Yield Corporate Bond ETF (HYLB)

DBX ETF Trust
| Page | ||||
| 1 | ||||
| 3 | ||||
| 6 | ||||
| 8 | ||||
| 10 | ||||
| 12 | ||||
| 14 | ||||
| 16 | ||||
| 18 | ||||
| 19 | ||||
| 24 | ||||
| 31 | ||||
| 41 | ||||
| 50 | ||||
| 58 | ||||
| 76 | ||||
| 78 | ||||
| 80 | ||||
| 83 | ||||
| 86 | ||||
| 97 | ||||
| 99 | ||||
| 101 | ||||
| 102 | ||||
To our Shareholders:(Unaudited)
Dear Shareholder,
We are pleased to provide this annual report for our ETFs tracking the fixed income market for the period ended August 31, 2019.
The global economy experienced softened growth during the reporting period, owing togeo-political risks, delayed prospects for a U.S.-China trade agreement, and a downturn in the manufacturing sector. However, the slowdown was partly offset by resilience in domestic consumption underpinned by strong labor markets globally. The U.S. economy grew modestly, led by a fading fiscal stimulus, lagged effects of the Federal Reserve Board’s (FRB) tightening cycle, and a weaker external environment. The Eurozone posted weak growth, due to a contraction of net exports and fears of higher auto tariffs if the trade war escalates. Furthermore, the Chinese economy witnessed slower growth due to weak domestic demand and contracting exports. In emerging markets, growth was moderated by a series of transitory headwinds, such as trade disputes, rising interest rates, weaker emerging markets currencies, and political risks.
Amid the global growth slowdown and lingering trade tensions, central banks globally have signaled renewed easing on the back of declining inflation expectations and lower neutral rates. In a widely anticipated decision, the FRB lowered the target range for the federal funds rate by .25 percent, the first rate cut in a decade. The FRB clearly made this decision to support inflation, protect the economy against spillovers from weakness in other major economies, and enhance business confidence. Despite retaining optionality and a data-dependent focus, the FRB also signaled a willingness to enact further policy rate cuts. Moreover, prospects of interest rate cuts by central banks and hopes of improved U.S.-China trade relations buoyed equity markets to reach historical highs. The European Central Bank’s (ECB) monetary stance remained accommodative, with the reinvestment of maturing assets from its bond-purchase program. The ECB also expects to maintain its current interest rates at least through the first half of 2020 and would take necessary steps to revive inflation. Furthermore, yields on U.S.10-year Treasuries fell to their lowest levels since 2017, while yields on German10-year bunds turned negative for the first time since 2016.
While other central banks have shifted towards easing in the first half of 2019, the People’s Bank of China (PBoC) has refrained from lowering interest rates, despite weakening growth prospects and muted inflation. However, in an effort to improve policy transmission and lower funding costs, the PBoC unveiled a new market-based loan prime rate pricing mechanism. The Bank of Japan (BOJ) in its monetary policy meeting decided to retain its current monetary easing framework to keep the yield curve under control. The BOJ also said it would be committed to further easing to move towards achieving its inflation target. Elsewhere, the Bank of England kept its policy rate unchanged to help sustain growth and employment.
Trade frictions between the U.S. and China ahead of a criticalG-20 meeting, ano-deal Brexit1, and new trade barriers between the Europe and U.S. remain major headwinds for the economy. However, policy makers retain the willingness to support the economy by focusing on diverging their interpretations and policy recommendations. Furthermore, a consumption-backed service sector is keeping growth afloat, bolstering employment and consumer confidence. Given the economic backdrop of an uncertain environment, hedging interest rate exposure would play a significant role in managing investments in fixed income markets.
Our team appreciates your trust and looks forward to serving your investment needs through innovative index-driven strategies.
Sincerely,
/s/ Freddi Klassen
Freddi Klassen
President and Chief Executive Officer
1Brexit is a combination of the words “Britain” and “Exit” and describes the exit of the United Kingdom from the European Union.
Assumptions, estimates and opinions contained in this document constitute our judgment as of the date of the document and are subject to change without notice. Any projections are based on a number of assumptions as to market conditions and there can be no guarantee that any projected results will be achieved. Past performance is not a guarantee of future results.
1
This Page is Intentionally Left Blank
2
DBX ETF Trust
Xtrackers Barclays International Corporate Bond Hedged ETF
The Xtrackers Barclays International Corporate Bond Hedged ETF (IFIX) seeks investment results that correspond generally to the performance, before fees and expenses, of the Barclays Global Aggregate Corporate Ex USD Bond Index (USD Hedged) (the IFIX Index). The IFIX Index is designed to track the performance of investment grade corporate debt publicly issued in developed and emerging markets (excluding all securities denominated in U.S dollars) in the industrial, utility and financial sectors, while mitigating exposure to fluctuations between the value of the U.S. dollar and the currencies of the countries included in the underlying Index. For the12-month period ended August 31, 2019, IFIX shares returned 9.09%, compared to the IFIX Index return of 9.91%.
European and U.K. corporate bonds formed a significant part of the portfolio and contributed positively to performance. The Fund entered into forward foreign currency contracts during the period to hedge against changes in the value of the U.S. dollar against specifiednon-U.S. currencies. The currency hedging strategy contributed positively to performance.
Xtrackers Barclays International Treasury Bond Hedged ETF
The Xtrackers Barclays International Treasury Bond Hedged ETF (IGVT) seeks investment results that correspond generally to the performance, before fees and expenses, of the Barclays Global Aggregate TreasuryEx-USD Issuer Diversified Bond Index (USD Hedged) (the IGVT Index). The IGVT Index is designed to track the performance of investment grade sovereign debt publicly issued in the developed and emerging markets and denominated in the issuer’s own domestic currency (excluding all securities denominated in U.S. dollars), while mitigating exposure to fluctuations between the value of the U.S. dollar and the currencies of the countries included in the underlying Index. For the12-month period ended August 31, 2019, IGVT shares returned 11.70%, compared to the IGVT Index return of 12.05%.
Japanese and European sovereign bonds formed a significant part of the portfolio. From a geographical perspective, Japan and Thailand were among the major positive contributors, while China contributed negatively to performance. The Fund entered into forward foreign currency contracts during the period to hedge against changes in the value of the U.S. dollar against specifiednon-U.S. currencies. The currency hedging strategy contributed positively to performance.
Xtrackers High Beta High Yield Bond ETF
The Xtrackers High Beta High Yield Bond ETF (HYUP) seeks investment results that correspond generally to the performance, before fees and expenses, of the Solactive USD High Yield Corporates Total Market High Beta Index (the HYUP Index). The HYUP Index is designed to track the performance of the segment of the U.S. dollar denominated high yield corporate bond market that exhibits higher overall beta to the broader high yield corporate fixed income market. For the12-month period ended August 31, 2019 HYUP shares returned 5.90%, compared to the HYUP Index return of 5.88%.
The majority of sectors contributed positively to performance during the period with the greatest contribution coming from Communications, ConsumerNon-Cyclical and Consumer Cyclical, while the Energy sector was the only negative contributor to performance.
Xtrackers Low Beta High Yield Bond ETF
The Xtrackers Low Beta High Yield Bond ETF (HYDW) seeks investment results that correspond generally to the performance, before fees and expenses, of the Solactive USD High Yield Corporates Total Market Low Beta Index (the HYDW Index). The HYDW Index is designed to track the performance of the segment of the U.S. dollar denominated high yield corporate bond market that exhibits lower overall beta to the broader high yield corporate fixed income market. For the12-month period ended August 31, 2019 HYDW shares returned 7.84%, compared to the HYDW Index return of 7.92%.
All sectors contributed positively to performance during the period with the greatest contribution coming from Communications, Consumer Cyclical and ConsumerNon-Cyclical.
3
DBX ETF Trust
Management’s Discussion of Fund Performance(Unaudited) (Continued)
Xtrackers Short Duration High Yield Bond ETF
The Xtrackers Short Duration High Yield Bond ETF (SHYL) seeks investment results that correspond generally to the performance, before fees and expenses, of the Solactive USD High Yield Corporates Total Market0-5 Year Index (the SHYL Index). The SHYL Index is designed to track the performance of short-term publicly issued U.S dollar denominated below investment grade corporate debt. For the12-month period ended August 31, 2019, SHYL shares returned 4.79%, compared to the SHYL Index return of 4.74%.
The majority of sectors contributed positively to performance during the period with the greatest contribution coming from Communications, Consumer Cyclical and ConsumerNon-Cyclical, while the Energy sector was the only negative contributor to performance.
Xtrackers USD High Yield Corporate Bond ETF
The Xtrackers USD High Yield Corporate Bond ETF (HYLB) seeks investment results that correspond generally to the performance, before fees and expenses, of the Solactive USD High Yield Corporates Total Market Index (the HYLB Index). The HYLB Index is designed to track the performance of a basket of U.S. dollar denominated high yield liquid corporate bonds. For the12-month period ended August 31, 2019, HYLB shares returned 6.87%, compared to the HYLB Index return of 6.98%.
The majority of sectors contributed positively to performance during the period with the greatest contribution coming from Communications, ConsumerNon-Cyclical and Consumer Cyclical, while the Energy sector was the only negative contributor to performance.
*************************
Performance data quoted represents past performance and does not guarantee future results. Investment returns and principal value of an investment will fluctuate so that an investor’s shares, when sold or redeemed, may be worth more or less than their original cost. Current performance may be lower or higher than the performance data quoted. To obtain the most recentmonth-end performance data visit www.Xtrackers.com. Returns assume that dividends and capital gains distributions have been reinvested. See pages 6-17 of this report for additional performance information, including performance data based on market value. The views expressed in this report reflect those of the portfolio management team only through the end of the period of the report as stated on the cover. The management team’s views are subject to change at any time based on market and other conditions and should not be construed as a recommendation. Current and future portfolio holdings are subject to risk.
4
This Page is Intentionally Left Blank
5
DBX ETF Trust
Performance Summary(Unaudited)
Xtrackers Barclays International Corporate Bond Hedged ETF (IFIX)
The Xtrackers Barclays International Corporate Bond Hedged ETF (the “Fund”), using a “passive” or indexing investment approach, seeks investment results that correspond generally to the performance, before fees and expenses, of the Barclays Global Aggregate Corporate Ex USD Bond Index (USD Hedged) (the “Underlying Index”). The Underlying Index is designed to track the performance of investment grade corporate debt publicly issued in developed and emerging markets (excluding all securities denominated in U.S. dollars) in the industrial, utility and financial sectors while mitigating exposure to fluctuations between the value of the U.S. dollar and the currencies of the countries included in the Underlying Index. It is not possible to invest directly into an index.
| Performance as of August 31, 2019 |
| Average Annual Total Returns | ||||||||
| Net Asset Value | Market Value | Barclays Global Aggregate Corporate Ex USD Bond Index (USD Hedged) | Bloomberg Barclays Global Aggregate Bond Index | |||||
One Year | 9.09% | 9.12% | 9.91% | 7.77% | ||||
Since Inception1 | 4.67% | 4.72% | 5.24% | 2.94% | ||||
| Cumulative Total Returns | ||||||||
| Net Asset Value | Market Value | Barclays Global Aggregate Corporate Ex USD Bond Index (USD Hedged) | Bloomberg Barclays Global Aggregate Bond Index | |||||
One Year | 9.09% | 9.12% | 9.91% | 7.77% | ||||
Since Inception1 | 13.91% | 14.06% | 15.69% | 8.59% | ||||
1 Total returns are calculated based on the commencement of operations, October 25, 2016 (“Inception”).
Past performance is no guarantee of future results. Current performance may be lower or higher than the performance data quoted. Performance data current to the most recentmonth-end is available at www.Xtrackers.com. Performance results assume reinvestment of all dividends and capital gain distributions and do not reflect the deduction of taxes that a shareholder would pay on fund distributions or on the sale of fund shares or redemption of fund creation units. The investment return and principal value of shares will vary with changes in market conditions. Shares may be worth more or less than their original cost when they are sold in the market or redeemed. Performance for certain funds may reflect a waiver of a portion of investment management fees. Without such waiver, performance would have been lower. The estimated operating expense ratio as disclosed in the most recent prospectus dated December 28, 2018, was 0.30%, and may differ from the expense ratio disclosed in the Financial Highlights table in this report.
The Fund’s net asset value or “NAV” is calculated by dividing the value of the Fund’s total assets less total liabilities by the number of shares outstanding. The price used to calculate market return (“Market Price”) is determined by using the midpoint between the highest bid and the lowest offer on the primary stock exchange on which shares of a fund are listed for trading, as of the time that such fund’s NAV is calculated. Since shares of a fund may not have traded in the secondary market until after the fund’s inception, for the period from inception to the first day of secondary trading, the NAV of the fund is used as a proxy for the Market Price to calculate market returns. Market and NAV returns assume that dividends and capital gain distributions have been reinvested at Market Price and NAV, respectively.
An index is a statistical composite that tracks a specified financial market or sector. Unlike a fund, an index does not actually hold a portfolio of securities and therefore does not incur the expenses incurred by a fund. These expenses negatively impact fund performance. Also, market returns do not include brokerage commissions that may be payable on secondary market transactions. If brokerage commissions were included, market returns would be lower.
6
DBX ETF Trust
Performance Summary(Unaudited)
Xtrackers Barclays International Corporate Bond Hedged ETF (IFIX)(Continued)
| Growth of an Assumed $10,000 Investment |
1 Based on Net Asset Value from commencement of operations, October 25, 2016.
| Sector Diversification* as of August 31, 2019 |
Financial | 41.6% | |||
Consumer,Non-cyclical | 13.5% | |||
Communications | 11.2% | |||
Utilities | 8.0% | |||
Industrial | 7.5% | |||
Consumer, Cyclical | 6.4% | |||
Energy | 4.7% | |||
Technology | 3.5% | |||
Basic Materials | 1.9% | |||
Government | 1.7% | |||
|
| |||
Total | 100.0% |
Modified duration as of August 31, 2019: 5.7 years
Modified duration is an approximate measure of a fund’s sensitivity to movements in interest rates based on the current rate environment.
| Quality* as of August 31, 2019 |
| Description | % of Market Value | |||
AAA | 2.8% | |||
AA | 19.4% | |||
A | 35.6% | |||
BBB | 42.2% | |||
|
| |||
Total | 100.0% | |||
The quality ratings represent the higher of Moody’s Investor Services, Inc. (“Moody’s”), Fitch Ratings, Inc. (“Fitch”) or Standard & Poor’s Corporation (“S&P”) credit ratings. The ratings of Moody’s, Fitch and S&P represent their opinions as to the quality of the securities they rate. Credit quality measures a bond issuer’s ability to repay interest and principal in a timely manner and is measured on a scale that ranges from AAA (highest) to D (lowest). Ratings are relative and subjective and are not absolute standards of quality. Credit quality does not remove market risk and is subject to change.
| Country Diversification* as of August 31, 2019 |
United Kingdom | 19.2% | |||
Netherlands | 17.2% | |||
United States | 15.9% | |||
France | 10.7% | |||
Canada | 9.8% | |||
Germany | 8.2% | |||
Italy | 3.8% | |||
Japan | 3.5% | |||
Australia | 3.1% | |||
Spain | 2.3% | |||
Luxembourg | 2.0% | |||
Other | 4.3% | |||
|
| |||
Total | 100.0% |
* As a percent of total investments excluding cash equivalents.
Portfolio holdings and characteristics are subject to change. For more complete details about the Fund’s investment portfolio see page 19.
7
DBX ETF Trust
Performance Summary(Unaudited)
Xtrackers Barclays International Treasury Bond Hedged ETF (IGVT)
The Xtrackers Barclays International Treasury Bond Hedged ETF (the “Fund”), using a “passive” or indexing investment approach, seeks investment results that correspond generally to the performance, before fees and expenses, of the Barclays Global Aggregate Treasury Ex USD Issuer Diversified Bond Index (USD Hedged) (the “Underlying Index”). The Underlying Index is designed to track the performance of investment grade sovereign debt publicly issued in the developed and emerging markets and denominated in the issuer’s own domestic currency (excluding all securities denominated in U.S. dollars) while mitigating exposure to fluctuations between the value of the U.S. dollar and the currencies of the countries included in the Underlying Index. It is not possible to invest directly into an index.
| Performance as of August 31, 2019 |
| Average Annual Total Returns | ||||||||
| Net Asset Value | Market Value | Barclays Global Aggregate Treasury Ex USD Issuer Diversified Bond Index (USD Hedged) | Bloomberg Barclays Global Aggregate Bond Index | |||||
One Year | 11.70% | 11.63% | 12.05% | 7.77% | ||||
Since Inception1 | 4.34% | 4.39% | 4.80% | 2.94% | ||||
| Cumulative Total Returns | ||||||||
| Net Asset Value | Market Value | Barclays Global Aggregate Treasury Ex USD Issuer Diversified Bond Index (USD Hedged) | Bloomberg Barclays Global Aggregate Bond Index | |||||
One Year | 11.70% | 11.63% | 12.05% | 7.77% | ||||
Since Inception1 | 12.89% | 13.05% | 14.30% | 8.59% | ||||
1Total returns are calculated based on the commencement of operations, October 25, 2016 (“Inception”).
Past performance is no guarantee of future results. Current performance may be lower or higher than the performance data quoted. Performance data current to the most recentmonth-end is available at www.Xtrackers.com. Performance results assume reinvestment of all dividends and capital gain distributions and do not reflect the deduction of taxes that a shareholder would pay on fund distributions or on the sale of fund shares or redemption of fund creation units. The investment return and principal value of shares will vary with changes in market conditions. Shares may be worth more or less than their original cost when they are sold in the market or redeemed. Performance for certain funds may reflect a waiver of a portion of investment management fees. Without such waiver, performance would have been lower. The estimated operating expense ratio as disclosed in the most recent prospectus dated December 28, 2018, was 0.25%, and may differ from the expense ratio disclosed in the Financial Highlights table in this report.
The Fund’s net asset value or “NAV” is calculated by dividing the value of the Fund’s total assets less total liabilities by the number of shares outstanding. The price used to calculate market return (“Market Price”) is determined by using the midpoint between the highest bid and the lowest offer on the primary stock exchange on which shares of a fund are listed for trading, as of the time that such fund’s NAV is calculated. Since shares of a fund may not have traded in the secondary market until after the fund’s inception, for the period from inception to the first day of secondary trading, the NAV of the fund is used as a proxy for the Market Price to calculate market returns. Market and NAV returns assume that dividends and capital gain distributions have been reinvested at Market Price and NAV, respectively.
An index is a statistical composite that tracks a specified financial market or sector. Unlike a fund, an index does not actually hold a portfolio of securities and therefore does not incur the expenses incurred by a fund. These expenses negatively impact fund performance. Also, market returns do not include brokerage commissions that may be payable on secondary market transactions. If brokerage commissions were included, market returns would be lower.
8
DBX ETF Trust
Performance Summary(Unaudited)
Xtrackers Barclays International Treasury Bond Hedged ETF (IGVT)(Continued)
| Growth of an Assumed $10,000 Investment |
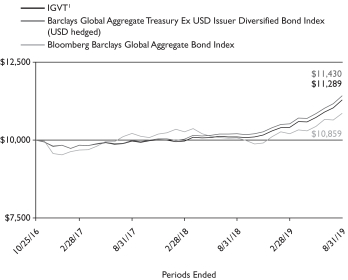
1 Based on Net Asset Value from commencement of operations, October 25, 2016.
| Country Diversification* as of August 31, 2019 |
Japan | 25.1% | |||
France | 7.4% | |||
Italy | 6.9% | |||
United Kingdom | 6.7% | |||
Germany | 4.9% | |||
Belgium | 4.7% | |||
Spain | 4.6% | |||
South Korea | 4.5% | |||
Canada | 3.8% | |||
Australia | 3.8% | |||
Netherlands | 3.7% | |||
Austria | 2.7% | |||
Other | 21.2% | |||
|
| |||
Total | 100.0% |
Modified duration as of August 31, 2019: 8.5 years
Modified duration is an approximate measure of a fund’s sensitivity to movements in interest rates based on the current rate environment.
| Quality* as of August 31, 2019 |
| Description | % of Market Value | |||
AAA | 17.5% | |||
AA | 26.2% | |||
A | 37.5% | |||
BBB | 16.0% | |||
BB | 0.1% | |||
Not Rated | 2.7% | |||
|
| |||
Total | 100.0% | |||
The quality ratings represent the higher of Moody’s Investor Services, Inc. (“Moody’s”), Fitch Ratings, Inc. (“Fitch”) or Standard & Poor’s Corporation (“S&P”) credit ratings. The ratings of Moody’s, Fitch and S&P represent their opinions as to the quality of the securities they rate. Credit quality measures a bond issuer’s ability to repay interest and principal in a timely manner and is measured on a scale that ranges from AAA (highest) to D (lowest). Ratings are relative and subjective and are not absolute standards of quality. Credit quality does not remove market risk and is subject to change.
* As a percent of total investments excluding exchange-traded funds and cash equivalents.
Portfolio holdings and characteristics are subject to change. For more complete details about the Fund’s investment portfolio see page 24.
9
DBX ETF Trust
Performance Summary(Unaudited)
Xtrackers High Beta High Yield Bond ETF (HYUP)
The Xtrackers High Beta High Yield Bond ETF (the “Fund”), using a “passive” or indexing investment approach, seeks investment results that correspond generally to the performance, before fees and expenses, of the Solactive USD High Yield Corporates Total Market High Beta Index (the “Underlying Index”). The Underlying Index is designed to track the performance of the segment of the U.S. dollar denominated high yield corporate bond market that exhibits higher overall beta to the broader high yield corporate fixed income market. It is not possible to invest directly into an index.
| Performance as of August 31, 2019 |
| Average Annual Total Returns | ||||||||
| Net Asset Value | Market Value | Solactive USD High Yield Corporates Total Market High Beta Index | Solactive USD High Yield Corporates Total Market Index | |||||
One Year | 5.90% | 5.72% | 5.88% | 6.98% | ||||
Since Inception1 | 4.82% | 4.71% | 4.89% | 5.20% | ||||
| Cumulative Total Returns | ||||||||
| Net Asset Value | Market Value | Solactive USD High Yield Corporates Total Market High Beta Index | Solactive USD High Yield Corporates Total Market Index | |||||
One Year | 5.90% | 5.72% | 5.88% | 6.98% | ||||
Since Inception1 | 8.02% | 7.84% | 8.14% | 8.66% | ||||
1Total returns are calculated based on the commencement of operations, January 11, 2018 (“Inception”).
Past performance is no guarantee of future results. Current performance may be lower or higher than the performance data quoted. Performance data current to the most recentmonth-end is available at www.Xtrackers.com. Performance results assume reinvestment of all dividends and capital gain distributions and do not reflect the deduction of taxes that a shareholder would pay on fund distributions or on the sale of fund shares or redemption of fund creation units. The investment return and principal value of shares will vary with changes in market conditions. Shares may be worth more or less than their original cost when they are sold in the market or redeemed. Performance for certain funds may reflect a waiver of a portion of investment management fees. Without such waiver, performance would have been lower. The estimated operating expense ratio as disclosed in the most recent prospectus dated December 28, 2018, as supplemented May 31, 2019, was 0.35%, and may differ from the expense ratio disclosed in the Financial Highlights table in this report.
The Fund’s net asset value or “NAV” is calculated by dividing the value of the Fund’s total assets less total liabilities by the number of shares outstanding. The price used to calculate market return (“Market Price”) is determined by using the midpoint between the highest bid and the lowest offer on the primary stock exchange on which shares of a fund are listed for trading, as of the time that such fund’s NAV is calculated. Since shares of a fund may not have traded in the secondary market until after the fund’s inception, for the period from inception to the first day of secondary trading, the NAV of the fund is used as a proxy for the Market Price to calculate market returns. Market and NAV returns assume that dividends and capital gain distributions have been reinvested at Market Price and NAV, respectively.
An index is a statistical composite that tracks a specified financial market or sector. Unlike a fund, an index does not actually hold a portfolio of securities and therefore does not incur the expenses incurred by a fund. These expenses negatively impact fund performance. Also, market returns do not include brokerage commissions that may be payable on secondary market transactions. If brokerage commissions were included, market returns would be lower.
10
DBX ETF Trust
Performance Summary(Unaudited)
Xtrackers High Beta High Yield Bond ETF (HYUP)(Continued)
| Growth of an Assumed $10,000 Investment |
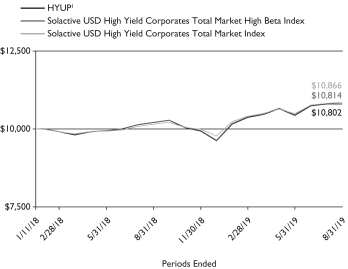
1 Based on Net Asset Value from commencement of operations, January 11, 2018.
| Sector Diversification* as of August 31, 2019 |
Communications | 29.1% | |||
Consumer,Non-cyclical | 19.6% | |||
Consumer, Cyclical | 12.6% | |||
Energy | 9.6% | |||
Financial | 9.3% | |||
Industrial | 7.7% | |||
Technology | 4.9% | |||
Basic Materials | 4.8% | |||
Utilities | 2.3% | |||
Diversified | 0.1% | |||
|
| |||
Total | 100.0% |
Modified duration as of August 31, 2019: 4.6 years
Modified duration is an approximate measure of a fund’s sensitivity to movements in interest rates based on the current rate environment.
| Quality* as of August 31, 2019 |
| Description | % of Market Value | |||
BBB | 2.8% | |||
BB | 40.0% | |||
B | 44.8% | |||
CCC | 12.3% | |||
CC | 0.1% | |||
|
| |||
Total | 100.0% | |||
The quality ratings represent the higher of Moody’s Investor Services, Inc. (“Moody’s”), Fitch Ratings, Inc. (“Fitch”) or Standard & Poor’s Corporation (“S&P”) credit ratings. The ratings of Moody’s, Fitch and S&P represent their opinions as to the quality of the securities they rate. Credit quality measures a bond issuer’s ability to repay interest and principal in a timely manner and is measured on a scale that ranges from AAA (highest) to D (lowest). Ratings are relative and subjective and are not absolute standards of quality. Credit quality does not remove market risk and is subject to change.
| Country Diversification* as of August 31, 2019 |
United States | 78.7% | |||
Netherlands | 4.9% | |||
Luxembourg | 4.8% | |||
Canada | 3.6% | |||
France | 2.2% | |||
Other | 5.8% | |||
|
| |||
Total | 100.0% |
* As a percent of total investments excluding securities lending collateral and cash equivalents.
Portfolio holdings and characteristics are subject to change. For more complete details about the Fund’s investment portfolio see page 31.
11
DBX ETF Trust
Performance Summary(Unaudited)
Xtrackers Low Beta High Yield Bond ETF (HYDW)
The Xtrackers Low Beta High Yield Bond ETF (the “Fund”), using a “passive” or indexing investment approach, seeks investment results that correspond generally to the performance, before fees and expenses, of the Solactive USD High Yield Corporates Total Market Low Beta Index (the “Underlying Index”). The Underlying Index is designed to track the performance of the segment of the U.S. dollar denominated high yield corporate bond market that exhibits lower overall beta to the broader high yield corporate fixed income market. It is not possible to invest directly into an index.
| Performance as of August 31, 2019 |
| Average Annual Total Returns | ||||||||
| Net Asset Value | Market Value | Solactive USD High Yield Corporates Total Market Low Beta Index | Solactive USD High Yield Corporates Total Market Index | |||||
One Year | 7.84% | 7.63% | 7.92% | 6.98% | ||||
Since Inception1 | 5.15% | 5.10% | 5.30% | 5.20% | ||||
| Cumulative Total Returns | ||||||||
| Net Asset Value | Market Value | Solactive USD High Yield Corporates Total Market Low Beta Index | Solactive USD High Yield Corporates Total Market Index | |||||
One Year | 7.84% | 7.63% | 7.92% | 6.98% | ||||
Since Inception1 | 8.57% | 8.49% | 8.82% | 8.66% | ||||
1 Total returns are calculated based on the commencement of operations, January 11, 2018 (“Inception”).
Past performance is no guarantee of future results. Current performance may be lower or higher than the performance data quoted. Performance data current to the most recentmonth-end is available at www.Xtrackers.com. Performance results assume reinvestment of all dividends and capital gain distributions and do not reflect the deduction of taxes that a shareholder would pay on fund distributions or on the sale of fund shares or redemption of fund creation units. The investment return and principal value of shares will vary with changes in market conditions. Shares may be worth more or less than their original cost when they are sold in the market or redeemed. Performance for certain funds may reflect a waiver of a portion of investment management fees. Without such waiver, performance would have been lower. The estimated operating expense ratio as disclosed in the most recent prospectus dated December 28, 2018, as supplemented May 31, 2019, was 0.25%, and may differ from the expense ratio disclosed in the Financial Highlights table in this report.
The Fund’s net asset value or “NAV” is calculated by dividing the value of the Fund’s total assets less total liabilities by the number of shares outstanding. The price used to calculate market return (“Market Price”) is determined by using the midpoint between the highest bid and the lowest offer on the primary stock exchange on which shares of a fund are listed for trading, as of the time that such fund’s NAV is calculated. Since shares of a fund may not have traded in the secondary market until after the fund’s inception, for the period from inception to the first day of secondary trading, the NAV of the fund is used as a proxy for the Market Price to calculate market returns. Market and NAV returns assume that dividends and capital gain distributions have been reinvested at Market Price and NAV, respectively.
An index is a statistical composite that tracks a specified financial market or sector. Unlike a fund, an index does not actually hold a portfolio of securities and therefore does not incur the expenses incurred by a fund. These expenses negatively impact fund performance. Also, market returns do not include brokerage commissions that may be payable on secondary market transactions. If brokerage commissions were included, market returns would be lower.
12
DBX ETF Trust
Performance Summary(Unaudited)
Xtrackers Low Beta High Yield Bond ETF (HYDW)(Continued)
| Growth of an Assumed $10,000 Investment | ||

1 Based on Net Asset Value from commencement of operations, January 11, 2018.
| Sector Diversification* as of August 31, 2019 |
Communications | 20.4% | |||
Consumer,Non-cyclical | 19.2% | |||
Consumer, Cyclical | 14.9% | |||
Energy | 13.1% | |||
Industrial | 10.7% | |||
Financial | 9.5% | |||
Technology | 4.4% | |||
Basic Materials | 4.1% | |||
Utilities | 3.7% | |||
|
| |||
Total | 100% |
Modified duration as of August 31, 2019: 4.1 years
Modified duration is an approximate measure of a fund’s sensitivity to movements in interest rates based on the current rate environment.
| Quality* as of August 31, 2019 |
| Description | % of Market Value | |||
BBB | 11.7% | |||
BB | 76.3% | |||
B | 12.0% | |||
|
| |||
Total | 100.0% | |||
The quality ratings represent the higher of Moody’s Investor Services, Inc. (“Moody’s”), Fitch Ratings, Inc. (“Fitch”) or Standard & Poor’s Corporation (“S&P”) credit ratings. The ratings of Moody’s, Fitch and S&P represent their opinions as to the quality of the securities they rate. Credit quality measures a bond issuer’s ability to repay interest and principal in a timely manner and is measured on a scale that ranges from AAA (highest) to D (lowest). Ratings are relative and subjective and are not absolute standards of quality. Credit quality does not remove market risk and is subject to change.
| Country Diversification* as of August 31, 2019 |
United States | 91.2% | |||
Canada | 3.9% | |||
Other | 4.9% | |||
|
| |||
| 100.0% |
* As a percent of total investments excluding securities lending collateral and cash equivalents.
Portfolio holdings and characteristics are subject to change. For more complete details about the Fund’s investment portfolio see page 41.
13
DBX ETF Trust
Performance Summary(Unaudited)
Xtrackers Short Duration High Yield Bond ETF (SHYL)
The Xtrackers Short Duration High Yield Bond ETF (the “Fund”), using a “passive” or indexing investment approach, seeks investment results that correspond generally to the performance, before fees and expenses, of the Solactive USD High Yield Corporates Total Market0-5 Year Index (the “Underlying Index”). The Underlying Index is designed to track the performance of short-term publicly issued U.S. dollar-denominated below investment grade corporate debt. It is not possible to invest directly into an index.
| Performance as of August 31, 2019 |
| Average Annual Total Returns | ||||||||
| Net Asset Value | Market Value | Solactive USD High Yield Corporates Total Market0-5 Year Index | Solactive USD High Yield Corporates Total Market Index | |||||
One Year | 4.79% | 4.55% | 4.74% | 6.98% | ||||
Since Inception1 | 4.39% | 4.27% | 4.41% | 5.00% | ||||
| Cumulative Total Returns | ||||||||
| Net Asset Value | Market Value | Solactive USD High Yield Corporates Total Market0-5 Year Index | Solactive USD High Yield Corporates Total Market Index | |||||
One Year | 4.79% | 4.55% | 4.74% | 6.98% | ||||
Since Inception1 | 7.31% | 7.10% | 7.34% | 8.33% | ||||
1 Total returns are calculated based on the commencement of operations, January 10, 2018 (“Inception”).
Past performance is no guarantee of future results. Current performance may be lower or higher than the performance data quoted. Performance data current to the most recentmonth-end is available at www.Xtrackers.com. Performance results assume reinvestment of all dividends and capital gain distributions and do not reflect the deduction of taxes that a shareholder would pay on fund distributions or on the sale of fund shares or redemption of fund creation units. The investment return and principal value of shares will vary with changes in market conditions. Shares may be worth more or less than their original cost when they are sold in the market or redeemed. Performance for certain funds may reflect a waiver of a portion of investment management fees. Without such waiver, performance would have been lower. The estimated operating expense ratio as disclosed in the most recent prospectus dated December 28, 2018, was 0.20%, and may differ from the expense ratio disclosed in the Financial Highlights table in this report.
The Fund’s net asset value or “NAV” is calculated by dividing the value of the Fund’s total assets less total liabilities by the number of shares outstanding. The price used to calculate market return (“Market Price”) is determined by using the midpoint between the highest bid and the lowest offer on the primary stock exchange on which shares of a fund are listed for trading, as of the time that such fund’s NAV is calculated. Since shares of a fund may not have traded in the secondary market until after the fund’s inception, for the period from inception to the first day of secondary trading, the NAV of the fund is used as a proxy for the Market Price to calculate market returns. Market and NAV returns assume that dividends and capital gain distributions have been reinvested at Market Price and NAV, respectively.
An index is a statistical composite that tracks a specified financial market or sector. Unlike a fund, an index does not actually hold a portfolio of securities and therefore does not incur the expenses incurred by a fund. These expenses negatively impact fund performance. Also, market returns do not include brokerage commissions that may be payable on secondary market transactions. If brokerage commissions were included, market returns would be lower.
14
DBX ETF Trust
Performance Summary(Unaudited)
Xtrackers Short Duration High Yield Bond ETF (SHYL)(Continued)
| Growth of an Assumed $10,000 Investment |

1 Based on Net Asset Value from commencement of operations, January 10, 2018.
| Sector Diversification* as of August 31, 2019 |
Communications | 22.9% | |||
Consumer,Non-cyclical | 19.3% | |||
Consumer, Cyclical | 13.7% | |||
Financial | 12.4% | |||
Energy | 10.5% | |||
Industrial | 9.6% | |||
Technology | 5.5% | |||
Basic Materials | 4.6% | |||
Utilities | 1.5% | |||
|
| |||
Total | 100.0% |
Modified duration as of August 31, 2019: 2.7 years
Modified duration is an approximate measure of a fund’s sensitivity to movements in interest rates based on the current rate environment.
| Quality* as of August 31, 2019 |
| Description | % of Market Value | |||
BBB | 7.3% | |||
BB | 59.0% | |||
B | 26.0% | |||
CCC | 7.6% | |||
CC | 0.1% | |||
|
| |||
Total | 100.0% | |||
The quality ratings represent the higher of Moody’s Investor Services, Inc. (“Moody’s”), Fitch Ratings, Inc. (“Fitch”) or Standard & Poor’s Corporation (“S&P”) credit ratings. The ratings of Moody’s, Fitch and S&P represent their opinions as to the quality of the securities they rate. Credit quality measures a bond issuer’s ability to repay interest and principal in a timely manner and is measured on a scale that ranges from AAA (highest) to D (lowest). Ratings are relative and subjective and are not absolute standards of quality. Credit quality does not remove market risk and is subject to change.
| Country Diversification* as of August 31, 2019 |
United States | 83.4% | |||
Canada | 4.0% | |||
United Kingdom | 3.2% | |||
Netherlands | 3.1% | |||
Luxembourg | 2.7% | |||
Other | 3.6% | |||
|
| |||
Total | 100.0% |
* As a percent of total investments excluding securities lending collateral and cash equivalents.
Portfolio holdings and characteristics are subject to change. For more complete details about the Fund’s investment portfolio see page 50.
15
DBX ETF Trust
Performance Summary(Unaudited)
Xtrackers USD High Yield Corporate Bond ETF (HYLB)
The Xtrackers USD High Yield Corporate Bond ETF (the “Fund”), using a “passive” or indexing investment approach, seeks investment results that correspond generally to the performance, before fees and expenses, of the Solactive USD High Yield Corporates Total Market Index (the “Underlying Index”). The Underlying Index is designed to track the performance of a basket of U.S. dollar-denominated high yield liquid corporate bonds. It is not possible to invest directly into an index.
| Performance as of August 31, 2019 |
| Average Annual Total Returns | ||||||||
| Net Asset Value | Market Value | Solactive USD High Yield Corporates Total Market Index | iBoxx USD Liquid High Yield Index | |||||
One Year | 6.87% | 6.89% | 6.98% | 7.12% | ||||
Since Inception1 | 5.87% | 5.82% | 6.13% | 6.09% | ||||
| Cumulative Total Returns | ||||||||
| Net Asset Value | Market Value | Solactive USD High Yield Corporates Total Market Index | iBoxx USD Liquid High Yield Index | |||||
One Year | 6.87% | 6.89% | 6.98% | 7.12% | ||||
Since Inception1 | 16.89% | 16.72% | 17.67% | 17.50% | ||||
1 Total returns are calculated based on the commencement of operations, December 7, 2016 (“Inception”).
Past performance is no guarantee of future results. Current performance may be lower or higher than the performance data quoted. Performance data current to the most recentmonth-end is available at www.Xtrackers.com. Performance results assume reinvestment of all dividends and capital gain distributions and do not reflect the deduction of taxes that a shareholder would pay on fund distributions or on the sale of fund shares or redemption of fund creation units. The investment return and principal value of shares will vary with changes in market conditions. Shares may be worth more or less than their original cost when they are sold in the market or redeemed. Performance for certain funds may reflect a waiver of a portion of investment management fees. Without such waiver, performance would have been lower. The estimated operating expense ratio as disclosed in the most recent prospectus dated December 28, 2018, as supplemented March 29, 2019, was 0.20%, and may differ from the expense ratio disclosed in the Financial Highlights table in this report.
The Fund’s net asset value or “NAV” is calculated by dividing the value of the Fund’s total assets less total liabilities by the number of shares outstanding. The price used to calculate market return (“Market Price”) is determined by using the midpoint between the highest bid and the lowest offer on the primary stock exchange on which shares of a fund are listed for trading, as of the time that such fund’s NAV is calculated. Since shares of a fund may not have traded in the secondary market until after the fund’s inception, for the period from inception to the first day of secondary trading, the NAV of the fund is used as a proxy for the Market Price to calculate market returns. Market and NAV returns assume that dividends and capital gain distributions have been reinvested at Market Price and NAV, respectively.
An index is a statistical composite that tracks a specified financial market or sector. Unlike a fund, an index does not actually hold a portfolio of securities and therefore does not incur the expenses incurred by a fund. These expenses negatively impact fund performance. Also, market returns do not include brokerage commissions that may be payable on secondary market transactions. If brokerage commissions were included, market returns would be lower.
16
DBX ETF Trust
Performance Summary(Unaudited)
Xtrackers USD High Yield Corporate Bond ETF (HYLB)(Continued)
| Growth of an Assumed $10,000 Investment |
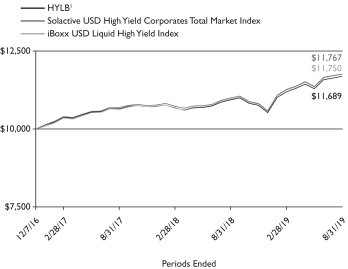
1 Based on Net Asset Value from commencement of operations, December 7, 2016.
| Sector Diversification* as of August 31, 2019 |
Communications | 24.6% | |||
Consumer,Non-cyclical | 19.8% | |||
Consumer, Cyclical | 13.8% | |||
Energy | 11.2% | |||
Financial | 9.4% | |||
Industrial | 9.1% | |||
Technology | 4.8% | |||
Basic Materials | 4.4% | |||
Utilities | 2.9% | |||
Diversified | 0.0% | |||
|
| |||
Total | 100.0% |
Modified duration as of August 31, 2019: 4.4 years
Modified duration is an approximate measure of a fund’s sensitivity to movements in interest rates based on the current rate environment.
| Quality* as of August 31, 2019 |
| Description | % of Market Value | |||
BBB | 6.9% | |||
BB | 56.8% | |||
B | 29.7% | |||
CCC | 6.5% | |||
C | 0.1% | |||
|
| |||
Total | 100.0% | |||
The quality ratings represent the higher of Moody’s Investor Services, Inc. (“Moody’s”), Fitch Ratings, Inc. (“Fitch”) or Standard & Poor’s Corporation (“S&P”) credit ratings. The ratings of Moody’s, Fitch and S&P represent their opinions as to the quality of the securities they rate. Credit quality measures a bond issuer’s ability to repay interest and principal in a timely manner and is measured on a scale that ranges from AAA (highest) to D (lowest). Ratings are relative and subjective and are not absolute standards of quality. Credit quality does not remove market risk and is subject to change.
| Country Diversification* as of August 31, 2019 |
United States | 84.8% | |||
Canada | 3.7% | |||
Luxembourg | 3.0% | |||
Netherlands | 2.7% | |||
Other | 5.8% | |||
|
| |||
Total | 100.0% |
* As a percent of total investments excluding securities lending collateral and cash equivalents.
Portfolio holdings and characteristics are subject to change. For more complete details about the Fund’s investment portfolio see page 58.
17
DBX ETF Trust
As a shareholder of one or more of the Funds, you incur two types of costs: (1) transaction costs, including brokerage commissions paid on purchases and sales of fund shares, and (2) ongoing costs, including management fees and other Fund expenses. In the most recentsix-month period the Funds limited these expenses; had they not done so, expenses would have been higher. The expense examples below are intended to help you understand your ongoing costs (in dollars) of investing in the Funds and to compare these costs with the ongoing costs of investing in other funds.
The examples in the tables are based on an investment of $1,000 invested at the beginning of thesix-month period and held for the entire period (March 1, 2019 to August 31, 2019).
Actual expenses
The first line in the following tables provides information about actual account values and actual expenses. You may use the information in this line, together with the amount you invested, to estimate the expenses that you paid over the period. Simply divide your account value by $1,000 (for example, an $8,600 account value divided by $1,000 = 8.6), then multiply the result by the number in the first line under the heading “Expenses Paid During the Period” to estimate the expenses you paid on your account during this period.
Hypothetical example for comparison purposes
The second line in the following tables provides information about hypothetical account values and hypothetical expenses based on the Funds’ actual expense ratios and an assumed rate of return of 5% per year before expenses (which is not the Funds’ actual return). The hypothetical account values and expenses may not be used to estimate the actual ending account balance or expenses you paid for the period. You may use this information to compare the ongoing costs of investing in the Fund and other funds. To do so, compare this 5% hypothetical example with the 5% hypothetical examples that appear in the shareholder reports of the other funds.
Please note that the expenses shown in the tables are meant to highlight your ongoing costs only, and do not reflect any transactional costs. Therefore the second line in the table is useful in comparing ongoing costs only, and will not help you determine the relative total costs of owning different funds. In addition, if these transactional costs were included, your costs would have been higher.
| Beginning Account Value March 1, 2019 | Ending Account Value August 31, 2019 | Annualized Expense Ratio | Expenses Paid During the Period Per $1,000(1) | |||||||||||||
| Xtrackers Barclays International Corporate Bond Hedged ETF |
| |||||||||||||||
Actual | $ | 1,000.00 | $ | 1,069.40 | 0.30 | % | $1.56 | |||||||||
Hypothetical (5% return before expenses) | $ | 1,000.00 | $ | 1,023.69 | 0.30 | % | $1.53 | |||||||||
| Xtrackers Barclays International Treasury Bond Hedged ETF |
| |||||||||||||||
Actual | $ | 1,000.00 | $ | 1,084.60 | 0.25 | % | $1.31 | |||||||||
Hypothetical (5% return before expenses) | $ | 1,000.00 | $ | 1,023.95 | 0.25 | % | $1.28 | |||||||||
| Xtrackers High Beta High Yield Bond ETF |
| |||||||||||||||
Actual | $ | 1,000.00 | $ | 1,041.40 | 0.27 | % | $1.39 | |||||||||
Hypothetical (5% return before expenses) | $ | 1,000.00 | $ | 1,023.84 | 0.27 | % | $1.38 | |||||||||
| Xtrackers Low Beta High Yield Bond ETF |
| |||||||||||||||
Actual | $ | 1,000.00 | $ | 1,046.80 | 0.22 | % | $1.13 | |||||||||
Hypothetical (5% return before expenses) | $ | 1,000.00 | $ | 1,024.10 | 0.22 | % | $1.12 | |||||||||
| Xtrackers Short Duration High Yield Bond ETF |
| |||||||||||||||
Actual | $ | 1,000.00 | $ | 1,026.10 | 0.20 | % | $1.02 | |||||||||
Hypothetical (5% return before expenses) | $ | 1,000.00 | $ | 1,024.20 | 0.20 | % | $1.02 | |||||||||
| Xtrackers USD High Yield Corporate Bond ETF |
| |||||||||||||||
Actual | $ | 1,000.00 | $ | 1,044.30 | 0.16 | % | $0.82 | |||||||||
Hypothetical (5% return before expenses) | $ | 1,000.00 | $ | 1,024.40 | 0.16 | % | $0.82 | |||||||||
(1) Expenses are equal to each Fund’s annualized expense ratio, multiplied by the average account value over the period, multiplied by 184 (the number of days in the most recentsix-month period), then divided by 365.
18
DBX ETF Trust
Schedule of Investments
Xtrackers Barclays International Corporate Bond Hedged ETF
August 31, 2019
Principal | Value | |||||||||
| CORPORATE BONDS — 95.7% |
| |||||||||
| Australia — 3.0% | ||||||||||
National Australia Bank Ltd., REGS Series GMTN, 0.625%, 11/10/23 | EUR | 25,000 | $ | 28,533 | ||||||
Series GMTN, 1.25%, 5/18/26 | EUR | 15,000 | 18,066 | |||||||
Wesfarmers Ltd., REGS Series EMTN, | EUR | 100,000 | 113,489 | |||||||
|
| |||||||||
| 160,088 | ||||||||||
|
| |||||||||
| Austria — 1.0% | ||||||||||
OMV AG, REGS | EUR | 35,000 | 41,547 | |||||||
Vienna Insurance Group AG Wiener Versicherung Gruppe, REGS | EUR | 10,000 | 12,512 | |||||||
|
| |||||||||
| 54,059 | ||||||||||
|
| |||||||||
| Belgium — 1.6% | ||||||||||
Anheuser-Busch InBev SA/NV, REGS Series EMTN, 1.75%, 3/7/25 | GBP | 25,000 | 31,291 | |||||||
Series EMTN, 1.50%, 4/18/30 | EUR | 10,000 | 12,248 | |||||||
Series EMTN, 2.75%, 3/17/36 | EUR | 30,000 | 42,578 | |||||||
|
| |||||||||
| 86,117 | ||||||||||
|
| |||||||||
| Canada — 9.5% | ||||||||||
407 International, Inc. Series MTN, 2.47%, 9/8/22 | CAD | 60,000 | 45,751 | |||||||
Bank of Montreal Series DPNT, | CAD | 50,000 | 40,732 | |||||||
Bank of Nova Scotia Series DPNT, | CAD | 50,000 | 40,444 | |||||||
Bell Canada, Inc., REGS Series MTN, | CAD | 15,000 | 12,479 | |||||||
Brookfield Asset Management, Inc. Series MTN, 3.80%, 3/16/27 | CAD | 25,000 | 19,974 | |||||||
Canadian National Railway Co. | CAD | 13,000 | 11,134 | |||||||
Canadian Natural Resources Ltd. Series MTN, 3.42%, 12/1/26 | CAD | 10,000 | 7,814 | |||||||
CU, Inc. | CAD | 20,000 | 18,980 | |||||||
Hydro One, Inc. Series MTN, | CAD | 20,000 | 16,991 | |||||||
Inter Pipeline Ltd. Series MTN, | CAD | 100,000 | 77,216 | |||||||
Loblaw Cos. Ltd. Series MTN, | CAD | 10,000 | 9,658 | |||||||
McGill University Series B, | CAD | 5,000 | 4,818 | |||||||
Metro, Inc. Series MTN, | CAD | 20,000 | 15,380 | |||||||
OMERS Realty Corp. Series 9, | CAD | 10,000 | 8,112 | |||||||
Series 11, 3.628%, 6/5/30 | CAD | 24,000 | 20,303 | |||||||
Royal Bank of Canada Series DPNT, | CAD | 35,000 | 26,619 | |||||||
Royal Office Finance LP Series A, | CAD | 35,577 | 34,005 | |||||||
Principal | Value | |||||||||
| Canada (Continued) | ||||||||||
Shaw Communications, Inc. | CAD | 30,000 | $ | 24,031 | ||||||
Suncor Energy, Inc. Series MTN, | CAD | 10,000 | 7,669 | |||||||
Toronto-Dominion Bank Series DPNT, | CAD | 85,000 | 67,585 | |||||||
|
| |||||||||
| 509,695 | ||||||||||
|
| |||||||||
| France — 10.4% | ||||||||||
BNP Paribas SA Series EMTN, | GBP | 10,000 | 13,368 | |||||||
BNP Paribas SA, REGS Series EMTN, | EUR | 40,000 | 49,627 | |||||||
Series EMTN, | EUR | 20,000 | 24,703 | |||||||
Engie SA, REGS Series EMTN, | EUR | 25,000 | 30,588 | |||||||
Series EMTN, 5.95%, 3/16/11 | EUR | 10,000 | 22,532 | |||||||
LVMH Moet Hennessy Louis Vuitton SE, REGS Series EMTN, | GBP | 10,000 | 12,236 | |||||||
Series EMTN, 0.75%, 5/26/24 | EUR | 30,000 | 34,589 | |||||||
Orange SA Series EMTN, | GBP | 25,000 | 43,935 | |||||||
Orange SA, REGS Series EMTN, | EUR | 100,000 | 126,074 | |||||||
PSA Tresorerie GIE | EUR | 5,000 | 8,005 | |||||||
RCI Banque SA, REGS Series EMTN, | EUR | 15,000 | 17,446 | |||||||
Suez, REGS Series EMTN, | EUR | 50,000 | 70,607 | |||||||
Total Capital International SA, REGS Series EMTN, 1.75%, 7/7/25 | GBP | 10,000 | 12,638 | |||||||
Total Capital SA, REGS Series EMTN, | EUR | 50,000 | 68,779 | |||||||
Veolia Environnement SA Series EMTN, | EUR | 10,000 | 19,591 | |||||||
|
| |||||||||
| 554,718 | ||||||||||
|
| |||||||||
| Germany — 8.0% | ||||||||||
BASF SE, REGS Series EMTN, | EUR | 20,000 | 22,734 | |||||||
Series DIP, 1.625%, 11/15/37 | EUR | 10,000 | 13,105 | |||||||
Bayer AG, REGS | EUR | 35,000 | 41,206 | |||||||
Commerzbank AG, REGS Series EMTN, | EUR | 40,000 | 48,936 | |||||||
Daimler AG, REGS Series EMTN, | EUR | 30,000 | 36,033 | |||||||
Deutsche Boerse AG, REGS | EUR | 10,000 | 12,218 | |||||||
Deutsche Post AG, REGS Series EMTN, | EUR | 15,000 | 19,248 | |||||||
Series EMTN, 1.00%, 12/13/27 | EUR | 15,000 | 17,989 | |||||||
| See Notes to Financial Statements. | 19 |
DBX ETF Trust
Schedule of Investments
Xtrackers Barclays International Corporate Bond Hedged ETF(Continued)
August 31, 2019
Principal | Value | |||||||||
| Germany (Continued) | ||||||||||
Series EMTN, 1.625%, 12/5/28 | EUR | 20,000 | $ | 25,173 | ||||||
E.ON SE, REGS Series EMTN, | EUR | 10,000 | 12,398 | |||||||
Henkel AG & Co. KGaA, REGS Series EMTN, 0.049%, 9/13/21 | EUR | 10,000 | 11,072 | |||||||
HOCHTIEF AG, REGS Series EMTN, | EUR | 15,000 | 17,735 | |||||||
Infineon Technologies AG, REGS | EUR | 25,000 | 28,676 | |||||||
Knorr-Bremse AG, REGS Series EMTN, | EUR | 25,000 | 29,436 | |||||||
LANXESS AG, REGS Series EMTN, | EUR | 20,000 | 23,337 | |||||||
Merck KGaA, REGS | EUR | 25,000 | 31,047 | |||||||
SAP SE, REGS Series EMTN, | EUR | 30,000 | 37,680 | |||||||
|
| |||||||||
| 428,023 | ||||||||||
|
| |||||||||
| Ireland — 1.5% | ||||||||||
Fresenius Finance Ireland PLC, REGS | EUR | 30,000 | 40,088 | |||||||
Freshwater Finance PLC, REGS Series A, | GBP | 10,000 | 17,490 | |||||||
GE Capital European Funding Unlimited Co. Series EMTN, | EUR | 5,000 | 8,012 | |||||||
GE Capital UK Funding Unlimited Co. Series EMTN, | GBP | 10,000 | 16,287 | |||||||
|
| |||||||||
| 81,877 | ||||||||||
|
| |||||||||
| Italy — 3.7% | ||||||||||
Assicurazioni Generali SpA, REGS Series EMTN, 5.125%, 9/16/24 | EUR | 50,000 | 69,356 | |||||||
Autostrade per l’Italia SpA Series EMTN, | GBP | 10,000 | 13,341 | |||||||
UniCredit SpA, REGS Series EMTN, | EUR | 100,000 | 115,280 | |||||||
|
| |||||||||
| 197,977 | ||||||||||
|
| |||||||||
| Japan — 1.8% | ||||||||||
Shinkin Central Bank Series 323, | JPY | 10,000,000 | 94,186 | |||||||
|
| |||||||||
| Luxembourg — 2.0% | ||||||||||
Hannover Finance Luxembourg SA | EUR | 50,000 | 58,273 | |||||||
HeidelbergCement Finance Luxembourg SA, REGS Series EMTN, | EUR | 25,000 | 29,894 | |||||||
Series EMTN, 1.75%, 4/24/28 | EUR | 15,000 | 18,174 | |||||||
|
| |||||||||
| 106,341 | ||||||||||
|
| |||||||||
Principal | Value | |||||||||
| Netherlands — 16.7% |
| |||||||||
ABN AMRO Bank NV, REGS Series EMTN, 1.00%, 4/16/25 | EUR | 40,000 | $ | 47,020 | ||||||
Allianz Finance II BV, REGS Series 61, | EUR | 100,000 | 140,488 | |||||||
BMW Finance NV, REGS Series EMTN, | EUR | 40,000 | 45,671 | |||||||
Cooperatieve Rabobank UA Series GMTN, 5.25%, 5/23/41 | GBP | 10,000 | 20,111 | |||||||
Cooperatieve Rabobank UA, REGS Series EMTN, 4.75%, 6/6/22 | EUR | 65,000 | 81,669 | |||||||
Series GMTN, 1.375%, 2/3/27 | EUR | 15,000 | 18,370 | |||||||
Daimler International Finance BV, REGS Series EMTN, 1.50%, 2/9/27 | EUR | 35,000 | 41,997 | |||||||
Deutsche Telekom International Finance BV, REGS Series EMTN, | EUR | 20,000 | 24,125 | |||||||
E.ON International Finance BV Series EMTN, 6.375%, 6/7/32 | GBP | 15,000 | 27,091 | |||||||
Enel Finance International NV Series EMTN, 5.25%, 9/29/23 | EUR | 30,000 | 40,234 | |||||||
Evonik Finance BV, REGS Series EMTN, | EUR | 20,000 | 23,492 | |||||||
innogy Finance BV, REGS Series EMTN, | EUR | 10,000 | 12,025 | |||||||
Series EMTN, 6.25%, 6/3/30 | GBP | 15,000 | 25,817 | |||||||
Series EMTN, 5.75%, 2/14/33 | EUR | 10,000 | 18,266 | |||||||
Linde Finance BV, REGS Series EMTN, | EUR | 15,000 | 18,371 | |||||||
Roche Finance Europe BV, REGS Series EMTN, 0.875%, 2/25/25 | EUR | 25,000 | 29,225 | |||||||
Shell International Finance BV, REGS Series EMTN, 0.875%, 8/21/28 | CHF | 25,000 | 28,322 | |||||||
Siemens Financieringsmaatschappij NV, REGS Series EMTN, | EUR | 50,000 | 68,372 | |||||||
Telefonica Europe BV, REGS Series EMTN, 5.875%, 2/14/33 | EUR | 10,000 | 17,683 | |||||||
Volkswagen Financial Services NV, REGS Series EMTN, | GBP | 40,000 | 49,178 | |||||||
Volkswagen International Finance NV, REGS | EUR | 50,000 | 60,770 | |||||||
Vonovia Finance BV, REGS Series DIP, | EUR | 45,000 | 53,689 | |||||||
|
| |||||||||
| 891,986 | ||||||||||
|
| |||||||||
| Spain — 2.3% |
| |||||||||
Banco Santander SA, REGS Series EMTN, | EUR | 100,000 | 121,051 | |||||||
|
| |||||||||
| See Notes to Financial Statements. | 20 |
DBX ETF Trust
Schedule of Investments
Xtrackers Barclays International Corporate Bond Hedged ETF(Continued)
August 31, 2019
Principal | Value | |||||||||
| United Kingdom — 18.7% |
| |||||||||
Barclays Bank PLC, REGS Series EMTN, | EUR | 100,000 | $ | 126,537 | ||||||
Centrica PLC, REGS Series EMTN, | GBP | 50,000 | 68,919 | |||||||
Credit Agricole SA, REGS Series EMTN, | EUR | 100,000 | 132,625 | |||||||
GlaxoSmithKline Capital PLC | EUR | 25,000 | 34,246 | |||||||
Series EMTN, 5.25%, 12/19/33 | GBP | 10,000 | 17,701 | |||||||
Heathrow Funding Ltd., REGS | GBP | 50,000 | 69,473 | |||||||
HSBC Bank PLC Series EMTN, | GBP | 50,000 | 76,466 | |||||||
HSBC Bank PLC, REGS Series EMTN, | EUR | 50,000 | 58,221 | |||||||
Lloyds Bank PLC, REGS Series EMTN, | EUR | 100,000 | 112,954 | |||||||
Series EMTN, 7.625%, 4/22/25 | GBP | 10,000 | 15,599 | |||||||
Segro PLC | GBP | 15,000 | 27,084 | |||||||
Severn Trent Utilities Finance PLC, REGS | GBP | 10,000 | 17,291 | |||||||
Southern Electric Power Distribution PLC, REGS | GBP | 10,000 | 16,972 | |||||||
THFC Funding No 1 PLC | GBP | 25,000 | 43,322 | |||||||
Vodafone Group PLC, REGS Series EMTN, | EUR | 100,000 | 112,958 | |||||||
Series MTN, 4.20%, 12/13/27 | AUD | 20,000 | 15,105 | |||||||
Series EMTN, 5.90%, 11/26/32 | GBP | 30,000 | 53,049 | |||||||
|
| |||||||||
| 998,522 | ||||||||||
|
| |||||||||
| United States — 15.5% |
| |||||||||
Apple, Inc. Series EMTN, | EUR | 100,000 | 114,899 | |||||||
AT&T, Inc. | EUR | 100,000 | 121,860 | |||||||
FedEx Corp. | EUR | 50,000 | 59,749 | |||||||
General Electric Co. Series EMTN, | GBP | 15,000 | 21,478 | |||||||
Goldman Sachs Group, Inc., REGS Series EMTN, | EUR | 30,000 | 34,549 | |||||||
Series EMTN, 1.00%, 11/24/25 | CHF | 5,000 | 5,428 | |||||||
Series EMTN, 2.00%, 3/22/28 | EUR | 20,000 | 24,736 | |||||||
Series EMTN, 2.00%, 11/1/28 | EUR | 25,000 | 31,050 | |||||||
Johnson & Johnson | GBP | 50,000 | 75,006 | |||||||
JPMorgan Chase & Co., REGS Series EMTN, | CHF | 5,000 | 5,307 | |||||||
Principal | Value | |||||||||||
| United States (Continued) | ||||||||||||
Kraft Heinz Foods Co., REGS | EUR | 100,000 | $ | 118,489 | ||||||||
McDonald’s Corp. Series EMTN, | GBP | 15,000 | 26,586 | |||||||||
Morgan Stanley Series GMTN, | EUR | 25,000 | 28,642 | |||||||||
Nestle Holdings, Inc., REGS Series DIP, | EUR | 15,000 | 17,568 | |||||||||
Prologis LP | EUR | 100,000 | 111,538 | |||||||||
TWDC Enterprises 18 Corp. Series MPLE, | CAD | 20,000 | 15,537 | |||||||||
Verizon Communications, Inc., REGS Series MTN, | AUD | 20,000 | 14,314 | |||||||||
|
| |||||||||||
| 826,736 | ||||||||||||
|
| |||||||||||
TOTAL CORPORATE BONDS | 5,111,376 | |||||||||||
|
| |||||||||||
| SOVEREIGN BONDS — 1.6% | ||||||||||||
| Japan — 1.6% |
| |||||||||||
Japan Government Ten Year Bond Series 345, | JPY | 4,500,000 | 43,905 | |||||||||
Japan Government Two Year Bond Series 400, | JPY | 4,800,000 | 45,482 | |||||||||
|
| |||||||||||
| 89,387 | ||||||||||||
|
| |||||||||||
TOTAL SOVEREIGN BONDS (Cost $86,048) | 89,387 | |||||||||||
|
| |||||||||||
Number of Shares | ||||||||||||
| CASH EQUIVALENTS — 0.8% | ||||||||||||
DWS Government Money Market Series “Institutional Shares”, 2.09% (b) | 41,312 | 41,312 | ||||||||||
|
| |||||||||||
TOTAL INVESTMENTS — 98.1% (Cost $5,114,303) | $ | 5,242,075 | ||||||||||
Other assets and liabilities, net —1.9% | 99,856 | |||||||||||
|
| |||||||||||
NET ASSETS — 100.0% | $ | 5,341,931 | ||||||||||
|
| |||||||||||
| See Notes to Financial Statements. | 21 |
DBX ETF Trust
Schedule of Investments
Xtrackers Barclays International Corporate Bond Hedged ETF(Continued)
August 31, 2019
A summary of the Fund’s transactions with affiliated investments during the year ended August 31, 2019 is as follows:
| Value ($) at 8/31/2018 | Purchases Cost ($) | Sales Proceeds ($) | Net Realized Gain/(Loss) ($) | Net Change in Unrealized Appreciation (Depreciation) ($) | Income ($) | Capital Gain Distributions ($) | Number of Shares at 8/31/2019 | Value ($) at 8/31/2019 | ||||||||||||||||||||||||||||||
CASH EQUIVALENTS —0.8% | ||||||||||||||||||||||||||||||||||||||
DWS Government Money Market Series “Institutional Shares”, 2.09%(b) | ||||||||||||||||||||||||||||||||||||||
| — | 429,551 | (388,239 | ) | — | — | 560 | — | 41,312 | 41,312 | |||||||||||||||||||||||||||||
| (a) | Perpetual, callable security with no stated maturity date. |
| (b) | Affiliated fund managed by DWS Investment Management Americas, Inc. The rate shown is the annualizedseven-day yield at period end. |
| DIP: | Debtor In Possession |
| DPNT: | Deposit Note |
| EMTN: | Euro Medium Term Note |
| GMTN: | Global Medium Term Note |
| MTN: | Medium Term Note |
| REGS: | Securities sold under Regulation S may not be offered, sold or delivered within the United States or to, or for the account or benefit of, U.S. persons, except pursuant to an exemption from, or in a transaction not subject to, the registration requirements of the Securities Act of 1933. |
As of August 31, 2019, the Fund had the following forward foreign currency contracts outstanding:
|
| |||||||||||||||||||||
Counterparty | Settlement Date | Currency To Deliver | Currency To Receive | Unrealized Appreciation | Unrealized Depreciation | |||||||||||||||||
The Bank of Nova Scotia | 9/5/2019 | AUD | 94,864 | USD | 65,448 | $ | 1,552 | $ | — | |||||||||||||
The Bank of Nova Scotia | 9/5/2019 | CAD | 697,098 | USD | 531,150 | 7,525 | — | |||||||||||||||
The Bank of Nova Scotia | 9/5/2019 | CHF | 36,600 | USD | 37,073 | 77 | — | |||||||||||||||
The Bank of Nova Scotia | 9/5/2019 | EUR | 3,199,936 | USD | 3,571,385 | 53,097 | — | |||||||||||||||
The Bank of Nova Scotia | 9/5/2019 | EUR | 87,365 | USD | 97,530 | 1,473 | — | |||||||||||||||
The Bank of Nova Scotia | 9/5/2019 | GBP | 584,945 | USD | 717,274 | 5,352 | — | |||||||||||||||
The Bank of Nova Scotia | 9/5/2019 | GBP | 70,420 | USD | 86,363 | 656 | — | |||||||||||||||
The Bank of Nova Scotia | 9/5/2019 | JPY | 19,563,110 | USD | 180,575 | — | (3,644 | ) | ||||||||||||||
The Bank of Nova Scotia | 9/5/2019 | USD | 35,384 | AUD | 51,275 | — | (847 | ) | ||||||||||||||
The Bank of Nova Scotia | 9/5/2019 | USD | 29,368 | AUD | 43,589 | — | (9 | ) | ||||||||||||||
The Bank of Nova Scotia | 9/5/2019 | USD | 524,607 | CAD | 697,098 | — | (982 | ) | ||||||||||||||
The Bank of Nova Scotia | 9/5/2019 | USD | 36,990 | CHF | 36,600 | 6 | — | |||||||||||||||
The Bank of Nova Scotia | 9/5/2019 | USD | 3,620,140 | EUR | 3,287,301 | — | (5,796 | ) | ||||||||||||||
The Bank of Nova Scotia | 9/5/2019 | USD | 798,136 | GBP | 655,365 | — | (507 | ) | ||||||||||||||
The Bank of Nova Scotia | 9/5/2019 | USD | 184,306 | JPY | 19,563,110 | — | (87 | ) | ||||||||||||||
The Bank of Nova Scotia | 10/3/2019 | AUD | 43,589 | USD | 29,392 | 7 | — | |||||||||||||||
The Bank of Nova Scotia | 10/3/2019 | CAD | 697,098 | USD | 524,836 | 980 | — | |||||||||||||||
The Bank of Nova Scotia | 10/3/2019 | CAD | 12,320 | USD | 9,281 | 23 | — | |||||||||||||||
The Bank of Nova Scotia | 10/3/2019 | CHF | 36,600 | USD | 37,086 | — | (6 | ) | ||||||||||||||
The Bank of Nova Scotia | 10/3/2019 | EUR | 3,287,301 | USD | 3,628,095 | 5,715 | — | |||||||||||||||
The Bank of Nova Scotia | 10/3/2019 | EUR | 32,000 | USD | 35,322 | 60 | — | |||||||||||||||
The Bank of Nova Scotia | 10/3/2019 | GBP | 655,365 | USD | 799,129 | 507 | — | |||||||||||||||
The Bank of Nova Scotia | 10/3/2019 | GBP | 24,520 | USD | 29,901 | 21 | — | |||||||||||||||
The Bank of Nova Scotia | 10/3/2019 | JPY | 19,563,110 | USD | 184,689 | 85 | — | |||||||||||||||
|
|
|
| |||||||||||||||||||
Total unrealized appreciation (depreciation) | $ | 77,136 | $ | (11,878 | ) | |||||||||||||||||
|
|
|
| |||||||||||||||||||
For information on the Fund’s policy and additional disclosures regarding forward foreign currency contracts, please refer to the Derivatives section of Note 2 in the accompanying Notes to Financial Statements.
| See Notes to Financial Statements. | 22 |
DBX ETF Trust
Schedule of Investments
Xtrackers Barclays International Corporate Bond Hedged ETF(Continued)
August 31, 2019
Currency Abbreviations
| AUD | Australian Dollar |
| CAD | Canadian Dollar |
| CHF | Swiss Franc |
| EUR | Euro |
| GBP | Pound Sterling |
| JPY | Japanese Yen |
| USD | U.S. Dollar |
Fair Value Measurements
Various inputs are used in determining the value of the Fund’s investments. These inputs are summarized in three broad levels. Level 1 includes quoted prices in active markets for identical securities. Level 2 includes other significant observable inputs (including quoted prices for similar securities, interest rates, prepayment speeds and credit risk). Level 3 includes significant unobservable inputs (including the Fund’s own assumptions in determining the fair value of investments). The level assigned to the securities valuations may not be an indication of the risk or liquidity associated with investing in those securities.
The following is a summary of the inputs used as of August 31, 2019 in valuing the Fund’s investments. For information on the Fund’s policy regarding the valuation of investments, please refer to the Security Valuation section of Note 2 in the accompanying Notes to Financial Statements.
Assets | Level 1 | Level 2 | Level 3 | Total | ||||||||||||
Corporate Bonds (c) | $ | — | $ | 5,111,376 | $ | — | $ | 5,111,376 | ||||||||
Sovereign Bonds | — | 89,387 | — | 89,387 | ||||||||||||
Short-Term Investments (c) | 41,312 | — | — | 41,312 | ||||||||||||
Derivatives (d) | ||||||||||||||||
Forward Foreign Currency Contracts | — | 77,136 | — | 77,136 | ||||||||||||
|
|
|
|
|
|
|
| |||||||||
TOTAL | $ | 41,312 | $ | 5,277,899 | $ | — | $ | 5,319,211 | ||||||||
|
|
|
|
|
|
|
| |||||||||
Liabilities | Level 1 | Level 2 | Level 3 | Total | ||||||||||||
Derivatives (d) | ||||||||||||||||
Forward Foreign Currency Contracts | $ | — | $ | (11,878 | ) | $ | — | $ | (11,878 | ) | ||||||
|
|
|
|
|
|
|
| |||||||||
TOTAL | $ | — | $ | (11,878 | ) | $ | — | $ | (11,878 | ) | ||||||
|
|
|
|
|
|
|
| |||||||||
| (c) | See Schedule of Investments for additional detailed categorizations. |
| (d) | Derivatives include unrealized appreciation (depreciation) on forward foreign currency contracts. |
| See Notes to Financial Statements. | 23 |
DBX ETF Trust
Schedule of Investments
Xtrackers Barclays International Treasury Bond Hedged ETF
August 31, 2019
Principal | Value | |||||||||||
| SOVEREIGN BONDS — 95.5% | ||||||||||||
| Australia — 3.6% | ||||||||||||
Australia Government Bond | AUD | 10,000 | $ | 7,703 | ||||||||
2.25%, 11/21/22 | AUD | 120,000 | 84,870 | |||||||||
5.50%, 4/21/23, REGS | AUD | 50,000 | 39,497 | |||||||||
3.25%, 4/21/25, REGS | AUD | 29,000 | 22,248 | |||||||||
4.25%, 4/21/26, REGS | AUD | 20,000 | 16,488 | |||||||||
4.75%, 4/21/27, REGS | AUD | 25,000 | 21,725 | |||||||||
2.75%, 11/21/27, REGS | AUD | 25,000 | 19,371 | |||||||||
2.25%, 5/21/28, REGS | AUD | 20,000 | 15,025 | |||||||||
2.75%, 11/21/28, REGS | AUD | 140,000 | 109,814 | |||||||||
4.50%, 4/21/33, REGS | AUD | 25,000 | 24,312 | |||||||||
3.25%, 6/21/39, REGS | AUD | 10,000 | 9,038 | |||||||||
3.00%, 3/21/47, REGS | AUD | 20,000 | 18,120 | |||||||||
|
| |||||||||||
| 388,211 | ||||||||||||
|
| |||||||||||
| Austria — 2.6% | ||||||||||||
Republic of Austria Government Bond | EUR | 35,000 | 43,070 | |||||||||
9/20/22, 144A, REGS | EUR | 10,000 | 11,273 | |||||||||
1.65%, 10/21/24, 144A, REGS | EUR | 5,000 | 6,187 | |||||||||
0.75%, 10/20/26, 144A, REGS | EUR | 10,000 | 12,087 | |||||||||
0.50%, 4/20/27, 144A, REGS | EUR | 5,000 | 5,965 | |||||||||
6.25%, 7/15/27 | EUR | 5,000 | 8,543 | |||||||||
0.75%, 2/20/28, 144A, REGS | EUR | 50,000 | 61,097 | |||||||||
2.40%, 5/23/34, 144A, REGS | EUR | 50,000 | 76,433 | |||||||||
3.15%, 6/20/44, 144A, REGS | EUR | 5,000 | 9,689 | |||||||||
1.50%, 2/20/47, 144A, REGS | EUR | 27,000 | 40,511 | |||||||||
2.10%, 9/20/17, 144A, REGS | EUR | 2,000 | 4,461 | |||||||||
|
| |||||||||||
| 279,316 | ||||||||||||
|
| |||||||||||
| Belgium — 4.5% | ||||||||||||
Kingdom of Belgium Government Bond | EUR | 30,000 | 34,574 | |||||||||
4.25%, 9/28/21, 144A, REGS | EUR | 20,000 | 24,324 | |||||||||
4.00%, 3/28/22 | EUR | 13,000 | 16,089 | |||||||||
0.20%, 10/22/23, 144A, REGS | EUR | 55,000 | 62,894 | |||||||||
0.80%, 6/22/25, 144A, REGS | EUR | 25,000 | 29,810 | |||||||||
1.00%, 6/22/26, 144A, REGS | EUR | 25,000 | 30,466 | |||||||||
0.80%, 6/22/27, 144A, REGS | EUR | 40,000 | 48,516 | |||||||||
5.50%, 3/28/28 | EUR | 10,000 | 16,735 | |||||||||
0.80%, 6/22/28, 144A, REGS | EUR | 15,000 | 18,303 | |||||||||
1.00%, 6/22/31, 144A, REGS | EUR | 25,000 | 31,494 | |||||||||
1.25%, 4/22/33, REGS | EUR | 30,000 | 39,180 | |||||||||
3.00%, 6/22/34, 144A, REGS | EUR | 2,000 | 3,203 | |||||||||
5.00%, 3/28/35, 144A, REGS | EUR | 5,000 | 9,806 | |||||||||
4.25%, 3/28/41, 144A, REGS | EUR | 23,000 | 46,672 | |||||||||
3.75%, 6/22/45, REGS | EUR | 3,000 | 6,091 | |||||||||
1.60%, 6/22/47, 144A, REGS | EUR | 35,000 | 50,433 | |||||||||
2.15%, 6/22/66, 144A, REGS | EUR | 5,000 | 8,466 | |||||||||
|
| |||||||||||
| 477,056 | ||||||||||||
|
| |||||||||||
| Canada — 3.7% | ||||||||||||
Canadian Government Bond | CAD | 30,000 | 22,355 | |||||||||
2.25%, 2/1/21 | CAD | 85,000 | 64,555 | |||||||||
0.75%, 3/1/21 | CAD | 30,000 | 22,303 | |||||||||
Principal | Value | |||||||||||
| Canada (Continued) | ||||||||||||
1.00%, 9/1/22 | CAD | 60,000 | $ | 44,684 | ||||||||
1.50%, 6/1/23 | CAD | 50,000 | 37,904 | |||||||||
8.00%, 6/1/27 | CAD | 25,000 | 28,210 | |||||||||
2.00%, 6/1/28 | CAD | 80,000 | 64,300 | |||||||||
5.75%, 6/1/29 | CAD | 10,000 | 10,647 | |||||||||
5.75%, 6/1/33 | CAD | 28,000 | 32,864 | |||||||||
3.50%, 12/1/45 | CAD | 27,000 | 29,403 | |||||||||
2.75%, 12/1/48 | CAD | 35,000 | 34,585 | |||||||||
|
| |||||||||||
| 391,810 | ||||||||||||
|
| |||||||||||
| Chile — 0.3% | ||||||||||||
Bonos de la Tesoreria de la Republica en pesos | CLP | 20,000,000 | 33,033 | |||||||||
|
| |||||||||||
| Cyprus — 0.1% | ||||||||||||
Cyprus Government International Bond | EUR | 7,000 | 9,090 | |||||||||
|
| |||||||||||
| Czech Republic — 0.5% | ||||||||||||
Czech Republic Government Bond | CZK | 500,000 | 26,021 | |||||||||
1.00%, 6/26/26, REGS | CZK | 600,000 | 25,589 | |||||||||
|
| |||||||||||
| 51,610 | ||||||||||||
|
| |||||||||||
| Denmark — 1.1% | ||||||||||||
Denmark Government Bond | DKK | 200,000 | 34,454 | |||||||||
0.50%, 11/15/27 | DKK | 200,000 | 32,747 | |||||||||
0.50%, 11/15/29, 144A, REGS | DKK | 325,000 | 53,910 | |||||||||
|
| |||||||||||
| 121,111 | ||||||||||||
|
| |||||||||||
| Finland — 1.1% | ||||||||||||
Finland Government Bond | EUR | 7,000 | 7,787 | |||||||||
1.625%, 9/15/22, 144A, REGS | EUR | 25,000 | 29,556 | |||||||||
2.00%, 4/15/24, 144A, REGS | EUR | 25,000 | 31,100 | |||||||||
4.00%, 7/4/25, 144A, REGS | EUR | 5,000 | 7,053 | |||||||||
0.75%, 4/15/31, 144A, REGS | EUR | 20,000 | 24,875 | |||||||||
1.375%, 4/15/47, 144A, REGS | EUR | 10,000 | 15,089 | |||||||||
|
| |||||||||||
| 115,460 | ||||||||||||
|
| |||||||||||
| France — 7.0% | ||||||||||||
French Republic Government Bond OAT | EUR | 45,000 | 50,097 | |||||||||
3.75%, 4/25/21, REGS | EUR | 5,000 | 5,916 | |||||||||
5/25/22, REGS | EUR | 50,000 | 56,279 | |||||||||
3/25/23, REGS | EUR | 70,000 | 79,297 | |||||||||
4.25%, 10/25/23, REGS | EUR | 10,000 | 13,356 | |||||||||
2.25%, 5/25/24, REGS | EUR | 100,000 | 125,971 | |||||||||
0.50%, 5/25/25, REGS | EUR | 20,000 | 23,544 | |||||||||
3.50%, 4/25/26, REGS | EUR | 6,000 | 8,471 | |||||||||
0.50%, 5/25/26, REGS | EUR | 60,000 | 71,109 | |||||||||
1.00%, 5/25/27, REGS | EUR | 10,000 | 12,353 | |||||||||
2.75%, 10/25/27, REGS | EUR | 10,000 | 14,038 | |||||||||
0.75%, 5/25/28, REGS | EUR | 5,000 | 6,107 | |||||||||
0.75%, 11/25/28, REGS | EUR | 30,000 | 36,715 | |||||||||
| See Notes to Financial Statements. | 24 |
DBX ETF Trust
Schedule of Investments
Xtrackers Barclays International Treasury Bond Hedged ETF(Continued)
August 31, 2019
Principal Amount | Value | |||||||||||
| France (Continued) | ||||||||||||
2.50%, 5/25/30, REGS | EUR | 40,000 | $ | 57,732 | ||||||||
4.75%, 4/25/35, REGS | EUR | 8,000 | 15,517 | |||||||||
1.25%, 5/25/36, 144A, REGS | EUR | 10,000 | 13,303 | |||||||||
1.75%, 6/25/39, 144A, REGS | EUR | 35,000 | 50,903 | |||||||||
4.50%, 4/25/41, REGS | EUR | 2,000 | 4,258 | |||||||||
3.25%, 5/25/45, REGS | EUR | 25,000 | 47,935 | |||||||||
2.00%, 5/25/48, 144A, REGS | EUR | 6,000 | 9,550 | |||||||||
4.00%, 4/25/60, REGS | EUR | 6,000 | 14,877 | |||||||||
1.75%, 5/25/66, 144A, REGS | EUR | 20,000 | 32,002 | |||||||||
|
| |||||||||||
| 749,330 | ||||||||||||
|
| |||||||||||
| Germany — 4.6% | ||||||||||||
Bundesrepublik Deutschland Bundesanleihe | EUR | 25,000 | 29,408 | |||||||||
1.75%, 7/4/22, REGS | EUR | 50,000 | 59,256 | |||||||||
1.50%, 5/15/23, REGS | EUR | 8,000 | 9,616 | |||||||||
1.75%, 2/15/24, REGS | EUR | 75,000 | 92,612 | |||||||||
0.50%, 2/15/26, REGS | EUR | 15,000 | 18,036 | |||||||||
0.25%, 2/15/27, REGS | EUR | 20,000 | 23,870 | |||||||||
0.50%, 2/15/28, REGS | EUR | 11,000 | 13,470 | |||||||||
4.75%, 7/4/28, REGS | EUR | 2,000 | 3,319 | |||||||||
0.25%, 8/15/28, REGS | EUR | 30,000 | 36,101 | |||||||||
6.25%, 1/4/30, REGS | EUR | 2,000 | 3,856 | |||||||||
4.75%, 7/4/34, REGS | EUR | 20,000 | 40,089 | |||||||||
3.25%, 7/4/42, REGS | EUR | 25,000 | 51,042 | |||||||||
2.50%, 7/4/44, REGS | EUR | 15,000 | 28,360 | |||||||||
2.50%, 8/15/46, REGS | EUR | 5,000 | 9,723 | |||||||||
1.25%, 8/15/48, REGS | EUR | 6,000 | 9,499 | |||||||||
Bundesschatzanweisungen | EUR | 60,000 | 66,528 | |||||||||
|
| |||||||||||
| 494,785 | ||||||||||||
|
| |||||||||||
| Hungary — 0.4% | ||||||||||||
Hungary Government Bond | HUF | 7,000,000 | 24,171 | |||||||||
3.00%, 6/26/24 | HUF | 5,000,000 | 18,274 | |||||||||
|
| |||||||||||
| 42,445 | ||||||||||||
|
| |||||||||||
| Indonesia — 1.7% | ||||||||||||
Indonesia Treasury Bond | IDR | 300,000,000 | 21,880 | |||||||||
8.375%, 3/15/24 | IDR | 400,000,000 | 29,952 | |||||||||
8.375%, 9/15/26 | IDR | 500,000,000 | 37,452 | |||||||||
8.25%, 5/15/29 | IDR | 900,000,000 | 67,698 | |||||||||
6.375%, 4/15/42 | IDR | 400,000,000 | 23,497 | |||||||||
|
| |||||||||||
| 180,479 | ||||||||||||
|
| |||||||||||
| Ireland — 1.4% | ||||||||||||
Ireland Government Bond | EUR | 15,000 | 19,180 | |||||||||
5.40%, 3/13/25 | EUR | 35,000 | 51,081 | |||||||||
1.00%, 5/15/26, REGS | EUR | 10,000 | 12,010 | |||||||||
0.90%, 5/15/28, REGS | EUR | 22,000 | 26,485 | |||||||||
2.40%, 5/15/30, REGS | EUR | 5,000 | 6,925 | |||||||||
1.70%, 5/15/37, REGS | EUR | 20,000 | 26,915 | |||||||||
2.00%, 2/18/45, REGS | EUR | 5,000 | 7,368 | |||||||||
|
| |||||||||||
| 149,964 | ||||||||||||
|
| |||||||||||
Principal | Value | |||||||||||
| Israel — 0.7% | ||||||||||||
Israel Government Bond | ILS | 110,000 | $ | 43,148 | ||||||||
2.00%, 3/31/27 | ILS | 100,000 | 30,892 | |||||||||
|
| |||||||||||
| 74,040 | ||||||||||||
|
| |||||||||||
| Italy — 6.6% | ||||||||||||
Italy Buoni Poliennali Del Tesoro | EUR | 25,000 | 27,626 | |||||||||
3.75%, 3/1/21 | EUR | 55,000 | 64,053 | |||||||||
3.75%, 8/1/21, 144A, REGS | EUR | 35,000 | 41,306 | |||||||||
5.00%, 3/1/22 | EUR | 5,000 | 6,183 | |||||||||
0.95%, 3/15/23 | EUR | 30,000 | 33,852 | |||||||||
1.85%, 5/15/24 | EUR | 55,000 | 64,593 | |||||||||
1.45%, 11/15/24, REGS | EUR | 10,000 | 11,559 | |||||||||
1.45%, 5/15/25, REGS | EUR | 40,000 | 46,233 | |||||||||
7.25%, 11/1/26 | EUR | 50,000 | 79,874 | |||||||||
6.50%, 11/1/27 | EUR | 5,000 | 7,965 | |||||||||
2.00%, 2/1/28, REGS | EUR | 60,000 | 72,327 | |||||||||
4.75%, 9/1/28, 144A, REGS | EUR | 14,000 | 20,578 | |||||||||
5.25%, 11/1/29 | EUR | 10,000 | 15,395 | |||||||||
3.50%, 3/1/30, 144A, REGS | EUR | 25,000 | 33,926 | |||||||||
1.65%, 3/1/32, 144A, REGS | EUR | 30,000 | 34,490 | |||||||||
5.75%, 2/1/33 | EUR | 15,000 | 25,232 | |||||||||
5.00%, 8/1/34, 144A, REGS | EUR | 30,000 | 48,455 | |||||||||
2.95%, 9/1/38, 144A, REGS | EUR | 15,000 | 19,857 | |||||||||
4.75%, 9/1/44, 144A, REGS | EUR | 25,000 | 42,574 | |||||||||
2.80%, 3/1/67, 144A, REGS | EUR | 4,000 | 5,074 | |||||||||
|
| |||||||||||
| 701,152 | ||||||||||||
|
| |||||||||||
| Japan — 23.9% | ||||||||||||
Japan Government Five Year Bond | JPY | 9,000,000 | 85,059 | |||||||||
0.10%, 6/20/21 | JPY | 4,000,000 | 37,924 | |||||||||
0.10%, 9/20/21 | JPY | 20,000,000 | 189,853 | |||||||||
0.10%, 6/20/22 | JPY | 3,000,000 | 28,578 | |||||||||
0.10%, 12/20/22 | JPY | 2,000,000 | 19,099 | |||||||||
0.10%, 3/20/23 | JPY | 2,000,000 | 19,128 | |||||||||
Japan Government Forty Year Bond | JPY | 5,000,000 | 67,361 | |||||||||
0.40%, 3/20/56 | JPY | 1,000,000 | 10,229 | |||||||||
0.50%, 3/20/59 | JPY | 2,000,000 | 21,238 | |||||||||
Japan Government Ten Year Bond | JPY | 10,000,000 | 95,950 | |||||||||
1.00%, 12/20/21 | JPY | 1,000,000 | 9,699 | |||||||||
0.90%, 6/20/22 | JPY | 8,000,000 | 77,882 | |||||||||
0.80%, 9/20/22 | JPY | 6,000,000 | 58,437 | |||||||||
0.60%, 3/20/23 | JPY | 2,000,000 | 19,461 | |||||||||
0.80%, 6/20/23 | JPY | 1,000,000 | 9,827 | |||||||||
0.60%, 12/20/23 | JPY | 2,000,000 | 19,605 | |||||||||
0.60%, 3/20/24 | JPY | 1,000,000 | 9,825 | |||||||||
0.30%, 12/20/24 | JPY | 21,000,000 | 204,824 | |||||||||
0.40%, 3/20/25 | JPY | 3,000,000 | 29,477 | |||||||||
0.10%, 6/20/26 | JPY | 2,000,000 | 19,452 | |||||||||
0.10%, 9/20/26 | JPY | 1,000,000 | 9,743 | |||||||||
0.10%, 12/20/26 | JPY | 2,000,000 | 19,513 | |||||||||
0.10%, 3/20/28 | JPY | 1,000,000 | 9,786 | |||||||||
0.10%, 6/20/28 | JPY | 1,000,000 | 9,786 | |||||||||
0.10%, 12/20/28 | JPY | 22,000,000 | 215,136 | |||||||||
| See Notes to Financial Statements. | 25 |
DBX ETF Trust
Schedule of Investments
Xtrackers Barclays International Treasury Bond Hedged ETF(Continued)
August 31, 2019
Principal | Value | |||||||||||
| Japan (Continued) | ||||||||||||
Japan Government Thirty Year Bond | JPY | 1,000,000 | $ | 12,350 | ||||||||
1.40%, 12/20/32 | JPY | 1,000,000 | 11,367 | |||||||||
2.50%, 3/20/38 | JPY | 9,000,000 | 123,723 | |||||||||
2.20%, 9/20/39 | JPY | 4,000,000 | 53,820 | |||||||||
2.00%, 9/20/41 | JPY | 4,000,000 | 53,552 | |||||||||
1.90%, 9/20/42 | JPY | 1,000,000 | 13,321 | |||||||||
1.80%, 3/20/43 | JPY | 1,000,000 | 13,174 | |||||||||
1.60%, 6/20/45 | JPY | 1,000,000 | 12,985 | |||||||||
1.40%, 9/20/45 | JPY | 1,200,000 | 15,037 | |||||||||
0.50%, 9/20/46 | JPY | 17,000,000 | 176,183 | |||||||||
Japan Government Twenty Year Bond | JPY | 4,000,000 | 40,002 | |||||||||
2.10%, 9/20/25 | JPY | 27,500,000 | 298,205 | |||||||||
1.80%, 9/20/30 | JPY | 4,000,000 | 46,235 | |||||||||
1.90%, 6/20/31 | JPY | 1,000,000 | 11,780 | |||||||||
1.70%, 9/20/32 | JPY | 5,000,000 | 58,610 | |||||||||
1.70%, 6/20/33 | JPY | 5,000,000 | 59,061 | |||||||||
1.50%, 6/20/34 | JPY | 22,000,000 | 256,638 | |||||||||
|
| |||||||||||
| 2,552,915 | ||||||||||||
|
| |||||||||||
| Lithuania — 0.1% | ||||||||||||
Lithuania Government International Bond | EUR | 5,000 | 5,981 | |||||||||
|
| |||||||||||
| Luxembourg — 0.1% | ||||||||||||
Luxembourg Government Bond | EUR | 5,000 | 6,144 | |||||||||
|
| |||||||||||
| Malaysia — 1.6% | ||||||||||||
Malaysia Government Bond | MYR | 350,000 | 86,289 | |||||||||
5.248%, 9/15/28 | MYR | 250,000 | 68,197 | |||||||||
Malaysia Government Investment Issue | MYR | 75,000 | 18,775 | |||||||||
|
| |||||||||||
| 173,261 | ||||||||||||
|
| |||||||||||
| Mexico — 1.6% | ||||||||||||
Mexican Bonos | MXN | 1,000,000 | 49,388 | |||||||||
5.75%, 3/5/26 | MXN | 1,700,000 | 79,606 | |||||||||
7.50%, 6/3/27 | MXN | 500,000 | 25,751 | |||||||||
7.75%, 11/23/34 | MXN | 300,000 | 15,655 | |||||||||
|
| |||||||||||
| 170,400 | ||||||||||||
|
| |||||||||||
| Netherlands — 3.5% | ||||||||||||
Netherlands Government Bond | EUR | 45,000 | 50,517 | |||||||||
7.50%, 1/15/23, 144A, REGS | EUR | 41,000 | 58,088 | |||||||||
1.75%, 7/15/23, 144A, REGS | EUR | 10,000 | 12,136 | |||||||||
2.00%, 7/15/24, 144A, REGS | EUR | 50,000 | 62,700 | |||||||||
0.50%, 7/15/26, 144A, REGS | EUR | 5,000 | 5,971 | |||||||||
0.75%, 7/15/27, 144A, REGS | EUR | 35,000 | 42,863 | |||||||||
2.50%, 1/15/33, 144A, REGS | EUR | 28,000 | 43,231 | |||||||||
4.00%, 1/15/37, 144A, REGS | EUR | 5,000 | 9,769 | |||||||||
3.75%, 1/15/42, 144A, REGS | EUR | 20,000 | 42,366 | |||||||||
2.75%, 1/15/47, 144A, REGS | EUR | 22,500 | 45,257 | |||||||||
|
| |||||||||||
| 372,898 | ||||||||||||
|
| |||||||||||
Principal | Value | |||||||||||
| New Zealand — 0.4% | ||||||||||||
New Zealand Government Bond | NZD | 30,000 | $ | 20,885 | ||||||||
4.50%, 4/15/27, REGS | NZD | 30,000 | 23,805 | |||||||||
|
| |||||||||||
| 44,690 | ||||||||||||
|
| |||||||||||
| Norway — 0.5% | ||||||||||||
Norway Government Bond | NOK | 100,000 | 11,469 | |||||||||
3.00%, 3/14/24, 144A, REGS | NOK | 200,000 | 23,789 | |||||||||
2.00%, 4/26/28, 144A, REGS | NOK | 100,000 | 11,803 | |||||||||
|
| |||||||||||
| 47,061 | ||||||||||||
|
| |||||||||||
| Poland — 1.1% | ||||||||||||
Republic of Poland Government Bond | PLN | 75,000 | 19,692 | |||||||||
1.75%, 7/25/21 | PLN | 20,000 | 5,051 | |||||||||
3.25%, 7/25/25 | PLN | 150,000 | 40,897 | |||||||||
2.50%, 7/25/26 | PLN | 175,000 | 46,104 | |||||||||
|
| |||||||||||
| 111,744 | ||||||||||||
|
| |||||||||||
| Portugal — 1.6% | ||||||||||||
Portugal Obrigacoes do Tesouro OT | EUR | 20,000 | 23,857 | |||||||||
4.95%, 10/25/23, 144A, REGS | EUR | 34,000 | 45,714 | |||||||||
5.65%, 2/15/24, 144A, REGS | EUR | 5,000 | 6,977 | |||||||||
2.875%, 10/15/25, 144A, REGS | EUR | 15,000 | 19,606 | |||||||||
2.125%, 10/17/28, 144A, REGS | EUR | 40,000 | 52,303 | |||||||||
3.875%, 2/15/30, 144A, REGS | EUR | 5,000 | 7,598 | |||||||||
4.10%, 2/15/45, 144A, REGS | EUR | 10,000 | 18,578 | |||||||||
|
| |||||||||||
| 174,633 | ||||||||||||
|
| |||||||||||
| Russia — 0.8% | ||||||||||||
Russian Federal Bond—OFZ | RUB | 2,500,000 | 38,031 | |||||||||
8.15%, 2/3/27 | RUB | 3,000,000 | 48,178 | |||||||||
|
| |||||||||||
| 86,209 | ||||||||||||
|
| |||||||||||
| Singapore — 0.9% | ||||||||||||
Singapore Government Bond | SGD | 9,000 | 6,743 | |||||||||
3.00%, 9/1/24 | SGD | 65,000 | 49,836 | |||||||||
2.875%, 7/1/29 | SGD | 50,000 | 39,705 | |||||||||
|
| |||||||||||
| 96,284 | ||||||||||||
|
| |||||||||||
| Slovak Republic — 0.5% | ||||||||||||
Slovakia Government Bond | EUR | 20,000 | 24,830 | |||||||||
0.625%, 5/22/26 | EUR | 15,000 | 17,811 | |||||||||
1.875%, 3/9/37, REGS | EUR | 5,000 | 7,058 | |||||||||
2.00%, 10/17/47, REGS | EUR | 2,000 | 3,131 | |||||||||
|
| |||||||||||
| 52,830 | ||||||||||||
|
| |||||||||||
| Slovenia — 0.4% | ||||||||||||
Slovenia Government Bond | EUR | 5,000 | 6,192 | |||||||||
1.00%, 3/6/28, REGS | EUR | 25,000 | 30,565 | |||||||||
|
| |||||||||||
| 36,757 | ||||||||||||
|
| |||||||||||
| See Notes to Financial Statements. | 26 |
DBX ETF Trust
Schedule of Investments
Xtrackers Barclays International Treasury Bond Hedged ETF(Continued)
August 31, 2019
Principal Amount | Value | |||||||||||
| South Korea — 4.3% | ||||||||||||
Korea Treasury Bond | KRW | 125,000,000 | $ | 105,175 | ||||||||
1.875%, 3/10/24 | KRW | 150,000,000 | 127,604 | |||||||||
1.875%, 6/10/26 | KRW | 100,000,000 | 85,878 | |||||||||
2.625%, 3/10/48 | KRW | 125,000,000 | 137,704 | |||||||||
|
| |||||||||||
| 456,361 | ||||||||||||
|
| |||||||||||
| Spain — 4.4% | ||||||||||||
Spain Government Bond | EUR | 25,000 | 28,176 | |||||||||
5.85%, 1/31/22, 144A, REGS | EUR | 35,000 | 44,460 | |||||||||
0.40%, 4/30/22 | EUR | 60,000 | 67,653 | |||||||||
0.35%, 7/30/23 | EUR | 30,000 | 33,992 | |||||||||
5.90%, 7/30/26, 144A, REGS | EUR | 45,000 | 70,421 | |||||||||
1.50%, 4/30/27, 144A, REGS | EUR | 7,000 | 8,641 | |||||||||
1.40%, 7/30/28, 144A, REGS | EUR | 25,000 | 30,892 | |||||||||
6.00%, 1/31/29 | EUR | 10,000 | 17,178 | |||||||||
1.95%, 7/30/30, 144A, REGS | EUR | 5,000 | 6,569 | |||||||||
2.35%, 7/30/33, 144A, REGS | EUR | 15,000 | 20,899 | |||||||||
4.20%, 1/31/37, 144A, REGS | EUR | 35,000 | 61,888 | |||||||||
4.90%, 7/30/40, 144A, REGS | EUR | 5,000 | 9,981 | |||||||||
4.70%, 7/30/41, 144A, REGS | EUR | 8,000 | 15,809 | |||||||||
2.70%, 10/31/48, 144A, REGS | EUR | 35,000 | 55,108 | |||||||||
|
| |||||||||||
| 471,667 | ||||||||||||
|
| |||||||||||
| Sweden — 0.7% | ||||||||||||
Sweden Government Bond | SEK | 350,000 | 42,237 | |||||||||
1.00%, 11/12/26, REGS | SEK | 300,000 | 34,096 | |||||||||
|
| |||||||||||
| 76,333 | ||||||||||||
|
| |||||||||||
| Switzerland — 1.0% | ||||||||||||
Swiss Confederation Government Bond | CHF | 10,000 | 11,948 | |||||||||
1.50%, 7/24/25, REGS | CHF | 10,000 | 11,715 | |||||||||
0.50%, 5/27/30, REGS | CHF | 45,000 | 53,277 | |||||||||
0.50%, 6/27/32, REGS | CHF | 2,000 | 2,412 | |||||||||
4.00%, 1/6/49, REGS | CHF | 10,000 | 25,107 | |||||||||
|
| |||||||||||
| 104,459 | ||||||||||||
|
| |||||||||||
| Thailand — 1.8% | ||||||||||||
Thailand Government Bond | THB | 1,000,000 | 34,987 | |||||||||
2.125%, 12/17/26 | THB | 3,000,000 | 102,952 | |||||||||
2.875%, 6/17/46 | THB | 1,400,000 | 57,363 | |||||||||
|
| |||||||||||
| 195,302 | ||||||||||||
|
| |||||||||||
| United Kingdom — 6.4% | ||||||||||||
United Kingdom Gilt | GBP | 5,000 | 6,899 | |||||||||
3.75%, 9/7/21, REGS | GBP | 30,000 | 38,967 | |||||||||
1.75%, 9/7/22, REGS | GBP | 25,000 | 31,697 | |||||||||
2.25%, 9/7/23, REGS | GBP | 70,000 | 91,686 | |||||||||
5.00%, 3/7/25, REGS | GBP | 10,000 | 15,288 | |||||||||
1.50%, 7/22/26, REGS | GBP | 20,000 | 26,338 | |||||||||
4.25%, 12/7/27, REGS | GBP | 45,000 | 72,349 | |||||||||
Principal Amount | Value | |||||||||||
| United Kingdom (Continued) | ||||||||||||
4.75%, 12/7/30, REGS | GBP | 5,000 | $ | 8,935 | ||||||||
4.25%, 6/7/32, REGS | GBP | 17,000 | 29,950 | |||||||||
4.25%, 3/7/36, REGS | GBP | 35,000 | 65,459 | |||||||||
4.75%, 12/7/38, REGS | GBP | 10,000 | 20,591 | |||||||||
4.25%, 12/7/40, REGS | GBP | 3,000 | 5,977 | |||||||||
4.50%, 12/7/42, REGS | GBP | 5,000 | 10,556 | |||||||||
3.25%, 1/22/44, REGS | GBP | 10,000 | 18,068 | |||||||||
3.50%, 1/22/45, REGS | GBP | 10,000 | 18,958 | |||||||||
4.25%, 12/7/46, REGS | GBP | 57,000 | 122,993 | |||||||||
4.25%, 12/7/49, REGS | GBP | 3,000 | 6,742 | |||||||||
1.75%, 7/22/57, REGS | GBP | 45,000 | 68,878 | |||||||||
3.50%, 7/22/68, REGS | GBP | 4,000 | 9,776 | |||||||||
1.625%, 10/22/71, REGS | GBP | 10,000 | 15,808 | |||||||||
|
| |||||||||||
| 685,915 | ||||||||||||
|
| |||||||||||
TOTAL SOVEREIGN BONDS | 10,180,736 | |||||||||||
|
| |||||||||||
Number | ||||||||||||
| EXCHANGE-TRADED FUNDS — 2.4% | ||||||||||||
Xtrackers II Harvest China Government Bond UCITS ETF (a) | 12,500 | 259,281 | ||||||||||
|
| |||||||||||
| CASH EQUIVALENTS — 0.0% | ||||||||||||
DWS Government Money Market Series “Institutional Shares”, | 3,813 | 3,813 | ||||||||||
|
| |||||||||||
TOTAL INVESTMENTS — 97.9% (Cost $9,954,713) | $ | 10,443,830 | ||||||||||
Other assets and liabilities, net —2.1% | 223,817 | |||||||||||
|
| |||||||||||
NET ASSETS — 100.0% | $ | 10,667,647 | ||||||||||
|
| |||||||||||
| See Notes to Financial Statements. | 27 |
DBX ETF Trust
Schedule of Investments
Xtrackers Barclays International Treasury Bond Hedged ETF(Continued)
August 31, 2019
A summary of the Fund’s transactions with affiliated investments during the year ended August 31, 2019 is as follows:
| Value ($) at 8/31/2018 | Purchases Cost ($) | Sales Proceeds ($) | Net Realized Gain/(Loss) ($) | Net Change in Unrealized Appreciation (Depreciation) ($) | Income ($) | Capital Gain Distributions ($) | Number of Shares at 8/31/2019 | Value ($) at 8/31/2019 | ||||||||||||||||||||||||||||||
EXCHANGE-TRADED FUNDS —2.4% | ||||||||||||||||||||||||||||||||||||||
Xtrackers II Harvest China Government Bond UCITS ETF (a) | ||||||||||||||||||||||||||||||||||||||
| — | 267,354 | — | — | (8,073 | ) | — | — | 12,500 | 259,281 | |||||||||||||||||||||||||||||
CASH EQUIVALENTS —0.0% | ||||||||||||||||||||||||||||||||||||||
DWS Government Money Market Series “Institutional Shares”, 2.09% (b) | ||||||||||||||||||||||||||||||||||||||
| — | 2,767,353 | (2,763,540 | ) | — | — | 1,230 | — | 3,813 | 3,813 | |||||||||||||||||||||||||||||
|
|
|
|
|
|
|
|
|
|
|
|
|
|
|
|
|
| |||||||||||||||||||||
| — | 3,034,707 | (2,763,540 | ) | — | (8,073 | ) | 1,230 | — | 16,313 | 263,094 | ||||||||||||||||||||||||||||
|
|
|
|
|
|
|
|
|
|
|
|
|
|
|
|
|
| |||||||||||||||||||||
| (a) | Affiliated fund advised by DWS Investment S.A. |
| (b) | Affiliated fund managed by DWS Investment Management Americas, Inc. The rate shown is the annualizedseven-day yield at period end. |
| OFZ: | Obligatsyi Federal’novo Zaima “Federal Loan Obligation” |
| REGS: | Securities sold under Regulation S may not be offered, sold or delivered within the United States or to, or for the account or benefit of, U.S. persons, except pursuant to an exemption from, or in a transaction not subject to, the registration requirements of the Securities Act of 1933. |
| 144A: | Security exempt from registration under Rule 144A of the Securities Act of 1933. These securities may be resold in transactions exempt from registration, normally to qualified institutional buyers. |
As of August 31, 2019, the Fund had the following forward foreign currency contracts outstanding:
Counterparty | Settlement Date | Currency To Deliver | Currency To Receive | Unrealized Appreciation | Unrealized Depreciation | |||||||||||||||||
The Bank of Nova Scotia | 9/5/2019 | AUD | 563,718 | USD | 388,915 | $ | 9,220 | $ | — | |||||||||||||
The Bank of Nova Scotia | 9/5/2019 | CAD | 484,833 | USD | 369,416 | 5,234 | — | |||||||||||||||
The Bank of Nova Scotia | 9/5/2019 | CAD | 28,740 | USD | 21,901 | 313 | — | |||||||||||||||
The Bank of Nova Scotia | 9/5/2019 | CHF | 95,146 | USD | 96,375 | 199 | — | |||||||||||||||
The Bank of Nova Scotia | 9/5/2019 | CLP | 22,444,038 | USD | 32,024 | 919 | — | |||||||||||||||
The Bank of Nova Scotia | 9/5/2019 | CNH | 806,000 | USD | 116,928 | 4,379 | — | |||||||||||||||
The Bank of Nova Scotia | 9/5/2019 | CNH | 300,000 | USD | 42,236 | 344 | — | |||||||||||||||
The Bank of Nova Scotia | 9/5/2019 | CNH | 743,000 | USD | 107,694 | 3,942 | — | |||||||||||||||
The Bank of Nova Scotia | 9/5/2019 | CZK | 1,194,820 | USD | 51,835 | 1,218 | — | |||||||||||||||
The Bank of Nova Scotia | 9/5/2019 | DKK | 770,000 | USD | 115,107 | 1,566 | — | |||||||||||||||
The Bank of Nova Scotia | 9/5/2019 | EUR | 3,620,269 | USD | 4,040,510 | 60,071 | — | |||||||||||||||
The Bank of Nova Scotia | 9/5/2019 | EUR | 40,102 | USD | 44,768 | 676 | — | |||||||||||||||
The Bank of Nova Scotia | 9/5/2019 | GBP | 549,540 | USD | 673,860 | 5,028 | — | |||||||||||||||
The Bank of Nova Scotia | 9/5/2019 | GBP | 15,375 | USD | 18,856 | 143 | — | |||||||||||||||
The Bank of Nova Scotia | 9/5/2019 | HUF | 12,495,780 | USD | 42,789 | 1,317 | — | |||||||||||||||
The Bank of Nova Scotia | 9/5/2019 | IDR | 2,512,094,803 | USD | 178,505 | 1,548 | — | |||||||||||||||
The Bank of Nova Scotia | 9/5/2019 | ILS | 252,764 | USD | 72,411 | 872 | — | |||||||||||||||
The Bank of Nova Scotia | 9/5/2019 | JPY | 268,009,447 | USD | 2,473,827 | — | (49,917 | ) | ||||||||||||||
The Bank of Nova Scotia | 9/5/2019 | JPY | 2,709,914 | USD | 25,019 | — | (499 | ) | ||||||||||||||
The Bank of Nova Scotia | 9/5/2019 | KRW | 534,477,498 | USD | 452,123 | 10,756 | — | |||||||||||||||
The Bank of Nova Scotia | 9/5/2019 | KRW | 13,586,854 | USD | 11,495 | 275 | — | |||||||||||||||
The Bank of Nova Scotia | 9/5/2019 | MXN | 3,379,481 | USD | 177,103 | 8,625 | — | |||||||||||||||
The Bank of Nova Scotia | 9/5/2019 | MYR | 713,740 | USD | 172,672 | 3,087 | — | |||||||||||||||
The Bank of Nova Scotia | 9/5/2019 | NOK | 433,940 | USD | 49,453 | 1,825 | — | |||||||||||||||
The Bank of Nova Scotia | 9/5/2019 | NZD | 67,800 | USD | 44,776 | 2,049 | — | |||||||||||||||
The Bank of Nova Scotia | 9/5/2019 | PLN | 442,919 | USD | 115,151 | 3,879 | — | |||||||||||||||
The Bank of Nova Scotia | 9/5/2019 | RUB | 5,593,310 | USD | 87,805 | 4,016 | — | |||||||||||||||
The Bank of Nova Scotia | 9/5/2019 | SEK | 730,250 | USD | 76,291 | 1,862 | — | |||||||||||||||
The Bank of Nova Scotia | 9/5/2019 | SGD | 132,200 | USD | 96,637 | 1,369 | — | |||||||||||||||
The Bank of Nova Scotia | 9/5/2019 | THB | 288,659 | USD | 9,392 | — | (51 | ) | ||||||||||||||
The Bank of Nova Scotia | 9/5/2019 | THB | 5,398,707 | USD | 175,907 | — | (704 | ) | ||||||||||||||
The Bank of Nova Scotia | 9/5/2019 | USD | 379,805 | AUD | 563,718 | — | (110 | ) | ||||||||||||||
The Bank of Nova Scotia | 9/5/2019 | USD | 386,494 | CAD | 513,573 | — | (724 | ) | ||||||||||||||
| See Notes to Financial Statements. | 28 |
DBX ETF Trust
Schedule of Investments
Xtrackers Barclays International Treasury Bond Hedged ETF(Continued)
August 31, 2019
Counterparty | Settlement Date | Currency To Deliver | Currency To Receive | Unrealized Appreciation | Unrealized Depreciation | |||||||||||||||||
The Bank of Nova Scotia | 9/5/2019 | USD | 96,160 | CHF | 95,146 | $ | 15 | $ | — | |||||||||||||
The Bank of Nova Scotia | 9/5/2019 | USD | 31,193 | CLP | 22,444,038 | — | (88 | ) | ||||||||||||||
The Bank of Nova Scotia | 9/5/2019 | USD | 258,351 | CNH | 1,849,000 | — | (157 | ) | ||||||||||||||
The Bank of Nova Scotia | 9/5/2019 | USD | 50,682 | CZK | 1,194,820 | — | (66 | ) | ||||||||||||||
The Bank of Nova Scotia | 9/5/2019 | USD | 113,727 | DKK | 770,000 | — | (187 | ) | ||||||||||||||
The Bank of Nova Scotia | 9/5/2019 | USD | 4,030,984 | EUR | 3,660,371 | — | (6,454 | ) | ||||||||||||||
The Bank of Nova Scotia | 9/5/2019 | USD | 687,982 | GBP | 564,915 | — | (437 | ) | ||||||||||||||
The Bank of Nova Scotia | 9/5/2019 | USD | 41,573 | HUF | 12,495,780 | — | (100 | ) | ||||||||||||||
The Bank of Nova Scotia | 9/5/2019 | USD | 177,095 | IDR | 2,512,094,803 | — | (138 | ) | ||||||||||||||
The Bank of Nova Scotia | 9/5/2019 | USD | 71,589 | ILS | 252,764 | — | (51 | ) | ||||||||||||||
The Bank of Nova Scotia | 9/5/2019 | USD | 2,550,467 | JPY | 270,719,361 | — | (1,205 | ) | ||||||||||||||
The Bank of Nova Scotia | 9/5/2019 | USD | 452,478 | KRW | 548,064,352 | 109 | — | |||||||||||||||
The Bank of Nova Scotia | 9/5/2019 | USD | 168,386 | MXN | 3,379,481 | 92 | — | |||||||||||||||
The Bank of Nova Scotia | 9/5/2019 | USD | 169,333 | MYR | 713,740 | 252 | — | |||||||||||||||
The Bank of Nova Scotia | 9/5/2019 | USD | 47,656 | NOK | 433,940 | — | (28 | ) | ||||||||||||||
The Bank of Nova Scotia | 9/5/2019 | USD | 42,761 | NZD | 67,800 | — | (35 | ) | ||||||||||||||
The Bank of Nova Scotia | 9/5/2019 | USD | 111,182 | PLN | 442,919 | 90 | — | |||||||||||||||
The Bank of Nova Scotia | 9/5/2019 | USD | 83,969 | RUB | 5,593,310 | — | (180 | ) | ||||||||||||||
The Bank of Nova Scotia | 9/5/2019 | USD | 74,324 | SEK | 730,250 | 105 | — | |||||||||||||||
The Bank of Nova Scotia | 9/5/2019 | USD | 95,300 | SGD | 132,200 | — | (32 | ) | ||||||||||||||
The Bank of Nova Scotia | 9/5/2019 | USD | 186,029 | THB | 5,687,366 | 25 | — | |||||||||||||||
The Bank of Nova Scotia | 10/3/2019 | AUD | 17,455 | USD | 11,771 | 4 | — | |||||||||||||||
The Bank of Nova Scotia | 10/3/2019 | AUD | 563,718 | USD | 380,118 | 95 | — | |||||||||||||||
The Bank of Nova Scotia | 10/3/2019 | CAD | 513,573 | USD | 386,663 | 722 | — | |||||||||||||||
The Bank of Nova Scotia | 10/3/2019 | CHF | 95,146 | USD | 96,409 | — | (16 | ) | ||||||||||||||
The Bank of Nova Scotia | 10/3/2019 | CLP | 22,444,038 | USD | 31,197 | 83 | — | |||||||||||||||
The Bank of Nova Scotia | 10/3/2019 | CZK | 1,194,820 | USD | 50,695 | 59 | — | |||||||||||||||
The Bank of Nova Scotia | 10/3/2019 | DKK | 770,000 | USD | 113,976 | 172 | — | |||||||||||||||
The Bank of Nova Scotia | 10/3/2019 | EUR | 3,660,371 | USD | 4,039,842 | 6,364 | — | |||||||||||||||
The Bank of Nova Scotia | 10/3/2019 | EUR | 99,557 | USD | 109,892 | 187 | — | |||||||||||||||
The Bank of Nova Scotia | 10/3/2019 | GBP | 564,915 | USD | 688,838 | 437 | — | |||||||||||||||
The Bank of Nova Scotia | 10/3/2019 | HUF | 12,495,780 | USD | 41,641 | 98 | — | |||||||||||||||
The Bank of Nova Scotia | 10/3/2019 | IDR | 2,512,094,803 | USD | 176,349 | 173 | — | |||||||||||||||
The Bank of Nova Scotia | 10/3/2019 | ILS | 252,764 | USD | 71,694 | 42 | — | |||||||||||||||
The Bank of Nova Scotia | 10/3/2019 | JPY | 270,719,361 | USD | 2,555,769 | 1,180 | — | |||||||||||||||
The Bank of Nova Scotia | 10/3/2019 | JPY | 1,359,184 | USD | 12,834 | 8 | — | |||||||||||||||
The Bank of Nova Scotia | 10/3/2019 | MXN | 3,379,481 | USD | 167,562 | — | (98 | ) | ||||||||||||||
The Bank of Nova Scotia | 10/3/2019 | MYR | 713,740 | USD | 168,933 | — | (2 | ) | ||||||||||||||
The Bank of Nova Scotia | 10/3/2019 | NOK | 433,940 | USD | 47,686 | 25 | — | |||||||||||||||
The Bank of Nova Scotia | 10/3/2019 | NZD | 67,800 | USD | 42,794 | 33 | — | |||||||||||||||
The Bank of Nova Scotia | 10/3/2019 | PLN | 442,919 | USD | 111,217 | — | (109 | ) | ||||||||||||||
The Bank of Nova Scotia | 10/3/2019 | RUB | 5,593,310 | USD | 83,652 | 179 | — | |||||||||||||||
The Bank of Nova Scotia | 10/3/2019 | SEK | 730,250 | USD | 74,463 | — | (110 | ) | ||||||||||||||
The Bank of Nova Scotia | 10/3/2019 | SGD | 132,200 | USD | 95,330 | 31 | — | |||||||||||||||
The Bank of Nova Scotia | 10/3/2019 | THB | 5,687,366 | USD | 185,725 | — | (471 | ) | ||||||||||||||
The Bank of Nova Scotia | 10/4/2019 | KRW | 548,064,352 | USD | 452,822 | — | (366 | ) | ||||||||||||||
The Bank of Nova Scotia | 10/9/2019 | CNH | 1,849,000 | USD | 258,057 | 166 | — | |||||||||||||||
|
|
|
| |||||||||||||||||||
Total unrealized appreciation (depreciation) | $ | 145,478 | $ | (62,335 | ) | |||||||||||||||||
|
|
|
| |||||||||||||||||||
For information on the Fund’s policy and additional disclosures regarding forward foreign currency contracts, please refer to the Derivatives section of Note 2 in the accompanying Notes to Financial Statements.
| See Notes to Financial Statements. | 29 |
DBX ETF Trust
Schedule of Investments
Xtrackers Barclays International Treasury Bond Hedged ETF(Continued)
August 31, 2019
Currency Abbreviations
| AUD | Australian Dollar |
| CAD | Canadian Dollar |
| CHF | Swiss Franc |
| CLP | Chilean Peso |
| CNH | Chinese Yuan |
| CZK | Czech Koruna |
| DKK | Danish Krone |
| EUR | Euro |
| GBP | Pound Sterling |
| HUF | Hungarian Forint |
| IDR | Indonesian Rupiah |
| ILS | Israeli Shekel |
| JPY | Japanese Yen |
| KRW | South Korean Won |
| MXN | Mexican Peso |
| MYR | Malaysian Ringgit |
| NOK | Norwegian Krone |
| NZD | New Zealand Dollar |
| PLN | Polish Zloty |
| RUB | Russian Ruble |
| SEK | Swedish Krona |
| SGD | Singapore Dollar |
| THB | Thai Baht |
| USD | U.S. Dollar |
Fair Value Measurements
Various inputs are used in determining the value of the Fund’s investments. These inputs are summarized in three broad levels. Level 1 includes quoted prices in active markets for identical securities. Level 2 includes other significant observable inputs (including quoted prices for similar securities, interest rates, prepayment speeds and credit risk). Level 3 includes significant unobservable inputs (including the Fund’s own assumptions in determining the fair value of investments). The level assigned to the securities valuations may not be an indication of the risk or liquidity associated with investing in those securities.
The following is a summary of the inputs used as of August 31, 2019 in valuing the Fund’s investments. For information on the Fund’s policy regarding the valuation of investments, please refer to the Security Valuation section of Note 2 in the accompanying Notes to Financial Statements.
Assets | Level 1 | Level 2 | Level 3 | Total | ||||||||||||
Sovereign Bonds (c) | $ | — | $ | 10,180,736 | $ | — | $ | 10,180,736 | ||||||||
Exchange-Traded Funds | 259,281 | — | — | 259,281 | ||||||||||||
Short-Term Investments (c) | 3,813 | — | — | 3,813 | ||||||||||||
Derivatives (d) | ||||||||||||||||
Forward Foreign Currency Contracts | — | 145,478 | — | 145,478 | ||||||||||||
|
|
|
|
|
|
|
| |||||||||
TOTAL | $ | 263,094 | $ | 10,326,214 | $ | — | $ | 10,589,308 | ||||||||
|
|
|
|
|
|
|
| |||||||||
Liabilities | Level 1 | Level 2 | Level 3 | Total | ||||||||||||
Derivatives (d) | ||||||||||||||||
Forward Foreign Currency Contracts | $ | — | $ | (62,335 | ) | $ | — | $ | (62,335 | ) | ||||||
|
|
|
|
|
|
|
| |||||||||
TOTAL | $ | — | $ | (62,335 | ) | $ | — | $ | (62,335 | ) | ||||||
|
|
|
|
|
|
|
| |||||||||
| (c) | See Schedule of Investments for additional detailed categorizations. |
| (d) | Derivatives include unrealized appreciation (depreciation) on forward foreign currency contracts. |
| See Notes to Financial Statements. | 30 |
DBX ETF Trust
Schedule of Investments
Xtrackers High Beta High Yield Bond ETF
August 31, 2019
Principal | Value | |||||||
| CORPORATE BONDS — 97.5% |
| |||||||
| Basic Materials — 4.7% |
| |||||||
| Chemicals — 2.4% | ||||||||
Chemours Co. | $ | 319,000 | $ | 325,779 | ||||
7.00%, 5/15/25 | 150,000 | 148,500 | ||||||
5.375%, 5/15/27 | 150,000 | 133,875 | ||||||
Consolidated Energy Finance SA | 200,000 | 205,000 | ||||||
6.50%, 5/15/26, 144A | 100,000 | 100,250 | ||||||
Element Solutions, Inc., 144A | 250,000 | 262,188 | ||||||
Hexion, Inc., 144A | 120,000 | 116,700 | ||||||
INEOS Group Holdings SA, 144A | 220,000 | 224,908 | ||||||
NOVA Chemicals Corp. | 150,000 | 153,450 | ||||||
5.25%, 6/1/27, 144A | 700,000 | 733,250 | ||||||
OCI NV, 144A | 200,000 | 212,000 | ||||||
Olin Corp. | 250,000 | 260,312 | ||||||
5.00%, 2/1/30 | 300,000 | 300,750 | ||||||
SPCM SA, 144A | 250,000 | 256,250 | ||||||
Starfruit Finco BV / Starfruit US Holdco LLC, 144A | 150,000 | 147,000 | ||||||
|
| |||||||
| 3,580,212 | ||||||||
|
| |||||||
| Iron/Steel — 0.6% | ||||||||
AK Steel Corp. | 50,000 | 49,938 | ||||||
Allegheny Technologies, Inc. | 155,000 | 166,819 | ||||||
Cleveland-Cliffs, Inc. | 101,000 | 101,505 | ||||||
5.875%, 6/1/27, 144A | 200,000 | 195,500 | ||||||
United States Steel Corp. | 246,000 | 234,696 | ||||||
6.25%, 3/15/26 | 200,000 | 177,626 | ||||||
|
| |||||||
| 926,084 | ||||||||
|
| |||||||
| Mining — 1.7% | ||||||||
Alcoa Nederland Holding BV | 240,000 | 252,600 | ||||||
7.00%, 9/30/26, 144A | 150,000 | 162,330 | ||||||
6.125%, 5/15/28, 144A | 200,000 | 208,500 | ||||||
Aleris International, Inc., 144A | 100,000 | 105,500 | ||||||
Constellium SE, 144A | 500,000 | 516,250 | ||||||
Freeport-McMoRan, Inc. | 185,000 | 185,000 | ||||||
5.25%, 9/1/29 | 185,000 | 183,892 | ||||||
Hudbay Minerals, Inc., 144A | 310,000 | 316,194 | ||||||
Principal | Value | |||||||
| Mining (Continued) | ||||||||
Joseph T Ryerson & Son, Inc., 144A | $ | 172,000 | $ | 180,654 | ||||
Novelis Corp., 144A | 470,000 | 497,612 | ||||||
|
| |||||||
| 2,608,532 | ||||||||
|
| |||||||
| Communications — 28.4% |
| |||||||
| Advertising — 0.2% | ||||||||
Acosta, Inc., 144A | 215,000 | 22,575 | ||||||
Outfront Media Capital LLC / Outfront Media Capital Corp., 144A | 200,000 | 207,250 | ||||||
|
| |||||||
| 229,825 | ||||||||
|
| |||||||
| Internet — 2.0% | ||||||||
Netflix, Inc. | 517,000 | 579,686 | ||||||
6.375%, 5/15/29, 144A | 340,000 | 392,700 | ||||||
5.375%, 11/15/29, 144A | 200,000 | 218,000 | ||||||
Symantec Corp., 144A | 400,000 | 402,922 | ||||||
Uber Technologies, Inc. | 150,000 | 157,125 | ||||||
8.00%, 11/1/26, 144A | 450,000 | 474,469 | ||||||
Zayo Group LLC / Zayo Capital, Inc. | 413,000 | 426,422 | ||||||
5.75%, 1/15/27, 144A | 385,000 | 393,663 | ||||||
|
| |||||||
| 3,044,987 | ||||||||
|
| |||||||
| Media — 14.0% | ||||||||
Altice Financing SA | 600,000 | 620,250 | ||||||
7.50%, 5/15/26, 144A | 750,000 | 800,625 | ||||||
Altice Finco SA, 144A | 100,000 | 103,750 | ||||||
Altice Luxembourg SA | 221,000 | 227,194 | ||||||
7.625%, 2/15/25, 144A | 570,000 | 591,375 | ||||||
10.50%, 5/15/27, 144A | 450,000 | 490,500 | ||||||
CCO Holdings LLC / CCO Holdings Capital Corp. | 450,000 | 475,312 | ||||||
5.125%, 5/1/27, 144A | 1,250,000 | 1,324,987 | ||||||
5.875%, 5/1/27, 144A | 100,000 | 106,750 | ||||||
5.00%, 2/1/28, 144A | 700,000 | 736,750 | ||||||
5.375%, 6/1/29, 144A | 450,000 | 482,062 | ||||||
Cengage Learning, Inc., 144A | 175,000 | 163,187 | ||||||
Clear Channel Worldwide Holdings, Inc. | 596,000 | 654,855 | ||||||
5.125%, 8/15/27, 144A | 400,000 | 419,500 | ||||||
CSC Holdings LLC | 250,000 | 268,125 | ||||||
5.50%, 4/15/27, 144A | 550,000 | 589,875 | ||||||
5.375%, 2/1/28, 144A | 225,000 | 240,808 | ||||||
7.50%, 4/1/28, 144A | 300,000 | 339,000 | ||||||
6.50%, 2/1/29, 144A | 450,000 | 505,125 | ||||||
| See Notes to Financial Statements. | 31 |
DBX ETF Trust
Schedule of Investments
Xtrackers High Beta High Yield Bond ETF(Continued)
August 31, 2019
Principal | Value | |||||||
| Media (Continued) | ||||||||
5.75%, 1/15/30, 144A | $ | 350,000 | $ | 366,625 | ||||
Diamond Sports Group LLC / Diamond Sports Finance Co. | 950,000 | 999,875 | ||||||
6.625%, 8/15/27, 144A | 400,000 | 420,000 | ||||||
DISH DBS Corp. | 784,000 | 814,380 | ||||||
5.00%, 3/15/23 | 350,000 | 344,750 | ||||||
5.875%, 11/15/24 | 550,000 | 525,278 | ||||||
7.75%, 7/1/26 | 675,000 | 664,875 | ||||||
Entercom Media Corp., 144A | 150,000 | 153,187 | ||||||
Gray Television, Inc. | 80,000 | 82,800 | ||||||
5.875%, 7/15/26, 144A | 300,000 | 314,250 | ||||||
7.00%, 5/15/27, 144A | 250,000 | 274,300 | ||||||
iHeartCommunications, Inc. | 200,000 | 217,000 | ||||||
8.375%, 5/1/27 | 450,000 | 487,688 | ||||||
5.25%, 8/15/27, 144A | 250,000 | 263,483 | ||||||
Meredith Corp. | 400,000 | 424,000 | ||||||
Nexstar Broadcasting, Inc., 144A | 400,000 | 417,000 | ||||||
Nexstar Escrow, Inc., 144A | 300,000 | 313,500 | ||||||
Sinclair Television Group, Inc., 144A | 300,000 | 301,440 | ||||||
Sirius XM Radio, Inc. | 450,000 | 476,438 | ||||||
5.50%, 7/1/29, 144A | 400,000 | 436,884 | ||||||
Telenet Finance Luxembourg Notes Sarl, 144A | 200,000 | 204,400 | ||||||
Univision Communications, Inc. | 350,000 | 347,375 | ||||||
5.125%, 2/15/25, 144A | 475,000 | 460,698 | ||||||
UPC Holding BV, 144A | 650,000 | 679,250 | ||||||
UPCB Finance IV Ltd., 144A | 400,000 | 413,700 | ||||||
Virgin Media Secured Finance PLC | 400,000 | 411,500 | ||||||
5.50%, 5/15/29, 144A | 250,000 | 261,875 | ||||||
Ziggo Bond Co. BV | 200,000 | 207,750 | ||||||
6.00%, 1/15/27, 144A | 100,000 | 104,750 | ||||||
Ziggo BV, 144A | 550,000 | 582,973 | ||||||
|
| |||||||
| 21,112,054 | ||||||||
|
| |||||||
| Telecommunications — 12.2% | ||||||||
Altice France SA | 1,800,000 | 1,926,000 | ||||||
8.125%, 2/1/27, 144A | 450,000 | 497,250 | ||||||
C&W Senior Financing DAC, 144A | 400,000 | 427,456 | ||||||
Principal | Value | |||||||
| Telecommunications (Continued) | ||||||||
CenturyLink, Inc. | $ | 506,000 | $ | 562,915 | ||||
5.625%, 4/1/25 | 200,000 | 205,000 | ||||||
Cincinnati Bell, Inc., 144A | 200,000 | 183,500 | ||||||
CommScope Technologies LLC | 350,000 | 314,125 | ||||||
5.00%, 3/15/27, 144A | 200,000 | 168,250 | ||||||
CommScope, Inc. | 140,000 | 140,526 | ||||||
5.50%, 3/1/24, 144A | 300,000 | 305,625 | ||||||
5.50%, 6/15/24, 144A | 850,000 | 808,562 | ||||||
6.00%, 3/1/26, 144A | 500,000 | 511,750 | ||||||
Consolidated Communications, Inc. | 160,000 | 150,400 | ||||||
DKT Finance ApS, 144A | 200,000 | 215,410 | ||||||
Frontier Communications Corp. | 226,000 | 118,650 | ||||||
10.50%, 9/15/22 | 600,000 | 314,250 | ||||||
7.125%, 1/15/23 | 200,000 | 103,000 | ||||||
7.625%, 4/15/24 | 250,000 | 126,325 | ||||||
6.875%, 1/15/25 | 259,000 | 133,385 | ||||||
11.00%, 9/15/25 | 1,070,000 | 548,375 | ||||||
8.50%, 4/1/26, 144A | 500,000 | 487,500 | ||||||
8.00%, 4/1/27, 144A | 550,000 | 574,750 | ||||||
Gogo Intermediate Holdings LLC / Gogo Finance Co., Inc., 144A | 250,000 | 261,563 | ||||||
GTT Communications, Inc., 144A | 150,000 | 96,000 | ||||||
Hughes Satellite Systems Corp. | 450,000 | 486,000 | ||||||
Inmarsat Finance PLC, 144A | 100,000 | 105,375 | ||||||
Intelsat Connect Finance SA, 144A | 350,000 | 313,250 | ||||||
Intelsat Jackson Holdings SA | 400,000 | 366,000 | ||||||
8.50%, 10/15/24, 144A | 900,000 | 895,500 | ||||||
9.75%, 7/15/25, 144A | 800,000 | 825,000 | ||||||
Intelsat Luxembourg SA | 100,000 | 95,500 | ||||||
8.125%, 6/1/23 (a) | 300,000 | 240,000 | ||||||
Level 3 Financing, Inc. | 447,000 | 467,115 | ||||||
Sable International Finance Ltd., 144A | 200,000 | 209,250 | ||||||
Sprint Communications, Inc. | 215,000 | 229,377 | ||||||
Sprint Corp. | 1,250,000 | 1,409,375 | ||||||
7.125%, 6/15/24 | 1,350,000 | 1,495,746 | ||||||
7.625%, 2/15/25 | 300,000 | 336,375 | ||||||
7.625%, 3/1/26 | 400,000 | 450,500 | ||||||
Telecom Italia SpA, 144A | 500,000 | 536,875 | ||||||
| See Notes to Financial Statements. | 32 |
DBX ETF Trust
Schedule of Investments
Xtrackers High Beta High Yield Bond ETF(Continued)
August 31, 2019
Principal | Value | |||||||
| Telecommunications (Continued) | ||||||||
ViaSat, Inc. | $ | 250,000 | $ | 253,125 | ||||
5.625%, 4/15/27, 144A | 200,000 | 213,000 | ||||||
West Corp., 144A | 350,000 | 273,000 | ||||||
|
| |||||||
| 18,380,930 | ||||||||
|
| |||||||
| Consumer, Cyclical — 12.3% |
| |||||||
| Auto Manufacturers — 1.0% | ||||||||
Allison Transmission, Inc. | 150,000 | 154,500 | ||||||
5.875%, 6/1/29, 144A | 100,000 | 107,500 | ||||||
Jaguar Land Rover Automotive PLC | 250,000 | 240,345 | ||||||
4.50%, 10/1/27, 144A | 125,000 | 99,112 | ||||||
Navistar International Corp., 144A | 400,000 | 407,000 | ||||||
Tesla, Inc., 144A | 500,000 | 448,125 | ||||||
|
| |||||||
| 1,456,582 | ||||||||
|
| |||||||
| Auto Parts & Equipment — 1.5% | ||||||||
Adient Global Holdings Ltd., 144A | 270,000 | 209,925 | ||||||
American Axle & Manufacturing, Inc. | 150,000 | 141,559 | ||||||
6.25%, 3/15/26 (a) | 198,000 | 184,635 | ||||||
6.50%, 4/1/27 (a) | 170,000 | 156,612 | ||||||
Dana, Inc. | 125,000 | 128,125 | ||||||
Goodyear Tire & Rubber Co. | 50,000 | 49,688 | ||||||
4.875%, 3/15/27 (a) | 500,000 | 484,375 | ||||||
Panther BF Aggregator 2 LP / Panther Finance Co., Inc. | 300,000 | 312,000 | ||||||
8.50%, 5/15/27, 144A | 600,000 | 586,500 | ||||||
Tenneco, Inc. | 100,000 | 78,188 | ||||||
|
| |||||||
| 2,331,607 | ||||||||
|
| |||||||
| Distribution/Wholesale — 0.3% | ||||||||
Core & Main LP, 144A | 175,000 | 178,500 | ||||||
KAR Auction Services, Inc., 144A | 300,000 | 310,500 | ||||||
|
| |||||||
| 489,000 | ||||||||
|
| |||||||
| Entertainment — 2.8% | ||||||||
AMC Entertainment Holdings, Inc. | 200,000 | 190,750 | ||||||
5.875%, 11/15/26 | 180,000 | 165,600 | ||||||
6.125%, 5/15/27 (a) | 187,000 | 173,442 | ||||||
Caesars Resort Collection LLC / CRC Finco, Inc., 144A | 500,000 | 510,000 | ||||||
Cedar Fair LP, 144A | 150,000 | 163,313 | ||||||
Principal | Value | |||||||
| Entertainment (Continued) | ||||||||
Churchill Downs, Inc. | $ | 200,000 | $ | 213,000 | ||||
4.75%, 1/15/28, 144A | 100,000 | 103,500 | ||||||
Cirsa Finance International Sarl, 144A | 200,000 | 212,131 | ||||||
International Game Technology PLC | 450,000 | 496,125 | ||||||
6.25%, 1/15/27, 144A | 200,000 | 220,250 | ||||||
Lions Gate Capital Holdings LLC | 100,000 | 105,869 | ||||||
5.875%, 11/1/24, 144A | 200,000 | 209,000 | ||||||
Merlin Entertainments PLC, 144A | 150,000 | 156,750 | ||||||
Mohegan Gaming & Entertainment, 144A | 175,000 | 169,890 | ||||||
Scientific Games International, Inc. | 350,000 | 362,509 | ||||||
8.25%, 3/15/26, 144A | 400,000 | 425,000 | ||||||
Stars Group Holdings BV / Stars Group US Co.-Borrower LLC, 144A | 310,000 | 329,763 | ||||||
|
| |||||||
| 4,206,892 | ||||||||
|
| |||||||
| Home Builders — 0.9% | ||||||||
Beazer Homes USA, Inc. | 100,000 | 104,750 | ||||||
5.875%, 10/15/27 | 107,000 | 101,917 | ||||||
CalAtlantic Group, Inc. | 75,000 | 75,188 | ||||||
Century Communities, Inc., 144A | 100,000 | 106,250 | ||||||
K Hovnanian Enterprises, Inc., 144A | 200,000 | 158,000 | ||||||
Mattamy Group Corp. | 150,000 | 156,938 | ||||||
6.50%, 10/1/25, 144A | 150,000 | 159,750 | ||||||
Taylor Morrison Communities, Inc. | 200,000 | 215,500 | ||||||
5.75%, 1/15/28, 144A | 95,000 | 101,175 | ||||||
William Lyon Homes, Inc. | 150,000 | 156,375 | ||||||
|
| |||||||
| 1,335,843 | ||||||||
|
| |||||||
| Home Furnishings — 0.2% | ||||||||
Tempur Sealy International, Inc. | 250,000 | 262,188 | ||||||
|
| |||||||
| Leisure Time — 0.2% | ||||||||
24 Hour Fitness Worldwide, Inc., 144A | 100,000 | 89,250 | ||||||
Viking Cruises Ltd., 144A | 270,000 | 280,800 | ||||||
|
| |||||||
| 370,050 | ||||||||
|
| |||||||
| Lodging — 1.6% | ||||||||
Boyd Gaming Corp. | 225,000 | 239,344 | ||||||
6.00%, 8/15/26 | 200,000 | 212,000 | ||||||
| See Notes to Financial Statements. | 33 |
DBX ETF Trust
Schedule of Investments
Xtrackers High Beta High Yield Bond ETF(Continued)
August 31, 2019
Principal | Value | |||||||
| Lodging (Continued) | ||||||||
Diamond Resorts International, Inc. | $ | 20,000 | $ | 20,225 | ||||
10.75%, 9/1/24, 144A (a) | 250,000 | 252,500 | ||||||
Melco Resorts Finance Ltd. | 250,000 | 248,921 | ||||||
5.25%, 4/26/26, 144A | 150,000 | 151,414 | ||||||
5.625%, 7/17/27, 144A | 200,000 | 204,236 | ||||||
Station Casinos LLC, 144A | 150,000 | 153,390 | ||||||
Wyndham Destinations, Inc. | 150,000 | 160,687 | ||||||
Wynn Las Vegas LLC / Wynn Las Vegas Capital Corp. | 300,000 | 317,250 | ||||||
5.25%, 5/15/27, 144A | 450,000 | 466,875 | ||||||
|
| |||||||
| 2,426,842 | ||||||||
|
| |||||||
| Retail — 3.5% | ||||||||
Beacon Roofing Supply, Inc., 144A | 430,000 | 425,700 | ||||||
eG Global Finance PLC, 144A | 150,000 | 145,312 | ||||||
Ferrellgas LP / Ferrellgas Finance Corp. | 350,000 | 299,250 | ||||||
6.75%, 6/15/23 (a) | 100,000 | 84,500 | ||||||
Golden Nugget, Inc. | 320,000 | 328,000 | ||||||
8.75%, 10/1/25, 144A | 280,000 | 294,350 | ||||||
IRB Holding Corp., 144A | 150,000 | 151,125 | ||||||
JC Penney Corp., Inc. | 150,000 | 126,750 | ||||||
8.625%, 3/15/25, 144A (a) | 170,000 | 85,425 | ||||||
L Brands, Inc. | 150,000 | 137,250 | ||||||
7.50%, 6/15/29 | 150,000 | 148,125 | ||||||
Michaels Stores, Inc., 144A | 150,000 | 144,220 | ||||||
Neiman Marcus Group Ltd. LLC / Neiman Marcus Group LLC / Mariposa Borrower / NMG | 200,000 | 69,000 | ||||||
8.75%, 10/25/24, 144A | 150,000 | 52,500 | ||||||
Penske Automotive Group, Inc. | 150,000 | 157,688 | ||||||
PetSmart, Inc. | 750,000 | 701,250 | ||||||
5.875%, 6/1/25, 144A | 322,000 | 317,170 | ||||||
8.875%, 6/1/25, 144A | 75,000 | 70,500 | ||||||
Rite Aid Corp., 144A | 518,000 | 420,228 | ||||||
Staples, Inc. | 650,000 | 658,125 | ||||||
10.75%, 4/15/27, 144A | 300,000 | 303,750 | ||||||
Suburban Propane Partners LP/Suburban Energy Finance Corp. | 150,000 | 153,000 | ||||||
|
| |||||||
| 5,273,218 | ||||||||
|
| |||||||
Principal | Value | |||||||
| Toys/Games/Hobbies — 0.3% | ||||||||
Mattel, Inc., 144A | $ | 400,000 | $ | 412,000 | ||||
|
| |||||||
| Consumer,Non-cyclical — 19.1% |
| |||||||
| Agriculture — 0.6% | ||||||||
JBS Investments II GmbH | 350,000 | 379,312 | ||||||
5.75%, 1/15/28, 144A (a) | 250,000 | 263,063 | ||||||
Vector Group Ltd., 144A | 250,000 | 246,250 | ||||||
|
| |||||||
| 888,625 | ||||||||
|
| |||||||
| Commercial Services — 3.6% | ||||||||
Ahern Rentals, Inc., 144A | 130,000 | 112,775 | ||||||
Algeco Global Finance PLC, 144A | 150,000 | 150,862 | ||||||
APX Group, Inc. | 382,000 | 364,810 | ||||||
7.875%, 12/1/22 | 350,000 | 334,687 | ||||||
Avis Budget Car Rental LLC / Avis Budget Finance, Inc., 144A | 100,000 | 102,095 | ||||||
Herc Holdings, Inc., 144A | 400,000 | 415,000 | ||||||
Hertz Corp. | 350,000 | 364,893 | ||||||
6.25%, 10/15/22 | 230,000 | 233,738 | ||||||
5.50%, 10/15/24, 144A | 225,000 | 221,625 | ||||||
7.125%, 8/1/26, 144A | 175,000 | 178,917 | ||||||
Nielsen Co. Luxembourg SARL, 144A | 200,000 | 198,500 | ||||||
Nielsen Finance LLC / Nielsen Finance Co., 144A | 610,000 | 616,100 | ||||||
Prime Security Services Borrower LLC / Prime Finance, Inc. | 259,000 | 272,850 | ||||||
5.25%, 4/15/24, 144A | 250,000 | 258,853 | ||||||
5.75%, 4/15/26, 144A | 200,000 | 209,000 | ||||||
Refinitiv US Holdings, Inc., 144A | 500,000 | 563,750 | ||||||
Team Health Holdings, Inc., 144A | 233,000 | 157,275 | ||||||
United Rentals North America, Inc. | 250,000 | 268,125 | ||||||
Verscend Escrow Corp., 144A | 300,000 | 322,299 | ||||||
|
| |||||||
| 5,346,154 | ||||||||
|
| |||||||
| Cosmetics/Personal Care — 0.4% | ||||||||
Avon Products, Inc. | 178,000 | 184,675 | ||||||
Coty, Inc., 144A | 200,000 | 189,500 | ||||||
Revlon Consumer Products Corp. | 150,000 | 137,250 | ||||||
6.25%, 8/1/24 | 110,000 | 63,800 | ||||||
|
| |||||||
| 575,225 | ||||||||
|
| |||||||
| See Notes to Financial Statements. | 34 |
DBX ETF Trust
Schedule of Investments
Xtrackers High Beta High Yield Bond ETF(Continued)
August 31, 2019
Principal | Value | |||||||
| Food — 2.7% | ||||||||
Albertsons Cos. LLC / Safeway, Inc. / New Albertsons LP / Albertson’s LLC | $ | 345,000 | $ | 363,112 | ||||
5.75%, 3/15/25 | 400,000 | 412,000 | ||||||
7.50%, 3/15/26, 144A | 250,000 | 279,375 | ||||||
5.875%, 2/15/28, 144A | 175,000 | 184,863 | ||||||
B&G Foods, Inc. | 300,000 | 305,340 | ||||||
JBS USA LUX SA / JBS USA Finance, Inc., 144A | 300,000 | 335,625 | ||||||
JBS USA LUX SA / JBS USA Food Co. / JBS USA Finance, Inc. | 400,000 | 444,000 | ||||||
5.50%, 1/15/30, 144A | 400,000 | 424,800 | ||||||
Pilgrim’s Pride Corp., 144A | 230,000 | 248,688 | ||||||
Post Holdings, Inc. | 125,000 | 130,781 | ||||||
5.75%, 3/1/27, 144A | 250,000 | 266,875 | ||||||
5.625%, 1/15/28, 144A | 80,000 | 85,500 | ||||||
5.50%, 12/15/29, 144A | 430,000 | 456,213 | ||||||
Sigma Holdco BV, 144A | 200,000 | 198,000 | ||||||
|
| |||||||
| 4,135,172 | ||||||||
|
| |||||||
| Healthcare-Products — 0.4% | ||||||||
Ortho-Clinical Diagnostics, Inc. / Ortho-Clinical Diagnostics SA, 144A | 450,000 | 436,500 | ||||||
Sotera Health Holdings LLC, 144A | 150,000 | 153,000 | ||||||
|
| |||||||
| 589,500 | ||||||||
|
| |||||||
| Healthcare-Services — 6.1% | ||||||||
AHP Health Partners, Inc., 144A | 200,000 | 215,825 | ||||||
CHS/Community Health Systems, Inc. | 300,000 | 301,125 | ||||||
6.875%, 2/1/22 | 762,000 | 531,274 | ||||||
6.25%, 3/31/23 | 1,036,000 | 1,006,319 | ||||||
9.875%, 6/30/23, 144A | 950,000 | 795,625 | ||||||
8.625%, 1/15/24, 144A | 200,000 | 200,500 | ||||||
8.125%, 6/30/24, 144A | 50,000 | 38,250 | ||||||
8.00%, 3/15/26, 144A | 500,000 | 481,250 | ||||||
DaVita, Inc. | 550,000 | 560,840 | ||||||
5.00%, 5/1/25 | 475,000 | 477,375 | ||||||
Envision Healthcare Corp., 144A | 400,000 | 220,000 | ||||||
MEDNAX, Inc. | 300,000 | 302,250 | ||||||
6.25%, 1/15/27, 144A | 250,000 | 245,625 | ||||||
MPH Acquisition Holdings LLC, 144A | 450,000 | 404,464 | ||||||
Quorum Health Corp. | 83,000 | 72,625 | ||||||
Principal | Value | |||||||
| Healthcare-Services (Continued) | ||||||||
RegionalCare Hospital Partners Holdings Inc / LifePoint Health Inc, 144A | $ | 500,000 | $ | 535,625 | ||||
Select Medical Corp., 144A | 175,000 | 182,525 | ||||||
Surgery Center Holdings, Inc., 144A | 100,000 | 96,000 | ||||||
Tenet Healthcare Corp. | 850,000 | 918,978 | ||||||
6.75%, 6/15/23 | 400,000 | 412,500 | ||||||
5.125%, 5/1/25 | 350,000 | 351,750 | ||||||
7.00%, 8/1/25 (a) | 475,000 | 481,531 | ||||||
6.25%, 2/1/27, 144A | 400,000 | 415,500 | ||||||
|
| |||||||
| 9,247,756 | ||||||||
|
| |||||||
| Pharmaceuticals — 5.3% | ||||||||
Bausch Health Americas, Inc., 144A | 500,000 | 567,500 | ||||||
Bausch Health Cos., Inc. | 915,000 | 944,738 | ||||||
9.00%, 12/15/25, 144A | 1,005,000 | 1,130,625 | ||||||
7.00%, 1/15/28, 144A | 200,000 | 210,086 | ||||||
7.25%, 5/30/29, 144A | 250,000 | 265,000 | ||||||
Endo Dac / Endo Finance LLC / Endo Finco, Inc. | 410,000 | 272,650 | ||||||
6.00%, 2/1/25, 144A | 320,000 | 201,600 | ||||||
Mallinckrodt International Finance SA | 158,000 | 59,862 | ||||||
Mallinckrodt International Finance SA / Mallinckrodt CB LLC | 270,000 | 157,950 | ||||||
5.625%, 10/15/23, 144A (a) | 150,000 | 77,250 | ||||||
5.50%, 4/15/25, 144A (a) | 250,000 | 115,781 | ||||||
Par Pharmaceutical, Inc., 144A | 500,000 | 467,500 | ||||||
Teva Pharmaceutical Finance Netherlands III BV | 1,250,000 | 1,175,000 | ||||||
2.80%, 7/21/23 | 900,000 | 760,500 | ||||||
6.00%, 4/15/24 (a) | 500,000 | 453,125 | ||||||
3.15%, 10/1/26 | 1,000,000 | 739,480 | ||||||
6.75%, 3/1/28 (a) | 450,000 | 380,430 | ||||||
|
| |||||||
| 7,979,077 | ||||||||
|
| |||||||
| Diversified — 0.1% |
| |||||||
| Holding Companies-Diversified — 0.1% | ||||||||
Stena AB, 144A | 150,000 | 147,750 | ||||||
|
| |||||||
| Energy — 9.3% |
| |||||||
| Energy-Alternate Sources — 0.1% | ||||||||
TerraForm Power Operating LLC, 144A | 200,000 | 209,254 | ||||||
|
| |||||||
| Oil & Gas — 8.0% | ||||||||
Antero Resources Corp. | 150,000 | 138,750 | ||||||
| See Notes to Financial Statements. | 35 |
DBX ETF Trust
Schedule of Investments
Xtrackers High Beta High Yield Bond ETF(Continued)
August 31, 2019
Principal | Value | |||||||
| Oil & Gas (Continued) | ||||||||
5.625%, 6/1/23 (a) | $ | 40,000 | $ | 37,100 | ||||
5.00%, 3/1/25 | 425,000 | 369,750 | ||||||
Ascent Resources Utica Holdings LLC / ARU Finance Corp. | 326,000 | 330,075 | ||||||
7.00%, 11/1/26, 144A | 200,000 | 167,190 | ||||||
Baytex Energy Corp., 144A | 150,000 | 149,250 | ||||||
Brazos Valley Longhorn LLC / Brazos Valley Longhorn Finance Corp. | 150,000 | 134,250 | ||||||
Bruin E&P Partners LLC, 144A | 150,000 | 107,625 | ||||||
California Resources Corp., 144A | 600,000 | 348,000 | ||||||
Callon Petroleum Co. | 100,000 | 97,500 | ||||||
Calumet Specialty Products Partners LP / Calumet Finance Corp. | 310,000 | 307,675 | ||||||
Carrizo Oil & Gas, Inc. | 175,000 | 168,262 | ||||||
Chesapeake Energy Corp. | 150,000 | 125,062 | ||||||
7.00%, 10/1/24 | 200,000 | 153,250 | ||||||
8.00%, 1/15/25 (a) | 384,000 | 292,800 | ||||||
8.00%, 3/15/26, 144A | 204,000 | 146,880 | ||||||
7.50%, 10/1/26 | 100,000 | 69,000 | ||||||
8.00%, 6/15/27 | 600,000 | 436,506 | ||||||
CNX Resources Corp. | 310,000 | 301,475 | ||||||
7.25%, 3/14/27, 144A | 200,000 | 168,500 | ||||||
Denbury Resources, Inc. | 155,000 | 141,825 | ||||||
9.25%, 3/31/22, 144A | 250,000 | 211,250 | ||||||
7.75%, 2/15/24, 144A | 70,000 | 49,364 | ||||||
Diamond Offshore Drilling, Inc. | 150,000 | 138,795 | ||||||
EP Energy LLC / Everest Acquisition Finance, Inc. | 550,000 | 44,000 | ||||||
8.00%, 11/29/24, 144A (a) | 200,000 | 86,000 | ||||||
7.75%, 5/15/26, 144A | 250,000 | 210,000 | ||||||
Extraction Oil & Gas, Inc. | 100,000 | 75,500 | ||||||
5.625%, 2/1/26, 144A | 300,000 | 199,500 | ||||||
Gulfport Energy Corp. | 575,000 | 421,187 | ||||||
Hilcorp Energy I LP / Hilcorp Finance Co., 144A | 150,000 | 138,750 | ||||||
MEG Energy Corp. | 250,000 | 237,187 | ||||||
7.00%, 3/31/24, 144A | 290,000 | 277,313 | ||||||
6.50%, 1/15/25, 144A | 280,000 | 282,450 | ||||||
Moss Creek Resources Holdings, Inc. | 200,000 | 140,500 | ||||||
Principal | Value | |||||||
| Oil & Gas (Continued) | ||||||||
10.50%, 5/15/27, 144A | $ | 150,000 | $ | 118,500 | ||||
Nabors Industries, Inc. | 100,000 | 89,625 | ||||||
5.75%, 2/1/25 | 300,000 | 241,500 | ||||||
Noble Holding International Ltd. | 150,000 | 96,000 | ||||||
7.875%, 2/1/26, 144A | 225,000 | 182,531 | ||||||
Oasis Petroleum, Inc. | 237,000 | 221,595 | ||||||
6.25%, 5/1/26, 144A (a) | 150,000 | 121,688 | ||||||
PDC Energy, Inc. | 120,000 | 120,000 | ||||||
5.75%, 5/15/26 | 175,000 | 171,483 | ||||||
QEP Resources, Inc. | 150,000 | 135,563 | ||||||
5.25%, 5/1/23 | 200,000 | 176,000 | ||||||
5.625%, 3/1/26 | 150,000 | 122,250 | ||||||
Range Resources Corp. | 50,000 | 46,875 | ||||||
5.00%, 3/15/23 | 402,000 | 356,775 | ||||||
4.875%, 5/15/25 (a) | 200,000 | 165,000 | ||||||
Rowan Cos., Inc. | 250,000 | 205,000 | ||||||
SM Energy Co. | 150,000 | 140,250 | ||||||
5.00%, 1/15/24 | 100,000 | 88,000 | ||||||
5.625%, 6/1/25 | 275,000 | 235,125 | ||||||
6.75%, 9/15/26 | 100,000 | 85,500 | ||||||
6.625%, 1/15/27 | 100,000 | 85,500 | ||||||
Southwestern Energy Co. | 307,000 | 270,160 | ||||||
7.50%, 4/1/26 | 200,000 | 176,040 | ||||||
7.75%, 10/1/27 (a) | 150,000 | 131,250 | ||||||
Transocean, Inc. | 300,000 | 311,244 | ||||||
7.50%, 1/15/26, 144A | 550,000 | 504,625 | ||||||
Ultra Resources, Inc. | 202,266 | 26,295 | ||||||
Valaris PLC | 250,000 | 159,950 | ||||||
Whiting Petroleum Corp. | 275,000 | 258,211 | ||||||
6.25%, 4/1/23 (a) | 150,000 | 118,500 | ||||||
6.625%, 1/15/26 | 300,000 | 218,610 | ||||||
|
| |||||||
| 12,082,166 | ||||||||
|
| |||||||
| Oil & Gas Services — 0.5% | ||||||||
KCA Deutag UK Finance PLC, 144A | 200,000 | 131,000 | ||||||
McDermott Technology Americas, Inc. / McDermott Technology US, Inc., 144A | 400,000 | 284,000 | ||||||
SESI LLC | 320,000 | 227,200 | ||||||
7.75%, 9/15/24 | 107,000 | 64,735 | ||||||
|
| |||||||
| 706,935 | ||||||||
|
| |||||||
| See Notes to Financial Statements. | 36 |
DBX ETF Trust
Schedule of Investments
Xtrackers High Beta High Yield Bond ETF(Continued)
August 31, 2019
Principal | Value | |||||||
| Pipelines — 0.7% | ||||||||
Antero Midstream Partners LP / Antero Midstream Finance Corp. | $ | 220,000 | $ | 202,400 | ||||
5.75%, 1/15/28, 144A | 200,000 | 182,500 | ||||||
Genesis Energy LP / Genesis Energy Finance Corp. | 200,000 | 195,500 | ||||||
6.25%, 5/15/26 | 170,000 | 163,266 | ||||||
NGL Energy Partners LP / NGL Energy Finance Corp. | 200,000 | 203,436 | ||||||
7.50%, 4/15/26, 144A | 100,000 | 101,500 | ||||||
|
| |||||||
| 1,048,602 | ||||||||
|
| |||||||
| Financial — 9.0% |
| |||||||
| Banks — 0.9% | ||||||||
Freedom Mortgage Corp. | 300,000 | 262,500 | ||||||
8.25%, 4/15/25, 144A | 100,000 | 87,500 | ||||||
Intesa Sanpaolo SpA | 450,000 | 461,587 | ||||||
5.71%, 1/15/26, 144A | 570,000 | 601,807 | ||||||
|
| |||||||
| 1,413,394 | ||||||||
|
| |||||||
| Diversified Financial Services — 3.8% | ||||||||
Allied Universal Holdco LLC / Allied Universal Finance Corp. | 250,000 | 266,250 | ||||||
9.75%, 7/15/27, 144A | 350,000 | 367,500 | ||||||
Ladder Capital Finance Holdings LLLP / Ladder Capital Finance Corp., 144A | 150,000 | 153,375 | ||||||
LPL Holdings, Inc., 144A | 300,000 | 316,500 | ||||||
Metropolitan Light Co. Ltd., 144A | 200,000 | 206,232 | ||||||
Nationstar Mortgage Holdings, Inc. | 300,000 | 311,424 | ||||||
9.125%, 7/15/26, 144A | 300,000 | 317,625 | ||||||
Nationstar Mortgage LLC / Nationstar Capital Corp. | 150,000 | 150,562 | ||||||
Navient Corp. | 450,000 | 474,323 | ||||||
7.25%, 9/25/23 | 400,000 | 445,500 | ||||||
Series MTN, 6.125%, 3/25/24 | 100,000 | 106,625 | ||||||
5.875%, 10/25/24 | 150,000 | 158,548 | ||||||
6.75%, 6/15/26 | 200,000 | 214,500 | ||||||
NFP Corp., 144A | 225,000 | 225,281 | ||||||
Quicken Loans, Inc. | 445,000 | 466,137 | ||||||
5.25%, 1/15/28, 144A | 330,000 | 343,613 | ||||||
Springleaf Finance Corp. | 600,000 | 681,750 | ||||||
7.125%, 3/15/26 | 327,000 | 373,557 | ||||||
6.625%, 1/15/28 | 200,000 | 220,000 | ||||||
|
| |||||||
| 5,799,302 | ||||||||
|
| |||||||
Principal | Value | |||||||
| Insurance — 1.2% | ||||||||
Acrisure LLC / Acrisure Finance, Inc. | $ | 250,000 | $ | 269,844 | ||||
7.00%, 11/15/25, 144A | 300,000 | 277,788 | ||||||
10.125%, 8/1/26, 144A | 110,000 | 113,300 | ||||||
Alliant Holdings Intermediate LLC / Alliant HoldingsCo-Issuer, 144A | 200,000 | 204,750 | ||||||
Ardonagh Midco 3 PLC, 144A | 130,000 | 126,425 | ||||||
AssuredPartners, Inc., 144A | 150,000 | 150,375 | ||||||
Genworth Holdings, Inc. | 200,000 | 209,500 | ||||||
HUB International Ltd., 144A | 450,000 | 457,875 | ||||||
|
| |||||||
| 1,809,857 | ||||||||
|
| |||||||
| Real Estate — 0.8% | ||||||||
Howard Hughes Corp., 144A | 315,000 | 326,025 | ||||||
Kennedy-Wilson, Inc. | 309,000 | 317,884 | ||||||
Realogy Group LLC / Realogy Co.-Issuer Corp. | 200,000 | 195,440 | ||||||
4.875%, 6/1/23, 144A (a) | 200,000 | 174,500 | ||||||
9.375%, 4/1/27, 144A (a) | 150,000 | 130,500 | ||||||
|
| |||||||
| 1,144,349 | ||||||||
�� |
| |||||||
| Real Estate Investment Trusts — 1.7% | ||||||||
Brookfield Property REIT, Inc. / BPR Cumulus LLC / BPR Nimbus LLC / GGSI Sellco LL, 144A | 300,000 | 316,875 | ||||||
CBL & Associates LP | 100,000 | 64,000 | ||||||
5.95%, 12/15/26 | 200,000 | 132,000 | ||||||
Iron Mountain, Inc. | 180,000 | 182,700 | ||||||
4.875%, 9/15/27, 144A | 320,000 | 330,202 | ||||||
5.25%, 3/15/28, 144A | 250,000 | 260,625 | ||||||
MPT Operating Partnership LP / MPT Finance Corp. | 300,000 | 312,562 | ||||||
Senior Housing Properties Trust | 150,000 | 150,557 | ||||||
Starwood Property Trust, Inc. | 150,000 | 154,125 | ||||||
Uniti Group LP / Uniti Fiber Holdings, Inc. / CSL Capital LLC, 144A | 30,000 | 25,350 | ||||||
Uniti Group LP / Uniti Group Finance, Inc. / CSL Capital LLC | 100,000 | 95,500 | ||||||
8.25%, 10/15/23 (a) | 494,000 | 439,660 | ||||||
Washington Prime Group LP | 150,000 | 144,900 | ||||||
|
| |||||||
| 2,609,056 | ||||||||
|
| |||||||
| See Notes to Financial Statements. | 37 |
DBX ETF Trust
Schedule of Investments
Xtrackers High Beta High Yield Bond ETF(Continued)
August 31, 2019
Principal | Value | |||||||
| Venture Capital — 0.6% | ||||||||
Icahn Enterprises LP / Icahn Enterprises Finance Corp. | $ | 250,000 | $ | 262,500 | ||||
6.375%, 12/15/25 | 200,000 | 212,250 | ||||||
6.25%, 5/15/26, 144A | 350,000 | 366,187 | ||||||
|
| |||||||
| 840,937 | ||||||||
|
| |||||||
| Industrial — 7.5% |
| |||||||
| Aerospace/Defense — 2.4% | ||||||||
Bombardier, Inc. | 150,000 | 152,063 | ||||||
6.00%, 10/15/22, 144A | 150,000 | 149,625 | ||||||
6.125%, 1/15/23, 144A | 800,000 | 798,000 | ||||||
7.50%, 12/1/24, 144A | 460,000 | 459,471 | ||||||
7.50%, 3/15/25, 144A | 300,000 | 293,250 | ||||||
7.875%, 4/15/27, 144A | 450,000 | 437,062 | ||||||
TransDigm, Inc. | 300,000 | 310,875 | ||||||
6.50%, 5/15/25 | 300,000 | 313,875 | ||||||
6.375%, 6/15/26 | 481,000 | 506,608 | ||||||
Triumph Group, Inc. | 150,000 | 150,750 | ||||||
|
| |||||||
| 3,571,579 | ||||||||
|
| |||||||
| Building Materials — 1.0% | ||||||||
Builders FirstSource, Inc. | 174,000 | 181,830 | ||||||
6.75%, 6/1/27, 144A | 150,000 | 164,625 | ||||||
Cornerstone Building Brands, Inc., 144A | 209,000 | 198,811 | ||||||
Griffon Corp. | 305,000 | 308,724 | ||||||
JELD-WEN, Inc. | 176,000 | 172,920 | ||||||
4.875%, 12/15/27, 144A | 135,000 | 130,950 | ||||||
Standard Industries, Inc. | 140,000 | 143,850 | ||||||
4.75%, 1/15/28, 144A | 210,000 | 211,838 | ||||||
|
| |||||||
| 1,513,548 | ||||||||
|
| |||||||
| Electrical Components & Equipment — 0.3% | ||||||||
Energizer Holdings, Inc. | 200,000 | 203,110 | ||||||
7.75%, 1/15/27, 144A | 300,000 | 328,875 | ||||||
|
| |||||||
| 531,985 | ||||||||
|
| |||||||
| Engineering & Construction — 0.2% | ||||||||
Brand Industrial Services, Inc., 144A | 341,000 | 302,211 | ||||||
|
| |||||||
| Environmental Control — 0.4% | ||||||||
Covanta Holding Corp. | 150,000 | 156,938 | ||||||
GFL Environmental, Inc. | 150,000 | 151,500 | ||||||
7.00%, 6/1/26, 144A | 150,000 | 156,000 | ||||||
8.50%, 5/1/27, 144A | 150,000 | 164,625 | ||||||
|
| |||||||
| 629,063 | ||||||||
|
| |||||||
Principal | Value | |||||||
| Machinery-Construction & Mining — 0.2% | ||||||||
Vertiv Group Corp., 144A | $ | 250,000 | $ | 237,500 | ||||
|
| |||||||
| Machinery-Diversified — 0.1% | ||||||||
Cloud Crane LLC, 144A | 162,000 | 174,555 | ||||||
|
| |||||||
| Packaging & Containers — 2.5% | ||||||||
Ardagh Packaging Finance PLC / Ardagh Holdings USA, Inc. | 650,000 | 680,469 | ||||||
5.25%, 8/15/27, 144A | 225,000 | 227,812 | ||||||
Berry Global, Inc. | 200,000 | 199,500 | ||||||
5.625%, 7/15/27, 144A | 100,000 | 105,250 | ||||||
Flex Acquisition Co., Inc. | 190,000 | 171,950 | ||||||
7.875%, 7/15/26, 144A | 150,000 | 136,125 | ||||||
LABL Escrow Issuer LLC | 250,000 | 257,500 | ||||||
10.50%, 7/15/27, 144A | 200,000 | 202,500 | ||||||
Mauser Packaging Solutions Holding Co. | 530,000 | 546,562 | ||||||
7.25%, 4/15/25, 144A | 350,000 | 335,563 | ||||||
Reynolds Group Issuer, Inc. / Reynolds Group Issuer LLC / Reynolds Group Issuer Lu, 144A | 250,000 | 258,906 | ||||||
Trivium Packaging Finance BV | 325,000 | 344,500 | ||||||
8.50%, 8/15/27, 144A | 215,000 | 231,663 | ||||||
|
| |||||||
| 3,698,300 | ||||||||
|
| |||||||
| Transportation — 0.3% | ||||||||
Hornbeck Offshore Services, Inc. | 200,000 | 99,000 | ||||||
Kenan Advantage Group, Inc., 144A | 150,000 | 133,875 | ||||||
XPO Logistics, Inc., 144A | 250,000 | 270,000 | ||||||
|
| |||||||
| 502,875 | ||||||||
|
| |||||||
| Trucking & Leasing — 0.1% | ||||||||
Fortress Transportation & Infrastructure Investors LLC, 144A | 100,000 | 103,250 | ||||||
|
| |||||||
| Technology — 4.8% |
| |||||||
| Computers — 1.7% | ||||||||
Banff Merger Sub, Inc., 144A | 450,000 | 411,750 | ||||||
Diebold Nixdorf, Inc. | 125,000 | 117,344 | ||||||
Exela Intermediate LLC / Exela Finance, Inc., 144A | 320,000 | 201,600 | ||||||
Harland Clarke Holdings Corp. | 250,000 | 235,000 | ||||||
8.375%, 8/15/22, 144A | 200,000 | 159,500 | ||||||
| See Notes to Financial Statements. | 38 |
DBX ETF Trust
Schedule of Investments
Xtrackers High Beta High Yield Bond ETF(Continued)
August 31, 2019
Principal | Value | |||||||
| Computers (Continued) | ||||||||
NCR Corp. | $ | 250,000 | $ | 252,955 | ||||
6.375%, 12/15/23 | 75,000 | 77,526 | ||||||
5.75%, 9/1/27, 144A | 150,000 | 158,971 | ||||||
6.125%, 9/1/29, 144A | 150,000 | 159,768 | ||||||
Western Digital Corp. | 700,000 | 718,165 | ||||||
|
| |||||||
| 2,492,579 | ||||||||
|
| |||||||
| Office/Business Equipment — 0.4% | ||||||||
Pitney Bowes, Inc. | 200,000 | 200,500 | ||||||
4.625%, 5/15/22 | 266,000 | 262,675 | ||||||
4.625%, 3/15/24 | 200,000 | 183,500 | ||||||
|
| |||||||
| 646,675 | ||||||||
|
| |||||||
| Software — 2.7% | ||||||||
CDK Global, Inc. | 100,000 | 106,585 | ||||||
4.875%, 6/1/27 | 200,000 | 207,648 | ||||||
5.25%, 5/15/29, 144A | 150,000 | 155,062 | ||||||
Change Healthcare Holdings LLC / Change Healthcare Finance, Inc., 144A | 370,000 | 373,778 | ||||||
Dun & Bradstreet Corp. | 200,000 | 217,125 | ||||||
10.25%, 2/15/27, 144A | 200,000 | 219,250 | ||||||
Infor US, Inc. | 450,000 | 459,000 | ||||||
Informatica LLC, 144A | 150,000 | 153,000 | ||||||
Nuance Communications, Inc. | 200,000 | 211,250 | ||||||
Rackspace Hosting, Inc., 144A | 390,000 | 359,775 | ||||||
Solera LLC / Solera Finance, Inc., 144A | 500,000 | 532,500 | ||||||
SS&C Technologies, Inc., 144A | 650,000 | 683,719 | ||||||
Veritas US, Inc. / Veritas Bermuda Ltd., 144A | 400,000 | 378,000 | ||||||
|
| |||||||
| 4,056,692 | ||||||||
|
| |||||||
| Utilities — 2.3% |
| |||||||
| Electric — 1.8% | ||||||||
Calpine Corp. | 300,000 | 304,851 | ||||||
5.875%, 1/15/24, 144A | 200,000 | 204,772 | ||||||
5.50%, 2/1/24 | 150,000 | 151,686 | ||||||
5.75%, 1/15/25 (a) | 500,000 | 509,375 | ||||||
5.25%, 6/1/26, 144A | 360,000 | 365,850 | ||||||
Clearway Energy Operating LLC | 70,000 | 72,012 | ||||||
5.75%, 10/15/25, 144A | 225,000 | 235,411 | ||||||
Drax Finco PLC, 144A | 100,000 | 103,750 | ||||||
Principal | Value | |||||||
| Electric (Continued) | ||||||||
InterGen NV, 144A | $ | 260,000 | $ | 240,500 | ||||
Talen Energy Supply LLC | 400,000 | 364,600 | ||||||
7.25%, 5/15/27, 144A | 100,000 | 99,750 | ||||||
6.625%, 1/15/28, 144A | 100,000 | 97,250 | ||||||
|
| |||||||
| 2,749,807 | ||||||||
|
| |||||||
| Gas — 0.5% | ||||||||
AmeriGas Partners LP / AmeriGas Finance Corp. | 250,000 | 265,625 | ||||||
5.875%, 8/20/26 | 200,000 | 218,190 | ||||||
5.75%, 5/20/27 | 180,000 | 191,358 | ||||||
|
| |||||||
| 675,173 | ||||||||
|
| |||||||
TOTAL CORPORATE BONDS | 146,905,749 | |||||||
|
| |||||||
Number | ||||||||
| SECURITIES LENDING COLLATERAL — 6.5% | ||||||||
DWS Government & Agency Securities Portfolio “DWS Government Cash Institutional Shares”, 2.04% (b)(c) | 9,810,481 | 9,810,481 | ||||||
|
| |||||||
| CASH EQUIVALENTS — 1.6% | ||||||||
DWS Government Money Market Series “Institutional Shares”, 2.09% (b) | 2,360,073 | 2,360,073 | ||||||
|
| |||||||
TOTAL INVESTMENTS — 105.6% (Cost $161,253,804) | $ | 159,076,303 | ||||||
Other assets and liabilities, net — (5.6%) | (8,376,923 | ) | ||||||
|
| |||||||
NET ASSETS — 100.0% | $ | 150,699,380 | ||||||
|
| |||||||
| See Notes to Financial Statements. | 39 |
DBX ETF Trust
Schedule of Investments
Xtrackers High Beta High Yield Bond ETF(Continued)
August 31, 2019
A summary of the Fund’s transactions with affiliated investments during the year ended August 31, 2019 is as follows:
| Value ($) at 8/31/2018 | Purchases Cost ($) | Sales Proceeds ($) | Net Realized Gain/(Loss) ($) | Net Change in Unrealized Appreciation (Depreciation) ($) | Income ($) | Capital Gain Distributions ($) | Number of Shares at 8/31/2019 | Value ($) at 8/31/2019 | ||||||||||||||||||||||||||||||
| SECURITIES LENDING COLLATERAL —6.5% | ||||||||||||||||||||||||||||||||||||||
| DWS Government & Agency Securities Portfolio “DWS Government Cash Institutional Shares”, 2.04% (b)(c) | ||||||||||||||||||||||||||||||||||||||
| 7,697,440 | 2,113,041(d) | — | — | — | 173,444 | — | 9,810,481 | 9,810,481 | ||||||||||||||||||||||||||||||
| CASH EQUIVALENTS —1.6% | ||||||||||||||||||||||||||||||||||||||
| DWS Government Money Market Series “Institutional Shares”, 2.09%(b) | ||||||||||||||||||||||||||||||||||||||
| — | 20,469,442 | (18,109,369 | ) | — | — | 22,171 | — | 2,360,073 | 2,360,073 | |||||||||||||||||||||||||||||
|
|
|
|
|
|
|
|
|
|
|
|
|
|
|
|
|
| |||||||||||||||||||||
| 7,697,440 | 22,582,483 | (18,109,369 | ) | — | — | 195,615 | — | 12,170,554 | 12,170,554 | |||||||||||||||||||||||||||||
|
|
|
|
|
|
|
|
|
|
|
|
|
|
|
|
|
| |||||||||||||||||||||
| (a) | All or a portion of these securities were on loan. In addition, “Other assets and liabilities, net” may include pending sales that are also on loan. The value of securities loaned at August 31, 2019 amounted to $10,694,071, which is 7.1% of net assets. |
| (b) | Affiliated fund managed by DWS Investment Management Americas, Inc. The rate shown is the annualizedseven-day yield at period end. |
| (c) | Represents cash collateral held in connection with securities lending. Income earned by the Fund is net of borrower rebates. In addition, the Fund heldnon-cash U.S. Treasury securities collateral having a value of $1,329,024. |
| (d) | Represents the net increase (purchase cost) or decrease (sales proceeds) in the amount invested in cash collateral for the period ended August 31, 2019. |
| MTN: | Medium Term Note |
| REIT: | Real Estate Investment Trust |
| PIK: | Denotes that all or a portion of the income is paidin-kind in the form of additional principal. |
| 144A: | Security exempt from registration under Rule 144A of the Securities Act of 1933. These securities may be resold in transactions exempt from registration, normally to qualified institutional buyers. |
Fair Value Measurements
Various inputs are used in determining the value of the Fund’s investments. These inputs are summarized in three broad levels. Level 1 includes quoted prices in active markets for identical securities. Level 2 includes other significant observable inputs (including quoted prices for similar securities, interest rates, prepayment speeds and credit risk). Level 3 includes significant unobservable inputs (including the Fund’s own assumptions in determining the fair value of investments). The level assigned to the securities valuations may not be an indication of the risk or liquidity associated with investing in those securities.
The following is a summary of the inputs used as of August 31, 2019 in valuing the Fund’s investments. For information on the Fund’s policy regarding the valuation of investments, please refer to the Security Valuation section of Note 2 in the accompanying Notes to Financial Statements.
Assets | Level 1 | Level 2 | Level 3 | Total | ||||||||||||
Corporate Bonds (e) | $ | — | $ | 146,905,749 | $ | — | $ | 146,905,749 | ||||||||
Short-Term Investments (e) | 12,170,554 | — | — | 12,170,554 | ||||||||||||
|
|
|
|
|
|
|
| |||||||||
TOTAL | $ | 12,170,554 | $ | 146,905,749 | $ | — | $ | 159,076,303 | ||||||||
|
|
|
|
|
|
|
| |||||||||
| (e) | See Schedule of Investments for additional detailed categorizations. |
| See Notes to Financial Statements. | 40 |
DBX ETF Trust
Schedule of Investments
Xtrackers Low Beta High Yield Bond ETF
August 31, 2019
Principal | Value | |||||||
| CORPORATE BONDS — 99.5% | ||||||||
| Basic Materials — 4.1% | ||||||||
| Chemicals — 1.5% | ||||||||
Ashland LLC | $ | 350,000 | $ | 369,148 | ||||
Blue Cube Spinco LLC | 225,000 | 247,500 | ||||||
10.00%, 10/15/25 | 200,000 | 225,500 | ||||||
CF Industries, Inc. | 250,000 | 256,592 | ||||||
NOVA Chemicals Corp., 144A | 400,000 | 412,000 | ||||||
PolyOne Corp. | 225,000 | 242,719 | ||||||
PQ Corp., 144A | 206,000 | 214,539 | ||||||
WR Grace & Co.-Conn, 144A | 250,000 | 260,625 | ||||||
|
| |||||||
| 2,228,623 | ||||||||
|
| |||||||
| Iron/Steel — 0.6% | ||||||||
Allegheny Technologies, Inc. | 250,000 | 256,875 | ||||||
Cleveland-Cliffs, Inc., 144A | 150,000 | 153,375 | ||||||
Steel Dynamics, Inc. | 306,000 | 307,236 | ||||||
5.25%, 4/15/23 | 210,000 | 213,623 | ||||||
|
| |||||||
| 931,109 | ||||||||
|
| |||||||
| Mining — 2.0% | ||||||||
FMG Resources August 2006 Pty Ltd. | 250,000 | 258,437 | ||||||
5.125%, 3/15/23, 144A | 150,000 | 156,375 | ||||||
5.125%, 5/15/24, 144A | 200,000 | 209,250 | ||||||
Freeport-McMoRan, Inc. | 643,000 | 646,215 | ||||||
6.875%, 2/15/23 | 275,000 | 290,015 | ||||||
3.875%, 3/15/23 | 655,000 | 663,450 | ||||||
4.55%, 11/14/24 | 270,000 | 273,324 | ||||||
Novelis Corp., 144A | 300,000 | 315,000 | ||||||
|
| |||||||
| 2,812,066 | ||||||||
|
| |||||||
| Communications — 20.3% | ||||||||
| Advertising — 0.7% | ||||||||
Lamar Media Corp. | 456,000 | 467,258 | ||||||
5.375%, 1/15/24 | 100,000 | 103,250 | ||||||
Outfront Media Capital LLC / Outfront Media Capital Corp. | 260,000 | 268,775 | ||||||
5.875%, 3/15/25 | 150,000 | 155,625 | ||||||
|
| |||||||
| 994,908 | ||||||||
|
| |||||||
| Internet — 2.5% | ||||||||
Match Group, Inc., 144A | 150,000 | 158,250 | ||||||
Principal | Value | |||||||
| Internet (Continued) | ||||||||
Netflix, Inc. | $ | 190,000 | $ | 197,125 | ||||
5.50%, 2/15/22 | 250,000 | 267,187 | ||||||
5.75%, 3/1/24 (a) | 125,000 | 137,656 | ||||||
5.875%, 2/15/25 | 250,000 | 276,562 | ||||||
4.375%, 11/15/26 | 350,000 | 359,188 | ||||||
4.875%, 4/15/28 | 592,000 | 620,860 | ||||||
Symantec Corp. | 300,000 | 304,410 | ||||||
3.95%, 6/15/22 | 125,000 | 127,677 | ||||||
VeriSign, Inc. | 320,000 | 326,000 | ||||||
5.25%, 4/1/25 | 175,000 | 191,844 | ||||||
4.75%, 7/15/27 | 175,000 | 185,719 | ||||||
Zayo Group LLC / Zayo Capital, Inc. | 500,000 | 518,190 | ||||||
|
| |||||||
| 3,670,668 | ||||||||
|
| |||||||
| Media — 9.4% | ||||||||
AMC Networks, Inc. | 250,000 | 254,375 | ||||||
5.00%, 4/1/24 | 425,000 | 438,812 | ||||||
4.75%, 8/1/25 | 230,000 | 235,750 | ||||||
Cablevision Systems Corp. | 250,000 | 268,050 | ||||||
CCO Holdings LLC / CCO Holdings Capital Corp. | 200,000 | 200,750 | ||||||
5.25%, 9/30/22 | 500,000 | 505,937 | ||||||
4.00%, 3/1/23, 144A | 130,000 | 131,625 | ||||||
5.125%, 5/1/23, 144A | 550,000 | 564,025 | ||||||
5.75%, 9/1/23 | 280,000 | 286,188 | ||||||
5.75%, 1/15/24 | 342,000 | 350,550 | ||||||
5.875%, 4/1/24, 144A | 550,000 | 574,062 | ||||||
5.375%, 5/1/25, 144A | 275,000 | 286,344 | ||||||
5.75%, 2/15/26, 144A | 855,000 | 907,369 | ||||||
Clear Channel Worldwide Holdings, Inc. | ||||||||
Series B, 6.50%, 11/15/22 | 700,000 | 715,169 | ||||||
Series A, 6.50%, 11/15/22 | 200,000 | 204,334 | ||||||
CSC Holdings LLC | 293,000 | 317,172 | ||||||
5.125%, 12/15/21, 144A | 300,000 | 301,125 | ||||||
5.125%, 12/15/21, 144A | 150,000 | 150,562 | ||||||
5.375%, 7/15/23, 144A | 400,000 | 412,104 | ||||||
7.75%, 7/15/25, 144A | 175,000 | 188,344 | ||||||
6.625%, 10/15/25, 144A | 290,000 | 311,193 | ||||||
10.875%, 10/15/25, 144A | 580,000 | 659,388 | ||||||
5.50%, 5/15/26, 144A | 500,000 | 530,000 | ||||||
DISH DBS Corp. | 600,000 | 633,480 | ||||||
Nexstar Broadcasting, Inc. | 98,000 | 99,960 | ||||||
Quebecor Media, Inc. | 300,000 | 326,349 | ||||||
Sirius XM Radio, Inc. | 425,000 | 434,563 | ||||||
4.625%, 5/15/23, 144A | 150,000 | 153,375 | ||||||
4.625%, 7/15/24, 144A | 500,000 | 523,125 | ||||||
| See Notes to Financial Statements. | 41 |
DBX ETF Trust
Schedule of Investments
Xtrackers Low Beta High Yield Bond ETF(Continued)
August 31, 2019
Principal | Value | |||||||
| Media (Continued) | ||||||||
5.375%, 4/15/25, 144A | $ | 234,000 | $ | 243,653 | ||||
5.375%, 7/15/26, 144A | 350,000 | 371,000 | ||||||
TEGNA, Inc. | 345,000 | 355,522 | ||||||
Tribune Media Co. | 400,000 | 405,876 | ||||||
Unitymedia GmbH, 144A | 400,000 | 418,700 | ||||||
Videotron Ltd. | 271,000 | 285,228 | ||||||
5.375%, 6/15/24, 144A | 300,000 | 325,125 | ||||||
5.125%, 4/15/27, 144A | 125,000 | 131,875 | ||||||
|
| |||||||
| 13,501,059 | ||||||||
|
| |||||||
| Telecommunications — 7.7% | ||||||||
CenturyLink, Inc. | ||||||||
Series S, 6.45%, 6/15/21 | 500,000 | 528,125 | ||||||
Series T, 5.80%, 3/15/22 | 465,000 | 489,994 | ||||||
GTH Finance BV, 144A | 200,000 | 222,760 | ||||||
Hughes Satellite Systems Corp. | 350,000 | 378,875 | ||||||
Inmarsat Finance PLC, 144A | 350,000 | 355,250 | ||||||
Intelsat Jackson Holdings SA | 175,000 | 203,219 | ||||||
8.00%, 2/15/24, 144A | 440,000 | 459,250 | ||||||
Level 3 Financing, Inc. | 575,000 | 577,516 | ||||||
5.625%, 2/1/23 | 100,000 | 101,971 | ||||||
5.125%, 5/1/23 | 280,000 | 285,611 | ||||||
5.375%, 1/15/24 | 230,000 | 234,600 | ||||||
Level 3 Parent LLC | 200,000 | 202,000 | ||||||
Nokia OYJ | 222,000 | 225,330 | ||||||
4.375%, 6/12/27 | 150,000 | 156,000 | ||||||
Qwest Corp. | 325,000 | 350,722 | ||||||
Sprint Communications, Inc. | 320,000 | 376,800 | ||||||
Sprint Corp. | 800,000 | 862,560 | ||||||
Telefonaktiebolaget LM Ericsson | 325,000 | 337,405 | ||||||
T-Mobile USA, Inc. | 400,000 | 408,000 | ||||||
6.50%, 1/15/24 | 350,000 | 365,652 | ||||||
6.00%, 4/15/24 | 350,000 | 365,750 | ||||||
6.375%, 3/1/25 | 660,000 | 685,080 | ||||||
5.125%, 4/15/25 | 370,000 | 386,861 | ||||||
6.50%, 1/15/26 | 575,000 | 619,562 | ||||||
4.50%, 2/1/26 | 300,000 | 312,375 | ||||||
5.375%, 4/15/27 (a) | 250,000 | 271,408 | ||||||
4.75%, 2/1/28 | 475,000 | 501,709 | ||||||
VEON Holdings BV | 300,000 | 304,191 | ||||||
Principal | Value | |||||||
| Telecommunications (Continued) | ||||||||
5.95%, 2/13/23, 144A | $ | 300,000 | $ | 324,966 | ||||
4.95%, 6/16/24, 144A | 150,000 | 159,225 | ||||||
|
| |||||||
| 11,052,767 | ||||||||
|
| |||||||
| Consumer, Cyclical — 14.8% | ||||||||
| Airlines — 0.4% | ||||||||
Air Canada, 144A | 150,000 | 161,338 | ||||||
American Airlines Group, Inc., 144A | 250,000 | 260,313 | ||||||
United Airlines Holdings, Inc. | 120,000 | 123,750 | ||||||
|
| |||||||
| 545,401 | ||||||||
|
| |||||||
| Apparel — 0.6% | ||||||||
Hanesbrands, Inc. | 318,000 | 334,297 | ||||||
4.875%, 5/15/26, 144A | 300,000 | 317,754 | ||||||
Levi Strauss & Co. | 200,000 | 209,000 | ||||||
|
| |||||||
| 861,051 | ||||||||
|
| |||||||
| Auto Manufacturers — 0.6% | ||||||||
Allison Transmission, Inc., 144A | 350,000 | 360,754 | ||||||
Fiat Chrysler Automobiles NV | 525,000 | 562,700 | ||||||
|
| |||||||
| 923,454 | ||||||||
|
| |||||||
| Auto Parts & Equipment — 0.2% | ||||||||
Goodyear Tire & Rubber Co. | 322,000 | 327,232 | ||||||
|
| |||||||
| Distribution/Wholesale — 0.5% | ||||||||
American Builders & Contractors Supply Co., Inc., 144A | 200,000 | 212,750 | ||||||
HD Supply, Inc., 144A | 250,000 | 267,550 | ||||||
LKQ Corp. | 227,000 | 231,256 | ||||||
|
| |||||||
| 711,556 | ||||||||
|
| |||||||
| Entertainment — 1.7% | ||||||||
Cinemark USA, Inc. | 197,000 | 200,940 | ||||||
4.875%, 6/1/23 | 200,000 | 204,500 | ||||||
Eldorado Resorts, Inc. | 324,000 | 345,060 | ||||||
6.00%, 9/15/26 | 100,000 | 109,875 | ||||||
International Game Technology PLC, 144A | 450,000 | 478,125 | ||||||
Live Nation Entertainment, Inc., 144A | 219,000 | 227,486 | ||||||
Scientific Games International, Inc. | 382,000 | 397,758 | ||||||
Six Flags Entertainment Corp. | 340,000 | 352,750 | ||||||
5.50%, 4/15/27, 144A | 110,000 | 117,975 | ||||||
|
| |||||||
| 2,434,469 | ||||||||
|
| |||||||
| See Notes to Financial Statements. | 42 |
DBX ETF Trust
Schedule of Investments
Xtrackers Low Beta High Yield Bond ETF(Continued)
August 31, 2019
Principal | Value | |||||||
| Food Service — 0.8% | ||||||||
Aramark Services, Inc. | $ | 405,000 | $ | 418,592 | ||||
5.00%, 4/1/25, 144A | 125,000 | 129,456 | ||||||
4.75%, 6/1/26 | 300,000 | 308,250 | ||||||
5.00%, 2/1/28, 144A | 300,000 | 312,375 | ||||||
|
| |||||||
| 1,168,673 | ||||||||
|
| |||||||
| Home Builders — 2.4% | ||||||||
Brookfield Residential Properties, Inc., 144A | 249,000 | 249,622 | ||||||
KB Home | 200,000 | 217,676 | ||||||
Lennar Corp. | 105,000 | 108,395 | ||||||
4.125%, 1/15/22 | 300,000 | 310,125 | ||||||
4.875%, 12/15/23 | 400,000 | 430,500 | ||||||
4.50%, 4/30/24 | 185,000 | 197,256 | ||||||
5.875%, 11/15/24 | 183,000 | 204,731 | ||||||
4.75%, 5/30/25 | 70,000 | 75,250 | ||||||
4.75%, 11/29/27 | 300,000 | 327,750 | ||||||
Meritage Homes Corp. | 100,000 | 110,875 | ||||||
PulteGroup, Inc. | 303,000 | 333,679 | ||||||
5.00%, 1/15/27 | 170,000 | 183,600 | ||||||
Toll Brothers Finance Corp. | 150,000 | 160,125 | ||||||
4.375%, 4/15/23 (a) | 159,000 | 166,553 | ||||||
4.875%, 3/15/27 | 150,000 | 163,500 | ||||||
4.35%, 2/15/28 | 138,000 | 144,900 | ||||||
|
| |||||||
| 3,384,537 | ||||||||
|
| |||||||
| Home Furnishings — 0.1% | ||||||||
Tempur Sealy International, Inc. | 150,000 | 154,875 | ||||||
|
| |||||||
| Housewares — 0.1% | ||||||||
ScottsMiracle-Gro Co. | 150,000 | 155,885 | ||||||
|
| |||||||
| Leisure Time — 0.4% | ||||||||
NCL Corp. Ltd., 144A | 204,000 | 207,570 | ||||||
Sabre GLBL, Inc. | 70,000 | 72,100 | ||||||
5.25%, 11/15/23, 144A | 230,000 | 237,475 | ||||||
|
| |||||||
| 517,145 | ||||||||
|
| |||||||
| Lodging — 3.8% | ||||||||
Boyd Gaming Corp. | 300,000 | 312,309 | ||||||
Hilton Domestic Operating Co., Inc. | 347,000 | 354,807 | ||||||
5.125%, 5/1/26 | 500,000 | 529,000 | ||||||
4.875%, 1/15/30, 144A | 300,000 | 321,750 | ||||||
Hilton Worldwide Finance LLC / Hilton Worldwide Finance Corp. | 280,000 | 289,800 | ||||||
4.875%, 4/1/27 | 250,000 | 264,062 | ||||||
Principal | Value | |||||||
| Lodging (Continued) | ||||||||
Jack Ohio Finance LLC / Jack Ohio Finance 1 Corp., 144A | $ | 250,000 | $ | 256,250 | ||||
MGM Resorts International | 525,000 | 572,250 | ||||||
7.75%, 3/15/22 | 250,000 | 281,308 | ||||||
6.00%, 3/15/23 | 365,000 | 402,413 | ||||||
5.75%, 6/15/25 | 350,000 | 387,198 | ||||||
4.625%, 9/1/26 | 150,000 | 156,000 | ||||||
5.50%, 4/15/27 | 400,000 | 434,500 | ||||||
Studio City Co. Ltd., 144A | 400,000 | 410,000 | ||||||
Wyndham Destinations, Inc. | 300,000 | 308,250 | ||||||
3.90%, 3/1/23 | 75,000 | 76,453 | ||||||
Wynn Las Vegas LLC / Wynn Las Vegas Capital Corp., 144A | 180,000 | 185,895 | ||||||
|
| |||||||
| 5,542,245 | ||||||||
|
| |||||||
| Retail — 3.2% | ||||||||
1011778 BC ULC / New Red Finance, Inc. | 480,000 | 483,000 | ||||||
4.25%, 5/15/24, 144A | 500,000 | 517,380 | ||||||
5.00%, 10/15/25, 144A | 800,000 | 828,000 | ||||||
Group 1 Automotive, Inc. | 225,000 | 227,531 | ||||||
KFC Holding Co./Pizza Hut Holdings LLC/Taco Bell of America LLC | 300,000 | 310,875 | ||||||
5.25%, 6/1/26, 144A | 440,000 | 466,400 | ||||||
4.75%, 6/1/27, 144A | 250,000 | 262,500 | ||||||
L Brands, Inc. | 361,000 | 380,855 | ||||||
5.625%, 10/15/23 | 150,000 | 158,250 | ||||||
Penske Automotive Group, Inc. | 150,000 | 152,340 | ||||||
QVC, Inc. | 175,000 | 184,897 | ||||||
4.375%, 3/15/23 | 200,000 | 209,037 | ||||||
4.85%, 4/1/24 | 155,000 | 164,761 | ||||||
4.45%, 2/15/25 | 300,000 | 312,224 | ||||||
|
| |||||||
| 4,658,050 | ||||||||
|
| |||||||
| Consumer,Non-cyclical — 19.1% | ||||||||
| Agriculture — 0.2% | ||||||||
Darling Ingredients, Inc., 144A | 200,000 | 213,750 | ||||||
|
| |||||||
| Commercial Services — 3.9% | ||||||||
Brink’s Co., 144A | 225,000 | 229,500 | ||||||
Gartner, Inc., 144A | 276,000 | 290,142 | ||||||
Jaguar Holding Co. II / Pharmaceutical Product Development LLC, 144A | 400,000 | 414,000 | ||||||
Nielsen Co. Luxembourg SARL, 144A | 425,000 | 427,295 | ||||||
| See Notes to Financial Statements. | 43 |
DBX ETF Trust
Schedule of Investments
Xtrackers Low Beta High Yield Bond ETF(Continued)
August 31, 2019
Principal | Value | |||||||
| Commercial Services (Continued) | ||||||||
Refinitiv US Holdings, Inc., 144A | $ | 425,000 | $ | 463,781 | ||||
Service Corp. International | 325,000 | 335,725 | ||||||
4.625%, 12/15/27 | 170,000 | 177,862 | ||||||
5.125%, 6/1/29 | 250,000 | 268,750 | ||||||
ServiceMaster Co. LLC, 144A | 275,000 | 289,336 | ||||||
United Rentals North America, Inc. | 300,000 | 307,688 | ||||||
5.50%, 7/15/25 | 268,000 | 280,395 | ||||||
4.625%, 10/15/25 | 425,000 | 438,685 | ||||||
5.875%, 9/15/26 | 300,000 | 322,875 | ||||||
6.50%, 12/15/26 | 350,000 | 381,938 | ||||||
5.50%, 5/15/27 | 50,000 | 53,838 | ||||||
4.875%, 1/15/28 | 750,000 | 789,375 | ||||||
WEX, Inc., 144A | 150,000 | 151,500 | ||||||
|
| |||||||
| 5,622,685 | ||||||||
|
| |||||||
| Cosmetics/Personal Care — 0.5% | ||||||||
Edgewell Personal Care Co. | 310,000 | 317,362 | ||||||
First Quality Finance Co., Inc. | 216,000 | 216,810 | ||||||
5.00%, 7/1/25, 144A | 150,000 | 156,000 | ||||||
|
| |||||||
| 690,172 | ||||||||
|
| |||||||
| Food — 2.4% | ||||||||
B&G Foods, Inc. | 250,000 | 251,750 | ||||||
JBS USA LUX SA / JBS USA Finance, Inc. | 400,000 | 412,750 | ||||||
5.75%, 6/15/25, 144A | 400,000 | 417,504 | ||||||
Lamb Weston Holdings, Inc. | 275,000 | 288,863 | ||||||
4.875%, 11/1/26, 144A | 285,000 | 298,894 | ||||||
Pilgrim’s Pride Corp., 144A | 300,000 | 312,750 | ||||||
Post Holdings, Inc. | 390,000 | 409,500 | ||||||
5.00%, 8/15/26, 144A | 575,000 | 601,594 | ||||||
TreeHouse Foods, Inc., 144A | 225,000 | 234,281 | ||||||
US Foods, Inc., 144A | 180,000 | 186,746 | ||||||
|
| |||||||
| 3,414,632 | ||||||||
|
| |||||||
| Healthcare-Products — 1.7% | ||||||||
Avantor, Inc. | 530,000 | 569,750 | ||||||
9.00%, 10/1/25, 144A | 650,000 | 732,875 | ||||||
Hill-Rom Holdings, Inc., 144A | 150,000 | 155,250 | ||||||
Hologic, Inc. | 450,000 | 462,375 | ||||||
4.625%, 2/1/28, 144A | 50,000 | 51,937 | ||||||
Principal | Value | |||||||
| Healthcare-Products (Continued) | ||||||||
Teleflex, Inc. | $ | 354,000 | $ | 374,695 | ||||
4.625%, 11/15/27 | 50,000 | 53,057 | ||||||
|
| |||||||
| 2,399,939 | ||||||||
|
| |||||||
| Healthcare-Services — 7.8% | ||||||||
Acadia Healthcare Co., Inc. | 250,000 | 256,560 | ||||||
Catalent Pharma Solutions, Inc. | 175,000 | 178,500 | ||||||
5.00%, 7/15/27, 144A | 150,000 | 157,516 | ||||||
Centene Corp. | 470,000 | 477,050 | ||||||
4.75%, 5/15/22 | 225,000 | 231,417 | ||||||
6.125%, 2/15/24 | 425,000 | 445,931 | ||||||
4.75%, 1/15/25 | 445,000 | 462,800 | ||||||
5.375%, 6/1/26, 144A | 600,000 | 642,930 | ||||||
Charles River Laboratories International, Inc., 144A | 150,000 | 160,860 | ||||||
Encompass Health Corp. | 344,000 | 349,590 | ||||||
HCA Healthcare, Inc. | 413,000 | 434,848 | ||||||
HCA, Inc. | 555,000 | 622,882 | ||||||
5.875%, 5/1/23 | 400,000 | 442,750 | ||||||
5.375%, 2/1/25 | 875,000 | 973,437 | ||||||
5.875%, 2/15/26 | 525,000 | 600,206 | ||||||
5.375%, 9/1/26 | 350,000 | 391,125 | ||||||
5.625%, 9/1/28 | 540,000 | 615,769 | ||||||
5.875%, 2/1/29 | 375,000 | 432,188 | ||||||
Molina Healthcare, Inc. | 250,000 | 268,135 | ||||||
RegionalCare Hospital Partners Holdings, Inc., 144A | 301,000 | 321,972 | ||||||
Tenet Healthcare Corp. | 600,000 | 619,500 | ||||||
4.625%, 9/1/24, 144A | 200,000 | 206,250 | ||||||
4.875%, 1/1/26, 144A | 750,000 | 771,638 | ||||||
5.125%, 11/1/27, 144A | 500,000 | 517,500 | ||||||
WellCare Health Plans, Inc. | 450,000 | 472,860 | ||||||
5.375%, 8/15/26, 144A | 250,000 | 267,188 | ||||||
|
| |||||||
| 11,321,402 | ||||||||
|
| |||||||
| Household Products/Wares — 0.4% | ||||||||
Prestige Brands, Inc. | 125,000 | 126,719 | ||||||
6.375%, 3/1/24, 144A | 150,000 | 157,875 | ||||||
Spectrum Brands, Inc. | 329,000 | 343,805 | ||||||
|
| |||||||
| 628,399 | ||||||||
|
| |||||||
| Pharmaceuticals — 2.2% | ||||||||
Bausch Health Cos., Inc. | 485,000 | 502,727 | ||||||
5.50%, 3/1/23, 144A | 102,000 | 103,402 | ||||||
| See Notes to Financial Statements. | 44 |
DBX ETF Trust
Schedule of Investments
Xtrackers Low Beta High Yield Bond ETF(Continued)
August 31, 2019
Principal | Value | |||||||
| Pharmaceuticals (Continued) | ||||||||
5.875%, 5/15/23, 144A | $ | 272,000 | $ | 276,420 | ||||
7.00%, 3/15/24, 144A | 700,000 | 741,062 | ||||||
5.50%, 11/1/25, 144A | 550,000 | 578,864 | ||||||
5.75%, 8/15/27, 144A | 300,000 | 322,500 | ||||||
Elanco Animal Health, Inc. | 175,000 | 178,417 | ||||||
4.272%, 8/28/23 | 250,000 | 261,956 | ||||||
4.90%, 8/28/28 | 250,000 | 272,654 | ||||||
|
| |||||||
| 3,238,002 | ||||||||
|
| |||||||
| Energy — 13.0% | ||||||||
| Coal — 0.2% | ||||||||
Peabody Energy Corp. | 175,000 | 180,359 | ||||||
6.375%, 3/31/25, 144A | 170,000 | 177,544 | ||||||
|
| |||||||
| 357,903 | ||||||||
|
| |||||||
| Energy-Alternate Sources — 0.1% | ||||||||
TerraForm Power Operating LLC, 144A | 158,000 | 162,685 | ||||||
|
| |||||||
| Oil & Gas — 6.2% | ||||||||
Aker BP ASA | 100,000 | 103,050 | ||||||
4.75%, 6/15/24, 144A | 250,000 | 256,250 | ||||||
5.875%, 3/31/25, 144A | 200,000 | 211,600 | ||||||
Antero Resources Corp. | 325,000 | 316,062 | ||||||
Baytex Energy Corp., 144A | 136,000 | 135,320 | ||||||
Callon Petroleum Co. | 235,000 | 229,125 | ||||||
CITGO Petroleum Corp., 144A | 108,000 | 108,945 | ||||||
CrownRock LP / CrownRock Finance, Inc., 144A | 345,000 | 342,844 | ||||||
Diamondback Energy, Inc. | 436,000 | 450,715 | ||||||
5.375%, 5/31/25 | 300,000 | 315,750 | ||||||
Endeavor Energy Resources LP / EER Finance, Inc. | 150,000 | 156,562 | ||||||
5.75%, 1/30/28, 144A | 205,000 | 215,762 | ||||||
Hilcorp Energy I LP / Hilcorp Finance Co. | 150,000 | 139,125 | ||||||
5.75%, 10/1/25, 144A | 200,000 | 187,500 | ||||||
Matador Resources Co. | 350,000 | 340,813 | ||||||
Murphy Oil Corp. | 200,000 | 201,000 | ||||||
4.20%, 12/1/22 | 250,000 | 253,750 | ||||||
6.875%, 8/15/24 | 150,000 | 157,920 | ||||||
5.75%, 8/15/25 | 190,000 | 193,268 | ||||||
Nabors Industries, Inc. | 200,000 | 191,500 | ||||||
Parkland Fuel Corp. | 175,000 | 184,406 | ||||||
5.875%, 7/15/27, 144A | 175,000 | 184,188 | ||||||
Principal | Value | |||||||
| Oil & Gas (Continued) | ||||||||
Parsley Energy LLC / Parsley Finance Corp. | $ | 140,000 | $ | 145,600 | ||||
5.375%, 1/15/25, 144A | 250,000 | 256,250 | ||||||
5.25%, 8/15/25, 144A | 400,000 | 408,000 | ||||||
PBF Holding Co LLC / PBF Finance Corp. | 245,000 | 254,717 | ||||||
PBF Holding Co. LLC / PBF Finance Corp. | 150,000 | 154,875 | ||||||
Puma International Financing SA | 200,000 | 187,530 | ||||||
5.00%, 1/24/26, 144A | 250,000 | 232,543 | ||||||
Range Resources Corp. | 150,000 | 149,250 | ||||||
Seven Generations Energy Ltd. | 250,000 | 251,875 | ||||||
6.875%, 6/30/23, 144A | 150,000 | 152,655 | ||||||
5.375%, 9/30/25, 144A | 200,000 | 192,250 | ||||||
Sunoco LP / Sunoco Finance Corp. | 350,000 | 358,750 | ||||||
5.50%, 2/15/26 | 200,000 | 208,000 | ||||||
6.00%, 4/15/27 | 275,000 | 290,125 | ||||||
WPX Energy, Inc. | 300,000 | 309,750 | ||||||
5.25%, 9/15/24 | 250,000 | 255,000 | ||||||
5.75%, 6/1/26 (a) | 200,000 | 208,250 | ||||||
|
| |||||||
| 8,890,875 | ||||||||
|
| |||||||
| Oil & Gas Services — 0.3% | ||||||||
USA Compression Partners LP / USA Compression Finance Corp. | 250,000 | 257,500 | ||||||
6.875%, 9/1/27, 144A | 200,000 | 206,716 | ||||||
|
| |||||||
| 464,216 | ||||||||
|
| |||||||
| Pipelines — 6.2% | ||||||||
Antero Midstream Partners LP / Antero Midstream Finance Corp. | 200,000 | 189,500 | ||||||
Blue Racer Midstream LLC / Blue Racer Finance Corp., 144A | 250,000 | 252,500 | ||||||
Cheniere Corpus Christi Holdings LLC | 400,000 | 462,500 | ||||||
5.875%, 3/31/25 | 500,000 | 558,750 | ||||||
5.125%, 6/30/27 | 500,000 | 553,750 | ||||||
Cheniere Energy Partners LP | 530,000 | 549,875 | ||||||
5.625%, 10/1/26 | 386,000 | 409,160 | ||||||
Crestwood Midstream Partners LP / Crestwood Midstream Finance Corp. | 115,000 | 117,587 | ||||||
5.75%, 4/1/25 (a) | 225,000 | 231,187 | ||||||
5.625%, 5/1/27, 144A | 200,000 | 200,436 | ||||||
DCP Midstream Operating LP | 250,000 | 256,875 | ||||||
3.875%, 3/15/23 | 150,000 | 152,250 | ||||||
5.375%, 7/15/25 | 276,000 | 292,560 | ||||||
5.125%, 5/15/29 | 200,000 | 205,260 | ||||||
| See Notes to Financial Statements. | 45 |
DBX ETF Trust
Schedule of Investments
Xtrackers Low Beta High Yield Bond ETF(Continued)
August 31, 2019
Principal | Value | |||||||
| Pipelines (Continued) | ||||||||
EnLink Midstream LLC | $ | 175,000 | $ | 171,675 | ||||
EnLink Midstream Partners LP | 320,000 | 318,000 | ||||||
4.85%, 7/15/26 | 306,000 | 301,027 | ||||||
Genesis Energy LP / Genesis Energy Finance Corp. | 300,000 | 304,380 | ||||||
6.00%, 5/15/23 | 125,000 | 124,687 | ||||||
NuStar Logistics LP | 120,000 | 122,100 | ||||||
6.00%, 6/1/26 | 150,000 | 161,250 | ||||||
5.625%, 4/28/27 | 200,000 | 208,750 | ||||||
Tallgrass Energy Partners LP / Tallgrass Energy Finance Corp. | 150,000 | 149,250 | ||||||
5.50%, 9/15/24, 144A | 263,000 | 257,740 | ||||||
5.50%, 1/15/28, 144A | 250,000 | 236,563 | ||||||
Targa Resources Partners LP / Targa Resources Partners Finance Corp. | 200,000 | 203,938 | ||||||
4.25%, 11/15/23 | 150,000 | 150,375 | ||||||
6.75%, 3/15/24 | 95,000 | 98,919 | ||||||
5.125%, 2/1/25 | 200,000 | 206,000 | ||||||
5.875%, 4/15/26 | 390,000 | 409,988 | ||||||
5.375%, 2/1/27 | 350,000 | 362,880 | ||||||
6.50%, 7/15/27, 144A | 250,000 | 271,875 | ||||||
5.00%, 1/15/28 | 195,000 | 196,463 | ||||||
6.875%, 1/15/29, 144A | 200,000 | 221,500 | ||||||
|
| |||||||
| 8,909,550 | ||||||||
|
| |||||||
| Financial — 9.4% | ||||||||
| Banks — 1.0% | ||||||||
CIT Group, Inc. | 250,000 | 255,937 | ||||||
5.00%, 8/15/22 | 325,000 | 347,292 | ||||||
5.00%, 8/1/23 | 261,000 | 283,837 | ||||||
4.75%, 2/16/24 | 200,000 | 215,250 | ||||||
5.25%, 3/7/25 | 120,000 | 134,700 | ||||||
6.125%, 3/9/28 | 150,000 | 179,813 | ||||||
|
| |||||||
| 1,416,829 | ||||||||
|
| |||||||
| Diversified Financial Services — 3.5% | ||||||||
Ally Financial, Inc. | 430,000 | 453,112 | ||||||
3.875%, 5/21/24 | 250,000 | 264,062 | ||||||
5.125%, 9/30/24 | 350,000 | 393,312 | ||||||
4.625%, 3/30/25 | 275,000 | 302,156 | ||||||
5.75%, 11/20/25 | 350,000 | 402,062 | ||||||
Ladder Capital Finance Holdings LLLP / Ladder Capital Finance Corp., 144A | 203,000 | 211,628 | ||||||
Navient Corp. | 300,000 | 307,875 | ||||||
5.875%, 3/25/21 | 200,000 | 210,250 | ||||||
6.625%, 7/26/21 | 375,000 | 402,188 | ||||||
Series MTN, 7.25%, 1/25/22 | 120,000 | 132,000 | ||||||
6.50%, 6/15/22 | 250,000 | 271,250 | ||||||
Principal | Value | |||||||
| Diversified Financial Services (Continued) | ||||||||
Springleaf Finance Corp. | $ | 350,000 | $ | 375,323 | ||||
7.75%, 10/1/21 | 300,000 | 328,875 | ||||||
6.125%, 5/15/22 | 300,000 | 324,750 | ||||||
5.625%, 3/15/23 | 281,000 | 302,778 | ||||||
6.125%, 3/15/24 | 400,000 | 437,000 | ||||||
|
| |||||||
| 5,118,621 | ||||||||
|
| |||||||
| Real Estate Investment Trusts — 4.4% | ||||||||
CyrusOne LP / CyrusOne Finance Corp. | 200,000 | 207,000 | ||||||
5.375%, 3/15/27 | 170,000 | 181,262 | ||||||
Equinix, Inc. | 620,000 | 637,050 | ||||||
5.75%, 1/1/25 | 175,000 | 183,094 | ||||||
5.875%, 1/15/26 | 350,000 | 373,187 | ||||||
5.375%, 5/15/27 | 400,000 | 433,132 | ||||||
ESH Hospitality, Inc., 144A | 410,000 | 424,862 | ||||||
Iron Mountain, Inc., 144A | 400,000 | 404,000 | ||||||
iStar, Inc. | 150,000 | 152,250 | ||||||
5.25%, 9/15/22 | 133,000 | 136,657 | ||||||
MGM Growth Properties Operating Partnership LP / MGP FinanceCo-Issuer, Inc. | 335,000 | 367,244 | ||||||
4.50%, 9/1/26 | 180,000 | 189,450 | ||||||
5.75%, 2/1/27, 144A | 250,000 | 276,300 | ||||||
MPT Operating Partnership LP / MPT Finance Corp. | 150,000 | 157,313 | ||||||
5.25%, 8/1/26 | 465,000 | 493,040 | ||||||
5.00%, 10/15/27 | 279,000 | 298,530 | ||||||
SBA Communications Corp. | 150,000 | 152,715 | ||||||
4.00%, 10/1/22 | 350,000 | 357,875 | ||||||
4.875%, 9/1/24 | 350,000 | 363,563 | ||||||
Starwood Property Trust, Inc. | 150,000 | 151,500 | ||||||
5.00%, 12/15/21 | 325,000 | 338,000 | ||||||
|
| |||||||
| 6,278,024 | ||||||||
|
| |||||||
| Venture Capital — 0.5% | ||||||||
Icahn Enterprises LP / Icahn Enterprises Finance Corp. | 344,000 | 350,880 | ||||||
6.25%, 2/1/22 | 420,000 | 433,650 | ||||||
|
| |||||||
| 784,530 | ||||||||
|
| |||||||
| Industrial — 10.7% | ||||||||
| Aerospace/Defense — 2.3% | ||||||||
Arconic, Inc. | 300,000 | 309,255 | ||||||
5.87%, 2/23/22 | 350,000 | 373,924 | ||||||
5.125%, 10/1/24 | 368,000 | 392,421 | ||||||
Bombardier, Inc., 144A | 300,000 | 326,625 | ||||||
| See Notes to Financial Statements. | 46 |
DBX ETF Trust
Schedule of Investments
Xtrackers Low Beta High Yield Bond ETF(Continued)
August 31, 2019
Principal | Value | |||||||
| Aerospace/Defense (Continued) | ||||||||
TransDigm, Inc. | $ | 400,000 | $ | 407,500 | ||||
6.25%, 3/15/26, 144A | 1,350,000 | 1,459,660 | ||||||
|
| |||||||
| 3,269,385 | ||||||||
|
| |||||||
| Building Materials — 0.8% | ||||||||
Standard Industries, Inc. | 150,000 | 154,125 | ||||||
5.375%, 11/15/24, 144A | 385,000 | 397,513 | ||||||
6.00%, 10/15/25, 144A | 425,000 | 448,906 | ||||||
Summit Materials LLC / Summit Materials Finance Corp. | 176,000 | 179,740 | ||||||
|
| |||||||
| 1,180,284 | ||||||||
|
| |||||||
| Electronics — 1.1% | ||||||||
ADT Security Corp. | 195,000 | 208,163 | ||||||
3.50%, 7/15/22 | 410,000 | 412,562 | ||||||
4.125%, 6/15/23 | 250,000 | 254,609 | ||||||
Itron, Inc., 144A | 150,000 | 153,750 | ||||||
Sensata Technologies BV | 215,000 | 226,363 | ||||||
5.625%, 11/1/24, 144A | 100,000 | 109,000 | ||||||
5.00%, 10/1/25, 144A | 220,000 | 234,300 | ||||||
|
| |||||||
| 1,598,747 | ||||||||
|
| |||||||
| Engineering & Construction — 0.6% | ||||||||
AECOM | 349,000 | 378,229 | ||||||
5.125%, 3/15/27 | 300,000 | 314,856 | ||||||
MasTec, Inc. | 125,000 | 127,500 | ||||||
|
| |||||||
| 820,585 | ||||||||
|
| |||||||
| Environmental Control — 0.5% | ||||||||
Advanced Disposal Services, Inc., 144A | 200,000 | 210,500 | ||||||
Clean Harbors, Inc., 144A | 200,000 | 212,000 | ||||||
Covanta Holding Corp. | 150,000 | 154,500 | ||||||
Stericycle, Inc., 144A | 150,000 | 154,125 | ||||||
|
| |||||||
| 731,125 | ||||||||
|
| |||||||
| Hand/Machine Tools — 0.3% | ||||||||
Colfax Corp. | 200,000 | 214,000 | ||||||
6.375%, 2/15/26, 144A | 150,000 | 163,313 | ||||||
|
| |||||||
| 377,313 | ||||||||
|
| |||||||
| Machinery-Diversified — 0.1% | ||||||||
Welbilt, Inc. | 150,000 | 161,625 | ||||||
|
| |||||||
Principal | Value | |||||||
| Packaging & Containers — 4.6% | ||||||||
Ardagh Packaging Finance PLC / Ardagh Holdings USA, Inc. | $ | 310,000 | $ | 315,037 | ||||
4.625%, 5/15/23, 144A | 300,000 | 307,788 | ||||||
4.125%, 8/15/26, 144A | 150,000 | 152,059 | ||||||
Ball Corp. | 514,000 | 526,850 | ||||||
5.00%, 3/15/22 | 200,000 | 212,500 | ||||||
4.00%, 11/15/23 | 150,000 | 158,812 | ||||||
5.25%, 7/1/25 | 500,000 | 562,500 | ||||||
4.875%, 3/15/26 | 200,000 | 220,000 | ||||||
Berry Global, Inc. | 175,000 | 178,596 | ||||||
5.125%, 7/15/23 | 350,000 | 360,063 | ||||||
4.875%, 7/15/26, 144A | 425,000 | 447,313 | ||||||
Crown Americas LLC / Crown Americas Capital Corp. IV | 305,000 | 321,013 | ||||||
Graphic Packaging International LLC | 181,000 | 186,204 | ||||||
Owens-Brockway Glass Container, Inc. | 170,000 | 174,675 | ||||||
5.875%, 8/15/23, 144A | 250,000 | 267,188 | ||||||
Reynolds Group Issuer, Inc. / Reynolds Group Issuer LLC / Reynolds Group Issuer Lu | 1,066,018 | 1,070,016 | ||||||
5.125%, 7/15/23, 144A | 575,000 | 592,566 | ||||||
Sealed Air Corp. | 100,000 | 103,500 | ||||||
5.125%, 12/1/24, 144A | 225,000 | 242,156 | ||||||
5.50%, 9/15/25, 144A | 200,000 | 217,500 | ||||||
|
| |||||||
| 6,616,336 | ||||||||
|
| |||||||
| Transportation — 0.3% | ||||||||
XPO Logistics, Inc. | 454,000 | 465,091 | ||||||
6.125%, 9/1/23, 144A | 50,000 | 51,825 | ||||||
|
| |||||||
| 516,916 | ||||||||
|
| |||||||
| Trucking & Leasing — 0.1% | ||||||||
Fortress Transportation & Infrastructure Investors LLC, 144A | 150,000 | 156,375 | ||||||
|
| |||||||
| Technology — 4.4% | ||||||||
| Computers — 1.4% | ||||||||
Dell International LLC / EMC Corp. | 567,000 | 576,570 | ||||||
7.125%, 6/15/24, 144A | 673,000 | 709,493 | ||||||
Dell, Inc. | 100,000 | 102,437 | ||||||
EMC Corp. | 350,000 | 347,199 | ||||||
Leidos Holdings, Inc. | 200,000 | 204,414 | ||||||
|
| |||||||
| 1,940,113 | ||||||||
|
| |||||||
| See Notes to Financial Statements. | 47 |
DBX ETF Trust
Schedule of Investments
Xtrackers Low Beta High Yield Bond ETF(Continued)
August 31, 2019
Principal | Value | |||||||
| Office/Business Equipment — 0.9% | ||||||||
CDW LLC / CDW Finance Corp. | $ | 150,000 | $ | 153,563 | ||||
5.50%, 12/1/24 | 200,000 | 218,750 | ||||||
5.00%, 9/1/25 | 250,000 | 262,031 | ||||||
Xerox Corp. | 400,000 | 412,000 | ||||||
4.125%, 3/15/23 | 300,000 | 306,750 | ||||||
|
| |||||||
| 1,353,094 | ||||||||
|
| |||||||
| Semiconductors — 0.2% | ||||||||
Qorvo, Inc. | 300,000 | 321,006 | ||||||
|
| |||||||
| Software — 1.9% | ||||||||
CDK Global, Inc. | 180,000 | 189,900 | ||||||
IQVIA, Inc. | 375,000 | 397,031 | ||||||
5.00%, 5/15/27, 144A | 200,000 | 211,750 | ||||||
MSCI, Inc. | 425,000 | 443,360 | ||||||
5.75%, 8/15/25, 144A | 150,000 | 158,250 | ||||||
5.375%, 5/15/27, 144A | 354,000 | 381,612 | ||||||
Open Text Corp. | 250,000 | 257,500 | ||||||
5.875%, 6/1/26, 144A | 230,000 | 246,376 | ||||||
TIBCO Software, Inc., 144A | 350,000 | 367,719 | ||||||
|
| |||||||
| 2,653,498 | ||||||||
|
| |||||||
| Utilities — 3.7% | ||||||||
| Electric — 3.5% | ||||||||
AES Corp. | 100,000 | 102,386 | ||||||
4.50%, 3/15/23 | 50,000 | 51,520 | ||||||
4.875%, 5/15/23 | 310,000 | 315,037 | ||||||
5.50%, 4/15/25 | 185,000 | 193,562 | ||||||
6.00%, 5/15/26 | 300,000 | 322,797 | ||||||
5.125%, 9/1/27 | 200,000 | 214,906 | ||||||
Calpine Corp., 144A | 300,000 | 303,234 | ||||||
NextEra Energy Operating Partners LP | 230,000 | 236,900 | ||||||
4.25%, 9/15/24, 144A (a) | 325,000 | 338,244 | ||||||
4.50%, 9/15/27, 144A | 105,000 | 108,281 | ||||||
NRG Energy, Inc. | 300,000 | 330,000 | ||||||
6.625%, 1/15/27 | 471,000 | 510,446 | ||||||
5.75%, 1/15/28 | 256,000 | 276,800 | ||||||
5.25%, 6/15/29, 144A | 250,000 | 267,080 | ||||||
Vistra Energy Corp. | 200,000 | 204,750 | ||||||
Vistra Operations Co. LLC | 325,000 | 342,063 | ||||||
5.625%, 2/15/27, 144A | 450,000 | 478,125 | ||||||
5.00%, 7/31/27, 144A | 450,000 | 465,750 | ||||||
|
| |||||||
| 5,061,881 | ||||||||
|
| |||||||
Principal | Value | |||||||
| Gas — 0.2% | ||||||||
AmeriGas Partners LP / AmeriGas Finance Corp. | $ | 225,000 | $ | 239,906 | ||||
|
| |||||||
TOTAL CORPORATE BONDS | 143,486,176 | |||||||
|
| |||||||
Number | ||||||||
| SECURITIES LENDING COLLATERAL — 0.8% | ||||||||
DWS Government & Agency Securities Portfolio “DWS Government Cash Institutional Shares”, 2.04% (b)(c) | 1,219,663 | 1,219,663 | ||||||
|
| |||||||
| CASH EQUIVALENTS — 1.3% | ||||||||
DWS Government Money Market Series “Institutional Shares”, 2.09% (b) | 1,864,770 | 1,864,770 | ||||||
|
| |||||||
TOTAL INVESTMENTS — 101.6% (Cost $142,942,577) | $ | 146,570,609 | ||||||
Other assets and liabilities, net — (1.6%) | (2,291,732 | ) | ||||||
|
| |||||||
NET ASSETS — 100.0% | $ | 144,278,877 | ||||||
|
| |||||||
| See Notes to Financial Statements. | 48 |
DBX ETF Trust
Schedule of Investments
Xtrackers Low Beta High Yield Bond ETF(Continued)
August 31, 2019
A summary of the Fund’s transactions with affiliated investments during the year ended August 31, 2019 is as follows:
| Value ($) at 8/31/2018 | Purchases Cost ($) | Sales Proceeds ($) | Net Realized Gain/(Loss) ($) | Net Change in Unrealized Appreciation (Depreciation) ($) | Income ($) | Capital Gain Distributions ($) | Number of Shares at 8/31/2019 | Value ($) at 8/31/2019 | ||||||||||||||||||||||||||||||
SECURITIES LENDING COLLATERAL —0.8% | ||||||||||||||||||||||||||||||||||||||
DWS Government & Agency Securities Portfolio “DWS Government Cash Institutional Shares”, 2.04% (b)(c) | ||||||||||||||||||||||||||||||||||||||
| 2,990,054 | — | (1,770,391 | )(d) | — | — | 15,389 | — | 1,219,663 | 1,219,663 | |||||||||||||||||||||||||||||
CASH EQUIVALENTS —1.3% | ||||||||||||||||||||||||||||||||||||||
DWS Government Money Market Series “Institutional Shares”, 2.09% (b) | ||||||||||||||||||||||||||||||||||||||
| — | 23,711,673 | (21,846,903 | ) | — | — | 31,675 | — | 1,864,770 | 1,864,770 | |||||||||||||||||||||||||||||
|
|
|
|
|
|
|
|
|
|
|
|
|
|
|
|
|
| |||||||||||||||||||||
| 2,990,054 | 23,711,673 | (23,617,294 | ) | — | — | 47,064 | — | 3,084,433 | 3,084,433 | |||||||||||||||||||||||||||||
|
|
|
|
|
|
|
|
|
|
|
|
|
|
|
|
|
| |||||||||||||||||||||
| (a) | All or a portion of these securities were on loan. In addition, “Other assets and liabilities, net” may include pending sales that are also on loan. The value of securities loaned at August 31, 2019 amounted to $1,488,709, which is 1.0% of net assets. |
| (b) | Affiliated fund managed by DWS Investment Management Americas, Inc. The rate shown is the annualizedseven-day yield at period end. |
| (c) | Represents cash collateral held in connection with securities lending. Income earned by the Fund is net of borrower rebates. In addition, the Fund heldnon-cash U.S. Treasury securities collateral having a value of $320,999. |
| (d) | Represents the net increase (purchase cost) or decrease (sales proceeds) in the amount invested in cash collateral for the period ended August 31, 2019. |
| MTN: | Medium Term Note |
| 144A: | Security exempt from registration under Rule 144A of the Securities Act of 1933. These securities may be resold in transactions exempt from registration, normally to qualified institutional buyers. |
Fair Value Measurements
Various inputs are used in determining the value of the Fund’s investments. These inputs are summarized in three broad levels. Level 1 includes quoted prices in active markets for identical securities. Level 2 includes other significant observable inputs (including quoted prices for similar securities, interest rates, prepayment speeds and credit risk). Level 3 includes significant unobservable inputs (including the Fund’s own assumptions in determining the fair value of investments). The level assigned to the securities valuations may not be an indication of the risk or liquidity associated with investing in those securities.
The following is a summary of the inputs used as of August 31, 2019 in valuing the Fund’s investments. For information on the Fund’s policy regarding the valuation of investments, please refer to the Security Valuation section of Note 2 in the accompanying Notes to Financial Statements.
Assets | Level 1 | Level 2 | Level 3 | Total | ||||||||||||
Corporate Bonds (e) | $ | — | $ | 143,486,176 | $ | — | $ | 143,486,176 | ||||||||
Short-Term Investments (e) | 3,084,433 | — | — | 3,084,433 | ||||||||||||
|
|
|
|
|
|
|
| |||||||||
TOTAL | $ | 3,084,433 | $ | 143,486,176 | $ | — | $ | 146,570,609 | ||||||||
|
|
|
|
|
|
|
| |||||||||
| (e) | See Schedule of Investments for additional detailed categorizations. |
| See Notes to Financial Statements. | 49 |
DBX ETF Trust
Schedule of Investments
Xtrackers Short Duration High Yield Bond ETF
August 31, 2019
Principal | Value | |||||||
| CORPORATE BONDS — 99.7% | ||||||||
| Basic Materials — 4.5% | ||||||||
| Chemicals — 1.7% | ||||||||
Ashland LLC | $ | 57,000 | $ | 60,118 | ||||
CF Industries, Inc. | 50,000 | 51,318 | ||||||
Chemours Co. | 54,000 | 55,148 | ||||||
NOVA Chemicals Corp. | 27,000 | 27,621 | ||||||
4.875%, 6/1/24, 144A | 50,000 | 51,500 | ||||||
OCI NV, 144A | 44,000 | 46,640 | ||||||
PolyOne Corp. | 32,000 | 34,520 | ||||||
WR Grace & Co.-Conn, 144A | 49,000 | 51,083 | ||||||
|
| |||||||
| 377,948 | ||||||||
|
| |||||||
| Iron/Steel — 0.6% | ||||||||
AK Steel Corp. | 31,000 | 30,961 | ||||||
Allegheny Technologies, Inc. | 29,000 | 29,797 | ||||||
7.875%, 8/15/23 | 27,000 | 29,059 | ||||||
Steel Dynamics, Inc. | 38,000 | 38,154 | ||||||
|
| |||||||
| 127,971 | ||||||||
|
| |||||||
| Mining — 2.2% | ||||||||
Aleris International, Inc., 144A | 30,000 | 31,650 | ||||||
FMG Resources August 2006 Pty Ltd. | 61,000 | 63,059 | ||||||
5.125%, 3/15/23, 144A | 50,000 | 52,125 | ||||||
5.125%, 5/15/24, 144A | 20,000 | 20,925 | ||||||
Freeport-McMoRan, Inc. | 100,000 | 100,500 | ||||||
6.875%, 2/15/23 | 39,000 | 41,129 | ||||||
3.875%, 3/15/23 | 102,000 | 103,316 | ||||||
Hudbay Minerals, Inc., 144A | 50,000 | 51,805 | ||||||
Joseph T Ryerson & Son, Inc., 144A | 32,000 | 33,610 | ||||||
|
| |||||||
| 498,119 | ||||||||
|
| |||||||
| Communications — 22.9% | ||||||||
| Advertising — 0.2% | ||||||||
Lamar Media Corp. | 49,000 | 50,210 | ||||||
|
| |||||||
| Internet — 1.5% | ||||||||
Netflix, Inc. | 27,000 | 28,012 | ||||||
5.50%, 2/15/22 | 38,000 | 40,613 | ||||||
5.75%, 3/1/24 | 25,000 | 27,531 | ||||||
Symantec Corp. | 39,000 | 39,573 | ||||||
3.95%, 6/15/22 | 22,000 | 22,471 | ||||||
Principal | Value | |||||||
| Internet (Continued) | ||||||||
Uber Technologies, Inc., 144A | $ | 50,000 | $ | 52,375 | ||||
VeriSign, Inc. | 39,000 | 39,731 | ||||||
Zayo Group LLC / Zayo Capital, Inc. | 75,000 | 77,729 | ||||||
|
| |||||||
| 328,035 | ||||||||
|
| |||||||
| Media — 9.1% | ||||||||
Altice Financing SA, 144A | 100,000 | 103,375 | ||||||
Altice Luxembourg SA, 144A | 100,000 | 102,802 | ||||||
AMC Networks, Inc. | 58,000 | 59,015 | ||||||
5.00%, 4/1/24 | 55,000 | 56,787 | ||||||
Cablevision Systems Corp. | 27,000 | 27,844 | ||||||
5.875%, 9/15/22 | 20,000 | 21,444 | ||||||
CCO Holdings LLC / CCO Holdings Capital Corp. | 166,000 | 167,971 | ||||||
4.00%, 3/1/23, 144A | 105,000 | 106,312 | ||||||
5.875%, 4/1/24, 144A | 100,000 | 104,375 | ||||||
Cengage Learning, Inc., 144A | 33,000 | 30,773 | ||||||
Clear Channel Worldwide Holdings, Inc. | 106,000 | 108,297 | ||||||
Series A, 6.50%, 11/15/22 | 40,000 | 40,867 | ||||||
9.25%, 2/15/24, 144A | 101,000 | 110,974 | ||||||
CSC Holdings LLC | 79,000 | 85,517 | ||||||
5.125%, 12/15/21, 144A | 30,000 | 30,113 | ||||||
5.375%, 7/15/23, 144A | 50,000 | 51,513 | ||||||
5.25%, 6/1/24 | 50,000 | 53,625 | ||||||
DISH DBS Corp. | 71,000 | 71,000 | ||||||
5.125%, 5/1/20 | 10,000 | 10,138 | ||||||
6.75%, 6/1/21 | 107,000 | 112,971 | ||||||
5.875%, 7/15/22 | 91,000 | 94,526 | ||||||
5.00%, 3/15/23 | 105,000 | 103,425 | ||||||
Quebecor Media, Inc. | 69,000 | 75,060 | ||||||
Sirius XM Radio, Inc. | 70,000 | 71,575 | ||||||
4.625%, 5/15/23, 144A | 50,000 | 51,125 | ||||||
TEGNA, Inc. | 35,000 | 36,068 | ||||||
Tribune Media Co. | 52,000 | 52,764 | ||||||
Univision Communications, Inc., 144A | 64,000 | 63,520 | ||||||
|
| |||||||
| 2,003,776 | ||||||||
|
| |||||||
| Telecommunications — 12.1% | ||||||||
CenturyLink, Inc. | 54,000 | 55,147 | ||||||
Series S, 6.45%, 6/15/21 | 66,000 | 69,712 | ||||||
| See Notes to Financial Statements. | 50 |
DBX ETF Trust
Schedule of Investments
Xtrackers Short Duration High Yield Bond ETF(Continued)
August 31, 2019
Principal | Value | |||||||
| Telecommunications (Continued) | ||||||||
Series T, 5.80%, 3/15/22 | $ | 74,000 | $ | 77,977 | ||||
Series W, 6.75%, 12/1/23 (a) | 20,000 | 21,725 | ||||||
Series Y, 7.50%, 4/1/24 (a) | 50,000 | 55,624 | ||||||
Cincinnati Bell, Inc., 144A | 50,000 | 45,875 | ||||||
CommScope, Inc. | 8,000 | 8,030 | ||||||
5.50%, 3/1/24, 144A | 66,000 | 67,238 | ||||||
5.50%, 6/15/24, 144A | 55,000 | 52,319 | ||||||
Consolidated Communications, Inc. | 22,000 | 20,680 | ||||||
Frontier Communications Corp. | 27,000 | 14,175 | ||||||
10.50%, 9/15/22 | 83,000 | 43,471 | ||||||
7.125%, 1/15/23 | 71,000 | 36,565 | ||||||
7.625%, 4/15/24 | 50,000 | 25,265 | ||||||
Gogo Intermediate Holdings LLC / Gogo Finance Co., Inc., 144A | 50,000 | 52,313 | ||||||
Hughes Satellite Systems Corp. | 49,000 | 53,043 | ||||||
Inmarsat Finance PLC, 144A | 150,000 | 152,250 | ||||||
Intelsat Connect Finance SA, 144A | 66,000 | 59,070 | ||||||
Intelsat Jackson Holdings SA | 49,000 | 56,901 | ||||||
5.50%, 8/1/23 | 96,000 | 87,840 | ||||||
Intelsat Luxembourg SA | 22,000 | 21,010 | ||||||
8.125%, 6/1/23 (a) | 57,000 | 45,600 | ||||||
Level 3 Financing, Inc. | 54,000 | 54,236 | ||||||
5.625%, 2/1/23 | 27,000 | 27,532 | ||||||
5.125%, 5/1/23 | 53,000 | 54,062 | ||||||
5.375%, 1/15/24 | 49,000 | 49,980 | ||||||
Level 3 Parent LLC | 32,000 | 32,320 | ||||||
Nokia OYJ | 27,000 | 27,405 | ||||||
Qwest Corp. | 51,000 | 55,036 | ||||||
Sprint Communications, Inc. | 54,000 | 55,215 | ||||||
7.00%, 8/15/20 | 80,000 | 83,240 | ||||||
11.50%, 11/15/21 | 54,000 | 63,585 | ||||||
6.00%, 11/15/22 | 121,000 | 129,091 | ||||||
Sprint Corp. | 120,000 | 129,384 | ||||||
7.875%, 9/15/23 | 223,000 | 251,433 | ||||||
7.125%, 6/15/24 | 131,000 | 145,143 | ||||||
Telefonaktiebolaget LM Ericsson | 54,000 | 56,061 | ||||||
T-Mobile USA, Inc. | 79,000 | 81,519 | ||||||
6.00%, 3/1/23 | 56,000 | 57,120 | ||||||
VEON Holdings BV, 144A | 200,000 | 202,794 | ||||||
|
| |||||||
| 2,676,986 | ||||||||
|
| |||||||
Principal | Value | |||||||
| Consumer, Cyclical — 13.6% | ||||||||
| Airlines — 1.2% | ||||||||
American Airlines Group, Inc. | $ | 90,000 | $ | 90,585 | ||||
4.625%, 3/1/20, 144A | 77,000 | 77,866 | ||||||
United Airlines Holdings, Inc. | 50,000 | 51,563 | ||||||
Virgin Australia Holdings Ltd., 144A | 52,000 | 52,221 | ||||||
|
| |||||||
| 272,235 | ||||||||
|
| |||||||
| Apparel — 0.1% | ||||||||
Hanesbrands, Inc., 144A | 25,000 | 26,281 | ||||||
|
| |||||||
| Auto Manufacturers — 2.0% | ||||||||
Fiat Chrysler Automobiles NV | 100,000 | 101,250 | ||||||
5.25%, 4/15/23 | 50,000 | 53,590 | ||||||
Jaguar Land Rover Automotive PLC | 50,000 | 49,856 | ||||||
3.50%, 3/15/20, 144A (a) | 230,000 | 229,713 | ||||||
|
| |||||||
| 434,409 | ||||||||
|
| |||||||
| Auto Parts & Equipment — 0.4% | ||||||||
American Axle & Manufacturing, Inc. | 40,000 | 40,450 | ||||||
Goodyear Tire & Rubber Co. | 51,000 | 51,829 | ||||||
|
| |||||||
| 92,279 | ||||||||
|
| |||||||
| Distribution/Wholesale — 0.2% | ||||||||
Anixter, Inc. | 5,000 | 5,244 | ||||||
LKQ Corp. | 32,000 | 32,600 | ||||||
|
| |||||||
| 37,844 | ||||||||
|
| |||||||
| Entertainment — 0.9% | ||||||||
Cinemark USA, Inc. | 22,000 | 22,440 | ||||||
4.875%, 6/1/23 | 40,000 | 40,900 | ||||||
International Game Technology PLC, 144A | 90,000 | 95,625 | ||||||
Lions Gate Capital Holdings LLC, 144A | 25,000 | 26,467 | ||||||
Scientific Games International, Inc. | 19,000 | 19,784 | ||||||
|
| |||||||
| 205,216 | ||||||||
|
| |||||||
| Food Service — 0.2% | ||||||||
Aramark Services, Inc. | 45,000 | 46,510 | ||||||
|
| |||||||
| Home Builders — 1.7% | ||||||||
Beazer Homes USA, Inc. | 47,000 | 49,232 | ||||||
K Hovnanian Enterprises, Inc. | 23,000 | 19,550 | ||||||
10.50%, 7/15/24, 144A | 20,000 | 15,800 | ||||||
| See Notes to Financial Statements. | 51 |
DBX ETF Trust
Schedule of Investments
Xtrackers Short Duration High Yield Bond ETF(Continued)
August 31, 2019
Principal | Value | |||||||
| Home Builders (Continued) | ||||||||
KB Home | $ | 24,000 | $ | 26,121 | ||||
Lennar Corp. | 20,000 | 20,062 | ||||||
4.125%, 1/15/22 | 76,000 | 78,565 | ||||||
4.75%, 11/15/22 | 40,000 | 42,350 | ||||||
4.50%, 4/30/24 | 50,000 | 53,313 | ||||||
Mattamy Group Corp., 144A | 20,000 | 20,925 | ||||||
Toll Brothers Finance Corp. | 56,000 | 58,660 | ||||||
|
| |||||||
| 384,578 | ||||||||
|
| |||||||
| Home Furnishings — 0.1% | ||||||||
Tempur Sealy International, Inc. | 24,000 | 24,780 | ||||||
|
| |||||||
| Leisure Time — 0.4% | ||||||||
24 Hour Fitness Worldwide, Inc., 144A | 27,000 | 24,098 | ||||||
Sabre GLBL, Inc., 144A | 58,000 | 59,740 | ||||||
|
| |||||||
| 83,838 | ||||||||
|
| |||||||
| Lodging — 2.7% | ||||||||
Boyd Gaming Corp. | 40,000 | 41,641 | ||||||
Diamond Resorts International, Inc., 144A | 27,000 | 27,304 | ||||||
Jack Ohio Finance LLC / Jack Ohio Finance 1 Corp., 144A | 39,000 | 39,975 | ||||||
MGM Resorts International | 79,000 | 86,110 | ||||||
7.75%, 3/15/22 | 58,000 | 65,263 | ||||||
6.00%, 3/15/23 | 126,000 | 138,915 | ||||||
Studio City Co. Ltd., 144A | 60,000 | 61,500 | ||||||
Wyndham Destinations, Inc. | 80,000 | 82,200 | ||||||
Wynn Las Vegas LLC / Wynn Las Vegas Capital Corp., 144A | 49,000 | 50,605 | ||||||
|
| |||||||
| 593,513 | ||||||||
|
| |||||||
| Retail — 3.7% | ||||||||
1011778 BC ULC / New Red Finance, Inc. | 36,000 | 36,225 | ||||||
4.25%, 5/15/24, 144A (a) | 175,000 | 181,083 | ||||||
Ferrellgas LP / Ferrellgas Finance Corp. | 27,000 | 23,085 | ||||||
6.75%, 1/15/22 | 25,000 | 21,250 | ||||||
6.75%, 6/15/23 (a) | 27,000 | 22,815 | ||||||
Group 1 Automotive, Inc. | 40,000 | 40,450 | ||||||
JC Penney Corp., Inc., 144A | 27,000 | 22,815 | ||||||
L Brands, Inc. | 34,000 | 35,870 | ||||||
5.625%, 10/15/23 | 50,000 | 52,750 | ||||||
Principal | Value | |||||||
| Retail (Continued) | ||||||||
Penske Automotive Group, Inc. | $ | 79,000 | $ | 80,232 | ||||
PetSmart, Inc., 144A | 101,000 | 94,435 | ||||||
QVC, Inc. | 119,000 | 125,730 | ||||||
Rite Aid Corp., 144A | 92,000 | 74,635 | ||||||
|
| |||||||
| 811,375 | ||||||||
|
| |||||||
| Consumer,Non-cyclical — 19.2% | ||||||||
| Commercial Services — 3.2% | ||||||||
Ahern Rentals, Inc., 144A | 30,000 | 26,025 | ||||||
Algeco Global Finance PLC, 144A | 25,000 | 25,144 | ||||||
APX Group, Inc. | 25,000 | 23,875 | ||||||
7.875%, 12/1/22 | 72,000 | 68,850 | ||||||
Hertz Corp. | 66,000 | 68,808 | ||||||
6.25%, 10/15/22 | 32,000 | 32,520 | ||||||
Jaguar Holding Co. II / Pharmaceutical Product Development LLC, 144A | 59,000 | 61,065 | ||||||
Nielsen Co. Luxembourg SARL, 144A | 33,000 | 33,178 | ||||||
Nielsen Finance LLC / Nielsen Finance Co. | 40,000 | 40,082 | ||||||
5.00%, 4/15/22, 144A | 123,000 | 124,230 | ||||||
Prime Security Services Borrower LLC / Prime Finance, Inc. | 37,000 | 38,979 | ||||||
5.25%, 4/15/24, 144A | 45,000 | 46,593 | ||||||
Service Corp. International | 50,000 | 51,650 | ||||||
United Rentals North America, Inc. | 54,000 | 55,384 | ||||||
WEX, Inc., 144A | 22,000 | 22,220 | ||||||
|
| |||||||
| 718,603 | ||||||||
|
| |||||||
| Cosmetics/Personal Care — 0.5% | ||||||||
Avon Products, Inc. | 26,000 | 26,975 | ||||||
Edgewell Personal Care Co. | 39,000 | 39,926 | ||||||
Revlon Consumer Products Corp. | 27,000 | 24,705 | ||||||
6.25%, 8/1/24 | 25,000 | 14,500 | ||||||
|
| |||||||
| 106,106 | ||||||||
|
| |||||||
| Food — 1.0% | ||||||||
Albertsons Cos. LLC / Safeway, Inc. / New Albertsons LP / Albertson’s LLC | 50,000 | 52,625 | ||||||
B&G Foods, Inc. | 40,000 | 40,280 | ||||||
JBS Investments GmbH, 144A | 50,000 | 51,237 | ||||||
| See Notes to Financial Statements. | 52 |
DBX ETF Trust
Schedule of Investments
Xtrackers Short Duration High Yield Bond ETF(Continued)
August 31, 2019
Principal | Value | |||||||
| Food (Continued) | ||||||||
JBS USA LUX SA / JBS USA Finance, Inc., 144A | $ | 50,000 | $ | 51,594 | ||||
TreeHouse Foods, Inc., 144A | 32,000 | 33,320 | ||||||
|
| |||||||
| 229,056 | ||||||||
|
| |||||||
| Healthcare-Products — 0.5% | ||||||||
Hill-Rom Holdings, Inc., 144A | 18,000 | 18,630 | ||||||
Ortho-Clinical Diagnostics, Inc. / Ortho-Clinical Diagnostics SA, 144A | 69,000 | 66,930 | ||||||
Sotera Health Holdings LLC, 144A | 24,000 | 24,480 | ||||||
|
| |||||||
| 110,040 | ||||||||
|
| |||||||
| Healthcare-Services — 9.2% | ||||||||
Acadia Healthcare Co., Inc. | 35,000 | 35,918 | ||||||
Centene Corp. | 151,000 | 153,265 | ||||||
4.75%, 5/15/22 | 52,000 | 53,483 | ||||||
CHS/Community Health Systems, Inc. | 84,000 | 84,315 | ||||||
6.875%, 2/1/22 (a) | 150,000 | 104,581 | ||||||
6.25%, 3/31/23 | 133,000 | 129,190 | ||||||
9.875%, 6/30/23, 144A | 94,000 | 78,725 | ||||||
8.625%, 1/15/24, 144A | 56,000 | 56,140 | ||||||
8.125%, 6/30/24, 144A | 70,000 | 53,550 | ||||||
DaVita, Inc. | 100,000 | 101,971 | ||||||
HCA Healthcare, Inc. | 204,000 | 214,792 | ||||||
HCA, Inc. | 87,000 | 97,641 | ||||||
5.875%, 5/1/23 | 66,000 | 73,054 | ||||||
MEDNAX, Inc., 144A | 50,000 | 50,375 | ||||||
Molina Healthcare, Inc. | 38,000 | 40,757 | ||||||
MPH Acquisition Holdings LLC, 144A | 80,000 | 71,905 | ||||||
Quorum Health Corp. | 22,000 | 19,250 | ||||||
RegionalCare Hospital Partners Holdings, Inc., 144A | 74,000 | 79,156 | ||||||
Tenet Healthcare Corp. | 27,000 | 27,472 | ||||||
4.50%, 4/1/21 | 46,000 | 47,633 | ||||||
4.375%, 10/1/21 | 57,000 | 59,480 | ||||||
8.125%, 4/1/22 | 129,000 | 139,468 | ||||||
6.75%, 6/15/23 | 100,000 | 103,125 | ||||||
4.625%, 7/15/24 | 150,000 | 154,875 | ||||||
|
| |||||||
| 2,030,121 | ||||||||
|
| |||||||
Principal | Value | |||||||
| Household Products/Wares — 0.3% | ||||||||
Prestige Brands, Inc. | $ | 50,000 | $ | 50,688 | ||||
6.375%, 3/1/24, 144A | 10,000 | 10,525 | ||||||
|
| |||||||
| 61,213 | ||||||||
|
| |||||||
| Pharmaceuticals — 4.5% | ||||||||
Bausch Health Cos., Inc. | 66,000 | 68,412 | ||||||
5.50%, 3/1/23, 144A | 32,000 | 32,440 | ||||||
5.875%, 5/15/23, 144A | 81,000 | 82,316 | ||||||
7.00%, 3/15/24, 144A | 150,000 | 158,799 | ||||||
Elanco Animal Health, Inc. | 89,000 | 93,257 | ||||||
Endo Dac / Endo Finance LLC / Endo Finco, Inc., 144A | 68,000 | 45,220 | ||||||
Mallinckrodt International Finance SA / Mallinckrodt CB LLC | 28,000 | 21,910 | ||||||
5.75%, 8/1/22, 144A (a) | 64,000 | 37,440 | ||||||
5.625%, 10/15/23, 144A (a) | 40,000 | 20,600 | ||||||
Teva Pharmaceutical Finance Netherlands III BV | 220,000 | 206,800 | ||||||
2.80%, 7/21/23 | 275,000 | 232,375 | ||||||
|
| |||||||
| 999,569 | ||||||||
|
| |||||||
| Energy — 10.5% | ||||||||
| Coal — 0.1% | ||||||||
Peabody Energy Corp., 144A | 27,000 | 27,827 | ||||||
|
| |||||||
| Energy-Alternate Sources — 0.2% | ||||||||
TerraForm Power Operating LLC, 144A | 39,000 | 40,156 | ||||||
|
| |||||||
| Oil & Gas — 6.9% | ||||||||
Antero Resources Corp. | 54,000 | 52,515 | ||||||
5.125%, 12/1/22 | 94,000 | 86,950 | ||||||
Ascent Resources Utica Holdings LLC / ARU Finance Corp., 144A | 52,000 | 52,650 | ||||||
Baytex Energy Corp. | 20,000 | 19,900 | ||||||
5.625%, 6/1/24, 144A | 25,000 | 23,375 | ||||||
Bruin E&P Partners LLC, 144A | 22,000 | 15,785 | ||||||
California Resources Corp., 144A | 108,000 | 62,640 | ||||||
Calumet Specialty Products Partners LP / Calumet Finance Corp. | 49,000 | 48,632 | ||||||
Carrizo Oil & Gas, Inc. | 35,000 | 33,652 | ||||||
Chesapeake Energy Corp. | 24,000 | 20,010 | ||||||
CITGO Petroleum Corp., 144A | 39,000 | 39,341 | ||||||
| See Notes to Financial Statements. | 53 |
DBX ETF Trust
Schedule of Investments
Xtrackers Short Duration High Yield Bond ETF(Continued)
August 31, 2019
Principal | Value | |||||||
| Oil & Gas (Continued) | ||||||||
CNX Resources Corp. | $ | 47,000 | $ | 45,707 | ||||
Denbury Resources, Inc. | 25,000 | 22,875 | ||||||
9.25%, 3/31/22, 144A | 24,000 | 20,280 | ||||||
7.75%, 2/15/24, 144A | 30,000 | 21,156 | ||||||
EP Energy LLC / Everest Acquisition Finance, Inc., 144A | 50,000 | 4,000 | ||||||
Extraction Oil & Gas, Inc., 144A | 15,000 | 11,325 | ||||||
MEG Energy Corp. | 43,000 | 40,796 | ||||||
7.00%, 3/31/24, 144A | 45,000 | 43,031 | ||||||
Murphy Oil Corp. | 74,000 | 75,110 | ||||||
Nabors Industries, Inc. | 38,000 | 36,385 | ||||||
5.50%, 1/15/23 (a) | 32,000 | 28,680 | ||||||
Oasis Petroleum, Inc. | 39,000 | 36,465 | ||||||
PBF Holding Co. LLC / PBF Finance Corp. | 27,000 | 27,878 | ||||||
QEP Resources, Inc. | 27,000 | 24,401 | ||||||
5.25%, 5/1/23 | 32,000 | 28,160 | ||||||
Range Resources Corp. | 31,000 | 29,063 | ||||||
5.00%, 3/15/23 | 40,000 | 35,500 | ||||||
Rowan Cos., Inc. | 33,000 | 27,060 | ||||||
Sable Permian Resources Land LLC / AEPB Finance Corp., 144A | 25,000 | 24,375 | ||||||
Seven Generations Energy Ltd. | 20,000 | 20,150 | ||||||
6.875%, 6/30/23, 144A | 25,000 | 25,443 | ||||||
SM Energy Co. | 26,000 | 24,310 | ||||||
5.00%, 1/15/24 | 27,000 | 23,760 | ||||||
Sunoco LP / Sunoco Finance Corp. | 54,000 | 55,350 | ||||||
Transocean, Inc., 144A | 47,000 | 48,762 | ||||||
Whiting Petroleum Corp. | 47,000 | 44,131 | ||||||
6.25%, 4/1/23 (a) | 22,000 | 17,380 | ||||||
WPX Energy, Inc. | 59,000 | 60,918 | ||||||
8.25%, 8/1/23 | 150,000 | 167,625 | ||||||
|
| |||||||
| 1,525,526 | ||||||||
|
| |||||||
| Oil & Gas Services — 0.6% | ||||||||
KCA Deutag UK Finance PLC | 25,000 | 16,375 | ||||||
9.625%, 4/1/23, 144A | 40,000 | 26,000 | ||||||
Principal | Value | |||||||
| Oil & Gas Services (Continued) | ||||||||
McDermott Technology Americas, Inc. / McDermott Technology US, Inc., 144A | $ | 63,000 | $ | 44,730 | ||||
SESI LLC | 43,000 | 30,530 | ||||||
|
| |||||||
| 117,635 | ||||||||
|
| |||||||
| Pipelines — 2.7% | ||||||||
Blue Racer Midstream LLC / Blue Racer Finance Corp., 144A | 79,000 | 79,790 | ||||||
Cheniere Corpus Christi Holdings LLC | 100,000 | 115,625 | ||||||
Crestwood Midstream Partners LP / Crestwood Midstream Finance Corp. | 38,000 | 38,855 | ||||||
DCP Midstream Operating LP | 65,000 | 65,942 | ||||||
3.875%, 3/15/23 | 44,000 | 44,660 | ||||||
Genesis Energy LP / Genesis Energy Finance Corp. | 89,000 | 90,299 | ||||||
NGL Energy Partners LP / NGL Energy Finance Corp. | 33,000 | 33,567 | ||||||
NuStar Logistics LP | 24,000 | 24,420 | ||||||
Tallgrass Energy Partners LP / Tallgrass Energy Finance Corp., 144A | 27,000 | 26,865 | ||||||
Targa Resources Partners LP / Targa Resources Partners Finance Corp. | 81,000 | 81,203 | ||||||
|
| |||||||
| 601,226 | ||||||||
|
| |||||||
| Financial — 12.4% | ||||||||
| Banks — 1.7% | ||||||||
CIT Group, Inc. | 100,000 | 106,859 | ||||||
5.00%, 8/1/23 | 59,000 | 64,162 | ||||||
Intesa Sanpaolo SpA, 144A | 200,000 | 205,150 | ||||||
|
| |||||||
| 376,171 | ||||||||
|
| |||||||
| Diversified Financial Services — 5.5% | ||||||||
Ally Financial, Inc. | 87,000 | 87,185 | ||||||
8.00%, 3/15/20 | 53,000 | 54,616 | ||||||
4.125%, 3/30/20 | 40,000 | 40,400 | ||||||
7.50%, 9/15/20 | 25,000 | 26,344 | ||||||
4.125%, 2/13/22 | 35,000 | 36,444 | ||||||
4.625%, 5/19/22 | 20,000 | 21,150 | ||||||
Metropolitan Light Co. Ltd., 144A | 50,000 | 51,558 | ||||||
Nationstar Mortgage Holdings, Inc., 144A | 51,000 | 52,942 | ||||||
Navient Corp. | ||||||||
Series MTN, 8.00%, 3/25/20 | 80,000 | 82,600 | ||||||
| See Notes to Financial Statements. | 54 |
DBX ETF Trust
Schedule of Investments
Xtrackers Short Duration High Yield Bond ETF(Continued)
August 31, 2019
Principal | Value | |||||||
| Diversified Financial Services (Continued) | ||||||||
5.00%, 10/26/20 | $ | 27,000 | $ | 27,709 | ||||
5.875%, 3/25/21 | 79,000 | 83,049 | ||||||
6.625%, 7/26/21 | 100,000 | 107,250 | ||||||
Series MTN, 7.25%, 1/25/22 | 40,000 | 44,000 | ||||||
6.50%, 6/15/22 | 54,000 | 58,590 | ||||||
5.50%, 1/25/23 | 40,000 | 42,162 | ||||||
7.25%, 9/25/23 | 10,000 | 11,137 | ||||||
Series MTN, 6.125%, 3/25/24 | 45,000 | 47,981 | ||||||
Springleaf Finance Corp. | 100,000 | 107,235 | ||||||
7.75%, 10/1/21 | 35,000 | 38,369 | ||||||
6.125%, 5/15/22 | 79,000 | 85,517 | ||||||
5.625%, 3/15/23 | 47,000 | 50,642 | ||||||
6.125%, 3/15/24 | 45,000 | 49,163 | ||||||
|
| |||||||
| 1,206,043 | ||||||||
|
| |||||||
| Insurance — 0.9% | ||||||||
Acrisure LLC / Acrisure Finance, Inc., 144A | 40,000 | 43,175 | ||||||
Alliant Holdings Intermediate LLC / Alliant HoldingsCo-Issuer, 144A | 80,000 | 81,900 | ||||||
Ardonagh Midco 3 PLC, 144A | 25,000 | 24,312 | ||||||
Genworth Holdings, Inc. | 38,000 | 39,805 | ||||||
|
| |||||||
| 189,192 | ||||||||
|
| |||||||
| Real Estate — 0.6% | ||||||||
Kennedy-Wilson, Inc. | 60,000 | 61,725 | ||||||
Realogy Group LLC / Realogy Co.-Issuer Corp. | 30,000 | 29,316 | ||||||
4.875%, 6/1/23, 144A (a) | 42,000 | 36,645 | ||||||
|
| |||||||
| 127,686 | ||||||||
|
| |||||||
| Real Estate Investment Trusts — 2.9% | ||||||||
CBL & Associates LP | 24,000 | 15,360 | ||||||
CyrusOne LP / CyrusOne Finance Corp. | 50,000 | 51,750 | ||||||
Equinix, Inc. | 40,000 | 41,100 | ||||||
5.375%, 4/1/23 | 54,000 | 55,283 | ||||||
Iron Mountain, Inc. | 77,000 | 77,770 | ||||||
6.00%, 8/15/23 | 32,000 | 32,800 | ||||||
iStar, Inc. | 32,000 | 32,880 | ||||||
SBA Communications Corp. | 40,000 | 40,724 | ||||||
4.00%, 10/1/22 | 40,000 | 40,900 | ||||||
Starwood Property Trust, Inc. | 55,000 | 57,200 | ||||||
Uniti Group LP / Uniti Group Finance, Inc. / CSL Capital LLC | 130,000 | 124,150 | ||||||
8.25%, 10/15/23 (a) | 50,000 | 44,500 | ||||||
Principal | Value | |||||||
| Real Estate Investment Trusts (Continued) | ||||||||
Washington Prime Group LP | $ | 40,000 | $ | 38,640 | ||||
|
| |||||||
| 653,057 | ||||||||
|
| |||||||
| Venture Capital — 0.8% | ||||||||
Icahn Enterprises LP / Icahn Enterprises Finance Corp. | 98,000 | 99,960 | ||||||
6.25%, 2/1/22 | 79,000 | 81,568 | ||||||
|
| |||||||
| 181,528 | ||||||||
|
| |||||||
| Industrial — 9.6% | ||||||||
| Aerospace/Defense — 2.3% | ||||||||
Arconic, Inc. | 105,000 | 108,588 | ||||||
5.40%, 4/15/21 | 66,000 | 68,036 | ||||||
5.87%, 2/23/22 | 37,000 | 39,529 | ||||||
Bombardier, Inc. | 47,000 | 47,646 | ||||||
6.00%, 10/15/22, 144A | 64,000 | 63,840 | ||||||
6.125%, 1/15/23, 144A | 66,000 | 65,835 | ||||||
TransDigm, Inc. | 61,000 | 62,144 | ||||||
6.50%, 7/15/24 | 50,000 | 51,813 | ||||||
|
| |||||||
| 507,431 | ||||||||
|
| |||||||
| Building Materials — 0.6% | ||||||||
Griffon Corp. | 54,000 | 54,660 | ||||||
Summit Materials LLC / Summit Materials Finance Corp. | 85,000 | 86,806 | ||||||
|
| |||||||
| 141,466 | ||||||||
|
| |||||||
| Electronics — 0.7% | ||||||||
ADT Security Corp. | 39,000 | 41,633 | ||||||
3.50%, 7/15/22 | 50,000 | 50,312 | ||||||
4.125%, 6/15/23 | 38,000 | 38,701 | ||||||
Sensata Technologies BV, 144A | 25,000 | 26,321 | ||||||
|
| |||||||
| 156,967 | ||||||||
|
| |||||||
| Engineering & Construction — 0.3% | ||||||||
MasTec, Inc. | 70,000 | 71,400 | ||||||
|
| |||||||
| Environmental Control — 0.1% | ||||||||
GFL Environmental, Inc., 144A | 22,000 | 22,220 | ||||||
|
| |||||||
| Hand/Machine Tools — 0.3% | ||||||||
Colfax Corp., 144A | 50,000 | 53,500 | ||||||
|
| |||||||
| Machinery-Diversified — 0.1% | ||||||||
Cloud Crane LLC, 144A | 25,000 | 26,937 | ||||||
|
| |||||||
| See Notes to Financial Statements. | 55 |
DBX ETF Trust
Schedule of Investments
Xtrackers Short Duration High Yield Bond ETF(Continued)
August 31, 2019
Principal | Value | |||||||
| Packaging & Containers — 4.2% | ||||||||
Ardagh Packaging Finance PLC / Ardagh Holdings USA, Inc., 144A | $ | 100,000 | $ | 102,596 | ||||
Ball Corp. | 40,000 | 42,500 | ||||||
4.00%, 11/15/23 | 100,000 | 105,875 | ||||||
Berry Global, Inc. | 27,000 | 27,555 | ||||||
6.00%, 10/15/22 | 22,000 | 22,467 | ||||||
Crown Americas LLC / Crown Americas Capital Corp. IV | 56,000 | 58,940 | ||||||
Graphic Packaging International LLC | 40,000 | 41,150 | ||||||
Mauser Packaging Solutions Holding Co., 144A | 78,000 | 80,437 | ||||||
Owens-Brockway Glass Container, Inc. | 65,000 | 66,787 | ||||||
5.875%, 8/15/23, 144A | 37,000 | 39,544 | ||||||
Reynolds Group Issuer, Inc. / Reynolds Group Issuer LLC / Reynolds Group Issuer Lu | 162,810 | 163,421 | ||||||
5.125%, 7/15/23, 144A | 85,000 | 87,597 | ||||||
Sealed Air Corp., 144A | 79,000 | 83,148 | ||||||
|
| |||||||
| 922,017 | ||||||||
|
| |||||||
| Transportation — 0.8% | ||||||||
Hornbeck Offshore Services, Inc. | 24,000 | 11,880 | ||||||
Kenan Advantage Group, Inc., 144A | 40,000 | 35,700 | ||||||
XPO Logistics, Inc. | 44,000 | 45,075 | ||||||
6.125%, 9/1/23, 144A | 29,000 | 30,058 | ||||||
6.75%, 8/15/24, 144A | 50,000 | 54,000 | ||||||
|
| |||||||
| 176,713 | ||||||||
|
| |||||||
| Trucking & Leasing — 0.2% | ||||||||
Fortress Transportation & Infrastructure Investors LLC, 144A | 38,000 | 39,615 | ||||||
|
| |||||||
| Technology — 5.5% | ||||||||
| Computers — 2.0% | ||||||||
Dell International LLC / EMC Corp., 144A | 86,000 | 87,452 | ||||||
Diebold Nixdorf, Inc. | 15,000 | 14,081 | ||||||
EMC Corp. | 124,000 | 123,533 | ||||||
3.375%, 6/1/23 (a) | 54,000 | 53,568 | ||||||
Exela Intermediate LLC / Exela Finance, Inc., 144A | 46,000 | 28,980 | ||||||
Principal | Value | |||||||
| Computers (Continued) | ||||||||
Harland Clarke Holdings Corp. | $ | 38,000 | $ | 35,720 | ||||
8.375%, 8/15/22, 144A | 40,000 | 31,900 | ||||||
NCR Corp. | 32,000 | 32,378 | ||||||
6.375%, 12/15/23 | 38,000 | 39,280 | ||||||
|
| |||||||
| 446,892 | ||||||||
|
| |||||||
| Office/Business Equipment — 1.4% | ||||||||
CDW LLC / CDW Finance Corp. | 118,000 | 120,802 | ||||||
Pitney Bowes, Inc. | 79,000 | 75,445 | ||||||
Xerox Corp. | 39,000 | 39,468 | ||||||
4.125%, 3/15/23 | 69,000 | 70,553 | ||||||
|
| |||||||
| 306,268 | ||||||||
|
| |||||||
| Software — 2.1% | ||||||||
Infor US, Inc. | 119,000 | 121,380 | ||||||
Informatica LLC, 144A | 35,000 | 35,700 | ||||||
Open Text Corp., 144A | 63,000 | 64,890 | ||||||
Solera LLC / Solera Finance, Inc., 144A | 105,000 | 111,825 | ||||||
TIBCO Software, Inc., 144A | 39,000 | 40,974 | ||||||
Veritas US, Inc. / Veritas Bermuda Ltd., 144A | 90,000 | 89,550 | ||||||
|
| |||||||
| 464,319 | ||||||||
|
| |||||||
| Utilities — 1.5% | ||||||||
| Electric — 1.5% | ||||||||
AES Corp. | 27,000 | 27,821 | ||||||
4.875%, 5/15/23 | 64,000 | 65,040 | ||||||
Calpine Corp. | 40,000 | 40,431 | ||||||
5.375%, 1/15/23 | 66,000 | 67,067 | ||||||
5.875%, 1/15/24, 144A | 50,000 | 51,193 | ||||||
5.50%, 2/1/24 | 35,000 | 35,394 | ||||||
NextEra Energy Operating Partners LP, 144A | 50,000 | 51,500 | ||||||
|
| |||||||
| 338,446 | ||||||||
|
| |||||||
TOTAL CORPORATE BONDS | 22,050,849 | |||||||
|
| |||||||
Number | ||||||||
| SECURITIES LENDING COLLATERAL — 8.3% | ||||||||
DWS Government & Agency Securities Portfolio “DWS Government Cash Institutional Shares”, 2.04% (b)(c) | 1,835,191 | 1,835,191 | ||||||
|
| |||||||
| See Notes to Financial Statements. | 56 |
DBX ETF Trust
Schedule of Investments
Xtrackers Short Duration High Yield Bond ETF(Continued)
August 31, 2019
Number | Value | |||||||
| CASH EQUIVALENTS — 1.4% | ||||||||
DWS Government Money Market Series “Institutional Shares”, 2.09% (b) | 311,842 | $ | 311,842 | |||||
|
| |||||||
TOTAL INVESTMENTS — 109.4% | $ | 24,197,882 | ||||||
Other assets and liabilities, net — (9.4%) | (2,088,310 | ) | ||||||
|
| |||||||
NET ASSETS — 100.0% | $ | 22,109,572 | ||||||
|
| |||||||
A summary of the Fund’s transactions with affiliated investments during the year ended August 31, 2019 is as follows:
| Value ($) at 8/31/2018 | Purchases Cost ($) | Sales Proceeds ($) | Net Realized Gain/(Loss) ($) | Net Change in Unrealized Appreciation (Depreciation) ($) | Income ($) | Capital Gain Distributions ($) | Number of Shares at 8/31/2019 | Value ($) at 8/31/2019 | ||||||||||||||||||||||||||||||
SECURITIES LENDING COLLATERAL —8.3% | ||||||||||||||||||||||||||||||||||||||
DWS Government & Agency Securities Portfolio “DWS Government Cash Institutional Shares”, 2.04% (b)(c) | ||||||||||||||||||||||||||||||||||||||
| 2,437,670 | — | (602,479 | )(d) | — | — | 29,591 | — | 1,835,191 | 1,835,191 | |||||||||||||||||||||||||||||
CASH EQUIVALENTS —1.4% | ||||||||||||||||||||||||||||||||||||||
DWS Government Money Market Series “Institutional Shares”, 2.09% (b) | ||||||||||||||||||||||||||||||||||||||
| — | 8,278,997 | (7,967,155 | ) | — | — | 6,484 | — | 311,842 | 311,842 | |||||||||||||||||||||||||||||
|
|
|
|
|
|
|
|
|
|
|
|
|
|
|
|
|
| |||||||||||||||||||||
| 2,437,670 | 8,278,997 | (8,569,634 | ) | — | — | 36,075 | — | 2,147,033 | 2,147,033 | |||||||||||||||||||||||||||||
|
|
|
|
|
|
|
|
|
|
|
|
|
|
|
|
|
| |||||||||||||||||||||
| * | Non-income producing security. |
| (a) | All or a portion of these securities were on loan. In addition, “Other assets and liabilities, net” may include pending sales that are also on loan. The value of securities loaned at August 31, 2019 amounted to $1,802,385, which is 8.2% of net assets. |
| (b) | Affiliated fund managed by DWS Investment Management Americas, Inc. The rate shown is the annualizedseven-day yield at period end. |
| (c) | Represents cash collateral held in connection with securities lending. Income earned by the Fund is net of borrower rebates. In addition, the Fund heldnon-cash U.S. Treasury securities collateral having a value of $37,961. |
| (d) | Represents the net increase (purchase cost) or decrease (sales proceeds) in the amount invested in cash collateral for the period ended August 31, 2019. |
| MTN: | Medium Term Note |
| 144A: | Security exempt from registration under Rule 144A of the Securities Act of 1933. These securities may be resold in transactions exempt from registration, normally to qualified institutional buyers. |
Fair Value Measurements
Various inputs are used in determining the value of the Fund’s investments. These inputs are summarized in three broad levels. Level 1 includes quoted prices in active markets for identical securities. Level 2 includes other significant observable inputs (including quoted prices for similar securities, interest rates, prepayment speeds and credit risk). Level 3 includes significant unobservable inputs (including the Fund’s own assumptions in determining the fair value of investments). The level assigned to the securities valuations may not be an indication of the risk or liquidity associated with investing in those securities.
The following is a summary of the inputs used as of August 31, 2019 in valuing the Fund’s investments. For information on the Fund’s policy regarding the valuation of investments, please refer to the Security Valuation section of Note 2 in the accompanying Notes to Financial Statements.
Assets | Level 1 | Level 2 | Level 3 | Total | ||||||||||||
Corporate Bonds (e) | $ | — | $ | 22,050,849 | $ | — | $ | 22,050,849 | ||||||||
Short-Term Investments (e) | 2,147,033 | — | — | 2,147,033 | ||||||||||||
|
|
|
|
|
|
|
| |||||||||
TOTAL | $ | 2,147,033 | $ | 22,050,849 | $ | — | $ | 24,197,882 | ||||||||
|
|
|
|
|
|
|
| |||||||||
| (e) | See Schedule of Investments for additional detailed categorizations. |
| See Notes to Financial Statements. | 57 |
DBX ETF Trust
Schedule of Investments
Xtrackers USD High Yield Corporate Bond ETF
August 31, 2019
Principal | Value | |||||||
| CORPORATE BONDS — 99.1% | ||||||||
| Basic Materials — 4.3% | ||||||||
| Chemicals — 1.9% | ||||||||
Ashland LLC | $ | 3,424,000 | $ | 3,611,327 | ||||
Blue Cube Spinco LLC | 1,037,000 | 1,140,700 | ||||||
10.00%, 10/15/25 | 2,888,000 | 3,256,220 | ||||||
CF Industries, Inc. | 2,307,000 | 2,367,836 | ||||||
Chemours Co. | 2,934,000 | 2,996,347 | ||||||
7.00%, 5/15/25 | 2,416,000 | 2,391,840 | ||||||
5.375%, 5/15/27 | 1,840,000 | 1,642,200 | ||||||
Consolidated Energy Finance SA | 2,352,000 | 2,410,800 | ||||||
6.50%, 5/15/26, 144A | 889,000 | 891,222 | ||||||
Element Solutions, Inc., 144A | 2,637,000 | 2,765,554 | ||||||
Hexion, Inc., 144A | 1,480,000 | 1,439,300 | ||||||
INEOS Group Holdings SA, 144A | 1,956,000 | 1,999,638 | ||||||
NOVA Chemicals Corp. | 1,906,000 | 1,949,838 | ||||||
4.875%, 6/1/24, 144A | 3,623,000 | 3,731,690 | ||||||
5.00%, 5/1/25, 144A | 1,872,000 | 1,923,480 | ||||||
5.25%, 6/1/27, 144A | 3,477,000 | 3,642,158 | ||||||
OCI NV, 144A | 2,306,000 | 2,444,360 | ||||||
Olin Corp. | 1,441,000 | 1,487,833 | ||||||
5.625%, 8/1/29 | 2,749,000 | 2,862,396 | ||||||
5.00%, 2/1/30 | 1,788,000 | 1,792,470 | ||||||
PolyOne Corp. | 1,803,000 | 1,944,986 | ||||||
PQ Corp., 144A | 2,383,000 | 2,481,775 | ||||||
SPCM SA, 144A | 1,568,000 | 1,607,200 | ||||||
Starfruit Finco BV / Starfruit US Holdco LLC, 144A | 2,001,000 | 1,960,980 | ||||||
WR Grace & Co.-Conn, 144A | 2,539,000 | 2,646,908 | ||||||
|
| |||||||
| 57,389,058 | ||||||||
|
| |||||||
| Iron/Steel — 0.6% | ||||||||
AK Steel Corp. | 1,429,000 | 1,427,214 | ||||||
Allegheny Technologies, Inc. | 1,575,000 | 1,618,312 | ||||||
7.875%, 8/15/23 | 1,850,000 | 1,991,062 | ||||||
Cleveland-Cliffs, Inc. | 1,264,000 | 1,292,440 | ||||||
5.75%, 3/1/25 (a) | 1,501,000 | 1,508,505 | ||||||
5.875%, 6/1/27, 144A | 2,735,000 | 2,673,462 | ||||||
Steel Dynamics, Inc. | 1,796,000 | 1,803,256 | ||||||
Principal | Value | |||||||
| Iron/Steel (Continued) | ||||||||
5.25%, 4/15/23 | $ | 1,306,000 | $ | 1,328,529 | ||||
5.50%, 10/1/24 | 1,866,000 | 1,927,578 | ||||||
United States Steel Corp. | 2,552,000 | 2,434,736 | ||||||
6.25%, 3/15/26 | 2,192,000 | 1,946,781 | ||||||
|
| |||||||
| 19,951,875 | ||||||||
|
| |||||||
| Mining — 1.8% | ||||||||
Alcoa Nederland Holding BV | 2,647,000 | 2,785,967 | ||||||
7.00%, 9/30/26, 144A | 1,633,000 | 1,767,233 | ||||||
6.125%, 5/15/28, 144A | 1,680,000 | 1,751,400 | ||||||
Aleris International, Inc., 144A | 1,136,000 | 1,198,480 | ||||||
Constellium SE | 883,000 | 911,698 | ||||||
6.625%, 3/1/25, 144A | 2,992,000 | 3,139,730 | ||||||
5.875%, 2/15/26, 144A | 1,503,000 | 1,570,635 | ||||||
FMG Resources August 2006 Pty Ltd. | 2,509,000 | 2,593,679 | ||||||
5.125%, 3/15/23, 144A | 1,562,000 | 1,628,385 | ||||||
5.125%, 5/15/24, 144A (a) | 2,510,000 | 2,626,088 | ||||||
Freeport-McMoRan, Inc. | 5,222,000 | 5,248,110 | ||||||
6.875%, 2/15/23 | 2,654,000 | 2,798,908 | ||||||
3.875%, 3/15/23 | 6,127,000 | 6,206,038 | ||||||
4.55%, 11/14/24 | 2,937,000 | 2,973,154 | ||||||
5.00%, 9/1/27 | 2,000,000 | 2,000,000 | ||||||
5.25%, 9/1/29 | 2,000,000 | 1,988,020 | ||||||
Hudbay Minerals, Inc. | 1,016,000 | 1,052,678 | ||||||
7.625%, 1/15/25, 144A | 2,382,000 | 2,429,592 | ||||||
Joseph T Ryerson & Son, Inc., 144A | 1,978,000 | 2,077,518 | ||||||
Novelis Corp. | 3,727,000 | 3,913,350 | ||||||
5.875%, 9/30/26, 144A | 4,900,000 | 5,187,875 | ||||||
|
| |||||||
| 55,848,538 | ||||||||
|
| |||||||
| Communications — 24.4% | ||||||||
| Advertising — 0.4% | ||||||||
Acosta, Inc., 144A | 1,934,000 | 203,070 | ||||||
Lamar Media Corp. | 1,830,000 | 1,875,178 | ||||||
5.375%, 1/15/24 | 1,812,000 | 1,870,890 | ||||||
5.75%, 2/1/26 | 2,080,000 | 2,212,600 | ||||||
Outfront Media Capital LLC / Outfront Media Capital Corp. | 1,156,000 | 1,195,015 | ||||||
5.875%, 3/15/25 | 1,763,000 | 1,829,112 | ||||||
5.00%, 8/15/27, 144A | 2,194,000 | 2,273,533 | ||||||
|
| |||||||
| 11,459,398 | ||||||||
|
| |||||||
| Internet — 2.2% | ||||||||
Match Group, Inc., 144A | 1,667,000 | 1,758,685 | ||||||
| See Notes to Financial Statements. | 58 |
DBX ETF Trust
Schedule of Investments
Xtrackers USD High Yield Corporate Bond ETF(Continued)
August 31, 2019
Principal | Value | |||||||
| Internet (Continued) | ||||||||
Netflix, Inc. | $ | 1,831,000 | $ | 1,899,662 | ||||
5.50%, 2/15/22 | 2,405,000 | 2,570,344 | ||||||
5.75%, 3/1/24 (a) | 703,000 | 774,179 | ||||||
5.875%, 2/15/25 | 2,705,000 | 2,992,406 | ||||||
4.375%, 11/15/26 | 3,533,000 | 3,625,741 | ||||||
4.875%, 4/15/28 | 5,984,000 | 6,275,720 | ||||||
5.875%, 11/15/28 | 6,228,000 | 6,983,145 | ||||||
6.375%, 5/15/29, 144A | 2,591,000 | 2,992,605 | ||||||
5.375%, 11/15/29, 144A | 2,600,000 | 2,834,000 | ||||||
Symantec Corp. | 2,332,000 | 2,366,282 | ||||||
3.95%, 6/15/22 | 1,150,000 | 1,174,624 | ||||||
5.00%, 4/15/25, 144A | 3,957,000 | 3,985,906 | ||||||
Uber Technologies, Inc. | 1,702,000 | 1,782,845 | ||||||
8.00%, 11/1/26, 144A | 4,974,000 | 5,244,461 | ||||||
VeriSign, Inc. | 2,502,000 | 2,548,912 | ||||||
5.25%, 4/1/25 | 1,628,000 | 1,784,695 | ||||||
4.75%, 7/15/27 | 1,851,000 | 1,964,374 | ||||||
Zayo Group LLC / Zayo Capital, Inc. | 4,793,000 | 4,967,369 | ||||||
6.375%, 5/15/25 | 3,469,000 | 3,581,743 | ||||||
5.75%, 1/15/27, 144A | 5,379,000 | 5,500,028 | ||||||
|
| |||||||
| 67,607,726 | ||||||||
|
| |||||||
| Media — 11.9% | ||||||||
Altice Financing SA | 6,672,000 | 6,897,180 | ||||||
7.50%, 5/15/26, 144A | 9,618,000 | 10,267,215 | ||||||
Altice Finco SA, 144A | 1,630,000 | 1,691,125 | ||||||
Altice Luxembourg SA | 1,493,000 | 1,534,841 | ||||||
7.625%, 2/15/25, 144A | 5,399,000 | 5,601,462 | ||||||
10.50%, 5/15/27, 144A | 5,280,000 | 5,755,200 | ||||||
AMC Networks, Inc. | 1,926,000 | 1,959,705 | ||||||
5.00%, 4/1/24 | 3,341,000 | 3,449,582 | ||||||
4.75%, 8/1/25 | 2,644,000 | 2,710,100 | ||||||
Cablevision Systems Corp. | 1,872,000 | 2,007,158 | ||||||
CCO Holdings LLC / CCO Holdings Capital Corp. | 1,231,000 | 1,235,616 | ||||||
5.25%, 9/30/22 | 4,000,000 | 4,047,500 | ||||||
5.125%, 2/15/23 | 3,679,000 | 3,747,981 | ||||||
4.00%, 3/1/23, 144A | 1,399,000 | 1,416,487 | ||||||
5.125%, 5/1/23, 144A | 3,376,000 | 3,462,088 | ||||||
5.75%, 9/1/23 | 1,494,000 | 1,527,017 | ||||||
5.75%, 1/15/24 | 3,464,000 | 3,550,600 | ||||||
5.875%, 4/1/24, 144A | 5,833,000 | 6,088,194 | ||||||
5.375%, 5/1/25, 144A | 2,487,000 | 2,589,589 | ||||||
5.75%, 2/15/26, 144A | 8,397,000 | 8,911,316 | ||||||
5.50%, 5/1/26, 144A | 5,165,000 | 5,455,531 | ||||||
5.125%, 5/1/27, 144A | 10,485,000 | 11,113,995 | ||||||
Principal | Value | |||||||
| Media (Continued) | ||||||||
5.875%, 5/1/27, 144A | $ | 2,812,000 | $ | 3,001,810 | ||||
5.00%, 2/1/28, 144A | 8,163,000 | 8,591,557 | ||||||
5.375%, 6/1/29, 144A | 4,960,000 | 5,313,400 | ||||||
Cengage Learning, Inc., 144A | 2,177,000 | 2,030,052 | ||||||
Clear Channel Worldwide Holdings, Inc. | ||||||||
Series B, 6.50%, 11/15/22 | 6,733,000 | 6,878,904 | ||||||
Series A, 6.50%, 11/15/22 | 2,308,000 | 2,358,014 | ||||||
9.25%, 2/15/24, 144A | 6,154,000 | 6,761,707 | ||||||
5.125%, 8/15/27, 144A | 4,100,000 | 4,299,875 | ||||||
CSC Holdings LLC | 3,449,000 | 3,733,542 | ||||||
5.125%, 12/15/21, 144A | 2,325,000 | 2,333,719 | ||||||
5.125%, 12/15/21, 144A | 1,801,000 | 1,807,754 | ||||||
5.375%, 7/15/23, 144A | 2,589,000 | 2,667,343 | ||||||
5.25%, 6/1/24 | 2,709,000 | 2,905,402 | ||||||
7.75%, 7/15/25, 144A (a) | 2,188,000 | 2,354,835 | ||||||
6.625%, 10/15/25, 144A | 4,191,000 | 4,497,278 | ||||||
10.875%, 10/15/25, 144A | 5,817,000 | 6,613,202 | ||||||
5.50%, 5/15/26, 144A | 4,883,000 | 5,175,980 | ||||||
5.50%, 4/15/27, 144A | 4,217,000 | 4,522,732 | ||||||
5.375%, 2/1/28, 144A | 3,320,000 | 3,553,263 | ||||||
7.50%, 4/1/28, 144A | 3,469,000 | 3,919,970 | ||||||
6.50%, 2/1/29, 144A | 6,036,000 | 6,775,410 | ||||||
5.75%, 1/15/30, 144A | 3,250,000 | 3,404,375 | ||||||
Diamond Sports Group LLC / Diamond Sports Finance Co. | 10,000,000 | 10,525,000 | ||||||
6.625%, 8/15/27, 144A | 6,000,000 | 6,300,000 | ||||||
DISH DBS Corp. | 6,487,000 | 6,848,975 | ||||||
5.875%, 7/15/22 | 6,545,000 | 6,798,619 | ||||||
5.00%, 3/15/23 | 4,905,000 | 4,831,425 | ||||||
5.875%, 11/15/24 | 6,840,000 | 6,532,542 | ||||||
7.75%, 7/1/26 | 6,619,000 | 6,519,715 | ||||||
Entercom Media Corp., 144A | 1,336,000 | 1,364,390 | ||||||
Gray Television, Inc. | 1,499,000 | 1,551,465 | ||||||
5.875%, 7/15/26, 144A (a) | 2,584,000 | 2,706,740 | ||||||
7.00%, 5/15/27, 144A | 2,391,000 | 2,623,405 | ||||||
iHeartCommunications, Inc. | 2,474,650 | 2,684,995 | ||||||
8.375%, 5/1/27 | 4,840,736 | 5,246,148 | ||||||
5.25%, 8/15/27, 144A | 2,500,000 | 2,634,825 | ||||||
Meredith Corp. | 4,237,000 | 4,491,220 | ||||||
Nexstar Broadcasting, Inc. | 1,158,000 | 1,181,160 | ||||||
5.625%, 8/1/24, 144A (a) | 3,039,000 | 3,168,158 | ||||||
Nexstar Escrow, Inc., 144A | 3,825,000 | 3,997,125 | ||||||
Quebecor Media, Inc. | 2,706,000 | 2,943,668 | ||||||
Sinclair Television Group, Inc. | 1,761,000 | 1,789,616 | ||||||
| See Notes to Financial Statements. | 59 |
DBX ETF Trust
Schedule of Investments
Xtrackers USD High Yield Corporate Bond ETF(Continued)
August 31, 2019
Principal | Value | |||||||
| Media (Continued) | ||||||||
5.625%, 8/1/24, 144A | $ | 2,267,000 | $ | 2,340,678 | ||||
5.125%, 2/15/27, 144A | 1,675,000 | 1,683,040 | ||||||
Sirius XM Radio, Inc. | 3,372,000 | 3,447,870 | ||||||
4.625%, 5/15/23, 144A | 1,833,000 | 1,874,243 | ||||||
4.625%, 7/15/24, 144A | 5,328,000 | 5,574,420 | ||||||
5.375%, 4/15/25, 144A | 3,277,000 | 3,412,176 | ||||||
5.375%, 7/15/26, 144A | 3,323,000 | 3,522,380 | ||||||
5.00%, 8/1/27, 144A | 5,210,000 | 5,516,088 | ||||||
5.50%, 7/1/29, 144A | 3,990,000 | 4,357,918 | ||||||
TEGNA, Inc. | 1,595,000 | 1,643,648 | ||||||
Telenet Finance Luxembourg Notes Sarl, 144A | 2,800,000 | 2,861,600 | ||||||
Tribune Media Co. | 3,991,000 | 4,049,628 | ||||||
Unitymedia GmbH, 144A | 3,297,000 | 3,451,135 | ||||||
Unitymedia Hessen GmbH & Co. KG / Unitymedia NRW GmbH, 144A | 1,923,000 | 1,992,940 | ||||||
Univision Communications, Inc. | 3,358,000 | 3,332,815 | ||||||
5.125%, 2/15/25, 144A | 5,121,000 | 4,966,807 | ||||||
UPC Holding BV, 144A | 1,790,000 | 1,870,550 | ||||||
UPCB Finance IV Ltd., 144A | 3,935,000 | 4,069,774 | ||||||
Videotron Ltd. | 2,799,000 | 2,945,948 | ||||||
5.375%, 6/15/24, 144A | 2,277,000 | 2,467,699 | ||||||
5.125%, 4/15/27, 144A | 2,107,000 | 2,222,885 | ||||||
Virgin Media Finance PLC, 144A | 1,706,000 | 1,767,843 | ||||||
Virgin Media Secured Finance PLC | 3,473,000 | 3,572,849 | ||||||
5.50%, 8/15/26, 144A | 2,012,000 | 2,110,085 | ||||||
5.50%, 5/15/29, 144A | 5,428,000 | 5,685,830 | ||||||
Ziggo Bond Co. BV | 1,350,000 | 1,402,313 | ||||||
6.00%, 1/15/27, 144A | 2,031,000 | 2,127,473 | ||||||
Ziggo BV, 144A | 6,646,000 | 7,044,428 | ||||||
|
| |||||||
| 364,573,860 | ||||||||
|
| |||||||
| Telecommunications — 9.9% | ||||||||
Altice France SA | 2,758,000 | 2,853,620 | ||||||
7.375%, 5/1/26, 144A | 17,294,000 | 18,504,580 | ||||||
8.125%, 2/1/27, 144A | 5,848,000 | 6,462,040 | ||||||
C&W Senior Financing DAC | 1,373,000 | 1,492,863 | ||||||
6.875%, 9/15/27, 144A | 4,221,000 | 4,510,729 | ||||||
CenturyLink, Inc. | ||||||||
Series S, 6.45%, 6/15/21 | 4,166,000 | 4,400,337 | ||||||
Series T, 5.80%, 3/15/22 | 4,662,000 | 4,912,582 | ||||||
Principal | Value | |||||||
| Telecommunications (Continued) | ||||||||
Series W, 6.75%, 12/1/23 (a) | $ | 2,043,000 | $ | 2,219,209 | ||||
Series Y, 7.50%, 4/1/24 (a) | 3,438,000 | 3,824,706 | ||||||
5.625%, 4/1/25 (a) | 1,793,000 | 1,837,825 | ||||||
Cincinnati Bell, Inc., 144A | 2,227,000 | 2,043,272 | ||||||
CommScope Technologies LLC | 5,165,000 | 4,635,587 | ||||||
5.00%, 3/15/27, 144A | 2,487,000 | 2,092,189 | ||||||
CommScope, Inc. | 1,500,000 | 1,505,640 | ||||||
5.50%, 3/1/24, 144A | 4,355,000 | 4,436,656 | ||||||
5.50%, 6/15/24, 144A | 1,754,000 | 1,668,492 | ||||||
6.00%, 3/1/26, 144A | 4,942,000 | 5,058,137 | ||||||
8.25%, 3/1/27, 144A | 3,189,000 | 3,137,179 | ||||||
Consolidated Communications, Inc. | 1,807,000 | 1,698,580 | ||||||
DKT Finance ApS, 144A | 1,073,000 | 1,155,675 | ||||||
Frontier Communications Corp. | 1,685,000 | 884,625 | ||||||
10.50%, 9/15/22 | 7,316,000 | 3,831,755 | ||||||
7.125%, 1/15/23 | 2,667,000 | 1,373,505 | ||||||
7.625%, 4/15/24 | 2,429,000 | 1,227,374 | ||||||
6.875%, 1/15/25 | 2,617,000 | 1,347,755 | ||||||
11.00%, 9/15/25 | 12,003,000 | 6,151,538 | ||||||
8.50%, 4/1/26, 144A | 5,175,000 | 5,045,625 | ||||||
8.00%, 4/1/27, 144A | 5,554,000 | 5,803,930 | ||||||
Gogo Intermediate Holdings LLC / Gogo Finance Co., Inc., 144A | 3,007,000 | 3,146,074 | ||||||
GTH Finance BV, 144A | 2,516,000 | 2,802,326 | ||||||
GTT Communications, Inc., 144A | 1,893,000 | 1,211,520 | ||||||
Hughes Satellite Systems Corp. | 2,625,000 | 2,841,563 | ||||||
5.25%, 8/1/26 | 2,496,000 | 2,655,120 | ||||||
6.625%, 8/1/26 (a) | 2,488,000 | 2,687,040 | ||||||
Inmarsat Finance PLC | 3,304,000 | 3,353,560 | ||||||
6.50%, 10/1/24, 144A | 1,424,000 | 1,500,540 | ||||||
Intelsat Connect Finance SA, 144A | 4,226,000 | 3,782,270 | ||||||
Intelsat Jackson Holdings SA | 1,602,000 | 1,860,323 | ||||||
5.50%, 8/1/23 | 6,353,000 | 5,812,995 | ||||||
8.00%, 2/15/24, 144A | 4,516,000 | 4,713,575 | ||||||
8.50%, 10/15/24, 144A | 9,767,000 | 9,718,165 | ||||||
9.75%, 7/15/25, 144A | 6,274,000 | 6,470,063 | ||||||
Intelsat Luxembourg SA | 1,168,000 | 1,115,440 | ||||||
8.125%, 6/1/23 (a) | 3,330,000 | 2,664,000 | ||||||
Level 3 Financing, Inc. | 2,911,000 | 2,923,736 | ||||||
5.625%, 2/1/23 | 2,013,000 | 2,052,676 | ||||||
5.125%, 5/1/23 | 2,479,000 | 2,528,679 | ||||||
5.375%, 1/15/24 | 3,198,000 | 3,261,960 | ||||||
| See Notes to Financial Statements. | 60 |
DBX ETF Trust
Schedule of Investments
Xtrackers USD High Yield Corporate Bond ETF(Continued)
August 31, 2019
Principal | Value | |||||||
| Telecommunications (Continued) | ||||||||
5.375%, 5/1/25 | $ | 3,108,000 | $ | 3,240,090 | ||||
5.25%, 3/15/26 | 1,976,000 | 2,064,920 | ||||||
Level 3 Parent LLC | 2,478,000 | 2,502,780 | ||||||
Nokia OYJ | 1,775,000 | 1,801,625 | ||||||
4.375%, 6/12/27 | 1,770,000 | 1,840,800 | ||||||
Qwest Corp. | 3,187,000 | 3,439,235 | ||||||
Sable International Finance Ltd., 144A | 1,191,000 | 1,246,084 | ||||||
Sprint Communications, Inc. | 3,796,000 | 4,469,790 | ||||||
6.00%, 11/15/22 | 7,481,000 | 7,981,254 | ||||||
Sprint Corp. | 6,813,000 | 7,345,777 | ||||||
7.875%, 9/15/23 | 14,523,000 | 16,374,683 | ||||||
7.125%, 6/15/24 | 7,841,000 | 8,687,514 | ||||||
7.625%, 2/15/25 | 5,069,000 | 5,683,616 | ||||||
7.625%, 3/1/26 | 4,934,000 | 5,556,918 | ||||||
Telecom Italia SpA, 144A | 4,691,000 | 5,036,961 | ||||||
Telefonaktiebolaget LM Ericsson | 3,427,000 | 3,557,809 | ||||||
T-Mobile USA, Inc. | 1,228,000 | 1,267,149 | ||||||
6.00%, 3/1/23 | 4,005,000 | 4,085,100 | ||||||
6.50%, 1/15/24 | 1,806,000 | 1,886,764 | ||||||
6.00%, 4/15/24 | 4,372,000 | 4,568,740 | ||||||
6.375%, 3/1/25 | 5,739,000 | 5,957,082 | ||||||
5.125%, 4/15/25 | 2,090,000 | 2,185,241 | ||||||
6.50%, 1/15/26 | 6,576,000 | 7,085,640 | ||||||
4.50%, 2/1/26 | 3,405,000 | 3,545,456 | ||||||
5.375%, 4/15/27 (a) | 1,686,000 | 1,830,372 | ||||||
4.75%, 2/1/28 | 5,236,000 | 5,530,420 | ||||||
VEON Holdings BV | 2,200,000 | 2,230,734 | ||||||
7.504%, 3/1/22, 144A | 1,148,000 | 1,263,799 | ||||||
5.95%, 2/13/23, 144A | 1,482,000 | 1,605,332 | ||||||
4.95%, 6/16/24, 144A | 1,434,000 | 1,522,191 | ||||||
ViaSat, Inc. | 2,354,000 | 2,383,425 | ||||||
5.625%, 4/15/27, 144A | 1,971,000 | 2,099,115 | ||||||
West Corp., 144A | 3,785,000 | 2,952,300 | ||||||
|
| |||||||
| 304,046,346 | ||||||||
|
| |||||||
| Consumer, Cyclical — 13.6% | ||||||||
| Airlines — 0.2% | ||||||||
Air Canada, 144A | 1,439,000 | 1,547,774 | ||||||
American Airlines Group, Inc., 144A | 2,777,000 | 2,891,551 | ||||||
United Airlines Holdings, Inc. | 1,244,000 | 1,282,875 | ||||||
|
| |||||||
| 5,722,200 | ||||||||
|
| |||||||
Principal | Value | |||||||
| Apparel — 0.2% | ||||||||
Hanesbrands, Inc. | $ | 2,943,000 | $ | 3,093,829 | ||||
4.875%, 5/15/26, 144A | 2,790,000 | 2,955,112 | ||||||
Levi Strauss & Co. | 1,516,000 | 1,584,220 | ||||||
|
| |||||||
| 7,633,161 | ||||||||
|
| |||||||
| Auto Manufacturers — 0.8% | ||||||||
Allison Transmission, Inc. | 3,465,000 | 3,571,462 | ||||||
4.75%, 10/1/27, 144A | 1,495,000 | 1,539,850 | ||||||
5.875%, 6/1/29, 144A | 1,420,000 | 1,526,500 | ||||||
Fiat Chrysler Automobiles NV | 4,829,000 | 5,175,770 | ||||||
Jaguar Land Rover Automotive PLC | 1,787,000 | 1,717,986 | ||||||
4.50%, 10/1/27, 144A | 1,795,000 | 1,423,256 | ||||||
Navistar International Corp., 144A | 3,640,000 | 3,703,700 | ||||||
Tesla, Inc., 144A | 6,023,000 | 5,398,114 | ||||||
|
| |||||||
| 24,056,638 | ||||||||
|
| |||||||
| Auto Parts & Equipment — 1.0% | ||||||||
Adient Global Holdings Ltd., 144A | 3,065,000 | 2,383,037 | ||||||
American Axle & Manufacturing, Inc. | 1,338,000 | 1,353,052 | ||||||
6.25%, 4/1/25 (a) | 2,510,000 | 2,368,762 | ||||||
6.25%, 3/15/26 (a) | 1,353,000 | 1,261,673 | ||||||
6.50%, 4/1/27 (a) | 1,662,000 | 1,531,118 | ||||||
Dana, Inc. | 1,420,000 | 1,455,500 | ||||||
Goodyear Tire & Rubber Co. | 3,150,000 | 3,201,188 | ||||||
5.00%, 5/31/26 (a) | 3,155,000 | 3,135,281 | ||||||
4.875%, 3/15/27 (a) | 2,281,000 | 2,209,719 | ||||||
Panther BF Aggregator 2 LP / Panther Finance Co., Inc. | 3,335,000 | 3,468,400 | ||||||
8.50%, 5/15/27, 144A | 6,528,000 | 6,381,120 | ||||||
Tenneco, Inc. | 1,576,000 | 1,232,243 | ||||||
|
| |||||||
| 29,981,093 | ||||||||
|
| |||||||
| Distribution/Wholesale — 0.4% | ||||||||
American Builders & Contractors Supply Co., Inc., 144A | 2,259,000 | 2,403,011 | ||||||
Anixter, Inc. | 1,393,000 | 1,460,909 | ||||||
Core & Main LP, 144A | 2,093,000 | 2,134,860 | ||||||
HD Supply, Inc., 144A | 2,513,000 | 2,689,412 | ||||||
KAR Auction Services, Inc., 144A | 2,978,000 | 3,082,230 | ||||||
| See Notes to Financial Statements. | 61 |
DBX ETF Trust
Schedule of Investments
Xtrackers USD High Yield Corporate Bond ETF(Continued)
August 31, 2019
Principal | Value | |||||||
| Distribution/Wholesale (Continued) | ||||||||
LKQ Corp. | $ | 1,749,000 | $ | 1,781,794 | ||||
|
| |||||||
| 13,552,216 | ||||||||
|
| |||||||
| Entertainment — 2.3% | ||||||||
AMC Entertainment Holdings, Inc. | 1,771,000 | 1,689,091 | ||||||
5.875%, 11/15/26 | 2,038,000 | 1,874,960 | ||||||
6.125%, 5/15/27 (a) | 1,861,000 | 1,726,077 | ||||||
Caesars Resort Collection LLC / CRC Finco, Inc., 144A | 5,672,000 | 5,785,440 | ||||||
Cedar Fair LP, 144A | 1,514,000 | 1,648,367 | ||||||
Churchill Downs, Inc. | 1,952,000 | 2,078,880 | ||||||
4.75%, 1/15/28, 144A | 1,677,000 | 1,735,695 | ||||||
Cinemark USA, Inc. | 633,000 | 645,660 | ||||||
4.875%, 6/1/23 | 2,662,000 | 2,721,895 | ||||||
Cirsa Finance International Sarl, 144A | 2,192,000 | 2,324,960 | ||||||
Eldorado Resorts, Inc. | 3,248,000 | 3,459,120 | ||||||
6.00%, 9/15/26 | 1,860,000 | 2,043,675 | ||||||
International Game Technology PLC | 4,806,000 | 5,106,375 | ||||||
6.50%, 2/15/25, 144A | 3,772,000 | 4,158,630 | ||||||
6.25%, 1/15/27, 144A | 2,434,000 | 2,680,442 | ||||||
Lions Gate Capital Holdings LLC | 1,993,000 | 2,109,969 | ||||||
5.875%, 11/1/24, 144A | 1,831,000 | 1,913,395 | ||||||
Live Nation Entertainment, Inc., 144A | 2,125,000 | 2,207,344 | ||||||
Merlin Entertainments PLC, 144A | 1,258,000 | 1,314,610 | ||||||
Mohegan Gaming & Entertainment, 144A | 1,681,000 | 1,631,915 | ||||||
Scientific Games International, Inc. | 4,205,000 | 4,378,456 | ||||||
5.00%, 10/15/25, 144A | 4,220,000 | 4,370,823 | ||||||
8.25%, 3/15/26, 144A | 3,499,000 | 3,717,688 | ||||||
Six Flags Entertainment Corp. | 3,675,000 | 3,812,813 | ||||||
5.50%, 4/15/27, 144A | 1,263,000 | 1,354,568 | ||||||
Stars Group Holdings BV / Stars Group US Co.-Borrower LLC, 144A | 3,300,000 | 3,510,375 | ||||||
|
| |||||||
| 70,001,223 | ||||||||
|
| |||||||
| Food Service — 0.4% | ||||||||
Aramark Services, Inc. | 3,331,000 | 3,442,788 | ||||||
5.00%, 4/1/25, 144A | 1,898,000 | 1,965,664 | ||||||
4.75%, 6/1/26 | 1,561,000 | 1,603,927 | ||||||
5.00%, 2/1/28, 144A | 4,150,000 | 4,321,188 | ||||||
|
| |||||||
| 11,333,567 | ||||||||
|
| |||||||
Principal | Value | |||||||
| Home Builders — 1.5% | ||||||||
Beazer Homes USA, Inc. | $ | 1,882,000 | $ | 1,971,395 | ||||
5.875%, 10/15/27 | 1,369,000 | 1,303,972 | ||||||
Brookfield Residential Properties, Inc., 144A | 1,806,000 | 1,810,515 | ||||||
Century Communities, Inc., 144A | 1,562,000 | 1,659,625 | ||||||
K Hovnanian Enterprises, Inc. | 1,417,000 | 1,204,450 | ||||||
10.50%, 7/15/24, 144A | 1,350,000 | 1,066,500 | ||||||
KB Home | 1,393,000 | 1,516,113 | ||||||
Lennar Corp. | 1,914,000 | 1,975,880 | ||||||
4.125%, 1/15/22 | 1,565,000 | 1,617,819 | ||||||
4.75%, 11/15/22 | 1,898,000 | 2,009,507 | ||||||
4.875%, 12/15/23 | 913,000 | 982,616 | ||||||
4.50%, 4/30/24 | 2,226,000 | 2,373,472 | ||||||
5.875%, 11/15/24 | 1,463,000 | 1,636,731 | ||||||
4.75%, 5/30/25 | 1,615,000 | 1,736,125 | ||||||
5.25%, 6/1/26 | 254,000 | 277,495 | ||||||
4.75%, 11/29/27 | 2,693,000 | 2,942,103 | ||||||
Mattamy Group Corp. | 1,286,000 | 1,345,478 | ||||||
6.50%, 10/1/25, 144A | 1,848,000 | 1,968,120 | ||||||
Meritage Homes Corp. | 1,340,000 | 1,485,725 | ||||||
PulteGroup, Inc. | 2,004,000 | 2,206,905 | ||||||
5.00%, 1/15/27 | 2,539,000 | 2,742,120 | ||||||
Taylor Morrison Communities, Inc. | 1,651,000 | 1,778,953 | ||||||
5.75%, 1/15/28, 144A | 1,500,000 | 1,597,500 | ||||||
Toll Brothers Finance Corp. | 1,365,000 | 1,457,138 | ||||||
4.375%, 4/15/23 (a) | 1,280,000 | 1,340,800 | ||||||
4.875%, 3/15/27 | 1,390,000 | 1,515,100 | ||||||
4.35%, 2/15/28 | 1,431,000 | 1,502,550 | ||||||
William Lyon Homes, Inc. | 1,454,000 | 1,475,810 | ||||||
|
| |||||||
| 46,500,517 | ||||||||
|
| |||||||
| Home Furnishings — 0.1% | ||||||||
Tempur Sealy International, Inc. | 1,184,000 | 1,222,480 | ||||||
5.50%, 6/15/26 | 2,291,000 | 2,402,686 | ||||||
|
| |||||||
| 3,625,166 | ||||||||
|
| |||||||
| Housewares — 0.0% | ||||||||
ScottsMiracle-Gro Co. | 1,347,000 | 1,399,843 | ||||||
|
| |||||||
| Leisure Time — 0.4% | ||||||||
24 Hour Fitness Worldwide, Inc., 144A | 1,623,000 | 1,448,528 | ||||||
Carlson Travel, Inc., 144A | 1,326,000 | 1,349,205 | ||||||
| See Notes to Financial Statements. | 62 |
DBX ETF Trust
Schedule of Investments
Xtrackers USD High Yield Corporate Bond ETF(Continued)
August 31, 2019
Principal | Value | |||||||
| Leisure Time (Continued) | ||||||||
NCL Corp. Ltd., 144A | $ | 2,249,000 | $ | 2,288,357 | ||||
Sabre GLBL, Inc. | 1,755,000 | 1,807,650 | ||||||
5.25%, 11/15/23, 144A | 1,688,000 | 1,742,860 | ||||||
Viking Cruises Ltd., 144A | 2,780,000 | 2,891,200 | ||||||
|
| |||||||
| 11,527,800 | ||||||||
|
| |||||||
| Lodging — 2.7% | ||||||||
Boyd Gaming Corp. | 2,457,000 | 2,557,811 | ||||||
6.375%, 4/1/26 | 3,432,000 | 3,650,790 | ||||||
6.00%, 8/15/26 | 2,310,000 | 2,448,600 | ||||||
Diamond Resorts International, Inc. | 1,624,000 | 1,642,270 | ||||||
10.75%, 9/1/24, 144A (a) | 2,012,000 | 2,032,120 | ||||||
Hilton Domestic Operating Co., Inc. | 3,170,000 | 3,241,325 | ||||||
5.125%, 5/1/26 | 5,955,000 | 6,300,390 | ||||||
4.875%, 1/15/30, 144A | 3,304,000 | 3,543,540 | ||||||
Hilton Worldwide Finance LLC / Hilton Worldwide Finance Corp. | 2,271,000 | 2,350,485 | ||||||
4.875%, 4/1/27 | 1,784,000 | 1,884,350 | ||||||
Jack Ohio Finance LLC / Jack Ohio Finance 1 Corp., 144A | 2,347,000 | 2,405,675 | ||||||
Melco Resorts Finance Ltd. | 2,226,000 | 2,216,389 | ||||||
5.25%, 4/26/26, 144A | 2,345,000 | 2,367,102 | ||||||
5.625%, 7/17/27, 144A | 2,000,000 | 2,042,363 | ||||||
MGM Resorts International | 4,640,000 | 5,057,600 | ||||||
7.75%, 3/15/22 | 2,843,000 | 3,199,029 | ||||||
6.00%, 3/15/23 | 4,455,000 | 4,911,637 | ||||||
5.75%, 6/15/25 | 3,835,000 | 4,242,584 | ||||||
4.625%, 9/1/26 | 1,805,000 | 1,877,200 | ||||||
5.50%, 4/15/27 | 2,849,000 | 3,094,726 | ||||||
Station Casinos LLC, 144A | 1,821,000 | 1,862,155 | ||||||
Studio City Co. Ltd., 144A | 2,994,000 | 3,068,850 | ||||||
Wyndham Destinations, Inc. | 2,363,000 | 2,427,982 | ||||||
3.90%, 3/1/23 | 1,253,000 | 1,277,277 | ||||||
5.75%, 4/1/27 | 1,398,000 | 1,497,608 | ||||||
Wynn Las Vegas LLC / Wynn Las Vegas Capital Corp. | 1,655,000 | 1,709,201 | ||||||
5.50%, 3/1/25, 144A | 5,916,000 | 6,256,170 | ||||||
5.25%, 5/15/27, 144A | 2,943,000 | 3,053,363 | ||||||
|
| |||||||
| 82,218,592 | ||||||||
|
| |||||||
| Retail — 3.4% | ||||||||
1011778 BC ULC / New Red Finance, Inc. | 3,992,000 | 4,016,950 | ||||||
4.25%, 5/15/24, 144A (a) | 4,969,000 | 5,141,722 | ||||||
5.00%, 10/15/25, 144A | 9,596,000 | 9,931,860 | ||||||
Principal | Value | |||||||
| Retail (Continued) | ||||||||
Beacon Roofing Supply, Inc., 144A | $ | 4,208,000 | $ | 4,165,920 | ||||
eG Global Finance PLC, 144A | 2,428,000 | 2,352,125 | ||||||
Ferrellgas LP / Ferrellgas Finance Corp. | 1,726,000 | 1,475,730 | ||||||
6.75%, 1/15/22 | 1,722,000 | 1,463,700 | ||||||
6.75%, 6/15/23 (a) | 1,424,000 | 1,203,280 | ||||||
Golden Nugget, Inc. | 4,371,000 | 4,480,275 | ||||||
8.75%, 10/1/25, 144A | 2,278,000 | 2,394,747 | ||||||
Group 1 Automotive, Inc. | 1,862,000 | 1,882,947 | ||||||
IRB Holding Corp., 144A | 1,619,000 | 1,631,142 | ||||||
JC Penney Corp., Inc. | 1,798,000 | 1,519,310 | ||||||
8.625%, 3/15/25, 144A (a) | 1,286,000 | 646,215 | ||||||
KFC Holding Co./Pizza Hut Holdings LLC/Taco Bell of America LLC | 3,363,000 | 3,484,909 | ||||||
5.25%, 6/1/26, 144A | 3,684,000 | 3,905,040 | ||||||
4.75%, 6/1/27, 144A | 2,317,000 | 2,432,850 | ||||||
L Brands, Inc. | 1,000,000 | 1,057,500 | ||||||
5.625%, 2/15/22 | 2,421,000 | 2,554,155 | ||||||
5.625%, 10/15/23 | 2,128,000 | 2,245,040 | ||||||
5.25%, 2/1/28 | 1,639,000 | 1,499,685 | ||||||
7.50%, 6/15/29 | 1,791,000 | 1,768,613 | ||||||
Michaels Stores, Inc., 144A | 1,690,000 | 1,624,884 | ||||||
Neiman Marcus Group Ltd. LLC / Neiman Marcus Group LLC / Mariposa Borrower / NMG | 2,000,000 | 690,000 | ||||||
8.75%, 10/25/24, 144A | 1,980,000 | 693,000 | ||||||
Penske Automotive Group, Inc. | 1,862,000 | 1,891,047 | ||||||
5.50%, 5/15/26 | 1,611,000 | 1,693,564 | ||||||
PetSmart, Inc. | 6,278,000 | 5,869,930 | ||||||
5.875%, 6/1/25, 144A (a) | 3,765,000 | 3,708,525 | ||||||
8.875%, 6/1/25, 144A (a) | 2,259,000 | 2,123,460 | ||||||
QVC, Inc. | 1,140,000 | 1,204,471 | ||||||
4.375%, 3/15/23 | 3,250,000 | 3,396,844 | ||||||
4.85%, 4/1/24 | 1,955,000 | 2,078,113 | ||||||
4.45%, 2/15/25 | 1,859,000 | 1,934,748 | ||||||
Rite Aid Corp., 144A | 5,834,000 | 4,732,833 | ||||||
Staples, Inc. | 6,721,000 | 6,805,013 | ||||||
10.75%, 4/15/27, 144A | 3,411,000 | 3,453,638 | ||||||
Suburban Propane Partners LP/Suburban Energy Finance Corp. | 1,771,000 | 1,806,420 | ||||||
|
| |||||||
| 104,960,205 | ||||||||
|
| |||||||
| See Notes to Financial Statements. | 63 |
DBX ETF Trust
Schedule of Investments
Xtrackers USD High Yield Corporate Bond ETF(Continued)
August 31, 2019
Principal | Value | |||||||
| Toys/Games/Hobbies — 0.2% | ||||||||
Mattel, Inc., 144A | $ | 4,906,000 | $ | 5,053,180 | ||||
|
| |||||||
| Consumer,Non-cyclical — 19.6% | ||||||||
| Agriculture — 0.4% | ||||||||
Darling Ingredients, Inc., 144A | 1,635,000 | 1,747,406 | ||||||
JBS Investments II GmbH | 3,300,000 | 3,576,375 | ||||||
5.75%, 1/15/28, 144A | 2,700,000 | 2,841,075 | ||||||
Vector Group Ltd., 144A | 2,981,000 | 2,936,285 | ||||||
|
| |||||||
| 11,101,141 | ||||||||
|
| |||||||
| Commercial Services — 3.7% | ||||||||
Ahern Rentals, Inc., 144A | 1,914,000 | 1,660,395 | ||||||
Algeco Global Finance PLC, 144A | 1,680,000 | 1,689,660 | ||||||
APX Group, Inc. | 1,723,000 | 1,645,465 | ||||||
7.875%, 12/1/22 | 3,057,000 | 2,923,256 | ||||||
7.625%, 9/1/23 (a) | 1,223,000 | 917,250 | ||||||
Avis Budget Car Rental LLC / Avis Budget Finance, Inc., 144A | 1,300,000 | 1,327,235 | ||||||
Brink’s Co., 144A | 2,081,000 | 2,122,620 | ||||||
Gartner, Inc., 144A | 2,397,000 | 2,519,822 | ||||||
Herc Holdings, Inc., 144A | 4,020,000 | 4,170,750 | ||||||
Hertz Corp. | 3,809,000 | 3,971,073 | ||||||
6.25%, 10/15/22 (a) | 1,947,000 | 1,978,639 | ||||||
5.50%, 10/15/24, 144A (a) | 2,706,000 | 2,665,410 | ||||||
7.125%, 8/1/26, 144A | 1,600,000 | 1,635,816 | ||||||
Jaguar Holding Co. II / Pharmaceutical Product Development LLC, 144A | 3,314,000 | 3,429,990 | ||||||
Nielsen Co. Luxembourg SARL | 1,812,000 | 1,821,785 | ||||||
5.00%, 2/1/25, 144A (a) | 1,914,000 | 1,899,645 | ||||||
Nielsen Finance LLC / Nielsen Finance Co. | 2,638,000 | 2,643,408 | ||||||
5.00%, 4/15/22, 144A | 7,724,000 | 7,801,240 | ||||||
Prime Security Services Borrower LLC / Prime Finance, Inc. | 3,747,000 | 3,947,371 | ||||||
5.25%, 4/15/24, 144A | 2,620,000 | 2,712,774 | ||||||
5.75%, 4/15/26, 144A (a) | 2,451,000 | 2,561,295 | ||||||
Refinitiv US Holdings, Inc. | 4,126,000 | 4,502,497 | ||||||
8.25%, 11/15/26, 144A | 5,425,000 | 6,116,687 | ||||||
Service Corp. International | 3,080,000 | 3,181,640 | ||||||
4.625%, 12/15/27 | 2,027,000 | 2,120,749 | ||||||
Principal | Value | |||||||
| Commercial Services (Continued) | ||||||||
5.125%, 6/1/29 | $ | 2,198,000 | $ | 2,362,850 | ||||
ServiceMaster Co. LLC, 144A | 2,447,000 | 2,574,562 | ||||||
Team Health Holdings, Inc., 144A | 2,913,000 | 1,966,275 | ||||||
United Rentals North America, Inc. | 3,292,000 | 3,376,357 | ||||||
5.50%, 7/15/25 | 1,691,000 | 1,769,209 | ||||||
4.625%, 10/15/25 | 4,069,000 | 4,200,022 | ||||||
5.875%, 9/15/26 | 3,575,000 | 3,847,594 | ||||||
6.50%, 12/15/26 | 3,184,000 | 3,474,540 | ||||||
5.50%, 5/15/27 | 4,349,000 | 4,682,829 | ||||||
4.875%, 1/15/28 | 5,346,000 | 5,626,665 | ||||||
5.25%, 1/15/30 | 2,099,000 | 2,251,178 | ||||||
Verscend Escrow Corp., 144A | 3,690,000 | 3,964,278 | ||||||
WEX, Inc., 144A | 1,026,000 | 1,036,260 | ||||||
|
| |||||||
| 113,099,091 | ||||||||
|
| |||||||
| Cosmetics/Personal Care — 0.4% | ||||||||
Avon Products, Inc. | 1,593,000 | 1,652,738 | ||||||
Coty, Inc., 144A | 1,898,000 | 1,798,355 | ||||||
Edgewell Personal Care Co. | 1,520,000 | 1,552,300 | ||||||
4.70%, 5/24/22 | 1,840,000 | 1,883,700 | ||||||
First Quality Finance Co., Inc. | 1,912,000 | 1,919,170 | ||||||
5.00%, 7/1/25, 144A | 1,461,000 | 1,519,440 | ||||||
Revlon Consumer Products Corp. | 2,117,000 | 1,937,055 | ||||||
6.25%, 8/1/24 | 1,304,000 | 756,320 | ||||||
|
| |||||||
| 13,019,078 | ||||||||
|
| |||||||
| Food — 2.6% | ||||||||
Albertsons Cos. LLC / Safeway, Inc. / New Albertsons LP / Albertson’s LLC | 4,365,000 | 4,594,162 | ||||||
5.75%, 3/15/25 | 4,648,000 | 4,787,440 | ||||||
7.50%, 3/15/26, 144A | 1,374,000 | 1,535,445 | ||||||
5.875%, 2/15/28, 144A | 2,500,000 | 2,640,900 | ||||||
B&G Foods, Inc. | 2,564,000 | 2,581,948 | ||||||
5.25%, 4/1/25 | 2,985,000 | 3,038,133 | ||||||
JBS Investments GmbH, 144A | 206,000 | 211,098 | ||||||
JBS USA LUX SA / JBS USA Finance, Inc. | 3,006,000 | 3,101,816 | ||||||
5.75%, 6/15/25, 144A | 3,748,000 | 3,912,012 | ||||||
6.75%, 2/15/28, 144A | 3,006,000 | 3,362,963 | ||||||
JBS USA LUX SA / JBS USA Food Co. / JBS USA Finance, Inc. | 4,673,000 | 5,187,030 | ||||||
5.50%, 1/15/30, 144A | 4,085,000 | 4,338,270 | ||||||
| See Notes to Financial Statements. | 64 |
DBX ETF Trust
Schedule of Investments
Xtrackers USD High Yield Corporate Bond ETF(Continued)
August 31, 2019
Principal | Value | |||||||
| Food (Continued) | ||||||||
Lamb Weston Holdings, Inc. | $ | 2,913,000 | $ | 3,059,844 | ||||
4.875%, 11/1/26, 144A | 3,039,000 | 3,187,151 | ||||||
Pilgrim’s Pride Corp. | 3,991,000 | 4,160,618 | ||||||
5.875%, 9/30/27, 144A | 2,806,000 | 3,033,988 | ||||||
Post Holdings, Inc. | 3,679,000 | 3,862,950 | ||||||
5.00%, 8/15/26, 144A | 5,821,000 | 6,090,221 | ||||||
5.75%, 3/1/27, 144A | 4,289,000 | 4,578,508 | ||||||
5.625%, 1/15/28, 144A | 3,073,000 | 3,284,269 | ||||||
5.50%, 12/15/29, 144A | 2,432,000 | 2,580,255 | ||||||
Sigma Holdco BV, 144A | 1,736,000 | 1,718,640 | ||||||
TreeHouse Foods, Inc., 144A | 2,149,000 | 2,237,646 | ||||||
US Foods, Inc., 144A | 2,289,000 | 2,374,792 | ||||||
|
| |||||||
| 79,460,099 | ||||||||
|
| |||||||
| Healthcare-Products — 0.9% | ||||||||
Avantor, Inc. | 5,461,000 | 5,870,575 | ||||||
9.00%, 10/1/25, 144A | 6,547,000 | 7,381,742 | ||||||
Hill-Rom Holdings, Inc., 144A | 1,571,000 | 1,625,985 | ||||||
Hologic, Inc. | 3,145,000 | 3,231,488 | ||||||
4.625%, 2/1/28, 144A | 1,306,000 | 1,356,608 | ||||||
Ortho-Clinical Diagnostics, Inc. / Ortho-Clinical Diagnostics SA, 144A | 4,256,000 | 4,128,320 | ||||||
Sotera Health Holdings LLC, 144A | 1,479,000 | 1,508,580 | ||||||
Teleflex, Inc. | 1,247,000 | 1,319,900 | ||||||
4.625%, 11/15/27 | 1,741,000 | 1,847,427 | ||||||
|
| |||||||
| 28,270,625 | ||||||||
|
| |||||||
| Healthcare-Services — 7.4% | ||||||||
Acadia Healthcare Co., Inc. | 2,422,000 | 2,485,553 | ||||||
AHP Health Partners, Inc., 144A | 1,555,000 | 1,678,039 | ||||||
Catalent Pharma Solutions, Inc. | 1,960,000 | 1,999,200 | ||||||
5.00%, 7/15/27, 144A | 1,300,000 | 1,365,143 | ||||||
Centene Corp. | 4,271,000 | 4,335,065 | ||||||
4.75%, 5/15/22 | 4,173,000 | 4,292,014 | ||||||
6.125%, 2/15/24 | 2,506,000 | 2,629,420 | ||||||
4.75%, 1/15/25 | 4,557,000 | 4,739,280 | ||||||
5.375%, 6/1/26, 144A | 6,002,000 | 6,431,443 | ||||||
Charles River Laboratories International, Inc., 144A | 2,302,000 | 2,468,665 | ||||||
CHS/Community Health Systems, Inc. | 2,905,000 | 2,915,894 | ||||||
Principal | Value | |||||||
| Healthcare-Services (Continued) | ||||||||
6.875%, 2/1/22 (a) | $ | 8,016,000 | $ | 5,588,835 | ||||
6.25%, 3/31/23 | 11,141,000 | 10,821,810 | ||||||
9.875%, 6/30/23, 144A (a) | 5,832,000 | 4,884,300 | ||||||
8.625%, 1/15/24, 144A | 3,151,000 | 3,158,877 | ||||||
8.125%, 6/30/24, 144A (a) | 4,425,000 | 3,385,125 | ||||||
8.00%, 3/15/26, 144A | 5,343,000 | 5,142,637 | ||||||
DaVita, Inc. | 3,824,000 | 3,864,534 | ||||||
5.125%, 7/15/24 | 5,863,000 | 5,978,560 | ||||||
5.00%, 5/1/25 | 4,970,000 | 4,994,850 | ||||||
Encompass Health Corp. | 3,711,000 | 3,771,304 | ||||||
Envision Healthcare Corp., 144A | 4,029,000 | 2,215,950 | ||||||
HCA Healthcare, Inc. | 3,186,000 | 3,354,539 | ||||||
HCA, Inc. | 6,495,000 | 7,289,403 | ||||||
5.875%, 5/1/23 | �� | 4,037,000 | 4,468,454 | |||||
5.375%, 2/1/25 | 8,813,000 | 9,804,463 | ||||||
5.875%, 2/15/26 | 5,111,000 | 5,843,151 | ||||||
5.375%, 9/1/26 | 3,257,000 | 3,639,698 | ||||||
5.625%, 9/1/28 | 4,831,000 | 5,508,850 | ||||||
5.875%, 2/1/29 | 3,510,000 | 4,045,275 | ||||||
MEDNAX, Inc. | 2,506,000 | 2,524,795 | ||||||
6.25%, 1/15/27, 144A | 3,509,000 | 3,447,593 | ||||||
Molina Healthcare, Inc. | 2,395,000 | 2,568,733 | ||||||
MPH Acquisition Holdings LLC, 144A | 5,276,000 | 4,742,122 | ||||||
Quorum Health Corp. | 1,332,000 | 1,165,500 | ||||||
RegionalCare Hospital Partners Holdings Inc / LifePoint Health Inc, 144A | 4,687,000 | 5,020,949 | ||||||
RegionalCare Hospital Partners Holdings, Inc., 144A | 2,640,000 | 2,823,942 | ||||||
Select Medical Corp., 144A | 1,800,000 | 1,877,400 | ||||||
Surgery Center Holdings, Inc., 144A | 1,414,000 | 1,357,440 | ||||||
Tenet Healthcare Corp. | 5,594,000 | 5,814,963 | ||||||
4.50%, 4/1/21 | 3,188,000 | 3,301,174 | ||||||
4.375%, 10/1/21 | 3,120,000 | 3,255,720 | ||||||
8.125%, 4/1/22 | 9,484,000 | 10,253,627 | ||||||
6.75%, 6/15/23 | 6,082,000 | 6,272,063 | ||||||
4.625%, 7/15/24 | 6,291,000 | 6,495,458 | ||||||
4.625%, 9/1/24, 144A | 2,000,000 | 2,062,500 | ||||||
5.125%, 5/1/25 | 4,789,000 | 4,812,945 | ||||||
7.00%, 8/1/25 (a) | 1,592,000 | 1,613,890 | ||||||
4.875%, 1/1/26, 144A | 6,660,000 | 6,852,141 | ||||||
6.25%, 2/1/27, 144A | 4,871,000 | 5,059,751 | ||||||
5.125%, 11/1/27, 144A | 5,000,000 | 5,175,000 | ||||||
| See Notes to Financial Statements. | 65 |
DBX ETF Trust
Schedule of Investments
Xtrackers USD High Yield Corporate Bond ETF(Continued)
August 31, 2019
Principal | Value | |||||||
| Healthcare-Services (Continued) | ||||||||
WellCare Health Plans, Inc. | $ | 4,268,000 | $ | 4,484,814 | ||||
5.375%, 8/15/26, 144A | 2,324,000 | 2,483,775 | ||||||
|
| |||||||
| 226,566,626 | ||||||||
|
| |||||||
| Household Products/Wares — 0.2% | ||||||||
Prestige Brands, Inc. | 1,103,000 | 1,118,166 | ||||||
6.375%, 3/1/24, 144A (a) | 1,885,000 | 1,983,963 | ||||||
Spectrum Brands, Inc. | 3,354,000 | 3,504,930 | ||||||
|
| |||||||
| 6,607,059 | ||||||||
|
| |||||||
| Pharmaceuticals — 4.0% | ||||||||
Bausch Health Americas, Inc. | 5,327,000 | 6,046,145 | ||||||
8.50%, 1/31/27, 144A | 5,690,000 | 6,330,011 | ||||||
Bausch Health Cos., Inc. | 3,823,000 | 3,962,731 | ||||||
5.50%, 3/1/23, 144A | 1,499,000 | 1,519,611 | ||||||
5.875%, 5/15/23, 144A | 4,112,000 | 4,178,820 | ||||||
7.00%, 3/15/24, 144A | 7,377,000 | 7,809,735 | ||||||
6.125%, 4/15/25, 144A | 11,162,000 | 11,524,765 | ||||||
5.50%, 11/1/25, 144A | 6,047,000 | 6,364,346 | ||||||
9.00%, 12/15/25, 144A | 5,162,000 | 5,807,250 | ||||||
5.75%, 8/15/27, 144A | 1,911,000 | 2,054,325 | ||||||
7.00%, 1/15/28, 144A | 2,405,000 | 2,526,284 | ||||||
7.25%, 5/30/29, 144A | 2,454,000 | 2,601,240 | ||||||
Elanco Animal Health, Inc. | 1,911,000 | 1,948,309 | ||||||
4.272%, 8/28/23 | 2,864,000 | 3,000,974 | ||||||
4.90%, 8/28/28 | 2,165,000 | 2,361,185 | ||||||
Endo Dac / Endo Finance LLC / Endo Finco, Inc. | 4,976,000 | 3,309,040 | ||||||
6.00%, 2/1/25, 144A | 3,795,000 | 2,390,850 | ||||||
Horizon Pharma USA, Inc., 144A | 2,050,000 | 2,142,250 | ||||||
Mallinckrodt International Finance SA | 1,361,000 | 515,649 | ||||||
Mallinckrodt International Finance SA / Mallinckrodt CB LLC | 2,011,000 | 1,176,435 | ||||||
5.625%, 10/15/23, 144A (a) | 2,476,000 | 1,275,140 | ||||||
5.50%, 4/15/25, 144A (a) | 2,069,000 | 958,206 | ||||||
Par Pharmaceutical, Inc., 144A | 4,910,000 | 4,590,850 | ||||||
Teva Pharmaceutical Finance Co. BV | ||||||||
Series 2, 3.65%, 11/10/21 | 700,000 | 668,500 | ||||||
2.95%, 12/18/22 | 560,000 | 490,700 | ||||||
Teva Pharmaceutical Finance Netherlands III BV | 12,860,000 | 12,088,400 | ||||||
2.80%, 7/21/23 | 9,090,000 | 7,681,050 | ||||||
6.00%, 4/15/24 (a) | 4,800,000 | 4,350,000 | ||||||
3.15%, 10/1/26 | 11,225,000 | 8,300,663 | ||||||
6.75%, 3/1/28 (a) | 4,700,000 | 3,973,380 | ||||||
|
| |||||||
| 121,946,844 | ||||||||
|
| |||||||
Principal | Value | |||||||
| Diversified — 0.1% | ||||||||
| Holding Companies-Diversified — 0.1% | ||||||||
Stena AB, 144A | $ | 1,650,000 | $ | 1,625,250 | ||||
|
| |||||||
| Energy — 11.2% | ||||||||
| Coal — 0.1% | ||||||||
Peabody Energy Corp. | 1,733,000 | 1,786,073 | ||||||
6.375%, 3/31/25, 144A | 1,952,000 | 2,038,620 | ||||||
|
| |||||||
| 3,824,693 | ||||||||
|
| |||||||
| Energy-Alternate Sources — 0.2% | ||||||||
TerraForm Power Operating LLC | 1,800,000 | 1,853,370 | ||||||
5.00%, 1/31/28, 144A | 2,160,000 | 2,259,943 | ||||||
|
| |||||||
| 4,113,313 | ||||||||
|
| |||||||
| Oil & Gas — 7.2% | ||||||||
Aker BP ASA | 1,254,000 | 1,292,247 | ||||||
4.75%, 6/15/24, 144A | 2,022,000 | 2,072,550 | ||||||
5.875%, 3/31/25, 144A | 1,864,000 | 1,972,112 | ||||||
Antero Resources Corp. | 2,925,000 | 2,844,562 | ||||||
5.125%, 12/1/22 | 3,297,000 | 3,049,725 | ||||||
5.625%, 6/1/23 (a) | 2,935,000 | 2,722,212 | ||||||
5.00%, 3/1/25 (a) | 2,090,000 | 1,818,300 | ||||||
Ascent Resources Utica Holdings LLC / ARU Finance Corp. | 3,237,000 | 3,277,462 | ||||||
7.00%, 11/1/26, 144A | 1,962,000 | 1,640,134 | ||||||
Baytex Energy Corp. | 1,202,000 | 1,195,990 | ||||||
5.625%, 6/1/24, 144A | 1,414,000 | 1,322,090 | ||||||
Brazos Valley Longhorn LLC / Brazos Valley Longhorn Finance Corp. | 2,606,000 | 2,332,370 | ||||||
Bruin E&P Partners LLC, 144A | 1,996,000 | 1,432,130 | ||||||
California Resources Corp., 144A | 6,745,000 | 3,912,100 | ||||||
Callon Petroleum Co. | 2,027,000 | 1,976,325 | ||||||
6.375%, 7/1/26 | 1,384,000 | 1,349,400 | ||||||
Calumet Specialty Products Partners LP / Calumet Finance Corp. | 3,321,000 | 3,296,092 | ||||||
Carrizo Oil & Gas, Inc. | 2,452,000 | 2,357,598 | ||||||
Chesapeake Energy Corp. | 1,499,000 | 1,249,791 | ||||||
7.00%, 10/1/24 (a) | 2,666,000 | 2,042,822 | ||||||
8.00%, 1/15/25 (a) | 4,277,000 | 3,261,212 | ||||||
8.00%, 3/15/26, 144A | 3,051,000 | 2,196,720 | ||||||
7.50%, 10/1/26 (a) | 1,426,000 | 983,940 | ||||||
8.00%, 6/15/27 (a) | 4,392,000 | 3,195,224 | ||||||
Citgo Holding, Inc., 144A | 2,550,000 | 2,703,000 | ||||||
| See Notes to Financial Statements. | 66 |
DBX ETF Trust
Schedule of Investments
Xtrackers USD High Yield Corporate Bond ETF(Continued)
August 31, 2019
Principal | Value | |||||||
| Oil & Gas (Continued) | ||||||||
CITGO Petroleum Corp., 144A | $ | 1,613,000 | $ | 1,627,114 | ||||
CNX Resources Corp. | 2,929,000 | 2,848,452 | ||||||
7.25%, 3/14/27, 144A | 1,591,000 | 1,340,417 | ||||||
CrownRock LP / CrownRock Finance, Inc., 144A | 3,804,000 | 3,780,225 | ||||||
Denbury Resources, Inc. | 1,881,000 | 1,721,115 | ||||||
9.25%, 3/31/22, 144A | 1,426,000 | 1,204,970 | ||||||
7.75%, 2/15/24, 144A | 1,851,000 | 1,305,325 | ||||||
Diamond Offshore Drilling, Inc. | 1,589,000 | 1,470,302 | ||||||
Diamondback Energy, Inc. | 4,121,000 | 4,260,084 | ||||||
5.375%, 5/31/25 | 2,808,000 | 2,955,420 | ||||||
Endeavor Energy Resources LP / EER Finance, Inc. | 2,089,000 | 2,180,394 | ||||||
5.75%, 1/30/28, 144A | 1,550,000 | 1,631,375 | ||||||
EP Energy LLC / Everest Acquisition Finance, Inc. | 3,116,000 | 249,280 | ||||||
8.00%, 11/29/24, 144A (a) | 1,667,000 | 716,810 | ||||||
7.75%, 5/15/26, 144A | 3,396,000 | 2,852,640 | ||||||
Extraction Oil & Gas, Inc. | 1,392,000 | 1,050,960 | ||||||
5.625%, 2/1/26, 144A | 2,403,000 | 1,597,995 | ||||||
Gulfport Energy Corp. | 2,167,000 | 1,587,327 | ||||||
6.375%, 5/15/25 | 1,986,000 | 1,439,850 | ||||||
6.375%, 1/15/26 | 1,490,000 | 1,080,250 | ||||||
Hilcorp Energy I LP / Hilcorp Finance Co. | 1,646,000 | 1,526,665 | ||||||
5.75%, 10/1/25, 144A | 1,639,000 | 1,536,563 | ||||||
6.25%, 11/1/28, 144A | 1,998,000 | 1,848,150 | ||||||
Matador Resources Co. | 3,564,000 | 3,470,445 | ||||||
MEG Energy Corp. | 2,785,000 | 2,642,269 | ||||||
7.00%, 3/31/24, 144A | 3,249,000 | 3,106,856 | ||||||
6.50%, 1/15/25, 144A | 2,510,000 | 2,531,963 | ||||||
Moss Creek Resources Holdings, Inc. | 2,149,000 | 1,509,673 | ||||||
10.50%, 5/15/27, 144A | 1,764,000 | 1,393,560 | ||||||
Murphy Oil Corp. | 1,803,000 | 1,812,015 | ||||||
4.20%, 12/1/22 | 1,997,000 | 2,026,955 | ||||||
6.875%, 8/15/24 | 1,630,000 | 1,716,064 | ||||||
5.75%, 8/15/25 | 1,893,000 | 1,925,560 | ||||||
Nabors Industries, Inc. | 2,036,000 | 1,949,470 | ||||||
5.50%, 1/15/23 (a) | 1,986,000 | 1,779,953 | ||||||
5.75%, 2/1/25 | 2,795,000 | 2,249,975 | ||||||
Noble Holding International Ltd. | 1,505,000 | 963,200 | ||||||
7.875%, 2/1/26, 144A | 2,481,000 | 2,012,711 | ||||||
Principal | Value | |||||||
| Oil & Gas (Continued) | ||||||||
Oasis Petroleum, Inc. | $ | 2,829,000 | $ | 2,645,115 | ||||
6.25%, 5/1/26, 144A (a) | 1,515,000 | 1,229,044 | ||||||
Parkland Fuel Corp. | 1,956,000 | 2,061,135 | ||||||
5.875%, 7/15/27, 144A | 1,400,000 | 1,473,500 | ||||||
Parsley Energy LLC / Parsley Finance Corp. | 616,000 | 640,640 | ||||||
5.375%, 1/15/25, 144A | 2,470,000 | 2,531,750 | ||||||
5.25%, 8/15/25, 144A | 2,613,000 | 2,665,260 | ||||||
5.625%, 10/15/27, 144A | 1,704,000 | 1,763,640 | ||||||
PBF Holding Co LLC / PBF Finance Corp. | 2,457,000 | 2,554,445 | ||||||
PBF Holding Co. LLC / PBF Finance Corp. | 1,409,000 | 1,454,793 | ||||||
PDC Energy, Inc. | 1,287,000 | 1,287,000 | ||||||
5.75%, 5/15/26 | 1,952,000 | 1,912,765 | ||||||
Puma International Financing SA | 1,650,000 | 1,547,123 | ||||||
5.00%, 1/24/26, 144A | 2,650,000 | 2,464,954 | ||||||
QEP Resources, Inc. | 1,659,000 | 1,499,321 | ||||||
5.25%, 5/1/23 | 2,126,000 | 1,870,880 | ||||||
5.625%, 3/1/26 | 1,563,000 | 1,273,845 | ||||||
Range Resources Corp. | 2,015,000 | 2,004,925 | ||||||
5.00%, 8/15/22 | 2,057,000 | 1,928,438 | ||||||
5.00%, 3/15/23 | 2,455,000 | 2,178,813 | ||||||
4.875%, 5/15/25 (a) | 2,492,000 | 2,055,900 | ||||||
Rowan Cos., Inc. | 2,067,000 | 1,694,940 | ||||||
Sable Permian Resources Land LLC / AEPB Finance Corp., 144A | 1,963,000 | 1,913,925 | ||||||
Seven Generations Energy Ltd. | 1,084,000 | 1,092,130 | ||||||
6.875%, 6/30/23, 144A | 1,549,000 | 1,576,417 | ||||||
5.375%, 9/30/25, 144A | 2,645,000 | 2,542,506 | ||||||
SM Energy Co. | 1,167,000 | 1,091,145 | ||||||
5.00%, 1/15/24 | 1,785,000 | 1,570,800 | ||||||
5.625%, 6/1/25 (a) | 1,715,000 | 1,466,325 | ||||||
6.75%, 9/15/26 (a) | 1,503,000 | 1,285,065 | ||||||
6.625%, 1/15/27 (a) | 1,866,000 | 1,595,430 | ||||||
Southwestern Energy Co. | 3,114,000 | 2,740,320 | ||||||
7.50%, 4/1/26 | 2,200,000 | 1,936,440 | ||||||
7.75%, 10/1/27 (a) | 1,619,000 | 1,416,625 | ||||||
Sunoco LP / Sunoco Finance Corp. | 2,791,000 | 2,860,775 | ||||||
5.50%, 2/15/26 | 2,296,000 | 2,387,840 | ||||||
6.00%, 4/15/27 | 2,261,000 | 2,385,355 | ||||||
Transocean, Inc. | 3,377,000 | 3,503,570 | ||||||
7.25%, 11/1/25, 144A | 2,228,000 | 2,035,835 | ||||||
7.50%, 1/15/26, 144A | 2,694,000 | 2,471,745 | ||||||
| See Notes to Financial Statements. | 67 |
DBX ETF Trust
Schedule of Investments
Xtrackers USD High Yield Corporate Bond ETF(Continued)
August 31, 2019
Principal | Value | |||||||
| Oil & Gas (Continued) | ||||||||
Valaris PLC | $ | 3,264,000 | $ | 2,088,307 | ||||
Whiting Petroleum Corp. | 2,938,000 | 2,758,635 | ||||||
6.25%, 4/1/23 (a) | 1,472,000 | 1,162,880 | ||||||
6.625%, 1/15/26 (a) | 3,209,000 | 2,338,398 | ||||||
WPX Energy, Inc. | 1,800,000 | 1,858,500 | ||||||
8.25%, 8/1/23 | 1,758,000 | 1,964,565 | ||||||
5.25%, 9/15/24 | 2,179,000 | 2,222,580 | ||||||
5.75%, 6/1/26 (a) | 1,675,000 | 1,744,094 | ||||||
|
| |||||||
| 221,146,893 | ||||||||
|
| |||||||
| Oil & Gas Services — 0.4% | ||||||||
KCA Deutag UK Finance PLC | 1,803,000 | 1,180,965 | ||||||
9.625%, 4/1/23, 144A | 1,415,000 | 919,750 | ||||||
McDermott Technology Americas, Inc. / McDermott Technology US, Inc., 144A | 4,049,000 | 2,874,790 | ||||||
SESI LLC | 2,464,000 | 1,749,440 | ||||||
7.75%, 9/15/24 | 1,787,000 | 1,081,135 | ||||||
USA Compression Partners LP / USA Compression Finance Corp. | 2,450,000 | 2,523,500 | ||||||
6.875%, 9/1/27, 144A | 2,379,000 | 2,458,887 | ||||||
|
| |||||||
| 12,788,467 | ||||||||
|
| |||||||
| Pipelines — 3.3% | ||||||||
Antero Midstream Partners LP / Antero Midstream Finance Corp. | 2,215,000 | 2,098,712 | ||||||
5.75%, 3/1/27, 144A | 2,276,000 | 2,093,920 | ||||||
5.75%, 1/15/28, 144A | 2,192,000 | 2,000,200 | ||||||
Blue Racer Midstream LLC / Blue Racer Finance Corp., 144A | 3,071,000 | 3,101,710 | ||||||
Cheniere Corpus Christi Holdings LLC | 4,105,000 | 4,746,406 | ||||||
5.875%, 3/31/25 | 4,777,000 | 5,338,297 | ||||||
5.125%, 6/30/27 | 4,937,000 | 5,467,727 | ||||||
Cheniere Energy Partners LP | 5,363,000 | 5,564,112 | ||||||
5.625%, 10/1/26 | 3,355,000 | 3,556,300 | ||||||
Crestwood Midstream Partners LP / Crestwood Midstream Finance Corp. | 2,432,000 | 2,486,720 | ||||||
5.75%, 4/1/25 | 1,592,000 | 1,635,780 | ||||||
5.625%, 5/1/27, 144A | 1,983,000 | 1,987,323 | ||||||
DCP Midstream Operating LP | 1,841,000 | 1,891,627 | ||||||
3.875%, 3/15/23 | 1,652,000 | 1,676,780 | ||||||
5.375%, 7/15/25 | 3,096,000 | 3,281,760 | ||||||
5.125%, 5/15/29 | 1,636,000 | 1,679,027 | ||||||
EnLink Midstream LLC | 1,642,000 | 1,610,802 | ||||||
Principal | Value | |||||||
| Pipelines (Continued) | ||||||||
EnLink Midstream Partners LP | $ | 1,810,000 | $ | 1,798,687 | ||||
4.15%, 6/1/25 | 2,517,000 | 2,413,174 | ||||||
4.85%, 7/15/26 | 1,728,000 | 1,699,920 | ||||||
Genesis Energy LP / Genesis Energy Finance Corp. | 2,300,000 | 2,333,580 | ||||||
6.00%, 5/15/23 | 1,193,000 | 1,190,018 | ||||||
6.50%, 10/1/25 | 2,124,000 | 2,076,210 | ||||||
6.25%, 5/15/26 | 1,343,000 | 1,289,804 | ||||||
NGL Energy Partners LP / NGL Energy Finance Corp. | 2,367,000 | 2,407,665 | ||||||
7.50%, 4/15/26, 144A (a) | 1,447,000 | 1,468,705 | ||||||
NuStar Logistics LP | 1,998,000 | 2,032,965 | ||||||
6.00%, 6/1/26 | 1,723,000 | 1,852,225 | ||||||
5.625%, 4/28/27 | 1,630,000 | 1,701,313 | ||||||
Tallgrass Energy Partners LP / Tallgrass Energy Finance Corp. | 173,000 | 172,135 | ||||||
5.50%, 9/15/24, 144A | 3,502,000 | 3,431,960 | ||||||
5.50%, 1/15/28, 144A | 2,687,000 | 2,542,574 | ||||||
Targa Resources Partners LP / Targa Resources Partners Finance Corp. | 2,083,000 | 2,124,014 | ||||||
4.25%, 11/15/23 | 2,037,000 | 2,042,093 | ||||||
6.75%, 3/15/24 | 1,522,000 | 1,584,783 | ||||||
5.125%, 2/1/25 | 1,562,000 | 1,608,860 | ||||||
5.875%, 4/15/26 | 3,620,000 | 3,805,525 | ||||||
5.375%, 2/1/27 | 2,043,000 | 2,118,182 | ||||||
6.50%, 7/15/27, 144A | 2,645,000 | 2,876,438 | ||||||
5.00%, 1/15/28 | 2,374,000 | 2,391,805 | ||||||
6.875%, 1/15/29, 144A | 2,223,000 | 2,461,973 | ||||||
|
| |||||||
| 99,641,811 | ||||||||
|
| |||||||
| Financial — 9.3% | ||||||||
| Banks — 1.0% | ||||||||
CIT Group, Inc. | 2,125,000 | 2,175,469 | ||||||
5.00%, 8/15/22 | 3,561,000 | 3,805,249 | ||||||
5.00%, 8/1/23 | 2,616,000 | 2,844,900 | ||||||
4.75%, 2/16/24 | 1,885,000 | 2,028,731 | ||||||
5.25%, 3/7/25 | 1,639,000 | 1,839,777 | ||||||
6.125%, 3/9/28 | 1,300,000 | 1,558,375 | ||||||
Freedom Mortgage Corp. | 1,621,000 | 1,418,375 | ||||||
8.25%, 4/15/25, 144A | 2,302,000 | 2,014,250 | ||||||
Intesa Sanpaolo SpA | 5,880,000 | 6,031,405 | ||||||
5.71%, 1/15/26, 144A | 5,756,000 | 6,077,190 | ||||||
|
| |||||||
| 29,793,721 | ||||||||
|
| |||||||
| Diversified Financial Services — 3.6% | ||||||||
Allied Universal Holdco LLC / Allied Universal Finance Corp. | 3,280,000 | 3,493,200 | ||||||
9.75%, 7/15/27, 144A | 3,410,000 | 3,580,500 | ||||||
| See Notes to Financial Statements. | 68 |
DBX ETF Trust
Schedule of Investments
Xtrackers USD High Yield Corporate Bond ETF(Continued)
August 31, 2019
Principal | Value | |||||||
| Diversified Financial Services (Continued) | ||||||||
Ally Financial, Inc. | $ | 1,284,000 | $ | 1,353,015 | ||||
4.25%, 4/15/21 | 2,786,000 | 2,873,062 | ||||||
4.125%, 2/13/22 | 1,994,000 | 2,076,252 | ||||||
4.625%, 5/19/22 | 1,338,000 | 1,414,935 | ||||||
3.875%, 5/21/24 | 1,485,000 | 1,568,531 | ||||||
5.125%, 9/30/24 | 2,571,000 | 2,889,161 | ||||||
4.625%, 3/30/25 | 2,054,000 | 2,256,832 | ||||||
5.75%, 11/20/25 | 3,476,000 | 3,993,055 | ||||||
Ladder Capital Finance Holdings LLLP / Ladder Capital Finance Corp. | 1,538,000 | 1,603,365 | ||||||
5.25%, 10/1/25, 144A | 1,357,000 | 1,387,533 | ||||||
LPL Holdings, Inc., 144A | 3,060,000 | 3,228,300 | ||||||
Metropolitan Light Co. Ltd., 144A | 2,564,000 | 2,643,896 | ||||||
Nationstar Mortgage Holdings, Inc. | 2,887,000 | 2,996,937 | ||||||
9.125%, 7/15/26, 144A | 2,621,000 | 2,774,984 | ||||||
Nationstar Mortgage LLC / Nationstar Capital Corp. | 1,951,000 | 1,958,316 | ||||||
Navient Corp. | 2,388,000 | 2,450,685 | ||||||
5.875%, 3/25/21 | 2,420,000 | 2,544,025 | ||||||
6.625%, 7/26/21 | 2,585,000 | 2,772,413 | ||||||
Series MTN, 7.25%, 1/25/22 | 2,620,000 | 2,882,000 | ||||||
6.50%, 6/15/22 | 2,787,000 | 3,023,895 | ||||||
5.50%, 1/25/23 | 3,024,000 | 3,187,447 | ||||||
7.25%, 9/25/23 | 1,683,000 | 1,874,441 | ||||||
Series MTN, 6.125%, 3/25/24 | 2,677,000 | 2,854,351 | ||||||
5.875%, 10/25/24 | 1,844,000 | 1,949,090 | ||||||
6.75%, 6/25/25 | 1,807,000 | 1,947,043 | ||||||
6.75%, 6/15/26 (a) | 1,705,000 | 1,828,613 | ||||||
NFP Corp., 144A | 2,575,000 | 2,578,219 | ||||||
Quicken Loans, Inc. | 4,660,000 | 4,881,350 | ||||||
5.25%, 1/15/28, 144A | 3,325,000 | 3,462,156 | ||||||
Springleaf Finance Corp. | 2,975,000 | 3,190,241 | ||||||
7.75%, 10/1/21 | 2,470,000 | 2,707,738 | ||||||
6.125%, 5/15/22 | 3,621,000 | 3,919,733 | ||||||
5.625%, 3/15/23 | 3,014,000 | 3,247,585 | ||||||
6.125%, 3/15/24 | 4,047,000 | 4,421,348 | ||||||
6.875%, 3/15/25 | 4,149,000 | 4,714,301 | ||||||
7.125%, 3/15/26 | 5,217,000 | 5,959,770 | ||||||
6.625%, 1/15/28 | 2,838,000 | 3,121,800 | ||||||
|
| |||||||
| 111,610,118 | ||||||||
|
| |||||||
| Insurance — 0.7% | ||||||||
Acrisure LLC / Acrisure Finance, Inc. | 2,277,000 | 2,457,737 | ||||||
7.00%, 11/15/25, 144A | 3,062,000 | 2,835,290 | ||||||
10.125%, 8/1/26, 144A | 1,400,000 | 1,442,000 | ||||||
Principal | Value | |||||||
| Insurance (Continued) | ||||||||
Alliant Holdings Intermediate LLC / Alliant HoldingsCo-Issuer, 144A | $ | 2,650,000 | $ | 2,712,937 | ||||
Ardonagh Midco 3 PLC, 144A | 1,803,000 | 1,753,418 | ||||||
AssuredPartners, Inc., 144A | 1,939,000 | 1,943,847 | ||||||
Genworth Holdings, Inc. | 2,328,000 | 2,438,580 | ||||||
HUB International Ltd., 144A | 4,526,000 | 4,605,205 | ||||||
|
| |||||||
| 20,189,014 | ||||||||
|
| |||||||
| Real Estate — 0.4% | ||||||||
Howard Hughes Corp., 144A | 3,352,000 | 3,469,320 | ||||||
Kennedy-Wilson, Inc. | 3,967,000 | 4,081,051 | ||||||
Realogy Group LLC / Realogy Co.-Issuer Corp. | 1,656,000 | 1,618,243 | ||||||
4.875%, 6/1/23, 144A (a) | 1,961,000 | 1,710,973 | ||||||
9.375%, 4/1/27, 144A (a) | 1,801,000 | 1,566,870 | ||||||
|
| |||||||
| 12,446,457 | ||||||||
|
| |||||||
| Real Estate Investment Trusts — 3.0% | ||||||||
Brookfield Property REIT, Inc. / BPR Cumulus LLC / BPR Nimbus LLC / GGSI Sellco LL, 144A | 3,540,000 | 3,739,125 | ||||||
CBL & Associates LP | 1,447,000 | 926,080 | ||||||
5.95%, 12/15/26 | 2,067,000 | 1,364,220 | ||||||
CyrusOne LP / CyrusOne Finance Corp. | 2,169,000 | 2,244,915 | ||||||
5.375%, 3/15/27 | 1,845,000 | 1,967,231 | ||||||
Equinix, Inc. | 2,350,000 | 2,414,625 | ||||||
5.375%, 4/1/23 | 3,224,000 | 3,300,570 | ||||||
5.75%, 1/1/25 | 2,218,000 | 2,320,582 | ||||||
5.875%, 1/15/26 | 3,607,000 | 3,845,964 | ||||||
5.375%, 5/15/27 | 4,305,000 | 4,661,583 | ||||||
ESH Hospitality, Inc., 144A | 4,306,000 | 4,462,092 | ||||||
Iron Mountain, Inc. | 1,337,000 | 1,350,370 | ||||||
6.00%, 8/15/23 | 2,197,000 | 2,251,925 | ||||||
5.75%, 8/15/24 | 3,344,000 | 3,394,160 | ||||||
4.875%, 9/15/27, 144A | 3,311,000 | 3,416,555 | ||||||
5.25%, 3/15/28, 144A | 2,613,000 | 2,724,053 | ||||||
iStar, Inc. | 1,475,000 | 1,497,125 | ||||||
5.25%, 9/15/22 | 1,317,000 | 1,353,217 | ||||||
MGM Growth Properties Operating Partnership LP / MGP FinanceCo-Issuer, Inc. | 3,850,000 | 4,220,563 | ||||||
| See Notes to Financial Statements. | 69 |
DBX ETF Trust
Schedule of Investments
Xtrackers USD High Yield Corporate Bond ETF(Continued)
August 31, 2019
Principal | Value | |||||||
| Real Estate Investment Trusts (Continued) | ||||||||
4.50%, 9/1/26 | $ | 1,627,000 | $ | 1,712,418 | ||||
5.75%, 2/1/27, 144A | 2,192,000 | 2,422,598 | ||||||
MPT Operating Partnership LP / MPT Finance Corp. | 1,435,000 | 1,504,956 | ||||||
5.25%, 8/1/26 | 2,035,000 | 2,157,711 | ||||||
5.00%, 10/15/27 | 3,951,000 | 4,227,570 | ||||||
4.625%, 8/1/29 | 3,162,000 | 3,294,409 | ||||||
SBA Communications Corp. | 1,840,000 | 1,873,304 | ||||||
4.00%, 10/1/22 | 3,046,000 | 3,114,535 | ||||||
4.875%, 9/1/24 | 4,151,000 | 4,311,851 | ||||||
Senior Housing Properties Trust | 1,637,000 | 1,643,075 | ||||||
Starwood Property Trust, Inc. | 1,670,000 | 1,686,700 | ||||||
5.00%, 12/15/21 | 2,212,000 | 2,300,480 | ||||||
4.75%, 3/15/25 | 1,711,000 | 1,758,053 | ||||||
Uniti Group LP / Uniti Fiber Holdings, Inc. / CSL Capital LLC, 144A | 2,109,000 | 1,782,105 | ||||||
Uniti Group LP / Uniti Group Finance, Inc. / CSL Capital LLC | 2,170,000 | 2,072,350 | ||||||
8.25%, 10/15/23 (a) | 3,485,000 | 3,101,650 | ||||||
Washington Prime Group LP | 2,565,000 | 2,477,790 | ||||||
|
| |||||||
| 92,896,510 | ||||||||
|
| |||||||
| Venture Capital — 0.6% | ||||||||
Icahn Enterprises LP / Icahn Enterprises Finance Corp. | 3,382,000 | 3,449,640 | ||||||
6.25%, 2/1/22 | 4,552,000 | 4,699,940 | ||||||
6.75%, 2/1/24 | 2,853,000 | 2,995,650 | ||||||
6.375%, 12/15/25 | 2,602,000 | 2,761,372 | ||||||
6.25%, 5/15/26, 144A | 4,107,000 | 4,296,949 | ||||||
|
| |||||||
| 18,203,551 | ||||||||
|
| |||||||
| Industrial — 9.0% | ||||||||
| Aerospace/Defense — 2.3% | ||||||||
Arconic, Inc. | 4,203,000 | 4,332,663 | ||||||
5.87%, 2/23/22 | 1,990,000 | 2,126,026 | ||||||
5.125%, 10/1/24 | 4,249,000 | 4,530,966 | ||||||
Bombardier, Inc. | 2,058,000 | 2,240,647 | ||||||
5.75%, 3/15/22, 144A | 3,818,000 | 3,870,497 | ||||||
6.00%, 10/15/22, 144A | 4,246,000 | 4,235,385 | ||||||
6.125%, 1/15/23, 144A | 3,958,000 | 3,948,105 | ||||||
7.50%, 12/1/24, 144A | 3,322,000 | 3,318,180 | ||||||
7.50%, 3/15/25, 144A | 4,871,000 | 4,761,402 | ||||||
7.875%, 4/15/27, 144A | 6,578,000 | 6,388,883 | ||||||
TransDigm, Inc. | 3,661,000 | 3,729,644 | ||||||
6.50%, 7/15/24 | 4,899,000 | 5,076,589 | ||||||
6.50%, 5/15/25 | 2,549,000 | 2,666,891 | ||||||
6.25%, 3/15/26, 144A | 12,795,000 | 13,834,338 | ||||||
Principal | Value | |||||||
| Aerospace/Defense (Continued) | ||||||||
6.375%, 6/15/26 | $ | 3,108,000 | $ | 3,273,470 | ||||
7.50%, 3/15/27, 144A (a) | 1,840,000 | 1,982,600 | ||||||
Triumph Group, Inc. | 1,553,000 | 1,560,765 | ||||||
|
| |||||||
| 71,877,051 | ||||||||
|
| |||||||
| Building Materials — 0.9% | ||||||||
Builders FirstSource, Inc. | 2,129,000 | 2,224,805 | ||||||
6.75%, 6/1/27, 144A | 1,492,000 | 1,637,470 | ||||||
Cornerstone Building Brands, Inc., 144A | 2,159,000 | 2,053,749 | ||||||
Griffon Corp. | 3,196,000 | 3,235,023 | ||||||
JELD-WEN, Inc. | 1,608,000 | 1,579,860 | ||||||
4.875%, 12/15/27, 144A | 1,038,000 | 1,006,860 | ||||||
Standard Industries, Inc. | 1,064,000 | 1,093,260 | ||||||
5.375%, 11/15/24, 144A | 4,109,000 | 4,242,542 | ||||||
6.00%, 10/15/25, 144A | 3,637,000 | 3,841,581 | ||||||
5.00%, 2/15/27, 144A | 1,637,000 | 1,682,018 | ||||||
4.75%, 1/15/28, 144A | 3,212,000 | 3,240,105 | ||||||
Summit Materials LLC / Summit Materials Finance Corp. | 2,183,000 | 2,229,389 | ||||||
|
| |||||||
| 28,066,662 | ||||||||
|
| |||||||
| Electrical Components & Equipment — 0.2% | ||||||||
Energizer Holdings, Inc. | 1,919,000 | 1,948,841 | ||||||
6.375%, 7/15/26, 144A (a) | 1,813,000 | 1,914,981 | ||||||
7.75%, 1/15/27, 144A | 1,917,000 | 2,101,511 | ||||||
|
| |||||||
| 5,965,333 | ||||||||
|
| |||||||
| Electronics — 0.5% | ||||||||
ADT Security Corp. | 3,193,000 | 3,408,528 | ||||||
3.50%, 7/15/22 | 3,997,000 | 4,021,981 | ||||||
4.125%, 6/15/23 | 1,661,000 | 1,691,625 | ||||||
Itron, Inc., 144A | 1,206,000 | 1,236,150 | ||||||
Sensata Technologies BV | 1,285,000 | 1,352,912 | ||||||
5.625%, 11/1/24, 144A | 1,599,000 | 1,742,910 | ||||||
5.00%, 10/1/25, 144A | 2,246,000 | 2,391,990 | ||||||
|
| |||||||
| 15,846,096 | ||||||||
|
| |||||||
| Engineering & Construction — 0.4% | ||||||||
AECOM | 2,877,000 | 3,117,949 | ||||||
5.125%, 3/15/27 | 3,061,000 | 3,212,581 | ||||||
Brand Industrial Services, Inc., 144A | 3,362,000 | 2,979,572 | ||||||
MasTec, Inc. | 1,529,000 | 1,559,580 | ||||||
|
| |||||||
| 10,869,682 | ||||||||
|
| |||||||
| See Notes to Financial Statements. | 70 |
DBX ETF Trust
Schedule of Investments
Xtrackers USD High Yield Corporate Bond ETF(Continued)
August 31, 2019
Principal | Value | |||||||
| Environmental Control — 0.5% | ||||||||
Advanced Disposal Services, Inc., 144A | $ | 1,470,000 | $ | 1,547,175 | ||||
Clean Harbors, Inc., 144A | 1,700,000 | 1,802,000 | ||||||
Covanta Holding Corp. | 1,077,000 | 1,109,310 | ||||||
5.875%, 7/1/25 | 1,663,000 | 1,739,914 | ||||||
6.00%, 1/1/27 | 1,257,000 | 1,313,565 | ||||||
GFL Environmental, Inc. | 1,409,000 | 1,423,090 | ||||||
7.00%, 6/1/26, 144A | 1,300,000 | 1,352,000 | ||||||
8.50%, 5/1/27, 144A | 1,867,000 | 2,049,032 | ||||||
Stericycle, Inc., 144A | 1,817,000 | 1,866,968 | ||||||
|
| |||||||
| 14,203,054 | ||||||||
|
| |||||||
| Hand/Machine Tools — 0.1% | ||||||||
Colfax Corp. | 2,028,000 | 2,169,960 | ||||||
6.375%, 2/15/26, 144A | 1,301,000 | 1,416,464 | ||||||
|
| |||||||
| 3,586,424 | ||||||||
|
| |||||||
| Machinery-Construction & Mining — 0.1% | ||||||||
Vertiv Group Corp., 144A | 2,642,000 | 2,509,900 | ||||||
|
| |||||||
| Machinery-Diversified — 0.1% | ||||||||
Cloud Crane LLC, 144A | 2,236,000 | 2,409,290 | ||||||
Welbilt, Inc. | 621,000 | 669,127 | ||||||
|
| |||||||
| 3,078,417 | ||||||||
|
| |||||||
| Packaging & Containers — 3.4% | ||||||||
Ardagh Packaging Finance PLC / Ardagh Holdings USA, Inc. | 3,356,000 | 3,410,535 | ||||||
4.625%, 5/15/23, 144A | 2,846,000 | 2,919,882 | ||||||
6.00%, 2/15/25, 144A | 5,820,000 | 6,092,812 | ||||||
4.125%, 8/15/26, 144A | 1,600,000 | 1,621,968 | ||||||
5.25%, 8/15/27, 144A | 2,600,000 | 2,632,500 | ||||||
Ball Corp. | 2,768,000 | 2,837,200 | ||||||
5.00%, 3/15/22 | 2,549,000 | 2,708,312 | ||||||
4.00%, 11/15/23 | 3,496,000 | 3,701,390 | ||||||
5.25%, 7/1/25 | 2,993,000 | 3,367,125 | ||||||
4.875%, 3/15/26 | 2,762,000 | 3,038,200 | ||||||
Berry Global, Inc. | 2,041,000 | 2,082,943 | ||||||
6.00%, 10/15/22 | 1,072,000 | 1,094,780 | ||||||
5.125%, 7/15/23 | 2,866,000 | 2,948,397 | ||||||
4.50%, 2/15/26, 144A | 1,823,000 | 1,818,442 | ||||||
4.875%, 7/15/26, 144A | 5,536,000 | 5,826,640 | ||||||
5.625%, 7/15/27, 144A | 39,000 | 41,047 | ||||||
Crown Americas LLC / Crown Americas Capital Corp. IV | 3,157,000 | 3,322,743 | ||||||
Flex Acquisition Co., Inc. | 2,028,000 | 1,835,340 | ||||||
Principal | Value | |||||||
| Packaging & Containers (Continued) | ||||||||
7.875%, 7/15/26, 144A | $ | 1,767,000 | $ | 1,603,553 | ||||
Graphic Packaging International LLC | 1,401,000 | 1,441,279 | ||||||
LABL Escrow Issuer LLC | 2,500,000 | 2,575,000 | ||||||
10.50%, 7/15/27, 144A | 2,090,000 | 2,116,125 | ||||||
Mauser Packaging Solutions Holding Co. | 4,774,000 | 4,923,188 | ||||||
7.25%, 4/15/25, 144A | 4,643,000 | 4,451,476 | ||||||
Owens-Brockway Glass Container, Inc. | 1,609,000 | 1,653,248 | ||||||
5.875%, 8/15/23, 144A | 2,349,000 | 2,510,494 | ||||||
Reynolds Group Issuer, Inc. / Reynolds Group Issuer LLC / Reynolds Group Issuer Lu | 8,934,204 | 8,967,707 | ||||||
5.125%, 7/15/23, 144A | 5,237,000 | 5,396,990 | ||||||
7.00%, 7/15/24, 144A | 2,558,000 | 2,649,129 | ||||||
Sealed Air Corp. | 1,506,000 | 1,558,710 | ||||||
4.875%, 12/1/22, 144A | 1,413,000 | 1,487,183 | ||||||
5.25%, 4/1/23, 144A | 1,939,000 | 2,074,730 | ||||||
5.125%, 12/1/24, 144A | 1,417,000 | 1,525,046 | ||||||
5.50%, 9/15/25, 144A | 1,070,000 | 1,163,625 | ||||||
Trivium Packaging Finance BV | 3,400,000 | 3,604,000 | ||||||
8.50%, 8/15/27, 144A | 2,300,000 | 2,478,250 | ||||||
|
| |||||||
| 103,479,989 | ||||||||
|
| |||||||
| Transportation — 0.4% | ||||||||
Hornbeck Offshore Services, Inc. | 1,581,000 | 782,595 | ||||||
Kenan Advantage Group, Inc., 144A | 1,378,000 | 1,229,865 | ||||||
XPO Logistics, Inc. | 3,632,000 | 3,720,730 | ||||||
6.125%, 9/1/23, 144A | 2,705,000 | 2,803,732 | ||||||
6.75%, 8/15/24, 144A | 3,278,000 | 3,540,240 | ||||||
|
| |||||||
| 12,077,162 | ||||||||
|
| |||||||
| Trucking & Leasing — 0.1% | ||||||||
Fortress Transportation & Infrastructure Investors LLC | 2,276,000 | 2,372,730 | ||||||
6.50%, 10/1/25, 144A | 1,567,000 | 1,617,928 | ||||||
|
| |||||||
| 3,990,658 | ||||||||
|
| |||||||
| Technology — 4.7% | ||||||||
| Computers — 1.5% | ||||||||
Banff Merger Sub, Inc., 144A | 4,792,000 | 4,384,680 | ||||||
Dell International LLC / EMC Corp. | 5,341,000 | 5,431,143 | ||||||
7.125%, 6/15/24, 144A | 4,743,000 | 5,000,187 | ||||||
Dell, Inc. | 1,385,000 | 1,418,759 | ||||||
Diebold Nixdorf, Inc. | 1,362,000 | 1,278,578 | ||||||
| See Notes to Financial Statements. | 71 |
DBX ETF Trust
Schedule of Investments
Xtrackers USD High Yield Corporate Bond ETF(Continued)
August 31, 2019
Principal | Value | |||||||
| Computers (Continued) | ||||||||
EMC Corp. | $ | 3,298,000 | $ | 3,271,604 | ||||
Exela Intermediate LLC / Exela Finance, Inc., 144A | 3,492,000 | 2,199,960 | ||||||
Harland Clarke Holdings Corp. | 2,376,000 | 2,233,440 | ||||||
8.375%, 8/15/22, 144A | 2,638,000 | 2,103,805 | ||||||
Leidos Holdings, Inc. | 1,382,000 | 1,412,501 | ||||||
NCR Corp. | 894,000 | 896,324 | ||||||
5.00%, 7/15/22 | 2,370,000 | 2,398,013 | ||||||
6.375%, 12/15/23 | 2,581,000 | 2,667,928 | ||||||
5.75%, 9/1/27, 144A | 1,600,000 | 1,695,696 | ||||||
6.125%, 9/1/29, 144A | 1,600,000 | 1,704,192 | ||||||
Western Digital Corp. | 7,776,000 | 7,977,787 | ||||||
|
| |||||||
| 46,074,597 | ||||||||
|
| |||||||
| Office/Business Equipment — 0.7% | ||||||||
CDW LLC / CDW Finance Corp. | 1,698,000 | 1,738,327 | ||||||
5.50%, 12/1/24 | 1,834,000 | 2,005,937 | ||||||
5.00%, 9/1/25 | 2,220,000 | 2,326,837 | ||||||
Pitney Bowes, Inc. | 2,325,000 | 2,330,813 | ||||||
4.625%, 5/15/22 | 2,197,000 | 2,169,538 | ||||||
4.95%, 4/1/23 | 1,673,000 | 1,597,715 | ||||||
4.625%, 3/15/24 | 1,200,000 | 1,101,000 | ||||||
Xerox Corp. | 3,666,000 | 3,775,980 | ||||||
4.125%, 3/15/23 | 3,354,000 | 3,429,465 | ||||||
|
| |||||||
| 20,475,612 | ||||||||
|
| |||||||
| Semiconductors — 0.1% | ||||||||
Qorvo, Inc. | 3,018,000 | 3,229,320 | ||||||
Sensata Technologies UK Financing Co. PLC, 144A | 245,000 | 261,467 | ||||||
|
| |||||||
| 3,490,787 | ||||||||
|
| |||||||
| Software — 2.4% | ||||||||
CDK Global, Inc. | 1,342,000 | 1,415,810 | ||||||
5.875%, 6/15/26 | 1,804,000 | 1,922,793 | ||||||
4.875%, 6/1/27 | 2,766,000 | 2,871,772 | ||||||
5.25%, 5/15/29, 144A | 1,205,000 | 1,245,669 | ||||||
Change Healthcare Holdings LLC / Change Healthcare Finance, Inc., 144A | 3,659,000 | 3,696,358 | ||||||
Dun & Bradstreet Corp. | 2,399,000 | 2,604,414 | ||||||
10.25%, 2/15/27, 144A | 2,602,000 | 2,852,442 | ||||||
Infor US, Inc. | 5,833,000 | 5,949,660 | ||||||
Informatica LLC, 144A | 2,806,000 | 2,862,120 | ||||||
Principal | Value | |||||||
| Software (Continued) | ||||||||
IQVIA, Inc. | $ | 3,327,000 | $ | 3,522,461 | ||||
5.00%, 5/15/27, 144A | 3,821,000 | 4,045,484 | ||||||
MSCI, Inc. | 2,522,000 | 2,630,950 | ||||||
5.75%, 8/15/25, 144A | 2,650,000 | 2,795,750 | ||||||
4.75%, 8/1/26, 144A | 1,806,000 | 1,894,043 | ||||||
5.375%, 5/15/27, 144A | 1,556,000 | 1,677,368 | ||||||
Nuance Communications, Inc. | 1,590,000 | 1,679,438 | ||||||
Open Text Corp. | 2,701,000 | 2,782,030 | ||||||
5.875%, 6/1/26, 144A | 2,668,000 | 2,857,962 | ||||||
Rackspace Hosting, Inc., 144A | 3,962,000 | 3,654,945 | ||||||
Solera LLC / Solera Finance, Inc., 144A | 7,513,000 | 8,001,345 | ||||||
SS&C Technologies, Inc., 144A | 6,563,000 | 6,903,456 | ||||||
TIBCO Software, Inc., 144A | 3,070,000 | 3,225,419 | ||||||
Veritas US, Inc. / Veritas Bermuda Ltd. | 1,387,000 | 1,380,065 | ||||||
10.50%, 2/1/24, 144A (a) | 2,712,000 | 2,562,840 | ||||||
|
| |||||||
| 75,034,594 | ||||||||
|
| |||||||
| Utilities — 2.9% | ||||||||
| Electric — 2.6% | ||||||||
AES Corp. | 1,987,000 | 2,034,410 | ||||||
4.50%, 3/15/23 | 1,287,000 | 1,326,125 | ||||||
4.875%, 5/15/23 | 1,803,000 | 1,832,299 | ||||||
5.50%, 4/15/25 | 2,100,000 | 2,197,188 | ||||||
6.00%, 5/15/26 | 1,819,000 | 1,957,226 | ||||||
5.125%, 9/1/27 | 1,508,000 | 1,620,391 | ||||||
Calpine Corp. | 2,400,000 | 2,425,872 | ||||||
5.375%, 1/15/23 | 4,022,000 | 4,087,036 | ||||||
5.875%, 1/15/24, 144A | 1,396,000 | 1,429,308 | ||||||
5.50%, 2/1/24 | 2,099,000 | 2,122,593 | ||||||
5.75%, 1/15/25 (a) | 3,661,000 | 3,729,644 | ||||||
5.25%, 6/1/26, 144A | 4,355,000 | 4,425,769 | ||||||
Clearway Energy Operating LLC | 2,402,000 | 2,471,057 | ||||||
5.75%, 10/15/25, 144A | 2,110,000 | 2,207,630 | ||||||
Drax Finco PLC, 144A | 1,738,000 | 1,803,175 | ||||||
InterGen NV, 144A | 1,354,000 | 1,252,450 | ||||||
NextEra Energy Operating Partners LP | 2,490,000 | 2,564,700 | ||||||
4.25%, 9/15/24, 144A | 1,483,000 | 1,543,432 | ||||||
4.50%, 9/15/27, 144A | 1,843,000 | 1,900,594 | ||||||
NRG Energy, Inc. | 3,624,000 | 3,986,400 | ||||||
6.625%, 1/15/27 | 4,520,000 | 4,898,550 | ||||||
5.75%, 1/15/28 | 2,843,000 | 3,073,994 | ||||||
5.25%, 6/15/29, 144A | 2,060,000 | 2,200,739 | ||||||
| See Notes to Financial Statements. | 72 |
DBX ETF Trust
Schedule of Investments
Xtrackers USD High Yield Corporate Bond ETF(Continued)
August 31, 2019
Principal | Value | |||||||
| Electric (Continued) | ||||||||
Talen Energy Supply LLC | $ | 1,998,000 | $ | 1,528,470 | ||||
10.50%, 1/15/26, 144A | 2,370,000 | 2,160,255 | ||||||
7.25%, 5/15/27, 144A | 2,040,000 | 2,034,900 | ||||||
6.625%, 1/15/28, 144A | 1,300,000 | 1,264,250 | ||||||
TransAlta Corp. | 1,200,000 | 1,236,951 | ||||||
Vistra Energy Corp. | 1,376,000 | 1,408,680 | ||||||
Vistra Operations Co. LLC | 3,590,000 | 3,778,475 | ||||||
5.625%, 2/15/27, 144A | 3,585,000 | 3,809,062 | ||||||
5.00%, 7/31/27, 144A | 4,550,000 | 4,709,250 | ||||||
|
| |||||||
| 79,020,875 | ||||||||
|
| |||||||
| Gas — 0.3% | ||||||||
AmeriGas Partners LP / AmeriGas Finance Corp. | 2,322,000 | 2,475,832 | ||||||
5.50%, 5/20/25 | 2,390,000 | 2,539,375 | ||||||
5.875%, 8/20/26 | 2,261,000 | 2,466,638 | ||||||
5.75%, 5/20/27 | 1,655,000 | 1,759,431 | ||||||
|
| |||||||
| 9,241,276 | ||||||||
|
| |||||||
TOTAL CORPORATE BONDS | 3,035,680,732 | |||||||
|
| |||||||
Number | Value | |||||||
| SECURITIES LENDING COLLATERAL — 5.3% | ||||||||
DWS Government & Agency Securities Portfolio “DWS Government Cash Institutional Shares”, 2.04% (b)(c) | 161,595,001 | $ | 161,595,001 | |||||
|
| |||||||
| CASH EQUIVALENTS — 1.2% | ||||||||
DWS Government Money Market Series “Institutional Shares”, 2.09% (b) | 36,745,383 | 36,745,383 | ||||||
|
| |||||||
TOTAL INVESTMENTS — 105.6% (Cost $3,210,284,952) | $ | 3,234,021,116 | ||||||
Other assets and liabilities, net — (5.6%) | (172,169,703 | ) | ||||||
|
| |||||||
NET ASSETS — 100.0% | $ | 3,061,851,413 | ||||||
|
| |||||||
A summary of the Fund’s transactions with affiliated investments during the year ended August 31, 2019 is as follows:
| Value ($) at 8/31/2018 | Purchases Cost ($) | Sales Proceeds ($) | Net Realized Gain/(Loss) ($) | Net Change in Unrealized Appreciation (Depreciation) ($) | Income ($) | Capital Gain Distributions ($) | Number of Shares at 8/31/2019 | Value ($) at 8/31/2019 | ||||||||||||||||||||||||||||||
SECURITIES LENDING COLLATERAL —5.3% | ||||||||||||||||||||||||||||||||||||||
DWS Government & Agency Securities Portfolio “DWS Government Cash Institutional Shares”, 2.04% (b)(c) | ||||||||||||||||||||||||||||||||||||||
| 111,668,629 | 49,926,372 | (d) | — | — | — | 1,779,174 | — | 161,595,001 | 161,595,001 | |||||||||||||||||||||||||||||
CASH EQUIVALENTS —1.2% | ||||||||||||||||||||||||||||||||||||||
DWS Government Money Market Series “Institutional Shares”, 2.09% (b) | ||||||||||||||||||||||||||||||||||||||
| — | 385,888,416 | (349,143,033 | ) | — | — | 367,822 | — | 36,745,383 | 36,745,383 | |||||||||||||||||||||||||||||
|
|
|
|
|
|
|
|
|
|
|
|
|
|
|
|
|
| |||||||||||||||||||||
| 111,668,629 | 435,814,788 | (349,143,033 | ) | — | — | 2,146,996 | — | 198,340,384 | 198,340,384 | |||||||||||||||||||||||||||||
|
|
|
|
|
|
|
|
|
|
|
|
|
|
|
|
|
| |||||||||||||||||||||
| * | Non-income producing security. |
| (a) | All or a portion of these securities were on loan. In addition, “Other assets and liabilities, net” may include pending sales that are also on loan. The value of securities loaned at August 31, 2019 amounted to $160,024,679, which is 5.2% of net assets. |
| (b) | Affiliated fund managed by DWS Investment Management Americas, Inc. The rate shown is the annualizedseven-day yield at period end. |
| (c) | Represents cash collateral held in connection with securities lending. Income earned by the Fund is net of borrower rebates. In addition, the Fund heldnon-cash U.S. Treasury securities collateral having a value of $4,955,725. |
| (d) | Represents the net increase (purchase cost) or decrease (sales proceeds) in the amount invested in cash collateral for the period ended August 31, 2019. |
| MTN: | Medium Term Note |
| REIT: | Real Estate Investment Trust |
| 144A: | Security exempt from registration under Rule 144A of the Securities Act of 1933. These securities may be resold in transactions exempt from registration, normally to qualified institutional buyers. |
| See Notes to Financial Statements. | 73 |
DBX ETF Trust
Schedule of Investments
Xtrackers USD High Yield Corporate Bond ETF(Continued)
August 31, 2019
Fair Value Measurements
Various inputs are used in determining the value of the Fund’s investments. These inputs are summarized in three broad levels. Level 1 includes quoted prices in active markets for identical securities. Level 2 includes other significant observable inputs (including quoted prices for similar securities, interest rates, prepayment speeds and credit risk). Level 3 includes significant unobservable inputs (including the Fund’s own assumptions in determining the fair value of investments). The level assigned to the securities valuations may not be an indication of the risk or liquidity associated with investing in those securities.
The following is a summary of the inputs used as of August 31, 2019 in valuing the Fund’s investments. For information on the Fund’s policy regarding the valuation of investments, please refer to the Security Valuation section of Note 2 in the accompanying Notes to Financial Statements.
Assets | Level 1 | Level 2 | Level 3 | Total | ||||||||||||
Corporate Bonds (e) | $ | — | $ | 3,035,680,732 | $ | — | $ | 3,035,680,732 | ||||||||
Short-Term Investments (e) | 198,340,384 | — | — | 198,340,384 | ||||||||||||
|
|
|
|
|
|
|
| |||||||||
TOTAL | $ | 198,340,384 | $ | 3,035,680,732 | $ | — | $ | 3,234,021,116 | ||||||||
|
|
|
|
|
|
|
| |||||||||
| (e) | See Schedule of Investments for additional detailed categorizations. |
| See Notes to Financial Statements. | 74 |
This Page is Intentionally Left Blank
75
DBX ETF Trust
August 31, 2019
| Xtrackers Barclays International Corporate Bond Hedged ETF | Xtrackers Barclays International Treasury Bond Hedged ETF | Xtrackers High Beta High Yield Bond ETF | Xtrackers Low Beta High Yield Bond ETF | |||||||||||||
Assets | ||||||||||||||||
Investment in non-affiliated securities at value | $ | 5,200,763 | $ | 10,180,736 | $ | 146,905,749 | $ | 143,486,176 | ||||||||
Investment in affiliated securities at value | — | 259,281 | — | — | ||||||||||||
Investment in DWS Government Money Market Series | 41,312 | 3,813 | 2,360,073 | 1,864,770 | ||||||||||||
Investment in DWS Government & Agency Securities Portfolio* | — | — | 9,810,481 | 1,219,663 | ||||||||||||
Foreign currency at value | 12,614 | 14,001 | — | — | ||||||||||||
Unrealized appreciation on forward foreign currency contracts | 77,136 | 145,478 | — | — | ||||||||||||
| Receivables: | ||||||||||||||||
Investment securities sold | — | 71,499 | 6,708,332 | 5,247,521 | ||||||||||||
Interest | 64,711 | 75,434 | 2,665,030 | 2,110,805 | ||||||||||||
Securities lending income | — | — | 14,688 | 237 | ||||||||||||
Foreign tax reclaim | 143 | 1,355 | — | — | ||||||||||||
|
|
|
|
|
|
|
| |||||||||
Total assets | $ | 5,396,679 | $ | 10,751,597 | $ | 168,464,353 | $ | 153,929,172 | ||||||||
|
|
|
|
|
|
|
| |||||||||
Liabilities | ||||||||||||||||
Due to custodian | $ | 24 | $ | 2 | $ | — | $ | 2,200 | ||||||||
Payable upon return of securities loaned | — | — | 9,810,481 | 1,219,663 | ||||||||||||
Unrealized depreciation on forward foreign currency contracts | 11,878 | 62,335 | — | — | ||||||||||||
| Payables: | ||||||||||||||||
Investment securities purchased | 41,492 | 19,453 | 7,929,231 | 8,404,175 | ||||||||||||
Investment advisory fees | 1,354 | 2,160 | 25,261 | 24,257 | ||||||||||||
|
|
|
|
|
|
|
| |||||||||
Total liabilities | 54,748 | 83,950 | 17,764,973 | 9,650,295 | ||||||||||||
|
|
|
|
|
|
|
| |||||||||
Net Assets, at value | $ | 5,341,931 | $ | 10,667,647 | $ | 150,699,380 | $ | 144,278,877 | ||||||||
|
|
|
|
|
|
|
| |||||||||
Net Assets Consist of | ||||||||||||||||
Paid-in capital | $ | 5,009,594 | $ | 9,953,183 | $ | 154,396,955 | $ | 142,034,522 | ||||||||
Distributable earnings (loss) | 332,337 | 714,464 | (3,697,575 | ) | 2,244,355 | |||||||||||
|
|
|
|
|
|
|
| |||||||||
Net Assets, at value | $ | 5,341,931 | $ | 10,667,647 | $ | 150,699,380 | $ | 144,278,877 | ||||||||
|
|
|
|
|
|
|
| |||||||||
Number of Common Shares outstanding | 100,001 | 200,001 | 3,100,001 | 2,850,001 | ||||||||||||
|
|
|
|
|
|
|
| |||||||||
Net Asset Value | $ | 53.42 | $ | 53.34 | $ | 48.61 | $ | 50.62 | ||||||||
|
|
|
|
|
|
|
| |||||||||
Investment in non-affiliated securities at cost | $ | 5,072,991 | $ | 9,683,546 | $ | 149,083,250 | $ | 139,858,144 | ||||||||
|
|
|
|
|
|
|
| |||||||||
Investment in affiliated securities at cost | $ | — | $ | 267,354 | $ | — | $ | — | ||||||||
|
|
|
|
|
|
|
| |||||||||
Value of securities loaned | $ | — | $ | — | $ | 10,694,071 | $ | 1,488,709 | ||||||||
|
|
|
|
|
|
|
| |||||||||
Investment in DWS Government Money Market Series at cost | $ | 41,312 | $ | 3,813 | $ | 2,360,073 | $ | 1,864,770 | ||||||||
|
|
|
|
|
|
|
| |||||||||
Investment in DWS Government & Agency Securities Portfolio at cost* | $ | — | $ | — | $ | 9,810,481 | $ | 1,219,663 | ||||||||
|
|
|
|
|
|
|
| |||||||||
Non-cash collateral for securities on loan | $ | — | $ | — | $ | 1,329,024 | $ | 320,999 | ||||||||
|
|
|
|
|
|
|
| |||||||||
Foreign currency at cost | $ | 12,689 | $ | 14,241 | $ | — | $ | — | ||||||||
|
|
|
|
|
|
|
| |||||||||
| * | Represents collateral on securities loaned. |
| See Notes to Financial Statements. | 76 |
DBX ETF Trust
Statements of Assets and Liabilities(Continued)
August 31, 2019
| Xtrackers Short Duration High Yield Bond ETF | Xtrackers USD High Yield Corporate Bond ETF | |||||||
Assets | ||||||||
Investment in non-affiliated securities at value | $ | 22,050,849 | $ | 3,035,680,732 | ||||
Investment in DWS Government Money Market Series | 311,842 | 36,745,383 | ||||||
Investment in DWS Government & Agency Securities Portfolio* | 1,835,191 | 161,595,001 | ||||||
| Receivables: | ||||||||
Investment securities sold | 102,192 | 19,804,361 | ||||||
Capital shares | – | 4,954,868 | ||||||
Interest | 358,148 | 50,284,004 | ||||||
Securities lending income | 1,421 | 157,267 | ||||||
|
|
|
| |||||
Total assets | $ | 24,659,643 | $ | 3,309,221,616 | ||||
|
|
|
| |||||
Liabilities | ||||||||
Due to custodian | $ | – | $ | 128,242 | ||||
Payable upon return of securities loaned | 1,835,191 | 161,595,001 | ||||||
| Payables: | ||||||||
Investment securities purchased | 711,154 | 85,264,407 | ||||||
Investment advisory fees | 3,726 | 382,553 | ||||||
|
|
|
| |||||
Total liabilities | 2,550,071 | 247,370,203 | ||||||
|
|
|
| |||||
Net Assets, at value | $ | 22,109,572 | $ | 3,061,851,413 | ||||
|
|
|
| |||||
Net Assets Consist of | ||||||||
Paid-in capital | $ | 22,608,480 | $ | 3,043,859,491 | ||||
Distributable earnings (loss) | (498,908 | ) | 17,991,922 | |||||
|
|
|
| |||||
Net Assets, at value | $ | 22,109,572 | $ | 3,061,851,413 | ||||
|
|
|
| |||||
Number of Common Shares outstanding | 450,001 | 60,950,001 | ||||||
|
|
|
| |||||
Net Asset Value | $ | 49.13 | $ | 50.24 | ||||
|
|
|
| |||||
Investment in non-affiliated securities at cost | $ | 22,096,598 | $ | 3,011,944,568 | ||||
|
|
|
| |||||
Value of securities loaned | $ | 1,802,385 | $ | 160,024,679 | ||||
|
|
|
| |||||
Investment in DWS Government Money Market Series at cost | $ | 311,842 | $ | 36,745,383 | ||||
|
|
|
| |||||
Investment in DWS Government & Agency Securities Portfolio at cost* | $ | 1,835,191 | $ | 161,595,001 | ||||
|
|
|
| |||||
Non-cash collateral for securities on loan | $ | 37,961 | $ | 4,955,725 | ||||
|
|
|
| |||||
| * | Represents collateral on securities loaned. |
| See Notes to Financial Statements. | 77 |
DBX ETF Trust
For the Year Ended August 31, 2019
| Xtrackers Barclays International Corporate Bond Hedged ETF | Xtrackers Barclays International Treasury Bond Hedged ETF | Xtrackers High Beta High Yield Bond ETF | Xtrackers Low Beta High Yield Bond ETF | |||||||||||||
Investment Income | ||||||||||||||||
Unaffiliated interest income* | $ | 69,527 | $ | 82,610 | $ | 10,381,806 | $ | 6,847,979 | ||||||||
Income distributions from affiliated funds | 560 | 1,230 | 22,171 | 31,675 | ||||||||||||
Affiliated securities lending income | – | – | 173,444 | 15,389 | ||||||||||||
|
|
|
|
|
|
|
| |||||||||
Total investment income | 70,087 | 83,840 | 10,577,421 | 6,895,043 | ||||||||||||
|
|
|
|
|
|
|
| |||||||||
Expenses | ||||||||||||||||
Investment advisory fees | 15,239 | 19,075 | 512,537 | 352,381 | ||||||||||||
Other expenses | 57 | 57 | 299 | 299 | ||||||||||||
|
|
|
|
|
|
|
| |||||||||
Total expenses | 15,296 | 19,132 | 512,836 | 352,680 | ||||||||||||
|
|
|
|
|
|
|
| |||||||||
Less fees waived (see note 3): | ||||||||||||||||
Waiver | (16 | ) | (154 | ) | (57,857 | ) | (19,176 | ) | ||||||||
|
|
|
|
|
|
|
| |||||||||
Net expenses | 15,280 | 18,978 | 454,979 | 333,504 | ||||||||||||
|
|
|
|
|
|
|
| |||||||||
Net investment income (loss) | 54,807 | 64,862 | 10,122,442 | 6,561,539 | ||||||||||||
|
|
|
|
|
|
|
| |||||||||
Realized and Unrealized Gain (Loss) | ||||||||||||||||
Net realized gain (loss) from: | ||||||||||||||||
Investments | (14,241 | ) | 3,345 | (2,102,427 | ) | (875,015 | ) | |||||||||
In-kind redemptions | – | – | – | 1,113 | ||||||||||||
Foreign currency transactions | (2,638 | ) | (1,342 | ) | – | – | ||||||||||
Forward foreign currency contracts | 351,452 | 309,932 | – | – | ||||||||||||
|
|
|
|
|
|
|
| |||||||||
Net realized gain (loss) | 334,573 | 311,935 | (2,102,427 | ) | (873,902 | ) | ||||||||||
Net change in unrealized appreciation (depreciation) on: | ||||||||||||||||
Investments | 37,666 | 549,562 | 422,918 | 5,099,880 | ||||||||||||
Investments in affiliates | – | (8,073 | ) | – | – | |||||||||||
Foreign currency translations | (125 | ) | (470 | ) | – | – | ||||||||||
Forward foreign currency contracts | 19,629 | 49,225 | – | – | ||||||||||||
|
|
|
|
|
|
|
| |||||||||
Net change in unrealized appreciation (depreciation) | 57,170 | 590,244 | 422,918 | 5,099,880 | ||||||||||||
|
|
|
|
|
|
|
| |||||||||
Net realized and unrealized gain (loss) on investments and foreign currency transactions | 391,743 | 902,179 | (1,679,509 | ) | 4,225,978 | |||||||||||
|
|
|
|
|
|
|
| |||||||||
Net Increase (Decrease) in Net Assets Resulting from Operations | $ | 446,550 | $ | 967,041 | $ | 8,442,933 | $ | 10,787,517 | ||||||||
|
|
|
|
|
|
|
| |||||||||
* Unaffiliated foreign tax withheld | $ | 278 | $ | – | $ | – | $ | – | ||||||||
| See Notes to Financial Statements. | 78 |
DBX ETF Trust
Statements of Operations(Continued)
For the Year Ended August 31, 2019
| Xtrackers Short Duration High Yield Bond ETF | Xtrackers USD High Yield Corporate Bond ETF | |||||||
Investment Income | ||||||||
Unaffiliated interest income | $ | 1,975,239 | $ | 149,258,585 | ||||
Income distributions from affiliated funds | 6,484 | 367,822 | ||||||
Affiliated securities lending income | 29,591 | 1,779,174 | ||||||
|
|
|
| |||||
Total investment income | 2,011,314 | 151,405,581 | ||||||
|
|
|
| |||||
Expenses | ||||||||
Investment advisory fees | 67,259 | 4,854,316 | ||||||
Other expenses | 43 | 3,713 | ||||||
|
|
|
| |||||
Total expenses | 67,302 | 4,858,029 | ||||||
|
|
|
| |||||
Less fees waived (see note 3): | ||||||||
Waiver | (193 | ) | (621,743 | ) | ||||
|
|
|
| |||||
Net expenses | 67,109 | 4,236,286 | ||||||
|
|
|
| |||||
Net investment income (loss) | 1,944,205 | 147,169,295 | ||||||
|
|
|
| |||||
Realized and Unrealized Gain (Loss) | ||||||||
Net realized gain (loss) from: | ||||||||
Investments | (506,108 | ) | (19,974,619 | ) | ||||
In-kind redemptions | (333,295 | ) | 13,390,157 | |||||
|
|
|
| |||||
Net realized gain (loss) | (839,403 | ) | (6,584,462 | ) | ||||
Net change in unrealized appreciation (depreciation) on: | ||||||||
Investments | 177,009 | 34,976,324 | ||||||
|
|
|
| |||||
Net change in unrealized appreciation (depreciation) | 177,009 | 34,976,324 | ||||||
|
|
|
| |||||
Net realized and unrealized gain (loss) on investments | (662,394 | ) | 28,391,862 | |||||
|
|
|
| |||||
Net Increase (Decrease) in Net Assets Resulting from Operations | $ | 1,281,811 | $ | 175,561,157 | ||||
|
|
|
| |||||
| See Notes to Financial Statements. | 79 |
DBX ETF Trust
| Xtrackers Barclays International Corporate Bond Hedged ETF | Xtrackers Barclays International Treasury Bond Hedged ETF | |||||||||||||||
| Year Ended August 31, 2019 | Year Ended August 31, 2018 | Year Ended August 31, 2019 | Year Ended August 31, 2018 | |||||||||||||
Increase (Decrease) in Net Assets from Operations | ||||||||||||||||
Net investment income (loss) | $ | 54,807 | $ | 38,156 | $ | 64,862 | $ | 33,401 | ||||||||
Net realized gain (loss) | 334,573 | 247,480 | 311,935 | 175,195 | ||||||||||||
Net change in net unrealized appreciation (depreciation) | 57,170 | (203,014 | ) | 590,244 | (143,716 | ) | ||||||||||
|
|
|
|
|
|
|
| |||||||||
Net increase (decrease) in net assets resulting from operations | 446,550 | 82,622 | 967,041 | 64,880 | ||||||||||||
|
|
|
|
|
|
|
| |||||||||
Distributions to Shareholders | (115,588 | ) | (113,203 | )* | (150,086 | ) | (63,240 | )* | ||||||||
|
|
|
|
|
|
|
| |||||||||
Fund Shares Transactions | ||||||||||||||||
Proceeds from shares sold | — | — | 4,951,893 | — | ||||||||||||
Value of shares redeemed | — | — | — | — | ||||||||||||
|
|
|
|
|
|
|
| |||||||||
Net increase (decrease) in net assets resulting from fund share transactions | — | — | 4,951,893 | — | ||||||||||||
|
|
|
|
|
|
|
| |||||||||
Total net increase (decrease) in Net Assets | 330,962 | (30,581 | ) | 5,768,848 | 1,640 | |||||||||||
Net Assets | ||||||||||||||||
Beginning of year | 5,010,969 | 5,041,550 | 4,898,799 | 4,897,159 | ||||||||||||
|
|
|
|
|
|
|
| |||||||||
End of year | $ | 5,341,931 | $ | 5,010,969 | ** | $ | 10,667,647 | $ | 4,898,799 | ** | ||||||
|
|
|
|
|
|
|
| |||||||||
Changes in Shares Outstanding | ||||||||||||||||
Shares outstanding, beginning of year | 100,001 | 100,001 | 100,001 | 100,001 | ||||||||||||
Shares sold | — | — | 100,000 | — | ||||||||||||
Shares redeemed | — | — | — | — | ||||||||||||
|
|
|
|
|
|
|
| |||||||||
Shares outstanding, end of year | 100,001 | 100,001 | 200,001 | 100,001 | ||||||||||||
|
|
|
|
|
|
|
| |||||||||
| * | Includes distributions from net investment income. |
| ** | Includes undistributed net investment income of $66,185 and $16,001 respectively. |
| See Notes to Financial Statements. | 80 |
DBX ETF Trust
Statements of Changes in Net Assets(Continued)
| Xtrackers High Beta High Yield Bond ETF | Xtrackers Low Beta High Yield Bond ETF | |||||||||||||||
| Year Ended August 31, 2019 | For the Period January 11, 2018(1) to August 31, 2018 | Year Ended August 31, 2019 | For the Period January 11, 2018(1) to August 31, 2018 | |||||||||||||
Increase (Decrease) in Net Assets from Operations | ||||||||||||||||
Net investment income (loss) | $ | 10,122,442 | $ | 5,906,468 | $ | 6,561,539 | $ | 3,668,878 | ||||||||
Net realized gain (loss) | (2,102,427 | ) | (250,530 | ) | (873,902 | ) | (1,084,231 | ) | ||||||||
Net change in net unrealized appreciation (depreciation) | 422,918 | (2,600,419 | ) | 5,099,880 | (1,471,848 | ) | ||||||||||
|
|
|
|
|
|
|
| |||||||||
Net increase (decrease) in net assets resulting from operations | 8,442,933 | 3,055,519 | 10,787,517 | 1,112,799 | ||||||||||||
|
|
|
|
|
|
|
| |||||||||
Distributions to Shareholders | (10,069,325 | ) | (5,126,702 | )* | (6,517,014 | ) | (3,138,241 | )* | ||||||||
|
|
|
|
|
|
|
| |||||||||
Fund Shares Transactions | ||||||||||||||||
Proceeds from shares sold | 4,812,681 | 149,584,224 | 7,295,389 | 139,667,206 | ||||||||||||
Value of shares redeemed | — | — | (4,928,829 | ) | — | |||||||||||
|
|
|
|
|
|
|
| |||||||||
Net increase (decrease) in net assets resulting from fund share transactions | 4,812,681 | 149,584,224 | 2,366,560 | 139,667,206 | ||||||||||||
|
|
|
|
|
|
|
| |||||||||
Total net increase (decrease) in Net Assets | 3,186,289 | 147,513,041 | 6,637,063 | 137,641,764 | ||||||||||||
Net Assets | ||||||||||||||||
Beginning of period | 147,513,091 | 50 | 137,641,814 | 50 | ||||||||||||
|
|
|
|
|
|
|
| |||||||||
End of period | $ | 150,699,380 | $ | 147,513,091 | ** | $ | 144,278,877 | $ | 137,641,814 | ** | ||||||
|
|
|
|
|
|
|
| |||||||||
Changes in Shares Outstanding | ||||||||||||||||
Shares outstanding, beginning of period | 3,000,001 | 1 | 2,800,001 | 1 | ||||||||||||
Shares sold | 100,000 | 3,000,000 | 150,000 | 2,800,000 | ||||||||||||
Shares redeemed | — | — | (100,000 | ) | — | |||||||||||
|
|
|
|
|
|
|
| |||||||||
Shares outstanding, end of period | 3,100,001 | 3,000,001 | 2,850,001 | 2,800,001 | ||||||||||||
|
|
|
|
|
|
|
| |||||||||
| (1) | Commencement of Operations. |
| * | Includes distributions from net investment income. |
| ** | Includes undistributed net investment income of $779,766 and $530,637 respectively. |
| See Notes to Financial Statements. | 81 |
DBX ETF Trust
Statements of Changes in Net Assets(Continued)
| Xtrackers Short Duration High Yield Bond ETF | Xtrackers USD High Yield Corporate Bond ETF | |||||||||||||||
| Year Ended August 31, 2019 | For the Period January 10, 2018(1) to August 31, 2018 | Year Ended August 31, 2019 | Year Ended August 31, 2018 | |||||||||||||
Increase (Decrease) in Net Assets from Operations | ||||||||||||||||
Net investment income (loss) | $ | 1,944,205 | $ | 1,195,352 | $ | 147,169,295 | $ | 52,854,950 | ||||||||
Net realized gain (loss) | (839,403 | ) | (64,402 | ) | (6,584,462 | ) | (1,691,911 | ) | ||||||||
Net change in net unrealized appreciation (depreciation) | 177,009 | (222,758 | ) | 34,976,324 | (13,361,568 | ) | ||||||||||
|
|
|
|
|
|
|
| |||||||||
Net increase (decrease) in net assets resulting from operations | 1,281,811 | 908,192 | 175,561,157 | 37,801,471 | ||||||||||||
|
|
|
|
|
|
|
| |||||||||
Distributions to Shareholders | (2,014,987 | ) | (1,017,257 | )* | (141,405,511 | ) | (45,466,199 | )* | ||||||||
|
|
|
|
|
|
|
| |||||||||
Fund Shares Transactions | ||||||||||||||||
Proceeds from shares sold | 12,264,827 | 39,864,822 | 2,772,020,595 | 1,813,276,805 | ||||||||||||
Value of shares redeemed | (29,177,886 | ) | — | (1,539,942,869 | ) | (230,205,552 | ) | |||||||||
|
|
|
|
|
|
|
| |||||||||
Net increase (decrease) in net assets resulting from fund share transactions | (16,913,059 | ) | 39,864,822 | 1,232,077,726 | 1,583,071,253 | |||||||||||
|
|
|
|
|
|
|
| |||||||||
Total net increase (decrease) in Net Assets | (17,646,235 | ) | 39,755,757 | 1,266,233,372 | 1,575,406,525 | |||||||||||
Net Assets | ||||||||||||||||
Beginning of period | 39,755,807 | 50 | 1,795,618,041 | 220,211,516 | ||||||||||||
|
|
|
|
|
|
|
| |||||||||
End of period | $ | 22,109,572 | $ | 39,755,807 | ** | $ | 3,061,851,413 | $ | 1,795,618,041 | ** | ||||||
|
|
|
|
|
|
|
| |||||||||
Changes in Shares Outstanding | ||||||||||||||||
Shares outstanding, beginning of period | 800,001 | 1 | 36,000,001 | 4,300,001 | ||||||||||||
Shares sold | 250,000 | 800,000 | 56,450,000 | 36,350,000 | ||||||||||||
Shares redeemed | (600,000 | ) | — | (31,500,000 | ) | (4,650,000 | ) | |||||||||
|
|
|
|
|
|
|
| |||||||||
Shares outstanding, end of period | 450,001 | 800,001 | 60,950,001 | 36,000,001 | ||||||||||||
|
|
|
|
|
|
|
| |||||||||
| (1) | Commencement of Operations. |
| * | Includes distributions from net investment income. |
| ** | Includes undistributed net investment income of $178,095 and $8,479,077 respectively. |
| See Notes to Financial Statements. | 82 |
DBX ETF Trust
Xtrackers Barclays International Corporate Bond Hedged ETF Selected Per Share Data | Years Ended August 31, | Period Ended 8/31/2017(a) | ||||||||||
| 2019 | 2018 | |||||||||||
Net Asset Value, beginning of period | $ | 50.11 | $ | 50.42 | $ | 50.00 | ||||||
|
|
|
|
|
| |||||||
| Income (loss) from investment operations: | ||||||||||||
Net investment income (loss)(b) | 0.55 | 0.38 | 0.43 | |||||||||
Net realized and unrealized gain (loss) | 3.92 | 0.44 | 0.91 | |||||||||
|
|
|
|
|
| |||||||
Total from investment operations | 4.47 | 0.82 | 1.34 | |||||||||
|
|
|
|
|
| |||||||
Less distributions from: | ||||||||||||
Net investment income | (1.16 | ) | (1.13 | ) | (0.92 | ) | ||||||
|
|
|
|
|
| |||||||
Total distributions | (1.16 | ) | (1.13 | ) | (0.92 | ) | ||||||
|
|
|
|
|
| |||||||
Net Asset Value, end of period | $ | 53.42 | $ | 50.11 | $ | 50.42 | ||||||
|
|
|
|
|
| |||||||
Total Return (%) | 9.09 | (c) | 1.65 | 2.72 | ** | |||||||
Ratios to Average Net Assets and Supplemental Data | ||||||||||||
Net Assets, end of period ($ millions) | 5 | 5 | 5 | |||||||||
Ratio of expenses before fee waiver (%) | 0.30 | 0.30 | 0.30 | * | ||||||||
Ratio of expenses after fee waiver (%) | 0.30 | 0.30 | 0.30 | * | ||||||||
Ratio of net investment income (loss) (%) | 1.08 | 0.76 | 1.01 | * | ||||||||
Portfolio turnover rate (%)(d) | 35 | 28 | 36 | ** | ||||||||
Xtrackers Barclays International Treasury Bond Hedged ETF Selected Per Share Data | Years Ended August 31, | Period Ended 8/31/2017(a) | ||||||||||
| 2019 | 2018 | |||||||||||
Net Asset Value, beginning of period | $ | 48.99 | $ | 48.97 | $ | 50.00 | ||||||
|
|
|
|
|
| |||||||
Income (loss) from investment operations: | ||||||||||||
Net investment income (loss)(b) | 0.43 | 0.33 | 0.25 | |||||||||
Net realized and unrealized gain (loss) | 5.18 | 0.32 | (0.40 | ) | ||||||||
|
|
|
|
|
| |||||||
Total from investment operations | 5.61 | 0.65 | (0.15 | ) | ||||||||
|
|
|
|
|
| |||||||
| Less distributions from: | ||||||||||||
Net investment income | (0.49 | ) | (0.63 | ) | (0.88 | ) | ||||||
Net realized gains | (0.77 | ) | — | — | ||||||||
|
|
|
|
|
| |||||||
Total distributions | (1.26 | ) | (0.63 | ) | (0.88 | ) | ||||||
|
|
|
|
|
| |||||||
Net Asset Value, end of period | $ | 53.34 | $ | 48.99 | $ | 48.97 | ||||||
|
|
|
|
|
| |||||||
Total Return (%) | 11.70 | (c) | 1.34 | (0.27 | )(e)** | |||||||
Ratios to Average Net Assets and Supplemental Data | ||||||||||||
Net Assets, end of period ($ millions) | 11 | 5 | 5 | |||||||||
Ratio of expenses before fee waiver (%) | 0.25 | 0.25 | 0.25 | * | ||||||||
Ratio of expenses after fee waiver (%) | 0.25 | 0.25 | 0.25 | * | ||||||||
Ratio of net investment income (loss) (%) | 0.85 | 0.68 | 0.60 | * | ||||||||
Portfolio turnover rate (%)(d) | 24 | 31 | 44 | ** | ||||||||
| (a) | For the period October 25, 2016 (commencement of operations) through August 31, 2017. |
| (b) | Based on average shares outstanding during the period. |
| (c) | Total Return would have been lower if certain expenses had not been reimbursed by the Advisor. |
| (d) | Portfolio turnover rate does not include securities received or delivered from processing creations or redemptions. |
| (e) | The Fund’s total return includes a reimbursement by the Advisor for a realized loss on a trade executed incorrectly, which otherwise would have reduced total return by 0.03%. |
| * | Annualized. |
| ** | Not Annualized. |
| See Notes to Financial Statements. | 83 |
DBX ETF Trust
Financial Highlights(Continued)
Xtrackers High Beta High Yield Bond ETF Selected Per Share Data | Year Ended 8/31/2019 | Period Ended 8/31/2018(a) | ||||||
Net Asset Value, beginning of period | $ | 49.17 | $ | 50.00 | ||||
|
|
|
| |||||
Income (loss) from investment operations: | ||||||||
Net investment income (loss)(b) | 3.32 | 2.07 | ||||||
Net realized and unrealized gain (loss) | (0.58 | ) | (1.11 | ) | ||||
|
|
|
| |||||
Total from investment operations | 2.74 | 0.96 | ||||||
|
|
|
| |||||
Less distributions from: | ||||||||
Net investment income | (3.30 | ) | (1.79 | ) | ||||
|
|
|
| |||||
Total distributions | (3.30 | ) | (1.79 | ) | ||||
|
|
|
| |||||
Net Asset Value, end of period | $ | 48.61 | $ | 49.17 | ||||
|
|
|
| |||||
Total Return (%) | 5.90 | (c) | 2.01 | ** | ||||
Ratios to Average Net Assets and Supplemental Data | ||||||||
Net Assets, end of period ($ millions) | 151 | 148 | ||||||
Ratio of expenses before fee waiver (%) | 0.35 | 0.35 | * | |||||
Ratio of expenses after fee waiver (%) | 0.31 | 0.35 | * | |||||
Ratio of net investment income (loss) (%) | 6.91 | 6.71 | * | |||||
Portfolio turnover rate (%)(d) | 51 | 34 | ** | |||||
Xtrackers Low Beta High Yield Bond ETF Selected Per Share Data | Year Ended 8/31/2019 | Period Ended 8/31/2018(a) | ||||||
Net Asset Value, beginning of period | $ | 49.16 | $ | 50.00 | ||||
|
|
|
| |||||
Income (loss) from investment operations: | ||||||||
Net investment income (loss)(b) | 2.29 | 1.37 | ||||||
Net realized and unrealized gain (loss) | 1.44 | (1.05 | ) | |||||
|
|
|
| |||||
Total from investment operations | 3.73 | 0.32 | ||||||
|
|
|
| |||||
Less distributions from: | ||||||||
Net investment income | (2.27 | ) | (1.16 | ) | ||||
|
|
|
| |||||
Total distributions | (2.27 | ) | (1.16 | ) | ||||
|
|
|
| |||||
Net Asset Value, end of period | $ | 50.62 | $ | 49.16 | ||||
|
|
|
| |||||
Total Return (%) | 7.84 | (c) | 0.68 | ** | ||||
Ratios to Average Net Assets and Supplemental Data | ||||||||
Net Assets, end of period ($ millions) | 144 | 138 | ||||||
Ratio of expenses before fee waiver (%) | 0.25 | 0.25 | * | |||||
Ratio of expenses after fee waiver (%) | 0.24 | 0.25 | * | |||||
Ratio of net investment income (loss) (%) | 4.66 | 4.44 | * | |||||
Portfolio turnover rate (%)(d) | 55 | 52 | ** | |||||
| (a) | For the period January 11, 2018 (commencement of operations) through August 31, 2018. |
| (b) | Based on average shares outstanding during the period. |
| (c) | Total Return would have been lower if certain expenses had not been reimbursed by the Advisor. |
| (d) | Portfolio turnover rate does not include securities received or delivered from processing creations or redemptions. |
| * | Annualized. |
| ** | Not Annualized. |
| See Notes to Financial Statements. | 84 |
DBX ETF Trust
Financial Highlights(Continued)
Xtrackers Short Duration High Yield Bond ETF Selected Per Share Data | Year Ended 8/31/2019 | Period Ended 8/31/2018(a) | ||||||||||
Net Asset Value, beginning of period | $ | 49.69 | $ | 50.00 | ||||||||
|
|
|
| |||||||||
Income (loss) from investment operations: | ||||||||||||
Net investment income (loss)(c) | 2.83 | 1.76 | ||||||||||
Net realized and unrealized gain (loss) | (0.54 | ) | (0.59 | ) | ||||||||
|
|
|
| |||||||||
Total from investment operations | 2.29 | 1.17 | ||||||||||
|
|
|
| |||||||||
Less distributions from: | ||||||||||||
Net investment income | (2.85 | ) | (1.48 | ) | ||||||||
|
|
|
| |||||||||
Total distributions | (2.85 | ) | (1.48 | ) | ||||||||
|
|
|
| |||||||||
Net Asset Value, end of period | $ | 49.13 | $ | 49.69 | ||||||||
|
|
|
| |||||||||
Total Return (%) | 4.79 | (d) | 2.41 | ** | ||||||||
Ratios to Average Net Assets and Supplemental Data | ||||||||||||
Net Assets, end of period ($ millions) | 22 | 40 | ||||||||||
Ratio of expenses before fee waiver (%) | 0.20 | 0.20 | * | |||||||||
Ratio of expenses after fee waiver (%) | 0.20 | 0.20 | * | |||||||||
Ratio of net investment income (loss) (%) | 5.78 | 5.56 | * | |||||||||
Portfolio turnover rate (%)(e) | 45 | 37 | ** | |||||||||
Xtrackers USD High Yield Corporate Bond ETF Selected Per Share Data | Years Ended August 31, | Period Ended 8/31/2017(b) | ||||||||||
| 2019 | 2018 | |||||||||||
Net Asset Value, beginning of period | $ | 49.88 | $ | 51.21 | $ | 50.00 | ||||||
|
|
|
|
|
| |||||||
Income (loss) from investment operations: | ||||||||||||
Net investment income (loss)(c) | 2.98 | 2.89 | 2.07 | |||||||||
Net realized and unrealized gain (loss) | 0.30 | (1.53 | ) | 1.11 | ||||||||
|
|
|
|
|
| |||||||
Total from investment operations | 3.28 | 1.36 | 3.18 | |||||||||
|
|
|
|
|
| |||||||
Less distributions from: | ||||||||||||
Net investment income | (2.92 | ) | (2.69 | ) | (1.97 | ) | ||||||
|
|
|
|
|
| |||||||
Total distributions | (2.92 | ) | (2.69 | ) | (1.97 | ) | ||||||
|
|
|
|
|
| |||||||
Net Asset Value, end of period | $ | 50.24 | $ | 49.88 | $ | 51.21 | ||||||
|
|
|
|
|
| |||||||
Total Return (%) | 6.87 | (d) | 2.76 | (d) | 6.43 | ** | ||||||
Ratios to Average Net Assets and Supplemental Data | ||||||||||||
Net Assets, end of period ($ millions) | 3,062 | 1,796 | 220 | |||||||||
Ratio of expenses before fee waiver (%) | 0.20 | 0.20 | 0.25 | * | ||||||||
Ratio of expenses after fee waiver (%) | 0.17 | 0.20 | 0.25 | * | ||||||||
Ratio of net investment income (loss) (%) | 6.06 | 5.86 | 5.57 | * | ||||||||
Portfolio turnover rate (%)(e) | 29 | 32 | 36 | ** | ||||||||
| (a) | For the period January 10, 2018 (commencement of operations) through August 31, 2018. |
| (b) | For the period December 7, 2016 (commencement of operations) through August 31, 2017. |
| (c) | Based on average shares outstanding during the period. |
| (d) | Total Return would have been lower if certain expenses had not been reimbursed by the Advisor. |
| (e) | Portfolio turnover rate does not include securities received or delivered from processing creations or redemptions. |
| * | Annualized. |
| ** | Not Annualized. |
| See Notes to Financial Statements. | 85 |
DBX ETF Trust
1. Organization
DBX ETF Trust (the “Trust”) is registered under the Investment Company Act of 1940, as amended (the “Act”), as an open-end registered management investment company organized as a Delaware statutory trust.
As of August 31, 2019, the Trust consists of thirty-eight investment series of exchange-traded funds (“ETFs”) (each a “Fund” and collectively, the “Funds”) in operation and trading. These financial statements report on the Funds listed below:
| Xtrackers Barclays International Corporate Bond Hedged ETF |
| Xtrackers Barclays International Treasury Bond Hedged ETF |
| Xtrackers High Beta High Yield Bond ETF |
| Xtrackers Low Beta High Yield Bond ETF |
| Xtrackers Short Duration High Yield Bond ETF |
| Xtrackers USD High Yield Corporate Bond ETF |
DBX Advisors LLC (“DBX” or the “Advisor”), an indirect, wholly-owned subsidiary of DWS Group Gmbh & Co. KGaA (“DWS Group”), serves as investment advisor to the Funds and has overall responsibility for the general management and administration of the Funds, subject to the supervision of the Funds’ Board of Trustees (“Board”).
Xtrackers Barclays International Corporate Bond Hedged ETF and Xtrackers Barclays International Treasury Bond Hedged ETF offer shares that are listed and traded on the Cboe BZX Exchange (“Cboe”). Xtrackers High Beta High Yield Bond ETF, Xtrackers Low Beta High Yield Bond ETF, Xtrackers Short Duration High Yield Bond ETF and Xtrackers USD High Yield Corporate Bond ETF offer shares that are listed and traded on the NYSE Arca, Inc. (“NYSE Arca”). Unlike conventional mutual funds, each Fund issues and redeems shares on a continuous basis, at net asset value (“NAV”), only in large specified lots consisting of 50,000 shares, each called a “Creation Unit”, to authorized participants who have entered into agreements with the Funds’ distributor. Shares are not individually redeemable securities of the Funds, and owners of the shares may acquire those shares from the Funds, or tender such shares for redemption to the Funds, in Creation Units only.
The investment objective of each Fund is to track the performance, before fees and expenses, of a particular index (the “Underlying Index”). The underlying indices for the Funds are:
Fund | Underlying Index | |
| Xtrackers Barclays International Corporate Bond Hedged ETF | Barclays Global Aggregate Corporate Ex USD Bond Index (USD Hedged) | |
| Xtrackers Barclays International Treasury Bond Hedged ETF | Barclays Global Aggregate Treasury Ex USD Issuer Diversified Bond Index (USD Hedged) | |
| Xtrackers High Beta High Yield Bond ETF | Solactive USD High Yield Corporates Total Market High Beta Index | |
| Xtrackers Low Beta High Yield Bond ETF | Solactive USD High Yield Corporates Total Market Low Beta Index | |
| Xtrackers Short Duration High Yield Bond ETF | Solactive USD High Yield Corporates Total Market 0-5 Year Index | |
| Xtrackers USD High Yield Corporate Bond ETF | Solactive USD High Yield Corporates Total Market Index |
The Barclays Global Aggregate Corporate Ex USD Bond Index (USD Hedged) is designed to track the performance of investment grade corporate debt publicly issued in developed and emerging markets (excluding all securities denominated in U.S. dollars) in the industrial, utility and financial sectors while mitigating exposure to fluctuations between the value of the U.S. dollar and the currencies of the countries included in the Underlying Index. The Barclays Global Aggregate Treasury Ex USD Issuer Diversified Bond Index (USD Hedged) is designed to track the performance of investment grade sovereign debt publicly issued in the developed and emerging markets and denominated in the issuer’s own domestic currency (excluding all securities denominated in U.S. dollars) while mitigating exposure to fluctuations between the value of the U.S. dollar and the currencies of the countries included in the Underlying Index. The Barclays Hedged Indices are rebalanced monthly on the last trading day of the month, when the index will reflect the effect of rolling into new 1-month forward contracts based on the newly determined weights of currency to be sold for the next month’s index calculation. The currency weights are determined as of the last calendar day of the preceding month. This means that no changes in the weights are made during the month to account for changes in the Underlying Index due to price movement
86
DBX ETF Trust
Notes to Financial Statements(Continued)
of constituent securities. With respect to the bond components of the Underlying Index, the Underlying Index is rebalanced on the last calendar day of the month. No changes are made to constituent holdings other than on month end rebalancing dates.
The Solactive USD High Yield Corporates Total Market High Beta Index is designed to track the performance of the segment of the U.S. dollar denominated high yield corporate bond market that exhibits higher overall beta to the broader high yield corporate fixed income market. The Solactive USD High Yield Corporates Total Market Low Beta Index is designed to track the performance of the segment of the U.S. dollar-denominated high yield corporate bond market that exhibits lower overall beta to the broader high yield corporate fixed income market. The Solactive USD High Yield Corporates Total Market 0-5 Year Index is designed to track the performance of short-term publicly issued U.S. dollar-denominated below investment grade corporate debt. The Solactive USD High Yield Corporates Total Market Index is designed to track the performance of a basket of U.S. dollar-denominated high yield liquid corporate bonds. The Solactive Indexes are rebalanced monthly on the last business day of each month.
Each Fund is entitled to use its respective Underlying Index pursuant to a licensing agreement between the Index Provider and DBX. There is no charge to the Funds in connection with these licensing agreements.
Each Fund is non-diversified and is not limited by the Act with regard to the percentage of its assets that may be invested in the securities of a single issuer. This means the securities of a particular issuer (or securities of issuers in particular industries) may dominate the Underlying Index of the Fund and, consequently, the Fund’s investment portfolio. This may adversely affect the Fund’s performance or subject the Fund’s shares to greater price volatility than that experienced by more diversified investment companies.
Pursuant to the Trust’s organizational documents, the Trust’s officers and trustees are indemnified against certain liabilities that may arise out of the performance of their duties to the Funds. Additionally, in the normal course of business the Trust enters into contracts that contain a variety of representations that provide indemnification for certain liabilities. The Trust’s maximum exposure under these arrangements is unknown, as this would involve future claims that may be made against the Funds that have not yet occurred. However, the Trust expects the risk of loss to be remote.
2. Significant Accounting Policies
The financial statements have been prepared in conformity with U.S. generally accepted accounting principles (“U.S. GAAP”), which require management to make certain estimates and assumptions that affect the reported amounts and disclosures in the financial statements. Actual results could differ from those estimates. Each Fund qualifies as an investment company under Topic 946 of the Accounting Standards Codification of U.S. GAAP. The following is a summary of significant accounting policies followed by the Funds.
In October 2018, the Securities and Exchange Commission adopted amendments to certain disclosure requirements in Securities Act Release No. 33-10532, Disclosure Update and Simplification, which is intended to facilitate the disclosure of information to investors and simplify compliance without significantly altering the total mix of information provided to investors. Effective with the current reporting period, the Funds adopted the amendments with the impacts being that the Funds are no longer required to present components of distributable earnings on the Statement of Assets and Liabilities or the sources of distributable earnings and the amount of undistributed net investment income on the Statements of Changes in Net Assets.
Security Valuation The NAV, of each Fund’s shares is calculated each business day as of the close of regular trading on the New York Stock Exchange, generally 4:00 p.m. Eastern Time. NAV per share is calculated by dividing a Fund’s net assets by the number of Fund shares outstanding.
Various inputs are used in determining the value of the Funds’ investments. These inputs are summarized in three broad levels. Level 1 includes quoted prices in active markets for identical securities. Level 2 includes other significant observable inputs (including quoted prices for similar securities, interest rates, prepayment speeds, and credit risk). Level 3 includes significant unobservable inputs (including the Funds’ own assumptions in determining the fair value of investments). The level assigned to the securities valuations may not be an indication of the risk or liquidity associated with investing in those securities.
87
DBX ETF Trust
Notes to Financial Statements(Continued)
Corporate and sovereign debt securities are valued at prices supplied by independent pricing services approved by the Funds’ Board. Such services may use various pricing techniques which take into account appropriate factors such as yield, quality, coupon rate, maturity, type of issue, trading characteristics and other data, as well as broker quotes. If the pricing services are unable to provide valuations, securities are valued at the mean between the bid and ask quotations or evaluated prices, as applicable, obtained from broker dealers. These securities are generally categorized as Level 2.
ETFs are valued at the most recent sale price or official closing price reported on the exchange (U.S. or foreign) or over-the-counter market on which they trade. ETFs for which no sales are reported are valued at the calculated mean between the most recent bid and asked quotations on the relevant market or, if a mean cannot be determined, at the most recent bid quotation. ETFs are generally categorized as Level 1.
Investments in open-end investment companies are valued at their NAV each business day and are categorized as Level 1.
Forward currency contracts are valued at the prevailing forward exchange rate of the underlying currencies and are categorized as Level 2.
Securities and other assets for which market quotations are not readily available or for which the above valuation procedures are deemed not to reflect fair value are valued in a manner that is intended to reflect their fair value as determined in accordance with procedures approved by the Board and are generally categorized as Level 3. In accordance with the Funds’ valuation procedures, factors considered in determining value may include, but are not limited to, the type of the security; the size of the holding; the initial cost of the security; the existence of any contractual restrictions on the security’s disposition; the price and extent of public trading in similar securities of the issuer or of comparable companies; quotations or evaluated prices from broker-dealers and/or pricing services; information obtained from the issuer, analysts, and/or the appropriate stock exchange (for exchange-traded securities); an analysis of the company’s or issuer’s financial statements; an evaluation of the forces that influence the issuer and the market(s) in which the security is purchased and sold; length of time of a halt in trading of the security; movement in the security’s proxy index; and with respect to debt securities, the maturity, coupon, creditworthiness, currency denomination and the movement of the market in which the security is normally traded. The value determined under these procedures may differ from published values for the same securities.
Fair value pricing could result in a difference between the prices used to calculate a Fund’s NAV and the prices used by the Fund’s Underlying Index, which in turn could result in a difference between the Fund’s performance and the performance of the Fund’s Underlying Index.
Disclosure about the classification of the fair value measurements is included in a table following the Fund’s Schedule of Investments.
Cash Cash consists of cash held at banks and is on deposit with major financial institutions.
Investment Transactions and Investment Income Investment transactions are recorded as of the date that the securities are purchased or sold (trade date). Realized gains and losses from the sale or disposition of securities are calculated on the identified cost-method. Interest income is recorded on the accrual basis. All premiums and discounts are amortized/accreted for both tax and financial reporting purposes.
Accounting Standard Update In March 2017, the Financial Accounting Standards Board issued Accounting Standards Update 2017-08, Receivables-Nonrefundable fees and Other Costs (Subtopic 310-20): Premium Amortization on Purchased Callable Debt Securities which amends the amortization period for certain purchased callable debt securities. Under the new guidance, premium amortization of purchased callable debt securities that have explicit, non-contingent call features and are callable at fixed prices will be amortized to the earliest call date. The guidance will be applied on a modified retrospective basis and is effective for fiscal years, and their interim periods, beginning after December 15, 2018. Management is currently evaluating the impact of this guidance to the Funds.
Tax Information and Dividends and Distributions to Shareholders It is each Fund’s policy to comply with all requirements of the Internal Revenue Code of 1986, as amended (“the Code”). Each Fund intends to qualify for and to elect treatment as a separate Regulated Investment Company (“RIC”) under Subchapter M of the Code. It is the policy of each Fund to pay out dividends from its net investment income, if any, to investors monthly. Taxable net realized
88
DBX ETF Trust
Notes to Financial Statements(Continued)
gains from investment transactions, reduced by capital loss carryforwards, if any, are declared and distributed to shareholders at least annually. The capital loss carryforward amount, if any, is available to offset future net capital gains. The Funds may occasionally be required to make supplemental distributions at some other time during the year. The Funds reserve the right to declare special distributions if, in their reasonable discretion, such action is necessary or advisable to preserve the status of each Fund as a RIC or to avoid imposition of income or excise taxes on undistributed income. Dividends and distributions to shareholders, if any, are recorded on the ex-dividend date. The amount of dividends and distributions from net investment income and net realized capital gains are determined in accordance with Federal income tax regulations which may differ from U.S. GAAP. These “book/tax” differences are either considered temporary or permanent in nature. To the extent these differences are permanent in nature, such amounts are reclassified at the end of the year within the components of net assets based on their federal tax treatment; temporary differences do not require reclassification. Dividends and distributions, which exceed earnings and profits for the full year for tax purposes, are reported as a tax return of capital.
In accordance with U.S. GAAP requirements regarding accounting for uncertainties in income taxes, management has analyzed the Funds’ tax positions taken or expected to be taken on foreign, federal and state income tax returns for all open tax years and has concluded that no provision for income tax is required in the Funds’ financial statements.
The Funds recognize interest and penalties, if any, related to uncertain tax positions as income tax expense on the Statements of Operations. For the year ended August 31, 2019, the Funds did not incur any interest or penalties.
As of August 31, 2019, the components of accumulated earnings (losses) on a tax basis were as follows:
| Undistributed Ordinary Income* | Undistributed Long-Term Capital Gains | Capital and Other Gains (Losses) | Unrealized Appreciation (Depreciation) | Total Accumulated Earnings (Losses) | ||||||||||||||||
Xtrackers Barclays International Corporate Bond Hedged ETF | $ | 108,272 | $ | 132,743 | $ | (12,514 | ) | $ | 103,836 | $ | 332,337 | |||||||||
Xtrackers Barclays International Treasury Bond Hedged ETF | 103,867 | 147,205 | (760 | ) | 464,152 | 714,464 | ||||||||||||||
Xtrackers High Beta High Yield Bond ETF | 832,883 | — | (2,261,929 | ) | (2,268,529 | ) | (3,697,575 | ) | ||||||||||||
Xtrackers Low Beta High Yield Bond ETF | 575,162 | — | (1,952,587 | ) | 3,621,780 | 2,244,355 | ||||||||||||||
Xtrackers Short Duration High Yield Bond ETF | 109,641 | — | (558,204 | ) | (50,345 | ) | (498,908 | ) | ||||||||||||
Xtrackers USD High Yield Corporate Bond ETF | 14,425,689 | — | (15,423,289 | ) | 18,989,522 | 17,991,922 | ||||||||||||||
The tax character of dividends and distributions declared for the periods ended August 31, 2019 and August 31, 2018 were as follows:
| Year Ended August 31, 2019 | ||||||||
| Ordinary Income* | Long-Term Capital Gains | |||||||
Xtrackers Barclays International Corporate Bond Hedged ETF | $ | 115,588 | $ | — | ||||
Xtrackers Barclays International Treasury Bond Hedged ETF | 88,514 | 61,572 | ||||||
Xtrackers High Beta High Yield Bond ETF | 10,069,325 | — | ||||||
Xtrackers Low Beta High Yield Bond ETF | 6,517,014 | — | ||||||
Xtrackers Short Duration High Yield Bond ETF | 2,014,987 | — | ||||||
Xtrackers USD High Yield Corporate Bond ETF | 141,405,511 | — | ||||||
| Year Ended August 31, 2018 | ||||||||
| Ordinary Income* | ||||||||
Xtrackers Barclays International Corporate Bond Hedged ETF |
| $ | 113,203 | |||||
Xtrackers Barclays International Treasury Bond Hedged ETF |
| 63,240 | ||||||
Xtrackers High Beta High Yield Bond ETF |
| 5,126,702 | ||||||
Xtrackers Low Beta High Yield Bond ETF |
| 3,138,241 | ||||||
Xtrackers Short Duration High Yield Bond ETF |
| 1,017,257 | ||||||
Xtrackers USD High Yield Corporate Bond ETF |
| 45,466,199 | ||||||
| * | For tax purposes short-term capital gain distributions are considered ordinary income distributions. |
89
DBX ETF Trust
Notes to Financial Statements(Continued)
At August 31, 2019, for Federal income tax purposes, the Funds have capital loss carryforwards available as shown in the table below, to the extent provided by regulations, to offset future capital gains for an unlimited period. To the extent that these loss carryforwards are used to offset future capital gains, it is probable that the capital gains so offset will not be distributed to shareholders.
| Short-Term | Long-Term | Total Amount | ||||||||||
Xtrackers High Beta High Yield Bond ETF | $ | 630,551 | $ | 1,631,378 | $ | 2,261,929 | ||||||
Xtrackers Low Beta High Yield Bond ETF | 1,742,449 | 210,138 | 1,952,587 | |||||||||
Xtrackers Short Duration High Yield Bond ETF | 385,880 | 169,996 | 555,876 | |||||||||
Xtrackers USD High Yield Corporate Bond ETF | 6,496,810 | 8,743,651 | 15,240,461 | |||||||||
Capital losses incurred after October 31 (“post-October capital losses”) and late year ordinary losses incurred after December 31 within the taxable year are deemed to arise on the first business day of each Fund’s next taxable year. During the fiscal year ended August 31, 2019, the following Funds incurred and will elect to defer post-October capital losses and late year ordinary losses as follows:
| Late Year Ordinary Losses | ||||
Xtrackers Barclays International Corporate Bond Hedged ETF | $ | 12,514 | ||
Xtrackers Barclays International Treasury Bond Hedged ETF | 760 | |||
For the fiscal year ended August 31, 2019, the effect of permanent “book/tax” reclassifications to the components of net assets are included below. These differences are primarily due to premium amortization on debt securities and redemptions-in-kind.
| Distributable earnings (loss) | Paid-In Capital | |||||||
Xtrackers Low Beta High Yield Bond ETF | $ | (706 | ) | $ | 706 | |||
Xtrackers Short Duration High Yield Bond ETF | 343,333 | (343,333 | ) | |||||
Xtrackers USD High Yield Corporate Bond ETF | (10,009,682 | ) | 10,009,682 | |||||
As of August 31, 2019, the aggregate cost of investments for federal income tax purposes, the net unrealized appreciation or (depreciation) and the aggregated gross unrealized appreciation (depreciation) on investments were as follows:
| Aggregate Tax Cost | Net Unrealized Appreciation (Depreciation) | Aggregate Gross Unrealized Appreciation | Aggregate Gross Unrealized (Depreciation) | |||||||||||||
Xtrackers Barclays International Corporate Bond Hedged ETF | $ | 5,136,505 | $ | 105,570 | $ | 156,091 | $ | (50,521 | ) | |||||||
Xtrackers Barclays International Treasury Bond Hedged ETF | 9,984,800 | 465,668 | 563,990 | (98,322 | ) | |||||||||||
Xtrackers High Beta High Yield Bond ETF | 161,344,832 | (2,268,529 | ) | 4,437,044 | (6,705,573 | ) | ||||||||||
Xtrackers Low Beta High Yield Bond ETF | 142,948,829 | 3,621,780 | 3,864,215 | (242,435 | ) | |||||||||||
Xtrackers Short Duration High Yield Bond ETF | 24,248,227 | (50,345 | ) | 396,070 | (446,415 | ) | ||||||||||
Xtrackers USD High Yield Corporate Bond ETF | 3,215,031,594 | 18,989,522 | 82,163,091 | (63,173,569 | ) | |||||||||||
Foreign Taxes The Funds may be subject to foreign taxes (a portion of which may be reclaimable) on income, capital gains on investments, certain foreign currency transactions or other corporate events. All foreign taxes are recorded in accordance with the applicable foreign tax regulations and rates that exist in the foreign jurisdictions in which the Funds invest. These foreign taxes, if any, are paid by the Funds and are reflected in their Statements of Operations as follows: foreign taxes withheld at source are presented as a reduction of income, and foreign taxes on capital gains from sales of investments and foreign currency transactions are included in their respective net realized gain (loss) categories. Foreign taxes payable as of August 31, 2019, if any, are disclosed in the Funds’ Statements of Assets and Liabilities.
Foreign Currency Translations The books and records of the Funds are maintained in U.S. dollars. Investment securities and other assets and liabilities denominated in a foreign currency are translated into U.S. dollars at the prevailing exchange rates at year end. Purchases and sales of investment securities, income and expenses are translated into U.S. dollars at the prevailing exchange rates on the respective dates of the transactions.
90
DBX ETF Trust
Notes to Financial Statements(Continued)
Net realized and unrealized gains and losses on foreign currency transactions represent net gains and losses between trade and settlement dates on securities transactions, the acquisition and disposition of foreign currencies, and the difference between the amount of net investment income accrued and the U.S. dollar amount actually received. The portion of both realized and unrealized gains and losses on investments that results from fluctuations in foreign currency exchange rates is not separately disclosed, but is included with net realized and unrealized gain/appreciation and loss/depreciation on investments.
Securities Lending The Funds may lend securities to certain financial institutions under the terms of their securities lending agreement. During the term of the loans the Funds continue to receive interest and dividends generated by the securities and to participate in any changes in their market value. The Funds require the borrowers of the securities to maintain collateral with the Funds consisting of cash and/or securities issued or guaranteed by the U.S. Government, its agencies or instrumentalities having a value at least equal to the value of the securities loaned. When the collateral falls below specified amounts, the lending agent will use its best effort to obtain additional collateral on the next business day to meet required amounts under the securities lending agreement. During the year ended August 31, 2019, the Funds invested the cash collateral into a joint trading account in DWS Government & Agency Securities Portfolio, an affiliated money market fund managed by DWS Investment Management Americas, Inc. DWS Investment Management Americas, Inc. receives a management/administration fee (0.11% annualized effective rate as of August 31, 2019) on the cash collateral invested in DWS Government & Agency Securities Portfolio. The Funds receive compensation for lending their securities either in the form of fees or by earning interest on invested cash collateral net of borrower rebates and fees paid to a lending agent. Either the Fund or the borrower may terminate the loan at any time and the borrower, after notice, is required to return borrowed securities within a standard time period. There may be risks of delay and costs in recovery of securities or even loss of rights in the collateral should the borrower of the securities fail financially. If the Funds are not able to recover securities lent, the Funds may sell the collateral and purchase a replacement investment in the market, incurring the risk that the value of the replacement security is greater than the value of the collateral. The Funds are also subject to all investment risks associated with the reinvestment of any cash collateral received, including, but not limited to, interest rate, credit and liquidity risk associated with such investments.
As of August 31, 2019, the Funds listed below had securities on loan, which were classified as bonds in the Schedule of Investments. The value of the related collateral exceeded the value of the securities loaned at year end.
Remaining Contractual Maturity of the Agreements, as of August 31, 2019 | ||||||||||||||||||||
| Securities Lending Transactions | Overnight and Continuous | <30 Days | Between 30 & 90 days | >90 days | Total | |||||||||||||||
Xtrackers High Beta High Yield Bond ETF | ||||||||||||||||||||
Corporate Bonds | $ | 9,810,481 | $ | 35,096 | $ | 60,540 | $ | 1,233,388 | $ | 11,139,505 | ||||||||||
|
|
|
|
|
|
|
|
|
| |||||||||||
Gross amount of recognized liabilities and non-cash collateral for securities lending transactions |
| $ | 11,139,505 | |||||||||||||||||
Xtrackers Low Beta High Yield Bond ETF | ||||||||||||||||||||
Corporate Bonds | $ | 1,219,663 | $ | 15,802 | $ | 25,952 | $ | 279,245 | $ | 1,540,662 | ||||||||||
|
|
|
|
|
|
|
|
|
| |||||||||||
Gross amount of recognized liabilities and non-cash collateral for securities lending transactions |
| $ | 1,540,662 | |||||||||||||||||
Xtrackers Short Duration High Yield Bond ETF | ||||||||||||||||||||
Corporate Bonds | $ | 1,835,191 | $ | — | $ | 697 | $ | 37,264 | $ | 1,873,152 | ||||||||||
|
|
|
|
|
|
|
|
|
| |||||||||||
Gross amount of recognized liabilities and non-cash collateral for securities lending transactions |
| $ | 1,873,152 | |||||||||||||||||
Xtrackers USD High Yield Corporate Bond ETF | ||||||||||||||||||||
Corporate Bonds | $ | 161,595,001 | $ | 212,450 | $ | 350,865 | $ | 4,392,410 | $ | 166,550,726 | ||||||||||
|
|
|
|
|
|
|
|
|
| |||||||||||
Gross amount of recognized liabilities and non-cash collateral for securities lending transactions |
| $ | 166,550,726 | |||||||||||||||||
During the year ended August 31, 2019, Xtrackers Barclays International Corporate Bond Hedged ETF and Xtrackers Barclays International Treasury Bond Hedged ETF had no securities on loan.
Derivatives
Forward Foreign Currency Contracts Xtrackers Barclays International Corporate Bond Hedged ETF and Xtrackers Barclays International Treasury Bond Hedged ETF enter into forward foreign currency contracts (“forward
91
DBX ETF Trust
Notes to Financial Statements(Continued)
currency contracts”) designed to offset the Fund’s exposure to non-U.S. currencies. In addition, the Funds may enter into forward currency contracts to facilitate local securities settlements or to protect against currency exposure in connection with distributions to Shareholders.
A forward currency contract is a commitment to purchase or sell a foreign currency at a future date at a negotiated forward rate. For the year ended August 31, 2019, the Funds invested in forward currency contracts to hedge against changes in the value of the U.S. dollar against specified non-U.S. currencies.
The gain or loss arising from the difference between the original contract and the closing of such contract would be included in net realized gain or loss on forward currency contracts. Risks may arise from the potential inability of a counterparty to meet the terms of a contract and from unanticipated movements in the value of a foreign currency relative to the U.S. dollar. The face or contract amount, in U.S. dollars reflects the total exposure the Fund has in that particular currency contract.
A summary of the open forward currency contracts as of August 31, 2019 is included in a table following the Funds’ Schedule of Investments. The investment in forward currency contracts short vs. U.S. dollars had a contract value generally indicative of a range of the total exposure the respective Fund had to the value of non U.S. currencies during the year ended August 31, 2019.
The following tables summarize the value of the Funds’ derivative instruments held as of August 31, 2019 and the related location in the accompanying Statement of Assets and Liabilities, presented by primary underlying risk exposure:
Asset Derivatives | Liability Derivatives | |||||||||||||
| Xtrackers Barclays International Corporate Bond Hedged ETF |
| |||||||||||||
| Foreign exchange contracts | Unrealized appreciation on forward foreign currency contracts | $ | 77,136 | Unrealized depreciation on forward foreign currency contracts | $ | 11,878 | ||||||||
| Xtrackers Barclays International Treasury Bond Hedged ETF |
| |||||||||||||
| Foreign exchange contracts | Unrealized appreciation on forward foreign currency contracts | $ | 145,478 | Unrealized depreciation on forward foreign currency contracts | $ | 62,335 | ||||||||
Additionally, the amount of realized and unrealized gains and losses on derivative instruments recognized in the Funds’ earnings during the year ended August 31, 2019 and the related location in the accompanying Statement of Operations is summarized in the following tables by primary underlying risk exposure:
Net Realized Gain (Loss) from: | ||||
| Forward Foreign Currency Contracts — Foreign Exchange Contracts | ||||
Xtrackers Barclays International Corporate Bond Hedged ETF | $ | 351,452 | ||
Xtrackers Barclays International Treasury Bond Hedged ETF | 309,932 | |||
Net Change in Unrealized Appreciation (Depreciation) on: | ||||
| Forward Foreign Currency Contracts — Foreign Exchange Contracts | ||||
Xtrackers Barclays International Corporate Bond Hedged ETF | $ | 19,629 | ||
Xtrackers Barclays International Treasury Bond Hedged ETF | 49,225 | |||
For the year ended August 31, 2019 the average monthly volume of derivatives was as follows:
| Forward Foreign Currency Contracts (Contract Value) | ||||
Xtrackers Barclays International Corporate Bond Hedged ETF | $ | (5,015,757 | ) | |
Xtrackers Barclays International Treasury Bond Hedged ETF | (7,526,215 | ) | ||
As of August 31, 2019, the Funds have transactions subject to enforceable master netting agreements which govern the terms of certain transactions, and reduce the counterparty risk associated with such transactions. Master netting agreements allow a Fund to close out and net total exposure to a counterparty in the event of a deterioration in the credit quality or contractual default with respect to all of the transactions with a counterparty. As defined by the master netting agreement, the Funds may have collateral agreements with certain counterparties to mitigate risk. Interest expense from collateral received, if any, is included in Other expenses on the Statements of Operations. For financial reporting purposes
92
DBX ETF Trust
Notes to Financial Statements(Continued)
the Statement of Assets and Liabilities generally shows derivatives assets and liabilities on a gross basis, which reflects the full risks and exposures prior to netting. A reconciliation of the gross amounts on the Statement of Assets and Liabilities to the net amounts by counterparty, including any collateral exposure, is included in the following tables:
| Gross Amounts of Assets Presented in the Statement of Assets and Liabilities | Financial Instruments and Derivatives Available for Offset | Collateral Received | Net Amount of Derivatives Assets | Gross Amounts of Liabilities Presented in the Statement of Assets and Liabilities | Financial Instruments and Derivatives Available for Offset | Collateral Pledged | Net Amount of Derivatives Liabilities | |||||||||||||||||||||||||
| Xtrackers Barclays International Corporate Bond Hedged ETF |
| |||||||||||||||||||||||||||||||
The Bank of Nova Scotia | $ | 77,136 | $ | (11,878 | ) | $ | — | $ | 65,258 | $ | 11,878 | $ | (11,878 | ) | $ | — | $ | — | ||||||||||||||
| Xtrackers Barclays International Treasury Bond Hedged ETF |
| |||||||||||||||||||||||||||||||
The Bank of Nova Scotia | $ | 145,478 | $ | (62,335 | ) | $ | — | $ | 83,143 | $ | 62,335 | $ | (62,335 | ) | $ | — | $ | — | ||||||||||||||
Affiliated Cash Management Vehicles The Funds may invest uninvested cash balances in DWS Government Money Market Series and DWS ESG Liquidity Fund, affiliated money market funds which are managed by DWS Investment Management Americas, Inc. (“DIMA”), also an indirect, wholly owned subsidiary of DWS Group GmbH & Co. KGaA. Each affiliated money market fund is managed in accordance with Rule 2a-7 under the 1940 Act, which governs the quality, maturity, diversity and liquidity of instruments in which a money market fund may invest. DWS Government Money Market Series seeks to maintain a stable NAV, and DWS ESG Liquidity Fund maintains a floating NAV. The Funds indirectly bear their proportionate share of the expenses of each affiliated money market fund in which they invest. The Advisor will waive an amount of the unitary management fee payable to the Advisor by the Funds equal to such acquired fund’s fees and expenses on the Funds’ assets invested in the affiliated money market funds.
3. Investment Advisory and Other Agreements
The Advisor has overall responsibility for the general management and administration of the Funds, subject to the supervision of the Funds’ Board of Trustees. Under an investment advisory agreement between the Trust, on behalf of the Funds, and the Advisor (the “Investment Advisory Agreement”), the Advisor is responsible for arranging sub-advisory, transfer agency, custody, fund administration, and all other non-distribution related services for the Funds to operate.
For its investment advisory services to the Funds below, the Advisor was entitled to receive a unitary management fee based on each Fund’s average daily net assets, computed and accrued daily and payable monthly, at an annual rate equal to:
| Unitary Management Fee | ||||
Xtrackers Barclays International Corporate Bond Hedged ETF | 0.30 | % | ||
Xtrackers Barclays International Treasury Bond Hedged ETF | 0.25 | % | ||
Xtrackers High Beta High Yield Bond ETF | 0.35 | % | ||
Xtrackers Low Beta High Yield Bond ETF | 0.25 | % | ||
Xtrackers Short Duration High Yield Bond ETF | 0.20 | % | ||
Xtrackers USD High Yield Corporate Bond ETF | 0.20 | % | ||
The Advisor for Xtrackers Barclays International Treasury Bond Hedged ETF has contractually agreed to waive a portion of its management fees in an amount equal to the acquired fund’s fees and expenses attributable to the Fund’s investments in affiliated funds. For the year ended August 31, 2019, the Advisor waived $120 expenses of the Fund.
Effective May 31, 2019, the Advisor for Xtrackers High Beta High Yield Bond ETF has contractually agreed, until June 1, 2020, to waive a portion of its management fees to the extent necessary to prevent the operating expenses of the Fund from exceeding 0.20% of the Fund’s average daily net assets. For the period from May 31, 2019 through August 31, 2019, the Advisor waived $57,208 of expenses to the Fund.
Effective May 31, 2019, the Advisor for Xtrackers Low Beta High Yield Bond ETF has contractually agreed, until June 1, 2020, to waive a portion of its management fees to the extent necessary to prevent the operating expenses of the Fund from exceeding 0.20% of the Fund’s average daily net assets. For the period from May 31, 2019 through August 31, 2019, the Advisor waived $18,193 of expenses to the Fund.
93
DBX ETF Trust
Notes to Financial Statements(Continued)
Effective March 29, 2019, the Advisor for Xtrackers USD High Yield Corporate Bond ETF has contractually agreed, until March 30, 2020, to waive a portion of its management fees to the extent necessary to prevent the operating expenses of the Fund from exceeding 0.15% of the Fund’s average daily net assets. For the period from March 29, 2019 through August 31, 2019, the Advisor waived $611,362 of expenses to the Fund.
The Advisor for the Funds below has contractually agreed to waive a portion of its management fees in an amount equal to the acquired fund’s fees and expenses attributable to the Funds’ investments in affiliated cash management vehicles. For the year ended August 31, 2019, the Advisor waived expenses of the Funds as follows:
| Expenses Waived | ||||
Xtrackers Barclays International Corporate Bond Hedged ETF | $ | 16 | ||
Xtrackers Barclays International Treasury Bond Hedged ETF | 34 | |||
Xtrackers High Beta High Yield Bond ETF | 649 | |||
Xtrackers Low Beta High Yield Bond ETF | 983 | |||
Xtrackers Short Duration High Yield Bond ETF | 193 | |||
Xtrackers USD High Yield Corporate Bond ETF | 10,381 | |||
Out of the unitary management fee, the Advisor pays substantially all expenses of each Fund, including the cost of transfer agency, custody, fund administration, legal, audit and other services, and expenses of the Independent Trustees. Each Fund is responsible for the payment of interest expense, taxes, brokerage expenses, distribution fees or expenses, if any, litigation expenses and extraordinary expenses.
The Bank of New York Mellon, a wholly-owned subsidiary of The Bank of New York Mellon Corporation, serves as Administrator, Custodian, Accounting Agent, Lending Agent and Transfer Agent for each Fund.
ALPS Distributors, Inc. (the “Distributor”) serves as the distributor of Creation Units for each Fund on an agency basis. The Distributor does not maintain a secondary market in shares of the Funds.
The Board of Trustees is currently comprised of four Trustees, including three Independent Trustees. The Advisor paid retainer fees and attendance fees to each Independent Trustee; retainer fees to the Chairman of the Board of Trustees and the Chairman of the Audit Committee; and attendance fees to each member of the Audit Committee (which is comprised of all of the Funds’ Independent Trustees).
4. Investment Portfolio Transactions
For the year ended August 31, 2019, the cost of investments purchased and proceeds from sale of investments (excluding in-kind transactions and short-term investments) were as follows:
| Purchases | Sales | |||||||
Xtrackers Barclays International Corporate Bond Hedged ETF | $ | 2,063,167 | $ | 1,732,753 | ||||
Xtrackers Barclays International Treasury Bond Hedged ETF | 7,039,329 | 1,846,500 | ||||||
Xtrackers High Beta High Yield Bond ETF | 72,696,804 | 72,983,597 | ||||||
Xtrackers Low Beta High Yield Bond ETF | 79,525,843 | 75,874,627 | ||||||
Xtrackers Short Duration High Yield Bond ETF | 14,711,421 | 14,691,620 | ||||||
Xtrackers USD High Yield Corporate Bond ETF | 721,608,963 | 690,336,095 | ||||||
For the year ended August 31, 2019, the cost of in-kind purchases and proceeds from in-kind sales were as follows:
| Purchases | Sales | |||||||
Xtrackers High Beta High Yield Bond ETF | $ | 4,643,886 | $ | — | ||||
Xtrackers Low Beta High Yield Bond ETF | 7,188,196 | 4,793,487 | ||||||
Xtrackers Short Duration High Yield Bond ETF | 12,164,148 | 28,317,601 | ||||||
Xtrackers USD High Yield Corporate Bond ETF | 2,732,959,384 | 1,510,105,316 | ||||||
Transactions with Affiliates. The Funds may purchase securities from, or sell securities to, an affiliated fund provided the affiliation is solely due to having a common investment advisor, common officers, or common
94
DBX ETF Trust
Notes to Financial Statements(Continued)
trustees. During the year ended August 31, 2019, the Funds engaged in securities purchases and securities sales with an affiliated fund in compliance with Rule 17a-7 under the 1940 Act as follows:
| Securities Purchased | Securities Sold | Net Realized Gain (Loss) on Securities Sold | ||||||||||
Xtrackers High Beta High Yield Bond ETF | $ | 17,091,804 | $ | 40,343,213 | $ | 577,453 | ||||||
Xtrackers Low Beta High Yield Bond ETF | 40,343,213 | 17,091,804 | (716,449 | ) | ||||||||
5. Fund Share Transactions
As of August 31, 2019, there were unlimited Fund shares, no par value, authorized by the Trust. Fund shares are issued and redeemed by each Fund only in Creation Units or multiples thereof. Except when aggregated in Creation Units, shares of each Fund are not redeemable. Transactions in capital shares for each Fund are disclosed in detail in the Statements of Changes in Net Assets. The consideration for the purchase of Creation Units of a Fund generally consists of the in-kind contribution of a designated portfolio of securities constituting a portfolio sampling representation of the securities included in the respective Fund’s Underlying Index and an amount of cash, which under certain circumstances may include cash in lieu of portfolio securities. Investors purchasing and redeeming Creation Units pay a purchase transaction fee and a redemption transaction fee to offset transfer and other transaction costs associated with the issuance and redemption of Creation Units.
6. Investing in High-Yield Debt Securities
High-yield debt securities or junk bonds are generally regarded as speculative with respect to the issuer’s continuing ability to meet principal and interest payments. A fund’s performance could be hurt if an issuer of a debt security suffers an adverse change in financial condition that results in the issuer not making timely payments of interest or principal, a security downgrade or an inability to meet a financial obligation. High-yield debt securities’ total return and yield may generally be expected to fluctuate more than the total return and yield of investment-grade debt securities. A real or perceived economic downturn or an increase in market interest rates could cause a decline in the value of high-yield debt securities, result in increased redemptions and/or result in increased portfolio turnover, which could result in a decline in NAV of a fund, reduce liquidity for certain investments and/or increase costs. High-yield debt securities are often thinly traded and can be more difficult to sell and value accurately than investment-grade debt securities as there may be no established secondary market. Investments in high-yield debt securities could increase liquidity risk for a fund. In addition, the market for high-yield debt securities can experience sudden and sharp volatility which is generally associated more with investments in stocks.
7. Line of Credit
The Trust has entered into a senior unsecured credit facility with a syndication of banks which allows the Xtrackers Barclays International Corporate Bond Hedged ETF, Xtrackers Barclays International Treasury Bond Hedged ETF, Xtrackers USD High Yield Corporate Bond ETF and certain other funds managed by the Advisor to borrow up to $105 million. Each Fund may borrow money under this credit facility to the extent necessary for temporary or emergency purposes, including the funding of shareholder redemption requests, trade settlements, and as necessary to distribute to shareholders any income necessary to maintain each Funds’ status as a regulated investment company. Borrowings are charged an interest rate of 1.25% per annum plus the greater of the Federal Funds Effective Rate or the one-month LIBOR Rate. Each Fund may borrow up to the lesser of a pro-rata share of the credit facility at the amount listed below or 33 percent of its net assets as permitted by the Act. The Funds had no outstanding loans at August 31, 2019.
| Pro-rata Share | ||||
Xtrackers Barclays International Corporate Bond Hedged ETF | $ | 1,050,000 | ||
Xtrackers Barclays International Treasury Bond Hedged ETF | 1,050,000 | |||
Xtrackers USD High Yield Corporate Bond ETF | 5,250,000 | |||
95
DBX ETF Trust
Notes to Financial Statements(Continued)
8. Fund Liquidation
On October 24, 2019, the Board of Trustees unanimously voted to close and liquidate Xtrackers Barclays International Corporate Bond Hedged ETF and Xtrackers Barclays International Treasury Bond Hedged ETF. After the close of business on November 12, 2019, the Funds will no longer accept creation orders and the final day of trading on the exchange will be November 12, 2019. Proceeds of the liquidation will be sent to shareholders on or about November 21, 2019.
96
DBX ETF Trust
To the Shareholders of
Xtrackers Barclays International Corporate Bond Hedged ETF, Xtrackers Barclays International Treasury Bond Hedged ETF, Xtrackers High Beta High Yield Bond ETF, Xtrackers Low Beta High Yield Bond ETF, Xtrackers Short Duration High Yield Bond ETF, Xtrackers USD High Yield Corporate Bond ETF, and the Board of Trustees of DBX ETF Trust:
Opinion on the Financial Statements
We have audited the accompanying statements of assets and liabilities of Xtrackers Barclays International Corporate Bond Hedged ETF, Xtrackers Barclays International Treasury Bond Hedged ETF, Xtrackers High Beta High Yield Bond ETF, Xtrackers Low Beta High Yield Bond ETF, Xtrackers Short Duration High Yield Bond ETF, and Xtrackers USD High Yield Corporate Bond ETF (collectively referred to as the “Funds”), (six of the funds constituting DBX ETF Trust (the “Trust”)), including the schedules of investments, as of August 31, 2019, and the related statements of operations and changes in net assets, and the financial highlights for each of the periods indicated in the table below and the related notes (collectively referred to as the “financial statements”). In our opinion, the financial statements present fairly, in all material respects, the financial position of each of the Funds (six of the funds constituting DBX ETF Trust) at August 31, 2019, and the results of their operations, changes in net assets and financial highlights for each of the periods indicated in the table below, in conformity with U.S. generally accepted accounting principles.
Individual fund constituting the DBX ETF Trust | Statement of operations | Statements of changes in net assets | Financial highlights | |||
Xtrackers Barclays International Corporate Bond Hedged ETF
Xtrackers Barclays International Treasury Bond Hedged ETF | For the year ended August 31, 2019 | For each of the two years in the period ended August 31, 2019 | For each of the two years in the period ended August 31, 2019 and the period from October 25, 2016 (commencement of operations) through August 31, 2017 | |||
Xtrackers USD High Yield Corporate Bond ETF | For the year ended August 31, 2019 | For each of the two years in the period ended August 31, 2019 | For each of the two years in the period ended August 31, 2019 and the period from December 7, 2016 (commencement of operations) through August 31, 2017 | |||
Xtrackers High Beta High Yield Bond ETF
Xtrackers Low Beta High Yield Bond ETF | For the year ended August 31, 2019 | For the year ended August 31, 2019 and for the period from January 11, 2018 (commencement of operations) through August 31, 2018 | ||||
| Xtrackers Short Duration High Yield Bond ETF | For the year ended August 31, 2019 | For the year ended August 31, 2019 and for the period from January 10, 2018 (commencement of operations) through August 31, 2018 | ||||
Basis for Opinion
These financial statements are the responsibility of the Trust’s management. Our responsibility is to express an opinion on each of the Funds’ financial statements based on our audits. We are a public accounting firm registered with the Public Company Accounting Oversight Board (United States) (“PCAOB”) and are required to be independent with respect to the Trust in accordance with the U.S. federal securities laws and the applicable rules and regulations of the Securities and Exchange Commission and the PCAOB.
97
DBX ETF Trust
Report of Independent Registered Public Accounting Firm(continued)
We conducted our audits in accordance with the standards of the PCAOB. Those standards require that we plan and perform the audit to obtain reasonable assurance about whether the financial statements are free of material misstatement, whether due to error or fraud. The Trust is not required to have, nor were we engaged to perform, an audit of the Trust’s internal control over financial reporting. As part of our audits we are required to obtain an understanding of internal control over financial reporting but not for the purpose of expressing an opinion on the effectiveness of the Trust’s internal control over financial reporting. Accordingly, we express no such opinion.
Our audits included performing procedures to assess the risks of material misstatement of the financial statements, whether due to error or fraud, and performing procedures that respond to those risks. Such procedures included examining, on a test basis, evidence regarding the amounts and disclosures in the financial statements. Our procedures included confirmation of securities owned as of August 31, 2019, by correspondence with the custodians and brokers or by other appropriate auditing procedures where replies from brokers were not received. Our audits also included evaluating the accounting principles used and significant estimates made by management, as well as evaluating the overall presentation of the financial statements. We believe that our audits provide a reasonable basis for our opinion.

We have served as the auditor of one or more investment companies in the DWS family of funds since at least 1979, but we are unable to determine the specific year.
New York, New York
October 25, 2019
98
DBX ETF Trust
Name, Year of Birth, Position with the Trust | Business Experience and Directorships During the Past 5 Years | Number of Portfolios in Fund Complex Overseen | Other Directorships Held by Board Member | |||
Independent Board Members | ||||||
Stephen R. Byers (1953) Chairman since 2016, and Board Member since 2011 (formerly, Lead Independent Board Member, 2015-2016) | Independent Director (2011-present); Independent Consultant (2014-present); Director of Investment Management, the Dreyfus Corporation (2000-2006) and Vice Chairman and Chief Investment Officer, the Dreyfus Corporation (2002-2006). | 38 | The Arbitrage Funds, Sierra Income Corporation, Mutual Fund Directors Forum | |||
George O. Elston (1964) Board Member since 2011, Chairman of the Audit Committee since 2015 | Chief Financial Officer, Enzyvant (2018-present); Chief Executive Officer, 2X Oncology, Inc.(2017-2018); Senior Vice President and Chief Financial Officer, Juniper Pharmaceuticals, Inc. (2014-2016); Senior Vice President and Chief Financial Officer, KBI BioPharma Inc. (2013-2014); Managing Partner, Chatham Street Partners(2010-2013). | 38 | — | |||
J. David Officer (1948) Board Member since 2011, Chairman of the Nominating Committee since 2015 | Independent Director (2010-present); Vice Chairman, the Dreyfus Corporation (2006-2009); President, The Dreyfus Family of Funds, Inc. (2006-2009). | 38 | (Chairman of) Ilex Management Ltd,; Old Westbury Funds | |||
Name, Year of Birth, Position with the Trust | Business Experience and Directorships During the Past 5 Years | Number of Portfolios in Fund Complex Overseen | Other Directorships Held by Board Member | |||
Interested Board Member(2) | ||||||
Michael Gilligan(2) (1966) Board Member since 2016, and Treasurer, Chief Financial Officer and Controller since 2010 | Director(3) in DWS Finance Division (2008-Present); Manager, Treasurer and Chief Financial Officer of the Advisor (2010-present); Chief Financial Officer of Global Passive Asset Management Platform(2012-2018); Global Finance Director, Alternative Investments (2018-present); Chief Financial Officer of RREEF America LLC (2018-present). | 38 | The Advisor, DBX Strategic Advisors LLC and DB Commodity Services LLC | |||
Name, Year of Birth, Position with the Trust | Business Experience and Directorships During the Past 5 Years | |||||
Officers(2) | ||||||
Freddi Klassen(5) (1975) President and Chief Executive Officer, 2016-present | Director(3) in DWS and Chief Operating Officer in the Americas for the Traditional Asset Classes Department(2014-present); Manager and Chief Operating Officer of DWS Investment Management Americas, Inc. (2018-present) and the Advisor (2016-present); Global Chief Operating Officer for Equities Technology in the Investment Bank Division at Deutsche Bank AG (2013-2014); Chief Operating Officer for Exchange Traded Funds and Systematic Funds in Europe (2008-2013). | |||||
99
DBX ETF Trust
Board Members and Officers(Unaudited) (Continued)
Name, Year of Birth, Position with the Trust | Business Experience and Directorships During the Past 5 Years | |||||
Luke Oliver(5) (1980) Chief Operating Officer,2019-present | Managing Director(3) in DWS (2017-present); Director(3) in DWS (2009-2017); Head of Passive Americas Asset Management Platform (2019-present); Manager, Chief Executive Officer and Chief Investment Officer of the Advisor (2019-present); Head of ETF Capital Markets, Americas (2012-2018); Lead Portfolio Manager of PowerShares DB ETFs(2009-2012). | |||||
Frank Gecsedi(5) (1967) Chief Compliance Officer,2010-present | Director(3) in DWS Compliance Department (2016-present), Vice President in the Deutsche Asset Management Compliance Department at Deutsche Bank AG (2013-2016) and Chief Compliance Officer of the Advisor (2010-present); Vice President in Deutsche Bank’s Global Markets Legal, Risk and Capital Division (2010-2012). | |||||
Bryan Richards(5) (1978) Vice President,2016-present | Managing Director(3) in DWS (2018-present); Director(3) in DWS (2014-2018); Portfolio Manager in the Passive Asset Management Department at DWS (2011-present); Primary Portfolio Manager for the PowerShares DB Commodity ETFs (2011-2015). | |||||
Leslie Lowenbraun(5) (1953) Secretary,2016-present | Director(3) in DWS US Retail Legal (2018-present) and Chief Legal Officer of the Advisor (2017-present); Vice President in DWS US Retail Legal (2014-2018); Counsel at Skadden, Arps, Slate, Meagher & Flom LLP (2005-2014). | |||||
John Millette(6) (1962) Assistant Secretary,2019-present | Director(3) in DWS US Retail Legal (2003-present); Vice President and Secretary of DWS US registered investment companies advised by DWS Investment Management Americas, Inc. (1999-present); Chief Legal Officer, DWS Investment Management Americas, Inc. (2015-present); and Director and Vice President of DWS Trust Company (2016-present); formerly: Secretary of Deutsche Investment Management Americas Inc. (2015-2017). | |||||
Kevin Teevan(5) (1973) Assistant Treasurer, 2018-present | Vice President in Finance for US Traditional Asset Classes of DWS (2018-present); Vice President in Chief Operating Office for Global Transaction Banking at Deutsche Bank AG (2014-2017); Vice President in Finance for US Passive Asset Management Platform at Deutsche Bank AG (2011-2014). | |||||
Christina A. Morse(7) (1964) Assistant Secretary,2017-present | Vice President at BNY Mellon-Asset Servicing (2014-present); Vice President and Counsel at Lord Abbett & Co. LLC (2013-2014). | |||||
| (1) | The length of time served is represented by the year in which the Board Member joined the Board. |
| (2) | As a result of their respective positions held with the Advisor and its affiliates, these individuals are considered “interested persons” of the Advisor within the meaning of the 1940 Act. Interested persons receive no compensation from the fund. |
| (3) | Executive title, not a board directorship. |
| (4) | The length of time served is represented by the year in which the officer was first elected to the Trust in such capacity. |
| (5) | Address: 345 Park Avenue, New York, New York 10154. |
| (6) | Address: One International Place, Boston, Massachusetts 02110. |
| (7) | Address: BNY Mellon Asset Servicing, Atlantic Terminal Office Tower, 2 Hanson Place, Brooklyn, NY 11217. |
Each Board Member serves until his or her successor is duly elected or appointed and qualified. Each officer serves until he or she resigns, is removed, dies, retires or becomes disqualified.
The Funds’ Statement of Additional Information (“SAI”) includes additional information about the Funds’ Board Members. The SAI is available by calling 855-329-3837, or on the Company’s website at www.Xtrackers.com.
100
DBX ETF Trust
Proxy Voting Policies and Procedures
The Funds’ policies and procedures for voting proxies for portfolio securities and information about how each Fund voted proxies related to its portfolio securities during the most recent 12-month period ended June 30 are available on our Web site — www.Xtrackers.com (click on “Resources” and “Proxy Voting” at the top of the page) — or on the SEC’s Web site — www.sec.gov. To obtain a written copy of the Funds’ policies and procedures without charge, upon request, call us toll free at 855-329-3837.
Portfolio Holdings Information
The Funds are required to file their complete schedule of portfolio holdings with the SEC for their first and third fiscal quarters on Form N-Q or Form N-PORT (available for filings after March 31, 2019). Copies of the filings are available without charge, upon request on the SEC’s website at www.sec.gov and are available by calling the Trust at 855-329-3837.
Information about each Fund’s portfolio holdings is available daily at www.Xtrackers.com.
Discount/Premium Information
Information regarding how often shares of each Fund traded on NYSE Arca or Cboe, as applicable, at a price above (i.e., at a premium) or below (i.e., at a discount) the NAV of the Fund can be found at www.Xtrackers.com.
Tax Information
Form 1099-DIV and other year-end tax information provide shareholders with actual calendar year amounts that should be included in their tax returns. Shareholders should consult their tax advisors.
101
DBX ETF Trust
DBX Advisors LLC (“Advisors”) collectsnon-public information about you from the following sources: (i) information received from you on applications or other forms; and (ii) information about your transactions with the Advisors, Advisors’ affiliates and third-party service providers and vendors. Advisors does not disclose anynon-public personal information about you to anyone, other than as set forth below, as permitted by applicable law and regulation. Advisors may disclosenon-public personal information about you to the funds in which you invest, to Advisors’ affiliates, and tonon-affiliated companies that work with Advisors to service your account(s), or to provide services or process transactions that you have requested. Advisors may disclosenon-public personal information in situations that may include, but are not limited to, in response to legal and/or regulatory inquiries and the proposed or actual sale, assignment merger or other transfer of all or a portion of Advisors’ business to another business entity. Advisors may also disclosenon-public personal information about you to parties representing you, such as your investment representative, your accountant, your tax advisor, or to other third parties at your direction/consent. Advisors will not sell, rent, license or trade your personal and financial information to or with third parties for their own direct marketing use unless you give us general or specific consent to do so. If you decide to close your account(s) or become an inactive customer, Advisors will adhere to the privacy policies and practices as described in this notice. Advisors restricts access to your personal and account information to those employees who need to know that information to provide products and services to you. Advisors maintains reasonable and customary physical, electronic and procedural safeguards to guard yournon-public personal information.
Advisors reserves the right, at their discretion, to change, modify, add, or remove portions of this Privacy Policy Notice, and any of the policies described herein, at any time. Advisors will indicate any such changes to the Privacy Policy Notice at the privacy link which can be found at www.Xtrackers.com. At all times, you are bound by the then-current version of the Privacy Policy and all applicable laws. Advisors highly recommends that you review this Privacy Policy Notice from time to time to ensure that you are familiar with the most recent version. The examples contained in this Privacy Policy Notice are illustrations; they are not intended to be exclusive.
102
DBX ETF Trust
This report is intended for the shareholders of the DBX ETF Trust.
This report must be preceded or accompanied by a prospectus.
Investing involves risk, including the possible loss of principal. Bond investments are subject to interest rate, credit, liquidity and market risks to varying degrees. When interest rates rise, bond prices generally fall. Foreign investing involves greater and different risks than investing in U.S. companies, including currency fluctuations, less liquidity, less developed or less efficient trading markets, lack of comprehensive company information, political instability and differing auditing and legal standards. Emerging markets tend to be more volatile and less liquid than the markets of more mature economies, and generally have less diverse and less mature economic structures and less stable political systems than those of developed countries. Funds investing in a single industry, or group of industries, country or in a limited geographic region generally are more volatile than more diversified funds. Investments in lower-quality (“junk bonds”) andnon-rated securities present greater risk of loss than investments in higher-quality securities. Distressed securities are speculative and involve substantial risks beyond the risks of investing in junk bonds, such as no interest payments or repayment of principal, or the loss of the entire investment in the distressed security. These funds are currentlynon-diversified and can take larger positions in fewer issues, increasing their potential risk. Credit risk refers to the ability of an issuer to make timely payments of principal and interest. Investing in derivatives entails special risks relating to liquidity, leverage and credit that may reduce returns and/or increase volatility. A Fund’s use of forward currency contracts may not be successful in hedging currency exchange rates changes and could eliminate some or all of the benefit of an increase in the value of a foreign currency versus the U.S. dollar. Performance of the Funds may diverge from that of the Underlying Index due to operating expenses, transaction costs, cash flows, use of sampling strategies or operational inefficiencies. An investment in these Funds should be considered only as a supplement to a complete investment program for those investors willing to accept the risks associated with the Funds. Please read the prospectus for more information.
Shares of the Funds are bought and sold at market price (not NAV) throughout the day on the NYSE Arca, Inc. or Cboe BZX Exchange, Inc., as applicable. Transactions in Fund shares may result in brokerage commissions and may generate tax consequences. There can be no assurance that an active trading market for shares of a Fund will develop or be maintained.
DBX ETF Trust Funds are distributed by ALPS Distributors, Inc. (“ALPS”) The Funds are managed by DBX Advisors LLC which is not affiliated with ALPS.
The brand DWS represents DWS Group GmbH & Co. KGaA and any of its subsidiaries such as DWS Distributors, Inc. which offers investment products or DWS Investment Management Americas Inc. and RREEF America L.L.C. which offer advisory services.
HYUP, HYDW, SHYL, and HYLB are not sponsored, promoted, sold or supported in any other manner by Solactive AG (the “Licensor”) nor does the trademark or the Index Price at any time or in any other respect.
BLOOMBERG® is a trademark and service mark of Bloomberg Finance L.P. and its affiliates (collectively “Bloomberg”). Bloomberg or Bloomberg’s licensors, own all proprietary rights in the Bloomberg Indices. Bloomberg is not affiliated with DBX Advisors LLC (the “Adviser”), and neither approves, endorses, reviews or recommends IFIX and IGVT (the “Funds”). Bloomberg does not guarantee the timeliness, accurateness or completeness of any data or information relating to Barclays Global Aggregate Corporate Ex USD Bond Index (USD Hedged) or Barclays Global Aggregate Treasury Ex USD Issuer Diversified Bond Index (USD Hedged) (the “Indices”), and shall not be liable in any way to the Adviser, the Funds, investors in the Funds, or other third parties in respect of the use or accuracy of the Indices or any data included therein.
Copyright © 2019 DWS Group. All rights reserved. XtrackersTM is a trademark of DWS Investment GmbH. All other trademarks, servicemarks or registered trademarks are the property of their respective owners.
Not FDIC Insured | No Bank Guarantee | May Lose Value
DBX ETF Trust
Investment advisor DBX Advisors LLC 345 Park Avenue New York, NY 10154 | Administrator, custodian, fund accounting agent, lending agent & transfer agent The Bank of New York Mellon 240 Greenwich Street New York, NY 10286 | Distributor ALPS Distributors, Inc. 1290 Broadway Suite 1100 Denver, CO 80203 | ||
Independent registered public accounting firm Ernst & Young LLP 5 Times Square New York, NY 10036 | Legal counsel Dechert LLP 1095 Avenue of the Americas New York, NY 10036 | |||
R-52201-3 (10/19) DBX004118 (10/20)
August 31, 2019
Annual Report
DBX ETF Trust
Xtrackers MSCI ACWI ex USA ESG Leaders Equity ETF (ACSG)
Xtrackers MSCI EAFE ESG Leaders Equity ETF (EASG)
Xtrackers MSCI Emerging Markets ESG Leaders Equity ETF (EMSG)
Xtrackers MSCI USA ESG Leaders Equity ETF (USSG)
Xtrackers S&P 500 ESG ETF (SNPE)

DBX ETF Trust
| Page | ||||
| 1 | ||||
| 3 | ||||
Performance Summary | ||||
| 6 | ||||
| 8 | ||||
| 10 | ||||
| 12 | ||||
| 14 | ||||
| 16 | ||||
Schedule of Investments | ||||
| 17 | ||||
| 28 | ||||
| 34 | ||||
| 41 | ||||
| 46 | ||||
| 52 | ||||
| 54 | ||||
| 56 | ||||
| 58 | ||||
| 61 | ||||
| 71 | ||||
| 73 | ||||
Board Considerations in Approval of Investment Advisory Contract | 75 | |||
| 77 | ||||
| 78 | ||||
To our Shareholders:(Unaudited)
Dear Shareholder,
We are pleased to provide this annual report for our five equity ETFs tracking the environmental, social and governance (ESG) market for the period ended August 31, 2019.
The global economy experienced softened growth during the reporting period against a backdrop of rising trade tensions, uncertainty regarding Brexit1, and growing geopolitical tensions. However, robust labor markets supported the global economy amid a slowdown in manufacturing activity. The U.S. economy grew at a modest pace amid softening imports. Meanwhile, a downturn in manufacturing activity continued across the eurozone, owing to weak external demand. The Chinese economy also experienced a slowdown due to weak domestic demand and contracting exports. Amid this volatile environment, evidence based on research suggests that companies with ESG focus are increasing their competitive advantage by taking initiatives in product innovation and sustainable resource usage.
ESG-focused strategies have helped listed companies improve their performance on material ESG issues and will continue to do so. More financial institutions, companies, governments, central banks, and regulators are moving from purely exclusionary to integrated ESG strategies. In a major development, climate negotiators reached an agreement to bolster the 2015 Paris Climate Agreement at the 24th Conference of the Parties to the United Nations Framework Convention on Climate Change held in Poland. Moreover, in 2018, the European Commission announced its Sustainable Finance Action Plan, which seeks to encourage capital flows into areas that promote the United Nations’ Sustainable Development Goals and manage financial risks from climate change. Another important focus of the EU Action Plan centers on disclosure, which can be a significant value driver in the investment process.
In the U.S., domestic consumption remained strong, offsetting the effect of decreasing exports and an inventorybuild-up, which resulted in the U.S. equity markets reaching new highs. However, growth was modest due to lagged effects of the Federal Reserve Board’s (FRB) tightening cycle and a weaker external environment. Furthermore, the manufacturing sector and imports showed signs of softening, in part reflecting the effect of trade tariffs2 and a fading fiscal stimulus. To insure against downside risks, the FRB lowered the target range for the federal funds rate by .25 percent, marking the first rate cut in a decade. The FRB reduced the rate to help counter effects of weak global growth, trade uncertainty, and muted inflation pressures.
Economic growth in the eurozone remained subdued throughout the reporting period as all the major economies lost steam. The downturn in the manufacturing sector affected Germany and Italy due to their traditionally export-reliant economies. Nonetheless, private consumption in the region should drive the economy going forward, supported by robust labor markets and healthy wage growth. Consequently, the European Central Bank stated it would maintain its accommodative stance at least through the first half of 2020. Elsewhere, the Japanese economy grew at a moderate pace as business investment fell modestly and both exports and imports declined sharply. However, public sector investments and spending in the housing sector supported the economy. Domestic demand remained strong during the period but a consumption tax hike scheduled for October 2019 could hurt sentiment. Escalating trade war, in addition to weaker currency, and rising debt levels across many economies have also put pressure on emerging markets.
Geopolitical tensions continue to command the attention of financial markets. Uncertainty regarding the trade deal, worries over ano-deal Brexit, and new trade barriers between Europe and the U.S. are some major headwinds ahead of the global economy. However, subdued inflation provides major central banks with an incentive to cut rates further. Furthermore, as sustainable investing now takes prominence with both policymakers and investors, we have integrated ESG factors into a range of passive equity products, which will help you invest for a sustainable future.
1
Our team appreciates your trust and looks forward to serving your investment needs through innovative index-driven strategies.
Sincerely,
/s/ Freddi Klassen
Freddi Klassen
President and Chief Executive Officer
1 Brexit is a combination of the words “Britain” and “Exit” and describes the exit of the United Kingdom from the European Union.
2 Tariffs are used to restrict imports by increasing the price of goods and services purchased from overseas and making them less attractive to consumers. A specific tariff is levied as a fixed fee based on the type of item.
Assumptions, estimates and opinions contained in this document constitute our judgment as of the date of the document and are subject to change without notice. Any projections are based on a number of assumptions as to market conditions and there can be no guarantee that any projected results will be achieved. Past performance is not a guarantee of future results.
2
DBX ETF Trust
Xtrackers MSCI ACWI ex USA ESG Leaders Equity ETF
The Xtrackers MSCI ACWI ex USA ESG Leaders Equity ETF (ACSG) seeks investment results that correspond generally to the performance, before fees and expenses, of the MSCI ACWI ex USA ESG Leaders Index (the ACSG Index). The ACSG Index provides exposure to companies in the developed and emerging markets that exhibit high Environmental, Social and Governance (ESG) performance compared to its sector peers. For the period ended December 6, 2018 (Commencement of Operations) to August 31, 2019, ACSG shares returned 3.44%, compared to the ACSG Index return of 3.56%.
The majority of sectors contributed positively to performance during the period with Information Technology and Consumer Discretionary contributing the most to performance. Energy was the only negative contributor to performance. From a geographical perspective, Australia, Switzerland and United Kingdom were the major positive contributors, while Republic of South Korea and South Africa were the major negative contributors to performance.
Xtrackers MSCI EAFE ESG Leaders Equity ETF
The Xtrackers MSCI EAFE ESG Leaders Equity ETF (EASG) seeks investment results that correspond generally to the performance, before fees and expenses, of the MSCI EAFE ESG Leaders Index (the EASG Index). The EASG Index provides exposure to companies across developed market countries, (except the United States and Canada) that exhibit high Environmental, Social and Governance (ESG) performance relative to their sector peers. For the period ended September 6, 2018 (Commencement of Operations) to August 31, 2019, EASG shares returned-0.91%, compared to the EASG Index return of-0.95%.
The Financials, Energy and Materials sectors were the major negative contributors to performance, while Consumer Staples and Health Care were the primary positive contributors to performance. From a geographical perspective, Switzerland, Australia and Denmark were the major positive contributors, while Japan and Germany were the major negative contributors to performance.
Xtrackers MSCI Emerging Markets ESG Leaders Equity ETF
The Xtrackers MSCI Emerging Markets ESG Leaders Equity ETF (EMSG), seeks investment results that correspond generally to the performance, before fees and expenses, of the MSCI Emerging Markets ESG Leaders Index (the EMSG Index). The EMSG Index is designed to provide exposure to large andmid-sized companies across emerging markets that exhibit high Environmental, Social and Governance (ESG) performance relative to its sector peers. For the period ended December 6, 2018 (Commencement of Operations) to August 31, 2019, EMSG shares returned-0.17%, compared to the EMSG Index return of 0.27%.
The Materials, Financials and Energy sectors were the major negative contributors to performance, while Consumer Discretionary and Information Technology were the primary positive contributors to performance. From a geographical perspective, Taiwan (Republic of China), China and Brazil were the major positive contributors, while Republic of South Korea and South Africa were the major negative contributors to performance.
Xtrackers MSCI USA ESG Leaders Equity ETF
The Xtrackers MSCI USA ESG Leaders Equity ETF (USSG) seeks investment results that correspond generally to the performance, before fees and expenses, of the MSCI USA ESG Leaders Index (the USSG Index). The USSG Index is designed to provide exposure to large and medium sized companies in US markets that exhibit high Environmental, Social and Governance (ESG) performance relative to its sector peers. For the period ended March 7, 2019 (Commencement of Operations) to August 31, 2019, USSG shares returned 7.23%, compared to the USSG Index return of 7.28%.
The majority of sectors contributed positively to performance during the period with Information Technology and Consumer Staples contributing the most to performance. Energy was the only negative contributor to performance.
3
DBX ETF Trust
Management’s Discussion of Fund Performance(Unaudited) (Continued)
Xtrackers S&P 500 ESG ETF
The Xtrackers S&P 500 ESG ETF (SNPE), seeks investment results that correspond generally to the performance, before fees and expenses, of the S&P 500 ESG Index (the SNPE Index). The SNPE Index measures the performance of securities that fulfills sustainability criteria, while preserving similar overall industry group weights as S&P 500 index. For the period ended June 26, 2019 (Commencement of Operations) to August 31, 2019, SNPE shares returned 1.20%, compared to the SNPE Index return of 1.22%.
The Information Services, Communication Services and Consumer Staples sectors were the primary positive contributors to performance, while Health Care and Energy were the major negative contributors to performance.
*************************
Performance data quoted represents past performance and does not guarantee future results. Investment returns and principal value of an investment will fluctuate so that an investor’s shares, when sold or redeemed, may be worth more or less than their original cost. Current performance may be lower or higher than the performance data quoted. To obtain the most recentmonth-end performance data visit www.Xtrackers.com. Returns assume that dividends and capital gains distributions have been reinvested. See pages6-15 of this report for additional performance information, including performance data based on market value.
The views expressed in this report reflect those of the portfolio management team only through the end of the period of the report as stated on the cover. The management team’s views are subject to change at any time based on market and other conditions and should not be construed as a recommendation. Current and future portfolio holdings are subject to risk.
4
This Page is Intentionally Left Blank
5
DBX ETF Trust
Xtrackers MSCI ACWI ex USA ESG Leaders Equity ETF (ACSG)
The Xtrackers MSCI ACWI ex USA ESG Leaders Equity ETF (the “Fund”), using a “passive” or indexing investment approach, seeks investment results that correspond generally to the performance, before fees and expenses, of the MSCI ACWI ex USA ESG Leaders Index (the “Underlying Index”). The Underlying Index is a capitalization weighted index that provides exposure to companies with high environmental, social and governance (“ESG”) performance relative to their sector peers and is constructed using regional indexes that provide exposure to large- and medium-capitalization companies from developed and emerging markets countries (excluding the United States). It is not possible to invest directly into an index.
| Performance as of August 31, 2019 |
| Cumulative Total Returns | ||||||||
| Net Asset Value | Market Value | MSCI ACWI ex USA ESG Leaders Index | MSCI ACWI ex USA Index | |||||
Since Inception1 | 3.44% | 3.48% | 3.56% | 3.01% | ||||
1 Total returns are calculated based on the commencement of operations, December 6, 2018 (“Inception”).
Past performance is no guarantee of future results. Current performance may be lower or higher than the performance data quoted. Performance data current to the most recentmonth-end is available at www.Xtrackers.com. Performance results assume reinvestment of all dividends and capital gain distributions and do not reflect the deduction of taxes that a shareholder would pay on fund distributions or on the sale of fund shares or redemption of fund creation units. The investment return and principal value of shares will vary with changes in market conditions. Shares may be worth more or less than their original cost when they are sold in the market or redeemed. Performance for certain funds may reflect a waiver of a portion of investment management fees. Without such waiver, performance would have been lower. The estimated operating expense ratio as disclosed in the most recent prospectus dated December 28, 2018, was 0.16%, and may differ from the expense ratio disclosed in the Financial Highlights table in this report.
The Fund’s net asset value or “NAV” is calculated by dividing the value of the Fund’s total assets less total liabilities by the number of shares outstanding. The price used to calculate market return (“Market Price”) is determined by using the midpoint between the highest bid and the lowest offer on the primary stock exchange on which shares of a fund are listed for trading, as of the time that such fund’s NAV is calculated. Since shares of a fund may not have traded in the secondary market until after the fund’s inception, for the period from inception to the first day of secondary trading, the NAV of the fund is used as a proxy for the Market Price to calculate market returns. Market and NAV returns assume that dividends and capital gain distributions have been reinvested at Market Price and NAV, respectively.
An index is a statistical composite that tracks a specified financial market or sector. Unlike a fund, an index does not actually hold a portfolio of securities and therefore does not incur the expenses incurred by a fund. These expenses negatively impact fund performance. Also, market returns do not include brokerage commissions that may be payable on secondary market transactions. If brokerage commissions were included, market returns would be lower.
6
DBX ETF Trust
Performance Summary(Unaudited)
Xtrackers MSCI ACWI ex USA ESG Leaders Equity ETF (ACSG)(Continued)
| Growth of an Assumed $10,000 Investment |
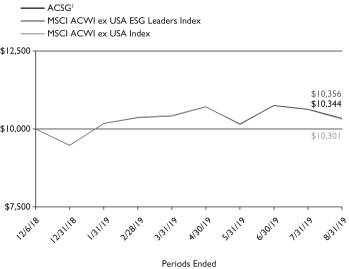
1 Based on Net Asset Value from commencement of operations, December 6, 2018.
| Sector Diversification* as of August 31, 2019 |
Financials | 21.7% | |||
Consumer Discretionary | 12.5% | |||
Industrials | 11.5% | |||
Consumer Staples | 9.5% | |||
Information Technology | 9.3% | |||
Health Care | 8.9% | |||
Materials | 7.4% | |||
Communication Services | 7.3% | |||
Energy | 5.3% | |||
Utilities | 3.5% | |||
Real Estate | 3.1% | |||
|
| |||
Total | 100.0% |
| Ten Largest Equity Holdings as of August 31, 2019 (14.7% of Net Assets) |
| Description | % of Net Assets | |||
Alibaba Group Holding Ltd. (China) | 2.4% | |||
Tencent Holdings Ltd. (China) | 2.3% | |||
Taiwan Semiconductor Manufacturing Co. Ltd. (Taiwan) | 2.0% | |||
Roche Holding AG (Switzerland) | 1.9% | |||
TOTAL SA (France) | 1.1% | |||
SAP SE (Germany) | 1.1% | |||
GlaxoSmithKline PLC (United Kingdom) | 1.0% | |||
Toronto-Dominion Bank (Canada) | 1.0% | |||
Naspers Ltd. (South Africa) | 1.0% | |||
Commonwealth Bank of Australia (Australia) | 0.9% | |||
| Country Diversification* as of August 31, 2019 |
Japan | 15.5% | |||
United Kingdom | 9.1% | |||
Canada | 7.6% | |||
China | 7.2% | |||
Germany | 6.9% | |||
Australia | 6.6% | |||
France | 6.6% | |||
Switzerland | 5.2% | |||
Taiwan | 4.1% | |||
Netherlands | 3.1% | |||
India | 2.8% | |||
Spain | 2.6% | |||
South Africa | 2.5% | |||
Hong Kong | 2.2% | |||
Sweden | 2.2% | |||
Other | 15.8% | |||
|
| |||
Total | 100.0% |
* As a percent of total investments excluding exchange-traded funds, securities lending collateral and cash equivalents.
Portfolio holdings and characteristics are subject to change. For more complete details about the Fund’s investment portfolio see page 17.
7
DBX ETF Trust
Performance Summary(Unaudited)
Xtrackers MSCI EAFE ESG Leaders Equity ETF (EASG)
The Xtrackers MSCI EAFE ESG Leaders Equity ETF (the “Fund”), using a “passive” or indexing investment approach, seeks investment results that correspond generally to the performance, before fees and expenses, of the MSCI EAFE ESG Leaders Index (the “Underlying Index”). The Underlying Index is a capitalization weighted index that provides exposure to companies with high environmental, social and governance (“ESG”) performance relative to their sector peers and consists of large- and medium-capitalization companies across developed markets countries, excluding Canada and the United States. It is not possible to invest directly into an index.
| Performance as of August 31, 2019 |
| Cumulative Total Returns | ||||||||
| Net Asset Value | Market Value | MSCI EAFE ESG Leaders Index | MSCI EAFE Index | |||||
Since Inception1 | -0.91% | -0.70% | -0.95% | -1.33% | ||||
1 Total returns are calculated based on the commencement of operations, September 6, 2018 (“Inception”).
Past performance is no guarantee of future results. Current performance may be lower or higher than the performance data quoted. Performance data current to the most recentmonth-end is available at www.Xtrackers.com. Performance results assume reinvestment of all dividends and capital gain distributions and do not reflect the deduction of taxes that a shareholder would pay on fund distributions or on the sale of fund shares or redemption of fund creation units. The investment return and principal value of shares will vary with changes in market conditions. Shares may be worth more or less than their original cost when they are sold in the market or redeemed. Performance for certain funds may reflect a waiver of a portion of investment management fees. Without such waiver, performance would have been lower. The estimated operating expense ratio as disclosed in the most recent prospectus dated December 28, 2018, was 0.14%, and may differ from the expense ratio disclosed in the Financial Highlights table in this report.
The Fund’s net asset value or “NAV” is calculated by dividing the value of the Fund’s total assets less total liabilities by the number of shares outstanding. The price used to calculate market return (“Market Price”) is determined by using the midpoint between the highest bid and the lowest offer on the primary stock exchange on which shares of a fund are listed for trading, as of the time that such fund’s NAV is calculated. Since shares of a fund may not have traded in the secondary market until after the fund’s inception, for the period from inception to the first day of secondary trading, the NAV of the fund is used as a proxy for the Market Price to calculate market returns. Market and NAV returns assume that dividends and capital gain distributions have been reinvested at Market Price and NAV, respectively.
An index is a statistical composite that tracks a specified financial market or sector. Unlike a fund, an index does not actually hold a portfolio of securities and therefore does not incur the expenses incurred by a fund. These expenses negatively impact fund performance. Also, market returns do not include brokerage commissions that may be payable on secondary market transactions. If brokerage commissions were included, market returns would be lower.
8
DBX ETF Trust
Performance Summary(Unaudited)
Xtrackers MSCI EAFE ESG Leaders Equity ETF (EASG)(Continued)
| Growth of an Assumed $10,000 Investment |
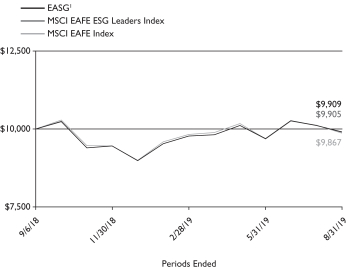
1 Based on Net Asset Value from commencement of operations, September 6, 2018.
| Sector Diversification* as of August 31, 2019 | ||
Financials | 19.2% | |||
Industrials | 14.6% | |||
Health Care | 12.3% | |||
Consumer Staples | 11.1% | |||
Consumer Discretionary | 11.0% | |||
Materials | 7.7% | |||
Information Technology | 7.3% | |||
Communication Services | 5.5% | |||
Utilities | 4.1% | |||
Real Estate | 3.6% | |||
Energy | 3.6% | |||
|
| |||
| 100.0% |
| Ten Largest Equity Holdings as of August 31, 2019 (15.7% of Net Assets) | ||
| Description | % of Net Assets | |||
Roche Holding AG (Switzerland) | 2.8% | |||
TOTAL SA (France) | 1.8% | |||
SAP SE (Germany) | 1.7% | |||
GlaxoSmithKline PLC (United Kingdom) | 1.5% | |||
Commonwealth Bank of Australia (Australia) | 1.4% | |||
ASML Holding NV (Netherlands) | 1.4% | |||
Allianz SE (Germany) | 1.4% | |||
Unilever NV (United Kingdom) | 1.3% | |||
Novo Nordisk A/S (Denmark) | 1.3% | |||
Siemens AG (Germany) | 1.1% | |||
| Country Diversification* as of August 31, 2019 | ||
Japan | 23.7% | |||
United Kingdom | 13.8% | |||
Germany | 10.4% | |||
France | 9.9% | |||
Australia | 9.9% | |||
Switzerland | 7.9% | |||
Netherlands | 4.7% | |||
Spain | 3.9% | |||
Sweden | 3.3% | |||
Denmark | 2.8% | |||
Hong Kong | 2.5% | |||
Other | 7.2% | |||
|
| |||
Total | 100.0% |
* As a percent of total investments excluding exchange-traded funds, securities lending collateral and cash equivalents.
Portfolio holdings and characteristics are subject to change. For more complete details about the Fund’s investment portfolio see page 28.
9
DBX ETF Trust
Performance Summary(Unaudited)
Xtrackers MSCI Emerging Markets ESG Leaders Equity ETF (EMSG)
The Xtrackers MSCI Emerging Markets ESG Leaders Equity ETF (the “Fund”), using a “passive” or indexing investment approach, seeks investment results that correspond generally to the performance, before fees and expenses, of the MSCI Emerging Markets ESG Leaders Index (the “Underlying Index”). The Underlying Index is a capitalization weighted index that provides exposure to companies with high environmental, social and governance (“ESG”) performance relative to their sector peers and consists of large- and medium-capitalization companies across emerging markets countries. It is not possible to invest directly into an index.
| Performance as of August 31, 2019 |
| Cumulative Total Returns | ||||||||
| Net Asset Value | Market Value | MSCI Emerging Markets ESG Leaders Index | MSCI Emerging Markets Index | |||||
Since Inception1 | -0.17% | -0.24% | 0.27% | -0.80% | ||||
1 Total returns are calculated based on the commencement of operations, December 6, 2018 (“Inception”).
Past performance is no guarantee of future results. Current performance may be lower or higher than the performance data quoted. Performance data current to the most recentmonth-end is available at www.Xtrackers.com. Performance results assume reinvestment of all dividends and capital gain distributions and do not reflect the deduction of taxes that a shareholder would pay on fund distributions or on the sale of fund shares or redemption of fund creation units. The investment return and principal value of shares will vary with changes in market conditions. Shares may be worth more or less than their original cost when they are sold in the market or redeemed. Performance for certain funds may reflect a waiver of a portion of investment management fees. Without such waiver, performance would have been lower. The estimated operating expense ratio as disclosed in the most recent prospectus dated December 28, 2018, was 0.20%, and may differ from the expense ratio disclosed in the Financial Highlights table in this report.
The Fund’s net asset value or “NAV” is calculated by dividing the value of the Fund’s total assets less total liabilities by the number of shares outstanding. The price used to calculate market return (“Market Price”) is determined by using the midpoint between the highest bid and the lowest offer on the primary stock exchange on which shares of a fund are listed for trading, as of the time that such fund’s NAV is calculated. Since shares of a fund may not have traded in the secondary market until after the fund’s inception, for the period from inception to the first day of secondary trading, the NAV of the fund is used as a proxy for the Market Price to calculate market returns. Market and NAV returns assume that dividends and capital gain distributions have been reinvested at Market Price and NAV, respectively.
An index is a statistical composite that tracks a specified financial market or sector. Unlike a fund, an index does not actually hold a portfolio of securities and therefore does not incur the expenses incurred by a fund. These expenses negatively impact fund performance. Also, market returns do not include brokerage commissions that may be payable on secondary market transactions. If brokerage commissions were included, market returns would be lower.
10
DBX ETF Trust
Performance Summary(Unaudited)
Xtrackers MSCI Emerging Markets ESG Leaders Equity ETF (EMSG)(Continued)
| Growth of an Assumed $10,000 Investment |
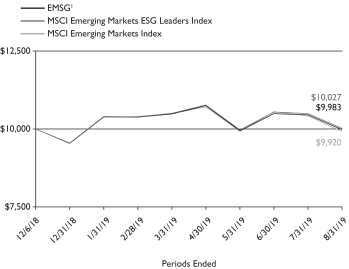
1 Based on Net Asset Value from commencement of operations, December 6, 2018.
| Sector Diversification* as of August 31, 2019 | ||
Financials | 25.0% | |||
Consumer Discretionary | 17.9% | |||
Information Technology | 14.2% | |||
Communication Services | 12.4% | |||
Consumer Staples | 6.3% | |||
Energy | 6.1% | |||
Materials | 5.8% | |||
Industrials | 4.4% | |||
Health Care | 3.1% | |||
Real Estate | 2.5% | |||
Utilities | 2.3% | |||
|
| |||
Total | 100.0% |
| Ten Largest Equity Holdings as of August 31, 2019 (39.0% of Net Assets) | ||
| Description | % of Net Assets | |||
Alibaba Group Holding Ltd. (China) | 9.1% | |||
Tencent Holdings Ltd. (China) | 8.6% | |||
Taiwan Semiconductor Manufacturing Co. Ltd. (Taiwan) | 7.4% | |||
Naspers Ltd. (South Africa) | 3.6% | |||
China Construction Bank Corp. (China) | 2.6% | |||
Reliance Industries Ltd. (India) | 1.8% | |||
Housing Development Finance Corp. Ltd. (India) | 1.8% | |||
Itau Unibanco Holding SA (Brazil) | 1.5% | |||
Infosys Ltd. (India) | 1.4% | |||
Banco Bradesco SA (Brazil) | 1.2% | |||
| Country Diversification* as of August 31, 2019 | ||
China | 27.0% | |||
Taiwan | 15.5% | |||
India | 10.9% | |||
South Africa | 9.4% | |||
Brazil | 6.9% | |||
South Korea | 5.3% | |||
Thailand | 4.0% | |||
Indonesia | 3.1% | |||
Malaysia | 3.0% | |||
Russia | 2.3% | |||
Hong Kong | 2.2% | |||
Other | 10.4% | |||
|
| |||
Total | 100.0% |
* As a percent of total investments excluding exchange-traded funds, securities lending collateral and cash equivalents.
Portfolio holdings and characteristics are subject to change. For more complete details about the Fund’s investment portfolio see page 34.
11
DBX ETF Trust
Performance Summary(Unaudited)
Xtrackers MSCI USA ESG Leaders Equity ETF (USSG)
Xtrackers MSCI USA ESG Leaders Equity ETF (the “Fund”), using a “passive” or indexing investment approach, seeks investment results that correspond generally to the performance, before fees and expenses, of the MSCI USA ESG Leaders Index (the “Underlying Index”). The Underlying Index is a capitalization weighted index that provides exposure to companies with high environmental, social and governance (“ESG”) performance relative to their sector peers and consists of large- and medium-capitalization companies in the U.S. market. The S&P 500 Index or the Standard & Poor’s 500 Index is a market-capitalization-weighted index of the 500 largest U.S. publicly traded companies. It is not possible to invest directly into an index.
| Performance as of August 31, 2019 |
| Cumulative Total Returns | ||||||||
| Net Asset Value | Market Value | MSCI USA ESG Leaders Index | S&P 500 Index | |||||
Since Inception1 | 7.23% | 7.15% | 7.28% | 6.63% | ||||
1 Total returns are calculated based on the commencement of operations, March 7, 2019 (“Inception”).
Past performance is no guarantee of future results. Current performance may be lower or higher than the performance data quoted. Performance data current to the most recentmonth-end is available at www.Xtrackers.com. Performance results assume reinvestment of all dividends and capital gain distributions and do not reflect the deduction of taxes that a shareholder would pay on fund distributions or on the sale of fund shares or redemption of fund creation units. The investment return and principal value of shares will vary with changes in market conditions. Shares may be worth more or less than their original cost when they are sold in the market or redeemed. Performance for certain funds may reflect a waiver of a portion of investment management fees. Without such waiver, performance would have been lower. The estimated operating expense ratio as disclosed in the most recent prospectus dated March 5, 2019, was 0.10%, and may differ from the expense ratio disclosed in the Financial Highlights table in this report.
The Fund’s net asset value or “NAV” is calculated by dividing the value of the Fund’s total assets less total liabilities by the number of shares outstanding. The price used to calculate market return (“Market Price”) is determined by using the midpoint between the highest bid and the lowest offer on the primary stock exchange on which shares of a fund are listed for trading, as of the time that such fund’s NAV is calculated. Since shares of a fund may not have traded in the secondary market until after the fund’s inception, for the period from inception to the first day of secondary trading, the NAV of the fund is used as a proxy for the Market Price to calculate market returns. Market and NAV returns assume that dividends and capital gain distributions have been reinvested at Market Price and NAV, respectively.
An index is a statistical composite that tracks a specified financial market or sector. Unlike a fund, an index does not actually hold a portfolio of securities and therefore does not incur the expenses incurred by a fund. These expenses negatively impact fund performance. Also, market returns do not include brokerage commissions that may be payable on secondary market transactions. If brokerage commissions were included, market returns would be lower.
12
DBX ETF Trust
Performance Summary(Unaudited)
Xtrackers MSCI USA ESG Leaders Equity ETF (USSG)(Continued)
| Growth of an Assumed $10,000 Investment |
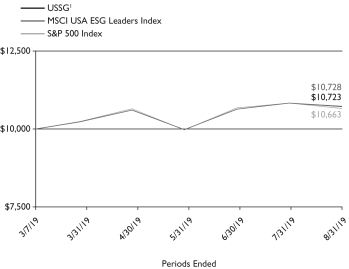
1 Based on Net Asset Value from commencement of operations, March 7, 2019.
| Sector Diversification* as of August 31, 2019 | ||
Information Technology | 22.7% | |||
Health Care | 13.4% | |||
Financials | 12.3% | |||
Communication Services | 11.1% | |||
Consumer Discretionary | 10.6% | |||
Industrials | 8.9% | |||
Consumer Staples | 7.6% | |||
Energy | 3.8% | |||
Utilities | 3.4% | |||
Real Estate | 3.4% | |||
Materials | 2.8% | |||
|
| |||
Total | 100.0% |
| Ten Largest Equity Holdings as of August 31, 2019 (29.9% of Net Assets) | ||
| Description | % of Net Assets | |||
Microsoft Corp. | 7.7% | |||
Alphabet, Inc. | 5.6% | |||
Johnson & Johnson | 2.6% | |||
Visa, Inc. | 2.4% | |||
Procter & Gamble Co. | 2.3% | |||
Mastercard, Inc. | 2.0% | |||
Home Depot, Inc. | 1.9% | |||
Walt Disney Co. | 1.9% | |||
Verizon Communications, Inc. | 1.8% | |||
Coca-Cola Co. | 1.7% | |||
* As a percent of total investments excluding securities lending collateral and cash equivalents.
Portfolio holdings and characteristics are subject to change. For more complete details about the Fund’s investment portfolio see page 41.
13
DBX ETF Trust
Performance Summary(Unaudited)
Xtrackers S&P 500 ESG ETF (SNPE)
Xtrackers S&P 500 ESG ETF (the “Fund”), using a “passive” or indexing investment approach, seeks investment results that correspond generally to the performance, before fees and expenses, of the S&P 500 ESG Index (the “Underlying Index”). The Underlying Index is a broad-based, market capitalization weighted index that provides exposure to companies with high environmental, social and governance (“ESG”) performance relative to their sector peers, while maintaining similar overall industry group weights as the S&P 500 Index. It is not possible to invest directly into an index.
| Performance as of August 31, 2019 |
| Cumulative Total Returns | ||||||||
| Net Asset Value | Market Value | S&P 500 ESG Index | S&P 500 Index | |||||
Since Inception1 | 1.20% | 1.20% | 1.22% | 0.68% | ||||
1 Total returns are calculated based on the commencement of operations, June 26, 2019 (“Inception”).
Past performance is no guarantee of future results. Current performance may be lower or higher than the performance data quoted. Performance data current to the most recentmonth-end is available at www.Xtrackers.com. Performance results assume reinvestment of all dividends and capital gain distributions and do not reflect the deduction of taxes that a shareholder would pay on fund distributions or on the sale of fund shares or redemption of fund creation units. The investment return and principal value of shares will vary with changes in market conditions. Shares may be worth more or less than their original cost when they are sold in the market or redeemed. Performance for certain funds may reflect a waiver of a portion of investment management fees. Without such waiver, performance would have been lower. The estimated operating expense ratio as disclosed in the most recent prospectus dated April 10, 2019, as amended June 26, 2019, was 0.11%, and may differ from the expense ratio disclosed in the Financial Highlights table in this report.
The Fund’s net asset value or “NAV” is calculated by dividing the value of the Fund’s total assets less total liabilities by the number of shares outstanding. The price used to calculate market return (“Market Price”) is determined by using the midpoint between the highest bid and the lowest offer on the primary stock exchange on which shares of a fund are listed for trading, as of the time that such fund’s NAV is calculated. Since shares of a fund may not have traded in the secondary market until after the fund’s inception, for the period from inception to the first day of secondary trading, the NAV of the fund is used as a proxy for the Market Price to calculate market returns. Market and NAV returns assume that dividends and capital gain distributions have been reinvested at Market Price and NAV, respectively.
An index is a statistical composite that tracks a specified financial market or sector. Unlike a fund, an index does not actually hold a portfolio of securities and therefore does not incur the expenses incurred by a fund. These expenses negatively impact fund performance. Also, market returns do not include brokerage commissions that may be payable on secondary market transactions. If brokerage commissions were included, market returns would be lower.
14
DBX ETF Trust
Xtrackers S&P 500 ESG ETF (SNPE)(Continued)
| Growth of an Assumed $10,000 Investment |
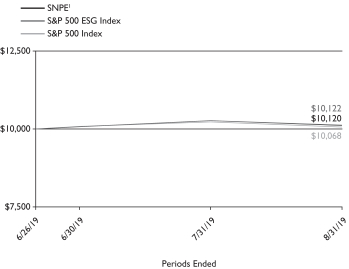
1 Based on Net Asset Value from commencement of operations, June 26, 2019.
| Sector Diversification* as of August 31, 2019 |
Information Technology | 23.2% | |||
Health Care | 14.5% | |||
Financials | 11.9% | |||
Consumer Discretionary | 11.0% | |||
Communication Services | 10.5% | |||
Industrials | 7.7% | |||
Consumer Staples | 7.7% | |||
Energy | 4.6% | |||
Utilities | 3.4% | |||
Real Estate | 3.2% | |||
Materials | 2.3% | |||
|
| |||
Total | 100.0% |
| Ten Largest Equity Holdings as of August 31, 2019 (28.5% of Net Assets) |
| Description | % of Net Assets | |||
Microsoft Corp. | 5.7% | |||
Apple, Inc. | 4.9% | |||
Amazon.com, Inc. | 4.0% | |||
Alphabet, Inc. | 3.9% | |||
JPMorgan Chase & Co. | 1.9% | |||
Johnson & Johnson | 1.8% | |||
Visa, Inc. | 1.7% | |||
Procter & Gamble Co. | 1.6% | |||
Exxon Mobil Corp. | 1.6% | |||
AT&T, Inc. | 1.4% | |||
* As a percent of total investments excluding securities lending collateral and cash equivalents.
Portfolio holdings and characteristics are subject to change. For more complete details about the Fund’s investment portfolio see page 46.
15
DBX ETF Trust
As a shareholder of one or more of the Funds, you incur two types of costs: (1) transaction costs, including brokerage commissions paid on purchases and sales of fund shares, and (2) ongoing costs, including management fees and other Fund expenses. In the most recentsix-month period the Funds limited these expenses; had they not done so, expenses would have been higher. The expense examples below are intended to help you understand your ongoing costs (in dollars) of investing in the Funds and to compare these costs with the ongoing costs of investing in other funds.
The examples in the tables are based on an investment of $1,000 invested at the beginning of the period and held for the entire period (March 1, 2019 to August 31, 2019), except Xtrackers MSCI USA ESG Leaders Equity ETF and Xtrackers S&P 500 ESG ETF which is based on an investment of $1,000 invested at the beginning of the period and held for the entire period (commencement of operations, as noted below, to August 31, 2019).
Actual expenses
The first line in the following tables provides information about actual account values and actual expenses. You may use the information in this line, together with the amount you invested, to estimate the expenses that you paid over the period. Simply divide your account value by $1,000 (for example, an $8,600 account value divided by $1,000 = 8.6), then multiply the result by the number in the first line under the heading “Expenses Paid During the Period” to estimate the expenses you paid on your account during this period.
Hypothetical example for comparison purposes
The second line in the following tables provides information about hypothetical account values and hypothetical expenses based on the Funds’ actual expense ratios and an assumed rate of return of 5% per year before expenses (which is not the Funds’ actual return). The hypothetical account values and expenses may not be used to estimate the actual ending account balance or expenses you paid for the period. You may use this information to compare the ongoing costs of investing in the Fund and other funds. To do so, compare this 5% hypothetical example with the 5% hypothetical examples that appear in the shareholder reports of the other funds.
Please note that the expenses shown in the tables are meant to highlight your ongoing costs only, and do not reflect any transactional costs. Therefore the second line in the table is useful in comparing ongoing costs only, and will not help you determine the relative total costs of owning different funds. In addition, if these transactional costs were included, your costs would have been higher.
| Beginning Account Value March 1, 2019 | Ending Account Value August 31, 2019 | Annualized Expense Ratio | Expenses Paid During the Period Per $1,000(1) | |||||||||||||
| Xtrackers MSCI ACWI ex USA ESG Leaders Equity ETF |
| |||||||||||||||
Actual | $ | 1,000.00 | $ | 998.20 | 0.16 | % | $ | 0.81 | ||||||||
Hypothetical (5% return before expenses) | $ | 1,000.00 | $ | 1,024.40 | 0.16 | % | $ | 0.82 | ||||||||
| Xtrackers MSCI EAFE ESG Leaders Equity ETF |
| |||||||||||||||
Actual | $ | 1,000.00 | $ | 1,013.90 | 0.14 | % | $ | 0.71 | ||||||||
Hypothetical (5% return before expenses) | $ | 1,000.00 | $ | 1,024.50 | 0.14 | % | $ | 0.71 | ||||||||
| Xtrackers MSCI Emerging Markets ESG Leaders Equity ETF |
| |||||||||||||||
Actual | $ | 1,000.00 | $ | 961.10 | 0.20 | % | $ | 0.99 | ||||||||
Hypothetical (5% return before expenses) | $ | 1,000.00 | $ | 1,024.20 | 0.20 | % | $ | 1.02 | ||||||||
| Xtrackers MSCI USA ESG Leaders Equity ETF |
| |||||||||||||||
Actual(2) | $ | 1,000.00 | $ | 1,072.30 | 0.10 | % | $ | 0.51 | ||||||||
Hypothetical (5% return before expenses) | $ | 1,000.00 | $ | 1,024.70 | 0.10 | % | $ | 0.51 | ||||||||
| Xtrackers S&P 500 ESG ETF |
| |||||||||||||||
Actual(3) | $ | 1,000.00 | $ | 1,012.00 | 0.11 | % | $ | 0.20 | ||||||||
Hypothetical (5% return before expenses) | $ | 1,000.00 | $ | 1,024.65 | 0.11 | % | $ | 0.56 | ||||||||
(1) Expenses are equal to each Fund’s annualized expense ratio, multiplied by the average account value over the period, multiplied by 184 (the number of days in the most recentsix-month period), then divided by 365.
(2) Expenses are equal to each Fund’s annualized expense ratio, multiplied by the average account value over the period, multiplied by 178 (the number of days in the period March 7, 2019 (commencement of operations) to August 31, 2019), then divided by 365.
(3) Expenses are equal to each Fund’s annualized expense ratio, multiplied by the average account value over the period, multiplied by 67 (the number of days in the period June 26, 2019 (commencement of operations) to August 31, 2019), then divided by 365.
16
DBX ETF Trust
Xtrackers MSCI ACWI ex USA ESG Leaders Equity ETF
August 31, 2019
Number | Value | |||||||
| COMMON STOCKS — 98.0% | ||||||||
| Argentina — 0.0% | ||||||||
Globant SA* | 26 | $ | 2,468 | |||||
Transportadora de Gas del Sur SA, ADR | 99 | 743 | ||||||
|
| |||||||
| 3,211 | ||||||||
|
| |||||||
| Australia — 6.5% | ||||||||
AMP Ltd. | 2,188 | 2,499 | ||||||
APA Group (a) | 835 | 6,194 | ||||||
ASX Ltd. | 155 | 9,013 | ||||||
Aurizon Holdings Ltd. | 1,511 | 6,017 | ||||||
AusNet Services | 892 | 1,082 | ||||||
Australia & New Zealand Banking Group Ltd. | 2,104 | 37,906 | ||||||
Bendigo & Adelaide Bank Ltd. | 349 | 2,629 | ||||||
BlueScope Steel Ltd. | 405 | 3,408 | ||||||
Boral Ltd. | 903 | 2,586 | ||||||
Brambles Ltd. | 1,155 | 8,793 | ||||||
Coca-Cola Amatil Ltd. | 374 | 2,739 | ||||||
Cochlear Ltd. | 42 | 6,169 | ||||||
Coles Group Ltd. | 913 | 8,513 | ||||||
Commonwealth Bank of Australia | 1,324 | 70,516 | ||||||
Computershare Ltd. | 382 | 3,958 | ||||||
CSL Ltd. | 341 | 55,340 | ||||||
Dexus REIT | 757 | 6,579 | ||||||
Fortescue Metals Group Ltd. (b) | 1,107 | 5,967 | ||||||
Goodman Group REIT | 1,223 | 11,964 | ||||||
GPT Group REIT | 1,286 | 5,537 | ||||||
Harvey Norman Holdings Ltd. | 273 | 806 | ||||||
Insurance Australia Group Ltd. | 1,678 | 9,112 | ||||||
Lendlease Group (a) | 426 | 4,897 | ||||||
Macquarie Group Ltd. | 247 | 20,609 | ||||||
Mirvac Group REIT | 2,834 | 6,091 | ||||||
National Australia Bank Ltd. | 2,057 | 37,918 | ||||||
Newcrest Mining Ltd. | 602 | 15,007 | ||||||
Orica Ltd. | 274 | 3,975 | ||||||
Origin Energy Ltd. | 1,289 | 6,626 | ||||||
Ramsay Health Care Ltd. | 100 | 4,423 | ||||||
SEEK Ltd. | 253 | 3,465 | ||||||
Stockland REIT | 1,811 | 5,515 | ||||||
Sydney Airport (a) | 803 | 4,561 | ||||||
Telstra Corp. Ltd. | 3,062 | 7,674 | ||||||
Transurban Group (a) | 2,013 | 20,276 | ||||||
Wesfarmers Ltd. | 868 | 22,866 | ||||||
Westpac Banking Corp. | 2,566 | 48,788 | ||||||
Woodside Petroleum Ltd. | 724 | 15,673 | ||||||
WorleyParsons Ltd. | 291 | 2,410 | ||||||
|
| |||||||
| 498,101 | ||||||||
|
| |||||||
| Austria — 0.1% | ||||||||
ANDRITZ AG | 45 | 1,588 | ||||||
OMV AG | 122 | 6,235 | ||||||
voestalpine AG (b) | 83 | 1,915 | ||||||
|
| |||||||
| 9,738 | ||||||||
|
| |||||||
| Belgium — 0.4% | ||||||||
Colruyt SA | 42 | 2,154 | ||||||
KBC Group NV | 182 | 10,551 | ||||||
Number | Value | |||||||
| Belgium (Continued) | ||||||||
Solvay SA | 55 | $ | 5,555 | |||||
UCB SA | 93 | 6,958 | ||||||
Umicore SA | 149 | 4,754 | ||||||
|
| |||||||
| 29,972 | ||||||||
|
| |||||||
| Brazil — 0.9% | ||||||||
Atacadao SA | 300 | 1,619 | ||||||
B3 SA — Brasil Bolsa Balcao | 1,535 | 16,642 | ||||||
Banco do Brasil SA | 647 | 7,240 | ||||||
Banco Santander Brasil SA | 305 | 3,144 | ||||||
BR Malls Participacoes SA | 662 | 2,160 | ||||||
Cielo SA | 960 | 1,800 | ||||||
Cosan SA | 109 | 1,319 | ||||||
Energisa SA | 124 | 1,425 | ||||||
Engie Brasil Energia SA | 121 | 1,317 | ||||||
Klabin SA | 521 | 1,899 | ||||||
Localiza Rent a Car SA | 385 | 4,383 | ||||||
Lojas Renner SA | 674 | 8,245 | ||||||
M Dias Branco SA | 87 | 762 | ||||||
Multiplan Empreendimentos Imobiliarios SA | 246 | 1,547 | ||||||
Natura Cosmeticos SA | 138 | 2,203 | ||||||
Notre Dame Intermedica Participacoes SA | 254 | 3,447 | ||||||
TIM Participacoes SA | 689 | 2,051 | ||||||
Ultrapar Participacoes SA | 512 | 2,035 | ||||||
WEG SA | 575 | 3,131 | ||||||
|
| |||||||
| 66,369 | ||||||||
|
| |||||||
| Canada — 7.5% | ||||||||
Agnico Eagle Mines Ltd. | 171 | 10,712 | ||||||
Alimentation Couche-Tard, Inc., Class B | 305 | 19,235 | ||||||
AltaGas Ltd. | 186 | 2,531 | ||||||
Aurora Cannabis, Inc.* | 487 | 2,690 | ||||||
Bank of Montreal | 466 | 32,004 | ||||||
Bank of Nova Scotia | 900 | 47,953 | ||||||
BlackBerry Ltd.* | 378 | 2,600 | ||||||
CAE, Inc. | 193 | 5,062 | ||||||
Canadian Imperial Bank of Commerce (b) | 324 | 25,146 | ||||||
Canadian National Railway Co. | 522 | 48,162 | ||||||
Canadian Tire Corp. Ltd., Class A | 43 | 4,352 | ||||||
Canopy Growth Corp.* | 148 | 3,504 | ||||||
Cenovus Energy, Inc. | 762 | 6,663 | ||||||
CGI, Inc.* | 166 | 13,045 | ||||||
Cronos Group, Inc.* | 142 | 1,570 | ||||||
Empire Co. Ltd., Class A | 130 | 3,593 | ||||||
Enbridge, Inc. | 1,461 | 48,960 | ||||||
Encana Corp. | 1,109 | 4,924 | ||||||
First Capital Realty, Inc. | 141 | 2,353 | ||||||
Fortis, Inc. | 335 | 13,858 | ||||||
Franco-Nevada Corp. | 136 | 13,311 | ||||||
Gildan Activewear, Inc. | 165 | 6,061 | ||||||
Loblaw Cos. Ltd. | 141 | 7,732 | ||||||
Lundin Mining Corp. | 473 | 2,260 | ||||||
Magna International, Inc. | 221 | 11,087 | ||||||
Metro, Inc. | 185 | 7,865 | ||||||
Nutrien Ltd. | 427 | 21,546 | ||||||
Open Text Corp. | 217 | 8,507 | ||||||
| See Notes to Financial Statements. | 17 |
DBX ETF Trust
Schedule of Investments
Xtrackers MSCI ACWI ex USA ESG Leaders Equity ETF(Continued)
August 31, 2019
Number | Value | |||||||
| Canada (Continued) | ||||||||
PrairieSky Royalty Ltd. | 128 | $ | 1,625 | |||||
Rogers Communications, Inc., Class B | 269 | 13,343 | ||||||
Shopify, Inc., Class A* | 75 | 28,944 | ||||||
Sun Life Financial, Inc. | 457 | 18,768 | ||||||
Suncor Energy, Inc. | 1,130 | 33,114 | ||||||
Teck Resources Ltd., Class B | 372 | 6,346 | ||||||
TELUS Corp. | 114 | 4,138 | ||||||
Toronto-Dominion Bank | 1,370 | 74,439 | ||||||
Vermilion Energy, Inc. (b) | 139 | 1,982 | ||||||
West Fraser Timber Co. Ltd. | 50 | 1,765 | ||||||
Wheaton Precious Metals Corp. | 312 | 9,195 | ||||||
WSP Global, Inc. | 69 | 3,743 | ||||||
|
| |||||||
| 574,688 | ||||||||
|
| |||||||
| Chile — 0.2% | ||||||||
Empresa Nacional de Telecomunicaciones SA* | 142 | 1,240 | ||||||
Empresas CMPC SA | 870 | 2,013 | ||||||
Empresas COPEC SA | 344 | 3,108 | ||||||
Enel Americas SA | 27,627 | 4,538 | ||||||
Latam Airlines Group SA | 241 | 2,030 | ||||||
SACI Falabella | 691 | 3,890 | ||||||
|
| |||||||
| 16,819 | ||||||||
|
| |||||||
| China — 7.1% | ||||||||
3SBio, Inc., 144A* | 961 | 1,482 | ||||||
51job, Inc., ADR* (b) | 19 | 1,367 | ||||||
AAC Technologies Holdings, Inc. | 587 | 2,540 | ||||||
Air China Ltd., Class H | 1,505 | 1,304 | ||||||
Alibaba Group Holding Ltd., ADR* | 1,043 | 182,556 | ||||||
BAIC Motor Corp. Ltd., Class H, 144A | 2,439 | 1,376 | ||||||
Baozun, Inc., ADR* (b) | 37 | 1,693 | ||||||
BYD Co. Ltd., Class H | 520 | 2,695 | ||||||
BYD Electronic International Co. Ltd. (b) | 923 | 1,111 | ||||||
China Aoyuan Group Ltd. | 943 | 1,112 | ||||||
China CITIC Bank Corp. Ltd., Class H | 5,765 | 3,017 | ||||||
China Conch Venture Holdings Ltd. | 1,074 | 3,578 | ||||||
China Construction Bank Corp., Class H | 70,999 | 52,737 | ||||||
China Eastern Airlines Corp. Ltd., Class A* | 1,000 | 708 | ||||||
China Longyuan Power Group Corp. Ltd., Class H | 2,531 | 1,392 | ||||||
China Medical System Holdings Ltd. | 1,129 | 1,409 | ||||||
China Merchants Bank Co. Ltd., Class H | 2,873 | 13,090 | ||||||
China Merchants Shekou Industrial Zone Holdings Co. Ltd., Class A | 300 | 828 | ||||||
China Minsheng Banking Corp. Ltd., Class H | 5,002 | 3,294 | ||||||
China Molybdenum Co. Ltd., Class H | 2,790 | 758 | ||||||
China Resources Pharmaceutical Group Ltd., 144A | 1,134 | 1,172 | ||||||
China Shenhua Energy Co. Ltd., Class A | 300 | 783 | ||||||
China Shenhua Energy Co. Ltd., Class H | 2,532 | 4,951 | ||||||
China Vanke Co. Ltd., Class A | 200 | 721 | ||||||
China Vanke Co. Ltd., Class H | 1,182 | 4,088 | ||||||
Country Garden Services Holdings Co. Ltd. | 762 | 2,208 | ||||||
CSPC Pharmaceutical Group Ltd. | 3,457 | 6,918 | ||||||
Dali Foods Group Co. Ltd., 144A | 2,295 | 1,529 | ||||||
Number | Value | |||||||
| China (Continued) | ||||||||
ENN Energy Holdings Ltd. | 577 | $ | 6,591 | |||||
Fosun International Ltd. | 1,660 | 2,136 | ||||||
Genscript Biotech Corp.* | 673 | 1,510 | ||||||
Greentown Service Group Co. Ltd. | 968 | 886 | ||||||
Guangzhou Automobile Group Co. Ltd., Class H | 2,280 | 2,299 | ||||||
HengTen Networks Group Ltd.* | 34,321 | 548 | ||||||
Huaneng Renewables Corp. Ltd., Class H (c) | 3,894 | 1,078 | ||||||
Inner Mongolia Yitai Coal Co. Ltd., Class B | 1,300 | 1,157 | ||||||
Jiangsu Expressway Co. Ltd., Class H | 979 | 1,299 | ||||||
Kingdee International Software Group Co. Ltd. | 1,806 | 1,637 | ||||||
Lenovo Group Ltd. | 5,418 | 3,568 | ||||||
Meituan Dianping, Class B* | 824 | 7,819 | ||||||
Pinduoduo, Inc., ADR*(b) | 165 | 5,407 | ||||||
Shandong Weigao Group Medical Polymer Co. Ltd., Class H | 1,701 | 1,756 | ||||||
Shanghai Pharmaceuticals Holding Co. Ltd., Class H | 766 | 1,447 | ||||||
Shenzhou International Group Holdings Ltd. | 602 | 8,183 | ||||||
Shui On Land Ltd. | 3,711 | 772 | ||||||
Sinopharm Group Co. Ltd., Class H | 908 | 3,285 | ||||||
Sinotrans Ltd., Class H | 2,766 | 893 | ||||||
SOHO China Ltd. | 2,427 | 712 | ||||||
Suning.com Co. Ltd., Class A | 800 | 1,201 | ||||||
Tencent Holdings Ltd. | 4,197 | 173,979 | ||||||
Tong Ren Tang Technologies Co. Ltd., Class H | 848 | 921 | ||||||
Vipshop Holdings Ltd., ADR* | 385 | 3,222 | ||||||
Wuxi Biologics Cayman, Inc., 144A* | 354 | 3,732 | ||||||
Xinjiang Goldwind Science & Technology Co. Ltd., Class H | 1,036 | 1,220 | ||||||
Yuzhou Properties Co. Ltd. | 2,258 | 951 | ||||||
Zhejiang Expressway Co. Ltd., Class H | 1,141 | 955 | ||||||
Zhongsheng Group Holdings Ltd. | 723 | 2,261 | ||||||
|
| |||||||
| 541,842 | ||||||||
|
| |||||||
| Colombia — 0.1% | ||||||||
Cementos Argos SA | 346 | 776 | ||||||
Grupo Argos SA | 309 | 1,624 | ||||||
Interconexion Electrica SA ESP | 400 | 2,123 | ||||||
|
| |||||||
| 4,523 | ||||||||
|
| |||||||
| Czech Republic — 0.0% | ||||||||
CEZ AS | 92 | 2,029 | ||||||
Komercni banka AS | 46 | 1,635 | ||||||
|
| |||||||
| 3,664 | ||||||||
|
| |||||||
| Denmark — 1.8% | ||||||||
Chr Hansen Holding A/S | 73 | 6,146 | ||||||
Coloplast A/S, Class B | 91 | 10,860 | ||||||
Demant A/S* | 75 | 2,276 | ||||||
Genmab A/S* | 45 | 9,202 | ||||||
H Lundbeck A/S | 52 | 1,897 | ||||||
ISS A/S | 111 | 2,822 | ||||||
Novo Nordisk A/S, Class B | 1,305 | 67,904 | ||||||
Novozymes A/S, Class B | 172 | 7,349 | ||||||
| See Notes to Financial Statements. | 18 |
DBX ETF Trust
Schedule of Investments
Xtrackers MSCI ACWI ex USA ESG Leaders Equity ETF(Continued)
August 31, 2019
Number | Value | |||||||
| Denmark (Continued) | ||||||||
Orsted A/S, 144A | 148 | $ | 14,161 | |||||
Pandora A/S (b) | 83 | 3,543 | ||||||
Tryg A/S | 104 | 3,115 | ||||||
Vestas Wind Systems A/S | 143 | 10,529 | ||||||
|
| |||||||
| 139,804 | ||||||||
|
| |||||||
| Egypt — 0.1% | ||||||||
Commercial International Bank Egypt SAE | 983 | 4,762 | ||||||
|
| |||||||
| Finland — 0.5% | ||||||||
Metso OYJ | 72 | 2,702 | ||||||
Neste OYJ | 335 | 10,566 | ||||||
Nokian Renkaat OYJ | 85 | 2,331 | ||||||
Orion OYJ, Class B | 74 | 2,752 | ||||||
Stora Enso OYJ, Class R | 402 | 4,502 | ||||||
UPM-Kymmene OYJ | 391 | 10,558 | ||||||
Wartsila OYJ Abp | 318 | 3,907 | ||||||
|
| |||||||
| 37,318 | ||||||||
|
| |||||||
| France — 6.5% | ||||||||
Accor SA | 126 | 5,448 | ||||||
Air Liquide SA | 309 | 43,097 | ||||||
Atos SE | 73 | 5,537 | ||||||
AXA SA | 1,445 | 33,211 | ||||||
Bouygues SA | 159 | 6,050 | ||||||
Carrefour SA | 432 | 7,374 | ||||||
Casino Guichard Perrachon SA (b) | 41 | 1,729 | ||||||
Cie de Saint-Gobain | 370 | 13,373 | ||||||
Cie Generale des Etablissements Michelin SCA | 135 | 14,213 | ||||||
CNP Assurances | 105 | 1,910 | ||||||
Credit Agricole SA | 859 | 9,829 | ||||||
Danone SA | 450 | 40,368 | ||||||
Eiffage SA | 49 | 5,085 | ||||||
EssilorLuxottica SA | 212 | 31,343 | ||||||
Eurazeo SE | 40 | 2,650 | ||||||
Gecina SA REIT | 34 | 5,399 | ||||||
Getlink SE | 349 | 4,919 | ||||||
Imerys SA | 31 | 1,267 | ||||||
Ingenico Group SA | 43 | 4,271 | ||||||
JCDecaux SA | 55 | 1,473 | ||||||
Kering SA | 57 | 27,644 | ||||||
L’Oreal SA | 189 | 51,743 | ||||||
Natixis SA | 593 | 2,300 | ||||||
Orange SA | 1,511 | 22,963 | ||||||
Schneider Electric SE | 407 | 34,136 | ||||||
Societe BIC SA | 18 | 1,152 | ||||||
Teleperformance | 43 | 9,404 | ||||||
TOTAL SA | 1,735 | 86,725 | ||||||
Unibail-Rodamco-Westfield REIT | 100 | 13,116 | ||||||
Valeo SA | 199 | 5,444 | ||||||
Wendel SA | 22 | 3,089 | ||||||
|
| |||||||
| 496,262 | ||||||||
|
| |||||||
| Germany — 6.6% | ||||||||
adidas AG | 129 | 38,314 | ||||||
Allianz SE | 309 | 68,227 | ||||||
BASF SE | 673 | 44,602 | ||||||
Number | Value | |||||||
| Germany (Continued) | ||||||||
Bayerische Motoren Werke AG | 249 | $ | 16,675 | |||||
Beiersdorf AG | 74 | 9,331 | ||||||
Commerzbank AG | 724 | 4,113 | ||||||
Deutsche Boerse AG | 142 | 20,916 | ||||||
Deutsche Post AG | 764 | 25,157 | ||||||
Deutsche Wohnen SE | 258 | 9,166 | ||||||
E.ON SE | 1,693 | 15,764 | ||||||
Fraport AG Frankfurt Airport Services Worldwide | 39 | 3,263 | ||||||
HeidelbergCement AG | 117 | 8,123 | ||||||
Henkel AG & Co. KGaA | 84 | 7,775 | ||||||
Infineon Technologies AG | 938 | 16,267 | ||||||
Merck KGaA | 102 | 10,925 | ||||||
METRO AG | 139 | 2,155 | ||||||
MTU Aero Engines AG | 38 | 10,391 | ||||||
Muenchener Rueckversicherungs-Gesellschaft AG in Muenchen | 107 | 25,676 | ||||||
RWE AG | 417 | 11,898 | ||||||
SAP SE | 717 | 85,750 | ||||||
Siemens AG | 555 | 55,588 | ||||||
Symrise AG | 103 | 9,632 | ||||||
Telefonica Deutschland Holding AG | 511 | 1,303 | ||||||
|
| |||||||
| 501,011 | ||||||||
|
| |||||||
| Greece — 0.1% | ||||||||
Alpha Bank AE* | 955 | 1,713 | ||||||
Hellenic Telecommunications Organization SA | 190 | 2,540 | ||||||
Motor Oil Hellas Corinth Refineries SA | 70 | 1,715 | ||||||
|
| |||||||
| 5,968 | ||||||||
|
| |||||||
| Hong Kong — 2.2% | ||||||||
Alibaba Health Information Technology Ltd.* | 2,674 | 2,536 | ||||||
Alibaba Pictures Group Ltd.* | 10,672 | 1,757 | ||||||
ASM Pacific Technology Ltd. | 245 | 2,809 | ||||||
Beijing Enterprises Water Group Ltd.* | 4,229 | 2,224 | ||||||
BOC Hong Kong Holdings Ltd. | 2,732 | 9,223 | ||||||
China Agri-Industries Holdings Ltd. | 3,075 | 867 | ||||||
China Everbright International Ltd. | 2,618 | 2,055 | ||||||
China First Capital Group Ltd.* | 2,400 | 919 | ||||||
China Mengniu Dairy Co. Ltd.* | 2,095 | 8,315 | ||||||
China Overseas Land & Investment Ltd. | 2,894 | 9,160 | ||||||
CLP Holdings Ltd. | 1,268 | 13,068 | ||||||
Geely Automobile Holdings Ltd. | 3,802 | 5,881 | ||||||
Hang Seng Bank Ltd. | 563 | 11,755 | ||||||
HKT Trust & HKT Ltd. (a) | 2,998 | 4,691 | ||||||
Hong Kong & China Gas Co. Ltd. | 7,564 | 14,616 | ||||||
Hong Kong Exchanges & Clearing Ltd. (b) | 884 | 27,077 | ||||||
Hutchison China MediTech Ltd., ADR* | 43 | 937 | ||||||
Hysan Development Co. Ltd. | 572 | 2,318 | ||||||
Lee & Man Paper Manufacturing Ltd. | 1,293 | 685 | ||||||
MTR Corp. Ltd. | 1,120 | 6,490 | ||||||
PCCW Ltd. | 3,393 | 1,840 | ||||||
Shangri-La Asia Ltd. | 1,109 | 1,159 | ||||||
Shenzhen Investment Ltd. | 985 | 373 | ||||||
Sino Biopharmaceutical Ltd. | 5,142 | 7,652 | ||||||
| See Notes to Financial Statements. | 19 |
DBX ETF Trust
Schedule of Investments
Xtrackers MSCI ACWI ex USA ESG Leaders Equity ETF(Continued)
August 31, 2019
Number | Value | |||||||
| Hong Kong (Continued) | ||||||||
Sun Hung Kai Properties Ltd. | 1,212 | $ | 17,185 | |||||
Swire Pacific Ltd., Class A | 377 | 3,693 | ||||||
Swire Properties Ltd. | 1,018 | 3,346 | ||||||
Techtronic Industries Co. Ltd. | 1,030 | 7,125 | ||||||
|
| |||||||
| 169,756 | ||||||||
|
| |||||||
| Hungary — 0.1% | ||||||||
MOL Hungarian Oil & Gas PLC | 348 | 3,413 | ||||||
OTP Bank Nyrt | 153 | 6,112 | ||||||
|
| |||||||
| 9,525 | ||||||||
|
| |||||||
| India — 2.8% | ||||||||
Asian Paints Ltd. | 253 | 5,726 | ||||||
Axis Bank Ltd. | 550 | 5,114 | ||||||
Axis Bank Ltd., GDR | 175 | 8,059 | ||||||
Bajaj Auto Ltd. | 62 | 2,421 | ||||||
Bharat Petroleum Corp. Ltd. | 627 | 3,119 | ||||||
Bharti Airtel Ltd. | 1,496 | 7,265 | ||||||
Dabur India Ltd. | 533 | 3,350 | ||||||
Eicher Motors Ltd. | 13 | 2,960 | ||||||
HCL Technologies Ltd. | 455 | 7,011 | ||||||
Hero MotoCorp Ltd. | 72 | 2,593 | ||||||
Hindalco Industries Ltd. | 1,148 | 2,965 | ||||||
Hindustan Unilever Ltd. | 518 | 13,652 | ||||||
Housing Development Finance Corp. Ltd. | 1,214 | 36,832 | ||||||
Infosys Ltd. | 1,180 | 13,466 | ||||||
Infosys Ltd., ADR (b) | 1,485 | 17,063 | ||||||
Mahindra & Mahindra Ltd. | 643 | 4,762 | ||||||
Nestle India Ltd. | 22 | 3,967 | ||||||
Reliance Industries Ltd. | 2,117 | 37,015 | ||||||
Tata Consultancy Services Ltd. | 668 | 21,138 | ||||||
Tech Mahindra Ltd. | 426 | 4,138 | ||||||
Titan Co. Ltd. | 275 | 4,256 | ||||||
UPL Ltd. | 480 | 3,786 | ||||||
Wipro Ltd. | 1,083 | 3,858 | ||||||
|
| |||||||
| 214,516 | ||||||||
|
| |||||||
| Indonesia — 0.8% | ||||||||
PT Astra International Tbk | 15,008 | 7,062 | ||||||
PT Bank Central Asia Tbk | 7,453 | 16,025 | ||||||
PT Bank Mandiri Persero Tbk | 13,891 | 7,100 | ||||||
PT Bank Negara Indonesia Persero Tbk | 5,468 | 2,968 | ||||||
PT Bank Rakyat Indonesia Persero Tbk | 40,841 | 12,294 | ||||||
PT Bukit Asam Tbk | 4,847 | 844 | ||||||
PT Indah Kiat Pulp & Paper Corp. Tbk | 2,093 | 1,011 | ||||||
PT Indofood CBP Sukses Makmur Tbk | 1,467 | 1,246 | ||||||
PT Indofood Sukses Makmur Tbk | 2,981 | 1,665 | ||||||
PT Kalbe Farma Tbk | 15,558 | 1,854 | ||||||
PT Pabrik Kertas Tjiwi Kimia Tbk | 1,518 | 1,065 | ||||||
PT Perusahaan Gas Negara Tbk | 8,505 | 1,151 | ||||||
PT Unilever Indonesia Tbk | 1,238 | 4,263 | ||||||
PT United Tractors Tbk | 1,262 | 1,862 | ||||||
|
| |||||||
| 60,410 | ||||||||
|
| |||||||
| Ireland — 0.6% | ||||||||
CRH PLC | 613 | 20,441 | ||||||
DCC PLC | 78 | 6,634 | ||||||
Kerry Group PLC, Class A | 124 | 14,789 | ||||||
Number | Value | |||||||
| Ireland (Continued) | ||||||||
Kingspan Group PLC | 108 | $ | 4,941 | |||||
|
| |||||||
| 46,805 | ||||||||
|
| |||||||
| Israel — 0.2% | ||||||||
Bank Hapoalim BM* | 859 | 6,301 | ||||||
Bank LeumiLe-Israel BM | 1,118 | 7,625 | ||||||
Mizrahi Tefahot Bank Ltd. | 116 | 2,671 | ||||||
|
| |||||||
| 16,597 | ||||||||
|
| |||||||
| Italy — 0.6% | ||||||||
Assicurazioni Generali SpA | 790 | 14,329 | ||||||
Intesa Sanpaolo SpA | 10,857 | 23,831 | ||||||
Snam SpA | 1,728 | 8,752 | ||||||
|
| |||||||
| 46,912 | ||||||||
|
| |||||||
| Japan — 15.4% | ||||||||
Aeon Co. Ltd. | 500 | 8,875 | ||||||
AEON Financial Service Co. Ltd. | 100 | 1,466 | ||||||
AGC, Inc. | 100 | 2,888 | ||||||
Ajinomoto Co., Inc. | 300 | 5,475 | ||||||
ANA Holdings, Inc. | 100 | 3,422 | ||||||
Asahi Kasei Corp. | 1,000 | 9,055 | ||||||
Astellas Pharma, Inc. | 1,400 | 19,415 | ||||||
Bridgestone Corp. | 400 | 15,273 | ||||||
Casio Computer Co. Ltd. | 100 | 1,397 | ||||||
Central Japan Railway Co. | 100 | 19,798 | ||||||
Chugai Pharmaceutical Co. Ltd. | 170 | 12,172 | ||||||
CyberAgent, Inc. | 100 | 4,513 | ||||||
Dai Nippon Printing Co. Ltd. | 200 | 4,332 | ||||||
Daicel Corp. | 200 | 1,547 | ||||||
Daifuku Co. Ltd. | 100 | 4,729 | ||||||
Daikin Industries Ltd. | 190 | 23,547 | ||||||
Daiwa House Industry Co. Ltd. | 400 | 12,556 | ||||||
Denso Corp. | 300 | 12,600 | ||||||
East Japan Railway Co. | 230 | 21,918 | ||||||
Eisai Co. Ltd. | 200 | 10,231 | ||||||
Fast Retailing Co. Ltd. | 44 | 25,800 | ||||||
Fujitsu Ltd. | 150 | 11,592 | ||||||
Hino Motors Ltd. | 200 | 1,575 | ||||||
Hirose Electric Co. Ltd. | 25 | 2,843 | ||||||
Hitachi Chemical Co. Ltd. | 100 | 3,128 | ||||||
Hitachi Construction Machinery Co. Ltd. | 100 | 2,139 | ||||||
Hitachi High-Technologies Corp. | 50 | 2,704 | ||||||
Hitachi Metals Ltd. | 200 | 2,155 | ||||||
Honda Motor Co. Ltd. | 1,200 | 28,529 | ||||||
Hulic Co. Ltd. | 200 | 1,911 | ||||||
Inpex Corp. | 700 | 6,061 | ||||||
Japan Retail Fund Investment Corp. REIT | 2 | 4,006 | ||||||
JFE Holdings, Inc. | 300 | 3,514 | ||||||
Kajima Corp. | 300 | 3,654 | ||||||
Kansai Paint Co. Ltd. | 100 | 2,083 | ||||||
Kao Corp. | 350 | 25,304 | ||||||
Kawasaki Heavy Industries Ltd. | 100 | 1,962 | ||||||
KDDI Corp. | 1,300 | 34,721 | ||||||
Keio Corp. | 100 | 6,256 | ||||||
Keyence Corp. | 68 | 40,296 | ||||||
Kikkoman Corp. | 100 | 4,503 | ||||||
Kobayashi Pharmaceutical Co. Ltd. | 50 | 3,750 | ||||||
| See Notes to Financial Statements. | 20 |
DBX ETF Trust
Schedule of Investments
Xtrackers MSCI ACWI ex USA ESG Leaders Equity ETF(Continued)
August 31, 2019
Number | Value | |||||||
| Japan (Continued) | ||||||||
Kobe Steel Ltd. | 200 | $ | 1,044 | |||||
Komatsu Ltd. | 700 | 14,884 | ||||||
Konami Holdings Corp. | 100 | 4,536 | ||||||
Konica Minolta, Inc. | 300 | 2,137 | ||||||
Kubota Corp. | 800 | 11,494 | ||||||
Kuraray Co. Ltd. | 200 | 2,284 | ||||||
Kurita Water Industries Ltd. | 100 | 2,603 | ||||||
Kyocera Corp. | 200 | 11,899 | ||||||
Kyushu Railway Co. | 100 | 3,001 | ||||||
Lawson, Inc. | 50 | 2,482 | ||||||
Marui Group Co. Ltd. | 100 | 1,993 | ||||||
Mitsubishi Chemical Holdings Corp. | 1,100 | 7,557 | ||||||
Mitsubishi Electric Corp. | 1,400 | 16,929 | ||||||
Mitsubishi Estate Co. Ltd. | 900 | 17,246 | ||||||
Mitsubishi Materials Corp. | 100 | 2,426 | ||||||
Mitsubishi UFJ Lease & Finance Co. Ltd. | 300 | 1,622 | ||||||
Mitsui Chemicals, Inc. | 100 | 2,139 | ||||||
Mitsui Fudosan Co. Ltd. | 700 | 16,790 | ||||||
Mizuho Financial Group, Inc. | 17,300 | 25,214 | ||||||
Murata Manufacturing Co. Ltd. | 400 | 16,803 | ||||||
Nabtesco Corp. | 100 | 2,878 | ||||||
Nagoya Railroad Co. Ltd. | 100 | 2,982 | ||||||
NEC Corp. | 200 | 8,573 | ||||||
NGK Insulators Ltd. | 200 | 2,687 | ||||||
NGK Spark Plug Co. Ltd. | 100 | 1,728 | ||||||
Nikon Corp. | 200 | 2,478 | ||||||
Nintendo Co. Ltd. | 85 | 32,264 | ||||||
Nippon Express Co. Ltd. | 50 | 2,586 | ||||||
Nippon Prologis REIT, Inc. REIT | 1 | 2,711 | ||||||
Nippon Yusen KK | 100 | 1,494 | ||||||
Nissin Foods Holdings Co. Ltd. | 50 | 3,472 | ||||||
Nitori Holdings Co. Ltd. | 60 | 8,663 | ||||||
Nitto Denko Corp. | 100 | 4,660 | ||||||
Nomura Real Estate Holdings, Inc. | 100 | 2,122 | ||||||
Nomura Research Institute Ltd. | 300 | 5,972 | ||||||
NSK Ltd. | 300 | 2,408 | ||||||
NTT DOCOMO, Inc. | 1,000 | 25,267 | ||||||
Obayashi Corp. | 400 | 3,689 | ||||||
Odakyu Electric Railway Co. Ltd. | 200 | 4,541 | ||||||
Omron Corp. | 150 | 7,433 | ||||||
Ono Pharmaceutical Co. Ltd. | 300 | 5,547 | ||||||
Oriental Land Co. Ltd. | 150 | 21,862 | ||||||
ORIX Corp. | 1,000 | 14,782 | ||||||
Osaka Gas Co. Ltd. | 300 | 5,376 | ||||||
Otsuka Corp. | 100 | 3,717 | ||||||
Panasonic Corp. | 1,600 | 12,362 | ||||||
Park24 Co. Ltd. | 100 | 2,053 | ||||||
Rakuten, Inc. | 700 | 6,601 | ||||||
Recruit Holdings Co. Ltd. | 900 | 27,294 | ||||||
Resona Holdings, Inc. | 1,500 | 5,893 | ||||||
Santen Pharmaceutical Co. Ltd. | 300 | 5,260 | ||||||
Secom Co. Ltd. | 150 | 12,809 | ||||||
Sega Sammy Holdings, Inc. | 200 | 2,743 | ||||||
Sekisui Chemical Co. Ltd. | 300 | 4,327 | ||||||
Sekisui House Ltd. | 400 | 7,105 | ||||||
Seven & i Holdings Co. Ltd. | 600 | 21,237 | ||||||
Sharp Corp. | 200 | 2,065 | ||||||
Number | Value | |||||||
| Japan (Continued) | ||||||||
Shimadzu Corp. | 200 | $ | 4,978 | |||||
Shimizu Corp. | 400 | 3,339 | ||||||
Shin-Etsu Chemical Co. Ltd. | �� | 250 | 25,237 | |||||
Shiseido Co. Ltd. | 300 | 24,561 | ||||||
Showa Denko KK | 100 | 2,583 | ||||||
Sohgo Security Services Co. Ltd. | 50 | 2,525 | ||||||
Sompo Holdings, Inc. | 250 | 9,996 | ||||||
Sony Corp. | 900 | 51,230 | ||||||
Stanley Electric Co. Ltd. | 100 | 2,488 | ||||||
Sumitomo Chemical Co. Ltd. | 1,100 | 4,819 | ||||||
Sumitomo Metal Mining Co. Ltd. | 200 | 5,637 | ||||||
Sumitomo Mitsui Trust Holdings, Inc. | 200 | 6,542 | ||||||
Sumitomo Rubber Industries Ltd. | 100 | 1,130 | ||||||
Suntory Beverage & Food Ltd. | 100 | 4,315 | ||||||
Sysmex Corp. | 100 | 6,389 | ||||||
T&D Holdings, Inc. | 400 | 3,898 | ||||||
Taisei Corp. | 100 | 3,542 | ||||||
Takeda Pharmaceutical Co. Ltd. | 1,100 | 37,204 | ||||||
Teijin Ltd. | 100 | 1,799 | ||||||
Tobu Railway Co. Ltd. | 100 | 3,071 | ||||||
Toho Co. Ltd. | 100 | 4,244 | ||||||
Tokyo Electron Ltd. | 115 | 20,590 | ||||||
Tokyo Gas Co. Ltd. | 300 | 7,590 | ||||||
Tokyu Corp. | 400 | 7,156 | ||||||
Toray Industries, Inc. | 1,000 | 7,137 | ||||||
TOTO Ltd. | 100 | 3,622 | ||||||
Toyo Suisan Kaisha Ltd. | 100 | 4,075 | ||||||
Unicharm Corp. | 300 | 9,228 | ||||||
USS Co. Ltd. | 200 | 3,783 | ||||||
West Japan Railway Co. | 100 | 8,432 | ||||||
Yakult Honsha Co. Ltd. | 100 | 5,766 | ||||||
Yamada Denki Co. Ltd. | 400 | 1,884 | ||||||
Yamaha Corp. | 100 | 4,320 | ||||||
Yamaha Motor Co. Ltd. | 200 | 3,275 | ||||||
Yaskawa Electric Corp. | 200 | 6,727 | ||||||
Yokogawa Electric Corp. | 200 | 3,636 | ||||||
|
| |||||||
| 1,175,167 | ||||||||
|
| |||||||
| Luxembourg — 0.1% | ||||||||
Millicom International Cellular SA SDR | 52 | 2,651 | ||||||
SES SA | 269 | 4,341 | ||||||
Tenaris SA | 322 | 3,516 | ||||||
|
| |||||||
| 10,508 | ||||||||
|
| |||||||
| Malaysia — 0.8% | ||||||||
AMMB Holdings Bhd | 1,400 | 1,398 | ||||||
Axiata Group Bhd | 2,125 | 2,552 | ||||||
CIMB Group Holdings Bhd | 3,482 | 4,189 | ||||||
DiGi.Com Bhd | 2,500 | 2,984 | ||||||
Fraser & Neave Holdings Bhd | 200 | 1,679 | ||||||
HAP Seng Consolidated Bhd | 500 | 1,179 | ||||||
Hartalega Holdings Bhd | 1,000 | 1,220 | ||||||
Hong Leong Bank Bhd | 500 | 1,974 | ||||||
IHH Healthcare Bhd | 1,900 | 2,616 | ||||||
Malayan Banking Bhd | 2,859 | 5,908 | ||||||
Malaysia Airports Holdings Bhd | 900 | 1,761 | ||||||
Maxis Bhd | 2,100 | 2,781 | ||||||
| See Notes to Financial Statements. | 21 |
DBX ETF Trust
Schedule of Investments
Xtrackers MSCI ACWI ex USA ESG Leaders Equity ETF(Continued)
August 31, 2019
Number | Value | |||||||
| Malaysia (Continued) | ||||||||
MISC Bhd | 900 | $ | 1,554 | |||||
Nestle Malaysia Bhd | 19 | 666 | ||||||
Petronas Dagangan Bhd | 300 | 1,632 | ||||||
PPB Group Bhd | 400 | 1,775 | ||||||
Press Metal Aluminium Holdings Bhd | 1,100 | 1,287 | ||||||
Public Bank Bhd | 2,100 | 10,147 | ||||||
RHB Bank Bhd | 900 | 1,220 | ||||||
Sime Darby Bhd | 2,000 | 1,089 | ||||||
Tenaga Nasional Bhd | 2,300 | 7,635 | ||||||
Top Glove Corp. Bhd | 1,000 | 1,129 | ||||||
Westports Holdings Bhd | 1,100 | 1,099 | ||||||
|
| |||||||
| 59,474 | ||||||||
|
| |||||||
| Mexico — 0.5% | ||||||||
Alfa SAB de CV, Class A | 2,091 | 1,784 | ||||||
Alsea SAB de CV* | 700 | 1,491 | ||||||
Arca Continental SAB de CV | 349 | 1,826 | ||||||
Cemex SAB de CV, Series CPO | 11,057 | 4,116 | ||||||
Coca-Cola Femsa SAB de CV | 384 | 2,269 | ||||||
Fomento Economico Mexicano SAB de CV | 1,459 | 13,307 | ||||||
Gruma SAB de CV, Class B | 161 | 1,497 | ||||||
Grupo Aeroportuario del Sureste SAB de CV, Class B | 173 | 2,542 | ||||||
Grupo Bimbo SAB de CV, Series A | 1,236 | 2,160 | ||||||
Industrias Penoles SAB de CV | 103 | 1,235 | ||||||
Infraestructura Energetica Nova SAB de CV* | 331 | 1,391 | ||||||
Kimberly-Clark de Mexico SAB de CV, Class A* | 1,156 | 2,361 | ||||||
|
| |||||||
| 35,979 | ||||||||
|
| |||||||
| Netherlands — 3.1% | ||||||||
Aegon NV | 1,443 | 5,503 | ||||||
Akzo Nobel NV | 165 | 14,804 | ||||||
ASML Holding NV | 314 | 69,937 | ||||||
EXOR NV | 85 | 5,757 | ||||||
ING Groep NV | 2,860 | 27,392 | ||||||
Koninklijke Ahold Delhaize NV | 920 | 21,565 | ||||||
Koninklijke DSM NV | 136 | 16,939 | ||||||
Koninklijke KPN NV | 2,733 | 8,668 | ||||||
Koninklijke Philips NV | 698 | 32,964 | ||||||
Koninklijke Vopak NV | 63 | 3,008 | ||||||
NN Group NV | 237 | 7,950 | ||||||
QIAGEN NV* | 164 | 5,709 | ||||||
Wolters Kluwer NV | 216 | 15,585 | ||||||
|
| |||||||
| 235,781 | ||||||||
|
| |||||||
| New Zealand — 0.2% | ||||||||
Auckland International Airport Ltd. | 706 | 4,284 | ||||||
Fletcher Building Ltd. | 728 | 2,039 | ||||||
Meridian Energy Ltd. | 827 | 2,597 | ||||||
Ryman Healthcare Ltd. (b) | 374 | 3,071 | ||||||
|
| |||||||
| 11,991 | ||||||||
|
| |||||||
| Norway — 0.6% | ||||||||
Aker BP ASA | 70 | 1,859 | ||||||
Equinor ASA | 680 | 11,634 | ||||||
Mowi ASA | 310 | 7,421 | ||||||
Number | Value | |||||||
| Norway (Continued) | ||||||||
Norsk Hydro ASA | 954 | $ | 3,021 | |||||
Orkla ASA | 628 | 5,760 | ||||||
Schibsted ASA, Class B | 73 | 2,116 | ||||||
Telenor ASA | 537 | 11,034 | ||||||
|
| |||||||
| 42,845 | ||||||||
|
| |||||||
| Philippines — 0.4% | ||||||||
Aboitiz Equity Ventures, Inc. | 1,620 | 1,677 | ||||||
Aboitiz Power Corp. | 1,700 | 1,241 | ||||||
Alliance Global Group, Inc. | 2,800 | 683 | ||||||
Ayala Land, Inc. | 6,000 | 5,452 | ||||||
Bank of the Philippine Islands | 790 | 1,335 | ||||||
BDO Unibank, Inc. | 1,500 | 4,293 | ||||||
Globe Telecom, Inc. | 30 | 1,170 | ||||||
JG Summit Holdings, Inc. | 1,700 | 2,349 | ||||||
Manila Electric Co. | 150 | 1,052 | ||||||
Metropolitan Bank & Trust Co. | 1,400 | 1,907 | ||||||
SM Investments Corp. | 160 | 3,153 | ||||||
SM Prime Holdings, Inc. | 8,000 | 5,425 | ||||||
|
| |||||||
| 29,737 | ||||||||
|
| |||||||
| Poland — 0.3% | ||||||||
Bank Millennium SA* | 409 | 686 | ||||||
Bank Polska Kasa Opieki SA | 118 | 2,892 | ||||||
CCC SA | 34 | 1,055 | ||||||
Grupa Lotos SA | 91 | 1,973 | ||||||
Jastrzebska Spolka Weglowa SA | 79 | 591 | ||||||
KGHM Polska Miedz SA* | 94 | 1,854 | ||||||
mBank SA* | 10 | 812 | ||||||
Polski Koncern Naftowy ORLEN SA | 251 | 5,728 | ||||||
Polskie Gornictwo Naftowe i Gazownictwo SA | 1,193 | 1,424 | ||||||
Powszechny Zaklad Ubezpieczen SA | 423 | 3,982 | ||||||
Santander Bank Polska SA | 23 | 1,766 | ||||||
|
| |||||||
| 22,763 | ||||||||
|
| |||||||
| Portugal — 0.2% | ||||||||
EDP — Energias de Portugal SA | 1,827 | 6,917 | ||||||
Galp Energia SGPS SA | 411 | 5,911 | ||||||
Jeronimo Martins SGPS SA | 203 | 3,356 | ||||||
|
| |||||||
| 16,184 | ||||||||
|
| |||||||
| Qatar — 0.3% | ||||||||
Commercial Bank PSQC | 1,380 | 1,804 | ||||||
Ooredoo QPSC | 670 | 1,288 | ||||||
Qatar National Bank QPSC | 3,331 | 17,516 | ||||||
|
| |||||||
| 20,608 | ||||||||
|
| |||||||
| Romania — 0.0% | ||||||||
NEPI Rockcastle PLC | 285 | 2,524 | ||||||
|
| |||||||
| Russia — 0.6% | ||||||||
Inter RAO UES PJSC | 26,571 | 1,711 | ||||||
LUKOIL PJSC | 292 | 23,582 | ||||||
Novatek PJSC, GDR | 66 | 12,797 | ||||||
PhosAgro PJSC, GDR | 105 | 1,357 | ||||||
Polymetal International PLC | 125 | 1,810 | ||||||
Polyus PJSC | 21 | 2,417 | ||||||
|
| |||||||
| 43,674 | ||||||||
|
| |||||||
| See Notes to Financial Statements. | 22 |
DBX ETF Trust
Schedule of Investments
Xtrackers MSCI ACWI ex USA ESG Leaders Equity ETF(Continued)
August 31, 2019
Number | Value | |||||||
| Saudi Arabia — 0.3% | ||||||||
Almarai Co. JSC | 185 | $ | 2,444 | |||||
Banque Saudi Fransi | 401 | 3,742 | ||||||
Saudi Arabian Mining Co.* | 302 | 3,567 | ||||||
Saudi Basic Industries Corp. | 553 | 14,729 | ||||||
|
| |||||||
| 24,482 | ||||||||
|
| |||||||
| Singapore — 1.1% | ||||||||
Ascendas Real Estate Investment Trust REIT | 1,700 | 3,774 | ||||||
BOC Aviation Ltd., 144A | 179 | 1,556 | ||||||
CapitaLand Commercial Trust REIT | 1,800 | 2,764 | ||||||
CapitaLand Ltd. | 1,800 | 4,503 | ||||||
CapitaLand Mall Trust REIT | 1,800 | 3,438 | ||||||
City Developments Ltd. | 300 | 2,072 | ||||||
DBS Group Holdings Ltd. | 1,300 | 22,988 | ||||||
Jardine Cycle & Carriage Ltd. | 100 | 2,220 | ||||||
Keppel Corp. Ltd. | 1,000 | 4,210 | ||||||
Oversea-Chinese Banking Corp. Ltd. | 2,300 | 17,658 | ||||||
Singapore Airlines Ltd. | 400 | 2,546 | ||||||
Singapore Exchange Ltd. | 500 | 2,956 | ||||||
Singapore Press Holdings Ltd. | 900 | 1,291 | ||||||
Singapore Telecommunications Ltd. | 5,600 | 12,797 | ||||||
UOL Group Ltd. | 400 | 2,119 | ||||||
|
| |||||||
| 86,892 | ||||||||
|
| |||||||
| South Africa — 2.5% | ||||||||
Absa Group Ltd. (b) | 507 | 5,132 | ||||||
Anglo American Platinum Ltd. | 37 | 2,268 | ||||||
Aspen Pharmacare Holdings Ltd. | 289 | 1,498 | ||||||
Bid Corp. Ltd. | 268 | 5,736 | ||||||
Bidvest Group Ltd. | 240 | 2,825 | ||||||
Clicks Group Ltd. | 194 | 2,543 | ||||||
Exxaro Resources Ltd. | 171 | 1,533 | ||||||
FirstRand Ltd. | 2,616 | 10,336 | ||||||
Foschini Group Ltd. | 192 | 1,903 | ||||||
Growthpoint Properties Ltd. REIT | 2,335 | 3,537 | ||||||
Investec Ltd. | 267 | 1,408 | ||||||
Investec PLC | 465 | 2,392 | ||||||
Kumba Iron Ore Ltd. (b) | 42 | 1,087 | ||||||
Life Healthcare Group Holdings Ltd. | 934 | 1,403 | ||||||
Mr Price Group Ltd. | 212 | 2,397 | ||||||
MTN Group Ltd. (b) | 1,249 | 8,439 | ||||||
MultiChoice Group Ltd.* | 327 | 2,867 | ||||||
Naspers Ltd., Class N | 319 | 72,562 | ||||||
Nedbank Group Ltd. | 290 | 4,316 | ||||||
Netcare Ltd. | 936 | 1,005 | ||||||
Old Mutual Ltd. (b) | 3,667 | 4,393 | ||||||
Pick n Pay Stores Ltd. | 305 | 1,161 | ||||||
PSG Group Ltd. | 110 | 1,453 | ||||||
Redefine Properties Ltd. REIT | 4,561 | 2,358 | ||||||
Remgro Ltd. | 410 | 4,637 | ||||||
RMB Holdings Ltd. | 489 | 2,301 | ||||||
Sanlam Ltd. | 1,309 | 6,272 | ||||||
Sappi Ltd. | 422 | 1,257 | ||||||
Sasol Ltd. (b) | 419 | 7,946 | ||||||
Shoprite Holdings Ltd. (b) | 317 | 2,359 | ||||||
SPAR Group Ltd. | 143 | 1,637 | ||||||
Number | Value | |||||||
| South Africa (Continued) | ||||||||
Standard Bank Group Ltd. | 927 | $ | 10,822 | |||||
Vodacom Group Ltd. | 442 | 3,356 | ||||||
Woolworths Holdings Ltd. (b) | 771 | 2,802 | ||||||
|
| |||||||
| 187,941 | ||||||||
|
| |||||||
| South Korea — 1.4% | ||||||||
Amorepacific Corp. | 27 | 2,898 | ||||||
AMOREPACIFIC Group | 25 | 1,218 | ||||||
BNK Financial Group, Inc. | 119 | 658 | ||||||
CJ CheilJedang Corp. | 7 | 1,321 | ||||||
CJ Corp. | 12 | 807 | ||||||
GS Engineering & Construction Corp. | 46 | 1,230 | ||||||
GS Holdings Corp. | 38 | 1,506 | ||||||
Hana Financial Group, Inc. | 223 | 5,984 | ||||||
Hankook Tire & Technology Co. Ltd. | 59 | 1,420 | ||||||
Hanwha Chemical Corp. | 92 | 1,314 | ||||||
Hyundai Marine & Fire Insurance Co. Ltd. | 48 | 947 | ||||||
KB Financial Group, Inc. | 294 | 9,636 | ||||||
LG Chem Ltd. | 36 | 9,823 | ||||||
LG Corp. | 70 | 4,115 | ||||||
LG Display Co. Ltd.* | 169 | 1,946 | ||||||
LG Electronics, Inc. | 81 | 4,099 | ||||||
LG Household & Health Care Ltd. | 7 | 6,814 | ||||||
LG Innotek Co. Ltd. | 18 | 1,464 | ||||||
Lotte Chemical Corp. | 13 | 2,415 | ||||||
Lotte Corp. | 25 | 688 | ||||||
OCI Co. Ltd. | 14 | 767 | ||||||
Samsung Fire & Marine Insurance Co. Ltd. | 23 | 4,348 | ||||||
Samsung SDI Co. Ltd. | 40 | 8,239 | ||||||
Shinhan Financial Group Co. Ltd. | 317 | 10,665 | ||||||
SK Holdings Co. Ltd. | 24 | 3,963 | ||||||
SK Innovation Co. Ltd. | 47 | 6,403 | ||||||
SK Telecom Co. Ltd. | 17 | 3,361 | ||||||
S-Oil Corp. | 33 | 2,635 | ||||||
Woongjin Coway Co. Ltd. | 41 | 2,850 | ||||||
Yuhan Corp. | 6 | 1,137 | ||||||
|
| |||||||
| 104,671 | ||||||||
|
| |||||||
| Spain — 2.6% | ||||||||
Amadeus IT Group SA | 329 | 24,550 | ||||||
Banco Bilbao Vizcaya Argentaria SA | 4,875 | 23,133 | ||||||
Banco de Sabadell SA | 4,377 | 3,754 | ||||||
Bankinter SA | 505 | 2,946 | ||||||
CaixaBank SA | 2,656 | 6,028 | ||||||
Enagas SA | 193 | 4,220 | ||||||
Ferrovial SA | 336 | 9,572 | ||||||
Iberdrola SA | 4,506 | 46,407 | ||||||
Industria de Diseno Textil SA | 837 | 25,920 | ||||||
Naturgy Energy Group SA | 237 | 6,212 | ||||||
Red Electrica Corp. SA | 328 | 6,547 | ||||||
Repsol SA | 1,054 | 15,345 | ||||||
Telefonica SA | 3,458 | 23,995 | ||||||
|
| |||||||
| 198,629 | ||||||||
|
| |||||||
| Sweden — 2.2% | ||||||||
Assa Abloy AB, Class B | 766 | 16,005 | ||||||
Atlas Copco AB, Class A | 517 | 15,452 | ||||||
Atlas Copco AB, Class B | 286 | 7,626 | ||||||
| See Notes to Financial Statements. | 23 |
DBX ETF Trust
Schedule of Investments
Xtrackers MSCI ACWI ex USA ESG Leaders Equity ETF(Continued)
August 31, 2019
Number | Value | |||||||
| Sweden (Continued) | ||||||||
Boliden AB | 195 | $ | 4,315 | |||||
Electrolux AB, Series B | 140 | 3,133 | ||||||
Essity AB, Class B | 444 | 13,859 | ||||||
Hennes & Mauritz AB, Class B | 651 | 12,479 | ||||||
Husqvarna AB, Class B | 321 | 2,491 | ||||||
ICA Gruppen AB (b) | 60 | 2,945 | ||||||
Investor AB, Class B | 348 | 16,330 | ||||||
Kinnevik AB, Class B | 194 | 5,290 | ||||||
L E Lundbergforetagen AB, Class B | 72 | 2,699 | ||||||
Sandvik AB | 803 | 11,525 | ||||||
Skandinaviska Enskilda Banken AB, Class A | 1,160 | 9,978 | ||||||
Skanska AB, Class B | 250 | 4,688 | ||||||
SKF AB, Class B | 253 | 4,085 | ||||||
Svenska Handelsbanken AB, Class A | 1,080 | 9,513 | ||||||
Swedbank AB, Class A | 651 | 8,371 | ||||||
Tele2 AB, Class B (b) | 361 | 5,096 | ||||||
Telia Co. AB | 2,244 | 9,830 | ||||||
|
| |||||||
| 165,710 | ||||||||
|
| |||||||
| Switzerland — 5.1% | ||||||||
ABB Ltd. | 1,387 | 26,283 | ||||||
Adecco Group AG | 120 | 6,314 | ||||||
Alcon, Inc.* | 323 | 19,685 | ||||||
Chocoladefabriken Lindt & Spruengli AG Participation Certificates | 1 | 7,403 | ||||||
Cie Financiere Richemont SA | 394 | 30,582 | ||||||
Clariant AG* | 145 | 2,670 | ||||||
Coca-Cola HBC AG* | 147 | 4,887 | ||||||
Givaudan SA | 7 | 18,932 | ||||||
Kuehne + Nagel International AG | 41 | 5,969 | ||||||
Lonza Group AG* | 56 | 19,798 | ||||||
Roche Holding AG | 515 | 140,845 | ||||||
SGS SA | 4 | 9,824 | ||||||
Sika AG | 95 | 13,643 | ||||||
Sonova Holding AG | 41 | 9,518 | ||||||
Swiss Re AG | 230 | 22,120 | ||||||
Swisscom AG | 19 | 9,488 | ||||||
Vifor Pharma AG | 33 | 5,233 | ||||||
Zurich Insurance Group AG | 111 | 39,511 | ||||||
|
| |||||||
| 392,705 | ||||||||
|
| |||||||
| Taiwan — 4.1% | ||||||||
Acer, Inc. | 2,216 | 1,213 | ||||||
Advantech Co. Ltd. | 243 | 2,066 | ||||||
ASE Technology Holding Co. Ltd. | 2,612 | 5,937 | ||||||
AU Optronics Corp. | 5,940 | 1,547 | ||||||
Catcher Technology Co. Ltd. | 471 | 3,306 | ||||||
Cathay Financial Holding Co. Ltd. | 5,796 | 7,409 | ||||||
Chailease Holding Co. Ltd. | 968 | 3,837 | ||||||
Cheng Shin Rubber Industry Co. Ltd. | 1,499 | 2,100 | ||||||
China Airlines Ltd. | 2,836 | 834 | ||||||
China Steel Corp. | 8,819 | 6,500 | ||||||
Chunghwa Telecom Co. Ltd. | 2,878 | 9,987 | ||||||
CTBC Financial Holding Co. Ltd. | 13,085 | 8,478 | ||||||
Delta Electronics, Inc. | 1,485 | 6,926 | ||||||
E.Sun Financial Holding Co. Ltd. | 7,559 | 6,077 | ||||||
Eva Airways Corp. | 3,561 | 1,604 | ||||||
Number | Value | |||||||
| Taiwan (Continued) | ||||||||
Evergreen Marine Corp. Taiwan Ltd.* | 2,384 | $ | 975 | |||||
Far Eastern New Century Corp. | 2,498 | 2,267 | ||||||
Far EasTone Telecommunications Co. Ltd. | 1,268 | 2,955 | ||||||
First Financial Holding Co. Ltd. | 6,955 | 4,761 | ||||||
Fubon Financial Holding Co. Ltd. | 5,213 | 7,244 | ||||||
Giant Manufacturing Co. Ltd. | 300 | 2,087 | ||||||
Hiwin Technologies Corp. | 166 | 1,345 | ||||||
Hotai Motor Co. Ltd. | 264 | 3,719 | ||||||
Hua Nan Financial Holdings Co. Ltd. | 3,156 | 2,004 | ||||||
Innolux Corp. | 7,081 | 1,583 | ||||||
Inventec Corp. | 1,950 | 1,335 | ||||||
Lite-On Technology Corp. | 1,579 | 2,514 | ||||||
MediaTek, Inc. | 1,101 | 12,882 | ||||||
Nan Ya Plastics Corp. | 4,026 | 8,818 | ||||||
President Chain Store Corp. | 448 | 4,165 | ||||||
Quanta Computer, Inc. | 1,910 | 3,436 | ||||||
SinoPac Financial Holdings Co. Ltd. | 6,388 | 2,410 | ||||||
Standard Foods Corp. | 609 | 1,206 | ||||||
Taishin Financial Holding Co. Ltd. | 7,427 | 3,168 | ||||||
Taiwan Business Bank | 3,323 | 1,301 | ||||||
Taiwan High Speed Rail Corp. | 1,537 | 1,855 | ||||||
Taiwan Mobile Co. Ltd. | 1,259 | 4,489 | ||||||
Taiwan Semiconductor Manufacturing Co. Ltd. | 18,041 | 148,762 | ||||||
Tatung Co. Ltd.* | 2,166 | 1,162 | ||||||
Uni-President Enterprises Corp. | 3,686 | 8,989 | ||||||
United Microelectronics Corp. | 9,051 | 3,876 | ||||||
Wistron Corp. | 2,104 | 1,668 | ||||||
Yuanta Financial Holding Co. Ltd. | 7,871 | 4,523 | ||||||
|
| |||||||
| 313,320 | ||||||||
|
| |||||||
| Thailand — 1.1% | ||||||||
Advanced Info Service PCL, NVDR | 800 | 6,071 | ||||||
Airports of Thailand PCL, NVDR | 3,100 | 7,301 | ||||||
Bangkok Dusit Medical Services PCL, NVDR | 7,200 | 5,558 | ||||||
Banpu PCL, NVDR | 5,300 | 2,202 | ||||||
BTS Group Holdings PCL, NVDR | 4,000 | 1,766 | ||||||
Bumrungrad Hospital PCL, NVDR | 300 | 1,359 | ||||||
Central Pattana PCL, NVDR | 1,400 | 3,079 | ||||||
CP ALL PCL, NVDR | 4,400 | 12,089 | ||||||
Electricity Generating PCL, NVDR | 200 | 2,198 | ||||||
Energy Absolute PCL, NVDR | 1,200 | 1,854 | ||||||
Home Product Center PCL, NVDR | 4,800 | 2,826 | ||||||
Indorama Ventures PCL, NVDR | 1,400 | 1,614 | ||||||
IRPC PCL, NVDR | 13,400 | 1,736 | ||||||
Kasikornbank PCL, NVDR | 1,400 | 7,327 | ||||||
Land & Houses PCL, NVDR | 4,800 | 1,696 | ||||||
Minor International PCL, NVDR | 1,600 | 1,989 | ||||||
Muangthai Capital PCL | 600 | 1,079 | ||||||
PTT Global Chemical PCL, NVDR | 1,700 | 2,961 | ||||||
Siam Cement PCL, NVDR | 600 | 8,164 | ||||||
Siam Commercial Bank PCL, NVDR | 700 | 2,828 | ||||||
Thai Oil PCL, NVDR | 1,300 | 2,881 | ||||||
TMB Bank PCL, NVDR | 10,900 | 556 | ||||||
True Corp. PCL, NVDR | 5,900 | 1,216 | ||||||
|
| |||||||
| 80,350 | ||||||||
|
| |||||||
| See Notes to Financial Statements. | 24 |
DBX ETF Trust
Schedule of Investments
Xtrackers MSCI ACWI ex USA ESG Leaders Equity ETF(Continued)
August 31, 2019
Number | Value | |||||||
| Turkey — 0.1% | ||||||||
KOC Holding AS | 746 | $ | 2,239 | |||||
Turkcell Iletisim Hizmetleri AS | 897 | 1,991 | ||||||
|
| |||||||
| 4,230 | ||||||||
|
| |||||||
| United Arab Emirates — 0.3% | ||||||||
Abu Dhabi Commercial Bank PJSC | 2,038 | 4,822 | ||||||
DP World PLC | 137 | 1,918 | ||||||
Dubai Islamic Bank PJSC | 1,453 | 2,025 | ||||||
First Abu Dhabi Bank PJSC | 1,987 | 8,255 | ||||||
NMC Health PLC (b) | 76 | 2,316 | ||||||
|
| |||||||
| 19,336 | ||||||||
|
| |||||||
| United Kingdom — 9.0% | ||||||||
3i Group PLC | 768 | 10,256 | ||||||
Associated British Foods PLC | 262 | 7,246 | ||||||
Aviva PLC | 2,991 | 12,898 | ||||||
Barratt Developments PLC | 808 | 6,223 | ||||||
Berkeley Group Holdings PLC | 102 | 4,866 | ||||||
British Land Co. PLC REIT | 710 | 4,408 | ||||||
BT Group PLC | 6,174 | 12,454 | ||||||
Burberry Group PLC | 313 | 8,249 | ||||||
CNH Industrial NV | 738 | 7,599 | ||||||
Coca-Cola European Partners PLC | 155 | 8,733 | ||||||
Compass Group PLC | 1,214 | 30,796 | ||||||
Croda International PLC | 97 | 5,555 | ||||||
easyJet PLC | 117 | �� | 1,373 | |||||
Ferguson PLC | 170 | 12,513 | ||||||
GlaxoSmithKline PLC | 3,609 | 75,229 | ||||||
Informa PLC | 969 | 10,267 | ||||||
InterContinental Hotels Group PLC | 132 | 8,239 | ||||||
Intertek Group PLC | 116 | 7,668 | ||||||
ITV PLC | 2,732 | 3,858 | ||||||
J Sainsbury PLC | 1,332 | 3,181 | ||||||
John Wood Group PLC | 502 | 2,304 | ||||||
Johnson Matthey PLC | 140 | 4,961 | ||||||
Kingfisher PLC | 1,399 | 3,313 | ||||||
Legal & General Group PLC | 4,727 | 12,642 | ||||||
London Stock Exchange Group PLC | 231 | 19,563 | ||||||
Marks & Spencer Group PLC | 1,542 | 3,610 | ||||||
Meggitt PLC | 540 | 4,071 | ||||||
Merlin Entertainments PLC, 144A | 570 | 3,136 | ||||||
Mondi PLC | 276 | 5,368 | ||||||
National Grid PLC | 2,632 | 27,518 | ||||||
Next PLC | 114 | 8,241 | ||||||
Pearson PLC | 580 | 5,873 | ||||||
Prudential PLC | 1,959 | 32,637 | ||||||
Reckitt Benckiser Group PLC | 508 | 39,589 | ||||||
RELX PLC | 1,472 | 35,253 | ||||||
Rentokil Initial PLC | 1,390 | 7,621 | ||||||
RSA Insurance Group PLC | 778 | 4,959 | ||||||
Schroders PLC | 107 | 3,557 | ||||||
Segro PLC REIT | 867 | 8,289 | ||||||
Smith & Nephew PLC | 632 | 15,124 | ||||||
Spirax-Sarco Engineering PLC | 52 | 5,082 | ||||||
SSE PLC | 766 | 10,737 | ||||||
Standard Chartered PLC | 2,017 | 15,279 | ||||||
Standard Life Aberdeen PLC | 1,754 | 5,325 | ||||||
Number | Value | |||||||
| United Kingdom (Continued) | ||||||||
Taylor Wimpey PLC | 2,688 | $ | 4,778 | |||||
Tesco PLC | 7,183 | 19,175 | ||||||
Unilever NV | 1,057 | 65,697 | ||||||
Unilever PLC | 829 | 52,459 | ||||||
Whitbread PLC | 104 | 5,539 | ||||||
Wm Morrison Supermarkets PLC | 1,741 | 3,872 | ||||||
WPP PLC | 924 | 10,918 | ||||||
|
| |||||||
| 688,101 | ||||||||
|
| |||||||
TOTAL COMMON STOCKS | 7,472,175 | |||||||
|
| |||||||
| PREFERRED STOCKS — 1.3% | ||||||||
| Brazil — 0.9% | ||||||||
Banco Bradesco SA | 3,025 | 24,121 | ||||||
Cia Brasileira de Distribuicao | 118 | 2,500 | ||||||
Cia Energetica de Minas Gerais | 642 | 2,293 | ||||||
Itau Unibanco Holding SA | 3,538 | 29,060 | ||||||
Itausa—Investimentos Itau SA | 3,246 | 9,654 | ||||||
Telefonica Brasil SA | 338 | 4,390 | ||||||
|
| |||||||
| 72,018 | ||||||||
|
| |||||||
| Chile — 0.1% | ||||||||
Embotelladora Andina SA, Class B | 379 | 1,175 | ||||||
Sociedad Quimica y Minera de Chile SA, Class B | 92 | 2,276 | ||||||
|
| |||||||
| 3,451 | ||||||||
|
| |||||||
| Germany — 0.3% | ||||||||
Bayerische Motoren Werke AG | 36 | 1,939 | ||||||
Henkel AG & Co. KGaA | 134 | 13,443 | ||||||
Sartorius AG | 27 | 5,409 | ||||||
|
| |||||||
| 20,791 | ||||||||
|
| |||||||
| South Korea — 0.0% | ||||||||
LG Chem Ltd. | 8 | 1,189 | ||||||
LG Household & Health Care Ltd. | 2 | 1,198 | ||||||
|
| |||||||
| 2,387 | ||||||||
|
| |||||||
TOTAL PREFERRED STOCKS | 98,647 | |||||||
|
| |||||||
| WARRANTS — 0.0% | ||||||||
| Thailand — 0.0% | ||||||||
Minor International PCL*, | 80 | 11 | ||||||
|
| |||||||
| EXCHANGE-TRADED FUNDS —0.0% | ||||||||
Xtrackers MSCI EAFE ESG Leaders Equity ETF (d) | 100 | 2,415 | ||||||
|
| |||||||
| SECURITIES LENDING COLLATERAL — 0.7% | ||||||||
DWS Government & Agency Securities Portfolio “DWS Government Cash Institutional Shares”, 2.04% (e)(f) | 51,069 | 51,069 | ||||||
|
| |||||||
| See Notes to Financial Statements. | 25 |
DBX ETF Trust
Schedule of Investments
Xtrackers MSCI ACWI ex USA ESG Leaders Equity ETF(Continued)
August 31, 2019
Number | Value | |||||||
| CASH EQUIVALENTS — 0.1% | ||||||||
DWS Government Money Market Series “Institutional Shares”, 2.09% (e) | 6,580 | $ | 6,580 | |||||
|
| |||||||
TOTAL INVESTMENTS — 100.1% | $ | 7,630,897 | ||||||
Other assets and liabilities, net — (0.1%) | (4,821 | ) | ||||||
|
| |||||||
NET ASSETS — 100.0% | $ | 7,626,076 | ||||||
|
| |||||||
A summary of the Fund’s transactions with affiliated investments during the period ended August 31, 2019 is as follows:
| Value ($) at 12/6/2018 (Commencement of Operations) | Purchases Cost ($) | Sales Proceeds ($) | Net Realized Gain/(Loss) ($) | Net Change in Unrealized Appreciation (Depreciation) ($) | Income ($) | Capital Gain Distributions ($) | Number of Shares at 8/31/2019 | Value ($) at 8/31/2019 | ||||||||||||||||||||||||||||||
EXCHANGE-TRADED FUNDS —0.0% | ||||||||||||||||||||||||||||||||||||||
Xtrackers MSCI EAFE ESG Leaders Equity ETF (d) | ||||||||||||||||||||||||||||||||||||||
| — | 96,883 | (93,923 | ) | (607 | ) | 62 | 116 | — | 100 | 2,415 | ||||||||||||||||||||||||||||
Xtrackers MSCI Emerging Markets ESG Leaders Equity ETF (d) | ||||||||||||||||||||||||||||||||||||||
| — | 34,040 | (32,564 | ) | (1,476 | ) | — | 28 | — | — | — | ||||||||||||||||||||||||||||
SECURITIES LENDING COLLATERAL —0.7% | ||||||||||||||||||||||||||||||||||||||
DWS Government & Agency Securities Portfolio “DWS Government Cash Institutional Shares”, 2.04% (e)(f) | ||||||||||||||||||||||||||||||||||||||
| — | 51,069 | (g) | — | — | — | 1,544 | — | 51,069 | 51,069 | |||||||||||||||||||||||||||||
CASH EQUIVALENTS —0.1% | ||||||||||||||||||||||||||||||||||||||
DWS Government Money Market Series “Institutional Shares”, 2.09%(e) | ||||||||||||||||||||||||||||||||||||||
| — | 2,204,425 | (2,197,845 | ) | — | — | 1,534 | — | 6,580 | 6,580 | |||||||||||||||||||||||||||||
|
|
|
|
|
|
|
|
|
|
|
|
|
|
|
|
|
| |||||||||||||||||||||
| — | 2,386,417 | (2,324,332 | ) | (2,083 | ) | 62 | 3,222 | — | 57,749 | 60,064 | ||||||||||||||||||||||||||||
|
|
|
|
|
|
|
|
|
|
|
|
|
|
|
|
|
| |||||||||||||||||||||
| * | Non-income producing security. |
| (a) | Stapled Security — A security contractually bound to one or more other securities to form a single saleable unit which cannot be sold separately. |
| (b) | All or a portion of these securities were on loan. In addition, “Other assets and liabilities, net” may include pending sales that are also on loan. The value of securities loaned at August 31, 2019 amounted to $106,526, which is 1.4% of net assets. |
| (c) | Investment was valued using significant unobservable inputs. |
| (d) | Affiliated fund advised by DBX Advisors LLC. |
| (e) | Affiliated fund managed by DWS Investment Management Americas, Inc. The rate shown is the annualizedseven-day yield at period end. |
| (f) | Represents cash collateral held in connection with securities lending. Income earned by the Fund is net of borrower rebates. In addition, the Fund heldnon-cash U.S. Treasury securities collateral having a value of $64,195. |
| (g) | Represents the net increase (purchase cost) or decrease (sales proceeds) in the amount invested in cash collateral for the period ended August 31, 2019. |
| ADR: | American Depositary Receipt |
| CPO: | Ordinary Participation Certificates |
| GDR: | Global Depositary Receipt |
| JSC: | Joint Stock Company |
| NVDR: | Non Voting Depositary Receipt |
| PJSC: | Public Joint Stock Company |
| PSQC: | Public Shareholders Qatari Company |
| QPSC: | Qatari Public Shareholders Company |
| REIT: | Real Estate Investment Trust |
| SAE: | Societe Anonyme Egyptienne |
| SDR: | Swedish Depositary Receipt |
| 144A: | Security exempt from registration under Rule 144A of the Securities Act of 1933. These securities may be resold in transactions exempt from registration, normally to qualified institutional buyers. |
| See Notes to Financial Statements. | 26 |
DBX ETF Trust
Schedule of Investments
Xtrackers MSCI ACWI ex USA ESG Leaders Equity ETF(Continued)
August 31, 2019
At August 31, 2019, open futures contracts purchased were as follows:
Contract Description | Currency | Number of Contracts | Notional Amount | Contract Value | Expiration Date | Unrealized Depreciation | ||||||||||||||||||
MSCI Emerging Markets Index Futures | USD | 1 | $ | 51,595 | $ | 49,200 | 9/20/2019 | $ | (2,395 | ) | ||||||||||||||
For information on the Fund’s policy and additional disclosures regarding open futures contracts, please refer to the Derivatives section of Note 2 in the accompanying Notes to Financial Statements.
Currency Abbreviations
| USD | U.S. Dollar |
Fair Value Measurements
Various inputs are used in determining the value of the Fund’s investments. These inputs are summarized in three broad levels. Level 1 includes quoted prices in active markets for identical securities. Level 2 includes other significant observable inputs (including quoted prices for similar securities, interest rates, prepayment speeds and credit risk). Level 3 includes significant unobservable inputs (including the Fund’s own assumptions in determining the fair value of investments). The level assigned to the securities valuations may not be an indication of the risk or liquidity associated with investing in those securities.
The following is a summary of the inputs used as of August 31, 2019 in valuing the Fund’s investments. For information on the Fund’s policy regarding the valuation of investments, please refer to the Security Valuation section of Note 2 in the accompanying Notes to Financial Statements.
Assets | Level 1 | Level 2 | Level 3 | Total | ||||||||||||
Common Stocks (h) | $ | 7,471,097 | $ | — | $ | 1,078 | $ | 7,472,175 | ||||||||
Preferred Stocks (h) | 98,647 | — | — | 98,647 | ||||||||||||
Warrants | 11 | — | — | 11 | ||||||||||||
Exchange-Traded Funds | 2,415 | — | — | 2,415 | ||||||||||||
Short-Term Investments (h) | 57,649 | — | — | 57,649 | ||||||||||||
|
|
|
|
|
|
|
| |||||||||
TOTAL | $ | 7,629,819 | $ | — | $ | 1,078 | $ | 7,630,897 | ||||||||
|
|
|
|
|
|
|
| |||||||||
Liabilities | Level 1 | Level 2 | Level 3 | Total | ||||||||||||
Derivatives (i) | ||||||||||||||||
Futures Contracts | $ | (2,395 | ) | $ | — | $ | — | $ | (2,395 | ) | ||||||
|
|
|
|
|
|
|
| |||||||||
TOTAL | $ | (2,395 | ) | $ | — | $ | — | $ | (2,395 | ) | ||||||
|
|
|
|
|
|
|
| |||||||||
| (h) | See Schedule of Investments for additional detailed categorizations. |
| (i) | Derivatives include unrealized appreciation (depreciation) on open futures contracts. |
| See Notes to Financial Statements. | 27 |
DBX ETF Trust
Xtrackers MSCI EAFE ESG Leaders Equity ETF
August 31, 2019
Number | Value | |||||||
| COMMON STOCKS — 98.6% | ||||||||
| Australia — 9.8% | ||||||||
AMP Ltd. (a) | 2,991 | $ | 3,416 | |||||
APA Group (b) | 1,232 | 9,139 | ||||||
ASX Ltd. | 211 | 12,270 | ||||||
Aurizon Holdings Ltd. | 2,166 | 8,625 | ||||||
AusNet Services | 2,103 | 2,550 | ||||||
Australia & New Zealand Banking Group Ltd. | 3,045 | 54,859 | ||||||
Bendigo & Adelaide Bank Ltd. | 504 | 3,796 | ||||||
BlueScope Steel Ltd. | 533 | 4,485 | ||||||
Boral Ltd. | 1,212 | 3,470 | ||||||
Brambles Ltd. | 1,761 | 13,407 | ||||||
Coca-Cola Amatil Ltd. | 522 | 3,823 | ||||||
Cochlear Ltd. | 59 | 8,666 | ||||||
Coles Group Ltd. | 1,262 | 11,768 | ||||||
Commonwealth Bank of Australia | 1,888 | 100,555 | ||||||
Computershare Ltd. | 508 | 5,264 | ||||||
CSL Ltd. | 482 | 78,222 | ||||||
Dexus REIT | 1,147 | 9,969 | ||||||
Fortescue Metals Group Ltd. (a) | 1,500 | 8,085 | ||||||
Goodman Group REIT | 1,780 | 17,413 | ||||||
GPT Group REIT | 1,875 | 8,072 | ||||||
Harvey Norman Holdings Ltd. (a) | 560 | 1,653 | ||||||
Insurance Australia Group Ltd. | 2,420 | 13,142 | ||||||
Lendlease Group (b) | 601 | 6,908 | ||||||
Macquarie Group Ltd. | 349 | 29,120 | ||||||
Mirvac Group REIT | 3,776 | 8,116 | ||||||
National Australia Bank Ltd. | 2,957 | 54,509 | ||||||
Newcrest Mining Ltd. | 824 | 20,541 | ||||||
Orica Ltd. | 392 | 5,686 | ||||||
Origin Energy Ltd. | 1,793 | 9,217 | ||||||
Ramsay Health Care Ltd. | 146 | 6,457 | ||||||
SEEK Ltd. | 340 | 4,657 | ||||||
Stockland REIT | 2,477 | 7,543 | ||||||
Sydney Airport (b) | 1,240 | 7,043 | ||||||
Telstra Corp. Ltd. | 4,396 | 11,018 | ||||||
Transurban Group (b) | 2,788 | 28,082 | ||||||
Wesfarmers Ltd. | 1,184 | 31,191 | ||||||
Westpac Banking Corp. | 3,692 | 70,197 | ||||||
Woodside Petroleum Ltd. | 981 | 21,236 | ||||||
WorleyParsons Ltd. | 352 | 2,915 | ||||||
|
| |||||||
| 707,085 | ||||||||
|
| |||||||
| Austria — 0.2% | ||||||||
ANDRITZ AG | 77 | 2,717 | ||||||
OMV AG | 155 | 7,922 | ||||||
voestalpine AG (a) | 146 | 3,368 | ||||||
|
| |||||||
| 14,007 | ||||||||
|
| |||||||
| Belgium — 0.6% | ||||||||
Colruyt SA | 62 | 3,180 | ||||||
KBC Group NV | 262 | 15,188 | ||||||
Solvay SA | 78 | 7,878 | ||||||
UCB SA | 140 | 10,475 | ||||||
Umicore SA | 216 | 6,891 | ||||||
|
| |||||||
| 43,612 | ||||||||
|
| |||||||
Number | Value | |||||||
| Denmark — 2.7% | ||||||||
Chr Hansen Holding A/S | 114 | $ | 9,597 | |||||
Coloplast A/S, Class B | 133 | 15,872 | ||||||
Demant A/S* | 126 | 3,824 | ||||||
Genmab A/S* | 63 | 12,883 | ||||||
H Lundbeck A/S | 72 | 2,627 | ||||||
ISS A/S | 175 | 4,450 | ||||||
Novo Nordisk A/S, Class B | 1,829 | 95,170 | ||||||
Novozymes A/S, Class B | 227 | 9,699 | ||||||
Orsted A/S, 144A | 197 | 18,849 | ||||||
Pandora A/S | 113 | 4,823 | ||||||
Tryg A/S | 136 | 4,074 | ||||||
Vestas Wind Systems A/S | 211 | 15,535 | ||||||
|
| |||||||
| 197,403 | ||||||||
|
| |||||||
| Finland — 0.7% | ||||||||
Metso OYJ | 108 | 4,053 | ||||||
Neste OYJ | 451 | 14,225 | ||||||
Nokian Renkaat OYJ | 117 | 3,208 | ||||||
Orion OYJ, Class B | 107 | 3,979 | ||||||
Stora Enso OYJ, Class R | 638 | 7,145 | ||||||
UPM-Kymmene OYJ | 561 | 15,149 | ||||||
Wartsila OYJ Abp | 467 | 5,737 | ||||||
|
| |||||||
| 53,496 | ||||||||
|
| |||||||
| France — 9.8% | ||||||||
Accor SA | 191 | 8,258 | ||||||
Air Liquide SA | 464 | 64,716 | ||||||
Atos SE | 101 | 7,661 | ||||||
AXA SA | 2,067 | 47,506 | ||||||
Bouygues SA | 252 | 9,588 | ||||||
Carrefour SA | 615 | 10,498 | ||||||
Casino Guichard Perrachon SA (a) | 57 | 2,404 | ||||||
Cie de Saint-Gobain | 520 | 18,794 | ||||||
Cie Generale des Etablissements Michelin SCA | 177 | 18,635 | ||||||
CNP Assurances | 187 | 3,402 | ||||||
Credit Agricole SA | 1,198 | 13,708 | ||||||
Danone SA | 657 | 58,938 | ||||||
Eiffage SA | 87 | 9,029 | ||||||
EssilorLuxottica SA | 297 | 43,909 | ||||||
Eurazeo SE | 36 | 2,385 | ||||||
Gecina SA REIT | 48 | 7,622 | ||||||
Getlink SE | 448 | 6,315 | ||||||
Imerys SA | 39 | 1,593 | ||||||
Ingenico Group SA | 62 | 6,159 | ||||||
JCDecaux SA | 80 | 2,143 | ||||||
Kering SA | 79 | 38,314 | ||||||
L’Oreal SA | 266 | 72,823 | ||||||
Natixis SA | 996 | 3,863 | ||||||
Orange SA | 2,138 | 32,492 | ||||||
Schneider Electric SE | 580 | 48,645 | ||||||
Societe BIC SA | 26 | 1,664 | ||||||
Teleperformance | 61 | 13,341 | ||||||
TOTAL SA | 2,542 | 127,064 | ||||||
Unibail-Rodamco-Westfield REIT | 144 | 18,887 | ||||||
Valeo SA | 271 | 7,413 | ||||||
| See Notes to Financial Statements. | 28 |
DBX ETF Trust
Schedule of Investments
Xtrackers MSCI EAFE ESG Leaders Equity ETF(Continued)
August 31, 2019
Number | Value | |||||||
| France (Continued) | ||||||||
Wendel SA | 28 | $ | 3,931 | |||||
|
| |||||||
| 711,700 | ||||||||
|
| |||||||
| Germany — 9.9% | ||||||||
adidas AG | 189 | 56,134 | ||||||
Allianz SE | 451 | 99,581 | ||||||
BASF SE | 986 | 65,345 | ||||||
Bayerische Motoren Werke AG | 363 | 24,309 | ||||||
Beiersdorf AG | 106 | 13,366 | ||||||
Commerzbank AG | 1,103 | 6,267 | ||||||
Deutsche Boerse AG | 201 | 29,606 | ||||||
Deutsche Post AG | 1,030 | 33,915 | ||||||
Deutsche Wohnen SE | 382 | 13,571 | ||||||
E.ON SE | 2,324 | 21,639 | ||||||
Fraport AG Frankfurt Airport Services Worldwide | 46 | 3,849 | ||||||
HeidelbergCement AG | 154 | 10,691 | ||||||
Henkel AG & Co. KGaA | 100 | 9,256 | ||||||
Infineon Technologies AG | 1,296 | 22,476 | ||||||
Merck KGaA | 142 | 15,209 | ||||||
METRO AG | 182 | 2,822 | ||||||
MTU Aero Engines AG | 53 | 14,492 | ||||||
Muenchener Rueckversicherungs-Gesellschaft AG in Muenchen | 158 | 37,914 | ||||||
RWE AG | 567 | 16,179 | ||||||
SAP SE | 1,047 | 125,217 | ||||||
Siemens AG | 816 | 81,730 | ||||||
Symrise AG | 135 | 12,625 | ||||||
Telefonica Deutschland Holding AG | 1,148 | 2,928 | ||||||
|
| |||||||
| 719,121 | ||||||||
|
| |||||||
| Hong Kong — 2.5% | ||||||||
ASM Pacific Technology Ltd. | 366 | 4,197 | ||||||
BOC Hong Kong Holdings Ltd. | 4,002 | 13,510 | ||||||
CLP Holdings Ltd. | 1,722 | 17,747 | ||||||
Hang Seng Bank Ltd. | 823 | 17,184 | ||||||
HKT Trust & HKT Ltd. (b) | 4,421 | 6,917 | ||||||
Hong Kong & China Gas Co. Ltd. | 10,587 | 20,457 | ||||||
Hong Kong Exchanges & Clearing Ltd. (a) | 1,267 | 38,809 | ||||||
Hysan Development Co. Ltd. | 667 | 2,703 | ||||||
MTR Corp. Ltd. | 1,511 | 8,755 | ||||||
PCCW Ltd. | 5,462 | 2,963 | ||||||
Shangri-La Asia Ltd. | 1,035 | 1,082 | ||||||
Sun Hung Kai Properties Ltd. | 1,710 | 24,246 | ||||||
Swire Pacific Ltd., Class A | 526 | 5,152 | ||||||
Swire Properties Ltd. | 1,261 | 4,144 | ||||||
Techtronic Industries Co. Ltd. | 1,430 | 9,892 | ||||||
|
| |||||||
| 177,758 | ||||||||
|
| |||||||
| Ireland — 0.9% | ||||||||
CRH PLC | 883 | 29,444 | ||||||
DCC PLC | 107 | 9,101 | ||||||
Kerry Group PLC, Class A | 176 | 20,991 | ||||||
Kingspan Group PLC | 154 | 7,045 | ||||||
|
| |||||||
| 66,581 | ||||||||
|
| |||||||
| Israel — 0.3% | ||||||||
Bank Hapoalim BM* | 1,202 | 8,817 | ||||||
Number | Value | |||||||
| Israel (Continued) | ||||||||
Bank LeumiLe-Israel BM | 1,563 | $ | 10,660 | |||||
Mizrahi Tefahot Bank Ltd. | 150 | 3,454 | ||||||
|
| |||||||
| 22,931 | ||||||||
|
| |||||||
| Italy — 0.9% | ||||||||
Assicurazioni Generali SpA | 1,178 | 21,366 | ||||||
Intesa Sanpaolo SpA | 16,096 | 35,331 | ||||||
Snam SpA | 2,022 | 10,241 | ||||||
|
| |||||||
| 66,938 | ||||||||
|
| |||||||
| Japan — 23.4% | ||||||||
Aeon Co. Ltd. (a) | 700 | 12,424 | ||||||
AEON Financial Service Co. Ltd. | 100 | 1,466 | ||||||
AGC, Inc. | 200 | 5,775 | ||||||
Ajinomoto Co., Inc. | 500 | 9,124 | ||||||
ANA Holdings, Inc. | 100 | 3,422 | ||||||
Asahi Kasei Corp. | 1,300 | 11,772 | ||||||
Astellas Pharma, Inc. | 2,000 | 27,736 | ||||||
Benesse Holdings, Inc. | 100 | 2,561 | ||||||
Bridgestone Corp. | 600 | 22,910 | ||||||
Casio Computer Co. Ltd. | 200 | 2,794 | ||||||
Central Japan Railway Co. | 150 | 29,698 | ||||||
Chugai Pharmaceutical Co. Ltd. | 250 | 17,900 | ||||||
CyberAgent, Inc. | 100 | 4,513 | ||||||
Dai Nippon Printing Co. Ltd. | 200 | 4,332 | ||||||
Daicel Corp. | 300 | 2,320 | ||||||
Daifuku Co. Ltd. | 100 | 4,729 | ||||||
Daikin Industries Ltd. | 260 | 32,223 | ||||||
Daiwa House Industry Co. Ltd. | 600 | 18,835 | ||||||
Denso Corp. | 460 | 19,320 | ||||||
East Japan Railway Co. | 300 | 28,588 | ||||||
Eisai Co. Ltd. | 300 | 15,347 | ||||||
Fast Retailing Co. Ltd. | 60 | 35,182 | ||||||
Fujitsu Ltd. | 200 | 15,456 | ||||||
Hino Motors Ltd. | 300 | 2,363 | ||||||
Hirose Electric Co. Ltd. | 40 | 4,548 | ||||||
Hitachi Chemical Co. Ltd. | 100 | 3,128 | ||||||
Hitachi Construction Machinery Co. Ltd. | 100 | 2,139 | ||||||
Hitachi High-Technologies Corp. | 100 | 5,408 | ||||||
Hitachi Metals Ltd. | 200 | 2,155 | ||||||
Honda Motor Co. Ltd. | 1,700 | 40,416 | ||||||
Hulic Co. Ltd. | 300 | 2,866 | ||||||
Inpex Corp. | 1,100 | 9,524 | ||||||
Japan Retail Fund Investment Corp. REIT (a) | 3 | 6,009 | ||||||
JFE Holdings, Inc. | 500 | 5,858 | ||||||
Kajima Corp. | 500 | 6,091 | ||||||
Kansai Paint Co. Ltd. | 200 | 4,166 | ||||||
Kao Corp. | 500 | 36,149 | ||||||
Kawasaki Heavy Industries Ltd. | 200 | 3,925 | ||||||
KDDI Corp. | 1,900 | 50,747 | ||||||
Keio Corp. | 100 | 6,256 | ||||||
Keyence Corp. | 100 | 59,259 | ||||||
Kikkoman Corp. | 200 | 9,007 | ||||||
Kobayashi Pharmaceutical Co. Ltd. | 50 | 3,750 | ||||||
Kobe Steel Ltd. | 300 | 1,566 | ||||||
Komatsu Ltd. | 1,000 | 21,263 | ||||||
| See Notes to Financial Statements. | 29 |
DBX ETF Trust
Schedule of Investments
Xtrackers MSCI EAFE ESG Leaders Equity ETF(Continued)
August 31, 2019
Number | Value | |||||||
| Japan (Continued) | ||||||||
Konami Holdings Corp. | 100 | $ | 4,536 | |||||
Konica Minolta, Inc. | 500 | 3,561 | ||||||
Kubota Corp. | 1,100 | 15,804 | ||||||
Kuraray Co. Ltd. | 300 | 3,425 | ||||||
Kurita Water Industries Ltd. | 100 | 2,603 | ||||||
Kyocera Corp. | 350 | 20,823 | ||||||
Kyushu Railway Co. | 200 | 6,001 | ||||||
Lawson, Inc. (a) | 100 | 4,965 | ||||||
Marui Group Co. Ltd. | 200 | 3,985 | ||||||
Mitsubishi Chemical Holdings Corp. | 1,400 | 9,618 | ||||||
Mitsubishi Electric Corp. | 2,000 | 24,184 | ||||||
Mitsubishi Estate Co. Ltd. | 1,200 | 22,995 | ||||||
Mitsubishi Materials Corp. | 100 | 2,426 | ||||||
Mitsubishi UFJ Lease & Finance Co. Ltd. | 400 | 2,163 | ||||||
Mitsui Chemicals, Inc. | 200 | 4,279 | ||||||
Mitsui Fudosan Co. Ltd. | 900 | 21,587 | ||||||
Mizuho Financial Group, Inc. | 25,300 | 36,873 | ||||||
Murata Manufacturing Co. Ltd. | 600 | 25,205 | ||||||
Nabtesco Corp. | 100 | 2,878 | ||||||
Nagoya Railroad Co. Ltd. | 200 | 5,963 | ||||||
NEC Corp. | 300 | 12,860 | ||||||
NGK Insulators Ltd. | 300 | 4,030 | ||||||
NGK Spark Plug Co. Ltd. | 200 | 3,456 | ||||||
Nikon Corp. | 300 | 3,717 | ||||||
Nintendo Co. Ltd. | 120 | 45,549 | ||||||
Nippon Express Co. Ltd. | 100 | 5,172 | ||||||
Nippon Prologis REIT, Inc. REIT | 2 | 5,423 | ||||||
Nippon Yusen KK | 200 | 2,988 | ||||||
Nissin Foods Holdings Co. Ltd. | 100 | 6,943 | ||||||
Nitori Holdings Co. Ltd. | 100 | 14,438 | ||||||
Nitto Denko Corp. | 200 | 9,319 | ||||||
Nomura Real Estate Holdings, Inc. | 100 | 2,122 | ||||||
Nomura Research Institute Ltd. | 300 | 5,972 | ||||||
NSK Ltd. | 400 | 3,211 | ||||||
NTT DOCOMO, Inc. | 1,400 | 35,374 | ||||||
Obayashi Corp. | 700 | 6,456 | ||||||
Odakyu Electric Railway Co. Ltd. | 300 | 6,811 | ||||||
Omron Corp. | 200 | 9,911 | ||||||
Ono Pharmaceutical Co. Ltd. | 400 | 7,395 | ||||||
Oriental Land Co. Ltd. | 200 | 29,149 | ||||||
ORIX Corp. | 1,400 | 20,694 | ||||||
Osaka Gas Co. Ltd. | 400 | 7,168 | ||||||
Otsuka Corp. | 100 | 3,717 | ||||||
Panasonic Corp. | 2,300 | 17,770 | ||||||
Park24 Co. Ltd. | 100 | 2,053 | ||||||
Rakuten, Inc. | 900 | 8,487 | ||||||
Recruit Holdings Co. Ltd. | 1,300 | 39,424 | ||||||
Resona Holdings, Inc. | 2,200 | 8,643 | ||||||
Santen Pharmaceutical Co. Ltd. | 400 | 7,013 | ||||||
Secom Co. Ltd. | 200 | 17,078 | ||||||
Sega Sammy Holdings, Inc. | 100 | 1,372 | ||||||
Sekisui Chemical Co. Ltd. | 400 | 5,769 | ||||||
Sekisui House Ltd. | 700 | 12,434 | ||||||
Seven & i Holdings Co. Ltd. | 800 | 28,316 | ||||||
Sharp Corp. | 200 | 2,065 | ||||||
Shimadzu Corp. | 200 | 4,978 | ||||||
Shimizu Corp. | 600 | 5,008 | ||||||
Number | Value | |||||||
| Japan (Continued) | ||||||||
Shin-Etsu Chemical Co. Ltd. | 400 | $ | 40,379 | |||||
Shiseido Co. Ltd. | 400 | 32,748 | ||||||
Showa Denko KK | 100 | 2,583 | ||||||
Sohgo Security Services Co. Ltd. | 100 | 5,050 | ||||||
Sompo Holdings, Inc. | 400 | 15,993 | ||||||
Sony Corp. | 1,350 | 76,845 | ||||||
Stanley Electric Co. Ltd. | 100 | 2,488 | ||||||
Sumitomo Chemical Co. Ltd. | 1,500 | 6,571 | ||||||
Sumitomo Metal Mining Co. Ltd. | 200 | 5,637 | ||||||
Sumitomo Mitsui Trust Holdings, Inc. | 300 | 9,813 | ||||||
Sumitomo Rubber Industries Ltd. | 200 | 2,259 | ||||||
Suntory Beverage & Food Ltd. | 200 | 8,630 | ||||||
Sysmex Corp. | 200 | 12,779 | ||||||
T&D Holdings, Inc. | 600 | 5,848 | ||||||
Taisei Corp. | 200 | 7,085 | ||||||
Takeda Pharmaceutical Co. Ltd. | 1,600 | 54,115 | ||||||
Teijin Ltd. | 200 | 3,599 | ||||||
Tobu Railway Co. Ltd. | 200 | 6,142 | ||||||
Toho Co. Ltd. | 100 | 4,244 | ||||||
Tokyo Electron Ltd. | 170 | 30,438 | ||||||
Tokyo Gas Co. Ltd. | 400 | 10,120 | ||||||
Tokyu Corp. | 500 | 8,945 | ||||||
Toray Industries, Inc. | 1,500 | 10,706 | ||||||
TOTO Ltd. | 200 | 7,245 | ||||||
Toyo Suisan Kaisha Ltd. | 100 | 4,075 | ||||||
Toyoda Gosei Co. Ltd. | 100 | 1,863 | ||||||
Unicharm Corp. | 400 | 12,304 | ||||||
USS Co. Ltd. | 200 | 3,783 | ||||||
West Japan Railway Co. | 200 | 16,864 | ||||||
Yakult Honsha Co. Ltd. | 100 | 5,766 | ||||||
Yamada Denki Co. Ltd. | 700 | 3,297 | ||||||
Yamaha Corp. | 150 | 6,479 | ||||||
Yamaha Motor Co. Ltd. | 300 | 4,912 | ||||||
Yaskawa Electric Corp. (a) | 300 | 10,090 | ||||||
Yokogawa Electric Corp. | 200 | 3,636 | ||||||
|
| |||||||
| 1,694,510 | ||||||||
|
| |||||||
| Luxembourg — 0.2% | ||||||||
Millicom International Cellular SA SDR | 70 | 3,569 | ||||||
SES SA | 378 | 6,101 | ||||||
Tenaris SA | 520 | 5,677 | ||||||
|
| |||||||
| 15,347 | ||||||||
|
| |||||||
| Netherlands — 4.6% | ||||||||
Aegon NV | 1,834 | 6,994 | ||||||
Akzo Nobel NV | 239 | 21,443 | ||||||
ASML Holding NV | 448 | 99,782 | ||||||
EXOR NV | 118 | 7,992 | ||||||
ING Groep NV | 4,156 | 39,804 | ||||||
Koninklijke Ahold Delhaize NV | 1,255 | 29,417 | ||||||
Koninklijke DSM NV | 194 | 24,163 | ||||||
Koninklijke KPN NV | 3,750 | 11,894 | ||||||
Koninklijke Philips NV | 999 | 47,180 | ||||||
Koninklijke Vopak NV | 71 | 3,390 | ||||||
NN Group NV | 331 | 11,103 | ||||||
QIAGEN NV* | 261 | 9,086 | ||||||
Wolters Kluwer NV | 303 | 21,863 | ||||||
|
| |||||||
| 334,111 | ||||||||
|
| |||||||
| See Notes to Financial Statements. | 30 |
DBX ETF Trust
Schedule of Investments
Xtrackers MSCI EAFE ESG Leaders Equity ETF(Continued)
August 31, 2019
Number | Value | |||||||
| New Zealand — 0.2% | ||||||||
Auckland International Airport Ltd. | 1,116 | $ | 6,771 | |||||
Fletcher Building Ltd. | 879 | 2,461 | ||||||
Meridian Energy Ltd. | 1,311 | 4,118 | ||||||
Ryman Healthcare Ltd. (a) | 402 | 3,301 | ||||||
|
| |||||||
| 16,651 | ||||||||
|
| |||||||
| Norway — 0.9% | ||||||||
Aker BP ASA | 107 | 2,841 | ||||||
Equinor ASA | 1,092 | 18,683 | ||||||
Mowi ASA | 457 | 10,941 | ||||||
Norsk Hydro ASA | 1,338 | 4,238 | ||||||
Orkla ASA | 857 | 7,860 | ||||||
Schibsted ASA, Class B | 100 | 2,899 | ||||||
Telenor ASA | 793 | 16,293 | ||||||
|
| |||||||
| 63,755 | ||||||||
|
| |||||||
| Portugal — 0.3% | ||||||||
EDP — Energias de Portugal SA | 2,674 | 10,124 | ||||||
Galp Energia SGPS SA | 522 | 7,508 | ||||||
Jeronimo Martins SGPS SA | 268 | 4,430 | ||||||
|
| |||||||
| 22,062 | ||||||||
|
| |||||||
| Singapore — 1.8% | ||||||||
Ascendas Real Estate Investment Trust REIT | 2,700 | 5,995 | ||||||
CapitaLand Commercial Trust REIT | 2,700 | 4,146 | ||||||
CapitaLand Ltd. | 2,700 | 6,754 | ||||||
CapitaLand Mall Trust REIT | 2,700 | 5,158 | ||||||
City Developments Ltd. | 500 | 3,453 | ||||||
DBS Group Holdings Ltd. | 1,900 | 33,598 | ||||||
Jardine Cycle & Carriage Ltd. | 100 | 2,220 | ||||||
Keppel Corp. Ltd. | 1,500 | 6,315 | ||||||
Oversea-Chinese Banking Corp. Ltd. | 3,400 | 26,103 | ||||||
Singapore Airlines Ltd. | 600 | 3,819 | ||||||
Singapore Exchange Ltd. | 900 | 5,320 | ||||||
Singapore Press Holdings Ltd. | 1,700 | 2,439 | ||||||
Singapore Telecommunications Ltd. | 8,600 | 19,652 | ||||||
UOL Group Ltd. | 500 | 2,649 | ||||||
|
| |||||||
| 127,621 | ||||||||
|
| |||||||
| South Africa — 0.1% | ||||||||
Investec PLC | 705 | 3,627 | ||||||
|
| |||||||
| Spain — 3.9% | ||||||||
Amadeus IT Group SA | 471 | 35,146 | ||||||
Banco Bilbao Vizcaya Argentaria SA | 6,610 | 31,366 | ||||||
Banco de Sabadell SA | 5,886 | 5,048 | ||||||
Bankinter SA | 710 | 4,142 | ||||||
CaixaBank SA | 4,036 | 9,160 | ||||||
Enagas SA | 234 | 5,117 | ||||||
Ferrovial SA | 520 | 14,814 | ||||||
Iberdrola SA | 6,400 | 65,913 | ||||||
Industria de Diseno Textil SA | 1,153 | 35,705 | ||||||
Naturgy Energy Group SA | 338 | 8,859 | ||||||
Red Electrica Corp. SA | 462 | 9,222 | ||||||
Repsol SA | 1,580 | 23,003 | ||||||
Telefonica SA | 4,989 | 34,619 | ||||||
|
| |||||||
| 282,114 | ||||||||
|
| |||||||
Number | Value | |||||||
| Sweden — 3.3% | ||||||||
Assa Abloy AB, Class B | 1,040 | $ | 21,729 | |||||
Atlas Copco AB, Class A | 695 | 20,772 | ||||||
Atlas Copco AB, Class B | 429 | 11,439 | ||||||
Boliden AB | 297 | 6,572 | ||||||
Electrolux AB, Series B | 218 | 4,879 | ||||||
Essity AB, Class B | 640 | 19,976 | ||||||
Hennes & Mauritz AB, Class B | 851 | 16,312 | ||||||
Husqvarna AB, Class B | 440 | 3,414 | ||||||
ICA Gruppen AB (a) | 86 | 4,221 | ||||||
Investor AB, Class B | 487 | 22,853 | ||||||
Kinnevik AB, Class B | 280 | 7,635 | ||||||
L E Lundbergforetagen AB, Class B | 82 | 3,074 | ||||||
Sandvik AB | 1,197 | 17,180 | ||||||
Skandinaviska Enskilda Banken AB, Class A | 1,738 | 14,951 | ||||||
Skanska AB, Class B | 355 | 6,657 | ||||||
SKF AB, Class B | 403 | 6,507 | ||||||
Svenska Handelsbanken AB, Class A | 1,677 | 14,771 | ||||||
Swedbank AB, Class A | 942 | 12,113 | ||||||
Tele2 AB, Class B | 529 | 7,468 | ||||||
Telia Co. AB | 2,965 | 12,989 | ||||||
|
| |||||||
| 235,512 | ||||||||
|
| |||||||
| Switzerland — 7.9% | ||||||||
ABB Ltd. | 1,996 | 37,824 | ||||||
Adecco Group AG | 171 | 8,997 | ||||||
Alcon, Inc.* | 471 | 28,704 | ||||||
Chocoladefabriken Lindt & Spruengli AG Participation Certificates | 2 | 14,806 | ||||||
Cie Financiere Richemont SA | 555 | 43,079 | ||||||
Clariant AG* | 205 | 3,775 | ||||||
Coca-Cola HBC AG* | 216 | 7,181 | ||||||
Givaudan SA | 10 | 27,045 | ||||||
Kuehne + Nagel International AG | 60 | 8,735 | ||||||
Lonza Group AG* | 80 | 28,282 | ||||||
Roche Holding AG | 744 | 203,473 | ||||||
SGS SA | 6 | 14,736 | ||||||
Sika AG | 134 | 19,245 | ||||||
Sonova Holding AG | 58 | 13,465 | ||||||
Swiss Re AG | 315 | 30,295 | ||||||
Swisscom AG | 28 | 13,982 | ||||||
Vifor Pharma AG | 47 | 7,453 | ||||||
Zurich Insurance Group AG | 161 | 57,309 | ||||||
|
| |||||||
| 568,386 | ||||||||
|
| |||||||
| United Arab Emirates — 0.1% | ||||||||
NMC Health PLC | 108 | 3,291 | ||||||
|
| |||||||
| United Kingdom — 13.6% | ||||||||
3i Group PLC | 1,021 | 13,634 | ||||||
Associated British Foods PLC | 373 | 10,316 | ||||||
Aviva PLC | 4,188 | 18,060 | ||||||
Barratt Developments PLC | 1,066 | 8,210 | ||||||
Berkeley Group Holdings PLC | 135 | 6,440 | ||||||
British Land Co. PLC REIT | 971 | 6,029 | ||||||
BT Group PLC | 9,145 | 18,448 | ||||||
Burberry Group PLC | 425 | 11,201 | ||||||
CNH Industrial NV | 1,061 | 10,925 | ||||||
| See Notes to Financial Statements. | 31 |
DBX ETF Trust
Schedule of Investments
Xtrackers MSCI EAFE ESG Leaders Equity ETF(Continued)
August 31, 2019
Number | Value | |||||||
| United Kingdom (Continued) | ||||||||
Coca-Cola European Partners PLC | 246 | $ | 13,860 | |||||
Compass Group PLC | 1,677 | 42,542 | ||||||
Croda International PLC | 132 | 7,559 | ||||||
easyJet PLC | 165 | 1,936 | ||||||
Ferguson PLC | 250 | 18,402 | ||||||
GlaxoSmithKline PLC | 5,286 | 110,185 | ||||||
Informa PLC | 1,360 | 14,410 | ||||||
InterContinental Hotels Group PLC | 176 | 10,985 | ||||||
Intertek Group PLC | 169 | 11,172 | ||||||
ITV PLC | 3,817 | 5,390 | ||||||
J Sainsbury PLC | 1,808 | 4,318 | ||||||
John Wood Group PLC | 728 | 3,342 | ||||||
Johnson Matthey PLC | 216 | 7,655 | ||||||
Kingfisher PLC | 2,079 | 4,923 | ||||||
Legal & General Group PLC | 6,457 | 17,269 | ||||||
London Stock Exchange Group PLC | 331 | 28,032 | ||||||
Marks & Spencer Group PLC | 1,906 | 4,463 | ||||||
Meggitt PLC | 838 | 6,317 | ||||||
Merlin Entertainments PLC, 144A | 733 | 4,032 | ||||||
Mondi PLC | 515 | 10,016 | ||||||
National Grid PLC | 3,619 | 37,838 | ||||||
Next PLC | 140 | 10,121 | ||||||
Pearson PLC | 806 | 8,161 | ||||||
Prudential PLC | 2,745 | 45,732 | ||||||
Reckitt Benckiser Group PLC | 750 | 58,448 | ||||||
RELX PLC | 2,109 | 50,508 | ||||||
Rentokil Initial PLC | 1,985 | 10,883 | ||||||
RSA Insurance Group PLC | 1,116 | 7,114 | ||||||
Schroders PLC | 129 | 4,289 | ||||||
Segro PLC REIT | 1,222 | 11,682 | ||||||
Smith & Nephew PLC | 924 | 22,112 | ||||||
Spirax-Sarco Engineering PLC | 77 | 7,525 | ||||||
SSE PLC | 1,130 | 15,840 | ||||||
Standard Chartered PLC | 2,972 | 22,513 | ||||||
Standard Life Aberdeen PLC | 2,674 | 8,118 | ||||||
Taylor Wimpey PLC | 3,532 | 6,278 | ||||||
Tesco PLC | 10,397 | 27,755 | ||||||
Unilever NV | 1,543 | 95,904 | ||||||
Number | Value | |||||||
| United Kingdom (Continued) | ||||||||
Unilever PLC | 1,177 | $ | 74,480 | |||||
Whitbread PLC | 142 | 7,562 | ||||||
Wm Morrison Supermarkets PLC | 2,717 | 6,042 | ||||||
WPP PLC | 1,337 | 15,797 | ||||||
|
| |||||||
| 984,773 | ||||||||
|
| |||||||
TOTAL COMMON STOCKS | 7,132,392 | |||||||
|
| |||||||
| EXCHANGE-TRADED FUNDS — 0.5% | ||||||||
iShares Trust iShares ESG MSCI EAFE ETF | 515 | 32,007 | ||||||
|
| |||||||
| PREFERRED STOCKS — 0.4% | ||||||||
| Germany — 0.4% | ||||||||
Bayerische Motoren Werke AG | 49 | 2,639 | ||||||
Henkel AG & Co. KGaA | 195 | 19,563 | ||||||
Sartorius AG | 37 | 7,412 | ||||||
|
| |||||||
| 29,614 | ||||||||
|
| |||||||
TOTAL PREFERRED STOCKS | 29,614 | |||||||
|
| |||||||
| SECURITIES LENDING COLLATERAL — 0.6% | ||||||||
DWS Government & Agency Securities Portfolio “DWS Government Cash Institutional Shares”, 2.04% (c)(d) | 42,850 | 42,850 | ||||||
|
| |||||||
| CASH EQUIVALENTS — 0.0% | ||||||||
DWS Government Money Market Series “Institutional Shares”, 2.09% (c) | 2,055 | 2,055 | ||||||
|
| |||||||
TOTAL INVESTMENTS — 100.1% (Cost $7,491,877) | $ | 7,238,918 | ||||||
Other assets and liabilities, net — (0.1%) | (7,542 | ) | ||||||
|
| |||||||
NET ASSETS — 100.0% | $ | 7,231,376 | ||||||
|
| |||||||
A summary of the Fund’s transactions with affiliated investments during the period ended August 31, 2019 is as follows:
| Value ($) at 9/6/2018 (Commencement of Operations) | Purchases Cost ($) | Sales Proceeds ($) | Net Realized Gain/(Loss) ($) | Net Change in Unrealized Appreciation (Depreciation) ($) | Income ($) | Capital Gain Distributions ($) | Number of Shares at 8/31/2019 | Value ($) at 8/31/2019 | ||||||||||||||||||||||||||||||
EXCHANGE-TRADED FUNDS —0.0% | ||||||||||||||||||||||||||||||||||||||
Xtrackers FTSE Developed ex US Comprehensive Factor ETF (e) | ||||||||||||||||||||||||||||||||||||||
| — | 17,184 | (17,166 | ) | (18 | ) | — | — | — | — | — | ||||||||||||||||||||||||||||
SECURITIES LENDING COLLATERAL —0.6% | ||||||||||||||||||||||||||||||||||||||
DWS Government & Agency Securities Portfolio “DWS Government Cash Institutional Shares”, 2.04% (c)(d) | ||||||||||||||||||||||||||||||||||||||
| — | 42,850 | (f) | — | — | — | 1,708 | — | 42,850 | 42,850 | |||||||||||||||||||||||||||||
CASH EQUIVALENTS —0.0% | ||||||||||||||||||||||||||||||||||||||
DWS Government Money Market Series “Institutional Shares”, 2.09% (c) | ||||||||||||||||||||||||||||||||||||||
| — | 248,343 | (246,288 | ) | — | — | 121 | — | 2,055 | 2,055 | |||||||||||||||||||||||||||||
|
|
|
|
|
|
|
|
|
|
|
|
|
|
|
|
|
| |||||||||||||||||||||
| — | 308,377 | (263,454 | ) | (18 | ) | — | 1,829 | — | 44,905 | 44,905 | ||||||||||||||||||||||||||||
|
|
|
|
|
|
|
|
|
|
|
|
|
|
|
|
|
| |||||||||||||||||||||
| See Notes to Financial Statements. | 32 |
DBX ETF Trust
Schedule of Investments
Xtrackers MSCI EAFE ESG Leaders Equity ETF(Continued)
August 31, 2019
| * | Non-income producing security. |
| (a) | All or a portion of these securities were on loan. In addition, “Other assets and liabilities, net” may include pending sales that are also on loan. The value of securities loaned at August 31, 2019 amounted to $86,719, which is 1.2% of net assets. |
| (b) | Stapled Security — A security contractually bound to one or more other securities to form a single saleable unit which cannot be sold separately. |
| (c) | Affiliated fund managed by DWS Investment Management Americas, Inc. The rate shown is the annualizedseven-day yield at period end. |
| (d) | Represents cash collateral held in connection with securities lending. Income earned by the Fund is net of borrower rebates. In addition, the Fund heldnon-cash U.S. Treasury securities collateral having a value of $52,518. |
| (e) | Affiliated fund advised by DBX Advisors LLC. |
| (f) | Represents the net increase (purchase cost) or decrease (sales proceeds) in the amount invested in cash collateral for the period ended August 31, 2019. |
| REIT: | Real Estate Investment Trust |
| SDR: | Swedish Depositary Receipt |
| 144A: | Security exempt from registration under Rule 144A of the Securities Act of 1933. These securities may be resold in transactions exempt from registration, normally to qualified institutional buyers. |
At August 31, 2019, open futures contracts purchased were as follows:
Contract Description | Currency | Number of Contracts | Notional Amount | Contract Value | Expiration Date | Unrealized Depreciation | ||||||||||||
EURO STOXX Futures | EUR | 2 | $ | 31,543 | $ | 30,989 | 9/20/2019 | $ | (66 | ) | ||||||||
For information on the Fund’s policy and additional disclosures regarding open futures contracts, please refer to the Derivatives section of Note 2 in the accompanying Notes to Financial Statements.
Currency Abbreviations
| EUR | Euro |
Fair Value Measurements
Various inputs are used in determining the value of the Fund’s investments. These inputs are summarized in three broad levels. Level 1 includes quoted prices in active markets for identical securities. Level 2 includes other significant observable inputs (including quoted prices for similar securities, interest rates, prepayment speeds and credit risk). Level 3 includes significant unobservable inputs (including the Fund’s own assumptions in determining the fair value of investments). The level assigned to the securities valuations may not be an indication of the risk or liquidity associated with investing in those securities.
The following is a summary of the inputs used as of August 31, 2019 in valuing the Fund’s investments. For information on the Fund’s policy regarding the valuation of investments, please refer to the Security Valuation section of Note 2 in the accompanying Notes to Financial Statements.
Assets | Level 1 | Level 2 | Level 3 | Total | ||||||||||||
Common Stocks (g) | $ | 7,132,392 | $ | — | $ | — | $ | 7,132,392 | ||||||||
Exchange-Traded Funds | 32,007 | — | — | 32,007 | ||||||||||||
Preferred Stocks | 29,614 | — | — | 29,614 | ||||||||||||
Short-Term Investments (g) | 44,905 | — | — | 44,905 | ||||||||||||
|
|
|
|
|
|
|
| |||||||||
TOTAL | $ | 7,238,918 | $ | — | $ | — | $ | 7,238,918 | ||||||||
|
|
|
|
|
|
|
| |||||||||
Liabilities | Level 1 | Level 2 | Level 3 | Total | ||||||||||||
Derivatives (h) | ||||||||||||||||
Futures Contracts | $ | (66 | ) | $ | — | $ | — | $ | (66 | ) | ||||||
|
|
|
|
|
|
|
| |||||||||
TOTAL | $ | (66 | ) | $ | — | $ | — | $ | (66 | ) | ||||||
|
|
|
|
|
|
|
| |||||||||
| (g) | See Schedule of Investments for additional detailed categorizations. |
| (h) | Derivatives include unrealized appreciation (depreciation) on open futures contracts. |
| See Notes to Financial Statements. | 33 |
DBX ETF Trust
Xtrackers MSCI Emerging Markets ESG Leaders Equity ETF
August 31, 2019
Number | Value | |||||||||||
| COMMON STOCKS — 95.4% | ||||||||||||
| Argentina — 0.2% | ||||||||||||
Banco BBVA Argentina SA, ADR | 220 | $ | 928 | |||||||||
Globant SA* | 95 | 9,018 | ||||||||||
Transportadora de Gas del Sur SA, ADR | 215 | 1,613 | ||||||||||
|
| |||||||||||
| 11,559 | ||||||||||||
|
| |||||||||||
| Belgium — 0.0% | ||||||||||||
Titan Cement International SA* | 106 | 2,136 | ||||||||||
|
| |||||||||||
| Brazil — 3.3% | ||||||||||||
Atacadao SA | 978 | 5,278 | ||||||||||
B2W Cia Digital* | 551 | 6,267 | ||||||||||
B3 SA — Brasil Bolsa Balcao | 5,537 | 60,030 | ||||||||||
Banco do Brasil SA | 2,323 | 25,995 | ||||||||||
Banco Santander Brasil SA | 1,106 | 11,402 | ||||||||||
BR Malls Participacoes SA | 2,076 | 6,772 | ||||||||||
Cielo SA | 3,378 | 6,336 | ||||||||||
Cosan SA | 386 | 4,670 | ||||||||||
Energisa SA | 424 | 4,873 | ||||||||||
Engie Brasil Energia SA | 558 | 6,074 | ||||||||||
Klabin SA | 1,931 | 7,038 | ||||||||||
Localiza Rent a Car SA | 1,595 | 18,157 | ||||||||||
Lojas Renner SA | 2,189 | 26,779 | ||||||||||
M Dias Branco SA | 214 | 1,875 | ||||||||||
Multiplan Empreendimentos Imobiliarios SA | 780 | 4,906 | ||||||||||
Natura Cosmeticos SA | 548 | 8,750 | ||||||||||
Notre Dame Intermedica Participacoes SA | 891 | 12,092 | ||||||||||
TIM Participacoes SA | 2,464 | 7,334 | ||||||||||
Ultrapar Participacoes SA | 2,000 | 7,947 | ||||||||||
WEG SA | 2,394 | 13,035 | ||||||||||
|
| |||||||||||
| 245,610 | ||||||||||||
|
| |||||||||||
| Chile — 0.8% | ||||||||||||
Aguas Andinas SA, Class A | 8,308 | 4,584 | ||||||||||
Empresa Nacional de Telecomunicaciones SA* | 448 | 3,913 | ||||||||||
Empresas CMPC SA | 3,321 | 7,685 | ||||||||||
Empresas COPEC SA | 1,110 | 10,029 | ||||||||||
Enel Americas SA | 100,347 | 16,484 | ||||||||||
Latam Airlines Group SA | 900 | 7,580 | ||||||||||
SACI Falabella | 1,900 | 10,694 | ||||||||||
|
| |||||||||||
| 60,969 | ||||||||||||
|
| |||||||||||
| China — 26.8% | ||||||||||||
3SBio, Inc., 144A* | 3,404 | 5,248 | ||||||||||
51job, Inc., ADR*(a) | 72 | 5,179 | ||||||||||
AAC Technologies Holdings, Inc. | 1,978 | 8,558 | ||||||||||
Air China Ltd., Class H | 5,074 | 4,397 | ||||||||||
Alibaba Group Holding Ltd., ADR* | 3,842 | 672,465 | ||||||||||
BAIC Motor Corp. Ltd., Class H, 144A | 4,815 | 2,716 | ||||||||||
Bank of Shanghai Co. Ltd., Class A | 2,300 | 2,899 | ||||||||||
Baozun, Inc., ADR*(a) | 100 | 4,576 | ||||||||||
BBMG Corp., Class A | 2,500 | 1,177 | ||||||||||
BBMG Corp., Class H | 3,314 | 943 | ||||||||||
BYD Co. Ltd., Class A | 200 | 1,382 | ||||||||||
BYD Co. Ltd., Class H | 1,785 | 9,249 | ||||||||||
BYD Electronic International Co. Ltd. (a) | 2,176 | 2,619 | ||||||||||
Number | Value | |||||||||
| China (Continued) | ||||||||||
China Aoyuan Group Ltd. | 3,646 | $ | 4,300 | |||||||
China CITIC Bank Corp. Ltd., Class H | 25,308 | 13,243 | ||||||||
China Conch Venture Holdings Ltd. | 4,398 | 14,650 | ||||||||
China Construction Bank Corp., Class H | 259,823 | 192,993 | ||||||||
China Eastern Airlines Corp. Ltd., Class A* | 1,600 | 1,133 | ||||||||
China Eastern Airlines Corp. Ltd., Class H* | 3,797 | 1,788 | ||||||||
China Everbright Bank Co. Ltd., Class H | 9,368 | 3,910 | ||||||||
China Longyuan Power Group Corp. Ltd., Class H | 8,106 | 4,459 | ||||||||
China Medical System Holdings Ltd. | 3,767 | 4,702 | ||||||||
China Merchants Bank Co. Ltd., Class H | 10,475 | 47,727 | ||||||||
China Merchants Securities Co. Ltd., Class A | 1,000 | 2,233 | ||||||||
China Merchants Shekou Industrial Zone Holdings Co. Ltd., Class A | 700 | 1,932 | ||||||||
China Minsheng Banking Corp. Ltd., Class H | 20,450 | 13,467 | ||||||||
China Molybdenum Co. Ltd., Class A | 2,000 | 1,003 | ||||||||
China Molybdenum Co. Ltd., Class H | 11,668 | 3,172 | ||||||||
China Resources Pharmaceutical Group Ltd., 144A | 4,506 | 4,658 | ||||||||
China Shenhua Energy Co. Ltd., Class A | 600 | 1,567 | ||||||||
China Shenhua Energy Co. Ltd., Class H | 9,300 | 18,184 | ||||||||
China Vanke Co. Ltd., Class A | 1,300 | 4,686 | ||||||||
China Vanke Co. Ltd., Class H | 3,864 | 13,364 | ||||||||
Contemporary Amperex Technology Co. Ltd., Class A | 100 | 1,010 | ||||||||
Country Garden Services Holdings Co. Ltd. | 3,274 | 9,485 | ||||||||
CSPC Pharmaceutical Group Ltd. | 12,534 | 25,083 | ||||||||
Dali Foods Group Co. Ltd., 144A | 5,848 | 3,896 | ||||||||
ENN Energy Holdings Ltd. | 2,099 | 23,976 | ||||||||
Fosun International Ltd. | 6,760 | 8,697 | ||||||||
Genscript Biotech Corp.* | 2,612 | 5,861 | ||||||||
Greenland Holdings Corp. Ltd., Class A | 1,200 | 1,112 | ||||||||
Greentown Service Group Co. Ltd. | 2,970 | 2,718 | ||||||||
Guangzhou Automobile Group Co. Ltd., Class A | 500 | 819 | ||||||||
Guangzhou Automobile Group Co. Ltd., Class H | 8,354 | 8,423 | ||||||||
HengTen Networks Group Ltd.* | 62,558 | 998 | ||||||||
Huaneng Renewables Corp. Ltd., Class H (b) | 11,456 | 3,173 | ||||||||
Inner Mongolia Yitai Coal Co. Ltd., Class B | 3,000 | 2,670 | ||||||||
Jiangsu Expressway Co. Ltd., Class H | 3,304 | 4,385 | ||||||||
Kingdee International Software Group Co. Ltd. | 6,381 | 5,782 | ||||||||
Legend Holdings Corp., Class H, 144A | 1,154 | 2,483 | ||||||||
Lenovo Group Ltd. | 19,000 | 12,513 | ||||||||
Meituan Dianping, Class B* | 2,693 | 25,554 | ||||||||
NARI Technology Co. Ltd., Class A | 400 | 967 | ||||||||
Offshore Oil Engineering Co. Ltd., Class A | 1,400 | 1,045 | ||||||||
Pinduoduo, Inc., ADR*(a) | 510 | 16,713 | ||||||||
Poly Developments and Holdings Group Co. Ltd., Class A | 1,100 | 2,067 | ||||||||
Shandong Weigao Group Medical Polymer Co. Ltd., Class H | 5,403 | 5,579 | ||||||||
| See Notes to Financial Statements. | 34 |
DBX ETF Trust
Schedule of Investments
Xtrackers MSCI Emerging Markets ESG Leaders Equity ETF(Continued)
August 31, 2019
Number | Value | |||||||||
| China (Continued) | ||||||||||
Shanghai International Airport Co. Ltd., Class A | 100 | $ | 1,174 | |||||||
Shanghai Pharmaceuticals Holding Co. Ltd., Class A | 300 | 790 | ||||||||
Shanghai Pharmaceuticals Holding Co. Ltd., Class H | 2,075 | 3,919 | ||||||||
Shenzhou International Group Holdings Ltd. | 2,008 | 27,293 | ||||||||
Shui On Land Ltd. | 8,670 | 1,804 | ||||||||
Sichuan Chuantou Energy Co. Ltd., Class A | 800 | 1,105 | ||||||||
Sihuan Pharmaceutical Holdings Group Ltd. | 9,902 | 1,769 | ||||||||
Sinopharm Group Co. Ltd., Class H | 3,330 | 12,049 | ||||||||
Sinotrans Ltd., Class H | 4,587 | 1,481 | ||||||||
SOHO China Ltd. | 5,067 | 1,487 | ||||||||
Suning.com Co. Ltd., Class A | 1,200 | 1,801 | ||||||||
TCL Corp., Class A | 2,900 | 1,305 | ||||||||
Tencent Holdings Ltd. | 15,435 | 639,829 | ||||||||
Tong Ren Tang Technologies Co. Ltd., Class H | 1,719 | 1,867 | ||||||||
Vipshop Holdings Ltd., ADR* | 1,178 | 9,860 | ||||||||
Wuxi Biologics Cayman, Inc., 144A* | 1,474 | 15,539 | ||||||||
Xinjiang Goldwind Science & Technology Co. Ltd., Class H | 2,164 | 2,549 | ||||||||
Yuzhou Properties Co. Ltd. | 5,252 | 2,212 | ||||||||
Zhejiang China Commodities City Group Co. Ltd., Class A | 1,400 | 745 | ||||||||
Zhejiang Expressway Co. Ltd., Class H | 4,006 | 3,354 | ||||||||
Zhongsheng Group Holdings Ltd. | 1,521 | 4,756 | ||||||||
|
| |||||||||
| 1,986,276 | ||||||||||
|
| |||||||||
| Colombia — 0.2% | ||||||||||
Cementos Argos SA | 1,301 | 2,917 | ||||||||
Grupo Argos SA | 860 | 4,520 | ||||||||
Interconexion Electrica SA ESP | 1,224 | 6,497 | ||||||||
|
| |||||||||
| 13,934 | ||||||||||
|
| |||||||||
| Czech Republic — 0.2% | ||||||||||
CEZ AS | 445 | 9,816 | ||||||||
Komercni banka AS | 204 | 7,251 | ||||||||
|
| |||||||||
| 17,067 | ||||||||||
|
| |||||||||
| Egypt — 0.2% | ||||||||||
Commercial International Bank Egypt SAE | 3,850 | 18,652 | ||||||||
|
| |||||||||
| Greece — 0.2% | ||||||||||
Alpha Bank AE* | 3,321 | 5,958 | ||||||||
Hellenic Telecommunications Organization SA | 621 | 8,302 | ||||||||
Motor Oil Hellas Corinth Refineries SA | 180 | 4,409 | ||||||||
|
| |||||||||
| 18,669 | ||||||||||
|
| |||||||||
| Hong Kong — 2.2% | ||||||||||
Alibaba Health Information Technology Ltd.* | 9,914 | 9,401 | ||||||||
Alibaba Pictures Group Ltd.* | 40,826 | 6,722 | ||||||||
Beijing Enterprises Water Group Ltd.* | 14,035 | 7,380 | ||||||||
China Agri-Industries Holdings Ltd. | 4,924 | 1,389 | ||||||||
Number | Value | |||||||||
| Hong Kong (Continued) | ||||||||||
China Everbright International Ltd. | 10,098 | $ | 7,926 | |||||||
China First Capital Group Ltd.* | 9,309 | 3,564 | ||||||||
China Mengniu Dairy Co. Ltd.* | 7,363 | 29,225 | ||||||||
China Overseas Land & Investment Ltd. | 10,221 | 32,351 | ||||||||
Geely Automobile Holdings Ltd. | 13,577 | 21,001 | ||||||||
Hutchison China MediTech Ltd., ADR* | 153 | 3,334 | ||||||||
Lee & Man Paper Manufacturing Ltd. | 2,038 | 1,079 | ||||||||
Shanghai Industrial Holdings Ltd. | 1,000 | 1,950 | ||||||||
Shenzhen Investment Ltd. | 9,074 | 3,439 | ||||||||
Sino Biopharmaceutical Ltd. | 19,339 | 28,779 | ||||||||
Towngas China Co. Ltd.* | 2,866 | 1,983 | ||||||||
|
| |||||||||
| 159,523 | ||||||||||
|
| |||||||||
| Hungary — 0.5% | ||||||||||
MOL Hungarian Oil & Gas PLC | 1,150 | 11,277 | ||||||||
OTP Bank Nyrt | 626 | 25,010 | ||||||||
|
| |||||||||
| 36,287 | ||||||||||
|
| |||||||||
| India — 10.8% | ||||||||||
Ashok Leyland Ltd. | 4,000 | 3,610 | ||||||||
Asian Paints Ltd. | 800 | 18,107 | ||||||||
Axis Bank Ltd. | 5,115 | 47,556 | ||||||||
Bajaj Auto Ltd. | 240 | 9,371 | ||||||||
Bharat Petroleum Corp. Ltd. | 1,750 | 8,706 | ||||||||
Bharti Airtel Ltd. | 5,496 | 26,692 | ||||||||
Britannia Industries Ltd. | 150 | 5,675 | ||||||||
Dabur India Ltd. | 1,500 | 9,428 | ||||||||
Eicher Motors Ltd. | 36 | 8,197 | ||||||||
Glenmark Pharmaceuticals Ltd. | 300 | 1,614 | ||||||||
HCL Technologies Ltd. | 1,461 | 22,513 | ||||||||
Hero MotoCorp Ltd. | 259 | 9,329 | ||||||||
Hindalco Industries Ltd. | 3,250 | 8,395 | ||||||||
Hindustan Petroleum Corp. Ltd. | 1,750 | 6,375 | ||||||||
Hindustan Unilever Ltd. | 1,755 | 46,252 | ||||||||
Housing Development Finance Corp. Ltd. | 4,414 | 133,917 | ||||||||
Indiabulls Housing Finance Ltd. | 700 | 4,464 | ||||||||
Infosys Ltd., ADR (a) | 5,867 | 67,412 | ||||||||
Infosys Ltd. | 3,400 | 38,801 | ||||||||
Lupin Ltd. | 550 | 5,707 | ||||||||
Mahindra & Mahindra Ltd. | 2,000 | 14,811 | ||||||||
Marico Ltd. | 1,300 | 7,120 | ||||||||
Nestle India Ltd. | 65 | 11,720 | ||||||||
Petronet LNG Ltd. | 1,500 | 5,605 | ||||||||
Pidilite Industries Ltd. | 300 | 5,788 | ||||||||
Piramal Enterprises Ltd. | 225 | 6,398 | ||||||||
Reliance Industries Ltd. | 7,691 | 134,476 | ||||||||
Tata Consultancy Services Ltd. | 2,433 | 76,989 | ||||||||
Tech Mahindra Ltd. | 1,250 | 12,142 | ||||||||
Titan Co. Ltd. | 850 | 13,155 | ||||||||
UPL Ltd. | 1,500 | 11,831 | ||||||||
Wipro Ltd. | 1,000 | 3,563 | ||||||||
Wipro Ltd., ADR (a) | 2,291 | 8,752 | ||||||||
Yes Bank Ltd. | 5,000 | 4,198 | ||||||||
|
| |||||||||
| 798,669 | ||||||||||
|
| |||||||||
| Indonesia — 3.1% | ||||||||||
PT Astra International Tbk | 55,181 | 25,966 | ||||||||
PT Bank Central Asia Tbk | 26,679 | 57,364 | ||||||||
| See Notes to Financial Statements. | 35 |
DBX ETF Trust
Schedule of Investments
Xtrackers MSCI Emerging Markets ESG Leaders Equity ETF(Continued)
August 31, 2019
Number | Value | |||||||||
| Indonesia (Continued) | ||||||||||
PT Bank Mandiri Persero Tbk | 49,153 | $ | 25,122 | |||||||
PT Bank Negara Indonesia Persero Tbk | 20,011 | 10,863 | ||||||||
PT Bank Rakyat Indonesia Persero Tbk | 152,637 | 45,947 | ||||||||
PT Barito Pacific Tbk | 65,955 | 4,208 | ||||||||
PT Bukit Asam Tbk | 5,510 | 960 | ||||||||
PT Indah Kiat Pulp & Paper Corp. Tbk | 7,865 | 3,798 | ||||||||
PT Indofood CBP Sukses Makmur Tbk | 6,431 | 5,463 | ||||||||
PT Indofood Sukses Makmur Tbk | 11,377 | 6,356 | ||||||||
PT Jasa Marga Persero Tbk | 6,026 | 2,379 | ||||||||
PT Kalbe Farma Tbk | 60,044 | 7,154 | ||||||||
PT Pabrik Kertas Tjiwi Kimia Tbk | 4,382 | 3,074 | ||||||||
PT Pakuwon Jati Tbk | 62,529 | 2,821 | ||||||||
PT Perusahaan Gas Negara Tbk | 29,323 | 3,969 | ||||||||
PT Unilever Indonesia Tbk | 4,235 | 14,584 | ||||||||
PT United Tractors Tbk | 4,520 | 6,668 | ||||||||
|
| |||||||||
| 226,696 | ||||||||||
|
| |||||||||
| Malaysia — 3.0% | ||||||||||
Alliance Bank Malaysia Bhd | 3,000 | 2,140 | ||||||||
AMMB Holdings Bhd | 3,600 | 3,595 | ||||||||
Axiata Group Bhd | 7,488 | 8,992 | ||||||||
CIMB Group Holdings Bhd | 12,700 | 15,281 | ||||||||
DiGi.Com Bhd | 8,400 | 10,027 | ||||||||
Fraser & Neave Holdings Bhd | 300 | 2,518 | ||||||||
HAP Seng Consolidated Bhd | 1,600 | 3,774 | ||||||||
Hartalega Holdings Bhd | 4,100 | 5,001 | ||||||||
Hong Leong Bank Bhd | 1,800 | 7,105 | ||||||||
IHH Healthcare Bhd | 6,400 | 8,811 | ||||||||
Malayan Banking Bhd | 10,918 | 22,560 | ||||||||
Malaysia Airports Holdings Bhd | 2,600 | 5,088 | ||||||||
Maxis Bhd | 6,700 | 8,874 | ||||||||
MISC Bhd | 3,000 | 5,179 | ||||||||
Nestle Malaysia Bhd | 200 | 7,015 | ||||||||
Petronas Dagangan Bhd | 700 | 3,808 | ||||||||
PPB Group Bhd | 1,700 | 7,543 | ||||||||
Press Metal Aluminium Holdings Bhd | 3,700 | 4,329 | ||||||||
Public Bank Bhd | 8,400 | 40,587 | ||||||||
RHB Bank Bhd | 4,000 | 5,421 | ||||||||
Sime Darby Bhd | 7,200 | 3,921 | ||||||||
Sime Darby Property Bhd | 3,100 | 649 | ||||||||
SP Setia Bhd Group | 3,580 | 1,328 | ||||||||
Telekom Malaysia Bhd | 3,000 | 2,675 | ||||||||
Tenaga Nasional Bhd | 8,400 | 27,884 | ||||||||
Top Glove Corp. Bhd | 4,500 | 5,083 | ||||||||
Westports Holdings Bhd | 2,700 | 2,696 | ||||||||
YTL Corp. Bhd | 6,600 | 1,569 | ||||||||
|
| |||||||||
| 223,453 | ||||||||||
|
| |||||||||
| Mexico — 1.7% | ||||||||||
Alfa SAB de CV, Class A | 7,804 | 6,658 | ||||||||
Alsea SAB de CV* | 1,203 | 2,562 | ||||||||
Arca Continental SAB de CV | 1,339 | 7,007 | ||||||||
Cemex SAB de CV, Series CPO | 40,930 | 15,236 | ||||||||
Coca-Cola Femsa SAB de CV | 1,451 | 8,573 | ||||||||
Fomento Economico Mexicano SAB de CV | 5,200 | 47,429 | ||||||||
Gruma SAB de CV, Class B | 634 | 5,897 | ||||||||
Number | Value | |||||||||
| Mexico (Continued) | ||||||||||
Grupo Aeroportuario del Sureste SAB de CV, Class B | 554 | $ | 8,140 | |||||||
Grupo Bimbo SAB de CV, Series A | 4,778 | 8,350 | ||||||||
Industrias Penoles SAB de CV | 390 | 4,676 | ||||||||
Infraestructura Energetica Nova SAB de CV* | 1,526 | 6,412 | ||||||||
Kimberly-Clark de Mexico SAB de CV, Class A* | 4,286 | 8,753 | ||||||||
|
| |||||||||
| 129,693 | ||||||||||
|
| |||||||||
| Philippines — 1.4% | ||||||||||
Aboitiz Equity Ventures, Inc. | 5,790 | 5,995 | ||||||||
Aboitiz Power Corp. | 4,700 | 3,431 | ||||||||
Alliance Global Group, Inc. | 11,500 | 2,805 | ||||||||
Ayala Land, Inc. | 20,360 | 18,499 | ||||||||
Bank of the Philippine Islands | 1,940 | 3,277 | ||||||||
BDO Unibank, Inc. | 5,370 | 15,370 | ||||||||
Globe Telecom, Inc. | 80 | 3,120 | ||||||||
JG Summit Holdings, Inc. | 7,670 | 10,601 | ||||||||
Manila Electric Co. | 580 | 4,067 | ||||||||
Metropolitan Bank & Trust Co. | 4,050 | 5,516 | ||||||||
SM Investments Corp. | 680 | 13,402 | ||||||||
SM Prime Holdings, Inc. | 27,900 | 18,919 | ||||||||
|
| |||||||||
| 105,002 | ||||||||||
|
| |||||||||
| Poland — 1.2% | ||||||||||
Bank Millennium SA* | 1,695 | 2,844 | ||||||||
Bank Polska Kasa Opieki SA | 455 | 11,151 | ||||||||
CCC SA | 82 | 2,546 | ||||||||
Grupa Lotos SA | 260 | 5,637 | ||||||||
Jastrzebska Spolka Weglowa SA | 230 | 1,721 | ||||||||
KGHM Polska Miedz SA* | 371 | 7,315 | ||||||||
mBank SA* | 50 | 4,061 | ||||||||
Orange Polska SA* | 1,812 | 2,908 | ||||||||
Polski Koncern Naftowy ORLEN SA | 800 | 18,256 | ||||||||
Polskie Gornictwo Naftowe i Gazownictwo SA | 4,993 | 5,959 | ||||||||
Powszechny Zaklad Ubezpieczen SA | 1,606 | 15,118 | ||||||||
Santander Bank Polska SA | 104 | 7,986 | ||||||||
|
| |||||||||
| 85,502 | ||||||||||
|
| |||||||||
| Qatar — 1.0% | ||||||||||
Commercial Bank PSQC | 5,290 | 6,914 | ||||||||
Ooredoo QPSC | 2,200 | 4,229 | ||||||||
Qatar National Bank QPSC | 12,106 | 63,659 | ||||||||
|
| |||||||||
| 74,802 | ||||||||||
|
| |||||||||
| Romania — 0.1% | ||||||||||
NEPI Rockcastle PLC | 985 | 8,725 | ||||||||
|
| |||||||||
| Russia — 2.3% | ||||||||||
Inter RAO UES PJSC | 110,479 | 7,115 | ||||||||
LUKOIL PJSC | 1,058 | 85,444 | ||||||||
Novatek PJSC, GDR | 244 | 47,311 | ||||||||
Novolipetsk Steel PJSC | 3,151 | 7,041 | ||||||||
PhosAgro PJSC, GDR | 301 | 3,889 | ||||||||
Polymetal International PLC | 563 | 8,154 | ||||||||
| See Notes to Financial Statements. | 36 |
DBX ETF Trust
Schedule of Investments
Xtrackers MSCI Emerging Markets ESG Leaders Equity ETF(Continued)
August 31, 2019
Number | Value | |||||||||
| Russia (Continued) | ||||||||||
Polyus PJSC | 73 | $ | 8,400 | |||||||
|
| |||||||||
| 167,354 | ||||||||||
|
| |||||||||
| Saudi Arabia — 1.2% | ||||||||||
Almarai Co. JSC | 668 | 8,825 | ||||||||
Banque Saudi Fransi | 1,454 | 13,568 | ||||||||
Saudi Arabian Mining Co.* | 1,088 | 12,851 | ||||||||
Saudi Basic Industries Corp. | 2,035 | 54,202 | ||||||||
|
| |||||||||
| 89,446 | ||||||||||
|
| |||||||||
| Singapore — 0.1% | ||||||||||
BOC Aviation Ltd., 144A | 534 | 4,641 | ||||||||
|
| |||||||||
| South Africa — 9.3% | ||||||||||
Absa Group Ltd. (a) | 1,947 | 19,708 | ||||||||
Anglo American Platinum Ltd. | 153 | 9,379 | ||||||||
Aspen Pharmacare Holdings Ltd. | 1,068 | 5,536 | ||||||||
Bid Corp. Ltd. | 900 | 19,264 | ||||||||
Bidvest Group Ltd. | 770 | 9,062 | ||||||||
Clicks Group Ltd. | 700 | 9,174 | ||||||||
Exxaro Resources Ltd. | 701 | 6,287 | ||||||||
FirstRand Ltd. | 9,273 | 36,637 | ||||||||
Fortress REIT Ltd., Class A REIT | 3,500 | 4,866 | ||||||||
Foschini Group Ltd. | 661 | 6,552 | ||||||||
Growthpoint Properties Ltd. REIT | 7,701 | 11,665 | ||||||||
Investec Ltd. | 900 | 4,747 | ||||||||
Kumba Iron Ore Ltd. (a) | 161 | 4,167 | ||||||||
Liberty Holdings Ltd. | 401 | 2,895 | ||||||||
Life Healthcare Group Holdings Ltd. | 4,045 | 6,077 | ||||||||
Momentum Metropolitan Holdings | 2,010 | 2,176 | ||||||||
Mr Price Group Ltd. | 745 | 8,424 | ||||||||
MTN Group Ltd. (a) | 4,685 | 31,655 | ||||||||
MultiChoice Group Ltd.* | 1,232 | 10,801 | ||||||||
Naspers Ltd., Class N | 1,184 | 269,321 | ||||||||
Nedbank Group Ltd. | 965 | 14,363 | ||||||||
Netcare Ltd. | 3,036 | 3,259 | ||||||||
Old Mutual Ltd. (a) | 13,340 | 15,981 | ||||||||
Pick n Pay Stores Ltd. | 1,000 | 3,807 | ||||||||
PSG Group Ltd. | 384 | 5,072 | ||||||||
Redefine Properties Ltd. REIT | 13,434 | 6,945 | ||||||||
Remgro Ltd. | 1,442 | 16,307 | ||||||||
RMB Holdings Ltd. | 2,000 | 9,411 | ||||||||
Sanlam Ltd. | 5,009 | 24,000 | ||||||||
Sappi Ltd. | 1,381 | 4,113 | ||||||||
Sasol Ltd. (a) | 1,500 | 28,447 | ||||||||
Shoprite Holdings Ltd. (a) | 1,300 | 9,674 | ||||||||
SPAR Group Ltd. | 508 | 5,816 | ||||||||
Standard Bank Group Ltd. | 3,522 | 41,117 | ||||||||
Vodacom Group Ltd. | 1,708 | 12,969 | ||||||||
Woolworths Holdings Ltd. (a) | 2,782 | 10,110 | ||||||||
|
| |||||||||
| 689,784 | ||||||||||
|
| |||||||||
| South Korea — 5.2% | ||||||||||
Amorepacific Corp. | 91 | 9,767 | ||||||||
AMOREPACIFIC Group | 84 | 4,092 | ||||||||
BNK Financial Group, Inc. | 786 | 4,348 | ||||||||
CJ CheilJedang Corp. | 21 | 3,962 | ||||||||
CJ Corp. | 40 | 2,691 | ||||||||
Number | Value | |||||||||
| South Korea (Continued) | ||||||||||
GS Engineering & Construction Corp. | 161 | $ | 4,307 | |||||||
GS Holdings Corp. | 140 | 5,548 | ||||||||
Hana Financial Group, Inc. | 784 | 21,036 | ||||||||
Hankook Tire & Technology Co. Ltd. | 215 | 5,174 | ||||||||
Hanwha Chemical Corp. | 290 | 4,142 | ||||||||
Hyundai Heavy Industries Holdings Co. Ltd. | 28 | 7,663 | ||||||||
Hyundai Marine & Fire Insurance Co. Ltd. | 172 | 3,394 | ||||||||
KB Financial Group, Inc. | 1,049 | 34,382 | ||||||||
Korea Gas Corp. | 80 | 2,579 | ||||||||
LG Chem Ltd. | 126 | 34,380 | ||||||||
LG Corp. | 268 | 15,754 | ||||||||
LG Display Co. Ltd.* | 650 | 7,486 | ||||||||
LG Electronics, Inc. | 293 | 14,828 | ||||||||
LG Household & Health Care Ltd. | 25 | 24,334 | ||||||||
LG Innotek Co. Ltd. | 40 | 3,253 | ||||||||
Lotte Chemical Corp. | 45 | 8,359 | ||||||||
Lotte Corp. | 68 | 1,872 | ||||||||
OCI Co. Ltd. | 55 | 3,015 | ||||||||
Samsung Card Co. Ltd. | 58 | 1,587 | ||||||||
Samsung Fire & Marine Insurance Co. Ltd. | 80 | 15,125 | ||||||||
Samsung SDI Co. Ltd. | 150 | 30,898 | ||||||||
Shinhan Financial Group Co. Ltd. | 1,198 | 40,304 | ||||||||
SK Holdings Co. Ltd. | 98 | 16,182 | ||||||||
SK Innovation Co. Ltd. | 150 | 20,433 | ||||||||
SK Telecom Co. Ltd. | 57 | 11,271 | ||||||||
S-Oil Corp. | 110 | 8,782 | ||||||||
Woongjin Coway Co. Ltd. | 137 | 9,524 | ||||||||
Yuhan Corp. | 26 | 4,926 | ||||||||
|
| |||||||||
| 385,398 | ||||||||||
|
| |||||||||
| Taiwan — 15.4% | ||||||||||
Acer, Inc. | 8,500 | 4,655 | ||||||||
Advantech Co. Ltd. | 944 | 8,024 | ||||||||
ASE Technology Holding Co. Ltd. | 9,462 | 21,509 | ||||||||
AU Optronics Corp. | 21,617 | 5,630 | ||||||||
Catcher Technology Co. Ltd. | 1,800 | 12,636 | ||||||||
Cathay Financial Holding Co. Ltd. | 20,662 | 26,411 | ||||||||
Chailease Holding Co. Ltd. | 3,195 | 12,664 | ||||||||
Cheng Shin Rubber Industry Co. Ltd. | 5,417 | 7,588 | ||||||||
China Airlines Ltd. | 8,225 | 2,420 | ||||||||
China Steel Corp. | 32,300 | 23,806 | ||||||||
Chunghwa Telecom Co. Ltd. | 10,106 | 35,070 | ||||||||
CTBC Financial Holding Co. Ltd. | 49,241 | 31,902 | ||||||||
Delta Electronics, Inc. | 5,163 | 24,081 | ||||||||
E.Sun Financial Holding Co. Ltd. | 27,651 | 22,228 | ||||||||
Eva Airways Corp. | 4,674 | 2,106 | ||||||||
Evergreen Marine Corp. Taiwan Ltd.* | 6,229 | 2,548 | ||||||||
Far Eastern New Century Corp. | 8,978 | 8,146 | ||||||||
Far EasTone Telecommunications Co. Ltd. | 4,279 | 9,972 | ||||||||
First Financial Holding Co. Ltd. | 28,065 | 19,210 | ||||||||
Fubon Financial Holding Co. Ltd. | 18,211 | 25,308 | ||||||||
Giant Manufacturing Co. Ltd. | 900 | 6,261 | ||||||||
Hiwin Technologies Corp. | 596 | 4,829 | ||||||||
Hotai Motor Co. Ltd. | 845 | 11,904 | ||||||||
Hua Nan Financial Holdings Co. Ltd. | 22,358 | 14,201 | ||||||||
| See Notes to Financial Statements. | 37 |
DBX ETF Trust
Schedule of Investments
Xtrackers MSCI Emerging Markets ESG Leaders Equity ETF(Continued)
August 31, 2019
Number | Value | |||||||||
| Taiwan (Continued) | ||||||||||
Innolux Corp. | 26,122 | $ | 5,838 | |||||||
Inventec Corp. | 6,889 | 4,715 | ||||||||
Lite-On Technology Corp. | 5,500 | 8,755 | ||||||||
MediaTek, Inc. | 4,043 | 47,304 | ||||||||
Nan Ya Plastics Corp. | 13,756 | 30,131 | ||||||||
President Chain Store Corp. | 1,577 | 14,660 | ||||||||
Quanta Computer, Inc. | 7,252 | 13,045 | ||||||||
Ruentex Development Co. Ltd.* | 1,335 | 1,808 | ||||||||
SinoPac Financial Holdings Co. Ltd. | 30,828 | 11,630 | ||||||||
Standard Foods Corp. | 1,072 | 2,123 | ||||||||
Taishin Financial Holding Co. Ltd. | 27,298 | 11,646 | ||||||||
Taiwan Business Bank | 11,499 | 4,503 | ||||||||
Taiwan High Speed Rail Corp. | 4,767 | 5,752 | ||||||||
Taiwan Mobile Co. Ltd. | 4,500 | �� | 16,046 | |||||||
Taiwan Semiconductor Manufacturing Co. Ltd. | 66,600 | 549,169 | ||||||||
Tatung Co. Ltd.* | 5,461 | 2,930 | ||||||||
Uni-President Enterprises Corp. | 12,880 | 31,411 | ||||||||
United Microelectronics Corp. | 30,399 | 13,017 | ||||||||
Wistron Corp. | 7,837 | 6,213 | ||||||||
Yuanta Financial Holding Co. Ltd. | 26,214 | 15,064 | ||||||||
|
| |||||||||
| 1,138,869 | ||||||||||
|
| |||||||||
| Thailand — 4.0% | ||||||||||
Advanced Info Service PCL, NVDR | 3,100 | 23,524 | ||||||||
Airports of Thailand PCL, NVDR | 11,900 | 28,025 | ||||||||
Bangkok Dusit Medical Services PCL, NVDR | 26,500 | 20,456 | ||||||||
Banpu PCL, NVDR | 13,000 | 5,400 | ||||||||
BTS Group Holdings PCL, NVDR | 18,200 | 8,037 | ||||||||
Bumrungrad Hospital PCL, NVDR | 1,100 | 4,983 | ||||||||
Central Pattana PCL, NVDR | 6,400 | 14,078 | ||||||||
CP ALL PCL, NVDR | 15,700 | 43,137 | ||||||||
Electricity Generating PCL, NVDR | 800 | 8,792 | ||||||||
Energy Absolute PCL, NVDR | 4,600 | 7,109 | ||||||||
Home Product Center PCL, NVDR | 17,400 | 10,245 | ||||||||
Indorama Ventures PCL, NVDR | 5,000 | 5,765 | ||||||||
IRPC PCL, NVDR | 30,000 | 3,886 | ||||||||
Kasikornbank PCL, NVDR | 5,600 | 29,307 | ||||||||
Land & Houses PCL, NVDR | 20,800 | 7,348 | ||||||||
Minor International PCL, NVDR | 7,800 | 9,695 | ||||||||
Muangthai Capital PCL, NVDR | 1,800 | 3,238 | ||||||||
PTT Global Chemical PCL, NVDR | 6,000 | 10,451 | ||||||||
Siam Cement PCL, NVDR | 2,100 | 28,575 | ||||||||
Siam Commercial Bank PCL, NVDR | 2,100 | 8,483 | ||||||||
Thai Oil PCL, NVDR | 3,300 | 7,313 | ||||||||
TMB Bank PCL, NVDR | 19,600 | 1,000 | ||||||||
True Corp. PCL, NVDR | 34,100 | 7,027 | ||||||||
|
| |||||||||
| 295,874 | ||||||||||
|
| |||||||||
| Turkey — 0.2% | ||||||||||
Arcelik AS* | 344 | 1,009 | ||||||||
KOC Holding AS | 2,100 | 6,304 | ||||||||
Turkcell Iletisim Hizmetleri AS | 2,621 | 5,817 | ||||||||
Turkiye Sise ve Cam Fabrikalari AS | 2,022 | 1,503 | ||||||||
|
| |||||||||
| 14,633 | ||||||||||
|
| |||||||||
Number | Value | |||||||||||
| United Arab Emirates — 0.8% | ||||||||||||
Abu Dhabi Commercial Bank PJSC | 7,792 | $ | 18,435 | |||||||||
DP World PLC | 461 | 6,454 | ||||||||||
Dubai Islamic Bank PJSC | 4,776 | 6,657 | ||||||||||
First Abu Dhabi Bank PJSC | 7,407 | 30,772 | ||||||||||
|
| |||||||||||
| 62,318 | ||||||||||||
|
| |||||||||||
TOTAL COMMON STOCKS | 7,071,541 | |||||||||||
|
| |||||||||||
| PREFERRED STOCKS — 3.8% | ||||||||||||
| Brazil — 3.6% | ||||||||||||
Banco Bradesco SA | 10,861 | 86,605 | ||||||||||
Cia Brasileira de Distribuicao | 447 | 9,472 | ||||||||||
Cia Energetica de Minas Gerais | 2,508 | 8,958 | ||||||||||
Itau Unibanco Holding SA | 13,078 | 107,417 | ||||||||||
Itausa — Investimentos Itau SA | 12,104 | 36,000 | ||||||||||
Telefonica Brasil SA | 1,192 | 15,482 | ||||||||||
|
| |||||||||||
| 263,934 | ||||||||||||
|
| |||||||||||
| Chile — 0.1% | ||||||||||||
Embotelladora Andina SA, Class B | 628 | 1,947 | ||||||||||
Sociedad Quimica y Minera de Chile SA, Class B | 331 | 8,188 | ||||||||||
|
| |||||||||||
| 10,135 | ||||||||||||
|
| |||||||||||
| South Korea — 0.1% | ||||||||||||
Amorepacific Corp. | 25 | 1,490 | ||||||||||
LG Chem Ltd. | 22 | 3,270 | ||||||||||
LG Household & Health Care Ltd. | 6 | 3,596 | ||||||||||
|
| |||||||||||
| 8,356 | ||||||||||||
|
| |||||||||||
TOTAL PREFERRED STOCKS | 282,425 | |||||||||||
|
| |||||||||||
Principal | ||||||||||||
| CORPORATE BONDS — 0.0% |
| |||||||||||
| India — 0.0% | ||||||||||||
Britannia Industries Ltd. | INR | 4,500 | 1 | |||||||||
|
| |||||||||||
Number | ||||||||||||
| WARRANTS — 0.0% |
| |||||||||||
| Thailand — 0.0% | ||||||||||||
Minor International PCL*, expires 9/30/21 |
| 305 | 41 | |||||||||
|
| |||||||||||
| EXCHANGE-TRADED FUNDS — 0.1% | ||||||||||||
iShares Core MSCI Emerging Markets ETF |
| 75 | 3,620 | |||||||||
Vanguard FTSE Emerging Markets ETF |
| 50 | 2,020 | |||||||||
|
| |||||||||||
TOTAL EXCHANGE-TRADED FUNDS |
| 5,640 | ||||||||||
|
| |||||||||||
| See Notes to Financial Statements. | 38 |
DBX ETF Trust
Schedule of Investments
Xtrackers MSCI Emerging Markets ESG Leaders Equity ETF(Continued)
August 31, 2019
| Number | Value | ||||||||||
| SECURITIES LENDING COLLATERAL — 1.8% | ||||||||||||
DWS Government & Agency Securities Portfolio “DWS Government Cash Institutional Shares”, 2.04% (c)(d) |
| 130,104 | $ | 130,104 | ||||||||
|
| |||||||||||
| CASH EQUIVALENTS — 0.2% | ||||||||||||
DWS Government Money Market Series “Institutional Shares”, 2.09% (c) | 16,016 | 16,016 | ||||||||||
|
| |||||||||||
TOTAL INVESTMENTS — 101.3% (Cost $7,658,086) | $ | 7,505,768 | ||||||||||
Other assets and liabilities, net — (1.3%) | (96,023 | ) | ||||||||||
|
| |||||||||||
NET ASSETS — 100.0% | $ | 7,409,745 | ||||||||||
|
| |||||||||||
A summary of the Fund’s transactions with affiliated investments during the period ended August 31, 2019 is as follows:
| Value ($) at 12/6/2018 (Commencement of Operations) | Purchases Cost ($) | Sales Proceeds ($) | Net Realized Gain/(Loss) ($) | Net Change in Unrealized Appreciation (Depreciation) ($) | Income ($) | Capital Gain Distributions ($) | Number of Shares at 8/31/2019 | Value ($) at 8/31/2019 | ||||||||||||||||||||||||||||||
SECURITIES LENDING COLLATERAL —1.8% | ||||||||||||||||||||||||||||||||||||||
DWS Government & Agency Securities Portfolio “DWS Government Cash Institutional Shares”, 2.04% (c)(d) | ||||||||||||||||||||||||||||||||||||||
| — | 130,104 | (e) | — | — | — | 907 | — | 130,104 | 130,104 | |||||||||||||||||||||||||||||
CASH EQUIVALENTS —0.2% | ||||||||||||||||||||||||||||||||||||||
DWS Government Money Market Series “Institutional Shares”, 2.09% (c) | ||||||||||||||||||||||||||||||||||||||
| — | 2,375,743 | (2,359,727 | ) | — | — | 7,847 | — | 16,016 | 16,016 | |||||||||||||||||||||||||||||
|
|
|
|
|
|
|
|
|
|
|
|
|
|
|
|
|
| |||||||||||||||||||||
| — | 2,505,847 | (2,359,727 | ) | — | — | 8,754 | — | 146,120 | 146,120 | |||||||||||||||||||||||||||||
|
|
|
|
|
|
|
|
|
|
|
|
|
|
|
|
|
| |||||||||||||||||||||
| * | Non-income producing security. |
| (a) | All or a portion of these securities were on loan. In addition, “Other assets and liabilities, net” may include pending sales that are also on loan. The value of securities loaned at August 31, 2019 amounted to $208,900, which is 2.8% of net assets. |
| (b) | Investment was valued using significant unobservable inputs. |
| (c) | Affiliated fund managed by DWS Investment Management Americas, Inc. The rate shown is the annualizedseven-day yield at period end. |
| (d) | Represents cash collateral held in connection with securities lending. Income earned by the Fund is net of borrower rebates. In addition, the Fund heldnon-cash U.S. Treasury securities collateral having a value of $97,105. |
| (e) | Represents the net increase (purchase cost) or decrease (sales proceeds) in the amount invested in cash collateral for the period ended August 31, 2019. |
| ADR: | American Depositary Receipt |
| CPO: | Ordinary Participation Certificates |
| GDR: | Global Depositary Receipt |
| JSC: | Joint Stock Company |
| NVDR: | Non Voting Depositary Receipt |
| PJSC: | Public Joint Stock Company |
| PSQC: | Public Shareholders Qatari Company |
| QPSC: | Qatari Public Shareholders Company |
| REIT: | Real Estate Investment Trust |
| SAE: | Societe Anonyme Egyptienne |
| 144A: | Security exempt from registration under Rule 144A of the Securities Act of 1933. These securities may be resold in transactions exempt from registration, normally to qualified institutional buyers. |
| See Notes to Financial Statements. | 39 |
DBX ETF Trust
Schedule of Investments
Xtrackers MSCI Emerging Markets ESG Leaders Equity ETF(Continued)
August 31, 2019
At August 31, 2019, open futures contracts purchased were as follows:
Contract Description | Currency | Number of Contracts | Notional Amount | Contract Value | Expiration Date | Unrealized Depreciation | ||||||||||||
MSCI Emerging Markets Index Futures | USD | 1 | $ | 50,365 | $ | 49,200 | 9/20/2019 | $ | (1,165 | ) | ||||||||
For information on the Fund’s policy and additional disclosures regarding open futures contracts, please refer to the Derivatives section of Note 2 in the accompanying Notes to Financial Statements.
Currency Abbreviations
| INR | Indian Rupee |
| USD | U.S. Dollar |
Fair Value Measurements
Various inputs are used in determining the value of the Fund’s investments. These inputs are summarized in three broad levels. Level 1 includes quoted prices in active markets for identical securities. Level 2 includes other significant observable inputs (including quoted prices for similar securities, interest rates, prepayment speeds and credit risk). Level 3 includes significant unobservable inputs (including the Fund’s own assumptions in determining the fair value of investments). The level assigned to the securities valuations may not be an indication of the risk or liquidity associated with investing in those securities.
The following is a summary of the inputs used as of August 31, 2019 in valuing the Fund’s investments. For information on the Fund’s policy regarding the valuation of investments, please refer to the Security Valuation section of Note 2 in the accompanying Notes to Financial Statements.
Assets | Level 1 | Level 2 | Level 3 | Total | ||||||||||||
Common Stocks (f) | $ | 7,068,368 | $ | — | $ | 3,173 | $ | 7,071,541 | ||||||||
Preferred Stocks (f) | 282,425 | — | — | 282,425 | ||||||||||||
Corporate Bonds | — | — | 1 | 1 | ||||||||||||
Warrants | 41 | — | — | 41 | ||||||||||||
Exchange-Traded Funds | 5,640 | — | — | 5,640 | ||||||||||||
Short-Term Investments (f) | 146,120 | — | — | 146,120 | ||||||||||||
|
|
|
|
|
|
|
| |||||||||
TOTAL | $ | 7,502,594 | $ | — | $ | 3,174 | $ | 7,505,768 | ||||||||
|
|
|
|
|
|
|
| |||||||||
Liabilities | Level 1 | Level 2 | Level 3 | Total | ||||||||||||
Derivatives (g) | ||||||||||||||||
Futures Contracts | $ | (1,165 | ) | $ | — | $ | — | $ | (1,165 | ) | ||||||
|
|
|
|
|
|
|
| |||||||||
TOTAL | $ | (1,165 | ) | $ | — | $ | — | $ | (1,165 | ) | ||||||
|
|
|
|
|
|
|
| |||||||||
| (f) | See Schedule of Investments for additional detailed categorizations. |
| (g) | Derivatives include unrealized appreciation (depreciation) on open futures contracts. |
| See Notes to Financial Statements. | 40 |
DBX ETF Trust
Xtrackers MSCI USA ESG Leaders Equity ETF
August 31, 2019
��
Number | Value | |||||||
| COMMON STOCKS — 99.6% | ||||||||
| Communication Services — 11.1% | ||||||||
Alphabet, Inc., Class A* | 30,706 | $ | 36,556,414 | |||||
Alphabet, Inc., Class C* | 32,222 | 38,282,958 | ||||||
CenturyLink, Inc. (a) | 100,054 | 1,138,615 | ||||||
Discovery, Inc., Class A*(a) | 15,662 | 432,271 | ||||||
Discovery, Inc., Class C* | 36,929 | 961,262 | ||||||
Electronic Arts, Inc.* | 30,723 | 2,878,131 | ||||||
Liberty Broadband Corp., Class C* | 11,398 | 1,201,805 | ||||||
Liberty Global PLC, Class A* | 16,699 | 446,197 | ||||||
Liberty Global PLC, Class C* | 50,990 | 1,331,859 | ||||||
Netflix, Inc.* | 44,805 | 13,161,469 | ||||||
Omnicom Group, Inc. | 22,921 | 1,743,371 | ||||||
TripAdvisor, Inc.* | 10,370 | 393,956 | ||||||
Verizon Communications, Inc. | 424,041 | 24,662,225 | ||||||
Walt Disney Co. | 184,239 | 25,288,645 | ||||||
|
| |||||||
| 148,479,178 | ||||||||
|
| |||||||
| Consumer Discretionary — 10.6% | ||||||||
Advance Auto Parts, Inc. | 7,259 | 1,001,379 | ||||||
Aptiv PLC | 27,069 | 2,251,329 | ||||||
Aramark | 24,995 | 1,021,296 | ||||||
Best Buy Co., Inc. | 24,995 | 1,590,932 | ||||||
Booking Holdings, Inc.* | 4,434 | 8,719,062 | ||||||
BorgWarner, Inc. | 20,847 | 680,238 | ||||||
Capri Holdings Ltd.* | 15,662 | 413,163 | ||||||
CarMax, Inc.*(a) | 17,736 | 1,477,054 | ||||||
Darden Restaurants, Inc. | 12,472 | 1,508,862 | ||||||
Domino’s Pizza, Inc. | 4,148 | 940,932 | ||||||
Expedia Group, Inc. | 14,328 | 1,864,073 | ||||||
Gap, Inc. (a) | 22,921 | 361,923 | ||||||
Garmin Ltd. | 13,121 | 1,070,280 | ||||||
Genuine Parts Co. | 14,625 | 1,320,491 | ||||||
H&R Block, Inc. (a) | 20,847 | 504,914 | ||||||
Hanesbrands, Inc. (a) | 36,402 | 497,251 | ||||||
Harley-Davidson, Inc. (a) | 16,699 | 532,698 | ||||||
Hasbro, Inc. | 12,444 | 1,374,689 | ||||||
Hilton Worldwide Holdings, Inc. | 28,968 | 2,675,774 | ||||||
Home Depot, Inc. | 113,017 | 25,757,704 | ||||||
Kohl’s Corp. | 16,699 | 789,195 | ||||||
L Brands, Inc. (a) | 23,958 | 395,546 | ||||||
LKQ Corp.* | 32,254 | 847,313 | ||||||
Lowe’s Cos., Inc. | 82,111 | 9,212,854 | ||||||
Lululemon Athletica, Inc.* | 11,584 | 2,139,217 | ||||||
Macy’s, Inc. | 30,180 | 445,457 | ||||||
McDonald’s Corp. | 78,347 | 17,077,296 | ||||||
MercadoLibre, Inc.* | 4,562 | 2,712,565 | ||||||
Mohawk Industries, Inc.* | 6,222 | 739,734 | ||||||
Newell Brands, Inc. (a) | 44,653 | 741,240 | ||||||
NIKE, Inc., Class B | 128,935 | 10,895,007 | ||||||
Nordstrom, Inc. (a) | 11,407 | 330,461 | ||||||
Norwegian Cruise Line Holdings Ltd.* | 21,884 | 1,110,613 | ||||||
NVR, Inc.* | 340 | 1,223,660 | ||||||
PVH Corp. | 8,016 | 607,613 | ||||||
Ross Stores, Inc. | 37,439 | 3,968,908 | ||||||
Royal Caribbean Cruises Ltd. | 18,306 | 1,908,950 | ||||||
Starbucks Corp. | 124,398 | 12,011,871 | ||||||
Tapestry, Inc. | 29,143 | 601,803 | ||||||
Number | Value | |||||||
| Consumer Discretionary (Continued) | ||||||||
Tesla, Inc.*(a) | 13,220 | $ | 2,982,564 | |||||
Tiffany & Co.(a) | 11,407 | 968,112 | ||||||
TJX Cos., Inc. | 124,545 | 6,846,239 | ||||||
Tractor Supply Co. | 12,444 | 1,267,795 | ||||||
Ulta Beauty, Inc.* | 5,927 | 1,409,026 | ||||||
Under Armour, Inc., Class A*(a) | 18,773 | 349,365 | ||||||
Under Armour, Inc., Class C* | 21,103 | 357,063 | ||||||
Vail Resorts, Inc. | 4,148 | 980,089 | ||||||
VF Corp. | 34,328 | 2,813,180 | ||||||
Whirlpool Corp. | 6,222 | 865,418 | ||||||
|
| |||||||
| 142,162,198 | ||||||||
|
| |||||||
| Consumer Staples — 7.5% | ||||||||
Bunge Ltd. | 14,625 | 781,121 | ||||||
Campbell Soup Co. | 17,736 | 798,120 | ||||||
Clorox Co. | 13,117 | 2,074,585 | ||||||
Coca-Cola Co. | 416,474 | 22,922,729 | ||||||
Colgate-Palmolive Co. | 84,199 | 6,243,356 | ||||||
Estee Lauder Cos., Inc., Class A | 22,337 | 4,422,503 | ||||||
General Mills, Inc. | 61,395 | 3,303,051 | ||||||
Hormel Foods Corp. (a) | 29,143 | 1,241,783 | ||||||
Kellogg Co. (a) | 26,032 | 1,634,809 | ||||||
Kimberly-Clark Corp. | 35,365 | 4,990,355 | ||||||
McCormick & Co., Inc. (a) | 12,472 | 2,031,315 | ||||||
PepsiCo, Inc. | 144,384 | 19,741,624 | ||||||
Procter & Gamble Co. | 256,416 | 30,828,896 | ||||||
|
| |||||||
| 101,014,247 | ||||||||
|
| |||||||
| Energy — 3.8% | ||||||||
Apache Corp. | 38,504 | 830,531 | ||||||
Baker Hughes a GE Co. | 53,099 | 1,151,717 | ||||||
Cheniere Energy, Inc.* | 23,434 | 1,399,244 | ||||||
Cimarex Energy Co. (a) | 10,370 | 443,629 | ||||||
ConocoPhillips | 115,772 | 6,040,983 | ||||||
Devon Energy Corp. | 46,063 | 1,012,925 | ||||||
Hess Corp. | 28,414 | 1,788,661 | ||||||
HollyFrontier Corp. | 16,638 | 738,062 | ||||||
Kinder Morgan, Inc. | 208,815 | 4,232,680 | ||||||
Marathon Oil Corp. | 85,353 | 1,010,579 | ||||||
Marathon Petroleum Corp. | 68,956 | 3,393,325 | ||||||
National Oilwell Varco, Inc. | 38,504 | 786,637 | ||||||
Noble Energy, Inc. (a) | 49,988 | 1,128,729 | ||||||
Occidental Petroleum Corp. | 91,827 | 3,992,638 | ||||||
ONEOK, Inc. | 41,694 | 2,971,948 | ||||||
Parsley Energy, Inc., Class A* | 28,818 | 516,130 | ||||||
Phillips 66 | 46,233 | 4,559,961 | ||||||
Pioneer Natural Resources Co. | 17,328 | 2,138,622 | ||||||
Schlumberger Ltd. | 141,842 | 4,599,936 | ||||||
Targa Resources Corp. (a) | 22,921 | 827,907 | ||||||
TechnipFMC PLC. | 43,768 | 1,087,197 | ||||||
Valero Energy Corp. | 42,731 | 3,216,790 | ||||||
Williams Cos., Inc. | 125,221 | 2,955,216 | ||||||
|
| |||||||
| 50,824,047 | ||||||||
|
| |||||||
| Financials — 12.2% | ||||||||
Affiliated Managers Group, Inc. | 5,185 | 397,327 | ||||||
Allstate Corp. | 33,798 | 3,460,577 | ||||||
Ally Financial, Inc. | 42,731 | 1,339,617 | ||||||
| See Notes to Financial Statements. | 41 |
DBX ETF Trust
Schedule of Investments
Xtrackers MSCI USA ESG Leaders Equity ETF(Continued)
August 31, 2019
Number | Value | |||||||
| Financials (Continued) | ||||||||
American Express Co. | 72,912 | $ | 8,776,417 | |||||
American Financial Group, Inc. | 7,259 | 732,941 | ||||||
American International Group, Inc. | 89,828 | 4,674,649 | ||||||
Ameriprise Financial, Inc. | 14,216 | 1,833,580 | ||||||
Aon PLC | 24,634 | 4,799,935 | ||||||
Arch Capital Group Ltd.* | 40,579 | 1,602,871 | ||||||
Arthur J Gallagher & Co. | 18,773 | 1,702,899 | ||||||
Assurant, Inc. | 6,287 | 773,301 | ||||||
AXA Equitable Holdings, Inc. | 30,197 | 627,192 | ||||||
Bank of New York Mellon Corp. | 87,586 | 3,683,867 | ||||||
BB&T Corp. (a) | 79,131 | 3,770,592 | ||||||
BlackRock, Inc. | 11,907 | 5,031,422 | ||||||
Capital One Financial Corp. | 48,357 | 4,188,683 | ||||||
Cboe Global Markets, Inc. | 11,177 | 1,331,851 | ||||||
Charles Schwab Corp. | 122,760 | 4,698,025 | ||||||
Chubb Ltd. | 46,879 | 7,326,250 | ||||||
CIT Group, Inc. | 10,370 | 441,658 | ||||||
Citizens Financial Group, Inc. | 46,879 | 1,581,697 | ||||||
CME Group, Inc. | 36,402 | 7,909,791 | ||||||
Comerica, Inc. | 16,699 | 1,029,493 | ||||||
Discover Financial Services | 34,328 | 2,745,210 | ||||||
E*TRADE Financial Corp. | 26,032 | 1,086,576 | ||||||
East West Bancorp, Inc. | 14,625 | 601,526 | ||||||
Erie Indemnity Co., Class A (a) | 2,356 | 516,694 | ||||||
FactSet Research Systems, Inc. (a) | 3,678 | 1,000,747 | ||||||
Fifth Third Bancorp | 75,421 | 1,994,885 | ||||||
First Republic Bank | 16,699 | 1,498,234 | ||||||
Franklin Resources, Inc. | 32,254 | 847,635 | ||||||
Hartford Financial Services Group, Inc. | 36,402 | 2,121,509 | ||||||
Huntington Bancshares, Inc. | 108,550 | 1,438,288 | ||||||
Intercontinental Exchange, Inc. | 57,920 | 5,414,362 | ||||||
Invesco Ltd. | 42,731 | 670,877 | ||||||
KeyCorp | 105,163 | 1,745,706 | ||||||
KKR & Co., Inc., Class A (a) | 47,557 | 1,228,873 | ||||||
Lincoln National Corp. | 21,884 | 1,157,226 | ||||||
Loews Corp. | 28,755 | 1,382,253 | ||||||
M&T Bank Corp. | 13,512 | 1,975,590 | ||||||
Marsh & McLennan Cos., Inc. | 52,062 | 5,200,473 | ||||||
Moody’s Corp. | 17,736 | 3,823,527 | ||||||
Nasdaq, Inc. | 11,407 | 1,138,875 | ||||||
Northern Trust Corp. | 20,847 | 1,833,077 | ||||||
People’s United Financial, Inc. | 38,504 | 553,303 | ||||||
PNC Financial Services Group, Inc. | 46,455 | 5,989,443 | ||||||
Principal Financial Group, Inc. | 29,143 | 1,550,990 | ||||||
Progressive Corp. | 60,358 | 4,575,136 | ||||||
Prudential Financial, Inc. | 41,379 | 3,314,044 | ||||||
Raymond James Financial, Inc. | 12,472 | 979,177 | ||||||
Regions Financial Corp. | 104,126 | 1,522,322 | ||||||
Reinsurance Group of America, Inc. | 6,222 | 958,001 | ||||||
S&P Global, Inc. | 25,246 | 6,568,757 | ||||||
Signature Bank | 5,412 | 631,310 | ||||||
State Street Corp. | 38,504 | 1,975,640 | ||||||
SunTrust Banks, Inc. | 45,842 | 2,819,741 | ||||||
SVB Financial Group* | 5,185 | 1,009,105 | ||||||
T. Rowe Price Group, Inc. | 24,995 | 2,764,947 | ||||||
TD Ameritrade Holding Corp. | 28,106 | 1,248,187 | ||||||
Travelers Cos., Inc. | 27,069 | 3,978,060 | ||||||
Number | Value | |||||||
| Financials (Continued) | ||||||||
US Bancorp | 157,017 | $ | 8,273,226 | |||||
Voya Financial, Inc. | 15,662 | 772,450 | ||||||
Willis Towers Watson PLC | 13,588 | 2,690,016 | ||||||
Zions Bancorp NA | 18,773 | 771,383 | ||||||
|
| |||||||
| 164,082,016 | ||||||||
|
| |||||||
| Health Care — 13.3% | ||||||||
AbbVie, Inc. | 151,790 | 9,978,675 | ||||||
Agilent Technologies, Inc. | 32,254 | 2,293,582 | ||||||
Align Technology, Inc.* | 7,922 | 1,450,597 | ||||||
AmerisourceBergen Corp. | 16,699 | 1,373,827 | ||||||
Amgen, Inc. | 62,660 | 13,072,129 | ||||||
Becton Dickinson and Co. | 27,724 | 7,039,678 | ||||||
Biogen, Inc.* | 19,983 | 4,391,264 | ||||||
BioMarin Pharmaceutical, Inc.* | 18,716 | 1,404,823 | ||||||
Bristol-Myers Squibb Co. | 168,521 | 8,100,804 | ||||||
Cardinal Health, Inc. | 30,559 | 1,318,010 | ||||||
Celgene Corp.* | 71,872 | 6,957,210 | ||||||
Centene Corp.* | 42,731 | 1,992,119 | ||||||
Cerner Corp. | 33,209 | 2,288,432 | ||||||
Cigna Corp. | 38,504 | 5,928,461 | ||||||
DENTSPLY SIRONA, Inc. | 22,921 | 1,195,330 | ||||||
DexCom, Inc.* | 9,407 | 1,614,335 | ||||||
Edwards Lifesciences Corp.* | 21,108 | 4,682,599 | ||||||
Gilead Sciences, Inc. | 130,678 | 8,303,280 | ||||||
HCA Healthcare, Inc. | 28,106 | 3,378,341 | ||||||
Henry Schein, Inc.* | 15,662 | 965,092 | ||||||
Hologic, Inc.* | 27,669 | 1,366,019 | ||||||
Humana, Inc. | 13,874 | 3,929,256 | ||||||
IDEXX Laboratories, Inc.* | 8,832 | 2,558,984 | ||||||
IQVIA Holdings, Inc.* | 16,699 | 2,590,850 | ||||||
Jazz Pharmaceuticals PLC* | 5,966 | 764,543 | ||||||
Johnson & Johnson | 273,237 | 35,072,701 | ||||||
Laboratory Corp. of America Holdings* | 10,370 | 1,737,597 | ||||||
Merck & Co., Inc. | 264,530 | 22,873,909 | ||||||
Mettler-Toledo International, Inc.* | 2,588 | 1,699,772 | ||||||
Perrigo Co. PLC | 11,915 | 557,384 | ||||||
Quest Diagnostics, Inc. | 13,586 | 1,390,799 | ||||||
ResMed, Inc. | 14,625 | 2,037,262 | ||||||
STERIS PLC | 8,713 | 1,345,287 | ||||||
Varian Medical Systems, Inc.* | 9,333 | 988,645 | ||||||
Vertex Pharmaceuticals, Inc.* | 26,032 | 4,686,281 | ||||||
Waters Corp.* | 7,259 | 1,538,109 | ||||||
Zoetis, Inc. | 49,211 | 6,221,255 | ||||||
|
| |||||||
| 179,087,241 | ||||||||
|
| |||||||
| Industrials — 8.9% | ||||||||
3M Co. | 59,037 | 9,547,464 | ||||||
Acuity Brands, Inc. | 4,148 | 520,201 | ||||||
Allegion PLC | 9,333 | 898,488 | ||||||
AMERCO | 1,037 | 364,630 | ||||||
Arconic, Inc. | 40,684 | 1,051,275 | ||||||
C.H. Robinson Worldwide, Inc. (a) | 13,588 | 1,148,050 | ||||||
Caterpillar, Inc. | 59,421 | 7,071,099 | ||||||
Copart, Inc.* | 21,884 | 1,649,835 | ||||||
CSX Corp. | 79,430 | 5,323,399 | ||||||
Cummins, Inc. | 15,662 | 2,337,867 | ||||||
| See Notes to Financial Statements. | 42 |
DBX ETF Trust
Schedule of Investments
Xtrackers MSCI USA ESG Leaders Equity ETF(Continued)
August 31, 2019
Number | Value | |||||||
| Industrials (Continued) | ||||||||
Deere & Co. | 31,217 | $ | 4,835,825 | |||||
Delta Air Lines, Inc. | 17,736 | 1,026,205 | ||||||
Dover Corp. | 14,625 | 1,370,947 | ||||||
Eaton Corp. PLC | 43,768 | 3,532,953 | ||||||
Expeditors International of Washington, Inc. | 17,736 | 1,261,030 | ||||||
Fastenal Co. | 58,094 | 1,778,838 | ||||||
Flowserve Corp. | 13,510 | 576,607 | ||||||
Fortune Brands Home & Security, Inc. | 14,625 | 746,752 | ||||||
IDEX Corp. | 7,249 | 1,193,983 | ||||||
IHS Markit Ltd.* | 38,336 | 2,515,225 | ||||||
Illinois Tool Works, Inc. | 33,529 | 5,024,656 | ||||||
Ingersoll-Rand PLC | 24,995 | 3,026,645 | ||||||
Johnson Controls International PLC | 81,651 | 3,485,681 | ||||||
Kansas City Southern | 10,370 | 1,304,546 | ||||||
Lennox International, Inc. (a) | 3,699 | 938,732 | ||||||
ManpowerGroup, Inc. | 6,222 | 508,586 | ||||||
Masco Corp. | 31,217 | 1,271,468 | ||||||
Nielsen Holdings PLC | 36,402 | 755,706 | ||||||
Norfolk Southern Corp. | 27,069 | 4,711,359 | ||||||
Owens Corning | 11,407 | 654,305 | ||||||
PACCAR, Inc. | 36,402 | 2,386,515 | ||||||
Parker-Hannifin Corp. | 13,588 | 2,252,483 | ||||||
Pentair PLC | 16,699 | 599,828 | ||||||
Robert Half International, Inc. | 12,472 | 666,878 | ||||||
Rockwell Automation, Inc. | 12,444 | 1,901,319 | ||||||
Roper Technologies, Inc. | 10,653 | 3,907,094 | ||||||
Sensata Technologies Holding PLC* | 15,514 | 707,128 | ||||||
Snap-on, Inc. (a) | 5,185 | 770,906 | ||||||
Southwest Airlines Co. | 13,997 | 732,323 | ||||||
Stanley Black & Decker, Inc. | 15,662 | 2,080,853 | ||||||
TransDigm Group, Inc. (a) | 4,955 | 2,667,376 | ||||||
Union Pacific Corp. | 72,715 | 11,776,921 | ||||||
United Parcel Service, Inc., Class B | 71,872 | 8,528,331 | ||||||
United Rentals, Inc.* | 7,923 | 891,813 | ||||||
W.W. Grainger, Inc. | 4,969 | 1,359,767 | ||||||
WABCO Holdings, Inc.* | 5,185 | 692,249 | ||||||
Waste Management, Inc. | 43,422 | 5,182,416 | ||||||
Xylem, Inc. | 17,736 | 1,358,755 | ||||||
|
| |||||||
| 118,895,312 | ||||||||
|
| |||||||
| Information Technology — 22.6% | ||||||||
Accenture PLC, Class A | 65,143 | 12,909,388 | ||||||
Adobe, Inc.* | 49,894 | 14,195,342 | ||||||
Applied Materials, Inc. | 97,447 | 4,679,405 | ||||||
Autodesk, Inc.* | 22,494 | 3,212,593 | ||||||
Cadence Design Systems, Inc.* | 29,143 | 1,995,713 | ||||||
Citrix Systems, Inc. | 13,510 | 1,256,160 | ||||||
Cognizant Technology Solutions Corp., Class A | 59,036 | 3,624,220 | ||||||
Dell Technologies, Inc., Class C* | 15,662 | 807,063 | ||||||
Hewlett Packard Enterprise Co. | 143,166 | 1,978,554 | ||||||
HP, Inc. | 157,403 | 2,878,901 | ||||||
Intel Corp. | 460,963 | 21,854,256 | ||||||
International Business Machines Corp. | 91,500 | 12,400,995 | ||||||
Intuit, Inc. | 26,659 | 7,687,389 | ||||||
Jack Henry & Associates, Inc. | 7,409 | 1,074,009 | ||||||
Number | Value | |||||||
| Information Technology (Continued) | ||||||||
Keysight Technologies, Inc.* | 18,773 | $ | 1,818,353 | |||||
Lam Research Corp. | 15,662 | 3,297,008 | ||||||
Marvell Technology Group Ltd. | 63,310 | 1,517,541 | ||||||
Mastercard, Inc., Class A | 93,515 | 26,312,315 | ||||||
Microsoft Corp. | 747,186 | 103,007,062 | ||||||
Motorola Solutions, Inc. | 16,699 | 3,021,016 | ||||||
NVIDIA Corp. | 59,002 | 9,883,425 | ||||||
salesforce.com, Inc.* | 85,168 | 13,292,170 | ||||||
TE Connectivity Ltd. | 35,365 | 3,225,995 | ||||||
Texas Instruments, Inc. | 96,122 | 11,895,097 | ||||||
Trimble, Inc.* | 26,032 | 976,721 | ||||||
Visa, Inc., Class A | 178,605 | 32,295,356 | ||||||
VMware, Inc., Class A | 8,296 | 1,173,386 | ||||||
Western Union Co. | 44,805 | 991,086 | ||||||
|
| |||||||
| 303,260,519 | ||||||||
|
| |||||||
| Materials — 2.8% | ||||||||
Avery Dennison Corp. | 8,296 | 958,769 | ||||||
Axalta Coating Systems Ltd.* | 21,884 | 632,010 | ||||||
Ball Corp. | 32,254 | 2,593,544 | ||||||
Celanese Corp. | 13,510 | 1,531,628 | ||||||
Ecolab, Inc. | 26,887 | 5,547,057 | ||||||
International Flavors & Fragrances, Inc. (a) | 9,952 | 1,092,232 | ||||||
International Paper Co. | 39,541 | 1,546,053 | ||||||
Linde PLC | 55,758 | 10,533,244 | ||||||
Mosaic Co. | 36,402 | 669,433 | ||||||
Newmont Goldcorp Corp. | 83,047 | 3,312,745 | ||||||
Nucor Corp. | 32,254 | 1,579,801 | ||||||
PPG Industries, Inc. | 23,958 | 2,654,307 | ||||||
Sherwin-Williams Co. | 8,651 | 4,556,914 | ||||||
|
| |||||||
| 37,207,737 | ||||||||
|
| |||||||
| Real Estate — 3.4% | ||||||||
Alexandria Real Estate Equities, Inc. REIT | 11,834 | 1,773,207 | ||||||
American Tower Corp. REIT | 45,633 | 10,504,260 | ||||||
Boston Properties, Inc. REIT | 15,662 | 2,011,314 | ||||||
Camden Property Trust REIT | 9,333 | 1,010,297 | ||||||
CBRE Group, Inc., Class A* | 33,291 | 1,740,121 | ||||||
Duke Realty Corp. REIT | 36,402 | 1,211,095 | ||||||
Equinix, Inc. REIT | 8,724 | 4,852,987 | ||||||
Federal Realty Investment Trust REIT | 7,259 | 937,935 | ||||||
HCP, Inc. REIT | 48,951 | 1,699,089 | ||||||
Host Hotels & Resorts, Inc. REIT | 76,020 | 1,219,361 | ||||||
Iron Mountain, Inc. REIT (a) | 28,106 | 895,176 | ||||||
Jones Lang LaSalle, Inc. | 4,852 | 650,411 | ||||||
Liberty Property Trust REIT | 14,625 | 762,255 | ||||||
Macerich Co. REIT (a) | 12,941 | 369,207 | ||||||
Prologis, Inc. REIT | 65,571 | 5,483,047 | ||||||
SBA Communications Corp. REIT | 11,407 | 2,993,539 | ||||||
UDR, Inc. REIT | 28,886 | 1,391,727 | ||||||
Welltower, Inc. REIT | 41,518 | 3,718,352 | ||||||
Weyerhaeuser Co. REIT | 76,020 | 2,000,086 | ||||||
|
| |||||||
| 45,223,466 | ||||||||
|
| |||||||
| Utilities — 3.4% | ||||||||
AES Corp. | 68,761 | 1,054,106 | ||||||
| See Notes to Financial Statements. | 43 |
DBX ETF Trust
Schedule of Investments
Xtrackers MSCI USA ESG Leaders Equity ETF(Continued)
August 31, 2019
Number | Value | |||||||
| Utilities (Continued) | ||||||||
Alliant Energy Corp. | 23,958 | $ | 1,256,597 | |||||
American Water Works Co., Inc. | 18,773 | 2,390,178 | ||||||
CMS Energy Corp. | 29,985 | 1,890,554 | ||||||
Consolidated Edison, Inc. | 32,931 | 2,927,566 | ||||||
Dominion Energy, Inc. | 82,147 | 6,377,072 | ||||||
DTE Energy Co. | 18,773 | 2,434,107 | ||||||
Edison International | 36,242 | 2,619,209 | ||||||
Eversource Energy | 32,254 | 2,584,513 | ||||||
NiSource, Inc. | 37,439 | 1,106,323 | ||||||
Pinnacle West Capital Corp. | 11,407 | 1,087,201 | ||||||
Public Service Enterprise Group, Inc. | 52,062 | 3,148,189 | ||||||
Sempra Energy | 28,064 | 3,974,704 | ||||||
Southern Co. | 105,163 | 6,126,797 | ||||||
WEC Energy Group, Inc. | 32,254 | 3,088,966 | ||||||
Xcel Energy, Inc. | 53,099 | 3,410,018 | ||||||
|
| |||||||
| 45,476,100 | ||||||||
|
| |||||||
TOTAL COMMON STOCKS | 1,335,712,061 | |||||||
|
| |||||||
Number | Value | |||||||
| SECURITIES LENDING COLLATERAL — 0.1% | ||||||||
DWS Government & Agency Securities Portfolio “DWS Government Cash Institutional Shares”, 2.04% (b)(c) | 719,723 | $ | 719,723 | |||||
|
| |||||||
| CASH EQUIVALENTS — 0.2% | ||||||||
DWS Government Money Market Series “Institutional Shares”, 2.09% (b) | 2,902,467 | 2,902,467 | ||||||
|
| |||||||
TOTAL INVESTMENTS — 99.9% (Cost $1,269,263,332) | $ | 1,339,334,251 | ||||||
Other assets and liabilities, net — 0.1% | 1,777,335 | |||||||
|
| |||||||
NET ASSETS — 100.0% | $ | 1,341,111,586 | ||||||
|
| |||||||
A summary of the Fund’s transactions with affiliated investments during the period ended August 31, 2019 is as follows:
| Value ($) at 3/7/2019 (Commencement of Operations) | Purchases Cost ($) | Sales Proceeds ($) | Net Realized Gain/(Loss) ($) | Net Change in Unrealized Appreciation (Depreciation) ($) | Income ($) | Capital Gain Distributions ($) | Number of Shares at 8/31/2019 | Value ($) at 8/31/2019 | ||||||||||||||||||||||||||||||
SECURITIES LENDING COLLATERAL —0.1% | ||||||||||||||||||||||||||||||||||||||
DWS Government & Agency Securities Portfolio “DWS Government Cash Institutional Shares”, 2.04% (b)(c) | ||||||||||||||||||||||||||||||||||||||
| — | 719,723 | (d) | — | — | — | 6,325 | — | 719,723 | 719,723 | |||||||||||||||||||||||||||||
CASH EQUIVALENTS —0.2% | ||||||||||||||||||||||||||||||||||||||
DWS Government Money Market Series “Institutional Shares”, 2.09% (b) | ||||||||||||||||||||||||||||||||||||||
| — | 12,143,856 | (9,241,389 | ) | — | — | 16,064 | — | 2,902,467 | 2,902,467 | |||||||||||||||||||||||||||||
|
|
|
|
|
|
|
|
|
|
|
|
|
|
|
|
|
| |||||||||||||||||||||
| — | 12,863,579 | (9,241,389 | ) | — | — | 22,389 | — | 3,622,190 | 3,622,190 | |||||||||||||||||||||||||||||
|
|
|
|
|
|
|
|
|
|
|
|
|
|
|
|
|
| |||||||||||||||||||||
| * | Non-income producing security. |
| (a) | All or a portion of these securities were on loan. In addition, “Other assets and liabilities, net” may include pending sales that are also on loan. The value of securities loaned at August 31, 2019 amounted to $22,416,992, which is 1.7% of net assets. |
| (b) | Affiliated fund managed by DWS Investment Management Americas, Inc. The rate shown is the annualizedseven-day yield at period end. |
| (c) | Represents cash collateral held in connection with securities lending. Income earned by the Fund is net of borrower rebates. In addition, the Fund heldnon-cash U.S. Treasury securities collateral having a value of $22,091,836. |
| (d) | Represents the net increase (purchase cost) or decrease (sales proceeds) in the amount invested in cash collateral for the period ended August 31, 2019. |
| REIT: | Real Estate Investment Trust |
At August 31, 2019, open futures contracts purchased were as follows:
Contract Description | Currency | Number of Contracts | Notional Amount | Contract Value | Expiration Date | Unrealized Appreciation | ||||||||||||||
E-Mini S&P 500 Futures | USD | 30 | $ | 4,371,512 | $ | 4,387,200 | 9/20/2019 | $ | 15,688 | |||||||||||
For information on the Fund’s policy and additional disclosures regarding open futures contracts, please refer to the Derivatives section of Note 2 in the accompanying Notes to Financial Statements.
Currency Abbreviations
| USD | U.S. Dollar |
| See Notes to Financial Statements. | 44 |
DBX ETF Trust
Schedule of Investments
Xtrackers MSCI USA ESG Leaders Equity ETF(Continued)
August 31, 2019
Fair Value Measurements
Various inputs are used in determining the value of the Fund’s investments. These inputs are summarized in three broad levels. Level 1 includes quoted prices in active markets for identical securities. Level 2 includes other significant observable inputs (including quoted prices for similar securities, interest rates, prepayment speeds and credit risk). Level 3 includes significant unobservable inputs (including the Fund’s own assumptions in determining the fair value of investments). The level assigned to the securities valuations may not be an indication of the risk or liquidity associated with investing in those securities.
The following is a summary of the inputs used as of August 31, 2019 in valuing the Fund’s investments. For information on the Fund’s policy regarding the valuation of investments, please refer to the Security Valuation section of Note 2 in the accompanying Notes to Financial Statements.
Assets | Level 1 | Level 2 | Level 3 | Total | ||||||||||||
Common Stocks (e) | $ | 1,335,712,061 | $ | — | $ | — | $ | 1,335,712,061 | ||||||||
Short-Term Investments (e) | 3,622,190 | — | — | 3,622,190 | ||||||||||||
Derivatives (f) | ||||||||||||||||
Futures Contracts | 15,688 | — | — | 15,688 | ||||||||||||
|
|
|
|
|
|
|
| |||||||||
TOTAL | $ | 1,339,349,939 | $ | — | $ | — | $ | 1,339,349,939 | ||||||||
|
|
|
|
|
|
|
| |||||||||
| (e) | See Schedule of Investments for additional detailed categorizations. |
| (f) | Derivatives include unrealized appreciation (depreciation) on open futures contracts. |
| See Notes to Financial Statements. | 45 |
DBX ETF Trust
August 31, 2019
Number | Value | |||||||
| COMMON STOCKS — 99.6% | ||||||||
| Communication Services — 10.4% | ||||||||
Activision Blizzard, Inc. | 468 | $ | 23,681 | |||||
Alphabet, Inc., Class A* | 185 | 220,248 | ||||||
Alphabet, Inc., Class C* | 191 | 226,927 | ||||||
AT&T, Inc. | 4,477 | 157,859 | ||||||
CBS Corp., Class B | 216 | 9,085 | ||||||
CenturyLink, Inc. (a) | 585 | 6,657 | ||||||
Charter Communications, Inc., Class A* | 108 | 44,236 | ||||||
Comcast Corp., Class A | 2,777 | 122,910 | ||||||
Discovery, Inc., Class A*(a) | 99 | 2,732 | ||||||
Discovery, Inc., Class C* | 234 | 6,091 | ||||||
Electronic Arts, Inc.* | 190 | 17,799 | ||||||
Interpublic Group of Cos., Inc. | 234 | 4,652 | ||||||
News Corp., Class A | 234 | 3,217 | ||||||
News Corp., Class B | 81 | 1,147 | ||||||
Omnicom Group, Inc. | 135 | 10,268 | ||||||
Take-Two Interactive Software, Inc.* | 72 | 9,502 | ||||||
TripAdvisor, Inc.* | 63 | 2,393 | ||||||
Twitter, Inc.* | 450 | 19,193 | ||||||
Verizon Communications, Inc. | 2,532 | 147,261 | ||||||
Viacom, Inc., Class B | 216 | 5,396 | ||||||
Walt Disney Co. | 1,064 | 146,045 | ||||||
|
| |||||||
| 1,187,299 | ||||||||
|
| |||||||
| Consumer Discretionary — 11.0% | ||||||||
Amazon.com, Inc.* | 255 | 452,954 | ||||||
Best Buy Co., Inc. | 144 | 9,166 | ||||||
BorgWarner, Inc. | 126 | 4,111 | ||||||
CarMax, Inc.*(a) | 108 | 8,994 | ||||||
Carnival Corp. (a) | 243 | 10,712 | ||||||
Darden Restaurants, Inc. | 77 | 9,316 | ||||||
Dollar Tree, Inc.* | 144 | 14,620 | ||||||
eBay, Inc. | 504 | 20,306 | ||||||
Ford Motor Co. | 2,383 | 21,852 | ||||||
Gap, Inc. (a) | 144 | 2,274 | ||||||
Garmin Ltd. | 72 | 5,873 | ||||||
General Motors Co. | 821 | 30,451 | ||||||
H&R Block, Inc. (a) | 126 | 3,052 | ||||||
Hanesbrands, Inc. | 225 | 3,074 | ||||||
Hasbro, Inc. | 72 | 7,954 | ||||||
Hilton Worldwide Holdings, Inc. | 180 | 16,627 | ||||||
Home Depot, Inc. | 674 | 153,611 | ||||||
Kohl’s Corp. | 99 | 4,679 | ||||||
L Brands, Inc. (a) | 144 | 2,377 | ||||||
Leggett & Platt, Inc. | 81 | 3,012 | ||||||
Lowe’s Cos., Inc. | 486 | 54,529 | ||||||
McDonald’s Corp. | 467 | 101,792 | ||||||
NIKE, Inc., Class B | 778 | 65,741 | ||||||
Nordstrom, Inc. (a) | 63 | 1,825 | ||||||
PVH Corp. | 45 | 3,411 | ||||||
Ralph Lauren Corp. | 36 | 3,180 | ||||||
Ross Stores, Inc. | 225 | 23,852 | ||||||
Starbucks Corp. | 751 | 72,517 | ||||||
Tapestry, Inc. | 180 | 3,717 | ||||||
Target Corp. | 315 | 33,718 | ||||||
Tiffany & Co. (a) | 74 | 6,280 | ||||||
TJX Cos., Inc. | 738 | 40,568 | ||||||
Number | Value | |||||||
| Consumer Discretionary (Continued) | ||||||||
Tractor Supply Co. | 72 | $ | 7,335 | |||||
VF Corp. | 198 | 16,226 | ||||||
Whirlpool Corp. | 40 | 5,564 | ||||||
Yum! Brands, Inc. | 189 | 22,071 | ||||||
|
| |||||||
| 1,247,341 | ||||||||
|
| |||||||
| Consumer Staples — 7.7% | ||||||||
Archer-Daniels-Midland Co. | 342 | 13,013 | ||||||
Brown-Forman Corp., Class B | 99 | 5,840 | ||||||
Campbell Soup Co. | 117 | 5,265 | ||||||
Clorox Co. | 81 | 12,811 | ||||||
Coca-Cola Co. | 2,349 | 129,289 | ||||||
Colgate-Palmolive Co. | 527 | 39,077 | ||||||
Conagra Brands, Inc. | 297 | 8,423 | ||||||
Constellation Brands, Inc., Class A | 108 | 22,070 | ||||||
General Mills, Inc. | 369 | 19,852 | ||||||
Hershey Co. | 85 | 13,471 | ||||||
Hormel Foods Corp. | 171 | 7,286 | ||||||
JM Smucker Co. | 72 | 7,572 | ||||||
Kellogg Co. (a) | 153 | 9,608 | ||||||
Kimberly-Clark Corp. | 211 | 29,774 | ||||||
Kraft Heinz Co. | 378 | 9,647 | ||||||
Kroger Co. | 495 | 11,722 | ||||||
McCormick & Co., Inc. (a) | 74 | 12,052 | ||||||
Molson Coors Brewing Co., Class B | 117 | 6,009 | ||||||
Mondelez International, Inc., Class A | 882 | 48,704 | ||||||
PepsiCo, Inc. | 859 | 117,451 | ||||||
Procter & Gamble Co. | 1,535 | 184,553 | ||||||
Sysco Corp. | 288 | 21,407 | ||||||
Tyson Foods, Inc., Class A | 180 | 16,747 | ||||||
Walgreens Boots Alliance, Inc. | 477 | 24,418 | ||||||
Walmart, Inc. | 862 | 98,492 | ||||||
|
| |||||||
| 874,553 | ||||||||
|
| |||||||
| Energy — 4.5% | ||||||||
Baker Hughes a GE Co. | 315 | 6,832 | ||||||
Chevron Corp. | 1,167 | 137,379 | ||||||
ConocoPhillips | 693 | 36,161 | ||||||
Exxon Mobil Corp. | 2,593 | 177,569 | ||||||
Halliburton Co. | 540 | 10,173 | ||||||
Hess Corp. | 162 | 10,198 | ||||||
HollyFrontier Corp. | 99 | 4,392 | ||||||
Kinder Morgan, Inc. | 1,177 | 23,858 | ||||||
Noble Energy, Inc. (a) | 288 | 6,503 | ||||||
Occidental Petroleum Corp. | 544 | 23,653 | ||||||
Phillips 66 | 263 | 25,940 | ||||||
Schlumberger Ltd. | 865 | 28,052 | ||||||
TechnipFMC PLC. | 261 | 6,483 | ||||||
Valero Energy Corp. | 265 | 19,949 | ||||||
|
| |||||||
| 517,142 | ||||||||
|
| |||||||
| Financials — 11.8% | ||||||||
Aflac, Inc. | 459 | 23,033 | ||||||
Allstate Corp. | 207 | 21,195 | ||||||
American Express Co. | 419 | 50,435 | ||||||
American International Group, Inc. | 531 | 27,633 | ||||||
Ameriprise Financial, Inc. | 81 | 10,447 | ||||||
Aon PLC | 143 | 27,864 | ||||||
| See Notes to Financial Statements. | 46 |
DBX ETF Trust
Schedule of Investments
Xtrackers S&P 500 ESG ETF(Continued)
August 31, 2019
Number | Value | |||||||
| Financials (Continued) | ||||||||
Bank of America Corp. | 5,408 | $ | 148,774 | |||||
Bank of New York Mellon Corp. | 540 | 22,712 | ||||||
BlackRock, Inc. | 76 | 32,115 | ||||||
Capital One Financial Corp. | 288 | 24,947 | ||||||
Cboe Global Markets, Inc. | 72 | 8,580 | ||||||
Charles Schwab Corp. | 729 | 27,899 | ||||||
Chubb Ltd. | 279 | 43,602 | ||||||
Citigroup, Inc. | 1,421 | 91,441 | ||||||
CME Group, Inc. | 223 | 48,456 | ||||||
Comerica, Inc. | 99 | 6,103 | ||||||
Discover Financial Services | 198 | 15,834 | ||||||
E*TRADE Financial Corp. | 153 | 6,386 | ||||||
Franklin Resources, Inc. | 180 | 4,730 | ||||||
Globe Life, Inc. | 63 | 5,623 | ||||||
Goldman Sachs Group, Inc. | 206 | 42,005 | ||||||
Hartford Financial Services Group, Inc. | 225 | 13,113 | ||||||
Intercontinental Exchange, Inc. | 342 | 31,970 | ||||||
Invesco Ltd. | 243 | 3,815 | ||||||
Jefferies Financial Group, Inc. | 153 | 2,852 | ||||||
JPMorgan Chase & Co. | 1,999 | 219,610 | ||||||
KeyCorp | 621 | 10,309 | ||||||
Lincoln National Corp. | 126 | 6,663 | ||||||
Marsh & McLennan Cos., Inc. | 315 | 31,465 | ||||||
MetLife, Inc. | 595 | 26,359 | ||||||
Moody’s Corp. | 99 | 21,342 | ||||||
Morgan Stanley | 783 | 32,487 | ||||||
MSCI, Inc. | 54 | 12,670 | ||||||
Nasdaq, Inc. | 72 | 7,188 | ||||||
Northern Trust Corp. | 135 | 11,871 | ||||||
PNC Financial Services Group, Inc. | 279 | 35,971 | ||||||
Principal Financial Group, Inc. | 162 | 8,622 | ||||||
Prudential Financial, Inc. | 252 | 20,183 | ||||||
Raymond James Financial, Inc. | 81 | 6,359 | ||||||
S&P Global, Inc. | 153 | 39,809 | ||||||
State Street Corp. | 225 | 11,545 | ||||||
Synchrony Financial | 387 | 12,403 | ||||||
T. Rowe Price Group, Inc. | 144 | 15,929 | ||||||
Travelers Cos., Inc. | 162 | 23,808 | ||||||
Unum Group | 126 | 3,202 | ||||||
US Bancorp | 918 | 48,369 | ||||||
|
| |||||||
| 1,347,728 | ||||||||
|
| |||||||
| Health Care — 14.4% | ||||||||
Abbott Laboratories | 1,080 | 92,146 | ||||||
AbbVie, Inc. | 908 | 59,692 | ||||||
Agilent Technologies, Inc. | 189 | 13,440 | ||||||
Alexion Pharmaceuticals, Inc.* | 140 | 14,106 | ||||||
Allergan PLC | 189 | 30,187 | ||||||
Amgen, Inc. | 377 | 78,650 | ||||||
Anthem, Inc. | 158 | 41,320 | ||||||
Baxter International, Inc. | 288 | 25,330 | ||||||
Becton Dickinson and Co. | 169 | 42,912 | ||||||
Biogen, Inc.* | 122 | 26,809 | ||||||
Boston Scientific Corp.* | 846 | 36,150 | ||||||
Bristol-Myers Squibb Co. | 1,008 | 48,454 | ||||||
Cardinal Health, Inc. | 180 | 7,763 | ||||||
Celgene Corp.* | 442 | 42,786 | ||||||
Number | Value | |||||||
| Health Care (Continued) | ||||||||
Cerner Corp. | 198 | $ | 13,644 | |||||
Cigna Corp. | 234 | 36,029 | ||||||
CVS Health Corp. | 807 | 49,162 | ||||||
Danaher Corp. | 387 | 54,989 | ||||||
DaVita, Inc.* | 81 | 4,566 | ||||||
Edwards Lifesciences Corp.* | 125 | 27,730 | ||||||
Gilead Sciences, Inc. | 781 | 49,625 | ||||||
Henry Schein, Inc.* | 90 | 5,546 | ||||||
Humana, Inc. | 89 | 25,206 | ||||||
IDEXX Laboratories, Inc.* | 54 | 15,646 | ||||||
Illumina, Inc.* | 90 | 25,321 | ||||||
Incyte Corp.* | 108 | 8,836 | ||||||
Johnson & Johnson | 1,636 | 209,997 | ||||||
Laboratory Corp. of America Holdings* | 63 | 10,556 | ||||||
McKesson Corp. | 117 | 16,178 | ||||||
Medtronic PLC | 828 | 89,333 | ||||||
Merck & Co., Inc. | 1,576 | 136,277 | ||||||
Mettler-Toledo International, Inc.* | 18 | 11,822 | ||||||
Pfizer, Inc. | 3,424 | 121,723 | ||||||
Quest Diagnostics, Inc. | 81 | 8,292 | ||||||
UnitedHealth Group, Inc. | 580 | 135,720 | ||||||
Vertex Pharmaceuticals, Inc.* | 153 | 27,543 | ||||||
|
| |||||||
| 1,643,486 | ||||||||
|
| |||||||
| Industrials — 7.7% | ||||||||
3M Co. | 352 | 56,925 | ||||||
Alaska Air Group, Inc. | 72 | 4,300 | ||||||
AMETEK, Inc. | 144 | 12,374 | ||||||
Arconic, Inc. | 243 | 6,279 | ||||||
Caterpillar, Inc. | 351 | 41,769 | ||||||
Cintas Corp. | 54 | 14,245 | ||||||
CSX Corp. | 468 | 31,365 | ||||||
Cummins, Inc. | 90 | 13,434 | ||||||
Deere & Co. | 198 | 30,672 | ||||||
Delta Air Lines, Inc. | 374 | 21,640 | ||||||
Dover Corp. | 90 | 8,437 | ||||||
Eaton Corp. PLC | 261 | 21,068 | ||||||
Emerson Electric Co. | 378 | 22,525 | ||||||
Equifax, Inc. | 76 | 11,125 | ||||||
Expeditors International of Washington, Inc. | 108 | 7,679 | ||||||
Fastenal Co. | 351 | 10,748 | ||||||
FedEx Corp. | 146 | 23,157 | ||||||
Flowserve Corp. | 81 | 3,457 | ||||||
General Electric Co. | 5,393 | 44,492 | ||||||
IHS Markit Ltd.* | 225 | 14,762 | ||||||
Illinois Tool Works, Inc. | 180 | 26,975 | ||||||
Ingersoll-Rand PLC | 149 | 18,042 | ||||||
Johnson Controls International PLC | 486 | 20,747 | ||||||
L3Harris Technologies, Inc. | 141 | 29,809 | ||||||
Nielsen Holdings PLC | 225 | 4,671 | ||||||
Norfolk Southern Corp. | 162 | 28,196 | ||||||
PACCAR, Inc. | 216 | 14,161 | ||||||
Pentair PLC | 99 | 3,556 | ||||||
Quanta Services, Inc. | 90 | 3,051 | ||||||
Republic Services, Inc. | 135 | 12,049 | ||||||
Robert Half International, Inc. | 72 | 3,850 | ||||||
| See Notes to Financial Statements. | 47 |
DBX ETF Trust
Schedule of Investments
Xtrackers S&P 500 ESG ETF(Continued)
August 31, 2019
Number | Value | |||||||
| Industrials (Continued) | ||||||||
Rockwell Automation, Inc. | 72 | $ | 11,001 | |||||
Roper Technologies, Inc. | 63 | 23,106 | ||||||
Snap-on, Inc. | 36 | 5,352 | ||||||
Southwest Airlines Co. | 297 | 15,539 | ||||||
Stanley Black & Decker, Inc. | 90 | 11,957 | ||||||
Union Pacific Corp. | 433 | 70,129 | ||||||
United Parcel Service, Inc., Class B | 433 | 51,380 | ||||||
United Rentals, Inc.* | 50 | 5,628 | ||||||
United Technologies Corp. | 499 | 64,990 | ||||||
W.W. Grainger, Inc. | 27 | 7,389 | ||||||
Wabtec Corp. (a) | 99 | 6,852 | ||||||
Waste Management, Inc. | 243 | 29,002 | ||||||
Xylem, Inc. | 108 | 8,274 | ||||||
|
| |||||||
| 876,159 | ||||||||
|
| |||||||
| Information Technology — 23.2% | ||||||||
Accenture PLC, Class A | 387 | 76,692 | ||||||
Adobe, Inc.* | 303 | 86,206 | ||||||
Akamai Technologies, Inc.* | 99 | 8,824 | ||||||
Alliance Data Systems Corp. | 27 | 3,320 | ||||||
ANSYS, Inc.* | 54 | 11,154 | ||||||
Apple, Inc. | 2,693 | 562,137 | ||||||
Applied Materials, Inc. | 567 | 27,227 | ||||||
Autodesk, Inc.* | 135 | 19,281 | ||||||
Automatic Data Processing, Inc. | 270 | 45,857 | ||||||
Cisco Systems, Inc. | 2,631 | 123,157 | ||||||
Citrix Systems, Inc. | 81 | 7,531 | ||||||
Corning, Inc. | 477 | 13,284 | ||||||
DXC Technology Co. | 162 | 5,382 | ||||||
Hewlett Packard Enterprise Co. | 819 | 11,319 | ||||||
HP, Inc. | 918 | 16,790 | ||||||
Intel Corp. | 2,746 | 130,188 | ||||||
Intuit, Inc. | 162 | 46,714 | ||||||
Juniper Networks, Inc. | 216 | 5,003 | ||||||
Keysight Technologies, Inc.* | 117 | 11,333 | ||||||
KLA Corp. | 99 | 14,642 | ||||||
Lam Research Corp. | 99 | 20,840 | ||||||
Mastercard, Inc., Class A | 554 | 155,879 | ||||||
Microchip Technology, Inc. | 144 | 12,431 | ||||||
Micron Technology, Inc.* | 675 | 30,557 | ||||||
Microsoft Corp. | 4,706 | 648,769 | ||||||
Motorola Solutions, Inc. | 99 | 17,910 | ||||||
NVIDIA Corp. | 371 | 62,146 | ||||||
QUALCOMM, Inc. | 744 | 57,861 | ||||||
salesforce.com, Inc.* | 521 | 81,312 | ||||||
Seagate Technology PLC | 153 | 7,682 | ||||||
Symantec Corp. | 387 | 8,998 | ||||||
TE Connectivity Ltd. | 207 | 18,883 | ||||||
Texas Instruments, Inc. | 576 | 71,280 | ||||||
Visa, Inc., Class A | 1,073 | 194,020 | ||||||
Xerox Holdings Corp. | 117 | 3,392 | ||||||
Xilinx, Inc. | 160 | 16,650 | ||||||
|
| |||||||
| 2,634,651 | ||||||||
|
| |||||||
| Materials — 2.3% | ||||||||
Air Products & Chemicals, Inc. | 135 | 30,499 | ||||||
Ball Corp. | 207 | 16,645 | ||||||
Number | Value | |||||||
| Materials (Continued) | ||||||||
CF Industries Holdings, Inc. | 135 | $ | 6,506 | |||||
DuPont de Nemours, Inc. | 459 | 31,180 | ||||||
Eastman Chemical Co. | 81 | 5,295 | ||||||
Ecolab, Inc. | 152 | 31,359 | ||||||
FMC Corp. | 81 | 6,993 | ||||||
Freeport-McMoRan, Inc. | 882 | 8,106 | ||||||
International Flavors & Fragrances, Inc. (a) | 63 | 6,914 | ||||||
Linde PLC | 333 | 62,907 | ||||||
LyondellBasell Industries NV, Class A | 189 | 14,625 | ||||||
Mosaic Co. | 216 | 3,972 | ||||||
Newmont Goldcorp Corp. | 504 | 20,105 | ||||||
Vulcan Materials Co. | 81 | 11,441 | ||||||
Westrock Co. | 153 | 5,229 | ||||||
|
| |||||||
| 261,776 | ||||||||
|
| |||||||
| Real Estate — 3.2% | ||||||||
Alexandria Real Estate Equities, Inc. REIT | 72 | 10,789 | ||||||
Apartment Investment & Management Co., Class A REIT | 90 | 4,590 | ||||||
AvalonBay Communities, Inc. REIT | 86 | 18,280 | ||||||
Boston Properties, Inc. REIT | 94 | 12,072 | ||||||
CBRE Group, Inc., Class A* | 189 | 9,879 | ||||||
Crown Castle International Corp. REIT | 256 | 37,164 | ||||||
Digital Realty Trust, Inc. REIT (a) | 126 | 15,577 | ||||||
Duke Realty Corp. REIT | 216 | 7,186 | ||||||
Equinix, Inc. REIT | 54 | 30,039 | ||||||
Equity Residential REIT | 225 | 19,071 | ||||||
Essex Property Trust, Inc. REIT | 43 | 13,814 | ||||||
Federal Realty Investment Trust REIT | 45 | 5,814 | ||||||
HCP, Inc. REIT | 288 | 9,996 | ||||||
Host Hotels & Resorts, Inc. REIT | 450 | 7,218 | ||||||
Iron Mountain, Inc. REIT (a) | 171 | 5,446 | ||||||
Kimco Realty Corp. REIT | 252 | 4,632 | ||||||
Macerich Co. REIT (a) | 63 | 1,797 | ||||||
Mid-America Apartment Communities, Inc. REIT | 72 | 9,121 | ||||||
Prologis, Inc. REIT | 387 | 32,361 | ||||||
Regency Centers Corp. REIT | 99 | 6,387 | ||||||
Simon Property Group, Inc. REIT | 189 | 28,150 | ||||||
SL Green Realty Corp. REIT | 54 | 4,332 | ||||||
UDR, Inc. REIT | 171 | 8,239 | ||||||
Ventas, Inc. REIT | 225 | 16,513 | ||||||
Vornado Realty Trust REIT | 117 | 7,075 | ||||||
Welltower, Inc. REIT | 256 | 22,927 | ||||||
Weyerhaeuser Co. REIT | 459 | 12,076 | ||||||
|
| |||||||
| 360,545 | ||||||||
|
| |||||||
| Utilities — 3.4% | ||||||||
AES Corp. | 405 | 6,209 | ||||||
Alliant Energy Corp. | 144 | 7,553 | ||||||
American Electric Power Co., Inc. | 308 | 28,074 | ||||||
CMS Energy Corp. | 171 | 10,782 | ||||||
Consolidated Edison, Inc. | 209 | 18,580 | ||||||
Dominion Energy, Inc. | 500 | 38,815 | ||||||
Duke Energy Corp. | 452 | 41,918 | ||||||
Edison International | 198 | 14,309 | ||||||
| See Notes to Financial Statements. | 48 |
DBX ETF Trust
Schedule of Investments
Xtrackers S&P 500 ESG ETF(Continued)
August 31, 2019
Number | Value | |||||||
| Utilities (Continued) | ||||||||
Entergy Corp. | 117 | $ | 13,202 | |||||
Eversource Energy | 198 | 15,866 | ||||||
Exelon Corp. | 594 | 28,072 | ||||||
NextEra Energy, Inc. | 296 | 64,848 | ||||||
NiSource, Inc. | 225 | 6,649 | ||||||
NRG Energy, Inc. | 162 | 5,897 | ||||||
Pinnacle West Capital Corp. | 72 | 6,862 | ||||||
Public Service Enterprise Group, Inc. | 306 | 18,504 | ||||||
Sempra Energy | 171 | 24,219 | ||||||
WEC Energy Group, Inc. | 202 | 19,346 | ||||||
Xcel Energy, Inc. | 315 | 20,229 | ||||||
|
| |||||||
| 389,934 | ||||||||
|
| |||||||
TOTAL COMMON STOCKS | 11,340,614 | |||||||
|
| |||||||
Number | Value | |||||||
| SECURITIES LENDING COLLATERAL — 0.0% | ||||||||
DWS Government & Agency Securities Portfolio “DWS Government Cash Institutional Shares”, 2.04% (b)(c) | 4,434 | $ | 4,434 | |||||
|
| |||||||
| CASH EQUIVALENTS — 0.1% | ||||||||
DWS Government Money Market Series “Institutional Shares”, 2.09% (b) | 5,888 | 5,888 | ||||||
|
| |||||||
TOTAL INVESTMENTS — 99.7% (Cost $11,262,472) | $ | 11,350,936 | ||||||
Other assets and liabilities, net — 0.3% | 33,212 | |||||||
|
| |||||||
NET ASSETS — 100.0% | $ | 11,384,148 | ||||||
|
| |||||||
A summary of the Fund’s transactions with affiliated investments during the period ended August 31, 2019 is as follows:
| Value ($) at 6/26/2019 (Commencement of Operations) | Purchases Cost ($) | Sales Proceeds ($) | Net Realized Gain/(Loss) ($) | Net Change in Unrealized Appreciation (Depreciation) ($) | Income ($) | Capital Gain Distributions ($) | Number of Shares at 8/31/2019 | Value ($) at 8/31/2019 | ||||||||||||||||||||||||||||||
SECURITIES LENDING COLLATERAL —0.0% | ||||||||||||||||||||||||||||||||||||||
DWS Government & Agency Securities Portfolio “DWS Government Cash Institutional Shares”, 2.04% (b)(c) | ||||||||||||||||||||||||||||||||||||||
| — | 4,434 | (d) | — | — | — | 14 | — | 4,434 | 4,434 | |||||||||||||||||||||||||||||
CASH EQUIVALENTS —0.1% | ||||||||||||||||||||||||||||||||||||||
DWS Government Money Market Series “Institutional Shares”, 2.09% (b) | ||||||||||||||||||||||||||||||||||||||
| — | 306,213 | (300,325 | ) | — | — | 66 | — | 5,888 | 5,888 | |||||||||||||||||||||||||||||
|
|
|
|
|
|
|
|
|
|
|
|
|
|
|
|
|
| |||||||||||||||||||||
| — | 310,647 | (300,325 | ) | — | — | 80 | — | 10,322 | 10,322 | |||||||||||||||||||||||||||||
|
|
|
|
|
|
|
|
|
|
|
|
|
|
|
|
|
| |||||||||||||||||||||
| * | Non-income producing security. |
| (a) | All or a portion of these securities were on loan. In addition, “Other assets and liabilities, net” may include pending sales that are also on loan. The value of securities loaned at August 31, 2019 amounted to $103,676, which is 0.9% of net assets. |
| (b) | Affiliated fund managed by DWS Investment Management Americas, Inc. The rate shown is the annualizedseven-day yield at period end. |
| (c) | Represents cash collateral held in connection with securities lending. Income earned by the Fund is net of borrower rebates. In addition, the Fund heldnon-cash U.S. Treasury securities collateral having a value of $101,458. |
| (d) | Represents the net increase (purchase cost) or decrease (sales proceeds) in the amount invested in cash collateral for the period ended August 31, 2019. |
| REIT: | Real Estate Investment Trust |
| See Notes to Financial Statements. | 49 |
DBX ETF Trust
Schedule of Investments
Xtrackers S&P 500 ESG ETF(Continued)
August 31, 2019
Fair Value Measurements
Various inputs are used in determining the value of the Fund’s investments. These inputs are summarized in three broad levels. Level 1 includes quoted prices in active markets for identical securities. Level 2 includes other significant observable inputs (including quoted prices for similar securities, interest rates, prepayment speeds and credit risk). Level 3 includes significant unobservable inputs (including the Fund’s own assumptions in determining the fair value of investments). The level assigned to the securities valuations may not be an indication of the risk or liquidity associated with investing in those securities.
The following is a summary of the inputs used as of August 31, 2019 in valuing the Fund’s investments. For information on the Fund’s policy regarding the valuation of investments, please refer to the Security Valuation section of Note 2 in the accompanying Notes to Financial Statements.
Assets | Level 1 | Level 2 | Level 3 | Total | ||||||||||||
Common Stocks (e) | $ | 11,340,614 | $ | — | $ | — | $ | 11,340,614 | ||||||||
Short-Term Investments (e) | 10,322 | — | — | 10,322 | ||||||||||||
|
|
|
|
|
|
|
| |||||||||
TOTAL | $ | 11,350,936 | $ | — | $ | — | $ | 11,350,936 | ||||||||
|
|
|
|
|
|
|
| |||||||||
| (e) | See Schedule of Investments for additional detailed categorizations. |
| See Notes to Financial Statements. | 50 |
This Page is Intentionally Left Blank
51
DBX ETF Trust
August 31, 2019
| Xtrackers MSCI ACWI ex USA ESG Leaders Equity ETF | Xtrackers MSCI EAFE ESG Leaders Equity ETF | Xtrackers MSCI Emerging Markets ESG Leaders Equity ETF | Xtrackers MSCI USA ESG Leaders Equity ETF | |||||||||||||
Assets | ||||||||||||||||
Investment innon-affiliated securities at value | $ | 7,570,833 | $ | 7,194,013 | $ | 7,359,648 | $ | 1,335,712,061 | ||||||||
Investment in affiliated securities at value | 2,415 | — | — | — | ||||||||||||
Investment in DWS Government Money Market Series | 6,580 | 2,055 | 16,016 | 2,902,467 | ||||||||||||
Investment in DWS Government & Agency Securities Portfolio* | 51,069 | 42,850 | 130,104 | 719,723 | ||||||||||||
Foreign currency at value | 40,056 | 9,159 | 82,552 | — | ||||||||||||
Deposit with broker for futures contracts | 2,600 | 1,672 | 2,600 | 189,000 | ||||||||||||
| Receivables: | ||||||||||||||||
Investment securities sold | — | — | 2,009 | — | ||||||||||||
Capital shares | — | — | — | 37,364,129 | ||||||||||||
Variation margin on futures contracts | 400 | 328 | 400 | — | ||||||||||||
Dividends | 17,151 | 19,349 | 9,268 | 2,393,162 | ||||||||||||
Interest | 10 | 7 | 10 | 4,029 | ||||||||||||
Securities lending income | 64 | 48 | 102 | 2,570 | ||||||||||||
Foreign tax reclaim | 3,979 | 5,599 | 120 | — | ||||||||||||
|
|
|
|
|
|
|
| |||||||||
Total assets | $ | 7,695,157 | $ | 7,275,080 | $ | 7,602,829 | $ | 1,379,287,141 | ||||||||
|
|
|
|
|
|
|
| |||||||||
Liabilities | ||||||||||||||||
Payable upon return of securities loaned | $ | 51,069 | $ | 42,850 | $ | 130,104 | $ | 719,723 | ||||||||
| Payables: | ||||||||||||||||
Investment securities purchased | 16,983 | — | 61,730 | 37,358,086 | ||||||||||||
Investment advisory fees | 1,029 | 854 | 1,250 | 94,896 | ||||||||||||
Variation margin on futures contracts | — | — | — | 2,850 | ||||||||||||
|
|
|
|
|
|
|
| |||||||||
Total liabilities | 69,081 | 43,704 | 193,084 | 38,175,555 | ||||||||||||
|
|
|
|
|
|
|
| |||||||||
Net Assets, at value | $ | 7,626,076 | $ | 7,231,376 | $ | 7,409,745 | $ | 1,341,111,586 | ||||||||
|
|
|
|
|
|
|
| |||||||||
Net Assets Consist of | ||||||||||||||||
Paid-in capital | $ | 7,501,563 | $ | 7,507,639 | $ | 7,485,979 | $ | 1,268,684,603 | ||||||||
Distributable earnings (loss) | 124,513 | (276,263 | ) | (76,234 | ) | 72,426,983 | ||||||||||
|
|
|
|
|
|
|
| |||||||||
Net Assets, at value | $ | 7,626,076 | $ | 7,231,376 | $ | 7,409,745 | $ | 1,341,111,586 | ||||||||
|
|
|
|
|
|
|
| |||||||||
Number of Common Shares outstanding | 300,001 | 300,001 | 300,001 | 50,250,001 | ||||||||||||
|
|
|
|
|
|
|
| |||||||||
Net Asset Value | $ | 25.42 | $ | 24.10 | $ | 24.70 | $ | 26.69 | ||||||||
|
|
|
|
|
|
|
| |||||||||
Investment innon-affiliated securities at cost | $ | 7,489,750 | $ | 7,446,972 | $ | 7,511,966 | $ | 1,265,641,142 | ||||||||
|
|
|
|
|
|
|
| |||||||||
Investment in affiliated securities at cost | $ | 2,353 | $ | — | $ | — | $ | — | ||||||||
|
|
|
|
|
|
|
| |||||||||
Value of securities loaned | $ | 106,526 | $ | 86,719 | $ | 208,900 | $ | 22,416,992 | ||||||||
|
|
|
|
|
|
|
| |||||||||
Investment in DWS Government Money Market Series at cost | $ | 6,580 | $ | 2,055 | $ | 16,016 | $ | 2,902,467 | ||||||||
|
|
|
|
|
|
|
| |||||||||
Investment in DWS Government & Agency Securities Portfolio at cost* | $ | 51,069 | $ | 42,850 | $ | 130,104 | $ | 719,723 | ||||||||
|
|
|
|
|
|
|
| |||||||||
Non-cash collateral for securities on loan | $ | 64,195 | $ | 52,518 | $ | 97,105 | $ | 22,091,836 | ||||||||
|
|
|
|
|
|
|
| |||||||||
Foreign currency at cost | $ | 40,265 | $ | 9,209 | $ | 82,763 | $ | — | ||||||||
|
|
|
|
|
|
|
| |||||||||
| * | Represents collateral on securities loaned. |
| See Notes to Financial Statements. | 52 |
DBX ETF Trust
Statements of Assets and Liabilities(Continued)
August 31, 2019
| Xtrackers S&P 500 ESG ETF | ||||
Assets | ||||
Investment innon-affiliated securities at value | $ | 11,340,614 | ||
Investment in DWS Government Money Market Series | 5,888 | |||
Investment in DWS Government & Agency Securities Portfolio* | 4,434 | |||
| Receivables: | ||||
Dividends | 39,445 | |||
Interest | 26 | |||
Securities lending income | 15 | |||
|
| |||
Total assets | $ | 11,390,422 | ||
|
| |||
Liabilities | ||||
Payable upon return of securities loaned | $ | 4,434 | ||
| Payables: | ||||
Investment advisory fees | 1,840 | |||
|
| |||
Total liabilities | 6,274 | |||
|
| |||
Net Assets, at value | $ | 11,384,148 | ||
|
| |||
Net Assets Consist of | ||||
Paid-in capital | $ | 11,208,594 | ||
Distributable earnings (loss) | 175,554 | |||
|
| |||
Net Assets, at value | $ | 11,384,148 | ||
|
| |||
Number of Common Shares outstanding | 450,001 | |||
|
| |||
Net Asset Value | $ | 25.30 | ||
|
| |||
Investment innon-affiliated securities at cost | $ | 11,252,150 | ||
|
| |||
Value of securities loaned | $ | 103,676 | ||
|
| |||
Investment in DWS Government Money Market Series at cost | $ | 5,888 | ||
|
| |||
Investment in DWS Government & Agency Securities Portfolio at cost* | $ | 4,434 | ||
|
| |||
Non-cash collateral for securities on loan | $ | 101,458 | ||
|
| |||
| * | Represents collateral on securities loaned. |
| See Notes to Financial Statements. | 53 |
DBX ETF Trust
For the Period Ended August 31, 2019
| Xtrackers MSCI ACWI ex USA ESG Leaders Equity ETF(1) | Xtrackers MSCI EAFE ESG Leaders Equity ETF(2) | Xtrackers MSCI Emerging Markets ESG Leaders Equity ETF(1) | Xtrackers MSCI USA ESG Leaders Equity ETF(3) | |||||||||||||
Investment Income | ||||||||||||||||
Unaffiliated dividend income* | $ | 185,409 | $ | 221,394 | $ | 144,658 | $ | 10,079,042 | ||||||||
Income distributions from affiliated funds | 1,678 | 121 | 7,847 | 16,064 | ||||||||||||
Unaffiliatednon-cash dividend income | — | 19,135 | 8,516 | — | ||||||||||||
Affiliated securities lending income | 1,544 | 1,708 | 907 | 6,325 | ||||||||||||
Unaffiliated securities lending income, net of borrower rebates | — | 221 | — | — | ||||||||||||
|
|
|
|
|
|
|
| |||||||||
Total investment income | 188,631 | 242,579 | 161,928 | 10,101,431 | ||||||||||||
|
|
|
|
|
|
|
| |||||||||
Expenses | ||||||||||||||||
Investment advisory fees | 9,053 | 10,007 | 11,244 | 509,339 | ||||||||||||
|
|
|
|
|
|
|
| |||||||||
Total expenses | 9,053 | 10,007 | 11,244 | 509,339 | ||||||||||||
|
|
|
|
|
|
|
| |||||||||
Less fees waived (see note 3): | ||||||||||||||||
Waiver | (51 | ) | (3 | ) | (215 | ) | (11,336 | ) | ||||||||
|
|
|
|
|
|
|
| |||||||||
Net expenses | 9,002 | 10,004 | 11,029 | 498,003 | ||||||||||||
|
|
|
|
|
|
|
| |||||||||
Net investment income (loss) | 179,629 | 232,575 | 150,899 | 9,603,428 | ||||||||||||
|
|
|
|
|
|
|
| |||||||||
Realized and Unrealized Gain (Loss) | ||||||||||||||||
Net realized gain (loss) from: | ||||||||||||||||
Investments | (10,487 | ) | (51,054 | ) | (47,220 | ) | (2,098,104 | ) | ||||||||
Investments in affiliates | (2,083 | ) | (18 | ) | — | — | ||||||||||
In-kind redemptions | — | — | — | 1,806,527 | ||||||||||||
Futures contracts | 11,644 | 40 | 39,007 | 57,578 | ||||||||||||
Foreign currency transactions | 3,028 | (2,841 | ) | 14,585 | — | |||||||||||
|
|
|
|
|
|
|
| |||||||||
Net realized gain (loss) | 2,102 | (53,873 | ) | 6,372 | (233,999 | ) | ||||||||||
Net change in unrealized appreciation (depreciation) on: | ||||||||||||||||
Investments | 81,083 | (252,959 | ) | (152,318 | ) | 70,070,919 | ||||||||||
Investments in affiliates | 62 | — | — | — | ||||||||||||
Futures contracts | (2,395 | ) | (66 | ) | (1,165 | ) | 15,688 | |||||||||
Foreign currency translations | (266 | ) | (81 | ) | (343 | ) | — | |||||||||
|
|
|
|
|
|
|
| |||||||||
Net change in unrealized appreciation (depreciation) | 78,484 | (253,106 | ) | (153,826 | ) | 70,086,607 | ||||||||||
|
|
|
|
|
|
|
| |||||||||
Net realized and unrealized gain (loss) on investments, futures and foreign currency transactions | 80,586 | (306,979 | ) | (147,454 | ) | 69,852,608 | ||||||||||
|
|
|
|
|
|
|
| |||||||||
Net Increase (Decrease) in Net Assets Resulting from Operations | $ | 260,215 | $ | (74,404 | ) | $ | 3,445 | $ | 79,456,036 | |||||||
|
|
|
|
|
|
|
| |||||||||
* Unaffiliated foreign tax withheld | $ | 25,400 | $ | 27,597 | $ | 20,832 | $ | 9 | ||||||||
| (1) | For the period December 6, 2018 (commencement of operations) through August 31, 2019. |
| (2) | For the period September 6, 2018 (commencement of operations) through August 31, 2019. |
| (3) | For the period March 7, 2019 (commencement of operations) through August 31, 2019. |
| See Notes to Financial Statements. | 54 |
DBX ETF Trust
Statements of Operations(Continued)
For the Period Ended August 31, 2019
| Xtrackers S&P 500 ESG ETF(1) | ||||
Investment Income | ||||
Unaffiliated dividend income | $ | 91,872 | ||
Income distributions from affiliated funds | 66 | |||
Affiliated securities lending income | 14 | |||
Unaffiliated securities lending income, net of borrower rebates | 2 | |||
|
| |||
Total investment income | 91,954 | |||
|
| |||
Expenses | ||||
Investment advisory fees | 4,623 | |||
|
| |||
Total expenses | 4,623 | |||
|
| |||
Less fees waived (see note 3): | ||||
Waiver | (3 | ) | ||
|
| |||
Net expenses | 4,620 | |||
|
| |||
Net investment income (loss) | 87,334 | |||
|
| |||
Realized and Unrealized Gain (Loss) | ||||
Net realized gain (loss) from: | ||||
Investments | 805 | |||
In-kind redemptions | (71,022 | ) | ||
|
| |||
Net realized gain (loss) | (70,217 | ) | ||
Net change in unrealized appreciation (depreciation) on: | ||||
Investments | 88,464 | |||
|
| |||
Net change in unrealized appreciation (depreciation) | 88,464 | |||
|
| |||
Net realized and unrealized gain (loss) on investments | 18,247 | |||
|
| |||
Net Increase (Decrease) in Net Assets Resulting from Operations | $ | 105,581 | ||
|
| |||
| (1) | For the period June 26, 2019 (commencement of operations) through August 31, 2019. |
| See Notes to Financial Statements. | 55 |
DBX ETF Trust
| Xtrackers MSCI ACWI ex USA ESG Leaders Equity ETF | Xtrackers MSCI EAFE ESG Leaders Equity ETF | Xtrackers MSCI Emerging Markets ESG Leaders Equity ETF | Xtrackers MSCI USA ESG Leaders Equity ETF | |||||||||||||
| For the Period December 6, 2018(1) to August 31, 2019 | For the Period September 6, 2018(1) to August 31, 2019 | For the Period December 6, 2018(1) to August 31, 2019 | For the Period March 7, 2019(1) to August 31, 2019 | |||||||||||||
Increase (Decrease) in Net Assets from Operations | ||||||||||||||||
Net investment income (loss) | $ | 179,629 | $ | 232,575 | $ | 150,899 | $ | 9,603,428 | ||||||||
Net realized gain (loss) | 2,102 | (53,873 | ) | 6,372 | (233,999 | ) | ||||||||||
Net change in net unrealized appreciation (depreciation) | 78,484 | (253,106 | ) | (153,826 | ) | 70,086,607 | ||||||||||
|
|
|
|
|
|
|
| |||||||||
Net increase (decrease) in net assets resulting from operations | 260,215 | (74,404 | ) | 3,445 | 79,456,036 | |||||||||||
|
|
|
|
|
|
|
| |||||||||
Distributions to Shareholders | (135,702 | ) | (201,859 | ) | (79,679 | ) | (5,225,013 | ) | ||||||||
|
|
|
|
|
|
|
| |||||||||
Fund Shares Transactions | ||||||||||||||||
Proceeds from shares sold | 7,501,538 | 7,507,614 | 7,485,954 | 1,307,476,148 | ||||||||||||
Value of shares redeemed | — | — | — | (40,595,610 | ) | |||||||||||
|
|
|
|
|
|
|
| |||||||||
Net increase (decrease) in net assets resulting from fund share transactions | 7,501,538 | 7,507,614 | 7,485,954 | 1,266,880,538 | ||||||||||||
|
|
|
|
|
|
|
| |||||||||
Total net increase (decrease) in Net Assets | 7,626,051 | 7,231,351 | 7,409,720 | 1,341,111,561 | ||||||||||||
Net Assets | ||||||||||||||||
Beginning of period | 25 | 25 | 25 | 25 | ||||||||||||
|
|
|
|
|
|
|
| |||||||||
End of period | $ | 7,626,076 | $ | 7,231,376 | $ | 7,409,745 | $ | 1,341,111,586 | ||||||||
|
|
|
|
|
|
|
| |||||||||
Changes in Shares Outstanding | ||||||||||||||||
Shares outstanding, beginning of period | 1 | 1 | 1 | 1 | ||||||||||||
Shares sold | 300,000 | 300,000 | 300,000 | 51,850,000 | ||||||||||||
Shares redeemed | — | — | — | (1,600,000 | ) | |||||||||||
|
|
|
|
|
|
|
| |||||||||
Shares outstanding, end of period | 300,001 | 300,001 | 300,001 | 50,250,001 | ||||||||||||
|
|
|
|
|
|
|
| |||||||||
| (1) | Commencement of Operations. |
| See Notes to Financial Statements. | 56 |
DBX ETF Trust
Statements of Changes in Net Assets(Continued)
| Xtrackers S&P 500 ESG ETF | ||||
| For the Period June 26, 2019(1) to August 31, 2019 | ||||
Increase (Decrease) in Net Assets from Operations | ||||
Net investment income (loss) | $ | 87,334 | ||
Net realized gain (loss) | (70,217 | ) | ||
Net change in net unrealized appreciation (depreciation) | 88,464 | |||
|
| |||
Net increase (decrease) in net assets resulting from operations | 105,581 | |||
|
| |||
Fund Shares Transactions | ||||
Proceeds from shares sold | 25,000,000 | |||
Value of shares redeemed | (13,721,458 | ) | ||
|
| |||
Net increase (decrease) in net assets resulting from fund share transactions | 11,278,542 | |||
|
| |||
Total net increase (decrease) in Net Assets | 11,384,123 | |||
Net Assets | ||||
Beginning of period | 25 | |||
|
| |||
End of period | $ | 11,384,148 | ||
|
| |||
Changes in Shares Outstanding | ||||
Shares outstanding, beginning of period | 1 | |||
Shares sold | 1,000,000 | |||
Shares redeemed | (550,000 | ) | ||
|
| |||
Shares outstanding, end of period | 450,001 | |||
|
| |||
| (1) | Commencement of Operations. |
| See Notes to Financial Statements. | 57 |
DBX ETF Trust
| Xtrackers MSCI ACWI ex USA ESG Leaders Equity ETF Selected Per Share Data | Period Ended 8/31/2019(a) | |||
Net Asset Value, beginning of period | $ | 25.00 | ||
|
| |||
| Income (loss) from investment operations: | ||||
Net investment income (loss) (c) | 0.60 | |||
Net realized and unrealized gain (loss) | 0.27 | |||
|
| |||
Total from investment operations | 0.87 | |||
|
| |||
| Less distributions from: |
| |||
Net investment income | (0.45 | ) | ||
|
| |||
Total distributions | (0.45 | ) | ||
|
| |||
Net Asset Value, end of period | $ | 25.42 | ||
|
| |||
Total Return (%) (d) | 3.44 | ** | ||
Ratios to Average Net Assets and Supplemental Data | ||||
Net Assets, end of period ($ millions) | 8 | |||
Ratio of expenses before fee waiver (%) | 0.16 | * | ||
Ratio of expenses after fee waiver (%) | 0.16 | * | ||
Ratio of net investment income (loss) (%) | 3.17 | * | ||
Portfolio turnover rate (%) (e) | 10 | ** | ||
| Xtrackers MSCI EAFE ESG Leaders Equity ETF Selected Per Share Data | Period Ended 8/31/2019(b) | |||
Net Asset Value, beginning of period | $ | 25.00 | ||
|
| |||
| Income (loss) from investment operations: | ||||
Net investment income (loss) (c) | 0.78 | |||
Net realized and unrealized gain (loss) | (1.01 | ) | ||
|
| |||
Total from investment operations | (0.23 | ) | ||
|
| |||
| Less distributions from: |
| |||
Net investment income | (0.66 | ) | ||
Net realized gains | (0.01 | ) | ||
|
| |||
Total distributions | (0.67 | ) | ||
|
| |||
Net Asset Value, end of period | $ | 24.10 | ||
|
| |||
Total Return (%) (d) | (0.91 | )** | ||
Ratios to Average Net Assets and Supplemental Data | ||||
Net Assets, end of period ($ millions) | 7 | |||
Ratio of expenses before fee waiver (%) | 0.14 | * | ||
Ratio of expenses after fee waiver (%) | 0.14 | * | ||
Ratio of net investment income (loss) (%) | 3.25 | * | ||
Portfolio turnover rate (%) (e) | 10 | ** | ||
| (a) | For the period December 6, 2018 (commencement of operations) through August 31, 2019. |
| (b) | For the period September 6, 2018 (commencement of operations) through August 31, 2019. |
| (c) | Based on average shares outstanding during the period. |
| (d) | Total Return would have been lower if certain expenses had not been reimbursed by the Advisor. |
| (e) | Portfolio turnover rate does not include securities received or delivered from processing creations or redemptions. |
| * | Annualized. |
| ** | Not Annualized. |
| See Notes to Financial Statements. | 58 |
DBX ETF Trust
Financial Highlights(Continued)
| Xtrackers MSCI Emerging Markets ESG Leaders Equity ETF Selected Per Share Data | Period Ended 8/31/2019(a) | |||
Net Asset Value, beginning of period | $ | 25.00 | ||
|
| |||
| Income (loss) from investment operations: | ||||
Net investment income (loss) (c) | 0.50 | |||
Net realized and unrealized gain (loss) | (0.53 | ) | ||
|
| |||
Total from investment operations | (0.03 | ) | ||
|
| |||
| Less distributions from: |
| |||
Net investment income | (0.27 | ) | ||
|
| |||
Total distributions | (0.27 | ) | ||
|
| |||
Net Asset Value, end of period | $ | 24.70 | ||
|
| |||
Total Return (%) (d) | (0.17 | )** | ||
Ratios to Average Net Assets and Supplemental Data | ||||
Net Assets, end of period ($ millions) | 7 | |||
Ratio of expenses before fee waiver (%) | 0.20 | * | ||
Ratio of expenses after fee waiver (%) | 0.20 | * | ||
Ratio of net investment income (loss) (%) | 2.68 | * | ||
Portfolio turnover rate (%) (e) | 16 | ** | ||
| Xtrackers MSCI USA ESG Leaders Equity ETF Selected Per Share Data | Period Ended 8/31/2019(b) | |||
Net Asset Value, beginning of period | $ | 25.00 | ||
|
| |||
| Income (loss) from investment operations: | ||||
Net investment income (loss) (c) | 0.24 | |||
Net realized and unrealized gain (loss) | 1.57 | |||
|
| |||
Total from investment operations | 1.81 | |||
|
| |||
| Less distributions from: |
| |||
Net investment income | (0.12 | ) | ||
|
| |||
Total distributions | (0.12 | ) | ||
|
| |||
Net Asset Value, end of period | $ | 26.69 | ||
|
| |||
Total Return (%) (d) | 7.23 | ** | ||
Ratios to Average Net Assets and Supplemental Data | ||||
Net Assets, end of period ($ millions) | 1,341 | |||
Ratio of expenses before fee waiver (%) | 0.10 | * | ||
Ratio of expenses after fee waiver (%) | 0.10 | * | ||
Ratio of net investment income (loss) (%) | 1.89 | * | ||
Portfolio turnover rate (%) (e) | 5 | ** | ||
| (a) | For the period December 6, 2018 (commencement of operations) through August 31, 2019. |
| (b) | For the period March 7, 2019 (commencement of operations) through August 31, 2019. |
| (c) | Based on average shares outstanding during the period. |
| (d) | Total Return would have been lower if certain expenses had not been reimbursed by the Advisor. |
| (e) | Portfolio turnover rate does not include securities received or delivered from processing creations or redemptions. |
| * | Annualized. |
| ** | Not Annualized. |
| See Notes to Financial Statements. | 59 |
DBX ETF Trust
Financial Highlights(Continued)
| Xtrackers S&P 500 ESG ETF Selected Per Share Data | Period Ended 8/31/2019(a) | |||
Net Asset Value, beginning of period | $ | 25.00 | ||
|
| |||
| Income (loss) from investment operations: | ||||
Net investment income (loss) (b) | 0.10 | |||
Net realized and unrealized gain (loss) | 0.20 | |||
|
| |||
Total from investment operations | 0.30 | |||
|
| |||
Net Asset Value, end of period | $ | 25.30 | ||
|
| |||
Total Return (%) (c) | 1.20 | ** | ||
Ratios to Average Net Assets and Supplemental Data | ||||
Net Assets, end of period ($ millions) | 11 | |||
Ratio of expenses before fee waiver (%) | 0.11 | * | ||
Ratio of expenses after fee waiver (%) | 0.11 | * | ||
Ratio of net investment income (loss) (%) | 2.08 | * | ||
Portfolio turnover rate (%) (d) | 0 | ** | ||
| (a) | For the period June 26, 2019 (commencement of operations) through August 31, 2019. |
| (b) | Based on average shares outstanding during the period. |
| (c) | Total Return would have been lower if certain expenses had not been reimbursed by the Advisor. |
| (d) | Portfolio turnover rate does not include securities received or delivered from processing creations or redemptions. |
| * | Annualized. |
| ** | Not Annualized. |
| See Notes to Financial Statements. | 60 |
DBX ETF Trust
1. Organization
DBX ETF Trust (the “Trust”) is registered under the Investment Company Act of 1940, as amended (the “Act”), as anopen-end registered management investment company organized as a Delaware statutory trust.
As of August 31, 2019, the Trust consists of thirty-eight investment series of exchange-traded funds (“ETFs”) (each a “Fund” and collectively, the “Funds”) in operation and trading. These financial statements report on the Funds listed below:
| Xtrackers MSCI ACWI ex USA ESG Leaders Equity ETF |
| Xtrackers MSCI EAFE ESG Leaders Equity ETF |
| Xtrackers MSCI Emerging Markets ESG Leaders Equity ETF |
| Xtrackers MSCI USA ESG Leaders Equity ETF |
| Xtrackers S&P 500 ESG ETF |
DBX Advisors LLC (“DBX” or the “Advisor”), an indirect, wholly-owned subsidiary of DWS Group Gmbh & Co. KGaA (“DWS Group”), serves as investment advisor to the Funds and has overall responsibility for the general management and administration of the Funds, subject to the supervision of the Funds’ Board of Trustees (“Board”).
Each Fund offers shares that are listed and traded on the NYSE Arca, Inc. (“NYSE Arca”). Unlike conventional mutual funds, each Fund issues and redeems shares on a continuous basis, at net asset value (“NAV”), only in large specified lots consisting of 50,000 shares, each called a “Creation Unit”, to authorized participants who have entered into agreements with the Funds’ distributor. Shares are not individually redeemable securities of the Funds, and owners of the shares may acquire those shares from the Funds, or tender such shares for redemption to the Funds, in Creation Units only.
The investment objective of each Fund is to track the performance, before fees and expenses, of a particular index (the “Underlying Index”). The underlying indices for the Funds are:
Fund | Underlying Index | |
| Xtrackers MSCI ACWI ex USA ESG Leaders Equity ETF | MSCI ACWI ex USA ESG Leaders Index | |
| Xtrackers MSCI EAFE ESG Leaders Equity ETF | MSCI EAFE ESG Leaders Index | |
| Xtrackers MSCI Emerging Markets ESG Leaders Equity ETF | MSCI Emerging Markets ESG Leaders Index | |
| Xtrackers MSCI USA ESG Leaders Equity ETF | MSCI USA ESG Leaders Index | |
| Xtrackers S&P 500 ESG ETF | S&P 500 ESG Index |
The MSCI ACWI ex USA ESG Leaders Index is a capitalization weighted index that provides exposure to companies with high Environmental, Social and Governance (“ESG”) performance relative to their sector peers. The Underlying Index is constructed using regional indexes that provide exposure to large- and medium-capitalization companies from developed and emerging markets countries (excluding the United States). The Underlying Index is rebalanced quarterly in February, May, August and November, and thus the Fund rebalances its portfolio in a corresponding fashion.
The MSCI EAFE ESG Leaders Index is a capitalization weighted index that provides exposure to companies with high ESG performance relative to their sector peers. The Underlying Index consists of large- and medium-capitalization companies across developed markets countries, excluding Canada and the United States. The Underlying Index is rebalanced quarterly in February, May, August and November, and thus the Fund rebalances its portfolio in a corresponding fashion.
The MSCI Emerging Markets ESG Leaders Index is a capitalization weighted index that provides exposure to companies with high ESG performance relative to their sector peers. The Underlying Index consists of large- and medium-capitalization companies across emerging markets countries. The Underlying Index is rebalanced quarterly in February, May, August and November, and thus the Fund rebalances its portfolio in a corresponding fashion.
MSCI USA ESG Leaders Index is a capitalization weighted index that provides exposure to companies with high ESG performance relative to their sector peers. The Underlying Index consists of large- and medium-capitalization companies in the U.S market. The Underlying Index is rebalanced quarterly in February, May, August and
61
DBX ETF Trust
Notes to Financial Statements(Continued)
November, and reconstituted semi-annually in May and November, and thus the Fund rebalances its portfolio in a corresponding fashion.
S&P 500 ESG Index is a broad-based, market capitalization weighted index that provides exposure to companies with high ESG performance relative to their sector peers, while maintaining similar overall industry group weights as the S&P 500 Index. The Underlying Index is rebalanced annually, effective after the close of the last business day of April, and thus the Fund rebalances its portfolio in a corresponding fashion.
Each Fund is entitled to use its respective Underlying Index pursuant to a licensing agreement between the Index Provider and DBX. There is no charge to the Funds in connection with these licensing agreements.
Each Fund isnon-diversified and is not limited by the Act with regard to the percentage of its assets that may be invested in the securities of a single issuer. This means the securities of a particular issuer (or securities of issuers in particular industries) may dominate the Underlying Index of the Fund and, consequently, the Fund’s investment portfolio. This may adversely affect the Fund’s performance or subject the Fund’s shares to greater price volatility than that experienced by more diversified investment companies. As of September 26, 2019, each Fund may change its diversification status over time and then change it back again, without shareholder approval, solely as a result of a change in relative market capitalization or index weighting of one or more constituents of the index each Fund tracks.
Pursuant to the Trust’s organizational documents, the Trust’s officers and trustees are indemnified against certain liabilities that may arise out of the performance of their duties to the Funds. Additionally, in the normal course of business the Trust enters into contracts that contain a variety of representations that provide indemnification for certain liabilities. The Trust’s maximum exposure under these arrangements is unknown, as this would involve future claims that may be made against the Funds that have not yet occurred. However, the Trust expects the risk of loss to be remote.
2. Significant Accounting Policies
The financial statements have been prepared in conformity with U.S. generally accepted accounting principles (“U.S. GAAP”), which require management to make certain estimates and assumptions that affect the reported amounts and disclosures in the financial statements. Actual results could differ from those estimates. Each Fund qualifies as an investment company under Topic 946 of Accounting Standards Codification of U.S. GAAP. The following is a summary of significant accounting policies followed by the Funds.
Security Valuation The NAV of each Fund’s shares is calculated each business day as of the close of regular trading on the New York Stock Exchange, generally 4:00 p.m. Eastern Time. NAV per share is calculated by dividing a Fund’s net assets by the number of Fund shares outstanding.
Various inputs are used in determining the value of the Funds’ investments. These inputs are summarized in three broad levels. Level 1 includes quoted prices in active markets for identical securities. Level 2 includes other significant observable inputs (including quoted prices for similar securities, interest rates, prepayment speeds, and credit risk). Level 3 includes significant unobservable inputs (including the Funds’ own assumptions in determining the fair value of investments). The level assigned to the securities valuations may not be an indication of the risk or liquidity associated with investing in those securities.
Equity securities and ETFs are valued at the most recent sale price or official closing price reported on the exchange (U.S. or foreign) orover-the-counter market on which they trade. Securities or ETFs for which no sales are reported are valued at the calculated mean between the most recent bid and asked quotations on the relevant market or, if a mean cannot be determined, at the most recent bid quotation. Equity securities and ETFs are generally categorized as Level 1.
Corporate and sovereign debt securities are valued at prices supplied by independent pricing services approved by the Funds’ Board. Such services may use various pricing techniques which take into account appropriate factors such as yield, quality, coupon rate, maturity, type of issue, trading characteristics and other data, as well as broker quotes. If the pricing services are unable to provide valuations, securities are valued at the mean between the bid and ask quotations or evaluated prices, as applicable, obtained from broker dealers. These securities are generally categorized as Level 2.
62
DBX ETF Trust
Notes to Financial Statements(Continued)
Investments inopen-end investment companies are valued at their NAV each business day and are categorized as Level 1.
Futures contracts are generally valued at the settlement prices established each day on the exchange on which they are traded and are categorized as Level 1.
Securities and other assets for which market quotations are not readily available or for which the above valuation procedures are deemed not to reflect fair value are valued in a manner that is intended to reflect their fair value as determined in accordance with procedures approved by the Board and are generally categorized as Level 3. In accordance with the Funds’ valuation procedures, factors considered in determining value may include, but are not limited to, the type of the security; the size of the holding; the initial cost of the security; the existence of any contractual restrictions on the security’s disposition; the price and extent of public trading in similar securities of the issuer or of comparable companies; quotations or evaluated prices from broker-dealers and/or pricing services; information obtained from the issuer, analysts, and/or the appropriate stock exchange (for exchange-traded securities); an analysis of the company’s or issuer’s financial statements; an evaluation of the forces that influence the issuer and the market(s) in which the security is purchased and sold; and with respect to debt securities, the maturity, coupon, creditworthiness, currency denomination and the movement of the market in which the security is normally traded. The value determined under these procedures may differ from published values for the same securities.
Fair value pricing could result in a difference between the prices used to calculate a Fund’s NAV and the prices used by the Fund’s Underlying Index, which in turn could result in a difference between the Fund’s performance and the performance of the Fund’s Underlying Index.
Disclosure about the classification of the fair value measurements is included in a table following the Fund’s Schedule of Investments.
Cash Cash consists of cash held at banks and is on deposit with major financial institutions.
Investment Transactions and Investment Income Investment transactions are recorded as of the date that the securities are purchased or sold (trade date). Realized gains and losses from the sale or disposition of securities are calculated on the identified cost-method. Dividend income is net of any foreign taxes withheld at source. Certain dividends from foreign securities may be recorded subsequent to theex-dividend date as soon as the fund is informed of such dividends. Interest income is recorded on the accrual basis. Distributions received from foreign domiciled corporations, generally determined to be passive foreign investment companies for tax reporting purposes, are included in dividend income.
Tax Information and Dividends and Distributions to Shareholders It is each Fund’s policy to comply with all requirements of the Internal Revenue Code of 1986, as amended (“the Code”). Each Fund intends to qualify for and to elect treatment as a separate Regulated Investment Company (“RIC”) under Subchapter M of the Code. It is the policy of each Fund to pay out dividends from its net investment income, if any, to investors semi-annually. Taxable net realized gains from investment transactions, reduced by capital loss carryforwards, if any, are declared and distributed to shareholders at least annually. The capital loss carryforward amount, if any, is available to offset future net capital gains. The Funds may occasionally be required to make supplemental distributions at some other time during the year. The Funds reserve the right to declare special distributions if, in their reasonable discretion, such action is necessary or advisable to preserve the status of each Fund as a RIC or to avoid imposition of income or excise taxes on undistributed income. Dividends and distributions to shareholders, if any, are recorded on theex-dividend date. The amount of dividends and distributions from net investment income and net realized capital gains are determined in accordance with Federal income tax regulations which may differ from U.S. GAAP. These “book/tax” differences are either considered temporary or permanent in nature. To the extent these differences are permanent in nature, such amounts are reclassified at the end of the year within the components of net assets based on their federal tax treatment; temporary differences do not require reclassification. Dividends and distributions, which exceed earnings and profits for the full year for tax purposes, are reported as a tax return of capital.
In accordance with U.S. GAAP requirements regarding accounting for uncertainties in income taxes, management has analyzed the Funds’ tax positions taken or expected to be taken on foreign, federal and state income tax
63
DBX ETF Trust
Notes to Financial Statements(Continued)
returns for all open tax years and has concluded that no provision for income tax is required in the Funds’ financial statements.
The Funds recognize interest and penalties, if any, related to uncertain tax positions as income tax expense on the Statements of Operations. For the period ended August 31, 2019, the Funds did not incur any interest or penalties.
As of August 31, 2019, the components of accumulated earnings (losses) on a tax basis were as follows:
| Undistributed Ordinary Income* | Undistributed Long-Term Capital Gains | Capital and Other Gains (Losses) | Unrealized Appreciation (Depreciation) | Total Accumulated Earnings (Losses) | ||||||||||||||||
Xtrackers MSCI ACWI ex USA ESG Leaders Equity ETF | $ | 60,773 | $ | — | $ | (1,888 | ) | $ | 65,628 | $ | 124,513 | |||||||||
Xtrackers MSCI EAFE ESG Leaders Equity ETF | 45,020 | — | (50,106 | ) | (271,177 | ) | (276,263 | ) | ||||||||||||
Xtrackers MSCI Emerging Markets ESG Leaders Equity ETF | 87,503 | 591 | — | (164,328 | ) | (76,234 | ) | |||||||||||||
Xtrackers MSCI USA ESG Leaders Equity ETF | 4,378,415 | — | (1,567,752 | ) | 69,616,320 | 72,426,983 | ||||||||||||||
Xtrackers S&P 500 ESG ETF | 87,334 | — | — | 88,220 | 175,554 | |||||||||||||||
The tax character of dividends and distributions declared for the period ended August 31, 2019 are as follows:
| Ordinary Income* | ||||
Xtrackers MSCI ACWI ex USA ESG Leaders Equity ETF | $ | 135,702 | ||
Xtrackers MSCI EAFE ESG Leaders Equity ETF | 201,859 | |||
Xtrackers MSCI Emerging Markets ESG Leaders Equity ETF | 79,679 | |||
Xtrackers MSCI USA ESG Leaders Equity ETF | 5,225,013 | |||
| * | For tax purposes short-term capital gain distributions are considered ordinary income distributions. |
At August 31, 2019, for Federal income tax purposes, the Funds have capital loss carryforwards available as shown in the table below, to the extent provided by regulations, to offset future capital gains for an unlimited period. To the extent that these loss carryforwards are used to offset future capital gains, it is probable that the capital gains so offset will not be distributed to shareholders.
| Short-Term | ||||
Xtrackers MSCI ACWI ex USA ESG Leaders Equity ETF | $ | 1,888 | ||
Xtrackers MSCI USA ESG Leaders Equity ETF | 1,567,752 | |||
Capital losses incurred after October 31 (“post-October capital losses”) and late year ordinary losses incurred after December 31 within the taxable year are deemed to arise on the first business day of each Fund’s next taxable year. During the period ended August 31, 2019, the Funds incurred and will elect to defer post-October capital losses and late year ordinary losses as follows:
| Post-October Losses on Capital | ||||
Xtrackers MSCI EAFE ESG Leaders Equity ETF | $ | 50,106 | ||
For the period ended August 31, 2019, the effect of permanent “book/tax” reclassifications to the components of net assets are included below. These differences are primarily due to redemptions-in-kind and partnership investments.
| Distributable earnings (loss) | Paid-In Capital | |||||||
Xtrackers MSCI USA ESG Leaders Equity ETF | $ | (1,804,040 | ) | $ | 1,804,040 | |||
Xtrackers S&P 500 ESG ETF | 69,973 | (69,973 | ) | |||||
64
DBX ETF Trust
Notes to Financial Statements(Continued)
As of August 31, 2019, the aggregate cost of investments for federal income tax purposes, the net unrealized appreciation or (depreciation) and the aggregated gross unrealized appreciation (depreciation) on investments were as follows:
| Aggregate Tax Cost | Net Unrealized Appreciation (Depreciation) | Aggregate Gross Unrealized Appreciation | Aggregate Gross Unrealized (Depreciation) | |||||||||||||
Xtrackers MSCI ACWI ex USA ESG Leaders Equity ETF | $ | 7,565,003 | $ | 65,894 | $ | 504,659 | $ | (438,765 | ) | |||||||
Xtrackers MSCI EAFE ESG Leaders Equity ETF | 7,510,014 | (271,096 | ) | 393,752 | (664,848 | ) | ||||||||||
Xtrackers MSCI Emerging Markets ESG Leaders Equity ETF | 7,669,753 | (163,985 | ) | 386,891 | (550,876 | ) | ||||||||||
Xtrackers MSCI USA ESG Leaders Equity ETF | 1,269,717,931 | 69,616,320 | 106,007,977 | (36,391,657 | ) | |||||||||||
Xtrackers S&P 500 ESG ETF | 11,262,716 | 88,220 | 417,012 | (328,792 | ) | |||||||||||
Foreign Taxes The Funds may be subject to foreign taxes (a portion of which may be reclaimable) on income, capital gains on investments, certain foreign currency transactions or other corporate events. All foreign taxes are recorded in accordance with the applicable foreign tax regulations and rates that exist in the foreign jurisdictions in which the Funds invest. These foreign taxes, if any, are paid by the Funds and are reflected in their Statements of Operations as follows: foreign taxes withheld at source are presented as a reduction of income, foreign taxes on capital gains from sales of investments and foreign currency transactions are included in their respective net realized gain (loss) categories, and deferred foreign taxes on unrealized gains are included in net change in unrealized appreciation (depreciation). Foreign taxes payable as of August 31, 2019, if any, are disclosed in the Funds’ Statements of Assets and Liabilities.
Foreign Currency Translations The books and records of the Funds are maintained in U.S. dollars. Investment securities and other assets and liabilities denominated in a foreign currency are translated into U.S. dollars at the prevailing exchange rates at period end. Purchases and sales of investment securities, income and expenses are translated into U.S. dollars at the prevailing exchange rates on the respective dates of the transactions.
Net realized and unrealized gains and losses on foreign currency transactions represent net gains and losses between trade and settlement dates on securities transactions, the acquisition and disposition of foreign currencies, and the difference between the amount of net investment income accrued and the U.S. dollar amount actually received. The portion of both realized and unrealized gains and losses on investments that results from fluctuations in foreign currency exchange rates is not separately disclosed, but is included with net realized and unrealized gain/appreciation and loss/depreciation on investments.
Securities Lending The Funds may lend securities to certain financial institutions under the terms of their securities lending agreement. During the term of the loans, the Funds continue to receive interest and dividends generated by the securities and to participate in any changes in their market value. The Funds require the borrowers of the securities to maintain collateral with the Funds consisting of cash and/or securities issued or guaranteed by the U.S. Government, its agencies or instrumentalities having a value at least equal to the value of the securities loaned. When the collateral falls below specified amounts, the lending agent will use its best effort to obtain additional collateral on the next business day to meet required amounts under the securities lending agreement. During the period ended August 31, 2019, the Funds invested the cash collateral into a joint trading account in DWS Government & Agency Securities Portfolio, an affiliated money market fund managed by DWS Investment Management Americas, Inc. DWS Investment Management Americas, Inc. receives a management/administration fee (0.11% annualized effective rate as of August 31, 2019) on the cash collateral invested in DWS Government & Agency Securities Portfolio. The Funds receive compensation for lending its securities either in the form of fees or by earning interest on invested cash collateral net of borrower rebates and fees paid to a lending agent. Either the Fund or the borrower may terminate the loan at any time and the borrower, after notice, is required to return borrowed securities within a standard time period. There may be risks of delay and costs in recovery of securities or even loss of rights in the collateral should the borrower of the securities fail financially. If the Funds are not able to recover securities lent, the Funds may sell the collateral and purchase a replacement investment in the market, incurring the risk that the value of the replacement security is greater than the value of the collateral. The Funds are also subject to all investment risks associated with the reinvestment of any cash collateral received, including, but not limited to, interest rate, credit and liquidity risk associated with such investments.
65
DBX ETF Trust
Notes to Financial Statements(Continued)
As of August 31, 2019, the Funds listed below had securities on loan, which were classified as Common Stocks in the Schedule of Investments. The value of the related collateral exceeded the value of the securities loaned at period end.
Remaining Contractual Maturity of the Agreements, as of August 31, 2019 | ||||||||||||||||||||
| Securities Lending Transactions | Overnight and Continuous | <30 Days | Between 30 & 90 days | >90 days | Total | |||||||||||||||
Xtrackers MSCI ACWI ex USA ESG Leaders Equity ETF |
| |||||||||||||||||||
Common Stocks | $ | 51,069 | $ | 1,307 | $ | 2,129 | $ | 60,759 | $ | 115,264 | ||||||||||
|
|
|
|
|
|
|
|
|
| |||||||||||
Gross amount of recognized liabilities and non-cash collateral for securities lending transactions |
| $ | 115,264 | |||||||||||||||||
Xtrackers MSCI EAFE ESG Leaders Equity ETF |
| |||||||||||||||||||
Common Stocks | $ | 42,850 | $ | 382 | $ | 376 | $ | 51,760 | $ | 95,368 | ||||||||||
|
|
|
|
|
|
|
|
|
| |||||||||||
Gross amount of recognized liabilities and non-cash collateral for securities lending transactions |
| $ | 95,368 | |||||||||||||||||
Xtrackers MSCI Emerging Markets ESG Leaders Equity ETF |
| |||||||||||||||||||
Common Stocks | $ | 130,104 | $ | 4,412 | $ | 7,601 | $ | 85,092 | $ | 227,209 | ||||||||||
|
|
|
|
|
|
|
|
|
| |||||||||||
Gross amount of recognized liabilities and non-cash collateral for securities lending transactions |
| $ | 227,209 | |||||||||||||||||
Xtrackers MSCI USA ESG Leaders Equity ETF |
| |||||||||||||||||||
Common Stocks | $ | 719,723 | $ | — | $ | 182,173 | $ | 21,909,663 | $ | 22,811,559 | ||||||||||
|
|
|
|
|
|
|
|
|
| |||||||||||
Gross amount of recognized liabilities and non-cash collateral for securities lending transactions |
| $ | 22,811,559 | |||||||||||||||||
Xtrackers S&P 500 ESG ETF | ||||||||||||||||||||
Common Stocks | $ | 4,434 | $ | 325 | $ | 572 | $ | 100,561 | $ | 105,892 | ||||||||||
|
|
|
|
|
|
|
|
|
| |||||||||||
Gross amount of recognized liabilities and non-cash collateral for securities lending transactions |
| $ | 105,892 | |||||||||||||||||
Derivatives
Futures Contracts Each Fund may enter into futures contracts. These futures contracts will be used to simulate investment in the respective Underlying Index, to facilitate trading or to reduce transaction costs. Each Fund will enter into futures contracts that are traded on a U.S. ornon-U.S. exchange. No Fund will use futures for speculative purposes. Futures contracts provide for the future sale by one party and purchase by another party of a specified amount of a specific instrument or index at a specified future time and at a specified price. For the period ended August 31, 2019, Xtrackers MSCI ACWI ex USA ESG Leaders Equity ETF, Xtrackers MSCI EAFE ESG Leaders Equity ETF, Xtrackers MSCI Emerging Markets ESG Leaders Equity ETF and Xtrackers MSCI USA ESG Leaders Equity ETF utilized futures in order to simulate investment in the Funds’ Underlying Index. To the extent required by law, liquid assets committed to futures contracts will be maintained.
At the time each Fund enters into a futures contract, each Fund deposits and maintains as collateral an initial margin with the broker, as required by the exchange on which the transaction is affected. Pursuant to the contract, each Fund agrees to receive from or pay to the broker an amount of cash equal to the daily fluctuation in the value of the contract. Such receipts or payments are known as variation margin and are recorded by each Fund as unrealized gains or losses. Risks may arise from the potential inability of a counterparty to meet the terms of the contract. The credit/counterparty risk for exchange-traded futures contracts is generally less than privately negotiated futures contracts, since the clearinghouse, which is the issuer or counterparty to each exchange-traded future, provides a guarantee of performance. The guarantee is supported by a daily payment system (i.e., margin requirements).
Use of long futures contracts subjects each Fund to risk of loss in excess of the amounts shown on the Statement of Assets and Liabilities, up to the notional value of the futures contracts. Use of short futures contracts subjects each Fund to unlimited risk of loss. Under some circumstances, futures exchanges may establish daily limits on the amount that the price of a futures contract can vary from the previous day’s settlement price, which could effectively prevent liquidation of unfavorable positions.
A summary of the open futures contracts as of August 31, 2019 is included in a table following the Funds’ Schedule of Investments.
66
DBX ETF Trust
Notes to Financial Statements(Continued)
The following tables summarize the value of the Funds’ derivative instruments held as of August 31, 2019 and the related location in the accompanying Statement of Assets and Liabilities, presented by primary underlying risk exposure:
Asset Derivatives | Liability Derivatives | |||||||||||||
| Xtrackers MSCI ACWI ex USA ESG Leaders Equity ETF | ||||||||||||||
| Equity contracts | Unrealized appreciation on futures contracts* | $ | — | Unrealized depreciation on futures contracts* | $ | 2,395 | ||||||||
| Xtrackers MSCI EAFE ESG Leaders Equity ETF | ||||||||||||||
| Equity contracts | Unrealized appreciation on futures contracts* | $ | — | Unrealized depreciation on futures contracts* | $ | 66 | ||||||||
| Xtrackers MSCI Emerging Markets ESG Leaders Equity ETF | ||||||||||||||
| Equity contracts | Unrealized appreciation on futures contracts* | $ | — | Unrealized depreciation on futures contracts* | $ | 1,165 | ||||||||
| Xtrackers MSCI USA ESG Leaders Equity ETF | ||||||||||||||
| Equity contracts | Unrealized appreciation on futures contracts* | $ | 15,688 | Unrealized depreciation on futures contracts* | $ | — | ||||||||
| * | Includes cumulative appreciation or cumulative depreciation of futures contracts as disclosed in the Schedule of Investments. Unsettled variation margin is disclosed separately within the Statement of Assets and Liabilities. |
Additionally, the amount of realized and unrealized gains and losses on derivative instruments recognized in the Funds’ earnings during the period ended August 31, 2019 and the related location in the accompanying Statement of Operations is summarized in the following tables by primary underlying risk exposure:
Net Realized Gain (Loss) from: | ||||
| Futures Contracts — Equity Contracts | ||||
Xtrackers MSCI ACWI ex USA ESG Leaders Equity ETF | $ | 11,644 | ||
Xtrackers MSCI EAFE ESG Leaders Equity ETF | 40 | |||
Xtrackers MSCI Emerging Markets ESG Leaders Equity ETF | 39,007 | |||
Xtrackers MSCI USA ESG Leaders Equity ETF | 57,578 | |||
Net Change in Unrealized Appreciation (Depreciation) on: | ||||
| Futures Contracts — Equity Contracts | ||||
Xtrackers MSCI ACWI ex USA ESG Leaders Equity ETF | $ | (2,395 | ) | |
Xtrackers MSCI EAFE ESG Leaders Equity ETF | (66 | ) | ||
Xtrackers MSCI Emerging Markets ESG Leaders Equity ETF | (1,165 | ) | ||
Xtrackers MSCI USA ESG Leaders Equity ETF | 15,688 | |||
For the period ended August 31, 2019 the average monthly volume of derivatives was as follows:
| Futures Contracts (Contract Value) | ||||
Xtrackers MSCI ACWI ex USA ESG Leaders Equity ETF | $ | 160,294 | ||
Xtrackers MSCI EAFE ESG Leaders Equity ETF | 47,635 | |||
Xtrackers MSCI Emerging Markets ESG Leaders Equity ETF | 469,440 | |||
Xtrackers MSCI USA ESG Leaders Equity ETF | 2,426,757 | |||
Affiliated Cash Management Vehicles The Funds may invest uninvested cash balances in DWS Government Money Market Series and DWS ESG Liquidity Fund, affiliated money market funds which are managed by DWS Investment Management Americas, Inc. (“DIMA”), also an indirect, wholly owned subsidiary of DWS Group GmbH & Co. KGaA. Each affiliated money market fund is managed in accordance with Rule2a-7 under the 1940 Act, which governs the quality, maturity, diversity and liquidity of instruments in which a money market fund may invest. DWS Government Money Market Series seeks to maintain a stable NAV, and DWS ESG Liquidity Fund
67
DBX ETF Trust
Notes to Financial Statements(Continued)
maintains a floating NAV. The Funds indirectly bear their proportionate share of the expenses of each affiliated money market fund in which they invest. The Advisor will waive an amount of the unitary management fee payable to the Advisor by the Funds equal to such acquired fund’s fees and expenses on the Funds’ assets invested in the affiliated money market funds.
3. Investment Advisory and Other Agreements
The Advisor has overall responsibility for the general management and administration of the Funds, subject to the supervision of the Funds’ Board of Trustees. Under an investment advisory agreement between the Trust, on behalf of the Funds, and the Advisor (the “Investment Advisory Agreement”), the Advisor is responsible for arrangingsub-advisory, transfer agency, custody, fund administration, and all othernon-distribution related services for the Funds to operate.
For its investment advisory services to the Funds below, the Advisor was entitled to receive a unitary management fee based on each Fund’s average daily net assets, computed and accrued daily and payable monthly, at an annual rate equal to:
| Unitary Management Fee | ||||
Xtrackers MSCI ACWI ex USA ESG Leaders Equity ETF | 0.16 | % | ||
Xtrackers MSCI EAFE ESG Leaders Equity ETF | 0.14 | % | ||
Xtrackers MSCI Emerging Markets ESG Leaders Equity ETF | 0.20 | % | ||
Xtrackers MSCI USA ESG Leaders Equity ETF | 0.10 | % | ||
Xtrackers S&P 500 ESG ETF | 0.11 | % | ||
Effective July 31, 2019, the Advisor for the Xtrackers MSCI USA ESG Leaders Equity ETF has voluntarily elected to waive its fees and/or reimburse Fund expenses to the extent necessary to maintain the Fund’s total annual operating expenses (excluding certain expenses such as extraordinary expenses, taxes, brokerage, interest expense and acquired fund fees and expenses) at 0.09% of the Fund’s average daily net assets. Any voluntary waiver or reimbursement implemented by the Adviser may be eliminated by the Adviser at any time. For the period from July 31, 2019 through August 31, 2019, the Advisor waived $10,929 of expenses to the Fund.
The Advisor for the Funds below has contractually agreed to waive a portion of its management fees in an amount equal to the acquired fund’s fees and expenses attributable to the Funds’ investments in affiliated cash management vehicles. For the period ended August 31, 2019, the Advisor waived expenses of the Funds as follows:
| Expenses Waived | ||||
Xtrackers MSCI ACWI ex USA ESG Leaders Equity ETF | $ | 51 | ||
Xtrackers MSCI EAFE ESG Leaders Equity ETF | 3 | |||
Xtrackers MSCI Emerging Markets ESG Leaders Equity ETF | 215 | |||
Xtrackers MSCI USA ESG Leaders Equity ETF | 407 | |||
Xtrackers S&P 500 ESG ETF | 3 | |||
Out of the unitary management fee, the Advisor pays substantially all expenses of each Fund, including the cost of transfer agency, custody, fund administration, legal, audit and other services, and expenses of the Independent Trustees. Each Fund is responsible for the payment of interest expense, taxes, brokerage expenses, distribution fees or expenses, if any, litigation expenses and extraordinary expenses.
The Bank of New York Mellon, a wholly-owned subsidiary of The Bank of New York Mellon Corporation, serves as Administrator, Custodian, Accounting Agent, Lending Agent and Transfer Agent for each Fund.
ALPS Distributors, Inc. (the “Distributor”) serves as the distributor of Creation Units for each Fund on an agency basis. The Distributor does not maintain a secondary market in shares of the Funds.
The Board of Trustees is currently comprised of four Trustees, including three Independent Trustees. The Advisor paid retainer fees and attendance fees to each Independent Trustee; retainer fees to the Chairman of the Board of Trustees and Chairman of the Audit Committee; and attendance fees to each member of the Audit Committee (which is comprised of all of the Funds’ Independent Trustees).
68
DBX ETF Trust
Notes to Financial Statements(Continued)
4. Investment Portfolio Transactions
For the period ended August 31, 2019, the cost of investments purchased and proceeds from sale of investments (excludingin-kind transactions and short-term investments) were as follows:
| Purchases | Sales | |||||||
Xtrackers MSCI ACWI ex USA ESG Leaders Equity ETF (1) | $ | 8,275,524 | $ | 774,394 | ||||
Xtrackers MSCI EAFE ESG Leaders Equity ETF (2) | 8,238,386 | 744,675 | ||||||
Xtrackers MSCI Emerging Markets ESG Leaders Equity ETF (1) | 8,696,781 | 1,139,207 | ||||||
Xtrackers MSCI USA ESG Leaders Equity ETF (3) | 48,336,576 | 48,927,729 | ||||||
Xtrackers S&P 500 ESG ETF (4) | 307,592 | 7,854 | ||||||
For the period ended August 31, 2019, the cost ofin-kind purchases and proceeds fromin-kind sales were as follows:
| Purchases | Sales | |||||||
Xtrackers MSCI USA ESG Leaders Equity ETF (3) | $ | 1,307,158,735 | $ | 40,537,763 | ||||
Xtrackers S&P 500 ESG ETF (4) | 24,743,190 | 13,719,695 | ||||||
| (1) | For the period December 6, 2018 (commencement of operations) through August 31, 2019. |
| (2) | For the period September 6, 2018 (commencement of operations) through August 31, 2019. |
| (3) | For the period March 7, 2019 (commencement of operations) through August 31, 2019. |
| (4) | For the period June 26, 2019 (commencement of operations) through August 31, 2019. |
5. Fund Share Transactions
As of August 31, 2019, there were unlimited Fund shares, no par value, authorized by the Trust. Fund shares are issued and redeemed by each Fund only in Creation Units or multiples thereof. Except when aggregated in Creation Units, shares of each Fund are not redeemable. Transactions in capital shares for each Fund are disclosed in detail in the Statements of Changes in Net Assets. The consideration for the purchase of Creation Units of a Fund generally consists of thein-kind contribution of a designated portfolio of securities constituting a portfolio sampling representation of the securities included in the respective Fund’s Underlying Index and an amount of cash, which under certain circumstances may include cash in lieu of portfolio securities. Investors purchasing and redeeming Creation Units pay a purchase transaction fee and a redemption transaction fee to offset transfer and other transaction costs associated with the issuance and redemption of Creation Units.
6. Concentration of Ownership
From time to time, the Funds may have a concentration of several shareholder accounts holding a significant percentage of shares outstanding. Investment activities of these shareholders could have a material impact on the Fund. At August 31, 2019, there was one affiliated shareholder account for each of the funds listed below holding a significant percentage of the shares outstanding:
| Approximate Percent of Outstanding Shares Held | ||||
Xtrackers MSCI ACWI ex USA ESG Leaders Equity ETF | 82 | % | ||
Xtrackers MSCI EAFE ESG Leaders Equity ETF | 75 | % | ||
Xtrackers MSCI Emerging Markets ESG Leaders Equity ETF | 87 | % | ||
7. Investing in Emerging Markets
The securities of issuers located in emerging markets tend to be more volatile and less liquid than securities of issuers located in more mature economies, and emerging markets generally have less diverse and less mature economic structures and less stable political systems than those of developed countries. The securities of issuers located or doing substantial business in emerging markets are often subject to rapid and large changes in price.
69
DBX ETF Trust
Notes to Financial Statements(Continued)
8. Line of Credit
The Trust has entered into a senior unsecured credit facility with a syndication of banks which allows the Xtrackers MSCI ACWI ex USA ESG Leaders Equity ETF, Xtrackers MSCI Emerging Markets ESG Leaders Equity ETF and certain other funds managed by the Advisor to borrow up to $105 million. Each Fund may borrow money under this credit facility to the extent necessary for temporary or emergency purposes, including the funding of shareholder redemption requests, trade settlements, and as necessary to distribute to shareholders any income necessary to maintain each Funds’ status as a regulated investment company. Borrowings are charged an interest rate of 1.25% per annum plus the greater of the Federal Funds Effective Rate or theone-month LIBOR Rate. Each Fund may borrow up to the lesser of apro-rata share of the credit facility at the amount listed below or 33 percent of its net assets as permitted by the Act. The Funds had no outstanding loans at August 31, 2019.
| Pro-rata Share | ||||
Xtrackers MSCI ACWI ex USA ESG Leaders Equity ETF | $ | 525,000 | ||
Xtrackers MSCI Emerging Markets ESG Leaders Equity ETF | 525,000 | |||
70
DBX ETF Trust
To the Shareholders
of Xtrackers MSCI ACWI ex USA ESG Leaders Equity ETF, Xtrackers MSCI EAFE ESG Leaders Equity ETF, Xtrackers MSCI Emerging Markets ESG Leaders Equity ETF, Xtrackers MSCI USA ESG Leaders Equity ETF, Xtrackers S&P 500 ESG ETF, and the Board of Trustees of DBX ETF Trust:
Opinion on the Financial Statements
We have audited the accompanying statements of assets and liabilities of Xtrackers MSCI ACWI ex USA ESG Leaders Equity ETF, Xtrackers MSCI EAFE ESG Leaders Equity ETF, Xtrackers MSCI Emerging Markets ESG Leaders Equity ETF, Xtrackers MSCI USA ESG Leaders Equity ETF, and Xtrackers S&P 500 ESG ETF (collectively referred to as the “Funds”), (five of the funds constituting DBX ETF Trust (the “Trust”)), including the schedules of investments, as of August 31, 2019, and the related statements of operations and changes in net assets, and the financial highlights for each of the periods indicated in the table below and the related notes (collectively referred to as the “financial statements”). In our opinion, the financial statements present fairly, in all material respects, the financial position of each of the Funds (five of the funds constituting DBX ETF Trust) at August 31, 2019, and the results of their operations, changes in net assets and financial highlights for each of the periods indicated in the table below, in conformity with U.S. generally accepted accounting principles.
Individual fund constituting the DBX ETF Trust | Statement of operations | Statements of changes in net assets | Financial highlights | |||
Xtrackers MSCI ACWI ex USA ESG Leaders Equity ETF
Xtrackers MSCI Emerging Markets ESG Leaders Equity ETF | For the period from December 6, 2018 (commencement of operations) through August 31, 2019 | |||||
| Xtrackers MSCI EAFE ESG Leaders Equity ETF | For the period from September 6, 2018 (commencement of operations) through August 31, 2019 | |||||
| Xtrackers MSCI USA ESG Leaders Equity ETF | For the period from March 7, 2019 (commencement of operations) through August 31, 2019 | |||||
| Xtrackers S&P 500 ESG ETF | For the period from June 26, 2019 (commencement of operations) through August 31, 2019 | |||||
Basis for Opinion
These financial statements are the responsibility of the Trust’s management. Our responsibility is to express an opinion on each of the Funds’ financial statements based on our audits. We are a public accounting firm registered with the Public Company Accounting Oversight Board (United States) (“PCAOB”) and are required to be independent with respect to the Trust in accordance with the U.S. federal securities laws and the applicable rules and regulations of the Securities and Exchange Commission and the PCAOB.
We conducted our audits in accordance with the standards of the PCAOB. Those standards require that we plan and perform the audit to obtain reasonable assurance about whether the financial statements are free of material misstatement, whether due to error or fraud. The Trust is not required to have, nor were we engaged to perform, an audit of the Trust’s internal control over financial reporting. As part of our audits we are required to obtain an understanding of internal control over financial reporting but not for the purpose of expressing an opinion on the effectiveness of the Trust’s internal control over financial reporting. Accordingly, we express no such opinion.
Our audits included performing procedures to assess the risks of material misstatement of the financial statements, whether due to error or fraud, and performing procedures that respond to those risks. Such procedures included examining, on a test basis, evidence regarding the amounts and disclosures in the financial statements. Our procedures included confirmation of securities owned as of August 31, 2019, by correspondence with the custodians and brokers or by other appropriate auditing procedures where replies from brokers were not
71
DBX ETF Trust
Report of Independent Registered Public Accounting Firm(Continued)
received. Our audits also included evaluating the accounting principles used and significant estimates made by management, as well as evaluating the overall presentation of the financial statements. We believe that our audits provide a reasonable basis for our opinion.

We have served as the auditor of one or more investment companies in the DWS family of funds since at least 1979, but we are unable to determine the specific year.
New York, New York
October 25, 2019
72
DBX ETF Trust
| Name, Year of Birth, Position with the Trust and Length of Time Served(1) | Business Experience and Directorships During the Past 5 Years | Number of Portfolios in Fund Complex Overseen | Other Directorships Held by Board Member | |||
Independent Board Members | ||||||
Stephen R. Byers (1953) Chairman since 2016, and Board Member since 2011 (formerly, Lead Independent Board Member,2015-2016) | Independent Director (2011-present); Independent Consultant (2014-present); Director of Investment Management, the Dreyfus Corporation (2000-2006) and Vice Chairman and Chief Investment Officer, the Dreyfus Corporation(2002-2006). | 38 | The Arbitrage Funds, Sierra Income Corporation, Mutual Fund Directors Forum | |||
George O. Elston (1964) Board Member since 2011, Chairman of the Audit Committee since 2015 | Chief Financial Officer, Enzyvant (2018-present); Chief Executive Officer, 2X Oncology, Inc. (2017-2018); Senior Vice President and Chief Financial Officer, Juniper Pharmaceuticals, Inc. (2014-2016); Senior Vice President and Chief Financial Officer, KBI BioPharma Inc. (2013-2014); Managing Partner, Chatham Street Partners(2010-2013). | 38 | — | |||
J. David Officer (1948) Board Member since 2011, Chairman of the Nominating Committee since 2015 | Independent Director (2010-present); Vice Chairman, the Dreyfus Corporation (2006-2009); President, The Dreyfus Family of Funds, Inc. (2006-2009). | 38 | (Chairman of) Ilex Management Ltd.; Old Westbury Funds | |||
| Name, Year of Birth, Position with the Trust and Length of Time Served(1) | Business Experience and Directorships During the Past 5 Years | Number of Portfolios in Fund Complex Overseen | Other Directorships Held by Board Member | |||
Interested Board Member(2) | ||||||
Michael Gilligan(2) (1966) Board Member since 2016, and Treasurer, Chief Financial Officer and Controller since 2010 | Director(3) in DWS Finance Division (2008-Present); Manager, Treasurer and Chief Financial Officer of the Advisor (2010-present); Chief Financial Officer of Global Passive Asset Management Platform (2012-2018); Global Finance Director, Alternative Investments (2018-present); Chief Financial Officer of RREEF America LLC (2018-present). | 38 | The Advisor, DBX Strategic Advisors LLC and DB Commodity Services LLC | |||
73
DBX ETF Trust
Board Members and Officers(Unaudited) (Continued)
| Name, Year of Birth, Position with the Trust and Length of Time Served(4) | Business Experience and Directorships During the Past 5 Years | |
Officers(2) | ||
Freddi Klassen(5) (1975) President and Chief Executive Officer,2016-present | Director(3) in DWS and Chief Operating Officer in the Americas for the Traditional Asset Classes Department (2014-present); Manager and Chief Operating Officer of DWS Investment Management Americas, Inc. (2018-present) and the Advisor (2016-present); Global Chief Operating Officer for Equities Technology in the Investment Bank Division at Deutsche Bank AG (2013-2014); Chief Operating Officer for Exchange Traded Funds and Systematic Funds in Europe(2008-2013). | |
Luke Oliver(5) (1980) Chief Operating Officer, 2019-present | Managing Director(3) in DWS (2017-present); Director(3) in DWS (2009-2017); Head of Passive Americas Asset Management Platform (2019-present); Manager, Chief Executive Officer and Chief Investment Officer of the Advisor (2019-present); Head of ETF Capital Markets, Americas (2012-2018); Lead Portfolio Manager of PowerShares DB ETFs(2009-2012). | |
Frank Gecsedi(5) (1967) Chief Compliance Officer, 2010-present | Director(3) in DWS Compliance Department (2016-present), Vice President in the Deutsche Asset Management Compliance Department at Deutsche Bank AG (2013-2016) and Chief Compliance Officer of the Advisor (2010-present); Vice President in Deutsche Bank’s Global Markets Legal, Risk and Capital Division(2010-2012). | |
Bryan Richards(5) (1978) Vice President, 2016-present | Managing Director(3) in DWS (2018-present); Director(3) in DWS (2014-2018); Portfolio Manager in the Passive Asset Management Department at DWS (2011-present); Primary Portfolio Manager for the PowerShares DB Commodity ETFs(2011-2015). | |
Leslie Lowenbraun(5) (1953) Secretary, 2016-present | Director(3) in DWS US Retail Legal (2018-present) and Chief Legal Officer of the Advisor (2017-present); Vice President in DWS US Retail Legal (2014-2018); Counsel at Skadden, Arps, Slate, Meagher & Flom LLP(2005-2014). | |
John Millette(6) (1962) Assistant Secretary,2019-present | Director(3) in DWS US Retail Legal (2003-present); Vice President and Secretary of DWS US registered investment companies advised by DWS Investment Management Americas, Inc. (1999-present); Chief Legal Officer, DWS Investment Management Americas, Inc. (2015-present); and Director and Vice President of DWS Trust Company (2016-present); formerly: Secretary of Deutsche Investment Management Americas Inc.(2015-2017). | |
Kevin Teevan(5) (1973) Assistant Treasurer,2018-present | Vice President in Finance for US Traditional Asset Classes of DWS (2018-present); Vice President in Chief Operating Office for Global Transaction Banking at Deutsche Bank AG (2014-2017); Vice President in Finance for US Passive Asset Management Platform at Deutsche Bank AG(2011-2014). | |
Christina A. Morse(7) (1964) Assistant Secretary,2017-present | Vice President at BNY Mellon-Asset Servicing (2014-present); Vice President and Counsel at Lord Abbett & Co. LLC(2013-2014). | |
(1) The length of time served is represented by the year in which the Board Member joined the Board.
(2) As a result of their respective positions held with the Advisor and its affiliates, these individuals are considered “interested persons” of the Advisor within the meaning of the 1940 Act. Interested persons receive no compensation from the fund.
(3) Executive title, not a board directorship.
(4) The length of time served is represented by the year in which the officer was first elected to the Trust in such capacity.
(5) Address: 345 Park Avenue, New York, New York 10154.
(6) Address: One International Place, Boston, Massachusetts 02110.
(7) Address: BNY Mellon Asset Servicing, Atlantic Terminal Office Tower, 2 Hanson Place, Brooklyn, NY 11217.
Each Board Member serves until his or her successor is duly elected or appointed and qualified. Each officer serves until he or she resigns, is removed, dies, retires or becomes disqualified.
The Funds’ Statement of Additional Information (“SAI”) includes additional information about the Funds’ Board Members. The SAI is available by calling855-329-3837, or on the Company’s website at www.Xtrackers.com.
74
DBX ETF Trust
Xtrackers MSCI USA ESG Leaders Equity ETF and Xtrackers S&P 500 ESG ETF
After discussions at the meeting of the Board of Trustees (“Board” or “Trustees”) held on February11-12, 2019, the Trustees, including the Independent Trustees (those not affiliated with DBX ETF Trust (the “Trust”) or its service providers), unanimously approved the Investment Advisory Agreement with respect to Xtrackers MSCI USA ESG Leaders Equity ETF and Xtrackers S&P 500 ESG ETF (each a “Fund,” and collectively, the “Funds”). The Independent Trustees were advised throughout the review and meetings by K&L Gates LLP (“Independent Trustee Counsel”).
In reaching this decision, the Board considered all factors it believed relevant, including (1) the nature, extent and quality of the services to be provided to the Funds and their shareholders; (2) the financial resources of DBX Advisors LLC (“DBX” or the “Advisor”) and its resulting ability to perform its obligations under the Investment Advisory Agreement; (3) the competitiveness of the advisory fees; (4) the total cost of the services to be provided by, and the anticipated profits to be realized, by the Advisor from its relationship with the Funds; (5) the extent to which economies of scale would be realized, and if the Funds’ shareholders would benefit from those economies.
The Board reached a determination, with the assistance of Dechert LLP (“Trust Counsel”) and through the exercise of its business judgment, that approval of the Investment Advisory Agreement and the compensation to be received thereunder is in the best interests of each Fund and its shareholders as well as consistent with the Board’s duties under state and federal law. The Board reached this conclusion based on multiple factors.
The Board considered the following in determining whether to approve the Investment Advisory Agreement:
Nature, Extent and Quality of Services. The Board reviewed in detail the nature, extent and quality of services to be provided by the Advisor under the Investment Advisory Agreement. The Board considered that these services include, among other things, furnishing a continuous investment program for the Funds, including arranging for, or implementing, the purchase and sale of portfolio securities, the provision of general corporate services such as portfolio management compliance services and the preparation and filing of certain reports on behalf of the Trust. The Board also considered, among other things, the professional experience, qualifications and performance of the senior management and key professional personnel of the Advisor, including portfolio management.
The Board considered that the Advisor will provide, at its own expense, office facilities and equipment for use by the Funds and supervisory persons responsible for supervising and monitoring the Trust’s service providers. The Board also considered that the Advisor will pay or arrange for the compensation of officers of the Trust who are also officers or employees of the Advisor or one of its Deutsche Bank affiliates, except as may otherwise be determined by the Board. In addition, the Board considered that the Advisor arranges for the provision of transfer agency, custody, fund administration and accounting, and othernon-distribution services necessary for the Funds’ operations. The Board also considered that in addition to managing the Funds’ portfolios directly, the Advisor will provide oversight ofday-to-day operations, including monitoring tracking error, providing services in connection with the creation and redemption of creation units and assistance in meeting legal, compliance and regulatory requirements applicable to the Funds.
Based on its review, the Board concluded that the nature, extent, and quality of services to be provided by the Advisor under the Investment Advisory Agreement are reasonable and appropriate in relation to the fees to be paid to the Advisor, taking special consideration of the fact that the advisory fee is a unitary fee and, as a result, a portion of the unitary advisory fee will be used to compensate the Funds’ service providers. The Board considered the staffing of the Advisor, including the training, qualifications and experience of investment personnel in managing the Funds. The Board also considered the expertise of the Advisor in supervising third party service providers to its currently managed Funds, such as the administrator and the custodian (which would also provide those services to the Funds), noting the Advisor’s extensive work with these service providers (including onsite due diligence sessions) to conduct such supervision (which would cover the Funds as well). The Board further considered the compliance program of the Advisor, which supports the compliance program of the Advisor’s currently managed Funds (which would also cover the Funds).
75
DBX ETF Trust
Board Considerations in Approval of Investment Advisory Contract(Continued)
Advisor’s Financial Resources. In connection with the assessment of the ability of the Advisor to perform its duties under the Investment Advisory Agreement, the Board considered the Advisor’s financial condition and whether it has the resources necessary to carry out its functions. The Board concluded that the Advisor has the financial resources necessary to perform its obligations under the Investment Advisory Agreement.
Reasonableness of Advisory Fee. The Board compared each Fund’s advisory fee to that of other pertinent exchange-traded funds (“ETFs”) and noted that each Fund’s fee is competitive with the fees of its respective peer group. The Board agreed that it was familiar with the Advisor’s methodology for selecting each Fund’s peer group and believed that the Funds’ peer groups were appropriate. The Board considered that the proposed fee for each of the Funds is a unitary fee pursuant to which the Advisor pays all of each Fund’s costs (subject to certain specified exceptions). The Board also considered that each Fund’s portfolio will be managed on aday-to-day basis by the Advisor and that the Advisor will also provide oversight ofday-to-day operations, including monitoring tracking error, providing services in connection with creation and redemption units and assistance in meeting legal and regulatory requirements applicable to the Funds. Based on its review, the Board concluded that the advisory fee for each Fund is reasonable in light of the services to be provided.
Costs of Services and Profitability. The Board considered the anticipated expenses of the Advisor in developing and rendering services to be provided to the Funds and the likelihood and level of profits in the early years of the Funds’ operations. The Board noted that because the Funds are new, it is difficult to estimate the profitability of the Funds to the Advisor at this time. The Board considered whether the Advisor would benefit in other ways from its relationships with the Funds and concluded that there were no materialfall-out benefits likely to accrue to the Advisor related to the operation of the Funds.
Economies of Scale. The Board noted that the Funds’ advisory fees were set at a competitive level that was designed to reflect scale in assets from the Funds’ commencement of operations. The Board noted that because the Funds are new, it is difficult to estimate whether the Funds would experience economies of scale beyond those already reflected in the advisory fee. The Board determined to evaluate economies of scale on an ongoing basis as a result of asset growth of the Funds.
Given all the information available to it and considering all material factors, the Board concluded that the Investment Advisory Agreement was fair and reasonable and it was unanimously approved.
76
DBX ETF Trust
Proxy Voting Policies and Procedures
The Funds’ policies and procedures for voting proxies for portfolio securities and information about how each Fund voted proxies related to its portfolio securities during the most recent12-month period ended June 30 are available on our Web site — www.Xtrackers.com (click on “Resources” and “Proxy Voting” at the top of the page) — or on the SEC’s Web site — www.sec.gov. To obtain a written copy of the Funds’ policies and procedures without charge, upon request, call us toll free at (855)329-3837.
Portfolio Holdings Information
The Funds are required to file their complete schedule of portfolio holdings with the SEC for their first and third fiscal quarters on FormN-Q or Form N-PORT (available for filings after March 31, 2019). Copies of the filings are available without charge, upon request on the SEC’s website at www.sec.gov and are available by calling the Trust at855-329-3837.
Information about each Fund’s portfolio holdings is available daily at www.Xtrackers.com.
Discount & Premium Information
Information regarding how often shares of each Fund traded on NYSE Arca at a price above (i.e.,at a premium) or below (i.e., at a discount) the NAV of the Fund can be found at www.Xtrackers.com.
Tax Information
Form1099-DIV and otheryear-end tax information provide shareholders with actual calendar year amounts that should be included in their tax returns. Shareholders should consult their tax advisors.
Each Fund designates the following amounts or, if subsequently determined to be different, the maximum allowable for its period ended August 31, 2019.
| Qualified Dividend Income* | Dividends Received Deduction* | |||||||
Xtrackers MSCI ACWI ex USA ESG Leaders Equity ETF | 68% | 0% | ||||||
Xtrackers MSCI EAFE ESG Leaders Equity ETF | 86% | 0% | ||||||
Xtrackers MSCI Emerging Markets ESG Leaders Equity ETF | 57% | 0% | ||||||
Xtrackers MSCI USA ESG Leaders Equity ETF | 100% | 95% | ||||||
Xtrackers S&P 500 ESG ETF | 0% | 0% | ||||||
* The above percentage is based on ordinary income dividends paid to shareholders during each Fund’s fiscal year.
Each Fund intends to elect to pass through to shareholders the credit for taxes paid to foreign countries. The gross foreign source income and foreign taxes paid are as follows:
| Gross Foreign Income | Foreign Taxes Income | |||||||
Xtrackers MSCI ACWI ex USA ESG Leaders Equity ETF | $ | 210,814 | $ | 20,354 | ||||
Xtrackers MSCI EAFE ESG Leaders Equity ETF | 267,785 | 20,965 | ||||||
Xtrackers MSCI Emerging Markets ESG Leaders Equity ETF | 173,547 | 19,767 | ||||||
77
DBX ETF Trust
DBX Advisors LLC (“Advisors”) collectsnon-public information about you from the following sources: (i) information received from you on applications or other forms; and (ii) information about your transactions with the Advisors, Advisors’ affiliates and third-party service providers and vendors. Advisors does not disclose anynon-public personal information about you to anyone, other than as set forth below, as permitted by applicable law and regulation. Advisors may disclosenon-public personal information about you to the funds in which you invest, to Advisors’ affiliates, and tonon-affiliated companies that work with Advisors to service your account(s), or to provide services or process transactions that you have requested. Advisors may disclosenon-public personal information in situations that may include, but are not limited to, in response to legal and/or regulatory inquiries and the proposed or actual sale, assignment merger or other transfer of all or a portion of Advisors’ business to another business entity. Advisors may also disclosenon-public personal information about you to parties representing you, such as your investment representative, your accountant, your tax advisor, or to other third parties at your direction/consent. Advisors will not sell, rent, license or trade your personal and financial information to or with third parties for their own direct marketing use unless you give us general or specific consent to do so. If you decide to close your account(s) or become an inactive customer, Advisors will adhere to the privacy policies and practices as described in this notice. Advisors restricts access to your personal and account information to those employees who need to know that information to provide products and services to you. Advisors maintains reasonable and customary physical, electronic and procedural safeguards to guard yournon-public personal information.
Advisors reserves the right, at their discretion, to change, modify, add, or remove portions of this Privacy Policy Notice, and any of the policies described herein, at any time. Advisors will indicate any such changes to the Privacy Policy Notice at the privacy link which can be found at www.Xtrackers.com. At all times, you are bound by the then-current version of the Privacy Policy and all applicable laws. Advisors highly recommends that you review this Privacy Policy Notice from time to time to ensure that you are familiar with the most recent version. The examples contained in this Privacy Policy Notice are illustrations; they are not intended to be exclusive.
78
DBX ETF Trust
This report is intended for the shareholders of the DBX ETF Trust.
This report must be preceded or accompanied by a prospectus.
Investing involves risk, including the possible loss of principal. ESG criteria in a Fund’s investment strategy does not guarantee a return or protect against loss. Stocks may decline in value. With respect to EASG, EMSG and ACSG foreign investing involves greater and different risks than investing in US companies, including currency fluctuations, less liquidity, less developed or less efficient trading markets, lack of comprehensive company information, political instability and differing auditing and legal standards. With respect to EMSG and ACSG, emerging markets tend to be more volatile and less liquid than the markets of more mature economies, and generally have less diverse and less mature economic structures and less stable political systems than those of developed countries. With respect to SNPE, stocks of medium-sized companies involve greater risk than securities of larger, more established companies. These Funds are currentlynon-diversified and can take larger positions in fewer issues, increasing its potential risk. With respect to SNPE, funds investing in a single industry, country or in a limited geographic region generally are more volatile than more diversified funds. Performance of a Fund may diverge from that of its Underlying Index due to operating expenses, transaction costs, cash flows, use of sampling strategies or operational inefficiencies. An investment in any Fund should be considered only as a supplement to a complete investment program for those investors willing to accept the risks associated with the Fund. Please read the prospectus for more information.
Shares of the Funds are bought and sold at market price (not NAV) throughout the day on the NYSE Arca, Inc. Transactions in Fund shares may result in brokerage commissions and may generate tax consequences. There can be no assurance that an active trading market for shares of a Fund will develop or be maintained.
DBX ETF Trust Funds are distributed by ALPS Distributors, Inc. (“ALPS”). The Funds are managed by DBX Advisors LLC which is not affiliated with ALPS.
The brand DWS represents DWS Group GmbH & Co. KGaA and any of its subsidiaries such as DWS Distributors, Inc. which offers investment products or Deutsche Investment Management Americas Inc. and RREEF America L.L.C. which offer advisory services.
The Funds or securities referred to herein are not sponsored, endorsed, or promoted by MSCI, and MSCI bears no liability with respect to any such Funds or securities or any index on which such Funds or securities are based. The prospectus contains a more detailed description of the limited relationship MSCI has with DBX Advisors and any related funds.
Copyright © 2019 DWS Group. All rights reserved. XtrackersTM is a trademark of DWS Investment GmbH. All other trademarks, servicemarks or registered trademarks are the property of their respective owners.
Not FDIC Insured | No Bank Guarantee | May Lose Value
DBX ETF Trust
Investment advisor DBX Advisors LLC 345 Park Avenue New York, NY 10154 | Administrator, custodian, The Bank of New York Mellon 240 Greenwich Street New York, NY 10286 | Distributor ALPS Distributors, Inc. 1290 Broadway Suite 1100 Denver, CO 80203 | ||
Independent registered public accounting firm Ernst & Young LLP 5 Times Square New York, NY 10036 | Legal counsel Dechert LLP 1095 Avenue of the Americas New York, NY 10036 | |||
R-70013-1 (10/19) DBX004119 (10/20)
| Item 2. | Code of Ethics. |
| (a) | The registrant, as of the end of the period covered by this report, has adopted a code of ethics that applies to the registrant’s principal executive officer, principal financial officer, principal accounting officer or controller, or persons performing similar functions, regardless of whether these individuals are employed by the registrant or a third party. |
| (b) | There have been no amendments, during the period covered by this report, to a provision of the code of ethics that applies to the registrant’s principal executive officer, principal financial officer, principal accounting officer or controller, or persons performing similar functions, regardless of whether these individuals are employed by the registrant or a third party, and that relates to any element of the code of ethics description. |
| (c) | The registrant has not granted any waivers, including an implicit waiver, from a provision of the code of ethics that applies to the registrant’s principal executive officer, principal financial officer, principal accounting officer or controller, or persons performing similar functions, regardless of whether these individuals are employed by the registrant or a third party, that relates to one or more of the items set forth in paragraph (b) of this item’s instructions. |
| Item 3. | Audit Committee Financial Expert. |
Stephen R. Byers, George O. Elston, and J. David Officer are the designated financial experts on the Audit Committee of DBX ETF Trust. With respect to DBX ETF Trust, Stephen Byers, George O. Elston, and J. David Officer are not “interested persons” as such terms are defined by Section 2(a)(19) of the Act (15 U.S.C.80a-2(a)(19)).
| Item 4. | Principal Accountant Fees and Services. |
Audit Fees
| (a) | The aggregate fees billed for each of the last two fiscal years for professional services rendered by the principal accountant for the audit of the registrant’s annual financial statements or services that are normally provided by the accountant in connection with statutory and regulatory filings or engagements for those fiscal years are $372,680 for 2019 and $259,680 for 2018. |
Audit-Related Fees
| (b) | The aggregate fees billed in each of the last two fiscal years for assurance and related services by the principal accountant that are reasonably related to the performance of the audit of the registrant’s financial statements and are not reported under paragraph (a) of this Item are $0 for 2019 and $0 for 2018. |
Tax Fees
| (c) | The aggregate fees billed in each of the last two fiscal years for professional services rendered by the principal accountant for tax compliance, tax advice, and tax planning are $233,825 for 2019 and $181,275 for 2018. |
All Other Fees
| (d) | The aggregate fees billed in each of the last two fiscal years for products and services provided by the principal accountant, other than the services reported in paragraphs (a) through (c) of this Item, are $0 for 2019 and $0 for 2018. |
| (e)(1) | Disclose the audit committee’spre-approval policies and procedures described in paragraph (c)(7) of Rule2-01 of RegulationS-X. |
In accordance with Rule2-01(c)(7)(A), the Audit Committeepre-approves all of the audit and permissiblenon-audit services of the Registrant.
| (e)(2) | All of the services described in paragraphs (b) through (d) above were approved by the Audit Committee in accordance with paragraph (c) (7) (i) (c) of Rule2-01 of RegulationS-X. |
| (f) | Not Applicable. |
| (g) | The aggregatenon-audit fees billed by the registrant’s accountant for services rendered to the registrant, and rendered to the registrant’s investment adviser (not including anysub-adviser whose role is primarily portfolio management and is subcontracted with or overseen by another investment adviser), and any entity controlling, controlled by, or under common control with the adviser that provides ongoing services to the registrant for each of the last two fiscal years of the registrant was $0 for 2019 and $0 for 2018. |
| (h) | The registrant’s audit committee of the board of directors has considered whether the provision ofnon-audit services that were rendered to the registrant’s investment adviser (not including anysub-adviser whose role is primarily portfolio management and is subcontracted with or overseen by another investment adviser), and any entity controlling, controlled by, or under common control with the investment adviser that provides ongoing services to the registrant that were notpre-approved pursuant to paragraph (c)(7)(ii) of Rule2-01 of RegulationS-X is compatible with maintaining the principal accountant’s independence. |
| Item 5. | Audit Committee of Listed Registrants. |
The Registrant is a listed issuer as defined in Rule10A-3 under the Exchange Act and has a separately-designated standing audit committee established in accordance with Section 3(a)(58)(A) of the Exchange Act. The Registrant’s audit committee members are Stephen R. Byers, George O. Elston, and J. David Officer.
| Item 6. | Investments. |
| (a) | Schedule of Investments in securities of unaffiliated issuers as of the close of the reporting period is included as part of the report to shareholders filed under Item 1 of this Form. |
| (b) | Not applicable. |
| Item 7. | Disclosure of Proxy Voting Policies and Procedures forClosed-End Management Investment Companies. |
Not applicable.
| Item 8. | Portfolio Managers ofClosed-End Management Investment Companies. |
Not applicable.
| Item 9. | Purchases of Equity Securities byClosed-End Management Investment Company and Affiliated Purchasers. |
Not applicable.
| Item 10. | Submission of Matters to a Vote of Security Holders. |
There were no material changes to the procedures by which shareholders may recommend nominees to the Registrant’s Board of Trustees.
| Item 11. | Controls and Procedures. |
| (a) | The Chief Executive and Financial Officers concluded that the Registrant’s Disclosure Controls and Procedures are effective based on the evaluation of the Disclosure Controls and Procedures as of a date within 90 days of the filing date of this report. |
| (b) | There have been no changes in the registrant’s internal control over financial reporting that occurred during the period covered by this report that has materially affected, or is reasonably likely to materially affect, the registrant’s internal controls over financial reporting. |
| Item 12. | Disclosure of Securities Lending Activities forClosed-End Management Investment Companies |
Not applicable.
| Item 13. | Exhibits. |
| (a)(1) | Code of ethics, or any amendment thereto, that is the subject of disclosure required by Item 2 is attached hereto. | |
| (a)(2) | Certifications pursuant to Rule30a-2(a) under the 1940 Act and Section 302 of the Sarbanes-Oxley Act of 2002 are attached hereto. | |
| (a)(3) | Not applicable. | |
| (a)(4) | Not applicable. | |
| (b) | Certifications pursuant to Rule30a-2(b) under the 1940 Act and Section 906 of the Sarbanes-Oxley Act of 2002 are attached hereto. | |
SIGNATURES
Pursuant to the requirements of the Securities Exchange Act of 1934 and the Investment Company Act of 1940, the registrant has duly caused this report to be signed on its behalf by the undersigned, thereunto duly authorized.
| (Registrant) | DBX ETF Trust | |
| By (Signature and Title)* | /s/ Freddi Klassen | |
| Freddi Klassen | ||
| President and Chief Executive Officer | ||
Date November 1, 2019
Pursuant to the requirements of the Securities Exchange Act of 1934 and the Investment Company Act of 1940, this report has been signed below by the following persons on behalf of the registrant and in the capacities and on the dates indicated.
| By (Signature and Title)* | /s/ Freddi Klassen | |
| Freddi Klassen | ||
| President and Chief Executive Officer |
Date November 1, 2019
| By (Signature and Title)* | /s/ Michael Gilligan | |
| Michael Gilligan | ||
Treasurer, Chief Financial Officer and Controller |
Date November 1, 2019
| * | Print the name and title of each signing officer under his or her signature. |