UNITED STATES
SECURITIES AND EXCHANGE COMMISSION
Washington, D.C. 20549
FORM N-CSR
CERTIFIED SHAREHOLDER REPORT OF REGISTERED
MANAGEMENT INVESTMENT COMPANIES
Investment Company Act file number: 811-22497
Strategy Shares
(Exact name of registrant as specified in charter)
36 North New York Avenue, Huntington, NY 11743
(Address of principal executive offices) (Zip code)
Citi Fund Services Ohio, Inc., 4400 Easton Commons, Suite 200, Columbus, OH 43219
(Name and address of agent for service)
Registrant’s telephone number, including area code: (855) 477-3837
Date of fiscal year end: April 30
Date of reporting period: April 30, 2022
Item 1. Reports to Stockholders.
 |
| Annual Shareholder Report |
| Strategy Shares Nasdaq 5HANDL™ Index ETF (FIVR) |
| Strategy Shares Gold-Hedged Bond ETF (GLDB) |
| Strategy Shares Nasdaq 7HANDL™ Index ETF (HNDL) |
| Strategy Shares Halt Climate Change ETF (NZRO) |
| Strategy Shares Newfound/Resolve Robust Momentum ETF (ROMO) |
| A P R I L 3 0 , 2 0 2 2 |
| You may elect to receive shareholder reports in paper free of charge. You can contact your financial intermediary to request that you receive paper copies of your reports. Your election to receive reports in paper will apply to all funds held with your financial intermediary. |
| TABLE OF CONTENTS | Page |
| Management’s Discussion of Fund Performance | |
| Strategy Shares Nasdaq 5HANDL™ Index ETF (FIVR) | 1 |
| Strategy Shares Gold-Hedged Bond ETF (GLDB) | 4 |
| Strategy Shares Nasdaq 7HANDL™ Index ETF (HNDL) | 6 |
| Strategy Shares Halt Climate Change ETF (NZRO) | 9 |
| Strategy Shares Newfound/ReSolve Robust Momentum ETF (ROMO) | 11 |
| Expense Examples | 13 |
| Portfolios of Investments | |
| Strategy Shares Nasdaq 5HANDL™ Index ETF (FIVR) | 14 |
| Strategy Shares Gold-Hedged Bond ETF (GLDB) | 15 |
| Strategy Shares Nasdaq 7HANDL™ Index ETF (HNDL) | 17 |
| Strategy Shares Halt Climate Change ETF (NZRO) | 18 |
| Strategy Shares Newfound/ReSolve Robust Momentum ETF (ROMO) | 20 |
| Statements of Assets and Liabilities | 21 |
| Statements of Operations | 23 |
| Statements of Changes in Net Assets | 25 |
| Financial Highlights | 28 |
| Notes to Financial Statements | 29 |
| Report of Independent Registered Public Accounting Firm | 37 |
| Additional Information | 39 |
| Board of Trustees and Trust Officers | 46 |
[THIS PAGE INTENTIONALLY LEFT BLANK]
| Strategy Shares Nasdaq 5HANDL™ Index ETF (Unaudited) | April 30, 2022 |
Management’s Discussion of Fund Performance
Dear Shareholder:
Income investors who focus purely on yield when evaluating potential investments do so at their own risk. Metrics that fail to incorporate risk are not meaningful when used to compare duration- managed bond pools, multi-asset income funds, REITS, MLPS and high dividend stocks. The HANDLS™ solution is designed to use the teachings of modern portfolio theory to deliver income-oriented investment solutions to investors. By building well-diversified, balanced portfolios of low- cost ETFs and using moderate amounts of leverage to achieve enhanced returns, investors seeking income can seek to minimize the idiosyncratic risk posed by concentrated investments and earn higher risk-adjusted returns.
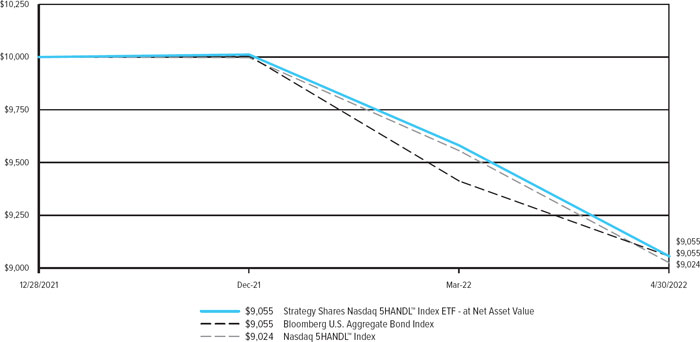
The Strategy Shares Nasdaq 5HANDL™ Index ETF (FIVR) seeks investment results that correlate generally, before fees and expenses, to the price and yield performance of the Nasdaq 5HANDL™ Index which has the goal, but not the guarantee, of achieving a total return sufficient, over time and after expenses, to support a five percent (5.0%) annual distribution rate. Nasdaq HANDLS™ Indexes have risk characteristics similar to the broad US capital markets and can be expected to generally rise and fall with prevailing market conditions. FIVR launched on December 28, 2021 and does not have a full fiscal year of performance yet. Since inception through April 30, 2022, FIVR generated a total return of -9.45% at net asset value and -9.33% at market value. During this same period, the Fund’s underlying index, the Nasdaq 5HANDL™ Index, returned -9.76%; the Fund’s benchmark, the Bloomberg U.S. Aggregate Bond Index, returned -9.45%.
In order to allow shareholders of the Fund to realize a predictable, but not assured, level of cash flow, FIVR has adopted a policy (which may be modified at any time by its Board of Trustees) to pay monthly distributions on Fund shares at a target rate that represents an annualized payout of approximately 5.0% on the Fund’s per-share net asset value on the date of a distribution’s declaration. Since inception through April 30, 2022, FIVR paid out total distributions of $0.40 per share between January 2022 and April 2022, during which period the average NAV on the distribution calculation date was $23.44.
To seek to accomplish its objective, HANDLS™ allocates across 19 exchange-traded funds (“ETFs”) and is split into two components, with a 50% allocation to fixed income and equity ETFs (the “Core Portfolio”) and a 50% allocation to ETFs of 12 asset categories using a proprietary Nasdaq Dorsey Wright algorithm (the “Explore Portfolio”) that have historically provided high levels of income. Because the Index is comprised of securities issued by other investment companies, FIVR operates as a “fund of funds.”
| For the fiscal period ended April 30, 2022, the five best performing holdings were: | Category | Return |
| Global X MLP ETF (MLPA) | US Alternative | 15.65% |
| Alerian MLP ETF (AMLP) | US Alternative | 6.75% |
| Utilities Select Sector SPDR Fund ETF (XLU) | US Equity | 3.36% |
| Xtrackers USD High Yield Corporate Bond ETF (HYLB) | US Fixed Income | -1.01% |
| Fidelity MSCI Utilities Index ETF (FUTY) | US Equity | -1.20% |
| And the five weakest performing holdings were: | Category | Return |
| Invesco QQQ Trust Series 1 ETF (QQQ) | US Equity | -19.42% |
| WisdomTree US Efficient Core Fund ETF (NTSX) | US Blend | -16.61% |
| Invesco Taxable Municipal Bond ETF (BAB) | US Fixed Income | -13.98% |
| Global X US Preferred ETF (PFFD) | US Equity | -13.16% |
| Vanguard Intermediate-Term Corporate Bond ETF (VCIT) | US Fixed Income | -11.61% |
Annual Shareholder Report | 1
Strategy Shares Nasdaq 5HANDL™ Index ETF (Unaudited) (Continued)
Investors have different risk appetites, but we believe diversification remains the best path to high risk-adjusted returns. This year’s launch is a complement to our 7HANDL™ Index ETF (HNDL). Both FIVR and HNDL seek to deliver high current income using a common, well-diversified portfolio seeking high risk-adjusted returns. The primary difference is that FIVR uses no leverage, pays a lower managed distribution, and, by design, is expected to experience about 23% less volatility over time.
For investors looking to fund their day-to-day lives, we believe HANDLS™ offers a better approach; one that focuses on seeking to maximize risk-adjusted returns and manufacturing a distribution. We believe managed distribution rates provide an additional benefit to investors by minimizing the need to manage cash reserves and make piecemeal asset sales to finance lifestyle needs.
We are pleased with the Fund’s performance relative to its benchmark and remain convinced that Investors are best served by relying upon diversified portfolios to maximize risk-adjusted returns; even when those market returns are negative. Investors concerned about the prospect of future interest rate hikes by the Federal Reserve may find it beneficial to review the historical performance of balanced portfolios during previous periods of rising interest rates.1
We appreciate your confidence and thank you for your continued interest in the Fund.
Sincerely,

David Miller
Portfolio Manager
Strategy Shares Nasdaq 5HANDL™ Index ETF
| 1 | https://catalyst-insights.com/dont-fight-the-fed-2/ |
The views and opinions expressed in management’s discussion of Fund performance are those of Rational Advisers, Inc. and its affiliates. These views and opinions are subject to change at any time based on factors such as market and economic conditions. These views and opinions may not be relied upon as investment advice or recommendations, or as an offer for a particular security. The information is not a complete analysis of every aspect of any market, country, industry, security or the Fund. Statements of fact are from sources considered reliable, but Rational Advisers, Inc. makes no representation or warranty as to their completeness or accuracy. Although historical performance is no guarantee of future results, these insights may help you understand our investment management philosophy.
Must be preceded or accompanied by a prospectus.
All investments involve risk, including loss of principal. Past performance is no guarantee of future results. Please see the Fund’s prospectus for specific details regarding investment objectives, risks, performance, and other important information. Review this information carefully before you make any investment decision. Investors cannot invest directly in an index, and unmanaged index returns do not reflect any fees, expenses or sales charges.
The Fund is distributed by Foreside Fund Services, LLC.
2 | Annual Shareholder Report
Strategy Shares Nasdaq 5HANDL™ Index ETF (Unaudited) (Continued)
Investment Objective
Strategy Shares Nasdaq 5HANDL™ Index ETF seeks to achieve investment results that correlate generally, before fees and expenses, to the price and yield performance of the Nasdaq 5HANDL™ Index.
Fund Performance (as of 4/30/22)
| Average Annual Total Returns | Expense Ratios(a) | |||||||
| One Year | Inception(b) | Gross | Net | |||||
| Strategy Shares Nasdaq 5HANDL™ Index ETF - Total Return (at Net Asset Value)(c) | N/A | -9.45% | 0.90% | 0.88% | ||||
| Strategy Shares Nasdaq 5HANDL™ Index ETF - Total Return (at Market Value)(d) | N/A | -9.33% | 0.90% | 0.88% | ||||
| Nasdaq 5HANDL™ Index | N/A | -9.76% | N/A | N/A | ||||
| Bloomberg U.S. Aggregate Bond Index(e) | N/A | -9.45% | N/A | N/A | ||||
Hypothetical Growth of a $10,000 Investment (*)
Past performance does not guarantee future results. Return calculations assume the reinvestment of distributions and do not reflect taxes that a shareholder would pay on Fund distributions or on the redemption of Fund shares. The performance data quoted represent past performance and current returns may be lower or higher. The investment return and principal value will fluctuate so that an investor’s shares, when redeemed may be worth more or less than the original cost. The performance above reflects any fee reductions during the applicable periods. If such fee reductions had not occurred, the quoted performance would be lower. To obtain performance information current to the most recent month-end, please call 855-477-3837 or visit http://strategysharesetfs.com/
| * | The chart represents historical performance of a hypothetical investment of $10,000 in Strategy Shares Nasdaq 5HANDL™ Index ETF and represents the reinvestment of of dividends and capital gains in the Fund. |
| (a) | The expense ratios reflect the expense ratios as reported in the Fund’s Prospectus dated December 28, 2021. However, the Advisor has agreed to contractual waivers in effect through August 31, 2023 and has agreed to limit total annual fund operating expenses to the net expense ratios shown. Please see the Fund’s most recent prospectus for details. Additional information pertaining to the Fund’s expense ratio as of April 30, 2022 can be found in the Financial Highlights. |
| (b) | Commencement of operations: December 28, 2021. |
| (c) | Net asset value total return is calculated assuming an initial investment made at the net asset value at the beginning of the period, reinvestment of all distributions, including dividends and return of capital, at net asset value during the period, if any, and redemption on the last day of the period at net asset value. This percentage is not an indication of the performance of a shareholder’s investment in the Fund based on market value due to differences between the market price of the shares and the net asset value per share of the Fund. |
| (d) | Market value total return is calculated assuming an initial investment made at the market value at the beginning of the period, reinvestment of all distributions, including dividends and return of capital, at net asset value during the period, if any, and redemption on the last day of the period at market value. Market value is determined by the composite closing price. Composite closing security price is defined as the last reported sale price from the Fund’s listing market (e.g., Nasdaq) or participating regional exchanges or markets. The composite closing price is the last reported sale price from any of the eligible sources, regardless of volume and not an average price and may have occurred on a date prior to the close of the reporting period. Market value may be greater or less than net asset value, depending on the Fund’s closing price on the listing market. |
| (e) | The Bloomberg U.S. Aggregate Bond Index is a broad-based flagship benchmark that measures the investment grade, U.S. dollar-denominated, fixed-rate taxable bond market. This includes Treasuries, government-related and corporate securities, mortgage-backed securities (agency fixed-rate and hybrid ARM pass-throughs), asset-backed securities and collateralized mortgage-backed securities (agency and non-agency). An investor cannot invest directly in an index. |
Annual Shareholder Report | 3
| Strategy Shares Gold-Hedged Bond ETF (Unaudited) | April 30, 2022 |
Management’s Discussion of Fund Performance
Dear Shareholder:
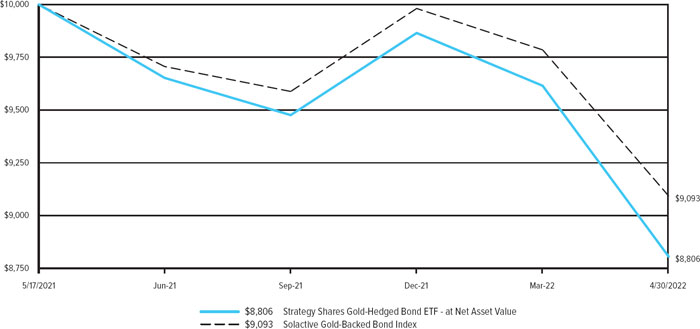
The Strategy Shares Gold-Hedged Bond ETF (GLDB) seeks investment results that correlate, before fees and expenses, to the performance of the Solactive Gold -Backed Bond Index (the “Index”). The Fund was designed on the belief that the best way for investors to generate income that maintains its purchasing power is to combine bonds and a gold overlay within one portfolio. The Index seeks to provide 100% exposure to the U.S. dollar - denominated investment grade corporate bond sector (the “Bond Component”) plus a gold inflation hedge with a notional value designed to correspond to the value of the Bond Component, with such notional value reset on a monthly basis (the “Gold Hedge Component”). The Bond Index aims to mirror the performance of investment grade corporate bonds issued in U.S. dollars. The Fund seeks to achieve its gold inflation hedge through the Gold Hedge Index which tracks the performance of the near month gold futures contracts listed on the Chicago Mercantile Exchange.
GLDB launched on May 17, 2021 and does not have a full fiscal year of performance yet. Since inception through April 30, 2022, GLDB generated a total return of -11.94% at net asset value and -11.17% at market value. During this same period, the Fund’s benchmark and underlying index, the Solactive Gold-Backed Bond Index, returned -9.07%.
The Fund’s exposure to gold futures contracts was the primary source of positive contribution during the reporting period. We continue to believe that an investment in gold can potentially provide a hedge against inflation for a bond. The best performing bonds during the reporting period were ABIBB 4 ¾ 01/23/29 (CUSIP: 035240AQ3, Sector: Consumer Staples), IBM 3 ½ 05/15/29 (CUSIP: 459200KA8, Sector: Information Technology), GS 4.223 05/01/29 (CUSIP: 38141GWZ3, Sector: Financials), TMUS 3 ⅞ 04/15/30 (CUSIP: 87264ABF1, Sector: Communication Services) and PPG 3 ¾ 03/15/28 (CUSIP: 693506BP1, Sector: Materials). The worst performing bonds during the reporting period were ORCL 5 ⅜ 07/15/40 (CUSIP: 68389XAM7, Sector: Information Technology), DOW 3.6 11/15/50 (CUSIP: 260543DD2, Sector: Materials), VZ 4.522 09/15/48 (CUSIP: 92343VCX0, Sector: Communication Services), GS 1.992 01/27/32 (CUSIP: 38141GXR0, Sector: Financials) and ABIBB 4.7 02/01/36 (CUSIP: 03522AAH3, Sector: Consumer Staples).
We appreciate your confidence and continued interest in the Fund.
Sincerely,
David Miller and Charles Ashley
Co-Portfolio Managers
Strategy Shares Gold-Hedged Bond ETF
The views and opinions expressed in management’s discussion of Fund performance are those of Rational Advisers, Inc. and its affiliates. These views and opinions are subject to change at any time based on factors such as market and economic conditions. These views and opinions may not be relied upon as investment advice or recommendations, or as an offer for a particular security. The information is not a complete analysis of every aspect of any market, country, industry, security or the Fund. Statements of fact are from sources considered reliable, but Rational Advisers, Inc. makes no representation or warranty as to their completeness or accuracy. Although historical performance is no guarantee of future results, these insights may help you understand our investment management philosophy.
Must be preceded or accompanied by a prospectus.
All investments involve risk, including loss of principal. Past performance is no guarantee of future results. Please see the Fund’s prospectus for specific details regarding investment objectives, risks, performance, and other important information. Review this information carefully before you make any investment decision. Investors cannot invest directly in an index, and unmanaged index returns do not reflect any fees, expenses or sales charges.
The Fund is distributed by Foreside Fund Services, LLC.
4 | Annual Shareholder Report
Strategy Shares Gold-Hedged Bond ETF (Unaudited) (Continued)
Investment Objective
Strategy Shares Gold-Hedged Bond ETF seeks to provide investment returns that correspond, before fees and expenses, to the performance of the Solactive Gold Backed Bond Index.
Fund Performance (as of 4/30/22)
| Average Annual Total Returns | Expense Ratios(a) | |||||||
| One Year | Inception(b) | Gross | Net | |||||
| Strategy Shares Gold-Hedged Bond ETF - Total Return (at Net Asset Value)(c) | N/A | -11.94% | 0.79% | 0.79% | ||||
| Strategy Shares Gold-Hedged Bond ETF - Total Return (at Market Value)(d) | N/A | -11.17% | 0.79% | 0.79% | ||||
| Solactive Gold-Backed Bond Index(e) | N/A | -9.07% | N/A | N/A | ||||
Hypothetical Growth of a $10,000 Investment (*)
Past performance does not guarantee future results. Return calculations assume the reinvestment of distributions and do not reflect taxes that a shareholder would pay on Fund distributions or on the redemption of Fund shares. The performance data quoted represent past performance and current returns may be lower or higher. The investment return and principal value will fluctuate so that an investor’s shares, when redeemed may be worth more or less than the original cost. The performance above reflects any fee reductions during the applicable periods. If such fee reductions had not occurred, the quoted performance would be lower. To obtain performance information current to the most recent month-end, please call 855-477-3837 or visit http://strategysharesetfs.com/
| * | The chart represents historical performance of a hypothetical investment of $10,000 in Strategy Shares Gold-Hedged Bond ETF and represents the reinvestment of dividends and capital gains in the Fund. |
| (a) | The expense ratios reflect the expense ratios as reported in the Fund’s Prospectus dated May 17, 2021. Please see the Fund’s most recent prospectus for details. Additional information pertaining to the Fund’s expense ratio as of April 30, 2022 can be found in the Financial Highlights. |
| (b) | Commencement of operations: May 17, 2021. |
| (c) | Net asset value total return is calculated assuming an initial investment made at the net asset value at the beginning of the period, reinvestment of all distributions, including dividends and return of capital, at net asset value during the period, if any, and redemption on the last day of the period at net asset value. This percentage is not an indication of the performance of a shareholder’s investment in the Fund based on market value due to differences between the market price of the shares and the net asset value per share of the Fund. |
| (d) | Market value total return is calculated assuming an initial investment made at the market value at the beginning of the period, reinvestment of all distributions, including dividends and return of capital, at net asset value during the period, if any, and redemption on the last day of the period at market value. Market value is determined by the composite closing price. Composite closing security price is defined as the last reported sale price from the Fund’s listing market (e.g., Cboe) or participating regional exchanges or markets. The composite closing price is the last reported sale price from any of the eligible sources, regardless of volume and not an average price and may have occurred on a date prior to the close of the reporting period. Market value may be greater or less than net asset value, depending on the Fund’s closing price on the listing market. |
| (e) | Solactive Gold-Backed Bond Index is designed to replicate the performance of a hypothetical investment in the Investment Grade Corporate Bond Sector, with the return stream denominated in Gold rather than dollars. The Solactive Gold- Backed Bond Index consists of a 1x exposure to the Investment Grade Corporate Bond Sector along with a 1x exposure to the Gold Sector. An investor cannot invest directly in an index. |
Annual Shareholder Report | 5
| Strategy Shares Nasdaq 7HANDL™ Index ETF (Unaudited) | April 30, 2022 |
Management’s Discussion of Fund Performance
Dear Shareholder:
Income investors who focus purely on yield when evaluating potential investments do so at their own risk. Metrics that fail to incorporate risk are not meaningful when used to compare duration- managed bond pools, multi-asset income funds, REITS, MLPS and high dividend stocks. The HANDLS™ solution is designed to use the teachings of modern portfolio theory to deliver income-oriented investment solutions to investors. By building well-diversified, balanced portfolios of low- cost ETFs and using moderate amounts of leverage to achieve enhanced returns, investors seeking income can seek to minimize the idiosyncratic risk posed by concentrated investments and earn higher risk-adjusted returns.
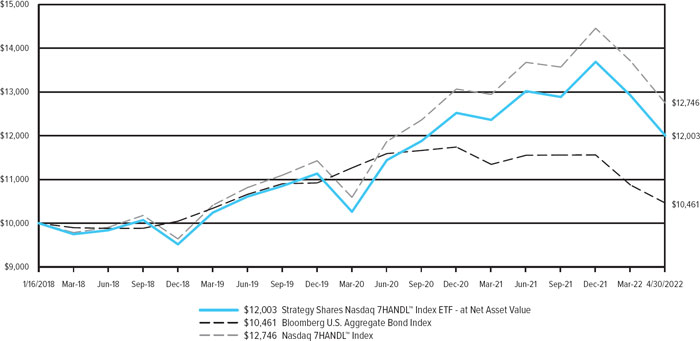
The Strategy Shares Nasdaq 7HANDL™ Index ETF (HNDL) seeks investment results that correlate generally, before fees and expenses, to the price and yield performance of the Nasdaq 7HANDL™ Index which has the goal, but not the guarantee, of achieving a total return sufficient, over time and after expenses, to support a seven percent (7.0%) annual distribution rate. Nasdaq HANDLS™ Indexes have risk characteristics similar to the broad US capital markets and can be expected to generally rise and fall with prevailing market conditions. For the fiscal year ended April 30, 2022, HNDL generated a total return of -5.46% at net asset value and -5.36% at market value. During this same period, the Fund’s underlying index, the Nasdaq 7HANDL™ Index, returned -4.27%. The Fund’s benchmark, the Bloomberg U.S. Aggregate Bond Index, returned -8.51%.
In order to allow shareholders of the Fund to realize a predictable, but not assured, level of cash flow, HNDL has adopted a policy (which may be modified at any time by its Board of Trustees) to pay monthly distributions on Fund shares at a target rate that represents an annualized payout of approximately 7.0% on the Fund’s per-share net asset value on the date of a distribution’s declaration. For the fiscal year ended April 30, 2022, HNDL paid out total distributions of $1.76 per share between May 2021 and April 2022, during which period the average NAV on the distribution calculation date was $25.18.
To seek to accomplish its objective, HANDLS™ allocates across 19 exchange-traded funds (“ETFs”) and is split into two components, with a 50% allocation to fixed income and equity ETFs (the “Core Portfolio”) and a 50% allocation to ETFs of 12 asset categories using a proprietary Nasdaq Dorsey Wright algorithm (the “Explore Portfolio”) that have historically provided high levels of income. Because the Index is comprised of securities issued by other investment companies, HNDL operates as a “fund of funds.”
| For the year, the five best performing holdings were: | Category | Return |
| Global X MLP ETF (MLPA) | US Alternative | 16.58% |
| Schwab U.S. REIT ETF (SCHH) | US Equity | 9.92% |
| Vanguard Total Stock Market ETF (VTI) | US Equity | 9.31% |
| iShares Core S&P Total US Stock Market ETF (ITOT) | US Equity | 9.25% |
| Alerian MLP ETF (AMLP) | US Alternative | 6.75% |
| And the five weakest performing holdings were: | Category | Return |
| Schwab US Large-Cap ETF (SCHX) | US Equity | -11.40% |
| Invesco Taxable Municipal Bond ETF (BAB) | US Fixed Income | -11.13% |
| iShares Core S&P 500 ETF | US Equity | -11.11% |
| Global X US Preferred ETF | US Equity | -11.07% |
| Vanguard Intermediate-Term Corporate Bond ETF | US Fixed Income | -10.53% |
6 | Annual Shareholder Report
Strategy Shares Nasdaq 7HANDL™ Index ETF (Unaudited) (Continued)
Investors have different risk appetites, but we believe diversification remains the best path to high risk-adjusted returns. Recently, we launched the Strategy Shares Nasdaq 5HANDL™ Index ETF (FIVR), a complement to our 7HANDL™ Index ETF (HNDL). Both FIVR and HNDL seek to deliver high current income using a common, well-diversified portfolio seeking high risk-adjusted returns. The primary difference is that FIVR uses no leverage, pays a lower managed distribution, and, by design, is expected to experience about 23% less volatility.
For investors looking to fund their day-to-day lives, we believe HANDLS™ offers a better approach; one that focuses on seeking to maximize risk-adjusted returns and manufacturing a distribution. We believe managed distribution rates provide an additional benefit to investors by minimizing the need to manage cash reserves and make piecemeal asset sales to finance lifestyle needs.
We are pleased with the Fund’s performance relative to its benchmark and remain convinced that Investors are best served by relying upon diversified portfolios to maximize risk-adjusted returns; even when those market returns are negative. Investors concerned about the prospect of future interest rate hikes by the Federal Reserve may find it beneficial to review the historical performance of balanced portfolios during previous periods of rising interest rates.1
We appreciate your confidence and thank you for your continued interest in the Fund.
Sincerely,
David Miller
Portfolio Manager
Strategy Shares Nasdaq 7HANDL™ Index ETF
| 1 | https://catalyst-insights.com/dont-fight-the-fed-2/ |
The views and opinions expressed in management’s discussion of Fund performance are those of Rational Advisers, Inc. and its affiliates. These views and opinions are subject to change at any time based on factors such as market and economic conditions. These views and opinions may not be relied upon as investment advice or recommendations, or as an offer for a particular security. The information is not a complete analysis of every aspect of any market, country, industry, security or the Fund. Statements of fact are from sources considered reliable, but Rational Advisers, Inc. makes no representation or warranty as to their completeness or accuracy. Although historical performance is no guarantee of future results, these insights may help you understand our investment management philosophy.
Must be preceded or accompanied by a prospectus.
All investments involve risk, including loss of principal. Past performance is no guarantee of future results. Please see the Fund’s prospectus for specific details regarding investment objectives, risks, performance, and other important information. Review this information carefully before you make any investment decision. Investors cannot invest directly in an index, and unmanaged index returns do not reflect any fees, expenses or sales charges.
The Fund is distributed by Foreside Fund Services, LLC.
Annual Shareholder Report | 7
Strategy Shares Nasdaq 7HANDL™ Index ETF (Unaudited) (Continued)
Investment Objective
Strategy Shares Nasdaq 7HANDL™ Index ETF seeks to achieve investment results that correlate generally, before fees and expenses, to the price and yield performance of the Nasdaq 7HANDL™ Index.
Fund Performance (as of 4/30/22)
| Average Annual Total Returns | Expense Ratios(a) | |||||||
| One Year | Inception(b) | Gross | Net | |||||
| Strategy Shares Nasdaq 7HANDL™ Index ETF - Total Return (at Net Asset Value)(c) | -5.46% | 4.35% | 1.12% | 0.97% | ||||
| Strategy Shares Nasdaq 7HANDL™ Index ETF - Total Return (at Market Value)(d) | -5.36% | 4.39% | 1.12% | 0.97% | ||||
| Nasdaq 7HANDL™ Index | -4.27% | 5.82% | N/A | N/A | ||||
| Bloomberg U.S. Aggregate Bond Index(e) | -8.51% | 1.06% | N/A | N/A | ||||
Hypothetical Growth of a $10,000 Investment (*)
Past performance does not guarantee future results. Return calculations assume the reinvestment of distributions and do not reflect taxes that a shareholder would pay on Fund distributions or on the redemption of Fund shares. The performance data quoted represent past performance and current returns may be lower or higher. The investment return and principal value will fluctuate so that an investor’s shares, when redeemed may be worth more or less than the original cost. The performance above reflects any fee reductions during the applicable periods. If such fee reductions had not occurred, the quoted performance would be lower. To obtain performance information current to the most recent month-end, please call 855-477-3837 or visit http://strategysharesetfs.com/
| * | The chart represents historical performance of a hypothetical investment of $10,000 in Strategy Shares Nasdaq 7HANDL™ Index ETF and represents the reinvestment of dividends and capital gains in the Fund. |
| (a) | The expense ratios reflect the expense ratios as reported in the Fund’s Prospectus dated September 1, 2021. However, the Advisor has agreed to contractual waivers in effect through August 31, 2022 and has agreed to limit total annual fund operating expenses to the net expense ratios shown. Please see the Fund’s most recent prospectus for details. Additional information pertaining to the Fund’s expense ratio as of April 30, 2022 can be found in the Financial Highlights. |
| (b) | Commencement of operations: January 16, 2018. |
| (c) | Net asset value total return is calculated assuming an initial investment made at the net asset value at the beginning of the period, reinvestment of all distributions, including dividends and return of capital, at net asset value during the period, if any, and redemption on the last day of the period at net asset value. This percentage is not an indication of the performance of a shareholder’s investment in the Fund based on market value due to differences between the market price of the shares and the net asset value per share of the Fund. |
| (d) | Market value total return is calculated assuming an initial investment made at the market value at the beginning of the period, reinvestment of all distributions, including dividends and return of capital, at net asset value during the period, if any, and redemption on the last day of the period at market value. Market value is determined by the composite closing price. Composite closing security price is defined as the last reported sale price from the Fund’s listing market (e.g., Nasdaq) or participating regional exchanges or markets. The composite closing price is the last reported sale price from any of the eligible sources, regardless of volume and not an average price and may have occurred on a date prior to the close of the reporting period. Market value may be greater or less than net asset value, depending on the Fund’s closing price on the listing market. |
| (e) | The Bloomberg U.S. Aggregate Bond Index is a broad-based flagship benchmark that measures the investment grade, U.S. dollar-denominated, fixed-rate taxable bond market. This includes Treasuries, government -related and corporate securities, mortgage-backed securities (agency fixed-rate and hybrid ARM pass-throughs), asset-backed securities and collateralized mortgage-backed securities (agency and non-agency). An investor cannot invest directly in an index. |
8 | Annual Shareholder Report
| Strategy Shares Halt Climate Change ETF (Unaudited) | April 30, 2022 |
Management’s Discussion of Fund Performance
Dear Shareholder:
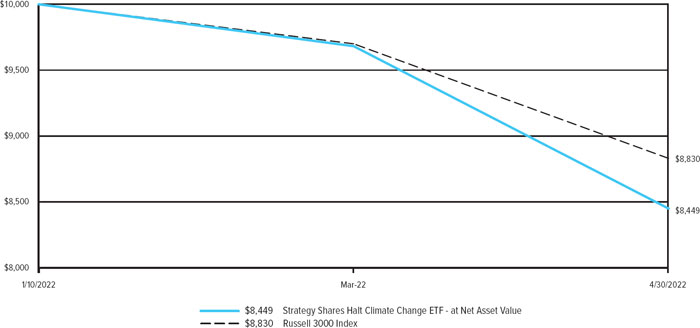
The Strategy Shares Halt Climate Change ETF (NZRO) invests in companies that the investment adviser believes are committed to curbing or mitigating the deleterious effects of climate change. The Fund invests in the equity securities of what the investment adviser believes to be climate conscious and environmentally friendly companies with clear sustainability goals. We believe that investing in an ETF that not only screens for climate conscious companies but also takes an active approach in reversing climate change through outside initiatives is an important way to help in the fight for carbon neutrality.
NZRO launched on January 10, 2022 and does not have a full fiscal year of performance yet. Since inception through April 30, 2022, NZRO generated a total return of -15.51% at net asset value and - 13.02% at market value. During this same period, the Fund’s benchmark, the Russell 3000 Index, returned -11.70%. During the period, the Fund had a growth tilt according to Morningstar, and, on this basis, the Fund performed well relative to the Russell 3000 Growth Index, which returned -16.05% for the period. Additionally, because of the nature of the strategy, the Fund was underexposed to the energy sector and overexposed to the technology sector, both of which produced +23.00% and -17.29% returns, respectively.
The Fund’s exposure to US and clean energy equities were the primary sources of positive performance during the reporting period. We continue to remain allocated to a wide range of companies with direct net zero commitments that meet our rigorous green criteria. The best performing holdings during the reporting period were US Ecology Inc (Ticker: ECOL, Sector: Industrials), Renewable Energy Group Inc (Ticker: REGI, Sector: Energy), Aris Water Solution Inc (Ticker: ARIS, Sector: Industrials), Montauk Renewables Inc (Ticker: MNTK, Sector: Utilities) and Enviva Inc (Ticker: EVA, Sector: Energy). The worst performing holdings during the reporting period were Fluence Energy Inc (Ticker: FLNC, Sector: Industrials), Netflix Inc (Ticker: NFLX, Sector: Communication Services), Arcimoto Inc (Ticker: FUV, Sector: Consumer Discretionary), Shoals Technologies Group Inc (Ticker: SHLS, Sector: Industrials) and Array Technologies Inc (Ticker: ARRY, Sector: Industrials).
We are optimistic regarding the potential for future performance of our portfolio, as we believe our investments in companies that are working to be active leaders in the fight against climate change are well-positioned for the future. We appreciate your confidence and continued interest in the Fund.
Sincerely,
David Miller, Charles Ashley and Rob Gough
Portfolio Managers
Strategy Shares Halt Climate Change ETF
The views and opinions expressed in management’s discussion of Fund performance are those of Rational Advisers, Inc. and its affiliates. These views and opinions are subject to change at any time based on factors such as market and economic conditions. These views and opinions may not be relied upon as investment advice or recommendations, or as an offer for a particular security. The information is not a complete analysis of every aspect of any market, country, industry, security or the Fund. Statements of fact are from sources considered reliable, but Rational Advisers, Inc. makes no representation or warranty as to their completeness or accuracy. Although historical performance is no guarantee of future results, these insights may help you understand our investment management philosophy.
Must be preceded or accompanied by a prospectus.
All investments involve risk, including loss of principal. Past performance is no guarantee of future results. Please see the Fund’s prospectus for specific details regarding investment objectives, risks, performance, and other important information. Review this information carefully before you make any investment decision. Investors cannot invest directly in an index, and unmanaged index returns do not reflect any fees, expenses or sales charges.
The Fund is distributed by Foreside Fund Services, LLC.
Annual Shareholder Report | 9
Strategy Shares Halt Climate Change ETF (Unaudited) (Continued)
Investment Objective
Strategy Shares Halt Climate Change ETF seeks long-term capital appreciation.
Fund Performance (as of 4/30/22)
| Average Annual Total Returns | Expense Ratios(a) | |||||||
| One Year | Inception(b) | Gross | Net | |||||
| Strategy Shares Halt Climate Change ETF - Total Return (at Net Asset Value)(c) | N/A | -15.51% | 0.95% | 0.95% | ||||
| Strategy Shares Halt Climate Change ETF - Total Return (at Market Value)(d) | N/A | -13.02% | 0.95% | 0.95% | ||||
| Russell 3000 Index(e) | N/A | -11.70% | N/A | N/A | ||||
Hypothetical Growth of a $10,000 Investment (*)
Past performance does not guarantee future results. Return calculations assume the reinvestment of distributions and do not reflect taxes that a shareholder would pay on Fund distributions or on the redemption of Fund shares. The performance data quoted represent past performance and current returns may be lower or higher. The investment return and principal value will fluctuate so that an investor’s shares, when redeemed may be worth more or less than the original cost. The performance above reflects any fee reductions during the applicable periods. If such fee reductions had not occurred, the quoted performance would be lower. To obtain performance information current to the most recent month-end, please call 855-477-3837 or visit http://strategysharesetfs.com/
| * | The chart represents historical performance of a hypothetical investment of $10,000 in Strategy Shares Halt Climate Change ETF and represents the reinvestment of dividends and capital gains in the Fund. |
| (a) | The expense ratios reflect the expense ratios as reported in the Fund’s Prospectus dated January 7, 2022. Please see the Fund’s most recent prospectus for details. Additional information pertaining to the Fund’s expense ratio as of April 30, 2022 can be found in the Financial Highlights. |
| (b) | Commencement of operations: January 10, 2022. |
| (c) | Net asset value total return is calculated assuming an initial investment made at the net asset value at the beginning of the period, reinvestment of all distributions, including dividends and return of capital, at net asset value during the period, if any, and redemption on the last day of the period at net asset value. This percentage is not an indication of the performance of a shareholder’s investment in the Fund based on market value due to differences between the market price of the shares and the net asset value per share of the Fund. |
| (d) | Market value total return is calculated assuming an initial investment made at the market value at the beginning of the period, reinvestment of all distributions, including dividends and return of capital, at net asset value during the period, if any, and redemption on the last day of the period at market value. Market value is determined by the composite closing price. Composite closing security price is defined as the last reported sale price from the Fund’s listing market (e.g., Nasdaq) or participating regional exchanges or markets. The composite closing price is the last reported sale price from any of the eligible sources, regardless of volume and not an average price and may have occurred on a date prior to the close of the reporting period. Market value may be greater or less than net asset value, depending on the Fund’s closing price on the listing market. |
| (e) | The Russell 3000 Index is a market-capitalization-weighted equity index maintained by FTSE Russell that provides exposure to the entire U.S. stock market. The index tracks the performance of the 3,000 largest U.S.-traded stocks, which represent about 97% of all U.S.-incorporated equity securities. An investor cannot invest directly in an index. |
10 | Annual Shareholder Report
| Strategy Shares Newfound/ReSolve Robust Momentum ETF (Unaudited) | April 30, 2022 |
Management’s Discussion of Fund Performance
Dear Shareholder:
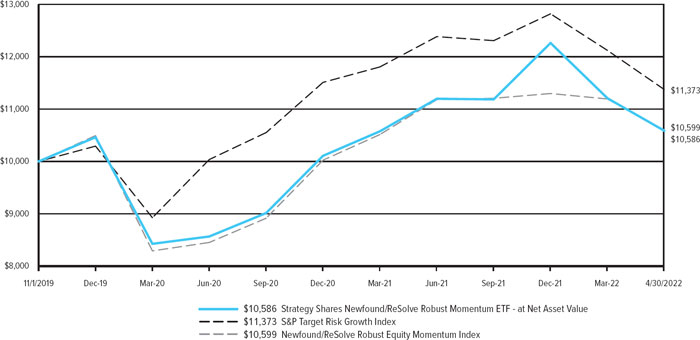
The Strategy Shares Newfound/ReSolve Robust Momentum ETF (ROMO) seeks to provide investment returns that correspond, before fees and expenses, to the performance of the Newfound/ReSolve Robust Equity Momentum Index. The Index generally consists of exchange-traded funds (ETFs) that track regional equity indices, representative of U.S. equities, developed international equities and emerging market equities, as well as ETFs that track U.S. Treasury market indices. Because the Index is comprised of securities issued by other investment companies, ROMO operates as a “fund of funds.”
For the fiscal year ended April 30, 2022, ROMO generated a total return of - 3.97% at net asset value and -3.79% at market value. During this same period, the Fund’s underlying index, the Newfound/ReSolve Robust Equity Momentum Index, returned -3.48% and the Fund’s benchmark, the S&P Target Risk Growth Index, returned -6.31%.
The Fund’s exposure to US equity ETFs was the primary source of outperformance relative to its benchmark during the reporting period. The positive trend in the equity markets for most of the trailing year positioned the Fund with a heavier allocation to equity ETFs and limited the Fund’s allocations to fixed income ETFs. The best performing holding during the reporting period was iShares Core S&P 500 ETF (Ticker: IVV, Category: US Equity). The worst performing holdings during the reporting period were iShares 7-10 Year Treasury Bond ETF (Ticker: IEF, Category: US Fixed Income), iShares Core MSCI EAFE ETF (Ticker: IEFA, Category: International Equity) and iShares 1-3 Year Treasury Bond ETF (Ticker: SHY, Category: US Fixed Income).
We are pleased with the performance of the Fund and its underlying index. We appreciate your confidence and continued interest in the Fund.
Sincerely,
David Miller & Charles Ashley
Co-Portfolio Manager
Strategy Shares Newfound/ReSolve Robust Momentum ETF
The views and opinions expressed in management’s discussion of Fund performance are those of Rational Advisers, Inc. and its affiliates. These views and opinions are subject to change at any time based on factors such as market and economic conditions. These views and opinions may not be relied upon as investment advice or recommendations, or as an offer for a particular security. The information is not a complete analysis of every aspect of any market, country, industry, security or the Fund. Statements of fact are from sources considered reliable, but Rational Advisers, Inc. makes no representation or warranty as to their completeness or accuracy. Although historical performance is no guarantee of future results, these insights may help you understand our investment management philosophy.
Must be preceded or accompanied by a prospectus.
All investments involve risk, including loss of principal. Past performance is no guarantee of future results. Please see the Fund’s prospectus for specific details regarding investment objectives, risks, performance, and other important information. Review this information carefully before you make any investment decision. Investors cannot invest directly in an index, and unmanaged index returns do not reflect any fees, expenses or sales charges.
The Fund is distributed by Foreside Fund Services, LLC.
Annual Shareholder Report | 11
Strategy Shares Newfound/ReSolve Robust Momentum ETF (Unaudited) (Continued)
Investment Objective
Strategy Shares Newfound/ReSolve Robust Momentum ETF seeks to provide investment returns that correspond, before fees and expenses, to the performance of the Newfound/ReSolve Robust Equity Momentum Index.
Fund Performance (as of 4/30/22)
| Average Annual Total Returns | Expense Ratios(a) | |||||||
| One Year | Inception(b) | Gross | Net | |||||
| Strategy Shares Newfound/ReSolve Robust Momentum ETF - Total Return (at Net Asset Value)(c) | -3.97% | 2.31% | 0.97% | 0.82% | ||||
| Strategy Shares Newfound/ReSolve Robust Momentum ETF - Total Return (at Market Value)(d) | -3.79% | 2.35% | 0.97% | 0.82% | ||||
| Newfound/ReSolve Robust Equity Momentum Index | -3.48% | 2.36% | N/A | N/A | ||||
| S&P Target Risk Growth Index(e) | -6.31% | 5.29% | N/A | N/A | ||||
Hypothetical Growth of a $10,000 Investment (*)
Past performance does not guarantee future results. Return calculations assume the reinvestment of distributions and do not reflect taxes that a shareholder would pay on Fund distributions or on the redemption of Fund shares. The performance data quoted represent past performance and current returns may be lower or higher. The investment return and principal value will fluctuate so that an investor’s shares, when redeemed may be worth more or less than the original cost. The performance above reflects any fee reductions during the applicable periods. If such fee reductions had not occurred, the quoted performance would be lower. To obtain performance information current to the most recent month-end, please call 855-477-3837 or visit http://strategysharesetfs.com/
| * | The chart represents historical performance of a hypothetical investment of $10,000 in Strategy Shares Newfound/ReSolve Robust Momentum ETF and represents the reinvestment of dividends and capital gains in the Fund. |
| (a) | The expense ratios reflect the expense ratios as reported in the Fund’s Prospectus dated September 1, 2021. However, the Advisor has agreed to contractual waivers in effect through August 31, 2022 and has agreed to limit total annual fund operating expenses to the net expense ratios shown. Please see the Fund’s most recent prospectus for details. Additional information pertaining to the Fund’s expense ratio as of April 30, 2022 can be found in the Financial Highlights. |
| (b) | Commencement of operations: November 1, 2019. |
| (c) | Net asset value total return is calculated assuming an initial investment made at the net asset value at the beginning of the period, reinvestment of all distributions, including dividends and return of capital, at net asset value during the period, if any, and redemption on the last day of the period at net asset value. This percentage is not an indication of the performance of a shareholder’s investment in the Fund based on market value due to differences between the market price of the shares and the net asset value per share of the Fund. |
| (d) | Market value total return is calculated assuming an initial investment made at the market value at the beginning of the period, reinvestment of all distributions, including dividends and return of capital, at net asset value during the period, if any, and redemption on the last day of the period at market value. Market value is determined by the composite closing price. Composite closing security price is defined as the last reported sale price from the Fund’s listing market (e.g., Cboe) or participating regional exchanges or markets. The composite closing price is the last reported sale price from any of the eligible sources, regardless of volume and not an average price and may have occurred on a date prior to the close of the reporting period. Market value may be greater or less than net asset value, depending on the Fund’s closing price on the listing market. |
| (e) | The S&P Target Risk Growth Index is designed to measure the performance of equity allocations, while seeking to provide limited fixed income exposure to diversify risk. An investor cannot invest directly in an index. |
12 | Annual Shareholder Report
| Expense Examples (Unaudited) | April 30, 2022 |
As a Fund shareholder, you may incur two types of costs: (1) transaction costs, including commissions on trading, as applicable; and (2) ongoing costs, including advisory fees and other Fund expenses. These examples are intended to help you understand your ongoing costs (in dollars) of investing in a Fund and to compare these costs with the ongoing costs of investing in other mutual funds.
The expense examples below are based on an investment of $1,000 invested at November 1, 2021 and held through the period ended April 30, 2022.
The Actual Expense figures in the table below provide information about actual account values and actual expenses. You may use this information, together with the amount you invested, to estimate the expenses that you paid over the period. Simply divide your account value by $1,000 (for example, an $ 8,600 account value divided by $1,000 = 8.6), then multiply the result by the number in the table under the heading entitled “Actual Expenses Paid During the Period” to estimate the expenses you paid on your account during this period.
The Hypothetical Expense figures in the table below provides information about hypothetical account values and hypothetical expenses based on each Fund’s actual expense ratio and an assumed rate of return of 5% per year before expenses, which is not each Fund’s actual return. The hypothetical account values and expenses may not be used to estimate the actual ending account balance or expenses you paid for the period. You may use this information to compare the ongoing costs of investing in your Fund and other funds. To do so, compare this 5% hypothetical example with the 5% hypothetical examples that appear in the shareholder reports of the other funds.
Please note that the expenses shown in the table are meant to highlight your ongoing costs only and do not reflect any transactional costs. Therefore, the examples are useful in comparing ongoing costs only and will not help you determine the relative total cost of owning different funds. In addition, if these transactional costs were included, your costs would have been higher.
| Beginning | Actual Ending | Hypothetical | Actual | Hypothetical | Annualized | |
| Account | Account | Ending | Expenses | Expenses | Net Expense | |
| Value | Value | Account Value | Paid During | Paid During | Ratio During | |
| Fund | 11/1/21 | 4/30/22 | 4/30/22(1) | the Period | the Period(1)(2) | the Period |
| Strategy Shares Nasdaq 5HANDL™ Index ETF (FIVR) | $1,000.00 | $905.50 | $1,021.27 | $2.30 (3) | $3.56 | 0.71% |
| Strategy Shares Gold-Hedged Bond ETF (GLDB) | 1,000.00 | 915.50 | 1,020.93 | 3.70 (4) | 3.91 | 0.78% |
| Strategy Shares Nasdaq 7HANDL™ Index ETF (HNDL) | 1,000.00 | 893.80 | 1,020.93 | 3.66 (4) | 3.91 | 0.78% |
| Strategy Shares Halt Climate Change ETF (NZRO) | 1,000.00 | 844.90 | 1,020.13 | 2.64 (5) | 4.71 | 0.94% |
| Strategy Shares Newfound/ReSolve Robust Momentum ETF (ROMO) | 1,000.00 | 892.60 | 1,021.08 | 3.52 (4) | 3.76 | 0.75% |
| (1) | Represents the hypothetical 5% annual return before expenses. |
| (2) | Expenses are equal to the average hypothetical account value over the period multiplied by the Fund’s annualized expense ratio, multiplied by the number of days in a hypothetical fiscal half-year divided by the number of days in the fiscal year (to reflect the one-half year period). |
| (3) | Expenses are equal to the Fund’s annualized expense ratio multiplied by the average account value over the period multiplied by 124/365 (to reflect the period since Fund inception). |
| (4) | Expenses are equal to the Fund’s annualized expense ratio multiplied by the average account value over the period multiplied by 181/365 (to reflect the one half year period). |
| (5) | Expenses are equal to the Fund’s annualized expense ratio multiplied by the average account value over the period multiplied by 111/365 (to reflect the period since Fund inception). |
Annual Shareholder Report | 13
| Strategy Shares Nasdaq 5HANDL™ Index ETF (FIVR) | April 30, 2022 |
Portfolio of Investments Summary Table
| Percentage of Fair Value | |
| Exchange-Traded Funds | 100.0% |
| Total | 100.0% |
Portfolio holdings and allocations are subject to change. As of April 30, 2022, percentages in the table above are based on total investments. Such total investments may differ from the percentages set forth in the following Portfolio of Investments which are computed using the Fund’s total net assets.
Portfolio of Investments
| Shares | Fair Value | |||||||
| Exchange-Traded Funds — 99.9% | ||||||||
| 5,920 | Alerian MLP ETF | $ | 225,374 | |||||
| 755 | Fidelity Total Bond ETF | 36,165 | ||||||
| 5,630 | Global X U.S. Preferred ETF | 122,340 | ||||||
| 610 | Invesco QQQ Trust | 191,083 | ||||||
| 2,545 | Invesco Taxable Municipal Bond ETF | 71,515 | ||||||
| 2,430 | iShares Broad USD High Yield Corporate Bond ETF | 90,007 | ||||||
| 160 | iShares Core S&P 500 ETF | 66,170 | ||||||
| 3,210 | iShares Core U.S. Aggregate Bond ETF | 330,212 | ||||||
| 1,845 | JPMorgan Equity Premium Income ETF | 108,080 | ||||||
| 1,365 | Schwab U.S. Large-Cap ETF | 66,885 | ||||||
| 6,835 | Schwab U.S. REIT ETF | 163,903 | ||||||
| 12,370 | SPDR Portfolio Aggregate Bond ETF | 330,154 | ||||||
| 2,030 | Utilities Select Sector SPDR Fund ETF | 144,658 | ||||||
| 1,280 | Vanguard Dividend Appreciation ETF | 196,941 | ||||||
| 655 | Vanguard Intermediate-Term Corporate Bond ETF | 53,428 | ||||||
| 375 | Vanguard Mortgage-Backed Securities ETF | 18,086 | ||||||
| 175 | Vanguard S&P 500 ETF | 66,273 | ||||||
| 4,325 | Vanguard Total Bond Market ETF | 329,522 | ||||||
| 4,665 | WisdomTree U.S. Efficient Core Fund | 169,853 | ||||||
| Total Exchange-Traded Funds (Cost $2,963,965) | $ | 2,780,649 | ||||||
| Total Investments — 99.9% (Cost $2,963,965) | $ | 2,780,649 | ||||||
| Other Assets less Liabilities — 0.1% | 3,318 | |||||||
| Net Assets — 100.0% | $ | 2,783,967 | ||||||
ETF — Exchange-Traded Fund
MLP — Master Limited Partnership
REIT — Real Estate Investment Trust
S&P — Standard and Poor’s
SPDR — Standard and Poor’s Depositary Receipts
USD — United States Dollar
(See notes which are an integral part of the Financial Statements)
14 | Annual Shareholder Report
| Strategy Shares Gold-Hedged Bond ETF (GLDB) | April 30, 2022 |
Portfolio of Investments Summary Table
| Percentage of Fair Value | |
| Communication Services | 11.0% |
| Consumer Discretionary | 6.1% |
| Consumer Staples | 12.6% |
| Energy | 8.3% |
| Financials | 20.8% |
| Health Care | 8.4% |
| Industrials | 8.5% |
| Information Technology | 11.0% |
| Materials | 3.2% |
| Real Estate | 3.9% |
| Utilities | 6.2% |
| Total | 100.0% |
Portfolio holdings and allocations are subject to change. As of April 30, 2022, percentages in the table above are based on total investments. Such total investments may differ from the percentages set forth in the following Portfolio of Investments which are computed using the Fund’s total net assets.
Portfolio of Investments
| Principal Amount | Fair Value | |||||||
| Corporate Bonds — 80.0% | ||||||||
| Communication Services — 6.7% | ||||||||
| $ | 532,000 | Verizon Communications, Inc., 4.52%, 9/15/48 | $ | 516,485 | ||||
| 560,000 | Walt Disney Co. (The), 2.65%, 1/13/31 | 499,360 | ||||||
| 1,015,845 | ||||||||
| Consumer Discretionary — 5.2% | ||||||||
| 504,000 | Amazon.com, Inc., 1.50%, 6/03/30 | 423,530 | ||||||
| 308,000 | Home Depot, Inc. (The), 5.88%, 12/16/36 | 363,269 | ||||||
| 786,799 | ||||||||
| Consumer Staples — 10.7% | ||||||||
| 532,000 | Anheuser-Busch Companies LLC / Anheuser-Busch InBev Worldwide, Inc., 4.70%, 2/01/36 | 526,502 | ||||||
| 420,000 | BAT Capital Corp., 3.56%, 8/15/27 | 391,493 | ||||||
| 448,000 | Coca-Cola Co. (The), 1.38%, 3/15/31 | 367,083 | ||||||
| 392,000 | Costco Wholesale Corp., 1.60%, 4/20/30 | 332,744 | ||||||
| 1,617,822 | ||||||||
| Energy — 4.4% | ||||||||
| 392,000 | Chevron Corp., 2.24%, 5/11/30 | 349,268 | ||||||
| 364,000 | MPLX LP, 2.65%, 8/15/30 | 312,420 | ||||||
| 661,688 | ||||||||
| Financials — 17.8% | ||||||||
| 168,000 | Capital One Financial Corp., 3.80%, 1/31/28 | 161,458 | ||||||
| 532,000 | Citigroup, Inc., 4.41%, 3/31/31 | 519,621 | ||||||
| 532,000 | Goldman Sachs Group, Inc. (The), 1.99%, 1/27/32 | 429,775 | ||||||
| 504,000 | JPMorgan Chase & Co., 4.49%, 3/24/31 | 502,320 | ||||||
| 392,000 | MetLife, Inc., 4.55%, 3/23/30 | 404,401 | ||||||
| 168,000 | Northern Trust Corp., 1.95%, 5/01/30 | 146,151 | ||||||
| 532,000 | Wells Fargo & Co., 3.00%, 10/23/26 | 507,980 | ||||||
| 2,671,706 | ||||||||
| Principal Amount | Fair Value | |||||||
| Health Care — 7.2% | ||||||||
| $ | 420,000 | AbbVie, Inc., 3.20%, 11/21/29 | $ | 390,833 | ||||
| 336,000 | Amgen, Inc., 2.20%, 2/21/27 | 311,971 | ||||||
| 392,000 | CVS Health Corp., 4.30%, 3/25/28 | 393,739 | ||||||
| 1,096,543 | ||||||||
| Industrials — 7.2% | ||||||||
| 448,000 | Boeing Co. (The), 5.15%, 5/01/30 | 444,456 | ||||||
| 280,000 | General Electric Co., 5.88%, 1/14/38 | 308,686 | ||||||
| 336,000 | Southwest Airlines Co., 5.13%, 6/15/27 | 348,310 | ||||||
| 1,101,452 | ||||||||
| Information Technology — 9.4% | ||||||||
| 364,000 | Apple, Inc., 3.35%, 2/09/27 | 362,186 | ||||||
| 364,000 | Broadcom Corp. / Broadcom Cayman Finance, Ltd., 3.88%, 1/15/27 | 355,024 | ||||||
| 392,000 | Fiserv, Inc., 3.50%, 7/01/29 | 365,759 | ||||||
| 364,000 | Oracle Corp., 5.38%, 7/15/40 | 348,522 | ||||||
| 1,431,491 | ||||||||
| Materials — 2.7% | ||||||||
| 252,000 | Dow Chemical Co. (The), 3.60%, 11/15/50 | 206,995 | ||||||
| 224,000 | Sherwin-Williams Co. (The), 2.95%, 8/15/29 | 205,876 | ||||||
| 412,871 | ||||||||
| Real Estate — 3.4% | ||||||||
| 560,000 | Equinix, Inc., 3.20%, 11/18/29 | 507,653 | ||||||
| Utilities — 5.3% | ||||||||
| 476,000 | NextEra Energy Capital Holdings, Inc., 2.25%, 6/01/30 | 406,611 | ||||||
| 420,000 | Pacific Gas and Electric Co., 4.55%, 7/01/30 | 388,956 | ||||||
| 795,567 | ||||||||
| Total Corporate Bonds (Cost $12,847,559) | $ | 12,099,437 | ||||||
(See notes which are an integral part of the Financial Statements)
Annual Shareholder Report | 15
| Strategy Shares Gold-Hedged Bond ETF (GLDB) (Continued) | April 30, 2022 |
| Principal Amount | Fair Value | |||||||
| Yankee Dollars — 5.4% | ||||||||
| Communication Services — 2.7% | ||||||||
| $ | 308,000 | Orange SA, 9.00%, 3/01/31 | $ | 405,726 | ||||
| Energy — 2.7% | ||||||||
| 336,000 | Shell International Finance BV, 6.38%, 12/15/38 | 410,900 | ||||||
| Total Yankee Dollars (Cost $869,655) | $ | 816,626 | ||||||
| Total Investments — 85.4% | ||||||||
| (Cost $13,717,214) | $ | 12,916,063 | ||||||
| Other Assets less Liabilities — 14.6% | 2,213,134 | |||||||
| Net Assets — 100.0% | $ | 15,129,197 | ||||||
Portfolio of Investments is presented on a consolidated basis. See Note 2.A. in the Notes to Financial Statements.
LLC — Limited Liability Corporation
LP — Limited Partnership
Total Return Swap Agreements
| Value and | ||||||||||||||||||
| Unrealized | ||||||||||||||||||
| Pay/ | Financing | Payment | Expiration | Notional | Appreciation/ | |||||||||||||
| Receive | Rate | Description | Counterparty | Frequency | Date | Amount | (Depreciation) | |||||||||||
| Receive | Effective Federal Funds Rate(a) + 85 bps | iShares Gold Trust | BNP Paribas SA | Monthly | 5/23/22 | $ | 16,322,680 | $ | (641,922 | ) | ||||||||
| Receive | Effective Federal Funds Rate(a) + 85 bps | iShares IBoxx $Investment Grade Corporate Bond | BNP Paribas SA | Monthly | 5/23/22 | 2,939,466 | (101,737 | ) | ||||||||||
| $ | (743,659 | ) | ||||||||||||||||
| (a) | The Effective Federal Funds Rate at April 30, 2022 was 0.33%. |
SA — Société Anonyme (French public limited company)
The derivative instruments outstanding as of April 30, 2022, as disclosed in the Portfolio of Investments and the amounts of realized and changes in unrealized gains and losses on swaps during the period as disclosed in the Statements of Operations serve as indicators of the volume of derivative activity for the Fund.
(See notes which are an integral part of the Financial Statements)
16 | Annual Shareholder Report
| Strategy Shares Nasdaq 7HANDL™Index ETF (HNDL) | April 30, 2022 |
Portfolio of Investments Summary Table
| Percentage of Fair Value | |
| Exchange-Traded Funds | 100.0% |
| Total | 100.0% |
Portfolio holdings and allocations are subject to change. As of April 30, 2022, percentages in the table above are based on total investments. Such total investments may differ from the percentages set forth in the following Portfolio of Investments which are computed using the Fund’s total net assets.
Portfolio of Investments
| Shares | Fair Value | |||||||
| Exchange-Traded Funds — 90.3% | ||||||||
| 2,859,575 | Alerian MLP ETF | $ | 108,864,020 | |||||
| 366,475 | Fidelity Total Bond ETF | 17,554,153 | ||||||
| 2,720,475 | Global X U.S. Preferred ETF | 59,115,922 | ||||||
| 294,250 | Invesco QQQ Trust | 92,173,813 | ||||||
| 1,230,500 | Invesco Taxable Municipal Bond ETF | 34,577,050 | ||||||
| 1,174,325 | iShares Broad USD High Yield Corporate Bond ETF | 43,496,998 | ||||||
| 77,575 | iShares Core S&P 500 ETF | 32,081,917 | ||||||
| 1,551,500 | iShares Core U.S. Aggregate Bond ETF | 159,602,804 | ||||||
| 890,775 | JPMorgan Equity Premium Income ETF | 52,181,600 | ||||||
| 660,725 | Schwab U.S. Large-Cap ETF | 32,375,525 | ||||||
| 3,300,950 | Schwab U.S. REIT ETF | 79,156,781 | ||||||
| 5,975,950 | SPDR Portfolio Aggregate Bond ETF | 159,498,105 | ||||||
| 979,050 | Utilities Select Sector SPDR Fund ETF | 69,767,103 | ||||||
| 617,925 | Vanguard Dividend Appreciation ETF | 95,073,941 | ||||||
| 318,325 | Vanguard Intermediate-Term Corporate Bond ETF | 25,965,770 | ||||||
| 181,900 | Vanguard Mortgage-Backed Securities ETF | 8,773,037 | ||||||
| 85,600 | Vanguard S&P 500 ETF | 32,416,720 | ||||||
| 2,089,175 | Vanguard Total Bond Market ETF | 159,174,243 | ||||||
| 2,252,350 | WisdomTree U.S. Efficient Core Fund | 82,008,064 | ||||||
| Total Exchange-Traded Funds (Cost $1,442,817,294) | $ | 1,343,857,566 | ||||||
| Total Investments — 90.3% (Cost $1,442,817,294) | $ | 1,343,857,566 | ||||||
| Other Assets less Liabilities — 9.7% | 144,090,575 | |||||||
| Net Assets — 100.0% | $ | 1,487,948,141 | ||||||
ETF — Exchange-Traded Fund
MLP — Master Limited Partnership
REIT — Real Estate Investment Trust
S&P — Standard and Poor’s
SPDR — Standard and Poor’s Depositary Receipts
USD — United States Dollar
Total Return Swap Agreements
| Value and | ||||||||||||||||||
| Unrealized | ||||||||||||||||||
| Pay/ | Financing | Payment | Expiration | Notional | Appreciation/ | |||||||||||||
| Receive | Rate | Description | Counterparty | Frequency | Date | Amount | (Depreciation) | |||||||||||
| Receive | Effective Federal Funds Rate(a) + 85 bps | Nasdaq 7HANDL™ Index | BNP Paribas SA | Monthly | 1/11/23 | $ | 629,822,374 | $ | (29,864,681 | ) | ||||||||
| (a) | The Effective Federal Funds Rate at April 30, 2022 was 0.33%. |
SA — Société Anonyme (French public limited company)
The derivative instruments outstanding as of April 30, 2022, as disclosed in the Portfolio of Investments and the amounts of realized and changes in unrealized gains and losses on swaps during the period as disclosed in the Statements of Operations serve as indicators of the volume of derivative activity for the Fund.
(See notes which are an integral part of the Financial Statements)
Annual Shareholder Report | 17
| Strategy Shares Halt Climate Change ETF (NZRO) | April 30, 2022 |
Portfolio of Investments Summary Table
| Percentage of Fair Value | |
| Communication Services | 4.9% |
| Consumer Discretionary | 4.0% |
| Consumer Staples | 4.5% |
| Energy | 3.1% |
| Financials | 0.7% |
| Health Care | 23.3% |
| Industrials | 16.5% |
| Information Technology | 31.3% |
| Materials | 1.9% |
| Real Estate | 0.6% |
| Utilities | 9.2% |
| Total | 100.0% |
Portfolio holdings and allocations are subject to change. As of April 30, 2022, percentages in the table above are based on total investments. Such total investments may differ from the percentages set forth in the following Portfolio of Investments which are computed using the Fund’s total net assets.
Portfolio of Investments
| Shares | Fair Value | |||||||
| Common Stocks — 97.3% | ||||||||
| Communication Services — 4.8% | ||||||||
| 15 | Alphabet, Inc., Class C † | $ | 34,490 | |||||
| 141 | Meta Platforms, Inc., Class A † | 28,266 | ||||||
| 66 | Netflix, Inc. † | 12,564 | ||||||
| 75,320 | ||||||||
| Consumer Discretionary — 3.9% | ||||||||
| 150 | Arcimoto, Inc. † | 504 | ||||||
| 1,998 | Canoo, Inc. † | 9,590 | ||||||
| 861 | Fisker, Inc. † | 8,662 | ||||||
| 45 | Tesla, Inc. † | 39,185 | ||||||
| 1,329 | Workhorse Group, Inc. † | 4,000 | ||||||
| 61,941 | ||||||||
| Consumer Staples — 4.5% | ||||||||
| 183 | Beyond Meat, Inc. † | 6,749 | ||||||
| 129 | Ingredion, Inc. | 10,979 | ||||||
| 132 | McCormick & Co., Inc. | 13,275 | ||||||
| 1,596 | Oatly Group AB ADR † | 5,682 | ||||||
| 696 | Unilever PLC ADR | 32,197 | ||||||
| 68,882 | ||||||||
| Energy — 3.0% | ||||||||
| 405 | Aemetis, Inc. † | 3,698 | ||||||
| 174 | Enviva, Inc. | 14,675 | ||||||
| 3,087 | Gevo, Inc. † | 11,453 | ||||||
| 285 | Renewable Energy Group, Inc. † | 17,402 | ||||||
| 47,228 | ||||||||
| Financials — 0.7% | ||||||||
| 261 | Hannon Armstrong Sustainable Infrastructure Capital, Inc. | 10,437 | ||||||
| Health Care — 22.6% | ||||||||
| 273 | Abbott Laboratories | 30,985 | ||||||
| 273 | AbbVie, Inc. | 40,098 | ||||||
| 162 | Amgen, Inc. | 37,777 | ||||||
| 147 | Baxter International, Inc. | 10,446 | ||||||
| 183 | Beam Therapeutics, Inc. † | 6,868 | ||||||
| 591 | Boston Scientific Corp. † | 24,887 | ||||||
| 105 | CIGNA Corp. | 25,912 | ||||||
| Shares | Fair Value | |||||||
| Common Stocks — (Continued) | ||||||||
| Health Care — (Continued) | ||||||||
| 204 | Edwards Lifesciences Corp. † | $ | 21,579 | |||||
| 351 | Gilead Sciences, Inc. | 20,828 | ||||||
| 96 | IQVIA Holdings, Inc. † | 20,927 | ||||||
| 171 | Moderna, Inc. † | 22,984 | ||||||
| 672 | Pfizer, Inc. | 32,975 | ||||||
| 81 | UnitedHealth Group, Inc. | 41,192 | ||||||
| 36 | Waters Corp. † | 10,909 | ||||||
| 30 | West Pharmaceutical Services, Inc. | 9,452 | ||||||
| 357,819 | ||||||||
| Industrials — 16.1% | ||||||||
| 186 | Ameresco, Inc., Class A † | 9,382 | ||||||
| 372 | Aris Water Solution, Inc., Class A | 6,302 | ||||||
| 903 | Array Technologies, Inc. † | 5,897 | ||||||
| 1,092 | Ballard Power Systems, Inc. † | 9,064 | ||||||
| 540 | Blink Charging Co. † | 10,314 | ||||||
| 669 | Bloom Energy Corp., Class A † | 12,416 | ||||||
| 156 | Casella Waste Systems, Inc. † | 12,829 | ||||||
| 756 | Chargepoint Holdings, Inc. † | 9,783 | ||||||
| 30 | Cintas Corp. | 11,918 | ||||||
| 162 | EnerSys | 10,605 | ||||||
| 465 | Fluence Energy, Inc. † | 4,264 | ||||||
| 1,329 | Freyr Battery SA † | 11,934 | ||||||
| 2,481 | FuelCell Energy, Inc. † | 10,122 | ||||||
| 564 | GreenPower Motor Co., Inc. † | 3,440 | ||||||
| 141 | Heritage-Crystal Clean, Inc. † | 3,849 | ||||||
| 315 | Johnson Controls International PLC | 18,859 | ||||||
| 126 | ManpowerGroup, Inc. | 11,365 | ||||||
| 1,257 | Nikola Corp. † | 9,025 | ||||||
| 507 | Plug Power, Inc. † | 10,657 | ||||||
| 699 | ReneSola, Ltd. ADR † | 3,369 | ||||||
| 597 | Shoals Technologies Group, Inc., Class A † | 5,958 | ||||||
| 222 | Stericycle, Inc. † | 11,142 | ||||||
| 402 | Sunrun, Inc. † | 8,032 | ||||||
| 1,572 | Sunworks, Inc. † | 2,720 | ||||||
| 318 | TPI Composites, Inc. † | 3,638 | ||||||
(See notes which are an integral part of the Financial Statements)
18 | Annual Shareholder Report
| Strategy Shares Halt Climate Change ETF (NZRO) (Continued) | April 30, 2022 |
| Shares | Fair Value | |||||||
| Common Stocks — (Continued) | ||||||||
| Industrials — (Continued) | ||||||||
| 402 | US Ecology, Inc. † | $ | 19,292 | |||||
| 66 | Watts Water Technologies, Inc. | 8,412 | ||||||
| 111 | Xylem, Inc. | 8,936 | ||||||
| 253,524 | ||||||||
| Information Technology — 30.2% | ||||||||
| 72 | Adobe, Inc. † | 28,508 | ||||||
| 222 | Advanced Micro Devices, Inc. † | 18,984 | ||||||
| 273 | Apple, Inc. | 43,038 | ||||||
| 93 | Autodesk, Inc. † | 17,603 | ||||||
| 432 | Canadian Solar, Inc. † | 11,889 | ||||||
| 612 | Cisco Systems, Inc. | 29,976 | ||||||
| 135 | Citrix Systems, Inc. | 13,514 | ||||||
| 87 | Enphase Energy, Inc. † | 14,042 | ||||||
| 150 | First Solar, Inc. † | 10,955 | ||||||
| 42 | Gartner, Inc. † | 12,203 | ||||||
| 63 | Intuit, Inc. | 26,381 | ||||||
| 66 | Keysight Technologies, Inc. † | 9,258 | ||||||
| 99 | Mastercard, Inc., Class A | 35,975 | ||||||
| 354 | Maxeon Solar Technologies, Ltd. † | 4,099 | ||||||
| 150 | Microsoft Corp. | 41,629 | ||||||
| 138 | NetApp, Inc. | 10,109 | ||||||
| 423 | Oracle Corp. | 31,048 | ||||||
| 162 | Salesforce, Inc. † | 28,502 | ||||||
| 63 | ServiceNow, Inc. † | 30,120 | ||||||
| 51 | SolarEdge Technologies, Inc. † | 12,771 | ||||||
| 666 | SunPower Corp. † | 10,996 | ||||||
| 168 | Visa, Inc., Class A | 35,806 | ||||||
| 477,406 | ||||||||
| Materials — 1.9% | ||||||||
| 108 | Ecolab, Inc. | 18,289 | ||||||
| 1,485 | PureCycle Technologies, Inc. † | 11,583 | ||||||
| 29,872 | ||||||||
| Real Estate — 0.6% | ||||||||
| 120 | CBRE Group, Inc., Class A † | 9,965 | ||||||
| Utilities — 9.0% | ||||||||
| 75 | American Water Works Co., Inc. | 11,557 | ||||||
| 378 | Atlantica Sustainable Infrastructure PLC | 11,680 | ||||||
| 381 | Brookfield Renewable Corp., Class A | 13,678 | ||||||
| 189 | California Water Service Group | 9,803 | ||||||
| 381 | Clearway Energy, Inc., Class C | 11,632 | ||||||
| 273 | Global Water Resources, Inc. | 3,909 | ||||||
| 1,320 | Montauk Renewables, Inc. † | 14,995 | ||||||
| 165 | NextEra Energy Partners LP | 10,999 | ||||||
| 435 | NextEra Energy, Inc. | 30,894 | ||||||
| 168 | Ormat Technologies, Inc. | 13,054 | ||||||
| 546 | Sunnova Energy International, Inc. † | 9,429 | ||||||
| 141,630 | ||||||||
| Total Common Stocks (Cost $1,762,936) | $ | 1,534,024 | ||||||
| Total Investments — 97.3% (Cost $1,762,936) | $ | 1,534,024 | ||||||
| Other Assets less Liabilities — 2.7% | 42,629 | |||||||
| Net Assets — 100.0% | $ | 1,576,653 | ||||||
ADR — American Depositary Receipt
LP — Limited Partnership
PLC — Public Liability Company
| † | Non-income producing security |
(See notes which are an integral part of the Financial Statements)
Annual Shareholder Report | 19
| Strategy Shares Newfound/ReSolve Robust Momentum ETF (ROMO) | April 30, 2022 |
Portfolio of Investments Summary Table
| Percentage of Fair Value | |
| Exchange-Traded Funds | 100.0% |
| Total | 100.0% |
Portfolio holdings and allocations are subject to change. As of April 30, 2022, percentages in the table above are based on total investments. Such total investments may differ from the percentages set forth in the following Portfolio of Investments which are computed using the Fund’s total net assets.
Portfolio of Investments
| Shares | Fair Value | |||||||
| Exchange-Traded Funds — 99.8% | ||||||||
| 187,110 | iShares 1-3 Year Treasury Bond ETF | $ | 15,511,419 | |||||
| 123,508 | iShares 7-10 Year Treasury Bond ETF | 12,697,857 | ||||||
| 1,925 | iShares Core MSCI EAFE ETF | 124,759 | ||||||
| 52,591 | iShares Core S&P 500 ETF | 21,749,535 | ||||||
| Total Exchange-Traded Funds (Cost $50,354,419) | $ | 50,083,570 | ||||||
| Total Investments — 99.8% (Cost $50,354,419) | $ | 50,083,570 | ||||||
| Other Assets less Liabilities — 0.2% | 104,479 | |||||||
| Net Assets — 100.0% | $ | 50,188,049 | ||||||
ETF — Exchange-Traded Fund
MSCI EAFE — MSCI Europe, Australasia and Far East
S&P — Standard and Poor’s
(See notes which are an integral part of the Financial Statements)
20 | Annual Shareholder Report
| Statements of Assets and Liabilities | April 30, 2022 |
| Strategy Shares | Strategy Shares | Strategy Shares | ||||||||||
| Nasdaq 5HANDL™ | Gold-Hedged Bond | Nasdaq 7HANDL™ | ||||||||||
| Index ETF (FIVR) | ETF (GLDB)(a) | Index ETF (HNDL) | ||||||||||
| Assets: | ||||||||||||
| Investments, at value (Cost $2,963,965, $13,717,214 and $1,442,817,294) | $ | 2,780,649 | $ | 12,916,063 | $ | 1,343,857,566 | ||||||
| Cash and Cash Equivalents | 14,026 | 1,620,657 | 120,744,577 | |||||||||
| Segregated cash balances for swap agreements with custodian | — | 1,210,000 | 55,000,000 | |||||||||
| Dividends and interest receivable | 74 | 132,790 | 36,170 | |||||||||
| Receivable for investments sold | — | — | 4,565,023 | |||||||||
| Receivable from Advisor | 4,764 | — | — | |||||||||
| Prepaid expenses | 5,079 | — | 35,870 | |||||||||
| Deferred offering costs | 4,082 | — | — | |||||||||
| Total Assets | 2,808,674 | 15,879,510 | 1,524,239,206 | |||||||||
| Liabilities: | ||||||||||||
| Payable for capital shares redeemed | — | — | 5,069,510 | |||||||||
| Unrealized depreciation on swap agreements | — | 743,659 | 29,864,681 | |||||||||
| Accrued expenses: | ||||||||||||
| Advisory | — | 6,654 | 777,719 | |||||||||
| Administration | 1,279 | — | 41,472 | |||||||||
| Related Parties | 2,500 | — | 38,857 | |||||||||
| Custodian | 930 | — | 18,635 | |||||||||
| Fund accounting | 56 | — | 64 | |||||||||
| Other | 19,942 | — | 480,127 | |||||||||
| Total Liabilities | 24,707 | 750,313 | 36,291,065 | |||||||||
| Net Assets | $ | 2,783,967 | $ | 15,129,197 | $ | 1,487,948,141 | ||||||
| Net Assets consist of: | ||||||||||||
| Paid in Capital | $ | 3,030,509 | $ | 16,674,007 | $ | 1,700,927,424 | ||||||
| Total Distributable Earnings / (Loss) | (246,542 | ) | (1,544,810 | ) | (212,979,283 | ) | ||||||
| Net Assets | $ | 2,783,967 | $ | 15,129,197 | $ | 1,487,948,141 | ||||||
| Net Assets: | $ | 2,783,967 | $ | 15,129,197 | $ | 1,487,948,141 | ||||||
| Shares of Beneficial Interest Outstanding (unlimited number of shares authorized, no par value): | 125,000 | 700,000 | 66,875,000 | |||||||||
| Net Asset Value (offering and redemption price per share): | $ | 22.27 | $ | 21.61 | $ | 22.25 | ||||||
| (a) | Statement has been consolidated. See Note 2.A. in the Notes to Financial Statements for basis of consolidation. |
(See notes which are an integral part of the Financial Statements)
Annual Shareholder Report | 21
| Statements of Assets and Liabilities | April 30, 2022 |
| Strategy Shares | ||||||||
| Strategy Shares | Newfound/ReSolve | |||||||
| Halt Climate Change | Robust Momentum | |||||||
| (NZRO) | ETF (ROMO) | |||||||
| Assets: | ||||||||
| Investments, at value (Cost $1,762,936 and $50,354,419) | $ | 1,534,024 | $ | 50,083,570 | ||||
| Cash and Cash Equivalents | 43,311 | 150,488 | ||||||
| Dividends and interest receivable | 567 | — | ||||||
| Prepaid expenses | — | 3,327 | ||||||
| Total Assets | 1,577,902 | 50,237,385 | ||||||
| Liabilities: | ||||||||
| Accrued expenses: | ||||||||
| Advisory | 1,249 | 19,188 | ||||||
| Administration | — | 6,332 | ||||||
| Related Parties | — | 2,500 | ||||||
| Custodian | — | 820 | ||||||
| Fund accounting | — | 11 | ||||||
| Other | — | 20,485 | ||||||
| Total Liabilities | 1,249 | 49,336 | ||||||
| Net Assets | $ | 1,576,653 | $ | 50,188,049 | ||||
| Net Assets consist of: | ||||||||
| Paid in Capital | $ | 1,805,840 | 51,596,069 | |||||
| Total Distributable Earnings / (Loss) | (229,187 | ) | (1,408,020 | ) | ||||
| Net Assets | $ | 1,576,653 | $ | 50,188,049 | ||||
| Net Assets: | $ | 1,576,653 | $ | 50,188,049 | ||||
| Shares of Beneficial Interest Outstanding (unlimited number of shares authorized, no par value): | 75,000 | 1,925,000 | ||||||
| Net Asset Value (offering and redemption price per share): | $ | 21.02 | $ | 26.07 | ||||
(See notes which are an integral part of the Financial Statements)
22 | Annual Shareholder Report
| Statements of Operations | For the Periods Indicated |
| Strategy Shares | Strategy Shares | Strategy Shares | ||||||||||
| Nasdaq 5HANDL™ | Gold-Hedged Bond | Nasdaq 7HANDL™ | ||||||||||
| Index ETF (FIVR) | ETF (GLDB)(a) | Index ETF (HNDL) | ||||||||||
| For the period | For the period | |||||||||||
| December 28, 2021(b) | May 17, 2021(b) | |||||||||||
| through | through | Year Ended | ||||||||||
| April 30, 2022 | April 30, 2022 | April 30, 2022 | ||||||||||
| Investment Income: | ||||||||||||
| Dividend income | $ | 17,572 | $ | — | $ | 30,856,079 | ||||||
| Interest income | — | 70,228 | 9,509 | |||||||||
| Total Investment Income | 17,572 | 70,228 | 30,865,588 | |||||||||
| Expenses: | ||||||||||||
| Advisory | 3,512 | 27,066 | 7,122,308 | |||||||||
| Administration | 5,087 | — | 412,240 | |||||||||
| Related Parties | 10,242 | — | 333,747 | |||||||||
| Fund accounting | 121 | — | 402 | |||||||||
| Custodian | 1,245 | — | 57,960 | |||||||||
| Trustee | 4,405 | — | 13,229 | |||||||||
| Compliance services | 2,705 | — | 37,795 | |||||||||
| Legal and audit | 19,517 | — | 42,308 | |||||||||
| Printing | 357 | — | 397,908 | |||||||||
| Nasdaq registration | 385 | — | 613,230 | |||||||||
| Other fees | 1,354 | — | 141,836 | |||||||||
| Offering costs | 2,064 | — | — | |||||||||
| Recoupment of prior expenses reduced by the Advisor | — | — | 156,007 | |||||||||
| Total Expenses before fee reductions | 50,994 | 27,066 | 9,328,970 | |||||||||
| Expenses contractually waived or reimbursed by the Advisor | (45,540 | ) | — | — | ||||||||
| Total Net Expenses | 5,454 | 27,066 | 9,328,970 | |||||||||
| Net Investment Income | 12,118 | 43,162 | 21,536,618 | |||||||||
| Realized and Unrealized Gains (Losses): | ||||||||||||
| Net realized gains (losses) from investment transactions | (38,341 | ) | — | (27,339,607 | ) | |||||||
| Net realized gains (losses) from in-kind transactions | — | 16,982 | 21,327,992 | |||||||||
| Net realized gains(losses) from swap agreements | — | 136,914 | (7,893,338 | ) | ||||||||
| Change in unrealized appreciation/depreciation on investments | (183,316 | ) | (801,151 | ) | (107,352,168 | ) | ||||||
| Change in unrealized appreciation/depreciation on swaps | — | (743,659 | ) | (31,612,360 | ) | |||||||
| Net Realized and Unrealized Gains (Losses) | (221,657 | ) | (1,390,914 | ) | (152,869,481 | ) | ||||||
| Change in Net Assets Resulting From Operations | $ | (209,539 | ) | $ | (1,347,752 | ) | $ | (131,332,863 | ) | |||
| (a) | Statement has been consolidated. See Note 2.A. in the Notes to Financial Statements for basis of consolidation. |
| (b) | Commencement of operations. |
(See notes which are an integral part of the Financial Statements)
Annual Shareholder Report | 23
| Statements of Operations | For the Periods Indicated |
| Strategy Shares | ||||||||
| Strategy Shares | Newfound/ReSolve | |||||||
| Halt Climate Change | Robust Momentum | |||||||
| (NZRO) | ETF (ROMO) | |||||||
| For the period | ||||||||
| January 10, 2022(a) | ||||||||
| through | Year Ended | |||||||
| April 30, 2022 | April 30, 2022 | |||||||
| Investment Income: | ||||||||
| Dividend income | $ | 2,998 | $ | 639,880 | ||||
| Interest income | — | 18 | ||||||
| Foreign tax withholding | (12 | ) | — | |||||
| Total Investment Income | 2,986 | 639,898 | ||||||
| Expenses: | ||||||||
| Advisory | 3,169 | 229,681 | ||||||
| Administration | — | 59,207 | ||||||
| Related Parties | — | 30,000 | ||||||
| Fund accounting | — | 80 | ||||||
| Custodian | — | 3,142 | ||||||
| Trustee | — | 13,229 | ||||||
| Compliance services | — | 10,443 | ||||||
| Legal and audit | — | 24,913 | ||||||
| Printing | — | 656 | ||||||
| Other fees | — | 11,548 | ||||||
| Total Expenses before fee reductions | 3,169 | 382,899 | ||||||
| Expenses contractually waived or reimbursed by the Advisor | — | (31,186 | ) | |||||
| Total Net Expenses | 3,169 | 351,713 | ||||||
| Net Investment Income (Loss) | (183 | ) | 288,185 | |||||
| Realized and Unrealized Gains (Losses): | ||||||||
| Net realized gains (losses) from investment transactions | (275 | ) | (944,487 | ) | ||||
| Net realized gains (losses) from in-kind transactions | — | 2,984,043 | ||||||
| Change in unrealized appreciation/depreciation on investments | (228,912 | ) | (4,691,545 | ) | ||||
| Net Realized and Unrealized Gains (Losses) | (229,187 | ) | (2,651,989 | ) | ||||
| Change in Net Assets Resulting From Operations | $ | (229,370 | ) | $ | (2,363,804 | ) | ||
| (a) | Commencement of operations. |
(See notes which are an integral part of the Financial Statements)
24 | Annual Shareholder Report
Statements of Changes in Net Assets
| Strategy Shares | Strategy Shares | |||||||
| Nasdaq 5HANDL™ | Gold-Hedged Bond | |||||||
| Index ETF (FIVR) | ETF (GLDB)(a) | |||||||
| For the period | For the period | |||||||
| December 28, 2021(b) | May 17, 2021(b) | |||||||
| through | through | |||||||
| April 30, 2022 | April 30, 2022 | |||||||
| From Investment Activities: | ||||||||
| Operations: | ||||||||
| Net investment income | $ | 12,118 | $ | 43,162 | ||||
| Net realized gains (losses) from investment and in-kind transactions and swap agreements | (38,341 | ) | 153,896 | |||||
| Change in unrealized appreciation/depreciation on investments and swaps | (183,316 | ) | (1,544,810 | ) | ||||
| Change in net assets resulting from operations | (209,539 | ) | (1,347,752 | ) | ||||
| Distributions to Shareholders: | ||||||||
| Total distributions | (37,003 | ) | (59,219 | ) | ||||
| Change in net assets from distributions | (37,003 | ) | (59,219 | ) | ||||
| Capital Transactions: | ||||||||
| Proceeds from shares issued | 3,030,509 | 17,160,835 | ||||||
| Cost of shares redeemed | — | (624,667 | ) | |||||
| Change in net assets from capital transactions | 3,030,509 | 16,536,168 | ||||||
| Change in net assets | 2,783,967 | 15,129,197 | ||||||
| Net Assets: | ||||||||
| Beginning of period | — | — | ||||||
| End of period | $ | 2,783,967 | $ | 15,129,197 | ||||
| Share Transactions: | ||||||||
| Issued | 125,000 | 725,000 | ||||||
| Redeemed | — | (25,000 | ) | |||||
| Change in shares | 125,000 | 700,000 | ||||||
| (a) | Statement has been consolidated. See Note 2.A. in the Notes to Financial Statements for basis of consolidation. |
| (b) | Commencement of operations. |
(See notes which are an integral part of the Financial Statements)
Annual Shareholder Report | 25
Statements of Changes in Net Assets
| Strategy Shares Nasdaq 7HANDL™ | Strategy Shares Halt | |||||||||||
| Index ETF (HNDL) | Climate Change (NZRO) | |||||||||||
| For the period | ||||||||||||
| January 10, 2022(a) | ||||||||||||
| Year Ended | Year Ended | through | ||||||||||
| April 30, 2022 | April 30, 2021 | April 30, 2022 | ||||||||||
| From Investment Activities: | ||||||||||||
| Operations: | ||||||||||||
| Net investment income (loss) | $ | 21,536,618 | $ | 2,520,853 | $ | (183 | ) | |||||
| Net realized gains (losses) from investment and in-kind transactions and swap agreements | (13,904,953 | ) | 2,544,753 | (275 | ) | |||||||
| Change in unrealized appreciation/depreciation on investments and swaps | (138,964,528 | ) | 9,303,802 | (228,912 | ) | |||||||
| Change in net assets resulting from operations | (131,332,863 | ) | 14,369,408 | (229,370 | ) | |||||||
| Distributions to Shareholders: | ||||||||||||
| Total distributions | (80,924,668 | ) | (9,583,229 | ) | — | |||||||
| Return of capital | (3,551,942 | ) | — | — | ||||||||
| Change in net assets from distributions | (84,476,610 | ) | (9,583,229 | ) | — | |||||||
| Capital Transactions: | ||||||||||||
| Proceeds from shares issued | 1,511,516,935 | 447,792,753 | 1,806,023 | |||||||||
| Cost of shares redeemed | (273,483,325 | ) | (6,745,765 | ) | — | |||||||
| Change in net assets from capital transactions | 1,238,033,610 | 441,046,988 | 1,806,023 | |||||||||
| Change in net assets | 1,022,224,137 | 445,833,167 | 1,576,653 | |||||||||
| Net Assets: | ||||||||||||
| Beginning of period | 465,724,004 | 19,890,837 | — | |||||||||
| End of period | $ | 1,487,948,141 | $ | 465,724,004 | $ | 1,576,653 | ||||||
| Share Transactions: | ||||||||||||
| Issued | 59,425,000 | 17,875,000 | 75,000 | |||||||||
| Redeemed | (11,000,000 | ) | (275,000 | ) | — | |||||||
| Change in shares | 48,425,000 | 17,600,000 | 75,000 | |||||||||
| (a) | Commencement of operations. |
(See notes which are an integral part of the Financial Statements)
26 | Annual Shareholder Report
Statements of Changes in Net Assets
| Strategy Shares Newfound/ReSolve Robust Momentum ETF (ROMO) | ||||||||
| Year Ended | Year Ended | |||||||
| April 30, 2022 | April 30, 2021 | |||||||
| From Investment Activities: | ||||||||
| Operations: | ||||||||
| Net investment income | $ | 288,185 | $ | 317,888 | ||||
| Net realized gains from investment and in-kind transactions | 2,039,556 | 4,883,895 | ||||||
| Change in unrealized appreciation/depreciation on investments | (4,691,545 | ) | 4,197,856 | |||||
| Change in net assets resulting from operations | (2,363,804 | ) | 9,399,639 | |||||
| Distributions to Shareholders: | ||||||||
| Total distributions | (286,753 | ) | (381,434 | ) | ||||
| Return of capital | — | (6,072 | ) | |||||
| Change in net assets from distributions | (286,753 | ) | (387,506 | ) | ||||
| Capital Transactions: | ||||||||
| Proceeds from shares issued | 20,128,765 | 27,101,100 | ||||||
| Cost of shares redeemed | (9,611,292 | ) | (14,264,194 | ) | ||||
| Change in net assets from capital transactions | 10,517,473 | 12,836,906 | ||||||
| Change in net assets | 7,866,916 | 21,849,039 | ||||||
| Net Assets: | ||||||||
| Beginning of period | 42,321,133 | 20,472,094 | ||||||
| End of period | $ | 50,188,049 | $ | 42,321,133 | ||||
| Share Transactions: | ||||||||
| Issued | 700,000 | 1,200,000 | ||||||
| Redeemed | (325,000 | ) | (600,000 | ) | ||||
| Change in shares | 375,000 | 600,000 | ||||||
(See notes which are an integral part of the Financial Statements)
Annual Shareholder Report | 27
| Financial Highlights | Strategy Shares |
| Net Asset Value, beginning of period | Net investment income (loss)(a) | Net realized and unrealized gains (losses) | Total from investment activities | Distributions from net investment income | Distributions from Return of Capital | Total distributions | Net Asset Value, end of period | Total return at Net Asset Value(b)(c) | Total return at market(b)(d) | Ratio of Net Expenses to Average Net Assets(e) | Ratio of Gross Expenses to Average Net Assets(e)(f) | Ratio of Net Investment Income (Loss) to Average Net Assets(e) | Net Assets at end of period (000’s) | Portfolio turnover(b)(g) | ||||||||||||||||||||||||||||||||||||||||||||||
| Strategy Shares Nasdaq 5HANDL™ Index ETF (FIVR) | ||||||||||||||||||||||||||||||||||||||||||||||||||||||||||||
| December 28, 2021(h) through April 30, 2022 | $ | 25.01 | 0.13 | (2.47 | ) | (2.34 | ) | (0.40 | ) | — | (0.40 | ) | $ | 22.27 | (9.45 | )% | (9.33 | )% | 0.71 | % (i) | 6.61 | % (i) | 1.57 | % | $ | 2,784 | 58 | % | ||||||||||||||||||||||||||||||||
| Strategy Shares Gold-Hedged Bond ETF (GLDB)(j) | ||||||||||||||||||||||||||||||||||||||||||||||||||||||||||||
| May 17, 2021(h) through April 30, 2022 | $ | 25.00 | 0.28 | (3.22 | ) | (2.94 | ) | (0.33 | ) | — | (0.33 | ) | $ | 21.61 | (11.94 | )% | (11.17 | )% | 0.78 | % | 0.78 | % | 1.24 | % | $ | 15,129 | — | |||||||||||||||||||||||||||||||||
| Strategy Shares Nasdaq 7HANDL™ Index ETF (HNDL) | ||||||||||||||||||||||||||||||||||||||||||||||||||||||||||||
| Year Ended April 30, 2022 | $ | 25.24 | 0.45 | (1.68 | ) | (1.23 | ) | (1.69 | ) | (0.07 | ) | (1.76 | ) | $ | 22.25 | (5.46 | )% | (5.36 | )% | 0.78 | % (i) | 0.78 | % (i) | 1.81 | % | $ | 1,487,948 | 119 | % | |||||||||||||||||||||||||||||||
| Year Ended April 30, 2021 | $ | 23.40 | 0.45 | 3.13 | 3.58 | (1.74 | ) | — | (1.74 | ) | $ | 25.24 | 15.74 | % | 15.86 | % | 0.95 | % (i) | 0.95 | % (i) | 1.82 | % | $ | 465,724 | 68 | % | ||||||||||||||||||||||||||||||||||
| Year Ended April 30, 2020 | $ | 23.70 | 0.59 | 0.79 | 1.38 | (1.40 | ) | (0.28 | ) | (1.68 | ) | $ | 23.40 | 5.98 | % | 5.71 | % | 0.95 | % (i) | 1.40 | % (i) | 2.47 | % | $ | 19,891 | 83 | % | |||||||||||||||||||||||||||||||||
| Year Ended April 30, 2019 | $ | 23.84 | 0.56 | 0.95 | 1.51 | (0.92 | ) | (0.73 | ) | (1.65 | ) | $ | 23.70 | 6.65 | % | 6.68 | % | 0.95 | % (i) | 2.30 | % (i) | 2.41 | % | $ | 12,442 | 118 | % | |||||||||||||||||||||||||||||||||
| January 16, 2018(h) through April 30, 2018 | $ | 25.00 | 0.13 | (0.87 | ) | (0.74 | ) | — | (0.42 | ) | (0.42 | ) | $ | 23.84 | (2.96 | )% | (2.76 | )% | 0.95 | % (i) | 6.33 | % (i) | 2.00 | % | $ | 3,576 | 18 | % | ||||||||||||||||||||||||||||||||
| Strategy Shares Halt Climate Change (NZRO) | ||||||||||||||||||||||||||||||||||||||||||||||||||||||||||||
| January 10, 2022(h) through April 30, 2022 | $ | 24.88 | (0.00 | ) (k) | (3.86 | ) | (3.86 | ) | — | — | — | $ | 21.02 | (15.51 | )% | (13.02 | )% | 0.94 | % | 0.94 | % | (0.05 | )% | $ | 1,577 | 0 | % (l) | |||||||||||||||||||||||||||||||||
| Strategy Shares Newfound/ReSolve Robust Momentum ETF (ROMO) | ||||||||||||||||||||||||||||||||||||||||||||||||||||||||||||
| Year Ended April 30, 2022 | $ | 27.30 | 0.17 | (1.23 | ) | (1.06 | ) | (0.17 | ) | — | (0.17 | ) | $ | 26.07 | (3.97 | )% | (3.79 | )% | 0.75 | % (i) | 0.82 | % (i) | 0.61 | % | $ | 50,188 | 221 | % | ||||||||||||||||||||||||||||||||
| Year Ended April 30, 2021 | $ | 21.55 | 0.21 | 5.78 | 5.99 | (0.24 | ) | (0.00 | ) (k) | (0.24 | ) | $ | 27.30 | 27.91 | % | 27.64 | % | 0.75 | % (i) | 0.90 | % (i) | 0.88 | % | $ | 42,321 | 309 | % | |||||||||||||||||||||||||||||||||
| November 1, 2019(h) through April 30, 2020 | $ | 25.15 | 0.11 | (3.56 | ) | (3.45 | ) | (0.15 | ) | — | (0.15 | ) | $ | 21.55 | (13.82 | )% | (13.70 | )% | 0.75 | % (i) | 1.56 | % (i) | 0.94 | % | $ | 20,472 | 145 | % | ||||||||||||||||||||||||||||||||
| (a) | Calculated using the average shares method. |
| (b) | Not annualized for periods less than one year. |
| (c) | Net asset value total return is calculated assuming an initial investment made at the net asset value at the beginning of the period, reinvestment of all distributions, including dividends and return of capital, at net asset value during the period, if any, and redemption on the last day of the period at net asset value. This percentage is not an indication of the performance of a shareholder’s investment in the Fund based on market value due to differences between the market price of the shares and the net asset value per share of the Fund. |
| (d) | Market value total return is calculated assuming an initial investment made at the market value at the beginning of the period, reinvestment of all distributions, including dividends and return of capital, at net asset value during the period, if any, and redemption on the last day of the period at market value. Market value is determined by the composite closing price. Composite closing security price is defined as the last reported sale price from any primary listing market (e.g., Nasdaq) or participating regional exchanges or markets. The composite closing price is the last reported sale price from any of the eligible sources, regardless of volume and not an average price and may have occurred on a date prior to the close of the reporting period. Market value may be greater or less than net asset value, depending on the Fund’s closing price on the listing market. |
| (e) | Annualized for periods less than one year. |
| (f) | Certain fees were waived and/or reimbursed. If such waivers/reimbursements had not occurred, the ratios would have been as indicated. |
| (g) | Portfolio turnover increases/decreases due to change within portfolio holdings during the period. |
| (h) | Commencement of operations. |
| (i) | The Fund invests in other funds and indirectly bears its proportionate shares of fees and expenses incurred by the underlying funds in which the Fund is invested. This ratio does not include these indirect fees and expenses. |
| (j) | Statement has been consolidated. See Note 2.A. in the Notes to Financial Statements for basis of consolidation. |
| (k) | Amount is less than ($0.005). |
| (l) | Amount is less than 0.5%. |
(See notes which are an integral part of the Financial Statements)
28 | Annual Shareholder Report
| Notes to Financial Statements | April 30, 2022 |
(1) Organization
Strategy Shares (the “Trust”) was organized on September 7, 2010 as a Delaware statutory trust. The Trust is registered under the Investment Company Act of 1940 (the “1940 Act”), as an open-end management investment company. The Declaration of Trust permits the Trust to issue an unlimited number of shares of beneficial interest (“Shares”) in one or more series representing interests in separate portfolios of securities. Currently, the Trust offers its Shares in seven separate series. The accompanying Financial Statements relate to the following series: Strategy Shares Nasdaq 5HANDL™ Index ETF (FIVR) (“Nasdaq 5HANDL™ Index ETF”), Strategy Shares Gold- Hedged Bond ETF (GLDB) (“Gold-Hedged Bond ETF”), Strategy Shares Nasdaq 7HANDL™ Index ETF (HNDL) (“Nasdaq 7HANDL™ Index ETF”), Strategy Shares Halt Climate Change ETF (NZRO) (“Halt Climate Change ETF”), and Strategy Shares Newfound/ReSolve Robust Momentum ETF (ROMO) (“Newfound/ReSolve Robust Momentum ETF”), (individually referred to as a “Fund,” or collectively as the “Funds”). Nasdaq 5HANDL™ Index ETF, Nasdaq 7HANDL™ Index ETF, and Newfound/ ReSolve Robust Momentum ETF are classified as diversified under the 1940 Act, while Gold-Hedged Bond ETF and Halt Climate Change ETF are classified as non-diversified under the 1940 Act. The Funds are passively-managed exchange-traded funds, except for Halt Climate Change ETF, which is actively managed. The investment objective of the Nasdaq 5HANDL™ Index ETF is to seek investment results that correlate generally, before fees and expenses, to the price and yield performance of the Nasdaq 5HANDL™ Index. The investment objective of the Gold-Hedged Bond ETF is to seek investment results that correlate, before fees and expenses, to the performance of the Solactive Gold-Backed Bond Index. The investment objective of the Nasdaq 7HANDL™ Index ETF is to seek investment results that correlate generally, before fees and expenses, to the price and yield performance of the Nasdaq 7HANDL™ Index. The investment objective of the Halt Climate Change ETF is to seek long-term capital appreciation. The investment objective of the Newfound/ReSolve Robust Momentum ETF is to seek to provide investment returns that correspond, before fees and expenses, to the performance of the Newfound/ReSolve Robust Equity Momentum Index. The Funds’ prospectuses provide a description of each Fund’s investment objectives, policies, and strategies. The assets of each Fund are segregated and a shareholder’s interest is limited to the Fund in which shares are held.
The Nasdaq 7HANDL™ Index ETF commenced operations on January 16, 2018, the Newfound/ReSolve Robust Momentum ETF commenced operations on November 1, 2019, the Gold-Hedged Bond ETF commenced operations on May 17, 2021, the Nasdaq 5HANDL™ Index ETF commenced operations on December 28, 2021, and the Halt Climate Change ETF commenced operations on January 10, 2022.
Shares of the Nasdaq 5HANDL™ Index ETF, Nasdaq 7HANDL™ Index ETF and the Halt Climate Change ETF are listed and traded on Nasdaq. Shares of the Gold- Hedged Bond ETF and Newfound/ReSolve Robust Momentum ETF are listed and traded on the Cboe BZX Exchange, Inc. Market prices for the Shares may be different from their net asset value (“NAV”) . Each Fund issues and redeems Shares on a continuous basis at NAV only in large blocks, currently 25,000 Shares, called “Creation Units.” Creation Units are issued and redeemed principally in-kind for securities included in a specified universe. Once created, Shares generally trade in the secondary market at market prices that change throughout the day in amounts less than a Creation Unit.
Under the Trust���s organizational documents, its officers and Board of Trustees (“the Board”) are indemnified against certain liabilities arising out of the performance of their duties to the Funds. In addition, in the normal course of business, the Trust may enter into contracts with vendors and others that provide for general indemnifications. The Trust’s maximum exposure under these arrangements is unknown, as this would involve future claims that may be made against the Trust. However, based on experience, the Trust expects that risk of loss to be remote.
(2) Significant Accounting Policies
The following is a summary of significant accounting policies consistently followed by each Fund in the preparation of its financial statements. These policies are in conformity with generally accepted accounting principles in the United States of America (“GAAP”). Each Fund is an investment company and accordingly follows the investment company accounting and reporting guidance of the Financial Accounting Standards Board (“FASB”) Accounting Standards Codification Topic 946 Financial Services - Investment Companies. The preparation of financial statements in conformity with GAAP requires management to make estimates and assumptions that affect the amounts of assets, liabilities and disclosure of contingent assets and liabilities at the date of the financial statements and the reported amounts of increases and decreases in net assets from operations during the reporting period. Actual results could differ from those estimates.
A. Basis of Consolidation
The accompanying Consolidated Portfolio of Investments, Consolidated Statement of Assets and Liabilities, Consolidated Statement of Operations, Consolidated Statement of Changes in Net Assets, and Consolidated Financial Highlights of the Gold-Hedged Bond ETF include the accounts of its wholly owned subsidiary, SSGBI Fund Limited (the “Subsidiary”). The Subsidiary is organized under the laws of the Cayman Islands, and primarily invests in gold futures contracts and total return swaps as well as cash and cash equivalents such as treasury securities which serve as collateral for the Subsidiary’s investment in gold futures contracts and total return swap investments. The Fund will invest up to 25% of its total assets in its Subsidiary. As of April 30, 2022, the net assets of the Subsidiary was 4.88% of the total net assets of the Fund. The Subsidiary is subject to the same investment restrictions as the Fund, when viewed on a consolidated basis.
B. Investment in a Subsidiary
By investing in the Subsidiary, the Gold-Hedged Bond ETF is indirectly exposed to the commodities risks associated with the Subsidiary’s investments in commodity-related instruments. There can be no assurance that the Subsidiary’s investments will contribute to the Gold-Hedged Bond ETF’s returns. The Subsidiary is not registered under the 1940 Act and is not subject to all the investor protections of the 1940 Act. The Board, however, has oversight responsibility for the investment activities of the Gold- Hedged Bond ETF, including its investment in its Subsidiary, and the Gold-Hedged Bond ETF’s role as the sole shareholder of the Subsidiary. Changes in the laws of the United States and/or the Cayman Islands could result in the inability of the Gold-Hedged Bond ETF and/or the Subsidiary to operate as described in the prospectus and could adversely affect the Gold-Hedged Bond ETF, such as by reducing the Gold-Hedged Bond ETF’s investment returns. The financial statements of the Subsidiary have been consolidated with the Gold Hedged Bond ETF’s financial statements in this report.
Annual Shareholder Report | 29
Notes to Financial Statements (Continued)
C. Investment Valuations
The Funds hold investments at fair value. Fair value is defined as the price that would be expected to be received to sell an asset or paid to transfer a liability in an orderly transaction between market participants at the measurement date. The valuation techniques used to determine fair value are further described below.
Security values are ordinarily obtained through the use of independent pricing services in accordance with procedures adopted by the Trust’s Board. Pursuant to these procedures, the Funds may use a pricing service, bank, or broker-dealer experienced in such matters to value the Funds’ securities. When reliable market quotations are not readily available for any security, the fair value of that security will be determined by a committee established by the Board in accordance with procedures adopted by the Board. The fair valuation process is designed to value the subject security at the price the Funds would reasonably expect to receive upon its current sale. Additional consideration is given to securities that have experienced a decrease in the volume or level of activity or to circumstances that indicate that a transaction is not orderly.
The Trust has a three-tier fair value hierarchy that is dependent upon the various “inputs” used to determine the value of the Funds’ investments. The valuation techniques described below maximize the use of observable inputs and minimize the use of unobservable inputs in determining fair value. These inputs are summarized in the three broad levels listed below:
| • | Level 1 – Quoted prices in active markets for identical assets. |
| • | Level 2 – Other observable pricing inputs at the measurement date (including quoted prices for similar securities, interest rates, prepayment speeds, credit risk, etc.). |
| • | Level 3 – Significant unobservable pricing inputs at the measurement date (including the Fund’s own assumptions in determining the fair value of investments). |
The inputs or methodology used for valuing investments are not necessarily an indication of the risk associated with investing in those investments.
Equity securities (including foreign equity securities) traded on a securities exchange are valued at the last reported sales price on the principal exchange. Equity securities quoted by Nasdaq are valued at the Nasdaq official closing price. If there is no reported sale on the principal exchange, and in the case of over-the-counter securities, equity securities are valued at a bid price estimated by the security pricing service. In each of these situations, valuations are typically categorized as Level 1 in the fair value hierarchy.
Debt securities traded on a national securities exchange or in the over- the-counter market are valued at the last reported sales price on the principal exchange. If there is no reported sale on the principal exchange, and for all other debt securities, debt securities are valued at a bid price estimated by a security pricing service. In each of these situations, valuations are typically categorized as Level 2 in the fair value hierarchy.
Swaps are priced daily based on the underlying index and are typically categorized as Level 2 in the fair value hierarchy.
The following table provides the fair value measurement as of April 30, 2022.
| Total | ||||||||||||
| Fund | Level 1 | Level 2 | Investments | |||||||||
| Nasdaq 5HANDL™ Index ETF | ||||||||||||
| Exchange-Traded Funds | $ | 2,780,649 | $ | — | $ | 2,780,649 | ||||||
| Total Investments | $ | 2,780,649 | $ | — | $ | 2,780,649 | ||||||
| Gold-Hedged Bond ETF | ||||||||||||
| Corporate Bonds | $ | — | $ | 12,099,437 | $ | 12,099,437 | ||||||
| Yankee Dollars | — | 816,626 | 816,626 | |||||||||
| Other Financial Instruments(1) | ||||||||||||
| Total Return Swap Agreements | — | (743,659 | ) | (743,659 | ) | |||||||
| Total Investments | $ | — | $ | 12,172,404 | $ | 12,172,404 | ||||||
| Nasdaq 7HANDL™ Index ETF | ||||||||||||
| Exchange-Traded Funds | $ | 1,343,857,566 | $ | — | $ | 1,343,857,566 | ||||||
| Other Financial Instruments(1) | ||||||||||||
| Total Return Swap Agreements | — | (29,864,681 | ) | (29,864,681 | ) | |||||||
| Total Investments | $ | 1,343,857,566 | ($ | 29,864,681 | ) | $ | 1,313,992,885 | |||||
| Halt Climate Change ETF | ||||||||||||
| Common Stocks | $ | 1,534,024 | $ | — | $ | 1,534,024 | ||||||
| Total Investments | $ | 1,534,024 | $ | — | $ | 1,534,024 | ||||||
| Newfound/ReSolve Robust | ||||||||||||
| Momentum ETF | ||||||||||||
| Exchange-Traded Funds | $ | 50,083,570 | $ | — | $ | 50,083,570 | ||||||
| Total Investments | $ | 50,083,570 | $ | — | $ | 50,083,570 | ||||||
| (1) | Other Financial Instruments are derivative instruments not reflected in the total investments, such as swap agreements, which are valued at fair value. |
For the fiscal year or period ended April 30, 2022, there were no Level 3 investments for which significant unobservable inputs were used to determine fair value.
D. Security Transactions and Related Income
Investment transactions are accounted for no later than the first calculation of the NAV on the business day following the trade date. For financial reporting purposes, however, security transactions are accounted for on the trade date on the last business day of the reporting period. Discounts and premiums on securities purchased are amortized over the lives of the respective securities using the effective interest method. Securities gains and losses are calculated on the identified cost basis. Interest income and expenses are accrued daily. Dividends, less foreign tax withholding, if any, are recorded on the ex-dividend date. Investment income from non-U.S. sources received by a Fund is generally subject to non-U.S. withholding taxes at rates ranging up to 30%. Such withholding taxes may be reduced or eliminated under the terms of applicable U.S. income tax treaties. The Funds may be subject to foreign taxes on gains in investments or currency repatriation. The Funds accrue such taxes, as applicable, based on their current interpretation of tax rules in the foreign markets in which they invest.
E. Cash and Cash Equivalents
Idle cash may be swept into various overnight demand deposits and is classified as cash and cash equivalents on the Statements of Assets and Liabilities. The Funds maintain cash in bank deposit accounts which, at times, may exceed United States federally insured limits. Amounts swept overnight are available on the next business day.
30 | Annual Shareholder Report
Notes to Financial Statements (Continued)
F. Derivative Instruments
Swap Agreements: The Funds may enter into swap agreements (“swaps”) in an attempt to obtain a particular desired return at a lower cost to the Fund than if it had been invested directly in an instrument that yielded that desired return. Swap agreements are two-party contracts entered into primarily by institutional investors for periods ranging from a few weeks to more than one year. In a standard swap transaction, two parties agree to exchange the returns (or differentials in rates of returns) earned or realized on particular predetermined investments or instruments. The gross returns to be exchanged or “swapped” between the parties are calculated with respect to a “notional amount,” i.e., the return on or increase in value of a particular dollar amount invested in a “basket” of securities representing a particular index. The “notional amount” of the swap agreement is only a fictive basis on which to calculate the obligations the parties to a swap agreement have agreed to exchange. A Fund’s obligations (or rights) under a swap agreement will generally be equal only to the amount to be paid or received under the agreement based on the relative values of the positions held by each party to the agreement (the “net amount”).
Total Return Swaps: The Funds may enter into total return swaps to gain or mitigate exposure to the underlying securities or indices. In “long” total return swaps, the counterparty will generally agree to pay the Fund the amount, if any, by which the notional amount of the swaps would have increased in value had it been invested in the particular instruments, plus an amount equal to any dividends or interest that would have been received on those instruments. The Fund will agree to pay to the counterparty an amount equal to a fixed or floating rate of interest on the notional amount of the swaps plus the amount, if any, by which the notional amount would have decreased in value had it been invested in such instruments plus, in certain instances, commissions or trading spreads on the notional amount. Total return swaps do not involve the delivery of securities or other underlying instruments. Until a total return swap is settled in cash, the gain or loss on the notional amount plus dividends or interest on the instruments less the interest paid by the Fund on the notional amount is recorded as “unrealized appreciation or depreciation on swap agreements” and, when cash is exchanged, the gain or loss realized is recorded as “realized gains or losses on swap agreements.” A Fund may enter into total return swaps that provide the opposite return of its benchmark index or security (“short” the index or security). Its operations are similar to those swaps disclosed above except that the counterparty pays interest to the Fund on the notional amount outstanding and that dividends or interest on the underlying instruments reduce the value of the swaps plus, in certain instances, the Fund will agree to pay to the counterparty commissions or trading spreads on the notional amount. These amounts are netted against any unrealized appreciation or depreciation to determine the value of the swaps.
The primary risks associated with the use of swaps are an imperfect correlation between the prices of financial instruments and movements in the prices of the underlying investments and the inability of counterparties to perform under the agreement. The counterparty to any swap agreement will typically be a bank, investment banking firm or broker- dealer. The Fund will bear the counterparty risk (i.e., the risk of loss of the net amount), if any, expected to be received under a swap in the event of the default or bankruptcy of the swap counterparty. As of April 30, 2022, the Nasdaq 7HANDL™ Index ETF and the Gold Hedged Bond ETF invested in total return swaps. The unrealized appreciation/(depreciation) as of April 30, 2022 is disclosed in the Total Return Swap Agreement tables found earlier in this report.
Summary of Derivative Instruments
The following table summarizes the fair values of derivative instruments on the Statements of Assets and Liabilities, categorized by risk exposure, as of April 30, 2022.
| Assets | Liabilities | |
| Fund | Unrealized Appreciation | Unrealized Depreciation |
| on Swap Agreements | on Swap Agreements | |
| Commodity Risk Exposure: | ||
| Gold-Hedged Bond ETF | $— | $743,659 |
| Equity Risk Exposure: | ||
| Nasdaq 7HANDL™ Index ETF | — | 29,864,681 |
The following table presents the effect of derivative instruments on the Statements of Operations, categorized by risk exposure, for the fiscal year or period ended April 30, 2022.
| Net Realized | ||
| Gains (Losses) from | Change in Unrealized | |
| Swap Agreements | Appreciation/Depreciation | |
| Fund | Recognized as a | on Swaps Recognized |
| Result from Operations | from Operations | |
| Commodity Risk Exposure: | ||
| Gold-Hedged Bond ETF | $136,914 | $(743,659) |
| Equity Risk Exposure: | ||
| Nasdaq 7HANDL™ Index ETF | (7,893,338) | (31,612,360) |
G. Dividends and Distributions to Shareholders
Dividends to shareholders are recorded on the ex- dividend date. For the Nasdaq 5HANDL™ Index ETF, the Gold-Hedged Bond ETF and the Nasdaq 7HANDL™ Index ETF, dividends from net investment income, if any, are declared and paid monthly. For the Halt Climate Change ETF and Newfound/ReSolve Robust Momentum ETF, dividends from net investment income, if any, are declared and paid annually. Net realized capital gains, if any, are distributed at least annually.
The amount of dividends from net investment income and net realized gains are determined in accordance with federal income tax regulations, which may differ from GAAP. These “book/tax” differences are considered either temporary or permanent in nature. To the extent these differences are permanent in nature (e.g., distributions and income received from pass-through investments, differing treatment of income relating to swap agreements), such amounts are reclassified within the capital accounts based on their nature for federal income tax purposes; temporary differences do not require reclassification. Temporary differences are primarily due to wash sales and differing treatment on certain investments. To the extent dividends and distributions exceed net investment income and net realized gains for tax purposes, they are reported as distribution of capital.
The Funds may own shares of real estate investments trusts (“REITs”), which report information on the source of their distributions annually. Distributions received from investments in REITs in excess of income from underlying investments are recorded as realized gain and/or as a reduction to the cost of the individual REIT.
H. Allocation of Expenses
Expenses directly attributable to a Fund are charged to that Fund. Expenses not directly attributable to a Fund are allocated proportionally among all series of the Trust in relation to the net assets of each series or on another reasonable basis. Those expenses that are shared are allocated proportionally among each of the trusts or on another reasonable basis.
Annual Shareholder Report | 31
Notes to Financial Statements (Continued)
(3) Investment Advisory and Other Contractual Services A. Investment Advisory Fees
The Advisor serves as the Funds’ investment advisor. The Advisor is under common control with Catalyst Capital Advisors LLC and AlphaCentric Advisors LLC, the investment advisors of other funds in the same group of investment companies also known as a “fund complex.” The Nasdaq 5HANDL™ Index ETF, the Nasdaq 7HANDL™ Index ETF and the Newfound/ReSolve Robust Momentum ETF pay 0.46%, 0.60%, and 0.49%, respectively, of each Fund’s average daily net assets, computed daily and paid monthly, for the advisory services it receives from the Advisor.
For the Gold-Hedged Bond ETF and the Halt Climate Change ETF, the Advisor receives a fee for its services, a “Unified Fee.” The Gold Hedged Bond ETF and the Halt Climate Change ETF pay 0.79% and 0.95%, respectively, of the Fund’s average daily net assets, computed daily and paid monthly. Out of the Unified Fee, the Advisor is obligated to pay or arrange for the payment of substantially all expenses of the Funds, (including, without limitation, transfer agent fees, administrative fees and expenses, custodian fees, legal fees, accounting fees, any other expenses (including clerical expenses) of issue, sale, repurchase or redemption of shares, expenses of registering or qualifying shares for sale, transfer taxes, all expenses of preparing the Trust’s registration statements and prospectuses for the Funds, and the cost of printing and delivering to shareholders prospectuses and reports), except the Fund’s management fee; taxes; brokerage commissions and trading costs; interest (including borrowing costs and overdraft charges); short sale dividends and interest expenses; acquired fund fees and expenses; and non- routine or extraordinary expenses of the Funds (such as litigation or reorganizational costs), each of which is paid by the Funds. The Advisor’s Unified Fee is designed to cause substantially all of the Fund’s expenses to be paid and to compensate the Advisor for providing services for the Funds.
The Advisor has contractually agreed to waive all or a portion of its management fee and/or reimburse certain operating expenses of the Nasdaq 5HANDL™ Index ETF, the Nasdaq 7HANDL™ Index ETF and the Newfound/ReSolve Robust Momentum ETF (exclusive of acquired fund fees and expenses; brokerage commissions and trading costs; interest (including borrowing costs and overdraft charges), taxes, short sale dividends and interest expenses, and non-routine or extraordinary expenses (such as litigation or reorganizational costs)) in order to limit total annual fund operating expenses after fee waivers and expense reimbursement to 0.71%, 0.80% and 0.75%, respectively, of the Fund’s average annual daily net assets (“Expense Cap”). For the period May 1, 2021 through August 31, 2021, the previous Expense Cap for the Nasdaq 7HANDL™ Index ETF was 0.95%. The current Expense Cap will remain in effect until at least August 31, 2022 for the Nasdaq 7HANDL™ Index ETF and the Newfound/ReSolve Robust Momentum ETF. The Expense Cap will remain in effect until at least August 31, 2023 for the Nasdaq 5HNDL™ Index ETF. The Expense Cap may be terminated earlier only upon the approval of the Board. The Advisor may recoup management fees that it waived or Fund expenses that it paid under this agreement for a period of three years after the fees were waived or expenses paid, if the recoupment can be achieved without causing the expense ratio (after the recoupment is taken into account) to exceed the lesser of (i) the expense limit in effect at the time the fees were waived or expenses paid, or (ii) the expense limit in place at the time of recoupment.
As of April 30, 2022, the Advisor may recoup amounts from the Funds as follows:
| Expires | Expires | Expires | ||||||||||||||
| Fund | 4/30/23 | 4/30/24 | 4/30/25 | Total | ||||||||||||
| Nasdaq 5HANDL™ Index ETF | $ | — | $ | — | $ | 45,540 | $ | 45,540 | ||||||||
| Nasdaq 7HANDL™ Index ETF | — | — | — | — | ||||||||||||
| Newfound/ReSolve Robust Momentum ETF | 49,237 | 54,116 | 31,186 | 134,539 | ||||||||||||
B. Administration, Transfer Agent and Accounting Fees
Citi Fund Services Ohio, Inc. (“Citi”) provides financial administration, transfer agency and portfolio accounting services to the Trust. Citi performs certain services on behalf of the Trust including but not limited to: (1) preparing and filing the Trust’s periodic financial reports on forms prescribed by the Securities and Exchange Commission (“SEC”); (2) calculating Fund expenses and making required disbursements; (3) calculating Fund performance data; and (4) providing certain compliance support services. As transfer agent, Citi issues shares of a Fund in Creation Units to fill purchase orders for Fund shares, maintains records of the issuance and redemption of each Fund’s shares, and acts as each Fund’s dividend disbursing agent. As portfolio accountant, Citi maintains certain financial records of the Trust and provides accounting services to each Fund which include the daily calculation of each Fund’s NAV. Citi also performs certain other services on behalf of the Trust including providing financial information for the Trust’s federal and state tax returns and financial reports required to be filed with the SEC.
Administration Fees (as well as substantially all other expenses) for the Gold-Hedged Bond ETF and Halt Climate Change ETF are paid by the Advisor from the amounts received from the Unified Fee, as detailed previously.
MFund Services LLC (“MFund”), an affiliate of the Advisor, provides the Funds with various management and legal administrative services. For these services, each Fund pays MFund a fee accrued daily and paid monthly based on a percentage of each Fund’s average net assets, subject to a minimum annual fee. The fees are as follows:
– 0.030% of the aggregate net assets from $0 to $1 billion; and
– 0.020% of the aggregate net assets above $1 billion
The asset -based fees are subject to an annual minimum of $30,000 per Fund. In addition, the Funds reimburse MFund for any reasonable out-of-pocket expenses incurred in the performance of its duties.
C. Distribution and Shareholder Services Fees
Foreside Fund Services, LLC (the “Distributor”) is the principal underwriter and distributor of each Fund’s Shares. The Distributor is compensated by the Advisor in accordance with a Distribution Services Agreement between the Advisor and the Distributor. The Trust has adopted but has yet to implement a Rule 12b-1 Distribution Plan (the “Plan”). The Plan is designed to compensate or reimburse financial intermediaries (including the Distributor, the Advisor, and their affiliates) for activities principally intended to result in the sale of Fund shares, such as advertising and marketing of shares (including printing and disseminating prospectuses and sales literature to prospective shareholders and financial intermediaries) and providing incentives to financial intermediaries to sell shares. The Plan is also designed to cover the cost of administrative services performed in conjunction with the sale of shares, including, but not limited to, shareholder services, recordkeeping services and educational services, as well as the costs of implementing and operating the Plan. In accordance with
32 | Annual Shareholder Report
Notes to Financial Statements (Continued)
the Plan, the Distributor may enter into agreements with financial intermediaries and dealers relating to distribution and/or marketing services with respect to the Funds. Pursuant to the Plan, the Funds may pay a 12b-1 fee not to exceed 0.25% per year of each Fund’s average daily net assets. No 12b-1 fee is currently paid by the Funds and the Board has not approved any payments under the Plan.
D. Custodian Fees
Citibank, N.A. (the “Custodian”), an affiliate of Citi, serves as custodian for each Fund and safeguards and holds each Fund’s cash and securities, settles each Fund’s securities transactions, and collects income on Fund investments. The Custodian receives fees based on the level of each Fund’s average daily net assets for the period plus out-of-pocket expenses.
E. Compliance Services
Pursuant to a Compliance Services Agreement, MFund, an affiliate of the Advisor, provides chief compliance officer services to the Funds. The Funds pay MFund a monthly fee plus an asset-based fee. In addition, the Funds reimburse MFund for any reasonable out-of-pocket expenses incurred in the performance of its duties under the Compliance Services Agreement.
F. General
The Advisor paid all organizational costs of the Funds. For Nasdaq 5HANDL™ Index ETF, certain offering costs are being expensed over the first 12 months of operations. As of April 30, 2022, the balance of offering costs remaining to be expensed is shown on the Nasdaq 5HANDL™ Index ETF’s Statement of Assets and Liabilities as “Deferred offering costs.” For Gold-Hedged Bond ETF and Halt Climate Change ETF, the Advisor paid all offering costs.
(4) Investment Transactions
Purchases and sales of investments, excluding in -kind transactions and short-term investments, for the fiscal year or period ended April 30, 2022 were as follows:
| Fund | Purchases | Sales | ||||||
| Nasdaq 5HANDL™ Index ETF | $ | 1,288,999 | $ | 1,279,795 | ||||
| Gold-Hedged Bond ETF | 14,230,819 | — | ||||||
| Nasdaq 7HANDL™ Index ETF | 1,245,228,815 | 1,336,945,536 | ||||||
| Halt Climate Change ETF | 1,774 | 1,779 | ||||||
| Newfound/ReSolve Robust Momentum ETF | 102,947,978 | 103,039,283 | ||||||
Purchases and sales of in-kind transactions for the fiscal year or period ended April 30, 2022 were as follows:
| Fund | Purchases | Sales | ||||||
| Nasdaq 5HANDL™ Index ETF | $ | 2,993,102 | $ | — | ||||
| Gold-Hedged Bond ETF | — | 508,339 | ||||||
| Nasdaq 7HANDL™ Index ETF | 1,356,037,531 | 217,351,251 | ||||||
| Halt Climate Change ETF | 1,763,240 | — | ||||||
| Newfound/ReSolve Robust Momentum ETF | 20,074,827 | 9,473,706 | ||||||
(5) Capital Share Transactions
Shares are issued and redeemed by each Fund only in aggregations of a specified number of shares or multiples thereof at net asset value. Except when aggregated in Creation Units, shares of each Fund are not redeemable. Transactions in shares for each Fund are disclosed in detail on the Statements of Changes in Net Assets.
The consideration for the purchase of Creation Units of a Fund generally consists of the in -kind deposit of a designated basket of securities, which constitutes an optimized representation of the securities of that Fund’s specified universe, and an amount of cash. Investors purchasing and redeeming Creation Units may be charged a transaction fee to cover the transfer and other transactional costs it incurs to issue or redeem Creation Units. The standard charge and maximum transaction fee for each Fund are $250 and $1,000, respectively.
From time to time, settlement of securities related to subscriptions-in-kind or redemptions-in-kind may be delayed. In such cases, securities related to in-kind contributions are reflected as “Due from custodian” and securities related to in-kind redemptions are reflected as “Securities payable related to in-kind transactions” on the Statements of Assets and Liabilities.
During the fiscal year or period ended April 30, 2022, the Funds received securities in exchange for subscriptions of capital shares (subscriptions-in-kind) and distributed securities in exchange for redemptions (redemptions-in-kind) as follows:
| Fund | Fair Value of Subscriptions-in-Kind | Fair Value of Redemptions-in-Kind | ||||||
| Nasdaq 5HANDL™ Index ETF | $ | 2,993,102 | $ | — | ||||
| Gold-Hedged Bond ETF | — | 508,339 | ||||||
| Nasdaq 7HANDL™ Index ETF | 1,356,037,531 | 217,351,251 | ||||||
| Halt Climate Change ETF | 1,763,240 | — | ||||||
| Newfound/ReSolve Robust Momentum ETF | 20,074,827 | 9,473,706 | ||||||
(6) Federal Income Taxes
It is the policy of each Fund to qualify or continue to qualify as a regulated investment company by complying with the provisions available to certain investment companies, as defined in applicable sections of the Internal Revenue Code, and to make distributions of net investment income and net realized capital gains sufficient to relieve it from all, or substantially all, federal income taxes.
The Trust has evaluated tax positions taken or expected to be taken in the course of preparing each Fund’s tax returns to determine whether it is more-likely-than not (i.e., greater than 50-percent chance) that each tax position will be sustained upon examination by a taxing authority based on the technical merits of the position. A tax position that meets the more-likely-than-not recognition threshold is measured to determine the amount of benefit to recognize in the financial statements. Differences between tax positions taken in a tax return and amounts recognized in the financial statements will generally result in an increase in a liability for taxes payable (or a reduction of a tax refund receivable), including the recognition of any related interest and penalties as an operating expense. Tax positions taken in tax years remain subject to examination by tax authorities (generally three years plus the interim tax period since then for federal income tax purposes). The determination has been made that there are not any uncertain tax positions that would require the Funds to record a tax liability and, therefore, there is no impact to the Funds’ financial statements. The Funds recognize interest and penalties, if any, related to unrecognized tax benefits as income tax expense on the Statements of Operations. During the fiscal year or period ended April 30, 2022, the Funds did not incur any interest or penalties. The tax year end for the Nasdaq 5HANDL™ Index ETF and Nasdaq 7HANDL™ Index ETF is December 31 and the tax year end for the Gold -Hedged Bond ETF, Halt Climate Change ETF and Newfound/ReSolve Robust Momentum ETF is April 30.
Annual Shareholder Report | 33
Notes to Financial Statements (Continued)
As of the most recent tax year end, the tax cost of securities and the breakdown of unrealized appreciation/depreciation for each Fund were as follows:
| Fund | Tax Cost of Securities | Unrealized Appreciation | Unrealized Depreciation | Net Unrealized Appreciation/ (Depreciation) | ||||||||||||
| December 31 | ||||||||||||||||
| Nasdaq 5HANDL™ Index ETF | $ | 611,634 | $ | 1,645 | $ | 1,806 | $ | (161 | ) | |||||||
| Nasdaq 7HANDL™ Index ETF | 1,353,553,061 | 45,252,946 | 6,414,707 | 38,838,239 | ||||||||||||
| April 30 | ||||||||||||||||
| Gold-Hedged Bond ETF | 13,717,214 | — | 801,151 | (801,151 | ) | |||||||||||
| Halt Climate Change ETF | 1,762,936 | 14,040 | 242,952 | (228,912 | ) | |||||||||||
| Newfound/Resolve Robust Momentum ETF | 51,051,395 | — | 967,825 | (967,825 | ) | |||||||||||
The differences between book-basis and tax-basis unrealized appreciation/depreciation are attributable primarily to basis adjustments for wash sales, mark-to-market on swap agreements, and the character of distributions received from Real Estate Investment Trusts (REITs).
The tax character of distributions paid during the most recent tax year end were as follows:
| Distributions paid from | ||||||||||||||||||||
| Fund | Ordinary Income | Net Long Term Capital Gains | Total Taxable Distributions | Return of Capital | Total Distributions Paid | |||||||||||||||
| December 31 | ||||||||||||||||||||
| Nasdaq 5HANDL™ Index ETF | $ | — | $ | — | $ | — | $ | — | $ | — | ||||||||||
| Nasdaq 7HANDL™ Index ETF | 49,358,019 | — | 49,358,019 | 3,551,942 | 52,909,961 | |||||||||||||||
| April 30 | ||||||||||||||||||||
| Gold-Hedged Bond ETF | 59,219 | — | 59,219 | — | 59,219 | |||||||||||||||
| Halt Climate Change ETF | — | — | — | — | — | |||||||||||||||
| Newfound/Resolve Robust Momentum ETF | 286,753 | — | 286,753 | — | 286,753 | |||||||||||||||
The tax character of distributions paid during the previous tax year end were as follows:
| Distributions paid from | ||||||||||||||||||||
| Fund | Ordinary Income | Net Long Term Capital Gains | Total Taxable Distributions | Return of Capital | Total Distributions Paid | |||||||||||||||
| December 31 | ||||||||||||||||||||
| Nasdaq 7HANDL™ Index ETF | $ | 3,188,317 | $ | — | $ | 3,188,317 | $ | — | $ | 3,188,317 | ||||||||||
| April 30 | ||||||||||||||||||||
| Newfound/Resolve Robust Momentum ETF | 381,434 | — | 381,434 | 6,072 | 387,506 | |||||||||||||||
As of the most recent tax year end, the components of distributed earnings/(loss) on a tax basis were as follows:
| Fund | Undistributed Ordinary Income | Undistributed Long Term Capital Gains | Distributed Earnings | Accumulated Capital and Other Losses | Unrealized Appreciation/ (Depreciation) | Total Distributed Earnings/(Loss) | ||||||||||||||||||
| December 31 | ||||||||||||||||||||||||
| Nasdaq 5HANDL™ Index ETF | $ | 776 | $ | — | $ | 776 | $ | — | $ | (161 | ) | $ | 615 | |||||||||||
| Nasdaq 7HANDL™ Index ETF | — | — | — | (1,401,505 | ) | 38,838,239 | 37,436,734 | |||||||||||||||||
| April 30 | ||||||||||||||||||||||||
| Gold-Hedged Bond ETF | — | — | — | — | (1,544,810 | ) | (1,544,810 | ) | ||||||||||||||||
| Halt Climate Change ETF | — | — | — | (275 | ) | (228,912 | ) | (229,187 | ) | |||||||||||||||
| Newfound/Resolve Robust Momentum ETF | — | — | — | (440,195 | ) | (967,825 | ) | (1,408,020 | ) | |||||||||||||||
34 | Annual Shareholder Report
Notes to Financial Statements (Continued)
Permanent Tax Differences:
As of the most recent tax year end, the following reclassifications relating primarily to redemptions in-kind, Controlled Foreign Corporations, Taxable over-distributions, Return of Capital, and Net Operating Losses have been made to increase (decrease) such accounts with offsetting adjustments as indicated.
| Fund | Total Distributable Earnings / (Loss) | Paid in Capital | ||||||
| December 31 | ||||||||
| Nasdaq 5HANDL™ Index ETF | $ | — | $ | — | ||||
| Nasdaq 7HANDL™ Index ETF | (1,393,616 | ) | 1,393,616 | |||||
| April 30 | ||||||||
| Gold-Hedged Bond ETF | (137,839 | ) | 137,839 | |||||
| Halt Climate Change ETF | 183 | (183 | ) | |||||
| Newfound/Resolve Robust Momentum ETF | (2,978,568 | ) | 2,978,568 | |||||
Temporary tax differences (e.g. wash sales) do not require a reclassification.
Under current tax law, certain ordinary losses arising after December 31 of a Fund’s fiscal year may be deferred and treated as occurring on the first business day of the following fiscal year for tax purposes. The following Funds deferred losses are as follows:
| Fund | Late Year Ordinary Loss Deferrals | |||
| December 31 | ||||
| Nasdaq 5HANDL™ Index ETF | $ | — | ||
| Nasdaq 7HANDL™ Index ETF | — | |||
| April 30 | ||||
| Gold-Hedged Bond ETF | — | |||
| Halt Climate Change ETF | — | |||
| Newfound/Resolve Robust Momentum ETF | 43,148 | |||
As of the most recent tax year end, no Funds utilized capital loss carryforwards to offset capital gains. The Funds have a net CLCF as summarized in the table below. This CLCF is not subject to expiration:
| Fund | Short-Term Amount | Long-Term Amount | Total | |||||||||
| December 31 | ||||||||||||
| Nasdaq 5HANDL™ Index ETF | $ | — | $ | — | $ | — | ||||||
| Nasdaq 7HANDL™ Index ETF | 1,161,317 | 240,188 | 1,401,505 | |||||||||
| April 30 | ||||||||||||
| Gold-Hedged Bond ETF | — | — | — | |||||||||
| Halt Climate Change ETF | 275 | — | 275 | |||||||||
| Newfound/Resolve Robust Momentum ETF | 397,047 | — | 397,047 | |||||||||
(7) Investment Risks
This section discusses certain common principal risks encountered by the Funds. Each Fund may be subject to other risks in addition to these identified risks. The risks are presented in an order intended to facilitate readability, and their order does not imply that the realization of one risk is likely to occur more frequently than another risk, nor does it imply that the realization of one risk is likely to have a greater adverse impact than another risk.
ETF Risk
The NAV of a Fund can fluctuate up or down, and you could lose money investing in a Fund if the prices of the securities owned by the Fund decline. In addition, a Fund may be subject to the following risks: (1) the market price of a Fund’s shares may trade above or below its NAV; (2) an active trading market for a Fund’s shares may not develop or be maintained; or (3) trading of a Fund’s shares may be halted if the listing exchange’s officials deem such action appropriate, the shares are delisted from the exchange, or the activation of market wide “circuit breakers” (which are tied to large decreases in stock prices) halts stock trading generally.
Market Risk
Overall market risks may also affect the value of the Funds. The market values of securities or other investments owned by the Funds will go up or down, sometimes rapidly or unpredictably. Factors such as economic growth and market conditions, interest rate levels, exchange rates and political events affect the securities markets. Changes in market conditions and interest rates generally do not have the same impact on all types of securities and instruments. Unexpected local, regional or global events and their aftermath, such as war; acts of terrorism; financial, political or social disruptions; natural, environmental or man made disasters; the spread of infectious illnesses or other public health issues; recessions and depressions; or other tragedies, catastrophes and events could have a significant impact on the Funds and their investments and could result in increased premiums or discounts to the Funds’ net asset values, and may impair market liquidity, thereby increasing liquidity risk. Such events can cause investor fear and panic, which can adversely affect the economies of many companies, sectors, nations, regions and the market in general, in ways that cannot necessarily be foreseen. The Funds could lose money over short periods
Annual Shareholder Report | 35
Notes to Financial Statements (Continued)
due to short-term market movements and over longer periods during more prolonged market downturns. During a general market downturn, multiple asset classes may be negatively affected. In times of severe market disruptions you could lose your entire investment.
An outbreak of infectious respiratory illness caused by a novel coronavirus known as COVID-19 was first detected in China in December 2019 and subsequently spread globally. This coronavirus has resulted in, among other things, travel restrictions, closed international borders, enhanced health screenings at ports of entry and elsewhere, disruption of and delays in healthcare service preparation and delivery, prolonged quarantines, significant disruptions to business operations, market closures, cancellations and restrictions, supply chain disruptions, lower consumer demand, and significant volatility and declines in global financial markets, as well as general concern and uncertainty. The impact of COVID-19 has adversely affected, and other infectious illness outbreaks that may arise in the future could adversely affect, the economies of many nations and the entire global economy, individual issuers and capital markets in ways that cannot necessarily be foreseen. In addition, the impact of infectious illnesses in emerging market countries may be greater due to generally less established healthcare systems. Public health crises caused by the COVID-19 outbreak may exacerbate other pre-existing political, social and economic risks in certain countries or globally. The duration of the COVID-19 outbreak and its effects cannot be determined with certainty.
Underlying Fund Risk
The ETFs in which the Funds invest are subject to investment advisory and other expenses, which will be indirectly paid by the Funds. As a result, the cost of investing in the Funds will be higher than the cost of investing directly in the ETFs and may be higher than other funds that invest directly in stocks and bonds. Each of the ETFs is subject to its own specific risks.
As of April 30, 2022, 43.34%, 30.91% and 25.30% of the Newfound/ReSolve Robust Momentum ETF’s net assets were invested in the iShares Core S&P 500 ETF, iShares 1-3 Year Treasury Bond ETF and iShares 7 -10 Year Treasury Bond ETF, respectively. The financial statements of the iShares Core S&P 500 ETF, iShares 1- 3 Year Treasury Bond ETF and iShares 7-10 Year Treasury Bond ETF, including their portfolio of investments, can be found at the SEC’s website www.sec.gov and should be read in conjunction with the Newfound/Resolve Robust Momentum ETF’s financial statements.
(8) Subsequent Events
Management of the Funds has evaluated the need for disclosures and/or adjustments resulting from subsequent events through the date these financial statements were issued. Based upon this evaluation, no additional disclosures or adjustments were required to the financial statements as of April 30, 2022.
36 | Annual Shareholder Report

REPORT OF INDEPENDENT REGISTERED PUBLIC ACCOUNTING FIRM
To the Shareholders of Strategy Shares Nasdaq 5HANDL™ Index ETF, Strategy Shares Gold-Hedged Bond ETF, Strategy Shares Nasdaq 7HANDL™ Index ETF, Strategy Shares Halt Climate Change ETF, and Strategy Shares Newfound/ReSolve Robust Momentum ETF and Board of Trustees of Strategy Shares
Opinion on the Financial Statements
We have audited the accompanying statements of assets and liabilities, including the portfolios of investments, of the funds listed below (the “Funds”), each a series of Strategy Shares, as of April 30, 2022, the related statements of operations, the statements of changes in net assets, the related notes, and the financial highlights for each of the periods indicated below (collectively referred to as the “financial statements”). In our opinion, the financial statements present fairly, in all material respects, the financial position of each of the Funds as of April 30, 2022, the results of their operations, the changes in net assets, and the financial highlights for each of the periods indicated below, in conformity with accounting principles generally accepted in the United States of America.
| Statements of | |||
| Statements of | Changes in Net | ||
| Fund Name | Operations | Assets | Financial Highlights |
| Strategy Shares Nasdaq 5HANDL™ Index ETF | For the period from December 28, 2021 (commencement of operations) through April 30, 2022 | ||
| Strategy Shares Gold-Hedged Bond ETF* | For the period from May 17, 2021 (commencement of operations) through April 30, 2022 | ||
| Strategy Shares Nasdaq 7HANDL™ Index ETF | For the year ended April 30, 2022 | For the years ended April 30, 2022 and 2021 | For the years ended April 30, 2022, 2021, 2020, and 2019, and for the period from January 16, 2018 (commencement of operations) through April 30, 2018 |
| Strategy Shares Halt Climate Change ETF | For the period from January 10, 2022 (commencement of operations) through April 30, 2022 | ||
| Strategy Shares Newfound/ReSolve Robust Momentum ETF | For the year ended April 30, 2022 | For the years ended April 30, 2022 and 2021 | For the years ended April 30, 2022 and 2021, and for the period from November 1, 2019 (commencement of operations) through April 30, 2020 |
| * | The financial statements referred to above are Consolidated Financial Statements. |
C O H E N & C O M P A N Y , L T D .
800.229.1099 | 866.818.4535 fax | cohencpa.com
Registered with the Public Company Accounting Oversight Board
Annual Shareholder Report | 37
Basis for Opinion
These financial statements are the responsibility of the Funds’ management. Our responsibility is to express an opinion on the Funds’ financial statements based on our audits. We are a public accounting firm registered with the Public Company Accounting Oversight Board (United States) (“PCAOB”) and are required to be independent with respect to the Funds in accordance with the U.S. federal securities laws and the applicable rules and regulations of the Securities and Exchange Commission and the PCAOB.
We conducted our audits in accordance with the standards of the PCAOB. Those standards require that we plan and perform the audit to obtain reasonable assurance about whether the financial statements are free of material misstatement whether due to error or fraud.
Our audits included performing procedures to assess the risks of material misstatement of the financial statements, whether due to error or fraud, and performing procedures that respond to those risks. Such procedures included examining, on a test basis, evidence regarding the amounts and disclosures in the financial statements. Our procedures included confirmation of securities owned as of April 30, 2022, by correspondence with the custodian and brokers; when replies were not received from brokers, we performed other auditing procedures. Our audits also included evaluating the accounting principles used and significant estimates made by management, as well as evaluating the overall presentation of the financial statements. We believe that our audits provide a reasonable basis for our opinion.
We have served as auditor of one or more investment companies with a related advisor since 2015.

COHEN & COMPANY, LTD.
Cleveland, Ohio
June 29, 2022
38 | Annual Shareholder Report
Additional Information
Additional Federal Income Tax Information (Unaudited)
As of the most recent tax year end, the following percentages of the total ordinary income distributions paid by the Funds qualify for the distributions received deduction available to corporate shareholders.
| Distributions Received | ||
| Fund | Deduction | |
| Newfound/ReSolve Robust Momentum ETF | 1.29% |
As of the most recent tax year end, distributions paid by the Funds may be subject to a maximum tax rate of 15%, as provided by the Jobs and Growth Tax Relief Reconciliation Act of 2003. The Funds intend to designate the maximum amount allowable as taxed at a maximum rate of 15%. Complete information will be reported in conjunction with your 2022 Form 1099-DIV.
As of the most recent tax year end, the percentages of Qualified Dividend Income are as follows:
| Qualified Dividend | ||
| Fund | Income | |
| Nasdaq 7HANDL™ Index ETF | 8.79% | |
| Newfound/ReSolve Robust Momentum ETF | 100.00% |
As of the most recent tax year end, the percentages of interest-related dividends for certain non-U.S. resident investors are as follows:
| Qualified Dividend | ||
| Fund | Income | |
| Gold-Hedged Bond ETF | 87.32% | |
| Nasdaq 7HANDL™ Index ETF | 0.02% | |
| Newfound/ReSolve Robust Momentum ETF | 5.98% |
The Newfound/Resolve Robust Momentum ETF intends to elect to pass through to shareholders the income tax credit for taxes paid to foreign countries. Foreign source income and foreign tax expense per outstanding shares on April 30, 2022 are as follows:
| Foreign Source | ||
| Fund | Income | |
| Newfound/ReSolve Robust Momentum ETF | $0.06 |
The pass-through of the foreign tax credit will only affect those persons who are shareholders on the dividend record date in December 2022. These shareholders will receive more detailed information along with their 2022 Form 1099-DIV.
Premium/Discount Information (Unaudited)
The Funds’ website at www.strategysharesetfs.com shows the previous day’s closing NAV and closing market price for the Fund’s ETF Shares. The website also discloses, in the Premium/Discount section, how frequently each Fund’s ETF Shares traded at a premium or discount to NAV (based on closing NAVs and market prices) and the magnitudes of such premiums and discounts.
Annual Shareholder Report | 39
Additional Information (Continued)
Approval of Management Agreement with respect to Strategy Shares Gold-Hedged Bond ETF (the “Gold ETF”)
At a meeting of the Board of Trustees of Strategy Shares (the “Trust”), held on September 18, 2020, the Board, which is comprised of Trustees who are not “interested persons” of the Trust, as that term is defined in the Investment Company Act of 1940, as amended, of the Fund, discussed the approval of the management agreement between the Trust and Rational with respect to the Gold ETF (the “Gold ETF Management Agreement”).
In connection with the Board’s consideration of the renewal of the Gold ETF Management Agreement as required by Section 15(c) of the Investment Company Act of 1940, the Board requested and received due diligence materials prepared by Rational (the “Rational 15(c) Response”). The Board was assisted by legal counsel throughout the review process and relied upon the advice of legal counsel and its own business judgment in evaluating the Gold ETF Management Agreement and the weight to be given to each factor considered. The conclusions reached by the Board were based upon a comprehensive evaluation and discussion of all the information provided for the Gold ETF with respect to the approval of the Gold ETF Management Agreement and were not the result of any one factor. Moreover, each Trustee might have afforded different weight to the various factors in reaching his conclusions with respect to the Gold ETF Management Agreement.
Review of Rational 15(c) Response
Nature, Extent, and Quality of Services. The Board reviewed the services that Rational would provide to the Fund and information concerning the financial condition and resources, personnel, business, operations, and compliance program of Rational. The Board noted its familiarity with the key personnel serving the other series of the Trust and other affiliated funds, and discussed the quality of services provided by the team of professionals at Rational. The Board then discussed the firm’s culture of compliance and risk management program. After further discussion and review of the Rational 15(c) Response, the Board concluded that Rational would provide an acceptable level of services to Gold ETF.
Performance. The Board noted that although neither Rational nor its portfolio managers had previously managed a strategy that was comparable to that of the Gold ETF, the portfolio managers did have experience managing an income -oriented portfolio, Catalyst Insider Income Fund, a series of Mutual Fund Series Trust, as well as two other passively managed series of the Trust: Strategy Shares 7HANDL™ Index ETF (the “7HANDL ETF”) and Strategy Shares Newfound/ReSolve Robust Momentum ETF (the “Newfound/ReSolve ETF”). The Board reviewed the returns of these funds for various periods ended June 30, 2020 compared to the Bloomberg US Govt/Credit 1-3 Year TR Index (the “1-3 Year Index”), the Bloomberg U.S. Aggregate Bond Index (the “U.S. Aggregate Bond Index”), and the S&P Target Risk Growth Index (the “Target Risk Index”), as applicable.
The Board considered that Catalyst Insider Income Fund Class I shares had outperformed the 1 3 Year Index for the 3- and 5-year periods but had underperformed that index for the 1-year period and the period since that Fund’s inception on July 29, 2014. The Board also considered that 7HANDL ETF had underperformed the U.S. Aggregate Bond Index for the 1-year period and the period since the Fund’s inception on January 16, 2018; and Newfound/ReSolve ETF had underperformed the Target Risk Index for the period since that Fund’s inception on November 1, 2019. After further discussion and review of the Rational 15(c) Response, the Board acknowledged the performance results of these Funds under Rational’s management, and noted that the Board would revisit the Gold ETF’s performance after it commenced investment operations.
Fees and Expenses. The Board reviewed the proposed advisory fee for Gold ETF of 0.79% as compared to funds in a peer group of funds that focus on investments in gold, a subset of the Morningstar Commodities Focused category. The Board considered that the fee payable to Rational was a “unitary fee” under which Rational would be responsible for paying all of the Fund’s routine expenses, with certain exceptions including brokerage and trading costs, interest, acquired fund fees and expenses, and non-routine or extraordinary expenses. The Board noted that the proposed unitary fee was 4 basis points higher than the highest advisory fee charged by a peer group fund, and within the range of fees charged to funds in the Morningstar category. The Board also considered that many of the peer group funds mainly invested in gold and gold-linked derivatives and did not include a fixed income strategy. The Board also considered that the peer group funds that did include a fixed income strategy focused on Treasury securities and money market instruments, in comparison to the Gold ETF’s proposed fixed income strategy that would focus on corporate issuers. After further discussion and review of the Rational 15(c) Response, the Board concluded that the proposed fee payable to Rational was reasonable.
40 | Annual Shareholder Report
Additional Information (Continued)
Profitability. The Board reviewed the projected profitability analysis that Rational had provided with respect to Gold ETF and considered that Rational did not expect to realize a profit from its management of the Gold ETF in the first 12 months of operations, but did expect to realize a profit during the second year.
“Fall-out” Benefits. The Board considered the fall-out benefits that Rational was expected to receive from its relationship with Gold ETF and the Trust.
Economies of Scale. The Board considered the terms of the Gold ETF Management Agreement and noted that the fee payable under the Agreement was a unitary fee, and the Agreement did not contain breakpoints that would reduce the fee rate payable by Gold ETF as assets reached certain levels. The Board considered that Rational, in its 15(c) Response, stated that it anticipated that neither the Gold ETF nor Rational would benefit from economies of scale because at higher asset levels, the Gold ETF would approach an expense ratio that would be covered by the unitary fee. After further discussion, the Board determined that the issue of economies of scale would be revisited as assets of the Gold ETF grew materially.
Conclusion. No single factor was determinative to the decision of the Board. Having reviewed and discussed in depth such information from Rational as the Board believed to be reasonably necessary to evaluate the terms of the Gold ETF Management Agreement, and as assisted by the advice of counsel, the Board concluded that approval of the Gold ETF Management Agreement was in the best interests of the Gold ETF and its future shareholders.
Annual Shareholder Report | 41
Additional Information (Continued)
Renewal/Approval of Management Agreements with respect to Strategy Shares Nasdaq 7HANDL™ Index ETF (“7HANDL ETF”), Strategy Shares Newfound/ReSolve Robust Momentum ETF (“Newfound/ReSolve ETF”), Strategy Shares Nasdaq 5HANDL™ Index ETF (the “5HANDL ETF”), and Strategy Shares Halt Climate Change ETF (the “Halt Climate Change ETF”)
At a meeting of the Board of Trustees of Strategy Shares (the “Trust”), held in December, 2021, the Board, which is comprised of Trustees who are not “interested persons” of the Trust, as that term is defined in the Investment Company Act of 1940, as amended, of the Fund, discussed the following: (a) the renewal of the management agreement between the Trust and Rational with respect to the 7HANDL ETF and Newfound/ReSolve ETF (the “Rational Management Agreement”); (b) the approval of the management agreement between the Trust and Rational with respect to the 5HANDL ETF (the “5HANDL Management Agreement”); and (c) the approval of a revised management agreement between the Trust and Rational with respect to the Halt Climate Change ETF (the “Halt Climate Change Management Agreement”) (each such Agreement a “Management Agreement” and collectively, the “Management Agreements”).
In connection with the Board’s consideration of the approval/renewal of the agreements as required by Section 15(c) of the Investment Company Act of 1940, the Board requested and received due diligence materials prepared by Rational (the “Rational 15(c) Response”) and considered the information presented at Board meetings throughout the year. The Board was assisted by legal counsel throughout the review process and relied upon the advice of legal counsel and its own business judgment in evaluating each Management Agreement and the weight to be given to each factor considered. The conclusions reached by the Board were based upon a comprehensive evaluation and discussion of all the information provided for the Fund with respect to the approval of each Management Agreement and were not the result of any one factor. Moreover, each Trustee might have afforded different weight to the various factors in reaching his conclusions with respect to a Management Agreement.
Renewal of the Rational Management Agreement with respect to the 7HANDL ETF and Newfound/ReSolve ETF
Review of Rational 15(c) Response
Nature, Extent, and Quality of Services. The Board reviewed the services provided by the team of professionals at Rational. The Board reviewed information concerning Rational’s resources, personnel, business operations, and culture of compliance. The Board discussed Rational’s Form ADV as of April 27, 2021, and the firm’s balance sheet as of September 30, 2021. The Board noted that there were no new compliance or regulatory issues. After further discussion and review of the Rational 15(c) Response, the Board concluded that Rational had sufficient quality of personnel, resources, operations and compliance policies and procedures essential to performing its duties under the Rational Management Agreement and that the nature, overall quality and extent of the advisory services provided to the 7HANDL ETF and Newfound/ReSolve ETF by Rational were acceptable.
Performance
7HANDL ETF. The Board compared the Fund’s returns to those of its peer group, Morningstar Allocation 15% to 30% Equity category, Morningstar Allocation 30% to 50% Equity category, Bloomberg U.S. Aggregate Bond TR Index, and Nasdaq 7HANDL Index for the 1- and 3-year periods ended September 30, 2021, and the period from the Fund’s inception on January 16, 2018, through September 30, 2021. The Board noted that the Fund had underperformed each metric, except for the Bloomberg U.S. Aggregate Bond TR Index, for the one-year period but had outperformed each metric, except the Nasdaq 7HANDL Index, for the three-year and since inception periods. The Board noted that the Fund’s investment objective is to seek investment results that correspond, before fees and expenses, to the performance of the Nasdaq 7HANDL Index and that the Fund has delivered returns in line with the Index, less annualized net expense ratios. After further discussion, the Board determined that the Fund’s performance was acceptable.
Newfound/ReSolve ETF. The Board compared the Fund’s returns to those of its peer group, Morningstar categories, and benchmarks for the year ended September 30, 2021, and the period from the Fund’s inception on November 1, 2019, through September 30, 2021. The Board noted that the Fund had outperformed the peer group, Morningstar Tactical Allocation category, and S&P Target Risk Growth Index for the 1-year period; underperformed the Morningstar Allocation 70%-85% Equity category and the Newfound/ReSolve Robust Equity Momentum Index (the “Newfound/ReSolve Index”) for the 1-year and since-inception periods; and underperformed each of these metrics since inception. The Board noted that the Fund’s investment objective is to seek investment results that correspond, before fees and expenses, to the performance of the Newfound/Resolve Index and that the Fund has delivered returns in line with the Index, less annualized net expense ratios. After further discussion, the Board determined that the Fund’s performance was acceptable.
42 | Annual Shareholder Report
Additional Information (Continued)
Fees and Expenses.
7HANDL ETF. The Board considered that the Fund’s assets had grown considerably over the year ended September 30, 2021. The Board compared the Fund’s management fees and net expenses to those of its peer group and Morningstar categories. The Board considered that Rational’s management fee for the Fund was higher than the median and average advisory fee for the peer group, the Morningstar Allocation 15% to 30% Equity category, and the Morningstar Allocation 30% to 50% Equity category. The Fund’s management fee was equal to the highest advisory fee in the Morningstar Allocation 15% to 30% Equity category, and within the range of advisory fees for the peer group and the Morningstar Allocation 30% to 50% Equity category. The Board considered Rational’s view that the Fund’s management fees reflected the specialized nature of the Fund’s strategy, including the use of swaps to obtain leverage to track the 7HANDL Index. After further discussion, the Board concluded that the management fees payable to Rational with respect to the Fund were reasonable.
The Board considered that the 7HANDL ETF’s net expense ratio was higher than the median and average expense ratios of the peer group and the Morningstar Allocation 30% to 50% Equity category, and higher than the median but lower than the average expense ratio of the Morningstar Allocation 15% to 30% Equity category. After further discussion, the Board concluded that the Fund’s net expenses were reasonable.
Newfound/ReSolve ETF. The Board considered that the Fund’s assets had grown over the year ended September 30, 2021. The Board compared the Fund’s management fees and net expenses to those of its peer group and Morningstar categories. The Board considered that Rational’s management fee for the Fund was below the median and average advisory fees its peer group, the Morningstar Allocation 70%-85% Equity category, and the Morningstar Tactical Allocation category. The Board considered Rational’s view that the Fund’s management fees reflected the tactical, non-traditional nature of the Fund’s principal strategies. The Board noted that with the contractual expense cap in place, Rational was currently waiving a portion of its fees. After further discussion, the Board concluded that the management fees payable to Rational with respect to the Fund were reasonable.
The Board considered that the Newfound/ReSolve ETF’s net expense ratio was lower than the average and median expense ratios of the peer group, higher than the median but lower than the average expense ratio of the Morningstar Tactical Allocation category, and higher than the median and average, but within the range of, expense ratios of the Morningstar Allocation 70%-85% Equity category. After further discussion, the Board concluded that the Fund’s net expenses were reasonable.
Profitability. The Board reviewed a report from Rational analyzing the firm’s profitability with respect to its relationship with the 7HANDL ETF and Newfound/ReSolve ETF, and noted that Rational was managing each Fund at a loss, after accounting for marketing expenses. The Board concluded that the level of Rational’s profitability with respect to the Funds did not raise any concerns.
“Fall-out” Benefits. The Board considered fall -out benefits that Rational and its affiliates received from their relationship with the 7HANDL ETF, the Newfound/ReSolve ETF, and the Trust.
Economies of Scale. The Board considered whether Rational was sharing economies of scale with the 7HANDL ETF and the Newfound/ReSolve ETF. The Board noted that the Management Agreement did not contain breakpoints that reduce the fee rate on assets above specified levels. The Board considered Rational’s view that economies of scale had not been reached and agreed that the matter of economies of scale would be revisited as the Funds’ assets increased.
Conclusion. The Board considered many factors, and no single factor was determinative to the decision of the Board. Having, requested, reviewed, and discussed in depth such information from Rational as the Board believed to be reasonably necessary to evaluate the terms of the Rational Management Agreement, and as assisted by the advice of counsel, the Board concluded that renewal of the Rational Management Agreement was in the best interest of the 7HANDL ETF and Newfound/ReSolve ETF and their shareholders.
Annual Shareholder Report | 43
Additional Information (Continued)
Approval of the 5HANDL Management Agreement
Review of Rational 15(c) Response
Nature, Extent, and Quality of Services. The Board reviewed the services that Rational would provide to the 5HANDL ETF and information concerning the financial condition and resources, personnel, business, operations, and compliance program of Rational. The Board noted its familiarity with the key personnel serving the other series of the Trust and other affiliated funds, and discussed the consistent and quality services provided by the team of qualified professionals at Rational. The Board then discussed the firm’s culture of compliance and risk management program. After further discussion and review of the Rational 15(c) Response, the Board concluded that Rational would provide an acceptable level of services to the 5HANDL ETF.
Performance. The Board reviewed the performance information presented with respect to the 7HANDL ETF, which had a strategy that was comparable to that of the 5HANDL ETF and was managed by the same portfolio managers that would manage the 5HANDL ETF.
The Board compared the investment performance of the 7HANDL ETF to that of its peer group, Morningstar Allocation 15% to 30% Equity category, Morningstar Allocation 30% to 50% Equity category, Bloomberg U.S. Aggregate Bond TR Index, for the 1- and 3-year periods ended September 30, 2021, and the period from the 7HANDL ETF’s inception on January 16, 2018, through September 30, 2021. The Board noted that the 7HANDL ETF had underperformed each metric, except for the Bloomberg U.S. Aggregate Bond TR Index, for the one- year period but had outperformed each metric, except the Nasdaq 7HANDL Index, for the three-year and since inception periods. The Board noted that the 7HANDL ETF’s investment objective is to seek investment results that correspond, before fees and expenses, to the performance of the Nasdaq 7HANDL Index and that the Fund has delivered returns in line with the Index, less annualized net expense ratios. After further discussion and review of the Rational 15(c) Response, the Board acknowledged the performance results of the 7HANDL ETF under Rational’s management, and noted that the Board would revisit the 5HANDL ETF’s performance after it commenced investment operations.
Fees and Expenses . The Board reviewed the proposed advisory fee for the 5HANDL ETF of 0.46% as compared to a peer group of targeted-income strategy funds, the Morningstar 15%-30% Equity category, and the Morningstar 30% -50% Equity category. The Board noted that the proposed advisory fee was below the median, above the average and within the range of advisory fees charged to the peer group and both Morningstar categories. After further discussion and review of the Rational 15(c) Response, the Board concluded that the proposed fee payable to Rational was reasonable. The Board noted that the proposed net expense ratio of 0.71% for the Fund was higher than the median and average expense ratios of the peer group and the Morningstar Allocation 30-50% Equity category, and lower than the median and average expense ratios of the Morningstar 15%-30% Equity category. The Board discussed Rational’s willingness to subsidize Fund expenses under the proposed expense limitation agreement between the Trust and Rational.
Profitability. The Board reviewed the projected profitability analysis that Rational had provided with respect to the 5HANDL ETF and considered that Rational expected to realize a profit from its management of the Fund in the first 2 years of operations. The Board concluded that the expected level of Rational’s profitability with respect to the Fund did not raise any concerns.
Economies of Scale. The Board considered the terms of the Management Agreement and noted that the Agreement did not contain breakpoints that would reduce the fee rate payable by the 5HANDL ETF as assets reached certain levels. After further discussion, the Board determined that the issue of economies of scale would be revisited as assets of the Fund grew materially.
“Fall-out” Benefits. The Board considered the fall-out benefits that Rational was expected to receive from its relationship with the 5HANDL ETF and the Trust.
Conclusion. No single factor was determinative to the decision of the Board. Having reviewed and discussed in depth such information from Rational as the Board believed to be reasonably necessary to evaluate the terms of the 5HANDL Management Agreement, and as assisted by the advice of counsel, the Board concluded that approval of the 5HANDL Management Agreement was in the best interests of the 5HANDL ETF and its future shareholders.
44 | Annual Shareholder Report
Additional Information (Continued)
Approval of the Halt Climate Change Management Agreement
Review of Rational 15(c) Response
Nature, Extent, and Quality of Services. The Board reviewed the services that Rational would provide to the Halt Climate Change ETF and information concerning the financial condition and resources, personnel, business, operations, and compliance program of Rational. The Board noted its familiarity with the key personnel serving the other series of the Trust and other affiliated funds and discussed the quality of services provided by the team of professionals at Rational. The Board then discussed the firm’s culture of compliance and risk management program. After further discussion and review of the Rational 15(c) Response, the Board concluded that Rational would provide an acceptable level of services to the Halt Climate Change ETF.
Performance. The Board noted that although neither Rational nor its portfolio managers had previously managed a strategy that was comparable to that of the Halt Climate Change ETF, the portfolio managers did have experience managing the 7HANDL ETF and Newfound/ReSolve ETF, which maintain equity exposure, and a thematic equity mutual fund, Catalyst Insider Buying Fund (the “Catalyst Fund”), a series of Mutual Fund Series Trust managed by Catalyst Capital Advisors LLC, an affiliate of Rational . The Board reviewed the investment performance of these products for various periods ended September 30, 2021.
The Board considered that Class I shares of the Catalyst Fund had underperformed the S&P 500 Total Return Index for the 1-, 3-, and 5-year periods and since the Catalyst Fund’s inception on July 29, 2011; the 7HANDL ETF had outperformed the Bloomberg U.S. Aggregate Bond Index for the 1-year period, 3 -year period, and the period since the Fund’s inception on January 16, 2018; and the Newfound/ReSolve ETF had outperformed the S&P Target Risk Growth Index for the 1-year period and underperformed for the period since that Fund’s inception on November 1, 2019. After further discussion and review of the Rational 15(c) Response, the Board acknowledged the performance results of these funds under Rational’s management, and noted that the Board would revisit the Halt Climate Change ETF’s performance after it commenced investment operations.
Fees and Expenses. The Board reviewed the proposed advisory fee for the Halt Climate Change ETF of 0.95% as compared to a peer group of funds with environmental-focused themes, the Morningstar Miscellaneous Sector category, the Catalyst Fund, the 7HANDL ETF and the Newfound/ReSolve ETF. The Board considered that the fee payable to Rational was a “unitary fee” under which Rational would be responsible for paying all of the Fund’s routine expenses, with certain exceptions including brokerage and trading costs, interest, acquired fund fees and expenses, and non-routine or extraordinary expenses. The Board noted that the proposed unitary fee was higher than the median and average advisory fees and expense ratios but within the range of net expenses charged to the peer group and the Morningstar category; lower than advisory fee and expense ratio of the Class I shares of the Catalyst Fund; higher than the advisory fee but lower than the net expense ratio of the 7HANDL ETF; and higher than advisory fee and net expense ratio of the Newfound/ReSolve ETF. After further discussion and review of the Rational 15(c) Response, the Board concluded that the proposed fee payable to Rational was reasonable.
Profitability. The Board reviewed the projected profitability analysis that Rational had provided with respect to Halt Climate Change ETF and considered that Rational did not expect to realize a profit from its management of the Fund in the first 12 months of operations, but did expect to realize a profit during the second year. The Board concluded that the level of Rational’s profitability with respect to the Fund did not raise any concerns.
Economies of Scale. The Board considered the terms of the Rational Management Agreement and noted that the fee payable under the Agreement was a unitary fee, and the Agreement did not contain breakpoints that would reduce the fee rate payable by the Halt Climate Change ETF as assets reached certain levels. The Board considered that Rational, in its 15(c) Response, stated that it anticipated that neither Fund nor Rational would benefit from economies of scale because even at higher asset levels, the Fund would still have a certain level of ongoing operating expenses that would be covered by the unitary fee. After further discussion, the Board determined that the issue of economies of scale would be revisited as assets of the Fund grew materially.
“Fall-out” Benefits. The Board considered the fall-out benefits that Rational was expected to receive from its relationship with the Halt Climate Change ETF and the Trust.
Conclusion. No single factor was determinative to the decision of the Board. Having reviewed and discussed in depth such information from Rational as the Board believed to be reasonably necessary to evaluate the terms of the Halt Climate Change Management Agreement, and as assisted by the advice of counsel, the Board concluded that approval of the Halt Climate Change Management Agreement was in the best interests of the Halt Climate Change ETF and its future shareholders.
Annual Shareholder Report | 45
Board of Trustees and Trust Officers (Unaudited)
The following tables provide information about Board of Trustees and the senior officers of the Trust. Each of the Trustees is deemed to be an Independent Trustee of the Trust. Each Trustee oversees all portfolios of the Trust and serves for an indefinite term. Information about each Trustee is provided below and includes each person’s: name, address, age (as of the date of the Funds’ most recent fiscal year end), present position(s) held with the Trust, and principal occupations for the past five years. Unless otherwise noted, the business address of each person listed below is c/o Strategy Shares, 36 North New York Avenue, Huntington, NY 11743. Unless otherwise noted, each officer is elected annually by the Board. Unless otherwise noted, each Trustee and officer also serves in the same capacity for Mutual Fund and Variable Insurance Trust, another open-end investment company whose series are managed by Rational Advisors, Inc. (“Rational”), and AlphaCentric Prime Meridian Income Fund, a closed-end investment company managed by AlphaCentric Advisors, LLC, an affiliate of Rational. Collectively, the Trust, Mutual Fund and Variable Insurance Trust, Mutual Fund Series Trust, and AlphaCentric Prime Meridian Income Fund comprise the “Fund Complex” as of April 30, 2022.
Independent Trustees Background
| Number of | |||||
| Portfolios | |||||
| in Fund | |||||
| Position | Term of Office | Complex | |||
| Name, Address | with | and Length of | Principal Occupation(s) | Overseen | |
| and Year of Birth | the Trust | Time Served | During Past 5 Years | by Trustee | Other Directorships Held by Trustee |
| Tobias Caldwell Year of Birth: 1967 | Chairman of the Board and Trustee | Since 2016 | Managing Member, Genovese Family Enterprises, LLC (real estate firm) since 1999; Managing member, Bear Properties, LLC (real estate firm) since 2006; Managing member, PTL Real Estate, LLC (real estate/ investment firm), 2000–2019. | 54 | Chairman of the Board of Trustees, Mutual Fund and Variable Insurance Trust since 2016; Lead independent Trustee and Chairman of Audit Committee, Mutual Fund Series Trust since 2006; Independent Trustee and Chair of Audit Committee, Variable Insurance Trust since 2010; Trustee, IDX Funds (formerly M3Sixty Funds Trust) since 2016; Chairman of the Board, AlphaCentric Prime Meridian Income Fund since 2018. |
| Stephen P. Lachenauer Year of Birth: 1967 | Trustee and Chair of the Audit, Risk and Compliance, and Investment Committees | Trustee and Chair of Audit, Risk and Compliance Committees since 2016 Chair of Investment Committee since November 2020 | Attorney, private practice since 2011 | 54 | Chair of the Audit and Risk and Compliance Committees and Trustee since 2016, and Chair of the Investment Committee since November 2020, Mutual Fund and Variable Insurance Trust; Trustee, TCG Financial Series Trusts I-X since 2015; Trustee and Chair of the Audit Committee since 2018, and Chair of the Investment Committee since November 2020, AlphaCentric Prime Meridian Income Fund; Trustee, Mutual Fund Series Trust since April 2022. |
Donald McIntosh Year of Birth: 1967 | Trustee | Since 2016 | Business Control & Risk Management Advisor, Santander Bank, since 2019; Quality Control Advisor, Santander Bank, 2016–2019. | 16 | Trustee, Mutual Fund and Variable Insurance Trust since 2016; Trustee, AlphaCentric Prime Meridian Income Fund since 2018. |
46 | Annual Shareholder Report
Board of Trustees and Trust Officers (Unaudited) (Continued)
Officers*
| Term of Office | |||
| Name, Address | Position with | and Length of | |
| and Year of Birth | the Trust | Time Served | Principal Occupation(s) During Past 5 Years |
| Michael Schoonover 53 Palmeras St., Suite 601 San Juan, PR 00901 Year of Birth: 1983 | President | Since 2022 | Vice President of the Trust from 2018 through 2021; Chief Operating Officer (“COO”), Catalyst Capital Advisors LLC and Rational Advisors, Inc. since 2017; Portfolio Manager, Catalyst Capital Advisors LLC, 2013–May 2021; President, MFund Distributors LLC since January 2020; COO, Catalyst International Advisors LLC, since 2019; COO, Insights Media LLC since 2019; COO, MFund Management LLC since 2019; COO, AlphaCentric Advisors LLC since January 2021; Portfolio Manager, Rational Advisors, Inc., 2016–2018 |
| Alex Merino 53 Palmeras St. Suite 601 San Juan, PR 00901 Year of Birth: 1985 | Vice President | Since 2022 | Investment Operations Manager, MFund Management LLC since 2022; Investment Operations Analyst, MFund Management LLC, 2020--2021; Tax Senior Associate, PwC Asset & Wealth Management NY Metro, 2016–2019. |
| James Szilagyi Year of Birth: 1963 | Treasurer | Since 2016 | Product Manager, Catalyst Capital Advisors LLC since 2015. |
| Frederick J. Schmidt Year of Birth: 1959 | Chief Compliance Officer | Since 2016 | Director, MFund Services LLC since 2015. |
| Jennifer A. Bailey Year of Birth: 1968 | Secretary | Since 2016 | Director of Legal Services, MFund Services LLC since 2012. |
| * | Officers do not receive any compensation from the Trust |
The Funds’ Statement of Additional Information (“SAI”) includes additional information about the Trustees and is available without charge, upon request. You may call toll-free at 855-477-3837 to request a copy of the SAI or to make shareholder inquiries.
Annual Shareholder Report | 47
VOTING PROXIES ON FUND PORTFOLIO SECURITIES
A copy of the policies and procedures that the Funds use to determine how to vote proxies relating to securities held in the Funds’ portfolios, as well as a record of how the Funds voted any such proxies during the most recent 12-month period ended June 30, is available without charge and upon request by calling 1-855-HSS-ETFS or 1-855-477-3837 or at www.strategysharesetfs.com. This information is also available from the EDGAR database on the SEC’s website at www.sec.gov.
QUARTERLY PORTFOLIO SCHEDULE
The Funds file with the SEC a complete schedule of their portfolio holdings, as of the close of the first and third quarters of their fiscal year, on Form N-PORT. These filings are available on the SEC’s website at www.sec.gov. You may also access this information at www.strategysharesetfs.com by selecting Form N-PORT.
Rational Advisors, Inc. is the investment advisor of the Funds. Rational Advisors, Inc. maintains corporate records of the Funds. Foreside Fund Services, LLC is the principal underwriter and distributor of each Fund’s shares.
Exchange-traded funds are not bank deposits or obligations, are not guaranteed by any bank, and are not insured or guaranteed by the U.S. government, the Federal Deposit Insurance Corporation, the Federal Reserve Board, or any other government agency. Investment in exchange-traded funds involves investment risk, including the possible loss of principal.
This report is authorized for distribution to prospective investors only when preceded or accompanied by a prospectus which contains facts concerning the Funds’ objectives and policies, management fees, expenses and other information.
| Strategy Shares | Strategy Shares | Strategy Shares | Strategy Shares | Strategy Shares |
| Nasdaq 5HANDL™ Index ETF (FIVR) | Gold-Hedged Bond ETF (GLDB) | Nasdaq 7HANDL™ Index ETF (HNDL) | Halt Climate Change ETF (NZRO) | Newfound/ReSolve Robust Momentum ETF (ROMO) |
| Cusip 86280R852 | Cusip 86280R878 | Cusip 86280R506 | Cusip 86280R837 | Cusip 86280R886 |
Strategy Shares Shareholder Services: 1-855-477-3837
 |
| Annual Shareholder Report |
| Day Hagan/Ned Davis Research Smart Sector ETF (SSUS) |
| Day Hagan/Ned Davis Research Smart Sector Fixed Income ETF (SSFI) |
| APRIL 30, 2022 |
| You may elect to receive all shareholder reports in paper free of charge. You can contact your financial intermediary to request that you receive paper copies of your reports. Your election to receive reports in paper will apply to all funds held with your financial intermediary. |
| TABLE OF CONTENTS | Page |
| Management’s Discussion of Fund Performance | |
| Day Hagan/Ned Davis Research Smart Sector ETF (SSUS) | 1 |
| Day Hagan/Ned Davis Research Smart Sector Fixed Income ETF (SSFI) | 4 |
| Expense Examples | 7 |
| Portfolio of Investments | |
| Day Hagan/Ned Davis Research Smart Sector ETF (SSUS) | 8 |
| Day Hagan/Ned Davis Research Smart Sector Fixed Income ETF (SSFI) | 9 |
| Statements of Assets and Liabilities | 10 |
| Statements of Operation | 11 |
| Statements of Changes in Net Assets | 12 |
| Financial Highlights | 13 |
| Notes to Financial Statements | 14 |
| Report of Independent Registered Public Accounting Firm | 19 |
| Additional Information | 21 |
| Board of Trustees and Trust Officers | 23 |
[THIS PAGE INTENTIONALLY LEFT BLANK]
| Day Hagan/Ned Davis Research Smart Sector ETF (SSUS) (Unaudited) | April 30, 2022 |
Management Discussion of Fund Performance
Dear Shareholder:
The Fund is actively managed using proprietary investment models co-developed with Ned Davis Research (“NDR”). The Fund is considered a “fund of funds” that, under normal market conditions, seeks to achieve its investment objective by principally investing in unaffiliated equity exchange traded funds (“ETFs”) that track the performance of the individual sectors (“Sectors”) of the S&P 500 Index (“Index”). The Fund will attempt to enhance returns relative to the Index by overweighting and underweighting its exposure to the Sectors relative to the Index and may reduce its overall exposure to ETFs as determined by its risk management model.
The Fund utilizes the NDR U.S. Sector Model to determine its allocation to each Sector. The models combine sector-specific price-based, economic, fundamental, and behavioral indicators to form composites for each Sector. By combining multiple and diverse indicators, which historically have been shown to add value in Sector allocation decisions, the model seeks to objectively assess the weight of the evidence and generate sector allocation recommendations. As of April 30, 2022, the targeted Sectors are real estate, utilities, consumer staples, information technology, health care, financials, energy, consumer discretionary, materials, industrials, and communications services.
The Fund’s risk management model, the NDR U.S. Stock Market Model Composite (“NDR Catastrophic Stop Model”), defines the Fund’s overall equity allocation target. The model reading represents the net percentage of indicators that are bullish. By taking the weight of the evidence of technical, monetary, economic, valuation, and sentiment indicators, the model measures the potential risk level of factors the stock market faces.
Under normal market conditions, the Fund intends to invest predominantly in ETFs but will reduce its exposure by as much as 50% of its assets during times that the model deems the market to have a low reward-to-risk ratio from a historical perspective. During these times, the Fund may hold up to 50% of its assets in cash and cash equivalents.
On January 31, 2022, the NDR Catastrophic Stop Model triggered a sell signal whereby the Fund moved to an approximately 50% cash position. The Model then generated a buy signal on March 29, 2022, and the strategy moved back to fully invested.
During the time the NDR Catastrophic Stop model was defensive, central banks tightened policy, interest rates moved significantly higher, global recession fears grew, reported inflation statistics hit record levels, commodity prices spiked, energy prices melted up, concerns grew around the U.S. dollar’s status as a reserve currency, fears (internationally) around COVID BA.2 led to regional lockdowns, supply shortages continued, and, Russia began its invasion of Ukraine. The NDR Catastrophic Stop model’s cash position, in our view, guarded well against those potential catastrophic threats to the financial markets.
With the model returning to a buy signal, our objective modeling indicates that, at this point, those risks have been largely priced in and recent indicator improvement leads us to a fully invested position. We now focus on the NDR Smart Sector models to provide the portfolio’s risk management.
To be clear, should risks re-accelerate, we will move the portfolio back to a defensive positioning.
Regarding the NDR Catastrophic Stop Model: There was improvement across a number of indicator types during the reporting period, including strengthening equity market trends, rising stock/bond relative strength, and broadening global equity market participation. Although not on bullish signals yet, global high yield option-adjusted spreads have started to roll over from elevated levels. We believe this measure could be demonstrating initial signs of improving activity within the global economy and financial markets. However, if economic growth rolls over and the market-based indicators confirm sustained weakness, the NDR Catastrophic Stop model is designed to respond accordingly by raising cash.
Annual Shareholder Report | 1
| Day Hagan/Ned Davis Research Smart Sector ETF (SSUS) (Unaudited) (Continued) |
There are two sides to every strategy: when to sell and when to buy. The other side of this strategy is that we seek to get reinvested as soon as the models show risks have abated and it appears the potential for reward has improved. Whether it takes one day, one week, one month, or several quarters, the NDR models will guide our investment path.
This strategy utilizes measures of price, valuation, economic trends, monetary liquidity, and market sentiment to make objective, unemotional, rational decisions about how much capital to place at risk, as well as where to place that capital.
For the year ending April 30, 2022, the Day Hagan/Ned Davis Research Smart Sector ETF (SSUS) generated a total return of 1.26% at net asset value and 1.29% at market value. During this same period, the Fund’s benchmark, the S&P 500 Index was up 0.21%.
We are pleased with the Fund’s performance relative to its benchmark, especially given the backdrop of a more hawkish Fed, inflation, rising interest rates, and geopolitical upheavals. We continue to focus on our objective, quantitative, and unemotional indicators and models to guide our path forward.
Sincerely,

Donald L. Hagan, CFA
Portfolio Manager
Day Hagan/Ned Davis Research Smart Sector ETF
The views and opinions expressed in management’s discussion of Fund performance are those of Day Hagan Asset Management and its affiliates. These views and opinions are subject to change at any time based on factors such as market and economic conditions. These views and opinions may not be relied upon as investment advice or recommendations, or as an offer for a particular security. The information is not a complete analysis of every aspect of any market, country, industry, security or the Fund. Statements of fact are from sources considered reliable, but Day Hagan Asset Management makes no representation or warranty as to their completeness or accuracy. Although historical performance is no guarantee of future results, these insights may help you understand our investment management philosophy.
The S&P 500 Index is a capitalization-weighted, composite index of 500 stocks designed to measure the performance of the broad domestic economy through changes in the aggregate market value of 500 stocks representing all major industries.
Must be preceded or accompanied by a prospectus.
All investments involve risk, including loss of principal. Past performance is no guarantee of future results. Please see the Fund’s prospectus for specific details regarding investment objectives, risks, performance, and other important information. Review this information carefully before you make any investment decision. Investors cannot invest directly in an index, and unmanaged index returns do not reflect any fees, expenses or sales charges.
The Fund is distributed by Foreside Fund Services, LLC.
2 | Annual Shareholder Report
| Day Hagan/Ned Davis Research Smart Sector ETF (SSUS) (Unaudited) (Continued) |
Investment Objective
Day Hagan/Ned Davis Research Smart Sector ETF seeks long-term capital appreciation and preservation of capital.
Fund Performance (as of 4/30/22)
| Average Annual Total Returns | Expense Ratios(a) | |||||||
| One Year | Inception(b) | Gross | Net | |||||
| Day Hagan/Ned Davis Research Smart Sector ETF - Total Return (at Net Asset Value)(c) | 1.26% | 13.23% | 0.81% | 0.81% | ||||
| Day Hagan/Ned Davis Research Smart Sector ETF - Total Return (at Market Value)(d) | 1.29% | 13.22% | 0.81% | 0.81% | ||||
| S&P 500 Index(e) | 0.21% | 11.84% | N/A | N/A | ||||
Hypothetical Growth of a $10,000 Investment (*)
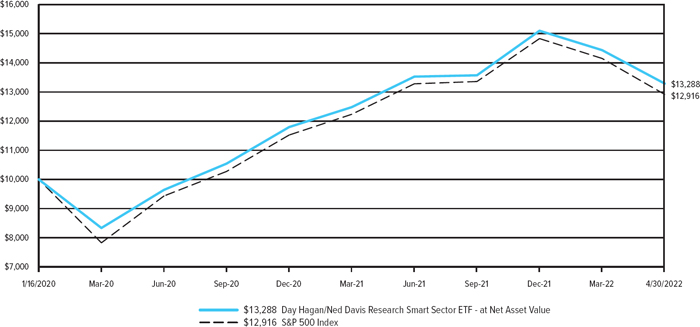
Past performance does not guarantee future results.. Return calculations assume the reinvestment of distributions and do not reflect taxes that a shareholder would pay on Fund distributions or on the redemption of Fund shares.. The performance data quoted represent past performance and current returns may be lower or higher.. The investment return and principal value will fluctuate so that an investor’s shares, when redeemed may be worth more or less than the original cost. . The performance above reflects any fee reductions during the applicable periods. . If such fee reductions had not occurred, the quoted performance would be lower.. To obtain performance information current to the most recent month-end, please call 800-594-7930 or visit http://dhfunds..com/
| * | The chart represents historical performance of a hypothetical investment of $10,000 in Day Hagan/Ned Davis Research Smart Sector ETF and represents the reinvestment of dividends and capital gains in the Fund. |
| (a) | The expense ratios reflect the expense ratios as reported in the Fund’s Prospectus dated September 1, 2021. Additional information pertaining to the Fund’s expense ratio as of April 30, 2022 can be found in the Financial Highlights. |
| (b) | Commencement of operations: January 16, 2020. |
| (c) | Net asset value total return is calculated assuming an initial investment made at the net asset value at the beginning of the period, reinvestment of all distributions, including dividends and return of capital, at net asset value during the period, if any, and redemption on the last day of the period at net asset value. This percentage is not an indication of the performance of a shareholder’s investment in the Fund based on market value due to differences between the market price of the shares and the net asset value per share of the Fund. |
| (d) | Market value total return is calculated assuming an initial investment made at the market value at the beginning of the period, reinvestment of all distributions, including dividends and return of capital, at net asset value during the period, if any, and redemption on the last day of the period at market value. Market value is determined by the composite closing price. Composite closing security price is defined as the last reported sale price from the Fund’s listing market (e.g., NYSE Arca) or participating regional exchanges or markets. The composite closing price is the last reported sale price from any of the eligible sources, regardless of volume and not an average price and may have occurred on a date prior to the close of the reporting period. Market value may be greater or less than net asset value, depending on the Fund’s closing price on the listing market. |
| (e) | The S&P 500 Index is widely regarded as the best single gauge of large-cap U.S. equities. The index includes 500 leading companies and covers approximately 80% of available market capitalization. An investor cannot invest directly in an index. |
Annual Shareholder Report | 3
| Day Hagan/Ned Davis Research Smart Sector Fixed Income ETF (SSFI) (Unaudited) | April 30, 2022 |
Management Discussion of Fund Performance
Dear Shareholder:
The Fund is actively managed using proprietary investment models co-developed with Ned Davis Research (“NDR”). The Fund is considered a “fund of funds” that, under normal market conditions, seeks to achieve its investment objective by principally investing in unaffiliated fixed income exchange traded funds (“ETFs”) that invest in fixed income categories (“Underlying Funds”). The fixed income categories to which the Fund may seek exposure through the Underlying Funds are U.S. investment grade corporate, U.S. long-term treasury, U.S. mortgage-backed securities, international investment grade bonds, U.S. treasury inflation-protected securities, U.S. high yield bonds, emerging market bonds, and U.S. floating rate notes (each, a “Category”, and collectively, the “Categories”).
The Fund utilizes the Ned Davis Research Fixed Income Model developed by NDR, to determine its allocation to each Category. The model combines unique macroeconomic and technical indicators that are designed to (i) evaluate the relative attractiveness of Underlying Funds across Categories; (ii) reallocate assets from categories with unfavorable characteristics to areas providing the greatest opportunities; and (iii) protect capital by lowering duration and reducing credit risk during weak economic environments. The indicators for each Category focus on risk/reward characteristics of each category with the goal of investing in the areas that have the highest probability of maximizing total return. By combining multiple and diverse indicators, which historically have been shown to add value in Category allocation decisions, the model seeks to objectively assess the weight of the evidence and generate Category allocation recommendations.
The risk management aspect of the Fund’s Fixed Income Model, which is also used in the Day Hagan / Ned Davis Research Smart Sector® ETF, defines the Fund’s overall cash allocation. By taking the weight of the evidence of technical, monetary, economic, valuation, and sentiment indicators, the model measures the potential risk level that certain categories of the fixed income market may face. When the model triggers a sell, cash is raised by reducing the Fixed Income Model allocations to the U.S. floating rate, U.S. investment grade, U.S. high yield and emerging market bond categories by half. It is our view that these fixed income categories have high correlations to equity markets.
On January 31, 2022, the model triggered a sell signal. The model then generated a buy signal on March 29, 2022, and the strategy moved back to the full recommended allocation percentages of the various fixed income categories.
During the time the model was defensive, central banks tightened policy, interest rates moved significantly higher, global recession fears grew, reported inflation statistics hit record levels, commodity prices spiked, energy prices melted up, concerns grew around the U.S. dollar’s status as a reserve currency, fears (internationally) around COVID BA.2 led to regional lockdowns, supply shortages continued, and Russia began its invasion of Ukraine. The model’s sell signal, in our view, guarded well against those potential catastrophic threats to the financial markets.
With the model returning to a buy signal, our objective modeling indicates that, at this point, those risks have been largely priced in. To be clear, should risks re-accelerate, we will be quick to move the portfolio back to a defensive positioning by reducing exposure to the fixed income categories that have, in our interpretation, high correlation to equity markets.
There are two sides to every strategy: when to sell and when to buy. The other side of this strategy is that we seek to get reinvested in those fixed income categories as soon as the model shows risks have abated and the potential for reward has improved. Whether it takes one day, one week, one month, or several quarters, the NDR models will guide our investment path.
4 | Annual Shareholder Report
| Day Hagan/Ned Davis Research Smart Sector Fixed Income ETF (SSFI) (Unaudited) (Continued) |
The Fund was launched on September 28, 2021. Since inception, the Day Hagan/Ned Davis Research Smart Sector® Fixed Income ETF (SSFI) generated a return of -7.06% at market value, and -7.10% at net asset value. During this same period, the Fund’s benchmark, the Bloomberg US Aggregate Bond Index, was down -9.40%.
We are pleased with the Fund’s performance relative to its benchmark, especially given the backdrop of a more hawkish Fed, inflation, rising interest rates, and geopolitical upheavals. We continue to focus on our objective, quantitative, and unemotional indicators and models to guide our path forward.
Sincerely,
Donald L. Hagan, CFA
Portfolio Manager
Day Hagan/Ned Davis Research Smart Sector® Fixed Income ETF
The views and opinions expressed in management’s discussion of Fund performance are those of Day Hagan Asset Management and its affiliates. These views and opinions are subject to change at any time based on factors such as market and economic conditions. These views and opinions may not be relied upon as investment advice or recommendations, or as an offer for a particular security. The information is not a complete analysis of every aspect of any market, country, industry, security or the Fund. Statements of fact are from sources considered reliable, but Day Hagan Asset Management makes no representation or warranty as to their completeness or accuracy. Although historical performance is no guarantee of future results, these insights may help you understand our investment management philosophy.
The Bloomberg US Aggregate Bond Index is a broad based, market capitalization-weighted bond market index representing intermediate term investment grade bonds traded in the United States. The index tracks investment grade corporate debt, government debt, mortgage-backed securities (MBS) and asset-backed securities (ABS) to simulate the universe of investable bonds that are rated investment grade or higher, have an outstanding par value of at least $100 million, and have at least one year to maturity.
Must be preceded or accompanied by a prospectus.
All investments involve risk, including loss of principal. Past performance is no guarantee of future results. Please see the Fund’s prospectus for specific details regarding investment objectives, risks, performance, and other important information. Review this information carefully before you make any investment decision. Investors cannot invest directly in an index, and unmanaged index returns do not reflect any fees, expenses or sales charges.
The Fund is distributed by Foreside Fund Services, LLC.
Annual Shareholder Report | 5
| Day Hagan/Ned Davis Research Smart Sector Fixed Income ETF (SSFI) (Unaudited) (Continued) |
Investment Objective
Day Hagan/Ned Davis Research Smart Sector Fixed Income ETF’s investment objective is total return, consisting of income and capital appreciation.
Fund Performance (as of 4/30/22)
| Average Annual Total Returns | Expense Ratios(a) | |||||||
| One Year | Inception(b) | Gross | Net | |||||
| Day Hagan/Ned Davis Research Smart Sector Fixed Income ETF - Total Return (at Net Asset Value)(c) | N/A | -7.10% | 0.79% | 0.79% | ||||
| Day Hagan/Ned Davis Research Smart Sector Fixed Income ETF - Total Return (at Market Value)(d) | N/A | -7.06% | 0.79% | 0.79% | ||||
| Bloomberg U.S. Aggregate Bond Index(e) | N/A | -9.40% | N/A | N/A | ||||
Hypothetical Growth of a $10,000 Investment (*)
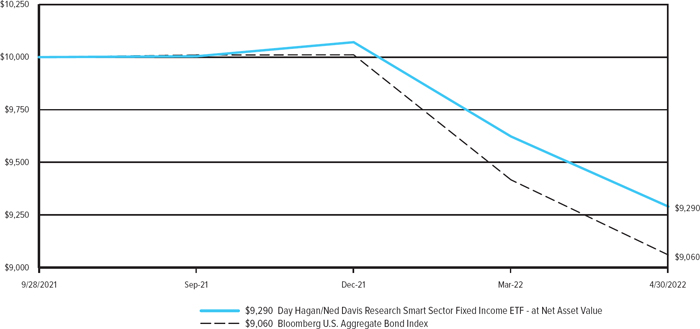
Past performance does not guarantee future results.. Return calculations assume the reinvestment of distributions and do not reflect taxes that a shareholder would pay on Fund distributions or on the redemption of Fund shares.. The performance data quoted represent past performance and current returns may be lower or higher.. The investment return and principal value will fluctuate so that an investor’s shares, when redeemed may be worth more or less than the original cost. . The performance above reflects any fee reductions during the applicable periods. . If such fee reductions had not occurred, the quoted performance would be lower.. To obtain performance information current to the most recent month-end, please call 800-594-7930 or visit http://dhfunds..com/
| * | The chart represents historical performance of a hypothetical investment of $10,000 in Day Hagan/Ned Davis Research Smart Sector Fixed Income ETF and represents the income and capital appreciation in the Fund. |
| (a) | The expense ratios reflect the expense ratios as reported in the Fund’s Prospectus dated September 27, 2021. Additional information pertaining to the Fund’s expense ratio as of April 30, 2022 can be found in the Financial Highlights. |
| (b) | Commencement of operations: September 28, 2021. |
| (c) | Net asset value total return is calculated assuming an initial investment made at the net asset value at the beginning of the period, reinvestment of all distributions, including dividends and return of capital, at net asset value during the period, if any, and redemption on the last day of the period at net asset value. This percentage is not an indication of the performance of a shareholder’s investment in the Fund based on market value due to differences between the market price of the shares and the net asset value per share of the Fund. |
| (d) | Market value total return is calculated assuming an initial investment made at the market value at the beginning of the period, reinvestment of all distributions, including dividends and return of capital, at net asset value during the period, if any, and redemption on the last day of the period at market value. Market value is determined by the composite closing price. Composite closing security price is defined as the last reported sale price from the Fund’s listing market (e.g., NYSE Arca) or participating regional exchanges or markets. The composite closing price is the last reported sale price from any of the eligible sources, regardless of volume and not an average price and may have occurred on a date prior to the close of the reporting period. Market value may be greater or less than net asset value, depending on the Fund’s closing price on the listing market. |
| (e) | The Bloomberg U.S. Aggregate Bond Index is a broad-based flagship benchmark that measures the investment grade, U.S. dollar-denominated, fixed-rate taxable bond market. This includes Treasuries, government -related and corporate securities, mortgage-backed securities (agency fixed-rate and hybrid ARM pass-throughs), asset-backed securities and collateralized mortgage-backed securities (agency and non-agency). An investor cannot invest directly in an index. |
6 | Annual Shareholder Report
| Expense Examples (Unaudited) | April 30, 2022 |
As a Fund shareholder, you may incur two types of costs: (1) transaction costs, including commissions on trading, as applicable; and (2) ongoing costs, including advisory fees and other Fund expenses. These examples are intended to help you understand your ongoing costs (in dollars) of investing in the Fund and to compare these costs with the ongoing costs of investing in other mutual funds.
The expense examples below are based on an investment of $1,000 invested at November 1, 2021 and held through the period ended April 30, 2022.
The Actual Expense figures in the table below provide information about actual account values and actual expenses. You may use this information, together with the amount you invested, to estimate the expenses that you paid over the period. Simply divide your account value by $1,000 (for example, an $8,600 account value divided by $1,000 = 8.6), then multiply the result by the number in the table under the heading entitled “Actual Expenses Paid During the Period” to estimate the expenses you paid on your account during this period.
The Hypothetical Expense figures in the table below provides information about hypothetical account values and hypothetical expenses based on each Fund’s actual expense ratio and an assumed rate of return of 5% per year before expenses, which is not each Fund’s actual return. The hypothetical account values and expenses may not be used to estimate the actual ending account balance or expenses you paid for the period. You may use this information to compare the ongoing costs of investing in your Fund and other funds. To do so, compare this 5% hypothetical example with the 5% hypothetical examples that appear in the shareholder reports of the other funds.
Please note that the expenses shown in the table are meant to highlight your ongoing costs only and do not reflect any transactional costs. Therefore, the examples are useful in comparing ongoing costs only and will not help you determine the relative total cost of owning different funds. In addition, if these transactional costs were included, your costs would have been higher.
| Beginning | Actual Ending | Hypothetical | Actual | Hypothetical | Annualized | |
| Account | Account | Ending | Expenses | Expenses | Net Expense | |
| Value | Value | Account Value | Paid During | Paid During | Ratio During | |
| Fund | 11/1/21 | 4/30/22 | 4/30/22(1) | the Period(2) | the Period(1) | the Period |
| Day Hagan/Ned Davis Research Smart Sector ETF (SSUS) | $1,000.00 | $912.80 | $1,021.42 | $3.23 | $3.41 | 0.68% |
| Day Hagan/Ned Davis Research Smart Sector Fixed Income ETF (SSFI) | 1,000.00 | 923.80 | 1,021.42 | 3.24 | 3.41 | 0.68% |
| (1) | Represents the hypothetical 5% annual return before expenses. |
| (2) | Expenses are equal to the Fund’s annualized expense ratio multiplied by the average account value over the period multiplied by 181/365 (to reflect the one half year period). |
Annual Shareholder Report | 7
| Day Hagan/Ned Davis Research Smart Sector ETF (SSUS) | April 30, 2022 |
Portfolio of Investments Summary Table
| Percentage of Fair Value | |
| Exchange-Traded Funds | 100.0% |
| Total | 100.0% |
Portfolio holdings and allocations are subject to change. As of April 30, 2022, percentages in the table above are based on total investments. Such total investments may differ from the percentages set forth in the following Portfolio of Investments which are computed using the Fund’s total net assets.
Portfolio of Investments
| Shares | Fair Value | |||||||
| Exchange-Traded Funds — 99.0% | ||||||||
| 745,455 | Communication Services Select Sector SPDR Fund ETF | $ | 44,026,572 | |||||
| 176,264 | Consumer Discretionary Select Sector SPDR Fund ETF | 28,709,880 | ||||||
| 370,896 | Consumer Staples Select Sector SPDR Fund ETF | 28,796,365 | ||||||
| 395,972 | Energy Select Sector SPDR Fund ETF | 29,757,296 | ||||||
| 1,289,126 | Financial Select Sector SPDR Fund ETF | 44,487,738 | ||||||
| 553,469 | Health Care Select Sector SPDR Fund ETF | 72,111,476 | ||||||
| 426,541 | Industrial Select Sector SPDR Fund ETF | 40,581,111 | ||||||
| 259,029 | Materials Select Sector SPDR Fund ETF | 22,025,236 | ||||||
| 211,476 | Real Estate Select Sector SPDR Fund ETF | 9,854,782 | ||||||
| 846,958 | Technology Select Sector SPDR Fund ETF | 119,776,801 | ||||||
| 250,954 | Utilities Select Sector SPDR Fund ETF | 17,882,982 | ||||||
| 21,422 | Vanguard Communication Services ETF | 2,187,186 | ||||||
| 12,810 | Vanguard Consumer Staples ETF | 2,563,409 | ||||||
| Total Exchange-Traded Funds (Cost $484,938,740) | $ | 462,760,834 | ||||||
| Total Investments — 99.0% (Cost $484,938,740) | $ | 462,760,834 | ||||||
| Other Assets less Liabilities — 1.0% | 4,645,833 | |||||||
| Net Assets — 100.0% | $ | 467,406,667 | ||||||
ETF — Exchange-Traded Fund
SPDR — Standard and Poor’s Depositary Receipts
(See notes which are an integral part of the Financial Statements)
8 | Annual Shareholder Report
| Day Hagan/Ned Davis Research Smart Sector Fixed Income ETF (SSFI) | April 30, 2022 |
Portfolio of Investments Summary Table
| Percentage of Fair Value | |
| Exchange-Traded Funds | 100.0% |
| Total | 100.0% |
Portfolio holdings and allocations are subject to change. As of April 30, 2022, percentages in the table above are based on total investments. Such total investments may differ from the percentages set forth in the following Portfolio of Investments which are computed using the Fund’s total net assets.
Portfolio of Investments
| Shares | Fair Value | |||||||
| Exchange-Traded Funds — 86.4% | ||||||||
| 125,453 | SPDR Bloomberg Investment Grade Floating Rate ETF | $ | 3,822,553 | |||||
| 79,664 | SPDR Portfolio Corporate Bond ETF | 2,408,243 | ||||||
| 127,553 | SPDR Portfolio High Yield Bond ETF | 3,068,925 | ||||||
| 68,785 | SPDR Portfolio Long Term Treasury ETF | 2,361,389 | ||||||
| 85,680 | SPDR Portfolio Mortgage Backed Bond ETF | 1,975,781 | ||||||
| 47,422 | Vanguard Emerging Markets Government Bond ETF | 3,085,275 | ||||||
| 40,243 | Vanguard Short-Term Inflation-Protected Securities ETF | 2,039,113 | ||||||
| 48,983 | Vanguard Total International Bond ETF | 2,489,806 | ||||||
| Total Exchange-Traded Funds (Cost $22,772,259) | $ | 21,251,085 | ||||||
| Total Investments — 86.4% (Cost $22,772,259) | $ | 21,251,085 | ||||||
| Other Assets less Liabilities — 13.6% | 3,360,271 | |||||||
| Net Assets — 100.0% | $ | 24,611,356 | ||||||
| ETF — Exchange-Traded Fund |
| SPDR — Standard and Poor’s Depositary Receipts |
(See notes which are an integral part of the Financial Statements)
Annual Shareholder Report | 9
| Statements of Assets and Liabilities | April 30, 2022 |
| Day Hagan/Ned Davis | Day Hagan/Ned Davis | |||||||
| Research Smart Sector | Research Smart Sector | |||||||
| ETF (SSUS) | Fixed Income ETF (SSFI) | |||||||
| Assets: | ||||||||
| Investments, at value (Cost $484,938,740 and $22,772,259) | $ | 462,760,834 | $ | 21,251,085 | ||||
| Cash and Cash Equivalents | 4,906,203 | 3,374,248 | ||||||
| Receivable for capital shares issued | 845,357 | — | ||||||
| Total Assets | 468,512,394 | 24,625,333 | ||||||
| Liabilities: | ||||||||
| Payable for investments purchased | 836,541 | — | ||||||
| Accrued expenses: | ||||||||
| Advisory | 269,186 | 13,977 | ||||||
| Total Liabilities | 1,105,727 | 13,977 | ||||||
| Net Assets | $ | 467,406,667 | $ | 24,611,356 | ||||
| Net Assets consist of: | ||||||||
| Paid in Capital | $ | 494,470,602 | $ | 26,673,678 | ||||
| Total Distributable Earnings / (Loss) | (27,063,935 | ) | (2,062,322 | ) | ||||
| Net Assets | $ | 467,406,667 | $ | 24,611,356 | ||||
| Net Assets: | $ | 467,406,667 | $ | 24,611,356 | ||||
| Shares of Beneficial Interest Outstanding (unlimited number of shares authorized, no par value): | 14,300,000 | 1,075,000 | ||||||
| Net Asset Value (offering and redemption price per share): | $ | 32.69 | $ | 22.89 | ||||
(See notes which are an integral part of the Financial Statements)
10 | Annual Shareholder Report
| Statements of Operation | For the Periods Indicated |
| Day Hagan/Ned Davis | Day Hagan/Ned Davis | |||||||
| Research Smart Sector | Research Smart Sector | |||||||
| ETF (SSUS) | Fixed Income ETF (SSFI) | |||||||
| For the period | ||||||||
| Year Ended | September 28, 2021(a) | |||||||
| April 30, 2022 | through April 30, 2022 | |||||||
| Investment Income: | ||||||||
| Dividend income | $ | 4,030,768 | $ | 293,298 | ||||
| Interest income | 3,451 | — | ||||||
| Total Investment Income | 4,034,219 | 293,298 | ||||||
| Expenses: | ||||||||
| Advisory | 2,276,860 | 77,918 | ||||||
| Total Net Expenses | 2,276,860 | 77,918 | ||||||
| Net Investment Income | 1,757,359 | 215,380 | ||||||
| Realized and Unrealized Gains (Losses): | ||||||||
| Net realized gains (losses) from investment transactions | (2,860,927 | ) | (574,542 | ) | ||||
| Net realized gains (losses) from in-kind transactions | 37,413,221 | — | ||||||
| Change in unrealized appreciation/depreciation on investments | (51,179,437 | ) | (1,521,174 | ) | ||||
| Net Realized and Unrealized Gains (Losses) | (16,627,143 | ) | (2,095,716 | ) | ||||
| Change in Net Assets Resulting From Operations | $ | (14,869,784 | ) | $ | (1,880,336 | ) | ||
| (a) | Commencement of operations. |
(See notes which are an integral part of the Financial Statements)
Annual Shareholder Report | 11
| Statements of Changes in Net Assets |
| Day Hagan/Ned Davis | ||||||||||||
| Day Hagan/Ned Davis Research | Research Smart Sector | |||||||||||
| Smart Sector ETF (SSUS) | Fixed Income ETF (SSFI) | |||||||||||
| For the period | ||||||||||||
| Year Ended | Year Ended | September 28, 2021(a) | ||||||||||
| April 30, 2022 | April 30, 2021 | through April 30, 2022 | ||||||||||
| From Investment Activities: | ||||||||||||
| Operations: | ||||||||||||
| Net investment income | $ | 1,757,359 | $ | 840,949 | $ | 215,380 | ||||||
| Net realized gains (losses) from investment and in-kind transactions | 34,552,294 | 14,731,390 | (574,542 | ) | ||||||||
| Change in unrealized appreciation/depreciation on investments | (51,179,437 | ) | 29,693,548 | (1,521,174 | ) | |||||||
| Change in net assets resulting from operations | (14,869,784 | ) | 45,265,887 | (1,880,336 | ) | |||||||
| Distributions to Shareholders: | ||||||||||||
| Total distributions | (2,097,898 | ) | (684,487 | ) | (181,986 | ) | ||||||
| Change in net assets from distributions | (2,097,898 | ) | (684,487 | ) | (181,986 | ) | ||||||
| Capital Transactions: | ||||||||||||
| Proceeds from shares issued | 426,409,759 | 191,689,432 | 26,673,678 | |||||||||
| Cost of shares redeemed | (163,572,462 | ) | (61,011,503 | ) | — | |||||||
| Change in net assets from capital transactions | 262,837,297 | 130,677,929 | 26,673,678 | |||||||||
| Change in net assets | 245,869,615 | 175,259,329 | 24,611,356 | |||||||||
| Net Assets: | ||||||||||||
| Beginning of period | 221,537,052 | 46,277,723 | — | |||||||||
| End of period | $ | 467,406,667 | $ | 221,537,052 | $ | 24,611,356 | ||||||
| Share Transactions: | ||||||||||||
| Issued | 12,125,000 | 6,850,000 | 1,075,000 | |||||||||
| Redeemed | (4,650,000 | ) | (2,125,000 | ) | — | |||||||
| Change in shares | 7,475,000 | 4,725,000 | 1,075,000 | |||||||||
| (a) | Commencement of operations. |
(See notes which are an integral part of the Financial Statements)
12 | Annual Shareholder Report
| Financial Highlights |
| Net | Ratio of Net | |||||||||||||
| realized | Ratio of | Investment | Net | |||||||||||
| Net Asset | and | Distributions | Net Asset | Total | Ratio of Net | Gross | Income | Assets | ||||||
| Value, | Net | unrealized | Total from | from net | Value, | return at | Total | Expenses | Expenses | (Loss) to | at end | |||
| beginning | investment | gains | investment | investment | Total | end of | Net Asset | return at | to Average | to Average | Average | of period | Portfolio | |
| of period | income(a) | (losses) | activities | income | distributions | period | Value(b)(c) | market(b)(d) | Net Assets(e) | Net Assets(e) | Net Assets(e) | (000’s) | turnover(b)(f) | |
| Day Hagan/Ned Davis Research Smart Sector ETF (SSUS) | ||||||||||||||
| Year Ended April 30, 2022 | $32.46 | 0.18 | 0.25 | 0.43 | (0.20) | (0.20) | $32.69 | 1.26% | 1.29% | 0.68%(g) | 0.68%(g) | 0.52% | $467,407 | 111% |
| Year Ended April 30, 2021 | $22.04 | 0.20 | 10.36(h) | 10.56 | (0.14) | (0.14) | $32.46 | 48.02% | 47.19% | 0.68%(g) | 0.68%(g) | 0.71% | $221,537 | 84% |
| January 16, 2020(h) through April 30, 2020 | $24.86 | 0.01 | (2.83) | (2.82) | — | — | $22.04 | (11.34)% | (10.90)% | 0.68%(g) | 0.68%(g) | 0.23% | $46,278 | 27% |
| Day Hagan/Ned Davis Research Smart Sector Fixed Income ETF (SSFI) | ||||||||||||||
| September 28, 2021(i) through April 30, 2022 | $24.85 | 0.27 | (2.02) | (1.75) | (0.21) | (0.21) | $22.89 | (7.10)% | (7.06)% | 0.68%(g) | 0.68%(g) | 1.87% | $24,611 | 85% |
| (a) | Calculated using the average shares method. |
| (b) | Not annualized for periods less than one year. |
| (c) | Net asset value total return is calculated assuming an initial investment made at the net asset value at the beginning of the period, reinvestment of all dividends and distributions at net asset value during the period, if any, and redemption on the last day of the period at net asset value. This percentage is not an indication of the performance of a shareholder’s investment in the Fund based on market value due to differences between the market price of the shares and the net asset value per share of the Fund. |
| (d) | Market value total return is calculated assuming an initial investment made at the market value at the beginning of the period, reinvestment of all dividends and distributions at net asset value during the period, if any, and redemption on the last day of the period at market value. Market value is determined by the composite closing price. Composite closing security price is defined as the last reported sale price from any primary listing market (e.g., NYSE Arca) or participating regional exchanges or markets. The composite closing price is the last reported sale price from any of the eligible sources, regardless of volume and not an average price and may have occurred on a date prior to the close of the reporting period. Market value may be greater or less than net asset value, depending on the Fund’s closing price on the listing market. |
| (e) | Annualized for period less than one year. |
| (f) | Portfolio turnover increases/decreases due to change within portfolio holdings during the period. |
| (g) | The Fund invests in other funds and indirectly bears its proportionate shares of fees and expenses incurred by the underlying funds in which the Fund is invested. This ratio does not include these indirect fees and expenses. |
| (h) | The amount of net realized and unrealized gain on investments per share does not accord with the amounts in the Statements of Operations due to the timing of shareholder subscriptions and redemptions relative to fluctuating net asset values during the year. |
| (i) | Commencement of operations. |
(See notes which are an integral part of the Financial Statements)
Annual Shareholder Report | 13
| Notes to Financial Statements | April 30, 2022 |
(1) Organization
Strategy Shares (the “Trust”) was organized on September 7, 2010 as a Delaware statutory trust. The Trust is registered under the Investment Company Act of 1940 (the “1940 Act”), as an open-end management investment company. The Declaration of Trust permits the Trust to issue an unlimited number of shares of beneficial interest (“Shares”) in one or more series representing interests in separate portfolios of securities. Currently, the Trust offers its Shares in seven separate series. The assets of each series are segregated and a shareholder’s interest is limited to the series in which shares are held. The accompanying Financial Statements relate to the following series: Day Hagan/Ned Davis Research Smart Sector ETF (SSUS) and Day Hagan/Ned Davis Research Smart Sector Fixed Income ETF (SSFI) (individually referred to as a “Fund,” or collectively as the “Funds”). Each Fund is classified as non diversified under the 1940 Act and is an actively-managed exchange traded fund. The investment objective of the Day Hagan/Ned Davis Research Smart Sector ETF is to seek long-term capital appreciation and preservation of capital. The investment objective of the Day Hagan/ Ned Davis Research Smart Sector Fixed Income ETF is total return, consisting of income and capital appreciation. The Funds’ prospectuses provide a description of each Fund’s investment objectives, policies, and strategies. The assets of each Fund are segregated and a shareholder’s interest is limited to the Fund in which shares are held.
Day Hagan/Ned Davis Research Smart Sector ETF commenced operations on January 16, 2020. Day Hagan/Ned Davis Research Smart Sector Fixed Income ETF commenced operations on September 28, 2021. Shares of each Fund are listed and traded on the NYSE Arca, Inc. Market prices for the Shares may be different from their net asset value (“NAV”). Each Fund issues and redeems Shares on a continuous basis at NAV only in large blocks, currently 25,000 Shares, called “Creation Units.” Creation Units are issued and redeemed principally in- kind for securities included in a specified universe. Once created, Shares generally trade in the secondary market at market prices that change throughout the day in amounts less than a Creation Unit.
Under the Trust’s organizational documents, its officers and Board of Trustees (the “Board”) are indemnified against certain liabilities arising out of the performance of their duties to the Funds. In addition, in the normal course of business, the Trust may enter into contracts with vendors and others that provide for general indemnifications. The Trust’s maximum exposure under these arrangements is unknown, as this would involve future claims that may be made against the Trust. However, based on experience, the Trust expects that risk of loss to be remote.
(2) Significant Accounting Policies
The following is a summary of significant accounting policies consistently followed by each Fund in the preparation of its financial statements. These policies are in conformity with generally accepted accounting principles in the United States of America (“GAAP”). Each Fund is an investment company and accordingly follows the investment company accounting and reporting guidance of the Financial Accounting Standards Board (“FASB”) Accounting Standards Codification Topic 946 Financial Services - Investment Companies. The preparation of financial statements in conformity with GAAP requires management to make estimates and assumptions that affect the amounts of assets, liabilities and disclosure of contingent assets and liabilities at the date of the financial statements and the reported amounts of increases and decreases in net assets from operations during the reporting period. Actual results could differ from those estimates.
A. Investment Valuations
The Funds hold investments at fair value. Fair value is defined as the price that would be expected to be received to sell an asset or paid to transfer a liability in an orderly transaction between market participants at the measurement date. The valuation techniques used to determine fair value are further described below.
Security values are ordinarily obtained through the use of independent pricing services in accordance with procedures adopted by the Trust’s Board. Pursuant to these procedures, the Funds may use a pricing service, bank, or broker-dealer experienced in such matters to value the Funds’ securities. When reliable market quotations are not readily available for any security, the fair value of that security will be determined by a committee established by the Board in accordance with procedures adopted by the Board. The fair valuation process is designed to value the subject security at the price the Funds would reasonably expect to receive upon its current sale. Additional consideration is given to securities that have experienced a decrease in the volume or level of activity or to circumstances that indicate that a transaction is not orderly.
The Trust has a three- tier fair value hierarchy that is dependent upon the various “inputs” used to determine the value of the Funds’ investments. The valuation techniques described below maximize the use of observable inputs and minimize the use of unobservable inputs in determining fair value. These inputs are summarized in the three broad levels listed below:
| ● | Level 1 – Quoted prices in active markets for identical assets. |
| ● | Level 2 – Other observable pricing inputs at the measurement date (including quoted prices for similar securities, interest rates, prepayment speeds, credit risk, etc.). |
| ● | Level 3 – Significant unobservable pricing inputs at the measurement date (including the Fund’s own assumptions in determining the fair value of investments). |
The inputs or methodology used for valuing investments are not necessarily an indication of the risk associated with investing in those investments.
Equity securities (including foreign equity securities) traded on a securities exchange are valued at the last reported sales price on the principal exchange. Equity securities quoted by Nasdaq are valued at the Nasdaq official closing price. If there is no reported sale on the principal exchange, and in the case of over-the-counter securities, equity securities are valued at a bid price estimated by the security pricing service. In each of these situations, valuations are typically categorized as Level 1 in the fair value hierarchy.
Debt securities traded on a national securities exchange or in the over-the-counter market are valued at the last reported sales price on the principal exchange. If there is no reported sale on the principal exchange, and for all other debt securities, debt securities are valued at a bid price estimated by a security pricing service. In each of these situations, valuations are typically categorized as Level 2 in the fair value hierarchy.
14 | Annual Shareholder Report
| Notes to Financial Statements (Continued) |
The following table provides the fair value measurement as of April 30, 2022.
| Total | ||||||||
| Fund | Level 1 | Investments | ||||||
| Day Hagan/Ned Davis Research Smart Sector ETF | ||||||||
| Exchange-Traded Funds | $ | 462,760,834 | $ | 462,760,834 | ||||
| Total Investments | $ | 462,760,834 | $ | 462,760,834 | ||||
| Day Hagan/Ned Davis Research Smart Sector Fixed Income ETF | ||||||||
| Exchange-Traded Funds | $ | 21,251,085 | $ | 21,251,085 | ||||
| Total Investments | $ | 21,251,085 | $ | 21,251,085 | ||||
For the fiscal year or period ended April 30, 2022, there were no Level 3 investments for which significant unobservable inputs were used to determine fair value.
B. Security Transactions and Related Income
Investment transactions are accounted for no later than the first calculation of the NAV on the business day following the trade date. For financial reporting purposes, however, security transactions are accounted for on the trade date on the last business day of the reporting period. Discounts and premiums on securities purchased are amortized over the lives of the respective securities using the effective interest method. Securities gains and losses are calculated on the identified cost basis. Interest income and expenses are accrued daily. Dividends, less foreign tax withholding, if any, are recorded on the ex-dividend date. Investment income from non-U.S. sources received by the Fund is generally subject to non-U.S. withholding taxes at rates ranging up to 30%. Such withholding taxes may be reduced or eliminated under the terms of applicable U.S. income tax treaties. The Funds may be subject to foreign taxes on gains in investments or currency repatriation. The Funds accrue such taxes, as applicable, based on their current interpretation of tax rules in the foreign markets in which they invest.
C. Cash and Cash Equivalents
Idle cash may be swept into various overnight demand deposits and is classified as cash and cash equivalents on the Statement of Assets and Liabilities. The Funds maintain cash in bank deposit accounts which, at times, may exceed United States federally insured limits. Amounts swept overnight are available on the next business day.
D. Dividends and Distributions to Shareholders
Dividends to shareholders are recorded on the ex-dividend date. For the Day Hagan/Ned Davis Research Smart Sector ETF, dividends from net investment income, if any, are declared and paid annually. For the Day Hagan/Ned Davis Research Smart Sector Fixed Income ETF, dividends from net investment income, if any, are declared and paid quarterly. Net realized capital gains, if any, are distributed at least annually.
The amount of dividends from net investment income and net realized gains are determined in accordance with federal income tax regulations, which may differ from GAAP. These “book/tax” differences are considered either temporary or permanent in nature. To the extent these differences are permanent in nature (e.g., distributions and income received from pass-through investments, differing treatment
of income relating to swap agreements), such amounts are reclassified within the capital accounts based on their nature for federal income tax purposes; temporary differences do not require reclassification. Temporary differences are primarily due to wash sales and differing treatment on certain investments. To the extent dividends and distributions exceed net investment income and net realized gains for tax purposes, they are reported as distribution of capital.
E. Allocation of Expenses
Expenses directly attributable to a Fund are charged to that Fund. Expenses not directly attributable to a Fund are allocated proportionally among all series of the Trust in relation to the net assets of each series or on another reasonable basis. The Trust may share expenses with Mutual Fund and Variable Insurance Trust, an open-end management investment company managed by Rational Advisors, Inc. Those expenses that are shared are allocated proportionally among each of the trusts or on another reasonable basis.
(3) Investment Advisory and Other Contractual Services A. Investment Advisory Fees
Donald L. Hagan, LLC, doing business as Day Hagan Asset Management (the “Advisor”), serves as the Funds’ investment advisor pursuant to a Management Agreement. Subject at all times to the oversight of the Board, the Advisor is responsible for the overall management of the Funds. The Trust has arranged for distribution, custody, fund administration, transfer agency and all other services necessary for the Funds to operate. The Advisor receives a fee for its services, a “Unified Fee.” Each Fund pays 0.68% of its average daily net assets, computed daily and paid monthly. Out of the Unified Fee, the Advisor is obligated to pay or arrange for the payment of substantially all expenses of the Funds, (including, without limitation, transfer agent fees, administrative fees and expenses, custodian fees, legal fees, accounting fees, any other expenses (including clerical expenses) of issue, sale, repurchase or redemption of shares, expenses of registering or qualifying shares for sale, transfer taxes, all expenses of preparing the Trust’s registration statements and prospectuses for the Funds, and the cost of printing and delivering to shareholders prospectuses and reports), except the Funds’ management fee; taxes; brokerage commissions and trading costs; interest (including borrowing costs and overdraft charges); short sale dividends and interest expenses; acquired fund fees and expenses; and non-routine or extraordinary expenses of the Funds (such as litigation or reorganizational costs), each of which is paid by the Funds. The Advisor’s Unified Fee is designed to cause substantially all of the Funds’ expenses to be paid and to compensate the Advisor for providing services for the Funds.
B. Distribution and Shareholder Services Fees
Foreside Fund Services, LLC (the “Distributor”) is the principal underwriter and distributor of each Fund’s Shares. The Distributor is compensated by the Advisor in accordance with a Distribution Services Agreement between the Advisor and the Distributor. The Trust has adopted but has yet to implement a Rule 12b-1 Distribution Plan (the “Plan”). The Plan is designed to compensate or reimburse financial intermediaries (including the Distributor, the Advisor, and their affiliates) for activities principally intended to result in the sale of Fund
Annual Shareholder Report | 15
| Notes to Financial Statements (Continued) |
shares, such as advertising and marketing of shares (including printing and disseminating prospectuses and sales literature to prospective shareholders and financial intermediaries) and providing incentives to financial intermediaries to sell shares. The Plan is also designed to cover the cost of administrative services performed in conjunction with the sale of shares, including, but not limited to, shareholder services, recordkeeping services and educational services, as well as the costs of implementing and operating the Plan. In accordance with the Plan, the Distributor may enter into agreements with financial intermediaries and dealers relating to distribution and/or marketing services with respect to the Funds. Pursuant to the Plan, the Funds may pay a 12b-1 fee not to exceed 0.25% per year of each Fund’s average daily net assets. No 12b-1 fee is currently paid by the Funds and the Board has not approved any payments under the Plan.
(4) Investment Transactions
Purchases and sales of investments, excluding in-kind transactions and short-term investments, for the fiscal year or period ended April 30, 2022 were as follows:
| Fund | Purchases | Sales | ||||||
| Day Hagan/Ned Davis Research Smart Sector ETF | $ | 372,855,938 | $ | 344,167,975 | ||||
| Day Hagan/Ned Davis Research Smart Sector Fixed Income ETF | 13,925,833 | 15,420,177 | ||||||
Purchases and sales of in-kind transactions for the fiscal year or period ended April 30, 2022 were as follows:
| Fund | Purchases | Sales | ||||||
| Day Hagan/Ned Davis Research Smart Sector ETF | $ | 390,214,835 | $ | 159,408,405 | ||||
| Day Hagan/Ned Davis Research Smart Sector Fixed Income ETF | 24,854,586 | — | ||||||
(5) Capital Share Transactions
Shares are issued and redeemed by each Fund only in aggregations of a specified number of shares or multiples thereof at net asset value. Except when aggregated in Creation Units, shares of each Fund are not redeemable. Transactions in shares for each Fund are disclosed in detail on the Statements of Changes in Net Assets.
The consideration for the purchase of Creation Units of a Fund generally consists of the in-kind deposit of a designated basket of securities, which constitutes an optimized representation of the securities of that Fund’s specified universe, and an amount of cash. Investors purchasing and redeeming Creation Units may be charged a transaction fee to cover the transfer and other transactional costs it incurs to issue or redeem Creation Units. The standard charge and maximum transaction fee for each Fund are $250 and $1,000, respectively.
From time to time, settlement of securities related to subscriptions-in-kind or redemptions-in-kind may be delayed. In such cases, securities related to in-kind contributions are reflected as “Due from custodian” and securities related to in-kind redemptions are reflected as “Securities payable related to in-kind transactions” on the Statements of Assets and Liabilities.
During the fiscal year or period ended April 30, 2022, the Fund received securities in exchange for subscriptions of capital shares (subscriptions-in-kind) and distributed securities in exchange for redemptions (redemptions-in-kind) as follows:
| Fair Value of | Fair Value of | |||||||
| Fund | Subscriptions-in-Kind | Redemptions-in-Kind | ||||||
| Day Hagan/Ned Davis Research Smart Sector ETF | $ | 390,214,835 | $ | 159,408,405 | ||||
| Day Hagan/Ned Davis Research Smart Sector Fixed Income ETF | 24,854,586 | — | ||||||
(6) Federal Income Taxes
It is the policy of each Fund to qualify or continue to qualify as a regulated investment company by complying with the provisions available to certain investment companies, as defined in applicable sections of the Internal Revenue Code, and to make distributions of net investment income and net realized capital gains sufficient to relieve it from all, or substantially all, federal income taxes.
The Trust has evaluated tax positions taken or expected to be taken in the course of preparing each Fund’s tax returns to determine whether it is more-likely-than not (i.e., greater than 50-percent chance) that each tax position will be sustained upon examination by a taxing authority based on the technical merits of the position. A tax position that meets the more -likely-than -not recognition threshold is measured to determine the amount of benefit to recognize in the financial statements. Differences between tax positions taken in a tax return and amounts recognized in the financial statements will generally result in an increase in a liability for taxes payable (or a reduction of a tax refund receivable), including the recognition of any related interest and penalties as an operating expense. Tax positions taken in tax years remain subject to examination by tax authorities (generally three years plus the interim tax period since then for federal income tax purposes). The determination has been made that there are not any uncertain tax positions that would require the Funds to record a tax liability and, therefore, there is no impact to the Funds’ financial statements. The Funds recognize interest and penalties, if any, related to unrecognized tax benefits as income tax expense on the Statements of Operations. During the fiscal year or period ended April 30, 2022, the Funds did not incur any interest or penalties. The tax year end for the Funds is April 30.
16 | Annual Shareholder Report
Notes to Financial Statements (Continued)
As of April 30, 2022, the tax cost of securities and the breakdown of unrealized appreciation/depreciation were as follows:
| Net Unrealized | ||||||||||||||||
| Tax Cost of | Unrealized | Unrealized | Appreciation/ | |||||||||||||
| Fund | Securities | Appreciation | Depreciation | (Depreciation) | ||||||||||||
| Day Hagan/Ned Davis Research Smart Sector ETF | $ | 484,987,511 | $ | 8,407,792 | $ | 30,634,469 | $ | (22,226,677 | ) | |||||||
| Day Hagan/Ned Davis Research Smart Sector Fixed Income ETF | 22,830,407 | — | 1,579,322 | (1,579,322 | ) | |||||||||||
The differences between book-basis and tax-basis unrealized appreciation/depreciation are attributable primarily to basis adjustments for wash sales.
The tax character of distributions paid during the tax year or period ended April 30, 2022 were as follows:
| Distributions paid from | ||||||||||||||||||||
| Ordinary | Net Long Term | Total Taxable | Return | Total Distributions | ||||||||||||||||
| Fund | Income | Capital Gains | Distributions | of Capital | Paid | |||||||||||||||
| Day Hagan/Ned Davis Research Smart Sector ETF | $ | 2,097,898 | $ | — | $ | 2,097,898 | $ | — | $ | 2,097,898 | ||||||||||
| Day Hagan/Ned Davis Research Smart Sector Fixed Income ETF | 181,986 | — | 181,986 | — | 181,986 | |||||||||||||||
The tax character of distributions paid during the tax year or period ended April 30, 2021 were as follows:
| Distributions paid from | ||||||||||||||||||||
| Ordinary | Net Long Term | Total Taxable | Return | Total Distributions | ||||||||||||||||
| Fund | Income | Capital Gains | Distributions | of Capital | Paid | |||||||||||||||
| Day Hagan/Ned Davis Research Smart Sector ETF | $ | 684,487 | $ | — | $ | 684,487 | $ | — | $ | 684,487 | ||||||||||
As of April 30, 2022, the components of distributed earnings/(loss) on a tax basis were as follows:
| Undistributed | Undistributed | Accumulated | Unrealized | |||||||||||||||||||||
| Ordinary | Long Term | Distributed | Capital and | Appreciation/ | Total Distributed | |||||||||||||||||||
| Fund | Income | Capital Gains | Earnings | Other Losses | (Depreciation) | Earnings/(Loss) | ||||||||||||||||||
| Day Hagan/Ned Davis Research Smart Sector ETF | $ | — | $ | — | $ | — | $ | (4,837,258 | )(a) | $ | (22,226,677 | ) | $ | (27,063,935 | ) | |||||||||
| Day Hagan/Ned Davis Research Smart Sector Fixed Income ETF | 33,394 | — | 33,394 | (516,394 | ) | (1,579,322 | ) | (2,062,322 | ) | |||||||||||||||
| (a) | The Fund deferred late year ordinary losses in the amount of $159,320, which is included in accumulated capital and other losses. |
Permanent Tax Differences:
As of the tax year or period ended April 30, 2022, the following reclassifications relating primarily to redemptions in-kind and taxable over distributions have been made to increase (decrease) such accounts with offsetting adjustments as indicated.
| Total Distributable | Paid in | |||||||
| Fund | Earnings / (Loss) | Capital | ||||||
| Day Hagan/Ned Davis Research Smart Sector ETF | $ | (37,067,405 | ) | $ | 37,067,405 | |||
| Day Hagan/Ned Davis Research Smart Sector Fixed Income ETF | — | — | ||||||
Temporary tax differences (e.g. wash sales) do not require a reclassification.
As of April 30, 2022, the Funds have a net CLCF as summarized in the table below. This CLCF is not subject to expiration:
| Fund | Short-Term Amount | Long-Term Amount | Total | |||||||||
| Day Hagan/Ned Davis Research Smart Sector ETF | $ | 4,677,938 | $ | — | $ | 4,677,938 | ||||||
| Day Hagan/Ned Davis Research Smart Sector Fixed Income ETF | 516,394 | — | 516,394 | |||||||||
Annual Shareholder Report | 17
Notes to Financial Statements (Continued)
(7) Investment Risks
This section discusses certain common principal risks encountered by the Funds. Each Fund may be subject to other risks in addition to these identified risks. The risks are presented in an order intended to facilitate readability, and their order does not imply that the realization of one risk is likely to occur more frequently than another risk, nor does it imply that the realization of one risk is likely to have a greater adverse impact than another risk.
ETF Risk
The NAV of a Fund can fluctuate up or down, and you could lose money investing in a Fund if the prices of the securities owned by the Fund decline. In addition, a Fund may be subject to the following risks: (1) the market price of a Fund’s shares may trade above or below its NAV; (2) an active trading market for a Fund’s shares may not develop or be maintained; or (3) trading of a Fund’s shares may be halted if the listing exchange’s officials deem such action appropriate, the shares are delisted from the exchange, or the activation of market-wide “circuit breakers” (which are tied to large decreases in stock prices) halts stock trading generally.
Market Risk
Overall market risks may also affect the value of the Funds. The market values of securities or other investments owned by the Funds will go up or down, sometimes rapidly or unpredictably. Factors such as economic growth and market conditions, interest rate levels, exchange rates and political events affect the securities markets. Changes in market conditions and interest rates generally do not have the same impact on all types of securities and instruments. Unexpected local, regional or global events and their aftermath, such as war; acts of terrorism; financial, political or social disruptions; natural, environmental or manmade disasters; the spread of infectious illnesses or other public health issues; recessions and depressions; or other tragedies, catastrophes and events could have a significant impact on the Funds and their investments and could result in increased premiums or discounts to the Funds’ net asset values, and may impair market liquidity, thereby increasing liquidity risk. Such events can cause investor fear and panic, which can adversely affect the economies of many companies, sectors, nations, regions and the market in general, in ways that cannot necessarily be foreseen. The Funds could lose money over short periods due to short-term market movements and over longer periods during more prolonged market downturns. During a general market downturn, multiple asset classes may be negatively affected. In times of severe market disruptions you could lose your entire investment.
An outbreak of infectious respiratory illness caused by a novel coronavirus known as COVID-19 was first detected in China in December 2019 and subsequently spread globally. This coronavirus has resulted in, among other things, travel restrictions, closed international borders, enhanced health screenings at ports of entry and elsewhere, disruption of and delays in healthcare service preparation and delivery, prolonged quarantines, significant disruptions to business operations, market closures, cancellations and restrictions, supply chain disruptions, lower consumer demand, and significant volatility and declines in global financial markets, as well as general concern and uncertainty. The impact of COVID-19 has adversely affected, and other infectious illness outbreaks that may arise in the future could adversely affect, the economies of many nations and the entire global economy, individual issuers and capital markets in ways that cannot necessarily be foreseen. In addition, the impact of infectious illnesses in emerging market countries may be greater due to generally less established healthcare systems. Public health crises caused by the COVID-19 outbreak may exacerbate other pre-existing political, social and economic risks in certain countries or globally. The duration of the COVID-19 outbreak and its effects cannot be determined with certainty.
Underlying Fund Risk
The ETFs in which the Funds invest are subject to investment advisory and other expenses, which will be indirectly paid by the Funds. As a result, the cost of investing in the Funds will be higher than the cost of investing directly in the ETFs and may be higher than other funds that invest directly in stocks and bonds. Each of the ETFs is subject to its own specific risks.
As of April 30, 2022, 25.63% of the Day Hagan/Ned Davis Research Smart Sector ETF’s net assets were invested in the Technology Select Sector SPDR Fund ETF. The financial statements of the Technology Select Sector SPDR Fund ETF, including its portfolio of investments, can be found at the SEC’s website www.sec.gov and should be read in conjunction with the Day Hagan/Ned Davis Research Smart Sector ETF’s financial statements.
(8) Subsequent Events
Management of the Funds has evaluated the need for disclosures and/or adjustments resulting from subsequent events through the date these financial statements were issued. Based upon this evaluation, no additional disclosures or adjustments were required to the financial statements as of April 30, 2022.
18 | Annual Shareholder Report

REPORT OF INDEPENDENT REGISTERED PUBLIC ACCOUNTING FIRM
To the Shareholders of Day Hagan/Ned Davis Research Smart Sector ETF, and Day Hagan/Ned Davis Research Smart Sector Fixed Income ETF and
Board of Trustees of Strategy Shares
Opinion on the Financial Statements
We have audited the accompanying statements of assets and liabilities, including the portfolios of investments, of the funds listed below (the “Funds”), each a series of Strategy Shares, as of April 30, 2022, the related statements of operations, the statements of changes in net assets, the related notes, and the financial highlights for each of the periods indicated below (collectively referred to as the “financial statements”). In our opinion, the financial statements present fairly, in all material respects, the financial position of each of the Funds as of April 30, 2022, the results of their operations, the changes in net assets, and the financial highlights for each of the periods indicated below in conformity with accounting principles generally accepted in the United States of America.
| Fund Name | Statements of Operations | Statements of Changes in Net Assets | Financial Highlights |
Day Hagan/Ned Davis Research Smart Sector ETF | For the year ended April 30, 2022 | For the years ended April 30, 2022 and 2021 | For the years ended April 30, 2022 and 2021, and for the period from January 16, 2020 (commencement of operations) through April 30, 2020 |
Day Hagan/Ned Davis Research Smart Sector Fixed Income ETF | For the period from September 28, 2021 (commencement of operations) through April 30, 2022 | ||
Basis for Opinion
These financial statements are the responsibility of the Funds’ management. Our responsibility is to express an opinion on the Funds’ financial statements based on our audits. We are a public accounting firm registered with the Public Company Accounting Oversight Board (United States) (“PCAOB”) and are required to be independent with respect to the Funds in accordance with the U.S. federal securities laws and the applicable rules and regulations of the Securities and Exchange Commission and the PCAOB.
We conducted our audits in accordance with the standards of the PCAOB. Those standards require that we plan and perform the audit to obtain reasonable assurance about whether the financial statements are free of material misstatement whether due to error or fraud.
COHEN & COMPANY, LTD.
800.229.1099 | 866.818.4535 fax | cohencpa.com
Registered with the Public Company Accounting Oversight Board
Annual Shareholder Report | 19
Our audits included performing procedures to assess the risks of material misstatement of the financial statements, whether due to error or fraud, and performing procedures that respond to those risks. Such procedures included examining, on a test basis, evidence regarding the amounts and disclosures in the financial statements. Our procedures included confirmation of securities owned as of April 30, 2022, by correspondence with the custodians and brokers; when replies were not received from brokers, we performed other auditing procedures. Our audits also included evaluating the accounting principles used and significant estimates made by management, as well as evaluating the overall presentation of the financial statements. We believe that our audits provide a reasonable basis for our opinion.
We have served as the Funds’ auditor since 2019.

COHEN & COMPANY, LTD.
Cleveland, Ohio
June 29, 2022
20 | Annual Shareholder Report
Additional Information
Additional Federal Income Tax Information (Unaudited)
For the tax year ended April 30, 2022, the following percentages of the total ordinary income distributions paid by the Fund qualify for the distributions received deduction available to corporate shareholders.
| Distributions Received | ||
| Fund | Deduction | |
| Day Hagan/Ned Davis Research Smart Sector ETF | 27.53% |
For the tax year ended April 30, 2022, distributions paid by the Fund may be subject to a maximum tax rate of 15%, as provided by the Jobs and Growth Tax Relief Reconciliation Act of 2003. The Fund intends to designate the maximum amount allowable as taxed at a maximum rate of 15%. Complete information will be reported in conjunction with your 2022 Form 1099-DIV.
For the tax year ended April 30, 2022, the percentages of Qualified Dividend Income are as follows:
| Qualified Dividend | ||
| Fund | Income | |
| Day Hagan/Ned Davis Research Smart Sector ETF | 99.72% |
As of the most recent tax year end, the Day Hagan/Ned Davis Research Smart Sector ETF designated 0.08% as interest-related dividends for certain non-U.S. resident investors.
Premium/Discount Information (Unaudited)
The Fund’s website at www.dhfunds.com shows the previous day’s closing NAV and closing market price for the Fund’s ETF Shares. The website also discloses, in the Premium/Discount section, how frequently the Fund’s ETF Shares traded at a premium or discount to NAV (based on closing NAVs and market prices) and the magnitudes of such premiums and discounts.
Annual Shareholder Report | 21
Additional Information (Continued)
Renewal of Management Agreement between Strategy Shares (the “Trust”) with respect to Day Hagan/Ned Davis Research Smart Sector ETF (the “Day Hagan ETF”)
At a meeting of the Board of Trustees of the Trust held in December 2021, the Board, which is comprised of Trustees who are not “interested persons,” as that term is defined in the Investment Company Act of 1940, as amended (the “1940 Act”), of the Trust, discussed the renewal of the management agreement between the Trust and Day Hagan Asset Management (“Day Hagan”) with respect to the Day Hagan ETF (the “Day Hagan Management Agreement”).
In connection with the Board’s consideration of the renewal of the Day Hagan Management Agreement as required by Section 15(c) of the 1940 Act, the Board requested and received due diligence materials prepared by Day Hagan (the “Day Hagan 15(c) Response”) and considered the information presented at Board meetings throughout the year. The Board was assisted by legal counsel throughout the review process and relied upon the advice of legal counsel and its own business judgment in evaluating the Day Hagan Management Agreement and the weight to be given to each factor considered. The conclusions reached by the Board were based upon a comprehensive evaluation and discussion of all the information provided for the Fund with respect to the approval of the Day Hagan Management Agreement and were not the result of any one factor. Moreover, each Trustee might have afforded different weight to the various factors in reaching his conclusions with respect to the Day Hagan Management Agreement.
Review of Day Hagan 15(c) Response
Nature, Extent, and Quality of Services. The Board reviewed the services provided by the team of professionals at Day Hagan. The Board reviewed information concerning Day Hagan’s resources, personnel, business operations, and culture of compliance. The Board discussed Day Hagan’s Form ADV as of October 26, 2021, the firm’s profit and loss statement for the period from January 1, 2021, to September 30, 2021, and the firm’s balance sheets as of December 31, 2020, and September 30, 2021. The Board noted that there were no new compliance or regulatory issues. After further discussion and review of the Day Hagan 15(c) Response, the Board concluded that Day Hagan had sufficient quality of personnel, resources, operations and compliance policies and procedures essential to performing its duties under the Day Hagan Management Agreement and that the nature, overall quality and extent of the advisory services provided to the Day Hagan ETF by Day Hagan were acceptable.
Performance. The Board compared the Day Hagan Fund’s returns to those of its peer group and benchmark for the 1-year period ended September 30, 2021, and the period from the Fund’s inception on January 7, 2020, through September 30, 2021. The Fund underperformed the S&P 500 Index for the 1-year period but outperformed the Index since inception. The Board considered Day Hagan’s view that the Fund has delivered investment results generally in line with those of the S&P 500 Index. After further discussion, the Board determined that the Fund’s performance was acceptable.
Fees and Expenses. The Board considered that the Fund’s assets had grown considerably over the year ended September 30, 2020. The Board compared the Day Hagan ETF’s management fees and net expenses to those of its peer group and the Morningstar Large Blend category. The Board noted that Day Hagan’s management fee was structured as a “unified fee” under which Day Hagan pays all the routine expenses of the Fund, other than the management fee and certain other expenses. The Fund’s management fee was lower than the median and higher than the average advisory fees of the peer group, but lower than the median and average advisory fees of the Morningstar Large Blend category. After further discussion, the Board concluded that the management fees payable to Day Hagan with respect to the Fund were reasonable.
The Board considered that the Day Hagan ETF’s net expense ratio was higher than the median and lower than the average expense ratios of the peer group, higher than the median and average expense ratios of the Morningstar Large Blend category, and within the range of net expenses of both the peer group and Morningstar category. After further discussion, the Board concluded that the Fund’s net expenses were reasonable.
Profitability. The Board reviewed a report from Day Hagan analyzing the firm’s profitability with respect to its relationship with the Day Hagan ETF, and noted that Day Hagan was managing the Fund at a profit. The Board concluded that the level of Day Hagan’s profitability with respect to the Fund did not raise any concerns.
“Fall-out” Benefits. The Board considered fall-out benefits that Day Hagan and its affiliates received from their relationship with the Day Hagan ETF and the Trust.
Economies of Scale. The Board considered whether Day Hagan was sharing economies of scale with the Day Hagan ETF. The Board noted that the Day Hagan Management Agreement did not contain breakpoints that reduce the fee rate on assets above specified levels. The Board considered Day Hagan’s view that advisory fee breakpoints were not appropriate at the Fund’s current asset level. The Board determined, after further discussion, that economies of scale had not been reached and agreed that the matter of economies of scale would be revisited as the Fund’s assets increased.
Conclusion. The Board considered many factors, and no single factor was determinative to the decision of the Board. Having, requested, reviewed, and discussed in depth such information from Day Hagan as the Board believed to be reasonably necessary to evaluate the terms of the Day Hagan Management Agreement, and as assisted by the advice of counsel, the Board concluded that renewal of the Day Hagan Management Agreement was in the best interest of the Day Hagan ETF and its shareholders.
22 | Annual Shareholder Report
Board of Trustees and Trust Officers (Unaudited)
The following tables provide information about Board of Trustees and the senior officers of the Trust. Each of the Trustees is deemed to be an Independent Trustee of the Trust. Each Trustee oversees all portfolios of the Trust and serves for an indefinite term. Information about each Trustee is provided below and includes each person’s: name, address, age (as of the date of the Funds’ most recent fiscal year end), present position(s) held with the Trust, and principal occupations for the past five years. Unless otherwise noted, the business address of each person listed below is c/o Strategy Shares, 36 North New York Avenue, Huntington, NY 11743. Unless otherwise noted, each officer is elected annually by the Board. Unless otherwise noted, each Trustee and officer also serves in the same capacity for Mutual Fund and Variable Insurance Trust, another open-end investment company whose series are managed by Rational Advisors, Inc. (“Rational”), and AlphaCentric Prime Meridian Income Fund, a closed-end investment company managed by AlphaCentric Advisors, LLC, an affiliate of Rational. Collectively, the Trust, Mutual Fund and Variable Insurance Trust, Mutual Fund Series Trust, and AlphaCentric Prime Meridian Income Fund comprise the “Fund Complex” as of April 30, 2022.
Independent Trustees Background
| Name, Address and Year of Birth | Position with the Trust | Term of Office and Length of Time Served | Principal Occupation(s) During Past 5 Years | Number of Portfolios in Fund Complex Overseen by Trustee | Other Directorships Held by Trustee |
| Tobias Caldwell Year of Birth: 1967 | Chairman of the Board and Trustee | Since 2016 | Managing Member, Genovese Family Enterprises, LLC (real estate firm) since 1999; Managing member, Bear Properties, LLC (real estate firm) since 2006; Managing member, PTL Real Estate, LLC (real estate/ investment firm), 2000–2019. | 54 | Chairman of the Board of Trustees, Mutual Fund and Variable Insurance Trust since 2016; Lead independent Trustee and Chairman of Audit Committee, Mutual Fund Series Trust since 2006; Independent Trustee and Chair of Audit Committee, Variable Insurance Trust since 2010; Trustee, IDX Funds (formerly M3Sixty Funds Trust) since 2016; Chairman of the Board, AlphaCentric Prime Meridian Income Fund since 2018. |
| Stephen P. Lachenauer Year of Birth: 1967 | Trustee and Chair of the Audit, Risk and Compliance, and Investment Committees | Trustee and Chair of Audit, Risk and Compliance Committees since 2016 Chair of Investment Committee since November 2020 | Attorney, private practice since 2011 | 54 | Chair of the Audit and Risk and Compliance Committees and Trustee since 2016, and Chair of the Investment Committee since November 2020, Mutual Fund and Variable Insurance Trust; Trustee, TCG Financial Series Trusts I-X since 2015; Trustee and Chair of the Audit Committee since 2018, and Chair of the Investment Committee since November 2020, AlphaCentric Prime Meridian Income Fund; Trustee, Mutual Fund Series Trust since April 2022. |
| Donald McIntosh Year of Birth: 1967 | Trustee | Since 2016 | Business Control & Risk Management Advisor, Santander Bank, since 2019; Quality Control Advisor, Santander Bank, 2016–2019. | 16 | Trustee, Mutual Fund and Variable Insurance Trust since 2016; Trustee, AlphaCentric Prime Meridian Income Fund since 2018. |
Annual Shareholder Report | 23
Board of Trustees and Trust Officers (Unaudited) (Continued)
Officers*
| Name, Address and Year of Birth | Position with the Trust | Term of Office and Length of Time Served | Principal Occupation(s) During Past 5 Years |
| Michael Schoonover 53 Palmeras St., Suite 601 San Juan, PR 00901 Year of Birth: 1983 | President | Since 2022 | Vice President of the Trust from 2018 through 2021; Chief Operating Officer (“COO”), Catalyst Capital Advisors LLC and Rational Advisors, Inc. since 2017; Portfolio Manager, Catalyst Capital Advisors LLC, 2013–May 2021; President, MFund Distributors LLC since January 2020; COO, Catalyst International Advisors LLC, since 2019; COO, Insights Media LLC since 2019; COO, MFund Management LLC since 2019; COO, AlphaCentric Advisors LLC since January 2021; Portfolio Manager, Rational Advisors, Inc., 2016–2018 |
| Alex Merino 53 Palmeras St. Suite 601 San Juan, PR 00901 Year of Birth: 1985 | Vice President | Since 2022 | Investment Operations Manager, MFund Management LLC since 2022; Investment Operations Analyst, MFund Management LLC, 2020–2021; Tax Senior Associate, PwC Asset & Wealth Management NY Metro, 2016–2019. |
| James Szilagyi Year of Birth: 1963 | Treasurer | Since 2016 | Product Manager, Catalyst Capital Advisors LLC since 2015. |
| Frederick J. Schmidt Year of Birth: 1959 | Chief Compliance Officer | Since 2016 | Director, MFund Services LLC since 2015. |
| Jennifer A. Bailey Year of Birth: 1968 | Secretary | Since 2016 | Director of Legal Services, MFund Services LLC since 2012. |
| * | Officers do not receive any compensation from the Trust |
The Funds’ Statement of Additional Information (“SAI”) includes additional information about the Trustees and is available without charge, upon request. You may call toll-free at 800-594-7930 to request a copy of the SAI or to make shareholder inquiries.
24 | Annual Shareholder Report
[THIS PAGE INTENTIONALLY LEFT BLANK]
[THIS PAGE INTENTIONALLY LEFT BLANK]
[THIS PAGE INTENTIONALLY LEFT BLANK]
VOTING PROXIES ON FUND PORTFOLIO SECURITIES
A copy of the policies and procedures that the Funds use to determine how to vote proxies relating to securities held in the Funds’ portfolio, as well as a record of how the Funds voted any such proxies during the most recent 12 -month period ended June 30, is available without charge and upon request by calling 1-800-594-7930 or at https://dhfunds.com. This information is also available from the EDGAR database on the SEC’s website at www.sec.gov.
QUARTERLY PORTFOLIO SCHEDULE
The Funds file with the SEC a complete schedule of its portfolio holdings, as of the close of the first and third quarters of their fiscal year, on Form N-PORT. These filings are available on the SEC’s website at www.sec.gov. You may also access this information at https://dhfunds.com by selecting “Form N-PORT.”
Donald L. Hagan, LLC, doing business as Day Hagan Asset Management, is the investment advisor of the Funds. Day Hagan Asset Management maintains corporate records of the Funds. Foreside Fund Services, LLC is the principal underwriter and distributor of the Funds’ shares.
Exchange-traded funds are not bank deposits or obligations, are not guaranteed by any bank, and are not insured or guaranteed by the U.S. government, the Federal Deposit Insurance Corporation, the Federal Reserve Board, or any other government agency. Investment in exchange-traded funds involves investment risk, including the possible loss of principal.
This report is authorized for distribution to prospective investors only when preceded or accompanied by a prospectus which contains facts concerning the Funds’ objectives and policies, management fees, expenses and other information.
| Day Hagan/Ned Davis Research Smart Sector ETF (SSUS) | Day Hagan/Ned Davis Research Smart Sector Fixed Income ETF (SSFI) |
| Cusip 86280R803 | Cusip 86280R860 |
| 1-800-594-7930 |
Item 2. Code of Ethics.
(a) As of the end of the period covered by the report, the registrant has adopted a code of ethics that applies to the registrant’s Principal Executive Officer and Principal Financial Officer.
(b) Not applicable.
(c) During the period covered by the report, with respect to the registrant’s code of ethics that applies to its Principal Executive Officer and Principal Financial Officer: there have been no amendments to a provision that relates to any element of the code of ethics definition enumerated in paragraph (b) of this Item 2.
(d) During the period covered by the report, with respect to the registrant’s code of ethics that applies to its Principal Executive Officer and Principal Financial Officer: there have been no waivers granted from a provision that relates to any element of the code of ethics definition enumerated in paragraph (b) of this Item 2.
(e) Not applicable.
Item 3. Audit Committee Financial Expert.
3(a)(1) The registrant’s Board of Trustees has determined that the registrant has at least one audit committee financial expert serving on its audit committee.
3(a)(2) The audit committee financial expert is Stephen P. Lachenauer, who is “independent” for purposes of this Item 3 of Form N-CSR.
Item 4. Principal Accountant Fees and Services.
(a) Audit Fees billed to the registrant by its principal accountants for the two most recent fiscal years:
Fiscal year ended 2022: $76,000
Fiscal year ended 2021: $32,250
(b) Audit-Related Fees billed to the registrant by its principal accountants for the two most recent fiscal years:
Fiscal year ended 2022: $ -
Fiscal year ended 2021: $ -
(c) Tax Fees billed to the registrant by its principal accountants for the two most recent fiscal years:
Fiscal year ended 2022: $15,100
Fiscal year ended 2021: $6,100
Fees for 2020 and 2021 related to the review of the registrant’s tax returns.
(d) All other fees billed to the registrant by its principal accountants for the two most recent fiscal years:
Fiscal year ended 2022: $ -
Fiscal year ended 2021: $ -
Amount requiring approval of the registrant’s audit committee pursuant to paragraph (c)(7)(ii) of Rule 2-01 of Regulation S-X, $0 and $0 respectively.
(e)(1) Audit and Non-Audit Services Pre-Approval Policies and Procedures
I. Purpose
Under the Sarbanes-Oxley Act of 2002 (the “Act”), the Audit Committee of the Board of Trustees of The Huntington Strategy Shares (the “Trust”) is responsible for the appointment, compensation and oversight of the work of the Trust’s independent auditor. As part of this responsibility, the Audit Committee is required to grant approval for audit and non-audit services performed by the independent auditor for the Trust in order assure that they do not impair the auditor’s independence from the Trust. In addition, the Audit Committee also must pre-approve its independent auditor’s engagement for non-audit services with the Trust’s investment adviser (not including a sub-adviser whose role is primarily portfolio management and is sub-contracted or overseen by another investment adviser) and any entity controlling, controlled by, or under common control with the investment adviser that provides ongoing services to the Trust, if the engagement relates directly to the operations and/or financial reporting of the Trust.
To implement these provisions of the Act, the Securities and Exchange Commission (the “SEC”) has issued rules specifying the types of services that the Trust’s independent auditor may not provide to the Trust, as well as the Audit Committee’s administration of the engagement of the independent auditor. Under these rules, the SEC has provided that a permissible approval of audit and non-audit services can take the form of either (i) a general pre-approval, or (ii) a specific pre-approval (where a specific type of service is authorized, generally subject to a fee maximum). General pre-approvals are authorized by SEC rules only subject to detailed policies and procedures. Unless a type of service has received general pre-approval, it will require specific pre-approval by the Audit Committee if it is to be provided by the independent auditor. Accordingly, the Audit Committee has adopted these Audit and Non-Audit Services Pre-Approval Policies and Procedures, which set forth the procedures and the conditions pursuant to which services for the Trust may be performed by the independent auditor under pre-approvals.
II. General Pre-Approval Policies
It is the policy of the Audit Committee that audit and non-audit services to be performed by the Trust’s independent auditor be pre-approved only when in the best interests of the Trust’s shareholders and fully consistent with applicable law and, particularly, the maintenance of the auditor’s independence. In granting any pre-approval, consideration shall be given to:
| 1. | the qualifications of the auditor to perform the services involved; |
| 2. | the proposed costs (which may be presented as an estimate or based on professional time charges subject to a ceiling) of the services and the reasonableness thereof; |
| 3. | the permissibility of the services under applicable rules and guidance of the SEC; |
| 4. | the effect, if any, of the performance of the proposed services on the auditor’s independence; |
| 5. | the effect of the compensation for the proposed services on the auditor’s independence; and |
| 6. | the effect, if any, of the proposed services on the Trust’s ability to manage or control risk or to improve audit quality. |
In accordance with SEC rules, non-audit services performed by the Trust’s independent auditor may not include the following:
| 1. | Bookkeeping or other services related to the accounting records or financial statements of the audit client; |
| 2. | Financial information systems design and implementation; |
| 3. | Appraisal or valuation services, fairness opinions or contribution-in-kind reports; |
| 4. | Actuarial services; |
| 5. | Internal audit outsourcing services; |
| 6. | Management functions or human resources; |
| 7. | Broker-dealer, investment adviser or investment banking services; and |
| 8. | Legal services and expert services unrelated to the audit. |
III. Procedures for Pre-Approval by the Audit Committee
| 1. | Requests for pre-approval shall be in writing and may be made by either the independent auditors or by management of the Trust. |
| 2. | All requests for pre-approval shall be made to the full Audit Committee at regularly scheduled meetings thereof (or at a special meeting of the Audit Committee set to coincide with regular meetings of the Trust’s Board of Trustees) whenever practicable. |
| 3. | Under normal circumstances, requests for pre-approval should be presented at least 7 days prior (and in no event later than 48 hours prior) to the proposed commencement of the engagement. |
| 4. | If consideration of a request for pre-approval on the dates identified in Section III (2) would not be timely, the requesting party shall notify the Chairman of the Audit Committee. The Chairman of the Audit Committee shall then determine whether to schedule a special meeting of the Audit Committee (which may be conducted telephonically) on an alternative date or whether the request may appropriately be presented to a delegate of the Audit Committee under procedures set forth in Section IV below. |
| 5. | Requests for pre-approval may include, but are not limited to, the following services: |
a. audit engagement, particularly for interim periods;
b. tax compliance, tax planning, and tax advice;
| c. | review and consents with respect to use of reports in post-effective amendments to the registration statements of the Trust; |
d. review of IRS shareholder materials;
| e. | review and validation of Trust procedures (e.g., valuation, interTrust lending, etc.), and |
f. market research and strategic insights.
| 6. | Requests for pre-approval should identify the nature of the services to be provided in a manner sufficiently specific to allow evaluation of the considerations identified above in Section II. |
| 7. | In accordance with PCAOB Rule 3524, requests for pre-approval of permissible tax services by the independent auditor must have the following items described in writing for the audit committee: |
a. the scope of the proposed tax service,
b. the fee structure for the engagement,
| c. | any side letters, amendments to the engagement letter or any other agreements, whether oral, written, or otherwise, relating to the service between the audit firm and the Trusts, and |
| d. | any compensation arrangements or other agreements between the audit firm and any third party with respect to promoting, marketing, or recommending a transaction covered by the proposed tax service. |
The audit firm should discuss with the Audit Committee the potential effect of the proposed tax service(s) on the audit firm’s independence.
| 8. | Requests for pre-approval must include an assessment by the independent auditor of its independence should the request be granted and the proposed services rendered. |
| 9. | The Audit Committee’s action on a request for pre-approval shall be recorded in the Audit Committee’s minutes. |
| 10. | The Audit Committee’s action on a request for pre-approval shall be communicated in writing to the independent auditor and, under normal circumstances, a copy of this communication shall be provided to the Trust’s management. |
| 11. | The Audit Committee’s action on a request for pre-approval shall be reported to the full Board of Trustees. |
12. Pre-approvals will be granted for a period of no more than one year.
IV. Procedures for Pre-Approval by a Delegate of the Audit Committee
| 1. | Where it has been determined by the Chairman of the Audit Committee that consideration of a request for pre-approval by the full Audit Committee would not be timely, the Chairman may determine that the request be presented to a member(s) of the Audit Committee appointed by the Audit Committee as its delegate (the “Delegate”) for this purpose. (As of the date of the adoption of these guidelines and procedures, the Chairman of the Audit Committee has been so appointed, and such appointment may be revoked or modified by the Audit Committee at any time.) |
| 2. | Requests for pre-approval shall be in writing and may be made by either the independent auditors or by management of the Trust. |
| 3. | Under normal circumstances, requests for pre-approval should be presented at least 7 days prior (and in no event later than 48 hours prior) to the proposed commencement of the engagement. |
| 4. | Requests for pre-approval may include, but are not limited to, the following services: |
a. audit engagement, particularly for interim periods;
b. tax compliance, tax planning, and tax advice;
| c. | review and consents with respect to use of reports in post-effective amendments to the registration statements of the Trust; |
d. review of IRS shareholder materials;
| e. | review and validation of Trust procedures (e.g., valuation, interfund lending, etc.); and |
f. market research and strategic insights.
| 5. | Requests for pre-approval should identify the nature of the services to be provided in a manner sufficiently specific to allow evaluation of the considerations identified above in Section II. |
| 6. | Requests for pre-approval must include an assessment by the independent auditor of its independence should the request be granted and the proposed services rendered. |
| 7. | The Delegate’s action on a request for pre-approval shall be communicated in writing to the independent auditor, with a copy to each other member of the Audit Committee and, under normal circumstances, to the Trust’s management. |
| 8. | Pre-approvals by the Delegate shall be reviewed by the Audit Committee at a meeting held no later than the next scheduled meeting of the Board of Trustees or the Audit Committee, whichever occurs sooner. An earlier review shall be conducted upon the written request of one or more Audit Committee members addressed to the Chairman of the Audit Committee. |
| 9. | Pre-approvals by the Delegate may be modified or revoked by the Audit Committee, but will not absolve the Trust of its responsibility to compensate the independent auditor for services rendered prior to such modification or revocation. |
| 10. | The results of the Audit Committee’s review of the Delegate’s action on a request for pre-approval shall be recorded in the Audit Committee’s minutes and reported to the full Board of Trustees. |
| 11. | Pre-approvals will be granted by the Delegate for a period of no more than one year. |
V. Procedures for Monitoring Engagements Authorized Under Pre-Approval Procedures
The independent auditor shall inform the Audit Committee in writing upon the commencement of services rendered under a pre-approval. The independent auditor shall thereafter provide the Audit Committee with written quarterly progress reports within one month of the close of each calendar quarter detailing the work done and fees and other charges incurred during said calendar quarter. Should fees and expenses exceed those specified in a pre-approval (or appear likely to do so prior to completion of the work), the independent auditor or management shall so apprise the Audit Committee and an additional express approval or pre-approval must be obtained.
VI. Amendment
These Policies and Procedures may be amended or revoked at any time by the Audit Committee and shall be reviewed at least annually in conjunction with review of the Audit Committee Charter.
(e)(2) No Services included in (b)-(d) above were approved pursuant to paragraph (c)(7)(i)(C) of Rule 2-01 of Regulation S-X.
(f) Not applicable.
(g) Not applicable.
(h) The registrant’s Audit Committee has considered whether the provision of non audit services that were rendered to registrant’s investment adviser (not including any sub adviser whose role is primarily portfolio management and is subcontracted with or overseen by another investment adviser), and any entity controlling, controlled by, or under common control with the investment adviser that provide ongoing services to the registrant that were not pre-approved pursuant to paragraph (c)(7)(ii) of Rule 2-01 of Regulation S-X is compatible with maintaining the principal account’s independence.
| Item 5. | Audit Committee of Listed Registrants. |
The Registrant is a listed issuer as defined in Rule 10A-3 under the Exchange Act and has a separately-designated standing audit committee established in accordance with Section 3(a)(58)(A) of the Exchange Act. The Registrant’s audit committee members are Stephen P. Lachenauer (Chairman), Tobias Caldwell and Donald McIntosh.
| Item 6. | Investments. |
(a) The schedules of investments are included as part of the report to shareholders filed under Item 1of this form.
(b) Not applicable.
Item 7. Disclosure of Proxy Voting Policies and Procedures for Closed-End Management Investment Companies.
Not applicable.
Item 8. Portfolio Managers of Closed-End Management Investment Companies.
Not applicable.
Item 9. Purchases of Equity Securities by Closed-End Management Investment Company and Affiliated Purchasers.
Not applicable.
Item 10. Submission of Matters to a Vote of Security Holders.
Not applicable.
Item 11. Controls and Procedures.
(a) The registrant’s Principal Executive Officer and Principal Financial Officer have concluded that the registrant’s disclosure controls and procedures (as defined in Rule 30a-3(c) under the Act) are effective in design and operation and are sufficient to form the basis of the certifications required by Rule 30a-2 under the Act, based on their evaluation of these disclosure controls and procedures within 90 days of the filing of this report on Form N-CSR.
(b)There were no changes in the registrant’s internal control over financial reporting (as defined in Rule 30a-3(d) under the Act (17 CFR 270.30a-3(d)) that occurred during the second fiscal quarter of the period covered by this report that have materially affected or are reasonably likely to materially affect, the registrant’s internal control over financial reporting.
Item 12. Disclosure of Securities Lending Activities for Closed-End Management Investment Companies.
Not applicable.
Item 13. Exhibits.
(a)(1) The code of ethics that is the subject of the disclosure required by Item 2 is attached hereto.
(a)(2) Certifications pursuant to Rule 30a-2(a) are attached hereto.
(a)(3) Not applicable.
(b) Certifications pursuant to Rule 30a-2(b) are furnished herewith.
SIGNATURES
Pursuant to the requirements of the Securities Exchange Act of 1934 and the Investment Company Act of 1940, the registrant
has duly caused this report to be signed on its behalf by the undersigned, thereunto duly authorized.
(Registrant) Strategy Shares
By (Signature and Title) /s/ Michael Schoonover
Michael Schoonover, Chief Executive Officer
Date June 28, 2022
Pursuant to the requirements of the Securities Exchange Act of 1934 and the Investment Company Act of 1940, this report has been signed below by the following persons on behalf of the registrant and in the capacities and on the dates indicated.
By (Signature and Title) /s/ Michael Schoonover
Michael Schoonover, Chief Executive Officer
Date June 28, 2022
By (Signature and Title) /s/ James Szilagyi
James Szilagyi, Treasurer
Date June 28, 2022