UNITED STATES
SECURITIES AND EXCHANGE COMMISSION
WASHINGTON, D.C. 20549
FORM N-CSR
CERTIFIED SHAREHOLDER REPORT OF REGISTERED MANAGEMENT
INVESTMENT COMPANIES
Investment Company Act file number: 811-22498
New Frontiers Trust
(Exact name of registrant as specified in charter)
| 30195 CHAGRIN BLVD. | |
| Suite 118N | |
| Pepper Pike, OH | 44124 |
| (Address of principal executive offices) | (Zip code) |
Rakesh Mehra
30195 Chagrin Blvd., Suite 118N,
Pepper Pike, OH 44124
(Name and address of agent for service)
Registrant's telephone number, including area code: (216) 831-8400
Date of fiscal year end: January 31
Date of reporting period: January 31, 2013
Form N-CSR is to be used by management investment companies to file reports with the Commission not later than 10 days after the transmission to stockholders of any report that is required to be transmitted to stockholders under Rule 30e-1 under the Investment Company Act of 1940 (17 CFR 270.30e -1). The Commission may use the information provided on Form N-CSR in its regulatory, disclosure review, inspection and policymaking roles.
A registrant is required to disclose the information specified by Form N-CSR, and the Commission will make this information public. A registrant is not required to respond to the collection of information contained in Form N-CSR unless the Form displays a currently valid Office of Management and Budget ("OMB") control number. Please direct comments concerning the accuracy of the information collection burden estimate and any suggestions for reducing the burden to Secretary, Securities and Exchange Commission, 450 Fifth Street, NW, Washington, DC 20549-0609. The OMB has reviewed this collection of information under the clearance requirements of 44 U.S.C. § 3507.
Item 1. Reports to Stockholders.

NEW FRONTIERS KC INDIA FUND
ANNUAL REPORT
January 31, 2013
New Frontiers KC India Fund
Annual Report
January 31, 2013
Dear Fellow Shareholders,
This was a good year in the Indian stock markets, an eventful year on the policy front in India with both positive, as well as negative changes in the Indian economy. Externally the on-going developments at the European Union ("EU"), the US elections and the threat of the fiscal cliff all played a part in the developments in India. The Indian rupee/US dollar exchange rate traded in a narrow band.
The Indian Bombay Stock Exchange 100 Index ("BSE 100" or "Index") was up 28.6% for the calendar year ended 2012. The Index jumped up strongly in January and then proceeded to weaken until May; after May it rose steadily to end the year with a strong performance. Our Fund was up 29.9% for the same period and it experienced good returns in all sectors except communications and infrastructure. For fiscal year ended January 2013, the BSE 100 was up 10.8% while our Fund was up 8.9% . In January 2013 even though the BSE 100 experienced strong gains, these gains occurred in a limited number of its component companies. We have invested the Fund widely across the Indian economy to perform better than its benchmark over the long run.
The Central Bank of India (“RBI”) plays a major role in the Indian economy, as do similar institutions in other countries. Last year the RBI held the Bank Repo rate high (Repo rate is the rate RBI lends to Indian commercial banks) to control inflation. The decision by the RBI to hold the rates high helped bring down the wholesale price index to a more acceptable level, and the inflation projections are now at 6.8% compared to 7.5% earlier in the year. In a year where the Finance Ministry of India became increasingly frustrated by the refusal of RBI to lower rates to help it grow the economy, the RBI not only controlled inflation, but it also forced the government to make tough economic choices. The RBI did lower the rates twice in fiscal 2012: once in April 2012 by 50 basis points and once in January 2013 by 75 basis points. The RBI has also successively lowered the cash reserve ratio (the ratio of cash the banks must keep with the RBI with reference to their total net liabilities) to 4%, which is the lowest level seen in decades. This measure injects more liquidity into the monetary system without lowering the cost of funds.
On the policy front, India followed a pattern of two steps forward and one step backward. The Indian federal budget presented in February 2012 contained a couple of regressive policy announcements for foreign investors. These policy announcements resulted in major outflows of funds from India following the announcements. As a measure of damage control the Finance Minister of India was replaced with someone who is considered more pragmatic. To reassure foreign investors, the new Finance Minister put one of the measures on hold and the other matter was referred to a panel for review. Due to the pressure from RBI, the Indian Industry and foreign investors, the Indian government finally allowed 51% holdings by foreign investors in multi-line retailers; this policy change will benefit companies like Walmart, Target etc. by allowing them to invest in India, and it will benefit India by providing much needed logistic and supply chain expertise. The government of India also loosened the rules to invest in Indian airlines and insurance companies. These measures were taken to kick start the economy as the estimates for the Gross Domestic Product ("GDP") growth in India have been coming down along with the increase in the federal deficit. In the year ending in March 2013, the Indian economy is estimated to grow at 5.5% and for the year ending in March 2014 at 6.0% . This compared to the 7-9% growth in the previous years. The budget deficit in
2013 Annual Report 1
India as a percent of GDP is expected to be 5.3% for the year ending in March 2013 which is much higher than what policy makers, investors and the credit rating agencies would like to see.
We have been disappointed by the lack of progress in improving the infrastructure in India. We believe that major infrastructure developments will lead to a rise in the GDP, will reduce the deficit and will improve investor confidence. There is still a lack of urgency in approving infrastructure projects, as approvals get stuck in layers of bureaucracy resulting in delays which result in cost overruns. We have been encouraged by the Finance Minister's declaration of an "austere budget", which we believe means that it will be a budget which cuts subsidies and expenditures. Any lowering of deficits and infrastructure improvements will make us more optimistic about the near term.
Keeping in mind the timing and uncertainty of the policy implementation, our Fund is broadly diversified. The Fund's holdings in defensive stocks, such as consumer staple and healthcare industries, acted as a buffer during the earlier part of the year; while our holding in autos, financials, pharmaceuticals and some infrastructure companies was instrumental in outperforming the Index. One of our holdings, Tata Motors, was one of best performers on the BSE 100. Tata Motors was helped by results from its Jaguar Land Rover division which has performed admirably well after its acquisition by Tata Motors from Ford Motor company in 2007. Glenmark Pharmaceutical, another top performing holding last year, is a leading player in the discovery of new molecules, and it also has a significant presence in the branded generic markets across emerging economies. It also supplies active pharmaceutical ingredients to other pharmaceutical companies.
While we have been disappointed by the slow progress in the development of infrastructure and the back and forth in the implementation of economic policy, we are at the same time encouraged by the positive steps taken by the Indian government in the last nine months and also by the relaxation of the hawkish policy by the RBI. We would like to see a cut in subsidies in the upcoming budget, while and at the same time, we would like to see an ongoing sale of the government stake in public companies. We believe this will help the companies become more efficient and free up much needed funds for the government. We will continue to invest in India while keeping an eye on the progress on the policy front as well as how the RBI fares against its constant battle against inflation.
Sincerely,
Rakesh Mehra
The views and opinions in this report were current as of January 31, 2013. They are not guarantees of performance or investment results and should not be taken as investment advice. Investment decisions reflect a variety of factors, and the manager reserves the right to change its views about individual stocks, sectors and the markets at any time. As a result, the views expressed should not be relied upon as a forecast of the Fund’s future investment intent.
2013 Annual Report 2
NEW FRONTIERS KC INDIA FUND
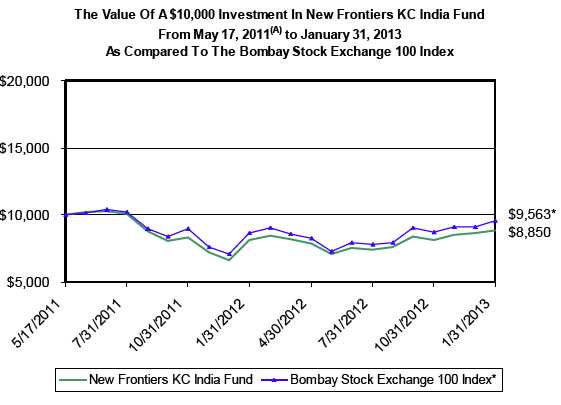
PERFORMANCE INFORMATION (Unaudited)
1/31/13 NAV $8.85
AVERAGE ANNUAL RATE OF RETURN (%) FOR THE PERIODS ENDED JANUARY 31, 2013
| Since | ||||
| 1 Year(A) | Inception(A) | |||
| New Frontiers KC India Fund | 8.86% | -6.88% | ||
| Bombay Stock Exchange 100 Index(B) | 10.83% | -2.57% |
The Fund's Total Annual Operating Expense Ratio (from 6/1/12 Prospectus): Net 2.09%
(A)1 Year and Since Inception returns include change in share prices and in each case includes reinvestment of any dividends and capital gain distributions. The inception date of the New Frontiers KC India Fund was February 24, 2011. The performance numbers represent performance beginning on the first day of security trading (May 17, 2011).
(B)The Bombay Stock Exchange 100 Index (BSE-100) is a market capitalization weighted index of the 100 stocks listed on the Bombay Stock Exchange.
PAST PERFORMANCE DOES NOT GUARANTEE FUTURE RESULTS. INVESTMENT RETURN AND PRINCIPAL VALUE WILL FLUCTUATE SO THAT SHARES, WHEN REDEEMED, MAY BE WORTH MORE OR LESS THAN THEIR ORIGINAL COST. RETURNS DO NOT REFLECT THE DEDUCTION OF TAXES THAT A SHAREHOLDER WOULD PAY ON FUND DISTRIBUTIONS OR THE REDEMPTION OF FUND SHARES. CURRENT PERFORMANCE MAY BE LOWER OR HIGHER THAN THE PERFORMANCE DATA QUOTED. TO OBTAIN PERFORMANCE DATA CURRENT TO THE MOST RECENT MONTH-END, PLEASE CALL 1-800-839-6587.
2013 Annual Report 3
NEW FRONTIERS KC INDIA FUND
NEW FRONTIERS KC INDIA FUND
by Sectors (Unaudited)
(as a percentage of Net Assets)
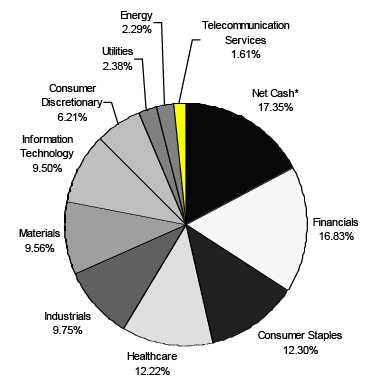
* Net Cash represents cash equivalents and liabilities in excess of other assets.
Availability of Quarterly Schedule of Investments (Unaudited)
The Fund files its complete schedule of portfolio holdings with the Securities and Exchange Commission ("SEC") for the first and third quarters of each fiscal year on Form N-Q. The Fund’s Form N-Q is available on the SEC's Web site at http://www.sec.gov. The Fund’s Form N-Q may also be reviewed and copied at the SEC's Public Reference Room in Washington, DC. Information on the operation of the Public Reference Room may be obtained by calling 1-800-SEC-0330.
Proxy Voting Guidelines (Unaudited)
New Frontiers Advisory Group, LLC, the Fund’s investment advisor (“Advisor”), is responsible for exercising the voting rights associated with the securities held by the Fund. A description of the policies and procedures used by the Advisor in fulfilling this responsibility is available without charge on the Fund’s website at www.newfrontiersfund.com. It is also included in the Fund’s Statement of Additional Information, which is available on the SEC’s website at http://www.sec.gov.
Information regarding how the Fund voted proxies, Form N-PX, relating to portfolio securities during the most recent 12-month period ended June 30th, is available without charge, upon request, by calling our toll free number (1-800-839-6587). This information is also available on the SEC’s website at http://www.sec.gov.
2013 Annual Report 4
Disclosure of Expenses
(Unaudited)
Shareholders of this Fund incur ongoing costs, including investment advisor fees and other Fund expenses. The following example is intended to help you understand your ongoing costs of investing in the Fund and to compare these costs with similar costs of investing in other mutual funds. If shares are redeemed within 90 days of purchase from the Fund, the shares are subject to a 1% redemption fee. The example is based on an investment of $1,000 invested at the beginning of the period and held for the entire period from August 1, 2012 to January 31, 2013.
The first line of the table below provides information about actual account values and actual expenses. In order to estimate the expenses a shareholder paid during the period covered by this report, shareholders can divide their account value by $1,000 (for example, an $8,600 account value divided by $1,000 = 8.6) and then multiply the result by the number in the first line under the heading entitled "Expenses Paid During the Period." The second line of the table below provides information about hypothetical account values and hypothetical expenses based on the Fund's actual expense ratio and an assumed rate of return of 5% per year before expenses, which is not the Fund’s actual return. The hypothetical account values and expenses may not be used to estimate the actual ending account balance or expenses paid by a shareholder for the period. You may use this information to compare the ongoing costs of investing in the Fund and other funds. To do so, compare the 5% hypothetical example with the 5% hypothetical examples that appear in other funds' shareholder reports.
| Expenses Paid | ||||||
| Beginning | Ending | During the Period* | ||||
| Account Value | Account Value | August 1, 2012 to | ||||
| August 1, 2012 | January 31, 2013 | January 31, 2013 | ||||
| Actual | $1,000.00 | $1,189.52 | $11.04 | |||
| Hypothetical | $1,000.00 | $1,015.17 | $10.16 | |||
| (5% annual return | ||||||
| before expenses) | ||||||
| * Expenses are equal to the Fund’s annualized expense ratio of 2.00%, multiplied by the average account value over the period, multiplied by 184/365 (to reflect the one-half year period). |
2013 Annual Report 5
| New Frontiers KC India Fund | |||||
| Schedule of Investments | |||||
| January 31, 2013 | |||||
| Shares/Principal Amount | Fair Value | % of Net Assets | |||
| COMMON STOCKS (INDIA) | |||||
| Auto Components | |||||
| 20,900 | Exide Industries, Ltd. | $ | 48,220 | 1.89 | % |
| Automobiles | |||||
| 1,900 | Mahindra & Mahindra, Ltd. | 31,744 | |||
| 14,000 | Tata Motors, Ltd. | 78,384 | |||
| 110,128 | 4.32 | % | |||
| Cement | |||||
| 800 | UltraTech Cement, Ltd. | 28,597 | 1.12 | % | |
| Chemicals | |||||
| 1,700 | Asian Paints, Ltd. | 143,766 | 5.64 | % | |
| Commercial Banks | |||||
| 15,000 | Allahabad Bank | 46,092 | |||
| 4,000 | Axis Bank, Ltd. | 113,116 | |||
| 4,200 | HDFC Bank, Ltd. | 50,743 | |||
| 5,000 | ICICI Bank, Ltd. | 111,898 | |||
| 321,849 | 12.62 | % | |||
| Construction & Engineering | |||||
| 2,500 | Larsen & Toubro, Ltd. | 72,421 | 2.84 | % | |
| Consumer Finance | |||||
| 1,000 | Shriram Transport Finance Co. | 14,839 | 0.58 | % | |
| Electrical Equipment | |||||
| 10,000 | Crompton Greaves, Ltd. | 20,094 | |||
| 7,000 | Havells India, Ltd. | 86,578 | |||
| 106,672 | 4.18 | % | |||
| Electrical Utilities | |||||
| 15,000 | Tata Power Co. | 28,492 | 1.12 | % | |
| Food | |||||
| 1,700 | GlaxoSmithKline Consumer Healthcare, Ltd. | 120,457 | |||
| 350 | Nestle India, Ltd. | 31,206 | |||
| 151,663 | 5.95 | % | |||
| Gas Utilities | |||||
| 5,000 | Gail India, Ltd. | 32,151 | 1.26 | % | |
| Information Technology Services | |||||
| 1,600 | eClerx Services Ltd. | 18,809 | |||
| 2,300 | HCL Technologies, Ltd. | 29,730 | |||
| 4,000 | Tata Consultancy Services, Ltd. | 101,017 | |||
| 12,000 | Wipro, Ltd. | 92,787 | |||
| 242,343 | 9.50 | % | |||
| Infrastructure | |||||
| 11,000 | IRB Infrastructure Developers, Ltd. | 25,090 | 0.98 | % | |
| Infrastructure Finance | |||||
| 10,500 | IDFC, Ltd. | 33,478 | 1.31 | % | |
| Metals & Mining | |||||
| 10,000 | NMDC, Ltd. | 29,018 | |||
| 4,500 | Sesa Goa, Ltd. | 15,772 | |||
| 3,500 | Tata Steel, Ltd | 26,626 | |||
| 71,416 | 2.80 | % | |||
| Mortgage Finance | |||||
| 4,000 | Housing Development Financial Corp. | 59,111 | 2.32 | % | |
| Oil & Gas | |||||
| 3,500 | Reliance Industries, Ltd. | 58,305 | 2.29 | % | |
| Personal Care | |||||
| 1,900 | Colgate-Palmolive India, Ltd. | 48,195 | |||
| 3,000 | Emami Limited | 32,976 | |||
| 81,171 | 3.18 | % | |||
| The accompanying notes are an integral part of these financial statements. |
2013 Annual Report 6
| New Frontiers KC India Fund | ||||||
| Schedule of Investments | ||||||
| January 31, 2013 | ||||||
| Shares/Principal Amount | Fair Value | % of Net Assets | ||||
| COMMON STOCKS (INDIA) | ||||||
| Pharmaceuticals | ||||||
| 7,000 | Aurobindo Pharma, Ltd. | $ | 24,646 | |||
| 7,000 | Cipla, Ltd. | 53,534 | ||||
| 19,000 | Glenmark Pharmaceuticals, Ltd. | 179,380 | ||||
| 4,000 | Sun Pharmaceuticals, Ltd. | 53,960 | ||||
| 311,520 | 12.22 | % | ||||
| Project Consultancy | ||||||
| 6,500 | Engineers India, Ltd. | 26,977 | 1.06 | % | ||
| Road & Rail | ||||||
| 1,000 | Container Corp. of India, Ltd. | 17,561 | 0.69 | % | ||
| Telecommunications | ||||||
| 6,500 | Tata Communications, Ltd. | 28,424 | 1.11 | % | ||
| Tobacco | ||||||
| 14,000 | ITC, Ltd. | 80,923 | 3.17 | % | ||
| Wireless Telecom | ||||||
| 2,000 | Bharti Airtel, Ltd. | 12,761 | 0.50 | % | ||
| Total for Common Stocks (India) (Cost $2,145,982) | 2,107,878 | 82.65 | % | |||
| MONEY MARKET FUNDS (United States) | ||||||
| 445,878 | Highmark 100% US Treasury Fund 0.00% * | 445,878 | 17.48 | % | ||
| (Cost $445,878) | ||||||
| Total Investment Securities | 2,553,756 | 100.13 | % | |||
| (Cost $2,591,860) | ||||||
| Liabilities in Excess of Other Assets | (3,426 | ) | -0.13 | % | ||
| Net Assets | $ | 2,550,330 | 100.00 | % | ||
| * Variable rate security; the yield rate shown represents the rate at January 31, 2013. The accompanying notes are an integral part of these financial statements. |
2013 Annual Report 7
| New Frontiers KC India Fund | |||
| Statement of Assets and Liabilities | |||
| January 31, 2013 | |||
| Assets: | |||
| Investment Securities at Fair Value | $ | 2,553,756 | |
| (Cost $2,591,860) | |||
| Foreign Currency at Fair Value | |||
| (Cost $532) | 536 | ||
| Cash | 1,000 | ||
| Dividends Receivable | 226 | ||
| Total Assets | 2,555,518 | ||
| Liabilities: | |||
| Payable to Advisor | 3,743 | ||
| Payable to Custodian | 1,445 | ||
| Total Liabilities | 5,188 | ||
| Net Assets | $ | 2,550,330 | |
| Net Assets Consist of: | |||
| Capital Paid In | $ | 2,789,303 | |
| Accumulated Net Investment Loss | (3,016 | ) | |
| Accumulated Realized Loss on Investments and Foreign Currency | |||
| Related Transactions - Net | (197,857 | ) | |
| Unrealized Depreciation in Value of Investments and Foreign | |||
| Related Transactions Based on Identified Cost - Net | (38,100 | ) | |
| Net Assets, for 288,322 Shares Outstanding | $ | 2,550,330 | |
| (Without par value, unlimited shares authorized) | |||
| Net Asset Value and Offering Price Per Share | |||
| ($2,550,330/288,322 shares) | $ | 8.85 | |
| Minimum Redemption Price Per Share ($8.85 * 0.99) (Note 2) | $ | 8.76 | |
| Statement of Operations | |||
| For the fiscal year ended January 31, 2013 | |||
| Investment Income: | |||
| Dividends and Interest | $ | 25,291 | |
| Total Investment Income | 25,291 | ||
| Expenses: | |||
| Management Fees | 39,036 | ||
| Custody Transaction Charges | 92 | ||
| Total Expenses | 39,128 | ||
| Net Investment Loss | (13,837 | ) | |
| Realized and Unrealized Gain/(Loss) on Investments and Foreign Currency Related Transactions: | |||
| Realized Loss on Investments and Foreign Currency Related Transactions | (111,172 | ) | |
| Net Change in Unrealized Depreciation on Investments and Foreign Currency | |||
| Related Transactions | 314,826 | ||
| Net Realized and Unrealized Gain/(Loss) on Investments and Foreign Currency | |||
| Related Transactions | 203,654 | ||
| Net Increase in Net Assets from Operations | $ | 189,817 | |
| The accompanying notes are an integral part of these financial statements. |
2013 Annual Report 8
| New Frontiers KC India Fund | ||||||
| Statements of Changes in Net Assets | ||||||
| 2/1/2012 | 2/24/2011* | |||||
| to | to | |||||
| 1/31/2013 | 1/31/2012 | |||||
| From Operations: | ||||||
| Net Investment Loss | $ | (13,837 | ) | $ | (8,701 | ) |
| Net Realized Loss on Investments and Foreign Currency | (111,172 | ) | (90,144 | ) | ||
| Related Transactions | ||||||
| Change in Net Unrealized Depreciation on Investments and | ||||||
| Foreign Currency Related Transactions | 314,826 | (352,926 | ) | |||
| Decrease in Net Assets from Operations | 189,817 | (451,771 | ) | |||
| From Distributions to Shareholders: | ||||||
| Net Investment Income | - | - | ||||
| Net Realized Gain from Security Transactions | - | - | ||||
| Change in Net Assets from Distributions | - | - | ||||
| From Capital Share Transactions: | ||||||
| Proceeds From Sale of Shares | 770,664 | 2,383,356 | ||||
| Proceeds From Redemption Fees (Note 2) | 129 | - + | ||||
| Shares Issued on Reinvestment of Dividends | - | - | ||||
| Cost of Shares Redeemed | (333,367 | ) | (108,498 | ) | ||
| Net Increase from Shareholder Activity | 437,426 | 2,274,858 | ||||
| Net Increase in Net Assets | 627,243 | 1,823,087 | ||||
| Net Assets at Beginning of Period | 1,923,087 | 100,000 | ||||
| Net Assets at End of Period (Including Accumulated Undistributed | ||||||
| Net Investment Income of $0 and $0, respectively) | $ | 2,550,330 | $ | 1,923,087 | ||
| Share Transactions: | ||||||
| Issued | 93,320 | 241,191 | ||||
| Reinvested | - | - | ||||
| Redeemed | (41,606 | ) | (14,583 | ) | ||
| Net Increase in Shares | 51,714 | 226,608 | ||||
| Shares Outstanding Beginning of Period | 236,608 | 10,000 | ||||
| Shares Outstanding End of Period | 288,322 | 236,608 | ||||
| * The Fund commenced operations on February 24, 2011 and commenced investment operations on May 17, 2011. + Amount calculated is less than $0.50. |
| The accompanying notes are an integral part of these financial statements. |
2013 Annual Report 9
| New Frontiers KC India Fund | ||||||
| Financial Highlights | ||||||
| Selected data for a share outstanding | ||||||
| throughout the period: | 2/1/2012 | 2/24/2011* | ||||
| to | to | |||||
| 1/31/2013 | 1/31/2012 | |||||
| Net Asset Value - | ||||||
| Beginning of Period | $ | 8.13 | $ | 10.00 | ||
| Net Investment Loss (a) | (0.06 | ) | (0.05 | ) | ||
| Net Gain (Loss) on Investments and Foreign Currency Related | ||||||
| Transactions (Realized and Unrealized) (b) | 0.78 | (1.82 | ) | |||
| Total from Investment Operations | 0.72 | (1.87 | ) | |||
| Distributions (From Net Investment Income) | - | - | ||||
| Distributions (From Realized Capital Gains) | - | - | ||||
| Total Distributions | - | - | ||||
| Proceeds from Redemption Fees (Note 2) | - | (c) | - | (c) | ||
| Net Asset Value - | ||||||
| End of Period | $ | 8.85 | $ | 8.13 | ||
| Total Return (d) | 8.86% | (18.70)% | *** (e) | |||
| Ratios/Supplemental Data | ||||||
| Net Assets - End of Period (Thousands) | $ | 2,550 | $ | 1,923 | ||
| Before Waiver | ||||||
| Ratio of Expenses to Average Net Assets | 2.00% | 2.09% | ** | |||
| Ratio of Net Investment Income (Loss) to Average Net Assets | (0.71)% | (0.74)% | ** | |||
| After Waiver | ||||||
| Ratio of Expenses to Average Net Assets | 2.00% | 1.95% | ** | |||
| Ratio of Net Investment Income (Loss) to Average Net Assets | (0.71)% | (0.60)% | ** | |||
| Portfolio Turnover Rate | 10.80% | 3.92% | *** | |||
| * The Fund commenced operations on February 24, 2011 and commencement of investment operations was May 17, 2011. ** Annualized. *** Not Annualized. (a) Per share amounts were calculated using the average shares method. (b) Realized and unrealized gains and losses per share in this caption are balancing amounts necessary to reconcile the change in net asset value for the period, and may not reconcile with the aggregate gains and losses in the Statement of Operations due to share transactions for the period. (c) Amount calculated is less than $0.005. (d) Total return in the above table represents the rate that the investor would have earned or lost on an investment in the Fund assuming reinvestment of dividends and distributions. (e) Represents performance beginning on the first day of security trading (May 17, 2011). |
| The accompanying notes are an integral part of these financial statements. |
2013 Annual Report 10
NOTES TO FINANCIAL STATEMENTS
NEW FRONTIERS KC INDIA FUND
January 31, 2013
1.) ORGANIZATION:
New Frontiers KC India Fund (the "Fund") is a non-diversified series of the New Frontiers Trust (the "Trust"), an open-end investment company under the Investment Company Act of 1940, as amended. The Trust was organized in Ohio as a business trust on November 18, 2010 and may offer an unlimited number of shares of beneficial interest in a number of separate series, each series representing a distinct fund with its own investment objectives and policies. At present, there is one series authorized by the Trust. The Fund commenced operations on February 24, 2011 and the Fund commenced investing in accordance with its objectives on May 17, 2011. The Fund's investment objective is to seek long-term capital appreciation. The investment advisor to the Fund is New Frontiers Advisory Group, LLC (the “Advisor”).
2.) SIGNIFICANT ACCOUNTING POLICIES:
SECURITY VALUATION:
All investments in securities are recorded at their estimated fair value, as described in Note 3.
FEDERAL INCOME TAXES:
The Fund’s policy is to comply with the requirements of the Internal Revenue Code that are applicable to regulated investment companies and to distribute all of its taxable income to shareholders. Therefore, no federal income tax provision is required. It is the Fund’s policy to distribute annually, prior to the end of the calendar year, dividends sufficient to satisfy excise tax requirements of the Internal Revenue Code. This Internal Revenue Code requirement may cause an excess of distributions over the book year-end accumulated income. In addition, it is the Fund’s policy to distribute annually, after the end of the fiscal year, any remaining net investment income and net realized capital gains.
The Fund recognizes the tax benefits of certain tax positions only where the position is “more likely than not” to be sustained assuming examination by tax authorities. Management has analyzed the Fund’s tax positions, and has concluded that no liability for unrecognized tax benefits should be recorded related to uncertain tax positions taken on returns filed for open tax year 2011, or expected to be taken in the Fund’s 2012 tax returns. The Fund identifies its major tax jurisdictions as U.S. Federal tax authorities; however, the Fund is not aware of any tax positions for which it is reasonably possible that the total amounts of unrecognized tax benefits will change materially in the next twelve months. The Fund recognizes interest and penalties, if any, related to unrecognized tax benefits as income tax expense in the statement of operations. During the fiscal year ended January 31, 2013, the Fund did not incur any interest or penalties.
FOREIGN TAXES:
The Fund is subject to a tax imposed on short-term capital gains on securities of issuers domiciled in India. The Fund records an estimated deferred tax liability for securities that have been held for less than one year at the end of the reporting period, assuming those positions were disposed of at the end of the period. In determining the estimated deferred tax liability, the Fund considers any available capital loss carryforwards. Realized losses on the sale of securities of issuers domiciled in India can be carried forward for eight years to offset potential future short-term realized capital gains. As of January 31, 2013, the Fund estimated that there was $0 for such potential future India capital gains taxes.
SHARE VALUATION:
The net asset value per share of the Fund is calculated daily by dividing the total value of the Fund’s assets, less liabilities, by the number of shares outstanding, rounded to the nearest cent. The offering and redemption price per share is equal to the net asset value per share, except that shares of the Fund are subject to a redemption fee of 1% if redeemed after holding them for 90 days or less. During the fiscal year ended January 31, 2013, proceeds from redemption fees amounted to $129.
FOREIGN CURRENCY:
Investment securities and other assets and liabilities denominated in foreign currencies are translated into U.S. dollar amounts based on the exchange rate of such currencies against U.S. dollars on the date of valuation. Purchases and sales of investment securities and income and expense items denominated in foreign currencies are translated into U.S. dollar amounts at the exchange rate in effect on the respective dates of such transactions.
2013 Annual Report 11
Notes to Financial Statements - continued
The Fund does not isolate that portion of the results of operations resulting from changes in foreign exchange rates on investments from the fluctuations arising from changes in market prices of securities held. Such fluctuations are included with the net realized and unrealized gain or loss from investments.
Reported net realized foreign exchange gains or losses arise from sales of foreign currencies, currency gains or losses realized between the trade and settlement dates on securities transactions, and the difference between the amounts of dividends, interest, and foreign withholding taxes recorded on the Fund's books and the U.S. dollar equivalent of the amounts actually received or paid. Net unrealized foreign exchange gains and losses arise from changes in the fair values of assets and liabilities, other than investments in securities at fiscal period end, resulting from changes in exchange rates.
DISTRIBUTIONS TO SHAREHOLDERS:
Distributions to shareholders, which are determined in accordance with income tax regulations, are recorded on the ex-dividend date.
The treatment for financial reporting purposes of distributions made to shareholders during the period from net investment income or net realized capital gains may differ from their ultimate treatment for federal income tax purposes. These differences are caused primarily by differences in the timing of the recognition of certain components of income, expense, or realized capital gain for federal income tax purposes. Where such differences are permanent in nature, they are reclassified in the components of the net assets based on their ultimate characterization for federal income tax purposes. Any such reclassifications will have no effect on net assets, results of operations, or net asset value per share of the Fund. For the fiscal year ended January 31, 2013, paid in capital was reduced by $7,106, net investment losses were reduced by $10,821, and accumulated capital losses were increased by $3,715 as a result of such permanent differences.
USE OF ESTIMATES:
The preparation of financial statements in conformity with accounting principles generally accepted in the United States of America (“GAAP”) requires management to make estimates and assumptions that affect the reported amounts of assets and liabilities and disclosure of contingent assets and liabilities at the date of the financial statements and the reported amounts of increases and decreases in net assets from operations during the reporting period. Actual results could differ from those estimates.
OTHER:
The Fund records security transactions based on the trade date. Dividend income is generally recognized on the ex-dividend date. Dividend income for certain issuers headquartered in India may not be recorded until approved by the shareholders (which may occur after the ex-dividend date) if, in the judgment of management, such dividends are not reasonably determined as of the ex-dividend date. Interest income is recognized on an accrual basis. The Fund uses the specific identification method in computing gain or loss on the sale of investment securities. Discounts and premiums on securities purchased are amortized over the life of the respective securities. Withholding taxes on foreign dividends have been provided for in accordance with the Fund's understanding of the applicable country's tax rules and rates.
CONCENTRATION OF RISK:
The Fund will invest primarily in the securities of Indian companies, and as a result, the value of its shares will be significantly affected by political, economic, regulatory and other developments in India, as well as changes in the status of India's relation with other countries. Investments in India generally are considered to be more speculative than investments in more developed markets of the world, and therefore may be subject to a greater risk of loss.
3.) SECURITIES VALUATIONS:
The Fund utilizes various methods to measure the fair value of its investments on a recurring basis. GAAP establishes a hierarchy that prioritizes inputs to valuation methods. The three levels of inputs are:
Level 1 - Unadjusted quoted prices in active markets for identical assets or liabilities that the Fund has the ability to access.
Level 2 - Observable inputs other than quoted prices included in level 1 that are observable for the asset or liability, either directly or indirectly. These inputs may include quoted prices for the identical instrument on an inactive market, prices for similar instruments, interest rates, prepayment speeds, credit risk, yield curves, default rates and similar data.
2013 Annual Report 12
Notes to Financial Statements - continued
Level 3 - Unobservable inputs for the asset or liability, to the extent relevant observable inputs are not available, representing the Fund’s own assumptions about the assumptions a market participant would use in valuing the asset or liability, and would be based on the best information available.
The availability of observable inputs can vary from security to security and is affected by a wide variety of factors, including, for example, the type of security, whether the security is new and not yet established in the marketplace, the liquidity of markets, and other characteristics particular to the security. To the extent that valuation is based on models or inputs that are less observable or unobservable in the market, the determination of fair value requires more judgment. Accordingly, the degree of judgment exercised in determining fair value is greatest for instruments categorized in level 3.
The inputs used to measure fair value may fall into different levels of the fair value hierarchy. In such cases, for disclosure purposes, the level in the fair value hierarchy within which the fair value measurement falls in its entirety, is determined based on the lowest level input that is significant to the fair value measurement in its entirety.
FAIR VALUE MEASUREMENTS
A description of the valuation techniques applied to the Fund’s major categories of assets and liabilities measured at fair value on a recurring basis follows.
Equity securities (common stocks - India). Equity securities are carried at fair value. The market quotation used for common stocks, including those listed on the NASDAQ National Market System, is the last sale price on the date on which the valuation is made or, in the absence of sales, at the closing bid price. Foreign securities are usually valued on the basis of the most recent closing price of the foreign markets on which such securities principally trade. Over-the-counter securities will be valued on the basis of the bid price at the close of each business day. Generally, if the security is traded in an active market and is valued at the last sale price, the security is categorized as a level 1 security. When the security position is not considered to be part of an active market or when the security is valued at the bid price, the position is generally categorized as level 2. When market quotations are not readily available, when the Advisor determines the last bid price does not accurately reflect the current value or when restricted securities are being valued, such securities are valued as determined in good faith by the Advisor, in conformity with guidelines adopted by and subject to review of the Board of Trustees (the “Trustees”) and are categorized in level 2 or level 3, when appropriate.
The Fund may invest in portfolio securities that are primarily listed on foreign exchanges or other markets that trade on weekends and other days when the Fund does not price its shares. As a result, the market value of these investments may change on days when the Fund does not calculate the value of such investments. In this regard, it should be noted that the National Stock Exchange of India is generally open Monday through Friday from 9:15 a.m. until 3:30 p.m., India time (10:45 p.m. until 5:00 a.m., Eastern time), except for certain holidays recognized by the exchange or the Indian government. Events affecting the value of foreign investments may occur between the time at which they are determined and when the Fund calculates its NAV, which is normally the close of trading on the New York Stock Exchange (the “NYSE”). If such events render market quotations unreliable, and the impact of such events can be reasonably determined, the investments will be valued at their fair value as determined in conformity with guidelines adopted by and subject to review of the Trustees. The fair value of a security held by the Fund may be determined using the services of third-party pricing services or such securities are valued as determined in good faith by the Advisor, in conformity with guidelines adopted by and subject to review of the Trustees and are typically categorized in level 2 or level 3, when appropriate.
Money market funds. Shares of money market funds are valued at a net asset value of $1.00 and are classified in level 1 of the fair value hierarchy.
Fixed income securities. Fixed income securities generally are valued by using market quotations, but may be valued on the basis of prices furnished by a pricing service when the Advisor believes such prices accurately reflect the fair value of such securities. A pricing service utilizes electronic data processing techniques based on yield spreads relating to securities with similar characteristics to determine prices for normal institutional-size trading units of debt securities without regard to sale or bid prices. When prices are not readily available from a pricing service, or when restricted or illiquid securities are being valued, securities are valued at fair value as determined in good faith by the Advisor, subject to review of the Trustees. Short-term investments in fixed income securities with maturities of less than 60 days when acquired, or which subsequently are within 60 days of maturity, are valued by using the amortized cost method of valuation. Generally, fixed income securities are categorized as level 2.
2013 Annual Report 13
Notes to Financial Statements - continued
In accordance with the Trust's good faith pricing guidelines, the Advisor is required to consider all appropriate factors relevant to the value of securities for which it has determined other pricing sources are not available or reliable as described above. There is no single procedure for determining fair value, since fair value depends upon the circumstances of each individual case. As a general principle, the current fair value of an issue of securities being valued by the Advisor would appear to be the amount which the owner might reasonably expect to receive for them upon their current sale. Methods which are in accordance with this principle may, for example, be based on (i) a multiple of earnings; (ii) a discount from market of a similar freely traded security (including a derivative security or a basket of securities traded on other markets, exchanges or among dealers); or (iii) yield to maturity with respect to debt issues, or a combination of these and other methods.
Foreign securities held by the Fund may be traded on days and at times when the NYSE is closed. Accordingly, the NAV of the Fund may be significantly affected on days when shareholders have no access to the Fund.
The following table summarizes the inputs used to value the Fund’s assets measured at fair value as of January 31, 2013:
| Valuation Inputs of Assets | Level 1 | Level 2 | Level 3 | Total | ||||
| Common Stocks (India) | $2,107,878 | $0 | $0 | $2,107,878 | ||||
| Money Market Funds | 445,878 | 0 | 0 | 445,878 | ||||
| Total | $2,553,756 | $0 | $0 | $2,553,756 |
Refer to the Fund’s Schedule of Investments for a listing of securities by industry. The Fund did not hold any level 3 assets during the fiscal year ended January 31, 2013. There were no transfers into or out of the levels during the fiscal year ended January 31, 2013. It is the Fund’s policy to consider transfers into or out of the levels as of the end of the reporting period.
The Fund did not invest in derivative instruments during the fiscal year ended January 31, 2013.
4.) INVESTMENT ADVISORY AGREEMENT AND RELATED PARTY TRANSACTIONS:
The Fund has entered into an investment advisory agreement (“Management Agreement”) with the Advisor. Under the terms of the Fund's Management Agreement, the Advisor manages the Fund's investments subject to approval of the Board of Trustees and pays all of the expenses of the Fund except brokerage fees and commissions, transaction charges of the Fund's custodian on Fund trades, taxes, borrowing costs (such as (a) interest and (b) dividend expenses on securities sold short), 12b-1 fees and such extraordinary or non-recurring expenses as may arise, including litigation to which the Fund may be a party and indemnification of the Trustees and officers with respect thereto. As compensation for its management services and agreement to pay the Fund's expenses, the Fund is obligated to pay the Advisor a fee (based on average daily net assets) computed and accrued daily and paid monthly at the following annual rates: 2.00% on the first $500 million in assets, 1.75% for the assets over $500 million up to $1 billion, and 1.55% for assets in excess of $1 billion.
For the fiscal year ended January 31, 2013, the Advisor earned management fees totaling $39,036. The Fund owed the Advisor $3,743 as of January 31, 2013 for management fees earned for the fiscal year ended January 31, 2013.
The Fund has adopted a plan pursuant to Rule 12b-1 under the 1940 Act (the "Plan"). The Fund pays the Advisor for certain distribution and promotion expenses related to marketing shares of the Fund pursuant to the Plan. Under the terms of the Plan, the amount payable annually by the Fund would be 0.25% of its average daily net assets. At present, the Plan is not implemented, although the Trustees may do so at any time upon notice to shareholders.
An officer and a shareholder of the Advisor is also an officer and a Trustee of the Trust. These individuals may receive benefits from the Advisor resulting from management and services fees paid to the Advisor by the Fund.
The Trustees who are not interested persons of the Fund were each paid Trustees’ fees of $8,500 plus travel and related expenses for the fiscal year ended January 31, 2013. Under the Management Agreement, the Advisor pays these fees.
5.) CAPITAL SHARES:
The Trust is authorized to issue an unlimited number of shares of beneficial interest. Paid in capital at January 31, 2013 was $2,789,303 representing 288,322 shares outstanding.
2013 Annual Report 14
Notes to Financial Statements - continued
6.) PURCHASES AND SALES OF SECURITIES:
For the fiscal year ended January 31, 2013, purchases and sales of investment securities other than U.S. Government obligations and short-term investments aggregated $265,299 and $198,920, respectively. Purchases and sales of U.S. Government obligations aggregated $0 and $0, respectively.
7.) SECURITY TRANSACTIONS:
For Federal income tax purposes, the cost of investments owned at January 31, 2013 was $2,644,626. At January 31, 2013, the composition of unrealized appreciation (the excess of value over tax cost) and depreciation (the excess of tax cost over value) on investments was as follows:
| Appreciation | (Depreciation) | Net Appreciation (Depreciation) | ||||
| $220,892 | ($311,762) | ($90,870) |
8.) CONTROL OWNERSHIP:
The beneficial ownership, either directly or indirectly, of more than 25% of the voting securities of a fund creates a presumption of control of a fund, under Section 2(a)(9) of the Investment Company Act of 1940. As of January 31, 2013, National Financial Services, LLC, located at 200 Liberty Street, New York, New York for the benefit of their clients, beneficially held, in aggregate 54.51% of the shares of the Fund, and therefore may be deemed to control the Fund. Also, as of January 31, 2013, Band & Co., located at 1555 North Rivercenter Drive, Suite 302, Milwaukee, Wisconsin for the benefit of their clients, beneficially held, in aggregate 28.53% of the shares of the Fund, and therefore may be deemed to control the Fund.
9.) DISTRIBUTIONS TO SHAREHOLDERS:
There were no distributions paid during the fiscal year ended January 31, 2013 and the period February 24, 2011 through January 31, 2012.
As of January 31, 2013, the components of distributable earnings (accumulated losses) on a tax basis were as follows:
| Undistributed capital gain/(accumulated losses) | $ | (145,091 | ) |
| Unrealized appreciation/(depreciation) | (90,870 | ) | |
| $ | (235,961 | ) |
Book to tax differences are primarily attributable to deferred post-October losses of $52,766, and the deferral of late year losses totaling $3,012.
10.) CAPITAL LOSS CARRYFORWARDS
As of January 31, 2013, the Fund had available for federal tax purposes capital loss carryfor-wards of $145,091, of which $100,019 may be used to offset future short-term capital gains and $45,072 may be used to offset future long-term capital gains. The Fund’s available capital loss carryforwards have no expiration. To the extent that these carryforwards are used to offset future capital gains, it is probable that the amount that is offset will not be distributed to shareholders.
ADDITIONAL INFORMATION
January 31, 2013
(Unaudited)
APPROVAL OF INVESTMENT ADVISORY AGREEMENT
On January 15, 2013 the Board of Trustees (the “Board” or the “Trustees”) considered the renewal of the Management Agreement (the "Agreement"). In renewing the Management Agreement, the Board of Trustees received material from the Advisor (the "Report") addressing the following factors: (i) the investment performance of the Fund and the Advisor; (ii) the nature, extent and quality of the services provided by the Advisor to the Fund; (iii) the cost of the services to be provided and the profits to be realized by the Advisor and its affiliates from the relationship with the Fund; (iv) the extent to which economies of scale will be realized as the Fund grows; and (v) whether the fee levels reflect these economies of scale to the benefit of shareholders.
The Board met with the Advisor to discuss the terms of the Agreement. The Board reviewed the history of the Advisor, including background and investment management experience, as well as the Fund's performance since its' inception, important factors relating to the Fund's performance, the Advisor's investment and research strategy, the Advisor's strength, and expected expenses and revenue from the Fund.
2013 Annual Report 15
Additional Information - continued
As to the performance of the Fund, the materials from the Advisor included information regarding the Fund's performance compared to a peer group of 16 similar funds (the "Peer Group"). For the calendar year-to-date period ended November 30, 2012, the Fund was up 27.48% compared to 28.97% for the Peer Group, and 28.04% for the Bombay Stock Exchange 100 Index (the "Benchmark". Additionally, it was noted that for the one-year period ended December 31, 2012, the Fund was up 29.88% compared to the Benchmark's performance of 28.53% . For the periods indicated, the Trustees noted that the Fund performed within the range of the Peer Group and was competitive against the Benchmark. Having considered the comparative data as described above, the Trustees concluded the Fund's performance was either consistent with or above their expectations.
As to the nature, extent and quality of the services provided by the Advisor, the Trustees analyzed the Advisor's experience and capabilities. The Advisor summarized the information provided to the Board. The Trustees discussed the Advisor's financial condition, the portfolio manager's background and investment management experience. The Advisor reviewed and discussed with the Board the its ADV and the Rule 17j-1 Code of Ethics certifications. The Trustees discussed the quality of the Advisor's compliance efforts and financial stability. After reviewing the foregoing and further information from the Advisor, the Board concluded that the quality, extent, and nature of the services being provided by the Advisor were satisfactory and adequate.
As to the cost of the services to be provided and the profits to be realized by the Advisor and its affiliates from the relationship with the Fund, it was noted that the Advisor is paying substantially all operating expenses of the Fund pursuant to the unitary fee arrangement. Additionally, the Advisor provides the Fund with officers, including the CCO, marketing support and office space. The Trustees noted that while the Fund had adopted a distribution plan in accordance with Rule 12b-1 under the 1940 Act, the plan is not currently implemented. The Trustees noted that the management fee of 2.00% was above the peer group average, but that the Fund's net expense ratio was slightly below the average of the Peer Group. The Trustees noted that due to the unitary expense structure, it was important to consider the Peer Group's net expenses when assessing the reasonableness of the management fee. Then, the Trustees reviewed a summary of the Advisor's profitability resulting from the services provided to the Fund for the last 12 months of operations, and it was noted that the Advisor had incurred losses related to its operation of Fund. Having considered the comparative data as described above, the Trustees concluded that the Fund's management fee and expense ratio were reasonable.
As for potential economies of scale, the Trustees discussed and considered information regarding whether there have been economies of scale with respect to the management of the Fund, whether the Fund has appropriately benefited from any economies of scale, and whether there is potential for realization of any further economies of scale. The Trustees noted that based on the current asset size of the Fund, the Advisor was not achieving profits nor realizing any economy of scale benefits with respect to the management of the Fund. The Advisor pointed out that as the assets of the Fund grow, the Fund's management fee agreement includes break points which will allow for sharing the benefits of economies of scale.
Next, the Independent Trustees met in executive session to discuss the continuation of the Agreement. The officers of the Trust were excused during this discussion.
Upon reconvening the meeting, the Trustees reported that after further consideration, they were satisfied with the performance of the Fund. They concluded that the nature and extent of services provided by the Advisor was consistent with the Board's expectations. The Trustees also concluded that the Advisor has sufficient resources and had provided quality advisory services to the Fund. The Board agreed that the fees in the Agreement were reasonable and that profits incurred by the Advisor were reasonable. The Trustees agreed that economics of scale would not be a material consideration until the Fund was substantially larger. It was the consensus of the Trustees, including the Independent Trustees that renewal of the Agreement would be in the best interests of the Fund.
2013 Annual Report 16
| Cohen Fund Audit Services, Ltd. | 216.649.1700 | |
| 1350 Euclid Avenue, Ste 800 | 216.579.0111 | fax |
| Cleveland, Ohio 44115 | ||
| www.cohenfund.com | ||
REPORT OF INDEPENDENT REGISTERED PUBLIC ACCOUNTING FIRM
To the Shareholders and Board of Trustees
New Frontiers KC India Fund
(a Series of New Frontiers Trust)
We have audited the accompanying statement of assets and liabilities, including the schedule of investments of New Frontiers KC India Fund (the "Fund"), a series of the New Frontiers Trust, as of January 31, 2013, and the related statement of operations for the year then ended, the statements of changes in net assets and the financial highlights for each of the two periods in the period then ended. These financial statements and financial highlights are the responsibility of the Fund's management. Our responsibility is to express an opinion on these financial statements and financial highlights based on our audits.
We conducted our audits in accordance with the standards of the Public Company Accounting Oversight Board (United States). Those standards require that we plan and perform the audit to obtain reasonable assurance about whether the financial statements and financial highlights are free of material misstatement. An audit includes examining, on a test basis, evidence supporting the amounts and disclosures in the financial statements. Our procedures included confirmation of securities owned as of January 31, 2013, by correspondence with the custodian. An audit also includes assessing the accounting principles used and significant estimates made by management, as well as evaluating the overall financial statement presentation. We believe that our audits provide a reasonable basis for our opinion.
In our opinion, the financial statements and financial highlights referred to above present fairly, in all material respects, the financial position of New Frontiers KC India Fund as of January 31, 2013, the results of its operations for the year then ended, and the changes in its net assets and the financial highlights for each of the two periods in the period then ended, in conformity with accounting principles generally accepted in the United States of America.
COHEN FUND AUDIT SERVICES, LTD.
Cleveland, Ohio
March 15, 2013
2013 Annual Report 17
TRUSTEES AND OFFICERS
(Unaudited)
The Board of Trustees supervises the business activities of the Trust. The names of the Trustees and executive officers of the Trust are shown below. Each Trustee serves until the Trustee dies, resigns, retires or is removed. Officers hold office for one year and until their respective successors are chosen and qualified.
The trustees and officers of the Trust and their principal business activities during the past five years are:
Interested Trustees and Officers
| Position | Principal | Number of | Other | ||
| Name, | with the | Length of | Occupation(s) | Portfolios | Directorships |
| Address(1), | Trust | Time | During | Overseen | Held By |
| and Age | Served | Past 5 Years | By Trustee | Trustee | |
| Rakesh Mehra(2), 53 | President, Secretary, | Indefinite | Managing Member, New Frontiers | 1 | None |
| Treasurer | Term, | Advisory Group LLC (since 2010); | |||
| and Trustee | Since 2010 | founder and President, RM Invest- | |||
| ment Management, Inc. (since | |||||
| 1993). | |||||
| Frank Pedicini, 56 | Chief Compliance | Indefinite | Director of Finance and Administra- | N/A | None |
| Officer | Term, | tion, Skoda Minotti (CPA, business | |||
| Since 2011 | and financial advisory services | ||||
| firm) (2002–10) Chief Compliance | |||||
| Officer, Aurum Wealth Management | |||||
| Group (2006–07). | |||||
(1) The address of each Trustee and officer is c/o New Frontiers Advisory Group, LLC, 30195 Chagrin Blvd., Suite 118N, Pepper Pike, OH 44124.
(2) Rakesh Mehra is considered an “interested person” as defined in Section 2(a)(19) of the Investment Company Act of 1940 by virtue of his affiliation with the Advisor.
Independent Trustees
| Name, | Position | Length of | Principal | Number of | Other |
| Address(1), | with the | Time | Occupation(s) | Portfolios | Directorships |
| and Age | Trust | Served | During | Overseen | Held By |
| Past 5 Years | By Trustee | Trustee | |||
| Gerald A. Fallon, 63 | Trustee | Indefinite | Retired (since 2010); Chairman & | 1 | Digital |
| Term, | CEO, Lander North Asset Manage- | Lightwave, Inc. | |||
| Since 2011 | ment LLC (2008–10); Director, Digi- | and PVF | |||
| tal Lightwave, Inc. (telecommunica- | Capital Corp. | ||||
| tions equipment provider)(1999– | |||||
| 2010); Director, PVF Capital Corp. | |||||
| (community bank) (2002–08). | |||||
| Richard C. Ruhland, | Trustee | Indefinite | Retired (since 2007); founder, | 1 | None |
| 71 | Term, | owner and Certified Public Account, | |||
| Since 2011 | Ruhland & Associates (1981–2007). | ||||
| Robert Warren, Jr., 63 | Trustee | Indefinite | Partner, Hermann, Cahn & | 1 | None |
| Term, | Schneider, LLP (law firm) (since | ||||
| Since 2011 | 1982); Trustee, Cleveland Clinic | ||||
| Foundation (since 2009). | |||||
(1) The address of each Trustee and officer is c/o New Frontiers Advisory Group, LLC, 30195 Chagrin Blvd., Suite 118N, Pepper Pike, OH 44124.
The Statement of Additional Information contains additional and more detailed information about the trustees and is available without charge by calling the transfer agent at 1-800-839-6587.
2013 Annual Report 18
Board of Trustees
|
| This report is provided for the general information of the shareholders of the New Frontiers KC India Fund. This report is not intended for distribution to prospective investors in the Fund, unless preceded or accompanied by an effective prospectus. |
NEW FRONTIERS KC INDIA FUND
30195 Chagrin Blvd., Suite 118N
Pepper Pike, OH 44124
Item 2. Code of Ethics.
The registrant has adopted a code of ethics that applies to the registrant’s principal executive officer and the principal financial officer. The registrant has not made any amendments to its code of ethics during the covered period. The registrant has not granted any waivers from any provisions of the code of ethics during the covered period. A copy of the registrant’s Code of Ethics is filed herewith.
Item 3. Audit Committee Financial Expert.
The registrant’s Board of Trustees has determined that Richard Ruhland is an audit committee finical expert. Mr. Ruhland is independent for purposes of this Item 3.
Item 4. Principal Accountant Fees and Services.
(a-d) The following table details the aggregate fees billed for each of the last two fiscal years for audit fees, audit-related fees, tax fees and other fees by the principal accountant to the registrant. The principal accountant has provided no services to the adviser or any entity controlled by, or under common control with the adviser that provides ongoing services to the registrant.
| FYE 1/31/2013 | FYE 1/31/2012 | |||
| Audit Fees | $13,000 | $13,000 | ||
| Audit-Related Fees | $0 | $0 | ||
| Tax Fees | $2,500 | $2,500 | ||
| All Other Fees | $750 | $0 |
Nature of Tax Fees: preparation of Excise Tax Statement and 1120 RIC.
All Other Fees: Semi-Annual review fee.
(e) (1) The audit committee approves all audit and non-audit related services and, therefore, has not adopted pre-approval policies and procedures described in paragraph (c)(7) of Rule 2-01 of Regulation S-X.
(e) (2) None of the services described in paragraph (b) through (d) of this Item were approved by the audit committee pursuant to paragraph (c)(7)(i)(C) of Rule 2-01 of Regulation S-X.
(f) All of the principal accountant’s hours spent on auditing the registrant’s financial statements were attributed to work performed by full-time permanent employees of the principal accountant.
(g) The following table indicates the aggregate non-audit fees billed by the registrant’s principal accountant for services to the registrant , the registrant’s investment adviser (not sub-adviser), and any entity controlling, controlled by, or under common control with the adviser that provides ongoing services to the registrant, for the last two years.
| Non-Audit Fees | FYE 1/31/2013 | FYE 1/31/2012 | ||
| Registrant | $3,250 | $2,500 | ||
| Registrant’s Investment Adviser | $0 | $0 |
(h) The principal accountant provided no services to the investment adviser or any entity controlling, controlled by, or under common control with the adviser that provides ongoing services to the registrant.
Item 5. Audit Committee of Listed Companies. Not applicable.
Item 6. Schedule of Investments. Schedule filed with Item 1.
Item 7. Disclosure of Proxy Voting Policies and Procedures for Closed-End Management Investment Companies. Not applicable.
Item 8. Portfolio Managers of Closed End Management Investment Companies. Not applicable.
Item 9. Purchases of Equity Securities by Closed-End Management Investment Companies and Affiliated Purchasers. Not applicable.
Item 10. Submission of Matters to a Vote of Security Holders.
The registrant has not adopted procedures by which shareholders may recommend nominees to the registrant’s board of trustees.
Item 11. Controls and Procedures.
(a) The registrant’s president and chief financial officer concluded that the disclosure controls and procedures (as defined in Rule 30a-3(c) under the Investment Company Act of 1940 (the “Act”)) were effective as of a date within 90 days of the filing date of this report, based on the evaluation of these controls and procedures required by Rule 30a-3(b) under the Act.
(b) There were no changes in the registrant’s internal control over financial reporting (as defined in Rule 30a-3(d) under the Act) that occurred during the registrant’s second fiscal quarter of the period covered by this report that have materially affected, or are reasonably likely to materially affect, the registrant’s internal control over financial reporting.
Item 12. Exhibits.
(a)(1) Code of Ethics. Filed herewith.
(a)(2) Certifications pursuant to Section 302 of the Sarbanes-Oxley Act of 2002. Filed herewith.
(b) Certification pursuant to Section 906 Certification of the Sarbanes-Oxley Act of 2002. Filed herewith.
SIGNATURES
Pursuant to the requirements of the Securities Exchange Act of 1934 and the Investment Company Act of 1940, the registrant has duly caused this report to be signed on its behalf by the undersigned, thereunto duly authorized.
NEW FRONTIERS TRUST
By: /s/Rakesh Mehra
Rakesh Mehra
President
Date: 3/18/13
Pursuant to the requirements of the Securities Exchange Act of 1934 and the Investment Company Act of 1940, this report has been signed below by the following persons on behalf of the registrant and in the capacities and on the dates indicated.
By: /s/Rakesh Mehra
Rakesh Mehra
President
Date: 3/18/13
By: /s/Rakesh Mehra
Rakesh Mehra
Chief Financial Officer
Date: 3/18/13