Exhibit 99.1
PRO FORMA VALUATION REPORT
CLIFTON SAVINGS BANCORP, INC.
Clifton, New Jersey
PROPOSED HOLDING COMPANY FOR:
CLIFTON SAVINGS BANK
Clifton, New Jersey
Dated As Of:
November 19, 2010
Prepared By:
RP® Financial, LC.
1100 North Glebe Road
Suite 1100
Arlington, Virginia 22201
RP® FINANCIAL, LC.
Serving the Financial Services Industry Since 1988
November 19, 2010
Boards of Directors
Clifton MHC
Clifton Savings Bancorp, Inc.
Clifton Savings Bank
1433 Van Houten Avenue
Clifton, New Jersey 07015-2149
Members of the Boards of Directors:
At your request, we have completed and hereby provide an independent appraisal (“Appraisal”) of the estimated pro forma market value of the common stock which is to be issued in connection with the mutual-to-stock conversion transaction described below.
This Appraisal is furnished pursuant to the requirements of the Code of Federal Regulations 563b.7 and has been prepared in accordance with the “Guidelines for Appraisal Reports for the Valuation of Savings and Loan Associations Converting from Mutual to Stock Form of Organization” of the Office of Thrift Supervision (“OTS”), and applicable regulatory interpretations thereof.
Description of Plan of Conversion and Reorganization
On November 8, 2010, the respective Boards of Directors of Clifton MHC (the “MHC”), Clifton Savings Bancorp, Inc. (“Clifton Savings” or the “Company”) and Clifton Savings Bank (the “Bank”), Clifton, New Jersey, adopted a Plan of Conversion (the “Plan of Conversion”) whereby the MHC will convert to stock form. As a result of the conversion, Clifton Savings, which currently owns a majority of the issued and outstanding common stock of the Company, will be succeeded by a newly formed Nevada corporation with the name of New Clifton Savings Bancorp, Inc. Following the conversion, the MHC will no longer exist. For purposes of this document, the existing consolidated entity and the newly incorporated entity will hereinafter be referred to as Clifton Savings or the Company, unless otherwise noted. As of September 30, 2010, the MHC had a majority ownership interest in, and its principal asset consisted of approximately 64.24% of the common stock (the “MHC Shares”) of Clifton Savings. The remaining 35.76% of Clifton Savings common stock is owned by public stockholders.
It is our understanding that Clifton Savings will offer its stock, representing the majority ownership interest held by the MHC, in a subscription offering to Eligible Account Holders, Tax-Qualified Employee Stock Benefit Plans including the Bank’s employee stock ownership plan (the “ESOP”), Supplemental Eligible Account Holders and Other Members, as such terms are defined for purposes of applicable federal regulatory requirements governing mutual-to-stock conversions. To the extent that shares remain available for purchase after satisfaction of all subscriptions received in the subscription offering, the shares are expected to be offered for sale in a community offering. Shares not purchased in the subscription and community offerings may be offered for sale to the general public in a syndicated offering.
Washington Headquarters Three Ballston Plaza 1100 North Glebe Road, Suite 1100 Arlington, VA 22201 www.rpfinancial.com | Telephone: (703) 528-1700 Fax No.: (703) 528-1788 Toll-Free No.: (866) 723-0594 E-Mail: mail@rpfinancial.com |
Boards of Directors
November 19, 2010
Page 2
Upon completing the mutual-to-stock conversion and stock offering (the “Second-Step Conversion”), the Company will be 100% owned by public shareholders, the publicly-held shares of Clifton Savings will be exchanged for shares in the Company at a ratio that retains their ownership interest at the time the conversion is completed and the MHC assets will be consolidated with the Company.
RP® Financial, LC.
RP® Financial, LC. (“RP Financial”) is a financial consulting firm serving the financial services industry nationwide that, among other things, specializes in financial valuations and analyses of business enterprises and securities, including the pro forma valuation for savings institutions converting from mutual-to-stock form. The background and experience of RP Financial is detailed in Exhibit V-1. We believe that, except for the fee we will receive for our appraisal, we are independent of the Company, the Bank, the MHC and the other parties engaged by the Bank or the Company to assist in the stock conversion process.
Valuation Methodology
In preparing our Appraisal, we have reviewed the regulatory applications of the Company, the Bank and the MHC, including the prospectus as filed with the OTS and the Securities and Exchange Commission (“SEC”). We have conducted a financial analysis of the Company, the Bank and the MHC that has included a review of audited financial information for the fiscal years ended March 31, 2006 through March 31, 2010 and unaudited financial information through September 30, 2010, as well as due diligence related discussions with the Company’s management; ParenteBeard LLC, the Company’s independent auditor; Kilpatrick Stockton LLP, the Company’s conversion counsel; and Sandler O’Neill & Partners, L.P., the Company’s marketing advisor in connection with the stock offering. All assumptions and conclusions set forth in the Appraisal were reached independently from such discussions. In addition, where appropriate, we have considered information based on other available published sources that we believe are reliable. While we believe the information and data gathered from all these sources are reliable, we cannot guarantee the accuracy and completeness of such information.
We have investigated the competitive environment within which Clifton Savings operates and have assessed Clifton Savings’ relative strengths and weaknesses. We have kept abreast of the changing regulatory and legislative environment for financial institutions and analyzed the potential impact on Clifton Savings and the industry as a whole. We have analyzed the potential effects of the stock conversion on Clifton Savings’ operating characteristics and financial performance as they relate to the pro forma market value of Clifton Savings. We have analyzed the assets held by the MHC, which will be consolidated with Clifton Savings’ assets and equity pursuant to the completion of the second-step conversion. We have reviewed the economic and demographic characteristics of the Company’s primary market area. We have compared Clifton Savings’ financial performance and condition with selected thrift holding companies in accordance with the Valuation Guidelines. We have reviewed the current conditions in the securities markets in general and the market for thrift stocks in particular,
Boards of Directors
November 19, 2010
Page 3
including the market for existing thrift issues, initial public offerings by thrifts and thrift holding companies, and second-step conversion offerings. We have excluded from such analyses thrifts subject to announced or rumored acquisition, and/or institutions that exhibit other unusual characteristics.
The Appraisal is based on Clifton Savings’ representation that the information contained in the regulatory applications and additional information furnished to us by Clifton Savings and its independent auditor, legal counsel and other authorized agents are truthful, accurate and complete. We did not independently verify the financial statements and other information provided by Clifton Savings, or its independent auditor, legal counsel and other authorized agents nor did we independently value the assets or liabilities of Clifton Savings. The valuation considers Clifton Savings only as a going concern and should not be considered as an indication of Clifton Savings’ liquidation value.
Our appraised value is predicated on a continuation of the current operating environment for Clifton Savings and for all thrifts and their holding companies. Changes in the local, state and national economy, the legislative and regulatory environment for financial institutions and mutual holding companies, the stock market, interest rates, and other external forces (such as natural disasters or significant world events) may occur from time to time, often with great unpredictability and may materially impact the value of thrift stocks as a whole or the value of Clifton Savings’ stock alone. It is our understanding that there are no current plans for selling control of Clifton Savings following completion of the second-step conversion. To the extent that such factors can be foreseen, they have been factored into our analysis.
The estimated pro forma market value is defined as the price at which Clifton Savings’ common stock, immediately upon completion of the second-step stock offering, would change hands between a willing buyer and a willing seller, neither being under any compulsion to buy or sell and both having reasonable knowledge of relevant facts.
Valuation Conclusion
It is our opinion that, as of November 19, 2010, the estimated aggregate pro forma valuation of the shares of the Company to be issued and outstanding at the end of the conversion offering – including (1) the shares to be issued publicly representing the MHC’s current ownership interest in the Company and (2) exchange shares issued to existing public shareholders of Clifton Savings – was $233,482,832 at the midpoint, equal to 29,185,354 shares at $8.00 per share.
Establishment of the Exchange Ratio
OTS regulations provide that in a conversion of a mutual holding company, the minority stockholders are entitled to exchange the public shares for newly issued shares in the fully converted company. The Boards of Directors of the MHC, Clifton Savings and the Bank have independently determined the exchange ratio, which has been designed to preserve the current aggregate percentage ownership in the Company held by the public shareholders. The exchange ratio to be received by the existing minority shareholders of the Company will be determined at the end of the offering, based on the total number of shares sold in the
Boards of Directors
November 19, 2010
Page 4
subscription, community, and syndicated offerings and the final appraisal. Based on the valuation conclusion herein, the resulting offering value, and the $8.00 per share offering price, the indicated exchange ratio at the midpoint is 1.1166 shares of the Company for every one public share held by public shareholders. Furthermore, based on the offering range of value, the indicated exchange ratio is 0.9491 at the minimum, 1.2841 at the maximum and 1.4767 at the supermaximum. RP Financial expresses no opinion on the proposed exchange of newly issued Company shares for the shares held by the public stockholders or on the proposed exchange ratio. The resulting range of value pursuant to regulatory guidelines, the corresponding number of shares based on the Board approved $8.00 per share offering price, and the resulting exchange ratios are shown below.
| Total Shares | Offering Shares | Exchange Shares Issued to Public Shareholders | Exchange Ratio | |||||||||||||
Shares | ||||||||||||||||
Maximum, as Adjusted | 38,597,631 | 24,796,875 | 13,800,756 | 1.4767 | ||||||||||||
Maximum | 33,563,157 | 21,562,500 | 12,000,657 | 1.2841 | ||||||||||||
Midpoint | 29,185,354 | 18,750,000 | 10,435,354 | 1.1166 | ||||||||||||
Minimum | 24,807,551 | 15,937,500 | 8,870,051 | 0.9491 | ||||||||||||
Distribution of Shares | ||||||||||||||||
Maximum, as Adjusted | 100.00 | % | 64.24 | % | 35.76 | % | ||||||||||
Maximum | 100.00 | % | 64.24 | % | 35.76 | % | ||||||||||
Midpoint | 100.00 | % | 64.24 | % | 35.76 | % | ||||||||||
Minimum | 100.00 | % | 64.24 | % | 35.76 | % | ||||||||||
Aggregate Market Value at $8.00 Per Share | ||||||||||||||||
Maximum, as Adjusted | $ | 308,781,048 | $ | 198,375,000 | $ | 110,406,048 | ||||||||||
Maximum | $ | 268,505,256 | $ | 172,500,000 | $ | 96,005,256 | ||||||||||
Midpoint | $ | 233,482,832 | $ | 150,000,000 | $ | 83,482,832 | ||||||||||
Minimum | $ | 198,460,408 | $ | 127,500,000 | $ | 70,960,408 | ||||||||||
Limiting Factors and Considerations
Our valuation is not intended, and must not be construed, as a recommendation of any kind as to the advisability of purchasing shares of the common stock. Moreover, because such valuation is necessarily based upon estimates and projections of a number of matters, all of which are subject to change from time to time, no assurance can be given that persons who purchase shares of common stock in the conversion will thereafter be able to buy or sell such shares at prices related to the foregoing valuation of the estimated pro forma market value thereof. The appraisal reflects only a valuation range as of this date for the pro forma market value of Clifton Savings immediately upon issuance of the stock and does not take into account any trading activity with respect to the purchase and sale of common stock in the secondary market following the completion of the second-step offering.
Boards of Directors
November 19, 2010
Page 5
RP Financial’s valuation was based on the financial condition, operations and shares outstanding of Clifton Savings as of September 30, 2010, the date of the financial data included in the prospectus. The proposed exchange ratio to be received by the current public stockholders of Clifton Savings and the exchange of the public shares for newly issued shares of Clifton Savings common stock as a full public company was determined independently by the Boards of Directors of the MHC, Clifton Savings and the Bank. RP Financial expresses no opinion on the proposed exchange ratio to public stockholders or the exchange of public shares for newly issued shares.
RP Financial is not a seller of securities within the meaning of any federal and state securities laws and any report prepared by RP Financial shall not be used as an offer or solicitation with respect to the purchase or sale of any securities. RP Financial maintains a policy which prohibits RP Financial, its principals or employees from purchasing stock of its client institutions.
This valuation will be updated as provided for in the conversion regulations and guidelines. These updates will consider, among other things, any developments or changes in the financial performance and condition of Clifton Savings, management policies, and current conditions in the equity markets for thrift shares, both existing issues and new issues. These updates may also consider changes in other external factors which impact value including, but not limited to: various changes in the legislative and regulatory environment for financial institutions, the stock market and the market for thrift stocks, and interest rates. Should any such new developments or changes be material, in our opinion, to the valuation of the shares, appropriate adjustments to the estimated pro forma market value will be made. The reasons for any such adjustments will be explained in the update at the date of the release of the update. The valuation will also be updated at the completion of Clifton Savings’ stock offering.
| Respectfully submitted, |
| RP® FINANCIAL, LC. |
 |
| Ronald S. Riggins |
| President and Managing Director |
 |
| James P. Hennessey |
| Director |
| RP® Financial, LC. | TABLE OF CONTENTS i |
TABLE OF CONTENTS
CLIFTON SAVINGS BANCORP, INC.
CLIFTON SAVINGS BANK
Clifton, New Jersey
DESCRIPTION | PAGE NUMBER | |||||||
CHAPTER ONE OVERVIEW AND FINANCIAL ANALYSIS | ||||||||
Introduction | I.1 | |||||||
Plan of Conversion and Reorganization | I.2 | |||||||
Purpose of the Reorganization | I.3 | |||||||
Strategic Overview | I.4 | |||||||
Balance Sheet Growth Trends | I.7 | |||||||
Income and Expense Trends | I.12 | |||||||
Interest Rate Risk Management | I.17 | |||||||
Lending Activities and Strategy | I.18 | |||||||
Origination, Purchasing, and Servicing of Loans | I.19 | |||||||
Asset Quality | I.20 | |||||||
Funding Composition and Strategy | I.21 | |||||||
Subsidiaries | I.22 | |||||||
Legal Proceedings | I.22 | |||||||
CHAPTER TWO MARKET AREA ANALYSIS | ||||||||
Introduction | II.1 | |||||||
Market Area Demographics | II.3 | |||||||
Summary of Local Economy | II.6 | |||||||
Unemployment Trends | II.7 | |||||||
Market Area Deposit Characteristics | II.8 | |||||||
CHAPTER THREE PEER GROUP ANALYSIS | ||||||||
Peer Group Selection | III.1 | |||||||
Financial Condition | III.7 | |||||||
Income and Expense Components | III.10 | |||||||
Loan Composition | III.12 | |||||||
Interest Rate Risk | III.14 | |||||||
Credit Risk | III.15 | |||||||
Summary | III.16 | |||||||
| RP® Financial, LC. | TABLE OF CONTENTS ii |
TABLE OF CONTENTS
CLIFTON SAVINGS BANCORP, INC.
CLIFTON SAVINGS BANK
Clifton, New Jersey
(continued)
DESCRIPTION | PAGE NUMBER | |||||||
CHAPTER FOUR VALUATION ANALYSIS | ||||||||
Introduction | IV.1 | |||||||
Appraisal Guidelines | IV.1 | |||||||
RP Financial Approach to the Valuation | IV.1 | |||||||
Valuation Analysis | IV.2 | |||||||
1. Financial Condition | IV.2 | |||||||
2. Profitability, Growth and Viability of Earnings | IV.4 | |||||||
3. Asset Growth | IV.5 | |||||||
4. Primary Market Area | IV.5 | |||||||
5. Dividends | IV.6 | |||||||
6. Liquidity of the Shares | IV.7 | |||||||
7. Marketing of the Issue | IV.7 | |||||||
A. The Public Market | IV.8 | |||||||
B. The New Issue Market | IV.13 | |||||||
C. The Acquisition Market | IV.14 | |||||||
D Trading in Clifton Savings’ Stock | IV.17 | |||||||
8. Management | IV.17 | |||||||
9. Effect of Government Regulation and Regulatory Reform | IV.18 | |||||||
Summary of Adjustments | IV.18 | |||||||
Valuation Approaches | IV.18 | |||||||
1. Price-to-Earnings (“P/E”) | IV.20 | |||||||
2. Price-to-Book (“P/B”) | IV.21 | |||||||
3. Price-to-Assets (“P/A”) | IV.23 | |||||||
Comparison to Recent Offerings | IV.23 | |||||||
Valuation Conclusion | IV.24 | |||||||
Establishment of the Exchange Ratio | IV.24 | |||||||
| RP® Financial, LC. | LIST OF TABLES iii |
LIST OF TABLES
CLIFTON SAVINGS BANCORP, INC.
CLIFTON SAVINGS BANK
Clifton, New Jersey
TABLE NUMBER | DESCRIPTION | PAGE | ||||||||
1.1 | Historical Balance Sheet Data | I.8 | ||||||||
1.2 | Historical Income Statements | I.13 | ||||||||
2.1 | Deposit Market Share | II.2 | ||||||||
2.2 | Summary Demographic Data | II.4 | ||||||||
2.3 | Primary Market Area Employment Sectors | II.7 | ||||||||
2.4 | Market Area Unemployment Trends | II.8 | ||||||||
2.5 | Deposit Summary | II.9 | ||||||||
3.1 | Peer Group of Publicly-Traded Thrifts | III.4 | ||||||||
3.2 | Balance Sheet Composition and Growth Rates | III.8 | ||||||||
3.3 | Income as a % of Average Assets and Yields, Costs, Spreads | III.11 | ||||||||
3.4 | Loan Portfolio Composition and Related Information | III.13 | ||||||||
3.5 | Interest Rate Risk Measures and Net Interest Income Volatility | III.15 | ||||||||
3.6 | Credit Risk Measures and Related Information | III.16 | ||||||||
4.1 | Pricing Characteristics: Recent Conversions Completed | IV.15 | ||||||||
4.2 | Market Pricing Comparatives | IV.16 | ||||||||
4.3 | Public Market Pricing | IV.22 | ||||||||
| RP® Financial, LC. | OVERVIEW AND FINANCIAL ANALYSIS I. 1 |
I. OVERVIEW AND FINANCIAL ANALYSIS
Introduction
Clifton Savings Bank (the “Bank”) is a federally chartered savings bank headquartered in Clifton, New Jersey. The Bank conducts business from its main office and 11 branches, located in Passaic and Bergen Counties in New Jersey. In addition, the Bank delivers its banking products and services and related information services through alternative delivery channels including the Internet, a telephone call center, and 10 ATMs. The Bank was originally chartered in 1928 as a state-chartered savings and loan association and converted to a federal savings bank charter in September 2007. Clifton, New Jersey, is located in Passaic County in northeast New Jersey, approximately 20 miles west of New York City. The Bank’s branch banking locations are located in Passaic and Bergen Counties, while lending operations are concentrated in a more expansive area within northeast New Jersey in Essex, Morris, Hudson, and Union Counties. The Bank has one wholly-owned subsidiary, Botany, Inc. (“Botany”), which was organized in December 2004 under state law as a New Jersey Investment Company primarily to hold investments and mortgage-backed securities (“MBS”) in an effort to minimize its state tax liability.
In March 2004, Clifton Savings Bank was reorganized (then a state-chartered savings and loan association operating under the name Clifton Savings Bank, S.L.A.) into a state-chartered stock savings association within a mutual holding company structure. As part of the reorganization, the Bank formed a federal mid-tier stock holding company, Clifton Savings Bancorp, Inc. (“Clifton Savings” or the “Company”), and sold a minority of the common shares to the public in a subscription and community offering. The majority of Clifton Savings’ shares were issued to Clifton MHC (the “MHC”), a mutual holding company organized under federal law. The reorganization and minority stock issuance was completed as of March 3, 2004.
The Company has no significant assets, other than all of the outstanding shares of the Bank, and no significant liabilities. At September 30, 2010, the Company had 26,137,248 shares of common stock outstanding, whereby the MHC owns 16,791,758, shares or 64.2% of the common stock outstanding, of Clifton Savings and the minority public shareholders own the remaining 9,345,490 shares or 35.8%. The public shares are traded on Nasdaq under the trading symbol “CSBK”. The Bank is a member of the Federal Home Loan Bank (“FHLB”) system and its deposits are insured up to the regulatory maximums by the Federal Deposit
| RP® Financial, LC. | OVERVIEW AND FINANCIAL ANALYSIS I.2 |
Insurance Corporation (“FDIC”). The Bank is subject to extensive regulation, supervision and examination by the Office of Thrift Supervision (“OTS”) and by the FDIC. The MHC and the Company (currently and prospectively) are subject to regulation and supervision by the OTS.
The Company operates as a community-oriented financial institution offering traditional financial services to consumers and businesses in the regional market area, thereby attracting deposits from the general public and using those funds, together with FHLB advances, to originate loans to their customers and invest in securities such as U.S. Government and agency securities and MBS. At September 30, 2010, the Company had $1.1 billion of total assets, $459.7 million in loans, $820.9 million of total deposits, and stockholders’ equity equal to $176.9 million, equal to 15.6% of total assets. The Company does not have any intangible assets. For the twelve months ended September 30, 2010, the Company reported net income equal to $8.5 million, for a return on average assets equal to 0.79%. The Company’s audited financial statements are included by reference as Exhibit I-1 and key operating ratios are shown in Exhibit I-2.
Plan of Conversion and Reorganization
On November 8, 2010, Clifton Savings announced that the Boards of Directors of the MHC, Clifton Savings and the Bank unanimously adopted a Plan of Conversion and Reorganization (the “Plan of Conversion”), pursuant to which Clifton Savings will convert from the three-tier MHC structure to the full stock holding company structure and concurrently conduct a second-step conversion offering (“Second-Step Conversion” or “Offering”) that will include the sale of the MHC’s ownership interest in Clifton Savings. Pursuant to the Plan of Conversion, Clifton Savings will be succeeded by a newly formed Nevada corporation with the name of New Clifton Savings Bancorp, Inc. Following the conversion, the MHC will no longer exist. For purposes of this document, the existing consolidated entity and the newly incorporated entity will hereinafter be referred to as Clifton Savings or the Company, unless otherwise noted.
Pursuant to the Second-Step Conversion transaction, Clifton Savings will sell shares of its common stock in a subscription offering in descending order of priority to the Bank’s members and other stakeholders as follows: Eligible Account Holders; Tax-Qualified Employee Stock Benefit Plans; Supplemental Eligible Account Holders; and Other Members. Any shares of stock not subscribed for by the foregoing classes of persons will be offered for sale to certain members of the public through a community offering. Shares not purchased in the subscription
| RP® Financial, LC. | OVERVIEW AND FINANCIAL ANALYSIS I.3 |
and community offerings maybe be offered for sale to the general public in a syndicated offering or an underwritten public offering, or through a combination of such offerings. The Company will also issue exchange shares of its common stock to the current public shareholders in the Second-Step Conversion transaction pursuant to an exchange ratio that will result in the same aggregate ownership percentage as immediately before the Offering.
Purpose of the Reorganization
The Second-Step Conversion will increase the capital level to support further expansion, improve the overall competitive position of the Company in the local market area, enhance profitability, and reduce interest rate risk. Importantly, the additional equity will provide a larger capital base for continued growth and diversification, as well as increase the lending capability of the Company, including the funds available for lending. Future growth opportunities are expected through the current branch network as well as through de novo branching in the regional markets served. Additionally, the Company anticipates that growth opportunities will result from regional bank consolidation in the local market, particularly in the current economic and operating environment, and the resulting fallout of customers who are attracted to the Company’s customer service and various products. The Second-Step Conversion should facilitate the Company’s ability to pursue such acquisitions through increased capital as well as the ability to use common stock as merger consideration. Further, the Second-Step Conversion will increase the public ownership, which is expected to improve the liquidity of the common stock.
The projected use of stock proceeds is highlighted below.
| • | The Company. The Company is expected to retain up to 45% of the net conversion proceeds. At present, Company funds, net of the loan to the employee stock ownership plan (“ESOP”),, are expected to be invested initially into high quality investment securities with short-term maturities, generally consistent with the current investment mix. Over time, Company funds are anticipated to be utilized for various corporate purposes, possibly including acquisitions, infusing additional equity into the Bank, repurchases of common stock, and the payment of regular and/or special cash dividends. |
| • | The Bank. The balance of the net conversion proceeds will be infused into the Bank. Cash proceeds (i.e., net proceeds less deposits withdrawn to fund stock purchases) infused into the Bank are anticipated to become part of general operating funds, and are expected to initially be invested in short-term investments pending longer-term deployment, i.e., funding lending activities, purchasing loans in the market area, general corporate purposes and/or expansion and diversification. |
| RP® Financial, LC. | OVERVIEW AND FINANCIAL ANALYSIS I.4 |
In addition, pursuant to the Plan of Conversion, the assets and liabilities of the MHC at September 30, 2010 will be merged with the Company resulting in a net reduction of consolidated capital of $194,000, reflecting the MHC’s current net worth deficit.
The Company expects to continue to pursue a controlled growth strategy, leveraging its strong pro forma capital, and growing primarily through the current delivery channels. If appropriate, Clifton Savings may also consider various capital management strategies to assist in the long run objective of increasing return on equity (“ROE”).
Strategic Overview
Throughout much of its corporate history, the Company’s strategic focus has been that of a community-oriented financial institution with a primary focus on meeting the borrowing, savings, and other financial needs of its local customers in Passaic and Bergen Counties, where the Company maintains branch offices, as well as other nearby areas in northeast New Jersey in Essex, Morris, Hudson, and Union Counties. In this regard, the Company has historically pursued a traditional thrift strategy, in which the Company has emphasized the origination and purchase of 1-4 family first mortgage loans for investment, funded principally by retail deposits generated through the branch network. In this regard, the Company has emphasized high quality and flexible service, capitalizing on its local orientation, competitive rates, and safety and soundness.
In addition to originations, the Company supplements 1-4 family loan production through purchases of 1-4 family loans originated by third parties, secured by residential real estate properties located primarily within the state of New Jersey. Diversification into other types of lending has been very limited in comparison to many other similarly-sized financial institutions, and primarily includes multi-family and commercial real estate mortgage loans, as well as residential construction and consumer lending, to a lesser extent. As of September 30, 2010, 91.1% of total loans consisted of 1-4 family first mortgage loans. In addition to retail deposits, the Company utilizes borrowings as an alternative funding source for purposes of managing funding costs and interest rate risk. The Company’s streamlined operations have facilitated operating expense levels that are significantly below industry norms. At the same time, the limited diversification has also substantially limited revenues derived from non-interest sources.
| RP® Financial, LC. | OVERVIEW AND FINANCIAL ANALYSIS I.5 |
In recent years, the Company has continued a business strategy focused on steady growth through local 1-4 family residential mortgage lending underwritten pursuant to relatively conservative underwriting guidelines funded by competitively priced certificates of deposits (“CDs”). Management believes this philosophy has assisted the Company in remaining profitable during recent challenging times where many other, now struggling, institutions sought to achieve asset and earnings growth by engaging in riskier lending practices and/or by utilizing more volatile funding sources to achieve the targeted growth objectives. To facilitate growth objectives while limiting the exposure to various risk factors, the Company has implemented a branching strategy to expand to demographically similar areas within a small geographic area (typically within 20 miles of the Clifton headquarters). In conjunction with the branching strategy, the Company seeks to build the deposit base such that the incremental overhead expense of new branches is offset by revenues as quickly as possible. Management views the new branches as their vehicles for growth and has opened five branches in the last seven years and plans to open new branches at the rate of approximately one per year over the next three to four years.
As mentioned previously, residential mortgage loans comprise the majority of the loan portfolio, and equaled $421.7 million, or 91.1% of total loans, as of September 30, 2010. The Company’s lending platform has evolved as customer mortgage financing behaviors have changed. In this regard, the Company has utilized technology to originate loans through online loan lead generators, specifically the Loan Search website, whereby 32% of the residential mortgage loan volume has been generated in 2010. At the same time, the majority of the residential mortgage loans volumes are still originated through more traditional means, including internal originations through loan officers, as well as brokers and correspondent lenders on a limited basis.
The Company’s cash, liquidity and securities portfolios consist of interest-earning deposits and intermediate-to long-term investment securities and MBS, the majority of which are currently classified as held to maturity (“HTM”). Unlike many other financial institutions, the majority of the investment portfolio is in the HTM category to avoid the erratic swings in market valuations of bonds. Additionally, a significant portion of the growth in the investment portfolio was undertaken, utilizing borrowed funds to reinvest in MBS and investment securities for a positive spread, with the objective to enhance earnings per share and the ROE, following the completion of the first step mutual holding company offering.
| RP® Financial, LC. | OVERVIEW AND FINANCIAL ANALYSIS I.6 |
Retail deposits have consistently served as the primary interest-bearing funding source for the Company. The Company has sought to increase the deposit base through management’s efforts to enhance the convenience of the branch office network (two branch offices have been established over the last several fiscal years) and through competitive pricing, as described previously. The proportion of CDs and savings and club accounts to total deposits equaled 79.2% and 13.4%, respectively, as of September 30, 2010, and comprise the two largest individual segments of the deposit base. As a result, transaction and savings accounts currently comprise a modest portion of the Company’s deposit composition.
The Company utilizes borrowings as a supplemental funding source to facilitate management of funding costs and interest rate risk. FHLB advances constitute the Company’s principal source of borrowings. All of the Company’s FHLB advances have fixed rates. As noted above, the majority of the Company’s borrowings have been taken down in connection with a wholesale leveraging strategy whereby the Company sought to leverage its strong capital by utilizing FHLB advances to fund the purchase of investment securities with comparable durations at a positive spread.
The post-offering business plan of the Company is expected to continue to focus on products and services which have been the Company’s emphasis in recent years. The increased capital from the offering is expected to facilitate additional balance sheet growth, leveraging of operating expenses and infrastructure investments. The new capital will increase the Company’s competitive posture and financial strength. In terms of specific strategies, the Company plans to undertake the following key elements of its business plan on a post-Conversion basis, which largely represents a continuation of the strategies currently in place:
| • | Continue Residential Mortgage Emphasis. The Company will seek to continue to focus on residential mortgage lending activities which have comprised the majority of the Company’s lending to date. Coupled with the employment of relatively conservative underwriting guidelines, and maintenance of a very efficient cost-structure, the Company has been able to effectively limit its overhead costs, such that it can maintain profitability in an inherently low margin business such as residential mortgage lending. Similarly, the ability to minimize credit-related losses has been an important factor in the Company’s recent profitability during a period when many similar regional institutions have been impacted by credit quality problems. The Company will seek to originate residential loans through traditional means, while augmenting its origination capability through a variety of alternative means, including Internet based website referrals and potential purchases. |
| • | Expand Market Coverage. The Company will continue expanding the Company’s retail banking presence in the current markets, specifically within 20 miles of Clifton, by establishing new branches to enhance coverage in existing markets and |
| RP® Financial, LC. | OVERVIEW AND FINANCIAL ANALYSIS I.7 |
provide more customer convenience. The effort to expand the market presence will be accomplished largely through the establishment of new branches, but may also be accomplished through acquisition of branches or whole institutions. Management believes that notwithstanding the recessionary economy, it has the ability to grow as some competitors have retrenched owing to deteriorating asset quality and as a result of recent merger and acquisition activity in the market (i.e., acquisition of local community banks by out-of-market competitors), which will provide it with a competitive advantage to expand. Current plans call for the Company to establish new branches at the rate of one per year over the next several years and evaluate the potential for more significant growth through potential acquisition opportunities as they arise. |
| • | Funding Strategy. The Company intends to grow organically at existing branches and achieving potentially greater growth at recently and newly-established de novo branches through the competitive pricing of deposits, particularly with respect to CDs. This competitive pricing strategy has been successful for the Company as the incremental interest cost related to the strategy has been offset by the ability to limit overhead costs and operating expenses as noted below. |
| • | Control Operating Expenses. The Company seeks to maximize organizational and operational efficiency by limiting product lines to core products which, in turn, enhance the ability to limit management staffing and other overhead infrastructure. Thus, while the Company’s yield-cost spreads are thin, and fee income revenues are low in comparison to many peers, the Company benefits from a very low operating expense ratio and low credit losses. |
Balance Sheet Growth Trends
The Company’s recent operating strategy is evidenced in Table 1.1. Since March 31, 2006, total assets increased at a 7.1% compounded annual rate, expanding from $834.9 million to $1.1 billion as of September 30, 2010. Loans have realized a slower growth rate than total assets, however, and thus decreased in proportion to total assets, from 48.4% at March 31, 2006, to 40.5% at September 30, 2010. Specifically, loans have increased at a 2.9% annual rate from the end of fiscal 2006 through September 30, 2010, while investment securities increased at an 8.7% annual rate, increasing from 46.5% of total assets at the end of fiscal 2006 to 49.7% of assets as of September 30, 2010. In view of the limited loan demand experienced in recent periods and increasing deposit funds, the Company has increased excess investable funds into securities, primarily including government and agency securities and MBS.
The Company’s assets are funded through a combination of deposits, borrowings and retained earnings. Deposits have historically comprised the majority of funding liabilities, and increased at a compounded annual rate of 8.4% since the end of fiscal 2006. Deposit growth in recent years has been primarily driven by CDs, while core deposit accounts continue to increase with respect to their dollar balances, but have decreased as a percent of total
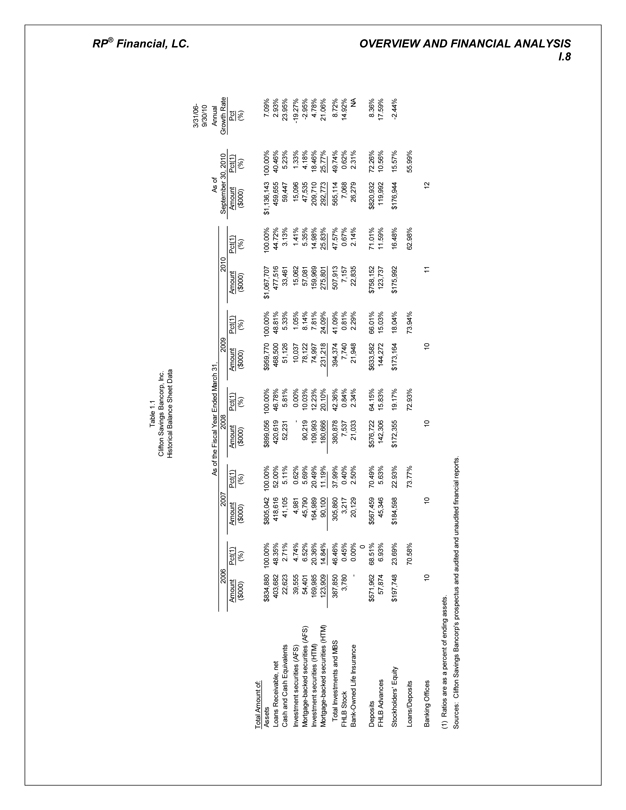
RP® Financial, LC. | OVERVIEW AND FINANCIAL ANALYSIS I.8 |
Table 1.1
Clifton Savings Bancorp, Inc.
Historical Balance Sheet Data
As of the Fiscal Year Ended March 31, | As of September 30, 2010 | 3/31/06- 9/30/10 Annual Growth Rate | ||||||||||||||||||||||||||||||||||||||||||||||||||
2006 | 2007 | 2008 | 2009 | 2010 | ||||||||||||||||||||||||||||||||||||||||||||||||
Amount | Pct(1) | Amount | Pct(1) | Amount | Pct(1) | Amount | Pct(1) | Amount | Pct(1) | Amount | Pct(1) | Pct | ||||||||||||||||||||||||||||||||||||||||
($000) | (%) | ($000) | (%) | ($000) | (%) | ($000) | (%) | ($000) | (%) | ($000) | (%) | (%) | ||||||||||||||||||||||||||||||||||||||||
Total Amount of: | ||||||||||||||||||||||||||||||||||||||||||||||||||||
Assets | $ | 834,880 |
|
| 100.00 | % | $ | 805,042 |
|
| 100.00 | % | $ | 899,056 |
|
| 100.00 | % | $ | 959,770 |
|
| 100.00 | % | $ | 1,067,707 |
|
| 100.00 | % | $ | 1,136,143 |
|
| 100.00 | % |
| 7.09 | % | |||||||||||||
Loans Receivable, net |
| 403,682 |
|
| 48.35 | % |
| 418,616 |
|
| 52.00 | % |
| 420,619 |
|
| 46.78 | % |
| 468,500 |
|
| 48.81 | % |
| 477,516 |
|
| 44.72 | % |
| 459,655 |
|
| 40.46 | % |
| 2.93 | % | |||||||||||||
Cash and Cash Equivalents |
| 22,623 |
|
| 2.71 | % |
| 41,105 |
|
| 5.11 | % |
| 52,231 |
|
| 5.81 | % |
| 51,126 |
|
| 5.33 | % |
| 33,461 |
|
| 3.13 | % |
| 59,447 |
|
| 5.23 | % |
| 23.95 | % | |||||||||||||
Investment securities (AFS) |
| 39,555 |
|
| 4.74 | % |
| 4,981 |
|
| 0.62 | % |
| — |
|
| 0.00 | % |
| 10,037 |
|
| 1.05 | % |
| 15,062 |
|
| 1.41 | % |
| 15,096 |
|
| 1.33 | % |
| -19.27 | % | |||||||||||||
Mortgage-backed securities (AFS) |
| 54,401 |
|
| 6.52 | % |
| 45,790 |
|
| 5.69 | % |
| 90,219 |
|
| 10.03 | % |
| 78,122 |
|
| 8.14 | % |
| 57,081 |
|
| 5.35 | % |
| 47,535 |
|
| 4.18 | % |
| -2.95 | % | |||||||||||||
Investment securities (HTM) |
| 169,985 |
|
| 20.36 | % |
| 164,989 |
|
| 20.49 | % |
| 109,993 |
|
| 12.23 | % |
| 74,997 |
|
| 7.81 | % |
| 159,969 |
|
| 14.98 | % |
| 209,710 |
|
| 18.46 | % |
| 4.78 | % | |||||||||||||
Mortgage-backed securities (HTM) |
| 123,909 |
|
| 14.84 | % |
| 90,100 |
|
| 11.19 | % |
| 180,666 |
|
| 20.10 | % |
| 231,218 |
|
| 24.09 | % |
| 275,801 |
|
| 25.83 | % |
| 292,773 |
|
| 25.77 | % |
| 21.06 | % | |||||||||||||
Total Investments and MBS |
| 387,850 |
|
| 46.46 | % |
| 305,860 |
|
| 37.99 | % |
| 380,878 |
|
| 42.36 | % |
| 394,374 |
|
| 41.09 | % |
| 507,913 |
|
| 47.57 | % |
| 565,114 |
|
| 49.74 | % |
| 8.72 | % | |||||||||||||
FHLB Stock |
| 3,780 |
|
| 0.45 | % |
| 3,217 |
|
| 0.40 | % |
| 7,537 |
|
| 0.84 | % |
| 7,740 |
|
| 0.81 | % |
| 7,157 |
|
| 0.67 | % |
| 7,068 |
|
| 0.62 | % |
| 14.92 | % | |||||||||||||
Bank-Owned Life Insurance |
| — |
|
| 0.00 | % |
| 20,129 |
|
| 2.50 | % |
| 21,033 |
|
| 2.34 | % |
| 21,948 |
|
| 2.29 | % |
| 22,835 |
|
| 2.14 | % |
| 26,279 |
|
| 2.31 | % |
| NA |
| |||||||||||||
| 0 |
| ||||||||||||||||||||||||||||||||||||||||||||||||||
Deposits | $ | 571,962 |
|
| 68.51 | % | $ | 567,459 |
|
| 70.49 | % | $ | 576,722 |
|
| 64.15 | % | $ | 633,582 |
|
| 66.01 | % | $ | 758,152 |
|
| 71.01 | % | $ | 820,932 |
|
| 72.26 | % |
| 8.36 | % | |||||||||||||
FHLB Advances |
| 57,874 |
|
| 6.93 | % |
| 45,346 |
|
| 5.63 | % |
| 142,306 |
|
| 15.83 | % |
| 144,272 |
|
| 15.03 | % |
| 123,737 |
|
| 11.59 | % |
| 119,992 |
|
| 10.56 | % |
| 17.59 | % | |||||||||||||
Stockholders’ Equity | $ | 197,748 |
|
| 23.69 | % | $ | 184,598 |
|
| 22.93 | % | $ | 172,355 |
|
| 19.17 | % | $ | 173,164 |
|
| 18.04 | % | $ | 175,992 |
|
| 16.48 | % | $ | 176,944 |
|
| 15.57 | % |
| -2.44 | % | |||||||||||||
Loans/Deposits |
| 70.58 | % |
| 73.77 | % |
| 72.93 | % |
| 73.94 | % |
| 62.98 | % |
| 55.99 | % | ||||||||||||||||||||||||||||||||||
Banking Offices |
| 10 |
|
| 10 |
|
| 10 |
|
| 10 |
|
| 11 |
|
| 12 |
| ||||||||||||||||||||||||||||||||||
(1) Ratios are as a percent of ending assets.
Sources: Clifton Savings Bancorp’s prospectus and audited and unaudited financial reports.
| RP® Financial, LC. | OVERVIEW AND FINANCIAL ANALYSIS I. 9 |
deposits. Borrowings serve as an alternative funding source for the Company to address funding needs for growth and to support management of deposit costs and interest rate risk. From fiscal year end 2006 through September 30, 2010, borrowings increased at an annual rate of 17.6%. The Company’s utilization of borrowings reached a peak balance of $144.3 million, or 15.0% of assets, at year end 2009, and subsequently trended lower to equal $120.0 million, or 10.6% of assets, at September 30, 2010, with the diminished level of borrowings reflecting the impact of strong deposit growth, coupled with the more limited need for funds as a result of slower growth of the loan portfolio. Additionally, the Company has limited its arbitrage activities (i.e., utilizing advances to duration to match fund investment securities at a positive spread) as a result of the current rate environment which has limited the ability to profitably execute a low risk arbitrage.
Equity diminished at a 2.4% compounded annual rate since the end of fiscal 2006, as capital management strategies (i.e., dividends and share repurchases by the Company) more than offset the capital growth provided by earnings. Accordingly, the Company’s capital ratio has diminished from 23.7% at the end of fiscal 2006, to 15.6% as of September 30, 2010. Going forward, the post-offering equity growth rate is expected to be impacted by a number of factors including the higher level of capitalization, the reinvestment and leveraging of the Offering proceeds, the expense of the stock benefit plans and the potential impact of dividends and stock repurchases.
Loans Receivable
Loans receivable totaled $459.7 million, or 40.5% of total assets, as of September 30, 2010, and reflects 2.9% annual growth since the end of fiscal 2006. Over this period, the proportion of loans to total assets has declined as the rate of asset growth exceeded the loan growth rate. This is due to a number of factors for the Company, including the recessionary environment in recent periods which has limited the demand for high credit quality loans and the low interest rate environment which has increased loan prepayment rates while focusing demand into longer term fixed rate loans. As a portfolio lender, Clifton Savings’ is sensitive to interest rate risk presented by long term fixed rate loans, particularly in recent periods when interest rates have been at or near their historical lows.
Clifton Savings’ niche lending strategy is highlighted by a loan portfolio composition that has consistently reflected a very high concentration of 1-4 family first mortgage loans. The ratio of 1-4 family first mortgage loans to total loans equaled 91.1% at September 30, 2010,
| RP® Financial, LC. | OVERVIEW AND FINANCIAL ANALYSIS I. 10 |
which was consistent with the ratio of 1-4 family loans comprising total loans over the period shown in Table 1.1. The Company has limited other lending primarily to multi-family and commercial real estate mortgage loans. Such loans are generally secured by mixed-use properties with residential units, as well as retail space. At September 30, 2010, multi-family and commercial real estate loans equaled 5.5% of total loans, which have grown in relation to total loans from 3.2% at fiscal year end 2006. Other areas of lending diversification for the Company at September 30, 2010 consisted substantially of consumer loans, which includes second mortgage loans and HELOCs (2.8% of total loans versus 2.5% at fiscal year end 2006), and residential construction loans (0.6% of total loans versus 0.9% at fiscal year end 2006).
The Company’s mortgage lending emphasis is evidenced by the fact that 97.2% of the loan portfolio is secured by mortgage loans (including construction loans); in contrast, consumer loans only comprised 2.8% of the loan portfolio. The Company typically does not offer commercial business loans.
Cash, Investments and Mortgage-Backed Securities
The intent of the Company’s investment policy is to provide adequate liquidity, to generate a favorable return on excess investable funds and to support the established credit and interest rate risk objectives. The ratio of cash and investments (including MBS and FHLB stock) has increased, from 49.6% of assets at the end of fiscal 2006 to 55.6% as of September 30, 2010. The increase in the cash and investment portfolio in proportion to total assets is primarily attributable to funds generated from the increase in deposits being primarily invested in cash and securities.
Investment securities, including MBS and government and agency securities, equaled $565.1 million, or 49.7% of total assets, as of September 30, 2010, while cash and equivalents totaled $59.4 million, or 5.2% of assets (see Exhibit I-3 for the investment portfolio composition). Additionally, the Company has an investment in FHLB stock of $7.1 million, or 0.6% of assets. The Company’s investment securities are classified as available for sale (“AFS”) and HTM with balances totaling $62.6 million and $502.5 million, respectively.
Recent trends in the composition of the Company’s investments show a decrease in AFS securities and an increase in HTM securities. Unlike many other financial institutions, the majority of the investment portfolio is in the HTM category to avoid the erratic swings in market valuations of bonds, therefore providing greater stability in the Company’s capital position and allowing for more precise capital planning.
| RP® Financial, LC. | OVERVIEW AND FINANCIAL ANALYSIS I. 11 |
No major changes to the composition and practices with respect to the management of the investment portfolio are anticipated over the near term, except that the level of cash and investments is anticipated to increase initially following the Second-Step Conversion. Over the longer term, it is the Company’s desire to leverage the proceeds with loans to a greater extent than investment securities, but achievement of this objective will be dependent upon numerous considerations, including loan demand, the competitive environment, and the interest rate environment. However, management has indicated that leveraging of the expanded capital base by utilizing investment securities, including MBS, will continue to be evaluated based on market, profitability, interest rate risk and other similar considerations.
Bank-Owned Life Insurance
As of September 30, 2010, bank-owned life insurance (“BOLI”) totaled $26.3 million,which reflects growth since the end of fiscal 2007 owing to increases in the cash surrender value of the policies. The balance of the BOLI reflects the value of life insurance contracts on selected members of the Company’s management and has been purchased with the intent to offset various benefit program expenses on a tax-advantaged basis. The increase in the cash surrender value of the BOLI is recognized as an addition to other non-interest income on an annual basis.
Funding Structure
Since fiscal year end 2006, deposits have grown at an 8.4% compounded annual rate, and the composition has changed modestly as time deposits have increased while the balance of savings and transaction accounts has changed modestly. The Company’s current funding strategy is primarily focused on offering a broad array of deposit accounts, but the deposit growth has been focused in the CD category as the most cost-effective means of increasing deposits, as their cost of the comparatively higher interest expense of CDs is offset by the more limited expense of attracting and servicing CD accounts. The proportion of CDs and savings and club accounts to total deposits equaled 79.2% and 13.4%, respectively, as of September 30, 2010, and comprise the two largest individual segments of the deposit base.
As of September 30, 2010, borrowed funds totaled $120.0 million, representing 10.6% of total assets. The Company’s increasing balance of borrowed funds consists of fixed rate FHLB advances. Given the recent environment, the Company has been utilizing term fixed rate advances for cost of funds and interest rate risk management purposes.
| RP® Financial, LC. | OVERVIEW AND FINANCIAL ANALYSIS I. 12 |
The Company’s current posture on funding with borrowings is to use such funds: (1) when they are priced attractively relative to deposits; (2) to lengthen the duration of liabilities; (3) to enhance earnings when attractive arbitrage opportunities arise; and, (4) to generate additional liquid funds, if required.
Equity
With the completion of the minority stock issuance under the MHC structure in March 2004, Clifton Savings’ equity was substantially bolstered and equaled $197.7 million, or 23.7% of assets, as of March 31, 2006. Since fiscal year end 2006, the Company’s equity has declined modestly as the capital management strategies implemented by the Company (dividends and share repurchases) have offset the retention of earnings through profitable operations. As of September 30, 2010, Clifton Savings’ stockholders’ equity totaled $176.9 million, equal to 15.6% of assets. The Company maintained surpluses relative to its regulatory capital requirements at September 30, 2010, and was qualified as a “well capitalized” institution. The Offering proceeds will serve to further strengthen the Company’s regulatory capital position and support the Company’s branching strategy and related growth in assets. As discussed previously, the post-offering equity growth rate is expected to be impacted by a number of factors including the higher level of capitalization, the reinvestment of the Offering proceeds, the expense of the stock benefit plans and the potential impact of dividends and stock repurchases. Additionally, the ability to increase capital will be dependent upon the ability of Clifton Savings to execute a business plan focused on balance sheet and earnings growth realized through incremental branching, competitive rates, and potential acquisitions.
Income and Expense Trends
Table 1.2 shows the Company’s historical income statements for the past five fiscal years as well as for the most recent twelve month period through September 30, 2010. The Company’s earnings declined from fiscal 2006 to fiscal 2008 while a favorable earnings trend was realized for the fiscal 2009 to fiscal 2010 period. The foregoing earnings pattern was largely the result of underlying changes in the net interest margin which deteriorated through fiscal 2008 while subsequently trending favorably. Net income increased from $3.7 million (0.43% of average assets) in fiscal 2006 to $8.5 million (0.79% of average assets) reported for the twelve months ended September 30, 2010. Clifton Savings’ core earnings, which consists of net income excluding net non-operating items on a tax effected basis, reflects a similar growth trend, increasing from $3.7 million (0.43% of average assets) in fiscal 2006, to $8.3
| RP® Financial, LC. | OVERVIEW AND FINANCIAL ANALYSIS I. 13 |
Table 1.2
Clifton Savings Bancorp, Inc.
Historical Income Statements
| As of the Fiscal Year Ended March 31, | 12 Months Ended | |||||||||||||||||||||||||||||||||||||||||||||||
| 2006 | 2007 | 2008 | 2009 | 2010 | September 30, 2010 | |||||||||||||||||||||||||||||||||||||||||||
| Amount | Pct(1) | Amount | Pct(1) | Amount | Pct(1) | Amount | Pct(1) | Amount | Pct(1) | Amount | Pct(1) | |||||||||||||||||||||||||||||||||||||
| ($000) | (%) | ($000) | (%) | ($000) | (%) | ($000) | (%) | ($000) | (%) | ($000) | (%) | |||||||||||||||||||||||||||||||||||||
Interest Income | $ | 35,352 | 4.15 | % | $ | 37,521 | 4.55 | % | $ | 38,570 | 4.72 | % | $ | 44,401 | 4.84 | % | $ | 44,956 | 4.43 | % | $ | 45,584 | 4.24 | % | ||||||||||||||||||||||||
Interest Expense | (17,572 | ) | -2.06 | % | (21,601 | ) | -2.62 | % | (24,485 | ) | -2.99 | % | (25,939 | ) | -2.83 | % | (22,966 | ) | -2.26 | % | (20,698 | ) | -1.93 | % | ||||||||||||||||||||||||
Net Interest Income | $ | 17,780 | 2.08 | % | $ | 15,920 | 1.93 | % | $ | 14,085 | 1.72 | % | $ | 18,462 | 2.01 | % | $ | 21,990 | 2.17 | % | $ | 24,886 | 2.32 | % | ||||||||||||||||||||||||
Provision for Loan Losses | (160 | ) | -0.02 | % | (90 | ) | -0.01 | % | (90 | ) | -0.01 | % | (260 | ) | -0.03 | % | (433 | ) | -0.04 | % | (160 | ) | -0.01 | % | ||||||||||||||||||||||||
Net Interest Income after Provisions | $ | 17,620 | 2.07 | % | $ | 15,830 | 1.92 | % | $ | 13,995 | 1.71 | % | $ | 18,202 | 1.98 | % | $ | 21,557 | 2.12 | % | $ | 24,726 | 2.30 | % | ||||||||||||||||||||||||
Other Operating Income | 265 | 0.03 | % | 373 | 0.05 | % | 1,138 | 0.14 | % | 1,150 | 0.13 | % | 1,136 | 0.11 | % | $ | 1,116 | 0.10 | % | |||||||||||||||||||||||||||||
Operating Expense | (12,095 | ) | -1.42 | % | (12,380 | ) | -1.50 | % | (12,125 | ) | -1.48 | % | (11,852 | ) | -1.29 | % | (13,250 | ) | -1.30 | % | (13,077 | ) | -1.22 | % | ||||||||||||||||||||||||
Net Operating Income | $ | 5,790 | 0.68 | % | $ | 3,823 | 0.46 | % | $ | 3,008 | 0.37 | % | $ | 7,500 | 0.82 | % | $ | 9,443 | 0.93 | % | $ | 12,765 | 1.19 | % | ||||||||||||||||||||||||
Gain on Disposal/Sale of Fixed Assets | $ | — | 0.00 | % | $ | — | 0.00 | % | $ | — | 0.00 | % | $ | — | 0.00 | % | $ | — | 0.00 | % | $ | 329 | 0.03 | % | ||||||||||||||||||||||||
Net Income Before Tax | $ | 5,790 | 0.68 | % | $ | 3,823 | 0.46 | % | $ | 3,008 | 0.37 | % | $ | 7,500 | 0.82 | % | $ | 9,443 | 0.93 | % | $ | 13,095 | 1.22 | % | ||||||||||||||||||||||||
Income Taxes | (2,124 | ) | -0.25 | % | (1,351 | ) | -0.16 | % | (636 | ) | -0.08 | % | (2,364 | ) | -0.26 | % | (3,146 | ) | -0.31 | % | (4,609 | ) | -0.43 | % | ||||||||||||||||||||||||
Net Income (Loss) Before Extraord. Items | $ | 3,667 | 0.43 | % | $ | 2,472 | 0.30 | % | $ | 2,372 | 0.29 | % | $ | 5,136 | 0.56 | % | $ | 6,297 | 0.62 | % | $ | 8,485 | 0.79 | % | ||||||||||||||||||||||||
Estimated Core Net Income | ||||||||||||||||||||||||||||||||||||||||||||||||
Net Income | $ | 3,667 | 0.43 | % | $ | 2,472 | 0.30 | % | $ | 2,372 | 0.29 | % | $ | 5,136 | 0.56 | % | $ | 6,297 | 0.62 | % | $ | 8,485 | 0.79 | % | ||||||||||||||||||||||||
Addback/(Deduct): Non-Recurring (Inc)/Exp | — | 0.00 | % | — | 0.00 | % | — | 0.00 | % | — | 0.00 | % | — | 0.00 | % | (329 | ) | -0.03 | % | |||||||||||||||||||||||||||||
Tax Effect (2) | — | 0.00 | % | — | 0.00 | % | — | 0.00 | % | — | 0.00 | % | — | 0.00 | % | 132 | 0.01 | % | ||||||||||||||||||||||||||||||
Estimated Core Net Income | $ | 3,667 | 0.43 | % | $ | 2,472 | 0.30 | % | $ | 2,372 | 0.29 | % | $ | 5,136 | 0.56 | % | $ | 6,297 | 0.62 | % | $ | 8,288 | 0.77 | % | ||||||||||||||||||||||||
Memo: | ||||||||||||||||||||||||||||||||||||||||||||||||
Expense Coverage Ratio | 147.01 | % | 128.60 | % | 116.16 | % | 155.77 | % | 165.96 | % | 190.30 | % | ||||||||||||||||||||||||||||||||||||
Efficiency Ratio | 67.02 | % | 75.98 | % | 79.65 | % | 60.43 | % | 57.29 | % | 50.29 | % | ||||||||||||||||||||||||||||||||||||
Effective Tax Rate | -36.67 | % | -35.35 | % | -21.14 | % | -31.52 | % | -33.32 | % | -35.20 | % | ||||||||||||||||||||||||||||||||||||
| (1) | Ratios are as a percent of average assets. |
| (2) | Assumes a marginal tax rate of 40%. |
| (3) | Expense coverage ratio calculated as net interest income before provisions for loan losses divided by operating expenses. |
| (4) | Efficiency ratio calculated as operating expenses divided by the sum of net interest income before provisions for loan losses plus other income (excluding net gains). |
Sources: Clifton Savings Bancorp’s prospectus and audited and unaudited financial reports.
| RP® Financial, LC. | OVERVIEW AND FINANCIAL ANALYSIS I. 14 |
million (0.77% of average assets) for the twelve months ended September 30, 2010. Growth in the Company’s reported and core profitability reflects the benefits of balance sheet growth, as growing operating costs have been effectively spread over an expanding asset base and as the Company’s net interest income has increased in recent periods, owing to both balance sheet growth and improving spreads. These trends are described more fully below.
Net Interest Income
As noted above, net interest income has fluctuated in dollar terms, from $17.8 million in fiscal 2006 to $24.9 million reported for the twelve months ended September 30, 2010, primarily reflecting the impact of balance sheet growth realized over the period. Over the corresponding timeframe, the Company’s net interest income to average assets ratio ranged from a low of 1.72% reported for fiscal 2008 to a high of 2.32% reported for the twelve months ended September 30, 2010. The reduction in the Company’s ratio of net interest income to average assets from fiscal 2006 to fiscal 2008 was the result of an increasing cost of funds, reflecting the impact of short-term interest rate hikes by the Federal Reserve. Comparatively, the increase in the net interest income ratio since 2009 has been facilitated by market interest rate trends, as the decline in short-term interest rates and resulting steeper yield curve has provided for a more significant decline in the Company’s funding costs relative to less rate sensitive interest-earning asset yields. Following the Second-Step Offering, the offering proceeds should increase net interest income, but have a limited impact on the Company’s overall spreads
As reflected in Exhibit I-4, which sets forth detailed information with respect to the Company’s historical yields, costs, and spreads, reflects the foregoing trends with respect to net interest income that are attributable in part to changes in the Company’s spreads. The Company’s yield-cost spread was at a relative low point in fiscal 2008, equal to only 1.09%, but has improved to 1.96% through the end of fiscal 2010, while realizing further improvement to 2.18% for the six months ended September 30, 2010. Importantly, notwithstanding the recent improvement, the Company’s spreads remain thin which is reflective of the low margins inherent in its core business (i.e., funding residential mortgage loans and investment securities primarily with CD deposits and, to a lesser extent, borrowings).
| RP® Financial, LC. | OVERVIEW AND FINANCIAL ANALYSIS I. 15 |
Loan Loss Provisions
For the twelve months ended September 30, 2010, loan loss provisions totaled $160,000, or 0.01% of average assets, which was below the level for the prior two fiscal years. While NPAs have increased for Clifton Savings, they remain at minimal levels relative to the broader industry averages. Additionally, the entire provision recognized in the most recent twelve month period was attributable to a specific reserve that was established on one impaired loan in foreclosure. Going forward, the Company will continue to evaluate the adequacy of the level of general valuation allowances (“GVAs”) on a regular basis, and establish additional loan loss provisions in accordance with the Company’s asset classification and loss reserve policies. Exhibit I-5 sets forth the Company’s loan loss allowance activity during the review period.
Non-Interest Income
Consistent with the Company’s adherence to a traditional thrift strategy and resultant limited diversification, sources of non-interest operating income have been a very minor contributor to earnings. Throughout the period shown in Table 1.2, sources of non-interest operating income have been maintained at relatively low levels, ranging from a low of 0.03% of average assets to a high of 0.14% of average assets, and equaling 0.10% of average assets for the twelve months ended September 30, 2010. Sources of non-interest operating income consist substantially of fees and service charges generated from the Company’s retail banking activities and through the BOLI investments. Since the Company is a portfolio lender, it does not earn secondary marketing or servicing income and loan fees such as late payment charges are limited, owing to the high credit quality of the portfolio.
Operating Expenses
The Company enjoys a very low operating expense ratio due to a relatively large average branch size, limited loan products and focus on funding with CDs and borrowings which entail a limited non-interest cost to acquire and service. The Company has been effective in limiting the growth in expenses, notwithstanding the addition of two branch offices over the last several years, as total operating expenses increased by approximately $1.0 million from the end of fiscal 2006 to the twelve months ended September 30, 2010, from a level of $12.1 million to $13.1 million. At the same time, operating expenses have trended lower as a percent of average assets from 1.42% in fiscal 2006 to 1.22% for the twelve months ended September 30, 2010. The decline in the operating expense ratio has been facilitated by leveraging the balance
| RP® Financial, LC. | OVERVIEW AND FINANCIAL ANALYSIS I. 16 |
sheet, while increases in operating expenses were contained through implementation of a growth strategy that did not require significant increases in personnel to generate and manage the growth. Upward pressure will be placed on the Company’s operating expense ratio following the Second-Step Conversion, due to expenses related to the stock benefit plans. At the same time, Clifton Savings will seek to offset anticipated growth in expenses from a profitability standpoint through balance sheet growth and by reinvestment of the Offering proceeds into investment securities over the near term (following the Second-Step Conversion) and into loans over the longer term.
Non-Operating Income/Expense
Non-operating income and expenses have typically had a limited impact on earnings over the last several years and were only reported in the most recent twelve month period. The Company reported non-operating income for the twelve months ended September 30, 2010, which resulted from a net gain on the sale of the Botany branch facility of $329,000.
Taxes
The Company’s average tax expense has fluctuated over the last five and a half fiscal periods, but has been in the range of 21.14% to 36.67%, and equaled 35.20% for the twelve months ended September 30, 2010. The Company is subject primarily to federal corporate taxation. While the state of New Jersey does impose a corporate income tax, Clifton Savings created a “passive investment company” (“PIC”), as permitted by New Jersey law, which has minimized the Company’s state corporate income tax liability.
Efficiency Ratio
The Company’s efficiency ratio reflects improvement over the last twelve months largely owing to expansion of the net interest margin, which is attributable to both balance sheet growth and improving spreads, while the ratio of the Company’s operating expenses to average assets has remained relatively unchanged. Specifically, the efficiency ratio diminished from 67.0% in fiscal 2006 to 50.3% reported for the twelve months ended September 30, 2010. On a post-Offering basis, the efficiency ratio may show some improvement from the benefit of reinvesting the proceeds from the Offering. However, a portion of the benefit is expected to be offset by the increased expense of the stock benefit plans.
| RP® Financial, LC. | OVERVIEW AND FINANCIAL ANALYSIS I. 17 |
Interest Rate Risk Management
The primary aspects of the Company’s interest rate risk management include:
| • | Seeking to originate shorter term fixed rate mortgage loans (i.e., maturities of 15 years or less) or adjustable loans whenever possible; |
| • | Maintaining an investment portfolio, comprised of high quality, liquid securities, many of which have short-to intermediate-term maturities; |
| • | Promoting transaction accounts and, when appropriate, longer term CDs; |
| • | Utilizing fixed rate borrowings to increase the average duration of the liability funding base; |
| • | Maintaining a strong capital level; |
| • | Maintaining low operating expenses; and, |
| • | Limiting investment in fixed assets and other non-earning assets, particularly by maintaining very strong credit quality. |
Importantly, the Company’s primary lending strategy is focused on residential mortgage lending where demand is limited to fixed rate loans in the current market environment. Accordingly, there is an inherent mismatch in the duration of loans and the funding liabilities at this point in time. Thus, the Company’s balance sheet is liability-sensitive in the short-term (less than one year) and, thus, the net interest margin will typically be adversely affected during periods of rising and higher interest rates. At the same time, the Company’s recent earnings have benefited from the low rates currently prevailing. The internal rate shock analysis as of September 30, 2010 reflects that the Company’s net portfolio value (“NPV”) declines by 24% pursuant to a positive 200 basis point instantaneous and permanent rate shock, and increased by 9% pursuant to a 100 basis point instantaneous and permanent reduction in interest rates (see Exhibit I-6). Overall, the projected impact to the Company’s NPV suggests that the Company’s exposure to rising interest rates up to a 200 basis point rate shock is relatively significant, while we believe a reduction in rates is highly unlikely given that short-term rates are near zero in the current environment. At the same time, the Company’s interest rate risk exposure is mitigated to an extent by Clifton Savings’ high capital ratio, on both a pre- and post-shock basis.
The infusion of stock proceeds will serve to further limit the Company’s interest rate risk exposure, as most of the net proceeds will be redeployed into interest-earning assets and the increase in the Company’s capital position will lessen the proportion of interest rate sensitive liabilities funding assets.
| RP® Financial, LC. | OVERVIEW AND FINANCIAL ANALYSIS I. 18 |
Lending Activities and Strategy
The Company’s lending activities have been focused primarily on residential mortgage lending, and to a lesser extent on multi-family and commercial mortgage lending, consumer and construction lending. Details regarding the Company’s loan portfolio composition and characteristics are included in Exhibits I-7 and I-8. As of September 30, 2010, the components of the loan portfolio were as follows:
| • | Permanent first mortgage loans secured by residential properties totaled $421.7 million, or 91.1% of total loans, thus comprising the majority of the loan portfolio; |
| • | Multi-family and commercial mortgages totaled $25.7 million, or 5.5% of total loans; |
| • | Consumer loans, including second mortgages and HELOCS, totaled $12.8 million, or 2.8% of total loans; and, |
| • | Construction loans totaled $2.8 million, or 0.6% of total loans. |
Residential Lending
As of September 30, 2010, the majority of the residential mortgage loans were fixed rate mortgages, with original maturities ranging from 15 to 30 years. The Company originates both fixed rate and adjustable rate 1-4 family loans for portfolio. The majority of the ARM loans in portfolio are hybrid loans with an initial period of fixed rates for either a 1, 5, 7, or 10 year period and subject to annual repricing thereafter, indexed to the one-year or three-year Constant Maturity Treasury Bill Index, plus a rate typically equal to 2.75%. The maximum amount by which the interest rate may be increased or decreased is generally 2% per adjustment period and the lifetime interest rate cap is generally 6% over the initial interest rate of the loan.
The Company originates 1-4 family loans up to a loan-to-value (“LTV”) ratio of 90%, with private mortgage insurance (“PMI”) or additional collateral being required for loans in excess of an 80% LTV ratio. The substantial portion of 1-4 family mortgage loans have been originated by the Company and are secured by residences in the local market area. At September 30, 2010, the residential mortgage portfolio had $421.7 million, or 91.1% of total loans.
| RP® Financial, LC. | OVERVIEW AND FINANCIAL ANALYSIS I. 19 |
Commercial Real Estate and Multi-family Mortgage Lending
As of September 30, 2010, multi-family and commercial real estate mortgage loans together equaled $25.7 million (5.5% of loans) and were secured by mixed-use properties with residential units as well as retail space located within the primary market area of Passaic, Bergen, Essex, Morris, Hudson, and Union Counties, New Jersey. Commercial mortgage loans may be made in amounts of up to 75% of the appraised value of the property and may be made with terms of up to 15 years and amortization schedules up to 25 years. These loans are offered with interest rates that are fixed or adjust periodically and are generally indexed to the one-year or five-year Constant Maturity Treasury Bill Index, plus a rate typically equal to 3.00%.
Construction Loans
Construction lending is a limited component of the loan portfolio, totaling $2.8 million, or 2.8% of the loan portfolio. The Company originates loans to finance the construction of residential dwellings through construction/permanent loans for the construction of 1-4 family homes to be occupied by the borrower. These construction loans tend to shorten the average duration of assets and support asset yields. Construction loans generally have a maximum LTV ratio of 70%. Construction lending has retrenched owing to limited construction in the current economic environment. However, the Company will continue to seek these loans from customers who intend to live in the houses they are constructing.
Non-Mortgage Lending
Consumer loans primarily consist of second mortgage and variable rate lines of credit, or HELOCs, which totaled approximately $11.6 million, or 2.5% of total loans as of September 30, 2010. The balance of consumer loans primarily consisted of loans secured by passbook or certificate accounts and totaled $1.2 million, equal to 0.3% of total loans.
Origination, Purchasing, and Servicing of Loans
The largest segment of the Company’s loan origination volume consists of residential mortgage loans, the vast majority of which are originated to customers through applications taken through the branches and underwritten and processed by in-house staff. However, in order to supplement the internal origination capacity, the Company utilizes technology to originate loans through online loan lead generators, particularly the Loan Search website. The website consolidates rates from lenders for the customer to research and the Company pays a fee for any closed loan. The Company retains for portfolio all of the loans that they originate.
| RP® Financial, LC. | OVERVIEW AND FINANCIAL ANALYSIS I. 20 |
In addition to internal originations, the Company occasionally purchases real estate loans on properties located primarily within the state of New Jersey and, to a much lesser extent, loans on properties located within the fifteen states on the Eastern Seaboard. At September 30, 2010, the outstanding balance of loans which were purchased and are serviced by other institutions totaled $32.8 million. Each purchased loan is subject to the same guidelines established for the Company’s own origination process. The Company also inspects properties securing a portion of the loans being purchased to verify that the value of the collateral is as stated in the loan documentation.
Exhibit I-9 provides a summary of the Company’s lending activities over the past three years. Originations and purchases of 1-4 family first mortgage loans dominated the Company’s lending activities during the past five years. Moreover, both loan originations and repayments increased significantly since the end of fiscal 2008, with total loan originations increasing to in excess of $100 million in fiscal 2009 and fiscal 2010, as mortgage loan interest rates continued to diminish to record low levels. At the same time, loan repayment rates also increased over the last several years such that the outstanding loan balance actually diminished. Loan balances have typically been enhanced by the Company’s philosophy of retaining all originations for investment. The origination and purchase data also shows that loan purchases have been comparatively modest ($2.9 million in fiscal 2010 and hasn’t exceeded $11.1 million since fiscal 2006).
Asset Quality
Historically, the Company’s credit quality measures have implied very limited credit risk exposure, given the focus on 1-4 family permanent mortgage loans and stringent underwriting. Over the past five years, Clifton Savings’ balance of non-performing assets trended upward, from de minimus levels in fiscal 2006 to $2.7 million, or 0.24% of assets, as of September 30, 2010 (see Exhibit I-10 for details with respect to the Company’s asset quality). The ratio of allowances to total loans equaled 0.48%, while reserve coverage in relation to NPAs equaled 82.31% (See Exhibit I-5 for details with respect to the Company’s valuation allowances and loan chargeoffs).
| RP® Financial, LC. | OVERVIEW AND FINANCIAL ANALYSIS I. 21 |
The Company’s management reviews and classifies loans on a monthly basis and establishes loan loss provisions based on the overall quality, size, and composition of the loan portfolio, as well as other factors such as historical loss experience, industry trends, and local real estate market and economic conditions.
Funding Composition and Strategy
As of September 30, 2010, deposits totaled $820.9 million (see Exhibit I-11). In recent years, CDs have accounted for the majority of the growth in the deposit portfolio attracted primarily through various marketing techniques and pricing mechanisms, including pricing CDs in targeted maturities at the upper end of the competitive range and through rate specials. Specifically, deposits grew by 29.4% from the end of fiscal 2009 to September 30, 2010, with much of the growth in CD accounts, which expanded by 33.6% over the corresponding timeframe. As of September 30, 2010, the Company’s balance of CDs equaled $650.4 million, or 79.2% of the Company’s deposits, and the majority of CDs have remaining maturities of one year or less (see Exhibit I-12). Jumbo CDs (balances of $100,000 or more) equaled $220.2 million, or 33.98% of total CDs. The Company does not hold any brokered CDs.
As of September 30, 2010, CDs were followed by savings and club accounts which totaled $109.7 million, which approximated 13.4% of the portfolio. The remaining core accounts consisting of interest bearing and non-interest bearing checking accounts and money market accounts totaled $60.8 million, or 7.4% of the deposit portfolio.
Borrowings have been utilized primarily as a supplemental funding source to fund lending activity and liquidity. As of September 30, 2010, the Company’s borrowings totaled $120.0 million, equal to 10.6% of total assets, consisting of fixed rate FHLB advances. Borrowed funds have been employed both as a liquidity management tool to bolster funds when deposits fall short of the Company’s requirements and also as an interest rate risk management tool. Additionally, the Company employed term FHLB advances from fiscal 2008 to fiscal 2009 in conjunction with wholesale leveraging strategies, but these particular borrowings are diminishing as they mature, as management believes the current rate environment has not been conducive to wholesale leverage at spreads which are sufficient to offset the perceived risks of the strategy. Exhibit I-13 provides details of the Company’s use of borrowed funds as of September 30, 2010.
| RP® Financial, LC. | OVERVIEW AND FINANCIAL ANALYSIS I. 22 |
Subsidiaries
Presently, the Bank is the only subsidiary of Clifton Savings. The Bank currently has one wholly-owned subsidiary, Botany, Inc., which operates as the Bank’s PIC, which exempts it from New Jersey income tax under current law and whose business consists solely of holding investment and MBS.
Legal Proceedings
As of September 30, 2010, the Company is not currently involved in any litigation which is expected to have a material impact on the Company’s financial condition or operations.
| RP® Financial, LC. | MARKET AREA ANALYSIS II. 1 |
II. MARKET AREA ANALYSIS
Introduction
Clifton Savings Bank was established in 1928 and currently serves the northeastern area of New Jersey. Over the years the Company has grown to a 12-branch operation, with full-service locations in Passaic and Bergen Counties, including the newly opened branch in Woodland Park, New Jersey. In addition, the Company delivers its banking products and services through alternative delivery mechanisms including the Internet, a telephone call center and 10 ATMs. The Company’s main office in Clifton is located approximately 20 miles west of New York City. The Company’s headquarters and all of its branches are located within the New York metropolitan statistical area (“MSA”). The Company’s branch banking locations are located in Passaic and Bergen Counties, while lending operations encompass a greater area of northeast New Jersey focused in Essex, Morris, Hudson, and Union Counties, but extending throughout the entire state, on a limited basis.
The New York MSA is the nation’s largest metropolitan area in terms of total population. Based on 2010 census data, the MSA population was estimated at 19.1 million. The two counties served by the Company’s branches had a total population of approximately 1.4 million. The economy in the Company’s market area is primarily oriented to the service, manufacturing, medical, and retail industries. With operations in densely populated metropolitan areas, the Company’s competitive environment includes a significant number of thrifts, commercial banks and other financial services companies, some of which have a regional or national presence. The regional economy is highly diversified and tends to parallel trends in the broader national economy. As counties surrounding the New York MSA, the regional market area includes a large commuter population with jobs in New York City and other areas in northern New Jersey. Accordingly, the local economy has felt the impact of the national recession as well as the credit crisis on Wall Street, as evidenced by increased unemployment rates and stable to declining real estate values throughout the markets served by the Company.
The New York MSA had an estimated gross metropolitan product of $1.13 trillion in 2005, making it the largest regional economy in the United States. New York City’s economy is a hub for the economy over the more expansive Tri-State area. Anchored by Wall Street, in Lower Manhattan, New York City is the financial capital of the world alongside London and is home to the New York Stock Exchange (“NYSE”), the world’s largest stock exchange by market
| RP® Financial, LC. | MARKET AREA ANALYSIS II. 2 |
capitalization of its listed companies. The New York area is also distinctive for its high concentrations of advanced service sector firms in fields such as law, accountancy, banking and management consultancy.
The New York MSA is a major center for financial services and Clifton Savings competes with a number of very large financial institutions that are either headquartered or maintain office networks in northeast New Jersey. Some of the larger commercial banks and thrifts operating in the Company’s market include JP Morgan Chase & Co., Wells Fargo, and Bank of America. Overall, the magnitude of the competition that Clifton Savings faces is apparent with more than 1,357 financial institution branches in Passaic and Bergen Counties within a 10 mile radius of a Clifton branch, as shown in Table 2.1.
Table 2.1
Clifton Savings Bancorp, Inc.
Deposit Market Share
Company | Headquarters | Branches | Deposits | |||||||||||||
| ($000) | (%) | |||||||||||||||
Clifton Savings Bancorp, Inc. | Clifton | NJ | 12 | $ | 1,110,692 | 0.0 | % | |||||||||
Deposit Competitors (1) | ||||||||||||||||
JPMorgan Chase & Co. | New York | NY | 273 | $ | 1,716,858,373 | 24.7 | % | |||||||||
Bank of America Corp. | Charlotte | NC | 176 | $ | 1,755,025,000 | 25.3 | % | |||||||||
Toronto-Dominion Bank | Toronto | Canada | 133 | $ | 175,076,389 | 2.5 | % | |||||||||
Valley National Bancorp | Wayne | NJ | 132 | $ | 14,092,469 | 0.2 | % | |||||||||
Wells Fargo & Co. | San Francisco | CA | 115 | $ | 1,132,511,559 | 16.3 | % | |||||||||
Capital One Financial Corp. | McLean | VA | 94 | $ | 195,006,134 | 2.8 | % | |||||||||
PNC Financial Services Group | Pittsburgh | PA | 92 | $ | 251,075,292 | 3.6 | % | |||||||||
Citigroup Inc. | New York | NY | 91 | $ | 1,321,138,731 | 19.0 | % | |||||||||
HSBC Holdings Plc | London | United Kingdom | 64 | $ | 185,548,756 | 2.7 | % | |||||||||
Banco Santander SA | Boadilla del Monte | Spain | 50 | $ | 79,140,339 | 1.1 | % | |||||||||
Hudson City Bancorp Inc. | Paramus | NJ | 45 | $ | 60,933,128 | 0.9 | % | |||||||||
Provident Financial Services | Jersey City | NJ | 25 | $ | 6,822,914 | 0.1 | % | |||||||||
Oritani Financial Corp. | Township of Washington | NJ | 23 | $ | 2,441,665 | 0.0 | % | |||||||||
New York Community Bancorp | Westbury | NY | 22 | $ | 42,303,060 | 0.6 | % | |||||||||
Columbia Savings Bank M.H.C. | Fair Lawn | NJ | 22 | $ | 4,638,721 | 0.1 | % | |||||||||
Total for All Competitors | 1,357 | $ | 6,943,723,222 | 100.0 | % | |||||||||||
(1) Defined for purposes of this presentation as institutions maintaining a branch office within 10 miles of a Clifton Bank branch.
Source: SNL Securities based on June 2010 deposit data.
The significant level of competition is demonstrated numerically in the schedule above which reflects that the two largest competitors for the Bank (as defined by financial institutions with branches within a 10 mile radius of the Bank’s branches) have nearly one-half of the
| RP® Financial, LC. | MARKET AREA ANALYSIS II. 3 |
deposit market share. Other formidable competitors include Citigroup, Inc, and Wells Fargo & Co. Importantly, there are many other competitors, in terms of thrifts, commercial banks, and credit unions in the market, as well. These numbers do not include competition from mortgage banking companies, investment houses, mutual funds and other sources.
The Company intends to continue expanding its regional branch office network through de novo branching and possibly the acquisition of branches or whole institutions if such opportunities should arise. A map showing the Company’s office coverage is set forth below and details regarding the Company’s offices and recent trends with respect to market interest rate levels are set forth in Exhibit II-1 and II-2, respectively.

Market Area Demographics
Key demographic and economic indicators in the Company’s market include population, number of households and household/per capita income levels. Trends in these key measures are summarized by the data presented in Table 2.2 for the period from 2000 to 2010, and projected through 2015. Data for the nation and the state of New Jersey is included for comparative purposes. The market area population ranges from 500,000 to 910,000 residents
| RP® Financial, LC. | MARKET AREA ANALYSIS II. 4 |
Table 2.2
Clifton Savings Bancorp, Inc.
Summary Demographic Data
| Year | Annual Growth Rate | |||||||||||||||||||
2000 | 2010 | 2015 | 2000- | 2010-2015 | ||||||||||||||||
Population (000) | ||||||||||||||||||||
United States | 281,422 | 311,213 | 323,209 | 1.0 | % | 0.8 | % | |||||||||||||
New Jersey | 8,414 | 8,822 | 8,926 | 0.5 | % | 0.2 | % | |||||||||||||
Passaic County | 489 | 500 | 500 | 0.2 | % | 0.0 | % | |||||||||||||
Bergen County | 884 | 910 | 918 | 0.3 | % | 0.2 | % | |||||||||||||
Households (000) | ||||||||||||||||||||
United States | 105,480 | 116,761 | 121,360 | 1.0 | % | 0.8 | % | |||||||||||||
New Jersey | 3,065 | 3,215 | 3,254 | 0.5 | % | 0.2 | % | |||||||||||||
Passaic County | 164 | 164 | 163 | 0.0 | % | -0.1 | % | |||||||||||||
Bergen County | 331 | 339 | 342 | 0.3 | % | 0.2 | % | |||||||||||||
Median Household Income ($) | ||||||||||||||||||||
United States | 42,164 | 54,442 | 61,189 | 2.6 | % | 2.4 | % | |||||||||||||
New Jersey | 55,083 | 72,519 | 83,186 | 2.8 | % | 2.5 | % | |||||||||||||
Passaic County | 49,211 | 62,332 | 72,474 | 2.4 | % | 2.7 | % | |||||||||||||
Bergen County | 64,914 | 84,344 | 97,063 | 2.7 | % | 2.6 | % | |||||||||||||
Per Capita Income ($) | ||||||||||||||||||||
United States | 21,587 | 26,739 | 30,241 | 2.2 | % | 2.5 | % | |||||||||||||
New Jersey | 27,006 | 34,739 | 39,759 | 2.6 | % | 2.7 | % | |||||||||||||
Passaic County | 21,370 | 26,575 | 30,191 | 2.2 | % | 2.6 | % | |||||||||||||
Bergen County | 33,638 | 42,353 | 48,142 | 2.3 | % | 2.6 | % | |||||||||||||
| 0-14 Years Old | 15-34 Years Old | 35-54 Years Old | 55-69 Years Old | 70 + Years Old | ||||||||||||||||
2010 Age Group Dist. (%) | ||||||||||||||||||||
United States | 20.1 | % | 27.2 | % | 28.0 | % | 15.5 | % | 9.1 | % | ||||||||||
New Jersey | 19.7 | % | 25.1 | % | 29.5 | % | 15.8 | % | 9.9 | % | ||||||||||
Passaic County | 21.3 | % | 27.8 | % | 28.1 | % | 14.2 | % | 8.7 | % | ||||||||||
Bergen County | 18.7 | % | 22.6 | % | 30.7 | % | 17.0 | % | 11.1 | % | ||||||||||
| Less Than $25,000 | $25,000 to 49,999 | $50,000 to $ 99,999 | $100,000+ | |||||||||||||||||
2010 HH Income Dist. (%) | ||||||||||||||||||||
United States | 20.8 | % | 24.7 | % | 35.7 | % | 18.8 | % | ||||||||||||
New Jersey | 14.0 | % | 16.6 | % | 38.4 | % | 31.0 | % | ||||||||||||
Passaic County | 16.8 | % | 20.4 | % | 38.2 | % | 24.6 | % | ||||||||||||
Bergen County | 10.5 | % | 11.7 | % | 36.9 | % | 41.0 | % | ||||||||||||
Source: SNL Financial.
| RP® Financial, LC. | MARKET AREA ANALYSIS II.5 |
in Passaic and Bergen Counties and have increased at comparatively modest paces of 0.2% and 0.3%, respectively, over the corresponding time frame, which are slightly below the New Jersey average of 0.5%. The population of the market area is projected to increase at a slower pace through 2015, which is comparable to the expected slower increase for the state as a whole.
Growth trends with regard to households have paralleled the population growth trends, with the Company’s markets generally experiencing slower household growth rates to the prevailing average for New Jersey and the U.S aggregates. Specifically, the number of households in Passaic and Bergen Counties increased at a 0.0% and 0.3% annual pace in the last 10 years as compared to 0.5% and 1.0% for the state and national aggregates.
New Jersey is the second wealthiest state in the United States by median household income. New Jersey’s close proximity to the metropolitan areas of New York and Philadelphia greatly influences its wealth. A vast majority of the state consists of suburbs of these two cities, which accounts for much of the state’s high incomes. Northern New Jersey is the wealthiest area of the state, as it lies in the middle of a wealth corridor that runs from the suburbs of Washington, D.C., all the way into southern New Hampshire. Bergen County is one of the state’s richest areas, which can be attributable to its close proximity to New York City, as the suburban area is home to a large commuter population with jobs in New York City. The lower income areas of the state include the urban cities across the Hudson River from New York City, which includes Passaic County.
Median household levels in the market area are relatively high ($84,344) for Bergen County and relatively low ($62,332) for Passaic County in comparison to the state average of $72,529 in 2010, which mirrors the explanation above. However, the market area median household levels are above the national aggregate of $54,442. Likewise, per capita income levels, as of 2010, equaled $42,353 and $26,575 for Bergen and Passaic Counties, as compared to the state and national aggregates of $34,739 and $26,739. The high income levels prevailing in Bergen County are evidenced by data which shows that Bergen County ranked 16th among the highest-income counties in the United States in 2009 in terms of per capita income and is home to four of the top 150 most expensive zip codes based upon median home price. Household income distribution patterns provide empirical support for earlier statements regarding the nature of the market area as 41.0% (in Bergen County) and 24.6% (in Passaic County) of all households had income levels in excess of $100,000 annually in 2010, exceeding the US aggregate of 18.8% and falling in between the New Jersey aggregate of 31.0%.
| RP® Financial, LC. | MARKET AREA ANALYSIS II. 6 |
Summary of Local Economy
Real Estate Market
According to the National Association of Realtors, consumers are fearful of job loss and are faced with few or limited mortgage options, thus resulting in hesitation to enter the market. In New Jersey, existing home sales are down 22% compared to the third quarter of last year. However, the same issues are halting sales activity to the same capacity nationwide, with U.S. resales down 21% compared to the same quarter of 2009. In northern New Jersey, where the Company’s branch locations and lending operations are based, there is a similar decline of 19.9% in existing home sales compared to the third quarter of 2009. The statewide median sale price of existing single-family homes in the third quarter of 2010 declined 1.4% to $316,700, compared with $321,200 for the same quarter a year ago. Likewise, in northern New Jersey, the price of existing single-family homes in the third quarter of 2010 declined 0.4% to $387,500, compared with $389,100 for the same quarter a year ago. Specifically, in Passaic County, (where the Company is headquartered and operates 7 branches) sales declined 35.7% to 402, compared with 625 a year ago, however the median sale price increased 2.5% to $319,200 in the third quarter of 2010 from $311,300 a year prior. Bergen County data was not available. Based on the above data and the Company’s relatively good asset quality, the real estate trends in the Company’s market area seem relatively stable.
Regional Employment
The economy of the Company’s markets has several large components. Comparative employment data is illustrated in Table 2.3. Consistent with U.S. employment data, service jobs represent the largest employment sector in New Jersey and the service sector has added the most jobs over the past few years. Wholesale/retail trade, government, and finance, insurance, and real estate comprised the other major employment sectors in New Jersey. The data shows that employment in services constitutes the primary source of employment in both of the market area counties, followed by wholesale/retail trade and government jobs in Passaic County, respectively. Meanwhile, wholesale/retail trade and financial services jobs were the highest source of jobs in Bergen County, as Bergen County borders New York City, just across the Hudson River to the east. As mentioned previously, New York City is the financial capital of the
| RP® Financial, LC. | MARKET AREA ANALYSIS II. 7 |
world, largely related to Wall Street and the NYSE. In line with national and state trends, service jobs have generally been the primary source of job growth in the primary market area counties, as reported by REIS Datasource 2008 data.
Table 2.3
Clifton Savings Bancorp, Inc.
Primary Market Area Employment Sectors
(Percent of Labor Force)(1)
Employment Sector | New Jersey | Passaic | Bergen | |||||||||
| (% of Total Employment) | ||||||||||||
Services | 42.3 | % | 40.5 | % | 45.1 | % | ||||||
Government | 12.7 | % | 13.1 | % | 8.2 | % | ||||||
Wholesale/Retail Trade | 15.3 | % | 17.7 | % | 17.6 | % | ||||||
Construction | 5.0 | % | 5.8 | % | 4.6 | % | ||||||
Finance/Insurance/Real Estate | 11.8 | % | 9.7 | % | 12.1 | % | ||||||
Manufacturing | 6.1 | % | 8.7 | % | 6.7 | % | ||||||
Transportation/Utility | 4.3 | % | 2.5 | % | 3.3 | % | ||||||
Agriculture | 0.3 | % | 0.1 | % | 0.0 | % | ||||||
Other | 2.3 | % | 1.9 | % | 2.4 | % | ||||||
Total | 100.0 | % | 100.0 | % | 100.0 | % | ||||||
Source: REIS DataSource 2008.
New York City has been a leading center of finance in the world economy since early in the last century. Based in New York City, the NYSE, located on Wall Street and the NASDAQ, are the world’s first and second largest stock exchanges, respectively, when measured by average daily trading volume and overall market capitalization. Moreover, financial services account for more than 35% of the city’s employment income. New York City is home to six major stock, commodities, and futures exchanges: American Stock Exchange, International Securities Exchange, NASDAQ, New York Board of Trade, New York Mercantile Exchange, and NYSE. This contributes to New York City being a major financial service exporter, both within the United States and globally.
Unemployment Trends
Unemployment trends in the market area and New Jersey are displayed in Table 2.4. The data indicates that the September 2010 unemployment rate of 9.4% for New Jersey was
| RP® Financial, LC. | MARKET AREA ANALYSIS II.8 |
slightly below the comparable U.S. unemployment rate of 9.6% and both the state and national aggregates have declined from September 2009 to September 2010. September 2010 unemployment rates for the primary market area counties ranged from a low of 7.8% in Bergen County to a high of 10.4% in Passaic County. Bergen County’s September 2010 unemployment rate was lower than the statewide and U.S. unemployment rates, while Passaic County was above the comparable aggregates. All of the primary market area counties recorded lower unemployment rates for September 2010 compared to the year ago period, which parallels the trends for New Jersey and the U.S.
Table 2.4
Clifton Savings Bancorp, Inc.
Market Area Unemployment Trends
| Sept. 2009 | Sept. 2010 (1) | |||||||
United States | 9.8 | % | 9.6 | % | ||||
New Jersey | 9.8 | % | 9.4 | % | ||||
Passaic County | 11.5 | % | 10.4 | % | ||||
Bergen County | 8.5 | % | 7.8 | % | ||||
| (1) | County data based on preliminary estimates. |
Source: U.S. Bureau of Labor Statistics.
Market Area Deposit Characteristics
Competition among financial institutions in the Company’s market is significant. As larger institutions compete for market share to achieve economies of scale, the environment for the Company’s products and services is expected to become increasingly competitive. Community-sized institutions such as Clifton Savings typically compete with larger institutions on pricing or operate in a “niche” that will allow for operating margins to be maintained at profitable levels. The Company’s business plan reflects elements of both strategies. Table 2.5 displays deposit market trends over recent years for Passaic and Bergen Counties. Annual deposit growth in Passaic and Bergen Counties over the last five years equaled 1.9% and 3.0%, respectively. Both Passaic and Bergen Counties are dominated by commercial banks, which hold an approximate 74% and 66% of the county deposit market share. Competition for deposits in New Jersey is intense, as the close proximity to New York City and the appeal of the suburban New Jersey market makes it very attractive to financial institutions. The Company’s annual deposit growth of 11.7% was highest in Bergen County, where five branches are
| RP® Financial, LC. | MARKET AREA ANALYSIS II.9 |
located, although the Company continues to hold a nominal market share. The Company held the largest deposit market share in Passaic County as of June 30, 2010, where Clifton Savings operates seven branches, holding 6.3% of the county deposits.
Table 2.5
Clifton Savings Bancorp, Inc.
Deposit Summary
| As of June 30, | ||||||||||||||||||||||||||||
| 2005 | 2010 | Deposit Growth Rate 2005-2010 | ||||||||||||||||||||||||||
| Deposits | Market Share | No. of Branches | Deposits | Market Share | No. of Branches | |||||||||||||||||||||||
| (Dollars In Thousands) | (%) | |||||||||||||||||||||||||||
Deposit Summary | ||||||||||||||||||||||||||||
State of New Jersey | $ | 222,556,000 | 100.0 | % | 3,222 | $ | 247,499,000 | 100.0 | % | 1,216 | 2.1 | % | ||||||||||||||||
Commercial Banks | 163,756,000 | 73.6 | % | 2,316 | 176,356,000 | 90.7 | % | 708 | 1.5 | % | ||||||||||||||||||
Savings Institutions | 58,800,000 | 26.4 | % | 906 | 71,143,000 | 9.3 | % | 508 | 3.9 | % | ||||||||||||||||||
Passaic County | $ | 9,079,640 | 100.0 | % | 153 | $ | 9,993,616 | 100.0 | % | 160 | 1.9 | % | ||||||||||||||||
Commercial Banks | 6,973,072 | 76.8 | % | 127 | 7,403,367 | 74.1 | % | 132 | 1.2 | % | ||||||||||||||||||
Savings Institutions | 2,106,568 | 23.2 | % | 26 | 2,590,249 | 25.9 | % | 28 | 4.2 | % | ||||||||||||||||||
Clifton Savings Bank | 459,537 | 5.1 | % | 7 | 625,412 | 6.3 | % | 7 | 6.4 | % | ||||||||||||||||||
Bergen County | $ | 33,136,190 | 100.0 | % | 483 | $ | 38,468,327 | 100.0 | % | 42 | 3.0 | % | ||||||||||||||||
Commercial Banks | 20,738,781 | 62.6 | % | 340 | 25,463,719 | 66.2 | % | 10 | 4.2 | % | ||||||||||||||||||
Savings Institutions | 12,397,409 | 37.4 | % | 143 | 13,004,608 | 33.8 | % | 32 | 1.0 | % | ||||||||||||||||||
Clifton Savings Bank | 111,373 | 0.3 | % | 3 | 193,473 | 0.5 | % | 5 | 11.7 | % | ||||||||||||||||||
| Source: FDIC. | ||||||||||||||||||||||||||||
| RP® Financial, LC. | PEER GROUP ANALYSIS III.1 |
III. PEER GROUP ANALYSIS
This chapter presents an analysis of Clifton Savings’ operations versus a group of comparable savings institutions (the “Peer Group”) selected from the universe of all publicly-traded savings institutions in a manner consistent with the regulatory valuation guidelines and other regulatory guidance. The basis of the pro forma market valuation of Clifton Savings is derived from the pricing ratios of the Peer Group institutions, incorporating valuation adjustments for key differences in relation to the Peer Group. Since no Peer Group can be exactly comparable to Clifton Savings, key areas examined for differences to determine if valuation adjustments are appropriate were in the following areas: financial condition; profitability, growth and viability of earnings; asset growth; primary market area; dividends; liquidity of the shares; marketing of the issue; management; and, effect of government regulations and regulatory reform.
Peer Group Selection
The Peer Group selection process is governed by the general parameters set forth in the regulatory valuation guidelines and other regulatory guidance. The Peer Group is comprised of only those publicly-traded thrifts whose common stock is either listed on a national exchange (NYSE or AMEX) or is NASDAQ listed, since their stock trading activity is regularly reported and generally more frequent than “non-listed thrifts” i.e., those listed on the Over-the-Counter Bulletin Board or Pink Sheets, as well as those that are non-publicly traded and closely-held. Non-listed institutions are inappropriate since the trading activity for thinly-traded or closely-held stocks is typically highly irregular in terms of frequency and price and thus may not be a reliable indicator of market value. We have also excluded from the Peer Group those companies under acquisition or subject to rumored acquisition, mutual holding companies, and recent conversions, since their pricing ratios are subject to unusual distortion and/or have limited trading history. We typically exclude those that were converted less than one year as their financial results do not reflect a full year of reinvestment benefit and since the stock trading activity is not seasoned, however we have made an exemption concerning one New Jersey thrift, which is explained further below. A recent listing of the universe of all publicly-traded savings institutions is included as Exhibit III-1.
Ideally, the Peer Group should be comprised of locally or regionally-based institutions with relatively comparable resources, strategies and financial characteristics. There are
| RP® Financial, LC. | PEER GROUP ANALYSIS III.2 |
approximately 144 publicly-traded thrift institutions nationally, which includes approximately 32 publicly-traded MHCs. Given the limited number of public full stock thrifts, it is typically the case that the Peer Group will be comprised of institutions which are not directly comparable, but the overall group will still be the “best fit” group. To the extent that key differences exist between the converting institution and the Peer Group, valuation adjustments will be applied to account for such key differences. Since Clifton Savings will be a full stock public company upon completion of the Second-Step Conversion offering, we considered only full stock companies to be viable candidates for inclusion in the Peer Group, excluding those in MHC form.
Based on the foregoing, from the universe of publicly-traded thrifts, we selected 10 institutions with characteristics similar to those of Clifton Savings. In the selection process, we applied three “screens” to the universe of all public thrifts that were eligible for consideration:
| • | Screen #1 – New Jersey thrifts with assets between $500 million and $10.0 billion, tangible equity-to-assets ratios of greater than 7.0%, NPAs-to-assets ratios of less than 3.0%, and positive core earnings. |
Five thrifts met the criteria for Screen #1 and three were included in the Peer Group: Ocean Shore Holding Co. of New Jersey, OceanFirst Financial Corp of New Jersey, and Provident Financial Services, Inc. of New Jersey. The other two thrifts were excluded since they completed their conversions within the past year: Colonial Financial Services, Inc. of New Jersey (completed July 13, 2010) and Oritani Financial Corp. of New Jersey (completed June 24, 2010).
Ocean Shore Holding Co. of New Jersey completed a second-step conversion on December 21, 2009, which is technically under a year ago, however, we have included this particular company in the Peer Group because it is New Jersey-based, which enhances the comparability to Clifton Savings.
| • | Screen #2 – Mid-Atlantic thrifts with assets between $700 million and $5.0 billion, tangible equity-to-assets ratios of greater than 7.0%, NPAs-to-assets ratios of less than 3.5%, and positive core earnings. |
Six thrifts met the criteria for Screen #2 and all were included in the Peer Group: Beacon Federal Bancorp of New York, ESSA Bancorp of Pennsylvania, Flushing Financial Corp. of New York, Provident NY Bancorp, Inc. of New York, TF Financial Corp. of Pennsylvania, and WSFS Financial Corp. of Delaware. Exhibit III-2 provides financial and public market pricing characteristics of all publicly-traded Mid-Atlantic thrifts.
| • | Screen #3 – New England thrifts with assets between $1.0 billion and $2.0 billion, tangible equity-to-assets ratios of greater than 10.0%, NPAs-to-assets ratios of less than 3.5%, and positive core earnings. |
With a total of nine peer group institutions selected based on the first two screening criteria, we fell short of the minimum of ten peer group institutions as prescribed by the regulatory appraisal guidelines, we expanded the Peer Group selection criteria beyond the Mid-Atlantic region to capture a tenth Peer Group company. Accordingly, we sought to include a financially comparable company
| RP® Financial, LC. | PEER GROUP ANALYSIS III.3 |
from the nearby New England region and tightened the financial selection criteria by narrowing the required asset size range and raising the minimum tangible equity ratio, but maintaining the same NPAs ratio. Thus, we set the minimum tangible equity ratio at 10% and assets in the $1.0 to $2.0 billion range. Of the two thrifts that met the criteria of Screen #3, we selected the one with the highest tangible equity ratio to be more comparable to Clifton Savings on a pro forma basis (recognizing that both were priced right at tangible book value): Westfield Financial, Inc. of Massachusetts. Exhibit III-3 provides financial and public market pricing characteristics of all publicly-traded New England thrifts.
Table 3.1 shows the general characteristics of each of the 10 Peer Group companies and Exhibit III-4 provides summary demographic and deposit market share data for the primary market areas served by each of the Peer Group companies. While there are expectedly some differences between the Peer Group companies and Clifton Savings, we believe that the Peer Group companies, on average, provide a good basis for valuation subject to valuation adjustments. The following sections present a comparison of Clifton Savings’ financial condition, income and expense trends, loan composition, interest rate risk and credit risk versus the Peer Group as of the most recent publicly available date.
In addition to the selection criteria used to identify the Peer Group companies, a summary description of the key comparable characteristics of each of the Peer Group companies relative to Clifton Savings’ characteristics is detailed below.
| • | Beacon Federal Bancorp of NY (“BFED”).BFED operates through a total of eight offices including three branches in upstate New York, as well as branches in Massachusetts, Tennessee and Texas, reflecting its legacy as a converted credit union. Also reflecting its status as a former credit union, BFED’s loan portfolio has the largest proportion of consumer loan in comparison to the Peer Group companies, although permanent 1-4 family mortgage loans comprise the largest segment of lending. BFED’s asset quality ratios are comparable to the Peer Group averages. At September 30, 2010, BFED had total assets of $1.1 billion, a tangible equity-to-assets ratio of 10.2% and reported a ROA of 0.46% for the twelve months ended September 30, 2010. |
| • | ESSA Bancorp, Inc. of PA (“ESSA”).ESSA operates 14 branch offices in northeastern Pennsylvania. ESSA maintains a high proportion of residential mortgage loans and a low proportion of higher risk-weighted construction and commercial mortgage loans relative to the Peer Group average. Earnings fall short of the Peer Group’s average, notwithstanding ESSA’s high capital ratio (the result of the completion of its standard conversion transaction in April 2007). At September 30, 2010, ESSA had total assets of $1.1 billion and a tangible equity-to-assets ratio of 16.0%, as well as a ROA of 0.43%, for the twelve months ended September 30, 2010. |
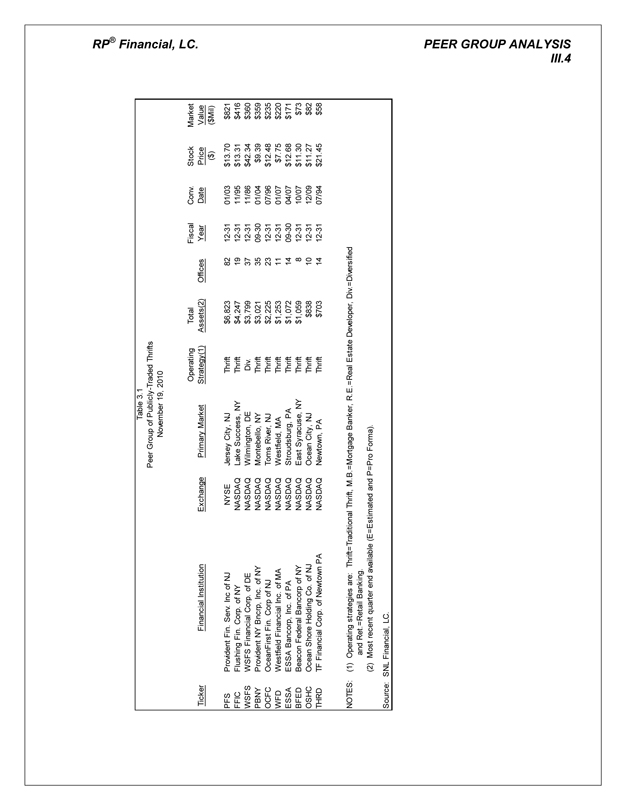
RP® Financial, LC. | PEER GROUP ANALYSIS 11I. 4 |
Table 3.1
Peer Group of Publicly-Traded Thrifts
November 19, 2010
Ticker | Financial Institution | Exchange | Primary Market | Operating | Total | Offices | Fiscal | Conv. | Stock | Market | ||||||||||||||||||||||||
($) | ($Mil) | |||||||||||||||||||||||||||||||||
PFS | Provident Fin. Serv. Inc of NJ |
| NYSE |
| Jersey City, NJ | Thrift | $ | 6,823 |
|
| 82 |
|
| 12-31 |
|
| 01/03 |
| $ | 13.70 |
| $ | 821 |
| ||||||||||
FFIC | Flushing Fin. Corp. of NY |
| NASDAQ |
| Lake Success, NY | Thrift | $ | 4,247 |
|
| 19 |
|
| 12-31 |
|
| 11/95 |
| $ | 13.31 |
| $ | 416 |
| ||||||||||
WSFS | WSFS Financial Corp. of DE |
| NASDAQ |
| Wilmington, DE | Div. | $ | 3,799 |
|
| 37 |
|
| 12-31 |
|
| 11/86 |
| $ | 42.34 |
| $ | 360 |
| ||||||||||
PBNY | Provident NY Bncrp, Inc. of NY |
| NASDAQ |
| Montebello, NY | Thrift | $ | 3,021 |
|
| 35 |
|
| 09-30 |
|
| 01/04 |
| $ | 9.39 |
| $ | 359 |
| ||||||||||
OCFC | OceanFirst Fin. Corp of NJ |
| NASDAQ |
| Toms River, NJ | Thrift | $ | 2,225 |
|
| 23 |
|
| 12-31 |
|
| 07/96 |
| $ | 12.48 |
| $ | 235 |
| ||||||||||
WFD | Westfield Financial Inc. of MA |
| NASDAQ |
| Westfield, MA | Thrift | $ | 1,253 |
|
| 11 |
|
| 12-31 |
|
| 01/07 |
| $ | 7.75 |
| $ | 220 |
| ||||||||||
ESSA | ESSA Bancorp, Inc. of PA |
| NASDAQ |
| Stroudsburg, PA | Thrift | $ | 1,072 |
|
| 14 |
|
| 09-30 |
|
| 04/07 |
| $ | 12.68 |
| $ | 171 |
| ||||||||||
BFED | Beacon Federal Bancorp of NY |
| NASDAQ |
| East Syracuse, NY | Thrift | $ | 1,059 |
|
| 8 |
|
| 12-31 |
|
| 10/07 |
| $ | 11.30 |
| $ | 73 |
| ||||||||||
OSHC | Ocean Shore Holding Co. of NJ |
| NASDAQ |
| Ocean City, NJ | Thrift | $ | 838 |
|
| 10 |
|
| 12-31 |
|
| 12/09 |
| $ | 11.27 |
| $ | 82 |
| ||||||||||
THRD | TF Financial Corp. of Newtown PA |
| NASDAQ |
| Newtown, PA | Thrift | $ | 703 |
|
| 14 |
|
| 12-31 |
|
| 07/94 |
| $ | 21.45 |
| $ | 58 |
| ||||||||||
NOTES: | (1) | Operating strategies are: Thrift=Traditional Thrift,M.B.=MortgageBanker,R.E.=Real Estate Developer, Div.=Diversified and Ret.=Retail Banking. | ||
(2) | Most recent quarter end available (E=Estimated and P=Pro Forma). | |||
Source: SNL Financial, LC. | ||||
| RP® Financial, LC. | PEER GROUP ANALYSIS III.5 |
| • | Flushing Fin. Corp. of NY (“FFIC”).FFIC operates through 19 branches in New York and an online banking division, which enables FFIC to expand outside of its current geographic footprint. FFIC has the highest proportion of multi-family and commercial real estate loans, which has contributed to FFIC’s high earnings, as FFIC has the highest return on average assets among the Peer Group members. Conversely, FFIC has the highest NPAs-to-assets ratio and lowest reserve coverage ratios as compared to the Peer Group. At September 30, 2010, FFIC had total assets of $4.2 billion, a tangible equity-to-assets ratio of 8.9%, and for the twelve months ended September 30, 2010, FFIC reported a ROA of 0.86%. |
| • | Ocean Shore Holding Co. of NJ (“OSHC”). OSHC operates 10 offices through two counties in eastern New Jersey. OSHC maintains the highest percentage of 1-4 family loans which also equates to a low risk weighted assets ratio. OSHC also maintained the lowest NPAs to assets ratio, due to its less diversified loan portfolio. OSHS operates with a tangible equity to assets ratio modestly above the Peer Group average, at 11.9%, due to the recent second-step conversion completed in December 2009. OSHC reported assets of $838 million as of September 30, 2010 and a ROA of 0.68% for the latest twelve month period. |
| • | OceanFirst Financial Corp of New Jersey (“OCFC”). OCFC operates through a total of 23 branches in eastern New Jersey. OCFC maintained a less diversified loan portfolio than compared to the Peer Group, with comparatively modest balances of commercial mortgage, business and consumer loans. At September 30, 2010, OCFC reported total assets of $2.2 billion, a tangible equity-to-assets ratio of 9.0% and reported a ROA of 0.86% for the twelve months ended September 30, 2010, which was equivalent to the highest ROA among all the Peer Group members. |
| • | Provident Financial Services, Inc. of NJ (“PFS”).PFS operates 82 offices through northern and central New Jersey. PFS maintains a diversified loan portfolio with the loan portfolio composition reflecting a relatively significant emphasis on commercial mortgage lending in comparison to the Peer Group as a whole. As of June 30, 2010, PFS reported $6.8 billion of assets, tangible equity-to-assets ratio of 8.8%, and an ROA of 0.58% for the latest twelve month period. |
| • | Provident NY Bancorp, Inc. of New York (“PBNY”). PBNY operates through 35 retail banking offices in the Hudson Valley region of New York. PBNY has a diversified loan portfolio with a lower proportion of residential real estate loans, similar proportion of commercial mortgage loans and a more significant emphasis on construction and commercial non-mortgage lending in comparison to the Peer Group. At September 30, 2010, PBNY reported total assets of $3.0 billion, a tangible equity-to-assets ratio of 8.8% and an ROA of 0.69% for the twelve months ended September 30, 2010. |
| • | TF Financial Corporation of PA (“THRD”).THRD operates 14 branches in the Philadelphia metropolitan area. THRD maintains a .loan portfolio composition similar to the Peer Group average in most respects, except with regard to the high proportion of 1-4 family mortgage loans. THRD also has the highest ratio of NPAs to assets (3.37%) which exceeded the Peer Group average and each of the Peer Group companies individually. At September 30, 2010, THRD reported total assets of $703 million, a tangible equity-to-assets ratio of 10.0% and a twelve month ROA of 0.54%. |
| • | WSFS Financial Corp. of DE (“WSFS”).WSFS operates through its headquarters office in Wilmington, Delaware and through 39 branch offices throughout Delaware, Pennsylvania, and Virginia. WSFS has the highest operating expense ratio among the |
| RP® Financial, LC. | PEER GROUP ANALYSIS III. 6 |
Peer Group members due to their diversified operations into non-interest earning activities including wealth management and trust services. Notwithstanding the resulting high level of fee income, WSFS’ earnings are at the lower end of the Peer Group range as a result of high operating expenses and loan loss provisions The loan loss provisions reported by WSFS were the result of its high NPAs, which were at the upper end of the Peer Group range. As of September 30, 2010, WSFS reported $3.8 billion in assets, 9.4% of tangible equity to assets, as well as a ROA of 0.32% for the twelve months ended September 30, 2010. |
| • | Westfield Financial, Inc. of MA (“WFD”). WFD operates through a total of 11 offices in western Massachusetts. Their ratio of NPAs to assets is below the Peer Group average. WFD’s ROA was also below the Peer Group average, reporting the lowest ROA of the Peer Group, notwithstanding WFD’s high tangible equity-to-assets ratio of 19.1% which was the result of the second-step conversion completed in January 2007. As of September 30, 2010, WFD reported total assets of $1.3 billion and a ROA of 0.29% for the latest twelve month period. |
In the aggregate, the Peer Group companies maintain a slightly higher tangible equity level in comparison to the industry average (11.25% of assets versus 10.71% for all public companies) and generate a higher level of core profitability (0.50% of average assets for the Peer Group versus a loss of 0.20% of average assets for all public companies). Accordingly, the Peer Group companies have a positive average core ROE, whereas all public companies have a negative average core ROE (4.67% for the Peer Group versus -0.83% for all public companies). Overall, the Peer Group’s pricing ratios were at a modest premium to all publicly traded thrift institutions on a P/TB and P/A basis and approximated all publicly traded thrifts on a Price/Core earnings basis (however many public companies did not have meaningful core earnings multiples owing to their trailing twelve month loss position).
| All Public- Thrifts | Peer Group | |||||||
Financial Characteristics (Averages) | ||||||||
Assets ($Mil) | $ | 2,779 | $ | 2,504 | ||||
Market Capitalization ($Mil) | $ | 305 | $ | 279 | ||||
Tangible Equity/Assets (%) | 10.71 | % | 11.25 | % | ||||
Core Return on Average Assets (%) | (0.20 | %) | 0.50 | % | ||||
Core Return on Average Equity (%) | (0.83 | %) | 4.67 | % | ||||
Pricing Ratios (Averages)(1) | ||||||||
Price/Core Earnings (x) | 16.85 | x | 16.91 | x | ||||
Price/Tangible Book (%) | 80.35 | % | 107.83 | % | ||||
Price/Assets (%) | 8.45 | % | 11.22 | % | ||||
| (1) | Based on market prices as of November 19, 2010. |
The thrifts selected for the Peer Group were relatively comparable to Clifton Savings in terms of all of the selection criteria and are considered the “best fit” group. While there are
| RP® Financial, LC. | PEER GROUP ANALYSIS III . 7 |
many similarities between Clifton Savings and the Peer Group on average, there are some notable differences that lead to valuation adjustments. The following comparative analysis highlights key similarities and differences between Clifton Savings and the Peer Group.
Financial Condition
Table 3.2 shows comparative balance sheet measures for Clifton Savings and the Peer Group, reflecting balances as of September 30, 2010, for the Company and as of September 30, 2010, or the most recent date available for the Peer Group. Clifton Savings’ equity-to-assets ratio of 15.6% was above the Peer Group’s average equity ratio of 12.3%. Tangible equity-to-assets ratios for the Company and the Peer Group equaled 15.6% and 11.1%, respectively. In addition, with the infusion of the net conversion proceeds, the Company’s equity ratios will exceed the Peer Group average and median ratios to a greater extent. The increase in Clifton Savings’ pro forma capital position will be favorable from a risk perspective and in terms of future earnings potential that could be realized through leverage and lower funding costs. At the same time, the Company’s higher pro forma capitalization will initially depress return on equity. Both Clifton Savings’ and the Peer Group’s capital ratios reflected capital surpluses with respect to the regulatory capital requirements. On a pro forma basis, the Company’s regulatory surpluses will become more significant and will exceed the Peer Group’s regulatory capital ratios.
The interest-earning assets (“IEA”) composition reflects differences in terms of the proportion of loans, as Clifton Savings’ ratio of loans to assets of 40.5% is lower than the Peer Group average ratio of 67.1%. Conversely, Clifton Savings’ level of cash and investments equal to 55.6% of assets was higher than the Peer Group average of 27.3%. The Company’s asset strategy revolves around two asset classes: investment securities and mortgage loans, with mortgage loans primarily consisting of one-to-four family mortgages within New Jersey. In the absence of strong loan demand, the Company’s investment portfolio provides an alternate source of low-risk investment to generate a return above the underlying funding costs. Overall, Clifton Savings’ IEA amounted to 96.1% of assets, which modestly exceeded the Peer Group’s average ratio of 94.4%. Both the Company’s and the Peer Group’s IEA ratios exclude BOLI as an IEA. On a pro forma basis immediately following the Second-Step Conversion, a portion of the proceeds will initially be invested into Federal funds or shorter-term investment securities increasing the relative proportion of cash and investments for the Company in comparison to the Peer Group over the short-term. Furthermore, the IEA advantage for the Company will strengthen.

RP® Financial, LC. | PEER GROUP ANALYSIS III. 8 |
Table 3.2
Balance Sheet Composition and Growth Rates
Comparable Institution Analysis
As of September 30, 2010
Balance Sheet as a Percent of Assets | Balance Sheet Annual Grow th Rates | Regulatory Capital | ||||||||||||||||||||||||||||||||||||||||||||||||||||||||||||||||||||||||||||||
Cash & | MBS& | BOLI | Loans | Deposits | Borrowed | Subd. Debt | Net | Goodwill | Tng | Assets | MBS, Cash | Loans | Deposits | Borrows. | Net | Tng | Tangible | Core | Reg.Cap. | |||||||||||||||||||||||||||||||||||||||||||||||||||||||||||||
Clifton Savings Bancorp, Inc. | ||||||||||||||||||||||||||||||||||||||||||||||||||||||||||||||||||||||||||||||||
September 30, 2010 |
| 5.2 | % |
| 50.4 | % |
| 2.3 | % |
| 40.5 | % |
| 72.3 | % |
| 10.6 | % |
| 0.0 | % |
| 15.6 | % |
| 0.0 | % |
| 15.6 | % |
| 11.72 | % |
| 28.97 | % |
| -5.77 | % |
| 18.97 | % |
| -15.74 | % |
| 0.95 | % |
| 0.95 | % |
| 14.03 | % |
| 14.03 | % |
| 41.36 | % | ||||||||||||||||||||
All Public Companies | ||||||||||||||||||||||||||||||||||||||||||||||||||||||||||||||||||||||||||||||||
Averages |
| 6.1 | % |
| 20.1 | % |
| 1.4 | % |
| 67.4 | % |
| 73.2 | % |
| 13.4 | % |
| 0.5 | % |
| 11.7 | % |
| 0.8 | % |
| 10.9 | % |
| 5.04 | % |
| 12.72 | % |
| 2.04 | % |
| 8.51 | % |
| -15.46 | % |
| 2.11 | % |
| 2.24 | % |
| 10.96 | % |
| 10.89 | % |
| 18.32 | % | ||||||||||||||||||||
Medians |
| 4.9 | % |
| 18.6 | % |
| 1.4 | % |
| 68.7 | % |
| 73.7 | % |
| 12.5 | % |
| 0.0 | % |
| 10.7 | % |
| 0.1 | % |
| 9.8 | % |
| 1.74 | % |
| 7.32 | % |
| -1.69 | % |
| 5.71 | % |
| -12.47 | % |
| 2.29 | % |
| 1.98 | % |
| 9.52 | % |
| 9.51 | % |
| 16.33 | % | ||||||||||||||||||||
State of NJ | ||||||||||||||||||||||||||||||||||||||||||||||||||||||||||||||||||||||||||||||||
Averages |
| 4.6 | % |
| 24.3 | % |
| 1.3 | % |
| 65.3 | % |
| 70.7 | % |
| 15.0 | % |
| 0.3 | % |
| 13.0 | % |
| 1.0 | % |
| 12.0 | % |
| 10.25 | % |
| 12.24 | % |
| 6.24 | % |
| 10.90 | % |
| -7.65 | % |
| 10.22 | % |
| 10.74 | % |
| 14.99 | % |
| 14.99 | % |
| 25.39 | % | ||||||||||||||||||||
Medians |
| 4.4 | % |
| 21.6 | % |
| 1.5 | % |
| 67.9 | % |
| 72.0 | % |
| 13.6 | % |
| 0.0 | % |
| 11.8 | % |
| 0.1 | % |
| 10.9 | % |
| 6.46 | % |
| 8.15 | % |
| 1.96 | % |
| 7.55 | % |
| -4.11 | % |
| 6.85 | % |
| 7.79 | % |
| 13.03 | % |
| 13.03 | % |
| 22.42 | % | ||||||||||||||||||||
Comparable Group | ||||||||||||||||||||||||||||||||||||||||||||||||||||||||||||||||||||||||||||||||
Averages |
| 3.5 | % |
| 23.8 | % |
| 1.9 | % |
| 67.1 | % |
| 67.7 | % |
| 18.4 | % |
| 0.6 | % |
| 12.3 | % |
| 1.2 | % |
| 11.1 | % |
| 4.19 | % |
| 5.44 | % |
| 0.43 | % |
| 10.09 | % |
| -8.31 | % |
| 8.66 | % |
| 9.22 | % |
| 11.18 | % |
| 11.18 | % |
| 19.94 | % | ||||||||||||||||||||
Medians |
| 1.7 | % |
| 20.4 | % |
| 1.7 | % |
| 71.2 | % |
| 70.6 | % |
| 16.5 | % |
| 0.0 | % |
| 11.2 | % |
| 0.2 | % |
| 9.7 | % |
| 2.00 | % |
| 2.96 | % |
| -0.12 | % |
| 6.86 | % |
| -9.60 | % |
| 4.38 | % |
| 6.20 | % |
| 9.33 | % |
| 9.33 | % |
| 15.88 | % | ||||||||||||||||||||
Comparable Group | ||||||||||||||||||||||||||||||||||||||||||||||||||||||||||||||||||||||||||||||||
BFED Beacon Federal Bancorp of NY |
| 1.2 | % |
| 18.8 | % |
| 1.0 | % |
| 76.0 | % |
| 65.8 | % |
| 23.5 | % |
| 0.0 | % |
| 10.2 | % |
| 0.0 | % |
| 10.2 | % |
| -1.00 | % |
| -2.44 | % |
| -1.14 | % |
| 2.36 | % |
| -12.14 | % |
| 7.73 | % |
| 7.73 | % |
| 9.14 | % |
| 9.14 | % |
| 12.97 | % | ||||||||||||||||||||
ESSA ESSA Bancorp, Inc. of PA |
| 1.0 | % |
| 26.7 | % |
| 1.4 | % |
| 68.2 | % |
| 50.4 | % |
| 32.7 | % |
| 0.0 | % |
| 16.0 | % |
| 0.0 | % |
| 16.0 | % |
| 2.87 | % |
| 10.34 | % |
| -0.37 | % |
| 32.18 | % |
| -20.18 | % |
| -7.48 | % |
| -7.48 | % |
| 15.07 | % |
| 15.07 | % |
| 32.67 | % | ||||||||||||||||||||
FFIC Flushing Fin. Corp. of NY |
| 0.6 | % |
| 18.3 | % |
| 1.7 | % |
| 76.7 | % |
| 69.1 | % |
| 20.1 | % |
| 0.7 | % |
| 9.3 | % |
| 0.4 | % |
| 8.9 | % |
| 1.67 | % |
| -5.96 | % |
| 3.09 | % |
| 8.84 | % |
| -13.72 | % |
| -5.57 | % |
| -5.71 | % |
| NA |
|
| NA |
|
| NA |
| ||||||||||||||||||||
OSHC Ocean Shore Holding Co. of NJ |
| 11.7 | % |
| 3.8 | % |
| 1.7 | % |
| 79.9 | % |
| 72.0 | % |
| 13.1 | % |
| 1.8 | % |
| 11.8 | % |
| 0.0 | % |
| 11.8 | % |
| 12.86 | % |
| NM |
|
| 2.19 | % |
| 13.27 | % |
| -5.92 | % |
| 47.35 | % |
| 47.35 | % |
| 10.25 | % |
| 10.25 | % |
| 19.67 | % | ||||||||||||||||||||
OCFC OceanFirst Fin. Corp of NJ |
| 1.3 | % |
| 19.3 | % |
| 1.8 | % |
| 75.0 | % |
| 73.0 | % |
| 15.8 | % |
| 1.2 | % |
| 9.0 | % |
| 0.0 | % |
| 9.0 | % |
| 18.81 | % |
| NM |
|
| 2.62 | % |
| 19.56 | % |
| 14.31 | % |
| 20.01 | % |
| 20.01 | % |
| 8.96 | % |
| 8.96 | % |
| 14.93 | % | ||||||||||||||||||||
PFS Provident Fin. Serv. Inc of NJ (1) |
| 4.0 | % |
| 23.9 | % |
| 2.0 | % |
| 62.5 | % |
| 71.9 | % |
| 14.0 | % |
| 0.0 | % |
| 13.4 | % |
| 5.2 | % |
| 8.2 | % |
| 2.32 | % |
| 10.94 | % |
| -0.93 | % |
| 4.18 | % |
| -7.05 | % |
| 4.40 | % |
| 8.30 | % |
| NA |
|
| NA |
|
| 14.17 | % | ||||||||||||||||||||
PBNY Provident NY Bncrp, Inc. of NY |
| 3.0 | % |
| 31.6 | % |
| 1.7 | % |
| 55.5 | % |
| 70.9 | % |
| 13.7 | % |
| 0.0 | % |
| 14.3 | % |
| 5.4 | % |
| 8.8 | % |
| -0.03 | % |
| -1.46 | % |
| 0.13 | % |
| 2.90 | % |
| -13.87 | % |
| 0.82 | % |
| 2.05 | % |
| 9.33 | % |
| 9.33 | % |
| NA |
| ||||||||||||||||||||
THRD TF Financial Corp. of New tow n PA |
| 1.0 | % |
| 19.2 | % |
| 2.5 | % |
| 74.1 | % |
| 78.6 | % |
| 9.8 | % |
| 0.0 | % |
| 10.6 | % |
| 0.6 | % |
| 10.0 | % |
| -1.30 | % |
| -3.29 | % |
| -2.27 | % |
| 3.87 | % |
| -31.15 | % |
| 4.36 | % |
| 4.66 | % |
| 9.32 | % |
| 9.32 | % |
| 16.83 | % | ||||||||||||||||||||
WSFS WSFS Financial Corp. of DE |
| 8.8 | % |
| 21.6 | % |
| 1.6 | % |
| 65.1 | % |
| 70.3 | % |
| 17.2 | % |
| 1.8 | % |
| 9.7 | % |
| 0.3 | % |
| 9.4 | % |
| 6.31 | % |
| 28.05 | % |
| -1.49 | % |
| 7.75 | % |
| -4.12 | % |
| 22.00 | % |
| 22.24 | % |
| 8.69 | % |
| 8.69 | % |
| 12.51 | % | ||||||||||||||||||||
WFD Westfield Financial Inc. of MA |
| 2.0 | % |
| 54.8 | % |
| 3.2 | % |
| 38.2 | % |
| 55.3 | % |
| 24.3 | % |
| 0.0 | % |
| 19.1 | % |
| 0.0 | % |
| 19.1 | % |
| -0.66 | % |
| 7.38 | % |
| 2.48 | % |
| 5.98 | % |
| 10.77 | % |
| -6.98 | % |
| -6.98 | % |
| 18.71 | % |
| 18.71 | % |
| 35.74 | % | ||||||||||||||||||||
(1) | Financial information is for the quarter ending June 30, 2010. |
Source: SNL Financial, LC. and RP® Financial, LC. calculations. The information provided in this table has been obtained from sources w e believe are reliable, but w e cannot guarantee the accuracy or completeness of such information.
Copyright (c) 2010 by RP® Financial, LC.
| RP® Financial, LC. | PEER GROUP ANALYSIS III. 9 |
Clifton Savings’ funding liabilities reflected a funding strategy that was similar to that of the Peer Group’s funding composition. The Company’s deposits equaled 72.3% of assets, which exceeded the Peer Group’s ratio of 67.7%. Comparatively, the Company maintained a slightly lower level of borrowings than the Peer Group, as indicated by borrowings-to-assets ratios of 10.6% and 18.4%, respectively. Total interest-bearing liabilities (“IBL”) maintained by the Company and the Peer Group, as a percent of assets, equaled 82.9% and 86.7%, respectively, with the Company’s lower ratio supported by maintenance of a higher capital position.
A key measure of balance sheet strength for a thrift institution is its IEA/IBL ratio. Presently, the Company’s IEA/IBL ratio is higher than the Peer Group’s ratio, based on IEA/IBL ratios of 115.9% and 108.9%, respectively. The additional capital realized from stock proceeds should increase the Company’s IEA/IBL ratio as the IBL ratio diminishes with the increased capital.
The growth rate section of Table 3.2 shows annual growth rates for key balance sheet items. For the twelve months ended September 30, 2010, Clifton Savings recorded asset growth of 11.7%, which was higher than the Peer Group’s asset growth rate of 4.2%. Asset growth for Clifton Savings was sustained through a 29.0% increase in cash and investments, which was slightly offset by a 5.8% decline in loans, with the Peer Group reporting weaker growth for cash and investments (5.4%) and almost no change in the loan balances on average. Loan growth for both the Company and the Peer Group has been impacted by the recession and low interest rates which has limited demand for credit by strong borrowers. This has caused residential mortgage loan demand to be concentrated in longer-term fixed rate loans, which many institutions limit for portfolio investment, owing to interest rate risk considerations.
Asset growth for Clifton Savings was funded with a 19.0% increase in deposits, as borrowings declined by 15.7%, while the Peer Group’s asset growth was funded with a lower 10.1% growth in deposits, as borrowings declined 8.3%. The Company’s capital increased by a minimal 1.0% during the twelve month period, which was below the Peer Group’s capital growth rate of 8.7%, which was supported by equity issuances by several companies. The Company’s post-conversion capital growth rate will initially be constrained by maintenance of a relatively high pro forma capital position and low investment yields available in today’s market.
| RP® Financial, LC. | PEER GROUP ANALYSIS III. 10 |
Income and Expense Components
Table 3.3 displays statements of operations for the Company for the twelve months ended September 30, 2010, and the Peer Group for the twelve months ended September 30, 2010. Clifton Savings reported net income equal to 0.79% of average assets, versus net income equal to 0.57% of average assets for the Peer Group. The Company’s higher return was supported by a lower ratio for loan loss provisions and lower level of operating expenses, which was somewhat offset by the Peer Group’s higher level of net interest income and higher ratio of non-interest fee income.
The Company maintained a lower net interest income to average assets ratio, which was reflective of the Company’s lower yield-cost spread, which equaled 2.16% versus 3.07% for the Peer Group. The Company maintained a lower yield on interest-earning assets (4.50% versus an average of 4.91% for the Peer Group), and a higher cost of funds (2.34% versus an average of 1.84% for the Peer Group). Overall, Clifton Savings and the Peer Group reported net interest income to average assets ratios of 2.32% and 3.03%, respectively.
In another key area of core earnings strength, the Company maintained a lower level of operating expenses than the Peer Group. Importantly, the Company’s primary operating strategy of residential lending funded by CDs is an inherently low net-interest margin business, therefore doing so efficiently, with lower expense and efficiency ratios is critical to the Company’s success. For the period covered in Table 3.3, the Company and the Peer Group reported operating expense to average assets ratios of 1.22% and 2.29%, respectively. Additionally, the lower proportion of loans and transaction deposit accounts, notwithstanding the emphasis on service and branch expansion, may also be factors leading to the Company’s lower operating expense ratio. Assets per full time equivalent employee equaled $10.8 million for Clifton Savings versus $6.7 million for the Peer Group on average.
When viewed together, net interest income and operating expenses provide considerable insight into a thrift’s earnings strength, since those sources of income and expenses are typically the most prominent components of earnings and are generally more predictable than losses and gains realized from the sale of assets or other non-recurring activities. In this regard, as measured by their expense coverage ratios (net interest income divided by operating expenses), the Peer Group’s and the Company’s earnings were both favorable. Expense coverage ratios posted by Clifton Savings and the Peer Group equaled 1.90x and 1.32x, respectively.

RP® Financial, LC. | PEER GROUP ANALYSIS III. 11 |
Table 3.3
Income as Percent of Average Assets and Yields, Costs, Spreads
Comparable Institution Analysis
For the 12 Months Ended September 30, 2010
Net Interest Income | Other Income | G&A/Other | Non-Op. | Yields, Costs, and | ||||||||||||||||||||||||||||||||||||||||||||||||||||||||||||||||||||||||||
Net | Income | Expense | NII | Loss | NII | Loan | R.E. | Other | Total | G&A | Goodw | Net | Extrao. | Yield | Cost | Yld-Cost | MEMO: | MEMO: | ||||||||||||||||||||||||||||||||||||||||||||||||||||||||||||
Clifton Savings Bancorp, Inc. | ||||||||||||||||||||||||||||||||||||||||||||||||||||||||||||||||||||||||||||||
September 30, 2010 |
| 0.79 | % |
| 4.24 | % |
| 1.93 | % |
| 2.32 | % |
| 0.01 | % |
| 2.30 | % |
| 0.00 | % |
| 0.00 | % |
| 0.10 | % |
| 0.10 | % |
| 1.22 | % |
| 0.00 | % |
| 0.03 | % |
| 0.00 | % |
| 4.50 | % |
| 2.34 | % |
| 2.16 | % | $ | 10,820 |
|
| 35.20 | % | |||||||||||||||||||||
All Public Companies | ||||||||||||||||||||||||||||||||||||||||||||||||||||||||||||||||||||||||||||||
Averages |
| -0.02 | % |
| 4.68 | % |
| 1.62 | % |
| 3.06 | % |
| 0.90 | % |
| 2.15 | % |
| 0.02 | % |
| -0.08 | % |
| 0.82 | % |
| 0.76 | % |
| 2.82 | % |
| 0.07 | % |
| 0.06 | % |
| 0.00 | % |
| 5.00 | % |
| 1.87 | % |
| 3.14 | % | $ | 6,051 |
|
| 30.66 | % | |||||||||||||||||||||
Medians |
| 0.36 | % |
| 4.71 | % |
| 1.61 | % |
| 3.08 | % |
| 0.52 | % |
| 2.44 | % |
| 0.00 | % |
| -0.01 | % |
| 0.58 | % |
| 0.55 | % |
| 2.75 | % |
| 0.00 | % |
| 0.04 | % |
| 0.00 | % |
| 5.00 | % |
| 1.86 | % |
| 3.18 | % | $ | 4,768 |
|
| 31.56 | % | |||||||||||||||||||||
State of NJ | ||||||||||||||||||||||||||||||||||||||||||||||||||||||||||||||||||||||||||||||
Averages |
| 0.57 | % |
| 4.63 | % |
| 1.69 | % |
| 2.94 | % |
| 0.38 | % |
| 2.56 | % |
| 0.00 | % |
| -0.01 | % |
| 0.30 | % |
| 0.30 | % |
| 2.07 | % |
| 0.01 | % |
| 0.00 | % |
| 0.00 | % |
| 4.91 | % |
| 1.95 | % |
| 2.96 | % | $ | 11,212 |
|
| 35.56 | % | |||||||||||||||||||||
Medians |
| 0.62 | % |
| 4.71 | % |
| 1.66 | % |
| 2.94 | % |
| 0.40 | % |
| 2.56 | % |
| 0.00 | % |
| 0.00 | % |
| 0.25 | % |
| 0.24 | % |
| 2.12 | % |
| 0.00 | % |
| 0.00 | % |
| 0.00 | % |
| 4.93 | % |
| 1.95 | % |
| 2.97 | % | $ | 7,329 |
|
| 37.43 | % | |||||||||||||||||||||
Comparable Group | ||||||||||||||||||||||||||||||||||||||||||||||||||||||||||||||||||||||||||||||
Averages |
| 0.57 | % |
| 4.63 | % |
| 1.60 | % |
| 3.03 | % |
| 0.53 | % |
| 2.50 | % |
| 0.02 | % |
| -0.02 | % |
| 0.54 | % |
| 0.55 | % |
| 2.29 | % |
| 0.01 | % |
| 0.08 | % |
| 0.00 | % |
| 4.91 | % |
| 1.84 | % |
| 3.07 | % | $ | 6,867 |
|
| 27.60 | % | |||||||||||||||||||||
Medians |
| 0.56 | % |
| 4.71 | % |
| 1.49 | % |
| 3.09 | % |
| 0.50 | % |
| 2.57 | % |
| 0.00 | % |
| 0.00 | % |
| 0.47 | % |
| 0.47 | % |
| 2.34 | % |
| 0.00 | % |
| 0.07 | % |
| 0.00 | % |
| 4.92 | % |
| 1.78 | % |
| 3.15 | % | $ | 5,908 |
|
| 26.33 | % | |||||||||||||||||||||
Comparable Group | ||||||||||||||||||||||||||||||||||||||||||||||||||||||||||||||||||||||||||||||
BFED | Beacon Federal Bancorp of NY |
| 0.46 | % |
| 5.15 | % |
| 2.25 | % |
| 2.90 | % |
| 0.67 | % |
| 2.24 | % |
| 0.00 | % |
| 0.00 | % |
| 0.50 | % |
| 0.50 | % |
| 1.89 | % |
| 0.00 | % |
| -0.12 | % |
| 0.00 | % |
| 5.36 | % |
| 2.50 | % |
| 2.86 | % | $ | 7,902 |
|
| 36.40 | % | ||||||||||||||||||||
ESSA | ESSA Bancorp, Inc. of PA |
| 0.43 | % |
| 4.67 | % |
| 2.02 | % |
| 2.65 | % |
| 0.21 | % |
| 2.44 | % |
| 0.05 | % |
| -0.11 | % |
| 0.67 | % |
| 0.60 | % |
| 2.59 | % |
| 0.00 | % |
| 0.15 | % |
| 0.00 | % |
| 4.87 | % |
| 2.46 | % |
| 2.40 | % |
| NM |
|
| 29.01 | % | ||||||||||||||||||||
FFIC | Flushing Fin. Corp. of NY |
| 0.86 | % |
| 5.49 | % |
| 2.31 | % |
| 3.18 | % |
| 0.48 | % |
| 2.70 | % |
| 0.08 | % |
| 0.00 | % |
| 0.19 | % |
| 0.27 | % |
| 1.63 | % |
| 0.01 | % |
| -0.14 | % |
| 0.00 | % |
| 5.73 | % |
| 2.56 | % |
| 3.17 | % | $ | 12,753 |
|
| 27.58 | % | ||||||||||||||||||||
OSHC | Ocean Shore Holding Co. of NJ |
| 0.68 | % |
| 4.84 | % |
| 1.80 | % |
| 3.04 | % |
| 0.15 | % |
| 2.89 | % |
| 0.00 | % |
| 0.01 | % |
| 0.42 | % |
| 0.42 | % |
| 2.21 | % |
| 0.00 | % |
| 0.00 | % |
| 0.00 | % |
| 5.08 | % |
| 2.07 | % |
| 3.01 | % | $ | 5,780 |
|
| 38.66 | % | ||||||||||||||||||||
OCFC | OceanFirst Fin. Corp of NJ |
| 0.86 | % |
| 4.74 | % |
| 1.18 | % |
| 3.56 | % |
| 0.39 | % |
| 3.18 | % |
| 0.01 | % |
| 0.00 | % |
| 0.56 | % |
| 0.58 | % |
| 2.47 | % |
| 0.00 | % |
| 0.11 | % |
| 0.00 | % |
| 4.97 | % |
| 1.31 | % |
| 3.66 | % | $ | 5,663 |
|
| 35.56 | % | ||||||||||||||||||||
PFS | Provident Fin. Serv. Inc of NJ (1) |
| 0.58 | % |
| 4.29 | % |
| 1.39 | % |
| 2.90 | % |
| 0.54 | % |
| 2.36 | % |
| 0.00 | % |
| 0.00 | % |
| 0.45 | % |
| 0.45 | % |
| 2.03 | % |
| 0.06 | % |
| 0.02 | % |
| 0.00 | % |
| 4.75 | % |
| 1.61 | % |
| 3.14 | % | $ | 7,329 |
|
| 20.85 | % | ||||||||||||||||||||
PBNY | Provident NY Bncrp, Inc. of NY |
| 0.69 | % |
| 4.03 | % |
| 0.89 | % |
| 3.14 | % |
| 0.34 | % |
| 2.80 | % |
| 0.00 | % |
| 0.00 | % |
| 0.61 | % |
| 0.61 | % |
| 2.74 | % |
| 0.06 | % |
| 0.31 | % |
| 0.00 | % |
| 4.48 | % |
| 1.05 | % |
| 3.43 | % | $ | 5,035 |
|
| 25.07 | % | ||||||||||||||||||||
THRD | TF Financial Corp. of New town PA |
| 0.54 | % |
| 4.84 | % |
| 1.56 | % |
| 3.28 | % |
| 0.53 | % |
| 2.75 | % |
| 0.00 | % |
| -0.02 | % |
| 0.38 | % |
| 0.36 | % |
| 2.55 | % |
| 0.00 | % |
| 0.15 | % |
| 0.00 | % |
| 5.10 | % |
| 1.76 | % |
| 3.34 | % | $ | 3,969 |
|
| 24.45 | % | ||||||||||||||||||||
WSFS | WSFS Financial Corp. of DE |
| 0.32 | % |
| 4.34 | % |
| 1.18 | % |
| 3.16 | % |
| 1.19 | % |
| 1.97 | % |
| 0.08 | % |
| -0.05 | % |
| 1.32 | % |
| 1.35 | % |
| 2.85 | % |
| 0.00 | % |
| 0.03 | % |
| 0.00 | % |
| 4.55 | % |
| 1.30 | % |
| 3.25 | % | $ | 5,908 |
|
| 24.13 | % | ||||||||||||||||||||
WFD | Westfield Financial Inc. of MA |
| 0.29 | % |
| 3.93 | % |
| 1.41 | % |
| 2.52 | % |
| 0.82 | % |
| 1.69 | % |
| 0.00 | % |
| -0.03 | % |
| 0.34 | % |
| 0.31 | % |
| 1.98 | % |
| 0.00 | % |
| 0.32 | % |
| 0.00 | % |
| 4.20 | % |
| 1.81 | % |
| 2.39 | % | $ | 7,460 |
|
| 14.27 | % | ||||||||||||||||||||
(1) | Financial information is for the quarter ending June 30, 2010. |
Source: SNL Financial, LC. and RP® Financial, LC. calculations. The information provided in this table has been obtained from sources we believe are reliable, but we cannot guarantee the accuracy or completeness of such information.
Copyright (c) 2010 by RP® Financial, LC.
| RP® Financial, LC. | PEER GROUP ANALYSIS III. 12 |
Sources of non-interest operating income provided a larger contribution to the Peer Group’s earnings than Clifton Savings, with such income amounting to 0.55% and 0.10%, respectively. The Company’s non-interest operating income is supported by revenues generated through service fees, which are generated primarily from its deposit base, as well as income from the cash surrender value of BOLI. Taking non-interest operating income into account, Clifton Savings’ efficiency ratio (operating expenses, net of amortization of intangibles, as a percent of the sum of non-interest operating income and net interest income) of 50.4% was at an advantage to the Peer Group’s efficiency ratio of 64.0%.
Loan loss provisions had a larger impact on the Peer Group’s earnings than for the Company, with loan loss provisions equaling 0.53% and 0.01% of average assets, respectively. The lower level of loan provisions established by the Company was supported by its very favorable credit quality measures.
Net gains and losses realized from the sale of assets and other non-operating items equaled a net gain of 0.03% of average assets for the Company and 0.08% of average assets for the Peer Group average. The net gain recorded by the Company was attributable to gains on the sale of premises and equipment related to the sale of the Botany branch facility in August 2010.
Taxes had a moderately larger impact on the Company’s earnings than the Peer Group’s earnings, with effective tax rates of 35.20% and 27.60%, respectively. As indicated in the prospectus, the Company’s effective marginal tax rate is equal to 40.0%.
Loan Composition
Table 3.4 presents data related to the comparative loan portfolio composition (including the investment in MBS). The Company’s loan portfolio composition reflected a higher concentration of 1-4 family permanent mortgage loans and mortgage-backed securities relative to the Peer Group average (67.1% of assets versus 54.7% for the Peer Group). The Company’s higher ratio was attributable to its higher MBS relative to the Peer Group, as the ratio of 1-4 family mortgage loans was similar.
The Peer Group reported an average balance of $201.7 million of loans serviced for others, while the Company does not sell loans into the secondary market and therefore does not have a balance of loans serviced for others, thereby indicating a greater influence of income on the Peer Group’s earnings. The Peer Group maintained a relatively modest balance of loan servicing intangibles, while the Company reported a zero balance.
| RP® Financial, LC. | PEER GROUP ANALYSIS III. 13 |
Table 3.4
Loan Portfolio Composition and Related Information
Comparable Institution Analysis
As of September 30, 2010
| Portfolio Composition as a Percent of Assets | ||||||||||||||||||||||||||||||||||||||
Institution | MBS | 1-4 Family | Constr. & Land | 5+Unit Comm RE | Commerc. Business | Consumer | RWA/ Assets | Serviced For Others | Servicing Assets | |||||||||||||||||||||||||||||
| (%) | (%) | (%) | (%) | (%) | (%) | (%) | ($000) | ($000) | ||||||||||||||||||||||||||||||
Clifton Savings Bancorp, Inc. | 29.95 | % | 37.12 | % | 0.25 | % | 2.26 | % | 0.00 | % | 1.13 | % | 34.15 | % | $ | 0 | $0 | |||||||||||||||||||||
All Public Companies | ||||||||||||||||||||||||||||||||||||||
Averages | 11.60 | % | 34.71 | % | 4.38 | % | 22.07 | % | 4.54 | % | 2.19 | % | 64.53 | % | $ | 672,425 | $5,235 | |||||||||||||||||||||
Medians | 10.19 | % | 34.60 | % | 3.49 | % | 21.14 | % | 3.39 | % | 0.53 | % | 64.74 | % | $ | 41,575 | $135 | |||||||||||||||||||||
State of NJ | ||||||||||||||||||||||||||||||||||||||
Averages | 15.11 | % | 41.85 | % | 3.23 | % | 19.23 | % | 2.49 | % | 0.42 | % | 57.02 | % | $ | 176,620 | $1,278 | |||||||||||||||||||||
Medians | 13.16 | % | 34.70 | % | 2.44 | % | 18.44 | % | 2.63 | % | 0.10 | % | 58.62 | % | $ | 5,495 | $4 | |||||||||||||||||||||
Comparable Group | ||||||||||||||||||||||||||||||||||||||
Averages | 17.49 | % | 37.20 | % | 2.99 | % | 19.65 | % | 6.05 | % | 1.98 | % | 61.50 | % | $ | 201,725 | $1,057 | |||||||||||||||||||||
Medians | 16.63 | % | 31.29 | % | 2.44 | % | 17.60 | % | 5.35 | % | 0.29 | % | 60.78 | % | $ | 123,370 | $478 | |||||||||||||||||||||
Comparable Group | ||||||||||||||||||||||||||||||||||||||
BFED | Beacon Federal Bancorp of NY | 16.69 | % | 34.60 | % | 2.43 | % | 15.34 | % | 8.41 | % | 16.44 | % | 76.81 | % | $ | 139,160 | $828 | ||||||||||||||||||||
ESSA | ESSA Bancorp, Inc. of PA | 18.26 | % | 60.46 | % | 1.01 | % | 4.93 | % | 2.29 | % | 0.18 | % | 46.16 | % | $ | 47,400 | $318 | ||||||||||||||||||||
FFIC | Flushing Fin. Corp. of NY | 16.57 | % | 23.43 | % | 1.89 | % | 45.13 | % | 6.74 | % | 0.01 | % | 66.59 | % | $ | 30,110 | $7 | ||||||||||||||||||||
OSHC | Ocean Shore Holding Co. of NJ | 1.43 | % | 70.65 | % | 2.10 | % | 6.84 | % | 0.65 | % | 0.08 | % | 52.13 | % | $ | 3,390 | $22 | ||||||||||||||||||||
| OCFC | OceanFirst Fin. Corp of NJ | 15.43 | % | 53.50 | % | 2.44 | % | 16.19 | % | 3.45 | % | 0.03 | % | 58.73 | % | $ | 933,650 | $5,661 | ||||||||||||||||||||
PFS | Provident Fin. Serv. Inc of NJ (1) | 18.96 | % | 27.97 | % | 2.71 | % | 27.18 | % | 3.95 | % | 1.21 | % | 61.86 | % | $ | 326,560 | $1,657 | ||||||||||||||||||||
PBNY | Provident NY Bncrp, Inc. of NY | 8.76 | % | 21.19 | % | 7.71 | % | 19.23 | % | 7.95 | % | 0.44 | % | 62.83 | % | $ | 186,560 | $1,172 | ||||||||||||||||||||
THRD | TF Financial Corp. of New tow n PA | 10.64 | % | 50.19 | % | 4.70 | % | 18.85 | % | 0.77 | % | 0.36 | % | 59.70 | % | $ | 107,580 | $637 | ||||||||||||||||||||
WSFS | WSFS Financial Corp. of DE | 19.26 | % | 19.82 | % | 4.07 | % | 26.50 | % | 15.16 | % | 0.78 | % | 76.59 | % | $ | 233,200 | $269 | ||||||||||||||||||||
WFD | Westfield Financial Inc. of MA | 48.94 | % | 10.19 | % | 0.81 | % | 16.34 | % | 11.11 | % | 0.24 | % | 53.58 | % | $ | 9,640 | $0 | ||||||||||||||||||||
| (1) | Financial information is for the quarter ending June 30, 2010. |
Source: SNL Financial LC. and RP® Financial, LC. calculations. The information provided in this table has been obtained from sources we believe are reliable, but we cannot guarantee the accuracy or completeness of such information.
Copyright (c) 2010 by RP® Financial, LC.
Diversification into higher risk and higher yielding types of lending was more significant for the Peer Group compared to the Company, largely on the basis of the higher concentration of commercial real estate and business loans maintained by the Peer Group. Commercial real estate and multi-family loans were limited for the Company (2.26% of assets), as were construction and land loans (0.25% of assets). By comparison, the Peer Group’s lending diversification consisted primarily of commercial real estate and multi-family loans (19.7% of assets), followed by commercial business loans (6.1% of assets). Construction and land loans and consumer loans were modest levels for both the Company and the Peer Group. The
| RP® Financial, LC. | PEER GROUP ANALYSIS III. 14 |
Company does not offer commercial business loans, as the Company’s primary emphasis is on local residential mortgage lending. Revealing the Company’s less significant lending diversification into higher risk types of loans, as well as the lower proportion of loans in IEA, the Company’s risk weighted assets-to-assets ratio was lower than the Peer Group’s ratio (34.2% versus 61.5% for the Peer Group).
Interest Rate Risk
Table 3.5 reflects various key ratios highlighting the relative interest rate risk exposure of the Company versus the Peer Group on a pre-Offering basis. In terms of balance sheet composition, Clifton Savings’ interest rate risk characteristics were considered to be more favorable to the comparable measures for the Peer Group. Most notably, the Company’s tangible equity-to-assets ratio and IEA/IBL ratio were higher than the comparable Peer Group ratios. At the same time, the Company’s level of non-interest earning assets was below the Peer Group’s ratio, which was also favorable from an interest rate risk exposure prospective. On a pro forma basis, the infusion of stock proceeds should serve to provide the Company with comparative advantages over the Peer Group’s balance sheet interest rate risk characteristics, with respect to the increases that will be realized in the Company’s equity-to-assets and IEA/IBL ratios.
To analyze interest rate risk associated with the net interest margin, we reviewed quarterly changes in net interest income as a percent of average assets for Clifton Savings and the Peer Group. In general, the more significant fluctuations in the Company’s ratios implied that the interest rate risk associated with the Company’s net interest income was greater in comparison to the Peer Group, based on the interest rate environment that prevailed during the period covered in Table 3.5. The stability of the Company’s net interest margin should be enhanced by the infusion of stock proceeds, as interest rate sensitive liabilities will be funding a lower portion of Clifton Savings’ assets and the proceeds will be substantially deployed into interest-earning assets.
| RP® Financial, LC. | PEER GROUP ANALYSIS III.15 |
Table 3.5
Interest Rate Risk Measures and Net Interest Income Volatility
Comparable Institution Analysis
As of September 30, 2010 or Most Recent Date Available
| Balance Sheet Measures | ||||||||||||||||||||||||||||||||||||||
| Non-Earn. Assets/ Assets | Quarterly Change in Net Interest Income | |||||||||||||||||||||||||||||||||||||
| Institution | Equity/ Assets | IEA/ IBL | 9/30/2010 | 6/30/2010 | 3/31/2010 | 12/31/2009 | 9/30/2009 | 6/30/2009 | ||||||||||||||||||||||||||||||
| (%) | (%) | (%) | (change in net interest income is annualized in basis points) | |||||||||||||||||||||||||||||||||||
Clifton Savings Bancorp, Inc. | 15.6 | % | 115.9 | % | 3.9 | % | -13 | -1 | 11 | 19 | 20 | -12 | ||||||||||||||||||||||||||
All Public Companies | 10.9 | % | 107.5 | % | 6.5 | % | 1 | 1 | 4 | 7 | 8 | 3 | ||||||||||||||||||||||||||
State of NJ | 12.0 | % | 110.1 | % | 5.8 | % | -2 | -3 | 10 | 9 | 16 | 5 | ||||||||||||||||||||||||||
Comparable Group | ||||||||||||||||||||||||||||||||||||||
Averages | 11.1 | % | 109.0 | % | 5.6 | % | -2 | -1 | 4 | 6 | 4 | 7 | ||||||||||||||||||||||||||
Medians | 9.7 | % | 106.9 | % | 4.6 | % | -4 | -2 | 4 | 5 | 2 | 8 | ||||||||||||||||||||||||||
Comparable Group | ||||||||||||||||||||||||||||||||||||||
BFED | Beacon Federal Bancorp of NY | 10.2 | % | 107.4 | % | 4.0 | % | 9 | -1 | 4 | 14 | 5 | 7 | |||||||||||||||||||||||||
ESSA | ESSA Bancorp, Inc. of PA | 16.0 | % | 115.4 | % | 4.1 | % | 3 | -24 | -5 | 0 | -2 | 9 | |||||||||||||||||||||||||
FFIC | Flushing Fin. Corp. of NY | 8.9 | % | 106.3 | % | 4.3 | % | 20 | -5 | 26 | 13 | -2 | 28 | |||||||||||||||||||||||||
OSHC | Ocean Shore Holding Co. of NJ | 11.8 | % | 109.7 | % | 4.6 | % | -16 | -2 | -4 | -2 | 12 | 8 | |||||||||||||||||||||||||
OCFC | OceanFirst Fin. Corp of NJ | 9.0 | % | 106.4 | % | 4.3 | % | -4 | -2 | 12 | -6 | 15 | 11 | |||||||||||||||||||||||||
PFS | Provident Fin. Serv. Inc of NJ (1) | 8.2 | % | 105.2 | % | 9.6 | % | NA | 8 | 13 | 16 | 7 | -8 | |||||||||||||||||||||||||
PBNY | Provident NY Bncrp, Inc. of NY | 8.8 | % | 106.4 | % | 9.9 | % | -16 | 15 | 5 | 1 | -7 | -5 | |||||||||||||||||||||||||
THRD | TF Financial Corp. of New town PA | 10.0 | % | 106.7 | % | 5.7 | % | 2 | 2 | 2 | 5 | 12 | 3 | |||||||||||||||||||||||||
WSFS | WSFS Financial Corp. of DE | 9.4 | % | 107.0 | % | 4.5 | % | -5 | 12 | 4 | 13 | -2 | 26 | |||||||||||||||||||||||||
WFD | Westfield Financial Inc. of MA | 19.1 | % | 119.3 | % | 5.0 | % | -8 | -13 | -18 | 4 | -1 | -12 | |||||||||||||||||||||||||
| (1) | Financial information is for the quarter ending June 30, 2010. |
NA=Change is greater than 100 basis points during the quarter.
Source: SNL Financial LC. and RP® Financial, LC. calculations. The information provided in this table has been obtained from sources we believe are reliable, but we cannot guarantee the accuracy or completeness of such information.
Copyright (c) 2010 by RP® Financial, LC.
Credit Risk
Overall, based on a comparison of credit quality measures, the Company’s credit risk exposure was considered to be more favorable than the Peer Group’s exposure levels. As shown in Table 3.6, the Company’s NPAs to assets and non-performing loans to loans ratios equaled 0.24% and 0.58%, respectively, versus comparable measures of 1.65% and 2.38% for the Peer Group. The Company’s and Peer Group’s average loss reserves as a percent of non-performing loans equaled 82.37% and 85.84%, respectively, with the Peer Group reporting a median ratio of 64.68%, which was below the level reported by the Company. Loss reserves maintained as a percent of loans receivable equaled 0.48% and 1.50% for the Company and the Peer Group, respectively. Net loan charge-offs as a percent of loans were lower for the Company than the Peer Group, as the Company reported a zero balance of net loan charge-offs versus 0.60% of loans for the Peer Group.
| RP® Financial, LC. | PEER GROUP ANALYSIS III. 16 |
Table 3.6
Credit Risk Measures and Related Information
Comparable Institution Analysis
As of September 30, 2010 or Most Recent Date Available
Institution | REO/ Assets | NPAs & 90+Del/ Assets | NPLs/ Loans | Rsrves/ Loans | Rsrves/ NPLs | Rsrves/ NPAs & 90+Del | Net Loan Chargoffs | NLCs/ Loans | ||||||||||||||||||||||||||
| (%) | (%) | (%) | (%) | (%) | (%) | ($000) | (%) | |||||||||||||||||||||||||||
Clifton Savings Bancorp, Inc. | 0.00 | % | 0.24 | % | 0.58 | % | 0.48 | % | 82.37 | % | 75.93 | % | $ | 0 | 0.00 | % | ||||||||||||||||||
All Public Companies | ||||||||||||||||||||||||||||||||||
Averages | 0.55 | % | 4.40 | % | 4.76 | % | 1.75 | % | 64.02 | % | 56.55 | % | $ | 1,460 | 0.71 | % | ||||||||||||||||||
Medians | 0.24 | % | 2.72 | % | 3.28 | % | 1.43 | % | 45.29 | % | 39.14 | % | $ | 527 | 0.38 | % | ||||||||||||||||||
State of NJ | ||||||||||||||||||||||||||||||||||
Averages | 0.33 | % | 0.48 | % | 4.30 | % | 1.10 | % | 38.46 | % | 98.27 | % | $ | 1,431 | 0.46 | % | ||||||||||||||||||
Medians | 0.09 | % | 0.48 | % | 3.82 | % | 1.08 | % | 36.91 | % | 98.27 | % | $ | 895 | 0.20 | % | ||||||||||||||||||
Comparable Group | ||||||||||||||||||||||||||||||||||
Averages | 0.12 | % | 1.65 | % | 2.38 | % | 1.50 | % | 85.84 | % | 82.55 | % | $ | 1,989 | 0.60 | % | ||||||||||||||||||
Medians | 0.12 | % | 1.53 | % | 2.02 | % | 1.51 | % | 64.68 | % | 72.18 | % | $ | 885 | 0.23 | % | ||||||||||||||||||
Comparable Group | ||||||||||||||||||||||||||||||||||
BFED | Beacon Federal Bancorp of NY | 0.08 | % | 1.53 | % | 1.84 | % | 2.37 | % | 128.73 | % | 120.87 | % | $ | 443 | 0.21 | % | |||||||||||||||||
ESSA | ESSA Bancorp, Inc. of PA | 0.19 | % | 1.18 | % | 2.02 | % | 1.01 | % | 50.02 | % | 59.33 | % | $ | 100 | 0.05 | % | |||||||||||||||||
FFIC | Flushing Fin. Corp. of NY | 0.13 | % | 2.94 | % | 3.54 | % | 0.83 | % | 23.54 | % | 21.92 | % | $ | 3,508 | 0.43 | % | |||||||||||||||||
OSHC | Ocean Shore Holding Co. of NJ | 0.01 | % | 0.48 | % | NA | 0.59 | % | NA | 98.27 | % | $ | 267 | 0.16 | % | |||||||||||||||||||
OCFC | OceanFirst Fin. Corp of NJ | 0.10 | % | 1.62 | % | 2.00 | % | 1.10 | % | 55.05 | % | 51.63 | % | $ | 153 | 0.04 | % | |||||||||||||||||
PFS | Provident Fin. Serv. Inc of NJ (1) | 0.08 | % | NA | 2.45 | % | 1.58 | % | 64.68 | % | NA | $ | 1,326 | 0.12 | % | |||||||||||||||||||
PBNY | Provident NY Bncrp, Inc. of NY | 0.13 | % | 1.08 | % | 1.36 | % | 1.81 | % | 132.66 | % | 94.70 | % | $ | 2,428 | 0.57 | % | |||||||||||||||||
THRD | TF Financial Corp. of New tow n PA | 0.31 | % | 3.37 | % | 4.08 | % | 1.44 | % | 35.30 | % | 32.10 | % | $ | 323 | 0.25 | % | |||||||||||||||||
WSFS | WSFS Financial Corp. of DE | 0.14 | % | 2.35 | % | 3.28 | % | 2.54 | % | 77.39 | % | 72.19 | % | $ | 7,754 | 1.22 | % | |||||||||||||||||
WFD | Westfield Financial Inc. of MA | 0.02 | % | 0.34 | % | 0.82 | % | 1.68 | % | 205.23 | % | 191.92 | % | $ | 3,587 | 2.93 | % | |||||||||||||||||
| (1) | Financial information is for the quarter ending June 30, 2010. |
Source: | Audited and unaudited financial statements, corporate reports and offering circulars, and RP® Financial, LC. calculations. The information provided in this table has been obtained from sources we believe are reliable, but we cannot guarantee the accuracy or completeness of such information. |
Copyright (c) 2010 by RP® Financial, LC.
Summary
Based on the above analysis and the criteria employed in the selection of the companies for the Peer Group, RP Financial concluded that the Peer Group forms a reasonable basis for determining the pro forma market value of Clifton Savings. In those areas where notable differences exist, we will apply appropriate valuation adjustments in the next section.
| RP® Financial, LC. | VALUATION ANALYSIS IV. 1 |
IV. VALUATION ANALYSIS
Introduction
This chapter presents the valuation analysis and methodology, prepared pursuant to the regulatory valuation guidelines, and valuation adjustments and assumptions used to determine the estimated pro forma market value of the common stock to be issued in conjunction with the Company’s conversion transaction.
Appraisal Guidelines
The OTS written appraisal guidelines specifies the market value methodology for estimating the pro forma market value of an institution pursuant to a mutual-to-stock conversion. Pursuant to this methodology: (1) a peer group of comparable publicly-traded institutions is selected; (2) a financial and operational comparison of the subject company to the peer group is conducted to discern key differences; and (3) a valuation analysis in which the pro forma market value of the subject company is determined based on the market pricing of the peer group as of the date of valuation, incorporating valuation adjustments for key differences. In addition, the pricing characteristics of recent conversions, both at conversion and in the aftermarket, must be considered.
RP Financial Approach to the Valuation
The valuation analysis herein complies with such regulatory approval guidelines. Accordingly, the valuation incorporates a detailed analysis based on the Peer Group, discussed in Chapter III, which constitutes “fundamental analysis” techniques. Additionally, the valuation incorporates a “technical analysis” of recently completed stock conversions, including closing pricing and aftermarket trading of such offerings. It should be noted that these valuation analyses cannot possibly fully account for all the market forces which impact trading activity and pricing characteristics of a particular stock on a given day.
The pro forma market value determined herein is a preliminary value for the Company’s to-be-issued stock. Throughout the conversion process, RP Financial will: (1) review changes in Clifton Savings’ operations and financial condition; (2) monitor Clifton Savings’ operations and financial condition relative to the Peer Group to identify any fundamental changes; (3) monitor the external factors affecting value including, but not limited to, local and national economic conditions, interest rates, and the stock market environment, including the market for thrift
| RP® Financial, LC. | VALUATION ANALYSIS IV. 2 |
stocks and Clifton Savings’ stock specifically; and (4) monitor pending conversion offerings (including those in the offering phase), both regionally and nationally. If material changes should occur during the conversion process, RP Financial will evaluate if updated valuation reports should be prepared reflecting such changes and their related impact on value, if any. RP Financial will also prepare a final valuation update at the closing of the offering to determine if the prepared valuation analysis and resulting range of value continues to be appropriate.
The appraised value determined herein is based on the current market and operating environment for the Company and for all thrifts. Subsequent changes in the local and national economy, the legislative and regulatory environment, the stock market, interest rates, and other external forces (such as natural disasters or major world events), which may occur from time to time (often with great unpredictability) may materially impact the market value of all thrift stocks, including Clifton Savings’ value, or Clifton Savings’ value alone. To the extent a change in factors impacting the Company’s value can be reasonably anticipated and/or quantified, RP Financial has incorporated the estimated impact into the analysis.
Valuation Analysis
A fundamental analysis discussing similarities and differences relative to the Peer Group was presented in Chapter III. The following sections summarize the key differences between the Company and the Peer Group and how those differences affect the pro forma valuation. Emphasis is placed on the specific strengths and weaknesses of the Company relative to the Peer Group in such key areas as financial condition, profitability, growth and viability of earnings, asset growth, primary market area, dividends, liquidity of the shares, marketing of the issue, management, and the effect of government regulations and/or regulatory reform. We have also considered the market for thrift stocks, in particular new issues, to assess the impact on value of the Company coming to market at this time.
| 1. | Financial Condition |
The financial condition of an institution is an important determinant in pro forma market value because investors typically look to such factors as liquidity, capital, asset composition and quality, and funding sources in assessing investment attractiveness. The similarities and differences in the Company’s and the Peer Group’s financial strengths are noted as follows:
| • | Overall A/L Composition. In comparison to the Peer Group, the Company’s IEA composition showed a moderately higher concentration of cash and investments and a lower concentration of loans. Lending diversification into higher risk and higher |
| RP® Financial, LC. | VALUATION ANALYSIS IV. 3 |
yielding types of loans was less significant for the Company, which is shown in the lower risk weighted assets-to-assets ratio in comparison to the Peer Group’s ratio. Overall, in comparison to the Peer Group, the Company’s IEA composition provided for a lower yield earned on IEA. The Company’s IBL cost was higher than the Peer Group’s cost of funds, as the Company maintained a higher level of deposits coupled with the Company’s competitive pricing strategy. Overall, as a percent of assets, the Company maintained a higher level of IEA and lower IBL compared to the Peer Group’s ratios, which resulted in a higher IEA/IBL ratio for the Company. After factoring in the impact of the net stock proceeds, the Company’s IEA/IBL ratio should continue to exceed the Peer Group’s ratio. |
| • | Credit Quality. The Company’s ratio of non-performing assets and non-performing loans were more favorable than the comparable Peer Group ratios. Loss reserves as a percent of non-performing loans were similar for the Company, falling between the median and average ratios of the Peer Group, while the Peer Group maintained higher loss reserves as a percent of loans, reflective of their less favorable asset quality ratios and lending strategy focused more on high risk-weight assets. The Company’s favorable asset quality limited net loan charge-offs to levels more favorable than the Peer Group. |
| • | Balance Sheet Liquidity. The Company operated with a higher level of cash and investment securities relative to the Peer Group. Following the infusion of stock proceeds, the Company’s cash and investments ratio is expected to increase as the proceeds retained at the holding company level will be initially deployed into investments. The Company’s future borrowing capacity was considered to be slightly greater than the Peer Group’s, given the lower level of borrowings currently funding the Company’s assets. |
| • | Funding Liabilities. The Company’s IBL composition reflected a higher concentration of deposits and a lower concentration of borrowings relative to the comparable Peer Group ratios, which provided for a slightly higher cost of funds for the Company than the Peer Group, based on the Company’s competitive pricing strategy. Total IBL as a percent of assets were slightly lower for the Company compared to the Peer Group’s ratio, which was attributable to Clifton Savings’ lower amount of borrowings. Following the stock offering, the increase in the Company’s capital position will reduce the level of IBL funding the Company’s assets to a ratio that is comparable to or lower than the Peer Group’s ratio. |
| • | Tangible Equity. The Company currently operates with a higher tangible equity-to-assets ratio than the Peer Group prior to completion of the Second-Step conversion. Following the stock offering, Clifton Savings’ pro forma tangible equity position will be increased to levels well in excess of the Peer Group average and median levels. The Company’s higher pro forma capital position implies greater leverage capacity, lower dependence on IBL to fund assets and a greater capacity to absorb unanticipated losses. At the same time, the Company’s more significant capital surplus will make it difficult to achieve a competitive ROE. |
On balance, Clifton Savings’ balance sheet strength was considered to be more favorable than that of the Peer Group’s and, thus, a moderate upward adjustment was applied for the Company’s financial condition.
| RP® Financial, LC. | VALUATION ANALYSIS IV. 4 |
| 2. | Profitability, Growth and Viability of Earnings |
Earnings are a key factor in determining pro forma market value, as the level and risk characteristics of a financial institution’s earnings stream and the prospects and ability to generate future earnings, heavily influence the multiple that the investment community will pay for earnings. The major factors considered in the valuation are described below.
| • | Reported Profitability. The Company reported higher profitability than the Peer Group. The Company’s higher returns were attributable to a lower level of operating expenses and lower level of loan loss provisions, which was partially offset by the Company’s lower level of net interest income and lower level of non-interest operating income based on the Peer Group averages. Reinvestment into IEA and leveraging of the pro forma equity position will serve to increase the Company’s earnings, with the benefit of reinvesting proceeds expected to be somewhat offset by implementation of additional stock benefit plans in connection with the Second-Step offering. |
| • | Core Profitability. Net interest income, operating expenses, non-interest operating income and loan loss provisions were reviewed in assessing the relative strengths and weaknesses of core profitability. The Company’s net interest income ratio and non-interest operating income were less favorable than the Peer Group ratios while operating expenses and loan loss provisions were more favorable as compared to the Peer Group averages. The Company’s lower ratios for net interest income and operating expenses translated into a higher expense coverage ratio in comparison to the Peer Group’s ratio (equal to 1.90x versus 1.32x for the Peer Group). Similarly, the Company’s efficiency ratio of 50.4% was more favorable than the Peer Group’s efficiency ratio of 64.0%. Overall, these measures, as well as the expected earnings benefits the Company should realize from the redeployment of stock proceeds into IEA and leveraging of post-conversion capital, which will be somewhat negated by expenses associated with the stock benefit plans, indicate that the Company’s pro forma core ROA will be more favorable than the Peer Group average. |
| • | Interest Rate Risk. Quarterly changes in the net interest income ratio for the Company indicated a similar level of volatility. Other measures of interest rate risk, such as capital and IEA/IBL ratios were more favorable as compared to the Peer Group. On a pro forma basis, the infusion of stock proceeds can be expected to provide the Company with equity-to-assets and IEA/IBL ratios that will be comparable to or exceed the Peer Group ratios, as well as enhance the stability of the Company’s net interest margin through the reinvestment of stock proceeds into IEA. |
| • | Credit Risk. Loan loss provisions were a less significant factor in the Company’s earnings in comparison to the Peer Group. In terms of the future exposure to credit-related losses, objective measures of the Company’s credit risk reflect comparatively less exposure relative to the Peer Group based on its lower ratio of NPAs and NPLs and higher ratio of reserves in relation to NPLs, based on the median. |
| • | Earnings Growth Potential. Several factors were considered in assessing earnings growth potential. First, the Company maintained a less favorable interest rate spread than the Peer Group, which would tend to support a stronger net interest margin going forward for the Peer Group. Second, the infusion of stock proceeds will |
| RP® Financial, LC. | VALUATION ANALYSIS IV. 5 |
provide the Company with more significant growth potential through leveraging than currently maintained by the Peer Group. Third, the Peer Group’s higher ratio of non-interest operating income and the Company’s lower operating expense ratio were viewed as respective advantages to sustain earnings growth during periods when net interest margins come under pressure as the result of adverse changes in interest rates. |
| • | Return on Equity. The Company’s pro forma capital position will exceed the Peer Group average. Thus, notwithstanding its modestly higher pro forma ROA, the Company’s pro forma core ROE is anticipated to be lower than the Peer Group average. |
On balance, Clifton Savings’ pro forma earnings strength was considered to be more favorable than the Peer Group’s and thus, a slight upward adjustment was applied for profitability, growth and viability of earnings.
| 3. | Asset Growth |
The Company’s asset growth rate was well above the Peer Group’s growth rate during the period covered in our comparative analysis, based on growth rates of 11.7% and 4.2%, respectively. Importantly, the Company’s loan portfolio diminished over the last year and thus, growth was directed toward the wholesale investment portfolio. Asset growth for the Peer Group consisted of a more balanced combination of growth between loans and cash and investments. On a pro forma basis, the Company’s tangible equity-to-assets ratio will exceed the Peer Group’s tangible equity-to-assets ratio, indicating greater leverage capacity for the Company. However, the Company may continue to be challenged to achieve profitable growth in loans and, while growth in the investment portfolio is likely continue to be profitable, such growth inherently has low margins. On balance, a slight upward adjustment was applied for asset growth.
| 4. | Primary Market Area |
The general condition of an institution’s market area has an impact on value, as future success is in part dependent upon opportunities for profitable activities in the local market served. Clifton Savings’ primary market area for loans and deposits is considered to be northeast New Jersey, where the Company maintains its branch network. At the same time, the Company faces significant competition for loans and deposits from larger financial institutions, which provide a broader array of services and have significantly larger branch networks. A number of the Peer Group companies on average operate in reasonably similar markets.
| RP® Financial, LC. | VALUATION ANALYSIS IV. 6 |
Demographic and economic trends and characteristics in the Company’s primary market area are comparable to the primary market areas served by the Peer Group companies (see Exhibit III-4). In this regard, the total population of the two county market area, on average, is higher than the average of the Peer Group’s primary markets, however, individually, Passaic County’s population is comparable to the Peer Group average, while Bergen County was above the average of the Peer Group. The 2000-2010 population growth rates for Passaic and Bergen Counties fall below the Peer Group markets’ average. Per capita income levels in Passaic County were below the Peer Group, while income levels in Bergen County were higher, but the deposit market share exhibited by the Company in Bergen County was below the Peer Group average and median, while the deposit market share in Passaic County was between the average and median. Unemployment rates for the markets served by the Peer Group companies were higher than the unemployment rate exhibited in Bergen County while the unemployment rate reported in Passaic County was less favorable than the Peer Group market average and median values.
On balance, we concluded that no adjustment was appropriate for the Company’s market area.
| 5. | Dividends |
The Company currently pays a quarterly dividend of $0.06 per share. Clifton Savings has indicated its intention to continue to pay a quarter dividend of $0.06 per share or $0.24 per share annually, equal to a 3% dividend yield based on an $8.00 per share IPO price. However, future declarations of dividends by the Board of Directors will depend upon a number of factors, including investment opportunities, growth objectives, financial condition, profitability, tax considerations, minimum capital requirements, regulatory limitations, stock market characteristics and general economic conditions.
All ten of the Peer Group companies pay regular cash dividends, with implied dividend yields ranging from 1.13% to 3.91%. The average dividend yield on the stocks of the Peer Group institutions was 2.70% as of November 19, 2010, representing an average payout ratio of 47.95% of core earnings. As of November 19, 2010, approximately 61% of all fully-converted publicly-traded thrifts had adopted cash dividend policies (see Exhibit IV-1), exhibiting an average yield of 3.00%. The dividend paying thrifts generally maintain higher than average profitability ratios, facilitating their ability to pay cash dividends.
| RP® Financial, LC. | VALUATION ANALYSIS IV. 7 |
The Company’s indicated dividend policy provides for a slightly higher yield compared to the Peer Group’s average dividend yield, while the Company’s implied payout ratio of 86.63% of pro forma earnings at the midpoint value is well above the Peer Group’s payout ratio. At the same time, the Company’s tangible equity-assets ratio, which will be at levels exceeding the Peer Group’s ratio across the conversion offering range, will support Clifton Savings’ dividend paying capacity from a capital perspective. Overall, we concluded that no adjustment was warranted for purposes of the Company’s dividend policy.
| 6. | Liquidity of the Shares |
The Peer Group is by definition composed of companies that are traded in the public markets. All ten of the Peer Group members trade on NASDAQ or NYSE. Typically, the number of shares outstanding and market capitalization provides an indication of how much liquidity there will be in a particular stock. The market capitalization of the Peer Group companies ranged from $57.6 million to $820.9 million as of November 19, 2010, with average and median market values of $279.4 million and $227.3 million, respectively. The shares issued and outstanding to the public shareholders of the Peer Group members ranged from 2.7 million to 59.9 million, with average and median shares outstanding of 21.5 million and 16.2 million, respectively. The Company’s Second-Step stock offering is expected to provide for a pro forma market value and shares outstanding that will be generally in the middle of the range of market values and shares outstanding indicated for the Peer Group companies. Like the large majority of the Peer Group companies, the Company’s stock will continue to be quoted on NASDAQ following the Second-Step stock offering. Overall, we anticipate that the Company’s public stock will have a comparable trading market as the Peer Group companies on average and, therefore, concluded no adjustment was necessary for this factor.
| 7. | Marketing of the Issue |
We believe that four separate markets exist for thrift stocks, including those coming to market such as Clifton Savings’: (A) the after-market for public companies, in which trading activity is regular and investment decisions are made based upon financial condition, earnings, capital, ROE, dividends and future prospects; (B) the new issue market in which converting thrifts are evaluated on the basis of the same factors, but on a pro forma basis without the benefit of prior operations as a fully-converted publicly-held company and stock trading history; (C) the acquisition market for thrift franchises in New Jersey; and (D) the market for the public stock of Clifton Savings. All of these markets were considered in the valuation of the Company’s to-be-issued stock.
| RP® Financial, LC. | VALUATION ANALYSIS IV. 8 |
| A. | The Public Market |
The value of publicly-traded thrift stocks is easily measurable, and is tracked by most investment houses and related organizations. Exhibit IV-1 provides pricing and financial data on all publicly-traded thrifts. In general, thrift stock values react to market stimuli such as interest rates, inflation, perceived industry health, projected rates of economic growth, regulatory issues and stock market conditions in general. Exhibit IV-2 displays historical stock market trends for various indices and includes historical stock price index values for thrifts and commercial banks. Exhibit IV-3 displays historical stock price indices for thrifts only.
In terms of assessing general stock market conditions, the performance of the overall stock market has been mixed in recent quarters. Stocks started 2010 in positive territory on mounting evidence of a global manufacturing rebound, while mixed earnings reports provided for an up and down market in mid-January. The DJIA moved into negative territory for the year heading in into late-January, with financial stocks leading the market lower as the White House proposed new limits on the size and activities of big banks. Technology stocks led the broader market lower at the close of January, as disappointing economic reports dampened growth prospects for 2010. Concerns about the global economy as well as European default worries pressured stocks lower in early-February as the DJIA closed below 10000 for the first time in three months. Upbeat corporate earnings and some favorable economic news out of Europe and China held stocks to rebound in mid-February. The positive trend in the broader stock market continued into the second half of February, as investors seized on mild inflation data and more signs that the U.S. economy was recovering. Weak economic data pulled stocks lower at the end of February, although the 2.6% increase in the DJIA for the month of February was its strongest showing since November.
The DJIA moved back into positive territory for 2010 in early-March, as the broader market rallied on a better-than-expected employment report for February. Stocks trended higher through mid-March, with the DJIA closing up for eight consecutive trading sessions. Factors contributing to the eight day winning streak included bullish comments by Citigroup, expectations of continued low borrowing costs following the Federal Reserve’s mid-March meeting that concluded with keeping its target rate near zero and a brightening manufacturing outlook. Following a one day pull back, the positive trend in the broader market continued
| RP® Financial, LC. | VALUATION ANALYSIS IV. 9 |
heading into late-March. Gains in the health-care sector following the passage of health-care legislation, better-than-expected existing home sales in February, first time jobless claims falling more than expected and solid earnings posted by Best Buy all contributed to the positive trend in stocks. The DJIA moved to a 19-month high approaching the end of the first quarter, as oil stocks led the market higher in response to new evidence of global economic strength. Overall, the DJIA completed its best first quarter since 1999, with a 4.1% increase for the quarter.
More signs of the economy gaining strength sustained the positive trend in the broader stock market at the start of the second quarter of 2010. The DJIA closed above 11000 heading into mid-April, based on growing optimism about corporate earnings and a recovering economy. Fraud charges against Goldman Sachs halted a six day rally in the market in mid-April, as financial stocks led a one day sell-off in the broader market. The broader stock market generally sustained a positive trend during the second half of April, with encouraging first quarter earnings reports and favorable economic data supporting the gains. Financial stocks pulled the broader stock market lower at the end of April on news of a criminal investigation of Goldman Sachs. The sell-off in the stock market sharpened during the first week of May, largely on the basis of heightened concerns about possible ripple effects stemming from Greece’s credit crisis. Stocks surged after European Union leaders agreed to a massive bailout to prevent Greece’s financial troubles from spreading throughout the region, but then reversed course heading into the second half of May on continued worries about the fallout from Europe’s credit crisis and an unexpected increase in U.S. jobless claims. China’s promise not to unload its European debt sparked a one-day rally in late-May, which was followed by a lower close for the DJIA on the last trading day of May as a downgrade of Spain’s credit rekindled investors’ fears about Europe’s economy. Overall, it was the worst May for the DJIA since 1940. Volatility in the broader stock market continued to prevail in early-June. A rebound in energy shares provided for the third biggest daily gain in the DJIA for 2010, which was followed by a one day decline of over 300 points in the DJIA as weaker than expected employment numbers for May sent the DJIA to a close below 10000. The DJIA rallied back over 10000 in mid-June, as stocks were boosted by upbeat comments from the European Central Bank, a rebound in energy stocks, tame inflation data and some regained confidence in the global economic recovery. Weak housing data for May and persistent worries about the global economy pulled stocks lower in late-June. The DJIA closed out the second quarter of 2010 at a new low for the year, reflecting a decline of 10% for the second quarter.
| RP® Financial, LC. | VALUATION ANALYSIS IV. 10 |
A disappointing employment report for June 2010 extended the selling during the first week of July. Following seven consecutive days of closing lower, the DJIA posted a gain as bargain hunters entered the market. Some strong earnings reports at the start of second quarter earnings season and upbeat data on jobs supported a seven day winning streak in the broader stock market and pushed the DJIA through the 10000 mark going into mid-July. Renewed concerns about the economy snapped the seven day winning streak in the DJIA, although losses in the broader stock market were pared on news that Goldman Sachs reached a settlement with the SEC. Stocks slumped heading into the second half of July, as Bank of America and Citigroup reported disappointing second quarter earnings and an early-July consumer confidence report showed that consumers were becoming more pessimistic. Favorable second quarter earnings supported a rally in the broader stock market in late-July, with the DJIA moving back into positive territory for the year. Overall, the DJIA was up 7.1% for the month of July, which was its strongest performance in a year.
Better-than-expected economic data helped to sustain the stock market rally at the beginning of August 2010, but stocks eased lower following the disappointing employment report for July. The downturn in the broader stock market accelerated in the second half of August, as a number of economic reports for July showed the economy was losing momentum which more than overshadowed a pick-up in merger activity. In addition, the DJIA had its worst August in nearly a decade, with the DJIA showing a loss of over 4% for the month. Stocks rebounded in the first half of September, as a favorable report on manufacturing activity in August and a better-than-expected employment report for August supported gains in the broader stock market. News of more takeovers, robust economic growth in China and passage of new global regulations for how much capital banks must maintain extended the rally into the third week of September, as the DJIA moved to a one month high. Despite a favorable report for August retail sales, worries about the European economy snapped a four day winning streak in the DJIIA in mid-September. The DJIA closed higher for the third week in a row heading into the second half of September, as stocks edged higher on positive earnings news coming out of the technology sector and merger activity. The positive trend in stock market continued for a fourth week in late-September, as investors viewed a rise in August business spending as a sign the recovery was on firmer ground. Stocks closed out the third quarter trading slightly lower on profit taking, but overall the DJIA showed a gain of 10.4% for the quarter and, thereby, reversing losses suffered in the second quarter.
Stocks leapt to a five-month high at the start of the fourth quarter of 2010, as investors responded to signals that the Federal Reserve was poised to step in to prop up the U.S.
| RP® Financial, LC. | VALUATION ANALYSIS IV. 11 |
economy. The rally in the broad market indices continued into early November 2010, with the DJIA increasing to the highest levels in the last two years as the Federal Reserve announced the magnitude of its quantitative easing strategy (“QE2”) as well as relatively favorable earnings reports by key companies. Through mid-November the broader stock market diminished modestly as a result of profit taking amid concerns that the G-20 summit did not result in any significant tangible results and that as a result, China might be required to raise interest to restrain its economy and inflation. Additionally, Cisco announced a negative earnings outlook which impacted the tech sector in particular. On November 19, the DJIA closed at 11203.6 an increase of 8.4% from one year ago and an increase of 5.9% year-to-date and the NASDAQ closed at 2518.1, an increase of 16.8% from one year ago and an increase of 9.1% year-to-date. The Standard & Poor’s 500 Index closed at 1199.7 on November 19, 2010, an increase of 9.6% from one year ago and an increase of 5.9% year-to-date.
The market for thrift stocks has been somewhat uneven in recent quarters, but in general has underperformed the broader stock market. Thrift stocks traded in a narrow range during the first few weeks of 2010, as investors awaited fourth quarter earnings reports that would provide further insight on credit quality trends. An unexpected jump in jobless claims and proposed restrictions by the White House on large banks depressed financial stocks in general heading into late-January. Amid mixed earnings reports, thrift stocks traded in a narrow range for the balance of January. Financial stocks led the broader market lower in early-February and then rebounded along with the broader market in mid-February on some positive economic data including signs that prices were rising in some large metropolitan areas. Mild inflation readings for wholesale and consumer prices in January sustained the upward trend in thrift stocks heading into the second half of February. Comments by the Federal Reserve Chairman that short-term interest rates were likely to remain low for at least several more months helped thrift stocks to ease higher in late-February.
The thrift sector moved higher along with the broader stock market in-early March 2010, aided by the better-than-expected employment report for February. Financial stocks propelled the market higher heading into mid-March on optimism that Citigroup would be able to repay the U.S. Government after a successful offering of trust preferred securities. The Federal Reserve’s recommitment to leaving its target rate unchanged “for an extended period” sustained the positive trend in thrift stocks through mid-March. Thrift stocks bounced higher along with the broader stock market heading into late-March, which was followed by a slight pullback as debt worries sent the yields on Treasury notes higher.
| RP® Financial, LC. | VALUATION ANALYSIS IV. 12 |
An improving outlook for financial stocks in general, along with positive reports for housing, employment and retail sales, boosted thrift stocks at the start of the second quarter of 2010. A nominal increase in March consumer prices and a strong first quarter earnings report from JP Morgan Chase & Co. supported a broad rally in bank and thrift stocks heading into mid-April, which was followed by a pullback on news that the SEC charged Goldman Sachs with fraud. Thrift stocks generally underperformed the broader stock market during the second half of April, as financial stocks in general were hurt by uncertainty about the progress of financial reform legislation, Greece’s debt crisis and news of a criminal investigation of Goldman Sachs. Thrift stocks retreated along the broader stock market in the first week of May, based on fears that the growing debt crisis in Europe could hurt the economic recovery. Likewise, thrift stocks surged higher along with the broader stock market after European Union officials announced a massive bailout plan to avert a public-debt crisis and then retreated heading into the second half of May on lingering concerns about the euro. News of rising mortgage delinquencies in the first quarter of 2010, an expected slowdown in new home construction and uncertainty over financial reform legislation further contributed to lower trading prices for thrift stocks. Thrift stocks participated in the one-day broader market rally in late-May and then declined along with the broader stock market at the close of May. Some positive economic reports provided a boost to thrift stocks at the start of June, which was followed a sharp decline in the sector on the disappointing employment report for May. Gains in the broader stock market provided a boost to thrift stocks as well heading in mid-June. Weaker-than-expected housing data for May and uncertainty surrounding the final stages of the financial reform legislation pressured thrift stocks lower in late-June.
Thrift stocks declined along with the broader stock market at the start of the third quarter of 2010, as home sales in May declined sharply following the expiration of a special tax credit for home buyers. A report showing that home loan delinquencies increased in May further depressed thrift stocks, while the broader market moved higher on more attractive valuations. Financial stocks helped to lead the stock market higher through mid-July, as State Street projected a second quarter profit well above analysts’ forecasts which fueled a more optimistic outlook for second quarter earnings reports for the financial sector. Thrift stocks retreated along with the financial sector in general in mid-July on disappointing retail sales data for June and second quarter earnings results for Bank of America and Citigroup reflecting an unexpected drop in their revenues. Some favorable second quarter earnings reports which reflected improving credit measures helped to lift the thrift sector in late-July and at the beginning of
| RP® Financial, LC. | VALUATION ANALYSIS I V. 13 |
August. Thrift stocks pulled back along with the broader market on weak employment data for July, which raised fresh concerns about the strength of the economy and the risk of deflation. Thrift stocks were particularly hard hit by the dismal housing data for July, which showed sharp declines in both existing and new home sales. August employment data coming in a little more favorable than expected boosted the thrift sector in early-September, which was followed by a narrow trading range into mid-September. Financial stocks in general posted gains in mid-September after global regulators gave banks eight years to meet tighter capital requirements, but then slipped lower going into the second half of September on mixed economic data. The thrift sector traded in a narrow range during the second half of September, with financial stocks in general underperforming the broader stock market during the third quarter. The divergence in the performance of financial stocks from the broader stock market was attributed to factors such as the uncertain impact of financial reform legislation would have on the earnings of financial institutions and continuing problems resulting from the collapse of the U.S. housing market.
The weak employment report for September 2010 and growing concerns about the fallout of alleged foreclosure abuses weighed on bank and thrift stocks during the first half of October, as financial stocks continued to underperform the broader stock market. Some better-than-expected earnings reports provided a slight boost to bank and thrift stocks heading into the second half of October and early November, while the announcement of QE2 provided further upward momentum for major banking institutions. On November 19, 2010, the SNL Index for all publicly-traded thrifts closed at 535.2, a decrease of 3.0% from one year ago and a decrease of 9.3% year-to-date.
| B. | The New Issue Market |
In addition to thrift stock market conditions in general, the new issue market for converting thrifts is also an important consideration in determining the Company’s pro forma market value. The new issue market is separate and distinct from the market for seasoned thrift stocks in that the pricing ratios for converting issues are computed on a pro forma basis, specifically: (1) the numerator and denominator are both impacted by the conversion offering amount, unlike existing stock issues in which price change affects only the numerator; and (2) the pro forma pricing ratio incorporates assumptions regarding source and use of proceeds, effective tax rates, stock plan purchases, etc. which impact pro forma financials, whereas pricing for existing issues are based on reported financials. The distinction between pricing of converting and existing issues is perhaps no clearer than in the case of the price/book (“P/B”) ratio in that the P/B ratio of a converting thrift will typically result in a discount to book value
| RP® Financial, LC. | VALUATION ANALYSIS IV. 14 |
whereas in the current market for existing thrifts the P/B ratio may reflect a premium to book value. Therefore, it is appropriate to also consider the market for new issues, both at the time of the conversion and in the aftermarket.
As shown in Table 4.1, four standard conversions and two second-step conversions have been completed during the past three months. The recently completed second-step conversions completed by Kaiser Federal Financial Group, Inc. of California (completed in November) and FedFirst Financial Corp. of Pennsylvania (completed in September) are considered to be more relevant for our analysis. In general, second-step conversions tend to be priced (and trade in the aftermarket) at higher P/B ratios than standard conversions. We believe investors take into consideration the generally more leveraged pro forma balance sheets of second-step companies, their track records as public companies prior to conversion, and their generally higher pro forma ROE measures relative to standard conversions in pricing their common stocks. As shown in Table 4.1, both of the second-step conversion offerings were completed between the minimum and midpoint of their offering ranges and their closing pro forma price/tangible book ratios equaled 66.6% and 52.0%. FedFirst Financial Corp.’s conversion reflected price appreciation of 12.3% after the first week of trading. As of November 19, 2010, FirstFed Financial Corp.’s price reflected an aggregate 33.3% increase in price. Kaiser Federal Financial Group, Inc. converted on the date of this valuation, and closed at a price of $9.99 per share, or slightly below the $10.00 per share IPO price.
Shown in Table 4.2 are the current pricing ratios for the fully-converted offerings completed during the past three months that trade on NASDAQ or an Exchange. The current average and median P/TB ratios for the recent fully-converted offerings equaled 65.05% and 67.93%, based on closing stock prices as of November 19, 2010.
| C. | The Acquisition Market |
Also considered in the valuation was the potential impact on Clifton Savings’ stock price of recently completed and pending acquisitions of other thrift institutions operating in New Jersey. As shown in Exhibit IV-4, there were five New Jersey thrift acquisitions completed from the beginning of 2006 through November 19, 2010. The recent acquisition activity involving New Jersey savings institutions may imply a certain degree of acquisition speculation for the Company’s stock. To the extent that acquisition speculation may impact the Company’s offering, we have largely taken this into account in selecting companies for the Peer Group which operate in markets that have experienced a comparable level of acquisition activity as the Company’s market and, thus, are subject to the same type of acquisition speculation that may
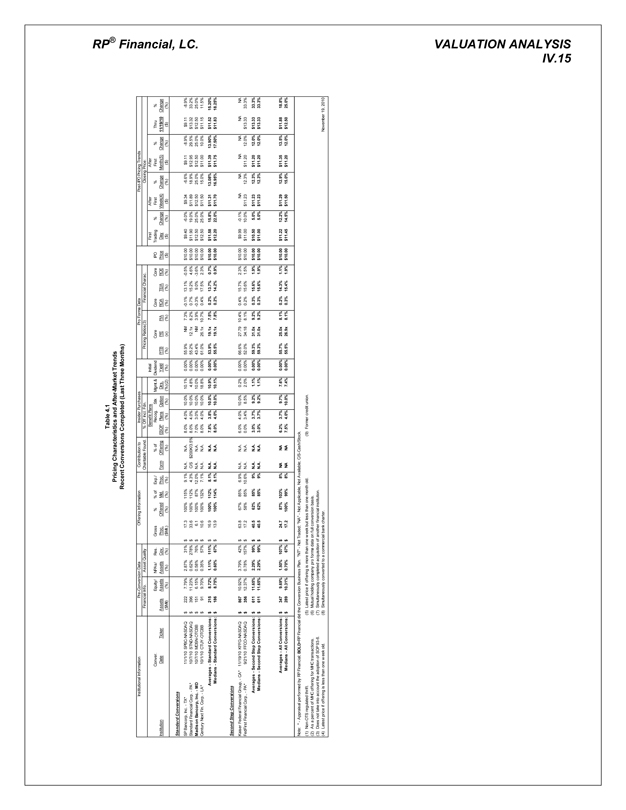
RP® Financial, LC. | VALUATION ANALYSIS IV. 15 |
Table 4.1
Pricing Characteristics and After-Market Trends
Recent Conversions Completed (Last Three Months)
Institutional Information | Pre-Conversion Data | Insider Purchases | Initial | Pro Forma Data | IPO | Post-IPO Pricing Trends | ||||||||||||||||||||||||||||||||||||||||||||||||||||||||||||||||||||||||||||||||||||||||||||||||||||||||||||||||||||||||||
Financial | Asset | Offering Information | Contribution | % Off Incl. Fdn. | Pricing | Financial | Closing Price: | |||||||||||||||||||||||||||||||||||||||||||||||||||||||||||||||||||||||||||||||||||||||||||||||||||||||||||||||||||||||||
Assets | Equity/ | NPAs/ | Res. | Gross | % | % Mid. | Exp./ Proc. | Form | % of | Benefit Plans | Mgmt.& | P/ | Core | P/A | Core | TE/ | Core | First | % | After | % | After | % | Thru | % | |||||||||||||||||||||||||||||||||||||||||||||||||||||||||||||||||||||||||||||||||||||||||||||||||||||||
Institution | Conver.Date | Ticker | ESOP | Recog. | Stk | |||||||||||||||||||||||||||||||||||||||||||||||||||||||||||||||||||||||||||||||||||||||||||||||||||||||||||||||||||||||||||
($Mil) | (%) | (%) | (%) | ($Mil.) | (%) | (%) | (%) | (%) | (%) | (%) | (%) | (%) | (2) | (%) | (%) | (x) | (%) | (%) | (%) | (%) | ($) | ($) | (%) | ($) | (%) | ($) | (%) | ($) | (%) | |||||||||||||||||||||||||||||||||||||||||||||||||||||||||||||||||||||||||||||||||||||||||||||||||||
Standard Conversions | ||||||||||||||||||||||||||||||||||||||||||||||||||||||||||||||||||||||||||||||||||||||||||||||||||||||||||||||||||||||||||||||||
SP Bancorp, Inc.—TX* |
| 11/1/10 |
| | SPBC- | | $ | 222 |
|
| 7.79 | % |
| 2.87 | % |
| 31 | % | $ | 17.3 |
|
| 100 | % |
| 115 | % |
| 9.1 | % |
| N.A. |
|
| N.A. |
|
| 8.0 | % |
| 4.0 | % |
| 10.0 | % |
| 10.1 | % |
| 0.00 | % |
| 55.9 | % |
| NM |
|
| 7.3 | % |
| -0.1 | % |
| 13.1 | % |
| -0.5 | % | $ | 10.00 |
| $ | 9.40 |
|
| -6.0 | % | $ | 9.34 |
|
| -6.6 | % | $ | 9.11 |
|
| -8.9 | % | $ | 9.11 |
|
| -8.9 | % | ||||||||||||||||||||||||||||||||
Standard Financial Corp.—PA* |
| 10/7/10 |
| | STND- | | $ | 396 |
|
| 11.23 | % |
| 0.62 | % |
| 278 | % | $ | 33.6 |
|
| 100 | % |
| 112 | % |
| 4.3 | % |
| C/S |
| $ | 200K/3.5 | % |
| 8.0 | % |
| 4.0 | % |
| 10.0 | % |
| 4.8 | % |
| 0.00 | % |
| 55.2 | % |
| 12.1x |
|
| 8.2 | % |
| 0.7 | % |
| 15.2 | % |
| 4.6 | % | $ | 10.00 |
| $ | 11.90 |
|
| 19.0 | % | $ | 11.89 |
|
| 18.9 | % | $ | 12.95 |
|
| 29.5 | % | $ | 13.32 |
|
| 33.2 | % | ||||||||||||||||||||||||||||||||
Madison Bancorp, Inc.—MD |
| 10/7/10 |
| | MDSN- | | $ | 151 |
|
| 6.15 | % |
| 0.58 | % |
| 76 | % | $ | 6.1 |
|
| 100 | % |
| 87 | % |
| 12.0 | % |
| N.A. |
|
| N.A. |
|
| 7.0 | % |
| 3.0 | % |
| 10.0 | % |
| 10.0 | % |
| 0.00 | % |
| 43.4 | % |
| NM |
|
| 3.9 | % |
| -0.3 | % |
| 9.0 | % |
| -3.6 | % | $ | 10.00 |
| $ | 12.50 |
|
| 25.0 | % | $ | 12.50 |
|
| 25.0 | % | $ | 12.50 |
|
| 25.0 | % | $ | 12.50 |
|
| 25.0 | % | ||||||||||||||||||||||||||||||||
Century Next Fin. Corp.—LA* |
| 10/1/10 |
| | CTUY- | | $ | 91 |
|
| 9.70 | % |
| 0.35 | % |
| 57 | % | $ | 10.6 |
|
| 100 | % |
| 132 | % |
| 7.1 | % |
| N.A. |
|
| N.A. |
|
| 8.0 | % |
| 4.0 | % |
| 10.0 | % |
| 18.8 | % |
| 0.00 | % |
| 61.0 | % |
| 26.1x |
|
| 10.7 | % |
| 0.4 | % |
| 17.5 | % |
| 2.3 | % | $ | 10.00 |
| $ | 12.50 |
|
| 25.0 | % | $ | 11.50 |
|
| 15.0 | % | $ | 11.00 |
|
| 10.0 | % | $ | 11.15 |
|
| 11.5 | % | ||||||||||||||||||||||||||||||||
| Averages - | | $ | 215 |
|
| 8.72 | % |
| 1.11 | % |
| 111 | % | $ | 16.9 |
|
| 100 | % |
| 112 | % |
| 8.1 | % |
| N.A. |
|
| N.A. |
|
| 7.8 | % |
| 3.8 | % |
| 10.0 | % |
| 10.9 | % |
| 0.00 | % |
| 53.9 | % |
| 19.1x |
|
| 7.5 | % |
| 0.2 | % |
| 13.7 | % |
| 0.7 | % | $ | 10.00 |
| $ | 11.58 |
|
| 15.8 | % | $ | 11.31 |
|
| 13.08 | % | $ | 11.39 |
|
| 13.90 | % | $ | 11.52 |
|
| 15.20 | % | ||||||||||||||||||||||||||||||||||||
| Medians - | | $ | 186 |
|
| 8.75 | % |
| 0.60 | % |
| 67 | % | $ | 13.9 |
|
| 100 | % |
| 114 | % |
| 8.1 | % |
| N.A. |
|
| N.A. |
|
| 8.0 | % |
| 4.0 | % |
| 10.0 | % |
| 10.1 | % |
| 0.00 | % |
| 55.5 | % |
| 19.1x |
|
| 7.8 | % |
| 0.2 | % |
| 14.2 | % |
| 0.9 | % | $ | 10.00 |
| $ | 12.20 |
|
| 22.0 | % | $ | 11.70 |
|
| 16.95 | % | $ | 11.75 |
|
| 17.50 | % | $ | 11.83 |
|
| 18.25 | % | ||||||||||||||||||||||||||||||||||||
Second Step Conversions | ||||||||||||||||||||||||||||||||||||||||||||||||||||||||||||||||||||||||||||||||||||||||||||||||||||||||||||||||||||||||||||||||
Kaiser Federal Financial Group,—CA* |
| 11/19/10 |
| | KFFG- | | $ | 867 |
|
| 10.92 | % |
| 3.79 | % |
| 42 | % | $ | 63.8 |
|
| 67 | % |
| 85 | % |
| 6.9 | % |
| N.A. |
|
| N.A. |
|
| 6.0 | % |
| 4.0 | % |
| 10.0 | % |
| 0.2 | % |
| 0.00 | % |
| 66.6 | % |
| 27.79 |
|
| 10.4 | % |
| 0.4 | % |
| 15.7 | % |
| 2.3 | % | $ | 10.00 |
| $ | 9.99 |
|
| -0.1 | % |
| NA |
|
| NA |
|
| NA |
|
| NA |
|
| NA |
|
| NA |
| ||||||||||||||||||||||||||||||||
FedFirst Financial Corp.,—PA* |
| 9/21/10 |
| | FFCO- | | $ | 356 |
|
| 12.37 | % |
| 0.78 | % |
| 157 | % | $ | 17.2 |
|
| 58 | % |
| 85 | % |
| 10.6 | % |
| N.A. |
|
| N.A. |
|
| 0.0 | % |
| 3.4 | % |
| 8.5 | % |
| 2.0 | % |
| 0.00 | % |
| 52.0 | % |
| 34.18 |
|
| 8.1 | % |
| 0.2 | % |
| 15.6 | % |
| 1.5 | % | $ | 10.00 |
| $ | 11.00 |
|
| 10.0 | % | $ | 11.23 |
|
| 12.3 | % | $ | 11.20 |
|
| 12.0 | % | $ | 13.33 |
|
| 33.3 | % | ||||||||||||||||||||||||||||||||
| Averages - | | $ | 611 |
|
| 11.65 | % |
| 2.29 | % |
| 99 | % | $ | 40.5 |
|
| 62 | % |
| 85 | % |
| 9 | % |
| N.A. |
|
| N.A. |
|
| 3.0 | % |
| 3.7 | % |
| 9.2 | % |
| 1.1 | % |
| 0.00 | % |
| 59.3 | % |
| 31.0x |
|
| 9.2 | % |
| 0.3 | % |
| 15.6 | % |
| 1.9 | % | $ | 10.00 |
| $ | 10.50 |
|
| 5.0 | % | $ | 11.23 |
|
| 12.3 | % | $ | 11.20 |
|
| 12.0 | % | $ | 13.33 |
|
| 33.3 | % | ||||||||||||||||||||||||||||||||||||
| Medians - | | $ | 611 |
|
| 11.65 | % |
| 2.29 | % |
| 99 | % | $ | 40.5 |
|
| 62 | % |
| 85 | % |
| 9 | % |
| N.A. |
|
| N.A. |
|
| 3.0 | % |
| 3.7 | % |
| 9.2 | % |
| 1.1 | % |
| 0.00 | % |
| 59.3 | % |
| 31.0x |
|
| 9.2 | % |
| 0.3 | % |
| 15.6 | % |
| 1.9 | % | $ | 10.00 |
| $ | 11.00 |
|
| 5.0 | % | $ | 11.23 |
|
| 12.3 | % | $ | 11.20 |
|
| 12.0 | % | $ | 13.33 |
|
| 33.3 | % | ||||||||||||||||||||||||||||||||||||
| Averages - | | $ | 347 |
|
| 9.69 | % |
| 1.50 | % |
| 107 | % | $ | 24.7 |
|
| 87 | % |
| 103 | % |
| 8 | % |
| NA |
|
| NA |
|
| 6.2 | % |
| 3.7 | % |
| 9.7 | % |
| 7.6 | % |
| 0.00 | % |
| 55.7 | % |
| 25.0x |
|
| 8.1 | % |
| 0.2 | % |
| 14.3 | % |
| 1.1 | % | $ | 10.00 |
| $ | 11.22 |
|
| 12.2 | % | $ | 11.29 |
|
| 12.9 | % | $ | 11.35 |
|
| 13.5 | % | $ | 11.88 |
|
| 18.8 | % | ||||||||||||||||||||||||||||||||||||
| Medians - | | $ | 289 |
|
| 10.31 | % |
| 0.70 | % |
| 67 | % | $ | 17.2 |
|
| 100 | % |
| 99 | % |
| 8 | % |
| NA |
|
| NA |
|
| 7.5 | % |
| 4.0 | % |
| 10.0 | % |
| 7.4 | % |
| 0.00 | % |
| 55.5 | % |
| 26.9x |
|
| 8.1 | % |
| 0.3 | % |
| 15.4 | % |
| 1.9 | % | $ | 10.00 |
| $ | 11.45 |
|
| 14.5 | % | $ | 11.50 |
|
| 15.0 | % | $ | 11.20 |
|
| 12.0 | % | $ | 12.50 |
|
| 25.0 | % | ||||||||||||||||||||||||||||||||||||
Note: * - Appraisal performed by RP Financial; BOLD=RP Financial did the Conversion Business Plan. “NT” - Not Traded; “NA” - Not Applicable, Not Available; C/S-Cash/Stock. | ||||
(1) Non-OTS regulated thrift. | (5) Latest price if offering is more than one w eek but less than one month old. | (9) Former credit union. | ||
(2) As a percent of MHC offering for MHC transactions. | (6) Mutual holding company pro forma data on full conversion basis. | |||
(3) Does not take into account the adoption of SOP 93-6. | (7) Simultaneously completed acquisition of another financial institution. | |||
(4) Latest price if offering is less than one w eek old. | (8) Simultaneously converted to a commercial bank charter. | November 19, 2010 | ||

RP® Financial, LC. | VALUATION ANALYSIS IV. 16 |
Table 4.2
Market Pricing Comparatives
Prices As of November 19, 2010
Market | Per Share Data | |||||||||||||||||||||||||||||||||||||||||||||||||||||||||||||||||||||||||||||||||
Capitalization | Core 12 Month EPS(2) | Book Value/ Share | Dvidends(4) | Fini ancial Chare tcteristics(6) | ||||||||||||||||||||||||||||||||||||||||||||||||||||||||||||||||||||||||||||||
Financial | Price/ Share(t) | Market Value | Pricing Ratios(3) | Amount/ Share | Yield | Payout Ralio(5) | Total Assets | Equity/ Assets | Tang Eq/ Assets | NPAs/ Assets | Reported | Core | ||||||||||||||||||||||||||||||||||||||||||||||||||||||||||||||||||||||
P/E | P/B | P/A | P/TB | P/Core | ROA | ROE | ROA | ROE | ||||||||||||||||||||||||||||||||||||||||||||||||||||||||||||||||||||||||||
($) | ($Mil) | ($) | ($) | (X) | (%) | (%) | (%) | (x) | ($) | (%) | (%) | ($MiI) | (%) | (%) | (%) | (%) | (%) | (%) | (%) | |||||||||||||||||||||||||||||||||||||||||||||||||||||||||||||||
All Public Companies | $ | 9.98 |
| $ | 272.50 |
| ($ | 0.15 | ) | $ | 13.04 |
|
| 17.52X |
|
| 76.44 | % |
| 9.15 | % |
| 84.06 | % |
| 17.15X |
| $ | 0.22 |
|
| 1.84 | % |
| 27.78 | % | $ | 2,633 |
|
| 11.36 | % |
| 10.95 | % |
| 4.40 | % |
| -0.08 | % |
| 0.56 | % |
| -0.13 | % |
| -0.33 | % | ||||||||||||||||||||||
Converted Last 3 Months (no MHC) | $ | 11.44 |
| $ | 49.36 |
| $ | 0.35 |
| $ | 18.48 |
|
| 22.88X |
|
| 61.76 | % |
| 9.69 | % |
| 65.05 | % |
| 21.90x |
| $ | 0.18 |
|
| 1.75 | % |
| 13.33 | % | $ | 488 |
|
| 3.26 | % |
| 12.71 | % |
| NA |
|
| 0.31 | % |
| 4.68 | % |
| 0.31 | % |
| 4.61 | % | ||||||||||||||||||||||
Converted Last 3 Months (no MHC) | ||||||||||||||||||||||||||||||||||||||||||||||||||||||||||||||||||||||||||||||||||
FFCO | FedFirst Financial Corp of PA | $ | 13.33 |
| $ | 39.90 |
| $ | 0.29 |
| $ | 19.67 |
|
| NM |
|
| 67.77 | % |
| 10.75 | % |
| 69.39 | % |
| NM |
| $ | 0.12 |
|
| 0.90 | % |
| 40.00 | % | $ | 371 |
|
| 5.61 | % |
| 5.44 | % |
| NA |
|
| 0.24 | % |
| 4.31 | % |
| 0.23 | % |
| 4.17 | % | |||||||||||||||||||||
KFFG | Kaiser Federal Fin Group of CA | $ | 9.99 |
| $ | 95.51 |
| $ | 0.36 |
| $ | 15.45 |
|
| 27.75X |
|
| 64.66 | % |
| 10.38 | % |
| 66.47 | % |
| 27.75X |
| $ | 0.61 |
|
| 6.11 | % |
| NM |
| $ | 920 |
|
| 7.41 | % |
| 45.38 | % |
| NA |
|
| 0.37 | % |
| 5.05 | % |
| 0.37 | % |
| 5.05 | % | |||||||||||||||||||||
SPBC | SP Bancorp, Inc. of TX | $ | 9.11 |
| $ | 15.71 |
| ($ | 0.08 | ) | $ | 17.90 |
|
| NM |
|
| 50.89 | % |
| 6.68 | % |
| 50.89 | % |
| NM |
| $ | 0.00 |
|
| 0.00 | % |
| 0.00 | % | $ | 235 |
|
| 0.00 | % |
| 0.00 | % |
| NA |
|
| 0.07 | % |
| NM |
|
| -0.06 | % |
| NM |
| |||||||||||||||||||||
STND | Standard Financial Corp. of PA | $ | 13.32 |
| $ | 46.33 |
| $ | 0.83 |
| $ | 20.91 |
|
| 18.00X |
|
| 63.70 | % |
| 10.93 | % |
| 73.47 | % |
| 16.05X |
| $ | 0.00 |
|
| 0.00 | % |
| 0.00 | % | $ | 424 |
|
| 0.00 | % |
| 0.00 | % |
| NA |
|
| 0.61 | % |
| NM |
|
| 0.68 | % |
| NM |
| |||||||||||||||||||||
(1) | Average of High/Low or Bid/Ask price per share. |
(2) | EPS (estimate core basis) is based on actual trailing 12 month data, adjusted to omit non-operating items on a tax-effected basis. |
(3) | P/E = Price to earnings; P/B = Price to book; P/A = Price to assets; P/TB = Price to tangible book value; and P/Core = Price to core earnings. |
(4) | Indicated 12 month dividend, based on last quarterly dividend declared. |
(5) | Indicated 12 month dividend as a percent of trailing 12 month estimated core earnings. |
(6) | ROA (return on assets) and ROE (return on equity) are indicated ratios based on trailing 12 month common earnings and average common equity and total assets balances. |
(7) | Excludes from averages and medians those companies the subject of actual or rumored acquisition activities or unusual operating characteristics. |
Source: SNL Financial, LC. and RP® Financial, LC. calculations. The information provided in this report has been obtained from sources we believe are reliable, but we cannot guarantee the accuracy or completeness of such information.
Copyright (c) 2010 by RP® Financial, LC.
| RP® Financial, LC. | VALUATION ANALYSIS IV. 17 |
influence Clifton Savings’ stock. However, since converting thrifts are subject to a three-year regulatory moratorium from being acquired, acquisition speculation in Clifton Savings’ stock would tend to be less compared to the stocks of the Peer Group companies.
| D. | Trading in Clifton Savings’ Stock |
Since Clifton Savings’ minority stock currently trades under the symbol “CSBK” on NASDAQ, RP Financial also considered the recent trading activity in the valuation analysis. Clifton Savings had a total of 26,137,248 shares issued and outstanding at November 19, 2010, of which 9,345,490 shares were held by public shareholders and traded as public securities. The Company’s stock has had a 52 week trading range of $8.08 to $10.22 per share and its closing price on November 19, 2010 was $9.19 for an implied market value of $240.2 million.
There are significant differences between the Company’s minority stock (currently being traded) and the conversion stock that will be issued by the Company. Such differences include different liquidity characteristics, a different return on equity for the conversion stock, the stock is currently traded based on speculation of a range of exchange ratios and dividend payments, if any, will be made on all shares outstanding. Since the pro forma impact has not been publicly disseminated to date, it is appropriate to discount the current trading level. As the pro forma impact is made known publicly, the trading level will become more informative.
* * * * * * * * * * *
In determining our valuation adjustment for marketing of the issue, we considered trends in both the overall thrift market, the new issue market including the new issue market for second-step conversions, the acquisition market and recent trading activity in the Company’s minority stock. Taking these factors and trends into account, RP Financial concluded that a slight downward adjustment was appropriate in the valuation analysis for purposes of marketing of the issue.
| 8. | Management |
The Company’s management team appears to have experience and expertise in all of the key areas of the Company’s operations. Exhibit IV-5 provides summary resumes of the Company’s Board of Directors and senior management. The financial characteristics of the Company suggest that the Board and senior management have been effective in implementing an operating strategy that can be well managed by the Company’s present organizational structure. The Company currently does not have any senior management positions that are vacant.
| RP® Financial, LC. | VALUATION ANALYSIS IV. 18 |
Overall, the returns, equity positions and other operating measures of the Peer Group companies are indicative of well-managed financial institutions, which have Boards and management teams that have been effective in implementing competitive operating strategies. Therefore, on balance, we concluded no valuation adjustment relative to the Peer Group was appropriate for this factor.
| 9. | Effect of Government Regulation and Regulatory Reform |
In summary, as a fully-converted regulated institution, Clifton Savings will operate in substantially the same regulatory environment as the Peer Group members — all of whom are adequately capitalized institutions and are operating with no apparent restrictions. Exhibit IV-6 reflects the Company’s pro forma regulatory capital ratios. On balance, no adjustment has been applied for the effect of government regulation and regulatory reform.
Summary of Adjustments
Overall, based on the factors discussed above, we concluded that the Company’s pro forma market value should reflect the following valuation adjustments relative to the Peer Group:
Key Valuation Parameters: | Valuation Adjustment | |
| Financial Condition | Moderate Upward | |
| Profitability, Growth and Viability of Earnings | Slight Upward | |
| Asset Growth | Slight Upward | |
| Primary Market Area | No Adjustment | |
| Dividends | No Adjustment | |
| Liquidity of the Shares | No Adjustment | |
| Marketing of the Issue | Slight Downward | |
| Management | No Adjustment | |
| Effect of Govt. Regulations and Regulatory Reform | No Adjustment | |
Valuation Approaches
In applying the accepted valuation methodology promulgated by the OTS and adopted by the FDIC, i.e., the pro forma market value approach, we considered the three key pricing ratios in valuing the Company’s to-be-issued stock — price/earnings (“P/E”), price/book (“P/B”),
| RP® Financial, LC. | VALUATION ANALYSIS IV. 19 |
and price/assets (“P/A”) approaches — all performed on a pro forma basis including the effects of the stock proceeds. In computing the pro forma impact of the conversion and the related pricing ratios, we have incorporated the valuation parameters disclosed in the Company’s prospectus for reinvestment rate, effective tax rate, stock benefit plan assumptions and expenses (summarized in Exhibits IV-7 and IV-8).
In our estimate of value, we assessed the relationship of the pro forma pricing ratios relative to the Peer Group and recent conversion offerings.
RP Financial’s valuation placed an emphasis on the following:
| • | P/E Approach. The P/E approach is generally the best indicator of long-term value for a stock and we have given it the most significant weight among the valuation approaches. Given certain similarities between the Company’s and the Peer Group’s earnings composition and overall financial condition, the P/E approach was carefully considered in this valuation. At the same time, recognizing that (1) the earnings multiples will be evaluated on a pro forma basis for the Company; and (2) the Peer Group companies have had the opportunity to realize the benefit of reinvesting and leveraging the offering proceeds, we also gave weight to the other valuation approaches. |
| • | P/B Approach. P/B ratios have generally served as a useful benchmark in the valuation of thrift stocks, particularly in the context of a conversion offering, as the earnings approach involves assumptions regarding the use of proceeds. RP Financial considered the P/B approach to be a valuable indicator of pro forma value, taking into account the pricing ratios under the P/E and P/A approaches. We have also modified the P/B approach to exclude the impact of intangible assets (i.e., price/tangible book value or “P/TB”), in that the investment community frequently makes this adjustment in its evaluation of this pricing approach. |
| • | P/A Approach. P/A ratios are generally a less reliable indicator of market value, as investors typically assign less weight to assets and attribute greater weight to book value and earnings. Furthermore, this approach as set forth in the regulatory valuation guidelines does not take into account the amount of stock purchases funded by deposit withdrawals, thus understating the pro forma P/A ratio. At the same time, the P/A ratio is an indicator of franchise value, and, in the case of highly capitalized institutions, high P/A ratios may limit the investment community’s willingness to pay market multiples for earnings or book value when ROE is expected to be low. |
| • | Trading of Clifton Savings’ stock. Converting institutions generally do not have stock outstanding. Clifton Savings, however, has public shares outstanding due to the mutual holding company form of ownership. Since Clifton Savings is currently traded on NASDAQ, it is an indicator of investor interest in the Company’s conversion stock and therefore received some weight in our valuation. Based on the November 19, 2010, stock price of $9.19 per share and the 26,137,248 shares of Clifton Savings stock outstanding, the Company’s implied market value of $240.2 million was |
| RP® Financial, LC. | VALUATION ANALYSIS IV. 20 |
considered in the valuation process. However, since the conversion stock will have different characteristics than the minority shares, and since pro forma information has not been publicly disseminated to date, the current trading price of Clifton Savings’ stock was somewhat discounted herein but will become more important towards the closing of the offering. |
The Company has adopted Statement of Position (“SOP”) 93-6, which causes earnings per share computations to be based on shares issued and outstanding excluding unreleased ESOP shares. For purposes of preparing the pro forma pricing analyses, we have reflected all shares issued in the offering, including all ESOP shares, to capture the full dilutive impact, particularly since the ESOP shares are economically dilutive, receive dividends and can be voted. However, we did consider the impact of the adoption of SOP 93-6 in the valuation.
In preparing the pro forma pricing analysis we have taken into account the pro forma impact of the MHC net assets that will be consolidated with the Company. At September 30, 2010, the MHC had unconsolidated net assets of negative $194,000 (i.e., net capital deficit). These entries have been added to the Company’s September 30, 2010, reported financial information to reflect the consolidation of the MHC into the Company’s operations.
Based on the application of the three valuation approaches, taking into consideration the valuation adjustments discussed above, RP Financial concluded that as of November 19, 2010, the aggregate pro forma market value of Clifton Savings’ conversion stock equaled $233,482,832 at the midpoint, equal to 29,185,354 shares at $8.00 per share. The $8.00 per share price was determined by the Clifton Savings’ Board. The midpoint and resulting valuation range is based on the sale of a 64.24% ownership interest to the public, which provides for a $150,000,000 public offering at the midpoint value.
1.Price-to-Earnings (“P/E”). The application of the P/E valuation method requires calculating the Company’s pro forma market value by applying a valuation P/E multiple to the pro forma earnings base. In applying this technique, we considered both reported earnings and a recurring earnings base, that is, earnings adjusted to exclude any one-time non-operating items, plus the estimated after-tax earnings benefit of the reinvestment of the net proceeds. The Company’s reported earnings equaled $8.485 million for the twelve months ended September 30, 2010. In deriving Clifton Savings’ core earnings, the adjustments made to reported earnings were to eliminate a gain on sale of fixed assets related to the sale of the Botany branch, mentioned previously ($329,000). As shown below, on a tax effected basis, assuming an effective marginal tax rate of 40.0% for the earnings adjustments, the Company’s core earnings were determined to equal $8.288 million for the twelve months ended September 30, 2010. (Note: see Exhibit IV-9 for the adjustments applied to the Peer Group’s earnings in the calculation of core earnings).
| RP® Financial, LC. | VALUATION ANALYSIS IV. 21 |
| Amount | ||||
| ($ | 000 | ) | ||
Net income(loss) | $ | 8,485 | ||
Deduct: Gain on disposal/sale of fixed assets | (329 | ) | ||
Tax effect | 132 | |||
Core earnings estimate | $ | 8,288 | ||
| (1) | Tax effected at 40.0%. |
Based on the Company’s reported and estimated core earnings, and incorporating the impact of the pro forma assumptions discussed previously, the Company’s pro forma reported and core P/E multiples at the $233.5 million midpoint value equaled 28.15 times and 28.84 times, respectively, indicating premiums of 35.9% and 70.6%, relative to the Peer Group’s average reported and core earnings multiples of 20.72 times and 16.91 times, respectively (see Table 4.3). In comparison to the Peer Group’s median reported and core earnings multiples of 15.44 times and 15.60 times, respectively, the Company’s pro forma reported and core P/E multiples at the midpoint value indicated premiums of 82.3% and 84.9%, respectively. The Company’s pro forma P/E ratios based on reported earnings at the minimum and the supermaximum equaled 23.85 times and 37.49 times, respectively, and based on core earnings at the minimum and the supermaximum equaled 24.43 times and 38.41 times, respectively.
2.Price-to-Book (“P/B”). The application of the P/B valuation method requires calculating the Company’s pro forma market value by applying a valuation P/B ratio, as derived from the Peer Group’s P/B ratio, to the Company’s pro forma book value. Based on the $233.5 million midpoint valuation, the Company’s pro forma P/B and P/TB ratios equaled 76.05% for both, respectively. In comparison to the average P/B and P/TB ratios for the Peer Group of 92.91% and 107.83%, the Company’s ratios reflected a discount of 18.2% on a P/B basis and a discount of 29.5% on a P/TB basis. In comparison to the Peer Group’s median P/B and P/TB ratios of 90.98% and 109.45%, respectively, the Company’s pro forma P/B and P/TB ratios at the midpoint value reflected discounts of 16.4% and 30.5%, respectively. At the top of the super range, both the Company’s P/B and P/TB ratios equaled 88.40%, respectively. In comparison to the Peer Group’s average P/B and P/TB ratios, the Company’s P/B and P/TB ratios at the top of the super range reflected discounts of 4.9% and 18.0%, respectively. In comparison to the Peer Group’s median P/B and P/TB ratios, the Company’s P/B and P/TB ratios at the top of the super range reflected discounts of 2.8% and 19.2%, respectively. RP Financial considered the

RP® Financial, LC. | VALUATION ANALYSIS I. 22 |
Table 4.3
Public Market Pricing
Clifton Saving Bancorp, Inc. and the Comparables
November 19,2010
Market | Per Share Data | Exchange | 2nd | |||||||||||||||||||||||||||||||||||||||||||||||||||||||||||||||||||||||||||||||||||||||
Pricing Ratios(3) | Dividends(4) | Financial Characteristics(6) | ||||||||||||||||||||||||||||||||||||||||||||||||||||||||||||||||||||||||||||||||||||||||
Core 12 | Book | Amount/ | Yield | Payout | Total | Equity/ | Tang Eq/ | NPAs/ | Reported | Core | ||||||||||||||||||||||||||||||||||||||||||||||||||||||||||||||||||||||||||||||||
Price/ | Market | Month | Value/ | P/E | P/B | P/A | P/TB | P/ | ROA | ROE | ROA | ROE | ||||||||||||||||||||||||||||||||||||||||||||||||||||||||||||||||||||||||||||||
($) | ($Mil) | ($) | ($) | (x) | (%) | (%) | (%) | (x) | ($) | (%) | (%) | ($Mil) | (%) | (%) | (%) | (%) | (%) | (%) | (%) | ($Mil) | ||||||||||||||||||||||||||||||||||||||||||||||||||||||||||||||||||||||
Clifton Savings Bancorp, Inc. | ||||||||||||||||||||||||||||||||||||||||||||||||||||||||||||||||||||||||||||||||||||||||||
Superrange | $ | 8.00 |
| $ | 308.78 |
| $ | 0.21 |
| $ | 9.05 |
|
| 37.49x |
|
| 88.40 | % |
| 23.60 | % |
| 88.40 | % |
| 38.41x |
| $ | 0.24 |
|
| 3.00 | % |
| 115.23 | % | $ | 1,309 |
|
| 26.70 | % |
| 26.70 | % |
| 0.32 | % |
| 0.63 | % |
| 2.36 | % |
| 0.61 | % |
| 2.30 | % |
| 1.4767 |
| $ | 198.38 |
| ||||||||||||||||||||||||
Maximum | $ | 8.00 |
| $ | 268.51 |
| $ | 0.24 |
| $ | 9.73 |
|
| 32.48x |
|
| 82.22 | % |
| 20.88 | % |
| 82.22 | % |
| 33.27x |
| $ | 0.24 |
|
| 3.00 | % |
| 99.82 | % | $ | 1,286 |
|
| 25.41 | % |
| 25.41 | % |
| 0.32 | % |
| 0.64 | % |
| 2.53 | % |
| 0.63 | % |
| 2.47 | % |
| 1.2841 |
| $ | 172.50 |
| ||||||||||||||||||||||||
Midpoint | $ | 8.00 |
| $ | 233.48 |
| $ | 0.28 |
| $ | 10.52 |
|
| 28.15x |
|
| 76.05 | % |
| 18.44 | % |
| 76.05 | % |
| 28.84x |
| $ | 0.24 |
|
| 3.00 | % |
| 86.51 | % | $ | 1,266 |
|
| 24.25 | % |
| 24.25 | % |
| 0.33 | % |
| 0.66 | % |
| 2.70 | % |
| 0.64 | % |
| 2.64 | % |
| 1.1166 |
| $ | 150.00 |
| ||||||||||||||||||||||||
Minimum | $ | 8.00 |
| $ | 198.46 |
| $ | 0.33 |
| $ | 11.58 |
|
| 23.85x |
|
| 69.08 | % |
| 15.92 | % |
| 69.08 | % |
| 24.43x |
| $ | 0.24 |
|
| 3.00 | % |
| 73.28 | % | $ | 1,246 |
|
| 23.05 | % |
| 23.05 | % |
| 0.33 | % |
| 0.67 | % |
| 2.90 | % |
| 0.65 | % |
| 2.83 | % |
| 0.9491 |
| $ | 127.50 |
| ||||||||||||||||||||||||
All Non-MHC Public Companies (7) | ||||||||||||||||||||||||||||||||||||||||||||||||||||||||||||||||||||||||||||||||||||||||||
Averages | $ | 10.41 |
| $ | 304.81 |
| ($ | 0.21 | ) | $ | 14.00 |
|
| 17.14x |
|
| 72.68 | % |
| 8.45 | % |
| 80.35 | % |
| 16.85x |
| $ | 0.23 |
|
| 1.83 | % |
| 29.41 | % | $ | 2,779 |
|
| 11.05 | % |
| 10.71 | % |
| 4.14 | % |
| -0.14 | % |
| 0.19 | % |
| -0.20 | % |
| -0.83 | % | ||||||||||||||||||||||||||||||
Medians | $ | 10.77 |
| $ | 57.77 |
| $ | 0.32 |
| $ | 13.45 |
|
| 14.87x |
|
| 73.33 | % |
| 7.21 | % |
| 76.06 | % |
| 15.44x |
| $ | 0.18 |
|
| 1.43 | % |
| 0.00 | % | $ | 941 |
|
| 9.93 | % |
| 9.19 | % |
| 2.78 | % |
| 0.31 | % |
| 3.16 | % |
| 0.27 | % |
| 2.85 | % | ||||||||||||||||||||||||||||||
All Non-MHC State of NJ (7) | ||||||||||||||||||||||||||||||||||||||||||||||||||||||||||||||||||||||||||||||||||||||||||
Averages | $ | 11.29 |
| $ | 1,144.76 |
| $ | 0.68 |
| $ | 12.63 |
|
| 16.47x |
|
| 91.76 | % |
| 12.25 | % |
| 102.92 | % |
| 15.46x |
| $ | 0.31 |
|
| 2.57 | % |
| 35.21 | % | $ | 10,659 |
|
| 13.45 | % |
| 12.46 | % |
| 0.48 | % |
| 0.65 | % |
| 6.12 | % |
| 0.66 | % |
| 6.16 | % | ||||||||||||||||||||||||||||||
Medians | $ | 11.27 |
| $ | 234.91 |
| $ | 0.73 |
| $ | 11.52 |
|
| 14.81x |
|
| 90.13 | % |
| 10.56 | % |
| 102.53 | % |
| 15.52x |
| $ | 0.40 |
|
| 3.21 | % |
| 16.74 | % | $ | 2,225 |
|
| 11.85 | % |
| 10.70 | % |
| 0.48 | % |
| 0.65 | % |
| 5.76 | % |
| 0.68 | % |
| 5.76 | % | ||||||||||||||||||||||||||||||
Comparable Group Averages | ||||||||||||||||||||||||||||||||||||||||||||||||||||||||||||||||||||||||||||||||||||||||||
Averages | $ | 15.57 |
| $ | 279.44 |
| $ | 0.72 |
| $ | 16.64 |
|
| 20.72x |
|
| 92.91 | % |
| 11.22 | % |
| 107.83 | % |
| 16.91x |
| $ | 0.38 |
|
| 2.70 | % |
| 47.95 | % | $ | 2,504 |
|
| 12.34 | % |
| 11.25 | % |
| 1.65 | % |
| 0.56 | % |
| 4.99 | % |
| 0.50 | % |
| 4.67 | % | ||||||||||||||||||||||||||||||
Medians | $ | 12.58 |
| $ | 227.28 |
| $ | 0.77 |
| $ | 13.15 |
|
| 15.44x |
|
| 90.98 | % |
| 10.19 | % |
| 109.45 | % |
| 15.60x |
| $ | 0.34 |
|
| 2.83 | % |
| 46.85 | % | $ | 1,739 |
|
| 11.24 | % |
| 9.74 | % |
| 1.53 | % |
| 0.56 | % |
| 4.78 | % |
| 0.52 | % |
| 4.37 | % | ||||||||||||||||||||||||||||||
Comparable Group | ||||||||||||||||||||||||||||||||||||||||||||||||||||||||||||||||||||||||||||||||||||||||||
BFED | Beacon Federal Bancorp of NY | $ | 11.30 |
| $ | 72.81 |
| $ | 0.90 |
| $ | 16.84 |
|
| 14.87x |
|
| 67.10 | % |
| 6.88 | % |
| 67.10 | % |
| 12.56x |
| $ | 0.20 |
|
| 1.77 | % |
| 26.32 | % | $ | 1,059 |
|
| 10.25 | % |
| 10.25 | % |
| 1.53 | % |
| 0.46 | % |
| 4.70 | % |
| 0.54 | % |
| 5.57 | % | |||||||||||||||||||||||||||||
ESSA | ESSA Bancorp, Inc. of PA | $ | 12.68 |
| $ | 171.47 |
| $ | 0.26 |
| $ | 12.69 |
|
| 38.42x |
|
| 99.92 | % |
| 16.00 | % |
| 99.92 | % |
| NM |
| $ | 0.20 |
|
| 1.58 | % |
| 60.61 | % | $ | 1,072 |
|
| 16.01 | % |
| 16.01 | % |
| 1.18 | % |
| 0.42 | % |
| 2.49 | % |
| 0.33 | % |
| 1.96 | % | |||||||||||||||||||||||||||||
FFIC | Flushing Fin. Corp. of NY | $ | 13.31 |
| $ | 415.78 |
| $ | 1.23 |
| $ | 12.60 |
|
| 11.99x |
|
| 105.63 | % |
| 9.79 | % |
| 110.64 | % |
| 10.82x |
| $ | 0.52 |
|
| 3.91 | % |
| 46.85 | % | $ | 4,247 |
|
| 9.27 | % |
| 8.89 | % |
| 2.94 | % |
| 0.83 | % |
| 9.03 | % |
| 0.91 | % |
| 10.01 | % | |||||||||||||||||||||||||||||
OSHC | Ocean Shore Holding Co. of NJ | $ | 11.27 |
| $ | 82.24 |
| $ | 0.73 |
| $ | 13.61 |
|
| 15.44x |
|
| 82.81 | % |
| 9.81 | % |
| 117.85 | % |
| 15.44x |
| $ | 0.24 |
|
| 2.13 | % |
| 32.88 | % | $ | 838 |
|
| 11.85 | % |
| 11.85 | % |
| 0.48 | % |
| 0.68 | % |
| 5.76 | % |
| 0.68 | % |
| 5.76 | % | |||||||||||||||||||||||||||||
OCFC | OceanFirst Fin. Corp of NJ | $ | 12.48 |
| $ | 234.91 |
| $ | 0.80 |
| $ | 10.59 |
|
| 14.18x |
|
| 117.85 | % |
| 10.56 | % |
| 147.47 | % |
| 15.60x |
| $ | 0.48 |
|
| 3.85 | % |
| 54.55 | % | $ | 2,225 |
|
| 8.96 | % |
| 8.96 | % |
| 1.62 | % |
| 0.79 | % |
| 8.90 | % |
| 0.71 | % |
| 8.09 | % | |||||||||||||||||||||||||||||
PFS | Provident Fin. Serv. Inc of NJ | $ | 13.70 |
| $ | 820.93 |
| $ | 0.65 |
| $ | 15.20 |
|
| 20.76x |
|
| 90.13 | % |
| 12.03 | % |
| 134.91 | % |
| 21.08x |
| $ | 0.44 |
|
| 3.21 | % |
| 66.67 | % | $ | 6,823 |
|
| 13.35 | % |
| 8.61 | % |
| NA |
|
| 0.58 | % |
| 4.45 | % |
| 0.57 | % |
| 4.38 | % | |||||||||||||||||||||||||||||
PBNY | Provident NY Bncrp, Inc. of NY | $ | 9.39 |
| $ | 359.28 |
| $ | 0.38 |
| $ | 11.26 |
|
| 17.39x |
|
| 83.39 | % |
| 11.89 | % |
| 82.12 | % |
| 24.71x |
| $ | 0.24 |
|
| 2.56 | % |
| 44.44 | % | $ | 3,021 |
|
| 14.26 | % |
| 9.32 | % |
| 1.08 | % |
| 0.70 | % |
| 4.85 | % |
| 0.49 | % |
| 3.41 | % | |||||||||||||||||||||||||||||
THRD | TF Fin. Corp. of New town PA | $ | 21.45 |
| $ | 57.59 |
| $ | 1.18 |
| $ | 27.81 |
|
| 14.90x |
|
| 77.13 | % |
| 8.20 | % |
| 108.26 | % |
| 18.18x |
| $ | 0.80 |
|
| 3.73 | % |
| 55.56 | % | $ | 703 |
|
| 10.63 | % |
| 10.05 | % |
| 3.37 | % |
| 0.54 | % |
| 5.31 | % |
| 0.44 | % |
| 4.35 | % | |||||||||||||||||||||||||||||
WSFS | WSFS Financial Corp. of DE | $ | 42.34 |
| $ | 359.76 |
| $ | 1.01 |
| $ | 37.37 |
|
| 38.49x |
|
| 113.30 | % |
| 9.47 | % |
| 118.24 | % |
| NM |
| $ | 0.48 |
|
| 1.13 | % |
| 43.64 | % | $ | 3,799 |
|
| 9.73 | % |
| 9.42 | % |
| 2.35 | % |
| 0.25 | % |
| 2.93 | % |
| 0.23 | % |
| 2.69 | % | |||||||||||||||||||||||||||||
WFD | Westfield Fin. Inc. of MA | $ | 7.75 |
| $ | 219.65 |
| $ | 0.04 |
| $ | 8.44 |
|
| NM |
|
| 91.82 | % |
| 17.53 | % |
| 91.82 | % |
| NM |
| $ | 0.24 |
|
| 3.10 | % |
| NM |
| $ | 1,253 |
|
| 19.09 | % |
| 19.09 | % |
| 0.34 | % |
| 0.30 | % |
| 1.50 | % |
| 0.09 | % |
| 0.46 | % | |||||||||||||||||||||||||||||
(1) | Average of High/Low or Bid/Ask price per share. |
(2) | EPS (estimate core basis) is based on actual trailing 12 month data, adjusted to omit non-operating items on a tax-effected basis, and is shown on a pro forma basis where appropriate. |
(3) | P/E = Price to earnings; P/B = Price to book; P/A = Price to assets; P/TB = Price to tangible book value; and P/Core = Price to core earnings. |
(4) | Indicated 12 month dividend, based on last quarterly dividend declared. |
(5) | Indicated 12 month dividend as a percent of trailing 12 month estimated core earnings. |
(6) | ROA (return on assets) and ROE (return on equity) are indicated ratios based on trailing 12 month common earnings and average common equity and total assets balances. |
(7) | Excludes from averages and medians those companies the subject of actual or rumored acquisition activities or unusual operating characteristics. |
Source: SNL Financial, LC. and RP® Financial, LC. calculations. The information provided in this table has been obtained from sources we believe are reliable, but we cannot guarantee the accuracy or completeness of such information.
Copyright (c) 2010 by RP® Financial, LC.
discounts under the P/B approach to be reasonable given the Company’s pro forma P/E multiples were at significant premiums to the Peer Group’s P/E multiples.
| RP® Financial, LC. | VALIATION ANALYSIS IV. 23 |
3.Price-to-Assets (“P/A”). The P/A valuation methodology determines market value by applying a valuation P/A ratio to the Company’s pro forma asset base, conservatively assuming no deposit withdrawals are made to fund stock purchases. In all likelihood there will be deposit withdrawals, which results in understating the pro forma P/A ratio which is computed herein. At the $233.5 million midpoint of the valuation range, the Company’s value equaled 18.44% of pro forma assets. Comparatively, the Peer Group companies exhibited an average P/A ratio of 11.22%, which implies a premium of 64.4% has been applied to the Company’s pro forma P/A ratio. In comparison to the Peer Group’s median P/A ratio of 10.19%, the Company’s pro forma P/A ratio at the midpoint value reflects a premium of 81.0%.
Comparison to Recent Offerings
As indicated at the beginning of this chapter, RP Financial’s analysis of recent conversion offering pricing characteristics at closing and in the aftermarket has been limited to a “technical” analysis and, thus, the pricing characteristics of recent conversion offerings can not be a primary determinate of value. Particular focus was placed on the P/TB approach in this analysis, since the P/E multiples do not reflect the actual impact of reinvestment and the source of the stock proceeds (i.e., external funds vs. deposit withdrawals). As discussed previously, two second-step conversions have been completed within the past three months and closed at an average pro forma price/tangible book ratio of 59.3% (see Table 4.1). FedFirst Financial Corp.’s conversion reflected price appreciation of 12.3% after the first week of trading and Kaiser Federal Financial Group, Inc. converted on the date of this valuation and closed down by $0.01 per share on the first day of trading. In comparison, the Company’s pro forma price/tangible book ratio at the appraised midpoint value reflects a premium of 28.3%. The current average P/TB ratio of the two recent second-step conversions based on closing stock prices as of November 19, 2010, equaled 67.9%. In comparison to the average current P/TB ratio of the two recent second-step conversions, the Company’s P/TB ratio at the midpoint value reflects an implied premium of 12.0% and at the top of the super range the Company’s P/TB ratio reflects an implied premium of 30.0%.
| RP® Financial, LC. | VALUATION ANALYSIS IV. 24 |
Valuation Conclusion
Based on the foregoing, it is our opinion that, as of November 19, 2010, the estimated aggregate pro forma valuation of the shares of the Company to be issued and outstanding at the end of the conversion offering – including (1) newly-issued shares representing the MHC’s current ownership interest in the Company and (2) exchange shares issued to existing public shareholders of the Company - was $233,482,832 at the midpoint, equal to 29,185,354 shares at a per share value of $8.00. The resulting range of value and pro forma shares, all based on $8.00 per share, are as follows: $198,460,408 or 24,807,551 shares at the minimum; $268,505,256, or 33,563,157 shares at the maximum; and $308,781,048 or 38,597,631 shares, at the supermaximum (also known as “maximum, as adjusted”).
Based on this valuation and taking into account the ownership interest represented by the shares owned by the MHC, the midpoint of the offering range is $150,000,000, equal to 18,750,000 shares at $8.00 per share. The resulting offering range and offering shares, all based on $8.00 per share, are as follows: $127,500,000, or 15,937,500 shares, at the minimum; $172,500,000 or 21,562,500 shares at the maximum; and $198,375,000 or 24,796,875 shares, at the supermaximum. The pro forma valuation calculations relative to the Peer Group are shown in Table 4.3 and are detailed in Exhibit IV-7 and Exhibit IV-8.
Establishment of the Exchange Ratio
OTS regulations provide that in a conversion of a mutual holding company, the minority stockholders are entitled to exchange the public shares for newly issued shares in the fully converted company. The Board of Directors of Clifton Savings has independently determined the exchange ratio, which has been designed to preserve the current aggregate percentage ownership in the Company held by the public shareholders. The exchange ratio to be received by the existing minority shareholders of the Company will be determined at the end of the offering, based on the total number of shares sold in the subscription and syndicated offerings and the final appraisal.
Based on the valuation conclusion herein, the resulting offering value and the $8.00 per share offering price, the indicated exchange ratio at the midpoint is 1.1166 shares of the Company for every one public share held by public shareholders. Furthermore, based on the offering range of value, the indicated exchange ratio is 0.9491 at the minimum, 1.2841 at the maximum and 1.4767 at the supermaximum. RP Financial expresses no opinion on the proposed exchange of newly issued Company shares for the shares held by the public stockholders or on the proposed exchange ratio.
| RP® Financial, LC. | VALUATION ANALYSIS IV. 25 |
| Total Shares | Offering Shares | Exchange Shares Issued to the Public Shareholders | Exchange Ratio | |||||||||||||
Shares | (x) | |||||||||||||||
Super Maximum | 38,597,631 | 24,796,875 | 13,800,756 | 1.4767 | ||||||||||||
Maximum | 33,563,157 | 21,562,500 | 12,000,657 | 1.2841 | ||||||||||||
Midpoint | 29,185,354 | 18,750,000 | 10,435,354 | 1.1166 | ||||||||||||
Minimum | 24,807,551 | 15,937,500 | 8,870,051 | 0.9491 | ||||||||||||
Distribution of Shares | ||||||||||||||||
Super Maximum | 100.00 | % | 64.24 | % | 35.76 | % | ||||||||||
Maximum | 100.00 | % | 64.24 | % | 35.76 | % | ||||||||||
Midpoint | 100.00 | % | 64.24 | % | 35.76 | % | ||||||||||
Minimum | 100.00 | % | 64.24 | % | 35.76 | % | ||||||||||
Aggregate Market Value(1) | ||||||||||||||||
Super Maximum | $ | 308,781,048 | $ | 198,375,000 | $ | 110,406,048 | ||||||||||
Maximum | $ | 268,505,256 | $ | 172,500,000 | $ | 96,005,256 | ||||||||||
Midpoint | $ | 233,482,832 | $ | 150,000,000 | $ | 83,482,832 | ||||||||||
Minimum | $ | 198,460,408 | $ | 127,500,000 | $ | 70,960,408 | ||||||||||
| (1) | Based on offering price of $8.00 per share. |
| RP® Financial, LC. | VALUATION ANALYSIS |
EXHIBITS
NUMERICAL EXHIBITS OMITTED IN ACCORDANCE WITH RULE 202 OF REGULATION S-T, THESE EXHIBITS ARE BEING FILED IN PAPER PURSUANT TO A CONTINUING HARDSHIP EXEMPTION.