Exhibit 99.1
 | |
| IR.MARA.COM |
Q4 2024
Shareholder Letter


| Contents | |
| To Our Shareholders | 3 |
| Financial and Operational Discussion | 8 |
| Earnings Webcast and Conference Call | 14 |
| Statements of Operations | 15 |
| Investor Notice | 18 |
| Forward-Looking Statements | 18 |

 | SHAREHOLDER LETTER Q4 2024 | 3 |
2024 was a transformative year for MARA. We accelerated our transition to a vertically integrated energy and digital infrastructure company.
What does this mean for MARA?
That we now have greater control over our energy, infrastructure, technology, and ultimately, our future. But before we explore what lies ahead for MARA, let’s reflect on the key financial and operational milestones that made 2024 truly transformative.
Despite the April halving, we had record-high revenue, net income, and Adjusted EBITDA for the full year and Q4 2024. Direct energy cost per bitcoin for 2024 was $28,801 from owned sites.
| ● | Revenues increased 37% to $214.4 million in Q4 2024 from $156.8 million in Q4 2023. For the full year, revenues grew 69% to $656.4 million from $387.5 million in 2023. |
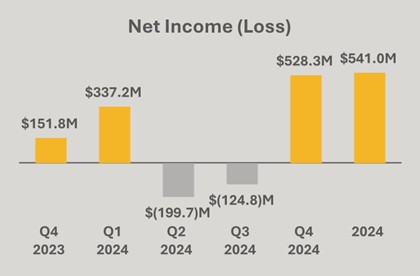
| ● | Net income increased 248% to $528.3 million in Q4 2024 from $151.8 million Q4 2023. For the full year, net income grew 107% to $541.0 million compared to $261.2 million in 2023. |
| ● | Adjusted EBITDA increased 207% to $794.4 million in Q4 2024, a new benchmark for the industry, from $259.0 million in Q4 2023. Full-year Adjusted EBITDA was $1.2 billion compared $417.1 million in 2023. |
| ● | Total blocks won increased 25% in Q4 2024 to 703 from 562 in Q4 2023. For the full year, blocks won grew 24% to 2,132 from 1,725 in 2023. |
| ● | Our direct energy cost per bitcoin was $28,801 and cost/KWh was $0.039 for our owned sites in 2024. |
| ● | Cost of revenue per petahash per day improved by 17% for the full year and 5% in Q4 2024 (excluding depreciation). |
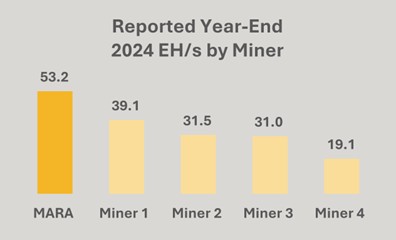
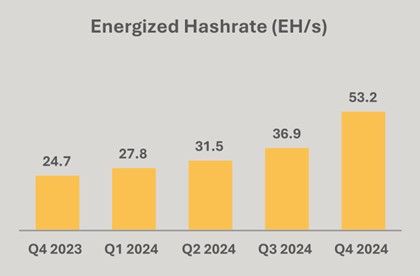
| ● | Energized hashrate (“EH/s”) increased 115% to 53.2 EH/s in Q4 2024 from 24.7 EH/s in Q4 2023. |
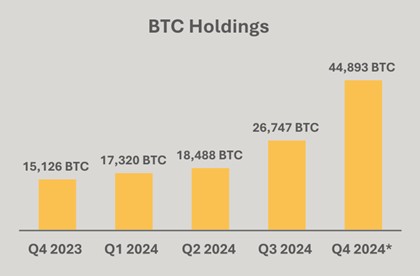
| ● | Bitcoin holdings (including loaned and collateralized bitcoin) increased 197% to 44,893 BTC (c. $4.6B) at year end, of which approximately 10,374 BTC was loaned to third parties or utilized as collateral for borrowings, generating additional return. |
| ● | In Q4, we mined 2,492 BTC and purchased 15,574 BTC using cash and proceeds from our zero-coupon convertible senior notes offerings. |
| ● | For 2024, we had a BTC yield per share of 62%. We did not sell any bitcoin (“bitcoin” or “BTC”) during the fourth quarter. |
| SHAREHOLDER LETTER Q4 2024 | 4 |
In 2024 we set in motion a transformation into a vertically integrated energy and technology solutions provider – a transformation we are accelerating in 2025.
| 1. | Since the beginning of 2024, we have secured 300% more energy capacity, expanding our total energy portfolio from ~0.5 GW to ~1.7 GW to continue vertically integrating and meet growing energy demand in our mining business. |
| ● | We secured approximately 1.2 GW of capacity at prices 28% lower than what our peers paid for similar acquisitions. As a result, we increased our owned data center portfolio since the beginning of the year from 0% to approximately 70%, reducing reliance on third parties and lowering our owned direct energy cost to $28,801 per bitcoin for 2024. |
| 2. | We deployed our first owned power generating assets, now operating 136 MW of capacity, reducing our reliance on grid power. |
| ● | We launched a 25-megawatt micro data center initiative at wellheads in Texas and North Dakota, converting excess flared gas into power for our operations. These sites reduce our reliance on grid power and provide us with the lowest cost per bitcoin mined of our currently operational sites. |
| ● | We acquired a wind farm in Texas with 240 MW of interconnection capacity and 114 MW of nameplate wind capacity. By taking excess wind behind the meter, we will reduce grid congestion and achieve near zero marginal costs. This will enable us to extend the economic life of last-generation hardware in ways our competitors cannot. This acquisition closed in Q1 2025. |
| 3. | We converted waste heat into opportunity, subsidizing our mining costs while providing a valuable service to local communities. |
| ● | In Finland, we deployed two pilot projects to recycle heat from our operations, providing heat to communities with a total population of nearly 80,000 residents. These sites offset our production costs through heat sales while reducing the local communities’ reliance on high carbon emitting biomass through the use of hydro power, delivering renewable energy and more affordable heating to communities. |
| 4. | We deployed Auradine ASIC miners and invested in distributed energy technology. |
| ● | We continue to receive timely shipments of Auradine ASIC miners and are deploying them. As a U.S.-based manufacturer founded by top Silicon Valley engineers, Auradine serves as a reliable, domestic hardware supplier. Our direct investments in Auradine reduce our dependency on foreign suppliers and the impact of potential tariffs. |
| ● | In 2024, we led the seed round for a residential solar and battery storage company that enables homeowners to mine bitcoin with excess energy. Their mission aligns with MARA’s vision of unlocking near zero energy costs and expanding distributed energy systems that reduce reliance on centralized power grids. |
| SHAREHOLDER LETTER Q4 2024 | 5 |
We’re proud of our transformation. But we’re far from done. While we remain bullish on bitcoin and our mining business, we’re continuing to explore how MARA can emerge as a leader in the next major opportunity: AI.
Today, the AI industry is at an inflection point, entering its second wave, and we intend to capitalize on the opportunities it will present.
The first wave saw an arms race to build massive, expensive data centers for training Large Language Models (“LLMs”) – AI models that process vast amounts of data to recognize patterns, generate text, and perform complex tasks. Companies locked themselves into high-capex, fixed-capacity infrastructure deals to meet the intense compute demands of AI training. These contracts were built on first-wave economics, where training was expensive, GPU supply was constrained, and hyperscalers raced to scale their compute capacity as fast as possible.
But the economics have changed. DeepSeek’s recent breakthrough with its R1 model has drastically reduced AI processing costs, forcing a rethink of AI deployment strategies. Generating one million tokens with DeepSeek-R1 costs just $2.19, compared to $12 for OpenAI’s ChatGPT-01 Mini – an 82% reduction. Efficiency gains like this are challenging AI economics and are only expected to continue. However, these efficiency gains may also fuel greater adoption of AI, reinforcing Jevons’ Paradox – an economic theory suggesting that efficiency gains often lead to increased overall consumption.
This perspective is echoed by Jon Gray, president and COO of Blackstone – one the largest investors in data centers and AI-driven infrastructure. He was recently quoted as saying that “the cost of compute is coming down pretty dramatically. But at the same time, that’s going to lead to more usage to more adoption.” We believe his comments suggest that there might be less training due to reduced intensity, but more inference and cloud computing.
We believe the second wave of AI is moving to inference on the edge, where trained LLMs are deployed to process requests, generate responses, and interact with users. Unlike training, which was concentrated in a few hyperscaled data centers, inference will require distributed, low-latency, and energy-efficient infrastructure closer to end users.
This shift is happening fast. According to Jefferies, AI inference workloads will grow from 12% in 2022 to 38% by 2027, which we believe will drive the vast majority of AI-related revenue.

Source: Jefferies, Bain & Company, Inc.
| SHAREHOLDER LETTER Q4 2024 | 6 |
Furthermore, a former Microsoft energy executive recently noted that “most of the GPUs that Nvidia ships over the next five years will end up as in inferencing, not training . . . inferencing is where the workload will go, and inferencing is going to look a whole lot like traditional cloud in terms of the infrastructure, the proximity to workloads and people, AZ configurations where you don’t have monolithic, a single site that can support three gigawatts, but rather you have three one-gigawatt sites that are all 20 kilometers from one another so that you’re going to have redundancy in all the time that you’re looking for.”
We believe MARA is well positioned to support this development. AI inference requires scalable, cost-effective compute infrastructure, something we excel at.
While many of our competitors rushed into AI hosting and high-performance compute (“HPC”) build outs, betting on large, high-capex data centers, MARA took a strategic pause, and for good reason. History has shown that the biggest opportunities often emerge in the second wave, not from those who jumped in first, but from those who observed the situation carefully and positioned themselves strategically.
To stay ahead, MARA is focusing on energy management, load balancing, and infrastructure technologies at the edge – key enablers of scalable inference.
| ● | Energy Management & Load Balancing – AI inference has variable, spiky energy demand, creating challenges for energy management. When AI workloads spike, they can strain the grid, drive up costs, and disrupt energy markets. When demand drops, excess capacity goes unused. MARA can co-locate with AI inference data centers to smooth out these fluctuations by adjusting power use in real time – scaling down when AI demand surges and ramping up when it tapers off, helping stabilize grids, monetize excess energy, and create a more predictable energy load. |
| ● | Infrastructure Technologies at the Edge – AI inference infrastructure needs to be closer to end users, and companies are already scouting commercial buildings and smaller data center sites for on-site or adjacent deployment. MARA is developing turnkey AI-at-the-edge immersion systems that allow operators to drop in GPUs and go. Our next-generation two-phase immersion cooling (2PIC) systems are designed specifically for these deployments, optimizing energy use and improving sustainability for data centers by eliminating water usage. We are currently deploying approximately 30 MW of 2PIC to internal and external customers. |
Looking ahead, our priorities for 2025 are centered around three key themes: Generate, Activate, and Differentiate.
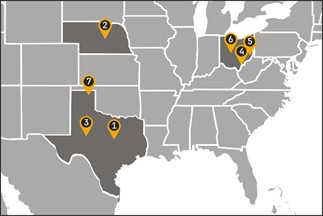
In 2024, we focused on energizing, optimizing, and diversifying – and we delivered. MARA is now widely recognized as the largest and one of the most efficient and diversified bitcoin miners. Our fleet of 16 data centers spans six states and four continents. We operate large, grid-connected deployments that help monetize excess energy and stabilize power grids, alongside small, modular sites that transform stranded or otherwise wasted energy into productive, sustainable assets.
Now, we aim to own and operate our infrastructure – not just data center assets but energy generation assets as well. To achieve this, we need to further activate opportunities to identify potential sites where we can generate low cost energy. By owning energy assets, we optimize how power is consumed, stored, and distributed. This allows us to activate new services for data centers, AI operators, and energy markets. We can co-locate with them, balance their load, and generate revenue to offset costs in ways that grid-reliant miners simply cannot.
For those miners still relying on grid-attached power, the writing is on the wall. Energy costs will only rise. The 2028 halving will likely force another industry-wide reckoning. Many may not survive. Those that do will need to differentiate by securing low cost energy, vertically integrating their operations, and expanding beyond traditional bitcoin mining to leverage their infrastructure for broader compute applications. Those that fail to differentiate will be relegated to being price takers in an increasingly competitive market.
MARA is taking an early lead. We have spent the last several months methodically executing a plan to build infrastructure that is not just about mining bitcoin, but about being the lowest-cost producer in an environment where efficiency and adaptability are paramount. Our ability to acquire sites and generate low cost energy, activate depreciated hardware and energy assets, and run a vertically integrated model – from software and hardware, and now, to energy generation – will provide us greater control over costs.
| SHAREHOLDER LETTER Q4 2024 | 7 |

On January 17, 2025, MARA composed the “Trump 47”
block commemorating the inauguration of President
Donald Trump – only made possible through MARA’s
vertically integrated tech stack.
Additionally, by ramping up our development and sales of data center infrastructure, we’re building a business that is more resilient to bitcoin’s price volatility. Like Cisco during the internet boom, we believe MARA will be the base layer of infrastructure that powers HPC applications. Whether for bitcoin mining or AI inference, we believe our technologies will activate others to build while MARA provides the picks and shovels to deploy new systems and services, such as energy management, load balancing, and infrastructure.
While we’re taking proactive steps to differentiate, we believe our peers will have to scramble to adapt or be left behind.
We established the company’s leadership in bitcoin mining through an asset light model, transformed it to a vertically integrated energy and infrastructure company in 2024, and in 2025, we will continue to focus on being the dominant player in bitcoin mining while expanding our footprint in energy generation. In conjunction with our emerging technology business, we are taking steps today, including investing in research and development, to establish our presence in AI and adjacent markets, which we expect will create additional revenue opportunities over the long term. We expect our costs to decline as we realize savings from owning our own sites and generating our own power, and we will be laser-focused on efficiency as we drive towards our goal of near zero cost of energy.
We assess opportunities with discipline, move with conviction, and execute at scale. The companies that dominate this industry will be those that generate their own energy, activate new products and services from leveraging their infrastructure and technology, and strategically differentiate themselves from the pack. We are paving that path.
We’re grateful to our partners for their trust, our employees for their hard work, and our shareholders for their support.
Sincerely,
____________________________________

MARA Chairman & CEO
| SHAREHOLDER LETTER Q4 2024 | 8 |
Fourth Quarter and Full Year 2024 Financial and Operational Discussion
Highlights
| – | For the full year and Q4 2024, we had record high revenue, net income, and Adjusted EBITDA. |
| – | Revenues increased 37% to $214.4 million in Q4 2024 from $156.8 million in Q4 2023. For 2024, revenues grew 69% to $656.4 million from $387.5 million in 2023. |
| – | Our direct energy cost per bitcoin was $28,801 and cost/KWh was $0.039 for our owned sites in 2024. |
| – | Cost of revenue per petahash per day (excluding depreciation) continued to improve by 5% this quarter and 17% for the full year. |
| – | Net income increased 248% to $528.3 million, or $1.24 per diluted share, in Q4 2024 from net income of $151.8 million, or $0.66 per diluted share, in Q4 2023. Net income includes $742.7 million income on fair value of digital assets. Full year net income grew 107% to $541.0 million compared to net income of $261.2 million in 2023. |
| – | Adjusted EBITDA increased to $794.4 million in Q4 2024, a new benchmark for the industry, from $259.0 million in Q4 2023. Full year Adjusted EBITDA was $1.2 billion compared to adjusted EBITDA of $417.1 million in the prior year period. |
| – | For the quarter, total blocks won increased 25% over the previous year to 703 from 562 in Q4 2023. For the full year, blocks won grew 24% to 2,132 from 1,725 in 2023. |
| – | Energized hashrate increased 115% to 53.2 EH/s in Q4 2024 from 24.7 EH/s in Q4 2023. Deployed 132,000 new miners with current energy efficiency of 19.2 joules per terahash (“J/TH”), as of January 2025. |
| – | At year end, we held 44,893 BTC (including loaned and collateralized bitcoin) . During Q4 2024, we mined 2,492 BTC and purchased 15,574 BTC using proceeds from our convertible senior note offerings. For 2024, we had a BTC yield per share of 62.4%. We did not sell any BTC in Q4 2024. |
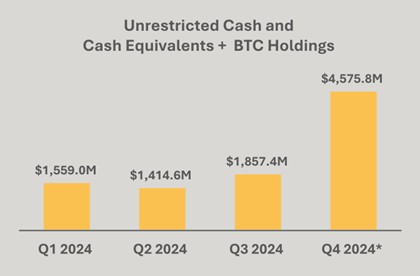
| – | Combined unrestricted cash and cash equivalents and BTC (including loaned and collateralized bitcoin) increased to $4.6 billion as of December 31, 2024. |
| – | In 2024, we acquired sites at an average price of ~$400K/MW, paying on average 28% less than what our three closest competitors paid for similar acquisitions. |
| – | Return on Capital Employed of 30.6% over the last 12-month period remains top tier amongst our competitors. |
Fourth Quarter and Full Year 2024 Production Highlight
| Prior Quarter Comparison | Year-over-Year Comparison | |||||||||||||||||||||||
| Metric | Q4 2024 | Q3 2024 | % Δ | FY2024 | FY2023 | % Δ | ||||||||||||||||||
| Number of Blocks Won | 703 | 604 | 16 | % | 2,132 | 1,725 | 24 | % | ||||||||||||||||
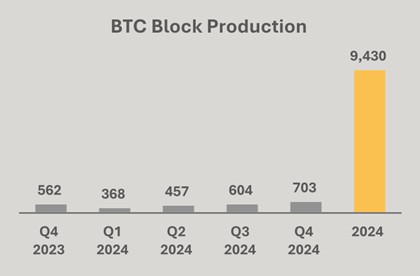
| BTC Produced | 2,492 | 2,070 | 20 | % | 9,430 | 12,852 | (27 | )% | ||||||||||||||||
| Average BTC Produced per Day | 27.1 | 22.5 | 20 | % | 25.8 | 35.2 | (27 | )% | ||||||||||||||||
| Share of Available Miners Rewards (1) | 5.6 | % | 4.8 | % | N/A | 4.1 | % | 3.6 | % | N/A | ||||||||||||||
| Energized Hashrate (EH/s) (2) | 53.2 | 36.9 | 44 | % | 53.2 | 24.7 | 115 | % | ||||||||||||||||
| 1. | Defined as the total amount of block rewards including transaction fees that MARA earned during the period divided by the total amount of block rewards and transaction fees awarded by the Bitcoin network during the period. |
| 2. | Defined as the amount of hashrate that could theoretically be generated if all miners that have been energized are currently in operation including miners that may be temporarily offline. Hashrates are estimates based on the manufacturers’ specifications. All figures are rounded. |
| SHAREHOLDER LETTER Q4 2024 | 9 |
In 2024, we strategically transitioned into a vertically integrated energy and digital infrastructure company by acquiring five data centers which we own and operate, increasing our percentage of owned capacity to approximately 70%. This is a critical step toward achieving greater operational control and efficiency.
ACQUISITIONS
Granbury, TX and Kearney, NE: In January 2024, we acquired two operational bitcoin mining sites totaling 390 MW of nameplate capacity. We believe our state-of-the-art 290 MW nameplate capacity data center in Granbury is one of the largest containerized liquid immersion-cooled sites worldwide. Since acquiring the site, profitability nearly doubled, we grew our average operational hashrate by 200%, and cost per petahash per day improved by 45%. In addition, we have made significant investments in the local community and continue to be a strategic partner.
Garden City, TX: In April 2024, we acquired an operational bitcoin mining site with 132 megawatts of operational capacity and 200 MW of nameplate capacity.
Hannibal, Hopedale, and Findlay, OH: In November 2024, we acquired two operational data centers with 222 MW of interconnect-approved capacity. In addition to the acquired data centers, we began developing a 150 MW greenfield operational data center in Findlay, Ohio.
Hansford County, TX: In February 2025, we acquired a wind farm with 240 MW of interconnection capacity and 114 MW of nameplate wind capacity.
REVENUE
Despite the April 2024 halving event and the 66% increase in global hashrate, MARA delivered record revenues for the year.
Revenues increased 37% to $214.4 million from $156.8 million in the fourth quarter of 2023. With the average price of BTC mined 132% higher this quarter than the prior year period, the increase in revenue was primarily driven by a $119.9 million increase in the average price of BTC, partially offset by a $64.2 million decrease in BTC production due to the halving event.
For the year ended December 31, 2024, we generated revenues of $656.4 million, compared to $387.5 million in the prior year period. The $268.9 million, or approximately 69% increase in revenues, was primarily driven by a $348.5 million increase in the average price of bitcoin mined, partially offset by a $111.3 million decrease in bitcoin production due to the April 2024 halving, and the inclusion of $31.6 million in revenues generated from providing hosting services as a result of site acquisitions in 2024.
We produced an average of 27.1 BTC each day during the quarter compared to 46.1 BTC each day in the prior year period and 1,750 less BTC in the fourth quarter of 2024 as compared to the prior year period, primarily due to the halving and increased global hashrate, partially offset by an increase in the our share of the network hashrate, which resulted in a 25% increase in number of blocks won.

| SHAREHOLDER LETTER Q4 2024 | 10 |
*as of last day of quarter
NET INCOME AND EARNINGS
We reported a net income of $528.3 million, or $1.24 per diluted share, in the quarter compared to a net income of $151.8 million, or $0.66 per diluted share, in the fourth quarter of last year. This was primarily driven by a $156.0 million increase in operating income, the $299.8 million change in fair value of digital assets - receivable, net, offset by a $102.2 million income tax benefit in the current period compared to the prior year period.
For the full year, we recorded net income of $541.0 million compared to net income of $261.2 million in the prior year period. The $279.8 million increase in net income was primarily driven by a $85.2 million increase in operating income, partially offset by a $69.1 million decrease in net gain from the extinguishment of debt and a $59.1 million income tax expense in the current period compared to the prior year period.
The price of BTC improved on December 31, 2024 versus September 30, 2024, resulting in income on digital assets (including BTC receivable) of $742.7 million during the fourth quarter of 2024. As we continue to hold a larger number of BTC on our balance sheet, we expect the volatility in BTC price to impact our earnings to a larger extent. For example, a $10,000 change in BTC price will result in over a $450 million impact in our earnings solely due to our large HODL position.
COST OF REVENUE
Our energy and hosting costs in the quarter were $127.4 million compared to $75.1 million in the prior year period. The $52.3 million or approximately 70% increase was primarily driven by the growth in our hashrate from the deployment and energization of mining rigs in existing and new facilities, which increased energy and hosting costs compared to the prior year period.
For the year ended December 31, 2024 energy and hosting costs totaled $381.6 million compared to $223.3 million in the prior year period. The $158.3 million or approximately 71% increase was primarily driven by the growth in our hashrate from the deployment and energization of mining rigs compared to the prior year period. Partially offsetting the increase was the impact of unexpected equipment failures and transmission line maintenance, which resulted in downtime that reduced energy and hosting costs.
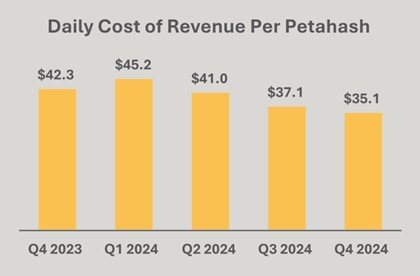
Our cost of revenue per petahash per day improved 17% from $42.3 in the fourth quarter of 2023 to $35.1 dollar per petahash per day in the fourth quarter of 2024. Sequentially, we improved this cost from $37.1 in Q3 2024, reflecting a 5% improvement despite a higher difficulty level to mine due to a higher global hashrate. Due to our shift from an asset-light to a vertically integrated strategy, we believe we are well-positioned to reduce our operating costs over time as we further expand our owned initiatives.
Finally, our direct energy cost per bitcoin for owned mining sites was $28,801 for 2024. Direct energy cost per bitcoin is calculated as the amounts paid to utility companies for power consumed divided by the quantity of bitcoin produced during the period related to our owned mining operations.
| SHAREHOLDER LETTER Q4 2024 | 11 |
Depreciation and amortization in the fourth quarter was $136.8 million, a $65.8 million increase from the same quarter in the prior year. The change was predominantly the result of deploying additional mining rigs since last year. Our energized hashrate grew 115% year-over-year from 24.7 exahash last year to 53.2 exahash at the end of 2024.
Our non-GAAP total margin, excluding depreciation and amortization was $84.0 million in the fourth quarter, compared to $81.7 million in the prior year period. The change was predominantly related to higher average BTC prices and increased operational efficiency.
| SHAREHOLDER LETTER Q4 2024 | 12 |
GENERAL AND ADMINISTRATIVE EXPENSES
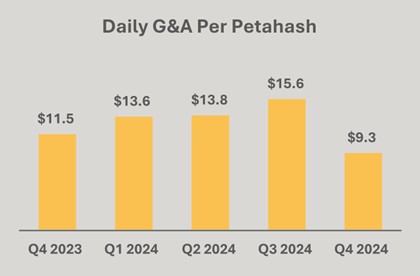
In the fourth quarter of 2024, general and administrative expenses (“G&A”), excluding stock-based compensation, was $23.9 million compared with $19.3 million in the prior year period. For the full year, G&A expenses excluding stock-based compensation was $114.4 million compared to $59.8 million in the prior year period.This increase in expenses was primarily due to the increasing scale of the business and acquisitions, including payroll and benefits, professional fees, facility and equipment repair and maintenance expenses, and other third-party costs. Our headcount grew from 48 employees at the end of Q4 last year to approximately 152 employees at the end of Q4 this year. We expect to continue funding diversified growth initiatives as we scale. Finally, G&A per petahash declined 40% sequentially in Q4 2024 and almost 20% year-over-year as we deployed more efficient miners and our hashrate grew 44% during the quarter.
ADJUSTED EBITDA
Primarily due to an increase in revenue, driven by higher average bitcoin price mined at a lower cost per petahash per day and an increase in the change in fair value of digital assets, partially offset by higher G&A expense excluding stock-based compensation, we reported adjusted EBITDA of $794.4 million compared to $259.0 million in the prior year period. The fair market value gain on digital assets was $742.7 million and $213.6 million for the periods, respectively.
Adjusted EBITDA was $1.2 billion for the year ended December 31, 2024 compared to adjusted EBITDA of $417.1 million in the prior year period. The $815.1 million increase was primarily due to an $80.2 million margin improvement from higher average bitcoin price mined at a lower cost per petahash per day and a $782.1 million increase in the change in fair value of digital assets, partially offset by an $54.7 million increase in G&A excluding stock-based compensation.
BALANCE SHEET AND TREASURY MANAGEMENT
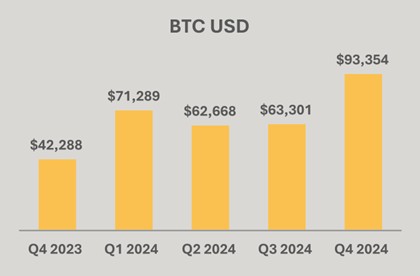
At year end, we held 44,893 bitcoin (including loaned and collateralized bitcoin) . During Q4 2024, we mined 2,492 BTC and purchased 15,574 BTC using proceeds from our convertible senior notes offerings. For the full year, we acquired 22,065 bitcoin at an average price of $87,205 and mined an additional 9,430 bitcoin, increasing our total bitcoin holdings to 44,893 as of December 31, 2024. These holdings were valued at approximately $3.9 billion based on a spot price of $93,354 per bitcoin at December 31, 2024. For 2024, we had a bitcoin yield per share of 62.4%. We did not sell any bitcoin during the quarter.
*including loaned and collateralized BTC
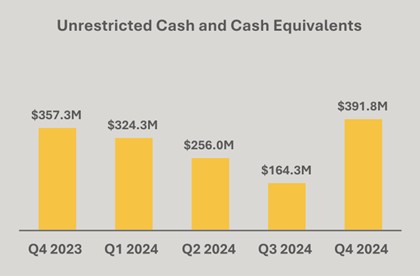
Digging more into our BTC holdings and cash position, unrestricted cash and cash equivalents totaled $391.8 million, up from $357.3 million in the prior year period. Combined, our balance of cash and BTC (including loaned and collateralized bitcoin) was approximately $4.6 billion as of December 31, 2024.
| SHAREHOLDER LETTER Q4 2024 | 13 |
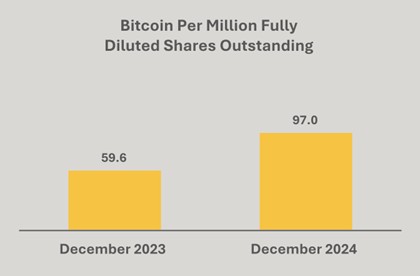
Our HODL strategy and the opportunistic BTC purchases that we made during the quarter have benefited our shareholders as they continue to see sustained yield when it comes to our BTC holdings from a per share perspective. A shareholder holding one million shares of MARA stock hypothetically holds approximately 97.0 BTC as of the end of Q4 2024, reflecting a 62.4% increase in BTC yield per share since last year. BTC yield is a key performance indicator that represents the ratio between our BTC holdings and fully diluted shares outstanding. Finally, it is important to note that our HODL per share is approximately three times more than our closest competition.
During 2024, we acquired 22,065 bitcoin at an average price of $87,205 and mined an additional 9,430 bitcoin, increasing our total bitcoin holdings to 44,893 as of December 31, 2024.
During 2024, we raised $1.9 billion from at-the-market (“ATM”) equity sales which we primarily used for miner purchases, operating costs, acquisition of infrastructure and for other general corporate purposes. ATM usage represented 43% of cash needs during the year compared to 97% in 2023.

MARA’s return on capital employed (defined as Trailing 12-months Adjusted EBITDA divided by Average Capital Employed) during the last 12-month period remains top tier amongst our competitors. This is a testament of MARA systematically investing in its mining and data center operations carefully and creating top tier value for our stockholders from a capital efficiency standpoint in this capital intensive industry. While ATMs have been the primary source of capital in this sector, as the industry evolves, we expect additional sources of capital and project finance availability thereby reducing reliance on ATM sales.
Finally, as of December 31, 2024, we held approximately $4.3 million, or 35 million Kaspa coins, on our balance sheet. During the year, we incurred significantly less cost to produce Kaspa , compared to bitcoin, which helps pay for our expenses and allows us to hold a larger amount of BTC on our balance sheet.
*including loaned and collateralized BTC
_____________________________________________

MARA Chief Financial Officer
| SHAREHOLDER LETTER Q4 2024 | 14 |
Earnings Webcast and Conference Call
MARA will hold a webcast and conference call today, February 26, 2025, at 5:00 p.m. Eastern time to discuss its financial results for the quarter and year ended December 31, 2024.
To register to participate in the conference call or to listen to the live audio webcast, please use this link. The webcast will also be broadcast live and available for replay via the investor relations section of our website.
Earnings Webcast and Conference Call Details
Date: Wednesday, February 26, 2025
Time: 5:00 p.m. Eastern time (2:00 p.m. Pacific time)
Registration link: LINK
If you have any difficulty connecting with the conference call, please contact MARA’s investor relations team at ir@mara.com
About MARA
MARA (NASDAQ: MARA) is a global leader in digital asset compute that develops and deploys innovative technologies to build a more sustainable and inclusive future. MARA secures the world’s preeminent blockchain ledger and supports the energy transformation by converting clean, stranded, or otherwise underutilized energy into economic value.
For more information, visit www.mara.com, or follow us on:
| @MARAHoldings | |
| MARAHoldings | |
| MARAHoldings | |
| @MARAHoldingsinc |
MARA Company Contacts:
Telephone: 1.800.804.1690
Email: ir@mara.com
MARA Media Contact:
Email: mara@wachsman.com
| SHAREHOLDER LETTER Q4 2024 | 15 |
MARA Holdings, Inc. and Subsidiaries
Consolidated Statements of Operations (Unaudited)
| Three Months Ended December 31, | Year Ended December 31, | |||||||||||||||
| (in thousands, except share and per share data) | 2024 | 2023 | 2024 | 2023 | ||||||||||||
| Total revenues | $ | 214,394 | $ | 156,768 | $ | 656,378 | $ | 387,508 | ||||||||
| Costs and expenses | ||||||||||||||||
| Cost of revenues | ||||||||||||||||
| Mining and hosting services | (130,420 | ) | (75,111 | ) | (412,045 | ) | (223,338 | ) | ||||||||
| Depreciation and amortization | (136,767 | ) | (70,957 | ) | (403,706 | ) | (179,513 | ) | ||||||||
| Total cost of revenues | (267,187 | ) | (146,068 | ) | (815,751 | ) | (402,851 | ) | ||||||||
| Operating expenses | ||||||||||||||||
| General and administrative expenses | (77,924 | ) | (38,014 | ) | (272,078 | ) | (92,418 | ) | ||||||||
| Change in fair value of digital assets | 442,918 | 213,616 | 813,814 | 331,484 | ||||||||||||
| Change in fair value of derivative instrument | 33,192 | — | (2,043 | ) | — | |||||||||||
| Research and development | (4,105 | ) | (1,239 | ) | (13,229 | ) | (2,812 | ) | ||||||||
| Early termination expenses | — | — | (38,061 | ) | — | |||||||||||
| Amortization of intangible assets | (261 | ) | — | (22,919 | ) | — | ||||||||||
| Total operating expenses | 393,820 | 174,363 | 465,484 | 236,254 | ||||||||||||
| Operating income | 341,027 | 185,063 | 306,111 | 220,911 | ||||||||||||
| Change in fair value of digital assets, restricted | 299,796 | — | 299,796 | — | ||||||||||||
| Gain on investments | — | — | 4,236 | — | ||||||||||||
| Gain (loss) on hedge instruments | 1,712 | (17,421 | ) | (580 | ) | (17,421 | ) | |||||||||
| Equity in net earnings of unconsolidated affiliate | (680 | ) | 30 | (1,505 | ) | (617 | ) | |||||||||
| Net gain from extinguishment of debt | 13,121 | — | 13,121 | 82,267 | ||||||||||||
| Interest income | 8,056 | 1,443 | 16,711 | 2,809 | ||||||||||||
| Interest expense | (8,029 | ) | (1,214 | ) | (12,996 | ) | (10,350 | ) | ||||||||
| Other non-operating income (loss) | (8,458 | ) | — | (8,391 | ) | — | ||||||||||
| Income before income taxes | 646,545 | 167,901 | 616,503 | 277,599 | ||||||||||||
| Income tax expense | (118,262 | ) | (16,075 | ) | (75,495 | ) | (16,426 | ) | ||||||||
| Net income | $ | 528,283 | $ | 151,826 | $ | 541,008 | $ | 261,173 | ||||||||
| Net loss attributable to noncontrolling interest | 245 | — | 245 | — | ||||||||||||
| Net income attributable to MARA | $ | 528,528 | $ | 151,826 | $ | 541,253 | $ | 261,173 | ||||||||
| Series A preferred stock accretion to redemption value | — | — | — | (2,121 | ) | |||||||||||
| Net income attributable to common stockholders | $ | 528,528 | $ | 151,826 | $ | 541,253 | $ | 259,052 | ||||||||
| Net income per share of common stock - basic | $ | 1.36 | $ | 0.67 | $ | 1.87 | $ | 1.41 | ||||||||
| Weighted average shares of common stock - basic | 388,689,395 | 227,444,786 | 289,961,989 | 183,855,570 | ||||||||||||
| Net income per share of common stock - diluted | $ | 1.24 | $ | 0.66 | $ | 1.72 | $ | 1.06 | ||||||||
| Weighted average shares of common stock - diluted | 419,880,332 | 233,358,831 | 311,841,347 | 192,293,277 | ||||||||||||
| SHAREHOLDER LETTER Q4 2024 | 16 |
| Unaudited | Three Months Ended December 31, | Year Ended December 31, | ||||||||||||||
| (in thousands, except share and per share data) | 2024 | 2023 | 2024 | 2023 | ||||||||||||
| Supplemental information: | ||||||||||||||||
| BTC production during the period, in whole BTC | 2,492 | 4,242 | 9,430 | 12,852 | ||||||||||||
| Average BTC per day, in whole BTC | 27.1 | 46.1 | 25.8 | 35.2 | ||||||||||||
| General and administrative expenses excluding stock-based compensation | $ | (23,867 | ) | $ | (19,277 | ) | $ | (114,436 | ) | $ | (59,774 | ) | ||||
| Energized Hashrate (Exahashes per second) - at end of period (2) | 53.2 | 24.7 | 53.2 | 24.7 | ||||||||||||
| Direct Energy Cost per bitcoin (2) | $ | 31,527 | $ | — | $ | 28,801 | $ | — | ||||||||
| Cost per kilowatt per hour (“KWh”) (2) | 0.046 | — | 0.039 | — | ||||||||||||
| Cost per Petahash per day (2) | $ | 35.1 | $ | 42.3 | $ | 38.6 | $ | 46.4 | ||||||||
| BTC Yield (2) | 23.6 | % | (3.1 | )% | 62.4 | % | (22.1 | )% | ||||||||
| Average cost BTC mined (2) | $ | 52,035 | $ | 18,086 | $ | 41,908 | $ | 17,530 | ||||||||
| Average cost BTC purchased (2) | $ | 98,531 | N/A | $ | 87,205 | N/A | ||||||||||
| Share of available miner rewards | 5.6 | % | 4.4 | % | 4.1 | % | 3.6 | % | ||||||||
| Number of blocks won | 703 | 562 | 2,132 | 1,725 | ||||||||||||
| Transaction fees as a percentage of total | 3.5 | % | 13.4 | % | 6.2 | % | 7.7 | % | ||||||||
| Reconciliation to Adjusted EBITDA: | ||||||||||||||||
| Net income | $ | 528,283 | $ | 151,826 | $ | 541,008 | $ | 261,173 | ||||||||
| Interest expense (income), net | (27 | ) | (229 | ) | (3,715 | ) | 7,541 | |||||||||
| Income tax expense | 118,262 | 16,075 | 75,495 | 16,426 | ||||||||||||
| Depreciation and amortization | 140,169 | 72,550 | 438,995 | 181,590 | ||||||||||||
| EBITDA | 786,687 | 240,222 | 1,051,783 | 466,730 | ||||||||||||
| Stock compensation expense | 54,057 | 18,737 | 157,642 | 32,644 | ||||||||||||
| Change in fair value of derivative instrument | (33,192 | ) | — | 2,043 | — | |||||||||||
| Early termination expenses and other | — | — | 33,825 | — | ||||||||||||
| Net gain from extinguishment of debt | (13,121 | ) | — | (13,121 | ) | (82,267 | ) | |||||||||
| Adjusted EBITDA (1) | $ | 794,431 | $ | 258,959 | $ | 1,232,172 | $ | 417,107 | ||||||||
| Reconciliation to Return on capital employed: | ||||||||||||||||
| Adjusted EBITDA (1) | $ | 1,232,172 | $ | 417,107 | ||||||||||||
| Average capital employed (1) | 4,032,570 | 1,481,959 | ||||||||||||||
| Return on capital employed | 30.6 | % | 28.1 | % | ||||||||||||
| Reconciliation to Total margin excluding depreciation and amortization: | ||||||||||||||||
| Total revenues | $ | 214,394 | $ | 156,768 | $ | 656,378 | $ | 387,508 | ||||||||
| Total cost of revenues | (267,187 | ) | (146,068 | ) | (815,751 | ) | (402,851 | ) | ||||||||
| Total margin | (52,793 | ) | 10,700 | (159,373 | ) | (15,343 | ) | |||||||||
| Less: Cost of revenues - depreciation and amortization | 136,767 | 70,957 | 403,706 | 179,513 | ||||||||||||
| Total margin excluding the depreciation and amortization: | ||||||||||||||||
| Mining | 85,118 | 81,657 | 243,098 | 164,170 | ||||||||||||
| Hosting services | (1,144 | ) | — | 1,235 | — | |||||||||||
| Total margin excluding the depreciation and amortization: | $ | 83,974 | $ | 81,657 | $ | 244,333 | $ | 164,170 | ||||||||
| SHAREHOLDER LETTER Q4 2024 | 17 |
(1) Non-GAAP Financial Measures. In order to provide a more comprehensive understanding of the information used by our management team in financial and operational decision-making, we supplement our Consolidated Financial Statements that have been prepared in accordance with generally accepted accounting principles in the United States (“GAAP”) with the non-GAAP financial measures of adjusted EBITDA, return on capital employed and total margin excluding depreciation and amortization.
The Company defines adjusted EBITDA as (a) GAAP net income (loss) plus (b) adjustments to add back the impacts of (1) interest income, (2) interest expense, (3) income tax expense (benefit), (4) depreciation and amortization, and (5) adjustments for non-cash and/or non-recurring items with currently include (i) stock compensation expense, (ii) change in fair value of derivative instrument, (iii) early termination expenses and other and (iv) net gain from extinguishment of debt. The Company defines return on capital employed as (a) adjusted EBITDA divided by (b) average capital employed calculated by averaging the trailing four quarters of total assets less current liabilities. The Company defines total margin excluding depreciation and amortization as (a) GAAP total margin less (b) depreciation and amortization.
Management uses adjusted EBITDA, return on capital employed and total margin excluding depreciation and amortization, along with the supplemental information provided herein, as a means of understanding, managing, and evaluating business performance and to help inform operating decision-making. The Company relies primarily on its Consolidated Financial Statements to understand, manage, and evaluate its financial performance and uses non-GAAP financial measures only supplementally.
We believe that adjusted EBITDA, return on capital employed and total margin excluding depreciation and amortization are useful measures to us and to our investors because they exclude certain financial, capital structure, and/or non-cash items that we do not believe directly reflect our core operations and may not be indicative of our recurring operations, in part because they may vary widely across time and within our industry independent of the performance of our core operations. We believe that excluding these items enables us to more effectively evaluate our performance period-over-period and relative to our competitors.
Adjusted EBITDA, return on capital employed and total margin excluding depreciation and amortization are not recognized measurements under GAAP. When analyzing our operating results, investors should use them in addition to, but not as an alternative for, the most directly comparable financial results calculated and presented in accordance with GAAP. Because our calculation of these non-GAAP financial measures may differ from other companies, our presentation of these measures may not be comparable to similarly titled measures of other companies.
(2) Mining and hosting services margin excluding the impact of depreciation and amortization is calculated using revenues less cost of revenues, excluding depreciation and amortization, for mining and hosting services, respectively. The Company defines Energized Hashrate as the total hashrate that could theoretically be generated if all mining rigs that have been operational are currently in operation and running at 100% of the manufacturers’ specifications (includes mining servers that are offline for maintenance or similar reasons). The Company uses this metric as an indicator of progress in bringing rigs online. Hashrates are estimates based on the manufacturers’ specifications. Direct Energy Cost per Coin is calculated as the amounts paid to utility companies for power consumed divided by the quantity of bitcoin produced during the period related to our owned mining operations. Cost per KWh is calculated using the amounts paid to utility companies for power consumed divided by the KWh consumed. Cost per Petahash per day is calculated using mining cost of revenues, excluding depreciation and amortization, divided by the daily average operational hashrate online during the period, excluding the Company’s share of the hashrate for the equity method investee, by a factor of 1,000. BTC Yield is a key performance indicator that represents the percentage change period-to-period of the ratio between the Company’s bitcoin holdings and its Assumed Fully Diluted Shares Outstanding. Assumed Fully Diluted Shares Outstanding refers to the aggregate of the Company’s actual shares of common stock outstanding as of the end of the applicable period plus all additional shares that would result from the assumed conversion of all outstanding convertible notes, exercise of all outstanding warrants and settlement of all outstanding restricted stock units and performance-based restricted stock units. Average cost of BTC mined is calculated using the bitcoin mining cost of revenues, excluding depreciation and amortization, divided by the bitcoin production, excluding the Company’s share of the bitcoin produced for the equity method investee, the ADGM entity. Average cost of BTC produced is calculated using the total cost of bitcoin purchased divided by the total bitcoin purchased. All figures are estimates and rounded.
The Company believes that these metrics are useful as an indicator of potential BTC production. However, these metrics cannot be tied directly to any production level expected to be actually achieved as (a) there may be delays in the energization of hashrate and (b) the Company cannot predict when operational mining rigs may be offline for any reason.
| SHAREHOLDER LETTER Q4 2024 | 18 |
Investing in our securities involves a high degree of risk. Before making an investment decision, you should carefully consider the risks, uncertainties and forward-looking statements described under the heading “Risk Factors” in our most recent annual report on Form 10-K and any other periodic reports that we may file with the U.S. Securities and Exchange Commission (the “SEC”). If any of these risks were to occur, our business, financial condition or results of operations would likely suffer. In that event, the value of our securities could decline, and you could lose part or all of your investment. The risks and uncertainties we describe are not the only ones facing us. Additional risks not presently known to us or that we currently deem immaterial may also impair our business operations. In addition, our past financial performance may not be a reliable indicator of future performance, and historical trends should not be used to anticipate results in the future. See “Forward-Looking Statements” below.
This press release contains forward-looking statements within the meaning of the federal securities laws. All statements, other than statements of historical fact, included in this press release are forward-looking statements. The words “may,” “will,” “could,” “anticipate,” “expect,” “intend,” “believe,” “continue,” “target” and similar expressions or variations or negatives of these words are intended to identify forward-looking statements, although not all forward-looking statements contain these identifying words. Such forward-looking statements include, among other things, statements related to our strategy, future operations, growth targets, developing technologies and expansion into adjacent markets. Such forward-looking statements are based on management’s current expectations about future events as of the date hereof and involve many risks and uncertainties that could cause our actual results to differ materially from those expressed or implied in our forward-looking statements. Subsequent events and developments, including actual results or changes in our assumptions, may cause our views to change. We do not undertake to update our forward-looking statements except to the extent required by applicable law. Readers are cautioned not to place undue reliance on such forward-looking statements. All forward-looking statements included herein are expressly qualified in their entirety by these cautionary statements. Our actual results and outcomes could differ materially from those included in these forward-looking statements as a result of various factors, including, but not limited to, the factors set forth under the heading “Risk Factors” in our most recent annual report on Form 10-K and any other periodic reports that we may file with the SEC.