Exhibit 99.1
TECHNICAL REPORT and Preliminary Economic ASSESSMENT FOR combined mill and heap leach processing at THE NORTH BULLFROG PROJECT,
BULLFROG MINING DISTRICT,
NYE COUNTY, NEVADA
June 16, 2015
Amended and Restated
May 18, 2016
PREPARED FOR:
CORVUS GOLD INC.
by
QUALIFIED PERSONS:
Scott E. Wilson, C.P.G., SME Metal Mining Consultants, Inc. 9137 S. Ridgeline Blvd., Ste. 140 Highlands Ranch, CO 80129 720-348-1646 | Stephen Batman, Mining Eng., SME SBB Mining Solutions, LLC #232, 12650 W 64th Avenue, Unit E Arvada, CO 80004 720-353-0573 |
| | |
Herbert C. Osborne, Metallurgical Eng, SME H. C. Osborne and Associates 12885 Lanewood Street Commerce City, CO 80022 303-654-0431 | William J. Pennstrom, Jr., Metallurgical Eng., SME Pennstrom Consulting Inc. 2728 Southshire Rd., Highlands Ranch, CO 80126 303-683-9227 |
Corvus Gold Corp. Technical Report – North Bullfrog Project |  | Page | 2 |
DATE AND SIGNATURE PAGE
Corvus Gold Inc.: Technical Report And Preliminary Economic Assessment For Combined Mill and Heap Leach Processing At The North Bullfrog Project, Bullfrog Mining District, Nye County, Nevada.
The effective date of this report June 16, 2015.
Dated this 19th day of May, 2016
| (signed/sealed) Scott E. Wilson | | |
| Scott E. Wilson, C.P.G., | | |
| Geologist | | |
| | | |
| (signed) Stephen B. Batman | | |
| Stephen B. Batman, SME-RM | | |
| Mining Engineer | | |
| | | |
| (signed) Herbert Osborne | | |
| Herbert Osborne, SME-RM | | |
| Metallurgist | | |
| | | |
| (signed) William J. Pennstrom, Jr. | | |
| William J. Pennstrom, Jr., SME-RM | | |
| Metallurgist | | |
Corvus Gold Corp. Technical Report – North Bullfrog Project | | Page | 3 |
AUTHOR’S CERTIFICATE
Scott E. Wilson
I, Scott E. Wilson, C.P.G, SME, of Highlands Ranch, Colorado, as an author of the technical report entitled “Technical Report and Preliminary Economic Assessment for Combined Mill and Heap Leach Processing at the North Bullfrog Project, Bullfrog Mining District, Nye County, Nevada” with an effective date of June 16, 2015 as amended and restated on May 18, 2016 prepared for Corvus Gold, Inc. (the “Issuer”), do hereby certify:
| 1. | I am currently employed as President by Metal Mining Consultants Inc., 9137 S. Ridgeline Blvd., Suite 140, Highlands Ranch, Colorado 80129. |
| | 2. | I graduated with a Bachelor of Arts degree in Geology from the California State University, Sacramento in 1989. |
| | 3. | I am a Certified Professional Geologist and member of the American Institute of Professional Geologists (CPG #10965) and a Registered Member (#4025107) of the Society for Mining, Metallurgy and Exploration, Inc. |
| | 4. | I have been employed as either a geologist or an engineer continuously for a total of 27 years. My experience included resource estimation, mine planning, geological modeling, geostatistical evaluations, project development, and authorship of numerous technical reports and preliminary economic assessments of various projects throughout North America, South America and Europe. Of note I was responsible for the mineral resource estimation for Hemco Nicaragua from 2009 through 2012, which is a producing underground epithermal gold deposit. I have employed and mentored mining engineers and geologists continuously since 2003. |
| | 5. | I have read the definition of “Qualified Person” set out in National Instrument 43-101 (“NI 43-101) and certify that by reason of my education, affiliation with a professional association (as defined in NI 43-101) and past relevant work experience, I fulfill the requirements to be a “Qualified Person” for the purposes of NI 43-101. |
| | 6. | I made a personal inspection of the North Bullfrog Project on January 30th and 31st, 2012, on March 24, 2014 and on November 2nd and 3rd, 2015. |
| | 7. | I am responsible for Sections 1 through 12, Section 14, Section 20 and Sections 23 through 27 of the technical report titled “Technical Report and Preliminary Economic Assessment for Combined Mill and Heap Leach Processing at the North Bullfrog Project, Bullfrog Mining District, Nye County, Nevada” as amended and restated on May 18, 2016 (the “Technical Report.”). |
| | 8. | I am independent of the issuer as independence is described in Section 1.5 of NI 43-101. |
| | 9. | Prior to being retained by Corvus Gold Inc. (the “issuer”), I have not had prior involvement with the property that is the subject of the Technical Report. |
| | 10. | That I have read NI 43-101 and Form 43-101F1, and that this Technical Report was prepared in compliance with NI 43-101. |
| | 11. | As of the effective date of this report, to the best of my knowledge, information and belief, the overall preparation of this report and specifically Sections 1 through 12, Section 14, Section 20 and Sections 23 through 27 of the Technical Report contains all scientific and technical information that is required to be disclosed to make the portions of the Technical Report for which I am responsible not misleading. |
Dated: May 19, 2016
| (signed/sealed) Scott Wilson | |
| Scott E. Wilson, C.P.G. | |
Corvus Gold Corp. Technical Report – North Bullfrog Project | | Page | 4 |
AUTHOR’S CERTIFICATE
Stephen Batman
I, Stephen Batman, Mining Engineer, SME of Arvada, Colorado, as an author of the technical report entitled “Technical Report and Preliminary Economic Assessment for Combined Mill and Heap Leach Processing at the North Bullfrog Project, Bullfrog Mining District, Nye County, Nevada” with an effective date of June 16, 2015 as amended and restated on May 18, 2016 prepared for Corvus Gold, Inc. (the “Issuer”), do hereby certify:
| | 1. | I am currently employed as Principle Mining Engineer by SBB Mining Solutions, LLC, #232, 12650 W 64th Avenue, Unit E, Arvada, Colorado 80004. |
| 2. | I graduated with a Bachelor of Science degree in Mining Engineering from the Colorado School of Mines, Golden, Colorado in 1985. |
| 3. | I am a Registered Member (#181580RM) of the Society for Mining, Metallurgy and Exploration, Inc. |
| 4. | I have been employed as either a miner or an engineer continuously for a total of 30 years. My experience included resource estimation, mine planning, pit optimizations and geostatistical evaluations of numerous technical reports and preliminary economic assessments of various projects throughout North America, South America and Africa. I have been involved in the evaluation and conceptual development of new and existing mining projects, managing studies to develop projects and managing due diligences for acquisitions. Prior to entering the consulting business, I was employed as a mining engineer twenty five of my thirty years at operating mines in Nevada, the US and Australia. I have prepared capital and operating budgets and developed mining and haulage studies. I have overseen and developed operational schedules and implemented mine plans to meet targets. I have been involved with mine supervision in several large pits, mining equipment purchases, and construction projects. I have employed and mentored mining engineers over the last ten years. |
| 5. | I have read the definition of “Qualified Person” set out in National Instrument 43-101 (“NI 43-101) and certify that by reason of my education, affiliation with a professional association (as defined in NI 43-101) and past relevant work experience, I fulfill the requirements to be a “Qualified Person” for the purposes of NI 43-101. |
| 6. | I made a personal inspection of the North Bullfrog Project on March 12,2015. |
| 7. | I am responsible for sections 15, 16, and relevant portions of 21 and 25 of the technical report titled “Technical Report and Preliminary Economic Assessment for Combined Mill and Heap Leach Processing at the North Bullfrog Project, Bullfrog Mining District, Nye County, Nevada, as amended and restated on May 18, 2016 (the “Technical Report.”). |
| 8. | I am independent of the issuer as independence is described in Section 1.5 of NI 43-101. |
| 9. | I have not had prior involvement with the property that is the subject of the Technical Report. |
| 10. | That I have read NI 43-101 and Form 43-101F1, and that this Technical Report was prepared in compliance with NI 43-101. |
| 11. | As of the effective date of this report, to the best of my knowledge, information and belief, the portions of the Technical Report for which I am responsible contains all scientific and technical information that is required to be disclosed to make the portions of the Technical Report for which I am responsible not misleading. |
Dated: May 19, 2016
| (signed) Stephen B. Batman | |
| Stephen B. Batman, SME-RM | |
Corvus Gold Corp. Technical Report – North Bullfrog Project | | Page | 5 |
AUTHOR’S CERTIFICATE
Herbert Osborne
I, Herbert Osborne, Metallurgist, SME, of Commerce City, Colorado, as an author of the technical report entitled “Technical Report and Preliminary Economic Assessment for Combined Mill and Heap Leach Processing at the North Bullfrog Project, Bullfrog Mining District, Nye County, Nevada” with an effective date of June 16, 2015 as amended and restated on May 18, 2016 prepared for Corvus Gold, Inc. (the “Issuer”), do hereby certify that:
| 1. | I am a consulting metallurgical engineer at H.C. Osborne and Associates and reside at 12885 Lanewood Street, Commerce City, CO, USA 80022. |
| 2. | I am a graduate of the Colorado School of Mines with a degree in Metallurgical Engineering. |
| 3. | I am Registered Member No. 2430050 RM, in good standing, of the Society of Mining, Metallurgy and Exploration. |
| 4. | I have worked in the Mineral Processing Industry for a total of 53 years after attending the Colorado School of Mines. During this time, I have held positions as Mill Engineer, Mill Superintendent, Plant Superintendent, Mine Manager and Manager of Mines. I have been a practicing consulting engineer since 1983. |
| 5. | I have read the definition of “qualified person” set out in National Instrument 43-101 (“NI 43-101”) and certify that by reason of education, past relevant work experience, and affiliation with a professional associations (as defined in NI 43-101), I fulfill the requirements to be a “qualified person” for the purposes of NI 43-101. |
| 6. | I have not visited the North Bullfrog Property. |
| 7. | I am responsible for the preparation of Section 13 and 17, and the relevant portions of Sections 1, and 25, of the technical report titled “Technical Report and Preliminary Economic Assessment for Combined Mill and Heap Leach Processing at the North Bullfrog Project, Bullfrog Mining District, Nye County, Nevada” as amended and restated on May 18, 2016 (the “Technical Report”). |
| 8. | I am independent of the issuer applying all of the tests in section 1.5 of NI 43-101. |
| 9. | I have not had prior involvement with the property that is the subject of the Technical Report. |
| 10. | I have read NI 43-101, and the portions of the Technical Report for which I am responsible have been prepared in compliance with NI 43-101. |
| 11. | As of the effective date of the Technical Report, to the best of my knowledge, information and belief, the portions of the Technical Report for which I am responsible contain all scientific and technical information that is required to be disclosed to make the portions of the Technical Report for which I am responsible not misleading. |
Dated May 19, 2016
| (signed) Herbert Osborne | |
| Herbert Osborne, SME-RM |
Corvus Gold Corp. Technical Report – North Bullfrog Project | | Page | 6 |
AUTHOR’S CERTIFICATE
William J. Pennstrom, Jr.
I, William J. Pennstrom, Jr., Metallurgist, SME, of Highlands Ranch, Colorado, as an author of the technical report entitled “Technical Report and Preliminary Economic Assessment for Combined Mill and Heap Leach Processing at the North Bullfrog Project, Bullfrog Mining District, Nye County, Nevada” with an effective date of June 16, 2015 as amended and restated on May 18, 2016 prepared for Corvus Gold, Inc. (the “Issuer”), do hereby certify that:
| 1. | I am a consulting metallurgical engineer and President of Pennstrom Consulting, Inc., 2728 Southshire Rd., Highlands Ranch, CO 80126, USA. |
| 2. | I am a graduate of the University of Missouri Rolla (currently known as Missouri S&T) with a BS degree in Metallurgical Engineering. I am also a graduate of Webster University in St. Louis, MO, with a MA degree in Business Management. |
| 3. | I am a Registered Member in good standing of the Society of Mining, Metallurgy and Exploration (#2503900RM). I am also a Qualified Professional Member of the Mining and Metallurgical Society of America. |
| 4. | I have worked in the Mineral Processing Industry for a total of 32 years since before, during, and after my attending the University of Missouri. I have been an independent process/metallurgical consultant for the last twelve (12) years for the mining industry. |
| 5. | I have read the definition of "qualified person" set out in National Instrument 43-101 (NI 43-101) and certify that by reason of education, experience, independence and affiliation with a professional association (as defined in NI 43-101), I meet the requirements of a Qualified Person as defined in NI 43-101. |
| 6. | I have visited the North Bullfrog Project site on January 30th and 31st, 2012 and on March 12, 2015. |
| 7. | I am responsible for the preparation of Sections 18, 19 and 22, portions of Section 21, and relevant portions of Sections 1 and 25 of the technical report titled "Technical Report and Preliminary Economic Assessment for Combined Mill and Heap Leach Processing at the North Bullfrog Project, Bullfrog Mining District, Nye County, Nevada” as amended and restated on May 18, 2016 (the “Technical Report” |
| 8. | I am independent of the issuer as independence is described in section 1.5 of NI 43-101. |
| 9. | I have not previously had any prior involvement with the property that is the subject of the Technical Report. |
| 10. | I have read National Instrument 43-101 and Form 43-101F1, and the Technical Report has been prepared in compliance with that instrument and form. |
| 11. | As of the effective date of the Technical Report, to the best of my knowledge, information and belief, the portions of the Technical Report for which I am responsible contains all scientific and technical information that is required to be disclosed to make the portions of the Technical Report for which I am responsible not misleading. |
Dated May 19, 2016
| (signed) William J. Pennstrom, Jr. | |
| William J. Pennstrom, Jr., SME-RM | |
Corvus Gold Corp. Technical Report – North Bullfrog Project | | Page | 7 |
TABLEOF CONTENTS
Corvus Gold Corp. Technical Report – North Bullfrog Project | | Page | 8 |
Corvus Gold Corp. Technical Report – North Bullfrog Project | | Page | 9 |
Corvus Gold Corp. Technical Report – North Bullfrog Project | | Page | 10 |
Corvus Gold Corp. Technical Report – North Bullfrog Project | | Page | 11 |
Corvus Gold Corp. Technical Report – North Bullfrog Project | | Page | 12 |
Corvus Gold Corp. Technical Report – North Bullfrog Project | | Page | 13 |
Corvus Gold Corp. Technical Report – North Bullfrog Project | | Page | 14 |
Corvus Gold Corp. Technical Report – North Bullfrog Project | | Page | 15 |
Corvus Gold Corp. Technical Report – North Bullfrog Project | | Page | 16 |
LIST OF TABLES
Corvus Gold Corp. Technical Report – North Bullfrog Project | | Page | 17 |
| Table 13-6 North Bullfrog Project Summary of Mcclelland Bulk Sample Column Leach Test Results | 137 |
| Table 13-7 North Bullfrog Project Summary Metallurgical Results, Grind Size Optimization Bottle Roll Tests, Bulk Mayflower Samples | 138 |
| Table 13-8 Summary Metallurgical Results, Bottle Roll Tests, North Bullfrog Drill Core Composites, Mayflower (MF) | 139 |
| Table 13-9 Summary Metallurgical Results, Bottle Roll Tests, North Bullfrog Drill Core Composites, Savage Valley (SV). | 140 |
| Table 13-10 Summary Metallurgical Results, Gold Recovery from Column Percolation Leach Tests, Mayflower Drill Core Composites (kg-Kilograms, mt – Metric Tonnes). | 141 |
| Table 13-11 Summary Metallurgical Results, Silver Recovery from Column Percolation Leach Tests, Mayflower Drill Core Composites (kg-Kilograms, mt – Metric Tonnes) | 142 |
| Table 13-12 Summary Metallurgical Results, Gold Recovery from Column Percolation Leach Tests, Savage Valley Drill Core Composites (kg-Kilograms; mt-Metric Tonnes). | 142 |
| Table 13-13 Summary Metallurgical Results, Silver Recovery from Column Percolation Leach Tests, Savage Valley Drill Core Composites (kg-Kilograms; mt-Metric Tonnes) | 143 |
| Table 13-14 Summary Metallurgical Results, Bottle Roll Tests, North Bullfrog Drill Composites, Sierra Blanca | 143 |
| Table 13-15 Summary Metallurgical Results, Bottle Roll Tests, North Bullfrog Drill Core Composites, Jolly Jane | 146 |
| Table 13-16 Summary Metallurgical Results, Gold Recovery from Column Percolation Leach Tests, Jolly Jane Drill Core Composites (82 to 92% -19mm). | 147 |
| Table 13-17 Summary Metallurgical Results, Silver Recovery from Column Percolation Leach Tests, Jolly Jane Drill Core Composites (82 to 92% -19mm) | 147 |
| Table 13-18 Summary Metallurgical Results, Gold Recovery from Column Percolation Leach Tests, Sierra Blanca Drill Core Composites (86 to 94% -19mm) | 148 |
| Table 13-19 Summary Metallurgical Results, Silver Recovery from Column Percolation Leach Tests, Sierra Blanca Drill Core Composites (86 to 94% -19mm) | 148 |
| Table 13-20 Summary Metallurgical Results, Bottle Roll Tests, Yellow Jacket Drill Core Composites, 80%-75 µm Feed Size | 149 |
| Table 13-21 Summary of Bottle Roll Tests, YellowJacket YJ PQ Drill Core Composites. | 152 |
| Table 13-22 Summary Metallurgical Results, Gold Recovery from Column Percolation Leach Tests, YellowJacket YJ PQ Drill Core Composites (80% -6.3mm and 80% -19mm) | 153 |
Corvus Gold Corp. Technical Report – North Bullfrog Project | | Page | 18 |
Corvus Gold Corp. Technical Report – North Bullfrog Project | | Page | 19 |
Corvus Gold Corp. Technical Report – North Bullfrog Project | | Page | 20 |
Corvus Gold Corp. Technical Report – North Bullfrog Project | | Page | 21 |
LIST OF FIGURES
Corvus Gold Corp. Technical Report – North Bullfrog Project | | Page | 22 |
Corvus Gold Corp. Technical Report – North Bullfrog Project | | Page | 23 |
Corvus Gold Corp. Technical Report – North Bullfrog Project | | Page | 24 |
Corvus Gold Corp. Technical Report – North Bullfrog Project | | Page | 25 |
| Figure 18-1 Conceptual Configuration of the North Bullfrog Surface Mines and Associated Overburden Storage, Mill, Tailings and Leach Pad Facilities. | 221 |
| Figure 22-1 Estimated Gold and Silver Production by Year for North Bullfrog Project (45% Measured and Indicated Resource; 55%% Inferred Resource). | 233 |
| Figure 22-2 Sensitivity of Estimated NPV @ 5% (after-Royalty and after-Tax) for Changes in Cost, Gold Recovery or Gold Price as a Percent of the Base Case at a Gold Price of $1,200 per Ounce, Gold:Silver Price Ratio of 73.7, 78%% Gold Recovery and Cost as Defined in Table 22-3 | 237 |
| Figure 22-3 Sensitivity of Estimated IRR (after-Royalty and after-Tax) for Changes in Cost, Gold Recovery or Gold Price as a Percent of the Base Case at a Gold Price of $1,200 per Ounce, Gold:Silver Price Ratio 0f 73.7, 78% Gold Recovery and Cost as Defined in Table 22-3. | 237 |
Corvus Gold Corp. Technical Report – North Bullfrog Project | | Page | 26 |
Metal Mining Consultants Inc. PEA Highlights: North Bullfrog Project. ("MMC"), SBB Mining Solutions LLC (“SBBM”), H. C. Osborne and Associates (“HCO”), and Pennstrom Consulting, Inc.(“PCI”) have been requested by Corvus Gold Inc. ("Corvus") to complete a Preliminary Economic Assessment (“PEA”) and associated National Instrument 43-101 (“NI 43-101”) Technical Report for the North Bullfrog Project (the "NBP" or the “Project”) located in Nevada.
The PEA has been prepared according to Canadian Institute of Mining, Metallurgy and Petroleum (“CIM”) Standards and in accordance with NI 43-101.
Summary results of the PEA are listed in Table 1-1. The PEA is preliminary in nature, and there is no certainty that the results set forth in the PEA will be realized. The mineral resource estimate included in this report includes inferred mineral resources which are too speculative geologically to have the economic considerations applied to them that would enable them to be categorized as Mineral Reserves. A summary of projected financial performance is listed in Table 1-2.
| Table 1-1 PEA Highlights: North Bullfrog Project |
| Note: The reader is cautioned that Mineral Resources are not Mineral Reserves, and as such, do not have demonstrated economic viability. |
| Project Element | Mill | Heap Leach |
| Mineral Resource (Measured and Indicated) |
| M&I Resource (M tonnes) | 5.67 | 23.15 |
| M&I Resource (gram Au/tonne) | 2.22 | 0.30 |
| M&I Resource (gram Ag/tonne) | 16.67 | 0.46 |
| M&I Silver : Gold ratio | 7.5:1 | 1.5:1 |
| Strip Ratio (waste/resource) | 2.0:1 | 0.4:1 |
| Mineral Resource (Inferred) |
| Inferred Resource (M tonnes) | 1.48 | 176.4 |
| Inferred Resource (grams Au/tonne) | 0.83 | 0.19 |
| Inferred Resource (grams Ag/tonne) | 4.26 | 0.67 |
| Inferred Silver : Gold ratio | 5.1:1 | 3.5:1 |
| Production |
| Mine Life (years) | 6 | 10 |
| tonnes / day (nominal) | 3,000 | 43,000 |
| Gold Recovery (%) | 87% | 74% |
| Silver Recovery (%) | 74% | 6% |
| Total koz. Recovered (Au)(1) | 379.9 | 811.8 |
| Total koz. Recovered (Ag)(1) | 2,280.9 | 203.9 |
| Total koz. Recovered (Au eq.)(1)(2) | 410.8 | 814.5 |
| Project Financials |
| Estimated Capital (US $) | 258.7M |
| Capital / Recovered Au eq oz (US $/oz) | 206 |
| Estimated Total Cash Cost / Recovered Au Eq Oz. (US $) | 635 |
| Cash Cost / Recovered Au eq oz(1)(2) (US $/oz) | 620 |
| Net Present Value (NPV), 5% (US $)(3) | 246M |
Undiscounted Total Cash Flow (US $)(3) Rate of Return (DCF/ROR)(3) | 338M 37.9% |
| Payback Period (years)(3) | 2.2 |
(1) Includes Inferred Ounces (2) Au Price = $1,200/oz; Ag Price = $16.28/oz (3) After Tax and Royalty |
Corvus Gold Corp. Technical Report – North Bullfrog Project | | Page | 27 |
Table 1-2 Projected North Bullfrog Project Economic Performance (US $).
| Item | Base Case |
| Gold Price Per Ounce | $1,200 |
| Silver Price Per Ounce | $16.28 |
| Pre-Tax Economics | |
| Net Cash Flow (US $Millions) | 479 |
| NPV @ 5% Discount Rate (US $Millions) | 365 |
| NPV @ 7.5% Discount Rate (US $Millions) | 320 |
| NPV @ 10% Discount Rate (US $Millions) | 281 |
| Internal Rate of Return | 53% |
| Operating Costs Per Ounce of Gold Produced (life of mine) | $635 |
| Total Costs Per Ounce of Gold Produced (includes all capital) | $841 |
| Post-Tax Economics | |
| Net Cash Flow (US $Millions) | 338 |
| NPV @ 5% Discount Rate (US $Millions) | 246 |
| NPV @ 7.5% Discount Rate (US $Millions) | 210 |
| NPV @ 10% Discount Rate (US $Millions) | 178 |
| Internal Rate of Return | 38% |
| Operating Costs Per Ounce of Gold Produced (life of mine) | $635 |
| Total Costs Per Ounce of Gold Produced (includes all capital) | $841 |
Mineral Resources are not Mineral Reserves and do not have demonstrated economic viability. This report presents the results of the PEA based on all available technical data and information as of June 16, 2015.
The authors have produced a Mineral Resource Estimate for the NBP with an effective date of June 16, 2015. The estimate is based on 664 holes comprising 113,492 metres of length, 72,655 Au samples and 64,200 Ag samples, completed through the effective date of this report. The Project has been modelled using the NAD 27 CONUS, ZONE 11 UTM coordinate grid system.
| 1.2 | PROPERTY DESCRIPTION AND OWNERSHIP |
The NBP is located in the Bullfrog Hills of northwestern Nye County, Nevada (Figure 4-1).
Corvus’ property covers approximately 7,223 hectares of patented and unpatented lode mining claims in Sections 20, 21, 25, 26, 27, 28, 29, 32, 33, 34, 35, and 36 of T10S, R46E; sections 1, 2, 11, 12, 13, and 14 of T11S, R46E; section 31 of T10S, R47E; and section 6, 9, 15, 16 and 17 of T11S, R47E, MDBM. The NBP is accessible as a two and one half hour (260 km) drive north of Las Vegas Nevada along US Highway 95. US 95 is the major transportation route between Las Vegas, Reno Nevada and Boise Idaho. Las Vegas is serviced by a major international airport. The Project lies immediately to the west of the highway. Beatty, Nevada is the closest town to the Project with a population of about 1,100 and contains most basic services. Access around the Project is by a series of reasonably good gravel roads that extend to most of the important exploration areas.
Corvus Gold Corp. Technical Report – North Bullfrog Project | | Page | 28 |
Corvus controls the Project through a number of private land leases and unpatented federal load claims listed in Table 4.1, Table 4.3 and Table 4.4 of Section 4. Corvus owns and leases several patented lode mining claims as well as maintaining a large contiguous block of federal unpatented lode mining claims. In 2014 Corvus purchased 162 hectares of surface lands in Sarcobatus Flats approximately 26 km north of the NBP, which included water rights for 1,600 acre feet per year.
| 1.3 | GEOLOGY AND MINERALIZATION |
Gold mineralization in the NBP is primarily hosted in the middle Miocene Sierra Blanca Tuff. Gold mineralization is also hosted to a lesser extent in monolithic and heterolithic debris-flow deposits, as well as in felsic dikes and plugs. Two district-scale north striking normal faults are the dominant structural features in the Project area, but several smaller-scale faults between them are important controls for distribution of hydrothermal alteration and gold mineralization.
Two styles of precious metal epithermal mineralization are present at the NBP: 1) high-grade, structurally controlled fissure veins and associated stockwork zones, and 2) low-grade disseminated or replacement deposits within altered volcanic rocks. Historic drilling (pre-NI 43-101) outlined areas of important mineralization at the NBP. Drilling by International Tower Hill Mines Ltd. (“ITH”), Corvus predecessor-in-interest, was used to develop initial resource estimates, to better understand precious metal mineralization at Air Track Hill, and as initial tests at the Sierra Blanca, Pioneer, Savage and YellowJacket targets.
| 1.3.1 | METALLURGICAL TESTING |
During 2012-2013 metallurgical testing was performed using composite samples developed from PQ core materials produced at Mayflower, Sierra Blanca, Savage Valley and Jolly Jane. Column leach testing on up to P80 minus 19mm indicated relatively high gold recoveries in the range of 80%, and confirmed the suitability of heap leach processing on disseminated mineralization. In 2014-2015, composite samples of PQ core materials were developed from YellowJacket vein and stockwork mineralization. Those tests indicate high solubility of contained gold in cyanide leach testing at P80minus 150 microns, but reduced gold recoveries at heap leach size particles. These tests indicate that mill processing would be required on YellowJacket mineralization. Further testing of composite samples, using gravity concentration, intense cyanide leaching of gravity concentrate and cyanide leaching of the gravity tails, indicate gold recoveries in the range of 90% and silver recoveries in the range of 70%.
Corvus Gold Corp. Technical Report – North Bullfrog Project | | Page | 29 |
| 1.3.2 | CURRENT EXPLORATION AND DEVELOPMENT |
Currently, Corvus drilling is focused on the identification of other structurally controlled high-grade vein/stockwork mineralization similar to YellowJacket and historic Bullfrog deposit. This exploration is currently focused along the YellowJacket structural zone and other similar structural zones in the immediate area of the Sierra Blanca and Jolly Jane deposits. The YellowJacket zone is open to the north, south and at depth so additional drilling would be required to close off the zone. In addition exploration drilling will test several vein system targets in the newly discovered Eastern Steam-heated zone along the eastern boundary of the property. This new emerging exploration area is essentially untested and covers an area three times the size of the current area hosting the projects resource base. An RC drilling program to test a number of the targets in the greater YellowJacket and Eastern Steam Heated zones will take place over the remainder of 2015.
| 1.3.3 | NORTH BULLFROG RESOURCE ESTIMATE |
The basis for the mineral resource estimates at the NBP are geologic models interpreted by Corvus geologists and constructed in Vulcan Software by MMC. Geostatistics and estimates of mineralization were prepared by MMC. The current mineralization update focused on updating the YellowJacket Zone drilling which was completed throughout 2014. Geologic logs, alteration, geochemical data and cyanidation leach indicators were used to define the mineralized zones, and were the limiting factor for gold distribution for the resource estimations. Industry accepted grade estimation techniques were used to develop global mineralization block models. Table 1-3 lists the Measured, Indicated and Inferred Mineral Resources at various cut-off grades effective as of June 16, 2015.
Table 1-3 North Bullfrog Project Pit Constrained Mineral Resource Estimate (MMC, Scott Wilson, C.P.G.).
| Resource Area | Classification | Cutoff | Tonnes (Mt) | Au (g/t) | Ag (g/t) | Contained
Au (000’s) | Contained
Ag (000’s) |
| YellowJacket Mill | Measured | 0.56 | 3.86 | 2.55 | 19.70 | 316.51 | 2,445.23 |
| Indicated | 1.81 | 1.53 | 10.20 | 89.09 | 593.25 |
| Inferred | 1.48 | 0.83 | 4.26 | 39.36 | 203.35 |
| Sierra Blanca and YellowJacket Heap Leach | Measured | 0.15 | 0.30 | 0.25 | 2.76 | 2.34 | 26.28 |
| Indicated | 0.13 | 0.25 | 1.99 | 1.07 | 8.56 |
| Inferred | 168.40 | 0.19 | 0.68 | 1,041.80 | 3,664.32 |
| Jolly Jane Heap Leach | Indicated | 0.15 | 17.60 | 0.25 | 0.43 | 141.44 | 240.99 |
| Inferred | 7.95 | 0.20 | 0.54 | 51.00 | 137.33 |
| Mayflower Heap Leach | Indicated | 0.20 | 5.13 | 0.47 | 0.41 | 77.26 | 68.27 |
Mineral resources are not mineral reserves and do not demonstrate economic viability. There is no certainty that all or any part of the mineral resource will be converted to mineral reserves. Quantity and grade are estimates and are rounded to reflect the fact that the resource estimate is an approximation.
Corvus has invested considerable effort and investment in the advancement of the North Bullfrog Project through drilling, permitting, technical and metallurgical evaluations, internally and with the assistance of reputable consulting firms. This evaluation indicates a strong positive and robust performance of a combination heap leaching and milling facility at the Project at the current metal price environment. The project performance is most sensitive to gold price and gold recovery. Metallurgical data to this point indicates economic extraction of metals is not complicated.
Corvus Gold Corp. Technical Report – North Bullfrog Project | | Page | 30 |
The project economics suggest that this is a project that can be put into production for a total capital investment of approximately US $258.7 million and with the initial capital being paid back within 2.2 years of startup. Good potential exists for the discovery of additional mill and heap leach Mineral Resources at exploration target areas identified within the Project claim block.
MMC is of the opinion that the current Mineral Resource at North Bullfrog is sufficient to warrant continued planning and effort to explore, permit, and develop the Project.
MMC believes there is sufficient data to support continued exploration, geologic modeling and continuing development of the project..
The PEA results, for the combined mill and heap leach configuration, indicate the substantial financial impact on project performance of the higher grade vein and vein stockwork mineralization. Therefore it is recommended that future exploration should focus on the identification and development of other structural related mineralization. These recommended activities are:
| · | Drill structures identified in the Eastern Steam-heated Alteration Zone |
| · | Explore Structural Targets around the YellowJacket-Sierra Blanca and Jolly Jane deposits |
| · | Continue Baseline project development Data Collection |
The projected costs for the next phase of this program are outlined in Table 1-4.
Table 1-4 Proposed Budget to Support Recommended Program at NBP.
| Activity | Amount |
| Exploration Drilling and Data Management | US$ 0.9 M |
| Baseline Data Collection | US$ 0.1 M |
| Total | US$ 1.0M |
Corvus Gold Corp. Technical Report – North Bullfrog Project | | Page | 31 |
Corvus Gold Inc. is a North American gold exploration and development company, focused on its near-term gold-silver mining project at North Bullfrog, Nevada. Corvus is listed on the TSX as “KOR”. This report is being prepared to incorporate recent drilling geological and metallurgical data developed in 2014 and 2015 on the YellowJacket zone into an updated Mineral Resource Estimate. A Preliminary Economic Assessment of the North Bullfrog Project based on combined mill processing of Mineral Resources from YellowJacket and heap leaching of lower grade disseminated mineralization in Sierra Blanca, Jolly Jane and Mayflower has also been performed.
The report has been amended and restated on May 18, 2016 to correct some of the information in Table 22-4 and in Table 16- 2 that was found to be in error. None of the results or conclusions of the report were effected.
The Authors used various forms of digital data in the Technical Report including geologic models based on surface mapping and drilling, assay data, and metallurgical testing data developed by Corvus, MMC, SBBM, HCO and PCI.
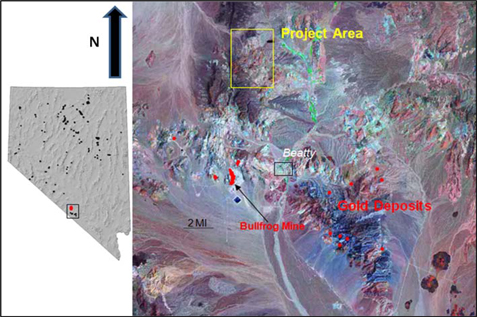
The NBP is located in northwestern Nye County, Nevada, in the Northern Bullfrog Hills about 15 km North of Beatty (Figure 2-1). The Project lies within the Walker Lane structural terrain about 12 km North of the Bullfrog mine where Barrick Gold Corp. (and predecessor companies) produced about 2.31 million ounces of gold and 3.0 million ounces of silver from 1989 through 1999 (NBMG MI-2000, page 34). The NBP contains numerous epithermal low-sulfidation volcanic rock-hosted gold showings that had limited historic production.
Corvus controls the Project through a number of private land leases with various land owners (Table 4-1 and Figure 4-1) and through numerous federal unpatented lode mining claim holdings. In 2006, Redstar Gold Corp (“RGC”) initially assembled 213 unpatented lode mining claims and 33 patented lode mining claims through six option agreements, which were the property subject to the original joint venture agreement between RGC and ITH (called the North Bullfrog Project Joint Venture – “NBPJV”). ITH leased an additional 11 patented lode mining claims in the Mayflower area, which became subject to the NBPJV agreement. ITH earned into the NBPJV when in August 2009 they negotiated an agreement to purchase RGC’s interest in the joint venture property. ITH spun out Corvus on August 26, 2010 as the controlling entity of the North Bullfrog property. Corvus completed one additional option agreement on patented lode mining claims in the Jolly Jane area in March 2011, for a total of eight option agreements on private lands. Corvus also expanded the North Bullfrog property in early 2012 by staking a total of 511 federal unpatented lode mining claims. In late 2012 Corvus staked an additional 297 unpatented lode mining claims to the north and east (Figure 4-1) bringing the total unpatented lode mining claim holdings to 808. All of these claims are in good standing with the BLM and Nye County.
On March 23, 2013 Corvus announced the purchase of surface rights only to five patented lode mining claims from Mr. and Mrs. Gordon Millman to facilitate shorter overburden haul distances for development of the Mayflower deposit. The terms of the purchase as outlined in the Corvus press release (February 21, 2013) are, “USD 160,000, payable at closing. The terms also include payment by Corvus Nevada of a fee of USD 0.02 per ton of overburden to be stored on the property, subject to payment for a minimum of 12 million short tons. The minimum tonnage fee (USD 240,000) bears an interest at 4.2% per annum from closing and is evidenced by a promissory note due on the sooner of the beginning of production or December 31, 2015.”
Corvus Gold Corp. Technical Report – North Bullfrog Project | | Page | 32 |
Figure 2-1 Regional Location Maps of the NBP; Nevada Map Shows Productive Gold Deposits in Black and Location of Enlarged Area with False-Color Remote Sensing Image Backdrop Showing the Project Area in Yellow and the Productive Gold Deposits in Red
Corvus requested that this Technical Report be prepared to support a revised Mineral Resource estimate to include the YellowJacket mineralization outlined in 2013-2014 drilling. This report also updates material changes in the NBP ownership, land position, metallurgical data and drilling data completed since the 2014 NI 43-101 report (Wilson et. al., 2014), as well as recommendations for the next phase of evaluation of the Project. This report outlines the geology, exploration history, and potential of the Project based on possible exploitation of mineralized areas. Mr. Scott E. Wilson (MMC), Mr. Stephen Batman (SBBM), Mr. Herbert Osborne (HCO) and Mr. William Pennstrom (PCI) were commissioned by Corvus to prepare this report.
The principal author, Mr. Scott E. Wilson, CPG #10965, and a Registered Member of SME, member number 4025107RM, as an independent Qualified Person, was responsible for the overall preparation of this report and specifically for Sections 1 through 12, Section 14, Section 20 and Sections 23 through 27 of the report. Mr. Wilson visited the North Bullfrog Site on January 30 and 31, 2013, March 24, 2014 and November 2 and 3, 2014. Mr. Wilson is independent of Corvus applying all of the tests in Section 1.5 of NI 43-101.
Corvus Gold Corp. Technical Report – North Bullfrog Project | | Page | 33 |
Mr. Stephen Batman, SME Registered Member 181580RM, was responsible for the preparation of Sections 15 and 16 and relevant parts of Sections 1, 21 and 25. Mr. Batman visited the site on March 12, 2015. Mr. Batman is independent of Corvus applying all of the tests in Section 1.5 of NI 43-101.
Mr. Herbert Osborne, Consulting Metallurgical Engineer and a Registered Member of SME, member number 2430050RM, as an independent Qualified Person, was responsible for Section 13 and Section 17 and relevant portions of Sections 1 and Sections 25. Mr. Osborne has not visited the NBP as a site visit was not required for the purposes of his participation. Mr. Osborne is independent of Corvus applying all of the tests in Section 1.5 of NI 43-101.
Mr. William J. Pennstrom, Jr., Consulting Metallurgical Engineer and Registered Member of SME, member number 2503900RM, as an independent Qualified Person, was responsible for Sections 18, 19, 22, and portions of Sections 21, and relevant parts of Sections 1 and 25 of the technical report. Mr. Pennstrom last visited the site on March 12, 2015. Mr. Pennstrom is independent of Corvus applying all of the tests in Section 1.5 of NI 43-101.
All dollar amounts in this document are United States dollars unless otherwise noted.
Corvus Gold Corp. Technical Report – North Bullfrog Project | | Page | 34 |
| 3 | RELIANCE ON OTHER RELEVANT EXPERTS |
Richard DeLong
Mr. Delong is the founder of Enviroscientists, Inc. a well-respected business known throughout the Northern Nevada mining community. Enviroscientists is a leading property development and permit acquisition firm that specializes in assisting natural resource development industries with property development needs, evaluation of environmental effects, and compliance with governing regulations. Mr. Delong is not a Qualified Person as defined by NI43-101. However, Mr. Delong’s opinions regarding regulatory compliance are widely sought after and his recommendations are typically followed. The author knows of Mr. Delong’s reputation, and has relied on Mr. Delong’s contributions to and review of Section 20.
Corvus Gold Corp. Technical Report – North Bullfrog Project | | Page | 35 |
| 4 | PROPERTY DESCRIPTION AND LOCATION |
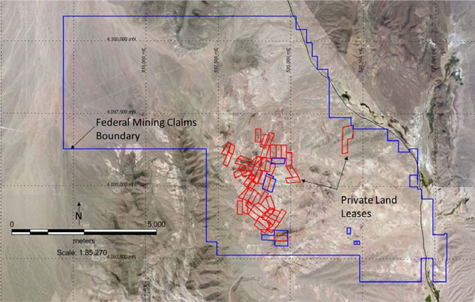
The NBP is located in the Bullfrog Hills of northwestern Nye County, Nevada. A map of the NBP property is presented in Figure 4-1, which shows the boundary defined by unpatented lode mining claims in blue and private land patented claims in red. Location of the property is indicated by the coordinate grid on the map which is in the UTm NAD27, Zone 11 coordinate system. The Project covers about 7,223 of patented and unpatented lode mining claims in Sections 20, 21, 25, 26, 27, 28, 29, 32, 33, 34, 35, and 36 of T10S, R46E; sections 1, 2, 11, 12, 13, and 14 of T11S, R46E; section 31 of T10S, R47E; and section 6,9,15,16 and 17, T11S, R47E, MDBM. A summarized list of the claims covered by the NBP is given in Table 4-2 and Table 4-4 in this section. Corvus has a total of nine option/lease agreements in place that give it control of 51 patented lode mining claims which are summarized in Table 4-1 below.
Figure 4-1 Property Map of the NBP (Blue). Leased Private Land Identified in Red (UTm NAD 27 Zone 11).
The claims and lease agreements give Corvus the right to explore the property and mine locatable minerals subject to required regulatory permits which are described in Section 20. Corvus currently has permits for exploration of the public and private land (Bureau of Land Management (BLM) and Nevada Department of Environmental Protection (NDEP)). The permits allow non-exclusive access to Corvus and its contractors, exploration drilling and sampling, geologic mapping, engineering characterization, baseline environmental data collection and new surface disturbance as defined by the permits. The leases and claims give Corvus the rights to conduct mining operations to extract the Mineral Resources subject to future permits described in Section 20.
Corvus Gold Corp. Technical Report – North Bullfrog Project | | Page | 36 |
| 4.2 | REDSTAR OPTION/JOINT VENTURE/ITH PURCHASE OF LAND |
RGC originally staked 213 unpatented lode mining claims and optioned 21 patented lode mining claims from six private parties in 2006. ITH optioned the original NBP land package from RGC in 2006, creating the NBPJV. ITH added 11 patented lode mining claims (the Mayflower property) to the NBPJV in 2007 under the Greenspun lease agreement. RGC added 12 patented lode mining claims (the Connection and adjacent properties) to the NBPJV in 2008 under the lease agreement with Lunar Landing LLC. In August 2009 ITH purchased 100% interest in the NBPJV from RGC by paying RGC CAD$250,000 and issuing 200,000 ITH common shares (News Release, August 4, 2009). These holdings were then transferred to Corvus during the spin out. Corvus completed one additional option agreement on two patented lode mining claims in the Jolly Jane area in March 2011. In May 2014, Corvus amended its existing lease agreement with Kolo Corp. to add the Yellowrose and Yellowrose No. 1 claims. In March 2015 Corvus added a second option agreement with Lunar Landing LLC, to lease the Sunflower, Sunflower No. 1 and Sunflower No. 2 claims for a total of nine option agreements on private land. Corvus has added an additional 808 federal unpatented lode mining claims which were staked in 2012, and added an additional 57 federal unpatented lode mining claims which were staked in 2015. Table 4-1 summarizes the obligations of the nine leases which are part of Corvus’ responsibilities on the Project and Table 4-2 lists the individual claim names and U.S Bureau of Land Management serial numbers for the nine lease obligations. The principal author has verified that all lease obligations have been met and are paid in full as of the date of this report.
All of these properties are held through CGN, which was a wholly owned subsidiary of ITH and was transferred to Corvus in connection with the spinout on August 26, 2010.
Corvus Gold Corp. Technical Report – North Bullfrog Project | | Page | 37 |
Table 4-1 Summary of Lease Obligations That Are Part of the Corvus Spin out (All Funds USD).
| Party | Area | Claims/Acres | Next
Payment | Property
Taxes | NSR | Signing Date | Term
(yrs) | Term
Extension | Option to
Purchase
Property | Option to
Purchase
Royalty | NSR
Option
Term |
| Gregory | North Pioneer | 1/8.2 | $3,600 | na | 2% | 6/16/2006 | 10 | yes | no | $1 M/% | na |
| Hall | Savage | 3/45.7 | $8,600 | na | 2% | 5/22/2006 | 5 | yes | no | $1 M/% | na |
| Kolo Corp | Jolly Jane & Yellowrose | 4/81.7 | $6,000 | $258 | 3% | 5/8/2006 | 10 | yes | no | $0.85/% | na |
| Milliken | Pioneer | 3/24.5 | $5,400 | na | 2% | 5/8/2006 | 10 | yes | no | $1M/% | na |
| Pritchard | Pioneer | 12/203.0 | $20,000 | na | 4% | 5/16/2006 | 10 | yes | no | $1M/% | na |
| Lunar Landing LLC | Connection | 12/195.0 | $16,200 | $207 | 4% | 10/27/2008 Amended 5/28/2014 | 10 | yes | $1 M | $1M/% | 35 yrs |
| Lunar Landing LLC | Sunflower | 3/59.2 | $5,000 | $180 | 4% | 3/30/2015 | 4 | 7yrs | $0.3 M | $0.5/% | 35 yrs |
| Greenspun1 | Mayflower | 11/183.05 | $10,0001 | $214 | 4% | 12/1/2007 | See Table 4-3 |
| Sussman | Jolly Jane | 2/37.4 | $30,000 | $113 | 2% | 3/14/2011 | 10 | 10 yrs | Inclusive in Royalty Purchase | $1M/% | na |
| Total | - | 51/748.7 | $104,800 | $972 | - | - | - | - | | - | - |
1Plus 50,000 ITH shares and 25,000 Corvus shares
Corvus Gold Corp. Technical Report – North Bullfrog Project | | Page | 38 |
ITH, through its Talon Gold Nevada Inc. subsidiary (now called “Corvus Gold Nevada Inc.” and owned by Corvus (“CGN”), entered into a mining lease with option to purchase with the Greenspun Group for 183 acres of patented lode mining claims that cover much of the Mayflower prospect. The Mayflower lease requires Corvus to make payments and complete work programs as outlined in Table 4-3. During the term of the lease any production from the Mayflower property is subject to a sliding scale royalty, also outlined in Table 4-3. Corvus has the right to purchase a 100% interest in the Mayflower property for $7.5 million plus a 0.5% NSR (if gold is less than $500) or 1.0% (if gold is above $500) at any time during the term of the lease (subject to escalation for inflation if the option is exercised after the 10th year of the lease). The annual property taxes to be paid by Corvus for the Mayflower property are $214. On February 11, 2015, the Mayflower mining lease with option to purchase was amended with the addition of an anti-dilute clause applying to the ITH shares and with an increase in the annual payment to include 25,000 Corvus shares.
On February 21, 2013, Corvus signed a purchase agreement, which was subsequently closed on March 27, 2013, for the surface rights only to five patented lode mining claims owned by Mr. and Mrs. Gordon Millman and located east of the Mayflower deposit. This ground could be used for potential overburden storage at the Mayflower deposit as well as improving access to the Mayflower deposit in general. Corvus purchased the surface rights for $160,000. Additionally, Corvus agreed to pay the Millmans a fee of $0.02 per ton of any potential overburden storage subject to a minimum storage of 12 million short tons of material. The minimum storage fee of $240,000 bears interest at 4.2% per annum from the closing date and is due on December 31, 2015.
| 4.4 | OTHER PROPERTY CONSIDERATIONS |
All of the unpatented lode mining claims are on U.S. public land administered by the Bureau of Land Management (“BLM”). These claims give Corvus the right to explore for and mine mineral which include the metal gold and silver, subject to the necessary permits described in Section 20. The current exploration permits from BLM and NDEP allow Corvus surface access, maintenance of roads, drilling and sampling, and a defined amount of accompanying surface disturbance. The unpatented lode mining claims require payment of yearly maintenance fees to the BLM and Nye County (recording fees) of an aggregate of $147,953 (estimated for 2015). Annual property taxes to be paid by Corvus for some of the properties subject to the original six RGC leases and subsequent leases are tabulated in Table 4-1.
Current exploration activities are covered by a Plan of Operations (NVN-83002) with the BLM. Two Plans of Operation are in place with the Nevada Department of Environmental Protection (“NDEP”) (NDEP#0280 and #0290) that fulfill the State of Nevada permitting obligations on private and public lands, respectively. Reclamation bonds, related to environmental liabilities to which the NBP is subject, are in place to cover activities on the property. Corvus’s reclamation liabilities are covered by surety bonds issued by Lexon Insurance Company in the amount of $341,341 for 103 acres of disturbance on public land with the BLM and $209,070 for 20.3 acres of disturbance on private land with NDEP. Additional permits and bonding will be required for the expanded exploration program outlined in the Recommendation Section of this report.
Corvus Gold Corp. Technical Report – North Bullfrog Project | | Page | 39 |
In December 2013, the Company completed the purchase of a 160 ha fee simple parcel of land 16 km north of the NBP which carries with it 1,600 acre feet of irrigation water rights within the Sarcobatus Flats water basin. Cost of the land was USD 1,000,000. The Company has registered the purchase of water rights with the Nevada State Engineer (“NSE”) and will make application to the NSE to move the production point to NBP, and change the application to mining. The water right requires annual renewal and has currently been extended through June 11, 2016.
None of the authors knows of any other significant factors and risks that may affect access or title to the NBP, or the right or ability to perform work on the Project.
Table 4-4 summarizes the unpatented lode mining claims on U.S. public land at the NBP.
Corvus Gold Corp. Technical Report – North Bullfrog Project | | Page | 40 |
Table 4-2 Summary of Patented Claims in the Nine NBP Lease Agreements
| Lease | Claim Name | U.S. Bureau of Land Management Serial Number |
| Gregory | Jim Dandy | 448055 |
| Hall | Gold Basin | 330227 |
| Hall | Savage | 330227 |
| Hall | Savage 2 | 330227 |
| KoloCorp. | Black Jack | 163170 |
| Kolo Corp | ZuZu | 261838 |
| Kolo Corp | Sunflower | 369130 |
| Kolo Corp | Sunflower No.1 | 369130 |
| Kolo Corp | Sunflower No. 2 | 369130 |
| Milliken | Indiana 1 | 245488 |
| Milliken | Indiana 2 | 245488 |
| Milliken | Indiana 3 | 245488 |
| Pritchard | Banker's Life | 493623 |
| Pritchard | Bimettalic 1 | 46204 |
| Pritchard | Bimettalic 2 | 46204 |
| Pritchard | Bimettalic 3 | 46205 |
| Pritchard | Bluff | 493623 |
| Pritchard | Conservative | 611953 |
| Pritchard | KK1 | 504301 |
| Pritchard | Mutual | 493623 |
| Pritchard | Penn Mutual | 493623 |
| Pritchard | Prudential | 493623 |
| Pritchard | Sunrise 1 | 114544 |
| Pritchard | Sunrise 2 | 114544 |
| Lunar Landing LLC | Dewey Bailey | 269019 |
| Lunar Landing LLC | Four Aces | 269019 |
| Lunar Landing LLC | Parson Haskins | 269019 |
| Lunar Landing LLC | Bull Con | 269019 |
| Lunar Landing LLC | Ugly | 296019 |
| Lunar Landing LLC | Hardtack | 341527 |
| Lunar Landing LLC | Connection Mine | 342533 |
| Lunar Landing LLC | Equity | 342533 |
| Lunar Landing LLC | Geraldine 3 | 342533 |
| Lunar Landing LLC | Grey Eagle 2 | 342533 |
| Lunar Landing LLC | Grey Eagle 4 | 342533 |
| Lunar Landing LLC | Vinegarroan | 342533 |
| Lunar Landing LLC | Yellowrose | 369130 |
| Lunar Landing LLC | Yellowrose No. 1 | 369130 |
| Greenspun | Mayflower Lode Mining Claim | 2548 |
| Greenspun | Mayflower No. 1 Lode Mining Claim | 2548 |
| Greenspun | Mayflower No. 2 Lode Mining Claim | 2548 |
| Greenspun | Mayflower No. 3 Lode Mining Claim | 2548 |
| Greenspun | Moonlight Lode Mining Claim | 2640 |
| Greenspun | Moonlight No. 1 Lode Mining Claim | 2640 |
| Greenspun | Moonlight No. 2 Lode Mining Claim | 2640 |
| Greenspun | Starlight No. 4 Lode Mining Claim | 2640 |
| Greenspun | Starlight No. 5 Lode Mining Claim | 2640 |
| Greenspun | Starlight No. 6 Lode Mining Claim | 2640 |
| Greenspun | Starlight No. 7 Lode Mining Claim | 2640 |
| Sussman | Jolly Jane | 402672 |
| Sussman | Valley View | 402672 |
Corvus Gold Corp. Technical Report – North Bullfrog Project | | Page | 41 |
Table 4-3 Summary of the Terms for the Mayflower/Greenspun Group Lease
| Term: Five Years Beginning December 1, 2007 |
| Five additional years with an additional five year period, plus an additional 3 year period or so long thereafter as commercial production continues |
| Lease Payments: Due on Each Anniversary Date of the Lease |
On regulatory acceptance - US$5,000 and 25,000 ITH shares Each of first – fourth anniversaries, US$ 5,000 and 20,000 ITH shares Each of fifth – ninth anniversaries,US$10,000 ,50,000 ITH shares and 25,000 Corvus shares |
| Work Commitments: Excess Expenditures in Any Year Can Be Carried Forward, or if under Spent the Unspent Portion Paid to Greenspun Group |
Years 1-3 US$100,000 each year the lease is in effect Years 4-6 US$200,000 each year the lease is in effect Years 7-10 US$300,000 each year the lease is in effect |
| Retained Royalty: Production Sliding Scale Net Smelter Return Based on Price of Gold Each Quarter |
2% if gold is less than US$300 per ounce 3% if gold is between US$300 and US$500 per ounce 4% if gold is more than US$500 per ounce |
| Advance Minimum Royalty Payments (if not in commercial production by the tenth anniversary, in order to extend lease for an additional three years) |
| Years 11-13 US$100,000 each year the lease is in effect and commercial production has not been achieved |
| PurchaseOption: |
During first 10 years property can be purchased for US$ 7.5 million plus an 0.5% NSR (if gold is less than US$ 500) or 1.0% (if gold is above US$ 500) After the tenth anniversary the US$ 7.5 million purchase price escalates by the Consumer Price Index, using the CPI immediately prior to the tenth anniversary as a base |
Table 4-4 Summary of the Unpatented Lode Mining Claims on U.S. Public Land at the NBP
| Land Holder | Claim Name | US Bureau of Land Management Serial
Number |
| Corvus Gold Nevada Inc. | NB 1 – NB 149 | 922928 – 923076 |
| Corvus Gold Nevada Inc. | NB 150 | 943108 |
| Corvus Gold Nevada Inc. | NB-151A | 1078379 |
| Corvus Gold Nevada Inc. | NB 152 – NB 154 | 943110 - 943112 |
| Corvus Gold Nevada Inc. | NB-155A | 1078381 |
| Corvus Gold Nevada Inc. | NB 156 – NB 161 | 943114 - 943119 |
| Corvus Gold Nevada Inc. | NB 162 – NB 213 | 989863 – 989914 |
| Corvus Gold Nevada Inc. | NB 214 – NB 510 | 1069332 - 1069628 |
| Corvus Gold Nevada Inc. | NB 511 | 1078379 |
| Corvus Gold Nevada Inc. | NB 512 – NB 808 | 1085130 - 1085426 |
| Corvus Gold Nevada Inc. | NB 809 – NB865 | 1109343 – 1109399 |
Corvus Gold Corp. Technical Report – North Bullfrog Project | | Page | 42 |
| 5 | ACCESSIBILITY, CLIMATE, LOCAL RESOURCES, INFRASTRUCTURE, AND PHYSIOGRAPHY |
The NBP is accessible as a two and one half hour (209 km, 130 mile) drive north of Las Vegas Nevada along US Highway 95. US 95 is the major transportation route between Las Vegas, Reno Nevada and Boise Idaho. Las Vegas is serviced by a major international airport. The Project lies immediately to the west of the highway. Beatty, Nevada is the closest town to the Project with a population of about 1,100 and contains most basic services. Access around the Project is by a series of reasonably good gravel and dirt roads that extend to most of the important exploration areas.
The NBP is in Western Nevada’s high desert which receives about 15 cm of precipitation per year, mostly as modest snow fall in the winter and thunderstorms in the summer. The average daily temperature (F) varies from a low of 40.8° in January to a high of 80.8° in July. Due to the mild climate at the NBP the operating season is year round. Occasional thunderstorms may prohibit drilling for periods of an hour or so due to safety concerns about lightning strikes.
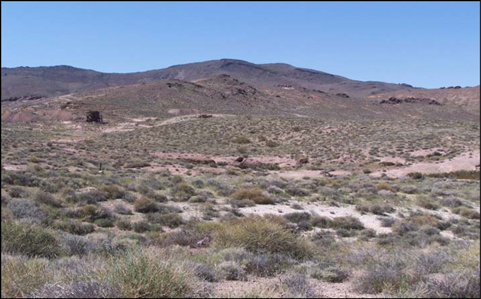
The hills at the Project are covered with sparse low brush including creosote, four-wing saltbush, rabbit brush and Nevada ephedra. The Project is in the Basin and Range province, but the local topographic relief is only a few hundred feet. The elevation of the Project ranges from 1,100m (3,600 feet) to 1,500m (4,800 feet). Most of the Project is characterized by low hills separated by modest width valleys (Figure 5-1).
As described in Section 4, Corvus maintains sufficient surface rights to support mining operations; including potential waste disposal areas, tailings storage areas, heap leach pads and potential mill sites. Claim blocks are contiguous, power is readily accessible and Corvus has secured access rights to water. The towns of Beatty, Pahrump and Tonopah support an ample population for mining personnel.
Figure 5-1 Mayflower Ridge Looking to the Northwest
Corvus Gold Corp. Technical Report – North Bullfrog Project | | Page | 43 |
The NBP is in the Bullfrog Mining District. Gold was discovered at what was to become the Original Bullfrog mine by Frank “Shorty” Harris and Ernest Cross on August 9, 1904 (Elliott, 1966). Two periods of mining activity account for the majority of production from the District. Lincoln (1923) reported 111,805 ounces of gold and 868,749 ounces of silver were produced between 1905 and 1921, after which there was little production until the 1980s. In early 1982 geologists from St. Joe America became interested in the District. They conducted extensive exploration in the area of the Montgomery-Shoshone and Senator Stewart mines, resulting in the discovery of the Bullfrog deposit in mid-1986. Several company acquisitions resulted in Barrick Gold Corporation being the final owner of the mine. The Bullfrog mine produced gold and silver from three separate deposits including: 1) main Bullfrog (open pit and underground); 2) Montgomery-Shoshone (open pit); and 3) Bonanza Mountain (open pit). Between 1989 and 1999, the Bullfrog mine produced 2.31 Moz of gold and 3.0 Moz of silver (NBMG MI-2000, page 34).
The early history of the NBP property is comingled with the greater Bullfrog Mining District. The Pioneer and Mayflower were the principal mines in the northern part of the district. The Pioneer mine was most active between 1909 and 1926 with about 15,000 feet of underground workings, all being developed within 330 feet of the surface. There are no accurate production figures, but limited records suggest that head grades were about one quarter ounce of gold per ton. The Mayflower mine was probably active during the same time, but again there are no reliable production records. Underground development at Sierra Blanca, Jolly Jane, Savage Valley, and Yellow Jacket also attest to historic mining and production, probably during the same period.
Modern exploration started in the early 1970s and, as outlined in Table 6-1, consisted of a number of companies with focuses on different parts of the Project. These programs consisted of a variety of activities including surface mapping and sampling, underground mapping and sampling, and drilling.
Table 6-1 Summary of Companies That Explored NBP.
| Company | Years of Activity | Principal Target |
| Cordex | 1974-1982 | Connection, Pioneer |
| US Borax | 1982 | Mayflower |
| Gexa/Galli | 1984-1991 | Pioneer, Connection |
| CR Exploration | 1984-1985 | Mayflower |
| Western States | 1987 | West Mayflower |
| Sunshine/Bond Gold JV | 1988-1994 | Sierra Blanca, Yellow Jacket |
| Pathfinder | 1991, 1992 | Pioneer |
| Barrick | 1995-1996 | Jolly Jane, Sierra Blanca, Mayflower |
Through the Barrick program approximately 249 rotary and reverse-circulation drill holes were drilled on the Project (see Section 10 for detailed description of these programs).
Corvus Gold Corp. Technical Report – North Bullfrog Project | | Page | 44 |
With the downturn in gold price at the start of the 21st Century interest in the Project was essentially nonexistent. RGC became attracted to the North Bullfrog area in late 2005, and started staking unpatented lode mining claims and acquiring leases on patented lode mining claims. In March 2007, RGC granted ITH the right to earn an interest in the NBP and thereafter form the NBPJV. In December 2007 ITH completed a lease of the Mayflower property, which was included in the NBPJV. Following the execution of the NBPJV option/joint venture agreement, ITH commenced active exploration on the NBP. In October 2008, RGC completed a lease of the Connection property, which was also included in the NBPJV. On August 4, 2009, ITH purchased RGC’s interests in the property and continued the exploration program as sole owner/lessor. On August 26, 2010 ITH spun out Corvus as a separate public company in a transaction which resulted in Corvus owning CGN, through which all interest in the NBP was held, thus resulting in Corvus indirectly acquiring all of the interest in and responsibilities for the NBP property.
Corvus Gold Corp. Technical Report – North Bullfrog Project | | Page | 45 |
| 7 | GEOLOGICAL SETTING AND MINERALIZATION |
| 7.1 | REGIONAL GEOLOGICAL SETTING |
The NBP is within the Walker Lane structural province and the Southwestern Nevada Volcanic Field (“SWNVF”). The Project lies approximately ten kilometres west of the western margin of the middle Miocene Timber Mountain caldera complex, which is the source of the voluminous ash flow tuffs of the SWNVF. Many of the volcanic units exposed at the NBP originated from the caldera complex. However, some of the most important host rocks for the mineralization at NBP are apparently locally derived and are currently known as the North Bullfrog Hills Volcanic Complex (“NBHVC”). The NBHVC rocks are slightly older than the main ash flows erupted from the Timber Mountain Caldera.
The region is underlain by Paleozoic sedimentary rocks, which form the basement for the mid-Miocene ash flow tuffs, lavas and lesser sedimentary rocks that comprise the SWNVF. The region was subjected to extensional faulting which was contemporaneous with SWNVF volcanism. As a result, fault-bounded sedimentary basins formed and filled with and basement debris, volcanic debris, and pyroclastic deposits. Multiple episodes of extension have been documented. Most of the major fault zones have northerly strikes with normal displacement down-to-the west. However, hanging wall antithetic faults are also present. Some of the major faults are interpreted to have listric shapes similar to the MP fault at the Bullfrog mine, and likely sole into a district-scale, low-angle detachment fault at depth. During younger periods of extension, many of the older faults in the hanging walls of these listric structures have experienced significant rotation and reactivation. The topography of the North Bullfrog District is a series of low rolling hills and ridges, separated by gravel filled valleys (see Section 5).
| 7.2.1.1 | LOCAL STRATIGRAPHY |
The stratigraphy of the Northern Bullfrog Hills (“NBH”) was most recently described by Connors et al. (1998) who mapped the area between 1989 and 1991. Based on the extensive drilling and geochronology studies conducted by Corvus, the local stratigraphy has been refined enough to warrant the identification of the NBHVC (Table 7-1).
As far as possible the terminology of Connors et al. (1998) has been preserved. New geochronology has shown that some units were incorrectly correlated and these have been given new names. The most significant examples are the Sierra Blanca Tuff and the Pioneer Formation, which were previously included in the Crater Flat Group. Brief descriptions of the Tertiary units which are present in the NBP area are given below.
Corvus Gold Corp. Technical Report – North Bullfrog Project | | Page | 46 |
Table 7-1 Overview of the stratigraphy of the North Bullfrog Hills.
| Major Unit Name | Symbol | Formation | Lithodeme | Major Unit Description | |
| Quaternary Cover | Qc | | | Unconsolidated Quaternary alluvium, colluvium, talus, and mine dumps | |
| Gravels of Sober-up Gulch | Tgs | | | Semi-consolidated boulder gravels | |
| Pumiceous Sediments | Tps | | | Light colored tuffaceous sandstone and pebble conglomerate with pumice clasts | |
| Rainbow Mountain Sequence | Trl | Donovan Mountain Latite | | Latite and quartz latite | |
| lava flows and flow breccias | |
| Trt & Trr | Tuffs and Lavas of Rainbow Mountain | | Non-welded crystal-lithic rhyolite tuff and aphanitic flow-banded rhyolite flows and domes with minor sedimentary interbeds. | |
| Tdf | Rainbow Mountain Debris Flow Sequence | | A sequence of intercalated heterolithic and monolithic debris flow breccias derived from local volcanic and sedimentary units. Heterolithic sequences are bedded but poorly sorted, consisting of sand- to large boulder-size clasts of predominantly volcanic rocks. Monolithic breccias are interpreted as landslide megabreccia deposits that were shed off local fault scarps. | |
| Timber Mountain Group | Tma | Ammonia Tanks Tuff | North Bullfrog Suite: rhyolite and dacite dikes, sills and plugs as well as rhyolite domes of ambiguous origin | Single cooling unit of poorly to densely welded crystal-rich rhyolite ash-flow tuff. | |
| Tmr | Rainier Mesa Tuff | Single cooling unit of slightly to densely welded crystal-rich rhyolite ash flow tuff | |
| Tprr | Pre-Ranier Rhyolite | Flow-banded to massive rhyolite lava flows | |
| Tprt | Pre-Ranier Tuff | Rhyolitic surge and ash-flow deposits | |
| Paintbrush Group | Tp | Paintbrush Tuff | Aphanitic shard-rich, phenocryst-poor welded rhyolite tuff. Regionally subdivided into the Topopah Springs and Tiva Canyon Tuffs but these are not distinguished in the NBH | |
| Rater Flat Group | Tcb | Bullfrog Tuff | Variably welded crystal-lithic rhyolite tuffs. Possible equivalents of Tram and Bullfrog Members of the Crater Flat Group | |
| Tcb | Tram Tuff | |
| North Bullfrog Hills Volcanic Complex | Td | Savage Valley Dacite | Intercalated lava flows, breccias and pyroclastics of dacitic to andesitic composition. Probable stratigraphic correlation to Tr1g quartz latite unit in Southern Bullfrog Hills | |
| |
| Lower Member may be complex mixture of rhyolitic to andesitic lava flows, tuffs, domes, breccias and sedimentary rocks covering post-Sierra Blanca surface | |
| |
| North Bullfrog Hills Volcanic Complex | Tsb | Sierra Blanca Tuff | Large compound cooling unit of variably welded crystal-lithic rhyolite tuff. Probable equivalent of the Upper Tuff of Sawtooth Mountain. | |
| |
| Tpf | Pioneer Formation | Upper Mixed Epiclastic Member: zone may be heterogeneous zone with tuffs and welded tuffs mixed with poorly sorted silty, sandy, pebbly and cobbly sediments | |
| "Green tuff" of Sierra Blanca; rhyolitic tuffs; heterogeneous non-welded to semi-welded, lithic-poor to lithic-rich crystal tuff with scattered intervals of bedded tuff and epiclastics. Possible equivalent of the Lower Tuff of Sawtooth Mountain. | |
| |
| Tnb | | |
| Tsf | Savage Formation | Sequence of intercalated lava flows, intrusives and epiclastic debris of dacitic to rhyolitic composition. | |
| |
| Tjj | Jolly Jane Formation | Heterogeneous sedimentary sequence consisting of mudstone, siltstone, sandstone and conglomerate accumulated in localized structural basins. | |
| |
| Paleozoic Basement | PzC | Carrara Limestone | Micritic to and argillaceous carbonaceous limestone | |
| PzZ | Zabriskie Quartzite | Massive marine quartzite | |
| PzW | Wood Canyon Formation | Quartz-rich calcareous siltstone, sandstone, quartzite | |
Corvus Gold Corp. Technical Report – North Bullfrog Project | | Page | 47 |
7.2.1.1.1 PALEOZOIC BASEMENT
7.2.1.1.1.1 WOOD CANYON FORMATION – PZW
The Wood Canyon Formation is Lower Cambrian in age and made up of shale, siltstone and sandstone with occasional beds of finely laminated limestone. The minimum thickness is believed to be 350m (Connors, et al. (1998).
7.2.1.1.1.2 ZABRISKIE QUARTZITE – PZZ
The Zabriskie Quartzite is Lower Cambrian in age and generally consists of fine- to medium-grained ortho-quartzite with poorly preserved bedding. Its minimum thickness is believed to be around 370 meters (Connors, et al. (1998).
7.2.1.1.1.3 CARRARA FORMATION – PZC
The Carrara Formation is Middle to Lower Cambrian in age and is made up of thin to medium bedded limestone. The lower parts of the Formation contain argillaceous and siliciclastic interbeds. The minimum thickness is around 280 meters (Connors, et al. (1998)
7.2.1.1.2 NORTH BULLFROG HILLS VOLCANIC COMPLEX
The North Bullfrog Hills Volcanic Complex is a name that has been given to a sequence of locally derived lavas and pyroclastic rocks that were in-part previously incorrectly correlated with the Crater Flat Group by Connors, et al. (1998). The subdivisions identified here are based primarily on stratigraphic data obtained from drilling that has helped clarify both the stratigraphic sequence and distribution of different units.
7.2.1.1.2.1 JOLLY JANE FORMATION – TJJ
The Jolly Jane Formation is consists of a basal Tertairy conglomerate, overlain by a heterogeneous sequence of sedimentary rocks including mudstone, siltstone and sandstone. The basal conglomerate is a time transgressive unit which characteristically contains abundant clasts of pre-Tertiary basement rocks. It is the litho-stratigraphic equivalent, but probably not the time-stratigraphic equivalent, to the Titus Canyon Formation of Connors et al. (1998).
The type locality for this unit is known from drilling in the Jolly Jane area and consists of up to 50 metres of heterogeneous sediments, which appear to have accumulated in isolated structural basins prior to and during the onset of volcanism. Sandstone, siltstone, shale and calcareous volcaniclastic sediments are typically hematitic and may be locally carbonaceous. It is common to see tuffaceous sediments in the upper portions of the sand and shale sequences. The thickness and composition of the Jolly Jane Formation is highly variable. It is interpreted to have been deposited on a Tertiary erosional unconformity of significant relief.
Corvus Gold Corp. Technical Report – North Bullfrog Project | | Page | 48 |
7.2.1.1.2.2 SAVAGE FORMATION – TSF
The Savage Formation consists of locally-sourced lava domes, flows, pyroclastics and associated intrusive rocks of dacitic to rhyolitic composition. The type locality for these rocks is the southern end of Savage Valley. The Savage Formation may also include intercalated epiclastic intervals of re-worked dacite and locally carbonaceous sediments. The unit overlies and intertongues with the Jolly Jane Formation. The thickness of the Savage Formation varies greatly from 0-100 metres, possibly reflecting both fault-bounded basins and the areal distribution of individual domes, flows and epiclastic intervals. Two distinct compositions can be identified on the basis of the Zr/Nb ratio. While these compositions have been recently mapped, no definitive patterns have yet been derived from their distribution. The Savage Formation is correlative to the lower portion of the Tr1 unit as described in the Southern Bullfrog Hills by Eng et.al. (1996). Tsf is locally mineralized in the Sierra Blanca and Jolly Jane areas.
7.2.1.1.2.3 NORTH BULLFROG DOMES AND INTRUSIVE –SUITE
The North Bullfrog Domes and Intrusive Suite (Tnb) consists of rhyolitic and dacitic bodies including plugs, domes, dikes and possibly sills that are recognized over much of the NBP. Tnb has been found in rocks ranging in age from the Paleozoic through the Pre-Timber Mountain Rhyolites. The Tnb unit has been separated into a lithodeme in order to deal with the ambiguity about the emplacement mechanism and relative age of many of these bodies (Table 7-1).
Plug or dome-like bodies of rhyolite and dacite are present at both the south end of Savage Valley and at Jolly Jane. In both cases, they are surrounded by pyroclastic rocks of the Savage or Pioneer Formations. Field relationships suggest that these bodies are intrusive into the pyroclastic Pioneer Formation, however, there does not appear to be a significant age difference between the two suites of rocks and for the most part they are geochemically indistinguishable (see Section 7.2.1.2).
There is one suite of rhyolite bodies that have no compositionally similar pyroclastic rocks. These rhyolites are relatively depleted in light rare earths such as cerium and lanthanum compared to the other rhyolites. They occur as intrusive plugs and flow-domes both above and below the Sierra Blanca Tuff. These rhyolites are important mineralization hosts particularly in the northern parts of Sierra Blanca where they frequently host higher-grade gold mineralization. Their genetic association with the mineralization events in the North Bullfrog District has yet to be determined.
7.2.1.1.2.4 PIONEER FORMATION – TPF
The Pioneer Formation consists of relatively monotonous lithic-lapilli tuffs which show marked variations in grain-size and clast composition ranging from coarse breccias to sandy facies. The type locality for this Formation is the prominent topographic high to the north of the Pioneer Mine. In the subsurface north of Sierra Blanca, the Pioneer Formation is mixed or interbedded with rhyolite bodies of a variety of textures which appear to be coeval with the pyroclastic deposits. Locally bedded epiclastic intervals have been observed throughout the unit. Near the upper contact of the unit, the lithic composition becomes quite heterogeneous with coarse epiclastic debris that creates the Upper Mixed Epiclastic Member, a semi-continuous marker horizon below base of the Sierra Blanca Tuff.
Corvus Gold Corp. Technical Report – North Bullfrog Project | | Page | 49 |
The thickness of the Pioneer Formation varies from several hundred metres north of Sierra Blanca to just a few metres at the south end of Savage Valley. Divergence of compaction foliation directions between the Pioneer Formation and the Sierra Blanca Tuff at Sierra Blanca seems to indicate that tilting and erosion took place prior to the eruption of the Sierra Blanca Tuff. The Pioneer Formation is widely mineralized but is generally lower grade than the overlying Sierra Blanca Tuff.
7.2.1.1.2.5 SIERRA BLANCA TUFF – TSB
The Sierra Blanca Tuff is a large cooling unit of rhyolitic ash flow tuff that blankets the entire Project area with the type locality being Sierra Blanca. This unit varies in thickness from 70 metres at Jolly Jane to 170 metres at North Sierra Blanca. It is likely that the deposit was sourced outside of the North Bullfrog Hills and it may be the equivalent of the Upper Tuff of Sawtooth Mountain (see 7.2.1.2 Geochronology). No definitive study has been done to confirm that correlation.
The Sierra Blanca Tuff has a very distinct geochemical stratigraphy, but macroscopically is difficult to subdivide. There is a distinctive, shard and pumice-rich interval in the basal 10-20 metres which is referred to as the lower Pumice Marker (Tsb1). Above that the tuff is a relatively homogeneous densely welded crystal tuff with variably developed compaction foliation.
At Jolly Jane there appears to be an interval of Savage Valley Dacite within the middle of the Sierra Blanca Tuff. While the Sierra Blanca Tuff appears to be a single cooling unit, there may have been enough time during the regional-scale eruptive cycle for a simultaneous local dacitic eruption to have occurred. The result is a lense of Savage Valley Dacite within the Sierra Blanca Tuff.
The brittle nature of the densely welded middle Sierra Blanca tuff allowed for significant fracturing. The increased permeability from brittle fracturing likely played a significant role in focusing hydrothermal fluids through the Sierra Blanca Tuff making it one of the more important hosts for both disseminated and vein style mineralization.
7.2.1.1.2.6 SAVAGE VALLEY DACITE – TD
The Savage Valley Dacite represents another sequence of locally-sourced volcanics. At the base of the unit there is a rather heterogeneous and somewhat discontinuous sequence of rhyolitic flow domes, pyroclastics and epiclastics deposits, which grades upward into lavas and pyroclastics of dacitic composition. The upper part of the unit is dominated by relatively homogenous, typically magnetic lavas and lesser pyroclastic rocks of dacitic to andesitic composition.
Two distinct compositions of dacite can be distinguished geochemically based on the zirconium/niobium ratio. These compositions are intercalated but no particular stratigraphic sequence has been defined. The temporal duration of the Savage Valley Dacite sequence is not clear. Locally the sequence appears to conformably overlie the Sierra Blanca Tuff but in other areas the dacite has apparently been deposited directly on the Pioneer Formation indicating the removal of 10’s to 100’s of metres of stratigraphy. The Savage Valley Dacite is correlative to the Tr1g unit as described in the Southern Bullfrog Hills by Eng et.al. (1996). The Savage Valley Dacite is mineralized in the Jolly Jane and Sierra Blanca resource areas.
Corvus Gold Corp. Technical Report – North Bullfrog Project | | Page | 50 |
7.2.1.1.3 CRATER FLATGROUP – TC
The regionally extensive Crater Flat Group has been described in detail by Carr et al. (1986) and several members have been defined. In the NBH, two of these members, the Bullfrog Tuff (Tcb) and the Tram Tuff (Tct), appear to be preserved in the hanging-wall of major down-to-the-east normal faults on the east sides of Savage Valley, YellowJacket and Jolly Jane. The Tram tuff is moderately to poorly-welded with large pumice clasts. In contrast, the Bullfrog Tuff is densely welded with the degree of welding decreasing in the upper portions. An interval of bedded epiclastic tuffs is locally present at the base of the Bullfrog Member. The Bullfrog Tuff has been dated at 13.25 Ma (Sawyer et al, 1994). The Tram and Bullfrog Tuffs are undifferentiated is some areas and may simply be referred to as the Crater Flat Group.
The contact between the Savage Valley Dacite and the Crater Flat Group is poorly exposed at the surface. The contact is likely an erosional unconformity of considerable relief since there is a 0.7-1.0 Ma time gap between the two units (see 7.2.1.2 Geochronology).
7.2.1.1.4 PAINTBRUSH GROUP - TP
In the Bullfrog Hills, the Paintbrush Group is comprised of Topopah Springs Tuff (12.8Ma) and the Tiva Canyon Tuff (12.7Ma) (Sawyer et al., 1994). The unit varies from 190 meters to >240 metres in thickness and has a number of locally developed facies defined by variations in welding and phenocryst content (Connors et al., 1998). The Paintbrush tuffs are typically reddish brown and are distinctly shard-rich and phenocryst-poor compared to other major ash flow sheets in the area.
Within the NBH, the Paintbrush Group exists primarily as large slide blocks and monolithic breccias within the Rainbow Mountain Debris Flow sequence. There is at least one large N-S-trending block of Paintbrush Group tuff on the east side of Jolly Jane that appears to be relatively intact suggesting it may be in place or has not moved very far. The Topopah Springs and Tiva Canyon subunits are not subdivided within the project area. To date no significant mineralization has been found within the Paintbrush tuffs. However, the tuff has been altered in a number of places and has potential to be a mineralization host.
7.2.1.1.5 TIMBER MOUNTAIN GROUP
Regionally there are two major ash flow sheets that make up the bulk of the Timber Mountain Group together with lesser localized lavas and tuffs (Table 7-1). The tuffs are very distinctive because of their large (2-3mm) and abundant (20%) phenocrysts of quartz and feldspar. The age of the Rainier Mesa tuff is 11.6Ma (Sawyer et al., 1994) and the age of the overlying Ammonia Tanks Tuff is 11.45Ma (Sawyer et al., 1994).
Corvus Gold Corp. Technical Report – North Bullfrog Project | | Page | 51 |
Prior to the eruption of the Timber Mountain ash flows, the area was covered by a thin ash unit known simply as the Pre-Timber Mountain Tuff. These tuffs are likely genetically related to the Pre-Timber Mountain Rhyolite group of lava flows.
In-situ bedrock exposures of the Timber Mountain tuffs and the Pre-Timber Mountain volcanics are found in the southern and eastern portions of the project area. Fragments of the Timber Mountain tuffs are a significant component of the Rainbow Mountain Debris Flow sequence. The Timber Mountain tuffs occur as large slide blocks and monolithic breccias within the Debris Flow sequence.
The Timber Mountain tuffs and the Pre-Timber Mountain rhyolites have been affected by the steam-heated alteration in the eastern part of the project area and may have significant potential to host both disseminated and vein type mineralization.
7.2.1.1.6 RAINBOW MOUNTAIN SEQUENCE
The Rainbow Mountain Sequence incorporates a complex group of sedimentary and volcanic deposits that record the onset of a major phase of tectonic activity in the area. Sediments and debris flows deposited at the base of the Rainbow Mountain sequence near the Mayflower deposit were rotated up to 30 degrees by the time the Rainbow Mountain Trt2 tuff was deposited. Connors et al. (1998) suggest that this period of intense activity began around 10.6Ma and ended before 9.4Ma.
7.2.1.1.6.1 RAINBOW MOUNTAIN DEBRIS FLOWS - TDF
The Rainbow Mountain Debris Flow sequence is the most heterogeneous unit of the NBH. It consists of intercalated sequences of heterolithic and monolithic sedimentary breccias as well as large slide bocks derived from Miocene volcanic and Paleozoic sedimentary units. Heterolithic sequences are bedded but poorly sorted, consisting of sand- to large boulder-size clasts of predominantly volcanic rocks.
The debris flow breccia deposits are largely the result of the re-working of volcanic and basement sedimentary rocks via gravity sliding and alluvial fan development around fault-bounded basement structural highs. The volcanic debris is derived from many of the SWNVF units including the Crater Flat, Paintbrush and Timber Mountain Groups (Table 7-1).
Massive, relatively intact blocks of monolithic breccias are interpreted as landslide megabreccia deposits that were shed off local fault scarps. Gold mineralization at Mayflower and Connection is hosted in the Debris Flow sequence. The Debris Flow sequence lies unconformably on an erosional surface (angular unconformity) cut on Sierra Blanca Tuff, Savage Dacite and Crater Flat Group tuffs. The thickness of Debris Flow sequence exceeds 300 metres in the Mayflower area. It hosts both disseminated and vein type mineralization at Mayflower.
Corvus Gold Corp. Technical Report – North Bullfrog Project | | Page | 52 |
7.2.1.1.6.2 RAINBOW MOUNTAIN TUFF - TRT2
This unit consists primarily of light-colored, poorly- to non-welded, pumiceous crystal- and lithic-rich tuff that overlies and intercalates with the Debris Flow sequence. It is correlative to the Tr11 unit within the Rainbow Mountain sequence as described by Eng et.al. (1996) in the Southern Bullfrog Hills. Thickness is up to 300 metres in the Mayflower-Pioneer area. The base of Trt2 is locally mineralized in the Mayflower area. Trt2 has been dated using Ar-Ar at 10.1 Ma (Connors et al, 1998).
7.2.1.1.6.3 RAINBOW MOUNTAIN RHYOLITE DOMES AND FLOWS - TRR
This unit consists of locally-sourced aphanitic flow-banded rhyolite plugs, domes and flows that may intrude, overlie, or be interbedded with Trt2 east of the Mayflower mine area. Trr is probably age equivalent to compositionally similar rhyolite flows in the Rainbow Mountain Sequence of the SBH.
7.2.1.1.6.4 DONOVAN MOUNTAIN LATITE - TL
The Donovan Mountain Latite consists of numerous lava flows and flow breccias of dark-colored latite and quartz latite. The latites are relatively unaltered, and occur primarily in the hanging wall (west) of the Donovan Mountain Fault. The unit is correlative to flows of similar composition that overlie the Rainbow Mountain Sequence in the SBH. Ar-Ar dates of between 10.0 and 10.7Ma are reported by Connors et al. (1998).
7.2.1.1.7 PUMICEOUS SEDIMENTS - TPS
Connors et al. (1998) describe the Pumiceous Sediments as “White, light-gray, greenish-gray, buff, and orangish-buff, weakly indurated, tuffaceous sandstone and conglomerate, typically with fluvial bedding, with interbeds of reworked and air-fall tuff.” The beds may be well to moderately sorted, with abundant small pumice fragments and shards. It contains abundant surrounded to angular grains of volcanic quartz, feldspar, and biotite. The unit intertongues with and overlies the Debris Flow sequence in the Eastern Steam-heated Zone. The thickness reflects varying paleo-topography, and ranges from 0 to more than 40 metres.
7.2.1.1.8 GRAVELS OF SOBER UP GULCH - TGS
Gently dipping, ridge-forming terraces of older alluvial deposits are correlated to the Gravels of Sober-up Gulch. The unit consists of semi-consolidated, heterolithic boulder gravels of probable late Miocene age that unconformably overlie older Miocene units throughout the NBH. Tgs is similar to Tdfh, but contains abundant conspicuous boulders of Donovan Mountain Latite. Tgs typically forms a gently (<5 degrees) east-dipping pediment surface. The gravel unit is not known to be mineralized, but contains clasts of altered and mineralized rock.
7.2.1.1.9 QUATERNARY COVER - QC
Quaternary Cover includes unconsolidated Quaternary deposits including alluvium, colluvium, talus and mine dump material.
Corvus Gold Corp. Technical Report – North Bullfrog Project | | Page | 53 |
7.2.1.2 GEOCHRONOLOGY
Most of the major units in the NBH are separated by significant erosional unconformities, which together with pervasive alteration have confounded local and regional stratigraphic correlations. For this reason a series of samples were submitted for geochronological studies. Laser ablation ICP analysis on zircons was used to determine the eruptive ages of the different volcanic units and Ar-Ar dating on adularia was used to date the vein mineralization.
7.2.1.2.1 ZIRCON DATING
Samples were submitted for analysis to two different laboratories; A to Z and Victor Valencia. Duplicate samples were included to confirm the analytical precision of the dates (Table 7-2).
Table 7-2 Summary of Zircon Dates from North Bullfrog Hills Volcanic Complex.
| . | Age
(Ma) | 2s | Locality | Description | Lab | Lab
ID | Number
of
Dates |
| Trt2 | 10.5 | 0.1 | Mayflower Mine | Rainbow Mountain Tuff | Valencia | 115904 | 27 |
| Trt2 | 11.4 | 0.2 | Mayflower Mine | Rainbow Mountain Tuff | AtoZ | 1335-003 | 26 |
| Tp | 12.7 | 0.2 | Jolly Jane | Paintbrush Tuff | Valencia | 115923 | 20 |
| Tcb | 13.3 | 0.2 | Ladd Mountain | Crater Flat Tuff, Bullfrog Member | AtoZ | 1335-001 | 25 |
| Tcb | 13.4 | 0.2 | East Savage Valley | Crater Flat Tuff, Bullfrog Member | Valencia | 115902 | 35 |
| Tcb | 13.5 | 0.2 | Ladd Mountain | Crater Flat Tuff, Bullfrog Member | Valencia | 115906 | 47 |
| Tcb | 13.5 | 0.2 | Ladd Mountain | Crater Flat Tuff, Bullfrog Member | Valencia | 115907 | 29 |
| Tcb | 13.5 | 0.2 | Jolly Jane | Crater Flat Tuff, Bullfrog Member | Valencia | 115924 | 34 |
| Tct | 13.7 | 0.2 | East Savage Valley | Crater Flat Tuff, Tram Member | Valencia | 115901 | 19 |
| Tct | 13.8 | 0.2 | YellowJacket | Crater Flat Tuff, Tram member | Valencia | M610285A | 13 |
| Tct | 14.3 | 0.2 | YellowJacket | Crater Flat Tuff, Tram Member | AtoZ | 1293-06 | 28 |
| Td2 | 14.4 | 0.2 | Jolly Jane | Savage Valley Dacite | AtoZ | 1293-10 | 21 |
| Td2 | 15.6 | 0.4 | YellowJacket | Savage Valley Dacite | AtoZ | 1293-01 | 8 |
| Td1 | 14.2 | 0.3 | Air Track Hill | Savage Valley Felsic Facies | Valencia | 115908 | 33 |
| Td1 | 14.8 | 0.2 | YellowJacket | Savage Valley Felsic Facies | Valencia | 115905 | 22 |
| Td1 | 15 | 0.3 | YellowJacket | Savage Valley Felsic Facies | AtoZ | 1293-02 | 28 |
| Trl | 14.9 | 0.2 | Sawtooth Mtn | Sawtooth Mtn Tuff, Upper Unit | AtoZ | 1335-005 | 26 |
| Tsb | 14.4 | 0.2 | YellowJacket | Sierra Blanca Tuff | Valencia | P346369 | 30 |
| Tsb | 14.5 | 0.2 | East Jolly Jane | Sierra Blanca Tuff | AtoZ | 1293-09 | 27 |
| Tsb | 14.7 | 0.3 | Jolly Jane | Sierra Blanca Tuff | Valencia | 115925 | 34 |
| Tsb | 15 | 0.2 | YellowJacket | Sierra Blanca Tuff | AtoZ | 1293-07 | 28 |
| Tsb | 15.1 | 0.2 | Pioneer | Sierra Blanca Tuff | AtoZ | 1335-002 | 29 |
| Tpf | 14.5 | 0.2 | YellowJacket | Pioneer Formation | AtoZ | 1293-05 | 27 |
| Tpf | 14.6 | 0.2 | YellowJacket | Pioneer Formation | AtoZ | 1293-08 | 28 |
| Tnb | 14.3 | 0.3 | YellowJacket | Rhyolite - spherulitic | Valencia | NB171608 | 32 |
| Tnb | 14.5 | 0.2 | YellowJacket | Rhyolite - flow banded | Valencia | P346202 | 20 |
| Tnb | 14.7 | 0.2 | Radio Tower Hill | Rhyolite - flow banded | Valencia | 115903 | 26 |
| Tnb | 14.7 | 0.2 | YellowJacket | Rhyolite - spherulitic | Valencia | P346250 | 26 |
| Tnb | 14.8 | 0.2 | YellowJacket | Rhyolite - flow banded | AtoZ | 1293-04 | 28 |
Corvus Gold Corp. Technical Report – North Bullfrog Project | | Page | 54 |
| . | Age
(Ma) | 2s | Locality | Description | Lab | Lab
ID | Number
of
Dates |
| Tnb | 15.3 | 0.3 | Gold Pit | Dacite Porphyry in Cambrian Basement | Valencia | P347979 | 28 |
| Tnb | 15.8 | 0.3 | Jolly Jane | Pre-Pioneer Formation Dacite | AtoZ | 1293-12 | 24 |
| Tnb | 15.9 | 0.3 | Radio Tower Hill | Rhyolite - flow banded | AtoZ | 1335-004 | 34 |
| Tnb | 16.1 | 0.3 | Savage Valley | Pre-Pioneer Formation Dacite | AtoZ | 1293-11 | 26 |
| | 1599.5 | 20.7 | YellowJacket | Basement Xenocrysts in Dacite | AtoZ | 1293-03 | 3 |
In general the match between the labs is reasonable, however, in many instances the A to Z dates are substantially older with differences far exceeding the analytical precision (Table 7-2). The dates of Victor Valencia match the published Ar-Ar ages for the Rainbow Mountain Tuff, the Paintbrush Tuff and the Crater Flat Group tuffs while the A to Z dates of the Rainbow Mountain and Crater Flat tuffs are almost 1Ma older than the published ages. Similarly, the A to Z age on the duplicate rhyolite from Radio Tower Hill is also approximately 1Ma older than the Valencia date (Table 7-2). For this reason it appears that the oldest dates from A to Z may be too old.
The zircon data confirm the age difference between the NBHVC and the Crater Flat Group tuffs and suggest that volcanism in the NBH complex extended from around 15Ma to 14Ma (Table 7-2). The zircon data also appear to confirm the proposed correlation between the Sierra Blanca Tuff and the Upper Tuff of Sawtooth Mountain (Table 7-2).
It is important to note that, prior to obtaining the zircon data, the Sierra Blanca Tuff was correlated with the ash flow tuff on the east side of Savage Valley and both were correlated to the Bullfrog Tuff of the Crater Flat Group. This error in stratigraphic correlation had structural implications that have now been corrected.
7.2.1.2.2 AR-ARDATING
A suite of eight adularia samples from the vein mineralization at YellowJacket and Mayflower were submitted to the University of Alaska Fairbanks for Ar-Ar dating (Benowitz and Layer, 2013). Only four of the samples returned statistically valid ages but these came from four different YellowJacket drill holes and seem to tightly constrain the age of mineralization there between 11.7-11.2Ma (Table 7-3).
In addition two samples of Alunite were submitted to the University of Nevada Las Vegas. The alunite from drill core had too much atmospheric argon to be dated accurately. However, a sample of coarse alunite collected from the eastern steam-heated alteration zone returned a good quality age of 9.5Ma (Table7-3). This age is similar to the age of adularia dated at Mayflower and the Bullfrog Mine (e.g. 10Ma; Weiss, 1996) and similar to the age of alunite obtained from Bailey’s Hot Springs in the southwest corner of the project area (Weiss, et al., 1994). These new ages for the large (~14 km2) Eastern Steam-heated Zone have highlighted the potential for the discovery of new Bullfrog/Mayflower-age, high-grade vein systems in this extensive area of alteration.
Corvus Gold Corp. Technical Report – North Bullfrog Project | | Page | 55 |
Table 7-3 Adularia and Alunite Ar-Ar Age Determinations. Adularia Samples Are All from the Yellowjacket Zone.
The Alunite Sample Is from the Eastern Steam-Heated Zone North of Alunite Hill.
| HoleID | Sample | Mineral | Integrated Age
(Ma) | Plateau
Age
(Ma) | Plateau
Information | Isochron
Age
(Ma) | % Atmospheric
40Ar | Lab |
| NB-12-127 | M610395 | Adularia | 11.2 ± 0.1 | 11.2 ± 0.1 | 5 of 7 fractions
98.4%39Ar release
MSWD = 1.09 | __ | 15.8 | University of Alaska Fairbanks |
| NB-12-139 | M612038 | Adularia | 11.6 ± 0.1 | 11.6 ± 0.2 | 4 of 7 fractions
99.1%39Ar release
MSWD = 2.43 | __ | 13.5 | University of Alaska Fairbanks |
| NB-12-126b | M610140 | Adularia | 15.5 ± 2.1 | 11.7 ± 0.4 | 4 of 7 fractions
51.3%39Ar release
MSWD = 1.21 | __ | 93 | University of Alaska Fairbanks |
| NB-12-138 | M611584 | Adularia | 11.7 ± 0.4 | 11.7 ± 0.4 | 6 of 7 fractions
97.6%39Ar release
MSWD = 0.51 | 11.4 ± 0.4 | 42.7 | University of Alaska Fairbanks |
| Alunite Hill | Alun SW107 | Alunite | 9.73 ± 0.5 | 9.52± 0.5 | 10 of 14 fractions
96%39Ar release | _ | _ | University of Nevada Las Vegas |
The 11.7 to 11.2Ma ages for YellowJacket vein mineralization are significant because they confirm earlier dating on adularia from this area published by Weiss (1996) that showed that YellowJacket vein mineralization ages were around 11.3Ma while the Mayflower vein adularia was considerably younger at 9.9Ma.
7.2.1.3 REGIONAL CORRELATION
The geochronological studies together with the refined stratigraphy of the NBH provide important information on the geological setting of the district. The first and most important conclusion is that with an age of 15-14Ma the NBHVC correlates with some of the oldest volcanics in the SNVF (Sawyer et al., 1994), as well as the Tr1 stratigraphic position of Eng et.al. (1996). This means that they have experienced several significant periods of tectonic reorganization. Sawyer et al. (1994) have one major period of extension between 13Ma and 12Ma culminating with the eruption of the Timber Mountain Group ash-flows between 11.6 and 11.45 Ma. These events are coincident with the YellowJacket mineralization age. Connors, et al. (1998) postulate a second major period of extension occurred between 11.4Ma and 9.4Ma which resulted in major block rotation and the deposition of the Rainbow Mountain debris flow deposits between 10.6Ma and 10.0Ma. The 9.9Ma age of Mayflower mineralization and the 9.5Ma age of the Eastern Steam-heated Zone coincide with the waning of this tectonic activity. Extension appears to have ceased by 9.4Ma (Connors, et al., 1998).
7.2.2 STRUCTURE
Both pre-Tertiary and Miocene rocks have been subjected to large-scale, W- to WNW-directed, syn-volcanic and syn-mineral extension between 16-9.4 Ma (faulting and east-tilting). It is important to recognize that this extension may not necessarily have been continuous, but may have comprised two separate periods of more intense fault activity. Both these events affected the rocks in the NBH. Figure 7-1 is a geologic map showing mineralized areas at NBP and major structures. A legend of geologic symbols used in this report is presented in Figure 7-2.
Corvus Gold Corp. Technical Report – North Bullfrog Project | | Page | 56 |
Some of the oldest faults in the NBH are probably represented by the Liberator, Savage, and East Jolly Jane Faults which have major down-to-the-east movements, and appear to define the eastern sides of YellowJacket, Savage Valley and Jolly Jane deposits (Figure 7-2, 7-3). Evidence for an older age on these structures is the fact that the Crater Flat Group is only preserved on the downthrown side of these faults and the Crater Flat Group is in turn overlain by relatively flat-dipping debris flow sediments that appear to cover these faults. It seems likely that these down-to-the-east faults developed during the 13-12Ma deformation event just after the emplacement of the Crater Flat Group. The Liberator Fault at YellowJacket was definitely mineralized at 11.6Ma and there is mineralization in the hanging-wall of the Savage Valley fault. At Jolly Jane, the Crater Flat Group is intensely altered in the hanging-wall of the East Jolly Jane Fault. These observations suggest that these major faults were present during the older mineralization event at North Bullfrog and may play an important role in the mineralizing process.
The most dramatic extension in both the northern and southern Bullfrog Hills took place during the second pulse of extension between 11.4 and 9.4Ma. During this time extension was accommodated by the Bullfrog Hills fault system (“BHFS”), a complex group of kinematically-linked, predominantly NNE- to NNW-trending, moderately west-dipping, down-to-the-west normal faults. Some of the larger displacement faults (e.g. the MP Fault at the Bullfrog Mine) are interpreted to have listric shapes, and likely sole into a district-scale low-angle detachment fault at depth. Hydrothermal alteration and gold mineralization are commonly spatially associated with major splays of the BHFS.
Three major splays of the BHFS cross the NBP including: the Donovan Mountain fault, the West Jolly Jane fault and the Road fault (Figure 7-1). These are generally northerly striking, west-dipping, down-to-the-west, normal faults with apparent dip-slip displacements of ~600 to >1000 metres (Figure 7-3). The Road fault is considered the northern continuation of the Contact fault from the Bullfrog mine area. The Contact fault comprises a bounding post-mineral structure that truncates the Montgomery-Shoshone deposit on the north (north of the main Bullfrog mine). The Contact fault also hosts low grade mineralization under Rhyolite Valley in the SBH.
In the NBH, differential movement between the main strands of the BHFS was accommodated by cross faults, the most notable of which is the Pioneer Shear (Figure 7-1). The Pioneer shear is a poorly understood E-W-trending structural zone that facilitated the block rotation in the hanging-wall of the Road Fault. This rotation allowed a basin to form with the accumulation of several hundred metres of debris-flow sediments in the Mayflower area prior to the eruption of the Rainbow Mountain Tuff (Trt2). The Vinegaroon Fault may represent the continuation of the Pioneer Shear to the east of the Road Fault (Figure 7-1)
The evolution of extension is well recorded at Mayflower where Rainbow Mountain Sequence sediments at the base of the Mayflower basin dip 45-55 degrees to the east but the Trt2 tuff dips only 20-30 degrees, similar to the dip observed farther to the north. Geopetal sedimentary structures in hydrothermal breccias at Mayflower have dips of less than five degrees, indicating that rotation had largely ceased by the time of mineralization at 10Ma.
Corvus Gold Corp. Technical Report – North Bullfrog Project | | Page | 57 |
With the exception of the Gravels of Sober-up Gulch, all of the stratigraphy in the NBH dips to the east at angles of between 10 and 60 degrees. The degree of tilting varies greatly indicating quite complex block rotation. The steepest dips observed are found in the hanging-wall of the Road Fault at the Pioneer Mine, where the Sierra Blanca Tuff compaction foliation is vertical and locally over-turned. Similarly, in the hanging-wall of the West Jolly Jane Fault, the Crater Flat Group tuffs dip 60-70 degrees to the east. These patterns suggest that the entire area has been affected by rotation on large down-to the-west listric normal faults.
Within the NBH there are many faults with relatively minor displacements, the ages of which are difficult to constrain. The “piano key” fault pattern at Sierra Blanca is an example of the small scale faulting that has affected the blocks between the larger faults (Figure 7-1, Figure 7-4). With the onset of major listric normal fault extension during the 11.4-10Ma event, any older faults riding in the hanging-wall would be rotated. This means that early east-dipping faults would steepen and early west-dipping faults would flatten. This is nicely exemplified by the NE40 fault at Sierra Blanca which appears to have a reverse motion at this time, probably as a result of rotation (Figure 7-4).
Figure 7-1 Geologic Map of the NBP with Target Areas, Resources and Property Outline.
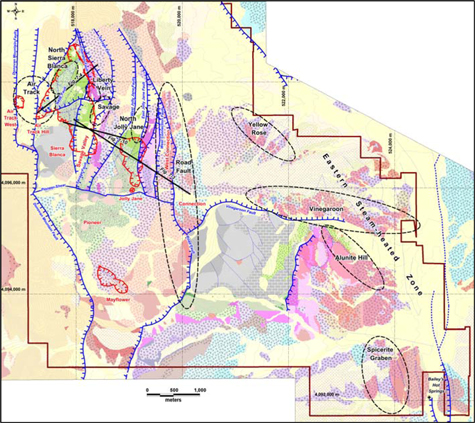
Corvus Gold Corp. Technical Report – North Bullfrog Project | | Page | 58 |
Figure 7-2 Legend of Geologic Symbols Used in This Report.
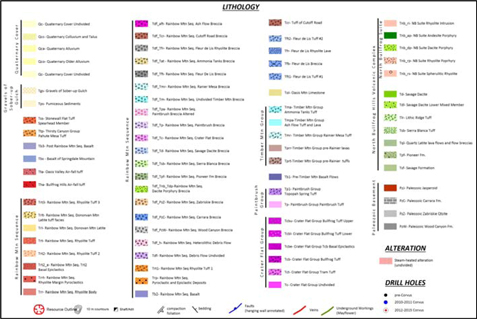
Figure 7-3 Geological Cross Section from Savage Valley to Connection Illustrating the Overall Structural Style of the Project Area. Section Location Is Shown in Figure 7 1 and the Legend Can Be Found in Figure 7-2.
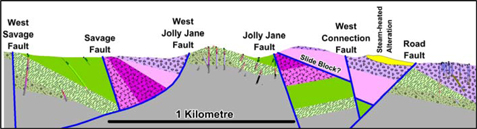
Corvus Gold Corp. Technical Report – North Bullfrog Project | | Page | 59 |
Figure 7-4 Geological Cross Section across Sierra Blanca Illustrating the Style of Faulting. Note That Faults Have Both Normal and Reverse Apparent Motions. The Location of Section Is Indicated in Figure 7 1 and the Legend Can Be Found in Figure 7-2.
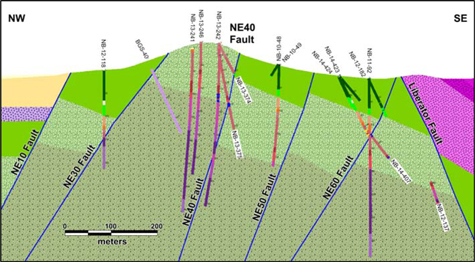
7.2.3 MINERALIZATION
All of the mineralization known to date in the NBH can be classified as low-sulphidation epithermal mineralization. As indicated above there are at least two and possibly three distinct periods of mineralization present at the NBP. Based on cross-cutting relationships it appears that the widespread silica-adularia alteration that typifies disseminated mineralization at Jolly Jane and Sierra Blanca predates the 11.6Ma quartz-adularia vein mineralization at YellowJacket by an unknown amount of time. There is widespread superposition of essentially barren jasper (hematitic quartz) veining on the silica-adularia prior to the development of the grey-quartz veins that carry the gold and silver mineralization. The silica-adularia alteration and YellowJacket veining will be discussed as “Older” mineralization. The younger 10Ma mineralization is represented by the more structurally controlled silica-adularia alteration found at Mayflower together with the quartz or calcite dominated gold mineralization found at both Mayflower and Pioneer. In addition there is the large area of opal-kaolinite-alunite alteration at the Eastern Steam-heated Zone that is temporally associated with the 10Ma Bullfrog and Mayflower hydrothermal events.
7.2.3.1 OLDER MINERALIZATION STYLES
Based on overprinting relationships observed in core it appears that multiple events have contributed to the gold endowment that developed before 11.2Ma, the youngest age observed at in the YellowJacket Zone.
7.2.3.1.1 PERVASIVE ALTERATION-STYLE MINERALIZATION
The most widespread mineralization at the NBP is associated with silica-adularia alteration and the pyritization of iron minerals in the volcanic host rocks. The grade of the alteration-mineralization reflects the intensity of silica-adularia or illite-adularia alteration, and the original iron content of the host rock succession. Gold grade in the Pioneer Formation and Sierra Blanca Tuff, which on average have 1% iron, is on the order of 200-300 ppb gold. In contrast, grades in the high Zr/Nb Savage Valley Dacite which has on average 4.2% iron, or the low Zr/Nb dacite which contain 2% iron, may reach several thousand ppb gold.
Corvus Gold Corp. Technical Report – North Bullfrog Project | | Page | 60 |
Silicate alteration associated with the sulphidation-style gold mineralization generally shows a progressive change from illite-smectite through illite-adularia to pure silica-adularia as the degree of mineralization increases.
The distribution of pervasive alteration-style mineralization appears to reflect a combination of rock matrix permeability and structural permeability. Although both the Sierra Blanca Tuff and the Pioneer Formation pyroclastic units are pervasively altered, it appears that the brittle nature of the densely-welded Sierra Blanca Tuff enhanced the permeability of that unit relative to the underlying less welded tuffs of the Pioneer Formation. In contrast, alteration in the underlying Savage Formation and the overlying Savage Dacite appear to be controlled almost exclusively by fault related permeability.
Alteration-style mineralization has been observed locally in the Paleozoic siliciclastic sediments but they are not generally well-mineralized. One possible explanation is that in many cases the iron in these marine sediments already formed pyrite before the mineralization event began. Jasperoid is developed in the Carrara Formation limestone just below the Tertiary unconformity in many drill holes at both Jolly Jane and Savage Valley. The jasperoid is typically weakly anomalous in Au, but locally yield 200-400 ppb values.
The normal silver to gold ratio of the alteration-style mineralization is approximately 1:1. However, in some instances it may be three or four times higher. This may indicate that there is more than one alteration-style mineralization event. Work is currently underway to map the Ag:Au ratio and see if it defines a spatial pattern.
7.2.3.1.2 STRUCTURALLY CONTROLLED MINERALIZATION
Structurally controlled mineralization consists of two distinct styles which may represent two periods of mineralization. The first is a structurally-controlled alteration-style mineralization and the second is quartz vein style mineralization.
The onset of structurally-controlled mineralization is marked by the formation of a distinctive suite of essentially barren jasper (quartz-hematite) veins that crosscut the older pervasive silica-adularia disseminated mineralization (Figure 7-5). After the formation of the jasper veins, it appears that movement on major fault structures (e.g. Liberator and NE30 faults) focused the flow of mineralizing fluids which resulted in a second stage of fault controlled sulphidation (Figure 7-5). This structurally- controlled mineralization can be distinguished from the earlier alteration event by a higher As/Au ratio, and is generally associated with a pale-grey to light brown illite or illite adularia alteration. In addition, this stage of mineralization appears to be higher grade than the earlier pervasive mineralization. Structurally-controlled alteration-style mineralization frequently yields grades greater than 1 g/t, and sometimes greater than 5 g/t where the fluids encounter higher iron contents. This alteration style mineralization is clearly crosscut by the later low sulphidation high-grade quartz veins.
Corvus Gold Corp. Technical Report – North Bullfrog Project | | Page | 61 |
Pre-11Ma quartz vein mineralization is found at the YellowJacket deposit and along the crest of Sierra Blanca ridge (Figure 7-1). A variety of textures typical of low sulphidation epithermal veins have been observed in these areas. Bladed quartz pseudomorphs after calcite and milky chalcedonic quartz with distinct but fuzzy banding are found at YellowJacket and are widespread around the Sierra Blanca area. Veins with these textures may be barren or have only very low grade gold mineralization. Occasionally there are some intervals with beautifully banded crustiform textures that may run several grams of gold per tonne. However, the most common and best mineralized quartz textures at YellowJacket are grey translucent veins with little distinctive internal structure (Figure 7-5).
Frequently fine particles of native gold can be observed in this quartz. Occasionally there may be faint banding with gold, acanthite or pyrite along individual bands. Where the quartz veins have formed in quartz-adularia-altered rocks, there may be very little alteration associated with the veining. Illite alteration overprinting the silica-adularia is often observed in the general vicinity of quartz veining. The illite overprint can locally be quite intense creating selvages around structures and destroying all the feldspar in the rocks. Fault breccias in the mineralized vein structures are frequently silicified.
The primary minerals associated with the vein-style mineralization are gold, electrum, acanthite (Ag2S) and pyrite. Petrographic studies have also documented pyrargyrite (Ag3SbS3), stromeyerite (AgCuS), proustite (Ag3AsS3), chalcopyrite (CuFeS2) and covellite (CuS). Sphalerite has been observed as a late cavity infill. In general, the silver to gold ratio in the vein mineralization is greater than 6:1 and can locally be 100’s:1.
Figure 7-5 Crossscutting Relationships between Older Mineralization Styles at Sierra Blanca. 1 - Pervasive Silica Adularia Alteration with Gold Related to Sulphidation of Iron, 2 - Jasper Veins Filling Brittle Fractures in Adularia Altered Tuff, 3 – White Illite-Adula.
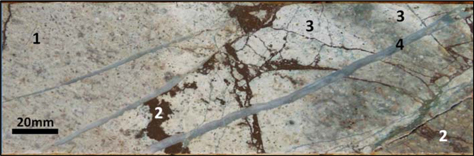
7.2.3.2 YOUNGER MINERALIZATION STYLES
In many cases the age of mineralization can be constrained by the fact that the mineralization is hosted in the Rainbow Mountain Debris Flow sequence, which had not yet been deposited at 11.6Ma. Recognition of differences in the styles between debris-flow hosted mineralization and the older styles of mineralization can be used to classify mineralization in more ambiguous structural settings.
Corvus Gold Corp. Technical Report – North Bullfrog Project | | Page | 62 |
7.2.3.2.1 SILICA-ADULARIA ALTERATION
At Mayflower, the debris flow sediments and the Trt2 tuff have been affected by silica-adularia alteration developed around a central zone of faulting. The silica-adularia alteration is mineralized and although the deposit is completely oxidized at present it appears that the original mineralizing process was sulphidation. This process is similar to, but younger than that observed with the silica-adularia alteration at Sierra Blanca and Jolly Jane.
The distribution of silica-adularia alteration appears to reflect a combination of structural and stratigraphic permeability. In the debris-flow sediments the alteration spreads out for 10’s of metres around the central structural zone, whereas in the Trt2tuff the alteration is restricted to just a few metres around the structures. The silica-adularia alteration was a very important ground preparation for later vein mineralization because it made the rock brittle which led to cavity formation during later faulting. The intensity of silica adularia alteration decreases relatively quickly distal to the mineralizing structures, and grades into a smectite-dominated assemblage. In the Trt2 tuff, zeolites are common outside of the alteration selvage.
The Mayflower deposit is almost completely oxidized so the sulphide mineralogy of the original alteration is not known. The concentrations of arsenic and other metals are quite low.
7.2.3.2.2 QUARTZ VEINING - SILICIFICATION
At Mayflower, quartz veining is only known from the southeastern part of the deposit and primarily from the historical mine dumps around the Mayflower Shaft. The quartz is generally white to grey translucent but is sometimes pink. It is frequently banded and may have very fine acicular textures indicating replacement of earlier adularia. Bladed pseudomorphs of quartz after calcite are found in outcrop at the Pioneer Mine but have not been observed at Mayflower. Blocks of silicified fault breccia have been observed on the Mayflower dumps. Microscopic studies have found disseminated native gold in silicified fault breccia at Mayflower. Argentite was also observed in thin section.
7.2.3.2.3 CALCITE VEINING
It appears that much of the gold at Mayflower is associated with grey calcite veining infill. Occasionally this calcite can be banded but it is generally coarse-grained and either lines cavities or fills them completely. Observations from both macroscopic and microscopic studies at Mayflower show visible gold in the calcite bands rather than in the quartz, and frequently gold grains are found at the calcite-wallrock contact. In the David Adit at Mayflower, the only cavity infill phase is coarse euhedral calcite. Although the calcite is not always mineralized, historical sampling combined with underground observations shows that the highest grade areas have calcite cavity linings. In core holes that have intersected high-grade mineralization at both Mayflower and Pioneer, the high-grade material is typically quartz-free and rich in iron-oxide and clay, which probably represents the carbonate weathering residue.
The fact that gold is associated with calcite at Mayflower is very different to YellowJacket where calcite is generally not associated with high-grade mineralization. Another difference is that the Ag:Au ratio at Mayflower is generally <0.5 WHEREAS AT YELLOWJACKET IT IS GENERALLY GREATER THAN 5.
Corvus Gold Corp. Technical Report – North Bullfrog Project | | Page | 63 |
7.2.3.2.4 STEAM-HEATED ALTERATION
Steam-heated alteration, characterized by low-temperature silica, kaolinite and locally alunite replacement, reflects the presence of acidic steam-heated waters interacting with the volcanic rocks. Steam-heated alteration has been identified on the NBP in a number of different places, most notably on eastern part of the project area, which is referred to as the “Eastern Steam-heated Zone”. Other locations of steam-heated alteration occur in several places along the Road Fault, particularly in the vicinity of the Connection prospect (Figure 7-1).
In modern geothermal systems, steam-heated alteration typically develops above a groundwater table, which in turn lies just above a boiling zone at depth. If the elevation of the groundwater table is known, then the depth to boiling can be estimated. As boiling is the dominant cause of gold precipitation in low-sulphidation epithermal systems, estimates can be made of the depth to the potentially productive gold deposition horizons. For fluids in the North Bullfrog Eastern Steam-heated Zone, this target depth is projected at 100 to 300 metres below the paleo-groundwater table.
Anomalous gold has been detected in rocks affected by steam-heated alteration at or near the currently mapped paleo-groundwater water table at the following target areas: Alunite Hill, Vinegaroon, Cat Hill, and Yellow Rose. There is a reasonably high probability that this alteration may be associated with a productive gold mineralization system at depth (Figure 7-1).
7.3 TARGET AREAS
Corvus and previous operators exploring in the NBH initially defined targets in areas of historic mines or prospects. More recently, Corvus has defined targets associated with high level epithermal alteration that has been identified as being of similar age to the Bullfrog and Mayflower deposits. The target areas that are discussed in detail within this report include Jolly Jane, Sierra Blanca, YellowJacket, Air Track West, Connection, Mayflower, Pioneer, the Road Fault and the Eastern Steam-heated Zone (Figure 7-1).
Most of the targets associated with historic prospects in the western part of the District have been drilled to some extent. In 2007-2008, ITH/Redstar (NBPJV) drilled several holes at Air Track Hill and Mayflower, with two holes each at Sierra Blanca, Pioneer, and Savage Valley. Between 2010 and 2014, Corvus drilled numerous holes at Sierra Blanca, Jolly Jane, Mayflower and Connection, leading to Mineral Resource estimates for those areas which are discussed in this document.
7.3.1 OLDER MINERALIZATION
7.3.1.1 JOLLY JANE
Jolly Jane is located in the middle of the NBP area, and virtually all of the geological elements common to the NBP are found there (Figure 7-1, Figure 7.6)
The pseudo-stratabound nature of disseminated mineralization within the Sierra Blanca Tuff at Jolly Jane was recognized by Barrick Gold in 1996, but was not of sufficient grade to be pursued at that time. This style of mineralization was one focus of Corvus’ drilling program in 2010-11, when twenty-seven holes totaling 4,128.5 metres (13,545 ft.) were drilled at Jolly Jane. In 2012 and 2013, 34 additional holes were drilled at Jolly Jane totaling 4,234 metres (13,891 feet). These included three PQ3 core holes for metallurgical samples, 29 infill RC holes on the ZuZu patented claim, and two step-out RC holes to the north of the Mineral Resource area (see Figure 7-7). Eight surface rock chip/channel lines totaling 384 metres (1,260 ft.) have been sampled at 5 ft. intervals to mimic drill holes. The results of the 2010-13 work, along with drill data from Barrick, are the basis for the Indicated and Inferred Resources presented in this document.
Corvus Gold Corp. Technical Report – North Bullfrog Project | | Page | 64 |
The stratigraphy of the Jolly Jane area includes the following major units in ascending stratigraphic order: 1) basement Cambrian Carrara Formation: 2) the Jolly Jane Formation; 3) the Savage Formation; 4) the Pioneer Formation; 5) rhyolite bodies of the North Bullfrog Lithodeme; 6) the Sierra Blanca Tuff; 7) the Savage Valley Dacite; 8) the Tram Tuff Member of the Crater Flat Group; 9) the Bullfrog Tuff Member of the Crater Flat Group; and 10) monolithic debris flow breccias of Paintbrush Tuff.
The Paleozoic Carrara Formation consists of primarily of calcareous shale, argillaceous limestone and micritic limestone. Jasperoid is common at the transition between shale and limestone in many drill holes. It is not clear whether the jasperoid is 100% hydrothermal in nature, or in-part a cherty interval at the shale/limestone stratigraphic transition. However, jasperoid occurs in proximity to gold mineralization in the overlying Sierra Blanca Tuff throughout the deposit area. The jasperoid is typically anomalous in gold (0.020-0.100 ppm), locally up to 0.372 ppm. The interpretation is that the jasperoid is a part of the mineralizing system, representing structurally controlled alteration in the basement.
The Jolly Jane Formation was deposited unconformably on the Cambrian basement and includes a rather heterogeneous sequence of: 1) siliceous hematitic conglomerate, pebbly sandstone and siltstone; 2) calcareous and variably carbonaceous lithic-volcanoclastic sediments that appears in-part to be re-worked dacite; and 3) locally intercalated monolithic debris flow breccias of the Carrara Fm. The conglomeratic intervals are largely Paleozoic-clast dominated, and generally occur directly along the basement unconformity, grading upward into finer pebbly sandstone and red siltstone. The volcanoclastic sedimentary rocks generally overlie the hematite-rich lithologies, but are locally intercalated. The overlying dacitic volcanic rocks of the Savage Formation apparently locally intertongue with sediments of the Jolly Jane Formation. The thickness of the Jolly Jane unit varies dramatically from 0-50 metres between drill holes, and lithologic variations are also quite dramatic between drill holes. This variation is due in-part to original basement topography (fault scarps and small adjacent basins), as well as subsequent juxtaposition by pre-, syn-, and post-mineral faulting and tilting.
The Savage Formation consists of aphanitic to porphyritic dacites and flow-banded to spherulitic rhyolites. It is interpreted as a dacitic to rhyolitic flow-dome complex with associated intrusives and intercalated pyroclastic and epiclastic deposits. The basal flows of the Savage Formation intercalate with the underlying sedimentary rocks. The Savage Formation varies dramatically in thickness from >100 metres in the south end of Jolly Jane to nothing in the northern portion of the Jolly Jane area.
The Pioneer Formation is only a few 10’s of metres thick at Jolly Jane, and thickness can vary dramatically across some faults suggesting that there was active tectonism between the eruptions of the Pioneer and Savage Formations (Figure 7-8). The preserved portion of the Pioneer Formation coincides with the uppermost intervals found at Sierra Blanca (see below), suggesting that Jolly Jane was a topographic high area during that time.
Corvus Gold Corp. Technical Report – North Bullfrog Project | | Page | 65 |
A number of aphanitic, commonly flow banded, rhyolite bodes are present in the Savage Formation and the Pioneer Formation at Jolly Jane. In many cases the origin of these is not clear but they do appear to cross cut the Pioneer Formation rocks at the southern end of Jolly Jane. Zircon dating of one of the bodies in the Pioneer Formation immediately southwest of Jolly Jane returned an age of 14.7Ma making it essentially contemporaneous with the Pioneer Formation (Radio Tower Locality, Table 7-2). If the stratigraphic association is unclear, these rhyolites may be assigned to the North Bullfrog Suite.
The Sierra Blanca Tuff is the dominant host rock for mineralization at Jolly Jane. The preserved thickness of the Sierra Blanca Tuff at Jolly Jane is approximately 70 metres, compared to a thickness of >160 metres at Sierra Blanca. This suggests that Jolly Jane continued to be a topographic high when the Sierra Blanca Tuff was deposited.
The Savage Valley Dacite overlies and apparently intercalates with the Sierra Blanca Tuff at Jolly Jane. As at Sierra Blanca, the Savage Valley Dacite is a heterogeneous sequence of lava flows, pyroclastics, and epiclastics of predominantly dacitic composition. There is likely an angular unconformity between the Sierra Blanca Tuff and the Savage Valley Dacite at Jolly Jane.
The Crater Flat Group of tuffs overlies the Savage Valley Dacite, and is juxtaposed against the Dacite along the East Jolly Jane Fault (Figure 7-6). Limited compaction foliation data indicate these tuffs dip to the northwest suggesting an unusual block rotation. The Crater Flat Group is intensely silica-adularia altered and was almost certainly present during the main mineralization event. Drilling to date has not identified any significant gold mineralization in this unit at Jolly Jane.
Corvus Gold Corp. Technical Report – North Bullfrog Project | | Page | 66 |
Figure 7-6 Geologic Map of the Jolly Jane Target Area. Legend Can Be Found in Figure 7-2.

Corvus Gold Corp. Technical Report – North Bullfrog Project | | Page | 67 |
Figure 7-7 Drill Hole Locations for the Jolly Jane Target Area and Location of the Zuzu Patented Claim.
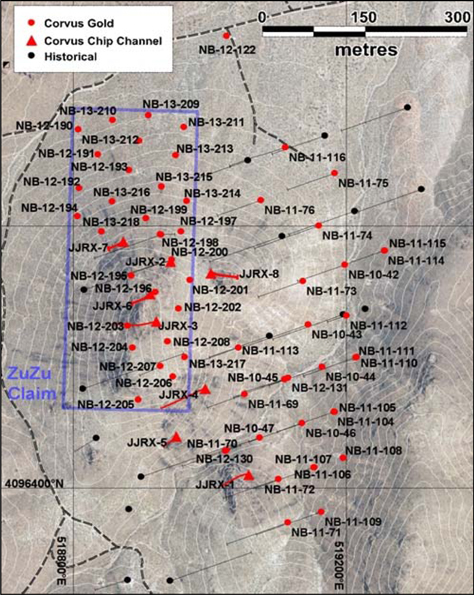
A large semi-tabular mass of Paintbrush Tuff and monolithic Paintbrush Tuff debris flow breccia (Tdf-Tp) comprises the ridge just east side of Jolly Jane (Figure 7-6). The compaction foliation in the welded tuff dips 20 to 30 degrees to the east indicating a significant angular discordance to the underlying Crater Flat Group. It is possible that the entire section represents a major slide block overlying the Crater Flat Group. Alternatively, a major down to the east fault may be present between the Crater Flat Group and the Paintbrush Tuff. The Paintbrush breccias are not mineralized at Jolly Jane, but they do exhibit silicification and were likely present at the time of mineralization.
Corvus Gold Corp. Technical Report – North Bullfrog Project | | Page | 68 |
The geology of Jolly Jane is quite complex, mostly due to the presence of active faulting and erosional unconformities between each of the major stratigraphic units. The Jolly Jane gold deposit is preserved as a horst between the West Jolly Jane and the East Jolly Jane Faults (Figures 7-3 and 7-8). The block between these two faults is cut by steep NE-trending faults that appear to have been critical controls on the deposition of the basal Tertiary sediments and the Sierra Blanca Tuff (Figure 7-8, Sections Long 04 and G). At the north end, the structure is relatively simple with large coherent zones between faults (Figure 7-8, Section K). In contrast, the structure in the south becomes increasingly complex with large volumes of Savage Formation (?) dacite and rhyolite developing beneath the Sierra Blanca Tuff (Figure 7-8, Section B).
The ZuZu portion of the Jolly Jane Mineral Resource is named for the ZuZu patented claim (Figure 7-7). The ZuZu claim covers a ridge top where the pseudo-stratabound Jolly Jane disseminated zone daylights at the surface. The Jolly Jane mineralized zone is truncated on the west side of the ZuZu claim by the West Jolly Jane Fault (Figure 7-6). The West Jolly Jane Fault exhibits ~600 metres of down-to-the-west normal displacement, which essentially repeats the Jolly Jane stratigraphy and mineralization under the Savage Valley area to the west (Figure 7-3).
Corvus Gold Corp. Technical Report – North Bullfrog Project | | Page | 69 |
Figure 7-8 Cross Sections through Jolly Jane Target Area. See Figure 7-6 for Section Locations. Drill Traces Are Colored by Gold Assay Values.
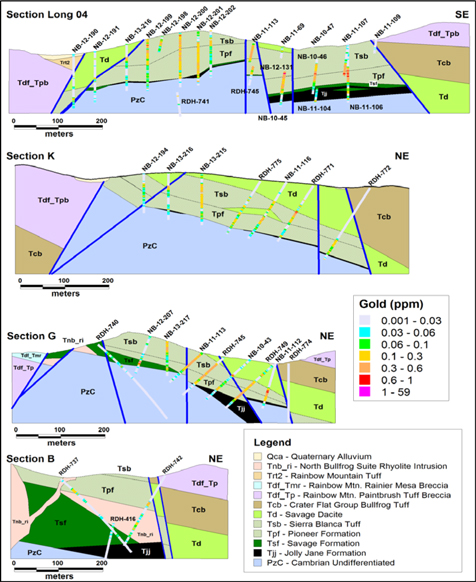
7.3.1.2 SIERRA BLANCA
The greater Sierra Blanca area includes the Savage Valley, Sierra Blanca, North Sierra Blanca, YellowJacket, Air Track Hill and Air Track West areas (Figure 7-9). In 2010-11, Corvus drilled 44 holes totaling 12,785 metres (41,945 feet) in the Sierra Blanca area. In 2012, 16 additional holes totaling 3,548 metres (11,640 feet) were drilled in and around the Sierra Blanca area including 4 PQ3 holes for metallurgical samples, 6 HQ3 exploration holes, and six step-out/infill RC holes. In 2013 Corvus drilled 87 holes totaling 19,000 metres (62,340 feet) including 35 HQ3 core holes, two PQ3 core holes for metallurgical samples, and 50 RC holes. In addition, 13 channel sample profiles were completed along new road cuts totaling 888 metres. In 2014 Corvus drilled 48 holes totaling 11,000 metres (36,100 feet) including 36 HQ3 core holes, and 12 PQ3 holes for metallurgical testing. In addition 180 meters of chip channel sampling was completed on Sierra Blanca road cuts. The Sierra Blanca Mineral Resource has been updated using this additional data.
Corvus Gold Corp. Technical Report – North Bullfrog Project | | Page | 70 |
7.3.1.2.1 SIERRA BLANCA GEOLOGY
7.3.1.2.1.1 STRATIGRAPHY
The stratigraphy of the Sierra Blanca-Savage Valley-YellowJacket-Air Track Hill and Air Track West area is similar to Jolly Jane including the following major units in ascending stratigraphic order: 1) early Paleozoic basement rocks including the Zabriskie Quartzite and Carrara Formation; 2) the Jolly Jane Formation; 3) the Savage Formation; 4) the Pioneer Formation; 5) the Sierra Blanca Tuff; 6) the Savage Valley Dacite; 7) rhyolite bodies of the North Bullfrog Lithodeme; 8) the Crater Flat Group; 9) monolithic and heterolithic debris flow breccias of the Rainbow Mountain Sequence; 10) the Trt2 tuff of the Rainbow Mountain Sequence; and 11) the Sober Up Gulch Gravels (Table 7-1).
The Zabriskie Quartzite (PzZ) crops out along the southwest side of Savage Valley, and was penetrated in a few drill holes (Figure 7-9). The Zabriskie consists of light brown, pink or light grey, non-calcareous to weakly calcareous vitreous quartzite. The Carrara Formation (PzC) overlies the Zabriskie and consists of primarily of carbonaceous calcareous shale, argillaceous limestone and micritic limestone, with lesser intervals of sandy limestone and calcareous sandstone. PzC is the primary bedrock unit encountered under Savage Valley. The stratigraphic transition zone from PzC to PzZ is present under the west side of Savage Valley. Jasperoid is locally developed in PzC in the Savage Valley drill holes. Jasperoid occurs in proximity to gold mineralization in the overlying units, and is locally anomalous in gold. The assumption is that the jasperoid is a part of the mineralizing system, representing structurally controlled alteration in the basement.
Corvus Gold Corp. Technical Report – North Bullfrog Project | | Page | 71 |
Figure 7-9 Geological Map of the Greater Sierra Blanca Area. Legend Can Be Found in Figure 7.2.
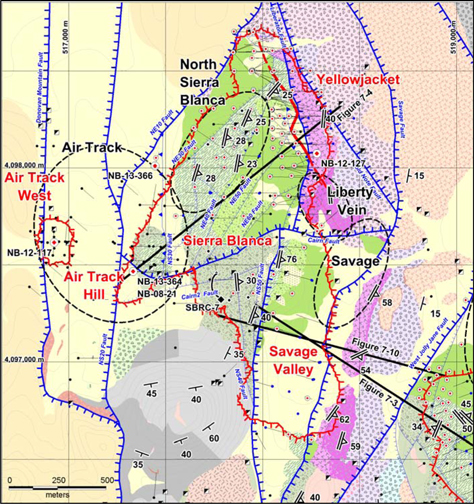
At Sierra Blanca, the Jolly Jane Formation includes a heterogeneous sequence of: 1) Paleozoic clast-dominated conglomeratic sediments; 2) calcareous and variably carbonaceous lithic-volcaniclastic sediments that appear to be largely re-worked dacite; and 3) rare monolithic debris flow breccias of the Carrara Formation. Basal Tertiary conglomerate is the common lithology at the basement unconformity, grading upward into volcaniclastic sediments. The Jolly Jane sediments under Savage Valley are typically intercalated with and overlain by porphyritic dacite lavas of the Savage Formation. The thickness of the Jolly Jane Formation varies dramatically from 0-35 metres between drill holes. Thickness and lithologic variation are due in-part to original basement topography (fault scarps and small adjacent basins). Monolithic breccias of Carrara Formation are interpreted to occur as local gravity slide blocks in proximity to buried basement fault scarps. The Jolly Jane Formation at Sierra Blanca is generally much thinner and less volumetrically significant than at Jolly Jane. Gold mineralization is very rare in the Jolly Jane Formation under Savage Valley.
Corvus Gold Corp. Technical Report – North Bullfrog Project | | Page | 72 |
The Savage Formation at Sierra Blanca consists of porphyritic dacite flows and intercalated dacite sediments. The flows thicken to the south where they apparently connect with the Savage Plug: a rhyo-dacite porphyry body that is part of the North Bullfrog Lithodeme. The Savage Formation is locally mineralized under south Savage Valley.
The Pioneer Formation exhibits dramatic thickness variation in the Sierra Blanca area ranging in thickness from 10’s of metres in the south to over 250 metres in the north. The base of the unit has never been drilled in the YellowJacket area. The sequence is composed primarily of felsic pyroclastic rocks, generally lithic lapilli tuffs. The Pioneer Formation exhibits varying degrees of silica-adularia alteration and host significant gold mineralization.
A distinctive four unit geochemical stratigraphy has been defined within the Pioneer Formation and it is this stratigraphy that has been used for the 3D geological model that forms the basis of the resource estimate reported here. The geochemical stratigraphy is based primarily on the Zr/Ce ratio which increases in a stepwise fashion going upward in the stratigraphy. The basal unit “A” has a Zr/Ce ratio of less than 8, “B” has a Zr/Ce ratio of 8-9, “C” has a Zr/Ce ratio of 10-11 and “D” has a Zr/Ce ratio >=12. Interpretation is based on sample sequences rather than individual samples. It should be noted that the geochemical data used for this classification come exclusively from the ALS Minerals 4-acid digest ICP-MS (ME-MS61) method with sufficient control to ensure homogeneity. Importantly, Unit D, which consists of a sequence of heterolithic pyroclastic and epiclastic rocks including spherulitic rhyolite clasts, appears to represent a major unconformity. Depending on location, Unit D is known to be deposited on all underlying stratigraphic units from the Paleozoic rocks to the Unit C of the Pioneer Formation.
In the northern area of Sierra Blanca, rhyolite bodies from the North Bullfrog Lithodeme appear within the Pioneer Formation. These exhibit a variety of textures including spectacular spherulitic flow-banded bodies and thick intervals of monolithic breccias, possibly representing some type of autobreccia. Based on zircon age dating and geochemical similarities between the Pioneer Formation tuffs and the rhyolites it appears that these rhyolites may be coeval with deposition of the Pioneer Formation. These rhyolites may represent both intrusive and extrusive phases of rhyolite volcanism contemporaneous with the Pioneer Formation.
The Sierra Blanca Tuff is the dominant host rock at Sierra Blanca. The preserved thickness of the Sierra Blanca tuff varies in thickness from >160 metres in the north to 30 metres in the south. The Sierra Blanca Tuff represents a single cooling unit which shows a high degree of compaction and welding. The tuff is frequently fractured and brecciated, and it appears that the brittle nature of the densely-welded tuff was important in facilitating the movement of hydrothermal fluids and. The unit is ubiquitously altered to a mixture of fine-grained quartz and adularia throughout the Sierra Blanca area.
The Sierra Blanca Tuff can be divided into 7 geochemically distinct subunits using a combination of zirconium, niobium, cerium, yttrium, titanium, and aluminum. The basal units A1 and A, which are characterized by relatively elevated zirconium compared to Unit B, vary considerably in thickness, often inversely, suggesting that they may be filling topography. Unit B accounts for the largest proportion of the total volume of ash and is chemically homogeneous. Unit C marks the beginning of a change in composition as the tuff becomes less silica-rich and has higher titanium concentrations. Units MZ1, MZ2 and MZ3 are marked by a stepwise increase in the Zr/Nb ratio and TiO2 together with an associated decrease in the SiO2 content of the ash. In the geological model used for the resource estimate reported here, the Sierra Blanca stratigraphy was simplified into units A, B, C and MZ.
Corvus Gold Corp. Technical Report – North Bullfrog Project | | Page | 73 |
The Sierra Blanca Tuff is unconformably overlain by the Savage Valley Dacite. The Savage Valley Dacite is a heterogeneous stratigraphic sequence of domes, flows, pyroclastic and epiclastic rocks of dacitic to andesitic composition. Several eruptive cycles, probably from multiple local vent sources, have been identified based on geochemistry. The unit exhibits inconsistent lithologies between drill holes, and the internal stratigraphy is still a work in progress. There is a rather heterogeneous lower pyroclastic and epiclastic sequence of rhyolite to dacite composition, which changes upward into a more uniform sequence of dacitic to andesitic lava flows and breccias. In contrast to the pervasive alteration that is typical in the Pioneer Formation and the Sierra Blanca Tuff, alteration in the Savage Valley Dacite is typically more structurally-controlled, which results in illite-adularia alteration that can have grades of several ppm gold.
The Crater Flat Group of tuffs is preserved along the eastern side of YellowJacket and Savage Valley (Figure 7-9). Both the Tram Tuff and Bullfrog Tuff members are believed to be present here, but may not always be distinguishable due to alteration. At YellowJacket, the Crater Flat Group dips 35-60° to the east-northeast and is intensely altered. To date no gold mineralization has been encountered at the surface, however, there is silicification associated with a structure known as the Liberty Vein. Recently in 2015, two holes were drilled to test the Liberty Vein with assays pending at this time. East of Savage Valley where the tuff is essentially unaltered, the Crater Flat Group dips 50-70° to the east-southeast (Figure 7-10).
A significant interval of monolithic Paintbrush Tuff debris flow breccia (Tdf-Tp) unconformably overlies Crater Flat Group along the eastern side of Savage Valley and YellowJacket. Scarce bedding measurements indicate that this unit may dip 25-30oto the east. At YellowJacket, the Paintbrush breccia unit appears to be overlain by and intercalates with heterolithic debris flow sediments of the Rainbow Mountain Sequence. The Paintbrush breccia is not known to be mineralized at Sierra Blanca, but can locally exhibit intense hydrothermal alteration (mostly silica-adularia). The age of the Paintbrush Tuff (12.8Ma) is contemporaneous with the onset of the 13-12Ma deformation event postulated by Sawyer et al. (1994). Therefore it is possible that these monolithic domains of breccia could have been in place prior to the onset of the 11.45Ma deformation event postulated by Connors et al. (1998). In either case it is possible that the Paintbrush blocks could have been in place during the 11.6-11.2Ma mineralization event and could be a favorable mineralization host.
Also to the east of YellowJacket and Savage Valley, the Paintbrush breccia and heterolithic debris flows are unconformably overlain by relatively unaltered, non-welded, pumiceous crystal-lithic rhyolite tuff of the Rainbow Mountain Sequence identified as Trt2 Tuff (Figure 7-9). The base of the Trt2 tuff is marked by a bedded epiclastic rocks that locally infill a significant erosional channel cut through the Paintbrush breccia into the Ctrater Flat Group. The lower contact of the tuff dips generally 15-20° to the east. The zircon age of this unit is 10.5Ma (Table 7-2) which agrees, within errors, with the 10.1Ma age reported by Connors et al. (1998) and indicates that this unit was deposited after the 11.6Ma mineralization event which has affected the Sierra Blanca Area.
Corvus Gold Corp. Technical Report – North Bullfrog Project | | Page | 74 |
The last unit of importance at Sierra Blanca is the Sober Up Gulch Gravels. These younger gravels fill the valley to the west of Air Track Hill. The gravel sequence is only known from percussion drilling in this area. Some of the gravel intervals have low concentrations of gold, and the Air Track West deposit appears to be hosted in these gravels. The mineralization at Air Track West appears to be a large slide block of silica-adularia-altered rhyolite within the heterolithic gravel unit. The abundance of Donovan Mountain Latite clasts suggests the gravels in this area are analogous to the Gravels of Sober-up Gulch. An alternative interpretation is that the relatively young gravels have been mineralized by a younger event not previously known to exist at the NBP. A small Mineral Resource has been defined at Air Track West.
7.3.1.2.1.2 STRUCTURE
The structural setting of the Sierra Blanca area is remarkably similar to Jolly Jane, and at least four times larger. Overall the Sierra Blanca deposit is exposed on a horst block defined by the combination of the Savage and Liberator Faults on the east, and on the NS20 and NE10 Faults on the west (Figure 7-9).
The area is effectively divided in two by the E-W-trending, north-dipping, down-to-the-north Cairn Fault which separate Savage Valley from Sierra Blanca (Figure 7-9).
The structure in Savage Valley is relatively simple with a series of down-to-the-east faults on the western side of the valley and then the large down-to-the-east Savage Fault on the eastern side (Figure 7-10). The stratigraphy dips steeply to the east between these faults probably reflecting rotation in the hanging-wall of the West Jolly Jane Fault (Figure 7-10).
The structure north of the Cairn Fault is more complex, with a “piano key” array of faults that all seem to dip to the west but have mixed apparent normal and reverse displacements (Figure 7-4). The dip in this block is quite variable but is generally 20-40° to the east-southeast.
Figure 7-10 Geological Cross Section through Savage Valley Illustrating the Style of Faulting. Location Is Shown on Figure 7-9. Legend Can Be Found on Figure 7-2.
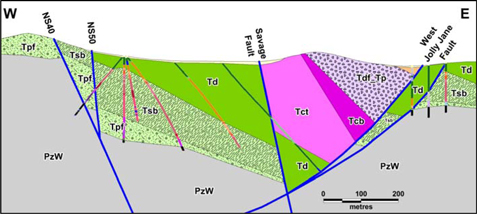
Corvus Gold Corp. Technical Report – North Bullfrog Project | | Page | 75 |
7.3.1.2.2 SIERRA BLANCA MINERALIZATION
Mineralization at Sierra Blanca can be classified into the following styles:
| · | Disseminated gold associated with pervasive silica-adularia and sulphidation of iron (ubiquitous) |
| · | Gold associated with fault controlled sulphidation (NE30, NE50, NE60 Faults) |
| · | Gold associated with quartz veining |
| · | Continuous quartz vein and associated stockwork (Josh Vein) |
| · | Localized quartz veins and stockworks (numerous zones) |
| · | Sulphide veining with gold and tellurium mineralization (Air Track Hill) |
Each of these mineralization styles have distinct spatial controls and metallurgical characteristics and the geological model used to estimate the Sierra Blanca resource was designed to that differentiate each of these styles of mineralization.
7.3.1.2.2.1 PERVASIVE DISSEMINATED MINERALIZATION
The Pioneer Formation and Sierra Blanca Tuff are mineralized over virtually the entire area at Sierra Blanca (see resource outline in Figure 7-1). The Sierra Blanca Tuff is moderate to strongly-altered to a fine-grained mixture of silica and adularia that is associated with disseminated gold mineralization. Silica-adularia alteration is consistently less well-developed in the underlying Pioneer Formation. In less altered areas, the Pioneer Formation tuffs are distinctly green with a smectite-chlorite-dominated assemblage. As the alteration intensity increases, the tuffs are progressively converted to illite-adularia and finally to silica-adularia. With wide-spaced drilling the detailed controls on alteration development are difficult to constrain. However, it appears that alteration is controlled by a combination of structure and stratigraphy. There is a major fluid upwelling zone beneath North Sierra Blanca where intense silica-adularia alteration extends for more than 200 metres vertically beneath the ridge, as evidenced by the resistivity anomaly and drill hole data.
In the unoxidized portions of the deposit, it appears that grade of mineralization is linked directly to the pyrite content, which in turn reflects the original iron content of the rock. Pyrite morphologies in the pervasive disseminated mineralization indicate a complex history with multiple generations of growth. Although some grains show zoned gold and arsenic, no consistent pattern was observed in the grains studied (AMTEL Report 11/34, 2011).
A gold deportment study carried out on the disseminated mineralization revealed that most of the gold is held in the lattice of the disseminated pyrite. When the pyrite is oxidized, the gold is readily recoverable with simple cyanide (AMTEL Report 11/34, 2011 & see Section 13).
Corvus Gold Corp. Technical Report – North Bullfrog Project | | Page | 76 |
7.3.1.2.2.2 FAULT-HOSTED MINERALIZATION
Fault-controlled alteration and mineralization constitutes an important mineralization style at Sierra Blanca. This mineralization is characterized by the development of disseminated pyrite within fault zones and within the wallrock immediately adjacent to the fault. In places these zones may be over 10 meters wide. Many large faults, including the NS10, NE30, NE40, NE50, NE60 and Savage Fault, host this type of mineralization. This style of mineralization has also been encountered in many areas where it is associated with smaller structures whose full extent has not yet been evaluated. This mineralization appears to postdate the earlier pervasive disseminated mineralization. The feature that distinguishes this mineralization from the more widespread disseminated mineralization is that it is consistently higher grade (1-17g/t gold) than the disseminated mineralization and is frequently associated with a distinctive illite-pyrite or illite-adularia-pyrite alteration. Where it is developed in the Sierra Blanca Tuff, the alteration tends to result in a bleached illite-adularia-pyrite assemblage (Figure 7-5). Where it is developed in the Savage Valley Dacite the alteration tends to be a brown illite-pyrite to illite-adularia-pyrite assemblage. The mineralization has a consistently higher As/Au ratio than the disseminated mineralization and where it overprints the earlier disseminated mineralization it appears to be able to increase the grade. The silver to gold ratio of this mineralization is generally less than one.
Where the Savage Valley Dacite comes in contact with these mineralizing fluids, pyritization can lead to the development of very good gold grades due to the original 5-6% iron content. This is particularly the case along the Liberator Fault, where gold grades of up to 17g/t have been encountered in Savage Valley Dacite. Metallurgical testing indicates that the gold in the oxidized parts of these faults responds well to cyanide leaching.
7.3.1.2.2.3 QUARTZ VEIN MINERALIZATION
Quartz vein stockwork type mineralization primarily occurs in the YellowJacket deposit: a structural corridor that lies between the east-dipping Liberator Fault and the west-dipping Josh Vein structure (Figure 7-11). This style of mineralization also has been identified in the main Sierra Blanca and Air Track Hill deposits
The gold-bearing veins and stockwork zones are generally gray translucent quartz that often exhibits colloform/crustiform banding and bladed calcite replacement textures typical of low-sulphidation epithermal veins. The quartz vein mineralogy is very simple and consists of native gold and electrum with varying amounts of acanthite and other silver sulphosalts. Only trace amounts of pyrite are found locally in the veins. Metallurgical testing has shown that the quartz vein and stockwork mineralization responds very well to cyanide leaching.
Most of the major faults in the YellowJacket area appear to have been present and active during the formation of the quartz vein mineralization. As a consequence, quartz vein splays and quartz stockwork zones are developed at numerous NNW and NNE structural intersections across the structural corridor, especially in the zone between the Josh Vein structure and the Liberator Fault (Figure 7-11). To date, drilling has confirmed the continuity of the YellowJacket vein system and related structures over a strike length of 850 metres. The individual Josh Vein has proven continuity over at least 700 metres of strike length.
In addition to the quartz vein and stockwork mineralization, the YellowJacket Zone also hosts pervasive disseminated and fault controlled mineralization. These later two mineralization types have been modeled as oxide and sulfide; with the oxide material being amenable to heap leaching. Below the level of oxidation, only the vein and stockwork material has been selected for processing. In order to confirm the definition of the vein and stockwork zone and its cyanide solubility, all samples with >0.3g/t gold were tested using a cyanide shake leach test. Only areas where the shake leach data showed significant cyanide soluble gold were allowed to be included in the quartz vein and stockwork volumes.
Corvus Gold Corp. Technical Report – North Bullfrog Project | | Page | 77 |
For the purposes of resource estimation two types of quartz vein mineralization were modeled in the YellowJacket Zone:
| 1. | Josh Vein and Stockwork – an envelope that encompasses all the quartz vein and stockwork veining associated with the Josh Vein Fault, and |
| 2. | Localized quartz vein stockworks – these are areas of splay veining that are developed along subsidiary structures or in larger zones of fracturing where two faults interact. |
7.3.1.2.2.3.1 JOSH VEIN
The Josh Vein was discovered with drill hole NB-12-138 and has been systematically followed north for more than 700 metres (Figure 7-11). The surface projection of the Josh Vein structure is shown in 7-11, but it is not recognizable at the surface.
The Josh Vein consists of a central vein structure surrounded by stockwork veining in the hanging-wall and footwall. The stockwork zone envelope has been defined using a combination of the percentage of quartz veins and the cyanide shake leach response. The Josh Vein itself is defined as the central quartz vein or quartz dominated breccia and can be several metres wide. The vein is surrounded by a stockwork that has 5-15% quartz veining. The thicknesses of these zones vary from section to section and the grade distribution can vary across the hanging-wall, main vein and footwall stockwork. The continuity along and across the overall veined zone is remarkably consistent (Figure 7-12).
7.3.1.2.2.3.2 LOCALIZED STOCKWORKS
A significant volume of grey-translucent quartz stockwork veining is developed in a number of areas within the YellowJacket Zone. For the purposes of resource estimation, the stockwork vein zones have been modeled separately as they pass through the surrounding zone of low-grade disseminated mineralization and below the oxidation contact.
In the core of the YellowJacket deposit, a large through-going body has been defined and modeled referred to as the Josh Vein zone. Around the main Josh Vein zone, a number of other stockwork zones with high-grade mineralization have been intersected. These other stockwork vein zones are hosted by NNE-trending cross structures and are currently modeled as separate small volume bodies. Potential exists for a number of these subsidiary NNE-trending bodies to expand with additional drilling. The YellowJacket structural zone remains open along strike and at depth.
The structural concepts developed at YellowJacket are now being applied to generate targets on the rest of the NBP. As part of this exploration program, Corvus is conducting an integrated high-grade targeting study that incorporates the new 3D IP geophysical data with new geological and structural mapping to further define and delineate new targets.
Corvus Gold Corp. Technical Report – North Bullfrog Project | | Page | 78 |
7.3.1.2.2.1 GOLD AND TELLURIUM MINERALIZATION
Another poorly understood style of mineralization at Sierra Blanca consists of quartz-free zones with anomalous tellurium and gold found at Air Track Hill in drill holes NB-08-21 and NB-13-364. Unfortunately, everywhere it has been encountered this mineralization has been completely oxidized so the original character is not known. However, based on the core drilled through this interval, the mineralization is most likely related to the occurrence of hairline pyrite veins in volcanic rocks.
7.3.1.3 AIR TRACK WEST
Air Track West is a block of mineralization located under alluvial cover to the west of Sierra Blanca (Figure 7-9). Air Track West was originally discovered by Sunshine Mining in 1991 when they found what appears to be detrital boulders of silica-adularia-altered volcanic rock in the pediment area ~500 metres west of Air Track Hill. The boulders have yielded gold values up to 0.273 g/t. Sunshine drilled the discovery hole GS-45 which yielded 17.8m (15.2-32m) grading 1.81 g/t gold. Sunshine did some additional drilling in the area and got a few additional low-grade intercepts. Corvus drilled one hole (NB-12-117) in 2012 and confirmed this mineralization with an intercept of 15.2m (10.7-25.9m) grading 2.36 g/t gold. At present, the mineralization is interpreted to be a monolithic slide block of North Bullfrog Lithodeme rhyolite within the Gravels of Sober-up Gulch. The mineralized block may have slid westward from the Sierra Blanca area into the hanging-wall of the NS10 Fault from (Figure 7-9).
Corvus Gold Corp. Technical Report – North Bullfrog Project | | Page | 79 |
Figure 7-11 Geolical Map of the YellowJacket Zone Showing Major Structures and Drill Holes Related to the Discovery of the High-Grade Vein System. Geological Sections Are Shown on Figure 7-12. Legend Can Be Found on Figure 7-2.
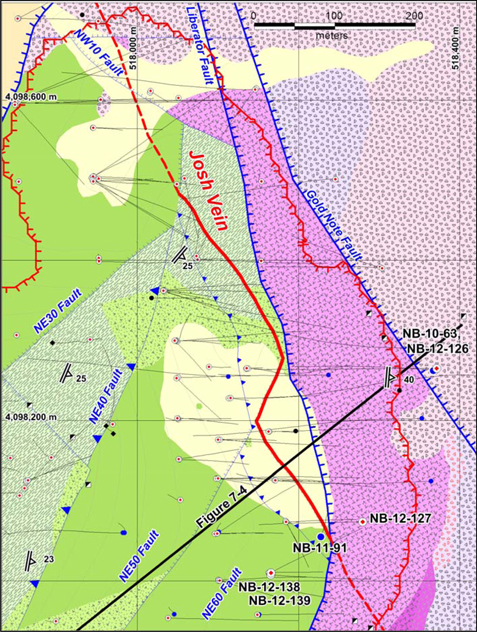
Corvus Gold Corp. Technical Report – North Bullfrog Project | | Page | 80 |
Figure 7-12 Geological Cross Section through Yellowjacket Illustrating the Spatial Relationships between the Various Structural Zones Modeled for the Mineralization Estimate. Section Location Is Shown on Figure 7-11.
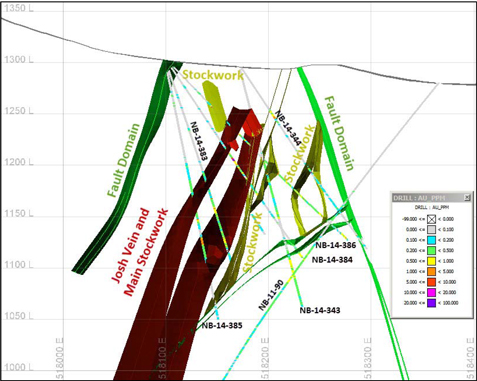
7.3.2 YOUNGER MINERALIZATION
Based on the combination of Ar-Ar dating and host rock ages, a number of deposits in the NBP area are believed to have formed after the deposition of the 10.5Ma Rainbow Mountain Tuff. These include the fracture controlled deposits at Mayflower, Pioneer and Connection. The steam-heated alteration along the Road Fault and the Eastern Steam-heated Zone are also related to this younger period of mineralization. The timing of the mineralization at the Connection deposit is somewhat problematic as it could represent older mineralization that was transported to the present position via mass-wasting during the second active tectonic period between 11.4-10Ma.
7.3.2.1 MAYFLOWER
Historically, the Mayflower mine was developed on a quartz-calcite vein and stockwork zone along a NW-striking, steeply SW-dipping fault zone in silica-adularia-altered heterolithic debris flow breccias. The zone is traceable for at least 900 metres along strike (Figure 7-1 and 7-13). The zone is possibly off-set by faulting on the northwest. Mineralization has been traced by drilling at least 275 metres down-dip from the surface. The zone is characterized by wall rock silica-adularia-alteration that surrounds a steeply southwesterly dipping zone of vein breccias and stockworks. Multiple high-grade gold areas have been identified, surrounded by lower grade mineralization.
Corvus Gold Corp. Technical Report – North Bullfrog Project | | Page | 81 |
Mineralization is controlled by a zone of anastomosing structures with local development of echelon veins. As evidenced in the geochemistry of the zone, there is a clear correlation between higher gold grades and arsenic, both of which are associated with potassium feldspar replacement (adularization) of the host lithology (Myers, 2008). Overall the zone appears to narrow with depth and has a steeper more planar hanging-wall than footwall.
The bulk of the mineralization occurs in debris flow sediments of the Rainbow Mountain Sequence, but mineralization locally extends upward into the overlying Rainbow Mountain Trt2 tuff. The Trt2 tuff unit was apparently not very permeable and alteration pinches down to only a few meters wide around the faults in this unit. Silica-adularia alteration extends out into the sediments for several 10’s of meters around the main fault zone, with certain horizons being more permeable than others and therefore altered for greater distances. The silica-adularia alteration is typically mineralized with significant gold grades. The initial development of the deposit was in the early 20th Century when an inclined shaft was opened and production came from four levels. The David adit was also driven to explore the northwest extension of the system. The Mayflower prospect was the focus of modern exploration and drilling by numerous companies starting in 1982 (Table 7-4). Drilling results have been collected for most of the drill holes. Original assay certificates are available for the Barrick drilling, and that data was used in the Mineral Resource estimation presented in Section 14.
The main paragenetic sequence for the Mayflower mineralization is silica-adularia-pyrite alteration containing low level gold (< 1 ppm) emplaced along NW striking, SW dipping anastomosing structures, which developed a hardened wall rock envelope around these structures. Later movement on the structures fractured the brittle silicified rock allowing high-grade gold-bearing quartz and/or calcite veining to enter the structures (Mayflower shaft area). Additional gold mineralization likely occurs on dry or clay filled fractures as found at the Pioneer Mine, a mile to the north of the Mayflower Mine (Hunter 2008).
Late stage black manganiferous calcite occurs as veins and fracture fillings along the mineralized structures. This calcite is not known to be mineralized, but because of the intimate spatial relationship with the mineralized structure it is thought to be a late stage of the waning hydrothermal system (Hunter 2008).
Historical records indicate that some stoping occurred on the 200, 300 and 400 levels with the bulk of the production coming from the 300 level (Spencer, 1919). Based on the 1919 map, it appears that approximately 17,000 tonnes of material had been extracted by that time, although no subsequent records are available. The David adit was driven to explore the northwest extension of the system. The only stoping occurred in a shoot that was also exploited by the Starlight workings. There is no information on the volumes stoped in the Starlight Shoot. Both the Mayflower Mine and the David adit were mapped and sampled by Cyprus Minerals Company in 1987. The David adit is still accessible and has been mapped by Corvus geologists.
Corvus Gold Corp. Technical Report – North Bullfrog Project | | Page | 82 |
In 2012, Corvus drilled 52 additional holes totaling 7,352 metres (24,120 feet) in the Mayflower area including: 1) 14 PQ3 core holes totaling 1,922 metres (6,306 feet); 2) 26 in-fill/definition RC holes totaling 3,077 metres (10,095 feet); 3) seven condemnation RC holes totaling 1218 metres (3,500 feet); 4) four water monitor wells (RC) totaling 981 metres (3,220 feet); and 5) one water pilot RC hole totaling 305 metres (1,000 feet, Table 7-4). All RC holes were sampled as typical exploration holes. The PQ3 core holes have been used for additional metallurgical testing including bottle roll and column leach tests, as well as waste rock characterization testing. Data for both the core holes and in-fill RC holes have been incorporated into the current Mineral Resource estimation.
Table 7-4 Companies That Drilled in the Mayflower Area
| Company | Year in Which Drilling Occurred |
| U.S. Borax | 1982 |
| CR Exploration | 1984-1985 |
| Western States | 1987 |
| Bond/Sunshine JV | 1989 1 hole-180 metres |
| Sunshine | 1991 1 hole-220 metres |
| Barrick | 1995-1996 26 reverse circulation holes – 3,880 metres |
| International Tower Hill Mines (Talon Gold) | 2008 24 reverse circulation holes - 5,953 metres |
| Corvus | 2012 14 PQ3 core holes - 1,922 metres |
| 2012 38 reverse circulation holes - 5,581 metres |
The mineralization at Mayflower is hosted in the Rainbow Mountain Sequence debris flow deposits (Tdf), which at this location are dominated by poorly-sorted conglomeratic debris flow sedimentary breccias with minor channelized sandstone interbeds. The debris flow stratigraphy has an average dip of 34° to the east-southeast. However, the dip decreases from 55° at the base to 25° the top where Tdf appears to be conformably overlain by the Rainbow Mountain Tuff (Trt2). The surface data indicate that the sediments were being deposited in an actively subsiding fault bounded basin controlled by the Road Fault to the east. There are significant conglomeratic interbeds near the base of the Trt2 sequence, suggesting that there was still some topography in the area during the onset of the Trt2 eruptions.
The clast assemblage in the Mayflower debris flow sequence is very diverse and includes both basement and volcanic clasts. The clasts in individual debris flow intervals are commonly dominated by a specific lithology suggesting that there were pulses of different clast sources being incorporated into the debris flow stratigraphy. Clasts up to 4 metres in diameter have been observed. In addition to the sedimentary components, a number of monolithic slide blocks are intercalated with the sedimentary units of Tdf. These are represented by monolithic breccia bodies of Paintbrush Tuff or Paleozoic units which have dimensions of >10 metres thick and >100 metres long (Figure 7-13, Tdf-Tp at SW end of Section 38).
Corvus Gold Corp. Technical Report – North Bullfrog Project | | Page | 83 |
Alteration and mineralization are controlled by the Mayflower Fault Zone (“MFZ”), a NW-trending zone of steeply SW-dipping fault strands with a complex network of fractures linking the main strands. Historical mining was developed on en echelon quartz-calcite veins and stockwork zones along the MFZ. Multiple high-grade gold areas have been identified, surrounded by lower grade disseminated mineralization. Based on the displacement of the base of the Trt2on Section 31, the total apparent vertical displacement across the MFZ is approximately 60 metres (Figure 7-14). However, the displacements on the various strands are generally less than 10 metres. At the northwestern edge of the resource polygon, the prominent marker unit of Paintbrush breccia is offset by approximately 15 metres across the MFZ (Figure 7-14). There may be a horizontal component of motion on the fault, but the actual movement vector cannot be determined with the present data.
There appear to be three main fault strands within the MFZ in the southeastern part of the deposit. Two of these strands merge in the vicinity of the David Adit and only two strands remain in the northwestern end of the deposit (Figures 7-13 and 7-14). Mineralization appears to be best developed in the zones between the structures rather than in the main fault strands. This suggests that dilation caused by differential movement between the faults was the main control on mineralization (Figure 7-14). The Mayflower inclined shaft was developed on the central Mayflower strand while the David Adit and Starlight workings were developed on the footwall David Adit strand. Overall, the zone appears to narrow with depth and has a steeper more planar hanging-wall than footwall (Figure 7-14).
Figure 7-13 Geologic Map of the Mayflower Prospect Showing Underground Workings, Drill Holes and Cross Section Locations. Legend Can Be Found in Figure 7-2.

As revealed in the David adit, there is an alteration and mineralization sequence that indicates at least two periods of hydrothermal activity. An early silica-adularia-pyrite low-grade gold event was followed by fracturing and the development of high-grade gold mineralization along a central fault zone. The zonation pattern that developed includes a central higher grade gold-calcite-quartz zone that is surrounded by lower-grade gold silica-adularia-pyrite zone with strongly anomalous arsenic. Outward from this core is a montmorillonite-rich zone with peripheral propylitic alteration. The entire Mayflower deposit is oxidized.
Corvus Gold Corp. Technical Report – North Bullfrog Project | | Page | 84 |
7.3.2.2 PIONEER
The historic Pioneer workings are located immediately north of the Mayflower Mine (Figure 7-1). A series of underground workings were developed at Pioneer in the early 1900’s, but little is known about the production or nature of the mineralization extracted. Based on maps of historical underground workings, mineralization appears to occur along intersecting northeast and northwest striking faults. Alteration styles from the waste dumps include silicification, adularization, argillization, and minor quartz veining. The fault zones also host argillized dacite dikes.
Figure 7-14 Cross Sections through the Mayflower Deposit. See Figure 7-13 for Cross Section Locations. The “Mineralized Volume” Is the Envelope That Constrained the Mineralization Inventory.

Corvus Gold Corp. Technical Report – North Bullfrog Project | | Page | 85 |
Much of the historic drilling as well as surface and underground sampling demonstrates that the remaining unmined mineralization is low-grade (<1 g/t Au). Most of the higher grade gold samples came from the upper levels of the Pioneer mine with grades over a few metres of 1 - 14 g/t Au. During 2007, the NBPJV drilled two holes to investigate the Pioneer mineralization. The first hole targeted the down dip extension of the mineralization. Anomalous gold was intersected across 130 metres, with a maximum value of 0.26 g/t Au in weakly silicified and argillized rock. A second hole was designed to drill across known higher grade mineralization. This hole encountered a total of eight metres of 2 g/t Au (including 17.6 g/t over 0.4 m) on either side of a 3.5 metre wide stope. This high-grade interval is in a clay altered fault zone without visible quartz veining. No new drilling has been undertaken at the Pioneer since 2007.
7.3.2.3 CONNECTION
A historical shaft and numerous prospect pits were developed at Connection in the early 1900’s (Figure 7-15). Between 1974 and 1982, Cordex drilled a number of holes and delineated a small mineralization inventory. Corvus drilled three holes totaling 606.6 metres (1990 feet) in 2010-11 with the objective of confirming the validity of the Cordex results. There has been no follow up drilling since that time.
Five general lithologic units were identified in the Connection area including (in ascending stratigraphic order): 1) probable rooted Sierra Blanca Tuff (or Crater Flat Group?) at depth below the debris flow sediments; 2) a monolithic debris flow breccia unit consisting of welded aphanitic crystal-poor tuff which is likely Paintbrush Tuff (Tdf-Tp); 3) a monolithic debris flow unit consisting of quartz-biotite welded tuff which is likely Rainier Mesa Tuff (Tdf-Tmr); 4) a massive slide block of jumbled Paleozoic lithologies; and 5) a quartzite-clast-dominated heterolithic debris flow (Tdfh) which caps Connection Hill. For the sake of simplicity, the Paleozoic slide block has been lumped together into a single unit; but it appears to contain a variety of Paleozoic lithologies including carbonaceous calcareous shale and limestone of probable Carrara Formation (40-50% of total volume) and calcareous siltstone and quartz sandstone of probable Wood Canyon Formation (50-60% of total volume). There is no indication of a preferential Pz host lithology as all Paleozoic lithologies appear to be mineralized. Some mineralization also occurs in overlying heterolithic debris flows. The established stratigraphy, based largely on the 2010-11 drill holes, is generally consistent with what can be observed at Cat Hill to the south and areas west of Connection. The true thickness of each unit is unknown and is expected to be highly variable in a debris flow environment. The slide block of Paleozoic rocks appears to pinch out to the north and south, and thickens dramatically at depth to the east of the resource, where it is largely Wood Canyon Formation.
In the Corvus drilling, two holes located within the historic mineralization area (NB-11-78 and NB-11-79) encountered significant intervals of expected gold mineralization in the Tdf_PzC slide block (Figure 7-15). While there is not a distinct correlation between gold and iron in the Paleozoic rocks, it is clear that with an average iron content of nearly five percent, the iron content of the slide block is much higher than the surrounding lithologies, which have one to two percent. In drill hole NB-11-78, the monolithic breccias of Paintbrush Tuff are weakly mineralized with gold and in NB-11-80 they are mineralized with silver. In addition, the Sierra Blanca Tuff (or Crater Flat Group?) beneath the debris flow sequence is silica-adularia altered with intervals of low-grade gold mineralization. At this time there is insufficient outcrop to accurately interpret the structural setting of this mineralization, its relationship to the nearby Road Fault, or relationship to structures to the south or east.
Corvus Gold Corp. Technical Report – North Bullfrog Project | | Page | 86 |
Given that the host lithologies are part of the Debris Flow sequence, this mineralization is most likely part of the younger hydrothermal system. However, given the style of mineralization in the Sierra Blanca Tuff (or Crater Flat Group?) at depth, it appears that the area may have also been affected by the older mineralizing event. It is possible that the PzC slide block was mineralized elsewhere and then transported to the present location by the debris flow process during later deformation. Unfortunately, the nearest well- mineralized Paleozoic rocks are found in the Bare Mountains 10 miles to the south.
Figure 7-15 Geological Map of the Connection Target Area. Legend Can Be Found in Figure 7-2.
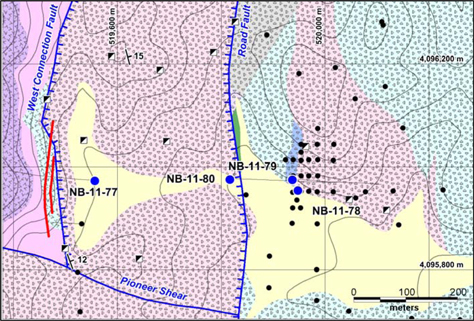
7.3.2.4 WEST CONNECTION VEIN
The West Connection vein lies ~1,500 ft. west of the Connection area (Figure 7-15). The vein consists of a zone of high-level chalcedonic quartz and quartz-flooded breccia up to 50 ft. wide, hosted within silicified monolithic debris flow breccias of Paintbrush Tuff. The vein zone strikes N5E, dips 70-80° to the east, and persists along strike for ~800-900 ft. The vein zone has formed along one or more hanging wall splays of the West Connection Fault. The fault and vein geometry suggests that the vein fluids may have ascended from the Road fault at depth.
In 1992, Pathfinder drilled a shallow hole (P92-3) which encountered 6.1 metres of 0.243 g/t Au from 48.7 to 54.9 metres at the south end of the vein zone on the Sunrise patented claim. This intercept has better gold grades than any of the surface rock sampling, indicating that the gold tenor is increasing with depth. The vein zone has yielded surface trace element values up to 503 ppm As, 33 ppm Sb, and 2.74 ppm Hg.
Corvus drilled one hole (NB-11-77) in 2011. The hole did not encounter significant quartz veining, but it intersected a zone of anomalous gold (>0.1 ppm) gold between 94 to 107 metres, and several zones with anomalous arsenic and antimony. Significantly, well-crystalline hydrothermal kaolinite was found in a number of intervals in this hole, possibly linking this structure to the opalite alteration along the Road Fault. There has been no follow-up drilling in this area since 2011.
Corvus Gold Corp. Technical Report – North Bullfrog Project | | Page | 87 |
8 DEPOSIT TYPES
Gold mineralization in the district is best characterized as low-sulfidation epithermal with the precious metal mineralization associated both with sulphidation of iron in the host rocks and the precipitation in veins of quartz and/or carbonate controlled by boiling. Silica-adularia alteration is intimately associated with the disseminated mineralization and is an important form of ground preparation for later vein forming events.
Mineralization at the NBP is typical of other low-sulfidation type gold systems in, and around, the Walker Lane trend, such as: Bullfrog, Round Mountain, Rawhide, Aurora, Bodie and Comstock. These deposits commonly contain higher grade gold in vein mineralization surrounded by zones of lower grade disseminated mineralization which is the accepted exploration model at NBP.
Corvus Gold Corp. Technical Report – North Bullfrog Project | | Page | 88 |
9 EXPLORATION
The mineralization potential of the NBP is significant and has only begun to be explored. The blind discovery of the YellowJacket high-grade vein/stockwork deposit in 2013 and the identification of the large and untested Eastern Steam-heated Zone in 2014 indicate significant exploration potential for the discovery of new blind high-grade deposits. In general, the opportunities for expanding the NBP resources include: 1) continued expansion of the YellowJacket deposit along strike and at depth; 2) new discoveries of blind, high-grade YellowJacket and/or Bullfrog style vein systems adjacent or within current disseminated resources; 3) new discoveries of either high-grade vein/stockwork and/or disseminated mineralization in the new Bullfrog age Eastern Steam-heated Zone; and 4) expanding the currently defined disseminated mineralization outside of the resource boundaries (Figure 9-1).
The YellowJacket Vein system remains open along strike and at depth in 2015. At the southern end of the YellowJacket deposit a new high level NNW trending vein occurrence known as the Liberty Vein will be tested several hundred metres southeast from the currently defined deposit. At the northern projection of the YellowJacket vein system, additional fence drilling will be conducted to assess the strike extent of new northern vein intersections like that in the Rhyolite vein (NB-14-392 with 11.3m @ 3.3g/t Au & 4.1g/t Ag). The YellowJacket Vein system has been drilled to a nominal depth of 200-250 metres with potential for extending the vein system further at depth.
Potential for the discovery of additional blind YellowJacket/Bullfrog-style high-grade veins exists around and within the disseminated resource areas. Much of the early resource definition drilling of the disseminated mineralization was vertical and was not effective at defining through going, steeply dipping vein targets. Several of these targets have been developed from new structural mapping and will be tested in the next phase of district exploration. In addition, blind targets have been developed along structural projections under shallow quaternary cover at Savage Valley, far north YellowJacket, northwest Sierra Blanca and north Jolly Jane.
In the Eastern Steam-heated Zone, new geologic mapping, age dating and rock sampling completed in 2014, has defined a series of high priority exploration targets. An additional 57 NB-claims were staked in late 2014, extending the NBP claim block to the southeast over newly identified areas exhibiting steam-heated alteration. In early 2015, a gravity survey was conducted over the Eastern Steam-heated zone in order to define possible structures beneath the extensive alteration zone which covers approximately 142kilometres (Figure 9-2). The gravity data modeled in conjunction with the detailed surface mapping has defined an NNW trending structural corridor that is over 5 km long and 2 km wide representing by far the largest altered and mineralized structural zone on the property and which remains essentially untested. These new large target areas will be drill tested in the 2015 exploration program.
Corvus Gold Corp. Technical Report – North Bullfrog Project | | Page | 89 |
There is high potential to grow the disseminated mineralization in the West Sierra Blanca area under shallow pediment cover north, south and west of Air Track Hill. Drill hole NB-13-366 encountered 40 metres of 1 ppm gold in Savage Dacite under less than 10 metres of pediment cover just west of Sierra Blanca (Figure 9-1). At North Jolly Jane, holes NB-12-122 and NB-12-123 were drilled 100 and 300 metres north of the Mineral Resource. These holes have intersected 92 metres and 138 metres of disseminated mineralization respectively (Figure 9-1). In 2013, roadcut channel sample profile SBRC-07 encountered new low-grade mineralization in the Pioneer Formation in the southwest portion of the Sierra Blanca Mineral Resource. The grades and thicknesses of these intercepts clearly show that the system is still strong in this these areas. Additional step-out drilling is warranted in all of these areas as there is good potential for significant expansion of the current heap leach resource.
Figure 9-1 NBP Exploration Target Location Map. Legend Can Be Found in Figure 7-2.
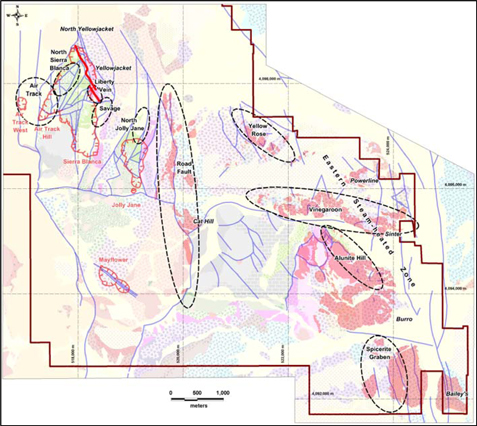
Several new target areas have been identified at the Eastern Steam-heated zone of the NBP, all of which are associated with shallow-level hydrothermal alteration including steam-heated opal-kaolinite-alunite assemblages and paleo-groundwater table silica accumulation. These target areas include Alunite Hill, Spicerite, Vinegaroon, Cat Hill, Yellow Rose, Sinter, Burro, Road Fault, Powerline and Bailey’s in order of priority (Figure 9-1).
Corvus Gold Corp. Technical Report – North Bullfrog Project | | Page | 90 |
A hypogene vein alunite sample from the Vinegaroon target area has yielded an Ar-Ar date of 9.5 Ma. This date, combined with a published date of 10.2 Ma from alunite at Bailey’s Hot Springs (Weiss, et al, 1994), indicates that the Eastern Steam-heated Zone is of similar age to the Mayflower and main Bullfrog deposits. Based on field evidence, the current interpretation is that the steam-heated alteration has largely been eroded away. The currently exposed level low-temperature silica accumulation generally defines the paleo-groundwater table, and forms a flat tabular body across much of the Eastern Steam-heated Zone. The steam heated alteration zone and paleo-groundwater table silica are largely barren of metals as would be expected at this level of erosion over a productive vein system. The target concept is to test for high-grade veins in the boiling zone below the steam-heated alteration and paleo-groundwater table. The depth of paleo-boiling has been identified in the Spicerite target of the Eastern Steam-heated Zone, with boiling and vein development at approximately 100 metres below the surface. Further testing of targets will focus on productive depths of 100-300 meters deep.
The Alunite Hill target is currently the most prospective target in the Eastern Steam-heated Zone. The target is the NW-trending Alunite Hill Fault, which hosts a quartz vein/stockwork zone up to 1 metre wide and 700 meters long. The Alunite Hill fault/vein yields gold and silver values up to 0.746 ppm Au and 13 ppm Ag. The vein also locally exhibits boiling textures (quartz replacing early bladed calcite), suggesting the present level of exposure is the upper portion of the paleo-boiling zone.
The Spicerite target area hosts at least three through-going NNW-trending, down-to-the-west normal faults that control steam-heated alteration. A fourth through-going fault is down-to-the-east, and forms the Spicerite Graben. The graben has been filled with largely non-steam-heated debris flow volcanic breccia, but contains cobbles and boulders of steam-heated rocks suggesting a very dynamic period of faulting, erosion and hydrothermal alteration between 9.5-10.2 Ma. It is hypothesized that the graben fill is concealing a primary vein target at depth.
The Vinegaroon target area is a large east-west trending structural corridor defined by the Vinegaroon Fault Zone, which separates volcanic rocks and debris flows (north or hanging wall side) from Paleozoic basement rocks to the south. The Vinegaroon Fault Zone can be mapped or inferred from the gravity data for over four kilometers of strike length from the Road Fault on the west to the Sinter target area on the east. Silicified ribs along or within the hanging wall of the Vinegaroon Fault contain anomalous gold values up to 1 ppm. The intersection between the Vinegaroon Fault and the Alunite Hill Fault is a primary target. Other targets include several NNW to NW-trending faults exhibiting anomalous gold in silicified ribs in the hanging wall of the Vinegaroon Fault.
Corvus Gold Corp. Technical Report – North Bullfrog Project | | Page | 91 |
Figure 9-2 Location of 2015 Gravity Stations on Complete Bouger Anomaly Data with 3rd Order Trend Removed.
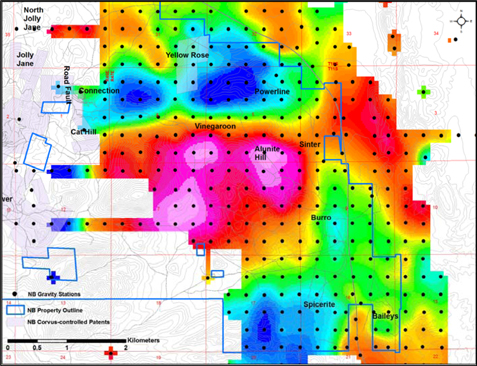
Corvus Gold Corp. Technical Report – North Bullfrog Project | | Page | 92 |
10 DRILLING
Between 1974 and 1996 approximately 249 rotary and reverse circulation holes totaling 33,775 metres were drilled on the Project by several different companies. RGC was able to obtain the assays and geological data for most of these holes and this data were acquired by ITH and then Corvus. Drilling by the NBPJV on many of the same targets encountered similar gold grades and thicknesses as the historic holes, suggesting that the earlier results are reliable. Additionally, much of the historic drilling was conducted by larger companies who mostly conducted sampling and assaying to industry standards at the time. Unfortunately, there is no quality control data available for these historic programs. Therefore, while it seems reasonable to put reliance on the older drill hole results they must be treated as historic and as guidelines to the location of mineralized areas.
The NBPJV drilled six core holes totaling 1,300 metres in 2007 and 35 reverse circulation holes in 2008 totaling 8,422 metres. All of the core holes were drilled at an angle to intersect the mineralized structures at nearly right angles. Sample intervals in core varied with rock and alteration type, and represent nearly true thicknesses. Most of the 2008 holes drilled at Air Track Hill and all of the Mayflower holes were angle drilled nearly perpendicular to the mineralized zones. Reverse circulation drilling above the water table was with a 5 ½ inch hammer bit and, where water became a problem, a 5 ¼ inch tricone bit was used. Samples were collected at 5 foot intervals starting from the top of each hole.
Corvus completed a 75 hole (17,820 metres, 58,465 feet) reverse circulation drilling program between October 2010 and June 2011 using Boart Longyear out of Elko, Nevada. Each five foot sample was analyzed using a hand held XRF unit at the drill site. The XRF analysis was used to determine the arsenic content of the sample (a direct indicator of mineralization) and the probable stratigraphic correlation of the sample. The drill chips were cursorily logged for lithology and alteration at the drill site, and later logged in greater detail in an office setting using a binocular microscope. Magnetic susceptibility was also measured on the chips for each five foot interval. The geologic characteristics that were determined routinely on drill chips include: lithology and stratigraphic unit assignment, alteration style and intensity, vein type and percentage, color, sulfide type and percentage, and oxide type and relative intensity. The following five oxide classes were used to quantify the oxidation state of each sample:
Class 1: Total sulfide, no oxide present
Class 2: Mostly sulfide with minor oxide present
Class 3: Mixed oxide/sulfide in generally equal proportions
Class 4: Mostly oxide with minor fresh sulfide present
Class 5: Total oxide, no sulfide present
Oxide classes 5, 4, and 3 have consistently yielded favorable gold recoveries in bottle rolls tests (Section 13). Model blocks assigned to classes 5, 4 and 3 comprise the oxide mineralization category. Oxide classes 2 and 1 have consistently yielded un-favorable gold recoveries in bottle roll tests. Model blocks assigned to oxide classes 2 and 1 comprise the sulfide mineralization category.
Corvus Gold Corp. Technical Report – North Bullfrog Project | | Page | 93 |
Between January 2012 and January 2013 additional geological information was collected including 47 new reverse circulation holes totaling 7,128 metres (23,386 feet), and 18 core holes totaling 3,438 metres (11,279 feet). The 2012 RC drilling included step-out holes in the Sierra Blanca, Jolly Jane, and ATW areas; infill holes in the Mayflower and Jolly Jane Mineral Resource areas; and condemnation holes and water monitor wells around the Mayflower area. The 2012 core drilling included PQ3 holes for metallurgical studies in the Mayflower, Jolly Jane and Sierra Blanca Mineral Resource areas; and HQ3 exploration holes in the Yellow Jacket area. Holes NB12-117 through 143 were drilled by AK Drilling and holes NB12-144 through 176 were drilled by Boart Longyear. Logging protocols were the same as those employed in 2010-2011, with the exception of the addition of a hydrochloric acid fizz test log which is now done on all RC and core samples.
In 2013, Corvus drilled 87 holes at Sierra Blanca and YellowJacket totaling 19,000 metres (62,340 feet) including 35 HQ3 core holes, 2 PQ3 core holes for metallurgical samples, and 50 RC holes. In addition, 13 channel sample profiles were completed along new roadcuts totaling 888 metres. The logging protocol was the same as that carried out in 2012. These new drill results formed the basis for a revised estimate of the Sierra Blanca Zone and first estimate of the YellowJacket Mineral Resource reported in April 2014.
In 2014, Corvus drilled 48 oriented core holes totaling 12,636 metres (41,456 feet). These included 36 HQ3 holes, and 12 PQ3 holes for metallurgical samples. The 2014 program was focused on resource definition and metallurgical sampling of the YellowJacket Vein and Stockwork system. Two additional channel sample profiles were completed along new roadcuts totaling 181 metres (595 feet). The logging protocol was refined somewhat to improve the logging of vein types and abundances. The 2014 drill results have been incorporated into the revised estimates of mineralized volumes in the Sierra Blanca Disseminated and the YellowJacket Vein-Stockwork zones reported in this document.
The YellowJacket vein mineralization is structurally-controlled and occurs in distinct quartz veins and stockwork zones, as opposed to the more typical disseminated mineralization at the NBP. Significant intercepts from YellowJacket drilling between January and the end of November, 2014 are listed in Table 10-1 to illustrate the distribution of veins and vein stockworks encountered in this structurally controlled mineralization. Corvus uses the Reflex ACT II core orientation tool to orient all core holes, and surveys all holes to support the structural interpretation which is ongoing at this time. There are no drilling, sampling or recovery factors identified that materially impact the accuracy and reliability of the results.
Corvus Gold Corp. Technical Report – North Bullfrog Project | | Page | 94 |
Table 10-1 Significant 2014 Drill Intercepts from the YellowJacket Structural Zone Showing the Distribution of Higher Grade Mineralization in Structurally Related Quartz Vein and Stockwork Intervals.
| HoleID and Orientation | From
(m) | To
(m) | Interval
(m) | Gold
(g/t) | Silver
(g/t) | Comments |
| | 98.0 | 116.4 | 18.4 | 0.14 | 0.93 | Disseminated |
| NB-14-377 | 116.4 | 122.5 | 6.1 | 0.81 | 1.86 | HW Peripheral |
| | 122.5 | 130.0 | 7.5 | 3.16 | 7.99 | HW Stockwork |
| | 130.0 | 133.7 | 3.7 | 1.80 | 19.2 | Josh Vein |
| | | | 17.3 | 2.04 | 8.23 | Vein + HW Stockwork |
| Az. 90 | 133.7 | 143.9 | 10.1 | 0.41 | 5.20 | FW Stockwork |
| Incl. -80 | 143.9 | 152.4 | 8.5 | 0.32 | 5.50 | FW Peripheral |
| | 73.2 | 74.2 | 1.0 | 1.23 | 9.60 | Isolated Vein |
| | 82.2 | 83.4 | 1.2 | 0.57 | 11.0 | JV HW Stockwork |
| NB-14-378 | 83.4 | 92.6 | 9.2 | 18.0 | 260 | Josh Vein |
| | 92.6 | 97.9 | 5.3 | 0.15 | 2.74 | JV FW Stockwork |
| | 97.9 | 105.6 | 7.7 | 0.31 | 1.92 | JV FW Peripheral |
| | 107.1 | 124.7 | 17.5 | 0.23 | 0.89 | JV HW Peripheral |
| | 25.2 | 29.3 | 4.1 | 0.16 | 0.94 | JV HW Peripheral |
| NB-14-379 | 29.3 | 32.3 | 3.1 | 0.34 | 2.32 | JV HW Stockwork |
| | 32.3 | 33.5 | 1.1 | 2.35 | 7.77 | Josh Vein |
| | 33.5 | 38.0 | 4.6 | 0.21 | 5.71 | JV FW Stockwork |
| Az. 90 | 80.9 | 81.1 | 0.2 | 0.05 | 57.5 | Isolated Vein |
| Incl. -45 | 126.6 | 129.1 | 2.5 | 0.53 | 1.09 | Isolated Vein |
| | 46.3 | 51.4 | 5.1 | 0.43 | 4.9 | NE50 HW Stockwork |
| | 51.4 | 54.9 | 3.6 | 4.19 | 149.8 | NE50 |
| | 54.9 | 63.0 | 8.0 | 0.31 | 10.0 | NE50 FW Stockwork |
| | | | 16.7 | 1.18 | 38.4 | NE50 + Stockwork |
| | 80.0 | 85.3 | 5.3 | 0.41 | 2.8 | JV HW Stockwork |
| NB-14-380 | 85.3 | 90.0 | 4.8 | 13.81 | 243.3 | Josh Vein |
| Az 90; Incl -70 | 90.0 | 92.7 | 2.7 | 1.04 | 4.8 | JV FWStockwork |
| | | | 12.7 | 5.57 | 93.5 | Josh Vein + Stockwork |
| | 113.2 | 114.9 | 1.7 | 0.88 | 1.9 | |
| | 120.2 | 157.4 | 37.2 | 0.34 | 1.0 | Disseminated |
| | 157.4 | 165.6 | 8.2 | 0.70 | 1.1 | Disseminated |
| NB-14-381 | 108.1 | 113.9 | 5.9 | 0.29 | 4.4 | Disseminated |
| Az 90; Incl -45 | 119.1 | 122.8 | 3.7 | 0.51 | 10.0 | Disseminated |
| | 97.5 | 104.0 | 6.5 | 0.25 | 1.4 | JV HW Stockwork |
| | 104.0 | 108.7 | 4.7 | 4.62 | 33.9 | Josh Vein |
| | 108.7 | 116.1 | 7.4 | 1.05 | 1.5 | JV FWStockwork |
| NB-14-382 | | | 18.6 | 1.67 | 9.6 | JoshVein + Stockwork |
| Az 90; Incl -80 | 116.1 | 159.1 | 43.0 | 2.56 | 2.3 | WV FWPeriph |
| Including | 127.2 | 127.7 | 0.5 | 181.50 | 94.0 | Single vein |
| | 167.7 | 170.5 | 2.7 | 0.11 | 141.6 | High Silver Fault Gouge |
| | 172.5 | 199.1 | 26.6 | 0.50 | 1.1 | Disseminated |
| | 124.4 | 129.1 | 4.7 | 0.55 | 2.2 | Disseminated |
| | 138.1 | 150.3 | 12.2 | 0.52 | 1.6 | JV HW Periph |
| | 150.3 | 160.1 | 9.9 | 0.86 | 8.0 | JV HW Stockwork |
| NB-14-383 | 160.1 | 164.9 | 4.7 | 0.40 | 4.0 | Josh Vein |
| | 164.9 | 192.5 | 27.6 | 0.43 | 1.6 | JV FW Stockwork |
| Az 90; Incl -80 | | | 42.2 | 0.52 | 3.4 | JoshVein + Stockwork |
| | 103.5 | 114.4 | 10.9 | 0.58 | 5.6 | JV HW Stockwork |
| NB-14-384 | 114.4 | 128.0 | 13.6 | 6.13 | 83 | Josh Vein |
| Including | 114.4 | 118.9 | 4.5 | 16.7 | 150 | |
| | 128.0 | 134.8 | 6.8 | 0.37 | 1.3 | JV FW Stockwork |
| | | | 31.3 | 2.95 | 0.8 | Josh Vein + Stockwork |
| Az 90 Incl -55 | 152.3 | 165.5 | 13.2 | 0.58 | 1.1 | FW Veining |
| | 224.8 | 234.1 | 9.3 | 0.46 | 0.8 | Ended in Min |
Corvus Gold Corp. Technical Report – North Bullfrog Project | | Page | 95 |
| HoleID and Orientation | From
(m) | To
(m) | Interval
(m) | Gold
(g/t) | Silver
(g/t) | Comments |
| | 133.5 | 162.3 | 28.8 | 0.59 | 2.6 | JV HWPeriph |
| Including | 138.1 | 151.8 | 13.7 | 0.77 | 2.9 | |
| | 175.7 | 177.7 | 2.0 | 0.61 | 2.3 | JV HW Stockwork |
| NB-14-385 | 177.7 | 183.4 | 5.7 | 2.10 | 3.9 | Josh Vein |
| | 183.4 | 195.6 | 12.2 | 0.35 | 4.3 | JV FW Stockwork |
| Az 90 Incl -78 | | | 19.9 | 0.88 | 4.0 | Josh Vein + Stockwork |
| | 61.0 | 64.2 | 3.2 | 9.43 | 87 | A Fault Vein |
| NB-14-386 | 89.5 | 103.9 | 14.4 | 1.53 | 10 | Josh Vein |
| Including | 92.2 | 95.7 | 3.5 | 2.86 | 28 | |
| | 103.9 | 123.3 | 19.4 | 1.49 | 4.0 | JV FW Stockwork |
| | | | 33.8 | 1.51 | 6.6 | Josh Vein + Stockwork |
| Az 90 Incl -45 | 130.9 | 173.1 | 42.3 | 0.65 | 3.0 | EZ Stockwork02 |
| | 176.7 | 220.6 | 44.0 | 0.48 | 1.5 | EZ Stockwork01b |
| | 153.3 | 170.2 | 17.0 | 0.82 | 4.4 | JV HW Stockwork |
| NB-14-387 | 170.2 | 173.6 | 3.3 | 1.85 | 13.8 | Josh Vein |
| | 173.6 | 181.1 | 7.5 | 0.98 | 6.4 | JV FW Stockwork |
| Az 90 incl -63 | | | 27.8 | 1.0 | 6.1 | Josh Vein + Stockwork |
| | 142.0 | 153.2 | 11.2 | 1.1 | 4.8 | JV HW Stockwork |
| NB-14-389 | 153.2 | 161.7 | 8.5 | 6.1 | 33.6 | Josh Vein |
| | 161.7 | 166.6 | 4.9 | 1.0 | 1.8 | JV FW Stockwork |
| Az 58 incl -57 | | | 24.6 | 2.8 | 14.1 | Josh Vein + Stockwork |
| | 130.8 | 147.0 | 16.2 | 0.58 | 1.72 | Disseminated |
| | 173.4 | 194.4 | 21.0 | 0.3 | 8.6 | NE30 |
| NB-14-390 | 194.4 | 198.4 | 4.0 | 0.2 | 7.8 | JV HW Stockwork |
| | 198.4 | 216.5 | 18.1 | 0.2 | 12.9 | JV FW Stockwork |
| | | | 22.1 | 0.2 | 12.0 | Josh Vein Stockwork |
| Az 90 incl -80 | 223.6 | 229.6 | 6.0 | 0.69 | 2.00 | Disseminated |
| NB-14-391 | 117.4 | 129.2 | 11.8 | 0.7 | 1.7 | NE30 |
| Including | 129.2 | 142.6 | 13.4 | 6.5 | 40.7 | JV HWStkwk |
| | 142.6 | 151.0 | 8.4 | 17.3 | 66.3 | Josh Vein |
| | 151.0 | 156.3 | 5.3 | 0.7 | 5.8 | JV FW Stockwork |
| | | | 27.1 | 8.7 | 41.8 | Josh Vein + Stockwork |
| Az 90 incl -67 | 204.5 | 228.0 | 23.5 | 0.67 | 0.85 | Disseminated |
| | 211.8 | 218.1 | 6.2 | 0.8 | 7.9 | JV HW Stockwork |
| NB-14-392 | 218.1 | 219.0 | 0.9 | 12.7 | 58.3 | Josh Vein |
| | 219.0 | 221.1 | 2.1 | 0.4 | 1.3 | JV FW Stockwork |
| | | | 9.3 | 1.9 | 11.5 | Josh Vein + Stockwork |
| Az 90 incl -45 | 251.1 | 262.4 | 11.3 | 3.32 | 4.14 | Rhyolite Stockwork |
| | 139.6 | 146.8 | 7.2 | 0.89 | 1.0 | Disseminated |
| | 181.6 | 187.2 | 5.6 | 0.82 | 1.1 | Disseminated |
| | 207.6 | 225.3 | 17.8 | 0.45 | 4.0 | JV HW Stockwork |
| NB-14-393 | 225.3 | 228.3 | 3.0 | 0.66 | 40.5 | Josh Vein |
| | 228.3 | 231.6 | 3.3 | 0.25 | 11.2 | JV FW Stockwork |
| Az 90 incl -51 | 293.5 | 360.1 | 66.7 | 0.46 | 0.9 | Disseminated |
| | 114.9 | 177.3 | 62.4 | 0.67 | 1.3 | Disseminated |
| | 242.2 | 253.8 | 11.6 | 0.25 | 5.9 | NE30 |
| NB-14-394 | 253.8 | 255.7 | 1.9 | 0.29 | 8.1 | JV HWStkwk |
| | 255.7 | 258.4 | 2.7 | 0.18 | 4.6 | JV FWStkwk |
| Az 90 incl -62 | 286.8 | 322.4 | 35.6 | 0.41 | 1.3 | Qtz Stockwork |
| | 229.2 | 240.5 | 11.3 | 0.77 | 16.4 | NE30 HWStkwk |
| NB-14-395 | 240.5 | 254.7 | 14.2 | 0.81 | 4.7 | NE30 |
| Az 69 incl -50 | 254.7 | 287.7 | 33.0 | 0.81 | 3.2 | NW10 Fault |
| NB-14-396 | 147.6 | 160.9 | 13.4 | 0.41 | 1.2 | Disseminated |
| | 328.6 | 333.4 | 4.8 | 1.03 | 2.9 | NW10 Fault |
| Az 66 incl -62 | 333.4 | 340.8 | 7.4 | 0.43 | 1.0 | NW10 HW Stockwork |
| | 40.5 | 44.2 | 3.7 | 0.44 | 5.0 | Silicified Fault in Debris Flow |
| NB-14-397 | 141.5 | 218.7 | 77.2 | 0.35 | 1.5 | Disseminated |
| | 316.3 | 324.8 | 8.5 | 0.70 | 1.6 | Py Veining |
| Az 90 incl -65 | 372.8 | 374.1 | 1.3 | 0.24 | 2.1 | NW10 Fault |
Corvus Gold Corp. Technical Report – North Bullfrog Project | | Page | 96 |
| HoleID and Orientation | From
(m) | To
(m) | Interval
(m) | Gold
(g/t) | Silver
(g/t) | Comments |
| | 147.4 | 166.8 | 19.4 | 0.37 | 0.9 | Disseminated |
| NB-14-398 | 170.8 | 191.8 | 21.0 | 0.42 | 0.7 | Disseminated |
| | 231.5 | 243.0 | 11.5 | 0.73 | 1.0 | Qtz Stockwork |
| Az 65 incl -68 | 334.7 | 340.0 | 5.3 | 0.41 | 1.0 | Qtz Stockwork |
| | 112.2 | 115.4 | 3.2 | 0.67 | 4.9 | JV HW Stockwork |
| NB-14-399 | 115.4 | 116.9 | 1.6 | 10.59 | 59.1 | Josh Vein |
| | 116.9 | 121.6 | 4.7 | 0.99 | 4.3 | JV FW Stockwork |
| | | | 9.4 | 2.5 | 13.7 | Josh Vein + Stockwork |
| Az 90 incl -45 | 147.1 | 154.2 | 7.1 | 0.66 | 1.0 | Qtz Stockwork |
| | 119.7 | 133.7 | 14.0 | 0.4 | 2.2 | JV HWStkwk |
| NB-14-400 | 133.7 | 139.3 | 5.6 | 13.9 | 60.1 | Josh Vein |
| | 139.3 | 155.6 | 16.3 | 32.6 | 20.3 | Footwall Stockwork |
| including | 145.0 | 151.7 | 6.7 | 73.5 | 38.4 | |
| Az 90 incl -60 | | | 35.9 | 17.1 | 19.5 | Josh Vein + Stockwork |
| | 145.7 | 166.8 | 21.1 | 6.9 | 8.0 | Hangingwall Stockwork |
| NB-14-401 | 166.8 | 167.7 | 0.9 | 0.7 | 5.5 | Josh Vein |
| | 167.7 | 177.7 | 10.0 | 1.0 | 2.4 | JV FWStkwk |
| Az 90 incl -73 | | | 32.0 | 4.9 | 6.2 | Vein + Stockwork |
| | 152.6 | 179.3 | 26.7 | 1.7 | 7.6 | JV HWStkwk |
| NB-14-402 | 179.3 | 183.7 | 4.5 | 14.6 | 79.0 | JV |
| | 183.7 | 195.5 | 11.8 | 0.5 | 10.1 | JV FWStkwk |
| Az 112 incl -46 | | | 63.2 | 4.2 | 11.9 | Josh Vein + Stockwork |
| | 129.0 | 130.7 | 1.7 | 145 | 22 | Upper Stockwork |
| | 148.6 | 172.6 | 24.0 | 0.4 | 1.8 | Hangingwall Stockwork |
| NB-14-403 | 172.6 | 173.6 | 1.0 | 0.5 | 4.5 | Josh Vein |
| | 173.6 | 180.8 | 7.1 | 0.4 | 3.9 | Footwall Stockwork |
| Az 136 incl -72 | | | 32.1 | 0.4 | 2.3 | Josh Vein + Stockwork |
| | 116.1 | 119.7 | 3.5 | 2.1 | 1.8 | Upper Stockwork |
| | 129.2 | 131.4 | 2.2 | 1.1 | 5.7 | Hangingwall Stockwork |
| NB-14-404 | 131.4 | 134.0 | 2.7 | 0.5 | 19.7 | Josh Vein |
| | 134.0 | 137.1 | 3.1 | 8.6 | 14.2 | Footwall Stockwork |
| Az 90 incl -54 | | | 7.9 | 3.8 | 13.7 | Josh Vein + Stockwork |
| | 135.8 | 144.5 | 8.7 | 2.4 | 12.3 | NE30 Fault |
| | 144.5 | 153.3 | 8.8 | 0.3 | 6.8 | NE30 Footwall Stockwork |
| | 170.2 | 174.7 | 4.4 | 0.4 | 17.3 | JV HWPeriph |
| | 174.7 | 179.6 | 5.0 | 2.8 | 26.6 | Hangingwall Stockwork |
| NB-14-405 | 179.6 | 186.0 | 6.4 | 2.0 | 41.1 | Josh Vein |
| | 186.0 | 192.6 | 6.5 | 2.2 | 6.7 | Footwall Stockwork |
| Az 90 incl -68 | | | 17.9 | 2.3 | 24.6 | Josh Vein + Stockwork |
| | 173.1 | 198.7 | 25.6 | 0.8 | 2.8 | Peripheral Stockwork |
| | 198.7 | 207.6 | 8.9 | 1.0 | 2.3 | Hangingwall Stockwork |
| NB-14-406 | 207.6 | 217.3 | 9.7 | 1.8 | 4.9 | Josh Vein |
| | 217.3 | 224.6 | 7.2 | 0.6 | 2.3 | Footwall Stockwork |
| Az 132 incl -71 | | | 25.8 | 1.2 | 3.3 | Josh Vein + Stockwork |
| NB-14-407 | 69.6 | 95.4 | 25.8 | 0.36 | 1.47 | Disseminated Oxide |
| Including | 73.3 | 78.7 | 5.4 | 0.82 | 2.49 | NE60 Fault |
| azi 90 incl -50 | | | | | | |
| | 141.9 | 147.4 | 5.5 | 0.65 | 2.4 | NE30 HW Stockwork |
| | 147.4 | 151.4 | 4.0 | 1.87 | 12.1 | NE30 Fault |
| | 151.4 | 155.0 | 3.6 | 0.42 | 4.3 | NE30 FW Stockwork |
| | | | 13.1 | 0.96 | 5.9 | Fault + Stockwork |
| NB-14-408 | 186.8 | 204.4 | 17.6 | 0.89 | 2.95 | JV HW Stockwork |
| | 189.7 | 193.9 | 4.1 | 2.11 | 6.51 | Including |
| | 204.4 | 208.4 | 4.0 | 0.39 | 2.51 | JV |
| | 208.4 | 216.2 | 7.8 | 0.41 | 1.48 | JV FW Stockwork |
| | | | 15.9 | 1.3 | 4.6 | Vein + Stockwork |
| azi 90 incl -74 | 216.2 | 237.1 | 20.9 | 0.81 | 2.3 | Sulphide Stockwork |
Corvus Gold Corp. Technical Report – North Bullfrog Project | | Page | 97 |
| HoleID and Orientation | From
(m) | To
(m) | Interval
(m) | Gold
(g/t) | Silver
(g/t) | Comments |
| | 102.1 | 106.1 | 4.0 | 0.37 | 6.0 | NE30 HW Stockwork |
| | 106.1 | 114.0 | 7.8 | 1.39 | 6.7 | NE30 Fault |
| | 114.0 | 126.0 | 12.0 | 0.77 | 5.2 | NE30 FW Stockwork |
| | | | 23.9 | 0.91 | 5.8 | Fault + Stockwork |
| NB-14-409 | 210.3 | 227.0 | 16.7 | 1.74 | 3.17 | JV HW Stockwork |
| | 227.0 | 228.0 | 1.0 | 4.22 | 8.05 | JV |
| | 228.0 | 239.9 | 11.8 | 0.69 | 1.70 | JV FW Stockwork |
| azi 118 incl -57 | | | 29.6 | 1.4 | 2.7 | Vein + Stockwork |
| | 128.3 | 132.2 | 4.0 | 1.15 | 53.90 | JV HW Stockwork |
| NB-14-410 | 132.2 | 134.4 | 2.2 | 8.87 | 450.09 | JV |
| | 134.4 | 138.2 | 3.8 | 2.00 | 8.60 | JV FW Stockwork |
| | | | 9.9 | 3.18 | 124.34 | Vein + Stockwork |
| azi 90 incl -64 | 149.2 | 150.8 | 1.6 | 13.57 | 3.92 | FW Zone |
| NB-14-411 | 96.9 | 100.6 | 3.7 | 5.7 | 19.2 | JV Fault |
| azi 125 incl -79 | | | | | | |
| | 131.5 | 141.7 | 10.2 | 0.50 | 7.83 | JV HW Stockwork |
| NB-14-412 | 141.7 | 146.3 | 4.5 | 0.95 | 19.74 | JV |
| | 146.3 | 159.9 | 13.7 | 1.32 | 6.11 | JV FW Stockwork |
| | | | 28.4 | 0.97 | 8.90 | Vein + Stockwork |
| | 159.9 | 169.5 | 9.6 | 0.76 | 4.07 | JV FW Peripheral |
| azi 90 incl -71 | 193.6 | 203.6 | 10.0 | 0.52 | 1.48 | FW Min |
| | 0.0 | 11.6 | 11.6 | 0.21 | 2.5 | Disseminated Oxide |
| | 11.6 | 21.4 | 9.8 | 0.50 | 2.9 | NE30 HW Stockwork |
| NB-14-413 | 21.4 | 26.4 | 5.0 | 0.21 | 5.9 | NE30 Fault |
| | | | 14.8 | 0.40 | 3.9 | Fault + Stockwork |
| | 29.2 | 77.6 | 48.4 | 0.31 | 1.1 | Disseminated Oxide |
| | 77.6 | 78.4 | 0.8 | 0.54 | 2.42 | JV Fault |
| | 78.4 | 82.7 | 4.2 | 6.99 | 4.23 | JV FW Stockwork |
| azi 163 incl -61 | | | 5.0 | 5.9 | 3.9 | Vein + Stockwork |
| | 153.3 | 154.1 | 0.8 | 0.53 | 7.27 | JV HW Stockwork |
| NB-14-414 | 154.1 | 165.0 | 11.0 | 8.13 | 30.53 | JV |
| | 165.0 | 175.9 | 10.8 | 0.54 | 2.40 | JV FW Stockwork |
| | | | 22.6 | 4.22 | 16.20 | Vein + Stockwork |
| azi 90 incl -63 | 175.9 | 191.1 | 15.2 | 0.49 | 1.27 | JV FW Peripheral |
| | 142.6 | 194.1 | 51.6 | 2.09 | 5.50 | JV HW Stockwork |
| | 191.4 | 192.3 | 0.9 | 78.90 | 32.00 | Including |
| NB-14-415 | 194.1 | 195.9 | 1.8 | 1.18 | 24.80 | JV |
| | 195.9 | 197.2 | 1.3 | 0.22 | 6.73 | JV FW Stockwork |
| azi 90 incl -53 | | | 54.6 | 2.0 | 6.2 | Vein + Stockwork |
| | 144.6 | 154.5 | 10.0 | 0.48 | 2.92 | JV HW Stockwork |
| NB-14-416 | 154.5 | 161.1 | 6.6 | 0.88 | 17.01 | JV |
| | 161.1 | 170.8 | 9.7 | 0.52 | 6.33 | JV FW Stockwork |
| | | | 26.3 | 0.59 | 7.71 | Vein + Stockwork |
| azi 79 incl -70 | 170.8 | 188.1 | 17.2 | 0.52 | 1.68 | JV FW Peripheral |
| NB-14-417 | 66.4 | 84.6 | 18.1 | 0.21 | 0.13 | Disseminated Oxide |
| | 103.3 | 153.3 | 50.1 | 0.35 | 0.98 | Disseminated Oxide |
| azi 90 incl -55 | 110.5 | 118.3 | 7.8 | 1.12 | 1.01 | NE70 Fault |
| | 64.2 | 65.1 | 0.9 | 30.50 | 255.0 | HW Vein |
| | 95.4 | 113.6 | 18.2 | 0.95 | 4.30 | JV HW Stockwork |
| NB-14-418 | 113.6 | 128.4 | 14.8 | 9.21 | 179.89 | JV |
| | 113.6 | 118.4 | 4.8 | 21.18 | 197.06 | Including |
| | 128.4 | 133.1 | 4.8 | 0.34 | 23.18 | JV FW Stockwork |
| azi 17 incl -68 | | | 37.7 | 4.1 | 75.4 | Vein + Stockwork |
| | 64.9 | 75.2 | 10.3 | 0.25 | 0.90 | Disseminated Oxide |
| NB-14-419 | 75.2 | 81.5 | 6.3 | 0.37 | 1.19 | NE60 Fault |
| | 81.5 | 90.8 | 9.3 | 0.43 | 2.54 | NE60 FWStkwk |
| azi 110 incl -50 | 90.8 | 107.6 | 16.8 | 0.25 | 1.99 | NE60 FWPeriph |
Corvus Gold Corp. Technical Report – North Bullfrog Project | | Page | 98 |
| HoleID and Orientation | From (m) | To
(m) | Interval
(m) | Gold
(g/t) | Silver
(g/t) | Comments |
| | 104.2 | 143.5 | 39.3 | 0.28 | 1.53 | Disseminated Oxide |
| | 174.4 | 181.3 | 6.9 | 0.86 | 5.05 | JV HW Stockwork |
| NB-14-420 | 181.3 | 182.9 | 1.6 | 0.32 | 7.06 | JV |
| | 182.9 | 185.8 | 2.9 | 0.83 | 6.46 | JV FW Stockwork |
| azi 90 incl -61 | | | 11.5 | 0.78 | 5.69 | Vein + Stockwork |
| NB-14-421 | 90.8 | 136.2 | 45.3 | 0.26 | 0.87 | Disseminated Oxide |
| Including | 111.3 | 124.9 | 13.6 | 0.33 | 0.70 | Including |
| azi 257incl -67 | | | | | | |
| NB-14-422 | 77.5 | 118.6 | 41.2 | 0.40 | 1.59 | Disseminated Oxide |
| | 180.8 | 212.8 | 32.0 | 0.61 | 1.19 | NE70 Zone |
| Including | 183.8 | 187.3 | 3.5 | 2.61 | 3.28 | |
| azi 70 incl -60 | | | | | | |
| | 100.0 | 101.5 | 1.5 | 0.34 | 1.63 | NE60 HWStkwk |
| NB-14-423 | 101.5 | 104.6 | 3.1 | 0.87 | 1.72 | NE60 |
| azi 103 incl -61 | 104.6 | 107.6 | 3.0 | 0.37 | 1.87 | NE60 FWStkwk |
| NB-14-424 | 114.6 | 161.6 | 47.0 | 0.24 | 1.63 | Disseminated Oxide |
| azi 101 incl -45 | 192.8 | 200.2 | 7.3 | 0.56 | 3.99 | Unnamed Quartz Vein |
| SBRC-15 | 0.0 | 74.7 | 74.7 | 0.36 | 0.68 | Veined Oxide |
| Including | 6.1 | 13.7 | 7.6 | 0.53 | 0.54 | Quartz Stockwork |
| Including | 35.0 | 41.2 | 6.1 | 0.79 | 1.42 | Quartz Stockwork |
Corvus Gold Corp. Technical Report – North Bullfrog Project | | Page | 99 |
11 SAMPLE PREPARATION, ANALYSES AND SECURITY
In the 2007 NBPJV core drilling program, HQ core was extracted using triple-tube barrels to insure the recovery in broken rock intervals. The entire core was oriented using an ACE accelerometer. Percent recovery, RQD, and magnetic susceptibility measurements were made on all core intervals. An assessment was made of the quality of the orientation data and the core was marked accordingly. The core was then logged recording lithological, alteration, mineralization, and structural information including the orientation of faults, fault lineation’s, fractures, veins, and bedding. With a few exceptions, the entire lengths of the holes were sampled. Sample intervals were based on the geological logging, separating different lithologies and styles of mineralization and alteration. Samples were marked and tagged in the core box before being photographed, after which the core was sawed in half with one half sent for assay and one half retained for future reference. Each sample interval was bagged separately and shipped to the lab for analysis.
During the 2008 reverse circulation drill program the cuttings were divided into two streams, one for sampling and the other for excess discarded to the sump. Using a “Y” splitter the sample stream was further divided into two sample bags: one designated for assaying and the second duplicate designated for QA/QC and metallurgical studies. Samples were collected at five foot intervals and bagged at the drill site. Each five foot sample was sealed at the drill site and not opened until it reached the analytical lab. At each 20 foot rod connection, the hole was blown clean to eliminate material that had fallen into the hole during the connection. The designated assay samples for each five foot interval were collected by the site geologist and moved to a secure sample collection area off of the property for shipment to the laboratory. The corresponding duplicate sample was retained at the drill site as a reference sample if needed. If the duplicate samples were not used prior to the reclamation of the pad they were interred in the sump at the time of reclamation.
Sample recovery was a problem in 11 of the NBPJV holes at Mayflower. Recovery issues were also noted on the logs for some of the Barrick drill holes. Recovery problems occurred in the silicified zones around the David adit. It appears that silicified rock is strongly fractured and contains open fractures so that sample is lost when drill chips move out into the fractures rather than along the hole and into the interchange. Zones of poor recovery up to 60 metres wide were encountered in strongly fractured rock. Where old workings were encountered the down-hole intervals also had poor recovery.
Table 11-1 outlines the intervals in the several holes where poor sample recovery occurred. Several of the intervals were in mineralized ground and may impact the Mineral Resource estimate. Of the 6,375 samples that were shipped for analyses in 2008, about 8% contained weights that were more than 1.5 standard deviations below the mean and only 145 samples were more than two standard deviations lighter than the mean. Because most of the light samples are from unmineralized intervals, the sample recovery issue does not represent a major problem in the Mineral Resource estimate. However, future drilling should try to overcome this problem.
Corvus Gold Corp. Technical Report – North Bullfrog Project | | Page | 100 |
Table 11-1 Intervals of Poor Recovery in the 2008 ITH Drilling in Mayflower Area.
| Drill hole number | From (metres) | To (metres) | Comment |
| NB-08-08 | 109.73 | 114.30 | Weak Au <0.25g/t around interval |
| NB-08-08 | 144.78 | 182.88 | No mineralization in and around interval |
| NB-08-11 | 128.02 | 132.59 | Mineralized zone at 1 g/t Au level |
| NB-08-16 | 79.25 | 134.11 | Variable recovery, >1g/t Au samples normal weights |
| NB-08-18 | 83.82 | 91.44 | Just above mineralized zone |
| NB-08-18 | 103.63 | 115.82 | Just below mineralized zone |
| NB-08-18 | 178.31 | 195.07 | Unmineralized zone |
| NB-08-40 | 80.77 | 88.39 | Well mineralized interval |
| NB-08-40 | 123.4 | 143.26 | Consistently poor recovery |
| NB-08-40 | 160.02 | 190.5 | Unmineralized in and around interval |
| NB-08-41 | 88.39 | 120.4 | Weak Au <0.25 g/t around interval |
There is no information available about how samples from the historic drilling were handled, processed, and analyzed.
In the 2007 NBPJV core program, blank basalt rock and certified standard materials were each inserted at a ratio of 1:20 throughout the sample sequence. Samples for duplicate analysis were identified at a ratio of 1:20 and given sequential sample numbers at the end of the shipment. Once the samples were marked out, the core was photographed and sawed in half using a diamond saw. Half of the core was then sent for assay and half was kept for future reference. Prior to shipment the samples were weighed, photographed and then placed in bags that were sealed with a security tag. Each hole was sent to ALS Minerals in Reno as a separate shipment with a chain of custody document to certify that the seals were intact when the shipment was received. In Reno, the samples were weighed so that the shipped and received weights could be compared and then the samples were sent to the crusher. Duplicate samples were prepared by splitting the crushed sample in half and creating two numbered samples. All samples were assayed for gold using a 50 gram fire assay and multi-elements were analyzed using a four acid digestion with ICP-MS analysis.
For the NBPJV RC drilling program in 2008 Hunter (2008) describes the procedures for inserting quality control samples into the drill sample sequence as noted below. The principal author observed these procedures and concurs with them. A similar approach was used during the 2007 core program with similar analytical results.
Corvus Gold Corp. Technical Report – North Bullfrog Project | | Page | 101 |
The samples are taken from the drill site to the sample prep area where they are laid out in order on a tarp to dry. Each drill hole is treated as a separate shipment. While the samples are drying, control samples are inserted. Pre-bagged crushed blank material supplied by ALS Chemex Labs [now, ALS Minerals], is inserted at the beginning of each shipment and also as every 20th sample throughout the hole. Commercially prepared (Rock Labs) standards with a known gold content are inserted throughout the hole as the 10th sample and every 20th sample after that so that every 10th sample in the shipment is either a blank or a standard. Generally three levels of gold standards are used; a low level (100-200 ppb), a medium level (1 ppm) and a high level (7 ppm). The geologist matches the level of gold standard to the anticipated level of mineralization in the drill hole. At the end of each shipment empty bags are provided for duplicate samples. There is approximately one duplicate sample for every 20 samples in the shipment. The samples to be duplicated are selected by the geologist and recorded in the drill log. The samples to be duplicated are split up in the lab and placed in the bar-coded empty bags provided by the geologist.
When the samples have dried to the point where they are dry or just damp a bar-coded tag is attached to each sample and the entire shipment is photographed. The photo is taken to establish that all samples are accounted for.
While placing the samples into rice bags for shipping each sample is weighed and the weight is recorded next to the sample number on the drill logs. Trucks from ALS Minerals pick the samples up from the sample prep area and take them directly to their Lab. When the lab receives the samples they weigh each one as they place their identifier on it and they are instructed to incorporate the attached barcodes for sample tracking.
The QA/QC protocol utilized inserted blanks and reference standards, as well as lab duplicates and field duplicates. Each drill hole was started with a blank (barren) sample inserted in the number sequence before the first sample. Reference standards and blanks were alternately inserted every 10th sample down the hole. Five samples were selected at random from each drill hole for lab duplicates. ALS Minerals was instructed to split off a lab duplicate from each selected sample, and each lab duplicate was assigned a new unique sample number at the end of the drill hole number sequence. Four drill site reject samples were also selected from each drill hole as field duplicates, and were later submitted to ALS Minerals in field duplicate shipments.
At ALS Minerals’ Sparks, Nevada facility the samples were dried as needed, then crushed and a 350-500 gram split of the crushed material was then pulverized to make the analytical sample. Fifty grams of this material was analyzed by fire assay with an atomic absorption finish (AuAA24 procedure). Samples were also analyzed for multi-elements using ALS Minerals’ ME-MS61m procedure. Grind tests were also reported as a further quality control to insure that the pulps were sufficiently fine to supply a quality analytical pulp.
Corvus Gold Corp. Technical Report – North Bullfrog Project | | Page | 102 |
Sample procedures for the 2010-11 RC drilling were similar to those of the 2008 RC drilling, with some variations described below. Standard RC drilling techniques were used to optimized recovery, minimize contamination, and keep the sampling circuit as clean as possible. Continuous sampling was done on 5 foot (1.52m) intervals, and the splitter was thoroughly cleaned prior to the start of drilling of each 20 foot rod. Two equal samples for each 5 foot interval were split-off at the drill site using a Y in the sample stream. One was used as the primary assay sample and the second retained as a drill site reject for QA/QC and metallurgical uses. The samples were captured, stored, and transported in pre-labeled barcoded sample bags. Large sample bags placed inside 5 gallon buckets were utilized throughout the program to minimize sample loss/overflow in high-water drilling and in clay-rich drilling intervals. The primary samples were analyzed using a handheld XRF unit at the drill site. The XRF analysis was used primarily to determine the arsenic content of the sample (a direct indication of mineralization) and the probable stratigraphic correlation of the sample. The primary assay samples were transported to a staging area near the property and placed in bulk polypropylene “super sacks” for shipment to ALS Minerals in Reno, NV. Each super sack was sealed with a security seal immediately after filling. Each drill hole was submitted to ALS as a single shipment with unique shipment number. All samples were transported by ALS Minerals to their lab in Reno. The drill site rejects remained at each drill site until the final results were received for each drill hole. The drill site rejects for all mineralized intervals were subsequently transported and preserved in a secure storage area near the property.
The 2012 and 2013 RC sampling protocol and analytical procedures were a continuation of those used in the 2010-11 RC program described above. The PQ3 core holes were drilled to supply metallurgical samples and were consumed in their entirety for testing. The HQ3 exploration core holes drilled at YellowJacket were sawn in half with one portion sent to ALS Minerals in Reno, NV for analyses with the other half retained on site for geological study.
11.1 CORVUS 2014 QA/QC PROGRAM
The principal author has reviewed previous QA/QC programs for the Project contained in previous reports and finds the information sufficient to confirm the validity of earlier sampling and assaying programs. This section summarizes QA/QC data related to new assaying carried out between January 2014 and February 2015 which has been used for the revised Sierra Blanca Mineral Resource estimate.
11.1.1 RC DRILLING
No RC drilling was carried out in 2014
11.1.2 CORE DRILLING
Corvus has also implemented a standard core sampling protocol in 2014 program. HQ3 and PQ3 core are drilled and extracted using triple-tube tooling to insure the best recovery through highly fractured intervals. Triple tube also minimizes core separation and rotation within the extraction tube, which is imperative in preserving reliable orientation data. The entire length of each hole is sampled with continuous intervals based on careful logging of geological characteristics. In conjunction with the logging, sample intervals are marked in the core box and assigned unique sample numbers in a sequence that includes pre-selected QA/QC samples every tenth sample. Each hole starts with a blank QA/QC sample, and alternates between blanks and reference standard. Once a hole is logged and tagged for sampling, each box is photographed within a fabricated lighting and reference frame. The reference frame allows rectification of the image so that in future applications true lengths can be measured on the core using the photos.Once a hole, or a group of boxes in a hole, are photographed, the photos are reviewed for adequacy and the photo files renamed using hole number and box number.
Corvus Gold Corp. Technical Report – North Bullfrog Project | | Page | 103 |
11.1.3 ACCREDITED LABORATORIES
Assaying for the NBP has been performed by ALS Minerals Laboratories primarily in Reno, Nevada and with some work performed in Vancouver, BC. Corvus has no business relationship with ALS Minerals beyond being a customer for analytical services. The Reno laboratory is Standards Council of Canada, Ottowa, ON Accredited Laboratory No. 660 and conforms with requirements of CAN-P-1579, CAN-P-4E (ISO/IEC 17025:2005). The North Vancouver, BC laboratory is Standards Council of Canada, Accredited Laboratory No. 579 and conforms with requirements of CAN-P-1579, CAN-P-4E (ISO/IEC 17025:2005).
Check assaying has been performed by Inspectorate America Corporation, Sparks NV. Corvus has no business relationship with Inspectorate America Corporation beyond being a customer for analytical services. The Laboratory is Accredited Laboratory No. 720 and conforms with requirements of CAN-P-1579, CAN-P-4E (ISO/IEC 17025:2005).
11.1.4 TRANSPORT AND SECURITY
Prior to shipment all rock and core samples were weighed, photographed and then placed in bags that are sealed with a security tag. RC samples are not weighed but are accumulated in super sacks which are sealed with a security tag prior to shipment. Each drill hole is sent to ALS Minerals in Reno, NV as a separate shipment with a chain of custody document to certify that the seals were intact when the shipment was received.
11.1.5 DUPLICATES
Duplicates are used to monitor the precision of the assays that are incorporated into the mineralization estimate. Duplicates monitor three sources of variation, e.g. sampling, preparation and assaying. Field duplicates are used to document the precision associated with sampling, prep duplicates are used to monitor the sample preparation process and pulp duplicates monitor the assaying process. Corvus uses all three types of duplicates to monitor the precision of the gold and silver analyses. However, in general field duplicates are only collected from RC holes.
11.1.5.1 FIELD DUPLICATES
In 2014 a series of quarter core samples were collected by Scott Burkett of Metal Mining Consultants and submitted for independent assaying to confirm the validity of the Corvus assay results. Quarter core is not an optimum type of field duplicate since it does not precisely represent the material in the original half core sample. However, it certainly gives an indication of the general concentration of gold in the sample.
Figure 11-1 and Figure 11-2 show that in general field duplicates reproduce within the analytical precision of both the gold and silver assays as defined by the analytical precision equation:
Analytical Precision = value+/- ((value*method precision)+(2*detection limit)).
Corvus Gold Corp. Technical Report – North Bullfrog Project | | Page | 104 |
The method precision quoted by ALS Minerals is 10% and the detection limit for the Au-ICP22 gold method is 0.001 ppm. The gold coefficient of variation for the field duplicates is 9% which is only marginally less than the method precision. For silver the coefficient of variation is 5%, which is half the method precision.
Both gold and silver for the field duplicates compare well with the original results, especially given the nature of these samples. Two of the three field duplicates fall within the analytical precision field (Figure 11-1 and Figure 11-2 ). The third falls just outside of the analytical precision field but still within 20% of the original. An important difference between these duplicates and others discussed below is that they are not the exact same material that was originally submitted.
Figure 11-1 Core Drilling Field Duplicate Gold Assays from Sierra Blanca in 2014.
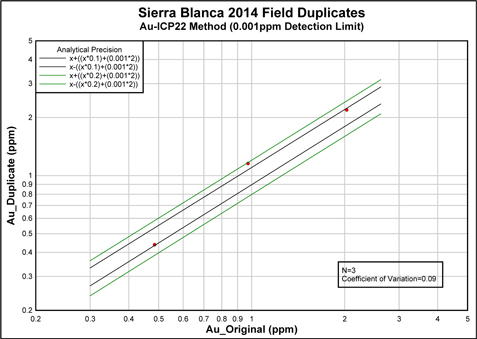
Corvus Gold Corp. Technical Report – North Bullfrog Project | | Page | 105 |
Figure 11-2 Core Drilling Field Duplicate Silver Assays from Sierra Blanca in 2014.
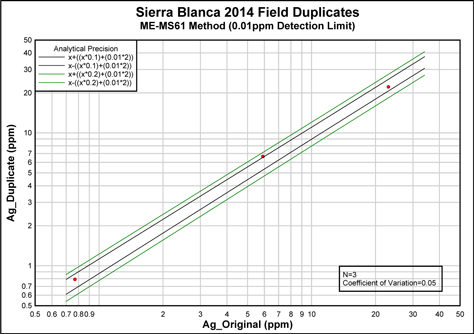
11.1.5.2 PREPARATION DUPLICATES
Sample preparation duplicates are created by crushing the sample and then splitting it in half. The two halves are then processed as separate samples. As a general rule the ratio of prep duplicates to samples is 1:20 but usually five prep duplicates are created for each drill hole. The selection of which samples to duplicate is made by the logging geologist based on their interpretation of lithologies and degree of mineralization.
Figure 11-3 and Figure 11-4 show that, in general, the preparation duplicates reproduce very well for both gold (coefficient of variation 21%) and silver (coefficient of variation 23%). There may be a hint of bias in both the gold and silver with slightly more samples falling below the analytical precision field than above. This effect is also under investigation by ALS Minerals.
Corvus Gold Corp. Technical Report – North Bullfrog Project | | Page | 106 |
Figure 11-3 Preparation Duplicate Gold Assays from Sierra Blanca in 2014.
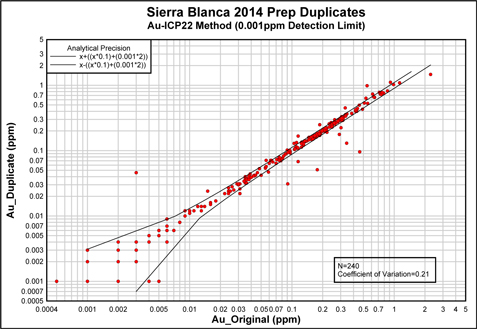
Figure 11-4 Preparation Duplicate Silver Assays from Sierra Blanca in 2014.
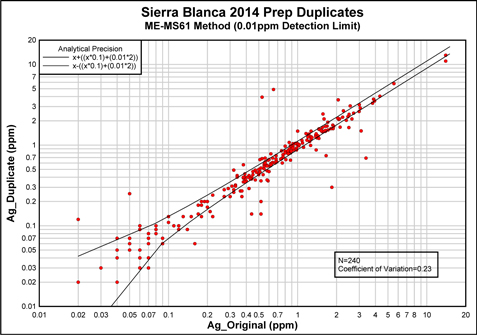
Corvus Gold Corp. Technical Report – North Bullfrog Project | | Page | 107 |
11.1.6 PULP DUPLICATES
11.1.6.1 ALS PULP DUPLICATES
Pulp duplicates reflect the homogeneity of the pulp material that is subjected to the fire assay and variations generally reflect the nugget effect in gold samples. In this instance ALS Minerals routinely run pulp duplicates as part of their internal QA/QC program and these assays are reported as part of the assay package.
Figure 11-5 and Figure 11-6 show that the pulp duplicates reproduced well for both gold (coefficient of variation 18%) and silver (coefficient of variation 15%). Given the amount of visible gold observed in the North Bullfrog samples the homogeneity of the pulps is actually surprising and provides confidence that the sample preparation process is effective.
Figure 11-5 ALS Pulp Duplicates Gold Assays for NBP in 2014.
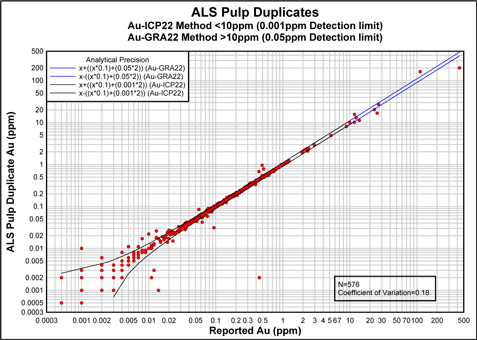
Corvus Gold Corp. Technical Report – North Bullfrog Project | | Page | 108 |
Figure 11-6 ALS Pulp Duplicate Silver Assays for NBP in 2014.
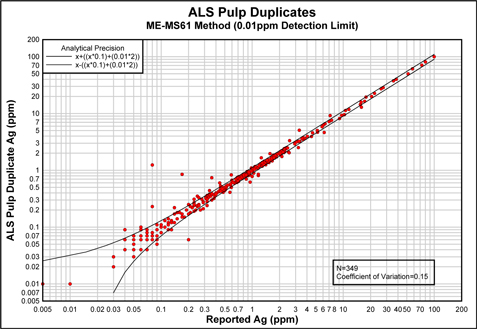
11.1.6.2 INSPECTORATE CHECK ASSAYS
Two hundred and seven (207) samples from four separate ALS workorders were sent to Inspectorate America Corporation in order to confirm the validity of the ALS Assays. Equivalent gold and multi element assaying methods were used at Inspectorate (Inspectorate FA450 and MA250 methods). The 207 samples included 181 original samples, 11 blanks, 11 Certified Reference Material (CRM) samples (seven different CRM’s), and five preparation duplicates. The same CRM’s were run in the same positions in both the Inspectorate and ALS jobs.
11.1.6.2.1 GOLD ASSAYS
In general the ALS and Inspectorate gold assays compare favorably both in terms of accuracy and precision (Figure 11-7). However, a closer inspection indicates that there is a distinct low bias in the Inspectorate gold assays. This is reflected both in the Certified Reference Material assays and the overall sample results when compared to ALS (Figure 11-8 and Figure 11-9). The median relative percent difference of the Inspectorate assays is -6.5%. Two of the three CRM’s that were assayed multiple times by Inspectorate showed variations in excess of 10% of the CRM value (Figure 11-8). In contrast the ALS CRM results all fall within 6% of the certified gold values (Figure 11-8).
The apparent low bias in the Inspectorate results were reported to Inspectorate who submitted the following conclusions via an email from Brooke Mills dated 07 May 2015:
Corvus Gold Corp. Technical Report – North Bullfrog Project | | Page | 109 |
“We did a comparison of Reno vs ALS, Reno vs Van and Van vs ALS. This was done using the entire group of samples for each comparison and for a subset of samples (0 to 1 ppm). This gives us the chance to see if the overall bias or the bias at a particular concentration range.
What we see is that overall, the trend line indicates that the Reno vs ALS, Reno vs Vancouver and Vancouver vs ALS all more or less agree with slopes very near equal to 1 (X=Y). However, when we look at the concentration range of 0 to 1 ppm, this tells a very different story. We see that Reno shows a negative bias relative to ALS of 8%. Even more pronounced is the bias between Reno and Vancouver at negative 17%, while Vancouver versus ALS shows that Vancouver has a moderately positive bias of about 5%.
Given the earlier study of looking at the nature of the sample materials, it does not look like the negative bias demonstrated by Reno is a function of the nature of the material (oxidized versus reduced ore) but rather it may be in part a calibration issue at the low end.
We also generated the R2 values that define how well the data clusters about the regression lines. We see that for Vancouver versus ALS we get a very good R2 value of approximately 0.985 for the overall comparison and an even better 0.988 value in the 0 to 1 ppm concentration range. This indicates that both labs are effectively extracting the gold and consistently reporting it (except for the bias). For Reno versus ALS and Reno versus Vancouver the R2 values are still quite good at 0.97 in the overall data. However, when we look at the 0 to 1 ppm concentration range we see that the R2 values drop to 0.947 and 0.944 relative to ALS and Vancouver respectively. This indicates more noise at the lower end that may be instrument or process related.
Currently in the Reno Analytical lab the first calibration point is 1ppm, we have noticed that a bulk of the assays fall under the 1ppm standard. To improve accuracy on the lower calibration curve a 0.5ppm calibration point has been added. In order to take a more proactive approach on the maintenance of the AA’s the Reno analytical lab will implement two more additional CCV standards at 0.1 and 0.25 to allow some greater visibility of the performance of the equipment. The results from Reno are requested with an AA finish whereas the Vancouver and ALS analyses were ICP finish. This would not cause the entirety of the variability but could be partially responsible. ICP is much more accurate at lower end concentrations than AA. However with the new calibration points we have increased the visibility at the lower end with the AA and this will help with the accuracy of the results.”
Based on this comparison and the results of the Inspectorate investigation it appears that the ALS assays are accurate and any discrepancy between the ALS and Inspectorate values is probably related to analytical problems at the Inspectorate Lab which are reflected in the poor performance of the CRM’s there.
Corvus Gold Corp. Technical Report – North Bullfrog Project | | Page | 110 |
Figure 11-7 Comparison of gold assays between ALS Minerals (Au-ICP22) and Inspectorate America (FA450). The Blue Line Indicates Equality between the Two Assays. Green lines indicate 10% precision with a detection limit of 0.001 ppm (the detection limit for Au-ICP22). The Data Show That in General the Assays Compare Favorably and That Most of the Assays Lie within 10% of Each Other.
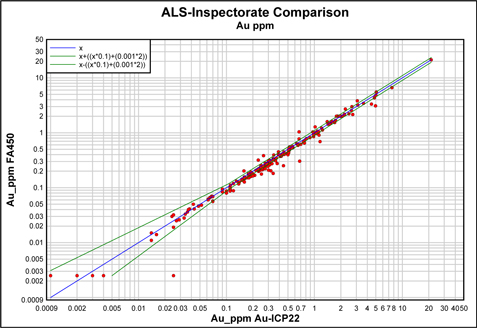
Figure 11-8 Comparison of Inspectorate and ALS Gold Assays on Certified Reference Materials. Relative Percent Difference Was Calculated as 100*(Lab-CRM)/CRM. Note That the Inspectorate Values Are Generally Less Than the Certified Values And for Two CRM’s That Were Analyzed Multiple Times by Inspectorate the Variation between Assays Is More Than 10%. In Contrast All the ALS Gold Assays Lie within 6% of the Certified Value and the Variation on CRM’s That Were Analyzed Multiple Times Is Less Than 5%.

Corvus Gold Corp. Technical Report – North Bullfrog Project | | Page | 111 |
Figure 11-9 Relative Percent Difference Versus the Als Gold Assay Value. Relative Percent Difference Was Calculated as 100*(Inspectorate-ALS)/ALS. The Data Suggest That the Inspectorate Low Bias Observed in the Crm Samples Is Also Reflected in the Rest of the Samples. Graphically the Bias Appears to Be Even More Extreme Than the CRM’s with Many Samples Reporting >10% Less Gold. However, the Median Relative Percent Difference Is -6.5% Which Is Similar to the CRM Bias.

11.1.6.2.2 SILVER ASSAYS
There is very good agreement between the ALS and Inspectorate values for silver (Figure 11-10). Only one of the 7 CRM’s used in this study have a fully certified silver value (CDN-GS-5P). The rest either have single assays published by the CRM manufacturer (all G series CRM’s except G300-8) or have assays determined by repeated analysis by Corvus Gold (G300-8 and OxD107). The Inspectorate silver values are marginally higher than the published values for most of the CRM’s but the assay for CDN-GS-5P is within 2% of the certified value of 119 ppm silver (Figure 11-11). The analysis of the relative percent difference between the ALS and Inspectorate assays shows that there does not appear to be a significant bias with the median value being 2% (Figure 11-12).
Corvus Gold Corp. Technical Report – North Bullfrog Project | | Page | 112 |
Figure 11-10 Comparison of Silver Assays between ALS Minerals (ME-MS61) and Inspectorate America (MA250). The Blue Line Indicates Equality between the Two Assays. The Green Lines Indicate 10% Precision for a Detection Limit of 0.01 Ppm (the Detection Limit of ME-MS61). The Data Indicate That the Assays Compare Favorably and That Most Lie within 10% of Each Other.
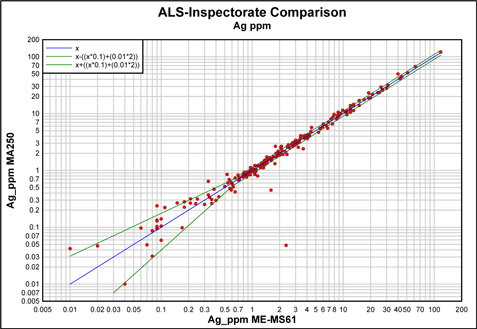
Figure 11-11 Comparison of Inspectorate and ALS Silver Assays to Published Values for the CRM’ Used in This Study. Cdn-Gs-5p Is the Only CRM That Has a Certified Silver Value. The Rest Are Values Reported by the Manufacturer but Not Certified. There Is Less Than 5% Difference between Inspectorate and ALS in 6 of the 11 Crm Samples (Some Are Not Visible Because They Are behind Other Data Points). For CRM’s Analyzed Multiple Times the Inspectorate Values Do Show Greater Variation Than the ALS Results.
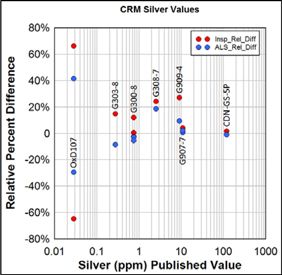
Corvus Gold Corp. Technical Report – North Bullfrog Project | | Page | 113 |
Figure 11-12 Relative Percent Difference Versus the ALS Silver Assay Value. Relative Percent Difference Was Calculated as 100*(Inspectorate- ALS)/ ALS. The Data Suggest That the Difference Is Relatively Evenly Distributed around Zero Indicating No Bias in the Data. The Median Relative Percent Difference Is 2%.
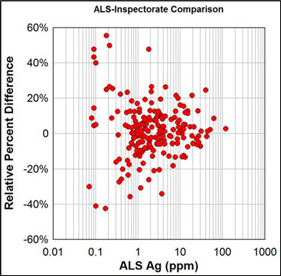
11.1.7 VISIBLE GOLD SAMPLING PROTOCOL
In 2013, many of the vein and stockwork intervals drilled on the NBP contained abundant visible gold. This represented a challenge for sampling which was overcome in the first instance by ensuring that all samples with visible gold were isolated and that the half core sample weights were between 500 and 1,200 grams. This meant that the entire sample could be processed using a metallic screen fire assay (ALS Minerals code Au-SCR24 (gold only)). Between 2012 and January 2015 a total of 378 samples were assayed in this way.
As the program went on and it was apparent that the number of visible gold samples was increasing it became important to evaluate what would happen if larger samples were taken and the samples were actually split to separate the one kg required for the metallic screen fire assay. To accomplish the objectives of the test without compromising the quality of the assays being used for the mineralization estimation a new method called Au-SCR24AV was developed at ALS Minerals. With this method samples of one to two kilograms are submitted to the lab. They are crushed and homogenized and then split in half and both halves are subjected to a metallic screen fire assay. The two results are then combined to produce a final assay which is reported on the certificate. Between 2013 and 2014 a total of 438 samples were analyzed in this way providing a body of data on how duplicate assays for the visible gold samples compare.
11.1.7.1 2014 PERFORMANCE OF 1KG NORMAL AU-SCR24 ANALYSES
The metallic screen fire assay reports the amount of gold that reports to the +100 micron and -100 micron fractions after screening. The degree to which coarse gold affects the assays can then be evaluated by considering the percentage of gold that ends up in the coarse fraction (Table 11-2). Of the 220 samples with visible gold submitted for metallic screen fire assay only about 2% have more that 35% of the gold in the coarse fraction.
Corvus Gold Corp. Technical Report – North Bullfrog Project | | Page | 114 |
Table 11-2 Distribution of Gold in the Plus Fraction of Metallic Screen Fire Assays.
| % Plus fraction Au | Count of Samples | % of Samples |
| <16% | 204 | 92.7% |
| btw 16% & 35% | 11 | 5.0% |
| btw 35% & 50% | 2 | 0.9% |
| >50% | 3 | 1.4% |
A simple plot of grade versus the percentage of gold in the coarse fraction shows that there is slight positive correlation between grade and percentage of gold in the coarse fraction (Figure 11-13). This is a change from 2013 where there was no correlation and samples with as little as 1g/t gold could have more than 60% of the gold in the coarse fraction. However, it is noteworthy that virtually all samples with more than 50g/t gold have more than 35% of the gold in the coarse fraction for both 2013 and 2014.
Figure 11-13 Gold Grade Versus the Percentage of Gold in the Coarse Fraction for Normal Au-Scr24 Assays.

The metallic screen fire assay also reports duplicate 50g fire assays from the minus 100 micron size fraction. Comparing these duplicate analyses measures the extent to which fine particulate gold still controls the assay value (Figure 11-14). It is clear from Figure 11-14 that only a small number of samples fall outside of the 20% precision field so it appears that the nugget effect is not minimal in the fine fraction.
Corvus Gold Corp. Technical Report – North Bullfrog Project | | Page | 115 |
Figure 11-14 Comparison of Duplicate Minus Fraction Fire Assays Generated as Part of the Metallic Screen Fire Assay. Precision Limits for 10% and 20% Are Shown for Comparison.
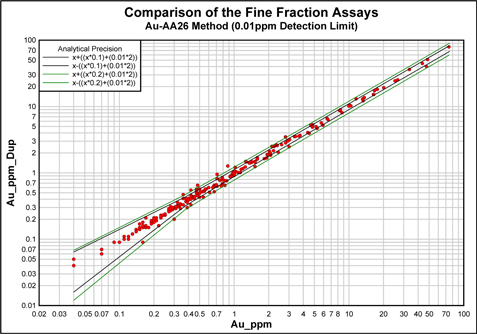
11.1.7.2 DUPLICATE METALLIC SCREEN FIRE ASSAYS
In order to evaluate the possible effect of splitting samples with visible gold samples weighing between one and two kilograms were crushed to 1.7mm and then split in half with both halves being subjected to metallic screen fire assays (Figure 11-15). These duplicates are equivalent to the preparation duplicates discussed earlier except that the entire sample has now been assayed. It is clear from Figure 11-15 that, in spite of the presence of visible gold, splitting the samples repeats to within the limits of 20% precision suggesting that, in general, the visible gold does not represent a severe sampling problem at the NBP for most samples. Two of the 282 samples (0.7%) assayed using the Au-SCR24AV method display serious nugget effect. Sample P490440 had over 90% of the gold reporting to the coarse fraction in only one split and sample Q796071 had more gold in one split over the other despite having nearly equal percentage of coarse gold (Figure 11-15).
Corvus Gold Corp. Technical Report – North Bullfrog Project | | Page | 116 |
Figure 11-15 Comparison of Duplicate Metallic Screen Fire Assays on Samples with Visible Gold.

11.1.8 BLANKS
Blank material is used to monitor for carryover contamination and to ensure that there is not a high bias in the assay. Carryover is a process where a small portion of the previous sample contaminates the next sample. ALS Minerals allows a total of 1% carryover from preparation and analytical processes combined. Each blank that assays higher than three times the detection limit is evaluated to see if the value reflects carryover or some other problem. For example, if a blank assayed 0.006 ppm Au for the Au-ICP22 method and the previous sample ran 1ppm Au then the blank is not investigated because acceptable carryover could explain up to 0.01 ppm. However, if the blank had assayed 0.015 ppm Au then that is more than can be explained by carryover from a 1 ppm previous sample and an investigation will be initiated. The investigation includes a rerun of the blank and surrounding samples as well as any documentation that was associated with the work order at ALS Minerals. There are cases where the investigation does not resolve the reason for the higher than expected value. Figure 11-16 and Figure 11-17 show the historical performance of blank samples submitted for the NBP Quality Control.
Corvus Gold Corp. Technical Report – North Bullfrog Project | | Page | 117 |
Figure 11-16 2014 Sierra Blanca Blanks for Au-Icp22 Method.
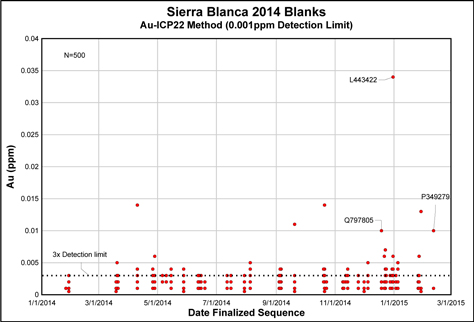
In Figure 11-16 all of the blanks over 3x the detection limit have been investigated and were found to have been affected by carryover from previous samples with the exceptions of Q797805 and P349279. Both of these blanks are currently under investigation so the cause for the high value is currently unknown. Sample L443422 was affected by carryover from the previous sample which ran 30.4 ppm Au and could therefore have contributed up to 0.304ppm Au and still be within the allowable 1% carryover outlined by ALS.
In Figure 11-17 two blanks used in the Au-SCR24/24AV method were higher than the accepted limit of 3x the detection limit. Q793627A was the first blank in the sample sequence and its initial reported value was below the detection limit. However, it was noted there was an error in the calculation of the Total Au for samples at or near the detection limit. Recalculation of the Total Au for Q793627A was then above the 3x detection limit threshold for blanks (Figure 11-17). Consequently, the high recalculated value was not investigated. It is standard practice at NBP to insert “wash” samples between samples with visible gold to clean the system and to reduce the amount of carryover between visible gold samples. Even with this practice in place to prevent carryover it does still occur. Q795480 was affected by carryover from the previous sample which reported 199.85ppm gold.
Corvus Gold Corp. Technical Report – North Bullfrog Project | | Page | 118 |
Figure 11-17 2014 Sierra Blanca Blanks for Au-Scr24/24AV
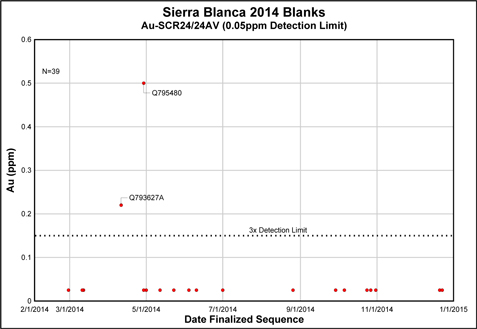
11.1.9 CERTIFIED REFERENCE MATERIALS
Certified Reference Materials (“CRM’s”) or “standards” are used to monitor the accuracy of the assay results reported by ALS Minerals. CRM’s are inserted into the sample sequence at a ratio of 1:20 and serve to monitor both accuracy and sample sequence errors. A number of different CRM’s covering a range of grades and mineral compositions are used at the NBP. Each CRM comes with a certified concentration with a stated uncertainty. However, the precision on the assay is ultimately controlled by the 10% analytical precision reported by ALS Minerals. Therefore in the following discussion the performance of the CRM’s is discussed relative to the theoretical ALS Minerals precision.
CRM’s used in the 2014 drilling campaign were analyzed using the Au-ICP22 analytical method. All the CRM values fall within the theoretical analytical precision quoted by ALS Minerals (Figure 11-8).
Corvus Gold Corp. Technical Report – North Bullfrog Project | | Page | 119 |
Figure 11-18 Au-Icp22 Certified Reference Material Gold Assays.
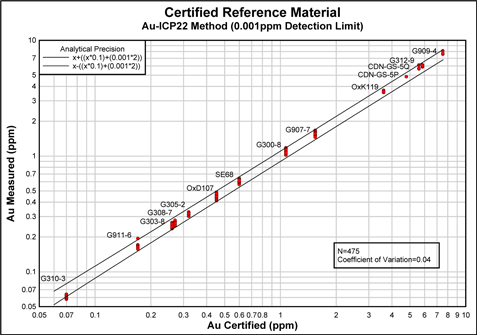
Figure 11-19 Performance of Crms Over Time.
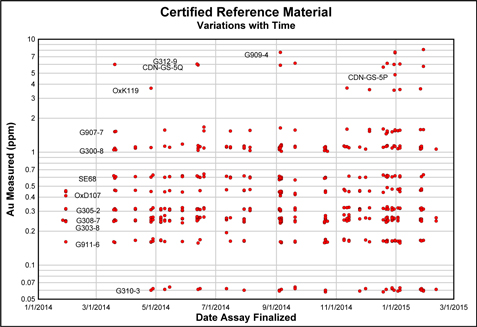
Figure 11-19 illustrates that a range of concentrations are being monitored with the CRM suite used at the NBP.
Corvus Gold Corp. Technical Report – North Bullfrog Project | | Page | 120 |
Some of the CRM’s used by Corvus have certified silver values while others that are certified for gold only have “reported” silver values. Nevertheless, these values can all be used to monitor the accuracy and precision of the silver assays (Figure 11-20). It is clear that most of the CRM silver values do report within the analytical precision of the ME-MS61 method. There are clearly problems with precision in the CRM’s with values less than 0.1ppm silver. In 2013, a change in the over limit method for Ag was implemented which greatly reduced the scatter of measured values for standards above 5ppm (Figure 11-21).
Figure 11-20 Silver Assays for CRM’s With Some Published but Not Certified Values.
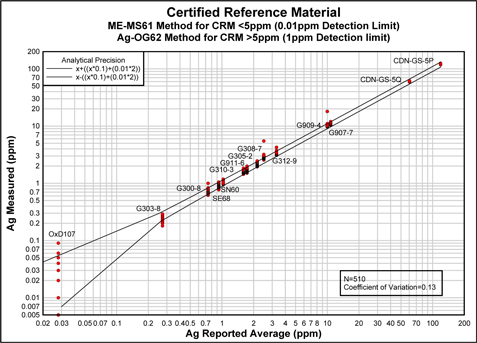
Corvus Gold Corp. Technical Report – North Bullfrog Project | | Page | 121 |
Figure 11-21 Silver Performance of CRM’s Over Time.

In 2014, two new CRM’s with certified silver values of 60 and 119 ppm have been added to the CRM suite. Both of these standards have performed well using the Ag over limit method (Ag-OG62).
11.1.10 OTHER SAMPLE QUALITY PARAMETERS
In addition to the accuracy and precision described above a number of other parameters can be used to monitor the reliability of the sampling used to support the Mineral Resource estimate. Among these are variations in sample recovery and tests for contamination in reverse circulation drilling.
11.1.10.1 SAMPLE RECOVERY
The sample recovery from drilling has an important effect on how representative the sample is of the volume of rock which has been sampled. Core recovery can be easily measured on site by the length of core recovered. For RC it is much more difficult to determine the actual recovery from the interval because of the way it is collected. As a result RC recovery is best reflected in the relative weights of the samples submitted for assay.
11.1.10.1.1 CORE RECOVERY
The core recovery at Sierra Blanca is reasonably good, with an overall average of 93% (Table 11-3). Twenty six percent (26%) of the intervals with less than 50% recovery are within 13 meters of the surface and reflect a combination of colluvium and heavily weathered rock. Runs reporting more than 100% recovery are attributed to a combination of poor measurements and intervals where core slipped out of the core barrel and were redrilled in the subsequent run.
Corvus Gold Corp. Technical Report – North Bullfrog Project | | Page | 122 |
Table 11-3 Core Recovery from Sierra Blanca.
| Recovery % | Total Meters | Percentage |
| >120 | 87.2 | 0.8% |
| 110-120 | 106.8 | 1.0% |
| 90-110 | 10056.6 | 92.4% |
| 85-90 | 215.3 | 2.0% |
| 50-85 | 328.4 | 3.0% |
| 5-50 | 74.8 | 0.7% |
| <5 | 9.2 | 0.1% |
| Total | 10886.1 | 100% |
Figure 11-22 Sierra Blanca Core Sample Recovery Versus Grade.
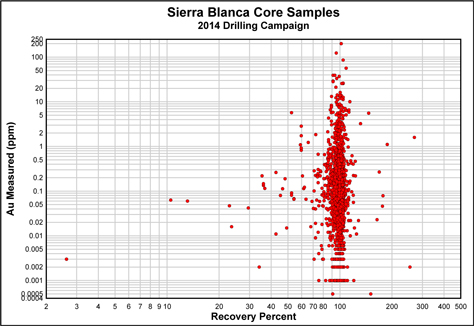
Figure 11-22 shows that there is no particular relationship between grade and core recovery. However, many of the samples from intervals with <60% recovery are from mineralized zones reflecting the inherent link between faults and mineralization at Sierra Blanca. Nevertheless only a small percentage of the samples are affected by low recoveries (Table 11-4).
Corvus Gold Corp. Technical Report – North Bullfrog Project | | Page | 123 |
Table 11-4 Sierra Blanca Core Samples with Less Than 85% Recovery.
| Au_ppm | # Samples with <85% Recovery | % of Total Samples |
| 0-0.1 | 149 | 1.71% |
| 0.1-0.25 | 72 | 0.82% |
| 0.25-0.5 | 65 | 0.74% |
| 0.5-1 | 20 | 0.23% |
| 1-5 | 7 | 0.08% |
| 5-25 | 2 | 0.02% |
| >25 | 0 | 0.00% |
11.1.10.1.2 RC RECOVERY
No RC drilling was carried out in 2014.
11.1.10.2 LABORATORY HANDLING OF SAMPLES
Samples are monitored throughout the preparation process with various weights, e.g. shipped weights, received weights, dry weights, and coarse reject weights. This data is used to monitor sample login, layout and sample spillage or mixing. Theoretically, the only difference between the “dry weight” and the “coarse reject weight” should be the weight of the material extracted for pulverizing. Beginning in 2012 this “extracted weight” has been reported by ALS Minerals as a certified value on assay certificates to help monitor excess material loss, e.g. spillage that could affect the representative nature of the sample.
The standard requested pulp size for all drill samples is one Kg with an acceptable range of values from 0.5 to 1.5Kg. Extracted weights outside of the acceptable range indicate there may be preparation issues such as spillage or blending of two samples. For blending of drill samples the protocol is to combine and homogenize all the materials from both samples and then split it in half to create two identical samples which are then assigned the original sample numbers. During 2014, ten instances of sample blending were documented. When a sample pair is partially blended, one sample will have exceedingly low (negative or below 0.5kg extracted weights) and the other sample will have a large weight extracted (Figure 11-24). Theoretically, the weights of blended samples will show a symmetric weight gain and loss. However, it is clear that this is not always the case. In Figure 11-23, one of the asymmetric samples was a prep dup specified by Corvus while another was selected by ALS Minerals for QA/QC testing.
Core samples extracted weights are generally within the accepted range throughout the year (Figure 11-24). At the end of 2014, there was an increase in extracted weight variability (Figure 11-24) and an increase in the number of blended samples (Figure 11-23).
Corvus Gold Corp. Technical Report – North Bullfrog Project | | Page | 124 |
Figure 11-23 Sierra Blanca Reported Extracted Weights for Blended Samples.

Figure 11-24 Sierra Blanca Core Extracted Weights for Pulp Over Time.
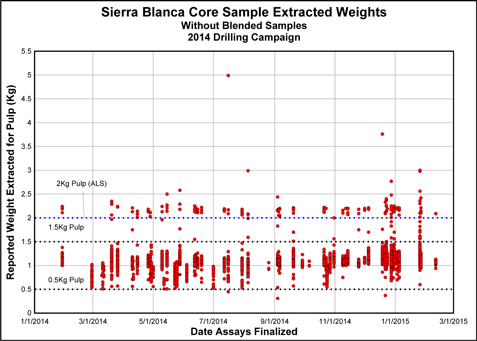
Corvus Gold Corp. Technical Report – North Bullfrog Project | | Page | 125 |
11.1.10.3 TWIN HOLE COMPARISONS
RC hole NB-08-21 was twinned with a core hole in 2013 to determine the nature of gold mineralization in the hole. The precise location of the collar for NB-08-21 could not be determined because the drill pad had been rehabilitated but the twin hole was within 4 metres of the original location. There is a good correlation between the gold values in both holes. It is noticeable that the detection limit for gold in NB-08-21 was 0.01g/t whereas in NB-13-364 it was 0.001 g/t. It is possible that the high gold peak at 30 metres in NB-13-364 could be the same structure as the high gold spike at 42 metres in NB-08-21 indicating a very oblique angle of intersection of that particular zone (Figure 11-25).
Figure 11-25 Gold Assays for Twin Holes NB-08-21 and NB-13-364.
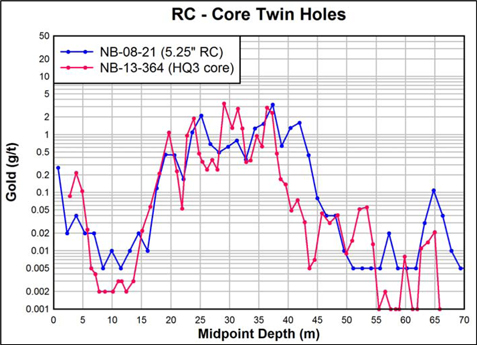
Drill hole NB-12-126 was drilled as an HQ3 core twin of RC hole NB-10-63 in order to determine the actual style of mineralization encountered in the original hole. A comparison of the two holes shows that the gold assays generally track each other quite well (Figure 11-26). Note that the detection limit for gold in NB-10-63 was 0.005 ppm while the detection limit for NB-12-126 was 0.001 ppm. In both holes all samples from depths less than 150 meters had values below detection. The assays from NB-12-126 do appear to have a low bias when compared to NB-1-63, particularly noticeable in the intervals 190-210 meters and 225-235 meters (Figure 11-26). These intervals coincide with zones of clay alteration and faulting and it is possible that the grade bias reflects sample loss during core cutting.
Corvus Gold Corp. Technical Report – North Bullfrog Project | | Page | 126 |
Figure 11-26 Gold Assays for Twin Core Holes NB-10-63 and NB-12-126.
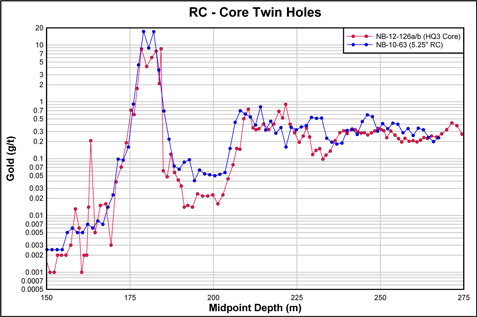
Drill hole NB-13-363 is a PQ3 diameter core hole drilled as a twin of HQ3 diameter NB-13-347 in order to collect metallurgical sample material (Figure 11-27). The average sample length of NB-13-363 was 3.3 metres while the sample length in NB-13-347 ranges from 0.1 metre to 1.4 metres. In order to facilitate comparison between the holes samples in hole NB-13-347 were combined into sample intervals of approximately 3 metres. It is important to understand that the original samples in NB-13-347 were taken in such a way that once the core was sawn in half the high grade samples were never split again and the entire sample was assayed using a metallic screen fire assay. This means that the nugget effect was minimized in the sampling. In contrast, for the metallurgical samples the entire core was sampled and crushed to 19mm before a 4 kg split was taken for the head assay. The 4kg split was then crushed to 1.7mm and 1kg was extracted for a metallic screen fire assay. This means the metallurgical samples were certainly affected by the nugget effect during sampling. This shows that there is a good correlation overall between the two holes with higher grade spikes in the original hole almost certainly reflecting the absence of nugget effect in those samples compared to the larger metallurgical samples.
Corvus Gold Corp. Technical Report – North Bullfrog Project | | Page | 127 |
Figure 11-27 Gold Assays for Twin Holes NB-13-347 and NB-13-363.
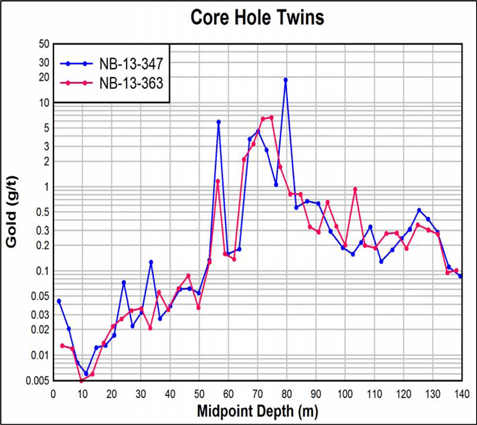
11.2 DATA ADEQUACY
In the opinion of the Author, sample preparation, security, and analytical procedures as described in Section 11, are sufficient and can be relied upon in the estimation of Mineral Resources.
Corvus Gold Corp. Technical Report – North Bullfrog Project | | Page | 128 |
12 DATA VERIFICATION
The principal author has verified the data used in this report by:
| | · | Visiting the Project and confirming the geology and mineralization |
| | · | Visiting the core and RC storage areas and inspecting the core cutting facility |
| | · | Reviewing drill core |
| | · | Verifying the location of drill holes in the field |
| | · | Reviewing the QA/QC protocols |
The principal author concludes that:
| | · | Exploration drilling, drillhole surveys, sampling, sample preparation, assaying, and density measurements have been carried out in accordance with CIM Best Practice Guidelines and are suitable to support Mineral Resource estimates |
| | · | Exploration and drilling programs are well planned and executed and supply sufficient information for Mineral Resource estimates and Mineral Resource classification |
| | · | Sampling and assaying includes sufficient quality assurance procedures |
| | · | Exploration databases are professionally constructed and are sufficiently error free to support Mineral Resource estimates. |
Therefore, in the opinion of the principal author, such data can be relied upon to estimate Mineral Resources at the NBP and for the purposes of the economic assessment as described in this report.
12.1 DATABASE ERROR CHECKS
The principal author reviewed the database by selecting 10% of the 72,655 gold sample records in the database. The certified assay certificates were reviewed and the results compared to data entry in the database. The principal author verified that the data entry procedures are accurate as compared to the certificates.
12.2 DATA VERIFICATION SAMPLES
The author independently collected three quarter core samples to submit for laboratory analysis at ALS Laboratory in Reno, NV to independently verify the existence of the mineralization and to review the reproducibility of the original Corvus assay. No limitations were placed on the author’s ability to review data or to independently verify the data used in the Mineral Resource estimate. Verification core samples were photographed and core boxes were marked by MMC with information regarding the selected sample (Date, MMC Sample#, HoleID, From, To). The core boxes were then taken to the core cutting facility where a technician cut the quarter core. MMC bagged the quarter core samples in the core shed and sent them to ALS Chemex for analysis. Figure 12-1 shows the cut quarter core, an example of the sample tag placed on the core box and the sample bag used to collect the sample that was shipped to the laboratory by MMC. The results for the check analysis are tabulated in Table 12-1. The results show that check samples grades range from 7% to 11% from the original individual sample grade.
Corvus Gold Corp. Technical Report – North Bullfrog Project | | Page | 129 |
Figure 12-1 Core Sample and Sampling Procedure Used by MMC.

Table 12-1 Data Verification Samples (MMC-2015).
| MMC Data Verification Samples - 2015 PEA |
Corvus Sample
# | MMC
Sample
# | Hole ID | From | To | Original Value | Verification
Value | MMC
Weight | ALS
Weight |
| Au | Ag | Au | Ag | kg | kg |
| P491238 | MMC_SB1_141102 | NB-14-392 | 261.71 | 262.43 | 0.973 | 0.77 | 1.155 | 0.79 | 0.89 | 0.9 |
| Q795239 | MMC_SB2_141102 | NB-14-380 | 89.44 | 90.03 | 2.03 | 23 | 2.19 | 22.2 | 0.93 | 0.93 |
| Q795685 | MMC_SB3_141103 | NB-14-384 | 104.55 | 105.63 | 0.485 | 5.9 | 0.438 | 6.65 | 1.62 | 1.63 |
Corvus Gold Corp. Technical Report – North Bullfrog Project | | Page | 130 |
13 MINERAL PROCESSING AND METALLURGICAL TESTING
Mining activities at NBP took place in the period 1909 – 1926, however, there are no metallurgical data available for that period. Data from subsequent exploration drilling at NBP between 1972 and 1996 by the various organizations listed in Table 6-1 do not contain any records of metallurgical test work. All of the known metallurgical test work on NBP mineralization have been produced by Corvus beginning in 2010.
NBP metallurgical test work has been performed on samples from core and RC drill cuttings generated during the exploration programs at NBP and on bulk sample materials collected from surface outcrops and from dumps resulting from previous underground mining at the NBP. The data consist of the results of cyanidation bottle roll tests at different particle sizes, cyanidation column leach tests at 80% passing (P80) -6.3mm, -12.5 mm (½ inch), -19 mm (3/4 inch) and -51 mm (2 inch), and gravity concentration with cyanidation leaching of tails tests. The metallurgical test work addresses both the disseminated, oxidized portion of the mineralization, suitable for heap leach processing and the higher grade, vein and stockwork mineralization from the YellowJacket zone which will require milling with gravity concentration and cyanide leaching of tails. These results demonstrate high cyanide solubility of the contained gold and silver in YellowJacket mineralization at 100-200 mesh. The data indicate that simple process systems based on cyanide leaching are suitable for both the disseminated, oxidized low grade mineralization and for the higher grade vein and vein stockwork mineralization at YellowJacket.
This section presents a general outline of the metallurgical testing performed to date and available for inclusion in this report. In section 13.1, the early bottle roll test data is summarized. Section 13.2 presents the results from the column leach testing, bottle roll tests from the bulk samples, from RC drilling cuttings and PQ3 core, and vat leaching tests to project particle size – Au recovery relationships for heap leaching of the disseminated mineralization. The discovery of the higher grade, vein and stockwork mineralization at YellowJacket required the expansion of the metallurgical program to include test work to define a mill process system. Section 13.2 also includes recent test results to support milling circuit recoveries for gravity concentration and cyanide leaching of concentrate and tails. Section 13.3 presents comminution test data for both disseminated mineralization and YellowJacket mineralization, and Section 13.4 discusses the results of gold deportment studies on tail material from leaching of unoxidized samples, and on gravity concentrates of the vein and vein stockwork mineralization.
The metallurgical testing that impacts the Mineral Resource estimate and Preliminary Economic Assessment was performed by McClelland Analytical Services Laboratories Inc. of Sparks Nevada (“McClelland”). McClelland is an ISO 17025 accredited facility that supplies quantitative chemical analysis in support of metallurgical, exploration and environmental testing using classic methods and modern analytical instrumentation. McClelland has met the requirements of the IAS Accredidations Criteria for Testing Laboratories (AC89), has demonstrated compliance with ANS/ISO/IEC Standard 17025:2005, General requirements for the competence of testing and calibration laboratories, and has been accredited, commencing November 12, 2012.
Corvus Gold Corp. Technical Report – North Bullfrog Project | | Page | 131 |
McClelland have performed bottle roll testing on RC cuttings and core sample materials from the Sierra Blanca, the Jolly Jane, the Savage Valley, and the Mayflower areas, and column leach tests at P80 of -12.5 mm (1/2 inch), -19 mm (3/4 inch) and -51 mm (2 inch) for the Sierra Blanca, Savage Valley, Jolly Jane, and Mayflower areas, bottle roll testing on these column leach composites at nominal P80 % of -75μm (-200 mesh) and 1.7 mm (-10 mesh), 6.3 mm (-1/4 inch), and 19 mm (-3/4 inch), bottle roll test results for vein and stockwork materials representative of the YellowJacket mineralization at various feed sizes and gravity concentration with cyanide leaching of tail materials on YellowJacket vein and vein stockwork mineralization.
Other scoping tests have been performed by lab organizations and are presented for completeness, including:
| · | Hazen Research, Inc., Golden, CO (“Hazen”) – bottle roll testing of six samples collected from drilling in the Mayflower area; |
| · | Kappes, Cassidy and Associates, Reno, NV (“KCA”) – bottle roll testing on materials from the Connection area, core material from the Sierra Blanca area, and on RC sample materials from the Sierra Blanca and Jolly Jane areas; |
| · | Advanced Mineral Technology Laboratory Limited (“AMTEL”), London, ON, Canada - gold deportment studies of two samples of leached tail fractions of unoxidized samples from the Savage Valley area. |
| · | Bureau Veritas Commodities Canada Ltd. – Quemscan analysis of gravity concentrate samples YellowJacket vein and stockwork materials. |
The gold mineralization at the NBP contains various amounts of silver. Silver ratios in the Sierra Blanca mineralization average 3.5 silver to 1.0 gold, the Jolly Jane mineralization averages 1.6 silver to 1.0 gold, and the Mayflower mineralization averages 0.64 silver to 1.0 gold. YellowJacket mineralization averages approximately 5 silver to 1 gold. Bottle roll and column leach recoveries of silver are also reported in the data. Column Silver recoveries ranged from 3% to 16%. Discussion of the silver data is contained in this report is limited to column leach testing of the disseminated low grade mineralization and to the YellowJacket data, where relatively high silver grades and recovery is indicated by the data.
Corvus Gold Corp. Technical Report – North Bullfrog Project | | Page | 132 |
13.1 METALLURGICAL TESTING – Initial BOTTLE ROLL TESTING 2008-2010
13.1.1 HAZEN – MAYFLOWER AREA
Initial metallurgical testing focused on the Mayflower area which was first investigated in 2008. A total of six samples of core material were submitted to Hazen. The results are summarized in Table 13-1.
Table 13-1 Summary of Cyanide Leach Testing of Mayflower Metallurgical Samples.
Hazen
ID | Corvu
ID | Hole
ID | From
(m) | To
(m) | From
(ft.) | To
(ft.) | Au (ppm) orig.
borehole assay | Head Assay
(ppm) | Tail
Assay
(ppm) | Estimated
Au Recovery
(%) |
| HRI 51858-1 | E152440 | NB08-07 | 47.24 | 48.77 | 155 | 160 | 0.80 | 0.6 | 0.2 | 67% |
| HRI 51858-2 | E152336 | NB08-10 | 102.11 | 103.63 | 335 | 340 | 1.62 | 1.7 | 0.3 | 83% |
| HRI 51858-3 | E155073 | NB08-11 | 117.35 | 118.87 | 385 | 390 | 0.87 | 1.1 | 0.1 | 91% |
| HRI 51858-4 | E155191 | NB08-12 | 70.10 | 71.63 | 230 | 235 | 3.09 | 2.4 | 0.9 | 63% |
| HRI 51858-5 | E155211 | NB08-12 | 97.54 | 99.06 | 320 | 325 | 14.20 | 11.1 | 1.2 | 89% |
| HRI 51858-6 | E157203 | NB08-17 | 91.44 | 92.96 | 300 | 305 | 2.03 | 1.2 | 0.4 | 67% |
The submitted samples were stage crushed to 100% -1.7 mm (-10 mesh) and then bottle roll leached for 72 hours. The test results are contained in a letter reportdated Hazen, 2008.
Each sample came from a separate borehole drilled at Mayflower, from depths ranging between 47 and 118 metres. Mayflower is distinctly different from the other resource areas currently being considered at the NBP, in that it forms along a high angle structure, striking NW. It is also higher grade than the other areas, and contains vein like intervals with much higher grade within the total mass.
13.1.2 KCA METALLURGICAL TESTING DATA
KCA performed three separate bottle roll test campaigns beginning in early 2010 and completing mid-2011. The first campaign was performed on material obtained from the Sierra Blanca area, the second campaign was performed on samples from the Sierra Blanca, Yellow Jacket, Savage Valley and Jolly Jane areas, and the third campaign was performed on samples from the Connection area. The test data generated by KCA are organized in three reports, which are discussed in the following sections.
13.1.2.1 KCA BOTTLE ROLLS SIERRA BLANCA CORE MATERIAL
The initial test work performed by KCA was on the Sierra Blanca area samples. Table 13-2 provides a summary of the bottle roll test results (KCA, 2010).
Corvus Gold Corp. Technical Report – North Bullfrog Project | | Page | 133 |
Table 13-2 North Bullfrog Project - Sierra Blanca Pulverized Material (Minus 0.075mm) Summary of Cyanide Bottle Roll Tests (Grams-g; Kilograms-kg; Tonnes-t).
KCA
Sample
No. | KCA
Test No. | Calculated
Head
(g Au/t) | Extracted
(g Au/t) | Avg. Tail
(g Au/t) | Au
Extracted
% | Leach
Time
(days) | Consumption
NaCN
(kg/t) | Addition
Ca(OH)2
(kg/t) |
| 43790 A | 44111 A | 0.59 | 0.46 | 0.13 | 78% | 3 | 0.04 | 0.50 |
| 43790 B | 44111 B | 0.78 | 0.56 | 0.22 | 71% | 3 | 0.09 | 0.50 |
| 43790 C | 44111 C | 0.46 | 0.42 | 0.03 | 92% | 3 | 0.09 | 0.50 |
| 43790 D | 41111 D | 0.63 | 0.52 | 0.11 | 82% | 3 | 0.04 | 0.50 |
| 43790 E | 41112 A | 0.34 | 0.29 | 0.05 | 84% | 3 | 0.11 | 1.00 |
| 43790 F | 41112 B | 0.40 | 0.35 | 0.05 | 88% | 3 | 0.24 | 0.50 |
| 43790 G | 41112 C | 0.47 | 0.43 | 0.04 | 91% | 3 | 0.08 | 0.50 |
| 43790 H | 41112 D | 0.28 | 0.08 | 0.19 | 30% | 3 | 0.05 | 0.50 |
| 43790 I | 41113 A | 0.29 | 0.13 | 0.16 | 46% | 3 | 0.09 | 0.50 |
| 43790 J | 41113 B | 0.64 | 0.02 | 0.62 | 4% | 3 | 0.27 | 1.00 |
| 43790 K | 41113 C | 0.74 | 0.13 | 0.62 | 17% | 3 | 0.17 | 1.00 |
| - | Average | 0.51 | 0.31 | 0.20 | 62% | — | 0.12 | 0.64 |
13.1.2.2 KCA BOTTLE ROLLS ON SIERRA BLANCA, YELLOW JACKET, SAVAGE VALLEY AND JOLLY JANE
The second test work program performed by KCA was on samples from the Sierra Blanca, Yellow Jacket, Savage Valley, and Jolly Jane areas.
Bottle roll testing results generated from RC samples are reported for Sierra Blanca (10 tests), Jolly Jane (4 tests), Savage Valley (6 tests) and Yellow Jacket (4 tests). The tests include oxide, mixed oxide/sulfide and sulfide sample material, which are listed in Table 13-3 (KCA, 2011a).
Corvus Gold Corp. Technical Report – North Bullfrog Project | | Page | 134 |
Table 13-3 North Bullfrog Project Pulverized Material (P80 -75μm) Summary of Cyanide Bottle Roll Leach Tests (Grams-g; Kilograms-kg; Tonnes-t).
| Hole ID | KCA
Sample
No. | KCA
Test
No. | Description | Area | Oxidation | Calculated
Head (g
Au/t) | Extracted (g Au/t) | Avg.
Tail
(g Au/t) | Au
Extracted
% | Leach
Time
(days) | Consumption
NaCN (kg/t) | Addition
Ca(OH)2
(kg/t) |
| NB-10-42 | 48425 A | 48432 A | NB150063M | Jolly Jane | 5-oxide | 0.46 | 0.42 | 0.04 | 90% | 3 | 0.08 | 1 |
| NB-10-43 | 48425 B | 48432 B | NB150157M | Jolly Jane | 5-oxide | 0.43 | 0.41 | 0.02 | 95% | 3 | 0.12 | 2.25 |
| NB-10-45 | 48425 C | 48432 C | NB150400M | Jolly Jane | 5-oxide | 0.34 | 0.3 | 0.04 | 89% | 3 | 0.08 | 1 |
| NB-10-47 | 48425 D | 48432 D | NB150639M | Jolly Jane | 5-oxide | 0.26 | 0.22 | 0.04 | 85% | 3 | 0.09 | 1 |
| NB-10-48 | 48425 E | 48433 A | NB150794M | Sierra Blanca | 4-mostly oxide | 0.35 | 0.3 | 0.04 | 87% | 3 | 0.08 | 1 |
| NB-10-48 | 48425 F | 48433 B | NB150879M | Sierra Blanca | 3-mixed ox/sulf | 0.3 | 0.14 | 0.16 | 47% | 3 | 0.16 | 1 |
| NB-10-51 | 48425 G | 48433 C | NB151271M | Sierra Blanca | 5-oxide | 0.35 | 0.27 | 0.08 | 77% | 3 | 0.08 | 1 |
| NB-10-51 | 48425 H | 48433 D | NB151279M | Sierra Blanca | 4-mostly oxide | 0.35 | 0.25 | 0.1 | 70% | 3 | 0.35 | 1 |
| NB-10-52 | 48425 I | 48434 A | NB151642M | Sierra Blanca | 1-sulfide | 0.46 | 0.03 | 0.44 | 6% | 3 | 0.27 | 1 |
| NB-10-53 | 48425 J | 48434 B | NB151685M | Sierra Blanca | 5-oxide | 0.27 | 0.24 | 0.03 | 90% | 3 | 0.32 | 1 |
| NB-10-55 | 48425 K | 48434 C | NB152098M | Sierra Blanca | 2-mostly sulfide | 0.3 | 0.06 | 0.24 | 19% | 3 | 0.19 | 1 |
| NB-10-55 | 48425 L | 48434 D | NB152104M | Sierra Blanca | 3-mixed ox/sulf | 0.27 | 0.19 | 0.07 | 72% | 3 | 0.16 | 1 |
| NB-10-55 | 48425 M | 48435 A | NB152106M | Sierra Blanca | 2-mostly sulfide | 0.3 | 0.06 | 0.24 | 20% | 3 | 0.21 | 1 |
| NB-10-56 | 48425 N | 48435 B | NB152362M | Sierra Blanca | 1-sulfide | 0.25 | 0.03 | 0.23 | 10% | 3 | 0.7 | 1 |
| NB-10-64 | 48425 O | 48435 C | NB153880M | Savage Valley | 1-sulfide | 0.43 | 0 | 0.43 | 0% | 3 | 0.08 | 1 |
| NB-10-64 | 48425 P | 48435 D | NB153910M | Savage Valley | 2-mostly sulfide | 0.46 | 0.06 | 0.4 | 12% | 3 | 0.08 | 1 |
| NB-10-64 | 48425 Q | 48436 A | NB153912M | Savage Valley | 3-mixed ox/sulf | 0.36 | 0.14 | 0.22 | 40% | 3 | 0.01 | 1 |
| NB-11-65 | 48425 R | 48436 B | NB154004M | Savage Valley | 5-oxide | 0.63 | 0.59 | 0.04 | 94% | 3 | 0.09 | 1.25 |
| NB-11-65 | 48425 S | 48436 C | NB154029M | Savage Valley | 5-oxide | 0.43 | 0.4 | 0.03 | 93% | 3 | 0.08 | 1 |
| NB-11-67 | 48425 T | 48436 D | NB154512M | Savage Valley | 1-sulfide | 0.62 | 0 | 0.62 | 0% | 3 | 0.08 | 1 |
| NB-10-62 | 48425 U | 48437 A | NB153462M | Yellow Jacket | 1-sulfide | 0.49 | 0.06 | 0.43 | 12% | 3 | 0.35 | 1 |
| NB-10-63 | 48425 V | 48437 B | NB153655M | Yellow Jacket | 1-sulfide | 16.66 | 14.37 | 2.28 | 86% | 6 | 0.59 | 1 |
| NB-10-63 | 48425 W | 48437 C | NB153677M | Yellow Jacket | 1-sulfide | 0.61 | 0.05 | 0.56 | 8% | 3 | 0.05 | 1 |
| NB-11-68 | 48425 X | 48437 D | NB154852M | Yellow Jacket | 1-sulfide | 0.35 | 0.11 | 0.25 | 30% | 3 | 0.09 | 1 |
13.1.2.3 KCA BOTTLE ROLLS ON CONNECTION
The third test work program performed by KCA was on samples from the Connection area.
Two oxide samples were selected from the drill holes in the Connection area. The bottle roll tests were performed on P80 -75μm material for 72 hours and are summarized in Table 13-4 (KCA, 2011b)
Corvus Gold Corp. Technical Report – North Bullfrog Project | | Page | 135 |
Table 13-4 North Bullfrog Project Pulverized Material (Minus 0.075mm) Summary of Cyanide Bottle Roll Leach Tests (Grams-g; Kilograms-kg; Tonnes-t).
KCA
Sample
No. | KCA
Test No. | Calculated
Head
(g Au/t) | Extracted
(g Au/t) | Avg. Tails,
(g Au/t) | Au
Extracted
% | Leach
Time,
(days) | Consumption
NaCN,
(kg/t) | Addition
Ca(OH)2
(kg/t) |
| 48455 A | 48456 A | 5.87 | 2.85 | 3.03 | 48% | 3 | 0.16 | 1.5 |
| 48455 B | 48456 B | 4.23 | 3.85 | 0.38 | 91% | 3 | 0.22 | 2.0 |
Connection is a relatively small portion of the mineralization at the NBP. Gold recovery was 48% and 91% in the two samples. Silver recovery was high at 91% and 73%, respectively. The submitted samples had relatively high Au grades (5.9 and 4.2 g/t).
13.2 McCLELLAND METALLURGICAL TESTING –2012 to 2015
The bulk of the metallurgical testing at NBP has been performed by McClelland Laboratories of Sparks, NV. Results of the different testing programs are reported in chronological order.
13.2.1 MCCLELLAND METALLURGICAL TESTING –2012
Surface outcrops at Jolly Jane and the existence of surface dumps from previous underground mining at Sierra Blanca provided an opportunity to develop bulk sample composites for column leach testing. These two areas comprise approximately 90% of the currently defined Mineral Resource. Three testing objectives were defined with the tests:
| · | Perform column leaching on duplicate samples at P80 of -12.5 mm (-½ inch) and -51mm (-2 inch) from bulk sample material of the Sierra Blanca and Jolly Jane areas; |
| · | Project a particle size – leach recovery relationship from combining the column leach results with bottle roll testing of material from the 2 bulk samples at P80s of -75μm ( -200 mesh) and -1.7 mm (-10 mesh); and |
| · | Perform comparative bottle roll testing on sample composites developed from RC drilling samples at the smaller particle sizes [P80s of -75μm ( -200 mesh) and -1.7mm (-10 mesh)] to verify that the bulk sample materials were characteristic of the low grade mineralized material throughout Sierra Blanca and Jolly Jane areas. |
13.2.1.1 MCCLELLAND BOTTLE ROLL TESTS
McClelland performed a series of bottle roll tests to evaluate cyanide leach recovery on material at a particle size of P80 -0.075μm (-200 mesh) and -1.7 mm (-10 mesh). Table 13-5 lists the results from these bottle roll tests.
Corvus Gold Corp. Technical Report – North Bullfrog Project | | Page | 136 |
Table 13-5 North Bullfrog Project Summary of McClelland Bottle Roll Tests.
| Composite | Area | Feed Size | Au Rec.
% | Tail
Grade
(g/t)* | Calculated
Head
(g/t)* | NaCN
Cons.
(kg/t)** | Lime
Added
(kg/t)** |
| NBMC-1 | Jolly Jane Oxide | 79.3%-1.7mm | 64.3 | 0.15 | 0.42 | 0.08 | 1.5 |
| NBMC-1 | Jolly Jane Oxide | 80%-75µm | 80.0 | 0.073 | 0.365 | 0.14 | 0.9 |
| NBMC-2 | Jolly Jane Oxide | 64.8%-1.7mm | 66.7 | 0.07 | 0.21 | 0.08 | 1.3 |
| NBMC-2 | Jolly Jane Oxide | 80%-75µm | 76.8 | 0.044 | 0.190 | 0.08 | 0.9 |
| NBMC-3 | Jolly Jane Oxide | 65.3%-1.7mm | 67.5 | 0.13 | 0.40 | 0.07 | 1.2 |
| NBMC-3 | Jolly Jane Oxide | 80%-75µm | 79.5 | 0.071 | 0.347 | 0.07 | 1.0 |
| NBMC-4 | Sierra Blanca Oxide | 79.5%-1.7mm | 88.1 | 0.05 | 0.42 | <0.07 | 1.3 |
| NBMC-4 | Sierra Blanca Oxide | 80%-75µm | 88.2 | 0.049 | 0.415 | <0.07 | 1.1 |
| NBMC-5 | Sierra Blanca Oxide | 69.7%-1.7mm | 83.8 | 0.06 | 0.37 | 0.07 | 1.3 |
| NBMC-5 | Sierra Blanca Oxide | 80%-75µm | 92.1 | 0.024 | 0.302 | <0.07 | 1.0 |
| NBMC-6 | Sierra Blanca Oxide | 78.5%-1.7mm | 52.6 | 0.09 | 0.19 | 0.15 | 1.4 |
| NBMC-6 | Sierra Blanca Oxide | 80%-75µm | 86.7 | 0.025 | 0.188 | 0.07 | 1.2 |
| NBMC-7 | Sierra Blanca Mixed | 20.4%-1.7mm | 68.0 | 0.08 | 0.25 | 0.09 | 1.8 |
| NBMC-7 | Sierra Blanca Mixed | 80%-75µm | 71.0 | 0.080 | 0.276 | 0.08 | 1.3 |
| NBMC-8 | Sierra Blanca Mixed | 85.3%-1.7mm | 71.1 | 0.11 | 0.38 | 0.15 | 2.1 |
| NBMC-8 | Sierra Blanca Mixed | 80%-75µm | 75.1 | 0.085 | 0.341 | 0.24 | 1.6 |
| NBMC-9 | Savage Valley Oxide | 48.7%-1.7mm | 63.8 | 0.21 | 0.58 | 0.14 | 1.3 |
| NBMC-9 | Savage Valley Oxide | 80%-75µm | 91.0 | 0.050 | 0.554 | 0.53 | 2.4 |
| NBMC-10 | Savage Valley Oxide | 70.3%-1.7mm | 87.1 | 0.04 | 0.31 | <0.07 | 1.4 |
| NBMC-10 | Savage Valley Oxide | 80%-75µm | 85.5 | 0.053 | 0.366 | 0.68 | 2.4 |
| NBMC-11 | Savage Valley Oxide | 63.8%-1.7mm | 76.5 | 0.04 | 0.17 | 0.07 | 1.4 |
| NBMC-11 | Savage Valley Oxide | 80%-75µm | 89.8 | 0.017 | 0.167 | 0.22 | 2.7 |
| NBMC-12 | Savage Valley Mixed | 74.4%-1.7mm | 73.5 | 0.09 | 0.34 | 0.08 | 1.4 |
| NBMC-12 | Savage Valley Mixed | 80%-75µm | 72.3 | 0.106 | 0.382 | 0.23 | 2.7 |
| NBMC-13 | Savage Valley Mixed | 45.7%-1.7mm | 66.7 | 0.07 | 0.21 | <0.07 | 1.5 |
| NBMC-13 | Savage Valley Mixed | 80%-75µm | 81.9 | 0.034 | 0.188 | 0.09 | 1.5 |
| SB Bulk Sample | Sierra Blanca Surface | 80%-1.7mm | 88.2 | 0.04 | 0.34 | <0.07 | 1.5 |
| SB Bulk Sample | Sierra Blanca Surface | 80%-1.7mm | 82.1 | 0.052 | 0.291 | <0.07 | 1.4 |
| SB1019 | Sierra Blanca Surface | 80%-1.7mm | 79.8 | 0.070 | 0.347 | 0.15 | 2.0 |
| SB Bulk Sample | Sierra Blanca Surface | 80%-75µm | 85.9 | 0.038 | 0.270 | 0.12 | 1.3 |
| JJ Bulk Sample | Jolly Jane Surface | 80%-1.7mm | 72.7 | 0.09 | 0.33 | <0.07 | 1.9 |
| JJ Bulk Sample | Jolly Jane Surface | 80%-1.7mm | 76.6 | 0.067 | 0.286 | 0.07 | 2.0 |
| JJ1019 | Jolly Jane Surface | 80%-1.7mm | 73.8 | 0.100 | 0.382 | <0.07 | 1.5 |
| JJ Bulk Sample | Jolly Jane Surface | 80%-75µm | 80.0 | 0.063 | 0.315 | 0.15 | 1.8 |
* (g/t) grams/tonne
** (kg/t) kilograms/tonne
Corvus Gold Corp. Technical Report – North Bullfrog Project | | Page | 137 |
13.2.1.2 MCCLELLAND SIERRA BLANCA AND JOLLY JANE BULK SAMPLE COLUMN LEACH TESTS
Four bulk samples were collected from surface outcrops at Jolly Jane (“JJ”) and from existing underground dumps at Sierra Blanca (“SB”) on the NBP. The samples were crushed to 80 percent -51 mm (-2 inch) and 80 percent -12.5 mm (-1/2 inch). Each sample was run with duplicate columns. Table 13-6 provides the summary data from these tests.
Table 13-6 North Bullfrog Project Summary of Mcclelland Bulk Sample Column Leach Test Results
Sample
ID | Test
No. | Feed
Size | Leach
Time
(days) | Au
Recovery
% | Extracted
Au
(g/t) | Tail
Assay
(g/t) | Calculated.
Head
(g/t) | Average
Head
(g/t) |
| SB Bulk Sample (Init.) | P-1 | 80%-50mm | 117 | 75.6 | 0.204 | 0.0860 | 0.290 | 0.277 |
| SB Bulk Sample (Dupl.) | P-2 | 80%-50mm | 117 | 72.2 | 0.200 | 0.0860 | 0.286 | 0.277 |
| JJ Bulk Sample (Init.) | P-3 | 80%-50mm | 117 | 64.0 | 0.208 | 0.120 | 0.328 | 0.318 |
| JJ Bulk Sample (Dupl.) | P-4 | 80%-12.5mm | 117 | 61.0 | 0.217 | 0.122 | 0.339 | 0.318 |
| SB Bulk Sample (Init.) | P-5 | 80%-12.5mm | 97 | 80.8 | 0.325 | 0.077 | 0.402 | 0.357 |
| SB Bulk Sample (Dupl.) | P-6 | 80%-12.5mm | 97 | 82.8 | 0.338 | 0.070 | 0.408 | 0.357 |
| JJ Bulk Sample (Init.) | P-7 | 80%-12.5mm | 97 | 65.0 | 0.227 | 0.122 | 0.349 | 0.367 |
| JJ Bulk Sample (Dupl.) | P-8 | 80%-12.5mm | 97 | 65.6 | 0.233 | 0.122 | 0.355 | 0.367 |
*(g/t) grams/tonne
13.2.2 MCCLELLAND MAYFLOWER DUMP BULK SAMPLE TESTING – JULY 2012
McClelland performed agitated cyanidation (bottle roll) leach tests on two bulk samples from the NBP Mayflower area (McClelland Laboratories, 2013a). The two bulk samples represented material from the Main Shaft dump and the David Adit of the Mayflower area (Table 13-7).
Bottle roll tests were conducted for both bulk samples at five feed sizes in duplicate. Splits were taken from material stage crushed to just passing 62.5mm, 80% -19mm, 80% -6.3mm, 80% -1.7mm and just passing 850μm. Splits taken from material stage crushed to just passing 850μm were stage ground to 80% -75μm using laboratory stainless steel ball mills. Bottle roll leaching was conducted using lime for pH control and 1.0 gNaCN/L at 40% solids. After 96 hours of leaching, the final residues were washed to remove residual cyanide and dissolved metals. Tail grades for the 62.5mm, -19mm, and -6.3mm charges were determined by tail screen analyses. Tails grades for the -1.7mm and -75μm charges were determined by triplicate direct assays. The feed sizes for the 100% -62.5mm charges during leaching were determined by tail screen analyses. These feed sizes ranged from 63% to 85% passing 38mm.
Corvus Gold Corp. Technical Report – North Bullfrog Project | | Page | 138 |
Table 13-7 North Bullfrog Project Summary Metallurgical Results, Grind Size Optimization Bottle Roll Tests, Bulk Mayflower Samples
Sample
ID | Sample
Location | Feed
Size | Au
Recovery,
% | g Au/mt mineralization | Reagent Consumption kg/mt mineralization |
| Extracted | Tail | Calculated
Head | Head
Assay | NaCN
Cons. | Lime
Added |
| May 1 | Main Dump | 85%-38mm | 36.0 | 0.695 | 1.237 | 1.932 | 5.290 | 0.09 | 0.6 |
| May 1 | Main Dump | 78%-38mm | 39.3 | 0.836 | 1.289 | 2.125 | 5.290 | 0.07 | 0.6 |
| May 1 | Main Dump | 80%-19mm | 55.1 | 0.679 | 0.553 | 1.232 | 5.290 | 0.08 | 0.8 |
| May 1 | Main Dump | 80%-19mm | 48.6 | 0.407 | 0.430 | 0.837 | 5.290 | 0.09 | 0.8 |
| May 1 | Main Dump | 80%-6.3mm | 46.5 | 1.083 | 1.246 | 2.329 | 5.290 | 0.17 | 1.3 |
| May 1 | Main Dump | 80%-6.3mm | 52.5 | 1.181 | 1.068 | 2.249 | 5.290 | 0.07 | 1.3 |
| May 1 | Main Dump | 80%-1.7mm | 62.6 | 2.676 | 1.598 | 4.274 | 5.290 | 0.07 | 0.8 |
| May 1 | Main Dump | 80%-1.7mm | 67.5 | 3.206 | 1.543 | 4.749 | 5.290 | <0.07 | 1.0 |
| May 1 | Main Dump | 80%-75µm | 98.5 | 4.240 | 0.065 | 4.305 | 5.290 | 0.19 | 1.2 |
| May 1 | Main Dump | 80%-75µm | 99.3 | 4.709 | 0.032 | 4.741 | 5.290 | 0.12 | 1.4 |
| | | | | | | | | | |
| May 2 | David Adit | 71%-38mm | 38.9 | 0.793 | 1.248 | 2.041 | 2.060 | <0.07 | 0.8 |
| May 2 | David Adit | 63%-38mm | 29.7 | 0.728 | 1.722 | 2.450 | 2.060 | <0.07 | 0.7 |
| May 2 | David Adit | 80%-19mm | 54.8 | 0.961 | 0.794 | 1.755 | 2.060 | <0.07 | 1.3 |
| May 2 | David Adit | 80%-19mm | 52.4 | 0.837 | 0.759 | 1.596 | 2.060 | 0.08 | 1.1 |
| May 2 | David Adit | 80%-6.3mm | 54.6 | 1.157 | 0.963 | 2.120 | 2.060 | <0.07 | 1.3 |
| May 2 | David Adit | 80%-6.3mm | 51.2 | 1.106 | 1.054 | 2.160 | 2.060 | <0.07 | 1.3 |
| May 2 | David Adit | 80%-1.7mm | 78.8 | 1.684 | 0.454 | 2.138 | 2.060 | <0.07 | 1.1 |
| May 2 | David Adit | 80%-1.7mm | 78.3 | 1.685 | 0.468 | 2.153 | 2.060 | <0.07 | 1.1 |
| May 2 | David Adit | 80%-75µm | 97.5 | 1.869 | 0.047 | 1.916 | 2.060 | 0.10 | 1.5 |
| May 2 | David Adit | 80%-75µm | 98.2 | 2.016 | 0.036 | 2.052 | 2.060 | 0.08 | 1.5 |
13.2.3 MCCLELLAND METALLURGICAL TESTING – 2ND HALF OF 2012
McClelland performed additional test work during the second half of 2012 which focused on the northern area of the NBP (Sierra Blanca, Savage Valley and Jolly Jane), and the Mayflower area (“Mayflower”). This test work included bottle roll testing of composite materials at particle sizes between 80% passing (P80) -75μm and -19mm, and column leach tests on each composite at a nominal P80 -19mm. Bottle roll tests were conducted in duplicate at nominal 19mm and 80% -6.3mm, -1.7mm, and -75μm feed sizes for each of the 12 composites. Tables 13-8 and 13-9 list the test results.
Corvus Gold Corp. Technical Report – North Bullfrog Project | | Page | 139 |
Table 13-8 Summary Metallurgical Results, Bottle Roll Tests, North Bullfrog Drill Core Composites,
Mayflower (MF)
MLI Test # | Composite | Feed
Size | Tail
Screen | Au Recovery, % | g Au/mt mineralization | Reagent Requirements
kg/mt mineralization |
| Extracted | Tail | Calculated Head | Head Grade | NaCN
Cons. | Lime
Added |
| CY-1 | MFC001 | 79%-19mm | 91%-19mm | 62.5 | 0.322 | 0.193 | 0.515 | 0.454 | N/A | 1.0 |
| CY-25 | MFC001 | 79%-19mm | 93%-19mm | 60.6 | 0.352 | 0.229 | 0.581 | 0.454 | 0.07 | 1.4 |
| CY-7 | MFC001 | 80%-6.3mm | | 74.9 | 0.365 | 0.122 | 0.487 | 0.454 | 0.09 | 1.1 |
| CY-31 | MFC001 | 80%-6.3mm | | 72.6 | 0.394 | 0.149 | 0.543 | 0.454 | <0.07 | 1.4 |
| CY-13 | MFC001 | 80%-1.7mm | | 81.7 | 0.407 | 0.091 | 0.498 | 0.454 | <0.07 | 1.9 |
| CY-37 | MFC001 | 80%-1.7mm | | 86.0 | 0.388 | 0.063 | 0.451 | 0.454 | 0.08 | 1.8 |
| CY-19 | MFC001 | 80%-75µm | | 96.1 | 0.489 | 0.020 | 0.509 | 0.454 | 0.21 | 2.1 |
| CY-43 | MFC001 | 80%-75µm | | 98.4 | 0.492 | 0.008 | 0.500 | 0.454 | 0.24 | 1.9 |
| CY-2 | MFC002 | 91%-19mm | 87%-19mm | 69.8 | 0.236 | 0.102 | 0.338 | 0.386 | <0.07 | 1.1 |
| CY-26 | MFC002 | 91%-19mm | 85%-19mm | 64.1 | 0.237 | 0.133 | 0.370 | 0.386 | <0.07 | 1.4 |
| CY-8 | MFC002 | 80%-6.3mm | | 82.4 | 0.313 | 0.067 | 0.380 | 0.386 | 0.18 | 1.2 |
| CY-32 | MFC002 | 80%-6.3mm | | 85.8 | 0.278 | 0.046 | 0.324 | 0.386 | <0.07 | 1.7 |
| CY-14 | MFC002 | 80%-1.7mm | | 93.4 | 0.366 | 0.026 | 0.392 | 0.386 | 0.07 | 1.8 |
| CY-38 | MFC002 | 80%-1.7mm | | 92.8 | 0.284 | 0.022 | 0.306 | 0.386 | 0.12 | 1.7 |
| CY-20 | MFC002 | 80%-75µm | | 97.5 | 0.383 | 0.010 | 0.393 | 0.386 | 0.22 | 2.0 |
| CY-44 | MFC002 | 80%-75µm | | 92.9 | 0.351 | 0.027 | 0.378 | 0.386 | 0.22 | 2.1 |
| CY-3R | MFC003 | 85%-19mm | 93%-19mm | 75.0 | 0.413 | 0.138 | 0.551 | 0.545 | 0.10 | 1.2 |
| CY-27 | MFC003 | 85%-19mm | 90%-19mm | 74.2 | 0.463 | 0.161 | 0.624 | 0.545 | <0.07 | 1.3 |
| CY-9 | MFC003 | 80%-6.3mm | | 82.1 | 0.407 | 0.089 | 0.496 | 0.545 | <0.07 | 1.2 |
| CY-33 | MFC003 | 80%-6.3mm | | 80.9 | 0.453 | 0.107 | 0.560 | 0.545 | 0.08 | 1.2 |
| CY-15 | MFC003 | 80%-1.7mm | | 90.5 | 0.457 | 0.048 | 0.505 | 0.545 | 0.10 | 1.7 |
| CY-39 | MFC003 | 80%-1.7mm | | 87.1 | 0.425 | 0.063 | 0.488 | 0.545 | <0.07 | 1.6 |
| CY-21 | MFC003 | 80%-75µm | | 92.9 | 0.445 | 0.034 | 0.479 | 0.545 | 0.14 | 1.9 |
| CY-45 | MFC003 | 80%-75µm | | 92.8 | 0.461 | 0.036 | 0.497 | 0.545 | 0.14 | 2.0 |
| CY-4 | MFC004 | 89%-19mm | 93%-19mm | 82.5 | 0.141 | 0.030 | 0.171 | 0.148 | 0.13 | 1.4 |
| CY-28 | MFC004 | 89%-19mm | 89%-19mm | 79.4 | 0.139 | 0.036 | 0.175 | 0.148 | <0.07 | 1.4 |
| CY-10 | MFC004 | 80%-6.3mm | | 85.6 | 0.143 | 0.024 | 0.167 | 0.148 | 0.10 | 1.4 |
| CY-34 | MFC004 | 80%-6.3mm | | 87.1 | 0.142 | 0.021 | 0.163 | 0.148 | <0.07 | 1.7 |
| CY-16 | MFC004 | 80%-1.7mm | | 91.1 | 0.153 | 0.015 | 0.168 | 0.148 | <0.07 | 1.8 |
| CY-40 | MFC004 | 80%-1.7mm | | 89.0 | 0.130 | 0.016 | 0.146 | 0.148 | <0.07 | 1.5 |
| CY-22 | MFC004 | 80%-75µm | | 92.2 | 0.154 | 0.013 | 0.167 | 0.148 | 0.36 | 2.2 |
| CY-46 | MFC004 | 80%-75µm | | 70.3 | 0.154 | 0.065 | 0.219 | 0.148 | 0.18 | 1.7 |
| CY-5 | MFC005 | 86%-19mm | 83%-19mm | 73.7 | 0.411 | 0.147 | 0.558 | 0.559 | <0.07 | 1.1 |
| CY-29 | MFC005 | 86%-19mm | 89%-19mm | 73.3 | 0.376 | 0.137 | 0.513 | 0.559 | 0.08 | 1.3 |
| CY-11 | MFC005 | 80%-6.3mm | | 81.3 | 0.371 | 0.086 | 0.457 | 0.559 | 0.08 | 1.3 |
| | | | | | | | | | | | |
Corvus Gold Corp. Technical Report – North Bullfrog Project | | Page | 140 |
MLI Test # | Composite | Feed
Size | Tail
Screen | Au Recovery, % |
g Au/mt mineralization | Reagent Requirements
kg/mt mineralization |
| Extracted | Tail | Calculated Head | Head Grade | NaCN
Cons. | Lime
Added |
| CY-35 | MFC005 | 80%-6.3mm | | 82.8 | 0.404 | 0.084 | 0.488 | 0.559 | <0.07 | 1.5 |
| CY-17 | MFC005 | 80%-1.7mm | | 86.7 | 0.455 | 0.070 | 0.525 | 0.559 | 0.13 | 1.8 |
| CY-41 | MFC005 | 80%-1.7mm | | 89.4 | 0.491 | 0.058 | 0.549 | 0.559 | <0.07 | 1.6 |
| CY-23 | MFC005 | 80%-75µm | | 92.0 | 0.473 | 0.041 | 0.514 | 0.559 | 0.18 | 1.8 |
| CY-47 | MFC005 | 80%-75µm | | 91.5 | 0.474 | 0.044 | 0.518 | 0.559 | 0.18 | 2.0 |
| CY-6 | MFC006 | 88%-19mm | 88%-19mm | 62.4 | 0.632 | 0.381 | 1.013 | 1.035 | 0.09 | 1.3 |
| CY-6R | MFC006 | 88%-19mm | 93%-19mm | 60.4 | 0.682 | 0.448 | 1.130 | 1.035 | <0.07 | 1.2 |
| CY-12 | MFC006 | 80%-6.3mm | | 75.0 | 0.805 | 0.268 | 1.0732 | 1.035 | 0.10 | 1.2 |
| CY-36 | MFC006 | 80%-6.3mm | | 74.2 | 0.835 | 0.290 | 1.125 | 1.035 | 0.10 | 1.6 |
| CY-18 | MFC006 | 80%-1.7mm | | 87.0 | 0.947 | 0.142 | 1.089 | 1.035 | <0.07 | 1.7 |
| CY-42 | MFC006 | 80%-1.7mm | | 87.4 | 0.863 | 0.124 | 0.987 | 1.035 | <0.07 | 1.6 |
| CY-24 | MFC006 | 80%-75µm | | 98.9 | 1.010 | 0.011 | 1.021 | 1.035 | <0.07 | 1.8 |
| CY-48 | MFC006 | 80%-75µm | | 98.6 | 0.969 | 0.014 | 0.983 | 1.035 | 0.14 | 1.8 |
Table 13-9 Summary Metallurgical Results, Bottle Roll Tests, North Bullfrog Drill Core Composites,
Savage Valley (SV).
MLI Test # | Composite | Feed
Size | Tail
Screen | Au Recovery, % |
g Au/mt mineralization | Reagent Requirements
kg/mt mineralization |
| Extracted | Tail | Calculated Head | Head Grade | NaCN
Cons. | Lime
Added |
| CY-49 | SVC001 | 78%-19mm | 89%-19mm | 81.1 | 0.613 | 0.143 | 0.756 | 0.754 | <0.07 | 0.8 |
| CY-73 | SVC001 | 78%-19mm | 80%-19mm | 81.0 | 0.587 | 0.138 | 0.725 | 0.754 | <0.07 | 0.9 |
| CY-55 | SVC001 | 80%-6.3mm | | 88.0 | 0.660 | 0.090 | 0.750 | 0.754 | 0.08 | 1.1 |
| CY-79 | SVC001 | 80%-6.3mm | | 87.8 | 0.650 | 0.090 | 0.740 | 0.754 | <0.07 | 1.3 |
| CY-61 | SVC001 | 80%-1.7mm | | 87.4 | 0.626 | 0.090 | 0.716 | 0.754 | 0.07 | 1.1 |
| CY-85 | SVC001 | 80%-1.7mm | | 87.3 | 0.690 | 0.100 | 0.790 | 0.754 | 0.16 | 1.0 |
| CY-67 | SVC001 | 80%-75µm | | 88.8 | 0.637 | 0.080 | 0.717 | 0.754 | 0.23 | 2.7 |
| CY-91 | SVC001 | 80%-75µm | | 90.5 | 0.661 | 0.069 | 0.730 | 0.754 | 0.15 | 1.2 |
| CY-50 | SVC002 | 77%-19mm | 80%-19mm | 73.4 | 0.494 | 0.179 | 0.673 | 0.664 | 0.08 | 0.7 |
| CY-74 | SVC002 | 77%-19mm | 87%-19mm | 78.3 | 0.494 | 0.137 | 0.631 | 0.664 | 0.16 | 0.7 |
| CY-56 | SVC002 | 80%-6.3mm | | 81.4 | 0.570 | 0.130 | 0.700 | 0.664 | <0.07 | 1.0 |
| CY-80 | SVC002 | 80%-6.3mm | | 83.3 | 0.550 | 0.110 | 0.660 | 0.664 | 0.08 | 0.9 |
| CY-62 | SVC002 | 80%-1.7mm | | 88.2 | 0.589 | 0.079 | 0.668 | 0.664 | 0.09 | 1.2 |
| CY-86 | SVC002 | 80%-1.7mm | | 88.4 | 0.610 | 0.080 | 0.690 | 0.664 | 0.14 | 1.0 |
| CY-68 | SVC002 | 80%-75µm | | 93.7 | 0.613 | 0.041 | 0.654 | 0.664 | 0.12 | 1.1 |
| CY-92 | SVC002 | 80%-75µm | | 93.0 | 0.602 | 0.045 | 0.647 | 0.664 | 0.16 | 1.2 |
| CY-51 | SVC003 | 79%-19mm | 89%-19mm | 87.0 | 0.107 | 0.016 | 0.123 | 0.115 | 0.11 | 1.0 |
| CY-75 | SVC003 | 79%-19mm | 92%-19mm | 88.9 | 0.088 | 0.110 | 0.099 | 0.115 | <0.07 | 1.3 |
| CY-57 | SVC003 | 80%-6.3mm | | 68.8 | 0.11 | 0.05 | 0.16 | 0.115 | <0.07 | 1.4 |
| CY-81 | SVC003 | 80%-6.3mm | | 68.8 | 0.11 | 0.05 | 0.16 | 0.115 | <0.07 | 1.2 |
| CY-63 | SVC003 | 80%-1.7mm | | 91.3 | 0.095 | 0.009 | 0.104 | 0.115 | 0.17 | 1.3 |
| CY-87 | SVC003 | 80%-1.7mm | | 93.4 | 0.114 | 0.008 | 0.122 | 0.115 | <0.07 | 1.2 |
| CY-69 | SVC003 | 80%-75µm | | 95.9 | 0.141 | 0.006 | 0.147 | 0.115 | 0.13 | 1.7 |
| CY-93 | SVC003 | 80%-75µm | | 95.1 | 0.116 | 0.006 | 0.122 | 0.115 | 0.22 | 2.4 |
Corvus Gold Corp. Technical Report – North Bullfrog Project | | Page | 141 |
MLI Test # | Composite | Feed
Size | Tail
Screen | Au Recovery, % | g Au/mt mineralization | Reagent Requirements
kg/mt mineralization |
| Extracted | Tail | Calculated Head | Head Grade | NaCN
Cons. | Lime
Added |
| CY-52 | SVC004 | 85%-19mm | 76%-19mm | 54.4 | 0.118 | 0.099 | 0.217 | 0.207 | <0.07 | 0.5 |
| CY-76 | SVC004 | 85%-19mm | 83%-19mm | 55.9 | 0.118 | 0.093 | 0.211 | 0.207 | <0.07 | 0.6 |
| CY-58 | SVC004 | 80%-6.3mm | | 70.0 | 0.14 | 0.06 | 0.20 | 0.207 | <0.07 | 0.9 |
| CY-82 | SVC004 | 80%-6.3mm | | 58.3 | 0.14 | 0.10 | 0.24 | 0.207 | 0.10 | 0.8 |
| CY-64 | SVC004 | 80%-1.7mm | | 75.2 | 0.152 | 0.050 | 0.202 | 0.207 | 0.21 | 1.1 |
| CY-88 | SVC004 | 80%-1.7mm | | 77.7 | 0.174 | 0.050 | 0.224 | 0.207 | 0.08 | 0.8 |
| CY-70 | SVC004 | 80%-75µm | | 79.1 | 0.159 | 0.042 | 0.201 | 0.207 | 0.23 | 1.2 |
| CY-53 | SVC005 | 84%-19mm | 85%-19mm | 78.5 | 0.318 | 0.087 | 0.405 | 0.365 | <0.07 | 1.0 |
| CY-77 | SVC005 | 84%-19mm | 87%-19mm | 80.5 | 0.264 | 0.064 | 0.328 | 0.365 | 0.11 | 0.9 |
| CY-59 | SVC005 | 80%-6.3mm | | 80.6 | 0.29 | 0.07 | 0.36 | 0.365 | 0.15 | 1.0 |
| CY-83 | SVC005 | 80%-6.3mm | | 74.4 | 0.29 | 0.10 | 0.39 | 0.365 | <0.07 | 1.0 |
| CY-65 | SVC005 | 80%-1.7mm | | 83.5 | 0.293 | 0.058 | 0.351 | 0.365 | 0.23 | 1.2 |
| CY-89 | SVC005 | 80%-1.7mm | | 84.1 | 0.291 | 0.055 | 0.346 | 0.365 | <0.07 | 1.1 |
| CY-71 | SVC005 | 80%-75µm | | 85.6 | 0.303 | 0.051 | 0.354 | 0.365 | <0.07 | 1.4 |
| CY-95 | SVC005 | 80%-75µm | | 87.7 | 0.121 | 0.049 | 0.399 | 0.365 | 0.16 | 1.1 |
| CY-54 | SVC006 | 86%-19mm | 89%-19mm | 53.6 | 0.105 | 0.091 | 0.196 | 0.185 | <0.07 | 0.6 |
| CY-78 | SVC006 | 86%-19mm | | 48.4 | 0.141 | 0.099 | 0.192 | 0.185 | 0.07 | 0.5 |
| CY-60 | SVC006 | 80%-6.3mm | | 60.0 | 0.12 | 0.08 | 0.20 | 0.185 | <0.07 | 1.0 |
| CY-84 | SVC006 | 80%-6.3mm | | 66.7 | 0.12 | 0.06 | 0.18 | 0.185 | <0.07 | 1.0 |
| CY-66 | SVC006 | 80%-1.7mm | | 77.2 | 0.149 | 0.044 | 0.193 | 0.185 | 0.17 | 1.1 |
| CY-90 | SVC006 | 80%-1.7mm | | 75.4 | 0.129 | 0.042 | 0.171 | 0.185 | <0.07 | 0.9 |
| CY-72 | SVC006 | 80%-75µm | | 82.5 | 0.141 | 0.030 | 0.171 | 0.185 | 0.22 | 1.2 |
| CY-96 | SVC006 | 80%-75µm | | 80.7 | 0.269 | 0.029 | 0.150 | 0.185 | 0.10 | 1.6 |
Duplicate column leach test were performed for Mayflower and Savage Valley composites at a nominal 19mm feed size. The results of the Mayflower column leach tests are shown in Tables 13-10 and 13-11 for gold and silver, respectively. The column leach test results for the Savage Valley column leach tests are listed in Tables 13-12 and 13-13, for gold and silver, respectively.
Table 13-10 Summary Metallurgical Results, Gold Recovery from Column Percolation Leach Tests, Mayflower Drill Core Composites (kg-Kilograms, mt – Metric Tonnes).
Test
No. | Sample
ID. | Feed
Size | Leach/Rinse
Time,
Days | Au Recovery, % |
g Au/mt mineralization | Reagents Required
kg/mt mineralization |
| Extracted | Tail
Screen | Calculated Head | Avg.
Head | NaCn
Cons. | Lime
Added |
| P-1 | MFC001 (Init.) | 79%-19mm | 155 | 89.3 | 0.449 | 0.054 | 0.503 | 0.488 | 1.62 | 1.2 |
| P-2 | MFC001 (Dup.) | 79%-19mm | 155 | 87.8 | 0.411 | 0.057 | 0.468 | 0.488 | 1.44 | 1.2 |
| P-3 | MFC002 (Init.) | 91%-19mm | 94 | 90.8 | 0.278 | 0.028 | 0.306 | 0.356 | 1.12 | 1.3 |
| P-4 | MFC002 (Dup.) | 91%-19mm | 94 | 88.6 | 0.280 | 0.036 | 0.316 | 0.356 | 1.07 | 1.3 |
| P-5 | MFC003 (Init.) | 85%-19mm | 156 | 87.3 | 0.473 | 0.069 | 0.542 | 0.534 | 2.05 | 1.2 |
| P-6 | MFC003 (Dup.) | 85%-19mm | 156 | 87.1 | 0.464 | 0.069 | 0.533 | 0.534 | 2.16 | 1.2 |
| P-7 | MFC004 (Init.) | 89%-19mm | 90 | 89.6 | 0.146 | 0.017 | 0.163 | 0.160 | 0.50 | 1.4 |
| P-8 | MFC004 (Dup.) | 89%-19mm | 90 | 88.4 | 0.129 | 0.017 | 0.146 | 0.160 | 0.45 | 1.4 |
| P-9 | MFC005 (Init.) | 86%-19mm | 94 | 85.7 | 0.406 | 0.068 | 0.474 | 0.522 | 0.96 | 1.3 |
| P-10 | MFC005 (Dup.) | 86%-19mm | 94 | 85.7 | 0.396 | 0.066 | 0.462 | 0.522 | 0.91 | 1.3 |
Corvus Gold Corp. Technical Report – North Bullfrog Project | | Page | 142 |
Table 13-11 Summary Metallurgical Results, Silver Recovery from Column Percolation Leach Tests, Mayflower Drill Core Composites (kg-Kilograms, mt – Metric Tonnes)
Test
No. | Sample
ID | Feed
Size | Leach/Rinse
Time, Days | Ag
Recovery, % |
g Ag/mt mineralization | Reagents Required
kg/mt mineralization |
| Extracted | Tail
Screen | Calculated.
Head | Avgerage
Head | NaCN
Cons. | Lime
Added |
| P-1 | MFC001 (Init.) | 79%-19mm | 155 | na | 0.220 | <1 | <1.220 | 0.488 | 1.62 | 1.2 |
| P-2 | MFC001 (Dup.) | 79%-19mm | 155 | na | 0.179 | <1 | <1.179 | 0.488 | 1.44 | 1.2 |
| P-3 | MFC002 (Init.) | 91%-19mm | 94 | 12.4 | 0.141 | 1 | 1.141 | 0.356 | 1.12 | 1.3 |
| P-4 | MFC002 (Dup.) | 91%-19mm | 94 | na | 0.107 | <1 | <1.107 | 0.356 | 1.07 | 1.3 |
| P-5 | MFC003 (Init.) | 85%-19mm | 156 | 9.0 | 0.099 | 1 | 1.099 | 0.534 | 2.05 | 1.2 |
| P-6 | MFC003 (Dup.) | 85%-19mm | 156 | na | 0.116 | <1 | <1.116 | 0.534 | 2.16 | 1.2 |
| P-7 | MFC004 (Init.) | 89%-19mm | 90 | na | 0.050 | <1 | <1.050 | 0.160 | 0.50 | 1.4 |
| P-8 | MFC004 (Dup.) | 89%-19mm | 90 | na | 0.040 | <1 | <1.040 | 0.160 | 0.45 | 1.4 |
| P-9 | MFC005 (Init.) | 86%-19mm | 94 | 10.8 | 0.121 | 1 | 1.121 | 0.522 | 0.96 | 1.3 |
| P-10 | MFC005 (Dup.) | 86%-19mm | 94 | na | 0.104 | <1 | <1.104 | 0.522 | 0.91 | 1.3 |
Table 13-12 Summary Metallurgical Results, Gold Recovery from Column Percolation Leach Tests, Savage Valley Drill Core Composites (kg-Kilograms; mt-Metric Tonnes).
Test
No. | Sample
I.D. | Feed Size | Leach
Time
Days | Au
Recovery
% |
g Au/mt mineralization | Reagents Required
kg/mt mineralization |
| Extracted | Tail
Screen | Calculated.
Head | Avg.
Head | NaCN Cons. | Lime Added |
| P-11 | SVC001 | 78%-19mm | 76 | 86.3 | 0.659 | 0.105 | 0.764 | 0.748 | 0.76 | 0.8 |
| P-12 | SVC001 | 78%-19mm | 78 | 87.4 | 0.627 | 0.090 | 0.717 | 0.748 | 0.88 | 0.8 |
| P-13 | SVC002 | 77%-19mm | 88 | 87.2 | 0.553 | 0.081 | 0.634 | 0.665 | 0.76 | 0.8 |
| P-14 | SVC002 | 77%-19mm | 88 | 87.5 | 0.582 | 0.083 | 0.665 | 0.665 | 0.70 | 0.8 |
| P-15 | SVC003 | 79%-19mm | 63 | 92.2 | 0.107 | 0.009 | 0.116 | 0.122 | 0.31 | 1.1 |
| P-16 | SVC003 | 79%-19mm | 63 | 91.7 | 0.100 | 0.009 | 0.109 | 0.122 | 0.32 | 1.1 |
| P-17 | SVC004 | 85%-19mm | 89 | 71.1 | 0.150 | 0.061 | 0.211 | 0.211 | 0.68 | 0.7 |
| P-18 | SVC004 | 85%-19mm | 89 | 68.7 | 0.147 | 0.067 | 0.214 | 0.211 | 0.56 | 0.7 |
| P-19 | SVC005 | 83%-19mm | 75 | 81.1 | 0.292 | 0.068 | 0.360 | 0.347 | 0.66 | 1.0 |
| P-20 | SVC005 | 83%-19mm | 74 | 82.1 | 0.289 | 0.063 | 0.352 | 0.347 | 0.66 | 1.0 |
| P-21 | SVC006 | 86%-19mm | 136 | 72.4 | 0.131 | 0.050 | 0.181 | 0.184 | 1.30 | 0.7 |
| P-22 | SVC006 | 86%-19mm | 136 | 72.3 | 0.133 | 0.051 | 0.184 | 0.184 | 1.20 | 0.7 |
Corvus Gold Corp. Technical Report – North Bullfrog Project | | Page | 143 |
Table 13-13 Summary Metallurgical Results, Silver Recovery from Column Percolation Leach Tests, Savage Valley Drill Core Composites (kg-Kilograms; mt-Metric Tonnes)
Test
No. | Sample
I.D. | Feed
Size | Leach
Time
Days | Ag
Recovery
% | g Ag/mt mineralization | Reagents Required
kg/mt mineralization |
| Extracted | Tail
Screen | Calculated
Head | Avgerage
Head | NaCN
Cons. | Lime
Added |
| P-11 | SVC001 | 78%-19mm | 76 | 9.3 | 0.102 | 1 | 1.102 | na | 0.76 | 0.8 |
| P-12 | SVC001 | 78%-19mm | 78 | na | 0.135 | <1 | <1.135 | na | 0.88 | 0.8 |
| P-13 | SVC002 | 77%-19mm | 88 | 16.1 | 0.192 | 1 | 1.192 | na | 0.76 | 0.8 |
| P-14 | SVC002 | 77%-19mm | 88 | 9.9 | 0.110 | 1 | 1.110 | na | 0.70 | 0.8 |
| P-15 | SVC003 | 79%-19mm | 63 | na | 0.068 | <1 | <1.068 | na | 0.31 | 1.1 |
| P-16 | SVC003 | 79%-19mm | 63 | na | 0.081 | <1 | <1.081 | na | 0.32 | 1.1 |
| P-17 | SVC004 | 85%-19mm | 89 | na | 0.041 | <1 | <1.041 | na | 0.68 | 0.7 |
| P-18 | SVC004 | 85%-19mm | 89 | na | 0.057 | <1 | <1.057 | na | 0.56 | 0.7 |
| P-19 | SVC005 | 83%-19mm | 75 | na | 0.122 | <1 | <1.122 | na | 0.66 | 1.0 |
| P-20 | SVC005 | 83%-19mm | 74 | na | 0.128 | <1 | <1.128 | na | 0.66 | 1.0 |
| P-21 | SVC006 | 86%-19mm | 136 | na | 0.052 | <1 | <1.052 | na | 1.30 | 0.7 |
| P-22 | SVC006 | 86%-19mm | 136 | na | 0.061 | <1 | <1.061 | na | 1.20 | 0.7 |
McClelland (2013) includes results for 96 bottle roll tests conducted on drill core composites from the Sierra Blanca and Jolly Jane areas. A total of 81 drill core intervals were received by McClelland from the Sierra Blanca and Jolly Jane zones for metallurgical testing. The 81 intervals were combined to make seven Sierra Blanca and five Jolly Jane composites for testing.
Bottle roll tests were conducted in duplicate at nominal 80% -19mm and 80% -6.3mm, -1.7mm, and -75μm feed sizes for each of the 12 composites. Tables 13-14 and 13-15 list the test results.
Table 13-14 Summary Metallurgical Results, Bottle Roll Tests, North Bullfrog Drill Composites, Sierra Blanca
| Composite | Feed
Size | Tail
Screen | Au Recovery, % | g Au/mt mineralization | Reagent Requirements
kg/mt mineralization |
| Extracted | Tail | Calculated Head | Head Grade | NaCN
Cons. | Lime
Added |
| SB01 cy-137 | 80%-19mm | 81%-19mm | 59.7 | 0.092 | 0.062 | 0.154 | 0.131 | <0.07 | 0.7 |
| SB01 cy-165 | 80%-19mm | 86%-19mm | 66.4 | 0.093 | 0.047 | 0.140 | 0.131 | 0.09 | 0.7 |
| SB01 cy-144 | 80%-6.3mm | | 69.8 | 0.088 | 0.038 | 0.126 | 0.131 | 0.10 | 0.8 |
| SB01 cy-172 | 80%-6.3mm | | 68.2 | 0.088 | 0.041 | 0.129 | 0.131 | <0.07 | 0.8 |
| SB01 cy-151 | 80%-1.7mm | | 82.8 | 0.135 | 0.028 | 0.163 | 0.131 | <0.07 | 0.9 |
Corvus Gold Corp. Technical Report – North Bullfrog Project | | Page | 144 |
| Composite | Feed
Size | Tail
Screen | Au Recovery, % |
g Au/mt mineralization | Reagent Requirements
kg/mt mineralization |
| Extracted | Tail | Calculated Head | Head Grade | NaCN
Cons. | Lime
Added |
| SB01 cy-179 | 80%-1.7mm | | 80.1 | 0.109 | 0.027 | 0.136 | 0.131 | <0.07 | 1.1 |
| SB01 cy-158 | 80%-75µm | | 88.1 | 0.156 | 0.021 | 0.177 | 0.131 | 0.13 | 1.1 |
| SB01 cy-186 | 80%-75µm | | 87.9 | 0.138 | 0.019 | 0.157 | 0.131 | 0.08 | 1.0 |
| SB02 cy-138 | 80%-19mm | 90%-19mm | 80.3 | 0.122 | 0.030 | 0.152 | 0.139 | <0.07 | 0.9 |
| SB02 cy-166 | 80%-19mm | 85%-19mm | 75.2 | 0.106 | 0.035 | 0.141 | 0.139 | <0.07 | 0.9 |
| SB02 cy-145 | 80%-6.3mm | | 86.0 | 0.123 | 0.020 | 0.143 | 0.139 | 0.13 | 1.2 |
| SB02 cy-173 | 80%-6.3mm | | 83.5 | 0.106 | 0.021 | 0.127 | 0.139 | <0.07 | 1.4 |
| SB02 cy-152 | 80%-1.7mm | | 88.4 | 0.130 | 0.017 | 0.147 | 0.139 | <0.07 | 1.2 |
| SB02 cy-180 | 80%-1.7mm | | 89.9 | 0.134 | 0.015 | 0.149 | 0.139 | <0.07 | 1.3 |
| SB02 cy-159 | 80%-75µm | | 92.9 | 0.144 | 0.011 | 0.155 | 0.139 | <0.07 | 1.5 |
| SB02 cy-187 | 80%-75µm | | 94.5 | 0.206 | 0.012 | 0.218 | 0.139 | 0.10 | 1.2 |
| SB03 cy-139 | 80%-19mm | 89%-19mm | 58.7 | 0.158 | 0.111 | 0.269 | 0.228 | <0.07 | 0.7 |
| SB03 cy-167 | 80%-19mm | 88%-19mm | 60.5 | 0.170 | 0.111 | 0.281 | 0.228 | <0.07 | 0.7 |
| SB03 cy-146 | 80%-6.3mm | | 59.4 | 0.142 | 0.097 | 0.239 | 0.228 | 0.09 | 1.0 |
| SB03 cy-174 | 80%-6.3mm | | 57.4 | 0.140 | 0.104 | 0.244 | 0.228 | <0.07 | 0.8 |
| SB03 cy-153 | 80%-1.7mm | | 66.1 | 0.154 | 0.079 | 0.233 | 0.228 | <0.07 | 1.1 |
| SB03 cy-181 | 80%-1.7mm | | 66.4 | 0.158 | 0.080 | 0.238 | 0.228 | <0.07 | 1.0 |
| SB03 cy-160 | 80%-75µm | | 71.1 | 0.180 | 0.073 | 0.253 | 0.228 | <0.07 | 1.3 |
| SB03 cy-188 | 80%-75µm | | 72.0 | 0.198 | 0.077 | 0.275 | 0.228 | 0.07 | 1.0 |
| SB04 cy-140 | 80%-19mm | 93%-19mm | 82.0 | 0.424 | 0.093 | 0.517 | 0.482 | <0.07 | 0.9 |
| SB04 cy-168 | 80%-19mm | 93%-19mm | 80.9 | 0.446 | 0.105 | 0.551 | 0.482 | <0.07 | 0.9 |
| 04 cy-147 | 80%-6.3mm | | 86.4 | 0.413 | 0.065 | 0.478 | 0.482 | <0.07 | 1.1 |
| SB04 cy-175 | 80%-6.3mm | | 86.5 | 0.398 | 0.062 | 0.460 | 0.482 | <0.07 | 1.0 |
| SB04 cy-154 | 80%-1.7mm | | 89.6 | 0.433 | 0.050 | 0.483 | 0.482 | <0.07 | 1.3 |
| B04 cy-182 | 80%-1.7mm | | 89.4 | 0.445 | 0.053 | 0.498 | 0.482 | <0.07 | 1.4 |
| SB04 cy-161 | 80%-75µm | | 93.2 | 0.643 | 0.047 | 0.690 | 0.482 | <0.07 | 1.4 |
| SB04 cy-189 | 80%-75µm | | 92.3 | 0.503 | 0.042 | 0.545 | 0.482 | <0.07 | 1.4 |
| SB05 cy-141 | 80%-19mm | 93%-19mm | 79.5 | 0.124 | 0.032 | 0.156 | 0.127 | <0.07 | 0.9 |
| SB05 cy-169 | 80%-19mm | 84%-19mm | 78.9 | 0.120 | 0.032 | 0.152 | 0.127 | <0.07 | 0.9 |
| SB05 cy-148 | 80%-6.3mm | | 75.6 | 0.090 | 0.029 | 0.119 | 0.127 | <0.07 | 1.1 |
| SB05 cy-176 | 80%-6.3mm | | 73.6 | 0.078 | 0.028 | 0.106 | 0.127 | <0.07 | 1.0 |
| SB05 cy-155 | 80%-1.7mm | | 82.7 | 0.124 | 0.026 | 0.150 | 0.127 | <0.07 | 1.2 |
| SB05 cy-183 | 80%-1.7mm | | 79.2 | 0.095 | 0.025 | 0.120 | 0.127 | <0.07 | 1.4 |
| SB05 cy-162 | 80%-75µm | | 85.1 | 0.120 | 0.021 | 0.141 | 0.127 | <0.07 | 1.2 |
| SB05 cy-190 | 80%-75µm | | 86.6 | 0.116 | 0.018 | 0.134 | 0.127 | 0.06 | 1.3 |
| SB06 cy-142 | 80%-19mm | 90%-19mm | 89.8 | 0.326 | 0.037 | 0.363 | 0.335 | <0.07 | 1.0 |
| SB06 cy-170 | 80%-19mm | 94%-19mm | 90.3 | 0.393 | 0.042 | 0.435 | 0.335 | <0.07 | 1.0 |
| SB06 cy-149 | 80%-6.3mm | | 90.6 | 0.310 | 0.032 | 0.342 | 0.335 | <0.07 | 1.0 |
| SB06 cy-177 | 80%-6.3mm | | 90.7 | 0.311 | 0.032 | 0.343 | 0.335 | <0.07 | 1.0 |
Corvus Gold Corp. Technical Report – North Bullfrog Project | | Page | 145 |
| Composite | Feed
Size | Tail
Screen | Au Recovery, % |
g Au/mt mineralization | Reagent Requirements
kg/mt mineralization |
| Extracted | Tail | Calculated Head | Head Grade | NaCN
Cons. | Lime
Added |
| SB06 cy-156 | 80%-1.7mm | | 93.6 | 0.349 | 0.024 | 0.373 | 0.335 | <0.07 | 1.3 |
| SB06 cy-184 | 80%-1.7mm | | 92.5 | 0.333 | 0.027 | 0.360 | 0.335 | <0.07 | 1.3 |
| SB06 cy-163 | 80%-75µm | | 94.9 | 0.353 | 0.019 | 0.372 | 0.335 | 0.12 | 1.2 |
| SB06 cy-191 | 80%-75µm | | 93.4 | 0.284 | 0.020 | 0.304 | 0.335 | 0.24 | 1.2 |
| SB07 cy-143 | 80%-19mm | 92%-19mm | 82.8 | 0.125 | 0.026 | 0.151 | 0.117 | <0.07 | 1.1 |
| SB07 cy-171 | 80%-19mm | 89%-19mm | 80.4 | 0.090 | 0.022 | 0.112 | 0.117 | <0.07 | 1.0 |
| SB07 cy-150 | 80%-6.3mm | | 85.0 | 0.108 | 0.019 | 0.127 | 0.117 | <0.07 | 1.1 |
| SB07 cy-178 | 80%-6.3mm | | 83.3 | 0.090 | 0.018 | 0.108 | 0.117 | <0.07 | 1.0 |
| SB07 cy-157 | 80%-1.7mm | | 86.0 | 0.098 | 0.016 | 0.114 | 0.117 | <0.07 | 1.3 |
| SB07 cy-185 | 80%-1.7mm | | 87.9 | 0.109 | 0.015 | 0.124 | 0.117 | <0.07 | 1.3 |
| SB07 cy-164 | 80%-75µm | | 90.9 | 0.140 | 0.014 | 0.154 | 0.117 | 0.11 | 1.6 |
| SB07 cy-192 | 80%-75µm | | 89.1 | 0.114 | 0.014 | 0.128 | 0.117 | 0.09 | 1.5 |
Corvus Gold Corp. Technical Report – North Bullfrog Project | | Page | 146 |
Table 13-15 Summary Metallurgical Results, Bottle Roll Tests, North Bullfrog Drill Core Composites, Jolly Jane
| Composite |
Feed Size | Au Recovery, % |
g Au/mt mineralization | Reagent Requirements
kg/mt mineralization |
| Target | Head
Screen | Tail
Screen | Exttracted | Tail | Calculated Head | Head Grade | NaCN
Cons. | Lime
Added |
| JJC001 cy-97 | 80%-19mm | 88%-19mm | 87%-19mm | 84.4 | 0.135 | 0.025 | 0.160 | 0.157 | <0.07 | 0.9 |
| JJC001 cy-117 | 80%-19mm | 88%-19mm | 90%-19mm | 87.4 | 0.152 | 0.022 | 0.174 | 0.157 | <0.07 | 0.8 |
| JJC001 cy-102 | 80%-6.3mm | | | 82.7 | 0.129 | 0.027 | 0.156 | 0.157 | <0.07 | 0.8 |
| JJC001 cy-122 | 80%-6.3mm | | | 88.1 | 0.148 | 0.020 | 0.168 | 0.157 | 0.11 | 0.9 |
| JJC001 cy-107 | 80%-1.7mm | | | 83.4 | 0.136 | 0.027 | 0.163 | 0.157 | <0.07 | 1.4 |
| JJC001 cy-127 | 80%-1.7mm | | | 87.7 | 0.142 | 0.020 | 0.162 | 0.157 | 0.12 | 1.3 |
| JJC001 cy-112 | 80%-75µm | | | 88.8 | 0.143 | 0.018 | 0.161 | 0.157 | 0.22 | 1.2 |
| JJC001 cy-132 | 80%-75µm | | | 89.6 | 0.163 | 0.019 | 0.182 | 0.157 | 0.10 | 1.2 |
| JJC002 cy-98 | 80%-19mm | 82%-19mm | 80%-19mm | 49.2 | 0.227 | 0.234 | 0.461 | 0.433 | <0.07 | 0.6 |
| JJC002 cy-118 | 80%-19mm | 82%-19mm | 74%-19mm | 44.2 | 0.210 | 0.265 | 0.475 | 0.433 | <0.07 | 0.7 |
| JJC002 cy-103 | 80%-6.3mm | | | 64.3 | 0.323 | 0.179 | 0.502 | 0.433 | <0.07 | 0.7 |
| JJC002 cy-128 | 80%-6.3mm | | | 60.0 | 0.285 | 0.190 | 0.475 | 0.433 | <0.07 | 0.9 |
| JJC002 cy-108 | 80%-1.7mm | | | 72.8 | 0.313 | 0.117 | 0.430 | 0.433 | 0.17 | 0.8 |
| JJC002 cy-128 | 80%-1.7mm | | | 71.8 | 0.306 | 0.120 | 0.426 | 0.433 | <0.07 | 1.0 |
| JJC002 cy-113 | 80%-75µm | | | 82.2 | 0.338 | 0.073 | 0.411 | 0.433 | <0.07 | 1.3 |
| JJC002 cy-133 | 80%-75µm | | | 80.0 | 0.320 | 0.080 | 0.400 | 0.433 | 0.07 | 1.3 |
| JJC003 cy-99 | 80%-19mm | 85%-19mm | 88%-19mm | 68.9 | 0.308 | 0.139 | 0.447 | 0.387 | <0.07 | 0.6 |
| JJC003 cy-119 | 80%-19mm | 85%-19mm | 90%-19mm | 71.2 | 0.312 | 0.126 | 0.438 | 0.387 | <0.07 | 0.8 |
| JJC003 cy-104 | 80%-6.3mm | | | 78.0 | 0.337 | 0.095 | 0.432 | 0.387 | <0.07 | 0.8 |
| JJC003 cy-124 | 80%-6.3mm | | | 74.4 | 0.320 | 0.110 | 0.430 | 0.387 | <0.07 | 1.0 |
| JJC003 cy-109 | 80%-1.7mm | | | 81.6 | 0.305 | 0.069 | 0.376 | 0.387 | 0.22 | 1.0 |
| JJC003 cy-129 | 80%-1.7mm | | | 80.2 | 0.288 | 0.071 | 0.359 | 0.387 | 0.16 | 1.1 |
| JJC003 cy-114 | 80%-75µm | | | 85.6 | 0.320 | 0.054 | 0.374 | 0.387 | 0.18 | 1.2 |
| JJC003 cy-134 | 80%-75µm | | | 87.6 | 0.331 | 0.047 | 0.378 | 0.387 | <0.07 | 1.4 |
| JJC004 cy-100 | 80%-19mm | 92%-19mm | 90%-19mm | 68.2 | 0.208 | 0.097 | 0.305 | 0.275 | <0.07 | 0.7 |
| JJC004 cy-120 | 80%-19mm | 92%-19mm | 85%-19mm | 65.5 | 0.205 | 0.108 | 0.313 | 0.275 | <0.07 | 0.8 |
| JJC004 cy-105 | 80%-6.3mm | | | 74.3 | 0.197 | 0.068 | 0.265 | 0.275 | <0.07 | 0.8 |
| JJC004 cy-125 | 80%-6.3mm | | | 76.2 | 0.234 | 0.073 | 0.307 | 0.275 | <0.07 | 0.9 |
| JJC004 cy-110 | 80%-1.7mm | | | 77.8 | 0.200 | 0.057 | 0.257 | 0.275 | 0.09 | 1.6 |
| JJC004 cy-130 | 80%-1.7mm | —— | —— | 77.6 | 0.215 | 0.062 | 0.277 | 0.275 | <0.07 | 1.2 |
| JJC004 cy-115 | 80%-75µm | —— | —— | 89.5 | 0.289 | 0.034 | 0.323 | 0.275 | 0.09 | 1.4 |
| JJC004 cy-135 | 80%-75µm | —— | —— | 86.9 | 0.213 | 0.032 | 0.245 | 0.275 | 0.11 | 1.6 |
| JJC005 cy-101 | 80%-19mm | 86%-19mm | 90%-19mm | 74.7 | 0.331 | 0.112 | 0.443 | 0.388 | <0.07 | 0.7 |
| JJC005 cy-121 | 80%-19mm | 86%-19mm | 90%-19mm | 70.9 | 0.297 | 0.122 | 0.419 | 0.388 | <0.07 | 1.0 |
| JJC005 cy-106 | 80%-6.3mm | —— | —— | 76.7 | 0.320 | 0.097 | 0.417 | 0.388 | <0.07 | 0.9 |
| JJC005 cy-126 | 80%-6.3mm | —— | —— | 76.3 | 0.303 | 0.094 | 0.397 | 0.388 | <0.07 | 1.0 |
| JJC005 cy-111 | 80%-1.7mm | —— | —— | 81.3 | 0.314 | 0.072 | 0.386 | 0.388 | <0.07 | 1.3 |
| JJC005 cy-131 | 80%-1.7mm | —— | —— | 81.3 | 0.313 | 0.072 | 0.385 | 0.388 | 0.08 | 1.4 |
| JJC005 cy-116 | 80%-75µm | —— | —— | 84.7 | 0.322 | 0.058 | 0.380 | 0.388 | 0.09 | 1.4 |
| JJC005 cy-136 | 80%-75µm | —— | —— | 83.8 | 0.301 | 0.058 | 0.359 | 0.388 | 0.15 | 1.6 |
Duplicate column leach tests were initiated for each of these composites at a nominal 80% -19mm feed size. The recoveries at the days leached shown for the Jolly Jane composites are shown in Table 13-16 and 13-17 for gold and silver, respectively. The final recoveries at the days leached shown for the Sierra Blanca composites are shown in Table 13-18 and 13-19 for gold and silver, respectively. The final recoveries are based on the calculated head which is the tail screen assay plus the gold recovered in solution in the test procedure
Corvus Gold Corp. Technical Report – North Bullfrog Project | | Page | 147 |
Table 13-16 Summary Metallurgical Results, Gold Recovery from Column Percolation Leach Tests, Jolly Jane Drill Core Composites (82 to 92% -19mm).
Sample
ID | Feed
Size
(P80) | Leach
Time
Days | Au
Recovery
% |
g Au/mt mineralization | Reagents Required kg/mt mineralization |
| Extracted | Tail
Screen | Calculated
Head | Avearage
Head | NaCn
Cons. | Lime
Added |
| JJC001 (p-23) | 88%-19mm | 71 | 83.6 | 0.127 | 0.025 | 0.152 | 0.157 | 0.54 | 0.9 |
| JJC001 (p-24) | 88%-19mm | 70 | 85.9 | 0.128 | 0.021 | 0.149 | 0.157 | 0.51 | 0.9 |
| JJC002 (p-25) | 82%-19mm | 161 | 64.3 | 0.272 | 0.151 | 0.423 | 0.433 | 1.06 | 0.7 |
| JJC002 (p-26) | 82%-19mm | 160 | 62.3 | 0.273 | 0.165 | 0.438 | 0.433 | 1.06 | 0.7 |
| JJC003 (p-27) | 85%-19mm | 127 | 76.5 | 0.299 | 0.092 | 0.391 | 0.387 | 0.92 | 0.8 |
| JJC003 (p-28) | 85%-19mm | 127 | 76.6 | 0.301 | 0.092 | 0.393 | 0.387 | 0.94 | 0.8 |
| JJC004 (p-29) | 92%-19mm | 89 | 75.6 | 0.204 | 0.066 | 0.270 | 0.275 | 0.65 | 0.8 |
| JJC004 (p-30) | 92%-19mm | 89 | 74.3 | 0.194 | 0.067 | 0.261 | 0.275 | 0.69 | 0.8 |
| JJC005 (p-31) | 86%-19mm | 89 | 73.8 | 0.287 | 0.102 | 0.389 | 0.388 | 0.74 | 0.9 |
| JJC005 (p-32) | 86%-19mm | 89 | 75.2 | 0.282 | 0.093 | 0.375 | 0.388 | 0.70 | 0.9 |
Table 13-17 Summary Metallurgical Results, Silver Recovery from Column Percolation Leach Tests, Jolly Jane Drill Core Composites (82 to 92% -19mm)
Sample
ID | Feed
Size
(P80) | Leach
Time,
days | Ag
Rec.
% |
g Ag/mt mineralization | Reagents Required
kg/mt mineralization |
| Extracted | Tail
Screen | Calculated
Head | Avearage
Head | NaCn
Cons. | Lime
Added |
| JJC001 (p-23) | 88%-19mm | 71 | na | 0.043 | <1 | <01.043 | na | 0.54 | 0.9 |
| JJC001 (p-24) | 88%-19mm | 70 | na | 0.034 | <1 | <1.034 | na | 0.51 | 0.9 |
| JJC002 (p-25) | 82%-19mm | 161 | 8.3 | 0.091 | 1 | 1.091 | na | 1.06 | 0.7 |
| JJC002 (p-26) | 82%-19mm | 160 | 9.7 | 0.108 | 1 | 1.108 | na | 1.06 | 0.7 |
| JJC003 (p-27) | 85%-19mm | 127 | na | 0.047 | <1 | <1.047 | na | 0.92 | 0.8 |
| JJC003 (p-28) | 85%-19mm | 127 | 4.5 | 0.047 | 1 | 1.047 | na | 0.94 | 0.8 |
| JJC004 (p-29) | 92%-19mm | 89 | na | 0.050 | <1 | <1.050 | na | 0.65 | 0.8 |
| JJC004 (p-30) | 92%-19mm | 89 | na | 0.067 | <1 | <1.067 | na | 0.69 | 0.8 |
| JJC005 (p-31) | 86%-19mm | 89 | na | 0.051 | <1 | <1.051 | na | 0.74 | 0.9 |
| JJC005 (p-32) | 86%-19mm | 89 | na | 0.063 | <1 | <1.063 | na | 0.70 | 0.9 |
Corvus Gold Corp. Technical Report – North Bullfrog Project | | Page | 148 |
Table 13-18 Summary Metallurgical Results, Gold Recovery from Column Percolation Leach Tests, Sierra Blanca Drill Core Composites (86 to 94% -19mm)
Sample
ID | Feed
Size
(P80) | Leach
Time,
days | Au
Recovery
% | g Au/mt mineralization | Reagent Required
kg/mt mineralization |
| Extracted | Tail
Screen | Calculated
Head | Avearage
Head | NaCn
Cons. | Lime
Added |
| SB01 (p-43.) | 86%-19mm | 105 | 76.6 | 0.105 | 0.032 | 0.137 | 0.140 | 0.64 | 0.8 |
| SB01 (p-44) | 86%-19mm | 102 | 84.6 | 0.104 | 0.019 | 0.123 | 0.140 | 0.55 | 0.8 |
| SB02 (p-45) | 88%-19mm | 105 | 86.5 | 0.115 | 0.018 | 0.133 | 0.146 | 0.49 | 1.1 |
| SB02 (p-46.) | 88%-19mm | 102 | 90.0 | 0.099 | 0.011 | 0.110 | 0.146 | 0.56 | 1.1 |
| SB03 (p-33) | 90%-19mm | 133 | 76.1 | 0.153 | 0.048 | 0.201 | 0.241 | 0.89 | 0.8 |
| SB03 (p-34) | 90%-19mm | 133 | 62.7 | 0.131 | 0.078 | 0.209 | 0.241 | 0.80 | 0.8 |
| SB04 (p-35) | 94%-19mm | 107 | 91.1 | 0.441 | 0.043 | 0.484 | 0.506 | 0.66 | 1.0 |
| SB04 (p-36) | 94%-19mm | 105 | 96.0 | 0.437 | 0.018 | 0.455 | 0.506 | 0.71 | 1.0 |
| SB05 (p-37) | 93%-19mm | 75 | 73.7 | 0.098 | 0.035 | 0.133 | 0.132 | 0.34 | 1.0 |
| SB05 (p-38) | 93%-19mm | 75 | 74.2 | 0.092 | 0.032 | 0.124 | 0.132 | 0.35 | 1.0 |
| SB06 (p-39) | 89%-19mm | 106 | 97.1 | 0.333 | 0.010 | 0.343 | 0.356 | 0.58 | 1.0 |
| SB06 (p-40) | 89%-19mm | 105 | 93.3 | 0.373 | 0.027 | 0.400 | 0.356 | 0.58 | 1.0 |
| SB07 (p-41) | 91%-19mm | 73 | 83.8 | 0.098 | 0.019 | 0.117 | 0.125 | 0.35 | 1.1 |
| SB07 (p-42) | 91%-19mm | 72 | 83.5 | 0.116 | 0.023 | 0.139 | 0.125 | 0.43 | 1.1 |
Table 13-19 Summary Metallurgical Results, Silver Recovery from Column Percolation Leach Tests, Sierra Blanca Drill Core Composites (86 to 94% -19mm)
Sample
ID | Feed
Size
(P80) | Leach
Time,
days | Ag
Recovery
% | g Ag g/mt mineralization | Reagents Required
kg/mt mineralization |
| Extracted | Calculated
Head | Avearage
Head | NaCN Cons. | Lime Added |
| SB01 (p-43.) | 86%-19mm | 105 | 9.7 | 0.107 | 1 | 1.107 | 0.64 | 0.8 |
| SB01 (p-44) | 86%-19mm | 102 | 12.0 | 0.136 | 1 | 1.136 | 0.55 | 0.8 |
| SB02 (p-45) | 88%-19mm | 105 | 5.3 | 0.056 | 1 | 1.056 | 0.49 | 1.1 |
| SB02 (p-46.) | 88%-19mm | 102 | 2.5 | 0.026 | 1 | 1.026 | 0.56 | 1.1 |
| SB03 (p-33) | 90%-19mm | 133 | na | 0.109 | <1 | <1.109 | 0.89 | 0.8 |
| SB03 (p-34) | 90%-19mm | 133 | na | 0.075 | <1 | <1.075 | 0.80 | 0.8 |
| SB04 (p-35) | 94%-19mm | 107 | 3.2 | 0.033 | 1 | 1.033 | 0.66 | 1.0 |
| SB04 (p-36) | 94%-19mm | 105 | 3.2 | 0.033 | 1 | 1.033 | 0.71 | 1.0 |
| SB05 (p-37) | 93%-19mm | 75 | 4.7 | 0.049 | 1 | 1.049 | 0.34 | 1.0 |
Corvus Gold Corp. Technical Report – North Bullfrog Project | | Page | 149 |
Sample
ID | Feed
Size
(P80) | Leach
Time,
days | Ag
Recovery
% | g Ag g/mt mineralization | Reagents Required
kg/mt mineralization |
| Extracted | Calculated
Head | Avearage
Head | NaCN Cons. | Lime Added |
| SB05 (p-38) | 93%-19mm | 75 | 5.0 | 0.053 | 1 | 1.053 | 0.35 | 1.0 |
| SB06 (p-39) | 89%-19mm | 106 | 2.3 | 0.024 | 1 | 1.024 | 0.58 | 1.0 |
| SB06 (p-40) | 89%-19mm | 105 | 3.1 | 0.032 | 1 | 1.032 | 0.58 | 1.0 |
| SB07 (p-41) | 91%-19mm | 73 | 3.2 | 0.033 | 1 | 1.033 | 0.35 | 1.1 |
| SB07 (p-42) | 91%-19mm | 72 | na | 0.041 | <1 | <1.041 | 0.43 | 1.1 |
13.2.4 MCCLELLAND YELLOWJACKET METALLURGICAL TESTING – 2013 -2015
The Yellow Jacket deposit is a steeply dipping quartz vein and adjacent stockworks on the eastern edge of the Sierra Blanca resource. A series of metallurgical tests have been performed on YellowJacket mineralization by McClelland Laboratories, which consisted of CN bottle roll tests on core samples ground to 80% - 75µm, CN bottle roll tests on samples with particle sizes ranging from 80% -19 mm to 80% - 75µm , column leach tests on materials with particle sizes of 80% - 6.3 mm and 80% -19mm, E-GRG tests on composite samples of vein material and stockwork material, Gravity concentration with CN leaching of the tail material, and gravity concentration with intensive CN leaching of the gravity concentrate followed by CN leaching of the combined tails. These data were reported by McClelland (2015a) and (2015b), and are discussed in the following sub-sections.
The two sets of composite samples, prepared to evaluate gravity concentration with CN leach of the tails, were developed for vein and vein stockwork samples from above the oxidation surface (YJ PQ composites) and from below the oxidation surface ( YJ JV composites).
13.2.4.1 SCOPING CN LEACH TESTS
McClelland Labs performed 24 bottle roll tests on 12 drilling core samples at nominal 80% -75µmfeed sizes. Table 13-20 list the results of the bottle roll tests for both gold and silver recovery.
Table 13-20 Summary Metallurgical Results, Bottle Roll Tests, Yellow Jacket Drill Core Composites, 80%-75µm Feed Size
| Composite | Au
Recovery.
% | gAu/mt mineralization | Ag
Recovery
% | gAg/mt mineralization | Reagent Requirements
kg/mt mineralization |
| Extracted | Tail
(1) | Calculated
Head | Head
Assay
(2) | Extracted | Tail
(1) | Calculated
Head | Head
Assay
(2) | NaCN C
ons. | Lime
Added |
| C226950 | 96.2 | 2.27 | 0.09 | 2.36 | 2.16 | 85.7 | 8.4 | 1.4 | 9.8 | 11 | 0.08 | 1.2 |
| C226950 | 96.4 | 2.40 | 0.09 | 2.49 | 2.16 | 85.6 | 8.3 | 1.4 | 9.7 | 11 | <0.07 | 1.3 |
| C226985 | 91.2 | 11.02 | 1.06 | 12.08 | 12.70 | 67.8 | 28.9 | 13.7 | 42.6 | 49 | 0.09 | 1.1 |
| C226985 | 89.9 | 9.32 | 1.05 | 10.37 | 12.70 | 65.1 | 27.4 | 14.7 | 42.1 | 49 | 0.14 | 1.2 |
| C226986 | 78.2 | 3.08 | 0.86 | 3.94 | 3.90 | 61.0 | 26.8 | 17.1 | 43.9 | 49 | 0.12 | 1.6 |
| C226986 | 79.9 | 3.06 | 0.77 | 3.83 | 3.90 | 73.0 | 33.2 | 12.3 | 45.5 | 49 | 0.21 | 1.6 |
| C226989 | 68.7 | 1.36 | 0.62 | 1.98 | 1.90 | 69.9 | 14.6 | 6.3 | 20.9 | 25 | 0.23 | 1.1 |
Corvus Gold Corp. Technical Report – North Bullfrog Project | | Page | 150 |
| Composite | Au
Recovery.
% | gAu/mt mineralization | Ag
Recovery
% | gAg/mt mineralization | Reagent Requirements
kg/mt mineralization |
| Extracted | Tail
(1) | Calculated
Head | Head
Assay
(2) | Extracted | Tail
(1) | Calculated
Head | Head
Assay
(2) | NaCN C
ons. | Lime
Added |
| C226989 | 73.1 | 1.41 | 0.52 | 1.93 | 1.90 | 76.4 | 15.2 | 4.7 | 19.9 | 25 | 0.13 | 1.0 |
| C226990 | 85.1 | 6.34 | 1.11 | 7.45 | 6.70 | 70.7 | 22.7 | 9.4 | 32.1 | 35 | 0.20 | 1.0 |
| C226990 | 85.6 | 6.10 | 1.03 | 7.13 | 6.70 | 72.8 | 24.3 | 9.1 | 33.4 | 35 | 0.21 | 0.9 |
| M612658 | 85.4 | 0.70 | 0.12 | 0.82 | 0.80 | 75.8 | 2.5 | 0.8 | 3.3 | 3 | 0.08 | 1.3 |
| M612658 | 86.9 | 0.73 | 0.11 | 0.84 | 0.80 | 78.8 | 2.6 | 0.7 | 3.3 | 3 | 0.07 | 1.4 |
| M612665 | 86.5 | 8.32 | 1.30 | 9.62 | 12.10 | 80.1 | 34.7 | 8.6 | 43.3 | 45 | 0.11 | 1.1 |
| M612665 | 89.3 | 8.64 | 1.04 | 9.68 | 12.10 | 79.2 | 33.8 | 8.9 | 42.7 | 45 | 0.17 | 1.1 |
| M612674 | 91.7 | 0.77 | 0.07 | 0.84 | 1.00 | 88.2 | 44.1 | 5.9 | 50.0 | 61 | 0.12 | 1.1 |
| M612674 | 92.9 | 0.78 | 0.06 | 0.84 | 1.00 | 85.7 | 46.2 | 7.7 | 53.9 | 61 | 0.13 | 1.1 |
| M612701 | 96.9 | 5.86 | 0.19 | 6.05 | 7.10 | 89.7 | 35.7 | 4.1 | 39.8 | 49 | 0.22 | 1.1 |
| M612701 | 95.7 | 5.53 | 0.25 | 5.78 | 7.10 | 89.1 | 36.0 | 4.4 | 40.4 | 49 | 0.15 | 1.1 |
| M612704 | 89.1 | 1.47 | 0.18 | 1.65 | 1.70 | 83.6 | 43.3 | 8.5 | 51.8 | 56 | 0.26 | 1.1 |
| M612704 | 85.9 | 1.40 | 0.23 | 1.63 | 1.70 | 83.5 | 43.9 | 8.7 | 52.6 | 56 | 0.34 | 1.1 |
| M612716 | 94.1 | 1.28 | 0.08 | 1.36 | 1.20 | 74.2 | 2.3 | 0.8 | 3.1 | 3 | 0.13 | 1.1 |
| M612716 | 95.1 | 1.37 | 0.07 | 1.44 | 1.20 | 75.0 | 2.4 | 0.8 | 3.2 | 3 | 0.08 | 1.2 |
| M612727 | 90.7 | 0.49 | 0.05 | 0.54 | 0.60 | 72.7 | 0.8 | 0.3 | 1.1 | 1 | <0.07 | 1.2 |
| M612727 | 91.7 | 0.66 | 0.06 | 0.72 | 0.60 | 66.7 | 0.8 | 0.4 | 1.2 | 1 | 0.11 | 1.2 |
(1) Average of triplicate assays
(2) Head assays were provided by Corvus
13.2.4.2 YJ PQ COMPOSITE TESTS
Extensive core was produced by drilling at YellowJacket during 2013 and 2014 was used to create composite samples designed to be representative of the types of mineralization represented by the Josh Vein and adjacent stockwork zones. Five composite samples (YJ PQ composites) were created from PQ core from above the oxidation surface and submitted to McClelland for testing. A series of tests were performed on the YJ PQ composite samples to identify processing alternatives. Those test series consisted of:
CN bottle roll tests at feed sizes of 80% -75µm, 80% - 0.106mm, 80% - 0.150mm, 80% - 1.7mm, 80% - 6.3mm and 80% - 19mm;
CN Column leach tests at 80% - 6.3mm and 80% - 19mm;
E-GRG tests at 80% -75µm, 80% - 250µm and 80% - 700µm;
Gravity concentration at feed size of 80% -212µm with CN leach of tails at 80% -75µm and 80% -150µm.
Results from each of the tests types is presented in the following sub-sections.
Corvus Gold Corp. Technical Report – North Bullfrog Project | | Page | 151 |
13.2.4.2.1 CN BOTTLE ROLL TESTS AT VARIOUS FEED SIZES
The results of bottle roll tests at particle size gradations of 80% -75µm, 80% - 0.106mm, 80% - 0.150mm, 80% - 1.7mm, 80% - 6.3mm and 80% - 19mm are listed in Table 13-21. The tests were performed to test the potential for heap leach processing of YellowJacket mineralization. The results indicated achieving high gold and silver CN recovery would require a mill to grind the mineralization, and that good leach recoveries could be achieved with feed sizes in the range of 80% -0.15mm to -75μ.
Corvus Gold Corp. Technical Report – North Bullfrog Project | | Page | 152 |
Table 13-21 Summary of Bottle Roll Tests, YellowJacket YJ PQ Drill Core Composites.
| Composite | Feed
Size
(P80) | Au
Recovery,
% | gAu/mt mineralization | Ag
Recovery,
% | gAg/mt mineralization | Reagent Requirements,
kg/mt mineralization |
| Extracted | Tail
(1) | Calculated
Head | Head
(2) | Extracted | Tail
(1) | Calculated
Head | Head
(2) | NaCN
Cons. | Lime
Added |
| YJPQ01 | 19mm | 12.7 | 0.91 | 6.23 | 7.14 | 5.39 | 10.5 | 4.5 | 38.4 | 42.9 | 47.5 | <0.09 | 0.5 |
| YJPQ01 | 6.3mm | 30.4 | 2.70 | 6.19 | 8.89 | 5.39 | 24.9 | 13.3 | 40.1 | 53.4 | 47.5 | 0.12 | 0.7 |
| YJPQ01 | 1.7mm | 50.0 | 3.88 | 3.88 | 7.76 | 5.39 | 46.9 | 22.5 | 25.5 | 48.0 | 47.5 | 0.17 | 0.7 |
| YJPQ01 | 0.150mm | 86.2 | 4.88 | 0.78 | 5.66 | 5.39 | 66.8 | 37.3 | 18.5 | 55.8 | 47.5 | <0.12 | 1.0 |
| YJPQ01 | 0.106mm | 88.4 | 4.44 | 0.58 | 5.02 | 5.39 | 68.7 | 37.1 | 16.9 | 54.0 | 47.5 | <0.12 | 1.0 |
| YJPQ01 | 0.075mm | 88.3 | 5.00 | 0.66 | 5.66 | 5.39 | 70.3 | 32.4 | 13.7 | 46.1 | 47.5 | 0.17 | 1.2 |
| | | | | | | | | | | | | | |
| YJPQ02 | 19mm | 11.3 | 0.60 | 4.69 | 5.29 | 9.74 | 15.0 | 3.4 | 19.2 | 22.6 | 25.0 | 0.11 | 0.7 |
| YJPQ02 | 6.3mm | 32.9 | 1.62 | 3.30 | 4.92 | 9.74 | 35.4 | 7.4 | 13.5 | 20.9 | 25.0 | <0.11 | 0.9 |
| YJPQ02 | 1.7mm | 53.6 | 3.53 | 3.06 | 6.59 | 9.74 | 50.2 | 12.0 | 11.9 | 23.9 | 25.0 | 0.12 | 0.9 |
| YJPQ02 | 0.150mm | 92.0 | 5.29 | 0.46 | 5.75 | 9.74 | 74.3 | 18.2 | 6.3 | 24.5 | 25.0 | 0.10 | 1.3 |
| YJPQ02 | 0.106mm | 92.9 | 5.35 | 0.41 | 5.76 | 9.74 | 75.8 | 19.1 | 6.1 | 25.2 | 25.0 | <0.07 | 1.4 |
| YJPQ02 | 0.075mm | 90.4 | 5.64 | 0.60 | 6.24 | 9.74 | 77.4 | 19.9 | 5.8 | 25.7 | 25.0 | 0.18 | 1.2 |
| | | | | | | | | | | | | | |
| YJPQ03 | 19mm | 13.7 | 0.27 | 1.70 | 1.97 | 1.49 | 11.4 | 0.9 | 7.0 | 7.9 | 9.1 | 0.09 | 0.6 |
| YJPQ03 | 6.3mm | 27.3 | 0.59 | 1.57 | 2.16 | 1.49 | 20.5 | 1.6 | 6.2 | 7.8 | 9.1 | <0.07 | 0.8 |
| YJPQ03 | 1.7mm | 45.9 | 0.73 | 0.86 | 1.59 | 1.49 | 38.4 | 3.3 | 5.3 | 8.6 | 9.1 | 0.12 | 1.1 |
| YJPQ03 | 0.150mm | 88.5 | 1.62 | 0.21 | 1.83 | 1.49 | 68.4 | 5.4 | 2.5 | 7.9 | 9.1 | <0.07 | 1.2 |
| YJPQ03 | 0.106mm | 88.3 | 1.58 | 0.21 | 1.79 | 1.49 | 65.9 | 5.6 | 2.9 | 8.5 | 9.1 | <0.07 | 1.3 |
| YJPQ03 | 0.075mm | 89.6 | 1.29 | 0.15 | 1.44 | 1.49 | 76.1 | 7.0 | 2.2 | 9.2 | 9.1 | 0.20 | 1.3 |
| | | | | | | | | | | | | | |
| YJPQ04 | 19mm | 23.1 | 0.09 | 0.30 | 0.39 | 0.62 | 16.7 | 0.8 | 4.0 | 4.8 | 4.6 | 0.07 | 0.8 |
| YJPQ04 | 6.3mm | 33.3 | 0.18 | 0.36 | 0.54 | 0.62 | 41.9 | 1.8 | 2.5 | 4.3 | 4.6 | <0.07 | 1.1 |
| YJPQ04 | 1.7mm | 57.8 | 0.37 | 0.27 | 0.64 | 0.62 | 52.3 | 2.3 | 2.1 | 4.4 | 4.6 | <0.09 | 1.2 |
| YJPQ04 | 0.150mm | 61.4 | 0.35 | 0.22 | 0.57 | 0.62 | 62.0 | 3.1 | 1.9 | 5.0 | 4.6 | 0.11 | 1.5 |
| YJPQ04 | 0.106mm | 67.3 | 0.37 | 0.18 | 0.55 | 0.62 | 66.0 | 3.1 | 1.6 | 4.7 | 4.6 | <0.07 | 1.6 |
| YJPQ04 | 0.075mm | 68.8 | 0.44 | 0.20 | 0.64 | 0.62 | 66.7 | 3.4 | 1.7 | 5.1 | 4.6 | <0.08 | 2.5 |
| | | | | | | | | | | | | | |
| YJPQ05 | 19mm | 43.9 | 0.18 | 0.23 | 0.41 | 0.33 | 29.4 | 0.5 | 1.2 | 1.7 | 1.9 | <0.07 | 1.0 |
| YJPQ05 | 6.3mm | 44.2 | 0.19 | 0.24 | 0.43 | 0.33 | 36.8 | 0.7 | 1.2 | 1.9 | 1.9 | 0.07 | 1.2 |
| YJPQ05 | 1.7mm | 54.0 | 0.27 | 0.23 | 0.50 | 0.33 | 47.4 | 0.9 | 1.0 | 1.9 | 1.9 | 0.16 | 1.3 |
| YJPQ05 | 0.150mm | 76.4 | 0.42 | 0.13 | 0.55 | 0.33 | 65.0 | 1.3 | 0.7 | 2.0 | 1.9 | <0.10 | 1.7 |
| YJPQ05 | 0.106mm | 76.2 | 0.32 | 0.10 | 0.42 | 0.33 | 70.0 | 1.4 | 0.6 | 2.0 | 1.9 | 0.10 | 1.8 |
| YJPQ05 | 0.075mm | 74.4 | 0.32 | 0.11 | 0.43 | 0.33 | 61.9 | 1.3 | 0.8 | 2.1 | 1.9 | <0.08 | 2.3 |
Corvus Gold Corp. Technical Report – North Bullfrog Project | | Page | 153 |
13.2.4.2.2 YJ PQ COLUMN LEACH TESTS
Although the bottle roll tests on the YJ PQ composites indicated that the mineralization would have to be milled to produce sufficient gold liberation to assure high recoveries, some column leach tests were performed for confirmation. Tests were performed for the relatively small particle size of P80 -6.3mm, with one sample tested at P80 -19mm. The results are listed in Tables 13-22 and 13-23 for gold and silver recoveries, respectively.
Table 13-22 Summary Metallurgical Results, Gold Recovery from Column Percolation Leach Tests, YellowJacket YJ PQ
Drill Core Composites (80% -6.3mm and 80% -19mm)
Composite/Feed Size,
(P80) | Leach/Rinse
Time
(days) | Au
Recovery
% |
g Au/mt | Reagent Requirements kg/mt |
| Extracted | Tail | Calculated Head | NaCn
Cons. | Lime
Added |
YJPQ01 -6.3mm | 181 | 53.6 | 5.0 | 4.36 | 9.36 | 7.06 | 0.8 |
YJPQ02 -6.3mm | 181 | 60.2 | 2.21 | 1.46 | 3.66 | 5.62 | 1.0 |
YJPQ03 -6.3mm | 137 | 37.8 | 0.65 | 1.12 | 1.77 | 3.14 | 0.9 |
YJPQ04 -6.3mm | 137 | 50.1 | 0.33 | 0.32 | 0.65 | 2.92 | 1.3 |
YJPQ05 -19mm | 140 | 46.5 | 0.17 | 0.19 | 0.36 | 1.46 | 1.2 |
YJPQ05 -6.3mm | 137 | 56.3 | 0.23 | 0.18 | 0.40 | 2.33 | 1.4 |
Table 13-23 Summary Metallurgical Results, Silver Recovery from Column Percolation Leach Tests, YellowJacket YJ PQ Drill Core Composites (80% -6.3mm and 80% -19mm)
Composite/Feed Size,
(P80) | Leach/Rinse
Time
(days) | Au
Recovery
% |
g Au/mt | Reagent Requirements kg/mt |
| Extracted | Tail | Calculated
Head | NaCn
Cons. | Lime Added |
YJPQ01 -6.3mm | 181 | 46.2 | 24.2 | 28.2 | 52.4 | 7.06 | 0.8 |
YJPQ02 -6.3mm | 181 | 47.7 | 10.5 | 11.6 | 22.1 | 5.62 | 1.0 |
YJPQ03 -6.3mm | 137 | 34.0 | 2.4 | 4.7 | 7.0 | 3.14 | 0.9 |
YJPQ04 -6.3mm | 137 | 48.4 | 2.4 | 2.6 | 4.9 | 2.92 | 1.3 |
YJPQ05 -19mm | 140 | 38.2 | 0.8 | 1.3 | 2.1 | 1.46 | 1.2 |
YJPQ05 -6.3mm | 137 | 48.7 | 0.9 | 1.0 | 1.9 | 2.33 | 1.4 |
Corvus Gold Corp. Technical Report – North Bullfrog Project | | Page | 154 |
13.2.4.2.3 YJ PQ E-GRG TESTS
Extended gravity recoverable gold (E-GRG) tests were performed on the YJ PQ composite samples to evaluate the grind size requirements to achieve good gravity recovery. This particular test is used as a basis for modeling performance of KnelsonTM concentrators in mill circuits for prediction of recovery performance. The gravity recoverable gold component is measured at 3 progressively finer grind sizes, P80 -700μm, -250μm, and -75μm. The E-GRG tests results for the YJ PQ composites are listed in Tables 13-24 and 13-25 for gold and silver, respectively. Insufficient material was available for the YJPQ05 sample for gravity testing.
Table 13-24 E-GRG Test Results for Gold Recovery from the YJ PQ composites
| Composite | Recovery, % of Total Au Nominal Grind Size | Head Grade g Au/mt mineralization |
| 700µm | 250µm | 75µm | Total | Calculated | Average |
| YJPQ01 | 33.3 | 23.2 | 9.4 | 65.9 | 8.13 | 7.56 |
| YJPQ02 | 34.5 | 33.9 | 11.4 | 79.8 | 5.46 | 5.66 |
| YJPQ03 | 18.0 | 17.6 | 11.1 | 46.7 | 1.39 | 1.66 |
| YJPQ04 | 12.3 | 17.8 | 12.8 | 42.9 | 0.74 | 0.60 |
Table 13-25 E-GRG Test Results for Silver Recovery from the YJ PQ composites
| Composite | Recovery, % of Total Ag Nominal Grind Size | Head Grade g Ag/mt mineralization |
| 700µm | 250µm | 75µm | Total | Calculated | Average |
| YJPQ01 | 11.5 | 12.2 | 2.8 | 26.5 | 45.9 | 49.3 |
| YJPQ02 | 7.0 | 8.1 | 4.1 | 19.2 | 19.1 | 22.9 |
| YJPQ03 | 2.8 | 3.0 | 2.0 | 7.8 | 7.6 | 8.0 |
| YJPQ04 | 4.5 | 4.6 | 3.1 | 12.2 | 4.3 | 4.8 |
13.2.4.2.4 YJPQ GRAVITY CONCENTRATION WITH CN TAIL LEACH TESTS
Combined gravity concentration with CN leaching of the gravity tail products was conducted on the YJ PQ composites. Based on the results of the E-GRG tests, the composite materials were ground to P80 -212μ (-65 mesh) before being fed into the KnelsonTM concentrator. The gravity gold recovery in the cleaner concentrate (Cl. Conc) and the CN leach recovery from the gravity tail component are listed in Table 13 -26 and 13-27 for gold and silver, respectively. The gravity concentrates from the YJ PQ composites were assayed to destruction, and therefore the combined recovery assumes that all of the metal in the gravity concentrate is recovered. This is consistent with typical process results where typically have 98% of the gold in the gravity concentrate is recovered in the refinery. Also, since the YJPQ composites were from above the oxidation surface, no gold lockup in sulphide remnants would be expected. The results indicated very high metal recoveries would be possible with a simple gravity with CN leaching plant.
Corvus Gold Corp. Technical Report – North Bullfrog Project | | Page | 155 |
Table 13-26 Gold Recovered from Gravity Concentrate and CN Leach of Gravity Tail, YJ PQ Composites
Composite/ Feed Size
(P80) | Au Distribution, % of total | g Au/mt mineralization | Reagent | Req. |
Au
rec.
from
Cl.
Conc. | Au rec.
from
gravity
tail | Comb. Au rec. | Au in
Tail | Extracted | Tail | Calc’d Head | NaCn Cons.
(kg/mt) | Lime Added (kg/mt) |
Cl.
Conc | CN | Comb. |
YJPQ01 150µm 75µm | 50.7 58.3 | 43.0 37.3 | 93.7 95.6 | 6.3 4.4 | 4.67 4.67 | 3.96 3.01 | 8.63 7.68 | 0.59 0.36 | 9.22 8.03 | 0.26 0.15 | 2.1 1.4 |
YJPQ02 150µm 75µm | 56.3 64.2 | 38.6 31.4 | 94.8 65.6 | 5.2 4.4 | 4.34 3.34 | 3.02 1.63 | 7.36 4.97 | 0.40 0.23 | 7.76 5.20 | 0.14 0.17 | 1.7 1.6 |
YJPQ03 150µm 75µm | 25.7 25.4 | 62.6 67.9 | 88.2 93.3 | 11.8 6.7 | 0.36 0.36 | 0.88 0.96 | 1.24 1.32 | 0.17 0.10 | 1.40 1.42 | 0.10 0.13 | 1.4 1.5 |
YJPQ04 150µm 75µm | 23.6 24.2 | 49.2 49.9 | 72.8 74.1 | 27.2 25.9 | 0.14 01.4 | 0.29 0.29 | 0.43 0.43 | 0.16 0.15 | 0.59 0.58 | 0.15 0.12 | 1.4 2.0 |
Table 13-27 Silver Recovered from Gravity Concentrate and CN Leach of Gravity Tail, YJ PQ Composites
Composite/ Feed Size
(P80) | Ag Distribution, % of total | g Ag/mt mineralization | Reagent | Req. |
Ag
rec.,from
Cl. Conc. | Ag rec.
for
gravity
tail | Comb.
Ag rec. | Ag
in
Tail | Extracted | Tail | Calc’d Head | NaCn Cons. (kg/mt) | Lime Added (kg/mt) |
Cl.
Conc | CN | Comb. |
YJPQ01 150µm 75µm | 11.7 11.7 | 63.4 66.5 | 75.0 78.2 | 25.0 21.8 | 5.5 5.5 | 30.1 31.6 | 35.6 37.1 | 11.9 10.4 | 47.4 47.5 | 0.26 0.15 | 2.1 1.4 |
YJPQ02 150µm 75µm | 5.8 5.9 | 71.2 75.0 | 76.9 80.8 | 23.1 19.2 | 1.2 1.2 | 15.0 15.5 | 16.2 16.7 | 4.9 4.0 | 21.0 20.6 | 0.14 0.17 | 1.7 1.6 |
YJPQ03 150µm 75µm | 2.3 2.2 | 68.9 74.9 | 71.1 77.1 | 28.9 22.9 | 0.2 0.2 | 5.6 6.2 | 5.8 6.4 | 2.4 1.9 | 8.2 8.3 | 0.10 0.13 | 1.4 1.5 |
YJPQ04 150µm 75µm | 1.9 1.8 | 62.3 66.5 | 64.2 68.2 | 35.8 31.8 | 0.1 0.1 | 3.1 3.4 | 3.2 3.5 | 1.8 1.6 | 4.9 5.1 | 0.15 0.12 | 1.4 2.0 |
13.2.4.3 YJ JV SAMPLES
PQ3 core drilling during 2014 sampled the Josh vein and vein stockwork mineralization at YellowJacket below the oxidation surface. Seven (7) samples (PQ JV samples) were developed to represent variations of the Josh vein and stockwork below the oxidation surface where sulphide minerals remained unoxidized. The total proportion of sulphide sulfur below oxidation was a minor component of the total rock mass, ranging between 1-2%, so any impacts were expected to be relatively small.
Corvus Gold Corp. Technical Report – North Bullfrog Project | | Page | 156 |
13.2.4.3.1 YJ JV BOTTLE ROLL TESTS
The YJ JV samples were crushed and a split from each was created for blending into two composites for bottle roll testing. Samples YJ JV01 and YJ JV02 were quartz vein and stongly veined stockwork and were blend to produce the Josh Vein Plus Stockwork (JV+Stockwork) Composite. Samples YJ JV03, YJ JV04, YJ JV05 and YJ JV06 were blended to produce a Stockwork composite. Sample YJ JV07 was stockwork material from above the oxidation surface and therefore not used in the composite preparation. The bottle roll test results are listed in Tables 13-28 and 13-29 list the test results for gold and silver, respectively. The tests indicated relatively high recovery of metal by cyanide leaching, although generally lower recovery was achieved than in the YJ PQ tests. Examination of the time-recovery curves indicated that metal dissolution was still increasing at 96 hours, suggesting that coarse gold particles had not been completely recovered in the bottle roll tests.
Table 13-28 Bottle Roll Tests from YJ JV Composites, Gold Recovery at Various Feed Sizes
| Composite | Feed
Size
(P80) | Test | Au
Rec.
(%) | g Au/mt mineralization | Reagent Req., kg/mt mineralization |
| Ext’d | Tail | Cal’d
Head | Head
Assay | NaCN
Cons. | Lime
Added |
| JV+Stockwork | 150μm | Initial | 76.2 | 3.72 | 1.16 | 4.88 | 4.60 | 0.19 | 0.6 |
| JV+Stockwork | 150μm | Dup | 76.4 | 3.72 | 1.15 | 4.87 | 4.60 | 0.21 | 0.6 |
| JV+Stockwork | 75μm | Initial | 76.7 | 3.75 | 1.14 | 4.89 | 4.60 | 0.22 | 0.7 |
| JV+Stockwork | 75μm | Dup | 77.0 | 3.64 | 1.09 | 4.73 | 4.60 | 0.19 | 0.9 |
| | | | | | | | | | |
| Stockwork | 150μm | Initial | 69.2 | 1.17 | 0.52 | 1.69 | 1.64 | <0.07 | 1.0 |
| Stockwork | 150μm | Dup | 56.3 | 0.90 | 0.70 | 1.60 | 1.64 | <0.07 | 1.1 |
| Stockwork | 75μm | Initial | 75.4 | 1.50 | 0.49 | 1.99 | 1.64 | 0.14 | 1.1 |
| Stockwork | 75μm | Dup | 73.5 | 1.39 | 0.50 | 1.89 | 1.64 | <0.07 | 1.3 |
Table 13-29 Bottle Roll Tests from YJ JV Composites, Silver Recovery at Various Feed Sizes
| Composite | Feed
Size
(P80) | Test | Ag
Rec.
(%) | g Ag/mt mineralization | Reagent Req., kg/mt mineralization |
| Ext’d | Tail | Cal’d
Head | Head
Assay | NaCN
Cons. | Lime
Added |
| JV+Stockwork | 150μm | Initial | 56.2 | 34.2 | 26.7 | 60.9 | 61.2 | 0.19 | 0.6 |
| JV+Stockwork | 150μm | Dup | 53.5 | 33.0 | 28.7 | 61.7 | 61.2 | 0.21 | 0.6 |
| JV+Stockwork | 75μm | Initial | 58.5 | 35.6 | 25.3 | 60.9 | 61.2 | 0.22 | 0.7 |
| JV+Stockwork | 75μm | Dup | 58.0 | 34.4 | 24.9 | 59.3 | 61.2 | 0.19 | 0.9 |
| | | | | | | | | | |
| Stockwork | 150μm | Initial | 53.8 | 3.5 | 3.0 | 6.5 | 7.5 | <0.07 | 1.0 |
| Stockwork | 150μm | Dup | 51.5 | 3.4 | 3.2 | 6.6 | 7.5 | <0.07 | 1.1 |
| Stockwork | 75μm | Initial | 57.1 | 3.6 | 2.7 | 6.3 | 7.5 | 0.14 | 1.1 |
| Stockwork | 75μm | Dup | 59.1 | 3.9 | 2.7 | 6.6 | 7.5 | <0.07 | 1.3 |
Corvus Gold Corp. Technical Report – North Bullfrog Project | | Page | 157 |
13.2.4.3.2 YJ JV E-GRG TESTS
E-GRG tests were conducted on splits of the two YJ JV composites to characterize metal recovery with increasingly fine grind size. The results are listed in Table 13-30 for both gold and silver.
Table 13-30 E-GRG Test Results for the YJ JV Composites, Gold and Silver Recovery
| Composite | Recovery, % of Total Metal Nominal Grind Size | Head Grade g /mt mineralization |
| 700µm | 250µm | 75µm | Total | Calculated | Average |
| Gold |
| JV+Stockwork | 30.4 | 22.3 | 15.6 | 68.3 | 4.56 | 4.80 |
| Stockwork | 31.6 | 25.2 | 11.0 | 67.8 | 1.75 | 1.82 |
| Silver |
| JV+Stockwork | 11.4 | 12.1 | 5.5 | 29.0 | 56.1 | 63.8 |
| Stockwork | 8.5 | 7.9 | 5.5 | 21.9 | 6.0 | 6.4 |
13.2.4.3.3 GRAVITY CONCENTRATION /GRAVITY PRODUCT CYANIDATION TESTS
Each YJ JV sample, JV01 through JV06, was feed individually into a KnelsonTM concentrator at a particale size of P80 -212μm (-65 mesh). The individual gravity concentrates were then blended to produce the two composite samples of Josh Vein+Stockwork (YJ JV01 and JV02) and Stockwork (YJ JV03, JV04, JV05 and JV06). Composites of the gravity tail material were also constructed. The gravity concentrates were then re-ground to P80 -45μm (-325 mesh) and then subjected to intense CN leaching for 104 hours. The gravity tail composites were re-ground to produce 3 samples at P80 -45μm (-325 mesh), -75μm (-200 mesh) and -150 μm (-100 mesh) to allow characterization of the impact of grind size on tail recovery. The leached gravity concentrate was then blended into the gravity tail material and leached for 104 hours. Gold and silver recoveries for combined tail leach and separate tail leach are listed in Table 13-31.
Corvus Gold Corp. Technical Report – North Bullfrog Project | | Page | 158 |
Table 13-31 Gold and Silver Recoveries from YJ JV Composites with Intense CN leaching of Gravity Concentrate and CN Leach of Tail
| Composite | Process | Gravity
Tail
Regrind
(P80) | Leach Recoveries
(%) | Reagent
Requirements, kg/mt
mineralization |
| Gold | Silver | NaCN | Lime |
| JV+Stkwrk | Conc. Int. CN w/Pretreat;Combined Tail Leach1 | 150μm | 87.1 | 66.5 | 0.22 | 0.7 |
| JV+Stkwrk | Conc. Int. CN w/Pretreat;Combined Tail Leach1 | 75μm | 89.0 | 69.7 | 0.23 | 1.1 |
| JV+Stkwrk | Conc. Int. CN no/Pretreat;Combined Tail Leach1 | 150μm | 86.2 | 66.3 | 0.22 | 0.7 |
| JV+Stkwrk | Conc. Int. CN no/Pretreat;Combined Tail Leach1 | 75μm | 88.2 | 69.6 | 0.23 | 1.1 |
| | | | | | | |
| JV+Stkwrk | Conc. Int. CN w/Pretreat;SeparateTail Leach2 | 150μm | 83.8 | 66.5 | 0.24 | 3.9 |
| JV+Stkwrk | Conc. Int. CN w/Pretreat;SeparateTail Leach2 | 75μm | 79.0 | 64.1 | 0.37 | 3.7 |
| JV+Stkwrk | Conc. Int. CN w/Pretreat;SeparateTail Leach2 | 45μm | 87.3 | 63.6 | 0.29 | 4.4 |
| JV+Stkwrk | Conc. Int. CN no Pretreat;SeparateTail Leach2 | 150μm | 79.2 | 66.1 | 0.24 | 3.5 |
| JV+Stkwrk | Conc. Int. CN no Pretreat;SeparateTail Leach2 | 75μm | 74.2 | 63.9 | 0.37 | 3.4 |
| JV+Stkwrk | Conc. Int. CN no Pretreat;SeparateTail Leach2 | 45μm | 83.1 | 63.2 | 0.29 | 4.0 |
| | | | | | | |
| Stockwork | Conc. Int. CN w/Pretreat;Combined Tail Leach1 | 150μm | 77.6 | 64.1 | 0.15 | 1.0 |
| Stockwork | Conc. Int. CN w/Pretreat;Combined Tail Leach1 | 75μm | 78.1 | 64.6 | 0.11 | 1.2 |
| Stockwork | Conc. Int. CN no/Pretreat;Combined Tail Leach1 | 150μm | 77.0 | 64.2 | 0.14 | 0.9 |
| Stockwork | Conc. Int. CN no/Pretreat;Combined Tail Leach1 | 75μm | 77.6 | 64.7 | 0.10 | 1.1 |
| | | | | | | |
| Stockwork | Conc. Int. CN w/Pretreat;SeparateTail Leach2 | 150μm | 72.6 | 60.8 | 0.11 | 1.2 |
| Stockwork | Conc. Int. CN w/Pretreat;SeparateTail Leach2 | 75μm | 74.2 | 64.4 | 0.10 | 1.3 |
| Stockwork | Conc. Int. CN w/Pretreat;SeparateTail Leach2 | 45μm | 73.7 | 68.0 | 0.11 | 1.8 |
| Stockwork | Conc. Int. CN no Pretreat;SeparateTail Leach2 | 150μm | 73.0 | 60.9 | 0.10 | 1.1 |
| Stockwork | Conc. Int. CN no Pretreat;SeparateTail Leach2 | 75μm | 74.7 | 64.6 | 0.09 | 1.2 |
| Stockwork | Conc. Int. CN no Pretreat;SeparateTail Leach2 | 45μm | 74.2 | 68.2 | 0.10 | 1.7 |
1-Combined recoveries and reagent consumptions for gravity concentrate at 80%-212μm, intensive cyanidation of gravity rougher concentrate at 80%-45μm regrind, and leaching of gravity rougher tailings (with the intensive cyanidation residue added for re-leaching) at the indicated regrind size.
2-Combined recoveries and reagent consumptions for gravity concentrate at 80%-212μm, intensive cyanidation of gravity rougher concentrate at 80%-45μm regrind, and leaching of gravity rougher tailings (with the intensive cyanidation residue added for re-leaching) at the indicated regrind size.
Gold and silver recoveries from the YJ JV composite samples were higher than the bottle roll testing confirming that leaching of coarse gold particles was incomplete in the bottle rolls. Total recoveries were high, but less than measured in the YJ PQ composite tests indicating some fall off below oxidation. The tests confirmed that gravity concentration of YellowJacket mineralization with CN leaching of the tails would produce a consistent and high metal recovery from a relatively simple mill circuit
Corvus Gold Corp. Technical Report – North Bullfrog Project | | Page | 159 |
13.3 COMMINUTION TEST WORK
Material from the Sierra Blanca, Jolly Jane, and Mayflower Bulk samples were submitted to McClelland for measurements of crusher work index, ball mill grindability and abrasion index. In addition, six composites were developed from PQ3 core holes NB-13-362 and NB-13-363 to develop comminution characteristics of vein and vein stockwork materials from the YellowJacket zone. The YellowJacket composites were developed for materials both above and below the oxidation surface. Table 13-32 lists the results of the both sets of tests.
Table 13-32 Summary of Comminution Test Work on Sierra Blanca, Jolly Jane, and Mayflower Bulk Materials and on YellowJacket PQ3 Core Materials
| Sample ID | Location with
respect to Oxidation
surface | Ball Mill Work Index
(kW-hr/tonne) | Crusher Work Index
(kW-hr/tonne) | Abrasion Index |
| Heap Leach |
| Sierra Blanca (SB 1019) | above | 23.27 | 16.68 | 0.4577 |
| Jolly Jane (JJ 1019) | above | 24.72 | 22.60 | 0.6260 |
| Mayflower | above | - | 14.05 | 0.3946 |
| Mill |
| YJ Comm Comp 1 | above | 22.8 | 12.3 | 0.7154 |
| YJ Comm Comp 1 | above | 22.1 | 9.8 | 0.4259 |
| YJ Comm Comp 1 | above | 21.5 | 7.8 | 0.2718 |
| YJ Comm Comp 1 | below | 22.1 | 10.9 | 0.5729 |
| YJ Comm Comp 1 | below | 22.5 | 10.5 | 0.5766 |
| YJ Comm Comp 1 | below | 22.0 | 10.6 | 0.4778 |
13.4 GOLD DEPORTMENT STUDIES
Investigations of gold deportment in NBP sample materials have been performed to add detail on the character of gold occurrence in the YellowJacket mineralization, and to develop preliminary information on gold occurrence in unoxidized sulphide mineralization.
13.4.1 GOLD DEPORTMENT IN JOSH VEIN AND STOCKWORKS
Gold and silver mineralization in the Josh Vein and associated stockwork zones at YellowJacket is predominantly native gold and electrum. This was indicated by the high metal recovery in the gravity concentration with CN leaching of tail materials for the YJ PQ and YJ JV composites. Samples of gravity concentrate from the YJ JV samples JV01 to JV07 were analyzed by QEMSCAN Particle Mineral Analysis (PMA), Trace Mineral Search (TMS), Whole Rock Analysis (WRA) and X-Ray Diffraction Analysis (XDF) by Bureau Veritas Commodities Canada Ltd. (McClelland 2015B). Conclusions and recommendations from the analyses were:
Corvus Gold Corp. Technical Report – North Bullfrog Project | | Page | 160 |
95% of the gold in the seven YJ JV concentrates presented as liberated particles or gold adhesion binaries with exposed surfaces. The liberated gold and gold adhesions were probably expected to be leached using further normal cyanidation leaching methodology. Gold leach recovery of 90% to 95% from these concentrates may be expected to be achieved.
The locked inclusion gold would be unlikely to be leached. The unliberated gold was principally locked with pyrite and non-sulphide gangue either in binary or multiphase forms.
The silver bearing minerals were identified as gold/electrum, acanthite/argentite, stephanite/pyrargyrite, stromeyerite and tetrahedrite. Unliberated silver was mostly associated with pyrite and non-sulphide gangue either in binary or multiphase forms.
13.4.2 GOLD DEPORTMENT IN SULPHIDE MINERALIZATION
In addition to the substantial oxidized gold mineralization, Josh vein and vein stockwork mineralization, other areas of unoxidized mineralized material exists at the NBP. Metallurgical testing has indicated that some of the unoxidized mineralized material are refractory, with gold recovery ranging from <10% - 40%. Some gold deportment work was performed on two samples of the unoxidized material to better understand the characteristics and occurrence of the gold that was not cyanide recoverable. The gold deportment analysis was performed on the tail material after 72 hours of cyanide leaching by AMTEL. In summary, the primary conclusion from the study was “The refractoriness to direct cyanidation of the North Bullfrog some unoxidized mineralization is directly related to the fact that the primary Au carrier is submicroscopic Au in pyrite.”
The gold deportment as submicroscopic particles was confirmed by metallic screen analysis at the +10 mesh in the study. The +10 mesh material contained 0.1% to 1.8% of the total gold in these tests.
The ICP analysis of all samples indicated that a weak relationship exists between arsenic and gold mineralization.
Bodies of sulphide mineralization with relatively high grades have been detected in drilling in the YellowJacket zone, along fault zones below oxidation and in drilling to the north of Sierra Blanca. A group of samples were developed to confirm previous indications of the metallurgical character of theses sulphide materials. Eleven sulphide composite samples, the YJS composites, were submitted to McClelland Labs for bottle roll testing ( McClelland 2014b). Gold head grades ranged from 0.4 g/t to 4 g/t, with gold recoveries ranging from 4% to 35% at a feed size of P80 -75μm. Silver head grades were similar, ranging from 0.9 g/t to 7.4 g/t, with silver recoveries ranging from 28% to 65%. These test results indicate that simple CN leaching of the sulphide ores will not be successful. The extent and quantity of these higher grade zones of sulphide mineralization are not currently known, and substantial volumes would be required to justify consideration of some type of oxidation processing system.
Corvus Gold Corp. Technical Report – North Bullfrog Project | | Page | 161 |
13.5 CRUSH SIZE VS RECOVERY PREDICTION FOR HEAP LEACHING
The metallurgical study was primarily based on column leach tests at a feed size of P80 -19mm (-3/4”) particle size. Projected heap leach recoveries and leach time were the defined using this column leach test data reported here. The test data indicate high solubility, and that ultimate gold recovery is time dependent only. The column test results indicate that there is no relationship between head grade to recovery, with lower grades reporting recoveries as high as the higher grades, albeit in shorter leach time
The time dependence is being investigated at larger particle sizes in vat leach tests on Mayflower and Sierra Blanca mineralized material. The vat leaching was done on select samples at nominal particle sizes of 200-250mm, 150 mm, and 75-90mm. The results are listed in Table 13-33. The projected recovery will based on the bottle roll tests, column tests, and vat leach tests, and adjustments for estimated actual field leach conditions incorporating delay in gold recovery due to wash efficiency and multiple lifts placed.
Table 13-33 Vat Leach Test Measurements of Gold Recovery on Large Particles Sizes from Mayflower and Sierra Blanca Dump Materials
| Sample | Nom.
Feed
Size
(mm) | Leach
Time,
Days | Au
Rec.,
(%) |
g Au/mt mineralization | Reagent Requirements Kg/mt mineralization |
| Ext’d | Tail | Calc’d
Head | NaCn
Cons. | Lime
Added |
| MF David Adit | 200 | 198 | 38.7 | 0.77 | 1.22 | 1.99 | 2.15 | 0.00 |
| MF David Adit | 150 | 197 | 71.9 | 1.20 | 0.47 | 1.67 | 1.23 | 0.00 |
| MF David Adit | 75 | 197 | 68.5 | 1.02 | 0.47 | 1.49 | 1.42 | 0.04 |
| MF Starlight | 200 | 198 | 45.7 | 0.63 | 0.75 | 1.38 | 1.88 | 0.00 |
| MF Starlight | 150 | 197 | 57.0 | 1.59 | 1.20 | 2.79 | 1.27 | 0.00 |
| MF Starlight | 75 | 197 | 57.8 | 1.78 | 1.30 | 3.08 | 1.40 | 0.00 |
| SB Dump | 250 | 114 | 21.7 | 0.05 | 0.18 | 0.23 | 0.36 | 0.35 |
| SB Dump | 150 | 114 | 31.4 | 0.11 | 0.24 | 0.35 | 0.42 | 0.67 |
| SB Dump | 90 | 114 | 57.1 | 0.12 | 0.09 | 0.21 | 0.71 | 0.93 |
Table 13-34 Vat Leach Test Measurements of Silver Recovery on Large Particles Sizes from Mayflower and Sierra Blanca Dump Materials
| Sample | Nom.
Feed
size
(mm) | Leach
Time
(days) | Ag Rec.,
(%) |
g Ag/mt mineralization | Reagent Requirements Kg/mt mineralization |
| Ext’d | Tail | Calc’d
Head | NaCn
Cons. | Lime
Added |
| MF David Adit | 200 | 198 | 7.7 | 0.1 | 1.2 | 1.3 | 2.15 | 0.00 |
| MF David Adit | 150 | 197 | 22.2 | 0.2 | 0.7 | 0.9 | 1.23 | 0.00 |
| MF David Adit | 75 | 197 | 9.1 | 0.1 | 1.0 | 1.1 | 1.42 | 0.04 |
| MF Starlight | 200 | 198 | 10.0 | 0.1 | 0.9 | 1.0 | 1.88 | 0.00 |
| MF Starlight | 150 | 197 | 20.0 | 0.3 | 1.2 | 1.5 | 1.27 | 0.00 |
| MF Starlight | 75 | 197 | 23.5 | 0.4 | 1.3 | 1.7 | 1.40 | 0.00 |
| SB Dump | 250 | 114 | <12.5 | <0.1 | <0.1 | <0.1 | 0.36 | 0.3 |
| SB Dump | 150 | 114 | <14.3 | <0.7 | <0.6 | <0.7 | 0.42 | 0.7 |
| SB Dump | 90 | 114 | <12.5 | <0.8 | <0.7 | <0.7 | 0.71 | 0.9 |
*silver head grade below detection resolution
Corvus Gold Corp. Technical Report – North Bullfrog Project | | Page | 162 |
13.6 METALLURGICAL SUMMARY
The samples tested are representative of the mineralization at the NBP. The core and bulk samples were augmented by samples from RC holes to project spatial and depth related variability. The Author knows of no known processing factors or deleterious elements that could have a significant effect on potential economic extraction.
The testing on higher grade vein and stockwork mineralization in the YellowJacket zone indicates it should be processed in a milling system using gravity concentration, intensive CN leaching of the gravity concentrate followed by CN leaching of the combined gravity tail and leached gravity concentrate. A conventional tailing management facility would be constructed for the limited volume of milled material. The grades and recoveries of the NBP disseminated mineralized material are suitable for heap leach processing.
13.6.1 MILL PROCESS CHARACTERISTICS AND RECOVERY
The parameters, listed in Table 13-35, assumed for the mill process assumed in the process analysis are based on metallurgical testing results for the gravity concentration, intense cyanide leaching of gravity concentrate and cyanide leaching of the combined gravity tail.
Table 13-35 Assumed Mill Process Parameters
| Process Parameter | Assumed Value |
| Primary Cush Size | P80 - 110mm |
| Secondary Crush Size | P80 - 32mm |
| Tertiary Crush Size | P80 - 9.4mm |
| Gravity Concentrate Feed | P80 – 212μm |
| Gravity Concentrate Mass Pull | 0.3 - 1% |
| Gravity Concentrate Re-grind Size | P80 -45μm (-325 mesh) |
| Ball Mill Cyclone Overflow | P80 -75μm (-200 mesh) |
| Gravity Concentrate Leach – NaCN consumption | 25 .0 kg/tonne |
| Gravity Concentrate Leach – Lime added | 14.0 kg/tonne |
| Gravity Tail Leach – NaCN consumption | 0.13 kg/tonne |
| Gravity Tail Leach – Lime added | 1.0 kg/tonne |
Metal recoveries indicated by the gravity concentration/CN leaching test work on YellowJacket vein and vein stockwork samples were high (+90%) across a grade range 1.5 – 9 g/t, then dropped at lower grade (0.5 g/t) for composite samples from above the oxidation surface. The recoveries for composite samples from below the oxidation surface were approximately 5% lower. Mineralization in YellowJacket, associated with the structural zones were subdivided by structure type, grade and location with respect to the oxidation surface to estimate gold and silver recovery. Minor amounts of pyrite (1-2%) were present in the mineralization below the oxidation surface and contained a small fraction of the gold, which probably impacted recovery. Table 13-36 lists the portions of metal projected to occur in each structural zone and the estimated metal recovery used to estimate a weighted average for the YellowJacket mineralization.
Corvus Gold Corp. Technical Report – North Bullfrog Project | | Page | 163 |
Table 13-36 Proportions of Metal and Estimated Gold and Silver Recovery
| Oxidation | Structural Zone | Estimated Au
Rec. (%) | Proportion of
Au (%) | Estimated Ag
Rec. (%) | Proportion of
Ag (%) |
| Above | Vein and Vein Stockwork | 91.0 | 36 | 78.2 | 52 |
| Above | Minor Stockwork | 92.9 | 4 | 79.0 | 2 |
| Above | Faults | 76.1 | 4 | 68.2 | 4 |
| Below | Vein and Vein Stockwork | 84.7 | 52 | 63.3 | 41 |
| Below | Minor Stockwork | 80.8 | 2 | 60.7 | 1 |
| Below | Faults | 71.0 | 1 | 60.7 | 1 |
| | | | | | |
| Weighted Average | All | 86.8 | 100 | 71.4 | 100 |
13.6.2 HEAP LEACH PROCESS CHARACTERISTICS AND RECOVERY
Column leach testing was performed on composites samples from Sierra Blanca/Savage Valley, Jolly Jane and Maflower resource areas. The testing indicated higher gold recovery with decreasing particle size, and ultra-high intensity blasting has been assumed during mining of the heap leach mineralization to produce particle size fraction similar to primary crushing at P80 -76 mm. Size vs recovery data has been used to extrapolate the column leach test results at P80 -19mm to the larger ROM size, and recoveries have been adjusted for time and lift height effects. Table 13-37 lists the projected field leach recoveries assumed after 1000 days of leaching, and the estimated field NaCN and Lime consumptions derived from the tests results.
Table 13-37 Assumed Heap Leach Metal Recoveries and Reagent Consumptions
| Resource Area | % of Total Au in
Heap Leach
Mineralization | Average Column
Test Au
Recovery* Au at
360 days (P80 -
19mm) | Projected Field Leach
Recovery* at 1000
days Assuming ROM at
P80 -76 mm | NaCN Cons.
(kg/tonne) | Lime Cons. (kg/tonne) |
| Au (%) | Ag (%) |
| Sierra Blanca/Savage Valley | 77 | 83.4 | 74.4 | 5.8 | 0.25 | 1.0 |
| Jolly Jane | 14 | 79.1 | 67.3 | 6.8 | 0.25 | 1.0 |
| Mayflower | 9 | 88.0 | 79.2 | 9.7 | 0.45 | 1.25 |
*The column leach recoveries at 360 days leach is based on column leach tests at P80 -19mm, without consideration of placement, wetting, heap retention, pond retention and process gold recovery. Projected field leach recoveries from the heap leach pad assume 1,000 days leaching and a ROM particle size gradation of P80 -76mm (similar to primary crushing) produced by ultra-high intensity blasting ..
Corvus Gold Corp. Technical Report – North Bullfrog Project | | Page | 164 |
14 MINERAL RESOURCE ESTIMATES
At the request of Corvus, MMC was contracted to complete a Mineral Resource update on the Sierra Blanca and YellowJacket gold mineral deposits for the North Bullfrog Project. Previous Mineral Resource estimates for Mayflower and Jolly Jane were not updated and remain current for the purpose of this report. Project mineral inventories are reported at various cut-off-grades and classifications. Mineral Resources stated for the North Bullfrog Project conform to the definition standards adopted by the Canadian Institute of Mining, Metallurgy and Petroleum (CIM), May 10th, 2014. Mineral Resources have been reported in accordance with the disclosure obligations under NI 43-101.
Vulcan Software was used to estimate and quantify the Project mineral resources. Vulcan software utilizes a block modeling approach to represent the deposit as a series of 3-D blocks to which grade attributes, and other attributes can be assigned. Mineral inventories have been pit constrained in order to demonstrate the reasonable prospects of eventual economic extraction. Mineral Resources are not Mineral Reserves and do not have demonstrated economic viability. MMC knows of no environmental, permitting, legal, socio-economic, marketing, political, or other factors that may materially affect the Mineral Resource estimate
14.1 DATABASE FOR NORTH BULLFROG MINERALIZATION INVENTORY ESTIMATION
Corvus provided MMC with a drillhole database in the form of Microsoft Excel spreadsheets which contained collar location, surveys, assays and lithology data. MMC audited the database for errors prior to defining mineral resources. The drillhole database has been converted to a Vulcan Isis database with the identifier of “final_db_150429.dhd.isis” – a naming convention that works with Vulcan software. The data provided to estimate the mineralization inventory consists of data from 664 drill holes, totaling 113,492 metres, which were drilled by a number of companies and verified by Corvus and the Authors. A total of 72,655 samples were assayed for gold and 64,200 samples were assayed for silver.
14.2 SIERRA BLANCA ZONE ESTIMATE
14.2.1 GEOLOGIC MODEL OF SIERRA BLANCA
The geological model provided as a basis for the 2015 estimate of mineralization at Sierra Blanca was constructed by Corvus geologists using the Corvus drill data together with the surface mapping of the area. The model consists of several elements including structure, stratigraphy, oxidation, and structurally controlled mineralization. Topologically coherent volumes have been created which allowed the block model to be tagged with all appropriate geological properties.
14.2.1.1 STRUCTURAL MODEL
The Sierra Blanca area has been divided into a number of structural blocks with coherent internal stratigraphy (Figure 14-1). Each of these blocks has an encompassing domain volume which is divided into sub-volumes according to the stratigraphy in the block. The outer limits of the model have been defined by fault surfaces that are known to truncate the mineralized stratigraphy in areas where insufficient data exists. No Mineral Resources have been defined in these areas.
Corvus Gold Corp. Technical Report – North Bullfrog Project | | Page | 165 |
Figure 14-1 Structural Blocks Defined within Sierra Blanca and YellowJacket.
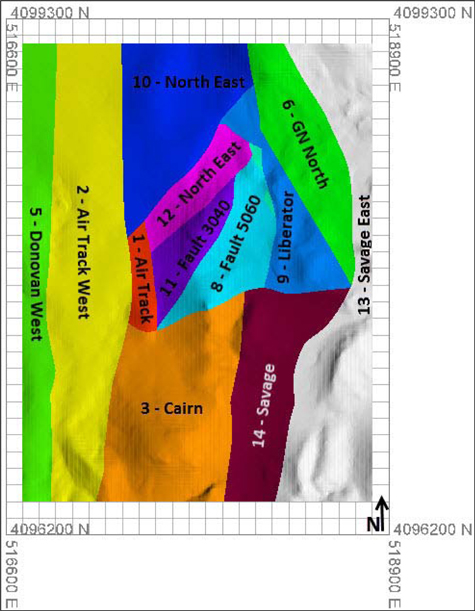
14.2.1.2 STRATIGRAPHIC MODEL
The Project stratigraphic model consists of seven units which from oldest to youngest include:
| | 1. | Cambrian basement (Camb), |
| | 2. | Pre-Sierra Blanca Volcanics and basal sediments (PreSB), |
| | 3. | Lower Sierra Blanca Tuff Sequence (SB Lower), |
| | 4. | Middle Sierra Blanca Tuff Sequence (SB Upper), |
Corvus Gold Corp. Technical Report – North Bullfrog Project | | Page | 166 |
| | 5. | Mélange / Heterolithic Fault Breccia (Mel) |
| | 6. | Post Sierra Blanca Tuff Volcanic rocks (Post SB), and |
| | 7. | Air Track West Gravel (Gravel) |
Within each structural block, stratigraphic units have a separate volume defined (Figure 14-2).
Figure 14-2 Stratigraphic Domains Modelled in South Sierra Blanca (N 4,092,300 Looking North).
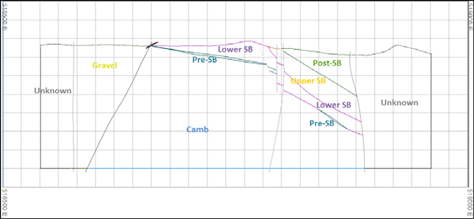
Figure 14-3 Stratigraphic Domains Modeled in the YellowJacket Area (N4,098,000 Looking North).
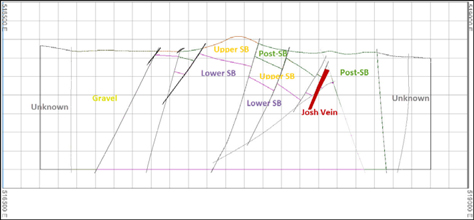
14.2.1.3 OXIDATION MODEL
With the exception of a few historical holes, the degree of oxidation has been determined for every sample in the drill database. The oxidation is evaluated on a scale of 1 to 5 with 1 being un-oxidized and 5 being completely oxidized. Cyanide shake leach and bottle roll tests have shown that oxidation levels 4 and 5 behave similar to level 3, which has mixed oxide and sulphide. Levels 2 and 1 are dominantly or completely sulphide and excluded from the processing the stream unless in the Josh Vein and Stockwork Veining.
Corvus Gold Corp. Technical Report – North Bullfrog Project | | Page | 167 |
The base of oxidation is sharp and easily definable. However, in order to determine the overall state of oxidation in areas with partial oxidation, the data were evaluated in 7 metre intervals to create a simplified model for the base of oxidation. The oxidation surface can be irregular across structural features. They reflect structural controls on oxidation which are inadequately sampled to resolve at this time. This base of oxidation surface was passed through the geological model to define the blocks above the base of oxidation.
14.2.2 MINERALIZATION MODEL
Mineralization at Sierra Blanca and YellowJacket occurs in two distinct settings; low grade disseminated mineralization and higher grade structurally controlled mineralization. The geological model has been constructed to reflect these two styles of mineralization. In areas of structurally controlled mineralization, individual domain volumes have been created. These domain volumes also consider cyanide shake leach data which indicates suitability for processing. In this way, mineralized domains are designed to both control estimation and insure the included mineralization is amenable to mineral processing.
Mineral domains used to control the estimation for mineralization are listed below:
| | 1. | Sierra Blanca: Disseminated gold mineralization found within the PreSB, SB Lower, SB Upper and Mélange volumes. |
| | 2. | Josh Vein Structure (Figure 14-6). |
| | 3. | Stockwork Vein zones that are adjacent to the main Josh Vein (Figure 14-7). |
| | 4. | Fault Zones that host mineralization and truncate the Josh Vein/Stockwork mineralization domains.(Figure 14-8) |
| | 5. | Air Track West Gravel: Mineralization hosted in Sober Up Gravels found in the Air Track West domain. |
Corvus Gold Corp. Technical Report – North Bullfrog Project | | Page | 168 |
Figure 14-4 Isometric View of Modeled Josh Vein Mineralization (Red).
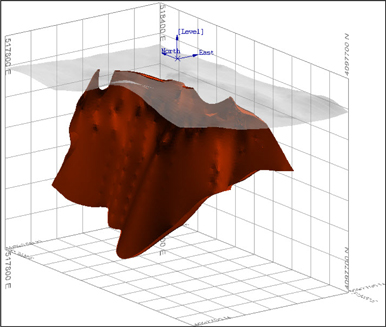
Figure 14-5 Isometric View of Modeled Stockwork Veining (Yellow) in the Footwall of the Josh Vein (Red)
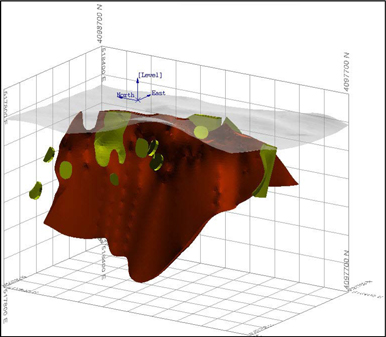
Corvus Gold Corp. Technical Report – North Bullfrog Project | | Page | 169 |
Figure 14-6 Isometric View of Modeled Stockwork Veining (Yellow) in the Hanging Wall of the Josh Vein (Red).
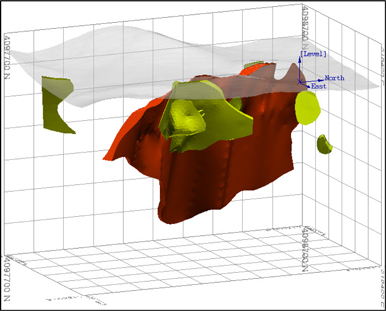
Figure 14-7 Isometric View of Modeled Fault Domains (Green) in the Foot Wall of the Josh Vein (Red).
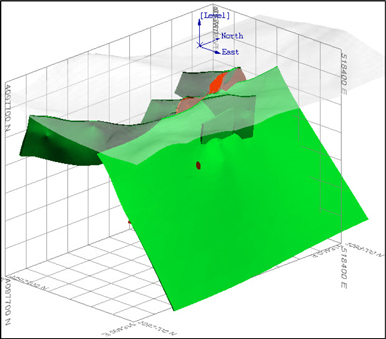
Corvus Gold Corp. Technical Report – North Bullfrog Project | | Page | 170 |
Figure 14-8 Isometric View of the Modeled Fault Domains (Green) in the Hanging Wall of the Josh Vein (Red).
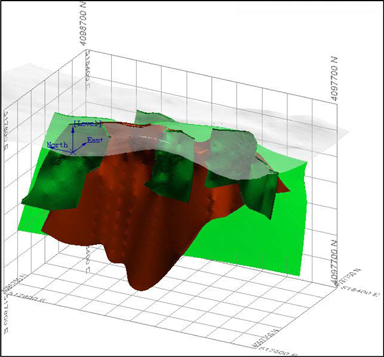
14.2.2.1 DISSEMINATED MINERALIZATION
Disseminated mineralization (“DM”) represents the majority of the mineralization at the Project and occurs in the Pre-Sierra Blanca volcanic rock, Sierra Blanca Tuff and Mélange. DM can be modelled by the estimation of grades within the Pre-SB and SB stratigraphic units (Lower and Upper) including the Mélange zone, a zone of complex faulting and mixed lithology types (SB and Rhyolite). Post mineralized extensional faulting has displaced the DM in the Sierra Blanca Tuff and Pre-Sierra Blanca units as much as 90 meters vertically.
14.2.2.2 YELLOWJACKET MINERALIZATION
14.2.2.2.1 JOSH VEIN
The Josh Vein domain is developed along the Vein Fault and has been modelled as a continuous volume. The volume represents the multiple stages and styles of veining associated with the Josh Vein mineralization. The location of the Josh Vein generally coincides with the point of stratigraphic displacement across the fault. The Josh Vein Domain was defined almost exclusively on the percentage of quartz veins logged in core holes and samples that showed significant cyanide soluble gold based on shake leach results. The reason for using this criteria rather than grade was that in some areas there is no grade associated with the veining.
Corvus Gold Corp. Technical Report – North Bullfrog Project | | Page | 171 |
14.2.2.2.2 STOCKWORK VEINING
Stockwork veining modeled shapes were created to capture areas where splay veining developed along subsidiary structures and in zones of fracturing where two faults interact. Wireframes were created to capture these areas of higher grade mineralization that show significant cyanide soluble gold based on the shake leach data. Modeled volumes vary in size but overall are restrictive laterally and vertically resulting in highly constrained estimates of mineralized material.
14.2.2.2.3 FAULT HOSTED MINERALIZATION
Fault domains were generated to represent a unique style of mineralization at Sierra Blanca. These domains capture disseminated pyrite within the wallrock immediately adjacent to regional scale faults. Fault hosted mineralization is believed to postdate the pervasive disseminated mineralization. Metallurgical testing indicates that gold in the oxidized parts of these faults responds well to cyanide leaching whereas the sulphide material has a much lower recovery. Below the oxide surface and within the main fault hosted zones, small volumes of material which responded well to cyanide shake leach tests were identified and modeled. These zones represent material below the oxide surface that may contribute to the reasonable prospects of eventual economic extraction.
14.2.3 EXPLORATORYDATA ANALYSIS
14.2.3.1 ASSAY STATISTICS
A total of 664 drill holes with 4,258 down hole surveys and 72,655 assays were provided to be used for the Project mineral estimate. Of these supplied drill holes, a total of 280 drill holes, totaling 57,348 meters, intersected the geologic solid models that define the Sierra Blanca and YellowJacket Deposits.
The drill holes were passed through the geologic solids and each assay was back tagged with a code and material type. These tags were used during the estimation process. Table 14-1 presents the gold assay statistics for each of the modeled geologic domains.
Corvus Gold Corp. Technical Report – North Bullfrog Project | | Page | 172 |
Table 14-1 Gold Assay Statistics Sorted By Domain
| Domain | Code | Material
Type | Number | Mean
Au
(g/t) | Stand.
Dev. | Min
Assay | Max
Assay | Coef.
of
Variation |
| Josh Vein | vn | Vein | 2433 | 3.55 | 16.67 | 0.01 | 431.00 | 4.70 |
| 56on286Stkwk | 56 | Stockwork | 10 | 0.47 | 0.14 | 0.27 | 0.73 | 0.30 |
| 66on256Stkwk | 66 | Stockwork | 5 | 1.31 | 1.57 | 0.14 | 4.04 | 1.20 |
| 85on321Stkwk | 85 | Stockwork | 4 | 28.25 | 55.83 | 0.26 | 112.00 | 1.98 |
| Au Stkwk 233 | 233 | Stockwork | 17 | 0.45 | 0.10 | 0.29 | 0.63 | 0.23 |
| Au 346 | 346 | Stockwork | 10 | 0.45 | 0.12 | 0.28 | 0.69 | 0.27 |
| Au Stkwk 403 | 403 | Stockwork | 11 | 0.42 | 0.11 | 0.27 | 0.63 | 0.26 |
| Au 346a | 346_a | Stockwork | 7 | 0.49 | 0.09 | 0.38 | 0.62 | 0.18 |
| A Fault Stkw | a flt | Stockwork | 3 | 13.71 | 22.05 | 0.86 | 39.17 | 1.61 |
| East Zone | east zone | Stockwork | 163 | 0.12 | 0.22 | 0.02 | 2.00 | 1.81 |
| ESZ01 | esz01 | Stockwork | 29 | 1.33 | 2.10 | 0.31 | 7.00 | 1.58 |
| ESZ01a | esz01_a | Stockwork | 3 | 3.50 | 5.71 | 0.15 | 10.10 | 1.63 |
| ESZ01b | esz01_b | Stockwork | 194 | 3.02 | 17.90 | 0.09 | 209.00 | 5.92 |
| ESZ02 | esz02 | Stockwork | 53 | 0.55 | 0.51 | 0.13 | 2.36 | 0.93 |
| ESZ03 | esz03 | Stockwork | 56 | 1.59 | 3.40 | 0.21 | 25.50 | 2.14 |
| EZ Stk01 | ez stk01 | Stockwork | 41 | 1.36 | 3.16 | 0.08 | 14.22 | 2.32 |
| EZ Stk02 | ez stk02 | Stockwork | 43 | 1.07 | 1.92 | 0.02 | 8.52 | 1.80 |
| NE30 FWStkwk | ne30 fwst | Stockwork | 16 | 0.50 | 0.23 | 0.17 | 0.93 | 0.46 |
| NE30 HWStkwk | ne30 hwst | Stockwork | 13 | 0.89 | 0.52 | 0.26 | 2.15 | 0.59 |
| NE30 HW2 | ne30 hwst2 | Stockwork | 11 | 0.35 | 0.14 | 0.16 | 0.60 | 0.42 |
| NE60Splay | ne60 splay | Stockwork | 9 | 0.38 | 0.13 | 0.24 | 0.61 | 0.34 |
| RhyZone | rhy zone2 | Stockwork | 48 | 2.33 | 3.94 | 0.15 | 18.05 | 1.69 |
| WSZ01 | wsz01 | Stockwork | 52 | 1.47 | 4.28 | 0.07 | 30.50 | 2.91 |
| WSZ01FW | wsz01_a | Stockwork | 14 | 0.72 | 0.71 | 0.13 | 2.48 | 0.98 |
| DGWDF | dgwdf | Fault | 286 | 0.30 | 0.50 | 0.0005 | 6.49 | 1.63 |
| Liberator | liberator | Fault | 91 | 1.50 | 3.03 | 0.001 | 17.30 | 2.03 |
| LibHW | liberator_a | Fault | 54 | 0.46 | 0.25 | 0.03 | 1.71 | 0.55 |
| LibYJCross | Liberator_b | Fault | 8 | 1.77 | 2.33 | 0.07 | 7.16 | 1.32 |
| NE30 | ne30 | Fault | 260 | 0.85 | 0.93 | 0.002 | 6.22 | 1.09 |
| NE50 | ne50 | Fault | 76 | 0.60 | 1.54 | 0.003 | 8.85 | 2.58 |
| NE60 | ne60 | Fault | 105 | 0.45 | 1.18 | 0.0005 | 11.75 | 2.64 |
| Pre SB, Lower SB, Upper SB | diss | Disseminated | 25210 | 0.16 | 0.20 | 0.0005 | 4.57 | 1.25 |
| Melange | Mel | Disseminated | 626 | 0.13 | 0.19 | 0.0005 | 2.05 | 1.47 |
| Air Track West Gravel | ATWG | Gravel | 2073 | 0.08 | 0.28 | 0.0005 | 3.72 | 3.62 |
| PostSB, Camb, Unknown | waste | Waste | 9276 | 0.05 | 0.16 | 0.0005 | 4.7 | 3.08 |
Corvus Gold Corp. Technical Report – North Bullfrog Project | | Page | 173 |
14.2.3.2 CAPPING
Grade distributions for gold and silver within each of the different material types was examined to determine if capping was required and, if so, at what level. Assays for each material type were graphically displayed as histograms and as log normal probability plots. The Josh Vein samples were capped at the 99.5th percentile where a natural break occurred in the log normal distribution curve. Stockwork and Fault samples were capped using the mean plus three standard deviations. Disseminated and Gravel samples were not capped. A detailed review of the disseminated group assays and statistics revealed that only one assay was outside of the population. This sample has a value of 4.57 g/t Au and is isolated at the bottom of the deposit, well below the oxide surface therefore would not impact the estimate of mineral resources. Highly anomalous Gravel samples from holes GS-45, GS-79 and NB-12-117 were drilled within a 3 meter radius and confirmed the gold grades in this zone. Table 14-2 describes the gold assay capping applied to the mineral resource estimate.
Table 14-2 Capping and Number Capped For Each Group
| Material Type | Au Cap (g/t) | Number Capped | Ag Cap (g/t) | Number Capped |
| Josh Vein | 100 | 12 | 750 | 11 |
| Stockwork | 31.3 | 5 | 52.3 | 7 |
| Fault | 4.72 | 15 | 58.7 | 12 |
The results from capping (Table 14-3) showed reduced standard deviations and reduced coefficients of variation in all groups when compared to the uncapped assays (Table 14-4).
Table 14-3 Capped Assay Statistics for Gold Sorted By Group
| Material Type | Number | Mean Au
(g/t) | Stand. Dev. | Min Assay | Max Assay | Coef.
of Variation |
| Josh Vein | 2433 | 3.08 | 9.95 | 0.01 | 100 | 3.23 |
| Stockwork | 812 | 1.10 | 3.35 | 0.017 | 31.3 | 3.06 |
| Fault | 880 | 0.58 | 0.85 | 0.0005 | 4.72 | 1.45 |
| Disseminated | 25,836 | 0.16 | 0.20 | 0.0005 | 4.57 | 1.24 |
| Gravel | 2,073 | 0.08 | 0.28 | 0.0005 | 3.72 | 3.62 |
Table 14-4 Uncapped Assay Statistics for Gold Sorted by Group
| Material Type | Number | Mean Au
(g/t) | Stand.
Dev. | Min Assay | Max Assay | Coef. Of
Variation |
| Josh Vein | 2433 | 3.55 | 16.67 | 0.01 | 431.00 | 4.70 |
| Stockwork | 812 | 1.58 | 9.90 | 0.02 | 209.00 | 6.25 |
| Fault | 880 | 0.65 | 1.35 | 0.0005 | 17.30 | 2.07 |
| Disseminated | 25,836 | 0.16 | 0.20 | 0.0005 | 4.57 | 1.25 |
| Gravel | 2,073 | 0.08 | 0.28 | 0.0005 | 3.72 | 3.62 |
Corvus Gold Corp. Technical Report – North Bullfrog Project | | Page | 174 |
14.2.4 COMPOSITES
Capped drillhole assays for Sierra Blanca were composited using 5 meter down–the–hole composite lengths. Composite lengths were chosen based on the anticipated mine selectivity of 5 meters which corresponds to the block size length in the z-direction. A total of 11,626 x 5m gold composites and 10,832 x 5m Ag composites were constructed. Intervals with missing assays were ignored and a new composite centroid was generated at that point. Geologic domain triangulations were treated as hard boundaries. A composite would truncate at a geologic boundary and then a new composite would be generated. This method reduces the amount of contact dilution between the different mineralization types found in this deposit. A merge tolerance of 2.5 meters was also used to limit the number of “short” composites lengths in the database. Small intervals at the solid boundaries less than 2.5 meters were combined with adjoining samples to produce a composite of 5.0 ± 2.5 meters. Composite statistics are compiled and listed in Table 14-5.
Table 14-5 Composite Statistics for Gold Sorted By Group
| Material Type | Number | Mean Au
(g/t) | Stand. Dev. | Min Assay | Max Assay | Coef. Of
Variation |
| Disseminated | 7374 | 0.16 | 0.16 | 0.0005 | 1.90 | 1.06 |
| Josh Vein | 465 | 1.80 | 3.38 | 0.0298 | 25.67 | 1.87 |
| Stockwork | 177 | 0.92 | 1.38 | 0.017 | 9.50 | 1.51 |
| Fault | 237 | 0.50 | 0.64 | 0.0005 | 4.22 | 1.27 |
| Gravel | 638 | 0.08 | 0.27 | 0.0005 | 3.01 | 3.43 |
14.2.5 BLOCK MODEL
The Mineral Resource model contains information about the deposit and is stored variably in each block. The information stored includes:
| | · | Estimated characteristics of Au and Ag |
| | · | Percentage of block below the surface topography (Mined variable) |
| | · | Percentage of block in each of the four mineralized zones (Josh Vein, Stockwork Veining, Fault Hosted and Disseminated) |
| | · | Structural domains defined by fault block triangulations (Total of 15 structural domains) |
| | · | Specific gravity defined by geologic triangulations |
| | · | Oxide type relative to a modeled oxide-sulphide surface. |
Table 14-6 outlines the framework for the Sierra Blanca block model.
Table 14-6 Sierra Blanca Block Model Framework
| Item | Easting | Northing | Elevation |
| Block Model Reference Point | 516760 | 4096460 | 720 |
| Number of Blocks | 197 | 259 | 148 |
| Parent Block Size | 10 | 10 | 5 |
Corvus Gold Corp. Technical Report – North Bullfrog Project | | Page | 175 |
14.2.6 BULK DENSITY
A total of 1,365 specific gravity measurements were used to define the density value of each block based on modeled lithology types. Basic statistics were compiled and tabulated (Table 14-7). The final density values assigned to the model were derived by eliminating 10% of the lowest and highest density values for each lithology type and using the mean value.
Table 14-7 Lithology Types and Corresponding Specific Gravity Values
| Lithology | All Samples | Minus 10% of Lowest and Highest Values |
| Count | min | max | mean | Count | min | max | mean |
| Post SB | 462 | 1.88 | 2.64 | 2.33 | 370 | 2.15 | 2.49 | 2.34 |
| Mélange | 40 | 1.74 | 2.53 | 2.34 | 32 | 2.2 | 2.49 | 2.36 |
| SB Middle | 484 | 2.04 | 2.63 | 2.42 | 387 | 2.29 | 2.54 | 2.43 |
| SB Lower | 165 | 2.19 | 2.58 | 2.46 | 132 | 2.33 | 2.55 | 2.47 |
| Pre SB | 1 | 1.86 | 1.86 | 1.86 | 1 | 1.86 | 1.86 | 1.86 |
| Camb | 1 | 2.56 | 2.56 | 2.56 | 1 | 2.56 | 2.56 | 2.56 |
| Gravel | 1 | 1.85 | 1.85 | 1.85 | 1 | 1.85 | 1.85 | 1.85 |
| Unknown Default | 1 | 1.85 | 1.85 | 1.85 | 1 | 1.85 | 1.85 | 1.85 |
| Rhyolite_9 | 68 | 1.85 | 2.50 | 2.18 | 54 | 2.00 | 2.41 | 2.18 |
| Rhyolite | 142 | 2.06 | 2.60 | 2.43 | 114 | 2.25 | 2.55 | 2.44 |
14.2.7 GRADE INTERPOLATION
Grades for gold and silver were estimated into the four mineralized material domains. Each material type and their corresponding composites were evaluated independently with unique estimation parameters. Estimation parameters were selected to best represent the style of mineralization and structural attitude of each component. The following sections outline the grade estimation for Josh Vein, Stockwork Veining, Fault Hosted and Disseminated mineralization.
14.2.7.1 YELLOWJACKET MINERALIZATION
14.2.7.1.1 JOSH VEIN
Grades for Gold and Silver were estimated using inverse distance to the third power (ID3). Search ellipsoid orientations and dimension were determined by evaluating the structural characteristics, and drill density along the vein. Two search ellipsoid orientations were utilized to accommodate a strike change in the Josh Vein. Vein blocks were flagged with an integer value (1-3) according to the orientation of the vein in its corresponding domain. Figure 14-7 is a horizontal section showing the three domains and the orientation of the two search ellipsoids used to estimate grades. A two pass estimation was performed using different minimum and maximum sample counts, minimum number of holes and search ellipsoid dimensions for each pass (Table 14-8). Blocks estimated on the first pass were flagged accordingly and omitted during the second pass. Only samples flagged in the composite file as Josh Vein were used during the estimation of Josh Vein blocks. Composites with lengths less than 1.0 meters were omitted from the estimation to eliminate the impact of short composites on the mineral estimate.
Corvus Gold Corp. Technical Report – North Bullfrog Project | | Page | 176 |
Table 14-8 Josh Vein Estimation Parameters for Au and Ag
| Josh Vein Estimation Parameters |
| Estimation Type | Inverse Distance Cubed (ID3) |
| Search Ellipsoid | Bearing | Plunge | Dip |
| Domain 1 and 3 | 340 | 0 | -70 |
| Domain 2 | 20 | 0 | -70 |
| Search Distance | Major Axis | Semi-Major Axis | Minor Axis |
| Pass 1 | 75 | 75 | 25 |
| Pass 2 | 150 | 150 | 25 |
| Samples | Min | Max | |
| Pass 1 | 4 | 6 |
| Pass 2 | 2 | 10 |
| Maximum Samples per Drillhole | Max |
| Pass 1 | 3 |
| Pass 2 | 1 |
Corvus Gold Corp. Technical Report – North Bullfrog Project | | Page | 177 |
Figure 14-9 Josh Vein Estimation Vector Map (Elevation 1,200 m)
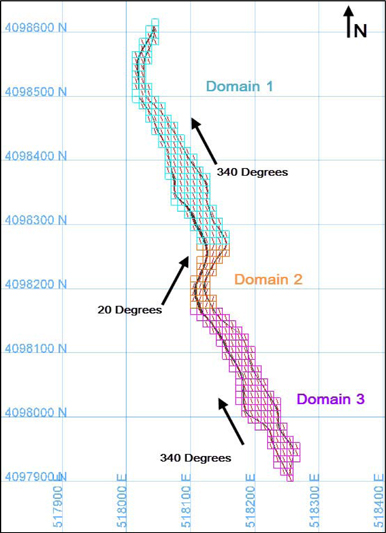
14.2.7.1.2 STOCKWORK VEINING
Two methods were used to determine the gold and silver grades for the stockwork domains (stockwork) due to size of the modeled volumes. A total of 23 unique stockwork domains were identified and modeled. Of the 23 zones, 19 were too small and did not have enough samples/drill holes to support a typical grade estimation technique such as inverse distance. To evaluate these small volumes weighted average grades based on composite length were calculated and then assigned to the 19 smaller stockwork zones (Table 14-9). Not all composite lengths represent true thickness. The remaining 4 larger modeled stockwork zones were independently estimated using inverse distance to the third power (ID3). Search ellipsoid orientations and dimensions were determined by evaluating the structural characteristics, drill density along the individual stockwork zones and modeled stockwork shapes (Table 14-10). Individual two pass estimations were performed using different minimum and maximum sample counts, minimum number of holes and search ellipsoid dimensions for each pass (Table 14-10). Blocks estimated on the first pass were flagged accordingly and omitted during the second pass. Only unique samples flagged in the composite file in each stockwork zone were used during the interpolation corresponding stockwork blocks. For example: Only composites flagged asst05 were used to estimate blocks flagged asst05. Composite with lengths less than 2.5 meters were omitted from the estimation to eliminate the impact of short composites on the mineral estimate.
Corvus Gold Corp. Technical Report – North Bullfrog Project | | Page | 178 |
The block grade, for gold in the stockwork mineralized domains, is a weighted average based on the total percent of stockwork mineralization.
Table 14-9 Calculated Weighted Average Stockwork Au and Ag Grades
| Calculated Average Stockwork Grades (Weighted by Composite Length) |
| Stockwork Zone | Number of
Composites | Total Length of
Composites | Au ppm | Ag ppm |
| st01 | 3 | 13.75 | 0.46 | 1.96 |
| st02 | 2 | 7.62 | 1.31 | 3.43 |
| st03 | 1 | 5.58 | 9.50 | 7.67 |
| st04 | 1 | 3.2 | 7.68 | 35.01 |
| st05 | Estimated ID3 |
| st06 | 6 | 31.36 | 1.44 | 1.62 |
| st06a | 1 | 2.2 | 4.70 | 5.43 |
| st06b | Estimated ID3 |
| st07 | Estimated ID3 |
| st08 | 13 | 61.08 | 1.46 | 3.17 |
| st09 | 7 | 35.04 | 1.06 | 2.87 |
| st10 | 11 | 51.67 | 0.84 | 2.38 |
| st11 | 2 | 10.41 | 0.48 | 0.90 |
| st12 | 2 | 9.22 | 0.48 | 0.67 |
| st13 | 3 | 16.6 | 0.50 | 1.54 |
| st14 | 2 | 10.68 | 0.81 | 16.69 |
| st15 | 2 | 11.05 | 0.35 | 9.41 |
| st16 | 3 | 13.69 | 0.38 | 0.32 |
| st17 | 11 | 51.5 | 1.53 | 2.67 |
| st18 | Estimated ID3 |
| st18a | 3 | 15.68 | 0.60 | 3.53 |
| st19 | 5 | 25.91 | 0.45 | 1.41 |
| st20 | 3 | 13.32 | 0.41 | 1.63 |
Corvus Gold Corp. Technical Report – North Bullfrog Project | | Page | 179 |
Table 14-10 Stockwork Veining Estimation Parameters for Au and Ag
| Stockwork Veining Estimation Parameters |
| Estimation Type | Inverse Distance Cubed (ID3) |
| Search Ellipsoid | Bearing | Plunge | Dip |
| st05 | 10 | 0 | -65 |
| st06b | 190 | 0 | -84 |
| st07 | 340 | 0 | -65 |
| st18 | 340 | 0 | -75 |
| Search Distance | Major Axis | Semi-Major Axis | Minor Axis |
| Pass 1 | 50 | 50 | 25 |
| Pass 2 | 100 | 100 | 25 |
| Samples | Min | Max | |
| Pass 1 | 2 | 4 |
| Pass 2 | 2 | 10 |
| Maximum Samples per Drillhole | Max |
| Pass 1 | 1 |
| Pass 2 | 2 |
14.2.7.1.3 FAULT HOSTED MINERALIZATION
Grades for gold and silver were estimated using inverse distance to the third power (ID3). Search ellipsoid orientations and dimension were determined by evaluating the structural characteristics and drill density along the modeled fault zone shapes. Individual single pass estimations were performed where only fault zone samples flagged in the composite file were used during the interpolation of blocks that have a fault percent value greater than 0.0%. For example: Only samples flagged asft01 were used to estimate blocks with flagged asft01. Table 14-11 lists the different search ellipsoid orientation for each fault zone, search distances used and minimum and maximum number of samples used in each estimation. Composite with lengths less than 2.5 meters were omitted from the estimation to eliminate the impact of short composites on the mineral estimate.
The block grade, for gold in the fault hosted mineralized, is a weighted average based on the total percent of fault mineralization.
Corvus Gold Corp. Technical Report – North Bullfrog Project | | Page | 180 |
Table 14-11 Fault Hosted Mineralization Estimation Parameters
| Fault Hosted Mineralization Estimation Parameters |
| Estimaton Type | Inverse Distance Cubed (ID3) |
| Search Ellipsoid | Bearing | Plunge | Dip |
| ft01 | 0 | 0 | -45 |
| ft02 | 10 | 0 | -70 |
| ft03 | 20 | 0 | -70 |
| ft04 | 40 | 0 | -90 |
| ft05 | 170 | 0 | -70 |
| ft05a | 20 | 0 | -75 |
| ft05b | 170 | 0 | -80 |
| Search Distance | Major Axis | Semi-Major Axis | Minor Axis |
| Pass 1 | 100 | 100 | 20 |
| Samples | Min | Max | |
| Pass 1 | 2 | 8 |
| Maximum Samples per Drillhole | Min | Max |
| Pass 1 | N/A |
14.2.8 DISSEMINATED MINERALIZATION
Grades for gold and silver were estimated into blocks using two different methods, Ordinary Kriging and inverse distance to the third power (ID3). Ordinary Kriging was utilized to estimate grades into combined Pre, Upper and Lower SB DM and ID3 was used to estimate the Air Track West Gravels (ATWG). During the Ordinary Kriging estimation, a total of 15 individual estimation runs were completed within structural domains (fault blocks). Only composites and blocks in the same domain were allowed to be used during the interpolation. This prevented mineralization within stratigraphic horizons to have influence on adjacent stratigraphic horizons that have been displaced by post mineral faulting. Single pass estimation runs were used in all cases. Drillhole data was used to define a variogram for the Ordinary Kriging and a uniform search ellipsoid was used for the ID3 interpolation. A final percent disseminated value was calculated by subtracting the structural components (Josh Vein, Stockwork and Fault) percent values. In areas where Josh Vein, Stockwork and Fault zones were not estimated, the percent of un-estimated material was added to the percent of disseminated material and assigned the disseminated gold and silver grade associated with that block. This methodology reflects the paragenesis of the deposit (disseminated mineralization overprinted by structurally controlled mineralization). Table 14-12 lists the variogram model parameters and Table 14-13 lists the estimation parameters used for Ordinary Kriging. Table 14-14 lists the estimation parameters used for the ID3 interpolation of the ATWG.
Corvus Gold Corp. Technical Report – North Bullfrog Project | | Page | 181 |
Table 14-12 Variogram Model Parameters
| Variogram Model Parameters |
| Nugget | 0.2 | Number of Structures | 2 | Distance (m) |
| Variogram Type | Sill Differential | Bearing | Plunge | Dip | Major
Axis | Semi-Major
Axis | Minor
Axis |
| Spherical | 0.651 | 30 | 0 | -30 | 47.88 | 16.1 | 13.88 |
| Spherical | 0.1 | 30 | 0 | -30 | 163 | 107 | 50.1 |
Figure 14-10 Major Variogram Model.
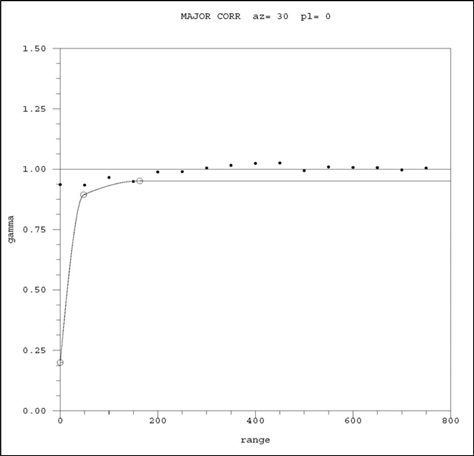
Corvus Gold Corp. Technical Report – North Bullfrog Project | | Page | 182 |
Table 14-13 Ordinary Kriging Estimation Parameters
| PreSB, SB Lower and SB Upper Estimation Parameters |
| Estimation Type | Ordinary Kriging |
| Search Ellipsoid | Bearing | Plunge | Dip |
| Pass 1 | 30 | 0 | -30 |
| Search Distance | Major Axis | Semi-Major Axis | Minor Axis |
| Pass 1 | 160 | 50 | 50 |
| Samples | Min | Max | |
| Pass 1 | 4 | 16 |
| Maximum Samples per Drillhole | Max |
| Pass 1 | 10 |
Table 14-14 Inverse Distance Cubed (ATWG) Estimation Parameters
| Air Track West Gravel Estimation Parameters |
| Estimation Type | Inverse Distance Cubed (ID3) |
| Search Ellipsoid | Bearing | Plunge | Dip |
| Pass 1 | 0 | 0 | 0 |
| Search Distance | Major Axis | Semi-Major Axis | Minor Axis |
| Pass 1 | 50 | 50 | 50 |
| Samples | Min | Max | |
| Pass 1 | 4 | 10 |
| Maximum Samples per Drillhole | Max |
| Pass 1 | 3 |
14.3 JOLLY JANE ZONE ESTIMATION
Ninety-four (94) reverse circulation drill holes and 5 surface outcrop channel sample lines define the Jolly Jane zone. Within the 9,450 gold assays supplied for Jolly Jane a total of 61 gaps in the assay record were identified. These gaps were filled with values of 0.001 g/t Au.
14.3.1 GEOLOGIC MODEL FOR JOLLY JANE
The geologic model for the Jolly Jane was built by Corvus geologists.
The 3D geology for Jolly Jane was modeled as two surfaces, one describing the lower contact of the mineralized Crater Flat Tuff and the other describing the upper contact. These 3D surfaces were constructed by Corvus geologists and are shown in Figure 14-3. The lower contact is sometimes the original depositional contact on Tertiary sediments or the basement Paleozoic sediments. However, in other places the lower contact is with post-mineral dacite intrusions. The lower contact has been offset by a series of west dipping faults. The upper contact is generally defined by post-mineral dacite intrusions or locally the next stratigraphic unit. Because the dacites are post-mineral they are not offset by the same faults as the lower contact. There are some minor internal dacite intervals. These dacites are a different composition to the post mineral intrusions and they are generally mineralized so they have been included in the volume between the upper and lower contacts. The upper and lower contacts have been extended north and south to the limits that should be modeled. Consequently, the volume to model should be defined by the upper and lower contacts together with the topography and then the ends should just be clipped with vertical planes which coincide with the edge of the triangulated surfaces.
Corvus Gold Corp. Technical Report – North Bullfrog Project | | Page | 183 |
Figure 14-11 Isometric View of Jolly Jane Looking Northeasterly Showing Mineralization Solid in Red, Drill Holes in Green and Surface Topography in Grey.
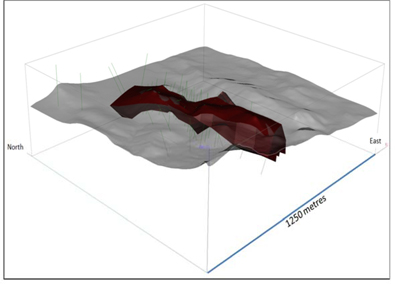
14.3.2 DATA ANALYSIS JOLLY JANE
Drill holes were compared to the geologic solid and the assays were back tagged with a mineralized code if inside the solid. The sample statistics are tabulated below (Table 14-15).
Table 14-15 Summary of Assay Statistics for Jolly Jane Mineralized Solid
| | Inside Solid | Outside Solid |
| | Au (g/t) | Ag (g/t) | Au (g/t) | Ag (g/t) |
| Number of Samples | 4,585 | 4,417 | 4,549 | 4,390 |
| Mean Grade | 0.143 | 0.361 | 0.033 | 0.288 |
| Standard Deviation | 0.164 | 0.378 | 0.075 | 0.639 |
| Minimum Value | 0.001 | 0.005 | 0.001 | 0.005 |
| Maximum Value | 1.45 | 4.46 | 0.93 | 17.75 |
| Coefficient of Variation | 1.14 | 1.04 | 2.29 | 2.22 |
The grade distribution for gold was evaluated using a lognormal cumulative frequency plot for samples within the mineralization solid. Five overlapping lognormal populations made up the gold distribution for the mineralized zone. The highest grade population, with a mean value of 0.85 g/t Au, represented 0.73% of the data or 33 samples and was not considered erratic high grade. A cap level was chosen at two standard deviations above the mean of this highest grade population. A cap value of 1.78 g/t Au was used and no assays required capping.
Corvus Gold Corp. Technical Report – North Bullfrog Project | | Page | 184 |
A similar exercise was completed for silver within the mineralization solid. No silver assays within the mineralization zone required capping.
For assays outside the mineralization solid a total of 55 assays were capped at 0.35 g/t Au and 13 assays were capped at 4.4 g/t Ag.
14.3.3 COMPOSITES JOLLY JANE
Drill holes at Jolly Jane were compared to the mineralization solid and the points at which each hole entered and left the solid were recorded. Uniform down hole composites, 5 metres in length, were formed and made to honor the solid boundaries. Intervals less than ½ the composite length at the solid boundaries were joined with adjoining samples to produce a composites file of uniform support, 5± 2.5 metres in length. The statistics for 5 metres composites are summarized below (Table 14-16). A similar exercise was completed for samples outside the solid.
Table 14-16 Summary of 5 M Composite Statistics for Mineralization Solid Jolly Jane
| | Mineralized Solid | Outside Solid |
| | Au (g/t) | Ag (g/t) | Au (g/t) | Ag (g/t) |
| Number of Samples | 1,441 | 1,408 | 1,414 | 1,396 |
| Mean Grade | 0.144 | 0.37 | 0.031 | 0.31 |
| Standard Deviation | 0.152 | 0.41 | 0.057 | 0.55 |
| Minimum Value | 0.001 | 0.005 | 0.001 | 0.005 |
| Maximum Value | 1.28 | 4.46 | 0.35 | 4.40 |
| Coefficient of Variation | 1.06 | 1.10 | 1.85 | 1.78 |
14.3.4 VARIOGRAPHY JOLLY JANE
Pairwise relative semivariograms were used to model the gold continuity at Jolly Jane. The direction of longest continuity for gold in the horizontal plane was along azimuth 0° dipping -30°. In the plane perpendicular to this the longest continuity was along azimuth 90o dipping -40o. Nested spherical models were fit to all directions. The nugget to sill ratio of 16% for Au and 11% for Ag were very good. For Au and Ag in waste isotropic spherical models were produced. The parameters are tabulated below.
The parameters are tabulated in Table 14-17.
Corvus Gold Corp. Technical Report – North Bullfrog Project | | Page | 185 |
Table 14-17 Summary of Jolly Jane Gold and Silver Semivariogram Parameters
| Domain | Azimuth | Dip | Co | C1 | C2 | Short Range (m) | Long Range (m) |
Mineralized Solid Au | 0o | -30o | 0.10 | 0.10 | 0.43 | 20 | 120 |
| 90o | -20o | 0.10 | 0.10 | 0.43 | 30 | 110 |
| 270o | -70o | 0.10 | 0.10 | 0.43 | 20 | 50 |
Mineralized Solid Ag | 0o | -30o | 0.05 | 0.10 | 0.30 | 30 | 120 |
| 90o | -40o | 0.05 | 0.10 | 0.30 | 40 | 80 |
| 270o | -50o | 0.05 | 0.10 | 0.30 | 15 | 60 |
| Waste Au | Omni Directional | 0.15 | 0.15 | 0.40 | 25 | 90 |
| Waste Ag | Omni Directional | 0.10 | 0.10 | 0.35 | 30 | 100 |
14.3.5 BULK DENSITY JOLLY JANE
During the 2010 drill campaign on the North Bullfrog Project, a total of 102 samples of RC chips were sent to ALS Minerals for specific gravity measurements by pycnometer (method OA-GRA08b). The average specific gravity from 46 samples within the oxidized Tuff units from mineralization zones drilled in 2010 was 2.60.
During the 2012 drill campaign 74 specific gravity determinations were made from drill core which is far more representative than RC Chips, as porosity is included. Of these samples 59 were within the Crater Flat Tuff unit which hosts the mineralization at Jolly Jane. The average specific gravity from these samples, listed in Table 14-18, was 2.34.
Corvus Gold Corp. Technical Report – North Bullfrog Project | | Page | 186 |
Table 14-18 Specific Gravity Determinations for Tuff Units-Jolly Jane
| HoleID | SampleID | From_m | To_m | SG | StratUnit1 |
| NB-12-130 | M610829 | 17.68 | 20.73 | 2.48 | fault zone |
| NB-12-130 | M610836 | 35.97 | 39.01 | 2.43 | fault zone |
| NB-12-130 | M610838 | 42.06 | 45.11 | 2.44 | fault zone |
| NB-12-130 | M610851 | 79.56 | 82.76 | 1.93 | fault zone |
| NB-12-130 | M610855 | 89.31 | 92.50 | 1.96 | fault zone |
| NB-12-131 | M612269 | 11.44 | 13.50 | 2.38 | fault zone |
| NB-12-131 | M612279 | 36.10 | 39.01 | 2.21 | fault zone |
| NB-12-131 | M612283 | 44.40 | 46.33 | 2.23 | fault zone |
| Average | | | | 2.26 | Fault zones |
| NB-12-131 | M612265 | 0.00 | 3.05 | 2.36 | Crater Flat Tuff |
| NB-12-131 | M612266 | 3.05 | 6.27 | 2.37 | Crater Flat Tuff |
| NB-12-131 | M612267 | 6.27 | 9.40 | 2.41 | Crater Flat Tuff |
| NB-12-130 | M610859 | 101.80 | 105.55 | 2.44 | lower Crater Flat Tuff |
| NB-12-130 | M610860 | 105.55 | 109.42 | 2.43 | lower Crater Flat Tuff |
| NB-12-130 | M610824 | 2.20 | 5.38 | 2.34 | middle Crater Flat Tuff |
| NB-12-130 | M610825 | 5.38 | 8.45 | 2.43 | middle Crater Flat Tuff |
| NB-12-130 | M610826 | 8.45 | 11.58 | 2.40 | middle Crater Flat Tuff |
| NB-12-130 | M610827 | 11.58 | 14.63 | 2.39 | middle Crater Flat Tuff |
| NB-12-130 | M610828 | 14.63 | 17.68 | 2.41 | middle Crater Flat Tuff |
| NB-12-130 | M610830 | 20.73 | 23.77 | 2.38 | middle Crater Flat Tuff |
| NB-12-130 | M610831 | 23.77 | 26.82 | 2.47 | middle Crater Flat Tuff |
| NB-12-130 | M610832 | 26.82 | 29.87 | 2.41 | middle Crater Flat Tuff |
| NB-12-130 | M610834 | 29.87 | 32.92 | 2.40 | middle Crater Flat Tuff |
| NB-12-130 | M610835 | 32.92 | 35.97 | 2.47 | middle Crater Flat Tuff |
| NB-12-130 | M610837 | 39.01 | 42.06 | 2.39 | middle Crater Flat Tuff |
| NB-12-130 | M610839 | 45.11 | 48.11 | 2.43 | middle Crater Flat Tuff |
| NB-12-130 | M610840 | 48.11 | 51.21 | 2.50 | middle Crater Flat Tuff |
| NB-12-130 | M610841 | 51.21 | 54.25 | 2.52 | middle Crater Flat Tuff |
| NB-12-130 | M610842 | 54.25 | 57.30 | 2.47 | middle Crater Flat Tuff |
| NB-12-130 | M610844 | 57.30 | 60.35 | 2.45 | middle Crater Flat Tuff |
| NB-12-130 | M610845 | 60.35 | 63.74 | 2.43 | middle Crater Flat Tuff |
| NB-12-130 | M610846 | 63.74 | 67.18 | 2.33 | middle Crater Flat Tuff |
| NB-12-130 | M610847 | 67.18 | 70.30 | 2.32 | middle Crater Flat Tuff |
| NB-12-130 | M610848 | 70.30 | 73.34 | 2.34 | middle Crater Flat Tuff |
| NB-12-130 | M610849 | 73.34 | 76.48 | 2.01 | middle Crater Flat Tuff |
| NB-12-130 | M610850 | 76.48 | 79.56 | 2.06 | middle Crater Flat Tuff |
| NB-12-130 | M610852 | 82.76 | 86.26 | 1.98 | middle Crater Flat Tuff |
| NB-12-130 | M610854 | 86.26 | 89.31 | 1.95 | middle Crater Flat Tuff |
| NB-12-130 | M610856 | 92.50 | 95.52 | 2.17 | middle Crater Flat Tuff |
Corvus Gold Corp. Technical Report – North Bullfrog Project | | Page | 187 |
| HoleID | SampleID | From_m | To_m | SG | StratUnit1 |
| NB-12-130 | M610857 | 95.52 | 98.63 | 2.30 | middle Crater Flat Tuff |
| NB-12-130 | M610858 | 98.63 | 101.80 | 2.27 | middle Crater Flat Tuff |
| NB-12-131 | M612276 | 27.53 | 30.29 | 2.34 | middle Crater Flat Tuff |
| NB-12-131 | M612277 | 30.29 | 33.22 | 2.39 | middle Crater Flat Tuff |
| NB-12-131 | M612278 | 33.22 | 36.10 | 2.32 | middle Crater Flat Tuff |
| NB-12-131 | M612280 | 39.01 | 42.06 | 2.35 | middle Crater Flat Tuff |
| NB-12-131 | M612282 | 42.06 | 44.40 | 2.31 | middle Crater Flat Tuff |
| NB-12-131 | M612284 | 46.33 | 49.68 | 2.36 | middle Crater Flat Tuff |
| NB-12-131 | M610862 | 49.68 | 52.73 | 2.28 | middle Crater Flat Tuff |
| NB-12-131 | M610863 | 52.73 | 56.66 | 2.21 | middle Crater Flat Tuff |
| NB-12-131 | M610864 | 56.66 | 60.35 | 2.34 | middle Crater Flat Tuff |
| NB-12-131 | M610865 | 60.35 | 64.10 | 2.38 | middle Crater Flat Tuff |
| NB-12-131 | M610866 | 64.10 | 67.97 | 2.40 | middle Crater Flat Tuff |
| NB-12-131 | M610867 | 67.97 | 71.60 | 2.49 | middle Crater Flat Tuff |
| NB-12-131 | M610868 | 71.60 | 75.24 | 2.45 | middle Crater Flat Tuff |
| NB-12-131 | M610869 | 75.24 | 78.64 | 2.37 | middle Crater Flat Tuff |
| NB-12-131 | M610870 | 78.64 | 81.69 | 2.42 | middle Crater Flat Tuff |
| NB-12-131 | M610872 | 81.69 | 84.73 | 2.22 | middle Crater Flat Tuff |
| NB-12-131 | M610873 | 84.73 | 87.78 | 2.30 | middle Crater Flat Tuff |
| NB-12-131 | M610874 | 87.78 | 90.83 | 2.29 | middle Crater Flat Tuff |
| NB-12-131 | M610875 | 90.83 | 93.88 | 2.31 | middle Crater Flat Tuff |
| NB-12-131 | M610876 | 93.88 | 97.88 | 2.22 | middle Crater Flat Tuff |
| NB-12-131 | M610877 | 97.88 | 101.72 | 2.50 | middle Crater Flat Tuff |
| NB-12-131 | M610878 | 101.72 | 105.58 | 2.47 | middle Crater Flat Tuff |
| NB-12-131 | M610879 | 105.58 | 109.32 | 2.43 | middle Crater Flat Tuff |
| NB-12-131 | M610880 | 109.32 | 112.34 | 2.22 | middle Crater Flat Tuff |
| NB-12-131 | M610882 | 112.34 | 116.30 | 2.13 | middle Crater Flat Tuff |
| NB-12-131 | M610883 | 116.30 | 119.40 | 2.34 | middle Crater Flat Tuff |
| NB-12-131 | M610884 | 119.40 | 120.94 | 2.10 | middle Crater Flat Tuff |
| Average | | | | 2.34 | Crater Flat Tuff |
| NB-12-131 | M612268 | 9.40 | 11.44 | 2.16 | dacite breccia |
| NB-12-131 | M612270 | 13.50 | 16.68 | 2.33 | dacite breccia |
| NB-12-131 | M612272 | 16.68 | 19.80 | 2.51 | dacite breccia |
| NB-12-131 | M612273 | 19.80 | 23.49 | 2.48 | dacite breccia |
| NB-12-131 | M612274 | 23.49 | 26.92 | 2.45 | dacite breccia |
| NB-12-131 | M612275 | 26.92 | 27.53 | 2.25 | dacite breccia |
| NB-12-131 | M610885 | 120.94 | 122.40 | 2.32 | dacite breccia |
| Average | | | | 2.36 | Dacite Breccia |
For this estimate a specific gravity of 2.34 was used to determine tonnage.
Corvus Gold Corp. Technical Report – North Bullfrog Project | | Page | 188 |
14.3.6 BLOCK MODEL JOLLY JANE
A block model with blocks 10 x 10 x 5 metres in dimension was superimposed over the Jolly Jane mineralization solid. The block model origin was as follows:
Lower left corner of model
| 518650 E | Column width – 10 m | 75 columns |
| | | |
| 4095860 N | Row width – 10 m | 127 rows |
| | | |
| Top of Model | | |
| 1400 Elevation Level width – 5 m | 80 levels | |
| | | |
| No Rotation | | |
Within each block the percentage below surface topography and the percentage within the mineralization solid were recorded.
14.3.7 GRADE INTERPRETATIONS
Grades for gold were interpolated by ordinary kriging into all blocks, with some percentage within the Jolly Jane mineralization solid. Kriging was completed in a series of passes with the dimensions and orientation of the search ellipse for each pass tied to the semivariogram for gold. The first pass used dimensions equal to ¼ of the semivariogram range in the three principal directions. If a minimum of 4 composites were found within this ellipse centered on a block, the block was estimated. For blocks not estimated, the search ellipse was expanded to ½ the semivariogram range. Again, a minimum of 4 composites within the search ellipse were required to estimate any given block. A third pass using the full semivariogram range was completed for blocks not estimated during the first two passes. Finally, a fourth pass using roughly twice the range was completed. In all cases if more than 12 composites were located in any search, the closest 12 were used. A maximum of 3 composites from any individual hole were allowed in all passes. The search parameters for the Kriging procedure are tabulated below (Table 14-19).
A similar procedure was used to estimate silver with the pass 4 ellipse expanded to the pass 4 gold search to insure all blocks estimated for gold had a silver value.
Volumes for each block estimated were determined by multiplying the block volume by the percentage of block below topography and within the solid. The tonnage was determined by multiplying the block volume by the S.G. (2.34).
Corvus Gold Corp. Technical Report – North Bullfrog Project | | Page | 189 |
Table 14-19 Summary of Kriging Search Parameters for Jolly Jane
| Domain | Pass | Number Estimated | Az/Dip | Dist. (m) | Az/Dip | Dist. (m) | Az/Dip | Dist. (m) |
Mineralized Solid Au | 1 | 3,145 | 0 / -30 | 30.0 | 270 / -70 | 12.5 | 90 / -20 | 27.5 |
| 2 | 35,918 | 0 / -30 | 60.0 | 270 / -70 | 25.0 | 90 / -20 | 55.0 |
| 3 | 34,632 | 0 / -30 | 120.0 | 270 / -70 | 50.0 | 90 / -20 | 110.0 |
| 4 | 7,968 | 0 / -30 | 240.0 | 270 / -70 | 100.0 | 90 / -20 | 220.0 |
Mineralized Solid Ag | 1 | 1,473 | 0 / -30 | 30.0 | 270 / -50 | 15.0 | 90 / -40 | 20.0 |
| 2 | 28,358 | 0 / -30 | 60.0 | 270 / -50 | 30.0 | 90 / -40 | 40.0 |
| 3 | 38,531 | 0 / -30 | 120.0 | 270 / -50 | 60.0 | 90 / -40 | 80.0 |
| 4 | 13,301 | 0 / -30 | 240.0 | 270 / -50 | 120.0 | 90 / -40 | 160.0 |
14.4 MAYFLOWER AREA MINERALIZATION ESTIMATION
14.4.1.1 DATA BASE FOR MAYFLOWER MINERALIZATION INVENTORY ESTIMATION
The supplied data for the Mayflower Estimation consisted of 104 drill holes totaling 17,228 m. Of these 104 supplied holes, 79 of them penetrated the mineralization solid and were used for this estimate. A total of 10,950 samples were assayed for gold and 10,492 for silver. A total of 87 gaps in the from–to record were identified and values of 0.001 g/t were inserted for Au and Ag in these intervals.
14.4.1.2 GEOLOGIC MODEL OF THE MAYFLOWER MINERALZATION ZONE
The distribution of mineralization at the Mayflower prospect is complicated. It is clear that mineralization is controlled by a complex fracture network without the clear definition of a simple central vein system. In order to define a volume to be included in the estimation model, a combination of the alteration, trace element geochemistry, and gold mineralization were taken into account. The underlying premise for the model was that the form of the zone should be roughly tabular following the main fault zone.
The Mayflower geochemical data show that there is a clear correlation between the higher-grade gold mineralization, potassium feldspar alteration and arsenic mineralization. The first step in building the model was to define the distribution of potassium feldspar alteration using the molar K/Al and Na/Al ratios. The next step was to look at the statistical distribution of arsenic and establish that the mineralized population begins at approximately 10 ppm arsenic in unit Trt2 and 25 ppm in all other lithologies. Finally, the cumulative frequency distribution of gold indicates that 0.04 g/t is the lower limit of the main mineralized population. The “Mayflower Zone” was then defined as continuous drilled intervals which had K-feldspar alteration, high As and Au>0.04 g/t.
The drill hole data with the “Mayflower Zone” designation was loaded into a 3-D view and the “Hanging wall” and “Footwall” was constructed using the top and bottom contacts of the “Mayflower Zone”. Once this was done, the surface was extended and modified by integrating the Barrick drilling data into the model. The same 0.04 g/t cutoff was used to define zones of mineralization in the Barrick holes. The resulting model surfaces were exported to SurpacTM where the final closed volume was constructed. The base of the modeled volume was arbitrarily cut off at an elevation of 1000 metres.
Corvus Gold Corp. Technical Report – North Bullfrog Project | | Page | 190 |
The overall form of the Mayflower Zone is narrow at depth and widens as it approaches the surface, a configuration that is quite common in near surface fault systems (Figures 14-7 and 14-8). The hanging wall is steeper and more planar than the footwall.
Figure 14-12 Mayflower Model Looking NW with the Mineralization Solid in Red and Topography in Grey.
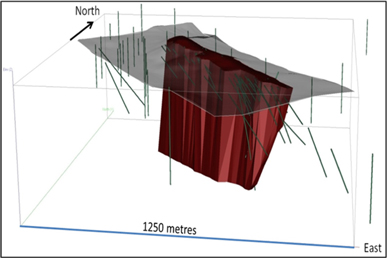
Figure 14-13 Isometric View Looking W of the Mayflower Geologic Solid in Red with Surface Topography Shown in Grey.
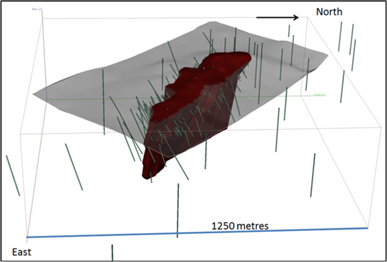
Corvus Gold Corp. Technical Report – North Bullfrog Project | | Page | 191 |
14.4.2 DATA ANALYSIS
Using the interpreted geologic solid, the assays were back tagged with a mineralization code if inside the mineralized solid. The sample statistics are tabulated below (Table 14-20).
Table 14-20 Summary of Assay Statistics for Mineralization Solid and Waste- Mayflower.
| | Inside Mineralization Solid | Outside Mineralization Solid |
| | Au (g/t) | Ag (g/t) | Au (g/t) | Ag (g/t) |
| Number of Samples | 5,408 | 5,408 | 5,629 | 5,171 |
| Mean Grade | 0.233 | 0.274 | 0.027 | 0.222 |
| Standard Deviation | 1.153 | 1.147 | 0.062 | 0.923 |
| Minimum Value | 0.001 | 0.001 | 0.001 | 0.001 |
| Maximum Value | 41.50 | 75.90 | 1.41 | 27.43 |
| Coefficient of Variation | 4.94 | 4.18 | 2.32 | 4.15 |
The grade distributions for gold and silver were evaluated using lognormal cumulative frequency plots for samples within both the mineralization solid and the surrounding waste. In all cases, multiple overlapping lognormal populations were seen. Within the mineralization zone for gold, there were five overlapping populations (Figure 14-9). The highest population with average grades of 37.2 g/t Au, represents 0.07% of the data, and was considered erratic high grade. A cap consisting of 2 standard deviations above the mean of population 2, a value of 22 g/t was used to cap 5 gold assays.
Figure 14-14 Lognormal Cumulative Frequency Plot for Au within the Mineralization Solid-Mayflower.
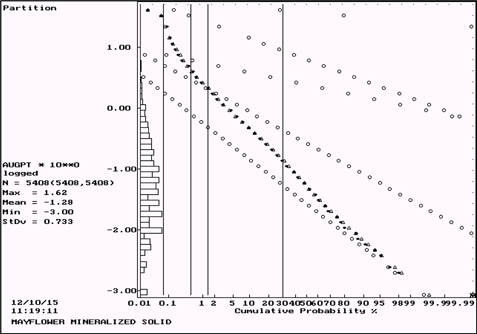
Corvus Gold Corp. Technical Report – North Bullfrog Project | | Page | 192 |
A similar exercise completed on silver, resulted in 4 assays capped at 8.0 g/t. Within waste, gold showed 6 overlapping lognormal populations with the upper two populations averaging 1.26 g/t and 0.85 g/t representing a combined 0.23% of the data, considered erratic. A cap level of 0.55 g/t or two standard deviations above the mean of population 3 was used to cap 13 gold assays at 0.55 g/t Au. For silver in waste a cap level of 3.8 g/t Ag was used to cap 27 assays. The results of capping reduce the mean grade slightly and significantly reduce the standard deviation and as a result the coefficient of variation in all variables. The capped assay statistics are listed in Table 14-21.
Table 14-21 Summary of Capped Assay Statistics for Mineralization Solid and Waste-Mayflower
| | Inside Mineralized Solid | Outside Mineralized Solid |
| | Au (g/t) | Ag (g/t) | Au (g/t) | Ag (g/t) |
| Number of Samples | 5,408 | 5,408 | 5,629 | 5,171 |
| Mean Grade | 0.224 | 0.257 | 0.026 | 0.188 |
| Standard Deviation | 0.884 | 0.385 | 0.048 | 0.433 |
| Minimum Value | 0.001 | 0.001 | 0.001 | 0.001 |
| Maximum Value | 22.00 | 8.00 | 0.55 | 3.80 |
| Coefficient of Variation | 3.95 | 1.50 | 1.85 | 2.30 |
14.4.3 COMPOSITES
Drill holes at Mayflower were compared to the mineralization solid and the points each hole entered and left the solid were recorded. Uniform down hole composites, 5 metres in length, were formed and made to honor the solid boundaries. Intervals less than ½ the composite length at the solid boundaries were joined with adjoining samples to produce a composites file of uniform support, 5± 2.5 metres in length. The statistics for 5 metre composites are summarized below (Table 14-22).
Table 14-22 Summary of 5 M Composite Statistics for Mineralization Solid-Mayflower
| | Inside Mineralized Solid |
| | Au (g/t) | Ag (g/t) |
| Number of Samples | 1,706 | 1,706 |
| Mean Grade | 0.222 | 0.261 |
| Standard Deviation | 0.617 | 0.296 |
| Minimum Value | 0.001 | 0.001 |
| Maximum Value | 13.60 | 4.74 |
| Coefficient of Variation | 2.78 | 1.14 |
14.4.4 VARIOGRAPHY
Pairwise relative semivariograms were produced from composites within the mineralization solid for both gold and silver. The semivariograms were produced along strike, down dip and across dip within the mineralized lens. Nested spherical models were fit to the three directions of anisotropy. The nugget to sill ratio was a reasonable 32% for gold and 24% for silver. The model parameters are summarized below (Table 14-23).
Corvus Gold Corp. Technical Report – North Bullfrog Project | | Page | 193 |
Table 14-23 Summary of Semivariogram Parameters-Mayflower
| Variable | Azimuth | Dip | Co | C1 | C2 | Short Range (m) | Long Range (m) |
| Au | 315o | 0o | 0.30 | 0.40 | 0.25 | 50 | 160 |
| 225o | -70o | 0.30 | 0.40 | 0.25 | 40 | 100 |
| 45o | -20o | 0.30 | 0.40 | 0.25 | 30 | 45 |
| Ag | 315o | 0o | 0.13 | 0.20 | 0.22 | 20 | 60 |
| 225o | -70o | 0.13 | 0.20 | 0.22 | 30 | 100 |
| 45o | -20o | 0.13 | 0.20 | 0.22 | 10 | 40 |
| Min Ind | 315o | 0o | 0.25 | 0.40 | 0.25 | 30 | 150 |
| 225o | -70o | 0.25 | 0.40 | 0.25 | 10 | 60 |
| 45o | -20o | 0.25 | 0.40 | 0.25 | 15 | 60 |
| Vein Ind | 315o | 0o | 1.20 | 0.45 | 0.35 | 15 | 100 |
| 225o | -70o | 1.20 | 0.45 | 0.35 | 30 | 80 |
| 45o | -20o | 1.20 | 0.45 | 0.35 | 10 | 64 |
14.4.5 BULK DENSITY
During the 2012 drill program a total of 271 specific gravity measurements were made from drill core using the weight in air/weight in water method. These determinations came from holes NB-12-132, 133, 140, 141, 142 and 143.
The results can be sorted by lithology and by gold grade. While there is a range of specific gravities for the various lithologies sampled, lithology has not been modeled so it is not of any use in assigning density to estimated blocks. There does, however, appear to be a reasonable correlation between gold grade and specific gravity as shown in Table 14-24 with higher densities associated with higher gold grades. As a result the specific gravity assigned to each block in the model is based on the estimated gold grade as tabulated below in Table 14-25.
Table 14-24 Specific Gravities Sorted By Lithology - Mayflower
| Lithology | Number | Min. SG | Max. SG | Average SG |
| Cz | 1 | | | 2.58 |
| Fault | 6 | 1.79 | 2.45 | 2.20 |
| Tcm | 1 | | | 2.26 |
| Tdfh | 214 | 2.02 | 2.63 | 2.28 |
| Tdfm | 4 | 2.35 | 2.40 | 2.38 |
| eTpbx | 2 | | | 2.38 |
| Trt2 | 43 | 1.59 | 2.56 | 2.19 |
| Total | 271 | 1.59 | 2.63 | 2.27 |
Corvus Gold Corp. Technical Report – North Bullfrog Project | | Page | 194 |
Table 14-25 Specific Gravities Sorted By Gold Grade - Mayflower
Gold Grade (g/t) | Average Au (g/t) | Number | Average SG |
| > 0.0 < 0.1 | 0.029 | 135 | 2.22 |
| ≥ 0.1 < 0.5 | 0.243 | 83 | 2.30 |
| ≥ 0.5 < 1.0 | 0.688 | 36 | 2.33 |
| ≥ 1.0 | 2.350 | 17 | 2.36 |
| Total | | 271 | 2.27 |
14.4.6 BLOCK MODEL
A block model with blocks 10 x 10 x 5 m in dimension was superimposed over the mineralization solid. The model was rotated 45 degrees to better fit the solid. The block model origin was as follows:
Lower left corner of model
| 518838.0 E | | Column width – 10 m | 30 columns |
| 4093900.0 N | | Row width – 10 m | 81 rows |
| | | | |
| Top of Model | | | |
| | | | |
| 1395 Elevation | | Level width – 5 m | 90 levels |
Rotation 45 degrees counter clockwise
Within each block, the percentage below surface topography and within the mineralization solid was recorded (Figure 14-11).
Figure 14-15 Isometric View Looking NNW Showing Block Model in White and Drill Holes in Magenta-Mayflower.
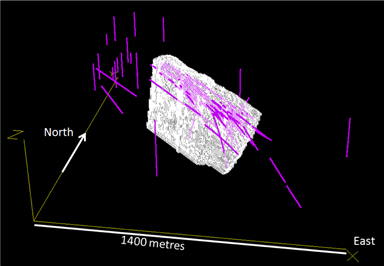
Corvus Gold Corp. Technical Report – North Bullfrog Project | | Page | 195 |
14.4.7 GRADE INTERPOLATION
Grades for gold and silver were interpolated into all blocks, with some percentage within the mineralization solid, by Ordinary Kriging. Kriging was completed in a series of passes with the dimensions and orientation of the search ellipse for each pass tied to the semivariogram. The first pass used dimensions equal to ¼ of the semivariogram range in the three principal directions. If a minimum of 4 composites were found within this ellipse centered on a block, the block was estimated. For blocks not estimated, the search ellipse was expanded to ½ the semivariogram range. Again, a minimum of 4 composites within the search ellipse were required to estimate any given block. A third pass using the full semivariogram range was completed for blocks not estimated during the first two passes. Finally, a fourth pass using roughly twice the range was completed. This pass was modified to use the maximum range for both gold and silver to ensure all blocks were estimated for both variables. In all cases, if more than 12 composites were located in any search, the closest 12 were used. In all cases, the maximum number of composites allowed, from a single drill hole, was set to 3 to ensure all blocks were estimated by a minimum of two drill holes. The search parameters for the Kriging procedure are tabulated below (Table 14-26). Volumes for each block estimated were determined by multiplying the block volume by the percentage of block below topography and within the solid. The tonnage was determined by multiplying the block volume by the block specific gravity.
In a similar manner the mineralization indicator and the vein indicator was kriged into all estimated blocks.
Table 14-26 Summary of Kriging Search Parameters - Mayflower
| Variable | Pass | N25umber Estimated | Az/Dip | Dist. (m) | Az/Dip | Dist. (m) | Az/Dip | Dist. (m) |
| Au | 1 | 12,486 | 315/0 | 40.0 | 225/-70 | 25.0 | 45/-20 | 11.25 |
| 2 | 13,510 | 315/0 | 80.0 | 225/-70 | 50.0 | 45/-20 | 22.5 |
| 3 | 7,417 | 315/0 | 160.0 | 225/-70 | 100.0 | 45/-20 | 45.0 |
| 4 | 6,412 | 315/0 | 320.0 | 225/-70 | 200.0 | 45/-20 | 90.0 |
| Ag | 1 | 3,089 | 315/0 | 15.0 | 225/-70 | 25.0 | 45/-20 | 10.0 |
| 2 | 14,774 | 315/0 | 30.0 | 225/-70 | 50.0 | 45/-20 | 20.0 |
| 3 | 12,562 | 315/0 | 60.0 | 225/-70 | 100.0 | 45/-20 | 40.0 |
| 4 | 9,400 | 315/0 | 320.0 | 225/-70 | 200.0 | 45/-20 | 90.0 |
14.5 CLASSIFICATION OF MINERALIZATION
Mineralization has been classified according to CIM, Measured Mineral Resources, Indicated Mineral Resources and Inferred Mineral Resources in accordance with NI 43-101 disclosure obligations. The level of geologic confidence, metallurgical testing and drillhole density were used to classify the Mineral Resource Estimate
Corvus Gold Corp. Technical Report – North Bullfrog Project | | Page | 196 |
14.5.1 SIERRA BLANCA
Within the Sierra Blanca mineralized zones the geological continuity has been established though surface mapping, and drill hole interpretation. Grade continuity can be demonstrated through modeled mineralized domains. By tying the classification to the search ellipsoid ranges and distance values (distance between composite and block centroid) stored in the block model, individual blocks were classified as follows:
Vein Classification:
Measured - Blocks estimated on the first pass with a distance less than or equal to 30 meters.
Indicated – Blocks estimated on first pass with a distance greater than 30 meters or blocks estimated on second pass with a distance less than or equal to 100 meters.
Inferred – All other blocks
Stockwork Classification:
Measured – No Measured Blocks
Indicated – Blocks estimated in Stockwork Volumes (st05, st06b, st07, st18) on the first pass.
Inferred – All remaining estimated blocks
Fault Classification:
Measured – No Measured Blocks
Indicated – No Indicated Blocks
Inferred – All estimated Fault Blocks
Disseminated Classification:
Measured – No Measured Blocks
Indicated – No Indicated Blocks
Inferred – All estimated Disseminated Blocks
14.5.2 JOLLY JANE
For the Jolly Jane Deposit, blocks estimated in Pass 1 or Pass 2 using up to one half the variogram ranges for the search ellipse, were classified as Indicated. All other blocks were classified as Inferred. All blocks at Jolly Jane are oxidized.
14.5.3 MAYFLOWER
For the Mayflower Deposit, Blocks estimated during pass 1 and 2 using search ellipses with dimensions up to ½ the variogram range were classified as Indicated. All other blocks were classified as Inferred. All blocks at Mayflower are oxidized.
Corvus Gold Corp. Technical Report – North Bullfrog Project | | Page | 197 |
14.6 MINERAL RESOURCE STATEMENT
14.6.1 WHITTLE OPTIMIZATION CRITERIA
To determine the quantities of materials with “reasonable prospects for economic extraction” by open pit methods, MMC determined pit constraining limits using the Lerchs-Grossman© economic algorithm which constructs lists of related blocks that should or should not be mined. The final list defines a surface pit shell that has the highest possible total value, while honoring the required surface mine slope and economic parameters.
Economic parameters used in the analysis are listed in Table 14-27 and are based on the following general assumptions:
Heap Leach processing of disseminated mineralization
Gravity – CIL mill processing of YellowJacket mineralization
Input parameters at US$1,200 per ounce gold price, and Gold:Silver price ratio of 59.2:1 for Mayflower and Jolly Jane, and of 73.7:1 for Sierra Blanca and YellowJacket.
Table 14-27 Pit Constraining Parameters Used For the North Bullfrog Project
| Parameter | Unit | Mayflower | Jolly Jane* | Sierra Blanca | YellowJacket |
| Mining Cost | US$/total tonne | 1.64 | 1.42 | 1.62 | 1.62 |
| Au Cut-Off | g/tonne | 0.2 | 0.15 | 0.15 | 0.56 |
| Processing Cost | US$/ process tonne | 1.72 | 1.72 | 1.27 | 11.57 |
| Au Recovery | % | 70 | 72 | 74 | 86.8 |
| Ag Recovery | % | 8 | 8 | 0 | 71.4 |
| Administrative Cost | US$/process tonne | 0.5 | 0.5 | 0.4 | 0.4 |
| Refining & Sales | US$/tonne | 0.07 | 0.04 | 0.02 | 0.11 |
| Au Selling Price | US$/oz | 1,200 | 1,200 | 1,200 | 1,200 |
| Slope Angle | Degrees | 50 | 50 | 50 | 50 |
The parameters listed in Table 14-27 define a realistic basis to estimate the Mineral Resources for the Project and are representative of similar mining operations throughout Nevada. The Mineral Resource has been limited to mineralized material that occurs within the pit shells and which could be scheduled to be processed based on the defined cut-off grade. All other material within the defined pit shells was characterized as non-mineralized material.
14.6.2 MINERAL RESOURCE STATEMENT
The estimate considers two processing methods; heap leach processing and mill processing. The Mineral Resource statement only considers YellowJacket mineralization for mill processing. Table 14-28 lists the project Mineral Resource estimate. Mineral Resources are not Mineral Reserves and do not have demonstrated economic viability.
Corvus Gold Corp. Technical Report – North Bullfrog Project | | Page | 198 |
Table 14-28 North Bullfrog Project Pit Constrained Mineral Resource Estimate.
| Resource Area | Classification | Cutoff | Tonnes (Mt) | Au (g/t) | Ag (g/t) | Contained
Au (000’s) | Contained
Ag (000’s) |
| YellowJacket Mill | Measured | 0.56 | 3.86 | 2.55 | 19.70 | 316.51 | 2,445.23 |
| Indicated | 1.81 | 1.53 | 10.20 | 89.09 | 593.25 |
| Inferred | 1.48 | 0.83 | 4.26 | 39.36 | 203.35 |
| Sierra Blanca and YellowJacket Heap Leach | Measured | 0.15 | 0.30 | 0.25 | 2.76 | 2.34 | 26.28 |
| Indicated | 0.13 | 0.25 | 1.99 | 1.07 | 8.56 |
| Inferred | 168.40 | 0.19 | 0.68 | 1,041.80 | 3,664.32 |
| Jolly Jane Heap Leach | Indicated | 0.15 | 17.60 | 0.25 | 0.43 | 141.44 | 240.99 |
| Inferred | 7.95 | 0.20 | 0.54 | 51.00 | 137.33 |
| Mayflower Heap Leach | Indicated | 0.20 | 5.13 | 0.47 | 0.41 | 77.26 | 68.27 |
| | * | Effective Date: June 16, 2015 |
| | ** | The Mineral Resource set out above, have been prepared by Scott E. Wilson, a Qualified Person under NI 43-101. |
| | *** | Numbers have been rounded. |
14.7 MINERALIZATION INVENTORY BY DEPOSIT
Resource tables for the Block Models at the individual mineralization areas are presented in the following sections and are accumulated according to the classification of the blocks. The following assumptions were made to generate the tables:
Au Cutoff derived from Whittle input parameters at US$1,200 per ounce gold price, and Gold Silver price ratio of 59.2:1 for Mayflower and Jolly Jane, and of 73.7:1 for Sierra Blanca and YellowJacket.
14.7.1 SIERRA BLANCA ESTIMATE OF MINERALIZATION INVENTORY
The results presented Table 14-29, show the resources separated by process method for Measured, Indicated and Inferred resources for YellowJacket and Sierra Blanca.
Table 14-29 Sierra Blanca and YellowJacket Resources
| | YellowJacket - Milling | Sierra Blanca - Heap Leach | Total |
| Classification | Cutoff
Au g/t | Tonnes
(Mt) | Au
g/t | Ag
g/t | Cutoff
Au
g/t | Tonnes
(Mt) | Au
g/t | Ag
g/t | Contained
Au (x1,000) | Contained
Ag (x1,000) |
| Measured | 0.56 | 3.86 | 2.55 | 19.7 | 0.15 | 0.30 | 0.25 | 2.76 | 318.9 | 2,471.5 |
| Indicated | 1.81 | 1.53 | 10.2 | 0.13 | 0.25 | 1.99 | 90.2 | 601.8 |
| Inferred | 1.48 | 0.83 | 4.26 | 168.40 | 0.19 | 0.68 | 1,081.2 | 3,867.7 |
14.7.2 JOLLY JANE ESTIMATE OF MINERALIZATION INVENTORY
The results presented in Table 14-30, show the Indicated and Inferred mineralization inventory for Jolly Jane.
Corvus Gold Corp. Technical Report – North Bullfrog Project | | Page | 199 |
Table 14-30 Jolly Jane Resource
| Classification | Tonnes (Mt) | Cutoff Au
g/t | Au g/t | Ag g/t | Contained Au
(x1,000) | Contained Ag
(x1,000) |
| Indicated | 17.60 | 0.15 | 0.25 | 0.43 | 141.48 | 241.05 |
| Inferred | 7.95 | 0.20 | 0.54 | 51.02 | 137.40 |
14.7.3MAYFLOWER ESTIMATE MINERALIZATION INVENTORY
The results presented in Table 14-31, show the Indicated and Inferred mineralization inventory for Mayflower.
Table 14-31 Mayflower Resource
| Classification | Tonnes (Mt) | Cutoff Au
g/t | Au g/t | Ag g/t | Contained Au
(x1,000) | Contained Ag
(x1,000) |
| Indicated | 4.29 | 0.20 | 0.47 | 0.41 | 69.04 | 59.88 |
14.8SENSITIVITY OF MINERALIZATION TO GOLD PRICE
The sensitivity of mineralization defined by the evaluation of the mineralization inventory at different gold prices was performed for gold prices of $1,000/oz, $1,200/oz and $1,400/oz. The input parameters defined in Table 14-32 were used in the analysis. Table 14-32 lists the amount of the mineralization contained within the pit shells that could be scheduled to process. The tabulated results are based on the following assumptions:
Table 14-32 Sensitivity of Mineralization Inventory Contained In Pit Shells Defined By Whittle Analyses at Different Gold Prices within Pit Shells
| | YellowJacket (milling) | Disseminated (heap leach) | Total |
WhittleTM
Pit Gold
Price* | Resources
Category | Cutoff
(Gold
g/t) | Tonnes
(Mt) | Gold
(g/t) | Silver
(g/t) | Cutoff
(Gold g/t) | Tonnes
(Mt) | Gold
(g/t) | Silver
(g/t) | Strip
Ratio | Contained
Au oz
(x1,000) | Contained
Ag oz
(x1,000) |
| $1,000 | Measured | 0.67 | 3.81 | 2.57 | 19.88 | 0.18 | 0.29 | 0.25 | 2.74 | 0.63 | 317.7 | 2,464.6 |
| Indicated | 1.72 | 1.58 | 10.57 | 18.02 | 0.31 | 0.42 | 266,.6 | 824.6 |
| Total M & I | 5.53 | 2.26 | 16.99 | 18.32 | 0.31 | 0.45 | 584.3 | 3,289.2 |
| Inferred | 1.38 | 0.86 | 4.44 | 155.29 | 0.20 | 0.70 | 1,025.4 | 3,716.0 |
| $1,200 | Measured | 0.56 | 3.86 | 2.55 | 19.70 | 0.15 | 0.30 | 0.25 | 2.76 | 0.70 | 318.9 | 2,471.5 |
| Indicated | 1.81 | 1.53 | 10.20 | 22.86 | 0.30 | 0.43 | 308.9 | 911.1 |
| Total M & I | 5.67 | 2.22 | 16.67 | 23.15 | 0.30 | 0.46 | 627.7 | 3,382.6 |
| Inferred | 1.48 | 0.83 | 4.26 | 176.35 | 0.19 | 0.67 | 1,132.2 | 4,005.0 |
| $1,400 | Measured | 0.48 | 3.88 | 2.54 | 19.62 | 0.13 | 0.30 | 0.25 | 2.76 | 0.77 | 319.4 | 2,475.0 |
| | Indicated | | 1.86 | 1.51 | 10.01 | | 25.82 | 0.30 | 0.44 | | 335.9 | 962.0 |
| Total M & I | 5.75 | 2.20 | 16.50 | 26.12 | 0.30 | 0.46 | 655.3 | 3,347.5 |
| Inferred | 1.53 | 0.84 | 4.19 | 189.5 | 0.19 | 0.66 | 1,194.5 | 4,216.2 |
Corvus Gold Corp. Technical Report – North Bullfrog Project | | Page | 200 |
14.9 MINERAL RESOURCE VISUALIZATION
The portions of the mineralization block models bounded by the WhittleTM defined open pit mining shells are illustrated in Figures 14-16 through 14-20. Figures 14-16 and 14-17 contain a long section through the YellowJacket mineralization and cross section through Sierra Blanca and YellowJacket, respectively. Figures 14-18 and 14-19 are cross sections and long sections, respectively, through Mayflower. Figure 14-20 shows a cross section through Jolly Jane.
Corvus Gold Corp. Technical Report – North Bullfrog Project | | Page | 201 |
Figure 14-16 Long Section through YellowJacket Mineral Resource Model.

Corvus Gold Corp. Technical Report – North Bullfrog Project | | Page | 202 |
Figure 14-17 Cross Section across Sierra Blanca and YellowJacket Looking North.

Figure 14-18 Cross Section through Mayflower Deposit.
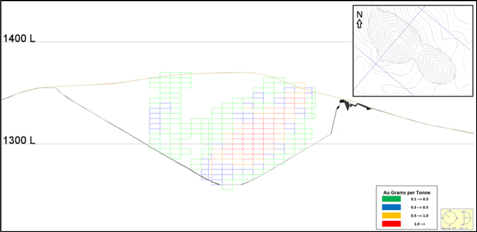
Corvus Gold Corp. Technical Report – North Bullfrog Project | | Page | 203 |
Figure 14-19 Long Section through Mayflower.
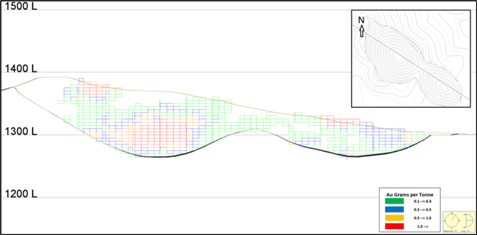
Figure 14-20 Cross Section through Jolly Jane.

Corvus Gold Corp. Technical Report – North Bullfrog Project | | Page | 204 |
15 MINERAL RESERVE ESTIMATES
No mineral reserve has been estimated for NBP.
16 MINING METHODS
This report assumes conventional surface mining methods using surface drill and blast techniques with off highway haul trucks and front end loaders.
This PEA is preliminary in nature, and is based on technical and economic assumptions which will be evaluated in more advanced studies. The PEA is based on the North Bullfrog Mineral Resource model (June 16, 2015) which includes Inferred Mineral Resources that are considered too speculative geologically to have the economic considerations applied to them that would enable them to be categorized as mineral reserves, and there is no certainty that the PEA will be realized. The basis for the PEA is to demonstrate the economic viability of the NBP. The PEA results are only intended as an initial, first-pass review of the potential project economics based on preliminary information. There are no advanced studies on the Project that would be impacted by the PEA.
16.1 MINE CONFIGURATION
Mineralized material will be delivered to one of two different processes; heap leaching or milling, dependent on the material type and gold grade. Structurally controlled mineralization in YellowJacket above 0.37 g/t would be delivered to a mill, comprising a crushing plant, where it would be crushed to meet mill feed requirements followed by grinding, gravity concentration and CIL leaching. Material between the grades of 0.10 g/t and 0.37 at YellowJacket and above 0.10 g/t from the disseminated mineralization in the other deposits would be delivered to a run-of-mine heap leaching facility by trucks to a conveyor stacker system on the heap leach pad. Cyanide solution would be used to dissolve the gold and then be processed through standard carbon-in-column leach plants. Loaded carbon will be refined into gold doré’ produced in an on-site refinery. Overburden material would be trucked to overburden storage facilities.
A single leach pad and process facility location is proposed to recover metal from mineralized material. The facility, with average daily leach pad placement of 41,400 tonnes per day, would be located near the northwest corner of the project site. The project would produce from the Company’s Federal land and private land resources. Each of the Project resource areas, Mayflower, Sierra Blanca, Jolly Jane and YellowJacket, would require a separate surface mine excavation. Material would be mined from each mine excavation at different times in the schedule.
In the conceptual mine plan, 10 meter high benches would be drilled and blasted, then loaded into 136 tonne haul trucks using 13 cubic meter front end loaders. Haul trucks would deliver the mineralized material to either the mill crushing system or a conveyor/stacker to place the blasted material on a leach pad. The mine plan calls for an average total mining rate of 25.2 M tonnes per year combined overburden and mineralized material. Of that, an average of 15 M tonnes per year would be mineralized material placed on a heap leach pad at an average rate of 41,400 tonnes per day. Another 1.1 M tonnes per year would be delivered to the mill at an average of 3,000 tonnes per day. The average overburden to mineralized material (strip ratio) would be 0.59. Based on this mining rate, the project would have an active life of 10 years, with minor gold production for the additional 3 year rinse down period on the leach pad.
Corvus Gold Corp. Technical Report – North Bullfrog Project | | Page | 205 |
16.2 MINE OPTIMIZATION
Economic mine limits were determined using Gemcom’s Whittle® 4.5 software which employs the Lerch-Grossman© economic algorithm. Whittle works on a block model of the mineralized material, and progressively constructs lists of related blocks that should or should not be mined. The final list defines a surface mine outline that has the highest possible total value, while honoring the required surface mine slope parameters.
The mine optimization was performed using the resource block models discussed in Section 14. The models were reviewed by the Stephen Batman and determined to be suitable for use in the mine optimization studies. The individual block models for each mineral deposit were each imported into Whittle. Model block sizes were re-blocked to 20m x 20m x 10m, and defined a minimum mining selection unit of 10 m. The following Table 16-1 lists the parameters used in Whittle to derive the ultimate pit limits.
Table 16-1 Whittle Parameters for the North Bullfrog Project
| Parameter | Unit | Mayflower | Jolly Jane* | Sierra Blanca | YellowJacket |
| Mining Cost | US$/total tonne | 1.64 | 1.42 | 1.62 | 1.62 |
| Au Cut-Off | g/tonne | 0.2 | 0.15 | 0.15 | 0.56 |
| Processing Cost | US$/ process tonne | 1.72 | 1.72 | 1.27 | 11.57 |
| Au Recovery | % | 70 | 72 | 74 | 86.8 |
| Ag Recovery | % | 8 | 8 | 0 | 71.4 |
| Administrative Cost | US$/process tonne | 0.5 | 0.5 | 0.4 | 0.4 |
| Refining & Sales | US$/tonne | 0.07 | 0.04 | 0.02 | 0.11 |
| Au Selling Price | US$/oz | 1,200 | 1,200 | 1,200 | 1,200 |
| Slope Angle | Degrees | 50 | 50 | 50 | 50 |
Only oxide mineralized material is considered for the Heap Leach circuit. Mineralization above and below the oxidation surface in the structurally controlled YellowJacket zone, where the gold occurs as free gold and electrum, was scheduled for treatment in the milling circuit. A series of nested excavation shells were created between $400 and $1,500 per gold ounce and used to guide phases within the surface mine plan. For the purposes of scheduling YellowJacket and Sierra Blanca were cut into multiple production phases based on Whittle pit shells.
Corvus Gold Corp. Technical Report – North Bullfrog Project | | Page | 206 |
16.3 MINE PRODUCTION SCHEDULE
Mining production would begin at an initial rate of 21,000 tonnes of mineralized material per day, increasing to a peak rate of 45,600 tonnes of mineralized material per day by the second production year. Total gold mined would begin at approximately 94,000 contained troy ounces for the first year and average at approximately 190,000 contained troy ounces per year for the first six years of production. Three key factors influenced the production schedule. First, the truck fleet requirement needed to be consistent throughout the life of the mine given that production would be limited to ten and a half years. Second, mill production would be limited at 3,000 tonnes per day. Third, and finally, the schedule would provide an approximately level ounce production rate through the life of the mine.
YellowJacket would be mined as the start-up pit to provide high grade feed for the mill at commissioning and would continue for 6 years. Sierra Blanca would be mined throughout the life of the operation and would be split into three phases; a starter phase, a mid-grade phase and a low grade phase. Mayflower would be mined in the midpoint of the mine life, followed by Jolly Jane for the remainder of production. The total project would contain 163.3 million mineralized tonnes at an average grade of 0.292 g/t gold and a byproduct silver grade of 1.87 g/t. The life of mine strip ratio would be 0.59:1, which includes all heap leach and mill material and pit slopes were assumed to be 50 degrees.
The LOM production schedule is displayed in Table 16-2 and are subdivided into the classifications of Measured and Indicated and Inferred Resources.
Corvus Gold Corp. Technical Report – North Bullfrog Project | | Page | 207 |
Table 16-2 Production Schedule by Resource Classification for Mill, Heap Leach and Waste Storage Facilities
| | Year -1 | Year 1 | Year 2 | Year 3 | Year 4 | Year 5 | Year 6 | Year 7 | Year 8 | Year 9 | Year 10 |
| | | | | | | | | | | | |
| Overburden | | | | | | | | | | | |
| Tonnes (mt) | 6,766,394 | 12,452,078 | 15,688,415 | 12,850,645 | 10,083,872 | 11,247,745 | 12,541,876 | 5,068,513 | 4,943,813 | 2,579,536 | 1,577,115 |
| | | | | | | | | | | | |
| Measured Mill | | | | | | | | | | | |
| Tonnes (mt) | - | 496,474 | 799,655 | 821,613 | 530,790 | 581,220 | 521,999 | - | - | - | - |
| Gold Grade (gpt) | - | 1.50 | 3.26 | 3.92 | 3.38 | 1.20 | 1.34 | - | - | - | - |
| Gold Ounces | - | 23,869 | 83,885 | 103,509 | 57,679 | 22,458 | 22,433 | - | - | - | - |
| Silver Grade (gpt) | - | 14.07 | 32.45 | 23.63 | 16.66 | 0.65 | 1.11 | - | - | - | - |
| Silver Ounces | - | 224,583 | 834,157 | 624,197 | 284,346 | 12,203 | 18,661 | - | - | - | - |
| Indicated Mill | | | | | | | | | | | |
| Tonnes (mt) | - | 381,251 | 144,030 | 144,624 | 215,009 | 364,223 | 424,920 | - | - | - | - |
| Grade (gpt) | - | 1.65 | 2.47 | 2.72 | 1.58 | 1.04 | 1.37 | - | - | - | - |
| Gold Ounces | - | 20,223 | 11,458 | 12,660 | 10,921 | 12,203 | 18,661 | - | - | - | - |
| Silver Grade (gpt) | - | 14.95 | 21.12 | 18.79 | 3.85 | 1.04 | 1.37 | - | - | - | - |
| Silver Ounces | - | 183,292 | 97,801 | 87,389 | 26,623 | 12,203 | 18,661 | - | - | - | - |
| M&I Mill Total | | | | | | | | | | | |
| Tonnes (mt) | - | 877,725 | 943,685 | 966,237 | 745,799 | 945,443 | 946,919 | - | - | - | - |
| Grade (gpt) | - | 1.56 | 3.14 | 3.74 | 2.86 | 1.14 | 1.35 | - | - | - | - |
| Gold Ounces | - | 44,093 | 95,343 | 116,169 | 68,599 | 34,661 | 41,094 | - | - | - | - |
| Silver Grade (gpt) | - | 14.45 | 30.72 | 22.91 | 12.97 | 0.80 | 1.23 | - | - | - | - |
| Silver Ounces | - | 407,875 | 931,958 | 711,586 | 310,969 | 24,406 | 37,322 | - | - | - | - |
| Measured Heap Leach | | | | | | | | | | | |
| Tonnes (mt) | - | 118,139 | 30,157 | - | - | - | - | - | - | - | - |
| Grade (gpt) | - | 0.26 | 0.31 | - | - | - | - | - | - | - | - |
| Gold Ounces | - | 981 | 299 | - | - | - | - | - | - | - | - |
| Silver Grade (gpt) | - | 0.14 | 0.76 | - | - | - | - | - | - | - | - |
| Silver Ounces | - | 546 | 733 | - | - | - | - | - | - | - | - |
| Indicated Heap Leach | | | | | | | | | | | |
| Tonnes (mt) | - | 58,399 | 3,132 | 10,061 | 28,841 | 677,634 | 2,371,720 | 2,036,854 | 1,763,035 | 6,451,353 | 7,067,939 |
| Grade (gpt) | - | 0.24 | 0.29 | 0.25 | 0.28 | 0.43 | 0.43 | 0.31 | 0.39 | 0.30 | 0.25 |
| Gold Ounces | - | 446 | 30 | 81 | 264 | 9,380 | 32,829 | 20,336 | 22,046 | 61,796 | 56,972 |
| Silver Grade (gpt) | - | 2.03 | 2.68 | 1.39 | 1.39 | 0.38 | 0.38 | 0.42 | 0.39 | 0.42 | 0.44 |
| Silver Ounces | - | 3,804 | 270 | 449 | 1,284 | 8,308 | 29,077 | 27,536 | 22,384 | 88,067 | 99,985 |
| M&I Total Heap Leach | | | | | | | | | | | |
| Tonnes (mt) | - | 176,538 | 33,289 | 10,061 | 28,841 | 677,634 | 2,371,720 | 2,036,854 | 1,763,035 | 6,451,353 | 7,067,939 |
| Grade (gpt) | - | 0.25 | 0.31 | 0.25 | 0.28 | 0.43 | 0.43 | 0.31 | 0.39 | 0.30 | 0.25 |
| Gold Ounces | - | 1,427 | 328 | 81 | 264 | 9,380 | 32,829 | 20,336 | 22,046 | 61,796 | 56,972 |
| Silver Grade (gpt) | - | 0.77 | 0.94 | 1.39 | 1.39 | 0.38 | 0.38 | 0.42 | 0.39 | 0.42 | 0.44 |
| Silver Ounces | - | 4,351 | 1,003 | 449 | 1,284 | 8,308 | 29,077 | 27,536 | 22,384 | 88,067 | 99,985 |
| Inferred Mill Material | | | | | | | | | | | |
| Tonnes (mt) | - | 217,891 | 151,504 | 121,432 | 343,372 | 146,682 | 106,622 | - | - | - | - |
| Grade (gpt) | - | 0.91 | 0.91 | 1.11 | 1.06 | 0.96 | 0.64 | - | - | - | - |
| Gold Ounces | - | 6,389 | 4,446 | 4,332 | 11,726 | 4,536 | 2,189 | - | - | - | - |
| Silver Grade (gpt) | - | 9.48 | 6.46 | 5.65 | 15.23 | 56.42 | 62.43 | - | - | - | - |
| Silver Ounces | - | 66,419 | 31,457 | 22,067 | 168,145 | 266,052 | 213,996 | - | - | - | - |
| Inferred Heap Leach Mat'l | | | | | | | | | | | |
| Tonnes (mt) | 1,172,881 | 18,944,908 | 15,897,521 | 17,021,004 | 17,882,214 | 14,446,486 | 11,909,328 | 13,973,673 | 13,794,698 | 6,490,216 | 4,691,313 |
| Grade (gpt) | 0.246 | 0.23 | 0.32 | 0.18 | 0.19 | 0.19 | 0.16 | 0.18 | 0.17 | 0.18 | 0.18 |
| Gold Ounces | 9,259 | 140,974 | 164,910 | 98,923 | 110,075 | 86,678 | 61,659 | 79,080 | 74,583 | 37,981 | 27,152 |
| Silver Grade (gpt) | 1.04 | 0.82 | 0.86 | 0.71 | 0.78 | 0.54 | 0.64 | 0.70 | 0.67 | 0.60 | 0.53 |
| Silver Ounces | 39,163 | 498,679 | 437,977 | 390,864 | 445,661 | 251,979 | 246,485 | 314,163 | 297,556 | 125,324 | 79,582 |
Note: Some difference may occur due to rounding.
Corvus Gold Corp. Technical Report – North Bullfrog Project | | Page | 208 |
16.4 MINE PRODUCTION
Mining production would come from open pit mining methods. As this is an assessment that is preliminary in nature, unsmoothed Whittle pits were used as the basis of the open pit production quantities. Volumes were extracted from the Vulcan block models and scheduled out with Microsoft Excel spreadsheets. Heap Leach mineralization in the production plan was selected on a whole block basis and was therefore assumed to include dilution. Mill mineralization in the production plan used perfect selection from the resource model and was then diluted with an additional 10% of material at an assumed grade of 0.24 g/t gold. That grade was consistent with sub-grade material in the YellowJacket structural mineralization. In all areas of the mine the swell factors used standard mining swell factors of 35% for all bucket and truck body calculations.
The Whittle process determines the pit volume. Destination of the material within the pit shell was determined by applying cut-off grades based on processing costs. The cut-off grades used for selection of the heap leach or mill were 0.1 g/t and 0.37 g/t, respectively. Mineralization below 0.1 g/t were scheduled for the waste storage facility.
16.4.1 YELLOWJACKET/SIERRA BLANCA PITS
YellowJacket contains both heap leach mineralization and mill grade mineralization. The pit would be in close proximity to the Sierra Blanca such that there would be a sharing of waste between the two pits. No detailed toe/crest mine designs or ramp configurations were created for the ultimate pit. The YellowJacket pit contains approximately 25% of the scheduled metal resource. The pit slope was assumed to be 50 degrees and the pit bottom would be beneath the water table.
For Sierra Blanca, no detailed toe/crest mine designs or ramp configurations were created for the ultimate pit. All resources used for production scheduling were based on the whole-block pits produced directly out of Gemcom’s Whittle® 4.5 software. The Sierra Blanca pit would be 1,600 metres long, 830 metres wide and 190 metres deep. Sierra Blanca’s ultimate pit depth was limited to the oxidation boundary and the pit slope was assumed to be 50 degrees.
16.4.2 MAYFLOWER PIT
The Mayflower pit would be approximately 760 metres long, 240 metres wide and 135 metres deep. For Mayflower, no detailed toe/crest mine designs or ramp configurations were created for the ultimate pit at the time of this report. All resources used for production scheduling were based on the whole-block pits produced directly out of Gemcom’s Whittle® 4.5 software.
For Whittle, an ultimate pit slope of 50 degrees was used
16.4.3 JOLLY JANE
For Jolly Jane, no detailed toe/crest mine designs or ramp configurations were created for the ultimate pit at the time of this report. All resources used for production scheduling were based on the whole-block pits produced directly out of Gemcom’s Whittle® 4.5 software
Corvus Gold Corp. Technical Report – North Bullfrog Project | | Page | 209 |
For Whittle, an ultimate pit slope of 50 degrees was used.
16.5 GENERAL SITE LAYOUT
A conceptual site layout has been developed to provide a basis to estimate haul distances for equipment specification and cost estimation. The layout is presented as Figure 16-1.
Figure 16-1 Conceptual Configuration of the North Bullfrog Surface Mines and Associated Overburden Storage, Mill, Tailings and Leach Pad Facilities
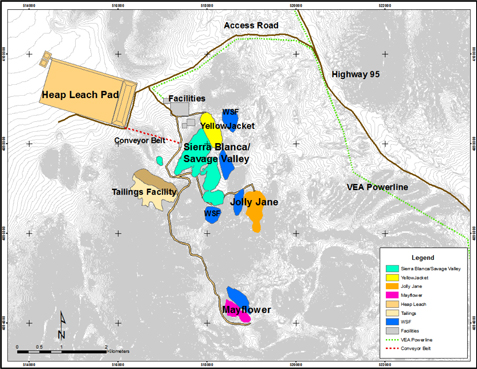
16.6 MINE FLEET AND CAPITAL
Preliminary mining fleet definitions were based on material haul routes and cycle times. Maptek’s Vulcan 3D mine planning software was used to digitize haulage routes from each surface mine to either the projected crusher location, feeder conveyor or the respective pit overburden storage facility. These routes, including distances and grade information, were exported to Microsoft Excel to calculate haul times. Different scenarios were evaluated based on different equipment options. Round-trip cycle times were calculated for 136 tonne haul trucks. These cycle times were used with the mine production schedule to determine fleet requirements.
The mining fleet is expected to contain four 13 cubic meter wheel loaders and twelve 136 tonne capacity haul trucks, three 306 kW bull dozers, four Rotary drills with 24.6 kilogram per centimeter squared compressors to handle the harder rock types, three 193 kW road graders along with associated support and maintenance equipment. A truck shop 40meters by 100 meters has been estimated and would include mine and maintenance offices above the warehouse first and second floors.
Corvus Gold Corp. Technical Report – North Bullfrog Project | | Page | 210 |
For the annual schedule, YellowJacket and Sierra Blanca deposits were broken into benches. Mayflower and Jolly Jane were summarized on one central bench and scheduled based on total pit resources. These benches were then scheduled until the annual goal was produced. For each bench, a round trip cycle time was calculated. Based on the calculated number of operating hours per truck using a utilization of 85% and availability of 85% and a target load of 127 tonnes, it was then possible to determine the number of trucks required per scheduled period. The equipment requirements were assumed to be truck constrained.
Table 16-3 lists the projected mining mobile equipment requirements for the North Bullfrog Project (Mining Cost Services, Costmine (2015)).
Table 16-3 Mining Capital Equipment Requirements
| Equipment | Quantity | Unit Cost (000s) | Total Cost (000s) |
| Front End Loader, 13 cu m bucket | 4 | $1,979 | $7,916 |
| Haul Truck, 136 Tonne | 12 | $2,657 | $31,884 |
| Rotary Blast hole Drill | 4 | $1,043 | $4,172 |
| Dozer | 3 | $922 | $2,768 |
| Grader | 3 | $491 | $1,473 |
| Water Truck | 1 | $258 | $258 |
| Bulk Explosive Truck | 1 | $257 | $257 |
| Service Truck | 3 | $86 | $258 |
| Tire Truck | 1 | $170 | $170 |
| Fuel Truck | 2 | $85 | $170 |
| Dispatch System | 1 | $790 | $790 |
| Light Vehicles, Pickups | 12 | $47 | $564 |
| Pumps and Light Plants | 5 | $16 | $88 |
| Truck Shop and Auxiliary Equipment | 10 | Varies | $7,564 |
As can be seen in the Table 16-3 above, the mine production fleet is designed to have up to 10 trucks operating under three wheel loaders at any time. This leaves 1 wheel loader and 2 trucks as spares to allow maintenance and servicing as needed on an ongoing basis. The availability of 85% and utilization of 85% is normally sufficient to allow normal maintenance on all of the mine equipment as required to meet manufacturer specifications. Based on a 250 hour preventative maintenance schedule, means truck and loaders would be maintained on day shift only and other mining equipment would be maintained on night shift. The 35 pieces of primary mining equipment must be maintained to meet the mining schedule as shown in Table 16-2.
Corvus Gold Corp. Technical Report – North Bullfrog Project | | Page | 211 |
Minimal replacement capital was assumed due to the short project life. The fleet was projected to meet the mine schedule without any major equipment replacement. All of the operating and major and minor servicing expenses were included in the hourly operating cost.
16.7 DRILL AND BLAST METHODS
The drill pattern spacing is based on a pattern spacing of 6 meter by 6 meter for a 10 meter bench height. The holes would be drilled 0.75 meters deeper than bench height on average to manage fall back and sub-drill needs. The mill feed and waste would be drilled and shot using an average pattern and powder factor, of 6m by 6m with a 0.2 kilogram per tonne powder factor, respectively.
The heap leach material to be stacked on the pad at North Bullfrog would be blasted using an ultra-high intensity blasting method that has been demonstrated in Australian surface mining as reported by Brent et al, 2014, to increase overall leaching recovery of metals. The basic description of the method would be to increase the powder factor by a factor of 1.9 and 3.8 times more than normal, for the top and bottom sections on any pattern with heap leach material. This method would be used to develop a finer particle size gradation (p80-76mm) and would induce micro fractures in the coarser particles to allow higher heap recoveries than a normal ROM material might achieve. The average powder factor using this high intensity blasting technique would be expected to increase to 0.38 kilograms per tonne of heap leach material. Only the heap leach material would utilize this blasting method. The process would normally load all holes but delay the timing of the second blast with electronic controls. First, the top hole of the bench would be blasted and the particles allowed to settle from the blasting energy. Then, the bottom of each hole and intermediate holes would be blasted on a second initiation of the shot pattern. This would allow a very high powder factor to provide finer rock particle sizes and develop micro-fractures to allow the cyanide on the heap leaching facility to infiltrate into the core of each coarse rock fragment. The plan would be to develop a square pattern that allows a center hole to be drilled and very heavily loaded with ANFO to provide ultra-high intensity blasting in the heap leach mineralized zones. This would require about 1 more hole for each 4 holes in the leach mineralization zones of the pits to be drilled and double initiation of shots. All heap zones holes would be double primed and then shot a second time in a short sequence to allow quick turnaround of these heap leach patterns.
16.8 MANPOWER
The North Bullfrog project’s mining group would be expected to operate on a 24 hour day and 365 days per year. The mining and maintenance operations plus support would be expected to be spread over a four crew rotation planned as 12 hour day and night shifts with rotation between Days and Nights as defined by the operations group. The engineering and geology groups would work a 4 day schedule and would have sufficient coverage over the weekends to limit any delays caused by manning schedules. The technical staff schedule would be based on rotating each month. This would provide overlap between the two survey, engineering and geology groups during the week when the workload would be heaviest. The projected staff requirements are shown in the Table 16-4.
Corvus Gold Corp. Technical Report – North Bullfrog Project | | Page | 212 |
Table 16-4 Mining Manpower Requirements
| Class | Function | No. of
Mining
Personnel |
| Salaried | Mine Manager | 1 |
| Shift Foreman | 8 |
| Chief Engineer | 1 |
| Mine Engineer | 2 |
| Surveyor | 1 |
| Asst. Surveyor | 1 |
| Environmental Tech | 2 |
| Chief Geologist | 2 |
| Ore Control Geologist | 1 |
| Maint. Foreman | 2 |
| Subtotal Salaried | 21 |
| Operations Hourly | Drill Operators | 12 |
| Loader Operators | 12 |
| Truck Drivers | 44 |
| Dozer Operators | 8 |
| Water Truck Operator | 4 |
| Grader Operators | 8 |
| | Blasters | 8 |
| Pump Operators | 4 |
| Training/Absentee | 4 |
| Subtotal Operations | 104 |
| Maintenance Hourly | Electrical | 8 |
| Mechanics | 16 |
| Welder/other | 8 |
| Subtotal Maintenance | 32 |
| Total | Total Mining | 157 |
The mine operation would be scheduled is based on a 4 days on, 4 days off schedule on a 12 hour shift basis. This would produce about 8 hours of overtime in an average week, which has been utilized for cost estimates. The burden rate was estimated at 38% above the base rate to cover the cost of insurance, social security and other benefits to be determined by the owners of this project.
Corvus Gold Corp. Technical Report – North Bullfrog Project | | Page | 213 |
17 RECOVERY METHODS
The method chosen for gold recovery for the disseminated mineralization in the Sierra Blanca/Savage Valley, Mayflower, and Jolly Jane material evaluated in this report is a standard heap leach recovery circuit commonly used in the region. The higher grade YellowJacket Josh Vein and stockwork material would be processed through a small gold milling / gravity / cyanide leach circuit.
Due to the apparent effect of particle size on gold recovery, the heap leach assessment was based on a feed size P80 -76mm (3 inches) produced from ultra-high intensity blasting, eliminating the need for crushing. This material would also be suitable for loading onto a conveyor and pad stacking system for delivering the mineralization to the heap leach pad.
The cyanide solutions from the heap leach would be treated in a Carbon-in-Columns (CIC) gold adsorption circuit, while the mill circuit would utilize Carbon-in-Leach (CIL) for gold recovery from the milled slurry. Carbon from the CIC and CIL circuits would be processed in one carbon handling circuit located at the mill. The carbon handling would include carbon stripping, acid washing, and reactivation circuits. The process would produce a doré bar for shipping to a refinery for final metal processing.
17.1 GOLD RECOVERY
17.1.1 HEAP LEACHING
The gold recovery and reagent consumptions for the heap leach materials are based on +100 bottle roll tests at varying sizes and 40 column tests, and are described in Section 13 of this report. In the test program Savage Valley ores were independently tested. Because of the metallurgical response, similar geology and overlapping location of the two pits, the Savage Valley and Sierra Blanca ores were combined and described hereafter as Sierra Blanca.
The average Au recovery for the heap leach, considering the 3 mineralization resources was 74%. Silver recoveries were assumed to range from 5.8% to 9.7% for the different resource areas, and would average 6%.
17.1.2 MILLING
The higher grade YellowJacket material would be processed using a small mill / gravity / cyanide leach circuit. The material would be stage crushed through tertiary crushing, followed by primary ball milling, gravity separation of the cyclone underflow, CIL leaching of the gravity tail (cyclone overflow), carbon stripping/acid washing/regenereation, and dore production. Projective modeling of gravity gold and silver recovery by a KnelsonTMconcentrator was reported by Fullam (2015) based the E-GRG test results for YellowJacket samples reported in Section 13. Using the plant gravity recoveries from the modeling and the leach recoveries of gold and silver from the concentrates and tail products as reported in Section 13, mill performance was projected for the Josh vein, vein stockworks and fault mineralization both above and below the oxidation surface. A weighted average estimate of gold and silver recovery was calculated considering the proportions of the mineralization in the resource. Average gold recovery was assumed to be 86.8% with an average silver recovery of 71.4%.
Corvus Gold Corp. Technical Report – North Bullfrog Project | | Page | 214 |
17.2 PROCESS GENERAL DESCRIPTION
The Figure 17-1 is an illustration of the process flow diagram for the North Bullfrog Project. Main electrical power and water are currently available in quantities sufficient for the operation and process reagents are common commodities utilized in the Nevada gold mining industry.
17.2.1 HEAP LEACHING
The North Bullfrog heap leach materials would be conveyed to the heap leach pad at a nominal rate of 41,400 tonnes per day. The mineralized material would be stacked on the heap in 30’ lifts. Lime would be added to the material stream on the heap leach feed conveyor belt. The heap would be leached using buried emitters with a weak cyanide solution. The leachate solution would be treated in 6-stage carbon columns. The loaded carbon from the 1st stage would be acid washed, stripped of gold values with the strip solution being sent to electrolytic cells for recovery in a precipitate sludge. The sludge would be retorted for mercury removal and then melted into doré bars in a furnace.
Figure 17-1 Block Processing Flow Diagram for Proposed Processing of North Bullfrog Mineralized Material.
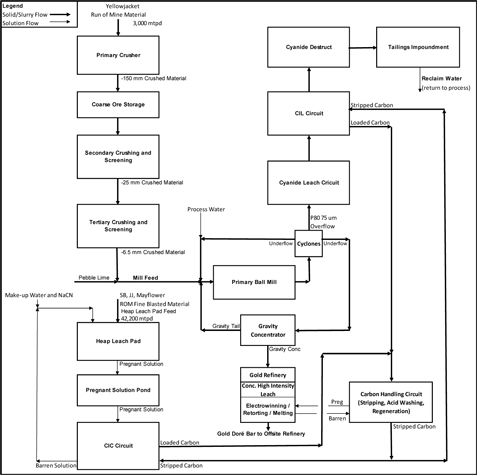
Corvus Gold Corp. Technical Report – North Bullfrog Project | | Page | 215 |
17.2.1.1 CONVEYING AND STACKING
ROM mineralized material would be ultra-fine blasted and delivered from the mine by haul truck and direct dumped into a hopper connected to the heap leach feed conveyor. A feeder would transfer the heap leach feed to a conveyor/stacker system. The product would be delivered to the heap leach pad and stacked by a series of overland and grasshopper conveyors, nominal 1.4m (54inch) wide. The mineralized material would be stacked on the heap using a system consisting of a self-propelled extendable 45 m (150ft) stacker.
Lime would be added to the feed conveyor using a lime feeder and silo adjacent to the conveyor.
17.2.1.2 CIC PLANT
The CIC Plant would consist of six-5.5 m (18 feet) cascading carbon columns processing approximately 30,300 l/m (8,000 gpm) of solution. The column train would be equipped with a feed box and trash carbon screen on the tailings. Carbon would be advanced on a daily basis countercurrent to the solution flow in two tonne lots and would be transferred to the carbon handling circuit using a carbon truck. Regenerated and washed stripped carbon would be brought back to the CIC circuit via return carbon truck, and added back into the circuit as needed to maintain sufficient carbon inventory.
17.2.1.3 HEAP LEACH DISTRIBUTION
The barren solution from the carbon columns would be adjusted with makeup water, sodium cyanide, anti-scalant and mercury inhibitor, and would be pumped to the heap leach. The pH would be adjusted with lime (CaO) onto the pad if necessary. The solution distribution on the heap would use buried emitters. Solution application rates would range from 0.12 l/min-m2 (0.003 gpm/ft2)to 0.06 l/min-m2 (0.0015 gpm/ft2). Provision would be made to recycle a portion of the heap leach to extend the leach times. The makeup water requirement for the heap leach pad loss was estimated to be 2800 l/min (750 gpm).
17.2.2 MILLING
Higher grade YellowJacket mineralization would be processed in a 3,000 tonne/day mill.
17.2.2.1 CRUSHING AND GRINDING
The mill feed material would be delivered from the mine via haul truck and dumped onto a concrete pad housing a variable rate feeder. Material would either be direct dumped and or pushed with a small track dozier into the feeder. The feeder would control the material processing rate to an average of 3,000 tonne/day. The mineralized material would be metered on to the primary crusher feed conveyor and carried to a primary jaw crusher. Product from the jaw crusher would be conveyed to a secondary crusher, the secondary crusher product would be screened with the minus 9.5 mm product passing the screen and continuing on to the mill feed conveyor. Material coarser than 9.5 mm would be conveyed to the tertiary crusher for final crushing to -9.5 mm. The tertiary crusher product would be combined with the screened product on the mill feed conveyor.
Corvus Gold Corp. Technical Report – North Bullfrog Project | | Page | 216 |
Milling would be performed using a single stage primary ball mill in closed circuit with cyclones. The ball mill product would be pumped to the cyclones with cyclone overflow at a P80 of 74 microns exiting the grinding circuit. Material coarser than 74 microns would report to the cyclone underflow for gravity separation and/or return to the ball mill for additional grinding.
The gravity circuit would consist of a single centrifugal type gravity separation unit (Knelson or Falcon type). The concentrate from the gravity concentrator would be flushed from the concentrator and pumped to the refinery for high intensity cyanide leaching. The tail from the concentrator would return to the ball mill for additional grinding and sizing.
17.2.2.2 CYANIDE LEACHING AND CARBON ADSORPTION
The mill product, cyclone overflow, would flow by gravity to a trash screen and the first of two leach tanks. The leach tanks would provide for approximately 24 hours of leach time. After leaching, the slurry would flow to the first of six Carbon in Leach (CIL) tanks. Stripped carbon would be added to the circuit in the last CIL tank and would be pumped once a day upstream into the fifth CIL tank. Carbon from the fifth tank would be pumped upstream to the fourth tank, fourth to third, and third to second, all once per day, creating a countercurrent to the slurry flow. Loaded carbon would be taken from the first CIL tank, for processing in the carbon handling circuit, where it would be screened, stripped of gold, acid washed, and regenerated in a reactivation kiln prior to being brought back to the sixth tank.
The slurry exiting the last CIL tank would be screened to remove carbon, and pumped to the tailings storage facility.
17.2.2.3 TAILINGS STORAGE
Material exiting the mill process facility would be pumped to a conventional tailings storage facility (TSF). The tailing would incorporate multipoint subaerial deposition to maximize tailings densification and decanted solution return. The TSF would be a lined facility with drainage layers and piping to improve water recovery and tails mass densification. Water reclaim pumps would be installed at the decant pond within the facility, and would pump recycled water back to the mill and heap leach pad for reuse.
17.2.2.4 CARBON HANDLING
Carbon recovered from the CIC circuit and the CIL circuit would be combined and processed in one carbon handling facility located at the mill. Carbon from both the mill and heap leach processes would be batch stripped in one of two strip vessels. Upon leaving the strip vessel, the carbon would be screened to have fine carbon removed from the circuit. After screening the carbon would be acid washed in a weak hydrochloric acid solution to remove calcium and other containments. The washed carbon would then be pumped to the regeneration kiln for reactivation.
As the carbon was processed in the kiln, the carbon would be heated to 700°C in a reducing atmosphere. This process would open the pores on the carbon and would raise the carbon’s affinity for gold and silver. Following reactivation, the carbon would be sized once again using a screen to remove any fines generated in the process. The screened reactivated carbon would then be returned as needed to the last CIL tank or into the CIC circuit for reloading.
Corvus Gold Corp. Technical Report – North Bullfrog Project | | Page | 217 |
17.2.3 REFINERY
The refinery would have electrowinning cells with sludge tanks, a mercury retort, flux mixer and furnace. The refinery would also contain the high intensity leach circuit for the gravity concentrate. Pregnant solutions from the high intensity leach would be combined with the pregnant strip solution from the strip circuit and would be processed in one of two electrowinning cells. Periodically, the electrowinng cells would be drained, cathodic sludge would be pressure washed from the cathodes, and the sludge would be drained from the cell and placed into a mercury retort for mercury removal.
Following retorting, the sludge would be placed into a furnace with fluxing agents, and the melted metal would be poured into doré bars for shipping to an outside refinery for final processing and sale.
The refinery would be enclosed with a pre-engineered steel building. The capital cost of the carbon handling plant and refinery included all valves, samplers, and security cameras necessary to operate in an efficient manner.
The State of Nevada requires that all processes with temperatures exceeding 175ºF be equipped with mercury abatement equipment. The North Bullfrog Project would comply with this requirement.
17.2.4 ASSAY LABORATORY
A full scale Assay Laboratory with Fire Assay and ICP capabilities would be built for the North Bullfrog Project. Because of the low cut-off grades, a 30g Fire Assay, followed by an ICP finish would be utilized on mine samples. The Assay Laboratory would contain equipment for sample preparation, for screening of crushed products and for carbon activity testing.
A metallurgical test laboratory within the assay laboratory would have screening, bottle roll and column testing facilities. As the project developed and bulk samples would become available, column and vat leach tests would be conducted on crushed and ROM samples.
Corvus Gold Corp. Technical Report – North Bullfrog Project | | Page | 218 |
17.3 PROCESS MANPOWER
Manpower requirements for the mill and heap leach process facilities is listed in Table 17-1.
Table 17-1 Process Manpower
| Class | Function | No. of
Mill
Personnel | Function | No. of
Heap Leach
Personnel |
| Salaried | Process Manager | 1 | Operations Planner | 1 |
| Chief Metallurgist | 1 | Maintenance Foreman | 1 |
| Metallurgist | 1 | Metallurgist | 1 |
| Shift Foreman | 4 | - | - |
| Maint,/Elect. Foreman | 1 | - | - |
| Chief Assayer | 1 | - | - |
| Refiner | 1 | - | - |
| | Subtotal | 10 | Subtotal | 4 |
Operations
Hourly | Crusher Operators | 4 | Assay Prep | 2 |
| Grinding Operators | 4 | Refiner | 1 |
| Mill Control Operators | 4 | Feeder/Conveyore Operators | 4 |
| Leach/CIP/Gravity Operators | 4 | Leach Pad Operators | 8 |
| Stripping Operators | 4 | Helpers | 4 |
| Tails Operator | 1 | - | - |
| Assayers | 2 | - | - |
| Subtotal | 23 | Subtotal | 19 |
| Maint. Hourly | Mechanics/Electricians | 8 | Mechanics/Electricians | 4 |
| Total Mill | 41 | Total Heap Leach | 27 |
| Total Process | 68 | - | - |
Corvus Gold Corp. Technical Report – North Bullfrog Project | | Page | 219 |
18 INFRASTRUCTURE
Much of the primary infrastructure required to develop a surface mine is available in close proximity to the NBP. The availability of these key infrastructure elements is described in the following sections on location and access, human resources, electrical power, water resources, and project infrastructure elements.
18.1 LOCATION AND ACCESS
The NBP is located approximately 16 km (9.3 miles) north of the community of Beatty, in Nye County Nevada. The property is approximately 3 km (2 miles) immediately west of Nevada Highway 95, which connects the major cities of Las Vegas and Reno. Access to the property from the highway is currently by several dirt roads that are maintained and provide access for a commercial aggregate producer, as well as, cattle grazing operations further to the west.
Major mining and construction equipment sales and service are readily available throughout Nevada; however, most major mining operations are located in the northern part of the State and are serviced from the cities of Reno and Elko. Las Vegas, 200 km (125 miles) south of NBP, has a major construction industry and heavy equipment sales and service are available there.
Beatty is primarily a small residential community, with motels, restaurants and stores.
18.2 HUMAN RESOURCES
Human resources are available within the community of Beatty, which has a population of approximately 1,100 people, and historically provided a substantial portion of the workforce for the Bullfrog Mine, which operated between 1989 and 1998 as both an open pit and underground gold mining operation. The community has a long association with the mining industry, and could contribute experienced personnel to a mining project at NBP. The community has schools, a medical clinic, motels, fuel service and food stores.
Pahrump, approximately 110 km (68 miles) to the southeast of Beatty, is a larger community with a population of 36,000. Pahrump is a local regional center, with a hospital and emergency medical services, a college campus with technical training for industrial support and expanded service sectors. Pahrump has traditionally provided human resources for the Nevada Test Site, which had numerous high technology and underground construction projects. The Test Site is approximately 40 miles from Pahrump, so locals are used to relatively long commutes on a daily basis.
18.3 ELECTRICAL POWER
Electrical power is provided to the immediate area of NBP by the Valley Electric Association (VEA), Inc., which is headquartered in Pahrump, NV. A 25 kVA line runs north from Beatty, NV along Highway 95. VEA has recently upgraded the main powerline, which now exceeds the projected requirements for NBP at 15 Mw capacity. Corvus NBP requirements were considered in the upgrade.
Corvus Gold Corp. Technical Report – North Bullfrog Project | | Page | 220 |
Two electrical feeder lines run west from the main line, one to the perimeter of the NBP property to power an aggregate crushing plant operating in the southern portion of NBP and a second that traverses the property to power a centrally located microwave station and the Company’s weather station which has been installed on Corvus controlled patented mining claims near Mayflower.
18.4 WATER RESOURCES
Water resources for a mining project at NBP must be obtained from the ground water in the Sarcobatis Flats. In 2014, Corvus purchased a 430 acre property located 48 km (30 miles) to the north of NBP in the Sarcobatus hygrographic basin which included a 1600 acre-foot water right. The northeast corner of NBP lies within the Sarcobatus hydrographic basin, and Corvus would explore for a water production well field in the basin near the project, and make application to the Nevada State Engineer for a temporary relocation of the production location.
Water wells, booster stations, and pipelines would be developed to provide water to the mine, process facilities, and ancillary structures. Water exploration would potentially locate several wells northwest of the heap leach pad and Corvus would install a fresh water pipeline from the well fields to the process plant.
Corvus Gold Corp. Technical Report – North Bullfrog Project | | Page | 221 |
18.5 PROJECT INFRASTRUCTURE ELEMENTS
A conceptual configuration of the NBP is shown in Figure 18-1.
Figure 18-1 Conceptual Configuration of the North Bullfrog Surface Mines and Associated Overburden Storage, Mill, Tailings and Leach Pad Facilities.

18.5.1 SITE ACCESS ROAD
Access to the North Bullfrog Project would be from US 95 just north of the Town of Beatty. The site access would follow an existing roadway corridor for approximately 7.5 km (4.6 miles) and would require improvement to allow 2 lane traffic. The access to the site from the access road would be designed such that the site would be secured with a perimeter fence and security gate, but historical access by others would not be impeded.
18.5.2 HAUL ROADS
The conceptual plan for loading the leach pad would use a feeder/conveyor/stacker system and haul roads would only be needed from the various mines to a central feeder projected to be located to the west of Sierra Blanca. The Mayflower mine requires the longest haul road with an approximate haul distance of 4.5 km (2.8 miles) along the western edge of the property to the central feeder location. The mine plan calls for the mining of the Sierra Blanca prior to mining of the Jolly Jane and a haul road within the Sierra Blanca pit would be planned for hauling from the Jolly Jane pit to the central feeder. The haul distance from the Sierra Blanca to the crusher pad is approximately 0.6 km (0.4 miles) and the haul road between the Jolly Jane and Sierra Blanca is approximately 250m (800 feet).
Corvus Gold Corp. Technical Report – North Bullfrog Project | | Page | 222 |
18.5.3 LEACH PAD ACCESS ROAD
An access road for maintenance of the feeder/conveyor/stacker system would be constructed from the feeder location to the leach pad. A leach pad perimeter road would be constructed for access to the leach pad and process ponds.
18.5.4 HEAP LEACH PAD AND PONDS
The heap leach pad would be located northwest of Sierra Blanca and is shown in Figure 18-1 with an approximate total storage capacity of 157 M tonnes of mineralized material. The final design of the leach pad would include construction specifications for a prepared subgrade, soil underliner, HDPE liner, solution collection system, and overliner layer. The leach pad would be constructed in phases with three expansions added to the initial leach pad constructed.
The final design would include a solution management system that connects the solution collection system within the leach pad, to the process pond and CIC array. It is intended that the final design would show the compartmentalization of the leach pad into solution collection cells and the individual cells would have flow measuring points and sampling locations. From this point, the solution would be directed to the pond or the CIC array, as necessary for maximizing recovery. Adjacent to the process pond would be an event pond and the two ponds would be connected by a spillway. The size of the ponds would be based on the 100-yr, 24-hr event and the 24-hr draindown of the leach pad, as well as, 0.6 m (2 feet) of freeboard per state regulations. Similar to the heap leach pad, the ponds would have a prepared subgrade, soil underliner, and two layers of HDPE liner for leak detection and primary containment, respectively.
18.5.5 MILL FACILITY
A mill facility would be constructed north of the YellowJacket portion of the Sierra Blanca pit, and would consist of primary, secondary and tertiary stage crushing equipment, ball mill, gravity concentrator and leach tanks. Minimal building would be required due to the relatively mild climate at NBP. The mill facility would be open air, with some portions of the plant roofed. The refinery and laboratory facilities would require climate controlled buildings.
18.5.6 TAILING STORAGE FACILITY
There are several natural impoundments at NBP that would be suitable for consideration as the location for the Tailing Storage Facility. An example is shown in the conceptual project configuration in Figure 18-1. Alternatively, there is a great deal of flat open terrain at the north end of NBP near the conceptual leach pad location. A conventional, lined TSF would be required, where tails are pumped as a slurry from the mill location.
18.5.7 ANCILLARY FACILITIES
The North Bullfrog project would require the design and the construction of several ancillary structures for the day to day operations of the mine. These facilities would include a truck/tire shop, warehouse, administration, and clinic, wash bay, fuel island, assay/met lab, security and maintenance facilities. These structures would be centrally located near the process plant and leach pad with access points to each of the facilities from the existing site access roadway from US 95. The aforementioned would be constructed in the first phase of mine development and infrastructure construction. To the extent possible, the facilities would be of a temporary nature consistent with the currently envisioned short life of the project.
Corvus Gold Corp. Technical Report – North Bullfrog Project | | Page | 223 |
18.5.8 SURFACE WATER MANAGEMENT FACILITIES
The location of the heap leach pad, ponds, and process plant would require diversion structures to redirect surface runoff around these facilities and discharge into natural drainage channels. For ease of construction, the channels were assumed to be 3 m (10 feet) wide at the bottom of the channel, 1.5m (5 feet) deep, and have side slopes of 3H:1V. The channel would be lined with a geotextile fabric and riprap along the entire length of the channel and up the side slopes to protect the channel for a flow depth of 1.2m (4 feet).
18.5.9 WASTE ROCK MANAGEMENT FACILITIES
Based on the most recent mine production schedule, 96 M tonnes of waste rock would need to be stockpiled. Figure 18-1 shows the potential locations of the waste rock stockpile on the east side of the Sierra Blanca pit and west of the Jolly Jane pit. These stockpiles would be for the waste rock that would be mined from the Sierra Blanca and Jolly Jane. Another waste rock stockpile would be located east of Mayflower.
Corvus Gold Corp. Technical Report – North Bullfrog Project | | Page | 224 |
19 MARKET STUDIES AND CONTRACTS
No market studies have been undertaken by the project at this time, and no contracts have been discussed for the sale of the gold which may be produced at the NBP. It is assumed that the process facilities at the NBP would produce a gold doré with high purity, which will be shipped to a commercial refiner such as Johnson Matthey in Salt Lake City. All-in charges from such refiners are currently in the range of US $1.50-2.00/Oz, based on a minimum one-year contract at quantity levels consistent with this project. Sales price would be based on the spot price of gold. A gold price of $1,200 per ounce has been assumed for the life of the mine.
Gold is readily sold on the spot market, and historically has not been a demand limited commodity. This PEA assumes that gold with be sold at spot price and this assumption is considered to be reasonable by the Author.
Corvus Gold Corp. Technical Report – North Bullfrog Project | | Page | 225 |
20 ENVIRONMENTAL STUDIES, PERMITTING AND SOCIAL OR COMMUNITY IMPACT
Corvus currently has permits to conduct exploration activities at NBP with both the Nevada Division of Environmental Protection (NDEP) Bureau of Mining Regulation and Reclamation (BMRR) and the Bureau of Land Management (BLM). Those permits allow 20 acres and 120 acres of surface disturbance on the private and public land, respectively. The permits for activities on the public lands are based on an Environmental Assessment that contains environmental baseline data on wildlife, climate and local physical characteristics.
20.1 EXISTING ENVIRONMENTAL BASELINE CHARACTERIZATION ACTIVITIES
Corvus has developed characterization plans which describe the on-going and future collection of baseline environmental data that will be required to support a future mine permitting process. Current baseline characterization activities include:
Geochemical characterization of waste rock geochemistry – Acid-Base Accounting (ABA) characterization of waste rock as defined in the current mining plans using static tests have been completed and a first phase of Humidity Cell Tests have been completed for the waste rock associated with mining the heap leach disseminated mineralization. The second phase of HCTs are being defined to characterize waste associated with the mining of the YellowJacket mineralization.
Hydrologic characterization testing has been performed during installation of 12 ground water monitoring wells. Collection of water quality data began in Q4 2012 on a quarterly basis for the ground water monitoring wells and a group of 12 surface springs surrounding NBP. NDEP Profile I parameters are reported for each ground water and spring sample.
Surveys of plants and wildlife have been conducted on a large portion of NBP, including special surveys for bats and Desert Tortoise. Desert Tortoise range is currently limited to the eastern portion of NBP, outside of the areas containing currently defined mineral resources. Recent habitat studies of the eastern portion of NBP have indicated that the area is not critical Tortise habitat.
A meteorological station has been in operation on the NBP site since August 2012.
These studies address baseline data whose collection is time critical to production of a mining plan of operations which would serve as the basis to initiate the BLM’s National Environmental Policy Act (NEPA) process (likely through the preparation of an environmental impact statement (EIS) that is required for the processing of a Plan of Operations. Other baseline characterization activities would be required, but would not control the schedule for completion of the EIS.
No known environmental issues have been identified at the NBP site that would materially affect the current mine design or scope of the needed environmental permits. Geochemical characteristics of the waste rock suggest that no acid generation and only minor metals leaching would be expected from the waste materials associated with the heap leach mineralization. Ground water quality is typical of the regional data and drilling activities suggest minimal water inflow because only a small portion mining would be below the water table.
Corvus Gold Corp. Technical Report – North Bullfrog Project | | Page | 226 |
20.2 PERMITS REQUIRED FOR FUTURE MINING ACTIVITIES
This section of the technical report summarizes the permits that will likely be required to conduct mining activities at the NBP. The details of the mine area and activities are not well defined at this time. However, in order to conduct mining and processing activities, the Project will need specific permits from the State of Nevada Division of Environmental Protection (NDEP) Bureau of Mining Regulation and Reclamation (BMRR) and the Bureau of Land Management (BLM). The following is a list of the major permits that will be required followed by a brief discussion of each. None of the permits are currently in application stage.
| | 1. | Plan of Operations/Nevada Reclamation Permit; |
| | 2. | Water Pollution Control Permit; |
| | 3. | Air Quality Operating Permits; |
| | 4. | Water Rights; and |
| | 5. | Industrial Artificial Pond Permit. |
20.3 PLAN OF OPERATIONS/NEVADA RECLAMATION PERMIT
A Plan of Operations/Nevada Reclamation Permit (Plan) is a joint application that is submitted to the BLM and NDEP BMRR that utilizes a format accepted by the BLM and BMRR. The application will describe the operational procedures for the construction, operation, and closure of the Project. As required by the BLM and BMRR, the Plan will include a waste rock management plan, quality assurance plan, a storm water spill contingency plan, reclamation plan, a monitoring plan, and an interim management plan. In addition, the Plan includes a Reclamation Cost Estimate for the closure of the Project. The mine design must be completed prior to submittal of the Plan.
20.4 WATER POLLUTION CONTROL PERMIT APPLICATION
The Water Pollution Control Permit (WPCP) application must address the open pit, waste rock dump, heap leach pad, mining activities, and the water management system, as well as the potential for these facilities to degrade waters of the state. The application includes an engineering design for the waste rock dump, a waste characterization report and a modeling report for the closure of the waste rock dump, as well as an engineering design for the water management system.
A Tentative Permanent Closure Plan must also be completed and submitted to the NDEP-BMRR in conjunction with the WPCP. A Final Permanent Closure Plan will need to be developed two years prior to Project closure.
20.5 AIR QUALITY OPERATING PERMITS
An Application for a Class II Air Quality Permit for those portions of the stationary source that have the potential to emit pollutants must be prepared using Bureau of Air Pollution Control (BAPC) forms. The Application includes a description of the facility and a detailed emission inventory. The Application also includes locations, plot plans, and process flow diagrams. The Application must also include a fugitive dust control Plan to be used during construction and operation of the Plan. If the facility will process loaded carbon or electrowinning precipitate, then a Mercury Operating Permit application and a Title V Operating Permit application will also be necessary, which will have to address the necessary state and federal mercury controls, respectively.
Corvus Gold Corp. Technical Report – North Bullfrog Project | | Page | 227 |
20.6 WATER RIGHTS
Water rights will need to be obtained from the Nevada Division of Water Resources (NDWR) to remove and utilize the water from the mining operation and to provide water for the public water system.
20.7 INDUSTRIAL ARTIFICIAL POND PERMIT
The development of the water storage pond, which is part of the water management system, will require an Industrial Artificial Pond Permit (IAPP) from the Nevada Department of Wildlife.
20.8 MINOR PERMITS AND APPLICATIONS
In addition to the above noted permits, table 20.1 lists potential other notifications or ministerial permits that will likely be necessary to conduct the mining operations.
Table 20-1 Required Minor Permits and Applications.
| Notification/Permit | Agency | Comments |
| Mine Registry | Nevada Division of Minerals | - |
| Mine Opening Notification | State Inspector of Mines | - |
| Solid Waste Landfill | Nevada Bureau of Waste Management | - |
| Hazardous Waste Management Permit | Nevada Bureau of Waste Management | - |
| General Storm Water Permit | Nevada Bureau of Water Pollution Control | - |
| Hazardous Materials Permit | State Fire Marshall | - |
| Fire and Life Safety | State Fire Marshall | - |
| Explosives Permit | Bureau of Alcohol, Tobacco, Firearms and Explosives | Mining contractor may be responsible for permit |
| Notification of Commencement of Operation | Mine Safety and Health Administration | - |
| Radio License | Federal Communications Commission | - |
| Public Water Supply Permit | NV Division of Environmental Protection | - |
| MSHA Identification Number and MSHA Coordination | U.S. Department of Labor Mine Safety and Health Administration (MSHA) | - |
| Septic Tank | NDEP – Bureau of Water Pollution Control | - |
| Petroleum Contaminated Soils | NV Division of Environmental Protection | - |
Corvus Gold Corp. Technical Report – North Bullfrog Project | | Page | 228 |
21 CAPITAL AND OPERATION COSTS
Capital and operating costs used for the PEA are based on evaluation of multiple sources of information. Active Nevada mining operations based on exclusive heap leach processing and combined heap leach processing and mill processing of gold ores were visited in the period November-December, 2011, again in October of 2014. Operating costs, consumable costs and construction costs were discussed with mine site staff during the visits, and were used as bench marks for establishing the PEA estimates. Capital and operating costs were developed using information available from the CostMine cost data service for 2015 by InfoMine USA, Inc. In addition, all available project technical data and metallurgical process related test work were considered to build up a processing operating cost estimate.
Preliminary site infrastructure (mill, tailing storage facility, heap leach pad, overburden storage facility, roads, shops, offices, etc.) have been evaluated and a conceptual arrangement was defined as the basis of capital costs estimates. Capital costs were developed based on the nominal mining rates of 44,400 tonnes of mineralized material per day. The capital cost includes estimates of sustaining capital and all facilities and equipment needed for all phases of the project over its projected 10 years of active mining. The mobile equipment were assumed to be financed over its first 5 years of use with 20% down payment and assuming 5% annual interest. All costs are in constant USD from 2015.
Cost accuracy is estimated to be + or – 30%, in the opinion of the Author.
21.1 CAPITAL COST ESTIMATE
Capital cost estimates are described in the general categories of initial capital and sustaining capital.
21.1.1 INITIAL CAPITAL COST ESTIMATE
The initial capital cost estimates are listed in Table 21-1 and consist of go-forward costs to be incurred after approval of a Plan of Operations, and after construction/operating permits have been received. It covers the schedule period year -1, and includes all construction costs up to the start of production, which is defined as when the first mineralized material is placed on the leach pad and the first mineralization is processed in the mill. The scope of the initial capital includes direct capital costs, indirect costs, Owner’s costs and contingency. Direct capital costs include the, heap leach facilities (I.e. ponds, initial leach pad construction, feeder-conveyor-stacker, carbon columns) and mill facilities (i.e. 3,000 mtpd crushing and grinding circuit, leach and CIL circuits, carbon ADR plant, tailings storage facility, and mill water storage ponds/tanks), infrastructure and the mobile mining fleet. Pre-production mining occurs in the construction year -1 to insure that YellowJacket mineralization would be available for the mill in year +1. Indirect costs include Engineering, Procurement, and Construction Management (“EPCM”). Owner’s costs include an allowance for property maintenance and the expansion and training of the mine management and labor force. Contingency was set at 25% on all items excluding mobile equipment, EPCM, Owner’s Cost and Working Capital.
Corvus Gold Corp. Technical Report – North Bullfrog Project | | Page | 229 |
Table 21-1 North Bullfrog Project – Initial Capital Cost Estimate
| Capital Item | Estimated Capital Cost (USD $M) |
| Initial Direct Capital Cost | 129.8 |
| EPCM | 19.1 |
| Contingency | 26.5 |
| Total | 175.4 |
The direct initial capital costs are further subdivided in Table 21-2. Only the first year, down payment on the mobile equipment was included in Table 21-2.
Table 21-2 North Bullfrog Project – Initial Direct Capital Cost Estimate (including Contingency)
| Capital Item | Estimated Capital Cost (USD $M) |
| Mill | 82.2 |
| Heap Leach | 19.2 |
| Mobile Equipment | 7.3 |
| Infrastructure & Facilities | 20.4 |
| Capitalized Mining | 13.3 |
| Total | 142.4 |
For indirect initial capital costs, listed in Table 21-3, EPCM was calculated as 18% of the initial capital costs for the mill, heap leach, and infrastructure.
Table 21-3 NBP - Initial Indirect Capital Cost Estimates (including contingency)
| Capital Item | Estimated Capital Cost (USD $M) |
| EPCM | 19.1 |
| Owner’s Cost | 3.0 |
| Freight | 10.9 |
| Total | 33.0 |
21.1.2 SUSTAINING CAPTIAL COST ESTIMATE
Sustaining capital cost estimates included all capital costs that would be incurred after production starts (year +1 to year 10). It included estimated capital for expansion of production capability (leach pad expansion, haul road construction, etc.) and replacement capital (mobile equipment overhaul or replacement of worn out equipment). Annual principal payments for the mobile equipment were also included in sustaining capital. Sustaining capital cost estimates are listed in Table 21-4, along with the remaining contingency calculated at 25% of cost items excluding the mobile equipment and working capital.
Corvus Gold Corp. Technical Report – North Bullfrog Project | | Page | 230 |
Table 21-4 NBP – Sustaining Capital Cost Estimates and Remaining Contingency
| Capital Item | Estimated Capital Cost (USD $M) |
| Sustaining LOM | 77.1 |
| Remaining EPCM | 2.6 |
| Remaining Contingency | 3.6 |
| Total | 83.3 |
21.1.3 WORKING CAPITAL
Working capital was estimated to be equivalent to operating costs for the first 3 months of production, or $16.1 M. Working capital is credited to the project operating costs in the first year of production. Initial fills costs were estimated to be $0.4 M and were recovered in the last year of active operation.
21.1.4 LIFE OF MINE CAPITAL ESTIMATE
Total estimated capital costs are listed in Table 21-5.
Table 21-5 NBP PEA – Total Capital Cost Estimate
| Capital Item | Estimated Capital Cost (USD $M) |
| Total Initial Capital | 175.4 |
| Sustaining Capital | 83.3 |
| Total* | 258.7 |
* includes working capital
21.2 OPERTATING COSTS ESTIMATES
Operating cost estimates were developed from spreadsheet cost models built up from first principles. These spreadsheets considered the schedule of production physicals, assumed equipment productivities, consumables, and operating maintenance and production labor. The projected unit costs were compared to benchmark information for the Nevada heap leach operations visited in late 2014. Mine operating costs were developed by Metal Mining Consultants, Inc. The process cost estimation spreadsheets were developed separately for heap leach processing and for the mill processing.
Operating costs were estimated for the categories of mining, processing, administration, and reclamation. Table 21-6 list the operating cost estimates used in the economic analysis.
Table 21-6 North Bullfrog Project – Average Operating Cost Assumptions
| Operating Cost Area | LOM Average Operating Cost ($/ process tonne) | LOM Average Operating Cost ($/Au oz) |
| Mining | 2.41 | 332 |
| Processing | 1.65 | 227 |
| Administration* | 0.43 | 60 |
| Reclamation | 0.12 | 17 |
| Total | 4.62 | 635 |
* excludes royalties
Mining costs were estimated at $1.52 per unit tonne of mineralized material or overburden material. The mill processing cost estimate averaged $11.57 per tonne processed and heap leach processing cost was estimated to average $1.20 per tonne processed.
Corvus Gold Corp. Technical Report – North Bullfrog Project | | Page | 231 |
22 ECONOMIC ANALYSIS
This PEA is preliminary in nature, and is based on technical and economic assumptions which will be evaluated in more advanced studies. The PEA is based on the North Bullfrog Mineral Resource model (June 16, 2015) which consists of material in Measured, Indicated and Inferred classifications. Inferred mineral resources are considered too speculative geologically to have the economic considerations applied to them that would enable them to be categorized as mineral reserves. The current basis of project information is not sufficient to convert the in-situ Mineral Resources to Mineral Reserves, and Mineral Resources that are not Mineral Reserves do not have demonstrated economic viability. Accordingly, there can be no certainty that the results estimated in this PEA will be realized. The PEA results are only intended as an initial, first-pass review of the potential project economics based on preliminary information.
The economic analysis of the North Bullfrog Project assumes constant 2015 US $, and is performed on an annual basis beginning at the start of year -1 when operating permits are assumed to have been issued. Construction was assumed to require 1 year with placement of mineralized material on a heap leach pad and mill processing to start at the beginning of year +1. The PEA utilized estimates mill gold recoveries based on bottle roll testing and gravity concentration testing performed on the YellowJacket Josh vein and stockwork materials. Heap leach recoveries were based on column leach testing data for composite samples constructed from Mayflower, Jolly Jane, Savage Valley and Sierra Blanca 2012 PQ core drilling.
The mill process recovery assumptions reflected overall gold and silver recoveries based on the flow diagram shown in Section 17. The average mill recoveries for gold were 86.8% and 71.4% for silver.
The heap leach process recovery assumptions reflected consideration of the particle size resulting from ultra-high intensity blasting to produce a gradation similar to primary crushing (P80 -76mm) and the leach pad placement schedule. The leach pad production model predicts an average gold recovery of 73.8%, and an average silver recovery of 6% of fire assay grade. The production model assumes a 3 year buildup of gold in solution inventory which would require 3 years of rinsing after the final leach pad placement to recover inventory. No cost escalation was included in the calculations, and the cash flows were presented after-royalty and after-tax. A gold price of $1,200 per ounce was assumed for all years (1-13) for the base case. All economic projections were made on an after-royalty and after-tax basis.
The analysis included Measured, Indicated and Inferred Mineral Resources in the mining and economic study. Measured and Indicated Resources make up 45%of the gold ounces in the total production plan. The remaining 55% of the gold ounces in the production plan are classified as Inferred Mineral Resources. Subdivided by process, 91% of the gold ounces in the mill production schedule are classified as Measured and Indicated Mineral Resources, and 17% of the gold ounces in the heap leach production schedule are classified as indicated Mineral Resources.
Corvus Gold Corp. Technical Report – North Bullfrog Project | | Page | 232 |
22.1 KEY PERFORMANCE PARAMTERS
Mining physicals in the production schedule presented in Table 16-2 were used in conjunction with unit operating cost assumptions to estimate opex costs on an annual basis. Estimated capital costs were input on an annual basis from a conceptual schedule that included initial capital associated with pre-mining construction of the project in year -1, and sustaining capital over the LOM. Mobile equipment were assumed to be financed with 20% down payment and a five year term at 5% interest. Interest costs were transferred to administrative operating cost.
Key performance parameters are listed in Table 22-1; Figure 22-1 shows the projected annual gold and silver production from North Bullfrog Project facilities.
Table 22-1 Projected Key Performance Parameters from the North Bullfrog Project Preliminary Economic Assessment (Constant $US, No Escalation, Constant $1,200 per Ounce Gold Price, after-Royalty and after-Tax)
| Parameter | Data Value |
| Measured Resource within Whittle Shells* | 4.0 M t at 2.43 g/t Au for 316.2 kozs and at 18.89 g/t Ag for 2.46 Mozs |
| Indicated Resource within Whittle Shells* | 22.1 M t at 0.41 g/t Au for 289.6 kozs and at 1.18 g/t Ag for 0.84 Mozs |
| Inferred Resource within Whittle Shells* | 137.1 M t at 0.21 g/t Au for 926.2 kozs and 0.75 g/t Ag for 3.32 Mozs |
| Post-Tax and Royalty NPV at 5% | $US 245.9 M |
| Post Tax and Royalty IRR | 37.9 % |
| Pre-tax cashflow ; IRR | $479 ; ≈53% |
| Overall Strip Ratio | 0.6:1 (overburden:mineralized material) |
| Average Annual Gold Production years 1-6 | 154 kozsz/year |
| Average Annual Gold Production years 7-10 | 69 kozs/year |
| Average Gold Recovery - mill | 86.8% |
| Average Gold Recovery- heap leach | 73.9% |
| Average Cash Cost | $US 635/Au Oz* |
| Average Silver Recovery-mill | 71.4% |
| Average Silver Recovery – heap leach | 6% |
| Average Total Mining Rate | 69.7k tonne/day |
| Average Mineralized Material Mining Rate | 44.4 k tonne/day |
* Mill selection COG = 0.372 g/t, Heap Leach selection COG= 0.1 g/t
Corvus Gold Corp. Technical Report – North Bullfrog Project | | Page | 233 |
Figure 22-1 Estimated Gold and Silver Production by Year for North Bullfrog Project (45% Measured and Indicated Resource; 55%% Inferred Resource).
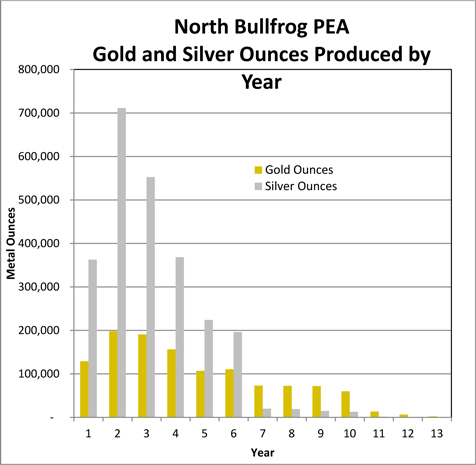
Physical data for the North Bullfrog Project are listed in Table 22-2, for the estimated mine life of 10 years of active mining (13 years with leach pad rinse down).
Table 22-2 Summary Projected Physical Data for the North Bullfrog Project Estimated Production Schedule
| Key Physical Data | Units | Value |
| Heap Leach Feed Mined | M tonnes | 156.8 |
| Mill Feed Mined | M tonnes | 7.1 |
| Overburden Mined | M tonnes | 95.8 |
| Total Material Mined | M tonnes | 259.7 |
| Mine Life* | Years | 10 |
| Contained Gold** | M Oz | 1.53 |
| Recovered Gold | M Oz | 1.19 |
| Contained Silver | M oz | 6.61 |
| Recovered Silver | M Oz | 2.49 |
Corvus Gold Corp. Technical Report – North Bullfrog Project | | Page | 234 |
| Key Physical Data | Units | Value |
| Average Strip Ratio | Overburden/Process Feed | 0.6 |
| Average Diluted Gold Grade Heap Leach | g/t | 0.22 |
| Average Diluted Gold Grade Mill | g/t | 1.92 |
| Average Gold Recovery | % | 77.5 |
| Annual Process Feed Mined | M tonnes/yr | 16.2 |
| Annual Gold Produced | K Oz/yr | 117.0 |
* active mining, excludes leach pad rinse period at end of mine life
** 40% Measured and Indicated Mineral Resource; 60% Inferred Mineral Resource
LOM unit costs for opex and capex are listed in Table 22-3.
Table 22-3 Projected LOM Unit Operating Cost and Capital Cost per Process Tonne and per Produced Au Ounce for the North Bullfrog Project (Constant 2015 $US, No Escalation).
| Cost Area | Cost per Process tonne* ($/tonne) | Cost per Recovered Gold Oz* ($/Oz) |
| Mining | $2.41 | $332 |
| Processing | $1.65 | $227 |
| Administration* | $0.41 | $ 60 |
| Reclamation | $0.12 | $16 |
| Total Operating Cost | $4.59 | $635 |
| Capital Cost | $1.50 | $206 |
| Projected Total Cost | $6.12 | $841 |
*-Excludes royalty on Jolly Jane and Mayflower production.
22.2 CASH FLOW
The projected annual production and cash flow (after-royalty and after-tax) for the North Bullfrog Project are listed in 22-4. The estimated payback period assuming the average gold price of $1,200 and average silver price of $16.28 per ounce is 2.2 years.
Corvus Gold Corp. Technical Report – North Bullfrog Project | | Page | 235 |
Table 22-4 Projected Annual Production and Cash Flow (after-Royalty and after-Tax) for the North Bullfrog Project – Base Case (Gold Price $1,200; Silver Price $16.28)
| Year | Over-
burden
Mined
(M t) | Process
Feed
Mined
(M t) | Contained
Au*
(k Oz) | Produced
Au
(k Oz) | Gold
Revenue
(US $M) | Produced
Ag
(k Oz) | Silver
Revenue
(US $M) | Operating
Cost
(US $M) | Capital
Cost (US
$M) | Pre-Tax/
Royalty
Cash Flow
(US $M) | Federal
Income
Tax
(US$M) | Nevada
NPT Tax
(US$M) | Royalty
(US $M) | Cash Flow
After Tax,
After
Royalty
(US $M) |
| (1) | 6.8 | | | | | | | | $(162.1) | $(162.1) | $0.0 | $0.0 | $0.0 | $(162.1) |
| 1 | 12.3 | 21.5 | 202.9 | 129.1 | $ 154.9 | 362.8 | $5.9 | $(87.4) | $ (26.7) | $46.7 | $(6.4 ) | $(2.4 ) | $0.0 | $37.9 |
| 2 | 15.6 | 17.1 | 265.9 | 198.0 | $237.6 | 711.4 | S11.6 | $(84.7) | $(14.6 ) | $149.9 | $(33.8 ) | $(7.7 ) | $0.0 | $108.4 |
| 3 | 12.7 | 18.2 | 220.3 | 190.8 | $228.9 | 552.7 | $9.0 | $ (84.9) | $(18.5 ) | $134.5 | $(34.7 ) | $(7.0 ) | $0.0 | $92.8 |
| 4 | 10.0 | 19.1 | 191.4 | 156.6 | $187.9 | 368.6 | $6.0 | $(84.5) | $(12.7 ) | $96.7 | $ (17.9) | $(4.8 ) | $0.0 | $74.0 |
| 5 | 11.1 | 16.3 | 136.1 | 106.8 | $128.2 | 224.1 | $3.6 | $(79.5) | $(2.2 ) | $50.1 | $(4.5 ) | $(2.0 ) | $(0.4 ) | $43.2 |
| 6 | 12.4 | 15.4 | 137.9 | 110.5 | $132.6 | 196.2 | $3.2 | $ (79.3) | $(8.3 ) | $48.2 | $(5.3 ) | $(2.1 ) | $(1.2 ) | $39.6 |
| 7 | 5.1 | 16.0 | 99.4 | 73.2 | 87.8 | 19.9 | $0.3 | $ (58.9) | $0.0 | $29.2 | $(1.5 ) | $(0.8) | $(0.6 ) | $26.3 |
| 8 | 4.9 | 15.6 | 96.9 | 72.6 | $87.2 | 19.1 | $0.3 | $ (58.5) | $(0.2) | $28.8 | $(2.7 ) | $0.0 | $(0.8 ) | $25.3 |
| 9 | 2.6 | 12.9 | 100.1 | 72.0 | $86.4 | 14.8 | $0.2 | $ (53.0) | $(0.2) | $33.4 | $(3.6 ) | $0.0 | $(1.8 ) | $28.0 |
| 10 | 2.2 | 11.7 | 86.0 | 59.9 | $71.9 | 12.6 | $0.2 | $(48.4) | $0.0 | $23.7 | $(2.6) | $0.0 | $(1.3) | $19.8 |
| 11 | | | | 13.2 | $15.9 | 1.6 | $0.0 | $(7.1 ) | $0.0 | $8.8 | $0.0 | $(0.4) | $0.0 | $8.4 |
| 12 | | | | 6.6 | $7.9 | 0.8 | $0.0 | $(7.1 ) | $0.0 | $0.8 | $0.0 | $0.0 | $0.0 | $0.8 |
| 13 | | | | 2.2 | $2.6 | 0.3 | $0.0 | $(6.8 ) | $0.0 | $(4.2) | $0.0 | $0.0 | $0.0 | $(4.2) |
| LOM | 95.7 | 163.8 | 1,536.9 | 1,191.5 | $ 1,429.8 | 2,484.9 | $40.3 | $(740.2) | $(245.5) | $484.4 | $(113.0) | $ (27.2) | $ (6.1) | $338.1 |
| | NPV@5%: US$365.1M | | | NPV@5% US$245.9M |
| *- Contained Au includes 6.6 kozs in vein dilution which are not classified | |
| | IRR: 53% | | | IRR: 38% |
Corvus Gold Corp. Technical Report – North Bullfrog Project | | Page | 236 |
22.3 SENSITIVITY
The sensitivity of the Preliminary Economic Assessment for the Project has been evaluated for variations in the gold price assumption, gold recovery assumption, operating cost and capital cost. These sensitivities are evaluated around the base case price assumptions of an average gold price of US $1,200 per ounce, and the average gold recovery, opex and capex price assumptions listed in Tables 22-2 and 22-3. Table 22-5 lists the estimated Net Present Value (NPV) at discount rates of 0%, 5%, 7.5%, and 10%, and the estimated Internal Rate of Return (“IRR”) for the gold price assumptions between US $1,000 and $1,500 per ounce.
Table 22-5 Projected Sensitivity of Net Present Value and Internal Rate of Return to Variation in Gold Price (after-Royalty and after-Tax)
Gold Price
($/Oz) | Total Cash
Flow (US $M) | NPV @ 5% (US
$M) | NPV @ 7.5%
(US $M) | NPV @ 10%
(US $M) | IRR (%) | Payback
(years) |
| $900 | $60.4 | 24.1 | 9.3 | $(3.8) | 9.2% | 3.0 |
| $1,000 | $159.8 | $102.9 | $80.2 | $60.4 | 20.5% | 3.0 |
| $1,100 | $249.7 | $174.9 | $145.3 | $119.7 | 29.6% | 2.5 |
| $1,200 | $338.1 | $245.9 | $209.6 | $178.2 | 37.9% | 2.2 |
| $1,300 | $427.5 | $317.4 | $274.2 | $237 | 45.8% | 1.9 |
| $1,400 | $515.2 | $387.6 | $337.6 | $294.6 | 53.2% | 1.8 |
| $1,500 | $602.4 | $457.3 | $400.6 | $352.0 | 60.4% | 1.6 |
Sensitivity to the proportional change from the base case economic projection, derived at an average gold price of US $1,200 per ounce and gold recovery, opex and capex unit costs listed in Tables 22-2 and 22-3, were estimated for a nominal range of + 25% to – 25% from the base case assumptions. The sensitivity is shown graphically for NPV @ 5% and for IRR in Figures 22-2 and 22-3, respectively.
Corvus Gold Corp. Technical Report – North Bullfrog Project | | Page | 237 |
Figure 22-2 Sensitivity of Estimated NPV @ 5% (after-Royalty and after-Tax) for Changes in Cost, Gold Recovery or Gold Price as a Percent of the Base Case at a Gold Price of $1,200 per Ounce, Gold:Silver Price Ratio of 73.7, 78%% Gold Recovery and Cost as Defined in Table 22-3
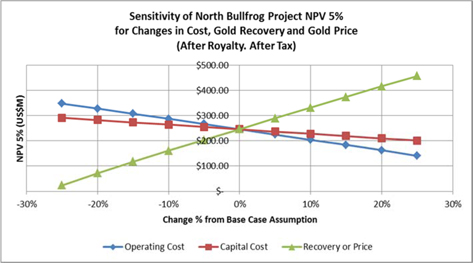
Figure 22-3 Sensitivity of Estimated IRR (after-Royalty and after-Tax) for Changes in Cost, Gold Recovery or Gold Price as a Percent of the Base Case at a Gold Price of $1,200 per Ounce, Gold:Silver Price Ratio 0f 73.7, 78% Gold Recovery and Cost as Defined in Table 22-3.
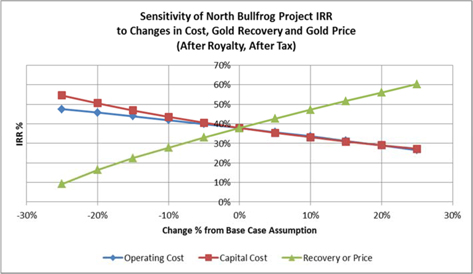
The sensitivity analysis indicates that the PEA of the North Bullfrog Project would be most sensitive to gold price and gold recovery assumptions. The PEA was less sensitive to changes in cost, with changes in capex having a greater effect than changes in opex.
Corvus Gold Corp. Technical Report – North Bullfrog Project | | Page | 238 |
22.4 TAXES, ROYALITES AND OTHER INTERESTS
Corvus would be subject to the following taxes as they relate to the Project:
| | · | Nevada Net Proceeds Tax |
| | · | Federal Income Tax |
Corvus would also be subject to royalties as described in Section 22.4.3.
Estimates of these taxes and royalties were made based on the production schedule in Table 22-4 and operating and capital cost estimates described in Section 21.
22.4.1 NEVADA NET PROCEEDS MINERAL TAX
In Nevada, if the net proceeds of a mine in the taxable year totals US$4 million or more the tax rate is 5%. The gross proceeds from the sale of the minerals minus certain allowable deductions were used to estimate the taxable net proceeds. The Nevada net proceeds tax is calculated before deductions of Federal income tax. In general, all operating costs and capital costs directly related to the mining operation are deductible, using Nevada depreciation and depletion schedules.
22.4.1.1 FEDERAL INCOME TAX
Corporate Federal income tax was estimated by computing the higher of a regular tax or a Tentative Minimum Tax (TMT). If the TMT exceeds the regular tax, the difference is called the Alternative Minimum Tax (AMT). Regular tax was estimated by subtracting Nevada Net Proceeds Mineral tax, all allowable operating expenses, overhead, depreciation, amortization and depletion from revenues on an annual basis to estimate the taxable income. The tax rate was then determined from the published progressive tax schedule. An operating loss may be used to offset taxable income, thereby reducing taxes owed, in the previous two and following 20 years. The highest effective corporate income tax is 35%.
The AMT was estimated in three steps. First, regular taxable income was adjusted by recalculating certain regular tax deductions, based on AMT laws, to estimate AMT Income (AMTI). Second, AMTI was multiplied by 20% to determine TMT. Third, if TMT exceeded the estimated regular tax, the excess was the AMT amount payable in addition to the regular tax liability.
22.4.2 DEPLETION
Generally speaking, depletion, like depreciation, is a form of cost recovery. Just as the owner of a business asset is allowed to recover the cost of an asset over its useful life, a miner would be allowed to recover the cost of the mineral property. Depletion was taken over the projected period that minerals would be extracted.
For federal income tax purposes, two forms of depletion are allowed: cost depletion and percentage depletion. The taxpayer is required to use the method that will result in the greatest deduction.
Corvus Gold Corp. Technical Report – North Bullfrog Project | | Page | 239 |
22.4.2.1 COST DEPLETION
Cost depletion was estimated based on the adjusted basis of the depletable property multiplied by the units of mineralized material projected to be produced over the production schedule in Table 16-1.
22.4.2.2 PERCENTAGE DEPLETION
Under the percentage depletion method, a flat percentage of 15% of adjusted gross income from gold mining was used to estimate the depletion allowance. However, the deduction for depletion cannot exceed 50% of the adjusted taxable income from the activity. This limitation was computed without regard to the depletion allowance. The amount of the deduction allowable under percentage depletion is not limited by the basis of the property, except for AMT purposes. Thus, even though the basis of the property would be reduced by the amount of depletion taken, if the basis becomes zero, the depletion based on the percentage of adjusted gross income may continue to be claimed for tax purposes.
22.4.2.3 DEPRECIATION
Cost recovery for capital invested was estimated using standard depreciation schedules specified for different types of investment. The estimated cost recovery for calculation of Federal income tax included the 7 years 200% declining balance calculation, a expense 73% with 6% for the next 4 years and the final 3% in the last year calculation, and a units of production depreciation schedule. Both an alternative minimum tax and regular tax depreciation was estimated.
22.4.3 ROYALTIES
The calculation of estimated royalties was based on projected mining production underlying individual leases to which royalties apply. The royalty status of the various patented claim blocks is discussed in Section 4.1, Table 4.1. Where lease agreements provide for royalties, annual gold and silver production from those claim blocks has been projected and used to estimate royalty ounces of gold and silver. Those royalty ounces are deducted from the payable gold and silver production.
Corvus Gold Corp. Technical Report – North Bullfrog Project | | Page | 240 |
23 ADJACENT PROPERTIES
There is one adjacent property that is relevant to the NBP: the Bullfrog mine.
Based on publically available information, the Bullfrog mine was operated by Barrick Gold Corp. (and several processor companies), produced 2.31 million ounces of gold and serves as a model, at least in part, for the NBP (Eng, et al., 1996). Epithermal gold mineralization occured with quartz-calcite veins and stockworks with associated adularia, fluorite, and barite. Mineralization was primarily along a northerly striking moderately west dipping fault zone that was up to 100 metres thick. At a 3 g/t cutoff the mineralized zone was commonly 5-15 metres wide, at least 1,600 metres along strike, and had been traced down-dip for 500 metres. There was commonly an interior high-grade gold zone surrounded by low-grade material. Anomalous arsenic, and possibly antimony and molybdenum formed a halo outside to the zone of gold mineralization.
The authors have been unable to verify the information available with respect to the Bullfrog mine property, and such information is not necessarily indicative of the mineralization at the NBP.
24 OTHER RELEVANT DATA AND INFORMATION
There is no other relevant data or information about the NBP.
Corvus Gold Corp. Technical Report – North Bullfrog Project | | Page | 241 |
25 INTERPRETATION AND CONCLUSIONS
The Project performance is most sensitive to gold price and recovery.
25.1 MINERAL RESOURCES
Previous PEA documents based on extraction of the low grade disseminated heap leachable Mineral Resource indicated viable potential. The addition of higher grade vein and vein stockwork Mineral Resources in the YellowJacket Zone suitable for mill processing has substantially improved the estimated performance of the Project. This improvement emphasizes the importance of further exploration for higher grade structural mineralization zones at NBP.
25.2 GEOLOGIC POTENTIAL
Recent exploration work at NBP has demonstrated that gold bearing quartz vein zones and replacement deposits exist at the NBP. In addition, 2012-2014 drilling has identified significant new gold and silver-rich quartz veins in the YellowJacket area of Sierra Blanca. This represents a completely blind discovery of a previously unrecognized style of mineralization at NBP. A 3D IP survey, a gravity survey in the eastern Steam-heated Zone along with more detailed structural/geologic mapping in early 2015 have provided the basis for target generation on the rest of NBP. These structural targets and the general Jolly Jane and Sierra Blanca areas are the priority for future work at the NBP. There are also other alteration and geochemical anomalies throughout in the Eastern Steam-heated Alteration Zone that the Project should evaluate.
The 2010-2014 drilling programs at several areas outlined significant and apparently continuous disseminated mineralization that needs additional drilling to fully define the extent. However, that exploration should have lower priority than the higher grade structural zone targets. Specifically, the Jolly Jane and Sierra Blanca, Yellow Jacket and Savage Valley areas contain significant low-grade gold-silver deposits. Drilling has shown that the Sierra Blanca Tuff is the primary host rock for broad areas of disseminated semi-stratabound gold mineralization. Much of the mineralization is near surface, oxidized, and metallurgical testing has indicated good heap leaching characteristics.
25.3 METALLURGICAL TESTING
Metallurgical testing data indicates that simple cyanide leach processing, either mill or heap leach, has high gold recovery in oxidized materials. Since the primary gold occurrence in the quartz vein and vein stockworks of the YellowJacket Zone is free gold and electrum, cyanide processing techniques would have good performance below the oxidation horizon. If the characteristics of any future discoveries are different than expected, Corvus should perform additional metallurgical tests.
Corvus Gold Corp. Technical Report – North Bullfrog Project | | Page | 242 |
26 RECOMMENDATIONS
The PEA results, for the combined mill and heap leach configuration, indicate the substantial impact on the potential project performance of the higher grade vein and vein stockwork mineralization. Therefore it is recommended that future exploration should focus on the identification of other structural related mineralization. These recommended activities for an initial phase are:
| | · | Drill structures identified in the Eastern Steam-heated Alteration Zone |
| | · | Explore Structural Targets around Sierra Blanca |
| | · | Continue Baseline Data Collection |
The projected costs for the next phase of this program are outlined in Table 26-1.
Table 26-1 Proposed Budget to Support Recommended Program at NBP
Activity | Amount |
| Exploration Drilling and Data Management | US$ 0.9 M |
| Baseline Data Collection | US$ 0.1 M |
| Total | US$ 1.0M |
Corvus Gold Corp. Technical Report – North Bullfrog Project | | Page | 243 |
27 REFERENCES
Baughman, Dave, 2008, Cyanidation Results for Coarse Gold Ore Samples: Hazen Research Inc. unpublished report, 9 pages, July 14, 2008.
Brent, G., Dare-Bryan, P., Hawk, S. and Rothery, M. (2014). Ultra-high-intensity blasting – a new paradigm in mining, AusIMM Billetin, Journal of the Australasian Institute of Mining and Metallurgy, No. 5, October 2014.
Brent, g., Rothery, M. D., Dare-Bryan, P.C., Hawke, S.J., Gomex, R. and Humeres, I., (2013). Ultra-high-intensity blasting for improved ore comminution, Rock Fragmentation by Blasting, Proceedings of the 10th International Symposium on Rock Fragmentation by Blasting, New Delhi, CRC Press.
Carr, W.J., Byers, F.M., and Orklid, P.P., 1986, Stratigraphic and volcano-tectonic relations of Crater Flat Tuff and some older volcanic units, Nye County, Nevada: USGS Professional Paper 1323, 28 p.
Connors, Katherine A., Weiss, Steven I., Noble, Donald C., 1998, Geologic Map of the Northeastern Bullfrog Hills and Vicinity, Southern Nye County, Nevada, Nevada Bureau of Mines and Geology Map 112.
Elliott, Russell R., 1966, Nevada’s Twentieth-Century Mining Boom-Tonopah, Goldfield, Ely, University of Nevada Press, Reno and Las Vegas, 344 pages.
Eng, Tony, Boden, David R., Reischman, Mark R., and Biggs, James O., 1996, Geology and mineralization of the Bullfrog Mine and vicinity, Nye County, Nevada, in Geology and Ore Deposits of the American Cordillera, Geological Society of Nevada Symposium Proceedings, Alan R. Coyner and Patrick L. Fahey eds., Reno, Nevada, pages 353-402.
Engineering Analystics, Inc, 2013b. Preliminary Evaluation of Pit Slope stability, Mayflower Deposit, North Bullfrog Project Nye County. Nevada, an unpublished report from Engineering Analytics, Inc. of Fort Collins, CO to Corvus Gold Nevada, Inc., Project No 110266, June 14, 2013.
Engineering Analytics, Inc. 2013a. Evaluation of Pit Slope Stability ZuZu Pit, North Bullfrog Project Nye County, Nevada, an unpublished report from Engineering Analytics, Inc. of Fort Collins, CO. to Corvus Gold Nevada, Inc., Projuct No 110266, October 03, 2013.
Fullam, M. (2015). Gravity Circuit Modeling Report, Corvus Gold Inc., YellowJacket Deposit. An unpublishjed report to Corvus Gold Nevada Inc. by FLSmidth, Salt Lake City Utah, January 6, 2015.
Hazen Research, Inc., Cyanidation Results for Coarse Gold Ore Samples Hazen Project 10825, an unpublished letter report from Hazen Research, Inc. of Golden, CO to Corvus Gold Nevada, Inc., July 14, 2008.
Hunter, Edward N., 2008, Summary Report on the North Bullfrog Project, Nye County, Nevada. International Tower Hill Mines Ltd. unpublished report, May 18, 2008, 24 pages.
Lincoln, F.C., 1923, Mining districts and mineral resources of Nevada, Reno, Nevada Newsletter Publishing Co., 296 pages.
Corvus Gold Corp. Technical Report – North Bullfrog Project | | Page | 244 |
Kappes, Cassiday & Associates, 2010, NB Project-Report of Metallurgical Test Work, March 2010, unpublished report to Talon Gold Alaska, Incorporated, 21 pages.
Kappes, Cassiday & Associates, 2011a, North Bullfrog Project, Report of Metallurgical Test Work, April 2011, unpublished report to Corvus Gold Nevada Inc., 37 pages.
Kappes, Cassiday & Associates, 2011b, North Bullfrog Project, Report of Metallurgical Test Work, May 2011, unpublished report to Corvus Gold Nevada Inc., 10 pages.
McClelland Laboratories, Inc., 2012. Unpublished transmittal of column percolation leach test results for Sierra Blanca Bulk Samples and Jolly Jane Bulk Samples, from Jeff Olson, Metallurgist, transmitted to Carl Brechtel, Corvus Gold, Inc., March 23, 2012.
McClelland Laboratories, Inc., 2012b. Unpublished letter transmittal of Bottle Roll Test Results and Preliminary Column Leach Tests for Mayflower and Savage Valley PQ Core Composite Samples, from Jeff Olson, Metallurgist, transmitted to Carl Brechtel, Corvus Gold, Inc., October 8, 2012.
McClelland Laboratories, Inc., 2012c. Unpublished letter transmittal of Bottle Roll Test Results for Jolly Jane and Sierra Blanca PQ Core Composite Samples and Preliminary Column Leach Results for Jolly Jane PQ Core Composite Samples, from Jeff Olson, Metallurgist, transmitted to Carl Brechtel, Corvus Gold, Inc., December 7, 2012.
McClelland Laboratories, Inc., 2012d. Unpublished letter transmittal of Bottle Roll Test Results for Jolly Jane and Sierra Blanca PQ Core Composite Samples and Preliminary Column Leach Results for Jolly Jane PQ Core Composite Samples, from Jeff Olson, Metallurgist, transmitted to Carl Brechtel, Corvus Gold, Inc., December 28, 2012.
McClelland Laboratories, Inc., 201 Report on North Bullfrog Test Work – Mayflower Bulk Samples, MLI Job No. 3670, April 29, 2013. An unpublished report to Corvus Gold Nevada, Inc. from McClelland Laboratories, Inc. Reno Nevada.
McClelland Laboratories, Inc., 2013b. Report on North Bullfrog Test Work – Mayflower Composites, MLI Job No. 3711, April 23, 2013. An unpublished report to Corvus Gold Nevada, Inc. from McClelland Laboratories, Inc. Reno Nevada.
McClelland Laboratories, Inc., 2013c. Report on North Bullfrog Test Work – Jolly Jane Composites, MLI Job No. 3711, May 15, 2013. An unpublished report to Corvus Gold Nevada, Inc. from McClelland Laboratories, Inc. Reno Nevada.
McClelland Laboratories, Inc., 2013d. Letter Report of 14 Column Leach tests on Sierra Blanca Composites, North Bullfrog Project, May 29, 2013. An unpublished letter report to Corvus Gold Nevada, Inc. from McClelland Laboratories, Inc. Reno Nevada.
McClelland Laboratories, Inc., 2013e. Letter Report of 12 Column Leach tests on Savage Valley Composites, North Bullfrog Project, January 29, 2013. An unpublished letter report to Corvus Gold Nevada, Inc. from McClelland Laboratories, Inc. Reno Nevada.
Corvus Gold Corp. Technical Report – North Bullfrog Project | | Page | 245 |
McClelland Laboratories, Inc., 2013f. Report on Metallurgical Testing - North Bullfrog Rock Samples MLI Job No. 3756, October 11, 2013. An unpublished letter report to Corvus Gold Nevada, Inc. from McClelland Laboratories, Inc. Reno Nevada.
McClelland Laboratories, Inc., 2014a. Letter Report of Results From Bottle Roll Cyanidation Tests on Five Drill Core Composites From the YellowJacket Project, March 24, 2014. An unpublished report to Corvus Gold Nevada, Inc. from McClelland Laboratories, Inc. Reno Nevada.
McClelland Laboratories, Inc., 2014b. Report on Flooded Vat Leach (Cyanidation) Tests – Sized Rock Samples, Sierra Blanca Adit Dump MLI Job No. 3865, August 19, 2014. An unpublished report to Corvus Gold Nevada, Inc. from McClelland Laboratories, Inc. Reno Nevada.
McClelland Laboratories, Inc., 2014b. 3916 Report Tables, November 24, 2014. An unpublished report to Corvus Gold Nevada, Inc. from McClelland Laboratories, Inc. Reno Nevada.
McClelland Laboratories, Inc., 2015a. Report on Bottle Roll and Column Leach Cyanidation Tests-YellowJacket Drill Core Composites MLI Job No’s. 3859/390 January 8, 2015. An unpublished report to Corvus Gold Nevada, Inc. from McClelland Laboratories, Inc. Reno Nevada.
McClelland Laboratories, Inc., 2015b. Summary Report on Bulk Gravity Concentration and Cyanidation Testing – Josh Vein Composites from the North Bullfrog Project MLI Job No. 3982, June 16, 2015. An unpublished report to Corvus Gold Nevada, Inc. from McClelland Laboratories, Inc. Reno Nevada.
Myers, Russell, 2008, Summary of Data Provided to Giroux Consulting Ltd. for Resource Modeling: Mayflower Prospect, Beatty, Nevada, International Tower Hill Ltd. unpublished report, 30 May 2008, 5 pages.
Nevada Bureau of Mine and Geology, 2000, Special Publication MI-2000: The Nevada Mineral Industry 2000, 62 pages.
Phillips Enterprises, LLC, Metallurgical Testing and Consulting Services, unpublished Letter Report to Jeff Olson of McClelland Laboratories, Inc. on crusher work index tests, ball mill grindability tests and abrasion index tests on North Bullfrog Samples SB 1019 and JJ 1019, December 21, 2011.
Sillitoe, R. H., 2015, Comments on the Eastern Zone of the North Bullfrog Gold-silver Project, Nevada, unpublished report prepared for Corvus Gold Inc., 11 pages
Steininger, Roger C., Wilson, Scott E., Giroux, Gary, and Pennstrom, W., (2012a) Technical Report and Preliminary Economic Assessment for the North Bullfrog Project, Bullfrog Mining District, Nye County, Nevada, NI 43-101 Report for Corvus Gold, Inc., filed on SEDAR.COM, dated February 28, 2012.
Steininger, Roger C., Wilson, Scott E., Giroux, Gary, and Pennstrom, W., (2012b) Technical Report and Preliminary Economic Assessment for Mayflower and the North Mine Area at the North Bullfrog Project, Bullfrog Mining District, Nye County, Nevada, NI 43-101 Report for Corvus Gold, Inc., filed on SEDAR.COM, dated December 6, 2012.
Corvus Gold Corp. Technical Report – North Bullfrog Project | | Page | 246 |
Steininger, Roger C., Giroux, Gary, Osborne, Herbert C. and Wilson, Scott E. (2013) Technical Report and Preliminary Economic Assessment for the North Bullfrog Project, Bullfrog Mining District, Nye County, Nevada, NI 43-101 Report for Corvus Gold, Inc., filed on SEDAR.COM, dated October 23, 2013.
Wilson, S., Giroux, G., and H.C. Osborne, (2014), Technical Report – The North Bullfrog Project, Bullfrog Mining District, Nye County, Nevada, April 1, 2014, NI 43-101 Report for Corvus Gold, Inc., filed on SEDAR.COM, dated April 1, 2014.
Weiss, S. I.,D. C. Noble,M. R. Jackson,K. A. Connors, andE. H. McKee (1994),Multiple Episodes of Hydrothermal Activity and Epithermal Mineralization in the Southwestern Nevada Volcanic Field and Their Relations to Magmatic Activity, Volcanism and Regional Extension, in: Evaluation of Geologic Relations and Seismotectonic Stability of the Yucca Mountain Area Nevada Nuclear Waste Site Investigations, Progress Report. Center for Neotectonic Studies, Mackay School of Mines, Univ. of Nevada,Reno, NV.
Weiss, S.I., 1996, Hydrothermal Activity, Epithermal Mineralization and Regional Extension in the Southwestern Nevada Volcanic Field: University of Nevada-Reno, Reno, Nevada, unpublished PhD dissertation, 212p.