UNITED STATES
SECURITIES AND EXCHANGE COMMISSION
Washington, D.C. 20549
FORM 6-K
REPORT OF FOREIGN PRIVATE ISSUER PURSUANT TO RULE 13a-16 OR 15d-16 UNDER THE SECURITIES EXCHANGE ACT OF 1934
For the month of November, 2018
Commission File Number: 001-35129
Arcos Dorados Holdings Inc.
(Exact name of registrant as specified in its charter)
Dr. Luis Bonavita 1294, Office 501
Montevideo, Uruguay, 11300 WTC Free Zone
(Address of principal executive office)
Indicate by check mark whether the registrant files or will file annual reports under cover of Form 20-F or Form 40-F:
| Form 20-F | X | Form 40-F | ||
Indicate by check mark if the registrant is submitting the Form 6-K in paper as permitted by Regulation S-T Rule 101(b)(1):
| Yes | No | X | ||
Indicate by check mark if the registrant is submitting the Form 6-K in paper as permitted by Regulation S-T Rule 101(b)(7):
| Yes | No | X | ||
ARCOS DORADOS HOLDINGS INC.
TABLE OF CONTENTS
| ITEM | |
| 1. | Press Release dated November 14, 2018 titled “Arcos Dorados Reports Third Quarter 2018 Financial Results” |
SIGNATURE
Pursuant to the requirements of the Securities Exchange Act of 1934, the registrant has duly caused this report to be signed on its behalf by the undersigned, thereunto duly authorized.
| Arcos Dorados Holdings Inc. | |||||
| By: | /s/ Juan David Bastidas | ||||
| Name: | Juan David Bastidas | ||||
| Title: | Chief Legal Counsel | ||||
Date: November 14, 2018
Item 1

FOR IMMEDIATE RELEASE
ARCOS DORADOS REPORTS THIRD QUARTER 2018 FINANCIAL RESULTS
Consolidated revenue growth of 8.3%, on a constant currency basis, supported by a 7.4% increase in comparable sales1.
Adjusted EBITDA margin expanded 340 basis points to 12.3%1.
Net income increased 68% to $42.7 million1.
Montevideo, Uruguay, November 14, 2018 – Arcos Dorados Holdings, Inc. (NYSE: ARCO) (“Arcos Dorados” or the “Company”), Latin America’s largest restaurant chain and the world’s largest independent McDonald’s franchisee, today reported unaudited results for the third quarter ended September 30, 2018.
Third Quarter 2018 Highlights – Excluding Venezuela
| • | On a constant currency basis2, consolidated revenues grew 8.3%. As reported, consolidated revenues decreased 12.9% to $720.3 million versus the third quarter of 2017. |
| • | Systemwide comparable sales2 rose 7.4% year-over-year. |
| • | As reported, Adjusted EBITDA2 increased 19.7% to $88.2 million compared with the prior-year quarter. |
| • | Consolidated Adjusted EBITDA margin expanded 340 basis points year-over-year to 12.3%. |
| • | As reported, General and Administrative (G&A) expenses decreased 16.2% versus the prior-year quarter. |
| • | As reported, net income increased 68% to $42.7 million, from $25.3 million in the third quarter of 2017. |
1Excluding Venezuela.
2For definitions please refer to page 14 of this document.
“Systemwide comparable sales grew 7.4% on top of the 10.4% achieved last year, with strong contributions from most of our markets throughout Latin America and the Caribbean. Our operating structure and disciplined approach to growth was supported by restaurant level, bottom line profitability and cash flow generation. In Brazil, sales grew over 2% in constant currency terms as we focused on consistently growing in a profitable manner. We achieved adjusted EBITDA margin expansion of 130 basis points, excluding other operating income mostly related to a tax credit, as we effectively managed food and paper as well as labor costs.
Our investments in innovative marketing and digital initiatives and in enhancing the guest experience also contributed to comparable sales growth, as guest traffic continued rising in increasingly important markets, such as Mexico and the Andean markets within the SLAD division. Comparable sales in our NOLAD division grew 6.7% in the quarter.
With the uncertainty about Mexico’s presidential election and the US trade agreement behind us and the choice of Brazil’s president decided, we are more optimistic about the macro environments of these two important markets. However, even under improving market conditions, we will remain vigilant, protecting and expanding our customer base across our markets while seeking to preserve and enhance our margins.
We are strong in a number of ways that support Arcos Dorados’ long-term, financial sustainability. Through leveraging our scale, vast geographic footprint, compelling line-up of menu items, and obsession with elevating our guests’ dining experience, we will successfully execute on our strategic plan,”said Sergio Alonso, Chief Executive Officer of Arcos Dorados.
2
Third Quarter 2018 Results
Consolidated
Figure 1. AD Holdings Inc Consolidated: Key Financial Results
(In millions of U.S. dollars, except as noted)
| 3Q17 (a) | Currency Translation - Excl. Venezuela (b) | Constant Currency Growth - Excl. Venezuela (c) | Venezuela (d) | 3Q18 (a+b+c+d) | % As Reported | % Constant Currency | |
| Total Restaurants (Units) | 2,160 | 2,195 | 1.6% | ||||
| Sales by Company-operated Restaurants | 803.4 | (167.4) | 65.2 | (9.9) | 691.3 | -14.0% | 684.6% |
| Revenues from franchised restaurants | 39.1 | (8.3) | 3.4 | (1.0) | 33.1 | -15.4% | 1832.1% |
| Total Revenues | 842.5 | (175.8) | 68.6 | (11.0) | 724.4 | -14.0% | 737.9% |
| Systemwide Comparable Sales | 942.2% | ||||||
| Adjusted EBITDA | 74.2 | (22.5) | 37.0 | (0.9) | 87.9 | 18.4% | 4672.6% |
| Adjusted EBITDA Margin | 8.8% | 12.1% | |||||
| Net income (loss) attributable to AD | 23.4 | (9.7) | 27.0 | (14.7) | 26.0 | 11.2% | -19580.6% |
| No. of shares outstanding (thousands) | 211,072 | 208,628 | |||||
| EPS (US$/Share) | 0.11 | 0.12 |
(3Q18 = 3Q17 + Currency Translation Excl. Venezuela + Constant Currency Growth Excl. Venezuela + Venezuela). Refer to “Definitions” section for further detail.
Arcos Dorados’ consolidated results continue to be heavily impacted by Venezuela’s macroeconomic volatility, including the ongoing hyperinflationary environment and the country’s heavily regulated currency. As such, reported results may contain significant non-cash accounting charges to operations in this market. In this quarter, we recorded a long-lived asset impairment charge of $11.1 million. Accordingly, the discussion of the Company’s operating performance is focused on consolidated results that exclude Venezuela.
Consolidated – excluding Venezuela
| Figure 2. AD Holdings Inc Consolidated - Excluding Venezuela: Key Financial Results (In millions of U.S. dollars, except as noted) |
| 3Q17 (a) | Currency Translation (b) | Constant Currency Growth (c) | 3Q18 (a+b+c) | % As Reported | % Constant Currency | |
| Total Restaurants (Units) | 2,030 | 2,067 | 1.8% | |||
| Sales by Company-operated Restaurants | 789.8 | (167.4) | 65.2 | 687.7 | -12.9% | 8.3% |
| Revenues from franchised restaurants | 37.6 | (8.3) | 3.4 | 32.6 | -13.2% | 9.0% |
| Total Revenues | 827.4 | (175.8) | 68.6 | 720.3 | -12.9% | 8.3% |
| Systemwide Comparable Sales | 7.4% | |||||
| Adjusted EBITDA | 73.7 | (22.5) | 37.0 | 88.2 | 19.7% | 50.1% |
| Adjusted EBITDA Margin | 8.9% | 12.3% | ||||
| Net income (loss) attributable to AD | 25.3 | (9.7) | 27.0 | 42.7 | 68.4% | 106.7% |
| No. of shares outstanding (thousands) | 211,072 | 208,628 | ||||
| EPS (US$/Share) | 0.12 | 0.20 |
3
Excluding the Company’s Venezuelan operation, as reported revenues decreased 12.9% year-over-year, primarily due to the negative impact of the 85% and 25% year-over-year average depreciations against the US dollar of the Argentine peso and the Brazilian real, respectively. This impact was partially offset by constant currency revenue growth of 8.3%. Constant currency revenue growth was supported by a 7.4% increase in systemwide comparable sales, largely driven by average check growth.
Adjusted EBITDA ($ million)
Breakdown of main variations contributing to 3Q18 Adjusted EBITDA
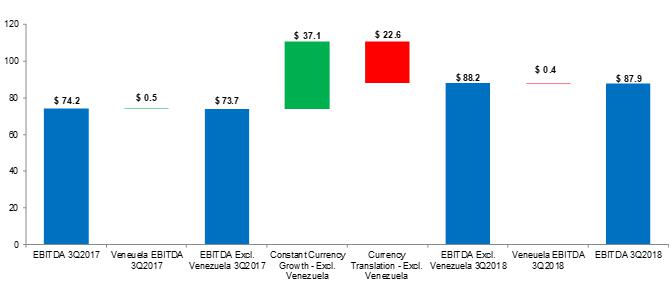
Third quarter consolidated as reported Adjusted EBITDA, excluding Venezuela, increased 19.7%, or 50.1% in constant currency terms. Adjusted EBITDA included a one-time amount of $23.2 million in other operating income, mostly related to a tax credit in the Brazil division. The Adjusted EBITDA margin expanded by 340 basis points to 12.3%. Excluding the aforementioned one-time other income amount, the Adjusted EBITDA margin would have expanded 10 basis points year-over-year, mainly driven by efficiencies in Payroll and G&A offset by a step up in Royalty Fees.
As reported, consolidated G&A decreased by 30 basis points as a percentage of revenues and was 16.2% lower year-over-year. On a constant currency basis, G&A increased 6.2%, below the blended inflation for the Company’s G&A.
4
Main variations in other operating income (expenses), net
Included in Adjusted EBITDA: In the third quarter of 2018, the Company recorded a one-time income of $23.2 million, mostly related to a tax credit in the Brazil division. Proceeds from refranchising were $2.2 million in the third quarter of 2018, compared to $1.7 million in the prior-year quarter.
Excluded from Adjusted EBITDA: In the third quarter of 2018, the Company recorded an impairment charge of $11.1 million related to its operations in Venezuela.
Non-operating Results
Non-operating results for the third quarter, excluding Venezuela, contain a $10.5 million non-cash foreign currency exchange gain, versus a non-cash gain of $6.0 million in 2017. Net interest expense was $2.8 million lower year-over-year.
The Company reported an income tax expense, excluding Venezuela, of $21.4 million in the quarter, compared to an income tax expense of $15.5 million in the prior year period.
Third quarter net income attributable to the Company totaled $42.7 million ($26.0 million, including Venezuela), compared to net income of $25.3 million ($23.4 million, including Venezuela) in the same period of 2017. This year’s higher operating income, which included the $23.2 million one-time income, combined with lower net interest expenses and a positive variance in foreign exchange results, was partially offset by higher income tax expenses.
The Company reported earnings per share of $0.20 ($0.12, including Venezuela) in the third quarter of 2018, compared to earnings per share of $0.12 ($0.11, including Venezuela) in the previous corresponding period. Due to share repurchases, total weighted average shares for the third quarter of 2018 decreased to 208,628,186 from 211,072,340 in the prior-year quarter.
5
Analysis by Division:
Brazil Division
| Figure 3. Brazil Division: Key Financial Results (In millions of U.S. dollars, except as noted) |
| 3Q17 (a) | Currency Translation (b) | Constant Currency Growth (c) | 3Q18 (a+b+c) | % As Reported | % Constant Currency | |
| Total Restaurants (Units) | 910 | 939 | 3.2% | |||
| Total Revenues | 378.4 | (76.1) | 7.8 | 310.1 | -18.0% | 2.1% |
| Systemwide Comparable Sales | 1.0% | |||||
| Adjusted EBITDA | 49.3 | (17.7) | 36.0 | 67.5 | 37.0% | 73.0% |
| Adjusted EBITDA Margin | 13.0% | 21.8% |
Brazil’s as reported revenues decreased 18.0%, impacted by the 25% year-over-year average depreciation of the Brazilian real. Excluding currency translation, constant currency revenues grew 2.1%, supported by systemwide comparable sales growth of 1.0%.
Marketing activities in the quarter included the launch ofTriplo Quarterão and Egg Quarterão sandwiches, among others. Other marketing campaigns in the quarter included the launch of McFlurry Laka & Black Diamond in the dessert category, and My Little Pony and Transformers in the Happy Meal. Also, in the quarter, the Company commemorated 50 years of the Big Mac with a McCoin campaign and hosted McDia, which helps raise funds for the Ronald McDonald House and the Ayrton Senna Institute.
As reported Adjusted EBITDA increased 37.0% year-over-year and 73.0% on a constant currency basis. Adjusted EBITDA was positively impacted by a one-time amount in other operating income of $23.2 million, mostly related to a tax credit resulting from the exclusion of ICMS from the Pis/Cofins calculation base. The Adjusted EBITDA margin expanded from 13.0% to 21.8%, positively impacted by this one-time tax credit. Excluding the tax credit, the Adjusted EBITDA margin would have expanded 130 basis points year-over-year to 14.3%, mainly driven by efficiencies in Payroll and Food and Paper (F&P) costs.
6
NOLAD
| Figure 4. NOLAD Division: Key Financial Results (In millions of U.S. dollars, except as noted) |
| 3Q17 (a) | Currency Translation (b) | Constant Currency Growth (c) | 3Q18 (a+b+c) | % As Reported | % Constant Currency | |
| Total Restaurants (Units) | 514 | 521 | 1.4% | |||
| Total Revenues | 102.3 | (3.0) | 6.8 | 106.1 | 3.7% | 6.7% |
| Systemwide Comparable Sales | 6.7% | |||||
| Adjusted EBITDA | 9.9 | (0.0) | (1.1) | 8.8 | -11.2% | -10.9% |
| Adjusted EBITDA Margin | 9.7% | 8.3% |
NOLAD’s as reported revenues increased 3.7% year-over-year, supported by constant currency growth of 6.7%, partially offset by a negative currency translation impact resulting from the Mexican peso’s 6% year-over-year average depreciation against the US dollar. Systemwide comparable sales increased 6.7%, driven by growth in guest traffic. Mexico traffic continues to perform strongly, recording a sixth consecutive quarter of positive comparable sales growth. The Company’s compelling menu, innovative marketing initiatives, as well as its focus on delivering an enhanced guest experience, continue to drive this improved performance.
Third quarter movie tie-in promotions for the Happy Meal included Hotel Transylvania 3, My Little Pony, Transformers and Super Mario. A new phase of the affordability platform “McTrío 3x3” continued in Mexico with Hamburguesa Gourmet. Also during the quarter, the Company launched Chipotle Ranch in the Signature Line and McFlurry Choco Roles in the dessert category.
As reported Adjusted EBITDA decreased 11.2%, or 10.9% on a constant currency basis. The Adjusted EBITDA margin contracted by 140 basis points to 8.3%, or by 30 basis points when excluding refranchising inflows recorded in the same quarter of last year. The margin contraction mainly reflects an increase in Royalty Fees, which accounted for 40 basis points of the decrease in the quarter’s margin.
7
SLAD
| Figure 5. SLAD Division: Key Financial Results (In millions of U.S. dollars, except as noted) |
| 3Q17 (a) | Currency Translation (b) | Constant Currency Growth (c) | 3Q18 (a+b+c) | % As Reported | % Constant Currency | |
| Total Restaurants (Units) | 386 | 390 | 1.0% | |||
| Total Revenues | 252.3 | (96.6) | 45.6 | 201.4 | -20.2% | 18.1% |
| Systemwide Comparable Sales | 18.1% | |||||
| Adjusted EBITDA | 26.3 | (10.4) | 1.5 | 17.3 | -34.1% | 5.6% |
| Adjusted EBITDA Margin | 10.4% | 8.6% |
SLAD’s as reported revenues decreased 20.2%, as constant currency growth of 18.1% was more than offset by negative currency translation effects resulting from the 85% year-over-year average depreciation of the Argentine peso against the US dollar. Systemwide comparable sales increased 18.1%, driven by average check growth.
Marketing activities in the quarter included the introduction of an Egg & Bacon premium burger in the Signature Line and the continuation of the McCombo of the Day in the affordability platform. The Happy Meal performed well with Hotel Transylvania 3 and Super Mario movie tie-ins. Also during the quarter, the Company launched Chicken Sticks, the first product in its new Snacks platform.
Adjusted EBITDA decreased 34.1% on an as reported basis and rose 5.6% in constant currency terms. The Adjusted EBITDA margin contracted 180 basis points to 8.6%, as efficiencies in Payroll costs were more than offset by higher F&P costs, Occupancy and Other Operating Expenses, and Royalty Fees as a percentage of revenues.
8
Caribbean Division
| Figure 6. Caribbean Division: Key Financial Results (In millions of U.S. dollars, except as noted) |
| 3Q17 (a) | Currency Translation (b) | Constant Currency Growth (c) | 3Q18 (a+b+c) | % As Reported | % Constant Currency | |
| Total Restaurants (Units) | 350 | 345 | -1.4% | |||
| Total Revenues | 109.4 | (6,158.6) | 6,155.9 | 106.7 | -2.4% | 5625.7% |
| Systemwide Comparable Sales | 8297.0% | |||||
| Adjusted EBITDA | 5.6 | (3,432.7) | 3,433.7 | 6.6 | 17.5% | 61151.6% |
| Adjusted EBITDA Margin | 5.1% | 6.2% |
The Caribbean division’s results continue to be heavily impacted by Venezuela’s macroeconomic volatility, including the ongoing hyperinflationary environment and the country’s heavily regulated currency. As such, reported results may contain significant non-cash accounting charges to operations in this market. In this quarter we recorded a long-lived asset impairment charge of $11.1 million Due to the distortive effects that Venezuela represents, the discussion of the Caribbean division’s operating performance is focused on results that exclude the Company’s operations in this country.
Caribbean Division – excluding Venezuela
| Figure 7. Caribbean Division - Excluding Venezuela: Key Financial Results (In millions of U.S. dollars, except as noted) |
| 3Q17 (a) | Currency Translation (b) | Constant Currency Growth (c) | 3Q18 (a+b+c) | % As Reported | % Constant Currency | |
| Total Restaurants (Units) | 220 | 217 | -1.4% | |||
| Total Revenues | 94.4 | (0.1) | 8.4 | 102.7 | 8.8% | 8.9% |
| Systemwide Comparable Sales | 12.7% | |||||
| Adjusted EBITDA | 5.1 | (0.0) | 1.9 | 7.0 | 35.8% | 36.2% |
| Adjusted EBITDA Margin | 5.4% | 6.8% |
As reported revenues in the Caribbean division, excluding Venezuela, increased 8.8%, or 8.9% in constant currency terms. Comparable sales increased 12.7%, well above the division’s blended inflation, driven by guest traffic and average check growth. The division’s comparable base positively benefitted from prior year impacts from natural disasters in Puerto Rico and the USVI. Marketing activities in the quarter included Hotel Transylvania 3 and My Little Pony for the Happy Meal and the launch of the McFlurry Pirulin Coco in the dessert category, among others. In addition, the 50th anniversary of the Big Mac was celebrated in Colombia with a McCoin campaign.
9
Adjusted EBITDA totaled $7.0 million, compared to $5.1 million in the same period of 2017. The Adjusted EBITDA margin expanded 140 basis points to 6.8%, mainly driven by efficiencies in G&A, F&P and Payroll costs.
New Unit Development
Figure 8. Total Restaurants (eop)*
| September 2018 | June 2018 | March 2018 | December 2017 | September 2017 | |
| Brazil | 939 | 933 | 929 | 929 | 910 |
| NOLAD | 521 | 522 | 522 | 519 | 514 |
| SLAD | 390 | 390 | 391 | 390 | 386 |
| Caribbean | 345 | 346 | 348 | 350 | 350 |
| TOTAL | 2,195 | 2,191 | 2,190 | 2,188 | 2,160 |
* Considers Company-operated and franchised restaurants at period-end
The Company opened 54 new restaurants during the twelve-month period ended September 30, 2018, resulting in a total of 2,195 restaurants. Also during the period, the Company added 285 Dessert Centers, bringing the total to 2,951 units. McCafés totaled 285, as of September 30, 2018.
10
Balance Sheet & Cash Flow Highlights
Cash and cash equivalents were $207.6 million at September 30, 2018. The Company’s total financial debt (including derivative instruments) was $566.8 million. Net debt (Total Financial Debtminus Cash and cash equivalents) was $359.2 million and the Net Debt/Adjusted EBITDA ratio was 1.3x at September 30, 2018.
Figure 9. Consolidated Financial Ratios |
| September 30 | December 31 | |
| 2018 | 2017 | |
| Cash & cash equivalents (i) | 207,553 | 328,079 |
| Total Financial Debt (ii) | 566,757 | 621,460 |
| Net Financial Debt (iii) | 359,204 | 293,381 |
| Total Financial Debt / LTM Adjusted EBITDA ratio | 2.0 | 2.0 |
| Net Financial Debt / LTM Adjusted EBITDA ratio | 1.3 | 1.0 |
(i) Cash & cash equivalents includes Short-term investment
(ii) Total financial debt includes long-term debt and derivative instruments (including the asset portion of derivatives amounting to $70.7 million and $35.1 million as a reduction of financial debt as of September 30, 2018 and December 31, 2017, respectively).
(iii) Total financial debt less cash and cash equivalents.
Net cash provided by operating activities totaled $52.8 million in the third quarter, while cash used in net investing activities totaled $40.8 million, which included capital expenditures of $55.9 million, compared to $43.4 million in the previous year’s quarter. Cash used in financing activities amounted to $9.3 million, including $8.3 million of treasury stock purchases.
11
First Nine Months of 2018
Excluding the Venezuelan operation and for the nine months ended September 30, 2018, the Company’s as reported revenues decreased 4.6% to $2,257.6 million, as constant currency growth of 8.6% was offset by negative currency translation.
As reported Adjusted EBITDA was $205.1 million, a 6.2% increase compared to the same period of last year. On a constant currency basis, Adjusted EBITDA increased 21.3%. The reported Adjusted EBITDA margin expanded by 90 basis points to 9.1%, mainly driven by the tax credit. Excluding the tax credit, the Adjusted EBITDA margin would have declined by 40 basis points, mostly a result of higher Royalty Fees and Occupancy and other operating expenses as a percentage of revenues.
Year-to-date consolidated net income amounted to $66.9 million, compared to net income of $67.4 million in the first nine months of 2017. The prior year’s result included $56.1 million from the Company’s re-development initiative compared to $0.2 million this year. The nine-month result also reflects lower net interest expenses, lower losses from derivative instruments, a positive variance in foreign currency exchange results, and higher income tax.
During the first nine months of 2018, capital expenditures totaled $119.0 million versus $108.6 million in the comparable period.
12
Other Third Quarter Highlights & Recent Developments
Share Repurchase Program
On May 22, 2018, the Board of Directors approved the adoption of a share repurchase program, pursuant to which the Company may repurchase from time to time up to $60 million of issued and outstanding Class A shares of no par value of the Company. The repurchase program began on this date and will expire at the close of business on May 22, 2019. As of September 30, 2018, the Company had purchased 3,900,103 shares at a total cost of $28.3 million.
| Investor Relations Contact | Media Contact |
| Patricio Iñaki Esnaola | InspIR Group |
| Director of Investor Relations | Barbara Cano |
| Arcos Dorados | barbara@inspirgroup.com |
| patricio.esnaola@ar.mcd.com | +1 646 452 2334 |
| +54 11 4711 2561 | |
www.arcosdorados.com/ir
|
13
Definitions:
Systemwide comparable sales growth: refers to the change, measured in constant currency, in our Company-operated and franchised restaurant sales in one period from a comparable period for restaurants that have been open for thirteen months or longer. While sales by our franchisees are not recorded as revenues by us, we believe the information is important in understanding our financial performance because these sales are the basis on which we calculate and record franchised revenues and are indicative of the financial health of our franchisee base.
Constant currency basis: refers to amounts calculated using the same exchange rate over the periods under comparison to remove the effects of currency fluctuations from this trend analysis. To better discern underlying business trends, this release uses non-GAAP financial measures that segregate year-over-year growth into two categories: (i) currency translation, (ii) constant currency growth. (i) Currency translation reflects the impact on growth of the appreciation or depreciation of the local currencies in which we conduct our business against the US dollar (the currency in which our financial statements are prepared). (ii) Constant currency growth reflects the underlying growth of the business excluding the effect from currency translation.
Excluding Venezuela basis: due to the ongoing political and macroeconomic uncertainty prevailing in Venezuela, and in order to provide greater clarity and visibility on the Company’s financial and operating overall performance, this release focuses on the results on an “Excluding-Venezuela” basis, which is non-GAAP measure.
Adjusted EBITDA: In addition to financial measures prepared in accordance with the general accepted accounting principles (GAAP), within this press release and the accompanying tables, we use a non-GAAP financial measure titled ‘Adjusted EBITDA’. We use Adjusted EBITDA to facilitate operating performance comparisons from period to period.
Adjusted EBITDA is defined as our operating income plus depreciation and amortization plus/minus the following losses/gains included within other operating income (expenses), net, and within general and administrative expenses in our statement of income: gains from sale or insurance recovery of property and equipment; write-offs of property and equipment; impairment of long-lived assets and goodwill; and incremental compensation related to the modification of our 2008 long-term incentive plan.
We believe Adjusted EBITDA facilitates company-to-company operating performance comparisons by backing out potential differences caused by variations such as capital structures (affecting net interest expense and other financial charges), taxation (affecting income tax expense) and the age and book depreciation of facilities and equipment (affecting relative depreciation expense), which may vary for different companies for reasons unrelated to operating performance. Figure 10 of this earnings release include a reconciliation for Adjusted EBITDA. For more information, please see Adjusted EBITDA reconciliation in Note 9 of our quarterly financial statements (6-K Form) filed today with the S.E.C.
14
About Arcos Dorados
Arcos Dorados is the world’s largest independent McDonald’s franchisee in terms of systemwide sales and number of restaurants, operating the largest quick service restaurant chain in Latin America and the Caribbean. It has the exclusive right to own, operate and grant franchises of McDonald’s restaurants in 20 Latin American and Caribbean countries and territories, including Argentina, Aruba, Brazil, Chile, Colombia, Costa Rica, Curaçao, Ecuador, French Guyana, Guadeloupe, Martinique, Mexico, Panama, Peru, Puerto Rico, St. Croix, St. Thomas, Trinidad & Tobago, Uruguay and Venezuela. The Company operates or franchises over 2,190 McDonald’s-branded restaurants with over 90,000 employees and is recognized as one of the best companies to work for in Latin America. Arcos Dorados is traded on the New York Stock Exchange (NYSE: ARCO). To learn more about the Company, please visit the Investors section of our website: www.arcosdorados.com/ir
Cautionary Statement on Forward-Looking Statements
This press release contains forward-looking statements. The forward-looking statements contained herein include statements about the Company’s business prospects, its ability to attract customers, its affordable platform, its expectation for revenue generation and its outlook and guidance for 2018. These statements are subject to the general risks inherent in Arcos Dorados' business. These expectations may or may not be realized. Some of these expectations may be based upon assumptions or judgments that prove to be incorrect. In addition, Arcos Dorados' business and operations involve numerous risks and uncertainties, many of which are beyond the control of Arcos Dorados, which could result in Arcos Dorados' expectations not being realized or otherwise materially affect the financial condition, results of operations and cash flows of Arcos Dorados. Additional information relating to the uncertainties affecting Arcos Dorados' business is contained in its filings with the Securities and Exchange Commission. The forward-looking statements are made only as of the date hereof, and Arcos Dorados does not undertake any obligation to (and expressly disclaims any obligation to) update any forward-looking statements to reflect events or circumstances after the date such statements were made, or to reflect the occurrence of unanticipated events.
15
Third Quarter 2018 Consolidated Results
(In thousands of U.S. dollars, except per share data)
| Figure 10. Third Quarter & First Nine Months of 2018 Consolidated Results (In thousands of U.S. dollars, except per share data) |
| For Three-Months ended | For Nine-Months ended | ||||
| September 30, | September 30, | ||||
| 2018 | 2017 | 2018 | 2017 | ||
| REVENUES | |||||
| Sales by Company-operated restaurants | 691,270 | 803,351 | 2,216,785 | 2,310,980 | |
| Revenues from franchised restaurants | 33,102 | 39,115 | 111,444 | 111,664 | |
| Total Revenues | 724,372 | 842,466 | 2,328,229 | 2,422,644 | |
| OPERATING COSTS AND EXPENSES | |||||
| Company-operated restaurant expenses: | |||||
| Food and paper | (245,141) | (283,892) | (779,977) | (820,097) | |
| Payroll and employee benefits | (141,439) | (174,023) | (470,703) | (508,914) | |
| Occupancy and other operating expenses | (190,964) | (213,467) | (607,509) | (623,215) | |
| Royalty fees | (37,851) | (40,092) | (118,625) | (117,450) | |
| Franchised restaurants - occupancy expenses | (15,382) | (17,000) | (50,324) | (49,651) | |
| General and administrative expenses | (50,155) | (60,203) | (167,073) | (175,950) | |
| Other operating (expenses) income, net | 9,959 | (6,021) | (49,415) | 45,314 | |
| Total operating costs and expenses | (670,973) | (794,698) | (2,243,626) | (2,249,963) | |
| Operating income | 53,399 | 47,768 | 84,603 | 172,681 | |
| Net interest expense | (12,229) | (15,045) | (39,326) | (54,503) | |
| Loss from derivative instruments | 140 | 195 | (191) | (7,036) | |
| Foreign currency exchange results | 10,523 | 5,635 | 15,651 | (18,476) | |
| Other non-operating expenses, net | 53 | 517 | (9) | (607) | |
| Income (expense) before income taxes | 51,886 | 39,070 | 60,728 | 92,059 | |
| Income tax (expense) benefit | (25,805) | (15,537) | (32,978) | (31,888) | |
| Net income (loss) | 26,081 | 23,533 | 27,750 | 60,171 | |
| (Less): Net income attributable to non-controlling interests | (55) | (128) | (140) | (277) | |
| Net income (loss) attributable to Arcos Dorados Holdings Inc. | 26,026 | 23,405 | 27,610 | 59,894 | |
| Earnings per share information ($ per share): | |||||
| Basic net income per common share | $ 0.12 | $ 0.11 | $ 0.13 | $ 0.28 | |
| Weighted-average number of common shares outstanding-Basic | 208,628,186 | 211,072,340 | 210,084,482 | 210,889,576 | |
| Adjusted EBITDA Reconciliation | |||||
| Operating income | 53,399 | 47,768 | 84,603 | 172,681 | |
| Depreciation and amortization | 25,195 | 25,298 | 77,285 | 73,190 | |
| Operating charges excluded from EBITDA computation | 9,293 | 1,170 | 10,009 | (52,354) | |
| Adjusted EBITDA | 87,887 | 74,236 | 171,897 | 193,517 | |
| Adjusted EBITDA Margin as % of total revenues | 12.1% | 8.8% | 7.4% | 8.0% | |
16
Third Quarter 2018 Consolidated Results – Excluding Venezuela
(In thousands of U.S. dollars, except per share data)
| Figure 11. Third Quarter & First Nine Months of 2018 Consolidated Results - Excluding Venezuela (In thousands of U.S. dollars, except per share data) |
| For Three-Months ended | For Nine-Months ended | ||||
| September 30, | September 30, | ||||
| 2018 | 2017 | 2018 | 2017 | ||
| REVENUES | |||||
| Sales by Company-operated restaurants | 687,679 | 789,836 | 2,153,929 | 2,261,106 | |
| Revenues from franchised restaurants | 32,628 | 37,604 | 103,667 | 106,072 | |
| Total Revenues | 720,307 | 827,440 | 2,257,596 | 2,367,178 | |
| OPERATING COSTS AND EXPENSES | |||||
| Company-operated restaurant expenses: | |||||
| Food and paper | (244,453) | (276,184) | (754,869) | (794,145) | |
| Payroll and employee benefits | (141,262) | (173,008) | (466,599) | (503,246) | |
| Occupancy and other operating expenses | (189,279) | (208,885) | (591,609) | (607,995) | |
| Royalty fees | (37,897) | (39,884) | (120,087) | (115,888) | |
| Franchised restaurants - occupancy expenses | (15,194) | (16,444) | (48,123) | (47,728) | |
| General and administrative expenses | (49,115) | (58,592) | (162,607) | (170,378) | |
| Other operating (expenses) income, net | 22,567 | (5,203) | 19,787 | 49,677 | |
| Total operating costs and expenses | (654,633) | (778,200) | (2,124,107) | (2,189,703) | |
| Operating income | 65,674 | 49,240 | 133,489 | 177,475 | |
| Net interest expense | (12,240) | (15,052) | (39,306) | (54,537) | |
| Loss from derivative instruments | 140 | 195 | (191) | (7,036) | |
| Foreign currency exchange results | 10,521 | 6,033 | 9,451 | (15,009) | |
| Other non-operating expenses, net | 53 | 537 | (11) | (587) | |
| Income (expense) before income taxes | 64,148 | 40,953 | 103,432 | 100,306 | |
| Income tax (expense) benefit | (21,437) | (15,491) | (36,367) | (32,625) | |
| Net income | 42,711 | 25,462 | 67,065 | 67,681 | |
| (Less): Net income attributable to non-controlling interests | (55) | (128) | (140) | (277) | |
| Net income attributable to Arcos Dorados Holdings Inc. | 42,656 | 25,334 | 66,925 | 67,404 | |
| Earnings per share information ($ per share): | |||||
| Basic net income per common share | $ 0.20 | $ 0.12 | $ 0.32 | $ 0.32 | |
| Weighted-average number of common shares outstanding-Basic | 208,628,186 | 211,072,340 | 210,084,482 | 210,889,576 | |
| Adjusted EBITDA Reconciliation | |||||
| Operating income | 65,674 | 49,240 | 133,489 | 177,475 | |
| Depreciation and amortization | 24,047 | 23,346 | 73,370 | 67,988 | |
| Operating charges excluded from EBITDA computation | (1,479) | 1,154 | (1,770) | (52,365) | |
| Adjusted EBITDA | 88,242 | 73,740 | 205,089 | 193,098 | |
| Adjusted EBITDA Margin as % of total revenues | 12.3% | 8.9% | 9.1% | 8.2% | |
17
Third Quarter 2018 Results by Division
(In thousands of U.S. dollars)
| Figure 12. Third Quarter & First Nine Months of 2018 Consolidated Results by Division (In thousands of U.S. dollars) |
| 3Q | YTD | ||||||||
| Three-Months ended | % Incr. | Constant | Nine-Months ended | % Incr. | Constant | ||||
| September 30, | / | Currency | September 30, | / | Currency | ||||
| 2018 | 2017 | (Decr) | Incr/(Decr)% | 2018 | 2017 | (Decr) | Incr/(Decr)% | ||
| Revenues | |||||||||
| Brazil | 310,129 | 378,404 | -18.0% | 2.1% | 991,785 | 1,093,338 | -9.3% | 2.2% | |
| Caribbean | 106,747 | 109,426 | -2.4% | 5625.7% | 375,190 | 331,941 | 13.0% | 2721.1% | |
| Caribbean - Excl. Venezuela | 102,682 | 94,400 | 8.8% | 8.9% | 304,557 | 276,475 | 10.2% | 7.9% | |
| NOLAD | 106,122 | 102,301 | 3.7% | 6.7% | 302,282 | 282,770 | 6.9% | 7.6% | |
| SLAD | 201,374 | 252,335 | -20.2% | 18.1% | 658,972 | 714,595 | -7.8% | 19.1% | |
| TOTAL | 724,372 | 842,466 | -14.0% | 737.9% | 2,328,229 | 2,422,644 | -3.9% | 380.4% | |
| TOTAL - Excl. Venezuela | 720,307 | 827,440 | -12.9% | 8.3% | 2,257,596 | 2,367,178 | -4.6% | 8.6% | |
| Operating Income (loss) | |||||||||
| Brazil | 54,740 | 35,073 | 56.1% | 97.6% | 111,726 | 99,032 | 12.8% | 31.1% | |
| Caribbean | (8,804) | (448) | -1865.2% | 765096.0% | (43,693) | (4,754) | -819.1% | 114482.0% | |
| Caribbean - Excl. Venezuela | 3,471 | 1,024 | 239.0% | 233.6% | 5,193 | 40 | 12882.5% | 11757.5% | |
| NOLAD | 3,762 | 4,396 | -14.4% | -17.3% | 7,715 | 62,606 | -87.7% | -87.6% | |
| SLAD | 13,793 | 22,684 | -39.2% | 5.7% | 43,800 | 53,625 | -18.3% | 12.9% | |
| Corporate and Other | (10,092) | (13,937) | 27.6% | -19.4% | (34,945) | (37,828) | 7.6% | -28.8% | |
| TOTAL | 53,399 | 47,768 | 11.8% | 7242.7% | 84,603 | 172,681 | -51.0% | 3135.5% | |
| TOTAL - Excl. Venezuela | 65,674 | 49,240 | 33.4% | 70.0% | 133,489 | 177,475 | -24.8% | -13.1% | |
| Adjusted EBITDA | |||||||||
| Brazil | 67,508 | 49,258 | 37.0% | 73.0% | 150,736 | 139,912 | 7.7% | 24.3% | |
| Caribbean | 6,599 | 5,615 | 17.5% | 61151.6% | (15,508) | 13,372 | -216.0% | 40738.2% | |
| Caribbean - Excl. Venezuela | 6,954 | 5,119 | 35.8% | 36.2% | 17,684 | 12,953 | 36.5% | 31.8% | |
| NOLAD | 8,774 | 9,879 | -11.2% | -10.9% | 23,319 | 23,456 | -0.6% | -0.2% | |
| SLAD | 17,328 | 26,290 | -34.1% | 5.6% | 57,112 | 64,790 | -11.9% | 16.6% | |
| Corporate and Other | (12,322) | (16,806) | 26.7% | -7.5% | (43,762) | (48,013) | 8.9% | -16.3% | |
| TOTAL | 87,887 | 74,236 | 18.4% | 4672.6% | 171,897 | 193,517 | -11.2% | 2834.1% | |
| TOTAL - Excl. Venezuela | 88,242 | 73,740 | 19.7% | 50.1% | 205,089 | 193,098 | 6.2% | 21.3% | |
| Figure 13. Average Exchange Rate per Quarter* | ||
| Brazil | Mexico | Argentina | |
| 3Q18 | 3.95 | 18.94 | 32.05 |
| 3Q17 | 3.16 | 17.81 | 17.27 |
18
Summarized Consolidated Balance Sheets
(In thousands of U.S. dollars)
| Figure 14. Summarized Consolidated Balance Sheets (In thousands of U.S. dollars) |
| September 30 | December 31 | |
| 2018 | 2017 | |
| ASSETS | ||
| Current assets | ||
| Cash and cash equivalents | 207,553 | 308,491 |
| Short-term investment | 0 | 19,588 |
| Accounts and notes receivable, net | 72,565 | 111,302 |
| Other current assets (1) | 164,861 | 213,656 |
| Total current assets | 444,979 | 653,037 |
| Non-current assets | ||
| Property and equipment, net | 806,061 | 890,736 |
| Net intangible assets and goodwill | 38,208 | 47,729 |
| Deferred income taxes | 61,566 | 74,299 |
| Other non-current assets (2) | 175,015 | 137,942 |
| Total non-current assets | 1,080,850 | 1,150,706 |
| Total assets | 1,525,829 | 1,803,743 |
| LIABILITIES AND EQUITY | ||
| Current liabilities | ||
| Accounts payable | 189,370 | 303,452 |
| Taxes payable (3) | 92,793 | 136,918 |
| Accrued payroll and other liabilities | 105,285 | 119,088 |
| Other current liabilities (4) | 17,115 | 23,715 |
| Provision for contingencies | 2,028 | 2,529 |
| Financial debt (5) | 13,310 | 19,881 |
| Total current liabilities | 419,901 | 605,583 |
| Non-current liabilities | ||
| Accrued payroll and other liabilities | 33,890 | 29,366 |
| Provision for contingencies | 31,284 | 25,427 |
| Financial debt (6) | 624,194 | 636,648 |
| Deferred income taxes | 9,315 | 10,577 |
| Total non-current liabilities | 698,683 | 702,018 |
| Total liabilities | 1,118,584 | 1,307,601 |
| Equity | ||
| Class A shares of common stock | 379,697 | 376,732 |
| Class B shares of common stock | 132,915 | 132,915 |
| Additional paid-in capital | 14,190 | 14,216 |
| Retained earnings | 403,837 | 401,134 |
| Accumulated other comprehensive losses | (495,554) | (429,347) |
| Common stock in treasury | (28,255) | 0 |
| Total Arcos Dorados Holdings Inc shareholders’ equity | 406,830 | 495,650 |
| Non-controlling interest in subsidiaries | 415 | 492 |
| Total equity | 407,245 | 496,142 |
| Total liabilities and equity | 1,525,829 | 1,803,743 |
(1) Includes "Other receivables", "Inventories", "Prepaid expenses and other current assets", and "McDonald's Corporation's indemnification for contingencies".
(2) Includes "Miscellaneous", "Collateral deposits", "Derivative Instruments", and "McDonald´s Corporation indemnification for contingencies".
(3) Includes "Income taxes payable" and "Other taxes payable".
(4) Includes "Royalties payable to McDonald´s Corporation" and "Interest payable".
(5) Includes "Short-term debt", "Current portion of long-term debt" and "Derivative instruments".
(6) Includes "Long-term debt, excluding current portion" and "Derivative instruments".
19