| | | Ticker Symbols | |
| | Investor Class | Institutional Class | IS Class |
| Jackson Square | | | |
| Global Growth Fund | JSPVX | JSPTX | JSPUX |
| | | | |
| Jackson Square | | | |
| International Growth Fund | JSSAX | JSSGX | JSSSX |
| | | | |
| Jackson Square | | | |
| Large-Cap Growth Fund | JSPJX | JSPIX | DPLGX |
| | | | |
| Jackson Square | | | |
| SMID-Cap Growth Fund | JSMVX | JSMTX | DCGTX |
Annual Report
| www.jspfunds.com | October 31, 2021 |
(This Page Intentionally Left Blank.)
Jackson Square Funds
October 31, 2021
Dear Shareholders:
Jackson Square Partners, LLC (“Jackson Square”), a U.S. registered investment adviser, is the adviser to the Jackson Square Global Growth Fund, Jackson Square International Growth Fund, Jackson Square Large-Cap Growth Fund, and Jackson Square SMID-Cap Growth Fund.
The fiscal period saw strong positive absolute returns in the equity market, which continued to build off the low base set in the first half of 2020, and which were accompanied by high volatility. COVID-19 continued to be a driving factor in that volatility as companies and the market alike sought to predict and digest the impact of re-opening and re-closing economies triggered by uneven global vaccination rates and mutations of the virus. Interest rates rose during the period, initially in reaction to the prospect of a cyclical recovery, and followed by mounting inflation concerns in the face of the global supply chain backlog and pressure from rising wages. Consequently, the composition of market strength changed meaningfully with value significantly outperforming growth, and a broader risk-off trend sometimes manifesting in a flight to the “safety” of the mega-caps.
In the US, there was increasing investor focus on assessing the impact of potential Biden Administration policy changes, including the latest political battles on how far to go on aggressive spending programs in infrastructure and social services. Overseas, the breadth and depth of Beijing’s intervention in the Chinese economy accelerated, sparking a selloff. Overall, the markets remained focused on near-term catalysts, seemingly awaiting further evidence of economic recovery to assign value to longer-term trends of fundamental performance.
Regardless of policy outcomes and oscillating investor sentiment, we remain consistent in our long-term investment philosophy: We want to own what we view as strong secular-growth companies with solid business models and competitive positions that we believe can grow market share and have the potential to deliver shareholder value in a variety of market environments.
Jackson Square Global Growth Fund
Global Growth Fund
Within the Fund
For the fiscal year ended October 31, 2021, Jackson Square Global Growth Fund IS and Institutional Class shares gained 35.90% and 35.79%, respectively. These figures reflect all distributions reinvested. During the same period, the Fund’s benchmark, the MSCI All Country World Index, rose 37.28%. For complete, annualized performance of Jackson Square Global Growth Fund, please see the table on page 4.
Strong relative performance in health care was outweighed by weak relative performance in financials. On a stock-specific level, the following were the most significant contributors and detractors during the period.
Datadog Inc, an enterprise software provider that allows companies to monitor and analyze their cloud-based infrastructure, was a contributor to performance during the period. The company’s core product is called “infrastructure monitoring”, which allows a company’s IT team to monitor and analyze usage in detail by cloud provider, geography, application, or microservice. This allows companies to find and fix issues, optimize performance, reduce compute usage, and secure their applications. Datadog serves a largely greenfield market, making it difficult for investors to appreciate the size of the long-term opportunity since there was no true on premise parallel. Similarly, investors don’t fully appreciate or believe the converge occurring between developers and IT operations teams, driving demand for a single pane of glass to deploy, monitor, analyze, and fix applications. We believe this will help Datadog expand into adjacent products like Application Performance Monitoring, Log Management, Network Management, and Security. We believe the market is underestimating the traction of Datadog’s emerging platform strategy and rapid product innovation that we feel will sustain high levels of growth at attractive economics for many years.
Farfetch Limited, a UK-based online retail business selling multi-brand digital luxury goods in over 100 countries, was a contributor to performance during the period. After surging in 2020, Farfetch underperformed in 2021 as the market rotated out of perceived COVID winners. We believe Farfetch remains in the best position to capitalize on the luxury industry moving online over the next several years. While we have expected this to play out in a linear fashion over many years as brands reassess their distribution strategies, we believe COVID-19 will likely accelerate this shift. Given 90% of luxury purchases are in store and the vast majority of demand is derived from cross-border travel, we believe the company is in the enviable position of having the best platform for the brands to utilize as demand migrates online. We remain constructive on the risk/reward profile and would note the balance sheet is well capitalized to absorb temporary disruptions.
ASML Holding N.V., a leader of photolithography systems for semiconductor manufacturers, was a contributor to performance during the period. The company produces systems which are critical for its customers and sits behind a number of tailwinds driving strong demand for ASML machines, notably 5G, AI and High Performance Computing as well as digital transformation within consumer, automotive. As the leader in lithography, an increasingly key component in chip manufacturing, we believe the company is one of the most important companies within the semiconductor ecosystem and critical to long term technology innovation.
Wix.com Ltd., a cloud-based web development platform, was a detractor from performance during the period. The company saw a moderation of demand after lapping the COVID-19 demand surge, but we believe the growth levels remain strong. Longer–term, we believe the opportunity remains attractive, due in part to the fact that there are over 400 million small and medium size businesses in the company’s target market--the majority of which have yet to obtain an online presence. We believe such a presence is becoming more necessary given COVID-19 disruptions and other challenges to the physical presence of many companies, along with the need to efficiently market online to customers.
Jackson Square Global Growth Fund
MonotaRO, Co, Ltd., a competitively advantaged supplier to a broad base of business clients in Japan that provides a premier ecommerce platform for maintenance, repair, and operations (MRO) products, was a detractor from performance during the period. The stock underperformed after having rallied to all-time highs during the COVID-19 pandemic. The company benefited during the pandemic as business customers of all sizes found it easier to order from Monotaro’s online and highly automated fulfillment process. Financially the company leverages their sales gains into more rapid operating profit growth and with efficiently utilized assets delivers very attractive returns on investment for owners. We believe the company is well positioned to continue to grow its market share supplying maintenance, repair, and operations parts to customers via its superior, automated, all-online offering. We believe the company will continue to compound sales growth at attractive margins and returns for many years.
Arco Platform, Ltd., a Brazilian provider of educational learning platforms and content, was a detractor from performance during the period. We believe the underperformance is macro-related; as Brazil continued to struggle to get COVID-19 under control there has been weakness across Brazilian equities, regardless of fundamentals. While COVID-19 provided a temporary pause to momentum, we believe the company is set up well to reaccelerate growth as schools adopt digital solutions at a faster pace and students return to classes. The company acquired three more brands for its portfolio, two learning systems from Pearson as well as an online test prep provider that brings it into the direct-to-consumer market. The company remains highly profitable and cash generative and we believe it has a long runway ahead.
Jackson Square Global Growth Fund
Value of $1,000,000 Investment (Unaudited)
The chart assumes an initial investment of $1,000,000. Performance reflects waivers of fee and operating expenses in effect. In the absence of such waivers, total return would be reduced. Past performance is not predictive of future performance. Investment return and principal value will fluctuate, so that your shares, when redeemed may be worth more or less than their original cost. Performance current to the most recent month-end may be lower or higher than the performance quoted and can be obtained by calling 1-844-577-3863. Performance assumes the reinvestment of capital gains and income distributions. The performance does not reflect the deduction of taxes that a shareholder would pay on Fund distributions or the redemption of Fund shares.
Annualized Rates of Return as of October 31, 2021
| | 1 year | 3 years | 5 years | Since Inception(1) |
| IS Class | 35.90% | 21.46% | 19.22% | 18.32% |
| Institutional Class | 35.79% | 21.42% | 19.19% | 18.28% |
| Investor Class | 35.43% | 21.04% | 18.81% | 17.91% |
MSCI All Country World Index(2) | 37.28% | 17.47% | 14.72% | 14.28% |
| (1) | Inception date of the IS Class and Institutional Class was September 19, 2016. The Investor Class commenced operations on August 31, 2021. Performance of the Investor Class prior to inception is based on the performance of the IS Class, adjusted for the higher expenses applicable to the Investor Class. |
| (2) | The MSCI All Country World Index is a free float adjusted market capitalization weighted index that is designed to measure the equity market performance of developed emerging markets. One cannot invest directly in an Index. |
The following is expense information for the Global Growth Fund (the “Fund”) as disclosed in the most recent prospectus dated February 28, 2021: IS Class – Gross Expenses: 1.87%, Net Expenses: 0.98%; Institutional Class – Gross Expenses: 1.97%, Net Expenses: 1.08%; Investor Class – Gross Expenses: 2.22%, Net Expenses: 1.33%. Jackson Square Partners, LLC (the “Adviser”) has contractually agreed to waive its management fees and pay Fund expenses in order to ensure the Total Annual Fund Operating Expenses (excluding Rule 12b-1 fees, shareholder servicing fees, acquired fund fees and expenses, brokerage commissions, leverage, interest, taxes, and extraordinary expenses) do not exceed 0.98% of the average daily net assets of the Fund. Fees waived and expenses paid by the Adviser may be recouped by the Adviser for a period of thirty-six months following the month during which such fee waiver and expense payment was made if such recoupment can be achieved without exceeding the expense limit in effect at the time the fee waiver and/or expense payment occurred and the expense limit in place at the time of recoupment. The Operating Expenses Limitation Agreement is indefinite, but cannot be terminated through at least February 28, 2022. Thereafter, the agreement may be terminated at any time upon 60 days’ written notice by the Board of Trustees (the “Board”) or the Adviser.
Jackson Square Global Growth Fund
Country Allocation(1) (Unaudited)
As of October 31, 2021
(% of Net Assets)
Top Ten Equity Holdings(1) (Unaudited)
As of October 31, 2021
(% of Net Assets)
| | Microsoft | | | 8.3 | % |
| | Datadog – Class A | | | 3.9 | % |
| | Mastercard – Class A | | | 3.7 | % |
| | Snowflake – Class A | | | 3.5 | % |
| | New York Times – Class A | | | 3.3 | % |
| | Netflix | | | 3.2 | % |
| | Edwards Lifesciences | | | 3.2 | % |
| | ServiceNow | | | 3.1 | % |
| | Visa – Class A | | | 3.0 | % |
| | Adyen | | | 3.0 | % |
| (1) | Fund holdings and sector allocations are subject to change at any time and are not recommendations to buy or sell any security. |
Jackson Square International Growth Fund
International Growth Fund
Within the Fund
For the fiscal year ended October 31, 2021, the International Growth Fund IS Class shares gained 34.97%. However the firm’s primary strategy and name changed from the All-Cap Growth Fund to the International Growth Fund on December 28, 2020. The All-Cap Growth Fund outperformed the Russell 3000® Growth Index from October 31, 2020 to December 28, 2020, primarily driven by stock selection.
This commentary will address the period from December 28, 2020 to October 31, 2021 during which International Growth Fund IS and Institutional Class shares gained 9.07% and 9.01%, respectively. These figures reflect all distributions reinvested. During the same period, the Fund’s benchmark, the MSCI ACWI ex US Index rose 9.95% and the Russell 3000® Growth Index rose 22.87%. For complete, annualized performance of International Growth Fund, please see the table on page 8.
Weak relative performance in consumer discretionary outweighed strong relative performance in health care. On a stock-specific level, the following were the most significant contributors and detractors during the period.
Atlassian Corp. Plc Class A, an enterprise software company focused on productivity and workflow management, was a contributor to performance during the period. The company shifted its business model from permanent on-premise software licensing to a fully subscription-based model over the period, which has created potential for accelerating revenue and expanding margins. We believe Atlassian is very well positioned for a cloud-based world and will have a much greater ability to create enterprise specific products and effectively upsell its wide range of customers over the next few years.
Recruit Holdings Co., Ltd., a provider of HR and business technology and staffing services, was a contributor to performance during the period. The company’s HR Technology segment, which includes Indeed and Glassdoor, saw incredible demand for hiring during the period while the media and solutions and staffing segments also saw strong rebounds from COVID-impaired comparables. Recruit continues to invest behind ongoing international expansion, and we believe the business model is positioned to generate solid margins in the future.
ASML Holding N.V., a leader of photolithography systems for semiconductor manufacturers, was a contributor to performance during the period. The company produces systems which are critical for its customers and sits behind a number of tailwinds driving strong demand for ASML machines, notably 5G, AI and High Performance Computing as well as digital transformation within consumer and automotive. As the leader in lithography, an increasingly key component in chip manufacturing, we believe the company is one of the most important players within the semiconductor ecosystem and critical to long term technology innovation.
StoneCo Ltd. Class A, a financial technology solutions company, was a detractor from performance during the period. Brazilian political, macroeconomic, and COVID dynamics all remained tumultuous over the year, creating significant headwinds for the stock. Stone’s also mis-fired out of the gate in its small and midsize business (SMB) credit opportunity and was too aggressive in its underwriting, causing a sizable write-down and one-time earnings headwind, which has impaired management’s credibility. This caused the company to pause lending until further notice and pivot the future model to an 100% asset-lite partnership (as opposed to a portion on balance sheet). We believe the core merchant acquiring thesis – although masked by the preceding overhangs – is fully intact with stable SMB take rates (excluding credit), and low penetration of a growing market. Long term, we believe Stone can gain market share from inferior incumbent solutions, primarily Cielo, and become a holistic enterprise resource planning and payments solution for mid-size merchants in Brazil.
Jackson Square International Growth Fund
Farfetch Limited, a UK-based online retail business selling multi-brand digital luxury goods in over 100 countries, was a detractor from performance during the period. After surging in 2020, Farfetch underperformed in 2021 as the market rotated out of perceived COVID winners. We believe Farfetch remains in the best position to capitalize on the luxury industry moving online over the next several years. While we have expected this to play out in a linear fashion over many years as brands reassess their distribution strategies, we believe COVID-19 will likely accelerate this shift. Given 90% of luxury purchases are in store and the vast majority of demand is derived from cross-border travel, we believe the company is in the enviable position of having the best platform for the brands to utilize as demand migrates online. We remain constructive on the risk/reward profile and would note the balance sheet is well capitalized to absorb temporary disruptions.
Arco Platform, Ltd., a Brazilian provider of educational learning platforms and content, was a detractor from performance during the period. We believe the underperformance is macro-related; as Brazil continued to struggle to get COVID-19 under control there has been weakness across Brazilian equities, regardless of fundamentals. While COVID-19 provided a temporary pause to momentum, we believe the company is set up well to reaccelerate growth as schools adopt digital solutions at a faster pace and students return to classes. The company acquired three more brands for its portfolio, two learning systems from Pearson as well as an online test prep provider that brings it into the direct-to-consumer market. The company remains highly profitable and cash generative and we believe it has a long runway ahead.
Jackson Square International Growth Fund
Value of $1,000,000 Investment (Unaudited)
The chart assumes an initial investment of $1,000,000. Performance reflects waivers of fee and operating expenses in effect. In the absence of such waivers, total return would be reduced. Past performance is not predictive of future performance. Investment return and principal value will fluctuate, so that your shares, when redeemed may be worth more or less than their original cost. Performance current to the most recent month-end may be lower or higher than the performance quoted and can be obtained by calling 1-844-577-3863. Performance assumes the reinvestment of capital gains and income distributions. The performance does not reflect the deduction of taxes that a shareholder would pay on Fund distributions or the redemption of Fund shares.
Annualized Rates of Return as of October 31, 2021(1)
| | 1 year | 3 years | 5 years | Since Inception(1)(2) |
| IS Class | 34.97% | 24.48% | 20.10% | 19.02% |
Russell 3000® Growth Index(3) | 42.81% | 28.66% | 24.96% | 24.00% |
MSCI All Country World Index – ex USA(4)(5) | 29.66% | 12.00% | 9.77% | 9.51% |
| | | | | |
| | | Since Inception(6)(7) | | |
| Institutional Class | | 9.01% | | |
| Investor Class | | 8.85% | | |
Russell 3000® Growth Index(3) | | 22.87% | | |
MSCI All Country World Index – ex USA(4)(5) | | 9.95% | | |
| (1) | Prior to December 28, 2020, the Fund was named Jackson Square All-Cap Growth Fund and had different principal investment strategies. |
| (2) | The IS Class commenced operations on September 19, 2016. |
| (3) | The Russell 3000® Growth Index measures the growth segment of the U.S. equity universe. It includes those Russell 3000® Index companies with higher price-to-book ratios and higher forecasted growth values. One cannot invest directly in an Index. |
| (4) | The MSCI All Country World Index – ex USA has replaced the Russell 3000® Growth Index as the Fund’s broad-based securities market index because it more closely aligns with the principal investment strategies of the Fund. One cannot invest directly in an Index. |
| (5) | The MSCI All Country World Index – ex USA is a free float adjusted market capitalization weighted index that is designed to measure the equity performance of developed and emerging markets, excluding the United States. One cannot invest directly in an Index. |
| (6) | The Institutional Class commenced operations on December 28, 2020 and the Investor Class commenced operations on August 31, 2021. Performance of the Investor Class prior to inception is based on the performance of the Institutional Class, adjusted for the higher expenses applicable to the Investor Class. |
| (7) | Returns under this heading have not been annualized. |
Jackson Square International Growth Fund
The following is expense information for the International Growth Fund (the “Fund”) as disclosed in the most recent prospectus dated February 28, 2021: IS Class – Gross Expenses: 2.57%, Net Expenses: 0.99%; Institutional Class – Gross Expenses: 2.67%, Net Expenses: 1.09%; Investor Class – Gross Expenses: 2.92%, Net Expenses: 1.34%. Jackson Square Partners, LLC (the “Adviser”) has contractually agreed to waive its management fees and pay Fund expenses in order to ensure the Total Annual Fund Operating Expenses (excluding Rule 12b-1 fees, shareholder servicing fees, acquired fund fees and expenses, brokerage commissions, leverage, interest, taxes, and extraordinary expenses) do not exceed 0.99% of the average daily net assets of the Fund. Fees waived and expenses paid by the Adviser may be recouped by the Adviser for a period of thirty-six months following the month during which such fee waiver and expense payment was made if such recoupment can be achieved without exceeding the expense limit in effect at the time the fee waiver and/or expense payment occurred and the expense limit in place at the time of recoupment. The Operating Expenses Limitation Agreement is indefinite, but cannot be terminated through at least February 28, 2022. Thereafter, the agreement may be terminated at any time upon 60 days’ written notice by the Board of Trustees (the “Board”) or the Adviser.
Jackson Square International Growth Fund
Country Allocation(1) (Unaudited)
As of October 31, 2021
(% of Net Assets)
Top Ten Equity Holdings(1) (Unaudited)
As of October 31, 2021
(% of Net Assets)
| | Adyen | | | 4.7 | % |
| | Lonza Group | | | 4.6 | % |
| | Recruit Holdings | | | 4.4 | % |
| | Sartorius Stedim Biotech | | | 4.3 | % |
| | Atlassian – Class A | | | 4.0 | % |
| | Experian | | | 3.9 | % |
| | DSV | | | 3.9 | % |
| | MercadoLibre | | | 3.6 | % |
| | Airbus | | | 3.4 | % |
| | ASML Holding | | | 3.4 | % |
| (1) | Fund holdings and sector allocations are subject to change at any time and are not recommendations to buy or sell any security. |
Jackson Square Large-Cap Growth Fund
Large-Cap Growth Fund
Within the Fund
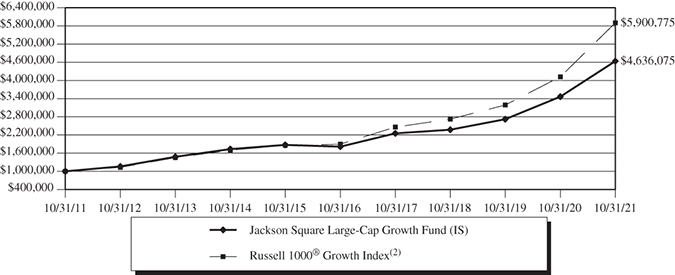
For the fiscal year ended October 31, 2021, Jackson Square Large-Cap Growth Fund IS, Institutional and Investor Classes shares gained 33.81%, 33.56% and 33.25%, respectively. These figures reflect all distributions reinvested. During the same period, the Fund’s benchmark, the Russell 1000® Growth Index, gained 43.21%. For complete, annualized performance of Large-Cap Growth Fund, please see the table on page 13.
Strong relative performance in financials was unable to overcome weak relative performance in information technology. On a stock-specific level, the following were the most significant contributors and detractors during the period.
KKR & Co. Inc. Class A, a global investment firm that manages multiple alternative asset classes across private and public markets, was a contributor to performance during the period. KKR’s equity continued to benefit from strengthening sentiment on strong earnings and upward revisions to the company’s medium-term distributable cash flow growth outlook. Over a long-term context, we believe the market underappreciates the company’s secular AUM growth opportunity, recurring fee-based revenues, brand, and scale-driven competitive moat.
Datadog Inc, an enterprise software provider that allows companies to monitor and analyze their cloud-based infrastructure, was a contributor to performance during the period. The company’s core product is called “infrastructure monitoring”, which allows a company’s IT team to monitor and analyze usage in detail by cloud provider, geography, application, or microservice. This allows companies to find and fix issues, optimize performance, reduce compute usage, and secure their applications. Datadog serves a largely greenfield market, making it difficult for investors to appreciate the size of the long-term opportunity since there was no true on premise parallel. Similarly, investors don’t fully appreciate or believe the converge occurring between developers and IT operations teams, driving demand for a single pane of glass to deploy, monitor, analyze, and fix applications. We believe this will help Datadog expand into adjacent products like Application Performance Monitoring, Log Management, Network Management, and Security. We believe the market is underestimating the traction of Datadog’s emerging platform strategy and rapid product innovation that we feel will sustain high levels of growth at attractive economics for many years.
Illumina, Inc., a leading provider of genomic sequencing systems and consumables, was a contributor to performance during the period. The company reported strong results throughout the period, significantly exceeding the market’s expectations for both revenue and earnings. Furthermore, Illumina announced breakthroughs that should enable them to lower sequencing costs to $100 per genome, which would greatly expand the application set for sequencing. Further, the company’s acquisition of GRAIL granted it access to the very large multi-cancer early detection market. Given the outperformance and several developments regarding qualitative aspects of the business, we re-underwrote our investment and concluded Illumina’s risk/reward profile was less compelling, particularly relative to prospective investments in other genomics companies. Therefore, we exited our position.
Wix.com Ltd., a cloud-based web development platform, was a detractor from performance during the period. The company saw a moderation of demand after lapping the COVID-19 demand surge, but we believe the growth levels remain strong. Longer–term, we believe the opportunity remains attractive, due in part to the fact that there are over 400 million small and medium size businesses in the company’s target market--the majority of which have yet to obtain an online presence. We believe such a presence is becoming more necessary given COVID-19 disruptions and other challenges to the physical presence of many companies, along with the need to efficiently market online to customers.
Jackson Square Large-Cap Growth Fund
Coupa Software, Inc., a cloud-based Software as a Service (“SaaS”) platform for business spend management, was a detractor from performance during the period. The stock suffered from (i) a value rotation (ii) a complex but strategically compelling acquisition that complicated near-term financial results (iii) COVID’s lingering impact on billings and (iv) an analyst day showcasing what we believe was an overly conservative guidance framework for Coupa Pay monetization designed to set a floor on investor expectations. After a strong 2020, we believe a confluence of transitory events has created a headwind and some digestion of the multiple in 2021, but our long-term thesis remains unchanged, and we believe clean execution and continued normalization of organic billings will help get the stock back on course. We feel the current price represents a substantial discount to the stock’s intrinsic business value without assuming any value for Coupa Pay, which steadily approaches materiality and has the potential to contribute materially to revenue over the next several years.
Twilio, Inc. Class A, a cloud communications platform, was a detractor from performance during the period. The company is a leading communications-as-a-service platform whose market share is a multiple of its next largest competitor. It has been a driving force to digitize and simplify communications across mediums and geographies with user-friendly tools for software developers. Given the transactional nature of the business, there will always be more variance and less visibility into specific quarters vs a true enterprise SaaS business, but we remain confident in their secular opportunity and product leadership. The stock has been volatile in 2021 given its strong performance last year, a healthy valuation level and its characterization from investors as a COVID winner. Despite transitory investor perspectives that may impact the stock in shorter time periods, we believe the company remains well positioned in the long run to help digitize communications and capture share of $100B+ of IT spend.
Jackson Square Large-Cap Growth Fund
Value of $1,000,000 Investment (Unaudited)
The chart assumes an initial investment of $1,000,000. Performance reflects waivers of fee and operating expenses in effect. In the absence of such waivers, total return would be reduced. Past performance is not predictive of future performance. Investment return and principal value will fluctuate, so that your shares, when redeemed may be worth more or less than their original cost. Performance current to the most recent month-end may be lower or higher than the performance quoted and can be obtained by calling 1-844-577-3863. Performance assumes the reinvestment of capital gains and income distributions. The performance does not reflect the deduction of taxes that a shareholder would pay on Fund distributions or the redemption of Fund shares.
Annualized Rates of Return as of October 31, 2021
| | 1 year | 5 years | 10 years | Since Inception(1) |
| IS Class | 33.81% | 20.64% | 16.58% | 9.83% |
| Institutional Class | 33.56% | 20.41% | 16.40% | 9.58% |
| Investor Class | 33.25% | 20.11% | 16.11% | 9.42% |
Russell 1000® Growth Index(2) | 43.21% | 25.49% | 19.42% | 11.30% |
| (1) | The Jackson Square Large-Cap Growth Fund (the “Fund”) acquired the assets and assumed the liabilities of the Delaware U.S. Growth Fund, a series of Delaware Group Adviser Funds (the “Predecessor Fund”), effective at the close of business on April 16, 2021 (the “Reorganization”), and the Predecessor Fund is the accounting and performance history survivor of the Reorganization. The performance information shown for the Fund’s Investor Class Shares represent the performance of the Predecessor Fund’s Class A shares, performance for the Fund’s Institutional Class Shares represent the performance of the Predecessor Fund’s Institutional Class shares, and performance for the Fund’s IS Class Shares represent the performance of the Predecessor Fund’s Class R6 shares. Prior to April 16, 2021, the Adviser served as sub-adviser to the Predecessor Fund. The IS Class performance has not been restated to reflect any differences in expenses paid by the Predecessor Fund and those paid by the Fund. The performance shown for the Investor Class Shares has been adjusted so that it does not reflect the Predecessor Fund’s 5.75% sales charge for its Class A shares, which does not apply to Investor Class shares. Performance shown for the periods prior to the inception of the Institutional Class and IS Class is based on the performance of the Investor Class shares, adjusted for the lower expenses applicable to the Institutional and IS classes. The Investor Class commenced operations on December 3, 1993, the Institutional Class commenced operations on February 3, 1994 and the IS Class commenced operations on May 2, 2016. |
| (2) | The Russell 1000® Growth Index measures the performance of the large cap growth segment of the U.S. equity universe. It includes those Russell 1000® Index companies with higher price-to-book ratios and higher forecasted growth values. One cannot invest directly in an Index. |
Jackson Square Large-Cap Growth Fund
The following is expense information for the Large-Cap Growth Fund (the “Fund”) as disclosed in the most recent prospectus dated February 28, 2021, and supplemented April 19, 2021: IS Class – Gross Expenses: 0.61%; Institutional Class – Gross Expenses: 0.71%; Investor Class – Gross Expenses: 0.96%. Jackson Square Partners, LLC (the “Adviser”) has contractually agreed to waive its management fees and pay Fund expenses in order to ensure the Total Annual Fund Operating Expenses (excluding Rule 12b-1 fees, shareholder servicing fees, acquired fund fees and expenses, brokerage commissions, leverage, interest, taxes, and extraordinary expenses) do not exceed 0.64% of the average daily net assets of the Fund. Fees waived and expenses paid by the Adviser may be recouped by the Adviser for a period of thirty-six months following the month during which such fee waiver and expense payment was made if such recoupment can be achieved without exceeding the expense limit in effect at the time the fee waiver and/or expense payment occurred and the expense limit in place at the time of recoupment. The Operating Expenses Limitation Agreement is indefinite, but cannot be terminated through at least April 30, 2023. Thereafter, the agreement may be terminated at any time upon 60 days’ written notice by the Board of Trustees (the “Board”) or the Adviser.
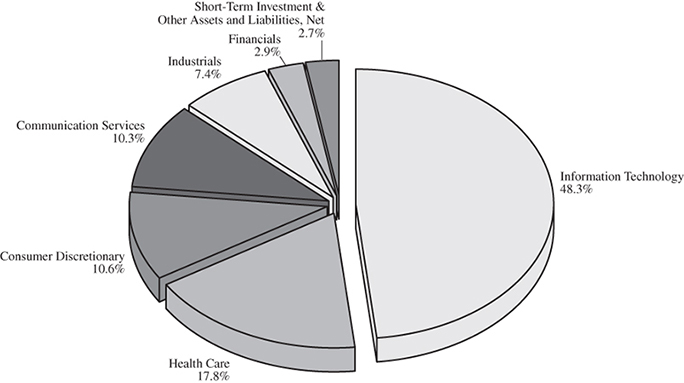
Jackson Square Large-Cap Growth Fund
Sector Allocation(1) (Unaudited)
As of October 31, 2021
(% of Net Assets)
Top Ten Equity Holdings(1) (Unaudited)
As of October 31, 2021
(% of Net Assets)
| | Microsoft | | | 10.2 | % |
| | Amazon.com | | | 5.3 | % |
| | Uber Technologies | | | 4.9 | % |
| | Visa – Class A | | | 4.7 | % |
| | ServiceNow | | | 4.5 | % |
| | Snowflake – Class A | | | 4.2 | % |
| | Datadog – Class A | | | 4.2 | % |
| | Mastercard – Class A | | | 4.2 | % |
| | Edwards Lifesciences | | | 3.9 | % |
| | Charter Communications – Class A | | | 3.9 | % |
| (1) | Fund holdings and sector allocations are subject to change at any time and are not recommendations to buy or sell any security. |
Jackson Square SMID-Cap Growth Fund
SMID-Cap Growth Fund
Within the Fund
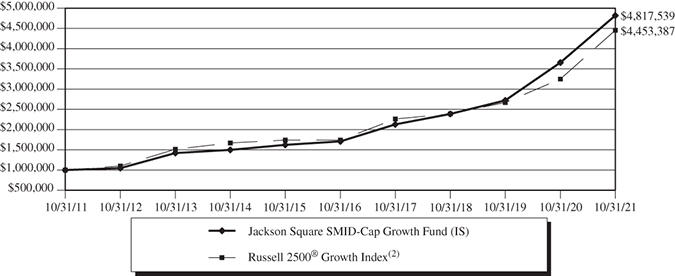
For the fiscal year ended October 31, 2021, SMID-Cap Growth Fund IS, Institutional and Investor Class shares gained 31.80%, 31.71% and 31.36%, respectively. These figures reflect all distributions reinvested. During the same period, the Fund’s benchmark, the Russell 2500® Growth Index, rose 37.12%. For complete, annualized performance of Jackson Square SMID-Cap Growth Fund, please see the table on page 18.
Strong relative performance in health care was unable to overcome weak relative performance in information technology. On a stock-specific level, the following were the most significant contributors and detractors during the period.
LendingClub Corp, a company that provides Internet financial services, was a contributor to performance during the period. Investors were positively surprised by company earnings and guidance. The market continued to digest the large step-function improvement in operating results announced since the acquisition of Radius Bank. The results highlight the strength of LendingClub’s hybrid strategy (the combination of a neo-bank and a marketplace offering). The market is just now showing early signs of interest in what we believe is a highly compelling 3-5 year investment opportunity.
Pacific Biosciences of California, Inc., a provider of long-read genomic sequencing systems and consumables, was a contributor to performance during the period. Investors reacted positively to management appointments of industry veterans from Illumina to the Chief Operating Officer and Chief Commercial Officer roles. Furthermore, PacBio announced a collaboration with Invitae, a leading medical genetics company, to develop a production-scale, high-throughput sequencing platform. This platform is intended to deliver sequencing costs substantially below $1,000 per genome, which would greatly expand the application set for long-read sequencing. The company also announced a potentially transformative $800 million acquisition of Omniome. Omniome is a new short-read sequencing company that employs a novel technology called sequencing-by-binding which we believe has a particularly compelling value proposition in the large and rapidly growing liquid biopsy market (i.e. cancer detection/monitoring). We remain constructive on PacBio’s long-term risk/reward profile given the significant under-penetration of genomic sequencing, the differentiated nature of long-read sequencing and therefore the company’s competitive position, and the attractive margin profile of their business.
Bio-Techne Corporation, a market leader in supplying proteins and antibodies for medical research and for diagnosing disease, was a contributor to performance during the period. Bio-Techne has a market leading position supplying proteins and antibodies for two attractive segments: medical research and disease diagnostics. Techne’s business model has delivered strong recurring revenues and high margins as customers have standardized their consumable research materials. The company’s end markets are growing as research into disease biology expands. The company is well positioned with a broad portfolio of needed products and a reputation for quality and service. We have confidence in their market opportunity and their ability to execute, which should result in high sustainable growth rates in coming years.
Grocery Outlet Holding Corp., an operator of discount grocery stores in the United States, was a detractor from performance during the period. Shares underperformed as the company lapped the extraordinary growth of early 2020. While Grocery Outlet has seen its two-year growth rate stabilize, this is occurring at a level that is disappointing to investors. We believe the shares fully price in a long-term bear scenario at this point while we expect improving trends in subsequent quarters. We continue to like Grocery Outlet given the tremendous unit growth opportunity ahead and solid economic model, especially in light of short- and intermediate-term impacts of COVID-19 that favor the company’s discount grocery model.
Jackson Square SMID-Cap Growth Fund
Wix.com Ltd., a cloud-based web development platform, was a detractor from performance during the period. The company saw a moderation of demand after lapping the COVID-19 demand surge, but we believe the growth levels remain strong. Longer–term, we believe the opportunity remains attractive, due in part to the fact that there are over 400 million small and medium size businesses in the company’s target market--the majority of which have yet to obtain an online presence. We believe such a presence is becoming more necessary given COVID-19 disruptions and other challenges to the physical presence of many companies, along with the need to efficiently market online to customers.
1Life Healthcare, Inc., a healthcare technology company that provides a membership-based primary care platform with digital health and inviting in-office care, was a detractor from performance during the period. One Medical shares underperformed following the company’s announced acquisition of Iora. We sold out of the position after evaluating the merits of the acquisition and the implications of a push into the Medicare full-risk market for One Medical.
Jackson Square SMID-Cap Growth Fund
Value of $1,000,000 Investment (Unaudited)
The chart assumes an initial investment of $1,000,000. Performance reflects waivers of fee and operating expenses in effect. In the absence of such waivers, total return would be reduced. Past performance is not predictive of future performance. Investment return and principal value will fluctuate, so that your shares, when redeemed may be worth more or less than their original cost. Performance current to the most recent month-end may be lower or higher than the performance quoted and can be obtained by calling 1-844-577-3863. Performance assumes the reinvestment of capital gains and income distributions. The performance does not reflect the deduction of taxes that a shareholder would pay on Fund distributions or the redemption of Fund shares.
Annualized Rates of Returns as of October 31, 2021
| | 1 year | 5 years | 10 years | Since Inception(1) |
| IS Class | 31.80% | 23.05% | 17.03% | 13.50% |
| Institutional Class | 31.71% | 22.98% | 16.94% | 13.41% |
| Investor Class | 31.36% | 22.63% | 16.63% | 13.11% |
Russell 2500® Growth Index(2) | 37.12% | 20.68% | 16.11% | 11.62% |
| (1) | The IS Class commenced operations on December 1, 2003, the Institutional Class commenced operations on September 16, 2016 and the Investor Class commenced operations on September 19, 2016. Performance of the Institutional Class and Investor Class prior to inception of each class is based on the performance of the IS Class, adjusted for the higher expenses applicable to each class’ shares. |
| (2) | The Russell 2500® Growth Index measures the performance of the small to mid-cap growth segment of the U.S. equity universe. It includes those Russell 2500® companies with higher price-to-book ratios and higher forecasted growth values. One cannot invest directly in an Index. |
The following is expense information for the SMID-Cap Growth Fund (the “Fund”) as disclosed in the most recent prospectus dated February 28, 2021: IS Class – Gross Expenses: 0.85%, Net Expenses: 0.87%; Institutional Class – Gross Expenses: 0.95%, Net Expenses: 0.97%; Investor Class – Gross Expenses: 1.20%, Net Expenses: 1.22%. Jackson Square Partners, LLC (the “Adviser”) has contractually agreed to waive its management fees and pay Fund expenses in order to ensure the Total Annual Fund Operating Expenses (excluding Rule 12b-1 fees, shareholder servicing fees, acquired fund fees and expenses, brokerage commissions, leverage, interest, taxes, and extraordinary expenses) do not exceed 0.87% of the average daily net assets of the Fund. Fees waived and expenses paid by the Adviser may be recouped by the Adviser for a period of thirty-six months following the month during which such fee waiver and expense payment was made if such recoupment can be achieved without exceeding the expense limit in effect at the time the fee waiver and/or expense payment occurred and the expense limit in place at the time of recoupment. The Operating Expenses Limitation Agreement is indefinite, but cannot be terminated through at least February 28, 2022. Thereafter, the agreement may be terminated at any time upon 60 days’ written notice by the Board of Trustees (the “Board”) or the Adviser.
Jackson Square SMID-Cap Growth Fund
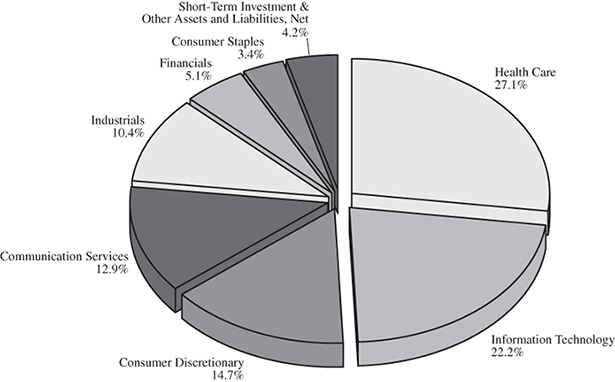
Sector Allocation(1) (Unaudited)
As of October 31, 2021
(% of Net Assets)
Top Ten Equity Holdings(1) (Unaudited)
As of October 31, 2021
(% of Net Assets)
| | Tandem Diabetes Care | | | 7.1 | % |
| | New York Times – Class A | | | 7.1 | % |
| | Elastic | | | 6.1 | % |
| | Lyft – Class A | | | 5.7 | % |
| | Pacific Biosciences of California | | | 5.5 | % |
| | LendingClub | | | 5.1 | % |
| | Bio-Techne | | | 5.0 | % |
| | Nevro | | | 4.0 | % |
| | Varonis Systems | | | 3.9 | % |
| | Dolby Laboratories – Class A | | | 3.5 | % |
| (1) | Fund holdings and sector allocations are subject to change at any time and are not recommendations to buy or sell any security. |
Jackson Square Funds
Expense Examples (Unaudited)
October 31, 2021
As a shareholder of a Fund, you incur two types of costs: (1) transactions costs, including brokerage commissions on purchases and sales of Fund shares, and (2) ongoing costs, including management fees; distribution and/or service (12b-1) fees, shareholder servicing fees, and other Fund expenses. This Example is intended to help you understand your ongoing costs (in dollars) of investing in the Fund and to compare these costs with the ongoing costs of investing in other mutual funds. The Example is based on an investment of $1,000 invested at the beginning of the period and held for the entire period (May 1, 2021 – October 31, 2021).
ACTUAL EXPENSES
For each class, the first line of the table provides information about actual account values and actual expenses. You may use the information in this line, together with the amount you invested, to estimate the expenses that you paid over the period. Simply divide your account value by $1,000 (for example, an $8,600 account value divided by $1,000 = 8.6), then multiply the result by the number in the first line under the heading entitled “Expenses Paid During Period” to estimate the expenses you paid on your account during this period.
HYPOTHETICAL EXAMPLE FOR COMPARISON PURPOSES
For each class, the second line of the table below provides information about hypothetical account values and hypothetical expenses based on the Fund’s actual expense ratio and an assumed rate of return of 5% per year before expenses, which is not the Fund’s actual return. The hypothetical account values and expenses may not be used to estimate the actual ending account balance or expenses you paid for the period.You may use this information to compare the ongoing costs of investing in the Fund and other funds. To do so, compare this 5% hypothetical example with the 5% hypothetical examples that appear in the shareholder reports of the other funds.
Please note that the expenses shown in the tables are meant to highlight your ongoing costs only. Therefore, the second line of the tables are useful in comparing ongoing costs only, and will not help you determine the relative total costs of owning different funds, In addition, if transactional costs were included, your costs may have been higher.
| Global Growth Fund | Beginning | Ending | Expenses Paid |
| | Account Value | Account Value | During Period(1) |
| | (5/1/2021) | (10/31/2021) | (5/1/2021 to 10/31/2021) |
IS Class Actual(2) | $1,000.00 | $1,052.90 | $5.07 |
| IS Class Hypothetical | | | |
| (5% return before expenses) | $1,000.00 | $1,020.27 | $4.99 |
| | | | |
Institutional Class Actual(2) | $1,000.00 | $1,052.10 | $5.59 |
| Institutional Class Hypothetical | | | |
| (5% return before expenses) | $1,000.00 | $1,019.76 | $5.50 |
| | | | |
Investor Class Actual(3)(4) | $1,000.00 | $1,009.50 | $2.23 |
| Investor Class Hypothetical | | | |
| (5% return before expenses) | $1,000.00 | $1,006.13 | $2.23 |
| (1) | Expenses are equal to the Fund’s annualized expense ratio for the most recent six-month period of 0.98% and 1.08% for the IS Class and Institutional Class, respectively, multiplied by the average account value over the period, multiplied by 184/365 to reflect the one-half year period. Expenses are equal to the Fund’s annualized expense ratio for the most recent six-month period of 1.33% for the Investor Class, multiplied by the average account value over the period, multiplied by 61/365 to reflect the since inception period. |
| (2) | Based on the actual returns for the six-month period ended October 31, 2021 of 5.29% and 5.21% for the IS Class and Institutional Class, respectively. |
| (3) | Based on the actual return for the period since inception through October 31, 2021 of 0.95% for the Investor Class. |
| (4) | Investor Class inception was August 31, 2021. All values assume a beginning date of August 31, 2021 for the Investor Class. |
Jackson Square Funds
Expense Examples (Unaudited) – Continued
October 31, 2021
| International Growth Fund | Beginning | Ending | Expenses Paid |
| | Account Value | Account Value | During Period(1) |
| | (5/1/2021) | (10/31/2021) | (5/1/2021 to 10/31/2021) |
IS Class Actual(2) | $1,000.00 | $1,028.70 | $5.06 |
| IS Class Hypothetical | | | |
| (5% return before expenses) | $1,000.00 | $1,020.21 | $5.04 |
| | | | |
Institutional Class Actual(2) | $1,000.00 | $1,028.10 | $5.62 |
| Institutional Class Hypothetical | | | |
| (5% return before expenses) | $1,000.00 | $1,019.66 | $5.60 |
| | | | |
Investor Class Actual(3)(4) | $1,000.00 | $ 965.80 | $2.20 |
| Investor Class Hypothetical | | | |
| (5% return before expenses) | $1,000.00 | $1,006.12 | $2.25 |
| (1) | Expenses are equal to the Fund’s annualized expense ratio for the most recent six-month period of 0.99% and 1.10% for the IS Class and Institutional Class, respectively, multiplied by the average account value over the period, multiplied by 184/365 to reflect the one-half year period. Expenses are equal to the Fund’s annualized expense ratio for the most recent six-month period of 1.34% for the Investor Class, multiplied by the average account value over the period, multiplied by 61/365 to reflect the since inception period. |
| (2) | Based on the actual returns for the six-month period ended October 31, 2021 of 2.87% and 2.81% for the IS Class and Institutional Class, respectively. |
| (3) | Based on the actual return for the period since inception through October 31, 2021 of -3.42% for the Investor Class. |
| (4) | Investor Class inception was August 31, 2021. All values assume a beginning date of August 31, 2021 for the Investor Class. |
| Large-Cap Growth Fund | Beginning | Ending | Expenses Paid |
| | Account Value | Account Value | During Period(5) |
| | (5/1/2021) | (10/31/2021) | (5/1/2021 to 10/31/2021) |
IS Class Actual(6) | $1,000.00 | $1,085.60 | $3.21 |
| IS Class Hypothetical | | | |
| (5% return before expenses) | $1,000.00 | $1,022.13 | $3.11 |
| | | | |
Institutional Class Actual(6) | $1,000.00 | $1,084.90 | $3.73 |
| Institutional Class Hypothetical | | | |
| (5% return before expenses) | $1,000.00 | $1,021.63 | $3.62 |
| | | | |
Investor Class Actual(6) | $1,000.00 | $1,083.60 | $5.04 |
| Investor Class Hypothetical | | | |
| (5% return before expenses) | $1,000.00 | $1,020.37 | $4.89 |
| (5) | Expenses are equal to the Fund’s annualized expense ratio for the most recent six-month period of 0.61%, 0.71% and 0.96% for the IS Class, Institutional Class and Investor Class, respectively, multiplied by the average account value over the period, multiplied by 184/365 to reflect the one-half year period. |
| (6) | Based on the actual returns for the six-month period ended October 31, 2021 of 8.56%, 8.49% and 8.36% for the IS Class, Institutional Class and Investor Class, respectively. |
Jackson Square Funds
Expense Examples (Unaudited) – Continued
October 31, 2021
| SMID-Cap Growth Fund | Beginning | Ending | Expenses Paid |
| | Account Value | Account Value | During Period(1) |
| | (5/1/2021) | (10/31/2021) | (5/1/2021 to 10/31/2021) |
IS Class Actual(2) | $1,000.00 | $ 993.00 | $4.07 |
| IS Class Hypothetical | | | |
| (5% return before expenses) | $1,000.00 | $1,021.12 | $4.13 |
| | | | |
Institutional Class Actual(2) | $1,000.00 | $ 992.50 | $4.57 |
| Institutional Class Hypothetical | | | |
| (5% return before expenses) | $1,000.00 | $1,020.62 | $4.63 |
| | | | |
Investor Class Actual(2) | $1,000.00 | $ 991.40 | $5.82 |
| Investor Class Hypothetical | | | |
| (5% return before expenses) | $1,000.00 | $1,019.36 | $5.90 |
| (1) | Expenses are equal to the Fund’s annualized expense ratio for the most recent six-month period of 0.81%, 0.91% and 1.16% for the IS Class, Institutional Class and Investor Class, respectively, multiplied by the average account value over the period, multiplied by 184/365 to reflect the one-half year period. |
| (2) | Based on the actual returns for the six-month period ended October 31, 2021 of -0.70%, -0.75% and -0.86% for the IS Class, Institutional Class and Investor Class, respectively. |
Jackson Square Global Growth Fund
Schedule of Investments
October 31, 2021
Description | | Shares | | | Value | |
| | | | | | | |
| COMMON STOCKS – 99.0% | | | | | | |
| | | | | | | |
| Brazil – 4.2% | | | | | | |
Afya – Class A* | | | 8,779 | | | $ | 153,193 | |
Arco Platform – Class A* | | | 6,674 | | | | 113,792 | |
MercadoLibre* | | | 298 | | | | 441,344 | |
| | | | | | | | 708,329 | |
| | | | | | | | | |
| China – 1.6% | | | | | | | | |
Bilibili – ADR* | | | 3,696 | | | | 270,917 | |
| | | | | | | | | |
| Denmark – 5.4% | | | | | | | | |
DSV (a) | | | 1,890 | | | | 439,268 | |
Vestas Wind Systems (a) | | | 10,646 | | | | 460,222 | |
| | | | | | | | 899,490 | |
| | | | | | | | | |
| France – 7.5% | | | | | | | | |
Airbus* (a) | | | 3,237 | | | | 415,250 | |
LVMH Moet Hennessy Louis Vuitton (a) | | | 580 | | | | 454,792 | |
Safran (a) | | | 2,898 | | | | 390,042 | |
| | | | | | | | 1,260,084 | |
| | | | | | | | | |
| Israel – 2.3% | | | | | | | | |
Wix.com* | | | 2,023 | | | | 376,197 | |
| | | | | | | | | |
| Japan – 5.4% | | | | | | | | |
Freee KK* (a) | | | 4,390 | | | | 315,096 | |
MonotaRO (a) | | | 12,898 | | | | 293,968 | |
Recruit Holdings (a) | | | 4,373 | | | | 290,888 | |
| | | | | | | | 899,952 | |
| | | | | | | | | |
| Netherlands – 5.9% | | | | | | | | |
Adyen* (a) | | | 164 | | | | 494,840 | |
ASML Holding (a) | | | 603 | | | | 490,180 | |
| | | | | | | | 985,020 | |
| | | | | | | | | |
| Singapore – 1.5% | | | | | | | | |
Sea – ADR* | | | 737 | | | | 253,211 | |
| | | | | | | | | |
| Switzerland – 2.9% | | | | | | | | |
Lonza Group (a) | | | 593 | | | | 487,328 | |
| | | | | | | | | |
| Taiwan – 2.2% | | | | | | | | |
Taiwan Semiconductor Manufacturing – ADR | | | 3,160 | | | | 359,292 | |
See Notes to the Financial Statements
Jackson Square Global Growth Fund
Schedule of Investments – Continued
October 31, 2021
Description | | Shares | | | Value | |
| | | | | | | |
| COMMON STOCKS – 99.0% (Continued) | | | | | | |
| | | | | | | |
| United Kingdom – 5.9% | | | | | | |
Experian (a) | | | 10,789 | | | $ | 494,689 | |
Farfetch – Class A* | | | 8,268 | | | | 324,188 | |
Intertek Group (a) | | | 2,493 | | | | 166,951 | |
| | | | | | | | 985,828 | |
| | | | | | | | | |
| United States – 54.2% | | | | | | | | |
Aon – Class A | | | 1,291 | | | | 413,017 | |
Datadog – Class A* | | | 3,906 | | | | 652,497 | |
DexCom* | | | 728 | | | | 453,697 | |
Edwards Lifesciences* | | | 4,426 | | | | 530,323 | |
IHS Markit | | | 3,025 | | | | 395,428 | |
Marqeta* | | | 3,766 | | | | 115,239 | |
Mastercard – Class A | | | 1,823 | | | | 611,653 | |
Match Group* | | | 2,567 | | | | 387,052 | |
Microsoft | | | 4,180 | | | | 1,386,172 | |
Netflix* | | | 778 | | | | 537,061 | |
New York Times – Class A | | | 10,194 | | | | 556,491 | |
ServiceNow* | | | 752 | | | | 524,716 | |
Snowflake – Class A* | | | 1,654 | | | | 585,251 | |
Twilio – Class A* | | | 1,005 | | | | 292,817 | |
Uber Technologies* | | | 10,524 | | | | 461,162 | |
Veeva Systems – Class A* | | | 1,208 | | | | 382,948 | |
Visa – Class A | | | 2,351 | | | | 497,871 | |
Zoom Video Communications – Class A* | | | 968 | | | | 265,861 | |
| | | | | | | | 9,049,256 | |
| TOTAL COMMON STOCKS | | | | | | | | |
| (Cost $10,102,503) | | | | | | | 16,534,904 | |
See Notes to the Financial Statements
Jackson Square Global Growth Fund
Schedule of Investments – Continued
October 31, 2021
Description | | Shares | | | Value | |
| | | | | | | |
| SHORT-TERM INVESTMENT – 2.3% | | | | | | |
| | | | | | | |
| Money Market Deposit Account – 2.3% | | | | | | |
U.S. Bank N.A., 0.00% (b) | | | | | | |
Total Money Market Deposit Account | | | 393,058 | | | $ | 393,058 | |
| TOTAL SHORT-TERM INVESTMENT | | | | | | | | |
| (Cost $393,058) | | | | | | | 393,058 | |
| Total Investments – 101.3% | | | | | | | | |
| (Cost $10,495,561) | | | | | | | 16,927,962 | |
| Other Assets and Liabilities, Net – (1.3)% | | | | | | | (221,229 | ) |
| Total Net Assets – 100.0% | | | | | | $ | 16,706,733 | |
*
| Non-income producing security. |
ADR – American Depositary Receipt
| (a) | Level 2 Security. |
| (b) | The Money Market Deposit Account (the “MMDA”) is a short-term investment vehicle in which the Fund holds cash balances. The MMDA will bear interest at a variable rate that is determined based on conditions and may change daily and by any amount. The rate shown is as of October 31, 2021. |
At October 31, 2021, the sector diversification for the Fund was as follows:
| | | % of |
| Sector | | Net Assets |
Information Technology# | | | 41.0 | % |
Industrials | | | 22.8 | % |
Communication Services | | | 12.0 | % |
Health Care | | | 11.1 | % |
Consumer Discretionary | | | 8.9 | % |
Financials | | | 3.2 | % |
Short-Term Investment | | | 2.3 | % |
Other Assets and Liabilities, Net | | | (1.3 | )% |
Total | |
| 100.0 | % |
| # | As of October 31, 2021, the Fund has a significant portion of its assets invested in this sector and therefore is subject to additional risks. See Note 10 in Notes to Financial Statements. |
The Global Industry Classification Standard (GICS®) was developed by and/or is the exclusive property of MSCI, Inc. (“MSCI”) and Standard & Poor’s Financial Services LLC (“S&P”). GICS® is a service mark of MSCI and S&P and has been licensed for use.
See Notes to the Financial Statements
Jackson Square International Growth Fund
Schedule of Investments
October 31, 2021
Description | | Shares | | | Value | |
| | | | | | | |
| COMMON STOCKS – 93.9% | | | | | | |
| | | | | | | |
| Australia – 4.0% | | | | | | |
Atlassian – Class A* | | | 1,034 | | | $ | 473,706 | |
| | | | | | | | | |
| Brazil – 5.8% | | | | | | | | |
Arco Platform – Class A* | | | 7,361 | | | | 125,505 | |
MercadoLibre* | | | 288 | | | | 426,534 | |
StoneCo – Class A* | | | 3,824 | | | | 129,481 | |
| | | | | | | | 681,520 | |
| | | | | | | | | |
| Canada – 3.2% | | | | | | | | |
Shopify – Class A* | | | 252 | | | | 369,616 | |
| | | | | | | | | |
| China – 3.9% | | | | | | | | |
Bilibili – ADR* | | | 3,326 | | | | 243,796 | |
GDS Holdings – Class A – ADR* | | | 3,610 | | | | 214,434 | |
| | | | | | | | 458,230 | |
| | | | | | | | | |
| Denmark – 7.2% | | | | | | | | |
DSV (a) | | | 1,951 | | | | 453,446 | |
Vestas Wind Systems (a) | | | 9,020 | | | | 389,931 | |
| | | | | | | | 843,377 | |
| | | | | | | | | |
| France – 16.4% | | | | | | | | |
Airbus* (a) | | | 3,135 | | | | 402,165 | |
L’Oreal (a) | | | 734 | | | | 335,772 | |
LVMH Moet Hennessy Louis Vuitton (a) | | | 484 | | | | 379,516 | |
Safran (a) | | | 2,241 | | | | 301,617 | |
Sartorius Stedim Biotech (a) | | | 911 | | | | 502,118 | |
| | | | | | | | 1,921,188 | |
| | | | | | | | | |
| Germany – 6.2% | | | | | | | | |
Delivery Hero* (a) | | | 1,880 | | | | 234,483 | |
Puma (a) | | | 2,448 | | | | 303,675 | |
Zalando* (a) | | | 1,996 | | | | 188,583 | |
| | | | | | | | 726,741 | |
| | | | | | | | | |
| Israel – 4.4% | | | | | | | | |
Fiverr International* | | | 1,531 | | | | 260,806 | |
Wix.com* | | | 1,348 | | | | 250,674 | |
| | | | | | | | 511,480 | |
| | | | | | | | | |
| Italy – 3.2% | | | | | | | | |
Stevanato Group* | | | 14,667 | | | | 376,502 | |
See Notes to the Financial Statements
Jackson Square International Growth Fund
Schedule of Investments – Continued
October 31, 2021
Description | | Shares | | | Value | |
| | | | | | | |
| COMMON STOCKS – 93.9% (Continued) | | | | | | |
| | | | | | | |
| Japan – 9.5% | | | | | | |
Freee KK* (a) | | | 4,231 | | | $ | 303,684 | |
MonotaRO (a) | | | 12,874 | | | | 293,421 | |
Recruit Holdings (a) | | | 7,784 | | | | 517,784 | |
| | | | | | | | 1,114,889 | |
| | | | | | | | | |
| Netherlands – 8.1% | | | | | | | | |
Adyen* (a) | | | 181 | | | | 546,134 | |
ASML Holding (a) | | | 492 | | | | 399,948 | |
| | | | | | | | 946,082 | |
| | | | | | | | | |
| Singapore – 3.1% | | | | | | | | |
Sea – ADR* | | | 1,047 | | | | 359,718 | |
| | | | | | | | | |
| Switzerland – 4.6% | | | | | | | | |
Lonza Group (a) | | | 653 | | | | 536,636 | |
| | | | | | | | | |
| Taiwan – 3.3% | | | | | | | | |
Taiwan Semiconductor Manufacturing – ADR | | | 3,440 | | | | 391,128 | |
| | | | | | | | | |
| United Kingdom – 8.6% | | | | | | | | |
Experian (a) | | | 10,011 | | | | 459,016 | |
Farfetch – Class A* | | | 7,613 | | | | 298,506 | |
Intertek Group (a) | | | 3,812 | | | | 255,282 | |
| | | | | | | | 1,012,804 | |
| | | | | | | | | |
| United States – 2.4% | | | | | | | | |
Lululemon Athletica* | | | 614 | | | | 286,130 | |
| TOTAL COMMON STOCKS | | | | | | | | |
| (Cost $9,956,760) | | | | | | | 11,009,747 | |
See Notes to the Financial Statements
Jackson Square International Growth Fund
Schedule of Investments – Continued
October 31, 2021
Description | | Shares | | | Value | |
| | | | | | | |
| SHORT-TERM INVESTMENT – 5.1% | | | | | | |
| | | | | | | |
| Money Market Deposit Account – 5.1% | | | | | | |
U.S. Bank N.A., 0.00% (b) | | | | | | |
Total Money Market Deposit Account | | | 601,962 | | | $ | 601,962 | |
| TOTAL SHORT-TERM INVESTMENT | | | | | | | | |
| (Cost $601,962) | | | | | | | 601,962 | |
| Total Investments – 99.0% | | | | | | | | |
| (Cost $10,558,722) | | | | | | | 11,611,709 | |
| Other Assets and Liabilities, Net – 1.0% | | | | | | | 118,484 | |
| Total Net Assets – 100.0% | | | | | | $ | 11,730,193 | |
| * | Non-income producing security. |
ADR – American Depositary Receipt
| (a) | Level 2 Security. |
| (b) | The Money Market Deposit Account (the “MMDA”) is a short-term investment vehicle in which the Fund holds cash balances. The MMDA will bear interest at a variable rate that is determined based on conditions and may change daily and by any amount. The rate shown is as of October 31, 2021. |
At October 31, 2021, the sector diversification for the Fund was as follows:
| | % of |
| Sector | Net Assets |
Information Technology# | 26.3 | % |
Industrials# | 26.2 | % |
Consumer Discretionary | 21.3 | % |
Health Care | 12.1 | % |
Communication Services | 5.1 | % |
Consumer Staples | 2.9 | % |
Short-Term Investment | 5.1 | % |
Other Assets and Liabilities, Net | 1.0 | % |
Total | 100.0 | % |
| # | As of October 31, 2021, the Fund has a significant portion of its assets invested in this sector and therefore is subject to additional risks. See Note 10 in Notes to Financial Statements. |
The Global Industry Classification Standard (GICS®) was developed by and/or is the exclusive property of MSCI, Inc. (“MSCI”) and Standard & Poor’s Financial Services LLC (“S&P”). GICS® is a service mark of MSCI and S&P and has been licensed for use.
See Notes to the Financial Statements
Jackson Square Large-Cap Growth Fund
Schedule of Investments
October 31, 2021
Description | | Shares | | | Value | |
| | | | | | | |
| COMMON STOCKS – 97.3% | | | | | | |
| | | | | | | |
| Communication Services – 10.3% | | | | | | |
Charter Communications – Class A* | | | 139,037 | | | $ | 93,834,681 | |
Match Group* | | | 558,956 | | | | 84,279,385 | |
Netflix* | | | 101,548 | | | | 70,099,600 | |
| | | | | | | | 248,213,666 | |
| | | | | | | | | |
| Consumer Discretionary – 10.6% | | | | | | | | |
Airbnb – Class A* | | | 252,800 | | | | 43,142,848 | |
Amazon.com* | | | 37,683 | | | | 127,083,280 | |
NIKE – Class B | | | 503,472 | | | | 84,225,831 | |
| | | | | | | | 254,451,959 | |
| | | | | | | | | |
| Financials – 2.9% | | | | | | | | |
KKR & Co. – Class A | | | 889,364 | | | | 70,855,630 | |
| | | | | | | | | |
| Health Care – 17.8% | | | | | | | | |
10X Genomics – Class A* | | | 311,024 | | | | 50,158,841 | |
Align Technology* | | | 104,127 | | | | 65,013,775 | |
Catalent* | | | 550,504 | | | | 75,892,481 | |
Edwards Lifesciences* | | | 791,373 | | | | 94,822,313 | |
Intuitive Surgical* | | | 208,270 | | | | 75,212,545 | |
Veeva Systems – Class A* | | | 209,009 | | | | 66,257,943 | |
| | | | | | | | 427,357,898 | |
| | | | | | | | | |
| Industrials – 7.4% | | | | | | | | |
Uber Technologies* | | | 2,679,541 | | | | 117,417,486 | |
Waste Management | | | 382,495 | | | | 61,287,174 | |
| | | | | | | | 178,704,660 | |
| | | | | | | | | |
Information Technology – 48.3%# | | | | | | | | |
Adobe* | | | 78,014 | | | | 50,737,185 | |
Coupa Software* | | | 233,150 | | | | 53,088,255 | |
Datadog – Class A* | | | 607,051 | | | | 101,407,870 | |
Mastercard – Class A | | | 299,344 | | | | 100,435,899 | |
Microsoft | | | 739,390 | | | | 245,196,512 | |
Paycom Software* | | | 106,618 | | | | 58,410,671 | |
PayPal Holdings* | | | 234,770 | | | | 54,605,154 | |
ServiceNow* | | | 153,629 | | | | 107,196,171 | |
Snowflake – Class A* | | | 287,218 | | | | 101,629,217 | |
Twilio – Class A* | | | 297,979 | | | | 86,819,162 | |
See Notes to the Financial Statements
Jackson Square Large-Cap Growth Fund
Schedule of Investments – Continued
October 31, 2021
Description | | Shares | | | Value | |
| | | | | | | |
| COMMON STOCKS – 97.3% (Continued) | | | | | | |
| | | | | | | |
Information Technology – 48.3%# (Continued) | | | | | | |
Visa – Class A | | | 535,639 | | | $ | 113,432,271 | |
Wix.com* | | | 267,244 | | | | 49,696,694 | |
Zoom Video Communications – Class A* | | | 147,120 | | | | 40,406,508 | |
| | | | | | | | 1,163,061,569 | |
| TOTAL COMMON STOCKS | | | | | | | | |
| (Cost $1,448,464,389) | | | | | | | 2,342,645,382 | |
| | | | | | | | | |
| SHORT-TERM INVESTMENT – 1.3% | | | | | | | | |
| | | | | | | | | |
| Money Market Deposit Account – 1.3% | | | | | | | | |
U.S. Bank N.A., 0.00% (a) | | | | | | | | |
Total Money Market Deposit Account | | | 31,895,425 | | | | 31,895,425 | |
| TOTAL SHORT-TERM INVESTMENT | | | | | | | | |
| (Cost $31,895,425) | | | | | | | 31,895,425 | |
| Total Investments – 98.6% | | | | | | | | |
| (Cost $1,480,359,814) | | | | | | | 2,374,540,807 | |
| Other Assets and Liabilities, Net – 1.4% | | | | | | | 33,309,105 | |
| Total Net Assets – 100.0% | | | | | | $ | 2,407,849,912 | |
| * | Non-income producing security. |
| # | As of October 31, 2021, the Fund has a significant portion of its assets invested in this sector and therefore is subject to additional risks. See Note 10 in Notes to Financial Statements. |
| (a) | The Money Market Deposit Account (the “MMDA”) is a short-term investment vehicle in which the Fund holds cash balances. The MMDA will bear interest at a variable rate that is determined based on conditions and may change daily and by any amount. The rate shown is as of October 31, 2021. |
The Global Industry Classification Standard (GICS®) was developed by and/or is the exclusive property of MSCI, Inc. (“MSCI”) and Standard & Poor’s Financial Services LLC (“S&P”). GICS® is a service mark of MSCI and S&P and has been licensed for use.
See Notes to the Financial Statements
Jackson Square SMID-Cap Growth Fund
Schedule of Investments
October 31, 2021
Description | | Shares | | | Value | |
| | | | | | | |
| COMMON STOCKS – 95.8% | | | | | | |
| | | | | | | |
| Communication Services – 12.9% | | | | | | |
Liberty Broadband – Class C* | | | 346,089 | | | $ | 56,222,158 | |
New York Times – Class A | | | 2,823,070 | | | | 154,111,391 | |
Vimeo* | | | 2,071,855 | | | | 69,883,669 | |
| | | | | | | | 280,217,218 | |
| | | | | | | | | |
| Consumer Discretionary – 14.7% | | | | | | | | |
Farfetch – Class A* | | | 1,662,437 | | | | 65,184,155 | |
Fiverr International* | | | 224,318 | | | | 38,212,571 | |
Papa John’s International | | | 440,934 | | | | 54,711,091 | |
Stitch Fix – Class A* | | | 1,881,736 | | | | 65,108,066 | |
Vroom* | | | 1,345,558 | | | | 25,740,524 | |
Wyndham Hotels & Resorts | | | 824,974 | | | | 69,685,554 | |
| | | | | | | | 318,641,961 | |
| | | | | | | | | |
| Consumer Staples – 3.4% | | | | | | | | |
Grocery Outlet Holding* | | | 3,334,710 | | | | 73,997,215 | |
| | | | | | | | | |
| Financials – 5.1% | | | | | | | | |
LendingClub* | | | 2,385,403 | | | | 109,633,122 | |
| | | | | | | | | |
Health Care – 27.1%# | | | | | | | | |
ABIOMED* | | | 140,330 | | | | 46,595,173 | |
Bio-Techne | | | 205,270 | | | | 107,489,635 | |
Nevro* | | | 758,818 | | | | 86,307,959 | |
Omnicell* | | | 69,484 | | | | 12,378,575 | |
Pacific Biosciences of California* | | | 4,512,095 | | | | 119,480,276 | |
Tandem Diabetes Care* | | | 1,131,216 | | | | 154,218,677 | |
Twist Bioscience* | | | 504,039 | | | | 59,879,833 | |
| | | | | | | | 586,350,128 | |
| | | | | | | | | |
| Industrials – 10.4% | | | | | | | | |
Graco | | | 705,031 | | | | 53,004,231 | |
Lyft – Class A* | | | 2,677,902 | | | | 122,835,365 | |
Upwork* | | | 1,024,121 | | | | 48,256,581 | |
| | | | | | | | 224,096,177 | |
See Notes to the Financial Statements
Jackson Square SMID-Cap Growth Fund
Schedule of Investments – Continued
October 31, 2021
Description | | Shares | | | Value | |
| | | | | | | |
| COMMON STOCKS – 95.8% (Continued) | | | | | | |
| | | | | | | |
| Information Technology – 22.2% | | | | | | |
Anaplan* | | | 861,518 | | | $ | 56,179,589 | |
Dolby Laboratories – Class A | | | 865,023 | | | | 76,424,782 | |
Elastic* | | | 764,526 | | | | 132,652,906 | |
SailPoint Technologies Holding* | | | 1,179,403 | | | | 56,587,756 | |
Varonis Systems* | | | 1,309,217 | | | | 84,758,709 | |
Wix.com* | | | 396,691 | | | | 73,768,658 | |
| | | | | | | | 480,372,400 | |
| TOTAL COMMON STOCKS | | | | | | | | |
| (Cost $1,625,182,324) | | | | | | | 2,073,308,221 | |
| | | | | | | | | |
| SHORT-TERM INVESTMENT – 4.1% | | | | | | | | |
| | | | | | | | | |
| Money Market Deposit Account – 4.1% | | | | | | | | |
U.S. Bank N.A., 0.00% (a) | | | | | | | | |
Total Money Market Deposit Account | | | 88,580,437 | | | | 88,580,437 | |
| TOTAL SHORT-TERM INVESTMENT | | | | | | | | |
| (Cost $88,580,437) | | | | | | | 88,580,437 | |
| Total Investments – 99.9% | | | | | | | | |
| (Cost $1,713,762,761) | | | | | | | 2,161,888,658 | |
| Other Assets and Liabilities, Net – 0.1% | | | | | | | 1,083,830 | |
| Total Net Assets – 100.0% | | | | | | $ | 2,162,972,488 | |
| * | Non-income producing security. |
| # | As of October 31, 2021, the Fund has a significant portion of its assets invested in this sector and therefore is subject to additional risks. |
| | See Note 10 in Notes to Financial Statements. |
| (a) | The Money Market Deposit Account (the “MMDA”) is a short-term investment vehicle in which the Fund holds cash balances. The MMDA will bear interest at a variable rate that is determined based on conditions and may change daily and by any amount. The rate shown is as of October 31, 2021. |
The Global Industry Classification Standard (GICS®) was developed by and/or is the exclusive property of MSCI, Inc. (“MSCI”) and Standard & Poor’s Financial Services LLC (“S&P”). GICS® is a service mark of MSCI and S&P and has been licensed for use.
See Notes to the Financial Statements
Jackson Square Funds
(This Page Intentionally Left Blank.)
Jackson Sqare Funds
Statements of Assets and Liabilities
October 31, 2021
| | | Global | | | International | | | Large-Cap | | | SMID-Cap | |
| | | Growth Fund | | | Growth Fund | | | Growth Fund | | | Growth Fund | |
| ASSETS: | | | | | | | | | | | | |
| Investment securities: | | | | | | | | | | | | |
| At cost | | $ | 10,495,561 | | | $ | 10,558,722 | | | $ | 1,480,359,814 | | | $ | 1,713,762,761 | |
| At value | | $ | 16,927,962 | | | $ | 11,611,709 | | | $ | 2,374,540,807 | | | $ | 2,161,888,658 | |
| Dividends & interest receivable | | | 3,931 | | | | 2,232 | | | | 451,431 | | | | 470,557 | |
| Receivable for investment securities sold | | | 70,166 | | | | 147,966 | | | | 34,799,700 | | | | 16,958,388 | |
| Receivable for capital shares sold | | | — | | | | — | | | | 2,522,442 | | | | 2,783,450 | |
| Receivable from investment adviser | | | 701 | | | | 5,801 | | | | — | | | | — | |
| Prepaid expenses | | | 13,469 | | | | 13,665 | | | | 80,590 | | | | 35,589 | |
| Total Assets | | | 17,016,229 | | | | 11,781,373 | | | | 2,412,394,970 | | | | 2,182,136,642 | |
| LIABILITIES: | | | | | | | | | | | | | | | | |
| Payable for investment securities purchased | | | 257,833 | | | | — | | | | — | | | | 16,582,236 | |
| Payable for capital shares redeemed | | | — | | | | — | | | | 2,476,602 | | | | 619,353 | |
| Payable to investment adviser | | | — | | | | — | | | | 1,106,340 | | | | 1,343,262 | |
| Payable for fund administration & accounting fees | | | 10,468 | | | | 10,357 | | | | 300,628 | | | | 184,347 | |
| Payable for compliance fees | | | 61 | | | | 46 | | | | 8,703 | | | | 7,967 | |
| Payable for transfer agent fees & expenses | | | 12,382 | | | | 12,340 | | | | 57,784 | | | | 53,501 | |
| Payable for custody fees | | | 4,800 | | | | 5,200 | | | | 55,639 | | | | 39,888 | |
| Payable for trustee fees | | | 80 | | | | 79 | | | | — | | | | — | |
| Accrued distribution and/or shareholder service fees | | | 82 | | | | 47 | | | | 426,483 | | | | 257,414 | |
| Payable for audit fees | | | 17,501 | | | | 16,999 | | | | 19,502 | | | | 18,501 | |
| Accrued expenses | | | 6,289 | | | | 6,112 | | | | 93,377 | | | | 57,685 | |
| Total Liabilities | | | 309,496 | | | | 51,180 | | | | 4,545,058 | | | | 19,164,154 | |
| NET ASSETS | | $ | 16,706,733 | | | $ | 11,730,193 | | | $ | 2,407,849,912 | | | $ | 2,162,972,488 | |
| NET ASSETS CONSIST OF: | | | | | | | | | | | | | | | | |
| Paid-in capital | | | 8,036,526 | | | | 7,447,542 | | | | 1,125,953,954 | | | | 1,405,022,081 | |
| Total distributable earnings | | | 8,670,207 | | | | 4,282,651 | | | | 1,281,895,958 | | | | 757,950,407 | |
| Total net assets | | $ | 16,706,733 | | | $ | 11,730,193 | | | $ | 2,407,849,912 | | | $ | 2,162,972,488 | |
| | | | | | | | | | | | | | | | | |
IS Class Shares: | | | | | | | | | | | | | | | | |
| Net Assets | | $ | 16,116,162 | | | $ | 11,597,318 | | | $ | 945,972,951 | | | $ | 1,016,051,552 | |
Shares issued and outstanding(1) | | | 432,938 | | | | 323,499 | | | | 29,852,384 | | | | 26,369,315 | |
| Net asset value, offering price, and redemption price per share | | $ | 37.23 | | | $ | 35.85 | | | $ | 31.69 | | | $ | 38.53 | |
| | | | | | | | | | | | | | | | | |
Institutional Class Shares: | | | | | | | | | | | | | | | | |
| Net Assets | | $ | 589,576 | | | $ | 131,928 | | | $ | 1,292,470,370 | | | $ | 1,039,785,884 | |
Shares issued and outstanding(1) | | | 15,865 | | | | 3,682 | | | | 41,260,702 | | | | 27,023,578 | |
| Net asset value, offering price, and redemption price per share | | $ | 37.16 | | | $ | 35.83 | | | $ | 31.32 | | | $ | 38.48 | |
| | | | | | | | | | | | | | | | | |
Investor Class Shares(2): | | | | | | | | | | | | | | | | |
| Net Assets | | $ | 995 | | | $ | 947 | | | $ | 169,406,591 | | | $ | 107,135,052 | |
Shares issued and outstanding(1) | | | 27 | | | | 27 | | | | 6,341,996 | | | | 2,824,563 | |
| Net asset value, offering price, and redemption price per share | | $ | 37.21 | | | $ | 35.85 | | | $ | 26.71 | | | $ | 37.93 | |
| (1) | Unlimited shares authorized without par value. |
| (2) | Prior to April 16, 2021, the Jackson Square Large-Cap Growth Fund's Investor Class shares were known as Class A Shares, and were subject to a sales load of up to 5.75%. |
See Notes to the Financial Statements
Jackson Square Funds
Statements of Operations
For the Year Ended October 31, 2021
| | | Global | | | International | | | Large-Cap | | | SMID-Cap | |
| | | Growth Fund | | | Growth Fund | | | Growth Fund | | | Growth Fund | |
| INVESTMENT INCOME: | | | | | | | | | | | | |
| Dividend income | | $ | 67,786 | | | $ | 41,224 | | | $ | 7,846,078 | | | $ | 2,962,515 | |
| Less: Foreign taxes withheld | | | (6,992 | ) | | | (4,732 | ) | | | — | | | | — | |
| Interest income | | | 4 | | | | 6 | | | | 1,810 | | | | 2,083 | |
| Total investment income | | | 60,798 | | | | 36,498 | | | | 7,847,888 | | | | 2,964,598 | |
| | | | | | | | | | | | | | | | | |
| EXPENSES: | | | | | | | | | | | | | | | | |
| Investment advisory fees (See Note 4) | | | 120,118 | | | | 90,217 | | | | 15,458,447 | | | | 15,195,845 | |
| Transfer agent fees & expenses (See Note 4) | | | 37,681 | | | | 36,190 | | | | 3,379,865 | | | | 188,483 | |
| Fund administration & accounting fees (See Note 4) | | | 35,070 | | | | 33,362 | | | | 670,721 | | | | 716,482 | |
| Custody fees (See Note 4) | | | 17,765 | | | | 17,627 | | | | 132,055 | | | | 181,784 | |
| Audit fees | | | 17,500 | | | | 16,995 | | | | 11,077 | | | | 18,500 | |
| Trustee fees | | | 16,985 | | | | 16,990 | | | | 86,267 | | | | 16,819 | |
| Federal & state registration fees | | | 14,727 | | | | 14,565 | | | | 82,573 | | | | 112,965 | |
| Other expenses | | | 10,317 | | | | 9,810 | | | | 33,787 | | | | 10,930 | |
| Legal fees | | | 6,850 | | | | 6,849 | | | | 64,904 | | | | 6,850 | |
| Insurance fees | | | 1,660 | | | | 1,633 | | | | 33,683 | | | | 9,624 | |
| Postage & printing fees | | | 1,196 | | | | 1,358 | | | | 277,069 | | | | 27,003 | |
| Compliance fees (See Note 4) | | | 290 | | | | 201 | | | | 15,462 | | | | 36,525 | |
| Distribution and/or shareholder service fees (See Note 5) | | | | | | | | | | | | | | | | |
| Institutional Class | | | 357 | | | | 50 | | | | 708,658 | | | | 940,781 | |
Investor Class(1) | | | 1 | | | | 1 | | | | 504,352 | | | | 397,292 | |
Class C(2) | | | — | | | | — | | | | 136,085 | | | | — | |
Class R(3) | | | — | | | | — | | | | 13,554 | | | | — | |
| Total expenses before reimbursement/waiver/recoupment | | | 280,517 | | | | 245,848 | | | | 21,635,559 | | | | 17,859,883 | |
| Plus: Adviser recoupment (See Note 4) | | | — | | | | — | | | | 72 | | | | 44,330 | |
| Less: reimbursement/waiver from adviser (See Note 4) | | | (123,096 | ) | | | (132,944 | ) | | | (481,702 | ) | | | — | |
| Total net expenses | | | 157,421 | | | | 112,904 | | | | 21,153,929 | | | | 17,904,213 | |
| NET INVESTMENT LOSS | | | (96,623 | ) | | | (76,406 | ) | | | (13,306,041 | ) | | | (14,939,615 | ) |
| | | | | | | | | | | | | | | | | |
| REALIZED AND UNREALIZED GAIN (LOSS) | | | | | | | | | | | | | | | | |
| ON INVESTMENTS AND TRANSLATIONS | | | | | | | | | | | | | | | | |
| OF FOREIGN CURRENCY | | | | | | | | | | | | | | | | |
| Net realized gain on investments, | | | | | | | | | | | | | | | | |
| including foreign currency gain/loss | | | 2,443,856 | | | | 3,779,991 | | | | 734,556,392 | | | | 363,025,635 | |
| Net change in unrealized appreciation/depreciation | | | | | | | | | | | | | | | | |
| of investments and translations of foreign currency | | | 2,169,493 | | | | (1,062,667 | ) | | | 78,212,691 | | | | 120,093,193 | |
Net realized and unrealized gain on investments | | | 4,613,349 | | | | 2,717,324 | | | | 812,769,083 | | | | 483,118,828 | |
| | | | | | | | | | | | | | | | | |
| NET INCREASE IN NET ASSETS | | | | | | | | | | | | | | | | |
| RESULTING FROM OPERATIONS | | $ | 4,516,726 | | | $ | 2,640,918 | | | $ | 799,463,042 | | | $ | 468,179,213 | |
| (1) | The Large-Cap Growth Fund Investor Class was previously known as Class A prior to April 16, 2021. See Note 1. |
| (2) | The Large-Cap Growth Fund Class C shares converted to Investor Class shares on April 16, 2021. See Note 1. |
| (3) | The Large-Cap Growth Fund Class R shares converted to Investor Class shares on April 16, 2021. See Note 1. |
See Notes to the Financial Statements
Jackson Square Global Growth Fund
Statements of Changes in Net Assets
| | | For the | | | For the | |
| | | Year Ended | | | Year Ended | |
| | | October 31, 2021 | | | October 31, 2020 | |
| OPERATIONS: | | | | | | |
| Net investment loss | | $ | (96,623 | ) | | $ | (56,802 | ) |
| Net realized gain on investments, including foreign currency gain (loss) | | | 2,443,856 | | | | 484,656 | |
| Net change in unrealized appreciation/depreciation | | | | | | | | |
| on investments and translations of foreign currency | | | 2,169,493 | | | | 1,526,770 | |
Net increase in net assets resulting from operations | | | 4,516,726 | | | | 1,954,624 | |
| | | | | | | | | |
| CAPITAL SHARE TRANSACTIONS: | | | | | | | | |
| IS Class: | | | | | | | | |
| Proceeds from shares sold | | | 388,481 | | | | 600,914 | |
| Proceeds from reinvestment of distributions | | | 346,744 | | | | 217,380 | |
| Payments for shares redeemed | | | (1,624,383 | ) | | | (1,132,360 | ) |
| Decrease in net assets resulting from IS Class transactions | | | (889,158 | ) | | | (314,066 | ) |
| Institutional Class: | | | | | | | | |
| Proceeds from shares sold | | | 228,000 | | | | 200,000 | |
| Proceeds from reinvestment of distributions | | | 3,040 | | | | — | |
| Payments for shares redeemed | | | (5,694 | ) | | | — | |
| Increase in net assets resulting from Institutional Class transactions | | | 225,346 | | | | 200,000 | |
Investor Class(1): | | | | | | | | |
| Proceeds from shares sold | | | 1,000 | | | | — | |
| Proceeds from reinvestment of distributions | | | — | | | | — | |
| Payments for shares redeemed | | | — | | | | — | |
| Increase in net assets resulting from Investor Class transactions | | | 1,000 | | | | — | |
Net decrease in net assets resulting from capital share transactions | | | (662,812 | ) | | | (114,066 | ) |
| | | | | | | | | |
| DISTRIBUTIONS TO SHAREHOLDERS: | | | | | | | | |
| IS Class | | | (398,874 | ) | | | (247,951 | ) |
| Institutional Class | | | (8,551 | ) | | | (1,488 | ) |
Investor Class(1) | | | — | | | | — | |
Total distributions to shareholders | | | (407,425 | ) | | | (249,439 | ) |
| TOTAL INCREASE IN NET ASSETS | | | 3,446,489 | | | | 1,591,119 | |
| | | | | | | | | |
| NET ASSETS: | | | | | | | | |
| Beginning of year | | | 13,260,244 | | | | 11,669,125 | |
| End of year | | $ | 16,706,733 | | | $ | 13,260,244 | |
| (1) | Inception date of the Investor Class was August 31, 2021. |
See Notes to the Financial Statements
Jackson Square International Growth Fund
Statements of Changes in Net Assets
| | | For the | | | For the | |
| | | Year Ended | | | Year Ended | |
| | | October 31, 2021 | | | October 31, 2020 | |
| OPERATIONS: | | | | | | |
| Net investment loss | | $ | (76,406 | ) | | $ | (24,527 | ) |
| Net realized gain on investments, including foreign currency gain (loss) | | | 3,779,991 | | | | 390,170 | |
| Net change in unrealized appreciation/depreciation | | | | | | | | |
| on investments and translations of foreign currency | | | (1,062,667 | ) | | | 1,194,508 | |
Net increase in net assets resulting from operations | | | 2,640,918 | | | | 1,560,151 | |
| | | | | | | | | |
| CAPITAL SHARE TRANSACTIONS: | | | | | | | | |
| IS Class: | | | | | | | | |
| Proceeds from shares sold | | | 3,766,317 | | | | 88,793 | |
| Proceeds from reinvestment of distributions | | | 293,963 | | | | 189,025 | |
| Payments for shares redeemed | | | (1,808,533 | ) | | | (503,565 | ) |
| Increase (Decrease) in net assets resulting from IS Class transactions | | | 2,251,747 | | | | (225,747 | ) |
Institutional Class(1): | | | | | | | | |
| Proceeds from shares sold | | | 235,000 | | | | — | |
| Proceeds from reinvestment of distributions | | | — | | | | — | |
| Payments for shares redeemed | | | (98,107 | ) | | | — | |
| Increase in net assets resulting from Institutional Class transactions | | | 136,893 | | | | — | |
Investor Class(2): | | | | | | | | |
| Proceeds from shares sold | | | 1,000 | | | | — | |
| Proceeds from reinvestment of distributions | | | — | | | | — | |
| Payments for shares redeemed | | | — | | | | — | |
| Increase in net assets resulting from Investor Class transactions | | | 1,000 | | | | — | |
Net increase (decrease) in net assets resulting from capital share transactions | | | 2,389,640 | | | | (225,747 | ) |
| | | | | | | | | |
| DISTRIBUTIONS TO SHAREHOLDERS: | | | | | | | | |
| IS Class | | | (381,666 | ) | | | (243,056 | ) |
Institutional Class(1) | | | — | | | | — | |
Investor Class(2) | | | — | | | | — | |
Total distributions to shareholders | | | (381,666 | ) | | | (243,056 | ) |
| TOTAL INCREASE IN NET ASSETS | | | 4,648,892 | | | | 1,091,348 | |
| | �� | | | | | | | |
| NET ASSETS: | | | | | | | | |
| Beginning of year | | | 7,081,301 | | | | 5,989,953 | |
| End of year | | $ | 11,730,193 | | | $ | 7,081,301 | |
| (1) | Inception date of the Institutional Class was December 28, 2020. |
| (2) | Inception date of the Investor Class was August 31, 2021. |
See Notes to the Financial Statements
Jackson Square Large-Cap Growth Fund
Statements of Changes in Net Assets
| | | For the | | | For the | |
| | | Year Ended | | | Year Ended | |
| | | October 31, 2021 | | | October 31, 2020 | |
| OPERATIONS: | | | | | | |
| Net investment loss | | $ | (13,306,041 | ) | | $ | (4,778,168 | ) |
| Net realized gain on investments, including foreign currency gain (loss) | | | 734,556,392 | | | | 284,874,274 | |
| Net change in unrealized appreciation on investments | | | | | | | | |
| and translations of foreign currency | | | 78,212,691 | | | | 300,692,536 | |
Net increase in net assets resulting from operations | | | 799,463,042 | | | | 580,788,642 | |
| | | | | | | | | |
| CAPITAL SHARE TRANSACTIONS: | | | | | | | | |
IS Class(1): | | | | | | | | |
| Proceeds from shares sold | | | 1,402,857,692 | | | | 1,154,307 | |
| Proceeds from acquisition (Note 1) | | | 79,071,717 | | | | — | |
| Proceeds from reinvestment of distributions | | | 1,028,826 | | | | 351,822 | |
| Payments for shares redeemed | | | (680,330,396 | ) | | | (969,306 | ) |
| Increase in net assets resulting from IS Class transactions | | | 802,627,839 | | | | 536,823 | |
| Institutional Class: | | | | | | | | |
| Proceeds from shares sold | | | 408,684,263 | | | | 561,725,417 | |
| Proceeds from acquisition (Note 1) | | | 1,272,275 | | | | — | |
| Proceeds from reinvestment of distributions | | | 488,179,321 | | | | 219,841,424 | |
| Payments for shares redeemed | | | (1,992,166,054 | ) | | | (1,065,340,123 | ) |
| Decrease in net assets resulting from Institutional Class transactions | | | (1,094,030,195 | ) | | | (283,773,282 | ) |
Investor Class(2): | | | | | | | | |
| Proceeds from shares sold | | | 21,085,616 | | | | 27,604,145 | |
| Proceeds from acquisition (Note 1) | | | 70,894 | | | | — | |
| Proceeds from reinvestment of distributions | | | 34,187,695 | | | | 12,521,618 | |
| Proceeds from exchange of Class C Shares | | | 26,301,193 | | | | — | |
| Proceeds from exchange of Class R Shares | | | 5,427,349 | | | | — | |
| Payments for shares redeemed | | | (64,491,702 | ) | | | (36,600,314 | ) |
| Increase in net assets resulting from Investor Class transactions | | | 22,581,045 | | | | 3,525,449 | |
Class C(3): | | | | | | | | |
| Proceeds from shares sold | | | 806,788 | | | | 3,876,101 | |
| Proceeds from reinvestment of distributions | | | 8,161,979 | | | | 4,470,467 | |
| Payment for shares issued in exchange for Investor Shares | | | (26,301,193 | ) | | | — | |
| Payments for shares redeemed | | | (9,190,637 | ) | | | (18,410,975 | ) |
| Decrease in net assets resulting from Class C transactions | | | (26,523,063 | ) | | | (10,064,407 | ) |
Class R(4): | | | | | | | | |
| Proceeds from shares sold | | | 213,698 | | | | 2,031,407 | |
| Proceeds from reinvestment of distributions | | | 1,331,846 | | | | 1,081,853 | |
| Payment for shares issued in exchange for Investor Shares | | | (5,427,349 | ) | | | — | |
| Payments for shares redeemed | | | (1,666,003 | ) | | | (7,214,005 | ) |
| Decrease in net assets resulting from Class R transactions | | | (5,547,808 | ) | | | (4,100,745 | ) |
Net decrease in net assets resulting from capital share transactions | | | (300,892,182 | ) | | | (293,876,162 | ) |
See Notes to the Financial Statements
Jackson Square Large-Cap Growth Fund
Statements of Changes in Net Assets – Continued
| | | For the | | | For the | |
| | | Year Ended | | | Year Ended | |
| | | October 31, 2021 | | | October 31, 2020 | |
| DISTRIBUTIONS TO SHAREHOLDERS: | | | | | | |
IS Class(1) | | $ | (1,054,886 | ) | | $ | (352,300 | ) |
| Institutional Class | | | (489,231,243 | ) | | | (220,903,754 | ) |
Investor Class(2) | | | (34,713,436 | ) | | | (12,780,403 | ) |
Class C(3) | | | (8,184,157 | ) | | | (4,508,811 | ) |
Class R(4) | | | (1,331,852 | ) | | | (1,081,857 | ) |
Total distributions to shareholders | | | (534,515,574 | ) | | | (239,627,125 | ) |
| TOTAL INCREASE (DECREASE) IN NET ASSETS | | | (35,944,714 | ) | | | 47,285,355 | |
| | | | | | | | | |
| NET ASSETS: | | | | | | | | |
| Beginning of year | | | 2,443,794,626 | | | | 2,396,509,271 | |
| End of year | | $ | 2,407,849,912 | | | $ | 2,443,794,626 | |
| (1) | The IS Class was previously known as Class R6 prior to April 16, 2021. See Note 1. |
| (2) | The Investor Class was previously known as Class A prior to April 16, 2021. See Note 1. |
| (3) | Class C shares converted to Investor Class shares on April 16, 2021. See Note 1. |
| (4) | Class R shares converted to Investor Class shares on April 16, 2021. See Note 1. |
See Notes to the Financial Statements
Jackson Square SMID-Cap Growth Fund
Statements of Changes in Net Assets
| | | For the | | | For the | |
| | | Year Ended | | | Year Ended | |
| | | October 31, 2021 | | | October 31, 2020 | |
| OPERATIONS: | | | | | | |
| Net investment loss | | $ | (14,939,615 | ) | | $ | (4,319,067 | ) |
| Net realized gain on investments, including foreign currency gain (loss) | | | 363,025,635 | | | | 101,950,759 | |
| Net change in unrealized appreciation | | | | | | | | |
| on investments and translations of foreign currency | | | 120,093,193 | | | | 258,759,212 | |
Net increase in net assets resulting from operations | | | 468,179,213 | | | | 356,390,904 | |
| | | | | | | | | |
| CAPITAL SHARE TRANSACTIONS: | | | | | | | | |
| IS Class: | | | | | | | | |
| Proceeds from shares sold | | | 300,146,563 | | | | 157,740,671 | |
| Proceeds from reinvestment of distributions | | | 39,392,094 | | | | 19,238,798 | |
| Payments for shares redeemed | | | (145,332,569 | ) | | | (116,046,399 | ) |
| Increase in net assets resulting from IS Class transactions | | | 194,206,088 | | | | 60,933,070 | |
| Institutional Class: | | | | | | | | |
| Proceeds from shares sold | | | 304,524,541 | | | | 191,547,831 | |
| Proceeds from reinvestment of distributions | | | 45,355,964 | | | | 20,626,602 | |
| Payments for shares redeemed | | | (220,162,155 | ) | | | (143,336,709 | ) |
| Increase in net assets resulting from Institutional Class transactions | | | 129,718,350 | | | | 68,837,724 | |
| Investor Class: | | | | | | | | |
| Proceeds from shares sold | | | 43,689,033 | | | | 12,375,096 | |
| Proceeds from reinvestment of distributions | | | 5,187,925 | | | | 3,262,845 | |
| Payments for shares redeemed | | | (38,430,286 | ) | | | (33,095,068 | ) |
| Increase (Decrease) in net assets resulting from Investor Class transactions | | | 10,446,672 | | | | (17,457,127 | ) |
Net increase in net assets resulting from capital share transactions | | | 334,371,110 | | | | 112,313,667 | |
| | | | | | | | | |
| DISTRIBUTIONS TO SHAREHOLDERS: | | | | | | | | |
| IS Class | | | (41,465,958 | ) | | | (19,750,206 | ) |
| Institutional Class | | | (47,286,027 | ) | | | (21,831,079 | ) |
| Investor Class | | | (5,199,692 | ) | | | (3,263,044 | ) |
Total distributions to shareholders | | | (93,951,677 | ) | | | (44,844,329 | ) |
| TOTAL INCREASE IN NET ASSETS | | | 708,598,646 | | | | 423,860,242 | |
| | | | | | | | | |
| NET ASSETS: | | | | | | | | |
| Beginning of year | | | 1,454,373,842 | | | | 1,030,513,600 | |
| End of year | | $ | 2,162,972,488 | | | $ | 1,454,373,842 | |
See Notes to the Financial Statements
Jackson Square Global Growth Fund
Financial Highlights
For a Fund share outstanding throughout the years.
| IS Class | | | | | | | | | | | | | | | |
| | | | | | | | | | | | | | | | |
| | | Year Ended | | | Year Ended | | | Year Ended | | | Year Ended | | | Year Ended | |
| | | October 31, | | | October 31, | | | October 31, | | | October 31, | | | October 31, | |
| | | 2021 | | | 2020 | | | 2019 | | | 2018 | | | 2017 | |
| Per Share Data | | | | | | | | | | | | | | | |
| | | | | | | | | | | | | | | | |
Net asset value, beginning of year | | $ | 28.12 | | | $ | 24.70 | | | $ | 23.28 | | | $ | 22.73 | | | $ | 17.66 | |
| | | | | | | | | | | | | | | | | | | | | |
| Investment operations: | | | | | | | | | | | | | | | | | | | | |
Net investment loss(1) | | | (0.21 | ) | | | (0.12 | ) | | | (0.04 | ) | | | (0.07 | ) | | | (0.02 | ) |
| Net realized and unrealized gain on investments | | | 10.22 | | | | 4.07 | | | | 2.87 | | | | 1.08 | | | | 5.09 | |
| Total from investment operations | | | 10.01 | | | | 3.95 | | | | 2.83 | | | | 1.01 | | | | 5.07 | |
| | | | | | | | | | | | | | | | | | | | | |
| Less distributions from: | | | | | | | | | | | | | | | | | | | | |
| Net investment income | | | — | | | | — | | | | — | | | | (0.01 | ) | | | — | |
| Net realized gains | | | (0.90 | ) | | | (0.53 | ) | | | (1.41 | ) | | | (0.45 | ) | | | — | |
| Total distributions | | | (0.90 | ) | | | (0.53 | ) | | | (1.41 | ) | | | (0.46 | ) | | | — | |
Net asset value, end of year | | $ | 37.23 | | | $ | 28.12 | | | $ | 24.70 | | | $ | 23.28 | | | $ | 22.73 | |
| | | | | | | | | | | | | | | | | | | | | |
| Total Return | | | 35.90 | % | | | 16.20 | % | | | 13.47 | % | | | 4.49 | % | | | 28.71 | % |
| | | | | | | | | | | | | | | | | | | | | |
| Supplemental Data and Ratios | | | | | | | | | | | | | | | | | | | | |
Net assets, end of year (in 000’s) | | $ | 16,116 | | | $ | 12,993 | | | $ | 11,599 | | | $ | 10,074 | | | $ | 9,121 | |
| | | | | | | | | | | | | | | | | | | | | |
Ratio of expenses to average net assets: | | | | | | | | | | | | | | | | | | | | |
| Before expense reimbursement/waiver | | | 1.77 | % | | | 1.92 | % | | | 2.01 | % | | | 2.00 | % | | | 2.39 | % |
| After expense reimbursement/waiver | | | 0.99 | %(2) | | | 1.05 | % | | | 1.05 | % | | | 1.05 | % | | | 1.05 | % |
| | | | | | | | | | | | | | | | | | | | | |
Ratio of net investment loss to average net assets: | | | | | | | | | | | | | | | | | | | | |
| After expense reimbursement/waiver | | | (0.61 | )% | | | (0.46 | )% | | | (0.17 | )% | | | (0.31 | )% | | | (0.12 | )% |
| | | | | | | | | | | | | | | | | | | | | |
Portfolio Turnover(3) | | | 31 | % | | | 41 | % | | | 28 | % | | | 41 | % | | | 37 | % |
| | | | | | | | | | | | | | | | | | | | | |
| (1) | Per share amounts calculated using the average shares method. |
| (2) | Prior to December 28, 2020, the annual expense limitation was 1.05% of the average daily net assets of the Fund. Thereafter, it was 0.98%. |
| (3) | Portfolio turnover disclosed is for the Fund as a whole. |
See Notes to the Financial Statements
Jackson Square Global Growth Fund
Financial Highlights
For a Fund share outstanding throughout the years.
Institutional Class
| | | Year Ended | | | Year Ended | | | Year Ended | | | Year Ended | | | Year Ended | |
| | | October 31, | | | October 31, | | | October 31, | | | October 31, | | | October 31, | |
| | | 2021 | | | 2020 | | | 2019 | | | 2018 | | | 2017 | |
| Per Share Data | | | | | | | | | | | | | | | |
| | | | | | | | | | | | | | | | |
Net asset value, beginning of year | | $ | 28.09 | | | $ | 24.68 | | | $ | 23.25 | | | $ | 22.71 | | | $ | 17.66 | |
| | | | | | | | | | | | | | | | | | | | | |
| Investment operations: | | | | | | | | | | | | | | | | | | | | |
Net investment loss(1) | | | (0.24 | ) | | | (0.12 | ) | | | (0.04 | ) | | | (0.07 | ) | | | (0.04 | ) |
| Net realized and unrealized gain on investments | | | 10.21 | | | | 4.06 | | | | 2.88 | | | | 1.07 | | | | 5.09 | |
| Total from investment operations | | | 9.97 | | | | 3.94 | | | | 2.84 | | | | 1.00 | | | | 5.05 | |
| | | | | | | | | | | | | | | | | | | | | |
| Less distributions from: | | | | | | | | | | | | | | | | | | | | |
| Net investment income | | | — | | | | — | | | | — | | | | (0.01 | ) | | | — | |
| Net realized gains | | | (0.90 | ) | | | (0.53 | ) | | | (1.41 | ) | | | (0.45 | ) | | | — | |
| Total distributions | | | (0.90 | ) | | | (0.53 | ) | | | (1.41 | ) | | | (0.46 | ) | | | — | |
Net asset value, end of year | | $ | 37.16 | | | $ | 28.09 | | | $ | 24.68 | | | $ | 23.25 | | | $ | 22.71 | |
| | | | | | | | | | | | | | | | | | | | | |
| Total Return | | | 35.79 | % | | | 16.17 | % | | | 13.53 | % | | | 4.45 | % | | | 28.60 | % |
| | | | | | | | | | | | | | | | | | | | | |
| Supplemental Data and Ratios | | | | | | | | | | | | | | | | | | | | |
Net assets, end of year (in 000’s) | | $ | 590 | | | $ | 267 | | | $ | 70 | | | $ | 66 | | | $ | 64 | |
| | | | | | | | | | | | | | | | | | | | | |
Ratio of expenses to average net assets: | | | | | | | | | | | | | | | | | | | | |
| Before expense reimbursement/waiver | | | 1.85 | % | | | 1.92 | % | | | 2.01 | % | | | 2.01 | % | | | 2.59 | % |
| After expense reimbursement/waiver | | | 1.06 | %(2) | | | 1.05 | % | | | 1.05 | % | | | 1.05 | % | | | 1.12 | % |
| | | | | | | | | | | | | | | | | | | | | |
Ratio of net investment loss | | | | | | | | | | | | | | | | | | | | |
to average net assets: | | | | | | | | | | | | | | | | | | | | |
| After expense reimbursement/waiver | | | (0.68 | )% | | | (0.46 | )% | | | (0.18 | )% | | | (0.31 | )% | | | (0.19 | )% |
| | | | | | | | | | | | | | | | | | | | | |
Portfolio Turnover(3) | | | 31 | % | | | 41 | % | | | 28 | % | | | 41 | % | | | 37 | % |
| | | | | | | | | | | | | | | | | | | | | |
| (1) | Per share amounts calculated using the average shares method. |
| (2) | Prior to December 28, 2020, the annual expense limitation was 1.05% of the average daily net assets of the Fund. Thereafter, it was 0.98%, excluding shareholder servicing fees. |
| (3) | Portfolio turnover disclosed is for the Fund as a whole. |
See Notes to the Financial Statements
Jackson Square Global Growth Fund
Financial Highlights
For a Fund share outstanding throughout the period.
Investor Class
| | | For the Period | |
| | | Inception(1) through | |
| | | October 31, 2021 | |
| Per Share Data | | | |
Net asset value, beginning of period | | $ | 36.86 | |
| | | | | |
| Investment operations: | | | | |
Net investment loss(2) | | | (0.07 | ) |
Net realized and unrealized gain on investments(3) | | | 0.42 | |
| Total from investment operations | | | 0.35 | |
| | | | | |
| Less distributions from: | | | | |
| Net investment income | | | — | |
| Net realized gains | | | — | |
| Total distributions | | | — | |
Net asset value, end of period | | $ | 37.21 | |
| | | | | |
Total Return(4) | | | 0.95 | % |
| | | | | |
| Supplemental Data and Ratios | | | | |
Net assets, end of period (in 000’s) | | $ | 1 | |
| | | | | |
Ratio of expenses to average net assets: | | | | |
Before expense reimbursement/waiver(5) | | | 1.81 | % |
After expense reimbursement/waiver(5) | | | 1.33 | % |
| | | | | |
Ratio of net investment loss to average net assets: | | | | |
After expense reimbursement/waiver(5) | | | (1.09 | )% |
| | | | | |
Portfolio Turnover(4)(6) | | | 31 | % |
| (1) | Inception date of the Investor Class was August 31, 2021. |
| (2) | Per share amounts calculated using the average shares method. |
| (3) | Net realized and unrealized gain per share in this caption is a balancing amount necessary to reconcile the change in net asset value per share for the period and may not reconcile with the aggregate gain on the Statement of Operations due to share transactions for the period. |
| (4) | Not annualized for periods less than one year. |
| (5) | Annualized for periods less than one year. |
| (6) | Portfolio turnover disclosed is for the Fund as a whole. |
See Notes to the Financial Statements
Jackson Square International Growth Fund
Financial Highlights
For a Fund share outstanding throughout the years.
IS Class
| | | Year Ended | | | Year Ended | | | Year Ended | | | Year Ended | | | Year Ended | |
| | | October 31, | | | October 31, | | | October 31, | | | October 31, | | | October 31, | |
| | | 2021 | | | 2020 | | | 2019 | | | 2018 | | | 2017 | |
| Per Share Data | | | | | | | | | | | | | | | |
| | | | | | | | | | | | | | | | |
Net asset value, beginning of year | | $ | 27.77 | | | $ | 22.60 | | | $ | 22.68 | | | $ | 21.21 | | | $ | 17.55 | |
| | | | | | | | | | | | | | | | | | | | | |
| Investment operations: | | | | | | | | | | | | | | | | | | | | |
Net investment loss(1) | | | (0.23 | ) | | | (0.09 | ) | | | (0.04 | ) | | | (0.03 | ) | | | (0.02 | ) |
| Net realized and unrealized gain on investments | | | 9.80 | | | | 6.18 | | | | 2.24 | | | | 1.53 | | | | 3.69 | |
| Total from investment operations | | | 9.57 | | | | 6.09 | | | | 2.20 | | | | 1.50 | | | | 3.67 | |
| | | | | | | | | | | | | | | | | | | | | |
| Less distributions from: | | | | | | | | | | | | | | | | | | | | |
| Net investment income | | | — | | | | — | | | | — | (2) | | | — | | | | (0.01 | ) |
| Net realized gains | | | (1.49 | ) | | | (0.92 | ) | | | (2.28 | ) | | | (0.03 | ) | | | — | |
| Total distributions | | | (1.49 | ) | | | (0.92 | ) | | | (2.28 | ) | | | (0.03 | ) | | | (0.01 | ) |
Net asset value, end of year | | $ | 35.85 | | | $ | 27.77 | | | $ | 22.60 | | | $ | 22.68 | | | $ | 21.21 | |
| | | | | | | | | | | | | | | | | | | | | |
| Total Return | | | 34.97 | % | | | 27.81 | % | | | 11.85 | % | | | 7.10 | % | | | 20.90 | % |
| | | | | | | | | | | | | | | | | | | | | |
| Supplemental Data and Ratios | | | | | | | | | | | | | | | | | | | | |
Net assets, end of year (in 000’s) | | $ | 11,597 | | | $ | 7,081 | | | $ | 5,990 | | | $ | 5,470 | | | $ | 5,070 | |
| | | | | | | | | | | | | | | | | | | | | |
Ratio of expenses to average net assets: | | | | | | | | | | | | | | | | | | | | |
| Before expense reimbursement/waiver | | | 2.13 | % | | | 2.42 | % | | | 2.47 | % | | | 2.45 | % | | | 2.93 | % |
| After expense reimbursement/waiver | | | 0.98 | %(3) | | | 0.90 | % | | | 0.90 | % | | | 0.90 | % | | | 0.90 | % |
| | | | | | | | | | | | | | | | | | | | | |
Ratio of net investment loss to average net assets: | | | | | | | | | | | | | | | | | | | | |
| After expense reimbursement/waiver | | | (0.66 | )% | | | (0.38 | )% | | | (0.17 | )% | | | (0.12 | )% | | | (0.10 | )% |
| | | | | | | | | | | | | | | | | | | | | |
Portfolio Turnover(4) | | | 80 | % | | | 59 | % | | | 49 | % | | | 61 | % | | | 60 | % |
| (1) | Per share amounts calculated using the average shares method. |
| (2) | Amount is less than $0.01 per share. |
| (3) | Effective December 28, 2020, the Jackson Square All-Cap Growth Fund changed its name to the Jackson Square International Growth Fund (See Note 1). Prior to December 28, 2020, the annual expense limitation was 0.90% of the average daily net assets of the Fund. Thereafter, it was 0.99%. |
| (4) | Portfolio turnover disclosed is for the Fund as a whole. |
See Notes to the Financial Statements
Jackson Square International Growth Fund
Financial Highlights
For a Fund share outstanding throughout the period.
Institutional Class
| | | For the Period | |
| | | Inception(1) through | |
| | | October 31, 2021 | |
| Per Share Data | | | |
| | | | |
Net asset value, beginning of period | | $ | 32.87 | |
| | | | | |
| Investment operations: | | | | |
Net investment loss(2) | | | (0.24 | ) |
| Net realized and unrealized gain on investments | | | 3.20 | |
| Total from investment operations | | | 2.96 | |
| | | | | |
| Less distributions from: | | | | |
| Net investment income | | | — | |
| Net realized gains | | | — | |
| Total distributions | | | — | |
Net asset value, end of period | | $ | 35.83 | |
| | | | | |
Total Return(3) | | | 9.01 | % |
| | | | | |
| Supplemental Data and Ratios | | | | |
Net assets, end of period (in 000’s) | | $ | 132 | |
| | | | | |
Ratio of expenses to average net assets: | | | | |
Before expense reimbursement/waiver(4) | | | 2.27 | % |
After expense reimbursement/waiver(4) | | | 1.09 | % |
| | | | | |
Ratio of net investment loss to average net assets: | | | | |
After expense reimbursement/waiver(4) | | | (0.80 | )% |
| | | | | |
Portfolio Turnover(3)(5) | | | 80 | % |
(1) | Inception date of the Institutional Class was December 28, 2020. |
(2) | Per share amounts calculated using the average shares method. |
(3) | Not annualized for periods less than one year. |
(4) | Annualized for periods less than one year. |
(5) | Portfolio turnover disclosed is for the Fund as a whole. |
See Notes to the Financial Statements
Jackson Square International Growth Fund
Financial Highlights
For a Fund share outstanding throughout the period.
Investor Class
| | | For the Period | |
| | | Inception(1) through | |
| | | October 31, 2021 | |
| Per Share Data | | | |
| | | | |
Net asset value, beginning of period | | $ | 37.12 | |
| | | | | |
| Investment operations: | | | | |
Net investment loss(2) | | | (0.07 | ) |
Net realized and unrealized loss on investments(3) | | | (1.20 | ) |
| Total from investment operations | | | (1.27 | ) |
| | | | | |
| Less distributions from: | | | | |
| Net investment income | | | — | |
| Net realized gains | | | — | |
| Total distributions | | | — | |
Net asset value, end of period | | $ | 35.85 | |
| | | | | |
Total Return(4) | | | -3.42 | % |
| | | | | |
| Supplemental Data and Ratios | | | | |
Net assets, end of period (in 000’s) | | $ | 1 | |
| | | | | |
Ratio of expenses to average net assets: | | | | |
Before expense reimbursement/waiver(5) | | | 2.59 | % |
After expense reimbursement/waiver(5) | | | 1.34 | % |
| | | | | |
Ratio of net investment loss to average net assets: | | | | |
After expense reimbursement/waiver(5) | | | (1.14 | )% |
| | | | | |
Portfolio Turnover(4)(6) | | | 80 | % |
| (1) | Inception date of the Investor Class was August 31, 2021. |
| (2) | Per share amounts calculated using the average shares method. |
| (3) | Net realized and unrealized loss per share in this caption is a balancing amount necessary to reconcile the change in net asset value per share for the period, and may not reconcile with the aggregate gain on the Statement of Operations due to share transactions for the period. |
| (4) | Not annualized for periods less than one year. |
| (5) | Annualized for periods less than one year. |
| (6) | Portfolio turnover disclosed is for the Fund as a whole. |
See Notes to the Financial Statements
Jackson Square Large-Cap Growth Fund
Financial Highlights
For a Fund share outstanding throughout the years.
IS Class(1)
| | | Year Ended | | | Year Ended | | | Year Ended | | | Year Ended | | | Year Ended | |
| | | October 31, | | | October 31, | | | October 31, | | | October 31, | | | October 31, | |
| | | 2021 | | | 2020 | | | 2019 | | | 2018 | | | 2017 | |
| Per Share Data | | | | | | | | | | | | | | | |
| | | | | | | | | | | | | | | | |
Net asset value, beginning of year | | $ | 28.72 | | | $ | 24.91 | | | $ | 26.72 | | | $ | 28.50 | | | $ | 24.68 | |
| | | | | | | | | | | | | | | | | | | | | |
| Investment operations: | | | | | | | | | | | | | | | | | | | | |
Net investment income (loss)(2) | | | (0.10 | ) | | | 0.01 | | | | 0.05 | | | | 0.05 | | | | 0.02 | |
| Net realized and unrealized gain on investments | | | 9.16 | | | | 6.25 | | | | 2.59 | | | | 1.38 | | | | 5.52 | |
| Total from investment operations | | | 9.06 | | | | 6.26 | | | | 2.64 | | | | 1.43 | | | | 5.54 | |
| | | | | | | | | | | | | | | | | | | | | |
| Less distributions from: | | | | | | | | | | | | | | | | | | | | |
| Net investment income | | | — | | | | — | | | | — | | | | (0.04 | ) | | | (0.07 | ) |
| Net realized gains | | | (6.09 | ) | | | (2.45 | ) | | | (4.45 | ) | | | (3.17 | ) | | | (1.65 | ) |
| Total distributions | | | (6.09 | ) | | | (2.45 | ) | | | (4.45 | ) | | | (3.21 | ) | | | (1.72 | ) |
Net asset value, end of year | | $ | 31.69 | | | $ | 28.72 | | | $ | 24.91 | | | $ | 26.72 | | | $ | 28.50 | |
| | | | | | | | | | | | | | | | | | | | | |
| Total Return | | | 33.81 | %(3) | | | 27.39 | %(3) | | | 14.60 | %(3) | | | 5.36 | % | | | 24.19 | % |
| | | | | | | | | | | | | | | | | | | | | |
| Supplemental Data and Ratios | | | | | | | | | | | | | | | | | | | | |
Net assets, end of year (in 000’s) | | $ | 945,973 | | | $ | 4,539 | | | $ | 3,408 | | | $ | 2,376 | | | $ | 2,053 | |
| | | | | | | | | | | | | | | | | | | | | |
Ratio of expenses to average net assets: | | | | | | | | | | | | | | | | | | | | |
| Before expense reimbursement/waiver | | | 0.61 | % | | | 0.65 | % | | | 0.67 | % | | | 0.65 | % | | | 0.67 | % |
| After expense reimbursement/waiver | | | 0.61 | %(4) | | | 0.62 | % | | | 0.63 | % | | | 0.65 | % | | | 0.67 | % |
| | | | | | | | | | | | | | | | | | | | | |
Ratio of net investment income (loss) | | | | | | | | | | | | | | | | | | | | |
to average net assets: | | | | | | | | | | | | | | | | | | | | |
| After expense reimbursement/waiver | | | (0.17 | )% | | | 0.02 | % | | | 0.16 | % | | | 0.16 | % | | | 0.08 | % |
| | | | | | | | | | | | | | | | | | | | | |
Portfolio Turnover(5) | | | 28 | % | | | 54 | % | | | 35 | % | | | 39 | % | | | 43 | % |
| (1) | Prior to April 16, 2021, the IS Class was known as Class R6. See Note 1. |
| (2) | Per share amounts calculated using the average shares method. |
| (3) | Total return during the period reflects a waiver by the manager. Performance would have been lower had the waiver not been in effect. |
| (4) | Prior to April 16, 2021, the annual expense limitation was 0.62% of the average daily net assets of the Fund. Thereafter, it was 0.64%. |
| (5) | Portfolio turnover disclosed is for the Fund as a whole. |
See Notes to the Financial Statements
Jackson Square Large-Cap Growth Fund
Financial Highlights
For a Fund share outstanding throughout the years.
Institutional Class
| | | Year Ended | | | Year Ended | | | Year Ended | | | Year Ended | | | Year Ended | |
| | | October 31, | | | October 31, | | | October 31, | | | October 31, | | | October 31, | |
| | | 2021 | | | 2020 | | | 2019 | | | 2018 | | | 2017 | |
| Per Share Data | | | | | | | | | | | | | | | |
| | | | | | | | | | | | | | | | |
Net asset value, beginning of year | | $ | 28.49 | | | $ | 24.78 | | | $ | 26.66 | | | $ | 28.46 | | | $ | 24.66 | |
| | | | | | | | | | | | | | | | | | | | | |
| Investment operations: | | | | | | | | | | | | | | | | | | | | |
Net investment loss(1) | | | (0.16 | ) | | | (0.04 | ) | | | (0.01 | ) | | | (0.01 | ) | | | (0.02 | ) |
| Net realized and unrealized gain on investments | | | 9.08 | | | | 6.20 | | | | 2.58 | | | | 1.39 | | | | 5.51 | |
| Total from investment operations | | | 8.92 | | | | 6.16 | | | | 2.57 | | | | 1.38 | | | | 5.49 | |
| | | | | | | | | | | | | | | | | | | | | |
| Less distributions from: | | | | | | | | | | | | | | | | | | | | |
| Net investment income | | | — | | | | — | | | | — | | | | (0.01 | ) | | | (0.04 | ) |
| Net realized gains | | | (6.09 | ) | | | (2.45 | ) | | | (4.45 | ) | | | (3.17 | ) | | | (1.65 | ) |
| Total distributions | | | (6.09 | ) | | | (2.45 | ) | | | (4.45 | ) | | | (3.18 | ) | | | (1.69 | ) |
Net asset value, end of year | | $ | 31.32 | | | $ | 28.49 | | | $ | 24.78 | | | $ | 26.66 | | | $ | 28.46 | |
| | | | | | | | | | | | | | | | | | | | | |
| Total Return | | | 33.56 | %(2) | | | 27.10 | %(2) | | | 14.33 | %(2) | | | 5.15 | % | | | 24.00 | % |
| | | | | | | | | | | | | | | | | | | | | |
| Supplemental Data and Ratios | | | | | | | | | | | | | | | | | | | | |
Net assets, end of year (in 000’s) | | $ | 1,292,470 | | | $ | 2,268,085 | | | $ | 2,231,134 | | | $ | 2,502,062 | | | $ | 2,780,191 | |
| | | | | | | | | | | | | | | | | | | | | |
Ratio of expenses to average net assets: | | | | | | | | | | | | | | | | | | | | |
| Before expense reimbursement/waiver | | | 0.81 | % | | | 0.89 | % | | | 0.90 | % | | | 0.87 | % | | | 0.81 | % |
| After expense reimbursement/waiver | | | 0.79 | %(3) | | | 0.84 | % | | | 0.86 | % | | | 0.87 | % | | | 0.81 | % |
| | | | | | | | | | | | | | | | | | | | | |
Ratio of net investment loss | | | | | | | | | | | | | | | | | | | | |
to average net assets: | | | | | | | | | | | | | | | | | | | | |
| After expense reimbursement/waiver | | | (0.52 | )% | | | (0.17 | )% | | | (0.07 | )% | | | (0.06 | )% | | | (0.06 | )% |
| | | | | | | | | | | | | | | | | | | | | |
Portfolio Turnover(4) | | | 28 | % | | | 54 | % | | | 35 | % | | | 39 | % | | | 43 | % |
| (1) | Per share amounts calculated using the average shares method. |
| (2) | Total return during the period reflects a waiver by the manager. Performance would have been lower had the waiver not been in effect. |
| (3) | Prior to April 16, 2021, the annual expense limitation was 0.84% of the average daily net assets of the Fund. Thereafter, it was 0.64%, excluding shareholder servicing fees. See Note 1. |
| (4) | Portfolio turnover disclosed is for the Fund as a whole. |
See Notes to the Financial Statements
Jackson Square Large-Cap Growth Fund
Financial Highlights
For a Fund share outstanding throughout the years.
Investor Class(1)
| | | Year Ended | | | Year Ended | | | Year Ended | | | Year Ended | | | Year Ended | |
| | | October 31, | | | October 31, | | | October 31, | | | October 31, | | | October 31, | |
| | | 2021 | | | 2020 | | | 2019 | | | 2018 | | | 2017 | |
| Per Share Data | | | | | | | | | | | | | | | |
| | | | | | | | | | | | | | | | |
Net asset value, beginning of year | | $ | 25.09 | | | $ | 22.15 | | | $ | 24.41 | | | $ | 26.37 | | | $ | 22.99 | |
| | | | | | | | | | | | | | | | | | | | | |
| Investment operations: | | | | | | | | | | | | | | | | | | | | |
Net investment loss(2) | | | (0.19 | ) | | | (0.10 | ) | | | (0.06 | ) | | | (0.08 | ) | | | (0.07 | ) |
| Net realized and unrealized gain on investments | | | 7.90 | | | | 5.49 | | | | 2.25 | | | | 1.29 | | | | 5.10 | |
| Total from investment operations | | | 7.71 | | | | 5.39 | | | | 2.19 | | | | 1.21 | | | | 5.03 | |
| | | | | | | | | | | | | | | | | | | | | |
| Less distributions from: | | | | | | | | | | | | | | | | | | | | |
| Net investment income | | | — | | | | — | | | | — | | | | — | | | | — | |
| Net realized gains | | | (6.09 | ) | | | (2.45 | ) | | | (4.45 | ) | | | (3.17 | ) | | | (1.65 | ) |
| Total distributions | | | (6.09 | ) | | | (2.45 | ) | | | (4.45 | ) | | | (3.17 | ) | | | (1.69 | ) |
Net asset value, end of year | | $ | 26.71 | | | $ | 25.09 | | | $ | 22.15 | | | $ | 24.41 | | | $ | 26.37 | |
| | | | | | | | | | | | | | | | | | | | | |
| Total Return | | | 33.25 | %(3) | | | 26.82 | %(3) | | | 14.04 | %(3) | | | 4.89 | % | | | 23.66 | % |
| | | | | | | | | | | | | | | | | | | | | |
| Supplemental Data and Ratios | | | | | | | | | | | | | | | | | | | | |
Net assets, end of year (in 000’s) | | $ | 169,407 | | | $ | 137,135 | | | $ | 116,986 | | | $ | 122,621 | | | $ | 148,867 | |
| | | | | | | | | | | | | | | | | | | | | |
Ratio of expenses to average net assets: | | | | | | | | | | | | | | | | | | | | |
| Before expense reimbursement/waiver | | | 1.04 | % | | | 1.14 | % | | | 1.15 | % | | | 1.12 | % | | | 1.06 | % |
| After expense reimbursement/waiver | | | 1.03 | %(4) | | | 1.09 | % | | | 1.11 | % | | | 1.12 | % | | | 1.06 | % |
| | | | | | | | | | | | | | | | | | | | | |
Ratio of net investment loss to average net assets: | | | | | | | | | | | | | | | | | | | | |
| After expense reimbursement/waiver | | | (0.75 | )% | | | (0.42 | )% | | | (0.32 | )% | | | (0.31 | )% | | | (0.31 | )% |
| | | | | | | | | | | | | | | | | | | | | |
Portfolio Turnover(5) | | | 28 | % | | | 54 | % | | | 35 | % | | | 39 | % | | | 43 | % |
| (1) | Prior to April 16, 2021, the Investor Class was known as Class A. See Note 1. |
| (2) | Per share amounts calculated using the average shares method. |
| (3) | Total return during the period reflects a waiver by the manager. Performance would have been lower had the waiver not been in effect. |
| (4) | Prior to April 16, 2021, the annual expense limitation was 0.84% of the average daily net assets of the Fund. Thereafter, it was 0.64%, excluding 12b-1 fees and shareholder servicing fees. |
| (5) | Portfolio turnover disclosed is for the Fund as a whole. |
See Notes to the Financial Statements
Jackson Square SMID-Cap Growth Fund
Financial Highlights
For a Fund share outstanding throughout the years.
IS Class
| | | Year Ended | | | Year Ended | | | Year Ended | | | Year Ended | | | Year Ended | |
| | | October 31, | | | October 31, | | | October 31, | | | October 31, | | | October 31, | |
| | | 2021 | | | 2020 | | | 2019 | | | 2018 | | | 2017 | |
| Per Share Data | | | | | | | | | | | | | | | |
| | | | | | | | | | | | | | | | |
Net asset value, beginning of year | | $ | 30.75 | | | $ | 23.88 | | | $ | 23.83 | | | $ | 21.37 | | | $ | 17.24 | |
| | | | | | | | | | | | | | | | | | | | | |
| Investment operations: | | | | | | | | | | | | | | | | | | | | |
Net investment income (loss)(1) | | | (0.26 | ) | | | (0.08 | ) | | | 0.01 | (2) | | | 0.08 | | | | 0.02 | |
| Net realized and unrealized gain on investments | | | 9.98 | | | | 7.99 | | | | 2.70 | | | | 2.50 | | | | 4.20 | |
| Total from investment operations | | | 9.72 | | | | 7.91 | | | | 2.71 | | | | 2.58 | | | | 4.22 | |
| | | | | | | | | | | | | | | | | | | | | |
| Less distributions from: | | | | | | | | | | | | | | | | | | | | |
| Net investment income | | | — | | | | (0.02 | ) | | | (0.06 | ) | | | — | | | | (0.02 | ) |
| Net realized gains | | | (1.94 | ) | | | (1.02 | ) | | | (2.60 | ) | | | (0.12 | ) | | | (0.07 | ) |
| Total distributions | | | (1.94 | ) | | | (1.04 | ) | | | (2.66 | ) | | | (0.12 | ) | | | (0.09 | ) |
Net asset value, end of year | | $ | 38.53 | | | $ | 30.75 | | | $ | 23.88 | | | $ | 23.83 | | | $ | 21.37 | |
| | | | | | | | | | | | | | | | | | | | | |
| Total Return | | | 31.80 | % | | | 34.36 | % | | | 14.02 | % | | | 12.13 | % | | | 24.59 | % |
| | | | | | | | | | | | | | | | | | | | | |
| Supplemental Data and Ratios | | | | | | | | | | | | | | | | | | | | |
Net assets, end of year (in 000’s) | | $ | 1,016,051 | | | $ | 650,845 | | | $ | 452,234 | | | $ | 197,538 | | | $ | 162,033 | |
| | | | | | | | | | | | | | | | | | | | | |
Ratio of expenses to average net assets: | | | | | | | | | | | | | | | | | | | | |
| Before expense waiver/recoupment | | | 0.82 | % | | | 0.85 | % | | | 0.87 | % | | | 0.89 | % | | | 0.93 | % |
| After expense waiver/recoupment | | | 0.82 | % | | | 0.87 | % | | | 0.87 | % | | | 0.87 | % | | | 0.87 | % |
| | | | | | | | | | | | | | | | | | | | | |
Ratio of net investment income (loss) | | | | | | | | | | | | | | | | | | | | |
to average net assets: | | | | | | | | | | | | | | | | | | | | |
| After expense waiver/recoupment | | | (0.84 | )% | | | (0.30 | )% | | | 0.04 | % | | | 0.33 | % | | | 0.10 | % |
| | | | | | | | | | | | | | | | | | | | | |
Portfolio Turnover | | | 56 | % | | | 49 | % | | | 35 | % | | | 47 | % | | | 23 | % |
| (1) | Per share amounts calculated using the average shares method. |
| (2) | Net realized and unrealized loss per share in this caption is a balancing amount necessary to reconcile the change n net asset value per share for the year, and may not reconcile with the aggregate gain on the Statement of Operations due to share transactions for the year. |
See Notes to the Financial Statements
Jackson Square SMID-Cap Growth Fund
Financial Highlights
For a Fund share outstanding throughout the years.
Institutional Class
| | | Year Ended | | | Year Ended | | | Year Ended | | | Year Ended | | | Year Ended | |
| | | October 31, | | | October 31, | | | October 31, | | | October 31, | | | October 31, | |
| | | 2021 | | | 2020 | | | 2019 | | | 2018 | | | 2017 | |
| Per Share Data | | | | | | | | | | | | | | | |
| | | | | | | | | | | | | | | | |
Net asset value, beginning of year | | $ | 30.73 | | | $ | 23.89 | | | $ | 23.81 | | | $ | 21.37 | | | $ | 17.24 | |
| | | | | | | | | | | | | | | | | | | | | |
| Investment operations: | | | | | | | | | | | | | | | | | | | | |
Net investment income (loss)(1) | | | (0.29 | ) | | | (0.10 | ) | | | (0.01 | ) | | | 0.06 | | | | 0.01 | |
| Net realized and unrealized gain on investments | | | 9.98 | | | | 7.98 | | | | 2.74 | | | | 2.50 | | | | 4.21 | |
| Total from investment operations | | | 9.69 | | | | 7.88 | | | | 2.73 | | | | 2.56 | | | | 4.22 | |
| | | | | | | | | | | | | | | | | | | | | |
| Less distributions from: | | | | | | | | | | | | | | | | | | | | |
| Net investment income | | | — | | | | (0.02 | ) | | | (0.05 | ) | | | — | | | | (0.02 | ) |
| Net realized gains | | | (1.94 | ) | | | (1.02 | ) | | | (2.60 | ) | | | (0.12 | ) | | | (0.07 | ) |
| Total distributions | | | (1.94 | ) | | | (1.04 | ) | | | (2.65 | ) | | | (0.12 | ) | | | (0.09 | ) |
Net asset value, end of year | | $ | 38.48 | | | $ | 30.73 | | | $ | 23.89 | | | $ | 23.81 | | | $ | 21.37 | |
| | | | | | | | | | | | | | | | | | | | | |
| Total Return | | | 31.71 | % | | | 34.20 | % | | | 14.08 | % | | | 12.04 | % | | | 24.50 | % |
| | | | | | | | | | | | | | | | | | | | | |
| Supplemental Data and Ratios | | | | | | | | | | | | | | | | | | | | |
Net assets, end of year (in 000’s) | | $ | 1,039,786 | | | $ | 725,204 | | | $ | 499,461 | | | $ | 297,023 | | | $ | 211,787 | |
| | | | | | | | | | | | | | | | | | | | | |
Ratio of expenses to average net assets: | | | | | | | | | | | | | | | | | | | | |
| Before expense waiver/recoupment | | | 0.91 | % | | | 0.93 | % | | | 0.95 | % | | | 0.97 | % | | | 0.99 | % |
| After expense waiver/recoupment | | | 0.91 | % | | | 0.95 | % | | | 0.95 | % | | | 0.95 | % | | | 0.92 | % |
| | | | | | | | | | | | | | | | | | | | | |
Ratio of net investment income (loss) | | | | | | | | | | | | | | | | | | | | |
to average net assets: | | | | | | | | | | | | | | | | | | | | |
| After expense waiver/recoupment | | | (0.76 | )% | | | (0.39 | )% | | | (0.04 | )% | | | 0.26 | % | | | 0.04 | % |
| | | | | | | | | | | | | | | | | | | | | |
Portfolio Turnover | | | 56 | % | | | 49 | % | | | 35 | % | | | 47 | % | | | 23 | % |
| (1) | Per share amounts calculated using the average shares method. |
See Notes to the Financial Statements
Jackson Square SMID-Cap Growth Fund
Financial Highlights
For a Fund share outstanding throughout the years.
Investor Class
| | | Year Ended | | | Year Ended | | | Year Ended | | | Year Ended | | | Year Ended | |
| | | October 31, | | | October 31, | | | October 31, | | | October 31, | | | October 31, | |
| | | 2021 | | | 2020 | | | 2019 | | | 2018 | | | 2017 | |
| Per Share Data | | | | | | | | | | | | | | | |
| | | | | | | | | | | | | | | | |
Net asset value, beginning of year | | $ | 30.39 | | | $ | 23.68 | | | $ | 23.67 | | | $ | 21.30 | | | $ | 17.23 | |
| | | | | | | | | | | | | | | | | | | | | |
| Investment operations: | | | | | | | | | | | | | | | | | | | | |
Net investment loss(1) | | | (0.38 | ) | | | (0.17 | ) | | | (0.07 | ) | | | — | (2) | | | (0.05 | ) |
| Net realized and unrealized gain on investments | | | 9.86 | | | | 7.91 | | | | 2.70 | | | | 2.49 | | | | 4.21 | |
| Total from investment operations | | | 9.48 | | | | 7.74 | | | | 2.63 | | | | 2.49 | | | | 4.16 | |
| | | | | | | | | | | | | | | | | | | | | |
| Less distributions from: | | | | | | | | | | | | | | | | | | | | |
| Net investment income | | | — | | | | (0.01 | ) | | | (0.02 | ) | | | — | | | | (0.02 | ) |
| Net realized gains | | | (1.94 | ) | | | (1.02 | ) | | | (2.60 | ) | | | (0.12 | ) | | | (0.07 | ) |
| Total distributions | | | (1.94 | ) | | | (1.03 | ) | | | (2.62 | ) | | | (0.12 | ) | | | (0.09 | ) |
Net asset value, end of year | | $ | 37.93 | | | $ | 30.39 | | | $ | 23.68 | | | $ | 23.67 | | | $ | 21.30 | |
| | | | | | | | | | | | | | | | | | | | | |
| Total Return | | | 31.36 | % | | | 33.88 | % | | | 13.69 | % | | | 11.75 | % | | | 24.12 | % |
| | | | | | | | | | | | | | | | | | | | | |
| Supplemental Data and Ratios | | | | | | | | | | | | | | | | | | | | |
Net assets, end of year (in 000’s) | | $ | 107,135 | | | $ | 78,325 | | | $ | 78,819 | | | $ | 68,451 | | | $ | 4,935 | |
| | | | | | | | | | | | | | | | | | | | | |
Ratio of expenses to average net assets: | | | | | | | | | | | | | | | | | | | | |
| Before expense waiver/recoupment | | | 1.17 | % | | | 1.20 | % | | | 1.22 | % | | | 1.24 | % | | | 1.28 | % |
| After expense waiver/recoupment | | | 1.17 | % | | | 1.22 | % | | | 1.22 | % | | | 1.22 | % | | | 1.22 | % |
| | | | | | | | | | | | | | | | | | | | | |
Ratio of net investment loss to average net assets: | | | | | | | | | | | | | | | | | | | | |
| After expense waiver/recoupment | | | (1.02 | )% | | | (0.65 | )% | | | (0.31 | )% | | | (0.02 | )% | | | (0.25 | )% |
| | | | | | | | | | | | | | | | | | | | | |
Portfolio Turnover | | | 56 | % | | | 49 | % | | | 35 | % | | | 47 | % | | | 23 | % |
| (1) | Per share amounts calculated using the average shares method. |
| (2) | Amount is less than $0.01 per share. |
See Notes to the Financial Statements
Jackson Square Funds
Notes to the Financial Statements
October 31, 2021
1. ORGANIZATION
Managed Portfolio Series (the “Trust”) was organized as a Delaware statutory trust on January 27, 2011. The Trust is registered under the Investment Company Act of 1940, as amended (the “1940 Act”), as an open-end management investment company. The Jackson Square Global Growth Fund (“Global Growth Fund”), Jackson Square International Growth Fund (“International Growth Fund”), Jackson Square Large-Cap Growth Fund (“Large-Cap Growth Fund”), and Jackson Square SMID-Cap Growth Fund (“SMID-Cap Growth Fund”) (each a “Fund” and collectively, the “Funds”) are investment companies and therefore follow the investment company accounting and reporting guidance of the Financial Accounting Standards Board (“FASB”) Accounting Standards Codification Topic 946 Financial Services – Investment Companies. The Global Growth Fund is a diversified series with its own investment objectives and policies within the Trust. The International Growth Fund, Large-Cap Growth Fund, and SMID-Cap Growth Fund are each a non-diversified series with their own investment objectives and policies within the Trust. The investment objective of each Fund is long-term capital appreciation. The Funds offer three different share classes – Investor Class, Institutional Class, and IS Class. The Global Growth Fund currently offers the IS Class shares and Institutional Class shares, each of which commenced operations on September 19, 2016, and Investor Class shares, which commenced operations on August 31, 2021. The International Growth Fund currently offers the IS Class shares, which commenced operations on September 19, 2016, the Institutional Class shares, which commenced operations on December 28, 2020, and the Investor Class shares, which commenced operations on August 31, 2021. The Large-Cap Growth Fund currently offers the IS Class shares (previously known as Class R6, prior to April 16, 2021), which commenced operations on May 2, 2016, the Institutional Class shares which commenced operations on February 3, 1994, and the Investor Class shares (previously known as Class A shares before April 16, 2021), which commenced operations on December 3, 1993. Effective April 16, 2021, the Large-Cap Growth Fund ceased offering Class C and Class R shares. The remaining Class C and Class R shares were converted to Investor Class shares at the close of business on April 16, 2021. The SMID-Cap Growth Fund currently offers the IS Class shares, which commenced operations on December 1, 2003, the Institutional Class shares which commenced operations on September 16, 2016, and the Investor Class shares, which commenced operations on September 19, 2016. Each class of shares has identical rights and privileges except with respect to shareholder servicing fees, 12b-1 fees, and voting rights on matters affecting a single share class. Institutional Class shares are subject to a maximum 0.10% shareholder servicing fee. Investor Class shares are subject to a 0.25% Rule 12b-1 distribution and servicing fee and a maximum 0.10% shareholder servicing fee. The Funds may issue an unlimited number of shares of beneficial interest with no par value.
Effective April 16, 2021, as the result of a tax-free reorganization, the Delaware U.S. Growth Fund (the “Predecessor Fund”), a series of the Delaware Group® Adviser Funds (“Delaware Funds”), a registered open-end management investment company, was transferred into the Trust. The plan of reorganization was approved by the shareholders of the Predecessor Fund on March 23, 2021. Effective April 16, 2021, the Predecessor Fund was renamed the Jackson Square Large-Cap Growth Fund. The shares of the Predecessor were exchanged pro rata as follows:
| Predecessor Fund Share Class | Large-Cap Growth Fund Share Class |
| Class A | Investor Class |
| Class C | Investor Class |
| Class R | Investor Class |
| Institutional Class | Institutional Class |
| Class R6 | IS Class |
Jackson Square Funds
Notes to the Financial Statements – Continued
October 31, 2021
The Predecessor Fund was deemed to be the accounting survivor for financial reporting purposes, and as a result, the financial statements and financial highlights of the Large-Cap Growth Fund reflects the operation of the Predecessor Fund for the periods prior to the reorganization date.
As a tax-free reorganization, any unrealized appreciation or depreciation on the securities on the date of reorganization was treated as a non-taxable event, thus the cost basis of the securities held reflect their historical cost basis as of the date of the reorganization. Immediately prior to the reorganization, the net assets, fair value of investments, and net unrealized appreciation of the Predecessor Fund was as follows:
| Net Assets | Fair Value of Investments | Net Unrealized Appreciation |
$2,835,578,449 | $2,837,967,769 | $1,095,203,433 |
At the date of reorganization, fund shares outstanding totaled 98,588,343 for the Predecessor Fund.
In connection with the reorganization, the net assets of the original Jackson Square Large-Cap Growth Fund (the “Acquired Fund”) were acquired by the Large-Cap Growth Fund (the “Acquiring Fund”) as of the close of business April 16, 2021. The Acquired Fund commenced operations on November 1, 2005. The purpose of the transaction was to combine two funds managed by Jackson Square Partners, LLC (the “Adviser”) with comparable investment objectives and strategies. The acquisition was accomplished by a tax-free exchange of all shares of the Acquired Fund for shares of the Large-Cap Growth Fund as described in the table on page 53. For financial reporting purposes, the Large-Cap Growth Fund (Predecessor Fund) is deemed to be the accounting survivor and as a result, the financial statements and financial highlights do not reflect the operations of the Acquired Fund. The assets received and shares issued by the Large-Cap Growth Fund were recorded at fair value; and, the cost basis of the investments received from the Acquired Fund were carried forward to align ongoing reporting of the Large-Cap Growth Fund’s realized and unrealized gains and losses with amounts distributable to shareholders for tax purposes. Information with respect to the net assets and other relevant operating data for the Acquired Fund on the merger date are included below:
| Acquired Fund | | | |
Net Assets – IS Class | | $ | 79,071,717 | |
Shares outstanding – IS Class | | | 6,383,238 | |
Net asset value – IS Class | | $ | 29.41 | |
Net Assets – Institutional Class | | $ | 1,272,275 | |
Shares outstanding – Institutional Class | | | 102,357 | |
Net asset value – Institutional Class | | $ | 29.09 | |
Net Assets – Investor Class | | $ | 70,894 | |
Shares outstanding – Investor Class | | | 5,763 | |
Net asset value – Investor Class | | $ | 24.84 | |
Investments at fair value | | $ | 80,428,536 | |
Unrealized appreciation | | $ | 29,319,964 | |
Tax capital loss carryforward | | | — | |
Jackson Square Funds
Notes to the Financial Statements – Continued
October 31, 2021
| Acquiring Fund | | | |
Net assets immediately prior to merger | | $ | 2,835,578,449 | |
Net assets immediately after merger | | $ | 2,915,993,335 | |
Fund shares issued in exchange for Acquired Fund – IS Class | | | 2,688,603 | |
Exchange rate for shares issued – IS Class | | | 0.42119732 | |
Fund shares issued in exchange for Acquired Fund – Institutional Class | | | 43,736 | |
Exchange rate for shares issued – Institutional Class | | | 0.42728552 | |
Fund shares issued in exchange for Acquired Fund – Investor Class | | | 2,854 | |
Exchange rate for shares issued – Investor Class | | | 0.49526987 | |
Because the combined investment portfolios have been managed as a single integrated portfolio since the merger was completed, it is not practicable to separate the amounts of revenue and earnings of the Acquired Fund that have been included in the Large-Cap Growth Fund’s statement of operations since April 16, 2021.
Assuming the merger had been completed on November 1, 2020, the beginning of the annual reporting period of the Large-Cap Growth Fund, the Large-Cap Growth Fund’s pro forma results of operations for the year ended October 31, 2021, are as follows:
Net investment loss | | $ | (13,427,859 | ) |
Net realized and unrealized gain on investments | | $ | 831,191,109 | |
Total increase from operations | | $ | 817,763,250 | |
2. SIGNIFICANT ACCOUNTING POLICIES
The following is a summary of significant accounting policies consistently followed by the Funds in preparation of its financial statements. These policies are in conformity with generally accepted accounting principles in the United States of America (“GAAP”).
Security Valuation – All investments in securities are recorded at their estimated fair value, as described in Note 3.
Federal Income Taxes – The Funds comply with the requirements of subchapter M of the Internal Revenue Code of 1986, as amended, necessary to qualify as regulated investment companies and distribute substantially all net taxable investment income and net realized gains to shareholders in a manner which results in no tax cost to the Funds. Therefore, no federal income or excise tax provision is required. As of and during the year ended October 31, 2021, the Funds did not have any tax positions that did not meet the “more-likely-than-not” threshold of being sustained by the applicable tax authority. As of and during the year ended October 31, 2021, the Funds did not have liabilities for any unrecognized tax benefits. The Funds recognize interest and penalties, if any, related to unrecognized tax benefits on uncertain tax positions as income tax expense in the Statement of Operations. As of and during the period ended October 31, 2021, the Funds did not incur any interest or penalties. The Funds are not subject to examination by U.S. tax authorities for tax years prior to the fiscal year ended October 31, 2018.
Security Transactions, Investment Income and Distributions – The Funds follow industry practice and record security transactions on the trade date. Realized gains and losses on sales of securities are calculated on the basis of identified cost. Dividend income is recorded on the ex-dividend date and interest income is recorded on an accrual basis. Withholding taxes on foreign dividends have been provided for in accordance with the Funds’ understanding of the applicable country’s tax rules and regulations. Discounts and premiums on securities purchased are amortized over the expected life of the respective securities using the constant yield method.
Jackson Square Funds
Notes to the Financial Statements – Continued
October 31, 2021
The Funds distribute substantially all net investment income and net realized capital gains, if any, at least annually. Distributions to shareholders are recorded on the ex-dividend date. The treatment for financial reporting purposes of distributions made to shareholders during the year from net investment income or net realized capital gains may differ from their treatment for federal income tax purposes. These differences are caused primarily by differences in the timing of the recognition of certain components of income, expense, or realized capital gain for federal income tax purposes. Where such differences are permanent in nature, GAAP requires that they be reclassified in the components of the net assets based on their ultimate characterization for federal income tax purposes. Any such reclassifications will have no effect on net assets, results of operations or net asset value (“NAV”) per share of the Funds. For the year ended October 31, 2021, the following reclassifications were made:
| Fund | Distributable Earnings | | | Paid-in Capital | |
| International Growth Fund | | $ | (105,165 | ) | | $ | 105,165 | |
| Global Growth Fund | | | (445,754 | ) | | | 445,754 | |
| Large-Cap Growth Fund | | | (34,269,566 | ) | | | 34,269,566 | |
| SMID-Cap Growth Fund | | | (33,944,582 | ) | | | 33,944,582 | |
Adjustments to the Funds shown in the table above were due to one or more of the following reasons: net operating loss forfeiture, equalization utilized, fund reorganization, and Section 988 reclasses.
Foreign Currency – Investment securities and other assets and liabilities denominated in foreign currencies are translated into U.S. dollar amounts at the date of valuation. Purchases and sales of investment securities and income and expense items denominated in foreign currencies are translated into U.S. dollar amounts on the respective dates of such transactions. The Funds do not isolate that portion of the results of operations resulting from changes in foreign exchange rates on investments from the fluctuations arising from changes in market prices of securities held. Such fluctuations are included with the net realized and unrealized gain or loss from investments and translations of foreign currency. The Funds report net realized foreign exchange gains or losses that arise from sales of foreign currencies, currency gains or losses realized between the trade and settlement dates on securities transactions, and the difference between the amounts of dividends, interest, and foreign withholding taxes recorded on the Funds’ books and the U.S. dollar equivalent of the amounts actually received or paid. Net unrealized foreign exchange gains and losses arise from changes in the fair values of assets and liabilities, other than investments in securities at fiscal period end, resulting from changes in exchange rates.
Allocation of Income, Expenses and Gains/Losses – Income, expenses (other than those deemed attributable to a specific share class), and gains and losses of the Funds are allocated daily to each class of shares based upon the ratio of net assets represented by each class as a percentage of the net assets of each Fund. Expenses deemed directly attributable to a class of shares are recorded by the specific class. Most Fund expenses are allocated by class based on relative net assets. Shareholder servicing fees are expensed at an annual rate up to 0.10% of Institutional Class and Investor Class shares and 12b-1 fees are expensed at annual rate of 0.25% of average daily net assets of Investor Class shares (See Note 5). Prior to April 16, 2021, 12b-1 fees were expensed at 1.00% and 0.50% of the average daily net assets of the Class C and Class R shares, respectively, of the Large-Cap Growth Fund. Expenses associated with a specific Fund in the Trust are charged to that Fund. Common Trust expenses are typically allocated evenly between the Funds of the Trust, or by other equitable means.
Use of Estimates – The preparation of financial statements in conformity with GAAP requires management to make estimates and assumptions that affect the reported amounts of assets and liabilities and disclosure of contingent assets and liabilities at the date of the financial statements and the reported amounts of revenues and expenses during the reporting period. Actual results could differ from those estimates.
Jackson Square Funds
Notes to the Financial Statements – Continued
October 31, 2021
3. SECURITIES VALUATION
The Funds have adopted authoritative fair value accounting standards which establish an authoritative definition of fair value and set out a hierarchy for measuring fair value. These standards require additional disclosures about the various inputs and valuation techniques used to develop the measurements of fair value, a discussion in changes in valuation techniques and related inputs during the period and expanded disclosure of valuation Levels for major security types. These inputs are summarized in the three broad Levels listed below:
| Level 1 – | Unadjusted quoted prices in active markets for identical assets or liabilities that the Funds have the ability to access. |
| | |
| Level 2 – | Observable inputs other than quoted prices included in Level 1 that are observable for the asset or liability, either directly or indirectly. These inputs may include quoted prices for the identical instrument on an inactive market, prices for similar instruments, interest rates, prepayment speeds, credit risk, yield curves, default rates and similar data. |
| | |
| Level 3 – | Unobservable inputs for the asset or liability, to the extent relevant observable inputs are not available, representing the Funds’ own assumptions about the assumptions a market participant would use in valuing the asset or liability, and would be based on the best information available. |
Following is a description of the valuation techniques applied to each Fund’s major categories of assets and liabilities measured at fair value on a recurring basis. Each Fund’s investments are carried at fair value.
Equity Securities – Equity securities that are primarily traded on a national securities exchange shall be valued at the last sale price on the exchange on which they are primarily traded on the day of valuation or, if there has been no sale on such day, at the mean between the bid and ask prices. Securities traded primarily in the Nasdaq Global Market System for which market quotations are readily available shall be valued using the Nasdaq Official Closing Price (“NOCP”). If the NOCP is not available, such securities shall be valued at the last sale price on the day of valuation, or if there has been no sale on such day, at the mean between the bid and ask prices. To the extent these securities are actively traded and valuation adjustments are not applied, they are categorized in Level 1 of the fair value hierarchy. If the market for a particular security is not active, and the mean between bid and ask prices is used, these securities are categorized in Level 2 of the fair value hierarchy.
In the case of foreign securities, the occurrence of events after the close of foreign markets, but prior to the time the Funds’ NAV is calculated will result in an adjustment to the trading prices of foreign securities when foreign markets open on the following business day. The Fund will value foreign securities at fair value, taking into account such events in calculating the NAV. In such cases, use of fair valuation can reduce an investor’s ability to seek to profit by estimating the Funds’ NAV in advance of the time the NAV is calculated. All foreign securities, with the exception of Canadian securities, Brazilian securities and those listed on a U.S. exchange, have an adjustment applied to their trade price and therefore are automatically deemed to be in Level 2 of the fair value hierarchy.
Short-Term Investments – Investments in other mutual funds, including money market funds, are valued at their NAV per share. Deposit accounts are valued at acquisition cost, which approximates fair value. To the extent these securities are actively traded and valuation adjustments are not applied, they are categorized in Level 1 of the fair value hierarchy.
U.S. government securities are normally valued using a model that incorporates market observable data such as reported sales of similar securities, broker quotes, yields, bids, offers, and reference data. These securities are valued principally using dealer quotations. U.S. government securities are categorized in Level 2 of the fair value hierarchy depending on the inputs used and market activity levels for specific securities.
Jackson Square Funds
Notes to the Financial Statements – Continued
October 31, 2021
Securities for which market quotations are not readily available, or if the closing price does not represent fair value, are valued following procedures approved by the Board of Trustees (the “Board”). These procedures consider many factors, including the type of security, size of holding, trading volume and news events. There can be no assurance that the Fund could obtain the fair value assigned to a security if they were to sell the security at approximately the time at which the Fund determines their net asset values per share. The Board has established a Valuation Committee to administer, implement, and oversee the fair valuation process, and to make fair value decisions when necessary. The Board regularly reviews reports of the Valuation Committee that describe any fair value determinations and methods.
The inputs or methodology used for valuing securities are not an indication of the risk associated with investing in those securities. The following tables are a summary of the inputs used to value each Fund’s securities as of October 31, 2021:
| Global Growth Fund | | Level 1 | | | Level 2 | | | Level 3 | | | Total | |
Common Stocks | | $ | 11,341,390 | | | $ | 5,193,514 | | | $ | — | | | $ | 16,534,904 | |
Short-Term Investment | | | 393,058 | | | | — | | | | — | | | | 393,058 | |
| Total Investments in Securities | | $ | 11,734,448 | | | $ | 5,193,514 | | | $ | — | | | $ | 16,927,962 | |
| | | | | | | | | | | | | | | | | |
| International Growth Fund | | Level 1 | | | Level 2 | | | Level 3 | | | Total | |
Common Stocks | | $ | 4,206,536 | | | $ | 6,803,211 | | | $ | — | | | $ | 11,009,747 | |
Short-Term Investment | | | 601,962 | | | | — | | | | — | | | | 601,962 | |
| Total Investments in Securities | | $ | 4,808,498 | | | $ | 6,803,211 | | | $ | — | | | $ | 11,611,709 | |
| | | | | | | | | | | | | | | | | |
| Large-Cap Growth Fund | | Level 1 | | | Level 2 | | | Level 3 | | | Total | |
Common Stocks | | $ | 2,342,645,382 | | | $ | — | | | $ | — | | | $ | 2,342,645,382 | |
Short-Term Investment | | | 31,895,425 | | | | — | | | | — | | | | 31,895,425 | |
| Total Investments in Securities | | $ | 2,374,540,807 | | | $ | — | | | $ | — | | | $ | 2,374,540,807 | |
| | | | | | | | | | | | | | | | | |
| SMID-Cap Growth Fund | | Level 1 | | | Level 2 | | | Level 3 | | | Total | |
Common Stocks | | $ | 2,073,308,221 | | | $ | — | | | $ | — | | | $ | 2,073,308,221 | |
Short-Term Investment | | | 88,580,437 | | | | — | | | | — | | | | 88,580,437 | |
| Total Investments in Securities | | $ | 2,161,888,658 | | | $ | — | | | $ | — | | | $ | 2,161,888,658 | |
Refer to the Schedules of Investments for further information on the classification of investments.
4. INVESTMENT ADVISORY FEE AND OTHER TRANSACTIONS WITH AFFILIATES
The Trust has an agreement with the Adviser to furnish investment advisory services to the Funds. For its services, the Funds pay the Adviser a monthly management fee based upon the average daily net assets of the Funds at the following annual rates:
| Fund | | |
Global Growth Fund | 0.75% | |
International Growth Fund | 0.80% | |
Large-Cap Growth Fund | 0.55% on assets up to $2.5 billion | |
| | 0.525% on assets between $2.5 billion and $5 billion | |
| | 0.50% on assets greater than $5 billion | |
SMID-Cap Growth Fund | 0.75% | |
Jackson Square Funds
Notes to the Financial Statements – Continued
October 31, 2021
Prior to December 28, 2020, the monthly management fee for the Global Growth Fund and International Growth Fund was equal to 0.80% and 0.65% of the daily net assets of each Fund, respectively.
Prior to April 16, 2021, Delaware Management Company (“DMC”) served as the investment manager of the Predecessor Fund and the Adviser served as the investment sub-adviser. DMC was entitled to receive an annual advisory fee based on the average daily net assets of the Predecessor Fund at 0.65% on the first $500 million, 0.60% on the next $500 million, 0.55% on the next $1.5 billion, and 0.50% on average daily net assets in excess of $2.5 billion. The sub-adviser fees were paid by DMC.
The Funds’ Adviser has contractually agreed to waive a portion or all of its management fees and/or reimburse the Funds for their expenses to ensure that total annual operating expenses (excluding Rule 12b-1 fees, shareholder servicing fees, acquired fund fees and expenses, brokerage commissions, leverage, interest, taxes, and extraordinary expenses) do not exceed the following rates (based upon the average daily net assets of the Funds):
| Fund | | | | |
Global Growth Fund | | | 0.98 | % | |
International Growth Fund | | | 0.99 | % | |
Large-Cap Growth Fund | | | 0.64 | % | |
SMID-Cap Growth Fund | | | 0.87 | % | |
Prior to December 28, 2020, the annual operating expense limitation for the International Growth Fund and Global Growth Fund was equal to 0.90% and 1.05% of the daily net assets of each Fund, respectively.
Fees waived and expenses reimbursed by the Adviser may be recouped by the Adviser for a period of thirty-six months following the month during which such waiver or reimbursement was made if such recoupment can be achieved without exceeding the expense limit in effect at the time the waiver or reimbursement occurred. The Operating Expense Limitation Agreement is indefinite in term, but cannot be terminated within a year after the effective date of the Funds’ prospectus. After that date, the agreement may be terminated at any time upon 60 days’ written notice by the Board or the Adviser. During the year ended October 31, 2021, the Adviser was able to recoup $72, and $44,330 from the Large-Cap Growth Fund and SMID-Cap Growth Fund, respectively, relating to fees waived in the prior or current fiscal years. Waived fees and reimbursed expenses subject to potential recovery by month of expiration are as follows:
| | | November 2021- | | | November 2022- | | | November 2023- | |
| Fund | | October 2022 | | | October 2023 | | | October 2024 | |
Global Growth Fund | | $ | 105,833 | | | $ | 108,254 | | | $ | 123,096 | |
International Growth Fund | | | 90,835 | | | | 97,056 | | | | 132,944 | |
Large-Cap Growth Fund | | | — | | | | — | | | | — | |
SMID-Cap Growth Fund | | | — | | | | — | | | | — | |
Prior to April 16, 2021, DMC had contractually agreed to limit its fees or reimburse expenses (excluding Rule 12b-1 fees, taxes, interest acquired fund fees and expenses, short sale dividend and interest expenses, brokerage fees, certain insurance costs, and nonroutine expenses or costs, including, but not limited to, those relating to reorganizations, litigation, conducting shareholder meetings and liquidations) to ensure total annual operating expenses do not exceed 0.84% of the average daily net assets of Class A, Class C, Class R and Institutional Class shares, and 0.62% of the Class R6 shares. Waived fees and reimbursed expenses subject to potential recovery during the months that DMC served as investment manager are not eligible for recoupment.
Jackson Square Funds
Notes to the Financial Statements – Continued
October 31, 2021
Prior to April 16, 2021, Delaware Investments Fund Services Company (“DIFSC”), an affiliate of DMC, was the Administrator, Fund Accountant and Transfer Agent for the Predecessor Fund. For the period November 1, 2020 through April 16, 2021, the Predecessor Fund was charged $44,527 and $108,437 for Administration and Fund Accounting fees and Transfer Agent fees, respectively.
U.S. Bancorp Fund Services, LLC (the “Administrator”), doing business as U.S. Bank Global Fund Services, acts as the Funds’ Administrator, Transfer Agent, and Fund Accountant. U.S. Bank N.A. (the “Custodian”) serves as the Custodian to the Funds. The Custodian is an affiliate of the Administrator. The Administrator performs various administrative and accounting services for the Funds. The Administrator prepares various federal and state regulatory filings, reports and returns for the Funds; prepares reports and materials to be supplied to the Trustees; monitors the activities of the Custodian; coordinates the payment of the Funds’ expenses and reviews the Funds’ expense accruals. The officers of the Trust, including the Chief Compliance Officer, are employees of the Administrator. As compensation for its services, the Administrator is entitled to a monthly fee at an annual rate based upon the average daily net assets of the Fund, subject to annual minimums. Fees paid by the Funds for administration and fund accounting, transfer agency, custody and compliance services for the year ended October 31, 2021, are disclosed in the Statements of Operations. For the period April 17, 2021 through October 31, 2021, the Large-Cap Growth Fund incurred $453,017, $104,100, $96,580 and $15,462 for administration and fund accounting, transfer agent (excluding transfer agency out-of-pocket expenses), custody and chief compliance officer fees, respectively.
5. DISTRIBUTION & SHAREHOLDER SERVICING FEES
The Funds have adopted a Distribution Plan pursuant to Rule 12b-1 (the “Plan”) in the Investor Class only. The Plan permits the Funds to pay for distribution and related expenses at an annual rate of 0.25% of the Investor Class average daily net assets. The expenses covered by the Plan may include the cost of preparing and distributing prospectuses and other sales material, advertising and public relations expenses, payments to financial intermediaries and compensation of personnel involved in selling shares of the Funds. For the year ended October 31, 2021, the Investor Class of the Funds incurred expenses pursuant to the Plan as follows:
| Fund | | | | |
Global Growth Fund | | $ | 1 | | |
International Growth Fund | | | 1 | | |
Large-Cap Growth Fund | | | 230,876 | | |
SMID-Cap Growth Fund | | | 283,780 | | |
Prior to April 16, 2021, pursuant to a distribution agreement and distribution plan, the Predecessor Fund paid Delaware Distributors, LP (“DDLP”), the distributor and an affiliate of DMC, an annual 12b-1 fee of 0.25%, 1.00% and 0.50% of the average daily net assets of the Class A, Class C and Class R shares, respectively. The fees were calculated daily and paid monthly. For the period November 1, 2020 through April 16, 2021, Class A, Class C and Class R incurred expenses of $184,638, $136,085 and $13,554 respectively.
For the period November 1, 2020 through April 16, 2021, DDLP earned $8,315 for commissions on sales of the Predecessor Fund's Class A shares. For the same period, DDLP received gross CDSC commissions of $13 and $595 of the Predecessor Fund's Class A and Class C shares, respectively, and these commissions were entirely used to offset upfront commissions previously paid by DDLP to broker/dealers on sales of those shares.
The Funds have entered into a shareholder servicing agreement (the “Agreement”) where the Adviser acts as the shareholder agent, under which the Funds may pay servicing fees at an annual rate of up to 0.10% of the average daily net assets of the Institutional Class and Investor Class. Payments, if any, to the Adviser under the Agreement
Jackson Square Funds
Notes to the Financial Statements – Continued
October 31, 2021
may reimburse the Adviser for payments it makes to selected brokers, dealers and administrators which have entered into service agreements with the Adviser for services provided to shareholders of the Funds. Payments may also be made directly to the intermediaries providing shareholder services. The services provided by such intermediaries are primarily designed to assist shareholders of the Fund and include the furnishing of office space and equipment, telephone facilities, personnel and assistance to the Funds in servicing such shareholders. Services provided by such intermediaries also include the provision of support services to the Funds and include establishing and maintaining shareholders’ accounts and record processing, purchase and redemption transactions, answering routine client inquiries regarding the Funds, and providing such other personal services to shareholders as the Fund may reasonably request. For the year ended October 31, 2021, Funds incurred shareholder servicing fees as follows:
| Fund | | Institutional Class | | | Investor Class | |
| Global Growth Fund | | $ | 357 | | | $ | — | |
| International Growth Fund | | | 50 | | | | — | |
| Large-Cap Growth Fund | | | 708,658 | | | | 88,838 | |
| SMID-Cap Growth Fund | | | 940,781 | | | | 113,512 | |
6. CAPITAL SHARE TRANSACTIONS
Transactions in shares of the Funds were as follows:
| | | Global Growth Fund | | | International Growth Fund | |
| | | Year Ended | | | Year Ended | | | Year Ended | | | Year Ended | |
| | | October 31, 2021 | | | October 31, 2020 | | | October 31, 2021 | | | October 31, 2020 | |
| IS Class: | | | | | | | | | | | | |
Shares sold | | | 10,951 | | | | 28,338 | | | | 111,223 | | | | 3,557 | |
Shares issued in reinvestment | | | | | | | | | | | | | | | | |
of distributions | | | 10,201 | | | | 8,535 | | | | 8,992 | | | | 8,291 | |
Shares redeemed | | | (50,234 | ) | | | (44,375 | ) | | | (51,749 | ) | | | (21,885 | ) |
| Net increase (decrease) | | | (29,082 | ) | | | (7,502 | ) | | | 68,466 | | | | (10,037 | ) |
Institutional Class(1): | | | | | | | | | | | | | | | | |
Shares sold | | | 6,436 | | | | 6,688 | | | | 6,578 | | | | — | |
Shares issued in reinvestment | | | | | | | | | | | | | | | | |
of distributions | | | 89 | | | | — | | | | — | | | | — | |
Shares redeemed | | | (170 | ) | | | — | | | | (2,896 | ) | | | — | |
| Net increase | | | 6,355 | | | | 6,688 | | | | 3,682 | | | | — | |
Investor Class(2): | | | | | | | | | | | | | | | | |
Shares sold | | | 27 | | | | — | | | | 27 | | | | — | |
Shares issued in reinvestment | | | | | | | | | | | | | | | | |
of distributions | | | — | | | | — | | | | — | | | | — | |
Shares redeemed | | | — | | | | — | | | | — | | | | — | |
| Net increase | | | 27 | | | | — | | | | 27 | | | | — | |
| Net increase (decrease) | | | | | | | | | | | | | | | | |
| in capital shares | | | (22,700 | ) | | | (814 | ) | | | 72,175 | | | | (10,037 | ) |
(1) | The International Growth Institutional Class launched on December 28, 2020. |
(2) | The International Growth and Global Growth Investor Class launched on August 31, 2021. |
Jackson Square Funds
Notes to the Financial Statements – Continued
October 31, 2021
| | | Large-Cap Growth Fund | |
| | | Year Ended | | | Year Ended | |
| | | October 31, 2021 | | | October 31, 2020 | |
IS Class(1): | | | | | | |
Shares sold | | | 48,909,128 | | | | 45,489 | |
Shares issued in connection with acquisition (Note 1) | | | 2,688,603 | | | | — | |
Shares issued in reinvestment of distributions | | | 34,255 | | | | 15,054 | |
Shares redeemed | | | (21,937,641 | ) | | | (39,338 | ) |
| Net increase | | | 29,694,345 | | | | 21,205 | |
| Institutional Class: | | | | | | | | |
Shares sold | | | 13,868,211 | | | | 22,944,032 | |
Shares issued in connection with acquisition (Note 1) | | | 43,736 | | | | — | |
Shares issued in reinvestment of distributions | | | 16,410,026 | | | | 9,463,686 | |
Shares redeemed | | | (68,664,689 | ) | | | (42,847,718 | ) |
| Net decrease | | | (38,342,716 | ) | | | (10,440,000 | ) |
Investor Class(2): | | | | | | | | |
Shares sold | | | 794,359 | | | | 1,218,848 | |
Shares issued in connection with acquisition (Note 1) | | | 2,854 | | | | — | |
Shares issued in reinvestment of distributions | | | 1,335,379 | | | | 610,811 | |
Shares issued in exchange for Class C shares | | | 1,058,645 | | | | — | |
Shares issued in exchanges for Class R shares | | | 218,468 | | | | — | |
Shares redeemed | | | (2,532,790 | ) | | | (1,645,050 | ) |
| Net increase | | | 876,915 | | | | 184,609 | |
Class C(3): | | | | | | | | |
Shares sold | | | 38,990 | | | | 221,126 | |
Shares issued in reinvestment of distributions | | | 425,030 | | | | 274,768 | |
Shares exchanged for Investor Class shares | | | (1,445,946 | ) | | | — | |
Shares redeemed | | | (453,376 | ) | | | (1,028,777 | ) |
| Net decrease | | | (1,435,302 | ) | | | (532,883 | ) |
Class R(4): | | | | | | | | |
Shares sold | | | 8,512 | | | | 94,807 | |
Shares issued in reinvestment of distributions | | | 56,401 | | | | — | |
Shares exchanged for Investor Class shares | | | (238,775 | ) | | | 56,435 | |
Shares redeemed | | | (67,049 | ) | | | (359,722 | ) |
| Net decrease | | | (240,911 | ) | | | (208,480 | ) |
| Net decrease in capital shares | | | (9,447,669 | ) | | | (10,975,549 | ) |
(1) | The IS Class was previously known as Class R6 prior to April 16, 2021. |
(2) | The Investor Class was previously known as Class A prior to April 16, 2021. |
(3) | Class C shares converted to Investor Class shares on April 16, 2021. |
(4) | Class R shares converted to Investor Class shares on April 16, 2021. |
Jackson Square Funds
Notes to the Financial Statements – Continued
October 31, 2021
| | | SMID-Cap Growth Fund | |
| | | Year Ended | | | Year Ended | |
| | | October 31, 2021 | | | October 31, 2020 | |
| IS Class: | | | | | | |
Shares sold | | | 7,870,039 | | | | 5,903,797 | |
Shares issued in reinvestment of distributions | | | 1,053,265 | | | | 801,951 | |
Shares redeemed | | | (3,721,610 | ) | | | (4,474,380 | ) |
| Net increase | | | 5,201,694 | | | | 2,231,368 | |
| Institutional Class: | | | | | | | | |
Shares sold | | | 7,978,622 | | | | 7,442,741 | |
Shares issued in reinvestment of distributions | | | 1,213,375 | | | | 859,800 | |
Shares redeemed | | | (5,765,015 | ) | | | (5,614,477 | ) |
| Net increase | | | 3,426,982 | | | | 2,688,064 | |
| Investor Class: | | | | | | | | |
Shares sold | | | 1,128,873 | | | | 453,004 | |
Shares issued in reinvestment of distributions | | | 140,480 | | | | 137,210 | |
Shares redeemed | | | (1,021,915 | ) | | | (1,341,024 | ) |
| Net increase (decrease) | | | 247,438 | | | | (750,810 | ) |
| Net increase in capital shares | | | 8,876,114 | | | | 4,168,622 | |
7. INVESTMENT TRANSACTIONS
The aggregate purchases and sales, excluding short-term investments, by Fund for the year ended October 31, 2021, were as follows:
| | | U.S. Government Securities | | | Other Securities | |
| Fund | | Purchases | | | Sales | | | Purchases | | | Sales | |
Global Growth Fund | | $ | — | | | $ | — | | | $ | 4,813,254 | | | $ | 6,009,138 | |
International Growth Fund | | | — | | | | — | | | | 10,085,153 | | | | 8,828,185 | |
Large-Cap Growth Fund | | | — | | | | — | | | | 758,248,632 | | | | 1,744,514,273 | |
SMID-Cap Growth Fund | | | — | | | | — | | | | 1,301,097,512 | | | | 1,079,087,364 | |
8. FEDERAL TAX INFORMATION
The aggregate gross unrealized appreciation and depreciation of securities held by the Funds and the total cost of securities for federal income tax purposes at October 31, 2021, were as follows:
| | | Aggregate Gross | | | Aggregate Gross | | | Net Unrealized | | | Federal Income | |
| Fund | | Appreciation | | | Depreciation | | | Appreciation | | | Tax Cost | |
Global Growth Fund | | $ | 6,902,158 | | | $ | (500,387 | ) | | $ | 6,401,771 | | | $ | 10,526,191 | |
International Growth Fund | | | 2,139,229 | | | | (1,086,242 | ) | | | 1,052,987 | | | | 10,558,722 | |
Large-Cap Growth Fund | | | 962,093,868 | | | | (77,152,745 | ) | | | 884,941,123 | | | | 1,489,599,684 | |
SMID-Cap Growth Fund | | | 599,059,217 | | | | (154,556,086 | ) | | | 444,503,131 | | | | 1,717,385,527 | |
The differences between book-basis and tax-basis unrealized appreciation (depreciation) is attributable primarily to the deferral of wash sale losses.
Jackson Square Funds
Notes to the Financial Statements – Continued
October 31, 2021
At October 31, 2021, the components of distributable earnings on a tax-basis were as follows:
| | | Undistributed | | | Undistributed | | | Other | | | Net | | | Total | |
| | | Ordinary | | | Long-Term | | | Accumulated | | | Unrealized | | | Distributable | |
| Fund | | Income | | | Capital Gains | | | Gains (Losses) | | | Appreciation | | | Earnings | |
Global Growth Fund | | $ | 642,762 | | | $ | 1,643,748 | | | $ | (74 | ) | | $ | 6,401,771 | | | $ | 8,670,207 | |
International Growth Fund | | | 1,641,526 | | | | 1,588,176 | | | | (38 | ) | | | 1,052,987 | | | | 4,282,651 | |
Large-Cap Growth Fund | | | 21,477,448 | | | | 375,477,387 | | | | — | | | | 884,941,123 | | | | 1,281,895,958 | |
SMID-Cap Growth Fund | | | — | | | | 315,991,796 | | | | (2,544,520 | ) | | | 444,503,131 | | | | 757,950,407 | |
As of October 31, 2021, the Funds had no capital loss carryovers. A regulated investment company may elect for any taxable year to treat any portion of any qualified late year loss as arising on the first day of the next taxable year. Qualified late year losses are certain capital, and ordinary losses which occur during the portion of the Fund’s taxable year subsequent to October 31 and December 31, respectively. For the taxable year ended October 31, 2021, the Funds did not defer any post-October losses. The SMID-Cap Growth Fund deferred, on a tax basis, qualified late year losses of $2,559,913.
The tax character of distributions paid during the year ended October 31, 2021, was as follows:
| Fund | | Ordinary Income* | | | Long-Term Capital Gains | | | Total | |
Global Growth Fund | | $ | 22,804 | | | $ | 384,621 | | | $ | 407,425 | |
International Growth Fund | | | — | | | | 381,666 | | | | 381,666 | |
Large-Cap Growth Fund** | | | 3,743,264 | | | | 12,597,530 | | | | 16,340,794 | |
SMID-Cap Growth Fund | | | 6,175,803 | | | | 87,775,874 | | | | 93,951,677 | |
The tax character of distributions paid during the year ended October 31, 2020, was as follows:
| Fund | | Ordinary Income* | | | Long-Term Capital Gains | | | Total | |
Global Growth Fund | | $ | — | | | $ | 249,439 | | | $ | 249,439 | |
International Growth Fund | | | 6,141 | | | | 236,915 | | | | 243,056 | |
Large-Cap Growth Fund** | | | 1,648,863 | | | | 12,456,545 | | | | 14,105,408 | |
SMID-Cap Growth Fund | | | 2,029,405 | | | | 42,814,924 | | | | 44,844,329 | |
*
| | For Federal income tax purposes, distributions of short-term capital gains are treated as ordinary income distributions. |
**
| | The tax character of distributions paid during the years ended October 31, 2021 and 2020, differ from the distributions disclosed on the Statements of Changes, as the Predecessor Fund was deemed to be the accounting survivor for financial reporting purposes while the Acquired Fund was deemed to be the tax survivor for Federal income tax purposes. |
9. LINE OF CREDIT
The Large-Cap Growth Fund and SMID-Cap Growth Fund (collectively, the “Funds”) have established an unsecured line of credit (“LOC”) in the amount of $75,000,000, 15% of a Fund’s gross market value or 33.33% of the fair value of the Fund’s investments, whichever is less. The LOC matures, unless renewed on July 22, 2022. The LOC is intended to provide short-term financing, if necessary, subject to certain restrictions and covenants, in connection with shareholder redemptions and other short-term liquidity needs of the Funds. The LOC is with the Custodian. Interest is charged at the prime rate which was 3.25% as of October 31, 2021. The interest rate during the year was 3.25%. The Funds have authorized the Custodian. to charge any of the accounts of the Funds for any missed payments. For the year ended October 31, 2021, the Funds did not have any borrowings under the LOC.
Jackson Square Funds
Notes to the Financial Statements – Continued
October 31, 2021
Prior to July 23, 2021, the date the LOC was renewed, the LOC was limited to the lesser of $25,000,000, 15% of a Fund’s gross market value or 33.33% of the fair value of the Fund’s investments, whichever is less.
Prior to April 16, 2021, the Predecessor Fund, along with other Funds in the Delaware Funds (“Participants”) was a participant in a $250,000,000 revolving line of credit (“Agreement”) intended to be used for temporary or emergency purposes as an additional source of liquidity to fund redemptions of investor shares. Under the Agreement, the Participants were charged an annual commitment fee of 0.15%, which was allocated across the Participants based on a weighted average of the respective net assets of each Participant. The Participants were permitted to borrow up to a maximum of one-third of their net assets under the Agreement. Each Participant was individually, and not jointly, liable for its particular advances, if any, under the line of credit. The line of credit available under the Agreement expired on November 2, 2020.
On November 2, 2020, the Predecessor Fund, along with the other Participants entered into an amendment to the Agreement for an amount of $225,000,000 to be used as described above. The line of credit available under the Agreement expires November 1, 2021.
The Predecessor Fund had no amounts outstanding during the period November 1, 2020 through April 16, 2021.
10. SECTOR RISKS
As of October 31, 2021, the Global Growth Fund, International Growth Fund, and Large-Cap Growth Fund had a significant portion of their assets invested in the information technology sector. The information technology sector may be more sensitive to changes in domestic and international competition, economic cycles, financial resources, personnel availability, rapid innovation and intellectual property issues.
As of October 31, 2021, the International Growth Fund has a significant portion of their assets invested in the industrials sector. The industrials sector may be more sensitive to changes in supply and demand, government regulations, world events, and economic conditions.
As of October 31, 2021, the SMID-Cap Growth Fund has a significant portion of their assets invested in the health care sector. The heath care sector is subject to risks such as litigation, intellectual property issues, competition, government regulation, product approval or rejection and product obsolescence.
11. CONTROL OWNERSHIP
The beneficial ownership, either directly or indirectly, of more than 25% of the voting securities of a fund creates a presumption of control of the fund, under Section 2(a)(9) of the 1940 Act. As of October 31, 2021, each Fund’s percentage of control ownership positions greater than 25% are as follows:
| Fund | Shareholder | Percent of Shares Held |
Global Growth Fund | Charles Schwab | 36.92% |
International Growth Fund | Charles Schwab | 39.94% |
Large-Cap Growth Fund | Wells Fargo | 35.51% |
Large-Cap Growth Fund | American Enterprise Investment Services | 33.28% |
SMID-Cap Growth Fund | National Financial Services | 34.72% |
Jackson Square Funds
Notes to the Financial Statements – Continued
October 31, 2021
12. RECENT REGULATORY UPDATE
In December 2020, the SEC adopted a new rule providing a framework for fund valuation practices (“Rule 2a-5”). Rule 2a-5 establishes requirements for determining fair value in good faith for purposes of the 1940 Act. Rule 2a-5 will permit fund boards to designate certain parties to perform fair value determinations, subject to board oversight and certain other conditions. Rule 2a-5 also defines when market quotations are “readily available” for purposes of the 1940 Act and the threshold for determining whether a fund must fair value a security. In connection with Rule 2a-5, the SEC also adopted related recordkeeping requirements and is rescinding previously issued guidance, including with respect to the role of a board in determining fair value and the accounting and auditing of fund investments. The Funds will be required to comply with the rules by September 8, 2022. Management is currently assessing the potential impact of the new rules on the Funds’ financial statements, if any.
13. COVID-19
The global outbreak of COVID-19 (commonly referred to as “coronavirus”) has disrupted economic markets and the prolonged economic impact is uncertain. The ultimate economic fallout from the pandemic, and long-term impact on economies, markets, industries and individual issuers, are not known. The operational and finance performance of the issuers of securities in which the Funds invest depends on future developments, including the duration and spread of the outbreak, and such uncertainty may in turn adversely affect the value and liquidity of the Funds’ investments, impair the Funds’ ability to satisfy redemption requests, and negatively impact the Funds’ performance.
14. REPORT OF THE LARGE-CAP GROWTH FUND’S SPECIAL SHAREHOLDER MEETING
A Special Meeting of Shareholders of the Delaware U.S. Growth Fund (the “Acquired Fund”), a series of the Delaware Group® Adviser Funds, took place on March 23, 2021 to approve a proposed Agreement of and Plan of Reorganization for the Acquired Fund, whereby the Large-Cap Growth Fund, a series of Managed Portfolio Series, would acquire all the assets and liabilities of the Acquired Fund, in exchange for shares of the Acquiring Fund which would be distributed pro rata by the Acquired Fund to its shareholders, in complete liquidation and termination of the Acquired Fund (the “Reorganization”).
All Acquired Fund shareholders of record at the close of business on January 29, 2021, were entitled to vote. As of the Acquired Fund had 92,981,216 shares outstanding.
Of the 54,557,151 shares of the Acquired Fund present in person or by proxy at the meeting on March 23, 2021: 54,280,454, or 99.5% voted in favor of the Reorganization (representing 58.4% of total outstanding shares), 101,424, or 0.2%, voted against the Reorganization, and 175,273, or 0.3% withheld from voting for the Reorganization. Accordingly, the Reorganization was approved.
15. CHANGE IN INDEPENDENT REGISTERED PUBLIC ACCOUNTING FIRM
As a result of the reorganization of the Predecessor Fund into the Trust on April 16, 2021, PricewaterhouseCoopers LLP was dismissed as independent registered public accounting for the Predecessor Fund, a series of the Delaware Group® Adviser Funds. The Board, upon the recommendation of the Trust’s audit committee, selected Cohen & Company Ltd. as independent registered public accounting firm for the Large-Cap Growth Fund, a series within the Trust.
During the last two fiscal years ended October 31, 2020 and October 31, 2019, and the subsequent interim period through April 16, 2021, there were no (1) disagreements with PricewaterhouseCoopers LLP on any matters of
Jackson Square Funds
Notes to the Financial Statements – Continued
October 31, 2021
accounting principles or practices, financial statement disclosure, or auditing scope or procedures, which disagreements, if not resolved to their satisfaction, would have caused them to make reference in connection with their opinion to the subject matter of the disagreements, or (2) reportable events.
The audited reports by PricewaterhouseCoopers LLP on the financial statements of the Predecessor Fund as of and for the fiscal years ended October 31, 2020 and 2019, did not contain an adverse opinion or disclaimer of opinion, nor were they qualified or modified as to uncertainty, audit scope, or accounting principles. The Predecessor Fund has provided PricewaterhouseCoopers LLP with a copy of the disclosures and has requested that PricewaterhouseCoopers LLP furnish a letter stating whether it agrees with the statements and, if not, stating the respects in which it does not agree.
During the last two fiscal years ended October 31, 2020 and October 31, 2019, and the subsequent interim period through April 16, 2021, (i) the Predecessor Fund did not (a) consult with Cohen & Company Ltd. as to the application of accounting principles to a specified transaction, either completed or proposed, or the type of audit opinion that might be rendered on the financial statements or (b) receive a written report or oral advice that Cohen & Company Ltd. concluded was an important factor considered in reaching a decision as to such accounting, auditing, or financial reporting issue; and (ii) the Predecessor Fund did not consult Cohen & Company Ltd. on any matter that was either the subject of a “disagreement” (as that term is defined in Item 304(a)(1)(iv) of Regulation S-K and the related instructions) or a “reportable event” (as that term is defined in Item 304(a)(1)(v) of Regulation S-K).
16. SUBSEQUENT EVENTS
On December 16, 2021, the following Funds paid short-term capital gain distributions in the amount as shown in the table.
| | | Short-Term Capital | | | Short-Term Capital | |
| Fund | | Gain Dollar Amount | | | Gain Per Share Amount | |
| Global Growth Fund – Investor Class | | $ | 37 | | |
| $1.38492 | |
| Global Growth Fund - Institutional Class | | | 21,972 | | | | 1.38492 | |
| Global Growth Fund – IS Class | | | 602,758 | | | | 1.38492 | |
| International Growth Fund – Investor Class | | | 133 | | | | 5.03759 | |
| International Growth Fund – Institutional Class | | | 21,409 | | | | 5.03759 | |
| International Growth Fund – IS Class | | | 1,619,984 | | | | 5.03759 | |
| Large-Cap Growth Fund – Investor Class | | | 2,581,344 | | | | 0.41589 | |
| Large-Cap Growth Fund – Institutional Class | | | 6,647,439 | | | | 0.41589 | |
| Large-Cap Growth Fund – IS Class | | | 12,249,112 | | | | 0.41589 | |
Jackson Square Funds
Notes to the Financial Statements – Continued
October 31, 2021
On December 16, 2021, each Fund paid long-term capital gain distributions in the amount as shown in the table.
| | | Long-Term Capital | | | Long-Term Capital | |
| Fund | | Gain Dollar Amount | | | Gain Per Share Amount | |
| Global Growth Fund – Investor Class | | $ | 97 | | |
| $3.64370 | |
| Global Growth Fund – Institutional Class | | | 57,807 | | | | 3.64370 | |
| Global Growth Fund – IS Class | | | 1,585,845 | | | | 3.64370 | |
| International Growth Fund – Investor Class | | | 129 | | | | 4.87387 | |
| International Growth Fund – Institutional Class | | | 20,713 | | | | 4.87387 | |
| International Growth Fund – IS Class | | | 1,567,335 | | | | 4.87387 | |
| Large-Cap Growth Fund – Investor Class | | | 45,127,194 | | | | 7.27061 | |
| Large-Cap Growth Fund – Institutional Class | | | 116,210,860 | | | | 7.27061 | |
| Large-Cap Growth Fund – IS Class | | | 214,139,595 | | | | 7.27061 | |
| SMID-Cap Growth Fund – Investor Class | | | 16,179,692 | | | | 6.09081 | |
| SMID-Cap Growth Fund – Institutional Class | | | 145,233,908 | | | | 6.09081 | |
| SMID-Cap Growth Fund – IS Class | | | 154,578,238 | | | | 6.09081 | |
Management has performed an evaluation of subsequent events through the date the financial statements were issued and has determined that no additional items require recognition or disclosure.
Jackson Square Funds
Report of Independent Registered Public Accounting Firm
To the Shareholders of Jackson Square Funds and
Board of Trustees of Managed Portfolio Series
Opinion on the Financial Statements
We have audited the accompanying statements of assets and liabilities, including the schedules of investments, of the Funds listed below (“Jackson Square Funds” or the “Funds”), each a series of Managed Portfolio Series, as of October 31, 2021, the related statements of operations, the statements of changes in net assets, the related notes, and the financial highlights for each of the periods indicated below (collectively referred to as the “financial statements”). In our opinion, the financial statements present fairly, in all material respects, the financial position of each of the Funds as of October 31, 2021, the results of their operations, the changes in net assets, and the financial highlights for each of the periods indicated below in conformity with accounting principles generally accepted in the United States of America.
| | | Statements of | |
| | Statements | Changes in | |
Fund Name | of Operations | Net Assets | Financial Highlights |
Jackson Square Global Growth Fund, | For the year ended | For the years ended | For the years ended |
Jackson Square International Growth Fund, | October 31, 2021 | October 31, 2021 | October 31, 2021, |
and Jackson Square SMID-Cap Growth Fund | | and 2020 | 2020, 2019, 2018, and 2017 |
| | | | |
Jackson Square Large-Cap | For the year ended | For the year ended | For the year ended |
Growth Fund | October 31, 2021 | October 31, 2021 | October 31, 2021 |
The Delaware U.S. Growth Fund, predecessor fund to the Jackson Square Large-Cap Growth Fund, financial statements and financial highlights for the years ended October 31, 2020, and prior, were audited by other auditors whose report dated December 21, 2020, expressed an unqualified opinion on those financial statements and financial highlights.
Basis for Opinion
These financial statements are the responsibility of the Funds’ management. Our responsibility is to express an opinion on the Funds’ financial statements based on our audits. We are a public accounting firm registered with the Public Company Accounting Oversight Board (United States) (“PCAOB”) and are required to be independent with respect to the Funds in accordance with the U.S. federal securities laws and the applicable rules and regulations of the Securities and Exchange Commission and the PCAOB.
We conducted our audits in accordance with the standards of the PCAOB. Those standards require that we plan and perform the audit to obtain reasonable assurance about whether the financial statements are free of material misstatement whether due to error or fraud.
Our audits included performing procedures to assess the risks of material misstatement of the financial statements, whether due to error or fraud, and performing procedures that respond to those risks. Such procedures included examining, on a test basis, evidence regarding the amounts and disclosures in the financial statements. Our procedures included confirmation of securities owned as of October 31, 2021, by correspondence with the custodian and brokers; when replies were not received from brokers, we performed other auditing procedures. Our audits also included evaluating the accounting principles used and significant estimates made by management, as well as evaluating the overall presentation of the financial statements. We believe that our audits provide a reasonable basis for our opinion.
We have served as the Funds’ auditor since 2016.
COHEN & COMPANY, LTD.
Milwaukee, Wisconsin
December 30, 2021
Jackson Square Funds
Additional Information (Unaudited)
Statement Regarding the Funds’ Liquidity Risk Management Program
Pursuant to Rule 22e-4 under the Investment Company Act of 1940, the Trust, on behalf of the Jackson Square Global Growth Fund, the Jackson Square International Growth Fund, the Jackson Square Large-Cap Growth Fund and the Jackson Square SMID-Cap Growth Fund (each a “Fund” and together, the “Funds”), has adopted and implemented a written liquidity risk management program (the “Program”) that includes policies and procedures reasonably designed to comply with the requirements of Rule 22e-4, including: (i) assessment, management and periodic review of liquidity risk; (ii) classification of portfolio holdings; (iii) establishment of a highly liquid investment minimum (“HLIM”), as applicable; (iv) limitation on illiquid investments; and (v) redemptions in-kind. The Trust’s Board of Trustees (the “Board”) has approved the designation of Jackson Square Partners, LLC (“Jackson Square”) as the administrator of the Program (the “Program Administrator”). Personnel of Jackson Square conduct the day-to-day operation of the Program pursuant to policies and procedures administered by the Program Administrator.
In accordance with Rule 22e-4, the Board reviewed a report prepared by the Program Administrator (the “Report”) regarding the operation of the Program and its adequacy and effectiveness of implementation for the period January 1, 2020, through December 31, 2020 (the “Reporting Period”). No significant liquidity events impacting the Funds during the Reporting Period or material changes to the Program were noted in the Report. Effective April 16, 2021, the Delaware U.S. Growth Fund (the “Predecessor Fund”) was reorganized into the Jackson Square Large-Cap Growth Fund. Prior to April 16, 2021, and throughout the Reporting Period, the Predecessor Fund had a separate Program and Program Administrator from the Funds.
Under the Program, the Program Administrator manages and periodically reviews each Fund’s liquidity risk, including consideration of applicable factors specified in Rule 22e-4 and the Program. Liquidity risk is defined as the risk that a Fund could not meet shareholder redemption requests without significant dilution of remaining shareholders’ interests in the Fund. In general, this risk was managed during the Reporting Period by monitoring the degree of liquidity of each Fund’s investments, limiting the amount of each Fund’s illiquid investments, and utilizing various risk management tools and facilities available to each Fund for meeting shareholder redemptions, among other means. In the Report, Jackson Square provided its assessment that, based on the information considered in its review, the Program remains reasonably designed to manage each Fund’s liquidity risk and each Fund’ s investment strategy remains appropriate for an open-end fund.
Pursuant to the Program, the Program Administrator oversaw the classification of each of the Funds portfolio investments as highly liquid, moderately liquid, less liquid or illiquid during the Reporting Period, including in connection with recording investment classifications on Form N-PORT. The process utilized by Jackson Square for determining the degree of liquidity of each Fund’s investments is supported by one or more third-party liquidity assessment vendors.
Each Fund qualified as a “primarily highly liquid fund” as defined in the Program during the Reporting Period. Accordingly, each Fund was not required to establish a HLIM or comply with the related Program provisions during the Reporting Period.
During the Reporting Period, each Fund’s investments were monitored for compliance with the 15% limitation on illiquid investments pursuant to the Program and in accordance with Rule 22e-4.
The Report noted that the Funds did not have any redemptions in-kind during the Reporting Period. The Report concluded, with respect to each Fund: (i) the Program was implemented and operated effectively to achieve the goal of assessing and managing the Fund’s liquidity risk during the Reporting Period; and (ii) the Fund was able to meet requests for redemption without significant dilution of remaining investors’ interests in the Fund during the Reporting Period.
Jackson Square Funds
Additional Information (Unaudited) – Continued
October 31, 2021
TRUSTEES AND OFFICERS
| | | Term of | Number of | | Other |
| | | Office and | Portfolios | | Directorships |
| | Position(s) | Length of | in Trust | | Held by |
| Name, Address and | Held with | Time | Overseen | Principal Occupation(s) | Trustee During |
| Year of Birth | the Trust | Served | by Trustee | During the Past Five Years | the Past Five Years |
| | | | | | |
| Independent Trustees | | | | | |
| | | | | | |
Leonard M. Rush, CPA | Chairman, | Indefinite | 32 | Retired, Chief Financial Officer, | Independent Trustee, |
615 E. Michigan St. | Trustee | Term; Since | | Robert W. Baird & Co. Incorporated, | ETF Series Solutions |
Milwaukee, WI 53202 | and Audit | April 2011 | | (2000-2011). | (51 Portfolios) |
Year of Birth: 1946 | Committee | | | | (2012-Present) |
| | Chairman | | | | |
| | | | | | |
David A. Massart | Trustee | Indefinite | 32 | Co-Founder and Chief Investment | Independent Trustee, |
615 E. Michigan St. | | Term; Since | | Strategist, Next Generation Wealth | ETF Series Solutions |
Milwaukee, WI 53202 | | April 2011 | | Management, Inc. (2005-present). | (51 Portfolios) |
Year of Birth: 1967 | | | | | (2012-Present) |
Jackson Square Funds
Additional Information (Unaudited) – Continued
October 31, 2021
| | | Term of | Number of | | Other |
| | | Office and | Portfolios | | Directorships |
| | Position(s) | Length of | in Trust | | Held by |
| Name, Address and | Held with | Time | Overseen | Principal Occupation(s) | Trustee During |
| Year of Birth | the Trust | Served | by Trustee | During the Past Five Years | the Past Five Years |
David M. Swanson | Trustee and | Indefinite | 32 | Founder and Managing Partner, | Independent Trustee, |
615 E. Michigan St. | Nominating & | Term; Since | | SwanDog Strategic Marketing, LLC | ALPS Variable |
Milwaukee, WI 53202 | Governance | April 2011 | | (2006-present); Executive Vice | Investment Trust |
Year of Birth: 1957 | Committee | | | President, Calamos Investments | (7 Portfolios) (2006- |
| | Chairman | | | (2004-2006). | Present); Independent |
| | | | | | Trustee, RiverNorth |
| | | | | | Funds (3 Portfolios) |
| | | | | | (2018-Present); |
| | | | | | RiverNorth Managed |
| | | | | | Duration Municipal |
| | | | | | Income Fund Inc. |
| | | | | | (1 Portfolio) (2019- |
| | | | | | Present); RiverNorth |
| | | | | | Specialty Finance |
| | | | | | Corporation (1 |
| | | | | | Portfolio) (2018- |
| | | | | | Present); RiverNorth/ |
| | | | | | DoubleLine Strategic |
| | | | | | Opportunity Fund, |
| | | | | | Inc. (1 Portfolio) |
| | | | | | (2018-Present); |
| | | | | | RiverNorth |
| | | | | | Opportunities Fund, |
| | | | | | Inc. (1 Portfolio) |
| | | | | | (2015-Present); |
| | | | | | RiverNorth |
| | | | | | Opportunistic |
| | | | | | Municipal Income |
| | | | | | Fund, Inc. |
| | | | | | (1 Portfolio) (2018- |
| | | | | | Present); RiverNorth |
| | | | | | Flexible Municipal |
| | | | | | Income Fund |
| | | | | | (2020-Present). |
| | | | | | |
Robert J. Kern | Trustee | Indefinite | 32 | Retired (2018-present); Executive | None |
615 E. Michigan St. | | Term; Since | | Vice President, U.S. Bancorp Fund | |
Milwaukee, WI 53202 | | January 2011 | | Services, LLC (1994-2018). | |
Year of Birth: 1958 | | | | | |
Jackson Square Funds
Additional Information (Unaudited) – Continued
October 31, 2021
| | | Term of | Number of | | Other |
| | | Office and | Portfolios | | Directorships |
| | Position(s) | Length of | in Trust | | Held by |
| Name, Address and | Held with | Time | Overseen | Principal Occupation(s) | Trustee During |
| Year of Birth | the Trust | Served | by Trustee | During the Past Five Years | the Past Five Years |
| | | | | | |
| Officers | | | | | |
| | | | | | |
Brian R. Wiedmeyer | President and | Indefinite | N/A | Vice President, U.S. Bancorp Fund | N/A |
615 E. Michigan St. | Principal | Term, Since | | Services, LLC (2005-present). | |
Milwaukee, WI 53202 | Executive | November 2018 | | | |
Year of Birth: 1973 | Officer | | | | |
| | | | | | |
Deborah Ward | Vice President, | Indefinite | N/A | Senior Vice President, U.S. Bancorp | N/A |
615 E. Michigan St. | Chief | Term; Since | | Fund Services, LLC (2004-present). | |
Milwaukee, WI 53202 | Compliance | April 2013 | | | |
Year of Birth: 1966 | Officer and | | | | |
| | Anti-Money | | | | |
| | Laundering | | | | |
| | Officer | | | | |
| | | | | | |
Benjamin Eirich | Treasurer, | Indefinite | N/A | Assistant Vice President, U.S. Bancorp | N/A |
615 E. Michigan St. | Principal | Term; Since | | Fund Services, LLC (2008-present). | |
Milwaukee, WI 53202 | Financial | August 2019 | | | |
Year of Birth: 1981 | Officer and | (Treasurer); | | | |
| | Vice President | Indefinite | | | |
| | | Term; Since | | | |
| | | November 2018 | | | |
| | | (Vice President) | | | |
| | | | | | |
Joseph Destache | Secretary | Indefinite | N/A | Assistant Vice President, U.S. Bancorp | N/A |
615 E. Michigan St. | | Term; Since | | Fund Services, LLC (2019-present); | |
Milwaukee, WI 53202 | | March 2021 | | Regulatory Administration Intern, | |
Year of Birth: 1991 | | | | U.S. Bancorp Fund Services, LLC | |
| | | | | (2018–2019); Law Student (2016–2019). | |
| | | | | | |
Douglas Schafer | Assistant | Indefinite | N/A | Assistant Vice President, U.S. Bancorp | N/A |
615 E. Michigan St. | Treasurer | Term; Since | | Fund Services, LLC (2002-present). | |
Milwaukee, WI 53202 | and Vice | May 2016 | | | |
Year of Birth: 1970 | President | (Assistant | | | |
| | | Treasurer); | | | |
| | | Indefinite | | | |
| | | Term; Since | | | |
| | | November 2018 | | | |
| | | (Vice President) | | | |
| | | | | | |
Michael J. Cyr II, CPA | Assistant | Indefinite | N/A | Assistant Vice President, U.S. Bancorp | N/A |
615 E. Michigan St. | Treasurer and | Term: Since | | Fund Services, LLC (2013-present). | |
Milwaukee, WI 53202 | Vice President | August 2019 | | | |
Year of Birth: 1992 | | | | | |
Jackson Square Funds
Additional Information (Unaudited) – Continued
October 31, 2021
AVAILABILITY OF FUND PORTFOLIO INFORMATION
Each Fund files complete schedules of portfolio holdings with the SEC for the first and third quarters of each fiscal year on Part F of Form N-PORT. The Funds’ Part F of N-PORT are available on the SEC’s website at www.sec.gov and may be reviewed and coped at the SEC’s Public Reference Room in Washington, D.C. For information on the Public Reference Room call 1-800-SEC-0330. In addition, each Funds’ Part F of Form N-PORT is available without charge upon request by calling 1-844-577-3863.
AVAILABILITY OF FUND PROXY VOTING INFORMATION
A description of the Funds’ Proxy Voting Policies and Procedures is available without charge, upon request, by calling 1-844-577-3863. Information regarding how the Funds voted proxies relating to portfolio securities during the most recent 12 month period ended June 30 is available (1) without charge, upon request, by calling 1-844-577-3863, or (2) on the SEC’s website at www.sec.gov.
QUALIFIED DIVIDEND INCOME/DIVIDENDS RECEIVED DEDUCTION
For the fiscal year ended October 31, 2021, certain dividends paid by the Funds may be reported as qualified dividend income and may be eligible for taxation at capital gain rates. The percentage of dividends declared from ordinary income designated as qualified dividend income was as follows:
| Fund | | | | |
| Global Growth Fund | | | 100.00 | % | |
| Large-Cap Growth Fund | | | 25.75 | % | |
| SMID-Cap Growth Fund | | | 74.41 | % | |
For corporate shareholders, the percent of ordinary income distributions qualifying for the corporate dividends received deduction for the fiscal year ended October 31, 2021 was as follows:
| Fund | | | | |
| Global Growth Fund | | | 100.00 | % | |
| Large-Cap Growth Fund | | | 25.40 | % | |
| SMID-Cap Growth Fund | | | 68.39 | % | |
The percentage of taxable ordinary income distributions that are designated as short-term capital gain distributions under Internal Revenue Section 871(k)(2)(C) for each Fund were as follows:
| Fund | | | | |
| Global Growth Fund | | | 100.00 | % | |
| Large-Cap Growth Fund | | | 100.00 | % | |
| SMID-Cap Growth Fund | | | 100.00 | % | |
Jackson Square Funds
Privacy Notice (Unaudited)
The Funds collect only relevant information about you that the law allows or requires it to have in order to conduct its business and properly service you. The Funds collect financial and personal information about you (“Personal Information”) directly (e.g., information on account applications and other forms, such as your name, address, and social security number, and information provided to access account information or conduct account transactions online, such as password, account number, e-mail address, and alternate telephone number), and indirectly (e.g., information about your transactions with us, such as transaction amounts, account balance and account holdings).
The Funds do not disclose any non-public personal information about its shareholders or former shareholders other than for everyday business purposes such as to process a transaction, service an account, respond to court orders and legal investigations or as otherwise permitted by law. Third parties that may receive this information include companies that provide transfer agency, technology and administrative services to the Funds, as well as the Funds’ investment adviser who is an affiliate of the Funds. If you maintain a retirement/educational custodial account directly with the Funds, we may also disclose your Personal Information to the custodian for that account for shareholder servicing purposes. The Funds limit access to your Personal Information provided to unaffiliated third parties to information necessary to carry out their assigned responsibilities to the Funds. All shareholder records will be disposed of in accordance with applicable law. The Funds maintain physical, electronic and procedural safeguards to protect your Personal Information and requires its third party service providers with access to such information to treat your Personal Information with the same high degree of confidentiality.
In the event that you hold shares of the Funds through a financial intermediary, including, but not limited to, a broker-dealer, credit union, bank or trust company, the privacy policy of your financial intermediary governs how your non-public personal information is shared with unaffiliated third parties.
Jackson Square Funds
Disclosures (Unaudited)
The materials provided herein are for general information purposes only and may not be copied or redistributed without Jackson Square’s prior consent. The views expressed represent Jackson Square’s assessment of the strategy and market environment as of the date identified herein and should not be considered a recommendation to buy, hold, or sell any security, and should not be relied on as research or investment advice. The information in this presentation, including statements concerning financial markets is based on current market conditions, which will fluctuate and may be superseded by subsequent market events or for other reasons.
Opinions expressed are those of Jackson Square Partners, LLC and are subject to change, are not guaranteed and should not be considered investment advice.
Holdings are as of the date provided and subject to change. Please see the Schedule of Investments in this report for a complete list of fund holdings.
Mutual fund investing involves risk. Principal loss is possible. With the exception of the Global Growth Fund, the Funds are non-diversified meaning they may concentrate their assets in fewer individual holdings than a diversified fund. Therefore these Funds are more exposed to individual stock volatility than a diversified fund. Small- and Mid-capitalization companies tend to have limited liquidity and greater price volatility than large capitalization companies. Investments in foreign securities involve greater volatility and political economic and currency risks and differences in accounting methods. These risks are greater in emerging and frontier markets. Frontier market countries generally have smaller economies and even less developed capital markets than traditional emerging markets, and, as a result, the risks of investing in emerging market countries are magnified in frontier market countries. Investments in Real Estate Investment Trusts (REITs) involve additional risks such as declines in the value of real estate and increased susceptibility to adverse economic or regulatory developments. When the Funds buy or sell securities on a foreign stock exchange, the transaction is undertaken in the local currency rather than in U.S. dollars. The value of the foreign currency may increase or decrease against the value of the U.S. dollar, which may impact the value of the Funds’ portfolio holdings and your investment. Other countries may adopt economic policies and/or currency exchange controls that affect their currency valuations in a manner that is disadvantageous to U.S. investors and companies. From time to time, the trading market for a particular security or type of security in which the Funds invest may become less liquid or even illiquid.
Past performance is no guarantee of future results.
Diversification does not assure a profit, nor does it protect against a loss in a declining market.
For comparison purposes, the indices are fully invested and include the reinvestment of income. Index returns do not reflect management fees, transaction costs, or expenses. The indices are unmanaged, and one cannot invest directly in an index. Benchmark information contained herein has been obtained from third party sources believed to be reliable, but we cannot guarantee its accuracy or completeness. All third-party marks are the property of their respective owners. All performance data regarding the indices are historical and are not indicative of future results, and there can be no assurance that these or comparable results will actually be achieved by the strategies or that the strategies’ investment objectives will be achieved.
Russell 1000® Growth Index measures the performance of the large-cap growth segment of the U.S. equity universe. It includes those Russell 1000® companies with higher price-to-book ratios and higher forecasted growth values. The index is unmanned and an investment cannot be made into the index.
Jackson Square Funds
Disclosures (Unaudited) – Continued
Russell 2500® Growth Index. The Russell 2500® Growth Index measures the performance of the small- to mid-cap growth segment of the U.S. equity universe. It includes those Russell 2500® companies with higher price-to-book ratios and higher forecasted growth values. The index is unmanned and an investment cannot be made into the index.
Russell 3000® Growth Index measures the performance of the broad growth segment of the U.S. equity universe. It includes those Russell 3000® companies with higher price-to-book ratios and higher forecasted growth values. The index is unmanned and an investment cannot be made into the index.
MSCI All Country World Index. The MSCI All Country World Index is a free float-adjusted market capitalization weighted index designed to measure equity market performance across developed markets world-wide. Index “net” return reflects minimum possible dividend reinvestment, after deduction of withholding tax at the highest possible rate. The index is unmanned and an investment cannot be made into the index. The index is a service mark of MSCI Barra. MSCI makes no express or implied warranties or representations and shall have no liability whatsoever with respect to any MSCI data contained herein. The MSCI data may not be further redistributed or used as a basis for other indices or any securities or financial products. This report is not approved, reviewed, or produced by MSCI.
The MSCI All Country World Index – ex USA is a free float-adjusted capitalization weighted index designed to measure market performance across developed markets world-wide excluding the USA.
The report must be preceded or accompanied by a prospectus.
Jackson Square Partners, LLC is the adviser to the Jackson Square Funds, which are distributed by Quasar Distributors, LLC.
Investment Adviser
Jackson Square Partners, LLC
One Letterman Drive
Building A, Suite A3-200
San Francisco, California 94129
Distributor
Quasar Distributors, LLC
111 East Kilbourn Avenue, Suite 2200
Milwaukee, Wisconsin 53202
Custodian
U.S. Bank N.A.
1555 North Rivercenter Drive, Suite 302
Milwaukee, Wisconsin 53212
Administrator, Fund Accountant
And Transfer Agent
U.S. Bancorp Fund Services, LLC
615 East Michigan Street
Milwaukee, Wisconsin 53202
Independent Registered Public Accounting Firm
Cohen & Company, Ltd.
342 North Water Street, Suite 830
Milwaukee, Wisconsin 53202
Legal Counsel
Stradley Ronon Stevens & Young, LLP
2005 Market Street, Suite 2600
Philadelphia, Pennsylvania 19103
This report should be accompanied or preceded by a prospectus.
The Funds’ Statement of Additional Information contains additional information about the
Funds’ trustees and is available without charge upon request by calling 1-844-577-3863.
(b) Not Applicable.
Item 2. Code of Ethics.
The Registrant has adopted a code of ethics that applies to the Registrant’s principal executive officer and principal financial officer. The Registrant has not made any substantive amendments to its code of ethics during the period covered by this period.
The Registrant has not granted any waivers from any provisions of the code of ethics during the period covered by this report.
A copy of the Registrant’s code of ethics that applies to the Registrant’s principal executive officer and principal financial officer is filed herewith.
Item 3. Audit Committee Financial Expert.
The Registrant’s Board of Trustees has determined that there is at least one audit committee financial expert serving on its audit committee. Leonard M. Rush is the “audit committee financial expert” and is considered to be “independent” as each term is defined in Item 3 of Form N-CSR.
Item 4. Principal Accountant Fees and Services.
The Registrant has engaged its principal accountant to perform audit services, audit-related services, tax services and other services during the past two fiscal years. “Audit services” refer to performing an audit of the Registrant's annual financial statements or services that are normally provided by the accountant in connection with statutory and regulatory filings or engagements for the past fiscal year. “Audit-related services” refer to the assurance and related services by the principal accountant that are reasonably related to the performance of the audit. “Tax services” refer to professional services rendered by the principal accountant for tax compliance, tax advice, and tax planning, including reviewing the Fund’s tax returns and distribution calculations. There were no “other services” provided by the principal accountant. For the fiscal years ended October 31, 2021 and October 31, 2020, the Funds’ principal accountant was Cohen & Company, Ltd. The following table details the aggregate fees billed or expected to be billed for each of the last fiscal year for audit fees, audit-related fees, tax fees and other fees by the principal accountant.
| | FYE 10/31/2021 | FYE 10/31/2020 |
(a) Audit Fees | $60,500 | $65,500 |
(b) Audit-Related Fees | $0 | $0 |
(c) Tax Fees | $21,000 | $18,000 |
(d) All Other Fees | $0 | $0 |
(e)(1) The audit committee has adopted pre-approval policies and procedures that require the audit committee to pre‑approve all audit and non‑audit services of the Registrant, including services provided to any entity affiliated with the Registrant.
(e)(2) The percentage of fees billed by Cohen & Company, Ltd. applicable to non-audit services pursuant to waiver of pre-approval requirement was as follows:
| | FYE 10/31/2021 | FYE 10/31/2020 |
Audit-Related Fees | 0% | 0% |
Tax Fees | 0% | 0% |
All Other Fees | 0% | 0% |
(f) All of the principal accountant’s hours spent on auditing the Registrant’s financial statements were attributed to work performed by full‑time permanent employees of the principal accountant.
(g) The following table indicates the non-audit fees billed or expected to be billed by the Registrant’s accountant for services to the Registrant and to the Registrant’s investment adviser (and any other controlling entity, etc.—not sub-adviser) for the last two years.
(h) The audit committee of the board of trustees/directors has considered whether the provision of non-audit services that were rendered to the Registrant's investment adviser is compatible with maintaining the principal accountant's independence and has concluded that the provision of such non-audit services by the accountant has not compromised the accountant’s independence.
Non-Audit Related Fees | FYE 10/31/2021 | FYE 10/31/2020 |
Registrant | 0% | 0% |
Registrant’s Investment Adviser | 0% | 0% |
(i) Not applicable.
(j) Not applicable.
Item 5. Audit Committee of Listed Registrants.
Not applicable to Registrants who are not listed issuers (as defined in Rule 10A-3 under the Securities Exchange Act of 1934).
Item 6. Schedule of Investments.
(a) Schedule of Investments is included as part of the report to shareholders filed under Item 1 of this Form.
(b) Not applicable.
Item 7. Disclosure of Proxy Voting Policies and Procedures for Closed-End Management Investment Companies.
Not applicable to open-end investment companies.
Item 8. Portfolio Managers of Closed-End Management Investment Companies.
Not applicable to open-end investment companies.
Item 9. Purchases of Equity Securities by Closed‑End Management Investment Company and Affiliated Purchasers.
Not applicable to open-end investment companies.
Item 10. Submission of Matters to a Vote of Security Holders.
There have been no material changes to the procedures by which shareholders may recommend nominees to the Registrant’s Board of Trustees.
Item 11. Controls and Procedures.
(a) | The Registrant’s President and Treasurer have reviewed the Registrant's disclosure controls and procedures (as defined in Rule 30a-3(c) under the Investment Company Act of 1940 (the “Act”)) as of a date within 90 days of the filing of this report, as required by Rule 30a-3(b) under the Act and Rules 13a-15(b) or 15d‑15(b) under the Securities Exchange Act of 1934. Based on their review, such officers have concluded that the disclosure controls and procedures are effective in ensuring that information required to be disclosed in this report is appropriately recorded, processed, summarized and reported and made known to them by others within the Registrant and by the Registrant’s service provider. |
(b) | There were no significant changes in the Registrant's internal control over financial reporting (as defined in Rule 30a-3(d) under the Act) that occurred during the period covered by this report that has materially affected, or is reasonably likely to materially affect, the Registrant's internal control over financial reporting. |
Item 12. Disclosure of Securities Lending Activities for Closed-End Management Investment Companies
Not applicable to open-end investment companies.
Item 13. Exhibits.
(3) Any written solicitation to purchase securities under Rule 23c‑1 under the Act sent or given during the period covered by the report by or on behalf of the Registrant to 10 or more persons. Not applicable to open-end investment companies.
(4) Change in the Registrant’s independent public accountant. As a result of the reorganization of the Predecessor Fund into the Trust on April 16, 2021, PricewaterhouseCoopers LLP was dismissed as independent registered public accounting for the Predecessor Fund, a series of the Delaware Group® Adviser Funds. The Board, upon the recommendation of the Trust’s audit committee, selected Cohen & Company Ltd. as independent registered public accounting firm for the Large-Cap Growth Fund, a Fund within the Trust.
During the last two fiscal years ended October 31, 2020 and October 31, 2019, and the subsequent interim period through April 16, 2021, there were no (1) disagreements with PricewaterhouseCoopers LLP on any matters of accounting principles or practices, financial statement disclosure, or auditing scope or procedures, which disagreements if not resolved to their satisfaction would have caused them to make reference in connection with their opinion to the subject matter of the disagreements, or (2) reportable events.
The audited reports by PricewaterhouseCoopers LLP on the financial statements of the Predecessor Fund as of and for the fiscal years ended October 31, 2020 and 2019, did not contain an adverse opinion or disclaimer of opinion, nor were they qualified or modified as to uncertainty, audit scope, or accounting principles.
The Predecessor Fund has provided PricewaterhouseCoopers LLP with a copy of the disclosures and has requested that PricewaterhouseCoopers LLP furnish a letter stating whether it agrees with the statements and, if not, stating the respects in which it does not agree. A letter from PricewaterhouseCoopers LLP is attached hereto as Exhibit 13.1.
During the last two fiscal years ended October 31, 2020 and October 31, 2019, and the subsequent interim period through April 16, 2021, (i) the Predecessor Fund did not both (a) consult with Cohen & Company Ltd. as to the application of accounting principles to a specified transaction, either completed or proposed, or the type of audit opinion that might be rendered on the financial statements and (b) receive a written report or oral advice that Cohen & Company Ltd. concluded was an important factor considered in reaching a decision as to such accounting, auditing, or financial reporting issue; and (ii) the Predecessor Fund did not consult Cohen & Company Ltd. on any matter that was either the subject of a “disagreement” (as that term is defined in Item 304(a)(1)(iv) of Regulation S-K and the related instructions) or a “reportable event” (as that term is defined in Item 304(a)(1)(v) of Regulation S-K).
SIGNATURES
Pursuant to the requirements of the Securities Exchange Act of 1934 and the Investment Company Act of 1940, the Registrant has duly caused this report to be signed on its behalf by the undersigned, thereunto duly authorized.
(Registrant) Managed Portfolio Series
By (Signature and Title) /s/Brian R. Wiedmeyer
Brian R. Wiedmeyer, President
Date January 7, 2022
Pursuant to the requirements of the Securities Exchange Act of 1934 and the Investment Company Act of 1940, this report has been signed below by the following persons on behalf of the Registrant and in the capacities and on the dates indicated.
By (Signature and Title) /s/Brian R. Wiedmeyer
Brian R. Wiedmeyer, President
Date January 7, 2022
By (Signature and Title) /s/Benjamin J. Eirich
Benjamin J. Eirich, Treasurer
Date January 7, 2022