Reinhart Mid Cap PMV Fund
Investor Class Shares – RPMMX
Advisor Class Shares – RPMVX
Institutional Class Shares – RPMNX
Reinhart Genesis PMV Fund
Investor Class Shares – RPMAX
Advisor Class Shares – RPMFX
Annual Report
| www.ReinhartFunds.com | May 31, 2022 |
Reinhart Mid Cap PMV Fund (Unaudited)
June 21, 2022
Fellow Shareholders,
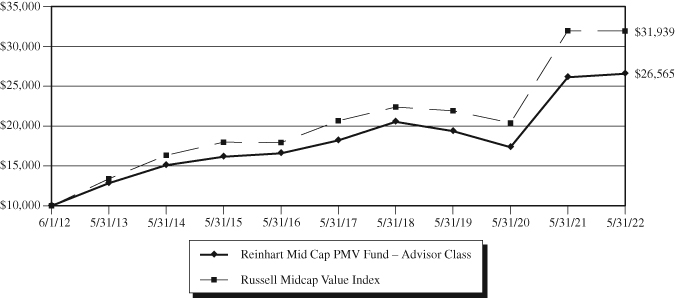
The Reinhart Mid Cap PMV Fund – Advisor Class (the “Fund”) gained +1.68% for the 12-month period ended May 31, 2022, compared to the Russell Midcap Value Index’s return of -0.06% during that same time frame, providing downside protection in a period of heightened volatility. Market factors shifted quickly over the year, as inflation and interest rates rose sharply, supply chains problems worsened, consumers shifted spending from goods to services and travel, and geopolitical instability came to the fore. These changes have taken the air out of the more speculative pockets of the market as investors have refocused on company fundamentals, seeking out businesses with sustainable moats and pricing power. This has always been our approach as quality value investors, and the Fund should be well positioned if this environment continues.
We took advantage of the volatility and bought seven new positions over the course of the year and added to several positions where we felt short-term concerns were being overly reflected in valuations. The portfolio also benefitted from three buyout announcements after having none in the previous year, (rare for our strategy). Today the portfolio continues to overweight Financials given banks will benefit from higher interest rates, and Industrial companies where we expect our less cyclical holdings to hold up better should macroeconomic weakness occur.
Consumer Discretionary was the best performing sector for the Fund as we avoided the most challenged industries including clothing retailers and travel-related stocks in favor of steadier businesses such as discount warehouse. Financials also outperformed, driven by our Property & Casualty insurance holdings which are raising prices and more than offsetting loss cost inflation, thereby improving underwriting profitability. The third largest positive contributing sector was Industrials, led by our holdings with significant Defense exposure.
Energy was by far the best performing sector during the year, and given the Fund was considerably underweight, it was the largest detractor in the portfolio. There are fewer high-quality companies within the Energy sector relative to other areas of the market, in our view, given the commodity nature of the product with little differentiation, heavy capital intensity and a long industry track record of meager cash flow generation. As such we are comfortable enduring periods of short-term underperformance when energy prices rise, as we believe our clients’ capital is better invested in more durable businesses over the long term. The Health Care sector was also a detractor as several of our holdings saw weak volumes due to medical facilities hampered by an overflow of Covid patients. These companies are also dealing with health care worker shortages, which is pressuring margins. We expect both issues to improve as Covid cases recede and the labor landscape improves.
The biggest question now facing the market is whether the Federal Reserve can stymie inflation with tighter monetary policy without sending the economy into a recession. As always, we would not pretend to have a better prediction of the outcome when it comes to recessions or stock market movements. But we believe our company-level focus on quality and valuation keeps us invested in steady, resilient businesses that are better able to withstand economic dislocations, should that occur.
Thank you for your ongoing investment in Reinhart’s Mid Cap PMV Fund.
Sincerely,
Josh Wheeler
Portfolio Manager, Reinhart Partners Inc.
Reinhart Mid Cap PMV Fund (Unaudited)
Must be preceded or accompanied by a prospectus.
Past performance is not a guarantee of future results.
Mutual fund investing involves risk. There can be no guarantee that any strategy will be successful. Principal loss is possible. Investing in medium-sized companies involves greater risk than those associated with investing in large company stocks, such as business risk, significant stock price fluctuations and illiquidity. The Fund’s value investments are subject to the risk that their intrinsic values may not be recognized by the broad market or that their prices may decline.
Opinions expressed are those of the fund manager and are subject to change, are not guaranteed and should not be considered a recommendation to buy or sell any security.
| • | Russell Midcap Value Index: an unmanaged equity index which measures the performance of mid-sized U.S. companies classified by Russell as ‘value’. It is not possible to invest directly into an index. |
Fund holdings and sector allocations are subject to change at any time and should not be considered recommendations to buy or sell any security. Please refer to the Schedule of Investments in this report for a complete list of fund holdings.
Quasar Distributors, LLC, Distributor.
Reinhart Mid Cap PMV Fund
Value of $10,000 Investment (Unaudited)
The chart assumes an initial investment of $10,000. Performance reflects waivers of fee and operating expenses in effect. In the absence of such waivers, total return would be reduced. Performance data quoted represents past performance and does not guarantee future results. Investment returns and principal value will fluctuate, and when sold, may be worth more or less than their original cost. Performance current to the most recent month-end may be lower or higher than the performance quoted and can be obtained by calling 855-774-3863. Performance assumes the reinvestment of capital gains and income distributions. The performance does not reflect the deduction of taxes that a shareholder would pay on Fund distributions or the redemption of Fund shares.
Annualized Rates of Return as of May 31, 2022
| | 1-Year | 3-Year | 5-Year | 10-Year | Since Inception(1) |
| Investor Class | 1.43% | 10.81% | 7.58% | 9.99% | 9.99% |
| Advisor Class | 1.68% | 11.10% | 7.85% | 10.26% | 10.26% |
| Institutional Class | 1.87% | 11.27% | 8.01% | 10.43% | 10.43% |
Russell Midcap Value Index(2) | -0.06% | 13.37% | 9.10% | 12.31% | 12.31% |
| (1) | Period from Fund inception through May 31, 2022. The Advisor and Investor Class commenced operations on June 1, 2012, and the Institutional Class commenced operations on September 29, 2017. Performance shown for the Institutional Class prior to the inception of the Institutional Class is based on the performance of the Advisor Class, adjusted for the lower expenses applicable to the Institutional Class. |
| (2) | The Russell Midcap Value Index measures the performance of those Russell Midcap companies with lower price-to-book ratios and lower forecasted growth values. This index cannot be invested in directly. |
The following is expense information for the Reinhart Mid Cap PMV Fund as disclosed in the Fund’s most recent prospectus dated September 28, 2021:
Investor Class Gross Expense Ratio – 1.57% | Net Expense Ratio – 1.30% |
Advisor Class Gross Expense Ratio – 1.24% | Net Expense Ratio – 1.05% |
Institutional Class Gross Expense Ratio – 1.18% | Net Expense Ratio – 0.90% |
Reinhart Mid Cap PMV Fund
Reinhart Partners, Inc. (the “Adviser” or “Reinhart”) has contractually agreed to waive its management fees and pay Fund expenses in order to ensure that Total Annual Fund Operating Expenses (excluding Acquired Fund Fees and Expenses (“AFFE”), leverage/borrowing interest, interest expense, taxes, brokerage commissions, and extraordinary expenses) do not exceed 1.30% of the average daily net assets of the Investor Class, 1.05% of the average daily net assets of the Advisor Class and 0.90% of the average daily net assets of the Institutional Class. Fees waived and expenses paid by the Adviser may be recouped by the Adviser for a period of 36 months following the month during which such fee waiver and expense payment was made, if such recoupment can be achieved without exceeding the expense limit in effect at the time the fee waiver and expense payment occurred and the expense limit in effect at the time of recoupment. The Operating Expenses Limitation Agreement is indefinite in term and cannot be terminated through at least September 28, 2028. Thereafter, the agreement may be terminated at any time upon 60 days’ written notice by the Trust’s Board of Trustees (the “Board”) or the Adviser, with the consent of the Board.
The actual net expense ratios applicable to shareholders, as disclosed in the Financial Highlights for the year ended May 31, 2022, was 1.30%, 1.05% and 0.90% for the Investor Class, Advisor Class and Institutional Class, respectively.
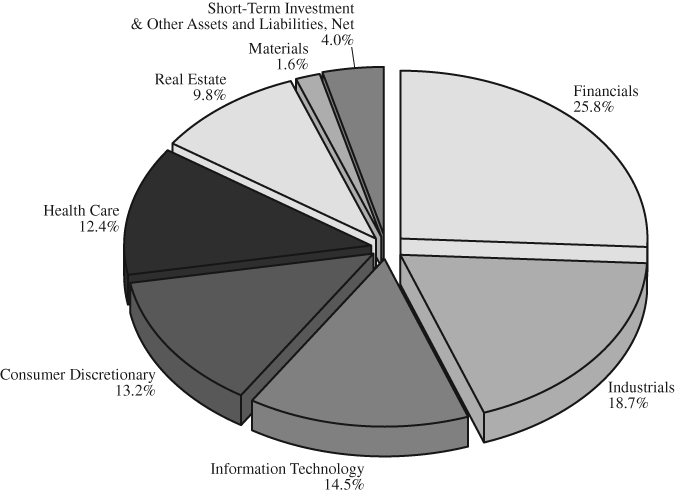
Reinhart Mid Cap PMV Fund
Allocation of Portfolio Net Assets(1) (Unaudited)
May 31, 2022
(% of Net Assets)
Top Ten Equity Holdings(1) (Unaudited)
May 31, 2022
(% of Net Assets)
| | Vistra | | | 4.2 | % |
| | Baker Hughes, Class A | | | 3.5 | % |
| | LKQ | | | 3.3 | % |
| | American Campus Communities – REIT | | | 2.9 | % |
| | Encompass Health | | | 2.9 | % |
| | White Mountains Insurance Group | | | 2.9 | % |
| | BJ’s Wholesale Club Holdings | | | 2.7 | % |
| | Interpublic Group of Companies | | | 2.7 | % |
| | Global Payments | | | 2.6 | % |
| | Citizens Financial Group | | | 2.6 | % |
| (1) | Fund Holdings and Sector allocations are subject to change at any time and are not recommendations to buy or sell any security. |
Reinhart Genesis PMV Fund (Unaudited)
June 21, 2022
Fellow Shareholders,
The Reinhart Genesis PMV Fund – Advisor Class (the “Fund”) generated a return of -1.86% for the 12-month period ended May 31, 2022. The portfolio’s Russell 2500 benchmark generated a return of return of -11.62% over the same period. Over the past twelve months, investor attention has turned from COVID to inflation and concerns about the overall health of the economy. This has resulted in increased volatility in the stock market as investors attempt to assess the impact of the first inflationary environment in several decades. The Reinhart Genesis PMV portfolio companies have fared well in this uncertain environment.
While most sectors were positive contributors within the portfolio, the Healthcare sector was a notable standout. As the worst performing sector in the Russell 2500 index, Healthcare was down more than 32%. However, Reinhart Genesis PMV’s Healthcare sector holdings increased by a weighted average of 13%, thanks in large part to Lantheus Holdings, a producer of specialty medical imaging contrast agents. Lantheus recently launched a new product to improve diagnosis of prostate cancer. This new product has been enthusiastically received by diagnosticians and the stock price now reflects an even more optimistic future for the company.
The portfolio also benefitted from the announced buyout of portfolio holding Switch Inc., a data center company with best-in-class energy efficiency which is a key value driver within the industry. The acquisition of Switch highlights an advantage of our Private Market Value approach. Most “value managers” would have scoffed at the stock’s valuation when we initially purchased it in August of 2021. However, our analysis of prior merger and acquisition data within the data center industry suggested that the private market value of a company as well positioned as Switch was significantly higher than the prevailing price. Given the quality of the business and the discount to PMV, we were not surprised to see an interested buyer.
On the downside, our lack of exposure to the Energy sector was a material detractor from relative performance. As the economy re-opened following the COVID lock downs, demand for gasoline quickly recovered. The war in Ukraine has caused oil supply disruptions, adding fuel to the fire of rising gas prices. Energy stocks have spiked higher as a result. Dramatic swings in the price of oil leads to substantial volatility in Energy sector stock prices. We realize that dynamic can lead to brief periods of “missing out” due to our avoidance of the group. However, these companies do not typically meet our investment framework that focuses on competitively advantaged businesses. These are capital intensive companies that produce a commodity, and take whatever price the market sets. While temporary oil price spikes can leave us a with a bit of envy in the short term, high prices tend to encourage additional production, which pushes prices back down – as is the nature of commodities. We believe the portfolio will produce superior results over the long term by avoiding such commodity businesses.
Pricing power is one of the key factors we assess when considering investments for the portfolio. In recent commentaries, we have emphasized the growing importance this factor plays as inflation pressures build within the US economy. Companies that have the ability to raise prices without losing customers should perform relatively well while the cost of labor and materials are increasing rapidly. The stock prices of these ‘quality companies’ have generally performed well recently. Given the current environment, we believe this theme is in the early stages.
As of this writing, the Genesis PMV portfolio is trading at an average discount-to-PMV of 33%, which has historically proven to be an attractive level. We are confident in the portfolio’s ability to execute in the uncertain environment ahead.
Thank you for your confidence in Reinhart Partners.
Reinhart Genesis PMV Fund (Unaudited)
Sincerely,
Matt Martinek, CFA
Portfolio Manager, Reinhart Partners Inc.
Must be preceded or accompanied by a prospectus.
Past performance is not a guarantee of future results.
Mutual fund investing involves risk. There can be no guarantee that any strategy will be successful. Principal loss is possible. Investing in medium-sized companies involves greater risk than those associated with investing in large company stocks, such as business risk, significant stock price fluctuations and illiquidity. The Fund’s value investments are subject to the risk that their intrinsic values may not be recognized by the broad market or that their prices may decline.
Opinions expressed are those of the fund manager and are subject to change, are not guaranteed and should not be considered a recommendation to buy or sell any security.
| • | Russell 2500 Index: an unmanaged equity index which measures the performance of the 2,500 smallest companies in the Russell 3000 Index. It is not possible to invest directly into an index. |
| | |
| • | Russell 2500 Value Index: an unmanaged equity index which measures the performance of smid-cap companies classified by Russell as ‘value’. It is not possible to invest directly into an index. |
| | |
| • | Private Market Value (PMV): the estimated price per share of a stock that a corporate buyer or private equity firm would be willing to pay to buyout and control the entire company. |
Fund holdings and sector allocations are subject to change at any time and should not be considered recommendations to buy or sell any security. Please refer to the Schedule of Investments in this report for a complete list of fund holdings.
Quasar Distributors, LLC, Distributor.
Reinhart Genesis PMV Fund
Value of $10,000 Investment (Unaudited)
The chart assumes an initial investment of $10,000. Performance reflects waivers of fee and operating expenses in effect. In the absence of such waivers, total return would be reduced. Performance data quoted represents past performance and does not guarantee future results. Investment returns and principal value will fluctuate, and when sold, may be worth more or less than their original cost. Performance current to the most recent month-end may be lower or higher than the performance quoted and can be obtained by calling 855-774-3863. Performance assumes the reinvestment of capital gains and income distributions. The performance does not reflect the deduction of taxes that a shareholder would pay on Fund distributions or the redemption of Fund shares.
Annualized Rates of Return as of May 31, 2022
| | 1-Year | 3-Year | Since Inception(1) |
| Investor Class | -2.09% | 9.84% | 7.48% |
| Advisor Class | -1.86% | 10.11% | 7.77% |
Russell 2500 Index(2) | -11.62% | 12.05% | 7.72% |
Russell 2500 Value Index(3) | -3.81% | 12.70% | 7.30% |
| (1) | Inception date of the Fund was June 1, 2018. |
| (2) | The Russell 2500 Index measures the performance of the small to mid-cap segment of the U.S. equity universe, commonly referred to as “smid” cap. The Russell 2500 Index is a subset of the Russell 3000 Index. It includes approximately 2,500 of the smallest securities based on a combination of their market cap and current index membership. This index cannot be invested in directly. |
| (3) | The Russell 2500 Value Index measures the performance of the small to mid-cap value segment of the U.S. equity universe. It includes those Russell 2500 companies that are considered more value oriented relative to the overall market as defined by Russell’s leading style methodology. This index cannot be invested in directly. |
The following is expense information for the Reinhart Genesis PMV Fund as disclosed in the Fund’s most recent prospectus dated September 28, 2021:
| Investor Class Gross Expense Ratio – 1.49% | Net Expense Ratio – 1.20% |
| Advisor Class Gross Expense Ratio – 1.27% | Net Expense Ratio – 0.95% |
Reinhart Genesis PMV Fund
Reinhart Partners, Inc. (the “Adviser” or “Reinhart”) has contractually agreed to waive its management fees and pay Fund expenses in order to ensure that Total Annual Fund Operating Expenses (excluding AFFE, leverage/borrowing interest, interest expense, taxes, brokerage commissions, and extraordinary expenses) do not exceed 1.20% of the average daily net assets of the Investor Class and 0.95% of the average daily net assets of the Advisor Class. Fees waived and expenses paid by the Adviser may be recouped by the Adviser for a period of 36 months following the month during which such fee waiver and expense payment was made, if such recoupment can be achieved without exceeding the expense limit in effect at the time the fee waiver and expense payment occurred and the expense limit in effect at the time of recoupment. The Operating Expenses Limitation Agreement is indefinite in term and cannot be terminated through at least September 28, 2022. Thereafter, the agreement may be terminated at any time upon 60 days’ written notice by the Trust’s Board of Trustees (the “Board”) or the Adviser, with the consent of the Board.
The actual net expense ratios applicable to shareholders, as disclosed in the Financial Highlights for the year ended May 31, 2022, was 1.20% and 0.95% for the Investor Class and Advisor Class, respectively.
Reinhart Genesis PMV Fund
Allocation of Portfolio Net Assets(1) (Unaudited)
May 31, 2022
(% of Net Assets)
Top Ten Equity Holdings(1) (Unaudited)
May 31, 2022
(% of Net Assets)
| | Maxar Technologies | | | 5.1 | % |
| | Insperity | | | 4.7 | % |
| | Marcus & Millichap | | | 4.0 | % |
| | Alexander & Baldwin – REIT | | | 3.6 | % |
| | ACI Worldwide | | | 3.6 | % |
| | Grand Canyon Education | | | 3.4 | % |
| | Aerojet Rocketdyne Holdings | | | 3.4 | % |
| | First Citizens BancShares, Class A | | | 3.4 | % |
| | Air Lease, Class A | | | 3.3 | % |
| | AMERCO | | | 3.3 | % |
| (1) | Fund Holdings and Sector allocations are subject to change at any time and are not recommendations to buy or sell any security. |
Reinhart Funds
Expense Examples (Unaudited)
May 31, 2022
As a shareholder of a Fund, you incur two types of costs: (1) transaction costs and (2) ongoing costs, including management fees; distribution (12b-1) fees; shareholder service fees; and other Fund expenses. This Example is intended to help you understand your ongoing costs (in dollars) of investing in a Fund and to compare these costs with the ongoing costs of investing in other mutual funds. The Example is based on an investment of $1,000 invested at the beginning of the period and held for the entire period (December 1, 2021 – May 31, 2022).
ACTUAL EXPENSES
For each class, the first line of the table provides information about actual account values and actual expenses. You may use the information in this line, together with the amount you invested, to estimate the expenses that you paid over the period. Simply divide your account value by $1,000 (for example, an $8,600 account value divided by $1,000 = 8.6), then multiply the result by the number in the first line under the heading entitled “Expenses Paid During Period” to estimate the expenses you paid on your account during this period.
HYPOTHETICAL EXAMPLE FOR COMPARISON PURPOSES
For each class, the second line of the table below provides information about hypothetical account values and hypothetical expenses based on the Fund’s actual expense ratio and an assumed rate of return of 5% per year before expenses, which is not the Fund’s actual return. The hypothetical account values and expenses may not be used to estimate the actual ending account balance or expenses you paid for the period. You may use this information to compare the ongoing costs of investing in the Fund and other funds. To do so, compare this 5% hypothetical example with the 5% hypothetical examples that appear in the shareholder reports of the other funds.
Please note that the expenses shown in the table are meant to highlight your ongoing costs only and do not reflect any transactional costs. Therefore, the second line of the table is useful in comparing ongoing costs only, and will not help you determine the relative total costs of owning different funds. In addition, if transactional costs were included, your costs may have been higher.
Reinhart Mid Cap PMV Fund
| | Beginning | Ending | Expenses Paid |
| | Account Value | Account Value | During Period(1) |
| | (12/1/2021) | (5/31/2022) | (12/1/2021 to 5/31/2022) |
Investor Class Actual(2) | $1,000.00 | $ 980.20 | $6.42 |
Investor Class Hypothetical | | | |
(5% annual return before expenses) | $1,000.00 | $1,018.45 | $6.54 |
| | | | |
Advisor Class Actual(2) | $1,000.00 | $ 980.70 | $5.19 |
Advisor Class Hypothetical | | | |
(5% annual return before expenses) | $1,000.00 | $1,019.70 | $5.29 |
| | | | |
Institutional Class Actual(2) | $1,000.00 | $ 981.30 | $4.45 |
Institutional Class Hypothetical | | | |
(5% annual return before expenses) | $1,000.00 | $1,020.44 | $4.53 |
| (1) | Expenses are equal to the Fund’s annualized expense ratio for most recent six-month period of 1.30%, 1.05%, 0.90%, for the Investor Class, Advisor Class and Institutional Class, respectively, multiplied by the average account value over the period, multiplied by 182/365 to reflect the one-half year period. |
| (2) | Based on the actual returns for the six-month period ended May 31, 2022 of -1.98%, -1.93% and -1.87% for the Investor Class, Advisor Class and Institutional Class, respectively. |
Reinhart Funds
Expense Examples (Unaudited) – Continued
May 31, 2022
Reinhart Genesis PMV Fund
| | Beginning | Ending | Expenses Paid |
| | Account Value | Account Value | During Period(1) |
| | (12/1/2021) | (5/31/2022) | (12/1/2021 to 5/31/2022) |
Investor Class Actual(2) | $1,000.00 | $ 973.60 | $5.90 |
Investor Class Hypothetical | | | |
(5% annual return before expenses) | $1,000.00 | $1,018.95 | $6.04 |
| | | | |
Advisor Class Actual(2) | $1,000.00 | $ 974.50 | $4.68 |
Advisor Class Hypothetical | | | |
(5% annual return before expenses) | $1,000.00 | $1,020.19 | $4.78 |
| (1) | Expenses are equal to the Fund’s annualized expense ratio for most recent six-month period of 1.20% and 0.95% for the Investor Class and Advisor Class, respectively, multiplied by the average account value over the period, multiplied by 182/365 to reflect the one-half year period. |
| (2) | Based on the actual returns for the six-month period ended May 31, 2022 of -2.64% and -2.55% for the Investor Class and Advisor Class, respectively. |
Reinhart Mid Cap PMV Fund
Schedule of Investments
May 31, 2022
Description | | Shares | | | Value | |
| | | | | | | |
| COMMON STOCKS – 94.9% | | | | | | |
| | | | | | | |
| Communication Services – 2.7% | | | | | | |
Interpublic Group of Companies | | | 194,140 | | | $ | 6,257,132 | |
| | | | | | | | | |
| Consumer Discretionary – 9.5% | | | | | | | | |
Allison Transmission Holdings | | | 146,840 | | | | 5,875,068 | |
eBay | | | 81,540 | | | | 3,968,552 | |
Leslie’s* | | | 229,565 | | | | 4,458,152 | |
LKQ | | | 150,430 | | | | 7,730,598 | |
| | | | | | | | 22,032,370 | |
| | | | | | | | | |
| Consumer Staples – 2.7% | | | | | | | | |
BJ’s Wholesale Club Holdings* | | | 109,500 | | | | 6,336,765 | |
| | | | | | | | | |
| Energy – 3.5% | | | | | | | | |
Baker Hughes, Class A | | | 228,030 | | | | 8,204,519 | |
| | | | | | | | | |
| Financials – 20.4% | | | | | | | | |
American Financial Group | | | 37,000 | | | | 5,228,100 | |
BOK Financial | | | 68,541 | | | | 5,906,178 | |
Citizens Financial Group | | | 143,630 | | | | 5,943,410 | |
Loews | | | 49,145 | | | | 3,218,506 | |
Northern Trust | | | 46,695 | | | | 5,218,166 | |
Progressive | | | 43,700 | | | | 5,216,906 | |
SEI Investments | | | 80,000 | | | | 4,674,400 | |
Signature Bank | | | 24,720 | | | | 5,346,195 | |
White Mountains Insurance Group | | | 5,333 | | | | 6,638,838 | |
| | | | | | | | 47,390,699 | |
| | | | | | | | | |
| Health Care – 7.5% | | | | | | | | |
Dentsply Sirona | | | 121,691 | | | | 4,814,096 | |
Encompass Health | | | 102,687 | | | | 6,730,106 | |
Zimmer Biomet Holdings | | | 47,400 | | | | 5,697,954 | |
Zimvie* | | | 4,740 | | | | 103,190 | |
| | | | | | | | 17,345,346 | |
| | | | | | | | | |
| Industrials – 13.3% | | | | | | | | |
Aerojet Rocketdyne Holdings* | | | 132,260 | | | | 5,388,273 | |
AMERCO | | | 9,865 | | | | 4,833,653 | |
Carlisle Companies | | | 15,780 | | | | 4,014,905 | |
Curtiss-Wright | | | 33,000 | | | | 4,685,340 | |
General Dynamics | | | 14,185 | | | | 3,190,348 | |
Snap-on | | | 21,595 | | | | 4,791,499 | |
Stanley Black & Decker | | | 33,500 | | | | 3,976,115 | |
| | | | | | | | 30,880,133 | |
See Notes to the Financial Statements
Reinhart Mid Cap PMV Fund
Schedule of Investments – Continued
May 31, 2022
Description | | Shares | | | Value | |
| | | | | | | |
| COMMON STOCKS – 94.9% (Continued) | | | | | | |
| | | | | | | |
| Information Technology – 10.8% | | | | | | |
Cognizant Technology Solutions, Class A | | | 73,390 | | | $ | 5,482,233 | |
Fidelity National Financial | | | 90,000 | | | | 3,807,000 | |
Global Payments | | | 45,825 | | | | 6,004,908 | |
National Instruments | | | 141,790 | | | | 5,008,023 | |
Sensata Technologies Holding plc | | | 99,070 | | | | 4,758,332 | |
| | | | | | | | 25,060,496 | |
| | | | | | | | | |
| Materials – 5.5% | | | | | | | | |
Eagle Materials | | | 25,910 | | | | 3,382,810 | |
FMC | | | 41,705 | | | | 5,112,199 | |
Sealed Air | | | 71,030 | | | | 4,416,645 | |
| | | | | | | | 12,911,654 | |
| | | | | | | | | |
| Real Estate – 10.9% | | | | | | | | |
American Campus Communities – REIT | | | 104,000 | | | | 6,760,000 | |
Americold Realty Trust | | | 189,220 | | | | 5,239,502 | |
Camden Property Trust – REIT | | | 19,725 | | | | 2,830,340 | |
Ventas – REIT | | | 101,920 | | | | 5,782,941 | |
Weyerhaeuser – REIT | | | 122,520 | | | | 4,841,990 | |
| | | | | | | | 25,454,773 | |
| | | | | | | | | |
| Utilities – 8.1% | | | | | | | | |
Avista | | | 109,697 | | | | 4,765,238 | |
UGI | | | 101,250 | | | | 4,327,425 | |
Vistra | | | 367,750 | | | | 9,697,567 | |
| | | | | | | | 18,790,230 | |
| TOTAL COMMON STOCKS | | | | | | | | |
| (Cost $174,801,232) | | | | | | | 220,664,117 | |
| | | | | | | | | |
| SHORT-TERM INVESTMENT – 4.9% | | | | | | | | |
First American Treasury Obligations Fund, Class X, 0.67%^ | | | | | | | | |
| (Cost $11,388,087) | | | 11,388,087 | | | | 11,388,087 | |
| Total Investments – 99.8% | | | | | | | | |
| (Cost $186,189,319) | | | | | | | 232,052,204 | |
| Other Assets and Liabilities, Net – 0.2% | | | | | | | 497,419 | |
| Total Net Assets – 100.0% | | | | | | $ | 232,549,623 | |
* | Non-income producing security. |
REIT – Real Estate Investment Trust
^ | The rate shown is the annualized seven-day effective yield as of May 31, 2022. |
The Global Industry Classification Standard (“GICS”®) was developed by and is the exclusive property of MSCI, Inc. (“MSCI”) and Standard & Poor’s Financial Services LLC (“S&P”). GICS is a service mark of MSCI and S&P and has been licensed for use.
See Notes to the Financial Statements
Reinhart Genesis PMV Fund
Schedule of Investments
May 31, 2022
Description | | Shares | | | Value | |
| | | | | | | |
| COMMON STOCKS – 96.0% | | | | | | |
| | | | | | | |
| Consumer Discretionary – 13.2% | | | | | | |
Carter’s | | | 40,250 | | | $ | 3,101,263 | |
frontdoor* | | | 286,000 | | | | 7,075,640 | |
Gentex | | | 92,430 | | | | 2,872,724 | |
Grand Canyon Education* | | | 108,400 | | | | 9,666,028 | |
Hillman Solutions* | | | 770,000 | | | | 8,785,700 | |
Thor Industries | | | 73,680 | | | | 5,597,470 | |
| | | | | | | | 37,098,825 | |
| | | | | | | | | |
Financials# – 25.8% | | | | | | | | |
1st Source | | | 48,860 | | | | 2,297,397 | |
AdaptHealth* | | | 329,000 | | | | 5,918,710 | |
Air Lease, Class A | | | 248,980 | | | | 9,364,138 | |
Assured Guaranty | | | 100,000 | | | | 5,885,000 | |
First American Financial | | | 55,000 | | | | 3,332,450 | |
First Citizens BancShares, Class A | | | 13,630 | | | | 9,546,452 | |
First Hawaiian | | | 343,490 | | | | 8,796,779 | |
International Bancshares | | | 115,520 | | | | 4,843,753 | |
LPL Financial Holdings | | | 20,500 | | | | 4,021,895 | |
White Mountains Insurance Group | | | 7,400 | | | | 9,211,964 | |
Wintrust Financial | | | 103,100 | | | | 9,009,909 | |
| | | | | | | | 72,228,447 | |
| | | | | | | | | |
| Health Care – 12.4% | | | | | | | | |
Encompass Health | | | 127,920 | | | | 8,383,877 | |
Lantheus Holdings* | | | 85,000 | | | | 5,824,200 | |
Premier, Class A | | | 215,310 | | | | 8,054,747 | |
Sotera Health* | | | 328,000 | | | | 6,986,400 | |
Syneos Health, Class A* | | | 75,000 | | | | 5,541,750 | |
| | | | | | | | 34,790,974 | |
| | | | | | | | | |
| Industrials – 18.7% | | | | | | | | |
Aerojet Rocketdyne Holdings* | | | 235,000 | | | | 9,573,900 | |
AMERCO | | | 19,043 | | | | 9,330,689 | |
EMCOR Group | | | 24,300 | | | | 2,566,809 | |
Evo Payments, Class A* | | | 295,000 | | | | 6,799,750 | |
GMS* | | | 73,562 | | | | 3,664,123 | |
Insperity | | | 130,830 | | | | 13,092,158 | |
TriNet Group* | | | 94,000 | | | | 7,382,760 | |
| | | | | | | | 52,410,189 | |
See Notes to the Financial Statements
Reinhart Genesis PMV Fund
Schedule of Investments – Continued
May 31, 2022
Description | | Shares | | | Value | |
| | | | | | | |
| COMMON STOCKS – 96.0% (Continued) | | | | | | |
| | | | | | | |
| Information Technology – 14.5% | | | | | | |
ACI Worldwide* | | | 380,000 | | | $ | 10,123,200 | |
Change Healthcare* | | | 319,000 | | | | 7,684,710 | |
Maxar Technologies | | | 477,026 | | | | 14,243,996 | |
MAXIMUS | | | 55,000 | | | | 3,568,950 | |
PAR Technology* | | | 133,375 | | | | 5,012,233 | |
| | | | | | | | 40,633,089 | |
| | | | | | | | | |
| Materials – 1.6% | | | | | | | | |
Element Solutions | | | 203,000 | | | | 4,321,870 | |
| | | | | | | | | |
| Real Estate – 9.8% | | | | | | | | |
Alexander & Baldwin – REIT | | | 500,836 | | | | 10,217,054 | |
Marcus & Millichap | | | 265,060 | | | | 11,100,713 | |
Ryman Hospitality Properties – REIT* | | | 69,440 | | | | 6,200,298 | |
| | | | | | | | 27,518,065 | |
| TOTAL COMMON STOCKS | | | | | | | | |
| (Cost $250,914,958) | | | | | | | 269,001,459 | |
| | | | | | | | | |
| SHORT-TERM INVESTMENT – 4.6% | | | | | | | | |
First American Treasury Obligations Fund, Class X, 0.67%^ | | | | | | | | |
| (Cost $12,985,666) | | | 12,985,666 | | | | 12,985,666 | |
| Total Investments – 100.6% | | | | | | | | |
| (Cost $263,900,624) | | | | | | | 281,987,125 | |
| Other Assets and Liabilities, Net – (0.6)% | | | | | | | (1,633,698 | ) |
| Total Net Assets – 100.0% | | | | | | $ | 280,353,427 | |
| * | Non-income producing security. |
| # | As of May 31, 2022, the Fund had a significant portion of its assets invested in this sector. See Note 9 in the Notes to the Financial Statements. |
REIT – Real Estate Investment Trust
| ^ | The rate shown is the annualized seven-day effective yield as of May 31, 2022. |
The Global Industry Classification Standard (“GICS”®) was developed by and is the exclusive property of MSCI, Inc. (“MSCI”) and Standard & Poor’s Financial Services LLC (“S&P”). GICS is a service mark of MSCI and S&P and has been licensed for use.
See Notes to the Financial Statements
Reinhart Funds
Statements of Assets and Liabilities
May 31, 2022
| | | Mid Cap | | | Genesis | |
| | | PMV Fund | | | PMV Fund | |
| ASSETS: | | | | | | |
Investments, at value | | | | | | |
(cost $186,189,319 and $263,900,624) | | $ | 232,052,204 | | | $ | 281,987,125 | |
Dividends & interest receivable | | | 192,251 | | | | 214,420 | |
Receivable for capital shares sold | | | 855,568 | | | | 553,135 | |
Receivable for foreign withholding tax reclaim | | | 1,357 | | | | — | |
Prepaid expenses | | | 21,533 | | | | 27,874 | |
Total assets | | | 233,122,913 | | | | 282,782,554 | |
| | | | | | | | | |
| LIABILITIES: | | | | | | | | |
Payable for investment securities purchased | | | — | | | | 1,628,587 | |
Payable for capital shares redeemed | | | 250,000 | | | | 468,937 | |
Payable to investment adviser | | | 155,408 | | | | 185,272 | |
Payable for fund administration & accounting fees | | | 57,074 | | | | 62,253 | |
Payable for compliance fees | | | 3,132 | | | | 3,131 | |
Payable for transfer agent fees & expenses | | | 22,200 | | | | 12,781 | |
Payable for custody fees | | | 2,143 | | | | 3,405 | |
Accrued distribution & shareholder service fees | | | 49,633 | | | | 29,155 | |
Accrued other fees | | | 33,700 | | | | 35,606 | |
Total liabilities | | | 573,290 | | | | 2,429,127 | |
| | | | | | | | | |
| NET ASSETS | | $ | 232,549,623 | | | $ | 280,353,427 | |
| | | | | | | | | |
| NET ASSETS CONSIST OF: | | | | | | | | |
Paid-in capital | | $ | 187,158,226 | | | $ | 252,642,305 | |
Total distributable earnings | | | 45,391,397 | | | | 27,711,122 | |
Net Assets | | $ | 232,549,623 | | | $ | 280,353,427 | |
| | | | | | | | | |
| Investor Class | | | | | | | | |
Net Assets | | $ | 25,776,937 | | | $ | 17,299,452 | |
Shares issued and outstanding(1) | | | 1,404,710 | | | | 1,378,005 | |
Net asset value, redemption price and offering price per share | | $ | 18.35 | | | $ | 12.55 | |
| | | | | | | | | |
| Advisor Class | | | | | | | | |
Net Assets | | $ | 172,639,838 | | | $ | 263,053,975 | |
Shares issued and outstanding(1) | | | 9,423,547 | | | | 20,857,504 | |
Net asset value, redemption price and offering price per share | | $ | 18.32 | | | $ | 12.61 | |
| | | | | | | | | |
| Institutional Class | | | | | | | | |
Net Assets | | $ | 34,132,848 | | | | — | |
Shares issued and outstanding(1) | | | 1,855,180 | | | | — | |
Net asset value, redemption price and offering price per share | | $ | 18.40 | | | | — | |
(1) | Unlimited shares authorized without par value. |
See Notes to the Financial Statements
Reinhart Funds
Statements of Operations
For the Year Ended May 31, 2022
| | | Mid Cap | | | Genesis | |
| | | PMV Fund | | | PMV Fund | |
| INVESTMENT INCOME: | | | | | | |
Dividend income | | $ | 4,680,945 | | | $ | 3,609,301 | |
Interest income | | | 9,529 | | | | 9,290 | |
Total investment income | | | 4,690,474 | | | | 3,618,591 | |
| | | | | | | | | |
| EXPENSES: | | | | | | | | |
Investment adviser fees (See Note 4) | | | 2,061,944 | | | | 2,494,818 | |
Fund administration & accounting fees (See Note 4) | | | 244,643 | | | | 249,756 | |
Transfer agent fees & expenses (See Note 4) | | | 96,170 | | | | 60,200 | |
Federal & state registration fees | | | 51,057 | | | | 42,409 | |
Audit fees | | | 17,992 | | | | 17,505 | |
Trustee fees | | | 17,991 | | | | 17,991 | |
Postage & printing fees | | | 16,107 | | | | 19,233 | |
Custody fees (See Note 4) | | | 15,697 | | | | 18,856 | |
Compliance fees (See Note 4) | | | 12,714 | | | | 12,714 | |
Other fees | | | 8,505 | | | | 7,945 | |
Legal fees | | | 7,951 | | | | 7,847 | |
Insurance fees | | | 2,699 | | | | 2,674 | |
Distribution & shareholder service fees (See Note 5): | | | | | | | | |
Investor Class | | | 82,067 | | | | 44,424 | |
Advisor Class | | | 68,096 | | | | 91,477 | |
Total expenses before waiver | | | 2,703,633 | | | | 3,087,849 | |
Less: waiver from investment adviser (See Note 4) | | | (300,293 | ) | | | (550,093 | ) |
Net expenses | | | 2,403,340 | | | | 2,537,756 | |
| | | | | | | | | |
| NET INVESTMENT INCOME | | | 2,287,134 | | | | 1,080,835 | |
| | | | | | | | | |
| REALIZED AND UNREALIZED GAIN (LOSS) ON INVESTMENTS: | | | | | | | | |
Net realized gain on investments | | | 18,784,497 | | | | 22,011,459 | |
Net change in unrealized appreciation/depreciation on investments | | | (17,249,632 | ) | | | (28,764,118 | ) |
Net realized and unrealized gain (loss) on investments | | | 1,534,865 | | | | (6,752,659 | ) |
| | | | | | | | | |
| NET INCREASE (DECREASE) IN NET ASSETS | | | | | | | | |
| RESULTING FROM OPERATIONS | | $ | 3,821,999 | | | $ | (5,671,824 | ) |
See Notes to the Financial Statements
Reinhart Mid Cap PMV Fund
Statements of Changes in Net Assets
| | | Year Ended | | | Year Ended | |
| | | May 31, 2022 | | | May 31, 2021 | |
| OPERATIONS: | | | | | | |
Net investment income | | $ | 2,287,134 | | | $ | 1,690,974 | |
Net realized gain on investments | | | 18,784,497 | | | | 5,830,350 | |
Net change in unrealized appreciation/depreciation on investments | | | (17,249,632 | ) | | | 69,856,079 | |
Net increase in net assets resulting from operations | | | 3,821,999 | | | | 77,377,403 | |
| | | | | | | | | |
| CAPITAL SHARE TRANSACTIONS: | | | | | | | | |
Investor Class: | | | | | | | | |
| Proceeds from shares sold | | | 6,805,015 | | | | 1,907,972 | |
| Proceeds from reinvestment of distributions | | | 164,757 | | | | 126,735 | |
| Payments for shares redeemed | | | (2,237,535 | ) | | | (2,425,071 | ) |
Increase (decrease) in net assets from Investor Class transactions | | | 4,732,237 | | | | (390,364 | ) |
Advisor Class: | | | | | | | | |
| Proceeds from shares sold | | | 35,075,397 | | | | 38,817,590 | |
| Proceeds from reinvestment of distributions | | | 1,747,128 | | | | 1,205,266 | |
| Payments for shares redeemed | | | (32,268,119 | ) | | | (51,316,729 | ) |
Increase (decrease) in net assets from Advisor Class transactions | | | 4,554,406 | | | | (11,293,873 | ) |
Institutional Class: | | | | | | | | |
| Proceeds from shares sold | | | 12,598,242 | | | | 6,190,900 | |
| Proceeds from reinvestment of distributions | | | 437,449 | | | | 379,903 | |
| Payments for shares redeemed | | | (17,782,304 | ) | | | (12,451,641 | ) |
Decrease in net assets from Institutional Class transactions | | | (4,746,613 | ) | | | (5,880,838 | ) |
Net increase (decrease) in net assets resulting from capital share transactions | | | 4,540,030 | | | | (17,565,075 | ) |
| | | | | | | | | |
| DISTRIBUTIONS TO SHAREHOLDERS: | | | | | | | | |
| Net distributions to shareholders – Investor Class | | | (165,916 | ) | | | (129,165 | ) |
| Net distributions to shareholders – Advisor Class | | | (1,885,093 | ) | | | (1,285,042 | ) |
| Net distributions to shareholders – Institutional Class | | | (461,132 | ) | | | (392,526 | ) |
Total distributions to shareholders | | | (2,512,141 | ) | | | (1,806,733 | ) |
| | | | | | | | | |
| TOTAL INCREASE IN NET ASSETS | | | 5,849,888 | | | | 58,005,595 | |
| | | | | | | | | |
| NET ASSETS: | | | | | | | | |
Beginning of year | | | 226,699,735 | | | | 168,694,140 | |
End of year | | $ | 232,549,623 | | | $ | 226,699,735 | |
See Notes to the Financial Statements
Reinhart Genesis PMV Fund
Statements of Changes in Net Assets
| | | Year Ended | | | Year Ended | |
| | | May 31, 2022 | | | May 31, 2021 | |
OPERATIONS:
| | | | | | | | |
Net investment income | | $ | 1,080,835 | | | $ | 783,190 | |
Net realized gain on investments | | | 22,011,459 | | | | 4,498,444 | |
Net change in unrealized appreciation/depreciation on investments | | | (28,764,118 | ) | | | 48,913,743 | |
Net increase (decrease) in net assets resulting from operations | | | (5,671,824 | ) | | | 54,195,377 | |
| | | | | | | | | |
| CAPITAL SHARE TRANSACTIONS: | | | | | | | | |
Investor Class: | | | | | | | | |
| Proceeds from shares sold | | | 2,020 | | | | 1,352,760 | |
| Proceeds from reinvestment of distributions | | | 750,468 | | | | 8,573 | |
| Payments for shares redeemed | | | (669 | ) | | | (10,642 | ) |
Increase in net assets from Investor Class transactions | | | 751,819 | | | | 1,350,691 | |
Advisor Class: | | | | | | | | |
| Proceeds from shares sold | | | 135,146,060 | | | | 126,676,426 | |
| Proceeds from reinvestment of distributions | | | 10,433,243 | | | | 190,312 | |
| Payments for shares redeemed | | | (58,412,524 | ) | | | (40,616,022 | ) |
Increase in net assets from Advisor Class transactions | | | 87,166,779 | | | | 86,250,716 | |
Net increase in net assets resulting from capital share transactions | | | 87,918,598 | | | | 87,601,407 | |
| | | | | | | | | |
| DISTRIBUTIONS TO SHAREHOLDERS: | | | | | | | | |
| Net distributions to shareholders – Investor Class | | | (750,468 | ) | | | (8,573 | ) |
| Net distributions to shareholders – Advisor Class | | | (10,801,957 | ) | | | (196,298 | ) |
Total distributions to shareholders | | | (11,552,425 | ) | | | (204,871 | ) |
| | | | | | | | | |
| TOTAL INCREASE IN NET ASSETS | | | 70,694,349 | | | | 141,591,913 | |
| | | | | | | | | |
| NET ASSETS: | | | | | | | | |
Beginning of year | | | 209,659,078 | | | | 68,067,165 | |
End of year | | $ | 280,353,427 | | | $ | 209,659,078 | |
See Notes to the Financial Statements
Reinhart Mid Cap PMV Fund
Financial Highlights
For a Fund share outstanding throughout the year.
| | | Year Ended | | | Year Ended | | | Year Ended | | | Year Ended | | | Year Ended | |
| | | May 31, 2022 | | | May 31, 2021 | | | May 31, 2020 | | | May 31, 2019 | | | May 31, 2018 | |
| Investor Class | | | | | | | | | | | | | | | |
| | | | | | | | | | | | | | | | |
| PER SHARE DATA: | | | | | | | | | | | | | | | |
Net asset value, beginning of year | | $ | 18.23 | | | $ | 12.23 | | | $ | 13.76 | | | $ | 16.02 | | | $ | 15.49 | |
| | | | | | | | | | | | | | | | | | | | | |
| INVESTMENT OPERATIONS: | | | | | | | | | | | | | | | | | | | | |
| Net investment income | | | 0.12 | | | | 0.10 | | | | 0.09 | | | | 0.05 | | | | 0.08 | |
| Net realized and unrealized | | | | | | | | | | | | | | | | | | | | |
| gain (loss) on investments | | | 0.14 | | | | 6.01 | | | | (1.54 | ) | | | (1.12 | ) | | | 1.82 | |
| Total from investment operations | | | 0.26 | | | | 6.11 | | | | (1.45 | ) | | | (1.07 | ) | | | 1.90 | |
| | | | | | | | | | | | | | | | | | | | | |
| LESS DISTRIBUTIONS FROM: | | | | | | | | | | | | | | | | | | | | |
| Net investment income | | | (0.14 | ) | | | (0.11 | ) | | | (0.08 | ) | | | (0.02 | ) | | | (0.04 | ) |
| Net realized gains | | | — | | | | — | | | | — | | | | (1.17 | ) | | | (1.33 | ) |
| Total distributions | | | (0.14 | ) | | | (0.11 | ) | | | (0.08 | ) | | | (1.19 | ) | | | (1.37 | ) |
| | | | | | | | | | | | | | | | | | | | | |
Net asset value, end of year | | $ | 18.35 | | | $ | 18.23 | | | $ | 12.23 | | | $ | 13.76 | | | $ | 16.02 | |
| | | | | | | | | | | | | | | | | | | | | |
| TOTAL RETURN | | | 1.43 | % | | | 50.16 | % | | | -10.67 | % | | | -5.89 | % | | | 12.56 | % |
| | | | | | | | | | | | | | | | | | | | | |
| SUPPLEMENTAL DATA AND RATIOS: | | | | | | | | | | | | | | | | | | | | |
Net assets, end of year (in millions) | | $ | 25.8 | | | $ | 21.0 | | | $ | 14.4 | | | $ | 17.0 | | | $ | 18.1 | |
| | | | | | | | | | | | | | | | | | | | | |
Ratio of expenses to average net assets: | | | | | | | | | | | | | | | | | | | | |
| Before expense waiver | | | 1.48 | % | | | 1.57 | % | | | 1.58 | % | | | 1.52 | % | | | 1.56 | % |
| After expense waiver | | | 1.30 | % | | | 1.30 | % | | | 1.30 | % | | | 1.30 | % | | | 1.32 | % |
| | | | | | | | | | | | | | | | | | | | | |
Ratio of net investment income | | | | | | | | | | | | | | | | | | | | |
to average net assets: | | | | | | | | | | | | | | | | | | | | |
| Before expense waiver | | | 0.57 | % | | | 0.38 | % | | | 0.33 | % | | | 0.18 | % | | | 0.08 | % |
| After expense waiver | | | 0.75 | % | | | 0.65 | % | | | 0.61 | % | | | 0.40 | % | | | 0.32 | % |
| | | | | | | | | | | | | | | | | | | | | |
Portfolio turnover rate | | | 31 | % | | | 38 | % | | | 53 | % | | | 54 | % | | | 77 | % |
See Notes to the Financial Statements
Reinhart Mid Cap PMV Fund
Financial Highlights
For a Fund share outstanding throughout the year.
| | | Year Ended | | | Year Ended | | | Year Ended | | | Year Ended | | | Year Ended | |
| | | May 31, 2022 | | | May 31, 2021 | | | May 31, 2020 | | | May 31, 2019 | | | May 31, 2018 | |
| Advisor Class | | | | | | | | | | | | | | | |
| | | | | | | | | | | | | | | | |
| PER SHARE DATA: | | | | | | | | | | | | | | | |
Net asset value, beginning of year | | $ | 18.22 | | | $ | 12.22 | | | $ | 13.75 | | | $ | 16.05 | | | $ | 15.54 | |
| | | | | | | | | | | | | | | | | | | | | |
| INVESTMENT OPERATIONS: | | | | | | | | | | | | | | | | | | | | |
| Net investment income | | | 0.19 | | | | 0.15 | | | | 0.12 | | | | 0.10 | | | | 0.09 | |
| Net realized and unrealized | | | | | | | | | | | | | | | | | | | | |
| gain (loss) on investments | | | 0.12 | | | | 6.00 | | | | (1.53 | ) | | | (1.15 | ) | | | 1.85 | |
| Total from investment operations | | | 0.31 | | | | 6.15 | | | | (1.41 | ) | | | (1.05 | ) | | | 1.94 | |
| | | | | | | | | | | | | | | | | | | | | |
| LESS DISTRIBUTIONS FROM: | | | | | | | | | | | | | | | | | | | | |
| Net investment income | | | (0.21 | ) | | | (0.15 | ) | | | (0.12 | ) | | | (0.08 | ) | | | (0.10 | ) |
| Net realized gains | | | — | | | | — | | | | — | | | | (1.17 | ) | | | (1.33 | ) |
| Total distributions | | | (0.21 | ) | | | (0.15 | ) | | | (0.12 | ) | | | (1.25 | ) | | | (1.43 | ) |
| | | | | | | | | | | | | | | | | | | | | |
Net asset value, end of year | | $ | 18.32 | | | $ | 18.22 | | | $ | 12.22 | | | $ | 13.75 | | | $ | 16.05 | |
| | | | | | | | | | | | | | | | | | | | | |
| TOTAL RETURN | | | 1.68 | % | | | 50.56 | % | | | -10.41 | % | | | -5.69 | % | | | 12.81 | % |
| | | | | | | | | | | | | | | | | | | | | |
| SUPPLEMENTAL DATA AND RATIOS: | | | | | | | | | | | | | | | | | | | | |
Net assets, end of year (in millions) | | $ | 172.6 | | | $ | 167.3 | | | $ | 123.8 | | | $ | 157.9 | | | $ | 165.5 | |
| | | | | | | | | | | | | | | | | | | | | |
Ratio of expenses to average net assets: | | | | | | | | | | | | | | | | | | | | |
| Before expense waiver | | | 1.16 | % | | | 1.24 | % | | | 1.25 | % | | | 1.22 | % | | | 1.26 | % |
| After expense waiver | | | 1.05 | % | | | 1.05 | % | | | 1.05 | % | | | 1.05 | % | | | 1.07 | % |
Ratio of net investment income | | | | | | | | | | | | | | | | | | | | |
to average net assets: | | | | | | | | | | | | | | | | | | | | |
| Before expense waiver | | | 0.89 | % | | | 0.71 | % | | | 0.65 | % | | | 0.48 | % | | | 0.40 | % |
| After expense waiver | | | 1.00 | % | | | 0.90 | % | | | 0.86 | % | | | 0.65 | % | | | 0.59 | % |
| | | | | | | | | | | | | | | | | | | | | |
Portfolio turnover rate | | | 31 | % | | | 38 | % | | | 53 | % | | | 54 | % | | | 77 | % |
See Notes to the Financial Statements
Reinhart Mid Cap PMV Fund
Financial Highlights
For a Fund share outstanding throughout the period.
| | | | | | | | | | | | | | | For the Period | |
| | | Year Ended | | | Year Ended | | | Year Ended | | | Year Ended | | | Inception(1) through | |
| | | May 31, 2022 | | | May 31, 2021 | | | May 31, 2020 | | | May 31, 2019 | | | May 31, 2018 | |
| Institutional Class | | | | | | | | | | | | | | | |
| | | | | | | | | | | | | | | | |
| PER SHARE DATA: | | | | | | | | | | | | | | | |
Net asset value, beginning of period | | $ | 18.27 | | | $ | 12.25 | | | $ | 13.77 | | | $ | 16.06 | | | $ | 16.11 | |
| | | | | | | | | | | | | | | | | | | | | |
| INVESTMENT OPERATIONS: | | | | | | | | | | | | | | | | | | | | |
| Net investment income | | | 0.21 | | | | 0.16 | | | | 0.15 | | | | 0.12 | | | | 0.13 | |
| Net realized and unrealized | | | | | | | | | | | | | | | | | | | | |
| gain (loss) on investments | | | 0.13 | | | | 6.02 | | | | (1.54 | ) | | | (1.15 | ) | | | 1.26 | |
| Total from investment operations | | | 0.34 | | | | 6.18 | | | | (1.39 | ) | | | (1.03 | ) | | | 1.39 | |
| | | | | | | | | | | | | | | | | | | | | |
| LESS DISTRIBUTIONS FROM: | | | | | | | | | | | | | | | | | | | | |
| Net investment income | | | (0.21 | ) | | | (0.16 | ) | | | (0.13 | ) | | | (0.09 | ) | | | (0.11 | ) |
| Net realized gains | | | — | | | | — | | | | — | | | | (1.17 | ) | | | (1.33 | ) |
| Total distributions | | | (0.21 | ) | | | (0.16 | ) | | | (0.13 | ) | | | (1.26 | ) | | | (1.44 | ) |
| | | | | | | | | | | | | | | | | | | | | |
Net asset value, end of period | | $ | 18.40 | | | $ | 18.27 | | | $ | 12.25 | | | $ | 13.77 | | | $ | 16.06 | |
| | | | | | | | | | | | | | | | | | | | | |
| TOTAL RETURN | | | 1.87 | % | | | 50.75 | % | | | -10.28 | % | | | -5.57 | % | | | 8.92 | %(2) |
| | | | | | | | | | | | | | | | | | | | | |
| SUPPLEMENTAL DATA AND RATIOS: | | | | | | | | | | | | | | | | | | | | |
Net assets, end of period (in millions) | | $ | 34.1 | | | $ | 38.4 | | | $ | 30.5 | | | $ | 44.9 | | | $ | 40.0 | |
| | | | | | | | | | | | | | | | | | | | | |
Ratio of expenses to average net assets: | | | | | | | | | | | | | | | | | | | | |
| Before expense waiver | | | 1.12 | % | | | 1.18 | % | | | 1.17 | % | | | 1.16 | % | | | 1.19 | %(3) |
| After expense waiver | | | 0.90 | % | | | 0.90 | % | | | 0.90 | % | | | 0.90 | % | | | 0.90 | %(3) |
| | | | | | | | | | | | | | | | | | | | | |
Ratio of net investment income | | | | | | | | | | | | | | | | | | | | |
to average net assets: | | | | | | | | | | | | | | | | | | | | |
| Before expense waiver | | | 0.93 | % | | | 0.77 | % | | | 0.73 | % | | | 0.54 | % | | | 0.29 | %(3) |
| After expense waiver | | | 1.15 | % | | | 1.05 | % | | | 1.01 | % | | | 0.80 | % | | | 0.58 | %(3) |
| | | | | | | | | | | | | | | | | | | | | |
Portfolio turnover rate | | | 31 | % | | | 38 | % | | | 53 | % | | | 54 | % | | | 77 | %(2) |
(1) | Inception date of the Institutional Class was September 29, 2017. |
(2) | Not annualized. |
(3) | Annualized. |
| | |
See Notes to the Financial Statements
Reinhart Genesis PMV Fund
Financial Highlights
For a Fund share outstanding throughout the year.
| | | Year Ended | | | Year Ended | | | Year Ended | | | Year Ended | |
| | | May 31, 2022 | | | May 31, 2021 | | | May 31, 2020 | | | May 31, 2019 | |
| Investor Class | | | | | | | | | | | | |
| | | | | | | | | | | | | |
| PER SHARE DATA: | | | | | | | | | | | | |
Net asset value, beginning of year | | $ | 13.39 | | | $ | 8.71 | | | $ | 9.94 | | | $ | 10.00 | |
| | | | | | | | | | | | | | | | | |
| INVESTMENT OPERATIONS: | | | | | | | | | | | | | | | | |
| Net investment income | | | 0.03 | | | | 0.04 | | | | 0.02 | | | | 0.03 | |
| Net realized and unrealized | | | | | | | | | | | | | | | | |
| gain (loss) on investments | | | (0.30 | ) | | | 4.65 | | | | (1.20 | ) | | | 0.03 | (1) |
| Total from investment operations | | | (0.27 | ) | | | 4.69 | | | | (1.18 | ) | | | 0.06 | |
| | | | | | | | | | | | | | | | | |
| LESS DISTRIBUTIONS FROM: | | | | | | | | | | | | | | | | |
| Net investment income | | | (0.06 | ) | | | (0.01 | ) | | | (0.01 | ) | | | (0.02 | ) |
| Net realized gains | | | (0.51 | ) | | | — | | | | (0.04 | ) | | | (0.10 | ) |
| Total distributions | | | (0.57 | ) | | | (0.01 | ) | | | (0.05 | ) | | | (0.12 | ) |
| | | | | | | | | | | | | | | | | |
Net asset value, end of year | | $ | 12.55 | | | $ | 13.39 | | | $ | 8.71 | | | $ | 9.94 | |
| | | | | | | | | | | | | | | | | |
| TOTAL RETURN | | | -2.09 | % | | | 53.82 | % | | | -12.00 | % | | | 0.69 | % |
| | | | | | | | | | | | | | | | | |
| SUPPLEMENTAL DATA AND RATIOS: | | | | | | | | | | | | | | | | |
Net assets, end of year (in millions) | | $ | 17.3 | | | $ | 17.7 | | | $ | 10.3 | | | $ | 10.6 | |
| | | | | | | | | | | | | | | | | |
Ratio of expenses to average net assets: | | | | | | | | | | | | | | | | |
| Before expense reimbursement/waiver | | | 1.37 | % | | | 1.49 | % | | | 1.99 | % | | | 3.13 | % |
| After expense reimbursement/waiver | | | 1.20 | % | | | 1.20 | % | | | 1.20 | % | | | 1.20 | % |
Ratio of net investment income (loss) | | | | | | | | | | | | | | | | |
to average net assets: | | | | | | | | | | | | | | | | |
| Before expense reimbursement/waiver | | | 0.01 | % | | | 0.09 | % | | | (0.60 | )% | | | (1.67 | )% |
| After expense reimbursement/waiver | | | 0.18 | % | | | 0.38 | % | | | 0.19 | % | | | 0.26 | % |
| | | | | | | | | | | | | | | | | |
Portfolio turnover rate | | | 33 | % | | | 32 | % | | | 46 | % | | | 31 | % |
| (1) | Realized and unrealized gain on investments per share in this caption are balancing amounts necessary to reconcile the change in net asset value per share for the year, and may not reconcile with the aggregate gains and losses in the Statements of Operations due to share transactions for the year. |
See Notes to the Financial Statements
Reinhart Genesis PMV Fund
Financial Highlights
For a Fund share outstanding throughout the year.
| | | Year Ended | | | Year Ended | | | Year Ended | | | Year Ended | |
| | | May 31, 2022 | | | May 31, 2021 | | | May 31, 2020 | | | May 31, 2019 | |
| Advisor Class | | | | | | | | | | | | |
| | | | | | | | | | | | | |
| PER SHARE DATA: | | | | | | | | | | | | |
Net asset value, beginning of year | | $ | 13.45 | | | $ | 8.73 | | | $ | 9.96 | | | $ | 10.00 | |
| | | | | | | | | | | | | | | | | |
| INVESTMENT OPERATIONS: | | | | | | | | | | | | | | | | |
| Net investment income | | | 0.05 | | | | 0.05 | | | | 0.03 | | | | 0.04 | |
| Net realized and unrealized | | | | | | | | | | | | | | | | |
| gain (loss) on investments | | | (0.29 | ) | | | 4.69 | | | | (1.20 | ) | | | 0.05 | (1) |
| Total from investment operations | | | (0.24 | ) | | | 4.74 | | | | (1.17 | ) | | | 0.09 | |
| | | | | | | | | | | | | | | | | |
| LESS DISTRIBUTIONS FROM: | | | | | | | | | | | | | | | | |
| Net investment income | | | (0.09 | ) | | | (0.02 | ) | | | (0.02 | ) | | | (0.03 | ) |
| Net realized gains | | | (0.51 | ) | | | — | | | | (0.04 | ) | | | (0.10 | ) |
| Total distributions | | | (0.60 | ) | | | (0.02 | ) | | | (0.06 | ) | | | (0.13 | ) |
| | | | | | | | | | | | | | | | | |
Net asset value, end of year | | $ | 12.61 | | | $ | 13.45 | | | $ | 8.73 | | | $ | 9.96 | |
| | | | | | | | | | | | | | | | | |
| TOTAL RETURN | | | -1.86 | % | | | 54.33 | % | | | -11.85 | % | | | 1.04 | % |
| | | | | | | | | | | | | | | | | |
| SUPPLEMENTAL DATA AND RATIOS: | | | | | | | | | | | | | | | | |
Net assets, end of year (in millions) | | $ | 263.1 | | | $ | 192.0 | | | $ | 57.7 | | | $ | 5.9 | |
| | | | | | | | | | | | | | | | | |
Ratio of expenses to average net assets: | | | | | | | | | | | | | | | | |
| Before expense reimbursement/waiver | | | 1.16 | % | | | 1.27 | % | | | 1.66 | % | | | 2.87 | % |
| After expense reimbursement/waiver | | | 0.95 | % | | | 0.95 | % | | | 0.95 | % | | | 0.95 | % |
Ratio of net investment income (loss) | | | | | | | | | | | | | | | | |
to average net assets: | | | | | | | | | | | | | | | | |
| Before expense reimbursement/waiver | | | 0.22 | % | | | 0.32 | % | | | (0.27 | )% | | | (1.35 | )% |
| After expense reimbursement/waiver | | | 0.43 | % | | | 0.64 | % | | | 0.44 | % | | | 0.57 | % |
| | | | | | | | | | | | | | | | | |
Portfolio turnover rate | | | 33 | % | | | 32 | % | | | 46 | % | | | 31 | % |
| (1) | Realized and unrealized gain on investments per share in this caption are balancing amounts necessary to reconcile the change in net asset value per share for the year, and may not reconcile with the aggregate gains and losses in the Statements of Operations due to share transactions for the year. |
See Notes to the Financial Statements
Reinhart Funds
Notes to the Financial Statements
May 31, 2022
1. ORGANIZATION
Managed Portfolio Series (the “Trust”) was organized as a Delaware statutory trust under a Declaration of Trust dated January 27, 2011. The Trust is registered under the Investment Company Act of 1940, as amended (the “1940 Act”), as an open-end management investment company. The Reinhart Mid Cap PMV Fund (the “Mid Cap Fund”) and Reinhart Genesis PMV Fund (the “Genesis Fund”) (each a “Fund” and collectively, the “Funds”) are each a diversified series with their own investment objectives and policies within the Trust. The investment objective of the Funds is long-term capital appreciation. The Funds are investment companies and accordingly follow the investment company accounting and reporting guidance of the Financial Accounting Standards Board (“FASB”) Accounting Standards Board Codification Topic 946 Financial Services – Investment Companies. The Mid Cap Fund commenced operations on June 1, 2012 and the Genesis Fund commenced operations on June 1, 2018. The Mid Cap Fund currently offers three classes of shares, the Investor Class, Advisor Class and the Institutional Class. The Mid Cap Fund Institutional Class commenced operations on September 29, 2017. The Genesis Fund currently offers two classes of shares, the Investor Class and the Advisor Class. Investor Class shares are subject to a 0.25% Rule 12b-1 distribution and servicing fee. The Investor Class and Advisor Class shares are subject to a maximum 0.15% shareholder servicing fee. Each class of shares has identical rights and privileges except with respect to the distribution fees and voting rights on matters affecting a single share class. The Funds may issue an unlimited number of shares of beneficial interest, with no par value.
2. SIGNIFICANT ACCOUNTING POLICIES
The following is a summary of significant accounting policies consistently followed by the Fund in preparation of its financial statements. These policies are in conformity with generally accepted accounting principles in the United States of America (“GAAP”).
Security Valuation – All investments in securities are recorded at their estimated fair value, as described in Note 3.
Federal Income Taxes – The Funds comply with the requirements of subchapter M of the Internal Revenue Code of 1986, as amended, necessary to qualify as a regulated investment company and distributes substantially all net taxable investment income and net realized gains to shareholders in a manner which results in no tax cost to the Funds. Therefore, no federal income tax provision is required. As of and during the year ended May 31, 2022, the Funds did not have any tax positions that did not meet the “more-likely-than-not” threshold of being sustained by the applicable tax authority. The Funds recognize interest and penalties, if any, related to unrecognized tax benefits on uncertain tax positions as income tax expense in the Statements of Operations. As of and during the year ended May 31, 2022, the Funds did not incur any interest or penalties. The Funds are not subject to examination by U.S. tax authorities for tax years prior to the year ended May 31, 2019.
Security Transactions and Investment Income – The Funds follow industry practice and record security transactions on the trade date. Realized gains and losses on sales of securities are calculated on the basis of identified cost. Dividend income is recorded on the ex-dividend date and interest income is recorded on an accrual basis. Withholding taxes on foreign dividends have been provided for in accordance with the Funds’ understanding of the applicable country’s tax rules and regulations. Discounts and premiums on securities purchased are amortized over the expected life of the respective securities using the constant yield method.
The Funds distribute all net investment income, if any, and net realized capital gains, if any, annually. Distributions to shareholders are recorded on the ex-dividend date. The Funds may utilize earnings and profits distributed to shareholders on redemptions of shares as part of the dividends paid deduction. The treatment for
Reinhart Funds
Notes to the Financial Statements – Continued
May 31, 2022
financial reporting purposes of distributions made to shareholders during the year from net investment income or net realized capital gains may differ from their ultimate treatment for federal income tax purposes. These differences are caused primarily by differences in the timing of the recognition of certain components of income, expense or realized capital gain for federal income tax purposes. Where such differences are permanent in nature, GAAP requires that they be reclassified in the components of the net assets based on their ultimate characterization for federal income tax purposes. Any such reclassifications will have no effect on net assets, results of operations or net asset values per share of the Funds. For the year ended May 31, 2022, no such reclassifications were made for the Mid Cap Fund. The Genesis Fund increased paid-in-capital and decreased distributable earnings by $1,648,243. The permanent difference is due to the usage of tax equalization.
Use of Estimates – The preparation of financial statements in conformity with GAAP requires management to make estimates and assumptions that affect the reported amounts of assets and liabilities and disclosure of contingent assets and liabilities at the date of the financial statements and the reported amounts of revenues and expenses during the reporting period. Actual results could differ from those estimates.
Allocation of Income, Expenses and Gains/Losses – Income, expenses (other than those deemed attributable to a specific share class), and gains and losses of the Funds are allocated daily to each class of shares based upon the ratio of net assets represented by each class as a percentage of the net assets of each Fund. Expenses deemed directly attributable to a class of shares are recorded by the specific class. Most Fund expenses are allocated by class based on relative net assets. Shareholder servicing fees are expensed at an annual rate up to 0.15% of Investor Class and Advisor Class shares and 12b-1 fees are expensed at 0.25% of average daily net assets of Investor Class shares (See Note 5). Expenses associated with a specific fund in the Trust are charged to that fund. Common Trust expenses are typically allocated evenly between the funds of the Trust, or by other equitable means.
3. SECURITIES VALUATION
The Funds have adopted authoritative fair value accounting standards which establish an authoritative definition of fair value and set out a hierarchy for measuring fair value. These standards require additional disclosures about the various inputs and valuation techniques used to develop the measurements of fair value, a discussion of changes in valuation techniques and related inputs during the period and expanded disclosure of valuation levels for major security types. These inputs are summarized in the three broad levels listed below:
| Level 1 – | Unadjusted quoted prices in active markets for identical assets or liabilities that the Funds have the ability to access. |
| | |
| Level 2 – | Observable inputs other than quoted prices included in Level 1 that are observable for the asset or liability, either directly or indirectly. These inputs may include quoted prices for the identical instrument on an inactive market, prices for similar instruments, interest rates, prepayment speeds, credit risk, yield curves, default rates and similar data. |
| | |
| Level 3 – | Unobservable inputs for the asset or liability, to the extent relevant observable inputs are not available, representing the Funds’ own assumptions about the assumptions a market participant would use in valuing the asset or liability, and would be based on the best information available. |
Following is a description of the valuation techniques applied to each Funds’ major categories of assets and liabilities measured at fair value on a recurring basis. The Funds’ investments are carried at fair value.
Reinhart Funds
Notes to the Financial Statements – Continued
May 31, 2022
Equity Securities – Equity securities, including common stocks, preferred stocks, exchange-traded funds (“ETFs”) and real estate investment trusts (“REITs”) that are primarily traded on a national securities exchange are valued at the last sale price on the exchange on which they are primarily traded on the day of valuation or, if there has been no sale on such day, at the mean between the bid and ask prices. Securities traded primarily in the Nasdaq Global Market System for which market quotations are readily available are valued using the Nasdaq Official Closing Price (“NOCP”). If the NOCP is not available, such securities are valued at the last sale price on the day of valuation, or if there has been no sale on such day, at the mean between the bid and ask prices. To the extent these securities are actively traded and valuation adjustments are not applied, they are categorized in Level 1 of the fair value hierarchy.
Short-Term Investments – Investments in other mutual funds, including money market funds, are valued at their net asset value per share. To the extent these securities are actively traded and valuation adjustments are not applied, they are categorized in Level 1 of the fair value hierarchy.
Securities for which market quotations are not readily available, or if the closing price does not represent fair value, are valued following procedures approved by the Board of Trustees (the “Board”). These procedures consider many factors, including the type of security, size of holding, trading volume and news events. There can be no assurance that the Fund could obtain the fair value assigned to a security if they were to sell the security at approximately the time at which the Fund determines their net asset values per share. The Board has established a Valuation Committee to administer, implement, and oversee the fair valuation process, and to make fair value decisions when necessary. The Board regularly reviews reports that describe any fair value determinations and methods.
The inputs or methodology used for valuing securities are not an indication of the risk associated with investing in those securities. The following is a summary of the inputs used to value the Funds’ securities as of May 31, 2022:
| Mid Cap Fund | | Level 1 | | | Level 2 | | | Level 3 | | | Total | |
| Common Stocks | | $ | 220,664,117 | | | $ | — | | | $ | — | | | $ | 220,664,117 | |
| Short-Term Investment | | | 11,388,087 | | | | — | | | | — | | | | 11,388,087 | |
| Total Investments in Securities | | $ | 232,052,204 | | | $ | — | | | $ | — | | | $ | 232,052,204 | |
| | | | | | | | | | | | | | | | | |
| Genesis Fund | | Level 1 | | | Level 2 | | | Level 3 | | | Total | |
| Common Stocks | | $ | 269,001,459 | | | $ | — | | | $ | — | | | $ | 269,001,459 | |
| Short-Term Investment | | | 12,985,666 | | | | — | | | | — | | | | 12,985,666 | |
| Total Investments in Securities | | $ | 281,987,125 | | | $ | — | | | $ | — | | | $ | 281,987,125 | |
Refer to the Schedule of Investments for further information on the classification of investments.
In December 2020, the SEC adopted a new rule providing a framework for fund valuation practices (“Rule 2a-5”). Rule 2a-5 establishes requirements for determining fair value in good faith for purposes of the 1940 Act. Rule 2a-5 will permit fund boards to designate certain parties to perform fair value determinations, subject to board oversight and certain other conditions. Rule 2a-5 also defines when market quotations are “readily available” for purposes of the 1940 Act and the threshold for determining whether a fund must fair value a security. In connection with Rule 2a-5, the SEC also adopted related recordkeeping requirements and is rescinding previously issued guidance, including with respect to the role of a board in determining fair value and the accounting and auditing of fund investments. The Funds will be required to comply with the rules by September 8, 2022. Management is currently assessing the potential impact of the new rules on the Funds’ financial statements.
Reinhart Funds
Notes to the Financial Statements – Continued
May 31, 2022
The global outbreak of COVID-19 (commonly referred to as “coronavirus”) has disrupted economic markets and the prolonged economic impact is uncertain. The ultimate economic fallout from the pandemic, and the long-term impact on economies, markets, industries and individual issuers, are not known. The operational and financial performance of the issuers of securities in which the Funds invest depends on future developments, including the duration and spread of the outbreak, and such uncertainty may in turn adversely affect the value and liquidity of the Funds’ investments, impair the Funds’ ability to satisfy redemption requests, and negatively impact the Funds’ performance.
On February 24, 2022, Russia commenced a military attack on Ukraine. The outbreak of hostilities between the two countries could result in more widespread conflict and could have a severe adverse effect on the region and the markets. In addition, sanctions imposed on Russia by the United States and other countries, and any sanctions imposed in the future could have a significant adverse impact on the Russian economy and related markets. The price and liquidity of investments may fluctuate widely as a result of the conflict and related events. How long such conflict and related events will last and whether it will escalate further cannot be predicted, nor its effect on the Funds.
4. INVESTMENT ADVISORY FEE AND OTHER TRANSACTIONS WITH AFFILIATES
The Trust has an agreement with Reinhart Partners, Inc. (the “Adviser”) to furnish investment advisory services to the Funds. For its services, the Funds pay the Adviser a monthly management fee based upon the average daily net assets of the Funds at the following rates:
| Fund | | | | |
Mid Cap Fund | | | 0.90 | % | |
Genesis Fund | | | 0.95 | % | |
The Funds’ Adviser has contractually agreed to waive its management fees and pay Fund expenses in order to ensure that Total Annual Fund Operating Expenses (excluding acquired fund fees and expenses, leverage/borrowing interest, interest expense, taxes, brokerage commissions, and extraordinary expenses) do not exceed the following rates (based upon the average daily net assets of the Funds):
| Fund | Investor Class | Advisor Class | Institutional Class | |
Mid Cap Fund | 1.30% | 1.05% | 0.90% | |
Genesis Fund | 1.20% | 0.95% | N/A | |
Reinhart Funds
Notes to the Financial Statements – Continued
May 31, 2022
Fees waived and expenses paid by the Adviser may be recouped by the Adviser for a period of thirty-six months following the month during which such fee waiver and expense payment was made, if such recoupment can be achieved without exceeding the expense limit in effect at the time the fee waiver and expense payment occurred and the expense limit in effect at the time of recoupment. The Operating Expenses Limitation Agreements are indefinite in term and cannot be terminated through at least September 28, 2028, for the Mid Cap Fund and September 28, 2022, for the Genesis Fund. Thereafter, the agreements may be terminated at any time upon 60 days’ written notice by the Trust’s Board or the Adviser, with the consent of the Board. Waived Fees and reimbursed expenses subject to potential recovery by month of expiration are as follows:
| Fund | Expiration | Amount | |
Mid Cap Fund | June 2022 – May 2023 | $467,366 | |
| | June 2023 – May 2024 | $399,577 | |
| | June 2024 – May 2025 | $300,293 | |
| | | | |
Genesis Fund | June 2022 – May 2023 | $282,671 | |
| | June 2023 – May 2024 | $405,777 | |
| | June 2024 – May 2025 | $550,093 | |
U.S. Bancorp Fund Services, LLC (the “Administrator”), doing business as U.S. Bank Global Fund Services, acts as the Funds’ Administrator, Transfer Agent, and Fund Accountant. U.S. Bank, N.A. (the “Custodian”) serves as the custodian to the Funds. The Custodian is an affiliate of the Administrator. The Administrator performs various administrative and accounting services for the Funds. The Administrator prepares various federal and state regulatory filings, reports and returns for the Funds; prepares reports and materials to be supplied to the Trustees; monitors the activities of the Funds’ custodian; coordinates the payment of the Funds’ expenses and reviews the Funds’ expense accruals. The officers of the Trust, including the Chief Compliance Officer, are employees of the Administrator. As compensation for its services, the Administrator is entitled to a monthly fee at an annual rate based upon the average daily net assets of the Funds, subject to annual minimums. Fees paid by the Funds for administration and accounting, transfer agency, custody and chief compliance officer services for the year ended May 31, 2022, are disclosed in the Statements of Operations.
5. DISTRIBUTION & SHAREHOLDER SERVICE FEES
The Funds have adopted a Distribution Plan pursuant to Rule 12b-1 (the “Plan”) in the Investor Class only. The Plan permits the Funds to pay for distribution and related expenses at an annual rate of 0.25% of the average daily net assets of the Investor Class. The expenses covered by the Plan may include the cost of preparing and distributing prospectuses and other sales material, advertising and public relations expenses, payments to financial intermediaries and compensation of personnel involved in selling shares of the Funds. Payments made pursuant to the Plan will represent compensation for distribution and service activities, not reimbursements for specific expenses incurred. For the year ended May 31, 2022, the Funds incurred the following expenses pursuant to the Plan:
| Fund | Amount | |
Mid Cap Fund | $55,528 | |
Genesis Fund | $44,424 | |
The Funds have entered into a shareholder servicing agreement (the “Agreement”) where the Adviser acts as the shareholder agent, under which the Funds may pay a servicing fee at an annual rate up to 0.15% of the average daily net assets of the Investor Class and Advisor Class. Payments, if any, to the Adviser under the Agreement may reimburse the Adviser for payments it makes to selected brokers, dealers and administrators which have
Reinhart Funds
Notes to the Financial Statements – Continued
May 31, 2022
entered into service agreements with the Adviser for services provided to shareholders of the Funds. Payments may also be made directly to the intermediaries providing shareholder services. The services provided by such intermediaries are primarily designed to assist shareholders of the Funds and include the furnishing of office space and equipment, telephone facilities, personnel and assistance to the Funds in servicing such shareholders. Services provided by such intermediaries also include the provision of support services to the Funds and includes establishing and maintaining shareholders’ accounts and record processing, purchase and redemption transactions, answering routine client inquiries regarding the Funds, and providing such other personal services to shareholders as the Funds may reasonably request. For the year ended May 31, 2022, the Funds incurred the following expenses pursuant to the Plan:
| Fund | Investor Class | Advisor Class | |
Mid Cap Fund | $26,539 | $68,096 | |
Genesis Fund | — | 91,477 | |
6. CAPITAL SHARE TRANSACTIONS
Transactions in shares of the Funds were as follows:
| | | Mid Cap Fund | | | Genesis Fund | |
| | | Year Ended | | | Year Ended | | | Year Ended | | | Year Ended | |
| | | May 31, 2022 | | | May 31, 2021 | | | May 31, 2022 | | | May 31, 2021 | |
| Investor Class: | | | | | | | | | | | | |
| Shares sold | | | 365,740 | | | | 124,840 | | | | 153 | | | | 133,393 | |
| Shares issued to holders in | | | | | | | | | | | | | | | | |
| reinvestment of dividends | | | 8,930 | | | | 8,427 | | | | 58,814 | | | | 755 | |
| Shares redeemed | | | (121,639 | ) | | | (156,096 | ) | | | (49 | ) | | | (1,199 | ) |
| Net increase (decrease) in | | | | | | | | | | | | | | | | |
| Investor Class shares | | | 253,031 | | | | (22,829 | ) | | | 59,918 | | | | 132,949 | |
| Advisor Class: | | | | | | | | | | | | | | | | |
| Shares sold | | | 1,908,787 | | | | 2,578,342 | | | | 10,239,651 | | | | 11,270,675 | |
| Shares issued to holders in | | | | | | | | | | | | | | | | |
| reinvestment of dividends | | | 94,953 | | | | 80,297 | | | | 815,097 | | | | 16,954 | |
| Shares redeemed | | | (1,762,775 | ) | | | (3,604,530 | ) | | | (4,471,990 | ) | | | (3,625,899 | ) |
| Net increase (decrease) in | | | | | | | | | | | | | | | | |
| Advisor Class shares | | | 240,965 | | | | (945,891 | ) | | | 6,582,758 | | | | 7,661,730 | |
| Institutional Class: | | | | | | | | | | | | | | | | |
| Shares sold | | | 677,209 | | | | 430,668 | | | | — | | | | — | |
| Shares issued to holders in | | | | | | | | | | | | | | | | |
| reinvestment of dividends | | | 23,684 | | | | 25,242 | | | | — | | | | — | |
| Shares redeemed | | | (949,012 | ) | | | (842,984 | ) | | | — | | | | — | |
| Net decrease in | | | | | | | | | | | | | | | | |
| Institutional Class shares | | | (248,119 | ) | | | (387,074 | ) | | | — | | | | — | |
| Net increase (decrease) | | | | | | | | | | | | | | | | |
| in shares outstanding | | | 245,877 | | | | (1,355,794 | ) | | | 6,641,676 | | | | 7,794,679 | |
Reinhart Funds
Notes to the Financial Statements – Continued
May 31, 2022
7. INVESTMENT TRANSACTIONS
The aggregate purchases and sales, excluding short-term investments, by the Funds for the year ended May 31, 2022, were as follows:
| | | U.S. Government Securities | | | Other | |
| Fund | | Purchases | | | Sales | | | Purchases | | | Sales | |
Mid Cap Fund | | $ | — | | | $ | — | | | $ | 75,223,691 | | | $ | 68,725,581 | |
Genesis Fund | | $ | — | | | $ | — | | | $ | 157,792,422 | | | $ | 83,316,306 | |
8. FEDERAL TAX INFORMATION
The aggregate gross unrealized appreciation and depreciation of securities held by the Funds and the total cost of securities for federal income tax purposes at May 31, 2022, the Funds’ most recent fiscal year, were as follows:
| | | Aggregate | | | Aggregate | | | | | | Federal | |
| | | Gross | | | Gross | | | Net | | | Income | |
| Fund | | Appreciation | | | Depreciation | | | Appreciation | | | Tax Cost | |
Mid Cap Fund | | $ | 54,239,003 | | | $ | (10,111,499 | ) | | $ | 44,127,504 | | | $ | 187,924,700 | |
Genesis Fund | | | 36,873,020 | | | | (21,247,142 | ) | | | 15,625,878 | | | | 266,361,247 | |
The difference between book-basis and tax basis unrealized appreciation is attributable primarily to the differences in tax treatment of wash sales.
At May 31, 2022, the Funds’ most recent fiscal year end, components of distributable earnings on a tax-basis were as follows:
| | | Undistributed | | | Undistributed | | | | | | Total | |
| | | Ordinary | | | Long-Term | | | Net | | | Distributable | |
| Fund | | Income | | | Capital Gains | | | Appreciation | | | Earnings | |
Mid Cap Fund | | $ | 296,104 | | | $ | 967,789 | | | $ | 44,127,504 | | | $ | 45,391,397 | |
Genesis Fund | | | 1,696,841 | | | | 10,388,403 | | | | 15,625,878 | | | | 27,711,122 | |
As of May 31, 2022, the Funds did not have any capital loss carryovers. The Mid Cap Fund utilized $17,385,200 of capital loss carry forward from the prior year. A regulated investment company may elect for any taxable year to treat any portion of any qualified late year loss as arising on the first day of the next taxable year. Qualified late year losses are certain capital, and ordinary losses which occur during the portion of the Funds’ taxable year subsequent to October 31 and December 31, respectively. The Funds do not plan to defer any qualified late-year losses.
The tax character of distributions paid during the year ended May 31, 2022, were as follows:
| | | Ordinary | | | Long-Term | | | | |
| Fund | | Income* | | | Capital Gains | | | Total | |
Mid Cap Fund | | $ | 2,512,141 | | | $ | — | | | $ | 2,512,141 | |
Genesis Fund | | | 3,926,903 | | | | 7,625,522 | | | | 11,552,425 | |
Reinhart Funds
Notes to the Financial Statements – Continued
May 31, 2022
The tax character of distributions paid during the year ended May 31, 2021, were as follows:
| | | Ordinary | | | Long-Term | | | | |
| Fund | | Income* | | | Capital Gains | | | Total | |
Mid Cap Fund | | $ | 1,806,733 | | | $ | — | | | $ | 1,806,733 | |
Genesis Fund | | | 204,871 | | | $ | — | | | | 204,871 | |
| * | For Federal income tax purposes, distributions of short-term capital gains are treated as ordinary income. |
9. SECTOR RISK
As of May 31, 2022, the Reinhart Genesis PMV Fund had a significant portion of its assets invested in the financials sector. Changes in governmental regulation, interest rates, domestic and international economics, loan losses, price competition and industry consolidation may affect companies in this sector.
10. CONTROL OWNERSHIP
The beneficial ownership, either directly or indirectly, of more than 25% of the voting securities of a fund creates a presumption of control of the fund, under Section 2(a)(9) of the 1940 Act. As of May 31, 2022, Wells Fargo Clearing Services, LLC, for the benefit of their customers, owned 27.04% of the outstanding shares of the Mid Cap Fund. Morgan Stanley Smith Barney, LLC, for the benefit of their customers, owned 40.32% of the outstanding shares of the Genesis Fund.
11. SUBSEQUENT EVENTS
The Trust launched a new series on June 1, 2022: The Reinhart International PMV Fund (ticker: RPMYX). The Fund: 1) is a diversified fund, 2) has an investment objective of capital appreciation, 3) offers one class of shares, Advisor Class, with a $5,000 investment minimum, and 4) has the same Adviser as the Mid Cap PMV and Genesis PMV Funds.
Reinhart Funds
Report of Independent Registered Public Accounting Firm
To the Shareholders of Reinhart Funds
and Board of Trustees of Managed Portfolio Series
Opinion on the Financial Statements
We have audited the accompanying statements of assets and liabilities, including the schedules of investments, of Reinhart Funds comprising the funds listed below (“Reinhart Funds” or the “Funds”), each a series of Managed Portfolio Series, as of May 31, 2022, the related statements of operations, the statements of changes in net assets, the related notes, and the financial highlights for each of the periods indicated below (collectively referred to as the “financial statements”). In our opinion, the financial statements present fairly, in all material respects, the financial position of each of the Funds as of May 31, 2022, the results of their operations, the changes in net assets, and the financial highlights for each of the periods indicated below in conformity with accounting principles generally accepted in the United States of America.
| | Statements | Statements of | |
Fund Name | of Operations | Changes in Net Assets | Financial Highlights |
Reinhart Mid Cap PMV Fund | For the year ended | For the years ended | For the years ended |
| | May 31, 2022 | May 31, 2022 and 2021 | May 31, 2022, 2021, |
| | | | 2020, 2019, and 2018 |
| | | | |
Reinhart Genesis PMV Fund | For the year ended | For the years ended | For the years ended |
| | May 31, 2022 | May 31, 2022 and 2021 | May 31, 2022, 2021, |
| | | | 2020, and 2019 |
Basis for Opinion
These financial statements are the responsibility of the Funds’ management. Our responsibility is to express an opinion on the Funds’ financial statements based on our audits. We are a public accounting firm registered with the Public Company Accounting Oversight Board (United States) (“PCAOB”) and are required to be independent with respect to the Funds in accordance with the U.S. federal securities laws and the applicable rules and regulations of the Securities and Exchange Commission and the PCAOB.
We conducted our audits in accordance with the standards of the PCAOB. Those standards require that we plan and perform the audit to obtain reasonable assurance about whether the financial statements are free of material misstatement whether due to error or fraud.
Our audits included performing procedures to assess the risks of material misstatement of the financial statements, whether due to error or fraud, and performing procedures that respond to those risks. Such procedures included examining, on a test basis, evidence regarding the amounts and disclosures in the financial statements. Our procedures included confirmation of securities owned as of May 31, 2022, by correspondence with the custodian and brokers. Our audits also included evaluating the accounting principles used and significant estimates made by management, as well as evaluating the overall presentation of the financial statements. We believe that our audits provide a reasonable basis for our opinion.
We have served as the Funds’ auditor since 2012.
COHEN & COMPANY, LTD.
Milwaukee, Wisconsin
July 28, 2022
Reinhart Funds
Approval of Investment Advisory Agreement (Unaudited)
At the regular meeting of the Board of Trustees of Managed Portfolio Series (“Trust”) on February 22-23, 2022, the Trust’s Board of Trustees (“Board”), each of whom were present virtually via video conference, including all of the Trustees who are not “interested persons” of the Trust, as that term is defined in Section 2(a)(19) of the Investment Company Act of 1940, as amended, (“Independent Trustees”) considered and approved the continuation of the Investment Advisory Agreement between the Trust and Reinhart Partners, Inc. (“Reinhart” or the “Adviser”) regarding the Reinhart Mid Cap PMV Fund and the Reinhart Genesis PMV Fund (each a “Fund” or collectively, the “Funds”) (the “Investment Advisory Agreement”) for another annual term.
Prior to the meeting and at a meeting held on January 11, 2022, the Trustees received and considered information from Reinhart and the Trust’s administrator designed to provide the Trustees with the information necessary to evaluate the continuance of the Investment Advisory Agreement (“Support Materials”). Before voting to approve the continuance of the Investment Advisory Agreement, the Trustees reviewed the Support Materials with Trust management and with counsel to the Independent Trustees, and received a memorandum from such counsel discussing the legal standards for the Trustees’ consideration of the renewal of the Investment Advisory Agreement. This information, together with the information provided to the Board throughout the course of the year, formed the primary (but not exclusive) basis for the Board’s determinations.
In determining whether to continue the Investment Advisory Agreement, the Trustees considered all factors they believed relevant, including the following with respect to each Fund: (1) the nature, extent, and quality of the services provided by Reinhart with respect to the Fund; (2) the Fund’s historical performance and the performance of other investment accounts managed by Reinhart; (3) the costs of the services provided by Reinhart and the profits realized by Reinhart from services rendered to the Fund; (4) comparative fee and expense data for the Fund and other investment companies with similar investment objectives; (5) the extent to which economies of scale may be realized as the Fund grows, and whether the advisory fee for the Fund reflects such economies of scale for the Fund’s benefit; and (6) other benefits to Reinhart resulting from its relationship with the Fund. In their deliberations, the Trustees weighed to varying degrees the importance of the information provided to them, did not identify any particular information that was all-important or controlling, and considered the information and made its determinations for each Fund separately and independently of the other Fund.
Based upon the information provided to the Board throughout the course of the year, including at an in-person presentation by representatives of Reinhart, and the Support Materials, the Board concluded that the overall arrangements between the Trust and Reinhart set forth in the Investment Advisory Agreement, as it relates to each Fund, continue to be fair and reasonable in light of the services Reinhart performs, the investment advisory fees that each Fund pays, and such other matters as the Trustees considered relevant in the exercise of their reasonable business judgment. The material factors and conclusions that formed the basis of the Trustees’ determination to approve the continuation of the Investment Advisory Agreement, as it relates to each Fund, are summarized below.
Nature, Extent and Quality of Services Provided. The Trustees considered the scope of services that Reinhart provides under the Investment Advisory Agreement with respect to each Fund, noting that such services include, but are not limited to, the following: (1) investing the Fund’s assets consistent with the Fund’s investment objective and investment policies; (2) determining the portfolio securities to be purchased, sold, or otherwise disposed of and the timing of such transactions; (3) voting all proxies, if any, with respect to the Fund’s portfolio securities; (4) maintaining the required books and records for transactions that Reinhart effects on behalf of the Fund; (5) selecting broker-dealers to execute orders on behalf of the Fund; (6) monitoring and maintaining the Fund’s compliance with policies and procedures of the Trust and with applicable securities laws. The Trustees
Reinhart Funds
Approval of Investment Advisory Agreement (Unaudited) – Continued
reviewed Reinhart’s financial statements, assets under management and capitalization. The Trustees concluded that Reinhart had sufficient resources to support the management of the Funds. The Trustees further considered the investment philosophy and experience of the portfolio managers and noted the lead portfolio manager’s twenty years of experience managing assets using investment philosophies similar to that employed for the Funds. The Trustees concluded that they are satisfied with the nature, extent and quality of services that Reinhart provides to each of the Funds under the Investment Advisory Agreement.
Fund Historical Performance and the Overall Performance of Reinhart. In assessing the quality of the portfolio management delivered by Reinhart, the Trustees reviewed the performance of the Reinhart Mid Cap PMV Fund and Reinhart Genesis PMV Fund on both an absolute basis and in comparison to an appropriate benchmark index, each Fund’s respective peer funds according to Morningstar classifications as compiled by Barrington Partners (each a “Morningstar BP Cohort”), and the composite of separate accounts that Reinhart manages utilizing a similar investment strategy as that of each Fund. When comparing each Fund’s performance against its respective Morningstar BP Cohort, the Trustees took into account that the investment objective and strategies of each Fund, as well as the Fund’s level of risk tolerance, may differ significantly from funds in the per group.
| | • | Reinhart Mid Cap PMV Fund. The Trustees noted that, with respect to the Fund’s Morningstar BP Cohort, the Institutional Class shares of the Fund had outperformed the Morningstar BP Cohort average for the one-year period ended September 30, 2021, but underperformed the Morningstar BP Cohort for the three-year period ended September 30, 2021. The Trustees also considered that the Fund had underperformed its benchmark index for the year-to-date period ended September 30, 2021, and for the one-year, three-year, five-year and since inception periods ended December 31, 2020. The Trustees took into account that the Fund achieved an overall positive return since its inception. The Trustees also considered that the Fund’s performance was consistent with, but slightly trailed the returns of the composite over all relevant time periods. |
| | | |
| | • | Reinhart Genesis PMV Fund. The Trustees noted that the Fund had outperformed its Morningstar BP Cohort for the one-year period ended September 30, 2021, but slightly underperformed its Morningstar BP Cohort average over the three-year period ended September 30, 2021. The Trustees also noted that the Fund had outperformed its primary benchmark index for the year-to-date period ended September 30, 2021, but underperformed its primary benchmark index for the one-year and since inception periods ended December 31, 2020. The Trustees took into account that the Fund achieved an overall positive return since its inception. The Trustees also considered that the Fund’s performance was consistent with, but slightly trailed the returns of the composite over all relevant time periods. |
Cost of Advisory Services and Profitability. The Trustees considered the annual advisory fee that each Fund pays to Reinhart under the Investment Advisory Agreement, as well as Reinhart’s profitability from services that it rendered to each Fund during the 12-month period ended September 30, 2021. The Trustees also considered the effect of an expense limitation agreement on Reinhart’s compensation and that Reinhart has contractually agreed to reduce its advisory fees and, if necessary, reimburse the Funds for operating expenses, as specified in the Funds’ prospectuses. In that regard, the Trustees noted that Reinhart had waived a portion of its advisory fees for each Fund during the one-year period ended September 30, 2021. The Trustees further considered that the management fees Reinhart charges to separately managed accounts with asset levels similar to that of the Funds are lower than the advisory fee for the Funds. They also noted, however, that Reinhart has additional responsibilities with respect to the Funds, including additional compliance obligations and the preparation of Board and shareholder materials that justify the higher fee. The Trustees concluded that Reinhart’s service relationship with the each Fund yields a reasonable profit.
Reinhart Funds
Approval of Investment Advisory Agreement (Unaudited) – Continued
Comparative Fee and Expense Data. The Trustees considered a comparative analysis of contractual expenses borne by each Fund and those of funds within the same Morningstar BP Cohort. The Trustees noted:
| | • | Reinhart Mid Cap PMV Fund. The Fund’s advisory fee was higher than the Morningstar BP Cohort average. They also considered that the total expenses of the Fund’s Institutional Class (after waivers and expense reimbursements) were below the Morningstar BP Cohort average. Regarding the Fund’s Advisor and Investor classes, the Trustees noted the total expenses (after waivers and expense reimbursements), including applicable shareholder servicing and Rule 12b-1 fees, were higher than the Morningstar BP Cohort average. |
| | | |
| | • | Reinhart Genesis PMV Fund. The Fund’s advisory fee was higher than the Morningstar BP Cohort average. The Trustees noted that the total expenses for the Advisor Class shares of the Fund (after waivers and expense reimbursements) were below the Morningstar BP Cohort average. Regarding the Investor Class, the Trustees noted that the total expenses (after waivers and expense reimbursements), including Rule 12b-1 fees, were higher than the Morningstar BP Cohort average. |
While recognizing that it is difficult to compare advisory fees because the scope of advisory services provided may vary from one investment adviser to another, the Trustees concluded that Reinhart’s advisory fee with respect to each Fund continues to be reasonable.
Economies of Scale. The Trustees considered whether the Funds would benefit from any economies of scale, noting that the investment advisory fees for the Funds do not contain breakpoints. The Trustees noted that at current asset levels, it was not necessary to consider the implementation of fee breakpoints at the present time, but agreed to revisit the issue in the future as circumstances change and asset levels increase. The Trustees also took into account the fact that Reinhart expressed reservations about the implementation of advisory fee breakpoints for the Reinhart Mid Cap PMV Fund because of potential capacity constraints associated with the Fund’s strategy.
Other Benefits. The Trustees considered the direct and indirect benefits that could be realized by the Adviser from its relationship with the Funds. The Trustees considered the extent to which Reinhart utilizes soft dollar arrangements with respect to portfolio transactions, and considered that Reinhart does not utilize any affiliated brokers to execute the Funds’ portfolio transactions. While the Trustees noted Rule 12b-1 fees may be paid for shareholder and distribution services performed on behalf of the Funds, the Trustees also observed that the distribution expenses that Reinhart incurred significantly exceed any Rule 12b-1 payments from the Funds. The Trustees considered that Reinhart may receive some form of reputational benefit from services rendered to the Funds, but that such benefits are immaterial and cannot otherwise be quantified. The Trustees concluded that Reinhart does not receive additional material benefits from its relationship with the Funds.
Reinhart Funds
Statement Regarding the Funds’ Liquidity Risk Management Program (Unaudited)
Pursuant to Rule 22e-4 under the Investment Company Act of 1940, Managed Portfolio Series (the “Trust”), on behalf of the Reinhart Mid Cap PMV Fund and the Reinhart Genesis PMV Fund (each a “Fund” and together, the “Funds”), has adopted and implemented a written liquidity risk management program (the “Program”) that includes policies and procedures reasonably designed to comply with the requirements of Rule 22e-4, including: (i) assessment, management and periodic review of liquidity risk; (ii) classification of portfolio holdings; (iii) establishment of a highly liquid investment minimum (“HLIM”), as applicable; (iv) limitation on illiquid investments; and (v) redemptions in-kind. The Trust’s Board of Trustees (the “Board”) has approved the designation of Reinhart Partners, Inc. (“Reinhart”) as the administrator of the Program (the “Program Administrator”). Personnel of Reinhart conduct the day-to-day operation of the Program pursuant to policies and procedures administered by the Reinhart Risk Committee.
In accordance with Rule 22e-4, the Board reviewed a report prepared by the Program Administrator (the “Report”) regarding the operation of the Program and its adequacy and effectiveness of implementation for the period January 1, 2021, through December 31, 2021 (the “Reporting Period”). No significant liquidity events impacting the Funds during the Reporting Period or material changes to the Program were noted in the Report. The Report did not cover the Reinhart International PMV Fund as it had not yet commenced operations during the Reporting Period.
Under the Program, Reinhart manages and periodically reviews each Fund’s liquidity risk, including consideration of applicable factors specified in Rule 22e-4 and the Program. Liquidity risk is defined as the risk that a Fund could not meet shareholder redemption requests without significant dilution of remaining shareholders’ interests in the Fund. In general, this risk was managed during the Reporting Period by monitoring the degree of liquidity of each Fund’s investments, limiting the amount of each Fund’s illiquid investments, and utilizing various risk management tools and facilities available to each Fund for meeting shareholder redemptions, among other means. In the Report, Reinhart provided its assessment that, based on the information considered in its review, the Program remains reasonably designed to manage each Fund’s liquidity risk and each Fund’ s investment strategy remains appropriate for an open-end fund.
Pursuant to the Program, the Reinhart Risk Committee oversaw the classification of each Fund’s portfolio investments as highly liquid, moderately liquid, less liquid or illiquid during the Reporting Period, including in connection with recording investment classifications on Form N-PORT. Reinhart’s process of determining the degree of liquidity of each Fund’s investments is supported by one or more third-party liquidity assessment vendors.
Each Fund qualified as a “primarily highly liquid fund” as defined in the Program during the Reporting Period. Accordingly, each Fund was not required to establish a HLIM or comply with the related Program provisions during the Reporting Period.
During the Reporting Period, each Fund’s investments were monitored for compliance with the 15% limitation on illiquid investments pursuant to the Program and in accordance with Rule 22e-4.
While there were no redemptions in-kind during the Reporting Period, the Report noted that such transactions would be in compliance with the Trust’s Redemption in Kind Policy. The Report concluded, with respect to each Fund: (i) the Program was implemented and operated effectively to achieve the goal of assessing and managing the Fund’s liquidity risk during the Reporting Period; and (ii) the Fund was able to meet requests for redemption without significant dilution of remaining investors’ interests in the Fund during the Reporting Period.
Reinhart Funds
Additional Information (Unaudited)
May 31, 2022
TRUSTEES & OFFICERS
| | | | | | Other |
| | | | Number of | | Directorships |
| | | Term of | Portfolios | | Held by |
| | Position(s) | Office and | in Trust | | Trustee |
| Name, Address | Held with | Length of | Overseen | Principal Occupation(s) | During the |
| and Year of Birth | the Trust | Time Served | by Trustee | During the Past Five Years | Past Five Years |
| Independent Trustees | | | | | |
| | | | | | |
Leonard M. Rush, CPA | Chairman, | Indefinite | 36 | Retired, Chief Financial Officer, | Independent |
615 E. Michigan St. | Trustee | Term; | | Robert W. Baird & Co. | Trustee, ETF |
Milwaukee, WI 53202 | and Audit | Since | | Incorporated (2000-2011). | Series Solutions |
Year of Birth: 1946 | Committee | April 2011 | | | (60 Portfolios) |
| | Chairman | | | | (2012-Present). |
| | | | | | |
David A. Massart | Trustee | Indefinite | 36 | Partner and Managing Director, | Independent |
615 E. Michigan St. | | Term; | | Beacon Pointe Advisors, LLC | Trustee, ETF |
Milwaukee, WI 53202 | | Since | | (since 2022); Co-Founder and | Series Solutions |
Year of Birth: 1967 | | April 2011 | | Chief Investment Strategist, | (60 Portfolios) |
| | | | | Next Generation Wealth | (2012-Present). |
| | | | | Management, Inc. (2005-2021). | |
Reinhart Funds
Additional Information (Unaudited) – Continued
May 31, 2022
| | | | | | Other |
| | | | Number of | | Directorships |
| | | Term of | Portfolios | | Held by |
| | Position(s) | Office and | in Trust | | Trustee |
| Name, Address | Held with | Length of | Overseen | Principal Occupation(s) | During the |
| and Year of Birth | the Trust | Time Served | by Trustee | During the Past Five Years | Past Five Years |
| Independent Trustees | | | | | |
| | | | | | |
David M. Swanson | Trustee and | Indefinite | 36 | Founder and Managing Principal, | Independent |
615 E. Michigan St. | Nominating | Term; | | SwanDog Strategic Marketing, LLC | Trustee, ALPS |
Milwaukee, WI 53202 | & | Since | | (2006-present); Executive Vice | Variable |
Year of Birth: 1957 | Governance | April 2011 | | President, Calamos Investments | Investment Trust |
| | Committee | | | (2004-2006). | (7 Portfolios) |
| | Chairman | | | | (2006-Present); |
| | | | | | Independent |
| | | | | | Trustee, |
| | | | | | RiverNorth Funds |
| | | | | | (3 Portfolios) |
| | | | | | (2018-Present); |
| | | | | | RiverNorth |
| | | | | | Managed Duration |
| | | | | | Municipal Income |
| | | | | | Fund Inc. |
| | | | | | (1 Portfolio) |
| | | | | | (2019 to present); |
| | | | | | RiverNorth |
| | | | | | Specialty Finance |
| | | | | | Corporation |
| | | | | | (1 Portfolio) |
| | | | | | (2018 to present); |
| | | | | | RiverNorth/ |
| | | | | | DoubleLine |
| | | | | | Strategic |
| | | | | | Opportunity Fund, |
| | | | | | Inc. (1 Portfolio) |
| | | | | | (2018 to present); |
| | | | | | RiverNorth |
| | | | | | Opportunities |
| | | | | | Fund, Inc. |
| | | | | | (1 Portfolio) |
| | | | | | (2015 to present); |
| | | | | | RiverNorth |
| | | | | | Opportunistic |
| | | | | | Municipal Income |
| | | | | | Fund, Inc. |
| | | | | | (1 Portfolio) |
| | | | | | (2018 to present); |
| | | | | | RiverNorth |
| | | | | | Flexible Municipal |
| | | | | | Income Fund |
| | | | | | (2020 to present). |
Reinhart Funds
Additional Information (Unaudited) – Continued
May 31, 2022
| | | | | | Other |
| | | | Number of | | Directorships |
| | | Term of | Portfolios | | Held by |
| | Position(s) | Office and | in Trust | | Trustee |
| Name, Address | Held with | Length of | Overseen | Principal Occupation(s) | During the |
| and Year of Birth | the Trust | Time Served | by Trustee | During the Past Five Years | Past Five Years |
| Independent Trustees | | | | | |
| | | | | | |
Robert J. Kern | Trustee | Indefinite | 36 | Retired (July 2018 – present); | None |
615 E. Michigan St. | | Term; | | Executive Vice President, | |
Milwaukee, WI 53202 | | Since | | U.S. Bancorp Fund Services, | |
Year of Birth: 1958 | | January 2011 | | LLC (1994-2018). | |
| | | | | | |
| Officers | | | | | |
| | | | | | |
Brian R. Wiedmeyer | President | Indefinite | N/A | Vice President, U.S. Bancorp Fund | N/A |
615 E. Michigan St. | and | Term, | | Services, LLC (2005-present). | |
Milwaukee, WI 53202 | Principal | Since | | | |
Year of Birth: 1973 | Executive | November 2018 | | | |
| | Officer | | | | |
| | | | | | |
Deborah Ward | Vice | Indefinite | N/A | Senior Vice President, U.S. | N/A |
615 E. Michigan St. | President, | Term; | | Bancorp Fund Services, LLC | |
Milwaukee, WI 53202 | Chief | Since | | (2004-present). | |
Year of Birth: 1966 | Compliance | April 2013 | | | |
| | Officer and | | | | |
| | Anti-Money | | | | |
| | Laundering | | | | |
| | Officer | | | | |
| | | | | | |
Benjamin Eirich | Treasurer, | Indefinite | N/A | Assistant Vice President, U.S. | N/A |
615 E. Michigan St. | Principal | Term; | | Bancorp Fund Services, LLC | |
Milwaukee, WI 53202 | Financial | Since | | (2008-present). | |
Year of Birth: 1981 | Officer and | August 2019 | | | |
| | Vice | (Treasurer); | | | |
| | President | Since | | | |
| | | November 2018 | | | |
| | | (Vice President) | | | |
| | | | | | |
John Hadermayer | Secretary | Indefinite | N/A | U.S. Bancorp Fund Services, | N/A |
615 E. Michigan St. | | Term; | | LLC (2022-present); Executive | |
Milwaukee, WI 53202 | | Since | | Director, AQR Capital Management, | |
Year of Birth: 1977 | | May 2022 | | LLC (2013-present). | |
| | | | | | |
Douglas Schafer | Assistant | Indefinite | N/A | Assistant Vice President, U.S. | N/A |
615 E. Michigan St. | Treasurer | Term; | | Bancorp Fund Services, LLC | |
Milwaukee, WI 53202 | and Vice | Since | | (2002-present). | |
Year of Birth: 1970 | President | May 2016 | | | |
| | | (Assistant | | | |
| | | Treasurer); | | | |
| | | Indefinite | | | |
| | | Term; Since | | | |
| | | November 2018 | | | |
| | | (Vice President) | | | |
Reinhart Funds
Additional Information (Unaudited) – Continued
May 31, 2022
| | | | | | Other |
| | | | Number of | | Directorships |
| | | Term of | Portfolios | | Held by |
| | Position(s) | Office and | in Trust | | Trustee |
| Name, Address | Held with | Length of | Overseen | Principal Occupation(s) | During the |
| and Year of Birth | the Trust | Time Served | by Trustee | During the Past Five Years | Past Five Years |
| Officers | | | | | |
| | | | | | |
Sara J. Bollech | Assistant | Indefinite | N/A | Officer, U.S. Bancorp Fund | N/A |
615 E. Michigan St. | Treasurer | Term; | | Services, LLC (2007-present). | |
Milwaukee, WI 53202 | and Vice | Since | | | |
Year of Birth: 1977 | President | November 2021 | | | |
| | | | | | |
Peter A. Walker, CPA | Assistant | Indefinite | N/A | Officer, U.S. Bancorp Fund | N/A |
615 E. Michigan St. | Treasurer | Term; | | Services, LLC (2016-present). | |
Milwaukee, WI 53202 | and Vice | Since | | | |
Year of Birth: 1993 | President | November 2021 | | | |
Reinhart Funds
Additional Information (Unaudited) – Continued
May 31, 2022
AVAILABILITY OF FUND PORTFOLIO INFORMATION
Each Fund files complete schedules of portfolio holdings with the SEC for the first and third quarters of each fiscal year on Part F of Form N-PORT. The Funds’ Part F of Form N-PORT are each available on the SEC’s website at www.sec.gov and may be reviewed and copied at the SEC’s Public Reference Room in Washington, D.C. For information on the Public Reference Room call 1-800-SEC-0330. In addition, each Fund’s Part F of Form N-PORT is available without charge upon request by calling 1-855-774-3863.
AVAILABILITY OF PROXY VOTING INFORMATION
A description of the Funds’ Proxy Voting Policies and Procedures is available without charge, upon request, by calling 1-855-774-3863. Information regarding how the Funds voted proxies relating to portfolio securities during the most recent 12-month period ended June 30, is available (1) without charge, upon request, by calling 1-855-774-3863, or (2) on the SEC’s website at www.sec.gov.
QUALIFIED DIVIDEND INCOME/DIVIDENDS RECEIVED DEDUCTION
For the fiscal year ended May 31, 2022, certain dividends paid by the Funds may be reported as qualified dividend income and may be eligible for taxation at capital gain rates. The percentage of dividends declared from ordinary income designated as qualified dividend income was as follows:
| Fund | | | | |
Mid Cap Fund | | | 100.00 | % | |
Genesis Fund | | | 70.82 | % | |
For corporate shareholders, the percent of ordinary income distributions qualifying for the corporate dividends received deduction for the fiscal year ended May 31, 2022, was as follows:
| Fund | | | | |
Mid Cap Fund | | | 100.00 | % | |
Genesis Fund | | | 70.83 | % | |
The percentage of taxable ordinary income distributions that are designated as short-term capital gain distributions under Internal Revenue Section 871(k)(2)(c) were as follows:
| Fund | | | | |
Mid Cap Fund | | | 0.00 | % | |
Genesis Fund | | | 57.87 | % | |
Reinhart Funds
Privacy Notice
The Funds collect only relevant information about you that the law allows or requires it to have in order to conduct its business and properly service you. The Funds collect financial and personal information about you (“Personal Information”) directly (e.g., information on account applications and other forms, such as your name, address, and social security number, and information provided to access account information or conduct account transactions online, such as password, account number, e-mail address, and alternate telephone number), and indirectly (e.g., information about your transactions with us, such as transaction amounts, account balance and account holdings).
The Funds do not disclose any non-public personal information about its shareholders or former shareholders other than for everyday business purposes such as to process a transaction, service an account, respond to court orders and legal investigations or as otherwise permitted by law. Third parties that may receive this information include companies that provide transfer agency, technology and administrative services to the Funds, as well as the Funds’ investment adviser who is an affiliate of the Funds. If you maintain a retirement/educational custodial account directly with the Funds, we may also disclose your Personal Information to the custodian for that account for shareholder servicing purposes. The Funds limit access to your Personal Information provided to unaffiliated third parties to information necessary to carry out their assigned responsibilities to the Funds. All shareholder records will be disposed of in accordance with applicable law. The Funds maintain physical, electronic and procedural safeguards to protect your Personal Information and requires its third-party service providers with access to such information to treat your Personal Information with the same high degree of confidentiality.
In the event that you hold shares of the Funds through a financial intermediary, including, but not limited to, a broker-dealer, credit union, bank or trust company, the privacy policy of your financial intermediary governs how your non-public personal information is shared with unaffiliated third parties.
(This Page Intentionally Left Blank.)
INVESTMENT ADVISER
Reinhart Partners, Inc.
1500 West Market Street, Suite 100
Mequon, WI 53092
DISTRIBUTOR
Quasar Distributors, LLC
111 East Kilbourn Avenue, Suite 2200
Milwaukee, WI 53202
CUSTODIAN
U.S. Bank, N.A.
1555 North River Center Drive, Suite 302
Milwaukee, WI 53212
ADMINISTRATOR, FUND ACCOUNTANT
AND TRANSFER AGENT
U.S. Bancorp Fund Services, LLC
615 East Michigan Street
Milwaukee, WI 53202
INDEPENDENT REGISTERED PUBLIC ACCOUNTING FIRM
Cohen & Company, Ltd.
342 North Water Street, Suite 830
Milwaukee, WI 53202
LEGAL COUNSEL
Stradley Ronon Stevens & Young, LLP
2005 Market Street, Suite 2600
Philadelphia, PA 19103
This report must be accompanied or preceded by a prospectus.
The Funds’ Statement of Additional Information contains additional information about the
Funds’ trustees and is available without charge upon request by calling 1-855-774-3863.
Item 2. Code of Ethics.
The registrant has adopted a code of ethics that applies to the Registrant’s principal executive officer and principal financial officer. The registrant has not made any substantive amendments to its code of ethics during the period covered by this report.
The registrant has not granted any waivers from any provisions of the code of ethics during the period covered by this report.
A copy of the registrant’s code of ethics that applies to the registrant’s principal executive officer and principal financial officer is filed herewith.
Item 3. Audit Committee Financial Expert.
The registrant’s Board of Trustees has determined that there is at least one audit committee financial expert serving on its audit committee. Leonard M. Rush is the “audit committee financial expert” and is considered to be “independent” as each term is defined in Item 3 of Form N-CSR.
Item 4. Principal Accountant Fees and Services.
The registrant has engaged its principal accountant to perform audit services, audit-related services, tax services and other services during the past two fiscal years. “Audit services” refer to performing an audit of the registrant's annual financial statements or services that are normally provided by the accountant in connection with statutory and regulatory filings or engagements for those fiscal years. “Audit-related services” refer to the assurance and related services by the principal accountant that are reasonably related to the performance of the audit. “Tax services” refer to professional services rendered by the principal accountant for tax compliance, tax advice, and tax planning. There were no “other services” provided by the principal accountant. For the fiscal years ended May 31, 2022, and May 31, 2021, the Funds’ principal accountant was Cohen & Company, Ltd. The following table details the aggregate fees billed or expected to be billed for each of the last two fiscal years for audit fees, audit-related fees, tax fees and other fees by the principal accountant.
| | FYE 5/31/2022 | FYE 5/31/2021 |
| ( a ) Audit Fees | $28,500 | $28,500 |
| ( b ) Audit-Related Fees | $0 | $0 |
| ( c ) Tax Fees | $7,000 | $7,000 |
| ( d ) All Other Fees | $0 | $0 |
(e)(1) The audit committee has adopted pre-approval policies and procedures that require the audit committee to pre‑approve all audit and non‑audit services of the registrant, including services provided to any entity affiliated with the registrant.
(e)(2) The percentage of fees billed by Cohen & Company, Ltd. for the fiscal years ended May 31, 2022, and May 31, 2021, applicable to non-audit services pursuant to waiver of pre-approval requirement was as follows:
| | FYE 5/31/2022 | FYE 5/31/2021 |
Audit-Related Fees | 0% | 0% |
Tax Fees | 0% | 0% |
All Other Fees | 0% | 0% |
(f) All of the principal accountant’s hours spent on auditing the registrant’s financial statements were attributed to work performed by full‑time permanent employees of the principal accountant.
(g) The following table indicates the non-audit fees billed or expected to be billed by the registrant’s accountant for services to the registrant and to the registrant’s investment adviser (and any other controlling entity, etc.—not sub-adviser) for the last two years.
Non-Audit Related Fees | FYE 5/31/2022 | FYE 5/31/2021 |
Registrant | $0 | $0 |
Registrant’s Investment Adviser | $0 | $0 |
(h) The audit committee of the board of trustees/directors has considered whether the provision of non-audit services that were rendered to the registrant's investment adviser is compatible with maintaining the principal accountant's independence and has concluded that the provision of such non-audit services by the accountant has not compromised the accountant’s independence.
(i) Not applicable
(j) Not applicable
Item 5. Audit Committee of Listed Registrants.
Not applicable to registrants who are not listed issuers (as defined in Rule 10A-3 under the Securities Exchange Act of 1934).
Item 6. Investments.
(a) | Schedule of Investments is included as part of the report to shareholders filed under Item 1 of this Form. |
Item 7. Disclosure of Proxy Voting Policies and Procedures for Closed-End Management Investment Companies.
Not applicable to open-end investment companies.
Item 8. Portfolio Managers of Closed-End Management Investment Companies.
Not applicable to open-end investment companies.
Item 9. Purchases of Equity Securities by Closed‑End Management Investment Company and Affiliated Purchasers.
Not applicable to open-end investment companies.
Item 10. Submission of Matters to a Vote of Security Holders.
There have been no material changes to the procedures by which shareholders may recommend nominees to the registrant’s board of trustees.
Item 11. Controls and Procedures.
(a) | The Registrant’s President and Treasurer have reviewed the Registrant's disclosure controls and procedures (as defined in Rule 30a-3(c) under the Investment Company Act of 1940 (the “Act”)) as of a date within 90 days of the filing of this report, as required by Rule 30a-3(b) under the Act and Rules 13a-15(b) or 15d‑15(b) under the Securities Exchange Act of 1934. Based on their review, such officers have concluded that the disclosure controls and procedures are effective in ensuring that information required to be disclosed in this report is appropriately recorded, processed, summarized and reported and made known to them by others within the Registrant and by the Registrant’s service provider. |
(b) | There were no changes in the Registrant's internal control over financial reporting (as defined in Rule 30a-3(d) under the Act) that occurred during the period covered by this report that have materially affected, or are reasonably likely to materially affect, the Registrant's internal control over financial reporting. |
Item 12. Disclosure of Securities Lending Activities for Closed-End Management Investment Companies
Not applicable to open-end investment companies.
Item 13. Exhibits.
(a) | (1) Any code of ethics or amendment thereto, that is subject of the disclosure required by Item 2, to the extent that the registrant intends to satisfy Item 2 requirements through filing an exhibit. Filed herewith. |
(3) Any written solicitation to purchase securities under Rule 23c‑1 under the Act sent or given during the period covered by the report by or on behalf of the registrant to 10 or more persons. Not applicable to open-end investment companies.
(4) Change in the registrant’s independent public accountant. There was no change in the registrant’s independent public accountant for the period by this report.
SIGNATURES
Pursuant to the requirements of the Securities Exchange Act of 1934 and the Investment Company Act of 1940, the registrant has duly caused this report to be signed on its behalf by the undersigned, thereunto duly authorized.
(Registrant) Managed Portfolio Series
By (Signature and Title)* /s/Brian R. Wiedmeyer
Brian R. Wiedmeyer, President
Date August 2, 2022
Pursuant to the requirements of the Securities Exchange Act of 1934 and the Investment Company Act of 1940, this report has been signed below by the following persons on behalf of the registrant and in the capacities and on the dates indicated.
By (Signature and Title)* /s/Brian R. Wiedmeyer
Brian R. Wiedmeyer, President
Date August 2, 2022
By (Signature and Title)* /s/Benjamin J. Eirich
Benjamin J. Eirich, Treasurer
Date August 2, 2022
* Print the name and title of each signing officer under his or her signature.