Coho Relative Value Equity Fund
cohox
Coho Relative Value ESG Fund
cesgx
Annual Report
July 31, 2022
COHO FUNDS
Dear Fellow Shareholders:
As August 31, 2022 marks the end of the Coho Relative Value Equity and Coho Relative Value ESG Funds’ most recent annual period, we are pleased to provide you with an update. At Coho Partners, Ltd., we remain committed to achieving the Funds’ investment objectives and providing our shareholders with open and active communication so they may gain a clear understanding of our investment process, the Funds’ performance results, and our most recent thoughts on the economy and the equity markets.
Fund Performance Review
From August 1, 2021 to July 31, 2022, the Coho Relative Value Equity Fund returned 1.96% and the Coho Relative Value ESG Fund returned -0.02% versus -4.64% for the S&P 500® Index and -1.43% for the Russell 1000 Value® Index. The Funds’ positive relative performance for the period was driven by both allocation and selection effect.
From a sector perspective versus the S&P 500® Index, both Funds’ overweight in Consumer Staples and Health Care along with the underweight in Communication Services were the largest contributors to the relative performance. Both Funds also benefited from positive stock selection in Consumer Staples and Health Care. These contributors more than offset the negative effect of the stock selection in Technology had on both Funds’ performance. The absence of Energy in the Coho Relative Value ESG Fund did negatively impact the performance.
The top five contributors to the Coho Relative Value Equity Fund’s performance were Chevron Corporation, UnitedHealth Group Inc., W.W. Grainger, Inc., AmerisourceBergen Corporation, and CVS Health Corporation. The five largest individual detractors during the period were Global Payments Inc., Ross Stores, Inc., Stanley Black & Decker, Inc., Medtronic PLC, and State Street Corporation.
The Coho Relative Value ESG Fund’s top contributors to performance were UnitedHealth Group Inc., W.W. Grainger, Inc., Sysco Corporation, CVS Health Corporation, and Dollar General Corporation. The five largest individual detractors during the period were Ross Stores, Inc., Global Payments Inc., Stanley Black & Decker, Inc., Medtronic PLC, and State Street Corporation.
Market Review
Trading during this twelve-month period was active due to the opportunities provided by the volatility of the market. We eliminated three positions, Merck & Co., Inc., Unilever PLC and Automatic Data Processing Inc. in both Funds. We also eliminated Altria Group in the Coho Relative Equity Fund. The proceeds from these sales were partially redeployed into three new positions, Mondelez International Inc., The Walt Disney Company, and Nike, Inc. We also made several trims to current positions based on valuation and added to holdings in the portfolio that we believe had a better risk/reward profile.
Our initial purchase of Merck was informed by our conviction that market expectations for sales of its oncology drug, Keytruda, were too conservative over both the near- and long-term. During our period of ownership, Keytruda sales have meaningfully exceeded consensus estimates and future expectations have continually ramped higher. Despite this significant revenue outperformance, Merck’s stock price has not followed. The outsized growth of Keytruda has led to concerns over the company’s ability to manage through the patent expiration for Keytruda despite it not occurring until 2028. We believe the company has begun to backfill its pipeline with several business development deals and that the potential for its vaccine portfolio is underappreciated. However, we acknowledge that the Keytruda patent cliff, even though seven years away, will likely remain an overhang on the stock price. We took advantage of the strength on the back of positive data for its COVID drug, Molnupiravir.
COHO FUNDS
We eliminated our position in Unilever due to a Position Paper violation. In our discussions with management, we understood that large transformational deals were not a necessary part of the company’s repositioning toward higher growth categories. Recently, however, the company announced its intention to acquire the consumer health joint venture of GlaxoSmithKline and Pfizer, a deal nearly half the size of Unilever’s total market capitalization. Even though the company walked away from the transaction, we have lost confidence in this management team’s strategic vision and execution.
Our sale of the Automatic Data Processing (ADP) position was purely due to valuation. ADP has performed very well since we purchased it during the pandemic but now employment has recovered and rates have begun to rise benefiting the Funds Held for Clients (tax withholdings). All of this good news appears to be priced into the stock.
Several developments concerning Altria Group (MO) arose that made us more cautious about maintaining the position in the portfolio. A recent ruling has stopped the company’s ability to import IQOS, Altria’s reduced risk product, from Philip Morris International. IQOS was to be a major driver to future revenues and profits. Moreover, there is a dispute between Altria and Philip Morris International as to whether or not the company has achieved necessary milestones to extend their exclusive distribution agreement.
Historically, rising gasoline prices have had a negative impact on cigarette demand, as consumers lose discretionary spending dollars. Clearly gas prices have risen dramatically of late and we anticipate lower volumes and possible downtrading.
One of the new positions we initiated in 2022 was The Walt Disney Company (DIS). We believe DIS will be one of the long-term winners in the global media landscape as the industry shifts toward a future dominated by streaming services. We do not believe the path to that success will be linear. We have been monitoring the company’s business model transition over the last several years to evaluate its progress while expecting some volatility along the way that could provide an investment opportunity at an attractive valuation. In mid-April, we believed we had reached that point. While there may be some additional volatility ahead, we view DIS as at the beginning stages of an earnings growth reacceleration that should lead to a resumption of capital returns to shareholders. As the direct-to-consumer streaming business matures it should result in more stable and predictable revenue and cash flow. Additionally, we believe the market is underestimating the profitability of the Parks division that should also contribute to the reacceleration of earnings growth and provide a diversifying revenue and income stream.
Mondelez (MDLZ) derives 80% of its revenue from advantaged categories including chocolate and cookies, with the Cadbury and Milka brands holding the top market share position in many geographies and Oreo being the number one cookie in the world. About 34% of revenue is derived from emerging markets and we expect future growth to be driven by channel expansion, high growth segments and adjacencies (soft cakes). Mondelez is not immune to the cost pressures impacting all companies; however, the chocolate category provides the company with greater pricing flexibility than almost any other food category, with just a couple of brands dominating and private label having a minimal presence. The current management team has executed well against the strategic plan it launched three years ago, with a focus on delivering balanced revenue and profit growth. The dividend has grown at least in line with earnings and we expect continued growth. We believe the company is well positioned to deliver on its long-term operating and financial targets.
Nike, Inc. (NKE) shares have been moving down in price and the stock was on our bullpen list. Investors were disappointed with the company’s fiscal 4th quarter results and FY23 outlook. We believe execution in the quarter was good, considering an unexpected negative impact from lockdowns and inventory clearance in China, along with ongoing supply chain challenges. Management plans very conservatively and guidance incorporates additional actions to reduce inventory in China. We expect these issues to be transitory and see excellent value at these levels.
COHO FUNDS
We believe the role of dividends to overall portfolio return has been underappreciated as the mega-cap growth stocks have dominated returns and those companies tend to have little or no dividend yield. Dividend growth can be a wonderful hedge to inflationary pressures and the companies in which we choose to invest have historically increased their dividends annually. We believe income will continue to be an important component of the total return for Fund shareholders.
Fund Advisor Outlook
On the sustainability front, we recently published an ESG white paper on the topic of expanding access to fresh and healthy food. We believe food retailers and manufacturers can play a key part in addressing this problem by improving access to nutritious food options and we highlight Kroger Co. and Dollar General’s actions in promoting healthier food choices. As the second largest grocer in the U.S., Kroger’s business strategy and brand are centered on providing access to fresh, affordable, and healthy food. The company is one of the leaders in driving increased penetration of natural and organic products through its Simple Truth® brand. Adapting to the digital trend, Kroger’s mobile application OptUP helps customers make smarter decisions shopping for health and wellness. On the corporate governance side, Kroger integrated a Fresh Equity metric, based on improvement in produce share, into the incentive plan for senior executives. Another portfolio holding, Dollar General plays a significant role providing food access to underserved communities. In-house distribution capacity for fresh products has enabled the company to accelerate the rollout of fresh produce to 3,000 stores by year-end 2022 from just 750 two years ago, with plans to expand access to more than 10,000 stores over the next several years with rural markets prioritized. In addition, the company has introduced 8,080 healthier products including the Good & Smart private brand.
The macroeconomic outlook remains very uncertain. We were struck by the range of views provided recently by three of the largest financial institutions, namely J.P. Morgan, Citibank, and Wells Fargo. J.P. Morgan was the most concerned, with its Chief Executive Officer, Jamie Dimon, calling for a significant slowdown and this bank’s Board recommendation to suspend any further stock repurchase. In contrast, the other two banks were much more constructive about the outlook. We posit that all three of these banks are analyzing the same data but coming to much different conclusions. Similarly, some took Federal Reserve Board Chair Jerome Powell’s commentary following the most recent 75 basis point Fed Funds’ rate hike as dovish while others viewed it as hawkish. During the earnings season that is now underway, several companies have called out a slowdown in consumer demand, yet others have spoken to consumers’ resiliency. Whenever the outlook is murky, we take comfort in knowing that our portfolio is invested in companies that we believe have the potential to deliver consistent revenue, earnings, and cash flow growth regardless of the broader macro backdrop.
We thank you for your investment and continued confidence in the Coho Relative Value Equity and Coho Relative Value ESG Funds. We look forward to serving your interests over the many quarters and years to come.
Sincerely,
Coho Partners, Ltd.
COHO FUNDS
Past performance does not guarantee future results.
Opinions expressed are subject to change at any time, are not guaranteed and should not be considered investment advice.
Mutual fund investing involves risk. Principal loss is possible. The Funds may have a relatively high concentration of assets in a single or small number of issuers, which may reduce their diversification and result in increased volatility. The Funds typically invest in large-cap companies which are sometimes unable to attain the high growth rates of successful, smaller companies, especially during extended periods of economic expansion. The Funds may also invest in mid-cap companies which involve additional risks such as limited liquidity and greater volatility than larger capitalization companies. Investments in securities of foreign issuers involve risks not ordinarily associated with investment in securities and instruments of U.S. issuers, including risks relating to political, social and economic developments abroad, differences between U.S. and foreign regulatory and accounting requirements, tax risks, and market practices, as well as fluctuations in foreign currencies. The principal value and investment return of an investment will fluctuate so an investor’s shares, when redeemed, may be worth more or less than the initial investment. Applying ESG (environmental, social, and governance) criteria to the Coho Relative Value ESG Fund’s investment process may exclude securities of certain issuers for non-investment reasons and therefore the Fund may forgo some market opportunities available to funds that do not use ESG criteria. Securities of companies with ESG practices may shift into and out of favor depending on market and economic conditions, and the Fund’s performance may at times be better or worse than the performance of funds that do not use ESG criteria. Growth stocks typically are more volatile than value stocks; however, value stocks have a lower expected growth rate in earnings and sales.
Fund holdings and sector allocations are subject to change at any time and should not be considered a recommendation to buy or sell any security. Please see the schedule of investments section in this report for a full listing of each Fund’s holdings.
The S&P 500® Index is a stock market index based on the market capitalizations of 500 leading companies publicly traded in the U.S. stock market, as determined by Standard & Poor’s. One cannot invest directly in an index.
The Russell 1000®Value Index measures the performance of equity securities of Russell 1000® Index issuers with lower price-to-book ratios and lower forecasted growth. One cannot invest directly in an index.
Basis Points are a unit of measure used to describe the percentage change in the value of financial instruments or the rate change in an index or other benchmark. One basis point is equivalent to 0.01% (1/100th of a percent) or 0.0001 in decimal form.
Permitted Use of the Russell 1000® Value Index
Source: London Stock Exchange Group plc and its group undertakings (collectively, the “LSE Group”). © LSE Group 2020.
The Coho Relative Value Equity and Coho Relative Value ESG strategies have been developed solely by Coho Partners, Ltd. The strategies are not in any way connected to or sponsored, endorsed, sold or promoted by the London Stock Exchange Group plc and its group undertakings. FTSE Russell is a trading name of certain of the LSE Group companies.
All rights in the Russell 1000® Value Index vest in the relevant LSE Group company which owns the Russell 1000® Value Index. Russell® is a trademark of the relevant LSE Group company and is used by any other LSE Group company under license.
The Russell 1000® Value Index is calculated by or on behalf of FTSE International Limited or its affiliate, agent or partner. The LSE Group does not accept any liability whatsoever to any person arising out of (a) the use of, reliance on or any error in the Russell 1000® Value Index or (b) investment in or operation of the Coho Relative Value Equity and Coho Relative Value ESG strategies. The LSE Group makes no claim, prediction, warranty or representation either as to the results to be obtained from the Coho Relative Value Equity and Coho Relative Value ESG strategies or the suitability of the Russell 1000® Value Index for the purpose to which it is being put by Coho Partner, Ltd.
The Coho Relative Value Equity Fund and Coho Relative Value ESG Fund are distributed by Compass Distributors, LLC.
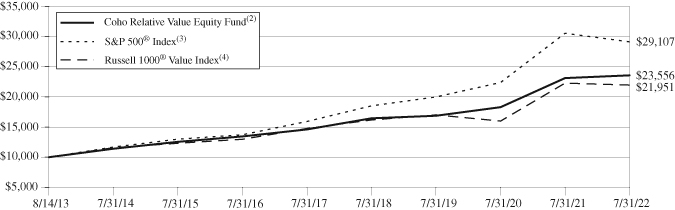
COHO RELATIVE VALUE EQUITY FUND
Value of $10,000 Investment (Unaudited)
The chart assumes an initial investment of $10,000. Performance reflects waivers of fee and operating expenses in effect. In the absence of such waivers, total return would be reduced. Performance data quoted represents past performance and does not guarantee future results. Investment returns and principal value will fluctuate, and when sold, may be worth more or less than their original cost. Performance current to the most recent month-end may be lower or higher than the performance quoted and can be obtained by calling 866-COHO-234. Performance assumes the reinvestment of capital gains and income distributions. The performance does not reflect the deduction of taxes that a shareholder would pay on Fund distributions or the redemption of Fund shares.
Annualized Rates Of Return (%) — July 31, 2022
| | | 1 Year | 3 Year | 5 Year | Since Inception(1) |
| | Coho Relative Value Equity Fund(2) | 1.96% | 11.79% | 10.04% | 10.03% |
| | S&P 500® Index(3) | -4.64% | 13.36% | 12.83% | 12.66% |
| | Russell 1000® Value Index(4) | -1.43% | 8.88% | 8.26% | 9.17% |
(1) | Period from Fund inception through July 31, 2022. The Fund commenced operations on August 14, 2013. |
(2) | On November 22, 2019, the Fund’s Institutional Class shares were merged into the Advisor Class shares. The Advisor Class name was subsequently discontinued following the merger. |
(3) | The S&P 500® Index is an unmanaged, capitalization-weighted index generally representative of the U.S. market for large capitalization stocks. One cannot invest directly in an Index. |
(4) | The Russell 1000® Value Index measures the performance of the small cap value segment of U.S. equity securities. It includes those Russell 1000® Index companies with lower price-to-book ratios and lower forecasted growth values. One cannot invest directly in an Index. |
The following is expense information for the Coho Relative Value Equity Fund as disclosed in the Fund’s most recent prospectus dated November 28, 2021:
Gross Expenses: 0.78%; Net Expenses: 0.79%. Coho Partners, Ltd. (the “Adviser” or “Coho”) has contractually agreed to waive its management fees and pay Fund expenses in order to ensure that Total Annual Fund Operating Expenses (excluding acquired fund fees and expenses, leverage/borrowing interest, interest expense, dividends paid on short sales, taxes, brokerage commissions and extraordinary expenses) do not exceed 0.79% of the average daily net assets of the Fund. Fees waived and expenses paid by the Adviser may be recouped by the Adviser for a period of 36 months following the month during which such fee waiver and expense payment was made if such recoupment can be achieved without exceeding the expense limit in effect at the time the fee waiver and expense payment occurred and the expense limit in place at the time of recoupment. The Operating Expenses Limitation Agreement is indefinite but cannot be terminated through at least November 28, 2022. Thereafter, the agreement may be terminated at any time upon 60 days’ written notice by the Trust’s Board of Trustees (the “Board”) or the Adviser, with the consent of the Board.
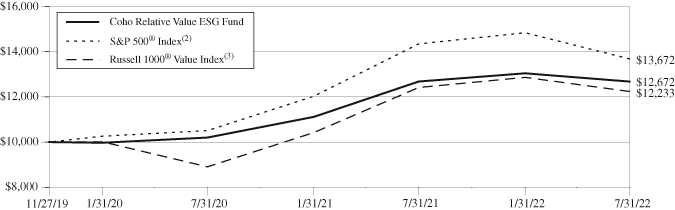
COHO RELATIVE VALUE ESG FUND
Value of $10,000 Investment (Unaudited)
The chart assumes an initial investment of $10,000. Performance reflects waivers of fee and operating expenses in effect. In the absence of such waivers, total return would be reduced. Performance data quoted represents past performance and does not guarantee future results. Investment returns and principal value will fluctuate, and when sold, may be worth more or less than their original cost. Performance current to the most recent month-end may be lower or higher than the performance quoted and can be obtained by calling 866-COHO-234. Performance assumes the reinvestment of capital gains and income distributions. The performance does not reflect the deduction of taxes that a shareholder would pay on Fund distributions or the redemption of Fund shares.
Annualized Rates Of Return (%) — July 31, 2022
| | | 1 Year | Since Inception(1) |
| | Coho Relative Value ESG Fund | -0.02% | 9.25% |
| | S&P 500® Index(2) | -4.64% | 12.39% |
| | Russell 1000® Value Index(3) | -1.43% | 7.82% |
(1) | Period from Fund inception through July 31, 2022. The Fund commenced operations on November 27, 2019. |
(2) | The S&P 500® Index is an unmanaged, capitalization-weighted index generally representative of the U.S. market for large capitalization stocks. One cannot invest directly in an Index. |
(3) | The Russell 1000® Value Index measures the performance of the small cap value segment of U.S. equity securities. It includes those Russell 1000® Index companies with lower price-to-book ratios and lower forecasted growth values. One cannot invest directly in an Index. |
The following is expense information for the Coho Relative Value ESG Fund as disclosed in the Fund’s most recent prospectus dated November 28, 2021:
Gross Expenses: 1.81%; Net Expenses: 0.79%. Coho Partners, Ltd. (the “Adviser” or “Coho”) has contractually agreed to waive its management fees and pay Fund expenses in order to ensure that Total Annual Fund Operating Expenses (excluding acquired fund fees and expenses, leverage/borrowing interest, interest expense, dividends paid on short sales, taxes, brokerage commissions and extraordinary expenses) do not exceed 0.79% of the average daily net assets of the Fund. Fees waived and expenses paid by the Adviser may be recouped by the Adviser for a period of 36 months following the month during which such fee waiver and expense payment was made if such recoupment can be achieved without exceeding the expense limit in effect at the time the fee waiver and expense payment occurred and the expense limit in place at the time of recoupment. The Operating Expenses Limitation Agreement is indefinite in term but cannot be terminated through at least November 28, 2022. Thereafter, the agreement may be terminated at any time upon 60 days’ written notice by the Trust’s Board of Trustees (the “Board”) or the Adviser, with the consent of the Board.
COHO FUNDS
Expense Examples (Unaudited)
July 31, 2022
As a shareholder of a Fund, you incur two types of costs: (1) transaction costs, including brokerage commissions on purchases and sales of Fund shares, and (2) ongoing costs, including management fees and other Fund expenses. This Example is intended to help you understand your ongoing costs (in dollars) of investing in a Fund and to compare these costs with the ongoing costs of investing in other mutual funds. The Example is based on an investment of $1,000 invested at the beginning of the period and held for the entire period (February 1, 2022 – July 31, 2022).
ACTUAL EXPENSES
The first line of each table below provides information about actual account values and actual expenses. You may use the information in this line, together with the amount you invested, to estimate the expenses that you paid over the period. Simply divide your account value by $1,000 (for example, an $8,600 account value divided by $1,000 = 8.6), then multiply the result by the number in the first line under the heading entitled “Expenses Paid During Period” to estimate the expenses you paid on your account during this period.
HYPOTHETICAL EXAMPLE FOR COMPARISON PURPOSES
The second line of each table below provides information about hypothetical account values and hypothetical expenses based on the Fund’s actual expense ratio and an assumed rate of return of 5% per year before expenses, which is not the Fund’s actual return. The hypothetical account values and expenses may not be used to estimate the actual ending account balance or expenses you paid for the period. You may use this information to compare the ongoing costs of investing in the Fund and other funds. To do so, compare this 5% hypothetical example with the 5% hypothetical examples that appear in the shareholder reports of the other funds.
Please note that the expenses shown in the tables are meant to highlight your ongoing costs only and do not reflect any transactional costs. Therefore, the second line of each table is useful in comparing ongoing costs only and will not help you determine the relative total costs of owning different funds. In addition, if transactional costs were included, your costs may have been higher.
Coho Relative Value Equity Fund
| | Beginning | Ending | Expenses Paid |
| | Account Value | Account Value | During Period(1) |
| | (2/1/2022) | (7/31/2022) | (2/1/2022 to 7/31/2022) |
Actual(2) | $1,000.00 | $ 982.70 | $3.88 |
Hypothetical (5% return before expenses) | $1,000.00 | $1,020.88 | $3.96 |
(1) | Expenses are equal to the Fund’s annualized expense ratio for the most recent six-month period of 0.79%, multiplied by the average account value over the period, multiplied by 181/365 to reflect the one-half year period. |
(2) | Based on the actual return for the six-month period ended July 31, 2022 of -1.73%. |
Coho Relative Value ESG Fund
| | Beginning | Ending | Expenses Paid |
| | Account Value | Account Value | During Period(3) |
| | (2/1/2022) | (7/31/2022) | (2/1/2022 to 7/31/2022) |
Actual(4) | $1,000.00 | $ 972.00 | $3.86 |
Hypothetical (5% return before expenses) | $1,000.00 | $1,020.88 | $3.96 |
(3) | Expenses are equal to the Fund’s annualized expense ratio for the most recent six-month period of 0.79%, multiplied by the average account value over the period, multiplied by 181/365 to reflect the one-half year period. |
(4) | Based on the actual return for the six-month period ended July 31, 2022 of -2.80%. |
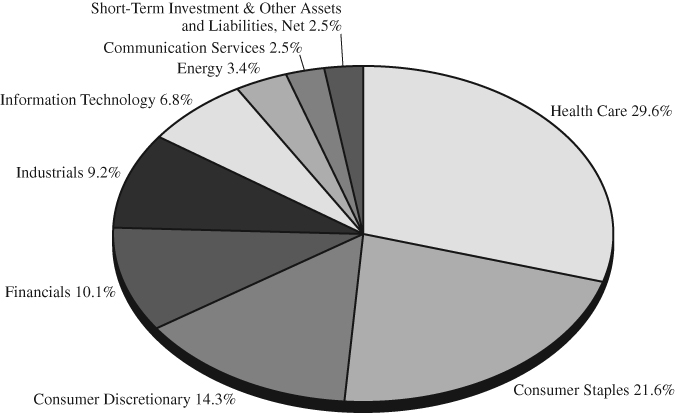
COHO RELATIVE VALUE EQUITY FUND
Sector Allocation(1) (Unaudited)
as of July 31, 2022
(% of net assets)
Top Ten Equity Holdings(1) (Unaudited)
as of July 31, 2022
(% of net assets)
| | Sysco | | | 5.0 | % |
| | CVS Health | | | 4.6 | % |
| | Dollar General | | | 4.5 | % |
| | AmerisourceBergen | | | 4.4 | % |
| | UnitedHealth Group | | | 4.4 | % |
| | Lowe’s Companies | | | 4.3 | % |
| | W.W. Grainger | | | 4.1 | % |
| | Johnson & Johnson | | | 4.1 | % |
| | U.S. Bancorp | | | 3.6 | % |
| | Microchip Technology | | | 3.6 | % |
(1) | Fund holdings and sector allocations are subject to change at any time and are not recommendations to buy or sell any security. |
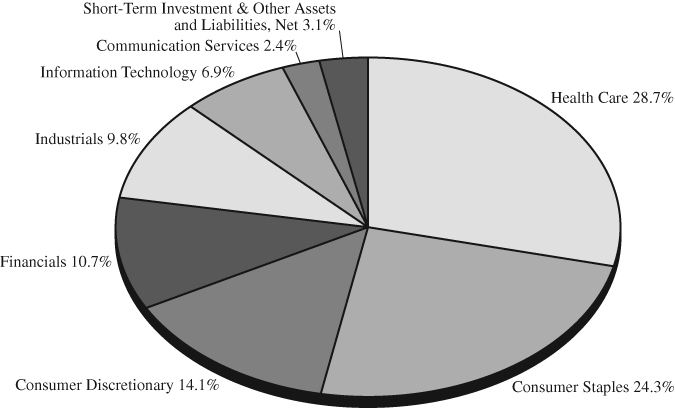
COHO RELATIVE VALUE ESG FUND
Sector Allocation(1) (Unaudited)
as of July 31, 2022
(% of net assets)
Top Ten Equity Holdings(1) (Unaudited)
as of July 31, 2022
(% of net assets)
| | Sysco | | | 5.4 | % |
| | CVS Health | | | 4.7 | % |
| | W.W. Grainger | | | 4.7 | % |
| | Johnson & Johnson | | | 4.5 | % |
| | Dollar General | | | 4.5 | % |
| | Lowe’s Companies | | | 4.2 | % |
| | UnitedHealth Group | | | 4.2 | % |
| | U.S. Bancorp | | | 3.7 | % |
| | Marsh & McLennan Companies | | | 3.7 | % |
| | Mondelez International | | | 3.7 | % |
(1) | Fund holdings and sector allocations are subject to change at any time and are not recommendations to buy or sell any security. |
COHO RELATIVE VALUE EQUITY FUND
Schedule of Investments
July 31, 2022
| | | Shares | | | Value | |
| | | | | | | |
| COMMON STOCKS — 97.5% | | | | | | |
| | | | | | | |
| Communication Services — 2.5% | | | | | | |
Walt Disney* | | | 221,557 | | | $ | 23,507,198 | |
| | | | | | | | | |
| | | | | | | | | |
| Consumer Discretionary — 14.3% | | | | | | | | |
Dollar General | | | 173,928 | | | | 43,208,933 | |
Lowe’s Companies | | | 216,241 | | | | 41,416,639 | |
Nike — Class B | | | 176,031 | | | | 20,229,483 | |
Ross Stores | | | 397,186 | | | | 32,275,334 | |
| | | | | | | | 137,130,389 | |
| | | | | | | | | |
| Consumer Staples — 21.6% | | | | | | | | |
Coca-Cola | | | 508,744 | | | | 32,646,103 | |
Conagra Brands | | | 757,234 | | | | 25,904,975 | |
JM Smucker | | | 156,706 | | | | 20,735,338 | |
Kroger | | | 410,629 | | | | 19,069,611 | |
Mondelez International | | | 529,180 | | | | 33,888,687 | |
Philip Morris International | | | 276,934 | | | | 26,904,138 | |
Sysco | | | 565,728 | | | | 48,030,307 | |
| | | | | | | | 207,179,159 | |
| | | | | | | | | |
| Energy — 3.4% | | | | | | | | |
Chevron | | | 200,814 | | | | 32,889,317 | |
| | | | | | | | | |
| | | | | | | | | |
| Financials — 10.1% | | | | | | | | |
Marsh & McLennan Companies | | | 204,452 | | | | 33,521,950 | |
State Street | | | 407,014 | | | | 28,914,274 | |
U.S. Bancorp | | | 735,735 | | | | 34,726,692 | |
| | | | | | | | 97,162,916 | |
| | | | | | | | | |
Health Care — 29.6%# | | | | | | | | |
AmerisourceBergen | | | 291,818 | | | | 42,585,001 | |
Amgen | | | 131,710 | | | | 32,594,274 | |
CVS Health | | | 464,990 | | | | 44,490,243 | |
Johnson & Johnson | | | 222,691 | | | | 38,864,033 | |
Medtronic PLC | | | 289,432 | | | | 26,778,249 | |
Perrigo PLC | | | 591,598 | | | | 24,770,208 | |
Thermo Fisher Scientific | | | 53,062 | | | | 31,752,831 | |
UnitedHealth Group | | | 77,514 | | | | 42,038,943 | |
| | | | | | | | 283,873,782 | |
See Notes to the Financial Statements
COHO RELATIVE VALUE EQUITY FUND
Schedule of Investments – Continued
July 31, 2022
| | | Shares | | | Value | |
| | | | | | | |
| Industrials — 9.2% | | | | | | |
Stanley Black & Decker | | | 163,510 | | | $ | 15,914,428 | |
United Parcel Service — Class B | | | 165,494 | | | | 32,253,126 | |
W.W. Grainger | | | 73,096 | | | | 39,729,869 | |
| | | | | | | | 87,897,423 | |
| | | | | | | | | |
| Information Technology — 6.8% | | | | | | | | |
Global Payments | | | 247,001 | | | | 30,213,162 | |
Microchip Technology | | | 501,515 | | | | 34,534,323 | |
| | | | | | | | 64,747,485 | |
| Total Common Stocks | | | | | | | | |
| (Cost $787,541,913) | | | | | | | 934,387,669 | |
| | | | | | | | | |
| SHORT-TERM INVESTMENT — 2.4% | | | | | | | | |
U.S. Bank N.A., 1.00%^ | | | | | | | | |
| (Cost $22,852,102) | | | 22,852,102 | | | | 22,852,102 | |
| Total Investments — 99.9% | | | | | | | | |
| (Cost $810,394,015) | | | | | | | 957,239,771 | |
| Other Assets and Liabilities, Net — 0.1% | | | | | | | 915,338 | |
| Total Net Assets — 100.0% | | | | | | $ | 958,155,109 | |
PLC
| Public Limited Company |
| * | Non-income producing. |
| # | As of July 31, 2022, the Fund had a significant portion of its assets invested in this sector and therefore is subject to additional risks. See Note 8 in the Notes to the Financial Statements. |
| ^ | The Money Market Deposit Account (“MMDA”) is a short-term investment vehicle in which the Fund holds cash balances. The MMDA will bear interest at a variable rate that is determined based on market conditions and may change daily and by any amount. The rate shown is as of July 31, 2022. |
The Global Industry Classification Standard (“GICS®”) was developed by and/or is the exclusive property of MSCI, Inc. (“MSCI”) and Standard & Poor Financial Services LLC (“S&P”). GICS® is a service mark of MSCI and S&P and has been licensed for use.
See Notes to the Financial Statements
COHO RELATIVE VALUE ESG FUND
Schedule of Investments
July 31, 2022
| | | Shares | | | Value | |
| | | | | | | |
| COMMON STOCKS — 96.9% | | | | | | |
| | | | | | | |
| Communication Services — 2.4% | | | | | | |
Walt Disney* | | | 11,039 | | | $ | 1,171,238 | |
| | | | | | | | | |
| | | | | | | | | |
| Consumer Discretionary — 14.1% | | | | | | | | |
Dollar General | | | 8,808 | | | | 2,188,171 | |
Lowe’s Companies | | | 10,659 | | | | 2,041,518 | |
Nike — Class B | | | 8,914 | | | | 1,024,397 | |
Ross Stores | | | 19,129 | | | | 1,554,423 | |
| | | | | | | | 6,808,509 | |
| | | | | | | | | |
| Consumer Staples — 24.3% | | | | | | | | |
Coca-Cola | | | 26,245 | | | | 1,684,142 | |
Colgate-Palmolive | | | 19,497 | | | | 1,535,194 | |
Conagra Brands | | | 41,979 | | | | 1,436,101 | |
JM Smucker | | | 12,793 | | | | 1,692,770 | |
Kroger | | | 21,882 | | | | 1,016,200 | |
Mondelez International | | | 27,537 | | | | 1,763,469 | |
Sysco | | | 30,518 | | | | 2,590,978 | |
| | | | | | | | 11,718,854 | |
| | | | | | | | | |
| Financials — 10.7% | | | | | | | | |
Marsh & McLennan Companies | | | 10,893 | | | | 1,786,016 | |
State Street | | | 22,300 | | | | 1,584,192 | |
U.S. Bancorp | | | 37,984 | | | | 1,792,845 | |
| | | | | | | | 5,163,053 | |
| | | | | | | | | |
| Health Care — 28.7%# | | | | | | | | |
Amgen | | | 6,926 | | | | 1,713,977 | |
CVS Health | | | 23,898 | | | | 2,286,561 | |
Johnson & Johnson | | | 12,541 | | | | 2,188,655 | |
Medtronic PLC | | | 15,222 | | | | 1,408,340 | |
Perrigo PLC | | | 35,028 | | | | 1,466,622 | |
Quest Diagnostics | | | 8,099 | | | | 1,106,080 | |
Thermo Fisher Scientific | | | 2,768 | | | | 1,656,399 | |
UnitedHealth Group | | | 3,730 | | | | 2,022,928 | |
| | | | | | | | 13,849,562 | |
| | | | | | | | | |
| Industrials — 9.8% | | | | | | | | |
Stanley Black & Decker | | | 8,212 | | | | 799,274 | |
United Parcel Service — Class B | | | 8,533 | | | | 1,662,997 | |
W.W. Grainger | | | 4,157 | | | | 2,259,454 | |
| | | | | | | | 4,721,725 | |
See Notes to the Financial Statements
COHO RELATIVE VALUE ESG FUND
Schedule of Investments – Continued
July 31, 2022
| | | Shares | | | Value | |
| | | | | | | |
| Information Technology — 6.9% | | | | | | |
Global Payments | | | 12,778 | | | $ | 1,563,005 | |
Microchip Technology | | | 25,452 | | | | 1,752,625 | |
| | | | | | | | 3,315,630 | |
| Total Common Stocks | | | | | | | | |
| (Cost $47,175,146) | | | | | | | 46,748,571 | |
| | | | | | | | | |
| SHORT-TERM INVESTMENT — 3.1% | | | | | | | | |
U.S. Bank N.A., 1.00%^ | | | | | | | | |
| (Cost $1,504,338) | | | 1,504,338 | | | | 1,504,338 | |
| Total Investments — 100.0% | | | | | | | | |
| (Cost $48,679,484) | | | | | | | 48,252,909 | |
| Other Assets and Liabilities, Net — (0.0)% | | | | | | | (5,265 | ) |
| Total Net Assets — 100.0% | | | | | | $ | 48,247,644 | |
| PLC | Public Limited Company |
| * | Non-income producing. |
| # | As of July 31, 2022, the Fund had a significant portion of its assets invested in this sector and therefore is subject to additional risks. See Note 8 in the Notes to the Financial Statements. |
| ^ | The Money Market Deposit Account (“MMDA”) is a short-term investment vehicle in which the Fund holds cash balances. The MMDA will bear interest at a variable rate that is determined based on market conditions and may change daily and by any amount. The rate shown is as of July 31, 2022. |
The Global Industry Classification Standard (“GICS®”) was developed by and/or is the exclusive property of MSCI, Inc. (“MSCI”) and Standard & Poor Financial Services LLC (“S&P”). GICS® is a service mark of MSCI and S&P and has been licensed for use.
See Notes to the Financial Statements
COHO FUNDS
Statements of Assets and Liabilities
July 31, 2022
| | | Coho | | | Coho | |
| | | Relative Value | | | Relative Value | |
| | | Equity Fund | | | ESG Fund | |
| ASSETS: | | | | | | |
Investments, at value | | | | | | |
(Cost: $810,394,015 & $48,679,484, respectively) | | $ | 957,239,771 | | | $ | 48,252,909 | |
Dividends and interest receivable | | | 616,079 | | | | 40,577 | |
Receivable for capital shares sold | | | 1,054,521 | | | | 8,208 | |
Prepaid expenses | | | 25,185 | | | | 9,328 | |
Total assets | | | 958,935,556 | | | | 48,311,022 | |
| | | | | | | | | |
| LIABILITIES: | | | | | | | | |
Payable to investment adviser | | | 551,116 | | | | 18,987 | |
Payable for fund administration & accounting fees | | | 80,937 | | | | 7,032 | |
Payable for capital shares redeemed | | | 76,418 | | | | — | |
Payable for audit fees | | | 18,999 | | | | 19,000 | |
Payable for custody fees | | | 13,402 | | | | 1,504 | |
Payable for transfer agent fees & expenses | | | 11,430 | | | | 3,033 | |
Payable for legal fees | | | 8,862 | | | | 8,035 | |
Payable for compliance fees | | | 2,082 | | | | 2,082 | |
Accrued expenses | | | 17,201 | | | | 3,705 | |
Total liabilities | | | 780,447 | | | | 63,378 | |
| | | | | | | | | |
| NET ASSETS | | $ | 958,155,109 | | | $ | 48,247,644 | |
| | | | | | | | | |
| NET ASSETS CONSIST OF: | | | | | | | | |
Paid-in capital | | $ | 758,813,404 | | | $ | 47,638,093 | |
Total distributable earnings | | | 199,341,705 | | | | 609,551 | |
Net Assets | | $ | 958,155,109 | | | $ | 48,247,644 | |
| | | | | | | | | |
Net Assets | | $ | 958,155,109 | | | $ | 48,247,644 | |
Shares issued and outstanding(1) | | | 58,132,049 | | | | 4,093,161 | |
Net asset value, redemption price and offering price per share | | $ | 16.48 | | | $ | 11.79 | |
(1) | Unlimited shares authorized without par value. |
See Notes to the Financial Statements
COHO FUNDS
Statements of Operations
For the Year Ended July 31, 2022
| | | Coho | | | Coho | |
| | | Relative Value | | | Relative Value | |
| | | Equity Fund | | | ESG Fund | |
| INVESTMENT INCOME: | | | | | | |
Dividend income | | $ | 20,630,203 | | | $ | 708,683 | |
Less: Foreign taxes withheld | | | (45,126 | ) | | | (1,019 | ) |
Interest income | | | 21,675 | | | | 1,157 | |
Total investment income | | | 20,606,752 | | | | 708,821 | |
| | | | | | | | | |
| EXPENSES: | | | | | | | | |
Investment adviser fees (See Note 4) | | | 6,725,070 | | | | 249,241 | |
Fund administration & accounting fees (See Note 4) | | | 491,799 | | | | 36,621 | |
Custody fees (See Note 4) | | | 82,071 | | | | 8,468 | |
Transfer agent fees & expenses (See Note 4) | | | 68,980 | | | | 18,117 | |
Federal & state registration fees | | | 32,348 | | | | 24,316 | |
Audit fees | | | 20,496 | | | | 20,496 | |
Trustee fees | | | 18,628 | | | | 18,322 | |
Postage & printing fees | | | 12,883 | | | | 497 | |
Compliance fees (See Note 4) | | | 12,494 | | | | 12,494 | |
Other expenses | | | 10,317 | | | | 6,049 | |
Legal fees | | | 6,916 | | | | 8,325 | |
Insurance fees | | | 6,241 | | | | 2,023 | |
Total expenses before waiver/recoupment | | | 7,488,243 | | | | 404,969 | |
Plus: Adviser recoupment (See Note 4) | | | 101,478 | | | | — | |
Less: waiver from investment adviser (See Note 4) | | | — | | | | (123,655 | ) |
Net expenses | | | 7,589,721 | | | | 281,314 | |
| | | | | | | | | |
| NET INVESTMENT INCOME | | | 13,017,031 | | | | 427,507 | |
| | | | | | | | | |
| REALIZED AND UNREALIZED | | | | | | | | |
| GAIN (LOSS) ON INVESTMENTS | | | | | | | | |
Net realized gain on investments | | | 81,303,568 | | | | 1,301,702 | |
Net change in unrealized | | | | | | | | |
appreciation/depreciation on investments | | | (73,739,061 | ) | | | (2,719,833 | ) |
| | | | | | | | | |
Net realized and unrealized gain (loss) on investments | | | 7,564,507 | | | | (1,418,131 | ) |
| | | | | | | | | |
| NET INCREASE (DECREASE) IN NET ASSETS | | | | | | | | |
| RESULTING FROM OPERATIONS | | $ | 20,581,538 | | | $ | (990,624 | ) |
See Notes to the Financial Statements
COHO RELATIVE VALUE EQUITY FUND
Statements of Changes in Net Assets
| | | Year Ended | | | Year Ended | |
| | | July 31, 2022 | | | July 31, 2021 | |
| OPERATIONS: | | | | | | |
Net investment income | | $ | 13,017,031 | | | $ | 13,499,187 | |
Net realized gain on investments | | | 81,303,568 | | | | 56,765,808 | |
Net change in unrealized appreciation/depreciation on investments | | | (73,739,061 | ) | | | 134,320,868 | |
Net increase in net assets resulting from operations | | | 20,581,538 | | | | 204,585,863 | |
| | | | | | | | | |
| CAPITAL SHARE TRANSACTIONS: | | | | | | | | |
Proceeds from shares sold | | | 144,111,995 | | | | 211,820,096 | |
Proceeds from reinvestment of distributions | | | 37,951,291 | | | | 16,518,865 | |
Payments for shares redeemed | | | (155,880,505 | ) | | | (151,507,896 | ) |
Redemptions fees | | | — | | | | 41,654 | |
Increase in net assets resulting from capital share transactions | | | 26,182,781 | | | | 76,872,719 | |
| | | | | | | | | |
| DISTRIBUTIONS TO SHAREHOLDERS | | | (77,870,490 | ) | | | (34,023,745 | ) |
| | | | | | | | | |
| TOTAL INCREASE (DECREASE) IN NET ASSETS | | | (31,106,171 | ) | | | 247,434,837 | |
| | | | | | | | | |
| NET ASSETS: | | | | | | | | |
Beginning of year | | | 989,261,280 | | | | 741,826,443 | |
End of year | | $ | 958,155,109 | | | $ | 989,261,280 | |
See Notes to the Financial Statements
COHO RELATIVE VALUE ESG FUND
Statements of Changes in Net Assets
| | | Year Ended | | | Year Ended | |
| | | July 31, 2022 | | | July 31, 2021 | |
| OPERATIONS: | | | | | | |
Net investment income | | $ | 427,507 | | | $ | 156,620 | |
Net realized gain on investments | | | 1,301,702 | | | | 573,019 | |
Net change in unrealized appreciation/depreciation on investments | | | (2,719,833 | ) | | | 1,936,028 | |
Net increase (decrease) in net assets resulting from operations | | | (990,624 | ) | | | 2,665,667 | |
| | | | | | | | | |
| CAPITAL SHARE TRANSACTIONS: | | | | | | | | |
Proceeds from shares sold | | | 30,450,060 | | | | 17,457,519 | |
Proceeds from reinvestment of distributions | | | 1,231,637 | | | | 117,541 | |
Payments for shares redeemed | | | (3,407,179 | ) | | | (1,622,239 | ) |
Net increase in net assets resulting from capital share transactions | | | 28,274,518 | | | | 15,952,821 | |
| | | | | | | | | |
| DISTRIBUTIONS TO SHAREHOLDERS: | | | (1,239,297 | ) | | | (122,178 | ) |
| | | | | | | | | |
| TOTAL INCREASE IN NET ASSETS | | | 26,044,597 | | | | 18,496,310 | |
| | | | | | | | | |
| NET ASSETS: | | | | | | | | |
Beginning of year | | | 22,203,047 | | | | 3,706,737 | |
End of year | | $ | 48,247,644 | | | $ | 22,203,047 | |
See Notes to the Financial Statements
COHO RELATIVE VALUE EQUITY FUND
Financial Highlights
For a Fund share outstanding throughout the years.
| | | Year Ended | | | Year Ended | | | Year Ended | | | Year Ended | | | Year Ended | |
| | | July 31, 2022 | | | July 31, 2021 | | | July 31, 2020 | | | July 31, 2019 | | | July 31, 2018 | |
| | | | | | | | | | | | | | | | |
PER SHARE DATA(1): | | | | | | | | | | | | | | | |
Net asset value, beginning of year | | $ | 17.51 | | | $ | 14.42 | | | $ | 14.20 | | | $ | 14.87 | | | $ | 13.71 | |
| | | | | | | | | | | | | | | | | | | | | |
| INVESTMENT OPERATIONS: | | | | | | | | | | | | | | | | | | | | |
Net investment income | | | 0.23 | (2) | | | 0.25 | (2) | | | 0.25 | (2) | | | 0.28 | | | | 0.22 | |
Net realized and unrealized | | | | | | | | | | | | | | | | | | | | |
gain on investments | | | 0.12 | | | | 3.46 | | | | 0.93 | | | | 0.06 | | | | 1.49 | |
Total from investment operations | | | 0.35 | | | | 3.71 | | | | 1.18 | | | | 0.34 | | | | 1.71 | |
| | | | | | | | | | | | | | | | | | | | | |
| LESS DISTRIBUTIONS FROM: | | | | | | | | | | | | | | | | | | | | |
Net investment income | | | (0.24 | ) | | | (0.22 | ) | | | (0.26 | ) | | | (0.23 | ) | | | (0.17 | ) |
Net realized gains | | | (1.14 | ) | | | (0.40 | ) | | | (0.70 | ) | | | (0.78 | ) | | | (0.38 | ) |
Total distributions | | | (1.38 | ) | | | (0.62 | ) | | | (0.96 | ) | | | (1.01 | ) | | | (0.55 | ) |
| | | | | | | | | | | | | | | | | | | | | |
Paid-in capital from redemption fees | | | — | | | | — | (3) | | | — | (3) | | | — | (3) | | | — | (3) |
| | | | | | | | | | | | | | | | | | | | | |
Net asset value, end of year | | $ | 16.48 | | | $ | 17.51 | | | $ | 14.42 | | | $ | 14.20 | | | $ | 14.87 | |
| | | | | | | | | | | | | | | | | | | | | |
| TOTAL RETURN | | | 1.96 | % | | | 26.33 | % | | | 8.45 | % | | | 2.55 | % | | | 12.63 | % |
| | | | | | | | | | | | | | | | | | | | | |
| SUPPLEMENTAL DATA | | | | | | | | | | | | | | | | | | | | |
| AND RATIOS: | | | | | | | | | | | | | | | | | | | | |
Net assets, end of year (in 000’s) | | $ | 958,155 | | | $ | 989,261 | | | $ | 741,826 | | | $ | 171,070 | | | $ | 214,614 | |
| | | | | | | | | | | | | | | | | | | | | |
Ratio of expenses to | | | | | | | | | | | | | | | | | | | | |
average net assets: | | | | | | | | | | | | | | | | | | | | |
| Before expense waiver/recoupment | | | 0.78 | % | | | 0.78 | % | | | 0.82 | % | | | 0.93 | % | | | 0.94 | % |
| After expense waiver/recoupment | | | 0.79 | % | | | 0.79 | % | | | 0.81 | %(4) | | | 0.94 | % | | | 0.94 | % |
| | | | | | | | | | | | | | | | | | | | | |
Ratio of net investment income | | | | | | | | | | | | | | | | | | | | |
to average net assets: | | | | | | | | | | | | | | | | | | | | |
| After expense waiver/recoupment | | | 1.35 | % | | | 1.53 | % | | | 1.76 | % | | | 1.71 | % | | | 1.44 | % |
| | | | | | | | | | | | | | | | | | | | | |
Portfolio turnover rate | | | 23 | % | | | 26 | % | | | 27 | % | | | 20 | % | | | 21 | % |
(1) | On November 22, 2019 the Fund’s Institutional Class shares were merged into the Advisor Class shares. The Advisor Class name was subsequently discontinued following the merger. |
(2) | Per share amounts calculated using the average shares method. |
(3) | Amount per share is less than $0.01. |
(4) | Prior to November 22, 2019, the annual expense limitation was 0.94% of the average daily net assets for the Advisor Class. Thereafter it was 0.79% for the existing class. |
See Notes to the Financial Statements
COHO RELATIVE VALUE ESG FUND
Financial Highlights
For a Fund share outstanding throughout the periods.
| | | | | | | | | Since Inception(1) | |
| | | Year Ended | | | Year Ended | | | through | |
| | | July 31, 2022 | | | July 31, 2021 | | | July 31, 2020 | |
| | | | | | | | | | |
| PER SHARE DATA: | | | | | | | | | |
Net asset value, beginning of period | | $ | 12.43 | | | $ | 10.19 | | | $ | 10.00 | |
| | | | | | | | | | | | | |
| INVESTMENT OPERATIONS: | | | | | | | | | | | | |
Net investment income | | | 0.09 | | | | 0.08 | | | | 0.05 | |
Net realized and unrealized gain (loss) on investments | | | (0.08 | )(4) | | | 2.37 | | | | 0.15 | |
Total from investment operations | | | 0.01 | | | | 2.45 | | | | 0.20 | |
| | | | | | | | | | | | | |
| LESS DISTRIBUTIONS FROM: | | | | | | | | | | | | |
Net investment income | | | (0.08 | ) | | | (0.05 | ) | | | (0.01 | ) |
Net realized gains | | | (0.57 | ) | | | (0.16 | ) | | | — | |
Total distributions | | | (0.65 | ) | | | (0.21 | ) | | | (0.01 | ) |
| | | | | | | | | | | | | |
Net asset value, end of period | | $ | 11.79 | | | $ | 12.43 | | | $ | 10.19 | |
| | | | | | | | | | | | | |
TOTAL RETURN(2) | | | -0.02 | % | | | 24.26 | % | | | 2.00 | % |
| | | | | | | | | | | | | |
| SUPPLEMENTAL DATA AND RATIOS: | | | | | | | | | | | | |
Net assets, end of period (in 000’s) | | $ | 48,248 | | | $ | 22,203 | | | $ | 3,707 | |
| | | | | | | | | | | | | |
Ratio of expenses to average net assets: | | | | | | | | | | | | |
Before expense waiver/reimbursement(3) | | | 1.14 | % | | | 1.81 | % | | | 9.78 | % |
After expense waiver/reimbursement(3) | | | 0.79 | % | | | 0.79 | % | | | 0.79 | % |
| | | | | | | | | | | | | |
Ratio of net investment income to average net assets: | | | | | | | | | | | | |
After expense waiver/reimbursement(3) | | | 1.20 | % | | | 1.15 | % | | | 1.48 | % |
| | | | | | | | | | | | | |
Portfolio turnover rate(2) | | | 22 | % | | | 25 | % | | | 10 | % |
(1) | Inception date for the Fund was November 27, 2019. |
(2) | Not annualized for period less than one year. |
(3) | Annualized for period less than one year. |
(4) | Net realized and unrealized loss per share in this caption is a balancing amount necessary to reconcile changes in net asset value per share for the year, and may not reconcile with the aggregate gain on the Statement of Operations due to share transactions for the year. |
See Notes to the Financial Statements
COHO FUNDS
Notes to the Financial Statements
July 31, 2022
1. ORGANIZATION
Managed Portfolio Series (the “Trust”) was organized as a Delaware statutory trust on January 27, 2011. The Trust is registered under the Investment Company Act of 1940, as amended (the “1940 Act”), as an open-end management investment company. Both the Coho Relative Value Equity Fund (the “Equity Fund”) and Coho Relative Value ESG Fund (the “ESG Fund”) (each a “Fund” and collectively, the “Funds”) are diversified series, each with their own investment objectives and policies within the Trust. The investment objective of both Funds is total return. The Funds are investment companies and accordingly follow the investment company accounting and reporting guidance of the Financial Accounting Standards Board (“FASB”) Accounting Standards Codification Topic 946, Financial Services — Investment Companies. The Equity Fund commenced operations on August 14, 2013 and currently offers only one class of shares. Effective November 22, 2019, the Fund ceased offering its Institutional Class shares. The remaining Institutional Class shares were converted to Advisor Class shares at the close of business on November 22, 2019 and the Advisor Class name was subsequently discontinued. The Advisor Class shares were previously subject up to a maximum 0.15% shareholder servicing fee which is not applicable to the existing share class. Each class of shares had identical rights and privileges except with respect to shareholder servicing fees and voting rights on matters affecting a single class. The ESG Fund commenced operations on November 27, 2019 and currently offers only one class of shares. Both Funds may issue an unlimited number of shares of beneficial interest, with no par value.
2. SIGNIFICANT ACCOUNTING POLICIES
The following is a summary of significant accounting policies consistently followed by the Funds in the preparation of their financial statements. These policies are in conformity with generally accepted accounting principles in the United States of America (“GAAP”).
Security Valuation – All investments in securities are recorded at their estimated fair value, as described in Note 3.
Federal Income Taxes – The Funds comply with the requirements of Subchapter M of the Internal Revenue Code of 1986, as amended, necessary to qualify as regulated investment companies and distribute substantially all net taxable investment income and net realized gains to shareholders in a manner which results in no tax cost to the Funds. Therefore, no federal income or excise tax provision is required. As of and during the year ended July 31, 2022, the Funds did not have any tax positions that did not meet the “more-likely-than-not” threshold of being sustained by the applicable tax authority. As of and during the year ended July 31, 2022, the Funds did not have any liabilities for any unrecognized tax benefits. The Funds recognize interest and penalties, if any, related to unrecognized tax benefits on uncertain tax positions as income tax expense in the Statement of Operations. As of and during the year ended July 31, 2022, the Funds did not incur any interest or penalties. The Funds are not subject to examination by U.S. tax authorities for tax years prior to the fiscal year ended July 31, 2019.
Security Transactions, Income and Distributions — The Funds follow industry practice and record security transactions on the trade date. Realized gains and losses on sales of securities are calculated on the basis of identified cost. Dividend income is recorded on the ex-dividend date and interest income and expense is recorded on an accrual basis. Withholding taxes on foreign dividends have been provided for in accordance with each Fund’s understanding of the applicable country’s tax rules and regulations. Discounts and premiums on securities purchased are amortized over the expected life of the respective securities using the constant yield method.
The Funds distribute substantially all net investment income and net realized capital gains, if any, at least annually. Distributions to shareholders are recorded on the ex-dividend date. The treatment for financial reporting purposes of distributions made to shareholders during the year from net investment income or net realized capital gains may differ from their ultimate treatment for federal income tax purposes. These differences are caused primarily by differences
COHO FUNDS
Notes to the Financial Statements – Continued
July 31, 2022
in the timing of the recognition of certain components of income, expense or realized capital gain for federal income tax purposes. Where such differences are permanent in nature, GAAP requires that they be reclassified in the components of the net assets based on their ultimate characterization for federal income tax purposes. Any such reclassifications will have no effect on net assets, results of operations or net asset value (“NAV”) per share of the Funds. For the year ended July 31, 2022, the Equity Fund decreased distributable earnings by $5,313,811 and increased paid-in capital by $5,313,811 and the ESG Fund decreased distributable earnings by $63,613 and increased paid-in capital by $63,613. These adjustments were largely due to the use of tax equalization by each Fund and a distribution reclass by the ESG Fund.
Expenses — Expenses associated with a specific fund in the Trust are charged to that fund. Common Trust expenses are typically allocated evenly between the funds of the Trust, or by other equitable means.
Use of Estimates – The preparation of financial statements in conformity with GAAP requires management to make estimates and assumptions that affect the reported amounts of assets and liabilities and disclosure of contingent assets and liabilities at the date of the financial statements and the reported amounts of revenues and expenses during the reporting period. Actual results could differ from those estimates.
3. SECURITIES VALUATION
The Funds have adopted authoritative fair value accounting standards which establish an authoritative definition of fair value and set out a hierarchy for measuring fair value. These standards require additional disclosures about the various inputs and valuation techniques used to develop the measurements of fair value, a discussion of changes in valuation techniques and related inputs during the period and expanded disclosure of valuation Levels for major security types. These inputs are summarized in the three broad Levels listed below:
| Level 1 — | Unadjusted quoted prices in active markets for identical assets or liabilities that the Funds has the ability to access. |
| | |
| Level 2 — | Observable inputs other than quoted prices included in Level 1 that are observable for the asset or liability, either directly or indirectly. These inputs may include quoted prices for the identical instrument on an inactive market, prices for similar instruments, interest rates, prepayment speeds, credit risk, yield curves, default rates and similar data. |
| | |
| Level 3 — | Unobservable inputs for the asset or liability, to the extent relevant observable inputs are not available, representing the Funds’ own assumptions about the assumptions a market participant would use in valuing the asset or liability, and would be based on the best information available. |
Following is a description of the valuation techniques applied to the Funds’ major categories of assets and liabilities measured at fair value on a recurring basis. The Funds’ investments are carried at fair value.
Equity Securities — Equity securities that are primarily traded on a national securities exchange are valued at the last sale price on the exchange on which they are primarily traded on the day of valuation or, if there has been no sale on such day, at the mean between the bid and ask prices. Securities traded primarily in the Nasdaq Global Market System for which market quotations are readily available are valued using the Nasdaq Official Closing Price (“NOCP”). If the NOCP is not available, such securities are valued at the last sale price on the day of valuation, or if there has been no sale on such day, at the mean between the bid and ask prices. To the extent these securities are actively traded and valuation adjustments are not applied, they are categorized in Level 1 of the fair value hierarchy.
Short-Term Investments — Investments in other mutual funds, including money market funds, are valued at their net asset value per share. Deposit accounts are valued at acquisition cost, which approximates fair value. To the extent valuation adjustments are not applied, these securities are categorized in Level 1 of the fair value hierarchy.
COHO FUNDS
Notes to the Financial Statements – Continued
July 31, 2022
Securities for which market quotations are not readily available, or if the closing price does not represent fair value, are valued following procedures approved by the Board of Trustees (the “Board”). These procedures consider many factors, including the type of security, size of holding, trading volume and news events. There can be no assurance that the Funds could obtain the fair value assigned to a security if they were to sell the security at approximately the time at which the Funds determine their net asset value per share. The Board has established a Valuation Committee to administer, implement, and oversee the fair valuation process, and to make fair value decisions when necessary. The Board regularly reviews reports of the Valuation Committee that describe any fair value determinations and methods.
The inputs or methodology used for valuing securities are not an indication of the risk associated with investing in those securities. The following is a summary of the inputs used to value the Funds’ securities as of July 31, 2022:
| Equity Fund | | | | | | | | | | | | |
| | | Level 1 | | | Level 2 | | | Level 3 | | | Total | |
| Common Stocks | | $ | 934,387,669 | | | $ | — | | | $ | — | | | $ | 934,387,669 | |
| Short-Term Investment | | | 22,852,102 | | | | — | | | | — | | | | 22,852,102 | |
| Total Investments in Securities* | | $ | 957,239,771 | | | $ | — | | | $ | — | | | $ | 957,239,771 | |
| | | | | | | | | | | | | | | | | |
| ESG Fund | | | | | | | | | | | | | | | | |
| | | Level 1 | | | Level 2 | | | Level 3 | | | Total | |
| Common Stocks | | $ | 46,748,571 | | | $ | — | | | $ | — | | | $ | 46,748,571 | |
| Short-Term Investment | | | 1,504,338 | | | | — | | | | — | | | | 1,504,338 | |
| Total Investments in Securities* | | $ | 48,252,909 | | | $ | — | | | $ | — | | | $ | 48,252,909 | |
| * | Refer to the Schedule of Investments for further information on the classification of investments. |
4. INVESTMENT ADVISORY FEE AND OTHER TRANSACTIONS WITH AFFILIATES
The Trust has an agreement with the Adviser to furnish investment advisory services to the Funds. For its services, the Funds pay the Adviser, on a monthly basis, an annual advisory fee equal to 0.70% of the daily net assets of the Funds.
The Adviser has contractually agreed to waive a portion or all of its management fees and/or reimburse each Fund for their expenses to ensure total annual operating expenses (excluding acquired fund fees and expenses, brokerage commissions, interest, taxes, and extraordinary expenses) do not exceed 0.79% of each Fund’s average daily net assets.
Fees waived and expenses reimbursed by the Adviser may be recouped by the Adviser for a period of thirty-six months following the month during which such waiver or reimbursement was made if such recoupment can be achieved without exceeding the expense limit in effect at the time the waiver or reimbursement occurred. The Operating Expense Limitation Agreement is indefinite in term but cannot be terminated within a year after the effective date of the Funds’ prospectus. After that date, the agreement may be terminated at any time upon 60 days’ written notice by the Board or the Adviser, with the consent of the Board. During the year ended July 31, 2022, the Adviser was able to recoup $101,478 relating to fees waived in prior fiscal years for the Equity Fund. Waived fees and reimbursed expenses for the Funds subject to potential recovery by month of expiration are as follows:
| | | | Equity Fund | | | ESG Fund | |
| | Expiration | | Amount | | | Amount | |
| | August 2022 — July 2023 | | $ | 151,217 | | | $ | 89,779 | * |
| | August 2023 — July 2024 | | | — | | | | 137,972 | |
| | August 2024 — July 2025 | | | — | | | | 123,655 | |
| * | The potential recovery by month of expiration for this amount is December 2022 – July 2023. |
COHO FUNDS
Notes to the Financial Statements – Continued
July 31, 2022
U.S. Bancorp Fund Services, LLC (the “Administrator”), doing business as U.S. Bank Global Fund Services, acts as the Funds’ Administrator, Transfer Agent, and Fund Accountant. U.S. Bank N.A. (the “Custodian”) serves as the custodian to the Funds. The Custodian is an affiliate of the Administrator. The Administrator performs various administrative and accounting services for the Funds. The Administrator prepares various federal and state regulatory filings, reports and returns for the Funds; prepares reports and materials to be supplied to the Trustees; monitors the activities of the Custodian; coordinates the payment of the Funds’ expenses and reviews the Funds’ expense accruals. The officers of the Trust, including the Chief Compliance Officer, are employees of the Administrator. As compensation for its services, the Administrator is entitled to a monthly fee at an annual rate based upon the average daily net assets of the Funds, subject to annual minimums. Fees paid by the Funds for administration and accounting, transfer agency, custody and compliance services for the year ended July 31, 2022, are disclosed in the Statement of Operations.
5. CAPITAL SHARE TRANSACTIONS
Transactions in shares of the Funds were as follows:
| Equity Fund | | | | | | |
| | | Year Ended | | | Year Ended | |
| | | July 31, 2022 | | | July 31, 2021 | |
| Shares sold | | | 8,651,626 | | | | 13,507,550 | |
| Shares issued to holders in reinvestment of distributions | | | 2,260,592 | | | | 1,072,939 | |
| Shares redeemed | | | (9,272,560 | ) | | | (9,518,648 | ) |
| Net increase in shares outstanding | | | 1,639,658 | | | | 5,061,841 | |
| | | | | | | | | |
| ESG Fund | | | | | | | | |
| | | Year Ended | | | Year Ended | |
| | | July 31, 2022 | | | July 31, 2021 | |
| Shares sold | | | 2,487,592 | | | | 1,548,844 | |
| Shares issued to holders in reinvestment of distributions | | | 101,073 | | | | 10,641 | |
| Shares redeemed | | | (281,095 | ) | | | (137,706 | ) |
| Net increase in shares outstanding | | | 2,307,570 | | | | 1,421,779 | |
6. INVESTMENT TRANSACTIONS
The aggregate purchases and sales, excluding short-term investments, of the Funds for the year ended July 31, 2022, were as follows:
| | | Equity Fund | | | ESG Fund | |
| | | Purchases | | | Sales | | | Purchases | | | Sales | |
| U.S. Government Securities | | $ | — | | | $ | — | | | $ | — | | | $ | — | |
| Other Securities | | $ | 218,012,046 | | | $ | 259,988,066 | | | $ | 34,048,459 | | | $ | 7,474,464 | |
COHO FUNDS
Notes to the Financial Statements – Continued
July 31, 2022
7. INCOME TAX INFORMATION
The aggregate gross unrealized appreciation and depreciation of securities held by the Funds and the total cost of securities for federal income tax purposes at July 31, 2022, the Funds’ most recently completed fiscal year end, were as follows:
| | | Aggregate | | | Aggregate | | | Net | | | Federal | |
| | | Gross | | | Gross | | | Unrealized | | | Income | |
| | | Appreciation | | | Depreciation | | | Appreciation | | | Tax Cost | |
| Equity Fund | | $ | 186,232,791 | | | $ | (45,580,036 | ) | | $ | 140,652,755 | | | $ | 816,587,016 | |
| ESG Fund | | | 2,984,295 | | | | (3,440,763 | ) | | | (456,468 | ) | | | 48,709,377 | |
Any difference between book-basis and tax-basis unrealized appreciation is attributable primarily to the tax deferral of losses on wash sales in the Funds.
At July 31, 2022, components of distributable earnings on a tax-basis were as follows:
| | | Undistributed | | | Undistributed | | | Net | | | Total | |
| | | Ordinary | | | Long-Term | | | Unrealized | | | Distributable | |
| | | Income | | | Capital Gains | | | Appreciation | | | Earnings | |
| Equity Fund | | $ | 6,799,080 | | | $ | 51,889,870 | | | $ | 140,652,755 | | | $ | 199,341,705 | |
| ESG Fund | | | 271,849 | | | | 794,170 | | | | (456,468 | ) | | | 609,551 | |
As of July 31, 2022, the Funds did not have any capital loss carryovers. A regulated investment company may elect for any taxable year to treat any portion of any qualified late year loss as arising on the first day of the next taxable year. Qualified late year losses are certain capital, and ordinary losses which occur during the portion of a fund’s taxable year subsequent to October 31 and December 31, respectively. For the taxable year ended July 31, 2022, the Funds did not defer any qualified late year losses.
The tax character of distributions paid by the Funds for the year ended July 31, 2022, were as follows:
| | | Ordinary | | | Long Term | | | | |
| | | Income* | | | Capital Gains | | | Total | |
| Equity Fund | | $ | 24,589,743 | | | $ | 53,280,747 | | | $ | 77,870,490 | |
| ESG Fund | | | 790,887 | | | | 448,410 | | | | 1,239,297 | |
The tax character of distributions paid for the year ended July 31, 2021, were as follows:
| | | Ordinary | | | Long Term | | | | |
| | | Income* | | | Capital Gains | | | Total | |
| Equity Fund | | $ | 12,457,443
| | | $ | 21,566,302 | | | $ | 34,023,745 | |
| ESG Fund | | | 122,178
| | | | —
| | | | 122,178 | |
| * | For federal income tax purposes, distributions of short-term capital gains are treated as ordinary income distributions. |
COHO FUNDS
Notes to the Financial Statements – Continued
July 31, 2022
8. SECTOR RISK
As of July 31, 2022, each Fund had a significant portion of its assets invested in the health care sector. Companies in this sector are subject to risks such as litigation, intellectual property issues, competition, government regulation, product approval or rejection and product obsolescence.
9. CONTROL OWNERSHIP
The beneficial ownership, either directly or indirectly, of more than 25% of the voting securities of a Fund creates a presumption of control of the Fund, under Section 2(a)(9) of the Investment Company Act of 1940. As of July 31, 2022, Wells Fargo Bank, for the benefit of its customers, owned 34.1% of the outstanding shares of the Equity Fund. As of July 31, 2022, Charles Schwab & Co. owned 63.3% of the outstanding shares of the ESG Fund.
10. LINE OF CREDIT
The Equity Fund has established an unsecured Line of Credit (“LOC”) in the amount of $50,000,000 or 33.33% of the fair value of the Fund’s investments, whichever is less. The LOC matures, unless renewed, on July 21, 2023. This LOC is intended to provide short-term financing, if necessary, subject to certain restrictions, in connection with shareholder redemptions and other short-term liquidity needs of the Fund. The LOC is with the Custodian. Interest is charged at the prime rate which was 5.50% as of July 31, 2022. The interest rate during the period was between 3.25% and 5.50%. The Equity Fund has authorized the Custodian to charge any of the Fund’s accounts for any missed payments. For the year ended July 31, 2022, the Fund did not have any borrowings under the LOC.
11. REGULATORY UPDATE
In December 2020, the SEC adopted a new rule providing a framework for fund valuation practices (“Rule 2a-5”). Rule 2a-5 establishes requirements for determining fair value in good faith for purposes of the 1940 Act. Rule 2a-5 will permit fund boards to designate certain parties to perform fair value determinations, subject to board oversight and certain other conditions. Rule 2a-5 also defines when market quotations are “readily available” for purposes of the 1940 Act and the threshold for determining whether a fund must fair value a security. In connection with Rule 2a-5, the SEC also adopted related recordkeeping requirements and is rescinding previously issued guidance, including with respect to the role of a board in determining fair value and the accounting and auditing of fund investments. The Funds will be required to comply with the rules by September 8, 2022. Management is currently assessing the potential impact of the new rules on the Funds’ financial statements.
12. GENERAL RISK
The global outbreak of COVID-19 has disrupted economic markets and the prolonged economic impact is uncertain. The operational and financial performance of the issuers of securities in which the Funds invest depends on future developments, including the duration and spread of the outbreak, and such uncertainty may in turn impact the value of the Funds’ investments.
On February 24, 2022, Russia commenced a military attack on Ukraine. The outbreak of hostilities between the two countries could result in more widespread conflict and could have a severe adverse effect on the region and the markets. In addition, sanctions imposed on Russia by the United States and other countries, and any sanctions imposed in the future could have a significant adverse impact on the Russian economy and related markets. The price and liquidity of investments may fluctuate widely as a result of the conflict and related events. How long such conflict and related events will last and whether it will escalate further cannot be predicted, nor its effect on the Funds.
COHO FUNDS
Report of Independent Registered Public Accounting Firm
To the Shareholders of Coho Funds and
Board of Trustees of Managed Portfolio Series
Opinion on the Financial Statements
We have audited the accompanying statements of assets and liabilities, including the schedules of investments, of Coho Relative Value Equity Fund and Coho Relative Value ESG Fund (“Coho Funds” or the “Funds”), each a series of Managed Portfolio Series, as of July 31, 2022, the related statements of operations, the statements of changes in net assets, the related notes, and the financial highlights for each of the periods indicated below (collectively referred to as the “financial statements”). In our opinion, the financial statements present fairly, in all material respects, the financial position of each of the Funds as of July 31, 2022, the results of their operations, the changes in net assets, and the financial highlights for each of periods indicated below, in conformity with accounting principles generally accepted in the United States of America.
| Statements of | Statements of | |
Fund Name | Operations | Changes in Net Assets | Financial Highlights |
Coho Relative | For the year ended | For the years ended | For the years ended July 31, 2022, |
Value Equity Fund | July 31, 2022 | July 31, 2022 and 2021 | 2021, 2020, 2019, and 2018 |
Coho Relative | For the year ended | For the years ended | For the years ended July 31, 2022 |
Value ESG Fund | July 31, 2022 | July 31, 2022 and 2021 | and 2021 and for the period from |
| | | | November 27, 2019 (commencement |
| | | | of operations) through July 31, 2020 |
Basis for Opinion
These financial statements are the responsibility of the Funds’ management. Our responsibility is to express an opinion on the Funds’ financial statements based on our audits. We are a public accounting firm registered with the Public Company Accounting Oversight Board (United States) (“PCAOB”) and are required to be independent with respect to the Funds in accordance with the U.S. federal securities laws and the applicable rules and regulations of the Securities and Exchange Commission and the PCAOB.
We conducted our audits in accordance with the standards of the PCAOB. Those standards require that we plan and perform the audit to obtain reasonable assurance about whether the financial statements are free of material misstatement whether due to error or fraud.
Our audits included performing procedures to assess the risks of material misstatement of the financial statements, whether due to error or fraud, and performing procedures that respond to those risks. Such procedures included examining, on a test basis, evidence regarding the amounts and disclosures in the financial statements. Our procedures included confirmation of securities owned as of July 31, 2022, by correspondence with the custodian. Our audits also included evaluating the accounting principles used and significant estimates made by management, as well as evaluating the overall presentation of the financial statements. We believe that our audits provide a reasonable basis for our opinion.
We have served as the Funds’ auditor since 2012.
COHEN & COMPANY, LTD.
Milwaukee, Wisconsin
September 28, 2022
COHO FUNDS
Additional Information (Unaudited)
July 31, 2022
TRUSTEES AND OFFICERS
| | | | Number of | | |
| | | | Portfolios | | Other |
| | Position(s) | Term of Office | in Trust | | Directorships Held |
| Name, Address and | Held with | and Length of | Overseen | Principal Occupation(s) | by Trustee During |
Year of Birth | the Trust | Time Served | by Trustee | During the Past Five Years | the Past Five Years |
| | | | | | |
| Independent Trustees | | | | | |
| | | | | | |
Leonard M. Rush, CPA | Chairman, | Indefinite Term; | 37 | Retired, Chief Financial | Independent Trustee, |
615 E. Michigan St. | Trustee | Since | | Officer, Robert W. Baird | ETF Series Solutions |
Milwaukee, WI 53202 | and Audit | April 2011 | | & Co. Incorporated | (60 Portfolios) |
Year of Birth: 1946 | Committee | | | (2000-2011). | (2012-Present) |
| | Chairman | | | | |
| | | | | | |
David A. Massart | Trustee | Indefinite Term; | 37 | Partner and Managing | Independent Trustee, |
615 E. Michigan St. | | Since | | Director, Beacon | ETF Series Solutions |
Milwaukee, WI 53202 | | April 2011 | | Pointe Advisors, LLC | (60 Portfolios) |
Year of Birth: 1967 | | | | (since 2022); Co-Founder | (2012-Present) |
| | | | | and Chief Investment | |
| | | | | Strategist, Next Generation | |
| | | | | Wealth Management, Inc. | |
| | | | | (2005-2021). | |
COHO FUNDS
Additional Information (Unaudited) – Continued
July 31, 2022
| |
| | Number of | | |
| |
|
| Portfolios | | Other |
| | Term of Office | | | Directorships Held |
| Name, Address and | Held with | and Length of | Overseen | Principal Occupation(s) | by Trustee During |
Year of Birth | the Trust | Time Served | by Trustee | During the Past Five Years | the Past Five Years |
| | | | | | |
| Independent Trustees | | | | | |
| | | | | | |
David M. Swanson | Trustee and | Indefinite Term; | 37 | Founder and Managing | Independent Trustee, |
615 E. Michigan St. | Nominating | Since | | Principal, SwanDog | ALPS Variable |
Milwaukee, WI 53202 | & | April 2011 | | Strategic Marketing, LLC | Investment Trust |
Year of Birth: 1957 | Governance | | | (2006-Present). | (7 Portfolios) |
| | Committee | | | | (2006-Present); |
| | Chairman | | | | Independent Trustee, |
| | | | | | RiverNorth Funds |
| | | | | | (3 Portfolios) |
| | | | | | (2018-Present); |
| | | | | | RiverNorth Managed |
| | | | | | Duration Municipal |
| | | | | | Income Fund Inc. |
| | | | | | (1 Portfolio) |
| | | | | | (2019-Present); |
| | | | | | RiverNorth Specialty |
| | | | | | Finance Corporation |
| | | | | | (1 Portfolio) |
| | | | | | (2018-Present); |
| | | | | | RiverNorth/ |
| | | | | | DoubleLine Strategic |
| | | | | | Opportunity Fund, |
| | | | | | Inc. (1 Portfolio) |
| | | | | | (2018-Present); |
| | | | | | RiverNorth |
| | | | | | Opportunities Fund, |
| | | | | | Inc. (1 Portfolio) |
| | | | | | (2015-Present); |
| | | | | | RiverNorth |
| | | | | | Opportunistic |
| | | | | | Municipal Income |
| | | | | | Fund, Inc. |
| | | | | | (1 Portfolio) |
| | | | | | (2018-Present), |
| | | | | | Rivernorth Flexible |
| | | | | | Municipal Income |
| | | | | | Fund (2020-Present). |
COHO FUNDS
Additional Information (Unaudited) – Continued
July 31, 2022
| | | | Number of | | |
| | | | Portfolios | | Other |
| | Position(s) | Term of Office | in Trust | | Directorships Held |
| Name, Address and | Held with | and Length of | Overseen | Principal Occupation(s) | by Trustee During |
Year of Birth | the Trust | Time Served | by Trustee | During the Past Five Years | the Past Five Years |
| | | | | | |
| Independent Trustees | | | | | |
| | | | | | |
Robert J. Kern | Trustee | Indefinite Term; | 37 | Retired (July 2018- | None |
615 E. Michigan St. | | Since | | Present); Executive Vice | |
Milwaukee, WI 53202 | | January 2011 | | President, U.S. Bancorp | |
Year of Birth: 1958 | | | | Fund Services, LLC | |
| | | | | (1994-2018). | |
| | | | | | |
| Officers | | | | | |
| | | | | | |
Brian R. Wiedmeyer | President | Indefinite Term; | N/A | Vice President, U.S. | N/A |
615 E. Michigan St. | and | Since | | Bancorp Fund Services, | |
Milwaukee, WI 53202 | Principal | November 2018 | | LLC (2005-Present). | |
Year of Birth: 1973 | Executive | | | | |
| | Officer | | | | |
| | | | | | |
Deborah Ward | Vice | Indefinite Term; | N/A | Senior Vice President, | N/A |
615 E. Michigan St. | President, | Since | | U.S. Bancorp Fund | |
Milwaukee, WI 53202 | Chief | April 2013 | | Services, LLC | |
Year of Birth: 1966 | Compliance | | | (2004-Present). | |
| | Officer and | | | | |
| | Anti-Money | | | | |
| | Laundering | | | | |
| | Officer | | | | |
| | | | | | |
Benjamin Eirich | Treasurer, | Indefinite Term; | N/A | Assistant Vice President, | N/A |
615 E. Michigan St. | Principal | Since | | U.S. Bancorp Fund | |
Milwaukee, WI 53202 | Financial | August 2019 | | Services, LLC | |
Year of Birth: 1981 | Officer and | (Treasurer); | | (2008-Present). | |
| | Vice | Indefinite Term; | | | |
| | President | Since | | | |
| | | November 2018 | | | |
| | | (Vice President) | | | |
| | | | | | |
John Hadermayer | Secretary | Indefinite Term; | N/A | Vice President, U.S. | N/A |
615 E. Michigan St. | | Since | | Bancorp Fund Services, | |
Milwaukee, WI 53202 | | May 2022 | | LLC (2022-Present); | |
Year of Birth: 1977 | | | | Executive Director, AQR | |
| | | | | Capital Management, | |
| | | | | LLC (2013-2022). | |
COHO FUNDS
Additional Information (Unaudited) – Continued
July 31, 2022
| | | | Number of | | |
| | | | Portfolios | | Other |
| | Position(s) | Term of Office | in Trust | | Directorships Held |
| Name, Address and | Held with | and Length of | Overseen | Principal Occupation(s) | by Trustee During |
Year of Birth | the Trust | Time Served | by Trustee | During the Past Five Years | the Past Five Years |
| | | | | | |
| Officers | | | | | |
| | | | | | |
Douglas Schafer | Assistant | Indefinite Term; | N/A | Assistant Vice President, | N/A |
615 E. Michigan St. | Treasurer | Since | | U.S. Bancorp Fund Services, | |
Milwaukee, WI 53202 | and Vice | May 2016 | | LLC (2002-Present). | |
Year of Birth: 1970 | President | (Assistant | | | |
| | | Treasurer); | | | |
| | | Indefinite Term; | | | |
| | | Since | | | |
| | | November 2018 | | | |
| | | (Vice President) | | | |
| | | | | | |
Sara J. Bollech | Assistant | Indefinite Term; | N/A | Officer, U.S. Bancorp Fund | N/A |
615 E. Michigan St. | Treasurer | Since | | Services, LLC (2007-Present). | |
Milwaukee, WI 53202 | and Vice | November 2021 | | | |
Year of Birth: 1977 | President | | | | |
| | | | | | |
Peter A. Walker, CPA | Assistant | Indefinite Term; | N/A | Officer, U.S. Bancorp Fund | N/A |
615 E. Michigan St. | Treasurer | Since | | Services, LLC (2016-Present). | |
Milwaukee, WI 53202 | and Vice | November 2021 | | | |
Year of Birth: 1993 | President | | | | |
COHO FUNDS
Additional Information (Unaudited) – Continued
July 31, 2022
APPROVAL OF INVESTMENT ADVISORY AGREEMENT – Coho Partners, Ltd.
At the regular meeting of the Board of Trustees of Managed Portfolio Series (“Trust”) on February 22-23, 2022, the Trust’s Board of Trustees (“Board”), each of whom were present virtually via video conference, including all of the Trustees who are not “interested persons” of the Trust, as that term is defined in Section 2(a)(19) of the Investment Company Act of 1940, as amended, (“Independent Trustees”) considered and approved the continuation of the Investment Advisory Agreement between the Trust and Coho Partners, Ltd. (“Coho” or the “Adviser”) regarding the Coho Relative Value Equity Fund and the Coho Relative Value ESG Fund (each a “Fund” or collectively, the “Funds”) (the “Investment Advisory Agreement”) for an additional annual term.
Prior to the meeting and at a meeting held on January 11, 2022, the Trustees received and considered information from Coho and the Trust’s administrator designed to provide the Trustees with the information necessary to evaluate the continuance of the Investment Advisory Agreement (“Support Materials”). Before voting to approve the continuance of the Investment Advisory Agreement, the Trustees reviewed the Support Materials with Trust management and with counsel to the Independent Trustees, and received a memorandum from such counsel discussing the legal standards for the Trustees’ consideration of the renewal of the Investment Advisory Agreement. This information, together with the information provided to the Board throughout the course of the year, formed the primary (but not exclusive) basis for the Board’s determinations.
In determining whether to continue the Investment Advisory Agreement, the Trustees considered all factors they believed relevant, including the following with respect to each Fund: (1) the nature, extent, and quality of the services provided by Coho with respect to the Fund; (2) the Fund’s historical performance and the performance of other investment accounts managed by Coho; (3) the costs of the services provided by Coho and the profits realized by Coho from services rendered to the Fund; (4) comparative fee and expense data for the Fund and other investment companies with similar investment objectives; (5) the extent to which economies of scale may be realized as the Fund grows, and whether the advisory fee for the Fund reflects such economies of scale for the Fund’s benefit; and (6) other benefits to Coho resulting from its relationship with the Fund. In their deliberations, the Trustees weighed to varying degrees the importance of the information provided to them, did not identify any particular information that was all-important or controlling, and considered the information and made its determinations for each Fund separately and independently of the other Fund.
Based upon the information provided to the Board throughout the course of the year, including at an in-person presentation by representatives of Coho, and the Support Materials, the Board concluded that the overall arrangements between the Trust and Coho set forth in the Investment Advisory Agreement, as it relates to each Fund, continue to be fair and reasonable in light of the services that Coho performs, investment advisory fees that each Fund pays, and such other matters as the Trustees considered relevant in the exercise of their reasonable business judgment. The material factors and conclusions that formed the basis of the Trustees’ determination to approve the continuation of the Investment Advisory Agreement, as it relates to each Fund, are summarized below.
Nature, Extent and Quality of Services Provided. The Trustees considered the scope of services that Coho provides under the Investment Advisory Agreement with respect to each Fund, noting that such services include, but are not limited to the following with respect to each Fund: (1) investing the Fund’s assets consistent with the Fund’s investment objective and investment policies; (2) determining the portfolio securities to be purchased, sold or otherwise disposed of and the timing of such transactions; (3) voting all proxies, if any, with respect to the Fund’s portfolio securities; (4) maintaining the required books and records for transactions that Coho effects on the Fund’s
COHO FUNDS
Additional Information (Unaudited) – Continued
July 31, 2022
behalf; (5) selecting broker-dealers to execute orders on behalf of the Fund; and (6) monitoring and maintaining the Fund’s compliance with policies and procedures of the Trust and with applicable securities laws. The Trustees considered the significant investment analysis and portfolio management experience of the Funds’ portfolio managers, as well as Coho’s strong capitalization and its firm assets under management, which were approximately $9.5 billion as of September 30, 2021. The Trustees also reviewed Coho’s audited financial statements. In that regard, the Trustees concluded that Coho had sufficient resources to support the portfolio management team in its implementation of each Fund’s strategies. The Trustees concluded that they were satisfied with the nature, extent and quality of services that Coho provides to each Fund under the Investment Advisory Agreement.
Fund Historical Performance and the Overall Performance of Coho. In assessing the quality of the portfolio management delivered by Coho, the Trustees considered the short-term and long-term performance of each Fund on both an absolute basis and in comparison to an appropriate benchmark index, each Fund’s respective peer funds according to Morningstar classifications, and as compiled by Barrington Partners (each a “Morningstar BP Cohort”), and each Fund’s respective composite of separate accounts that Coho manages utilizing a similar investment strategy, where applicable. When comparing each Fund’s performance against its respective its Morningstar BP Cohort, the Trustees took into account that the investment objective and strategies of each Fund, as well as the Fund’s level of risk tolerance, may differ significantly from the funds in the peer group.
| | • | Coho Relative Value Equity Fund. The Trustees noted that the Fund’s performance was above the Morningstar BP Cohort average for the three-year and five-year periods ended September 30, 2021, but below its Morningstar BP Cohort average for the year-to-date and one-year periods. The Trustees also observed that the Fund had underperformed its primary benchmark for the year-to-date period ended September 30, 2021, and for the one-year, three-year, five-year and since inception periods ended December 31, 2020, but outperformed a secondary benchmark over the same periods. The Trustees also considered that the Fund had achieved positive total returns across each of the periods reviewed. The Trustees further considered that Coho had represented to the Board that in managing the Fund they seek to capture a reasonable percentage of up markets and a smaller percentage of down markets. The Trustees also noted that the Fund’s performance had been consistent with the composite of separate accounts managed by Coho with similar strategies to the Fund. |
| | | |
| | • | Coho Relative Value ESG Fund. The Trustees noted that the Fund had only recently commenced operations in November 2019 and therefore had a limited performance history. The Trustees also noted that the Fund had underperformed its Morningstar BP Cohort average for the year-to-date and one-year periods ended September 30, 2021. The Trustees also observed that the Fund had underperformed its primary benchmark for the year-to-date period ended September 30, 2021, and for the one-year and since inception period ended December 31, 2020, but outperformed a secondary benchmark for the one-year and since inception periods ended December 31, 2020 and underperformed its secondary benchmark for the year-to-date period ended September 30, 2021. The Trustees also noted that the Fund’s performance had been consistent with the composite of separate accounts managed by Coho with similar strategies to the Fund |
Cost of Advisory Services and Profitability. The Trustees considered the annual advisory fee that each Fund pays to Coho under the Investment Advisory Agreement, as well as Coho’s profitability from services that it rendered to each Fund during the 12-month period ended September 30, 2021. The Trustees also considered the effect of an expense limitation agreement on Coho’s compensation and that Coho has contractually agreed to reduce its advisory fees and, if necessary, reimburse each Fund for operating expenses, as specified in the Fund’s prospectus. The Trustees also considered that the advisory fees Coho charges to each Fund fall within the range of the fees Coho
COHO FUNDS
Additional Information (Unaudited) – Continued
July 31, 2022
charges to its separately managed accounts with similar investment strategies. The Trustees further considered that Coho has additional responsibilities with respect to the Funds, including more frequent trading and cash management stemming from the Fund’s daily subscriptions and redemptions, additional compliance obligations, and the preparation of Board and shareholder materials. The Trustees concluded that Coho’s service relationship with the Fund has yielded Coho a reasonable profit with respect to the Coho Relative Value Equity Fund but that the relationship with the Coho Relative Value ESG Fund had not been profitable. In that regard, the Trustees determined that Coho had adequate resources to support the portfolio management of the Coho Relative Value ESG Fund and plans to grow assets in the Fund which may lead to the relationship being profitable for Coho. The Trustees also agreed to continue to review the Coho Relative Value ESG Fund’s profitability as part of its annual review of the investment advisory contract with Coho.
Comparative Fee and Expense Data. The Trustees considered a comparative analysis of the contractual expenses borne by each Fund and those of funds in the same Morningstar peer group. The Trustees noted:
| | • | Coho Relative Value Equity Fund. The Fund’s advisory fee was above the Morningstar BP Cohort average. The Trustees also considered that the total expenses (after waivers and expense reimbursements) of the Fund were equal to the Morningstar BP Cohort average total expenses. |
| | | |
| | • | Coho Relative Value ESG Fund. The Fund’s advisory fee was slightly above the Morningstar BP Cohort average. The Trustees also considered that the total expenses (after waivers and expense reimbursements) of the Fund were below the Morningstar BP Cohort average total expenses. |
While recognizing that it is difficult to compare advisory fees because the scope of advisory services provided may vary from one investment adviser to another, the Trustees concluded that Coho’s advisory fee continues to be reasonable.
Economies of Scale. The Trustees considered whether the Funds may benefit from any economies of scale, noting that the investment advisory fee for each Fund does not contain breakpoints. The Trustees noted given current asset levels, it was not necessary to consider the implementation of fee breakpoints at the present time, but agreed to revisit the issue in the future as circumstances change and the Funds’ asset levels increase. The Trustees also considered that Coho had agreed to consider breakpoints in the future in response to asset growth.
Other Benefits. The Trustees considered the direct and indirect benefits that could be realized by the Adviser from its relationship with each Fund. The Trustees noted Coho does not utilize soft dollar arrangements with respect to portfolio transactions and has no affiliated brokers to execute the Funds’ portfolio transactions. The Trustees considered that Coho may receive some form of reputational benefit from services rendered to the Funds, but that such benefits are immaterial and cannot otherwise be quantified. The Trustees concluded that Coho does not receive additional material benefits from its relationship with the Funds.
COHO FUNDS
Additional Information (Unaudited) – Continued
July 31, 2022
STATEMENT REGARDING THE FUND’S LIQUIDITY RISK MANAGEMENT PROGRAM
Pursuant to Rule 22e-4 under the Investment Company Act of 1940, Managed Portfolio Series (the “Trust”), on behalf of the Coho Relative Value Equity Fund and the Coho Relative Value ESG Fund (each a “Fund” and together, the “Funds”), has adopted and implemented a written liquidity risk management program (the “Program”) that includes policies and procedures reasonably designed to comply with the requirements of Rule 22e-4, including: (i) assessment, management and periodic review of liquidity risk; (ii) classification of portfolio holdings; (iii) establishment of a highly liquid investment minimum (“HLIM”), as applicable; (iv) limitation on illiquid investments; and (v) redemptions in-kind. The Trust’s Board of Trustees (the “Board”) has approved the designation of Coho Partners, Ltd. (“Coho”) as the administrator of the Program (the “Program Administrator”). Personnel of Coho conduct the day-to-day operation of the Program pursuant to policies and procedures administered by the Coho LRMP Committee.
In accordance with Rule 22e-4, the Board reviewed a report prepared by the Program Administrator (the “Report”) regarding the operation of the Program and its adequacy and effectiveness of implementation for the period January 1, 2021, through December 31, 2021 (the “Reporting Period”). No significant liquidity events impacting the Funds during the Reporting Period or material changes to the Program were noted in the Report.
Under the Program, Coho manages and periodically reviews each Fund’s liquidity risk, including consideration of applicable factors specified in Rule 22e-4 and the Program. Liquidity risk is defined as the risk that a Fund could not meet shareholder redemption requests without significant dilution of remaining shareholders’ interests in the Fund. In general, this risk was managed during the Reporting Period by monitoring the degree of liquidity of each Fund’s investments, limiting the amount of each Fund’s illiquid investments, and utilizing various risk management tools and facilities available to each Fund for meeting shareholder redemptions, among other means. In the Report, Coho provided its assessment that, based on the information considered in its review, the Program remains reasonably designed to manage each Fund’s liquidity risk and each Fund’ s investment strategy remains appropriate for an open-end fund.
Pursuant to the Program, the Coho LRMP Committee oversaw the classification of each of the Funds’ portfolio investments as highly liquid, moderately liquid, less liquid or illiquid during the Reporting Period, including in connection with recording investment classifications on Form N-PORT. Coho’s process of determining the degree of liquidity of each Fund’s investments is supported by one or more third-party liquidity assessment vendors.
Each Fund qualified as a “primarily highly liquid fund” as defined in the Program during the Reporting Period. Accordingly, each Fund was not required to establish a HLIM or comply with the related Program provisions during the Reporting Period.
During the Reporting Period, each Fund’s investments were monitored for compliance with the 15% limitation on illiquid investments pursuant to the Program and in accordance with Rule 22e-4.
The Report noted that the Funds did not effect redemptions in-kind during the Reporting Period pursuant to the Program. The Report concluded, with respect to each Fund: (i) the Program was implemented and operated effectively to achieve the goal of assessing and managing each Fund’s liquidity risk during the Reporting Period; and (ii) that each Fund was able to meet requests for redemption without significant dilution of remaining investors’ interests in the Funds during the Reporting Period.
COHO FUNDS
Additional Information (Unaudited) – Continued
July 31, 2022
AVAILABILITY OF FUNDS PORTFOLIO INFORMATION
Each Fund files complete schedules of portfolio holdings with the SEC for the first and third quarters of each fiscal year on Part F of Form N-PORT. Each Fund’s Part F of Form N-PORT is available on the SEC’s website at www.sec.gov and may be reviewed and copied at the SEC’s Public Reference Room in Washington, D.C. For information on the Public Reference Room call 1-800-SEC-0330. In addition, each Fund’s Part F of Form N-PORT is available without charge upon request by calling 1-866-264-6234.
AVAILABILITY OF PROXY VOTING INFORMATION
A description of the Funds’ Proxy Voting Policies and Procedures is available without charge, upon request, by calling 1-866-264-6234. Information regarding how the Funds voted proxies relating to portfolio securities during the most recent 12-month year ended June 30, is available (1) without charge, upon request, by calling 1-866-264-6234, or (2) on the SEC’s website at www.sec.gov.
QUALIFIED DIVIDEND INCOME/DIVIDENDS RECEIVED DEDUCTION
For the fiscal year ended July 31, 2022, certain dividends paid by the Funds may be reported as qualified dividend income and may be eligible for taxation at capital gain rates. The percentage of dividends declared from ordinary income designated as qualified dividend income was 88.49% and 64.92% for the Equity Fund and ESG Fund, respectively.
For corporate shareholders, the percent of ordinary income distributions qualifying for the corporate dividends received deduction for the year ended July 31, 2022 was 84.38% and 62.60% for the Equity Fund and ESG Fund, respectively.
The percentage of taxable ordinary income distributions that are designated as short-term capital gain distributions under Internal Revenue Section 871(k)(2)(C) was 44.37% and 64.85% for the Equity Fund and ESG Fund, respectively.
COHO FUNDS
Privacy Notice (Unaudited)
The Funds collect only relevant information about you that the law allows or requires it to have in order to conduct its business and properly service you. The Funds collect financial and personal information about you (“Personal Information”) directly (e.g., information on account applications and other forms, such as your name, address, and social security number, and information provided to access account information or conduct account transactions online, such as password, account number, e-mail address, and alternate telephone number), and indirectly (e.g., information about your transactions with us, such as transaction amounts, account balance and account holdings).
The Funds do not disclose any non-public personal information about its shareholders or former shareholders other than for everyday business purposes such as to process a transaction, service an account, respond to court orders and legal investigations or as otherwise permitted by law. Third parties that may receive this information include companies that provide transfer agency, technology and administrative services to the Funds, as well as the Funds’ investment adviser who is an affiliate of the Funds. If you maintain a retirement/educational custodial account directly with the Funds, we may also disclose your Personal Information to the custodian for that account for shareholder servicing purposes. The Funds limit access to your Personal Information provided to unaffiliated third parties to information necessary to carry out their assigned responsibilities to the Funds. All shareholder records will be disposed of in accordance with applicable law. The Funds maintains physical, electronic and procedural safeguards to protect your Personal Information and require its third-party service providers with access to such information to treat your Personal Information with the same high degree of confidentiality.
In the event that you hold shares of the Funds through a financial intermediary, including, but not limited to, a broker-dealer, credit union, bank or trust company, the privacy policy of your financial intermediary governs how your non-public personal information is shared with unaffiliated third parties.
(This Page Intentionally Left Blank.)
INVESTMENT ADVISER
Coho Partners, Ltd.
300 Berwyn Park
801 Cassatt Road, Suite 100
Berwyn, PA 19312
DISTRIBUTOR
Compass Distributors, LLC
Three Canal Plaza, Suite 100
Portland, ME 04101
CUSTODIAN
U.S. Bank N.A.
1555 North Rivercenter Drive, Suite 302
Milwaukee, WI 53212
ADMINISTRATOR, FUNDS ACCOUNTANT
AND TRANSFER AGENT
U.S. Bancorp Fund Services, LLC
615 East Michigan Street
Milwaukee, WI 53202
INDEPENDENT REGISTERED PUBLIC ACCOUNTING FIRM
Cohen & Company, Ltd.
342 North Water Street, Suite 830
Milwaukee, WI 53202
LEGAL COUNSEL
Stradley Ronon Stevens & Young LLP
2005 Market Street, Suite 2600
Philadelphia, PA 19103
This report should be accompanied or preceded by a prospectus.
The Funds’ Statement of Additional Information contains additional information about the
Funds’ trustees and is available without charge upon request by calling 1-866-264-6234.
Item 2. Code of Ethics.
The Registrant has adopted a code of ethics that applies to the Registrant’s principal executive officer and principal financial officer. The Registrant has not made any substantive amendments to its code of ethics during the period covered by this report.
The Registrant has not granted any waivers from any provisions of the code of ethics during the period covered by this report.
A copy of the Registrant’s code of ethics that applies to the Registrant’s principal executive officer and principal financial officer is filed herewith.
Item 3. Audit Committee Financial Expert.
The Registrant’s Board of Trustees has determined that there is at least one audit committee financial expert serving on its audit committee. Leonard M. Rush is the “audit committee financial expert” and is considered to be “independent” as each term is defined in Item 3 of Form N-CSR.
Item 4. Principal Accountant Fees and Services.
The Registrant has engaged its principal accountant to perform audit services, audit-related services, tax services and other services during the past two fiscal years. “Audit services” refer to performing an audit of the Registrant's annual financial statements or services that are normally provided by the accountant in connection with statutory and regulatory filings or engagements for those fiscal years. “Audit-related services” refer to the assurance and related services by the principal accountant that are reasonably related to the performance of the audit. “Tax services” refer to professional services rendered by the principal accountant for tax compliance, tax advice, and tax planning; including reviewing the Fund’s tax returns and distributions calculations. There were no “other services” provided by the principal accountant. For the fiscal years ended July 31, 2022 and July 31, 2021, the Fund’s principal accountant was Cohen & Company, Ltd. The following table details the aggregate fees billed or expected to be billed for each of the last two fiscal years for audit fees, audit-related fees, tax fees and other fees by the principal accountant.
| | FYE 7/31/2022 | FYE 7/31/2021
|
(a) Audit Fees | $28,000 | $28,000 |
(b) Audit-Related Fees | $0 | $0 |
(c) Tax Fees | $10,000 | $10,000 |
(d) All Other Fees | $0 | $0 |
(e)(1) The audit committee has adopted pre-approval policies and procedures that require the audit committee to pre‑approve all audit and non‑audit services of the Registrant, including services provided to any entity affiliated with the Registrant.
(e)(2)The percentage of fees billed by Cohen & Company, Ltd applicable to non-audit services pursuant to waiver of pre-approval requirement were as follows:
| | FYE 7/31/2022 | FYE 7/31/2021 |
Audit-Related Fees | 0% | 0% |
Tax Fees | 0% | 0% |
All Other Fees | 0% | 0% |
(f) All of the principal accountant’s hours spent on auditing the Registrant’s financial statements were attributed to work performed by full‑time permanent employees of the principal accountant.
(g) The following table indicates the non-audit fees billed or expected to be billed by the Registrant’s accountant for services to the Registrant and to the Registrant’s investment adviser (and any other controlling entity, etc.—not sub-adviser) for the last two years.
Non-Audit Related Fees | FYE 7/31/2022 | FYE 7/31/2021 |
Registrant | $0 | $0 |
Registrant’s Investment Adviser | $0 | $0 |
(h) The audit committee of the board of trustees/directors has considered whether the provision of non-audit services that were rendered to the Registrant's investment adviser is compatible with maintaining the principal accountant's independence and has concluded that the provision of such non-audit services by the accountant has not compromised the accountant’s independence.
(i) Not applicable.
(j) Not applicable.
Item 5. Audit Committee of Listed Registrants.
Not applicable to Registrants who are not listed as issuers (as defined in Rule 10A-3 under the Securities Exchange Act of 1934).
Item 6. Schedule of Investments.
(a) Schedule of Investments is included as part of the report to shareholders filed under Item 1 of this Form.
(b) Not applicable.
Item 7. Disclosure of Proxy Voting Policies and Procedures for Closed-End Management Investment Companies.
Not applicable to open-end investment companies.
Item 8. Portfolio Managers of Closed-End Management Investment Companies.
Not applicable to open-end investment companies.
Item 9. Purchases of Equity Securities by Closed‑End Management Investment Company and Affiliated Purchases.
Not applicable to open-end investment companies.
Item 10. Submission of Matters to a Vote of Security Holders.
There have been no material changes to the procedures by which shareholders may recommend nominees to the Registrant’s board of trustees.
Item 11. Controls and Procedures.
| (a) | The Registrant’s President and Treasurer have reviewed the Registrant's disclosure controls and procedures (as defined in Rule 30a-3(c) under the Investment Company Act of 1940 (the “Act”)) as of a date within 90 days of the filing of this report, as required by Rule 30a-3(b) under the Act and Rules 13a-15(b) or 15d‑15(b) under the Securities Exchange Act of 1934. Based on their review, such officers have concluded that the disclosure controls and procedures are effective in ensuring that information required to be disclosed in this report is appropriately recorded, processed, summarized and reported and made known to them by others within the Registrant and by the Registrant’s service provider. |
| (b) | There were no significant changes in the Registrant's internal control over financial reporting (as defined in Rule 30a-3(d) under the Act) that occurred during the period covered by this report that has materially affected, or is reasonably likely to materially affect, the Registrant's internal control over financial reporting. |
Item 12. Disclosure of Securities Lending Activities for Closed-End Management Investment Companies
Not applicable to open-end investment companies
Item 13. Exhibits.
(3) Any written solicitation to purchase securities under Rule 23c‑1 under the Act sent or given during the period covered by the report by or on behalf of the Registrant to 10 or more persons. Not applicable to open-end investment companies.
(4) Change in the Registrant’s independent public accountant. There was no change in the Registrant’s independent public accountant for the period covered by this report.
SIGNATURES
Pursuant to the requirements of the Securities Exchange Act of 1934 and the Investment Company Act of 1940, the Registrant has duly caused this report to be signed on its behalf by the undersigned, thereunto duly authorized.
(Registrant) Managed Portfolio Series
By (Signature and Title) /s/Brian R. Wiedmeyer
Brian R. Wiedmeyer, President
Date October 7, 2022
Pursuant to the requirements of the Securities Exchange Act of 1934 and the Investment Company Act of 1940, this report has been signed below by the following persons on behalf of the Registrant and in the capacities and on the dates indicated.
By (Signature and Title) /s/Brian R. Wiedmeyer
Brian R. Wiedmeyer, President
Date October 7, 2022
By (Signature and Title) /s/Benjamin J. Eirich
Benjamin J. Eirich, Treasurer
Date October 7, 2022