ATAC Rotation Fund
Investor Class (ATACX)
Institutional Class (ATCIX)
Annual Report
| www.atacfunds.com | August 31, 2022 |
(This Page Intentionally Left Blank.)
September 25, 2022
Dear Fellow Shareholders:
On behalf of the Toroso team, we would like to thank you for your continued investment in the ATAC Rotation Fund.
The goal of the ATAC Rotation Fund (“ATACX”) is to serve as a strategy which over time may enhance a portfolio’s overall risk and return characteristics. By utilizing a buy and rotate approach which uses historically leading indicators of volatility, our Fund places a large emphasis on risk management, seeking to rotate fully into Treasuries in advance of conditions that favor market stress.
In 2022, an unusual dynamic happened in the market, whereby Treasuries have been the source of market stress rather than the beneficiary of it. The drawdown in long duration Treasuries, the “risk-off” asset, coincided in a historically anomalous way to the drawdown in the stock market, both in depth and frequency of loss. There is no precedent going back to 1961 that resembles the highly challenging and unusual market environment of this year.
For the annual period ending August 31, 2022, the ATAC Rotation Fund Investor Class and Institutional Class returned -30.12% and -29.92% respectively, versus a return of -14.02% for the Lipper Flexible Portfolio Fund Index and a return of -11.23% for the S&P 500® Index.
Needless to say, this has been a very challenging environment not just for stock investors and bond investors, but for those that rotate between the two when conditions warrant. We are confident that this dynamic will change at some point, and the good news is that the devastation across stocks and bonds will eventually bring with it opportunities to rotate between the two successfully again. But when living in the anomaly as this year has proven to be, the best any investor can do in any asset is to wait for the light to change and for markets to normalize again.
Otherwise, with $30 trillion of government debt, we all have bigger things to worry about. The dislocation across markets becomes a dislocation in the very fabric of capitalism itself. With that said, over a complete market cycle, it is risk management which we believe is the most effective way to compound wealth. Compounding wealth requires positive returns and the avoidance of large losses. Unfortunately, the source of the large losses this year is due to the asset class which most benefits historically from equity losses (long duration Treasuries). We urge shareholders to maintain a longer-term view and evaluate a strategy beyond small samples of time, understanding the role that strategy has in one’s overall portfolio asset allocation.
Thank you again for your trust and confidence in our distinctive approach to portfolio management.
Sincerely,
Michael A. Gayed, CFA and Michael Venuto
Past performance is not a guarantee of future results.
Opinions expressed are those of Toroso Investments, LLC and are subject to change, are not guaranteed and should not be considered investment advice.
Mutual fund investing involves risk. Principal loss is possible. Because the Fund invests primarily in ETFs, it may invest a greater percentage of its assets in the securities of a single issuer and therefore could be considered non-diversified. If a fund invests a greater percentage of its assets in the securities of a single issuer, its value may decline to a greater degree than if the fund held were a more diversified mutual fund. The Fund is expected to have a high portfolio turnover ratio which has the potential to result in the realization by the Fund and distribution to shareholders of a greater amount of capital gains. This means that investors will be likely to have a higher tax liability. Because the Fund invests in Underlying ETFs an investor will indirectly bear the principal risks of the Underlying ETFs, including but not limited to, risks associated with investments in ETFs, large and smaller companies, real estate investment trusts, foreign securities, non-diversification, high yield bonds, fixed income investments, derivatives, leverage, short sales and commodities. The Fund will bear its share of the fees and expenses of the Underlying ETFs. Shareholders will pay higher expenses than would be the case if making direct investments in the Underlying ETFs.
Duration is the measure of the sensitivity of the price of a bond to change in interest rates.
The Lipper Flexible Portfolio Fund Index is an equal dollar weighted index of the largest mutual funds within the Flexible Portfolio fund classification, as defined by Lipper.
The S&P 500® Index is a broad-based unmanaged index of 500 stocks, which is widely recognized as representative of the equity market in general.
One may not directly invest in an index.
Must be preceded or accompanied by a current prospectus.
Quasar Distributors, LLC, distributor
Value of $10,000 Investment (Unaudited)
The chart assumes an initial investment of $10,000. Performance reflects waivers of fee and operating expenses in effect. In the absence of such waivers, total return would be reduced. Performance data quoted represents past performance and does not guarantee future results. Investment returns and principal value will fluctuate, and when sold, may be worth more or less than their original cost. Performance current to the most recent month-end may be lower or higher than the performance quoted and can be obtained by calling 1-855-282-2386. Performance assumes the reinvestment of capital gains and income distributions. The performance does not reflect the deduction of taxes that a shareholder would pay on Fund distributions or the redemption of Fund shares.
Annualized Rates of Return (%) – As of August 31, 2022
| | 1 Year | 3 Year | 5 Year | Since Inception(1) |
| Investor Class | -30.12% | 3.30% | 3.69% | 4.99% |
| Institutional Class | -29.92% | 3.58% | 3.97% | 5.26% |
S&P 500® Index(2) | -11.23% | 12.39% | 11.82% | 12.93% |
Lipper Flexible Portfolio Fund Index(3) | -14.02% | 5.86% | 5.48% | 6.42% |
| (1) | Period from Fund inception through August 31, 2022. The Investor Class commenced operations on September 10, 2012, and the Institutional Class commenced operations on March 26, 2018. Performance shown for the Institutional Class prior to the inception of the Institutional Class is based on the performance of the Investor Class, adjusted for the lower expenses applicable to the Institutional Class. |
| (2) | The S&P 500® Index is a broad based unmanaged index of 500 stocks, which is widely recognized as representative of the equity market in general. One cannot invest directly in an index. |
| (3) | The Lipper Flexible Portfolio Fund Index is an equal dollar weighted index of the largest mutual funds within the Flexible Portfolio fund classification, as defined by Lipper. One cannot invest directly in an index. |
The following is expense information for the ATAC Rotation Fund (the “Fund”) as disclosed in the Fund’s most recent prospectus dated December 29, 2021: Investor Class – Gross Expenses: 1.92%, Net Expenses: 1.90%. Institutional Class – Gross Expenses: 1.68%, Net Expenses: 1.65%. Toroso Investments, LLC (the “Adviser”) has contractually agreed to waive a portion or all of its management fees and reimburse Fund expenses, in order to ensure that Total Annual Fund Operating Expenses (excluding certain expenses such as taxes, leverage interest, interest expense, dividends paid on short sales, brokerage commissions, acquired fund fees and expenses, or extraordinary expenses) do not exceed 1.74% of the average daily net assets of the Fund’s Investor Class shares and do not exceed 1.49% of the average daily net assets of the Fund’s Institutional Class shares. Fees waived and expenses paid by the Adviser may be recouped by the Adviser for a period of 36 months following the month during which such fee waiver and expense payment was made if such recoupment can be achieved without exceeding the expense limit in effect at the time the fee waiver and expense payment occurred and the expense limit in place at the time of recoupment. The Operating Expenses Limitation Agreement is indefinite, but cannot be terminated through at least December 29, 2022. Thereafter, the agreement may be terminated at any time upon 60 days’ written notice by the Trust’s Board of Trustees (the “Board”) or the Adviser, with the consent of the Board.
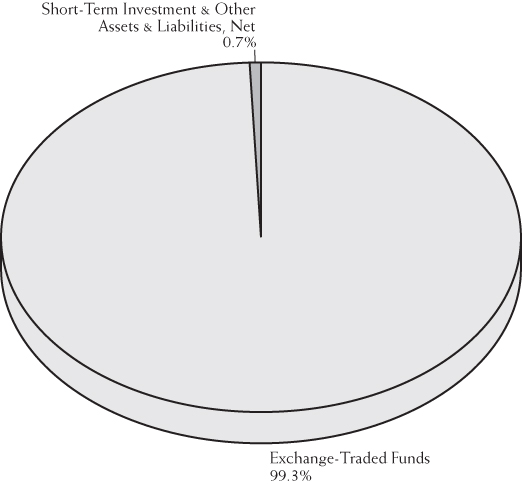
Asset Allocation (Unaudited)
as of August 31, 2022(1)
(% of net assets)
Fund Holdings (Unaudited)
as of August 31, 2022(1)
(% of net assets)
| iShares Core S&P Small-Cap Fund | | | 35.1 | % |
| Schwab U.S. Small-Cap Fund | | | 25.3 | % |
| iShares Russell 2000 Fund | | | 15.1 | % |
| Direxion Daily Small Cap Bull 3x Fund | | | 13.8 | % |
| SPDR Portfolio S&P 600 Small Cap Fund | | | 10.0 | % |
| (1) | Fund holdings and asset allocation are subject to change and are not recommendations to buy or sell any security. |
Expense Example (Unaudited)
August 31, 2022
As a shareholder of the Fund, you incur two types of costs: (1) transaction costs, including brokerage commissions on purchases and sales of Fund shares, and (2) ongoing costs, including management fees; distribution and/or service (12b-1) fees; interest expense; and other Fund expenses. This Example is intended to help you understand your ongoing costs (in dollars) of investing in the Fund and to compare these costs with the ongoing costs of investing in other mutual funds. The Example is based on an investment of $1,000 invested at the beginning of the period and held for the entire period (March 1, 2022 – August 31, 2022).
ACTUAL EXPENSES
For each class, the first line of the table below provides information about actual account values and actual expenses. You may use the information in this line, together with the amount you invested, to estimate the expenses that you paid over the period. Simply divide your account value by $1,000 (for example, an $8,600 account value divided by $1,000 = 8.6), then multiply the result by the number in the first line under the heading entitled “Expenses Paid During Period” to estimate the expenses you paid on your account during this period.
HYPOTHETICAL EXAMPLE FOR COMPARISON PURPOSES
For each class, the second line of the table below provides information about hypothetical account values and hypothetical expenses based on the Fund’s actual expense ratio and an assumed rate of return of 5% per year before expenses, which is not the Fund’s actual return. The hypothetical account values and expenses may not be used to estimate the actual ending account balance or expenses you paid for the period. You may use this information to compare the ongoing costs of investing in the Fund and other funds. To do so, compare this 5% hypothetical example with the 5% hypothetical examples that appear in the shareholder reports of the other funds.
Please note that the expenses shown in the table are meant to highlight your ongoing costs only and do not reflect any transactional costs. Therefore, the second line of the table is useful in comparing ongoing costs only, and will not help you determine the relative total costs of owning different funds. In addition, if transactional costs were included, your costs may have been higher.
| | | | Expenses Paid |
| | Beginning Account | Ending Account | During Period(1) |
| | Value (3/1/22) | Value (8/31/22) | (3/1/22 – 8/31/22) |
Investor Class Actual(2)(3) | $1,000.00 | $ 778.80 | $8.07 |
Investor Class Hypothetical(4) | | | |
| (5% return before expenses) | $1,000.00 | $1,016.13 | $9.15 |
| | | | |
Institutional Class Actual(2)(3) | $1,000.00 | $ 780.00 | $6.95 |
Institutional Class Hypothetical(4) | | | |
| (5% return before expenses) | $1,000.00 | $1,017.39 | $7.88 |
| (1) | Expenses are equal to the Fund’s annualized expense ratio for the most recent six-month period of1.80% and1.55% for the Investor Class and Institutional Class, respectively, multiplied by the average account value over the period, multiplied by 184/365 to reflect the one-half year period. |
| (2) | Based on the actual returns for the six-month period ended August 31, 2022 of -22.12% and-22.00% for the Investor Class and Institutional Class, respectively. |
| (3) | Excluding interest expense, the actual expenses would be$7.80 and$6.68 for the Investor Class and Institutional Class, respectively. |
| (4) | Excluding interest expense, the hypothetical expenses would be$8.84 and$7.58 for the Investor Class and Institutional Class, respectively. |
Schedule of Investments
August 31, 2022
Description | | Shares | | | Value | |
| EXCHANGE-TRADED FUNDS – 99.3% | | | | | | |
| | | | | | | |
| U.S. Domestic Equity – 99.3% | | | | | | |
Direxion Daily Small Cap Bull 3x Fund + | | | 306,450 | | | $ | 12,273,322 | |
iShares Core S&P Small-Cap Fund *+ | | | 321,388 | | | | 31,238,914 | |
iShares Russell 2000 Fund + | | | 73,365 | | | | 13,462,477 | |
Schwab U.S. Small-Cap Fund *+ | | | 534,067 | | | | 22,484,221 | |
SPDR Portfolio S&P 600 Small Cap Fund + | | | 235,747 | | | | 8,932,454 | |
| Total Exchange-Traded Funds | | | | | | | | |
| (Cost $93,200,430) | | | | | | | 88,391,388 | |
| | | | | | | | | |
| SHORT-TERM INVESTMENT – 0.6% | | | | | | | | |
| First American Government Obligations Fund – Class X, 2.05%^ | | | | | | | | |
| (Cost $481,189) | | | 481,189 | | | | 481,189 | |
| Total Investments – 99.9% | | | | | | | | |
| (Cost $93,681,619) | | | | | | | 88,872,577 | |
| Other Assets and Liabilities, Net – 0.1% | | | | | | | 108,926 | |
| Total Net Assets – 100.0% | | | | | | $ | 88,981,503 | |
+ | All or a portion of this security is designated as collateral for a line of credit. See Note 10 for additional information. |
| * | Fair Value of this security exceeds 25% of the Fund’s net assets. Additional information for this security, including the financial statements, is available from the SEC’s EDGAR database at www.sec.gov. |
| ^ | The rate shown is the annualized seven day effective yield as of August 31, 2022. |
See Notes to the Financial Statements
Statement of Assets and Liabilities
August 31, 2022
| ASSETS: | | | |
| Investments, at value: | | | |
| Unaffiliated issuers (Cost: $93,681,619) | | $ | 88,872,577 | |
| Cash collateral for line of credit | | | 925,793 | |
| Dividends & interest receivable | | | 1,526 | |
| Receivables for capital shares sold | | | 12,184 | |
| Prepaid expenses | | | 26,765 | |
| Total assets | | | 89,838,845 | |
| | | | | |
| LIABILITIES: | | | | |
| Loans payable | | | 559,721 | |
| Payable to investment adviser | | | 120,735 | |
| Payable for capital shares redeemed | | | 51,401 | |
| Payable for fund administration & accounting fees | | | 22,864 | |
| Payable for compliance fees | | | 2,500 | |
| Payable for transfer agent fees & expenses | | | 35,457 | |
| Payable for custody fees | | | 3,896 | |
| Payable for audit fees | | | 19,498 | |
| Payable for interest expense | | | 1,768 | |
| Accrued expenses | | | 21,861 | |
| Accrued distribution fees | | | 17,641 | |
| Total liabilities | | | 857,342 | |
| | | | | |
| NET ASSETS | | $ | 88,981,503 | |
| | | | | |
| NET ASSETS CONSIST OF: | | | | |
| Paid-in capital | | $ | 139,917,150 | |
| Total accumulated loss | | | (50,935,647 | ) |
| Net Assets | | $ | 88,981,503 | |
| | | | | |
| Investor Class | | | | |
| Net Assets | | $ | 26,645,647 | |
Shares issued and outstanding(1) | | | 883,967 | |
| Net asset value, redemption price and offering price per share | | $ | 30.14 | |
| | | | | |
| Institutional Class | | | | |
| Net Assets | | $ | 62,335,856 | |
Shares issued and outstanding(1) | | | 2,049,387 | |
| Net asset value, redemption price and offering price per share | | $ | 30.42 | |
| (1) | Unlimited shares authorized without par value. |
See Notes to the Financial Statements
Statement of Operations
For the Year Ended August 31, 2022
| INVESTMENT INCOME: | | | |
| Dividend income – Unaffiliated issuers | | $ | 1,893,641 | |
| Interest income | | | 3,697 | |
| Total investment income | | | 1,897,338 | |
| | | | | |
| EXPENSES: | | | | |
| Investment adviser fees (See Note 4) | | | 1,842,575 | |
| Fund administration & accounting fees (See Note 4) | | | 187,874 | |
| Transfer agent fees & expenses (See Note 4) | | | 177,638 | |
| Distribution fees – Investor Class (See Note 5) | | | 127,477 | |
| Federal & state registration fees | | | 55,179 | |
| Audit fees | | | 19,496 | |
| Custody fees (See Note 4) | | | 19,284 | |
| Trustee fees (See Note 4) | | | 18,049 | |
| Compliance fees (See Note 4) | | | 15,001 | |
| Postage & printing fees | | | 14,821 | |
| Legal fees | | | 13,909 | |
| Other expenses | | | 7,464 | |
| Insurance fees | | | 1,635 | |
| Total expenses before interest expense, recoupment & waiver | | | 2,500,402 | |
| Interest expense (See Note 10) | | | 95,955 | |
| Total expenses before recoupment & waiver | | | 2,596,357 | |
| Add: fee recoupment (See Note 4) | | | 18,736 | |
| Less: waiver from investment adviser (See Note 4) | | | (195,953 | ) |
| Net expenses | | | 2,419,140 | |
| | | | | |
| NET INVESTMENT LOSS | | | (521,802 | ) |
| | | | | |
| REALIZED AND UNREALIZED GAIN (LOSS) ON INVESTMENTS: | | | | |
| Net realized loss on: | | | | |
| Unaffiliated issuers | | | (39,022,939 | ) |
| Affiliated issuers | | | (3,412,157 | ) |
| Net realized loss | | | (42,435,096 | ) |
| | | | | |
| Net change in unrealized appreciation/depreciation: | | | | |
| Unaffiliated issuers | | | (5,614,388 | ) |
| Affiliated issuers | | | — | |
| Net change in unrealized appreciation/depreciation on investments | | | (5,614,388 | ) |
| | | | | |
| Net realized and unrealized loss on investments | | | (48,049,484 | ) |
| | | | | |
| NET DECREASE IN NET ASSETS RESULTING FROM OPERATIONS | | $ | (48,571,286 | ) |
See Notes to the Financial Statements
Statements of Changes in Net Assets
| | | Year Ended | | | Year Ended | |
| | | August 31, 2022 | | | August 31, 2021 | |
| OPERATIONS: | | | | | | |
| Net investment loss | | $ | (521,802 | ) | | $ | (914,973 | ) |
| Net realized gain (loss) on investment transactions | | | (42,435,096 | ) | | | 5,951,350 | |
| Net change in unrealized appreciation/depreciation | | | | | | | | |
| on investments | | | (5,614,388 | ) | | | 1,697,420 | |
| Net increase (decrease) in net assets resulting from operations | | | (48,571,286 | ) | | | 6,733,797 | |
| | | | | | | | | |
| CAPITAL SHARE TRANSACTIONS: | | | | | | | | |
| Investor Class: | | | | | | | | |
| Proceeds from shares sold | | | 7,112,750 | | | | 73,783,708 | |
| Proceeds from reinvestment of distributions | | | — | | | | 14,962,589 | |
| Payments for shares redeemed | | | (48,438,709 | ) | | | (120,792,196 | ) |
| Decrease in net assets resulting from Investor Class transactions | | | (41,325,959 | ) | | | (32,045,899 | ) |
| Institutional Class: | | | | | | | | |
| Proceeds from shares sold | | | 37,330,611 | | | | 154,453,608 | |
| Proceeds from reinvestment of distributions | | | — | | | | 18,479,085 | |
| Payments for shares redeemed | | | (79,343,843 | ) | | | (162,792,219 | ) |
| Increase (Decrease) in net assets resulting from | | | | | | | | |
| Institutional Class transactions | | | (42,013,232 | ) | | | 10,140,474 | |
| Net decrease in net assets resulting from | | | | | | | | |
| capital share transactions | | | (83,339,191 | ) | | | (21,905,425 | ) |
| | | | | | | | | |
| DISTRIBUTIONS TO SHAREHOLDERS: | | | | | | | | |
| Investor Class | | | — | | | | (15,800,813 | ) |
| Institutional Class | | | — | | | | (19,775,111 | ) |
| Total distributions to shareholders | | | — | | | | (35,575,924 | ) |
| | | | | | | | | |
| TOTAL DECREASE IN NET ASSETS | | | (131,910,477 | ) | | | (50,747,552 | ) |
| | | | | | | | | |
| NET ASSETS: | | | | | | | | |
| Beginning of year | | | 220,891,980 | | | | 271,639,532 | |
| End of year | | $ | 88,981,503 | | | $ | 220,891,980 | |
See Notes to the Financial Statements
Statement of Cash Flows
| | | Year Ended | |
| | | August 31, 2022 | |
| Increase (Decrease) in Cash: | | | |
| Cash flows provided by (used for) operating activities: | | | |
| Net decrease in net assets resulting from operations | | $ | (48,571,286 | ) |
| Adjustments to reconcile net decrease in net assets from | | | | |
| operations to net cash used for operating activities: | | | — | |
| Purchases of investments | | | (3,847,902,747 | ) |
| Proceeds from sales of investments | | | 3,931,743,926 | |
| Purchases and sales of short-term investments, net | | | (480,664 | ) |
| Changes in operating assets and liabilities | | | — | |
| Decrease in receivable for investment securities sold | | | 12,711,957 | |
| Increase in dividends & interest receivable | | | (1,525 | ) |
| Decrease in prepaid expenses | | | 10,938 | |
| Decrease in payable to investment adviser | | | (117,353 | ) |
| Decrease in accrued interest expense | | | (4,674 | ) |
| Decrease in other expenses | | | (58,950 | ) |
| Net change in unrealized depreciation of investments | | | 5,614,388 | |
| Net realized loss | | | 42,435,096 | |
| Net cash provided by operating activities | | | 95,379,106 | |
| Cash flows provided by (used for) financing activities: | | | | |
Proceeds from shares sold(a) | | | 44,718,383 | |
Cost of shares redeemed(b) | | | (128,369,416 | ) |
| Loan borrowings | | | 65,510,720 | |
| Loan repayments | | | (76,313,000 | ) |
| Dividends paid to shareholders, net of reinvestments | | | — | |
| Net cash used for financing activities | | | (94,453,313 | ) |
| Net change in cash | | | 925,793 | |
| Cash: | | | | |
| Beginning of year | | | — | |
| End of year | | $ | 925,793 | |
| Supplemental disclosure of cash flow and non-cash information: | | | | |
| Interest and service-related interest charges paid | | $ | 95,955 | |
| (a) | Includes a decrease in receivable for capital shares sold of $275,022. |
| (b) | Includes a decrease in payable for capital shares redeemed of $586,864. |
See Notes to the Financial Statements
Financial Highlights
For a Fund share outstanding throughout the years.
| Investor Class | | Year Ended | | | Year Ended | | | Year Ended | | | Year Ended | | | Year Ended | |
| | | August 31, | | | August 31, | | | August 31, | | | August 31, | | | August 31, | |
| | | 2022 | | | 2021 | | | 2020 | | | 2019 | | | 2018 | |
PER SHARE DATA(1): | | | | | | | | | | | | | | | |
| Net asset value, beginning of year | | $ | 43.13 | | | $ | 47.60 | | | $ | 31.20 | | | $ | 33.01 | | | $ | 31.45 | |
| | | | | | | | | | | | | | | | | | | | | |
| INVESTMENT OPERATIONS: | | | | | | | | | | | | | | | | | | | | |
Net investment income (loss)(2) | | | (0.20 | ) | | | (0.21 | ) | | | 0.08 | | | | 0.17 | | | | 0.08 | |
Net realized and unrealized gains (losses) on investments(3) | | | (12.79 | ) | | | 1.76 | | | | 16.59 | | | | (1.67 | ) | | | 4.10 | |
| Total from investment operations | | | (12.99 | ) | | | 1.55 | | | | 16.67 | | | | (1.50 | ) | | | 4.18 | |
| | | | | | | | | | | | | | | | | | | | | |
| LESS DISTRIBUTIONS: | | | | | | | | | | | | | | | | | | | | |
| From net investment income | | | — | | | | (0.03 | ) | | | (0.27 | ) | | | — | | | | (0.09 | ) |
| From net capital gains | | | — | | | | (5.99 | ) | | | — | | | | (0.31 | ) | | | (2.53 | ) |
| Total distributions | | | — | | | | (6.02 | ) | | | (0.27 | ) | | | (0.31 | ) | | | (2.62 | ) |
| | | | | | | | | | | | | | | | | | | | | |
| Net asset value, end of year | | $ | 30.14 | | | $ | 43.13 | | | $ | 47.60 | | | $ | 31.20 | | | $ | 33.01 | |
| | | | | | | | | | | | | | | | | | | | | |
| TOTAL RETURN | | | -30.12 | % | | | 2.49 | % | | | 53.92 | % | | | -4.45 | % | | | 13.81 | % |
| | | | | | | | | | | | | | | | | | | | | |
| SUPPLEMENTAL DATA AND RATIOS: | | | | | | | | | | | | | | | | | | | | |
| Net assets, end of year (in millions) | | $ | 26.6 | | | $ | 84.5 | | | $ | 128.7 | | | $ | 31.1 | | | $ | 55.6 | |
| | | | | | | | | | | | | | | | | | | | | |
Ratio of expenses to average net assets(4): | | | | | | | | | | | | | | | | | | | | |
| Before expense waiver/recoupment | | | 1.92 | % | | | 1.77 | % | | | 1.86 | % | | | 1.94 | % | | | 2.12 | % |
| After expense waiver/recoupment | | | 1.80 | % | | | 1.75 | % | | | 1.74 | % | | | 1.75 | % | | | 2.08 | % |
| | | | | | | | | | | | | | | | | | | | | |
| Ratio of expenses excluding interest | | | | | | | | | | | | | | | | | | | | |
expenses to average net assets(4): | | | | | | | | | | | | | | | | | | | | |
| Before expense waiver/recoupment | | | 1.86 | % | | | 1.76 | % | | | 1.86 | % | | | 1.93 | % | | | 1.78 | % |
| After expense waiver/recoupment | | | 1.74 | % | | | 1.74 | % | | | 1.74 | % | | | 1.74 | % | | | 1.74 | % |
| | | | | | | | | | | | | | | | | | | | | |
| Ratio of net investment income (loss) | | | | | | | | | | | | | | | | | | �� | | |
to average net assets(4): | | | | | | | | | | | | | | | | | | | | |
| After expense waiver/recoupment | | | (0.51 | )% | | | (0.45 | )% | | | 0.21 | % | | | 0.56 | % | | | 0.24 | % |
| | | | | | | | | | | | | | | | | | | | | |
Portfolio turnover rate(5) | | | 2,610 | % | | | 2,030 | % | | | 1,785 | % | | | 2,053 | % | | | 1,856 | % |
| (1) | Per share data calculated using the average shares outstanding method. |
| (2) | Recognition of net investment income (loss) by the Fund is affected by the timing of the declaration of dividends by the underlying investment companies in which the Fund invests. |
| (3) | Realized and unrealized gains (losses) per share in this caption are balancing amounts necessary to reconcile the change in net asset value per share for the year, and may not reconcile with the aggregate gains on the Statement of Operations due to share transactions for the year. |
| (4) | Does not include expenses of investment companies in which the Fund invests. |
| (5) | Portfolio turnover disclosed is for the Fund as a whole. |
See Notes to the Financial Statements
Financial Highlights
For a Fund share outstanding throughout the periods.
| Institutional Class | | | | | | | | | | | | | | For the Period | |
| | | | | | | | | | | | | | | Inception(1) | |
| | | | | | | | | | | | | | | through | |
| | | Year Ended | | | Year Ended | | | Year Ended | | | Year Ended | | | Year Ended | |
| | | August 31, | | | August 31, | | | August 31, | | | August 31, | | | August 31, | |
| | | 2022 | | | 2021 | | | 2020 | | | 2019 | | | 2018 | |
PER SHARE DATA(2): | | | | | | | | | | | | | | | |
| Net asset value, beginning of period | | $ | 43.41 | | | $ | 47.81 | | | $ | 31.32 | | | $ | 33.05 | | | $ | 31.04 | |
| | | | | | | | | | | | | | | | | | | | | |
| INVESTMENT OPERATIONS: | | | | | | | | | | | | | | | | | | | | |
Net investment income (loss)(3) | | | (0.10 | ) | | | (0.09 | ) | | | 0.18 | | | | 0.24 | | | | (0.03 | ) |
Net realized and unrealized gains (losses) on investments(4) | | | (12.89 | ) | | | 1.77 | | | | 16.64 | | | | (1.66 | ) | | | 2.04 | |
| Total from investment operations | | | (12.99 | ) | | | 1.68 | | | | 16.82 | | | | (1.42 | ) | | | 2.01 | |
| | | | | | | | | | | | | | | | | | | | | |
| LESS DISTRIBUTIONS: | | | | | | | | | | | | | | | | | | | | |
| From net investment income | | | — | | | | (0.09 | ) | | | (0.33 | ) | | | — | | | | — | |
| From net capital gains | | | — | | | | (5.99 | ) | | | — | | | | (0.31 | ) | | | — | |
| Total distributions | | | — | | | | (6.08 | ) | | | (0.33 | ) | | | (0.31 | ) | | | — | |
| | | | | | | | | | | | | | | | | | | | | |
| Net asset value, end of period | | $ | 30.42 | | | $ | 43.41 | | | $ | 47.81 | | | $ | 31.32 | | | $ | 33.05 | |
| | | | | | | | | | | | | | | | | | | | | |
TOTAL RETURN(5) | | | -29.92 | % | | | 2.75 | % | | | 54.32 | % | | | -4.20 | % | | | 6.48 | % |
| | | | | | | | | | | | | | | | | | | | | |
| SUPPLEMENTAL DATA AND RATIOS: | | | | | | | | | | | | | | | | | | | | |
| Net assets, end of period (in millions) | | $ | 62.3 | | | $ | 136.4 | | | $ | 142.9 | | | $ | 39.1 | | | $ | 60.0 | |
| | | | | | | | | | | | | | | | | | | | | |
Ratio of expenses to average net assets(6)(7): | | | | | | | | | | | | | | | | | | | | |
| Before expense waiver/recoupment | | | 1.68 | % | | | 1.53 | % | | | 1.64 | % | | | 1.69 | % | | | 1.66 | % |
| After expense waiver/recoupment | | | 1.56 | % | | | 1.50 | % | | | 1.49 | % | | | 1.50 | % | | | 1.50 | % |
| | | | | | | | | | | | | | | | | | | | | |
| Ratio of expenses excluding interest expenses | | | | | | | | | | | | | | | | | | | | |
to average net assets(6)(7): | | | | | | | | | | | | | | | | | | | | |
| Before expense waiver/recoupment | | | 1.61 | % | | | 1.52 | % | | | 1.64 | % | | | 1.68 | % | | | 1.65 | % |
| After expense waiver/recoupment | | | 1.49 | % | | | 1.49 | % | | | 1.49 | % | | | 1.49 | % | | | 1.49 | % |
| | | | | | | | | | | | | | | | | | | | | |
| Ratio of net investment income (loss) | | | | | | | | | | | | | | | | | | | | |
to average net assets(6)(7): | | | | | | | | | | | | | | | | | | | | |
| After expense waiver/recoupment | | | (0.27 | )% | | | (0.20 | )% | | | 0.46 | % | | | 0.81 | % | | | (0.18 | )% |
| | | | | | | | | | | | | | | | | | | | | |
Portfolio turnover rate(5)(8) | | | 2,610 | % | | | 2,030 | % | | | 1,785 | % | | | 2,053 | % | | | 1,856 | % |
| (1) | Inception date of the Institutional Class was March 26, 2018. |
| (2) | Per share data calculated using the average shares outstanding method. |
| (3) | Recognition of net investment income (loss) by the Fund is affected by the timing of the declaration of dividends by the underlying investment companies in which the Fund invests. |
| (4) | Realized and unrealized gains (losses) per share in this caption are balancing amounts necessary to reconcile the change in net asset value per share for the year, and may not reconcile with the aggregate gains on the Statement of Operations due to share transactions for the year. |
| (5) | Not annualized for periods less than one year. |
| (6) | Does not include expenses of investment companies in which the Fund invests. |
| (7) | Annualized for periods less than one year. |
| (8) | Portfolio turnover disclosed is for the Fund as a whole. |
See Notes to the Financial Statements
Notes to the Financial Statements
August 31, 2022
1. ORGANIZATION
Managed Portfolio Series (the “Trust”) was organized as a Delaware statutory trust on January 27, 2011. The Trust is registered under the Investment Company Act of 1940, as amended (the “1940 Act”), as an open-end management investment company. The ATAC Rotation Fund (the “Fund”) is a diversified series with its own investment objectives and policies within the Trust. The investment objective of the Fund is to achieve absolute positive returns over time. The Fund is an investment company and accordingly follows the investment company accounting and reporting guidance of the Financial Accounting Standards Board (“FASB”) Accounting Standards Codification Topic 946 Financial Services – Investment Companies. The Fund currently offers two classes of shares, the Investor Class and the Institutional Class. Each class of shares has identical rights and privileges except with respect to the distribution fees and voting rights on matters affecting a single share class. The Investor Class shares are subject to a 0.25% Rule 12b-1 distribution and servicing fee. The Fund may issue an unlimited number of shares of beneficial interest, with no par value.
2. SIGNIFICANT ACCOUNTING POLICIES
The following is a summary of significant accounting policies consistently followed by the Fund in preparation of its financial statements. These policies are in conformity with generally accepted accounting principles in the United States of America (“GAAP”).
Security Valuation – All investments in securities are recorded at their estimated fair value, as described in Note 3.
Federal Income Taxes – The Fund complies with the requirements of subchapter M of the Internal Revenue Code of 1986, as amended, necessary to qualify as a regulated investment company and distributes substantially all net taxable investment income and net realized gains to shareholders in a manner which results in no tax cost to the Fund. Therefore, no federal income or excise tax provision is required. As of and during the year ended August 31, 2022, the Fund did not have any tax positions that did not meet the “more-likely-than-not” threshold of being sustained by the applicable tax authority. The Fund recognizes interest and penalties, if any, related to unrecognized tax benefits on uncertain tax positions as income tax expense in the Statement of Operations. As of and during the year ended August 31, 2022, the Fund did not incur any interest or penalties. The Fund is not subject to examination by U.S. tax authorities for tax years prior to the fiscal year ended August 31, 2019.
Security Transactions, Income, and Distributions – The Fund follows industry practice and records security transactions on the trade date. Realized gains and losses on sales of securities are calculated on the basis of identified cost. Dividend income is recorded on the ex-dividend date and interest income is recorded on an accrual basis. Withholding taxes on foreign dividends have been provided for in accordance with the Fund’s understanding of the applicable country’s tax rules and regulations. Discounts and premiums on securities purchased are amortized over the expected life of the respective securities using the constant yield method.
The Fund distributes substantially all net investment income and net realized capital gains, if any, at least annually. Distributions to shareholders are recorded on the ex-dividend date. The treatment for financial reporting purposes of distributions made to shareholders during the year from net investment income and expense or net realized capital gains may differ from their ultimate treatment for federal income tax purposes. These differences are caused primarily by differences in the timing of the recognition of certain components of income, expense or realized capital gain for federal income tax purposes. Where such differences are permanent in nature, GAAP requires that they be reclassified in the components of the net assets based on their ultimate characterization for federal income tax purposes. Any such reclassifications will have no effect on net assets, results of operations or net asset values per share of the Fund.
Notes to the Financial Statements – Continued
August 31, 2022
For the year ended August 31, 2022, the Fund decreased paid-in-capital by $442,443 and decreased accumulated loss by $442,443. The adjustment was due to a net operating loss reclassification.
Allocation of Income, Expenses and Gains/Losses – Income, expenses (other than those deemed attributable to a specific share class), and gains and losses of the Fund are allocated daily to each class based upon the ratio of net assets represented by each class as a percentage of the net assets of the Fund. Expenses deemed directly attributable to a class of shares are recorded by the specific class. Most Fund expenses are allocated by class based on relative net assets. 12b-1 fees are expensed at 0.25% of average daily net assets of Investor Class shares (see Note 5). Expenses associated with a specific fund in the Trust are charged to that fund. Common Trust expenses are typically allocated evenly between the funds of the Trust, or by other equitable means.
Use of Estimates – The preparation of financial statements in conformity with GAAP requires management to make estimates and assumptions that affect the reported amounts of assets and liabilities and disclosure of contingent assets and liabilities at the date of the financial statements and the reported amounts of revenues and expenses during the reporting period. Actual results could differ from those estimates.
3. SECURITIES VALUATION
The Fund has adopted authoritative fair value accounting standards which establish an authoritative definition of fair value and set out a hierarchy for measuring fair value. These standards require additional disclosures about the various inputs and valuation techniques used to develop the measurements of fair value, a discussion of changes in valuation techniques and related inputs during the period and expanded disclosure of valuation Levels for major security types. These inputs are summarized in the three broad Levels listed below:
| Level 1 – | Unadjusted quoted prices in active markets for identical assets or liabilities that the Fund has the ability to access. |
| | |
| Level 2 – | Observable inputs other than quoted prices included in Level 1 that are observable for the asset or liability, either directly or indirectly. These inputs may include quoted prices for the identical instrument on an inactive market, prices for similar instruments, interest rates, prepayment speeds, credit risk, yield curves, default rates and similar data. |
| | |
| Level 3 – | Unobservable inputs for the asset or liability, to the extent relevant observable inputs are not available, representing each Fund’s own assumptions about the assumptions a market participant would use in valuing the asset or liability, and would be based on the best information available. |
Following is a description of the valuation techniques applied to the Fund’s major categories of assets and liabilities measured at fair value on a recurring basis. The Fund’s investments are carried at fair value.
Short-Term Investments – Investments in other mutual funds, including money market funds, are valued at their net asset value per share. To the extent these securities are actively traded and valuation adjustments are not applied, they are categorized in Level 1 of the fair value hierarchy.
Exchange-Traded Funds – Exchange-traded funds (“ETFs”) are valued at the last reported sale price on the exchange on which the security is principally traded. If, on a particular day, an ETF does not trade, then the mean between the most recent quoted bid and asked prices will be used. To the extent these securities are actively traded and valuation adjustments are not applied, they are categorized in Level 1 of the fair value hierarchy.
Notes to the Financial Statements – Continued
August 31, 2022
Securities for which market quotations are not readily available, or if the closing price does not represent fair value, are valued following procedures approved by the Board of Trustees (the “Board”). These procedures consider many factors, including the type of security, size of holding, trading volume and news events. There can be no assurance that the Fund could obtain the fair value assigned to a security if they were to sell the security at approximately the time at which the Fund determine their net asset values per share. The Board has established a Valuation Committee to administer, implement, and oversee the fair valuation process, and to make fair value decisions when necessary. The Board regularly reviews reports that describe any fair value determinations and methods.
The inputs or methodology used for valuing securities are not an indication of the risk associated with investing in those securities. The following is a summary of the inputs used to value the Fund’s securities as of August 31, 2022:
| | | Level 1 | | | Level 2 | | | Level 3 | | | Total | |
| Exchange-Traded Funds | | $ | 88,391,388 | | | $ | — | | | $ | — | | | $ | 88,391,388 | |
| Short-Term Investment | | | 481,189 | | | | — | | | | — | | | | 481,189 | |
| Total Investments | | $ | 88,872,577 | | | $ | — | | | $ | — | | | $ | 88,872,577 | |
Refer to the Schedule of Investments for further information on the classification of investments.
4. INVESTMENT ADVISORY FEE AND OTHER TRANSACTIONS WITH AFFILIATES
The Trust has an agreement with Toroso Investments, LLC (the “Adviser”) to furnish investment advisory services to the Fund. For its services, the Fund pays the Adviser a monthly management fee of 1.25% of the Fund’s average daily net assets up to $500 million, 1.15% of the Fund’s average daily net assets on the next $250 million, 1.05% of the Fund’s average daily net assets on the next $250 million, and 0.95% of the Fund’s average daily net assets in excess of $1 billion.
The Adviser has contractually agreed to waive a portion or all of its management fees and reimburse the Fund for its expenses to ensure that total annual operating expenses (excluding certain expenses such as taxes, leverage interest, interest expense, dividends paid on short sales, brokerage commissions, acquired fund fees and expenses, or extraordinary expenses) based upon the average daily net assets of the Fund not exceeding an annual rate of 1.74% and 1.49% of the Investor Class and Institutional Class, respectively.
Fees waived and expenses reimbursed by the Adviser may be recouped by the Adviser for a period of thirty-six months following the month during which such waiver or reimbursement was made if such recoupment can be achieved without exceeding the expense limit in effect at the time the waiver or reimbursement occurred. The Operating Expenses Limitation Agreement is indefinite in term, but cannot be terminated through at least December 29, 2022. After that date, the agreement may be terminated at any time upon 60 days’ written notice by the Board or the Adviser, with the consent of the Board. During the year ended August 31, 2022, the Adviser was able to recoup $18,736, relating to fees waived in prior fiscal years. Waived fees and reimbursed expenses subject to potential recovery by month of expiration are as follows:
| Expiration | | Amount | | |
| May 2023 – August 2023 | | $ | 17,202 | | |
| September 2023 – August 2024 | | $ | 93,796 | | |
| September 2024 – August 2025 | | $ | 195,953 | | |
Notes to the Financial Statements – Continued
August 31, 2022
U.S. Bancorp Fund Services, LLC (the “Administrator”), doing business as U.S. Bank Global Fund Services, acts as the Fund’s Administrator, Transfer Agent, and Fund Accountant. U.S. Bank N.A. (the “Custodian”) serves as the custodian to the Fund. The Custodian is an affiliate of the Administrator. The Administrator performs various administrative and accounting services for the Fund. The Administrator prepares various federal and state regulatory filings, reports and returns for the Fund; prepares reports and materials to be supplied to the Trustees; monitors the activities of the Custodian; coordinates the payment of the Fund’s expenses and reviews the Fund’s expense accruals. The officers of the Trust, including the Chief Compliance Officer, are employees of the Administrator. As compensation for its services, the Administrator is entitled to a monthly fee at an annual rate based upon the average daily net assets of the Fund, subject to annual minimums. Fees paid by the Fund for administration and accounting, transfer agency, custody and compliance services for the year ended August 31, 2022 are disclosed in the Statements of Operations.
5. DISTRIBUTION COSTS
The Fund has adopted a Distribution Plan pursuant to Rule 12b-1 (the “Plan”) in the Investor Class only. The Plan permits the Fund to pay for distribution and related expenses at an annual rate of 0.25% of the Investor Class’ average daily net assets. The expenses covered by the Plan may include the cost of preparing and distributing prospectuses and other sales material, advertising and public relations expenses, payments to financial intermediaries and compensation of personnel involved in selling shares of the Fund. For the year ended August 31, 2022, the Fund’s Investor Class incurred $127,477 for expenses pursuant to the Plan.
6. CAPITAL SHARE TRANSACTIONS
| | | Year Ended | | | Year Ended | |
| | | August 31, 2022 | | | August 31, 2021 | |
| Transactions in shares of the Fund were as follows: | | | | | | |
| | | | | | | |
| Investor Class: | | | | | | |
| Shares sold | | | 186,634 | | | | 1,569,765 | |
| Shares issued to holders in reinvestment of distributions | | | — | | | | 325,698 | |
| Shares redeemed | | | (1,260,822 | ) | | | (2,640,283 | ) |
| Net decrease | | | (1,074,188 | ) | | | (744,820 | ) |
| Institutional Class: | | | | | | | | |
| Shares sold | | | 936,239 | | | | 3,298,210 | |
| Shares issued in reinvestment of distributions | | | — | | | | 400,327 | |
| Shares redeemed | | | (2,030,095 | ) | | | (3,545,332 | ) |
| Net increase (decrease) | | | (1,093,854 | ) | | | 153,205 | |
| Net decrease in shares outstanding | | | (2,168,042 | ) | | | (591,615 | ) |
7. INVESTMENT TRANSACTIONS
The aggregate purchases and sales, excluding short-term investments, by the Fund for the year ended August 31, 2022, were as follows:
| U.S. Government Securities | | Other | |
| Purchases | Sales | | Purchases | Sales | |
| $ — | $ — | | $3,847,902,747 | $3,931,743,926 | |
Notes to the Financial Statements – Continued
August 31, 2022
8. FEDERAL TAX INFORMATION
The aggregate gross unrealized appreciation and depreciation of securities held by the Fund and the total cost of securities for federal income tax purposes at August 31, 2022, were as follows:
| Aggregate | Aggregate | | Federal | |
| Gross | Gross | Net | Income | |
| Appreciation | Depreciation | Depreciation | Tax Cost | |
| $ — | $(5,745,301) | $(5,745,301) | $94,617,878 | |
Any difference between book-basis and tax-basis unrealized appreciation (depreciation) would be attributable primarily to the tax deferral of losses on wash sales, and a net operating loss reclass.
At August 31, 2022, components of accumulated earnings on a tax-basis were as follows:
| Undistributed | | Other | Total | |
| Ordinary | Unrealized | Accumulated | Accumulated | |
| Income | Depreciation | Loss | Loss | |
| $ — | $(5,745,301) | $(45,190,346) | $(50,935,647) | |
As of August 31, 2022, the Fund had a short-term capital loss carryover of $43,752,052. A regulated investment company may elect for any taxable year to treat any portion of any qualified late year loss as arising on the first day of the next taxable year. Qualified late year losses are certain capital, and ordinary losses which occur during the portion of the Fund’s taxable year subsequent to October 31 and December 31, respectively. The Fund deferred, on a tax basis, post-October losses of $79,359. The Fund did not defer any qualified late year losses.
The Fund did not pay a distribution for the year ended August 31, 2022.
The tax character of distributions paid for the year ended August 31, 2021, were as follows:
| Ordinary Income* | Long-Term Capital Gains | Total | |
| $35,575,924 | $ — | $35,575,924 | |
| * | For federal income tax purposes, distributions of short-term capital gains are treated as ordinary income distributions. |
9. TRANSACTIONS WITH AFFILIATES
If the Fund’s holding represents ownership of 5% or more of the voting securities of a company, the company is deemed to be an affiliate as defined by the 1940 Act. The Fund conducted transactions during the year ended August 31, 2022 with affiliated companies as so defined:
| | Beginning shares | Additions | Reductions | Ending Shares |
| Direxion Daily Emerging Markets Bull 3x Fund | — | 1,172,471 | (1,172,471) | — |
| | | | | |
| | | | | Change in |
| | | | | Unrealized |
| | Value | Dividend | Realized | Appreciation/ |
| | August 31, 2022 | Income | Loss | Depreciation |
| Direxion Daily Emerging Markets Bull 3x Fund | $ — | $ — | $(3,412,157) | $ — |
Notes to the Financial Statements – Continued
August 31, 2022
10. LINE OF CREDIT
The Fund established an unsecured line of credit (“LOC”) in the amount of $12,000,000, 10% of the gross fair value of the Fund, or 33.33% of the fair value of the Fund’s investments, whichever is less. The LOC matures, unless renewed on July 21, 2023. This LOC is intended to provide short-term financing, if necessary, subject to certain restrictions and covenants in connection with shareholder redemptions and other short-term liquidity needs of the Fund. The LOC is with the Custodian. Interest is charged at the prime rate, which was 5.50% as of August 31, 2022. The interest rate during the period was between 3.25% and 5.50%. The weighted average interest rate paid on outstanding borrowing was 3.39% The Fund has authorized the Custodian to charge any of the accounts of the Fund for any missed payments.
The Fund also has a secured line of credit with Huntington National Bank for investment purposes with a maximum amount of $30,000,000 or 20% of the market value of the Fund’s collateral, whichever is less. This line has a maturity date of December 9, 2022. Borrowings bear interest at the 3-month LIBOR rate plus 170 basis points, which was 4.09% as of August 31, 2022. The interest rate during the period was between 1.83% and 4.09%. The weighted interest rate paid on outstanding borrowings was 3.03%. Collateral for all borrowing with this credit facility is held at the Custodian and is part of the Fund’s holdings. As of August 31, 2022, the value of the collateral was $71,638,897. Refer to the Schedule of Investments for further information.
For the year ended August 31, 2022, the Fund’s credit facility activity is as follows:
| Credit | | Average | | | Amount Outstanding | | | Interest | | | Service | | | Maximum | | Maximum |
| Facility Agent | | Borrowings | | | as of August 31, 2022 | | | Expense | | | Charges | | | Borrowing | | Borrowing Date |
| U.S. Bank N.A. | | $ | 472,890 | | | $ | — | | | $ | 16,250 | | | $ | — | | | $ | 14,568,000 | | October 12, 2021 |
| Huntington Bank | | $ | 1,073,699 | | | $ | 559,721 | | | $ | 32,962 | | | $ | 46,743 | | | $ | 16,559,721 | | June 23-July 5, 2022 |
11. LEVERAGED ETFS
Leveraged ETFs are funds that rely on financial derivatives and/or debt (“leverage”) to amplify the investment return of an underlying index. The use of leverage will magnify the effect of any increase or decrease in the value of a Leveraged ETF’s portfolio. During the year ended August 31, 2022, the Fund invested in Leveraged ETFs.
12. CONTROL OWNERSHIP
The beneficial ownership, either directly or indirectly, of more than 25% of the voting securities of a fund creates a presumption of control of that fund, under Section 2(a)(9) of the 1940 Act. As of August 31, 2022, UBS Wealth Management held 37.3% of the Fund.
13. REGULATORY UPDATE
In December 2020, the SEC adopted a new rule providing a framework for fund valuation practices (“Rule 2a-5”). Rule 2a-5 establishes requirements for determining fair value in good faith for purposes of the 1940 Act. Rule 2a-5 will permit fund boards to designate certain parties to perform fair value determinations, subject to board oversight and certain other conditions. Rule 2a-5 also defines when market quotations are “readily available” for purposes of the 1940 Act and the threshold for determining whether a fund must fair value a security. In connection with Rule 2a-5, the SEC also adopted related recordkeeping requirements and is rescinding previously issued guidance, including with respect to the role of a board in determining fair value and the accounting and auditing of fund investments. The Fund will be required to comply with the rules by September 8, 2022.
Notes to the Financial Statements – Continued
August 31, 2022
14. GENERAL RISKS
The global outbreak of COVID-19 has disrupted economic markets and the prolonged economic impact is uncertain. The operational and financial performance of the issuers of securities in which the Fund invests depends on future developments, including the duration and spread of the outbreak, and such uncertainty may in turn impact the value of the Fund’s investments.
On February 24, 2022, Russia commenced a military attack on Ukraine. The outbreak of hostilities between the two countries could result in more widespread conflict and could have a severe adverse effect on the region and the markets. In addition, sanctions imposed on Russia by the United States and other countries, and any sanctions imposed in the future could have a significant adverse impact on the Russian economy and related markets. The price and liquidity of investments may fluctuate widely as a result of the conflict and related events. How long such conflict and related events will last and whether it will escalate further cannot be predicted, nor its effect on the Fund.
Report of Independent Registered Public Accounting Firm
To the Shareholders of ATAC Rotation Fund and
Board of Trustees of Managed Portfolio Series
Opinion on the Financial Statements
We have audited the accompanying statement of assets and liabilities, including the schedule of investments, of ATAC Rotation Fund (the “Fund”), a series of Managed Portfolio Series, as of August 31, 2022, the related statement of operations and cash flows for the year then ended, the statements of changes in net assets for each of the two years in the period then ended, the related notes, and the financial highlights for each of the five years in the period then ended (collectively referred to as the “financial statements”). In our opinion, the financial statements present fairly, in all material respects, the financial position of the Fund as of August 31, 2022, the results of its operations and its cash flows for the year then ended, the changes in net assets for each of the two years in the period then ended, and the financial highlights for each of the five years in the period then ended, in conformity with accounting principles generally accepted in the United States of America.
Basis for Opinion
These financial statements are the responsibility of the Fund’s management. Our responsibility is to express an opinion on the Fund’s financial statements based on our audits. We are a public accounting firm registered with the Public Company Accounting Oversight Board (United States) (“PCAOB”) and are required to be independent with respect to the Fund in accordance with the U.S. federal securities laws and the applicable rules and regulations of the Securities and Exchange Commission and the PCAOB.
We conducted our audits in accordance with the standards of the PCAOB. Those standards require that we plan and perform the audit to obtain reasonable assurance about whether the financial statements are free of material misstatement whether due to error or fraud.
Our audit included performing procedures to assess the risks of material misstatement of the financial statements, whether due to error or fraud, and performing procedures that respond to those risks. Such procedures included examining, on a test basis, evidence regarding the amounts and disclosures in the financial statements. Our procedures included confirmation of securities owned as of August 31, 2022, by correspondence with the custodian. Our audits also included evaluating the accounting principles used and significant estimates made by management, as well as evaluating the overall presentation of the financial statements. We believe that our audits provide a reasonable basis for our opinion.
We have served as the Fund’s auditor since 2012.
COHEN & COMPANY, LTD.
Milwaukee, Wisconsin
October 31, 2022
Additional Information (Unaudited)
August 31, 2022
| | | | Number of | | |
| | | Term of | Portfolios | Principal | Other Directorships |
| | Position(s) | Office and | in Trust | Occupation(s) | Held by Trustee |
| Name, Address | Held with | Length of | Overseen | During the Past | During the Past |
| and Year of Birth | the Trust | Time Served | by Trustee | Five Years | Five Years |
| Independent Trustees | | | | | |
| Leonard M. Rush, CPA | Lead | Indefinite | 37 | Retired, Chief Financial | Independent Trustee, |
| 615 E. Michigan St. | Independent | Term; Since | | Officer, Robert W. | ETF Series Solutions |
| Milwaukee, WI 53202 | Trustee | April 2011 | | Baird & Co. Incorporated | (60 Portfolios) |
| Year of Birth: 1946 | and Audit | | | (2000-2011). | (2012-Present) |
| | Committee | | | | |
| | Chairman | | | | |
| David A. Massart | Trustee | Indefinite | 37 | Partner and Managing | Independent Trustee, |
| 615 E. Michigan St. | | Term; Since | | Director, Beacon Pointe | ETF Series Solutions |
| Milwaukee, WI 53202 | | April 2011 | | Advisors, LLC (since 2022); | (60 Portfolios) |
| Year of Birth: 1967 | | | | Co-Founder and Chief | (2012-Present) |
| | | | | Investment Strategist; | |
| | | | | Next Generation Wealth | |
| | | | | Management, Inc. (2005-2021). | |
| David M. Swanson | Trustee and | Indefinite | 37 | Founder and Managing | Independent Trustee, |
| 615 E. Michigan St. | Nominating & | Term; Since | | Principal, SwanDog | ALPS Variable |
| Milwaukee, WI 53202 | Governance | April 2011 | | Strategic Marketing, LLC | Investment Trust |
| Year of Birth: 1957 | Committee | | | (2006-present). | (7 Portfolios) |
| | Chairman | | | | (2006-Present); |
| | | | | | Independent Trustee, |
| | | | | | RiverNorth Funds |
| | | | | | (3 Portfolios) |
| | | | | | (2018-Present); |
| | | | | | RiverNorth Managed |
| | | | | | Duration Municipal |
| | | | | | Income Fund Inc. |
| | | | | | (1 Portfolio) |
| | | | | | (2019-Present); |
| | | | | | RiverNorth Specialty |
| | | | | | Finance Corporation |
| | | | | | (1 Portfolio) |
| | | | | | (2018-Present); |
| | | | | | RiverNorth/DoubleLine |
| | | | | | Strategic Opportunity |
| | | | | | Fund, Inc. (1 Portfolio) |
| | | | | | (2018-Present); |
| | | | | | RiverNorth |
| | | | | | Opportunities Fund, Inc. |
| | | | | | (1 Portfolio) |
| | | | | | (2015-Present); |
| | | | | | RiverNorth |
| | | | | | Opportunistic Municipal |
| | | | | | Income Fund, Inc. |
| | | | | | (1 Portfolio) |
| | | | | | (2018-Present); |
| | | | | | RiverNorth Flexible |
| | | | | | Municipal Income |
| | | | | | Fund (2020-Present) |
Additional Information (Unaudited) – Continued
August 31, 2022
| | | | Number of | | |
| | | Term of | Portfolios | Principal | Other Directorships |
| | Position(s) | Office and | in Trust | Occupation(s) | Held by Trustee |
| Name, Address | Held with | Length of | Overseen | During the Past | During the Past |
| and Year of Birth | the Trust | Time Served | by Trustee | Five Years | Five Years |
| Robert J. Kern | Trustee | Indefinite | 37 | Retired (July 2018-Present); | None |
| 615 E. Michigan St. | | Term; Since | | Executive Vice President, | |
| Milwaukee, WI 53202 | | January 2011 | | U.S. Bancorp Fund | |
| Year of Birth: 1958 | | | | Services, LLC (1994-2018). | |
| Officers | | | | | |
| Brian R. Wiedmeyer | President | Indefinite | N/A | Vice President, U.S. Bancorp | N/A |
| 615 E. Michigan St. | and Principal | Term; Since | | Fund Services, LLC | |
| Milwaukee, WI 53202 | Executive | November 2018 | | (2005-present). | |
| Year of Birth: 1973 | Officer | | | | |
| Deborah Ward | Vice | Indefinite | N/A | Senior Vice President, | N/A |
| 615 E. Michigan St. | President, | Term; Since | | U.S. Bancorp Fund | |
| Milwaukee, WI 53202 | Chief | April 2013 | | Services, LLC | |
| Year of Birth: 1966 | Compliance | | | (2004-present). | |
| | Officer and | | | | |
| | Anti-Money | | | | |
| | Laundering | | | | |
| | Officer | | | | |
| Benjamin Eirich | Treasurer, | Indefinite | N/A | Assistant Vice President, | N/A |
| 615 E. Michigan St. | Principal | Term; Since | | U.S. Bancorp Fund | |
| Milwaukee, WI 53202 | Financial | August 2019 | | Services, LLC | |
| Year of Birth: 1981 | Officer | (Treasurer); | | (2008-present). | |
| | and Vice | Since | | | |
| | President | November 2018 | | | |
| | | (Vice President) | | | |
| John Hadermayer | Secretary | Indefinite | N/A | Vice President, U.S. Bank | N/A |
| 615 E. Michigan St. | | Term; Since | | Global Fund Services | |
| Milwaukee, WI 53202 | | May 2022 | | (2022-present); Executive | |
| Year of Birth: 1977 | | | | Director, AQR Capital | |
| | | | | Management, LLC | |
| | | | | (2013-2022). | |
| Douglas Schafer | Vice | Indefinite | N/A | Assistant Vice President, | N/A |
| 615 E. Michigan St. | President | Term; Since | | U.S. Bancorp Fund | |
| Milwaukee, WI 53202 | and Assistant | May 2016 | | Services, LLC | |
| Year of Birth: 1970 | Treasurer | (Assistant | | (2002-present). | |
| | | Treasurer); | | | |
| | | Since | | | |
| | | November 2018 | | | |
| | | (Vice President) | | | |
| Sara J. Bollech | Assistant | Indefinite | N/A | Officer, U.S. Bancorp Fund | N/A |
| 615 E. Michigan St. | Treasurer | Term; Since | | Services, LLC (2007-present). | |
| Milwaukee, WI 53202 | and Vice | November 2021 | | | |
| Year of Birth: 1977 | President | | | | |
| Peter A. Walker, CPA | Assistant | Indefinite | N/A | Officer, U.S. Bancorp Fund | N/A |
| 615 E. Michigan St. | Treasurer | Term; Since | | Services, LLC (2016-present). | |
| Milwaukee, WI 53202 | and Vice | November 2021 | | | |
| Year of Birth: 1993 | President | | | | |
Additional Information (Unaudited) – Continued
August 31, 2022
AVAILABILITY OF FUND PORTFOLIO INFORMATION
The Fund files a complete schedule of portfolio holdings with the SEC for the first and third quarters of each fiscal year on Part F of Form N-PORT. The Fund’s Part F of Form N-PORT is available on the SEC’s website at www.sec.gov and may be reviewed and copied at the SEC’s Public Reference Room in Washington, D.C. For information on the Public Reference Room call 1-800-SEC-0330. In addition, the Fund’s Part F of Form N-PORT is available without charge upon request by calling 1-855-282-2386.
AVAILABILITY OF PROXY VOTING INFORMATION
A description of the Fund’s Proxy Voting Policies and Procedures is available without charge, upon request, by calling 1-855-282-2386. Information regarding how the Fund voted proxies relating to portfolio securities during the most recent 12 month period ended June 30, is available (1) without charge, upon request, by calling 1-855-282-2386, or (2) on the SEC’s website at www.sec.gov.
QUALIFIED DIVIDEND INCOME/DIVIDENDS RECEIVED DEDUCTION
For the fiscal year ended August 31, 2022, certain dividends paid by the Fund may be reported as qualified dividend income and may be eligible for taxation at capital gain rates. The percentage of dividends declared from ordinary income as qualified dividend income was 0.00% for the Fund.
For corporate shareholders, the percent of ordinary income distributions qualified for the corporate dividends received deduction for the fiscal year ended August 31, 2022, was 0.00% for the Fund.
The percentage of taxable ordinary income distributions that are designated as short-term capital gains distributions under Internal Revenue Section 871(k)(2)(c) was 0.00%.
Statement Regarding the Fund’s Liquidity Risk Management Program (Unaudited)
Pursuant to Rule 22e-4 under the Investment Company Act of 1940, Managed Portfolio Series (the “Trust”), on behalf of the ATAC Rotation Fund (the “Fund”), has adopted and implemented a written liquidity risk management program (the “Program”) that includes policies and procedures reasonably designed to comply with the requirements of Rule 22e-4, including: (i) assessment, management and periodic review of liquidity risk; (ii) classification of portfolio holdings; (iii) establishment of a highly liquid investment minimum (“HLIM”), as applicable; (iv) limitation on illiquid investments; and (v) redemptions in-kind. The Trust’s Board of Trustees (the “Board”) has approved the designation of Toroso Investments, LLC (“Toroso”) as the administrator of the Program (the “Program Administrator”). Personnel of Toroso conduct the day-to-day operation of the Program pursuant to policies and procedures administered by the Program Administrator.
In accordance with Rule 22e-4, the Board reviewed a report prepared by the Program Administrator (the “Report”) regarding the operation of the Program and its adequacy and effectiveness of implementation for the period of January 1, 2021, through December 31, 2021 (the “Reporting Period”). No significant liquidity events impacting the Fund during the Reporting Period or material changes to the Program were noted in the Report.
Under the Program, Toroso manages and periodically reviews the Fund’s liquidity risk, including consideration of applicable factors specified in Rule 22e-4 and the Program. Liquidity risk is defined as the risk that the Fund could not meet shareholder redemption requests without significant dilution of remaining shareholders’ interests in the Fund. In general, this risk was managed during the Reporting Period by monitoring the degree of liquidity of the Fund’s investments, limiting the amount of the Fund’s illiquid investments, and utilizing various risk management tools and facilities available to the Fund for meeting shareholder redemptions, among other means. In the Report, Toroso provided its assessment that, based on the information considered in its review, the Program remains reasonably designed to manage the Fund’s liquidity risk and the Fund’ s investment strategy remains appropriate for an open-end fund.
Pursuant to the Program, the Program Administrator oversaw the classification of each of the Fund’s portfolio investments as highly liquid, moderately liquid, less liquid or illiquid during the Reporting Period, including in connection with recording investment classifications on Form N-PORT. Toroso’s process of determining the degree of liquidity of the Fund’s investments is supported by one or more third-party liquidity assessment vendors.
The Fund qualified as a “primarily highly liquid fund” as defined in the Program during the Reporting Period. Accordingly, the Fund was not required to establish a HLIM or comply with the related Program provisions during the Reporting Period.
During the Reporting Period, the Fund’s investments were monitored for compliance with the 15% limitation on illiquid investments pursuant to the Program and in accordance with Rule 22e-4.
The Report noted that the Fund did not effect redemptions in-kind during the Reporting Period. The Report concluded: (i) the Program was implemented and operated effectively to achieve the goal of assessing and managing the Fund’s liquidity risk during the Reporting Period; and (ii) the Fund was able to meet requests for redemption without significant dilution of remaining investors’ interests in the Fund during the Reporting Period.
Privacy Notice (Unaudited)
The Fund collects only relevant information about you that the law allows or requires it to have in order to conduct its business and properly service you. The Fund collects financial and personal information about you (“Personal Information”) directly (e.g., information on account applications and other forms, such as your name, address, and social security number, and information provided to access account information or conduct account transactions online, such as password, account number, e-mail address, and alternate telephone number), and indirectly (e.g., information about your transactions with us, such as transaction amounts, account balance and account holdings).
The Fund does not disclose any non-public personal information about its shareholders or former shareholders other than for everyday business purposes such as to process a transaction, service an account, respond to court orders and legal investigations or as otherwise permitted by law. Third parties that may receive this information include companies that provide transfer agency, technology and administrative services to the Fund, as well as the Fund’s investment adviser who is an affiliate of the Fund. If you maintain a retirement/educational custodial account directly with the Fund, we may also disclose your Personal Information to the custodian for that account for shareholder servicing purposes. The Fund limits access to your Personal Information provided to unaffiliated third parties to information necessary to carry out their assigned responsibilities to the Fund. All shareholder records will be disposed of in accordance with applicable law. The Fund maintains physical, electronic and procedural safeguards to protect your Personal Information and requires its third party service providers with access to such information to treat your Personal Information with the same high degree of confidentiality.
In the event that you hold shares of the Fund through a financial intermediary, including, but not limited to, a broker-dealer, credit union, bank or trust company, the privacy policy of your financial intermediary governs how your non-public personal information is shared with unaffiliated third parties.
INVESTMENT ADVISER
Toroso Investments, LLC
898 North Broadway, Suite 2
Massapequa, NY 11758
DISTRIBUTOR
Quasar Distributors, LLC
111 East Kilbourn Avenue, Suite 2200
Milwaukee, WI 53202
CUSTODIAN
U.S. Bank N.A.
1555 North Rivercenter Drive, Suite 302
Milwaukee, WI 53212
ADMINISTRATOR, FUND ACCOUNTANT
AND TRANSFER AGENT
U.S. Bancorp Fund Services, LLC
615 East Michigan Street
Milwaukee, WI 53202
INDEPENDENT REGISTERED PUBLIC ACCOUNTING FIRM
Cohen & Company, Ltd.
342 North Water Street, Suite 830
Milwaukee, WI 53202
LEGAL COUNSEL
Stradley Ronon Stevens & Young, LLP
2005 Market Street, Suite 2600
Philadelphia, PA 19103
This report should be accompanied or preceded by a prospectus.
The Fund’s Statement of Additional Information contains additional information about the
Fund’s trustees and is available without charge upon request by calling 1-855-282-2386.
(b) Not applicable.
Item 2. Code of Ethics.
The Registrant has adopted a code of ethics that applies to the Registrant’s principal executive
officer and principal financial officer. The Registrant has not made any substantive amendments
to its code of ethics during the period covered by this report. The Registrant has not granted any waivers from any provisions of the code of ethics during the period covered by this report.
A copy of the Registrant’s Code of Ethics that applies to the Registrant’s principal executive officer and principal financial officer is filed herewith.
Item 3. Audit Committee Financial Expert.
The Registrant’s board of trustees has determined that there is at least one audit committee financial expert serving on its audit committee. Leonard M. Rush is the “audit committee financial expert” and is considered to be “independent” as each term is defined in Item 3 of Form N‑CSR.
Item 4. Principal Accountant Fees and Services.
The Registrant has engaged its principal accountant to perform audit services, audit-related services, tax services and other services during the past two fiscal years. “Audit services” refer to performing an audit of the Registrant's annual financial statements or services that are normally provided by the accountant in connection with statutory and regulatory filings or engagements for those fiscal years. “Audit-related services” refer to the assurance and related services by the principal accountant that are reasonably related to the performance of the audit. “Tax services” refer to professional services rendered by the principal accountant for tax compliance, tax advice, and tax planning; including reviewing the Fund’s tax returns and distributions calculations. There were no “other services” provided by the principal accountant. For the fiscal years ended August 31, 2022 and August 31, 2021, the Fund’s principal accountant was Cohen & Company, Ltd. The following table details the aggregate fees billed or expected to be billed for each of the last two fiscal years for audit fees, audit-related fees, tax fees and other fees by the principal accountant.
| | FYE 8/31/2022 | FYE 8/31/2021 |
(a) Audit Fees | $14,500 | $14,500 |
(b) Audit-Related Fees | $0 | $0 |
(c) Tax Fees | $3,500 | $5,000 |
(d) All Other Fees | $0 | $0 |
(e)(1) The audit committee has adopted pre-approval policies and procedures that require the audit committee to pre‑approve all audit and non‑audit services of the Registrant, including services provided to any entity affiliated with the Registrant.
(e)(2) The percentage of fees billed by Cohen & Company, Ltd applicable to non-audit services pursuant to waiver of pre-approval requirement were as follows:
.
| | FYE 8/31/2022 | FYE 8/31/2021 |
Audit-Related Fees | 0% | 0% |
Tax Fees | 0% | 0% |
All Other Fees | 0% | 0% |
(f) All of the principal accountant’s hours spent on auditing the Registrant’s financial statements were attributed to work performed by full‑time permanent employees of the principal accountant.
(g) The following table indicates the non-audit fees billed or expected to be billed by the Registrant’s accountant for services to the Registrant and to the Registrant’s investment adviser (and any other controlling entity, etc.—not sub-adviser) for the last two years.
Non-Audit Related Fees | FYE 8/31/2022 | FYE 8/31/2021 |
Registrant | N/A | N/A |
Registrant’s Investment Adviser | N/A | N/A |
(h) The audit committee of the board of trustees/directors has considered whether the provision of non-audit services that were rendered to the Registrant's investment adviser is compatible with maintaining the principal accountant's independence and has concluded that the provision of such non-audit services by the accountant has not compromised the accountant’s independence.
(j) Not applicable.
Item 5. Audit Committee of Listed Registrants.
Not applicable to Registrants who are not listed as issuers (as defined in Rule 10A-3 under the Securities Exchange Act of 1934).
Item 6. Schedule of Investments.
| (a) | Schedule of Investments is included as part of the report to shareholders filed under Item 1 of this Form. |
Item 7. Disclosure of Proxy Voting Policies and Procedures for Closed-End Management Investment Companies.
Not applicable to open-end investment companies.
Item 8. Portfolio Managers of Closed-End Management Investment Companies.
Not applicable to open-end investment companies.
Item 9. Purchases of Equity Securities by Closed‑End Management Investment Company and Affiliated Purchases.
Not applicable to open-end investment companies.
Item 10. Submission of Matters to a Vote of Security Holders.
There have been no material changes to the procedures by which shareholders may recommend nominees to the Registrant’s Board of Trustees.
Item 11. Controls and Procedures.
| (a) | The Registrant’s President and Treasurer have reviewed the Registrant's disclosure controls and procedures (as defined in Rule 30a-3(c) under the Investment Company Act of 1940 (the “Act”)) as of a date within 90 days of the filing of this report, as required by Rule 30a-3(b) under the Act and Rules 13a-15(b) or 15d‑15(b) under the Securities Exchange Act of 1934. Based on their review, such officers have concluded that the disclosure controls and procedures are effective in ensuring that information required to be disclosed in this report is appropriately recorded, processed, summarized and reported and made known to them by others within the Registrant and by the Registrant’s service provider. |
| (b) | There were no significant changes in the Registrant's internal control over financial reporting (as defined in Rule 30a-3(d) under the Act) that occurred during the period covered by this report that has materially affected, or is reasonably likely to materially affect, the Registrant's internal control over financial reporting. |
Item 12. Disclosure of Securities Lending Activities for Closed-End Management Investment Companies
Not applicable to open-end investment companies.
Item 13. Exhibits.
(3) Any written solicitation to purchase securities under Rule 23c‑1 under the Act sent or given during the period covered by the report by or on behalf of the Registrant to 10 or more persons. Not applicable to open-end investment companies.
(4) Change in the Registrant’s independent public accountant. There was no change in the Registrant’s independent public accountant for the period covered by this report.
SIGNATURES
Pursuant to the requirements of the Securities Exchange Act of 1934 and the Investment Company Act of 1940, the Registrant has duly caused this report to be signed on its behalf by the undersigned, thereunto duly authorized.
(Registrant) Managed Portfolio Series
By (Signature and Title) /s/Brian R. Wiedmeyer
Brian R. Wiedmeyer, President
Date November 4, 2022
Pursuant to the requirements of the Securities Exchange Act of 1934 and the Investment Company Act of 1940, this report has been signed below by the following persons on behalf of the Registrant and in the capacities and on the dates indicated.
By (Signature and Title) /s/Brian R. Wiedmeyer
Brian R. Wiedmeyer, President
Date November 4, 2022
By (Signature and Title) /s/Benjamin J. Eirich
Benjamin J. Eirich, Treasurer
Date November 4, 2022