| | | Ticker Symbols | |
| | Investor Class | Institutional Class | IS Class |
| Jackson Square | | | |
| Large-Cap Growth Fund | JSPJX | JSPIX | DPLGX |
| | | | |
| Jackson Square | | | |
| SMID-Cap Growth Fund | JSMVX | JSMTX | DCGTX |
Annual Report
| www.jspartners.com/funds/ | October 31, 2022 |
(This Page Intentionally Left Blank.)
Jackson Square Funds
October 31, 2022
Dear Shareholders:
Jackson Square Partners, LLC (“Jackson Square”), a U.S. registered investment adviser, is the adviser to the Jackson Square Large-Cap Growth Fund and Jackson Square SMID-Cap Growth Fund.
A broad swath of publicly-traded asset classes struggled during the fiscal period, which saw relentless volatility amid Russia’s invasion of Ukraine, persistent inflation, hawkish Fed policies, a surging U.S. dollar, continued fall-out from COVID, and increasing fears of recession. Time horizons compressed substantially and markets moved in a correlated fashion in response to headlines and shorter-term trends. Growth equities, particularly at the lower end of the cap spectrum, were especially challenged, often without much regard for underlying company fundamentals. Correlations spiked alongside volatility, with higher duration growth stocks moving largely in lockstep down in price, and equity valuations fell sharply, reaching 2016 levels for forward earnings and revenue multiples by the end of the period.
We believe the deviation between stock performance and company fundamentals is not sustainable over the long-term, making it more important than ever to retain a long-term outlook. In our view, the broader de-rating, particularly of higher duration growth stocks, has removed much of the valuation risk from the market. While bear market sell-offs are not cause for celebration, we believe it is important to take advantage of opportunistic entry points for attractive companies with strong potential for long-term growth of intrinsic value. In a meaningful shift from the capital markets’ posture over the past several years, we believe the best-positioned companies are now clearly communicating a path to profitability, taking sensible cost-cutting measures while continuing to invest in growth.
We expect inflation and rates to continue to drive market volatility. Top of mind are: (1) compressing consumer spending, particularly on the lower end of the income spectrum, with a continuation of the trend of shifting from goods to services, (2) slowing business investment, and (3) softening labor markets. We believe company fundamentals, quality, and resiliency will be increasingly important as those companies which can successfully navigate the obstacle course of macro headwinds should stand out. As we look five-to-then years ahead and compare our assessment of intrinsic value vs. recent stock movements, it is clear to us that very little of the price action in 2022 has been driven by changes in fundamental outlook. History tells us these moments (while quite humbling) tend to be transitory and it is our core, bottom-up stock theses that will drive returns through market cycles.
Regardless of policy outcomes and oscillating investor sentiment, we remain consistent in our investment philosophy: we want to own what we view as strong secular-growth companies, with solid business models and competitive positions that we believe can grow market share and have the potential to deliver shareholder value in a variety of market environments.
Jackson Square Large-Cap Growth Fund
Within the Fund
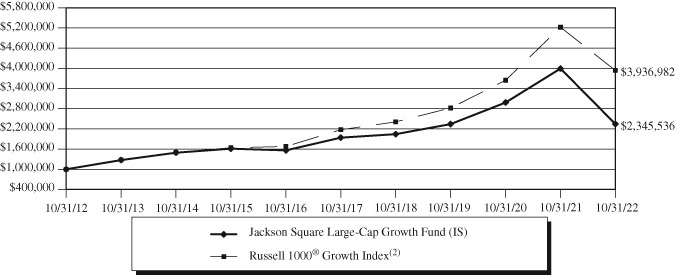
For the fiscal year ended October 31, 2022, Jackson Square Large-Cap Growth Fund IS, Institutional and Investor Classes shares returned -41.26%, -41.27%, and -41.38%, respectively. These figures reflect all distributions reinvested. During the same period, the Fund’s benchmark, the Russell 1000® Growth Index, returned -24.60%. For complete, annualized performance of Large-Cap Growth Fund, please see the table on page 9.
Underperformance was driven by the fund’s Information Technology and Health Care allocations. In the Information Technology sector, Disruptors (young challengers reinvesting today to drive scale, attacking large addressable markets with top-tier underlying unit economics) were a source of underperformance during the period. These names faced macro headwinds from rising rates along with a growth rotation that saw the entire subset trade in a highly correlated fashion, regardless of underlying fundamentals and despite these stocks having completely different business models, different end markets, and unique growth drivers. We believe the market has broadly penalized these assets while the Fed continues hiking at an unprecedented pace (two and likely three consecutive 75 basis point rate increases). Our view is that pace will unquestionably slow, and as it does, buyers will return to these names with a more discerning eye for business quality and cash flow growth potential – all of which should benefit our portfolio disproportionately. We believe our holdings have over-corrected to the point where the market is discounting a long-term rate of inflation that is highly improbable. We therefore maintain an appropriately sized exposure to the category at less than 20% of the portfolio.
Healthcare has also been a headwind this year, though our weight is in highly profitable, high return on invested capital growth businesses within protected industry structures. Unfortunately, despite already-reasonable valuations (which are now even cheaper), correlations spilled over into this category to an extent that surprised us. Additionally, there has been no lack of challenges from other macro headwinds – including COVID, supply chains, labor shortages, and USD strength – but all of which are transitory. After a disappointing 2022, we expect valuation support to provide a floor, and for this sector to generate significant positive attribution over the next one-to-three years as the market returns to the fundamentals.
More defensive holdings benefited from the market rotation during the period and contributed to performance.
In terms of our portfolio actions during the period – we have resisted adding broad exposure to fallen angels during this paradigm change for names lacking near-term cash flow support. Instead, we have made selective, high-impact changes grounded in visibility and medium-term risk/reward asymmetry. We have consolidated weight into those businesses where (1) our thesis conviction is strongest, (2) management understands how to set appropriate expectations for delivering both growth and incremental margin, and (3) capital allocation remains sensible. Names we hold, and new ideas initiated, remain on track along these fundamental lines.
On a stock-specific level, the following were the most significant contributors and detractors during the period.
Mastercard and Visa, two of the world’s leading digital payments companies, were contributors to performance. Both companies benefited from the continued rebound in cross-border travel as countries continued to relax international travel constraints. We believe the companies should continue to benefit from the structural growth of consumers switching from paying with cash to paying with Visa and Mastercard branded cards. In addition, both companies have a long tail of opportunities to capture new payment flows in areas such as peer-to-peer, business-to-consumer, business-to-business, and government-to-consumer. We remain bullish on both stocks given their competitive position, growth opportunities, and valuation.
Canadian Pacific Railway Limited (CP), a North American railroad, contributed to performance during the period. CP benefited from a market rotation that favored defensive names as well as commodity tailwinds. CP
Jackson Square Large-Cap Growth Fund
operates in an oligopolistic industry structure, and after the company’s acquisition of Kansas City Southern, CP is the only Class 1 rail spanning from Canada to Mexico, allowing for continuous service while circumventing many of the most congested areas in the U.S. freight system. In essence, a longer “line” means fewer touches and substantial cost saving opportunities are created by choosing CP over alternatives. We also believe CP’s CEO and management team is the most effective leadership group in the industry, having driven CP’s standalone return on invested capital (ROIC) from single-digits to high-teens over the last decade. The rail industry is now substantially finished with PSR efforts (“precision scheduled railroading”), which we believe is key to the railroads’ ability to provide the service and reliability necessary to earn greater share of freight vs. trucking, which still dominates the freight landscape despite higher costs and emissions.
Twilio, Inc. Class A, a cloud communications platform, was a detractor from performance during the period. The company is a leading communications-as-a-service platform with market share that is a multiple of its next largest competitor. It has been a driving force to digitize and simplify communications across mediums and geographies with user-friendly tools for software developers. The stock sold off with other longer duration technology names, and, in our view, failed to act with urgency to address the current market environment, which we believe called for a pivot towards profitability. Investors grew impatient as management guided toward profitability in 2023 but failed to provide specific targets. We exited the position after the close of the period as we lost faith in the management team.
Match Group, Inc., a provider of dating products worldwide, was a detractor from performance during the period. The company underperformed on challenging comps. There were both execution and macro-driven issues, including COVID as well as significant FX headwinds. Feature development was a problem for both new user acquisition and monetization. The firm took personnel action and reset guidance, as they sought to simultaneously jumpstart innovation to sustain growth while focusing on cost controls to keep margins flat. We believe the company should benefit from continued international expansion and reopening. Further, if investors can get confidence that Tinder will in fact re-accelerate and Hinge continues to operate in the top 3 of dating apps globally, the stock should generate attractive returns.
Coupa Software, Inc., a cloud-based Software as a Service (“SaaS”) platform for business spend management, was a detractor from performance. Buy-side sentiment for the stock remained negative throughout the period; however the company’s fundamentals remained solid despite continued macro headwinds which lengthened sales cycles and a strong U.S. dollar which cut into margins. The company’s new CFO seems to be earning back credibility with investors, and we believe the company can outperform as it laps compares complicated by the sizable Llamasoft acquisition and is able to showcase strong organic growth.
Jackson Square SMID-Cap Growth Fund
Within the Fund
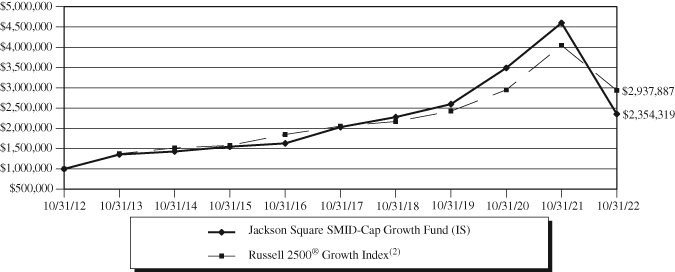
For the fiscal year ended October 31, 2022, SMID-Cap Growth Fund IS, Institutional and Investor Class shares returned -49.75%, -49.84% and -49.97%, respectively. These figures reflect all distributions reinvested. During the same period, the Fund’s benchmark, the Russell 2500® Growth Index, returned -29.39%. For complete, annualized performance of Jackson Square SMID-Cap Growth Fund, please see the table on page 12.
Underperformance was driven by the fund’s Health Care allocation as well as Disruptor exposure (young challengers reinvesting today to drive scale, attacking large addressable markets with top-tier underlying unit economics) across Consumer Discretionary, Communication Services, Information Technology and Industrials.
As a result of heightened macro concerns, we feel that Style and Factor continue to have a more significant impact on portfolio performance than at any other time in our 15+ year history of managing the strategy. Covid introduced elevated Style risk in 2020-2022 and we have done a poor job navigating this risk after the 2020 uplift. We are committed to returning the portfolio to a more neutral Style footprint over time and to that end are actively incorporating more robust risk and factor dashboards, seeking more muted Style and Factor exposure.
We felt a noticeable drag from Health Care holdings during the period. This drag stands in sharp contrast to the strong secular growth we see ahead for the sector. We are disappointed by the recent weakness, which we believe has been driven by a variety of factors, including Covid-induced business slowdowns, supply chain disruptions, capital markets uncertainty around Biotech, China weakness and FX issues, etc. Few if any of these concerns impact long-term fundamentals – we view them as temporary speedbumps. Our time-tested emphasis on long investment horizons and concentration has at times required tolerating interim volatility. In the current – ongoing – instance, we are willing to accept this often painful volatility due to our conviction in the life and world-changing potential in these companies, and the strong financial returns that we believe will follow.
Though Disruptors have been a significant source of detraction over the period, it is important to note that they have been the portfolio’s single largest source of alpha over the course of the product’s history, even incorporating recent underperformance, over a range of market and interest rate environments. We continue to believe in the asymmetrical return potential of our Disruptors and note some positive signs in the 3rd quarter markets, where Disruptors performed in line with the index and correlations began to ease in September. We continue to be highly engaged with portfolio holdings in key areas that we believe can drive alpha near term. In particular, we have been engaging with company management teams on changes they can make in order to pivot towards incremental profitability. The “new” environment is rewarding slower, more sustainable growth rates at higher marginal levels of profitability.
On a stock-specific level, the following were the most significant contributors and detractors during the period.
Grocery Outlet Holding Corp. (GO), an operator of discount grocery stores in the United States, was a contributor to performance. GO came more into favor with investors seeking companies able to weather or even benefit from an economic downturn and inflationary environment. The company guided to an improvement in business trends and executed a sizable share repurchase program. As noted in last year’s annual report, we believed the shares last fall had fully discounted a long-term bear scenario, and had added to the position on that view. We continue to like Grocery Outlet given not only the tremendous unit growth opportunity we believe is ahead but also its solid economic model.
SailPoint Technologies Holding (SAIL), a software company focusing on identity governance, was a contributor to performance. SAIL was acquired at a premium by the private equity shop Thoma Bravo. As tech and high duration growth sold off, the company’s nearly flawless execution and consistent, positive earnings results limited
Jackson Square SMID-Cap Growth Fund
both its price decline and multiple compression. In our view, SAIL established a commanding lead in the critical and under-appreciated niche of cybersecurity, which likely represents the most durable bucket of IT spend over the next decade, as no company wants to be the next NYT headline.
Wyndham Hotels & Resorts, Inc. (WH), a hotel chain, was a contributor to performance. As an asset-lite hotel franchisor, with ~85% of its EBITDA generated in the U.S., the company’s earnings were hard-hit by COVID-19. We saw a severely dislocated stock, a resilient balance sheet, and a midscale / economy “drive-to-rural” footprint that would hold up better than luxury hotel peers. This played out as WH’s revenue per available room (RevPar) troughed at a fraction of the decline of its hotel peers and has since made a steady recovery. This gained further momentum during the period as earnings results came in well ahead of consensus and the company revised their rooms outlook upward. The company has also now entirely shed the remainder of its non-core, non-franchise assets, including unprofitable management contracts and owned hotels in Orlando and Puerto Rico that were clouding the narrative and impairing the cost of capital. We are encouraged that continued acceleration in rooms growth can close its valuation gap vs. peers. Additionally, WH exhibits ballast-like, uncorrelated performance during periods of volatility. We believe the company is poised for an acceleration in free cash flow (FCF) growth and capital return from here, and we that the market is re-warming to this equity after getting de-railed by COVID.
LendingClub Corp, a company that provides financial services through an internet-based platform, was a detractor from performance during the period as markets became concerned with consumer credit as a category. The market continues to digest the large step-function improvement in operating results announced since the acquisition of Radius Bank, which we believe were beyond even the most optimistic investor assumptions and highlight the strength of LendingClub’s hybrid strategy (the combination of a neo-bank and a marketplace offering). However, LC remains an underfollowed equity and as such is experiencing a pull-back on sentiment. The market is just now showing early signs of interest in what we believe is a highly compelling three-to-five year investment opportunity.
Pacific Biosciences of California, Inc. (PACB), a provider of long-read genomic sequencing systems and consumables, was a detractor to performance during the period. The stock came under pressure given the broader sell-off in growth companies. This sell-off was particularly acute in the genomics sector given exposure to several macro risks, including (1) COVID-related lockdowns in China, (2) increasing supply chain concerns, (3) greater inflationary pressures, and (4) weakening public and venture capital funding for biotech companies. The stock outperformed significantly at the end of the period as it announced new long read and short read sequencers in October, earlier than forecast and with better-than-expected instrument performance and delivery timelines. We remain constructive on PacBio’s long-term risk/reward profile given the significant under-penetration of genomic sequencing, the differentiated nature of long-read sequencing and therefore the company’s competitive position, and the attractive long-term margin profile of their business.
Vimeo, Inc. (VMEO), a subscription-driven video management platform, and a tail position in the portfolio, was a detractor from performance during the period. The company spun out of IAC in May 2021, and had a volatile start as it embarked upon a transformative business model pivot towards enterprise (away from individual self-serve). Vimeo struggled with macro headwinds, and was negatively surprised by lower-than-expected ARPU (amount of revenue per user) in its self-serve business as travel / outdoor activity picked up. Though the company brought in a new CFO – a change we had pushed for with the board of directors – Vimeo has not effectively managed investor expectations in an unforgiving market environment. We believe the company has the most complete and strongest-performing video management platform, a nascent category poised to become increasingly critical to employee and customer communication over time, especially in a permanent hybrid environment. We invested based on a thesis that it can transition its business model towards enterprise-grade customers, where interest and intent to upgrade are high. With consistent execution, this can drive stronger growth, lower churn, greater upsell opportunity, a higher-quality customer mix, and re-rating potential beyond what the market appreciates.
Jackson Square Funds
The materials provided herein are for general information purposes only and may not be copied or redistributed without Jackson Square’s prior consent. The views expressed represent Jackson Square’s assessment of the strategy and market environment as of the date identified herein and should not be considered a recommendation to buy, hold, or sell any security, and should not be relied on as research or investment advice. The information in this presentation, including statements concerning financial markets is based on current market conditions, which will fluctuate and may be superseded by subsequent market events or for other reasons.
Opinions expressed are those of Jackson Square Partners, LLC and are subject to change, are not guaranteed and should not be considered investment advice.
Holdings are as of the date provided and subject to change. Please see the Schedule of Investments in this report for a complete list of fund holdings.
Mutual fund investing involves risk. Principal loss is possible. The Funds are non-diversified meaning they may concentrate their assets in fewer individual holdings than a diversified fund. Therefore these Funds are more exposed to individual stock volatility than a diversified fund. Small- and Mid-capitalization companies tend to have limited liquidity and greater price volatility than large capitalization companies. Investments in foreign securities involve greater volatility and political economic and currency risks and differences in accounting methods. These risks are greater in emerging and frontier markets. Frontier market countries generally have smaller economies and even less developed capital markets than traditional emerging markets, and, as a result, the risks of investing in emerging market countries are magnified in frontier market countries. Investments in Real Estate Investment Trusts (REITs) involve additional risks such as declines in the value of real estate and increased susceptibility to adverse economic or regulatory developments. When the Funds buy or sell securities on a foreign stock exchange, the transaction is undertaken in the local currency rather than in U.S. dollars. The value of the foreign currency may increase or decrease against the value of the U.S. dollar, which may impact the value of the Funds’ portfolio holdings and your investment. Other countries may adopt economic policies and/or currency exchange controls that affect their currency valuations in a manner that is disadvantageous to U.S. investors and companies. From time to time, the trading market for a particular security or type of security in which the Funds invest may become less liquid or even illiquid.
Past performance is no guarantee of future results.
Diversification does not assure a profit, nor does it protect against a loss in a declining market.
For comparison purposes, the indices are fully invested and include the reinvestment of income. Index returns do not reflect management fees, transaction costs, or expenses. The indices are unmanaged, and one cannot invest directly in an index. Benchmark information contained herein has been obtained from third party sources believed to be reliable, but we cannot guarantee its accuracy or completeness. All third-party marks are the property of their respective owners. All performance data regarding the indices are historical and are not indicative of future results, and there can be no assurance that these or comparable results will actually be achieved by the strategies or that the strategies’ investment objectives will be achieved.
Free Cash Flow – The amount of cash generated each year that is free and clear of all internal or external obligations.
Russell 1000® Growth Index measures the performance of the large-cap growth segment of the U.S. equity universe. It includes those Russell 1000® companies with higher price-to-book ratios and higher forecasted growth values. The index is unmanned and an investment cannot be made into the index.
Russell 2500® Growth Index. The Russell 2500® Growth Index measures the performance of the small- to mid-cap growth segment of the U.S. equity universe. It includes those Russell 2500® companies with higher price-to-book ratios and higher forecasted growth values. The index is unmanned and an investment cannot be made into the index.
The report must be preceded or accompanied by a prospectus.
Jackson Square Partners, LLC is the adviser to the Jackson Square Funds, which are distributed by Quasar Distributors, LLC.
Jackson Square Large-Cap Growth Fund
Value of $1,000,000 Investment (Unaudited)
The chart assumes an initial investment of $1,000,000. Performance reflects waivers of fee and operating expenses in effect. In the absence of such waivers, total return would be reduced. Past performance is not predictive of future performance. Investment return and principal value will fluctuate, so that your shares, when redeemed may be worth more or less than their original cost. Performance current to the most recent month-end may be lower or higher than the performance quoted and can be obtained by calling 1-844-577-3863. Performance assumes the reinvestment of capital gains and income distributions. The performance does not reflect the deduction of taxes that a shareholder would pay on Fund distributions or the redemption of Fund shares.
Annualized Rates of Return as of October 31, 2022
| | 1 year | 5 years | 10 years | Since Inception(1) |
| IS Class | -41.26% | 3.87% | 8.90% | 7.48% |
| Institutional Class | -41.27% | 3.69% | 8.74% | 7.37% |
| Investor Class | -41.38% | 3.45% | 8.48% | 7.09% |
Russell 1000® Growth Index(2) | -24.60% | 12.59% | 14.69% | 9.81% |
| (1) | The Jackson Square Large-Cap Growth Fund (the “Fund”) acquired the assets and assumed the liabilities of the Delaware U.S. Growth Fund, a series of Delaware Group Adviser Funds (the “Predecessor Fund”), effective at the close of business on April 16, 2021 (the “Reorganization”), and the Predecessor Fund is the accounting and performance history survivor of the Reorganization. The performance information shown for the Fund’s Investor Class Shares represents the performance of the Predecessor Fund’s Class A shares, performance for the Fund’s Institutional Class Shares represents the performance of the Predecessor Fund’s Institutional Class shares, and performance for the Fund’s IS Class Shares represents the performance of the Predecessor Fund’s Class R6 shares. Prior to April 16, 2021, the Adviser served as sub-adviser to the Predecessor Fund. The IS Class performance has not been restated to reflect any differences in expenses paid by the Predecessor Fund and those paid by the Fund. The performance shown for the Investor Class Shares has been adjusted so that it does not reflect the Predecessor Fund’s 5.75% sales charge for its Class A shares, which does not apply to Investor Class shares. Performance shown for the periods prior to the inception of the Institutional Class and IS Class is based on the performance of the Investor Class shares, adjusted for the lower expenses applicable to the Institutional and IS classes. The Investor Class commenced operations on December 3, 1993, the Institutional Class commenced operations on February 3, 1994 and the IS Class commenced operations on May 2, 2016. |
| (2) | The Russell 1000® Growth Index measures the performance of the large cap growth segment of the U.S. equity universe. It includes those Russell 1000® Index companies with higher price-to-book ratios and higher forecasted growth values. One cannot invest directly in an Index. |
Jackson Square Large-Cap Growth Fund
The following is expense information for the Large-Cap Growth Fund (the “Fund”) as disclosed in the most recent prospectus dated March 1, 2022: IS Class – Gross Expenses: 0.64%; Institutional Class – Gross Expenses: 0.74%; Investor Class – Gross Expenses: 0.99%. Jackson Square Partners, LLC (the “Adviser”) has contractually agreed to waive its management fees and pay Fund expenses in order to ensure the Total Annual Fund Operating Expenses (excluding Rule 12b-1 fees, shareholder servicing fees, acquired fund fees and expenses, brokerage commissions, leverage, interest, taxes, and extraordinary expenses) do not exceed 0.64% of the average daily net assets of the Fund. Prior to April 16, 2021, the Fund’s expenses were capped at 0.62% of the Fund’s average daily net assets for IS Class shares (formerly, Class R6), and 0.84% of the Fund’s average daily net assets for all other share classes. Fees waived and expenses paid by the Adviser may be recouped by the Adviser for a period of thirty-six months following the month during which such fee waiver and expense payment was made if such recoupment can be achieved without exceeding the expense limit in effect at the time the fee waiver and/or expense payment occurred and the expense limit in place at the time of recoupment. Expenses paid prior to April 16, 2021, may not be recouped. The Operating Expenses Limitation Agreement is indefinite, but cannot be terminated through at least April 30, 2023. Thereafter, the agreement may be terminated at any time upon 60 days’ written notice by the Board of Trustees (the “Board”) or the Adviser.
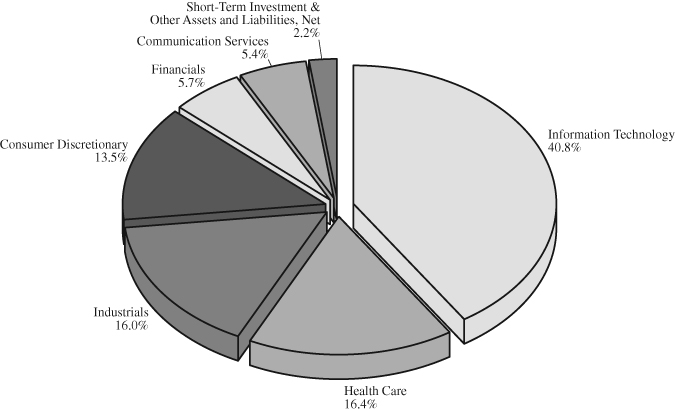
Jackson Square Large-Cap Growth Fund
Sector Allocation(1) (Unaudited)
As of October 31, 2022
(% of Net Assets)
Top Ten Equity Holdings(1) (Unaudited)
As of October 31, 2022
(% of Net Assets)
| | Microsoft | | | 11.4 | % |
| | Amazon.com | | | 8.5 | % |
| | Mastercard – Class A | | | 7.7 | % |
| | Visa – Class A | | | 7.4 | % |
| | Canadian Pacific Railway | | | 4.7 | % |
| | Edwards Lifesciences | | | 4.1 | % |
| | ServiceNow | | | 4.0 | % |
| | Uber Technologies | | | 3.8 | % |
| | Waste Management | | | 3.8 | % |
| | Boeing | | | 3.7 | % |
| (1) | Fund holdings and sector allocations are subject to change at any time and are not recommendations to buy or sell any security. |
Jackson Square SMID-Cap Growth Fund
Value of $1,000,000 Investment (Unaudited)
The chart assumes an initial investment of $1,000,000. Performance reflects waivers of fee and operating expenses in effect. In the absence of such waivers, total return would be reduced. Past performance is not predictive of future performance. Investment return and principal value will fluctuate, so that your shares, when redeemed may be worth more or less than their original cost. Performance current to the most recent month-end may be lower or higher than the performance quoted and can be obtained by calling 1-844-577-3863. Performance assumes the reinvestment of capital gains and income distributions. The performance does not reflect the deduction of taxes that a shareholder would pay on Fund distributions or the redemption of Fund shares.
Annualized Rates of Return as of October 31, 2022
| | 1 year | 5 years | 10 years | Since Inception(1) |
| IS Class | -48.81% | 2.99% | 8.94% | 8.82% |
| Institutional Class | -48.89% | 2.92% | 8.86% | 8.73% |
| Investor Class | -49.01% | 2.64% | 8.57% | 8.45% |
Russell 2500® Growth Index(2) | -27.38% | 7.41% | 11.38% | 9.11% |
| (1) | The IS Class commenced operations on December 1, 2003, the Institutional Class commenced operations on September 16, 2016 and the Investor Class commenced operations on September 19, 2016. Performance of the Institutional Class and Investor Class prior to inception of each class is based on the performance of the IS Class, adjusted for the higher expenses applicable to each class’s shares. |
| (2) | The Russell 2500® Growth Index measures the performance of the small to mid-cap growth segment of the U.S. equity universe. It includes those Russell 2500® companies with higher price-to-book ratios and higher forecasted growth values. One cannot invest directly in an Index. |
The following is expense information for the SMID-Cap Growth Fund (the “Fund”) as disclosed in the most recent prospectus dated March 1, 2022: IS Class – Gross Expenses: 0.82%; Institutional Class – Gross Expenses: 0.92%; Investor Class – Gross Expenses: 1.17%. Jackson Square Partners, LLC (the “Adviser”) has contractually agreed to waive its management fees and pay Fund expenses in order to ensure the Total Annual Fund Operating Expenses (excluding Rule 12b-1 fees, shareholder servicing fees, acquired fund fees and expenses, brokerage commissions, leverage, interest, taxes, and extraordinary expenses) do not exceed 0.87% of the average daily net assets of the Fund. Fees waived and expenses paid by the Adviser may be recouped by the Adviser for a period of thirty-six months following the month during which such fee waiver and expense payment was made if such recoupment can be achieved without exceeding the expense limit in effect at the time the fee waiver and/or expense payment occurred and the expense limit in place at the time of recoupment. The Operating Expenses Limitation Agreement is indefinite, but cannot be terminated through at least February 28, 2023. Thereafter, the agreement may be terminated at any time upon 60 days’ written notice by the Board of Trustees (the “Board”) or the Adviser.
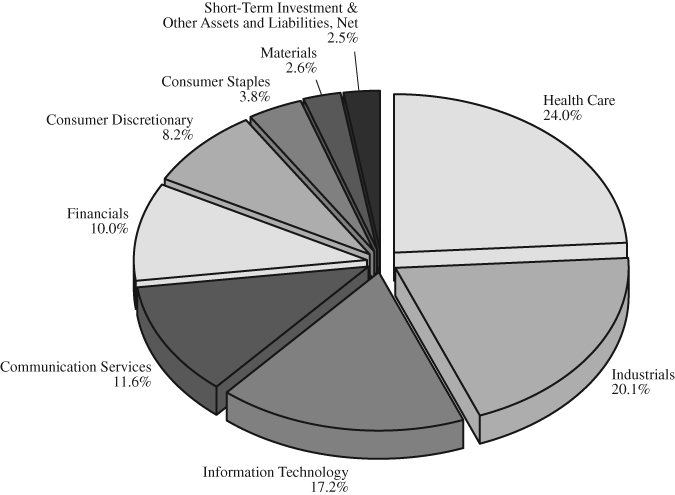
Jackson Square SMID-Cap Growth Fund
Sector Allocation(1) (Unaudited)
As of October 31, 2022
(% of Net Assets)
Top Ten Equity Holdings(1) (Unaudited)
As of October 31, 2022
(% of Net Assets)
| | New York Times – Class A | | | 7.3 | % |
| | Westinghouse Air Brake Technologies | | | 6.2 | % |
| | Charles River Laboratories International | | | 5.5 | % |
| | Graco | | | 5.1 | % |
| | Wix.com | | | 5.1 | % |
| | Pacific Biosciences of California | | | 4.6 | % |
| | Bio-Techne | | | 4.6 | % |
| | LPL Financial Holdings | | | 4.4 | % |
| | Aspen Technology | | | 3.9 | % |
| | Grocery Outlet Holding | | | 3.8 | % |
| (1) | Fund holdings and sector allocations are subject to change at any time and are not recommendations to buy or sell any security. |
Jackson Square Funds
Expense Examples (Unaudited)
October 31, 2022
As a shareholder of a Fund, you incur two types of costs: (1) transactions costs, including brokerage commissions on purchases and sales of Fund shares, and (2) ongoing costs, including management fees; distribution and/or service (12b-1) fees, shareholder servicing fees, and other Fund expenses. This Example is intended to help you understand your ongoing costs (in dollars) of investing in the Fund and to compare these costs with the ongoing costs of investing in other mutual funds. The Example is based on an investment of $1,000 invested at the beginning of the period and held for the entire period (May 1, 2022 – October 31, 2022).
ACTUAL EXPENSES
For each class, the first line of the table provides information about actual account values and actual expenses. You may use the information in this line, together with the amount you invested, to estimate the expenses that you paid over the period. Simply divide your account value by $1,000 (for example, an $8,600 account value divided by $1,000 = 8.6), then multiply the result by the number in the first line under the heading entitled “Expenses Paid During Period” to estimate the expenses you paid on your account during this period.
HYPOTHETICAL EXAMPLE FOR COMPARISON PURPOSES
For each class, the second line of the table below provides information about hypothetical account values and hypothetical expenses based on the Fund’s actual expense ratio and an assumed rate of return of 5% per year before expenses, which is not the Fund’s actual return. The hypothetical account values and expenses may not be used to estimate the actual ending account balance or expenses you paid for the period.You may use this information to compare the ongoing costs of investing in the Fund and other funds. To do so, compare this 5% hypothetical example with the 5% hypothetical examples that appear in the shareholder reports of the other funds.
Please note that the expenses shown in the tables are meant to highlight your ongoing costs only. Therefore, the second line of the tables are useful in comparing ongoing costs only, and will not help you determine the relative total costs of owning different funds, In addition, if transactional costs were included, your costs may have been higher.
Large-Cap Growth Fund
| | Beginning | Ending | Expenses Paid |
| | Account Value | Account Value | During Period(1) |
| | (5/1/2022) | (10/31/2022) | (5/1/2022 to 10/31/2022) |
IS Class Actual(2) | $1,000.00 | $ 842.60 | $2.97 |
| IS Class Hypothetical | | | |
| (5% return before expenses) | $1,000.00 | $1,021.98 | $3.26 |
| | | | |
Institutional Class Actual(2) | $1,000.00 | $ 842.50 | $3.07 |
| Institutional Class Hypothetical | | | |
| (5% return before expenses) | $1,000.00 | $1,021.88 | $3.36 |
| | | | |
Investor Class Actual(2) | $1,000.00 | $ 841.80 | $4.18 |
| Investor Class Hypothetical | | | |
| (5% return before expenses) | $1,000.00 | $1,020.67 | $4.58 |
| (1) | Expenses are equal to the Fund’s annualized expense ratio for the most recent six-month period of 0.64%, 0.66% and 0.90% for the IS Class, Institutional Class and Investor Class, respectively, multiplied by the average account value over the period, multiplied by 184/365 to reflect the one-half year period. |
| (2) | Based on the actual returns for the six-month period ended October 31, 2022 of -15.74%, -15.75% and -15.82% for the IS Class, Institutional Class and Investor Class, respectively. |
Jackson Square Funds
Expense Examples (Unaudited) – Continued
October 31, 2022
SMID-Cap Growth Fund
| | Beginning | Ending | Expenses Paid |
| | Account Value | Account Value | During Period(1) |
| | (5/1/2022) | (10/31/2022) | (5/1/2022 to 10/31/2022) |
IS Class Actual(2) | $1,000.00 | $ 856.80 | $3.88 |
| IS Class Hypothetical | | | |
| (5% return before expenses) | $1,000.00 | $1,021.02 | $4.23 |
| | | | |
Institutional Class Actual(2) | $1,000.00 | $ 856.40 | $4.30 |
| Institutional Class Hypothetical | | | |
| (5% return before expenses) | $1,000.00 | $1,020.57 | $4.69 |
| | | | |
Investor Class Actual(2) | $1,000.00 | $ 855.30 | $5.52 |
| Investor Class Hypothetical | | | |
| (5% return before expenses) | $1,000.00 | $1,019.26 | $6.01 |
| (1) | Expenses are equal to the Fund’s annualized expense ratio for the most recent six-month period of 0.83%, 0.92% and 1.18% for the IS Class, Institutional Class and Investor Class, respectively, multiplied by the average account value over the period, multiplied by 184/365 to reflect the one-half year period. |
| (2) | Based on the actual returns for the six-month period ended October 31, 2022 of -14.32%, -14.36% and -14.47% for the IS Class, Institutional Class and Investor Class, respectively. |
Jackson Square Large-Cap Growth Fund
Schedule of Investments
October 31, 2022
Description | | Shares | | | Value | |
| | | | | | | |
| COMMON STOCKS – 97.8% | | | | | | |
| | | | | | | |
| Communication Services – 5.4% | | | | | | |
Charter Communications – Class A* | | | 21,584 | | | $ | 7,934,710 | |
Match Group* | | | 86,787 | | | | 3,749,198 | |
| | | | | | | | 11,683,908 | |
| | | | | | | | | |
| Consumer Discretionary – 13.5% | | | | | | | | |
Airbnb – Class A* | | | 35,878 | | | | 3,835,717 | |
Amazon.com* | | | 179,212 | | | | 18,358,478 | |
NIKE – Class B | | | 78,121 | | | | 7,240,254 | |
| | | | | | | | 29,434,449 | |
| | | | | | | | | |
| Financials – 5.7% | | | | | | | | |
KKR & Co. – Class A | | | 119,514 | | | | 5,811,966 | |
S&P Global | | | 20,272 | | | | 6,512,380 | |
| | | |
| | | | 12,324,346 | |
| | | | | | | | | |
| Health Care – 16.4% | | | | | | | | |
Align Technology* | | | 18,158 | | | | 3,528,099 | |
Catalent* | | | 106,192 | | | | 6,980,000 | |
Edwards Lifesciences* | | | 123,071 | | | | 8,914,033 | |
Intuitive Surgical* | | | 32,368 | | | | 7,977,741 | |
Veeva Systems – Class A* | | | 48,336 | | | | 8,117,548 | |
| | | | | | | | 35,517,421 | |
| | | | | | | | | |
| Industrials – 16.0% | | | | | | | | |
Boeing* | | | 56,993 | | | | 8,122,072 | |
Canadian Pacific Railway | | | 135,629 | | | | 10,103,004 | |
Uber Technologies* | | | 314,365 | | | | 8,352,678 | |
Waste Management | | | 51,815 | | | | 8,205,942 | |
| | | | | | | | 34,783,696 | |
| | | | | | | | | |
Information Technology – 40.8%# | | | | | | | | |
Coupa Software* | | | 57,312 | | | | 3,050,718 | |
Datadog – Class A* | | | 44,545 | | | | 3,586,318 | |
Gitlab* | | | 80,442 | | | | 3,898,219 | |
Mastercard – Class A | | | 50,858 | | | | 16,690,578 | |
Microsoft | | | 106,551 | | | | 24,733,684 | |
NVIDIA | | | 34,471 | | | | 4,652,551 | |
ServiceNow* | | | 20,798 | | | | 8,750,550 | |
Snowflake – Class A* | | | 23,062 | | | | 3,696,839 | |
Twilio – Class A* | | | 46,238 | | | | 3,438,720 | |
Visa – Class A | | | 77,443 | | | | 16,043,092 | |
| | | | | | | | 88,541,269 | |
| TOTAL COMMON STOCKS | | | | | | | | |
| (Cost $249,338,227) | | | | | | | 212,285,089 | |
See Notes to the Financial Statements
Jackson Square Large-Cap Growth Fund
Schedule of Investments – Continued
October 31, 2022
Description | | Shares | | | Value | |
| | | | | | | |
| SHORT-TERM INVESTMENT – 2.0% | | | | | | |
| | | | | | | |
| Money Market Deposit Account – 2.0% | | | | | | |
U.S. Bank N.A., 1.50% (a) | | | | | | |
Total Money Market Deposit Account | | | 4,365,700 | | | $ | 4,365,700 | |
| TOTAL SHORT-TERM INVESTMENT | | | | | | | | |
| (Cost $4,365,700) | | | | | | | 4,365,700 | |
| Total Investments – 99.8% | | | | | | | | |
| (Cost $253,703,927) | | | | | | | 216,650,789 | |
| Other Assets and Liabilities, Net – 0.2% | | | | | | | 397,216 | |
| Total Net Assets – 100.0% | | | | | | $ | 217,048,005 | |
| * | | Non-income producing security. |
| # | | As of October 31, 2022, the Fund had a significant portion of its assets invested in this sector and therefore is subject to additional risks. See Note 10 in Notes to the Financial Statements. |
| (a) | | The Money Market Deposit Account (the “MMDA”) is a short-term investment vehicle in which the Fund holds cash balances. The MMDA will bear interest at a variable rate that is determined based on conditions and may change daily and by any amount. The rate shown is as of October 31, 2022. |
The Global Industry Classification Standard (“GICS®”) was developed by and/or is the exclusive property of MSCI, Inc. (“MSCI”) and Standard & Poor’s Financial Services LLC (“S&P”). GICS® is a service mark of MSCI and S&P and has been licensed for use.
See Notes to the Financial Statements
Jackson Square SMID-Cap Growth Fund
Schedule of Investments
October 31, 2022
Description | | Shares | | | Value | |
| | | | | | | |
| COMMON STOCKS – 97.5% | | | | | | |
| | | | | | | |
| Communication Services – 11.6% | | | | | | |
New York Times – Class A | | | 2,292,375 | | | $ | 66,387,180 | |
Vimeo* | | | 2,824,130 | | | | 10,731,694 | |
Warner Music Group | | | 1,108,127 | | | | 28,833,464 | |
| | | | | | | | 105,952,338 | |
| | | | | | | | | |
| Consumer Discretionary – 8.2% | | | | | | | | |
Allbirds* | | | 846,136 | | | | 2,910,708 | |
Papa John’s International | | | 414,596 | | | | 30,112,108 | |
Peloton Interactive* | | | 1,428,396 | | | | 11,998,526 | |
Wyndham Hotels & Resorts | | | 391,972 | | | | 29,762,434 | |
| | | | | | | | 74,783,776 | |
| | | | | | | | | |
| Consumer Staples – 3.8% | | | | | | | | |
Grocery Outlet Holding* | | | 1,000,234 | | | | 34,578,089 | |
| | | | | | | | | |
| Financials – 10.0% | | | | | | | | |
LendingClub* | | | 2,159,661 | | | | 22,978,793 | |
LPL Financial Holdings | | | 157,698 | | | | 40,315,494 | |
MarketAxess Holdings | | | 114,497 | | | | 27,941,848 | |
| | | | | | | | 91,236,135 | |
| | | | | | | | | |
| Health Care – 24.0% | | | | | | | | |
ABIOMED* | | | 94,875 | | | | 23,916,090 | |
Azenta | | | 616,136 | | | | 27,356,438 | |
Bio-Techne | | | 140,110 | | | | 41,508,989 | |
Catalent* | | | 325,362 | | | | 21,386,044 | |
Charles River Laboratories International* | | | 234,976 | | | | 49,873,656 | |
Pacific Biosciences of California* | | | 5,019,530 | | | | 42,364,833 | |
Twist Bioscience* | | | 387,088 | | | | 12,708,099 | |
| | | | | | | | 219,114,149 | |
| | | | | | | | | |
| Industrials – 20.1% | | | | | | | | |
Graco | | | 673,000 | | | | 46,827,340 | |
Howmet Aerospace | | | 752,860 | | | | 26,764,173 | |
Lyft – Class A* | | | 1,100,894 | | | | 16,117,088 | |
SiteOne Landscape Supply* | | | 195,007 | | | | 22,595,461 | |
Upwork* | | | 1,062,623 | | | | 14,292,280 | |
Westinghouse Air Brake Technologies | | | 606,836 | | | | 56,605,662 | |
| | | | | | | | 183,202,004 | |
See Notes to the Financial Statements
Jackson Square SMID-Cap Growth Fund
Schedule of Investments – Continued
October 31, 2022
Description | | Shares | | | Value | |
| | | | | | | |
| COMMON STOCKS – 97.5% (Continued) | | | | | | |
| | | | | | | |
| Information Technology – 17.2% | | | | | | |
Aspen Technology* | | | 148,524 | | | $ | 35,861,120 | |
Coupa Software* | | | 377,341 | | | | 20,085,861 | |
Dolby Laboratories – Class A | | | 332,948 | | | | 22,254,244 | |
Elastic* | | | 500,485 | | | | 32,006,016 | |
Wix.com* | | | 548,256 | | | | 46,108,330 | |
| | | | | | | | 156,315,571 | |
| | | | | | | | | |
| Materials – 2.6% | | | | | | | | |
FMC Corp. | | | 200,491 | | | | 23,838,380 | |
| TOTAL COMMON STOCKS | | | | | | | | |
| (Cost $1,206,837,569) | | | | | | | 889,020,442 | |
| | | | | | | | | |
| | | | | | | | | |
| SHORT-TERM INVESTMENT – 2.5% | | | | | | | | |
| | | | | | | | | |
| Money Market Deposit Account – 2.5% | | | | | | | | |
U.S. Bank N.A., 1.50% (a) | | | | | | | | |
Total Money Market Deposit Account | | | 23,232,750 | | | | 23,232,750 | |
| TOTAL SHORT-TERM INVESTMENT | | | | | | | | |
| (Cost $23,232,750) | | | | | | | 23,232,750 | |
| Total Investments – 100.0% | | | | | | | | |
| (Cost $1,230,070,319) | | | | | | | 912,253,192 | |
| Other Assets and Liabilities, Net – 0.0% | | | | | | | 30,439 | |
| Total Net Assets – 100.0% | | | | | | $ | 912,283,631 | |
| * | | Non-income producing security. |
| (a) | | The Money Market Deposit Account (the “MMDA”) is a short-term investment vehicle in which the Fund holds cash balances. The MMDA will bear interest at a variable rate that is determined based on conditions and may change daily and by any amount. The rate shown is as of October 31, 2022. |
The Global Industry Classification Standard (“GICS®”) was developed by and/or is the exclusive property of MSCI, Inc. (“MSCI”) and Standard & Poor’s Financial Services LLC (“S&P”). GICS® is a service mark of MSCI and S&P and has been licensed for use.
See Notes to the Financial Statements
Jackson Square Funds
Statements of Assets and Liabilities
October 31, 2022
| | | Large-Cap | | | SMID-Cap | |
| | | Growth Fund | | | Growth Fund | |
| ASSETS: | | | | | | |
| Investment securities: | | | | | | |
| At cost | | $ | 253,703,927 | | | $ | 1,230,070,319 | |
| At value | | $ | 216,650,789 | | | $ | 912,253,192 | |
| Dividends & interest receivable | | | 29,639 | | | | 153,975 | |
| Dividend tax reclaim receivable | | | 327,100 | | | | 245,246 | |
| Receivable for investment securities sold | | | 1,018,567 | | | | 731,359 | |
| Receivable for capital shares sold | | | 321,313 | | | | 1,429,411 | |
| Prepaid expenses | | | 33,858 | | | | 23,444 | |
| Total Assets | | | 218,381,266 | | | | 914,836,627 | |
| LIABILITIES: | | | | | | | | |
| Payable for investment securities purchased | | | — | | | | 1,047,938 | |
| Payable for capital shares redeemed | | | 716,293 | | | | 441,884 | |
| Payable to investment adviser | | | 282,021 | | | | 548,465 | |
| Payable for fund administration & accounting fees | | | 71,725 | | | | 230,028 | |
| Payable for compliance fees | | | 4,665 | | | | 17,474 | |
| Payable for transfer agent fees & expenses | | | 91,818 | | | | 104,056 | |
| Payable for custody fees | | | 4,028 | | | | 15,083 | |
| Accrued distribution and/or shareholder service fees | | | 122,851 | | | | 116,552 | |
| Payable for audit fees | | | 18,468 | | | | 18,524 | |
| Accrued expenses | | | 21,392 | | | | 12,992 | |
| Total Liabilities | | | 1,333,261 | | | | 2,552,996 | |
| NET ASSETS | | $ | 217,048,005 | | | $ | 912,283,631 | |
| | | | | | | | | |
| NET ASSETS CONSIST OF: | | | | | | | | |
| Paid-in capital | | | 256,793,944 | | | | 1,459,025,156 | |
| Total accumulated losses | | | (39,745,939 | ) | | | (546,741,525 | ) |
| Total net assets | | $ | 217,048,005 | | | $ | 912,283,631 | |
IS Class Shares: | | | | | | | | |
| Net Assets | | $ | 40,436,080 | | | $ | 552,793,979 | |
Shares issued and outstanding(1) | | | 2,950,580 | | | | 34,736,625 | |
| Net asset value, offering price, and redemption price per share | | $ | 13.70 | | | $ | 15.91 | |
Institutional Class Shares: | | | | | | | | |
| Net Assets | | $ | 105,097,395 | | | $ | 320,391,662 | |
Shares issued and outstanding(1) | | | 7,794,584 | | | | 20,197,531 | |
| Net asset value, offering price, and redemption price per share | | $ | 13.48 | | | $ | 15.86 | |
Investor Class Shares: | | | | | | | | |
| Net Assets | | $ | 71,514,530 | | | $ | 39,097,990 | |
Shares issued and outstanding(1) | | | 6,652,908 | | | | 2,515,454 | |
| Net asset value, offering price, and redemption price per share | | $ | 10.75 | | | $ | 15.54 | |
| (1) | Unlimited shares authorized without par value. |
See Notes to the Financial Statements
Jackson Square Funds
Statements of Operations
For the Year Ended October 31, 2022
| | | Large-Cap | | | SMID-Cap | |
| | | Growth Fund | | | Growth Fund | |
| INVESTMENT INCOME: | | | | | | |
| Dividend income | | $ | 2,655,622 | | | $ | 4,680,061 | |
| Less: Foreign taxes withheld | | | (37,198 | ) | | | (60,722 | ) |
| Interest income | | | 15,475 | | | | 77,723 | |
| Total investment income | | | 2,633,899 | | | | 4,697,062 | |
| | | | | | | | | |
| EXPENSES: | | | | | | | | |
| Investment advisory fees (See Note 4) | | | 4,655,084 | | | | 9,613,941 | |
| Fund administration & accounting fees (See Note 4) | | | 247,695 | | | | 489,367 | |
| Transfer agent fees & expenses (See Note 4) | | | 210,221 | | | | 205,983 | |
| Federal & state registration fees | | | 102,041 | | | | 41,871 | |
| Custody fees (See Note 4) | | | 40,564 | | | | 71,176 | |
| Audit fees | | | 24,466 | | | | 18,523 | |
| Trustee fees | | | 18,072 | | | | 17,894 | |
| Compliance fees (See Note 4) | | | 15,840 | | | | 28,341 | |
| Legal fees | | | 6,045 | | | | 7,680 | |
| Insurance fees | | | 5,553 | | | | 9,956 | |
| Other expenses | | | — | | | | 19,519 | |
| Postage & printing fees | | | — | | | | 28,596 | |
| Distribution and/or shareholder service fees (See Note 5) | | | | | | | | |
| Institutional Class | | | 223,052 | | | | 520,916 | |
| Investor Class | | | 290,227 | | | | 199,529 | |
| Total expenses before reimbursement/waiver/recoupment | | | 5,838,860 | | | | 11,273,292 | |
| Plus: Adviser recoupment (See Note 4) | | | 180,716 | | | | — | |
| Less: reimbursement/waiver from adviser (See Note 4) | | | (208,134 | ) | | | (22,916 | ) |
| Total net expenses | | | 5,811,442 | | | | 11,250,376 | |
| NET INVESTMENT LOSS | | | (3,177,543 | ) | | | (6,553,314 | ) |
| | | | | | | | | |
| REALIZED AND UNREALIZED GAIN (LOSS) ON INVESTMENTS | | | | | | | | |
| AND TRANSLATIONS OF FOREIGN CURRENCY | | | | | | | | |
| Net realized gain (loss) on investments, including foreign currency gain (loss) | | | 448,891,006 | (1) | | | (220,803,949 | ) |
| Net change in unrealized appreciation/depreciation of investments | | | | | | | | |
| and translations of foreign currency | | | (931,234,611 | ) | | | (765,969,373 | ) |
Net realized and unrealized loss on investments | | | (482,343,605 | ) | | | (986,773,322 | ) |
| | | | | | | | | |
| NET DECREASE IN NET ASSETS RESULTING FROM OPERATIONS | | $ | (485,521,148 | ) | | $ | (993,326,636 | ) |
| (1) | Includes $107,978,005 net realized gain from an in-kind transaction. In-kind realized gains generally do not need to be distributed as capital gain distributions. |
See Notes to the Financial Statements
Jackson Square Large-Cap Growth Fund
Statements of Changes in Net Assets
| | | For the | | | For the | |
| | | Year Ended | | | Year Ended | |
| | | October 31, 2022 | | | October 31, 2021 | |
| OPERATIONS: | | | | | | |
| Net investment loss | | $ | (3,177,543 | ) | | $ | (13,306,041 | ) |
| Net realized gain on investments, including foreign currency gain (loss) | | | 448,891,006 | | | | 734,556,392 | |
| Net change in unrealized appreciation/depreciation | | | | | | | | |
| on investments and translations of foreign currency | | | (931,234,611 | ) | | | 78,212,691 | |
Net increase (decrease) in net assets resulting from operations | | | (485,521,148 | ) | | | 799,463,042 | |
| | | | | | | | | |
| CAPITAL SHARE TRANSACTIONS: | | | | | | | | |
IS Class(1): | | | | | | | | |
| Proceeds from shares sold | | | 96,337,923 | | | | 1,402,857,692 | |
| Proceeds from acquisition (See Note 1) | | | — | | | | 79,071,717 | |
| Proceeds from reinvestment of distributions | | | 226,234,969 | | | | 1,028,826 | |
| Payments for shares redeemed | | | (80,198,416 | ) | | | (680,330,396 | ) |
| Payment for redemption in-kind(5) | | | (650,546,364 | ) | | | — | |
| Increase (Decrease) in net assets resulting from IS Class transactions | | | (408,171,888 | ) | | | 802,627,839 | |
| Institutional Class: | | | | | | | | |
| Proceeds from shares sold | | | 35,836,230 | | | | 408,684,263 | |
| Proceeds from acquisition (See Note 1) | | | — | | | | 1,272,275 | |
| Proceeds from reinvestment of distributions | | | 121,353,186 | | | | 488,179,321 | |
| Payments for shares redeemed | | | (1,066,863,744 | ) | | | (1,992,166,054 | ) |
| Decrease in net assets resulting from Institutional Class transactions | | | (909,674,328 | ) | | | (1,094,030,195 | ) |
Investor Class(2): | | | | | | | | |
| Proceeds from shares sold | | | 2,160,777 | | | | 21,085,616 | |
| Proceeds from acquisition (See Note 1) | | | — | | | | 70,894 | |
| Proceeds from reinvestment of distributions | | | 43,714,844 | | | | 34,187,695 | |
| Proceeds from exchange of Class C Shares | | | — | | | | 26,301,193 | |
| Proceeds from exchange of Class R Shares | | | — | | | | 5,427,349 | |
| Payments for shares redeemed | | | (36,354,620 | ) | | | (64,491,702 | ) |
| Increase in net assets resulting from Investor Class transactions | | | 9,521,001 | | | | 22,581,045 | |
Class C(3): | | | | | | | | |
| Proceeds from shares sold | | | — | | | | 806,788 | |
| Proceeds from reinvestment of distributions | | | — | | | | 8,161,979 | |
| Payment for shares issued in exchange for Investor Shares | | | — | | | | (26,301,193 | ) |
| Payments for shares redeemed | | | — | | | | (9,190,637 | ) |
| Decrease in net assets resulting from Class C transactions | | | — | | | | (26,523,063 | ) |
Class R(4): | | | | | | | | |
| Proceeds from shares sold | | | — | | | | 213,698 | |
| Proceeds from reinvestment of distributions | | | — | | | | 1,331,846 | |
| Payment for shares issued in exchange for Investor Shares | | | — | | | | (5,427,349 | ) |
| Payments for shares redeemed | | | — | | | | (1,666,003 | ) |
| Decrease in net assets resulting from Class C transactions | | | — | | | | (5,547,808 | ) |
Net decrease in net assets resulting from capital share transactions | | | (1,308,325,215 | ) | | | (300,892,182 | ) |
See Notes to the Financial Statements
Jackson Square Large-Cap Growth Fund
Statements of Changes in Net Assets – Continued
| | | For the | | | For the | |
| | | Year Ended | | | Year Ended | |
| | | October 31, 2022 | | | October 31, 2021 | |
| DISTRIBUTIONS TO SHAREHOLDERS: | | | | | | |
IS Class(1) | | $ | (226,388,707 | ) | | $ | (1,054,886 | ) |
| Institutional Class | | | (122,858,298 | ) | | | (489,231,243 | ) |
Investor Class(2) | | | (47,708,539 | ) | | | (34,713,436 | ) |
Class C(3) | | | — | | | | (8,184,157 | ) |
Class R(4) | | | — | | | | (1,331,852 | ) |
Total distributions to shareholders | | | (396,955,544 | ) | | | (534,515,574 | ) |
| TOTAL DECREASE IN NET ASSETS | | | (2,190,801,907 | ) | | | (35,944,714 | ) |
| | | | | | | | | |
| NET ASSETS: | | | | | | | | |
| Beginning of year | | | 2,407,849,912 | | | | 2,443,794,626 | |
| End of year | | $ | 217,048,005 | | | $ | 2,407,849,912 | |
| (1) | The IS Class was previously known as Class R6 prior to April 16, 2021. See Note 1 in Notes to Financial Statements. |
| (2) | The Investor Class was previously known as Class A prior to April 16, 2021. See Note 1 in Notes to Financial Statements. |
| (3) | Class C shares converted to Investor Class shares on April 16, 2021. See Note 1 in Notes to Financial Statements. |
| (4) | Class R shares converted to Investor Class shares on April 16, 2021. See Note 1 in Notes to Financial Statements. |
| (5) | A redemption in-kind occurred on April 25, 2022 for the IS Class, which consisted of $631,793,017 in securities and $18,753,347 in cash. |
See Notes to the Financial Statements
Jackson Square SMID-Cap Growth Fund
Statements of Changes in Net Assets
| | | For the | | | For the | |
| | | Year Ended | | | Year Ended | |
| | | October 31, 2022 | | | October 31, 2021 | |
| OPERATIONS: | | | | | | |
| Net investment loss | | $ | (6,553,314 | ) | | $ | (14,939,615 | ) |
| Net realized gain (loss) on investments, including foreign currency gain (loss) | | | (220,803,949 | ) | | | 363,025,635 | |
| Net change in unrealized appreciation/depreciation | | | | | | | | |
| on investments and translations of foreign currency | | | (765,969,373 | ) | | | 120,093,193 | |
Net increase (decrease) in net assets resulting from operations | | | (993,326,636 | ) | | | 468,179,213 | |
| | | | | | | | | |
| CAPITAL SHARE TRANSACTIONS: | | | | | | | | |
| IS Class: | | | | | | | | |
| Proceeds from shares sold | | | 186,086,454 | | | | 300,146,563 | |
| Proceeds from reinvestment of distributions | | | 147,698,829 | | | | 39,392,094 | |
| Payments for shares redeemed | | | (144,072,426 | ) | | | (145,332,569 | ) |
| Increase in net assets resulting from IS Class transactions | | | 189,712,857 | | | | 194,206,088 | |
| Institutional Class: | | | | | | | | |
| Proceeds from shares sold | | | 253,353,654 | | | | 304,524,541 | |
| Proceeds from reinvestment of distributions | | | 139,315,673 | | | | 45,355,964 | |
| Payments for shares redeemed | | | (517,174,844 | ) | | | (220,162,155 | ) |
| Increase (Decrease) in net assets resulting from Institutional Class transactions | | | (124,505,517 | ) | | | 129,718,350 | |
| Investor Class: | | | | | | | | |
| Proceeds from shares sold | | | 8,480,345 | | | | 43,689,033 | |
| Proceeds from reinvestment of distributions | | | 16,161,227 | | | | 5,187,925 | |
| Payments for shares redeemed | | | (31,219,296 | ) | | | (38,430,286 | ) |
| Increase (Decrease) in net assets resulting from Investor Class transactions | | | (6,577,724 | ) | | | 10,446,672 | |
Net increase in net assets resulting from capital share transactions | | | 58,629,616 | | | | 334,371,110 | |
| | | | | | | | | |
| DISTRIBUTIONS TO SHAREHOLDERS: | | | | | | | | |
| IS Class | | | (154,578,237 | ) | | | (41,465,958 | ) |
| Institutional Class | | | (145,233,908 | ) | | | (47,286,027 | ) |
| Investor Class | | | (16,179,692 | ) | | | (5,199,692 | ) |
Total distributions to shareholders | | �� | (315,991,837 | ) | | | (93,951,677 | ) |
| TOTAL INCREASE (DECREASE) IN NET ASSETS | | | (1,250,688,857 | ) | | | 708,598,646 | |
| | | | | | | | | |
| NET ASSETS: | | | | | | | | |
| Beginning of year | | | 2,162,972,488 | | | | 1,454,373,842 | |
| End of year | | $ | 912,283,631 | | | $ | 2,162,972,488 | |
See Notes to the Financial Statements
Jackson Square Large-Cap Growth Fund
Financial Highlights
For a Fund share outstanding throughout the years.
IS Class(1)
| | | Year Ended | | | Year Ended | | | Year Ended | | | Year Ended | | | Year Ended | |
| | | October 31, | | | October 31, | | | October 31, | | | October 31, | | | October 31, | |
| | | 2022 | | | 2021 | | | 2020 | | | 2019 | | | 2018 | |
| Per Share Data | | | | | | | | | | | | | | | |
| | | | | | | | | | | | | | | | |
Net asset value, beginning of year | | $ | 31.69 | | | $ | 28.72 | | | $ | 24.91 | | | $ | 26.72 | | | $ | 28.50 | |
| | | | | | | | | | | | | | | | | | | | | |
| Investment operations: | | | | | | | | | | | | | | | | | | | | |
Net investment income (loss)(2) | | | (0.07 | ) | | | (0.10 | ) | | | 0.01 | | | | 0.05 | | | | 0.05 | |
| Net realized and unrealized | | | | | | | | | | | | | | | | | | | | |
| gain (loss) on investments | | | (10.23 | ) | | | 9.16 | | | | 6.25 | | | | 2.59 | | | | 1.38 | |
| Total from investment operations | | | (10.30 | ) | | | 9.06 | | | | 6.26 | | | | 2.64 | | | | 1.43 | |
| | | | | | | | | | | | | | | | | | | | | |
| Less distributions from: | | | | | | | | | | | | | | | | | | | | |
| Net investment income | | | — | | | | — | | | | — | | | | — | | | | (0.04 | ) |
| Net realized gains | | | (7.69 | ) | | | (6.09 | ) | | | (2.45 | ) | | | (4.45 | ) | | | (3.17 | ) |
| Total distributions | | | (7.69 | ) | | | (6.09 | ) | | | (2.45 | ) | | | (4.45 | ) | | | (3.21 | ) |
Net asset value, end of year | | $ | 13.70 | | | $ | 31.69 | | | $ | 28.72 | | | $ | 24.91 | | | $ | 26.72 | |
| | | | | | | | | | | | | | | | | | | | | |
| Total Return | | | -41.26 | % | | | 33.81 | %(3) | | | 27.39 | %(3) | | | 14.60 | %(3) | | | 5.36 | % |
| | | | | | | | | | | | | | | | | | | | | |
| Supplemental Data and Ratios | | | | | | | | | | | | | | | | | | | | |
Net assets, end of year (in 000’s) | | $ | 40,436 | | | $ | 945,973 | | | $ | 4,539 | | | $ | 3,408 | | | $ | 2,376 | |
| | | | | | | | | | | | | | | | | | | | | |
Ratio of expenses to average net assets: | | | | | | | | | | | | | | | | | | | | |
| Before expense reimbursement/waiver/recoupment | | | 0.63 | % | | | 0.61 | % | | | 0.65 | % | | | 0.67 | % | | | 0.65 | % |
| After expense reimbursement/waiver/recoupment | | | 0.63 | % | | | 0.61 | %(4) | | | 0.62 | % | | | 0.63 | % | | | 0.65 | % |
| | | | | | | | | | | | | | | | | | | | | |
Ratio of net investment income (loss) | | | | | | | | | | | | | | | | | | | | |
to average net assets: | | | | | | | | | | | | | | | | | | | | |
| After expense reimbursement/waiver/recoupment | | | (0.31 | )% | | | (0.17 | )% | | | 0.02 | % | | | 0.16 | % | | | 0.16 | % |
| | | | | | | | | | | | | | | | | | | | | |
Portfolio Turnover(5) | | | 35 | %(6) | | | 28 | % | | | 54 | % | | | 35 | % | | | 39 | % |
| (1) | Prior to April 16, 2021, the IS Class was known as Class R6. See Note 1 in Notes to Financial Statements. |
| (2) | Per share amounts calculated using the average shares method. |
| (3) | Total return during the period reflects a waiver by the manager. Performance would have been lower had the waiver not been in effect. |
| (4) | Prior to April 16, 2021, the annual expense limitation was 0.62% of the average daily net assets of the Fund. Thereafter, it was 0.64%. |
| (5) | Portfolio turnover disclosed is for the Fund as a whole. |
| (6) | Excludes the value of securities delivered as a result of an in-kind redemption of the Fund’s capital shares on April 25,2022. |
See Notes to the Financial Statements
Jackson Square Large-Cap Growth Fund
Financial Highlights
For a Fund share outstanding throughout the years.
Institutional Class
| | | Year Ended | | | Year Ended | | | Year Ended | | | Year Ended | | | Year Ended | |
| | | October 31, | | | October 31, | | | October 31, | | | October 31, | | | October 31, | |
| | | 2022 | | | 2021 | | | 2020 | | | 2019 | | | 2018 | |
| Per Share Data | | | | | | | | | | | | | | | |
| | | | | | | | | | | | | | | | |
Net asset value, beginning of year | | $ | 31.32 | | | $ | 28.49 | | | $ | 24.78 | | | $ | 26.66 | | | $ | 28.46 | |
| | | | | | | | | | | | | | | | | | | | | |
| Investment operations: | | | | | | | | | | | | | | | | | | | | |
Net investment loss(1) | | | (0.08 | ) | | | (0.16 | ) | | | (0.04 | ) | | | (0.01 | ) | | | (0.01 | ) |
| Net realized and unrealized | | | | | | | | | | | | | | | | | | | | |
| gain (loss) on investments | | | (10.07 | ) | | | 9.08 | | | | 6.20 | | | | 2.58 | | | | 1.39 | |
| Total from investment operations | | | (10.15 | ) | | | 8.92 | | | | 6.16 | | | | 2.57 | | | | 1.38 | |
| | | | | | | | | | | | | | | | | | | | | |
| Less distributions from: | | | | | | | | | | | | | | | | | | | | |
| Net investment income | | | — | | | | — | | | | — | | | | — | | | | (0.01 | ) |
| Net realized gains | | | (7.69 | ) | | | (6.09 | ) | | | (2.45 | ) | | | (4.45 | ) | | | (3.17 | ) |
| Total distributions | | | (7.69 | ) | | | (6.09 | ) | | | (2.45 | ) | | | (4.45 | ) | | | (3.18 | ) |
Net asset value, end of year | | $ | 13.48 | | | $ | 31.32 | | | $ | 28.49 | | | $ | 24.78 | | | $ | 26.66 | |
| | | | | | | | | | | | | | | | | | | | | |
| Total Return | | | -41.27 | % | | | 33.56 | %(2) | | | 27.10 | %(2) | | | 14.33 | %(2) | | | 5.15 | % |
| | | | | | | | | | | | | | | | | | | | | |
| Supplemental Data and Ratios | | | | | | | | | | | | | | | | | | | | |
Net assets, end of year (in 000’s) | | $ | 105,097 | | | $ | 1,292,470 | | | $ | 2,268,085 | | | $ | 2,231,134 | | | $ | 2,502,062 | |
| | | | | | | | | | | | | | | | | | | | | |
Ratio of expenses to average net assets: | | | | | | | | | | | | | | | | | | | | |
| Before expense reimbursement/waiver/recoupment | | | 0.70 | % | | | 0.81 | % | | | 0.89 | % | | | 0.90 | % | | | 0.87 | % |
| After expense reimbursement/waiver/recoupment | | | 0.70 | % | | | 0.79 | %(3) | | | 0.84 | % | | | 0.86 | % | | | 0.87 | % |
| | | | | | | | | | | | | | | | | | | | | |
Ratio of net investment income (loss) | | | | | | | | | | | | | | | | | | | | |
to average net assets: | | | | | | | | | | | | | | | | | | | | |
| After expense reimbursement/waiver/recoupment | | | (0.39 | )% | | | (0.52 | )% | | | (0.17 | )% | | | (0.07 | )% | | | (0.06 | )% |
| | | | | | | | | | | | | | | | | | | | | |
Portfolio Turnover(4) | | | 35 | %(5) | | | 28 | % | | | 54 | % | | | 35 | % | | | 39 | % |
| (1) | Per share amounts calculated using the average shares method. |
| (2) | Total return during the period reflects a waiver by the manager. Performance would have been lower had the waiver not been in effect. |
| (3) | Prior to April 16, 2021, the annual expense limitation was 0.84% of the average daily net assets of the Fund. Thereafter, it was 0.64%, excluding Shareholder Servicing Plan fees. See Note 1 in Notes to the Financial Statements. |
| (4) | Portfolio turnover disclosed is for the Fund as a whole. |
| (5) | Excludes the value of securities delivered as a result of an in-kind redemption of the funds capital shares on April 25, 2022. |
See Notes to the Financial Statements
Jackson Square Large-Cap Growth Fund
Financial Highlights
For a Fund share outstanding throughout the years.
Investor Class(1)
| | | Year Ended | | | Year Ended | | | Year Ended | | | Year Ended | | | Year Ended | |
| | | October 31, | | | October 31, | | | October 31, | | | October 31, | | | October 31, | |
| | | 2022 | | | 2021 | | | 2020 | | | 2019 | | | 2018 | |
| Per Share Data | | | | | | | | | | | | | | | |
| | | | | | | | | | | | | | | | |
Net asset value, beginning of year | | $ | 26.71 | | | $ | 25.09 | | | $ | 22.15 | | | $ | 24.41 | | | $ | 26.37 | |
| | | | | | | | | | | | | | | | | | | | | |
| Investment operations: | | | | | | | | | | | | | | | | | | | | |
Net investment loss(2) | | | (0.09 | ) | | | (0.19 | ) | | | (0.10 | ) | | | (0.06 | ) | | | (0.08 | ) |
| Net realized and unrealized | | | | | | | | | | | | | | | | | | | | |
| gain (loss) on investments | | | (8.18 | ) | | | 7.90 | | | | 5.49 | | | | 2.25 | | | | 1.29 | |
| Total from investment operations | | | (8.27 | ) | | | 7.71 | | | | 5.39 | | | | 2.19 | | | | 1.21 | |
| | | | | | | | | | | | | | | | | | | | | |
| Less distributions from: | | | | | | | | | | | | | | | | | | | | |
| Net investment income | | | — | | | | — | | | | — | | | | — | | | | — | |
| Net realized gains | | | (7.69 | ) | | | (6.09 | ) | | | (2.45 | ) | | | (4.45 | ) | | | (3.17 | ) |
| Total distributions | | | (7.69 | ) | | | (6.09 | ) | | | (2.45 | ) | | | (4.45 | ) | | | (3.17 | ) |
Net asset value, end of year | | $ | 10.75 | | | $ | 26.71 | | | $ | 25.09 | | | $ | 22.15 | | | $ | 24.41 | |
| | | | | | | | | | | | | | | | | | | | | |
| Total Return | | | -41.38 | % | | | 33.25 | %(3) | | | 26.82 | %(3) | | | 14.04 | %(3) | | | 4.89 | % |
| | | | | | | | | | | | | | | | | | | | | |
| Supplemental Data and Ratios | | | | | | | | | | | | | | | | | | | | |
Net assets, end of year (in 000’s) | | $ | 71,515 | | | $ | 169,407 | | | $ | 137,135 | | | $ | 116,986 | | | $ | 122,621 | |
| | | | | | | | | | | | | | | | | | | | | |
Ratio of expenses to average net assets: | | | | | | | | | | | | | | | | | | | | |
| Before expense reimbursement/waiver/recoupment | | | 0.91 | % | | | 1.04 | % | | | 1.14 | % | | | 1.15 | % | | | 1.12 | % |
| After expense reimbursement/waiver/recoupment | | | 0.90 | % | | | 1.03 | %(4) | | | 1.09 | % | | | 1.11 | % | | | 1.12 | % |
| | | | | | | | | | | | | | | | | | | | | |
Ratio of net investment loss to average net assets: | | | | | | | | | | | | | | | | | | | | |
| After expense reimbursement/waiver/recoupment | | | (0.59 | )% | | | (0.75 | )% | | | (0.42 | )% | | | (0.32 | )% | | | (0.31 | )% |
| | | | | | | | | | | | | | | | | | | | | |
Portfolio Turnover(5) | | | 35 | %(6) | | | 28 | % | | | 54 | % | | | 35 | % | | | 39 | % |
| (1) | Prior to April 16, 2021, the Investor Class was known as Class A. |
| (2) | Per share amounts calculated using the average shares method. |
| (3) | Total return during the period reflects a waiver by the manager. Performance would have been lower had the waiver not been in effect. |
| (4) | Prior to April 16, 2021, the annual expense limitation was 0.84% of the average daily net assets of the Fund. Thereafter, it was 0.64%, excluding 12b-1 fees and shareholder servicing fees. |
| (5) | Portfolio turnover disclosed is for the Fund as a whole. |
| (6) | Excludes the value of securities delivered as a result of an in-kind redemption of the Fund’s capital shares on April 25, 2022. |
See Notes to the Financial Statements
Jackson Square SMID-Cap Growth Fund
Financial Highlights
For a Fund share outstanding throughout the years.
IS Class
| | | Year Ended | | | Year Ended | | | Year Ended | | | Year Ended | | | Year Ended | |
| | | October 31, | | | October 31, | | | October 31, | | | October 31, | | | October 31, | |
| | | 2022 | | | 2021 | | | 2020 | | | 2019 | | | 2018 | |
| Per Share Data | | | | | | | | | | | | | | | |
| | | | | | | | | | | | | | | | |
Net asset value, beginning of year | | $ | 38.53 | | | $ | 30.75 | | | $ | 23.88 | | | $ | 23.83 | | | $ | 21.37 | |
| | | | | | | | | | | | | | | | | | | | | |
| Investment operations: | | | | | | | | | | | | | | | | | | | | |
Net investment income (loss)(1) | | | (0.09 | ) | | | (0.26 | ) | | | (0.08 | ) | | | 0.01 | (2) | | | 0.08 | |
| Net realized and unrealized | | | | | | | | | | | | | | | | | | | | |
| gain (loss) on investments | | | (16.44 | ) | | | 9.98 | | | | 7.99 | | | | 2.70 | | | | 2.50 | |
| Total from investment operations | | | (16.53 | ) | | | 9.72 | | | | 7.91 | | | | 2.71 | | | | 2.58 | |
| | | | | | | | | | | | | | | | | | | | | |
| Less distributions from: | | | | | | | | | | | | | | | | | | | | |
| Net investment income | | | — | | | | — | | | | (0.02 | ) | | | (0.06 | ) | | | — | |
| Net realized gains | | | (6.09 | ) | | | (1.94 | ) | | �� | (1.02 | ) | | | (2.60 | ) | | | (0.12 | ) |
| Total distributions | | | (6.09 | ) | | | (1.94 | ) | | | (1.04 | ) | | | (2.66 | ) | | | (0.12 | ) |
Net asset value, end of year | | $ | 15.91 | | | $ | 38.53 | | | $ | 30.75 | | | $ | 23.88 | | | $ | 23.83 | |
| | | | | | | | | | | | | | | | | | | | | |
| Total Return | | | -48.81 | % | | | 31.80 | % | | | 34.36 | % | | | 14.02 | % | | | 12.13 | % |
| | | | | | | | | | | | | | | | | | | | | |
| Supplemental Data and Ratios | | | | | | | | | | | | | | | | | | | | |
Net assets, end of year (in 000’s) | | $ | 552,794 | | | $ | 1,016,051 | | | $ | 650,845 | | | $ | 452,234 | | | $ | 197,538 | |
| | | | | | | | | | | | | | | | | | | | | |
Ratio of expenses to average net assets: | | | | | | | | | | | | | | | | | | | | |
| Before expense waiver/recoupment | | | 0.83 | % | | | 0.82 | % | | | 0.85 | % | | | 0.87 | % | | | 0.89 | % |
| After expense waiver/recoupment | | | 0.82 | % | | | 0.82 | % | | | 0.87 | % | | | 0.87 | % | | | 0.87 | % |
| | | | | | | | | | | | | | | | | | | | | |
Ratio of net investment income (loss) | | | | | | | | | | | | | | | | | | | | |
to average net assets: | | | | | | | | | | | | | | | | | | | | |
| After expense waiver/recoupment | | | (0.46 | )% | | | (0.84 | )% | | | (0.30 | )% | | | 0.04 | % | | | 0.33 | % |
| | | | | | | | | | | | | | | | | | | | | |
Portfolio Turnover(3) | | | 78 | % | | | 56 | % | | | 49 | % | | | 35 | % | | | 47 | % |
| (1) | Per share amounts calculated using the average shares method. |
| (2) | Net realized and unrealized loss per share in this caption is a balancing amount necessary to reconcile the change in net asset value per share for the year and may not reconcile with the aggregate gain on the Statement of Operations due to share transactions for the year. |
| (3) | Portfolio turnover disclosed is for the Fund as a whole. |
See Notes to the Financial Statements
Jackson Square SMID-Cap Growth Fund
Financial Highlights
For a Fund share outstanding throughout the years.
Institutional Class
| | | Year Ended | | | Year Ended | | | Year Ended | | | Year Ended | | | Year Ended | |
| | | October 31, | | | October 31, | | | October 31, | | | October 31, | | | October 31, | |
| | | 2022 | | | 2021 | | | 2020 | | | 2019 | | | 2018 | |
| Per Share Data | | | | | | | | | | | | | | | |
| | | | | | | | | | | | | | | | |
Net asset value, beginning of year | | $ | 38.48 | | | $ | 30.73 | | | $ | 23.89 | | | $ | 23.81 | | | $ | 21.37 | |
| | | | | | | | | | | | | | | | | | | | | |
| Investment operations: | | | | | | | | | | | | | | | | | | | | |
Net investment income (loss)(1) | | | (0.12 | ) | | | (0.29 | ) | | | (0.10 | ) | | | (0.01 | ) | | | 0.06 | |
| Net realized and unrealized | | | | | | | | | | | | | | | | | | | | |
| gain (loss) on investments | | | (16.41 | ) | | | 9.98 | | | | 7.98 | | | | 2.74 | | | | 2.50 | |
| Total from investment operations | | | (16.53 | ) | | | 9.69 | | | | 7.88 | | | | 2.73 | | | | 2.56 | |
| | | | | | | | | | | | | | | | | | | | | |
| Less distributions from: | | | | | | | | | | | | | | | | | | | | |
| Net investment income | | | — | | | | — | | | | (0.02 | ) | | | (0.05 | ) | | | — | |
| Net realized gains | | | (6.09 | ) | | | (1.94 | ) | | | (1.02 | ) | | | (2.60 | ) | | | (0.12 | ) |
| Total distributions | | | (6.09 | ) | | | (1.94 | ) | | | (1.04 | ) | | | (2.65 | ) | | | (0.12 | ) |
Net asset value, end of year | | $ | 15.86 | | | $ | 38.48 | | | $ | 30.73 | | | $ | 23.89 | | | $ | 23.81 | |
| | | | | | | | | | | | | | | | | | | | | |
| Total Return | | | -48.89 | % | | | 31.71 | % | | | 34.20 | % | | | 14.08 | % | | | 12.04 | % |
| | | | | | | | | | | | | | | | | | | | | |
| Supplemental Data and Ratios | | | | | | | | | | | | | | | | | | | | |
Net assets, end of year (in 000’s) | | $ | 320,392 | | | $ | 1,039,786 | | | $ | 725,204 | | | $ | 499,461 | | | $ | 297,023 | |
| | | | | | | | | | | | | | | | | | | | | |
Ratio of expenses to average net assets: | | | | | | | | | | | | | | | | | | | | |
| Before expense waiver/recoupment | | | 0.92 | % | | | 0.91 | % | | | 0.93 | % | | | 0.95 | % | | | 0.97 | % |
| After expense waiver/recoupment | | | 0.91 | % | | | 0.91 | % | | | 0.95 | % | | | 0.95 | % | | | 0.95 | % |
| | | | | | | | | | | | | | | | | | | | | |
Ratio of net investment income (loss) | | | | | | | | | | | | | | | | | | | | |
to average net assets: | | | | | | | | | | | | | | | | | | | | |
| After expense waiver/recoupment | | | (0.55 | )% | | | (0.76 | )% | | | (0.39 | )% | | | (0.04 | )% | | | 0.26 | % |
| | | | | | | | | | | | | | | | | | | | | |
Portfolio Turnover(2) | | | 78 | % | | | 56 | % | | | 49 | % | | | 35 | % | | | 47 | % |
| (1) | Per share amounts calculated using the average shares method. |
| (2) | Portfolio turnover disclosed is for the Fund as a whole. |
See Notes to the Financial Statements
Jackson Square SMID-Cap Growth Fund
Financial Highlights
For a Fund share outstanding throughout the years.
Investor Class
| | | Year Ended | | | Year Ended | | | Year Ended | | | Year Ended | | | Year Ended | |
| | | October 31, | | | October 31, | | | October 31, | | | October 31, | | | October 31, | |
| | | 2022 | | | 2021 | | | 2020 | | | 2019 | | | 2018 | |
| Per Share Data | | | | | | | | | | | | | | | |
| | | | | | | | | | | | | | | | |
Net asset value, beginning of year | | $ | 37.93 | | | $ | 30.39 | | | $ | 23.68 | | | $ | 23.67 | | | $ | 21.30 | |
| | | | | | | | | | | | | | | | | | | | | |
| Investment operations: | | | | | | | | | | | | | | | | | | | | |
Net investment loss(1) | | | (0.17 | ) | | | (0.38 | ) | �� | | (0.17 | ) | | | (0.07 | ) | | | — | (2) |
| Net realized and unrealized | | | | | | | | | | | | | | | | | | | | |
| gain (loss) on investments | | | (16.13 | ) | | | 9.86 | | | | 7.91 | | | | 2.70 | | | | 2.49 | |
| Total from investment operations | | | (16.30 | ) | | | 9.48 | | | | 7.74 | | | | 2.63 | | | | 2.49 | |
| | | | | | | | | | | | | | | | | | | | | |
| Less distributions from: | | | | | | | | | | | | | | | | | | | | |
| Net investment income | | | — | | | | — | | | | (0.01 | ) | | | (0.02 | ) | | | — | |
| Net realized gains | | | (6.09 | ) | | | (1.94 | ) | | | (1.02 | ) | | | (2.60 | ) | | | (0.12 | ) |
| Total distributions | | | (6.09 | ) | | | (1.94 | ) | | | (1.03 | ) | | | (2.62 | ) | | | (0.12 | ) |
Net asset value, end of year | | $ | 15.54 | | | $ | 37.93 | | | $ | 30.39 | | | $ | 23.68 | | | $ | 23.67 | |
| | | | | | | | | | | | | | | | | | | | | |
| Total Return | | | -49.01 | % | | | 31.36 | % | | | 33.88 | % | | | 13.69 | % | | | 11.75 | % |
| | | | | | | | | | | | | | | | | | | | | |
| Supplemental Data and Ratios | | | | | | | | | | | | | | | | | | | | |
Net assets, end of year (in 000’s) | | $ | 39,098 | | | $ | 107,135 | | | $ | 78,325 | | | $ | 78,819 | | | $ | 68,451 | |
| | | | | | | | | | | | | | | | | | | | | |
Ratio of expenses to average net assets: | | | | | | | | | | | | | | | | | | | | |
| Before expense waiver/recoupment | | | 1.17 | % | | | 1.17 | % | | | 1.20 | % | | | 1.22 | % | | | 1.24 | % |
| After expense waiver/recoupment | | | 1.17 | % | | | 1.17 | % | | | 1.22 | % | | | 1.22 | % | | | 1.22 | % |
| | | | | | | | | | | | | | | | | | | | | |
Ratio of net investment loss to average net assets: | | | | | | | | | | | | | | | | | | | | |
| After expense waiver/recoupment | | | (0.80 | )% | | | (1.02 | )% | | | (0.65 | )% | | | (0.31 | )% | | | (0.02 | )% |
| | | | | | | | | | | | | | | | | | | | | |
Portfolio Turnover(3) | | | 78 | % | | | 56 | % | | | 49 | % | | | 35 | % | | | 47 | % |
| (1) | Per share amounts calculated using the average shares method. |
| (2) | Amount is less than $0.01 per share. |
| (3) | Portfolio turnover disclosed is for the Fund as a whole. |
See Notes to the Financial Statements
Jackson Square Funds
Notes to the Financial Statements
October 31, 2022
1. ORGANIZATION
Managed Portfolio Series (the “Trust”) was organized as a Delaware statutory trust on January 27, 2011. The Trust is registered under the Investment Company Act of 1940, as amended (the “1940 Act”), as an open-end management investment company. The Jackson Square Large-Cap Growth Fund (“Large-Cap Growth Fund”), and Jackson Square SMID-Cap Growth Fund (“SMID-Cap Growth Fund”) (each a “Fund” and collectively, the “Funds”) are investment companies and therefore follow the investment company accounting and reporting guidance of the Financial Accounting Standards Board (“FASB”) Accounting Standards Codification Topic 946 Financial Services – Investment Companies. The Large-Cap Growth Fund and SMID-Cap Growth Fund are each non-diversified series with their own investment objectives and policies within the Trust. The investment objective of each Fund is long-term capital appreciation. The Funds offer three different share classes – Investor Class, Institutional Class, and IS Class. The Large-Cap Growth Fund currently offers the IS Class shares (previously known as Class R6, prior to April 16, 2021), which commenced operations on May 2, 2016, the Institutional Class shares which commenced operations on February 3, 1994, and the Investor Class shares (previously known as Class A shares before April 16, 2021), which commenced operations on December 3, 1993. Effective April 16, 2021, the Large-Cap Growth Fund ceased offering Class C and Class R shares. The remaining Class C and Class R shares were converted to Investor Class shares at the close of business on April 16, 2021. The SMID-Cap Growth Fund currently offers the IS Class shares, which commenced operations on December 1, 2003, the Institutional Class shares which commenced operations on September 16, 2016, and the Investor Class shares, which commenced operations on September 19, 2016. Each class of shares has identical rights and privileges except with respect to shareholder servicing fees, 12b-1 fees, and voting rights on matters affecting a single share class. Institutional Class shares are subject to a maximum 0.10% shareholder servicing fee. Investor Class shares are subject to a 0.25% Rule 12b-1 distribution and servicing fee and a maximum 0.10% shareholder servicing fee. The Funds may issue an unlimited number of shares of beneficial interest with no par value.
Effective April 16, 2021, as the result of a tax-free reorganization, the Delaware U.S. Growth Fund (the “Predecessor Fund”), a series of the Delaware Group® Adviser Funds, a registered open-end management investment company, was transferred into the Trust. The plan of reorganization was approved by the shareholders of the Predecessor Fund on March 23, 2021. Effective April 16, 2021, the Predecessor Fund was renamed the Jackson Square Large-Cap Growth Fund. The shares of the Predecessor were exchanged pro rata as follows:
| Predecessor Fund Share Class | Large-Cap Growth Fund Share Class |
| Class A | Investor Class |
| Class C | Investor Class |
| Class R | Investor Class |
| Institutional Class | Institutional Class |
| Class R6 | IS Class |
The Predecessor Fund was deemed to be the accounting survivor for financial reporting purposes, and as a result, the financial statements and financial highlights of the Large-Cap Growth Fund reflects the operation of the Predecessor Fund for the periods prior to the reorganization date.
Jackson Square Funds
Notes to the Financial Statements – Continued
October 31, 2022
As a tax-free reorganization, any unrealized appreciation or depreciation on the securities on the date of reorganization was treated as a non-taxable event, thus the cost basis of the securities held reflect their historical cost basis as of the date of the reorganization. Immediately prior to the reorganization, the net assets, fair value of investments, and net unrealized appreciation of the Predecessor Fund was as follows:
| Net Assets | Fair Value of Investments | Net Unrealized Appreciation |
$2,835,578,449 | $2,837,967,769 | $1,095,203,433 |
At the date of reorganization, fund shares outstanding totaled 98,588,343 for the Predecessor Fund.
In connection with the reorganization, the net assets of the original Jackson Square Large-Cap Growth Fund (the “Acquired Fund”) were acquired by the Large-Cap Growth Fund (the “Acquiring Fund”) as of the close of business April 16, 2021. The Acquired Fund commenced operations on November 1, 2005. The purpose of the transaction was to combine two funds managed by Jackson Square Partners, LLC (the “Adviser”) with comparable investment objectives and strategies. The acquisition was accomplished by a tax-free exchange of all IS Class, Institutional Class and Investor Class shares of the Acquired Fund for shares of the Large-Cap Growth Fund, as described on page 31. For financial reporting purposes, the Large-Cap Growth Fund (Predecessor Fund) is deemed to be the accounting survivor and as a result, the financial statements and financial highlights do not reflect the operations of the Acquired Fund. The assets received and shares issued by the Large-Cap Growth Fund were recorded at fair value; and, the cost basis of the investments received from the Acquired Fund were carried forward to align ongoing reporting of the Large-Cap Growth Fund’s realized and unrealized gains and losses with amounts distributable to shareholders for tax purposes. Information with respect to the net assets and other relevant operating data for the Acquired Fund on the merger date are included below:
| Acquired Fund | | | |
Net Assets – IS Class | | $ | 79,071,717 | |
Shares outstanding – IS Class | | | 6,383,238 | |
Net asset value – IS Class | | $ | 29.41 | |
Net Assets – Institutional Class | | $ | 1,272,275 | |
Shares outstanding – Institutional Class | | | 102,357 | |
Net asset value – Institutional Class | | $ | 29.09 | |
Net Assets – Investor Class | | $ | 70,894 | |
Shares outstanding – Investor Class | | | 5,763 | |
Net asset value – Investor Class | | $ | 24.84 | |
Investments at fair value | | $ | 80,428,536 | |
Unrealized appreciation | | $ | 29,319,964 | |
Tax capital loss carryforward | | | — | |
Jackson Square Funds
Notes to the Financial Statements – Continued
October 31, 2022
| Acquiring Fund | | | |
Net assets immediately prior to merger | | $ | 2,835,578,449 | |
Net assets immediately after merger | | $ | 2,915,993,335 | |
Fund shares issued in exchange for Acquired Fund – IS Class | | | 2,688,603 | |
Exchange rate for shares issued – IS Class | | | 0.42119732 | |
Fund shares issued in exchange for Acquired Fund – Institutional Class | | | 43,736 | |
Exchange rate for shares issued – Institutional Class | | | 0.42728552 | |
Fund shares issued in exchange for Acquired Fund – Investor Class | | | 2,854 | |
Exchange rate for shares issued – Investor Class | | | 0.49526987 | |
Because the combined investment portfolios have been managed as a single integrated portfolio since the merger was completed, it is not practicable to separate the amounts of revenue and earnings of the Acquired Fund that have been included in the Large-Cap Growth Fund’s statement of operations since April 16, 2021.
Assuming the merger had been completed on November 1, 2020, the beginning of the annual reporting period of the Large-Cap Growth Fund, the Large-Cap Growth Fund’s pro forma results of operations for the year ended October 31, 2021, are as follows:
Net investment loss | | $ | (13,427,859 | ) |
Net realized and unrealized gain on investments | | $ | 831,191,109 | |
Total increase from operations | | $ | 817,763,250 | |
2. SIGNIFICANT ACCOUNTING POLICIES
The following is a summary of significant accounting policies consistently followed by the Funds in preparation of their financial statements. These policies are in conformity with generally accepted accounting principles in the United States of America (“GAAP”).
Security Valuation – All investments in securities are recorded at their estimated fair value, as described in Note 3.
Federal Income Taxes – The Funds comply with the requirements of subchapter M of the Internal Revenue Code of 1986, as amended, necessary to qualify as regulated investment companies and distribute substantially all net taxable investment income and net realized gains to shareholders in a manner which results in no tax cost to the Funds. Therefore, no federal income or excise tax provision is required. As of and during the period ended October 31, 2022, the Funds did not have any tax positions that did not meet the “more-likely-than-not” threshold of being sustained by the applicable tax authority. As of and during the period ended October 31, 2022, the Funds did not have liabilities for any unrecognized tax benefits. The Funds recognize interest and penalties, if any, related to unrecognized tax benefits on uncertain tax positions as income tax expense in the Statement of Operations. As of and during the period ended October 31, 2022, the Funds did not incur any interest or penalties. The Funds are not subject to examination by U.S. tax authorities for tax years prior to the fiscal year ended October 31, 2019.
Security Transactions, Investment Income and Distributions – The Funds follow industry practice and record security transactions on the trade date. Realized gains and losses on sales of securities are calculated on the basis of identified cost. Dividend income is recorded on the ex-dividend date and interest income is recorded on an accrual basis. Withholding taxes on foreign dividends have been provided for in accordance with the Funds’ understanding of the applicable country’s tax rules and regulations. Discounts and premiums on securities purchased are amortized over the expected life of the respective securities using the constant yield method.
Jackson Square Funds
Notes to the Financial Statements – Continued
October 31, 2022
The Funds distribute substantially all net investment income and net realized capital gains, if any, at least annually. Distributions to shareholders are recorded on the ex-dividend date. The treatment for financial reporting purposes of distributions made to shareholders during the year from net investment income or net realized capital gains may differ from their treatment for federal income tax purposes. These differences are caused primarily by differences in the timing of the recognition of certain components of income, expense, or realized capital gain for federal income tax purposes. Where such differences are permanent in nature, GAAP requires that they be reclassified in the components of the net assets based on their ultimate characterization for federal income tax purposes. Any such reclassifications will have no effect on net assets, results of operations or net asset value (“NAV”) per share of the Funds. For the year ended October 31, 2022, the following reclassifications were made:
| Fund | | Distributable Earnings | | | Paid-in Capital | |
| Large-Cap Growth Fund | | $ | (439,165,206 | ) | | $ | 439,165,206 | |
| SMID-Cap Growth Fund | | | 4,626,540 | | | | (4,626,540 | ) |
Adjustments to the Funds shown in the table above were due to one or more of the following reasons: net operating loss reclassifications, dividend reclassifications, equalization utilized, and redemptions in kind.
Foreign Currency – Investment securities and other assets and liabilities denominated in foreign currencies are translated into U.S. dollar amounts at the date of valuation. Purchases and sales of investment securities and income and expense items denominated in foreign currencies are translated into U.S. dollar amounts on the respective dates of such transactions. The Funds do not isolate that portion of the results of operations resulting from changes in foreign exchange rates on investments from the fluctuations arising from changes in market prices of securities held. Such fluctuations are included with the net realized and unrealized gain or loss from investments and translations of foreign currency. The Funds report net realized foreign exchange gains or losses that arise from sales of foreign currencies, currency gains or losses realized between the trade and settlement dates on securities transactions, and the difference between the amounts of dividends, interest, and foreign withholding taxes recorded on the Funds’ books and the U.S. dollar equivalent of the amounts actually received or paid. Net unrealized foreign exchange gains and losses arise from changes in the fair values of assets and liabilities, other than investments in securities at fiscal period end, resulting from changes in exchange rates.
Allocation of Income, Expenses and Gains/Losses – Income, expenses (other than those deemed attributable to a specific share class), and gains and losses of the Funds are allocated daily to each class of shares based upon the ratio of net assets represented by each class as a percentage of the net assets of each Fund. Expenses deemed directly attributable to a class of shares are recorded by the specific class. Most Fund expenses are allocated by class based on relative net assets. Shareholder servicing fees are expensed at an annual rate up to 0.10% of Institutional Class and Investor Class shares and 12b-1 fees are expensed at annual rate of 0.25% of average daily net assets of Investor Class shares (See Note 5). Prior to April 16, 2021, 12b-1 fees were expensed at 1.00% and 0.50% of the average daily net assets of the Class C and Class R shares of the Large-Cap Growth Fund. Expenses associated with a specific Fund in the Trust are charged to that Fund. Common Trust expenses are typically allocated evenly between the Funds of the Trust, or by other equitable means.
Use of Estimates – The preparation of financial statements in conformity with GAAP requires management to make estimates and assumptions that affect the reported amounts of assets and liabilities and disclosure of contingent assets and liabilities at the date of the financial statements and the reported amounts of revenues and expenses during the reporting period. Actual results could differ from those estimates.
Jackson Square Funds
Notes to the Financial Statements – Continued
October 31, 2022
3. SECURITIES VALUATION
The Funds have adopted authoritative fair value accounting standards which establish an authoritative definition of fair value and set out a hierarchy for measuring fair value. These standards require additional disclosures about the various inputs and valuation techniques used to develop the measurements of fair value, a discussion in changes in valuation techniques and related inputs during the period and expanded disclosure of valuation Levels for major security types. These inputs are summarized in the three broad Levels listed below:
| Level 1 – | Unadjusted quoted prices in active markets for identical assets or liabilities that the Funds have the ability to access. |
| | |
| Level 2 – | Observable inputs other than quoted prices included in Level 1 that are observable for the asset or liability, either directly or indirectly. These inputs may include quoted prices for the identical instrument on an inactive market, prices for similar instruments, interest rates, prepayment speeds, credit risk, yield curves, default rates and similar data. |
| | |
| Level 3 – | Unobservable inputs for the asset or liability, to the extent relevant observable inputs are not available, representing the Funds’ own assumptions about the assumptions a market participant would use in valuing the asset or liability, and would be based on the best information available. |
Following is a description of the valuation techniques applied to each Fund’s major categories of assets and liabilities measured at fair value on a recurring basis. Each Fund’s investments are carried at fair value.
Equity Securities – Equity securities that are primarily traded on a national securities exchange shall be valued at the last sale price on the exchange on which they are primarily traded on the day of valuation or, if there has been no sale on such day, at the mean between the bid and ask prices. Securities traded primarily in the Nasdaq Global Market System for which market quotations are readily available shall be valued using the Nasdaq Official Closing Price (“NOCP”). If the NOCP is not available, such securities shall be valued at the last sale price on the day of valuation, or if there has been no sale on such day, at the mean between the bid and ask prices. To the extent these securities are actively traded and valuation adjustments are not applied, they are categorized in Level 1 of the fair value hierarchy. If the market for a particular security is not active, and the mean between bid and ask prices is used, these securities are categorized in Level 2 of the fair value hierarchy.
In the case of foreign securities, the occurrence of events after the close of foreign markets, but prior to the time the Funds’ NAV is calculated will result in an adjustment to the trading prices of foreign securities when foreign markets open on the following business day. The Funds will value foreign securities at fair value, taking into account such events in calculating the NAV. In such cases, use of fair valuation can reduce an investor’s ability to seek to profit by estimating the Funds’ NAV in advance of the time the NAV is calculated. All foreign securities, with the exception of Canadian securities and those listed on a U.S. exchange, have an adjustment applied to their trade price and therefore are automatically deemed to be in Level 2 of the fair value hierarchy.
Short-Term Investments – Investments in other mutual funds, including money market funds, are valued at their NAV per share. Deposit accounts are valued at acquisition cost, which approximates fair value. To the extent these securities are actively traded and valuation adjustments are not applied, they are categorized in Level 1 of the fair value hierarchy.
U.S. government securities are normally valued using a model that incorporates market observable data such as reported sales of similar securities, broker quotes, yields, bids, offers, and reference data. These securities are
Jackson Square Funds
Notes to the Financial Statements – Continued
October 31, 2022
valued principally using dealer quotations. U.S. government securities are categorized in Level 2 of the fair value hierarchy depending on the inputs used and market activity levels for specific securities.
The Board of Trustees (the “Board”) has adopted a pricing and valuation policy for use by the Funds and their Valuation Designee (as defined below) in calculating the Funds’ NAV. Pursuant to Rule 2a-5 under the 1940 Act, the Funds have designated the Adviser as its “Valuation Designee” to perform all the fair value determinations as well as to perform all of the responsibilities that may be performed by the Valuation Designee in accordance with Rule 2a-5. The Valuation Designee is authorized to make all necessary determinations of the fair values of portfolio securities and other assets for which market quotations are not readily available or if it is deemed that the prices obtained from brokers and dealers, or independent pricing services are unreliable.
The inputs or methodology used for valuing securities are not an indication of the risk associated with investing in those securities. The following tables are a summary of the inputs used to value each Fund’s securities as of October 31, 2022:
| Large-Cap Growth Fund | | Level 1 | | | Level 2 | | | Level 3 | | | Total | |
Common Stocks | | $ | 212,285,089 | | | $ | — | | | $ | — | | | $ | 212,285,089 | |
Short-Term Investment | | | 4,365,700 | | | | — | | | | — | | | | 4,365,700 | |
| Total Investments in Securities | | $ | 216,650,789 | | | $ | — | | | $ | — | | | $ | 216,650,789 | |
| | | | | | | | | | | | | | | | | |
| SMID-Cap Growth Fund | | Level 1 | | | Level 2 | | | Level 3 | | | Total | |
Common Stocks | | $ | 889,020,442 | | | $ | — | | | $ | — | | | $ | 889,020,442 | |
Short-Term Investment | | | 22,232,750 | | | | — | | | | — | | | | 23,232,750 | |
| Total Investments in Securities | | $ | 912,253,192 | | | $ | — | | | $ | — | | | $ | 912,253,192 | |
Refer to the Schedules of Investments for further information on the classification of investments.
4. INVESTMENT ADVISORY FEE AND OTHER TRANSACTIONS WITH AFFILIATES
The Trust has an agreement with the Adviser to furnish investment advisory services to the Funds. For its services, the Funds pay the Adviser a monthly management fee based upon the average daily net assets of the Funds at the following annual rates:
| Fund | | |
Large-Cap Growth Fund | 0.55% on assets up to $2.5 billion | |
| | 0.525% on assets between $2.5 billion and $5 billion | |
| | 0.50% on assets greater than $5 billion | |
SMID-Cap Growth Fund | 0.75% | |
Prior to April 16, 2021, Delaware Management Company (“DMC”) served as the investment manager of the Predecessor Fund and the Adviser served as the investment sub-adviser. DMC was entitled to receive an annual advisory fee based on the average daily net assets of the Predecessor Fund at 0.65% on the first $500 million, 0.60% on the next $500 million, 0.55% on the next $1.5 billion, and 0.50% on average daily net assets in excess of $2.5 billion. The sub-adviser fees were paid by DMC.
Jackson Square Funds
Notes to the Financial Statements – Continued
October 31, 2022
The Funds’ Adviser has contractually agreed to waive a portion or all of its management fees and/or reimburse the Funds for their expenses to ensure that total annual operating expenses (excluding Rule 12b-1 fees, shareholder servicing fees, acquired fund fees and expenses, brokerage commissions, leverage, interest, taxes, and extraordinary expenses) do not exceed the following rates (based upon the average daily net assets of the Funds):
| Fund | | | | |
Large-Cap Growth Fund | | | 0.64 | % | |
SMID-Cap Growth Fund | | | 0.87 | % | |
Fees waived and expenses reimbursed by the Adviser may be recouped by the Adviser for a period of thirty-six months following the month during which such waiver or reimbursement was made if such recoupment can be achieved without exceeding the expense limit in effect at the time the waiver or reimbursement occurred. The Operating Expense Limitation Agreement is indefinite in term, but cannot be terminated within a year after the effective date of the Funds’ prospectus. After that date, the agreement may be terminated at any time upon 60 days’ written notice by the Board or the Adviser. During the year ended October 31, 2022, the Adviser was able to recoup $180,716 from the Large-Cap Growth Fund, relating to fees waived in the current fiscal year. Waived fees and reimbursed expenses subject to potential recovery by month of expiration are as follows:
| | | November 2022 – | | | November 2023 – | | | November 2024 – | |
| Fund | | October 2023 | | | October 2024 | | | October 2025 | |
Large-Cap Growth Fund | | $ | — | | | $ | — | | | $ | 27,417 | |
SMID-Cap Growth Fund | | | — | | | | — | | | | 22,916 | |
Prior to April 16, 2021, DMC had contractually agreed to limit its fees or reimburse expenses (excluding Rule 12b-1 fees, taxes, interest acquired fund fees and expenses, short sale dividend and interest expenses, brokerage fees, certain insurance costs, and nonroutine expenses or costs, including, but not limited to, those relating to reorganizations, litigation, conducting shareholder meetings and liquidations) to ensure total annual operating expenses do not exceed 0.84% of the average daily net assets of Class A, Class C, Class R and Institutional Class shares, and 0.62% of the Class R6 shares. Waived fees and reimbursed expenses subject to potential recovery during the months that DMC served as investment manager are not eligible for recoupment.
Prior to April 16, 2021, Delaware Investments Fund Services Company (“DIFSC”), an affiliate of DMC, was the Administrator, Fund Accountant and Transfer Agent for the Predecessor Fund. For the period November 1, 2020 through April 16, 2021, the Predecessor Fund was charged $44,527 and $108,437 for Administration and Fund Accounting fees and Transfer Agent fees, respectively.
U.S. Bancorp Fund Services, LLC (the “Administrator”), doing business as U.S. Bank Global Fund Services, acts as the Funds’ Administrator, Transfer Agent, and Fund Accountant. U.S. Bank N.A. (the “Custodian”) serves as the Custodian to the Funds. The Custodian is an affiliate of the Administrator. The Administrator performs various administrative and accounting services for the Funds. The Administrator prepares various federal and state regulatory filings, reports and returns for the Funds; prepares reports and materials to be supplied to the Trustees; monitors the activities of the Custodian; coordinates the payment of the Funds’ expenses and reviews the Funds’ expense accruals. The officers of the Trust, including the Chief Compliance Officer, are employees of the Administrator. As compensation for its services, the Administrator is entitled to a monthly fee at an annual rate based upon the average daily net assets of the Fund, subject to annual minimums. Fees paid by the Funds for administration and fund accounting, transfer agency, custody and compliance services for the year ended October 31, 2022, are disclosed in the Statements of Operations.
Jackson Square Funds
Notes to the Financial Statements – Continued
October 31, 2022
5. DISTRIBUTION & SHAREHOLDER SERVICING FEES
The Funds have adopted a Distribution Plan pursuant to Rule 12b-1 (the “Plan”) in the Investor Class only. The Plan permits the Funds to pay for distribution and related expenses at an annual rate of 0.25% of the Investor Class average daily net assets. The expenses covered by the Plan may include the cost of preparing and distributing prospectuses and other sales material, advertising and public relations expenses, payments to financial intermediaries and compensation of personnel involved in selling shares of the Funds. For the year ended October 31, 2022, the Investor Class of the Funds incurred expenses pursuant to the Plan as follows:
| Fund | | | |
Large-Cap Growth Fund | | $ | 268,532 | |
SMID-Cap Growth Fund | | | 142,521 | |
Prior to April 16, 2021, pursuant to a distribution agreement and distribution plan, the Predecessor Fund paid Delaware Distributors, LP (“DDLP”), the distributor and an affiliate of DMC, an annual 12b-1 fee of 0.25%, 1.00%, and 0.50% of the average daily net assets of the Class A, Class C and Class R shares, respectively. The fees were calculated daily and paid monthly. For the period November 1, 2020 through April 16, 2021, Class A, Class C and Class R incurred expenses of $184,638, $136,085 and $13,554 respectively, pursuant to the Plan.
For the period November 1, 2020 through April 16, 2021, DDLP earned $8,315 for commissions on sales of the Predecessor Fund’s Class A shares. For the same period, DDLP received gross CDSC commissions of $13 and $595 of the Predecessor Fund’s Class A and Class C shares, respectively, and these commissions were entirely used to offset upfront commissions previously paid by the DDLP to broker/dealers on short sales of those shares.
The Funds have entered into a shareholder servicing agreement (the “Agreement”) with the Adviser, where the Adviser acts as the shareholder agent, under which the Funds may pay servicing fees at an annual rate of up to 0.10% of the average daily net assets of the Institutional Class and Investor Class. Payments, if any, to the Adviser under the Agreement may reimburse the Adviser for payments it makes to selected brokers, dealers and administrators which have entered into service agreements with the Adviser for services provided to shareholders of the Funds. Payments may also be made directly to the intermediaries providing shareholder services. The services provided by such intermediaries are primarily designed to assist shareholders of the Fund and include the furnishing of office space and equipment, telephone facilities, personnel and assistance to the Funds in servicing such shareholders. Services provided by such intermediaries also include the provision of support services to the Funds and include establishing and maintaining shareholders’ accounts and record processing, purchase and redemption transactions, answering routine client inquiries regarding the Funds, and providing such other personal services to shareholders as the Fund may reasonably request. For the year ended October 31, 2022, Funds incurred shareholder servicing fees as follows:
| Fund | | Institutional Class | | | Investor Class | |
| Large-Cap Growth Fund | | $ | 223,052 | | | $ | 21,695 | |
| SMID-Cap Growth Fund | | | 520,916 | | | | 57,008 | |
Jackson Square Funds
Notes to the Financial Statements – Continued
October 31, 2022
6. CAPITAL SHARE TRANSACTIONS
| | | Large-Cap Growth Fund | |
| | | Year Ended | | | Year Ended | |
| | | October 31, 2022 | | | October 31, 2021 | |
IS Class(1): | | | | | | |
Shares sold | | | 4,594,166 | | | | 48,909,128 | |
Shares issued in connection with acquisition (See Note 1) | | | — | | | | 2,688,603 | |
Shares issued in reinvestment of distributions | | | 10,561,857 | | | | 34,255 | |
Shares redeemed | | | (3,974,538 | ) | | | (21,937,641 | ) |
Shares redeemed in-kind | | | (38,083,289 | ) | | | — | |
| Net increase (decrease) | | | (26,901,804 | ) | | | 29,694,345 | |
| Institutional Class: | | | | | | | | |
Shares sold | | | 1,796,378 | | | | 13,868,211 | |
Shares issued in connection with acquisition (See Note 1) | | | — | | | | 43,736 | |
Shares issued in reinvestment of distributions | | | 5,756,792 | | | | 16,410,026 | |
Shares redeemed | | | (41,019,288 | ) | | | | |
| Net decrease | | | (33,466,118 | ) | | | (38,342,716 | ) |
Investor Class(2): | | | | | | | | |
Shares sold | | | 156,020 | | | | 794,359 | |
Shares issued in connection with acquisition (See Note 1) | | | — | | | | 2,854 | |
Shares issued in reinvestment of distributions | | | 2,595,893 | | | | 1,335,379 | |
Shares issued in exchange for Class C shares | | | — | | | | 1,058,645 | |
Shares issued in exchanges for Class R shares | | | — | | | | 218,468 | |
Shares redeemed | | | (2,441,001 | ) | | | (2,532,790 | ) |
| Net increase | | | 310,912 | | | | 876,915 | |
Class C(3): | | | | | | | | |
Shares sold | | | — | | | | 38,990 | |
Shares issued in reinvestment of distributions | | | — | | | | 425,030 | |
Shares exchanged for Investor Class shares | | | — | | | | (1,445,946 | ) |
Shares redeemed | | | — | | | | (453,376 | ) |
| Net decrease | | | — | | | | (1,435,302 | ) |
Class R(4): | | | | | | | | |
Shares sold | | | — | | | | 8,512 | |
Shares issued in reinvestment of distributions | | | — | | | | 56,401 | |
Shares exchanged for Investor Class shares | | | — | | | | (238,775 | ) |
Shares redeemed | | | — | | | | (67,049 | ) |
| Net decrease | | | — | | | | (240,911 | ) |
| Net decrease in capital shares | | | (60,057,010 | ) | | | (9,447,669 | ) |
(1) | The IS Class was previously known as Class R6 prior to April 16, 2021. |
(2) | The Investor Class was previously known as Class A prior to April 16, 2021. |
(3) | Class C shares converted to Investor Class shares on April 16, 2021. |
(4) | Class R shares converted to Investor Class shares on April 16, 2021. |
Jackson Square Funds
Notes to the Financial Statements – Continued
October 31, 2022
| | | SMID-Cap Growth Fund | |
| | | Year Ended | | | Year Ended | |
| | | October 31, 2022 | | | October 31, 2021 | |
| IS Class: | | | | | | |
Shares sold | | | 9,374,834 | | | | 7,870,039 | |
Shares issued in reinvestment of distributions | | | 5,810,339 | | | | 1,053,265 | |
Shares redeemed | | | (6,817,863 | ) | | | (3,721,610 | ) |
| Net increase | | | 8,367,310 | | | | 5,201,694 | |
| Institutional Class: | | | | | | | | |
Shares sold | | | 12,188,922 | | | | 7,978,622 | |
Shares issued in reinvestment of distributions | | | 5,491,354 | | | | 1,213,375 | |
Shares redeemed | | | (24,506,324 | ) | | | (5,765,015 | ) |
| Net increase (decrease) | | | (6,826,048 | ) | | | 3,426,982 | |
| Institutional Class: | | | | | | | | |
Shares sold | | | 426,809 | | | | 1,128,873 | |
Shares issued in reinvestment of distributions | | | 648,785 | | | | 140,480 | |
Shares redeemed | | | (1,384,702 | ) | | | (1,021,915 | ) |
| Net increase (decrease) | | | (309,108 | ) | | | 247,438 | |
| Net increase in capital shares | | | 1,232,154 | | | | 8,876,114 | |
7. INVESTMENT TRANSACTIONS
The aggregate purchases and sales, excluding short-term investments, by Fund for the year ended October 31, 2022, were as follows:
| | | U.S. Government Securities | | | Other Securities | |
| Fund | | Purchases | | | Sales | | | Purchases | | | Sales | |
Large-Cap Growth Fund | | $ | — | | | $ | — | | | $ | 290,996,942 | | | $ | 1,307,215,212 | * |
SMID-Cap Growth Fund | | | — | | | | — | | | | 985,142,362 | | | | 1,148,408,122 | |
| * | Sales for the Large-Cap Growth Fund exclude securities redeemed in-kind of $631,793,016 |
8. FEDERAL TAX INFORMATION
The aggregate gross unrealized appreciation and depreciation of securities held by the Funds and the total cost of securities for federal income tax purposes at October 31, 2022, were as follows:
| | | Aggregate Gross | | | Aggregate Gross | | | Net Unrealized | | | Federal Income | |
| Fund | | Appreciation | | | Depreciation | | | Depreciation | | | Tax Cost | |
Large-Cap Growth Fund | | $ | 29,021,268 | | | $ | (66,600,083 | ) | | $ | (37,578,815 | ) | | $ | 254,229,604 | |
SMID-Cap Growth Fund | | | 74,487,830 | | | | (433,471,197 | ) | | | (358,983,367 | ) | | | 1,271,236,559 | |
The differences between book-basis and tax-basis unrealized appreciation (depreciation) is attributable primarily to the deferral of wash sale losses.
Jackson Square Funds
Notes to the Financial Statements – Continued
October 31, 2022
At October 31, 2022, the components of distributable earnings on a tax-basis were as follows:
| | | Undistributed | | | Undistributed | | | Other | | | Net | | | Total | |
| | | Ordinary | | | Long-Term | | | Accumulated | | | Unrealized | | | Distributable | |
| Fund | | Income | | | Capital Gains | | | Losses | | | Depreciation | | | Earnings | |
Large-Cap Growth Fund | | $ | — | | | $ | — | | | $ | (2,167,124 | ) | | $ | (37,578,815 | ) | | $ | (39,745,939 | ) |
SMID-Cap Growth Fund | | | — | | | | — | | | | (187,758,158 | ) | | | (358,983,367 | ) | | | (546,741,525 | ) |
As of October 31, 2022, the SMID-Cap Growth Fund had a non-expiring short-term capital loss carryforward of $181,751,657. A regulated investment company may elect for any taxable year to treat any portion of any qualified late year loss as arising on the first day of the next taxable year. Qualified late year losses are certain capital, and ordinary losses which occur during the portion of a Fund’s taxable year subsequent to October 31 and December 31, respectively. For the taxable year ended October 31, 2022, the Funds did not defer any post-October losses. The Large-Cap Growth Fund deferred, on a tax basis, qualified late year losses of $2,166,644. The SMID-Cap Growth Fund deferred, on a tax basis, qualified late year losses of $4,486,355.
The tax character of distributions paid during the period ended October 31, 2022, was as follows:
| Fund | | Ordinary Income* | | | Long-Term Capital Gains | | | Total | |
Large-Cap Growth Fund | | $ | 21,477,448 | | | $ | 375,478,096 | | | $ | 396,955,544 | |
SMID-Cap Growth Fund | | | — | | | | 315,991,837 | | | | 315,991,837 | |
The tax character of distributions paid during the year ended October 31, 2021, was as follows:
| Fund | | Ordinary Income* | | | Long-Term Capital Gains | | | Total | |
Large-Cap Growth Fund | | $ | 3,743,264 | | | $ | 12,597,530 | | | $ | 16,340,794 | |
SMID-Cap Growth Fund | | | 6,175,803 | | | | 87,775,874 | | | | 93,951,677 | |
| * | For Federal income tax purposes, distributions of short-term capital gains are treated as ordinary income distributions. |
9. LINE OF CREDIT
The Large-Cap Growth Fund and SMID-Cap Growth Fund (collectively, the “Funds”) have established an unsecured line of credit (“LOC”) in the amount of $75,000,000, 15% of a Fund’s gross market value or 33.33% of the fair value of the Fund’s investments, whichever is less. The LOC matures, unless renewed on July 21, 2023. The LOC is intended to provide short-term financing, if necessary, subject to certain restrictions and covenants, in connection with shareholder redemptions and other short-term liquidity needs of the Funds. The LOC is with the Custodian. Interest is charged at the prime rate which was 6.25% as of October 31, 2022. The interest rate during the period was between 3.25% and 6.25%. The Funds have authorized the Custodian to charge any of the accounts of the Funds for any missed payments. For the period ended October 31, 2022, the Funds did not have any borrowings under the LOC.
Prior to April 16, 2021, the Predecessor Fund, along with other Funds in the Delaware Funds (“Participants”) was a participant in a $250,000,000 revolving line of credit (“Agreement”) intended to be used for temporary or emergency purposes as an additional source of liquidity to fund redemptions of investor class shares. Under the Agreement, the Participants were charged an annual commitment fee of 0.15%, which was allocated across the Participants based on a weighted average of the respective net assets of each Participant. The Participants were
Jackson Square Funds
Notes to the Financial Statements – Continued
October 31, 2022
permitted to borrow up to a maximum of one-third of their net assets under the Agreement. Each Participant was individually, and not jointly, liable for its particular advances, if any, under the line of credit. The line of credit available under the Agreement expired on November 2, 2020.
On November 2, 2020, the Predecessor Fund, along with other Participants entered into an amendment to the Agreement for an amount of $225,000,000 to be used as described above. The line of credit available under the Agreement expired November 1, 2021.
The Predecessor Fund had no amounts outstanding during the period November 1, 2020 through April 16, 2021.
10. SECTOR RISKS
As of October 31, 2022, the Large-Cap Growth Fund had a significant portion of their assets invested in the information technology sector. The information technology sector may be more sensitive to changes in domestic and international competition, economic cycles, financial resources, personnel availability, rapid innovation and intellectual property issues.
11. CONTROL OWNERSHIP
The beneficial ownership, either directly or indirectly, of more than 25% of the voting securities of a fund creates a presumption of control of the fund, under Section 2(a)(9) of the 1940 Act. As of October 31, 2022, National Financial Services, for the benefit of its customers, owned 29.79% of the SMID-Cap Growth Fund’s outstanding shares. The Large-Cap Growth Fund did not have any ownership greater than 25%.
12. GENERAL RISK
The global outbreak of COVID-19 has disrupted economic markets and the prolonged economic impact is uncertain. The operational and financial performance of the issuers of securities in which each Fund invests depends on future developments, including the duration and spread of the outbreak, and such uncertainty may in turn impact the value of the Fund’s investments.
On February 24, 2022, Russia commenced a military attack on Ukraine. The outbreak of hostilities between the two countries could result in more widespread conflict and could have a severe adverse effect on the region and the markets. In addition, sanctions imposed on Russia by the United States and other countries, and any sanctions imposed in the future could have a significant adverse impact on the Russian economy and related markets. The price and liquidity of investments may fluctuate widely as a result of the conflict and related events. How long such conflict and related events will last and whether it will escalate further cannot be predicted, nor its effect on the Funds.
Jackson Square Funds
Report of Independent Registered Public Accounting Firm
To the Shareholders of Jackson Square Funds and
Board of Trustees of Managed Portfolio Series
Opinion on the Financial Statements
We have audited the accompanying statements of assets and liabilities, including the schedules of investments, of the funds listed below (“Jackson Square Funds” or the “Funds”), each a series of Managed Portfolio Series, as of October 31, 2022, the related statements of operations, the statements of changes in net assets, the related notes, and the financial highlights for each of the periods indicated below (collectively referred to as the “financial statements”). In our opinion, the financial statements present fairly, in all material respects, the financial position of each of the Funds as of October 31, 2022, the results of their operations, the changes in net assets, and the financial highlights for each of the periods indicated below in conformity with accounting principles generally accepted in the United States of America.
| | | Statements of | |
| | Statements | Changes in | |
Fund Name | of Operations | Net Assets | Financial Highlights |
Jackson Square SMID-Cap Growth Fund | For the year ended | For the years ended | For the years ended |
| | October 31, 2022 | October 31, 2022 | October 31, 2022, 2021, |
| | | and 2021 | 2020, 2019, and 2018 |
| | | | |
Jackson Square Large-Cap Growth Fund | For the year ended | For the years ended | For the years ended |
| | October 31, 2022 | October 31, 2022 | October 31, 2022 and 2021 |
| | | and 2021 | |
The Delaware U.S. Growth Fund, predecessor fund to the Jackson Square Large-Cap Growth Fund, financial highlights for the years ended October 31, 2020, and prior, were audited by other auditors whose report dated December 21, 2020, expressed an unqualified opinion on those financial highlights.
Basis for Opinion
These financial statements are the responsibility of the Funds’ management. Our responsibility is to express an opinion on the Funds’ financial statements based on our audits. We are a public accounting firm registered with the Public Company Accounting Oversight Board (United States) (“PCAOB”) and are required to be independent with respect to the Funds in accordance with the U.S. federal securities laws and the applicable rules and regulations of the Securities and Exchange Commission and the PCAOB.
We conducted our audits in accordance with the standards of the PCAOB. Those standards require that we plan and perform the audit to obtain reasonable assurance about whether the financial statements are free of material misstatement whether due to error or fraud.
Our audits included performing procedures to assess the risks of material misstatement of the financial statements, whether due to error or fraud, and performing procedures that respond to those risks. Such procedures included examining, on a test basis, evidence regarding the amounts and disclosures in the financial statements. Our procedures included confirmation of securities owned as of October 31, 2022, by correspondence with the custodian and brokers. Our audits also included evaluating the accounting principles used and significant estimates made by management, as well as evaluating the overall presentation of the financial statements. We believe that our audits provide a reasonable basis for our opinion.
We have served as the auditor of one or more investment companies advised by Jackson Square Partners, LLC since 2016.
COHEN & COMPANY, LTD.
Milwaukee, Wisconsin
December 30, 2022
Jackson Square Funds
Additional Information (Unaudited)
Statement Regarding the Funds’ Liquidity Risk Management Program
Pursuant to Rule 22e-4 under the Investment Company Act of 1940, Managed Portfolio Series (the “Trust”), on behalf of the Jackson Square Large-Cap Growth Fund and the Jackson Square SMID-Cap Growth Fund (each a “Fund” and together, the “Funds”), has adopted and implemented a written liquidity risk management program (the “Program”) that includes policies and procedures reasonably designed to comply with the requirements of Rule 22e-4, including: (i) assessment, management and periodic review of liquidity risk; (ii) classification of portfolio holdings; (iii) establishment of a highly liquid investment minimum (“HLIM”), as applicable; (iv) limitation on illiquid investments; and (v) redemptions in-kind. The Trust’s Board of Trustees (the “Board”) has approved the designation of Jackson Square Partners, LLC (“Jackson Square”) as the administrator of the Program (the “Program Administrator”). Personnel of Jackson Square conduct the day-to-day operation of the Program pursuant to policies and procedures administered by the Program Administrator.
In accordance with Rule 22e-4, the Board reviewed a report prepared by the Program Administrator (the “Report”) regarding the operation of the Program and its adequacy and effectiveness of implementation for the period January 1, 2021, through December 31, 2021 (the “Reporting Period”). No significant liquidity events impacting the Funds during the Reporting Period or material changes to the Program were noted in the Report.
Under the Program, the Program Administrator manages and periodically reviews each Fund’s liquidity risk, including consideration of applicable factors specified in Rule 22e-4 and the Program. Liquidity risk is defined as the risk that a Fund could not meet shareholder redemption requests without significant dilution of remaining shareholders’ interests in the Fund. In general, this risk was managed during the Reporting Period by monitoring the degree of liquidity of each Fund’s investments, limiting the amount of each Fund’s illiquid investments, and utilizing various risk management tools and facilities available to each Fund for meeting shareholder redemptions, among other means. In the Report, Jackson Square provided its assessment that, based on the information considered in its review, the Program remains reasonably designed to manage each Fund’s liquidity risk and each Fund’ s investment strategy remains appropriate for an open-end fund.
Pursuant to the Program, the Program Administrator oversaw the classification of each of the Funds’ portfolio investments as highly liquid, moderately liquid, less liquid or illiquid during the Reporting Period, including in connection with recording investment classifications on Form N-PORT. The process utilized by Jackson Square for determining the degree of liquidity of each Fund’s investments is supported by one or more third-party liquidity assessment vendors.
Each Fund qualified as a “primarily highly liquid fund” as defined in the Program during the Reporting Period. Accordingly, each Fund was not required to establish a HLIM or comply with the related Program provisions during the Reporting Period.
During the Reporting Period, each Fund’s investments were monitored for compliance with the 15% limitation on illiquid investments pursuant to the Program and in accordance with Rule 22e-4. The Report noted that the Funds did not have any redemptions in-kind during the Reporting Period.
The Report concluded, with respect to each Fund: (i) the Program was implemented and operated effectively to achieve the goal of assessing and managing the Fund’s liquidity risk during the Reporting Period; and (ii) the Fund was able to meet requests for redemption without significant dilution of remaining investors’ interests in the Fund during the Reporting Period.
Jackson Square Funds
Additional Information (Unaudited) – Continued
October 31, 2022
TRUSTEES & OFFICERS
| | | Term of | Number of | | Other |
| | | Office and | Portfolios | | Directorships |
| | Position(s) | Length of | in Trust | | Held by |
| Name, Address and | Held with | Time | Overseen | Principal Occupation(s) | Trustee During |
| Year of Birth | the Trust | Served | by Trustee | During the Past Five Years | the Past Five Years |
| | | | | | |
| Independent Trustees | | | | | |
| | | | | | |
Leonard M. Rush, CPA | Lead | Indefinite | 35 | Retired, Chief Financial Officer, | Independent Trustee, |
615 E. Michigan St. | Independent | Term; Since | | Robert W. Baird & Co. Incorporated | ETF Series Solutions |
Milwaukee, WI 53202 | Trustee | April 2011 | | (2000-2011). | (60 Portfolios) |
Year of Birth: 1946 | and Audit | | | (2012-Present); | |
| | Committee | | | | |
| | Chairman | | | | |
| | | | | | |
David A. Massart | Trustee | Indefinite | 35 | Partner and Managing Director, Beacon | Independent Trustee, |
615 E. Michigan St. | | Term; Since | | Pointe Advisors, LLC (since 2022); | ETF Series Solutions |
Milwaukee, WI 53202 | | April 2011 | | Co-Founder and Chief Investment | (60 Portfolios) |
Year of Birth: 1967 | | | | Strategist; Next Generation Wealth | (2012-Present) |
| | | | | Management, Inc. (2005-2021). | |
Jackson Square Funds
Additional Information (Unaudited) – Continued
October 31, 2022
| | | Term of | Number of | | Other |
| | | Office and | Portfolios | | Directorships |
| | Position(s) | Length of | in Trust | | Held by |
| Name, Address and | Held with | Time | Overseen | Principal Occupation(s) | Trustee During |
| Year of Birth | the Trust | Served | by Trustee | During the Past Five Years | the Past Five Years |
| | | | | | |
David M. Swanson | Trustee and | Indefinite | 35 | Founder and Managing Principal, | Independent Trustee, |
615 E. Michigan St. | Nominating & | Term; Since | | SwanDog Strategic Marketing, LLC | ALPS Variable |
Milwaukee, WI 53202 | Governance | April 2011 | | (2006-present). | Investment Trust |
Year of Birth: 1957 | Committee | | | | (7 Portfolios) |
| | Chairman | | | | (2006-Present); |
| | | | | | Independent Trustee, |
| | | | | | RiverNorth Funds |
| | | | | | (3 Portfolios) (2018- |
| | | | | | Present); RiverNorth |
| | | | | | Managed Duration |
| | | | | | Municipal Income |
| | | | | | Fund Inc. |
| | | | | | (1 Portfolio) (2019- |
| | | | | | Present); RiverNorth |
| | | | | | Specialty Finance |
| | | | | | Corporation |
| | | | | | (1 Portfolio) |
| | | | | | (2018-Present); |
| | | | | | RiverNorth/ |
| | | | | | DoubleLine Strategic |
| | | | | | Opportunity Fund, |
| | | | | | Inc. (1 Portfolio) |
| | | | | | (2018-Present); |
| | | | | | RiverNorth |
| | | | | | Opportunities Fund, |
| | | | | | Inc.(1 Portfolio) |
| | | | | | (2015-Present); |
| | | | | | RiverNorth |
| | | | | | Opportunistic |
| | | | | | Municipal Income |
| | | | | | Fund, Inc. |
| | | | | | (1 Portfolio) (2018- |
| | | | | | Present); RiverNorth |
| | | | | | Flexible Municipal |
| | | | | | Income Fund |
| | | | | | (2020-Present) |
| | | | | | |
Robert J. Kern | Trustee | Indefinite | 35 | Retired (July 2018-Present); Executive | None |
615 E. Michigan St. | | Term; Since | | Vice President, U.S. Bancorp Fund | |
Milwaukee, WI 53202 | | January 2011 | | Services, LLC (1994-2018). | |
Year of Birth: 1958 | | | | | |
Jackson Square Funds
Additional Information (Unaudited) – Continued
October 31, 2022
| | | Term of | Number of | | Other |
| | | Office and | Portfolios | | Directorships |
| | Position(s) | Length of | in Trust | | Held by |
| Name, Address and | Held with | Time | Overseen | Principal Occupation(s) | Trustee During |
| Year of Birth | the Trust | Served | by Trustee | During the Past Five Years | the Past Five Years |
| | | | | | |
| Officers | | | | | |
| | | | | | |
Brian R. Wiedmeyer | President and | Indefinite | N/A | Vice President, U.S. Bancorp Fund | N/A |
615 E. Michigan St. | Principal | Term; Since | | Services, LLC (2005-present). | |
Milwaukee, WI 53202 | Executive | November 2018 | | | |
Year of Birth: 1973 | Officer | | | | |
| | | | | | |
Deborah Ward | Vice President, | Indefinite | N/A | Senior Vice President, U.S. Bancorp | N/A |
615 E. Michigan St. | Chief | Term; Since | | Fund Services, LLC (2004-present). | |
Milwaukee, WI 53202 | Compliance | April 2013 | | | |
Year of Birth: 1966 | Officer and | | | | |
| | Anti-Money | | | | |
| | Laundering | | | | |
| | Officer | | | | |
| | | | | | |
Benjamin Eirich | Treasurer, | Indefinite | N/A | Assistant Vice President, U.S. Bancorp | N/A |
615 E. Michigan St. | Principal | Term; Since | | Fund Services, LLC (2008-present). | |
Milwaukee, WI 53202 | Financial | August 2019 | | | |
Year of Birth: 1981 | Officer and | (Treasurer); | | | |
| | Vice President | Since | | | |
| | | November 2018 | | | |
| | | (Vice President) | | | |
| | | | | | |
John Hadermayer | Secretary | Indefinite | N/A | Vice President, U.S. Bank Global Fund | N/A |
615 E. Michigan St. | | Term; Since | | Services (2022-present); Executive | |
Milwaukee, WI 53202 | | May 2022 | | Director, AQR Capital Management, | |
Year of Birth: 1977 | | LLC (2013-2022). | | | |
| | | | | | |
Douglas Schafer | Vice President | Indefinite | N/A | Assistant Vice President, U.S. Bancorp | N/A |
615 E. Michigan St. | and Assistant | Term; Since | | Fund Services, LLC (2002-present). | |
Milwaukee, WI 53202 | Treasurer | May 2016 | | | |
Year of Birth: 1970 | | (Assistant | | | |
| | | Treasurer); | | | |
| | | Since | | | |
| | | November 2018 | | | |
| | | (Vice President) | | | |
| | | | | | |
Sara J. Bollech | Assistant | Indefinite | N/A | Officer, U.S. Bancorp Fund Services, | N/A |
615 E. Michigan St. | Treasurer and | Term; Since | | LLC (2007-present). | |
Milwaukee, WI 53202 | Vice President | November 2021 | | | |
Year of Birth: 1977 | | | | | |
| | | | | | |
Peter A. Walker, CPA | Assistant | Indefinite | N/A | Officer, U.S. Bancorp Fund Services, | N/A |
615 E. Michigan St. | Treasurer and | Term; Since | | LLC (2016-present). | |
Milwaukee, WI 53202 | Vice President | November 2021 | | | |
Year of Birth: 1993 | | | | | |
Jackson Square Funds
Additional Information (Unaudited) – Continued
October 31, 2022
AVAILABILITY OF FUND PORTFOLIO INFORMATION
Each Fund files complete schedules of portfolio holdings with the SEC for the first and third quarters of each fiscal year on Part F of Form N-PORT. The Funds’ Part F of N-PORT are available on the SEC’s website at www.sec.gov and may be reviewed and coped at the SEC’s Public Reference Room in Washington, D.C. For information on the Public Reference Room call 1-800-SEC-0330. In addition, each Funds’ Part F of Form N-PORT is available without charge upon request by calling 1-844-577-3863.
AVAILABILITY OF FUND PROXY VOTING INFORMATION
A description of the Funds’ Proxy Voting Policies and Procedures is available without charge, upon request, by calling 1-844-577-3863. Information regarding how the Funds voted proxies relating to portfolio securities during the most recent 12-month period ended June 30 is available (1) without charge, upon request, by calling 1-844-577-3863, or (2) on the SEC’s website at www.sec.gov.
QUALIFIED DIVIDEND INCOME/DIVIDENDS RECEIVED DEDUCTION
For the fiscal year ended October 31, 2022, certain dividends paid by the Funds may be reported as qualified dividend income and may be eligible for taxation at capital gains rates. The percentage of dividends declared from ordinary income designated as qualified dividend income was as follows:
| Fund | | | | |
| Large-Cap Growth Fund | | | 9.10 | % | |
| SMID-Cap Growth Fund | | | 0.00 | % | |
For corporate shareholders, the percent of ordinary income distributions qualifying for the corporate dividends received deduction for the fiscal year ended October 31,2022 was as follows:
| Fund | | | | |
| Large-Cap Growth Fund | | | 9.10 | % | |
| SMID-Cap Growth Fund | | | 0.00 | % | |
The percentage of taxable ordinary income distributions that are designated as short-term capital gain distributions under the Internal Revenue Section 871(k)(2)(C) for each Fund were as follows:
| Fund | | | | |
| Large-Cap Growth Fund | | | 100.00 | % | |
| SMID-Cap Growth Fund | | | 0.00 | % | |
Jackson Square Funds
Privacy Notice (Unaudited)
The Funds collect only relevant information about you that the law allows or requires it to have in order to conduct its business and properly service you. The Funds collect financial and personal information about you (“Personal Information”) directly (e.g., information on account applications and other forms, such as your name, address, and social security number, and information provided to access account information or conduct account transactions online, such as password, account number, e-mail address, and alternate telephone number), and indirectly (e.g., information about your transactions with us, such as transaction amounts, account balance and account holdings).
The Funds do not disclose any non-public personal information about its shareholders or former shareholders other than for everyday business purposes such as to process a transaction, service an account, respond to court orders and legal investigations or as otherwise permitted by law. Third parties that may receive this information include companies that provide transfer agency, technology and administrative services to the Funds, as well as the Funds’ investment adviser who is an affiliate of the Funds. If you maintain a retirement/educational custodial account directly with the Funds, we may also disclose your Personal Information to the custodian for that account for shareholder servicing purposes. The Funds limit access to your Personal Information provided to unaffiliated third parties to information necessary to carry out their assigned responsibilities to the Funds. All shareholder records will be disposed of in accordance with applicable law. The Funds maintain physical, electronic and procedural safeguards to protect your Personal Information and requires its third party service providers with access to such information to treat your Personal Information with the same high degree of confidentiality.
In the event that you hold shares of the Funds through a financial intermediary, including, but not limited to, a broker-dealer, credit union, bank or trust company, the privacy policy of your financial intermediary governs how your non-public personal information is shared with unaffiliated third parties.
Jackson Square Funds
Disclosures (Unaudited)
The materials provided herein are for general information purposes only and may not be copied or redistributed without Jackson Square’s prior consent. The views expressed represent Jackson Square’s assessment of the strategy and market environment as of the date identified herein and should not be considered a recommendation to buy, hold, or sell any security, and should not be relied on as research or investment advice. The information in this presentation, including statements concerning financial markets is based on current market conditions, which will fluctuate and may be superseded by subsequent market events or for other reasons.
Opinions expressed are those of Jackson Square Partners, LLC and are subject to change, are not guaranteed and should not be considered investment advice.
Holdings are as of the date provided and subject to change. Please note that where a partial list of holdings has been provided, a full list is available upon request.
Mutual fund investing involves risk. Principal loss is possible. The Funds are non-diversified meaning they may concentrate their assets in fewer individual holdings than a diversified fund. Therefore each Fund is more exposed to individual stock volatility than a diversified fund. Small- and Mid-capitalization companies tend to have limited liquidity and greater price volatility than large capitalization companies. Investments in foreign securities involve greater volatility and political economic and currency risks and differences in accounting methods. These risks are greater in emerging and frontier markets. Frontier market countries generally have smaller economies and even less developed capital markets than traditional emerging markets, and, as a result, the risks of investing in emerging market countries are magnified in frontier market countries. Investments in Real Estate Investment Trusts (REITs) involve additional risks such as declines in the value of real estate and increased susceptibility to adverse economic or regulatory developments. When the Fund buys or sells securities on a foreign stock exchange, the transaction is undertaken in the local currency rather than in U.S. dollars. The value of the foreign currency may increase or decrease against the value of the U.S. dollar, which may impact the value of the Fund’s portfolio holdings and your investment. Other countries may adopt economic policies and/or currency exchange controls that affect their currency valuations in a manner that is disadvantageous to U.S. investors and companies. From time to time, the trading market for a particular security or type of security in which the Funds invest may become less liquid or even illiquid.
Past performance is no guarantee of future results.
Diversification does not assure a profit, nor does it protect against a loss in a declining market.
For comparison purposes, the indices are fully invested and include the reinvestment of income. Index returns do not reflect management fees, transaction costs, or expenses. The indices are unmanaged, and one cannot invest directly in an index. Benchmark information contained herein has been obtained from third party sources believed to be reliable, but we cannot guarantee its accuracy or completeness. All third-party marks are the property of their respective owners. All performance data regarding the indices are historical and are not indicative of future results, and there can be no assurance that these or comparable results will actually be achieved by the strategies or that the strategies’ investment objectives will be achieved.
Russell 1000® Growth Index measures the performance of the large-cap growth segment of the U.S. equity universe. It includes those Russell 1000® companies with higher price-to-book ratios and higher forecasted growth values. The index is unmanned and an investment cannot be made into the index.
Jackson Square Funds
Disclosures (Unaudited) – Continued
Russell 2500® Growth Index. The Russell 2500® Growth Index measures the performance of the small- to mid-cap growth segment of the U.S. equity universe. It includes those Russell 2500® companies with higher price-to-book ratios and higher forecasted growth values. The index is unmanned and an investment cannot be made into the index.
The report must be preceded or accompanied by a prospectus.
Jackson Square Partners, LLC is the adviser to the Jackson Square Partner Funds, which are distributed by Quasar Distributors, LLC.
Investment Adviser
Jackson Square Partners, LLC
One Letterman Drive
Building A, Suite A3-200
San Francisco, California 94129
Distributor
Quasar Distributors, LLC
111 East Kilbourn Avenue, Suite 2200
Milwaukee, Wisconsin 53202
Custodian
U.S. Bank N.A.
1555 North Rivercenter Drive, Suite 302
Milwaukee, Wisconsin 53212
Administrator, Fund Accountant
And Transfer Agent
U.S. Bancorp Fund Services, LLC
615 East Michigan Street
Milwaukee, Wisconsin 53202
Independent Registered Public Accounting Firm
Cohen & Company, Ltd.
342 North Water Street, Suite 830
Milwaukee, Wisconsin 53202
Legal Counsel
Stradley Ronon Stevens & Young, LLP
2005 Market Street, Suite 2600
Philadelphia, Pennsylvania 19103
This report should be accompanied or preceded by a prospectus.
The Funds’ Statement of Additional Information contains additional information about the
Funds’ trustees and is available without charge upon request by calling 1-844-577-3863.
(b) Not Applicable.
Item 2. Code of Ethics.
The Registrant has adopted a code of ethics that applies to the Registrant’s principal executive officer and principal financial officer. The Registrant has not made any substantive amendments to its code of ethics during the period covered by this period.
The Registrant has not granted any waivers from any provisions of the code of ethics during the period covered by this report.
A copy of the Registrant’s code of ethics that applies to the Registrant’s principal executive officer and principal financial officer is filed herewith.
Item 3. Audit Committee Financial Expert.
The Registrant’s Board of Trustees has determined that there is at least one audit committee financial expert serving on its audit committee. Leonard M. Rush is the “audit committee financial expert” and is considered to be “independent” as each term is defined in Item 3 of Form N-CSR.
Item 4. Principal Accountant Fees and Services.
The Registrant has engaged its principal accountant to perform audit services, audit-related services, tax services and other services during the past two fiscal years. “Audit services” refer to performing an audit of the Registrant's annual financial statements or services that are normally provided by the accountant in connection with statutory and regulatory filings or engagements for the past fiscal year. “Audit-related services” refer to the assurance and related services by the principal accountant that are reasonably related to the performance of the audit. “Tax services” refer to professional services rendered by the principal accountant for tax compliance, tax advice, and tax planning, including reviewing the Fund’s tax returns and distribution calculations. There were no “other services” provided by the principal accountant. For the fiscal years ended October 31, 2022 and October 31, 2021, the Funds’ principal accountant was Cohen & Company, Ltd. The following table details the aggregate fees billed or expected to be billed for each of the last fiscal year for audit fees, audit-related fees, tax fees and other fees by the principal accountant.
| | FYE 10/31/2022 | FYE 10/31/2021 |
(a) Audit Fees | $28,000 | $60,500 |
(b) Audit-Related Fees | $0 | $0 |
(c) Tax Fees | $8,500 | $21,000 |
(d) All Other Fees | $0 | $0 |
(e)(1) The audit committee has adopted pre-approval policies and procedures that require the audit committee to pre‑approve all audit and non‑audit services of the Registrant, including services provided to any entity affiliated with the Registrant.
(e)(2) The percentage of fees billed by Cohen & Company, Ltd. applicable to non-audit services pursuant to waiver of pre-approval requirement was as follows:
| | FYE 10/31/2022 | FYE 10/31/2021 |
Audit-Related Fees | 0% | 0% |
Tax Fees | 0% | 0% |
All Other Fees | 0% | 0% |
(f) All of the principal accountant’s hours spent on auditing the Registrant’s financial statements were attributed to work performed by full‑time permanent employees of the principal accountant.
(g) The following table indicates the non-audit fees billed or expected to be billed by the Registrant’s accountant for services to the Registrant and to the Registrant’s investment adviser (and any other controlling entity, etc.—not sub-adviser) for the last two years.
Non-Audit Related Fees | FYE 10/31/2022 | FYE 10/31/2021 |
Registrant | $0 | $0 |
Registrant’s Investment Adviser | $0 | $0 |
(h) The audit committee of the board of trustees/directors has considered whether the provision of non-audit services that were rendered to the Registrant's investment adviser is compatible with maintaining the principal accountant's independence and has concluded that the provision of such non-audit services by the accountant has not compromised the accountant’s independence.
(i) Not applicable.
(j) Not applicable.
Item 5. Audit Committee of Listed Registrants.
Not applicable to Registrants who are not listed issuers (as defined in Rule 10A-3 under the Securities Exchange Act of 1934).
Item 6. Schedule of Investments.
(a) Schedule of Investments is included as part of the report to shareholders filed under Item 1 of this Form.
(b) Not applicable.
Item 7. Disclosure of Proxy Voting Policies and Procedures for Closed-End Management Investment Companies.
Not applicable to open-end investment companies.
Item 8. Portfolio Managers of Closed-End Management Investment Companies.
Not applicable to open-end investment companies.
Item 9. Purchases of Equity Securities by Closed‑End Management Investment Company and Affiliated Purchasers.
Not applicable to open-end investment companies.
Item 10. Submission of Matters to a Vote of Security Holders.
There have been no material changes to the procedures by which shareholders may recommend nominees to the Registrant’s Board of Trustees.
Item 11. Controls and Procedures.
| (a) | The Registrant’s President and Treasurer have reviewed the Registrant's disclosure controls and procedures (as defined in Rule 30a-3(c) under the Investment Company Act of 1940 (the “Act”)) as of a date within 90 days of the filing of this report, as required by Rule 30a-3(b) under the Act and Rules 13a-15(b) or 15d‑15(b) under the Securities Exchange Act of 1934. Based on their review, such officers have concluded that the disclosure controls and procedures are effective in ensuring that information required to be disclosed in this report is appropriately recorded, processed, summarized and reported and made known to them by others within the Registrant and by the Registrant’s service provider. |
| (b) | There were no significant changes in the Registrant's internal control over financial reporting (as defined in Rule 30a-3(d) under the Act) that occurred during the period covered by this report that has materially affected, or is reasonably likely to materially affect, the Registrant's internal control over financial reporting. |
Item 12. Disclosure of Securities Lending Activities for Closed-End Management Investment Companies
Not applicable to open-end investment companies.
Item 13. Exhibits.
(3) Any written solicitation to purchase securities under Rule 23c‑1 under the Act sent or given during the period covered by the report by or on behalf of the Registrant to 10 or more persons. Not applicable to open-end investment companies.
(4) Change in the Registrant’s independent public accountant. There was no change in the Registrant’s independent public accountant for the period covered by this report.
SIGNATURES
Pursuant to the requirements of the Securities Exchange Act of 1934 and the Investment Company Act of 1940, the Registrant has duly caused this report to be signed on its behalf by the undersigned, thereunto duly authorized.
(Registrant) Managed Portfolio Series
By (Signature and Title) /s/Brian R. Wiedmeyer
Brian R. Wiedmeyer, President
Date January 8, 2023
Pursuant to the requirements of the Securities Exchange Act of 1934 and the Investment Company Act of 1940, this report has been signed below by the following persons on behalf of the Registrant and in the capacities and on the dates indicated.
By (Signature and Title) /s/Brian R. Wiedmeyer
Brian R. Wiedmeyer, President
Date January 8, 2023
By (Signature and Title) /s/Benjamin J. Eirich
Benjamin J. Eirich, Treasurer
Date January 6, 2023