Item 1. Report to Stockholders.
Annual Report
December 31, 2022
| Kensington Active Advantage Fund |
Class A Shares (KADAX)
Class C Shares (KADCX)
Institutional Class Shares (KADIX)
| Kensington Managed Income Fund |
Class A Shares (KAMAX)
Class C Shares (KAMCX)
Institutional Class Shares (KAMIX)
| Kensington Dynamic Growth Fund |
Class A Shares (KAGAX)
Class C Shares (KAGCX)
Institutional Class Shares (KAGIX)
1-855-375-3060
www.kensingtonassetmanagement.com
Distributed by Quasar Distributors, LLC
KENSINGTON FUNDS
February 2023
2022 will likely be remembered as a year of great change in the international landscape, with countries increasingly charting their own courses outside the post-World War II monetary framework. The recent invasion of Ukraine by Russia has highlighted the vulnerability of countries to the West’s financial system, and it is likely that the West’s competitors and adversaries will adjust their policies over time to reduce this exposure.
One prime example of this shift is the recent agreement between China and Arab nations in the Gulf to purchase oil and gas in renminbi, rather than dollars. The shift away from the dollar in global trade reduces U.S. influence and increases China’s importance and influence over time. This change is driven by the fact that renminbi oil futures are directly convertible into gold, offering Arab countries the option of being paid in dollars or gold.
Additionally, 2022 was a challenging year for investors, with the S&P 500 finishing the year down 18.11% and the Nasdaq 100 declining by 32.38%. The Federal Reserve’s efforts to slow inflation by tightening financial conditions through rapid Federal Fund rate increases, and the reversal of its quantitative easing program, removed liquidity from the markets. This caught many investors off guard. The shift in dominance between growth and value stocks was noteworthy, with S&P Value outperforming S&P Growth by roughly 2200 basis points.
The bond market experienced the consequences of duration risk with the broad U.S. Treasury Index falling 12.46%. The poor performance was driven by the collision of historically low interest rates, and the worst bout of inflation in a generation, which forced the monetary authorities to embark on a series of rapid rate hikes. Bank loans were an exception, performing relatively well due to their adjustable rates and short duration, while every other major bond index was down double digits. The high yield market declined 11.22%, driven by the general rise in interest rates, but spreads indicate minimal credit risk.
Despite the challenges faced last year, we take pride in having achieved our main objective of preserving investor principal during adverse market conditions. Notwithstanding the subpar performance, we remain hopeful that the previous year has created new opportunities. By being adaptable and staying true to our investment goals, we are confident in our ability to overcome these uncertain times and generate positive returns for our shareholders.
The Kensington Asset Management Team
MARKET OUTLOOK
The U.S. economy is facing persistent inflation with the possibility of a recession, leading to concerns about corporate profits and overall market stability. Historically, equities have rallied an average of 15% following down calendar years, however, the circumstances heading into 2023 are unique. Volatility is expected to persist as liquidity continues to dry up, which can lead to uncertainty across equity markets. A high risk-free rate may negatively impact growth stocks as investors weigh the advantages and disadvantages of the equity risk premium.
In terms of fixed income, there are lingering questions surrounding the Federal Reserve’s rate hikes and the potential for a blowout in spreads in the face of a potential downturn. The increase in current yields, along with the possibility of a reversal by the Federal Reserve, may provide attractive opportunities for patient fixed income investors.
PORTFOLIO MANAGEMENT REPORT
Investment Objective
The Kensington Active Advantage Fund seeks total return.
KENSINGTON FUNDS
How did the Fund perform?
Since the inception date of March 23, 2022, the institutional class shares of the Fund decreased by 7.26%; the load-waived class A shares of the Fund decreased by 7.49%; the class A with maximum load shares of the Fund decreased by 11.90%; the load-waived class C shares of the Fund decreased by 7.95%; and the class C with maximum deferred sales charge load shares of the Fund decreased by 8.86%. A blended 50% Bloomberg U.S. Aggregate Bond and 50% S&P 500 Index decreased by 9.91% for the period.
What factors influenced performance?
Last year, the 60/40 stock/bond portfolio recorded one of its worst years in history, only ranking behind 1931 and 1937. The investment community perceived it as the "Death of the Balanced Fund." The reason for the poor performance was the unusually high correlation between stocks and bonds, which eliminated the historical benefit of bonds acting as a hedge against declining equity prices. As a result, the 60/40 portfolio was unable to insulate losses for investors.
Active Advantage was able to benefit from its flexible mandate to pivot defensively during the difficult market conditions. By moving to a 100% risk-off posture the Fund was able to avoid much of the market drawdown and beat its benchmark by 2.65%. The Fund's reduced overall volatility of 9.29% standard deviation compared to 17.16% for the benchmark was a result of avoiding the market's declines and reducing the impact of elevated stock-bond correlations.
Investment Objective
The Kensington Managed Income Fund seeks income.
How did the Fund perform?
During the period, the institutional class shares of the Fund decreased by 6.11%; the load-waived class A shares of the Fund decreased by 6.31%; the class A with maximum load shares of the Fund decreased by 10.78%; the load-waived class C shares of the Fund decreased by 7.00%; and the class C with maximum deferred sales charge load shares of the Fund decreased by 7.92%. The Bloomberg U.S. Aggregate Bond Index decreased by 13.01% for the period, and the ICE BofA High Yield Master II Index decreased by 11.22% for the period.
What factors influenced performance?
In a challenging year for fixed income, Managed Income adopted a risk-off posture for most of the year. This allowed the Fund to avoid much of the downside volatility that was seen in the market as the Aggregate Bond Index and 10-year Treasury Notes experienced one of the worst performances in history. Managed Income had a low monthly standard deviation of 5.84% compared to 8.33% and 11.85% for the AGG and High Yield Index, respectively. Additionally, the low correlation of 0.44 between Managed Income and the AGG provided diversification to portfolios during a time when correlations across asset classes were high.
Investment Objective
The Kensington Dynamic Growth Fund seeks capital gains.
How did the Fund perform?
During the period, the institutional class shares of the Fund decreased by 8.67%; the load-waived class A shares of the Fund decreased by 8.96%; the class A with maximum load shares of the Fund decreased by 13.28%; the load-waived class C shares of the Fund decreased by 9.65%; and the class C with maximum deferred sales charge load shares of the Fund decreased by 10.55%. The S&P 500 Index decreased by 18.11% for the period.
KENSINGTON FUNDS
What factors influenced performance?
The equity markets experienced a steady decline throughout the first half of the year, with a temporary surge in March. To counter this, Dynamic Growth took a defensive stance, sidestepping the initial losses. The Fund executed three tactical trades in March, May, and June, when the risk was considered acceptable. The Fund achieved year-to-date positive returns in June, but these gains were erased by a selloff caused by inflation concerns. Dynamic Growth remained in a defensive strategy for the rest of the year due to heightened volatility indicators. Dynamic Growth had a strong performance in 2022, finishing 9.44% ahead of the S&P 500 benchmark. The Fund was able to reduce volatility with a standard deviation of 17.43%, compared to 23.0%.
Past performance is no guarantee of future results.
Investors may not invest in an index directly; unlike the Funds’ returns, an index does not reflect any fees or expenses.
Opinions expressed are those of the Investment Manager, are subject to change, are not guaranteed, and should not be considered investment advice.
Investing in a mutual fund involves risk, including loss of principal. There is no guarantee that a Fund will meet its investment objectives. Risks specific to each Fund are detailed in the prospectus and include Management Risk, Market Risk, Underlying Funds Risk, Non- Diversification Risk, Turnover Risk, U.S. Government Securities Risk, and Models and Data Risk. Additional risks that may apply include High-Yield Bond Risk, Fixed-Income Securities Risk, Equity Securities Risk, Foreign Investment Risk, Loans Risk, Small and Mid-Capitalization Companies Risk, LIBOR Risk, and Limited History of Operations Risk. For details regarding each risk, please see the Fund’s prospectus.
The S&P 500 Index is an unmanaged market capitalization-weighted index which is comprised of 500 of the largest U.S. domiciled companies and includes the reinvestment of all dividends.
The NASDAQ 100 Index is a modified capitalization-weighted index which is comprised of 102 equity securities issued by 101 of the largest non-financial companies listed on the NASDAQ stock exchange.
The Russell 2000 Small Cap Index makes up the smallest 2,000 stocks in the Russell 3000 Index, a capitalization-weighted index comprised of the 3,000 largest publicly held companies in the U.S.
The Bloomberg U.S. Aggregate Bond Index is an unmanaged index comprised of U.S. investment grade, fixed rate bond market securities, including government, government agency, corporate and mortgage-backed securities.
ICE BofA High Yield Master II Index measures the performance of below investment grade $US-denominated corporate bonds publicly issued in the US market. The index is unmanaged; includes net reinvested dividends; does not reflect fees or expenses; and is not available for direct investment.
Fund holdings and sector allocations are subject to change at any time and should not be considered a recommendation to buy or sell any security.
Forward price-to-earnings (“Forward P/E”) is a version of the ratio of price-to-earnings (“P/E”) that uses forecasted earnings for the P/E calculation.
This report must be preceded or accompanied by a current prospectus.
Kensington Asset Management, LLC is the adviser to the Funds, distributed by Quasar Distributors, LLC. Member FINRA/SIPC. Kensington Asset Management, LLC is not affiliated with Quasar.
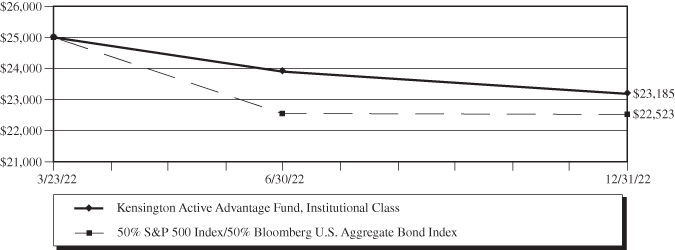
KENSINGTON ACTIVE ADVANTAGE FUND
Value of $25,000 Investment (Unaudited)
The chart assumes an initial investment of $25,000. Performance reflects waivers of fee and operating expenses in effect. In the absence of such waivers, total return would be reduced. Performance data quoted represents past performance and does not guarantee future results. Investment returns and principal value will fluctuate, and when sold, may be worth more or less than their original cost. Performance current to the most recent month-end may be lower or higher than the performance quoted and can be obtained by calling 855-375-3060. Performance assumes the reinvestment of capital gains and income distributions. The performance does not reflect the deduction of taxes that a shareholder would pay on Fund distributions or the redemption of Fund shares.
Rates of Return as of December 31, 2022
| | Since |
| | Inception(1) |
| Class A | -7.49% |
| Class A with load | -11.90% |
| Class C | -7.95% |
| Institutional Class | -7.26% |
50% S&P 500 Index/50% Bloomberg U.S. Aggregate Bond Index(2) | -9.91% |
| (1) | March 23, 2022. |
| (2) | The Standard & Poor’s 500 Index (S&P 500) is an unmanaged, capitalization-weighted index generally representative of the U.S. market for large capitalization stocks. The Bloomberg U.S. Aggregate Bond Index is an unmanaged index comprised of U.S. investment grade, fixed rate bond market securities, including government, government agency, corporate and mortgage-backed securities. Investors cannot invest directly in an index. |
The following is expense information for the Kensington Active Advantage Fund as disclosed in the Fund’s most recent prospectus dated March 19, 2022:
| Class A Gross Expense Ratio – 1.99% | Net Expense Ratio – 1.86% |
| Class C Gross Expense Ratio – 2.74% | Net Expense Ratio – 2.61% |
| Institutional Class Gross Expense Ratio – 1.74% | Net Expense Ratio – 1.61% |
KENSINGTON ACTIVE ADVANTAGE FUND
Kensington Asset Management, LLC (the “Adviser”) has contractually agreed to waive its management fee and pay Fund expenses to ensure that Total Annual Fund Operating Expenses (excluding Acquired Fund Fees and Expenses (“AFFE”), leverage/borrowing interest, interest expense, dividends paid on short sales, taxes, brokerage commissions, extraordinary expenses, and distribution (12b-1) fees and expenses) do not exceed 1.35% of the average net assets of each share class. Fees waived and expenses paid by the Adviser may be recouped by the Adviser for a period of 36 months following the month during which such fee waiver and expense payment was made if such recoupment can be achieved without exceeding the expense limit in effect at the time the fee waiver and expense payment occurred and the expense limit in effect at the time of recoupment. The Operating Expense Limitation Agreement is indefinite in term and cannot be terminated through at least June 30, 2024. Thereafter, the agreement may be terminated at any time upon 60 days’ written notice by the Trust's Board of Trustees (the “Board”) or the Adviser.
The actual net expense ratio applicable to shareholders, as disclosed in the Financial Highlights for the period ended December 31, 2022, was 1.60%, 2.35% and 1.35% for the Class A, Class C and Institutional Class, respectively.
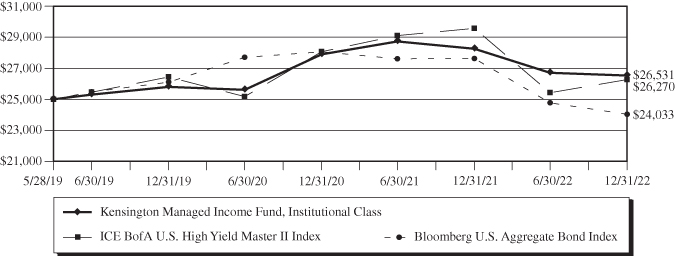
KENSINGTON MANAGED INCOME FUND
Value of $25,000 Investment (Unaudited)
The chart assumes an initial investment of $25,000. Performance reflects waivers of fee and operating expenses in effect. In the absence of such waivers, total return would be reduced. Performance data quoted represents past performance and does not guarantee future results. Investment returns and principal value will fluctuate, and when sold, may be worth more or less than their original cost. Performance current to the most recent month-end may be lower or higher than the performance quoted and can be obtained by calling 855-375-3060. Performance assumes the reinvestment of capital gains and income distributions. The performance does not reflect the deduction of taxes that a shareholder would pay on Fund distributions or the redemption of Fund shares.
Average Annual Rates of Return as of December 31, 2022
| | | | Since |
| | 1 Year | 3 Year | Inception(1) |
| Class A | -6.31% | 0.70% | 1.42% |
| Class A with load | -10.78% | -0.92% | 0.05% |
| Class C | -7.00% | -0.06% | 0.27% |
| Institutional Class | -6.11% | 0.94% | 1.67% |
ICE BofA U.S. High Yield Master II Index(2) | -11.17% | -0.21% | 1.40% |
Bloomberg U.S. Aggregate Bond Index(3) | -13.01% | -2.71% | -1.09% |
| (1) | May 28, 2019 for the Class A and Institutional Class and August 27, 2019 for the Class C. Performance shown for the Class C prior to the inception of the Class C is based on the performance of the Institutional Class shares, adjusted for the lower expenses applicable to Class C shares. |
| (2) | ICE BofA U.S. High Yield Master II Index measures the performance of below investment grade U.S.-denominated corporate bonds publicly issued in the U.S. market. The index is unmanaged; includes net reinvested dividends; does not reflect fees or expenses; and is not available for direct investment. |
| (3) | The Bloomberg U.S. Aggregate Bond Index is an unmanaged index comprised of U.S. investment grade, fixed rate bond market securities, including government, government agency, corporate and mortgage-backed securities. Investors cannot invest directly in an index. |
KENSINGTON MANAGED INCOME FUND
The following is expense information for the Kensington Managed Income Fund as disclosed in the Fund’s most recent prospectus dated March 19, 2022:
Class A Gross Expense Ratio – 2.07%
Class C Gross Expense Ratio – 2.82%
Institutional Class Gross Expense Ratio – 1.82%
Kensington Asset Management, LLC (the “Adviser”) has contractually agreed to waive its management fee and pay Fund expenses to ensure that Total Annual Fund Operating Expenses (excluding AFFE, leverage/borrowing interest, interest expense, dividends paid on short sales, taxes, brokerage commissions, extraordinary expenses, and distribution (12b-1) fees and expenses) do not exceed 1.35% of the average net assets of each share class. Fees waived and expenses paid by the Adviser may be recouped by the Adviser for a period of 36 months following the month during which such fee waiver and expense payment was made if such recoupment can be achieved without exceeding the expense limit in effect at the time the fee waiver and expense payment occurred and the expense limit in effect at the time of recoupment. The Operating Expense Limitation Agreement is indefinite in term and cannot be terminated through at least June 30, 2024. Thereafter, the agreement may be terminated at any time upon 60 days’ written notice by the Trust’s Board of Trustees (the “Board”) or the Adviser.
The actual net expense ratio applicable to shareholders, as disclosed in the Financial Highlights for the period ended December 31, 2022, was 1.61%, 2.36% and 1.36% for the Class A, Class C and Institutional Class, respectively.
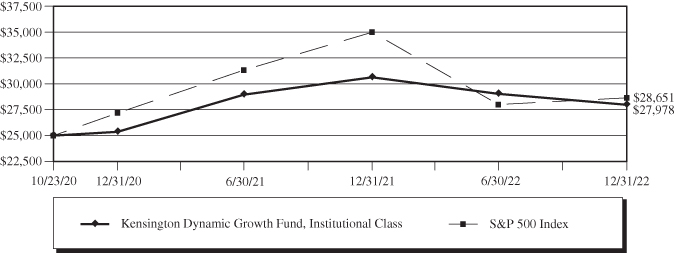
KENSINGTON DYNAMIC GROWTH FUND
Value of $25,000 Investment (Unaudited)
The chart assumes an initial investment of $25,000. Performance reflects waivers of fee and operating expenses in effect. In the absence of such waivers, total return would be reduced. Performance data quoted represents past performance and does not guarantee future results. Investment returns and principal value will fluctuate, and when sold, may be worth more or less than their original cost. Performance current to the most recent month-end may be lower or higher than the performance quoted and can be obtained by calling 855-375-3060. Performance assumes the reinvestment of capital gains and income distributions. The performance does not reflect the deduction of taxes that a shareholder would pay on Fund distributions or the redemption of Fund shares.
Average Annual Rates of Return as of December 31, 2022
| | | Since |
| | 1 Year | Inception(1) |
| Class A | -8.96% | 4.95% |
| Class A with load | -13.28% | 2.64% |
| Class C | -9.65% | 4.24% |
| Institutional Class | -8.67% | 5.28% |
S&P 500 Index(2) | -18.11% | 6.43% |
| (1) | October 23, 2020. |
| (2) | The S&P 500 Index is an unmanaged market capitalization-weighted index which is comprised of 500 of the largest U.S. domiciled companies and includes the reinvestment of all dividends. Investors cannot invest directly in an index. |
The following is expense information for the Kensington Managed Income Fund as disclosed in the Fund’s most recent prospectus dated March 19, 2022:
Class A Gross Expense Ratio – 1.76%
Class C Gross Expense Ratio – 2.51%
Institutional Class Gross Expense Ratio – 1.51%
KENSINGTON DYNAMIC GROWTH FUND
Kensington Asset Management, LLC (the “Adviser”) has contractually agreed to waive its management fee and pay Fund expenses to ensure that Total Annual Fund Operating Expenses (excluding AFFE, leverage/borrowing interest, interest expense, dividends paid on short sales, taxes, brokerage commissions, extraordinary expenses, and distribution (12b-1) fees and expenses) do not exceed 1.38% of the average net assets of each share class. Fees waived and expenses paid by the Adviser may be recouped by the Adviser for a period of 36 months following the month during which such fee waiver and expense payment was made if such recoupment can be achieved without exceeding the expense limit in effect at the time the fee waiver and expense payment occurred and the expense limit in effect at the time of recoupment. The Operating Expense Limitation Agreement is indefinite in term and cannot be terminated through at least June 30, 2024. Thereafter, the agreement may be terminated at any time upon 60 days’ written notice by the Trust’s Board of Trustees (the “Board”) or the Adviser.
The actual net expense ratio applicable to shareholders, as disclosed in the Financial Highlights for the period ended December 31, 2022, was 1.62%, 2.37% and 1.37% for the Class A, Class C and Institutional Class, respectively.
KENSINGTON FUNDS
Expense Examples (Unaudited)
December 31, 2022
As a shareholder of the Fund, you incur two types of costs: (1) transaction costs, including sales charges (loads) on purchase payments, reinvested dividends, or other distributions; exchange fees; and (2) ongoing costs, including management fees; distribution (12b-1) fees; and other Fund expenses. This example is intended to help you understand your ongoing costs (in dollars) of investing in the Fund and to compare these costs with the ongoing costs of investing in other mutual funds. The example is based on an investment of $1,000 invested at the beginning of the period and held for the entire period (July 1, 2022 – December 31, 2022).
ACTUAL EXPENSES
For each class, the first line of the table provides information about actual account values and actual expenses. You may use the information in this line, together with the amount you invested, to estimate the expenses that you paid over the period. Simply divide your account value by $1,000 (for example, an $8,600 account value divided by $1,000 = 8.6), then multiply the result by the number in the first line under the heading entitled “Expenses Paid During Period” to estimate the expenses you paid on your account during this period.
HYPOTHETICAL EXAMPLE FOR COMPARISON PURPOSES
For each class, the second line of the table below provides information about hypothetical account values and hypothetical expenses based on the Fund’s actual expense ratio and an assumed rate of return of 5% per year before expenses, which is not the Fund’s actual return. The hypothetical account values and expenses may not be used to estimate the actual ending account balance or expenses you paid for the period. You may use this information to compare the ongoing costs of investing in the Fund and other funds. To do so, compare this 5% hypothetical example with the 5% hypothetical examples that appear in the shareholder reports of the other funds.
Please note that the expenses shown in the table are meant to highlight your ongoing costs only and do not reflect any transactional costs, such as redemption fees or exchange fees. Therefore, the second line of the table is useful in comparing ongoing costs only, and will not help you determine the relative total costs of owning different funds. In addition, if these transactional costs were included, your costs would have been higher.
Kensington Active Advantage Fund
| | Beginning | Ending | Expenses Paid |
| | Account Value | Account Value | During Period(1) |
| | (7/1/22) | (12/31/22) | (7/1/22 to 12/31/22) |
Institutional Class | | | |
Actual(2) | $1,000.00 | $ 970.10 | $6.70 |
Hypothetical (5% return before expenses) | $1,000.00 | $1,018.40 | $6.87 |
| | | | |
A Class | | | |
Actual(2) | $1,000.00 | $ 969.70 | $7.94 |
Hypothetical (5% return before expenses) | $1,000.00 | $1,017.14 | $8.13 |
| | | | |
C Class | | | |
Actual(2) | $1,000.00 | $ 967.00 | $11.65 |
Hypothetical (5% return before expenses) | $1,000.00 | $1,013.36 | $11.93 |
| (1) | Expenses are equal to the fund’s annualized expense ratio for the most recent six-month period of 1.35%, 1.60% and 2.35% for the Institutional Class, A Class and C Class, respectively, multiplied by the average account value over the period, multiplied 184/365 to reflect the one-half year period. |
| (2) | Based on the actual returns for the six-month period ended December 31, 2022, of -2.99%, -3.03% and -3.30% for the Institutional Class, A Class, and C Class, respectively. |
KENSINGTON FUNDS
Expense Examples (Unaudited) – Continued
December 31, 2022
Kensington Managed Income Fund
| | Beginning | Ending | Expenses Paid |
| | Account Value | Account Value | During Period(1) |
| | (7/1/22) | (12/31/22) | (7/1/22 to 12/31/22) |
Institutional Class | | | |
Actual(2) | $1,000.00 | $ 993.40 | $6.78 |
Hypothetical (5% return before expenses) | $1,000.00 | $1,018.40 | $6.87 |
| | | | |
A Class | | | |
Actual(2) | $1,000.00 | $ 992.40 | $8.04 |
Hypothetical (5% return before expenses) | $1,000.00 | $1,017.14 | $8.13 |
| | | | |
C Class | | | |
Actual(2) | $1,000.00 | $ 989.30 | $11.78 |
Hypothetical (5% return before expenses) | $1,000.00 | $1,013.36 | $11.93 |
| (1) | Expenses are equal to the fund’s annualized expense ratio for the most recent six-month period of 1.35%, 1.60% and 2.35% for the Institutional Class, A Class and C Class, respectively, multiplied by the average account value over the period, multiplied 184/365 to reflect the one-half year period. |
| (2) | Based on the actual returns for the six-month period ended December 31, 2022, of -0.66%, -0.76% and -1.07% for the Institutional Class, A Class, and C Class, respectively. |
Kensington Dynamic Growth Fund
| | Beginning | Ending | Expenses Paid |
| | Account Value | Account Value | During Period(1) |
| | (7/1/22) | (12/31/22) | (7/1/22 to 12/31/22) |
Institutional Class | | | |
Actual(2) | $1,000.00 | $ 963.60 | $ 6.73 |
Hypothetical (5% return before expenses) | $1,000.00 | $1,018.35 | $ 6.92 |
A Class | | | |
Actual(2) | $1,000.00 | $ 962.50 | $ 7.96 |
Hypothetical (5% return before expenses) | $1,000.00 | $1,017.09 | $ 8.19 |
C Class | | | |
Actual(2) | $1,000.00 | $ 958.30 | $11.65 |
Hypothetical (5% return before expenses) | $1,000.00 | $1,013.31 | $11.98 |
| (1) | Expenses are equal to the fund’s annualized expense ratio for the most recent six-month period of 1.36%, 1.61% and 2.36% for the Institutional Class, A Class and C Class, respectively, multiplied by the average account value over the period, multiplied 184/365 to reflect the one-half year period. |
| (2) | Based on the actual returns for the six-month period ended December 31, 2022, of -3.64%, -3.75% and -4.17% for the Institutional Class, A Class, and C Class, respectively. |
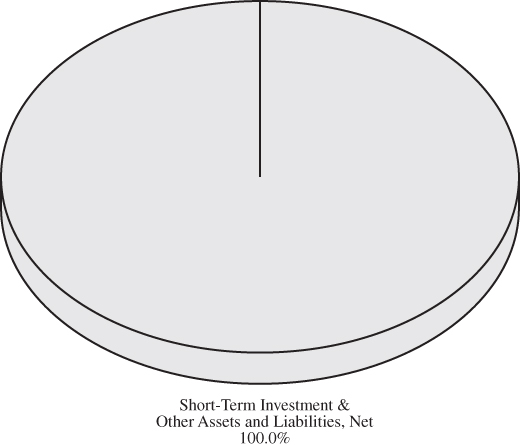
KENSINGTON ACTIVE ADVANTAGE FUND
Allocation of Portfolio(1) (% of Net Assets) (Unaudited)
December 31, 2022
Top Holdings(1)(2) (Unaudited)
as of December 31, 2022
(% of Net Assets)
None
| (1) | Fund holdings and sector allocations are subject to change at any time and are not recommendations to buy or sell any security. |
| (2) | Excludes short-term investments. |
KENSINGTON MANAGED INCOME FUND
Allocation of Portfolio(1) (% of Net Assets) (Unaudited)
December 31, 2022
Top Holdings(1)(2) (Unaudited)
as of December 31, 2022
(% of Net Assets)
None
| (1) | Fund holdings and sector allocations are subject to change at any time and are not recommendations to buy or sell any security. |
| (2) | Excludes short-term investments. |
KENSINGTON DYNAMIC GROWTH FUND
Allocation of Portfolio(1) (% of Net Assets) (Unaudited)
December 31, 2022
Top Holdings(1)(2) (Unaudited)
as of December 31, 2022
(% of Net Assets)
None
| (1) | Fund holdings and sector allocations are subject to change at any time and are not recommendations to buy or sell any security. |
| (2) | Excludes short-term investments. |
KENSINGTON ACTIVE ADVANTAGE FUND
Schedule of Investments
December 31, 2022
Description | | Shares | | | Value | |
| | | | | | | |
| SHORT-TERM INVESTMENT – 99.6% | | | | | | |
| | | | | | | |
| Money Market Deposit Account – 99.6% | | | | | | |
U.S. Bank N.A., 4.230% (a) | | | | | | |
| (Cost $21,263,994) | | | 21,263,994 | | | $ | 21,263,994 | |
| Total Investments – 99.6% | | | | | | | | |
| (Cost $21,263,994) | | | | | | | 21,263,994 | |
| Other Assets in Excess of Liabilities, Net – 0.4% | | | | | | | 81,108 | |
Total Net Assets – 100.0%(1) | | | | | | $ | 21,345,102 | |
| (a) | The Money Market Deposit Account (the “MMDA”) is a short-term investment vehicle in which the Fund holds cash balances. The MMDA will bear interest at a variable rate that is determined based on conditions and may change daily and by any amount. The rate shown is as of December 31, 2022. Cash held by the Funds may be in excess of Federal Deposit Insurance Corporation (FDIC) limitations. |
See Notes to the Financial Statements
KENSINGTON MANAGED INCOME FUND
Schedule of Investments
December 31, 2022
Description | | Shares | | | Value | |
| | | | | | | |
| SHORT-TERM INVESTMENT – 99.4% | | | | | | |
| | | | | | | |
| Money Market Deposit Account – 99.4% | | | | | | |
U.S. Bank N.A., 4.230% (a) | | | | | | |
| (Cost $976,747,691) | | | 976,747,691 | | | $ | 976,747,691 | |
| Total Investments – 99.4% | | | | | | | | |
| (Cost $976,747,691) | | | | | | | 976,747,691 | |
| Other Assets in Excess of Liabilities, Net – 0.6% | | | | | | | 6,008,091 | |
Total Net Assets – 100.0%(1) | | | | | | $ | 982,755,782 | |
| (a) | The Money Market Deposit Account (the “MMDA”) is a short-term investment vehicle in which the Fund holds cash balances. The MMDA will bear interest at a variable rate that is determined based on conditions and may change daily and by any amount. The rate shown is as of December 31, 2022. Cash held by the Funds may be in excess of Federal Deposit Insurance Corporation (FDIC) limitations. |
See Notes to the Financial Statements
KENSINGTON DYNAMIC GROWTH FUND
Schedule of Investments
December 31, 2022
Description | | Shares | | | Value | |
| | | | | | | |
| SHORT-TERM INVESTMENT – 99.1% | | | | | | |
| | | | | | | |
| Money Market Deposit Account – 99.1% | | | | | | |
U.S. Bank N.A., 4.230% (a) | | | | | | |
| (Cost $926,695,533) | | | 926,695,533 | | | $ | 926,695,533 | |
| Total Investments – 99.1% | | | | | | | | |
| (Cost $926,695,533) | | | | | | | 926,695,533 | |
| Other Assets in Excess of Liabilities, Net – 0.9% | | | | | | | 8,592,681 | |
Total Net Assets – 100.0%(1) | | | | | | $ | 935,288,214 | |
| (a) | The Money Market Deposit Account (the “MMDA”) is a short-term investment vehicle in which the Fund holds cash balances. The MMDA will bear interest at a variable rate that is determined based on conditions and may change daily and by any amount. The rate shown is as of December 31, 2022. Cash held by the Funds may be in excess of Federal Deposit Insurance Corporation (FDIC) limitations. |
See Notes to the Financial Statements
KENSINGTON FUNDS
(This Page Intentionally Left Blank.)
KENSINGTON FUNDS
Statements of Assets and Liabilities
December 31, 2022
| | | Kensington | | | Kensington | | | Kensington | |
| | | Active Advantage | | | Managed Income | | | Dynamic Growth | |
| | | Fund | | | Fund | | | Fund | |
| ASSETS: | | | | | | | | | |
| Unaffiliated investments, at fair value | | | | | | | | | |
| (cost $21,263,994, $976,747,691 and | | | | | | | | | |
| $926,695,533, respectively) | | $ | 21,263,994 | | | $ | 976,747,691 | | | $ | 926,695,533 | |
| Cash | | | 193 | | | | — | | | | — | |
| Dividends & interest receivable | | | 57,880 | | | | 3,362,646 | | | | 2,091,540 | |
| Receivable for capital shares sold | | | 74,110 | | | | 4,559,624 | | | | 9,548,597 | |
| Prepaid expenses and other assets | | | 20,467 | | | | 28,802 | | | | 106,985 | |
| Total assets | | | 21,416,644 | | | | 984,698,763 | | | | 938,442,655 | |
| | | | | | | | | | | | | |
| LIABILITIES: | | | | | | | | | | | | |
| Payable for capital shares redeemed | | | 32,532 | | | | 746,393 | | | | 1,959,859 | |
| Payable to investment adviser, net | | | 4,488 | | | | 990,910 | | | | 975,918 | |
| Payable for fund administration & accounting fees | | | 2,456 | | | | 43,410 | | | | 39,505 | |
| Payable for compliance fees | | | 1,447 | | | | 1,558 | | | | 1,440 | |
| Payable for custody fees | | | 840 | | | | 17,219 | | | | 10,565 | |
| Payable for audit & tax fees | | | 17,992 | | | | 18,001 | | | | 18,001 | |
| Payable for transfer agent fees & expenses | | | 6,795 | | | | 35,741 | | | | 28,756 | |
| Accrued expenses | | | 4,887 | | | | 58,182 | | | | 103,297 | |
| Accrued distribution fees | | | 105 | | | | 31,567 | | | | 17,100 | |
| Total liabilities | | | 71,542 | | | | 1,942,981 | | | | 3,154,441 | |
| Net Assets | | $ | 21,345,102 | | | $ | 982,755,782 | | | $ 935,288,214 | |
| | | | | | | | | | | | | |
| NET ASSETS CONSIST OF: | | | | | | | | | | | | |
| Paid-in capital | | $ | 22,401,791 | | | $ | 1,057,772,057 | | | $ | 1,017,881,816 | |
| Total accumulated loss | | | (1,056,689 | ) | | | (75,016,275 | ) | | | (82,593,602 | ) |
| Net Assets | | $ | 21,345,102 | | | $ | 982,755,782 | | | $ | 935,288,214 | |
See Notes to the Financial Statements
KENSINGTON FUNDS
Statements of Assets and Liabilities – Continued
December 31, 2022
| | | Kensington | | | Kensington | | | Kensington | |
| | | Active Advantage | | | Managed Income | | | Dynamic Growth | |
| | | Fund | | | Fund | | | Fund | |
| Institutional Class | | | | | | | | | |
Net assets | | $ | 21,314,671 | | | $ | 895,810,926 | | | $ | 885,688,435 | |
Shares issued and outstanding(1) | | | 2,308,629 | | | | 90,818,309 | | | | 86,679,825 | |
Net asset value, redemption price and | | | | | | | | | | | | |
minimum offering price per share | | $ | 9.23 | | | $ | 9.86 | | | $ | 10.22 | |
| | | | | | | | | | | | | |
| A Class | | | | | | | | | | | | |
Net Assets | | $ | 1,011 | | | $ | 71,700,057 | | | $ | 28,581,903 | |
Shares issued and outstanding(1) | | | 110 | | | | 7,286,546 | | | | 2,815,135 | |
Net asset value, redemption price and | | | | | | | | | | | | |
minimum offering price per share | | $ | 9.22 | | | $ | 9.84 | | | $ | 10.15 | |
Maximum offering price per share(2) | | $ | 9.68 | | | $ | 10.33 | | | $ | 10.66 | |
| | | | | | | | | | | | | |
| C Class | | | | | | | | | | | | |
Net Assets | | $ | 29,420 | | | $ | 15,244,799 | | | $ | 21,017,876 | |
Shares issued and outstanding(1) | | | 3,202 | | | | 1,564,148 | | | | 2,101,116 | |
Net asset value, redemption price and | | | | | | | | | | | | |
minimum offering price per share | | $ | 9.19 | | | $ | 9.75 | | | $ | 10.00 | |
| (1) | Unlimited shares authorized. |
| (2) | The offering price is calculated by dividing the net asset value by 1 minus the maximum sales charge of 4.75%. |
See Notes to the Financial Statements
KENSINGTON FUNDS
Statements of Operations
For the Year or Period Ended December 31, 2022
| | | Kensington | | | Kensington | | | Kensington | |
| | | Active Advantage | | | Managed Income | | | Dynamic Growth | |
| | | Fund(1) | | | Fund | | | Fund | |
| INVESTMENT INCOME: | | | | | | | | | |
Dividend income | | $ | 42,461 | | | $ | 8,439,176 | | | $ | 2,701,843 | |
Interest income | | | 146,425 | | | | 11,772,878 | | | | 6,686,345 | |
Total investment income | | | 188,886 | | | | 20,212,054 | | | | 9,388,188 | |
| | | | | | | | | | | | | |
| EXPENSES: | | | | | | | | | | | | |
Advisory fees (See Note 5) | | | 83,940 | | | | 11,722,914 | | | | 8,628,860 | |
Registration fees | | | 49,385 | | | | 170,927 | | | | 184,577 | |
Fund administration & accounting fees (See Note 5) | | | 30,655 | | | | 453,509 | | | | 342,370 | |
Transfer agent fees & expenses (See Note 5) | | | 29,323 | | | | 341,288 | | | | 268,839 | |
Audit & tax fees | | | 17,992 | | | | 18,001 | | | | 18,001 | |
Trustee fees | | | 12,999 | | | | 7,442 | | | | 12,700 | |
Legal fees | | | 7,462 | | | | 13,916 | | | | 14,221 | |
Custody fees (See Note 5) | | | 6,683 | | | | 99,343 | | | | 63,053 | |
Compliance fees (See Note 5) | | | 6,203 | | | | 5,169 | | | | 5,051 | |
Other fees | | | 2,652 | | | | 41,789 | | | | 39,362 | |
Postage and printing fees | | | 1,695 | | | | 77,008 | | | | 45,154 | |
Insurance fees | | | — | | | | 7,675 | | | | 3,782 | |
Distribution fees (See Note 6): | | | | | | | | | | | | |
| A Class | | | 3 | | | | 190,957 | | | | 73,262 | |
| C Class | | | 103 | | | | 157,666 | | | | 183,579 | |
Total expenses before recoupment/reimbursement | | | 249,095 | | | | 13,307,604 | | | | 9,882,811 | |
Fee recoupment | | | — | | | | 390 | | | | — | |
Less: expense reimbursement by investment adviser | | | (158,334 | ) | | | (187,525 | ) | | | (140,372 | ) |
Net expenses | | | 90,761 | | | | 13,120,469 | | | | 9,742,439 | |
| NET INVESTMENT INCOME (LOSS) | | | 98,125 | | | | 7,091,585 | | | | (354,251 | ) |
| | | | | | | | | | | | | |
| REALIZED AND UNREALIZED | | | | | | | | | | | | |
| GAIN (LOSS) ON INVESTMENTS | | | | | | | | | | | | |
Net realized loss on unaffiliated investments | | | (1,056,889 | ) | | | (74,457,529 | ) | | | (82,593,602 | ) |
Capital gain distributions from | | | | | | | | | | | | |
underlying investment companies | | | — | | | | 5,559,843 | | | | — | |
Net realized loss on affiliated investments | | | — | | | | (4,013,651 | ) | | | — | |
Net change in unrealized appreciation/depreciation | | | | | | | | | | | | |
of unaffiliated investments | | | — | | | | 5,100,259 | | | | 4,544,612 | |
Net change in unrealized appreciation/depreciation | | | | | | | | | | | | |
of affiliated investments | | | — | | | | — | | | | — | |
Net realized and unrealized loss on investments | | | (1,056,889 | ) | | | (67,811,078 | ) | | | (78,048,990 | ) |
| | | | | | | | | | | | | |
| NET DECREASE IN NET ASSETS | | | | | | | | | | | | |
| RESULTING FROM OPERATIONS | | $ | (958,764 | ) | | $ | (60,719,493 | ) | | $ | (78,403,241 | ) |
| (1) | For the period March 23, 2022 (inception date of the Fund) through December 31, 2022. |
See Notes to the Financial Statements
KENSINGTON FUNDS
(This Page Intentionally Left Blank.)
KENSINGTON FUNDS
Statements of Changes in Net Assets
| | | Kensington Active | | | Kensington | |
| | | Advantage Fund | | | Managed Income Fund | |
| | | Period | | | | | | | |
| | | Since Inception(1) | | | | | | | |
| | | through | | | Year Ended | | | Year Ended | |
| | | December 31, | | | December 31, | | | December 31, | |
| | | 2022 | | | 2022 | | | 2021 | |
| OPERATIONS: | | | | | | | | | |
Net investment income | | $ | 98,125 | | | $ | 7,091,585 | | | $ | 14,802,406 | |
Net realized gain (loss) on unaffiliated investments | | | (1,056,889 | ) | | | (74,457,529 | ) | | | 4,216,178 | |
Net realized loss on affiliated investments | | | — | | | | (4,013,651 | ) | | | — | |
Capital gain distributions from | | | | | | | | | | | | |
underlying investment companies | | | — | | | | 5,559,843 | | | | 826,908 | |
Net change in unrealized appreciation/depreciation | | | | | | | | | | | | |
of unaffiliated investments | | | — | | | | 5,100,259 | | | | (19,613,093 | ) |
Net change in unrealized appreciation/depreciation | | | | | | | | | | | | |
of affiliated investments | | | — | | | | — | | | | — | |
Net increase (decrease) in net assets resulting from operations | | | (958,764 | ) | | | (60,719,493 | ) | | | 232,399 | |
| CAPITAL SHARE TRANSACTIONS: | | | | | | | | | | | | |
Institutional Class: | | | | | | | | | | | | |
| Proceeds from shares sold | | | 24,327,003 | | | | 688,576,129 | | | | 575,574,722 | |
| Proceeds from reinvestment of distributions | | | 93,718 | | | | 5,875,858 | | | | 15,937,627 | |
| Payments for shares redeemed | | | (2,051,041 | ) | | | (459,176,586 | ) | | | (146,512,492 | ) |
Increase in net assets from Institutional Class transactions | | | 22,369,680 | | | | 235,275,401 | | | | 444,999,857 | |
A Class: | | | | | | | | | | | | |
Proceeds from shares sold(2) | | | 1,095 | | | | 58,427,602 | | | | 50,723,419 | |
| Proceeds from reinvestment of distributions | | | — | | | | 381,465 | | | | 1,656,457 | |
| Payments for shares redeemed | | | — | | | | (42,545,640 | ) | | | (27,691,206 | ) |
Increase in net assets from A Class transactions | | | 1,095 | | | | 16,263,427 | | | | 24,688,670 | |
C Class: | | | | | | | | | | | | |
| Proceeds from shares sold | | | 31,000 | | | | 5,827,693 | | | | 8,398,109 | |
| Proceeds from reinvestment of distributions | | | 16 | | | | 50,730 | | | | 347,280 | |
Payments for shares redeemed(2) | | | — | | | | (6,142,117 | ) | | | (3,375,996 | ) |
Increase (Decrease) in net assets from C Class transactions | | | 31,016 | | | | (263,694 | ) | | | 5,369,393 | |
Net increase in net assets resulting | | | | | | | | | | | | |
from capital share transactions | | | 22,401,791 | | | | 251,275,134 | | | | 475,057,920 | |
See Notes to the Financial Statements
KENSINGTON FUNDS
Statements of Changes in Net Assets – Continued
| | | Kensington Active | | | Kensington | |
| | | Advantage Fund | | | Managed Income Fund | |
| | | Period | | | | | | | |
| | | Since Inception(1) | | | | | | | |
| | | through | | | Year Ended | | | Year Ended | |
| | | December 31, | | | December 31, | | | December 31, | |
| | | 2022 | | | 2022 | | | 2021 | |
| DISTRIBUTIONS TO SHAREHOLDERS: | | | | | | | | | |
| Institutional Class | | $ | (97,873 | ) | | $ | (6,656,393 | ) | | $ | (20,347,069 | ) |
| A Class | | | (3 | ) | | | (391,530 | ) | | | (1,789,734 | ) |
| C Class | | | (49 | ) | | | (53,306 | ) | | | (371,543 | ) |
Total distributions to shareholders | | | (97,925 | ) | | | (7,101,229 | ) | | | (22,508,346 | ) |
| TOTAL INCREASE IN NET ASSETS | | | 21,345,102 | | | | 183,454,412 | | | | 452,781,973 | |
| NET ASSETS: | | | | | | | | | | | | |
Beginning of period | | | — | | | | 799,301,370 | | | | 346,519,397 | |
End of period | | $ | 21,345,102 | | | $ | 982,755,782 | | | $ | 799,301,370 | |
| TRANSACTIONS IN SHARES: | | | | | | | | | | | | |
Institutional Class: | | | | | | | | | | | | |
| Shares sold | | | 2,517,646 | | | | 67,300,002 | | | | 52,663,848 | |
| Shares issued to holders in reinvestment of dividends | | | 10,139 | | | | 595,084 | | | | 1,479,504 | |
| Shares redeemed | | | (219,156 | ) | | | (45,271,897 | ) | | | (13,426,701 | ) |
Increase in Institutional Class shares outstanding | | | 2,308,629 | | | | 22,623,189 | | | | 40,716,651 | |
A Class: | | | | | | | | | | | | |
Shares sold(2) | | | 110 | | | | 5,642,866 | | | | 4,649,893 | |
| Shares issued to holders in reinvestment of dividends | | | — | | | | 38,767 | | | | 153,890 | |
| Shares redeemed | | | — | | | | (4,184,070 | ) | | | (2,550,368 | ) |
Increase in A Class shares outstanding | | | 110 | | | | 1,497,563 | | | | 2,253,415 | |
C Class: | | | | | | | | | | | | |
| Shares sold | | | 3,200 | | | | 571,436 | | | | 775,632 | |
| Shares issued to holders in reinvestment of dividends | | | 2 | | | | 5,203 | | | | 32,465 | |
Shares redeemed(2) | | | — | | | | (603,051 | ) | | | (311,460 | ) |
Increase (decrease) in C Class shares outstanding | | | 3,202 | | | | (26,412 | ) | | | 496,637 | |
| Net increase in shares outstanding | | | 2,311,941 | | | | 24,094,340 | | | | 43,466,703 | |
| (1) | March 23, 2022. |
| (2) | Includes exchanges between share classes of the fund. |
See Notes to the Financial Statements
KENSINGTON FUNDS
Statements of Changes in Net Assets – Continued
| | | Kensington | |
| | | Dynamic Growth Fund | |
| | | Year Ended | | | Year Ended | |
| | | December 31, | | | December 31, | |
| | | 2022 | | | 2021 | |
| OPERATIONS: | | | | | | |
Net investment loss | | $ | (354,251 | ) | | $ | (1,759,440 | ) |
Net realized gain (loss) on investments | | | (82,593,602 | ) | | | 38,567,920 | |
Net change in unrealized appreciation/depreciation of investments | | | 4,544,612 | | | | (6,513,138 | ) |
Net increase (decrease) in net assets resulting from operations | | | (78,403,241 | ) | | | 30,295,342 | |
| CAPITAL SHARE TRANSACTIONS: | | | | | | | | |
Institutional Class: | | | | | | | | |
| Proceeds from shares sold | | | 974,697,042 | | | | 316,815,125 | |
| Proceeds from reinvestment of distributions | | | 8,152,939 | | | | 19,265,419 | |
| Payments for shares redeemed | | | (354,416,549 | ) | | | (59,194,427 | ) |
Increase in net assets from Institutional Class transactions | | | 628,433,432 | | | | 276,886,117 | |
A Class: | | | | | | | | |
Proceeds from shares sold(1) | | | 23,975,548 | | | | 19,200,985 | |
| Proceeds from reinvestment of distributions | | | 269,781 | | | | 1,267,298 | |
| Payments for shares redeemed | | | (12,834,776 | ) | | | (3,141,753 | ) |
Increase in net assets from A Class transactions | | | 11,410,553 | | | | 17,326,530 | |
C Class: | | | | | | | | |
| Proceeds from shares sold | | | 14,587,548 | | | | 11,496,433 | |
| Proceeds from reinvestment of distributions | | | 166,475 | | | | 728,659 | |
Payments for shares redeemed(1) | | | (2,797,240 | ) | | | (2,633,879 | ) |
Increase in net assets from C Class transactions | | | 11,956,783 | | | | 9,591,213 | |
| Net increase in net assets resulting from capital share transactions | | | 651,800,768 | | | | 303,803,860 | |
See Notes to the Financial Statements
KENSINGTON FUNDS
Statements of Changes in Net Assets – Continued
| | | Kensington | |
| | | Dynamic Growth Fund | |
| | | Year Ended | | | Year Ended | |
| | | December 31, | | | December 31, | |
| | | 2022 | | | 2021 | |
| DISTRIBUTIONS TO SHAREHOLDERS: | | | | | | |
| Institutional Class | | $ | (8,635,460 | ) | | $ | (25,264,064 | ) |
| A Class | | | (279,507 | ) | | | (1,541,537 | ) |
| C Class | | | (209,684 | ) | | | (866,507 | ) |
Total distributions to shareholders | | | (9,124,651 | ) | | | (27,672,108 | ) |
| TOTAL INCREASE IN NET ASSETS | | | 564,272,876 | | | | 306,427,094 | |
| NET ASSETS: | | | | | | | | |
Beginning of year | | | 371,015,338 | | | | 64,588,244 | |
End of year | | $ | 935,288,214 | | | $ | 371,015,338 | |
| TRANSACTIONS IN SHARES: | | | | | | | | |
Institutional Class: | | | | | | | | |
| Shares sold | | | 88,890,176 | | | | 27,537,835 | |
| Shares issued to holders in reinvestment of dividends | | | 797,744 | | | | 1,701,892 | |
| Shares redeemed | | | (33,035,251 | ) | | | (5,038,215 | ) |
Increase in Institutional Class shares outstanding | | | 56,652,669 | | | | 24,201,512 | |
A Class: | | | | | | | | |
Shares sold(1) | | | 2,175,317 | | | | 1,618,214 | |
| Shares issued to holders in reinvestment of dividends | | | 26,579 | | | | 112,349 | |
| Shares redeemed | | | (1,200,173 | ) | | | (272,433 | ) |
Increase in A Class shares outstanding | | | 1,001,723 | | | | 1,458,130 | |
C Class: | | | | | | | | |
| Shares sold | | | 1,335,947 | | | | 958,354 | |
| Shares issued to holders in reinvestment of dividends | | | 16,648 | | | | 65,059 | |
Shares redeemed(1) | | | (260,725 | ) | | | (220,579 | ) |
Increase in C Class shares outstanding | | | 1,091,870 | | | | 802,834 | |
| Net increase in shares outstanding | | | 58,746,262 | | | | 26,462,476 | |
| (1) | Includes exchanges between share classes of the fund. |
See Notes to the Financial Statements
KENSINGTON ACTIVE ADVANTAGE FUND
Financial Highlights
Institutional Class
| | | Since Inception(1) | |
| | | through | |
| | | December 31, | |
| | | 2022 | |
| | | | |
PER COMMON SHARE DATA(2): | | | |
Net asset value, beginning of period | | $ | 10.00 | |
| | | | | |
| INVESTMENT OPERATIONS: | | | | |
Net investment income(3) | | | 0.04 | |
| Net realized and unrealized loss on investments | | | (0.77 | ) |
Total from investment operations | | | (0.73 | ) |
| | | | | |
| LESS DISTRIBUTIONS FROM: | | | | |
| Net investment income | | | (0.04 | ) |
| Net realized gains | | | — | |
Total distributions | | | (0.04 | ) |
| | | | | |
Net asset value, end of period | | $ | 9.23 | |
| | | | | |
TOTAL RETURN(4) | | | (7.26 | )% |
| | | | | |
| SUPPLEMENTAL DATA AND RATIOS: | | | | |
Net assets, end of period (in 000’s) | | $ | 21,315 | |
Ratio of expenses to average net assets(5)(6): | | | | |
| Before expense waiver | | | 3.64 | % |
| After expense waiver | | | 1.35 | % |
Ratio of net investment gain to average net assets(6) | | | 1.46 | % |
Portfolio turnover rate(4) | | | 1,515 | % |
| (1) | March 23, 2022. |
| (2) | For an Institutional Class Share outstanding for the entire period. |
| (3) | Recognition of net investment income by the Fund is affected by the timing of the declaration of dividends by the underlying investment companies in which the Fund invests. |
| (4) | Not annualized for periods less than one year. |
| (5) | Does not include expenses of investment companies in which the Fund invests. |
| (6) | Annualized for periods less than one year. |
See Notes to the Financial Statements
KENSINGTON ACTIVE ADVANTAGE FUND
Financial Highlights – Continued
A Class
| | | Since Inception(1) | |
| | | through | |
| | | December 31, | |
| | | 2022 | |
PER COMMON SHARE DATA(2): | | | |
Net asset value, beginning of period | | $ | 10.00 | |
| | | | | |
| INVESTMENT OPERATIONS: | | | | |
Net investment income(3) | | | 0.09 | |
| Net realized and unrealized loss on investments | | | (0.84 | ) |
Total from investment operations | | | (0.75 | ) |
| | | | | |
| LESS DISTRIBUTIONS FROM: | | | | |
| Net investment income | | | (0.03 | ) |
| Net realized gains | | | — | |
Total distributions | | | (0.03 | ) |
| | | | | |
Net asset value, end of period | | $ | 9.22 | |
| | | | | |
TOTAL RETURN(4)(5) | | | (7.49 | )% |
| | | | | |
| SUPPLEMENTAL DATA AND RATIOS: | | | | |
Net assets, end of period (in 000’s) | | $ | 1 | |
Ratio of expenses to average net assets(6)(7): | | | | |
| Before expense waiver | | | 255.94 | % |
| After expense waiver | | | 1.60 | % |
Ratio of net investment income to average net assets(7) | | | 1.20 | % |
Portfolio turnover rate(5) | | | 1,515 | % |
| (1) | March 23, 2022. |
| (2) | For an A Class Share outstanding for the entire period. |
| (3) | Recognition of net investment income by the Fund is affected by the timing of the declaration of dividends by the underlying investment companies in which the Fund invests. |
| (4) | Total return does not reflect sales charges. |
| (5) | Not annualized for periods less than one year. |
| (6) | Does not include expenses of investment companies in which the Fund invests. |
| (7) | Annualized for periods less than one year. |
See Notes to the Financial Statements
KENSINGTON ACTIVE ADVANTAGE FUND
Financial Highlights – Continued
C Class
| | | Since Inception(1) | |
| | | through | |
| | | December 31, | |
| | | 2022 | |
PER COMMON SHARE DATA(2): | | | |
Net asset value, beginning of period | | $ | 10.00 | |
| | | | | |
| INVESTMENT OPERATIONS: | | | | |
Net investment income(3) | | | 0.02 | |
| Net realized and unrealized loss on investments | | | (0.81 | ) |
Total from investment operations | | | (0.79 | ) |
| | | | | |
| LESS DISTRIBUTIONS FROM: | | | | |
| Net investment income | | | (0.02 | ) |
| Net realized gains | | | — | |
Total distributions | | | (0.02 | ) |
| | | | | |
Net asset value, end of period | | $ | 9.19 | |
| | | | | |
TOTAL RETURN(4)(5) | | | (7.95 | )% |
| | | | | |
| SUPPLEMENTAL DATA AND RATIOS: | | | | |
Net assets, end of period (in 000’s) | | $ | 29 | |
Ratio of expenses to average net assets(6)(7): | | | | |
| Before expense waiver | | | 23.83 | % |
| After expense waiver | | | 2.35 | % |
Ratio of net investment income to average net assets(7) | | | 0.46 | % |
Portfolio turnover rate(5) | | | 1,515 | % |
| (1) | March 23, 2022. |
| (2) | For a C Class Share outstanding for the entire period. |
| (3) | Recognition of net investment income by the Fund is affected by the timing of the declaration of dividends by the underlying investment companies in which the Fund invests. |
| (4) | Total return does not reflect sales charges. |
| (5) | Not annualized for periods less than one year. |
| (6) | Does not include expenses of investment companies in which the Fund invests. |
| (7) | Annualized for periods less than one year. |
KENSINGTON MANAGED INCOME FUND
Financial Highlights
Institutional Class
| | | Year | | | Year | | | Year | | | Since Inception(1) | |
| | | Ended | | | Ended | | | Ended | | | through | |
| | | December 31, | | | December 31, | | | December 31, | | | December 31, | |
| | | 2022 | | | 2021 | | | 2020 | | | 2019 | |
PER COMMON SHARE DATA(2): | | | | | | | | | | | | |
Net asset value, beginning of period | | $ | 10.58 | | | $ | 10.80 | | | $ | 10.21 | | | $ | 10.00 | |
| | | | | | | | | | | | | | | | | |
| INVESTMENT OPERATIONS: | | | | | | | | | | | | | | | | |
Net investment income(3) | | | 0.07 | | | | 0.28 | (4) | | | 0.32 | (4) | | | 0.17 | (4) |
| Net realized and unrealized | | | | | | | | | | | | | | | | |
| gain (loss) on investments | | | (0.72 | ) | | | (0.13 | ) | | | 0.51 | | | | 0.15 | |
Total from investment operations | | | (0.65 | ) | | | 0.15 | | | | 0.83 | | | | 0.32 | |
| | | | | | | | | | | | | | | | | |
| LESS DISTRIBUTIONS FROM: | | | | | | | | | | | | | | | | |
| Net investment income | | | (0.07 | ) | | | (0.27 | ) | | | (0.21 | ) | | | (0.11 | ) |
| Net realized gains | | | — | | | | (0.10 | ) | | | (0.02 | ) | | | — | |
| Return of capital | | | — | | | | — | | | | (0.01 | ) | | | — | |
Total distributions | | | (0.07 | ) | | | (0.37 | ) | | | (0.24 | ) | | | (0.11 | ) |
| | | | | | | | | | | | | | | | | |
Net asset value, end of period | | $ | 9.86 | | | $ | 10.58 | | | $ | 10.80 | | | $ | 10.21 | |
| | | | | | | | | | | | | | | | | |
TOTAL RETURN(5) | | | (6.11 | )% | | | 1.29 | % | | | 8.13 | % | | | 3.20 | % |
| | | | | | | | | | | | | | | | | |
| SUPPLEMENTAL DATA AND RATIOS: | | | | | | | | | | | | | | | | |
Net assets, end of period (in 000’s) | | $ | 895,811 | | | $ | 721,445 | | | $ | 296,660 | | | $ | 54,723 | |
Ratio of expenses to average net assets(6)(7)(8): | | | | | | | | | | | | | | | | |
| Before expense waiver/recoupment | | | 1.38 | % | | | 1.41 | % | | | 1.59 | % | | | 2.20 | % |
| After expense waiver/recoupment | | | 1.36 | % | | | 1.41 | % | | | 1.61 | % | | | 1.99 | % |
Ratio of net investment income to average net assets(7) | | | 0.79 | % | | | 2.54 | % | | | 3.06 | % | | | 2.83 | % |
Portfolio turnover rate(5) | | | 1,244 | % | | | 220 | % | | | 233 | % | | | 61 | % |
| | | | | | | | | | | | | | | | | |
| (1) | May 28, 2019. |
| (2) | For an Institutional Class Share outstanding for the entire period. |
| (3) | Recognition of net investment income by the Fund is affected by the timing of the declaration of dividends by the underlying investment companies in which the Fund invests. |
| (4) | Per share amounts calculated using average shares method. |
| (5) | Not annualized for periods less than one year. |
| (6) | Does not include expenses of investment companies in which the Fund invests. |
| (7) | Annualized for periods less than one year. |
| (8) | On June 24, 2022, the Adviser lowered the limit of annual operating expenses from 1.45% to 1.35%. |
See Notes to the Financial Statements
KENSINGTON MANAGED INCOME FUND
Financial Highlights – Continued
A Class
| | | Year | | | Year | | | Year | | | Since Inception(1) | |
| | | Ended | | | Ended | | | Ended | | | through | |
| | | December 31, | | | December 31, | | | December 31, | | | December 31, | |
| | | 2022 | | | 2021 | | | 2020 | | | 2019 | |
PER COMMON SHARE DATA(2): | |
Net asset value, beginning of period | | $ | 10.56 | | | $ | 10.78 | | | $ | 10.20 | | | $ | 10.00 | |
| | | | | | | | | | | | | | | | | |
| INVESTMENT OPERATIONS: | |
Net investment income(3) | | | 0.05 | | | | 0.25 | (4) | | | 0.31 | (4) | | | 0.15 | (4) |
| Net realized and unrealized | | | | | | | | | | | | | | | | |
| gain (loss) on investments | | | (0.72 | ) | | | (0.13 | ) | | | 0.49 | | | | 0.15 | |
Total from investment operations | | | (0.67 | ) | | | 0.12 | | | | 0.80 | | | | 0.30 | |
| | | | | | | | | | | | | | | | | |
| LESS DISTRIBUTIONS FROM: | |
| Net investment income | | | (0.05 | ) | | | (0.24 | ) | | | (0.19 | ) | | | (0.10 | ) |
| Net realized gains | | | — | | | | (0.10 | ) | | | (0.02 | ) | | | — | |
| Return of capital | | | — | | | | — | | | | (0.01 | ) | | | — | |
Total distributions | | | (0.05 | ) | | | (0.34 | ) | | | (0.22 | ) | | | (0.10 | ) |
| | | | | | | | | | | | | | | | | |
Net asset value, end of period | | $ | 9.84 | | | $ | 10.56 | | | $ | 10.78 | | | $ | 10.20 | |
| | | | | | | | | | | | | | | | | |
TOTAL RETURN(5)(6) | | | (6.31 | )% | | | 1.05 | % | | | 7.87 | % | | | 3.01 | % |
| | | | | | | | | | | | | | | | | |
| SUPPLEMENTAL DATA AND RATIOS: | |
Net assets, end of period (in 000’s) | | $ | 71,700 | | | $ | 61,130 | | | $ | 38,110 | | | $ | 4,867 | |
Ratio of expenses to average net assets(7)(8)(9): | | | | | | | | | | | | | | | | |
| Before expense waiver/recoupment | | | 1.63 | % | | | 1.66 | % | | | 1.77 | % | | | 2.42 | % |
| After expense waiver/recoupment | | | 1.61 | % | | | 1.66 | % | | | 1.79 | % | | | 2.39 | % |
Ratio of net investment income to average net assets(8) | | | 0.54 | % | | | 2.31 | % | | | 2.93 | % | | | 2.44 | % |
Portfolio turnover rate(6) | | | 1,244 | % | | | 220 | % | | | 233 | % | | | 61 | % |
| (1) | May 28, 2019. |
| (2) | For an A Class Share outstanding for the entire period. |
| (3) | Recognition of net investment income by the Fund is affected by the timing of the declaration of dividends by the underlying investment companies in which the Fund invests. |
| (4) | Per share amounts calculated using average shares method. |
| (5) | Total return does not reflect sales charges. |
| (6) | Not annualized for periods less than one year. |
| (7) | Does not include expenses of investment companies in which the Fund invests. |
| (8) | Annualized for periods less than one year. |
| (9) | On June 24, 2022, the Adviser lowered the limit of annual operating expenses from 2.05% to 1.60%. |
See Notes to the Financial Statements
KENSINGTON MANAGED INCOME FUND
Financial Highlights – Continued
C Class
| | | Year | | | Year | | | Year | | | Since Inception(1) | |
| | | Ended | | | Ended | | | Ended | | | through | |
| | | December 31, | | | December 31, | | | December 31, | | | December 31, | |
| | | 2022 | | | 2021 | | | 2020 | | | 2019 | |
PER COMMON SHARE DATA(2): | |
Net asset value, beginning of period | | $ | 10.52 | | | $ | 10.74 | | | $ | 10.19 | | | $ | 10.17 | |
| | | | | | | | | | | | | | | | | |
| INVESTMENT OPERATIONS: | |
Net investment income (loss)(3) | | | (0.03 | ) | | | 0.17 | (4) | | | 0.22 | (4) | | | 0.06 | (4) |
| Net realized and unrealized | | | | | | | | | | | | | | | | |
| gain (loss) on investments | | | (0.71 | )(5) | | | (0.13 | ) | | | 0.49 | | | | 0.05 | |
Total from investment operations | | | (0.74 | ) | | | 0.04 | | | | 0.71 | | | | 0.11 | |
| | | | | | | | | | | | | | | | | |
| LESS DISTRIBUTIONS FROM: | |
| Net investment income | | | (0.03 | ) | | | (0.16 | ) | | | (0.13 | ) | | | (0.09 | ) |
| Net realized gains | | | — | | | | (0.10 | ) | | | (0.02 | ) | | | — | |
| Return of capital | | | — | | | | — | | | | (0.01 | ) | | | — | |
Total distributions | | | (0.03 | ) | | | (0.26 | ) | | | (0.16 | ) | | | (0.09 | ) |
| | | | | | | | | | | | | | | | | |
Net asset value, end of period | | $ | 9.75 | | | $ | 10.52 | | | $ | 10.74 | | | $ | 10.19 | |
| | | | | | | | | | | | | | | | | |
TOTAL RETURN(6)(7) | | | (7.00 | )% | | | 0.35 | % | | | 6.95 | % | | | 1.09 | % |
| | | | | | | | | | | | | | | | | |
| SUPPLEMENTAL DATA AND RATIOS: | |
Net assets, end of period (in 000’s) | | $ | 15,245 | | | $ | 16,727 | | | $ | 11,749 | | | $ | 2,156 | |
Ratio of expenses to average net assets(8)(9)(10): | | | | | | | | | | | | | | | | |
| Before expense waiver/recoupment | | | 2.38 | % | | | 2.41 | % | | | 2.55 | % | | | 3.03 | % |
| After expense waiver/recoupment | | | 2.36 | % | | | 2.41 | % | | | 2.57 | % | | | 2.99 | % |
Ratio of net investment income (loss) | | | | | | | | | | | | | | | | |
to average net assets(9) | | | (0.21 | )% | | | 1.59 | % | | | 2.07 | % | | | 2.22 | % |
Portfolio turnover rate(7) | | | 1,244 | % | | | 220 | % | | | 233 | % | | | 61 | % |
| (1) | August 27, 2019. |
| (2) | For a C Class Share outstanding for the entire period. |
| (3) | Recognition of net investment income (loss) by the Fund is affected by the timing of the declaration of dividends by the underlying investment companies in which the Fund invests. |
| (4) | Per share amounts calculated using average shares method. |
| (5) | Realized and unrealized gains (losses) per share in this caption are balancing amounts necessary to reconcile the change in net asset value per share for the year, and may not reconcile with the aggregate gains on the Statement of Operations due to share transactions for the year. |
| (6) | Total return does not reflect sales charges. |
| (7) | Not annualized for periods less than one year. |
| (8) | Does not include expenses of investment companies in which the Fund invests. |
| (9) | Annualized for periods less than one year. |
| (10) | On June 24, 2022, the Adviser lowered the limit of annual operating expenses from 2.99% to 2.35%. |
See Notes to the Financial Statements
KENSINGTON DYNAMIC GROWTH FUND
Financial Highlights
Institutional Class
| | | Year | | | Year | | | Since Inception(1) | |
| | | Ended | | | Ended | | | through | |
| | | December 31, | | | December 31, | | | December 31, | |
| | | 2022 | | | 2021 | | | 2020 | |
PER COMMON SHARE DATA(2): | | | | | | | | | |
Net asset value, beginning of period | | $ | 11.30 | | | $ | 10.11 | | | $ | 10.00 | |
| | | | | | | | | | | | | |
| INVESTMENT OPERATIONS: | | | | | | | | | | | | |
Net investment loss(3) | | | — | (4) | | | (0.09 | )(5) | | | 0.04 | (5) |
| Net realized and unrealized | | | | | | | | | | | | |
| gain (loss) on investments | | | (0.98 | ) | | | 2.19 | | | | 0.11 | |
Total from investment operations | | | (0.98 | ) | | | 2.10 | | | | 0.15 | |
| | | | | | | | | | | | | |
| LESS DISTRIBUTIONS FROM: | | | | | | | | | | | | |
| Net investment income | | | — | | | | — | | | | (0.04 | ) |
| Net realized gains | | | (0.10 | ) | | | (0.91 | ) | | | — | |
Total distributions | | | (0.10 | ) | | | (0.91 | ) | | | (0.04 | ) |
| | | | | | | | | | | | | |
Net asset value, end of period | | $ | 10.22 | | | $ | 11.30 | | | $ | 10.11 | |
| | | | | | | | | | | | | |
TOTAL RETURN(6) | | | (8.67 | )% | | | 20.76 | % | | | 1.47 | % |
| | | | | | | | | | | | | |
| SUPPLEMENTAL DATA AND RATIOS: | | | | | | | | | | | | |
Net assets, end of period (in 000’s) | | $ | 885,688 | | | $ | 339,324 | | | | 58,914 | |
Ratio of expenses to average net assets(7)(8)(9): | | | | | | | | | | | | |
| Before expense waiver/recoupment | | | 1.39 | % | | | 1.45 | % | | | 2.12 | % |
| After expense waiver/recoupment | | | 1.37 | % | | | 1.47 | % | | | 1.64 | % |
Ratio of net investment income (loss) | | | | | | | | | | | | |
to average net assets(8) | | | (0.01 | )% | | | (0.73 | )% | | | 2.20 | % |
Portfolio turnover rate(6) | | | 1,127 | % | | | 786 | % | | | 277 | % |
| (1) | October 23, 2020. |
| (2) | For an Institutional Class Share outstanding for the entire period. |
| (3) | Recognition of net investment loss by the Fund is affected by the timing of the declaration of dividends by the underlying investment companies in which the Fund invests. |
| (4) | Amount per share rounds to $0.00. |
| (5) | Per share amounts calculated using average shares method. |
| (6) | Not annualized for periods less than one year. |
| (7) | Does not include expenses of investment companies in which the Fund invests. |
| (8) | Annualized for periods less than one year. |
| (9) | On June 24, 2022, the Adviser lowered the limit of annual operating expenses from 1.64% to 1.38%. |
See Notes to the Financial Statements
KENSINGTON DYNAMIC GROWTH FUND
Financial Highlights – Continued
A Class
| | | Year | | | Year | | | Since Inception(1) | |
| | | Ended | | | Ended | | | through | |
| | | December 31, | | | December 31, | | | December 31, | |
| | | 2022 | | | 2021 | | | 2020 | |
PER COMMON SHARE DATA(2): | | | | | | | | | |
Net asset value, beginning of period | | $ | 11.26 | | | $ | 10.10 | | | $ | 10.00 | |
| | | | | | | | | | | | | |
| INVESTMENT OPERATIONS: | | | | | | | | | | | | |
Net investment income (loss)(3) | | | (0.04 | ) | | | (0.13 | )(4) | | | 0.05 | (4) |
| Net realized and unrealized | | | | | | | | | | | | |
| gain (loss) on investments | | | (0.97 | ) | | | 2.20 | | | | 0.08 | |
Total from investment operations | | | (1.01 | ) | | | 2.07 | | | | 0.13 | |
| | | | | | | | | | | | | |
| LESS DISTRIBUTIONS FROM: | | | | | | | | | | | | |
| Net investment income | | | — | | | | — | | | | (0.03 | ) |
| Net realized gains | | | (0.10 | ) | | | (0.91 | ) | | | — | |
Total distributions | | | (0.10 | ) | | | (0.91 | ) | | | (0.03 | ) |
| | | | | | | | | | | | | |
Net asset value, end of period | | $ | 10.15 | | | $ | 11.26 | | | $ | 10.10 | |
| | | | | | | | | | | | | |
TOTAL RETURN(5)(6) | | | (8.96 | )% | | | 20.48 | % | | | 1.35 | % |
| | | | | | | | | | | | | |
| SUPPLEMENTAL DATA AND RATIOS: | | | | | | | | | | | | |
Net assets, end of period (in 000’s) | | $ | 28,582 | | | $ | 20,413 | | | $ | 3,588 | |
Ratio of expenses to average net assets(7)(8)(9): | | | | | | | | | | | | |
| Before expense waiver/recoupment | | | 1.64 | % | | | 1.70 | % | | | 2.36 | % |
| After expense waiver/recoupment | | | 1.62 | % | | | 1.72 | % | | | 2.04 | % |
Ratio of net investment income (loss) | | | | | | | | | | | | |
to average net assets(8) | | | (0.26 | )% | | | (1.06 | )% | | | 2.71 | % |
Portfolio turnover rate(6) | | | 1,127 | % | | | 786 | % | | | 277 | % |
| (1) | October 23, 2020. |
| (2) | For an A Class Share outstanding for the entire period. |
| (3) | Recognition of net investment income (loss) by the Fund is affected by the timing of the declaration of dividends by the underlying investment companies in which the Fund invests. |
| (4) | Per share amounts calculated using average shares method. |
| (5) | Total return does not reflect sales charges. |
| (6) | Not annualized for periods less than one year. |
| (7) | Does not include expenses of investment companies in which the Fund invests. |
| (8) | Annualized for periods less than one year. |
| (9) | On June 24, 2022, the Adviser lowered the limit of annual operating expenses from 2.04% to 1.63%. |
See Notes to the Financial Statements
KENSINGTON DYNAMIC GROWTH FUND
Financial Highlights – Continued
C Class
| | | Year | | | Year | | | Since Inception(1) | |
| | | Ended | | | Ended | | | through | |
| | | December 31, | | | December 31, | | | December 31, | |
| | | 2022 | | | 2021 | | | 2020 | |
PER COMMON SHARE DATA(2): | | | | | | | | | |
Net asset value, beginning of period | | $ | 11.18 | | | $ | 10.11 | | | $ | 10.00 | |
| | | | | | | | | | | | | |
| INVESTMENT OPERATIONS: | | | | | | | | | | | | |
Net investment income (loss)(3) | | | (0.10 | ) | | | (0.21 | )(4) | | | 0.05 | (4) |
| Net realized and unrealized | | | | | | | | | | | | |
| gain (loss) on investments | | | (0.98 | ) | | | 2.19 | | | | 0.09 | |
Total from investment operations | | | (1.08 | ) | | | 1.98 | | | | 0.14 | |
| | | | | | | | | | | | | |
| LESS DISTRIBUTIONS FROM: | | | | | | | | | | | | |
| Net investment income | | | — | | | | — | | | | (0.03 | ) |
| Net realized gains | | | (0.10 | ) | | | (0.91 | ) | | | — | |
Total distributions | | | (0.10 | ) | | | (0.91 | ) | | | (0.03 | ) |
| | | | | | | | | | | | | |
Net asset value, end of period | | $ | 10.00 | | | $ | 11.18 | | | $ | 10.11 | |
| | | | | | | | | | | | | |
TOTAL RETURN(5)(6) | | | (9.65 | )% | | | 19.57 | % | | | 1.39 | % |
| | | | | | | | | | | | | |
| SUPPLEMENTAL DATA AND RATIOS: | | | | | | | | | | | | |
Net assets, end of period (in 000’s) | | $ | 21,018 | | | $ | 11,279 | | | $ | 2,086 | |
Ratio of expenses to average net assets(7)(8)(9): | | | | | | | | | | | | |
| Before expense waiver/recoupment | | | 2.39 | % | | | 2.44 | % | | | 2.96 | % |
| After expense waiver/recoupment | | | 2.37 | % | | | 2.47 | % | | | 2.64 | % |
Ratio of net investment income (loss) | | | | | | | | | | | | |
to average net assets(8) | | | (1.01 | )% | | | (1.77 | )% | | | 2.50 | % |
Portfolio turnover rate(6) | | | 1,127 | % | | | 786 | % | | | 277 | % |
| (1) | October 23, 2020. |
| (2) | For a C Class Share outstanding for the entire period. |
| (3) | Recognition of net investment loss by the Fund is affected by the timing of the declaration of dividends by the underlying investment companies in which the Fund invests. |
| (4) | Per share amounts calculated using average shares method. |
| (5) | Total return does not reflect sales charges. |
| (6) | Not annualized for periods less than one year. |
| (7) | Does not include expenses of investment companies in which the Fund invests. |
| (8) | Annualized for periods less than one year. |
| (9) | On June 24, 2022, the Adviser lowered the limit of annual operating expenses from 2.64% to 2.38%. |
See Notes to the Financial Statements
KENSINGTON FUNDS
Notes to the Financial Statements
December 31, 2022
Managed Portfolio Series (the “Trust”) was organized as a Delaware statutory trust on January 27, 2011. The Trust is registered under the Investment Company Act of 1940, as amended (the “1940 Act”), as an open-end management investment company. The Kensington Active Advantage Fund (“Active Advantage Fund”), the Kensington Managed Income Fund (“Managed Income Fund”), and the Kensington Dynamic Growth Fund (“Dynamic Growth Fund”) (or collectively, “the Funds”) are each a non-diversified series with their own investment objectives and policies within the Trust. The Trust has evaluated the structure, objective and activities of the Funds and determined that they meet the characteristics of an investment company. As such, these financial statements have applied the guidance as set forth in the Accounting Standards Codifications (“ASC”) 946, Financial Services Investment Companies.
The investment objective of the Active Advantage Fund is total return. The Active Advantage Fund seeks to achieve its objective by employing a fund-of-funds approach that utilizes a proprietary trend-following process which seeks to benefit from longer-term trends in equity and fixed income markets. The Active Advantage Fund commenced operations on March 23, 2022.
The investment objective of the Managed Income Fund is to generate income. The Managed Income Fund seeks to achieve its objective by employing a fund-of-funds approach that achieves exposure to (i) high-yield, income-producing securities or (ii) cash, cash equivalents, and U.S. Treasury securities based on a proprietary model that looks at trends and patterns in the high-yield fixed income market. The Managed Income Fund commenced operations on May 28, 2019. On June 24, 2022, the Kensington Managed Income Fund, a series of Advisors Preferred Trust (the “Acquired Fund”), reorganized into the Managed Income Fund, a series of the Trust. All shares of the Acquired Fund were exchanged for shares of the Managed Income Fund on a pro rata basis immediately after the closing date. This qualified as a tax-free reorganization under Section 368(a)(1)(C) of the Internal Revenue Code.
The investment objective of the Dynamic Growth Fund seeks capital gains. The Dynamic Growth Fund seeks to achieve its objective by employing a fund-of-funds approach that achieves exposure to (i) domestic equity securities or (ii) cash, cash equivalents, and U.S. Treasury securities based on a proprietary model that looks at trends in the U.S. equity market. The Dynamic Growth Fund commenced operations on October 23, 2020. On June 24, 2022, the Kensington Dynamic Growth Fund, a series of Advisors Preferred Trust (the “Acquired Fund”), reorganized into the Dynamic Growth Fund, a series of the Trust. All shares of the Acquired Fund were exchanged for shares of the Dynamic Growth Fund on a pro rata basis immediately after the closing date. This qualified as a tax-free reorganization under Section 368(a)(1)(C) of the Internal Revenue Code.
The Funds offer three classes of shares: the Institutional Class, the A Class and the C Class. Institutional Class shares have no sales charge and are offered only to qualifying institutional investors and certain other qualifying accounts. A Class shares may be subject to a front-end sales charge of up to 4.75%. C Class shares may be subject to a deferred sales charge of up to 1.00%. The Funds have adopted a Distribution Plan pursuant to Rule 12b-1 in the A Class and C Class. The Plan permits each Fund to pay for distribution and related expenses at an annual rate of 0.25% of the A Class and 1.00% of the C Class average daily net assets.
| 2. | SIGNIFICANT ACCOUNTING POLICIES |
The following is a summary of significant accounting policies followed by the Funds in the preparation of their financial statements. These policies are in conformity with generally accepted accounting principles in the United States of America (“GAAP”).
KENSINGTON FUNDS
Notes to the Financial Statements – Continued
December 31, 2022
Securities Valuation – All investments in securities are recorded at their estimated fair value, as described in Note 3.
Federal Income Taxes – The Funds intend to meet the requirements of subchapter M of the Internal Revenue Code applicable to regulated investment companies and to distribute substantially all net taxable investment income and net realized gains to shareholders in a manner which results in no tax cost to the Funds. Therefore, no federal income or excise tax provision is required. As of December 31, 2022, the Funds did not have any tax positions that did not meet the “more-likely-than-not” threshold of being sustained by the applicable tax authority. The Funds recognize interest and penalties, if any, related to unrecognized tax benefits on uncertain tax positions as income tax expense in the Statements of Operations. During the year or period ended December 31, 2022, the Funds did not incur any interest or penalties. The Funds are subject to examination by U.S. taxing authorities for the tax period since the commencement of operations.
Securities Transactions, Income and Distributions – Securities transactions are accounted for on the date the securities are purchased or sold (trade date). Realized gains and losses are reported on a specific identified cost basis. Interest income is recognized on an accrual basis, including amortization of premiums and accretion of discounts. Dividend income and distributions are recorded on the ex-dividend date. Withholding taxes on foreign dividends have been provided for in accordance with the Funds’ understanding of the applicable country’s tax rules and regulations. Distributions received from the Funds’ investments generally are comprised of ordinary income and return of capital. The Funds allocate distributions between investment income, capital gain, and return of capital based on estimates made at the time such distributions are received. Such estimates are based on information provided by each portfolio company and other industry sources. These estimates may subsequently be revised based on actual allocations received from the portfolio companies after their tax reporting periods are concluded, as the actual character of these distributions is not known until after the fiscal year end of the Funds.
The Funds will make distributions of net investment income, if any, quarterly and net realized capital gains, if any, annually. Distributions to shareholders are recorded on the ex-dividend date. The treatment for financial reporting purposes of distributions made to shareholders during the year from net investment income or net realized capital gains may differ from their ultimate treatment for federal income tax purposes. These differences are caused primarily by differences in the timing of the recognition of certain components of income, expense or realized capital gain for federal income tax purposes. Where such differences are permanent in nature, GAAP requires that they be reclassified in the components of the net assets based on their ultimate characterization for federal income tax purposes. Any such reclassifications will have no effect on net assets, results of operations or net asset values per share of the Funds. For the year ended December 31, 2022, the Managed Income Fund decreased paid-in capital by $9,644 and increased accumulated loss by $9,644 and the Dynamic Growth Fund decreased paid-in capital by $354,292 and increased accumulated loss by $354,292. The reclassifications were primarily due to reclassification of dividends for the Managed Income Fund and net operating losses for the Dynamic Growth Fund.
Use of Estimates – The preparation of financial statements in conformity with GAAP requires management to make estimates and assumptions that affect the reported amounts of assets and liabilities and disclosure of contingent assets and liabilities at the date of the financial statements and the reported amounts of revenues and expenses during the reporting period. Actual results could differ from those estimates.
Allocation of Income, Expenses and Gains/Losses – Income, expenses (other than those deemed attributable to a specific share class), and gains and losses of the Funds are allocated daily to each class of shares based upon the ratio of net assets represented by each class as a percentage of the net assets of each Fund. Expenses deemed directly attributable to a class of shares are recorded by the specific class. Most Fund expenses are allocated by
KENSINGTON FUNDS
Notes to the Financial Statements – Continued
December 31, 2022
class based on relative net assets. 12b-1 fees are expensed at 0.25% and 1.00% of average daily net assets of A Class shares and C Class shares, respectively. Trust expenses associated with a specific fund in the Trust are charged to that fund. Common Trust expenses are typically allocated evenly between the funds of the Trust, or by other equitable means.
Illiquid or Restricted Securities – A security may be considered illiquid if it lacks a readily available market. Securities are generally considered liquid if they can be sold or disposed of in the ordinary course of business within seven days at approximately the price at which the security is valued by the Funds. Illiquid securities may be valued under methods approved by the Board of Trustees as reflecting fair value. Each Fund will not hold more than 15% of the value of its net assets in illiquid securities. Certain restricted securities may be considered illiquid. Restricted securities are often purchased in private placement transactions, are not registered under the Securities Act of 1933, may have contractual restrictions on resale, and may be valued under methods approved by the Board of Trustees as reflecting fair value. At December 31, 2022, the Funds did not hold any illiquid securities.
Indemnifications – Under the Trust’s organizational documents, its officers and trustees are indemnified against certain liabilities arising out of the performance of their duties to the Trust. In addition, in the normal course of business, the Trust may enter into contracts that provide general indemnification to other parties. The Trust’s maximum exposure under these arrangements is unknown, as this would involve future claims that may be made against the Trust that have not yet occurred and may not occur. However, the Trust has not had prior claims or losses pursuant to these contracts and expects the risk of loss to be remote.
Cash and Cash Equivalents – Cash and cash equivalents include short-term, liquid investments with an original maturity of three months or less and include money market fund accounts. Cash held by the Funds may be in excess of Federal Deposit Insurance Corporation (FDIC) limitations.
Organizational and Offering Costs – All organization and offering costs for the Fund were covered by the Adviser, Kensington Asset Management, LLC.
Temporary Investments – To respond to adverse market, economic, political, or other conditions, a Fund may invest 100% of its total assets, without limitation, in high-quality short-term debt securities and money market instruments. A Fund may be invested in these instruments for extended periods, depending on the Adviser’s assessment of market conditions. These short-term debt securities and money market instruments may include shares of other mutual funds, commercial paper, certificates of deposit, bankers’ acceptances, U.S. Government securities and repurchase agreements. While a Fund is in a defensive position, the opportunity to achieve its investment objective will be limited. Furthermore, to the extent that a Fund invests in money market mutual funds for its cash position, there will be some duplication of expenses because the Fund would bear its pro rata portion of such money market funds’ advisory and operational fees.
The Funds have adopted fair value accounting standards, which establish an authoritative definition of fair value and set out a hierarchy for measuring fair value. These standards require additional disclosures about the various inputs and valuation techniques used to develop the measurements of fair value, a discussion of changes in valuation techniques and related inputs during the period and expanded disclosure of valuation levels for major security types. These inputs are summarized in the three broad levels listed below:
| Level 1 – | Quoted prices in active markets for identical assets or liabilities. |
KENSINGTON FUNDS
Notes to the Financial Statements – Continued
December 31, 2022
| Level 2 – | Observable inputs other than quoted prices included in Level 1. These inputs may include quoted prices for similar instruments, interest rates, prepayment speeds, credit risk, yield curves, default rates and similar data. |
| | |
| Level 3 – | Significant unobservable inputs for the asset or liability, representing the Fund’s view of assumptions a market participant would use in valuing the asset or liability. |
Following is a description of the valuation techniques applied to each Fund’s major categories of assets and liabilities measured at fair value on a recurring basis. Each Fund’s investments are carried at fair value.
Exchange-Traded Funds – Exchange-traded funds (“ETFs”) are valued at the last reported sale price on the exchange on which the security is principally traded. If, on a particular day, an ETF does not trade, then the mean between the most recent quoted bid and asked prices will be used. To the extent these securities are actively traded and valuation adjustments are not applied, they are categorized in Level 1 of the fair value hierarchy.
Short-Term Investments – Investments in other mutual funds, including money market funds, are valued at their net asset value per share. Deposit accounts are valued at acquisition cost, which approximates fair value. To the extent these securities are actively traded and valuation adjustments are not applied, they are categorized in Level 1 of the fair value hierarchy.
The Board of Trustees (the “Board”) has adopted a pricing and valuation policy for use by the Funds and their Valuation Designee (as defined below) in calculating the Funds’ NAV. Pursuant to Rule 2a-5 under the 1940 Act, the Funds have designated Kensington Asset Management, LLC (the “Adviser”) as its “Valuation Designee” to perform all of the fair value determinations as well as to perform all of the responsibilities that may be performed by the Valuation Designee in accordance with Rule 2a-5. The Valuation Designee is authorized to make all necessary determinations of the fair values of portfolio securities and other assets for which market quotations are not readily available or if it is deemed that the prices obtained from brokers and dealers or independent pricing services are unreliable.
The inputs or methodology used for valuing securities are not an indication of the risk associated with investing in those securities.
The following table is a summary of the inputs used to value each Fund’s securities by level within the fair value hierarchy as of December 31, 2022:
| Active Advantage Fund | | Level 1 | | | Level 2 | | | Level 3 | | | Total | |
Short-Term Investment | | $ | 21,263,994 | | | $ | — | | | $ | — | | | $ | 21,263,994 | |
Total Investments | | $ | 21,263,994 | | | $ | — | | | $ | — | | | $ | 21,263,994 | |
| | | | | | | | | | | | | |
| Managed Income Fund | | Level 1 | | | Level 2 | | | Level 3 | | | Total | |
Short-Term Investment | | $ | 976,747,691 | | | $ | — | | | $ | — | | | $ | 976,747,691 | |
Total Investments | | $ | 976,747,691 | | | $ | — | | | $ | — | | | $ | 976,747,691 | |
| | | | | | | | | | | | | |
| Dynamic Growth Fund | | Level 1 | | | Level 2 | | | Level 3 | | | Total | |
Short-Term Investment | | $ | 926,695,533 | | | $ | — | | | $ | — | | | $ | 926,695,533 | |
Total Investments | | $ | 926,695,533 | | | $ | — | | | $ | — | | | $ | 926,695,533 | |
Refer to each Fund’s Schedule of Investments for industry classifications.
KENSINGTON FUNDS
Notes to the Financial Statements – Continued
December 31, 2022
The global outbreak of COVID-19 (commonly referred to as “coronavirus”) has disrupted economic markets and the prolonged economic impact is uncertain. The ultimate economic fallout from the pandemic, and the long-term impact on economies, markets, industries and individual issuers, are not known. The operational and financial performance of the issuers of securities in which the Funds invest depends on future developments, including the duration and spread of the outbreak, and such uncertainty may in turn adversely affect the value and liquidity of the Funds’ investments, impair the Funds’ ability to satisfy redemption requests, and negatively impact the Funds’ performance.
On February 24, 2022, Russia commenced a military attack on Ukraine. The outbreak of hostilities between the two countries could result in more widespread conflict and could have a severe adverse effect on the region and the markets. In addition, sanctions imposed on Russia by the United States and other countries, and any sanctions imposed in the future could have a significant adverse impact on the Russian economy and related markets. The price and liquidity of investments may fluctuate widely as a result of the conflict and related events. How long such conflict and related events will last and whether it will escalate further cannot be predicted, nor its effect on the Funds.
| 5. | INVESTMENT ADVISORY FEE AND OTHER TRANSACTIONS WITH AFFILIATES |
The Trust has an agreement with Kensington Asset Management LLC (the “Adviser”) to furnish investment advisory services to the Funds. Pursuant to an Investment Advisory Agreement between the Trust and the Adviser, the Adviser is entitled to receive, on a monthly basis, an annual advisory fee equal to 1.25% of each Fund’s average daily net assets. Prior to June 24, 2022, the Funds had an agreement with Advisors Preferred LLC (the “Predecessor Adviser”) to furnish investment advisory services to the Funds. Prior to June 24, 2022, Advisors Preferred LLC engaged Kensington Asset Management LLC to serve as sub-advisor to the Funds whereby the sub-advisor would direct investment activities of the Funds. For its services, Advisors Preferred LLC, was entitled to receive, on a monthly basis, an annual advisory fee equal to 1.25% of each Fund’s average daily net assets. The sub-advisor was paid by Advisors Preferred LLC, not the Funds. For the period from January 1, 2022 to June 24, 2022, the Managed Income Fund and Dynamic Growth Fund paid the Predecessor Adviser $5,245,989 and $3,065,483, respectively. For the period June 25, 2022 through December 31, 2022, the Managed Income Fund and Dynamic Growth Fund paid the Adviser $6,476,925 and $5,563,377, respectively.
The Funds’ Adviser has contractually agreed to reimburse each Fund for its expenses to ensure that total annual operating expenses (excluding acquired fund fees and expenses, leverage/borrowing interest, interest expense, dividends paid on short sales, taxes, brokerage commissions, extraordinary expenses, and distribution (12b-1) fees and expenses) for each Fund do not exceed 1.35% of the average daily net assets of the Active Advantage Fund and Managed Income Fund and 1.38% of the average daily net assets of the Dynamic Growth Fund. Prior to June 24, 2022, the contractual expense limitations in place for the Managed Income Fund were 2.05%, 1.45% and 2.99% of average daily net assets of the Class A, Institutional Class and Class C, respectively. The expiration dates of the prior agreements were January 14, 2022, April 30, 2022, and August 20, 2020, for Class A, Institutional Class and Class C, respectively. Expenses reimbursed by the Adviser may be recouped by the Adviser for a period of thirty-six months following the date on which such reimbursement was made if such recoupment can be achieved without exceeding the expense limit in effect at the time the expense reimbursement occurred and at the time of recoupment. The Operating Expense Limitation Agreement is intended to be continual in nature and cannot be terminated within a year after the effective date of the Funds’ prospectus. During the year ended December 31, 2022, the Managed Income Fund recouped $390 of previously waived expenses. Reimbursed expenses subject to potential recovery by month of expiration are as follows:
Active Advantage Fund | | | |
March 2025 – December 2025 | | $ | 158,334 | |
KENSINGTON FUNDS
Notes to the Financial Statements – Continued
December 31, 2022
Managed Income Fund | | | |
June 2025 – December 2025 | | $ | 187,135 | |
| | | | | |
Dynamic Growth Fund | | | | |
June 2025 – December 2025 | | $ | 140,372 | |
For the period from January 1, 2022 to June 24, 2022, the fees waived by the Adviser for the Managed Income Fund and Dynamic Growth Fund were $0 and $0, respectively.
U.S. Bancorp Fund Services, LLC, doing business as U.S. Bank Global Fund Services (“Fund Services” or the “Administrator”) acts as the Funds’ Administrator, Transfer Agent and fund accountant. U.S. Bank, N.A. (the “Custodian”) serves as the custodian to the Funds. The Custodian is an affiliate of the Administrator. The Administrator performs various administrative and accounting services for the Funds. The Administrator prepares various federal and state regulatory filings, reports and returns for the Funds; prepares reports and materials to be supplied to the Trustees; monitors the activities of the Funds’ custodian; coordinates the payment of the Funds’ expenses and reviews the Funds’ expense accruals. The officers of the Trust including the Chief Compliance Officer are employees of the Administrator. As compensation for its services, the Administrator is entitled to a monthly fee at an annual rate based on the average daily net assets of the Funds, subject to annual minimums. Fees paid by the Funds for administration and accounting, transfer agency, custody and compliance services for the year ended December 31, 2022, are disclosed in the Statements of Operations. Prior to June 24, 2022, the Funds engaged Ultimus Fund Solutions, LLC to provide administration, fund accounting, and transfer agent services to the Funds.
For the period from January 1, 2022 to June 24, 2022, the Funds paid Ultimus Fund Solutions, LLC as follows:
| | | Managed Income Fund | | | Dynamic Growth Fund | |
Administration and Fund Accounting | | $ | 226,260 | | | $ | 148,025 | |
Transfer Agent Fees | | | 123,892 | | | | 72,708 | |
For the period June 25, 2022 through December 31, 2022, the Funds paid Fund Services as follows:
| | | Managed Income Fund | | | Dynamic Growth Fund | |
Administration and Fund Accounting | | $ | 227,249 | | | $ | 194,345 | |
Transfer Agent Fees | | | 217,396 | | | | 196,131 | |
For the period June 25, 2022 through December 31, 2022, the Funds paid U.S. Bank, N.A. as follows:
| | Managed Income Fund | | Dynamic Growth Fund | |
Custody | | $ | 62,159 | | | $ | 30,357 | |
Prior to June 24, 2022, the Funds engaged Ceros Financial Services, Inc. to serve as the Funds’ Distributor. Ceros Financial Services, Inc., a registered broker/dealer and an affiliate of Advisors Preferred LLC, executed trades on behalf of the Managed Income Fund and Dynamic Growth Fund and received $107,700 and $164,481 in trade commissions, respectively.
The Funds have adopted a Distribution Plan pursuant to Rule 12b-1 (the “Plan”) in the A Class and the C Class. The Plan permits each Fund to pay for distribution and related expenses at an annual rate of 0.25% of the A Class and 1.00% of the C Class average daily net assets. The expenses covered by the Plan may include the cost of
KENSINGTON FUNDS
Notes to the Financial Statements – Continued
December 31, 2022
preparing and distributing prospectuses and other sales material, advertising and public relations expenses, payments to financial intermediaries and compensation of personnel involved in selling shares of the Funds. For the year ended December 31, 2022, expenses incurred by the A Class and C Class pursuant to the Plan were as follows:
| Fund | | A Class | | | C Class | |
Active Advantage Fund | | $ | 3 | | | $ | 103 | |
Managed Income | | | 190,957 | | | | 157,666 | |
Dynamic Growth Fund | | | 73,262 | | | | 183,579 | |
Prior to June 24, 2022, the Funds had adopted a Distribution Plan and Agreement (the “Rule 12b-1 Plan”) pursuant to Rule 12b-1 under the 1940 Act for each Fund’s Class A shares pursuant to which the Funds pay fees to Ceros Financial Services, Inc. (“Ceros” or “Distributor”), an affiliate of the Advisor, to provide distribution and/or shareholder services to each Fund. During the period from January 1, 2022 through June 24, 2022, pursuant to the Rule 12b-1 Plan, the Class A and Class C shares of the Managed Income Fund paid $87,385 and $73,496, respectively, and the Class A and Class C shares of the Dynamic Growth Fund paid $31,570 and $76,061, respectively, which was paid out to brokers and dealers.
| 7. | AFFILIATED COMPANY TRANSACTIONS |
A summary of the transactions in affiliated companies during the year ended December 31, 2022, is as follows:
Managed Income Fund
| | | | | | | | | Net Change in |
| | 12/31/21 | | | Realized | | 12/31/22 | | Unrealized |
| Investment | Share | Gross | Gross | Gain/ | Distributions | Share | 12/31/22 | Appreciation/ |
| Security | Balance | Additions | Reductions | (Loss) | Received | Balance | Value | Depreciation |
ProShares | | | | | | | | |
Short High | | | | | | | | |
Yield ETF | — | $81,037,676 | $(77,024,024) | $(4,013,652) | $— | — | $— | $— |
| 8. | INVESTMENT TRANSACTIONS |
The aggregate purchases and sales, excluding U.S. government securities and short-term investments, by the Funds for the year or period ended December 31, 2022, were as follows:
| Fund | | Purchases | | | Sales | |
Active Advantage Fund | | $ | 39,911,541 | | | $ | 38,854,652 | |
Managed Income | | | 2,743,083,700 | | | | 2,942,865,761 | |
Dynamic Growth Fund | | | 3,620,671,457 | | | | 3,765,326,244 | |
| 9. | FEDERAL TAX INFORMATION |
As of December 31, 2022, the Funds’ most recent fiscal year end, the cost basis of investments for federal income tax purposes and the components of accumulated losses on a tax basis were as follows:
| | | Aggregate Gross | | | Aggregate Gross | | | Net | | | Federal Income | |
| Fund | | Appreciation | | | Depreciation | | | Appreciation | | | Tax Cost | |
| Active Advantage Fund | | $ | — | | | $ | — | | | $ | — | | | $ | 21,263,994 | |
| Managed Income Fund | | | — | | | | — | | | | — | | | | 976,747,691 | |
| Dynamic Growth Fund | | | — | | | | — | | | | — | | | | 926,695,533 | |
KENSINGTON FUNDS
Notes to the Financial Statements – Continued
December 31, 2022
At December 31, 2022, components of distributable earnings on a tax-basis were as follows:
| | | Undistributed | | | Undistributed | | | Other | | | | | | Total | |
| | | Ordinary | | | Long-Term | | | Accumulated | | | Unrealized | | | Distributable | |
| Fund | | Income | | | Capital Gains | | | Losses | | | Appreciation | | | Earnings | |
| Active Advantage Fund | | $ | 200 | | | $ | — | | | $ | (1,056,889 | ) | | $ | — | | | $ | (1,056,689 | ) |
| Managed Income Fund | | | — | | | | — | | | | (75,016,275 | ) | | | — | | | | (75,016,275 | ) |
| Dynamic Growth Fund | | | — | | | | — | | | | (82,593,602 | ) | | | — | | | | (82,593,602 | ) |
As of December 31, 2022, the Funds’ most recent fiscal year end, the Active Advantage Fund, Managed Income Fund and Dynamic Growth Fund had short-term capital loss carryovers of $1,056,889, $75,016,275 and $82,593,602, respectively, which may be carried over for an unlimited period. A regulated investment company may elect for any taxable year to treat any portion of any qualified late year loss as arising on the first day of the next taxable year. Qualified late year losses are certain capital, and ordinary losses which occur during the portion of the Fund’s taxable year subsequent to October 31. For the taxable year ended December 31, 2022, the Funds do not plan to defer any qualified late year losses.
During the year ended December 31, 2022, the Funds paid the following distributions to shareholders:
| | | Active | | | Managed | | | Dynamic | |
| | | Advantage Fund | | | Income Fund | | | Growth Fund | |
Ordinary income* | | $ | 97,925 | | | $ | 7,101,229 | | | $ | 9,124,651 | |
Short-term capital gains | | | — | | | | — | | | | — | |
Long-term capital gains** | | | — | | | | — | | | | — | |
Total distributions | | $ | 97,925 | | | $ | 7,101,229 | | | $ | 9,124,651 | |
During the year ended December 31, 2021, the Funds paid the following distributions to shareholders:
| | | Managed | | | Dynamic | |
| | | Income Fund | | | Growth Fund | |
Ordinary income* | | $ | 19,935,950 | | | $ | 27,672,108 | |
Long-term capital gains** | | | 2,572,396 | | | | — | |
Total distributions | | $ | 22,508,346 | | | $ | 27,672,108 | |
| * | | For federal income tax purposes, distributions of short-term capital gains are treated as ordinary income distributions. |
| ** | | The Funds designate as long-term capital gain distributions, pursuant to Internal Revenue Code Section 852(b)(3)(c). |
Effective September 30, 2022, the Funds established an unsecured line of credit (“LOC”) in the amount of $100,000,000, 20% of a Fund’s gross market value (except no more than 10.00% of the gross market value of the Kensington Active Advantage Fund) or 33.33% of the unencumbered assets of a Fund, whichever is less. The LOC matures, unless renewed on July 21, 2023. The LOC is intended to provide short-term financing, if necessary, subject to certain restrictions and covenants, in connection with shareholder redemptions and other short-term liquidity needs of the Funds. The LOC is with the Custodian. Interest is charged at the prime rate which was 7.50% as of December 31, 2022. The interest rate during the period was between 6.25% and 7.50%. The Funds have authorized the Custodian to charge any of the accounts of the Funds for any missed payments. For the period ended December 31, 2022, the Funds did not have any borrowings under the LOC.
KENSINGTON FUNDS
Notes to the Financial Statements – Continued
December 31, 2022
The beneficial ownership, either directly or indirectly, of more than 25% of the voting securities of a fund creates a presumption of control of the fund, under Section 2(a)(9) of the Investment Company Act of 1940. As of December 31, 2022, National Financial Services, LLC held approximately 45.91% of the Active Advantage Fund for the benefit of its customers and TD Ameritrade Inc. held approximately 27.81% of the Dynamic Growth Fund for the benefit of its customers.
| 12. | REORGANIZATION OF MANAGED INCOME FUND AND DYNAMIC GROWTH FUND |
On June 24, 2022, as the result of a tax-free reorganization, the Kensington Managed Income Fund and the Kensington Dynamic Growth Fund (the “Predecessor Funds”), each a series in Advisors Preferred Trust, were reorganized into the Trust by transferring all of the Predecessor Funds’ assets to the Managed Income Fund and Dynamic Growth Fund in the Trust. The Predecessor Funds were deemed to be the accounting survivors for financial reporting purposes. The Reorganizations enabled Kensington Asset Management, LLC (“Kensington”), the investment sub-adviser of the Predecessor Funds and the investment adviser of the Funds, to serve as the sole investment adviser. The Reorganizations provided Kensington with the opportunity to create future economies of scale that could benefit shareholders if certain fixed costs can be spread across a larger asset base.
As a tax-free reorganization, any unrealized appreciation or depreciation on the securities on the date of reorganization was treated as a non-taxable event, thus the cost basis of the securities held reflect the historical cost basis as of the date of reorganization. Immediately prior to the reorganization, the net assets, fair value of investments, and net unrealized appreciation of the Kensington Managed Income Fund was $961,547,791, $960,064,142 and $(6,237,046), respectively and the net assets, fair value of investments, and net unrealized appreciation of the Kensington Dynamic Growth Fund was $640,424,705, $640,221,327, and $0, respectively.
At the date of reorganization, fund shares outstanding for the Predecessor Managed Income Fund were 8,376,485, 86,567,926 and 1,507,096 for the Class A, Institutional Class and Class C, respectively, and shares outstanding for the Predecessor Dynamic Growth Fund were 2,861,838, 55,338,259 and 1,725,787 for the Class A, Institutional Class and Class C, respectively.
| 13. | REPORT OF THE FUNDS’ SPECIAL SHAREHOLDER MEETING (UNAUDITED) |
A Special Meeting of Shareholders of the Kensington Managed Income Fund and Kensington Dynamic Growth Fund (“The Acquired Funds”), each a series of Advisors Preferred Trust, took place on June 22, 2022, to approve a proposed Agreement of and Plan of Reorganization for the Acquired Funds, whereby the Managed Income Fund and Dynamic Growth Fund (“the Acquiring Funds”), each a series of Managed Portfolio Series, would acquire all the assets and liabilities of the Acquired Funds, in exchange for shares of the Acquiring Funds which would be distributed pro rata by the Acquired Funds to its shareholders, in complete liquidation and termination of the Acquired Funds (the “Reorganization”).
All Acquired Funds’ shareholders of record at the close of business on March 16, 2022, were entitled to vote. As of the record date, the Kensington Managed Income Fund and Kensington Dynamic Growth Fund had 82,703,946, and 43,071,270 shares outstanding respectively.
Of the 41,814,245 shares of the Kensington Managed Income Fund present in person or by proxy at the meeting on June 22, 2022: 29,499,928, or 88.9% voted in favor of the Reorganization (representing 35.7% of total outstanding shares), 203,339, or 0.6%, voted against the Reorganization, and 3,483,235, or 10.5% withheld from voting for the Reorganization. Accordingly, the Reorganization was approved.
KENSINGTON FUNDS
Notes to the Financial Statements – Continued
December 31, 2022
Of the 22,019,140 shares of the Kensington Dynamic Growth Fund present in person or by proxy at the meeting on June 22, 2022: 7,261,456, or 88.9% voted in favor of the Reorganization (representing 40.1% of total outstanding shares), 139,625, or 0.7%, voted against the Reorganization, and 2,015,193, or 10.4% withheld from voting for the Reorganization. Accordingly, the Reorganization was approved.
| 14. | CHANGE IN INDEPENDENT REGISTERED PUBLIC ACCOUNTING FIRM (UNAUDITED) |
As a result of the reorganization of the Predecessor Funds into newly created series of the Trust on June 24, 2022, the The Board of Trustees of the Trust, upon the recommendation of the Trust’s Audit Committee, selected and formally engaged Cohen & Company, Ltd. (“Cohen”) as the Funds’ independent registered public accounting firm for the fiscal year ending December 31, 2022.
On October 26, 2021, the Audit Committee of Advisors Preferred Trust appointed and formally engaged BBD, LLP (“BBD”) as the Funds’ independent registered public accounting firm for the fiscal year ending December 31, 2021.
BBD’s report on the Funds’ financial statements for the fiscal year ending December 31, 2021 did not contain an adverse opinion or a disclaimer of opinion, nor was such report qualified or modified as to uncertainty, audit scope or accounting principles.
During the year ended December 31, 2021, there were no disagreements between the Funds and BBD on any matter of accounting principles or practices, financial statement disclosure, or auditing scope or procedure, which disagreements, if not resolved to the satisfaction of BBD, would have caused it to make reference to the subject matter of the disagreement in its report on the financial statements for such period. During the year ended December 31, 2021, there were no reportable events (as defined in Item 304(a)(1)(v) of Regulation S-K).
During the year ended December 31, 2021, neither the Funds nor anyone on its behalf has consulted with BBD regarding; (i) the application of accounting principles to a specified transaction, either completed or proposed; or the type of audit opinion that might be rendered on the Funds’ financial statements, and neither a written report was provided to the Funds nor oral advice was provided that BBD concluded was an important factor considered by the Funds in reaching a decision as to any accounting, auditing or financial reporting issue; or (ii) any matter that was the subject of a disagreement (as that term is defined in Item 304 (a)(1)(iv) of Regulation S-K and the related instructions to Item 304 of Regulation S-K) or a reportable event (as that term is defined in Item 304 (a)(1)(v) of Regulation S-K).
Management has performed an evaluation of subsequent events through the date the financial statements were issued and has determined that no additional items require recognition or disclosure.
KENSINGTON FUNDS
Report of Independent Registered Public Accounting Firm
To the Shareholders of Kensington Funds and
Board of Trustees of Managed Portfolio Series
Opinion on the Financial Statements
We have audited the accompanying statements of assets and liabilities, including the schedules of investments, of the funds listed below (“Kensington Funds” or the “Funds”), each a series of Managed Portfolio Series, as of December 31, 2022, the related statements of operations, the statements of changes in net assets, the related notes, and the financial highlights for each of the periods indicated below (collectively referred to as the “financial statements”). In our opinion, the financial statements present fairly, in all material respects, the financial position of each of the Funds as of December 31, 2022, the results of their operations, the changes in net assets, and the financial highlights for each of the periods indicated below in conformity with accounting principles generally accepted in the United States of America.
| | Statements of | Statements of | |
| Fund Name | Operations | Changes in Net Assets | Financial Highlights |
Kensington Active Advantage Fund | For the period from March 23, 2022 (commencement of operations) |
| | through December 31, 2022 |
| | | | |
Kensington Managed Income Fund | For the year ended | | For the years ended December 31, 2022 |
| | December 31, 2022 | | and 2020, and for the period from |
| | | | May 28, 2019 (commencement of |
| | | | operations) through December 31, 2019 |
| | | | |
Kensington Dynamic Growth Fund | For the year ended | | For the year ended December 31, 2022, |
| | December 31, 2022 | | and for the period from October 23, 2020 |
| | | | (commencement of operations) through |
| | | | December 31, 2020 |
The Funds’ financial statements and financial highlights for the period ended December 31, 2021, were audited by other auditors whose report dated February 25, 2022, expressed an unqualified opinion on those financial statements and financial highlights.
Basis for Opinion
These financial statements are the responsibility of the Funds’ management. Our responsibility is to express an opinion on the Funds’ financial statements based on our audits. We are a public accounting firm registered with the Public Company Accounting Oversight Board (United States) (“PCAOB”) and are required to be independent with respect to the Funds in accordance with the U.S. federal securities laws and the applicable rules and regulations of the Securities and Exchange Commission and the PCAOB.
We conducted our audits in accordance with the standards of the PCAOB. Those standards require that we plan and perform the audit to obtain reasonable assurance about whether the financial statements are free of material misstatement whether due to error or fraud.
KENSINGTON FUNDS
Report of Independent Registered Public Accounting Firm – Continued
Our audits included performing procedures to assess the risks of material misstatement of the financial statements, whether due to error or fraud, and performing procedures that respond to those risks. Such procedures included examining, on a test basis, evidence regarding the amounts and disclosures in the financial statements. Our procedures included confirmation of securities owned as of December 31, 2022 by correspondence with the custodian. Our audits also included evaluating the accounting principles used and significant estimates made by management, as well as evaluating the overall presentation of the financial statements. We believe that our audits provide a reasonable basis for our opinion.
We have consecutively served as the Funds’ auditor since 2022. In addition, we served as the Funds’ auditor from 2019 through 2020.
COHEN & COMPANY, LTD.
Milwaukee, Wisconsin
March 1, 2023
KENSINGTON FUNDS
Approval of Investment Advisory Agreement (Unaudited)
At the regular meeting of the Board of Trustees of Managed Portfolio Series (“Trust”) on February 22-23, 2022, the Trust’s Board of Trustees (“Board”), each of whom were present virtually, including all of the Trustees who are not “interested persons” of the Trust, as that term is defined in Section 2(a)(19) of the Investment Company Act of 1940, as amended, (“Independent Trustees”) considered and approved the Investment Advisory Agreement between the Trust and Kensington Asset Management, LLC (“Kensington” or the “Adviser”) regarding the Kensington Managed Income Fund (the “Managed Income Fund”), the Kensington Dynamic Growth Fund (the “Dynamic Growth Fund”), and the Kensington Active Advantage Fund (the “Active Advantage Fund”, together with the Managed Income Fund and the Dynamic Growth Fund, the “Funds” or the “Kensington Funds”) (the “Kensington Advisory Agreement”) for an initial two-year term.
Prior to the meeting and at the meeting, the Trustees received and considered information from the Adviser and the Trust’s administrator designed to provide the Trustees with the information necessary to evaluate the approval of the Kensington Advisory Agreement (“Support Materials”). The Independent Trustees then reviewed the Support Materials with regard to Kensington and the Funds. They discussed initial SEC filings for the Funds. They reviewed and considered the Kensington’s responses to the due diligence questionnaires regarding each Fund’s investment strategy, services that Kensington proposed to provide to the Funds, proposed Fund management fees and the profitability that Kensington expects to realize from its management of each Fund, any additional benefits that Kensington expects to realize from its management of the Funds, and other matters that the Trustees deemed relevant. The Trustees also reviewed Kensington’s financial statements and considered the financial condition of the firm. They also reviewed analyses which were prepared by the administrator of each Fund’s proposed and projected expenses relative to other funds in the same Morningstar category. Before voting to approve the Advisory Agreement, the Trustees reviewed the Support Materials with Trust management and with counsel to the Independent Trustees, and received a memorandum from such counsel discussing the legal standards for the Trustees’ consideration of the approval of the Advisory Agreement. This information, together with the information provided to the Board throughout the course of the year, formed the primary (but not exclusive) basis for the Board’s determinations.
In determining whether to approve the Kensington Advisory Agreement, the Trustees considered all factors they believed relevant, including the following with respect to each Kensington Fund: (1) the nature, extent, and quality of the services to be provided by Kensington with respect to the Fund; (2) the cost of the services to be provided and the profits to be realized by Kensington from services rendered to the Fund; (3) comparative fee and expense data for the Fund and other investment companies with similar investment objectives; (4) the extent to which economies of scale may be realized as the Fund grows, and whether the proposed advisory fee for the Fund reflects such economies of scale for the Fund’s benefit; and (5) other benefits to Kensington resulting from services rendered to the Fund. In their deliberations, the Trustees did not identify any particular information that was all-important or controlling.
Nature, Extent and Quality of Services Provided. The Trustees considered the scope of services that Kensington will provide under the Advisory Agreement with respect to each Kensington Fund, noting that such services include but are not limited to the following with respect to each Kensington Fund: (1) investing the Fund’s assets consistent with the Fund’s investment objective and investment policies; (2) determining the portfolio securities to be purchased, sold, or otherwise disposed of and the timing of such transactions; (3) voting all proxies with respect to the Fund’s portfolio securities; (4) maintaining the required books and records for transactions effected by Kensington on behalf of the Fund; and (5) selecting broker-dealers to execute orders on behalf of the Fund.
KENSINGTON FUNDS
Approval of Investment Advisory Agreement (Unaudited) – Continued
The Trustees noted that Kensington is well capitalized. The Trustees also considered Kensington’s assets under management. The Trustees noted that Kensington had been managing the Managed Income Fund and the Dynamic Growth Fund as series of another investment company, since 2019 in the case of the Managed Income Fund and since 2020 in the case of the Dynamic Growth Fund, and manages a composite of separately managed accounts with investment objectives and investment strategies that are substantially similar to the Managed Income Fund and the Dynamic Growth Fund. The Trustees also considered the experience of the portfolio managers that Kensington will utilize in managing each Kensington Fund’s assets and that the lead portfolio manager of the Managed Income Fund and the Dynamic Growth Fund has been the same since each Fund’s inception. The Trustees concluded that they were satisfied with the nature, extent, and quality of services that Kensington proposes to provide to each Kensington Fund under the Kensington Advisory Agreement.
Cost of Advisory Services and Profitability. The Trustees considered the proposed annual management fee that each Kensington Fund will pay to Kensington under the Kensington Advisory Agreement in the amount of 1.25% of the Fund’s average annual daily net assets. They also considered Kensington’s pro forma profitability analysis for the 12-month period ended August 31, 2022 for services that Kensington rendered to each Kensington Fund. In that regard, the Trustees noted that the Managed Income Fund and the Dynamic Growth Fund had each been profitable to Kensington over that period. The Trustees noted that Kensington manages a composite of separately managed accounts with investment strategies that are substantially similar to the Managed Income Fund and the Dynamic Growth Fund. The Trustees noted that the management fee charged to the separately managed accounts is equal to or lower than the management fee to be charged by corresponding Kensington Fund. Kensington identified additional services provided to the Kensington Funds to justify a higher management fee. The Trustees also noted that Kensington had contractually agreed, for a period of at least one year from the effective date of the Funds’ prospectus, to waive its management fees and reimburse the Fund for its operating expenses to the extent necessary to ensure that Total Annual Fund Operating Expenses (excluding Rule 12b-1 fees, shareholder servicing plan fees, front-end or contingent deferred loads, taxes, leverage/borrowing interest, interest expense, dividends paid on short sales, brokerage commissions, acquired fund fees and expenses, expenses incurred in connection with any merger or reorganization, or extraordinary expenses such as litigation) do not exceed 1.35% of the average daily net assets of the Managed Income Fund and the Active Advantage Fund, and 1.38% of the average daily net assets of the Dynamic Growth Fund. The Trustees expected that Kensington’s service relationship with each Fund would yield a reasonable profit.
Comparative Fee and Expense Data. The Trustees considered a comparative analysis of contractual expenses that each Kensington Fund will bear and those of funds in the Morningstar benchmark peer group. The Trustees noted that:
| | • | Managed Income Fund. The Managed Income Fund’s proposed management fee of 1.25% was above the median and average management fee for the peer group. The projected total expenses of the Managed Income Fund’s Institutional Class shares, Class A shares and Class C shares were higher than the peer group median and average total expenses. The Trustees further took into account that the proposed management fee was well within the range of the management fees in the peer group. |
| | | |
| | • | Dynamic Growth Fund. The Dynamic Growth Fund’s proposed management fee of 1.25% was above the median and average management fee for the peer group. The projected total expenses of each class of the Dynamic Growth Fund (after fee waivers and expense reimbursements) was higher than the peer group median and average total expenses. The Trustees further took into account that the proposed management fee was well within the range of the management fees in the peer group. |
KENSINGTON FUNDS
Approval of Investment Advisory Agreement (Unaudited) – Continued
| | • | Active Advantage Fund. The Active Advantage Fund’s proposed management fee of 1.25% was above the median and average management fee for the peer group. The projected total expenses of each class of the Active Advantage Fund (after fee waivers and expense reimbursements) was higher than the peer group median and average total expenses. The Trustees further took into account that the average net assets of the funds comprising the peer group were significantly higher than the projected assets of the Active Advantage Fund and that the proposed management fee was well within the range of the management fees in the peer group. |
While recognizing that it is difficult to compare advisory fees because the scope of advisory services provided may vary from one investment adviser to another, the Trustees concluded that Kensington’s proposed advisory fee is reasonable.
Economies of Scale. The Trustees considered whether the Kensington Funds would benefit from any economies of scale, noting that the proposed management fee for the Managed Income Fund and Dynamic Growth Fund each includes breakpoints once a Fund hits $1 billion in assets. The Trustees also took into account that the Active Advantage Fund’s management fee did not have breakpoints. Given the Active Advantage Fund had not yet commenced operations, the Trustees concluded that it is not necessary to consider the implementation of fee breakpoints at this time, but committed to revisit this issue in the future as circumstances change and asset levels increase.
Other Benefits. The Trustees considered the direct and indirect benefits that could be realized by Kensington, and its affiliates, from their respective relationships with the Kensington Funds. The Trustees noted that Kensington may utilize soft dollar arrangements with respect to portfolio transactions. The Trustees noted that Kensington will not use affiliated brokers to execute the Kensington Funds’ portfolio transactions. The Trustees considered that Kensington may receive some form of reputational benefit from services rendered to the Kensington Funds, but that such benefits are immaterial and cannot otherwise be quantified. The Trustees concluded that Kensington do not receive additional material benefits from their relationship with the Kensington Funds.
Based upon Kensington’s presentation and information from Kensington and the Trust’s administrator designed to provide the Trustees with the information necessary to evaluate the terms of the proposed Kensington Advisory Agreement, the Board concluded that the overall arrangements between the Trust and Kensington as will be set forth in the Advisory Agreement, as the proposed agreement relates to each Kensington Fund, are fair and reasonable in light of the services that Kensington will perform, the investment advisory fees that Kensington will receive for such services, and such other matters as the Trustees considered relevant in the exercise of their reasonable business judgment.
KENSINGTON FUNDS
Additional Information (Unaudited)
December 31, 2022
TRUSTEES AND OFFICERS
| | | Term of | | | |
| | | Office | Number of | | Other |
| Name, | | and | Portfolios | Principal | Directorships |
| Address | Position(s) | Length | in Trust | Occupation(s) | Held by Trustee |
| and Year | Held with | of Time | Overseen | During the Past | During the Past |
| of Birth | the Trust | Served | by Trustee | Five Years | Five Years |
| Independent Trustees | | | | | |
| | | | | | |
Leonard M. Rush, CPA | Chairman, | Indefinite | 35 | Retired, Chief Financial | Independent Trustee, |
615 E. Michigan St. | Trustee | Term; Since | | Officer, Robert W. Baird | ETF Series Solutions |
Milwaukee, WI 53202 | and Audit | April 2011 | | & Co. Incorporated | (53 Portfolios) |
Year of Birth: 1946 | Committee | | | (2000-2011). | (2012-Present). |
| | Chairman | | | | |
| | | | | | |
David A. Massart | Trustee | Indefinite | 35 | Partner and Managing | Independent Trustee, |
615 E. Michigan St. | | Term; Since | | Director, Beacon Pointe | ETF Series Solutions |
Milwaukee, WI 53202 | | April 2011 | | Advisors, LLC | (53 Portfolios) |
Year of Birth: 1967 | | | | (since 2022); Co-Founder | (2012-Present). |
| | | | | and Chief Investment | |
| | | | | Strategist, Next Generation | |
| | | | | Wealth Management, Inc. | |
| | | | | (2005-2021). | |
KENSINGTON FUNDS
Additional Information (Unaudited) – Continued
December 31, 2022
| | | Term of | | | |
| | | Office | Number of | | Other |
| Name, | | and | Portfolios | Principal | Directorships |
| Address | Position(s) | Length | in Trust | Occupation(s) | Held by Trustee |
| and Year | Held with | of Time | Overseen | During the Past | During the Past |
| of Birth | the Trust | Served | by Trustee | Five Years | Five Years |
| Independent Trustees |
| | | | | | |
David M. Swanson | Trustee and | Indefinite | 35 | Founder and Managing | Independent Trustee, |
615 E. Michigan St. | Nominating | Term; Since | | Principal, SwanDog | ALPS Variable |
Milwaukee, WI 53202 | & Governance | April 2011 | | Strategic Marketing, LLC | Investment Trust |
Year of Birth: 1957 | Committee | | | (2006-present). | (7 Portfolios) |
| | Chairman | | |
| (2006-Present); |
| | | | | | Independent Trustee, |
| | | | | | RiverNorth Funds |
| | | | | | (3 Portfolios) |
| | | | | | (2018-Present); |
| | | | | | RiverNorth Managed |
| | | | | | Duration Municipal |
| | | | | | Income Fund Inc. |
| | | | | | (1 Portfolio) |
| | | | | | (2019 to present); |
| | | | | | RiverNorth Specialty |
| | | | | | Finance Corporation |
| | | | | | (1 Portfolio) |
| | | | | | (2018 to present); |
| | | | | | RiverNorth/DoubleLine |
| | | | | | Strategic Opportunity |
| | | | | | Fund, Inc. (1 Portfolio) |
| | | | | | (2018 to present); |
| | | | | | RiverNorth |
| | | | | | Opportunities |
| | | | | | Fund, Inc. (1 Portfolio) |
| | | | | | (2015 to present); |
| | | | | | RiverNorth |
| | | | | | Opportunistic |
| | | | | | Municipal Income |
| | | | | | Fund, Inc. (1 Portfolio) |
| | | | | | (2018 to present); |
| | | | | | RiverNorth Flexible |
| | | | | | Municipal Income Fund |
| | | | | | (2020 to present). |
| | | | | | |
Robert J. Kern | Trustee | Indefinite | 35 | Retired (July 2018- | None |
615 E. Michigan St. | | Term; Since | | present); Executive | |
Milwaukee, WI 53202 | | January 2011 | | Vice President, | |
Year of Birth: 1958 | | | | U.S. Bancorp Fund | |
| | | | | Services, LLC | |
| | | | | (1994-2018). | |
KENSINGTON FUNDS
Additional Information (Unaudited) – Continued
December 31, 2022
| | | Term of | | | |
| | | Office | Number of | | Other |
| Name, | | and | Portfolios | Principal | Directorships |
| Address | Position(s) | Length | in Trust | Occupation(s) | Held by Trustee |
| and Year | Held with | of Time | Overseen | During the Past | During the Past |
| of Birth | the Trust | Served | by Trustee | Five Years | Five Years |
| Officers | | | | | |
| | | | | | |
Brian R. Wiedmeyer | President | Indefinite | N/A | Vice President, | N/A |
615 E. Michigan St. | and Principal | Term, Since | | U.S. Bancorp Fund Services, | |
Milwaukee, WI 53202 | Executive | November | | LLC (2005-present). | |
Year of Birth: 1973 | Officer | 2018 | | | |
| | | | | | |
Deborah Ward | Vice President, | Indefinite | N/A | Senior Vice President, | N/A |
615 E. Michigan St. | Chief | Term; Since | | U.S. Bancorp Fund Services, | |
Milwaukee, WI 53202 | Compliance | April 2013 | | LLC (2004-present). | |
Year of Birth: 1966 | Officer and | | | | |
| | Anti-Money | | | | |
| | Laundering | | | | |
| | Officer | | | | |
| | | | | | |
Benjamin Eirich | Treasurer, | Indefinite | N/A | Assistant Vice President, | N/A |
615 E. Michigan St. | Principal | Term; Since | | U.S. Bancorp Fund Services, | |
Milwaukee, WI 53202 | Financial | August 2019 | | LLC (2008-present). | |
Year of Birth: 1981 | Officer and | (Treasurer); | | | |
| Vice President | Since | | | |
| | | November | | | |
| | | 2018 (Vice | | | |
| | | President) | | | |
| | | | | | |
John Hadermayer | Secretary | Indefinite | N/A | U.S. Bancorp Fund Services, | N/A |
615 E. Michigan St. | | Term; Since | | LLC (2022-present); Executive | |
Milwaukee, WI 53202 | | May 2022 | | Director, AQR Capital | |
Year of Birth: 1977 | | | | Management, LLC (2013-present). | |
| | | | | | |
Douglas Schafer | Assistant | Indefinite | N/A | Assistant Vice President, | N/A |
615 E. Michigan St. | Treasurer | Term; Since | | U.S. Bancorp Fund Services, | |
Milwaukee, WI 53202 | and Vice | May 2016 | | LLC (2002-present). | |
Year of Birth: 1970 | President | (Assistant | | | |
| | | Treasurer); | | | |
| | | Indefinite | | | |
| | | Term; Since | | | |
| | | November | | | |
| | | 2018 (Vice | | | |
| | | President) | | | |
KENSINGTON FUNDS
Additional Information (Unaudited) – Continued
December 31, 2022
| | | Term of | | | |
| | | Office | Number of | | Other |
| Name, | | and | Portfolios | Principal | Directorships |
| Address | Position(s) | Length | in Trust | Occupation(s) | Held by Trustee |
| and Year | Held with | of Time | Overseen | During the Past | During the Past |
| of Birth | the Trust | Served | by Trustee | Five Years | Five Years |
| Officers | | | | | |
| | | | | | |
Sara J. Bollech | Assistant | Indefinite | N/A | Officer, U.S. Bancorp | N/A |
615 E. Michigan St. | Treasurer | Term; Since | | Fund Services, LLC | |
Milwaukee, WI 53202 | and Vice | November | | (2007-present). | |
Year of Birth: 1977 | President | 2021 | | | |
| | | | | | |
Peter A. Walker, CPA | Assistant | Indefinite | N/A | Officer, U.S. Bancorp | N/A |
615 E. Michigan St. | Treasurer | Term; Since | | Fund Services, LLC | |
Milwaukee, WI 53202 | and Vice | November | | (2016-present). | |
Year of Birth: 1993 | President | 2021 | | | |
KENSINGTON FUNDS
Additional Information (Unaudited) – Continued
December 31, 2022
AVAILABILITY OF FUND PORTFOLIO INFORMATION
The Funds file complete schedules of portfolio holdings with the SEC for the first and third quarters of each fiscal year on Part F of Form N-PORT. The Funds’ Part F of Form N-PORT is available on the SEC’s website at www.sec.gov and may be reviewed and copied at the SEC’s Public Reference Room in Washington, D.C. Information on the operation of the Public Reference Room may be obtained by calling 1-800-732-0330. The Funds’ Part F of Form N-PORT may also be obtained by calling toll-free 1-855-375-3060.
AVAILABILITY OF PROXY VOTING INFORMATION
A description of the Funds’ Proxy Voting Policies and Procedures is available without charge, upon request, by calling 1-855-375-3060. Information regarding how the Funds voted proxies relating to portfolio securities during the most recent 12-month period ended June 30, is available (1) without charge, upon request, by calling 1-855-375-3060, or (2) on the SEC’s website at www.sec.gov.
QUALIFIED DIVIDEND INCOME/DIVIDENDS RECEIVED DEDUCTION
For the fiscal year ended December 31, 2022, certain dividends paid by the Funds may be reported as qualified dividend income and may be eligible for taxation at capital gain rates. The percentage of dividends declared from ordinary income designated as qualified dividend income was as follows:
Fund |
| |
Active Advantage Fund | 0.13% | |
Managed Income Fund | 0.26% | |
Dynamic Growth Fund | 3.02% | |
For corporate shareholders, the percent of ordinary income distributions qualifying for the corporate dividends received deduction for the fiscal year ended December 31, 2022, was as follows:
Fund |
| |
Active Advantage Fund | 0.00% | |
Managed Income Fund | 0.00% | |
Dynamic Growth Fund | 0.00% | |
The percentage of taxable ordinary income distributions that are designated as short-term capital gain distributions under Internal Revenue Section 871(k)(2)(C) for each Fund were as follows:
Fund |
| |
Active Advantage Fund | 0.00% | |
Managed Income Fund | 0.00% | |
Dynamic Growth Fund | 100.00% | |
(This Page Intentionally Left Blank.)
KENSINGTON FUNDS
Privacy Notice (Unaudited)
The Funds collect only relevant information about you that the law allows or requires it to have in order to conduct its business and properly service you. The Funds collect financial and personal information about you (“Personal Information”) directly (e.g., information on account applications and other forms, such as your name, address, and social security number, and information provided to access account information or conduct account transactions online, such as password, account number, e-mail address, and alternate telephone number), and indirectly (e.g., information about your transactions with us, such as transaction amounts, account balance and account holdings).
The Funds do not disclose any non-public personal information about its shareholders or former shareholders other than for everyday business purposes such as to process a transaction, service an account, respond to court orders and legal investigations or as otherwise permitted by law. Third parties that may receive this information include companies that provide transfer agency, technology and administrative services to the Funds, as well as the Funds’ investment adviser who is an affiliate of the Funds. If you maintain a retirement/educational custodial account directly with the Funds, we may also disclose your Personal Information to the custodian for that account for shareholder servicing purposes. The Funds limit access to your Personal Information provided to unaffiliated third parties to information necessary to carry out their assigned responsibilities to the Funds. All shareholder records will be disposed of in accordance with applicable law. The Funds maintain physical, electronic and procedural safeguards to protect your Personal Information and requires its third-party service providers with access to such information to treat your Personal Information with the same high degree of confidentiality.
In the event that you hold shares of the Funds through a financial intermediary, including, but not limited to, a broker-dealer, credit union, bank or trust company, the privacy policy of your financial intermediary governs how your non-public personal information is shared with unaffiliated third parties.
CONTACTS
BOARD OF TRUSTEES
David Massart
Leonard Rush, CPA
David Swanson
Robert Kern
INVESTMENT ADVISER
Kensington Asset Management LLC
901 S Mopac Expy Ste 225
Austin, TX 78746
INDEPENDENT REGISTERED PUBLIC ACCOUNTING FIRM
Cohen & Company, Ltd.
342 North Water Street, Suite 830
Milwaukee, WI 53202
TRANSFER AGENT, FUND ACCOUNTANT AND FUND ADMINISTRATOR
U.S. Bancorp Fund Services, LLC
777 East Wisconsin Avenue
Milwaukee, WI 53202
DISTRIBUTOR
Quasar Distributors, LLC
111 E. Kilbourn Avenue, Suite 2200
Milwaukee, WI 53202
CUSTODIAN
U.S. Bank, N.A.
1555 North Rivercenter Drive
Milwaukee, WI 53212
FUND COUNSEL
Stradley Ronon Stevens & Young, LLP
2005 Market Street, Suite 2600
Philadelphia, PA 19103-7096
855-375-3060
This report must be accompanied or preceded by a prospectus.
The Funds’ Statement of Additional Information contains additional information about the
Funds’ trustees and is available without charge upon request by calling 1-855-375-3060.
(b) Not applicable.
Item 2. Code of Ethics.
The Registrant has adopted a code of ethics that applies to the Registrant’s principal executive officer and principal financial officer. The Registrant has not made any substantive amendments to its code of ethics during the period covered by this report. The Registrant has not granted any waivers from any provisions of the code of ethics during the period covered by this report.
A copy of the Registrant’s Code of Ethics that applies to the Registrant’s principal executive officer and principal financial officer is filed herewith.
Item 3. Audit Committee Financial Expert.
The Registrant’s board of trustees has determined that there is at least one audit committee financial expert serving on its audit committee. Leonard M. Rush is the “audit committee financial expert” and is considered to be “independent” as each term is defined in Item 3 of Form N‑CSR.
Item 4. Principal Accountant Fees and Services.
The Registrant has engaged its principal accountant to perform audit services, audit-related services, tax services and other services during the past two fiscal years. “Audit services” refer to performing an audit of the Registrant's annual financial statements or services that are normally provided by the accountant in connection with statutory and regulatory filings or engagements for those fiscal years. “Audit-related services” refer to the assurance and related services by the principal accountant that are reasonably related to the performance of the audit. “Tax services” refer to professional services rendered by the principal accountant for tax compliance, tax advice, and tax planning; including reviewing the Fund’s tax returns and distributions calculations. There were no “other services” provided by the principal accountant. For the fiscal year ended December 31, 2022, the Funds’ principal accountant was Cohen & Company, Ltd. For the fiscal year ended December 31, 2021, the Kensington Managed Income Fund’s and Kensington Dynamic Growth Fund’s principal accountant was BBD, LLP. The following table details the aggregate fees billed or expected to be billed for each of the last two fiscal years for audit fees, audit-related fees, tax fees and other fees by the principal accountant.
| | FYE 12/31/2022 | FYE 12/31/2021 |
(a) Audit Fees | $43,500 | $27,000 |
(b) Audit-Related Fees | $0 | $0 |
(c) Tax Fees | $10,500 | $6,000 |
(d) All Other Fees | $0 | $0 |
(e)(1) The audit committee has adopted pre-approval policies and procedures that require the audit committee to pre‑approve all audit and non‑audit services of the Registrant, including services provided to any entity affiliated with the Registrant.
(e)(2) The percentage of fees billed by Cohen & Company, Ltd for the fiscal year ended December 31, 2022 and the percentage of fees billed by BBD, LLP for the fiscal year ended December 31, 2021 applicable to non-audit services pursuant to waiver of pre-approval requirement were as follows:
.
| | FYE 12/31/2022 | FYE 12/31/2021 |
Audit-Related Fees | 0% | 0% |
Tax Fees | 0% | 0% |
All Other Fees | 0% | 0% |
(f) All of the principal accountant’s hours spent on auditing the Registrant’s financial statements were attributed to work performed by full‑time permanent employees of the principal accountant.
(g) The following table indicates the non-audit fees billed or expected to be billed by the Registrant’s accountant for services to the Registrant and to the Registrant’s investment adviser (and any other controlling entity, etc.—not sub-adviser) for the last two years.
Non-Audit Related Fees | FYE 12/31/2022 | FYE 12/31/2021 |
Registrant | N/A | N/A |
Registrant’s Investment Adviser | N/A | N/A |
(h) The audit committee of the board of trustees/directors has considered whether the provision of non-audit services that were rendered to the Registrant's investment adviser is compatible with maintaining the principal accountant's independence and has concluded that the provision of such non-audit services by the accountant has not compromised the accountant’s independence.
Item 5. Audit Committee of Listed Registrants.
Not applicable to Registrants who are not listed as issuers (as defined in Rule 10A-3 under the Securities Exchange Act of 1934).
Item 6. Schedule of Investments.
| (a) | Schedule of Investments is included as part of the report to shareholders filed under Item 1 of this Form. |
Item 7. Disclosure of Proxy Voting Policies and Procedures for Closed-End Management Investment Companies.
Not applicable to open-end investment companies.
Item 8. Portfolio Managers of Closed-End Management Investment Companies.
Not applicable to open-end investment companies.
Item 9. Purchases of Equity Securities by Closed‑End Management Investment Company and Affiliated Purchases.
Not applicable to open-end investment companies.
Item 10. Submission of Matters to a Vote of Security Holders.
There have been no material changes to the procedures by which shareholders may recommend nominees to the Registrant’s Board of Trustees.
Item 11. Controls and Procedures.
| (a) | The Registrant’s President and Treasurer have reviewed the Registrant's disclosure controls and procedures (as defined in Rule 30a-3(c) under the Investment Company Act of 1940 (the “Act”)) as of a date within 90 days of the filing of this report, as required by Rule 30a-3(b) under the Act and Rules 13a-15(b) or 15d‑15(b) under the Securities Exchange Act of 1934. Based on their review, such officers have concluded that the disclosure controls and procedures are effective in ensuring that information required to be disclosed in this report is appropriately recorded, processed, summarized and reported and made known to them by others within the Registrant and by the Registrant’s service provider. |
| (b) | There were no significant changes in the Registrant's internal control over financial reporting (as defined in Rule 30a-3(d) under the Act) that occurred during the period covered by this report that has materially affected, or is reasonably likely to materially affect, the Registrant's internal control over financial reporting. |
Item 12. Disclosure of Securities Lending Activities for Closed-End Management Investment Companies
Not applicable to open-end investment companies.
Item 13. Exhibits.
(3) Any written solicitation to purchase securities under Rule 23c‑1 under the Act sent or given during the period covered by the report by or on behalf of the Registrant to 10 or more persons. Not applicable to open-end investment companies.
(4) Change in the Registrant’s independent public accountant. There was a change in the Registrant’s independent public accountant for the period covered by this report. For the fiscal year ended December 31, 2022, the Funds’ principal accountant was Cohen & Company, Ltd. For the fiscal year ended December 31, 2021, the Kensington Managed Income Fund’s and Kensington Dynamic Growth Fund’s principal accountant was BBD, LLP.
SIGNATURES
Pursuant to the requirements of the Securities Exchange Act of 1934 and the Investment Company Act of 1940, the Registrant has duly caused this report to be signed on its behalf by the undersigned, thereunto duly authorized.
(Registrant) Managed Portfolio Series
By (Signature and Title) /s/ Brian R. Wiedmeyer
Brian R. Wiedmeyer, President
Date March 6, 2023
Pursuant to the requirements of the Securities Exchange Act of 1934 and the Investment Company Act of 1940, this report has been signed below by the following persons on behalf of the Registrant and in the capacities and on the dates indicated.
By (Signature and Title) /s/ Brian R. Wiedmeyer
Brian R. Wiedmeyer, President
Date March 6, 2023
By (Signature and Title) /s/ Benamin J. Eirich
Benjamin J. Eirich, Treasurer