Annual Report
March 31, 2023
CornerCap Small-Cap Value Fund
Table of Contents
| Manager’s Report to Shareholders (Unaudited) | 1 |
| Fund Expenses (Unaudited) | 6 |
| Schedule of Investments | 7 |
| Statement of Assets and Liabilities | 18 |
| Statement of Operations | 19 |
| Statements of Changes in Net Assets | 20 |
| Financial Highlights | 21 |
| Notes to Financial Statements | 23 |
| Report of Independent Registered Public Accounting Firm | 31 |
| Additional Information (Unaudited) | 32 |
Manager’s Report to Shareholders (Unaudited)
March 31, 2023
MANAGEMENT DISCUSSION OF FUND PERFORMANCE
Over the past 12 months, the Federal Reserve launched an aggressive effort to fight inflation, and investors witnessed one of the fastest increases in interest rates in modern history. The policy to raise rates meaningfully throughout the year brought high volatility to equity markets and generally upended many of the popular high-flyers that dominated the pandemic of 2020 and 2021.
Despite the challenging period, we are pleased that the Fundametrics Small Cap Value Strategy performed well and largely as expected. For the year, the strategy beat its benchmark, the Russell 2000 Value, by an impressive 550 basis points and did not experience the major weakness of growth indexes.
For most of the fiscal year (the first three quarters), low valuations, strong momentum in stock price, and improving earnings fundamentals, among other factors, drove the best relative performance. These are conditions that tend to favor our approach, and our Buy decisions beat our Sell decisions by a healthy spread. By comparison, rising rates created a challenge for higher growth stocks, many of which are unprofitable, discounting their future earnings at higher rates and thereby compressing P/E multiples.
Our strategy’s research incorporates diverse fundamental factors and sectors when making decisions, and this breadth of exposure also helped our relative performance. For much of this period, our stock selection was favorable across the majority of the 11 principal sectors, with relative strength particularly in health care and technology.
At the start of 2023, equity investors began taking the view that inflation and rates are peaking, even as the economy cools, creating prospects for falling rates and low economic growth. This swing in sentiment is common and to be expected in the ebb-and-flow of investing, and it was the first time in two years where our Buy-rated stocks lagged our Sells. Among small stocks, unprofitable tech companies with high growth expectations surged.
In addition, in late February, increasingly tighter lending standards, rendered more acute by the failure of a handful of isolated banks, made investors even more defensive, seeking safety in secular growth companies and larger stocks. Our valuation-sensitive strategy is less effective when this investor preference is dominating, and we barely beat our benchmark.
During the year, our research team made two important additions to our fundamental models: one by adding exposure to unprofitable biotech companies, and the other by beginning to refine our analysis of banks stocks following the rare, “outlier” events in February and March.
In biotech, we determined that the strategy needed exposure because this group had become a relatively large part of our benchmark—and yet, our methodology traditionally avoided most of the group, since they are at early stages in their cycles and unprofitable. The team developed a new peer group, with new factors largely centering on drug pipelines, and added it to the Fundametrics model in March of last year. At the time, quantifiable datapoints indicated it was a relatively attractive time to build exposure based on observable trends in R&D spending compared to stock values.
For banks, we are in process of deepening our inputs for unrealized gains and losses on the balance sheet of banks, as well as quality of deposits. These initiatives should strengthen how we value and test capital in the sector.
Given the uncertain outlook for monetary policy, interest rates, and timing of recession, we continue to expect volatility in equity markets. We believe leading indicators indicate a high probability of recession in the next twelve months. At two standard deviations below the average, our research shows that small-cap P/E multiples are already pricing in significant recession — more so than similar metrics for large stocks. This level in small stocks has occurred three times in the last twenty years: 2008, 2009 and 2020. Median one-year returns for the small cap investable universe and Russell 2000 Value Index following these events were over 50% with no negative results.
We believe this environment should continue to create opportunities for long-term, active investment managers to exploit.
Annual Report | March 31, 2023
Manager’s Report to Shareholders (Unaudited)
March 31, 2023
| CornerCap Investment Counsel | March 31, 2023 |
The views in this letter reflect the opinions of CornerCap Group of Funds as of March 31, 2023 and may not necessarily reflect the same views on the date this letter is first published or any time thereafter. These views are intended to help shareholders in understanding the fund’s investment methodology and do not constitute investment advice. Past performance does not guarantee future results.
Equity securities, such as common stocks, are subject to market, economic and business risks that may cause their prices to fluctuate. Investments made in small companies may be more volatile and less liquid due to limited resources or product lines and more sensitive to economic factors. As interest rates rise the value of bond prices will decline. If the Fund invests in ETFs (Exchange-Traded Funds), it will be subject to the same risks as the underlying securities in which the ETF invests as well as entails higher expenses than if invested into the underlying ETF directly.
The Russell 2000 Value Index is an index that measures the 2,000 smallest of the 3,000 largest U.S. Companies (based on total market capitalization) that have lower price-to-book ratios and lower forecasted growth values. It is not possible to invest directly in an index.
Manager’s Report to Shareholders (Unaudited)
March 31, 2023
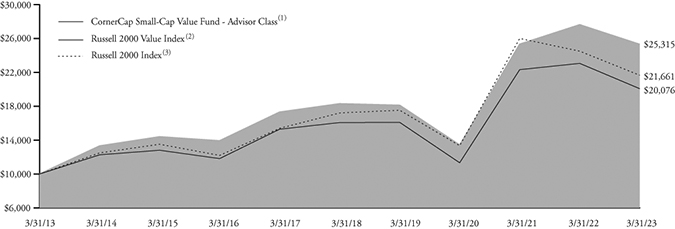
Investment Performance through March 31, 2023 (In Thousands)
The chart assumes an initial investment of $10,000. Performance reflects waivers of fee and operating expenses in effect. In the absence of such waivers, total return would be reduced. Performance data quoted represents past performance and does not guarantee future results. Investment returns and principal value will fluctuate, and when sold, may be worth more or less than their original cost. Performance current to the most recent month-end may be lower or higher than the performance quoted and can be obtained by calling 888-813-8637. Performance assumes the reinvestment of capital gains and income distributions. The performance does not reflect the deduction of taxes that a shareholder would pay on Fund distributions or the redemption of Fund shares.
Annualized Rates of Return as of March 31, 2023
| | 1-Year | 3-Year | 5-Year | 10-Year | Since Inception(5) |
Advisor Class(1) | -8.38% | 23.54% | 6.70% | 9.73% | 9.32% |
Institutional Class(4) | -8.12% | 23.91% | 7.02% | 9.98% | 9.40% |
Russell 2000 Value Index(2) | -12.96% | 21.01% | 4.55% | 7.22% | 9.86% |
Russell 2000 Index(3) | -11.61% | 17.51% | 4.71% | 8.04% | 9.07% |
(1) | Performance shown for Advisor Class is that of the Predecessor Fund’s Investor Shares (See Note 12), and is calculated using the fees and expenses in effect for the Investor Shares during the periods shown, net of any applicable fee and expense limitations or waivers. |
(2) | The Russell 2000 Value Index is an index that measures the 2,000 smallest of the 3,000 largest U.S. Companies (based on total market capitalization) that have lower price-to-book ratios and lower forecasted growth values. It is not possible to invest directly in an index. |
(3) | The Russell 2000 Index is an index that measures the performance of the 2,000 smallest companies in the Russell 3000® Index. The index figures do not reflect any deduction for fees, expenses or taxes. It is not possible to invest directly in an index. |
(4) | Performance shown for Institutional Class is that of the Predecessor Fund’s Institutional Shares. Institutional Shares of the Predecessor Fund commenced operations on December 29, 2015. Performance for the 10 year and Since Inception periods is a blended average annual return which includes the returns of Investor Shares of the Predecessor Fund (inception date September 30, 1992) prior to the commencement of operations of Institutional Shares of the Predecessor Fund, and is calculated using the fees and expenses in effect for the Investor Shares during the periods shown, net of any applicable fee and expense limitations or waivers. If Institutional Shares had been available during periods prior to December 29, 2015, the performance shown may have been different. The performance shown for the periods following the Predecessor Fund’s commencement of Institutional Shares reflects the fees and expenses of Institutional Shares, net of any applicable fee and expense limitations or waivers. |
(5) | Inception date of the Advisor Class was September 30, 1992 and the Institutional Class was December 29, 2015. |
Annual Report | March 31, 2023
Manager’s Report to Shareholders (Unaudited)
March 31, 2023
The following is expense information for the CornerCap Small-Cap Value Fund as disclosed in the Fund’s most recent prospectus dated November 18, 2022:
| Advisor Class Gross Expense Ratio: 1.36% | Net Expense Ratio: 1.25% |
| Institutional Class Gross Expense Ratio: 1.06% | Net Expense Ratio: 0.95% |
CornerCap Investment Counsel, Inc. (the “Adviser”) has contractually agreed to waive a portion or all of its management fees and pay Fund expenses (excluding Rule 12b-1 fees, Shareholder Servicing Plan fees, leverage/borrowing interest, interest expense, dividends paid on short sales, brokerage and other transactional expenses, acquired fund fees and expenses, expenses incurred in connection with any merger or reorganization, or extraordinary expenses) in order to limit the total annual fund operating expenses to 0.95% of average daily net assets of the Fund. Fees waived and expenses paid by the Adviser may be recouped by the Adviser for a period of 36 months following the day on which such fee waiver and/or expense payment was made, if such recoupment can be achieved without exceeding the expense limit in effect at the time the fee waiver and/or expense payment occurred and the expense limit in place at the time of recoupment. The Operating Expenses Limitation Agreement cannot be terminated through at least November 18, 2025. Thereafter, the agreement may be terminated at any time upon 60 days’ written notice by the Trust’s Board of Trustees (the “Board”) or the Adviser, with the consent of the Board.
The actual net expense ratio applicable to investors, as disclosed in the Financial Highlights for the year ended March 31, 2023, was 1.25% and 0.98% for the Advisor Class and Institutional Class, respectively.
Manager’s Report to Shareholders (Unaudited)
March 31, 2023
Allocation of Portfolio Net Assets(1)(2) at March 31, 2023 (% of Net Assets)
Top Ten Equity Holdings(1) at March 31, 2023 (% of Net Assets)
| iRadimed Corp. | 0.6% |
| Primoris Services Corp. | 0.5% |
| NMI Holdings, Inc. – Class A | 0.5% |
| BGC Partners, Inc. – Class A | 0.5% |
| Chord Energy Corp. | 0.5% |
| Brady Corp. – Class A | 0.5% |
| Eagle Materials, Inc. | 0.5% |
| Avanos Medical, Inc. | 0.5% |
| Blackbaud, Inc. | 0.5% |
| EMCOR Group, Inc. | 0.5% |
(1) | Fund holdings and sector allocations are subject to change at any time and are not recommendations to buy or sell any security. |
(2) | Excludes securities lending collateral. |
Annual Report | March 31, 2023
Fund Expenses (Unaudited)
March 31, 2023
As a shareholder of a Fund, you incur two types of costs: (1) transaction costs, which may include but are not limited to, sales charges (loads) on purchases; and (2) ongoing costs, including management fees, distribution and service (12b-1) fees, shareholder servicing fees, and other Fund expenses. This Example is intended to help you understand your ongoing costs (in dollars) of investing in the Fund and to compare these costs with the ongoing costs of investing in other mutual funds. The Example is based on an investment of $1,000 invested at the beginning of the period and held for the entire period (November 18, 2022 – March 31, 2023).
Actual Expenses – For each class, the first line of the table provides information about actual account values and actual expenses. You may use the information in this line, together with the amount you invested, to estimate the expenses that you paid over the period. Simply divide your account value by $1,000 (for example, an $8,600 account value divided by $1,000 = 8.6), then multiply the result by the number in the first line under the heading entitled “Expenses Paid During Period” to estimate the expenses you paid on your account during this period.
Hypothetical Example for Comparison Purposes – For each class, the second line of the table below provides information about hypothetical account values and hypothetical expenses based on the Fund’s actual expense ratio and an assumed rate of return of 5% per year before expenses, which is not the Fund’s actual return. The hypothetical account values and expenses may not be used to estimate the actual ending account balance or expenses you paid for the period. You may use this information to compare the ongoing costs of investing in the Fund and other funds. To do so, compare this 5% hypothetical example with the 5% hypothetical examples that appear in the shareholder reports of the other funds.
Please note that the expenses shown in the table are meant to highlight your ongoing costs only and do not reflect any transactional costs. Therefore, the second line of the table is useful in comparing ongoing costs only, and will not help you determine the relative total costs of owning different funds. In addition, if transactional costs were included, your costs may have been higher.
| | Beginning | Ending | Expenses Paid |
| | Account Value | Account Value | During Period(1) |
| | (11/18/2022) | (3/31/2023) | (11/18/2022 – 3/31/2023) |
| Advisor Class | | | |
Actual(2) | $1,000.00 | $1,096.60 | $4.77 |
| Hypothetical (5% return before expenses) | $1,000.00 | $1,013.66 | $4.59 |
| | | | |
| Institutional Class | | | |
Actual(2) | $1,000.00 | $1,098.30 | $3.63 |
| Hypothetical (5% return before expenses) | $1,000.00 | $1,014.76 | $3.49 |
(1) | Expenses are equal to the Fund’s annualized expense ratio for the period since the Fund’s reorganization on November 18, 2022 of 1.25% for the Advisor Class, multiplied by the average account value over the period, multiplied by 133/365 to reflect the period since the Fund’s reorganization . Expenses are equal to the Fund’s annualized expense ratio for the period since the Fund’s reorganization on November 18, 2022 of 0.95% for the Institutional Class, multiplied by the average account value over the period, multiplied by 133/365 to reflect the period since the Fund’s reorganization (See Note 1 in Notes to Financial Statements). |
(2) | Based on the actual returns for the six-month period ended March 31, 2023, of 9.66% and 9.83% for the Advisor Class and Institutional Class, respectively. |
Schedule of Investments
March 31, 2023
| | | Shares | | | Fair Value | |
| COMMON STOCK (98.7%) | | | | | | |
| | | | | | | |
| Advertising (0.2%) | | | | | | |
| Stagwell, Inc. * | | | 32,167 | | | $ | 238,679 | |
| | | | | | | | | |
| Agriculture (1.3%) | | | | | | | | |
| Fresh Del Monte Produce, Inc. | | | 18,930 | | | | 569,982 | |
| The Andersons Inc. | | | 5,862 | | | | 242,218 | |
| Turning Point Brands, Inc. | | | 8,798 | | | | 184,758 | |
| Vector Group Ltd. | | | 50,071 | | | | 601,353 | |
| | | | | | | | 1,598,311 | |
| Airlines (0.4%) | | | | | | | | |
| Alaska Air Group, Inc. * | | | 12,216 | | | | 512,583 | |
| | | | | | | | | |
| Auto Manufacturers (0.2%) | | | | | | | | |
Wabash National Corp. (a) | | | 10,104 | | | | 248,457 | |
| | | | | | | | | |
| Auto Parts & Equipment (1.0%) | | | | | | | | |
| Allison Transmission Holdings, Inc. | | | 11,060 | | | | 500,354 | |
| Douglas Dynamics, Inc. | | | 14,577 | | | | 464,861 | |
| Gentex Corp. | | | 9,724 | | | | 272,564 | |
| | | | | | | | 1,237,779 | |
| Banks (14.5%) | | | | | | | | |
| Associated Banc-Corp | | | 23,319 | | | | 419,276 | |
Bank OZK (a) | | | 12,324 | | | | 421,481 | |
| Banner Corp. | | | 4,143 | | | | 225,255 | |
| BayCom Corp. | | | 12,230 | | | | 208,888 | |
| BCB Bancorp, Inc. | | | 16,644 | | | | 218,536 | |
| Bridgewater Bancshares, Inc. * | | | 20,766 | | | | 225,103 | |
| Business First Bancshares, Inc. | | | 12,759 | | | | 218,562 | |
| Byline Bancorp, Inc. | | | 21,379 | | | | 462,214 | |
| Capital City Bank Group, Inc. | | | 4,107 | | | | 120,376 | |
| Carter Bankshares, Inc. * | | | 17,125 | | | | 239,750 | |
| Cathay General Bancorp | | | 12,634 | | | | 436,126 | |
| Coastal Financial Corp./WA * | | | 5,833 | | | | 210,046 | |
| Columbia Banking System, Inc. | | | 22,434 | | | | 480,536 | |
| ConnectOne Bancorp, Inc. | | | 23,363 | | | | 413,058 | |
| CrossFirst Bankshares, Inc. * | | | 19,812 | | | | 207,630 | |
| Customers Bancorp, Inc. * | | | 24,434 | | | | 452,518 | |
| Dime Community Bancshares, Inc. | | | 15,821 | | | | 359,453 | |
| Enterprise Financial Services Corp. | | | 11,079 | | | | 494,013 | |
First Bank/Hamilton NJ (a) | | | 18,323 | | | | 185,062 | |
| First Busey Corp. | | | 20,333 | | | | 413,573 | |
| First Commonwealth Financial Corp. | | | 37,767 | | | | 469,444 | |
First Financial Bancorp (a) | | | 21,875 | | | | 476,219 | |
| First Foundation, Inc. | | | 57,638 | | | | 429,403 | |
| First Internet Bancorp | | | 11,369 | | | | 189,294 | |
| First Merchants Corp. | | | 13,050 | | | | 429,997 | |
| FNB Corp./PA | | | 41,268 | | | | 478,709 | |
The accompanying notes to financial statements are an integral part of these financial statements.
Annual Report | March 31, 2023
Schedule of Investments (continued)
March 31, 2023
| | | Shares | | | Fair Value | |
| Banks (14.5%) (continued) | | | | | | |
| Great Southern Bancorp, Inc. | | | 4,380 | | | $ | 221,978 | |
| Hancock Whitney Corp. | | | 9,769 | | | | 355,592 | |
| HBT Financial, Inc. | | | 13,031 | | | | 256,971 | |
| Heartland Financial USA, Inc. | | | 5,450 | | | | 209,062 | |
| Independent Bank Group, Inc. | | | 10,354 | | | | 479,908 | |
| Lakeland Bancorp, Inc. | | | 29,154 | | | | 455,969 | |
| Mercantile Bank Corp. | | | 14,206 | | | | 434,419 | |
| Merchants Bancorp/IN | | | 18,932 | | | | 492,989 | |
| Metropolitan Bank Holding Corp. * | | | 3,257 | | | | 110,380 | |
Mid Penn Bancorp, Inc. (a) | | | 7,700 | | | | 197,197 | |
| Northeast Bank | | | 6,015 | | | | 202,465 | |
| Northrim BanCorp, Inc. | | | 4,382 | | | | 206,743 | |
| Old Second Bancorp, Inc. | | | 15,946 | | | | 224,201 | |
| Peapack-Gladstone Financial Corp. | | | 8,008 | | | | 237,197 | |
| Pinnacle Financial Partners, Inc. | | | 8,585 | | | | 473,549 | |
| Preferred Bank/Los Angeles CA | | | 8,294 | | | | 454,594 | |
| Premier Financial Corp. | | | 10,725 | | | | 222,329 | |
| QCR Holdings, Inc. | | | 9,483 | | | | 416,399 | |
| RBB Bancorp | | | 27,123 | | | | 420,406 | |
| Republic Bancorp Inc. – Class A | | | 12,223 | | | | 518,622 | |
| Synovus Financial Corp. | | | 6,761 | | | | 208,442 | |
| The First Bancshares Inc. | | | 8,739 | | | | 225,728 | |
| UMB Financial Corp. | | | 3,841 | | | | 221,702 | |
| Univest Financial Corp. | | | 10,252 | | | | 243,382 | |
| Valley National Bancorp | | | 48,792 | | | | 450,838 | |
| Veritex Holdings, Inc. | | | 24,221 | | | | 442,275 | |
| Webster Financial Corp. | | | 12,018 | | | | 473,750 | |
| Wintrust Financial Corp. | | | 6,291 | | | | 458,928 | |
| | | | | | | | 18,200,537 | |
| Beverages (0.9%) | | | | | | | | |
| Coca-Cola Consolidated, Inc. | | | 1,125 | | | | 601,965 | |
| The Boston Beer Co. Inc. * | | | 1,592 | | | | 523,290 | |
| | | | | | | | 1,125,255 | |
| Biotechnology (4.2%) | | | | | | | | |
| Allovir, Inc. * | | | 22,843 | | | | 90,001 | |
| ANI Pharmaceuticals, Inc. * | | | 5,680 | | | | 225,610 | |
| Annexon, Inc. * | | | 22,256 | | | | 85,686 | |
| Arcus Biosciences, Inc. * | | | 6,192 | | | | 112,942 | |
| Athira Pharma, Inc. * | | | 37,648 | | | | 94,120 | |
| BioAtla, Inc. * | | | 29,805 | | | | 79,877 | |
| C4 Therapeutics, Inc. * | | | 23,160 | | | | 72,722 | |
| Caribou Biosciences, Inc. * | | | 18,665 | | | | 99,111 | |
| Century Therapeutics, Inc. * | | | 25,978 | | | | 90,144 | |
| Cullinan Oncology, Inc. * | | | 8,053 | | | | 82,382 | |
| CytomX Therapeutics, Inc. * | | | 41,458 | | | | 62,602 | |
| Denali Therapeutics, Inc. * | | | 3,241 | | | | 74,673 | |
The accompanying notes to financial statements are an integral part of these financial statements.
Schedule of Investments (continued)
March 31, 2023
| | | Shares | | | Fair Value | |
| Biotechnology (4.2%) (continued) | | | | | | |
| Edgewise Therapeutics, Inc. * | | | 15,147 | | | $ | 101,030 | |
| Editas Medicine, Inc. * | | | 5,658 | | | | 41,021 | |
| EQRx, Inc. * | | | 50,138 | | | | 97,268 | |
| Erasca, Inc. * | | | 27,198 | | | | 81,866 | |
| Fate Therapeutics, Inc. * | | | 20,683 | | | | 117,893 | |
| Generation Bio Co. * | | | 15,099 | | | | 64,926 | |
| Graphite Bio, Inc. * | | | 35,187 | | | | 86,208 | |
| Halozyme Therapeutics, Inc. * | | | 5,603 | | | | 213,979 | |
| Homology Medicines, Inc. * | | | 39,929 | | | | 41,127 | |
| Ikena Oncology, Inc. * | | | 14,078 | | | | 48,569 | |
| ImmunoGen, Inc. * | | | 25,306 | | | | 97,175 | |
| Intellia Therapeutics, Inc. * | | | 3,072 | | | | 114,493 | |
| Ionis Pharmaceuticals, Inc. * | | | 2,806 | | | | 100,286 | |
| Iovance Biotherapeutics, Inc. * | | | 18,507 | | | | 113,078 | |
| iTeos Therapeutics, Inc. * | | | 6,219 | | | | 84,641 | |
| Kronos Bio, Inc. * | | | 14,607 | | | | 21,326 | |
| LianBio – ADR * | | | 84,288 | | | | 164,362 | |
| MacroGenics, Inc. * | | | 27,977 | | | | 200,595 | |
| MeiraGTx Holdings Plc * | | | 13,290 | | | | 68,709 | |
| Mersana Therapeutics, Inc. * | | | 23,652 | | | | 97,210 | |
| Monte Rosa Therapeutics, Inc. * | | | 13,615 | | | | 106,061 | |
| Nektar Therapeutics * | | | 32,720 | | | | 22,999 | |
| NGM Biopharmaceuticals, Inc. * | | | 22,437 | | | | 91,543 | |
| Nkarta, Inc. * | | | 19,358 | | | | 68,721 | |
| Nurix Therapeutics, Inc. * | | | 9,383 | | | | 83,321 | |
| Nuvation Bio, Inc. * | | | 64,161 | | | | 106,507 | |
| Olema Pharmaceuticals, Inc. * | | | 27,664 | | | | 95,994 | |
Omeros Corp. *(a) | | | 27,686 | | | | 128,740 | |
| Poseida Therapeutics, Inc. * | | | 16,677 | | | | 51,365 | |
| Praxis Precision Medicines, Inc. * | | | 37,838 | | | | 30,611 | |
| Precision BioSciences, Inc. * | | | 69,694 | | | | 52,521 | |
| Puma Biotechnology, Inc. * | | | 62,472 | | | | 193,038 | |
| Sage Therapeutics, Inc. * | | | 2,919 | | | | 122,481 | |
| Sangamo Therapeutics, Inc. * | | | 33,434 | | | | 58,844 | |
| Selecta Biosciences, Inc. * | | | 51,193 | | | | 71,158 | |
| Shattuck Labs, Inc. * | | | 26,530 | | | | 77,998 | |
| Surface Oncology, Inc. * | | | 55,378 | | | | 38,698 | |
| Sutro Biopharma, Inc. * | | | 18,563 | | | | 85,761 | |
| Taysha Gene Therapies, Inc. * | | | 26,474 | | | | 21,116 | |
| TCR2 Therapeutics, Inc. * | | | 34,649 | | | | 51,974 | |
| United Therapeutics Corp. * | | | 2,027 | | | | 453,967 | |
| Vir Biotechnology, Inc. * | | | 5,227 | | | | 121,632 | |
| | | | | | | | 5,260,682 | |
| Building Materials (2.7%) | | | | | | | | |
| American Woodmark Corp. * | | | 9,452 | | | | 492,166 | |
| Apogee Enterprises, Inc. | | | 11,221 | | | | 485,308 | |
The accompanying notes to financial statements are an integral part of these financial statements.
Annual Report | March 31, 2023
Schedule of Investments (continued)
March 31, 2023
| | | Shares | | | Fair Value | |
| Building Materials (2.7%) (continued) | | | | | | |
| Armstrong World Industries, Inc. | | | 3,437 | | | $ | 244,852 | |
| Eagle Materials, Inc. | | | 4,325 | | | | 634,694 | |
| Gibraltar Industries, Inc. * | | | 10,248 | | | | 497,028 | |
| Masonite International Corp. * | | | 5,615 | | | | 509,674 | |
| PGT Innovations, Inc. * | | | 19,595 | | | | 492,030 | |
| | | | | | | | 3,355,752 | |
| Chemicals (0.6%) | | | | | | | | |
| AZZ, Inc. | | | 6,745 | | | | 278,164 | |
| Ecovyst, Inc. * | | | 29,577 | | | | 326,826 | |
| Valhi, Inc. | | | 11,542 | | | | 200,946 | |
| | | | | | | | 805,936 | |
| Coal (0.2%) | | | | | | | | |
| Hallador Energy Co. * | | | 33,889 | | | | 311,440 | |
| | | | | | | | | |
| Commercial Services (7.0%) | | | | | | | | |
| Adtalem Global Education, Inc. * | | | 13,436 | | | | 518,898 | |
| Alarm.com Holdings, Inc. * | | | 10,983 | | | | 552,225 | |
| API Group Corp. * | | | 12,600 | | | | 283,248 | |
| ASGN, Inc. * | | | 2,967 | | | | 245,282 | |
| BrightView Holdings, Inc. * | | | 51,183 | | | | 287,649 | |
| Ennis, Inc. | | | 23,343 | | | | 492,304 | |
| Euronet Worldwide, Inc. * | | | 4,929 | | | | 551,555 | |
| Forrester Research, Inc. * | | | 15,601 | | | | 504,692 | |
| Graham Holdings Co. – Class B | | | 838 | | | | 499,314 | |
| Heidrick & Struggles International, Inc. | | | 15,982 | | | | 485,214 | |
| Huron Consulting Group, Inc. * | | | 3,860 | | | | 310,228 | |
Laureate Education, Inc. *(a) | | | 20,064 | | | | 235,953 | |
| LiveRamp Holdings, Inc. * | | | 27,037 | | | | 592,921 | |
| ManpowerGroup, Inc. * | | | 5,721 | | | | 472,154 | |
| Medifast, Inc. | | | 1,414 | | | | 146,589 | |
| Perdoceo Education Corp. * | | | 38,523 | | | | 517,364 | |
| Repay Holdings Corp. * | | | 77,238 | | | | 507,454 | |
| SP Plus Corp. * | | | 7,725 | | | | 264,890 | |
| Sterling Check Corp. * | | | 21,926 | | | | 244,475 | |
| The Aaron’s Co. Inc. | | | 50,874 | | | | 491,443 | |
| WEX, Inc. * | | | 3,343 | | | | 614,744 | |
| | | | | | | | 8,818,596 | |
| Computers (1.3%) | | | | | | | | |
| Integral Ad Science Holding Corp. * | | | 16,988 | | | | 242,419 | |
| NetScout Systems, Inc. * | | | 16,251 | | | | 465,591 | |
| Qualys, Inc. * | | | 3,475 | | | | 451,819 | |
| Varonis Systems, Inc. * | | | 18,361 | | | | 477,570 | |
| | | | | | | | 1,637,399 | |
The accompanying notes to financial statements are an integral part of these financial statements.
Schedule of Investments (continued)
March 31, 2023
| | | Shares | | | Fair Value | |
| Distribution/Wholesale (1.0%) | | | | | | |
| MRC Global, Inc. * | | | 42,976 | | | $ | 417,727 | |
| Resideo Technologies, Inc. * | | | 16,523 | | | | 302,040 | |
| ScanSource, Inc. * | | | 17,238 | | | | 524,725 | |
| | | | | | | | 1,244,492 | |
| Diversified Financial Services (2.2%) | | | | | | | | |
Affiliated Managers Group, Inc. (a) | | | 3,229 | | | | 459,874 | |
Amerant Bancorp, Inc. (a) | | | 19,535 | | | | 425,082 | |
| BGC Partners, Inc. – Class A | | | 122,392 | | | | 640,110 | |
| Blue Owl Capital, Inc. | | | 22,832 | | | | 252,978 | |
| PJT Partners, Inc. | | | 3,157 | | | | 227,904 | |
| StoneX Group, Inc. * | | | 5,130 | | | | 531,109 | |
| Victory Capital Holdings, Inc. | | | 8,519 | | | | 249,351 | |
| | | | | | | | 2,786,408 | |
| Electric (1.8%) | | | | | | | | |
| ALLETE, Inc. | | | 7,294 | | | | 469,515 | |
| Black Hills Corp. | | | 8,279 | | | | 522,405 | |
| NorthWestern Corp. | | | 8,876 | | | | 513,565 | |
| Portland General Electric Co. | | | 4,839 | | | | 236,579 | |
| Unitil Corp. | | | 8,274 | | | | 471,949 | |
| | | | | | | | 2,214,013 | |
| Electrical Components & Equipment (0.2%) | | | | | | | | |
| Acuity Brands, Inc. | | | 1,375 | | | | 251,254 | |
| | | | | | | | | |
| Electronics (2.9%) | | | | | | | | |
| Brady Corp. – Class A | | | 11,882 | | | | 638,420 | |
| Jabil, Inc. | | | 5,377 | | | | 474,036 | |
| OSI Systems, Inc. * | | | 4,789 | | | | 490,202 | |
Sanmina Corp. *(a) | | | 8,560 | | | | 522,074 | |
| Sensata Technologies Holding Plc | | | 10,285 | | | | 514,456 | |
| TTM Technologies, Inc. * | | | 34,833 | | | | 469,897 | |
| Vishay Intertechnology, Inc. | | | 21,069 | | | | 476,581 | |
| | | | | | | | 3,585,666 | |
| Engineering & Construction (1.4%) | | | | | | | | |
| EMCOR Group, Inc. | | | 3,816 | | | | 620,444 | |
| Primoris Services Corp. | | | 26,591 | | | | 655,734 | |
| Sterling Infrastructure, Inc. * | | | 12,173 | | | | 461,113 | |
| | | | | | | | 1,737,291 | |
| Entertainment (0.8%) | | | | | | | | |
| Accel Entertainment, Inc. * | | | 61,345 | | | | 558,853 | |
| Marriott Vacations Worldwide Corp. | | | 3,205 | | | | 432,226 | |
| | | | | | | | 991,079 | |
The accompanying notes to financial statements are an integral part of these financial statements.
Annual Report | March 31, 2023
Schedule of Investments (continued)
March 31, 2023
| | | Shares | | | Fair Value | |
| Environmental Control (0.5%) | | | | | | |
| Centrus Energy Corp. * | | | 13,920 | | | $ | 448,224 | |
Stericycle, Inc. *(a) | | | 5,381 | | | | 234,665 | |
| | | | | | | | 682,889 | |
| Food (1.0%) | | | | | | | | |
| Calavo Growers, Inc. | | | 15,972 | | | | 459,515 | |
| Mission Produce, Inc. * | | | 21,875 | | | | 243,031 | |
| United Natural Foods, Inc. * | | | 19,448 | | | | 512,455 | |
| | | | | | | | 1,215,001 | |
| Food Service (0.5%) | | | | | | | | |
| Sovos Brands, Inc. * | | | 34,902 | | | | 582,165 | |
| | | | | | | | | |
| Gas (2.1%) | | | | | | | | |
| Chesapeake Utilities Corp. | | | 4,106 | | | | 525,527 | |
| National Fuel Gas Co. | | | 8,888 | | | | 513,193 | |
| Northwest Natural Holding Co. | | | 10,932 | | | | 519,926 | |
| Spire, Inc. | | | 7,434 | | | | 521,421 | |
UGI Corp. (a) | | | 14,876 | | | | 517,090 | |
| | | | | | | | 2,597,157 | |
| Hand/Machine Tools (0.2%) | | | | | | | | |
| Cadre Holdings, Inc. | | | 12,185 | | | | 262,465 | |
| | | | | | | | | |
| Healthcare-Products (3.6%) | | | | | | | | |
| Avanos Medical, Inc. * | | | 21,051 | | | | 626,057 | |
| Haemonetics Corp. * | | | 6,930 | | | | 573,457 | |
| Integer Holdings Corp. * | | | 3,526 | | | | 273,265 | |
Integra LifeSciences Holdings Corp. *(a) | | | 8,908 | | | | 511,408 | |
| iRadimed Corp. | | | 19,238 | | | | 757,015 | |
| Merit Medical Systems, Inc. * | | | 6,527 | | | | 482,672 | |
| NuVasive, Inc. * | | | 11,136 | | | | 460,028 | |
| Patterson Cos., Inc. | | | 18,054 | | | | 483,306 | |
| Semler Scientific, Inc. * | | | 11,681 | | | | 313,051 | |
| | | | | | | | 4,480,259 | |
| Healthcare-Services (1.0%) | | | | | | | | |
| Addus HomeCare Corp. * | | | 4,748 | | | | 506,897 | |
| Encompass Health Corp. | | | 9,398 | | | | 508,432 | |
| The Pennant Group Inc. * | | | 15,801 | | | | 225,638 | |
| | | | | | | | 1,240,967 | |
| Home Builders (0.9%) | | | | | | | | |
| Beazer Homes USA, Inc. * | | | 36,481 | | | | 579,318 | |
| M/I Homes, Inc. * | | | 8,886 | | | | 560,618 | |
| | | | | | | | 1,139,936 | |
| Household Products/Wares (0.6%) | | | | | | | | |
| ACCO Brands Corp. | | | 42,401 | | | | 225,573 | |
Quanex Building Products Corp. (a) | | | 23,304 | | | | 501,735 | |
| | | | | | | | 727,308 | |
The accompanying notes to financial statements are an integral part of these financial statements.
Schedule of Investments (continued)
March 31, 2023
| | | Shares | | | Fair Value | |
| Insurance (3.3%) | | | | | | |
| Axis Capital Holdings Ltd. | | | 8,593 | | | $ | 468,490 | |
| CNO Financial Group, Inc. | | | 21,922 | | | | 486,449 | |
| Essent Group Ltd. | | | 13,108 | | | | 524,975 | |
Jackson Financial, Inc. – Class A (a) | | | 14,211 | | | | 531,634 | |
| James River Group Holdings Ltd. | | | 22,813 | | | | 471,088 | |
| MGIC Investment Corp. | | | 37,862 | | | | 508,108 | |
| NMI Holdings, Inc. – Class A * | | | 29,133 | | | | 650,540 | |
| Palomar Holdings, Inc. * | | | 8,898 | | | | 491,170 | |
| | | | | | | | 4,132,454 | |
| Internet (2.1%) | | | | | | | | |
| HealthStream, Inc. * | | | 10,110 | | | | 273,981 | |
| Q2 Holdings, Inc. * | | | 9,690 | | | | 238,568 | |
| Squarespace, Inc. * | | | 18,630 | | | | 591,875 | |
| TechTarget, Inc. * | | | 13,518 | | | | 488,270 | |
TripAdvisor, Inc. *(a) | | | 24,165 | | | | 479,917 | |
| Yelp, Inc. * | | | 17,482 | | | | 536,697 | |
| | | | | | | | 2,609,308 | |
| Iron/Steel (0.8%) | | | | | | | | |
| Carpenter Technology Corp. | | | 13,118 | | | | 587,162 | |
| Haynes International, Inc. | | | 9,659 | | | | 483,819 | |
| | | | | | | | 1,070,981 | |
| Leisure Time (1.4%) | | | | | | | | |
| Brunswick Corp./DE | | | 6,352 | | | | 520,864 | |
Harley-Davidson, Inc. (a) | | | 11,436 | | | | 434,225 | |
| Malibu Boats, Inc. – Class A * | | | 9,248 | | | | 522,050 | |
| MasterCraft Boat Holdings, Inc. * | | | 7,979 | | | | 242,801 | |
| | | | | | | | 1,719,940 | |
| Lodging (1.5%) | | | | | | | | |
| Boyd Gaming Corp. | | | 9,126 | | | | 585,159 | |
| Hilton Grand Vacations, Inc. * | | | 5,934 | | | | 263,648 | |
| Playa Hotels & Resorts NV * | | | 55,126 | | | | 529,210 | |
| Travel + Leisure Co. | | | 12,443 | | | | 487,765 | |
| | | | | | | | 1,865,782 | |
| Machinery – Construction & Mining (0.6%) | | | | | | | | |
| Oshkosh Corp. | | | 5,882 | | | | 489,265 | |
| Terex Corp. | | | 4,861 | | | | 235,175 | |
| | | | | | | | 724,440 | |
| Machinery-Diversified (1.0%) | | | | | | | | |
| Cactus, Inc. – Class A | | | 5,503 | | | | 226,889 | |
| Gates Industrial Corp Plc * | | | 37,037 | | | | 514,444 | |
| Thermon Group Holdings, Inc. * | | | 19,606 | | | | 488,581 | |
| | | | | | | | 1,229,914 | |
The accompanying notes to financial statements are an integral part of these financial statements.
Annual Report | March 31, 2023
Schedule of Investments (continued)
March 31, 2023
| | | Shares | | | Fair Value | |
| Media (1.9%) | | | | | | |
| AMC Networks, Inc. – Class A * | | | 9,749 | | | $ | 171,388 | |
Cable One, Inc. (a) | | | 802 | | | | 563,004 | |
| Gray Television, Inc. | | | 53,835 | | | | 469,441 | |
Sinclair Broadcast Group, Inc. – Class A (a) | | | 29,244 | | | | 501,827 | |
| TEGNA, Inc. | | | 14,009 | | | | 236,892 | |
| The EW Scripps Co. – Class A * | | | 44,778 | | | | 421,361 | |
| | | | | | | | 2,363,913 | |
| Metal Fabricate/Hardware (0.6%) | | | | | | | | |
| Northwest Pipe Co. * | | | 7,476 | | | | 233,476 | |
| Standex International Corp. | | | 4,775 | | | | 584,651 | |
| | | | | | | | 818,127 | |
| Miscellaneous Manufacturing (0.4%) | | | | | | | | |
| ESCO Technologies, Inc. | | | 5,544 | | | | 529,175 | |
| | | | | | | | | |
| Office Furnishings (0.5%) | | | | | | | | |
| Steelcase, Inc. – Class A * | | | 69,886 | | | | 588,440 | |
| | | | | | | | | |
| Office/Business Equipment (0.2%) | | | | | | | | |
| Xerox Holdings Corp. | | | 15,841 | | | | 243,951 | |
| | | | | | | | | |
| Oil & Gas (3.4%) | | | | | | | | |
| APA Corp. | | | 12,591 | | | | 454,031 | |
| Berry Corp. | | | 65,567 | | | | 514,701 | |
| Chord Energy Corp. | | | 4,745 | | | | 638,677 | |
| CVR Energy, Inc. | | | 15,261 | | | | 500,256 | |
Helmerich & Payne, Inc. (a) | | | 11,702 | | | | 418,346 | |
Magnolia Oil & Gas Corp. (a) | | | 22,763 | | | | 498,054 | |
| Murphy Oil Corp. | | | 10,766 | | | | 398,127 | |
| Ovintiv, Inc. | | | 9,601 | | | | 346,404 | |
| PDC Energy, Inc. | | | 7,275 | | | | 466,910 | |
| | | | | | | | 4,235,506 | |
| Oil & Gas Services (1.1%) | | | | | | | | |
| DMC Global, Inc. * | | | 11,275 | | | | 247,712 | |
| Liberty Energy, Inc. | | | 35,226 | | | | 451,245 | |
| ProPetro Holding Corp. * | | | 64,000 | | | | 460,160 | |
| RPC, Inc. | | | 30,342 | | | | 233,330 | |
| | | | | | | | 1,392,447 | |
| Packaging & Containers (0.3%) | | | | | | | | |
| Clearwater Paper Corp. * | | | 12,342 | | | | 412,470 | |
| | | | | | | | | |
| Pharmaceuticals (3.2%) | | | | | | | | |
| Alector, Inc. * | | | 11,767 | | | | 72,838 | |
| Amneal Pharmaceuticals, Inc. * | | | 85,996 | | | | 119,534 | |
| Amphastar Pharmaceuticals, Inc. * | | | 12,678 | | | | 475,425 | |
| Arvinas, Inc. * | | | 2,644 | | | | 72,234 | |
Assertio Holdings, Inc. *(a) | | | 57,735 | | | | 367,772 | |
| Catalyst Pharmaceuticals, Inc. * | | | 22,901 | | | | 379,699 | |
The accompanying notes to financial statements are an integral part of these financial statements.
Schedule of Investments (continued)
March 31, 2023
| | | Shares | | | Fair Value | |
| Pharmaceuticals (3.2%) (continued) | | | | | | |
| Enanta Pharmaceuticals, Inc. * | | | 2,784 | | | $ | 112,585 | |
| Foghorn Therapeutics, Inc. * | | | 13,147 | | | | 81,511 | |
| Fulcrum Therapeutics, Inc. * | | | 21,643 | | | | 61,683 | |
| Gritstone bio, Inc. * | | | 40,619 | | | | 112,921 | |
Herbalife Nutrition Ltd. *(a) | | | 10,784 | | | | 173,622 | |
| Jounce Therapeutics, Inc. * | | | 48,257 | | | | 89,276 | |
| Lyell Immunopharma, Inc. * | | | 44,651 | | | | 105,376 | |
| Option Care Health, Inc. * | | | 15,835 | | | | 503,078 | |
| Passage Bio, Inc. * | | | 51,410 | | | | 49,235 | |
| Premier, Inc. – Class A | | | 16,286 | | | | 527,178 | |
| Prestige Consumer Healthcare, Inc. * | | | 9,080 | | | | 568,680 | |
| Y-mAbs Therapeutics, Inc. * | | | 24,560 | | | | 123,046 | |
| | | | | | | | 3,995,693 | |
| Pipelines (0.6%) | | | | | | | | |
| EnLink Midstream LLC | | | 52,486 | | | | 568,948 | |
| Excelerate Energy, Inc. – Class A * | | | 11,508 | | | | 254,787 | |
| | | | | | | | 823,735 | |
| Real Estate Investment Trusts (REITs) (8.1%) | | | | | | | | |
| Alexander & Baldwin, Inc. | | | 22,946 | | | | 433,909 | |
| American Assets Trust, Inc. | | | 21,225 | | | | 394,573 | |
| Apple Hospitality REIT, Inc. | | | 33,392 | | | | 518,244 | |
Brixmor Property Group, Inc. (a) | | | 20,455 | | | | 440,192 | |
| CareTrust REIT, Inc. | | | 21,110 | | | | 413,334 | |
| Chatham Lodging Trust | | | 38,119 | | | | 399,868 | |
| DiamondRock Hospitality Co. | | | 54,633 | | | | 444,166 | |
Douglas Emmett, Inc. (a) | | | 14,668 | | | | 180,856 | |
EastGroup Properties, Inc. (a) | | | 2,203 | | | | 364,200 | |
| EPR Properties | | | 11,602 | | | | 442,036 | |
| Equity Commonwealth | | | 17,340 | | | | 359,111 | |
| Highwoods Properties, Inc. | | | 6,243 | | | | 144,775 | |
| Indus Realty Trust, Inc. | | | 8,557 | | | | 567,244 | |
Independence Realty Trust, Inc. (a) | | | 35,976 | | | | 576,695 | |
Innovative Industrial Properties, Inc. (a) | | | 3,585 | | | | 272,424 | |
Kilroy Realty Corp. (a) | | | 6,573 | | | | 212,965 | |
National Storage Affiliates Trust (a) | | | 12,068 | | | | 504,201 | |
| One Liberty Properties, Inc. | | | 8,416 | | | | 192,979 | |
| Outfront Media, Inc. | | | 25,663 | | | | 416,511 | |
Park Hotels & Resorts, Inc. (a) | | | 35,218 | | | | 435,294 | |
| Phillips Edison & Co, Inc. | | | 12,017 | | | | 391,995 | |
| Retail Opportunity Investments Corp. | | | 32,639 | | | | 455,640 | |
RLJ Lodging Trust (a) | | | 37,575 | | | | 398,295 | |
| The Howard Hughes Corp. * | | | 3,311 | | | | 264,880 | |
| The Necessity Retail REIT Inc. – Class A | | | 30,064 | | | | 188,802 | |
Uniti Group, Inc. (a) | | | 73,508 | | | | 260,953 | |
| Whitestone REIT | | | 51,193 | | | | 470,976 | |
| | | | | | | | 10,145,118 | |
The accompanying notes to financial statements are an integral part of these financial statements.
Annual Report | March 31, 2023
Schedule of Investments (continued)
March 31, 2023
| | | Shares | | | Fair Value | |
| Retail (1.5%) | | | | | | |
| American Eagle Outfitters, Inc. * | | | 17,798 | | | $ | 239,205 | |
| FirstCash Holdings, Inc. | | | 2,917 | | | | 278,194 | |
| La-Z-Boy, Inc. | | | 15,189 | | | | 441,696 | |
| TravelCenters of America, Inc. * | | | 4,829 | | | | 417,709 | |
| World Fuel Services Corp. | | | 19,172 | | | | 489,845 | |
| | | | | | | | 1,866,649 | |
| Savings & Loans (2.7%) | | | | | | | | |
Axos Financial, Inc. *(a) | | | 11,085 | | | | 409,258 | |
| Brookline Bancorp, Inc. | | | 43,600 | | | | 457,800 | |
| Flushing Financial Corp. | | | 15,966 | | | | 237,734 | |
| FS Bancorp, Inc. | | | 9,148 | | | | 274,531 | |
| Home Bancorp, Inc. | | | 6,032 | | | | 199,237 | |
| HomeTrust Bancshares, Inc. | | | 11,645 | | | | 286,351 | |
| OceanFirst Financial Corp. | | | 29,666 | | | | 548,228 | |
| Southern Missouri Bancorp, Inc. | | | 5,714 | | | | 213,761 | |
Washington Federal, Inc. (a) | | | 17,666 | | | | 532,100 | |
| WSFS Financial Corp. | | | 6,125 | | | | 230,361 | |
| | | | | | | | 3,389,361 | |
| Semiconductors (1.1%) | | | | | | | | |
| Amkor Technology, Inc. | | | 12,239 | | | | 318,459 | |
Cohu, Inc. *(a) | | | 15,267 | | | | 586,100 | |
| MaxLinear, Inc. * | | | 14,132 | | | | 497,588 | |
| | | | | | | | 1,402,147 | |
| Software (5.1%) | | | | | | | | |
| Bandwidth, Inc. * | | | 32,863 | | | | 499,518 | |
| Blackbaud, Inc. * | | | 9,025 | | | | 625,432 | |
| Box, Inc. – Class A * | | | 15,212 | | | | 407,529 | |
| CommVault Systems, Inc. * | | | 8,062 | | | | 457,438 | |
| Concentrix Corp. | | | 1,936 | | | | 235,321 | |
| Everbridge, Inc. * | | | 8,309 | | | | 288,073 | |
| HireRight Holdings Corp. * | | | 21,848 | | | | 231,807 | |
| Immersion Corp. | | | 31,751 | | | | 283,854 | |
| JFrog Ltd. * | | | 22,850 | | | | 450,145 | |
| New Relic, Inc. * | | | 7,030 | | | | 529,289 | |
| Pegasystems, Inc. | | | 9,961 | | | | 482,909 | |
| Progress Software Corp. | | | 9,593 | | | | 551,118 | |
| RingCentral, Inc. * | | | 7,480 | | | | 229,412 | |
| Sapiens International Corp. NV * | | | 25,741 | | | | 559,095 | |
| SolarWinds Corp. * | | | 31,292 | | | | 269,111 | |
SPS Commerce, Inc. *(a) | | | 1,947 | | | | 296,528 | |
| | | | | | | | 6,396,579 | |
The accompanying notes to financial statements are an integral part of these financial statements.
Schedule of Investments (continued)
March 31, 2023
| | | Shares | | | Fair Value | |
| Telecommunications (1.2%) | | | | | | |
| A10 Networks, Inc. | | | 35,013 | | | $ | 542,351 | |
| Cambium Networks Corp. * | | | 13,088 | | | | 231,919 | |
| CommScope Holding Co, Inc. * | | | 30,102 | | | | 191,750 | |
| Viavi Solutions, Inc. * | | | 48,759 | | | | 528,060 | |
| | | | | | | | 1,494,080 | |
| Transportation (0.9%) | | | | | | | | |
| Daseke, Inc. * | | | 36,576 | | | | 282,732 | |
| Teekay Tankers Ltd. – Class A * | | | 12,114 | | | | 520,054 | |
XPO Logistics, Inc. *(a) | | | 9,335 | | | | 297,787 | |
| | | | | | | | 1,100,573 | |
| TOTAL COMMON STOCK | | | | | | | | |
| (COST $128,186,248) | | | | | | | 123,640,539 | |
| | | | | | | | | |
| CONTINGENT VALUE RIGHTS (0.0%) | | | | | | | | |
Ligand Pharmaceuticals, Inc. Earn-Out Shares 1 *(b) | | | 491 | | | | — | |
Ligand Pharmaceuticals, Inc. Earn-Out Shares 2 *(b) | | | 491 | | | | — | |
| TOTAL CONTINGENT VALUE RIGHTS | | | | | | | | |
| (COST $—) | | | | | | | — | |
| | | | | | | | | |
| Money Market Fund (0.9%) | | | | | | | | |
| First American Government Obligations Fund – Class X, 4.640%) ^ | | | | | | | | |
| (COST $1,129,600) | | | 1,129,600 | | | | 1,129,600 | |
| | | | | | | | | |
| Investments Purchased with Proceeds from Securities Lending (10.7%) | | | | | | | | |
| Mount Vernon Liquid Assets Portfolio LLC, 4.930%) ^ | | | | | | | | |
| (COST $13,331,257) | | | 13,331,257 | | | | 13,331,257 | |
| | | | | | | | | |
| TOTAL INVESTMENTS | | | | | | | | |
| (COST $142,647,105) | | | 110.3 | % | | | 138,101,396 | |
| OTHER ASSETS AND LIABILITIES, NET | | | (10.3 | )% | | | (12,880,893 | ) |
| TOTAL NET ASSETS | | | 100.0 | % | | $ | 125,220,503 | |
| * | Non-income producing security. |
| (a) | This security or a portion of this security was out on loan at March 31, 2023. Total loaned securities had a fair value of $13,312,901 at March 31, 2023. |
| (b) | Security is categorized in Level 3 of the fair value hierarchy. These Level 3 securities have a total fair value of $0, which represents 0.0% of total net assets. See Note 3 In the Notes to the Financial Statements. |
| ADR – | American Depositary Receipt |
| REIT – | Real Estate Investment Trust |
| ^ | The rate shown is the annualized seven-day effective yield as of March 31, 2023. |
The accompanying notes to financial statements are an integral part of these financial statements.
Annual Report | March 31, 2023
Statement of Assets and Liabilities
March 31, 2023
| ASSETS: | | | |
| Investment securities: | | | |
| At cost | | $ | 142,647,105 | |
At value(1) | | $ | 138,101,396 | |
| Receivable for investment securities sold | | | 2,678,993 | |
| Dividends & interest receivable | | | 148,473 | |
| Receivable for capital shares sold | | | 7,839 | |
| Income receivable from securities lending | | | 2,402 | |
| Prepaid expenses | | | 58,799 | |
| Total Assets | | | 140,997,902 | |
| | | | | |
| LIABILITIES: | | | | |
| Payable upon return of securities loaned (See Note 9) | | | 13,331,257 | |
| Payable for investment securities purchased | | | 2,085,254 | |
| Payable for capital shares redeemed | | | 184,240 | |
| Payable to investment adviser | | | 63,225 | |
| Payable for fund administration & accounting fees | | | 41,515 | |
| Payable for compliance fees | | | 5,461 | |
| Payable for transfer agent fees & expenses | | | 16,897 | |
| Payable for custody fees | | | 3,898 | |
| Payable for audit and tax fees | | | 21,251 | |
| Payable for trustee fees | | | 2,986 | |
| Accrued other fees | | | 21,408 | |
| Accrued distribution & shareholder service fees | | | 7 | |
| Total Liabilities | | | 15,777,399 | |
| NET ASSETS | | $ | 125,220,503 | |
| | | | | |
| COMPOSITION OF NET ASSETS | | | | |
| Paid-in capital | | $ | 129,598,764 | |
| Total accumulated losses | | | (4,378,261 | ) |
| Total net assets | | $ | 125,220,503 | |
(1) | Includes loaned securities of: | | $ | 13,312,901 | |
| Advisor Class Shares: | | | |
| Net Assets | | $ | 9,372 | |
Shares issued and outstanding(2) | | | 756 | |
| Net asset value, offering price, and redemption price per share | | $ | 12.40 | |
| Institutional Class Shares: | | | | |
| Net Assets | | $ | 125,211,131 | |
Shares issued and outstanding(2) | | | 10,042,438 | |
| Net asset value, offering price, and redemption price per share | | $ | 12.47 | |
(2) | Unlimited shares authorized without par value. |
The accompanying notes to financial statements are an integral part of these financial statements.
Statement of Operations
For the Year Ended March 31, 2023
| INVESTMENT INCOME: | | | |
| Interest income | | $ | 25,442 | |
| Dividend income | | | 2,600,373 | |
| Less: Foreign taxes withheld | | | (3,899 | ) |
| Securities lending income | | | 6,963 | |
| Total investment income | | | 2,628,879 | |
| | | | | |
| EXPENSES: | | | | |
| Investment advisory fees (See Note 4) | | | 1,210,522 | |
| Operating service fees – Investor Class (See Note 4) | | | 188,998 | |
| Operating service fees – Institutional Class (See Note 4) | | | 40,330 | |
| Fund administration & accounting fees (See Note 4) | | | 41,515 | |
| Audit & tax fees | | | 21,251 | |
| Transfer agent fees & expenses (See Note 4) | | | 16,897 | |
| Federal & state registration fees | | | 15,649 | |
| Trustee fees | | | 8,823 | |
| Compliance fees (See Note 4) | | | 5,461 | |
| Legal fees | | | 3,996 | |
| Custody fees (See Note 4) | | | 3,898 | |
| Other fees | | | 3,688 | |
| Postage & printing fees | | | 2,997 | |
| Insurance fees | | | 234 | |
| Distribution & shareholder service fees – Advisor Class (See Note 5) | | | 7 | |
| Total expenses before waiver | | | 1,564,266 | |
| Less: Fee waiver from investment adviser (See Note 4) | | | (90,816 | ) |
| Total net expenses | | | 1,473,450 | |
| NET INVESTMENT INCOME | | | 1,155,429 | |
| REALIZED AND UNREALIZED GAIN (LOSS) ON INVESTMENTS | | | | |
| Net realized gain on investments | | | 969,514 | |
| Net change in unrealized appreciation/depreciation of investments | | | (14,275,630 | ) |
| Net realized and unrealized loss on investments | | | (13,306,116 | ) |
| NET DECREASE IN NET ASSETS FROM OPERATIONS | | $ | (12,150,687 | ) |
The accompanying notes to financial statements are an integral part of these financial statements.
Annual Report | March 31, 2023
Statements of Changes in Net Assets
| | | CornerCap Small-Cap Value Fund | |
| | | For the Year | | | For the Year | |
| | | Ended | | | Ended | |
| | | March 31, 2023 | | | March 31, 2022 | |
| OPERATIONS: | | | | | | |
| Net investment income | | $ | 1,155,429 | | | $ | 1,291,473 | |
| Net realized gain on investments | | | 969,514 | | | | 39,386,985 | |
| Net change in unrealized appreciation/depreciation of investments | | | (14,275,630 | ) | | | (25,635,543 | ) |
| Net increase (decrease) resulting from operations | | | (12,150,687 | ) | | | 15,042,915 | |
| CAPITAL SHARE TRANSACTIONS: | | | | | | | | |
| Advisor Class: | | | | | | | | |
| Proceeds from shares sold | | | 10,000 | | | | — | |
| Proceeds from reinvestment of distributions | | | 449 | | | | — | |
| Payments for shares redeemed | | | — | | | | — | |
| Increase in net assets from Advisor Class transactions | | | 10,449 | | | | — | |
| Institutional Class: | | | | | | | | |
| Proceeds from shares sold | | | 12,036,118 | | | | 18,312,919 | |
| Proceeds from reinvestment of distributions | | | 12,342,886 | | | | 17,787,764 | |
| Payments for shares redeemed | | | (21,082,709 | ) | | | (18,063,249 | ) |
| Redemption Fees | | | 7 | | | | 997 | |
| Proceeds from conversion of Investor Class (See Note 12) | | | 73,231,101 | | | | — | |
| Increase in net assets from Institutional Class transactions | | | 76,527,403 | | | | 18,037,434 | |
| Investor Class: | | | | | | | | |
| Proceeds from shares sold | | | 3,604,989 | | | | 6,898,459 | |
| Proceeds from reinvestment of distributions | | | — | | | | 23,162,296 | |
| Payments for shares redeemed | | | (8,517,907 | ) | | | (40,361,324 | ) |
| Redemption fees | | | 4 | | | | — | |
| Payments from conversion into Institutional Class | | | (73,231,101 | ) | | | — | |
| Decrease in net assets from Investor Class transactions | | | (78,144,015 | ) | | | (10,300,569 | ) |
| Net increase (decrease) in net assets from capital share transactions | | | (1,606,163 | ) | | | 7,737,862 | |
| DISTRIBUTIONS TO SHAREHOLDERS: | | | | | | | | |
| Net Distributions to Shareholders – Advisor Class | | | (449 | ) | | | — | |
| Net Distributions to Shareholders – Institutional Class | | | (12,343,162 | ) | | | (41,479,890 | ) |
| Total distributions to shareholders | | | (12,343,611 | ) | | | (41,479,890 | ) |
| Total decrease in net assets | | | (26,100,461 | ) | | | (18,699,113 | ) |
| NET ASSETS: | | | | | | | | |
| Beginning of Year | | | 151,320,964 | | | | 170,020,077 | |
| End of Year | | $ | 125,220,503 | | | $ | 151,320,964 | |
The accompanying notes to financial statements are an integral part of these financial statements.
Financial Highlights
CornerCap Small-Cap Value Fund – Advisor Class
| | | Period Since | |
| | | Commencement | |
| | | of Operations(1) | |
| | | through | |
| For a Fund share outstanding throughout the period. | | March 31, 2023 | |
| PER COMMON SHARE DATA | | | |
| Net asset value, beginning of period | | $ | 14.21 | |
| INVESTMENT OPERATIONS: | | | | |
| Net investment income | | | 0.05 | (2) |
| Net realized and unrealized loss on investments | | | (0.60 | ) |
| Total from investment operations | | | (0.55 | ) |
| | | | | |
| LESS DISTRIBUTIONS FROM: | | | | |
| Net investment income | | | (0.07 | ) |
| Net realized gains | | | (1.19 | ) |
| Total distributions | | | (1.26 | ) |
| Net asset value, end of period | | $ | 12.40 | |
Total return(3) | | | -4.00 | % |
| | | | | |
| SUPPLEMENTAL DATA AND RATIOS: | | | | |
| Net assets, at end of period (000’s) | | $ | 9 | |
| | | | | |
RATIO OF EXPENSES TO AVERAGE NET ASSETS(4): | | | | |
| Before expense waiver | | | 1.45 | % |
| After expense waiver | | | 1.25 | % |
| | | | | |
RATIO OF NET INVESTMENT INCOME TO AVERAGE NET ASSETS(4): | | | | |
| After expense waiver | | | 1.15 | % |
| Portfolio Turnover Rate | | | 131 | % |
________________________
(1) | Commencement of operations of the Advisor Class was November 18, 2022. |
(2) | Per share amounts calculated using the average shares method. |
(3) | Not annualized. |
(4) | Annualized. |
The accompanying notes to financial statements are an integral part of these financial statements.
Annual Report | March 31, 2023
Financial Highlights
CornerCap Small-Cap Value Fund – Institutional Class
| | | Year Ended March 31, | |
| For a Fund share outstanding throughout each year. | | 2023 | | | 2022 | | | 2021 | | | 2020 | | | 2019 | |
| PER COMMON SHARE DATA | | | | | | | | | | | | | | | |
| Net asset value, beginning of year | | $ | 14.93 | | | $ | 18.16 | | | $ | 9.69 | | | $ | 13.15 | | | $ | 15.30 | |
| INVESTMENT OPERATIONS: | | | | | | | | | | | | | | | | | | | | |
Net investment income(1) | | | 0.12 | | | | 0.17 | | | | 0.18 | | | | 0.14 | | | | 0.13 | |
| Net realized and unrealized gain (loss) on investments | | | (1.31 | ) | | | 1.63 | | | | 8.43 | | | | (3.48 | ) | | | (0.39 | ) |
| Total from investment operations | | | (1.19 | ) | | | 1.80 | | | | 8.61 | | | | (3.34 | ) | | | (0.26 | ) |
| | | | | | | | | | | | | | | | | | | | | |
| LESS DISTRIBUTIONS FROM: | | | | | | | | | | | | | | | | | | | | |
| Net investment income | | | (0.08 | ) | | | (0.17 | ) | | | (0.14 | ) | | | (0.12 | ) | | | (0.08 | ) |
| Net realized gains | | | (1.19 | ) | | | (4.86 | ) | | | — | | | | — | | | | (1.81 | ) |
| Total distributions | | | (1.27 | ) | | | (5.03 | ) | | | (0.14 | ) | | | (0.12 | ) | | | (1.89 | ) |
Paid-in Capital from Redemption Fees(1) | | | — | (2) | | | — | (2) | | | — | (2) | | | — | (2) | | | — | (2) |
| Net asset value, end of year | | $ | 12.47 | | | $ | 14.93 | | | $ | 18.16 | | | $ | 9.69 | | | $ | 13.15 | |
| Total return | | | -8.12 | % | | | 9.45 | % | | | 89.19 | % | | | -25.72 | % | | | -0.68 | % |
| | | | | | | | | | | | | | | | | | | | | |
| SUPPLEMENTAL DATA AND RATIOS: | | | | | | | | | | | | | | | | | | | | |
| Net assets, at end of year (000’s) | | $ | 125,211 | | | $ | 69,206 | | | $ | 63,407 | | | $ | 27,890 | | | $ | 34,161 | |
| | | | | | | | | | | | | | | | | | | | | |
| RATIO OF EXPENSES TO AVERAGE NET ASSETS: | | | | | | | | | | | | | | | | | | | | |
| Before expense waiver | | | 1.08 | % | | | 1.00 | % | | | 1.00 | % | | | 1.00 | % | | | 1.00 | % |
| After expense waiver | | | 0.98 | %(3) | | | 1.00 | % | | | 1.00 | % | | | 1.00 | % | | | 1.00 | % |
| | | | | | | | | | | | | | | | | | | | | |
| RATIO OF NET INVESTMENT INCOME | | | | | | | | | | | | | | | | | | | | |
| TO AVERAGE NET ASSETS: | | | | | | | | | | | | | | | | | | | | |
| After expense waiver | | | 0.96 | % | | | 0.96 | % | | | 1.31 | % | | | 1.05 | % | | | 0.84 | % |
| Portfolio Turnover Rate | | | 131 | % | | | 116 | % | | | 121 | % | | | 127 | % | | | 147 | % |
________________________
(1) | Per share amounts calculated using the average shares method. |
(2) | Less than $0.005 per share. |
(3) | Effective November 18, 2022, the Adviser entered into an Operating Expenses Limitation Agreement to ensure that total annual operating expenses do not exceed 0.95% of the average daily net assets of the Fund (See Note 4 in Notes to Financial Statements). |
The accompanying notes to financial statements are an integral part of these financial statements.
Notes to Financial Statements
March 31, 2023
1. ORGANIZATION
Managed Portfolio Series (the “Trust”) was organized as a Delaware statutory trust on January 27, 2011. The Trust is registered under the Investment Company Act of 1940, as amended (the “1940 Act”), as an open-end management investment company. The CornerCap Small-Cap Value Fund (the “Fund”) is a diversified series with its own investment objectives and policies within the Trust. The investment objective of the Fund is long-term capital appreciation with a secondary objective of generating income from dividends or interest on securities. The Fund is an investment company and accordingly follows the investment company accounting and reporting guidance of the Financial Accounting Standards Board (“FASB”) Accounting Standards Codification (“ASC”) 946 Financial Services – Investment Companies. The Fund commenced operations on September 30, 1992. On November 18, 2022, the CornerCap Small-Cap Value Fund, a series of The CornerCap Group of Funds (the “Acquired Fund”), reorganized into the Fund, a series of the Trust. The Fund currently offers two classes, the Advisor Class and the Institutional Class. The Adviser Class commenced operations on November 18, 2022. Advisor Class shares are subject to a 0.25% of average daily net assets distribution and servicing fee and a shareholder servicing fee of up to 0.05% of average daily net assets. Each class of shares has identical rights and privileges with respect to voting on matters affecting a single share class. The Fund may issue an unlimited number of shares of beneficial interest, with no par value.
2. SIGNIFICANT ACCOUNTING POLICIES
The following is a summary of significant accounting policies consistently followed by the Fund in the preparation of its financial statements. These policies are in conformity with generally accepted accounting principles in the United States of America (“GAAP”).
Security Valuation – All investments in securities are recorded at their estimated fair value, as described in Note 3.
Federal Income Taxes – The Fund complies with the requirements of Subchapter M of the Internal Revenue Code of 1986, as amended, necessary to qualify as a regulated investment company and distributes substantially all net taxable investment income and net realized gains to shareholders in a manner which results in no tax cost to the Fund. Therefore, no federal income or excise tax provision is required. As of and during the year ended March 31, 2023, the Fund did not have any tax positions that did not meet the “more-likely-than-not” threshold of being sustained by the applicable tax authority. The Fund recognizes interest and penalties, if any, related to unrecognized tax benefits on uncertain tax positions as income tax expense in the Statement of Operations. During the year ended March 31, 2023, the Fund did not incur any interest or penalties. The Fund is subject to examination by U.S. taxing authorities for the tax years ended March 31, 2020 through 2023.
Security Transactions, Income and Distributions – The Fund follows industry practice and records security transactions on the trade date. Realized gains and losses on sales of securities are calculated on the basis of identified cost. Dividend income is recorded on the ex-dividend date and interest income is recorded on an accrual basis. Withholding taxes on foreign dividends have been provided for in accordance with the Fund’s understanding of the applicable country’s tax rules and regulations. Discounts and premiums on securities purchased are amortized over the expected life of the respective securities using the constant yield method of calculation.
The Fund will make distributions, if any, of net investment income annually. The Fund will also distribute net realized capital gains, if any, annually. Distributions to shareholders are recorded on the ex-dividend date. The treatment for financial reporting purposes of distributions made to shareholders during the year from net investment income or net realized capital gains may differ from their treatment for federal income tax purposes. These differences are caused primarily by differences in the timing of the recognition of certain components of income, expense or realized capital gain for federal income tax purposes. Where such differences are permanent in nature, GAAP requires that they be reclassified in the components of the net assets based on their ultimate characterization for federal income tax purposes. Any such reclassifications will have no effect on net assets, results of operations or net asset values per share of the Fund. For the year ended March 31, 2023, there were no reclassifications.
Annual Report | March 31, 2023
Notes to Financial Statements
March 31, 2023
Use of Estimates – The preparation of financial statements in conformity with GAAP requires management to make estimates and assumptions that affect the reported amounts of assets and liabilities and disclosure of contingent assets and liabilities at the date of the financial statements and the reported amounts of revenues and expenses during the reporting period. Actual results could differ from those estimates.
Allocation of Income, Expenses and Gains/Losses – Income, expenses (other than those deemed attributable to a specific share class), and gains and losses of the Fund are allocated daily to each class of shares based upon the ratio of net assets represented by each class as a percentage of the net assets of the Fund. Expenses deemed directly attributable to a class of shares are recorded by the specific class. Most Fund expenses are allocated by class based on relative net assets. 12b-1 fees are expensed at 0.25% of average daily net assets of Advisor Class shares. Shareholder service fees are expensed at up to 0.05% of average daily net assets Advisor Class shares. Expenses associated with a specific fund in the Trust are charged to that fund. Common Trust expenses are typically allocated evenly between the funds of the Trust, or by other equitable means.
Illiquid Securities – A security may be considered illiquid if it lacks a readily available market. Securities are generally considered liquid if they can be sold or disposed of in the ordinary course of business within seven days at approximately the price at which the security is valued by the Funds. Illiquid securities may be valued under methods approved by the Board as reflecting fair value. The Fund will not hold more than 15% of the value of its net assets in illiquid securities. At March 31, 2023, the Fund had investments in illiquid securities with a total value of $0 or 0.0% of total assets.
| Security | Shares | Date Acquired | Cost Basis |
| Ligand Pharmaceuticals, Inc. Earn-Out Shares 1 | 491 | 11/2022 | $0 |
| Ligand Pharmaceuticals, Inc. Earn-Out Shares 2 | 491 | 11/2022 | $0 |
Security Loans – When the Fund loans securities held in its portfolio, the Fund receives compensation in the form of fees, or retains a portion of the interest on the investment of any cash received as collateral. The Fund also continues to receive dividends on the securities loaned. The loans are secured by collateral at least equal to 105% of the value of the loaned securities that are foreign securities or 102% of the value of any other loaned securities marked-to market daily. Loans shall be marked to market daily and the margin restored in the event collateralization is below 100% of the value of securities loaned. Gain or loss in the value of securities loaned that may occur during the term of the loan will be for the account of the Fund. The Fund has the right under the lending agreement to recover the securities from the borrower on demand. See Note 9.
3. SECURITIES VALUATION
The Fund has adopted authoritative fair value accounting standards which establish an authoritative definition of fair value and set out a hierarchy for measuring fair value. These standards require additional disclosures about the various inputs and valuation techniques used to develop the measurements of fair value, a discussion in changes in valuation techniques and related inputs during the period and expanded disclosure of valuation levels for major security types. These inputs are summarized in the three broad levels listed below:
| Level 1 – | Unadjusted quoted prices in active markets for identical assets or liabilities that the Fund has the ability to access. |
| | |
| Level 2 – | Observable inputs other than quoted prices included in Level 1 that are observable for the asset or liability, either directly or indirectly. These inputs may include quoted prices for the identical instrument on an inactive market, prices for similar instruments, interest rates, prepayment speeds, credit risk, yield curves, default rates and similar data. |
| | |
| Level 3 – | Unobservable inputs for the asset or liability, to the extent relevant observable inputs are not available, representing the Fund’s own assumptions about the assumptions a market participant would use in valuing the asset or liability, and would be based on the best information available. |
Following is a description of the valuation techniques applied to the Fund’s major categories of assets and liabilities measured at fair value on a recurring basis. The Fund’s investments are carried at fair value.
Notes to Financial Statements
March 31, 2023
Equity Securities – Securities that are primarily traded on a national securities exchange are valued at the last sale price on the exchange on which they are primarily traded on the day of valuation or, if there has been no sale on such day, at the mean between the bid and ask prices. Securities traded primarily in the Nasdaq Global Market System for which market quotations are readily available are valued using the Nasdaq Official Closing Price (“NOCP”). If the NOCP is not available, such securities are valued at the last sale price on the day of valuation, or if there has been no sale on such day, at the mean between the bid and ask prices. To the extent these securities are actively traded and valuation adjustments are not applied, they are categorized in Level 1 of the fair value hierarchy.
Short-Term Investments – Investments in other mutual funds, including money market funds are valued at their net asset value per share and are categorized in Level 1 of the fair value hierarchy. To the extent these securities are actively traded and valuation adjustments are not applied, they are categorized in Level 1 of the fair value hierarchy.
The Board of Trustees (the “Board”) has adopted a pricing and valuation policy for use by the Funds and their Valuation Designee (as defined below) in calculating the Funds’ NAV. Pursuant to Rule 2a-5 under the 1940 Act, the Funds have designated CornerCap Investment Counsel, Inc. (the “Adviser”) as its “Valuation Designee” to perform all of the fair value determinations as well as to perform all of the responsibilities that may be performed by the Valuation Designee in accordance with Rule 2a-5. The Valuation Designee is authorized to make all necessary determinations of the fair values of portfolio securities and other assets for which market quotations are not readily available or if it is deemed that the prices obtained from brokers and dealers or independent pricing services are unreliable.
The inputs or methodology used for valuing securities are not an indication of the risk associated with investing in those securities. The following is a summary of the inputs used to value the Fund’s securities as of March 31, 2023:
| Small-Cap Value Fund | | Uncategorized | | | Level 1 | | | Level 2 | | | Level 3** | | | Total | |
| Common Stocks | | $ | — | | | $ | 123,640,539 | | | $ | — | | | $ | — | | | $ | 123,640,539 | |
| Investment Purchased with | | | | | | | | | | | | | | | | | | | | |
| Proceeds from Securities Lending* | | | 13,331,257 | | | | — | | | | — | | | | — | | | | 13,331,257 | |
| Contingent Value Rights | | | — | | | | — | | | | — | | | | — | | | | — | |
| Money Market Fund | | | — | | | | 1,129,600 | | | | — | | | | — | | | | 1,129,600 | |
| Total Investments | | $ | 13,331,257 | | | $ | 124,770,139 | | | $ | — | | | $ | — | | | $ | 138,101,396 | |
| * | Certain investments that are measured at fair value using the NAV per share (or its equivalent) as a practical expedient have not been characterized in the fair value hierarchy. The fair value amounts presented in the table are intended to permit reconciliation of the fair value hierarchy to the amount presented in the Statements of Assets and Liabilities. See Note 9 for additional information regarding securities lending activity. |
| ** | Additional Level 3 disclosures deemed immaterial to the financial statements. |
Refer to the Schedule of Investments for further information on the classification of investments.
The following is a reconciliation of Level 3 assets for which significant unobservable inputs were used to determine fair value:
| | | Investments | |
| | | in Securities | |
| Balance as of 3/31/2022 | | $ | — | |
| Accrued discounts/ premiums | | | — | |
| Realized gain (loss) | | | — | |
| Change in net unrealized appreciation (depreciation) | | | — | |
| Net purchases (sales) | | | — | |
| Transfers in and/or out of Level 3 | | | — | |
| Balance as of 3/31/2023 | | $ | — | |
| Net change in unrealized appreciation/depreciation of Level 3 assets as of March 31, 2023 | | $ | — | |
Annual Report | March 31, 2023
Notes to Financial Statements
March 31, 2023
4. INVESTMENT ADVISORY FEE AND OTHER TRANSACTIONS WITH AFFILIATES
The Trust has an agreement with the Adviser to furnish investment advisory services to the Fund. Pursuant to an Investment Advisory Agreement between the Trust and the Adviser, the Adviser is entitled to receive, on a monthly basis, an annual advisory fee equal to 0.88% of the Fund’s average daily net assets. Prior to November 18, 2022, the Acquired Fund had an Investment Advisory Agreement with the Adviser, pursuant to which the Adviser received, on a monthly basis, an annual advisory fee equal to 0.90% of the Acquired Fund’s average daily net assets. In addition, prior to November 18, 2022, the Acquired Fund and the Adviser entered into an Operating Services Agreement whereby the Adviser received an Operating Services Fee, computed daily and payable monthly, at an annual rate of 0.40% and 0.10% of the average daily net assets of the Acquired Fund’s Investor Class and Institutional Class, respectively. For the period April 1, 2022 to November 18, 2022, the Acquired Fund paid the Predecessor Adviser $229,328 in Operating Service Fees. The Adviser paid all operating expenses of the Acquired Fund.
Effective November 18, 2022, the Fund’s Adviser has contractually agreed to waive a portion or all of its management fees and reimburse the Fund for its expenses to ensure that total annual operating expenses (excluding Rule 12b-1 fees, Shareholder Servicing Plan fees, leverage/borrowing interest, interest expense, dividend paid on short sales, brokerage and other transactional expenses, acquired fund fees and expenses, expenses incurred in connection with any merger or reorganization, or extraordinary expenses) for the Fund do not exceed 0.95% of average daily net assets of the Fund. Prior to November 18, 2022, the contractual expense limitation in place for the Fund was 1.30% (excluding interest, taxes, brokerage fees and commissions, acquired fund fees and expenses and extraordinary expenses) of average daily net assets of the Fund’s Investor Class. Fees waived and expenses reimbursed by the Adviser may be recouped by the Adviser for a period of thirty-six months following the month during which such waiver or reimbursement was made if such recoupment can be achieved without exceeding the expense limit in effect at the time the waiver and reimbursement occurred. The Operating Expenses Limitation Agreement cannot be terminated through at least November 18, 2025. Thereafter, the agreement may be terminated at any time upon 60 days’ written notice by the Trust’s Board of Trustees (the “Board”) or the Adviser, with the consent of the Board. For the year ended March 31, 2023, the Adviser did not recoup any previously waived expenses. Waived fees and reimbursed expenses subject to potential recovery by year of expiration are as follows:
| Expiration | Amount | |
| November 2025 – March 2026 | $90,816 | |
For the period from April 1, 2022 to November 18, 2022, the fees waived by the Adviser for the Fund was $0. Additionally, there are no previously waived fees subject to recoupment prior to November 18, 2022.
U.S. Bancorp Fund Services, LLC, doing business as U.S. Bank Global Fund Services, (“Fund Services” or the “Administrator”), acts as the Fund’s Administrator, Transfer Agent, and Fund Accountant. U.S. Bank N.A. (the “Custodian”) serves as the custodian to the Fund. The Custodian is an affiliate of the Administrator. The Administrator performs various administrative and accounting services for the Fund. The Administrator prepares various federal and state regulatory filings, reports and returns for the Fund; prepares reports and materials to be supplied to the Trustees; monitors the activities of the Fund’s custodian; coordinates the payment of the Fund’s expenses and reviews the Fund’s expense accruals. The officers of the Trust, including the Chief Compliance Officer are employees of the Administrator. As compensation for its services, the Administrator is entitled to a monthly fee at an annual rate based upon the average daily net assets of the Fund, subject to annual minimums. Fees paid by the Fund for administration and accounting, transfer agency, custody and compliance services for the period from November 13, 2022, through March 31, 2023, are disclosed in the Statement of Operations. Prior to November 18, 2022, the Fund engaged Atlantic Fund Administration, doing business as Apex Fund Services (“Apex”) to provide fund accounting, fund administration, and transfer agency services to the Fund. Apex was paid by the Adviser for its service from the Operating Services Fee it received.
Notes to Financial Statements
March 31, 2023
5. DISTRIBUTION & SHAREHOLDER SERVICING FEES
The Fund has adopted a Distribution Plan pursuant to Rule 12b-1 (the “Plan”) in the Advisor Class only. The Plan permits the Fund to pay for distribution and related expenses at an annual rate of 0.25% of the Advisor Class average daily net assets. The expenses covered by the Plan may include the cost of preparing and distributing prospectuses and other sales material, advertising and public relations expenses, payments to financial intermediaries and compensation of personnel involved in selling shares of the Fund. Payments made pursuant to the Plan will represent compensation for distribution and service activities, not reimbursements for specific expenses incurred. For the period ended March 31, 2023, the Advisor Class incurred expenses of $6 pursuant to the Plan.
The Fund has entered into a shareholder servicing agreement (the “Agreement”) where the Adviser acts as the shareholder agent, under which the Fund may pay servicing fees at an annual rate of up to 0.05% of the average daily net assets of the Advisor Class. Payments, if any, to the Adviser under the Agreement may reimburse the Adviser for payments it makes to selected brokers, dealers and administrators which have entered into service agreements with the Adviser for services provided to shareholders of the Fund. Payments may also be made directly to the intermediaries providing shareholder services. Services provided by such intermediaries also include the provision of support services to the Fund and includes establishing and maintaining shareholders’ accounts and record processing, purchase and redemption transactions, answering routine client inquiries regarding the Fund, and providing such other personal services to shareholders as the Fund may reasonably request. For the period ended March 31, 2023, the Advisor Class incurred $1 of shareholder servicing fees under the Agreement.
6. CAPITAL SHARE TRANSACTIONS
Transactions in shares of the Fund were as follows:
| | | Small-Cap Value Fund | |
| | | Year Ended | | | Year Ended | |
| | | March 31, 2023 | | | March 31, 2022 | |
Advisor Class(1): | | | | | | |
| Shares sold | | | 721 | | | | — | |
| Shares issued in reinvestment of distributions | | | 35 | | | | — | |
| Shares redeemed | | | — | | | | — | |
| Net increase | | | 756 | | | | — | |
| Institutional Class: | | | | | | | | |
| Shares sold | | | 906,115 | | | | 1,028,194 | |
| Shares issued in reinvestment of distributions | | | 963,987 | | | | 1,171,789 | |
| Shares redeemed | | | (1,594,964 | ) | | | (1,054,424 | ) |
Shares converted from Investor Class(2) | | | 5,130,700 | | | | — | |
| Net increase | | | 5,405,838 | | | | 1,145,559 | |
| Investor Class: | | | | | | | | |
| Shares sold | | | 263,039 | | | | 397,521 | |
| Shares issued in reinvestment of distributions | | | — | | | | 1,528,864 | |
| Shares redeemed | | | (624,806 | ) | | | (2,295,513 | ) |
Shares converted into Institutional Class(2) | | | (5,154,535 | ) | | | — | |
| Net decrease | | | (5,516,302 | ) | | | (369,128 | ) |
| Net increase (decrease) in capital shares | | | (109,708 | ) | | | 776,431 | |
(1) | Advisor Class inception was November 18, 2022. |
(2) | Effective November 18, 2022, all outstanding shares of the Investor Class were merged into the Institutional Class (See Note 12). |
Annual Report | March 31, 2023
Notes to Financial Statements
March 31, 2023
7. INVESTMENT TRANSACTIONS
The aggregate purchases and sales, excluding short-term investments, by the Fund for the year ended March 31, 2023, were as follows:
| | | Purchases | | | Sales | |
| U.S. Government | | $ | — | | | $ | — | |
| Other | | $ | 175,692,178 | | | $ | 187,387,102 | |
8. FEDERAL TAX INFORMATION
The aggregate gross unrealized appreciation and depreciation of securities held by the Fund and the total cost of securities for federal income tax purposes at March 31, 2023, the Fund’s most recent fiscal year end, were as follows:
| Aggregate Gross | Aggregate Gross | | Federal Income |
| Appreciation | Depreciation | Net Depreciation | Tax Cost |
| $10,362,158 | $(14,907,867) | $(4,545,709) | $142,647,105 |
At March 31, 2023, components of distributable earnings on a tax-basis were as follows:
| | Undistributed | | | |
| Undistributed | Long-Term | Other | Unrealized | Total |
| Ordinary Income | Capital Gains | Accumulated Losses | Depreciation | Accumulated Losses |
| $421,539 | — | $(254,091) | $(4,545,709) | $(4,378,261) |
As of March 31, 2023, the Fund’s most recent fiscal year end, the Fund did not have any capital loss carryovers. A regulated investment company may elect for any taxable year to treat any portion of any qualified late year loss as arising on the first day of the next taxable year. Qualified late year losses are certain capital, and ordinary losses which occur during the portion of the Fund’s taxable year subsequent to October 31. For the taxable year ended March 31, 2023, the Fund plans to defer $254,091 of post-October losses.
The tax character of distributions paid during the year ended March 31, 2023, were as follows:
| | Long-Term | |
| Ordinary Income* | Capital Gains** | Total |
| $3,776,748 | $8,566,865 | $12,343,613 |
The tax character of distributions paid during the year ended March 31, 2022, were as follows:
| | Long-Term | |
| Ordinary Income* | Capital Gains** | Total |
| $25,828,099 | $15,651,791 | $41,479,890 |
| * | For federal income tax purposes, distributions of short-term capital gains are treated as ordinary income distributions. |
| ** | The Fund designated as long-term capital gain dividend, pursuant to Internal Revenue Code Section 852(b)(3), the amount necessary to reduce the earnings and profits of the Fund related to net capital gain to zero for the tax year ended March 31, 2023. |
Notes to Financial Statements
March 31, 2023
9. SECURITIES LENDING
Following the terms of a securities lending agreement with the Fund’s Custodian, the Fund may lend securities from its portfolio to brokers, dealers and financial institutions in order to increase the return on its portfolio, primarily through the receipt of borrowing fees and earnings on invested collateral. Any such loan must be continuously secured by collateral in cash or cash equivalents maintained on a current basis in an amount at least equal to 105% of the value of the loaned securities that are foreign securities or 102% of the value of any other loaned securities marked-to-market daily. Loans shall be marked to market daily and the margin restored in the event the collateralization is below 100% of the value of the securities loaned. During the time securities are on loan, the borrower will pay the applicable Fund any accrued income on those securities, and the Fund may invest the cash collateral and earn income or receive an agreed-upon fee from a borrower that has delivered cash-equivalent collateral. In determining whether or not to lend a security to a particular broker, dealer or financial institution, the Adviser considers all relevant facts and circumstances, including the size, creditworthiness and reputation of the broker, relevant facts dealer or financial institution. Securities lending involves the risk of a default or insolvency of the borrower. In either of these cases, a Fund could experience delays in recovering securities or collateral or could lose all or part of the value of the loaned securities. A Fund also could lose money in the event of a decline in the value of the collateral provided for loaned securities. Additionally, the loaned portfolio securities may not be available to a Fund on a timely basis and that Fund may therefore lose the opportunity to sell the securities at a desirable price. Any decline in the value of a security that occurs while the security is out on loan would continue to be borne by the applicable Fund. As of March 31, 2023, the Fund had securities on loan with a value of $13,312,901 and collateral value of $13,331,257.
The Fund receives cash as collateral in return for securities lent as part of the securities lending program. The collateral is invested in the Mount Vernon Liquid Assets Portfolio, LLC of which the investment objective is to seek to maximize current income to the extent with the preservation of capital and liquidity and maintain a stable NAV of $1.00 per unit. The remaining contractual maturity of all securities lending transactions is overnight and continuous. The Fund is not subject to a master netting agreement with respect to securities lending; therefore, no additional disclosures are required. The net income earned by the Fund on investments of cash collateral received from borrowers for the securities loaned to them are reflected in the Fund’s Statements of Operations. Securities lending income, as disclosed in the Fund’s Statements of Operations, represents the income earned from the investment of cash collateral, net of fee rebates paid to the borrower and net of fees paid to the Custodian as lending agent.
10. CONTROL OWNERSHIP
The beneficial ownership, either directly or indirectly, of more than 25% of the voting securities of a fund creates a presumption of control of the fund, under Section 2(a)(9) of the Investment Company Act of 1940. As of March 31, 2023, Charles Schwab & Co., Inc, for the benefit of its customers, owned 75.74% of the Fund.
11. GENERAL RISK
The recent global outbreak of COVID-19 has disrupted economic markets and the prolonged economic impact is uncertain. The operational and financial performance of the issuers of securities in which the Fund invests depends on future developments, including the duration and spread of the outbreak, and such uncertainty may in turn impact the value of the Fund’s investments.
On February 24, 2022, Russia commenced a military attack on Ukraine. The outbreak of hostilities between the two countries could result in more widespread conflict and could have a severe adverse effect on the region and the markets. In addition, sanctions imposed on Russia by the United States and other countries, and any sanctions imposed in the future could have a significant adverse impact on the Russian economy and related markets. The price and liquidity of investments may fluctuate widely as a result of the conflict and related events. How long such conflict and related events will last and whether it will escalate further cannot be predicted, nor its effect on the Fund.
Annual Report | March 31, 2023
Notes to Financial Statements
March 31, 2023
12. REORGANIZATION OF THE FUND
On November 18, 2022, as the result of a tax-free reorganization, the CornerCap Small-Cap Value Fund (the “Predecessor Fund”), a series in The CornerCap Group of Funds, was reorganized into the Trust by transferring all of the Predecessor Fund’s assets to the Fund in the Trust. The Predecessor Fund was deemed to be the accounting survivor for financial reporting purposes. The primary purpose of the Reorganization is to provide shareholders with the opportunity to continue their CornerCap mutual fund investment while benefiting from lower annual fund operating expenses within a larger investment company comprised of numerous funds.
As a tax-free reorganization, any unrealized appreciation or depreciation on the securities on the date of reorganization was treated as a non-taxable event, thus the cost basis of the securities held reflect the historical cost basis as of the date of reorganization. Immediately prior to the reorganization, the net assets, fair value of investments, and net unrealized appreciation of the CornerCap Small-Cap Value Fund was $139,905,974, $137,174,412 and $128,696, respectively. At the date of reorganization, fund shares outstanding for the Predecessor Fund were 5,154,535 and 4,671,358 for the Investor Class and Institutional Class, respectively. As part of the reorganization, the Predecessor Fund’s Investor Class shares were converted into the Fund’s Institutional Class. The shareholders of the Predecessor Fund's Investor Class were exchanged for the Fund’s Institutional Class shares on a pro rata basis. The Adviser paid for all costs of the Reorganization.
13. REPORT OF THE FUND’S SPECIAL SHAREHOLDER MEETING (UNAUDITED)
A Special Meeting of Shareholders of the CornerCap Small-Cap Value Fund (the “Acquired Fund”), a series of The CornerCap Group of Funds, took place on November 4, 2022, to approve a proposed Agreement of and Plan of Reorganization for the Acquired Fund, whereby the Fund (the “Acquiring Fund”), a series of Managed Portfolio Series, would acquire all the assets and liabilities of the Acquired Fund, in exchange for shares of the Acquiring Fund which would be distributed pro rata by the Acquired Fund to its shareholders, in complete liquidation and termination of the Acquired Fund (the “Reorganization”).
All Acquired Fund’s shareholders of record at the close of business on November 4, 2022, were entitled to vote. As of the record date, the Acquired Fund had 9,697,706 shares outstanding. Of the 7,597,126 shares of the Acquired Fund present in person or by proxy at the meeting on November 4, 2022: 7,588,303, or 99.9% voted in favor of the Reorganization (representing 78.2% of total outstanding shares), zero, or 0.0%, voted against the Reorganization, and 8,823, or 0.1% withheld from voting for the Reorganization. Accordingly, the Reorganization was approved.
14. SUBSEQUENT EVENTS
Management has performed an evaluation of subsequent events through the date the financial statements were issued and has determined that no additional items require recognition or disclosure.
Report of Independent Registered Public Accounting Firm
To the Shareholders of CornerCap Small-Cap Value Fund and
Board of Trustees of Managed Portfolio Series
Opinion on the Financial Statements
We have audited the accompanying statement of assets and liabilities, including the schedule of investments, of CornerCap Small-Cap Value Fund (the “Fund”), a series of Managed Portfolio Series, as of March 31, 2023, the related statement of operations for the year then ended, the statements of changes in net assets for each of the two years in the period then ended, the related notes, and the financial highlights for each of the five years in the period then ended (collectively referred to as the “financial statements”). In our opinion, the financial statements present fairly, in all material respects, the financial position of the Fund as of March 31, 2023, the results of its operations for the year then ended, the changes in net assets for each of the two years in the period then ended, and the financial highlights for each of the five years in the period then ended, in conformity with accounting principles generally accepted in the United States of America.
Basis for Opinion
These financial statements are the responsibility of the Fund’s management. Our responsibility is to express an opinion on the Fund’s financial statements based on our audits. We are a public accounting firm registered with the Public Company Accounting Oversight Board (United States) (“PCAOB”) and are required to be independent with respect to the Fund in accordance with the U.S. federal securities laws and the applicable rules and regulations of the Securities and Exchange Commission and the PCAOB.
We conducted our audits in accordance with the standards of the PCAOB. Those standards require that we plan and perform the audit to obtain reasonable assurance about whether the financial statements are free of material misstatement whether due to error or fraud.
Our audits included performing procedures to assess the risks of material misstatement of the financial statements, whether due to error or fraud, and performing procedures that respond to those risks. Such procedures included examining, on a test basis, evidence regarding the amounts and disclosures in the financial statements. Our procedures included confirmation of securities owned as of March 31, 2023, by correspondence with the custodian and brokers. Our audits also included evaluating the accounting principles used and significant estimates made by management, as well as evaluating the overall presentation of the financial statements. We believe that our audits provide a reasonable basis for our opinion.
We have served as the Fund’s auditor since 2004.
COHEN & COMPANY, LTD.
Milwaukee, Wisconsin
May 25, 2023
Annual Report | March 31, 2023
Additional Information (Unaudited)
March 31, 2023
TRUSTEES AND OFFICERS
| | | | Number of | | |
| | | Term of | Portfolios | | |
| | Position(s) | Office and | in Trust | Principal | Other Directorships |
| Name, Address and | Held with | Length of | Overseen | Occupation(s) During | Held by Trustee During |
| Year of Birth | the Trust | Time Served | by Trustee | the Past Five Years | the Past Five Years |
| INDEPENDENT TRUSTEES | | | | | |
| | | | | | |
| Leonard M. Rush, CPA | Chairman, | Indefinite | 31 | Retired; Chief Financial | Independent Trustee, |
| 615 E. Michigan St. | Trustee | Term; Since | | Officer, Robert W. Baird | ETF Series Solutions |
| Milwaukee, WI 53202 | and Audit | April 2011 | | & Co. Incorporated, | (56 Portfolios) |
| Year of Birth: 1946 | Committee | | | (2000-2011). | (2012-Present) |
| David A. Massart | Trustee | Indefinite | 31 | Partner and Managing | Independent Trustee, |
| 615 E. Michigan St. | | Term; Since | | Director, Beacon Pointe | ETF Series Solutions |
| Milwaukee, WI 53202 | | April 2011 | | Advisors, LLC (since | (56 Portfolios) |
| Year of Birth: 1967 | | | | 2022); Co-Founder and | (2012-Present) |
| | | | | Chief Investment | |
| | | | | Strategist, Next | |
| | | | | Generation Wealth | |
| | | | | Management, Inc. | |
| | | | | (2005-2021). | |
Additional Information (Unaudited)
March 31, 2023
| | | | Number of | | |
| | | Term of | Portfolios | | |
| | Position(s) | Office and | in Trust | Principal | Other Directorships |
| Name, Address and | Held with | Length of | Overseen | Occupation(s) During | Held by Trustee During |
| Year of Birth | the Trust | Time Served | by Trustee | the Past Five Years | the Past Five Years |
| David M. Swanson | Trustee and | Indefinite | 31 | Founder and Managing | Independent Trustee, |
| 615 E. Michigan St. | Nominating & | Term; Since | | Principal, SwanDog | ALPS Variable |
| Milwaukee, WI 53202 | Governance | April 2011 | | Strategic Marketing, LLC | Investment Trust |
| Year of Birth: 1957 | Committee | | | (2006-present). | (7 Portfolios) (2006 to |
| | Chairman | | | | Present); Independent |
| | | | | | Trustee, RiverNorth |
| | | | | | Funds (3 Portfolios) |
| | | | | | (2018 to Present); |
| | | | | | RiverNorth Managed |
| | | | | | Duration Municipal |
| | | | | | Income Fund, Inc. |
| | | | | | (1 Portfolio) (2019 to |
| | | | | | Present); RiverNorth |
| | | | | | Opportunistic Municipal |
| | | | | | Income Fund, Inc. |
| | | | | | (1 Portfolio) (2018 to |
| | | | | | Present); RiverNorth |
| | | | | | Capital and Income Fund |
| | | | | | (1 Portfolio) (2018 to |
| | | | | | Present); RiverNorth |
| | | | | | Opportunities Fund |
| | | | | | (1 Portfolio) (2015 to |
| | | | | | Present); RiverNorth/ |
| | | | | | DoubleLine Strategic |
| | | | | | Opportunity Fund, Inc. |
| | | | | | (1 Portfolio) (2019 to |
| | | | | | Present); RiverNorth |
| | | | | | Flexible Municipal |
| | | | | | Income Fund, Inc. |
| | | | | | (1 Portfolio) (2020 to |
| | | | | | Present); RiverNorth |
| | | | | | Flexible Municipal |
| | | | | | Income Fund II, Inc. |
| | | | | | (1 Portfolio) (2021 to |
| | | | | | Present); RiverNorth |
| | | | | | Managed Duration |
| | | | | | Municipal Income Fund |
| | | | | | II, Inc. (1 Portfolio) |
| | | | | | (2022 to Present). |
Annual Report | March 31, 2023
Additional Information (Unaudited)
March 31, 2023
| | | | Number of | | |
| | | Term of | Portfolios | | |
| | Position(s) | Office and | in Trust | Principal | Other Directorships |
| Name, Address and | Held with | Length of | Overseen | Occupation(s) During | Held by Trustee During |
| Year of Birth | the Trust | Time Served | by Trustee | the Past Five Years | the Past Five Years |
| Robert J. Kern | Trustee | Indefinite | 31 | Retired (2018-present); | None |
| 615 E. Michigan St. | | Term; Since | | Executive Vice President, | |
| Milwaukee, WI 53202 | | January 2011 | | U.S. Bancorp Fund | |
| Year of Birth: 1958 | | | | Services, LLC (1994-2018). | |
| OFFICERS | | | | | |
| | | | | | |
| Brian R. Wiedmeyer | President and | Indefinite | N/A | Vice President, U.S. | N/A |
| 615 E. Michigan St. | Principal | Term; Since | | Bancorp Fund Services, | |
| Milwaukee, WI 53202 | Executive | November | | LLC (2005-present). | |
| Year of Birth: 1973 | Officer | 2018 | | | |
| Deborah Ward | Vice President, | Indefinite | N/A | Senior Vice President, | N/A |
| 615 E. Michigan St. | Chief | Term; Since | | U.S. Bancorp Fund | |
| Milwaukee, WI 53202 | Compliance | April 2013 | | Services, LLC | |
| Year of Birth: 1966 | Officer and | | | (2004-present). | |
| | Anti-Money | | | | |
| | Laundering | | | | |
| | Officer | | | | |
| Benjamin Eirich | Treasurer, | Indefinite | N/A | Assistant Vice President, | N/A |
| 615 E. Michigan St. | Principal | Term; Since | | U.S. Bancorp Fund | |
| Milwaukee, WI 53202 | Financial | August 2019 | | Services, LLC | |
| Year of Birth: 1981 | Officer and | (Treasurer); | | (2008-present). | |
| | Vice President | Indefinite | | | |
| | | Term; Since | | | |
| | | November | | | |
| | | 2018 (Vice | | | |
| | | President) | | | |
| John Hadermayer | Secretary | Indefinite | N/A | Vice President, U.S. | N/A |
| 615 E. Michigan St. | | Term; Since | | Bancorp Fund Services, | |
| Milwaukee, WI 53202 | | May 2022 | | LLC (2022-present); | |
| Year of Birth: 1977 | | | | Executive Director, | |
| | | | | AQR Capital Management, | |
| | | | | LLC (2013-2022). | |
| Douglas Schafer | Assistant | Indefinite | N/A | Assistant Vice President, | N/A |
| 615 E. Michigan St. | Treasurer | Term; Since | | U.S. Bancorp Fund | |
| Milwaukee, WI 53202 | and Vice | May 2016 | | Services, LLC | |
| Year of Birth: 1970 | President | (Assistant | | (2002-present). | |
| | | Treasurer); | | | |
| | | Indefinite | | | |
| | | Term; Since | | | |
| | | November | | | |
| | | 2018 (Vice | | | |
| | | President) | | | |
Additional Information (Unaudited)
March 31, 2023
| | | | Number of | | |
| | | Term of | Portfolios | | |
| | Position(s) | Office and | in Trust | Principal | Other Directorships |
| Name, Address and | Held with | Length of | Overseen | Occupation(s) During | Held by Trustee During |
| Year of Birth | the Trust | Time Served | by Trustee | the Past Five Years | the Past Five Years |
| Sara J. Bollech | Assistant | Indefinite | N/A | Officer, U.S. Bancorp | N/A |
| 615 E. Michigan St. | Treasurer | Term: Since | | Fund Services, LLC | |
| Milwaukee, WI 53202 | and Vice | November | | (2007-present). | |
| Year of Birth: 1977 | President | 2021 | | | |
| Peter A. Walker, CPA | Assistant | Indefinite | N/A | Officer, U.S. Bancorp | N/A |
| 615 E. Michigan St. | Treasurer | Term: Since | | Fund Services, LLC | |
| Milwaukee, WI 53202 | and Vice | November | | (2016-present). | |
| Year of Birth: 1993 | President | 2021 | | | |
Annual Report | March 31, 2023
Additional Information (Unaudited)
March 31, 2023
BOARD APPROVAL OF THE INVESTMENT ADVISORY AGREEMENT
At a regular meetings of the Board of Trustees of Managed Portfolio Series (“Trust”) on August 16-17, 2022, the Trust’s Board of Trustees (“Board”), including all of the Trustees who are not “interested persons” of the Trust, as that term is defined in Section 2(a)(19) of the Investment Company Act of 1940, as amended (“Independent Trustees”), considered and approved the Investment Advisory Agreement between the Trust and CornerCap Investment Counsel, Inc. (“CornerCap” or “Adviser”) regarding the CornerCap Small-Cap Value Fund (the “Fund”) (the “Advisory Agreement”) for an initial two-year term.
Prior to and at the meeting, the Trustees received and considered information from the Adviser and the Trust’s administrator designed to provide the Trustees with the information necessary to evaluate the approval of the Advisory Agreement (“Support Materials”). The Independent Trustees then reviewed the Support Materials with regard to CornerCap and the Fund. They discussed initial SEC filings for the Fund. They reviewed and considered the Fund’s investment strategy, services that CornerCap proposed to provide to the Fund, the proposed management fee and the profitability that CornerCap expects to realize from its management of the Fund, any additional benefits that CornerCap expects to realize from its management of the Fund, and other matters that the Trustees deemed relevant. The Trustees also reviewed analyses which were prepared by the Fund’s administrator of the Fund’s proposed and projected expenses relative to other funds in the same Morningstar category. Before voting to approve the Advisory Agreement, the Trustees reviewed the Support Materials with Trust management and with counsel to the Independent Trustees, and received a summary from such counsel discussing the legal standards for the Trustees’ consideration of the approval of the Advisory Agreement. This information, together with the information provided to the Board throughout the course of the year, formed the primary (but not exclusive) basis for the Board’s determinations.
In determining whether to approve the Advisory Agreement, the Trustees considered all factors they believed relevant, including the following with respect to the Fund: (1) the nature, extent, and quality of the services to be provided by CornerCap with respect to the Fund; (2) the cost of the services to be provided and the profits to be realized by CornerCap, and the revenue received, from services rendered to the Fund; (3) comparative fee and expense data for the Fund and other investment companies with similar investment objectives; (4) the extent to which economies of scale may be realized as the grows, and whether the proposed advisory fee for the Fund reflects such economies of scale for the Fund’s benefit; and (5) other benefits to CornerCap resulting from services rendered to the Fund. In their deliberations, the Trustees did not identify any particular information that was all-important or controlling.
Nature, Extent and Quality of Services Provided. The Trustees considered the scope of services that CornerCap will provide under the Advisory Agreement with respect to the Fund, noting that such services include but are not limited to the following: (1) investing the Fund’s assets consistent with its investment objectives and investment policies; (2) determining the portfolio securities to be purchased, sold, or otherwise disposed of and the timing of such transactions; (3) voting all proxies with respect to the Fund’s portfolio securities; (4) maintaining the required books and records for transactions effected by CornerCap on behalf of the Fund; and (5) selecting broker-dealers to execute orders on behalf of the Fund. The Trustees noted that CornerCap is well capitalized. The Trustees also considered CornerCap’s assets under management. The Trustees considered the experience of the proposed portfolio managers from CornerCap in having managed the predecessor fund to be reorganized into the Fund, with substantially identical strategies as the Fund. The Trustees also reviewed the performance of this predecessor fund noting it had performed well versus its peer group and benchmark over all periods presented. The Trustees concluded that they were satisfied with the nature, extent, and quality of services that CornerCap proposes to provide to the Fund under the Advisory Agreement.
Cost of Advisory Services and Profitability. The Trustees considered the proposed management fee that the Fund will pay to CornerCap under the Advisory Agreement in the amount of 0.88% of the Fund’s average annual daily net assets. They also considered CornerCap’s profitability analysis (12-month pro-forma) for services that CornerCap will render to Fund. In that regard, the Trustees noted that CornerCap expects to waive a portion of its management fees during the first three years of the Fund’s operations under the proposed operating expenses limitation agreement.
Additional Information (Unaudited)
March 31, 2023
Comparative Fee and Expense Data. The Trustees considered an analysis that the Trust’s administrator had prepared, comparing the contractual expenses that the Fund will bear to those of funds in the same Morningstar category. The Trustees noted that the Fund’s proposed management fee of 0.88% is above the peer group median and average, though still in the third quartile. The Trustees also noted that the projected total contractual expenses for the Fund’s Institutional Class are below the peer group median and average, in the second quartile. While recognizing that it is difficult to compare advisory fees because the scope of advisory services provided may vary from one investment adviser to another, the Trustees concluded that CornerCap’s proposed advisory fee was reasonable.
Economies of Scale. The Trustees considered whether the Fund would benefit from any economies of scale, noting that the proposed investment advisory fee for the Fund does not contain breakpoints. The Trustees took into account CornerCap’s commitment to reinvest in new personnel, data sources, and infrastructure through future Fund asset growth. The Trustees concluded that it is not necessary to consider the implementation of fee breakpoints, but committed to revisit this issue in the future as circumstances change and asset levels increase.
Other Benefits. The Trustees considered the direct and indirect benefits that could be realized by CornerCap from its relationships with the Fund. The Trustees noted that CornerCap will not use affiliated brokers to execute the Fund’s portfolio transactions. The Trustees considered that CornerCap may receive some form of reputational benefit from services rendered to the Fund, but that such benefits are immaterial and cannot otherwise be quantified. The Trustees concluded that CornerCap does not receive additional material benefits from its relationship with the Fund.
Annual Report | March 31, 2023
Additional Information (Unaudited)
March 31, 2023
AVAILABILITY OF FUND PORTFOLIO INFORMATION
The Fund files complete schedules of portfolio holdings with the U.S. Securities and Exchange Commission (the “SEC”) for the first and third quarters of each fiscal year on Part F of Form N-PORT. The Fund’s Part F of Form N-PORT is available on the SEC’s website at www.sec.gov and may be reviewed and copied at the SEC’s Public Reference Room in Washington, D.C. Information on the operation of the Public Reference Room may be obtained by calling 1-800-732-0330. The Fund’s Part F of Form N-PORT may also be obtained by calling 1-888-813-8637.
AVAILABILITY OF PROXY VOTING INFORMATION
A description of the Fund’s Proxy Voting Policies and Procedures is available without charge, upon request, by calling 1-888-813-8637. Information regarding how the Fund voted proxies relating to portfolio securities during the most recent 12-month period ended June 30, is available (1) without charge, upon request, by calling 1-888-621-9258, or (2) on the SEC’s website at www.sec.gov.
QUALIFIED DIVIDEND INCOME/DIVIDENDS RECEIVED DEDUCTION
For the fiscal year ended March 31, 2023, certain dividends paid by the Fund may be reported as qualified dividend income and may be eligible for taxation at capital gains rates. The percentage of dividends declared from ordinary income designated as qualified dividend income was 30.96% for the Fund.
For corporate shareholders, the percent of ordinary income distributions qualifying for the corporate dividends received deduction for the fiscal year ended March 31, 2023 was 30.68% for the Fund.
The percentage of taxable ordinary income distributions that are designated as short-term capital gain distributions under Internal Revenue Section 871 (k)(2)(c) was 78.66%.
Privacy Notice
The Fund collects only relevant information about you that the law allows or requires it to have in order to conduct its business and properly service you. The Fund collects financial and personal information about you (“Personal Information”) directly (e.g., information on account applications and other forms, such as your name, address, and social security number, and information provided to access account information or conduct account transactions online, such as password, account number, e-mail address, and alternate telephone number), and indirectly (e.g., information about your transactions with us, such as transaction amounts, account balance and account holdings).
The Fund does not disclose any non-public personal information about its shareholders or former shareholders other than for everyday business purposes such as to process a transaction, service an account, respond to court orders and legal investigations or as otherwise permitted by law. Third parties that may receive this information include companies that provide transfer agency, technology and administrative services to the Fund, as well as the Fund’s investment adviser who is an affiliate of the Fund. If you maintain a retirement/educational custodial account directly with the Fund, we may also disclose your Personal Information to the custodian for that account for shareholder servicing purposes. The Fund limits access to your Personal Information provided to unaffiliated third parties to information necessary to carry out their assigned responsibilities to the Fund. All shareholder records will be disposed of in accordance with applicable law. The Fund maintains physical, electronic and procedural safeguards to protect your Personal Information and requires its third-party service providers with access to such information to treat your Personal Information with the same high degree of confidentiality.
In the event that you hold shares of the Fund through a financial intermediary, including, but not limited to, a broker dealer, bank, credit union or trust company, the privacy policy of your financial intermediary governs how your nonpublic personal information is shared with unaffiliated third parties.
Annual Report | March 31, 2023
[INTENTIONALLY LEFT BLANK]
INVESTMENT ADVISER
CornerCap Investment Counsel, Inc.
1355 Peachtree Street NE, Suite 1700
Atlanta, GA 30309
DISTRIBUTOR
Foreside Fund Services, LLC
Three Canal Plaza, Suite 100
Portland, ME 04101
CUSTODIAN
U.S. Bank, N.A.
1555 North Rivercenter Drive
Milwaukee, WI 53212
ADMINISTRATOR, FUND ACCOUNTANT
AND TRANSFER AGENT
U.S. Bancorp Fund Services, LLC
615 East Michigan Street
Milwaukee, WI 53202
INDEPENDENT REGISTERED PUBLIC ACCOUNTING FIRM
Cohen & Company, Ltd.
342 North Water Street, Suite 830
Milwaukee, WI 53202
LEGAL COUNSEL
Stradley Ronon Stevens & Young, LLP
2005 Market Street, Suite 2600
Philadelphia, PA 19103
This report must be accompanied or preceded by a prospectus.
The Fund’s Statement of Additional Information contains additional information about the
Fund’s trustees and is available without charge upon request by calling 1-888-813-8637.
www.cornercapfunds.com
888-813-8637
| DISTRIBUTOR Foreside Fund Services, LLC Three Canal Plaza, Suite 100 Portland, Maine 04101 www.foreside.com |
| This report is submitted for the general information of the shareholders of the Fund. It is not authorized for distribution to prospective investors unless preceded or accompanied by an effective prospectus, which includes information regarding the Fund’s risks, objectives, fees and expenses, experience of their management and other information. |
(b) Not Applicable.
Item 2. Code of Ethics.
The Registrant has adopted a code of ethics that applies to the Registrant’s principal executive officer and principal financial officer. The Registrant has not made any substantive amendments to its code of ethics during the period covered by this report.
The Registrant has not granted any waivers from any provisions of the code of ethics during the period covered by this report.
A copy of the Registrant’s Code of Ethics that applies to the Registrant’s principal executive officer and principal financial officer is filed herewith.
Item 3. Audit Committee Financial Expert.
The Registrant’s board of trustees has determined that there is at least one audit committee financial expert serving on its audit committee. Leonard M. Rush is the “audit committee financial expert” and is considered to be “independent” as each term is defined in Item 3 of Form N‑CSR.
Item 4. Principal Accountant Fees and Services.
The Registrant has engaged its principal accountant to perform audit services, audit-related services, tax services and other services during the past two fiscal years. “Audit services” refer to performing an audit of the Registrant's annual financial statements or services that are normally provided by the accountant in connection with statutory and regulatory filings or engagements for those fiscal years. “Audit-related services” refer to the assurance and related services by the principal accountant that are reasonably related to the performance of the audit. “Tax services” refer to professional services rendered by the principal accountant for tax compliance, tax advice, and tax planning; including reviewing the Fund’s tax returns and distributions calculations. There were no “other services” provided by the principal accountant. For the fiscal years ended March 31, 2023 and March 31, 2022, the Fund’s principal accountant was Cohen & Company, Ltd. The following table details the aggregate fees billed or expected to be billed for each of the last two fiscal years for audit fees, audit-related fees, tax fees and other fees by the principal accountant.
| | FYE 3/31/2023 | FYE 3/31/2022 |
(a) Audit Fees | $17,750 | $13,000 |
(b) Audit-Related Fees | $0 | $0 |
(c) Tax Fees | $3,500 | $3,000 |
(d) All Other Fees | $0 | $0 |
(e)(1) The audit committee has adopted pre-approval policies and procedures that require the audit committee to pre‑approve all audit and non‑audit services of the Registrant, including services provided to any entity affiliated with the Registrant.
(e)(2) The percentage of fees billed by Cohen & Company, Ltd. for the fiscal years ended March 31, 2023 and March 31, 2022, applicable to non-audit services pursuant to waiver of pre-approval requirement were as follows:
.
| | FYE 3/31/2023 | FYE 3/31/2022 |
| Audit-Related Fees | 0% | 0% |
| Tax Fees | 0% | 0% |
| All Other Fees | 0% | 0% |
(f) All of the principal accountant’s hours spent on auditing the Registrant’s financial statements were attributed to work performed by full‑time permanent employees of the principal accountant.
(g) The following table indicates the non-audit fees billed or expected to be billed by the Registrant’s accountant for services to the Registrant and to the Registrant’s investment adviser (and any other controlling entity, etc.—not sub-adviser) for the last two years.
| Non-Audit Related Fees | FYE 3/31/2023 | FYE 3/31/2022 |
| Registrant | N/A | N/A |
| Registrant’s Investment Adviser | N/A | N/A |
(h) The audit committee of the board of trustees/directors has considered whether the provision of non-audit services that were rendered to the Registrant's investment adviser is compatible with maintaining the principal accountant's independence and has concluded that the provision of such non-audit services by the accountant has not compromised the accountant’s independence.
(j) Not applicable.
Item 5. Audit Committee of Listed Registrants.
Not applicable to Registrants who are not listed as issuers (as defined in Rule 10A-3 under the Securities Exchange Act of 1934).
Item 6. Schedule of Investments.
| (a) | Schedule of Investments is included as part of the report to shareholders filed under Item 1 of this Form. |
Item 7. Disclosure of Proxy Voting Policies and Procedures for Closed-End Management Investment Companies.
Not applicable to open-end investment companies.
Item 8. Portfolio Managers of Closed-End Management Investment Companies.
Not applicable to open-end investment companies.
Item 9. Purchases of Equity Securities by Closed‑End Management Investment Company and Affiliated Purchases.
Not applicable to open-end investment companies.
Item 10. Submission of Matters to a Vote of Security Holders.
There have been no material changes to the procedures by which shareholders may recommend nominees to the Registrant’s Board of Trustees.
Item 11. Controls and Procedures.
| (a) | The Registrant’s President and Treasurer have reviewed the Registrant's disclosure controls and procedures (as defined in Rule 30a-3(c) under the Investment Company Act of 1940 (the “Act”)) as of a date within 90 days of the filing of this report, as required by Rule 30a-3(b) under the Act and Rules 13a-15(b) or 15d‑15(b) under the Securities Exchange Act of 1934. Based on their review, such officers have concluded that the disclosure controls and procedures are effective in ensuring that information required to be disclosed in this report is appropriately recorded, processed, summarized and reported and made known to them by others within the Registrant and by the Registrant’s service provider. |
| (b) | There were no significant changes in the Registrant's internal control over financial reporting (as defined in Rule 30a-3(d) under the Act) that occurred during the period covered by this report that has materially affected, or is reasonably likely to materially affect, the Registrant's internal control over financial reporting. |
Item 12. Disclosure of Securities Lending Activities for Closed-End Management Investment Companies
Not applicable to open-end investment companies.
Item 13. Exhibits.
(3) Any written solicitation to purchase securities under Rule 23c‑1 under the Act sent or given during the period covered by the report by or on behalf of the Registrant to 10 or more persons. Not applicable to open-end investment companies.
(4) Change in the registrant’s independent public accountant. There was no change in the registrant’s independent public accountant for the period covered by this report.
SIGNATURES
Pursuant to the requirements of the Securities Exchange Act of 1934 and the Investment Company Act of 1940, the Registrant has duly caused this report to be signed on its behalf by the undersigned, thereunto duly authorized.
(Registrant) Managed Portfolio Series
By (Signature and Title) /s/Brian R. Wiedmeyer
Brian R. Wiedmeyer, President
Date: 6/2/2023
Pursuant to the requirements of the Securities Exchange Act of 1934 and the Investment Company Act of 1940, this report has been signed below by the following persons on behalf of the Registrant and in the capacities and on the dates indicated.
By (Signature and Title) /s/Brian R. Wiedmeyer
Brian R. Wiedmeyer, President
Date: 6/2/2023
By (Signature and Title) /s/Benjamin J. Eirich
Benjamin J. Eirich, Treasurer
Date: 6/2/2023