UNITED STATES
SECURITIES AND EXCHANGE COMMISSION
Washington, D.C. 20549
FORM N-CSR
CERTIFIED SHAREHOLDER REPORT OF REGISTERED
MANAGEMENT INVESTMENT COMPANIES
Investment Company Act file number 811-22525
Managed Portfolio Series
(Exact name of registrant as specified in charter)
615 East Michigan Street
Milwaukee, WI 53202
(Address of principal executive offices) (Zip code)
Brian R. Wiedmeyer, President
Managed Portfolio Series
c/o U.S. Bancorp Fund Services, LLC
777 East Wisconsin Ave, 5th Fl
Milwaukee, WI 53202
(Name and address of agent for service)
(414) 765-6844
Registrant's telephone number, including area code
Date of fiscal year end: November 30, 2021
Date of reporting period: November 30, 2021
Item 1. Reports to Stockholders.

2021 Annual Report
November 30, 2021
| |
| |
| |
| |
| TortoiseEcofin |
| 2021 Annual Report |
| |
This combined financial report provides you with a comprehensive review of our funds that span the entire energy value chain.
| | | |
| Table of Contents | | |
| | | |
| Letter to Shareholders | | 2 |
| Tortoise MLP & Pipeline Fund | | 5 |
| Tortoise MLP & Energy Income Fund | | 8 |
| Ecofin Global Energy Transition Fund | | 11 |
| Ecofin Global Renewables Infrastructure Fund | | 14 |
| Expense Examples | | 18 |
| Financial Statements | | 21 |
| Notes to Financial Statements | | 46 |
| Report of Independent Registered Public Accounting Firm | | 56 |
| Investment Advisory Agreement | | 57 |
| Trustees & Officers | | 59 |
| Additional Information | | 61 |
TortoiseEcofin
| |
| |
| 2021 Annual Report | November 30, 2021 |
| |
| |
| |
| |
Open-end fund comparison
| | | | | Total assets | | | | |
| Name/Ticker | | Primary focus | | ($ Millions)(1) | | Portfolio mix by asset type(1) | | Portfolio mix by ownership(1) |
 | Tortoise MLP & Pipeline
Fund Institutional Class (TORIX)
A Class (TORTX)
Inception: 5/2011
C Class (TORCX)
Inception: 9/2012 | | North American pipeline companies | | $1,932.1 | | 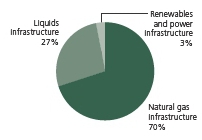 | | 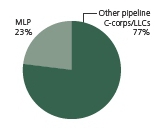 |
Tortoise MLP & Energy
Income Fund Institutional Class (INFIX)
A Class (INFRX)
Inception: 5/2011
C Class (INFFX)
Inception: 4/2012 | | Energy infrastructure equity and debt | | $415.8 | | 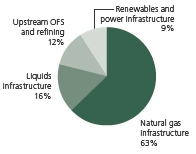 | | 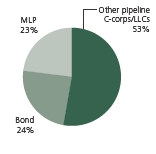 |
 | Ecofin Global Energy
Transition Fund Institutional Class (EETIX)
A Class (EETAX)
Inception: 10/2021 | | Global Securities benefiting from long-term growth associated with energy transition | | $51.0 | | 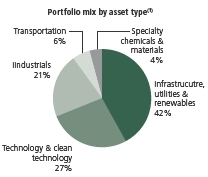 | | 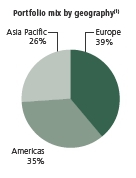 |
Ecofin Global Renewables
Infrastructure Fund
Institutional Class (ECOIX)
A Class (ECOAX)
Inception: 8/2020 | | Global Securities benefiting from long-term growth associated with energy transition | | $382.4 | | 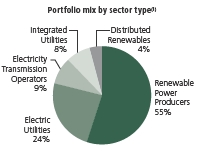 | | 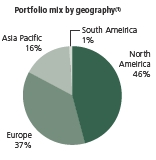 |
| (unaudited) | |
| | |
| TortoiseEcofin | 1 |
| |
| |
| |
| |
| Tortoise |
| 2021 Annual Report |
Dear shareholder
After years of suboptimal returns, energy was the top performing sector in 2021. The broad energy sector performance surged in spite of investor concerns about the COVID-19 Omicron variant’s impact on global energy demand. The global economic recovery is expected to continue into 2022, driving further demand for essential assets.
Energy and power infrastructure
The broader energy sector, as represented by the S&P Energy Select Sector® Index, finished the fiscal year ending November 30, 2021, returning 47.1%. Global underinvestment resulting from environmental, social and governance (ESG) commitments and energy transition is likely to keep global inventories balances for all energy commodities tight for the foreseeable future, a dynamic that presents higher but perhaps more volatile prices.
Throughout 2021, OPEC+ producers closely managed the crude oil market resulting in a drawdown in inventories. A tighter market led to rising commodity prices even with bouts of the Delta and Omicron COVID variants during the second half of 2021. Despite uncertainty, OPEC+ maintained plans to increase production by 400,000 barrels per month. Various OPEC+ countries face obstacles to raising production, complicating assessments of the actual amount of supply that will be added over the next year. Finally, in 2022 the OPEC+ group’s spare capacity is in focus. If spare capacity is lower than market participants assume, prices could be biased towards further upside.
In North America, higher prices spurred a revival of shale drilling. The Permian, America’s biggest oil field, was the primary driver of production growth. In fact, during the fourth quarter, production within the basin reached an all-time high of almost 5.0 million barrels per day.1 The surge is driven by private operators, rather than the publicly traded companies that fueled the previous booms. For 2022, the Energy Information Agency (EIA) forecasts U.S. production will increase from 11.8 million barrels per day (b/d), up from 11.2 million b/d at the end of 2021.
In the second half of 2021, stress on global power markets pulled on all available natural gas supplies, pushing prices to the highest levels in over a decade. This led to switching to coal and even fuel oil for power generation. Due to its low emission intensity relative to other dispatchable fuels, natural gas is being called on to fill power generation gaps created by intermittent renewable sources. Demand for U.S. liquefied natural gas (LNG) was on full display in the fourth quarter. Exports of U.S. feedgas hit an incredible 13 billion cubic feet per day (bcf/d) during the quarter, or 14% of U.S. production.2 From zero a few years ago, the U.S. is now the world’s largest LNG exporter.
Midstream energy, represented by the Tortoise North American Pipeline IndexSM, returned 31.1% during the fiscal year. This performance resulted in outperformance versus the S&P 500® Index in calendar year 2021 for the first time since 2016. 2021 was a story of consistency for energy infrastructure fundamentals. A pandemic recovery coupled with growing free cash flow and the return of capital to shareholders were the main drivers of returns. 2021 EBITDA expectations were consistently revised higher based on increasing pipeline volumes as the economy reopened. Companies stayed disciplined on capital expenditures and used excess cash flow to reduce debt with stock buybacks as a secondary and growing consideration. At year-end, seventeen midstream companies maintained active equity buyback programs totaling more than $2 billion in buybacks through the third quarter of 2021. In 2022, we expect return of capital to continue with capital expenditures declining and free cash flow returned to investors via buybacks and higher distributions. Finally, with balance sheets strengthened, the industry could see additional mergers and acquisitions (M&A) as we saw in 2021 with exploration and production companies (E&Ps).
On the legislative front, the Congressional infrastructure bill was passed in November. Hydrogen received significant funding with targeted development of regional hubs presenting growth opportunities for energy infrastructure companies. Of more significance is the outcome of climate change legislation. If a bill is passed in 2022, it will likely focus more on tax credits rather than more restrictive, comprehensive climate policies. We believe the bill will also include regulatory support for existing infrastructure. For example, the expansion of Section 45Q tax credit would incentivize more widespread carbon capture adoption for harder to abate sectors such as steel, cement, and chemicals.
On the regulatory front, demand for low-cost U.S. natural gas created a need for additional natural gas pipelines and LNG export terminals. In the northeast Marcellus Basin, pipeline infrastructure is constrained. Despite this need, the regulatory environment remains incredibly challenging as evidenced by the recent cancellations of the Atlantic Coast Pipeline and the Constitution Pipeline. The one major pipeline under construction is the Mountain Valley Pipeline. The long-haul natural gas pipeline received key water permits during the fourth quarter with a couple hurdles to overcome before becoming operational. While LNG export facilities take time to construct, with the largest outstanding LNG opportunity, Cheniere Energy expects to advance their Corpus Christi stage 3 in 2022, once remaining investment and commercial parameters are met. Finally, Enbridge received final regulatory approval on its Line 3 crude oil pipeline project and started moving volumes during the fourth quarter, making it the largest crude oil project to come online in 2021.
| (unaudited) | |
| | |
| 2 | TortoiseEcofin |
| |
| |
| 2021 Annual Report | November 30, 2021 |
| |
| |
| |
| |
Several events in 2021 reminded investors how critical energy infrastructure is to daily life. Notable events like Winter Storm Uri in Texas, the cyber-attack of the Colonial Pipeline, Hurricane Ida in the Gulf Coast, or U.S. LNG cargoes rapidly replenishing Europe’s low gas storage levels via LNG tankers all argue towards a holistic view towards energy transition. With the understanding that fossil fuels will remain critical to the economy for decades, we believe focusing on decarbonizing existing infrastructure is the best approach to reducing emissions.
Midstream companies concentrated on decarbonization throughout 2021. Sustainability reports included more granular detail than previous annual reports, net-zero emission targets were established, pledges were made to reduce methane intensity, and companies engaged with projects and growth opportunities around energy transition. Energy transition projects support the longevity of existing assets and cash flow growth. Fuels including carbon (through carbon capture and sequestration), hydrogen, renewable diesel, and renewable natural gas all create a pathway to a lower carbon future. Repurposing existing pipelines significantly reduces the capital expenditures versus building a new pipeline as we expect energy infrastructure companies to take advantage of the existing infrastructure already in the ground.
With inflation increasing throughout the year, many investors began to recognize midstream as an asset class with inflation protection. Pipelines typically have long-term contracts with inflation protection from regulated tariff escalators. Additionally, tariffs on regulated liquid pipelines typically include an inflation escalator. This allows increases aligned with the Producer Price Index (PPI) offering some protection from inflation. Through November 2021, the PPI increased by 9.0% from the prior year which could be a material driver of cash flows in 2022.
As the world economy continues to reopen, the energy sector is positioned for a reflation around increased energy demand. The focus continues to be on companies with strong balance sheets and exposure to the most competitive basins for hydrocarbon production, including the Permian and Marcellus basins. The fund also continues to emphasize export infrastructure, both LNG and liquefied petroleum gas (LPG).
The downstream portion of the energy value chain continues its recovery from the COVID-19 pandemic. The EIA sees refined product demand increasing 3% year over year driven largely by increases in jet fuel. U.S. demand for gasoline and distillate normalized in 2021 relative to 2019 levels while jet fuel demand is still down from pre-COVID levels. The natural gas liquids backdrop is strong entering 2022. NGL prices have been elevated on favorable fundamentals including constrained supply and low stockpiles. There has been particular strength in LPGs (liquid petroleum gases) where demand is driven by global population growth and improvements in living standards in Asia, notably in China and India.
Sustainable infrastructure
The renewables sector had a difficult year in terms of share price performance— in part due to the starting point left by large gains from 2020. After being recognized in 2020 as a larger secular growth sector than previously realised, some near-term challenges to fundamental momentum emerged. A combination of fears around equipment cost inflation and its impact on development project returns, rising interest rates and their impact on discounted cash flows, and COVID-related development and construction delays and their impact on the pace of growth all conspired to question the robustness of the growth story. Consequently, concerns about near-term earnings growth prospects emerged for some companies, leading to negative near-term revisions, with attendant share price weakness, especially for smaller companies and unregulated companies who have less offsetting predictable businesses that provide greater visibility into their growth prospects.
At the same time, the sector saw improved policy frameworks in some emerging markets (particularly in China) but lost some momentum on the policy front in certain developed markets, which also had an adverse impact on the sector and the strategy. The following developments from late in the fourth quarter are worth highlighting:
California Net Energy Metering 3.0 (NEM 3.0): NEM allows customers who generate their own energy to receive a financial credit on their electric bills for any surplus energy sent to the grid. The Californian Public Utility Commission (CPUC) reviewed the financial benefit received in particular by rooftop solar customers and its proposed decision (NEM 3.0) was worse than expected, with lower prices for excess power and particularly with regard to a “connection fee”, which would introduce a new monthly fixed cost for future rooftop solar owners to remain connected to the grid. The reaction of the stocks exposed to rooftop solar reflected that worse-than-expected proposed decision. The final decision on NEM 3.0 is due at the end of January at the earliest. It is unlikely that the final decision will be even more onerous on the rooftop solar industry, and there is a chance that after the consultation period the outcome could be either neutral or improved relative to the proposal.
Build Back Better (BBB): The proposed US BBB bill seems to be highly uncertain at this stage, due to objections from a single Senator, whose vote is needed for passage. This development late in December was negative for investor sentiment across much
| (unaudited) | |
| | |
| TortoiseEcofin | 3 |
of the energy transition space as the bill was not only a targeted form of financial support for renewables, storage, green hydrogen and electric vehicles, but importantly also signalled a somewhat unprecedented U.S. intent to accelerate decarbonization. We believe that current incentive policies such as the solar ITC (Investment Tax Credit) and wind PTC (Production Tax Credit) have a higher probability to be extended through a tax extenders package should BBB fail to be enacted in any form. However, policies that require new legislation – such as green hydrogen subsidization, Carbon Capture & Storage (CCS) incentives, standalone storage ITCs, domestic manufacturing credits – have a lower probability of making it into subsequent legislation, thereby removing the odds of an important positive catalyst. As with all political negotiations, these situations are fluid and could break in either direction.
Concluding thoughts
We are extremely optimistic about our essential asset investments for 2022 and well into the future. It appears that the end may be in sight on the global pandemic, which will support increased pent-up demand for the assets in which the funds invest. There are indications of global acceptance that natural gas should be included as a sustainable energy source along with renewables and an investment option as energy transitions. We believe that all of these catalysts will lead to strong returns. We are positioning the funds to take advantage of this momentum and have a positive outlook for 2022 and beyond.
The S&P 500® Index is an unmanaged market-value weighted index of stocks, which is widely regarded as the standard for measuring large-cap U.S. stock market performance. The S&P Energy Select Sector® Index is a capitalization-weighted index of S&P 500® Index companies in the energy sector involved in the development or production of energy products. The Tortoise North American Pipeline IndexSM is a float adjusted, capitalization-weighted index of energy pipeline companies domiciled in the United States and Canada. The Tortoise MLP Index® is a float-adjusted, capitalization-weighted index of energy master limited partnerships.
The Tortoise indices are the exclusive property of TIS Advisors which has contracted with S&P Opco, LLC (a subsidiary of S&P Dow Jones Indices LLC) to calculate and maintain the Tortoise MLP Index® and Tortoise North American Pipeline IndexSM (the “Indices”). The Indices are not sponsored by S&P Dow Jones Indices or its affiliates or its third party licensors (collectively, “S&P Dow Jones Indices LLC”). S&P Dow Jones Indices will not be liable for any errors or omission in calculating the Indices. “Calculated by S&P Dow Jones Indices” and its related stylized mark(s) are service marks of S&P Dow Jones Indices and have been licensed for use by TIS Advisors and its affiliates. S&P® is a registered trademark of Standard & Poor’s Financial Services LLC (“SPFS”), and Dow Jones® is a registered trademark of Dow Jones Trademark Holdings LLC (“Dow Jones”).
Free cash flow is the cash a company produces through its operations, less the cost of total capital expenditures (growth and maintenance).
It is not possible to invest directly in an index.
Performance data quoted represent past performance; past performance does not guarantee future results. Like any other stock, total return and market value will fluctuate so that an investment, when sold, may be worth more or less than its original cost.
1 | EIA Drilling Productivity Report |
2 | S&P Global Market Intelligence |
| (unaudited) | | |
| | | |
| 4 | | TortoiseEcofin |
| |
| |
| 2021 Annual Report | November 30, 2021 |
| |
| Tortoise |
| MLP & Pipeline Fund |
| |
Basic fund facts
Investment objective: Total return
Structure: Regulated investment company
| | Institutional | | A Class | | C Class |
| Ticker | | | TORIX | | | | TORTX | | | TORCX | |
| Gross expense ratio | | | 0.94% | | | | 1.19% | | | 1.94% | |
| Redemption fee | | | None | | | | None | | | None | |
| Maximum front-end | | | None | (1) | | | 5.50% | (2) | | None | (1) |
| sales load | | | | | | | | | | | |
| Maximum deferred | | | None | | | | None | (3) | | 1.00% | (4) |
| sales load | | | | | | | | | | | |
| (1) | While the Institutional and C Classes have no front-end load, advisory and other expenses still apply. |
| (2) | You may qualify for sales charge discounts if you invest at least $50,000. |
| (3) | No front-end sales charge is payable on A Class investments of $1 million or more, although the fund may impose a Contingent Deferred Sales Charge (“CDSC”) of 1% on certain redemptions made within 12 months of purchase. |
| (4) | The C Class CDSC applies to redemptions made within 12 months of purchase. |
Targeted investment characteristics
The fund’s targeted investments generally will have the following characteristics:
| ● | Strategic assets that fuel the economy |
| | |
| ● | Diversified asset base |
| | |
| ● | Limited direct commodity price exposure |
| | |
| ● | History of predictable, recurring cash flows |
| | |
| ● | Total-return potential through growth and current income |
| | |
| ● | Experienced management teams |
Top ten holdings (as of November 30, 2021)
| 1. | Cheniere Energy, Inc. | | 10.6% |
| 2. | Targa Resources Corp. | | 9.3% |
| 3. | ONEOK, Inc. | | 8.3% |
| 4. | Enbridge Inc. | | 7.9% |
| 5. | The Williams Companies, Inc. | | 7.7% |
| 6. | Kinder Morgan, Inc. | | 7.4% |
| 7. | Energy Transfer LP | | 5.0% |
| 8. | MPLX LP | | 5.0% |
| 9. | Plains GP Holdings, L.P | | 5.0% |
| 10. | Pembina Pipeline Corporation | | 4.9% |
Key asset performance drivers
| ● | All segments had positive performance |
| | |
| ● | The fund’s large allocation to natural gas pipeline companies added the most to performance |
| | |
| ● | The fund’s allocation to energy technology companies added the least to performance |
| Top five contributors |
| Targa Resources Corp. |
| Cheniere Energy Inc. |
| ONEOK, Inc. |
| Williams Companies, Inc. |
| MPLX LP |
| Bottom five contributors |
| NuStar Energy L.P |
| Crestwood Equity Partners LP |
| DT Midstream Inc. |
| Sempra Energy |
| Nextera Energy Inc. |
| (unaudited) | |
| | |
| TortoiseEcofin | 5 |
| |
| |
| |
| |
| Tortoise |
| MLP & Pipeline Fund (continued) |
| |
| Value of $1,000,000 vs. S&P 500® Index |
| November 30, 2011 through November 30, 2021 |
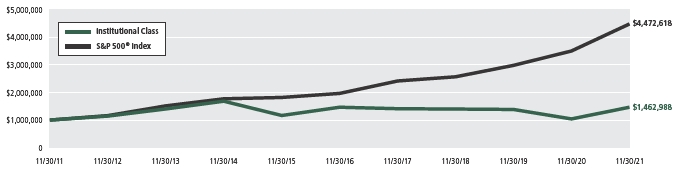 |
This chart illustrates the performance of a hypothetical $1,000,000 investment made on November 30, 2011 and is not intended to imply any future performance. The returns shown do not reflect the deduction of taxes that a shareholder would pay on fund distributions or the redemption of fund shares. The returns reflect fee waivers in effect. In the absence of such waivers, total return would be reduced. The chart assumes reinvestment of capital gains and dividends for a fund and dividends for the index.
The performance data quoted above represents past performance since inception on November 30, 2011 through November 30, 2021. Past performance is no guarantee of future results. The investment return and value of an investment will fluctuate so that an investor’s shares, when redeemed, may be worth more or less than their original cost. Current performance of the fund may be obtained through the most recent month-end by calling 855-TCA-FUND (855-822-3863). Future performance may be lower or higher than the performance stated above.
The S&P 500® Index is an unmanaged market-value weighted index of stocks, which is widely regarded as the standard for measuring large-cap U.S. stock market performance. Returns include reinvested dividends. You cannot invest directly in an index.
| (unaudited) | |
| | |
| 6 | TortoiseEcofin |
| |
| |
| 2021 Annual Report | November 30, 2021 |
| |
| |
| |
| |
Total returns (as of November 30, 2021)
| Ticker | | Class | | 1 year | | 3 years | | 5 years | | 10 years(1) | | Since Inception(2) | | Gross expense ratio |
| TORIX | | Institutional | | 40.51% | | 1.52% | | | -0.01% | | | | 3.88% | | | | 4.72% | | | | 0.94 | % | |
| TORTX | | A Class (excluding load)(3) | | 40.12% | | 1.23% | | | -0.31% | | | | 3.59% | | | | 4.41% | | | | 1.19 | % | |
| TORTX | | A Class (maximum load)(3) | | 32.41% | | -0.67% | | | -1.44% | | | | 3.01% | | | | 3.85% | | | | 1.19 | % | |
| TORCX | | C Class (excluding CDSC) | | 39.00% | | 0.49% | | | -1.01% | | | | 2.84% | | | | 3.66% | | | | 1.94 | % | |
| TORCX | | C Class (including CDSC) | | 38.00% | | 0.49% | | | -1.01% | | | | 2.84% | | | | 3.66% | | | | 1.94 | % | |
| S&P 500® Index(4) | | | | 27.92% | | 20.38% | | | 17.90% | | | | 16.16% | | | | 14.62% | | | | — | | |
| TNAPT(5) | | | | 31.13% | | 5.33% | | | 3.88% | | | | 6.17% | | | | 6.63% | | | | — | | |
| (1) | The C Class Shares commenced operations on September 19, 2012. Performance shown for the C Class prior to the inception of the C Class is based on the performance of the Institutional Class Shares, adjusted for the higher expenses applicable to the C Class Shares. |
| (2) | Reflects period from May 31, 2011 through November 30, 2021. The Institutional and A Class Shares commenced operations on May 31, 2011 and C Class Shares commenced operations on September 19, 2012. Performance shown for the C Class prior to inception of the C Class Shares is based on the performance of the Institutional Class Shares, adjusted for the higher expenses applicable to C Class Shares. |
| (3) | Prior to March 30, 2019, A Class Shares were known as Investor Class Shares. |
| (4) | The S&P 500® Index is an unmanaged market-value weighted index of stocks, which is widely regarded as the standard for measuring large-cap U.S. stock market performance. Returns include reinvested dividends. You cannot invest directly in an index. |
| (5) | The Tortoise North American Pipeline IndexSM is a float-adjusted, capitalization weighted index of pipeline companies headquartered in the United States and Canada. You cannot invest directly in an index. |
Note: For periods over 1 year, performance reflected is for the average annual returns. Performance data shown for the A Class (maximum load) reflects a sales charge of 5.50%. Performance data shown “excluding load” does not reflect the deduction of the maximum sales load. Performance data shown for the C Class (including CDSC) reflects a contingent deferred sales charge (“CDSC”) of 1% for the first 12 months of investment. Performance data shown “excluding CDSC” does not reflect the deduction of the CDSC. If reflected, the load and CDSC would reduce the performance quoted. Investment performance reflects fee waivers in effect. In the absence of such waivers, total return would be reduced.
Performance data quoted represents past performance; past performance does not guarantee future results. The investment return and principal value of an investment will fluctuate so that an investor’s shares, when redeemed, may be worth more or less than their original cost. Current performance of the portfolio may be lower or higher than the performance quoted. Performance data current to the most recent month end may be obtained by calling 855-TCA-FUND (855-822-3863).
| (unaudited) | |
| | |
| TortoiseEcofin | 7 |
| |
| |
| |
| |
| Tortoise |
| MLP & Energy Income Fund |
| |
Basic fund facts
Investment objective: Current income and long-term capital appreciation
Structure: Regulated investment company
| | Institutional | | A Class | | C Class |
| Ticker | | | INFIX | | | | INFRX | | | INFFX | |
| Gross expense ratio(5) | | | 1.14% | | | | 1.39% | | | 2.14% | |
| Redemption fee | | | None | | | | None | | | None | |
| Maximum front-end | | | None | (1) | | | 5.50% | (2) | | None | (1) |
| sales load | | | | | | | | | | | |
| Maximum deferred | | | None | | | | None | | | 1.00% | (4) |
| sales load | | | | | | | | | | | |
| (1) | While the Institutional and C Classes have no front-end load, advisory and other expenses still apply. |
| (2) | You may qualify for sales charge discounts if you invest at least $50,000. |
| (3) | No front-end sales charge is payable on A Class investments of $1 million or more, although the fund may impose a Contingent Deferred Sales Charge (“CDSC”) of 1% on certain redemptions made within 12 months of purchase. |
| (4) | The C Class CDSC applies to redemptions made within 12 months of purchase. |
| (5) | The expense ratios reflect those in the most recent prospectus and may not agree to the financial highlights. |
Targeted investment characteristics
The fund’s targeted investments generally will have the following characteristics:
| ● | Securities from across the capital structure and energy value chain |
| | |
| ● | Strategic assets that fuel the economy |
| | |
| ● | Diversified asset base |
| | |
| ● | Limited direct commodity price exposure |
| | |
| ● | History of predictable, recurring cash flows |
| | |
| ● | Current income through distributions |
| | |
| ● | A flexible asset allocation dependent on current market opportunities |
| | |
| ● | Experienced management team |
Top ten holdings (as of November 30, 2021)
| 1. | Cheniere Energy, Inc. | | 5.8% |
| 2. | ONEOK, Inc. | | 4.8% |
| 3. | The Williams Companies, Inc. | | 4.7% |
| 4. | DCP Midstream, LP | | 4.6% |
| 5. | Energy Transfer LP | | 4.2% |
| 6. | NextEra Energy Partners LP | | 3.9% |
| 7. | MPLX LP | | 3.8% |
| 8. | Plains GP Holdings, L.P | | 3.7% |
| 9. | NGPL Pipeco LLC | | 3.1% |
| 10. | ConocoPhillips | | 3.0% |
Key asset performance drivers
| ● | All segments had positive performance |
| | |
| ● | The fund’s large allocation to natural gas pipeline companies added the most to performance |
| | |
| ● | The fund’s small allocation to local gas distribution companies added the least to performance |
| Top five contributors |
| Cheniere Energy Inc. |
| ONEOK, Inc. |
| MPLX LP |
| DCP Midstream LP |
| Energy Transfer LP |
| Bottom five contributors |
| New Fortress Energy Inc. |
| New Fortress Energy Inc., 6.750% Due 9/15/2025 |
| Ovintiv Inc. |
| Crestwood Equity Partners LP |
| New Fortress Energy Inc., 6.500% Due 9/30/2026 |
| (unaudited) | |
| | |
| 8 | TortoiseEcofin |
| |
| |
| 2021 Annual Report | November 30, 2021 |
| |
| |
| |
| |
| Value of $1,000,000 vs. the Alerian MLP Index |
| November 30, 2011 through November 30, 2021 |
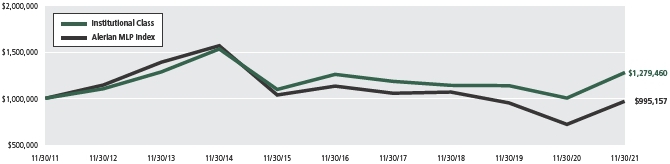 |
This chart illustrates the performance of a hypothetical $1,000,000 investment made on November 30, 2011 and is not intended to imply any future performance. The returns shown do not reflect the deduction of taxes that a shareholder would pay on fund distributions or the redemption of fund shares. The returns reflect fee waivers in effect. In the absence of such waivers, total return would be reduced. The chart assumes reinvestment of capital gains and dividends for a fund and dividends for the index.
The performance data quoted above represents past performance from November 30, 2011 through November 30, 2021. Past performance is no guarantee of future results. The investment return and value of an investment will fluctuate so that an investor’s shares, when redeemed, may be worth more or less than their original cost. Current performance of the fund may be obtained through the most recent month-end by calling 855-TCA-FUND (855-822-3863). Future performance may be lower or higher than the performance stated above.
The Alerian MLP Index is the leading gauge of energy infrastructure Master Limited Partnerships (MLPs). The capped, float-adjusted, capitalization-weighted index, whose constituents earn the majority of their cash flow from midstream activities involving energy commodities, is disseminated real-time on a pricereturn basis (AMZ) and on a total-return basis (AMZX).
| (unaudited) | |
| | |
| TortoiseEcofin | 9 |
| |
| |
| |
| |
| Tortoise |
| MLP & Energy Income Fund (continued) |
| |
Total returns (as of November 30, 2021)
| Ticker | | Class | | 1 year | | 3 years | | 5 years | | 10 years(1) | | Since Inception(2) | | Gross expense ratio |
| INFIX | | Institutional | | 27.63% | | | 3.91% | | | | 0.31% | | | | 2.50% | | | | 3.36% | | | | 1.16 | % | |
| INFRX | | A Class (excluding load) | | 27.19% | | | 3.70% | | | | 0.08% | | | | 2.25% | | | | 3.12% | | | | 1.41 | % | |
| INFRX | | A Class (maximum load) | | 20.27% | | | 1.76% | | | | -1.04% | | | | 1.67% | | | | 2.59% | | | | 1.41 | % | |
| INFFX | | C Class (excluding CDSC) | | 26.35% | | | 2.87% | | | | -0.69% | | | | 1.46% | | | | 2.41% | | | | 2.16 | % | |
| INFFX | | C Class (including CDSC) | | 25.35% | | | 2.87% | | | | -0.69% | | | | 1.46% | | | | 2.41% | | | | 2.16 | % | |
| Alerian MLP Index(3) | | | | 38.75% | | | -2.31% | | | | -2.55% | | | | -0.05% | | | | 0.80% | | | | — | | |
| (1) | The C Class Shares commenced operations on April 2, 2012. Performance shown for the C Class prior to the inception of the C Class is based on the performance of the Institutional Class Shares, adjusted for the higher expenses applicable to the C Class Shares. |
| (2) | Reflects period from fund inception on December 27, 2010 through November 30, 2021. The Institutional Class commenced operations on December 27, 2010, the A Class Shares commenced operation on May 18, 2011 and the C Class Shares commenced operations on April 2, 2012. Performance shown for the A Class and C Class prior to the inception of the A Class Shares and C Class Shares is based on the performance of the Institutional Class Shares, adjusted for the higher expenses applicable to the A Class Shares and the C Class Shares, respectively. |
| (3) | The Alerian MLP Index is the leading gauge of energy infrastructure Master Limited Partnerships (MLPs). The capped, float-adjusted, capitalization-weighted index, whose constituents earn the majority of their cash flow from midstream activities involving energy commodities, is disseminated real-time on a pricereturn basis (AMZ) and on a total-return basis (AMZX). |
Note: For periods over 1 year, performance reflected is for the average annual returns. Performance data shown for the A Class (maximum load) reflects a sales charge of 5.50%. Performance data shown “excluding load” does not reflect the deduction of the maximum sales load. Performance data shown for the C Class (including CDSC) reflects a contingent deferred sales charge (“CDSC”) of 1% for the first 18 months of investment. Performance data shown “excluding CDSC�� does not reflect the deduction of the CDSC. If reflected, the load and CDSC would reduce the performance quoted. Investment performance reflects fee waivers in effect. In the absence of such waivers, total return would be reduced.
Performance data quoted represents past performance; past performance does not guarantee future results. The investment return and principal value of an investment will fluctuate so that an investor’s shares, when redeemed, may be worth more or less than their original cost. Current performance of the portfolio may be lower or higher than the performance quoted. Performance data current to the most recent month end may be obtained by calling 855-TCA-FUND (855-822-3863).
| (unaudited) | |
| | |
| 10 | TortoiseEcofin |
| |
| |
2021 Annual Report | November 30, 2021 |
| |
| Ecofin |
| Global Energy Transition Fund |
| |
Basic fund facts
Investment objective: Current income and long-term capital appreciation
Structure: Regulated investment company
| | Institutional | | A Class |
| Ticker | | | EETIX | | | | EETAX | | |
| Net expense ratio(1) | | | 0.90% | | | | 1.15% | | |
| Redemption fee | | | None | | | | None | | |
| Maximum front-end sales load | | | None | (2) | | | 5.50% | (3) | |
| Maximum deferred sales load | | | None | | | | None | (4) | |
| (1) | Tortoise has contractually agreed to limit total operating expenses (excluding acquired fund fees and expenses, brokerage commissions, leverage/borrowing interest, interest expense, taxes and extraordinary expenses) through 8/25/2022. Reimbursed expenses may be recouped for a period of thirty-six months if such recoupment can be achieved without exceeding these expense limits. |
| (2) | While the Institutional Class has no front-end load, advisory and other expenses still apply. |
| (3) | You may qualify for sales charge discounts if you invest at least $50,000. |
| (4) | No front-end sales charge is payable on A Class investments of $1 million or more, although the fund may impose a Contingent Deferred Sales Charge (“CDSC”) of 1% on certain redemptions made within 12 months of purchase. |
Targeted investment characteristics
Top ten holdings (as of November 30, 2021)
| 1. | NextEra Energy, Inc. | | 6.3% |
| 2. | TE Connectivity Ltd. | | 5.5% |
| 3. | Exelon Corporation | | 5.4% |
| 4. | EDP - Energias de Portugal, S.A. | | 5.3% |
| 5. | ROHM Co., Ltd. | | 5.2% |
| 6. | Nidec Corp. | | 4.8% |
| 7. | Prysmian SpA | | 4.4% |
| 8. | China Longyuan Power Group Corp Ltd. | | 4.3% |
| 9. | Autodesk, Inc. | | 4.2% |
| 10. | Infineon Technologies AG | | 4.0% |
Key asset performance drivers
| ● | The fund’s relatively small allocation to global wind companies contributed the most to the fund’s positive performance |
| | |
| ● | Exposure to raw materials companies in the industrials sector also added to performance |
| | |
| ● | A data center in the technology and clean technology sector was the biggest detractor from performance |
| Top five contributors |
| China Longyuan Power |
| Contemporary Amperex |
| Norsk Hydro |
| Covanta Holding Corporation |
| TE Connectivity LTD |
| Bottom five contributors |
| GDS Holdings LTD |
| Orsted A/S |
| Scatec Solar USA |
| Volkswagen AG-Pref |
| Sunrun Inc. |
| (unaudited) | |
| | |
| TortoiseEcofin | 11 |
| |
| |
|
| |
| Ecofin |
| Global Energy Transition Fund (continued) |
| |
| Value of $1,000,000 vs. MSCI ACWI Index |
| April 30, 2019 through November 30, 2021 |
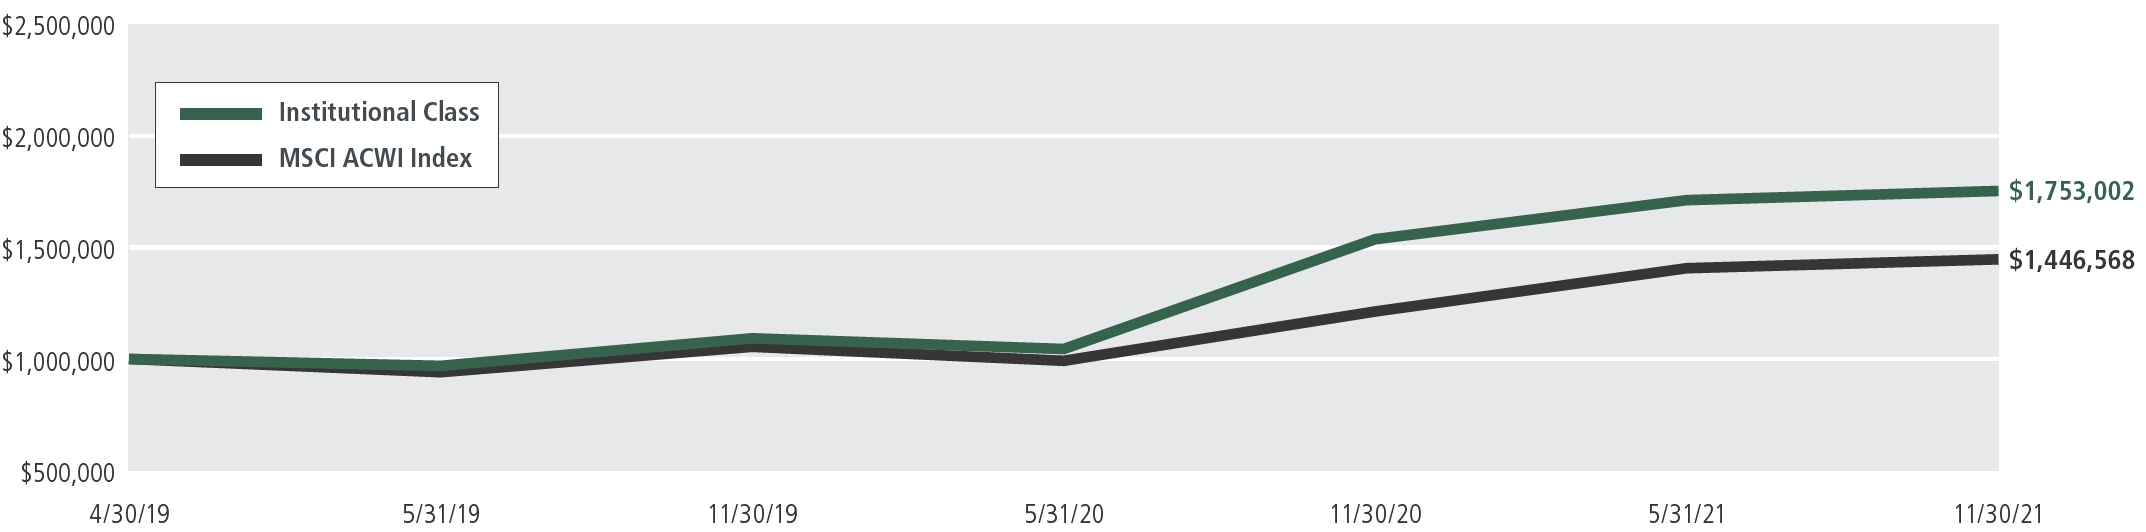 |
The Fund commenced operations on October 15, 2021. This chart illustrates the performance of a hypothetical $1,000,000 investment made on April 30, 2019 and is not intended to imply any future performance. The returns shown do not reflect the deduction of taxes that a shareholder would pay on fund distributions or the redemption of fund shares. The returns reflect fee waivers in effect. In the absence of such waivers, total return would be reduced. The chart assumes reinvestment of capital gains and dividends for a fund and dividends for the index.
The performance data quoted above represents past performance on April 30, 2019 through November 30, 2021. Past performance is no guarantee of future results. The investment return and value of an investment will fluctuate so that an investor’s shares, when redeemed, may be worth more or less than their original cost. Current performance of the fund may be obtained through the most recent month-end by calling 855-TCA-FUND (855-822-3863). Future performance may be lower or higher than the performance stated above.
The MSCI ACWI Index is designed to represent performance of the full opportunity set of large- and mid-cap stocks across 23 developed and 25 emerging markets. You cannot invest directly in an index.
| (unaudited) | |
| | |
| 12 | TortoiseEcofin |
| |
| |
2021 Annual Report | November 30, 2021 |
| |
| |
| |
| |
Total returns (as of November 30, 2021)
| Ticker | | Class | | 1 year | | Since Inception | | Gross expense ratio(5) |
| EETIX(1)(2) | | Institutional | | | 14.06 | % | | | | 24.24 | % | | | | 1.40 | % | |
| EETAX(1)(3) | | A Class (excluding load) | | | 13.69 | % | | | | 23.89 | % | | | | 1.65 | % | |
| EETAX(1)(3) | | A Class (including load) | | | 7.46 | % | | | | 21.21 | % | | | | 1.65 | % | |
| MSCI ACWI Index (Net)(4) | | | | | 19.27 | % | | | | 15.34 | % | | | | — | | |
| (1) | Fund commenced operations on October 15, 2021. |
| (2) | The performance data quoted for the period prior to October 18, 2021 is that of the Long Only sub-fund of the Ecofin Vista Master Fund Limited (the “Predecessor Fund”) and has been adjusted to reflect the Fund’s share class’ fees and expenses. The Predecessor Fund commenced operations on April 30, 2019, and was not a registered mutual fund subject to the same investment and tax restrictions as the Fund. If it had, the Predecessor Fund’s performance might have been lower. The Predecessor Fund’s shares were exchanged for the Fund’s Institutional Class shares on October 15, 2021. |
| (3) | Performance of the A Class prior to the inception of the class is based on the performance of the Predecessor Fund, adjusted for the higher expenses applicable to the class compared to the Institutional Class. |
| (4) | The MSCI ACWI Index is designed to represent performance of the full opportunity set of large- and mid-cap stocks across 23 developed and 25 emerging markets. You cannot invest directly in an index. |
| (5) | The gross expense ratio is in line with the Global Energy Transition Fund’s most recent effective prospectus and may not reflect current year activity. |
Note: For periods over 1 year, performance reflected is for the average annual returns. Performance data shown for the A Class (maximum load) reflects a sales charge of 5.50%. Performance data shown “excluding load” does not reflect the deduction of the maximum sales load.
Performance data quoted represents past performance; past performance does not guarantee future results. The investment return and principal value of an investment will fluctuate so that an investor’s shares, when redeemed, may be worth more or less than their original cost. Current performance of the portfolio may be lower or higher than the performance quoted. Performance data current to the most recent month end may be obtained by calling 855-TCA-FUND (855-822-3863).
| (unaudited) | |
| | |
| TortoiseEcofin | 13 |
| |
| |
|
| |
| Ecofin |
| Global Renewables Infrastructure Fund |
| |
Basic fund facts
Investment objective: Total Return
Structure: Regulated Investment Company
| | Institutional | | A Class |
| Ticker | | | ECOIX | | | | | ECOAX | | |
| Net Expense Ratio(1) | | | 1.00% | | | | | 1.25% | | |
| Redemption fee | | | None | | | | | None | | |
| Maximum front-end sales load | | | None | (2) | | | | 5.50% | (3) | |
| Maximum deferred sales load | | | None | | | | | None | (4) | |
| (1) | Tortoise has contractually agreed to limit total operating expenses (excluding acquired fund fees and expenses, brokerage commissions, leverage/borrowing interest, interest expense, taxes and extraordinary expenses) through 3/31/2022. Reimbursed expenses may be recouped for a period of thirty-six months if such recoupment can be achieved without exceeding these expense limits. |
| (2) | While the Institutional Class has no front-end load, advisory and other expenses still apply. |
| (3) | You may qualify for sales charge discounts if you invest at least $50,000. |
| (4) | No front-end sales charge is payable on A Class investments of $1 million or more, although the fund may impose a Contingent Deferred Sales Charge (“CDSC”) of 1% on certain redemptions made within 12 months of purchase. |
Targeted investment characteristics
The fund’s targeted investments generally will have the following characteristics:
| ● | Securities from across the capital structure and energy value chain |
| | |
| ● | Strategic assets that fuel the economy |
| | |
| ● | Diversified asset base |
| | |
| ● | Limited direct commodity price exposure |
| | |
| ● | History of predictable, recurring cash flows |
| | |
| ● | Current income through distributions |
| | |
| ● | A flexible asset allocation dependent on current market opportunities |
| | |
| ● | Experienced management team |
Top ten holdings (as of November 30, 2021)
| 1. | NextEra Energy, Inc. | | 5.4% |
| 2. | EDP - Energias de Portugal, S.A. | | 4.5% |
| 3. | TransAlta Renewables Inc. | | 4.4% |
| 4. | Edison International | | 4.3% |
| 5. | ERG SpA | | 4.0% |
| 6. | China Longyuan Power Group Corp Ltd. | | 4.0% |
| 7. | China Suntien Green Energy Corp Ltd. | | 4.0% |
| 8. | Exelon Corporation | | 3.9% |
| 9. | Atlantica Yield plc | | 3.9% |
| 10. | Terna - Rete Elettrica Nazionale SpA | | 3.8% |
Key asset performance drivers
| ● | The fund’s large allocation to power companies focusing on renewable energy contributed the most to the fund’s positive performance |
| | |
| ● | Exposure to transportation and storage companies also added to performance |
| | |
| ● | Exposure to renewables infrastructure, including solar detracted from performance |
| Top five contributors |
| China Suntien Green Energy |
| China Longyuan Power |
| Covanta Holding Corporation |
| Renova Inc. |
| Exelon Corp. |
| Bottom five contributors |
| Scatec Solar USA |
| Enel Chile SA |
| Orsted A/S |
| Sunrun Inc. |
| Renew Energy Global PLC |
| (unaudited) | |
| | |
| 14 | TortoiseEcofin |
| |
| |
2021 Annual Report | November 30, 2021 |
| |
| |
| |
| |
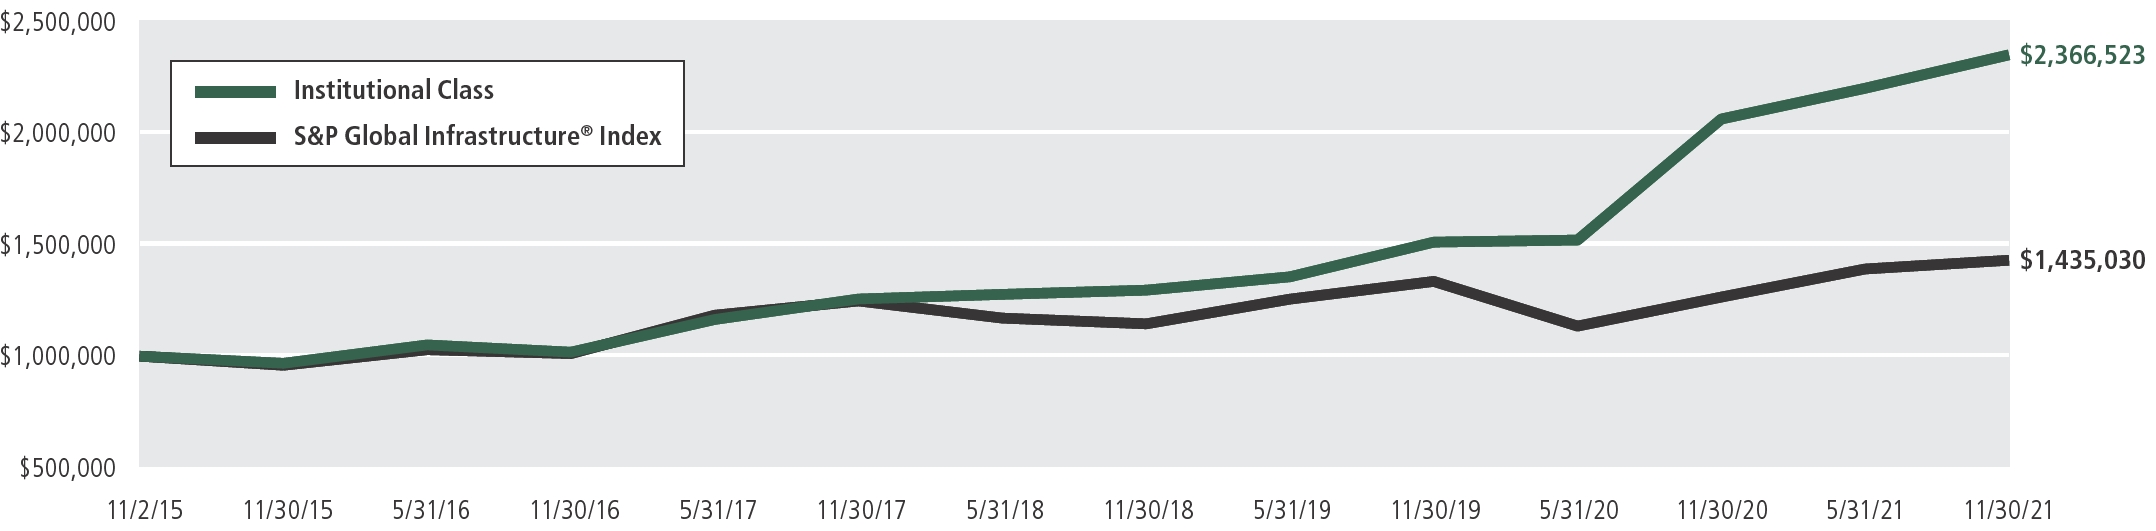
Value of $1,000,000 vs. S&P Global Infrastructure® Index |
November 2, 2015 through November 30, 2021 |
|
The Fund commenced operations on August 7, 2020. This chart illustrates the performance of a hypothetical $1,000,000 investment made on November 2, 2015 and is not intended to imply any future performance. The returns shown do not reflect the deduction of taxes that a shareholder would pay on fund distributions or the redemption of fund shares. The returns reflect fee waivers in effect. In the absence of such waivers, total return would be reduced. The chart assumes reinvestment of capital gains and dividends for a fund and dividends for the index.
The performance data quoted above represents past performance on November 2, 2015 through November 30, 2021. Past performance is no guarantee of future results. The investment return and value of an investment will fluctuate so that an investor’s shares, when redeemed, may be worth more or less than their original cost. Current performance of the fund may be obtained through the most recent month-end by calling 855-TCA-FUND (855-822-3863). Future performance may be lower or higher than the performance stated above.
The S&P Global Infrastructure® Index is designed to track 75 companies from around the world chosen to represent the listed infrastructure industry while maintaining liquidity and tradability. You cannot invest directly in an index.
| (unaudited) | |
| | |
| TortoiseEcofin | 15 |
Total returns (as of November 30, 2021)
| Ticker | | Class | | 1 Year | | 3 Years | | 5 Years | | Since inception | | Gross expense ratio(5) |
| ECOIX(1)(2) | | Institutional | | | 14.02% | | | | 21.72% | | | | 18.40% | | | | 15.24% | | | | 0.99% | |
| ECOAX(1)(3) | | A Class (excluding load) | | | 13.66% | | | | 21.44% | | | | 18.12% | | | | 14.97% | | | | 1.24% | |
| ECOAX(1)(3) | | A Class (including load) | | | 7.46% | | | | 19.18% | | | | 16.79% | | | | 13.90% | | | | 1.24% | |
| S&P Global Infrastructure Index(4) | | | | | 8.05% | | | | 6.76% | | | | 7.03% | | | | 6.12% | | | | — | |
| S&P Global Infrastructure Index (Net)(4) | | | | | 7.26% | | | | 5.86% | | | | 6.09% | | | | 5.19% | | | | — | |
| (1) | Fund commenced operations on August 7, 2020. |
| (2) | The performance data quoted for the period prior to August 7, 2020 is that of the Tortoise Global Renewables Infrastructure Fund Limited (the “Predecessor Fund”) and has been adjusted to reflect the Fund’s share class’ fees and expenses. The Predecessor Fund commenced operations on November 2, 2015, and was not a registered mutual fund subject to the same investment and tax restrictions as the Fund. If it had, the Predecessor Fund’s performance might have been lower. The Predecessor Fund’s shares were exchanged for the Fund’s Institutional Class shares on August 7, 2020. |
| (3) | Performance of the A Class prior to the inception of the class is based on the performance of the Predecessor Fund, adjusted for the higher expenses applicable to the class compared to the Institutional Class. |
| (4) | The S&P Global Infrastructure® Index is designed to track 75 companies from around the world chosen to represent the listed infrastructure industry while maintaining liquidity and tradability. You cannot invest directly in an index. |
| (5) | The gross expense ratio is in line with the Global Renewables Infrastructure Fund’s most recent effective prospectus and may not reflect current year activity. |
Note: For periods over 1 year, performance reflected is for the average annual returns. Performance data shown for the A Class (maximum load) reflects a sales charge of 5.50%. Performance data shown “excluding load” does not reflect the deduction of the maximum sales load.
Performance data quoted represents past performance; past performance does not guarantee future results. The investment return and principal value of an investment will fluctuate so that an investor’s shares, when redeemed, may be worth more or less than their original cost. Current performance of the portfolio may be lower or higher than the performance quoted. Performance data current to the most recent month end may be obtained by calling 855-TCA-FUND (855-822-3863).
| (unaudited) | |
| | |
| 16 | TortoiseEcofin |
| |
| |
2021 Annual Report | November 30, 2021 |
| |
| |
| |
| |
Mutual fund investing involves risk. Principal loss is possible. The funds are non-diversified, meaning they may concentrate their assets in fewer individual holdings than a diversified fund. Therefore, the funds are more exposed to individual stock volatility than diversified funds. Investing in specific sectors such as North American energy may involve greater risk and volatility than less concentrated investments. Risks include, but are not limited to, risks associated with energy investments, including upstream energy companies, midstream companies, downstream companies, energy company beneficiaries, master limited partnerships (MLPs), MLP affiliates, commodity price volatility, supply and demand, regulatory, environmental, operating, capital markets, terrorism, natural disaster and climate change risks. The tax benefits received by an investor investing in the funds differ from that of a direct investment in an MLP by an investor. The value of the funds’ investments in an MLP will depend largely on the MLP’s treatment as a partnership for U.S. federal income tax purposes. If the MLP is deemed to be a corporation then its income would be subject to federal taxation, reducing the amount of cash available for distribution to the funds which could result in a reduction of the funds’ values. Investments in foreign companies involve risk not ordinarily associated with investments in securities and instruments of U.S. issuers, including risks related to political, social and economic developments abroad, differences between U.S. and foreign regulatory and accounting requirements, tax risk and market practices, as well as fluctuations in foreign currencies. The funds invest in large, small and mid-cap companies, which involve additional risks such as limited liquidity and greater volatility than larger companies. Investments in debt securities typically decrease in value when interest rates rise. This risk is usually greater for longer-term debt securities. Investment in lower-rated and non-rated securities presents a greater risk of loss to principal and interest than higher-rated securities. The funds may also write call options which may limit the funds’ abilities to profit from increases in the market value of a security, but cause it to retain the risk of loss should the price of the security decline. Some funds may invest in other derivatives including options, futures and swap agreements, which can be highly volatile, illiquid and difficult to value, and changes in the value of a derivative held by the funds may not correlate with the underlying instrument or the fund’s other investments and can include additional risks such as liquidity risk, leverage risk and counterparty risk that are possibly greater than risks associated with investing directly in the underlying investments. Some funds may engage in short sales and in doing so are subject to the risk that they may not always be able to borrow a security, or close out a short position at a particular time or at an acceptable price.
Nothing contained on this communication constitutes tax, legal, or investment advice. Investors must consult their tax advisor or legal counsel for advice and information concerning their particular situation.
This report reflects our views and opinions as of the date herein, which are subject to change at any time based on market and other conditions. We disclaim any responsibility to update these views. The views should not be relied on as investment advice or an indication of trading intent on behalf of the funds.
Fund holdings and allocations are subject to change at any time and should not be considered a recommendation to buy or sell any security. For a complete list of fund holdings, please refer to the fund’s Schedule of Investments in this report.
| (unaudited) | |
| | |
| TortoiseEcofin | 17 |
Expense example
As a shareholder of the Fund, you incur two types of costs: (1) transaction costs, including sales charges (loads) on purchase payments, reinvested dividends, or other distributions; exchange fees; and (2) ongoing costs, including management fees; distribution (12b-1) fees; and other Fund expenses. This example is intended to help you understand your ongoing costs (in dollars) of investing in the Fund and to compare these costs with the ongoing costs of investing in other mutual funds. The example is based on an investment of $1,000 invested at the beginning of the period and held for the entire period (June 1, 2021 – November 30, 2021).
Actual expenses
For each class, the first line of the table below provides information about actual account values and actual expenses. You may use the information in this line, together with the amount you invested, to estimate the expenses that you paid over the period. Simply divide your account value by $1,000 (for example, an $8,600 account value divided by $1,000 = 8.6), then multiply the result by the number in the first line under the heading entitled “Expenses Paid During Period” to estimate the expenses you paid on your account during this period.
Hypothetical example for comparison purposes
For each class, the second line of the table below provides information about hypothetical account values and hypothetical expenses based on the Fund’s actual expense ratio and an assumed rate of return of 5% per year before expenses, which is not the Fund’s actual return. The hypothetical account values and expenses may not be used to estimate the actual ending account balance or expenses you paid for the period. You may use this information to compare the ongoing costs of investing in the Fund and other funds. To do so, compare this 5% hypothetical example with the 5% hypothetical examples that appear in the shareholder reports of the other funds.
Please note that the expenses shown in the table are meant to highlight your ongoing costs only and do not reflect any transactional costs, such as redemption fees or exchange fees. Therefore, the second line of the table is useful in comparing ongoing costs only, and will not help you determine the relative total costs of owning different funds. In addition, if these transactional costs were included, your costs would have been higher.
| Tortoise MLP & Pipeline Fund | | | | | | |
| | Beginning | | Ending | | Expenses Paid |
| | Account Value | | Account Value | | During Period(1) |
| | (06/01/2021) | | (11/30/2021) | | (06/01/2021 – 11/30/2021) |
| Institutional Class Actual(2)(3) | | $ 1,000.00 | | $ 1,037.60 | | $ 4.70 |
| Institutional Class Hypothetical (5% annual return before expenses)(4) | | $ 1,000.00 | | $ 1,020.46 | | $ 4.66 |
| A Class Actual(2)(3) | | $ 1,000.00 | | $ 1,035.20 | | $ 5.97 |
| A Class Hypothetical (5% annual return before expenses)(4) | | $ 1,000.00 | | $ 1,019.20 | | $ 5.92 |
| C Class Actual(2)(3) | | $ 1,000.00 | | $ 1,031.80 | | $ 9.78 |
| C Class Hypothetical (5% annual return before expenses)(4) | | $ 1,000.00 | | $ 1,015.44 | | $ 9.70 |
| (1) | Expenses are equal to the Fund’s annualized expense ratio for the most recent six-month period of 0.92%, 1.17%, and 1.92% for the Institutional Class, A Class and C Class, respectively, multiplied by the average account value over the period, multiplied by 183/365 to reflect the one-half year period. |
| (2) | Based on the actual returns for the six-month period ended November 30, 2021 of 3.76%, 3.52% and 3.18% for the Institutional Class, A Class and C Class, respectively. |
| (3) | Excluding interest expense, the actual expenses would be $4.70, $5.97 and $9.78 for the Institutional Class, A Class and C Class, respectively. |
| (4) | Excluding interest expense, the hypothetical expenses would be $4.66, $5.92 and $9.70 for the Institutional Class, A Class and C Class, respectively. |
| (unaudited) | |
| | |
| 18 | TortoiseEcofin |
| |
| |
| 2021 Annual Report | November 30, 2021 |
| |
| |
| |
| |
| Tortoise MLP & Energy Income Fund | | | | | | |
| | Beginning | | Ending | | Expenses Paid |
| | Account Value | | Account Value | | During Period(1) |
| | (06/01/2021) | | (11/30/2021) | | (06/01/2021 – 11/30/2021) |
| Institutional Class Actual(2) | | | $ | 1,000.00 | | | | $ | 1,028.60 | | | | $ | 6.97 | |
| Institutional Class Hypothetical (5% annual return before expenses) | | | $ | 1,000.00 | | | | $ | 1,018.20 | | | | $ | 6.93 | |
| A Class Actual(2) | | | $ | 1,000.00 | | | | $ | 1,027.00 | | | | $ | 7.11 | |
| A Class Hypothetical (5% annual return before expenses) | | | $ | 1,000.00 | | | | $ | 1,018.05 | | | | $ | 7.08 | |
| C Class Actual(2) | | | $ | 1,000.00 | | | | $ | 1,023.30 | | | | $ | 5.07 | |
| C Class Hypothetical (5% annual return before expenses) | | | $ | 1,000.00 | | | | $ | 1,020.05 | | | | $ | 5.06 | |
| (1) | Expenses are equal to the Fund’s annualized expense ratio for the most recent six-month period of 1.15%, 1.40%, and 2.15% for the Institutional Class, A Class and C Class, respectively, multiplied by the average account value over the period, multiplied by 183/365 to reflect the one-half year period. |
| (2) | Based on the actual returns for the six-month period ended November 30, 2021 of 2.86%, 2.70% and 2.33% for the Institutional Class, A Class and C Class, respectively. |
| Ecofin Global Energy Transition Fund | | | | | | | | | | | | | | | |
| | Beginning | | Ending | | Expenses Paid |
| | Account Value | | Account Value | | During Period(1) |
| | (06/01/2021) | | (11/30/2021) | | (06/01/2021 – 11/30/2021) |
| Institutional Class Actual(2) | | | $ | 1,000.00 | | | | $ | 1,022.00 | | | | $ | 1.10 | |
| Institutional Class Hypothetical (5% annual return before expenses) | | | $ | 1,000.00 | | | | $ | 1,004.94 | | | | $ | 1.09 | |
| A Class Actual(2) | | | $ | 1,000.00 | | | | $ | 997.00 | | | | $ | 1.38 | |
| A Class Hypothetical (5% annual return before expenses) | | | $ | 1,000.00 | | | | $ | 1,004.64 | | | | $ | 1.39 | |
| (1) | Expenses are equal to the Fund’s annualized expense ratio for the period since commencement of operations of 0.90% and 1.15% for the Institutional Class and A Class, respectively, multiplied by the average account value over the period, multiplied by 44/365 to reflect the period since commencement of operations. |
| (2) | Based on the actual returns for the period October 15, 2021 (inception date) through November 30, 2021 of 2.20% for the Institutional Class and for the period October 18, 2021 (inception date) through November 30, 2021 of -0.30% for the A Class. |
| (unaudited) | |
| | |
| TortoiseEcofin | 19 |
| Ecofin Global Renewables Infrastructure Fund | | | | | | | | | | | | | | | |
| | Beginning | | Ending | | Expenses Paid |
| | Account Value | | Account Value | | During Period(1) |
| | (06/01/2021) | | (11/30/2021) | | (06/01/2021 – 11/30/2021) |
| Institutional Class Actual(2) | | | $ | 1,000.00 | | | | $ | 1,068.40 | | | | $ | 5.13 | |
| Institutional Class Hypothetical (5% annual return before expenses) | | | $ | 1,000.00 | | | | $ | 1,020.10 | | | | $ | 5.01 | |
| A Class Actual(2) | | | $ | 1,000.00 | | | | $ | 1,066.40 | | | | $ | 6.42 | |
| A Class Hypothetical (5% annual return before expenses) | | | $ | 1,000.00 | | | | $ | 1,018.85 | | | | $ | 6.28 | |
| (1) | Expenses are equal to the Fund’s annualized expense ratio for the most recent six-month period of 0.99% and 1.24% for the Institutional Class and A Class, respectively, multiplied by the average account value over the period, multiplied by 183/365 to reflect the one-half year period. |
| (2) | Based on the actual returns for the six-month period ended November 30, 2021 of 6.84% for the Institutional Class and 6.64% for the A Class, respectively. |
| (unaudited) | |
| | |
| 20 | TortoiseEcofin |
| |
| |
| 2021 Annual Report | November 30, 2021 |
| |
| Tortoise MLP & Pipeline Fund |
| Schedule of Investments |
| November 30, 2021 |
| Shares | | Fair Value | |
| | | | | |
| Common Stock — 76.9%(1) | | | | | |
| Canadian Crude Oil Pipelines — 12.8%(1) | | | | | |
| Enbridge Inc. | 3,932,817 | | $ | 147,637,950 | |
| Pembina Pipeline Corporation | 3,081,744 | | | 91,189,419 | |
| | | | 238,827,369 | |
| | | | | |
| Canadian Natural Gas/Natural Gas Liquids Pipelines — 7.0%(1) | | | | | |
| Keyera Corp. | 2,436,175 | | | 53,512,130 | |
| TC Energy Corporation | 1,630,079 | | | 76,467,006 | |
| | | | 129,979,136 | |
| | | | | |
| United States Crude Oil Pipelines — 5.0%(1) | | | | | |
| Plains GP Holdings, L.P. | 9,372,593 | | | 93,725,930 | |
| | | | | |
| United States Energy Technology — 0.4%(1) | | | | | |
| ESS Tech Inc. | 454,808 | | | 7,254,188 | |
| | | | | |
| United States Natural Gas Gathering/Processing — 15.1%(1) | | | | | |
| Antero Midstream Corporation | 1,960,135 | | | 19,032,911 | |
| DT Midstream, Inc. | 355,906 | | | 16,325,408 | |
| EnLink Midstream, LLC | 1,437,466 | | | 9,357,903 | |
| Equitrans Midstream Corporation | 5,573,600 | | | 53,618,032 | |
| Hess Midstream LP | 441,009 | | | 10,919,383 | |
| Targa Resources Corp. | 3,354,170 | | | 173,175,797 | |
| | | | 282,429,434 | |
| | | | | |
| United States Natural Gas/Natural Gas Liquids Pipelines — 33.9%(1) | | | | | |
| Cheniere Energy, Inc. | 1,889,807 | | | 198,070,672 | |
| Kinder Morgan, Inc. | 8,893,390 | | | 137,491,809 | |
| ONEOK, Inc. | 2,588,214 | | | 154,878,726 | |
| The Williams Companies, Inc. | 5,373,886 | | | 143,966,406 | |
| | | | 634,407,613 | |
| | | | | |
| United States Renewables and Power Infrastructure — 2.7%(1) | | | | | |
| Clearway Energy, Inc. | 377,640 | | | 14,093,525 | |
| NextEra Energy Partners LP | 331,649 | | | 28,206,747 | |
| Sempra Energy | 72,564 | | | 8,698,247 | |
| | | | 50,998,519 | |
| Total Common Stock | | | | | |
| (Cost $1,049,332,113) | | | | 1,437,622,189 | |
| | | | | |
| Master Limited Partnerships — 23.0%(1) | | | | | |
| United States Crude Oil Pipelines — 1.7%(1) | | | | | |
| Genesis Energy, L.P. | 558,695 | | | 5,637,232 | |
| Nustar Energy L.P. | 1,864,436 | | | 26,102,104 | |
| | | | 31,739,336 | |
| | | | | |
| United States Natural Gas Gathering/Processing — 2.7%(1) | | | | | |
| Crestwood Equity Partners LP | 304,605 | | | 7,785,704 | |
| Western Midstream Partners, LP | 2,210,335 | | | 42,504,742 | |
| | | | 50,290,446 | |
| | | | | |
| United States Natural Gas/Natural Gas Liquids Pipelines — 10.8%(1) | | | | | |
| DCP Midstream, LP | 1,240,142 | | | 32,652,939 | |
| Energy Transfer LP | 11,164,090 | | | 94,001,638 | |
| Enterprise Products Partners L.P. | 3,470,153 | | | 74,226,572 | |
| | | | 200,881,149 | |
| | | | | |
| United States Other — 0.1%(1) | | | | | |
| Westlake Chemical Partners LP | 115,077 | | | 2,664,033 | |
| | | | | |
| United States Refined Product Pipelines — 7.7%(1) | | | | | |
| Magellan Midstream Partners, L.P. | 722,278 | | | 33,499,254 | |
| MPLX LP | 3,199,946 | | | 93,790,417 | |
| Phillips 66 Partners LP | 492,451 | | | 16,960,012 | |
| | | | 144,249,683 | |
| Total Master Limited Partnerships | | | | | |
| (Cost $382,793,949) | | | | 429,824,647 | |
| | | | | |
| Short-Term Investment — 0.6%(1) | | | | | |
| United States Investment Company — 0.6%(1) | | | | | |
| First American Government Obligations Fund, | | | | | |
| Class X, 0.03%(2) | | | | | |
| (Cost $11,152,675) | 11,152,675 | | | 11,152,675 | |
| | | | | |
| Total Investments — 100.5%(1) | | | | | |
| (Cost $1,443,278,737) | | | | 1,878,599,511 | |
| Liabilities in Excess of | | | | | |
| Other Assets, Net — (0.5%)(1) | | | | (8,881,344 | ) |
| Total Net Assets — 100.0%(1) | | | $ | 1,869,718,167 | |
| (1) | Calculated as a percentage of net assets. |
| (2) | Rate indicated is the current yield as of November 30, 2021. |
| See accompanying Notes to Financial Statements. | |
| | |
| TortoiseEcofin | 21 |
| |
| |
| |
| |
| Tortoise MLP & Energy Income Fund |
| Schedule of Investments |
| November 30, 2021 |
| Shares | | Fair Value |
| Common Stocks — 51.6%(1) | | | | | |
| Britain Renewables and Power Infrastructure — 1.7%(1) | | | | | |
| Atlantica Yield plc | | 182,140 | | $ | 6,986,890 |
| | | | | |
| Canadian Crude Oil Pipelines — 2.8%(1) | | | | | |
| Enbridge Inc. | | 304,484 | | | 11,430,329 |
| | | | | |
| Canadian Natural Gas Pipelines — 3.1%(1) | | | | | |
| Ovintiv, Inc. | | 55,000 | | | 1,911,800 |
| TC Energy Corporation | | 235,875 | | | 11,064,896 |
| | | | | 12,976,696 |
| | | | | |
| United States Crude Oil Pipelines — 3.7%(1) | | | | | |
| Plains GP Holdings, L.P. | | 1,538,108 | | | 15,381,080 |
| | | | | |
| United States Gathering and Processing — 4.0%(1) | | | | | |
| Equitrans Midstream Corporation | | 706,020 | | | 6,791,912 |
| Targa Resources Corp. | | 194,134 | | | 10,023,139 |
| | | | | 16,815,051 |
| | | | | |
| United States Local Distribution Pipelines — 1.1%(1) | | | | | |
| CenterPoint Energy, Inc. | | 169,528 | | | 4,392,472 |
| | | | | |
| United States Natural Gas/Natural Gas Liquids Pipelines — 19.7%(1) | | | | | |
| Cheniere Energy, Inc. | | 228,685 | | | 23,968,475 |
| Kinder Morgan, Inc. | | 770,377 | | | 11,910,028 |
| New Fortress Energy, Inc. | | 271,245 | | | 6,751,288 |
| ONEOK, Inc. | | 329,694 | | | 19,728,889 |
| The Williams Companies, Inc. | | 720,624 | | | 19,305,517 |
| | | | | 81,664,197 |
| | | | | |
| United States Oil & Gas Production — 9.2%(1) | | | | | |
| Cabot Oil & Gas Corporation | | 97,500 | | | 1,957,800 |
| ConocoPhillips | | 178,975 | | | 12,551,517 |
| Devon Energy Corporation | | 53,000 | | | 2,229,180 |
| EQT Corporation(2) | | 487,205 | | | 9,466,393 |
| Pioneer Natural Resources Company | | 67,190 | | | 11,981,321 |
| | | | | 38,186,211 |
| | | | | |
| United States Renewables and Power Infrastructure — 6.3%(1) | | | | | |
| Clearway Energy, Inc. | | 261,095 | | | 9,744,066 |
| NextEra Energy Partners LP | | 192,040 | | | 16,333,002 |
| | | | | 26,077,068 |
| Total Common Stocks | | | | | |
| (Cost $187,911,163) | | | | | 213,909,994 |
| | | | | | |
| | | Principal Amount | | | |
| Corporate Bonds — 23.6%(1) | | | | | |
| Canadian Natural Gas Pipelines — 1.8%(1) | | | | | |
| Rockpoint Gas Storage Canada Ltd. | | | | | |
| 7.000%, 03/31/2023(3) | | 7,600,000 | | | 7,548,966 |
| | | | | |
| Marshall Island Marine Transportation — 1.0%(1) | | | | | |
| Teekay Corporation | | | | | |
| 9.250%, 11/15/2022(3) | | 4,050,000 | | | 4,165,931 |
| | | | | |
| United States Gathering and Processing — 10.8%(1) | | | | | |
| Antero Midstream Partners LP / | | | | | |
| Antero Midstream Finance Corp. | | | | | |
| 5.750%, 03/01/2027(3) | | 6,370,000 | | | 6,419,686 |
| Blue Racer Midstream LLC / | | | | | |
| Blue Racer Finance Corp. | | | | | |
| 7.625%, 12/15/2025(3) | | 3,575,000 | | | 3,770,231 |
| 6.625%, 07/15/2026(3) | | 3,800,000 | | | 3,872,656 |
| EnLink Midstream Partners, LP | | | | | |
| 4.850%, 07/15/2026 | | 7,550,000 | | | 7,759,815 |
| EnLink Midstream, LLC | | | | | |
| 5.375%, 06/01/2029 | | 4,455,000 | | | 4,483,601 |
| Hess Midstream Operations LP | | | | | |
| 5.625%, 02/15/2026(3) | | 8,125,000 | | | 8,320,284 |
| 5.125%, 06/15/2028(3) | | 4,050,000 | | | 4,148,233 |
| Targa Resources Partners LP / Targa | | | | | |
| Resources Partners Finance Corp. | | | | | |
| 6.500%, 07/15/2027 | | 5,537,000 | | | 5,897,514 |
| | | | | 44,672,020 |
| | | | | |
| United States Natural Gas Pipelines — 5.2%(1) | | | | | |
| NGPL Pipeco LLC | | | | | |
| 7.768%, 12/15/2037(3) | | 9,125,000 | | | 13,030,230 |
| Tallgrass Energy Partners LP / | | | | | |
| Tallgrass Energy Finance Corp. | | | | | |
| 6.000%, 03/01/2027(3) | | 850,000 | | | 873,409 |
| 5.500%, 01/15/2028(3) | | 7,925,000 | | | 7,757,426 |
| | | | | 21,661,065 |
| | | | | |
| United States Oil Field Services — 1.6%(1) | | | | | |
| Archrock Partners LP / | | | | | |
| Archrock Partners Finance Corp. | | | | | |
| 6.875%, 04/01/2027(3) | | 6,575,000 | | | 6,851,512 |
| | | | | |
| United States Other — 3.2%(1) | | | | | |
| New Fortress Energy, Inc. | | | | | |
| 6.750%, 09/15/2025(3) | | 8,800,000 | | | 8,471,100 |
| 6.500%, 09/30/2026(3) | | 5,000,000 | | | 4,738,325 |
| | | | | 13,209,425 |
| Total Corporate Bonds | | | | | |
| (Cost $94,720,308) | | | | | 98,108,919 |
| See accompanying Notes to Financial Statements. | |
| | |
| 22 | TortoiseEcofin |
| |
| |
| 2021 Annual Report | November 30, 2021 |
| |
| Tortoise MLP & Energy Income Fund |
| Schedule of Investments (continued) |
| November 30, 2021 |
| Shares | | Fair Value |
| Master Limited Partnerships — 22.2%(1) | | | | |
| United States Natural Gas Gathering/Processing — 2.6%(1) | | | | |
| Crestwood Equity Partners LP | 80,135 | | $ | 2,048,250 |
| Western Midstream Partners, LP | 446,900 | | | 8,593,887 |
| | | | 10,642,137 |
| | | | |
| United States Natural Gas Pipelines — 11.5%(1) | | | | |
| DCP Midstream, LP | 725,924 | | | 19,113,579 |
| Energy Transfer LP | 2,063,943 | | | 17,378,400 |
| Enterprise Products Partners L.P. | 523,312 | | | 11,193,644 |
| | | | 47,685,623 |
| | | | |
| United States Refined Product Pipelines — 8.1%(1) | | | | |
| Magellan Midstream Partners, L.P. | 261,848 | | | 12,144,510 |
| MPLX LP | 532,817 | | | 15,616,866 |
| Phillips 66 Partners LP | 171,090 | | | 5,892,340 |
| | | | 33,653,716 |
| Total Master Limited Partnerships | | | | |
| (Cost $71,773,189) | | | | 91,981,476 |
| | | | | |
| Short-Term Investment — 2.0%(1) | | | | |
| United States Investment Company — 2.0%(1) | | | | |
| First American Government Obligations Fund, | | | | |
| Class X, 0.03%(4) | | | | |
| (Cost $8,433,696) | 8,433,696 | | | 8,433,696 |
| | | | |
| Total Investments — 99.4%(1) | | | | |
| (Cost $362,838,356) | | | | 412,434,085 |
| Other Assets in Excess of | | | | |
| Liabilities, Net — 0.6%(1) | | | | 2,609,829 |
| Total Net Assets — 100.0%(1) | | | $ | 415,043,914 |
| (1) | Calculated as a percentage of net assets. |
| (2) | Non-income producing security. |
| (3) | Security purchased within the terms of a private placement memorandum, except from registration under Rule 144A of the Securities Act 0f 1933, as amended, and may be sold only to dealers in that program or other “qualified institutional buyers.” As of November 30, 2021, the value of these investments were $79,967,989 or 19.3% of total net assets. |
| (4) | Rate indicated is the current yield as of November 30, 2021. |
| See accompanying Notes to Financial Statements. | |
| | |
| TortoiseEcofin | 23 |
| |
| |
| |
| |
Ecofin Global Energy Transition Fund
Schedule of Investments |
| November 30, 2021 |
| Shares | | Fair Value |
| Common Stock — 84.3%(1) | | | | |
| Denmark Infrastructure, Utilities and Renewables — 3.9%(1) |
| Orsted A/S | 15,365 | | $ | 1,975,603 |
| Germany Clean Technology — 4.0%(1) | | | | |
| Infineon Technologies AG | 45,255 | | | 2,046,127 |
| Hong Kong Clean Technology — 4.0%(1) | | | |
| GDS Holdings Ltd.(2) | 284,194 | | | 2,006,699 |
| Hong Kong Infrastructure, Utilities and Renewables — 4.3%(1) |
| China Longyuan Power Group Corp Ltd. | 1,064,334 | | | 2,175,570 |
| Ireland Industrials — 2.4%(1) | | | | |
| Trane Technologies Plc | 6,487 | | | 1,210,799 |
| Italy Industrials — 4.4%(1) | | | | |
| Prysmian SpA | 60,677 | | | 2,249,585 |
| Japan Industrials — 10.0%(1) | | | | |
| Nidec Corp. | 21,093 | | | 2,415,309 |
| Japan Clean Technology — 5.0%(1) | | | | |
| ROHM Co., Ltd. | 28,316 | | | 2,629,542 |
| Japan Infrastructure, Utilities and Renewables — 3.4%(1) |
| Keyence Corp. | 2,830 | | | 1,747,756 |
| Norway Infrastructure, Utilities and Renewables — 2.5%(1) |
| Scatec ASA | 72,485 | | | 1,273,995 |
| Norway Specialty Chemicals & Materials — 0.4%(1) | | | |
| Norsk Hydro ASA | 33,105 | | | 214,391 |
| Portugal Infrastructure, Utilities and Renewables — 5.3%(1) |
| EDP — Energias de Portugal, S.A. | 487,679 | | | 2,672,442 |
| Switzerland Clean Technology — 5.5%(1) | | | |
| TE Connectivity Ltd. | 18,017 | | | 2,773,357 |
| Switzerland Specialty Chemicals & Materials — 3.3%(1) | | | |
| Sika AG | 4,254 | | | 1,661,191 |
| Taiwan Clean Technology — 0.8%(1) | | | | |
| Delta Electronics, Inc. | 42,378 | | | 389,577 |
| United States Clean Technology — 4.2%(1) | | | |
| Autodesk, Inc.(2) | 8,471 | | | 2,153,244 |
| United States Infrastructure, Utilities and Renewables — 13.1%(1) |
| Exelon Corporation | 52,116 | | | 2,748,077 |
| First Solar, Inc.(2) | 13,394 | | | 1,387,618 |
| Fluence Energy, Inc.(2) | 34,570 | | | 1,095,523 |
| STEM, Inc.(2) | 66,007 | | | 1,400,669 |
| | | | | 6,631,887 |
| United States Infrastructure, Utilities and Renewables — 6.3%(1) |
| NextEra Energy, Inc. | 36,828 | | $ | 3,195,934 |
| United States Industrials — 3.7%(1) | | | | |
| Sunrun, Inc.(2) | 40,242 | | | 1,852,742 |
| United States Transportation — 2.8%(1) | | | | |
| Lyft, Inc.(2) | 34,925 | | | 1,418,304 |
| Total Common Stock | | | | |
| (Cost $37,487,665) | | | | 42,694,054 |
| |
| Preferred Stock — 2.0%(1) | | | | |
| Germany Transportation — 2.0%(1) | | | | |
| Volkswagen AG | | | | |
| (Cost $1,387,440) | 5,641 | | | 1,030,579 |
| |
| Short-Term Investment — 0.5%(1) | | | | |
| United States Investment Company — 0.5%(1) | | | |
| First American Government Obligations Fund, | | | |
| Class X, 0.03%(3) | | | | |
| (Cost $269,055) | 269,055 | | | 269,055 |
| |
| Total Investments — 86.8%(1) | | | | |
| (Cost $39,144,160) | | | | 43,993,688 |
| Other Assets in Excess of | | | | |
| Liabilities, Net — 13.2%(1) | | | | 6,675,543 |
| Total Net Assets — 100.0%(1) | | | $ | 50,669,231 |
| (1) | Calculated as a percentage of net assets. |
| (2) | Non-income producing security. |
| (3) | Rate indicated is the current yield as of November 30, 2021. |
| See accompanying Notes to Financial Statements. | |
| | |
| 24 | TortoiseEcofin |
| |
| |
| 2021 Annual Report | November 30, 2021 |
| |
Ecofin Global Energy Transition Fund
Open Swap Contracts |
| November 30, 2021 |
| | | | | | | | | | | | | | | | | | | |
| | | | | | Pay/Receive | | | | | | | | | | | | | |
| | | | | | on | | | | | | | | | | | Unrealized |
| | | | Termination | | Financing | | | | Payment | | | | Notional | | Appreciation |
| Counterparty | | Security | | Date | | Rate | | Financing Rate | | Frequency | | Shares | | Amount | | (Depreciation)* |
| Morgan Stanley | | Schneider SA | | 5/6/22 | | Pay | | 0.200% + Euro | | Monthly | | 12,043 | | $ | 2,133,639 | | $ | (50,261 | ) |
| | | | | | | | Overnight Index Average | | | | | | | | | | | |
| Morgan Stanley | | Drax Group PLC | | 8/17/22 | | Pay | | 0.200% + Federal | | Monthly | | 185,557 | | | 1,357,295 | | | (70,028 | ) |
| | | | | | | | Funds Effective Rate | | | | | | | | | | | |
| Morgan Stanley | | Amperex Tech | | 5/27/22 | | Pay | | 0.510% + Federal | | Monthly | | 12,120 | | | 1,293,581 | | | 18,181 | |
| | | | | | | | Funds Effective Rate | | | | | | | | | | | |
| | | | | | | | | | | | | | | | | $ | (102,108 | ) |
| * | Based on the net swap value held at each counterparty. Unrealized appreciation (depreciation) is a receivable (payable). |
| See accompanying Notes to Financial Statements. | |
| | |
| TortoiseEcofin | 25 |
| |
| |
| |
| |
Ecofin Global Renewables Infrastructure Fund
Schedule of Investments |
| November 30, 2021 |
| Shares | | Fair Value |
| Common Stock — 76.0%(1) | | | | |
| Australia Electricity Transmission Operators — 1.2%(1) | | | |
| Spark Infrastructure Group | 2,217,877 | | $ | 4,516,191 |
| Belgium Electricity Transmission Operators — 2.2%(1) | | | |
| Elia Group SA/NV | 67,253 | | | 8,378,428 |
| Canada Renewable Power Producers — 7.2%(1) | | | |
| Innergex Renewable Energy Inc. | 714,080 | | | 10,598,424 |
| TransAlta Renewables Inc. | 1,139,204 | | | 16,533,596 |
| | | | | 27,132,020 |
| Chile Electric Utilities — 0.6%(1) | | | | |
| Enel Chile S.A. | 48,073,526 | | | 2,097,673 |
| Denmark Renewable Power Producers — 2.9%(1) | | | |
| Orsted A/S | 84,681 | | | 10,888,124 |
| Germany Renewable Power Producers — 2.2%(1) | | | |
| Encavis AG | 445,405 | | | 8,235,311 |
| Hong Kong Integrated Utilities — 4.0%(1) | | | |
| China Suntien Green Energy Corp Ltd. | 21,342,128 | | | 14,932,368 |
| Hong Kong Renewable Power Producers — 4.0%(1) | | | |
| China Longyuan Power Group Corp Ltd. | 7,308,513 | | | 14,939,091 |
| Italy Renewable Power Producers — 4.0%(1) | | | |
| ERG SpA | 459,570 | | | 15,063,276 |
| Italy Electricity Transmission Operators — 3.9%(1) | | | |
| Terna — Rete Elettrica Nazionale SpA | 1,929,682 | | | 14,349,769 |
| Japan Renewable Power Producers — 2.2%(1) | | | |
| RENOVA, Inc.(2) | 171,544 | | | 8,067,491 |
| Norway Renewable Power Producers — 2.2%(1) | | | |
| Scatec ASA | 467,277 | | | 8,212,855 |
| Portugal Electric Utilities — 4.5%(1) | | | | |
| EDP — Energias de Portugal, S.A. | 3,042,463 | | | 16,672,456 |
| Spain Renewable Power Producers — 3.5%(1) | | | |
| Corp ACCIONA Energias Renovables SA(2) | 374,910 | | | 12,955,348 |
| Thailand Renewable Power Producers — 1.1%(1) | | | |
| Super Energy Corporation PCL | 145,715,900 | | | 4,069,092 |
| United States Electric Utilities — 15.8%(1) | | | |
| Edison International | 246,769 | | | 16,109,080 |
| Exelon Corporation | 279,511 | | | 14,738,615 |
| NextEra Energy, Inc. | 232,729 | | | 20,196,223 |
| Public Service Enterprise Group | | | | |
| Incorporated | 126,466 | | | 7,902,861 |
| | | | | 58,946,779 |
| United States Renewable Power Producers — 11.4%(1) |
| Atlantica Yield plc | 381,136 | | | 14,620,377 |
| Clearway Energy, Inc. | 382,228 | | | 14,264,749 |
| NextEra Energy Partners LP | 163,002 | | | 13,863,320 |
| | | | | 42,748,446 |
| United States Distributed Renewables — 3.1%(1) | | | |
| Sunrun, Inc.(2) | 256,305 | | | 11,800,283 |
| Total Common Stock | | | | |
| (Cost $261,711,026) | | | | 284,005,001 |
| Master Limited Partnership — 2.6%(1) | | | |
| United States Renewable Power Producers — 2.6%(1) |
| Brookfield Renewable Partners LP | | | | |
| (Cost $9,127,463) | 273,066 | | | 9,912,295 |
| Short-Term Investment — 1.9%(1) | | | | |
| United States Investment Company — 1.9%(1) | | | |
| First American Government Obligations Fund, | | | |
| Class X, 0.03%(3) | | | | |
| (Cost $6,963,485) | 6,963,485 | | | 6,963,485 |
| Total Investments — 80.5%(1) | | | | |
| (Cost $277,801,974) | | | | 300,880,781 |
| Other Assets in Excess of | | | | |
| Liabilities, Net — 19.5%(1) | | | | 72,967,066 |
| Total Net Assets — 100.0%(1) | | | $ | 373,847,847 |
| (1) | Calculated as a percentage of net assets. |
| (2) | Non-income producing security. |
| (3) | Rate indicated is the current yield as of November 30, 2021. |
| See accompanying Notes to Financial Statements. | |
| | |
| 26 | TortoiseEcofin |
| |
| |
| 2021 Annual Report | November 30, 2021 |
| |
Ecofin Global Renewables Infrastructure Fund
Open Swap Contracts |
| November 30, 2021 |
| | | | | | Pay/Receive | | | | | | | | | | | | | |
| | | | | | on | | | | | | | | | | | Unrealized |
| | | | Termination | | Financing | | | | Payment | | | | Notional | | Appreciation |
| Counterparty | | Security | | Date | | Rate | | Financing Rate | | Frequency | | Shares | | Amount | | (Depreciation)* |
| Morgan Stanley | | SSE PLC | | 8/17/22 | | Pay | | 0.200% + Sterling | | Monthly | | 436,526 | | $ | 9,010,232 | | $ | (178,252 | ) |
| | | | | | | | Overnight Index Average | | | | | | | | | | | |
| Morgan Stanley | | Drax Group PLC | | 8/17/22 | | Pay | | 0.200% + Federal | | Monthly | | 1,981,920 | | | 14,497,161 | | | (749,814 | ) |
| | | | | | | | Funds Effective Rate | | | | | | | | | | | |
| Morgan Stanley | | Greencoat UK Wind | | 8/17/22 | | Pay | | 0.200% + Sterling | | Monthly | | 7,368,976 | | | 13,152,060 | | | 146,771 | |
| | PLC | | | | | | Overnight Index Average | | | | | | | | | | | |
| | | | | | | | | | | | | | | | | $ | (781,295 | ) |
| * | Based on the net swap value held at each counterparty. Unrealized appreciation (depreciation) is a receivable (payable). |
| |
| |
| |
| |
| |
| Statements of Assets & Liabilities |
| November 30, 2021 |
| | Tortoise MLP & |
| | Pipeline Fund |
| Assets: | | | |
| | Investments, at fair value (cost $1,443,278,737, $362,838,356, $39,144,160 and $277,801,974, respectively) | $ | 1,878,599,511 | |
| Cash | | — | |
| Foreign cash (cost $0, $0, $260,392, and $101,605, respectively) | | — | |
| Cash held as collateral | | — | |
| Dividends and interest receivable | | 3,024,181 | |
| Receivable for investment securities sold | | 46,249,671 | |
| Receivable for capital shares sold | | 4,202,254 | |
| Receivable for Adviser expense reimbursement | | — | |
| Prepaid expenses and other assets | | 29,884 | |
| Total assets | | 1,932,105,501 | |
| Liabilities: | | | |
| Payable for swap contracts | | — | |
| Payable for investment securities purchased | | 3,408,205 | |
| Payable for capital shares redeemed | | 57,145,493 | |
| Payable to Adviser | | 1,435,298 | |
| Payable for fund administration & accounting fees | | 133,311 | |
| Payable for compliance fees | | 1,732 | |
| Payable for custody fees | | 24,556 | |
| Payable for audit & tax | | 53,796 | |
| Payable for transfer agent fees & expenses | | 47,885 | |
| Accrued expenses | | 72,211 | |
| Accrued distribution fees | | 64,847 | |
| Total liabilities | | 62,387,334 | |
| Net Assets | $ | 1,869,718,167 | |
| Net Assets Consist of: | | | |
| Capital Stock | $ | 2,909,398,096 | |
| Total distributable earnings (loss) | | (1,039,679,929 | ) |
| Net Assets | $ | 1,869,718,167 | |
| |
| Institutional Class | | | |
| Net Assets | $ | 1,680,833,837 | |
| Shares issued and outstanding(1) | | 150,088,424 | |
| Net asset value, redemption price and minimum offering price per share | $ | 11.20 | |
| |
| A Class | | | |
| Net Assets | $ | 168,258,943 | |
| Shares issued and outstanding(1) | | 15,193,908 | |
| Net asset value, redemption price and minimum offering price per share | $ | 11.07 | |
| Maximum offering price per share(2) | $ | 11.71 | |
| |
| C Class | | | |
| Net Assets | $ | 20,625,387 | |
| Shares issued and outstanding(1) | | 1,888,400 | |
| Net asset value, redemption price and minimum offering price per share | $ | 10.92 | |
| (1) | Unlimited shares authorized. |
| (2) | The offering price is calculated by dividing the net asset value by 1 minus the maximum sales charge of 5.50%. |
| See accompanying Notes to Financial Statements. | |
| | |
| 28 | TortoiseEcofin |
| |
| |
| 2021 Annual Report | November 30, 2021 |
| |
| |
| |
| |
| Tortoise MLP | | Ecofin Global | | Ecofin Global | |
| & Energy | | Energy | | Renewables | |
| Income Fund | | Transition Fund | | Infrastructure Fund | |
| $ | 412,434,085 | | | $ | 43,993,688 | | $ | 300,880,781 | |
| — | | | | 2,074,856 | | | 16,350,073 | |
| — | | | | 263,540 | | | 101,097 | |
| — | | | | 4,500,000 | | | 47,794,093 | |
| 2,569,880 | | | | 64,201 | | | 831,419 | |
| — | | | | — | | | 15,362,032 | |
| 774,933 | | | | — | | | 1,053,243 | |
| — | | | | 37,537 | | | — | |
| 26,037 | | | | 38,237 | | | 21,727 | |
| 415,804,935 | | | | 50,972,059 | | | 382,394,465 | |
| | |
| — | | | | 102,108 | | | 781,295 | |
| — | | | | 107,149 | | | 6,840,220 | |
| 259,369 | | | | — | | | 584,325 | |
| 356,303 | | | | 34,909 | | | 209,674 | |
| 46,573 | | | | 11,399 | | | 35,320 | |
| 3,412 | | | | 1,738 | | | 1,734 | |
| 5,634 | | | | 5,000 | | | 18,631 | |
| 31,424 | | | | 25,641 | | | 28,201 | |
| 20,635 | | | | 4,598 | | | 16,822 | |
| 30,492 | | | | 5,642 | | | 29,165 | |
| 7,179 | | | | 4,644 | | | 1,231 | |
| 761,021 | | | | 302,828 | | | 8,546,618 | |
| $ | 415,043,914 | | | $ | 50,669,231 | | $ | 373,847,847 | |
| | |
| $ | 827,146,539 | | | $ | 44,435,489 | | $ | 343,594,003 | |
| (412,102,625 | ) | | | 6,233,742 | | | 30,253,844 | |
| $ | 415,043,914 | | | $ | 50,669,231 | | $ | 373,847,847 | |
| | |
| | |
| $ | 353,594,772 | | | $ | 50,609,037 | | $ | 368,864,429 | |
| 54,841,799 | | | | 4,949,863 | | | 29,193,493 | |
| $ | 6.45 | | | $ | 10.22 | | $ | 12.64 | |
| | |
| | |
| $ | 38,146,244 | | | $ | 60,194 | | $ | 4,983,418 | |
| 5,781,269 | | | | 6,037 | | | 393,899 | |
| $ | 6.60 | | | $ | 9.97 | | $ | 12.65 | |
| $ | 6.98 | | | $ | 10.55 | | $ | 13.39 | |
| | |
| | |
| $ | 23,302,898 | | | $ | — | | $ | — | |
| 3,530,321 | | | | — | | | — | |
| $ | 6.60 | | | $ | — | | $ | — | |
| |
| |
| |
| |
| Statements of Operations |
| For the Year Ended November 30, 2021 |
| |
| Tortoise MLP & |
| Pipeline Fund |
| Investment Income: | | | |
| Dividends and distributions from unaffiliated common stock | $ | 61,466,514 | |
| Dividends and distributions from affiliated common stock | | 7,366,806 | |
| Distributions from master limited partnerships | | 42,550,120 | |
| Less: return of capital on distributions from unaffiliated investments | | (66,384,636 | ) |
| Less: return of capital on distributions from affiliated investments | | (7,366,806 | ) |
| Less: foreign taxes withheld | | (3,755,083 | ) |
| Net dividends and distributions from investments | | 33,876,915 | |
| Dividends from money market mutual funds | | 3,038 | |
| Interest income | | — | |
| Total investment income | | 33,879,953 | |
| Expenses: | | | |
| Advisory fees (See Note 6) | | 15,479,147 | |
| Fund administration & accounting fees (See Note 6) | | 725,954 | |
| Transfer agent fees & expenses (See Note 6) | | 336,165 | |
| Shareholder communication fees | | 141,733 | |
| Registration fees | | 106,964 | |
| Custody fees (See Note 6) | | 98,891 | |
| Audit & tax fees | | 51,274 | |
| Trustee fees | | 17,785 | |
| Other | | 13,906 | |
| Insurance fees | | 10,974 | |
| Legal fees | | 9,640 | |
| Compliance fees (See Note 6) | | 9,601 | |
| Distribution fees (See Note 7): | | | |
| A Class | | 390,061 | |
| C Class | | 213,551 | |
| Total expenses before interest expense on line of credit and income tax expense | | 17,605,646 | |
| Interest expense on line of credit (See Note 11) | | 61,375 | |
| Income Tax Expense | | — | |
| Total expenses before reimbursement/recoupment | | 17,667,021 | |
| Fee recoupment (See Note 6) | | — | |
| Less: expense reimbursement by Adviser | | — | |
| Net expenses | | 17,667,021 | |
| Net Investment Income (Loss) | | 16,212,932 | |
| Realized and Unrealized Gain (Loss) on Investments and Translations of Foreign Currency | | | |
| Net realized gain (loss) on: | | | |
| Unaffiliated Investments, including foreign currency gain (loss) | | (66,534,844 | ) |
| Affiliated Investments | | (62,301,046 | ) |
| Swap contracts | | — | |
| Net change in unrealized appreciation of: | | | |
| Unaffiliated Investments and translations of foreign currency | | 618,176,147 | |
| Affiliated Investments | | 79,372,535 | |
| Swap contracts | | — | |
| Net Realized and Unrealized Gain on Investments and Translations of Foreign Currency | | 568,712,792 | |
| Net Increase in Net Assets Resulting from Operations | $ | 584,925,724 | |
| See accompanying Notes to Financial Statements. | |
| | |
| 30 | TortoiseEcofin |
| |
| |
| 2021 Annual Report | November 30, 2021 |
| |
| |
| |
| |
| Tortoise MLP | | Ecofin Global | | Ecofin Global | |
| & Energy | | Energy | | Renewables | |
| Income Fund | | Transition Fund(1) | | Infrastructure Fund | |
| $ | 8,913,377 | | | $ | 43,126 | | | $ | 5,896,432 | | |
| — | | | | — | | | | — | | |
| 8,395,541 | | | | — | | | | 486,516 | | |
| (14,080,667 | ) | | | — | | | | (467,665 | ) | |
| — | | | | — | | | | — | | |
| (277,774 | ) | | | (1,351 | ) | | | (664,746 | ) | |
| 2,950,477 | | | | 41,775 | | | | 5,250,537 | | |
| 2,411 | | | | 142 | | | | 2,098 | | |
| 5,564,265 | | | | — | | | | 13,145 | | |
| 8,517,153 | | | | 41,917 | | | | 5,265,780 | | |
| | |
| 3,940,707 | | | | 50,804 | | | | 1,747,588 | | |
| 271,046 | | | | 14,135 | | | | 172,541 | | |
| 130,647 | | | | 4,598 | | | | 79,824 | | |
| 51,148 | | | | 2,002 | | | | 16,238 | | |
| 85,856 | | | | 8,052 | | | | 57,349 | | |
| 17,594 | | | | 5,214 | | | | 83,952 | | |
| 30,797 | | | | 25,641 | | | | 32,135 | | |
| 17,406 | | | | 473 | | | | 17,476 | | |
| 6,459 | | | | 4,004 | | | | 7,389 | | |
| 3,491 | | | | — | | | | 1,846 | | |
| 11,157 | | | | 1,496 | | | | 7,761 | | |
| 11,267 | | | | 1,738 | | | | 10,141 | | |
| | |
| 92,184 | | | | 13 | | | | 9,215 | | |
| 246,418 | | | | — | | | | — | | |
| 4,916,177 | | | | 118,170 | | | | 2,243,455 | | |
| 2,283 | | | | — | | | | — | | |
| — | | | | — | | | | 1,982 | | |
| 4,918,460 | | | | 118,170 | | | | 2,245,437 | | |
| 1,896 | | | | — | | | | 102,151 | | |
| (1,896 | ) | | | (61,002 | ) | | | (6,782 | ) | |
| 4,918,460 | | | | 57,168 | | | | 2,340,806 | | |
| 3,598,693 | | | | (15,251 | ) | | | 2,924,974 | | |
| | |
| | |
| (5,223,579 | ) | | | 898,949 | | | | 6,833,431 | | |
| — | | | | — | | | | — | | |
| — | | | | 599,570 | | | | 3,452,115 | | |
| | |
| 97,698,912 | | | | 4,750,569 | | | | 3,951,740 | | |
| — | | | | — | | | | — | | |
| — | | | | (95 | ) | | | (821,135 | ) | |
| 92,475,333 | | | | 6,248,993 | | | | 13,416,151 | | |
| $ | 96,074,026 | | | $ | 6,233,742 | | | $ | 16,341,125 | | |
(1) | Period from October 15, 2021 (inception date) through November 30, 2021. |
| |
| |
| |
| |
| Statements of Changes in Net Assets |
| |
| |
| | Tortoise MLP & Pipeline Fund | | Tortoise MLP & Energy Income Fund |
| | Year Ended | | Year Ended | | Year Ended | | Year Ended |
| | November 30, 2021 | | November 30, 2020 | | November 30, 2021 | | November 30, 2020 |
| Operations | | | | | | | | | | | | | | | | |
| Net investment income | | $ | 16,212,932 | | | $ | 38,804,483 | | | $ | 3,598,693 | | | $ | 9,285,062 | |
| Net realized loss on unaffiliated investments | | | | | | | | | | | | | | | | |
| and foreign currency | | | (66,534,844 | ) | | | (933,053,281 | ) | | | (5,223,579 | ) | | | (115,487,856 | ) |
| Net realized loss on affiliated investments | | | | | | | | | | | | | | | | |
| and foreign currency | | | (62,301,046 | ) | | | (50,625,613 | ) | | | — | | | | — | |
| Net change in unrealized depreciation of affiliated | | | | | | | | | | | | | | | | |
| investments and translations of foreign currency | | | 79,372,535 | | | | (39,596,967 | ) | | | — | | | | — | |
| Net change in unrealized appreciation (depreciation) | | | | | | | | | | | | | | | | |
| of unaffiliated investments and translations | | | | | | | | | | | | | | | | |
| of foreign currency | | | 618,176,147 | | | | (84,888,734 | ) | | | 97,698,912 | | | | (13,443,404 | ) |
| Net increase (decrease) in net assets resulting | | | | | | | | | | | | | | | | |
| from operations | | | 584,925,724 | | | | (1,069,360,112 | ) | | | 96,074,026 | | | | (119,646,198 | ) |
| Capital Share Transactions | | | | | | | | | | | | | | | | |
| Institutional Class: | | | | | | | | | | | | | | | | |
| Proceeds from shares sold | | | 553,132,343 | | | | 1,666,220,458 | | | | 76,576,578 | | | | 216,836,920 | |
| Proceeds from merger | | | — | | | | — | | | | 19,649,330 | | | | — | |
| Proceeds from reinvestment of distributions | | | 60,090,696 | | | | 80,595,382 | | | | 13,379,948 | | | | 20,273,405 | |
| Payments for shares redeemed | | | (882,170,574 | ) | | | (2,480,220,357 | ) | | | (104,997,029 | ) | | | (435,561,392 | ) |
| Increase (Decrease) in net assets from | | | | | | | | | | | | | | | | |
| Institutional Class transactions | | | (268,947,535 | ) | | | (733,404,517 | ) | | | 4,608,827 | | | | (198,451,067 | ) |
| A Class: | | | | | | | | | | | | | | | | |
| Proceeds from shares sold(1) | | | 37,233,600 | | | | 66,455,457 | | | | 14,931,536 | | | | 21,090,138 | |
| Proceeds from reinvestment of distributions | | | 6,323,120 | | | | 8,121,627 | | | | 807,528 | | | | 1,114,922 | |
| Payments for shares redeemed | | | (50,752,781 | ) | | | (246,342,793 | ) | | | (15,665,826 | ) | | | (23,895,013 | ) |
| Increase (Decrease) in net assets from | | | | | | | | | | | | | | | | |
| A Class transactions | | | (7,196,061 | ) | | | (171,765,709 | ) | | | 73,238 | | | | (1,689,953 | ) |
| C Class: | | | | | | | | | | | | | | | | |
| Proceeds from shares sold | | | 2,405,198 | | | | 6,315,299 | | | | 3,473,284 | | | | 5,103,535 | |
| Proceeds from reinvestment of distributions | | | 722,288 | | | | 716,944 | | | | 742,517 | | | | 1,061,684 | |
| Payments for shares redeemed(1) | | | (8,040,273 | ) | | | (14,426,219 | ) | | | (8,676,063 | ) | | | (19,839,051 | ) |
| Decrease in net assets from C Class transactions | | | (4,912,787 | ) | | | (7,393,976 | ) | | | (4,460,262 | ) | | | (13,673,832 | ) |
| Net increase (decrease) in net assets resulting | | | | | | | | | | | | | | | | |
| from capital share transactions | | | (281,056,383 | ) | | | (912,564,202 | ) | | | 221,803 | | | | (213,814,852 | ) |
| Distributions to Shareholders | | | | | | | | | | | | | | | | |
| From distributable earnings | | | | | | | | | | | | | | | | |
| Institutional Class | | | (26,652,621 | ) | | | (33,907,900 | ) | | | (3,422,418 | ) | | | (5,229,945 | ) |
| A Class | | | (2,511,690 | ) | | | (3,340,533 | ) | | | (352,333 | ) | | | (442,607 | ) |
| C Class | | | (329,437 | ) | | | (127,088 | ) | | | (213,058 | ) | | | (346,587 | ) |
| From tax return of capital | | | | | | | | | | | | | | | | |
| Institutional Class | | | (45,994,013 | ) | | | (63,087,200 | ) | | | (21,033,692 | ) | | | (29,373,316 | ) |
| A Class | | | (4,176,309 | ) | | | (5,107,626 | ) | | | (2,209,445 | ) | | | (2,566,298 | ) |
| C Class | | | (520,464 | ) | | | (692,215 | ) | | | (1,346,675 | ) | | | (2,021,216 | ) |
| Total distributions to shareholders | | | (80,184,534 | ) | | | (106,262,562 | ) | | | (28,577,621 | ) | | | (39,979,969 | ) |
| Total Increase (Decrease) in Net Assets | | | 223,684,808 | | | | (2,088,186,876 | ) | | | 67,718,208 | | | | (373,441,019 | ) |
| Net Assets | | | | | | | | | | | | | | | | |
| Beginning of year | | | 1,646,033,359 | | | | 3,734,220,235 | | | | 347,325,706 | | | | 720,766,725 | |
| End of year | | $ | 1,869,718,167 | | | $ | 1,646,033,359 | | | $ | 415,043,914 | | | $ | 347,325,706 | |
(1) | Includes exchanges between share classes of the fund. |
| See accompanying Notes to Financial Statements. | |
| | |
| 32 | TortoiseEcofin |
| |
| |
| 2021 Annual Report | November 30, 2021 |
| |
| Statements of Changes in Net Assets (continued) |
| |
| |
| | Tortoise MLP & Pipeline Fund | | Tortoise MLP & Energy Income Fund |
| | Year Ended | | Year Ended | | Year Ended | | Year Ended |
| | November 30, 2021 | | November 30, 2020 | | November 30, 2021 | | November 30, 2020 |
| Transactions in Shares: | | | | | | | | | | | | |
| Institutional Class: | | | | | | | | | | | | |
| Shares sold | | 53,825,231 | | | 196,548,538 | | | 13,354,587 | | | 37,743,731 | |
| Shares acquired from merger | | — | | | — | | | 2,917,825 | | | — | |
| Shares issued to holders in reinvestment | | | | | | | | | | | | |
| of dividends | | 5,787,033 | | | 8,890,623 | | | 2,111,746 | | | 3,616,878 | |
| Shares redeemed | | (88,758,089 | ) | | (304,075,115 | ) | | (17,093,452 | ) | | (81,062,908 | ) |
| Increase (Decrease) in Institutional Class shares | | | | | | | | | | | | |
| outstanding | | (29,145,825 | ) | | (98,635,954 | ) | | 1,290,706 | | | (39,702,299 | ) |
| A Class: | | | | | | | | | | | | |
| Shares sold(1) | | 3,626,684 | | | 7,776,352 | | | 2,373,493 | | | 3,567,851 | |
| Shares issued to holders in reinvestment | | | | | | | | | | | | |
| of dividends | | 614,530 | | | 877,896 | | | 125,007 | | | 194,479 | |
| Shares redeemed | | (5,145,356 | ) | | (33,402,644 | ) | | (2,521,193 | ) | | (4,583,449 | ) |
| Decrease in A Class shares outstanding | | (904,142 | ) | | (24,748,396 | ) | | (22,693 | ) | | (821,119 | ) |
| C Class: | | | | | | | | | | | | |
| Shares sold | | 239,209 | | | 647,938 | | | 536,997 | | | 897,219 | |
| Shares issued to holders in reinvestment | | | | | | | | | | | | |
| of dividends | | 71,351 | | | 85,701 | | | 114,877 | | | 185,660 | |
| Shares redeemed(1) | | (809,970 | ) | | (1,671,446 | ) | | (1,364,216 | ) | | (3,659,576 | ) |
| Decrease in C Class shares outstanding | | (499,410 | ) | | (937,807 | ) | | (712,342 | ) | | (2,576,697 | ) |
| Net increase (decrease) in shares outstanding | | (30,549,377 | ) | | (124,322,157 | ) | | 555,671 | | | (43,100,115 | ) |
(1) | Includes exchanges between share classes of the fund. |
| See accompanying Notes to Financial Statements. | |
| | |
| TortoiseEcofin | 33 |
| |
| |
| |
| |
| Statements of Changes in Net Assets (continued) |
| |
| |
| | Ecofin Global Energy | | Ecofin Global Renewables |
| | Transition Fund | | Infrastructure Fund |
| | Period from | | | | Period from |
| | Inception(1) to | | Year Ended | | Inception(2) to |
| | November 30, 2021 | | November 30, 2021 | | November 30, 2020 |
| Operations | | | | | | | | | | | | |
| Net investment income (loss) | | $ | (15,251 | ) | | $ | 2,924,974 | | | $ | 416,394 | |
| Net realized gain on investments, swaps contracts and foreign currency | | | 1,498,519 | | | | 10,285,546 | | | | 1,352,376 | |
| Net change in unrealized appreciation of investments, swap contracts and | | | | | | | | | | | | |
| translations of foreign currency | | | 4,750,474 | | | | 3,130,605 | | | | 19,121,491 | |
| Net increase in net assets resulting from operations | | | 6,233,742 | | | | 16,341,125 | | | | 20,890,261 | |
| Capital Share Transactions | | | | | | | | | | | | |
| Institutional Class: | | | | | | | | | | | | |
| Proceeds from shares sold | | | 279,950 | | | | 268,214,088 | | | | 17,033,185 | |
| Proceeds from reinvestment of distributions | | | — | | | | 5,405,379 | | | | 208,962 | |
| Payments for shares redeemed | | | — | | | | (22,310,756 | ) | | | (203,273 | ) |
| Proceeds related to shares issued from reorganization (See Note 13) | | | 44,093,614 | | | | — | | | | 70,442,917 | |
| Increase in net assets from Institutional Class transactions | | | 44,373,564 | | | | 251,308,711 | | | | 87,481,791 | |
| A Class: | | | | | | | | | | | | |
| Proceeds from shares sold | | | 62,824 | | | | 4,143,904 | | | | 1,227,248 | |
| Proceeds from reinvestment of distributions | | | — | | | | 56,001 | | | | 115 | |
| Payments for shares redeemed | | | (899 | ) | | | (583,311 | ) | | | — | |
| Decrease in net assets from A Class transactions | | | 61,925 | | | | 3,616,594 | | | | 1,227,363 | |
| Net increase in net assets resulting from capital share transactions | | | 44,435,489 | | | | 254,925,305 | | | | 88,709,154 | |
| Distributions to Shareholders | | | | | | | | | | | | |
| From distributable earnings | | | | | | | | | | | | |
| Institutional Class | | | — | | | | (6,223,846 | ) | | | (211,910 | ) |
| A Class | | | — | | | | (86,224 | ) | | | (1,385 | ) |
| From net realized gains | | | | | | | | | | | | |
| Institutional Class | | | — | | | | (487,568 | ) | | | — | |
| A Class | | | — | | | | (7,065 | ) | | | — | |
| Total distributions to shareholders | | | — | | | | (6,804,703 | ) | | | (213,295 | ) |
| Total Increase in Net Assets | | | 50,669,231 | | | | 264,461,727 | | | | 109,386,120 | |
| Net Assets | | | | | | | | | | | | |
| Beginning of period | | | — | | | | 109,386,120 | | | | — | |
| End of period | | $ | 50,669,231 | | | $ | 373,847,847 | | | $ | 109,386,120 | |
| Transactions in Shares: | | | | | | | | | | | | |
| (1) | Inception date of the the Fund was October 15, 2021. |
| (2) | Inception date of the Institutional Class was August 7, 2020 and the A Class was September 25, 2020. |
| See accompanying Notes to Financial Statements. | |
| | |
| 34 | TortoiseEcofin |
| |
| |
| 2021 Annual Report | November 30, 2021 |
| |
| Statements of Changes in Net Assets (continued) |
| |
| |
| | Ecofin Global Energy | | Ecofin Global Renewables |
| | Transition Fund | | Infrastructure Fund |
| | Period from | | | | Period from |
| | Inception(1) to | | Year Ended | | Inception(2) to |
| | November 30, 2021 | | November 30, 2021 | | November 30, 2020 |
| Institutional Class: | | | | | | | | | |
| Shares sold | | 26,568 | | | 21,097,049 | | | 1,636,928 | |
| Shares issued to holders in reinvestment of dividends | | — | | | 435,783 | | | 18,395 | |
| Shares redeemed | | — | | | (1,800,978 | ) | | (18,902 | ) |
| Shares issued from reorganization (See Note 13) | | 4,923,295 | | | — | | | 7,825,218 | |
| Increase in Institutional Class shares outstanding | | 4,949,863 | | | 19,731,854 | | | 9,461,639 | |
| A Class: | | | | | | | | | |
| Shares sold | | 6,124 | | | 320,402 | | | 116,973 | |
| Shares issued to holders in reinvestment of dividends | | — | | | 4,517 | | | 10 | |
| Shares redeemed | | (87 | ) | | (48,003 | ) | | — | |
| Increase in A Class shares outstanding | | 6,037 | | | 276,916 | | | 116,983 | |
| Net increase in shares outstanding | | 4,955,900 | | | 20,008,770 | | | 9,578,622 | |
| (1) | Inception date of the the Fund was October 15, 2021. |
| (2) | Inception date of the Institutional Class was August 7, 2020 and the A Class was September 25, 2020. |
| See accompanying Notes to Financial Statements. | |
| | |
| TortoiseEcofin | 35 |
| |
| |
| |
| |
Tortoise MLP & Pipeline Fund
Financial Highlights |
| Institutional Class |
| | Year Ended | | Year Ended | | Year Ended | | Year Ended | | Year Ended |
| | November 30, | | November 30, | | November 30, | | November 30, | | November 30, |
| | 2021 | | 2020 | | 2019 | | 2018 | | 2017 |
| Per Common Share Data(1) | | | | | | | | | | | | | | | | | | | | | | | | | |
| Net asset value, beginning of year | | $ | 8.33 | | | | $ | 11.61 | | | | $ | 12.29 | | | | $ | 12.85 | | | | $ | 13.76 | | |
| Investment operations: | | | | | | | | | | | | | | | | | | | | | | | | | |
| Net investment income(2) | | | 0.06 | | | | | 0.12 | | | | | 0.14 | | | | | 0.16 | | | | | 0.15 | | |
| Net realized and unrealized gain (loss) on investments | | | | | | | | | | | | | | | | | | | | | | | | | |
| and translations of foreign currency(2) | | | 3.27 | | | | | (2.96 | ) | | | | (0.26 | ) | | | | (0.26 | ) | | | | (0.64 | ) | |
| Total from investment operations | | | 3.33 | | | | | (2.84 | ) | | | | (0.12 | ) | | | | (0.10 | ) | | | | (0.49 | ) | |
| Less distributions from: | | | | | | | | | | | | | | | | | | | | | | | | | |
| Net investment income | | | (0.16 | ) | | | | (0.14 | ) | | | | (0.20 | ) | | | | (0.17 | ) | | | | (0.22 | ) | |
| Net realized gains | | | — | | | | | — | | | | | — | | | | | — | | | | | — | | |
| Return of capital | | | (0.30 | ) | | | | (0.30 | ) | | | | (0.36 | ) | | | | (0.29 | ) | | | | (0.20 | ) | |
| Total distributions | | | (0.46 | ) | | | | (0.44 | ) | | | | (0.56 | ) | | | | (0.46 | ) | | | | (0.42 | ) | |
| Net asset value, end of year | | $ | 11.20 | | | | $ | 8.33 | | | | $ | 11.61 | | | | $ | 12.29 | | | | $ | 12.85 | | |
| Total Return | | | 40.51 | | % | | | (24.70 | ) | % | | | (1.09 | ) | % | | | (0.88 | ) | % | | | (3.63 | ) | % |
| Supplemental Data and Ratios | | | | | | | | | | | | | | | | | | | | | | | | | |
| Net assets, end of year (in 000's) | | $ | 1,680,834 | | | | $ | 1,493,621 | | | | $ | 3,226,450 | | | | $ | 3,544,401 | | | | $ | 2,872,704 | | |
| Ratio of expenses to average net assets | | | 0.94 | | % | | | 0.94 | | % | | | 0.93 | | % | | | 0.93 | | % | | | 0.96 | | % |
| Ratio of expenses excluding interest expense | | | | | | | | | | | | | | | | | | | | | | | | | |
| to average net assets | | | 0.93 | | % | | | 0.94 | | % | | | 0.93 | | % | | | 0.93 | | % | | | 0.96 | | % |
| Ratio of net investment income to average net assets | | | 0.92 | | % | | | 1.64 | | % | | | 1.01 | | % | | | 1.06 | | % | | | 1.17 | | % |
| Portfolio turnover rate | | | 32 | | % | | | 39 | | % | | | 19 | | % | | | 14 | | % | | | 15 | | % |
| (1) | For an Institutional Class Share outstanding for the entire period. |
| (2) | The per common share data for the years ended November 30, 2020, 2019, 2018, and 2017 do not reflect the change in estimate of investment income and return of capital. See Note 2 to the financial statements for further disclosure. |
| See accompanying Notes to Financial Statements. | |
| | |
| 36 | TortoiseEcofin |
| |
| |
| 2021 Annual Report | November 30, 2021 |
| |
Tortoise MLP & Pipeline Fund
Financial Highlights (continued) |
| A Class |
| Year Ended | | Year Ended | | Year Ended | | Year Ended | | Year Ended |
| November 30, | | November 30, | | November 30, | | November 30, | | November 30, |
| 2021 | | 2020 | | 2019 | | 2018 | | 2017 |
| Per Common Share Data(1) | | | | | | | | | | | | | | | | | | | | | | | | |
| Net asset value, beginning of year | $ | 8.25 | | | | $ | 11.50 | | | | $ | 12.18 | | | | $ | 12.77 | | | | $ | 13.67 | | |
| Investment operations: | | | | | | | | | | | | | | | | | | | | | | | | |
| Net investment income(2) | | 0.08 | | | | | 0.16 | | | | | 0.11 | | | | | 0.06 | | | | | 0.13 | | |
| Net realized and unrealized gain (loss) on investments | | | | | | | | | | | | | | | | | | | | | | | | |
| and translations of foreign currency(2) | | 3.19 | | | | | (3.01 | ) | | | | (0.26 | ) | | | | (0.22 | ) | | | | (0.64 | ) | |
| Total from investment operations | | 3.27 | | | | | (2.85 | ) | | | | (0.15 | ) | | | | (0.16 | ) | | | | (0.51 | ) | |
| Less distributions from: | | | | | | | | | | | | | | | | | | | | | | | | |
| Net investment income | | (0.16 | ) | | | | (0.11 | ) | | | | (0.18 | ) | | | | (0.16 | ) | | | | (0.20 | ) | |
| Net realized gains | | — | | | | | — | | | | | — | | | | | — | | | | | — | | |
| Return of capital | | (0.29 | ) | | | | (0.29 | ) | | | | (0.35 | ) | | | | (0.27 | ) | | | | (0.19 | ) | |
| Total distributions | | (0.45 | ) | | | | (0.40 | ) | | | | (0.53 | ) | | | | (0.43 | ) | | | | (0.39 | ) | |
| Net asset value, end of year | $ | 11.07 | | | | $ | 8.25 | | | | $ | 11.50 | | | | $ | 12.18 | | | | $ | 12.77 | | |
| Total Return(3) | | 40.12 | | % | | | (24.94 | ) | % | | | (1.38 | ) | % | | | (1.31 | ) | % | | | (3.81 | ) | % |
| Supplemental Data and Ratios | | | | | | | | | | | | | | | | | | | | | | | | |
| Net assets, end of year (in 000's) | $ | 168,259 | | | | $ | 132,882 | | | | $ | 469,882 | | | | $ | 474,785 | | | | $ | 300,926 | | |
| Ratio of expenses to average net assets | | 1.19 | | % | | | 1.19 | | % | | | 1.18 | | % | | | 1.18 | | % | | | 1.21 | | % |
| Ratio of expenses excluding interest expense | | | | | | | | | | | | | | | | | | | | | | | | |
| to average net assets | | 1.18 | | % | | | 1.18 | | % | | | 1.18 | | % | | | 1.18 | | % | | | 1.21 | | % |
| Ratio of net investment income | | | | | | | | | | | | | | | | | | | | | | | | |
| to average net assets | | 0.67 | | % | | | 1.40 | | % | | | 0.76 | | % | | | 0.81 | | % | | | 0.92 | | % |
| Portfolio turnover rate | | 32 | | % | | | 39 | | % | | | 19 | | % | | | 14 | | % | | | 15 | | % |
| (1) | For an A Class Share outstanding for the entire period. Prior to March 30, 2019, A Class Shares were known as Investor Class Shares. |
| (2) | The per common share data for the years ended November 30, 2020, 2019, 2018, and 2017 do not reflect the change in estimate of investment income and return of capital. See Note 2 to the financial statements for further disclosure. |
| (3) | Total return does not reflect sales charges. |
| See accompanying Notes to Financial Statements. | |
| | |
| TortoiseEcofin | 37 |
| |
| |
| |
| |
Tortoise MLP & Pipeline Fund
Financial Highlights (continued) |
| C Class |
| Year Ended | | Year Ended | | Year Ended | | Year Ended | | Year Ended |
| November 30, | | November 30, | | November 30, | | November 30, | | November 30, |
| 2021 | | 2020 | | 2019 | | 2018 | | 2017 |
| Per Common Share Data(1) | | | | | | | | | | | | | | | | | | | | | | | | |
| Net asset value, beginning of year | $ | 8.18 | | | | $ | 11.39 | | | | $ | 12.05 | | | | $ | 12.61 | | | | $ | 13.51 | | |
| Investment operations: | | | | | | | | | | | | | | | | | | | | | | | | |
| Net investment income (loss)(2) | | (0.07 | ) | | | | 0.05 | | | | | (0.01 | ) | | | | — | (3) | | | 0.02 | | |
| Net realized and unrealized gain (loss) on investments | | | | | | | | | | | | | | | | | | | | | | | | |
| and translations of foreign currency(2) | | 3.23 | | | | | (2.94 | ) | | | | (0.23 | ) | | | | (0.23 | ) | | | | (0.62 | ) | |
| Total from investment operations | | 3.16 | | | | | (2.89 | ) | | | | (0.24 | ) | | | | (0.23 | ) | | | | (0.60 | ) | |
| Less distributions from: | | | | | | | | | | | | | | | | | | | | | | | | |
| Net investment income | | (0.16 | ) | | | | (0.11 | ) | | | | (0.15 | ) | | | | (0.12 | ) | | | | (0.16 | ) | |
| Net realized gains | | — | | | | | — | | | | | — | | | | | — | | | | | — | | |
| Return of capital | | (0.26 | ) | | | | (0.21 | ) | | | | (0.27 | ) | | | | (0.21 | ) | | | | (0.14 | ) | |
| Total distributions | | (0.42 | ) | | | | (0.32 | ) | | | | (0.42 | ) | | | | (0.33 | ) | | | | (0.30 | ) | |
| Net asset value, end of year | $ | 10.92 | | | | $ | 8.18 | | | | $ | 11.39 | | | | $ | 12.05 | | | | $ | 12.61 | | |
| Total Return(4) | | 39.00 | | % | | | (25.41 | ) | % | | | (2.13 | ) | % | | | (1.89 | ) | % | | | (4.51 | ) | % |
| Supplemental Data and Ratios | | | | | | | | | | | | | | | | | | | | | | | | |
| Net assets, end of year (in 000's) | $ | 20,625 | | | | $ | 19,530 | | | | $ | 37,888 | | | | $ | 51,458 | | | | $ | 58,147 | | |
| Ratio of expenses to average net assets | | 1.94 | | % | | | 1.94 | | % | | | 1.93 | | % | | | 1.93 | | % | | | 1.96 | | % |
| Ratio of expenses excluding interest expense | | | | | | | | | | | | | | | | | | | | | | | | |
| to average net assets | | 1.93 | | % | | | 1.94 | | % | | | 1.93 | | % | | | 1.93 | | % | | | 1.96 | | % |
| Ratio of net investment income (loss) | | | | | | | | | | | | | | | | | | | | | | | | |
| to average net assets | | (0.08 | ) | % | | | 0.64 | | % | | | 0.01 | | % | | | 0.06 | | % | | | 0.17 | | % |
| Portfolio turnover rate | | 32 | | % | | | 39 | | % | | | 19 | | % | | | 14 | | % | | | 15 | | % |
| (1) | For a C Class Share outstanding for the entire period. |
| (2) | The per common share data for the years ended November 30, 2020, 2019, 2018, and 2017 do not reflect the change in estimate of investment income and return of capital. See Note 2 to the financial statements for further disclosure. |
| (3) | Amount per share is less than $0.01. |
| (4) | Total return does not reflect sales charges. |
| See accompanying Notes to Financial Statements. | |
| | |
| 38 | TortoiseEcofin |
| |
| |
| 2021 Annual Report | November 30, 2021 |
| |
| Tortoise MLP & Energy Income Fund |
| Financial Highlights |
| Institutional Class |
| | Year Ended | | Year Ended | | Year Ended | | Year Ended | | Year Ended |
| | November 30, | | November 30, | | November 30, | | November 30, | | November 30, |
| | 2021 | | 2020 | | 2019 | | 2018 | | 2017 |
| | | | | | | | | | | | | | | | | | | | | |
| Per Common Share Data(1) | | | | | | | | | | | | | | | | | | | | | | | | | |
| Net asset value, beginning of year | | $ | 5.44 | | | | $ | 6.74 | | | | $ | 7.43 | | | | $ | 8.42 | | | | $ | 9.70 | | |
| Investment operations: | | | | | | | | | | | | | | | | | | | | | | | | | |
| Net investment income | | | 0.10 | | | | | 0.11 | (2) | | | 0.81 | | | | | 0.08 | (2) | | | 0.11 | (2) |
| Net realized and unrealized gain (loss) on investments | | | | | | | | | | | | | | | | | | | | | | | | | |
| and translations of foreign currency | | | 1.38 | | | | | (0.91 | ) | | | | (0.82 | ) | | | | (0.35 | ) | | | | (0.68 | ) | |
| Total from investment operations | | | 1.48 | | | | | (0.80 | ) | | | | (0.01 | ) | | | | (0.27 | ) | | | | (0.57 | ) | |
| Less distributions from: | | | | | | | | | | | | | | | | | | | | | | | | | |
| Net investment income | | | (0.07 | ) | | | | (0.08 | ) | | | | (0.01 | ) | | | | (0.43 | ) | | | | (0.16 | ) | |
| Net realized gains | | | — | | | | | — | | | | | — | | | | | — | | | | | — | | |
| Return of capital | | | (0.40 | ) | | | | (0.42 | ) | | | | (0.67 | ) | | | | (0.29 | ) | | | | (0.55 | ) | |
| Total distributions | | | (0.47 | ) | | | | (0.50 | ) | | | | (0.68 | ) | | | | (0.72 | ) | | | | (0.71 | ) | |
| Redemption fee proceeds | | | — | | | | | — | | | | | — | (3) | | | — | (2)(3) | | | — | (2)(3) |
| Net asset value, end of year | | $ | 6.45 | | | | $ | 5.44 | | | | $ | 6.74 | | | | $ | 7.43 | | | | $ | 8.42 | | |
| Total Return | | | 27.63 | | % | | | (11.83 | ) | % | | | (0.29 | ) | % | | | (3.66 | ) | % | | | (6.03 | ) | % |
| Supplemental Data and Ratios | | | | | | | | | | | | | | | | | | | | | | | | | |
| Net assets, end of year (in 000's) | | $ | 353,595 | | | | $ | 291,420 | | | | $ | 628,295 | | | | $ | 748,415 | | | | $ | 735,670 | | |
| Ratio of expenses to average net assets | | | 1.16 | | % | | | 1.14 | | % | | | 1.17 | | % | | | 1.16 | | % | | | 1.14 | | % |
| Ratio of expenses excluding interest expense | | | | | | | | | | | | | | | | | | | | | | | | | |
| to average net assets | | | 1.16 | | % | | | 1.13 | | % | | | 1.17 | | % | | | 1.16 | | % | | | 1.14 | | % |
| Ratio of net investment income (loss) | | | | | | | | | | | | | | | | | | | | | | | | | |
| to average net assets | | | 1.00 | | % | | | 2.02 | | % | | | 1.68 | | % | | | 0.99 | | % | | | 1.23 | | % |
| Portfolio turnover rate | | | 22 | | % | | | 43 | | % | | | 48 | | % | | | 55 | | % | | | 30 | | % |
| (1) | For an Institutional Class Share outstanding for the entire period. |
| (2) | Per share amounts calculated using average shares method. |
| (3) | Amount per share is less than $0.01. |
| See accompanying Notes to Financial Statements. | |
| | |
| TortoiseEcofin | 39 |
| |
| |
| |
| |
| Tortoise MLP & Energy Income Fund |
| Financial Highlights (continued) |
| A Class |
| Year Ended | | Year Ended | | Year Ended | | Year Ended | | Year Ended |
| November 30, | | November 30, | | November 30, | | November 30, | | November 30, |
| 2021 | | 2020 | | 2019 | | 2018 | | 2017 |
| | | | | | | | | | | | | | | | | | | | | | | | | |
| Per Common Share Data(1) | | | | | | | | | | | | | | | | | | | | | | | | |
| Net asset value, beginning of year | $ | 5.56 | | | | $ | 6.87 | | | | $ | 7.56 | | | | $ | 8.57 | | | | $ | 9.87 | | |
| Investment operations: | | | | | | | | | | | | | | | | | | | | | | | | |
| Net investment income (loss) | | 0.05 | | | | | 0.10 | (2) | | | 0.79 | | | | | 0.06 | (2) | | | 0.09 | (2) |
| Net realized and unrealized gain (loss) on | | | | | | | | | | | | | | | | | | | | | | | | |
| investments and translations of foreign currency | | 1.44 | | | | | (0.93 | ) | | | | (0.80 | ) | | | | (0.36 | ) | | | | (0.69 | ) | |
| Total from investment operations | | 1.49 | | | | | (0.83 | ) | | | | (0.01 | ) | | | | (0.30 | ) | | | | (0.60 | ) | |
| Less distributions from: | | | | | | | | | | | | | | | | | | | | | | | | |
| Net investment income | | (0.06 | ) | | | | (0.07 | ) | | | | (0.01 | ) | | | | (0.42 | ) | | | | (0.16 | ) | |
| Net realized gains | | — | | | | | — | | | | | — | | | | | — | | | | | — | | |
| Return of capital | | (0.39 | ) | | | | (0.41 | ) | | | | (0.67 | ) | | | | (0.29 | ) | | | | (0.54 | ) | |
| Total distributions | | (0.45 | ) | | | | (0.48 | ) | | | | (0.68 | ) | | | | (0.71 | ) | | | | (0.70 | ) | |
| Redemption fee proceeds | | — | | | | | — | | | | | — | (3) | | | — | (2)(3) | | | — | (2)(3) |
| Net asset value, end of year | $ | 6.60 | | | | $ | 5.56 | | | | $ | 6.87 | | | | $ | 7.56 | | | | $ | 8.57 | | |
| Total Return(4) | | 27.19 | | % | | | (11.96 | ) | % | | | (0.41 | ) | % | | | (3.95 | ) | % | | | (6.26 | ) | % |
| Supplemental Data and Ratios | | | | | | | | | | | | | | | | | | | | | | | | |
| Net assets, end of year (in 000's) | $ | 38,146 | | | | $ | 32,256 | | | | $ | 45,492 | | | | $ | 55,436 | | | | $ | 62,135 | | |
| Ratio of expenses to average net assets | | 1.41 | | % | | | 1.39 | | % | | | 1.42 | | % | | | 1.41 | | % | | | 1.39 | | % |
| Ratio of expenses excluding interest expense | | | | | | | | | | | | | | | | | | | | | | | | |
| to average net assets | | 1.41 | | % | | | 1.38 | | % | | | 1.42 | | % | | | 1.41 | | % | | | 1.39 | | % |
| Ratio of net investment income (loss) | | | | | | | | | | | | | | | | | | | | | | | | |
| to average net assets | | 0.75 | | % | | | 1.76 | | % | | | 1.43 | | % | | | 0.74 | | % | | | 0.98 | | % |
| Portfolio turnover rate | | 22 | | % | | | 43 | | % | | | 48 | | % | | | 55 | | % | | | 30 | | % |
| (1) | For an A Class Share outstanding for the entire period. |
| (2) | Per share amounts calculated using average shares method. |
| (3) | Amount per share is less than $0.01. |
| (4) | Total return does not reflect sales charges. |
| See accompanying Notes to Financial Statements. | |
| | |
| 40 | TortoiseEcofin |
| |
| |
| 2021 Annual Report | November 30, 2021 |
| |
| Tortoise MLP & Energy Income Fund |
| Financial Highlights (continued) |
| C Class |
| | Year Ended | | Year Ended | | Year Ended | | Year Ended | | Year Ended |
| | November 30, | | November 30, | | November 30, | | November 30, | | November 30, |
| | 2021 | | 2020 | | 2019 | | 2018 | | 2017 |
| | | | | | | | | | | | | | | | | | | | | | | | | | |
| Per Common Share Data(1) | | | | | | | | | | | | | | | | | | | | | | | | | |
| Net asset value, beginning of year | | $ | 5.57 | | | | $ | 6.89 | | | | $ | 7.59 | | | | $ | 8.60 | | | | $ | 9.90 | | |
| Investment operations: | | | | | | | | | | | | | | | | | | | | | | | | | |
| Net investment income (loss) | | | (0.18 | ) | | | | 0.06 | (3) | | | 0.67 | | | | | — | (2)(3) | | | 0.02 | (3) |
| Net realized and unrealized gain (loss) on investments | | | | | | | | | | | | | | | | | | | | | | | | | |
| and translations of foreign currency | | | 1.63 | | | | | (0.94 | ) | | | | (0.75 | ) | | | | (0.37 | ) | | | | (0.69 | ) | |
| Total from investment operations | | | 1.45 | | | | | (0.88 | ) | | | | (0.08 | ) | | | | (0.37 | ) | | | | (0.67 | ) | |
| Less distributions from: | | | | | | | | | | | | | | | | | | | | | | | | | |
| Net investment income | | | (0.06 | ) | | | | (0.07 | ) | | | | (0.01 | ) | | | | (0.38 | ) | | | | (0.14 | ) | |
| Net realized gains | | | — | | | | | — | | | | | — | | | | | — | | | | | — | | |
| Return of capital | | | (0.36 | ) | | | | (0.37 | ) | | | | (0.61 | ) | | | | (0.26 | ) | | | | (0.49 | ) | |
| Total distributions | | | (0.42 | ) | | | | (0.44 | ) | | | | (0.62 | ) | | | | (0.64 | ) | | | | (0.63 | ) | |
| Redemption fee proceeds | | | — | | | | | — | | | | | — | (2) | | | — | (2)(3) | | | — | (2)(3) |
| Net asset value, end of year | | $ | 6.60 | | | | $ | 5.57 | | | | $ | 6.89 | | | | $ | 7.59 | | | | $ | 8.60 | | |
| Total Return(4) | | | 26.35 | | % | | | (12.72 | ) | % | | | (1.30 | ) | | | | (4.64 | ) | % | | | (6.95 | ) | % |
| Supplemental Data and Ratios | | | | | | | | | | | | | | | | | | | | | | | | | |
| Net assets, end of year (in 000's) | | $ | 23,303 | | | | $ | 23,650 | | | | $ | 46,979 | | | | $ | 55,341 | | | | $ | 68,541 | | |
| Ratio of expenses to average net assets | | | 2.16 | | % | | | 2.14 | | % | | | 2.17 | | % | | | 2.16 | | % | | | 2.14 | | % |
| Ratio of expenses excluding interest expense | | | | | | | | | | | | | | | | | | | | | | | | | |
| to average net assets | | | 2.16 | | % | | | 2.13 | | % | | | 2.17 | | % | | | 2.16 | | % | | | 2.14 | | % |
| Ratio of net investment income (loss) | | | | | | | | | | | | | | | | | | | | | | | | | |
| to average net assets | | | (0.00 | ) | % | | | 1.02 | | % | | | 0.68 | | % | | | (0.01 | ) | % | | | 0.23 | | % |
| Portfolio turnover rate | | | 22 | | % | | | 43 | | % | | | 48 | | % | | | 55 | | % | | | 30 | | % |
| (1) | For a C Class Share outstanding for the entire period. |
| (2) | Amount per share is less than $0.01. |
| (3) | Per share amounts calculated using average shares method. |
| (4) | Total return does not reflect sales charges. |
| See accompanying Notes to Financial Statements. | |
| | |
| TortoiseEcofin | 41 |
| |
| |
| |
| |
| Ecofin Global Energy Transition Fund |
| Financial Highlights |
| Institutional Class |
| | Period from |
| | Inception(1) |
| | to November 30, |
| | 2021 |
| | | | | | |
| Per Common Share Data(2) | | | | | |
| Net asset value, beginning of period | | $ | 10.00 | | |
| Investment operations: | | | | | |
| Net investment income | | | — | (3) |
| Net realized and unrealized gain on investments and translations of foreign currency | | | 0.22 | | |
| Total from investment operations | | | 0.22 | | |
| Less distributions from: | | | | | |
| Net investment income | | | — | | |
| Net realized gains | | | — | | |
| Return of capital | | | — | | |
| Total distributions | | | — | | |
| Net asset value, end of period | | $ | 10.22 | | |
| Total Return(4) | | | 14.06 | | % |
| Supplemental Data and Ratios | | | | | |
| Net assets, end of period (in 000's) | | $ | 50,609 | | |
| Ratio of expenses to average net assets: | | | | | |
| Before expense waiver(5) | | | 1.86 | | % |
| After expense waiver(5) | | | 0.90 | | % |
| Ratio of net investment loss to average net assets: | | | | | |
| Before expense waiver(5) | | | (1.20 | ) | % |
| After expense waiver(5) | | | (0.24 | ) | % |
| Portfolio turnover rate(4) | | | 13 | | % |
| (1) | October 15, 2021. |
| (2) | For an Institutional Class Share outstanding for the entire period. |
| (3) | Amount per share is less than $0.01. |
| (4) | Not annualized. |
| (5) | Annualized. |
| See accompanying Notes to Financial Statements. | |
| | |
| 42 | TortoiseEcofin |
| |
| |
| 2021 Annual Report | November 30, 2021 |
| |
| Ecofin Global Energy Transition Fund |
| Financial Highlights (continued) |
| A Class |
| | Period from |
| | Inception(1) |
| | to November 30, |
| | 2021 |
| | | | | | |
| Per Common Share Data(2) | | | | | |
| Net asset value, beginning of period | | $ | 10.00 | | |
| Investment operations: | | | | | |
| Net investment income | | | — | (3) |
| Net realized and unrealized gain on investments and translations of foreign currency | | | (0.03 | ) | |
| Total from investment operations | | | (0.03 | ) | |
| Less distributions from: | | | | | |
| Net investment income | | | — | | |
| Net realized gains | | | — | | |
| Return of capital | | | — | | |
| Total distributions | | | — | | |
| Net asset value, end of period | | $ | 9.97 | | |
| Total Return(4)(5) | | | 13.69 | | % |
| Supplemental Data and Ratios | | | | | |
| Net assets, end of period (in 000's) | | | 60 | | |
| Ratio of expenses to average net assets: | | | | | |
| Before expense waiver(6) | | | 2.11 | | % |
| After expense waiver(6) | | | 1.15 | | % |
| Ratio of net investment loss to average net assets: | | | | | |
| Before expense waiver(6) | | | (1.37 | ) | % |
| After expense waiver(6) | | | (0.49 | ) | % |
| Portfolio turnover rate(5) | | | 13 | | % |
| (1) | October 18, 2021. |
| (2) | For an A Class Share outstanding for the entire period. |
| (3) | Amount per share is less than $0.01. |
| (4) | Total return does not reflect sales charges. |
| (5) | Not annualized. |
| (6) | Annualized. |
| |
| |
| |
| |
| Ecofin Global Renewables Infrastructure Fund |
| Financial Highlights |
| Institutional Class |
| | | | | | | Period |
| | Year Ended | | from Inception(1) |
| | November 30, | | to November 30, |
| | 2021 | | 2020 |
| Per Common Share Data(2) | | | | | | | | | | |
| Net asset value, beginning of period | | $ | 11.42 | | | | $ | 10.00 | | |
| Investment operations: | | | | | | | | | | |
| Net investment income | | | 0.15 | (3) | | | 0.04 | | |
| Net realized and unrealized gain on investments and translations of foreign currency | | | 1.43 | | | | | 1.40 | | |
| Total from investment operations | | | 1.58 | | | | | 1.44 | | |
| Less distributions from: | | | | | | | | | | |
| Net investment income | | | (0.28 | ) | | | | (0.02 | ) | |
| Net realized gains | | | (0.05 | ) | | | | — | | |
| Return of capital | | | (0.03 | ) | | | | — | | |
| Total distributions | | | (0.36 | ) | | | | (0.02 | ) | |
| Net asset value, end of period | | $ | 12.64 | | | | $ | 11.42 | | |
| Total Return(4) | | | 14.02 | | % | | | 14.43 | | % |
| Supplemental Data and Ratios | | | | | | | | | | |
| Net assets, end of period (in 000's) | | $ | 368,864 | | | | $ | 108,048 | | |
| Ratio of expenses to average net assets: | | | | | | | | | | |
| Before expense waiver/recoupment(5) | | | 0.96 | | % | | | 1.46 | | % |
| After expense waiver/recoupment(5) | | | 1.00 | | % | | | 1.00 | | % |
| Ratio of net investment income to average net assets: | | | | | | | | | | |
| Before expense waiver/recoupment(5) | | | 1.30 | | % | | | 1.05 | | % |
| After expense waiver/recoupment(5) | | | 1.26 | | % | | | 1.51 | | % |
| Portfolio turnover rate(4) | | | 41 | | % | | | 20 | | % |
| (1) | August 7, 2020. |
| (2) | For an Institutional Class Share outstanding for the entire period. |
| (3) | Per share amounts calculated using average shares method. |
| (4) | Not annualized for periods less than one year. |
| (5) | Annualized for period less than one year. |
| See accompanying Notes to Financial Statements. | |
| | |
| 44 | TortoiseEcofin |
| |
| |
| 2021 Annual Report | November 30, 2021 |
| |
| Ecofin Global Renewables Infrastructure Fund |
| Financial Highlights (continued) |
| A Class |
| | | | | | | Period |
| | Year Ended | | from Inception(1) |
| | November 30, | | to November 30, |
| | 2021 | | 2020 |
| Per Common Share Data(2) | | | | | | | | | | |
| Net asset value, beginning of period | | $ | 11.44 | | | | $ | 9.72 | | |
| Investment operations: | | | | | | | | | | |
| Net investment income | | | 0.13 | (3) | | | 0.03 | | |
| Net realized and unrealized gain on investments and translations of foreign currency | | | 1.44 | | | | | 1.70 | | |
| Total from investment operations | | | 1.57 | | | | | 1.73 | | |
| Less distributions from: | | | | | | | | | | |
| Net investment income | | | (0.28 | ) | | | | (0.01 | ) | |
| Net realized gains | | | (0.05 | ) | | | | — | | |
| Return of capital | | | (0.03 | ) | | | | — | | |
| Total distributions | | | (0.36 | ) | | | | (0.01 | ) | |
| Net asset value, end of period | | $ | 12.65 | | | | $ | 11.44 | | |
| Total Return(4)(5) | | | 13.66 | | % | | | 17.82 | | % |
| Supplemental Data and Ratios | | | | | | | | | | |
| Net assets, end of period (in 000's) | | $ | 4,983 | | | | $ | 1,338 | | |
| Ratio of expenses to average net assets: | | | | | | | | | | |
| Before expense waiver/recoupment(6) | | | 1.21 | | % | | | 2.08 | | % |
| After expense waiver/recoupment(6) | | | 1.25 | | % | | | 1.25 | | % |
| Ratio of net investment income to average net assets: | | | | | | | | | | |
| Before expense waiver/recoupment(6) | | | 1.05 | | % | | | 2.43 | | % |
| After expense waiver/recoupment(6) | | | 1.01 | | % | | | 3.26 | | % |
| Portfolio turnover rate(4) | | | 41 | | % | | | 20 | | % |
| (1) | September 25, 2020. |
| (2) | For an A Class Share outstanding for the entire period. |
| (3) | Per share amounts calculated using average shares method. |
| (4) | Total return does not reflect sales charges. |
| (5) | Not annualized. |
| (6) | Annualized. |
| See accompanying Notes to Financial Statements. | |
| | |
| TortoiseEcofin | 45 |
| |
| |
| |
| |
| Notes to Financial Statements |
| November 30, 2021 |
| |
1. Organization
Managed Portfolio Series (the “Trust”) was organized as a Delaware statutory trust on January 27, 2011. The Trust is registered under the Investment Company Act of 1940, as amended (the “1940 Act”), as an open-end management investment company. The Tortoise MLP & Pipeline Fund (“MLP & Pipeline Fund”), the Tortoise MLP & Energy Income Fund (“MLP & Energy Income Fund”), the Ecofin Global Energy Transition Fund (“Global Energy Transition Fund”) and the Ecofin Global Renewables Infrastructure Fund (“Global Renewables Infrastructure Fund”) (or collectively, “the Funds”) are each a non-diversified series with their own investment objectives and policies within the Trust. The Trust has evaluated the structure, objective and activities of the Funds and determined that they meet the characteristics of an investment company. As such, these financial statements have applied the guidance as set forth in the Accounting Standards Codifications (“ASC”) 946, Financial Services Investment Companies.
The investment objective of the MLP & Pipeline Fund is total return. The MLP & Pipeline Fund seeks to achieve its objective by investing primarily in equity securities of master limited partnerships (“MLPs”) and pipeline companies that own and operate a network of energy infrastructure asset systems that transport, store, distribute, gather and/or process crude oil, refined petroleum products (including biodiesel and ethanol), natural gas or natural gas liquids. The MLP & Pipeline Fund commenced operations on May 31, 2011.
The investment objective of the MLP & Energy Income Fund is primarily to seek current income and secondarily to seek long-term capital appreciation. The MLP & Energy Income Fund primarily invests in equity and debt securities of MLPs focused in the energy infrastructure sector and in equity and debt securities of other companies focused in the energy infrastructure sector. The MLP & Energy Income Fund commenced operations on December 27, 2010. On June 25, 2021, the Tortoise MLP & Energy Infrastructure Fund (the “Acquired Fund”) merged into the MLP & Energy Income Fund. All shares of the Acquired Fund were exchanged for shares of the MLP & Energy Income Fund on a pro rata basis immediately after the closing date. This merger qualified as a tax-free reorganization under Section 368(a)(1)(C) of the Internal Revenue Code.
The investment objective of the Global Energy Transition Fund is to generate long-term total return. The Global Energy Transition Fund primarily invests in equity securities of companies that are positively exposed to long-term structural trends related to the energy transition associated with decarbonization. The strategy is focused on changes in the way energy is produced and consumed globally. The Global Energy Transition Fund commenced operations on October 15, 2021.
The investment objective of the Global Renewables Infrastructure Fund is to generate long-term total return derived principally from a combination of capital appreciation and income over time. the Fund will principally focus its investment activities in equity securities of companies who are developers, owners and operators, in full or in part, of renewable electricity technology plants and systems, and related infrastructure investments. The Fund will typically emphasize those companies achieving measurable improvements in overall emissions, as defined as those gases and particles that are exhausted into the air as a result of fuel combustion-related activities, relative to their market peers. The Fund’s investments in equity securities may include investments in other investment companies, real estate investment trusts, foreign investment funds, preferred stocks, rights, warrants, convertible securities, and initial public offerings. The Fund will be invested in a range of both developed and non-developed markets, commensurate with its investment criteria. The Fund considers non-developed market countries to be those countries defined as such by the MSCI Market Classification Framework. The Global Renewables Infrastructure Fund commenced operations on August 7, 2020.
The MLP & Pipeline Fund and the MLP & Energy Income Fund offer three classes of shares: the Institutional Class, the A Class and the C Class. The Global Energy Transition Fund and the Global Renewables Infrastructure Fund offers two classes of shares: The Institutional Class and the A Class. Institutional Class shares have no sales charge and are offered only to qualifying institutional investors and certain other qualifying accounts. A Class shares may be subject to a front-end sales charge of up to 5.50%. Prior to November 15, 2019, the MLP & Pipeline Fund A Class shares were subject to a front-end sales charge of up to 5.75%. C Class shares may be subject to a deferred sales charge of up to 1.00%.
2. Significant Accounting Policies
The following is a summary of significant accounting policies followed by the Funds in the preparation of its financial statements. These policies are in conformity with generally accepted accounting principles in the United States of America (“GAAP”).
Securities Valuation — All investments in securities are recorded at their estimated fair value, as described in Note 3.
Foreign Currency Translation — The books and records relating to the Funds’ non-U.S. dollar denominated investments are maintained in U.S. dollars on the following bases: (1) market value of investment securities, assets, and liabilities are translated at the current rate of exchange; and (2) purchases and sales of investment securities, income, and expenses are translated at the relevant rates of exchange prevailing on the respective dates of such transactions. The Funds do not isolate the portion of gains and losses on investments in equity securities that is due to changes in the foreign exchange rates from that which is due to changes in market prices of equity securities. The Funds report certain foreign currency-related transactions as components of realized gains for financial reporting purposes, whereas such components are treated as ordinary income for federal income tax purposes.
Federal Income Taxes — The Funds intend to meet the requirements of subchapter M of the Internal Revenue Code applicable to regulated investment companies and to distribute substantially all net taxable investment income and net realized gains to shareholders in a manner which results in no tax cost to the Funds. Therefore, no federal income or excise tax provision is required. As of November 30, 2021, the Funds did
| |
| |
| 2021 Annual Report | November 30, 2021 |
| |
| Notes to Financial Statements (continued) |
| |
| |
not have any tax positions that did not meet the “more-likely-than-not” threshold of being sustained by the applicable tax authority. The Funds recognize interest and penalties, if any, related to unrecognized tax benefits on uncertain tax positions as income tax expense in the Statements of Operations. During the period ended November 30, 2021, the Global Renewables Infrastructure Fund incurred $1,982 in income tax expense. During the period ended November 30, 2021, the MLP & Pipeline Fund, the MLP & Energy Income Fund and Global Energy Transition Fund did not incur any interest or penalties. The Global Energy Transition Fund is subject to examination by U.S. taxing authorities for the period ended November 30, 2021. The Global Renewables Infrastructure Fund is subject to examination by U.S. taxing authorities for the year ended November 30, 2020 through 2021. The MLP & Pipeline Fund and the MLP & Energy Income Fund are subject to examination by U.S. taxing authorities for the tax years ended November 30, 2018 through 2021.
Securities Transactions, Income and Distributions — Securities transactions are accounted for on the date the securities are purchased or sold (trade date). Realized gains and losses are reported on a specific identified cost basis. Interest income is recognized on an accrual basis, including amortization of premiums and accretion of discounts. Dividend income and distributions are recorded on the ex-dividend date. Withholding taxes on foreign dividends have been provided for in accordance with the Funds’ understanding of the applicable country’s tax rules and regulations. Distributions received from the Funds’ investments generally are comprised of ordinary income and return of capital. The Funds allocate distributions between investment income and return of capital based on estimates made at the time such distributions are received. Such estimates are based on information provided by each portfolio company and other industry sources. These estimates may subsequently be revised based on actual allocations received from the portfolio companies after their tax reporting periods are concluded, as the actual character of these distributions is not known until after the fiscal year end of the Funds.
During the year ended November 30, 2021, the MLP & Pipeline Fund reallocated the amount of return of capital recognized based on the 2020 tax reporting information received. The impact of this adjustment is a decrease to return of capital by approximately $628,037.
During the year ended November 30, 2021, the MLP & Energy Income Fund reallocated the amount of return of capital recognized based on the 2020 tax reporting information received. The impact of this adjustment is an increase to return of capital by approximately $1,652,739.
During the year ended November 30, 2021, the Global Renewables Infrastructure Fund reallocated the amount of return of capital recognized based on the 2020 tax reporting information received. The impact of this adjustment is an increase to return of capital by approximately $51,470.
The MLP & Pipeline Fund, Global Energy Transition Fund and Global Renewables Infrastructure Fund will make distributions of net investment income, if any, semi-annually and net realized capital gains, if any, annually. The MLP & Energy Income Fund will make distributions of net investment income, if any, quarterly and net realized capital gains, if any, annually. Distributions to shareholders are recorded on the ex-dividend date. The treatment for financial reporting purposes of distributions made to shareholders during the year from net investment income or net realized capital gains may differ from their ultimate treatment for federal income tax purposes. These differences are caused primarily by differences in the timing of the recognition of certain components of income, expense or realized capital gain for federal income tax purposes. Where such differences are permanent in nature, GAAP requires that they be reclassified in the components of the net assets based on their ultimate characterization for federal income tax purposes. Any such reclassifications will have no effect on net assets, results of operations or net asset values per share of the Funds.
Reclassification of Capital Accounts — GAAP requires that certain components of net assets relating to permanent differences be reclassified between financial and tax reporting. These differences are caused primarily by differences in the timing of the recognition of certain components of income, expense or realized capital gain for federal income tax purposes. These reclassifications have no effect on net assets, results of operations or net asset value per share. For the year ended November 30, 2021, the following reclassifications were made:
| Fund | | Distributable Earnings | | Paid-in Capital |
| MLP & Pipeline Fund | | | $ | (1,333,554 | ) | | | $ | 1,333,554 | |
| MLP & Energy Income Fund | | | | (138,916,343 | ) | | | | 138,916,343 | |
| Global Energy Transition Fund | | | | — | | | | | — | |
| Global Renewables Infrastructure Fund | | | | 40,456 | | | | | (40,456 | ) |
Use of Estimates — The preparation of financial statements in conformity with GAAP requires management to make estimates and assumptions that affect the reported amounts of assets and liabilities and disclosure of contingent assets and liabilities at the date of the financial statements and the reported amounts of revenues and expenses during the reporting period. Actual results could differ from those estimates.
Allocation of Income, Expenses and Gains/Losses — Income, expenses (other than those deemed attributable to a specific share class), and gains and losses of the Funds are allocated daily to each class of shares based upon the ratio of net assets represented by each class as a percentage of the net assets of each Fund. Expenses deemed directly attributable to a class of shares are recorded by the specific class. Most Fund expenses are allocated by class based on relative net assets. 12b-1 fees are expensed at 0.25% and 1.00% of average daily net assets of A Class shares and C Class shares, respectively. Trust expenses associated with a specific fund in the Trust are charged to that fund. Common Trust expenses are typically allocated evenly between the funds of the Trust, or by other equitable means.
| |
| |
| |
| |
| Notes to Financial Statements (continued) |
| |
| |
Illiquid or Restricted Securities — A security may be considered illiquid if it lacks a readily available market. Securities are generally considered liquid if they can be sold or disposed of in the ordinary course of business within seven days at approximately the price at which the security is valued by the Funds. Illiquid securities may be valued under methods approved by the Board of Trustees as reflecting fair value. Each Fund will not hold more than 15% of the value of its net assets in illiquid securities. Certain restricted securities may be considered illiquid. Restricted securities are often purchased in private placement transactions, are not registered under the Securities Act of 1933, may have contractual restrictions on resale, and may be valued under methods approved by the Board of Trustees as reflecting fair value. At November 30, 2021, the Funds did not hold any illiquid securities.
Indemnifications — Under the Trust’s organizational documents, its officers and trustees are indemnified against certain liabilities arising out of the performance of their duties to the Trust. In addition, in the normal course of business, the Trust may enter into contracts that provide general indemnification to other parties. The Trust’s maximum exposure under these arrangements is unknown, as this would involve future claims that may be made against the Trust that have not yet occurred and may not occur. However, the Trust has not had prior claims or losses pursuant to these contracts and expects the risk of loss to be remote.
Cash and Cash Equivalents — Cash and cash equivalents include short-term, liquid investments with an original maturity of three months or less and include money market fund accounts.
3. Securities Valuation
The Funds have adopted fair value accounting standards, which establish an authoritative definition of fair value and set out a hierarchy for measuring fair value. These standards require additional disclosures about the various inputs and valuation techniques used to develop the measurements of fair value, a discussion of changes in valuation techniques and related inputs during the period and expanded disclosure of valuation levels for major security types. These inputs are summarized in the three broad levels listed below:
| Level 1 — | Quoted prices in active markets for identical assets or liabilities. |
| Level 2 — | Observable inputs other than quoted prices included in Level 1. These inputs may include quoted prices for similar instruments, interest rates, prepayment speeds, credit risk, yield curves, default rates and similar data. |
| Level 3 — | Significant unobservable inputs for the asset or liability, representing the Fund’s view of assumptions a market participant would use in valuing the asset or liability. |
Following is a description of the valuation techniques applied to each Fund’s major categories of assets and liabilities measured at fair value on a recurring basis. Each Fund’s investments are carried at fair value.
Common stock (including MLPs) — Securities that are primarily traded on a national securities exchange are valued at the last sale price on the exchange on which they are primarily traded on the day of valuation or, if there has been no sale on such day, at the mean between the bid and ask prices. Securities traded primarily on the Nasdaq Global Market System for which market quotations are readily available are valued using the Nasdaq Official Closing Price (“NOCP”). If the NOCP is not available, such securities are valued at the last sale price on the day of valuation, or if there has been no sale on such day, at the mean between the bid and ask prices. To the extent these securities are actively traded and valuation adjustments are not applied, they are categorized in Level 1 of the fair value hierarchy.
Corporate and Municipal Bonds — Corporate and municipal bonds, including listed issues, are valued at fair value on the basis of valuation furnished by an independent pricing service which utilized both dealer-supplied valuations and formula-based techniques. The pricing service may consider recently executed transactions in securities of the issuer or comparable issuers, market price quotations (where observable), bond spreads, and fundamental data relating to the issuer. Most corporate and municipal bonds are categorized in Level 2 of the fair value hierarchy.
Investment Companies — Investments in other mutual funds, including money market funds, are valued at their net asset value per share. To the extent these securities are actively traded and valuation adjustments are not applied, they are categorized in Level 1 of the fair value hierarchy.
Restricted Securities — Restricted securities are subject to statutory or contractual restrictions on their public resale, which may make it more difficult to obtain a valuation and may limit a Fund’s ability to dispose of them. Investments in private placement securities and other securities for which market quotations are not readily available are valued in good faith by using fair value procedures. Such fair value procedures may consider factors such as discounts to publicly traded issues and time until conversion date.
Derivative Instruments — Listed derivatives, including options, rights, swaps, warrants and futures that are actively traded are valued based on quoted prices from the exchange and categorized in Level 1 of the fair value hierarchy.
Securities for which market quotations are not readily available, or if the closing price does not represent fair value, are valued following procedures approved by the Board of Trustees. These procedures consider many factors, including the type of security, size of holding, trading volume and news events. There can be no assurance that the Funds could obtain the fair value assigned to a security if they were to sell the security at approximately the time at which the Funds determine their net asset value per share. The Board of Trustees has established a Valuation Committee to administer, implement, and oversee the fair valuation process, and to make fair value decisions when necessary. The Board of Trustees regularly reviews reports that describe any fair value determinations and methods.
| |
| |
| 2021 Annual Report | November 30, 2021 |
| |
| Notes to Financial Statements (continued) |
| |
| |
The inputs or methodology used for valuing securities are not an indication of the risk associated with investing in those securities.
The following table is a summary of the inputs used to value each Fund’s securities by level within the fair value hierarchy as of November 30, 2021:
| MLP & Pipeline Fund | | Level 1 | | Level 2 | | Level 3 | | Total |
| Common stock | | $ | 1,437,622,189 | | $ | — | | | $ | — | | $ | 1,437,622,189 | |
| Master limited partnerships | | | 429,824,647 | | | — | | | | — | | | 429,824,647 | |
| Short-term investment | | | 11,152,675 | | | — | | | | — | | | 11,152,675 | |
| Total investments in securities | | $ | 1,878,599,511 | | $ | — | | | $ | — | | $ | 1,878,599,511 | |
| |
| MLP & Energy Income Fund | | Level 1 | | Level 2 | | Level 3 | | Total |
| Common stock | | $ | 213,909,994 | | $ | — | | | $ | — | | $ | 213,909,994 | |
| Corporate bonds | | | — | | | 98,108,919 | | | | — | | | 98,108,919 | |
| Master limited partnerships | | | 91,981,476 | | | — | | | | — | | | 91,981,476 | |
| Short-term investment | | | 8,433,696 | | | — | | | | — | | | 8,433,696 | |
| Total investments in securities | | $ | 314,325,166 | | $ | 98,108,919 | | | $ | — | | $ | 412,434,085 | |
| |
| Global Energy Transition Fund | | Level 1 | | Level 2 | | Level 3 | | Total |
| Common stock | | $ | 19,236,266 | | $ | 23,457,788 | | | $ | — | | $ | 42,694,054 | |
| Preferred Stock | | | — | | | 1,030,579 | | | | — | | | 1,030,579 | |
| Short-term investment | | | 269,055 | | | — | | | | — | | | 269,055 | |
| Total investments in securities | | $ | 19,505,321 | | $ | 24,488,367 | | | $ | — | | $ | 43,993,688 | |
As of November 30, 2021, the Fund’s investments in other financial instruments* were classified as follows:
| Swap Contracts | | $ | — | | $ | (102,108 | ) | | $ | — | | $ | (102,108 | ) |
| Total Other Financial Instruments | | $ | — | | $ | (102,108 | ) | | $ | — | | $ | (102,108 | ) |
| |
| Global Renewables Infrastructure Fund | | Level 1 | | Level 2 | | Level 3 | | Total |
| Common stock | | $ | 153,582,876 | $ | 130,422,125 | | | $ | — | | $ | 284,005,001 | |
| Master limited partnership | | | 9,912,295 | | | — | | | | — | | | 9,912,295 | |
| Short-term investment | | | 6,963,485 | | | — | | | | — | | | 6,963,485 | |
| Total investments in securities | | $ | 170,458,656 | $ | 130,422,125 | | | $ | — | | $ | 300,880,781 | |
As of November 30, 2021, the Fund’s investments in other financial instruments* were classified as follows:
| Swap Contracts | | $ | — | | $ | (781,295 | ) | | $ | — | | $ | (781,295 | ) |
| Total Other Financial Instruments | | $ | — | | $ | (781,295 | ) | | $ | — | | $ | (781,295 | ) |
| * | Other financial instruments are derivative instruments not reflected in the Schedule of Investments, such as futures, swap contracts and written options. Swap contracts are presented at the unrealized appreciation (depreciation) on the instruments. |
Refer to each Fund’s Schedule of Investments for additional industry information.
4. Derivatives Transactions
The Funds may use derivatives for different purposes, such as a substitute for taking a position in the underlying asset and/or as part of a strategy designed to reduce exposure to other risks, such as interest rate or currency risk. The various derivative instruments that the Funds may use are options, futures contracts and options on futures contracts and other derivative securities. The Funds may also use derivatives for leverage, in which case their use would involve leveraging risk. A Fund investing in a derivative instrument could lose more than the principal amount invested.
FASB Accounting Standards Codification 815, Derivatives and Hedging (“ASC 815”) requires enhanced disclosures about each Fund’s use of, and accounting for, derivative instruments and the effect of derivative instruments on each Fund’s results of operations and financial position. Tabular disclosure regarding derivative fair value and gain/loss by contract type (e.g., interest rate contracts, foreign exchange contracts, credit contracts, etc.) is required and derivatives accounted for as hedging instruments under ASC 815 must be disclosed separately from those that do not qualify
| |
| |
| |
| |
| Notes to Financial Statements (continued) |
| |
| |
for hedge accounting. Even though the Funds may use derivatives in an attempt to achieve an economic hedge, the Funds’ derivatives are not accounted for as hedging instruments under ASC 815 because investment companies account for their derivatives at fair value and record any changes in fair value in current period earnings.
For the year ended November 30, 2021, the Funds’ average quarterly notional values are as follows:
| | Long Total Return |
| Fund | | Swap Contracts |
| Global Energy Transition Fund | | $ | 4,784,515 |
| Global Renewables Infrastructure Fund | | $ | 17,807,360 |
The locations on the Statements of Assets and Liabilities of the Funds’ derivative positions by type of exposure, all of which are not accounted for as hedging instruments under ASC 815, are as follows:
Values of Derivative Instruments as of November 30, 2021, on the Statements of Assets and Liabilities:
Global Energy Transition Fund
| | Assets | | Liabilities |
| Derivatives not accounted for as | | | | | | | | | | |
| hedging instruments under ASC 815 | | Location | | Fair Value | | Location | | Fair Value |
| Equity Contracts – Swap | | Net Assets – unrealized | | | | | Net Assets – unrealized | | | |
| Contracts | | appreciation on swap contracts** | | $ | — | | depreciation on swap contracts** | | $ | 102,108 |
**Includes cumulative appreciation/depreciation on swap contracts as reported in the Schedule of Open Swap Contracts.
The effect of Derivative Instruments on the Statements of Operations for the period ended November 30, 2021:
Amount of Realized Gain (Loss) on Derivatives
| | Global Energy |
| | Transition Fund |
| Derivatives not accounted for as | | | |
| hedging instruments under ASC 815 | | | Swap Contracts |
| Equity Contracts | | $ | 599,570 |
Change in Unrealized Appreciation or (Depreciation) on Derivatives
| | Global Energy |
| | Transition Fund |
| Derivatives not accounted for as | | | | |
| hedging instruments under ASC 815 | | | Swap Contracts | |
| Equity Contracts | | $ | (95 | ) |
| Global Renewables Infrastructure Fund | | | | | | | | | | |
| | Assets | | Liabilities |
| Derivatives not accounted for as | | | | | | | | | | |
| hedging instruments under ASC 815 | | Location | | Fair Value | | Location | | Fair Value |
| Equity Contracts – Swap | | Net Assets – unrealized | | | | | Net Assets – unrealized | | | |
| Contracts | | appreciation on swap contracts** | | $ | — | | depreciation on swap contracts** | | $ | 781,295 |
**Includes cumulative appreciation/depreciation on swap contracts as reported in the Schedule of Open Swap Contracts.
The effect of Derivative Instruments on the Statements of Operations for the period ended November 30, 2021:
Amount of Realized Gain (Loss) on Derivatives
| | Global Renewables |
| | Infrastructure Fund |
| Derivatives not accounted for as | | | |
| hedging instruments under ASC 815 | | Swap Contracts |
| Equity Contracts | | $ | 3,452,115 |
Change in Unrealized Appreciation or (Depreciation) on Derivatives
| | Global Renewables |
| | Infrastructure Fund |
| Derivatives not accounted for as | | | | |
| hedging instruments under ASC 815 | | Swap Contracts |
| Equity Contracts | | $ | (821,135 | ) |
| |
| |
| 2021 Annual Report | November 30, 2021 |
| |
| Notes to Financial Statements (continued) |
| |
| |
Balance Sheet Offsetting Information
The following table provides a summary of offsetting financial liabilities and derivatives and the effect of derivative instruments on the Statements of Assets and Liabilities as of November 30, 2021.
| Global Energy Transition Fund | | | | | | | | | | | | | | | | | | | | |
| | | | | | | | | | | | | Gross Amounts Not Offset in |
| | | | | | | | | | | | | Statements of Assets and Liabilities |
| | | | | Gross Amounts | | Net Amounts | | | | | | | | | |
| | | | | Offset in | | of Assets Presented | | | | | | | | | |
| | Gross Amounts | | Statements of | | in Statements of | | Financial | | Cash Collateral | | | |
| Assets: | | Recognized | | Assets and Liabilities | | Assets and Liabilities | | Instruments | | Pledged | | Net Amount |
| Swap Contracts | | $ | 18,181 | | $ | (18,181 | ) | | $ | — | | | $ | — | | $ | — | | $ | — |
| |
| Liabilities: | | | | | | | | | | | | | | | | | | | | |
| Swap Contracts | | $ | 120,289 | | $ | (18,181 | ) | | $ | 102,108 | | | $ | — | | $ | 102,108 | | $ | — |
| |
| Global Renewables Infrastructure Fund | | | | | | | | | | | | | | | | | | |
| | | | | | | | | | | | | | | | | | |
| | | | | | | | | | | | | Gross Amounts Not Offset in |
| | | | | | | | | | | | | Statements of Assets and Liabilities |
| | | | | Gross Amounts | | Net Amounts | | | | | | | | | |
| | | | | Offset in | | of Assets Presented | | | | | | | | | |
| | Gross Amounts | | Statements of | | in Statements of | | Financial | | Cash Collateral | | | |
| Assets: | | Recognized | | Assets and Liabilities | | Assets and Liabilities | | Instruments | | | Pledged | | Net Amount |
| Swap Contracts | | $ | 146,771 | | $ | (146,771 | ) | | $ | — | | | $ | — | | $ | — | | $ | — |
| |
| Liabilities: | | | | | | | | | | | | | | | | | | | | |
| Swap Contracts | | $ | 928,065 | | $ | (146,771 | ) | | $ | 781,295 | | | $ | — | | $ | 781,295 | | $ | — |
During the ordinary course of business, the Funds may enter into transactions subject to enforceable netting agreements or other similar arrangements (“netting agreements”). Generally, the right to offset in netting agreements allows the Funds to offset any exposure to a specific counterparty with any collateral received or delivered to that counterparty based on the terms of the agreement. Generally, each fund manages its cash collateral and securities collateral on a counterparty basis. As of November 30, 2021, the Funds did not enter into any netting agreements which would require any portfolio securities to be netted.
5. Concentration Risk & General Risk
The MLP & Pipeline Fund seeks to achieve its investment objective by investing, under normal market conditions, at least 80% of its net assets in securities of MLP and pipeline companies. Funds that primarily invest in a particular sector may experience greater volatility than funds investing in a broad range of industry sectors.
The MLP & Energy Income Fund seeks to achieve their investment objective by investing, under normal market conditions, at least 80% of its net assets in securities of companies focused in the energy infrastructure sector. Funds that primarily invest in a particular sector may experience greater volatility than funds investing in a broad range of industry sectors.
The Global Energy Transition Fund seeks to achieve its investment objective by investing, under normal market conditions, at least 80% of its net assets in securities of energy transition companies. Funds that primarily invest in a particular sector may experience greater volatility than funds investing in a broad range of industry sectors.
The Global Renewables Infrastructure Fund seeks to achieve its investment objective by investing, under normal market conditions, at least 80% of its net assets in securities of renewable infrastructure companies. Funds that primarily invest in a particular sector may experience greater volatility than funds investing in a broad range of industry sectors.
The global outbreak of COVID-19 (commonly referred to as “coronavirus”) has disrupted economic markets and the prolonged economic impact is uncertain. The ultimate economic fallout from the pandemic, and the long-term impact on economies, markets, industries and individual issuers, are not known. The operational and financial performance of the issuers of securities in which the Funds invest depends on future developments, including the duration and spread of the outbreak, and such uncertainty may in turn adversely affect the value and liquidity of the Funds’ investments, impair the Funds’ ability to satisfy redemption requests, and negatively impact the Funds’ performance.
| |
| |
| |
| |
| Notes to Financial Statements (continued) |
| |
| |
6. Investment Advisory Fee and Other Transactions with Affiliates
The Trust has an agreement with Tortoise Capital Advisors, L.L.C. (the “Adviser”) to furnish investment advisory services to the Funds. Pursuant to an Investment Advisory Agreement between the Trust and the Adviser, the Adviser is entitled to receive, on a monthly basis, an annual advisory fee equal to 0.80% for the Global Energy Transition Fund, 0.75% for the Global Renewables Infrastructure Fund, 0.85% for the MLP & Pipeline Fund, and 1.00% for the MLP & Energy Income Fund of each Fund’s average daily net assets.
The Funds’ Adviser has contractually agreed to reimburse the Fund for its expenses to ensure that total annual operating expenses (excluding acquired fund fees and expenses, interest, taxes, brokerage commissions and extraordinary expenses) for each Fund do not exceed 0.90% for the Global Energy Transition Fund, 1.00% for the Global Renewables Infrastructure Fund, 1.10% for the MLP & Pipeline Fund and 1.25% for the MLP & Energy Income Fund of the average daily net assets of each Fund. Expenses reimbursed by the Adviser may be recouped by the Adviser for a period of thirty-six months following the date on which such reimbursement was made if such recoupment can be achieved without exceeding the expense limit in effect at the time the expense reimbursement occurred and at the time of recoupment. The Operating Expense Limitation Agreement is intended to be continual in nature and cannot be terminated within a year after the effective date of the Fund’s prospectus. During the year ended November 30, 2021, the Adviser recouped expenses of $1,896 and $102,151 relating to previously waived fees for the MLP & Energy Income Fund and Global Renewables Infrastructure Fund, respectively. Reimbursed expenses subject to potential recovery by month of expiration are as follows:
| Ecofin Global Energy Transition Fund | | | | | Ecofin Global Renewables Infrastructure Fund | | | |
| December 2021 – November 2022 | | $ | — | | December 2021 – November 2022 | | $ | — |
| December 2022 – November 2023 | | | — | | December 2022 – November 2023 | | | 25,263 |
| December 2023 – November 2024 | | | 61,002 | | December 2023 – November 2024 | | | 6,782 |
U.S. Bancorp Fund Services, LLC, doing business as U.S. Bank Global Fund Services (“Fund Services” or the “Administrator”) acts as the Funds’ Administrator, Transfer Agent and fund accountant. U.S. Bank, N.A. (the “Custodian”) serves as the custodian to the Funds. The Custodian is an affiliate of the Administrator. The Administrator performs various administrative and accounting services for the Funds. The Administrator prepares various federal and state regulatory filings, reports and returns for the Funds; prepares reports and materials to be supplied to the Trustees; monitors the activities of the Funds’ custodian; coordinates the payment of the Funds’ expenses and reviews the Funds’ expense accruals. The officers of the Trust including the Chief Compliance Officer are employees of the Administrator. As compensation for its services, the Administrator is entitled to a monthly fee at an annual rate of 0.07% of the first $125 million of the average daily net assets of each fund, 0.05% on the next $250 million of the average daily net assets and 0.0325% of the daily average net assets in excess of $375 million, subject to an annual minimum of $60,000 per fund. Fees paid by the Funds for administration and accounting, transfer agency, custody and compliance services for the year ended November 30, 2021 are disclosed in the Statements of Operations.
7. Distribution Costs
The MLP & Pipeline Fund and MLP & Energy Income have adopted a Distribution Plan pursuant to Rule 12b-1 (the “Plan”) in the A Class and the C Class. The Global Energy Transition Fund and Global Renewables Infrastructure Fund has adopted a Distribution Plan pursuant to Rule 12b-1 in the A Class. The Plan permits each Fund to pay for distribution and related expenses at an annual rate of 0.25% of the A Class and 1.00% of the C Class average daily net assets. The expenses covered by the Plan may include the cost of preparing and distributing prospectuses and other sales material, advertising and public relations expenses, payments to financial intermediaries and compensation of personnel involved in selling shares of the Funds. For the year ended November 30, 2021, expenses incurred by the A Class and C Class pursuant to the Plan were as follows:
| Fund | | A Class | | C Class |
| MLP & Pipeline Fund | | $ | 390,061 | | $ | 213,551 |
| MLP & Energy Income | | | 92,184 | | | 246,418 |
| Global Energy Transition Fund | | | 13 | | | N/A |
| Global Renewables Infrastructure Fund | | | 9,215 | | | N/A |
8. Investment Transactions
The aggregate purchases and sales, excluding U.S. government securities and short-term investments, by the Funds for the year ended November 30, 2021, were as follows:
| Fund | | Purchases | | Sales |
| MLP & Pipeline Fund | | $ | 560,015,423 | | $ | 802,423,476 |
| MLP & Energy Income Fund | | | 83,228,700 | | | 107,808,302 |
| Global Energy Transition Fund | | | 4,136,335 | | | 3,954,537 |
| Global Renewables Infrastructure Fund | | | 273,327,554 | | | 85,383,264 |
| |
| |
| 2021 Annual Report | November 30, 2021 |
| |
| Notes to Financial Statements (continued) |
| |
| |
9. Federal Tax Information
As of November 30, 2021, cost basis of investments for federal income tax purposes and the components of accumulated losses on a tax basis were as follows:
| | MLP & Pipeline | | MLP & Energy | | Global Energy | | Global Renewables |
| | Fund | | Income Fund | | Transition Fund | | Infrastructure Fund |
| Cost of investments | | $ | 1,653,914,602 | | | $ | 295,139,759 | | | $ | 39,252,144 | | | $ | 277,555,588 | |
| Gross unrealized appreciation | | $ | 567,356,029 | | | $ | 156,582,956 | | | $ | 8,278,865 | | | $ | 39,097,027 | |
| Gross unrealized depreciation | | | (583,189,093 | ) | | | (122,504,527 | ) | | | (3,534,267 | ) | | | (15,778,776 | ) |
| Net unrealized appreciation (depreciation) | | | (15,833,064 | ) | | | 34,078,429 | | | | 4,744,598 | | | | 23,318,251 | |
| Undistributed ordinary income | | | — | | | | — | | | | 817,493 | | | | 964,918 | |
| Undistributed long-term capital gain | | | — | | | | — | | | | 671,651 | | | | 5,970,675 | |
| Total distributable earnings | | | — | | | | — | | | | 1,489,144 | | | | 6,935,593 | |
| Other accumulated losses | | | (1,023,846,865 | ) | | | (446,181,054 | ) | | | — | | | | — | |
| Total accumulated gain (loss) | | $ | (1,039,679,929 | ) | | $ | (412,102,625 | ) | | $ | 6,233,742 | | | $ | 30,253,844 | |
The difference between book and tax-basis cost is attributable primarily to wash sales and MLP adjustments, if any.
As of November 30, 2021, the MLP & Pipeline Fund and the MLP & Energy Income Fund had short-term capital loss carryforwards of $72,621,605 and $150,561,720 respectively, and long-term capital loss carryforwards of $951,225,260 and $162,556,656 respectively, which may be carried forward for an unlimited period under the Regulated Investment Company Modernization Act of 2010. In addition to the total capital loss carryforward, the MLP & Energy Income Fund has a short-term carryforward of $60,745,779 and a long-term carryforward of $72,316,510 that it inherited as the result of the merger with Tortoise MLP & Energy Infrastructure Fund. These capital loss carryforwards are further subject to an initial annual limitation of $63,805 and $75,901 in short-term and long-term carryforwards, respectively pursuant to Section 382. To the extent the Funds realize future net capital gains, those gains will be offset by any unused capital loss carryforwards. Capital loss carryforwards will retain their character as either short-term or long-term capital losses. Thus, such losses must be used first to offset gains of the same character; for example, long-term loss carryforwards will first offset long-term gains, before they can be used to offset short-term gains. For the MLP & Pipeline Fund and MLP & Energy Income Fund the capital gains and losses have been estimated based on information currently available and are subject to revision upon receipt of the 2021 tax reporting information from the individual MLPs.
In order to meet certain excise tax distribution requirements, the Funds are required to measure and distribute annually net capital gains realized during a twelve month period ending November 30 and net investment income earned during a twelve month period ending December 31. In connection with this, the Funds are permitted for tax purposes to defer into their next fiscal year qualified late year losses. Qualified late year ordinary losses are any net ordinary capital losses incurred between January 1 and the end of their fiscal year, November 30, 2021. For the taxable year ended November 30, 2021, The MLP & Pipeline Fund, the MLP & Energy Income Fund, Ecofin Global Energy Transition, and the Global Renewables Infrastructure Fund do not plan to defer any late year losses.
During the year ended November 30, 2021, the Funds paid the following distributions to shareholders:
| | | | | | | | | | | Global Renewables |
| | MLP & Pipeline | | MLP & Energy | | Global Energy | | Infrastructure |
| | Fund | | Income Fund | | Transition Fund | | Fund |
| Ordinary income* | | $ | 29,493,748 | | $ | 3,987,809 | | $ | — | | $ | 6,804,703 |
| Long-term capital gains** | | | — | | | — | | | — | | | — |
| Return of capital | | | 50,690,785 | | | 24,589,812 | | | — | | | — |
| Total distributions | | $ | 80,184,533 | | $ | 28,577,621 | | $ | — | | $ | 6,804,703 |
During the year ended November 30, 2020, the Funds paid the following distributions to shareholders:
| | | | | | | | Global Renewables |
| | MLP & Pipeline | | MLP & Energy | | Infrastructure |
| | Fund | | Income Fund | | Fund |
| Ordinary income* | | $ | 37,375,521 | | $ | 6,019,139 | | $ | 213,295 |
| Long-term capital gains** | | | — | | | — | | | — |
| Return of capital | | | 68,887,041 | | | 33,960,830 | | | — |
| Total distributions | | $ | 106,262,562 | | $ | 39,979,969 | | $ | 213,295 |
| * | For federal income tax purposes, distributions of short-term capital gains are treated as ordinary income distributions. |
| ** | The Funds designate as long-term capital gain distributions, pursuant to Internal Revenue Code Section 852(b)(3)(c). |
| |
| |
| |
| |
| Notes to Financial Statements (continued) |
| |
| |
10. Transactions with Affiliates
If the Fund’s holding represents ownership of 5% or more of the voting securities of a company, the company is deemed to be an affiliate as defined by the 1940 Act. The MLP & Pipeline Fund conducted transactions during the year ended November 30, 2021 with affiliated companies as so defined:
| | Beginning shares | | Additions | | Reductions | | Ending shares |
| Plains GP Holdings L.P.(1) | | 12,061,845 | | 3,971,574 | | 6,660,826 | | 9,372,593 |
| | Value as of | | | | | | | | | | | | Change in |
| | November 30, | | | | | | | | Realized | | Unrealized |
| | 2021 | | Dividend Income | | Return of Capital | | Gain (Loss) | | Depreciation |
| Plains GP Holdings L.P.(1) | | $ | 93,725,930 | | $ | — | | $ | 7,366,806 | | $ | (62,301,046 | ) | | $ | 79,372,535 |
| (1) | Security is unaffiliated as of November 30, 2021. |
11. Line of Credit
The Funds have established a line of credit (“LOC”) in the amount of $150,000,000. Borrowings under the loan agreement are charged an interest rate equal to prime, 3.25% as of November 30, 2021. This LOC is intended to provide short-term financing, if necessary, subject to certain restrictions, in connection with shareholder redemptions. The credit facility is with the Funds custodian, U.S. Bank, N.A. During the year ended November 30, 2021, the Global Energy Transition Fund and Global Renewables Infrastructure Fund did not have any borrowings under the LOC. During the year ended November 30, 2021, MLP & Pipeline Fund and MLP & Energy Income Fund activity was as follows:
| | | | | | | | | Amount |
| | | | | | | | | Outstanding as |
| | Average | | Weighted-Average | | of November 30, |
| Fund | | Borrowings | | Interest Rate | | 2021 |
| MLP & Pipeline Fund | | $ | 1,890,025 | | | 3.25% | | | | $ | — | |
| MLP & Energy Income Fund | | | 51,063 | | | 3.25% | | | | | — | |
12. Control Ownership
The beneficial ownership, either directly or indirectly, of more than 25% of the voting securities of a fund creates a presumption of control of the fund, under Section 2(a)(9) of the Investment Company Act of 1940. As of November 30, 2021, each Fund’s percentage of control ownership positions greater than 25% are as follows:
| Fund | | Shareholder | | Percent of Shares Held |
| MLP & Energy Income Fund | | Merrill Lynch, Pierce, Fenner & Smith Inc. | | | 34.59% | |
| Global Energy Transition Fund | | Sequoia Holdings, LLC | | | 67.29% | |
| Global Renewables Infrastructure Fund | | JP Morgan Securities, LLC | | | 29.61% | |
| Global Renewables Infrastructure Fund | | National Financial Services, LLC | | | 40.82% | |
13. Reorganization of Global Energy Transition Fund
On October 15, 2021, as the result of a tax-free reorganization, the Long Only sub-fund of the Ecofin Vista Master Fund Limited, established in May 2019 (the “Predecessor Fund”), an unregistered Cayman limited liability company, was reorganized into the Trust by transferring a majority of the Predecessor Fund’s assets to the Global Energy Transition Fund in exchange for Institutional Class shares of the Global Energy Transition Fund. Effective on that date, the Predecessor Fund was renamed the Ecofin Global Energy Transition Fund. The Global Energy Transition Fund was deemed to be the accounting survivor for financial reporting purposes.
As a tax-free reorganization, any unrealized appreciation or depreciation on the securities on the date of reorganization was treated as a non-taxable event, thus the cost basis of the securities held reflect the historical cost basis as of the date of reorganization. Immediately prior to the reorganization, the net assets, fair value of investments, and net unrealized appreciation of the Predecessor Fund was $49,232,949, $42,980,306 and $5,063,451, respectively.
| |
| |
| 2021 Annual Report | November 30, 2021 |
| |
| Notes to Financial Statements (continued) |
| |
| |
14. Recent Regulatory Update
In October 2020, the SEC adopted new Rule 12d1-4 under the 1940 Act and other regulatory changes which were effective January 19, 2021 and the Fund must comply with by January 19, 2022. Those changes are intended to streamline and enhance the regulatory framework for investments by one fund into another fund or ‘fund-of-funds arrangements’. These regulatory changes may limit a Fund’s ability to pursue its principal investment strategies by investing in other investment companies or pooled investment vehicles or to invest in those investment companies or pooled investment vehicles it believes are most desirable.
In December 2020, the SEC adopted a new rule providing a framework for fund valuation practices (“Rule 2a-5”). Rule 2a-5 establishes requirements for determining fair value in good faith for purposes of the 1940 Act. Rule 2a-5 will permit fund boards to designate certain parties to perform fair value determinations, subject to board oversight and certain other conditions. Rule 2a-5 also defines when market quotations are “readily available” for purposes of the 1940 Act and the threshold for determining whether a fund must fair value a security. In connection with Rule 2a-5, the SEC also adopted related recordkeeping requirements and is rescinding previously issued guidance, including with respect to the role of a board in determining fair value and the accounting and auditing of fund investments. The Fund will be required to comply with the rules by September 8, 2022. Management is currently assessing the potential impact of the new rules on the Fund’s financial statements, if any.
15. Tortoise MLP & Energy Infrastructure Merger
Pursuant to a plan of merger approved by the Board of Trustees of Managed Portfolio Series, the MLP & Energy Income Fund (the “Acquiring Fund”) acquired all of the net assets of the MLP & Energy Infrastructure Fund (the “Acquired Fund”) on June 25, 2021. A total of 3,087,121 shares of the Acquired Fund were exchanged for 2,917,825 shares of the Acquiring Fund immediately after the closing date. This merger qualified as tax-free reorganizations under Section 368(a)(1)(C) of the Internal Revenue Code. The aggregate net assets of the Acquiring Fund prior to the reorganization totaled $406,999,786 and following the merger the combined net assets of the Acquiring Fund totaled $426,649,116. Assuming the acquisition had been completed on December 1, 2020, the beginning of the fiscal reporting period of the Acquired Fund, the pro forma results of operations for the period ended November 30, 2020, are as follows:
| – | Accumulated net investment loss: $ (10,727,573) |
| | |
| – | Accumulated net realized loss on investments: $ (127,913,189) |
| | |
| – | Net unrealized appreciation of investments and translations of foreign currency: $ 5,081,977 |
For financial reporting purposes, assets received and shares issued by the Acquiring Fund were recorded at fair value. However, the cost basis of the investments being received from the Acquired Fund were carried forward to align ongoing reporting of the Acquiring Fund’s realized and unrealized gains and losses with amounts distributable to shareholders for tax purposes.
16. Subsequent Events
On December 30, 2021, the MLP & Pipeline Fund paid an income distribution to the Institutional Class in the amount of $19,660,279 or $0.12623030 per share, the A Class in the amount of $1,836,716 or $0.12152556 per share and the C Class in the amount of $197,459 or $0.10731911 per share.
On December 30, 2021, the Global Energy Transition Fund paid an income distribution to the Institutional Class in the amount of $916,975 or $0.18372797 per share and the A Class in the amount of $1,069 or $0.17734535 per share.
On December 30, 2021, the Global Renewables Infrastructure Fund paid an income distribution to the Institutional Class in the amount of $2,560,984 or $0.08583927 per share and the A Class in the amount of $30,152 or $0.07883443 per share. The Global Renewables Infrastructure Fund paid a short-term capital gain distribution to the Institutional Class in the amount of $465,122 or $0.01559 per share and the A Class in the amount of 5,963 or $0.01559 per share. The Global Renewables Infrastructure Fund paid a long-term capital gain distribution to the Institutional Class in the amount of $75,577 or $0.19760 per share and the A Class in the amount of $5,895,325 or $0.19760 per share.
Management has performed an evaluation of subsequent events through the date the financial statements were issued and has determined that no additional items require recognition or disclosure.
| |
| |
| |
| |
| Report of Independent Registered Public Accounting Firm |
| |
| |
To the Shareholders and the Board of Trustees
Tortoise MLP & Pipeline Fund
Tortoise MLP & Energy Income Fund
Ecofin Global Energy Transition Fund
Ecofin Global Renewables Infrastructure Fund
Opinion on the Financial Statements
We have audited the accompanying statements of assets and liabilities of Tortoise MLP & Pipeline Fund, Tortoise MLP & Energy Income Fund, Ecofin Global Energy Transition Fund and Ecofin Global Renewables Infrastructure Fund, (collectively referred to as the “Funds”) (four of the funds constituting the Managed Portfolio Series (the “Trust”)), including the schedules of investments, as of November 30, 2021, and the related statements of operations, changes in net assets, and the financial highlights for each of periods indicated in the table below and the related notes (collectively referred to as the “financial statements”). In our opinion, the financial statements present fairly, in all material respects, the financial position of each of the Funds (four of the funds constituting the Managed Portfolio Series) at November 30, 2021, the results of their operations, changes in net assets and financial highlights for each of the for each of the periods indicated in the table below, in conformity with U.S. generally accepted accounting principles.
| Funds constituting | | Statement | | Statement of | | |
| Managed Portfolio Series | | of operations | | changes in net assets | | Financial highlights |
| Tortoise MLP & Pipeline Fund | | For the year ended | | For each of the two years | | For each of the five years |
| Tortoise MLP & Energy Income Fund | | November 30, 2021 | | in the period ended | | in the period ended |
| | | | November 30, 2021 | | November 30, 2021 |
| Ecofin Global Renewables Infrastructure Fund | | For the year ended | | For the year ended November 30, 2021 and the |
| | November 30, 2021 | | period from August 7, 2020 (commencement of |
| | | | operations) through November 30, 2020 |
| Ecofin Global Energy Transition Fund | | For the period October 15, 2021 (commencement of operations) to November 30, 2021 |
Basis for Opinion
These financial statements are the responsibility of the Trust’s management. Our responsibility is to express an opinion on each of the Funds’ financial statements based on our audits. We are a public accounting firm registered with the Public Company Accounting Oversight Board (United States) (“PCAOB”) and are required to be independent with respect to the Trust in accordance with the U.S. federal securities laws and the applicable rules and regulations of the Securities and Exchange Commission and the PCAOB.
We conducted our audits in accordance with the standards of the PCAOB. Those standards require that we plan and perform the audit to obtain reasonable assurance about whether the financial statements are free of material misstatement, whether due to error or fraud. The Trust is not required to have, nor were we engaged to perform, an audit of the Trust’s internal control over financial reporting. As part of our audits, we are required to obtain an understanding of internal control over financial reporting but not for the purpose of expressing an opinion on the effectiveness of the Trust’s internal control over financial reporting. Accordingly, we express no such opinion.
Our audits included performing procedures to assess the risks of material misstatement of the financial statements, whether due to error or fraud, and performing procedures that respond to those risks. Such procedures included examining, on a test basis, evidence regarding the amounts and disclosures in the financial statements. Our procedures included confirmation of securities owned as of November 30, 2021, by correspondence with the custodian and brokers or by other appropriate auditing procedures where replies from brokers were not received. Our audits also included evaluating the accounting principles used and significant estimates made by management, as well as evaluating the overall presentation of the financial statements. We believe that our audits provide a reasonable basis for our opinion.

We have served as the auditor for one or more of the portfolios that comprise the Managed Portfolio Series since 2011.
Minneapolis, Minnesota
January 28, 2022
| |
| |
| 2021 Annual Report | November 30, 2021 |
| |
| Investment Advisory Agreement (unaudited) |
| |
| |
Approval Of Investment Advisory Agreement — Tortoise Capital Advisors, L.L.C.
Approval Of Investment Sub-Advisory Agreement — Ecofin Advisors Limited
At the regular meeting of the Board of Trustees of Managed Portfolio Series (“Trust”) on August 24-25, 2021, the Trust’s Board of Trustees (“Board”), each of whom were present in person, including all of the Trustees who are not “interested persons” of the Trust, as that term is defined in Section 2(a)(19) of the Investment Company Act of 1940, as amended, (“Independent Trustees”) considered and approved the Investment Advisory Agreement between the Trust and Tortoise Capital Advisors, L.L.C. (“Tortoise” or “Adviser”) regarding the Ecofin Global Energy Transition Fund (the “Fund”) (the “Advisory Agreement”) and the Investment Sub-Advisory Agreement between Tortoise and Ecofin Advisors Limited (“Ecofin” or “Sub-Adviser”) regarding the Fund (the “Sub-Advisory Agreement”) for an initial two-year term.
Prior to the meeting and at the meeting, the Trustees received and considered information from Tortoise, Ecofin, and the Trust’s administrator designed to provide the Trustees with the information necessary to evaluate the approval of the Advisory Agreement and the Sub-Advisory Agreement (“Support Materials”). The Independent Trustees then reviewed the Support Materials with regard to Tortoise, Ecofin and the Fund. They discussed initial SEC filings for the Fund. They reviewed and considered Tortoise and Ecofin’s responses to the due diligence questionnaire regarding the Fund’s investment strategy, services that Tortoise and Ecofin propose to provide to the Fund, proposed Fund management fees and the profitability that Tortoise expects to realize from its management of the Fund, any additional benefits that Tortoise or Ecofin expect to realize from their management of the Fund, and other matters that the Trustees deemed relevant. The Trustees also reviewed Tortoise’s and Ecofin’s financial statements and considered the financial condition of the firms. They also reviewed analyses which were prepared by the administrator of the Fund’s proposed and projected expenses relative to other funds in the same Morningstar category. Before voting to approve the Advisory Agreement and Sub-Advisory Agreement, the Trustees reviewed the Support Materials with Trust management and with counsel to the Independent Trustees, and received a memorandum from such counsel discussing the legal standards for the Trustees’ consideration of the approval of the Advisory Agreement and Sub-Advisory Agreement. This information, together with the information provided to the Board throughout the course of the year, formed the primary (but not exclusive) basis for the Board’s determinations.
In determining whether to approve the Advisory Agreement and the Sub-Advisory Agreement, the Trustees considered all factors they believed relevant, including the following with respect to the Fund: 1) the nature, extent, and quality of the services to be provided by Tortoise and Ecofin with respect to the Fund; (2) the cost of the services to be provided and the profits to be realized by Tortoise, from services rendered to the Fund; (3) comparative fee and expense data for the Fund and other investment companies with similar investment objectives; (4) the extent to which economies of scale may be realized as the Fund grows, and whether the proposed advisory fee for the Fund reflects such economies of scale for the Fund’s benefit; and (5) other benefits to Tortoise or Ecofin resulting from services rendered to the Fund. In their deliberations, the Trustees weighed to varying degrees the importance of the information provided to them and did not identify any particular information that was all-important or controlling.
Based upon the information provided to the Board throughout the course of the year, including at a presentation by representatives from Tortoise and Ecofin, and the Support Materials, the Board concluded that the overall arrangements between the Trust and Tortoise as set forth in the Advisory Agreement, and between Tortoise and Ecofin as set forth in the Sub-Advisory Agreement, as each agreement relates to the Fund, continue to be fair and reasonable in light of the services that Tortoise and Ecofin perform, the investment advisory fees that each receives for such services, and such other matters as the Trustees considered relevant in the exercise of their reasonable business judgment. The material factors and conclusions that formed the basis of the Trustees’ determination to approve the Advisory Agreement and the Sub-Advisory Agreement are summarized below.
Nature, Extent and Quality of Services Provided. The Trustees considered the scope of services that Tortoise and Ecofin will collectively provide under the Advisory Agreement and Sub-Advisory Agreement with respect to the Fund, noting that such services include but are not limited to the following: (1) investing the Fund’s assets consistent with the Fund’s investment objective and investment policies; (2) determining the portfolio securities to be purchased, sold, or otherwise disposed of and the timing of such transactions; (3) voting all proxies with respect to the Fund’s portfolio securities; (4) maintaining the required books and records for transactions effected by Tortoise or Ecofin on behalf of the Fund; and (5) selecting broker-dealers to execute orders on behalf of the Fund. The Trustees noted that Tortoise is well capitalized. The Trustees also considered Tortoise’s assets under management. The Trustees considered the experience of the proposed portfolio managers from Ecofin in managing an unregistered private fund that would be converted into the Fund, as well as a composite of separately managed accounts managed in a strategy similar to the Fund. The Trustees noted that Tortoise would be responsible for oversight of Ecofin, providing back office support to Ecofin with respect to shareholder servicing, compliance and Board reporting. The Trustees further noted that Ecofin would be responsible for portfolio management and trading for the Fund. The Trustees concluded that they were satisfied with the nature, extent, and quality of services that Tortoise and Ecofin propose to provide to the Fund under the Advisory Agreement and Sub-Advisory Agreement.
Cost of Advisory Services and Profitability. The Trustees considered the proposed management fee that the Fund will pay to Tortoise under the Advisory Agreement in the amount of 0.80% of the Fund’s average annual daily net assets. They also considered Tortoise’s profitability analysis (12-month pro-forma) for services that Tortoise will render to the Fund. The Trustees considered that Ecofin is 100% owned by Tortoise and that the sub-advisory fees would be paid to Ecofin out of the gross advisory fees paid to Tortoise from the Fund. In that regard, the Trustees noted that Tortoise expects to waive a portion of its management fees during the first 12 months of the Fund’s operations under the proposed operating expenses limitation agreement. The Trustees also noted that the proposed management fee would be less than the management fee payable to Ecofin by the private fund that will convert into the Fund. The Trustees expected that Tortoise’s service relationship with the Fund would not be profitable during the first 12 months of operations.
The Trustees also considered the proposed annual sub-advisory fee that Tortoise will pay to Ecofin under the Sub-Advisory Agreement. The Trustees noted that because the sub-advisory fees are paid by Tortoise, the overall advisory fee paid by the Fund is not directly affected by the sub-advisory fees paid to Ecofin. Consequently, the Trustees did not consider the costs of services provided by Ecofin or the profitability of its relationship with the Fund to be material factors for consideration.
Comparative Fee and Expense Data. The Trustees considered an analysis that the Trust’s administrator had prepared, comparing the contractual expenses that the Fund will bear to those of funds in the same Morningstar category. The Trustees noted that the Fund’s proposed management fee of 0.80% was above the peer group median and average. The Trustees also noted that the projected total contractual expenses of the Fund’s Institutional Class were below to the peer group average and above the median. While recognizing that it is difficult to compare advisory fees because the scope of advisory services provided may vary from one investment adviser to another, the Trustees concluded that Tortoise’s proposed management fee is reasonable.
Economies of Scale. The Trustees considered whether the Fund would benefit from any economies of scale, noting that the proposed investment advisory fee for the Fund does not contain breakpoints. The Trustees took into account the fact that Tortoise had agreed to consider breakpoints in the future in response to asset growth in the Fund. The Trustees concluded that it is not necessary to consider the implementation of fee breakpoints at this time, but committed to revisit this issue in the future as circumstances change and asset levels increase.
Other Benefits. The Trustees considered the direct and indirect benefits that could be realized by Tortoise from its relationships with the Fund. The Trustees noted that Tortoise will not use affiliated brokers to execute the Fund’s portfolio transactions. The Trustees considered that Tortoise may receive some form of reputational benefit from services rendered to the Fund, but that such benefits are immaterial and cannot otherwise be quantified. The Trustees concluded that Tortoise does not receive additional material benefits from its relationship with the Fund.
| |
| |
| 2021 Annual Report | November 30, 2021 |
| |
| Trustees & Officers (unaudited) |
| November 30, 2021 |
| |
Name, Address
and Year of Birth | | Position(s) Held
with the Trust | | Term of Office
and Length of
Time Served | | Number of
Portfolios
in Trust
Overseen
by Trustee | | Principal Occupation(s)
During the Past Five Years | | Other Directorships
Held by Trustee During
the Past Five Years |
| Independent Trustees | | | | | | | | | | |
Leonard M. Rush, CPA
615 E. Michigan St.
Milwaukee, WI 53202
Year of Birth: 1946 | | Chairman,
Trustee and Audit
Committee Chairman | | Indefinite Term;
Since April 2011 | | 32 | | Retired, Chief Financial Officer,
Robert W. Baird & Co.
Incorporated (2000-2011). | | Independent Trustee, ETF Series
Solutions (51 Portfolios)
(2012-Present) |
David A. Massart
615 E. Michigan St.
Milwaukee, WI 53202
Year of Birth: 1967 | | Trustee | | Indefinite Term;
Since April 2011 | | 32 | | Co-Founder and Chief
Investment Strategist,
Next Generation Wealth
Management, Inc.
(2005-present). | | Independent Trustee, ETF Series
Solutions (51 Portfolios)
(2012-Present) |
David M. Swanson
615 E. Michigan St.
Milwaukee, WI 53202
Year of Birth: 1957 | | Trustee and Nominating
& Governance
Committee Chairman | | Indefinite Term; Since April 2011 | | 32 | | Founder and Managing
Partner, SwanDog Strategic
Marketing, LLC (2006-present);
Executive Vice President,
Calamos Investments
(2004-2006). | | Independent Trustee, ALPS Variable Investment Trust (7 Portfolios) (2006-Present); Independent Trustee, RiverNorth Funds (3 Portfolios) (2018-Present); RiverNorth Managed Duration Municipal Income Fund Inc. (1 Portfolio) (2019-Present); RiverNorth Specialty Finance Corporation (1 Portfolio) (2018-Present); RiverNorth/ DoubleLine Strategic Opportunity Fund, Inc. (1 Portfolio) (2018-Present); RiverNorth Opportunities Fund, Inc. (1 Portfolio) (2015-Present); RiverNorth Opportunistic Municipal Income Fund, Inc. (1 Portfolio) (2018-Present); RiverNorth Flexible Municipal Income Fund (2020-Present). |
Robert J. Kern*
615 E. Michigan St.
Milwaukee, WI 53202
Year of Birth: 1958 | | Trustee | | Indefinite Term;
Since January
2011 | | 32 | | Retired (2018-present);
Executive Vice President, U.S.
Bancorp Fund Services, LLC
(1994-2018). | | None |
| * | Mr. Kern became an independent Trustee on July 6, 2020. Previously he was an Interested Trustee. |
| |
| |
| |
| |
| Trustees & Officers (unaudited) (continued) |
| November 30, 2020 |
| |
Name, Address
and Year of Birth | | Position(s) Held
with the Trust | | Term of Office
and Length of
Time Served | | Number of
Portfolios
in Trust
Overseen
by Trustee | | Principal Occupation(s)
During the Past Five Years | | Other Directorships
Held by Trustee During
the Past Five Years |
| Officers | | | | | | | | | | |
Brian R. Wiedmeyer
615 E. Michigan St.
Milwaukee, WI 53202
Year of Birth: 1973 | | President and Principal
Executive Officer | | Indefinite Term;
Since November 2018 | | N/A | | Vice President,
U.S. Bancorp Fund Services, LLC
(2005-present). | | N/A |
Deborah Ward
615 E. Michigan St.
Milwaukee, WI 53202
Year of Birth: 1966 | | Vice President,
Chief Compliance
Officer and Anti-Money
Laundering Officer | | Indefinite Term;
Since April 2013 | | N/A | | Senior Vice President,
U.S. Bancorp Fund Services, LLC
(2004-present). | | N/A |
Benjamin Eirich
615 E. Michigan St.
Milwaukee, WI 53202
Year of Birth: 1981 | | Treasurer, Principal
Financial Officer
and Vice President | | Indefinite Term;
Since August 2019
(Treasurer);
Indefinite Term;
Since November 2018
(Vice President) | | N/A | | Assistant Vice President,
U.S. Bancorp Fund Services, LLC
(2008-present). | | N/A |
Joseph Destache
615 E. Michigan St.
Milwaukee, WI 53202
Year of Birth: 1991 | | Secretary | | Indefinite Term;
Since March 2021 | | N/A | | Assistant Vice President,
U.S. Bancorp Fund Services, LLC
(2019-present);
Regulatory Administration Intern,
U.S. Bancorp Fund Services, LLC
(2018–2019);
Law Student (2016–2019). | | N/A |
Douglas Schafer
615 E. Michigan St.
Milwaukee, WI 53202
Year of Birth: 1970 | | Assistant Treasurer
and Vice President | | Indefinite Term;
Since May 2016
(Assistant Treasurer);
Indefinite Term;
Since November 2018
(Vice President) | | N/A | | Assistant Vice President,
U.S. Bancorp Fund Services, LLC
(2002-present). | | N/A |
Peter Walker, CPA
615 E. Michigan St.
Milwaukee, WI 53202
Year of Birth: 1993 | | Assistant Treasurer
and Vice President | | Indefinite Term:
Since November 2021 | | N/A | | Officer,
U.S. Bancorp Fund Services, LLC
(2016-present). | | N/A |
Sara Bollech
615 E. Michigan St.
Milwaukee, WI 53202
Year of Birth: 1977 | | Assistant Treasurer
and Vice President | | Indefinite Term:
Since November 2021 | | N/A | | Officer,
U.S. Bancorp Fund Services, LLC
(2007-present). | | N/A |
| |
| |
| 2021 Annual Report | November 30, 2021 |
| |
| Additional Information (unaudited) |
| |
| |
Availability of Fund Portfolio Information
The Fund files complete schedules of portfolio holdings with the SEC for the first and third quarters of each fiscal year on Part F of Form N-PORT. The Funds’ Part F of Form N-PORT is available on the SEC’s website at www.sec.gov and may be reviewed and copied at the SEC’s Public Reference Room in Washington, D.C. Information on the operation of the Public Reference Room may be obtained by calling 1-800-732-0330. The Funds’ Part F of Form N-PORT may also be obtained by calling toll-free 1-855-TCA-Fund or 1-855-822-3863.
Availability of Proxy Voting Information
A description of the Funds’ Proxy Voting Policies and Procedures is available without charge, upon request, by calling 1-855-TCA-Fund or 1-855-822-3863. Information regarding how the Funds voted proxies relating to portfolio securities during the most recent 12 month period ended June 30, is available (1) without charge, upon request, by calling 1-855-TCA-Fund or 1-855-822-3863, or (2) on the SEC’s website at www.sec.gov.
Qualified Dividend Income/Dividends Received Deduction
For the fiscal year ended November 30, 2021, certain dividends paid by the Funds may be reported as qualified dividend income and may be eligible for taxation at capital gain rates. The percentage of dividends declared from ordinary income designated as qualified dividend income was 100.00%, 100.00%, 0.00%, and 59.30% for the MLP & Pipeline Fund, MLP & Energy Income Fund, Global Energy Transition Fund, and Global Renewables Infrastructure Fund, respectively.
For corporate shareholders, the percent of ordinary income distributions qualifying for the corporate dividends received deduction for the fiscal year ended November 30, 2021, was 41.55%, 68.15%, 0.00% and 18.29% for the MLP & Pipeline Fund, MLP & Energy Income Fund, Global Energy Transition Fund and Global Renewables Infrastructure Fund, respectively.
The percentage of taxable ordinary income distributions that are designated as short-term capital gain distributions under Internal Revenue Section 871 (k)(2)(C) was 0.00%, 0.00%, 0.00%, and 18.99% for the MLP & Pipeline Fund, MLP & Energy Income Fund, Global Energy Transition Fund, and Global Renewables Infrastructure Fund, respectively.
Foreign Tax Credit Pass Through
Pursuant to Section 853 of the Internal Revenue code, the Funds designate the following amounts as foreign taxes paid for the period ended November 30, 2021. Foreign taxes paid for purposes of Section 853 may be less than actual foreign taxes paid for financial statement purposes.
| | Creditable Foreign
Tax Credit Paid | | Per Share
Amount | | Portion of Ordinary Income
Distribution Derived From
Foreign Sourced Income |
| Global Renewables Infrastructure Fund | | $415,161 | | $0.014032 | | 75.84% |
Foreign taxes paid or withheld should be included in taxable income with an offsetting deduction from gross income or as a credit for taxes paid to foreign governments. Above figures may differ from those cited elsewhere in this report due to difference in the calculation of income and gains under GAAP purposes and Internal Revenue Service purposes. Shareholders are strongly advised to consult their own tax advisers with respect to the tax consequences of their investments in the Funds.
| |
| |
| |
| |
| Additional Information (unaudited) (continued) |
| |
| |
PRIVACY NOTICE
The Funds collect only relevant information about you that the law allows or requires it to have in order to conduct its business and properly service you. The Funds collect financial and personal information about you (“Personal Information”) directly (e.g., information on account applications and other forms, such as your name, address, and social security number, and information provided to access account information or conduct account transactions online, such as password, account number, e-mail address, and alternate telephone number), and indirectly (e.g., information about your transactions with us, such as transaction amounts, account balance and account holdings).
The Funds do not disclose any non-public personal information about its shareholders or former shareholders other than for everyday business purposes such as to process a transaction, service an account, respond to court orders and legal investigations or as otherwise permitted by law. Third parties that may receive this information include companies that provide transfer agency, technology and administrative services to the Funds, as well as the Funds’ investment adviser who is an affiliate of the Funds. If you maintain a retirement/educational custodial account directly with the Funds, we may also disclose your Personal Information to the custodian for that account for shareholder servicing purposes. The Funds limit access to your Personal Information provided to unaffiliated third parties to information necessary to carry out their assigned responsibilities to the Fund. All shareholder records will be disposed of in accordance with applicable law. The Funds maintain physical, electronic and procedural safeguards to protect your Personal Information and requires its third party service providers with access to such information to treat your Personal Information with the same high degree of confidentiality.
In the event that you hold shares of the Funds through a financial intermediary, including, but not limited to, a broker-dealer, credit union, bank or trust company, the privacy policy of your financial intermediary governs how your non-public personal information is shared with unaffiliated third parties.
| Contacts | | |
| | | |
Board of Trustees David Massart
Leonard Rush, CPA
David Swanson
Robert Kern Investment Adviser Tortoise Capital Advisors, L.L.C.
6363 College Boulevard, Suite 100A
Overland Park, KS 66211 Independent Registered Public Accounting Firm Ernst & Young, LLP
700 Nicollet Mall, Suite 500
Minneapolis, MN 55402 Transfer Agent, Fund Accountant And Fund Administrator U.S. Bancorp Fund Services, LLC
777 East Wisconsin Avenue
Milwaukee, WI 53202 Distributor Quasar Distributors, LLC
111 E. Kilbourn Avenue, Suite 2200
Milwaukee, WI 53202 | | Custodian U.S. Bank, N.A.
1555 North Rivercenter Drive
Milwaukee, WI 53212 Fund Counsel Stradley Ronon Stevens & Young, LLP
2005 Market Street, Suite 2600
Philadelphia, PA 19103-7096 855-TCA-FUND
(855-822-3863) This report must be accompanied or preceded by a prospectus. The Fund’s Statement of Additional Information contains additional information about the Fund’s trustees and is available without charge upon request by calling 1-855-TCA-Fund or 1-855-822-3863. |

6363 College Boulevard
Overland Park, KS 66211 www.TortoiseEcofin.com |
(b) Not applicable.
Item 2. Code of Ethics.
The registrant has adopted a code of ethics that applies to the registrant’s principal executive officer and principal financial officer. The registrant has not made any substantive amendments to its code of ethics during the period covered by this period.
The registrant has not granted any waivers from any provisions of the code of ethics during the period covered by this report.
A copy of the registrant’s code of ethics that applies to the registrant’s principal executive officer and principal financial officer is filed herewith.
Item 3. Audit Committee Financial Expert.
The registrant’s Board of Trustees has determined that there is at least one audit committee financial expert serving on its audit committee. Leonard M. Rush is the “audit committee financial expert” and is considered to be “independent” as each term is defined in Item 3 of Form N-CSR.
Item 4. Principal Accountant Fees and Services.
The registrant has engaged its principal accountant to perform audit services, audit-related services, tax services and other services during the past fiscal year. “Audit services” refer to performing an audit of the registrant's annual financial statements or services that are normally provided by the accountant in connection with statutory and regulatory filings or engagements for the past fiscal year. “Audit-related services” refer to the assurance and related services by the principal accountant that are reasonably related to the performance of the audit. “Tax services” refer to professional services rendered by the principal accountant for tax compliance, tax advice, and tax planning, including reviewing the Fund’s tax returns and distribution calculations. There were no “other services” provided by the principal accountant. For the fiscal years ended November 30, 2021 and November 30, 2020, the Fund’s principal accountant was Ernst & Young. The following table details the aggregate fees billed or expected to be billed for each of the last fiscal year for audit fees, audit-related fees, tax fees and other fees by the principal accountant.
| | FYE 11/30/2021 | | FYE 11/30/2020 |
| (a) Audit Fees | | $171,100 | | $191,000 |
| (b) Audit-Related Fees | | $0 | | $0 |
| (c) Tax Fees | | $95,640 | | $111,500 |
| (d) All Other Fees | | $0 | | $0 |
(e)(1) The audit committee has adopted pre-approval policies and procedures that require the audit committee to pre-approve all audit and non-audit services of the Registrant, including services provided to any entity affiliated with the Registrant.
(e)(2) The percentage of fees billed by Ernst & Young applicable to non-audit services pursuant to waiver of pre-approval requirement were as follows:
| | FYE 11/30/2021 | | FYE 11/30/2020 |
| Audit-Related Fees | | 0% | | 0% |
| Tax Fees | | 0% | | 0% |
| All Other Fees | | 0% | | 0% |
(f) All of the principal accountant’s hours spent on auditing the registrant’s financial statements were attributed to work performed by full-time permanent employees of the principal accountant.
(g) The following table indicates the non-audit fees, other than the tax services as noted above, billed or expected to be billed by the registrant’s accountant for services to the registrant and to the registrant’s investment adviser (and any other controlling entity, etc.—not sub-adviser) for the last two years.
(h) The audit committee of the board of trustees/directors has considered whether the provision of non-audit services that were rendered to the registrant's investment adviser is compatible with maintaining the principal accountant's independence and has concluded that the provision of such non-audit services by the accountant has not compromised the accountant’s independence.
| Non-Audit Related Fees | | FYE 11/30/2021 | | FYE 11/30/2020 |
| Registrant | | $0 | | $0 |
| Registrant’s Investment Adviser | | $31,400 | | $31,850 |
(i) Not applicable.
(j) Not applicable.
Item 5. Audit Committee of Listed Registrants.
Not applicable to registrants who are not listed issuers (as defined in Rule 10A-3 under the Securities Exchange Act of 1934).
Item 6. Investments.
(a) Schedule of Investments is included as part of the report to shareholders filed under Item 1 of this Form.
(b) Not applicable.
Item 7. Disclosure of Proxy Voting Policies and Procedures for Closed-End Management Investment Companies.
Not applicable to open-end investment companies.
Item 8. Portfolio Managers of Closed-End Management Investment Companies.
Not applicable to open-end investment companies.
Item 9. Purchases of Equity Securities by Closed-End Management Investment Company and Affiliated Purchasers.
Not applicable to open-end investment companies.
Item 10. Submission of Matters to a Vote of Security Holders.
There have been no material changes to the procedures by which shareholders may recommend nominees to the registrant’s board of trustees.
Item 11. Controls and Procedures.
| (a) | The Registrant’s President and Treasurer have reviewed the Registrant's disclosure controls and procedures (as defined in Rule 30a-3(c) under the Investment Company Act of 1940 (the “Act”)) as of a date within 90 days of the filing of this report, as required by Rule 30a-3(b) under the Act and Rules 13a-15(b) or 15d-15(b) under the Securities Exchange Act of 1934. Based on their review, such officers have concluded that the disclosure controls and procedures are effective in ensuring that information required to be disclosed in this report is appropriately recorded, processed, summarized and reported and made known to them by others within the Registrant and by the Registrant’s service provider. |
| | |
| (b) | There were no significant changes in the Registrant's internal control over financial reporting (as defined in Rule 30a-3(d) under the Act) that occurred during the period covered by this report that has materially affected, or is reasonably likely to materially affect, the Registrant's internal control over financial reporting. |
Item 12. Disclosure of Securities Lending Activities for Closed-End Management Investment Companies
Not applicable to open-end investment companies.
Item 13. Exhibits.
SIGNATURES
Pursuant to the requirements of the Securities Exchange Act of 1934 and the Investment Company Act of 1940, the registrant has duly caused this report to be signed on its behalf by the undersigned, thereunto duly authorized.
| | (Registrant) | Managed Portfolio Series |
| | By (Signature and Title)* | /S/ Brian R. Wiedmeyer |
| | Brian R. Wiedmeyer, President |
Pursuant to the requirements of the Securities Exchange Act of 1934 and the Investment Company Act of 1940, this report has been signed below by the following persons on behalf of the registrant and in the capacities and on the dates indicated.
| | By (Signature and Title)* | /S/ Brian R. Wiedmeyer |
| | Brian R. Wiedmeyer, President |
| | By (Signature and Title)* | /s/ Benjamin J. Eirich |
| | Benjamin J. Eirich, Treasurer |
* Print the name and title of each signing officer under his or her signature.