UNITED STATES
SECURITIES AND EXCHANGE COMMISSION
Washington, D.C. 20549
FORM N-CSR
CERTIFIED SHAREHOLDER REPORT OF REGISTERED
MANAGEMENT INVESTMENT COMPANIES
Investment Company Act file number 811-22525
Managed Portfolio Series
(Exact name of registrant as specified in charter)
615 East Michigan Street
Milwaukee, WI 53202
(Address of principal executive offices) (Zip code)
Brian R. Wiedmeyer, President
Managed Portfolio Series
c/o U.S. Bancorp Fund Services, LLC
777 East Wisconsin Ave, 5th Fl
Milwaukee, WI 53202
(Name and address of agent for service)
(414) 765-6844
Registrant’s telephone number, including area code
Date of fiscal year end: November 30, 2022
Date of reporting period: November 30, 2022
Updated August 1, 2011
Item 1. Reports to Stockholders.

2022 Annual Report
November 30, 2022

| | Midstream focused Tortoise MLP & Pipeline Fund Institutional Class Shares – TORIX A Class Shares – TORTX C Class Shares – TORCX Tortoise Energy Infrastructure
and Income Fund Institutional Class Shares – INFIX A Class Shares – INFRX C Class Shares – INFFX | Renewables Ecofin Global Energy
Transition Fund Institutional Class Shares – EETIX A Class Shares – EETAX Ecofin Global Renewables
Infrastructure Fund Institutional Class Shares – ECOIX A Class Shares – ECOAX Ecofin Sustainable
Water Fund Institutional Class Shares – AQUIX A Class Shares – AQUAX | |
www.TortoiseEcofin.com
TortoiseEcofin
2022 Annual Report
This combined financial report provides you with a comprehensive review of our funds that span the entire energy value chain.
| | | | |
| | | | |
| Table of Contents | | | |
| | | | |
| Letter to Shareholders | | 2 | |
| | | | |
| Tortoise MLP & Pipeline Fund | | 5 | |
| | | | |
| Tortoise Energy Infrastructure and Income Fund | | 8 | |
| | | | |
| Ecofin Global Energy Transition Fund | | 11 | |
| | | | |
| Ecofin Global Renewables Infrastructure Fund | | 14 | |
| | | | |
| Ecofin Sustainable Water Fund | | 17 | |
| | | | |
| Expense Examples | | 21 | |
| | | | |
| Financial Statements | | 24 | |
| | | | |
| Notes to Financial Statements | | 52 | |
| | | | |
| Report of Independent Registered Public Accounting Firm | | 62 | |
| | | | |
| Trustees & Officers | | 63 | |
| | | | |
| Additional Information | | 65 | |
TortoiseEcofin
2022 Annual Report | November 30, 2022
Open-end fund comparison
| | | Name/Ticker | | Primary focus | | Total investments
($ Millions)(1) | | Portfolio mix by asset type(1) | | Portfolio mix by ownership(1) |
 | | Tortoise MLP & Pipeline Fund Institutional Class (TORIX)
A Class (TORTX)
Inception: 5/2011
C Class (TORCX)
Inception: 9/2012 | | North American pipeline companies | | $2,435.6 | | 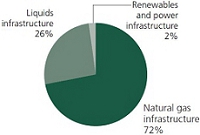 | | 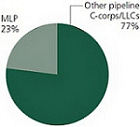 |
| | Tortoise Energy Infrastructure and Income Fund Institutional Class (INFIX)
A Class (INFRX)
Inception: 5/2011
C Class (INFFX)
Inception: 4/2012 | | Energy infrastructure equity and debt | | $525.8 | | 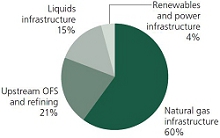 | | 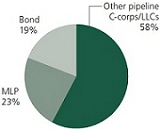 |
 | | Ecofin Global Energy Transition Fund Institutional Class (EETIX)
A Class (EETAX)
Inception: 10/2021 | | Global Securities benefiting from long-term growth associated with energy transition | | $42.2 | | Portfolio mix by asset type(1) 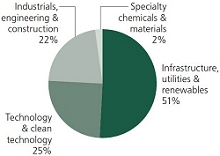
| | Portfolio mix by geography(1) 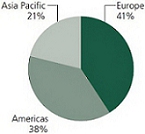
|
| | Ecofin Global Renewables Infrastructure Fund Institutional Class (ECOIX)
A Class (ECOAX)
Inception: 8/2020 | | Global Securities benefiting from long-term growth associated with energy transition | | $340.5 | | Portfolio mix by sector type(1) 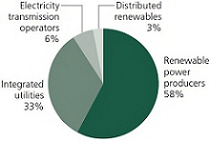
| | Portfolio mix by geography(1) 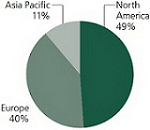
|
| | Ecofin Sustainable Water Fund
Institutional Class (AQUIX)
A Class (AQUAX)
Inception: 2/2022 | | Global Securities benefiting from the pursuit to solve the water supply/demand imbalance | | $2.1 | | 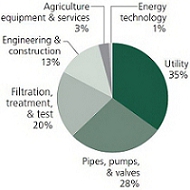 | |  |
| | |
| (1) As of 11/30/2022 | |
| | |
| (unaudited) | |
| | |
| TortoiseEcofin | 1 |
Tortoise
2022 Annual Report
Dear shareholder
The 2022 fiscal year proved to be a volatile environment with numerous headwinds for the broad market. Headwinds included recessionary concerns, rising inflation, as well as the anticipation of higher interest rates. The energy sector was an outlier with positive performance for the second consecutive fiscal year. In fact, as of December 31, 2022, midstream, represented by the Tortoise North American Pipeline IndexSM, and broader energy, represented by the S&P 500 Energy Select Sector® Index, outperformed the S&P 500 Index for the past two calendar years.
Renewable energy investments had a volatile year due to a variety of factors including inflation, sharply rising interest rates, political uncertainty, China COVID policies, decelerating economic growth and no end in sight to the war in Ukraine. Additional headwinds included uncertainties surrounding incentives legislation in the U.S., windfall taxes in Europe, security of energy supply, high energy prices, availability of equipment and components, and high logistics costs. However, the renewable energy sector was bolstered in August with the passage of the Inflation Reduction Act (IRA).
Global water equities were under pressure during the period, as a multitude of risk factors (inflation, monetary policy, interest rates and geopolitical tensions) weighed on risk-assets throughout the period. The drawdown in the sector was primarily caused by a de-rating from a multiple perspective.
Energy and power infrastructure
The broad energy sector returned 74.9% for the annual fiscal period. Energy started the year strong, sold off in June with the broader market on concerns about a looming recession but rallied into the fiscal year end as investors continued to rotate into the sector. The energy sector’s weight within the S&P 500 Index rose to above 5% for the first time since 2019 as investors sought inflation protection, rotated to a value bias from growth bias, and saw the Russia and Ukraine conflict bring energy security into focus. Potential concerns around a recession were offset by a tightening global energy supply as demand rebounds post-COVID. Global underinvestment resulting from environmental, social and governance (ESG) commitments and energy transition is likely to keep global stock balances extremely tight for the foreseeable future, a dynamic that presents higher, but perhaps more volatile prices as seen in 2022.
The global energy markets were dynamic throughout 2022. Organization of the Petroleum Exporting Countries+ (OPEC+) production continually undershot pledged production due to prolonged oil and gas underinvestment and rapidly shut-in production in 2020. The lack of supply coming to market complicates assessments over the actual amount of OPEC spare capacity. Spare capacity is critical as it guards against prices rapidly rising should a market exogenous event occur. In early October, the crude oil market tightened as OPEC+ responded to softening economic conditions in the Organization for Economic Cooperation and Development (OECD), namely Europe, by cutting production 2 million barrels per day (mm b/d). Separately, sanctions around exports of Russian energy took effect at the end of 2022 and are expected to increase in 2023 driven by an embargo of Russian crude oil above the price cap of $60. While Russian crude oil was more resilient than expected, in 2022 volumes are projected to decline and/or face longer transit times to their end market. Given these disruptions, the focus remains on the supply side of the equation. On the demand side, global inventories continued to be drawn upon and are well below their 5-year averages. The scarcity of commodities comes at a time when global demand should be boosted by China re-opening from COVID lockdowns in 2023. Chinese demand growth is expected to build throughout the year.
2022 was the eighth consecutive year of underinvestment in oil and gas. With supply sources more finite there is a renewed opportunity for short-cycle North American energy. In 2022, U.S. oil production crossed 12 mm b/d, a level not seen since April 2020. For 2023, the Energy Information Agency (EIA) forecasts that production will increase 0.3 mm b/d to 12.6 mm b/d, up from 12.3 mm b/d at the end of 2022. While production is projected to increase year-over-year, the change is notably lower than previously thought. Rising capital intensity for U.S. shale including inflationary materials and service costs has operators messaging 10-20% year over year inflation. The Permian basin, America’s biggest oil field, is expected to be the primary driver of production growth with major integrated energy companies expected to increase their production by 10-25%.
Transitioning to natural gas, the Russia-Ukraine conflict presents an enormous long-term opportunity for U.S. liquefied natural gas (LNG). Entering 2022, Russian natural gas exports to Europe accounted for 13-15 billion cubic feet per day (Bcf/d) or 35-40% of the EU’s gas supply. In 2023, we expect Russian exports of energy to further shrink. With energy security a higher priority and low natural gas inventories, Europe has been increasingly importing U.S. LNG. The U.S. LNG market, while young, grew from zero market share to the top export market in just over seven years. Throughout 2022, LNG exporters contracted almost 6 Bcf/d of new contracts, signing 15-25-year contracts with European and Asian counterparties. The market awaits several Final Investment Decisions (FIDs) in 2023 which would put the U.S. on track to roughly double LNG export capacity by end of the decade. We expect a more mixed setup for natural gas in 2023, as supply outpaces demand and unseasonably warm weather lessened gas demand for Europe and North America. One short-term positive is the expected restart of Freeport LNG, which has been offline since the second half of 2022.
The midstream energy sector returned 28.8% for the period. Investor sentiment rounded with positive retail flows coupled with companies buying back stock in the open market. Beyond the constructive technical setup, we believe midstream serves as a hedge to many current risks investors face. The midstream sector’s strong fundamentals, attractive valuations, defensive characteristics in a higher rate and inflationary environment, and improved free cash flow should support outperformance on a relative basis.
Recession concerns weighed on investor psyche the second half of the fiscal year. While there were several recessions in the last 40 years, energy demand increased in 38 out of the last 40 years (2008 and 2020 decreased). Due to actions taken during the 2020 recession, we believe the energy sector, and specifically midstream, is well prepared to deal with another potential recession. The world remains undersupplied in energy, and we believe sector balance sheets are in much better shape than in past recessions including 2001, 2008, and 2020. 2022 earnings exceeded expectations with energy the one part of the market where earnings grew at an accelerated rate.
| (unaudited) | |
| | |
| 2 | TortoiseEcofin |
| |
| |
| 2022 Annual Report | November 30, 2022 |
| |
| |
| |
| |
As more volumes flowed through pipeline systems in 2022, cash flow increased for midstream companies. The balanced return of capital story continued for investors via debt reduction, share buybacks and increased distributions. Specifically, deleveraging continued as companies targeted leverage between 3.0x-4.0x after years of leverage between 4.0x-5.0x, distribution growth accelerated to 7% in 2022 as companies targeted a return to pre-COVID levels, and share buybacks accelerated with $3.4bn repurchased through Q3. The other use of capital has been mergers and acquisitions (M&A). There were several accretive bolt-on acquisitions of private assets completed by larger energy infrastructure companies. These assets largely were complementary to existing assets, allowing operators to control energy volumes across more midstream activities.
With inflation surging to 40-year highs in 2022, midstream provided investors inflation protection. Pipelines typically have long-term contracts with inflation protection from regulated tariff escalators. Additionally, tariffs on regulated liquid pipelines often include an inflation escalator aligned with the Producer Price Index (PPI).1 Federal Energy Regulatory Commission (FERC) indexing could be a material driver of liquid pipeline cash flows with rates potentially increasing double digits next summer on top of an 8.7% increase that went into effect July 1, 2022.
Interest rates rose significantly in 2022 as the Federal Reserve took a more hawkish approach and started raising the Fed Funds rate. Historically, midstream energy displays strong historical returns in rising rate environments. In the 15 time periods of rising rates since 2001, midstream energy, represented by the Tortoise North American Pipeline IndexSM, returned an average return of 7.7%, compared to a S&P 500 average return of 6.1%, and bond return of -2.4% represented by the Bloomberg U.S. Aggregate Bond Index.2
With energy supply short and energy security concerns emerging globally, investors are reminded how critical energy infrastructure is to daily life. Even before the Ukraine conflict, U.S. LNG cargoes were rapidly replenishing Europe’s low gas storage levels via LNG tankers. LPGs (liquid petroleum gases) were being exported to India and China, where demand is driven by global population growth and improvements in living standards. Whether it’s LNG, liquefied petroleum gas (LPG), or crude oil, U.S. energy infrastructure companies have signed long-term contracts and have been exporting energy all around the world.
On the regulatory front, it was another year of mixed news flow. In August, the passage of the IRA was intended to benefit the entire energy value chain and provide energy infrastructure significant decarbonization opportunities. The IRA provides incentives for three energy infrastructure decarbonization opportunities, specifically a carbon capture and sequestration 45Q tax credit, a hydrogen production tax credit, and support for renewable natural gas. Following the passage of the IRA, Senator Manchin aimed to reform infrastructure permitting through the proposed Energy Independence and Security Act of 2022. Passage ultimately failed but could be revisited in 2023. Permitting reform is needed. In the northeast Marcellus Basin, pipeline infrastructure is constrained. Despite this need, the one major pipeline which continues to be under construction is the Mountain Valley Pipeline (MVP) and during the first half of 2022, the U.S. Court of Appeals for the Fourth Circuit overturned federal approval of a key forest-crossing permit.
Demand for low-cost U.S. natural gas creates a need for additional natural gas pipelines and LNG export terminals. Seeing the setback with MVP, companies are doing what they can to avoid the red-tape that comes with building new pipelines. For example, one company announced that its pipeline expansion will increase the mainline capacity from 2 Bcf/d to 2.5 Bcf/d through the planned installation of three new compressor stations. Adding compression stations, for example, can avoid some of the exhaustive permitting process affiliated with building new pipelines.
Sustainable infrastructure
The year was volatile due to mixed developments at the macro and sector levels. At a high level, inflation, sharply rising interest rates, political uncertainty in several countries, China COVID policies, decelerating economic growth, and no end in sight to the war in Ukraine were powerful headwinds.
At the sector level, uncertainties surrounding incentives legislation in the US, windfall taxes in Europe, security of energy supply, high energy prices, availability of equipment and components, and high logistics costs all created volatility throughout the year.
In that context, cyclical (including autos) and tech sectors underperformed the market. However, despite these difficult circumstances, the renewables sector demonstrated its secular growth resilience outperforming the broader market. US utilities outperformed their European counterparts, while the utilities sector as a whole beat the broader market.
Towards the end of the period, the Federal Reserve chairman’s somewhat dovish comments supported equity markets to the close of the period.
The following major developments affecting the sustainable infrastructure and energy transition sector during the year are worth mentioning.
Inflation Reduction Act:
The U.S. administration’s Inflation Reduction Act, which was passed during the year, contains most of the clean energy measures in the now defunct Build Back Better Act, and includes even more domestic manufacturing incentives than we expected. The $369 billion bill extends and upgrades various tax credits for technologies such as wind and solar, while introducing new tax credits and incentives for emergent technologies such as green hydrogen and standalone battery storage which should materially help accelerate deployment timelines. The manufacturing credits provided by the IRA should also accelerate and expand the onshoring of many cleantech value chains, from renewables and storage to autos and materials. In our view, it is a game changer for the entire energy transition and renewables value chain as it gives 10-year visibility to the space.
We expect the IRA to add to an inflection point in U.S. electricity demand, and demand for decarbonised electricity, delivering a growth phase for a sector that has seen limited demand growth for over a decade. We expect renewables developers to start announcing numerous new projects and to enhance the value of existing projects by taking advantage of more attractive incentives. We also foresee many more equipment manufacturing plants to be built in the US. We believe the positive impacts of the IRA aren’t yet
| (unaudited) | |
| | |
| TortoiseEcofin | 3 |
fully baked into market expectations. We expect many of the impacts of the IRA will move from drawing boards to revenues and earnings impacts starting in 2024, as new factories and operating assets start to come online.
Government Intervention:
Across Europe and for most of the year, uncertainty on potential government intervention weighed on the sector. Many of these concerns surrounded windfall taxes, a form of government intervention which confiscate a portion of profits companies gain due to the pervasive higher power price environment. These confiscated profits are then redistributed to support consumers facing unbearably high energy prices.
Upon the close of the period, we finally gained much more clarity on power prices and windfall taxes in Europe (UK, Italy and Germany) with a better outcome than feared for the majority of countries. This clarity will provide higher forward-looking visibility and stability.
Energy Security:
During the year, the Ukraine war escalated both militarily and in terms of gas supply volatility from Russia into Europe, which drove gas prices to new highs. There is still a risk to Winter 2023 gas supply and significant risk of further military escalation. The consequences of these impacts are primarily being felt in the EU Zone economy, but have a ripple effect beyond Europe, as manufacturing costs, forward activity, and concerns about access to energy-intensive materials become more acute.
Sustainable water
Fiscal year 2022 was a rough period for risk-assets, as investor concerns regarding inflation, tighter global monetary policies, higher interest rates and heightened geopolitical tensions weighed on global equity markets. During the period, elevated inflation data combined with hawkish pivots from key global central banks drove investor sentiment and valuations lower, especially in high growth (including several fund holdings) sectors. Following the weak start to the year for global equities, Russia’s invasion of Ukraine in February furthered “risk-off” sentiment as geopolitical tensions escalated and energy / commodity prices surged. Market sentiment continued to deteriorate in March with renewed COVID-driven lockdowns in China and the negative implications for supply chains and economic growth.
The second half of the year was mixed with the third quarter exhibiting similar “risk-off” performance from continued hawkish rate policies followed by a late year rally across the water sector in the fourth quarter. Nonetheless, the deteriorating economic growth outlook resulting from these factors, combined with elevated market risks, drove the water sector lower over the course of 2022. Specifically, many structural growth equities were de-rated and surging inflation led to concerns around margin compression causing a handful of names in the portfolio to be under considerable pressure. From a water value chain standpoint, Agriculture Equipment & Services and E&Cs were positive, while Filtration, Treatment & Test, Utilities, and Pipes, Pumps & Valves were negative. Fundamentals for portfolio companies remained healthy for the most part and earnings estimates were largely in-line with previous expectations for most sectors due to the underlying secular growth drivers for the sector. However, as the potential for a broader macroeconomic slowdown becomes more likely, it is expected that revisions to earnings estimates will be a key-focus for the portfolio during the course of 2023.
Concluding thoughts
With continued positive trends for the energy sector, we stand by our positive long-term outlook for the sector. With the help of the IRA, we are encouraged and hope for improved performance of sustainable infrastructure and climate action investments heading into 2023. We believe fundamentals for water companies remain healthy for the most part and earnings estimates are largely in-line with previous expectations for most sectors due to the underlying secular growth drivers for the sector. However, as the potential for a broader macroeconomic slowdown becomes more likely, it is expected that revisions to earnings estimates will be a key-focus for the water companies during the course of 2023.
The S&P 500® Index is an unmanaged market-value weighted index of stocks, which is widely regarded as the standard for measuring large-cap U.S. stock market performance. The S&P Energy Select Sector® Index is a capitalization-weighted index of S&P 500® Index companies in the energy sector involved in the development or production of energy products. The Tortoise North American Pipeline IndexSM is a float adjusted, capitalization-weighted index of energy pipeline companies domiciled in the United States and Canada. The Tortoise MLP Index® is a float-adjusted, capitalization-weighted index of energy master limited partnerships.
The Tortoise indices are the exclusive property of TIS Advisors which has contracted with S&P Opco, LLC (a subsidiary of S&P Dow Jones Indices LLC) to calculate and maintain the Tortoise MLP Index® and Tortoise North American Pipeline IndexSM (the “Indices”). The Indices are not sponsored by S&P Dow Jones Indices or its affiliates or its third party licensors (collectively, “S&P Dow Jones Indices LLC”). S&P Dow Jones Indices will not be liable for any errors or omission in calculating the Indices. “Calculated by S&P Dow Jones Indices” and its related stylized mark(s) are service marks of S&P Dow Jones Indices and have been licensed for use by TIS Advisors and its affiliates. S&P® is a registered trademark of Standard & Poor’s Financial Services LLC (“SPFS”), and Dow Jones® is a registered trademark of Dow Jones Trademark Holdings LLC (“Dow Jones”).
Free cash flow is the cash a company produces through its operations, less the cost of total capital expenditures (growth and maintenance).
It is not possible to invest directly in an index.
Performance data quoted represent past performance; past performance does not guarantee future results. Like any other stock, total return and market value will fluctuate so that an investment, when sold, may be worth more or less than its original cost.
| 1. | Producer Price Index (PPI): measures average change over time in the selling prices received by domestic producers for their output. |
| 2. | The Bloomberg U.S. Aggregate Bond Index is a broad-based flagship benchmark that measures the investment grade, U.S. dollar-denominated, fixed-rate taxable bond market. The index includes Treasuries, government-related and corporate securities, mortgage-backed securities (agency fixed-rate and hybrid adjustable rate mortgage pass-through securities), asset-backed securities and commercial mortgage-backed securities (agency and non-agency). |
| | |
| (unaudited) | |
| | |
| 4 | TortoiseEcofin |
| |
| |
| 2022 Annual Report | November 30, 2022 |
| |
| Tortoise |
| MLP & Pipeline Fund |
| |
Basic fund facts
Investment objective: Total return
Structure: Regulated investment company
| | | Institutional | | A Class | | C Class |
| Ticker | | TORIX | | | TORTX | | | TORCX | |
| Gross expense ratio(5) | | 0.94% | | | 1.19% | | | 1.94% | |
| Redemption fee | | None | | | None | | | None | |
| Maximum front-end sales load | | None | (1) | | 5.50% | (2) | | None | (1) |
| Maximum deferred sales load | | None | | | None | (3) | | 1.00% | (4) |
| (1) | While the Institutional and C Classes have no front-end load, advisory and other expenses still apply. |
| (2) | You may qualify for sales charge discounts if you invest at least $50,000. |
| (3) | No front-end sales charge is payable on A Class investments of $1 million or more, although the fund may impose a Contingent Deferred Sales Charge (“CDSC”) of 1% on certain redemptions made within 12 months of purchase. |
| (4) | The C Class CDSC applies to redemptions made within 12 months of purchase. |
| (5) | The expense ratios reflect those in the most recent prospectus and may not agree to the financial highlights. |
Targeted investment characteristics
The fund’s targeted investments generally will have the following characteristics:
| ● | Strategic assets that fuel the economy |
| | |
| ● | Diversified asset base |
| | |
| ● | Limited direct commodity price exposure |
| | |
| ● | History of predictable, recurring cash flows |
| | |
● | Total-return potential through growth and current income |
| | |
| ● | Experienced management teams |
Top ten holdings (as of November 30, 2022)
| 1. | Cheniere Energy, Inc. | | 10.2% |
| 2. | Targa Resources Corp. | | 9.7% |
| 3. | Kinder Morgan, Inc. | | 7.6% |
| 4. | The Williams Companies, Inc. | | 7.6% |
| 5. | Enbridge Inc. | | 7.6% |
| 6. | ONEOK, Inc. | | 7.0% |
| 7. | Plains GP Holdings, L.P. | | 4.8% |
| 8. | Energy Transfer LP | | 4.8% |
| 9. | Pembina Pipeline Corporation | | 4.7% |
| 10. | MPLX LP | | 4.7% |
Key asset performance drivers
| ● | All segments except the “other” segment had positive performance |
| | |
| ● | The fund’s largest allocation to natural gas pipeline companies added the most to performance |
| | |
| ● | The fund’s allocation to the “other” segment detracted the most from performance |
| Top five contributors |
| Cheniere Energy Inc |
| Targa Resources Corp. |
| Energy Transfer LP |
| Williams Companies, Inc |
| Kinder Morgan Inc |
| Bottom five contributors |
| Equitrans Midstream Corporation |
| ESS Tech Inc |
| NextDecade Corporation |
| ESS Tech Inc – Restricted |
| Genesis Energy L.P. |
| (unaudited) | |
| | |
| TortoiseEcofin | 5 |
| |
| |
| |
| |
| Tortoise |
| MLP & Pipeline Fund (continued) |
| |
Value of $1,000,000 vs. S&P 500® Index
November 30, 2012 through November 30, 2022
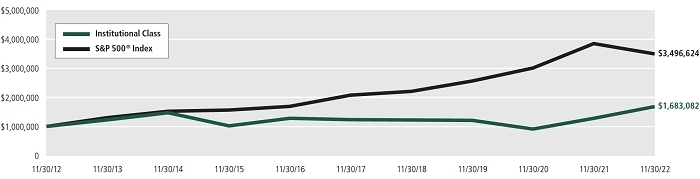
This chart illustrates the performance of a hypothetical $1,000,000 investment made on November 30, 2012 and is not intended to imply any future performance. The returns shown do not reflect the deduction of taxes that a shareholder would pay on fund distributions or the redemption of fund shares. The returns reflect fee waivers in effect. In the absence of such waivers, total return would be reduced. The chart assumes reinvestment of capital gains and dividends for a fund and dividends for the index.
The performance data quoted above represents past performance on November 30, 2012 through November 30, 2022. Past performance is no guarantee of future results. The investment return and value of an investment will fluctuate so that an investor’s shares, when redeemed, may be worth more or less than their original cost. Current performance of the fund may be obtained through the most recent month-end by calling 855-TCA-FUND (855-822-3863). Future performance may be lower or higher than the performance stated above.
The S&P 500® Index is an unmanaged market-value weighted index of stocks, which is widely regarded as the standard for measuring large-cap U.S. stock market performance. Returns include reinvested dividends. You cannot invest directly in an index.
| (unaudited) | |
| | |
| 6 | TortoiseEcofin |
| |
| |
| 2022 Annual Report | November 30, 2022 |
| |
| |
| |
| |
Total returns (as of November 30, 2022)
| Ticker | | Class | | 1 year | | 3 years | | 5 years | | 10 years(1) | | Since Inception(2) | | Gross expense ratio(6) |
| TORIX | | Institutional | | 31.52% | | 11.64% | | 6.41% | | 5.34% | | | 6.81% | | | | 0.94% | |
| TORTX | | A Class (excluding load)(3) | | 31.26% | | 11.35% | | 6.09% | | 5.06% | | | 6.51% | | | | 1.19% | |
| TORTX | | A Class (maximum load)(3) | | 24.09% | | 9.27% | | 4.90% | | 4.46% | | | 5.99% | | | | 1.19% | |
| TORCX | | C Class (excluding CDSC) | | 30.22% | | 10.52% | | 5.33% | | 4.29% | | | 5.73% | | | | 1.94% | |
| TORCX | | C Class (including CDSC) | | 29.22% | | 10.52% | | 5.33% | | 4.29% | | | 5.73% | | | | 1.94% | |
| S&P 500® Index(4) | | | | -9.21% | | 10.91% | | 10.98% | | 13.34% | | | 12.33% | | | | — | |
| TNAPT(5) | | | | 28.78% | | 12.43% | | 8.67% | | 7.69% | | | 8.39% | | | | — | |
| (1) | The C Class Shares commenced operations on September 19, 2012. Performance shown for the C Class prior to the inception of the C Class is based on the performance of the Institutional Class Shares, adjusted for the higher expenses applicable to the C Class Shares. |
| (2) | Reflects period from May 31, 2011 through November 30, 2022. The Institutional and A Class Shares commenced operations on May 31, 2011 and C Class Shares commenced operations on September 19, 2012. Performance shown for the C Class prior to inception of the C Class Shares is based on the performance of the Institutional Class Shares, adjusted for the higher expenses applicable to C Class Shares. |
| (3) | Prior to March 30, 2019, A Class Shares were known as Investor Class Shares. |
| (4) | The S&P 500® Index is an unmanaged market-value weighted index of stocks, which is widely regarded as the standard for measuring large-cap U.S. stock market performance. Returns include reinvested dividends. You cannot invest directly in an index. |
| (5) | The Tortoise North American Pipeline IndexSM is a float-adjusted, capitalization weighted index of pipeline companies headquartered in the United States and Canada. You cannot invest directly in an index. |
| (6) | The gross expense ratio is in line with the MLP & Pipeline Fund’s most recent effective prospectus and may not reflect current year activity. |
Note: For periods over 1 year, performance reflected is for the average annual returns. Performance data shown for the A Class (maximum load) reflects a sales charge of 5.50%. Performance data shown “excluding load” does not reflect the deduction of the maximum sales load. Performance data shown for the C Class (including CDSC) reflects a contingent deferred sales charge (“CDSC”) of 1% for the first 12 months of investment. Performance data shown “excluding CDSC” does not reflect the deduction of the CDSC. If reflected, the load and CDSC would reduce the performance quoted. Investment performance reflects fee waivers in effect. In the absence of such waivers, total return would be reduced.
Performance data quoted represents past performance; past performance does not guarantee future results. The investment return and principal value of an investment will fluctuate so that an investor’s shares, when redeemed, may be worth more or less than their original cost. Current performance of the portfolio may be lower or higher than the performance quoted. Performance data current to the most recent month end may be obtained by calling 855-TCA-FUND (855-822-3863).
| (unaudited) | |
| | |
| TortoiseEcofin | 7 |
| |
| |
| |
| |
| Tortoise |
| Energy Infrastructure and Income Fund |
| |
Basic fund facts
Investment objective: Current income and long-term capital appreciation
Structure: Regulated investment company
| | | Institutional | | A Class | | C Class |
| Ticker | | INFIX | | | INFRX | | | INFFX | |
| Gross expense ratio(5) | | 1.16% | | | 1.41% | | | 2.16% | |
| Redemption fee | | None | | | None | | | None | |
| Maximum front-end sales load | | None | (1) | | 5.50% | (2) | | None | (1) |
| Maximum deferred sales load | | None | | | None | (3) | | 1.00% | (4) |
| (1) | While the Institutional and C Classes have no front-end load, advisory and other expenses still apply. |
| (2) | You may qualify for sales charge discounts if you invest at least $50,000. |
| (3) | No front-end sales charge is payable on A Class investments of $1 million or more, although the fund may impose a Contingent Deferred Sales Charge (“CDSC”) of 1% on certain redemptions made within 12 months of purchase. |
| (4) | The C Class CDSC applies to redemptions made within 12 months of purchase. |
| (5) | The expense ratios reflect those in the most recent prospectus and may not agree to the financial highlights. |
Targeted investment characteristics
The fund’s targeted investments generally will have the following characteristics:
| ● | Securities from across the capital structure and energy value chain |
| | |
| ● | Strategic assets that fuel the economy |
| | |
| ● | Diversified asset base |
| | |
| ● | Limited direct commodity price exposure |
| | |
| ● | History of predictable, recurring cash flows |
| | |
| ● | Current income through distributions |
| | |
| ● | A flexible asset allocation dependent on current market opportunities |
| | |
| ● | Experienced management team |
Top ten holdings (as of November 30, 2022)
| 1. | Cheniere Energy, Inc. | | 7.6% |
| 2. | DCP Midstream, LP | | 6.2% |
| 3. | Energy Transfer LP | | 4.9% |
| 4. | The Williams Companies, Inc. | | 4.7% |
| 5. | ConocoPhillips | | 4.2% |
| 6. | EQT Corporation | | 3.9% |
| 7. | Plains GP Holdings, L.P. | | 3.8% |
| 8. | Targa Resources Corp. | | 3.5% |
| 9. | MPLX LP | | 3.4% |
| 10. | Pioneer Natural Resources Company | | 3.0% |
Key asset performance drivers
| ● | All segments had positive performance |
| | |
| ● | The fund’s large allocation to natural gas pipeline companies added the most to performance |
| | |
| ● | The fund’s allocation to diversified infrastructure companies detracted the most from performance |
| Top five contributors |
| Cheniere Energy Inc. |
| EQT Corp |
| DCP Midstream LP |
| Energy Transfer LP |
| ConocoPhillips |
| Bottom five contributors |
| NGPL Pipeco LLC |
| Atlantica Sustainable Infrastructure PLC |
| NextEra Energy Partners LP |
| Equitrans Midstream Corporation |
| Enbridge Inc |
| (unaudited) | |
| | |
| 8 | TortoiseEcofin |
| |
| |
| 2022 Annual Report | November 30, 2022 |
| |
| |
| |
| |
Value of $1,000,000 vs. the Alerian MLP Index
November 30, 2012 through November 30, 2022
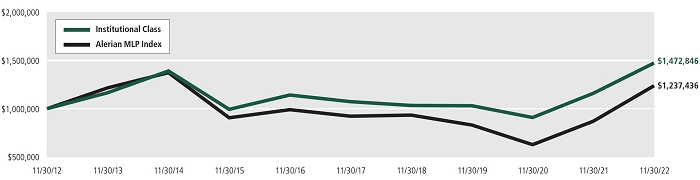
This chart illustrates the performance of a hypothetical $1,000,000 investment made on November 30, 2012 and is not intended to imply any future performance. The returns shown do not reflect the deduction of taxes that a shareholder would pay on fund distributions or the redemption of fund shares. The returns reflect fee waivers in effect. In the absence of such waivers, total return would be reduced. The chart assumes reinvestment of capital gains and dividends for a fund and dividends for the index.
The performance data quoted above represents past performance from November 30, 2012 through November 30, 2022. Past performance is no guarantee of future results. The investment return and value of an investment will fluctuate so that an investor’s shares, when redeemed, may be worth more or less than their original cost. Current performance of the fund may be obtained through the most recent month-end by calling 855-TCA-FUND (855-822-3863). Future performance may be lower or higher than the performance stated above.
The Alerian MLP Index is the leading gauge of energy infrastructure Master Limited Partnerships (MLPs). The capped, float-adjusted, capitalization-weighted index, whose constituents earn the majority of their cash flow from midstream activities involving energy commodities, is disseminated real-time on a pricereturn basis (AMZ) and on a total-return basis (AMZX).
| (unaudited) | |
| | |
| TortoiseEcofin | 9 |
| |
| |
| |
| |
| Tortoise |
| Energy Infrastructure and Income Fund (continued) |
| |
Total returns (as of November 30, 2022)
| Ticker | | Class | | 1 year | | 3 years | | 5 years | | 10 years | | Since Inception(1) | | Gross expense ratio(3) |
| INFIX | | Institutional | | 27.03% | | 12.65% | | 6.55% | | 3.95% | | | 5.17% | | | | 1.16% | |
| INFRX | | A Class (excluding load) | | 26.67% | | 12.36% | | 6.29% | | 3.69% | | | 4.44% | | | | 1.41% | |
| INFRX | | A Class (maximum load) | | 19.77% | | 10.26% | | 5.09% | | 3.11% | | | 3.93% | | | | 1.41% | |
| INFFX | | C Class (excluding CDSC) | | 25.76% | | 11.52% | | 5.47% | | 2.90% | | | 3.08% | | | | 2.16% | |
| INFFX | | C Class (including CDSC) | | 24.76% | | 11.52% | | 5.47% | | 2.90% | | | 3.08% | | | | 2.16% | |
| Alerian MLP Index(2) | | | | 42.25% | | 14.22% | | 6.06% | | 2.15% | | | 3.75% | | | | — | |
| (1) | Reflects period from fund inception on December 27, 2010 through November 30, 2022. The Institutional Class commenced operations on December 27, 2010, the A Class Shares commenced operation on May 18, 2011 and the C Class Shares commenced operations on April 2, 2012. Performance shown for the A Class and C Class prior to the inception of the A Class Shares and C Class Shares is based on the performance of the Institutional Class Shares, adjusted for the higher expenses applicable to the A Class Shares and the C Class Shares, respectively. |
| (2) | The Alerian MLP Index is the leading gauge of energy infrastructure Master Limited Partnerships (MLPs). The capped, float-adjusted, capitalization-weighted index, whose constituents earn the majority of their cash flow from midstream activities involving energy commodities, is disseminated real-time on a pricereturn basis (AMZ) and on a total-return basis (AMZX). |
| (3) | The gross expense ratio is in line with the MLP & Pipeline Fund’s most recent effective prospectus and may not reflect current year activity. |
Note: For periods over 1 year, performance reflected is for the average annual returns. Performance data shown for the A Class (maximum load) reflects a sales charge of 5.50%. Performance data shown “excluding load” does not reflect the deduction of the maximum sales load. Performance data shown for the C Class (including CDSC) reflects a contingent deferred sales charge (“CDSC”) of 1% for the first 18 months of investment. Performance data shown “excluding CDSC” does not reflect the deduction of the CDSC. If reflected, the load and CDSC would reduce the performance quoted. Investment performance reflects fee waivers in effect. In the absence of such waivers, total return would be reduced.
Performance data quoted represents past performance; past performance does not guarantee future results. The investment return and principal value of an investment will fluctuate so that an investor’s shares, when redeemed, may be worth more or less than their original cost. Current performance of the portfolio may be lower or higher than the performance quoted. Performance data current to the most recent month end may be obtained by calling 855-TCA-FUND (855-822-3863).
| (unaudited) | |
| | |
| 10 | TortoiseEcofin |
| |
| |
| 2022 Annual Report | November 30, 2022 |
| |
| Ecofin |
| Global Energy Transition Fund |
| |
Basic fund facts
Investment objective: Current income and long-term capital appreciation
Structure: Regulated investment company
| | | Institutional | | A Class |
| Ticker | | EETIX | | | | EETAX | |
| Net expense ratio(1) | | 0.90% | | | | 1.15% | |
| Redemption fee | | None | | | | None | |
| Maximum front-end sales load | | None | (2) | | | 5.50% | (3) |
| Maximum deferred sales load | | None | | | | None | (4) |
| (1) | Tortoise has contractually agreed to limit total operating expenses (excluding acquired fund fees and expenses, brokerage commissions, leverage/borrowing interest, interest expense, taxes and extraordinary expenses) through 3/31/2023. Reimbursed expenses may be recouped for a period of thirty-six months if such recoupment can be achieved without exceeding these expense limits. |
| (2) | While the Institutional Class has no front-end load, advisory and other expenses still apply. |
| (3) | You may qualify for sales charge discounts if you invest at least $50,000. |
| (4) | No front-end sales charge is payable on A Class investments of $1 million or more, although the fund may impose a Contingent Deferred Sales Charge (“CDSC”) of 1% on certain redemptions made within 12 months of purchase. |
Targeted investment characteristics
The fund’s targeted investments generally will have the following characteristics:
| ● | Exposure to structural growth opportunities related to the energy transition associated with decarbonization |
| | |
| ● | Changes the way energy is produced and consumed globally |
| | |
| ● | Focused on more efficient use of resources and emissions reduction |
| | |
| ● | Emphasize the following major investment themes: electrification, clean transportation, industrial and building efficiency and environment |
Top ten holdings (as of November 30, 2022)
| 1. | Infineon Technologies AG | | 6.4% |
| 2. | NextEra Energy, Inc. | | 6.3% |
| 3. | Constellation Energy Corporation | | 6.2% |
| 4. | Schneider Electric SE | | 6.0% |
| 5. | TE Connectivity Ltd. | | 5.2% |
| 6. | Enel SpA | | 5.1% |
| 7. | Keyence Corp. | | 5.0% |
| 8. | STEM, Inc. | | 4.6% |
| 9. | Sunrun, Inc. | | 4.6% |
| 10. | ROHM Co., Ltd. | | 4.5% |
Key asset performance drivers
| ● | The fund’s allocation to the “other” segment detracted the most from performance |
| | |
| ● | Wind companies also significantly detracted from performance |
| | |
| ● | The fund’s allocation to solar companies added the most to performance |
| Top five contributors |
| Constellation Energy Corp |
| First Solar, Inc. |
| Corporacion Acciona Energias Renovables SA |
| Schneider Electric SA |
| NextEra Energy Inc |
| Bottom five contributors |
| Lyft Inc |
| Nidec Corporation |
| China Longyuan Power Group Corporation Limited |
| Keyence Corporation |
| Scatec ASA |
| (unaudited) | |
| | |
| TortoiseEcofin | 11 |
| |
| |
| |
| |
| Ecofin |
| Global Energy Transition Fund (continued) |
| |
Value of $1,000,000 vs. MSCI ACWI Index
April 30, 2019 through November 30, 2022
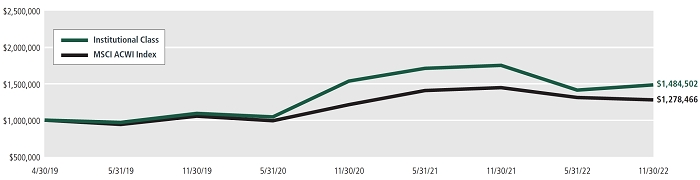
The Fund commenced operations on October 15, 2021. This chart illustrates the performance of a hypothetical $1,000,000 investment made on April 30, 2019 and is not intended to imply any future performance. The returns shown do not reflect the deduction of taxes that a shareholder would pay on fund distributions or the redemption of fund shares. The returns reflect fee waivers in effect. In the absence of such waivers, total return would be reduced. The chart assumes reinvestment of capital gains and dividends for a fund and dividends for the index.
The performance data quoted above represents past performance on April 30, 2019 through November 30, 2022. Past performance is no guarantee of future results. The investment return and value of an investment will fluctuate so that an investor’s shares, when redeemed, may be worth more or less than their original cost. Current performance of the fund may be obtained through the most recent month-end by calling 855-TCA-FUND (855-822-3863). Future performance may be lower or higher than the performance stated above.
The MSCI ACWI Index is designed to represent performance of the full opportunity set of large- and mid-cap stocks across 23 developed and 25 emerging markets. You cannot invest directly in an index.
| (unaudited) | |
| | |
| 12 | TortoiseEcofin |
| |
| |
| 2022 Annual Report | November 30, 2022 |
| |
| |
| |
| |
Total returns (as of November 30, 2022)
| Ticker | | Class | | 1 year | | 3 years | | Since Inception | | Gross expense ratio(5) |
| EETIX(1)(2) | | Institutional | | -15.32% | | 10.76% | | | 11.65% | | | | 1.86% | |
| EETAX(1)(3) | | A Class (excluding load) | | -15.56% | | 10.44% | | | 11.33% | | | | 2.11% | |
| EETAX(1)(3) | | A Class (including load) | | -20.20% | | 8.38% | | | 9.59% | | | | 2.11% | |
| MSCI ACWI Index (Net)(4) | | | | -11.62% | | 6.63% | | | 7.09% | | | | — | |
| (1) | Fund commenced operations on October 15, 2021. |
| (2) | The performance data quoted for the period prior to October 18, 2021 is that of the Long Only sub-fund of the Ecofin Vista Master Fund Limited (the “Predecessor Fund”) and has been adjusted to reflect the Fund’s share class’ fees and expenses. The Predecessor Fund commenced operations on April 30, 2019, and was not a registered mutual fund subject to the same investment and tax restrictions as the Fund. If it had, the Predecessor Fund’s performance might have been lower. The Predecessor Fund’s shares were exchanged for the Fund’s Institutional Class shares on October 15, 2021. |
| (3) | Performance of the A Class prior to the inception of the class is based on the performance of the Predecessor Fund, adjusted for the higher expenses applicable to the class compared to the Institutional Class. |
| (4) | The MSCI ACWI Index is designed to represent performance of the full opportunity set of large- and mid-cap stocks across 23 developed and 25 emerging markets. You cannot invest directly in an index. |
| (5) | The gross expense ratio is in line with the Global Energy Transition Fund’s most recent effective prospectus and may not reflect current year activity. |
Note: For periods over 1 year, performance reflected is for the average annual returns. Performance data shown for the A Class (maximum load) reflects a sales charge of 5.50%. Performance data shown “excluding load” does not reflect the deduction of the maximum sales load.
Performance data quoted represents past performance; past performance does not guarantee future results. The investment return and principal value of an investment will fluctuate so that an investor’s shares, when redeemed, may be worth more or less than their original cost. Current performance of the portfolio may be lower or higher than the performance quoted. Performance data current to the most recent month end may be obtained by calling 855-TCA-FUND (855-822-3863).
| (unaudited) | |
| | |
| TortoiseEcofin | 13 |
| |
| |
| |
| |
| Ecofin |
| Global Renewables Infrastructure Fund |
| |
Basic fund facts
Investment objective: Total Return
Structure: Regulated Investment Company
| | | Institutional | | A Class |
| Ticker | | ECOIX | | | | ECOAX | |
| Net Expense Ratio(1) | | 0.96% | | | | 1.21% | |
| Redemption fee | | None | | | | None | |
| Maximum front-end sales load | | None | (2) | | | 5.50% | (3) |
| Maximum deferred sales load | | None | | | | None | (4) |
| (1) | The expense ratios reflect those in the most recent prospectus and may not agree to the financial highlights. |
| (2) | While the Institutional Class has no front-end load, advisory and other expenses still apply. |
| (3) | You may qualify for sales charge discounts if you invest at least $50,000. |
| (4) | No front-end sales charge is payable on A Class investments of $1 million or more, although the fund may impose a Contingent Deferred Sales Charge (“CDSC”) of 1% on certain redemptions made within 12 months of purchase. |
Targeted investment characteristics
The fund’s targeted investments generally will have the following characteristics:
| ● | Securities from across the capital structure and energy value chain |
| | |
| ● | Strategic assets that fuel the economy |
| | |
| ● | Diversified asset base |
| | |
| ● | Limited direct commodity price exposure |
| | |
| ● | History of predictable, recurring cash flows |
| | |
| ● | Current income through distributions |
| | |
| ● | A flexible asset allocation dependent on current market opportunities |
| | |
| ● | Experienced management team |
Top ten holdings (as of November 30, 2022)
| 1. | NextEra Energy, Inc. | | 6.8% |
| 2. | Clearway Energy, Inc. | | 5.8% |
| 3. | ERG SpA | | 5.6% |
| 4. | NextEra Energy Partners LP | | 5.5% |
| 5. | Atlantica Sustainable Infrastructure plc | | 5.1% |
| 6. | Edison International | | 5.1% |
| 7. | Constellation Energy Corporation | | 4.7% |
| 8. | TransAlta Renewables Inc. | | 4.6% |
| 9. | Public Service Enterprise Group Incorporated | | 4.3% |
| 10. | Terna — Rete Elettrica Nazionale SpA | | 3.8% |
Key asset performance drivers
| ● | The fund’s allocation to power companies detracted the most from performance |
| | |
| ● | Wind companies also significantly detracted from performance |
| | |
| ● | Utilities added the most to performance |
| Top five contributors |
| Constellation Energy Corp |
| Corporacion Acciona Energias Renovables SA |
| Greencoat UK Wind PLC |
| Terna spa |
| SSE PLC |
| Bottom five contributors |
| China Longyuan Power Group Corporation Ltd |
| Orsted A/S |
| Sunrun Inc |
| TransAlta Renewables Inc |
| Renova Inc |
| (unaudited) | |
| | |
| 14 | TortoiseEcofin |
| |
| |
| 2022 Annual Report | November 30, 2022 |
| |
| |
| |
| |
Value of $1,000,000 vs. S&P Global Infrastructure® Index (Net)
November 2, 2015 through November 30, 2022
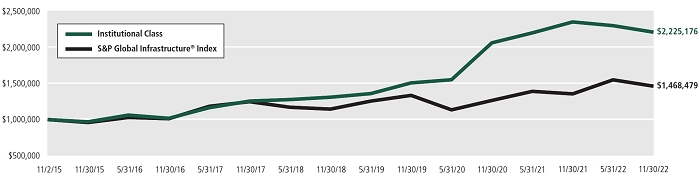
The Fund commenced operations on August 7, 2020. This chart illustrates the performance of a hypothetical $1,000,000 investment made on November 2, 2015 and is not intended to imply any future performance. The returns shown do not reflect the deduction of taxes that a shareholder would pay on fund distributions or the redemption of fund shares. The returns reflect fee waivers in effect. In the absence of such waivers, total return would be reduced. The chart assumes reinvestment of capital gains and dividends for a fund and dividends for the index.
The performance data quoted above represents past performance on November 2, 2015 through November 30, 2022. Past performance is no guarantee of future results. The investment return and value of an investment will fluctuate so that an investor’s shares, when redeemed, may be worth more or less than their original cost. Current performance of the fund may be obtained through the most recent month-end by calling 855-TCA-FUND (855-822-3863). Future performance may be lower or higher than the performance stated above.
The S&P Global Infrastructure® Index is designed to track 75 companies from around the world chosen to represent the listed infrastructure industry while maintaining liquidity and tradability. You cannot invest directly in an index.
| (unaudited) | |
| | |
| TortoiseEcofin | 15 |
| |
| |
| |
| |
| Ecofin |
| Global Renewables Infrastructure Fund (continued) |
| |
Total returns (as of November 30, 2022)
| Ticker | | Class | | 1 Year | | 3 Years | | 5 Years | | Since inception | | Gross expense ratio(5) |
| ECOIX(1)(2) | | Institutional | | -5.97% | | 13.69% | | 12.06% | | | 11.97% | | | | 0.96% | |
| ECOAX(1)(3) | | A Class (excluding load) | | -6.21% | | 13.43% | | 11.80% | | | 11.70% | | | | 1.21% | |
| ECOAX(1)(3) | | A Class (including load) | | -11.39% | | 11.31% | | 10.54% | | | 10.81% | | | | 1.21% | |
| S&P Global Infrastructure Index(4) | | | | 8.83% | | 3.93% | | 4.16% | | | 6.50% | | | | — | |
| S&P Global Infrastructure Index (Net)(4) | | | | 7.97% | | 3.12% | | 3.27% | | | 5.58% | | | | — | |
| (1) | Fund commenced operations on August 7, 2020. |
| (2) | The performance data quoted for the period prior to August 7, 2020 is that of the Tortoise Global Renewables Infrastructure Fund Limited (the “Predecessor Fund”) and has been adjusted to reflect the Fund’s share class’ fees and expenses. The Predecessor Fund commenced operations on November 2, 2015, and was not a registered mutual fund subject to the same investment and tax restrictions as the Fund. If it had, the Predecessor Fund’s performance might have been lower. The Predecessor Fund’s shares were exchanged for the Fund’s Institutional Class shares on August 7, 2020. |
| (3) | Performance of the A Class prior to the inception of the class is based on the performance of the Predecessor Fund, adjusted for the higher expenses applicable to the class compared to the Institutional Class. |
| (4) | The S&P Global Infrastructure® Index is designed to track 75 companies from around the world chosen to represent the listed infrastructure industry while maintaining liquidity and tradability. You cannot invest directly in an index. |
| (5) | The gross expense ratio is in line with the Global Renewables Infrastructure Fund’s most recent effective prospectus and may not reflect current year activity. |
Note: For periods over 1 year, performance reflected is for the average annual returns. Performance data shown for the A Class (maximum load) reflects a sales charge of 5.50%. Performance data shown “excluding load” does not reflect the deduction of the maximum sales load.
Performance data quoted represents past performance; past performance does not guarantee future results. The investment return and principal value of an investment will fluctuate so that an investor’s shares, when redeemed, may be worth more or less than their original cost. Current performance of the portfolio may be lower or higher than the performance quoted. Performance data current to the most recent month end may be obtained by calling 855-TCA-FUND (855-822-3863).
| (unaudited) | |
| | |
| 16 | TortoiseEcofin |
| |
| |
| 2022 Annual Report | November 30, 2022 |
| |
| Ecofin |
| Sustainable Water Fund |
| |
Basic fund facts
Investment objective: Long-term total return
Structure: Regulated investment company
| | | | Institutional | | | A Class |
| Ticker | | | AQUIX | | | | AQUAX | |
| Net expense ratio(1) | | | 0.95% | | | | 1.20% | |
| Redemption fee | | | None | | | | None | |
| Maximum front-end sales load | | | None | (2) | | | 5.50% | (3) |
| Maximum deferred sales load | | | None | | | | None | (4) |
| (1) | Tortoise has contractually agreed to limit total operating expenses (excluding acquired fund fees and expenses, brokerage commissions, leverage/borrowing interest, interest expense, taxes and extraordinary expenses) through 2/2/2023. Reimbursed expenses may be recouped for a period of thirty-six months if such recoupment can be achieved without exceeding these expense limits. |
| (2) | While the Institutional Class has no front-end load, advisory and other expenses still apply. |
| (3) | You may qualify for sales charge discounts if you invest at least $50,000. |
| (4) | No front-end sales charge is payable on A Class investments of $1 million or more, although the fund may impose a Contingent Deferred Sales Charge (“CDSC”) of 1% on certain redemptions made within 12 months of purchase. |
Targeted investment characteristics
The fund’s targeted investments generally will have the following characteristics:
| ● | Global |
| ● | Throughout the water cycle |
| ● | Positioned to benefit from the pursuit to solve the water supply/ demand imbalance |
| ● | Essential in connecting water supply with areas of demand, solving water scarcity and quality issues to improve health, human safety and environment |
| ● | Provide technological advancement in the water sector |
Top ten holdings (as of November 30, 2022)
| 1. | American Water Works Co., Inc. | 9.6% |
| 2. | Xylem, Inc. | 9.2% |
| 3. | Essential Utilities, Inc. | 9.2% |
| 4. | Veolia Environnement SA | 7.8% |
| 5. | Danaher Corp. | 7.2% |
| 6. | Advanced Drainage Systems, Inc. | 5.5% |
| 7. | Aecom | 4.2% |
| 8. | IDEX Corp. | 4.0% |
| 9. | Tetra Tech, Inc. | 3.9% |
| 10. | Kurita Water Industries Ltd. | 3.7% |
Key asset performance drivers
| ● | The funds large allocation to water infrastructure companies detracted the most from performance |
| ● | Water infrastructure companies also restrained performance |
| ● | Water utilities added the most to performance |
| Top five contributors |
| Xylem Inc. |
| Lindsay Corporation |
| IDEX Corporation |
| Aecom |
| Essential Utilities Inc |
| |
| Bottom five contributors |
| Veolia Environnement |
| Pentair Inc |
| Zurn Elkay Water Solutions Corp |
| China Water Affairs Group Ltd. |
| Advanced Drainage Systems Inc |
| (unaudited) | |
| | |
| TortoiseEcofin | 17 |
| |
| |
| |
| |
| Ecofin |
| Sustainable Water Fund (continued) |
| |
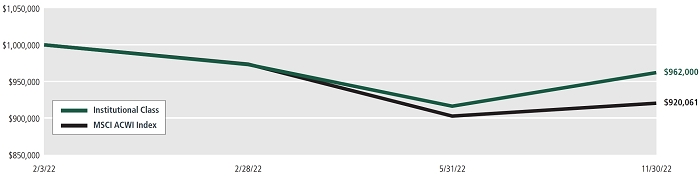
| Value of $1,000,000 vs. S&P Global Water Index |
| February 4, 2022 through November 30, 2022 |
|
The Fund commenced operations on February 4, 2022. This chart illustrates the performance of a hypothetical $1,000,000 investment made on February 4, 2022 and is not intended to imply any future performance. The returns shown do not reflect the deduction of taxes that a shareholder would pay on fund distributions or the redemption of fund shares. The returns reflect fee waivers in effect. In the absence of such waivers, total return would be reduced. The chart assumes reinvestment of capital gains and dividends for a fund and dividends for the index.
The performance data quoted above represents past performance on February 4, 2022 through November 30, 2022. Past performance is no guarantee of future results. The investment return and value of an investment will fluctuate so that an investor’s shares, when redeemed, may be worth more or less than their original cost. Current performance of the fund may be obtained through the most recent month-end by calling 855-TCA-FUND (855-822-3863). Future performance may be lower or higher than the performance stated above.
The S&P Global Water Index provides liquid and tradable exposure to 50 companies from around the world that are involved in two distinct water related businesses: Water Utilities & Infrastructure and Water Equipment & Materials.
| (unaudited) | |
| | |
| 18 | TortoiseEcofin |
| |
| |
| 2022 Annual Report | November 30, 2022 |
| |
| |
| |
| |
Total returns (as of November 30, 2022)
| Ticker | | Class | | Since Inception(1) | | Gross expense ratio(3) | |
| AQUIX | | Institutional | | -3.80% | | 1.74% | |
| AQUAX | | A Class (excluding load) | | -4.00% | | 1.99% | |
| AQUAX | | A Class (including load) | | -9.26% | | 1.99% | |
| S&P Global Water Index(2) | | | | -7.99% | | — | |
| (1) | Fund commenced operations on February 4, 2022. |
| (2) | The S&P Global Water Index provides liquid and tradable exposure to 50 companies from around the world that are involved in two distinct water related businesses: Water Utilities & Infrastructure and Water Equipment & Materials. |
| (3) | The gross expense ratio is in line with the Global Energy Transition Fund’s most recent effective prospectus and may not reflect current year activity. |
Note: For periods over 1 year, performance reflected is for the average annual returns. Performance data shown for the A Class (maximum load) reflects a sales charge of 5.50%. Performance data shown “excluding load” does not reflect the deduction of the maximum sales load.
Performance data quoted represents past performance; past performance does not guarantee future results. The investment return and principal value of an investment will fluctuate so that an investor’s shares, when redeemed, may be worth more or less than their original cost. Current performance of the portfolio may be lower or higher than the performance quoted. Performance data current to the most recent month end may be obtained by calling 855-TCA-FUND (855-822-3863).
| (unaudited) | |
| | |
| TortoiseEcofin | 19 |
Mutual fund investing involves risk. Principal loss is possible. The funds are non-diversified, meaning they may concentrate their assets in fewer individual holdings than a diversified fund. Therefore, the funds are more exposed to individual stock volatility than diversified funds. Investing in specific sectors such as North American energy may involve greater risk and volatility than less concentrated investments. Risks include, but are not limited to, risks associated with energy investments, including upstream energy companies, midstream companies, downstream companies, energy company beneficiaries, master limited partnerships (MLPs), MLP affiliates, commodity price volatility, supply and demand, regulatory, environmental, operating, capital markets, terrorism, natural disaster and climate change risks. The tax benefits received by an investor investing in the funds differ from that of a direct investment in an MLP by an investor. The value of the funds’ investments in an MLP will depend largely on the MLP’s treatment as a partnership for U.S. federal income tax purposes. If the MLP is deemed to be a corporation then its income would be subject to federal taxation, reducing the amount of cash available for distribution to the funds which could result in a reduction of the funds’ values. Investments in foreign companies involve risk not ordinarily associated with investments in securities and instruments of U.S. issuers, including risks related to political, social and economic developments abroad, differences between U.S. and foreign regulatory and accounting requirements, tax risk and market practices, as well as fluctuations in foreign currencies. The funds invest in large, small and mid-cap companies, which involve additional risks such as limited liquidity and greater volatility than larger companies. Investments in debt securities typically decrease in value when interest rates rise. This risk is usually greater for longer-term debt securities. Investment in lower-rated and non-rated securities presents a greater risk of loss to principal and interest than higher-rated securities. The funds may also write call options which may limit the funds’ abilities to profit from increases in the market value of a security, but cause it to retain the risk of loss should the price of the security decline. Some funds may invest in other derivatives including options, futures and swap agreements, which can be highly volatile, illiquid and difficult to value, and changes in the value of a derivative held by the funds may not correlate with the underlying instrument or the fund’s other investments and can include additional risks such as liquidity risk, leverage risk and counterparty risk that are possibly greater than risks associated with investing directly in the underlying investments. Some funds may engage in short sales and in doing so are subject to the risk that they may not always be able to borrow a security, or close out a short position at a particular time or at an acceptable price.
Nothing contained on this communication constitutes tax, legal, or investment advice. Investors must consult their tax advisor or legal counsel for advice and information concerning their particular situation.
This report reflects our views and opinions as of the date herein, which are subject to change at any time based on market and other conditions. We disclaim any responsibility to update these views. The views should not be relied on as investment advice or an indication of trading intent on behalf of the funds.
Fund holdings and allocations are subject to change at any time and should not be considered a recommendation to buy or sell any security. For a complete list of fund holdings, please refer to the fund’s Schedule of Investments in this report.
| (unaudited) | |
| | |
| 20 | TortoiseEcofin |
| |
| |
| 2022 Annual Report | November 30, 2022 |
| |
| |
| |
| |
Expense example
As a shareholder of the Fund, you incur two types of costs: (1) transaction costs, including sales charges (loads) on purchase payments, reinvested dividends, or other distributions; exchange fees; and (2) ongoing costs, including management fees; distribution (12b-1) fees; and other Fund expenses. This example is intended to help you understand your ongoing costs (in dollars) of investing in the Fund and to compare these costs with the ongoing costs of investing in other mutual funds. The example is based on an investment of $1,000 invested at the beginning of the period and held for the entire period (June 1, 2022 – November 30, 2022)
Actual expenses
For each class, the first line of the table below provides information about actual account values and actual expenses. You may use the information in this line, together with the amount you invested, to estimate the expenses that you paid over the period. Simply divide your account value by $1,000 (for example, an $8,600 account value divided by $1,000 = 8.6), then multiply the result by the number in the first line under the heading entitled “Expenses Paid During Period” to estimate the expenses you paid on your account during this period.
Hypothetical example for comparison purposes
For each class, the second line of the table below provides information about hypothetical account values and hypothetical expenses based on the Fund’s actual expense ratio and an assumed rate of return of 5% per year before expenses, which is not the Fund’s actual return. The hypothetical account values and expenses may not be used to estimate the actual ending account balance or expenses you paid for the period. You may use this information to compare the ongoing costs of investing in the Fund and other funds. To do so, compare this 5% hypothetical example with the 5% hypothetical examples that appear in the shareholder reports of the other funds.
Please note that the expenses shown in the table are meant to highlight your ongoing costs only and do not reflect any transactional costs, such as redemption fees or exchange fees. Therefore, the second line of the table is useful in comparing ongoing costs only, and will not help you determine the relative total costs of owning different funds. In addition, if these transactional costs were included, your costs would have been higher.
| Tortoise MLP & Pipeline Fund | | | | | | |
| | | Beginning
Account Value
(06/01/2022) | | Ending
Account Value
(11/30/2022) | | Expenses Paid
During Period(1)
(06/01/2022 – 11/30/2022) |
| Institutional Class Actual(2) | | | $1,000.00 | | | | $1,031.50 | | | | $4.74 | |
| Institutional Class Hypothetical (5% annual return before expenses) | | | $1,000.00 | | | | $1,020.41 | | | | $4.71 | |
| A Class Actual(2) | | | $1,000.00 | | | | $1,029.80 | | | | $6.00 | |
| A Class Hypothetical (5% annual return before expenses) | | | $1,000.00 | | | | $1,019.15 | | | | $5.97 | |
| C Class Actual(2) | | | $1,000.00 | | | | $1,025.90 | | | | $9.80 | |
| C Class Hypothetical (5% annual return before expenses) | | | $1,000.00 | | | | $1,015.39 | | | | $9.75 | |
| (1) | Expenses are equal to the Fund’s annualized expense ratio for the most recent six-month period of 0.93%, 1.18%, and 1.93% for the Institutional Class, A Class and C Class, respectively, multiplied by the average account value over the period, multiplied by 183/365 to reflect the one-half year period. |
| (2) | Based on the actual returns for the six-month period ended November 30, 2022 of 3.15%, 2.98% and 2.59% for the Institutional Class, A Class and C Class, respectively. |
| (unaudited) | |
| | |
| TortoiseEcofin | 21 |
| Tortoise Energy Infrastructure and Income Fund | | | | | | |
| | | Beginning
Account Value
(06/01/2022) | | Ending
Account Value
(11/30/2022) | | Expenses Paid
During Period(1)
(06/01/2022 – 11/30/2022) |
| Institutional Class Actual(2) | | | $1,000.00 | | | | $1,021.00 | | | $ | 5.72 | |
| Institutional Class Hypothetical (5% annual return before expenses) | | | $1,000.00 | | | | $1,019.40 | | | $ | 5.72 | |
| A Class Actual(2) | | | $1,000.00 | | | | $1,019.90 | | | $ | 6.99 | |
| A Class Hypothetical (5% annual return before expenses) | | | $1,000.00 | | | | $1,018.15 | | | $ | 6.98 | |
| C Class Actual(2) | | | $1,000.00 | | | | $1,015.60 | | | $ | 10.76 | |
| C Class Hypothetical (5% annual return before expenses) | | | $1,000.00 | | | | $1,014.39 | | | $ | 10.76 | |
| (1) | Expenses are equal to the Fund’s annualized expense ratio for the most recent six-month period of 1.13%, 1.38%, and 2.13% for the Institutional Class, A Class and C Class, respectively, multiplied by the average account value over the period, multiplied by 183/365 to reflect the one-half year period. |
| (2) | Based on the actual returns for the six-month period ended November 30, 2022 of 2.10%, 1.99% and 1.56% for the Institutional Class, A Class and C Class, respectively. |
| Ecofin Global Energy Transition Fund | | | | | | |
| | | Beginning
Account Value
(06/01/2022) | | Ending
Account Value
(11/30/2022) | | Expenses Paid
During Period(1)
(06/01/2022 – 11/30/2022) |
| Institutional Class Actual(2) | | | $1,000.00 | | | | $1,050.80 | | | $ | 4.63 | |
| Institutional Class Hypothetical (5% annual return before expenses) | | | $1,000.00 | | | | $1,020.56 | | | $ | 4.56 | |
| A Class Actual(2) | | | $1,000.00 | | | | $1,049.60 | | | $ | 5.86 | |
| A Class Hypothetical (5% annual return before expenses) | | | $1,000.00 | | | | $1,019.35 | | | $ | 5.77 | |
| (1) | Expenses are equal to the Fund’s annualized expense ratio for the most recent six month period of 0.90% and 1.15% for the Institutional Class and A Class, respectively, multiplied by the average account value over the period, multiplied by 183/365 to reflect the one-half year period. |
| (2) | Based on the actual returns for the six month period ended November 30, 2022 of 5.08% and 4.96% for the Institutional Class and A Class, respectively. |
| (unaudited) | |
| | |
| 22 | TortoiseEcofin |
| |
| |
| 2022 Annual Report | November 30, 2022 |
| |
| |
| |
| |
| Ecofin Global Renewables Infrastructure Fund | | | | | | |
| | | Beginning
Account Value
(06/01/2022) | | Ending
Account Value
(11/30/2022) | | Expenses Paid
During Period(1)
(06/01/2022 – 11/30/2022) |
| Institutional Class Actual(2) | | | $1,000.00 | | | $ | 960.70 | | | $ | 4.47 | |
| Institutional Class Hypothetical (5% annual return before expenses) | | | $1,000.00 | | | $ | 1,020.51 | | | $ | 4.61 | |
| A Class Actual(2) | | | $1,000.00 | | | $ | 959.10 | | | $ | 5.65 | |
| A Class Hypothetical (5% annual return before expenses) | | | $1,000.00 | | | $ | 1,019.30 | | | $ | 5.82 | |
| (1) | Expenses are equal to the Fund’s annualized expense ratio for the most recent six month period of 0.90% and 1.15% for the Institutional Class and A Class, respectively, multiplied by the average account value over the period, multiplied by 183/365 to reflect the one-half year period. |
| (2) | Based on the actual returns for the six month period ended November 30, 2022 of -3.93% and -4.09% for the Institutional Class and A Class, respectively. |
| Ecofin Sustainable Water Fund | | | | | | |
| | | Beginning
Account Value
(06/01/2022) | | Ending
Account Value
(11/30/2022) | | Expenses Paid
During Period(1)
(06/01/2022 – 11/30/2022) |
| Institutional Class Actual(2) | | | $1,000.00 | | | $ | 1,050.20 | | | $ | 4.88 | |
| Institutional Class Hypothetical (5% annual return before expenses) | | | $1,000.00 | | | $ | 1,020.31 | | | $ | 4.81 | |
| A Class Actual(2) | | | $1,000.00 | | | $ | 1,049.20 | | | $ | 6.16 | |
| A Class Hypothetical (5% annual return before expenses) | | | $1,000.00 | | | $ | 1,019.05 | | | $ | 6.07 | |
| (1) | Expenses are equal to the Fund’s annualized expense ratio for the most recent six month period of 0.95% and 1.20% for the Institutional Class and A Class, respectively, multiplied by the average account value over the period, multiplied by 183/365 to reflect the one-half year period. |
| (2) | Based on the actual returns for the six month period ended November 30, 2022 of 5.02% and 4.92% for the Institutional Class and A Class, respectively. |
| (unaudited) | |
| | |
| TortoiseEcofin | 23 |
| |
| |
| |
| |
| Tortoise MLP & Pipeline Fund |
| Schedule of Investments |
| November 30, 2022 |
| |
| | | Shares | | Fair Value |
| Common Stock — 75.0%(1) | | | | | | |
| Canada Crude Oil Pipelines — 12.3%(1) | | | | | | |
| Enbridge Inc. | | 4,475,824 | | $ | 184,806,773 | |
| Pembina Pipeline Corporation | | 3,177,271 | | | 115,998,795 | |
| | | | | | 300,805,568 | |
| | | | | | | |
| Canada Natural Gas/Natural Gas Liquids Pipelines — 6.0%(1) | | | | | | |
| Keyera Corp. | | 2,983,645 | | | 69,514,504 | |
| TC Energy Corporation | | 1,715,688 | | | 76,313,802 | |
| | | | | | 145,828,306 | |
| | | | | | | |
| United States Crude Oil Pipelines — 4.8%(1) | | | | | | |
| Plains GP Holdings, L.P. | | 8,945,696 | | | 118,351,558 | |
| | | | | | | |
| United States Natural Gas Gathering/Processing — 16.2%(1) | | | | | | |
| Antero Midstream Corporation | | 2,363,875 | | | 26,782,704 | |
| DT Midstream, Inc. | | 425,326 | | | 25,659,917 | |
| EnLink Midstream, LLC | | 2,465,422 | | | 31,705,327 | |
| Equitrans Midstream Corporation | | 5,510,147 | | | 46,230,133 | |
| Hess Midstream LP | | 903,621 | | | 28,220,084 | |
| Targa Resources Corp. | | 3,201,554 | | | 238,163,602 | |
| | | | | | 396,761,767 | |
| | | | | | | |
| United States Natural Gas/Natural Gas Liquids Pipelines — 33.4%(1) | | | | | | |
| Cheniere Energy, Inc. | | 1,427,064 | | | 250,249,943 | |
| Excelerate Energy, Inc. | | 225,436 | | | 6,393,365 | |
| Kinder Morgan, Inc. | | 9,717,577 | | | 185,800,072 | |
| Kinetik Holdings, Inc. | | 211,499 | | | 7,197,311 | |
| NextDecade Corp. | | 2,197,502 | | | 11,932,436 | |
| ONEOK, Inc. | | 2,543,131 | | | 170,186,326 | |
| The Williams Companies, Inc. | | 5,344,454 | | | 185,452,554 | |
| | | | | | 817,212,007 | |
| | | | | | | |
| United States Renewables and Power Infrastructure — 2.3%(1) | | | | | | |
| Clearway Energy, Inc. | | 344,932 | | | 12,224,390 | |
| NextEra Energy Partners LP | | 381,332 | | | 30,693,413 | |
| Sempra Energy | | 72,144 | | | 11,989,611 | |
| | | | | | 54,907,414 | |
Total Common Stock
(Cost $1,157,063,937) | | | | | 1,833,866,620 | |
| | | | | |
| Master Limited Partnerships — 22.6%(1) | | | | | | |
| United States Crude Oil Pipelines — 1.1%(1) | | | | | | |
| Nustar Energy L.P. | | 1,616,493 | | | 26,397,331 | |
| | | | | | | |
| United States Natural Gas Gathering/Processing — 3.8%(1) | | | | | | |
| Crestwood Equity Partners LP | | 587,104 | | | 17,390,021 | |
| Western Midstream Partners, LP | | 2,647,726 | | | 74,083,373 | |
| | | | | | 91,473,394 | |
| | | | | | | |
| United States Natural Gas/Natural Gas Liquids Pipelines — 11.0%(1) | | | | | | |
| DCP Midstream, LP | | 1,546,996 | | | 60,858,823 | |
| Energy Transfer LP | | 9,379,128 | | | 117,614,265 | |
| Enterprise Products Partners L.P. | | 3,663,316 | | | 90,886,870 | |
| | | | | | 269,359,958 | |
| | | | | | | |
| United States Other — 0.1%(1) | | | | | | |
| Westlake Chemical Partners LP | | 127,871 | | | 2,960,214 | |
| | | | | | | |
| United States Refined Product Pipelines — 6.6%(1) | | | | | | |
| Magellan Midstream Partners, L.P. | | 872,592 | | | 45,985,598 | |
| MPLX LP | | 3,398,090 | | | 115,501,079 | |
| | | | | | 161,486,677 | |
Total Master Limited Partnerships
(Cost $358,181,000) | | | | | 551,677,574 | |
| | | | | | | |
| Short-Term Investment — 2.0%(1) | | | | | | |
| United States Investment Company — 2.0%(1) | | | | |
First American Government Obligations Fund, Class X, 3.67%(2)
(Cost $50,089,705) | | 50,089,705 | | | 50,089,705 | |
| | | | | | | |
Total Investments — 99.6%(1)
(Cost $1,565,334,642) | | | | | 2,435,633,899 | |
| Other Assets in Excess of Liabilities, Net — 0.4%(1) | | | | | 9,528,365 | |
| Total Net Assets — 100.0%(1) | | | | $ | 2,445,162,264 | |
| (1) | Calculated as a percentage of net assets. |
| (2) | Rate indicated is the current yield as of November 30, 2022. |
| See accompanying Notes to Financial Statements. | |
| | |
| 24 | TortoiseEcofin |
| |
| |
| 2022 Annual Report | November 30, 2022 |
| |
| Tortoise Energy Infrastructure and Income Fund |
| Schedule of Investments |
| November 30, 2022 |
| |
| | | Shares | | Fair Value |
| Common Stocks — 57.0%(1) | | | | | | |
| Canada Crude Oil Pipelines — 2.4%(1) | | | | | | |
| Enbridge Inc. | | 304,484 | | $ | 12,572,144 | |
| | | | | | | |
| Canada Oil & Gas Production — 2.0%(1) | | | | | | |
| Ovintiv, Inc. | | 187,315 | | | 10,444,684 | |
| | | | | | | |
| United Kingdom Renewables and Power Infrastructure — 0.4%(1) | | | | | | |
| Atlantica Sustainable Infrastructure plc | | 80,553 | | | 2,247,429 | |
| | | | | | | |
| United States Crude Oil Pipelines — 3.8%(1) | | | | | | |
| Plains GP Holdings, L.P. | | 1,538,108 | | | 20,349,169 | |
| | | | | | | |
| United States Gathering and Processing — 4.6%(1) | | | | | | |
| Equitrans Midstream Corporation | | 706,020 | | | 5,923,508 | |
| Targa Resources Corp. | | 249,098 | | | 18,530,400 | |
| | | | | | 24,453,908 | |
| | | | | | | |
| United States Natural Gas Gathering/Processing — 1.0%(1) | | | | | | |
| Hess Midstream LP | | 168,038 | | | 5,247,827 | |
| | | | | | | |
| United States Natural Gas/Natural Gas Liquids Pipelines — 20.4%(1) | | | | | | |
| Cheniere Energy, Inc. | | 228,685 | | | 40,102,202 | |
| Kinder Morgan, Inc. | | 770,377 | | | 14,729,608 | |
| Kinetik Holdings, Inc. | | 40,684 | | | 1,384,477 | |
| New Fortress Energy, Inc. | | 271,245 | | | 13,806,370 | |
| ONEOK, Inc. | | 187,694 | | | 12,560,482 | |
| The Williams Companies, Inc. | | 720,624 | | | 25,005,653 | |
| | | | | | 107,588,792 | |
| | | | | | | |
| United States Oil & Gas Production — 17.5%(1) | | | | | | |
| ConocoPhillips | | 178,975 | | | 22,105,202 | |
| Coterra Energy Inc. | | 432,396 | | | 12,068,172 | |
| Devon Energy Corporation | | 170,926 | | | 11,711,850 | |
| Diamondback Energy, Inc. | | 67,187 | | | 9,945,020 | |
| EQT Corporation | | 487,205 | | | 20,662,364 | |
| Pioneer Natural Resources Company | | 67,190 | | | 15,856,168 | |
| | | | | | 92,348,776 | |
| | | | | | | |
| United States Refined Product Pipelines — 1.8%(1) | | | | | | |
| Phillips 66 | | 85,545 | | | 9,276,500 | |
| | | | | | | |
| United States Renewables and Power Infrastructure — 3.1%(1) | | | | | | |
| Clearway Energy, Inc. | | 154,878 | | | 5,488,877 | |
| NextEra Energy Partners LP | | 137,123 | | | 11,037,030 | |
| | | | | | 16,525,907 | |
Total Common Stocks
(Cost $206,553,233) | | | | | 301,055,136 | |
| | | | | | | |
| Master Limited Partnerships — 22.4%(1) | | | | | | |
| United States Natural Gas Gathering/Processing — 2.8%(1) | | | | | | |
| Crestwood Equity Partners LP | | 80,135 | | | 2,373,599 | |
| Western Midstream Partners, LP | | 446,900 | | | 12,504,262 | |
| | | | | | 14,877,861 | |
| United States Natural Gas Pipelines — 13.6%(1) | | | | | | |
| DCP Midstream, LP | | 838,485 | | | 32,986,000 | |
| Energy Transfer LP | | 2,063,943 | | | 25,881,845 | |
| Enterprise Products Partners L.P. | | 523,312 | | | 12,983,371 | |
| | | | | | 71,851,216 | |
| United States Refined Product Pipelines — 6.0%(1) | | | | | | |
| Magellan Midstream Partners, L.P. | | 261,848 | | | 13,799,389 | |
| MPLX LP | | 532,817 | | | 18,110,450 | |
| | | | | | 31,909,839 | |
Total Master Limited Partnerships
(Cost $63,110,537) | | | | | 118,638,916 | |
| See accompanying Notes to Financial Statements. | |
| | |
| TortoiseEcofin | 25 |
| |
| |
| |
| |
| Tortoise Energy Infrastructure and Income Fund |
| Schedule of Investments (continued) |
| November 30, 2022 |
| |
| | | Principal Amount | | | Fair Value |
| Corporate Bonds — 18.2%(1) | | | | | | | | |
| Canada Crude Oil Pipelines — 0.7%(1) | | | | | | | | |
| Enbridge, Inc. | | | | | | | | |
| 5.500%(3 Month LIBOR USD + | | | | | | | | |
| 3.418%), 07/15/2077(2) | | $ | 4,000,000 | | | $ | 3,506,461 | |
| | | | | | | | | |
| United States Natural Gas Gathering/Processing — 8.0%(1) | | | | | | | | |
| Antero Midstream Partners LP / Antero Midstream Finance Corp. | | | | | | | | |
| 5.750%, 03/01/2027(3) | | | 6,370,000 | | | | 6,090,496 | |
| Blue Racer Midstream LLC / Blue Racer Finance Corp. | | | | | | | | |
| 7.625%, 12/15/2025(3) | | | 3,575,000 | | | | 3,611,823 | |
| 6.625%, 07/15/2026(3) | | | 3,800,000 | | | | 3,708,743 | |
| EnLink Midstream Partners, LP | | | | | | | | |
| 4.850%, 07/15/2026 | | | 7,550,000 | | | | 7,157,039 | |
| EnLink Midstream, LLC | | | | | | | | |
| 5.375%, 06/01/2029 | | | 4,455,000 | | | | 4,204,005 | |
| Hess Midstream Operations LP | | | | | | | | |
| 5.625%, 02/15/2026(3) | | | 8,125,000 | | | | 7,997,844 | |
| 5.125%, 06/15/2028(3) | | | 4,050,000 | | | | 3,755,539 | |
| Targa Resources Partners LP / Targa Resources Partners Finance Corp. | | | | | | | | |
| 6.500%, 07/15/2027 | | | 5,537,000 | | | | 5,574,264 | |
| | | | | | | | 42,099,753 | |
| | | | | | | | | |
| United States Natural Gas Pipelines — 3.3%(1) | | | | | | | | |
| NGPL Pipeco LLC | | | | | | | | |
| 7.768%, 12/15/2037(3) | | | 9,125,000 | | | | 9,539,416 | |
| Tallgrass Energy Partners LP / Tallgrass Energy Finance Corp. | | | | | | | | |
| 6.000%, 03/01/2027(3) | | | 850,000 | | | | 809,455 | |
| 5.500%, 01/15/2028(3) | | | 7,925,000 | | | | 7,206,004 | |
| | | | | | | | 17,554,875 | |
| | | | | | | | | |
| United States Natural Gas/Natural Gas Liquids Pipelines — 2.5%(1) | | | | | | | | |
| DT Midstream, Inc. | | | | | | | | |
| 4.375%, 06/15/2031(3) | | | 6,100,000 | | | | 5,253,137 | |
| EQM Midstream Partners LP | | | | | | | | |
| 5.500%, 07/15/2028 | | | 8,500,000 | | | | 7,886,300 | |
| | | | | | | | 13,139,437 | |
| | | | | | | | | |
| United States Oil Field Services — 1.2%(1) | | | | | | | | |
| Archrock Partners LP / Archrock Partners Finance Corp. | | | | | | | | |
| 6.875%, 04/01/2027(3) | | | 6,575,000 | | | | 6,372,490 | |
| | | | | | | | | |
| United States Other — 2.5%(1) | | | | | | | | |
| New Fortress Energy, Inc. | | | | | | | | |
| 6.750%, 09/15/2025(3) | | | 8,800,000 | | | | 8,609,304 | |
| 6.500%, 09/30/2026(3) | | | 5,000,000 | | | | 4,839,000 | |
| | | | | | | | 13,448,304 | |
Total Corporate Bonds
(Cost $100,002,838) | | | | | | | 96,121,320 | |
| | | | | | | | | |
| Short-Term Investments — 1.9%(1) | | | | | | | | |
| United States Investment Company — 1.9%(1) | | | | | | | | |
First American Government Obligations Fund, Class X, 3.670%(4)
(Cost $9,998,804) | | | 9,998,804 | | | | 9,998,804 | |
| | | | | | | | | |
Total Investments — 99.5%(1)
(Cost $379,665,412) | | | | | | | 525,814,176 | |
| Other Assets in Excess of Liabilities, Net — 0.5%(1) | | | | | | | 2,842,740 | |
| Total Net Assets — 100.0%(1) | | | | | | $ | 528,656,916 | |
| (1) | Calculated as a percentage of net assets. |
| (2) | Variable rate security - The rate shown is the rate in effect as of November 30, 2022. |
| (3) | Security purchased within the terms of a private placement memorandum, exempt from registration under Rule 144A of the Securities Act of 1933, as amended, and may be sold only to dealers in that program or other “qualified institutional buyers.” As of November 30, 2022, the value of this investment was $67,793,251 or 12.8% of total net assets. |
| (4) | Rate indicated is the current yield as of November 30, 2022. |
| See accompanying Notes to Financial Statements. | |
| | |
| 26 | TortoiseEcofin |
| |
| |
| 2022 Annual Report | November 30, 2022 |
| |
| Ecofin Global Energy Transition Fund |
| Schedule of Investments |
| November 30, 2022 |
| |
| | | Shares | | Fair Value |
| Common Stock — 94.7%(1) | | | | | | |
| | | | | | | |
| Canada Renewable Power Producers — 2.1%(1) | | | | | | |
| Innergex Renewable Energy Inc. | | 73,821 | | $ | 924,169 | |
| | | | | | | |
| Denmark Infrastructure, Utilities and Renewables — 4.1%(1) | | | | | | |
| Orsted A/S | | 20,960 | | | 1,835,266 | |
| | | | | | | |
| France Industrials — 6.0%(1) | | | | | | |
| Schneider Electric SE | | 17,910 | | | 2,644,857 | |
| | | | | | | |
| Germany Clean Technology — 6.4%(1) | | | | | | |
| Infineon Technologies AG | | 84,545 | | | 2,839,917 | |
| | | | | | | |
| Hong Kong Infrastructure, Utilities and Renewables — 4.2%(1) | | | | | | |
| China Longyuan Power Group Corp Ltd. | | 1,525,848 | | | 1,881,840 | |
| | | | | | | |
| Ireland Clean Technology — 2.3%(1) | | | | | | |
| Aptiv Plc(2) | | 9,434 | | | 1,006,325 | |
| | | | | | | |
| Ireland Industrials — 3.7%(1) | | | | | | |
| Trane Technologies Plc | | 9,219 | | | 1,644,854 | |
| | | | | | | |
| Italy Industrials — 3.0%(1) | | | | | | |
| Prysmian SpA | | 37,114 | | | 1,307,933 | |
| | | | | | | |
| Italy Infrastructure, Utilities, and Renewables — 5.1%(1) | | | | | | |
| Enel SpA | | 423,038 | | | 2,282,209 | |
| | | | | | | |
| Japan Clean Technology — 4.5%(1) | | | | | | |
| ROHM Co., Ltd. | | 24,825 | | | 1,992,736 | |
| | | | | | | |
| Japan Industrials — 3.2%(1) | | | | | | |
| Nidec Corp. | | 22,735 | | | 1,431,682 | |
| | | | | | | |
| Japan Infrastructure, Utilities, and Renewables — 5.0%(1) | | | | | | |
| Keyence Corp. | | 5,270 | | | 2,229,905 | |
| | | | | | | |
| Portugal Infrastructure, Utilities and Renewables — 2.5%(1) | | | | | | |
| EDP — Energias de Portugal, S.A. | | 236,177 | | | 1,120,675 | |
| | | | | | | |
| Spain Infrastructure, Utilities, and Renewables — 3.6%(1) | | | | | | |
| Corp ACCIONA Energias Renovables SA | | 39,914 | | | 1,582,948 | |
| | | | | | | |
| Switzerland Specialty Chemical & Materials — 2.2%(1) | | | | | | |
| Sika AG | | 3,817 | | | 975,475 | |
| | | | | | | |
| Taiwan Clean Technology — 2.6%(1) | | | | | | |
| Delta Electronics, Inc. | | 114,347 | | | 1,130,745 | |
| | | | | |
| United States Clean Technology — 8.2%(1) | | | | | | |
| Autodesk, Inc.(2) | | 6,476 | | | 1,307,828 | |
| TE Connectivity Ltd. | | 18,340 | | | 2,313,041 | |
| | | | | | 3,620,869 | |
| | | | | | | |
| United States Industrials — 4.6%(1) | | | | | | |
| Sunrun, Inc.(2) | | 61,957 | | | 2,018,559 | |
| | | | | | | |
| United States Infrastructure, Utilities, and Renewables — 21.4%(1) | | | | | | |
| Constellation Energy Corporation | | 28,764 | | | 2,764,796 | |
| First Solar, Inc.(2) | | 10,919 | | | 1,883,855 | |
| NextEra Energy, Inc. | | 33,144 | | | 2,807,297 | |
| STEM, Inc.(2) | | 156,152 | | | 2,040,906 | |
| | | | | | 9,496,854 | |
Total Common Stock
(Cost $40,620,919) | | | | | 41,967,818 | |
| | | | | | | |
| Short-Term Investment — 0.6%(1) | | | | | | |
| United States Investment Company — 0.6%(1) | | | | | | |
First American Government Obligations Fund, Class X, 3.67%(3)
(Cost $259,631) | | 259,631 | | | 259,631 | |
| | | | | | | |
Total Investments — 95.3%(1)
(Cost $40,880,550) | | | | | 42,227,449 | |
| Other Assets in Excess of Liabilities, Net — 4.7%(1) | | | | | 2,101,136 | |
| Total Net Assets — 100.0%(1) | | | | $ | 44,328,585 | |
| (1) | Calculated as a percentage of net assets. |
| (2) | Non-income producing security. |
| (3) | Rate indicated is the current yield as of November 30, 2022. |
| See accompanying Notes to Financial Statements. | |
| | |
| TortoiseEcofin | 27 |
| |
| |
| |
| |
| Ecofin Global Energy Transition Fund |
| Open Swap Contracts |
| November 30, 2022 |
| |
| Counterparty | | Security | | Termination
Date | | Pay/Receive
on
Financing
Rate | | Financing Rate | | Payment
Frequency | | Shares | | Notional
Amount | | Unrealized
Appreciation
(Depreciation)* | |
| Morgan Stanley | | Drax Group PLC | | 10/19/23 | | Pay | | 0.200% + Federal | | Monthly | | 195,297 | | $ | 1,429,950 | | $ | (36,457 | ) |
| | | | | | | | | Funds Effective Rate | | | | | | | | | | | |
| Morgan Stanley | | Amperex Tech | | 8/28/23 | | Pay | | 0.200% + Federal | | Monthly | | 11,775 | | | 634,664 | | | 10,741 | |
| | | | | | | | | Funds Effective Rate | | | | | | | | | | | |
| | | | | | | | | | | | | | | | | | $ | (25,716 | ) |
| * | Based on the net swap value held at each counterparty. Unrealized appreciation (depreciation) is a receivable (payable). |
| See accompanying Notes to Financial Statements. | |
| | |
| 28 | TortoiseEcofin |
| |
| |
| 2022 Annual Report | November 30, 2022 |
| |
| Ecofin Global Renewables Infrastructure Fund |
| Schedule of Investments |
| November 30, 2022 |
| |
| | | Shares | | Fair Value |
| Common Stock — 88.5%(1) | | | | | | |
| | | | | | | |
| Belgium Electricity Transmission Operators — 2.2%(1) | | | | | | |
| Elia Group SA/NV | | 54,042 | | $ | 7,700,397 | |
| | | | | | | |
| Canada Renewable Power Producers — 7.4%(1) | | | | | | |
| Innergex Renewable Energy Inc. | | 801,728 | | | 10,036,873 | |
| TransAlta Renewables Inc. | | 1,533,542 | | | 16,291,354 | |
| | | | | | 26,328,227 | |
| | | | | | | |
| Denmark Renewable Power Producers — 3.3%(1) | | | | | | |
| Orsted A/S | | 134,187 | | | 11,749,468 | |
| | | | | | | |
| Germany Renewable Power Producers — 2.4%(1) | | | | | | |
| Encavis AG | | 412,682 | | | 8,644,598 | |
| | | | | | | |
| Hong Kong Renewable Power Producers — 4.0%(1) | | | | | | |
| China Longyuan Power Group Corp Ltd. | | 8,822,176 | | | 10,880,456 | |
| China Suntien Green Energy Corp Ltd. | | 7,470,122 | | | 3,115,208 | |
| | | | | | 13,995,664 | |
| | | | | | | |
| India Power — 3.1%(1) | | | | | | |
| ReNew Energy Global Plc(2) | | 1,794,198 | | | 10,890,782 | |
| | | | | | | |
| Italy Electricty Transmission Operators — 3.7%(1) | | | | | | |
| Terna — Rete Elettrica Nazionale SpA | | 1,739,595 | | | 13,325,258 | |
| | | | | | | |
| Italy Renewable Power Producers — 5.6%(1) | | | | | | |
| ERG SpA | | 628,551 | | | 19,981,745 | |
| | | | | | | |
| Japan Renewable Power Producers — 1.7%(1) | | | | | | |
| RENOVA, Inc.(2) | | 303,198 | | | 6,088,144 | |
| | | | | | | |
| Portugal Electric Utilities — 2.2%(1) | | | | | | |
| EDP — Energias de Portugal, S.A. | | 1,648,035 | | | 7,820,034 | |
| | | | | | | |
| Spain Renewable Power Producers — 2.6%(1) | | | | | | |
| Corp ACCIONA Energias Renovables SA | | 228,513 | | | 9,062,592 | |
| | | | | | | |
| Spain Integrated Utilities — 1.7%(1) | | | | | | |
| EDP Renovaveis SA | | 260,947 | | | 6,070,211 | |
| | | | | | | |
| Switzerland Integrated Utilities — 3.4%(1) | | | | | | |
| BKW Energie AG | | 92,910 | | | 12,081,542 | |
| | | | | | | |
| Thailand Renewable Power Producers — 1.2%(1) | | | | | | |
| Super Energy Corporation PCL | | 224,178,084 | | | 4,202,661 | |
| | | | | | | |
| United Kingdom Integrated Utilities — 2.1%(1) | | | | | | |
| SSE plc | | 352,607 | | | 7,313,295 | |
| | | | | | | |
| United Kingdom Renewable Power Producers — 7.3%(1) | | | | | | |
| Atlantica Sustainable Infrastructure plc | | 650,374 | | | 18,145,434 | |
| Greencoat UK Wind PLC | | 4,257,030 | | | 7,713,947 | |
| | | | | | 25,859,381 | |
| | | | | | | |
| United States Distributed Renewables — 2.4%(1) | | | | | | |
| Sunrun, Inc.(2) | | 268,047 | | | 8,732,971 | |
| | | | | | | |
| United States Electric Utilities — 20.9%(1) | | | | | | |
| Constellation Energy Corporation | | 174,934 | | | 16,814,656 | |
| Edison International | | 271,175 | | | 18,076,526 | |
| NextEra Energy, Inc. | | 284,162 | | | 24,068,521 | |
| Public Service Enterprise Group Incorporated | | 250,320 | | | 15,156,876 | |
| | | | | | 74,116,579 | |
| | | | | | | |
| United States Renewable Power Producers — 11.3%(1) | | | | | | |
| Clearway Energy, Inc. | | 583,125 | | | 20,665,950 | |
| NextEra Energy Partners LP | | 242,975 | | | 19,557,058 | |
| | | | | | 40,223,008 | |
Total Common Stock
(Cost $316,360,935) | | | | | 314,186,557 | |
| | | | | | | |
| Master Limited Partnership — 3.6%(1) | | | | | | |
| United States Renewable Power Producers — 3.6%(1) | | | | | | |
Brookfield Renewable Partners LP
(Cost $15,460,111) | | 450,988 | | | 12,758,451 | |
| | | | | | | |
| Short-Term Investment — 3.8%(1) | | | | | | |
| United States Investment Company — 3.8%(1) | | | | | | |
First American Government Obligations Fund, Class X, 3.67%(3)
(Cost $13,576,208) | | 13,576,208 | | | 13,576,208 | |
| | | | | | | |
Total Investments — 95.9%(1)
(Cost $345,397,254) | | | | | 340,521,216 | |
| Other Assets in Excess of Liabilities, Net — 4.1%(1) | | | | | 14,512,580 | |
| Total Net Assets — 100.0%(1) | | | | $ | 355,033,796 | |
| (1) | Calculated as a percentage of net assets. |
| (2) | Non-income producing security. |
| (3) | Rate indicated is the current yield as of November 30, 2022. |
| See accompanying Notes to Financial Statements. | |
| | |
| TortoiseEcofin | 29 |
| |
| |
| |
| |
| Ecofin Global Renewables Infrastructure Fund |
| Open Swap Contracts |
| November 30, 2022 |
| |
| Counterparty | | Security | | Termination
Date | | Pay/Receive
on
Financing
Rate | | Financing Rate | | Payment
Frequency | | Shares | | Notional
Amount | | Unrealized
Appreciation
(Depreciation)* | |
| | | | | | | | | | | | | | | | | | |
| Morgan Stanley | | Drax Group PLC | | 8/17/23 | | Pay | | 0.200% + Federal | | Monthly | | 1,826,602 | | $ | 13,374,240 | | $ | (340,188 | ) |
| | | | | | | | | Funds Effective Rate | | | | | | | | | | | |
| | | | | | | | | | | | | | | | | | $ | (340,188 | ) |
| * | Based on the net swap value held at each counterparty. Unrealized appreciation (depreciation) is a receivable (payable). |
| |
| |
| 2022 Annual Report | November 30, 2022 |
| |
| Ecofin Sustainable Water Fund |
| Schedule of Investments |
| November 30, 2022 |
| |
| | | Shares | | Fair Value |
| Common Stock — 96.6%(1) | | | | | | |
| Canada Engineering & Construction — 3.3%(1) | | | | | | |
| Stantec, Inc. | | 1,367 | | $ | 67,631 | |
| | | | | | | |
| France Utility — 7.8%(1) | | | | | | |
| Veolia Environnement SA | | 6,192 | | | 160,261 | |
| | | | | | | |
| Hong Kong Utility — 2.2%(1) | | | | | | |
| China Water Affairs Group Limited | | 56,000 | | | 45,637 | |
| | | | | | | |
| Japan Engineering & Construction — 1.1%(1) | | | | | | |
| Metawater Co Ltd. | | 1,700 | | | 22,265 | |
| | | | | | | |
| Japan Water Filtration, Treatment, & Testing — 3.7%(1) | | | | | | |
| Kurita Water Industries Ltd. | | 1,700 | | | 76,235 | |
| | | | | | | |
| Mexico Filtration, Treatment & Testing — 1.5%(1) | | | | | | |
| Grupo Rotoplas SAB de CV | | 17,243 | | | 29,778 | |
| | | | | | | |
| Switzerland Pipes, Pumps, & Valves — 0.5%(1) | | | | | | |
| Georg Fischer AG | | 180 | | | 10,980 | |
| | | | | | | |
| Switzerland Water Filtration, Treatment, & Test — 0.5%(1) | | | | | | |
| Geberit AG | | 21 | | | 10,066 | |
| | | | | | | |
| United Kingdom Water Filtration, Treatment, & Testing — 1.7%(1) | | | | | | |
| Pentair PLC | | 773 | | | 35,380 | |
| | | | | | | |
| United States Agriculture Equipment & Services — 2.8%(1) | | | | | | |
| Lindsay Corporation | | 330 | | | 58,242 | |
| | | | | | | |
| United States Engineering & Construction — 8.6%(1) | | | | | | |
| Aecom | | 1,007 | | | 85,595 | |
| Montrose Environmental Group, Inc.(2) | | 233 | | | 10,755 | |
| Tetra Tech, Inc. | | 519 | | | 80,232 | |
| | | | | | 176,582 | |
| | | | | | | |
| United States Pipes, Pumps, & Valves — 26.9%(1) | | | | | | |
| Advanced Drainage Systems, Inc. | | 1,170 | | | 113,794 | |
| Badger Meter, Inc. | | 298 | | | 34,514 | |
| Core & Main, Inc.(2) | | 1,468 | | | 30,535 | |
| Fortune Brands Home & Security, Inc. | | 326 | | | 21,301 | |
| IDEX Corp. | | 343 | | | 81,459 | |
| Masco Corporation | | 319 | | | 16,199 | |
| Mueller Water Products, Inc. | | 2,390 | | | 27,867 | |
| Xylem, Inc. | | 1,679 | | | 188,636 | |
| Zurn Elkay Water Solutions Corp. | | 1,585 | | | 38,373 | |
| | | | | | 552,678 | |
| | | | | | | |
| United States Utility — 2.9%(1) | | | | | | |
| SJW Group | | 791 | | | 59,080 | |
| | | | | | | |
| United States Water Filtration, Treatment, & Testing — 11.8%(1) | | | | | | |
| Aris Water Solution, Inc. | | 626 | | | 9,903 | |
| Danaher Corp. | | 544 | | | 148,735 | |
| Ecolab, Inc. | | 238 | | | 35,660 | |
| Evoqua Water Technologies Corp.(2) | | 1,112 | | | 48,361 | |
| | | | | | 242,659 | |
| | | | | | | |
| United States Water Utility — 21.3%(1) | | | | | | |
| American States Water Co. | | 171 | | | 16,756 | |
| American Water Works Co., Inc. | | 1,301 | | | 197,440 | |
| Essential Utilities, Inc. | | 3,908 | | | 188,522 | |
| Middlesex Water Company | | 208 | | | 19,438 | |
| The York Water Company | | 350 | | | 15,991 | |
| | | | | | 438,147 | |
Total Common Stock
(Cost $2,007,046) | | | | | 1,985,621 | |
| | | | | | | |
| Special Purpose Acquisition Company — 1.5%(1) | | | | | | |
| Energy Technology — 1.5%(1) | | | | | | |
Sustainable Development Acquisition I Corp.(2)
(Cost $30,362) | | 3,104 | | | 31,133 | |
| | | | | | | |
| Short-Term Investment — 2.3%(1) | | | | | | |
| United States Investment Company — 2.3%(1) | | | | | | |
First American Government Obligations Fund, Class X, 3.67%(3)
(Cost $47,429) | | 47,429 | | | 47,429 | |
| | | | | | | |
Total Investments — 100.4%(1)
(Cost $2,084,837) | | | | | 2,064,183 | |
| Liabilities in Excess of Other Assets, Net — (0.4%)(1) | | | | | (7,923 | ) |
| Total Net Assets — 100.0%(1) | | | | $ | 2,056,260 | |
| (1) | Calculated as a percentage of net assets. |
| (2) | Non-income producing security. |
| (3) | Rate indicated is the current yield as of November 30, 2022. |
| |
| |
| |
| |
| Statements of Assets & Liabilities |
| November 30, 2022 |
| |
| |
| | | Tortoise MLP &
Pipeline Fund |
| Assets: | | | | |
| Investments, at fair value (cost $1,565,334,642, $379,665,412, $40,880,550, $345,397,254 and $2,084,837, respectively) | | $ | 2,435,633,899 | |
| Cash held as collateral | | | — | |
| Dividends & interest receivable | | | 3,293,262 | |
| Receivable for investment securities sold | | | 6,038,963 | |
| Receivable for capital shares sold | | | 5,671,172 | |
| Receivable for Adviser expense reimbursement | | | — | |
| Prepaid expenses and other assets | | | 39,994 | |
| Total assets | | | 2,450,677,290 | |
| Liabilities: | | | | |
| Payble for swap contracts | | | — | |
| Payable for capital shares redeemed | | | 3,328,236 | |
| Payable to Adviser | | | 1,669,125 | |
| Payable for fund administration & accounting fees | | | 146,790 | |
| Payable for compliance fees | | | 1,613 | |
| Payable for custody fees | | | 53,905 | |
| Payable for audit & tax | | | 53,880 | |
| Payable for transfer agent fees & expenses | | | 61,781 | |
| Accrued interest expense | | | 312 | |
| Accrued trustee fees | | | 46 | |
| Accrued expenses | | | 81,626 | |
| Accrued distribution fees | | | 117,712 | |
| Total liabilities | | | 5,515,026 | |
| Net Assets | | $ | 2,445,162,264 | |
| Net Assets Consist of: | | | | |
| Capital Stock | | $ | 2,920,519,557 | |
| Total distributable earnings (loss) | | | (475,357,293 | ) |
| Net Assets | | $ | 2,445,162,264 | |
| | | | | |
| Institutional Class | | | | |
| Net Assets | | $ | 2,231,399,678 | |
| Shares issued and outstanding(1) | | | 159,755,060 | |
| Net asset value, redemption price and minimum offering price per share | | | $13.97 | |
| | | | | |
| A Class | | | | |
| Net Assets | | $ | 191,406,631 | |
| Shares issued and outstanding(1) | | | 13,873,269 | |
| Net asset value, redemption price and minimum offering price per share | | $ | 13.80 | |
| Maximum offering price per share(2) | | $ | 14.60 | |
| | | | | |
| C Class | | | | |
| Net Assets | | $ | 22,355,955 | |
| Shares issued and outstanding(1) | | | 1,647,367 | |
| Net asset value, redemption price and minimum offering price per share | | $ | 13.57 | |
| (1) | Unlimited shares authorized. |
| (2) | The offering price is calculated by dividing the net asset value by 1 minus the maximum sales charge of 5.50%. |
See accompanying Notes to Financial Statements.
| |
| |
| 2022 Annual Report | November 30, 2022 |
| |
| |
| |
| |
| |
Tortoise Energy
Infrastructure and
Income Fund | | Ecofin Global
Energy
Transition Fund | | Ecofin Global
Renewables
Infrastructure Fund | | Ecofin Sustainable
Water Fund | |
| | | | | | | | | | | | | | | | |
| $ | 525,814,176 | | | $ | 42,227,449 | | | $ | 340,521,216 | | | $ | 2,064,183 | | |
| | — | | | | 2,110,000 | | | | 13,753,406 | | | | — | | |
| | 3,041,187 | | | | 80,182 | | | | 946,408 | | | | 4,458 | | |
| | — | | | | — | | | | — | | | | — | | |
| | 701,102 | | | | — | | | | 689,537 | | | | — | | |
| | — | | | | 23,598 | | | | 2,100 | | | | 25,336 | | |
| | 30,103 | | | | 8,456 | | | | 24,793 | | | | 13,142 | | |
| | 529,586,568 | | | | 44,449,685 | | | | 355,937,460 | | | | 2,107,119 | | |
| | | | | | | | | | | | | | | | |
| | — | | | | 25,716 | | | | 340,188 | | | | — | | |
| | 355,873 | | | | — | | | | 224,439 | | | | — | | |
| | 430,688 | | | | 28,007 | | | | 212,054 | | | | 1,302 | | |
| | 53,158 | | | | 9,339 | | | | 36,710 | | | | 7,370 | | |
| | 1,613 | | | | 1,614 | | | | 1,613 | | | | 1,615 | | |
| | 7,925 | | | | 9,568 | | | | 27,504 | | | | 2,517 | | |
| | 31,580 | | | | 38,141 | | | | 31,080 | | | | 29,681 | | |
| | 21,966 | | | | 3,109 | | | | 17,989 | | | | 2,701 | | |
| | — | | | | — | | | | — | | | | — | | |
| | 1,021 | | | | 207 | | | | 163 | | | | — | | |
| | 21,744 | | | | 5,311 | | | | 10,275 | | | | 5,625 | | |
| | 4,084 | | | | 88 | | | | 1,649 | | | | 48 | | |
| | 929,652 | | | | 121,100 | | | | 903,664 | | | | 50,859 | | |
| $ | 528,656,916 | | | $ | 44,328,585 | | | $ | 355,033,796 | | | $ | 2,056,260 | | |
| | | | | | | | | | | | | | | | |
| $ | 837,817,512 | | | $ | 47,550,992 | | | $ | 361,136,089 | | | $ | 2,134,755 | | |
| | (309,160,596 | ) | | | (3,222,407 | ) | | | (6,102,293 | ) | | | (78,495 | ) | |
| $ | 528,656,916 | | | $ | 44,328,585 | | | $ | 355,033,796 | | | $ | 2,056,260 | | |
| | | | | | | | | | | | | | | | |
| $ | 458,577,523 | | | $ | 44,295,235 | | | $ | 352,725,850 | | | $ | 2,030,836 | | |
| | 59,569,719 | | | | 5,281,943 | | | | 31,109,566 | | | | 211,205 | | |
| $ | 7.70 | | | $ | 8.39 | | | $ | 11.34 | | | $ | 9.62 | | |
| | | | | | | | | | | | | | | | |
| $ | 45,740,780 | | | $ | 33,350 | | | $ | 2,307,946 | | | $ | 25,424 | | |
| | 5,803,350 | | | | 4,087 | | | | 203,474 | | | | 2,649 | | |
| $ | 7.88 | | | $ | 8.16 | | | $ | 11.34 | | | $ | 9.60 | | |
| $ | 8.34 | | | $ | 8.63 | | | $ | 12.00 | | | $ | 10.16 | | |
| | | | | | | | | | | | | | | | |
| $ | 24,338,613 | | | $ | — | | | $ | — | | | $ | — | | |
| | 3,094,759 | | | | — | | | | — | | | | — | | |
| $ | 7.86 | | | $ | — | | | $ | — | | | $ | — | | |
| |
| |
| |
| |
| Statements of Operations |
| For the Year Ended November 30, 2022 |
| |
| |
| | | Tortoise MLP &
Pipeline Fund |
| Investment Income: | | | | |
| Dividends and distributions from unaffiliated common stock | | $ | 81,305,531 | |
| Distributions from master limited partnerships | | | 43,994,211 | |
| Less: return of capital on distributions from unaffilated investments(1) | | | (66,654,591 | ) |
| Less: return of capital on distributions from affiliated investments(1) | | | (8,668,517 | ) |
| Less: foreign taxes withheld | | | (3,901,637 | ) |
| Net dividends and distributions from investments | | | 46,074,997 | |
| Dividends from money market mutual funds | | | 435,249 | |
| Interest income | | | — | |
| Total investment income | | | 46,510,246 | |
| Expenses: | | | | |
| Advisory fees (See Note 6) | | | 19,443,543 | |
| Fund administration & accounting fees (See Note 6) | | | 877,469 | |
| Transfer agent fees & expenses (See Note 6) | | | 336,145 | |
| Shareholder communication fees | | | 253,995 | |
| Custody fees (See Note 6) | | | 116,106 | |
| Registration fees | | | 76,094 | |
| Audit & tax fees | | | 53,804 | |
| Trustee fees | | | 18,994 | |
| Other | | | 14,505 | |
| Insurance fees | | | 13,190 | |
| Compliance fees (See Note 6) | | | 9,673 | |
| Legal fees | | | 8,733 | |
| Distribution fees (See Note 7): | | | | |
| A Class | | | 459,047 | |
| C Class | | | 215,026 | |
| Total expenses before interest expense on line of credit | | | 21,896,324 | |
| Interest expense on line of credit (See Note 11) | | | 20,413 | |
| Total expenses before reimbursement/recoupment | | | 21,916,737 | |
| Fee recoupment (See Note 6) | | | — | |
| Less: expense reimbursement by Adviser | | | — | |
| Net expenses | | | 21,916,737 | |
| Net Investment Income | | | 24,593,509 | |
| Realized and Unrealized Gain (Loss) on Investments and Translations of Foreign Currency | | | | |
| Net realized gain (loss) on: | | | | |
| Unaffiliated Investments, including foreign currency gain (loss) | | | 128,929,574 | |
| Affiliated investments | | | 20,283,241 | |
| Swap contracts | | | — | |
| Net change in unrealized appreciation (depreciation) of: | | | | |
| Unaffiliated investments and translations of foreign currency | | | 414,687,679 | |
| Affiliated investments | | | 20,287,676 | |
| Swap contracts | | | — | |
| Net Realized and Unrealized Gain (Loss) on Investments and Translations of Foreign Currency | | | 584,188,170 | |
| Net Increase (Decrease) in Net Assets Resulting from Operations | | $ | 608,781,679 | |
| (1) | Return of capital may be in excess of current year distributions due to prior year adjustments. See Note 2 to the financial statements for further disclosure. |
See accompanying Notes to Financial Statements.
| |
| |
| 2022 Annual Report | November 30, 2022 |
| |
| |
| |
| |
Tortoise Energy
Infrastructure and
Income Fund | | Ecofin Global
Energy
Transition Fund | | Ecofin Global
Renewables
Infrastructure Fund | | Ecofin Sustainable
Water Fund(1) | |
| | | | | | | | | | | | | | | | |
| $ | 13,040,439 | | | $ | 558,203 | | | $ | 7,858,697 | | | $ | 28,132 | | |
| | 7,869,643 | | | | — | | | | 391,009 | | | | — | | |
| | (12,116,645 | ) | | | — | | | | (1,687,500 | ) | | | — | | |
| | — | | | | — | | | | — | | | | — | | |
| | (219,054 | ) | | | (71,405 | ) | | | (767,376 | ) | | | (1,621 | ) | |
| | 8,574,383 | | | | 486,798 | | | | 5,794,830 | | | | 26,511 | | |
| | 157,467 | | | | 51,872 | | | | 183,144 | | | | 1,083 | | |
| | 5,735,862 | | | | — | | | | 269,313 | | | | — | | |
| | 14,467,712 | | | | 538,670 | | | | 6,247,287 | | | | 27,594 | | |
| | | | | | | | | | | | | | | | |
| | 4,888,189 | | | | 344,601 | | | | 2,627,164 | | | | 13,237 | | |
| | 299,852 | | | | 61,440 | | | | 234,215 | | | | 51,248 | | |
| | 125,239 | | | | 16,016 | | | | 114,728 | | | | 16,497 | | |
| | 48,037 | | | | 2,855 | | | | 19,699 | | | | 2,999 | | |
| | 17,889 | | | | 18,611 | | | | 49,742 | | | | 11,340 | | |
| | 54,775 | | | | 50,247 | | | | 29,044 | | | | 34,413 | | |
| | 28,776 | | | | 31,500 | | | | 30,999 | | | | 29,681 | | |
| | 19,056 | | | | 17,998 | | | | 18,047 | | | | 12,611 | | |
| | 9,053 | | | | 5,404 | | | | 6,653 | | | | 2,999 | | |
| | 4,236 | | | | 3,008 | | | | 2,435 | | | | 1,645 | | |
| | 7,993 | | | | 9,195 | | | | 9,671 | | | | 8,073 | | |
| | 10,380 | | | | 50,149 | | | | 26,792 | | | | 31,913 | | |
| | | | | | | | | | | | | | | | |
| | 106,648 | | | | 100 | | | | 9,171 | | | | 48 | | |
| | 246,503 | | | | — | | | | — | | | | — | | |
| | 5,866,626 | | | | 611,124 | | | | 3,178,360 | | | | 216,704 | | |
| | — | | | | — | | | | 2,186 | | | | — | | |
| | 5,866,626 | | | | 611,124 | | | | 3,180,546 | | | | 216,704 | | |
| | — | | | | — | | | | 32,045 | | | | — | | |
| | — | | | | (223,305 | ) | | | (2,100 | ) | | | (200,937 | ) | |
| | 5,866,626 | | | | 387,819 | | | | 3,210,491 | | | | 15,767 | | |
| | 8,601,086 | | | | 150,851 | | | | 3,036,796 | | | | 11,827 | | |
| | | | | | | | | | | | | | | | |
| | | | | | | | | | | | | | | | |
| | 6,992,524 | | | | (3,514,934 | ) | | | (1,812,313 | ) | | | (69,677 | ) | |
| | — | | | | — | | | | — | | | | — | | |
| | — | | | | (1,173,352 | ) | | | 3,422,984 | | | | — | | |
| | | | | | | | | | | | | | | | |
| | 96,548,445 | | | | (3,429,004 | ) | | | (27,514,649 | ) | | | (20,645 | ) | |
| | — | | | | — | | | | — | | | | — | | |
| | — | | | | (534 | ) | | | (3,240 | ) | | | — | | |
| | 103,540,969 | | | | (8,117,824 | ) | | | (25,907,218 | ) | | | (90,322 | ) | |
| $ | 112,142,055 | | | $ | (7,966,973 | ) | | $ | (22,870,422 | ) | | $ | (78,495 | ) | |
| (1) | The Ecofin Sustainable Water Fund’s commencement of operations was February 4, 2022. |
| |
| |
| |
| |
| Statements of Changes in Net Assets |
| |
| |
| |
| | | Tortoise MLP & Pipeline Fund | | Tortoise Energy Infrastructure and Income Fund |
| | | Year Ended
November 30, 2022 | | Year Ended
November 30, 2021 | | Year Ended
November 30, 2022 | | Year Ended
November 30, 2021 |
| | | | | | | | | | | | | | | | | |
| Operations | | | | | | | | | | | | | | | | |
| Net investment income | | $ | 24,593,509 | | | $ | 16,212,932 | | | $ | 8,601,086 | | | $ | 3,598,693 | |
| Net realized gain (loss) on unaffiliated investments and foreign currency | | | 128,929,574 | | | | (66,534,844 | ) | | | 6,992,524 | | | | (5,223,579 | ) |
| Net realized gain (loss) on affiliated investments and foreign currency | | | 20,283,241 | | | | (62,301,046 | ) | | | — | | | | — | |
| Net change in unrealized appreciation of affiliated investments and translations of foreign currency | | | 20,287,676 | | | | 79,372,535 | | | | — | | | | — | |
| Net change in unrealized appreciation of unaffiliated investments and translations of foreign currency | | | 414,687,679 | | | | 618,176,147 | | | | 96,548,445 | | | | 97,698,912 | |
| Net increase in net assets resulting from operations | | | 608,781,679 | | | | 584,925,724 | | | | 112,142,055 | | | | 96,074,026 | |
| Capital Share Transactions | | | | | | | | | | | | | | | | |
| Institutional Class: | | | | | | | | | | | | | | | | |
| Proceeds from shares sold | | | 791,935,121 | | | | 553,132,343 | | | | 131,182,150 | | | | 76,576,578 | |
| Proceeds from merger | | | — | | | | — | | | | — | | | | 19,649,330 | |
| Proceeds from reinvestment of distributions | | | 89,149,612 | | | | 60,090,696 | | | | 14,537,552 | | | | 13,379,948 | |
| Payments for shares redeemed | | | (773,660,536 | ) | | | (882,170,574 | ) | | | (110,089,321 | ) | | | (104,997,029 | ) |
| Increase (Decrease) in net assets from Institutional Class transactions | | | 107,424,197 | | | | (268,947,535 | ) | | | 35,630,381 | | | | 4,608,827 | |
| A Class: | | | | | | | | | | | | | | | | |
| Proceeds from shares sold(1) | | | 15,939,626 | | | | 37,233,600 | | | | 11,220,730 | | | | 14,931,536 | |
| Proceeds from reinvestment of distributions | | | 9,083,587 | | | | 6,323,120 | | | | 784,967 | | | | 807,528 | |
| Payments for shares redeemed | | | (42,004,560 | ) | | | (50,752,781 | ) | | | (11,588,648 | ) | | | (15,665,826 | ) |
| Increase (Decrease) in net assets from A Class transactions | | | (16,981,347 | ) | | | (7,196,061 | ) | | | 417,049 | | | | 73,238 | |
| C Class: | | | | | | | | | | | | | | | | |
| Proceeds from shares sold | | | 2,047,914 | | | | 2,405,198 | | | | 2,598,815 | | | | 3,473,284 | |
| Proceeds from reinvestment of distributions | | | 865,687 | | | | 722,288 | | | | 617,101 | | | | 742,517 | |
| Payments for shares redeemed(1) | | | (5,776,094 | ) | | | (8,040,273 | ) | | | (6,408,037 | ) | | | (8,676,063 | ) |
| Decrease in net assets from C Class transactions | | | (2,862,493 | ) | | | (4,912,787 | ) | | | (3,192,121 | ) | | | (4,460,262 | ) |
| Net increase (decrease) in net assets resulting from capital share transactions | | | 87,580,357 | | | | (281,056,383 | ) | | | 32,855,309 | | | | 221,803 | |
| Distributions to Shareholders | | | | | | | | | | | | | | | | |
| From distributable earnings | | | | | | | | | | | | | | | | |
| Institutional Class | | | (35,441,048 | ) | | | (26,652,621 | ) | | | (8,023,030 | ) | | | (3,422,418 | ) |
| A Class | | | (3,166,317 | ) | | | (2,511,690 | ) | | | (768,026 | ) | | | (352,333 | ) |
| C Class | | | (339,658 | ) | | | (329,437 | ) | | | (402,299 | ) | | | (213,058 | ) |
| From tax return of capital | | | | | | | | | | | | | | | | |
| Institutional Class | | | (74,978,057 | ) | | | (45,994,013 | ) | | | (19,366,065 | ) | | | (21,033,692 | ) |
| A Class | | | (6,317,239 | ) | | | (4,176,309 | ) | | | (1,853,869 | ) | | | (2,209,445 | ) |
| C Class | | | (675,620 | ) | | | (520,464 | ) | | | (971,073 | ) | | | (1,346,675 | ) |
| Total distributions to shareholders | | | (120,917,939 | ) | | | (80,184,534 | ) | | | (31,384,362 | ) | | | (28,577,621 | ) |
| Total Increase in Net Assets | | | 575,444,097 | | | | 223,684,808 | | | | 113,613,002 | | | | 67,718,208 | |
| Net Assets | | | | | | | | | | | | | | | | |
| Beginning of year | | | 1,869,718,167 | | | | 1,646,033,359 | | | | 415,043,914 | | | | 347,325,706 | |
| End of year | | $ | 2,445,162,264 | | | $ | 1,869,718,167 | | | $ | 528,656,916 | | | $ | 415,043,914 | |
| (1) | Includes exchanges between share classes of the fund. |
See accompanying Notes to Financial Statements.
| |
| |
| 2022 Annual Report | November 30, 2022 |
| |
| Statements of Changes in Net Assets (continued) |
| |
| |
| |
| | | Tortoise MLP & Pipeline Fund | | Tortoise Energy Infrastructure and Income Fund |
| | | Year Ended
November 30, 2022 | | Year Ended
November 30, 2021 | | Year Ended
November 30, 2022 | | Year Ended
November 30, 2021 |
| Transactions in Shares: | | | | | | | | | | | | | | | | |
| Institutional Class: | | | | | | | | | | | | | | | | |
| Shares sold | | | 63,007,479 | | | | 53,825,231 | | | | 18,108,248 | | | | 13,354,587 | |
| Shares acquired from merger | | | — | | | | — | | | | — | | | | 2,917,825 | |
| Shares issued to holders in reinvestment of dividends | | | 6,892,533 | | | | 5,787,033 | | | | 1,935,993 | | | | 2,111,746 | |
| Shares redeemed | | | (60,233,376 | ) | | | (88,758,089 | ) | | | (15,316,321 | ) | | | (17,093,452 | ) |
| Increase (Decrease) in Institutional Class shares outstanding | | | 9,666,636 | | | | (29,145,825 | ) | | | 4,727,920 | | | | 1,290,706 | |
| A Class: | | | | | | | | | | | | | | | | |
| Shares sold(1) | | | 1,232,582 | | | | 3,626,684 | | | | 1,509,036 | | | | 2,373,493 | |
| Shares issued to holders in reinvestment of dividends | | | 713,015 | | | | 614,530 | | | | 102,303 | | | | 125,007 | |
| Shares redeemed | | | (3,266,236 | ) | | | (5,145,356 | ) | | | (1,589,258 | ) | | | (2,521,193 | ) |
| Increase (Decrease) in A Class shares outstanding | | | (1,320,639 | ) | | | (904,142 | ) | | | 22,081 | | | | (22,693 | ) |
| C Class: | | | | | | | | | | | | | | | | |
| Shares sold | | | 166,322 | | | | 239,209 | | | | 356,245 | | | | 536,997 | |
| Shares issued to holders in reinvestment of dividends | | | 68,981 | | | | 71,351 | | | | 80,654 | | | | 114,877 | |
| Shares redeemed(1) | | | (476,336 | ) | | | (809,970 | ) | | | (872,461 | ) | | | (1,364,216 | ) |
| Decrease in C Class shares outstanding | | | (241,033 | ) | | | (499,410 | ) | | | (435,562 | ) | | | (712,342 | ) |
| Net increase (decrease) in shares outstanding | | | 8,104,964 | | | | (30,549,377 | ) | | | 4,314,439 | | | | 555,671 | |
| (1) | Includes exchanges between share classes of the fund. |
See accompanying Notes to Financial Statements.
| |
| |
| |
| |
| Statements of Changes in Net Assets (continued) |
| |
| |
| |
| | | Ecofin Global Energy Transition Fund | | Ecofin Global Renewables
Infrastructure Fund | | Ecofin
Sustainable
Water Fund |
| | | Year Ended
November 30,
2022 | | Period from
Inception(1) to
November 30,
2021 | | Year Ended
November 30,
2022 | | Year Ended
November 30,
2021 | | Period from
Inception(2) to
November 30,
2022 |
| Operations | | | | | | | | | | | | | | | | | | | | |
| Net investment income (loss) | | $ | 150,851 | | | $ | (15,251 | ) | | $ | 3,036,796 | | | $ | 2,924,974 | | | $ | 11,827 | |
| Net realized gain (loss) on investments, swaps contracts and foreign currency | | | (4,688,286 | ) | | | 1,498,519 | | | | 1,610,671 | | | | 10,285,546 | | | | (69,677 | ) |
| Net change in unrealized appreciation (depreciation) of investments, swap contracts and translations of foreign currency | | | (3,429,538 | ) | | | 4,750,474 | | | | (27,517,889 | ) | | | 3,130,605 | | | | (20,645 | ) |
| Net increase (decrease) in net assets resulting from operations | | | (7,966,973 | ) | | | 6,233,742 | | | | (22,870,422 | ) | | | 16,341,125 | | | | (78,495 | ) |
| Capital Share Transactions | | | | | | | | | | | | | | | | | | | | |
| Institutional Class: | | | | | | | | | | | | | | | | | | | | |
| Proceeds from shares sold | | | 1,970,344 | | | | 279,950 | | | | 136,494,089 | | | | 268,214,088 | | | | 2,356,181 | |
| Proceeds from reinvestment of distributions | | | 1,486,844 | | | | — | | | | 12,414,011 | | | | 5,405,379 | | | | — | |
| Payments for shares redeemed | | | (327,169 | ) | | | — | | | | (125,719,502 | ) | | | (22,310,756 | ) | | | (247,871 | ) |
| Proceeds related to shares issued from reorganization (See Note 13) | | | — | | | | 44,093,614 | | | | — | | | | — | | | | — | |
| Increase in net assets from Institutional Class transactions | | | 3,130,019 | | | | 44,373,564 | | | | 23,188,598 | | | | 251,308,711 | | | | 2,108,310 | |
| A Class: | | | | | | | | | | | | | | | | | | | | |
| Proceeds from shares sold | | | 11,259 | | | | 62,824 | | | | 744,014 | | | | 4,143,904 | | | | 27,450 | |
| Proceeds from reinvestment of distributions | | | 1,511 | | | | — | | | | 132,654 | | | | 56,001 | | | | — | |
| Payments for shares redeemed | | | (27,286 | ) | | | (899 | ) | | | (3,010,370 | ) | | | (583,311 | ) | | | (1,005 | ) |
| Increase (Decrease) in net assets from A Class transactions | | | (14,516 | ) | | | 61,925 | | | | (2,133,702 | ) | | | 3,616,594 | | | | 26,445 | |
| Net increase in net assets resulting from capital share transactions | | | 3,115,503 | | | | 44,435,489 | | | | 21,054,896 | | | | 254,925,305 | | | | 2,134,755 | |
| Distributions to Shareholders | | | | | | | | | | | | | | | | | | | | |
| From distributable earnings | | | | | | | | | | | | | | | | | | | | |
| Institutional Class | | | (916,975 | ) | | | — | | | | (6,979,158 | ) | | | (6,223,846 | ) | | | — | |
| A Class | | | (1,069 | ) | | | — | | | | (64,569 | ) | | | (86,224 | ) | | | — | |
| From net realized gains | | | | | | | | | | | | | | | | | | | | |
| Institutional Class | | | (570,690 | ) | | | — | | | | (6,360,448 | ) | | | (487,568 | ) | | | — | |
| A Class | | | (442 | ) | | | — | | | | (81,540 | ) | | | (7,065 | ) | | | — | |
| From tax return of capital | | | | | | | | | | | | | | | | | | | | |
| Institutional Class | | | — | | | | — | | | | (3,485,657 | ) | | | — | | | | — | |
| A Class | | | — | | | | — | | | | (27,153 | ) | | | — | | | | — | |
| Total distributions to shareholders | | | (1,489,176 | ) | | | — | | | | (16,998,525 | ) | | | (6,804,703 | ) | | | — | |
| Total Increase (Decrease) in Net Assets | | | (6,340,646 | ) | | | 50,669,231 | | | | (18,814,051 | ) | | | 264,461,727 | | | | 2,056,260 | |
| Net Assets | | | | | | | | | | | | | | | | | | | | |
| Beginning of period | | | 50,669,231 | | | | — | | | | 373,847,847 | | | | 109,386,120 | | | | — | |
| End of period | | $ | 44,328,585 | | | $ | 50,669,231 | | | $ | 355,033,796 | | | $ | 373,847,847 | | | $ | 2,056,260 | |
| (1) | Inception date of the the Fund was October 15, 2021. |
| (2) | Inception date of the the Fund was February 4, 2022. |
See accompanying Notes to Financial Statements.
| |
| |
| 2022 Annual Report | November 30, 2022 |
| |
| Statements of Changes in Net Assets (continued) |
| |
| |
| |
| | | Ecofin Global Energy Transition Fund | | Ecofin Global Renewables
Infrastructure Fund | | Ecofin
Sustainable
Water Fund |
| | | Year Ended
November 30,
2022 | | Period from
Inception(1) to
November 30,
2021 | | Year Ended
November 30,
2022 | | Year Ended
November 30,
2021 | | Period from
Inception(2) to
November 30,
2022 |
| Transactions in Shares: | | | | | | | | | | | | | | | | | | | | |
| Institutional Class: | | | | | | | | | | | | | | | | | | | | |
| Shares sold | | | 212,802 | | | | 26,568 | | | | 11,664,442 | | | | 21,097,049 | | | | 237,858 | |
| Shares issued to holders in reinvestment of dividends | | | 159,073 | | | | — | | | | 1,039,457 | | | | 435,783 | | | | (26,653 | ) |
| Shares redeemed | | | (39,795 | ) | | | — | | | | (10,787,826 | ) | | | (1,800,978 | ) | | | — | |
| Shares issued from reorganization (See Note 13) | | | — | | | | 4,923,295 | | | | — | | | | — | | | | — | |
| Increase in Institutional Class shares outstanding | | | 332,080 | | | | 4,949,863 | | | | 1,916,073 | | | | 9,461,639 | | | | 211,205 | |
| A Class: | | | | | | | | | | | | | | | | | | | | |
| Shares sold | | | 1,431 | | | | 6,124 | | | | 64,263 | | | | 320,402 | | | | 2,752 | |
| Shares issued to holders in reinvestment of dividends | | | 163 | | | | — | | | | 11,019 | | | | 4,517 | | | | (103 | ) |
| Shares redeemed | | | (3,544 | ) | | | (87 | ) | | | (265,707 | ) | | | (48,003 | ) | | | — | |
| Increase (Decrease) in A Class shares outstanding | | | (1,950 | ) | | | 6,037 | | | | (190,425 | ) | | | 276,916 | | | | 2,649 | |
| Net increase in shares outstanding | | | 330,130 | | | | 4,955,900 | | | | 1,725,648 | | | | 20,008,770 | | | | 213,854 | |
| (1) | Inception date of the the Fund was October 15, 2021. |
| (2) | Inception date of the the Fund was February 4, 2022. |
See accompanying Notes to Financial Statements.
| |
| |
| |
| |
| Tortoise MLP & Pipeline Fund |
| Financial Highlights |
| Institutional Class |
| |
| | | Year Ended
November 30,
2022 | | Year Ended
November 30,
2021 | | Year Ended
November 30,
2020 | | Year Ended
November 30,
2019 | | Year Ended
November 30,
2018 |
| | | | | | | | | | | | | | | | | | | | | |
| Per Common Share Data(1) | | | | | | | | | | | | | | | | | | | | |
| Net asset value, beginning of year | | $ | 11.20 | | | $ | 8.33 | | | $ | 11.61 | | | $ | 12.29 | | | $ | 12.85 | |
| Investment operations: | | | | | | | | | | | | | | | | | | | | |
| Net investment income(2) | | | 0.02 | | | | 0.06 | | | | 0.12 | | | | 0.14 | | | | 0.16 | |
| Net realized and unrealized gain (loss) on investments and translations of foreign currency(2) | | | 3.31 | | | | 3.27 | | | | (2.96 | ) | | | (0.26 | ) | | | (0.26 | ) |
| Total from investment operations | | | 3.33 | | | | 3.33 | | | | (2.84 | ) | | | (0.12 | ) | | | (0.10 | ) |
| Less distributions from: | | | | | | | | | | | | | | | | | | | | |
| Net investment income | | | (0.10 | ) | | | (0.16 | ) | | | (0.14 | ) | | | (0.20 | ) | | | (0.17 | ) |
| Net realized gains | | | — | | | | — | | | | — | | | | — | | | | — | |
| Return of capital | | | (0.46 | ) | | | (0.30 | ) | | | (0.30 | ) | | | (0.36 | ) | | | (0.29 | ) |
| Total distributions | | | (0.56 | ) | | | (0.46 | ) | | | (0.44 | ) | | | (0.56 | ) | | | (0.46 | ) |
| Net asset value, end of year | | $ | 13.97 | | | $ | 11.20 | | | $ | 8.33 | | | $ | 11.61 | | | $ | 12.29 | |
| Total Return | | | 31.52 | % | | | 40.51 | % | | | (24.70 | )% | | | (1.09 | )% | | | (0.88 | )% |
| Supplemental Data and Ratios | | | | | | | | | | | | | | | | | | | | |
| Net assets, end of year (in 000’s) | | $ | 2,231,400 | | | $ | 1,680,834 | | | $ | 1,493,621 | | | $ | 3,226,450 | | | $ | 3,544,401 | |
| Ratio of expenses to average net assets | | | 0.93 | % | | | 0.94 | % | | | 0.94 | % | | | 0.93 | % | | | 0.93 | % |
| Ratio of expenses excluding interest expense to average net assets | | | 0.93 | % | | | 0.93 | % | | | 0.94 | % | | | 0.93 | % | | | 0.93 | % |
| Ratio of net investment income to average net assets | | | 1.10 | % | | | 0.92 | % | | | 1.64 | % | | | 1.01 | % | | | 1.06 | % |
| Portfolio turnover rate | | | 20 | % | | | 32 | % | | | 39 | % | | | 19 | % | | | 14 | % |
| (1) | For an Institutional Class Share outstanding for the entire period. |
| (2) | The per common share data for the years ended November 30, 2021, 2020, 2019, and 2018 do not reflect the change in estimate of investment income and return of capital.
See Note 2 to the financial statements for further disclosure. |
| See accompanying Notes to Financial Statements. | |
| | |
| 40 | TortoiseEcofin |
| |
| |
| 2022 Annual Report | November 30, 2022 |
| |
| Tortoise MLP & Pipeline Fund |
| Financial Highlights (continued) |
| A Class |
| |
| | | Year Ended
November 30,
2022 | | Year Ended
November 30,
2021 | | Year Ended
November 30,
2020 | | Year Ended
November 30,
2019 | | Year Ended
November 30,
2018 |
| | | | | | | | | | | | | | | | | | | | | |
| Per Common Share Data(1) | | | | | | | | | | | | | | | | | | | | |
| Net asset value, beginning of year | | $ | 11.07 | | | $ | 8.25 | | | $ | 11.50 | | | $ | 12.18 | | | $ | 12.77 | |
| Investment operations: | | | | | | | | | | | | | | | | | | | | |
| Net investment income (loss)(2) | | | (0.03 | ) | | | 0.08 | | | | 0.16 | | | | 0.11 | | | | 0.06 | |
| Net realized and unrealized gain (loss) on investments and translations of foreign currency(2) | | | 3.30 | | | | 3.19 | | | | (3.01 | ) | | | (0.26 | ) | | | (0.22 | ) |
| Total from investment operations | | | 3.27 | | | | 3.27 | | | | (2.85 | ) | | | (0.15 | ) | | | (0.16 | ) |
| Less distributions from: | | | | | | | | | | | | | | | | | | | | |
| Net investment income | | | (0.10 | ) | | | (0.16 | ) | | | (0.11 | ) | | | (0.18 | ) | | | (0.16 | ) |
| Net realized gains | | | — | | | | — | | | | — | | | | — | | | | — | |
| Return of capital | | | (0.44 | ) | | | (0.29 | ) | | | (0.29 | ) | | | (0.35 | ) | | | (0.27 | ) |
| Total distributions | | | (0.54 | ) | | | (0.45 | ) | | | (0.40 | ) | | | (0.53 | ) | | | (0.43 | ) |
| Net asset value, end of year | | $ | 13.80 | | | $ | 11.07 | | | $ | 8.25 | | | $ | 11.50 | | | $ | 12.18 | |
| Total Return(3) | | | 31.26 | % | | | 40.12 | % | | | (24.94 | )% | | | (1.38 | )% | | | (1.31 | )% |
| Supplemental Data and Ratios | | | | | | | | | | | | | | | | | | | | |
| Net assets, end of year (in 000’s) | | $ | 191,407 | | | $ | 168,259 | | | $ | 132,882 | | | $ | 469,882 | | | $ | 474,785 | |
| Ratio of expenses to average net assets | | | 1.18 | % | | | 1.19 | % | | | 1.19 | % | | | 1.18 | % | | | 1.18 | % |
| Ratio of expenses excluding interest expense to average net assets | | | 1.18 | % | | | 1.18 | % | | | 1.18 | % | | | 1.18 | % | | | 1.18 | % |
| Ratio of net investment income to average net assets | | | 0.85 | % | | | 0.67 | % | | | 1.40 | % | | | 0.76 | % | | | 0.81 | % |
| Portfolio turnover rate | | | 20 | % | | | 32 | % | | | 39 | % | | | 19 | % | | | 14 | % |
| (1) | For an A Class Share outstanding for the entire period. Prior to March 30, 2019, A Class Shares were known as Investor Class Shares. |
| (2) | The per common share data for the years ended November 30, 2021, 2020, 2019, and 2018 do not reflect the change in estimate of investment income and return of capital.
See Note 2 to the financial statements for further disclosure. |
| (3) | Total return does not reflect sales charges. |
See accompanying Notes to Financial Statements.
| |
| |
| |
| |
| Tortoise MLP & Pipeline Fund |
| Financial Highlights (continued) |
| C Class |
| |
| | | Year Ended
November 30,
2022 | | Year Ended
November 30,
2021 | | Year Ended
November 30,
2020 | | Year Ended
November 30,
2019 | | Year Ended
November 30,
2018 |
| | | | | | | | | | | | | | | | | | | | | |
| Per Common Share Data(1) | | | | | | | | | | | | | | | | | | | | |
| Net asset value, beginning of year | | $ | 10.92 | | | $ | 8.18 | | | $ | 11.39 | | | $ | 12.05 | | | $ | 12.61 | |
| Investment operations: | | | | | | | | | | | | | | | | | | | | |
| Net investment income (loss)(2) | | | (0.15 | ) | | | (0.07 | ) | | | 0.05 | | | | (0.01 | ) | | | — | (3) |
| Net realized and unrealized gain (loss) on investments and translations of foreign currency(2) | | | 3.28 | | | | 3.23 | | | | (2.94 | ) | | | (0.23 | ) | | | (0.23 | ) |
| Total from investment operations | | | 3.13 | | | | 3.23 | | | | (2.89 | ) | | | (0.24 | ) | | | (0.23 | ) |
| Less distributions from: | | | | | | | | | | | | | | | | | | | | |
| Net investment income | | | (0.08 | ) | | | (0.16 | ) | | | (0.11 | ) | | | (0.15 | ) | | | (0.12 | ) |
| Net realized gains | | | — | | | | — | | | | — | | | | — | | | | — | |
| Return of capital | | | (0.40 | ) | | | (0.26 | ) | | | (0.21 | ) | | | (0.27 | ) | | | (0.21 | ) |
| Total distributions | | | (0.48 | ) | | | (0.42 | ) | | | (0.32 | ) | | | (0.42 | ) | | | (0.33 | ) |
| Net asset value, end of year | | $ | 13.57 | | | $ | 10.92 | | | $ | 8.18 | | | $ | 11.39 | | | $ | 12.05 | |
| Total Return(4) | | | 30.22 | % | | | 39.00 | % | | | (25.41 | )% | | | (2.13 | )% | | | (1.89 | )% |
| Supplemental Data and Ratios | | | | | | | | | | | | | | | | | | | | |
| Net assets, end of year (in 000’s) | | $ | 22,356 | | | $ | 20,625 | | | $ | 19,530 | | | $ | 37,888 | | | $ | 51,458 | |
| Ratio of expenses to average net assets | | | 1.93 | % | | | 1.94 | % | | | 1.94 | % | | | 1.93 | % | | | 1.93 | % |
| Ratio of expenses excluding interest expense to average net assets | | | 1.93 | % | | | 1.93 | % | | | 1.94 | % | | | 1.93 | % | | | 1.93 | % |
| Ratio of net investment income (loss) to average net assets | | | 0.11 | % | | | (0.08 | )% | | | 0.64 | % | | | 0.01 | % | | | 0.06 | % |
| Portfolio turnover rate | | | 20 | % | | | 32 | % | | | 39 | % | | | 19 | % | | | 14 | % |
| (1) | For a C Class Share outstanding for the entire period. |
| (2) | The per common share data for the years ended November 30, 2021, 2020, 2019, and 2018 do not reflect the change in estimate of investment income and return of capital.
See Note 2 to the financial statements for further disclosure. |
| (3) | Amount per share is less than $0.01. |
| (4) | Total return does not reflect sales charges. |
See accompanying Notes to Financial Statements.
| |
| |
| 2022 Annual Report | November 30, 2022 |
| |
| Tortoise Energy Infrastructure and Income Fund |
| Financial Highlights |
| Institutional Class |
| |
| | | Year Ended
November 30,
2022 | | Year Ended
November 30,
2021 | | Year Ended
November 30,
2020 | | Year Ended
November 30,
2019 | | Year Ended
November 30,
2018 |
| | | | | | | | | | | | | | | | | | | | | |
| Per Common Share Data(1) | | | | | | | | | | | | | | | | | | | | |
| Net asset value, beginning of year | | $ | 6.45 | | | $ | 5.44 | | | $ | 6.74 | | | $ | 7.43 | | | $ | 8.42 | |
| Investment operations: | | | | | | | | | | | | | | | | | | | | |
| Net investment income | | | 0.22 | | | | 0.10 | | | | 0.11 | (2) | | | 0.81 | | | | 0.08 | (2) |
| Net realized and unrealized gain (loss) on investments and translations of foreign currency | | | 1.50 | | | | 1.38 | | | | (0.91 | ) | | | (0.82 | ) | | | (0.35 | ) |
| Total from investment operations | | | 1.72 | | | | 1.48 | | | | (0.80 | ) | | | (0.01 | ) | | | (0.27 | ) |
| Less distributions from: | | | | | | | | | | | | | | | | | | | | |
| Net investment income | | | (0.14 | ) | | | (0.07 | ) | | | (0.08 | ) | | | (0.01 | ) | | | (0.43 | ) |
| Net realized gains | | | — | | | | — | | | | — | | | | — | | | | — | |
| Return of capital | | | (0.33 | ) | | | (0.40 | ) | | | (0.42 | ) | | | (0.67 | ) | | | (0.29 | ) |
| Total distributions | | | (0.47 | ) | | | (0.47 | ) | | | (0.50 | ) | | | (0.68 | ) | | | (0.72 | ) |
| Redemption fee proceeds | | | — | | | | — | | | | — | | | | — | (3) | | | — | (2)(3) |
| Net asset value, end of year | | $ | 7.70 | | | $ | 6.45 | | | $ | 5.44 | | | $ | 6.74 | | | $ | 7.43 | |
| Total Return | | | 27.03 | % | | | 27.63 | % | | | (11.83 | )% | | | (0.29 | )% | | | (3.66 | )% |
| Supplemental Data and Ratios | | | | | | | | | | | | | | | | | | | | |
| Net assets, end of year (in 000’s) | | $ | 458,578 | | | $ | 353,595 | | | $ | 291,420 | | | $ | 628,295 | | | $ | 748,415 | |
| Ratio of expenses to average net assets | | | 1.13 | % | | | 1.16 | % | | | 1.14 | % | | | 1.17 | % | | | 1.16 | % |
| Ratio of expenses excluding interest expense to average net assets | | | 1.13 | % | | | 1.16 | % | | | 1.13 | % | | | 1.17 | % | | | 1.16 | % |
| Ratio of net investment income to average net assets | | | 1.83 | % | | | 1.00 | % | | | 2.02 | % | | | 1.68 | % | | | 0.99 | % |
| Portfolio turnover rate | | | 10 | % | | | 22 | % | | | 43 | % | | | 48 | % | | | 55 | % |
| (1) | For an Institutional Class Share outstanding for the entire period. |
| (2) | Per share amounts calculated using average shares method. |
| (3) | Amount per share is less than $0.01. |
See accompanying Notes to Financial Statements.
| |
| |
| |
| |
| Tortoise Energy Infrastructure and Income Fund |
| Financial Highlights (continued) |
| A Class |
| |
| | | Year Ended
November 30,
2022 | | Year Ended
November 30,
2021 | | Year Ended
November 30,
2020 | | Year Ended
November 30,
2019 | | Year Ended
November 30,
2018 |
| | | | | | | | | | | | | | | | | | | | | |
| Per Common Share Data(1) | | | | | | | | | | | | | | | | | | | | |
| Net asset value, beginning of year | | $ | 6.60 | | | $ | 5.56 | | | $ | 6.87 | | | $ | 7.56 | | | $ | 8.57 | |
| Investment operations: | | | | | | | | | | | | | | | | | | | | |
| Net investment income | | | 0.13 | | | | 0.05 | | | | 0.10 | (2) | | | 0.79 | | | | 0.06 | (2) |
| Net realized and unrealized gain (loss) on investments and translations of foreign currency | | | 1.61 | | | | 1.44 | | | | (0.93 | ) | | | (0.80 | ) | | | (0.36 | ) |
| Total from investment operations | | | 1.74 | | | | 1.49 | | | | (0.83 | ) | | | (0.01 | ) | | | (0.30 | ) |
| Less distributions from: | | | | | | | | | | | | | | | | | | | | |
| Net investment income | | | (0.14 | ) | | | (0.06 | ) | | | (0.07 | ) | | | (0.01 | ) | | | (0.42 | ) |
| Net realized gains | | | —- | | | | — | | | | — | | | | — | | | | — | |
| Return of capital | | | (0.32 | ) | | | (0.39 | ) | | | (0.41 | ) | | | (0.67 | ) | | | (0.29 | ) |
| Total distributions | | | (0.46 | ) | | | (0.45 | ) | | | (0.48 | ) | | | (0.68 | ) | | | (0.71 | ) |
| Redemption fee proceeds | | | — | | | | — | | | | — | | | | — | (3) | | | — | (2)(3) |
| Net asset value, end of year | | $ | 7.88 | | | $ | 6.60 | | | $ | 5.56 | | | $ | 6.87 | | | $ | 7.56 | |
| Total Return(4) | | | 26.67 | % | | | 27.19 | % | | | (11.96 | )% | | | (0.41 | )% | | | (3.95 | )% |
| Supplemental Data and Ratios | | | | | | | | | | | | | | | | | | | | |
| Net assets, end of year (in 000’s) | | $ | 45,741 | | | $ | 38,146 | | | $ | 32,256 | | | $ | 45,492 | | | $ | 55,436 | |
| Ratio of expenses to average net assets | | | 1.38 | % | | | 1.41 | % | | | 1.39 | % | | | 1.42 | % | | | 1.41 | % |
| Ratio of expenses excluding interest expense to average net assets | | | 1.38 | % | | | 1.41 | % | | | 1.38 | % | | | 1.42 | % | | | 1.41 | % |
| Ratio of net investment income to average net assets | | | 1.58 | % | | | 0.75 | % | | | 1.76 | % | | | 1.43 | % | | | 0.74 | % |
| Portfolio turnover rate | | | 10 | % | | | 22 | % | | | 43 | % | | | 48 | % | | | 55 | % |
| (1) | For an A Class Share outstanding for the entire period. |
| (2) | Per share amounts calculated using average shares method. |
| (3) | Amount per share is less than $0.01. |
| (4) | Total return does not reflect sales charges. |
See accompanying Notes to Financial Statements.
| |
| |
| 2022 Annual Report | November 30, 2022 |
| |
| Tortoise Energy Infrastructure and Income Fund |
| Financial Highlights (continued) |
| C Class |
| |
| | | Year Ended
November 30,
2022 | | Year Ended
November 30,
2021 | | Year Ended
November 30,
2020 | | Year Ended
November 30,
2019 | | Year Ended
November 30,
2018 |
| | | | | | | | | | | | | | | | | | | | | |
| Per Common Share Data(1) | | | | | | | | | | | | | | | | | | | | |
| Net asset value, beginning of year | | $ | 6.60 | | | $ | 5.57 | | | $ | 6.89 | | | $ | 7.59 | | | $ | 8.60 | |
| Investment operations: | | | | | | | | | | | | | | | | | | | | |
| Net investment income (loss) | | | (0.11 | ) | | | (0.18 | ) | | | 0.06 | (3) | | | 0.67 | | | | — | (2)(3) |
| Net realized and unrealized gain (loss) on investments and translations of foreign currency | | | 1.79 | | | | 1.63 | | | | (0.94 | ) | | | (0.75 | ) | | | (0.37 | ) |
| Total from investment operations | | | 1.68 | | | | 1.45 | | | | (0.88 | ) | | | (0.08 | ) | | | (0.37 | ) |
| Less distributions from: | | | | | | | | | | | | | | | | | | | | |
| Net investment income | | | (0.12 | ) | | | (0.06 | ) | | | (0.07 | ) | | | (0.01 | ) | | | (0.38 | ) |
| Net realized gains | | | — | | | | — | | | | — | | | | — | | | | — | |
| Return of capital | | | (0.30 | ) | | | (0.36 | ) | | | (0.37 | ) | | | (0.61 | ) | | | (0.26 | ) |
| Total distributions | | | (0.42 | ) | | | (0.42 | ) | | | (0.44 | ) | | | (0.62 | ) | | | (0.64 | ) |
| Redemption fee proceeds | | | — | | | | — | | | | — | | | | — | (2) | | | — | (2)(3) |
| Net asset value, end of year | | $ | 7.86 | | | $ | 6.60 | | | $ | 5.57 | | | $ | 6.89 | | | $ | 7.59 | |
| Total Return(4) | | | 25.76 | % | | | 26.35 | % | | | (12.72 | )% | | | (1.30 | )% | | | (4.64 | )% |
| Supplemental Data and Ratios | | | | | | | | | | | | | | | | | | | | |
| Net assets, end of year (in 000’s) | | $ | 24,339 | | | $ | 23,303 | | | $ | 23,650 | | | $ | 46,979 | | | $ | 55,341 | |
| Ratio of expenses to average net assets | | | 2.13 | % | | | 2.16 | % | | | 2.14 | % | | | 2.17 | % | | | 2.16 | % |
| Ratio of expenses excluding interest expense to average net assets | | | 2.13 | % | | | 2.16 | % | | | 2.13 | % | | | 2.17 | % | | | 2.16 | % |
| Ratio of net investment income (loss) to average net assets | | | 0.83 | % | | | (0.00 | )% | | | 1.02 | % | | | 0.68 | % | | | (0.01 | )% |
| Portfolio turnover rate | | | 10 | % | | | 22 | % | | | 43 | % | | | 48 | % | | | 55 | % |
| (1) | For a C Class Share outstanding for the entire period. |
| (2) | Amount per share is less than $0.01. |
| (3) | Per share amounts calculated using average shares method. |
| (4) | Total return does not reflect sales charges. |
See accompanying Notes to Financial Statements.
| |
| |
| |
| |
| Ecofin Global Energy Transition Fund |
| Financial Highlights |
| Institutional Class |
| |
| | | Year Ended
November 30,
2022 | | Period from
Inception(1) to
November 30,
2021 |
| | | | | | | | | |
| Per Common Share Data(2) | | | | | | | | |
| Net asset value, beginning of period | | $ | 10.22 | | | $ | 10.00 | |
| Investment operations: | | | | | | | | |
| Net investment income (loss) | | | (0.03 | ) | | | — | (3) |
| Net realized and unrealized gain (loss) on investments and translations of foreign currency | | | (1.69 | ) | | | 0.22 | |
| Total from investment operations | | | (1.72 | ) | | | 0.22 | |
| Less distributions from: | | | | | | | | |
| Net investment income | | | — | | | | — | |
| Net realized gains | | | (0.11 | ) | | | — | |
| Return of capital | | | — | | | | — | |
| Total distributions | | | (0.11 | ) | | | — | |
| Net asset value, end of period | | $ | 8.39 | | | $ | 10.22 | |
| Total Return(4) | | | (15.32 | )% | | | 14.06 | % |
| Supplemental Data and Ratios | | | | | | | | |
| Net assets, end of period (in 000’s) | | $ | 44,295 | | | $ | 50,609 | |
| Ratio of expenses to average net assets: | | | | | | | | |
| Before expense waiver(5) | | | 1.42 | % | | | 1.86 | % |
| After expense waiver(5) | | | 0.90 | % | | | 0.90 | % |
| Ratio of net investment income (loss) to average net assets: | | | | | | | | |
| Before expense waiver(5) | | | (0.17 | )% | | | (1.20 | )% |
| After expense waiver(5) | | | 0.35 | % | | | (0.24 | )% |
| Portfolio turnover rate(4) | | | 55 | % | | | 13 | % |
| (1) | October 15, 2021. |
| (2) | For an Institutional Class Share outstanding for the entire period. |
| (3) | Amount per share is less than $0.01. |
| (4) | Not annualized for periods less than one year. |
| (5) | Annualized for periods less than one year. |
See accompanying Notes to Financial Statements.
| |
| |
| 2022 Annual Report | November 30, 2022 |
| |
| Ecofin Global Energy Transition Fund |
| Financial Highlights (continued) |
| A Class |
| |
| | | Year Ended
November 30,
2022 | | Period from
Inception(1) to
November 30,
2021 |
| | | | | | | | | |
| Per Common Share Data(2) | | | | | | | | |
| Net asset value, beginning of period | | $ | 9.97 | | | $ | 10.00 | |
| Investment operations: | | | | | | | | |
| Net investment income (loss) | | | (0.14 | ) | | | — | (3) |
| Net realized and unrealized loss on investments and translations of foreign currency | | | (1.56 | ) | | | (0.03 | ) |
| Total from investment operations | | | (1.70 | ) | | | (0.03 | ) |
| Less distributions from: | | | | | | | | |
| Net investment income | | | — | | | | — | |
| Net realized gains | | | (0.11 | ) | | | — | |
| Return of capital | | | — | | | | — | |
| Total distributions | | | (0.11 | ) | | | — | |
| Net asset value, end of period | | $ | 8.16 | | | $ | 9.97 | |
| Total Return(4)(5) | | | (15.56 | )% | | | 13.69 | % |
| Supplemental Data and Ratios | | | | | | | | |
| Net assets, end of period (in 000’s) | | $ | 33 | | | $ | 60 | |
| Ratio of expenses to average net assets: | | | | | | | | |
| Before expense waiver(6) | | | 1.67 | % | | | 2.11 | % |
| After expense waiver(6) | | | 1.15 | % | | | 1.15 | % |
| Ratio of net investment income (loss) to average net assets: | | | | | | | | |
| Before expense waiver(6) | | | (0.42 | )% | | | (1.37 | )% |
| After expense waiver(6) | | | 0.10 | % | | | (0.49 | )% |
| Portfolio turnover rate(5) | | | 55 | % | | | 13 | % |
| (1) | October 18, 2021. |
| (2) | For an A Class Share outstanding for the entire period. |
| (3) | Amount per share is less than $0.01. |
| (4) | Total return does not reflect sales charges. |
| (5) | Not annualized for period less than one year. |
| (6) | Annualized for periods less than one year. |
See accompanying Notes to Financial Statements.
| |
| |
| |
| |
| Ecofin Global Renewables Infrastructure Fund |
| Financial Highlights |
| Institutional Class |
| |
| | | Year Ended
November 30,
2022 | | Year Ended
November 30,
2021 | | Period from
Inception(1) to
November 30,
2020 |
| | | | | | | | | | | | | |
| Per Common Share Data(2) | | | | | | | | | | | | |
| Net asset value, beginning of period | | $ | 12.64 | | | $ | 11.42 | | | $ | 10.00 | |
| Investment operations: | | | | | | | | | | | | |
| Net investment income | | | 0.11 | | | | 0.15 | (3) | | | 0.04 | |
| Net realized and unrealized gain (loss) on investments and translations of foreign currency | | | (0.84 | ) | | | 1.43 | | | | 1.40 | |
| Total from investment operations | | | (0.73 | ) | | | 1.58 | | | | 1.44 | |
| Less distributions from: | | | | | | | | | | | | |
| Net investment income | | | (0.24 | ) | | | (0.31 | ) | | | (0.02 | ) |
| Net realized gains | | | (0.21 | ) | | | (0.05 | ) | | | — | |
| Return of capital | | | (0.12 | ) | | | — | | | | — | |
| Total distributions | | | (0.57 | ) | | | (0.36 | ) | | | (0.02 | ) |
| Net asset value, end of period | | $ | 11.34 | | | $ | 12.64 | | | $ | 11.42 | |
| Total Return(4) | | | (5.97 | )% | | | 14.02 | % | | | 14.43 | % |
| Supplemental Data and Ratios | | | | | | | | | | | | |
| Net assets, end of period (in 000’s) | | $ | 352,726 | | | $ | 368,864 | | | $ | 108,048 | |
| Ratio of expenses to average net assets: | | | | | | | | | | | | |
| Before expense waiver/recoupment(5) | | | 0.90 | % | | | 0.96 | % | | | 1.46 | % |
| After expense waiver/recoupment(5) | | | 0.91 | % | | | 1.00 | % | | | 1.00 | % |
| Ratio of net investment income to average net assets: | | | | | | | | | | | | |
| Before expense waiver/recoupment(5) | | | 0.88 | % | | | 1.30 | % | | | 1.05 | % |
| After expense waiver/recoupment(5) | | | 0.87 | % | | | 1.26 | % | | | 1.51 | % |
| Portfolio turnover rate(4) | | | 40 | % | | | 41 | % | | | 20 | % |
| (1) | August 7, 2020. |
| (2) | For an Institutional Class Share outstanding for the entire period. |
| (3) | Per share amounts calculated using average shares method. |
| (4) | Not annualized for periods less than one year. |
| (5) | Annualized for period less than one year. |
See accompanying Notes to Financial Statements.
| |
| |
| 2022 Annual Report | November 30, 2022 |
| |
| Ecofin Global Renewables Infrastructure Fund |
| Financial Highlights (continued) |
| A Class |
| |
| | | Year Ended
November 30,
2022 | | Year Ended
November 30,
2021 | | Period from
Inception(1) to
November 30,
2020 |
| | | | | | | | | | | | | |
| Per Common Share Data(2) | | | | | | | | | | | | |
| Net asset value, beginning of period | | $ | 12.65 | | | $ | 11.44 | | | $ | 9.72 | |
| Investment operations: | | | | | | | | | | | | |
| Net investment income | | | 0.16 | | | | 0.13 | (3) | | | 0.03 | |
| Net realized and unrealized gain (loss) on investments and translations of foreign currency | | | (0.92 | ) | | | 1.44 | | | | 1.70 | |
| Total from investment operations | | | (0.76 | ) | | | 1.57 | | | | 1.73 | |
| Less distributions from: | | | | | | | | | | | | |
| Net investment income | | | (0.23 | ) | | | (0.31 | ) | | | (0.01 | ) |
| Net realized gains | | | (0.21 | ) | | | (0.05 | ) | | | — | |
| Return of capital | | | (0.11 | ) | | | — | | | | — | |
| Total distributions | | | (0.55 | ) | | | (0.36 | ) | | | (0.01 | ) |
| Net asset value, end of period | | $ | 11.34 | | | $ | 12.65 | | | $ | 11.44 | |
| Total Return(4)(5) | | | (6.21 | )% | | | 13.66 | % | | | 17.82 | % |
| Supplemental Data and Ratios | | | | | | | | | | | | |
| Net assets, end of period (in 000’s) | | $ | 2,308 | | | $ | 4,983 | | | $ | 1,338 | |
| Ratio of expenses to average net assets: | | | | | | | | | | | | |
| Before expense waiver/recoupment(5) | | | 1.15 | % | | | 1.21 | % | | | 2.08 | % |
| After expense waiver/recoupment(5) | | | 1.16 | % | | | 1.25 | % | | | 1.25 | % |
| Ratio of net investment income to average net assets: | | | | | | | | | | | | |
| Before expense waiver/recoupment(5) | | | 0.63 | % | | | 1.05 | % | | | 2.43 | % |
| After expense waiver/recoupment(5) | | | 0.62 | % | | | 1.01 | % | | | 3.26 | % |
| Portfolio turnover rate(4) | | | 40 | % | | | 41 | % | | | 20 | % |
| (1) | September 25, 2020. |
| (2) | For an A Class Share outstanding for the entire period. |
| (3) | Per share amounts calculated using average shares method. |
| (4) | Total return does not reflect sales charges. |
| (5) | Not annualized for period less than one year. |
| (6) | Annualized for periods less than one year. |
See accompanying Notes to Financial Statements.
| |
| |
| |
| |
| Ecofin Sustainable Water Fund |
| Financial Highlights |
| Institutional Class |
| |
| | | Period from
Inception(1) to
November 30,
2022 |
| | | | | |
| Per Common Share Data(2) | | | | |
| Net asset value, beginning of period | | $ | 10.00 | |
| Investment operations: | | | | |
| Net investment income | | | 0.06 | |
| Net realized and unrealized loss on investments and translations of foreign currency | | | (0.44 | ) |
| Total from investment operations | | | (0.38 | ) |
| Less distributions from: | | | | |
| Net investment income | | | — | |
| Net realized gains | | | — | |
| Return of capital | | | — | |
| Total distributions | | | — | |
| Net asset value, end of period | | $ | 9.62 | |
| Total Return(3) | | | (3.80 | )% |
| Supplemental Data and Ratios | | | | |
| Net assets, end of period (in 000’s) | | $ | 2,031 | |
| Ratio of expenses to average net assets: | | | | |
| Before expense waiver(4) | | | 13.05 | % |
| After expense waiver(4) | | | 0.95 | % |
| Ratio of net investment income (loss) to average net assets: | | | | |
| Before expense waiver(4) | | | (11.38 | )% |
| After expense waiver(4) | | | 0.72 | % |
| Portfolio turnover rate(3) | | | 29 | % |
| (1) | February 4, 2022. |
| (2) | For an Institutional Class Share outstanding for the entire period. |
| (3) | Not annualized. |
| (4) | Annualized. |
See accompanying Notes to Financial Statements.
| |
| |
| 2022 Annual Report | November 30, 2022 |
| |
| Ecofin Sustainable Water Fund |
| Financial Highlights (continued) |
| A Class |
| |
| | | Period from
Inception(1) to
November 30,
2022 |
| | | | | |
| Per Common Share Data(2) | | | | |
| Net asset value, beginning of period | | $ | 10.00 | |
| Investment operations: | | | | |
| Net investment income | | | 0.03 | |
| Net realized and unrealized loss on investments and translations of foreign currency | | | (0.43 | ) |
| Total from investment operations | | | (0.40 | ) |
| Less distributions from: | | | | |
| Net investment income | | | — | |
| Net realized gains | | | — | |
| Return of capital | | | — | |
| Total distributions | | | — | |
| Net asset value, end of period | | $ | 9.60 | |
| Total Return(3)(4) | | | (4.00 | )% |
| Supplemental Data and Ratios | | | | |
| Net assets, end of period (in 000’s) | | $ | 25 | |
| Ratio of expenses to average net assets: | | | | |
| Before expense waiver(5) | | | 13.30 | % |
| After expense waiver(5) | | | 1.20 | % |
| Ratio of net investment income (loss) to average net assets: | | | | |
| Before expense waiver(5) | | | (11.64 | )% |
| After expense waiver(5) | | | 0.46 | % |
| Portfolio turnover rate(4) | | | 29 | % |
| (1) | February 4, 2022. |
| (2) | For an A Class Share outstanding for the entire period. |
| (3) | Total return does not reflect sales charges. |
| (4) | Not annualized. |
| (5) | Annualized. |
See accompanying Notes to Financial Statements.
Notes to Financial Statements
November 30, 2022
1. Organization
Managed Portfolio Series (the “Trust”) was organized as a Delaware statutory trust on January 27, 2011. The Trust is registered under the Investment Company Act of 1940, as amended (the “1940 Act”), as an open-end management investment company. The Tortoise MLP & Pipeline Fund (“MLP & Pipeline Fund”), the Tortoise Energy Infrastructure and Income Fund (“Energy Infrastructure and Income Fund”), the Ecofin Global Energy Transition Fund (“Global Energy Transition Fund”), the Ecofin Global Renewables Infrastructure Fund (“Global Renewables Infrastructure Fund”) and the Ecofin Sustainable Water Fund (“Sustainable Water Fund”) (or collectively, “the Funds”) are each a non-diversified series with their own investment objectives and policies within the Trust. The Trust has evaluated the structure, objective and activities of the Funds and determined that they meet the characteristics of an investment company. As such, these financial statements have applied the guidance as set forth in the Accounting Standards Codifications (“ASC”) 946, Financial Services Investment Companies.
The investment objective of the MLP & Pipeline Fund is total return. The MLP & Pipeline Fund seeks to achieve its objective by investing primarily in equity securities of master limited partnerships (“MLPs”) and pipeline companies that own and operate a network of energy infrastructure asset systems that transport, store, distribute, gather and/or process crude oil, refined petroleum products (including biodiesel and ethanol), natural gas or natural gas liquids. The MLP & Pipeline Fund commenced operations on May 31, 2011.
The investment objective of the Energy Infrastructure and Income Fund is primarily to seek current income and secondarily to seek long-term capital appreciation. The Energy Infrastructure and Income Fund primarily invests in equity and debt securities of MLPs focused in the energy infrastructure sector and in equity and debt securities of other companies focused in the energy infrastructure sector. The Energy Infrastructure and Income Fund commenced operations on December 27, 2010. On June 25, 2021, the Tortoise MLP & Energy Infrastructure Fund (the “Acquired Fund”) merged into the Energy Infrastructure and Income Fund. All shares of the Acquired Fund were exchanged for shares of the Energy Infrastructure and Income Fund on a pro rata basis immediately after the closing date. This merger qualified as a tax-free reorganization under Section 368(a)(1)(C) of the Internal Revenue Code.
The investment objective of the Global Energy Transition Fund is to generate long-term total return. The Global Energy Transition Fund primarily invests in equity securities of companies that are positively exposed to long-term structural trends related to the energy transition associated with decarbonization. The strategy is focused on changes in the way energy is produced and consumed globally. The Global Energy Transition Fund commenced operations on October 15, 2021.
The investment objective of the Global Renewables Infrastructure Fund is to generate long-term total return derived principally from a combination of capital appreciation and income over time. the Fund will principally focus its investment activities in equity securities of companies who are developers, owners and operators, in full or in part, of renewable electricity technology plants and systems, and related infrastructure investments. The Fund will typically emphasize those companies achieving measurable improvements in overall emissions, as defined as those gases and particles that are exhausted into the air as a result of fuel combustion-related activities, relative to their market peers. The Fund’s investments in equity securities may include investments in other investment companies, real estate investment trusts, foreign investment funds, preferred stocks, rights, warrants, convertible securities, and initial public offerings. The Fund will be invested in a range of both developed and non-developed markets, commensurate with its investment criteria. The Fund considers non-developed market countries to be those countries defined as such by the MSCI Market Classification Framework. The Global Renewables Infrastructure Fund commenced operations on August 7, 2020.
The investment objective of the Sustainable Water Fund is to generate long-term total return by investing primarily in equity securities of companies that design, build, own and operate water and water-related environmental infrastructure, as well as companies that provide the technology, equipment, and services to transport, treat and test water and advance water-related environmental protection and remediation. The Fund commenced operations on February 4, 2022.
The MLP & Pipeline Fund and the Energy Infrastructure and Income Fund offer three classes of shares: the Institutional Class, the A Class and the C Class. The Global Energy Transition Fund, the Global Renewables Infrastructure Fund and the Sustainable Water Fund offer two classes of shares: The Institutional Class and the A Class. Institutional Class shares have no sales charge and are offered only to qualifying institutional investors and certain other qualifying accounts. A Class shares may be subject to a front-end sales charge of up to 5.50%. Prior to November 15, 2019, the MLP & Pipeline Fund A Class shares were subject to a front-end sales charge of up to 5.75%. C Class shares may be subject to a deferred sales charge of up to 1.00%.
2. Significant Accounting Policies
The following is a summary of significant accounting policies followed by the Funds in the preparation of its financial statements. These policies are in conformity with generally accepted accounting principles in the United States of America (“GAAP”).
Securities Valuation — All investments in securities are recorded at their estimated fair value, as described in Note 3.
Foreign Currency Translation — The books and records relating to the Funds’ non-U.S. dollar denominated investments are maintained in U.S. dollars on the following bases: (1) market value of investment securities, assets, and liabilities are translated at the current rate of exchange; and (2) purchases and sales of investment securities, income, and expenses are translated at the relevant rates of exchange prevailing on the respective dates of such transactions. The Funds do not isolate the portion of gains and losses on investments in equity securities that is due to
| |
| |
| 2022 Annual Report | November 30, 2022 |
| |
Notes to Financial Statements (continued)
changes in the foreign exchange rates from that which is due to changes in market prices of equity securities. The Funds report certain foreign currency-related transactions as components of realized gains for financial reporting purposes, whereas such components are treated as ordinary income for federal income tax purposes.
Federal Income Taxes — The Funds intend to meet the requirements of subchapter M of the Internal Revenue Code applicable to regulated investment companies and to distribute substantially all net taxable investment income and net realized gains to shareholders in a manner which results in no tax cost to the Funds. Therefore, no federal income or excise tax provision is required. As of November 30, 2022, the Funds did not have any tax positions that did not meet the “more-likely-than-not” threshold of being sustained by the applicable tax authority. The Funds recognize interest and penalties, if any, related to unrecognized tax benefits on uncertain tax positions as income tax expense in the Statements of Operations. During the period ended November 30, 2022, the funds did not incur any interest or penalties. The Sustainable Water Fund is subject to examination by U.S. taxing authorities for the period since the commencement of operations. The Global Energy Transition Fund is subject to examination by U.S. taxing authorities for the tax years ended November 30, 2021 through 2022. The Global Renewables Infrastructure Fund is subject to examination by U.S. taxing authorities for the tax years ended November 30, 2020 through 2022. The MLP & Pipeline Fund and the Energy Infrastructure and Income Fund are subject to examination by U.S. taxing authorities for the tax years ended November 30, 2019 through 2022.
Securities Transactions, Income and Distributions — Securities transactions are accounted for on the date the securities are purchased or sold (trade date). Realized gains and losses are reported on a specific identified cost basis. Interest income is recognized on an accrual basis, including amortization of premiums and accretion of discounts. Dividend income and distributions are recorded on the ex-dividend date. Withholding taxes on foreign dividends have been provided for in accordance with the Funds’ understanding of the applicable country’s tax rules and regulations. Distributions received from the Funds’ investments generally are comprised of ordinary income and return of capital. The Funds allocate distributions between investment income and return of capital based on estimates made at the time such distributions are received. Such estimates are based on information provided by each portfolio company and other industry sources. These estimates may subsequently be revised based on actual allocations received from the portfolio companies after their tax reporting periods are concluded, as the actual character of these distributions is not known until after the fiscal year end of the Funds.
During the year ended November 30, 2022, the MLP & Pipeline Fund reallocated the amount of return of capital recognized based on the 2021 tax reporting information received. The impact of this adjustment is a decrease to return of capital by approximately $2,594,758.
During the year ended November 30, 2022, the Energy Infrastructure and Income Fund reallocated the amount of return of capital recognized based on the 2021 tax reporting information received. The impact of this adjustment is an increase to return of capital by approximately $151,505.
During the year ended November 30, 2022, the Global Renewables Infrastructure Fund reallocated the amount of return of capital recognized based on the 2021 tax reporting information received. The impact of this adjustment is an increase to return of capital by approximately $318,765.
The Global Energy Transition Fund, Global Renewables Infrastructure Fund and Sustainable Water Fund will make distributions of net investment income, if any, semi-annually and net realized capital gains, if any, annually. The MLP & Pipeline Fund and the Energy Infrastructure and Income Fund will make distributions of net investment income, if any, quarterly and net realized capital gains, if any, annually. Distributions to shareholders are recorded on the ex-dividend date. The treatment for financial reporting purposes of distributions made to shareholders during the year from net investment income or net realized capital gains may differ from their ultimate treatment for federal income tax purposes. These differences are caused primarily by differences in the timing of the recognition of certain components of income, expense or realized capital gain for federal income tax purposes. Where such differences are permanent in nature, GAAP requires that they be reclassified in the components of the net assets based on their ultimate characterization for federal income tax purposes. Any such reclassifications will have no effect on net assets, results of operations or net asset values per share of the Funds. These differences are primarily due to return of capital distributions and book/tax differences from underlying investments.
Reclassification of Capital Accounts — GAAP requires that certain components of net assets relating to permanent differences be reclassified between financial and tax reporting. These differences are caused primarily by differences in the timing of the recognition of certain components of income, expense or realized capital gain for federal income tax purposes. These reclassifications have no effect on net assets, results of operations or net asset value per share. For the year ended November 30, 2022, the following reclassifications were made:
| Fund | | Distributable Earnings | | Paid-in Capital | |
| MLP & Pipeline Fund | | | $(5,512,020 | ) | | | $5,512,020 | | |
| Energy Infrastructure and Income Fund | | | (6,671 | ) | | | 6,671 | | |
| Global Energy Transition Fund | | | — | | | | — | | |
| Global Renewables Infrastructure Fund | | | 3,512,810 | | | | (3,512,810 | ) | |
| Sustainable Water Fund | | | — | | | | — | | |
Use of Estimates — The preparation of financial statements in conformity with GAAP requires management to make estimates and assumptions that affect the reported amounts of assets and liabilities and disclosure of contingent assets and liabilities at the date of the financial statements and the reported amounts of revenues and expenses during the reporting period. Actual results could differ from those estimates.
Notes to Financial Statements (continued)
Allocation of Income, Expenses and Gains/Losses — Income, expenses (other than those deemed attributable to a specific share class), and gains and losses of the Funds are allocated daily to each class of shares based upon the ratio of net assets represented by each class as a percentage of the net assets of each Fund. Expenses deemed directly attributable to a class of shares are recorded by the specific class. Most Fund expenses are allocated by class based on relative net assets. 12b-1 fees are expensed at 0.25% and 1.00% of average daily net assets of A Class shares and C Class shares, respectively. Trust expenses associated with a specific fund in the Trust are charged to that fund. Common Trust expenses are typically allocated evenly between the funds of the Trust, or by other equitable means.
Illiquid or Restricted Securities — A security may be considered illiquid if it lacks a readily available market. Securities are generally considered liquid if they can be sold or disposed of in the ordinary course of business within seven days at approximately the price at which the security is valued by the Funds. Illiquid securities may be valued under methods approved by the Board of Trustees as reflecting fair value. Each Fund will not hold more than 15% of the value of its net assets in illiquid securities. Certain restricted securities may be considered illiquid. Restricted securities are often purchased in private placement transactions, are not registered under the Securities Act of 1933, may have contractual restrictions on resale, and may be valued under methods approved by the Board of Trustees as reflecting fair value. At November 30, 2022, the Funds did not hold any illiquid securities.
Indemnifications — Under the Trust’s organizational documents, its officers and trustees are indemnified against certain liabilities arising out of the performance of their duties to the Trust. In addition, in the normal course of business, the Trust may enter into contracts that provide general indemnification to other parties. The Trust’s maximum exposure under these arrangements is unknown, as this would involve future claims that may be made against the Trust that have not yet occurred and may not occur. However, the Trust has not had prior claims or losses pursuant to these contracts and expects the risk of loss to be remote.
Cash and Cash Equivalents — Cash and cash equivalents include short-term, liquid investments with an original maturity of three months or less and include money market fund accounts.
3. Securities Valuation
The Funds have adopted fair value accounting standards, which establish an authoritative definition of fair value and set out a hierarchy for measuring fair value. These standards require additional disclosures about the various inputs and valuation techniques used to develop the measurements of fair value, a discussion of changes in valuation techniques and related inputs during the period and expanded disclosure of valuation levels for major security types. These inputs are summarized in the three broad levels listed below:
| | Level 1 — | Quoted prices in active markets for identical assets or liabilities. |
| | | |
| | Level 2 — | Observable inputs other than quoted prices included in Level 1. These inputs may include quoted prices for similar instruments, interest rates, prepayment speeds, credit risk, yield curves, default rates and similar data. |
| | | |
| | Level 3 — | Significant unobservable inputs for the asset or liability, representing the Fund’s view of assumptions a market participant would use in valuing the asset or liability. |
Following is a description of the valuation techniques applied to each Fund’s major categories of assets and liabilities measured at fair value on a recurring basis. Each Fund’s investments are carried at fair value.
Common stock (including MLPs) — Securities that are primarily traded on a national securities exchange are valued at the last sale price on the exchange on which they are primarily traded on the day of valuation or, if there has been no sale on such day, at the mean between the bid and ask prices. Securities traded primarily on the Nasdaq Global Market System for which market quotations are readily available are valued using the Nasdaq Official Closing Price (“NOCP”). If the NOCP is not available, such securities are valued at the last sale price on the day of valuation, or if there has been no sale on such day, at the mean between the bid and ask prices. To the extent these securities are actively traded and valuation adjustments are not applied, they are categorized in Level 1 of the fair value hierarchy.
In the case of foreign securities, the occurrence of events after the close of foreign markets, but prior to the time the Funds’ NAV is calculated will result in an adjustment to the trading prices of foreign securities when foreign markets open on the following business day. The Fund will value foreign securities at fair value, taking into account such events in calculating the NAV. In such cases, use of fair valuation can reduce an investor’s ability to seek to profit by estimating the Funds’ NAV in advance of the time the NAV is calculated. All foreign securities, with the exception of Canadian securities and those listed on a U.S. exchange, have an adjustment applied to their trade price and therefore are automatically deemed to be in Level 2 of the fair value hierarchy.
Corporate and Municipal Bonds — Corporate and municipal bonds, including listed issues, are valued at fair value on the basis of valuation furnished by an independent pricing service which utilized both dealer-supplied valuations and formula-based techniques. The pricing service may consider recently executed transactions in securities of the issuer or comparable issuers, market price quotations (where observable), bond spreads, and fundamental data relating to the issuer. Most corporate and municipal bonds are categorized in Level 2 of the fair value hierarchy.
| |
| |
| 2022 Annual Report | November 30, 2022 |
| |
Notes to Financial Statements (continued)
Investment Companies — Investments in other mutual funds, including money market funds, are valued at their net asset value per share. To the extent these securities are actively traded and valuation adjustments are not applied, they are categorized in Level 1 of the fair value hierarchy.
Restricted Securities — Restricted securities are subject to statutory or contractual restrictions on their public resale, which may make it more difficult to obtain a valuation and may limit a Fund’s ability to dispose of them. Investments in private placement securities and other securities for which market quotations are not readily available are valued in good faith by using fair value procedures. Such fair value procedures may consider factors such as discounts to publicly traded issues and time until conversion date.
Derivative Instruments — Listed derivatives, including options, rights, swaps, warrants and futures that are actively traded are valued based on quoted prices from the exchange and categorized in Level 1 of the fair value hierarchy.
The Board of Trustees (the “Board”) has adopted a pricing and valuation policy for use by the Funds and their Valuation Designee (as defined below) in calculating the Funds’ NAV. Pursuant to Rule 2a-5 under the 1940 Act, the Funds have designated Tortoise Capital Advisors, LLC (the “Adviser”) as their“Valuation Designee” to perform all of the fair value determinations as well as to perform all of the responsibilities that may be performed by the Valuation Designee in accordance with Rule 2a-5. The Valuation Designee is authorized to make all necessary determinations of the fair values of portfolio securities and other assets for which market quotations are not readily available or if it is deemed that the prices obtained from brokers and dealers or independent pricing services are unreliable.
The inputs or methodology used for valuing securities are not an indication of the risk associated with investing in those securities.
The following table is a summary of the inputs used to value each Fund’s securities by level within the fair value hierarchy as of November 30, 2022:
| MLP & Pipeline Fund | | Level 1 | | Level 2 | | Level 3 | | Total |
| Common stock | | $ | 1,833,866,620 | | | $ | — | | | $ | — | | | $ | 1,833,866,620 | |
| Master limited partnerships | | | 551,677,574 | | | | — | | | | — | | | | 551,677,574 | |
| Short-term investment | | | 50,089,705 | | | | — | | | | — | | | | 50,089,705 | |
| Total investments in securities | | $ | 2,435,633,899 | | | $ | — | | | $ | — | | | $ | 2,435,633,899 | |
| | | | | | | | | | | | | | | | | |
| Energy Infrastructure and Income Fund | | Level 1 | | Level 2 | | Level 3 | | Total |
| Common stock | | $ | 301,055,136 | | | $ | — | | | $ | — | | | $ | 301,055,136 | |
| Master limited partnerships | | | 118,638,916 | | | | — | | | | — | | | | 118,638,916 | |
| Corporate bonds | | | — | | | | 96,121,320 | | | | — | | | | 96,121,320 | |
| Short-term investment | | | 9,998,804 | | | | — | | | | — | | | | 9,998,804 | |
| Total investments in securities | | $ | 429,692,856 | | | $ | 96,121,320 | | | $ | — | | | $ | 525,814,176 | |
| | | | | | | | | | | | | | | | | |
| Global Energy Transition Fund | | Level 1 | | Level 2 | | Level 3 | | Total |
| Common stock | | $ | 18,711,630 | | | $ | 23,256,188 | | | $ | — | | | $ | 41,967,818 | |
| Short-term investment | | | 259,631 | | | | — | | | | — | | | | 259,631 | |
| Total investments in securities | | $ | 18,971,261 | | | $ | 23,256,188 | | | $ | — | | | $ | 42,227,449 | |
| | | | | | | | | | | | | | | | | |
| As of November 30, 2022, the Fund’s investments in other financial instruments* were classified as follows: | | | | | |
| | | | | | | |
| Swap Contracts | | $ | (25,716 | ) | | $ | — | | | $ | — | | | $ | (25,716 | ) |
| Total Other Financial Instruments | | $ | (25,716 | ) | | $ | — | | | $ | — | | | $ | (25,716 | ) |
| | | | | | | | | | | | | | | | | |
| Global Renewables Infrastructure Fund | | Level 1 | | Level 2 | | Level 3 | | Total |
| Common stock | | $ | 178,437,001 | | | $ | 135,749,556 | | | $ | — | | | $ | 314.186,557 | |
| Master limited partnership | | | 12,758,451 | | | | — | | | | — | | | | 12,758,451 | |
| Short-term investment | | | 13,576,208 | | | | — | | | | — | | | | 13,576,208 | |
| Total investments in securities | | $ | 204,771,660 | | | $ | 135,749,556 | | | $ | — | | | $ | 340,521,216 | |
| | | | | | | | | | | | | | | | | |
| As of November 30, 2022, the Fund’s investments in other financial instruments* were classified as follows: | | | |
| | | | | | | |
| Swap Contracts | | $ | (340,188 | ) | | $ | — | | | $ | — | | | $ | (340,188 | ) |
| Total Other Financial Instruments | | $ | (340,188 | ) | | $ | — | | | $ | — | | | $ | (340,188 | ) |
Notes to Financial Statements (continued)
| Sustainable Water Fund | | Level 1 | | Level 2 | | Level 3 | | Total |
| Common stock | | $ | 1,660,177 | | | $ | 325,444 | | | $ | — | | | $ | 1,985,621 | |
| Special purpose acquisition company | | | 31,133 | | | | — | | | | — | | | | 31,133 | |
| Short-term investment | | | 47,429 | | | | — | | | | — | | | | 47,429 | |
| Total investments in securities | | $ | 1,738,739 | | | $ | 325,444 | | | $ | — | | | $ | 2,064,183 | |
| | |
| * | Other financial instruments are derivative instruments not reflected in the Schedule of Investments, such as futures, swap contracts and written options. Swap contracts are presented at the unrealized appreciation (depreciation) on the instruments. |
Refer to each Fund’s Schedule of Investments for additional industry information.
4. Derivatives Transactions
The Funds may use derivatives for different purposes, such as a substitute for taking a position in the underlying asset and/or as part of a strategy designed to reduce exposure to other risks, such as interest rate or currency risk. The various derivative instruments that the Funds may use are options, futures contracts and options on futures contracts and other derivative securities. The Funds may also use derivatives for leverage, in which case their use would involve leveraging risk. A Fund investing in a derivative instrument could lose more than the principal amount invested.
FASB Accounting Standards Codification 815, Derivatives and Hedging (“ASC 815”) requires enhanced disclosures about each Fund’s use of, and accounting for, derivative instruments and the effect of derivative instruments on each Fund’s results of operations and financial position. Tabular disclosure regarding derivative fair value and gain/loss by contract type (e.g., interest rate contracts, foreign exchange contracts, credit contracts, etc.) is required and derivatives accounted for as hedging instruments under ASC 815 must be disclosed separately from those that do not qualify for hedge accounting. Even though the Funds may use derivatives in an attempt to achieve an economic hedge, the Funds’ derivatives are not accounted for as hedging instruments under ASC 815 because investment companies account for their derivatives at fair value and record any changes in fair value in current period earnings.
For the year ended November 30, 2022, the Funds’ average quarterly notional values are as follows:
| Fund | | Long Total Return
Swap Contracts |
| Global Energy Transition Fund | | | $ 3,570,161 | |
| Global Renewables Infrastructure Fund | | | $27,758,874 | |
The locations on the Statements of Assets and Liabilities of the Funds’ derivative positions by type of exposure, all of which are not accounted for as hedging instruments under ASC 815, are as follows:
Values of Derivative Instruments as of November 30, 2022, on the Statements of Assets and Liabilities:
Global Energy Transition Fund
| | | Assets | | | Liabilities |
Derivatives not accounted for as
hedging instruments under ASC 815 | | Location | | Fair Value | | | Location | | Fair Value |
| Equity Contracts – Swap Contracts | | Net Assets – unrealized appreciation on swap contracts** | | $ | — | | | Net Assets – unrealized depreciation on swap contracts** | | $ | 25,716 |
| | |
| ** | Includes cumulative appreciation/depreciation on swap contracts as reported in the Schedule of Open Swap Contracts. |
The effect of Derivative Instruments on the Statements of Operations for the period ended November 30, 2022:
Amount of Realized Gain (Loss) on Derivatives
| | | Global Energy
Transition Fund |
Derivatives not accounted for as
hedging instruments under ASC 815 | | Swap Contracts |
| Equity Contracts | | $ | (1,173,352 | ) |
| | | | | |
| Change in Unrealized Appreciation or (Depreciation) on Derivatives | | | | |
| | | | | |
| | | Global Energy
Transition Fund |
Derivatives not accounted for as
hedging instruments under ASC 815 | | Swap Contracts |
| Equity Contracts | | $ | (534 | ) |
| |
| |
| 2022 Annual Report | November 30, 2022 |
| |
Notes to Financial Statements (continued)
Values of Derivative Instruments as of November 30, 2022, on the Statements of Assets and Liabilities:
Global Renewables Infrastructure Fund
| | | Assets | | | Liabilities |
Derivatives not accounted for as
hedging instruments under ASC 815 | | Location | | Fair Value | | | Location | | Fair Value |
| Equity Contracts – Swap Contracts | | Net Assets – unrealized appreciation on swap contracts** | | $ | — | | | Net Assets – unrealized depreciation on swap contracts** | | $ | 340,188 |
| | |
| ** | Includes cumulative appreciation/depreciation on swap contracts as reported in the Schedule of Open Swap Contracts. |
The effect of Derivative Instruments on the Statements of Operations for the year ended November 30, 2022:
Amount of Realized Gain (Loss) on Derivatives
| | | Global Renewables
Infrastructure Fund |
Derivatives not accounted for as
hedging instruments under ASC 815 | | Swap Contracts |
| Equity Contracts | | $ | 3,422,984 | |
| | | | | |
| Change in Unrealized Appreciation or (Depreciation) on Derivatives |
| | | | | |
| | | Global Renewables
Infrastructure Fund |
Derivatives not accounted for as
hedging instruments under ASC 815 | | Swap Contracts |
| Equity Contracts | | $ | (3,240 | ) |
Balance Sheet Offsetting Information
The following table provides a summary of offsetting financial liabilities and derivatives and the effect of derivative instruments on the Statements of Assets and Liabilities as of November 30, 2022.
Global Energy Transition Fund
| | | | | | | | | | | | Gross Amounts Not Offset in
Statements of Assets and Liabilities |
| Assets: | | Gross Amounts
Recognized | | Gross Amounts
Offset in
Statements of
Assets and Liabilities | | Net Amounts
of Assets Presented
in Statements of
Assets and Liabilities | | Financial
Instruments | | Cash Collateral
Pledged | | Net Amount |
| Swap Contracts | | $ | 10,741 | | | $ | (10,741 | ) | | $ | — | | | $ | — | | | $ | — | | | $ | — | |
| | | | | | | | | | | | | | | | | | | | | | | | | |
| Liabilities: | | | | | | | | | | | | | | | | | | | | | | | | |
| Swap Contracts | | $ | 36,457 | | | $ | (10,741 | ) | | $ | 25,716 | | | $ | — | | | $ | 25,716 | | | $ | — | |
| | | | | | | | | | | | | | | | | | | | | | | | | |
| Global Renewables Infrastructure Fund |
| | | | | | | | | | | | | | | | | | | | | | | | | |
| | | | | | | | | | | | | | | Gross Amounts Not Offset in
Statements of Assets and Liabilities |
| Assets: | | Gross Amounts
Recognized | | Gross Amounts
Offset in
Statements of
Assets and Liabilities | | Net Amounts
of Assets Presented
in Statements of
Assets and Liabilities | | Financial
Instruments | | Cash Collateral
Pledged | | Net Amount |
| Swap Contracts | | $ | — | | | $ | — | | | $ | — | | | $ | — | | | $ | — | | | $ | — | |
| | | | | | | | | | | | | | | | | | | | | | | | | |
| Liabilities: | | | | | | | | | | | | | | | | | | | | | | | | |
| Swap Contracts | | $ | 340,188 | | | $ | — | | | $ | 340,188 | | | $ | — | | | $ | 340,188 | | | $ | — | |
During the ordinary course of business, the Funds may enter into transactions subject to enforceable netting agreements or other similar arrangements (“netting agreements”). Generally, the right to offset in netting agreements allows the Funds to offset any exposure to a specific counterparty with any collateral received or delivered to that counterparty based on the terms of the agreement. Generally, each fund manages its cash collateral and securities collateral on a counterparty basis. As of November 30, 2022, the Funds did not enter into any netting agreements which would require any portfolio securities to be netted.
Notes to Financial Statements (continued)
5. Concentration Risk & General Risk
The MLP & Pipeline Fund seeks to achieve its investment objective by investing, under normal market conditions, at least 80% of its net assets in securities of MLP and pipeline companies. Funds that primarily invest in a particular sector may experience greater volatility than funds investing in a broad range of industry sectors.
The Energy Infrastructure and Income Fund seeks to achieve their investment objective by investing, under normal market conditions, at least 80% of its net assets in securities of companies focused in the energy infrastructure sector. Funds that primarily invest in a particular sector may experience greater volatility than funds investing in a broad range of industry sectors.
The Global Energy Transition Fund seeks to achieve its investment objective by investing, under normal market conditions, at least 80% of its net assets in securities of energy transition companies. Funds that primarily invest in a particular sector may experience greater volatility than funds investing in a broad range of industry sectors.
On February 24, 2022, Russia commenced a military attack on Ukraine. The outbreak of hostilities between the two countries could result in more widespread conflict and could have a severe adverse effect on the region and the markets. In addition, sanctions imposed on Russia by the United States and other countries, and any sanctions imposed in the future could have a significant adverse impact on the Russian economy and related markets. The price and liquidity of investments may fluctuate widely as a result of the conflict and related events. How long such conflict and related events will last and whether it will escalate further cannot be predicted, nor its effect on the Funds.
The Global Renewables Infrastructure Fund seeks to achieve its investment objective by investing, under normal market conditions, at least 80% of its net assets in securities of renewable infrastructure companies. Funds that primarily invest in a particular sector may experience greater volatility than funds investing in a broad range of industry sectors.
The Sustainable Water Fund seeks to achieve its investment objective by investing, under normal market conditions, at least 80% of its net assets in securities of sustainable water companies. Funds that primarily invest in a particular sector may experience greater volatility than funds investing in a broad range of industry sectors.
The global outbreak of COVID-19 (commonly referred to as “coronavirus”) has disrupted economic markets and the prolonged economic impact is uncertain. The ultimate economic fallout from the pandemic, and the long-term impact on economies, markets, industries and individual issuers, are not known. The operational and financial performance of the issuers of securities in which the Funds invest depends on future developments, including the duration and spread of the outbreak, and such uncertainty may in turn adversely affect the value and liquidity of the Funds’ investments, impair the Funds’ ability to satisfy redemption requests, and negatively impact the Funds’ performance.
6. Investment Advisory Fee and Other Transactions with Affiliates
The Trust has an agreement with Tortoise Capital Advisors, L.L.C. (the “Adviser”) to furnish investment advisory services to the Funds. Pursuant to an Investment Advisory Agreement between the Trust and the Adviser, the Adviser is entitled to receive, on a monthly basis, an annual advisory fee equal to 0.80% for the Global Energy Transition Fund and Sustainable Water Fund, 0.75% for the Global Renewables Infrastructure Fund, 0.85% for the MLP & Pipeline Fund, and 1.00% for the Energy Infrastructure and Income Fund of each Fund’s average daily net assets.
The Funds’ Adviser has contractually agreed to reimburse the Fund for its expenses to ensure that total annual operating expenses (excluding acquired fund fees and expenses, interest, taxes, brokerage commissions and extraordinary expenses) for each Fund do not exceed 0.90% for the Global Energy Transition Fund, 1.00% for the Global Renewables Infrastructure Fund, 0.95% of the Sustainable Water Fund, 1.10% for the MLP & Pipeline Fund and 1.25% for the Energy Infrastructure and Income Fund of the average daily net assets of each Fund. Expenses reimbursed by the Adviser may be recouped by the Adviser for a period of thirty-six months following the date on which such reimbursement was made if such recoupment can be achieved without exceeding the expense limit in effect at the time the expense reimbursement occurred and at the time of recoupment. The Operating Expense Limitation Agreement is intended to be continual in nature and cannot be terminated within a year after the effective date of the Fund’s prospectus. During the year ended November 30, 2022, the Adviser recouped expenses of $32,045 relating to previously waived fees for the Global Renewables Infrastructure Fund, respectively. Reimbursed expenses subject to potential recovery by month of expiration are as follows:
| Ecofin Global Energy Transition Fund | | |
| December 2022 – November 2023 | | $ | — |
| December 2023 – November 2024 | | | 61,002 |
| December 2024 – November 2025 | | | 223,305 |
| | | | |
| Ecofin Global Renewables Infrastructure Fund | | | |
| December 2022 – November 2023 | | $ | — |
| December 2023 – November 2024 | | | — |
| December 2024 – November 2025 | | | 2,100 |
| | | | |
| Sustainable Water Fund | | | |
| December 2022 – November 2023 | | $ | — |
| December 2023 – November 2024 | | | — |
| December 2024 – November 2025 | | | 200,937 |
| |
| |
| 2022 Annual Report | November 30, 2022 |
| |
Notes to Financial Statements (continued)
U.S. Bancorp Fund Services, LLC, doing business as U.S. Bank Global Fund Services (“Fund Services” or the “Administrator”) acts as the Funds’ Administrator, Transfer Agent and fund accountant. U.S. Bank, N.A. (the “Custodian”) serves as the custodian to the Funds. The Custodian is an affiliate of the Administrator. The Administrator performs various administrative and accounting services for the Funds. The Administrator prepares various federal and state regulatory filings, reports and returns for the Funds; prepares reports and materials to be supplied to the Trustees; monitors the activities of the Funds’ custodian; coordinates the payment of the Funds’ expenses and reviews the Funds’ expense accruals. The officers of the Trust including the Chief Compliance Officer are employees of the Administrator. As compensation for its services, the Administrator is entitled to a monthly fee at an annual rate of 0.07% of the first $125 million of the average daily net assets of each fund, 0.05% on the next $250 million of the average daily net assets and 0.0325% of the daily average net assets in excess of $375 million, subject to an annual minimum of $60,000 per fund. Fees paid by the Funds for administration and accounting, transfer agency, custody and compliance services for the year ended November 30, 2022 are disclosed in the Statements of Operations.
7. Distribution Costs
The MLP & Pipeline Fund and Energy Infrastructure and Income Fund have adopted a Distribution Plan pursuant to Rule 12b-1 (the “Plan”) in the A Class and the C Class. The Global Energy Transition Fund, Global Renewables Infrastructure Fund and Sustainable Water Fund have adopted a Distribution Plan pursuant to Rule 12b-1 in the A Class. The Plan permits each Fund to pay for distribution and related expenses at an annual rate of 0.25% of the A Class and 1.00% of the C Class average daily net assets. The expenses covered by the Plan may include the cost of preparing and distributing prospectuses and other sales material, advertising and public relations expenses, payments to financial intermediaries and compensation of personnel involved in selling shares of the Funds. For the year ended November 30, 2022, expenses incurred by the A Class and C Class pursuant to the Plan were as follows:
| Fund | | A Class | | | C Class |
| MLP & Pipeline Fund | | $ | 459,047 | | | $ | 215,026 |
| Energy Infrastructure and Income Fund | | | 106,648 | | | | 246,503 |
| Global Energy Transition Fund | | | 100 | | | | N/A |
| Global Renewables Infrastructure Fund | | | 9,171 | | | | N/A |
| Sustainable Water Fund | | | 48 | | | | N/A |
8. Investment Transactions
The aggregate purchases and sales, excluding U.S. government securities and short-term investments, by the Funds for the year ended November 30, 2022, were as follows:
| Fund | | Purchases | | | Sales |
| MLP & Pipeline Fund | | $ | 450,930,119 | | | $ | 441,880,651 |
| Energy Infrastructure and Income Fund | | | 65,981,662 | | | | 45,318,814 |
| Global Energy Transition Fund | | | 26,270,578 | | | | 21,032,545 |
| Global Renewables Infrastructure Fund | | | 186,617,643 | | | | 122,355,324 |
| Sustainable Water Fund | | | 2,661,264 | | | | 555,037 |
9. Federal Tax Information
As of November 30, 2022, cost basis of investments for federal income tax purposes and the components of accumulated losses on a tax basis were as follows:
| | | MLP & Pipeline
Fund | | | Energy Infrastructure
and Income Fund | | | Global Energy
Transition Fund | | | Global Renewables
Infrastructure Fund | | | Sustainable
Water Fund | |
| Cost of investments | | $ | 1,740,055,797 | | | $ | 307,018,576 | | | $ | 41,656,427 | | | $ | 345,565,226 | | | $ | 2,110,835 | |
| Gross unrealized appreciation | | $ | 959,103,259 | | | $ | 244,770,477 | | | $ | 5,823,255 | | | $ | 29,919,506 | | | $ | 131,341 | |
| Gross unrealized depreciation | | | (480,937,680 | ) | | | (105,860,934 | ) | | | (5,252,480 | ) | | | (34,974,609 | ) | | | (177,984 | ) |
| Net unrealized appreciation (depreciation) | | | 478,165,579 | | | | 138,909,543 | | | | 570,775 | | | | (5,055,103 | ) | | | (46,643 | ) |
| Undistributed ordinary income | | | — | | | | — | | | | — | | | | — | | | | 10,745 | |
| Undistributed long-term capital gain | | | — | | | | — | | | | — | | | | — | | | | — | |
| Total distributable earnings | | | — | | | | — | | | | — | | | | — | | | | 10,745 | |
| Other accumulated losses | | | (953,522,872 | ) | | | (448,070,139 | ) | | | (3,793,182 | ) | | | (1,047,190 | ) | | | (42,597 | ) |
| Total accumulated losses | | $ | (475,357,293 | ) | | $ | (309,026,481 | ) | | $ | (3,222,407 | ) | | $ | (6,102,293 | ) | | $ | (78,495 | ) |
The difference between book and tax-basis cost is attributable primarily to wash sales and MLP adjustments, if any.
Notes to Financial Statements (continued)
As of November 30, 2022, the MLP & Pipeline Fund, the Energy Infrastructure and Income Fund, Global Energy Transition Fund, Global Renewables Infrastructure Fund, and Sustainable Water Fund had short-term capital loss carryforwards of $74,983,340, $151,253,563, $2,159,033, $1,047,190, and $42,597, respectively, and the MLP & Pipeline Fund, Energy Infrastructure and Income Fund and Global Energy Transition Fund had long-term capital loss carryforwards of $878,539,532, $163,753,857, $756,869, respectively, which may be carried forward for an unlimited period under the Regulated Investment Company Modernization Act of 2010. In addition to the total capital loss carryforward, the Energy Infrastructure and Income Fund has a short-term carryforward of $60,744,580 and a long-term carryforward of $72,317,852 that it inherited as the result of the merger with Tortoise MLP & Energy Infrastructure Fund. These capital loss carryforwards are further subject to an initial annual limitation of $147,395 and $175,344 in short-term and long-term carryforwards, respectively, pursuant to Section 382. To the extent the Funds realize future net capital gains, those gains will be offset by any unused capital loss carryforwards. Capital loss carryforwards will retain their character as either short-term or long-term capital losses. Thus, such losses must be used first to offset gains of the same character; for example, long-term loss carryforwards will first offset long-term gains, before they can be used to offset short-term gains. For the MLP & Pipeline Fund and Energy Infrastructure and Income Fund, the capital gains and losses have been estimated based on information currently available and are subject to revision upon receipt of the 2022 tax reporting information from the individual MLPs. As of November 30, 2022, the MLP & Pipeline Fund utilized $70,323,993 of capital loss carryforwards in the current year.
In order to meet certain excise tax distribution requirements, the Funds are required to measure and distribute annually net capital gains realized during a twelve month period ending November 30 and net investment income earned during a twelve month period ending December 31. In connection with this, the Funds are permitted for tax purposes to defer into their next fiscal year qualified late year losses. Qualified late year ordinary losses are any net ordinary capital losses incurred between January 1 and the end of their fiscal year, November 30, 2022. For the taxable year ended November 30, 2022, The MLP & Pipeline Fund, the Energy Infrastructure and Income Fund, Global Renewables Infrastructure Fund, and Sustainable Water Fund do not plan to defer any late year losses. For the taxable year ended November 30, 2022, the Global Energy Transition Fund plans to defer $877,280 in late year losses.
During the year ended November 30, 2022, the Funds paid the following distributions to shareholders:
| | | MLP & Pipeline
Fund | | Energy
Infrastructure and
Income Fund | | Global Energy
Transition Fund | | Global Renewables
Infrastructure
Fund | | Sustainable Water
Fund |
| Ordinary income* | | $ | 38,947,023 | | $ | 9,193,355 | | $ | 817,525 | | $ | 7,515,040 | | $ | — |
| Long-term capital gains** | | | — | | | — | | | 671,651 | | | 5,970,675 | | | — |
| Return of capital | | | 81,970,916 | | | 22,191,007 | | | — | | | 3,512,810 | | | — |
| Total distributions | | $ | 120,917,939 | | $ | 31,384,362 | | $ | 1,489,176 | | $ | 16,998,525 | | $ | — |
| | | | | | | | | | | | | | | | |
During the year ended November 30, 2021, the Funds paid the following distributions to shareholders: |
| | | | | | | | | | | | | | | | |
| | | MLP & Pipeline
Fund | | Energy
Infrastructure and
Income Fund | | Global Renewables
Infrastructure
Fund | | | | | | |
| Ordinary income* | | $ | 29,493,748 | | $ | 3,987,809 | | $ | 6,804,703 | | | | | | |
| Long-term capital gains** | | | — | | | — | | | — | | | | | | |
| Return of capital | | | 50,690,786 | | | 24,589,812 | | | — | | | | | | |
| Total distributions | | $ | 80,184,534 | | $ | 28,577,621 | | $ | 6,804,703 | | | | | | |
| | |
| * | For federal income tax purposes, distributions of short-term capital gains are treated as ordinary income distributions. |
| ** | The Funds designate as long-term capital gain distributions, pursuant to Internal Revenue Code Section 852(b)(3)(c). |
10. Transactions with Affiliates
If the Funds’ holding represents ownership of 5% or more of the voting securities of a company, the company is deemed to be an affiliate as defined by the 1940 Act. The MLP & Pipeline Fund conducted transactions during the year ended November 30, 2022 with affiliated companies as so defined:
| | | Beginning Value | | | Additions | | | Reductions | | | Ending Value | | | | |
| Plains GP Holdings L.P.(1) | | $ | 93,725,930 | | | $ | 28,433,204 | | | $ | 36,298,977 | | | $ | 118,351,558 | | | | | |
| | | | | | | | | | | | | | | | | | | | | |
| | | Ending Shares as
of November 30,
2022 | | | Dividend Income | | | Return of Capital | | | Realized
Gain (Loss) | | | Change in
Unrealized
Appreciation | |
| Plains GP Holdings L.P.(1) | | | 8,945,696 | | | $ | — | | | $ | 8,668,517 | | | $ | 20,283,241 | | | $ | 20,287,676 | |
| | |
| (1) | Security is unaffiliated as of November 30, 2022. |
| |
| |
| 2022 Annual Report | November 30, 2022 |
| |
Notes to Financial Statements (continued)
11. Line of Credit
The Funds have established a line of credit (“LOC”) in the amount of $150,000,000. Borrowings under the loan agreement are charged an interest rate equal to prime, 7.00% as of November 30, 2022. This LOC is intended to provide short-term financing, if necessary, subject to certain restrictions, in connection with shareholder redemptions. The credit facility is with the Funds custodian, U.S. Bank, N.A. During the year ended November 30, 2022, the Global Energy Transition Fund and Global Renewables Infrastructure Fund did not have any borrowings under the LOC. During the year ended November 30, 2022, the MLP & Pipeline Fund and Global Renewables Infrastructure Fund Fund was as follows:
| Fund | | Average
Borrowings | | Weighted-Average
Interest Rate | | Amount
Outstanding as of
November 30,
2022 |
| MLP & Pipeline Fund | | $ | 421,277 | | | | 3.86 | % | | $ | — | |
| Global Renewables Infrastructure Fund | | | 65,562 | | | | 3.29 | % | | | — | |
12. Control Ownership
The beneficial ownership, either directly or indirectly, of more than 25% of the voting securities of a fund creates a presumption of control of the fund, under Section 2(a)(9) of the Investment Company Act of 1940. As of November 30, 2022, each Fund’s percentage of control ownership positions greater than 25% are as follows:
| Fund | | Shareholder | | Percent of Shares Held |
| Energy Infrastructure and Income Fund | | Merrill Lynch, Pierce, Fenner & Smith Inc. | | | 36.50% | |
| Global Energy Transition Fund | | JP Morgan Securities, LLC | | | 91.57% | |
| Global Renewables Infrastructure Fund | | National Financial Services, LLC | | | 39.12% | |
| Sustainable Water Fund | | Tortoise Capital Advisors, L.L.C | | | 94.69% | |
13. Reorganization of Global Energy Transition Fund
On October 15, 2021, as the result of a tax-free reorganization, the Long Only sub-fund of the Ecofin Vista Master Fund Limited, established in May 2019 (the “Predecessor Fund”), an unregistered Cayman limited liability company, was reorganized into the Trust by transferring a majority of the Predecessor Fund’s assets to the Global Energy Transition Fund in exchange for Institutional Class shares of the Global Energy Transition Fund. Effective on that date, the Predecessor Fund was renamed the Ecofin Global Energy Transition Fund. The Global Energy Transition Fund was deemed to be the accounting survivor for financial reporting purposes.
As a tax-free reorganization, any unrealized appreciation or depreciation on the securities on the date of reorganization was treated as a non-taxable event, thus the cost basis of the securities held reflect the historical cost basis as of the date of reorganization. Immediately prior to the reorganization, the net assets, fair value of investments, and net unrealized appreciation of the Predecessor Fund was $49,232,949, $42,980,306 and $5,063,451, respectively.
14. New Accounting Pronouncement
In December 2022, the Financial Accounting Standards Board (FASB) issued Accounting Standards Update (ASU) No. 2022-06 “Reference Rate Reform (Topic 848)”. ASU No. 2022-06 updates and clarifies ASU No. 2020-04, which provides optional, temporary relief with respect to the financial reporting of contracts subject to certain types of modifications due to the planned discontinuation of LIBOR and other interbank-offered reference rates. The temporary relief provided by ASU No. 2022-06 is effective immediately for certain reference rate-related contract modifications that occur through December 31, 2024. Management does not expect ASU No. 2022-06 to have a material impact on the financial statements.
15. Subsequent Events
On December 29, 2022, the MLP & Pipeline Fund paid an income distribution to the Institutional Class in the amount of $19,724,711, or $0.12518952 per share, the A Class in the amount of $1,686,062, or $0.12239046 per share and the C Class in the amount of $189,041, or $0.11430694 per share.
On December 29 2022, the Global Renewables Infrastructure Fund paid an income distribution to the Institutional Class in the amount of $2,003,434, or $0.06749003 per share and the A Class in the amount of $12,831, or $0.06511546 per share.
On December 29, 2022, the Sustainable Water Fund paid an income distribution to the Institutional Class in the amount of $10,660, or $0.05045725 and the A Class in the amount of $85, or $0.03225361 per share.
Management has performed an evaluation of subsequent events through the date the financial statements were issued and has determined that no additional items require recognition or disclosure.
| |
| |
| |
| |
| Report of Independent Registered Public Accounting Firm |
To the Shareholders of Tortoise MLP & Pipeline Fund,
Tortoise Energy Infrastructure and Income Fund,
Ecofin Global Energy Transition Fund,
Ecofin Global Renewables Infrastructure Fund and
Ecofin Sustainable Water Fund and the Board of Trustees
of Managed Portfolio Series
Opinion on the Financial Statements
We have audited the accompanying statements of assets and liabilities of Tortoise MLP & Pipeline Fund, Tortoise Energy Infrastructure and Income Fund, Ecofin Global Energy Transition Fund, Ecofin Global Renewables Infrastructure Fund, and Ecofin Sustainable Water Fund (collectively referred to as the “Funds”) (five of the funds constituting the Managed Portfolio Series (the “Trust”)), including the schedules of investments, as of November 30, 2022, and the related statements of operations, changes in net assets, and the financial highlights for each of periods indicated in the table below and the related notes (collectively referred to as the “financial statements”). In our opinion, the financial statements present fairly, in all material respects, the financial position of each of the Funds (five of the funds constituting the Managed Portfolio Series) at November 30, 2022, and the results of their operations, changes in net assets and financial highlights for each of the for each of the periods indicated in the table below, in conformity with U.S. generally accepted accounting principles.
Individual fund constituting
Managed Portfolio Series | | Statement
of operations | | Statement of
changes in net assets | | Financial highlights |
Tortoise MLP & Pipeline Fund
Tortoise Energy Infrastructure and Income Fund | | For the year ended
November 30, 2022 | | For each of the two years in the period ended November 30, 2022 | | For each of the five years in the period ended November 30, 2022 |
| Ecofin Global Renewables Infrastructure Fund | | For the year ended
November 30, 2022 | | For each of the two years in the period ended November 30, 2022 | | For each of the two years in the period ended November 30, 2022, and the period from August 7, 2020 (commencement of operations) through November 30, 2020 |
| Ecofin Global Energy Transition Fund | | For the year ended
November 30, 2022 | | For the year ended November 30, 2022, and the period from October 15, 2021 (commencement of operations) to November 30, 2021 |
| Ecofin Sustainable Water Fund | | For the period February 4, 2022 (commencement of operations) to November 30, 2022. |
Basis for Opinion
These financial statements are the responsibility of the Trust’s management. Our responsibility is to express an opinion on each of the Funds’ financial statements based on our audits. We are a public accounting firm registered with the Public Company Accounting Oversight Board (United States) (“PCAOB”) and are required to be independent with respect to the Trust in accordance with the U.S. federal securities laws and the applicable rules and regulations of the Securities and Exchange Commission and the PCAOB.
We conducted our audits in accordance with the standards of the PCAOB. Those standards require that we plan and perform the audit to obtain reasonable assurance about whether the financial statements are free of material misstatement, whether due to error or fraud. The Trust is not required to have, nor were we engaged to perform, an audit of the Trust’s internal control over financial reporting. As part of our audits, we are required to obtain an understanding of internal control over financial reporting but not for the purpose of expressing an opinion on the effectiveness of the Trust’s internal control over financial reporting. Accordingly, we express no such opinion.
Our audits included performing procedures to assess the risks of material misstatement of the financial statements, whether due to error or fraud, and performing procedures that respond to those risks. Such procedures included examining, on a test basis, evidence regarding the amounts and disclosures in the financial statements. Our procedures included confirmation of securities owned as of November 30, 2022, by correspondence with the custodian and brokers; when replies were not received from brokers, we performed other auditing procedures. Our audits also included evaluating the accounting principles used and significant estimates made by management, as well as evaluating the overall presentation of the financial statements. We believe that our audits provide a reasonable basis for our opinion.

We have served as the auditor for one or more of the portfolios that comprise the Managed Portfolio Series since 2011.
Minneapolis, Minnesota
January 27, 2023
| |
| |
| 2022 Annual Report | November 30, 2022 |
| |
| Trustees & Officers (unaudited) |
| November 30, 2022 |
| |
Name, Address
and Year of Birth | | Position(s) Held
with the Trust | | Term of Office
and Length of
Time Served | | Number of
Portfolios
in Trust
Overseen
by Trustee | | Principal Occupation(s)
During the Past Five Years | | Other Directorships
Held by Trustee During
the Past Five Years |
| Independent Trustees | | | | | | | | | | |
Leonard M. Rush, CPA
615 E. Michigan St.
Milwaukee, WI 53202
Year of Birth: 1946 | | Chairman, Trustee and Audit Committee Chairman | | Indefinite Term;
Since April 2011 | | 35 | | Retired, Chief Financial Officer, Robert W. Baird & Co. Incorporated (2000-2011). | | Independent Trustee, ETF Series Solutions (53 Portfolios) (2012-present). |
David A. Massart
615 E. Michigan St.
Milwaukee, WI 53202
Year of Birth: 1967 | | Trustee | | Indefinite Term;
Since April 2011 | | 35 | | Partner and Managing Director, Beacon Pointe Advisors, LLC (since 2022); Co-Founder and Chief Investment Strategist, Next Generation Wealth Management, Inc. (2005-2021). | | Independent Trustee, ETF Series Solutions (53 Portfolios) (2012-present). |
David M. Swanson
615 E. Michigan St.
Milwaukee, WI 53202 Year of Birth: 1957 | | Trustee and Nominating & Governance Committee Chairman | | Indefinite Term;
Since April 2011 | | 35 | | Founder and Managing Principal, SwanDog Strategic Marketing, LLC (2006-present). | | Independent Trustee, ALPS Variable Investment Trust (7 Portfolios) (2006-present); Independent Trustee, RiverNorth Funds (3 Portfolios) (2018-present); RiverNorth Managed Duration Municipal Income Fund Inc. (1 Portfolio) (2019-present); RiverNorth Specialty Finance Corporation (1 Portfolio) (2018-present); RiverNorth/DoubleLine Strategic Opportunity Fund, Inc. (1 Portfolio) (2018-present); RiverNorth Opportunities Fund, Inc. (1 Portfolio) (2015-present); RiverNorth Opportunistic Municipal Income Fund, Inc. (1 Portfolio) (2018-present); RiverNorth Flexible Municipal Income Fund (2020-present). |
Robert J. Kern
615 E. Michigan St.
Milwaukee, WI 53202
Year of Birth: 1958 | | Trustee | | Indefinite Term;
Since January 2011 | | 35 | | Retired (2018-present); Executive Vice President, U.S. Bancorp Fund Services, LLC (1994-2018). | | None |
| |
| |
| |
| |
| Trustees & Officers (unaudited) (continued) |
| November 30, 2022 |
| |
Name, Address
and Year of Birth | | Position(s) Held
with the Trust | | Term of Office
and Length of
Time Served | | Number of
Portfolios
in Trust
Overseen
by Trustee | | Principal Occupation(s)
During the Past Five Years | | Other Directorships
Held by Trustee During
the Past Five Years |
| Officers | | | | | | | | | | |
Brian R. Wiedmeyer
615 E. Michigan St.
Milwaukee, WI 53202
Year of Birth: 1973 | | President and Principal Executive Officer | | Indefinite Term;
Since November 2018 | | N/A | | Vice President, U.S. Bancorp Fund Services, LLC (2005-present). | | N/A |
Deborah Ward
615 E. Michigan St.
Milwaukee, WI 53202
Year of Birth: 1966 | | Vice President, Chief Compliance Officer and Anti-Money Laundering Officer | | Indefinite Term;
Since April 2013 | | N/A | | Senior Vice President, U.S. Bancorp Fund Services, LLC (2004-present). | | N/A |
Benjamin Eirich
615 E. Michigan St.
Milwaukee, WI 53202
Year of Birth: 1981 | | Treasurer, Principal Financial Officer and Vice President | | Indefinite Term;
Since August 2019
(Treasurer);
Indefinite Term;
Since November 2018
(Vice President) | | N/A | | Assistant Vice President, U.S. Bancorp Fund Services, LLC (2008-present). | | N/A |
John Hadermayer
615 E. Michigan St.
Milwaukee, WI 53202
Year of Birth: 1977 | | Secretary | | Indefinite Term;
Since May 2022 | | N/A | | U.S. Bancorp Fund Services, LLC (2022-present); Executive Director, AQR Capital Management, LLC (2013-present). | | N/A |
Douglas Schafer
615 E. Michigan St.
Milwaukee, WI 53202
Year of Birth: 1970 | | Assistant Treasurer and Vice President | | Indefinite Term;
Since May 2016
(Assistant Treasurer);
Indefinite Term;
Since November 2018
(Vice President) | | N/A | | Assistant Vice President, U.S. Bancorp Fund Services, LLC (2002-present). | | N/A |
Sara Bollech
615 E. Michigan St.
Milwaukee, WI 53202
Year of Birth: 1977 | | Assistant Treasurer and Vice President | | Indefinite Term:
Since November 2021 | | N/A | | Officer, U.S. Bancorp Fund Services, LLC (2007-present). | | N/A |
Peter Walker, CPA
615 E. Michigan St.
Milwaukee, WI 53202
Year of Birth: 1993 | | Assistant Treasurer and Vice President | | Indefinite Term:
Since November 2021 | | N/A | | Officer, U.S. Bancorp Fund Services, LLC (2016-present). | | N/A |
| |
| |
| 2022 Annual Report | November 30, 2022 |
| |
| Additional Information (unaudited) |
Availability of Fund Portfolio Information
The Fund files complete schedules of portfolio holdings with the SEC for the first and third quarters of each fiscal year on Part F of Form N-PORT. The Funds’ Part F of Form N-PORT is available on the SEC’s website at www.sec.gov and may be reviewed and copied at the SEC’s Public Reference Room in Washington, D.C. Information on the operation of the Public Reference Room may be obtained by calling 1-800-732-0330. The Funds’ Part F of Form N-PORT may also be obtained by calling toll-free 1-855-TCA-Fund or 1-855-822-3863.
Availability of Proxy Voting Information
A description of the Funds’ Proxy Voting Policies and Procedures is available without charge, upon request, by calling 1-855-TCA-Fund or 1-855-822-3863. Information regarding how the Funds voted proxies relating to portfolio securities during the most recent 12 month period ended June 30, is available (1) without charge, upon request, by calling 1-855-TCA-Fund or 1-855-822-3863, or (2) on the SEC’s website at www.sec.gov.
Qualified Dividend Income/Dividends Received Deduction
For the fiscal year ended November 30, 2022, certain dividends paid by the Funds may be reported as qualified dividend income and may be eligible for taxation at capital gain rates. The percentage of dividends declared from ordinary income designated as qualified dividend income was 100.00%, 95.65%, 5.28%, 83.02%, and 0.00% for the MLP & Pipeline Fund, Energy Infrastructure and Income Fund, Global Energy Transition Fund, Global Renewables Infrastructure Fund and Sustainable Water Fund, respectively.
For corporate shareholders, the percent of ordinary income distributions qualifying for the corporate dividends received deduction for the fiscal year ended November 30, 2022, was 54.93%, 79.13%, 4.18%, 31.99% and 0.00% for the MLP & Pipeline Fund, Energy Infrastructure and Income Fund, Global Energy Transition Fund, Global Renewables Infrastructure Fund and Sustainable Water Fund, respectively.
The percentage of taxable ordinary income distributions that are designated as short-term capital gain distributions under Internal Revenue Section 871 (k)(2)(C) was 0.00%, 0.00%, 40.57%, 4.27% and 0.00% for the MLP & Pipeline Fund, Energy Infrastructure and Income Fund, Global Energy Transition Fund, Global Renewables Infrastructure Fund and Sustainable Water Fund, respectively.
Foreign Tax Credit Pass Through
Pursuant to Section 853 of the Internal Revenue code, the Funds designate the following amounts as foreign taxes paid for the period ended November 30, 2022. Foreign taxes paid for purposes of Section 853 may be less than actual foreign taxes paid for financial statement purposes.
| | | Creditable Foreign
Tax Credit Paid | | Per Share
Amount | | Portion of Ordinary Income
Distribution Derived From
Foreign Sourced Income |
| Global Renewables Infrastructure Fund | | $436,521 | | $0.013941 | | 67.45% |
Foreign taxes paid or withheld should be included in taxable income with an offsetting deduction from gross income or as a credit for taxes paid to foreign governments. Above figures may differ from those cited elsewhere in this report due to difference in the calculation of income and gains under GAAP purposes and Internal Revenue Service purposes. Shareholders are strongly advised to consult their own tax advisers with respect to the tax consequences of their investments in the Funds.
| |
| |
| |
| |
| Additional Information (unaudited) (continued) |
PRIVACY NOTICE
The Funds collect only relevant information about you that the law allows or requires it to have in order to conduct its business and properly service you. The Funds collect financial and personal information about you (“Personal Information”) directly (e.g., information on account applications and other forms, such as your name, address, and social security number, and information provided to access account information or conduct account transactions online, such as password, account number, e-mail address, and alternate telephone number), and indirectly (e.g., information about your transactions with us, such as transaction amounts, account balance and account holdings).
The Funds do not disclose any non-public personal information about its shareholders or former shareholders other than for everyday business purposes such as to process a transaction, service an account, respond to court orders and legal investigations or as otherwise permitted by law. Third parties that may receive this information include companies that provide transfer agency, technology and administrative services to the Funds, as well as the Funds’ investment adviser who is an affiliate of the Funds. If you maintain a retirement/educational custodial account directly with the Funds, we may also disclose your Personal Information to the custodian for that account for shareholder servicing purposes. The Funds limit access to your Personal Information provided to unaffiliated third parties to information necessary to carry out their assigned responsibilities to the Fund. All shareholder records will be disposed of in accordance with applicable law. The Funds maintain physical, electronic and procedural safeguards to protect your Personal Information and requires its third party service providers with access to such information to treat your Personal Information with the same high degree of confidentiality.
In the event that you hold shares of the Funds through a financial intermediary, including, but not limited to, a broker-dealer, credit union, bank or trust company, the privacy policy of your financial intermediary governs how your non-public personal information is shared with unaffiliated third parties.


| Contacts | | |
| | | |
Board of Trustees David Massart
Leonard Rush, CPA
David Swanson
Robert Kern Investment Adviser Tortoise Capital Advisors, L.L.C.
6363 College Boulevard, Suite 100A
Overland Park, KS 66211 Independent Registered Public
Accounting Firm Ernst & Young LLP
700 Nicollet Mall, Suite 500
Minneapolis, MN 55402 Transfer Agent, Fund Accountant
And Fund Administrator U.S. Bancorp Fund Services, LLC
777 East Wisconsin Avenue
Milwaukee, WI 53202 Distributor Quasar Distributors, LLC
111 E. Kilbourn Avenue, Suite 2200
Milwaukee, WI 53202 | | Custodian U.S. Bank, N.A. 1555 North Rivercenter Drive
Milwaukee, WI 53212 Fund Counsel Stradley Ronon Stevens & Young, LLP
2005 Market Street, Suite 2600
Philadelphia, PA 19103-7096 855-TCA-FUND
(855-822-3863) This report must be accompanied or preceded by a prospectus. The Fund’s Statement of Additional Information contains additional information about the Fund’s trustees and is available without charge upon request by calling 1-855-TCA-Fund or 1-855-822-3863. |

6363 College Boulevard
Overland Park, KS 66211
www.TortoiseEcofin.com
(b) Not applicable.
Item 2. Code of Ethics.
The registrant has adopted a code of ethics that applies to the registrant’s principal executive officer and principal financial officer. The registrant has not made any substantive amendments to its code of ethics during the period covered by this period.
The registrant has not granted any waivers from any provisions of the code of ethics during the period covered by this report.
A copy of the registrant’s code of ethics that applies to the registrant’s principal executive officer and principal financial officer is filed herewith.
Item 3. Audit Committee Financial Expert.
The registrant’s Board of Trustees has determined that there is at least one audit committee financial expert serving on its audit committee. Leonard M. Rush is the “audit committee financial expert” and is considered to be “independent” as each term is defined in Item 3 of Form N-CSR.
Item 4. Principal Accountant Fees and Services.
The registrant has engaged its principal accountant to perform audit services, audit-related services, tax services and other services during the past fiscal year. “Audit services” refer to performing an audit of the registrant’s annual financial statements or services that are normally provided by the accountant in connection with statutory and regulatory filings or engagements for the past fiscal year. “Audit-related services” refer to the assurance and related services by the principal accountant that are reasonably related to the performance of the audit. “Tax services” refer to professional services rendered by the principal accountant for tax compliance, tax advice, and tax planning, including reviewing the Fund’s tax returns and distribution calculations. There were no “other services” provided by the principal accountant. For the fiscal years ended November 30, 2022 and November 30, 2021, the Fund’s principal accountant was Ernst & Young. The following table details the aggregate fees billed or expected to be billed for each of the last fiscal year for audit fees, audit-related fees, tax fees and other fees by the principal accountant.
| | | FYE 11/30/2022 | | FYE 11/30/2021 |
| (a) Audit Fees | | $173,800 | | $171,100 |
| (b) Audit-Related Fees | | $0 | | $0 |
| (c) Tax Fees | | $88,200 | | $95,640 |
| (d) All Other Fees | | $0 | | $0 |
1
(e)(1) The audit committee has adopted pre-approval policies and procedures that require the audit committee to pre-approve all audit and non-audit services of the Registrant, including services provided to any entity affiliated with the Registrant.
(e)(2) The percentage of fees billed by Ernst & Young applicable to non-audit services pursuant to waiver of pre-approval requirement were as follows:
| | | FYE 11/30/2022 | | FYE 11/30/2021 |
| Audit-Related Fees | | 0% | | 0% |
| Tax Fees | | 0% | | 0% |
| All Other Fees | | 0% | | 0% |
(f) All of the principal accountant’s hours spent on auditing the registrant’s financial statements were attributed to work performed by full-time permanent employees of the principal accountant.
(g) The following table indicates the non-audit fees, other than the tax services as noted above, billed or expected to be billed by the registrant’s accountant for services to the registrant and to the registrant’s investment adviser (and any other controlling entity, etc.—not sub-adviser) for the last two years.
(h) The audit committee of the board of trustees/directors has considered whether the provision of non-audit services that were rendered to the registrant’s investment adviser is compatible with maintaining the principal accountant’s independence and has concluded that the provision of such non-audit services by the accountant has not compromised the accountant’s independence.
| Non-Audit Related Fees | | FYE 11/30/2022 | | FYE 11/30/2021 |
| Registrant | | $0 | | $0 |
| Registrant’s Investment Adviser | | $29,850 | | $31,400 |
(i) Not applicable.
(j) Not applicable.
Item 5. Audit Committee of Listed Registrants.
Not applicable to registrants who are not listed issuers (as defined in Rule 10A-3 under the Securities Exchange Act of 1934).
Item 6. Investments.
(a) Schedule of Investments is included as part of the report to shareholders filed under Item 1 of this Form.
(b) Not applicable.
2
Item 7. Disclosure of Proxy Voting Policies and Procedures for Closed-End Management Investment Companies.
Not applicable to open-end investment companies.
Item 8. Portfolio Managers of Closed-End Management Investment Companies.
Not applicable to open-end investment companies.
Item 9. Purchases of Equity Securities by Closed-End Management Investment Company and Affiliated Purchasers.
Not applicable to open-end investment companies.
Item 10. Submission of Matters to a Vote of Security Holders.
There have been no material changes to the procedures by which shareholders may recommend nominees to the registrant’s board of trustees.
Item 11. Controls and Procedures.
| (a) | The Registrant’s President and Treasurer have reviewed the Registrant’s disclosure controls and procedures (as defined in Rule 30a-3(c) under the Investment Company Act of 1940 (the “Act”)) as of a date within 90 days of the filing of this report, as required by Rule 30a-3(b) under the Act and Rules 13a-15(b) or 15d-15(b) under the Securities Exchange Act of 1934. Based on their review, such officers have concluded that the disclosure controls and procedures are effective in ensuring that information required to be disclosed in this report is appropriately recorded, processed, summarized and reported and made known to them by others within the Registrant and by the Registrant’s service provider. |
| | |
| (b) | There were no significant changes in the Registrant’s internal control over financial reporting (as defined in Rule 30a-3(d) under the Act) that occurred during the period covered by this report that has materially affected, or is reasonably likely to materially affect, the Registrant’s internal control over financial reporting. |
Item 12. Disclosure of Securities Lending Activities for Closed-End Management Investment Companies
Not applicable to open-end investment companies.
Item 13. Exhibits.
(2) Certifications pursuant to Section 302 of the Sarbanes-Oxley Act of 2002. Filed herewith.
3
(3) Any written solicitation to purchase securities under Rule 23c-1 under the Act sent or given during the period covered by the report by or on behalf of the registrant to 10 or more persons. Not applicable to open-end investment companies.
(4) Change in the registrant’s independent public accountant. There was no change in the registrant’s independent public accountant for the period covered by this report.
4
SIGNATURES
Pursuant to the requirements of the Securities Exchange Act of 1934 and the Investment Company Act of 1940, the registrant has duly caused this report to be signed on its behalf by the undersigned, thereunto duly authorized.
| | (Registrant) | Managed Portfolio Series | |
| | | | |
| | By (Signature and Title)* | /s/ Brian R. Wiedmeyer | |
| | | Brian R. Wiedmeyer, President | |
| | | | |
Pursuant to the requirements of the Securities Exchange Act of 1934 and the Investment Company Act of 1940, this report has been signed below by the following persons on behalf of the registrant and in the capacities and on the dates indicated.
| | By (Signature and Title)* | /s/ Brian R. Wiedmeyer | |
| | | Brian R. Wiedmeyer, President | |
| | | | |
| | By (Signature and Title)* | /s/ Benjamin J. Eirich | |
| | | Benjamin J. Eirich, Treasurer | |
| | | | |
* Print the name and title of each signing officer under his or her signature.
5