Exhibit 99.1

BLOCK Q4 2022 Shareholder Letter investors.block.xyz
Q4’22 Highlights
 |  |  | ||
| In the fourth quarter of 2022, we generated gross profit of $1.66 billion, up 40% year over year. Square generated gross profit of $801 million, up 22% year over year, and Cash App generated gross profit of $848 million, up 64% year over year. | The breadth and cohesion of our Square ecosystem continued to be our biggest differentiator: In 2022, 44% of Square’s gross profit came from sellers that used four or more monetized products, an improvement of more than 15 points compared to three years ago. | In 2022, Cash App continued to efficiently grow its network: We ended the year with 51 million monthly transacting actives in December, with two out of three transacting each week on average. | ||
YoY Growth | 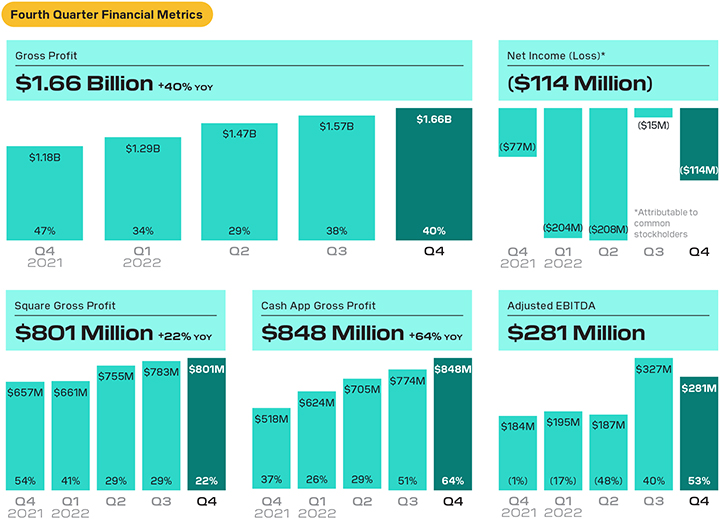 | |
YoY Growth
|
In the fourth quarter of 2022, total net revenue was $4.65 billion, up 14% year over year, and, excluding bitcoin revenue, revenue was $2.82 billion, up 33% year over year. Excluding bitcoin revenue and revenue from our buy-now-pay-later (BNPL) platform, revenue was $2.55 billion, up 21% year over year. We acquired our BNPL platform through the acquisition of Afterpay on January 31, 2022.
Reconciliations of non-GAAP financial measures used in this letter to their nearest GAAP equivalents are provided at the end of this letter. Please see these reconciliations for a description of certain items that impacted net income (loss) and operating income (loss) in 2022.
| BLOCK Q4 2022 2 |

2022 Highlights
 | ||||
For the full year of 2022, we generated gross profit of $5.99 billion, up 36% year over year. Square generated gross profit of $3.00 billion, up 30% year over year, and Cash App generated gross profit of $2.95 billion, up 43% year over year. | ||||
YoY Growth | 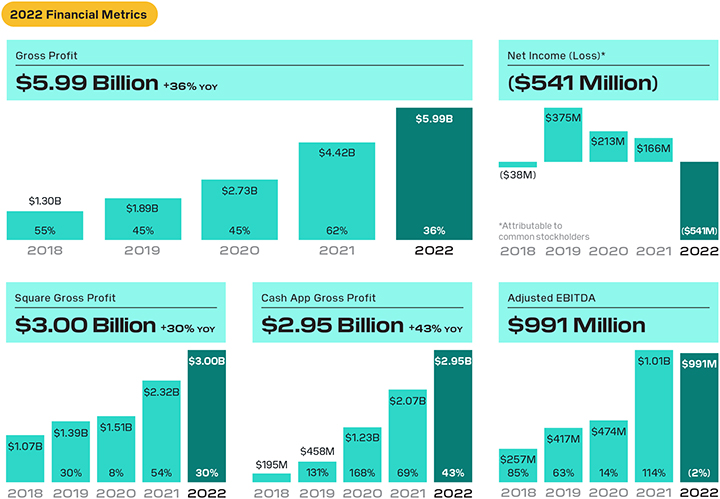 | |
YoY Growth
|
For the full year of 2022, total net revenue was $17.53 billion, down 1% year over year, and, excluding bitcoin revenue, revenue was $10.42 billion, up 36% year over year. Excluding bitcoin revenue and revenue from our buy-now-pay-later (BNPL) platform, revenue was $9.61 billion, up 26% year over year. We acquired our BNPL platform through the acquisition of Afterpay on January 31, 2022.
Reconciliations of non-GAAP financial measures used in this letter to their nearest GAAP equivalents are provided at the end of this letter. Please see these reconciliations for a description of certain items that impacted net income (loss) and operating income (loss) in 2022.
| BLOCK Q4 2022 3 |
ON THE COVER Boedecker Cellars is an urban winery in Portland, Oregon, that uses Square’s ecosystem — including Square Online, Square Point of Sale, Square Marketing, Square Team Management and Payroll, and multiple Square hardware devices — to power operations across multiple revenue streams, such as its wine club and tasting room experiences. |  | |
To Our Shareholders
| ||
February 23, 2023
In the fourth quarter, gross profit was affected by $18 million of amortization of acquired technology assets, the majority of which was from the acquisition of our BNPL platform.
We facilitated access to Paycheck Protection Program (PPP) loans for our sellers during the COVID-19 pandemic. We recognize revenue and gross profit over the life of the loan. If a loan is forgiven, we recognize the remaining revenue and gross profit in the period the loan is forgiven. | Over the last year, our ecosystem model helped drive resilience as we continued to serve a diverse base of global customers across a wide range of verticals, complementary products, and use cases. Looking ahead to 2023 and beyond, we are focused on balancing growth and efficiency and will prioritize speed, agility, and accountability. This framework will ensure we remain customer-led while building a disciplined and durable business for the long term.
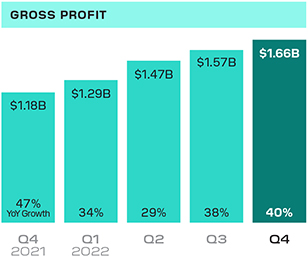
We delivered strong growth and profitability at scale during the fourth quarter of 2022. Gross profit grew 40% year over year to $1.66 billion. Excluding our BNPL platform, gross profit was $1.46 billion, up 24% year over year. Our Square ecosystem delivered gross profit of $801 million, an increase of 22% year over year and, excluding our BNPL platform, 7% year over year. Excluding gross profit from Paycheck Protection Program (PPP) loan forgiveness and our BNPL platform, Square gross profit increased 17% year over year. Our Cash App ecosystem delivered gross profit of $848 million, an increase of 64% year over year and, excluding our BNPL platform, an increase of 45% year over year. Adjusted EBITDA was $281 million. | Q4 2022 GROSS PROFIT
| ||||||||||||
As reported
| Gross Profit | YoY Growth | 3-year CAGR | |||||||||||
|
|
| ||||||||||||
| Block | $1,660M | 40% | 47% | |||||||||||
| Square | $801M | 22% | 28% | |||||||||||
| Cash App | $848M | 64% | 81% | |||||||||||
| ||||||||||||||
Excluding BNPL Platform | Gross Profit | YoY Growth | 3-year CAGR | |||||||||||
|
|
| ||||||||||||
| Block | $1,464M | 24% | 41% | |||||||||||
| Square | $703M | 7% | 23% | |||||||||||
| Cash App | $750M | 45% | 73% | |||||||||||
| ||||||||||||||
2022 GROSS PROFIT
| ||||||||||||||
As reported
| Gross Profit | YoY Growth | 3-year CAGR | |||||||||||
|
|
| ||||||||||||
| Block | $5,992M | 36% | 47% | |||||||||||
| Square | $3,001M | 30% | 29% | |||||||||||
| Cash App | $2,951M | 43% | 86% | |||||||||||
| ||||||||||||||
Excluding BNPL Platform | Gross Profit | YoY Growth | 3-year CAGR | |||||||||||
|
|
| ||||||||||||
| Block | $5,404M | 22% | 42% | |||||||||||
| Square | $2,707M | 17% | 25% | |||||||||||
| Cash App | $2,657M | 28% | 80% | |||||||||||
| ||||||||||||||
The compound annual growth rate (CAGR) is the mean annual growth rate over a specified time period. Given the impacts of the COVID-19 pandemic have lasted for nearly three years, ranging from March 2020 through today, we believe using three-year CAGRs from 2019 to 2022 helps reflect underlying growth trends through the fourth quarter of 2022. | ||||||||||||||
| BLOCK Q4 2022 4 |
Square Ecosystem
We continue to focus on our three strategic priorities to drive Square’s business: omnichannel, growing upmarket, and expanding globally.
Enhancing Our Ecosystem of Products
We remain focused on investing in omnichannel commerce to help sellers never miss a sale and operate more efficiently — especially during an uncertain macroeconomic environment. We believe our key differentiators are the depth and breadth of our products and software, along with the range of verticals we serve. In 2022, 44% of Square gross profit came from sellers that used four or more monetized products, an improvement of more than 15 points from three years ago. We have seen greater retention from larger sellers and those that adopt more products: In 2022, mid-market sellers who adopted four or more products had 15x greater retention than those who only adopted one.
Growing Upmarket
During the fourth quarter, mid-market sellers continued to be our fastest-growing segment, with gross profit up 16% year over year in the fourth quarter, outpacing total Square gross profit growth, excluding our BNPL platform. While we want to serve all types of sellers — including both sole proprietors who need us seasonally and enterprises who need us around the clock — we see the greatest opportunity with sellers with annualized GPV ranging from $500,000 to $10 million, which represents an addressable market of approximately $4.0 trillion in U.S. gross receipts and makes up more than half of our estimated $125 billion total addressable market on a gross profit basis.
We believe sellers who adopt more of our products can drive meaningful growth for Square and allow us to deepen our relationship with them. For example, The Market at Grelen, a Virginia-based garden shop and cafe with more than $2.5 million in annualized GPV, joined Square 10 years ago when their business was just getting started. Over the years, The Market at Grelen has grown to encompass a 1,000-acre multi-purpose property, a second location, and an online store. As they expanded, The Market at Grelen adopted more Square products to address their changing needs, including Square for Retail to manage inventory from more than 100 vendors and Square Online to support their eCommerce operations. These integrated solutions help The Market at Grelen more seamlessly operate their complex business both in person and online, which we believe is a key reason why they have been able to grow with Square for more than a decade.
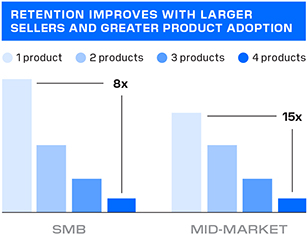
Chart depicts 2022 year-over-year seller count churn by seller size. Churn is defined as sellers who used at least one product in 2021 but did not use a product in 2022.
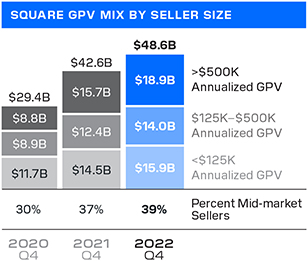
We determine seller size based on annualized GPV during the applicable quarter. A mid-market seller generates more than $500,000 in annualized GPV. GPV does not include transactions from our BNPL platform because GPV is related only to transaction-based revenue and not to subscription and services-based revenue.
| BLOCK Q4 2022 5 |
Expanding Globally
We are applying a product-centric approach to global expansion of our Square ecosystem. Our goal is to reach product parity across each of our markets, which will enable sellers to take full advantage of the breadth of our ecosystem. In Australia, we introduced Square for Retail and Square Appointments on Square Terminal, and in Ireland, we launched Square Appointments to provide a solution that integrates booking software with an all-in-one point of sale built for the Beauty and Personal Care sector.
We have heard from sellers that cash flow management is a top priority, which is why we provide integrated tools that connect directly with sellers’ payments. Since launching more of our banking products internationally, we have experienced steady demand with Square Loans: Through year-end 2022, we originated nearly $400 million in Square Loans throughout our global markets and achieved loss rates on these loans in line with Square Loans in the U.S.
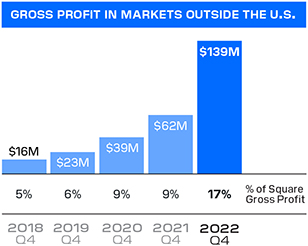
Square gross profit in markets outside the U.S. includes contributions from our BNPL platform during the fourth quarter of 2022. Excluding our BNPL platform, Square gross profit in markets outside the U.S. was $83 million, representing 12% of Square gross profit.
| BLOCK Q4 2022 6 |
A transacting active is a Cash App account that has at least one financial transaction using any product or service within Cash App during a specified period. A transacting active for a specific Cash App product has at least one financial transaction using that product during the specified period and is referred to as an active. Certain of these accounts may share an alias identifier with one or more other transacting active accounts. This could represent, among other things, one customer with multiple accounts or multiple customers sharing one alias identifier (for example, families).
Cash App Ecosystem
We use our inflows framework to assess the performance of Cash App’s gross profit as a result of three primary variables: (1) Actives, (2) Inflows per Active, and (3) Monetization Rate on Inflows. We are investing in the following development pillars: Community, Commerce, Crypto, Financial Services, Global, Operating System, and Trust. In the fourth quarter we made notable progress on Community, Financial Services, and Commerce, which meaningfully contributed to gross profit growth.
Community
We believe our ability to efficiently scale our network is one of our biggest differentiators: During December 2022, Cash App had 51 million monthly transacting actives, an increase of 16% year over year. Our acquisition cost remained stable in 2022 at $10 or less on average to acquire a new transacting active with strong returns on acquisition spend.
Creating unique experiences within peer-to-peer transactions allows us to engage our community in new and interesting ways. In the fourth quarter, we launched peer-to-peer gift cards, allowing customers to send a gift card from a wide range of merchants to their friends and family, who can then receive and spend it through their Cash App Card.
Financial services
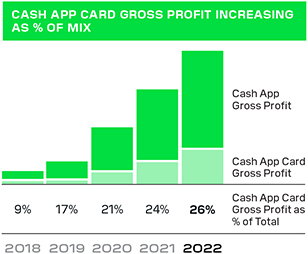
Cash App Card delivered strong growth over the past year, generating more than $750 million in gross profit during 2022, up 56% year over year from transactions on the card alone. This growth was driven by continued momentum from Cash App Card monthly actives and spend per active. Cash App Card is a key driver of increased inflows as Cash App Card actives brought 2x the amount of inflows into Cash App compared to peer-to-peer actives in the fourth quarter. Increased product adoption has positively impacted inflows per transacting active, which were $1,048 in the fourth quarter, up slightly year over year despite the benefit from government disbursements in the prior-year period.
| BLOCK Q4 2022 7 |
We are focused on continuing to build customer trust through the breadth of our banking offerings. Based on direct feedback from our customers, in January we rolled out Savings, which allows customers to hold a separate savings balance and easily set and track towards financial goals. Customers can add money to savings using their Cash App balance, a linked debit card, or through Round Ups on purchases with Cash App Card. This provides our customers with a meaningful tool to manage their money, and also furthers Cash App’s ability to be our customers’ primary bank of choice.
Commerce
As we continue our investment in Commerce, we are seeing new and meaningful opportunities in our BNPL platform that can further connect our Square and Cash App ecosystems. In the past year, we have channeled an opportunity to connect consumers with merchants by creating an ad and affiliate offering. With the offering available to both in- and out-of-network merchants, we are paid a commission when a consumer begins their shopping journey in the Afterpay app and makes a purchase. We also earn revenue through our BNPL platform from consumer clicks to a merchant site from the app as well as flat fees for premium ad placements.
Since launch, we have seen meaningful growth in the ad and affiliate offering of our BNPL platform. In 2022, the ads and affiliate program generated nearly $100 million in revenue across nearly 2,000 advertisers. As we build out Cash App’s commerce platform, we intend to integrate this demand generation engine from the Afterpay app, and pair ad and affiliate offerings with Cash App’s powerful Boost rewards and incentives capabilities.

In January 2023, we launched Savings, which allows our customers to budget better by saving in a separate balance within Cash App.
| BLOCK Q4 2022 8 |
Reconciliations of non-GAAP metrics used in this letter to their nearest GAAP equivalents are provided at the end of this letter.
We acquired our BNPL platform through the acquisition of Afterpay. We recognize revenue from our BNPL platform as subscription and services-based revenue, and have allocated 50% of revenue and gross profit from our BNPL platform to each of Square and Cash App. Revenue from our BNPL platform includes fees generated from consumer receivables, late fees, and certain affiliate and advertising fees from the platform.
GPV includes Square GPV and Cash App Business GPV. Square GPV is defined as the total dollar amount of all card payments processed by sellers using Square, net of refunds, and ACH transfers. Cash App Business GPV comprises Cash App activity related to peer-to-peer transactions received by business accounts, Cash App Pay transactions, and peer-to-peer payments sent from a credit card. GPV does not include transactions from our BNPL platform because GPV is related only to transaction-based revenue and not to subscription and services-based revenue.
Financial
Discussion
REVENUE AND GROSS PROFIT
Total net revenue was $4.65 billion in the fourth quarter of 2022, up 14% year over year. Excluding bitcoin revenue, revenue in the fourth quarter was $2.82 billion, up 33% year over year. For the full year of 2022, total net revenue was $17.53 billion, down 1% year over year. Excluding bitcoin revenue, revenue for the full year was $10.42 billion, up 36% year over year.
Gross profit was $1.66 billion in the fourth quarter of 2022, up 40% year over year. For the full year of 2022, gross profit was $5.99 billion, up 36% year over year. In the fourth quarter and for the full year, gross profit included $18 million and $70 million, respectively, of amortization of acquired technology assets, the majority of which was from the acquisition of our BNPL platform.
In the fourth quarter of 2022, our BNPL platform contributed $264 million of revenue and $196 million of gross profit. Excluding bitcoin revenue and our BNPL platform, revenue was $2.55 billion, up 21% year over year. Excluding our BNPL platform, gross profit was $1.46 billion, up 24% year over year.
For the full year of 2022, our BNPL platform contributed $811 million of revenue and $588 million of gross profit. Excluding bitcoin revenue and our BNPL platform, revenue was $9.61 billion, up 26% year over year. Excluding our BNPL platform, gross profit was $5.40 billion, up 22% year over year.
Transaction-based revenue was $1.47 billion in the fourth quarter of 2022, up 13% year over year, and transaction-based gross profit was $605 million, up 10% year over year. We processed $53.16 billion in GPV in the fourth quarter, up 15% year over year. Transaction-based gross profit as a percentage of GPV was 1.14% in the fourth quarter, up 1 basis point quarter over quarter and down 4 basis points year over year.
Bitcoin gross profit was $35 million in the fourth quarter of 2022. The total sale amount of bitcoin sold to customers, which we recognize as bitcoin revenue, was $1.83 billion. Bitcoin gross profit was 2% of bitcoin revenue.
| BLOCK Q4 2022 9 |
For the full year of 2022, transaction-based revenue was $5.70 billion, up 19% year over year, and transaction-based gross profit was $2.34 billion, up 13% year over year. We processed $203.54 billion in GPV for the full year of 2022, up 21% year over year. Transaction-based gross profit as a percentage of GPV was 1.15% for the full year of 2022, down 9 basis points year over year and up 7 basis points compared to 2019.
Subscription and services-based revenue was $1.31 billion in the fourth quarter of 2022, up 69% year over year, and subscription and services-based gross profit was $1.07 billion, up 70% year over year. Excluding our BNPL platform, subscription and services-based revenue was $1.04 billion and subscription and services-based gross profit was $871 million, up 35% and 39% year over year, respectively.
For the full year of 2022, subscription and services-based revenue was $4.55 billion, up 68% year over year, and subscription and services-based gross profit was $3.69 billion, up 66% year over year. Excluding our BNPL platform, subscription and services-based revenue was $3.74 billion and subscription and services-based gross profit was $3.10 billion, up 38% and 39% year over year, respectively.
| BLOCK Q4 2022 10 |
SQUARE ECOSYSTEM REVENUE
AND GROSS PROFIT
In the fourth quarter of 2022, Square generated $1.76 billion of revenue and $801 million of gross profit, up 19% and 22% year over year, respectively. For the full year of 2022, Square generated $6.70 billion of revenue and $3.00 billion of gross profit, up 29% and 30% year over year, respectively.
Our BNPL platform contributed $132 million of revenue and $98 million of gross profit to Square in the fourth quarter of 2022. Excluding our BNPL platform, Square generated $1.62 billion of revenue and $703 million of gross profit, up 10% and 7% on a year-over-year basis, respectively. For the full year of 2022, our BNPL platform contributed $406 million of revenue and $294 million of gross profit to Square. Excluding our BNPL platform, Square generated $6.29 billion of revenue and $2.71 billion of gross profit, up 21% and 17% on a year-over-year basis, respectively.
Excluding gross profit from PPP loan forgiveness and our BNPL platform, Square gross profit was up 17% and 19% year over year in the fourth quarter and for the full year of 2022, respectively.
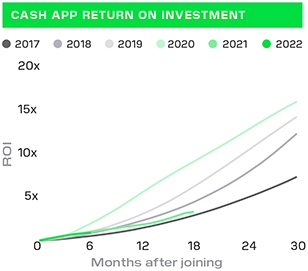
We target positive gross profit retention to measure our ability to support our sellers and help them grow over time. In 2022, each of our existing annual Square cohorts achieved positive gross profit retention when compared to 2021. Square cohorts onboarded prior to 2021 have achieved or are pacing towards an estimated return on investment of 3x or greater over four years. Our 2021 and 2022 cohorts have achieved or are pacing towards an estimated payback of six quarters or less.
Square GPV is defined as the total dollar amount of all card payments processed by sellers using Square, net of refunds, and ACH transfers. Square GPV does not include transactions from our BNPL platform because GPV is related only to transaction-based revenue and not to subscription and services-based revenue.
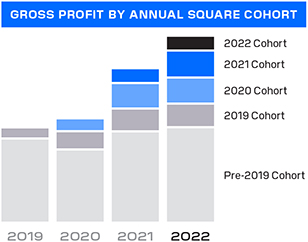
Square gross profit retention rate is calculated as the year-over-year gross profit growth of all existing quarterly seller cohorts, averaged over the last four quarters (excluding gross profit from our BNPL platform, hardware, Caviar, PPP loans, and Weebly prior to the acquisition). A Square cohort represents new sellers onboarded to Square during a given period.
| BLOCK Q4 2022 11 |
In the fourth quarter of 2022, Square generated $1.35 billion of transaction-based revenue, up 12% year over year, with growth from both in-person and online channels. During the quarter, Square saw a lower percentage of debit card transactions on a year-over-year basis, as the proportion of debit transactions was comparable to pre-pandemic levels. For the full year of 2022, Square transaction-based revenue was $5.24 billion, up 19% year over year.
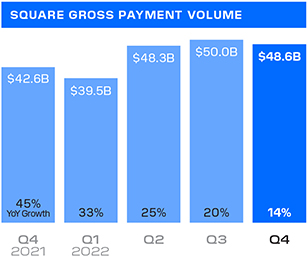
In the fourth quarter of 2022, Square GPV was $48.61 billion, up 14% year over year and 16% year over year on a constant currency basis. For the full year of 2022, Square GPV was $186.47 billion, up 22% year over year and 24% on a constant currency basis. We observed the following trends in Square GPV during the fourth quarter of 2022:
| • | Products: Card-present GPV was up 17% year over year and card-not-present GPV was up 9% year over year. |
| • | Geographies: Square GPV in our U.S. market grew 13% year over year, and growth in our international markets was 23% year over year. On a constant currency basis, Square GPV in our international markets was up 39% year over year. |
| • | Verticals: Square GPV was up 16% year over year in October, compared to 13% in November and 14% in December. Growth in Square GPV was slower in November and the first half of December compared to during the December holiday season. The slowdown was most pronounced in discretionary verticals, including food and drink and retail. |
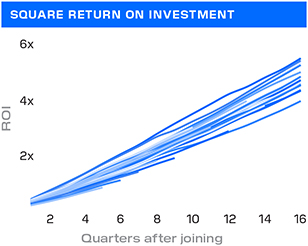
Return on investment, or payback, measures the effectiveness of sales and marketing spend. Return on investment (ROI) is calculated by dividing the cumulative cohort gross profit of each cohort of sellers by GAAP sales and marketing expenses for the applicable time period, excluding the following: Cash App sales and marketing expenses, BNPL platform sales and marketing expenses, Corporate and Other sales and marketing expenses, Caviar sales and marketing expenses, and the portion of sales and marketing expenses from the legacy Weebly business. Each line represents a quarterly cohort from the first quarter of 2013 to the third quarter of 2022.
| BLOCK Q4 2022 12 |
Square generated $368 million of subscription and services-based revenue during the fourth quarter of 2022, up 60% year over year. Excluding our BNPL platform, subscription and services-based revenue was $236 million, up 3% year over year. For the full year of 2022, Square subscription and services-based revenue was $1.30 billion, up 96% year over year. Excluding our BNPL platform, subscription and services-based revenue was $894 million, up 35% year over year.
| • | Banking: Excluding revenue from PPP loan forgiveness, revenue and gross profit from seller banking products achieved strong year- over-year growth in the fourth quarter of 2022. This includes Instant Transfer, Square Card, and Square Loans, which represent most of our financial services products for sellers. |
| • | Square Loans: Excluding revenue from PPP loan forgiveness, Square Loans achieved strong revenue and gross profit growth during the fourth quarter of 2022, facilitating approximately 124,000 loans totaling $1.16 billion in originations, up 37% year over year. Square Loans benefited from $2 million of PPP loan forgiveness revenue and gross profit during the fourth quarter of 2022, compared to $59 million in the fourth quarter of 2021. For the full year of 2022, Square Loans facilitated approximately 461,000 loans totaling $4.07 billion in originations, up 29% year over year. |
| • | Software: Revenue and gross profit from software subscriptions delivered strong year-over-year growth during the quarter, and gross profit growth continued to outpace overall Square gross profit growth. |
Hardware revenue in the fourth quarter of 2022 was $36 million, down 1% year over year, and generated a gross loss of $28 million as we use hardware as an acquisition tool. For the full year of 2022, hardware revenue was $164 million, up 13% year over year, and generated a gross loss of $123 million. Revenue growth for the full year of 2022 was driven by strong unit sales of Square Terminal, Square Register, and Square Reader for contactless and chip.
Q4 SQUARE SUBSCRIPTION AND SERVICES-BASED
REVENUE EX-PPP AND EX-BNPL PLATFORM
| Q419 | Q420 | Q421 | Q422 | |||||
| Square subscription and services-based revenue | $105M | $105M | $230M | $368M | ||||
| PPP loan forgiveness revenue | $0M | $2M | $59M | $2M | ||||
| Square subscription and services-based revenue excluding PPP forgiveness | $105M | $103M | $171M | $366M | ||||
| BNPL platform subscription and services-based revenue allocated to Square | $0M | $0M | $0M | $132M | ||||
|
|
|
| |||||
| Square subscription and services-based revenue excluding PPP forgiveness and excluding contributions from BNPL platform | $105M | $103M | $171M | $234M | ||||
FY SQUARE SUBSCRIPTION AND SERVICES-BASED
REVENUE EX-PPP AND EX-BNPL PLATFORM
| 2019 | 2020 | 2021 | 2022 | |||||
| Square subscription and services-based revenue | $369M | $376M | $664M | $1,300M | ||||
| PPP loan forgiveness revenue | $0M | $2M | $96M | $68M | ||||
| Square subscription and services-based revenue excluding PPP forgiveness | $369M | $374M | $568M | $1,232M | ||||
| BNPL platform subscription and services-based revenue allocated to Square | $0M | $0M | $0M | $406M | ||||
|
|
|
| |||||
| Square subscription and services-based revenue excluding PPP forgiveness and excluding contributions from BNPL platform | $369M | $374M | $568M | $827M | ||||
| BLOCK Q4 2022 13 |
CASH APP ECOSYSTEM REVENUE
AND GROSS PROFIT
In the fourth quarter of 2022, Cash App generated $2.86 billion of revenue and $848 million of gross profit, up 12% and 64% year over year, respectively. For the full year of 2022, Cash App generated $10.63 billion of revenue and $2.95 billion of gross profit, down 14% and up 43% year over year, respectively. The year-over-year decline in revenue was driven by a decrease in the total dollar amount of bitcoin sold to customers, which we recognize as bitcoin revenue, and bitcoin gross profit was 2% of bitcoin revenue in the quarter.
Our BNPL platform contributed $132 million of revenue and $98 million of gross profit to Cash App in the fourth quarter of 2022. Excluding bitcoin revenue and our BNPL platform, Cash App revenue was $892 million in the fourth quarter of 2022, up 51% year over year. Excluding our BNPL platform, Cash App gross profit was $750 million, up 45% year over year.
For the full year of 2022, our BNPL platform contributed $406 million of revenue and $294 million of gross profit to Cash App. Excluding bitcoin revenue and our BNPL platform, Cash App revenue was $3.11 billion for the full year of 2022, up 35% year over year. Excluding our BNPL platform, Cash App gross profit was $2.66 billion, up 28% year over year.
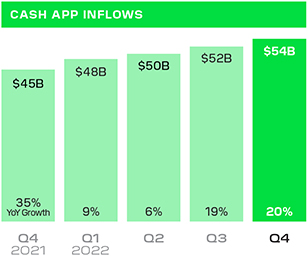
We drove growth in net new transacting actives and strong engagement across products in our Cash App ecosystem. Inflows per transacting active were $1,048 in the fourth quarter of 2022, up slightly year over year despite the benefit from government disbursements in the prior-year period. Overall inflows for the full year of 2022 were $203 billion, up from $179 billion in 2021.
Our Cash App ecosystem has achieved positive annual gross profit retention for our historical cohorts, demonstrating that existing customers have remained on the platform and increased their engagement with Cash App over time. We have seen strength in retention during recent years, with positive annual gross profit retention for all historical cohorts.
We continued to efficiently grow our customer base and generate strong returns on customer acquisition for Cash App. Our historical Cash App cohorts through 2020 have achieved a 6x ROI or greater over three years, and our 2021 and 2022 Cash App cohorts are at or pacing towards an estimated payback of less than one year. In 2022, we onboarded our largest annual cohort on a gross profit basis.
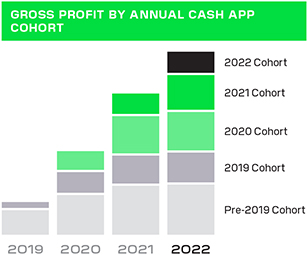
Cash App annual gross profit retention is calculated as the year-over-year gross profit growth of all existing quarterly Cash App cohorts, averaged over the last four quarters, and excluding BNPL platform gross profit, contra revenue, and interest income. A transacting active’s cohort is determined based on the date they first became a transacting active on the platform. For example, retention for our Q1 2019 cohort is the average annual gross profit growth from transacting actives who completed a first transaction in Q1 2019. Each of our annual Cash App cohorts since 2015 and the pre-2015 cohort have exhibited positive overall gross profit retention on aggregate from the date of their first transaction through December 31, 2022.
| BLOCK Q4 2022 14 |
Bitcoin revenue is the total sale amount of bitcoin sold to customers. Bitcoin costs are the total amount we pay to purchase bitcoin in order to facilitate customers’ access to bitcoin. In future quarters, bitcoin revenue and gross profit may fluctuate as a result of changes in customer demand or the market price of bitcoin.
In the fourth quarter of 2022, Cash App Business GPV was $4.55 billion, up 20% year over year. Cash App Business GPV comprises Cash App activity related to peer-to-peer transactions received by business accounts, Cash App Pay transactions, and peer-to-peer payments sent from a credit card. Cash App generated $122 million of transaction-based revenue during the fourth quarter of 2022, up 18% year over year. Growth was driven by an increase in the number of business accounts and in the number of transactions. For the full year of 2022, Cash App Business GPV was $17.07 billion, up 14% year over year, and Cash App transaction-based revenue was $466 million, up 14% year over year.
Cash App generated $901 million of subscription and services-based revenue during the fourth quarter of 2022, up 85% year over year. Growth in the quarter was driven by contributions from our BNPL platform, as well as transaction fees from both Cash App Card and Instant Deposit. Excluding our BNPL platform, subscription and services-based revenue was $769 million, up 58% year over year. For the full year of 2022, Cash App subscription and services-based revenue was $3.05 billion, up 61% year over year. Excluding our BNPL platform, subscription and services-based revenue was $2.64 billion, up 40% year over year.
Cash App generated $35 million of bitcoin gross profit in the fourth quarter of 2022, down 25% year over year. The total sale amount of bitcoin sold to customers, which we recognize as bitcoin revenue, was $1.83 billion, down 7% year over year. Bitcoin revenue and gross profit were relatively consistent compared to the third quarter of 2022. The year-over-year decrease in bitcoin revenue and gross profit was driven by a decline in the price of bitcoin. For the full year of 2022, Cash App generated $7.11 billion of bitcoin revenue and $156 million of bitcoin gross profit, down 29% and 28% year over year, respectively.
CORPORATE AND OTHER REVENUE
AND GROSS PROFIT
Corporate and Other generated $38 million in revenue and $11 million in gross profit in the fourth quarter of 2022. For the full year of 2022, Corporate and Other generated $206 million in revenue and $40 million in gross profit. Corporate and Other comprised areas outside Square and Cash App, which were primarily TIDAL and intersegment eliminations in 2022.
Return on investment, or payback, is calculated by taking a given Cash App monthly cohort’s cumulative variable profit and dividing by acquisition marketing spend for the initial month when onboarded. Each line represents the average monthly cohort for years 2017 to 2022.
Cohort variable profit is calculated as gross profit across Cash App transaction-based profit, Cash App Card gross profit, Instant Deposit gross profit for Cash App, bitcoin gross profit, less certain variable sales and marketing expenses, including peer-to-peer processing and risk loss. Cohort variable profit is based on our estimates for certain risk loss measures.
| BLOCK Q4 2022 15 |
We discuss Cash App marketing expenses because a large portion is generated by our peer-to-peer service, which we offer free to our Cash App customers, and we consider it to be a marketing tool to encourage the use of Cash App.
OPERATING EXPENSES
Operating expenses were $1.80 billion in the fourth quarter of 2022, up 45% year over year, and non-GAAP operating expenses were $1.40 billion, up 39% year over year. For the full year of 2022, operating expenses were $6.62 billion, up 55% year over year, and non-GAAP operating expenses were $5.07 billion, up 48% year over year. In the fourth quarter and for the full year, operating expenses included $35 million and $139 million, respectively, of amortization of customer and other acquired intangible assets, the majority of which was from the acquisition of our BNPL platform.
Product development expenses were $605 million on a GAAP basis and $382 million on a non-GAAP basis in the fourth quarter of 2022, up 54% and 60% year over year, respectively. The increase was driven primarily by headcount and personnel costs related to our engineering, data science, and design teams, as well as product development expenses related to our BNPL platform.
Sales and marketing expenses were $540 million on a GAAP basis and $508 million on a non-GAAP basis in the fourth quarter of 2022, up 11% and 9% year over year, respectively.
| • | Cash App marketing expenses were down 9% year over year, driven by a decrease in advertising and non-traditional marketing expenses. Cash App peer-to-peer processing costs, related peer-to-peer transaction losses, and card issuance costs were up 15% year over year. |
| • | Other sales and marketing expenses were up 48% year over year. The increase was driven primarily by sales and marketing expenses related to our BNPL platform. Other sales and marketing expenses also include expenses related to TIDAL. |
General and administrative expenses were $452 million on a GAAP basis and $343 million on a non-GAAP basis in the fourth quarter of 2022, up 51% and 43% year over year, respectively. The increase was due primarily to additions to customer support, human resources, finance, and legal personnel, as well as expenses related to our BNPL platform.
| BLOCK Q4 2022 16 |
The accounting rules for bitcoin currently require us to recognize any decreases in market price below carrying value as an impairment charge, with no upward revisions recognized when the market price increases until the sale of that bitcoin. Bitcoin impairment loss is a GAAP expense. Non-GAAP operating expenses exclude bitcoin impairment losses. To determine fair value, Block revalues its bitcoin holdings on a daily basis using the closing price at midnight Coordinated Universal Time (UTC).
Transaction, loan, and consumer receivables losses were $155 million in the fourth quarter of 2022, up 172% year over year. The increase was driven primarily from consumer receivables losses related to our BNPL platform, as well as growth in Square Loans volumes and Square GPV. In the fourth quarter, loss rates for Square GPV, Square Loans, and BNPL consumer receivables remained consistent with historical ranges, and we will continue to monitor trends closely given the dynamic macro environment.
In the fourth quarter of 2020 and first quarter of 2021, we invested $50 million and $170 million, respectively, in bitcoin. As an indefinite-lived intangible asset, bitcoin is subject to impairment losses if the fair value of bitcoin decreases below the carrying value during the assessed period. In the fourth quarter of 2022, we recognized a bitcoin impairment loss of $9 million on our bitcoin investment, and for the full year of 2022, we recognized a bitcoin impairment loss of $47 million on our investment. As of December 31, 2022, the fair value of our investment in bitcoin was $133 million based on observable market prices, which was $30 million greater than the carrying value of the investment after cumulative impairment charges.
| BLOCK Q4 2022 17 |
Beginning in the first quarter of 2022, we have included the tax impact of the non-GAAP adjustments in determining the Adjusted EPS. We determined the adjusted provision (benefit) for income taxes by calculating the estimated annual effective tax rate based on adjusted pre-tax income and applying it to Adjusted Net Income before income taxes.
EARNINGS
In the fourth quarter of 2022, operating loss was $135 million. For the full year of 2022, operating loss was $625 million.
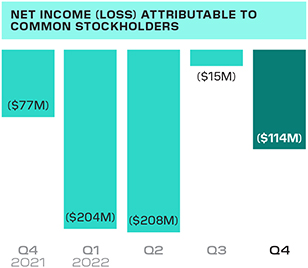
In the fourth quarter of 2022, net loss attributable to common stockholders was $114 million. Net loss per share attributable to common stockholders was $0.19 on a basic and diluted basis in the fourth quarter of 2022, based on 599 million weighted-average basic and diluted shares outstanding during the fourth quarter of 2022.
For the full year of 2022, net loss attributable to common stockholders was $541 million. Net loss per share was $0.93 on a basic and diluted basis, based on 579 million weighted-average basic and diluted shares outstanding during the full year of 2022.
Adjusted Operating Loss was $32 million in the fourth quarter of 2022. For the full year of 2022, Adjusted Operating Loss was $145 million. Adjusted Operating Income (Loss) is a non-GAAP financial measure that excludes certain expenses that we believe are not reflective of our core operating performance, including amortization of intangible assets, bitcoin impairment losses, acquisition-related accelerated share-based compensation expenses, and acquisition-related, integration, and other costs. We present Adjusted Operating Income (Loss) because we use it to evaluate our operating performance, generate future operating plans, and make strategic decisions.
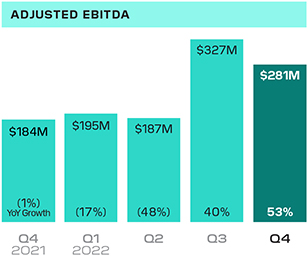
Adjusted EBITDA was $281 million in the fourth quarter of 2022, compared to $184 million in the fourth quarter of 2021. The increase in Adjusted EBITDA compared to the prior-year period was driven by gross profit growth across our Cash App and Square ecosystems. For the full year of 2022, Adjusted EBITDA was $991 million.
In the fourth quarter of 2022, Adjusted Net Income Per Share (Adjusted EPS) was $0.22 on a diluted basis based on 623 million weighted-average diluted shares, representing a $0.06 decrease year over year. For the full year of 2022, Adjusted EPS was $1.00 based on 615 million weighted-average diluted shares, compared to $1.28 for the full year of 2021.
Please see the reconciliations at the end of this letter for a description of certain items that impacted net income (loss) and operating income (loss) in 2022.
| BLOCK Q4 2022 18 |
BALANCE SHEET/CASH FLOW
We ended the fourth quarter of 2022 with $7.5 billion in available liquidity, with $6.9 billion in cash, cash equivalents, restricted cash, and investments in marketable debt securities, as well as $600 million available to be withdrawn from our revolving credit facility. Additionally, we had $389 million available to be withdrawn under our warehouse funding facilities, to support funding of growth in our consumer receivables related to our BNPL platform.
In the fourth quarter of 2022, Adjusted EBITDA contributed positively to our overall liquidity.
| BLOCK Q4 2022 19 |
Trends and Forward-Looking Commentary
| Q4 2022 YoY Growth % | Jan + Feb 2023 YoY Growth % | |||
BUSINESS TRENDS
| ||||
Block Gross Profit | 40% | 33% | ||
Block Combined Company Gross Profit*
| 21% | 25% | ||
|
|
|
Note: The table above presents preliminary gross profit growth estimates for the months of January and February 2023. These represent our current estimates as we have not yet finalized our financial statements for the months of January and February, and our monthly and combined company results are not subject to interim review by our auditors. As a result, actual January and February results may differ from these preliminary estimates
Given we acquired our BNPL platform on January 31, 2022 through the acquisition of Afterpay, we believe Block combined company gross profit is more representative of underlying growth trends in the first quarter. *Block combined company gross profit is calculated assuming a $51 million gross profit contribution from our BNPL platform in January 2022, as if our BNPL platform had been acquired on January 1, 2022. On a combined company basis, our BNPL platform contributed $143 million of gross profit in the first quarter of 2022 and $185 million in the fourth quarter of 2021.
OPERATING EXPENSES
| Q1 2023 | QoQ increase ($) | ||
Block Non-GAAP Operating Expenses1 | $1,430M | $30M | ||
|
|
|
On a GAAP basis, we currently expect to recognize approximately $53 million in quarterly expenses related to amortization of intangible assets over the next few years, based on the intangible assets as of December 31, 2022. This quarterly expense includes approximately $18 million recognized in cost of sales and approximately $35 million in operating expenses. These amounts may be affected by fluctuations in foreign exchange rates in future periods.
In the first quarter of 2023, we expect our share-based compensation expense to be relatively consistent quarter over quarter on a dollar basis. Share-based compensation expenses are not included in non-GAAP operating expenses.
2023 OUTLOOK
| 2023 | |||
Adjusted EBITDA1 | $1,300M | |||
Adjusted Operating Income (Loss)1 | ($150M) | |||
|
|
| ||
Based on trends in our business year to date as of earnings, we expect Adjusted EBITDA margin to expand by at least one percentage point year over year and Adjusted Operating Income margin to also expand on a year-over-year basis in 2023 compared to 2022.
1. We have not provided the forward-looking GAAP equivalents for certain forward-looking non-GAAP metrics, including Block Non-GAAP Operating Expenses, Adjusted EBITDA, Adjusted EBITDA margin, Adjusted Operating Income, Adjusted Operating Income margin, or GAAP reconciliations of any of the aforementioned, as a result of the uncertainty regarding, and the potential variability of, reconciling items such as share-based compensation expense. Accordingly, reconciliations of these non-GAAP guidance metrics to their corresponding GAAP equivalents are not available without unreasonable effort. However, it is important to note that material changes to reconciling items could have a significant effect on future GAAP results. We have provided reconciliations of other historical GAAP to non-GAAP metrics in tables at the end of this letter.
Adjusted EBITDA margin and Adjusted Operating Income margin are both defined by dividing the respective metric taken over a period by gross profit over the same period.
| BLOCK Q4 2022 20 |
INVESTMENT FRAMEWORK
Our investment framework can be articulated in a single sentence: Block and each ecosystem must show a believable path to gross profit retention of more than 100% and Rule of 40, measured as gross profit growth plus Adjusted Operating Income, over the long-term. Unlike Adjusted EBITDA, Adjusted Operating Income is a profitability measure which takes into account certain non-cash expenses, including share based compensation as well as depreciation and certain amortization expenses. As we transition to Adjusted Operating Income, we will continue to share Adjusted EBITDA as a measure of profitability.
We believe this framework will enhance our ecosystem model by allowing each ecosystem to make business decisions in parallel, and balance tradeoffs as we invest for growth with discipline. It also ensures we remain customer focused, and provides flexibility for products and businesses at varying stages of maturity.
| BLOCK Q4 2022 21 |
MEDIA CONTACT
press@block.xyz
INVESTOR RELATIONS
CONTACT
ir@block.xyz
Earnings
Webcast
Block (NYSE:SQ) will host a conference call and earnings webcast at 2:00 p.m. Pacific time/5:00 p.m. Eastern time, February 23, to discuss these financial results. To register to participate in the conference call, or to listen to the live audio webcast, please visit the Events & Presentations section of Block’s Investor Relations website at investors.block.xyz. A replay will be available on the same website following the call.
We will release financial results for the first quarter of 2023 on May 4, 2023, after the market closes, and will also host a conference call and earnings webcast at 2:00 p.m. Pacific time/5:00 p.m. Eastern time on the same day to discuss those financial results.
|
| |
| Jack Dorsey | Amrita Ahuja |


| BLOCK Q4 2022 22 |

“Making wine is easy, but selling is hard — and that’s where Square helps us provide a personalized, elevated customer experience. I can easily manage wine club memberships and securely keep cards on file with Square Subscriptions, while building brand loyalty and offering discounts to new and returning customers using Square Marketing.
My goal is to transform Boedecker into a destination where customers can enjoy a glass of wine and a bite to eat — and Square equips us with the tools we need to make this dream a reality.”
- Athena Poppas, Founder of Boedecker Cellars

With a debit card, acct #, routing #, direct deposit, and bitcoin, I see no need to use a traditional bank. #cashapp #Bitcoin @JSmilanic Via Twitter I use the Cash app Bitcoin roundup daily. Easy way to stack with no fees. @keithkman Via Reddit Yo cashapp got everything now haha. You can have a savings account, crypto, stocks, wallet, and even tax filing. @SILNTMUSIC Via Twitter My jaw dropped yesterday morning when I saw the “savings” widget (tab) definitely excited to start using this! I am actually saving for my first ever plane ticket (not sure where I’ll be going but I gotta get on a plane to get there!) so excited! @BradyRamsey777 Via Twitter #cashappgiftcards smart thinking cashapp ! @479_isaiah Via Instagram
SAFE HARBOR STATEMENT
This letter contains “forward-looking statements” within the meaning of the Safe Harbor provisions of the U.S. Private Securities Litigation Reform Act of 1995. All statements other than statements of historical fact could be deemed forward-looking, including, but not limited to, statements regarding the future performance of Block, Inc. and its consolidated subsidiaries (the Company); the Company’s strategies, including expected impact of such strategies on our customers, actives, and sellers as well as our business and financial performance, expected financial results, guidance, and general business outlook for current and future periods; the Company’s integration of Afterpay into its Square and Cash App businesses, and its impacts on the Company’s business and financial results; future profitability and growth in the Company’s businesses and products and the Company’s ability to drive such profitability and growth; the Company’s expectations regarding scale, economics, and the demand for or benefits from its products, product features, and services; the Company’s product development plans; the ability of the Company’s products to attract and retain customers, particularly in new or different markets or demographics; trends in the Company’s markets and the continuation of such trends; the Company’s expectations and intentions regarding future expenses, including future transaction and loan losses and the Company’s estimated reserves for such losses; the Company’s bitcoin investments and strategy as well as the potential financial impact and volatility; and management’s statements related to business strategy, plans, investments, opportunities, and objectives for future operations. In some cases, forward-looking statements can be identified by terms such as “may,” “will,” “appears,” “should,” “expects,” “plans,” “anticipates,” “could,” “intends,” “target,” “projects,” “contemplates,” “believes,” “estimates,” “predicts,” “potential,” or “continue,” or the negative of these words or other similar terms or expressions that concern our expectations, strategy, plans, or intentions.
Such statements are subject to a number of known and unknown risks, uncertainties, assumptions, and other factors that may cause the Company’s actual results, performance, or achievements to differ materially from results expressed or implied in this letter. Investors are cautioned not to place undue reliance on these statements, and reported results should not be considered as an indication of future performance.
Risks that contribute to the uncertain nature of the forward-looking statements include, among others, a continued or prolonged economic downturn in the United States and in other countries around the world; the Company’s investments in its business and ability to maintain profitability; the Company’s efforts to expand its product portfolio and market reach; the Company’s ability to develop products and services to address the rapidly evolving market for payments and financial services; the Company’s ability to deal with the substantial and increasingly intense competition in its industry; acquisitions, strategic investments, entries into new businesses, joint ventures, divestitures, and other transactions that the Company may undertake; the integration of Afterpay; uncertainty around the impacts of the COVID-19 pandemic and the related effects of government and other measures; the Company’s ability to ensure the integration of its services with a variety of operating systems and the interoperability of its technology with that of third parties; the Company’s ability to retain existing customers, attract new customers, and increase sales to all customers; the Company’s dependence on payment card networks and acquiring processors; the effect of extensive regulation and oversight related to the Company’s business in a variety of areas; the effect of management changes and business initiatives; the liabilities and loss potential associated with new products, product features, and services; litigation, including intellectual property claims, government investigations or inquiries, and regulatory matters or disputes; adoption of the Company’s products and services in international markets; changes in political, business, and economic conditions; as well as other risks listed or described from time to time in the Company’s filings with the Securities and Exchange Commission (the SEC), including the Company’s Annual Report on Form 10-K for the fiscal year ended December 31, 2021, and subsequent Quarterly Reports on Form 10-Q, which are on file with the SEC and available on the Investor Relations page of the Company’s website. Additional information will also be set forth in the Company’s Annual Report on Form 10-K for the fiscal year ended December 31, 2022. All forward-looking statements represent management’s current expectations and predictions regarding trends affecting the Company’s business and industry and are based on information and estimates available to the Company at the time of this letter and are not guarantees of future performance. Except as required by law, the Company assumes no obligation to update any of the statements in this letter.
| BLOCK Q4 2022 25 |
KEY OPERATING METRICS AND
NON-GAAP FINANCIAL MEASURES
To supplement our financial information presented in accordance with generally accepted accounting principles in the United States (GAAP), from period to period, we consider and present certain operating and financial measures that we consider key metrics or are not prepared in accordance with GAAP, including Gross Payment Volume (GPV), Adjusted EBITDA, Adjusted EBITDA margin, Adjusted Net Income (Loss), Diluted Adjusted Net Income (Loss) Per Share (Adjusted EPS), Adjusted Operating Income (Loss), constant currency, and non-GAAP operating expenses as well as other measures defined in this letter such as measures excluding bitcoin revenue or gross profit, bitcoin impairment losses, measures excluding gains or losses on equity investments, measures excluding amortization of intangibles, measures excluding our BNPL platform, measures excluding both our BNPL platform and bitcoin revenue or gross profit, and measures excluding both of our BNPL platform and PPP loan forgiveness gross profit. We believe these metrics and measures are useful to facilitate period-to-period comparisons of our business and to facilitate comparisons of our performance to that of other payments solution providers.
We define GPV as the total dollar amount of all card payments processed by sellers using Square, net of refunds, and ACH transfers. Additionally, GPV includes Cash App Business GPV, which comprises Cash App activity related to peer-to-peer transactions received by business accounts, Cash App Pay transactions, and peer-to-peer payments sent from a credit card. GPV does not include BNPL transactions.
Adjusted EBITDA, Adjusted EBITDA margin, Adjusted Net Income (Loss), Diluted Adjusted Net Income (Loss) Per Share (Adjusted EPS), and Adjusted Operating Income (Loss) are non-GAAP financial measures that represent our net income (loss) and net income (loss) per share (or, in the case of Adjusted Operating Income (Loss), represents our operating income (loss)), adjusted to eliminate the effect of share-based compensation expenses; amortization of intangible assets; gain or loss on revaluation of equity investments; bitcoin impairment losses; amortization of debt discount and issuance costs; and the gain or loss on the disposal of property and equipment, as applicable. We also exclude certain acquisition-related and integration costs associated with business combinations, and various other costs that are not reflective of our core operating performance. Acquisition-related costs include amounts paid to redeem acquirees’ unvested stock-based compensation awards, and legal, accounting, and due diligence costs. Integration costs include advisory and other professional services or consulting fees necessary to integrate acquired businesses. Other costs that are non-recurring operating expenses may include contingent losses, certain litigation, and regulatory charges. We also add back the impact of the acquired deferred revenue and deferred cost adjustment, which was written down to fair value in purchase accounting. Additionally, for purposes of calculating diluted Adjusted EPS, we add back cash interest expense on convertible senior notes, as if converted at the beginning of the period, if the impact is dilutive. In addition to the items above, Adjusted EBITDA is a non-GAAP financial measure that also excludes depreciation and amortization, interest income and expense, other income and expense, and provision or benefit from income taxes, as applicable. Adjusted EBITDA margin is calculated as Adjusted EBITDA divided by gross profit. To calculate the diluted Adjusted EPS, we adjust the weighted-average number of shares of common stock outstanding for the dilutive effect of all potential shares of common stock. In periods when we recorded an Adjusted Net Loss, the diluted Adjusted EPS is the same as basic Adjusted EPS because the effects of potentially dilutive items were anti-dilutive given the Adjusted Net Loss position.
Constant currency growth is calculated by assuming international results in a given period and the comparative prior period are translated from local currencies to the U.S. dollar at rates consistent with the monthly average rates in the comparative prior period. We discuss growth on a constant currency basis because a portion of our business operates in markets outside the U.S. and is subject to changes in foreign exchange rates.
Non-GAAP operating expenses is a non-GAAP financial measure that represents operating expenses adjusted to remove the impact of share-based compensation, depreciation and amortization, bitcoin impairment losses, loss on disposal of property and equipment, and acquisition-related integration and other costs.
We have included Adjusted EBITDA, Adjusted Net Income, Adjusted EPS, and non-GAAP operating expenses because they are key measures used by our management to evaluate our operating performance, generate future operating plans, and make strategic decisions, including those relating to operating expenses and the allocation of internal resources. Accordingly, we believe that Adjusted EBITDA, Adjusted Net Income, Adjusted EPS, and non-GAAP operating expenses provide useful information to investors and others in understanding and evaluating our operating results in the same manner as our management and board of directors. In addition, they provide useful measures for period-to-period comparisons of our business, as they remove the effect of certain non-cash items and certain variable charges that do not vary with our operations. We have included measures excluding our BNPL platform because we believe these measures are useful in understanding the ongoing results of our operations. We have included measures excluding bitcoin revenue because our role is to facilitate customers’ access to bitcoin. When customers buy bitcoin through Cash App, we only apply a small margin to the market cost of bitcoin, which tends to be volatile and outside our control. Therefore, we believe deducting bitcoin revenue or gross profit better reflects the economic benefits as well as our performance from these transactions. We also include measures that exclude both our BNPL platform and bitcoin revenue or gross profit in order to further facilitate comparison of our business without bitcoin revenue or gross profit to periods prior to the acquisition of BNPL. We have included measures excluding both our BNPL platform and PPP loan forgiveness gross profit because we believe these measures are useful in order to facilitate comparisons of our business without PPP loan forgiveness to periods prior to the acquisition of BNPL. We exclude amortization of intangible assets arising from business combinations because the amount of such expenses in any specific period may not directly correlate to the underlying performance of our ongoing business operations.
Adjusted EBITDA, Adjusted Net Income, Adjusted Operating Income (Loss), Adjusted EPS, and non-GAAP operating expenses, as well as other measures defined in the shareholder letter, such as measures excluding our BNPL platform, bitcoin revenue or gross profit, PPP loan forgiveness gross profit, bitcoin impairment losses, and measures excluding gains or losses on equity investments, have limitations as financial measures, should be considered as supplemental in nature, and are not meant as substitutes for the related financial information prepared in accordance with GAAP.
| BLOCK Q4 2022 26 |
KEY OPERATING METRICS AND
NON-GAAP FINANCIAL MEASURES
We believe that the aforementioned metrics and measures provide useful information about our operating results, enhance the overall understanding of our past performance and future prospects, and provide useful measures for period-to-period comparisons of our business, as they remove the effect of certain variable amounts, or they remove amounts that were not repeated across periods and therefore make comparisons more difficult. Our management uses these measures to evaluate our operating performance, generate future operating plans, and make strategic decisions, including those relating to operating expenses and the allocation of internal resources.
These non-GAAP financial measures should not be considered in isolation from, or as a substitute for, financial information prepared in accordance with GAAP. These non-GAAP financial measures are not based on any standardized methodology prescribed by GAAP. Other companies, including companies in our industry, may calculate the non-GAAP financial measures differently or not at all, which reduces their usefulness as comparative measures.
| BLOCK Q4 2022 27 |
Condensed Consolidated
Statements of Operations
AUDITED
In thousands, except per share data
| YEAR ENDED | ||||||||||||
| Dec 31, 2022 | Dec 31, 2021 | Dec 31, 2020 | ||||||||||
Revenue: | ||||||||||||
Transaction-based revenue | $ | 5,701,540 | $ | 4,793,146 | $ | 3,294,978 | ||||||
Subscription and services-based revenue | 4,552,773 | 2,709,731 | 1,539,403 | |||||||||
Hardware revenue | 164,418 | 145,679 | 91,654 | |||||||||
Bitcoin revenue | 7,112,856 | 10,012,647 | 4,571,543 | |||||||||
|
|
|
|
| ||||||||
Total net revenue | 17,531,587 | 17,661,203 | 9,497,578 | |||||||||
|
|
|
|
| ||||||||
Cost of revenue: | ||||||||||||
Transaction-based costs | 3,364,028 | 2,719,502 | 1,911,848 | |||||||||
Subscription and services-based costs | 861,745 | 483,056 | 222,712 | |||||||||
Hardware costs | 286,995 | 221,185 | 143,901 | |||||||||
Bitcoin costs | 6,956,733 | 9,794,992 | 4,474,534 | |||||||||
Amortization of acquired technology assets | 70,194 | 22,645 | 11,174 | |||||||||
|
|
|
|
| ||||||||
Total cost of revenue | 11,539,695 | 13,241,380 | 6,764,169 | |||||||||
|
|
|
|
| ||||||||
Gross profit | 5,991,892 | 4,419,823 | 2,733,409 | |||||||||
|
|
|
|
| ||||||||
Operating expenses: | ||||||||||||
Product development | 2,135,612 | 1,383,841 | 881,826 | |||||||||
Sales and marketing | 2,057,951 | 1,617,189 | 1,109,670 | |||||||||
General and administrative | 1,686,849 | 982,817 | 579,203 | |||||||||
Transaction, loan, and consumer receivable losses | 550,683 | 187,991 | 177,670 | |||||||||
Bitcoin impairment losses | 46,571 | 71,126 | — | |||||||||
Amortization of customer and other acquired intangible assets | 138,758 | 15,747 | 3,855 | |||||||||
|
|
|
|
| ||||||||
Total operating expenses | 6,616,424 | 4,258,711 | 2,752,224 | |||||||||
|
|
|
|
| ||||||||
Operating income (loss) | (624,532) | 161,112 | (18,815) | |||||||||
|
|
|
|
| ||||||||
Interest expense, net | 36,228 | 33,124 | 56,943 | |||||||||
Other income, net | (95,443) | (29,474) | (291,725) | |||||||||
|
|
|
|
| ||||||||
Income (loss) before income tax | (565,317) | 157,462 | 215,967 | |||||||||
|
|
|
|
| ||||||||
Provision (benefit) for income taxes | (12,312) | (1,364) | 2,862 | |||||||||
|
|
|
|
| ||||||||
Net income (loss) | (553,005) | 158,826 | 213,105 | |||||||||
Less: Net income (loss) attributable to noncontrolling interests | (12,258) | (7,458) | — | |||||||||
|
|
|
|
| ||||||||
Net income (loss) attributable to common stockholders | $ | (540,747) | $ | 166,284 | $ | 213,105 | ||||||
|
|
|
|
| ||||||||
Net income (loss) per share attributable to common stockholders: | ||||||||||||
Basic | $ | (0.93) | $ | 0.36 | $ | 0.48 | ||||||
|
|
|
|
| ||||||||
Diluted | $ | (0.93) | $ | 0.33 | $ | 0.44 | ||||||
|
|
|
|
| ||||||||
Weighted-average shares used to compute net income | ||||||||||||
(loss) per share attributable to common stockholders: | ||||||||||||
Basic | 578,949 | 458,432 | 443,126 | |||||||||
|
|
|
|
| ||||||||
Diluted | 578,949 | 501,779 | 482,167 | |||||||||
|
|
|
|
| ||||||||
| BLOCK Q4 2022 28 |
Condensed Consolidated
Balance Sheets
AUDITED
In thousands, except share and per share data
| Dec 31, 2022 | Dec 31, 2021 | |||||||
| Assets | ||||||||
Current assets: | ||||||||
Cash and cash equivalents | $ | 4,544,202 | $ | 4,443,669 | ||||
Investments in short-term debt securities | 1,081,851 | 869,283 | ||||||
Settlements receivable | 2,416,324 | 1,171,612 | ||||||
Customer funds | 3,180,324 | 2,830,995 | ||||||
Consumer receivables, net | 1,871,160 | — | ||||||
Loans held for sale | 474,036 | 517,940 | ||||||
Safeguarding asset related to bitcoin held for other parties | 428,243 | 1,100,596 | ||||||
Other current assets | 1,627,265 | 687,429 | ||||||
|
|
| ||||||
Total current assets | 15,623,405 | 11,621,524 | ||||||
|
|
| ||||||
Property and equipment, net | 329,302 | 282,140 | ||||||
Goodwill | 11,966,761 | 519,276 | ||||||
Acquired intangible assets, net | 2,014,034 | 257,049 | ||||||
Investments in long-term debt securities | 573,429 | 1,526,430 | ||||||
Operating lease right-of-use assets | 373,172 | 449,406 | ||||||
Other non-current assets | 484,237 | 370,535 | ||||||
|
|
| ||||||
Total assets | $ | 31,364,340 | $ | 15,026,360 | ||||
|
|
| ||||||
Liabilities and Stockholders’ Equity | ||||||||
Current liabilities: | ||||||||
Customers payable | $ | 5,548,656 | $ | 3,979,624 | ||||
Settlements payable | 462,505 | 254,611 | ||||||
Accrued expenses and other current liabilities | 1,056,676 | 702,881 | ||||||
Current portion of long-term debt | 460,356 | 455 | ||||||
Warehouse funding facilities, current | 461,240 | — | ||||||
Safeguarding obligation liability related to bitcoin held for other parties | 428,243 | 1,100,596 | ||||||
PPP Liquidity Facility advances | 16,840 | 497,533 | ||||||
|
|
| ||||||
Total current liabilities | 8,434,516 | 6,535,700 | ||||||
|
|
| ||||||
Deferred tax liabilities | 132,498 | 15,236 | ||||||
Warehouse funding facilities, non-current | 877,066 | — | ||||||
Long-term debt (Note 15) | 4,109,829 | 4,559,208 | ||||||
Operating lease liabilities, non-current | 357,419 | 395,017 | ||||||
Other non-current liabilities | 201,657 | 207,610 | ||||||
|
|
| ||||||
Total liabilities | 14,112,985 | 11,712,771 | ||||||
|
|
| ||||||
Commitments and contingencies | ||||||||
Stockholders’ equity: | ||||||||
Preferred stock, $0.0000001 par value: 100,000,000 shares authorized at December 31, 2022 and December 31, 2021. None issued and outstanding at December 31, 2022 and December 31, 2021. | — | — | ||||||
Class A common stock, $0.0000001 par value: 1,000,000,000 shares authorized at December 31, 2022 and December 31, 2021; 539,408,009 and 403,237,209 issued and outstanding at December 31, 2022 and December 31, 2021, respectively. | — | — | ||||||
Class B common stock, $0.0000001 par value: 500,000,000 shares authorized at December 31, 2022 and December 31, 2021; 60,651,533 and 61,706,578 issued and outstanding at December 31, 2022 and December 31, 2021, respectively. | — | — | ||||||
Additional paid-in capital | 18,314,681 | 3,317,255 | ||||||
Accumulated other comprehensive loss | (523,090) | (16,435) | ||||||
Accumulated deficit | (568,712) | (27,965) | ||||||
|
|
| ||||||
Total stockholders’ equity attributable to common stockholders | 17,222,879 | 3,272,855 | ||||||
Noncontrolling interests | 28,476 | 40,734 | ||||||
|
|
| ||||||
Total stockholders’ equity | 17,251,355 | 3,313,589 | ||||||
|
|
| ||||||
Total liabilities and stockholders’ equity | $ | 31,364,340 | $ | 15,026,360 | ||||
|
|
| ||||||
| BLOCK Q4 2022 29 |
Condensed Consolidated
Statements of Cash Flows
AUDITED
In thousands
| YEAR ENDED | ||||||||||||
| Dec 31, 2022 | Dec 31, 2021 | Dec 31, 2020 | ||||||||||
Cash Flows from Operating Activities | ||||||||||||
Net income (loss) | $ | (553,005) | $ | 158,826 | $ | 213,105 | ||||||
Adjustments to reconcile net income (loss) to net cash provided by operating activities: | ||||||||||||
Depreciation and amortization | 340,523 | 134,757 | 84,212 | |||||||||
Amortization of discounts and premiums and other non-cash adjustments | (592,489) | 31,104 | 76,129 | |||||||||
Loss on extinguishment of long-term debt | — | — | 6,651 | |||||||||
Non-cash lease expense | 129,811 | 83,137 | 70,253 | |||||||||
Share-based compensation | 1,071,278 | 608,040 | 397,800 | |||||||||
Gains on revaluation of equity investments | (73,457) | (35,492) | (295,297) | |||||||||
Transaction, loan, and consumer receivable losses | 550,683 | 187,991 | 177,670 | |||||||||
Bitcoin impairment losses | 46,571 | 71,126 | — | |||||||||
Change in deferred income taxes | (69,593) | (10,435) | (8,016) | |||||||||
Changes in operating assets and liabilities: | ||||||||||||
Settlements receivable | (1,499,057) | (346,217) | (547,484) | |||||||||
Purchases and originations of loans | (6,665,387) | (3,227,172) | (1,837,137) | |||||||||
Proceeds from payments and forgiveness of loans | 6,590,909 | 3,067,344 | 1,505,406 | |||||||||
Customers payable | 1,060,861 | 171,555 | 371,598 | |||||||||
Settlements payable | 207,894 | 15,249 | 143,528 | |||||||||
Other assets and liabilities | (369,639) | (61,983) | (185,308) | |||||||||
|
|
|
|
| ||||||||
Net cash provided by operating activities | 175,903 | 847,830 | 173,110 | |||||||||
|
|
|
|
| ||||||||
Cash Flows from Investing Activities | ||||||||||||
Purchases of marketable debt securities | (755,697) | (2,714,560) | (1,322,362) | |||||||||
Proceeds from maturities of marketable debt securities | 999,569 | 831,019 | 607,134 | |||||||||
Proceeds from sale of marketable debt securities | 449,723 | 617,097 | 585,427 | |||||||||
Purchases of marketable debt securities from customer funds | — | (488,851) | (642,252) | |||||||||
Proceeds from maturities of marketable debt securities from | 73,000 | 505,501 | 382,887 | |||||||||
customer funds | ||||||||||||
Proceeds from sale of marketable debt securities from customer funds | 316,576 | 35,071 | 51,430 | |||||||||
Payments for originations of consumer receivables | (18,361,871) | — | — | |||||||||
Proceeds from principal repayments and sales of consumer receivables | 18,192,470 | — | — | |||||||||
Purchases of property and equipment | (170,815) | (134,320) | (138,402) | |||||||||
Purchases of bitcoin investments | — | (170,000) | (50,000) | |||||||||
Purchases of other investments | (56,712) | (48,510) | (1,277) | |||||||||
Proceeds from sale of equity investments | — | 420,644 | — | |||||||||
Business combinations, net of cash acquired | 539,453 | (163,970) | (79,221) | |||||||||
|
|
|
|
| ||||||||
Net cash provided by (used in) investing activities | 1,225,696 | (1,310,879) | (606,636) | |||||||||
|
|
|
|
| ||||||||
| BLOCK Q4 2022 30 |
Condensed Consolidated
Statements of Cash Flows
AUDITED
In thousands
| YEAR ENDED | ||||||||||||
| Dec 31, 2022 | Dec 31, 2021 | Dec 31, 2020 | ||||||||||
Cash Flows from Financing Activities | ||||||||||||
Proceeds from issuance of convertible notes, net | — | — | 2,116,544 | |||||||||
Purchases of senior note hedges | — | — | (338,145 | ) | ||||||||
Proceeds from issuance of warrants | — | — | 232,095 | |||||||||
Proceeds from issuance of senior notes, net | — | 1,971,828 | — | |||||||||
Payments to redeem convertible notes | (1,071,788 | ) | — | — | ||||||||
Proceeds from PPP Liquidity Facility advances | — | 681,539 | 464,094 | |||||||||
Repayments of PPP Liquidity Facility advances | (480,694 | ) | (648,100 | ) | — | |||||||
Proceeds from warehouse facilities borrowings | 1,620,805 | — | — | |||||||||
Repayments of warehouse facilities borrowings | (391,463 | ) | — | — | ||||||||
Proceeds from the exercise of stock options and purchases under the employee stock purchase plan | 81,768 | 126,719 | 161,985 | |||||||||
Payments for tax withholding related to vesting of restricted stock units | (4,735 | ) | (323,011 | ) | (314,019 | ) | ||||||
Net increase in interest-bearing deposits | 82,049 | 59,844 | — | |||||||||
Other financing activities | (87,692 | ) | (9,948 | ) | (7,359 | ) | ||||||
Change in customer funds, restricted from use in the Company’s operations | 349,330 | 793,163 | 1,361,540 | |||||||||
|
|
|
|
| ||||||||
Net cash provided by financing activities | 97,580 | 2,652,034 | 3,676,735 | |||||||||
|
|
|
|
| ||||||||
Effect of foreign exchange rate on cash and cash equivalents | (38,363 | ) | (7,066 | ) | 12,995 | |||||||
|
|
|
|
| ||||||||
Net increase in cash, cash equivalents, restricted cash, and customer funds | 1,460,816 | 2,181,919 | 3,256,204 | |||||||||
Cash, cash equivalents, restricted cash, and customer funds, beginning of the year | 6,975,090 | 4,793,171 | 1,536,967 | |||||||||
|
|
|
|
| ||||||||
Cash, cash equivalents, restricted cash, and customer funds, end of the year | $ | 8,435,906 | $ | 6,975,090 | $ | 4,793,171 | ||||||
|
|
|
|
| ||||||||
| BLOCK Q4 2022 31 |
Reportable Segment Disclosures
Information on the reportable segments revenue and segment operating profit are
as follows (in thousands):
| THREE MONTHS ENDED | YEAR ENDED | |||||||||||||||||||||||||||||||
| DEC 31, 2022 | DEC 31, 2022 | |||||||||||||||||||||||||||||||
| (UNAUDITED) | (AUDITED) | |||||||||||||||||||||||||||||||
| Cash App
| Square
| Corporate and Other(i) | Total
| Cash App
| Square
| Corporate and Other(i) | Total
| |||||||||||||||||||||||||
Revenue | ||||||||||||||||||||||||||||||||
Transaction-based revenue | $ | 122,403 | $ | 1,352,571 | $ | — | $ | 1,474,974 | $ | 466,171 | $ | 5,235,369 | $ | — | $ | 5,701,540 | ||||||||||||||||
Subscription and services-based revenue | 900,921 | 367,855 | 38,073 | 1,306,849 | 3,047,084 | 1,300,043 | 205,646 | 4,552,773 | ||||||||||||||||||||||||
Hardware revenue | — | 35,653 | — | 35,653 | — | 164,418 | — | 164,418 | ||||||||||||||||||||||||
Bitcoin revenue | 1,833,426 | — | — | 1,833,426 | 7,112,856 | — | — | 7,112,856 | ||||||||||||||||||||||||
|
|
|
|
|
|
|
|
|
|
|
|
|
|
|
|
| ||||||||||||||||
Segment revenue (ii) | 2,856,750 | 1,756,079 | 38,073 | 4,650,902 | 10,626,111 | 6,699,830 | 205,646 | 17,531,587 | ||||||||||||||||||||||||
|
|
|
|
|
|
|
|
|
|
|
|
|
|
|
|
| ||||||||||||||||
Segment gross profit (iii, iv) | $ | 847,944 | $ | 801,349 | $ | 10,901 | $ | 1,660,194 | $ | 2,950,967 | $ | 3,000,978 | $ | 39,947 | $ | 5,991,892 | ||||||||||||||||
|
|
|
|
|
|
|
|
|
|
|
|
|
|
|
|
| ||||||||||||||||
| THREE MONTHS ENDED | YEAR ENDED | |||||||||||||||||||||||||||||||
| DEC 31, 2021 | DEC 31, 2021 | |||||||||||||||||||||||||||||||
| (UNAUDITED) | (AUDITED) | |||||||||||||||||||||||||||||||
| Cash App
| Square
| Corporate and Other(i) | Total
| Cash App
| Square
| Corporate and Other(i) | Total
| |||||||||||||||||||||||||
Revenue | ||||||||||||||||||||||||||||||||
Transaction-based revenue | $ | 103,743 | $ | 1,205,158 | $ | — | $ | 1,308,901 | $ | 409,844 | $ | 4,383,302 | $ | — | $ | 4,793,146 | ||||||||||||||||
Subscription and services-based revenue | 486,695 | 229,694 | 55,713 | 772,102 | 1,893,008 | 664,367 | 152,356 | 2,709,731 | ||||||||||||||||||||||||
Hardware revenue | — | 35,910 | — | 35,910 | — | 145,679 | — | 145,679 | ||||||||||||||||||||||||
Bitcoin revenue | 1,961,621 | — | — | 1,961,621 | 10,012,647 | — | — | 10,012,647 | ||||||||||||||||||||||||
|
|
|
|
|
|
|
|
|
|
|
|
|
|
|
|
| ||||||||||||||||
Segment revenue | 2,552,059 | 1,470,762 | 55,713 | 4,078,534 | 12,315,499 | 5,193,348 | 152,356 | 17,661,203 | ||||||||||||||||||||||||
|
|
|
|
|
|
|
|
|
|
|
|
|
|
|
|
| ||||||||||||||||
Segment gross profit (iv) | $ | 517,592 | $ | 657,293 | $ | 7,158 | $ | 1,182,043 | $ | 2,070,847 | $ | 2,316,671 | $ | 32,305 | $ | 4,419,823 | ||||||||||||||||
|
|
|
|
|
|
|
|
|
|
|
|
|
|
|
|
| ||||||||||||||||
| THREE MONTHS ENDED | YEAR ENDED | |||||||||||||||||||||||||||||||
| DEC 31, 2020 | DEC 31, 2020 | |||||||||||||||||||||||||||||||
| (UNAUDITED) | (AUDITED) | |||||||||||||||||||||||||||||||
| Cash App
| Square
| Corporate and Other(i) | Total
| Cash App
| Square
| Corporate and Other(i) | Total
| |||||||||||||||||||||||||
Revenue | ||||||||||||||||||||||||||||||||
Transaction-based revenue | $ | 71,550 | $ | 857,461 | $ | — | $ | 929,011 | $ | 233,747 | $ | 3,061,231 | $ | — | $ | 3,294,978 | ||||||||||||||||
Subscription and services-based revenue | 344,105 | 105,266 | — | 449,371 | 1,163,096 | 376,307 | — | 1,539,403 | ||||||||||||||||||||||||
Hardware revenue | — | 24,363 | — | 24,363 | — | 91,654 | — | 91,654 | ||||||||||||||||||||||||
Bitcoin revenue | 1,756,225 | — | — | 1,756,225 | 4,571,543 | — | — | 4,571,543 | ||||||||||||||||||||||||
|
|
|
|
|
|
|
|
|
|
|
|
|
|
|
|
| ||||||||||||||||
Segment revenue | 2,171,880 | 987,090 | — | 3,158,970 | 5,968,386 | 3,529,192 | — | 9,497,578 | ||||||||||||||||||||||||
|
|
|
|
|
|
|
|
|
|
|
|
|
|
|
|
| ||||||||||||||||
Segment gross profit (iv) | $ | 376,659 | $ | 427,031 | $ | — | $ | 803,690 | $ | 1,225,578 | $ | 1,507,831 | $ | — | $ | 2,733,409 | ||||||||||||||||
|
|
|
|
|
|
|
|
|
|
|
|
|
|
|
|
| ||||||||||||||||
(i) Corporate and other represents results related to products and services that are not assigned to a specific reportable segment, and intersegment eliminations.
(ii) The revenue for both Cash App and Square for the year ended December 31, 2022 included $405.7 million each, from Afterpay post-acquisition results following the closing of the acquisition.
(iii) The gross profit for both Cash App and Square for the year ended December 31, 2022 included $294.1 million each, from Afterpay post-acquisition results following the closing of the acquisition.
(iv) Segment gross profit for Cash App for the years ended December 31, 2022, 2021, and 2020 included $32.1 million, $10.5 million, and $5.4 million of amortization of acquired technology assets expense, respectively. Segment gross profit for Square for the years ended December 31, 2022, 2021, and 2020 included $32.2 million, $8.3 million, and $5.8 million of amortization of acquired technology assets expense, respectively. Amortization of acquired technology assets expense included in Corporate and Other was immaterial for the years ended December 31, 2022, 2021, and 2020.
| BLOCK Q4 2022 32 |
Operating Segment Disclosures
A reconciliation of total segment gross profit to the Company’s income (loss)
before applicable income taxes is as follows (in thousands):
| THREE MONTHS ENDED | YEAR ENDED | |||||||||||||||||||||||
| (UNAUDITED) | (AUDITED) | |||||||||||||||||||||||
| Dec 31, 2022 | Dec 31, 2021 | Dec 31, 2020 | Dec 31, 2022 | Dec 31, 2021 | Dec 31, 2020 | |||||||||||||||||||
Total segment gross profit | $ | 1,660,195 | $ | 1,182,043 | $ | 803,690 | $ | 5,991,892 | $ | 4,419,823 | $ | 2,733,409 | ||||||||||||
Less: Product development | 604,524 | 391,343 | 250,670 | 2,135,612 | 1,383,841 | 881,826 | ||||||||||||||||||
Less: Sales and marketing | 539,724 | 484,778 | 328,576 | 2,057,951 | 1,617,189 | 1,109,670 | ||||||||||||||||||
Less: General and administrative | 451,543 | 298,848 | 159,420 | 1,686,849 | 982,817 | 579,203 | ||||||||||||||||||
Less: Transaction, loan, and consumer receivable losses | 155,250 | 57,117 | 15,986 | 550,683 | 187,991 | 177,670 | ||||||||||||||||||
Less: Bitcoin impairment losses | 8,991 | — | — | 46,571 | 71,126 | — | ||||||||||||||||||
Less: Amortization of customer and other intangible assets | 35,344 | 4,571 | 3,855 | 138,758 | 15,747 | 3,855 | ||||||||||||||||||
Less: Interest expense, net | 1,472 | 12,998 | 17,988 | 36,228 | 33,124 | 56,943 | ||||||||||||||||||
Less: Other income (expense), net | (24,407 | ) | 6,775 | (271,212 | ) | (95,443 | ) | (29,474 | ) | (291,725 | ) | |||||||||||||
|
|
|
|
|
|
|
|
|
|
| ||||||||||||||
Income (loss) before income taxes | $ | (112,246 | ) | $ | (74,387 | ) | $ | 298,407 | $ | (565,317 | ) | $ | 157,462 | $ | 215,967 | |||||||||
|
|
|
|
|
|
|
|
|
|
| ||||||||||||||
Key Operating Metrics and
Non-GAAP Financial Measures
UNAUDITED
In thousands, except GPV and per share data
| THREE MONTHS ENDED | YEAR ENDED | |||||||||||||||||||||||||||||||
| Dec 31, 2022 | Dec 31, 2021 | Dec 31, 2020 | Dec 31, 2019 | Dec 31, 2022 | Dec 31, 2021 | Dec 31, 2020 | Dec 31, 2019 | |||||||||||||||||||||||||
Gross Payment Volume (GPV) (in millions) | $ | 53,160 | $ | 46,238 | $ | 32,022 | $ | 28,639 | $ | 203,536 | $ | 167,720 | $ | 112,295 | $ | 106,239 | ||||||||||||||||
Adjusted EBITDA (in thousands) | $ | 280,901 | $ | 184,181 | $ | 185,489 | $ | 118,529 | $ | 990,964 | $ | 1,013,657 | $ | 474,071 | $ | 416,853 | ||||||||||||||||
Adjusted Net Income Per Share: | ||||||||||||||||||||||||||||||||
Basic | $ | 0.22 | $ | 0.30 | $ | 0.37 | $ | 0.25 | $ | 1.05 | $ | 1.46 | $ | 0.72 | $ | 0.70 | ||||||||||||||||
Diluted | $ | 0.22 | $ | 0.27 | $ | 0.32 | $ | 0.23 | $ | 1.00 | $ | 1.28 | $ | 0.64 | $ | 0.62 | ||||||||||||||||
| BLOCK Q4 2022 33 |
Adjusted EBITDA(1)
UNAUDITED
In thousands
| THREE MONTHS ENDED | YEAR ENDED | |||||||||||||||||||||||
Dec 31, | Dec 31, 2021 | Dec 31, 2020 | Dec 31, | Dec 31, 2021 | Dec 31, 2020 | |||||||||||||||||||
Net income (loss) attributable to common stockholders | $ | (113,823) | $ | (76,830) | $ | 293,959 | $ | (540,747) | $ | 166,284 | $ | 213,105 | ||||||||||||
Net loss attributable to noncontrolling interests | (3,798) | (4,155) | — | (12,258) | (7,458) | — | ||||||||||||||||||
|
|
|
|
|
|
|
|
|
|
| ||||||||||||||
Net income (loss) | (117,621) | (80,985) | 293,959 | (553,005) | 158,826 | 213,105 | ||||||||||||||||||
Share-based compensation expense | 274,495 | 178,043 | 113,628 | 1,069,289 | 608,042 | 397,500 | ||||||||||||||||||
Depreciation and amortization | 90,907 | 39,051 | 22,471 | 340,523 | 134,756 | 84,212 | ||||||||||||||||||
Acquisition-related, integration, and other costs | 40,662 | 20,848 | 3,543 | 157,264 | 35,474 | 7,482 | ||||||||||||||||||
Interest expense, net | 1,472 | 12,998 | 17,988 | 36,228 | 33,124 | 56,943 | ||||||||||||||||||
Other expense (income), net | (24,407) | 6,775 | (271,212) | (95,443) | (29,474) | (291,725) | ||||||||||||||||||
Bitcoin impairment losses | 8,991 | — | — | 46,571 | 71,126 | — | ||||||||||||||||||
Provision (benefit) for income taxes | 5,375 | 6,597 | 4,448 | (12,312) | (1,364) | 2,862 | ||||||||||||||||||
Loss on disposal of property and equipment | 984 | 767 | 475 | 1,619 | 2,633 | 2,570 | ||||||||||||||||||
Acquired deferred revenue adjustment | 73 | 138 | 257 | 382 | 744 | 1,497 | ||||||||||||||||||
Acquired deferred cost adjustment | (30) | (51) | (68) | (152) | (230) | (375) | ||||||||||||||||||
|
|
|
|
|
|
|
|
|
|
| ||||||||||||||
Adjusted EBITDA | $ | 280,901 | $ | 184,181 | $ | 185,489 | $ | 990,964 | $ | 1,013,657 | $ | 474,071 | ||||||||||||
|
|
|
|
|
|
|
|
|
|
| ||||||||||||||
Adjustments for Adjusted Operating Income (Loss) | ||||||||||||||||||||||||
Share-based compensation expense | $ | 274,495 | $ | 178,043 | $ | 113,628 | $ | 1,069,289 | $ | 608,042 | $ | 397,500 | ||||||||||||
Acquisition related share based acceleration costs | — | — | — | (66,337) | — | — | ||||||||||||||||||
Depreciation and amortization | 90,907 | 39,051 | 22,471 | 340,523 | 134,756 | 84,212 | ||||||||||||||||||
Amortization of acquired intangibles | (53,664) | (11,215) | (4,582) | (208,952) | (38,392) | (15,029) | ||||||||||||||||||
Acquired deferred revenue adjustment | 73 | 138 | 257 | 382 | 744 | 1,497 | ||||||||||||||||||
Acquired deferred costs adjustment | (30) | (51) | (68) | (152) | (230) | (375) | ||||||||||||||||||
Loss (gain) on disposal of property and equipment | 984 | 767 | 475 | 1,619 | 2,633 | 2,570 | ||||||||||||||||||
|
|
|
|
|
|
|
|
|
|
| ||||||||||||||
Adjusted Operating Income (Loss) | $ | (31,864) | $ | (22,552) | $ | 184,181 | $ | (145,408) | $ | 306,104 | $ | 3,696 | ||||||||||||
|
|
|
|
|
|
|
|
|
|
| ||||||||||||||
(1) For a reconciliation of Adjusted EBITDA to net income (loss) for the years ended December 31, 2019 and 2018, please refer to the section entitled “Management’s Discussion and Analysis of Financial Condition and Results of Operations—Key Operating Metrics and Non-GAAP Financial Measures” within our Annual Report on Form 10-K for the year ended December 31, 2022, filed on February 23, 2023.
| BLOCK Q4 2022 34 |
Adjusted Net Income
and Adjusted EPS
UNAUDITED
In thousands, except per share data
| THREE MONTHS ENDED | YEAR ENDED | |||||||||||||||||||||||
| Dec 31, 2022 | Dec 31, 2021 | Dec 31, 2020 | Dec 31, 2022 | Dec 31, 2021 | Dec 31, 2020 | |||||||||||||||||||
Net income (loss) attributable to common stockholders | $ | (113,823) | $ | (76,830) | $ | 293,959 | $ | (540,747) | $ | 166,284 | $ | 213,105 | ||||||||||||
Net loss attributable to noncontrolling interests | (3,798) | (4,155) | — | (12,258) | (7,458) | — | ||||||||||||||||||
|
|
|
|
|
|
|
|
|
|
| ||||||||||||||
Net income (loss) | (117,621) | (80,985) | 293,959 | (553,005) | 158,826 | 213,105 | ||||||||||||||||||
Share-based compensation expense | 274,495 | 178,043 | 113,628 | 1,069,289 | 608,042 | 397,500 | ||||||||||||||||||
Acquisition related, integration, and other costs | 40,662 | 20,848 | 1,260 | 157,264 | 35,474 | 7,482 | ||||||||||||||||||
Amortization of intangible assets | 53,637 | 13,264 | 5,717 | 208,952 | 40,522 | 19,239 | ||||||||||||||||||
Amortization of debt discount and issuance costs | 3,855 | 2,817 | 20,355 | 15,162 | 9,822 | 67,979 | ||||||||||||||||||
Loss (gain) on revaluation of equity investments | (29,543) | 5,515 | (274,299) | (73,457) | (35,493) | (295,297) | ||||||||||||||||||
Loss on extinguishment of long-term debt | — | — | 4,258 | — | — | 6,651 | ||||||||||||||||||
Bitcoin impairment losses | 8,991 | — | — | 46,571 | 71,126 | — | ||||||||||||||||||
Loss on disposal of property and equipment | 984 | 767 | 475 | 1,619 | 2,633 | 2,570 | ||||||||||||||||||
Acquired deferred revenue adjustment | 73 | 138 | 928 | 382 | 744 | 1,497 | ||||||||||||||||||
Acquired deferred cost adjustment | (30) | (51) | (189) | (152) | (230) | (375) | ||||||||||||||||||
Tax effect of non-GAAP net income adjustments | $ | (102,523) | (34,754) | $ | (41,585) | $ | (264,523) | $ | (222,104) | $ | (102,383) | |||||||||||||
|
|
|
|
|
|
|
|
|
|
| ||||||||||||||
Adjusted Net Income - basic | $ | 132,980 | $ | 140,356 | $ | 166,092 | $ | 608,102 | $ | 669,362 | $ | 317,968 | ||||||||||||
|
|
|
|
|
|
|
|
|
|
| ||||||||||||||
Cash interest expense on convertible notes | $ | 1,263 | $ | 1,266 | $ | 1,596 | $ | 5,014 | $ | 6,099 | $ | 6,078 | ||||||||||||
|
|
|
|
|
|
|
|
|
|
| ||||||||||||||
Adjusted Net Income - diluted | $ | 134,243 | $ | 141,622 | $ | 167,688 | $ | 613,116 | $ | 675,461 | $ | 324,046 | ||||||||||||
|
|
|
|
|
|
|
|
|
|
| ||||||||||||||
Weighted-average shares used to compute Adjusted Net Income Per Share: | ||||||||||||||||||||||||
Basic | 598,875 | 462,562 | 452,869 | 578,949 | 458,432 | 443,126 | ||||||||||||||||||
|
|
|
|
|
|
|
|
|
|
| ||||||||||||||
Diluted | 622,520 | 523,169 | 523,586 | 615,034 | 525,725 | 507,229 | ||||||||||||||||||
|
|
|
|
|
|
|
|
|
|
| ||||||||||||||
Adjusted Net Income Per Share: | ||||||||||||||||||||||||
Basic | $ | 0.22 | $ | 0.30 | $ | 0.37 | $ | 1.05 | $ | 1.46 | $ | 0.72 | ||||||||||||
|
|
|
|
|
|
|
|
|
|
| ||||||||||||||
Diluted | $ | 0.22 | $ | 0.27 | $ | 0.32 | $ | 1.00 | $ | 1.28 | $ | 0.64 | ||||||||||||
|
|
|
|
|
|
|
|
|
|
| ||||||||||||||
| BLOCK Q4 2022 35 |
Select Financial Results Excluding
Bitcoin and Buy Now Pay Later
(“BNPL”) Platform
UNAUDITED
In thousands
| THREE MONTHS ENDED | YEAR ENDED | |||||||||||||||||||||||||||||||
| Dec 31, 2022 | Dec 31, 2021 | Dec 31, 2020 | Dec 31, 2019 | Dec 31, 2022 | Dec 31, 2021 | Dec 31, 2020 | Dec 31, 2019 | |||||||||||||||||||||||||
| Total net revenue (GAAP) | $ | 4,650,902 | $ | 4,078,534 | $ | 3,158,970 | $ | 1,313,429 | $ | 17,531,587 | $ | 17,661,203 | $ | 9,497,578 | $ | 4,713,500 | ||||||||||||||||
| Less: Bitcoin contribution to total net revenue | 1,833,426 | 1,961,621 | 1,756,225 | 177,567 | 7,112,856 | 10,012,647 | 4,571,543 | 516,465 | ||||||||||||||||||||||||
| Less: BNPL Platform contribution to total net revenue | 263,563 | — | — | — | 811,385 | — | — | — | ||||||||||||||||||||||||
|
|
|
|
|
|
|
|
|
|
|
|
|
|
| ||||||||||||||||||
Total net revenue, excluding Bitcoin and BNPL Platform | $ | 2,553,913 | $ | 2,116,913 | $ | 1,402,745 | $ | 1,135,862 | $ | 9,607,346 | $ | 7,648,556 | $ | 4,926,035 | $ | 4,197,035 | ||||||||||||||||
|
|
|
|
|
|
|
|
|
|
|
|
|
|
| ||||||||||||||||||
THREE MONTHS ENDED | YEAR ENDED | |||||||||||||||||||||||||||||||
| Dec 31, 2022 | Dec 31, 2021 | Dec 31, 2020 | Dec 31, 2019 | Dec 31, 2022 | Dec 31, 2021 | Dec 31, 2020 | Dec 31, 2019 | |||||||||||||||||||||||||
| Gross profit (GAAP) | $ | 1,660,195 | $ | 1,182,042 | $ | 803,690 | $ | 527,049 | $ | 5,991,892 | $ | 4,419,823 | $ | 2,733,409 | $ | 1,889,685 | ||||||||||||||||
| Less: BNPL Platform contribution to gross profit | 196,492 | — | — | — | 588,151 | — | — | — | ||||||||||||||||||||||||
|
|
|
|
|
|
|
|
|
|
|
|
|
|
| ||||||||||||||||||
Total gross profit, excluding BNPL Platform | $ | 1,463,703 | $ | 1,182,042 | $ | 803,690 | $ | 527,049 | $ | 5,403,741 | $ | 4,419,823 | $ | 2,733,409 | $ | 1,889,685 | ||||||||||||||||
|
|
|
|
|
|
|
|
|
|
|
|
|
|
| ||||||||||||||||||
| THREE MONTHS ENDED | YEAR ENDED | |||||||||||||||||||||||||||||||
| Dec 31, 2022 | Dec 31, 2021 | Dec 31, 2020 | Dec 31, 2019 | Dec 31, 2022 | Dec 31, 2021 | Dec 31, 2020 | Dec 31, 2019 | |||||||||||||||||||||||||
Bitcoin revenue | $ | 1,833,426 | $ | 1,961,621 | $ | 1,756,225 | $ | 177,567 | $ | 7,112,856 | $ | 10,012,647 | $ | 4,571,543 | $ | 516,465 | ||||||||||||||||
Bitcoin costs | 1,798,798 | 1,915,176 | 1,715,452 | 174,438 | 6,956,733 | 9,794,992 | 4,474,534 | 508,239 | ||||||||||||||||||||||||
|
|
|
|
|
|
|
|
|
|
|
|
|
|
| ||||||||||||||||||
Bitcoin gross profit | $ | 34,628 | $ | 46,445 | $ | 40,773 | $ | 3,129 | $ | 156,123 | $ | 217,655 | $ | 97,009 | $ | 8,226 | ||||||||||||||||
|
|
|
|
|
|
|
|
|
|
|
|
|
|
| ||||||||||||||||||
| THREE MONTHS ENDED | YEAR ENDED | |||||||||||||||||||||||||||||||
| Dec 31, 2022 | Dec 31, 2021 | Dec 31, 2020 | Dec 31, 2019 | Dec 31, 2022 | Dec 31, 2021 | Dec 31, 2020 | Dec 31, 2019 | |||||||||||||||||||||||||
Cash App revenue (GAAP) | $ | 2,856,750 | $ | 2,552,059 | $ | 2,171,880 | $ | 360,665 | $ | 10,626,111 | $ | 12,315,499 | $ | 5,968,386 | $ | 1,105,599 | ||||||||||||||||
| Less: Bitcoin contribution to Cash App revenue | 1,833,426 | 1,961,621 | 1,756,225 | 177,567 | 7,112,856 | 10,012,647 | 4,571,543 | 516,465 | ||||||||||||||||||||||||
| Less: BNPL Platform contribution to Cash App revenue | 131,782 | — | — | — | 405,693 | — | — | — | ||||||||||||||||||||||||
|
|
|
|
|
|
|
|
|
|
|
|
|
|
| ||||||||||||||||||
Total Cash App revenue, excluding Bitcoin and BNPL Platform | $ | 891,542 | $ | 590,438 | $ | 415,655 | $ | 183,098 | $ | 3,107,562 | $ | 2,302,852 | $ | 1,396,843 | $ | 589,134 | ||||||||||||||||
|
|
|
|
|
|
|
|
|
|
|
|
|
|
| ||||||||||||||||||
| THREE MONTHS ENDED | YEAR ENDED | |||||||||||||||||||||||||||||||
| Dec 31, 2022 | Dec 31, 2021 | Dec 31, 2020 | Dec 31, 2022 | Dec 31, 2021 | Dec 31, 2020 | |||||||||||||||||||||||||||
Square gross profit (GAAP) |
| $ | 801,349 | $ | 657,293 | $ | 427,031 | $ | 3,000,978 | $ | 12,316,671 | $ | 1,507,831 | |||||||||||||||||||
Less: Square gross profit – U.S. |
| 662,297 | 595,182 | 388,348 | 2,541,398 | 2,114,142 | 1,398,752 | |||||||||||||||||||||||||
|
|
|
|
|
|
|
|
|
|
| ||||||||||||||||||||||
Total Square gross profit – International |
| 139,052 | 62,111 | 38,683 | 459,580 | 202,529 | 109,079 | |||||||||||||||||||||||||
| Less: BNPL Platform contribution to Square gross profit – International |
| 55,866 | — | — | 176,639 | — | — | |||||||||||||||||||||||||
|
|
|
|
|
|
|
|
|
|
| ||||||||||||||||||||||
Total Square gross profit – International, excluding BNPL Platform |
| $ | 83,186 | $ | 62,111 | $ | 38,683 | $ | 282,941 | $ | 202,529 | $ | 109,079 | |||||||||||||||||||
|
|
|
|
|
|
|
|
|
|
| ||||||||||||||||||||||
| BLOCK Q4 2022 36 |
Select Financial Results Excluding
Bitcoin and Buy Now Pay Later
(“BNPL”) Platform, Continued
UNAUDITED
In thousands
| THREE MONTHS ENDED | YEAR ENDED | |||||||||||||||||||||||
| Dec 31, 2022 | Dec 31, 2021 | Dec 31, 2020 | Dec 31, 2022 | Dec 31, 2021 | Dec 31, 2020 | |||||||||||||||||||
| Subscription and services-based revenue (GAAP) | $ | 1,306,849 | $ | 772,102 | $ | 449,371 | $ | 4,552,773 | $ | 2,709,731 | $ | 1,539,403 | ||||||||||||
| Less: BNPL Platform contribution to subscription and services-based revenue | 263,563 | — | — | 811,385 | — | — | ||||||||||||||||||
|
|
|
|
|
|
|
|
|
|
| ||||||||||||||
Total subscription and services-based revenue, excluding BNPL Platform | $ | 1,043,286 | $ | 772,102 | $ | 449,371 | $ | 3,741,388 | $ | 2,709,731 | $ | 1,539,403 | ||||||||||||
|
|
|
|
|
|
|
|
|
|
| ||||||||||||||
| Subscription and services-based costs (GAAP) | $ | 239,714 | $ | 145,497 | $ | 65,046 | $ | 861,745 | $ | 483,056 | $ | 222,712 | ||||||||||||
| Less: BNPL Platform contribution to subscription and services-based costs | 67,071 | — | — | 223,234 | — | — | ||||||||||||||||||
|
|
|
|
|
|
|
|
|
|
| ||||||||||||||
Total subscription and services-based costs, excluding BNPL Platform | $ | 172,643 | $ | 145,497 | $ | 65,046 | $ | 638,511 | $ | 483,056 | $ | 222,712 | ||||||||||||
|
|
|
|
|
|
|
|
|
|
| ||||||||||||||
| Subscription and services-based gross profit (GAAP) | $ | 1,067,135 | $ | 626,605 | $ | 384,325 | $ | 3,691,028 | $ | 2,226,675 | $ | 1,316,691 | ||||||||||||
| Less: BNPL Platform contribution to subscription and services-based gross profit | 196,492 | — | — | 588,151 | — | — | ||||||||||||||||||
|
|
|
|
|
|
|
|
|
|
| ||||||||||||||
Total subscription and services-based gross profit, excluding BNPL Platform | $ | 870,643 | $ | 626,605 | $ | 384,325 | $ | 3,102,877 | $ | 2,226,675 | $ | 1,316,691 | ||||||||||||
|
|
|
|
|
|
|
|
|
|
| ||||||||||||||
| THREE MONTHS ENDED | THREE MONTHS ENDED | THREE MONTHS ENDED | THREE MONTHS ENDED | |||||||||||||||||||||||||||||
| DEC 31, 2022 | DEC 31, 2021 | DEC 31, 2020 | DEC 31, 2019 | |||||||||||||||||||||||||||||
| Cash App | Square | Cash App | Square | Cash App | Square | Cash App | Square | |||||||||||||||||||||||||
| Segment revenue (GAAP) | $ | 2,856,750 | $ | 1,756,079 | $ | 2,552,059 | $ | 1,470,762 | $ | 2,171,880 | $ | 987,090 | $ | 360,665 | $ | 937,718 | ||||||||||||||||
| Less: BNPL Platform contribution to segment revenue | 131,782 | 131,782 | — | — | — | — | — | — | ||||||||||||||||||||||||
|
|
|
|
|
|
|
|
|
|
|
|
|
|
| ||||||||||||||||||
Total segment revenue, excluding BNPL Platform | 2,724,968 | 1,624,297 | 2,552,059 | 1,470,762 | 2,171,880 | 987,090 | 360,665 | 937,718 | ||||||||||||||||||||||||
|
|
|
|
|
|
|
|
|
|
|
|
|
|
| ||||||||||||||||||
| Segment cost of revenue (GAAP) | 2,008,806 | 954,730 | 2,034,467 | 813,469 | 1,795,221 | 560,059 | 216,638 | 558,887 | ||||||||||||||||||||||||
| Less: BNPL Platform contribution to segment cost of revenue | 33,536 | 33,536 | — | — | — | — | — | — | ||||||||||||||||||||||||
|
|
|
|
|
|
|
|
|
|
|
|
|
|
| ||||||||||||||||||
Total segment cost of revenue, excluding BNPL Platform | 1,975,270 | 921,194 | 2,034,467 | 813,469 | 1,795,221 | 560,059 | 216,638 | 558,887 | ||||||||||||||||||||||||
|
|
|
|
|
|
|
|
|
|
|
|
|
|
| ||||||||||||||||||
| Segment gross profit (GAAP) | 847,944 | 801,349 | 517,592 | 657,293 | 376,659 | 427,031 | 144,027 | 378,831 | ||||||||||||||||||||||||
| Less: BNPL Platform contribution to segment gross profit | 98,246 | 98,246 | — | — | — | — | — | — | ||||||||||||||||||||||||
|
|
|
|
|
|
|
|
|
|
|
|
|
|
| ||||||||||||||||||
Total segment gross profit, excluding BNPL Platform | $ | 749,698 | $ | 703,103 | $ | 517,592 | $ | 657,293 | $ | 376,659 | $ | 427,031 | $ | 144,027 | $ | 378,831 | ||||||||||||||||
|
|
|
|
|
|
|
|
|
|
|
|
|
|
| ||||||||||||||||||
| BLOCK Q4 2022 37 |
Select Financial Results Excluding
Bitcoin and Buy Now Pay Later
(“BNPL”) Platform, Continued
UNAUDITED
In thousands
YEAR ENDED | YEAR ENDED | YEAR ENDED | YEAR ENDED | |||||||||||||||||||||||||||||
| DEC 31, 2022 | DEC 31, 2021 | DEC 31, 2020 | DEC 31, 2019 | |||||||||||||||||||||||||||||
| Cash App | Square | Cash App | Square | Cash App | Square | Cash App | Square | |||||||||||||||||||||||||
Segment revenue (GAAP) | $ | 10,626,111 | $ | 6,699,830 | $ | 12,315,499 | $ | 5,193,348 | $ | 5,968,386 | $ | 3,529,192 | $ | 1,105,599 | $ | 3,461,988 | ||||||||||||||||
Less: BNPL Platform contribution to segment revenue | 405,693 | 405,693 | — | — | — | — | — | — | ||||||||||||||||||||||||
|
|
|
|
|
|
|
|
|
|
|
|
|
|
| ||||||||||||||||||
Total segment revenue, excluding BNPL Platform | 10,220,418 | 6,294,137 | 12,315,499 | 5,193,348 | 5,968,386 | 3,529,192 | 1,105,599 | 3,461,988 | ||||||||||||||||||||||||
|
|
|
|
|
|
|
|
|
|
|
|
|
|
| ||||||||||||||||||
Segment cost of revenue (GAAP) | 7,675,144 | 3,698,852 | 10,244,652 | 2,876,677 | 4,742,808 | 2,021,361 | 647,931 | 2,071,561 | ||||||||||||||||||||||||
Less: BNPL Platform contribution to segment cost of revenue | 111,617 | 111,617 | — | — | — | — | — | — | ||||||||||||||||||||||||
|
|
|
|
|
|
|
|
|
|
|
|
|
|
| ||||||||||||||||||
Total segment cost of revenue, excluding BNPL Platform | 7,563,527 | 3,587,235 | 10,244,652 | 2,876,677 | 4,742,808 | 2,021,361 | 647,931 | 2,071,561 | ||||||||||||||||||||||||
|
|
|
|
|
|
|
|
|
|
|
|
|
|
| ||||||||||||||||||
Segment gross profit (GAAP) | 2,950,967 | 3,000,978 | 2,070,847 | 2,316,671 | 1,225,578 | 1,507,831 | 457,668 | 1,390,427 | ||||||||||||||||||||||||
Less: BNPL Platform contribution to segment gross profit | 294,076 | 294,076 | — | — | — | — | — | — | ||||||||||||||||||||||||
|
|
|
|
|
|
|
|
|
|
|
|
|
|
| ||||||||||||||||||
Total segment gross profit, excluding BNPL Platform | $ | 2,656,891 | $ | 2,706,902 | $ | 2,070,847 | $ | 2,316,671 | $ | 1,225,578 | $ | 1,507,831 | $ | 457,668 | $ | 1,390,427 | ||||||||||||||||
|
|
|
|
|
|
|
|
|
|
|
|
|
|
| ||||||||||||||||||
| BLOCK Q4 2022 38 |
Select Financial Results Excluding
Bitcoin and Buy Now Pay Later
(“BNPL”) Platform, Continued
UNAUDITED
In thousands
| THREE MONTHS ENDED | THREE MONTHS ENDED | THREE MONTHS ENDED | THREE MONTHS ENDED | |||||||||||||||||||||||||||||
| DEC 31, 2022 | DEC 31, 2021 | DEC 31, 2020 | DEC 31, 2019 | |||||||||||||||||||||||||||||
| Cash App | Square | Cash App | Square | Cash App | Square | Cash App | Square | |||||||||||||||||||||||||
Segment revenue, subscription and services-based (GAAP) | $ | 900,921 | $ | 367,855 | $ | 486,695 | $ | 229,694 | $ | 344,105 | $ | 105,266 | $ | 161,695 | $ | 104,674 | ||||||||||||||||
Less: BNPL Platform contribution to segment revenue, subscription and services-based (GAAP) | 131,782 | 131,782 | — | — | — | — | — | — | ||||||||||||||||||||||||
|
|
|
|
|
|
|
|
|
|
|
|
|
|
| ||||||||||||||||||
Total segment revenue, subscription and services-based excluding BNPL Platform | $ | 769,139 | $ | 236,073 | $ | 486,695 | $ | 229,694 | $ | 344,105 | $ | 105,266 | $ | 161,695 | $ | 104,674 | ||||||||||||||||
|
|
|
|
|
|
|
|
|
|
|
|
|
|
| ||||||||||||||||||
| YEAR ENDED | YEAR ENDED | YEAR ENDED | YEAR ENDED | |||||||||||||||||||||||||||||
| DEC 31, 2022 | DEC 31, 2021 | DEC 31, 2020 | DEC 31, 2019 | |||||||||||||||||||||||||||||
| Cash App | Square | Cash App | Square | Cash App | Square | Cash App | Square | |||||||||||||||||||||||||
Segment revenue, subscription and services-based (GAAP) | $ | 3,047,084 | $ | 1,300,043 | $ | 1,893,008 | $ | 664,367 | $ | 1,163,096 | $ | 376,307 | $ | 516,269 | $ | 369,274 | ||||||||||||||||
Less: BNPL Platform contribution to segment revenue, subscription and services-based (GAAP) | 405,693 | 405,693 | — | — | — | — | — | — | ||||||||||||||||||||||||
|
|
|
|
|
|
|
|
|
|
|
|
|
|
| ||||||||||||||||||
Total segment revenue, subscription and services-based excluding BNPL Platform | $ | 2,641,391 | $ | 894,350 | $ | 1,893,008 | $ | 664,367 | $ | 1,163,096 | $ | 376,307 | $ | 516,269 | $ | 369,274 | ||||||||||||||||
|
|
|
|
|
|
|
|
|
|
|
|
|
|
| ||||||||||||||||||
| THREE MONTHS ENDED | YEAR ENDED | |||||||||||||||
| Dec 31, 2022 | Dec 31, 2021 | Dec 31, 2022 | Dec 31, 2021 | |||||||||||||
Square gross profit (GAAP) | $ | 801,349 | $ | 657,293 | $ | 3,000,978 | $ | 2,316,671 | ||||||||
Less: BNPL Platform contribution to Square gross profit | 98,246 | — | 294,076 | — | ||||||||||||
Less: PPP loan forgiveness | 2,094 | 58,622 | 67,593 | 96,187 | ||||||||||||
|
|
|
|
|
|
| ||||||||||
Total Square gross profit – excluding BNPL Platform and PPP loan forgiveness | $ | 701,009 | $ | 598,671 | $ | 2,639,309 | $ | 2,220,484 | ||||||||
|
|
|
|
|
|
| ||||||||||
| BLOCK Q4 2022 39 |
Non-GAAP Operating Expenses
UNAUDITED
In thousands
| THREE MONTHS ENDED | YEAR ENDED | |||||||||||||||||||||||
| Dec 31, 2022 | Dec 31, 2021 | Dec 31, 2020 | Dec 31, 2022 | Dec 31, 2021 | Dec 31, 2020 | |||||||||||||||||||
Operating expenses | $ | (1,795,376) | $ | (1,236,657) | $ | (758,507) | $ | (6,616,424) | $ | (4,258,711) | $ | (2,752,224) | ||||||||||||
Share-based compensation | 274,353 | 177,943 | 113,531 | 1,068,795 | 607,632 | 397,132 | ||||||||||||||||||
Depreciation and amortization | 71,874 | 32,461 | 18,966 | 268,676 | 112,111 | 72,896 | ||||||||||||||||||
Acquisition related, integration, and other costs | 40,662 | 20,848 | 3,543 | 157,264 | 35,474 | 7,482 | ||||||||||||||||||
Bitcoin impairment losses | 8,991 | — | — | 46,571 | 71,126 | — | ||||||||||||||||||
Loss on disposal of property and equipment | 984 | 767 | 475 | 1,619 | 2,633 | 2,570 | ||||||||||||||||||
|
|
|
|
|
|
|
|
|
|
| ||||||||||||||
Non-GAAP operating expenses | $ | (1,398,512) | $ | (1,004,638) | $ | (621,992) | $ | (5,073,499) | $ | (3,429,735) | $ | (2,272,144) | ||||||||||||
|
|
|
|
|
|
|
|
|
|
| ||||||||||||||
Product development | $ | (604,524) | $ | (391,343) | $ | (253,448) | $ | (2,135,612) | $ | (1,383,841) | $ | (881,826) | ||||||||||||
Share-based compensation | 192,934 | 132,331 | 83,906 | 701,715 | 446,596 | 289,553 | ||||||||||||||||||
Depreciation and amortization | 29,943 | 20,299 | 13,724 | 122,266 | 77,544 | 53,080 | ||||||||||||||||||
Loss on disposal of property and equipment | — | 385 | 198 | 461 | 1,570 | 884 | ||||||||||||||||||
|
|
|
|
|
|
|
|
|
|
| ||||||||||||||
Non-GAAP product development | $ | (381,647) | $ | (238,328) | $ | (155,620) | $ | (1,311,170) | $ | (858,131) | $ | (538,309) | ||||||||||||
|
|
|
|
|
|
|
|
|
|
| ||||||||||||||
Sales and marketing | $ | (539,724) | $ | (484,778) | $ | (328,576) | $ | (2,057,951) | $ | (1,617,189) | $ | (1,109,670) | ||||||||||||
Share-based compensation | 30,098 | 16,390 | 9,273 | 105,231 | 57,070 | 36,627 | ||||||||||||||||||
Depreciation and amortization | 1,677 | 1,426 | 1,095 | 6,197 | 5,142 | 4,152 | ||||||||||||||||||
Loss (gain) on disposal of property and equipment | 192 | — | (3) | 244 | — | (2) | ||||||||||||||||||
|
|
|
|
|
|
|
|
|
|
| ||||||||||||||
Non-GAAP sales and marketing | $ | (507,757) | $ | (466,962) | $ | (318,211) | $ | (1,946,279) | $ | (1,554,977) | $ | (1,068,893) | ||||||||||||
|
|
|
|
|
|
|
|
|
|
| ||||||||||||||
General and administrative | $ | (451,543) | $ | (298,794) | $ | (159,420) | $ | (1,686,849) | $ | (982,817) | $ | (579,203) | ||||||||||||
Share-based compensation | 51,321 | 29,222 | 20,352 | 261,849 | 103,966 | 70,952 | ||||||||||||||||||
Acquisition related, integration and other costs | 40,662 | 20,848 | 3,543 | 157,264 | 35,474 | 7,482 | ||||||||||||||||||
Depreciation and amortization | 15,578 | 8,287 | 4,147 | 47,095 | 26,976 | 15,664 | ||||||||||||||||||
Loss on disposal of property and equipment | 792 | 382 | 280 | 914 | 1,063 | 1,688 | ||||||||||||||||||
|
|
|
|
|
|
|
|
|
|
| ||||||||||||||
Non-GAAP general and administrative | $ | (343,190) | $ | (240,055) | $ | (131,098) | $ | (1,219,727) | $ | (815,338) | $ | (483,417) | ||||||||||||
|
|
|
|
|
|
|
|
|
|
| ||||||||||||||
Adjusted Operating Income
(Loss)
UNAUDITED
In thousands
| THREE MONTHS ENDED | YEAR ENDED | |||||||||||||||||||||||
| Dec 31, 2022 | Dec 31, 2021 | Dec 31, 2020 | Dec 31, 2022 | Dec 31, 2021 | Dec 31, 2020 | |||||||||||||||||||
Operating income (loss) | $ | (135,181) | $ | (54,615) | $ | (45,183) | $ | (624,532) | $ | 161,112 | $ | (18,815) | ||||||||||||
Amortization of acquired technology assets | 18,320 | 6,590 | 3,505 | 70,194 | 22,645 | 11,174 | ||||||||||||||||||
Acquisition related, integration, and other costs | 40,662 | 20,848 | 3,543 | 157,264 | 35,474 | 7,482 | ||||||||||||||||||
Bitcoin impairment losses | 8,991 | — | — | 46,571 | 71,126 | — | ||||||||||||||||||
Amortization of customer and other acquired intangible assets | 35,344 | 4,625 | 1,077 | 138,758 | 15,747 | 3,855 | ||||||||||||||||||
Acquisition related share-based acceleration costs | — | — | — | 66,337 | — | — | ||||||||||||||||||
|
|
|
|
|
|
|
|
|
|
| ||||||||||||||
Adjusted Operating Income (Loss) | $ | (31,864) | $ | (22,552) | $ | 53,308 | $ | (145,408) | $ | 306,104 | $ | 3,696 | ||||||||||||
|
|
|
|
|
|
|
|
|
|
| ||||||||||||||
| BLOCK Q4 2022 40 |