Exhibit 99.2
POSTMEDIA NETWORK CANADA CORP.
INTERIM MANAGEMENT’S DISCUSSION AND ANALYSIS
FOR THE THREE AND SIX MONTHS ENDED FEBRUARY 28, 2014 AND 2013
Issued: April 10, 2014
MANAGEMENT’S DISCUSSION AND ANALYSIS
This management’s discussion and analysis of financial condition and results of operations of Postmedia Network Canada Corp. and its subsidiary Postmedia Network Inc. (collectively, “we”, “our”, “us”, or “Postmedia”) should be read in conjunction with the interim condensed consolidated financial statements and related notes of Postmedia for the three and six months ended February 28, 2014 and 2013 and the annual audited consolidated financial statements and related notes for the years ended August 31, 2013, 2012 and 2011. The interim condensed consolidated financial statements of Postmedia for the three and six months ended February 28, 2014 and 2013 and the annual audited consolidated financial statements for the years ended August 31, 2013, 2012 and 2011 are available on SEDAR at www.sedar.com and on the EDGAR system maintained by the U.S. Securities and Exchange Commission at www.sec.gov.
This discussion contains statements that are not historical facts and are forward-looking statements. These statements are subject to a number of risks described in the section entitled “Risk Factors” contained in our annual management’s discussion and analysis for the years ended August 31, 2013, 2012 and 2011. Risks and uncertainties may cause actual results to differ materially from those contained in such forward-looking statements. Such statements reflect management’s current views and are based on certain assumptions. They are only estimates of future developments, and actual developments may differ materially from these statements due to a number of factors. Investors are cautioned not to place undue reliance on such forward-looking statements. No forward-looking statement is a guarantee of future results. We have tried, where possible, to identify such statements by using words such as “believe”, “expect”, “estimate”, “anticipate”, “will”, “could” and similar expressions in connection with any discussion of future operating or financial performance. Except as required by law, we undertake no obligation to publicly update or revise any forward-looking statements or information, whether written or oral, that may be as a result of new information, future events or otherwise.
All amounts are expressed in Canadian dollars unless otherwise noted. The interim condensed consolidated financial statements of Postmedia for the three and six months ended February 28, 2014 and 2013 have been prepared in accordance with International Financial Reporting Standards (“IFRS”) and International Accounting Standard (“IAS”) 34 – Interim Financial Reporting.
This management’s discussion and analysis is dated April 10, 2014 and does not reflect changes or information subsequent to this date. Additional information in respect of Postmedia is available on SEDAR at www.sedar.com and EDGAR at www.sec.gov.
Overview and Background
We are the largest publisher by circulation of paid English-language daily newspapers in Canada, according to Newspapers Canada’s 2012 Circulation Data Report. We have the highest weekly print readership of paid English-language daily newspapers in Canada, based on the NADbank 2012 survey data. Our business consists of news and information gathering and dissemination operations, with products offered in major Canadian markets and a number of regional and local markets in Canada through a variety of print, web, tablet and smartphone platforms. The combination of these distribution platforms provides readers with a variety of mediums through which to access and interact with our content. The breadth of our reach and the diversity of our content enable advertisers to reach their target audiences on a local, regional or national scale through the convenience of a single provider.
For financial reporting purposes we have one operating segment, the Newspaper segment, which publishes daily and non-daily newspapers and operates digital media and online assets including the canada.com website, each newspaper’s online website and Infomart, our media monitoring service.
Recent Developments
In August 2013, we outsourced the production of the Edmonton Journal and entered into a print outsourcing agreement for the production of the Calgary Herald, which began in November 2013. On September 9, 2013, we announced our intention to sell two of our real estate holdings. The net proceeds from these potential sales will be used to make an offer to redeem an equal amount of our 8.25% Senior Secured Notes due 2017 (“First-Lien Notes”). In addition, in November 2013, we committed to third party outsourcing contracts for the production of both The Vancouver Sun and The Province.
Key Factors Affecting Operating Results
Revenue is earned primarily from advertising, circulation and digital sources. Print advertising revenue is a function of the volume, or linage, of advertising sold and rates charged. Print circulation revenue is derived from home-delivery subscriptions for newspapers, single copy sales at retail outlets and vending machines and is a function of the number of newspapers sold and the price per copy. Digital revenue consists of revenue from national and local display advertising on our newspaper and other websites, including canada.com, revenue from e-Papers and digital access subscriptions, as well as subscription revenue generated through Infomart, our media monitoring service.
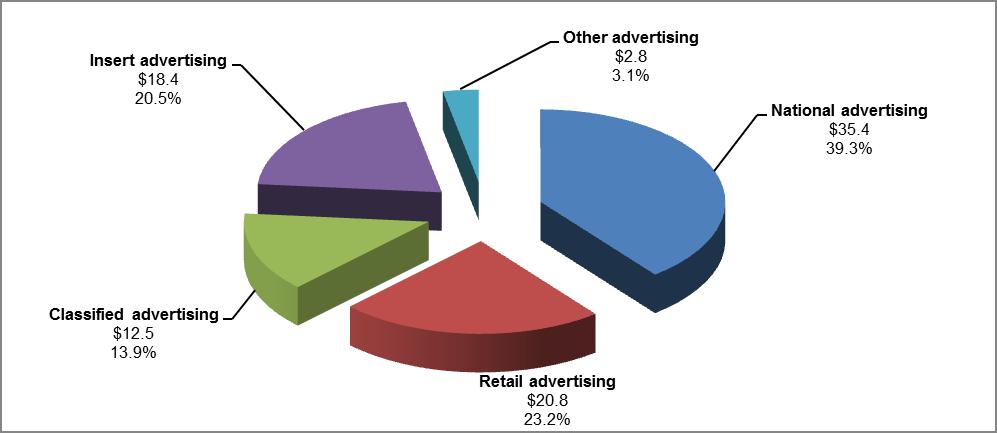
Print advertising revenue was $89.9 million for the three months ended February 28, 2014, representing 55.4% of total revenue. The following chart summarizes our print advertising revenue by category for the three months ended February 28, 2014 ($ in millions):
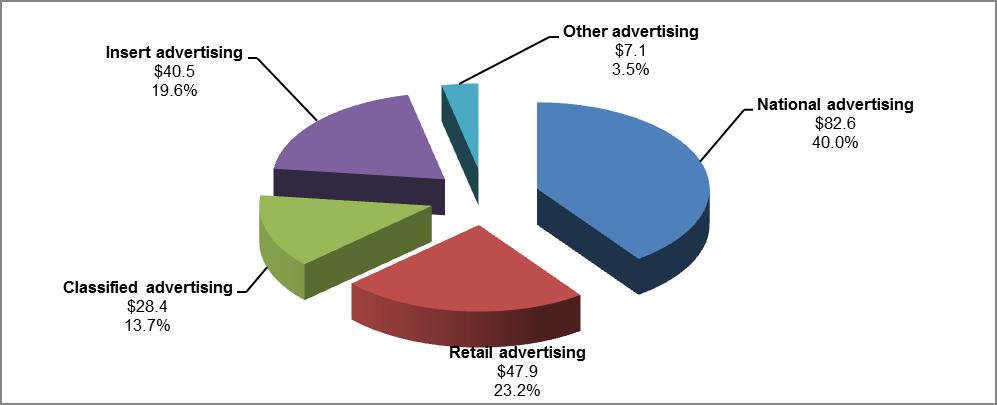
Print advertising revenue was $206.5 million for the six months ended February 28, 2014, representing 57.9% of total revenue. The following chart summarizes our print advertising revenue by category for the six months ended February 28, 2014 ($ in millions):
Print advertising is influenced by both the overall strength of the economy and significant structural changes in the newspaper industry and media in general. In recent years and continuing to date, economic uncertainty and structural changes in the industry have resulted in significant declines in print advertising as well as a continuing shift in advertising dollars from print advertising to advertising in other formats, particularly online and other digital platforms such as search and social media websites. This shift is expected to continue and may be permanent. We anticipate the print advertising market to remain challenging and expect current trends to continue throughout the remainder of fiscal 2014. During the three and six months ended February 28, 2014, we experienced print advertising revenue declines of 14.7% and 13.3%, respectively, as compared to the same periods in the prior year. The decline in print advertising revenue in the three and six months ended February 28, 2014 relates to weakness in most major advertising categories including classified, retail and national.
Print circulation revenue was $47.6 million and $97.1 million for the three and six months ended February 28, 2014, representing 29.3% and 27.3% of total revenue for such periods, respectively. Declines in circulation volumes have been experienced over the last few years and this trend continued in the three and six months ended February 28, 2014 however volume declines have been offset by price increases. Circulation revenues decreased $0.3 million in the three months ended February 28, 2014 but remained flat in the six months ended February 28, 2014, as compared to the same period in the prior year. We expect print circulation revenue to remain stable throughout the remainder of fiscal 2014.
Digital revenue was $21.1 million and $44.7 million for the three and six months ended February 28, 2014, representing 13.0% and 12.5% of total revenue for such periods, respectively. Digital revenues decreased 0.7% and 3.1% in the three and six months ended February 28, 2014, respectively, as compared to the same periods in the prior year as a result of decreases in local digital advertising revenue and digital classified revenue. We continue to believe digital revenue represents a future growth opportunity for Postmedia and as a result we are focused on various new products and initiatives in this area.
Our principal expenses consist of compensation, newsprint, and distribution. These composed 51.3%, 5.3% and 17.6%, respectively, of total operating expenses excluding depreciation, amortization and restructuring for the three months ended February 28, 2014 and 50.6%, 5.7% and 17.7%, respectively, of total operating expenses excluding depreciation, amortization and restructuring for the six months ended February 28, 2014. We experienced declines in compensation, newsprint and distribution expenses of 11.4%, 24.9% and 6.3%, respectively, in the three months ended February 28, 2014 and 11.2%, 24.8% and 6.5%, respectively, in the six months ended February 28, 2014, as compared to the same periods in the prior year.
We are in the process of implementing a three year business transformation program which was announced in July 2012 (“Transformation Program”) that will focus on the development of our digital products and is targeted to result in operating cost savings of 15% to 20%. During the three months ended February 28, 2014 as part of our Transformation Program we implemented initiatives which are expected to result in an additional $11 million of net annualized cost savings. In total, we have implemented net annualized cost savings of approximately $98 million, or 14% of operating costs, since the Transformation Program was announced.
Our operating results are affected by variations in the cost and availability of newsprint. Newsprint is the principal raw material used in the production of our daily newspapers and other print publications. It is a commodity that is generally subject to price volatility. We take advantage of the purchasing power that comes with the large volume of newsprint we purchase, as well as our proximity to paper mills across Canada, to minimize our total newsprint expense. Changes in newsprint prices can significantly affect our operating results. A $50 per tonne increase or decrease in the price of newsprint would be expected to affect our newsprint expense by approximately $2.7 million on an annualized basis. We don’t expect a material change in newsprint prices throughout the remainder of fiscal 2014.
Our distribution is primarily outsourced to third party suppliers. The key drivers of our distribution expenses are fuel costs and circulation and insert volumes. Our distribution expenses have decreased during the three and six months ended February 28, 2014 primarily as a result of a reduction in newspaper circulation volumes, including the elimination of unprofitable circulation as well as other cost reduction initiatives.
Additional IFRS Measures
We use operating income before depreciation, amortization and restructuring, as presented in the condensed consolidated statements of operations for the three and six months ended February 28, 2014 and 2013 and described in note 3 thereto, to assist in assessing our financial performance. Management and the Board of Directors of Postmedia use this measure to evaluate consolidated operating results and to assess Postmedia’s ability to incur and service debt. In addition, this measure is used to make operating decisions as it is an indicator of how much cash is being generated by Postmedia and assists in determining the need for additional cost reductions, evaluation of personnel and resource allocation decisions. Operating income before depreciation, amortization and restructuring is referred to as an additional IFRS measure and may not be comparable to similar measures presented by other companies.
Other Factors
Seasonality
Revenue has experienced, and is expected to continue to experience, significant seasonality due to seasonal advertising patterns and seasonal influences on media consumption habits. Typically, our advertising revenue is highest in the first and third fiscal quarters, while expenses are relatively constant throughout the fiscal year. These seasonal variations may lead to increased borrowing needs at certain points within the fiscal year.
Critical accounting estimates
The preparation of financial statements in accordance with IFRS requires management to make estimates, assumptions and judgements that affect the reported amounts of assets and liabilities, related amounts of revenues and expenses, and disclosure of contingent assets and liabilities. Although these estimates, assumptions and judgements are based upon management’s best knowledge of the amount, event or actions; actual results could differ from those estimates, assumptions and judgements. The critical accounting estimates used in our interim condensed consolidated financial statements for the three and six months ended February 28, 2014 and 2013 are not materially different from those disclosed in our annual management’s discussion and analysis and annual audited consolidated financial statements for the years ended August 31, 2013, 2012 and 2011 except as described below:
Employee future benefits
The cost of defined benefit pension benefit plans, post-retirement benefit plans and other long-term employee benefit plans and the present value of the defined benefit obligation are determined using actuarial valuations. An actuarial valuation involves making various assumptions including mortality rates. In July 2013, the Canadian Institute of Actuaries (“CIA”) issued a draft report proposing new mortality tables for use in the valuation of Canadian pension and benefit plans. On October 31, 2013 the CIA announced that the use of current mortality tables without adjustment would only be appropriate if supported by credible experience, the characteristics of the specific plan, or other quantifiable experience. As a result, during the three months ended November 30, 2013, we modified the mortality tables used to value the defined benefit pension benefit and post-retirement benefit obligations which resulted in an actuarial loss of $15.6 million recorded in other comprehensive income with an offsetting increase in other non-current liabilities. In February 2014, the CIA issued final mortality tables and we assessed the impact of the revisions and determined that no further adjustments were required during the three months ended February 28, 2014. The change in mortality rate assumptions is expected to result in increased funding valuations as well as increased defined benefit plan expense in future years.
Changes in accounting policies
We have adopted the following new and amended standards effective September 1, 2013. The comparative interim condensed consolidated financial statements have been revised as applicable to reflect the adopted standards as described below.
(i) IFRS 13 – Fair Value Measurement
IFRS 13 – Fair Value Measurement establishes a single source of guidance for fair value measurement across all IFRS standards. IFRS 13 defines fair value, provides guidance on measurement and introduces certain disclosure requirements. We adopted IFRS 13 on September 1, 2013 on a prospective basis. The adoption of IFRS 13 did not result in any measurement adjustments or changes to the valuation techniques used. We have included the required interim disclosures in note 11 of our interim condensed consolidated financial statements for the three and six months ended February 28, 2014 and 2013.
(ii) IAS 19 – Employee Benefits (Amended)
IAS 19 – Employee Benefits (Amended) includes a number of changes related to the recognition and measurement of defined benefit employee benefit plans and termination benefits. The amendments introduce a net interest approach that replaces the expected return on plan assets and interest costs on the defined benefit obligation with a single net interest component which will be determined based on the application of the discount rate on the net defined benefit obligation. As a result the discount rate previously used to calculate the interest costs on plan obligations is now also being used to calculate the expected return on plan assets. The amendments also require the recognition of all past service costs in profit or loss when the employee benefit plan is amended. We adopted IAS 19 on September 1, 2013 on a retrospective basis back to September 1, 2011. The adoption of IAS 19 has resulted in an adjustment to the opening deficit as at September 1, 2011 to reflect previously unrecognized past service costs. Additionally, the comparative figures in the interim condensed consolidated financial statements for the three and six months ended February 28, 2014 and 2013 have been revised as illustrated in the tables below to reflect the new standard.
The amended standard also clarifies when an employer offers voluntary termination benefits that the obligating event under such termination benefits is deemed to have occurred when an entity can no longer withdraw the offer. This resulted in a decrease to restructuring and other items of $10.5 million in the three months ended May 31, 2013 and a corresponding increase to restructuring and other items of $10.5 million in the three months ended August 31, 2013.
The following tables provide the impact of the IAS 19 changes described above on the comparative financial information in the interim condensed consolidated financial statements for the three and six months ended February 28, 2014 and 2013.
| Effect on comprehensive income attributable to equity holders of the Company |
| | | |
| | | Three months ended February 28, 2013 | | Six months ended February 28, 2013 |
| | | | | | | |
| Net loss attributable to equity holders of the Company as previously reported | | | (14,162 | ) | | | (5,858 | ) |
| | | | | | | | | |
| IAS 19 amendments increasing reported net loss | | | | | | | | |
| Compensation | | | (119 | ) | | | (238 | ) |
| Net financing expense relating to employee benefit plans | | | (1,480 | ) | | | (2,961 | ) |
| Total IAS 19 amendments increasing reported net loss | | | (1,599 | ) | | | (3,199 | ) |
Net loss attributable to equity holders of the Company revised (1) | | | (15,761 | ) | | | (9,057 | ) |
| | | | | | | | | |
| Comprehensive income attributable to equity holders of the Company as previously reported | | | 10,654 | | | | 9,340 | |
| | | | | | | | | |
| IAS 19 amendments increasing (decreasing) reported comprehensive income | | | | | | | | |
| Impact of IAS 19 amendments to net loss | | | (1,599 | ) | | | (3,199 | ) |
| Net actuarial gains on employee benefits | | | 1,661 | | | | 3,323 | |
| Total IAS 19 amendments increasing reported comprehensive income | | | 62 | | | | 124 | |
| Comprehensive income attributable to equity holders of the Company revised | | | 10,716 | | | | 9,464 | |
| |
(1) These adjustments increased basic and diluted net loss per share attributable to equity holders of the Company for the three and six months ended February 28, 2013 by $0.04 per share and $0.07 per share, respectively. |
| Effect on the consolidated statements of financial position | | | | | | | | | |
| | | | | | | | | | |
| Increase | | August 31, 2013 | | August 31, 2012 | | September 1, 2011 |
| | | | | | | | | | |
| Other non-current liabilities | | | 1,675 | | | | 1,923 | | | | 2,171 | |
| Deficit | | | 1,675 | | | | 1,923 | | | | 2,171 | |
| | | | | | | | | | | | | |
(iii) IFRS 10 – Consolidated Financial Statements
��
IFRS 10 – Consolidated Financial Statements replaces SIC-12 Consolidation – Special Purpose Entities and parts of IAS 27 – Consolidated and Separate Financial Statements and introduces a new definition of control that is intended to provide more consistent guidance in the determination of whether control exists and whether or not an entity should be included within the consolidated financial statements. The adoption of this standard did not have an impact on our interim condensed consolidated financial statements.
The following table provides our fiscal 2013 quarterly and full year consolidated statements of operations, revised for the adoption of IAS 19:
| | | Fiscal 2013 (revised) |
| | | Q1 | | Q2 | | Q3 | | Q4 | | Total |
| | | | | | | | | | | | | | | | | | | | |
| Revenues | | | | | | | | | | | | | | | | | | | |
| Print advertising | | | 132,741 | | | | 105,443 | | | | 113,395 | | | | 93,968 | | | | 445,547 | |
| Print circulation | | | 49,276 | | | | 47,863 | | | | 49,401 | | | | 49,359 | | | | 195,899 | |
| Digital | | | 24,813 | | | | 21,292 | | | | 24,093 | | | | 21,408 | | | | 91,606 | |
| Other | | | 4,842 | | | | 4,220 | | | | 4,895 | | | | 4,574 | | | | 18,531 | |
| Total revenues | | | 211,672 | | | | 178,818 | | | | 191,784 | | | | 169,309 | | | | 751,583 | |
| Expenses | | | | | | | | | | | | | | | | | | | | |
| Compensation | | | 83,067 | | | | 81,291 | | | | 83,075 | | | | 73,791 | | | | 321,224 | |
| Newsprint | | | 12,108 | | | | 9,856 | | | | 10,147 | | | | 8,791 | | | | 40,902 | |
| Distribution | | | 28,192 | | | | 26,365 | | | | 27,542 | | | | 25,806 | | | | 107,905 | |
| Other operating | | | 39,318 | | | | 36,240 | | | | 38,268 | | | | 37,800 | | | | 151,626 | |
| Operating income before depreciation, amortization, impairment and restructuring | | | 48,987 | | | | 25,066 | | | | 32,752 | | | | 23,121 | | | | 129,926 | |
| Depreciation | | | 6,890 | | | | 6,740 | | | | 6,706 | | | | 9,613 | | | | 29,949 | |
| Amortization | | | 10,734 | | | | 10,834 | | | | 11,111 | | | | 10,646 | | | | 43,325 | |
| Impairments | | | - | | | | - | | | | 93,883 | | | | 6,100 | | | | 99,983 | |
| Restructuring and other items | | | 4,797 | | | | 1,814 | | | | 6,305 | | | | 21,255 | | | | 34,171 | |
| Operating income (loss) | | | 26,566 | | | | 5,678 | | | | (85,253 | ) | | | (24,493 | ) | | | (77,502 | ) |
| Interest expense | | | 16,167 | | | | 15,606 | | | | 14,994 | | | | 15,133 | | | | 61,900 | |
| Net financing expense relating to employee benefit plans | | | 1,864 | | | | 1,863 | | | | 1,863 | | | | 1,868 | | | | 7,458 | |
| (Gain) loss on disposal of property and equipment and intangible assets | | | 268 | | | | (1,055 | ) | | | (202 | ) | | | (16 | ) | | | (1,005 | ) |
| Loss on derivative financial instruments | | | 697 | | | | 1,193 | | | | 760 | | | | 4,656 | | | | 7,306 | |
| Foreign currency exchange losses | | | 866 | | | | 3,832 | | | | 588 | | | | 1,779 | | | | 7,065 | |
| Earnings (loss) before income taxes | | | 6,704 | | | | (15,761 | ) | | | (103,256 | ) | | | (47,913 | ) | | | (160,226 | ) |
| Provision for income taxes | | | - | | | | - | | | | - | | | | - | | | | - | |
| Net earnings (loss) attributable to equity holders of the Company | | | 6,704 | | | | (15,761 | ) | | | (103,256 | ) | | | (47,913 | ) | | | (160,226 | ) |
| | | | | | | | | | | | | | | | | | | | | |
Operating Results
Postmedia’s operating results for the three months ended February 28, 2014 as compared to the three months ended February 28, 2013
| | | | | | | |
| | | 2014 | | | 2013 | |
| | | | | | (revised) (1) |
| Revenues | | | | | | |
| Print advertising | | | 89,944 | | | | 105,443 | |
| Print circulation | | | 47,550 | | | | 47,863 | |
| Digital | | | 21,136 | | | | 21,292 | |
| Other | | | 3,854 | | | | 4,220 | |
| Total revenues | | | 162,484 | | | | 178,818 | |
| Expenses | | | | | | | | |
| Compensation | | | 72,048 | | | | 81,291 | |
| Newsprint | | | 7,402 | | | | 9,856 | |
| Distribution | | | 24,704 | | | | 26,365 | |
| Other operating | | | 36,204 | | | | 36,240 | |
| Operating income before depreciation, amortization and restructuring | | | 22,126 | | | | 25,066 | |
| Depreciation | | | 11,169 | | | | 6,740 | |
| Amortization | | | 9,599 | | | | 10,834 | |
| Restructuring and other items | | | 5,425 | | | | 1,814 | |
| Operating income (loss) | | | (4,067 | ) | | | 5,678 | |
| Interest expense | | | 15,605 | | | | 15,606 | |
| Net financing expense relating to employee benefit plans | | | 1,404 | | | | 1,863 | |
| (Gain) loss on disposal of property and equipment | | | 27 | | | | (1,055 | ) |
| (Gain) loss on derivative financial instruments | | | (647 | ) | | | 1,193 | |
| Foreign currency exchange losses | | | 4,834 | | | | 3,832 | |
| Loss before income taxes | | | (25,290 | ) | | | (15,761 | ) |
| Provision for income taxes | | | - | | | | - | |
| Net loss attributable to equity holders of the Company | | | (25,290 | ) | | | (15,761 | ) |
| | | | | | | | | |
(1) See “Other Factors – Changes in accounting policies”. |
Revenue
Print advertising
Print advertising revenue decreased $15.5 million, or 14.7%, to $89.9 million for the three months ended February 28, 2014, as compared to the same period in the prior year. A decrease was experienced in most of our major categories of print advertising revenue, including decreases from national advertising of 14.3%, retail advertising of 22.9% and classified advertising of 22.0%. Partially offsetting these decreases was an increase in insert revenue of 4.5%. The total print advertising linage and average line rate decreased 14.0% and 5.3%, respectively, during the three months ended February 28, 2014, as compared to the same period in the prior year.
Print circulation
Print circulation revenue decreased $0.3 million to $47.6 million for the three months ended February 28, 2014 as compared to the same period in the prior year. Paid circulation volume decreased 11.4% during this period, as compared to the same period in the prior year, but this volume decrease was largely offset by price increases.
Digital
Digital revenue decreased $0.2 million to $21.1 million for the three months ended February 28, 2014, as compared to the same period in the prior year.
Other
Other revenue decreased $0.4 million, or 8.7%, to $3.9 million for the three months ended February 28, 2014, as compared to the same period in the prior year. The decline in other revenue is primarily a result of declines in commercial printing revenue.
Expenses
Compensation
Compensation expenses decreased $9.2 million, or 11.4%, to $72.0 million for the three months ended February 28, 2014, as compared to the same period in the prior year. The decrease is primarily due to lower salary and benefits expense of $10.0 million as a result of a reduction in employees due to the Transformation Program initiatives, partially offset by an increase in employee benefit plan expense of $0.5 million and an increase in non-cash share-based and other long-term incentive plan compensation expense of $0.5 million. Excluding non-cash share-based and other long-term incentive plan compensation expense, compensation expenses decreased $9.7 million, or 12.1%.
Newsprint
Newsprint expenses decreased $2.5 million, or 24.9%, to $7.4 million for the three months ended February 28, 2014, as compared to the same period in the prior year. Newsprint expense decreases are primarily a result of consumption decreases of 23.5% due to continued usage reduction efforts including reduced newspaper sizes and lower newspaper circulation volumes, combined with a decrease in newsprint cost per tonne of 1.8%. Newsprint expenses include newsprint purchased for production at both our owned and outsourced production facilities.
Distribution
Distribution expenses decreased $1.7 million, or 6.3%, to $24.7 million for the three months ended February 28, 2014, as compared to the same period in the prior year. Decreases in distribution expenses are primarily a result of a reduction in newspaper circulation volumes, including the elimination of unprofitable circulation as well as other cost reduction initiatives.
Other operating
Other operating expenses remained flat at $36.2 million for the three months ended February 28, 2014, as compared to the same period in the prior year. During the three months ended February 28, 2014 we realized cost savings as a result of ongoing cost savings initiatives, however these cost savings were largely offset by an increase in production costs as a result of the outsourced newspaper production described earlier in “Recent Developments”.
Operating income before depreciation, amortization and restructuring
Operating income before depreciation, amortization and restructuring decreased $2.9 million, or 11.7%, to $22.1 million for the three months ended February 28, 2014, as compared to the same period in the prior year. The decrease relates primarily to decreases in revenue, partially offset by decreases in expenses as discussed above. Excluding non-cash share-based and other long-term incentive plan compensation expense, operating income before depreciation, amortization and restructuring decreased $2.4 million, or 9.5%.
Depreciation
Depreciation expense increased $4.4 million to $11.2 million for the three months ended February 28, 2014, as compared to the same period in the prior year. The increase relates primarily to a change in the estimate of the useful lives of certain production assets as a result of outsourced newspaper production.
Amortization
Amortization expense decreased $1.2 million to $9.6 million for the three months ended February 28, 2014, as compared to the same period in the prior year. The decrease relates primarily to software that has come to the end of its useful life.
Restructuring and other items
Restructuring and other items expense increased $3.6 million to $5.4 million for the three months ended February 28, 2014 as compared to the same period in the prior year. Restructuring and other items expense for the three months ended February 28, 2014 consists of severance costs, which include both involuntary terminations and voluntary buyouts. Restructuring and other items expense for the three months ended February 28, 2013 consisted of $3.3 million of severance costs, which included both involuntary terminations and voluntary buyouts, and a recovery of $1.5 million due to a revised estimate relating to a change in benefits provided under an employee benefit plan as a result of an arbitrator’s ruling during the three months ended November 30, 2012.
Operating income (loss)
Operating loss was $4.1 million for the three months ended February 28, 2014, as compared to operating income of $5.7 million for the same period in the prior year. The operating loss was primarily a result of decreased operating income before depreciation, amortization and restructuring, increased depreciation expense and increased restructuring and other items expense, all as discussed above.
Interest expense
Interest expense remained flat at $15.6 million for the three months ended February 28, 2014, as compared to the same period in the prior year. Interest expense primarily relates to interest on our long-term debt that is recognized using the effective interest rate method, which amortizes the initial debt issuance costs and includes both cash and non-cash interest.
Net financing expense relating to employee benefit plans
Net financing expense relating to employee benefit plans decreased $0.5 million to $1.4 million for the three months ended February 28, 2014, as compared to the same period in the prior year. The decrease relates primarily to a reduction in our employee benefit plan liabilities.
(Gain) loss on disposal of property and equipment
During the three months ended February 28, 2014, we disposed of property and equipment and realized a nominal loss. During the three months ended February 28, 2013, we disposed of property and equipment and realized a gain of $1.1 million.
(Gain) loss on derivative financial instruments
Gain on derivative financial instruments for the three months ended February 28, 2014 was $0.6 million as compared to a loss of $1.2 million during the same period in the prior year. The gain and loss both relate to the change in fair value of our variable prepayment option embedded derivatives on the First-Lien Notes and 12.5% Senior Secured Notes due 2017 (“Second-Lien Notes”).
Foreign currency exchange losses
Foreign currency exchange losses for the three months ended February 28, 2014 were $4.8 million as compared to $3.8 million during the same period in the prior year.Foreign currency exchange losses consist primarily of unrealized losses related to the non-swapped portion of the Second-Lien Notes.
Loss before income taxes
Loss before income taxes was $25.3 million for the three months ended February 28, 2014, as compared to $15.8 million for the same period in the prior year. The increase in loss before income taxes is primarily the result of decreased operating income discussed above.
Provision for income taxes
We have not recorded a current or deferred tax expense or recovery for the three months ended February 28, 2014 or 2013. Current taxes payable or recoverable result in a decrease or increase, respectively, to our tax loss carryforward balances. The cumulative tax loss carryforward balances have not been recognized as a net deferred tax asset on the consolidated statement of financial position.
Net loss attributable to equity holders of the Company
Net loss for the three months ended February 28, 2014 was $25.3 million as compared to $15.8 million for the same period in the prior year, as a result of the factors described above in loss before income taxes.
Operating Results
Postmedia’s operating results for the six months ended February 28, 2014 as compared to the six months ended February 28, 2013
| | | | | | | |
| | | 2014 | | 2013 |
| | | | | (revised) (1) |
| Revenues | | | | | | |
| Print advertising | | | 206,549 | | | | 238,184 | |
| Print circulation | | | 97,138 | | | | 97,139 | |
| Digital | | | 44,690 | | | | 46,105 | |
| Other | | | 8,085 | | | | 9,062 | |
| Total revenues | | | 356,462 | | | | 390,490 | |
| Expenses | | | | | | | | |
| Compensation | | | 146,006 | | | | 164,358 | |
| Newsprint | | | 16,522 | | | | 21,964 | |
| Distribution | | | 51,012 | | | | 54,557 | |
| Other operating | | | 74,785 | | | | 75,558 | |
| Operating income before depreciation, amortization, and restructuring | | | 68,137 | | | | 74,053 | |
| Depreciation | | | 24,396 | | | | 13,630 | |
| Amortization | | | 20,011 | | | | 21,568 | |
| Restructuring and other items | | | 25,538 | | | | 6,611 | |
| Operating income (loss) | | | (1,808 | ) | | | 32,244 | |
| Interest expense | | | 31,338 | | | | 31,773 | |
| Net financing expense relating to employee benefit plans | | | 2,808 | | | | 3,727 | |
| (Gain) loss on disposal of property and equipment | | | 13 | | | | (787 | ) |
| (Gain) loss on derivative financial instruments | | | (4,701 | ) | | | 1,890 | |
| Foreign currency exchange losses | | | 5,829 | | | | 4,698 | |
| Loss before income taxes | | | (37,095 | ) | | | (9,057 | ) |
| Provision for income taxes | | | - | | | | - | |
| Net loss attributable to equity holders of the Company | | | (37,095 | ) | | | (9,057 | ) |
| | | | | | | | | |
(1) See “Other Factors – Changes in accounting policies”. | | | | | | | | |
Revenue
Print advertising
Print advertising revenue decreased $31.6 million, or 13.3%, to $206.5 million for the six months ended February 28, 2014, as compared to the same period in the prior year. A decrease was experienced in most of our major categories of print advertising revenue, including decreases from national advertising of 12.6%, retail advertising of 17.3% and classified advertising of 22.5%. Partially offsetting these decreases was an increase in insert revenue of 1.8%. The total print advertising linage and average line rate decreased 12.2% and 4.3%, respectively, during the six months ended February 28, 2014, as compared to the same period in the prior year.
Print circulation
Print circulation revenue remained flat for the six months ended February 28, 2014 as compared to the same period in the prior year. Paid circulation volume decreased 12.5% during this period, as compared to the same period in the prior year, but this volume decrease was offset by price increases.
Digital
Digital revenue decreased $1.4 million, or 3.1%, to $44.7 million for the six months ended February 28, 2014, as compared to the same period in the prior year. The decline in digital revenue is primarily a result of decreases in local digital advertising revenue of $0.8 million and digital classified revenue of $1.2 million, partially offset by an increase in digital circulation revenue of $0.8 million.
Other
Other revenue decreased $1.0 million, or 10.8%, to $8.1 million for the six months ended February 28, 2014, as compared to the same period in the prior year. The decline in other revenue is primarily a result of declines in commercial printing revenue.
Expenses
Compensation
Compensation expenses decreased $18.4 million, or 11.2%, to $146.0 million for the six months ended February 28, 2014, as compared to the same period in the prior year. The decrease is primarily due to lower salary and benefits expense of $17.7 million as a result of a reduction in employees due to the Transformation Program initiatives, a decrease in employee benefit plan expense of $0.3 million and a decrease in non-cash share-based and other long-term incentive plan compensation expense of $0.2 million. Excluding non-cash share-based and other long-term incentive plan compensation expense, compensation expense decreased $18.2 million, or 11.1%.
Newsprint
Newsprint expenses decreased $5.4 million, or 24.8%, to $16.5 million for the six months ended February 28, 2014, as compared to the same period in the prior year. Newsprint expense decreases are primarily a result of consumption decreases of 23.7% due to continued usage reduction efforts including reduced newspaper sizes and lower newspaper circulation volumes, combined with a decrease in newsprint cost per tonne of 1.4%. Newsprint expenses include newsprint purchased for production at both our owned and outsourced production facilities.
Distribution
Distribution expenses decreased $3.5 million, or 6.5%, to $51.0 million for the six months ended February 28, 2014, as compared to the same period in the prior year. Decreases in distribution expenses are primarily a result of a reduction in newspaper circulation volumes, the elimination of unprofitable circulation and other cost reduction initiatives.
Other operating
Other operating expenses decreased $0.8 million, or 1.0%, to $74.8 million for the six months ended February 28, 2014, as compared to the same period in the prior year. During the six months ended February 28, 2014 we realized cost savings as a result of ongoing cost savings initiatives, however these cost savings were largely offset by an increase in production costs as a result of the outsourced newspaper production described earlier in “Recent Developments”.
Operating income before depreciation, amortization and restructuring
Operating income before depreciation, amortization and restructuring decreased $5.9 million, or 8.0%, to $68.1 million for the six months ended February 28, 2014, as compared to the same period in the prior year. The decrease relates primarily to decreases in revenue, partially offset by decreases in expenses as discussed above. Excluding non-cash share-based and other long-term incentive plan compensation expense, operating income before depreciation, amortization and restructuring decreased $6.1 million, or 8.1%.
Depreciation
Depreciation expense increased $10.8 million to $24.4 million for the six months ended February 28, 2014, as compared to the same period in the prior year. The increase relates primarily to a change in the estimate of the useful lives of certain production assets as a result of outsourced newspaper production.
Amortization
Amortization expense decreased $1.6 million to $20.0 million for the six months ended February 28, 2014, as compared to the same period in the prior year. The decrease relates primarily to software that has come to the end of its useful life.
Restructuring and other items
Restructuring and other items expense increased $18.9 million to $25.5 million for the six months ended February 28, 2014 as compared to the same period in the prior year. Restructuring and other items expense for the six months ended February 28, 2014 consists of severance costs, which include both involuntary terminations and voluntary buyouts. Restructuring and other items expense for the six months ended February 28, 2013 included an estimated expense of $2.3 million related to changes made to an employee benefit plan as a result of an arbitrator’s ruling as well as $4.3 million of severance costs, which included both involuntary terminations and voluntary buyouts.
Operating income (loss)
Operating loss was $1.8 million for the six months ended February 28, 2014, as compared to operating income of $32.2 million for the same period in the prior year. The operating loss was primarily a result of decreased operating income before depreciation, amortization and restructuring, increased depreciation expense and increased restructuring and other items expense, all as discussed above.
Interest expense
Interest expense decreased $0.4 million, or 1.4%, to $31.3 million for the six months ended February 28, 2014, as compared to the same period in the prior year. Interest expense primarily relates to interest on our long-term debt that is recognized using the effective interest rate method, which amortizes the initial debt issuance costs and includes both cash and non-cash interest. The decrease in interest expense relates to a decrease in cash interest expense of $0.6 million during the six months ended February 28, 2014, as compared to the same period in the prior year, due to lower outstanding First-Lien Notes, partially offset by an increase in non-cash interest of $0.2 million.
Net financing expense relating to employee benefit plans
Net financing expense relating to employee benefit plans decreased $0.9 million to $2.8 million for the six months ended February 28, 2014, as compared to the same period in the prior year. The decrease relates primarily to a reduction in the employee benefit plan liabilities.
(Gain) Loss on disposal of property and equipment
During the six months ended February 28, 2014, we disposed of property and equipment and realized a nominal loss. During the six months ended February 28, 2013, we disposed of property and equipment and realized a gain of $0.8 million.
(Gain) loss on derivative financial instruments
Gain on derivative financial instruments for the six months ended February 28, 2014 was $4.7 million as compared to a loss of $1.9 million during the same period in the prior year. The gain and loss both relate to the change in fair value of our variable prepayment option embedded derivatives on the First-Lien Notes and Second-Lien Notes.
Foreign currency exchange losses
Foreign currency exchange losses for the six months ended February 28, 2014 were $5.8 million as compared to $4.7 million during the same period in the prior year.Foreign currency exchange losses consist primarily of unrealized losses related to the non-swapped portion of the Second-Lien Notes.
Loss before income taxes
Loss before income taxes was $37.1 million for the six months ended February 28, 2014, as compared to $9.1 million for the same period in the prior year. The increase in loss before income taxes is primarily the result of decreased operating income partially offset by gains on derivative financial instruments, both as discussed above.
Provision for income taxes
We have not recorded a current or deferred tax expense or recovery for the six months ended February 28, 2014 or 2013. Current taxes payable or recoverable result in a decrease or increase, respectively, to our tax loss carryforward balances. The cumulative tax loss carryforward balances have not been recognized as a net deferred tax asset on the consolidated statement of financial position.
Net loss attributable to equity holders of the Company
Net loss for the six months ended February 28, 2014 was $37.1 million as compared to $9.1 million for the same period in the prior year, as a result of the factors described above in loss before income taxes.
Consolidated quarterly financial information
| | | | | | | | | | | | | | | | | | | | | | | | | | | | | | | | | |
| | | Fiscal 2014 | | Fiscal 2013 | | Fiscal 2012 |
| ($ in thousands of Canadian dollars, except per share information) | | Q2 | | Q1 | | Q4 | | Q3 | | Q2 | | Q1 | | Q4 | | Q3 |
| | | | | | | | | | | revised (1) |
| | | | | | | | | | | | | | | | | | | | | | | | | | | | | | | | | |
| Total revenues | | | 162,484 | | | | 193,978 | | | | 169,309 | | | | 191,784 | | | | 178,818 | | | | 211,672 | | | | 190,124 | | | | 212,021 | |
| | | | | | | | | | | | | | | | | | | | | | | | | | | | | | | | | |
| Net earnings (loss) attributible to equity holders of the Company | | | (25,290 | ) | | | (11,805 | ) | | | (47,913 | ) | | | (103,256 | ) | | | (15,761 | ) | | | 6,704 | | | | (28,921 | ) | | | (12,707 | ) |
| Basic | | $ | (0.63 | ) | | $ | (0.29 | ) | | $ | (1.19 | ) | | $ | (2.57 | ) | | $ | (0.39 | ) | | $ | 0.17 | | | $ | (0.72 | ) | | $ | (0.32 | ) |
| Diluted | | $ | (0.63 | ) | | $ | (0.29 | ) | | $ | (1.19 | ) | | $ | (2.57 | ) | | $ | (0.39 | ) | | $ | 0.16 | | | $ | (0.72 | ) | | $ | (0.32 | ) |
| | | | | | | | | | | | | | | | | | | | | | | | | | | | | | | | | |
| Cash flows from operating activities | | | 14,659 | | | | 4,223 | | | | (11,562 | ) | | | 15,975 | | | | 20,706 | | | | 13,228 | | | | (7,472 | ) | | | 24,046 | |
| (1) See “Other Factors – Changes in accounting policies”. |
Liquidity and capital resources
Our principal uses of funds are for working capital requirements, debt servicing and capital expenditures. Based on our current and anticipated level of operations, we believe that our cash on hand, cash flows from operations and available borrowings under our Senior Secured Asset-based Revolving Credit Facility (“ABL Facility”) will enable us to meet our working capital, capital expenditure, debt servicing and other funding requirements. However, our ability to fund our working capital needs, debt servicing and other obligations depends on our future operating performance and cash flows. There are a number of factors which may adversely affect our operating performance and our ability to meet these obligations. See “Key Factors Affecting Operating Results”. Our cash flows from operating activities may be impacted by, among other things, the overall strength of the economy, competition from other newspapers and alternative forms of media and competition from alternative emerging technologies. In addition, in recent years there has been a growing shift in advertising dollars from newspaper advertising to other advertising formats, particularly online and other digital platforms such as search and social media websites. Although we expect to fund our capital needs with our available cash, cash generated from operations and available borrowings under the ABL Facility, our indebtedness could adversely affect our financial condition and prevent us from fulfilling our obligations under our debt agreements. The ABL Facility will terminate on July 13, 2014 and we are still in the process of determining if it will be renewed. We have not relied on the ABL Facility since its inception and based on our current forecasts we believe we can adequately fund our future obligations without the ABL Facility. As at February 28, 2014, no amounts were drawn under the ABL Facility. See “Risk Factor - We may not be able to refinance our ABL Facility on attractive terms, or at all” contained in our annual management’s discussion and analysis for the years ended August 31, 2013, 2012 and 2011.
Sources of Cash
Cash flows from operating activities
Our principal sources of liquidity are cash flows from operating activities. For the three and six months ended February 28, 2014, our cash flows from operating activities were inflows of $14.7 million and $18.9 million, respectively (2013 – $20.7 million and $33.9 million, respectively). Cash flows from operating activities decreased $6.0 million for the three months ended February 28, 2014, as compared to the same period in the prior year due to a decrease in operating income before depreciation, amortization and restructuring as well as an increase in restructuring payments. Cash flows from operating activities decreased $15.0 million for the six months ended February 28, 2014, as compared to the same period in the prior year due to a decrease in operating income before depreciation, amortization and restructuring as well as increased interest and restructuring payments. Partially offsetting these items was the absence of a settlement of a foreign currency interest rate swap designated as a cash flow hedge in the six months ended February 28, 2014.
As at February 28, 2014 we had cash of $45.3 million (August 31, 2013 - $40.8 million) and our ABL Facility remained undrawn (August 31, 2013 – nil). Availability under the ABL Facility as at February 28, 2014 was $18.1 million (August 31, 2013 - $20.7 million).
Uses of Cash
Cash flows from investing activities
For the three and six months ended February 28, 2014, our cash flows from investing activities were outflows of $4.4 million and $8.1 million, respectively (2012 – outflows of $2.4 million and inflows of $18.7 million, respectively). The net cash outflows from investing activities during the three months ended February 28, 2014 include outflows on capital expenditures related to property and equipment of $3.2 million and intangible assets of $1.2 million. The net cash outflows from investing activities during the three months ended February 28, 2013 included the net proceeds received on the sale of property and equipment and assets held-for-sale of $0.9 million, offset by outflows on capital expenditures related to property and equipment of $1.7 million and intangible assets of $1.7 million. The net cash outflows from investing activities during the six months ended February 28, 2014 include outflows on capital expenditures related to property and equipment of $6.2 million and intangible assets of $1.9 million. The net cash inflows from investing activities during the six months ended February 28, 2013, included the net proceeds received on the sale of property and equipment and asset held-for-sale of $25.6 million, offset by outflows on capital expenditures related to property and equipment of $4.3 million and intangible assets of $2.6 million.
Cash flows from financing activities
Cash outflows from financing activities for the three and six months ended February 28, 2014, were nil and $6.3 million, respectively (2012 – nominal and $23.3 million, respectively), and were related to our indebtedness as discussed below.
Indebtedness
As of February 28, 2014, we have $211.7 million First-Lien Notes and US$268.6 million Second-Lien Notes outstanding (August 31, 2013 - $218.0 million and US$268.6 million, respectively). During the six months ended February 28, 2014 and 2013, we redeemed $6.3 million and $23.2 million, respectively, of aggregate principal amount of First-Lien Notes at par in accordance with the terms and conditions of the First-Lien Notes indenture. There were no such redemptions in the three months ended February 28, 2014 and 2013.
The following tables set out the principal and carrying amount of our long-term debt outstanding as at February 28, 2014 and August 31, 2013. The first column of the table translates, where applicable, our US dollar debt to the Canadian equivalent based on foreign exchange rates specified in our foreign currency swap agreements for swapped debt and at the closing foreign exchange rate on February 28, 2014 and August 31, 2013, respectively, for our non-swapped debt.
| | | As at February 28, 2014 | |
| ($ in thousands of Canadian dollars) | | Principal
Outstanding
(US$ Debt
translated at
swapped or
period end rates) | | Principal
Outstanding
(US$ Debt
translated at
period end
exchange rates) | | Financing
fees,
discounts
and other | | Carrying
Value |
| First-Lien Notes (CDN$211.7M) | | | 211,710 | | | | 211,710 | | | | 5,195 | | | | 206,515 | |
| Second-Lien Notes (swapped) (US$167.5M) | | | 173,363 | | | | 185,489 | | | | 4,621 | | | | 180,868 | |
| Second-Lien Notes (non-swapped) (US$101.1M) | | | 111,997 | | | | 111,997 | | | | 2,790 | | | | 109,207 | |
| | | | 497,070 | | | | 509,196 | | | | 12,606 | | | | 496,590 | |
| | | | | | | | | | | | | | | | | |
| | | As at August 31, 2013 | |
| ($ in thousands of Canadian dollars) | | Principal
Outstanding
(US$ Debt
translated at
swapped or
period end rates) | | Principal
Outstanding
(US$ Debt
translated at
period end
exchange rates) | | Financing
fees,
discounts
and other | | Carrying
Value |
| First-Lien Notes (CDN$218.0M) | | | 217,960 | | | | 217,960 | | | | 5,927 | | | | 212,033 | |
| Second-Lien Notes (swapped) (US$167.5M) | | | 173,363 | | | | 176,378 | | | | 5,005 | | | | 171,373 | |
| Second-Lien Notes (non-swapped) (US$101.1M) | | | 106,495 | | | | 106,495 | | | | 3,021 | | | | 103,474 | |
| | | | 497,818 | | | | 500,833 | | | | 13,953 | | | | 486,880 | |
Financial Position as at February 28, 2014 and August 31, 2013
| | | | | | | |
| ($ in thousands of Canadian dollars) | | As at
February 28,
2014 | | | As at
August 31,
2013 | |
| | | | | | | |
| Current assets | | | 146,110 | | | | 138,200 | |
| Total assets | | | 838,676 | | | | 862,797 | |
| Current liabilities | | | 130,289 | | | | 130,860 | |
Total liabilities (revised) (1) | | | 741,042 | | | | 728,564 | |
Equity (revised) (1) | | | 97,634 | | | | 134,233 | |
(1) See “Other Factors – Changes in accounting policies”.
The increase in our current assets at February 28, 2014 as compared to August 31, 2013 is primarily due to an increase in cash and an increase in the carrying value of our current portion of derivative financial instrument assets, partially offset by a decrease in accounts receivable. Total assets at February 28, 2014 decreased compared to August 31, 2013, as a result of the decrease in the carrying value of property and equipment and intangible assets as a result of depreciation and amortization during the six months ended February 28, 2014, partially offset by an increase in the carrying value of our non-current portion of derivative financial instrument assets and an increase in current assets as previously described. Current liabilities have decreased due to decreased accounts payable and accrued liabilities partially offset by increased restructuring provisions as a result of the Transformation Program. The increase in total liabilities is primarily due to an increase in the carrying value of our long-term debt as a result of unrealized foreign currency exchange losses during the six months ended February 28, 2014, as well as an increase in the carrying value of our employee benefit plan liabilities which were primarily due to non-cash actuarial losses.
Financial Instruments and Financial Instruments Risk Management
The financial instruments and financial risk management policies and related risks are the same as disclosed in the audited consolidated financial statements for the years ended August 31, 2013, 2012 and 2011.
Guarantees and Off-Balance Sheet Arrangements
We do not have any significant guarantees or off-balance sheet arrangements.
Future Accounting Standards
We have not early adopted the following new standards and the impacts on the consolidated financial statements have not yet been determined:
(i) IFRS 9 – Financial Instruments
IFRS 9 – Financial Instruments was issued in November 2009 and is the same as disclosed in the audited consolidated financial statements for the years ended August 31, 2013, 2012 and 2011, except, for the addition of a new hedge accounting model and the removal of the mandatory effective date of implementation.
(ii) IFRIC 21 – Levies
IFRIC 21 - Levies clarifies the timing for the accounting of a liability that is imposed by governments should be based on the activity in the legislation that triggers the payment. This standard is required to be applied retrospectively for annual periods beginning on or after January 1, 2014, with earlier adoption permitted.
Risk Factors
The risks relating to our business are described in the section entitled “Risk Factors” included in our annual management’s discussion and analysis for the years ended August 31, 2013, 2012 and 2011, which section is incorporated by reference herein.
Internal Controls
Disclosure controls and procedures within the Company have been designed to provide reasonable assurance that all relevant information is identified to its management, including the President and Chief Executive Officer (“CEO”) and the Executive Vice President and Chief Financial Officer (“CFO”), as appropriate, to allow required disclosures to be made in a timely fashion.
Internal controls over financial reporting have been designed by management, under the supervision of and with the participation of the CEO and CFO, to provide reasonable assurance regarding the reliability of the Company’s financial reporting and the preparation of financial statements for external purposes in accordance with IFRS.
The CEO and CFO have evaluated whether there were changes to Postmedia's internal control over financial reporting during the three months ended February 28, 2014, that have materially affected, or are reasonably likely to materially affect, internal control over financial reporting. There were no changes identified during their evaluation.
Share Capital
As at April 7, 2014 we had the following number of shares and options outstanding:
Class C voting shares | | | 951,161 | |
Class NC variable voting shares | | | 39,258,458 | |
Total shares outstanding | | | 40,209,619 | |
| | | | | |
Total options and restricted share units outstanding (1) | | | 2,348,000 | |
(1) The total options and restricted share units outstanding are convertible into 1,730,000 Class C voting shares and 618,000 Class NC variable voting shares. The total options and restricted share units outstanding include 1,472,000 options that are vested and 876,000 options that are unvested.
22