Exhibit 15.2
POSTMEDIA NETWORK CANADA CORP.
MANAGEMENT’S DISCUSSION AND ANALYSIS
FOR THE YEARS ENDED AUGUST 31, 2013, 2012 and 2011
Issued: October 24, 2013
1
OCTOBER 24, 2013
MANAGEMENT’S DISCUSSION AND ANALYSIS
This management’s discussion and analysis of financial condition and results of operations of Postmedia Network Canada Corp. and its subsidiary Postmedia Network Inc. (collectively, “we”, “our”, “us”, or “Postmedia”) should be read in conjunction with the annual audited consolidated financial statements and related notes of Postmedia for the years ended August 31, 2013, 2012 and 2011. The audited consolidated financial statements of Postmedia for the years ended August 31, 2013, 2012 and 2011 are available on SEDAR atwww.sedar.com and on the EDGAR system maintained by the U.S. Securities and Exchange Commission atwww.sec.gov.
This discussion contains statements that are not historical facts and are forward-looking statements. These statements are subject to a number of risks described in the section entitled “Risk Factors”. Risks and uncertainties may cause actual results to differ materially from those contained in such forward-looking statements. Such statements reflect management’s current views and are based on certain assumptions. They are only estimates of future developments, and actual developments may differ materially from these statements due to a number of factors. Investors are cautioned not to place undue reliance on such forward-looking statements. No forward-looking statement is a guarantee of future results. We have tried, where possible, to identify such statements by using words such as “believe”, “expect”, “estimate”, “anticipate”, “will”, “could” and similar expressions in connection with any discussion of future operating or financial performance. Except as required by law, we undertake no obligation to publicly update or revise any forward-looking statements or information, whether written or oral, that may be as a result of new information, future events or otherwise.
All amounts are expressed in Canadian dollars unless otherwise noted. The audited consolidated financial statements of Postmedia for the years ended August 31, 2013, 2012 and 2011 have been prepared in accordance with International Financial Reporting Standards (“IFRS”).
This management’s discussion and analysis is dated October 24, 2013 and does not reflect changes or information subsequent to this date. Additional information in respect of Postmedia is available on SEDAR atwww.sedar.com and EDGAR atwww.sec.gov.
2
Additional IFRS Measures
We use operating income before depreciation, amortization, impairment and restructuring, as presented in the consolidated statements of operations for the years ended August 31, 2013, 2012 and 2011 and described in note 3 thereto, to assist in assessing our financial performance. Management and the Board of Directors of Postmedia use this measure to evaluate consolidated operating results and to assess Postmedia’s ability to incur and service debt. In addition, this measure is used to make operating decisions as it is an indicator of how much cash is being generated by Postmedia and assists in determining the need for additional cost reductions, evaluation of personnel and resource allocation decisions. Operating income before depreciation, amortization, impairment and restructuring is referred to as an additional IFRS measure and may not be comparable to similar measures presented by other companies.
Overview and Background
We are the largest publisher by circulation of paid English-language daily newspapers in Canada, according to the Newspapers Canada 2012 Circulation Data Report. Our paid English-language daily newspapers have, in total, the highest weekly print readership in Canada, based on the NADbank 2012 survey data. Our business consists of news and information gathering and dissemination operations, with products offered in major Canadian markets and a number of regional and local markets in Canada through a variety of print, web, tablet and smartphone platforms. The combination of these distribution platforms provides readers with a variety of mediums through which to access and interact with our content. The breadth of our reach and the diversity of our content enable advertisers to reach their target audiences on a local, regional or national scale through the convenience of a single provider.
During the year ended August 31, 2013, we amended our operating segments to reflect our change to a functional reporting structure which resulted in the elimination of publishers at our individual newspapers and the creation of Senior Vice President roles which will be responsible for specific functions across the entire business (the “Reorganization”). Prior to the Reorganization, we disclosed separately the results of both the Newspaper operating segment and an All other category which included other business activities and an operating segment which was not separately reportable. As a result of the changes to the reporting structure the All other category is now included in the Newspaper operating segment. Changes in reporting segments are to be applied retroactively; so because we now operate in only one operating segment there is no segment information to disclose and accordingly we have removed the discussion surrounding our segment operations from this management’s discussion and analysis. The Newspaper segment publishes daily and non-daily newspapers and operates digital media and online assets including the canada.com network, each newspaper’s online website and Infomart, our media monitoring service.
Significant developments
On April 4, 2011, we entered into an agreement with our lenders which amended certain terms of the Senior Secured Term Loan Credit Facility (“Term Loan Facility”). The amounts then outstanding under the original agreement, including a US tranche of $238.0 million (US$247.0 million) and a Canadian tranche of $107.3 million were repaid and replaced with a new US tranche. The new US tranche was issued for US$365.0 million (CDN$351.7 million), at a discount of 0.25%, for net proceeds of $350.8 million, before financing fees of $5.4 million.
On October 18, 2011, we entered into an asset purchase agreement with affiliates of Glacier Media Inc. to sell substantially all of the assets and liabilities of the Lower Mainland Publishing Group, the Victoria Times Colonist and the Vancouver Island Newspaper Group, collectively herein referred to as the Disposed Properties, for a purchase price of $86.5 million. On November 30, 2011, we completed the Transaction and recorded a gain on sale of the Disposed Properties of $17.1 million. In accordance with the terms and conditions of the Term Loan Facility, on November 30, 2011 the proceeds from the sale of the Disposed Properties were used to make a principal payment of US$84.6 million (CDN$86.5 million) on the Term Loan Facility. As a result of the Transaction we have presented the results of the Disposed Properties as discontinued operations for the years ended August 31, 2012 and 2011. Additional information on this transaction is available in note 23 of our audited consolidated financial statements for the years ended August 31, 2013, 2012 and 2011.
3
On June 26, 2012, we entered into an agreement of purchase and sale to sell the land and building located at 1450 Don Mills Road in Don Mills, Ontario for gross proceeds of $24 million. The sale closed on October 12, 2012. On November 12, 2012, the net proceeds from the sale were used for a mandatory redemption of $23.2 million aggregate principal amount of 8.25% Senior Secured Notes due 2017 (“First-Lien Notes”) at par in accordance with the terms and conditions of the First-Lien Notes indenture.
On August 16, 2012, we issued $250.0 million in aggregate principal amount of First-Lien Notes. The proceeds from the issuance were used to repay the amounts then outstanding on the Term Loan Facility of $238.3 million (US$240.0 million), accrued and unpaid interest of $3.4 million, and transaction fees of $6.6 million. The issuance of the First-Lien Notes and subsequent repayment of the then outstanding Term Loan Facility gave rise to a potential termination event under our existing foreign currency interest rate swap associated with the 12.5% Senior Secured Notes due 2017 (“Second-Lien Notes”). As a result, in September 2012, we settled a notional amount of US$97.5 million of the foreign currency interest rate swap for a cash payment of $9.6 million including accrued interest.
In August 2013, we outsourced production of the Edmonton Journal. In addition, on September 9, 2013, we announced our intention to sell two of our real estate holdings. The net proceeds from these potential sales will be used to make an offer to redeem an equal amount of our First-Lien Notes. We also entered into a print outsourcing agreement for the production of the Calgary Herald, beginning November 2013.
Selected Annual Information
| | | | | | | | | | | | |
| | | For the years ended August 31, | |
| | | 2013 | | | 2012 | | | 2011 | |
Revenue | | | 751,583 | | | | 831,877 | | | | 898,888 | |
| | | |
Net loss from continuing operations | | | (153,829 | ) | | | (37,275 | ) | | | (12,154 | ) |
Net loss per share from continuing operations | | | | | | | | | | | | |
Basic | | $ | (3.82 | ) | | $ | (0.92 | ) | | $ | (0.30 | ) |
Diluted | | $ | (3.82 | ) | | $ | (0.92 | ) | | $ | (0.30 | ) |
| | | |
Net loss attributible to equity holders of the Company | | | (153,829 | ) | | | (23,222 | ) | | | (9,589 | ) |
Net loss per share attributible to equity holders of the Company | | | | | | | | | | | | |
Basic | | $ | (3.82 | ) | | $ | (0.58 | ) | | $ | (0.24 | ) |
Diluted | | $ | (3.82 | ) | | $ | (0.58 | ) | | $ | (0.24 | ) |
| | | |
Total assets | | | 862,797 | | | | 1,044,848 | | | | 1,180,243 | |
Total long-term financial liabilities | | | 474,380 | | | | 480,118 | | | | 586,529 | |
| | | | | | | | | | | | |
Key Factors Affecting Operating Results
Revenue is earned primarily from advertising, circulation and digital sources. Print advertising revenue is a function of the volume, or linage, of advertising sold and rates charged. Print circulation revenue is derived from home-delivery subscriptions for newspapers, single copy sales at retail outlets and vending machines and is a function of the number of newspapers sold and the price per copy. Digital revenue consists of revenue from national and local display advertising on our newspaper and other websites, includingcanada.com, revenue from e-Papers and digital access subscriptions, as well as subscription revenue generated through Infomart, our media monitoring service.
As part of our fiscal 2014 planning process we updated our long-term financial forecast and as a result of lower than anticipated long-term revenue projections we recorded impairment losses during both the three months ended May 31, 2013 and August 31, 2013.
4
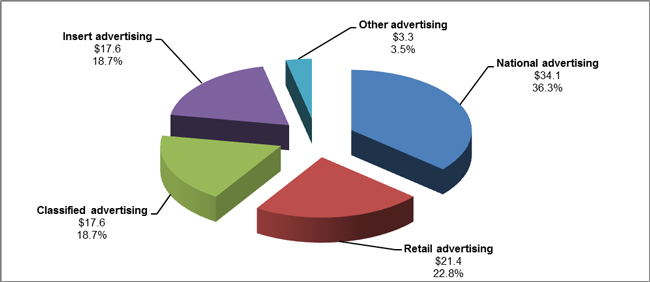
Print advertising revenue was $94.0 million for the three months ended August 31, 2013, representing 55.5% of total revenue. The following chart summarizes our print advertising revenue by category for the three months ended August 31, 2013 ($ in millions):
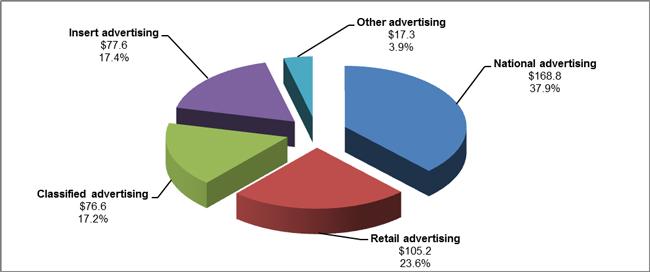
Print advertising revenue was $445.5 million for the year ended August 31, 2013, representing 59.3% of total revenue. The following chart summarizes our print advertising revenue by category for the year ended August 31, 2013 ($ in millions):
Print advertising is influenced by both the overall strength of the economy and significant structural changes in the newspaper industry and media in general. In recent years and continuing to date, economic uncertainty and structural changes in the industry have resulted in significant declines in print advertising as well as a continuing shift in advertising dollars from print advertising to advertising in other formats, particularly online and other digital platforms such as search and social media websites. This shift is expected to continue and may be permanent. We anticipate the print advertising market to remain challenging and expect current trends to continue into fiscal 2014. During the three months and year ended August 31, 2013, we experienced print advertising revenue declines of 16.2% and 13.5%, respectively, as compared to the same periods in the prior year.
5
The decline in print advertising revenue in the three months and year ended August 31, 2013 primarily relates to weakness in all major advertising categories including classified, retail and national.
Print circulation revenue was $49.4 million and $195.9 million for the three months and year ended August 31, 2013, representing 29.2% and 26.1% of total revenue for such periods, respectively. Declines in circulation volumes have been experienced over the last few years and this trend continued in the three months and year ended August 31, 2013. Circulation volume decreases have been partially offset by price increases. We expect these trends to continue into fiscal 2014. A portion of the print circulation volume decrease relates to the implementation of initiatives such as the elimination of unprofitable publishing days and circulation.
Digital revenue was $21.4 million and $91.6 million for the three months and year ended August 31, 2013, representing 12.6% and 12.2% of total revenue for such periods, respectively. Digital revenues decreased 2.4% and increased 2.8% in the three months and year ended August 31, 2013, respectively, as compared to the same periods in the prior year. Increases in digital revenue for the year ended August 31, 2013 are primarily a result of increases in local digital advertising revenue, partially offset by declines in digital classified revenue. We continue to believe digital revenue represents a future growth opportunity for Postmedia and as a result we are focused on various new products and initiatives in this area.
Our principal expenses consist of compensation, newsprint, and distribution. These composed 50.4%, 6.0% and 17.7%, respectively, of total operating expenses excluding depreciation, amortization, impairment and restructuring for the three months ended August 31, 2013 and 51.6%, 6.6% and 17.4%, respectively, of total operating expenses excluding depreciation, amortization, impairment and restructuring for the year ended August 31, 2013. We experienced declines in compensation, newsprint and distribution expenses of 9.5%, 25.0% and 11.7%, respectively, in the three months ended August 31, 2013 and declines of 7.9%, 22.3% and 12.9%, respectively, in the year ended August 31, 2013, as compared to the same periods in the prior year.
We are in the process of implementing a three year business transformation program which was announced in July 2012 (“Transformation Program”) that will focus on the development of our digital products and is expected to result in net operating cost savings of 15% to 20%. During the three months ended August 31, 2013 as part of our Transformation Program we implemented initiatives which are expected to result in an additional $20 million of net annualized cost savings, resulting in net annualized cost savings since the Transformation Program started of $82 million, or approximately a 12% decrease in net operating costs.
Our operating results are impacted by variations in the cost and availability of newsprint. Newsprint is the principal raw material used in the production of our daily newspapers and other print publications. It is a commodity that is generally subject to price volatility. We take advantage of the purchasing power that comes with the large volume of newsprint we purchase, as well as our proximity to paper mills across Canada, to minimize our total newsprint expense. Changes in newsprint prices can significantly affect our operating results. A $50 per tonne increase or decrease in the price of newsprint would be expected to affect our newsprint expense by approximately $3.3 million on an annualized basis. We don’t expect a material change in newsprint prices in fiscal 2014.
Our distribution is primarily outsourced to third party suppliers. The key drivers of our distribution expenses are fuel costs and circulation and insert volumes. Our distribution expenses have decreased during the three months and year ended August 31, 2013 as a result of Transformation Program initiatives implemented over the last year as well as decreased circulation and insert volumes. We are working to reduce distribution costs and expect to see further reductions in distribution expense in fiscal 2014.
6
Other Factors
Seasonality
Revenue has experienced, and is expected to continue to experience, significant seasonality due to seasonal advertising patterns and seasonal influences on media consumption habits. Typically, our advertising revenue is highest in the first and third fiscal quarters, while expenses are relatively constant throughout the fiscal year. These seasonal variations may lead to increased borrowing needs at certain points within the fiscal year.
Critical accounting estimates
The preparation of financial statements in accordance with IFRS requires management to make estimates, assumptions and judgements that affect the reported amounts of assets and liabilities, related amounts of revenues and expenses, and disclosure of contingent assets and liabilities. Although these estimates, assumptions and judgements are based upon management’s best knowledge of the amount, event or actions; actual results could differ from those estimates, assumptions and judgements.
We have identified the following significant areas that require management to use estimates, assumptions and judgements. These accounting estimates, assumptions and judgements are considered critical as changes in such estimates, assumptions an judgements have the potential to materially impact the consolidated financial statements. For a summary of our significant accounting policies please refer to note 2 of our audited consolidated financial statements for the years ended August 31, 2013, 2012 and 2011.
The following significant areas require management to use assumptions and to make estimates:
Impairment of goodwill and indefinite life intangible assets
We test goodwill and indefinite life intangible assets for impairment annually, or more frequently if there are indicators that an impairment may have arisen. In testing for impairment, assets, including indefinite lived intangible assets, are grouped into a cash generating unit (“CGU” or “CGUs”) which represent the lowest level for which there are separately identifiable cash inflows. For the purpose of goodwill impairment testing, goodwill is allocated to each CGU (or group of CGUs) based on the level at which management monitors goodwill, however not higher than an operating segment. Accordingly, management has allocated its goodwill to its single operating segment, the Newspaper operating segment, which is at the entity level, and the level at which goodwill is monitored, herein referred to as the Goodwill CGU. The recoverable amount of each CGU or group of CGUs is based on the higher of value in use and fair value less cost to sell calculations. We have computed the fair value less cost to sell of the Goodwill CGU and each individual CGU using a discounted cash flow model that requires market participant assumptions about future cash flows and discount rates. The future cash flows are based on management’s best estimate considering historical and expected operating plans, current strategies, economic conditions and the general outlook for the industry and markets in which we operate. The discounted cash flow calculations use cash flow projections which are based upon financial forecasts prepared by management covering a three year period. Cash flows after the three year period are extrapolated using industry growth rates.
7
Employee future benefits
The cost of defined benefit pension benefit plans, post-retirement benefit plans and other long-term employee benefit plans and the present value of the defined benefit obligation are determined using actuarial valuations. An actuarial valuation involves making various assumptions including the discount rate to measure obligations and the expected long-term rate of return on plan assets, among others. Due to the complexity of the actuarial valuations and the long-term nature of employee future benefits, the corresponding obligation is highly sensitive to changes in assumptions. A change in the discount rate used in the valuation of defined benefit obligations, affects the reported funded status of our plans as well as the net benefit cost in subsequent fiscal years. As at August 31, 2013 a 50 basis-point decrease in the discount rate would increase our defined benefit obligations by $34.0 million and a 50 basis-point increase in the discount rate would decrease our defined benefit obligations by $31.9 million. Discount rates and the expected return on plan assets compared to the actual return on plan assets are reviewed at each reporting date and corresponding adjustments are recognized in other comprehensive income and deficit.
The following area requires management to use significant judgements apart from those involving estimates:
Determination of useful lives for the depreciation and amortization of assets with finite lives
For each class of assets with finite lives, management has to determine over which period we will consume the assets future economic benefits. The determination of such periods and if necessary, the subsequent revision of such periods, involves judgement and has an impact on the depreciation and amortization recorded in the consolidated statements of operations. We take into account industry trends and industry specific factors, including changing technologies and expectations for the in-service period of assets when determining their respective useful lives.
8
Operating Results
Postmedia’s operating results for the three months ended August 31, 2013 as compared to the three months ended August 31, 2012
| | | | | | | | |
| | | 2013 | | | 2012 | |
Revenues | | | | | | | | |
Print advertising | | | 93,968 | | | | 112,157 | |
Print circulation | | | 49,359 | | | | 51,223 | |
Digital | | | 21,408 | | | | 21,937 | |
Other | | | 4,574 | | | | 4,807 | |
| | | | | | | | |
Total revenues | | | 169,309 | | | | 190,124 | |
Expenses | | | | | | | | |
Compensation | | | 73,673 | | | | 81,367 | |
Newsprint | | | 8,791 | | | | 11,717 | |
Distribution | | | 25,806 | | | | 29,218 | |
Other operating | | | 37,800 | | | | 39,649 | |
| | | | | | | | |
Operating income before depreciation, amortization, impairment and restructuring | | | 23,239 | | | | 28,173 | |
Depreciation | | | 9,613 | | | | 6,593 | |
Amortization | | | 10,646 | | | | 10,881 | |
Impairments | | | 6,100 | | | | — | |
Restructuring and other items | | | 10,746 | | | | 13,014 | |
| | | | | | | | |
Operating loss | | | (13,866 | ) | | | (2,315 | ) |
Interest expense | | | 15,133 | | | | 17,726 | |
Loss on debt repayment | | | — | | | | 9,178 | |
Net financing expense relating to employee benefit plans | | | 387 | | | | 975 | |
(Gain) loss on disposal of property and equipment and intangible assets | | | (16 | ) | | | 180 | |
Loss on derivative financial instruments | | | 4,656 | | | | 6,628 | |
Foreign currency exchange (gains) losses | | | 1,779 | | | | (8,651 | ) |
| | | | | | | | |
Loss before income taxes | | | (35,805 | ) | | | (28,351 | ) |
Provision for income taxes | | | — | | | | — | |
| | | | | | | | |
Net loss attributable to equity holders of the Company | | | (35,805 | ) | | | (28,351 | ) |
| | | | | | | | |
Revenue
Print advertising
Print advertising revenue decreased $18.2 million, or 16.2%, to $94.0 million for the three months ended August 31, 2013, as compared to the same period in the prior year. This decrease relates to most of our major categories of print advertising revenue, including decreases from national advertising of 20.3%, retail advertising of 14.0%, classified advertising of 16.7%, and insert advertising of 7.3%. The total print advertising linage and average line rate related to national, retail and classified advertising decreased 8.6% and 9.9%, respectively, during the three months ended August 31, 2013, as compared to the same period in the prior year. Insert revenue decreases are primarily related to volume decreases of 5.0% during the three months ended August 31, 2013, as compared to the same period in the prior year.
Print circulation
Print circulation revenue decreased $1.9 million, or 3.6%, to $49.4 million for the three months ended August 31, 2013, as compared to the same period in the prior year. Net paid circulation decreased 13.8% for the three months ended August 31, 2013, as compared to the same period in the prior year and was partially offset by price increases. A portion of the print circulation revenue decrease relates to the implementation of initiatives which include the elimination of unprofitable publishing days and circulation.
9
Digital
Digital revenue decreased $0.5 million, or 2.4%, to $21.4 million for the three months ended August 31, 2013, as compared to the same period in the prior year. The decline in digital revenue is primarily a result of declines of $1.1 million in digital classified revenue, partially offset by increases in local digital advertising revenue of $0.9 million.
Other
Other revenue decreased $0.2 million, or 4.8%, to $4.6 million for the three months ended August 31, 2013, as compared to the same period in the prior year.
Expenses
Compensation
Compensation expenses decreased $7.7 million, or 9.5%, to $73.7 million for the three months ended August 31, 2013, as compared to the same period in the prior year. The decrease is primarily due to lower salary costs of $10.4 million which are primarily as a result of a reduction in employees under the Transformation Program, partially offset by an increase in employee benefit plan expense of $2.1 million.
Newsprint
Newsprint expenses decreased $2.9 million, or 25.0%, to $8.8 million for the three months ended August 31, 2013, as compared to the same period in the prior year. Newsprint expense decreases are primarily a result of consumption decreases of 21.6% due to continued usage reduction efforts, reduced publishing days and lower newspaper circulation volumes, combined with a decrease in newsprint cost per tonne of 4.3%.
Distribution
Distribution expenses decreased $3.4 million, or 11.7%, to $25.8 million for the three months ended August 31, 2013, as compared to the same period in the prior year. Decreases in distribution expenses are primarily a result of a reduction in newspaper circulation volumes, the elimination of unprofitable publishing days and circulation and other cost reduction initiatives.
Other operating
Other operating expenses decreased $1.8 million, or 4.7%, to $37.8 million for the three months ended August 31, 2013, as compared to the same period in the prior year. Decreases in other operating expenses are primarily a result of ongoing cost savings initiatives.
Operating income before depreciation, amortization, impairment and restructuring
Operating income before depreciation, amortization, impairment and restructuring decreased $4.9 million, or 17.5%, to $23.2 million for the three months ended August 31, 2013, as compared to the same period in the prior year. The decrease relates primarily to decreases in revenue, partially offset by decreases in expenses as discussed above.
10
Depreciation
Depreciation increased $3.0 million to $9.6 million for the three months ended August 31, 2013, as compared to the same period in the prior year. The increase relates primarily to the change in the estimate of the useful lives of certain production assets as a result of production outsourcing agreements.
Amortization
Amortization decreased $0.2 million to $10.6 million for the three months ended August 31, 2013, as compared to the same period in the prior year.
Impairments
During the three months ended August 31, 2013, we completed our annual impairment testing of goodwill and indefinite life intangible assets. As a result of the impairment analysis we recorded an impairment loss of $6.1 million which consists of $2.5 million related to indefinite life intangible assets and $3.6 million related to property and equipment. The impairments were as a result of lower than anticipated long-term revenue projections due to economic and structural factors including the uncertainty of the print advertising market and the rapidly evolving digital advertising market. There were no such impairments in the three months ended August 31, 2012.
Restructuring and other items
Restructuring and other items expense decreased $2.3 million to $10.7 million for the three months ended August 31, 2013 as compared to the same period in the prior year. Restructuring and other items expense for the three months ended August 31, 2013 consists of severance costs, which include both involuntary terminations and voluntary buyouts. Restructuring and other items expense for the three months ended August 31, 2012 consisted of severance costs, which included both involuntary terminations and voluntary buyouts of $17.1 million and a recovery of $4.1 million which represented a curtailment gain in respect of our pension benefit plans related to such involuntary termination and voluntary buyouts.
Operating loss
Operating loss was $13.9 million for the three months ended May 31, 2013, as compared to $2.3 million for the same period in the prior year primarily as a result of increased operating loss before depreciation, amortization, impairment and restructuring, increased depreciation and the impairments recorded in the three months ended August 31, 2013 partially offset by decreased restructuring expenses, all as discussed above.
Interest expense
Interest expense decreased $2.6 million, or 14.6%, to $15.1 million for the three months ended August 31, 2013, as compared to the same period in the prior year. Interest expense primarily relates to interest on our long-term debt that is recognized using the effective interest rate method, which amortizes the initial debt issuance costs and includes both cash and non-cash interest. The decrease in interest expense for the three months ended August 31, 2013 relates to both a decrease in non-cash interest expense due to changes in amortization assumptions and cash interest as a result of lower debt levels as compared to the same period in the prior year, partially offset by an increase in the effective interest rate as a result of the refinancing on August 16, 2012. Cash interest expense decreased $0.6 million during the three months ended August 31, 2013, as compared to the same period in the prior year, due to reduced hedging on the Second-Lien Notes and lower debt levels, partially offset by an increase in the interest rate on first-lien debt as a result of the refinancing completed in August 2012.
11
Loss on debt repayment
During the three months ended August 31, 2012, we recorded a non-cash loss on debt repayment of $9.2 million representing unamortized discounts and financing fees related to the repayment of the then outstanding Term Loan Facility. There were no such losses in the three months ended August 31, 2013.
Net financing expense relating to employee benefit plans
Net financing expense relating to employee benefit plans decreased $0.6 million to $0.4 million for the three months ended August 31, 2013, as compared to the same period in the prior year. The decrease relates to both a decrease in the interest cost on plan obligations and an increase in the expected return on plan assets.
(Gain) Loss on disposal of property and equipment and intangible assets
During the three months ended August 31, 2013, we disposed of property and equipment and realized a nominal gain. During the three months ended August 31, 2012, we disposed of intangible assets and realized a loss of $0.2 million.
Loss on derivative financial instruments
Loss on derivative financial instruments for the three months ended August 31, 2013 was $4.7 million as compared to $6.6 million during the same period in the prior year. The loss for the three months ended August 31, 2013 relates to the change in fair value of our variable prepayment option embedded derivatives on the First-Lien Notes and Second-Lien Notes. The loss for the three months ended August 31, 2012 included a loss of $1.2 million related to the settlement of a cash flow swap designated as a hedge for cash consideration of $0.6 million, a realized loss of $0.8 million which represented a payment made to amend the terms of a cash flow swap designated as a hedge, a realized loss of $8.8 million related to the settlement of a fair value swap not designated as a hedge, partially offset by a gain of $2.4 million which occurred prior to the settlement of the fair value swap that was not designated as a hedge and gains of $1.9 million related to the variable prepayment option embedded derivatives on the First-Lien Notes and Second-Lien Notes.
Foreign currency exchange (gains) losses
Foreign currency exchange losses for the three months ended August 31, 2013 were $1.8 million as compared to foreign currency exchange gains of $8.7 million during the same period in the prior year. On August 16, 2012 we repaid our Term Loan Facility in its entirety, which was denominated in US dollars, and replaced it with the First-Lien Notes which are denominated in Canadian dollars, thereby permanently reducing our exposure to foreign currency fluctuations on a significant portion of our long-term debt. In September 2012, we settled a notional amount of US$97.5 million of the foreign currency interest rate swap designated as a cash flow hedge thereby increasing our exposure to foreign currency fluctuations on the non-swapped portion of the Second-Lien Notes from US$3.6 million to US$101.1 million. For the three months ended August 31, 2013 foreign currency exchange losses consist primarily of $1.6 million related to the non-swapped portion of the Second-Lien Notes. For the three months ended August 31, 2012 foreign currency exchange gains consisted primarily of realized gains of $8.4 million related to the repayment of the Term Loan Facility on August 16, 2012 and unrealized gains of $0.2 million related to the non-swapped portion of the Second-Lien Notes.
Loss before income taxes
Loss before income taxes was $35.8 million for the three months ended August 31, 2013, as compared to $28.4 million for the same period in the prior year. The increase in loss before income taxes is primarily the result of increased operating loss and foreign currency exchange losses, partially offset by decreased interest expense, decreased losses on derivative financial instruments and the loss on debt repayment in the three months ended August 31, 2012, all as discussed above.
12
Provision for income taxes
We have not recorded a current or deferred tax expense or recovery for the three months ended August 31, 2013 or 2012. Current taxes payable or recoverable result in a decrease or increase, respectively, to our tax loss carryforward balances. The cumulative tax loss carryforward balances have not been recognized as a net deferred tax asset on the statement of financial position.
Net loss attributable to equity holders of the Company
Net loss for the three months ended August 31, 2013 was $35.8 million as compared to $28.4 million for the same period in the prior year, as a result of the factors described above in loss before income taxes.
13
Postmedia’s operating results for the year ended August 31, 2013 as compared to the year ended August 31, 2012
| | | | | | | | |
| | | 2013 | | | 2012 | |
Revenues | | | | | | | | |
Print advertising | | | 445,547 | | | | 514,987 | |
Print circulation | | | 195,899 | | | | 209,177 | |
Digital | | | 91,606 | | | | 89,076 | |
Other | | | 18,531 | | | | 18,637 | |
| | | | | | | | |
Total revenues | | | 751,583 | | | | 831,877 | |
Expenses | | | | | | | | |
Compensation | | | 320,749 | | | | 348,133 | |
Newsprint | | | 40,902 | | | | 52,628 | |
Distribution | | | 107,905 | | | | 123,872 | |
Other operating | | | 151,626 | | | | 162,908 | |
| | | | | | | | |
Operating income before depreciation, amortization, impairment and restructuring | | | 130,401 | | | | 144,336 | |
Depreciation | | | 29,949 | | | | 26,157 | |
Amortization | | | 43,325 | | | | 43,566 | |
Impairments | | | 99,983 | | | | — | |
Restructuring and other items | | | 34,171 | | | | 35,355 | |
| | | | | | | | |
Operating income (loss) | | | (77,027 | ) | | | 39,258 | |
Interest expense | | | 61,900 | | | | 65,446 | |
Loss on debt repayment | | | — | | | | 9,178 | |
Net financing expense relating to employee benefit plans | | | 1,536 | | | | 3,900 | |
(Gain) loss on disposal of property and equipment and intangible assets | | | (1,005 | ) | | | 258 | |
(Gain) loss on derivative financial instruments | | | 7,306 | | | | (8,632 | ) |
Foreign currency exchange losses | | | 7,065 | | | | 6,383 | |
| | | | | | | | |
Loss before income taxes | | | (153,829 | ) | | | (37,275 | ) |
Provision for income taxes | | | — | | | | — | |
| | | | | | | | |
Net loss from continuing operations | | | (153,829 | ) | | | (37,275 | ) |
Net earnings from discontinued operations, net of tax of nil | | | — | | | | 14,053 | |
| | | | | | | | |
Net loss attributable to equity holders of the Company | | | (153,829 | ) | | | (23,222 | ) |
| | | | | | | | |
Revenue
Print advertising
Print advertising revenue decreased $69.4 million, or 13.5%, to $445.5 million for the year ended August 31, 2013, as compared to the same period in the prior year. This decrease relates to most of our major categories of print advertising revenue, including decreases from national advertising of 15.7%, retail advertising of 9.3%, classified advertising of 18.9%, and insert advertising of 7.3%. The total print advertising linage and average line rate related to national, retail and classified advertising decreased 9.3% and 5.9%, respectively, during the year ended August 31, 2013, as compared to the same period in the prior year. Insert revenue decreases are primarily related to volume decreases of 5.7% during the year ended August 31, 2013, as compared to the same period in the prior year.
14
Print circulation
Print circulation revenue decreased $13.3 million, or 6.3%, to $195.9 million for the year ended August 31, 2013, as compared to the same period in the prior year. Net paid circulation decreased 12.7% for the year ended August 31, 2013, as compared to the same period in the prior year and was partially offset by price increases. A portion of the print circulation revenue decrease relates to the implementation of initiatives which include the elimination of unprofitable publishing days and circulation.
Digital
Digital revenue increased $2.5 million, or 2.8%, to $91.6 million for the year ended August 31, 2013, as compared to the same period in the prior year. Growth in digital revenue is primarily a result of increases in local digital advertising revenue of $7.1 million partially offset by declines of $4.5 million in digital classified revenue.
Other
Other revenue decreased $0.1 million for the year ended August 31, 2013, as compared to the same period in the prior year.
Expenses
Compensation
Compensation expenses decreased $27.4 million, or 7.9%, to $320.7 million for the year ended August 31, 2013, as compared to the same period in the prior year. This decrease is primarily due to lower salary costs of $33.8 million as a result of a reduction in employees under the Transformation Program, partially offset by increased share-based and other long-term incentive plan compensation expense of $3.8 million as a result of changes in the share price of our Class C voting shares which is used to compute the fair value of our other long-term incentive plan and an increase in employee benefit plan expense of $2.3 million. Excluding non-cash share-based and other long-term incentive plan compensation expense, compensation expense decreased $31.2 million, or 8.9%.
Newsprint
Newsprint expenses decreased $11.7 million, or 22.3%, to $40.9 million for the year ended August 31, 2013, as compared to the same period in the prior year. Newsprint expense decreases are primarily a result of consumption decreases of 20.1% due to continued usage reduction efforts, reduced publishing days and lower newspaper circulation volumes, combined with a decrease in newsprint cost per tonne of 2.8%.
Distribution
Distribution expenses decreased $16.0 million, or 12.9%, to $107.9 million for the year ended August 31, 2013, as compared to the same period in the prior year. Decreases in distribution expenses are primarily a result of a reduction in newspaper circulation volumes, the elimination of unprofitable publishing days and circulation and other cost reduction initiatives.
Other operating
Other operating expenses decreased $11.3 million, or 6.9%, to $151.6 million for the year ended August 31, 2013, as compared to the same period in the prior year. Decreases in other operating expenses are primarily a result of ongoing cost savings initiatives. Partially offsetting these decreases are increased rent and occupancy costs associated with new property operating leases.
15
Operating income before depreciation, amortization, impairment and restructuring
Operating income before depreciation, amortization, impairment and restructuring decreased $13.9 million, or 9.7%, to $130.4 million for the year ended August 31, 2013, as compared to the same period in the prior year. The decrease relates primarily to decreases in revenue, partially offset by decreases in expenses as discussed above. Excluding non-cash share-based and other long-term incentive plan compensation expense, operating income before depreciation, amortization, impairment and restructuring decreased $10.2 million, or 7.2%.
Depreciation
Depreciation increased $3.8 million to $30.0 million for the year ended August 31, 2013, as compared to the same period in the prior year. The increase relates primarily to the change in the estimate of the useful lives of certain production assets as a result of production outsourcing arrangements.
Amortization
Amortization decreased $0.2 million to $43.3 million for the year ended August 31, 2013, as compared to the same period in the prior year.
Impairments
During the year ended August 31, 2013 as a result of interim and annual impairment testing of our goodwill and indefinite life intangible assets we recorded an impairment loss of $93.9 million which consists of $73.9 million related to goodwill, $16.4 million related to indefinite life intangible assets and $3.6 million related to property and equipment. The impairments were as a result of lower than anticipated long-term revenue projections due to economic and structural factors including the uncertainty of the print advertising market and the rapidly evolving digital advertising market. In addition, during the year ended August 31, 2013, we recorded an impairment loss of $6.1 million with respect to a production facility upon reclassification of the asset from property and equipment to asset held-for-sale. There were no such impairments in the year ended August 31, 2012.
Restructuring and other items
Restructuring and other items expense for the year ended August 31, 2013 decreased $1.2 million to $34.2 million as compared to the same period in the prior year. Restructuring and other items expense for the year ended August 31, 2013 includes an expense of $2.3 million related to changes made to an employee benefit plan as a result of an arbitrator’s ruling. Additionally, included in restructuring and other items is $31.9 million of severance costs, which include both involuntary terminations and voluntary buyouts. Restructuring and other items expense for the year ended August 31, 2012 consisted of $39.5 million related to severance costs, which included both involuntary terminations and voluntary buyouts and a recovery of $4.1 million which represented a curtailment gain in respect of our pension benefit plans related to such involuntary terminations and voluntary buyouts.
Operating income (loss)
Operating loss was $77.0 million for the year ended August 31, 2013, compared to operating income of $39.3 million for the same period in the prior year, primarily as a result of decreased operating income before depreciation, amortization, impairment and restructuring, increased depreciation and the impairments recorded in the year ended August 31, 2013, all as discussed above.
16
Interest expense
Interest expense decreased $3.5 million to $61.9 million for the year ended August 31, 2013, as compared to the same period in the prior year. Interest expense primarily relates to interest on our long-term debt that is recognized using the effective interest rate method which amortizes the initial debt issuance costs and includes both cash and non-cash interest. The decrease in interest expense for the year ended August 31, 2013 relates to decreases in interest expense due to lower debt levels as compared to the same period in the prior year, partially offset by an increase in the effective interest rate as a result of the refinancing on August 16, 2012. Cash interest expense decreased $1.6 million during the year ended August 31, 2013, as compared to the same period in the prior year, due to reduced hedging on the Second-Lien Notes and lower debt levels, partially offset by an increase in the interest rate on first-lien debt as a result of the refinancing completed in August 2012.
Loss on debt repayment
During the year ended August 31, 2012, we recorded a non-cash loss on debt repayment of $9.2 million representing unamortized discounts and financing fees related to the repayment of the then outstanding Term Loan Facility. There were no such losses in the year ended August 31, 2013.
Net financing expense relating to employee benefit plans
Net financing expense relating to employee benefit plans decreased $2.4 million to $1.5 million for the year ended August 31, 2013, as compared to the same period in the prior year. The decrease relates to both a decrease in the interest cost on plan obligations and an increase in the expected return on plan assets.
(Gain) loss on disposal of property and equipment and intangible assets
During the year ended August 31, 2013, we disposed of property and equipment and intangible assets and realized a net gain of $1.0 million. During the year ended August 31, 2012, we disposed of property and equipment and intangible assets and realized a loss of $0.3 million.
(Gain) loss on derivative financial instruments
Loss on derivative financial instruments for the year ended August 31, 2013 was $7.3 million as compared to a gain of $8.6 million during the same period in the prior year. The loss for the year ended August 31, 2013 relates to the change in fair value of our variable prepayment option embedded derivatives on the First-Lien Notes and Second-Lien Notes. The gain for the year ended August 31, 2012 included a gain of $13.4 million which occurred prior to the settlement of a fair value swap that was not designated as a hedge, gains of $9.6 million related to the variable prepayment option embedded derivatives on the First-Lien Notes and Second-Lien Notes, partially offset by a loss of $1.9 million related to the settlement of cash flow swaps designated as hedges for cash consideration of $1.3 million, a realized loss of $0.8 million which represents a payment made to amend the terms of cash flow swap designated as a hedge, a realized loss of $8.8 million related to the settlement of the fair value swap not designated as a hedge and net cash outflows of $2.8 million related to contractual cash interest settlements on a fair value swap not designated as a hedge.
17
Foreign currency exchange losses
Foreign currency exchange losses for the year ended August 31, 2013 were $7.1 million as compared to $6.4 million during the same period in the prior year. On August 16, 2012 we repaid our Term Loan Facility in its entirety, which was denominated in US dollars, and replaced it with the First-Lien Notes which are denominated in Canadian dollars, thereby permanently reducing our exposure to foreign currency fluctuations on a significant portion of our long-term debt. In September 2012, we settled a notional amount of US$97.5 million of the foreign currency interest rate swap designated as a cash flow hedge thereby increasing our exposure to foreign currency fluctuations on the non-swapped portion of the Second-Lien Notes from US$3.6 million to US$101.1 million. For the year ended August 31, 2013 foreign currency exchange losses consist primarily of unrealized losses of $6.8 million related to the non-swapped portion of the Second-Lien Notes. For the year ended August 31, 2012 foreign currency exchange losses consisted primarily of net realized losses of $6.3 million related to repayments of the Term Loan Facility and realized losses of $0.8 million on contractual principal settlements on the foreign currency interest rate swap not designated as a hedge, partially offset by unrealized gains of $0.5 million related to the non-swapped portion of the Second-Lien Notes.
Loss before income taxes
Loss before income taxes was $153.8 million for the year ended August 31, 2013, as compared to $37.3 million for the same period in the prior year. The increase in loss before income taxes is primarily the result of operating losses as discussed above.
Provision for income taxes
We have not recorded a current or deferred tax expense or recovery for the year ended August 31, 2013 and 2012. Current taxes payable or recoverable result in a decrease or increase, respectively, to our tax loss carryforward balances. The cumulative tax loss carryforward balances have not been recognized as a net deferred tax asset on the statement of financial position.
Net loss from continuing operations
Net loss from continuing operations was $153.8 million for the year ended August 31, 2013, as compared to $37.3 million for the same period in the prior year, as a result of the factors described above in loss before income taxes.
Net earnings from discontinued operations
We completed the sale of substantially all of the assets and liabilities of the Disposed Properties on November 30, 2011, and as a result there were no discontinued operations for the year ended August 31, 2013. Net earnings from discontinued operations for the year ended August 31, 2012 was $14.1 million and included a $17.1 million gain on sale of discontinued operations and an allocation of $6.4 million of interest expense representing an acceleration of debt issuance costs related to the debt repayment made with the net proceeds from the sale.
Net loss attributable to equity holders of the Company
Net loss for the year ended August 31, 2013 was $153.8 million as compared to $23.2 million for the same period in the prior year. The decrease is due to an increase in the net loss from continuing operations and no net earnings from discontinued operations, both as discussed above.
18
Postmedia’s operating results for the year ended August 31, 2012 as compared to the year ended August 31, 2011
| | | | | | | | |
| | | 2012 | | | 2011 | |
Revenues | | | | | | | | |
Print advertising | | | 514,987 | | | | 573,920 | |
Print circulation | | | 209,177 | | | | 219,296 | |
Digital | | | 89,076 | | | | 87,050 | |
Other | | | 18,637 | | | | 18,622 | |
| | | | | | | | |
Total revenues | | | 831,877 | | | | 898,888 | |
Expenses | | | | | | | | |
Compensation | | | 348,133 | | | | 368,516 | |
Newsprint | | | 52,628 | | | | 57,423 | |
Distribution | | | 123,872 | | | | 126,825 | |
Other operating | | | 162,908 | | | | 156,922 | |
| | | | | | | | |
Operating income before depreciation, amortization, and restructuring | | | 144,336 | | | | 189,202 | |
Depreciation | | | 26,157 | | | | 27,015 | |
Amortization | | | 43,566 | | | | 45,209 | |
Restructuring and other items | | | 35,355 | | | | 38,011 | |
| | | | | | | | |
Operating income | | | 39,258 | | | | 78,967 | |
Interest expense | | | 65,446 | | | | 72,284 | |
Loss on debt repayment | | | 9,178 | | | | 11,018 | |
Net financing expense relating to employee benefit plans | | | 3,900 | | | | 2,971 | |
Loss on disposal of property and equipment and intangible assets | | | 258 | | | | 176 | |
(Gain) loss on derivative financial instruments | | | (8,632 | ) | | | 21,414 | |
Foreign currency exchange (gains) losses | | | 6,383 | | | | (17,959 | ) |
Acquisition costs | | | — | | | | 1,217 | |
| | | | | | | | |
Loss before income taxes | | | (37,275 | ) | | | (12,154 | ) |
Provision for income taxes | | | — | | | | — | |
| | | | | | | | |
Net loss from continuing operations | | | (37,275 | ) | | | (12,154 | ) |
Net earnings from discontinued operations, net of tax of nil | | | 14,053 | | | | 2,565 | |
| | | | | | | | |
Net loss attributable to equity holders of the Company | | | (23,222 | ) | | | (9,589 | ) |
| | | | | | | | |
Revenue
Print advertising
Print advertising revenue decreased $58.9 million, or 10.3%, to $515.0 million for the year ended August 31, 2012, as compared to the same period in the prior year. This decrease relates to most of our major categories of print advertising revenue, including decreases from national advertising of 14.2%, retail advertising of 7.7%, classified advertising of 11.7%, and insert advertising of 3.6%. The total print advertising linage and average line rate related to national, retail and classified advertising decreased 8.4% and 3.8%, respectively, during the year ended August 31, 2012, as compared to the same period in the prior year. Insert revenue decreases are primarily related to volume decreases of 2.3% during the year ended August 31, 2012 as compared to the same period in the prior year.
Print circulation
Print circulation revenue decreased $10.1 million, or 4.6%, to $209.2 million for the year ended August 31, 2012, as compared to the same period in the prior year. Net paid circulation decreased 7.2% for the year ended August 31, 2012, as compared to the same period in the prior year and was partially offset by price increases.
19
Digital
Digital revenue increased $2.0 million, or 2.3%, to $89.1 million for the year ended August 31, 2012, as compared to the same period in the prior year. Growth in digital revenue is primarily a result of increases in revenue associated with Infomart of $0.5 million and increases in local digital advertising revenue of $6.5 million, partially offset by declines of $2.2 million in national digital advertising revenue and the loss of $2.8 million associated with a digital sales representation agreement that ended August 31, 2011.
Other
Other revenue was $18.6 million for the years ended August 31, 2012 and 2011.
Expenses
Compensation
Compensation expenses decreased $20.4 million, or 5.5%, to $348.1 million for the year ended August 31, 2012, as compared to the same period in the prior year. The decrease is the result of lower salary costs as a result of a reduction in employees under the Transformation Program, decreases to our short-term incentive plan awards, decreases in share-based and other long-term incentive plan compensation expense, partially offset by increases in employee benefit plan expenses. Excluding non-cash share-based and other long-term incentive plan compensation expense, compensation expense decreased $10.9 million, or 3.0%.
Newsprint
Newsprint expenses decreased $4.8 million, or 8.4%, to $52.6 million for the year ended August 31, 2012, as compared to the same period in the prior year. Newsprint expense decreases are primarily a result of consumption decreases of 7.2% due to continued usage reduction efforts and lower newspaper circulation volume, combined with a decrease in newsprint cost per tonne of 1.2%.
Distribution
Distribution expenses decreased $3.0 million, or 2.3%, to $123.9 million for the year ended August 31, 2012, as compared to the same period in the prior year. Decreases in distribution expenses are primarily a result of a reduction in newspaper circulation and insert volumes, combined with other cost reduction initiatives.
Other operating
Other operating expenses increased $6.0 million, or 3.8%, to $162.9 million for the year ended August 31, 2012, as compared to the same period in the prior year. Increases in other operating expenses are primarily related to marketing and promotion, legal and regulatory costs associated with being a public company. In addition during the year ended August 31, 2012, other operating expenses include a provision of $0.4 million for certain claims asserted against us as compared to a recovery to a previously recorded provision for certain claims asserted against us of $1.5 million in the year ended August 31, 2011.
Operating income before depreciation, amortization and restructuring
Operating income before depreciation, amortization and restructuring decreased $44.9 million, or 23.7%, to $144.3 million for the year ended August 31, 2012, as compared to the same period in the prior year. The decrease relates primarily to decreases in revenue and increases in other operating expenses, partially offset by decreases in compensation, newsprint and distribution expenses, all as discussed above. Excluding non-cash share-based and other long-term incentive plan compensation expense, operating income before depreciation, amortization, and restructuring decreased $54.4 million, or 27.7%.
20
Depreciation
Depreciation decreased $0.9 million, or 3.2%, to $26.2 million for the year ended August 31, 2012, as compared to the same period in the prior year.
Amortization
Amortization decreased $1.6 million, or 3.6%, to $43.6 million for the year ended August 31, 2012, as compared to the same period in the prior year.
Restructuring and other items
Restructuring and other items expense for the year ended August 31, 2012 decreased $2.7 million to $35.4 million as compared to the year ended August 31, 2011. Restructuring and other items expense for the year ended August 31, 2012 consisted of $39.5 million related to severance costs, which included both involuntary terminations and voluntary buyouts and a recovery of $4.1 million which represented a curtailment gain in respect of our pension benefit plans related to such involuntary terminations and voluntary buyouts. Restructuring and other items expense for the year ended August 31, 2011 included $38.5 million related to severance costs, which include both involuntary terminations and voluntary buyouts, a recovery of $3.7 million which represented curtailment gains in respect of our pension and post-retirement benefit plans related to such involuntary terminations and voluntary buyouts, and $3.2 million of expenses relating to the preparation of a non-offering prospectus and expenses incurred to comply with our contractual obligation to make an exchange offer for the Second-Lien Notes that is registered with the U.S. Securities and Exchange Commission and management oversight expenses of our various restructuring initiatives.
Operating income
Operating income was $39.3 million for the year ended August 31, 2012, as compared to $79.0 million for the same period in the prior year, as a result of the factors described above.
Interest expense
Interest expense decreased $6.8 million, or 9.5%, to $65.4 million for the year ended August 31, 2012, as compared to the same period in the prior year. The decrease relates to the lower effective interest rate in the year ended August 31, 2012 as a result of the refinancing of the Term Loan Facility on April 4, 2011 as well as the overall reduction in the Term Loan Facility due to principal repayments.
Loss on debt repayment
During the year ended August 31, 2012 we recorded a non-cash loss on debt repayment of $9.2 million representing unamortized discounts and financing fees related to the repayment of the then outstanding Term Loan Facility. During the year ended August 31, 2011 we recorded a loss on debt prepayment of $11.0 million. This included cash costs of $1.4 million incurred on the repayment of debt and a non-cash loss of $9.6 million of unamortized discounts and financing fees related to the repayment of the US and Canadian tranches of the Term Loan Facility.
Net financing expense relating to employee benefit plans
Net financing expense relating to employee benefit plans increased $0.9 million to $3.9 million for the year ended August 31, 2012, as compared to the same period in the prior year.
21
Loss on disposal of property and equipment and intangible assets
During the year ended August 31, 2012, we disposed of property and equipment and intangible assets and realized a loss of $0.3 million. During the year ended August 31, 2011, we disposed of property and equipment and realized a loss of $0.2 million.
(Gain) loss on derivative financial instruments
Gain on derivative financial instruments for the year ended August 31, 2012 was $8.6 million as compared to a loss of $21.4 million during the same period in the prior year. The gain for the year ended August 31, 2012 included a gain of $13.4 million which occurred prior to the settlement of a fair value swap that was not designated as a hedge, gains of $9.6 million related to the variable prepayment option embedded derivatives on the First-Lien Notes and Second-Lien Notes, partially offset by a loss of $1.9 million related to the settlement of cash flow swaps designated as a hedge for cash consideration of $1.3 million, a realized loss of $0.8 million which represents a payment made to amend the terms of cash flow swap designated as a hedge, a realized loss of $8.8 million related to the settlement of the fair value swap not designated as a hedge and net cash outflows of $2.8 million related to contractual cash interest settlements on a fair value swap not designated as a hedge. The loss for the year ended August 31, 2011 included a loss of $16.9 million related to a fair value swap that was not designated as a hedge, net cash outflows of $4.2 million related to contractual cash interest settlements on a fair value swap not designated as a hedge, a loss of $1.8 million which represents a payment made to amend the terms of our fair value swap that was not designated as a hedge, partially offset by a gain of $1.5 million related to a variable prepayment option embedded derivative on the Second-Lien Notes.
Foreign currency exchange (gains) losses
Foreign currency exchange losses for the year ended August 31, 2012 were $6.4 million as compared to gains of $18.0 million during the same period in the prior year. For the year ended August 31, 2012 foreign currency exchange losses consisted primarily of net realized losses of $6.3 million related to repayments of the Term Loan Facility and realized losses of $0.8 million on contractual principal settlements on the foreign currency interest rate swap not designated as a hedge, partially offset by unrealized gains of $0.5 million related to the non-swapped portion of the Second-Lien Notes. For the year ended August 31, 2011 foreign currency exchange gains consisted primarily of net realized gains of $26.9 million related to the US tranche of the Term Loan Facility that was repaid on April 4, 2011. Partially offsetting these gains were unrealized losses of $5.7 million related to the non-swapped portion of the Term Loan Facility and realized losses of $2.2 million on contractual principal settlements on the foreign currency interest rate swap not designated as a hedge.
Acquisition costs
During the year ended August 31, 2011, we incurred additional net acquisition costs of $1.2 million related to the July 13, 2010 acquisition of Canwest Limited Partnership. These costs were expensed as they were not directly related to either the issuance of debt or equity.
Loss before income taxes
Loss before income taxes was $37.3 million for the year ended August 31, 2012, as compared to $12.2 million for the same period in the prior year. The increase in loss before income taxes is primarily the result of decreased operating income, foreign currency exchange losses and decreased interest expense, partially offset by gains on derivative financial instruments, all as discussed above.
Provision for income taxes
We have not recorded a current or deferred tax expense or recovery for the year ended August 31, 2012 and 2011. Current taxes payable or recoverable result in a decrease or increase, respectively, to our tax loss carryforward balances. The cumulative tax loss carryforward balances have not been recognized as a net deferred tax asset on the statement of financial position.
22
Net loss from continuing operations
Net loss from continuing operations was $37.3 million for the year ended August 31, 2012, as compared to $12.2 million for the same period in the prior year as a result of the factors described above in loss before income taxes.
Net earnings from discontinued operations
Net earnings from discontinued operations for the year ended August 31, 2012 was $14.1 million and includes a $17.1 million gain on sale of discontinued operations and an allocation of $6.4 million of interest expense representing an accelerated amortization of debt issuance costs related to the debt repayment made with the net proceeds from the sale. The Transaction was completed on November 30, 2011, as a result there were no discontinued operations for the three months ended February 29, 2012, May 31, 2012 and August 31, 2012, as such the earnings are not comparable to the net earnings from discontinued operations of $2.6 million for the year ended August 31, 2011.
Net loss attributable to equity holders of the Company
Net loss for the year ended August 31, 2012 was $23.2 million as compared to $9.6 million for the same period in the prior year. The increase in net loss is due to the increase in net loss from continuing operations partially offset by the increase in net earnings from discontinued operations both as discussed above.
Consolidated quarterly financial information
| | | | | | | | | | | | | | | | | | | | | | | | | | | | | | | | |
| | | Fiscal 2013 | | | Fiscal 2012 | |
($ in thousands of Canadian dollars,
except per share information) | | Q4 | | | Q3 | | | Q2 | | | Q1 | | | Q4 | | | Q3 | | | Q2 | | | Q1 | |
Revenue | | | 169,309 | | | | 191,784 | | | | 178,818 | | | | 211,672 | | | | 190,124 | | | | 212,021 | | | | 198,642 | | | | 231,090 | |
| | | | | | | | |
Net earnings (loss) from continuing operations | | | (35,805 | ) | | | (112,166 | ) | | | (14,162 | ) | | | 8,304 | | | | (28,351 | ) | | | (12,137 | ) | | | (11,065 | ) | | | 14,278 | |
Net earnings (loss) per share from continuing operations | | | | | | | | | | | | | | | | | | | | | | | | | | | | | | | | |
Basic | | $ | (0.89 | ) | | $ | (2.79 | ) | | $ | (0.35 | ) | | $ | 0.21 | | | $ | (0.70 | ) | | $ | (0.30 | ) | | $ | (0.27 | ) | | $ | 0.35 | |
Diluted | | $ | (0.89 | ) | | $ | (2.79 | ) | | $ | (0.35 | ) | | $ | 0.20 | | | $ | (0.70 | ) | | $ | (0.30 | ) | | $ | (0.27 | ) | | $ | 0.35 | |
| | | | | | | | |
Net earnings (loss) attributible to equity holders of the Company | | | (35,805 | ) | | | (112,166 | ) | | | (14,162 | ) | | | 8,304 | | | | (28,351 | ) | | | (12,137 | ) | | | (11,065 | ) | | | 28,331 | |
Net earnings (loss) per share attributible to equity holders of the Company | | | | | | | | | | | | | | | | | | | | | | | | | | | | | | | | |
Basic | | $ | (0.89 | ) | | $ | (2.79 | ) | | $ | (0.35 | ) | | $ | 0.21 | | | $ | (0.70 | ) | | $ | (0.30 | ) | | $ | (0.27 | ) | | $ | 0.70 | |
Diluted | | $ | (0.89 | ) | | $ | (2.79 | ) | | $ | (0.35 | ) | | $ | 0.20 | | | $ | (0.70 | ) | | $ | (0.30 | ) | | $ | (0.27 | ) | | $ | 0.70 | |
| | | | | | | | |
Cash flows from operating activities | | | (11,562 | ) | | | 15,975 | | | | 20,706 | | | | 13,228 | | | | (7,472 | ) | | | 24,046 | | | | 16,045 | | | | 9,922 | |
23
Liquidity and capital resources
Our principal uses of funds are for working capital requirements, debt servicing and capital expenditures. Based on our current and anticipated level of operations, we believe that our cash on hand, cash flows from operations and available borrowings under our senior secured asset-based revolving credit facility (“ABL Facility”) will enable us to meet our working capital, capital expenditure, debt servicing and other funding requirements. However, our ability to fund our working capital needs, debt servicing and other obligations depends on our future operating performance and cash flows. There are a number of factors which may adversely affect our operating performance and our ability to meet these obligations. See “Key Factors Affecting Operating Results”. Our cash flows from operating activities may be impacted by, among other things, the overall strength of the economy, competition from other newspapers and alternative forms of media and competition from alternative emerging technologies. In addition, in recent years there has been a growing shift in advertising dollars from newspaper advertising to other advertising formats, particularly online and other digital platforms such as search and social media websites. Although we expect to fund our capital needs with our available cash, cash generated from operations and available borrowings under the ABL Facility, our indebtedness could adversely affect our financial condition and prevent us from fulfilling our obligations under our debt agreements. As at August 31, 2013, no amounts were drawn under the ABL Facility. See “Risk Factor - We may not be able to refinance our ABL Facility on attractive terms, or at all”.
As part of our annual budgeting process, management projects capital expenditures for the forthcoming fiscal year. Each project is subject to a detailed review on a case by case basis prior to approval. Investment projects must achieve an acceptable return on investment and generally are expected to demonstrate a payback period of no more than three years. In certain instances where there are strategic considerations, a longer timeframe may be considered. For the year ending August 31, 2014, we expect our major non-operating cash requirements to include discretionary capital expenditures of approximately $20 to $25 million and contractual principal repayments of long-term debt to total $12.5 million, which does not include the proceeds from certain potential asset sales which will be used to make an offer to redeem an equal amount of First-Lien Notes.
Sources of Cash
Cash flows from operating activities
Our principal sources of liquidity are cash flows from operating activities. For the three months and year ended August 31, 2013, our cash flows from operating activities were outflows of $11.6 million and inflows of $38.3 million, respectively (2012 – outflows of $7.5 million and inflows of $42.5 million, respectively) (year ended August 31, 2011 – inflows of $38.6 million). Cash flows from operating activities decreased $4.1 million for the three months ended August 31, 2013, as compared to the same period in the prior year due to a decrease in cash flows as a result of declines in operating income before depreciation, amortization, impairment and restructuring. Cash flows from operating activities decreased $4.2 million for the year ended August 31, 2013, as compared to the same period in the prior year due to a decrease in cash flows as a result of declines in operating income before depreciation, amortization, impairment and restructuring and the settlement of the foreign currency interest rate swap designated as a cash flow hedge offset by lower funding obligations on our employee benefit plans. Cash flows from operating activities increased $3.9 million for the year ended August 31, 2012, as compared to the same period in the prior year due to a decrease in non-cash working capital, partially offset by decreases in operating income before depreciation, amortization and restructuring. As at August 31, 2013 we had cash of $40.8 million (August 31, 2012 - $22.2 million) and our ABL Facility was undrawn (August 31, 2012 – nil). Availability under the ABL Facility as at August 31, 2013 was $20.7 million (August 31, 2012 - $23.3 million).
24
Cash flows from investing activities
For the three months and year ended August 31, 2013, our cash flows from investing activities were outflows of $4.1 million and inflows of $12.4 million, respectively (2012 – outflows of $4.2 million and inflows of $72.4 million) (year ended August 31, 2011 – outflows of $19.2 million). The net cash outflows from investing activities during the three months ended August 31, 2013 include outflows on capital expenditures related to property and equipment of $2.1 million and intangible assets of $2.0 million. The net cash outflows from investing activities during the three months ended August 31, 2012 included the outflows on capital expenditures related to property and equipment of $2.6 million and intangible assets of $1.6 million. The net cash inflows from investing activities during the year ended August 31, 2013 include the net proceeds received on the sale of property and equipment, intangible assets and asset held-for-sale of $25.9 million, which includes the proceeds from the sale of 1450 Don Mills Road discussed previously, offset by outflows on capital expenditures related to property and equipment of $7.6 million and intangible assets of $5.9 million. The net cash inflows from investing activities during the year ended August 31, 2012 included the net proceeds from the sale of the Disposed Properties of $87.3 million as discussed previously, offset by outflows on capital expenditures related to property and equipment of $8.2 million and intangible assets of $6.7 million. The net cash outflows from investing activities during the year ended August 31, 2011 included the net proceeds from the sale of property and equipment and intangible assets of $1.2 million, offset by outflows on capital expenditures related to property and equipment of $11.7 million and intangible assets of $8.7 million.
Uses of Cash
Cash flows from financing activities
Cash outflows from financing activities for the three months and year ended August 31, 2013, were nil and $32.2 million, respectively (2012 – inflows of $5.1 million and outflows of $103.2 million, respectively) (year ended August 31, 2011 – outflows of $49.2 million), and were related to our indebtedness as discussed below.
Indebtedness
As of August 31, 2013, we have $218.0 million First-Lien Notes and US$268.6 million Second-Lien Notes outstanding (August 31, 2012 - $250.0 million and US$268.6 million, respectively). During the three months and year ended August 31, 2013, we redeemed nil and $32.0 million, respectively, aggregate principal amount of First-Lien Notes at par in accordance with the terms and conditions of the First-Lien Notes indenture. During the three months ended August 31, 2012 we issued $250.0 million in aggregate principal amount of First-Lien Notes, before financing fees of $6.6 million. The net proceeds from issuance were used to repay the amounts then outstanding on the Term Loan Facility of $238.3 million (US$240.0 million). During the year ended August 31, 2012 we made mandatory and optional principal repayments on the Term Loan Facility of $102.0 million (US$100.0 million), which included the required repayment due to the sale of discontinued operations, as discussed previously. In addition, during the year ended August 31, 2012 we repurchased and retired US$6.4 million of the Second-Lien Notes for total cash consideration of $6.3 million (US$6.2 million).
During the year ended August 31, 2011 we made mandatory and optional principal repayments on the Term Loan Facility of $47.4 million (US$45.5 million and CDN$2.8 million). On April 4, 2011, we entered into an agreement to amend certain terms of the Term Loan Facility. As a result, amounts then outstanding under the Term Loan Facility including a US tranche of $238.0 million (US$247.0 million) and a Canadian tranche of $107.3 million were repaid and replaced with a new US tranche. The new US tranche was issued for US$365.0 million (CDN$351.7 million) at a discount of 0.25% for net proceeds of $350.8 million, before financing fees of $5.4 million. In addition, during the year ended August 31, 2011 we made a payment on a finance lease of $1.8 million.
25
The following tables set out the principal and carrying amount of our long-term debt outstanding as at August 31, 2013 and 2012. The first column of the table translates, where applicable, our US dollar debt to the Canadian equivalent based on foreign exchange rates specified in our foreign currency swap agreements for swapped debt and at the closing foreign exchange rate on August 31, 2013 and 2012, respectively, for our non-swapped debt.
| | | | | | | | | | | | | | | | |
| | | August 31, 2013 | |
($ in thousands of Canadian dollars) | | Principal
Outstanding
(US$ Debt
translated at
swapped or
period end rates) | | | Principal
Outstanding
(US$ Debt
translated at
period end
exchange rates) | | | Financing
fees,
discounts
and other | | | Carrying
Value | |
First-Lien Notes (CDN$218.0M) | | | 217,960 | | | | 217,960 | | | | 5,927 | | | | 212,033 | |
Second-Lien Notes (swapped) (US$167.5M) | | | 173,363 | | | | 176,378 | | | | 5,005 | | | | 171,373 | |
Second-Lien Notes (non-swapped) (US$101.1M) | | | 106,495 | | | | 106,495 | | | | 3,021 | | | | 103,474 | |
| | | | | | | | | | | | | | | | |
| | | 497,818 | | | | 500,833 | | | | 13,953 | | | | 486,880 | |
| | | | | | | | | | | | | | | | |
| | | | | | | | | | | | | | | | |
| | | August 31, 2012 | |
($ in thousands of Canadian dollars) | | Principal
Outstanding
(US$ Debt
translated at
swapped or
period end rates) | | | Principal
Outstanding
(US$ Debt
translated at
period end
exchange rates) | | | Financing
fees,
discounts
and other | | | Carrying
Value | |
First-Lien Notes (CDN$250.0M) | | | 250,000 | | | | 250,000 | | | | 5,866 | | | | 244,134 | |
Second-Lien Notes (swapped) (US$265.0M) | | | 274,275 | | | | 261,211 | | | | 8,904 | | | | 252,307 | |
Second-Lien Notes (non-swapped) (US$3.6M) | | | 3,583 | | | | 3,583 | | | | 122 | | | | 3,461 | |
| | | | | | | | | | | | | | | | |
| | | 527,858 | | | | 514,794 | | | | 14,892 | | | | 499,902 | |
| | | | | | | | | | | | | | | | |
26
Financial position as at August 31, 2013 and 2012
| | | | | | | | |
($ in thousands of Canadian dollars) | | August 31,
2013 | | | August 31,
2012 | |
Current assets | | | 138,200 | | | | 127,199 | |
Total assets | | | 862,797 | | | | 1,044,848 | |
Current liabilities | | | 130,860 | | | | 159,293 | |
Total liabilities | | | 726,889 | | | | 811,093 | |
Equity | | | 135,908 | | | | 233,755 | |
The increase in our current assets at August 31, 2013 as compared to August 31, 2012 is primarily due to an increase in cash, partially offset by a decrease in accounts receivable. Total assets at August 31, 2013 decreased compared to August 31, 2012, due to the impairments on property and equipment, intangible assets and goodwill, the disposal of an asset held-for-sale, as well as a decrease in the carrying value of property and equipment and intangible assets as a result of depreciation and amortization during the year ended August 31, 2013. These decreases were partially offset by the increase in current assets previously described. Current liabilities have decreased due to a reduction in the current portion of long term-debt due to the mandatory redemption of First-Lien Notes on November 12, 2012 as discussed previously, and the settlement of and decreases in the fair value of the current portion of derivative financial instrument liabilities, partially offset by increased accrued interest payable on long-term debt. The decrease in total liabilities is due to the decrease in current liabilities, the settlement of and decreases in the fair value of derivative financial instruments liabilities, decreases in other non-current liabilities due to a decrease in the carrying value of our employee benefit plan liabilities, partially offset by an increase in the carrying value of long-term debt as a result of unrealized foreign currency exchange losses during the year ended August 31, 2013.
Financial Instruments and Financial Instruments Risk Management
Our activities expose us to a variety of financial risks: market risk (including foreign currency risk and interest rate risk), credit risk and liquidity risk. We use derivative financial instruments to hedge certain foreign currency and interest rate risk exposures, all of which qualify for hedge accounting as at August 31, 2013.
Current risk management techniques utilized include monitoring fair value of derivative financial instruments, fair value of publicly traded debt, foreign exchange rates and interest rates with respect to interest rates and foreign currency risk, aging analysis and credit reviews for credit risk and cash flow projections for liquidity risk. Our enterprise risk management process is managed by a risk oversight committee composed of senior executives of Postmedia.
Derivative financial instruments
We have a foreign currency interest rate swap related to the Second-Lien Notes with a notional amount outstanding as at August 31, 2013 of US$167.5 million (2012- US$265 million), a fixed currency exchange rate of US$1:$1.035 and a fixed interest rate of 14.78% and a termination date of July 15, 2014, which includes a final exchange of the principal amount. We have designated this instrument as a hedge and utilize cash flow hedge accounting in our financial statements. On August 16, 2012, the issuance of the First-Lien Notes and the repayment of the Term Loan Facility, as described earlier, resulted in a termination event under the foreign currency interest rate swap agreement. As a result we entered into negotiations to amend the terms of the existing agreement. During August 2012, we amended the agreement on a notional amount of US$167.5 million for a fee of $0.8 million and in September 2012, we settled the remaining notional amount of US$97.5 million, for cash consideration of $9.6 million, including $0.6 million of accrued interest.
27
Foreign currency risk
As discussed above we have entered into transactions to reduce foreign currency risk exposure on our US dollar denominated long-term debt. As at August 31, 2013, approximately 56% of the outstanding principal on our long-term debt is payable in US dollars (August 31, 2012 – 51%). As at August 31, 2013, through our foreign currency interest rate swap we had hedged foreign currency risk on 62% of our US dollar denominated debt (August 31, 2012 - 99%). As at August 31, 2013, we were exposed to foreign currency risk on the non-swapped portion of the Second-Lien Notes of US$101.1 million (August 31, 2012 - US$3.6 million). As at August 31, 2013, a $0.01 change in the period end exchange rate of a Canadian dollar per one US dollar, holding all other variables constant, would have resulted in a $1.0 million increase or decrease to foreign currency exchange losses in the statement of operations.
Interest rate risk
We have no significant interest bearing assets. Our interest rate risk arises from borrowings at fixed rates which expose us to fair value interest rate risk as well as borrowings at variable rates which would expose us to cash flow interest rate risk. As at August 31, 2013, we held $500.8 million (2012 - $515.0 million) of debt subject to fair value interest rate risk and no debt subject to cash flow interest rate risk as the ABL Facility was undrawn at August 31, 2013 and 2012.
During the year ended August 31, 2013, if interest rates on long-term debt had been 100 basis points higher or lower, with all other variables held constant, there would have been no impact on interest expense (2012 - $2.2 million) (2011 - $3.5 million).
Credit risk
Credit risk is the risk of financial loss to Postmedia if a customer or counterparty to a financial asset fails to meet its contractual obligations. As at August 31, 2013, no individual balance represented a significant portion of our accounts receivable. We establish an allowance for doubtful accounts based on the specific credit risk of our customers and historical trends. The allowance for doubtful accounts amounted to $3.3 million as at August 31, 2013 (August 31, 2012 – $3.2 million).
We continuously monitor the financial condition of our customers, review the credit history of each customer, review the aging of accounts receivable, evaluate significant individual credit risk accounts and utilize each customer’s historical experience in order to both grant credit and set up our allowance for doubtful accounts. If such collectability estimates prove inaccurate, adverse adjustments to future operating results could occur and could be material.
Liquidity risk
Liquidity risk is the risk that we will not be able to meet our financial obligations as they come due or the risk that those financial obligations have to be met at excessive cost. We manage this exposure by using cash on hand and cash flow forecasts and by deferring or eliminating discretionary spending. We have an ABL Facility with a maximum availability of $45 million, which is described in note 12 of our audited consolidated financial statements for the years ending August 31, 2013, 2012 and 2011. As at August 31, 2013 we had availability of $20.7 million on the ABL Facility (August 31, 2012 – $23.3 million). See“Risk Factor - We may not be able to refinance our ABL Facility on attractive terms, or at all”.
28
Our obligations under firm contractual arrangements, including commitments for future payments under finance lease arrangements, operating lease arrangements, and pension funding agreements and debt and swap agreements as of August 31, 2013 are as follows:
| | | | | | | | | | | | | | | | | | | | | | | | |
| | | 2014 | | | 2015 | | | 2016 | | | 2017 | | | 2018 | | | Thereafter | |
Finance lease | | | — | | | | — | | | | — | | | | — | | | | — | | | | 1,560 | |
Operating leases and other | | | 25,081 | | | | 21,141 | | | | 18,228 | | | | 16,238 | | | | 10,589 | | | | 50,163 | |
Estimated employee benefit plan funding obligations(1) | | | 25,292 | | | | 29,062 | | | | 29,223 | | | | 29,572 | | | | 29,858 | | | | N/A | |
Long-term debt (2) | | | 12,500 | | | | 12,500 | | | | 12,500 | | | | 180,460 | | | | 282,873 | | | | — | |
Interest on long-term debt (2) | | | 53,658 | | | | 52,052 | | | | 51,020 | | | | 54,031 | | | | 35,359 | | | | — | |
Cash outflow on derivative financial instruments(3) | | | 198,959 | | | | — | | | | — | | | | — | | | | — | | | | — | |
Cash inflow on derivative financial instruments(3) | | | (198,425 | ) | | | — | | | | — | | | | — | | | | — | | | | — | |
| | | | | | | | | | | | | | | | | | | | | | | | |
| | | 117,065 | | | | 114,755 | | | | 110,971 | | | | 280,301 | | | | 358,679 | | | | 51,723 | |
| | | | | | | | | | | | | | | | | | | | | | | | |
Notes:
| (1) | Reflects expected contributions to our defined benefit pension benefit plans, post-retirement benefit plans and other long-term employee benefit plans. Information for our pension funding obligations is based upon our actuarial valuation dated December 31, 2012 and does not include calculations of our pension funding obligations beyond fiscal 2018. Future required payments are expected to be material. |
| (2) | Long-term debt and interest on long-term debt consist of only the mandatory contractual payments. US Dollar long-term debt and the related interest payments have been converted to Canadian dollars using the closing exchange rate as at August 31, 2013 and are calculated at the fixed interest rates underlying the obligation. |
| (3) | Cash outflows and inflows on derivative financial instruments represent contractual future cash payments based on fixed interest rates and have been converted to Canadian dollars using the closing exchange rate on August 31, 2013. |
Guarantees and Off-Balance Sheet Arrangements
We do not have any significant guarantees or off-balance sheet arrangements.
Future Accounting Standards
The following accounting standards are issued but not yet effective. The Company has not early adopted the following new standards and the impacts on the consolidated financial statements have not yet been determined, except as indicated below:
IFRS 9 - Financial Instruments
IFRS 9 was issued in November 2009 and contains requirements for financial assets. This standard addresses classification and measurement of financial assets and replaces the multiple category and measurement models in IAS 39 – Financial Instruments – Recognition and Measurement for debt instruments with a new mixed measurement model having only two categories: amortized cost and fair value through profit or loss. IFRS 9 also replaces the models for measuring equity instruments, and such instruments are either recognized at fair value through profit or loss or at fair value through other comprehensive income. Where such equity instruments are measured at fair value through other comprehensive income, dividends are recognized in profit or loss to the extent not clearly representing a return of investment; however, other gains and losses (including impairments) associated with such instruments remain in accumulated comprehensive income indefinitely.
Requirements for financial liabilities were added in October 2010 and they largely carry forward existing requirements in IAS 39, except that fair value changes due to credit risk for liabilities designated at fair value through profit and loss would generally be recorded in other comprehensive income.
This standard is required to be applied for annual periods beginning on or after January 1, 2015, with earlier adoption permitted.
29
IFRS 10 – Consolidated Financial Statements
IFRS 10 replaces SIC-12 Consolidation – Special Purposes Entities and parts of IAS 27 – Consolidated and Separate Financial Statements and introduces a new definition of control that is intended to provide more consistent guidance in the determination of whether control exists and whether or not an entity should be included within the consolidated financial statements.
This standard is required to be applied for annual periods beginning on or after January 1, 2013, with earlier adoption permitted. The adoption of this standard is not expected to have an impact on the consolidated financial statements.
IFRS 13 - Fair Value Measurement
IFRS 13 is a comprehensive standard for fair value measurement and disclosure requirements for use across all IFRS standards. The new standard clarifies that fair value is the price that would be received to sell an asset, or paid to transfer a liability in an orderly transaction between market participants, at the measurement date. It also establishes disclosures about fair value measurement. Under existing IFRS, guidance on measuring and disclosing fair value is dispersed among the specific standards requiring fair value measurements and in many cases does not reflect a clear measurement basis or consistent disclosures.
This standard is required to be applied for annual periods beginning on or after January 1, 2013, with earlier adoption permitted. The adoption of this standard will only impact the consolidated financial statement disclosures.
IAS 19 – Employee Benefits (Amended)
IAS 19 amendments include, among other changes, the immediate recognition of the actuarial gains and losses in other comprehensive income, the introduction of a net interest approach that replaces the expected return on plan assets and interest costs on the defined benefit obligation with a single net interest component and all past service costs are to be recognized in profit or loss when the employee benefit plan is amended. In addition, the amended standard clarifies the obligating event when an employer offers voluntary termination benefits. A liability is recognized when the entity can no longer withdraw an offer. This standard is required to be applied retrospectively for annual periods beginning on or after January 1, 2013. We will be adopting this standard effective September 1, 2013, for the year ending August 31, 2014, and at that time under the amended standard will be required to restate our results for the prior year, which is the year ending August 31, 2013. As a result, under the amended standard, for the year ending August 31, 2013 we anticipate that compensation expense and financing expense related to employee benefit plans will increase $0.5 million and $5.9 million, respectively, with an offsetting increase in other comprehensive income related to actuarial gains on employee benefits of $6.6 million. In addition, we anticipate that restructuring and other items will decrease $10.5 million in the three months ended May 31, 2013 and increase $10.5 million in the three months ended August 31, 2013. The aggregate anticipated impact for the year ended August 31, 2013 is an increase to comprehensive income of $0.2 million.
30
Risk Factors
The risks and uncertainties described below are those we currently believe to be material, but should not be considered exhaustive. If any of the following risks, or any other risks and uncertainties that we have not yet identified or that we currently consider not to be material, actually occur or become material risks, our business, financial condition, results of operations and cash flows and consequently the price of our shares, the First-Lien Notes and Second-Lien Notes could be materially and adversely affected.
Risks Relating to Our Business
Competition from other newspapers and alternative forms of media may impair our ability to generate advertising and circulation revenue.
Participants in the newspaper publishing industry depend primarily upon advertising sales, paid subscriptions and single copy newspaper sales in order to generate revenue. Competition for advertising, subscribers, readers and distribution is intense and comes primarily from television; radio; local, regional and national newspapers; magazines; free publications; direct mail; digital media; telephone directories; and other communications and advertising and subscriber-based media that operate in these markets. In addition, in recent years there has been a growing shift in advertising dollars from newspaper advertising to other advertising platforms, including digital media competitors such as search and social media, and this shift may be permanent. Participants in the digital media industry also depend upon the sale of advertisements and paid subscriptions in order to generate revenue. The digital media industry experiences additional competitive challenges because barriers to entry are low and geographic location is less relevant.
The cost of advertising in alternative forms of media such as those described above may decline, and the ease of producing advertising for alternative media might improve. Similarly, participants in alternative media platforms may improve their ability to target specific audiences and therefore become a more attractive media for advertisers. These circumstances could result in our newspaper or online media not being as competitive as they are currently in relation to these alternative forms of media. In order to respond to changing circumstances, the costs of producing or promoting editorial content may increase, or we may need to reduce our advertising and/or subscription rates, either of which could adversely affect our financial performance. Increased competition could also lead to additional expenditures for editorial content and marketing.
In addition, there is increasing consolidation in the Canadian newspaper publishing and other media industries, and competitors increasingly include market participants with interests in multiple media. These competitors may be more attractive than we are to certain advertisers because they may be able to bundle advertising sales across newspaper, television and internet platforms. Some of these competitors also have access to greater financial and other resources than we do.
31
Our ability to continue to compete successfully in the newspaper and online media industries and to attract advertising dollars, subscribers and readers will depend upon a number of factors, including:
| | • | | our continued ability to offer high-quality editorial content; |
| | • | | the variety, quality and attractiveness of our products and services; |
| | • | | the pricing of our products and services; |
| | • | | the platforms on which our products and services are offered; |
| | • | | the manner in which we market and promote our products and services; |
| | • | | the effectiveness of the distribution of our products and services; |
| | • | | our customer service; and |
| | • | | the emergence of technologies resulting in further shifts, which may be permanent, from newspaper advertising to advertising in other formats, including new media outlets. |
These factors are largely dependent upon on our ability to:
| | • | | identify and successfully respond to changes in technology, customer trends and preferences and online digital platforms such as search and social media; |
| | • | | develop new products across our business lines; |
| | • | | protect our intellectual property and avoid infringing the intellectual property rights of others; |
| | • | | avoid damage to our brands or reputation; |
| | • | | appeal to many demographics; and |
| | • | | expand into new distribution channels, particularly with respect to digital media and online products. |
There can be no assurance that existing and future competitors will not pursue or be capable of achieving similar or competitive business strategies. In addition, there can be no assurance that we will be able to compete successfully with existing or potential competitors, or that increased competition will not have an adverse effect on our business, financial condition or results of operations.
Advertising revenue is the largest component of our revenues and our advertising revenue is influenced by prevailing economic conditions and the prospects of our advertising customers. Advertising revenue has been declining since 2009.
We generate revenue primarily from the sale of advertising. Advertising revenue, including both print and digital advertising, represented 67.8% of our consolidated revenues in the year ended August 31, 2013 (2012 – 69.4%) (2011 – 70.6%).
Advertising revenue is affected in part by prevailing economic conditions. Adverse economic conditions generally, and downturns in the Canadian economy specifically, have a negative impact on the Canadian advertising industry and, consequently, on our financial prospects. We have been experiencing a decline in advertising revenue since 2009.
32
Advertising revenue has also been affected by a structural shift within the industry from print advertising to digital advertising. A recent study from the Pew Research Center in the United States found that, based on thirty-eight U.S. newspapers and interviews with executives from twelve companies, newspapers are losing seven dollars in print advertising for every one dollar they are gaining in new digital revenue. The ratio of print revenue losses to digital revenue gains for us is currently higher than such study, which demonstrates the difficulty in replacing print revenue with digital revenue.
Our advertising revenue is also dependent on the prospects of our advertising customers. Certain of our advertising customers operate in industries that may be cyclical or sensitive to general economic conditions, such as the automobile, financial, employment, technology, retail, food and beverage, telecommunications, travel, packaged goods and entertainment industries. Advertising customers could alter their spending priorities and reduce their advertising budgets in the event of a downturn in their business or prospects which would have an adverse effect on the revenue we generate from advertising. In addition, because a substantial portion of our revenue is derived from retail advertisers, our business, financial condition and results of operations would also be adversely affected by a further downturn in the retail sector.
A further reduction in our advertising revenues could result from:
| | • | | the continuing shift from newspaper advertising to advertising in other formats, including new media outlets, which shift may be permanent; |
| | • | | a continued decline in economic conditions; |
| | • | | a decline in the circulation volume of our newspapers, which decline may be permanent; |
| | • | | a decline in popularity of our editorial content or perceptions about our brands; |
| | • | | a change in the demographic makeup of the populations to which our newspapers are targeted; |
| | • | | the activities of our competitors, including increased competition from other forms of advertising-based media (e.g., magazines, radio and television broadcasters, cable television, direct mail and electronic media), and online digital platforms such as search and social media; and |
| | • | | a decline in the amount spent on advertising in general or in particular industries such as those discussed above. |
To the extent the current negative economic conditions continue or worsen and the structural shifts in advertising revenue and circulation continue, our business and advertising revenues will continue to be adversely affected, which would in turn adversely impact our operations and cash flows.
33
Failure to fulfill our strategy of building our digital media and online businesses would adversely affect our business prospects.
The competitive environment in which we operate demands, and our future growth strategies incorporate, the development of our digital media and online businesses. We believe the consumer preference for digital media and online products will accelerate as younger, more technologically savvy customers make up a greater portion of our potential customer base. In order for our digital media and online businesses to succeed, we must invest time and significant resources in them, to, among other things:
| | • | | accelerate the evolution of existing products (such as local newspaper websites and national content channels); |
| | • | | develop new digital media and online products (such as redesigned classified sites in automotive, employment and real estate categories); |
| | • | | develop new content channels (such as mobile optimized formats, online video capabilities and content and e-reader devices); |
| | • | | attract and retain talent for critical positions; |
| | • | | transform our organization and operating model to grow our digital media and online business; |
| | • | | continue to develop and upgrade our technologies and supporting processes to distinguish our products and services from those of our competitors; |
| | • | | sell advertising in significant markets, and be a compelling choice for advertisers online; |
| | • | | attract and retain a base of frequent, engaged visitors to our websites; and |
| | • | | continuously advance our digital offerings based on fast-moving trends that may pose opportunities as well as risks (e.g., e-readers and mobile applications). |
No assurance can be provided that we will be successful in achieving these and other necessary objectives or that our digital media and online businesses will be profitable or successful. Our failure to adapt to new technology or delivery methods, or our choice of one technological innovation over another, may have an adverse impact on our ability to compete for new customers or to meet the demands of our existing customers. If our digital media and online businesses are not successful, we could lose significant opportunities for new advertising revenue from digital sources while also losing advertising revenue from traditional sources due to the reallocation from print to digital advertising currently taking place. If we are not successful in achieving our digital media and online objectives, our business, financial condition and prospects would be materially adversely affected.
Our failure to maintain our print and online newspaper readership and circulation levels would limit our ability to generate advertising and circulation revenue.
Our ability to attract advertisers and thereby generate revenue and profits is dependent in large part upon our success in attracting readership of the newspapers and online publications that we publish. Readership and to a lesser extent circulation volume are the key drivers of advertising prices and revenue in the Canadian news and newspaper information industry.
34
We believe reader acceptance is a function of the editorial and advertising content being offered and is influenced by a number of factors, including:
| | • | | reviews of critics, promotions, the quality and acceptance of other competing editorial content in the marketplace; |
| | • | | the availability of alternative forms of news and other editorial content; |
| | • | | the availability of alternative forms of media technologies, such as the internet and other new media formats, that are often free for users; |
| | • | | a growing preference among some customers to receive all or a portion of their news from sources other than from a newspaper; |
| | • | | increases in subscription and newsstand rates; |
| | • | | general economic conditions, including the resulting decline in consumer spending on discretionary items such as newspapers; |
| | • | | public tastes and perceptions generally; and |
| | • | | other intangible factors. |
Circulation volumes of our newspapers have been declining in both the home delivered and single copy distribution channels. The rate of circulation decline could increase due to changing media consumption patterns of our readers or other factors, and these declines may be permanent. If we are unable to stop these declines or if the rate of decline were to accelerate, it will result in lower readership and circulation levels and, consequently, may lead to decreased advertising and other revenues.
Although we make significant investments in the editorial content of our newspapers, there can be no assurance provided that our newspapers will maintain satisfactory readership or circulation levels and any decrease in such levels may be permanent. In addition, factors affecting our readership levels could change rapidly, and many of the changes may be beyond our control and permanent. Loss of readership could have a material adverse effect on our ability to generate advertising and circulation revenue.
Because a high percentage of our operating expenses are fixed, a decrease in advertising revenue could have a negative impact on our results of operations.
Newspaper publishing is both capital and labour intensive and, as a result, newspapers have relatively high fixed cost structures. Advertising revenue, on which we rely for a majority of our revenue, may fluctuate due to a variety of factors whereas our expenses do not vary significantly with the increase or decrease in advertising revenue. As a result, a relatively small change in advertising revenue could have a disproportionate effect on our results of operations. For example, during periods of economic contraction, our advertising revenue may decline while most costs remain fixed, resulting in decreased earnings, as has been evident in the current economic environment.
The financial difficulties of certain of our contractors and vendors could have a negative impact on our results of operations.
The financial difficulties that some of our contractors and vendors may face, including one or more contractor or vendor bankruptcies due to poor economic conditions, may cause them to fail to provide us with products and/or services or may increase the cost of the products and services that they provide us. We may be unable to procure replacement products and/or services from other contractors or vendors in a timely and efficient manner and on acceptable terms, or at all. Any material change in these relationships, such as increased pricing, could have a material adverse effect on our business, financial condition, results of operations, liquidity and cash flow.
35
We compete with alternative emerging technologies and anticipate that we will be investing a significant amount of capital to address continued technological development.
The media industry is experiencing rapid and significant technological changes that have resulted in the development of alternative means of editorial content distribution. The continued growth of the internet has presented alternative content distribution options that compete with traditional media for advertising revenue. We may not be able to compete successfully with existing or newly developed alternative distribution technologies, or may be required to acquire, develop or integrate new technologies in order to compete. The cost of the acquisition, development or implementation of any such new technologies could be significant, and our ability to fund such implementation may be limited. In addition, even if we were able to fund such an implementation, we may be unable to implement any such technologies successfully. Any such event could have a material adverse effect on our business, financial condition or results of operations.
In addition, the continuing growth and technological expansion of internet-based services has increased existing competitive pressure on our businesses. As web-based and digital formats grab an increasingly larger share of consumer readership, we may lose customers or fail to attract new customers if we are not able to transition and update our publications and other products to these new and evolving formats. Furthermore, to the extent that advertisers continue to shift advertising dollars to new media outlets, which shift may be permanent, advertising revenues will decrease even if we are able to maintain our current share of print media advertising dollars. The increased competition may have a material adverse effect on our business and financial results.
We may not be able to achieve a profitable balance between circulation levels and advertising revenues.
We must balance our circulation levels with our advertising revenue objectives. This balancing necessitates a continuous effort that varies by publication and requires effective management of the circulation rate, the addition of new subscribers through cost-effective marketing methods and effective advertising operations. To maintain our readership and circulation rates, it may be necessary to incur additional costs that we may not be able to recover through circulation and advertising revenues. No assurance can be provided that we will be able to add and retain a sufficient number of newspaper subscribers in an economically efficient manner. Failure to do this could require reductions of our circulation rate or the elimination of certain products, which would negatively affect our advertising revenues and could materially and adversely affect our results of operations and financial condition.
We may not realize our anticipated cost savings from cost savings initiatives and any failure to manage costs would hamper profitability.
The level of our expenses impacts our profitability. Because of general economic and business conditions and our operating results, we have taken steps to lower operating costs by implementing cost savings initiatives including various transformation projects. During the year ended August 31, 2012 we began implementing a Transformation Program aimed at significantly reducing legacy newspaper infrastructure costs. Initiatives include the shutdown of Postmedia News, our proprietary breaking news service, the centralizing of editorial production services through Postmedia Editorial Services in Hamilton, the streamlining of advertiser flyer insert operations, the cancellation of Sunday editions in three markets due to unprofitability and the outsourcing of production in certain markets. In addition, we have implemented and continue to explore opportunities to reduce product costs by optimizing our distribution footprint, production schedules and shared distribution. We will continue to explore strategic initiatives, including additional transformation projects.
36
Estimates of cost savings are inherently uncertain, and we may not be able to achieve cost savings or expense reductions within the time frame we have projected or at all. Our ability to successfully realize savings and the timing of any realization may be affected by factors such as the need to ensure continuity in our operations, labour and other contracts, regulations and/or statutes governing employee/employer relationships, and other factors. In particular, certain of our collective bargaining agreements limit our ability to achieve operating efficiencies by limiting our ability to implement strategic initiatives. In addition, our implementation of these initiatives has and is expected to require upfront costs. There can be no assurance that we will be able to successfully contain our expenses or that even if our savings are achieved that implementation or other expenses will not offset any such savings. Our estimates of the future expenditures necessary to achieve the savings we have identified may not prove accurate, and any increase in such expenditures may affect our ability to achieve our anticipated savings. If these cost-control efforts do not reduce costs in line with our expectations, our financial position, results of operations and cash flows will be negatively affected.
Our revenue, which is generated primarily from advertisers, is subject to significant seasonal variations, which may increase our borrowing needs at various points in the year.
Our revenue has experienced, and is expected to continue to experience, significant seasonal variances due to seasonal advertising patterns and seasonal influences on media consumption habits. Typically, our revenue is lowest during the fourth quarter of our fiscal year, which ends in August, and highest during the first and third quarters, which end in November and May, respectively, while expenses are relatively constant throughout the fiscal year. These seasonal variations may lead to increased borrowing needs at certain points within the year. As a result, we may use amounts available under our ABL Facility to mitigate the impact of short-term fluctuations in cash flow, which could consequently leave us in a more constrained liquidity position. See“Risk Factor - We may not be able to refinance our ABL Facility on attractive terms, or at all”.
Our intellectual property rights are valuable, and any inability to protect them or liability for infringing the intellectual property rights of others could reduce the value of our services and our brands.
We rely on the trademark, copyright, internet/domain name, trade secret and other laws of Canada and other countries, as well as nondisclosure and confidentiality agreements, to protect our intellectual property rights. However, we may be unable to prevent third parties from using our intellectual property without our authorization, breaching any nondisclosure agreements with us, acquiring and maintaining domain names that infringe or otherwise decrease the value of our trademarks and other proprietary rights, or independently developing intellectual property that is similar to ours, particularly in those countries that do not protect our proprietary rights as fully as in Canada. The use of our intellectual property by others could reduce or eliminate any competitive advantage we have developed, cause us to lose sales or otherwise harm our businesses. If it became necessary to litigate to protect these rights, any proceedings could be burdensome and costly, and we may not prevail.
We have obtained and applied for several Canadian and foreign service mark and trademark registrations, and will continue to evaluate the registration of additional service marks and trademarks, as appropriate. We cannot guarantee that any of our pending applications will be approved by the applicable governmental authorities. Moreover, even if the applications are approved, third parties may seek to oppose or otherwise challenge these registrations. A failure to obtain trademark registrations in Canada and in other countries could limit our ability to protect our trademarks and impede our marketing efforts in those jurisdictions.
We cannot be certain that our intellectual property does not and will not infringe the intellectual property rights of others. We may be subject to legal proceedings and claims in the ordinary course of our business, including claims of alleged infringement of the trademarks, copyrights and other intellectual property rights of third parties. Any such claims, whether or not meritorious, could result in costly litigation and divert resources and the efforts of our personnel. Moreover, should we be found liable for infringement, we may be required to enter into licensing agreements (if available on acceptable terms, or at all) or to pay damages and to cease using certain trademarks or copyrights or making or selling certain products, or to redesign or rename some of our products or processes to avoid future infringement liability. Any of the foregoing could cause us to incur significant costs.
37
We maintain many well-known mastheads, consumer brands and trademarks, damage to the reputation of any of which could have an adverse impact upon our business, financial performance or results of operations.
The mastheads, brand names and trademarks that we own are well-known to consumers and are important in maintaining existing business and sourcing new business, as our ability to attract and retain customers is in part dependent upon our external perceptions, the quality of our products and services and our integrity. Damage to the reputation of any of these brands or negative publicity or perceptions about us could have an adverse impact upon the business, financial performance or results of operations.
We may be adversely affected by variations in the cost and availability of newsprint.
Newsprint is our largest raw material expense, representing approximately 6.6% of total operating costs in the year ended August 31, 2013 (2012 – 7.7%) (2011 -8.1%). Newsprint is a commodity and, as such, price varies considerably from time to time as a result of, among other factors, foreign currency exchange fluctuations and supply shortfalls. The price of newsprint can increase as a result of various factors, including consolidation in the newsprint industry, which has resulted in a smaller number of suppliers and reduced competition on price among them, and declining newsprint supply as a result of mill closures and conversions to other grades of paper. Changes in newsprint prices can significantly impact our operating results. We would expect a $50 per tonne increase or decrease in the price of newsprint to affect our operating expenses by approximately $3.3 million on an annualized basis. There can be no assurance that we will not be exposed to increased newsprint costs, which could have a material adverse effect on our business, financial condition or results of operations. In addition, if newspaper suppliers experience labour unrest, transportation difficulties or other supply disruptions, our ability to produce and deliver newspapers could be impaired and the cost of the newsprint could increase, both of which would negatively affect our operating results.
We rely upon information systems and technology and other manufacturing systems, disruptions to which could adversely affect our operations.
Our newspaper and digital media and online operations rely upon information technology systems, and other complex manufacturing systems, in order to produce and distribute our products. Our information technology and manufacturing systems may be vulnerable to unauthorized access, computer viruses, system failures, human error, natural disasters, fire, power loss, communications failure or acts of sabotage or terrorism. If a significant disruption or repeated failure were to occur, our business or revenue could be adversely affected. There may also be significant costs incurred as a result of such disruptions or failures that adversely affect our financial performance or capital expenditure levels.
Our operations could be adversely affected by labour disruptions, and labour agreements limit our ability to achieve operating efficiencies.
Approximately 36% of our employees were employed under 26 separate collective agreements as of August 31, 2013. A majority of our collective agreements include provisions that could impede restructuring efforts, including work force reduction, centralization, outsourcing and other initiatives. We are currently in negotiations with 4 bargaining units, covering the equivalent of 217 full-time employees, regarding expired agreements and one bargaining unit with respect to a first collective agreement for a newly certified bargaining unit. In addition, the Company has 14 agreements that cover approximately 400 full-time employees that will expire on December 31, 2013. The Company’s remaining agreements expire in 2014 and 2015, with the exception of one agreement that will expire in 2017.
38
There can be no assurance provided that any of these collective agreements will be renewed on satisfactory terms, or at all. Labour organizing activities could result in additional employees becoming unionized, which could result in higher ongoing labour costs and reduced flexibility in running our operations. In addition, labour disruptions or grievances could also affect our operations and certain unions have filed grievances against us alleging violations of one or more provisions of the applicable collective agreements. There can be no assurance provided that we will not experience other labour disruptions, or that a material grievance will not be decided against us, or that we will not experience other forms of labour protest. Any strike, lock out or other form of labour disruption could have a material adverse effect on our business, financial condition or results of our operations.
Equipment failure may have a material adverse effect.
There is a risk of equipment failure, primarily related to our printing facilities, due to wear and tear, latent defect, design error or operator error, among other things, which could have a material adverse effect on us. Although our printing facilities have generally operated in accordance with expectations, there can be no assurance that they will continue to do so. There may also be significant costs incurred as a result of such disruptions or failures that adversely affect our financial performance or capital expenditure levels.
We are subject to environmental, health and safety laws and regulations, which could subject us to liabilities, increase our costs or restrict our business or operations in the future.
We are subject to a variety of laws and regulations concerning emissions to the air, water and land, sewer discharges, handling, storage and disposal of, or exposure to, hazardous substances and wastes, recycling, remediation and management of contaminated sites, or otherwise relating to protection of the environment and employee health and safety. Environmental laws and regulations and their interpretation have become increasingly more stringent, and we may incur additional expenses to comply with existing or future requirements. If we fail to comply with environmental or health and safety requirements we could incur monetary fines, civil or criminal sanctions, third-party claims or cleanup obligations or other costs. In addition, our compliance with environmental and health and safety requirements could restrict our ability to expand our operations or require us to install costly pollution control equipment, incur other significant expenses or modify our printing processes.
We use and store hazardous substances such as inks and solvents in conjunction with our operations at our printing facilities. Such hazardous substances have in the past been stored in underground storage tanks at some of our properties. Some of our printing and other facilities are located in areas with a history of long-term industrial use, and they may be impacted by past activities onsite or by contamination emanating from nearby industrial sites. In the past, we have had contamination resulting from leaks and spills at some of our locations. We have not conducted environmental site assessments with respect to all of our owned and leased facilities, and where such assessments have been conducted, they may not have identified all potential causes of environmental liability. There can be no assurance provided that remediation costs or potential claims for personal injury or property or natural resource damages resulting from any newly-occurring or newly-discovered contamination will not be material, or that a material environmental condition does not otherwise exist at any of our properties.
Our editorial content may be controversial and may result in litigation.
We have had, in the ordinary course of our business, and expect to continue to have, litigation claims filed against us, most of which are claims for defamation arising from the publication of our editorial content. While we maintain insurance in respect of claims for defamation, some claims made against us may not be insured or may result in costs above our coverage limits. In the event that a judgment is rendered against us, there can be no assurance that our insurance coverage will cover that particular loss.
39
We are currently involved in unresolved litigation matters.
We are involved in various legal claims arising in the ordinary course of our newspaper and digital media and online businesses. The majority of these claims are brought pursuant to defamation laws in the province of publication. We maintain a multi-media liability insurance policy in respect of defamation claims. Subject to the terms and conditions of that policy, and the insurer’s coverage position in respect of individual claims, the resolution of these matters is not expected to have a material adverse effect on our consolidated financial position, results of operations or cash flows.
Failure to comply with “Canadian newspaper” status would materially affect our financial results and our business prospects.
Under the Tax Act, generally no deduction is allowed for an outlay or expense for advertising space in an issue of a newspaper for an advertisement directed primarily to a market in Canada, unless the issue is a “Canadian issue” of a “Canadian newspaper.”
In order to qualify as a “Canadian issue”, the issue generally must have its type set in Canada, be edited in Canada by individuals resident in Canada for purposes of the Tax Act and be printed and published in Canada. Issues of our newspapers currently meet these criteria.
The test of whether a newspaper is a “Canadian newspaper” depends on the jurisdiction, governance, factual control and share ownership of the corporation which directly publishes the newspaper. We publish our newspapers directly. In order to satisfy the requirements of a “Canadian newspaper” (subject to a statutory 12 month grace period), we must satisfy the following: (i) the corporation must be incorporated under the laws of Canada or a province thereof, (ii) the chairperson or other presiding officer and at least 75% of the directors or other similar officers of the corporation must be Canadian citizens, and (iii) the corporation must not be controlled, in fact, directly or indirectly, by persons or partnerships who could not themselves hold the right to produce and publish issues of a “Canadian newspaper”, including by citizens or subjects of a country other than Canada.
In addition, under the share ownership requirements, at least 75% of a non-public corporation’s voting shares and shares having a fair market value in total of at least 75% of the fair market value of all issued shares of a non-public corporation, must be beneficially owned by either (i) Canadian citizens or (ii) one or more Qualifying Public Corporations. Upon the listing of Postmedia Network Canada Corp’s shares on the Toronto Stock Exchange, it became a Qualifying Public Corporation. As Postmedia Network Inc. is a direct, wholly-owned subsidiary of Postmedia Network Canada Corp., our newspapers qualify as “Canadian newspapers”.
Issues of our newspapers therefore qualify as “Canadian issues” of “Canadian newspapers” (or otherwise fall outside of the limitation on deductibility of advertising expenses) and as a result advertisers currently have the right to deduct their advertising expenditures for Canadian tax purposes.
There can be no assurance that issues of the newspapers published or produced by us will continue to be “Canadian issues” of “Canadian newspapers” under the Tax Act, or that Canadian federal income tax laws respecting the treatment of deductibility of advertising expenses incurred in relation to “Canadian issues” of “Canadian newspapers” will not be changed in a manner which adversely affect us.
If our newspapers cease to be “Canadian newspapers” for purposes of the Tax Act, it is expected that our advertising revenue will decline significantly, which would have a material adverse effect on our business, financial condition and results of operations.
40
The collectability of accounts receivable could deteriorate to a greater extent than provided for in our financial statements.
In the normal course of business, we are exposed to credit risk for accounts receivable from our customers. Our accounts receivable are carried at net realizable value and our allowance for doubtful accounts has been determined based on several factors, including the aging of accounts receivable, evaluation of significant individual credit risk accounts and historical experience. If such collectability estimates prove inaccurate, adverse adjustments to future operating results could occur and could be material.
We may have goodwill and intangible asset impairments
At August 31, 2013, we had goodwill and other intangible assets of $473.4 million. We conduct annual impairment testing to determine if we will be able to recover all or a portion of the carrying value of goodwill and indefinite life intangible assets. In addition, we are required to review goodwill and indefinite life intangible assets for impairment more frequently if impairment indicators arise. If the fair value is insufficient to recover the carrying value of our goodwill and indefinite life intangible assets, we may be required to record a material non-cash charge to the statement of operations.
The fair values of our cash-generating units under IFRS and reporting units under US GAAP generally are based on discounted cash flow projections. The discounted cash flow projections are based on management’s best estimates considering historical and expected operating plans, economic conditions, and general outlook for the industry and geographic markets in which we operate. The discount rates used are based on an industry based debt/equity ratio and consider the risk free rate, risk premium and size premium for possible variations from management’s projections. The terminal value used in the discounted cash flow projections is the value attributed to the operations beyond the projected discrete period using a perpetuity growth rate based on industry, revenue and operating income trends and growth prospects.
As disclosed in note 4 of our audited consolidated financial statements for the years ended August 31, 2013, 2012 and 2011, we concluded that under IFRS during the year ended August 31, 2013 we had impairments of $100.0 million (2012 and 2011 – nil). The impairments included an impairment loss relating to: goodwill of $73.9 million, intangible assets and property and equipment of two cash-generating units of $16.4 million and $3.6 million, respectively. In addition, we had an impairment loss of $6.1 million during the year ended August 31, 2013 with respect to a production facility upon reclassification of the asset from property and equipment to asset held-for-sale on the consolidated statement of financial position.
We monitor impairment indicators on a quarterly basis. Significant changes in market conditions, and estimates or judgments used to determine expected future cash flows that indicate a reduction in carrying value, may give rise to impairments in the period that the change becomes known and such impairments could have a material adverse effect on our results of operations.
Disruptions in the credit markets could adversely affect the availability and cost of short-term funds for liquidity requirements, and could adversely affect our access to capital or our ability to obtain financing at reasonable rates and refinance existing debt at reasonable rates or at all.
If internal funds are not available from our operations, we may be required to rely on the banking and credit markets to meet our financial commitments and short-term liquidity needs. Disruptions in the capital and credit markets could adversely affect our ability to access additional funds in the capital markets or draw on or refinance our existing or any future credit facilities. Although we believe that our operating cash flow and access to capital and credit markets, including funds from our ABL Facility (which, as of August 31, 2013, was undrawn and had availability of $20.7 million), will give us the ability to meet our financial needs for the foreseeable future, there can be no assurance provided that continued or increased volatility and disruption in the capital and credit markets will not impair our liquidity. See“Risk Factor - We may not be able to refinance our ABL Facility on attractive terms, or at all”. If this should happen, we may not be able to put alternative credit arrangements in place or without a potentially significant increase in our cost of borrowing. As of August 31, 2013, we have $218.0 million First-Lien Notes and US$268.6 million Second-Lien Notes outstanding. No assurance can be provided that we will be able to refinance our indebtedness on attractive terms, or at all.
41
We may be adversely affected by the availability and terms of our insurance policies.
We carry liability, property and casualty insurance and director and officer liability insurance coverage subject to certain deductibles, limits and exclusions which we believe are customary or reasonable given the cost of procuring insurance and current operating conditions. However, there can be no assurance that: (i) such insurance coverage will continue to be offered on economically feasible terms, (ii) all events which could give rise to a loss or liability will be insurable, or (iii) the amounts of insurance coverage will at all times be sufficient to cover each and every material loss or claim which may occur involving our assets or operations.
Our underfunded registered pension plans or our inability to make required cash contributions to our pension plans could have a material adverse effect on us, our business, cash flows, operations and financial condition.
We maintain several defined benefit and defined contribution plans providing pension and other retirement and post-employment benefits to our employees. Provincial pension legislation requires that the funded status of registered defined benefit pension plans be determined on both a going concern basis (which essentially assumes the pension plan continues indefinitely) and a solvency basis (which essentially assumes a cessation of a pension plan, and is based on statutory requirements). Based on our most recently filed actuarial valuations as of December 31, 2012, the aggregate going concern unfunded liability was approximately $3.2 million and the aggregate wind up deficiency (which essentially assumed that all of the pension plans terminated on their actuarial valuation dates) was approximately $143.3 million. The actual funded status of our pension plans and our contribution requirements are dependent on many factors, including regulatory developments and changes to legislation, changes to the level of benefits provided by the plans, actuarial assumptions and methods used, changes in plan demographics and experience, and changes in the economic conditions, such as the return on fund assets and changes in interest rates and other factors. Additionally, significant changes in investment performance or in a change in the portfolio mix of invested assets can result in corresponding increases and decreases in the valuation of plan assets, particularly equity securities, or in a change to the expected rate of return on plan assets. Significant variations in pension performance could produce volatility in our reported results, and significant underfunding in our pension plans could necessitate higher company contributions to those plans, which could have a material effect on our cash flows, liquidity and financial condition.
Significant changes in pension fund investment performance or assumptions relating to pension costs may have a material effect on the valuation of pension obligations, the funded status of pension plans and our pension cost.
Our pension cost is materially affected by the discount rate used to measure pension obligations, the level of plan assets available to fund those obligations at the measurement date and the expected long-term rate of return on plan assets. A change in the discount rate could result in a significant increase or decrease in the valuation of pension obligations, affecting the reported funded status of our pension plans as well as the net pension cost in subsequent fiscal years. Similarly, changes in the expected return on plan assets can result in significant changes to the net pension cost of subsequent fiscal years.
42
We may be adversely affected by foreign exchange fluctuations.
As of August 31, 2013, approximately 56% of the outstanding principal of our long-term debt is denominated in US dollars and interest, principal and premium, if any, on such borrowings must be paid in US dollars. Through the use of foreign currency interest rate swaps we have hedged foreign exchange rate risk on 62% of our US dollar-denominated debt as at August 31, 2013 (August 31, 2012 – 99%) but no assurance can be given that any such hedging will be successful. We are still exposed to counterparty risk on the hedged portion and to foreign exchange rate risk on the unhedged portion of the Second-Lien Notes of US$101.1 million as at August 31, 2013 (August 31, 2012 – US$3.6 million). The outstanding foreign currency interest rate swap as at August 31, 2013 of US$167.5 million terminates on July 15, 2014. The Second-Lien notes have a principal amount outstanding as at August 31, 2013 of US$268.6 million and mature on July 15, 2018. Accordingly we may be exposed to additional foreign exchange risk if we are unable to amend existing swap agreements or enter into new swap agreements when the foreign currency interest rate swap terminates on July 15, 2014. Upon termination of this foreign currency interest rate swap, our exposure to foreign currency risk may increase significantly. Canadian currency is volatile and may retain the same or higher levels of volatility in the coming years. As a result, we have significant exposure to foreign exchange rate risk.
Our distribution costs could increase due to increases in fuel prices.
Although we do not incur significant fuel related distribution costs directly, our third-party distributors are adversely affected by rising fuel costs. Significant increases in fuel prices could result in increased fees paid to our distributors in the form of fuel subsidies or surcharges. Significant increases in fuel prices could result in material increases to our distribution expenses which could result in an adverse effect to our financial condition and results of operations.
We outsource certain aspects of our business to third-party vendors that may fail to reduce costs and may subject us to risks, including disruptions in our business and increased costs.
We continuously seek to make our cost structure more efficient and to focus on our core strengths. These efforts include contracting with other companies to perform functions or operations that, in the past, we have performed ourselves. We currently rely on partners or third-party service providers for services such as the provision of advertising production, certain of our printing operations and call center services, and we may outsource additional business functions in the future. Although we believe that outsourcing will result in lower costs and increased efficiencies, this may not be the case. Because these third parties may not be as responsive to our needs as we might be ourselves or they experience problems to their own operations beyond our control, outsourcing increases the risk of disruption to our operations. If we are unable to effectively utilize, or integrate with, our outsource providers, or if these partners or third-party service providers experience business difficulties or are unable to provide business services as anticipated, we may need to seek alternative service providers or resume providing these business processes internally, which could be costly and time-consuming and have a material adverse effect on our operating and financial results.
43
Our business may suffer if we are not able to retain and attract sufficient qualified personnel, including key managerial, editorial, technical, marketing and sales personnel.
We operate in an industry where there is intense competition for experienced personnel. We depend on our ability to identify, recruit, hire, train, develop and retain qualified and effective personnel. Our future success depends in large part upon the continued contribution of our senior management and other key employees. A loss of a significant number of skilled managerial, editorial or technical personnel would have a negative effect on the quality of our products. Similarly, a loss of a significant number of experienced and effective marketing and sales personnel would likely result in fewer sales of our products and could materially and adversely affect our results of operations and financial condition. Our ability to identify, recruit, hire, train, develop and retain qualified and effective personnel depends on numerous factors, including factors that we cannot control, such as competition and conditions in the local employment markets in which we operate. The loss of the services of any of our senior management or other key employees could harm our business and materially and adversely affect our ability to compete in our markets. Although we have employment agreements with certain members of senior management and key employees, those individuals may choose to terminate their respective employment at any time, and any such termination may have a material adverse effect on our business.
Increases in sales and other taxes could reduce our revenues and impact profit and cash flows.
In the markets in which we operate, some or all of our products are subject to local and national sales taxes and other taxes such as value-added taxes. Increases in taxes may have a negative effect on the sales of our products. Higher taxes may reduce profit margins on our products if we are unable to pass on the increase to our customers.
The occurrence of natural or man-made disasters could disrupt the marketing and promotion and delivery of our products and services, and adversely affect our financial condition and results of operation.
The success of our businesses is largely contingent on the availability of direct access to customers. As a result, any event that disrupts or limits our direct access to customers or disrupts our ability to rely on delivery services would materially and adversely affect our business. We are exposed to various risks arising out of natural disasters, as well as man-made disasters, including acts of terrorism and military actions. The threat of terrorism and ongoing military actions may cause significant volatility in global financial markets, and a natural or man-made disaster could trigger an economic downturn in the areas directly or indirectly affected by the disaster. These consequences could, among other things, result in a decline in business from those areas. Disasters also could disrupt public and private infrastructure, including communications and financial services, which could disrupt our normal business operations. In addition, increased energy costs, strikes and other labour-related supply chain disruptions could adversely affect our business. A natural or man-made disaster also could disrupt the operations of our counterparties or result in increased prices for the products and services they provide to us.
44
We have become subject to the requirements of Regulation 52-109 on Certification of Disclosure in Issuers’ Annual and Interim Filings and the Sarbanes Oxley Act and must devote time and resources to maintain compliance.
As a result of listing our shares on the TSX and our SEC-registered exchange offer for the Second-Lien Notes in the year ended August 31, 2011 and ongoing reporting requirements in the indenture governing the Second-Lien Notes, we are subject to the requirements of Regulation 52-109 and the Sarbanes Oxley Act, which requires, among other things, public companies to maintain disclosure controls and procedures to ensure timely disclosure of material information, and for foreign private issuers like ourselves, to have management review the effectiveness of those controls on an annual basis. These requirements may place a strain on our systems and resources. Sarbanes-Oxley also requires public companies to have and maintain internal controls over financial reporting to provide reasonable assurance regarding the reliability of financial reporting and preparation of financial statements and to have management review the effectiveness of those controls on an annual basis following the filing of a company’s first annual report. In order to maintain and improve our disclosure controls and procedures and internal control over financial reporting, significant resources and management oversight are required. This may divert management’s attention from other business concerns, which could have a material adverse effect on our business, financial condition, results of operations and cash flows.
If we fail to maintain an effective system of internal controls, we may not be able to provide timely and reliable financial reports.
We are responsible for establishing and maintaining adequate internal control over financial reporting, which is a process designed to provide reasonable assurance regarding the reliability of financial reporting and the preparation of financial statements for external purposes in accordance with IFRS. Because of its inherent limitations, internal control over financial reporting may not prevent or detect misstatements. Also, projections of any evaluation of effectiveness to future periods are subject to risk that controls may become inadequate because of changes in conditions, or that the degree of compliance with the policies or procedures may deteriorate.
Our business could be adversely affected by a change of laws.
Changes to the laws, regulations and policies governing our operations, the introduction of new laws, regulations or policies and changes to the treatment of the tax deductibility of advertising expenditures could have a material effect on our business, financial condition, prospects and results of operations. In addition, we may incur increased costs in order to comply with existing and newly adopted laws and regulations or pay penalties for any failure to comply. It is difficult to predict in what form laws and regulations will be adopted or how they will be construed by the relevant courts, or the extent to which any changes might adversely affect us.
45
Risks Related to our Indebtedness
Our substantial indebtedness could adversely affect our financial condition.
As of August 31, 2013, total carrying value of amounts outstanding under our respective debt agreements was $486.9 million, and we had availability of $20.7 million under our ABL Facility.
Subject to the limits contained in the credit agreement governing the ABL Facility, the indenture that governs the First-Lien Notes and the indenture that governs the Second-Lien Notes, we may be able to incur substantial additional debt from time to time to finance working capital, capital expenditures, investments or acquisitions, or for other purposes. If we do so, the risks related to our high level of debt could intensify. Specifically, our high level of debt could have important consequences, including the following:
| | • | | making it more difficult for us to satisfy our obligations with respect to the First-Lien Notes and Second-Lien Notes; |
| | • | | limiting our ability to obtain additional financing to fund future working capital, capital expenditures, acquisitions or other general corporate requirements; |
| | • | | requiring a substantial portion of our cash flows to be dedicated to debt service payments instead of other purposes, thereby reducing the amount of cash flows available for working capital, capital expenditures, acquisitions and other general corporate purposes; |
| | • | | increasing our vulnerability to general adverse economic and industry conditions; |
| | • | | exposing us to the risk of increased interest rates as certain of our borrowings, including borrowings under the ABL Facility, are at variable rates of interest; |
| | • | | limiting the flexibility in planning for and reacting to changes in the industry in which we compete; |
| | • | | placing us at a disadvantage compared to other, less leveraged competitors; and |
| | • | | increasing our cost of borrowing. |
In addition, the indenture that governs the First-Lien Notes, the indenture that governs the Second-Lien Notes and the credit agreement governing the ABL Facility contain restrictive covenants that limit our ability to engage in activities that may be in our long-term best interests. Our failure to comply with those covenants could result in an event of default which, if not cured or waived, could result in the acceleration of all our debts.
Despite our current level of indebtedness, we may be able to incur substantially more debt. This could further exacerbate the risks to our financial condition described above.
Our operating subsidiary may be able to incur significant additional indebtedness in the future. Although the indenture that governs the First-Lien Notes, the indenture that governs the Second-Lien Notes and the credit agreement that governs the ABL Facility contain restrictions on the incurrence of additional indebtedness, these restrictions are subject to a number of qualifications and exceptions and the additional indebtedness incurred in compliance with these exceptions could be substantial. We may be able to issue additional First-Lien Notes under the indenture under certain circumstances, and may be able to incur other indebtedness that ranks equally with the First-Lien Notes. Additionally, the ABL Facility provides commitments of up to $60 million in the aggregate, subject to the Borrowing Base and excess availability requirements. All of those borrowings would be secured indebtedness. If new debt is added to our current debt levels, the related risks that we and our operating subsidiary now face could intensify.
46
The terms of the ABL Facility, the First-Lien Notes and the Second-Lien Notes restrict our current and future operations, particularly our ability to respond to changes or to take certain actions.
The indenture that governs the First-Lien Notes, the indenture that governs the Second-Lien Notes and the credit agreement governing the ABL Facility contain a number of restrictive covenants that impose significant operating and financial restrictions on us and may limit our ability to engage in acts that may be in our long-term best interests, including, among other things, restrictions on our ability to:
| | • | | incur additional indebtedness; |
| | • | | pay dividends or make other distributions or repurchase or redeem certain indebtedness or capital stock; |
| | • | | make loans and investments; |
| | • | | enter into transactions with affiliates; |
| | • | | alter the businesses we conduct; |
| | • | | enter into agreements restricting any subsidiary’s ability to pay dividends; and |
| | • | | consolidate, merge or sell all or substantially all of our assets. |
There are limitations on our ability to incur the full $60 million of commitments under the ABL Facility. Availability will be limited to the lesser of the Borrowing Base and $60 million, in each case subject to reduction for a required excess availability amount of $15 million. The Borrowing Base is calculated on a monthly (or more frequently under certain circumstances) valuation of eligible accounts receivable. As a result, access to credit under the ABL Facility is potentially subject to significant fluctuation, depending on the value of the Borrowing Base eligible assets as of any measurement date. The ABL Facility provides the lenders considerable discretion to impose reserves, which could materially impair the amount of borrowings that would otherwise be available. There can be no assurance provided that the lenders under the ABL Facility will not impose such actions during the term of the ABL Facility and further, were they to do so, the resulting impact of this action could materially and adversely impair our ability to make interest payments on indebtedness. The inability to borrow under the ABL Facility may adversely affect our liquidity, financial position and results of operations. As at August 31, 2013, no amounts were drawn under the ABL Facility and we had availability of $20.7 million.
47
A breach of the covenants under the indenture that governs the First-Lien Notes, the indenture that governs the Second-Lien Notes or under the credit agreement that governs the ABL Facility could result in an event of default under the applicable indebtedness. Such default may allow our creditors to accelerate the related debt and may result in the acceleration of any other debt to which a cross-acceleration or cross-default provision applies. In addition, an event of default under the ABL Facility would permit the lenders under the ABL Facility to terminate all commitments to extend further credit under such facility. Furthermore, if we are unable to repay the amounts due and payable under the ABL Facility, the First-Lien Notes or the Second-Lien Notes, the applicable lenders could proceed against the collateral granted to such lenders to secure the indebtedness under the applicable facility. As a result of these restrictions, we may be:
| | • | | limited in how we conduct our business; |
| | • | | unable to raise additional debt or equity financing to operate during general economic or business downturns; or |
| | • | | unable to compete effectively or to take advantage of new business opportunities. |
These restrictions may affect our ability to grow in accordance with our plans.
We may not be able to refinance our ABL Facility on attractive terms, or at all
On February 1, 2013, the Supreme Court of Canada (the “SCC”) released its decision inSun Indalex Finance, LLC v. United Steelworkers, a case which dealt with the priority claims of pension plan members against those of secured creditors in the context of the insolvency of a plan sponsor. The SCC overturned the Ontario Court of Appeals decision that effectively subordinated a debtor-in-possession financing that had been granted super-priority status in aCompanies’ Creditors Arrangement Act proceeding to the wind up deficiency under a pension plan. The SCC, however, upheld the Ontario Court of Appeal’s expanded interpretation of the deemed trust provisions of the OntarioPension Benefits Act, and found that a deemed trust applies in respect of the entire wind up deficiency of a plan upon its wind up, which is an expansion from previous case law which limited the deemed trust to current service costs and special payments accrued and unpaid to the wind up date. The expanded definition of the deemed trust may affect the availability of credit to companies who sponsor defined benefit pension plans as lenders consider the possible impact of a future plan wind up on the security of any loan.
The deemed trust is limited in respect of the assets to which it applies. Specifically, wind up deficiencies have a priority charge only over a debtor company’s accounts receivable and inventory and their proceeds. Other assets are not subject to the deemed trust.
We have an ABL Facility with an availability of an aggregate amount of up to $60 million subject to a reduction for a required excess availability amount of $15 million. As at August 31, 2013, no amounts were drawn under the ABL Facility and we had availability of $20.7 million. The ABL Facility is secured on a first-priority basis by accounts receivable, cash and inventory of Postmedia Network Inc. and any related assets of Postmedia Network Canada Corp. As such, the ABL Facility is primarily secured by the assets over which a deemed trust could be found in the event of the wind up of a Postmedia sponsored pension plan. The ABL Facility terminates on July 13, 2014. Given that the SCC decision is recent and its impact on the credit markets is uncertain, as well as the current solvency deficiencies in our pension plans, there can be no assurance that we will be able to refinance the ABL Facility on attractive terms, or at all.
48
The ABL Facility contains restrictions on the ability to amend the First-Lien Notes and Second-Lien Notes.
The ABL Facility will restrict amendments to the First-Lien Notes and Second-Lien Notes to the extent such amendment, modification or waiver could reasonably be expected to be adverse in any material respect to the lenders under the ABL Facility. These restrictions could impact our ability to amend any provision of the indenture for the First-Lien Notes or the indenture governing the Second-Lien Notes, particularly since it may be difficult to determine whether an amendment is adverse to the lenders under the ABL Facility.
Our variable rate indebtedness subjects us to interest rate risk which could cause our indebtedness service obligations to increase significantly.
Borrowings under the ABL Facility are at variable rates of interest and will expose us to interest rate risk. If interest rates increase if any amount is owed under the ABL Facility, our debt service obligations on the variable rate indebtedness would increase even though the amount borrowed remained the same, and our net earnings and cash flows, including cash available for servicing our indebtedness, would correspondingly decrease. Further, we may not decide, or be able, to hedge all or any portion of the risk.
We may not be able to generate sufficient cash to service all of our indebtedness and may be forced to take other actions to satisfy our obligations under our indebtedness, which may not be successful.
Our ability to make scheduled payments on or to refinance our debt obligations and derivative financial instruments depends on our financial condition and operating performance, which are subject to prevailing economic and competitive conditions and to certain financial, business, legislative, regulatory and other factors beyond our control. We may be unable to maintain a level of cash flows from operating activities sufficient to permit us to pay the future amounts due on our indebtedness.
If our cash flows and capital resources are insufficient to fund our debt service and derivative financial instrument obligations, we could face substantial liquidity problems and could be forced to reduce or delay investments and capital expenditures or to dispose of material assets or operations, seek additional debt or equity capital or restructure or refinance indebtedness. We may not be able to effect any such alternative measures, if necessary, on commercially reasonable terms, or at all and, even if successful, such alternative actions may not allow us to meet our scheduled debt service and derivative financial instrument obligations. The credit agreement that governs the ABL Facility, the indenture that governs the First-Lien Notes and the indenture that governs the Second-Lien Notes restrict our ability to dispose of assets and use the proceeds from any such dispositions and may also restrict our ability to raise debt or equity capital to be used to repay other indebtedness when it becomes due. We may not be able to consummate those dispositions or to obtain proceeds in an amount sufficient to meet any debt service and derivative financial instrument obligations then due.
Our inability to generate sufficient cash flows to satisfy our debt and derivative financial instrument obligations, or to refinance indebtedness on commercially reasonable terms, or at all, would materially and adversely affect our business, financial position and results of operations, and our ability to satisfy such obligations.
If we cannot make scheduled payments on our debt, we will be in default and, as a result, holders of the First-Lien Notes and Second-Lien Notes could declare all outstanding principal and interest to be due and payable, the lenders under the ABL Facility could terminate their commitments to loan money and our secured lenders, including under the ABL Facility, could foreclose on or exercise other remedies against the assets securing such borrowings on a basis senior to the First-Lien Notes and we could be forced into bankruptcy, liquidation or other insolvency proceedings.
49
Risks Relating to Our Shares
An active public market for the Shares has not yet been developed.
On June 14, 2011 our Class C voting shares and our Class NC variable voting shares (“Shares”) began trading on the Toronto Stock Exchange. An active public market for the Shares has not yet developed and, if developed, may not be sustained. If an active public market does not develop, the liquidity of an investment in our Shares may be limited.
Volatile market price for the Shares.
The market price for the Shares may be volatile and subject to wide fluctuations in response to numerous factors, many of which are beyond our control, including the following:
| | • | | actual or anticipated fluctuations in our quarterly results of operations; |
| | • | | changes in estimates of future results of operations by ourselves or securities research analysts; |
| | • | | changes in the economic performance or market valuations of other companies that investors deem comparable to us; |
| | • | | addition or departure of our executive officers and other key personnel; |
| | • | | release or other transfer restrictions on outstanding Shares; |
| | • | | sales or perceived sales of additional Shares; |
| | • | | our dual class share structure; |
| | • | | significant acquisitions or business combinations, strategic partnerships, joint ventures or capital commitments by or involving ourselves or our competitors; and |
| | • | | news reports relating to trends, concerns or competitive developments, regulatory changes and other related issues in our industry or target markets. |
Financial markets have recently experienced significant price and volume fluctuations that have particularly affected the market prices of equity securities of companies and that have, in many cases, been unrelated to the operating performance, underlying asset values or prospects of such companies. Accordingly, the market price of the Shares may decline even if our operating results, underlying asset values or prospects have not changed. Additionally, these factors, as well as other related factors, may cause decreases in asset values which may result in impairment losses. As well, certain institutional investors may base their investment decisions on consideration of our environmental, governance and social practices and performance against such institutions’ respective investment guidelines and criteria, and failure to meet such criteria may result in a limited or no investment in the Shares by those institutions, which could adversely affect the trading price of the Shares. There can be no assurance that continuing fluctuations in price and volume will not occur. If such increased levels of volatility and market turmoil continue, our operations could be adversely impacted and the trading price of the Shares may be adversely affected.
50
We have a dual class share structure.
Our authorized capital consists of two classes: Voting Shares and Variable Voting Shares. The Voting Shares may only be beneficially owned and controlled, directly and indirectly, by persons that are not Non-Canadians. An outstanding Variable Voting Share will be converted into one Voting Share, automatically and without any further act of ourselves or the holder, if such Variable Voting Share is not or ceases to be beneficially owned or controlled, directly or indirectly, by one or more Non-Canadians. In addition to the automatic conversion feature, a holder of Voting Shares shall have the option at any time to convert some or all of such shares into Variable Voting Shares on a one-for-one basis and to convert those shares back to Voting Shares on a one-for-one basis. Given these conversion features and the fact that we will not know whether a purchaser of Variable Voting Shares is not a Non-Canadian unless such person completes a declaration provided by our transfer agent from time to time, the transfer agent’s records of the amount of Voting Shares and Variable Voting Shares outstanding at any one time may not be accurate. As we believe that the issued and outstanding Variable Voting Shares as at August 31, 2013 represent more than 97% of the outstanding Shares, if a person who is not a Non-Canadian acquires Variable Voting Shares such Shares would automatically convert into a larger percentage of the outstanding Voting Shares. In certain circumstances, such an acquisition may constitute an indirect take-over bid under applicable securities laws and require the offeror to make a formal take-over bid for the outstanding Voting Shares or, alternatively, rely on certain exemptions from the formal take-over bid requirements under applicable securities laws. Purchasers of our Shares should consider applicable take-over bid laws as well as the Postmedia Rights Plan prior to purchasing Shares that may represent more than 20% of any class. For purposes of determining beneficial ownership under the Postmedia Rights Plan, Variable Voting Shares beneficially owned or controlled by a person or subject of Canada are deemed to also include the Voting Shares into which such Variable Voting Shares could be converted. In addition, one class of Shares may be less liquid than the other and the classes of shares may have different trading prices.
Postmedia Network Canada Corp. is a holding company.
Postmedia Network Canada Corp. (“PNCC”) is a holding company and a substantial portion of its assets are the capital stock of its subsidiary, Postmedia Network Inc. (“PMNI”). As a result, investors in PNCC are subject to the risks attributable to PMNI. As a holding company, PNCC conducts substantially all of its business through PMNI, which generates substantially all of its revenues. Consequently, PNCC’s cash flows and ability to complete current or desirable future enhancement opportunities are dependent on the earnings of PMNI and the distribution of those earnings to PNCC. The ability of PMNI to pay dividends and other distributions will depend on its operating results and will be subject to applicable laws and regulations which require that solvency and capital standards be maintained, and contractual restrictions contained in the instruments governing its debt. In the event of a bankruptcy, liquidation or reorganization of PMNI, holders of indebtedness and trade creditors will generally be entitled to payment of their claims from the assets of the subsidiary before any assets are made available for distribution to PNCC.
Future sales of Shares by directors and executive officers.
Subject to compliance with applicable securities laws, officers and directors and their affiliates may sell some or all of their Shares in the future. No prediction can be made as to the effect, if any, such future sales of Shares will have on the market price of the Shares prevailing from time to time. However, the future sale of a substantial number of Shares by our officers and directors and their affiliates, or the perception that such sales could occur, could adversely affect prevailing market prices for the Shares.
Dilution and future sales of Shares may occur.
Our articles permit the issuance of an unlimited number of Shares, and shareholders will have no pre-emptive rights in connection with such further issuances. Our directors have the discretion to determine the price and the terms of issue of further issuances of Shares.
51
Internal Controls
Disclosure controls and procedures within the Company have been designed to provide reasonable assurance that all relevant information is identified to its management, including the President and Chief Executive Officer (“CEO”) and the Executive Vice President and Chief Financial Officer (“CFO”), as appropriate, to allow required disclosures to be made in a timely fashion.
Internal controls over financial reporting have been designed by management, under the supervision of and with the participation of the CEO and CFO, to provide reasonable assurance regarding the reliability of the Company’s financial reporting and the preparation of financial statements for external purposes in accordance with IFRS.
The CEO and CFO of the Company have evaluated the effectiveness of the Company’s internal controls over financial reporting during the year ended August 31, 2013. Based on this evaluation, the CEO and CFO concluded that disclosure controls and procedures and internal controls over financial reporting were effective as at August 31, 2013. The CEO and CFO have evaluated whether there were changes to Postmedia’s internal control over financial reporting during the year ended August 31, 2013, that have materially affected, or are reasonably likely to materially affect, internal control over financial reporting. There were no changes identified during their evaluation.
Share Capital
As at October 18, 2013 we had the following number of shares and options outstanding:
| | | | |
Class C voting shares | | | 981,861 | |
Class NC variable voting shares | | | 39,227,758 | |
| | | | |
Total shares outstanding | | | 40,209,619 | |
| | | | |
Total options and restricted share units outstanding(1) | | | 1,800,000 | |
| | | | |
| (1) | The total options and restricted share units outstanding are convertible into 1,730,000 Class C voting shares and 70,000 Class NC variable voting shares. The total options and restricted share units outstanding include 1,280,000 options that are vested and 520,000 options that are unvested. |
52