Exhibit 99.1

Global Net Lease Fourth Quarter Investor Presentation
2 OVERVIEW High - Quality, Mission Critical, Diversified Portfolio 1. As used herein, “Investment Grade Rating” includes both actual investment grade ratings of the tenant or Implied Investment G rad e. Implied Investment Grade includes ratings of tenant parent (regardless of whether or not the parent has guaranteed the tenant’s obligation under the lease) or lease guarantor. Implied Investment Grade ratings are determined u sin g proprietary Moody’s analytical tool, which compares the risk metrics of the non - rated company to those of a company with an actual rating. Ratings information is as of December 31, 2018. Long Duration Leases to Investment Grade Rated Tenants (1) Differentiated Strategy with International Exposure Proactive Asset Management to Drive Long Term Portfolio Value Highly Experienced Management Team Ability to Capitalize on Imbalance Between U.S. and European Markets to Deliver Superior Risk Adjusted Returns
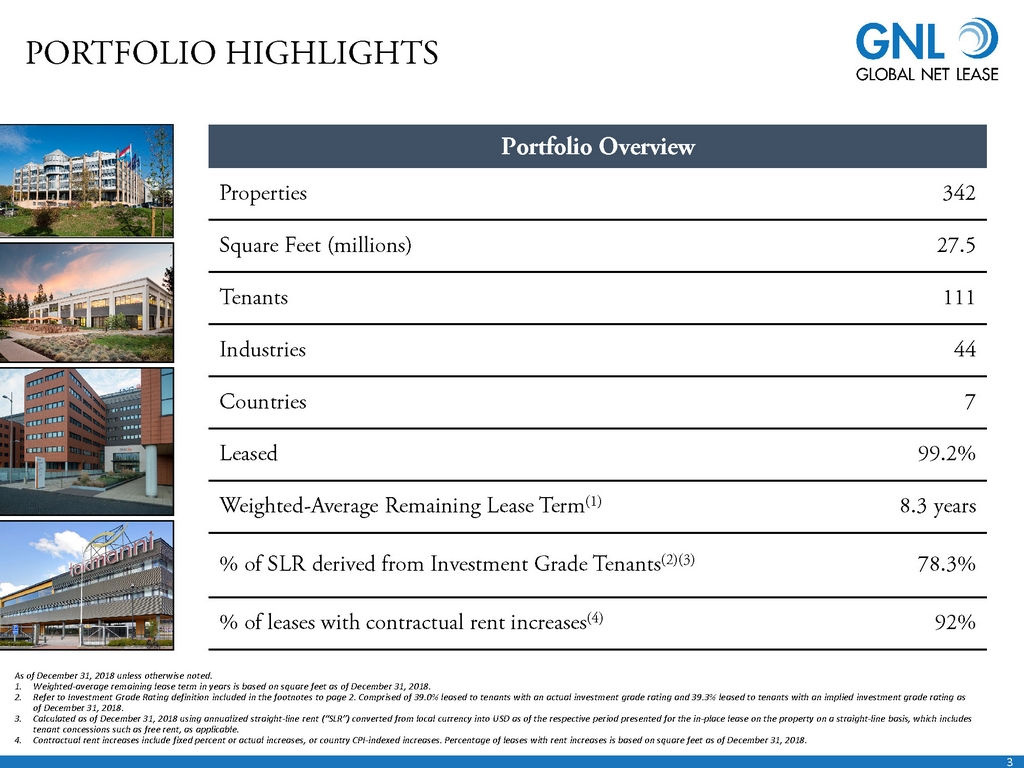
3 PORTFOLIO HIGHLIGHTS Properties 342 Square Feet (millions) 27.5 Tenants 111 Industries 44 Countries 7 Leased 99.2% Weighted - Average Remaining Lease Term (1) 8.3 years % of SLR derived from Investment Grade Tenants (2)(3) 78.3% % of leases with contractual rent increases (4) 92% Portfolio Overview As of December 31, 2018 unless otherwise noted. 1. Weighted - average remaining lease term in years is based on square feet as of December 31 , 2018. 2. Refer to Investment Grade Rating definition included in the footnotes to page 2. Comprised of 39.0% leased to tenants with an ac tual investment grade rating and 39.3% leased to tenants with an implied investment grade rating as of December 31, 2018 . 3. Calculated as of December 31 , 2018 using annualized straight - line rent (“SLR”) converted from local currency into USD as of the respective period presented for the in - place lease on the property on a straight - line basis, which includes tenant concessions such as free rent, as applicable. 4. Contractual rent increases include fixed percent or actual increases, or country CPI - indexed increases. Percentage of leases wit h rent increases is based on square feet as of December 31, 2018.
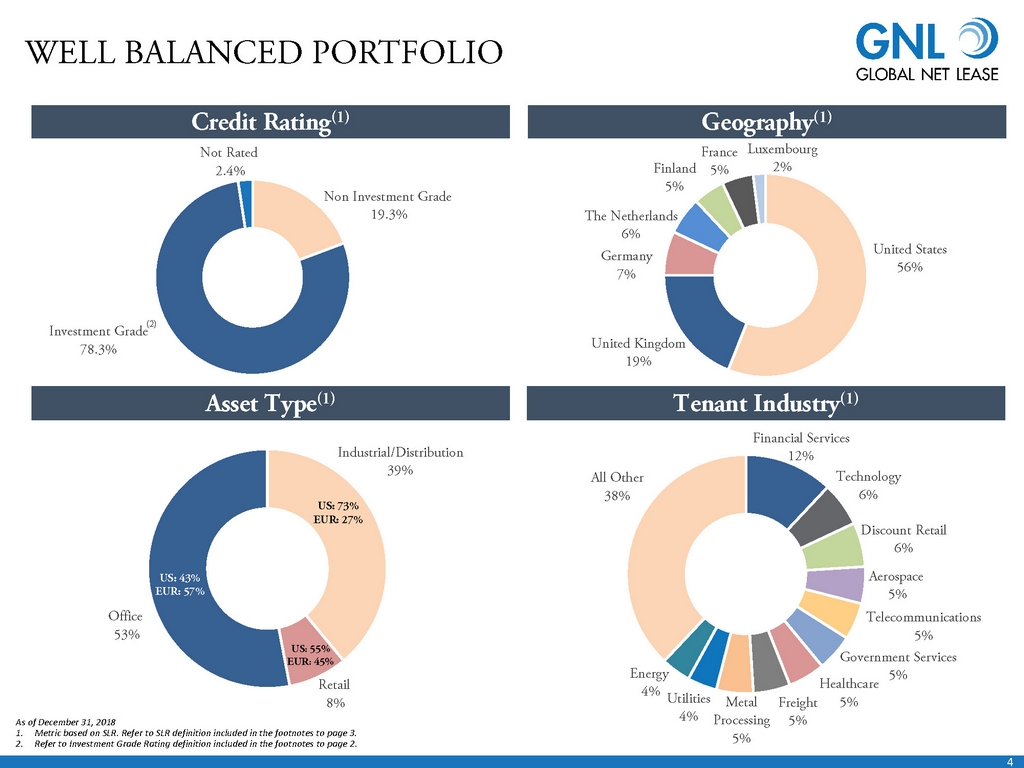
4 Non Investment Grade 19.3% Investment Grade 78.3% Not Rated 2.4% Industrial/Distribution 39% Retail 8% Office 53% WELL BALANCED PORTFOLIO As of December 31, 2018 1. Metric based on SLR. Refer to SLR definition included in the footnotes to page 3. 2. Refer to Investment Grade Rating definition included in the footnotes to page 2. Credit Rating (1) Tenant Industry (1) Geography (1) Asset Type (1) (2) US: 73 % EUR: 27% US: 55% EUR: 45% US: 43% EUR: 57% United States 56% United Kingdom 19% Germany 7% The Netherlands 6% Finland 5% France 5% Luxembourg 2% Financial Services 12% Technology 6% Discount Retail 6% Aerospace 5% Telecommunications 5% Government Services 5% Healthcare 5% Freight 5% Metal Processing 5% Utilities 4% Energy 4% All Other 38%
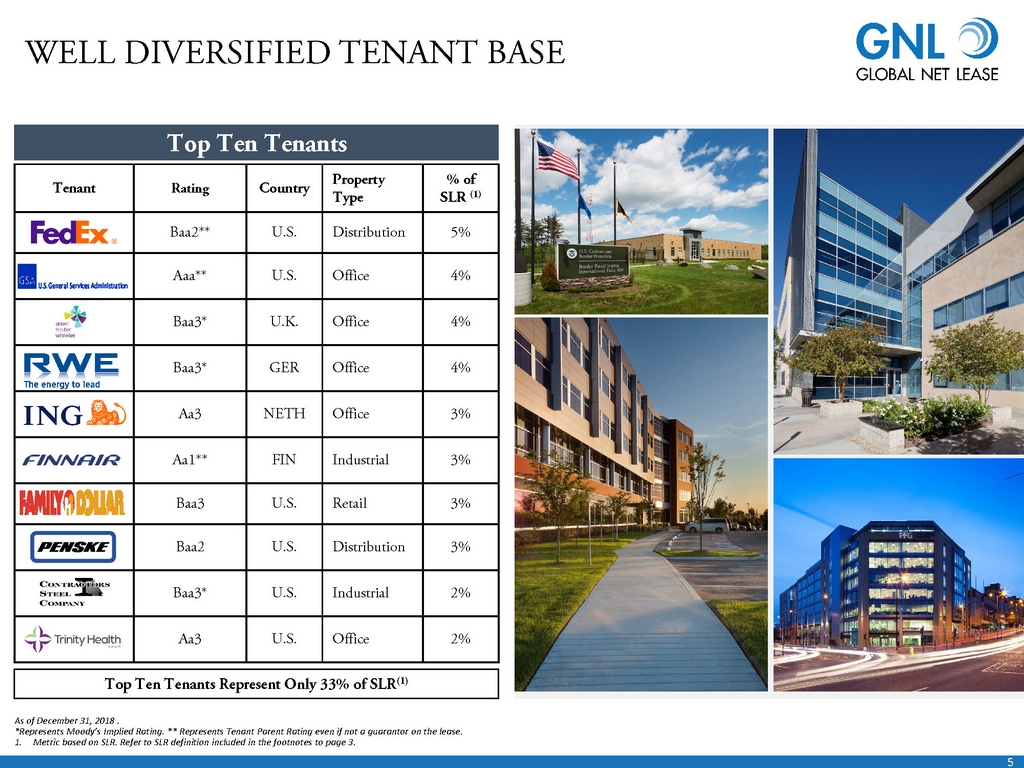
5 Tenant Rating Country Property Type % of SLR (1) Baa2** U.S. Distribution 5% Aaa** U.S. Office 4% Baa3* U.K. Office 4% Baa3* GER Office 4% Aa3 NETH Office 3% Aa1** FIN Industrial 3% Baa3 U.S. Retail 3% Baa2 U.S. Distribution 3% Baa3* U.S. Industrial 2% Aa3 U.S. Office 2% WELL DIVERSIFIED TENANT BASE Top Ten Tenants As of December 31, 2018 . *Represents Moody’s Implied Rating. ** Represents Tenant Parent Rating even if not a guarantor on the lease. 1. Metric based on SLR. Refer to SLR definition included in the footnotes to page 3. Top Ten Tenants Represent Only 33 % of SLR (1)

6 Office Distribution Industrial FOCUS ON HIGH - QUALITY TENANTS Only Focused on Markets with Quality Sovereign Debt Ratings (S&P) U.S. Luxembourg Germany The Netherlands Finland U.K. France AA+ AAA AAA AAA AA+ AA AA Best - in - class portfolio leased to largely Investment Grade Rated Tenants (1) in well established markets in the U.S. and Europe 1. Refer to Investment Grade Rating definition included in the footnotes to page 2.
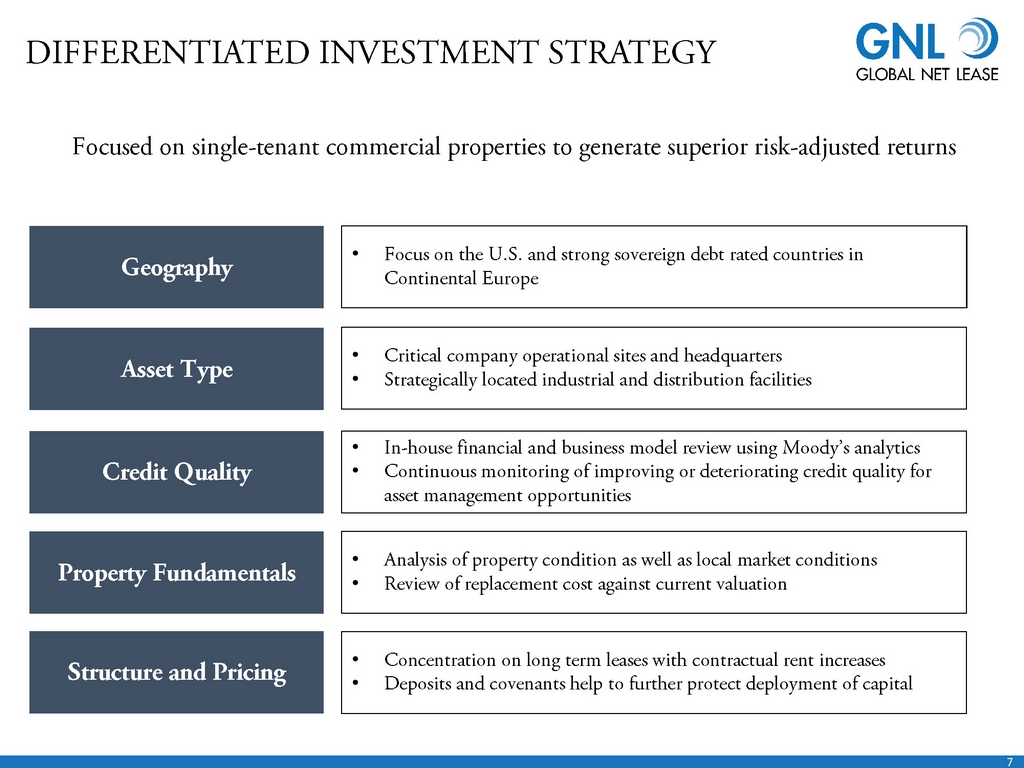
7 DIFFERENTIATED INVESTMENT STRATEGY Geography Asset Type Property Fundamentals Credit Quality Structure and Pricing Focused on single - tenant commercial properties to generate superior risk - adjusted returns • Focus on the U.S. and strong sovereign debt rated countries in Continental Europe • Critical company operational sites and headquarters • Strategically located industrial and distribution facilities • In - house financial and business model review using Moody’s analytics • Continuous monitoring of improving or deteriorating credit quality for asset management opportunities • Analysis of property condition as well as local market conditions • Review of replacement cost against current valuation • Concentration on long term leases with contractual rent increases • Deposits and covenants help to further protect deployment of capital
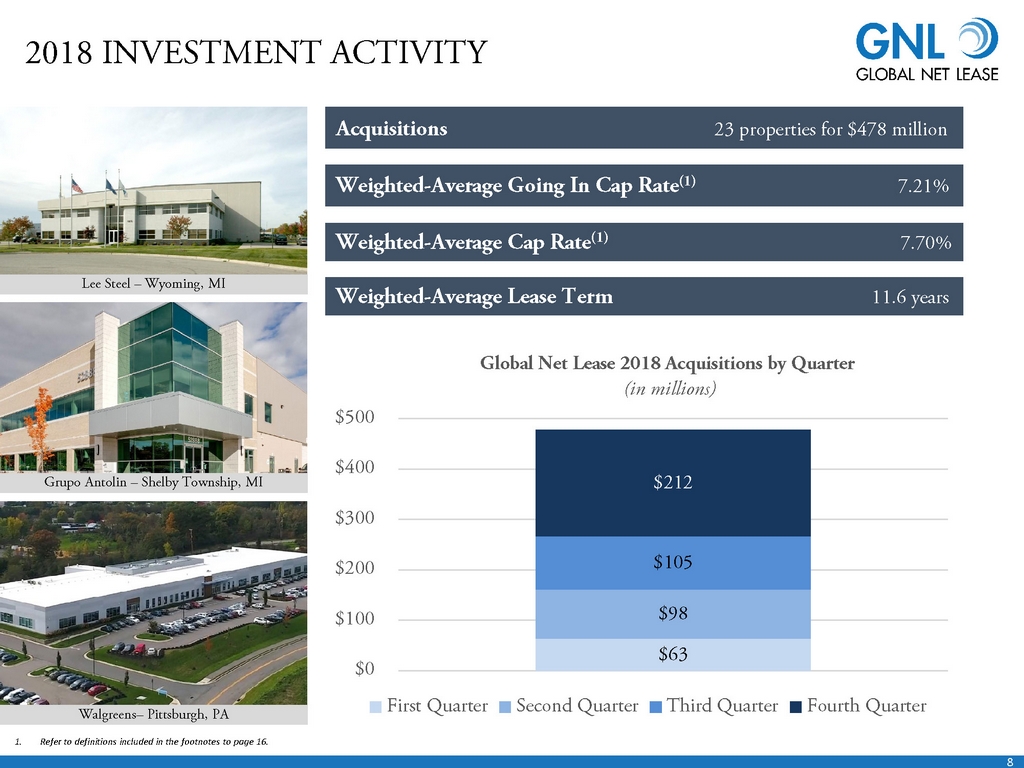
8 1. Refer to definitions included in the footnotes to page 16 . 2018 INVESTMENT ACTIVITY Acquisitions 23 properties for $478 million Weighted - Average Going In Cap Rate (1) 7.21% Weighted - Average Cap Rate (1) 7.70% Weighted - Average Lease Term 11.6 years $63 $98 $105 $212 $0 $100 $200 $300 $400 $500 Global Net Lease 2018 Acquisitions by Quarter (in millions) First Quarter Second Quarter Third Quarter Fourth Quarter Lee Steel – Wyoming, MI Walgreens – Pittsburgh, PA Grupo Antolin – Shelby Township, MI

9 *Represents Moody’s Implied Rating. ** Represents Tenant Parent Rating. 1. Refer to Average Cap Rate definition included in the footnotes to page 16. 2. Refer to Investment Grade Rating definition included in the footnotes to page 2 and page 3. 3. Represents remaining lease term as of acquisition date and are weighted based on square feet. 2018 INVESTMENT ACTIVITY (CONTINUED) Tenant Closing Date Properties Credit Rating (2) Asset Type Lease Term Remaining (3) Chemours Company, FC LLC Closed - 1Q 2018 1 Ba2** Distribution 9.9 Lee Steel Holdings, LLC Closed - 1Q 2018 1 B3* Industrial 10.5 LSI Steel Processing Closed - 1Q 2018 3 Baa1* Industrial 9.6 FCA US, LLC (Fiat Chrysler) Closed - 1Q 2018 1 Ba2** Industrial 9.9 Contractors Steel Company Closed - 2Q 2018 5 Baa3* Industrial 9.7 FedEx Freight – Blackfoot, ID Closed - 2Q 2018 1 Baa2 Distribution 14.3 DuPont Pioneer Closed - 2Q 2018 1 A3** Industrial 10.5 Rubbermaid Closed - 3Q 2018 1 Baa3 Industrial 10.5 NetScout Closed - 3Q 2018 1 Ba3* Office 12.0 FedEx Freight – Greenville, NC Closed - 3Q 2018 1 Baa2 Distribution 14.3 Bush Industries Closed - 3Q 2018 1 Ba1* Industrial 20.0 Penske Closed – 4Q 2018 1 Baa2 Distribution 10.0 NSA Industries Closed – 4Q 2018 1 B3* Industrial 20.0 LKQ Corporation Closed – 4Q 2018 1 Ba2 Distribution 12.1 Grupo Antolin Closed – 4Q 2018 1 Ba3 Industrial 13.8 Walgreens Closed – 4Q 2018 1 BBB Distribution 6.9 VersaFlex Closed – 4Q 2018 1 Ba1* Industrial 20.0 Total 23 11.6 GNL identified what it believes to be accretive acquisition opportunities to grow organically, adding $478 million of properties in 2018 with a weighted - average cap rate of 7.70 % (1)
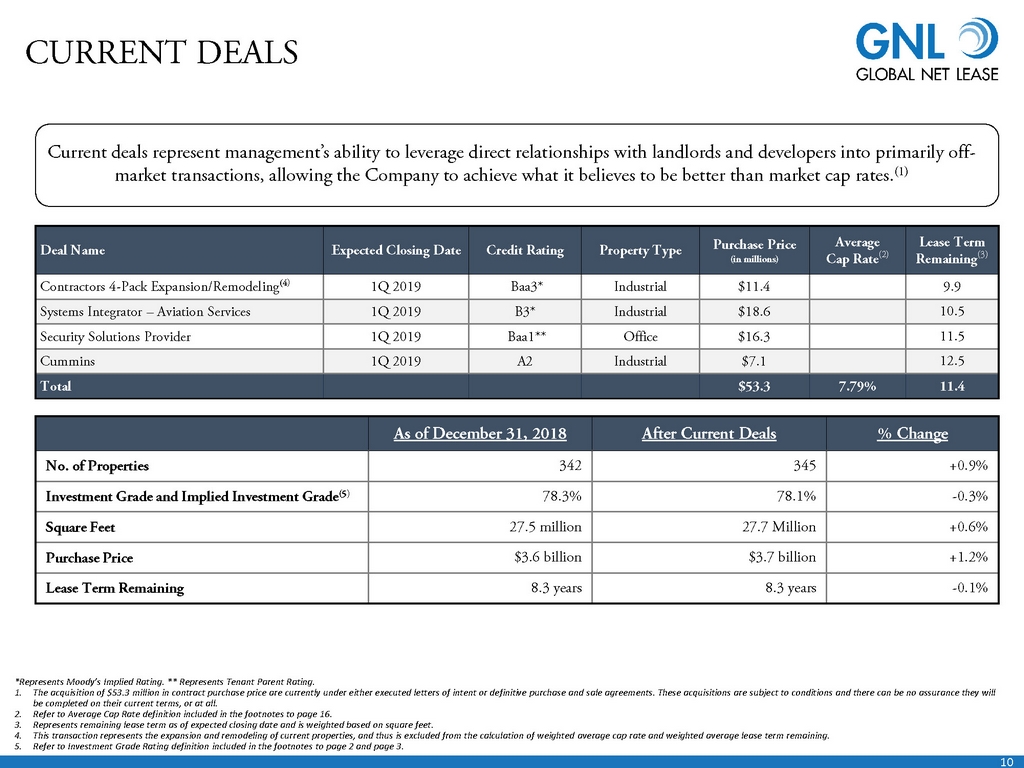
10 CURRENT DEALS *Represents Moody’s Implied Rating. ** Represents Tenant Parent Rating. 1. The acquisition of $53.3 million in contract purchase price are currently under either executed letters of intent or definiti ve purchase and sale agreements. These acquisitions are subject to conditions and there can be no assurance they will be completed on their current terms, or at all. 2. Refer to Average Cap Rate definition included in the footnotes to page 16. 3. Represents remaining lease term as of expected closing date and is weighted based on square feet. 4. This transaction represents the expansion and remodeling of current properties, and thus is excluded from the calculation of wei ghted average cap rate and weighted average lease term remaining. 5. Refer to Investment Grade Rating definition included in the footnotes to page 2 and page 3. Current deals represent management’s ability to leverage direct relationships with landlords and developers into primarily of f - market transactions, allowing the Company to achieve what it believes to be better than market cap rates. (1) As of December 31, 2018 After Current Deals % Change No. of Properties 342 345 +0.9% Investment Grade and Implied Investment Grade (5 ) 78.3% 78.1% - 0.3% Square Feet 27.5 million 27.7 Million +0.6% Purchase Price $3.6 billion $3.7 billion +1.2% Lease Term Remaining 8.3 years 8.3 years - 0.1% Deal Name Expected Closing Date Credit Rating Property Type Purchase Price (in millions) Average Cap Rate (2) Lease Term Remaining (3) Contractors 4 - Pack Expansion/Remodel ing (4 ) 1Q 2019 Baa3* Industrial $11.4 9.9 Systems Integrator – Aviation Services 1Q 2019 B3* Industrial $18.6 10.5 Security Solutions Provider 1Q 2019 Baa1** Office $16.3 11.5 Cummins 1Q 2019 A2 Industrial $7.1 12.5 Total $53.3 7.79% 11.4
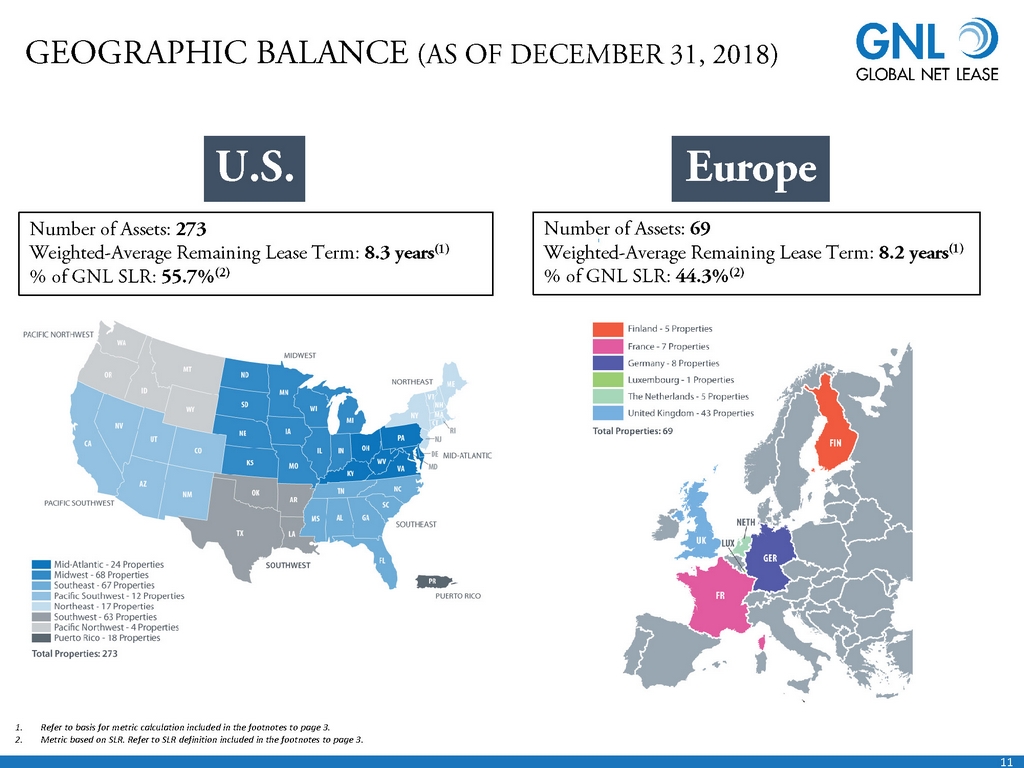
11 GEOGRAPHIC BALANCE (AS OF DECEMBER 31, 2018) 1. Refer to basis for metric calculation included in the footnotes to page 3. 2. Metric based on SLR. Refer to SLR definition included in the footnotes to page 3. U.S. Number of Assets: 273 Weighted - Average Remaining Lease Term: 8.3 years (1) % of GNL SLR: 55.7% (2) Europe Number of Assets: 69 Weighted - Average Remaining Lease Term: 8.2 years (1) % of GNL SLR: 44.3% (2)
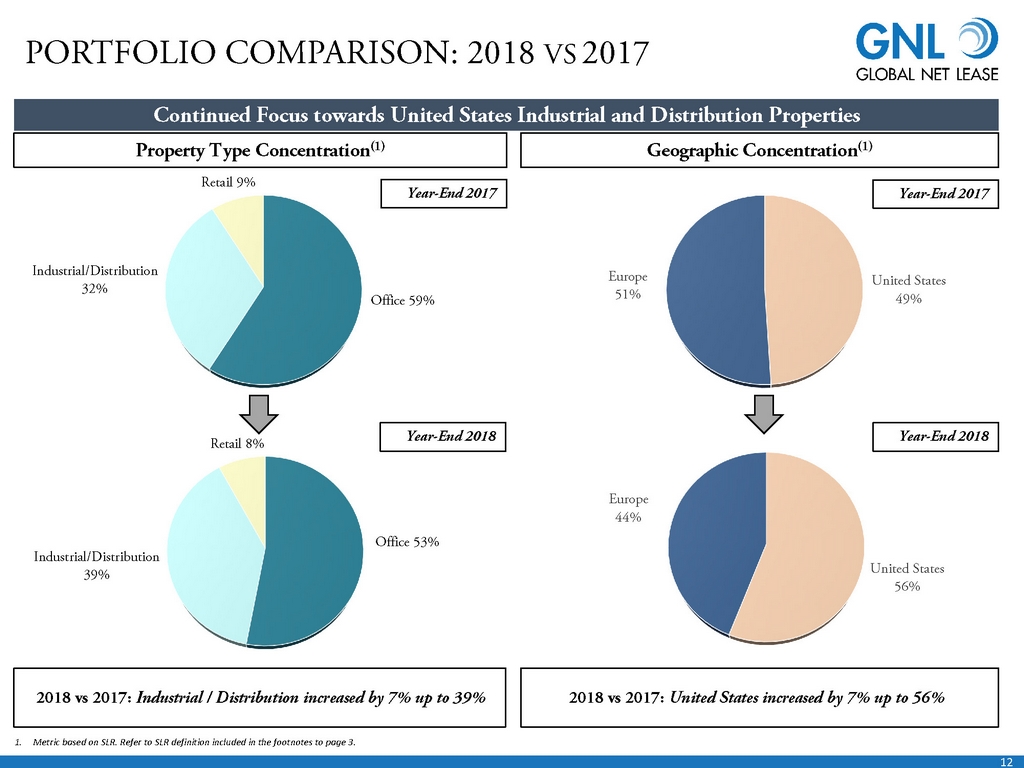
12 Office 53% Industrial/Distribution 39% Retail 8% PORTFOLIO COMPARISON: 2018 VS 2017 Continued Focus towards United States Industrial and Distribution Properties Office 59% Industrial/Distribution 32% Retail 9% United States 49% Europe 51% Property Type Concentration (1) Geographic Concentration (1) Year - End 2017 Year - End 2017 Year - End 2018 2018 vs 2017: Industrial / Distribution increased by 7% up to 39% United States 56% Europe 44% Year - End 2018 2018 vs 2017: United States increased by 7% up to 56% 1. Metric based on SLR. Refer to SLR definition included in the footnotes to page 3.
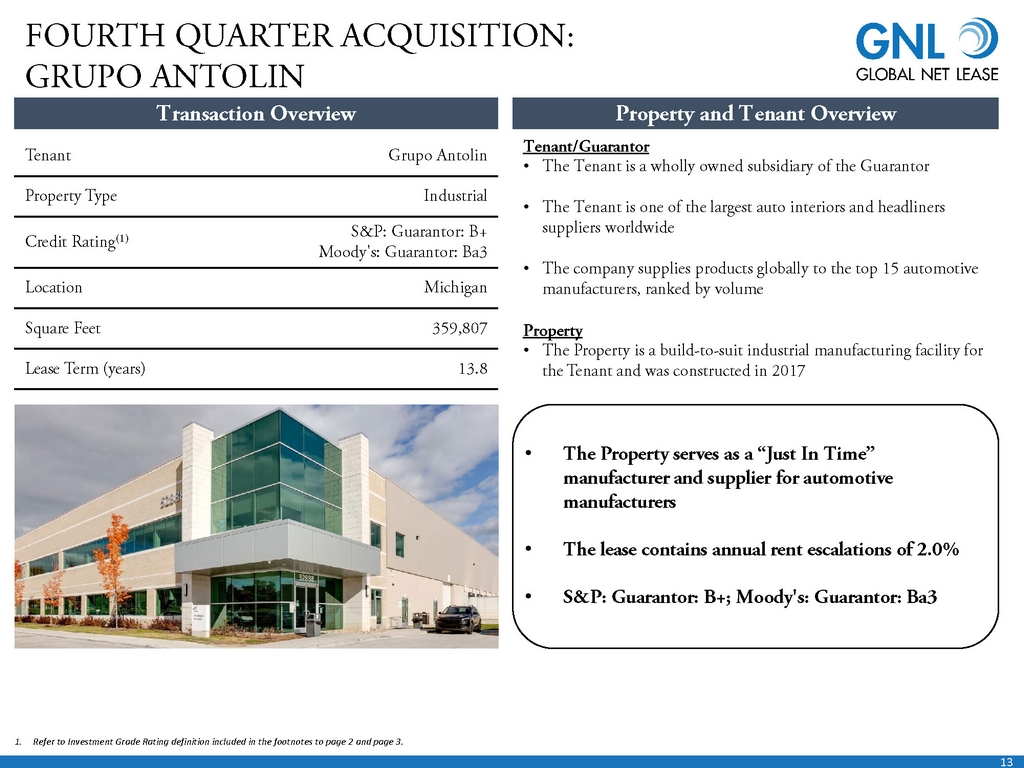
13 FOURTH QUARTER ACQUISITION: GRUPO ANTOLIN Property and Tenant Overview Tenant Grupo Antolin Property Type Industrial Credit Rating (1) S&P: Guarantor: B+ Moody's: Guarantor: Ba3 Location Michigan Square Feet 359,807 Lease Term (years) 13.8 Tenant/Guarantor • The Tenant is a wholly owned subsidiary of the Guarantor • The Tenant is one of the largest auto interiors and headliners suppliers worldwide • The company supplies products globally to the top 15 automotive manufacturers, ranked by volume Property • The Property is a build - to - suit industrial manufacturing facility for the Tenant and was constructed in 2017 • The Property serves as a “Just In Time” manufacturer and supplier for automotive manufacturers • The lease contains annual rent escalations of 2.0% • S&P: Guarantor: B+; Moody's: Guarantor: Ba3 Transaction Overview 1. Refer to Investment Grade Rating definition included in the footnotes to page 2 and page 3.
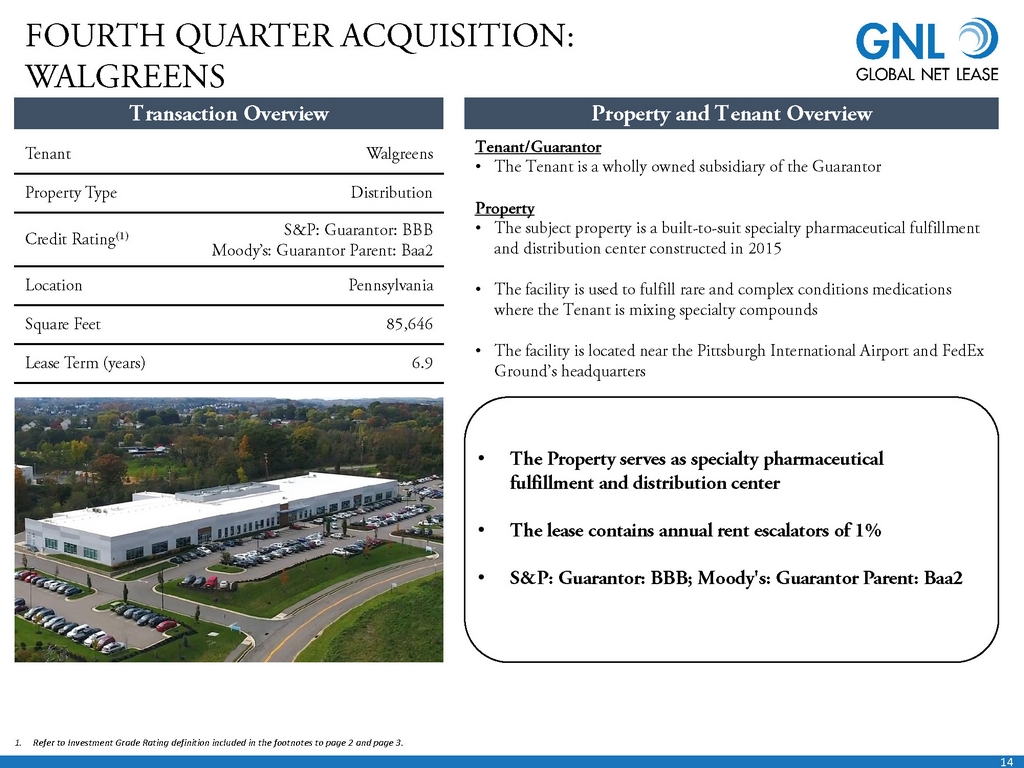
14 Transaction Overview Tenant Walgreens Property Type Distribution Credit Rating (1) S&P: Guarantor: BBB Moody’s: Guarantor Parent: Baa2 Location Pennsylvania Square Feet 85,646 Lease Term (years) 6.9 Tenant/Guarantor • The Tenant is a wholly owned subsidiary of the Guarantor Property • The subject property is a built - to - suit specialty pharmaceutical fulfillment and distribution center constructed in 2015 • The facility is used to fulfill rare and complex conditions medications where the Tenant is mixing specialty compounds • The facility is located near the Pittsburgh International Airport and FedEx Ground’s headquarters • The Property serves as specialty pharmaceutical fulfillment and distribution center • The lease contains annual rent escalators of 1% • S&P: Guarantor: BBB; Moody's: Guarantor Parent: Baa2 1. Refer to Investment Grade Rating definition included in the footnotes to page 2 and page 3. Property and Tenant Overview FOURTH QUARTER ACQUISITION: WALGREENS
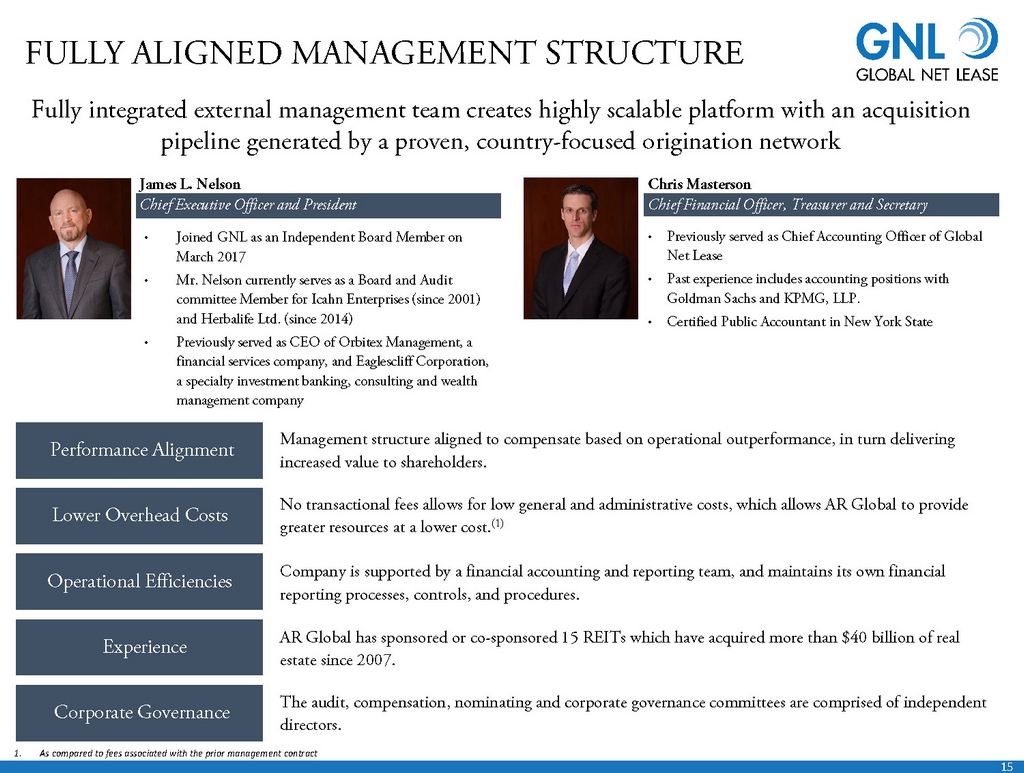
15 Chris Masterson Chief Financial Officer, Treasurer and Secretary FULLY ALIGNED MANAGEMENT STRUCTURE Fully integrated external management team creates highly scalable platform with an acquisition pipeline generated by a proven, country - focused origination network No transactional fees allows for low general and administrative costs, which allows AR Global to provide greater resources at a lower cost. (1) Lower Overhead Costs AR Global has sponsored or co - sponsored 15 REITs which have acquired more than $40 billion of real estate since 2007. Experience The audit, compensation, nominating and corporate governance committees are comprised of independent directors. Corporate Governance Performance Alignment Management structure aligned to compensate based on operational outperformance, in turn delivering increased value to shareholders. Company is supported by a financial accounting and reporting team, and maintains its own financial reporting processes, controls, and procedures. Operational Efficiencies James L. Nelson Chief Executive Officer and President • Joined GNL as an Independent Board Member on March 2017 • Mr. Nelson currently serves as a Board and Audit committee Member for Icahn Enterprises (since 2001) and Herbalife Ltd. (since 2014) • Previously served as CEO of Orbitex Management, a financial services company, and Eaglescliff Corporation, a specialty investment banking, consulting and wealth management company • Previously served as Chief Accounting Officer of Global Net Lease • Past experience includes accounting positions with Goldman Sachs and KPMG, LLP. • Certified Public Accountant in New York State 1. As compared to fees associated with the prior management contract
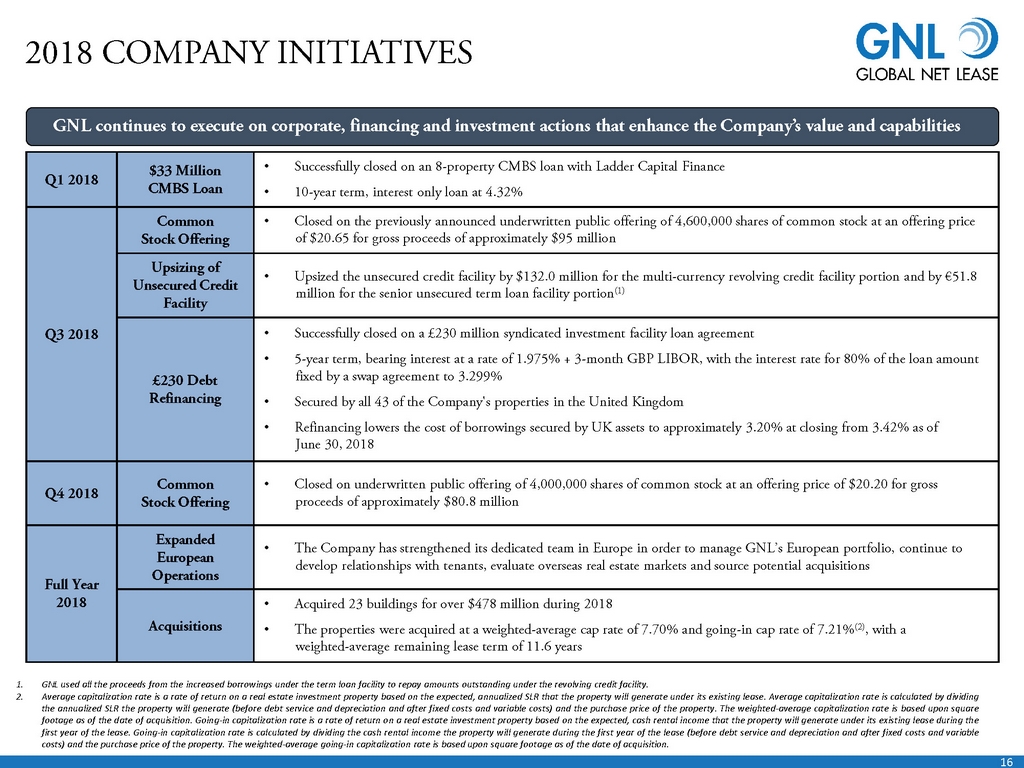
16 1. GNL used all the proceeds from the increased borrowings under the term loan facility to repay amounts outstanding under the revolving credit facility . 2. Average capitalization rate is a rate of return on a real estate investment property based on the expected, annualized SLR that the property will generate under its existing lease . Average capitalization rate is calculated by dividing the annualized SLR the property will generate (before debt service and depreciation and after fixed costs and variable costs) and the purchase price of the property . The weighted - average capitalization rate is based upon square footage as of the date of acquisition . Going - in capitalization rate is a rate of return on a real estate investment property based on the expected, cash rental income that the property will generate under its existing lease during the first year of the lease . Going - in capitalization rate is calculated by dividing the cash rental income the property will generate during the first year of the lease (before debt service and depreciation and after fixed costs and variable costs) and the purchase price of the property . The weighted - average going - in capitalization rate is based upon square footage as of the date of acquisition . 2018 COMPANY INITIATIVES GNL continues to execute on corporate, financing and investment actions that enhance the Company’s value and capabilities Q1 2018 $33 Million CMBS Loan • Successfully closed on an 8 - property CMBS loan with Ladder Capital Finance • 10 - year term, interest only loan at 4.32% Q3 2018 Common Stock Offering • Closed on the previously announced underwritten public offering of 4,600,000 shares of common stock at an offering price of $20.65 for gross proceeds of approximately $95 million Upsizing of Unsecured Credit Facility • Upsized the unsecured credit facility by $132.0 million for the multi - currency revolving credit facility portion and by €51.8 million for the senior unsecured term loan facility portion (1) £230 Debt Refinancing • Successfully closed on a £230 million syndicated investment facility loan agreement • 5 - year term, bearing interest at a rate of 1.975% + 3 - month GBP LIBOR, with the interest rate for 80% of the loan amount fixed by a swap agreement to 3.299% • Secured by all 43 of the Company's properties in the United Kingdom • Refinancing lowers the cost of borrowings secured by UK assets to approximately 3.20% at closing from 3.42% as of June 30, 2018 Q4 2018 Common Stock Offering • Closed on underwritten public offering of 4,000,000 shares of common stock at an offering price of $20.20 for gross proceeds of approximately $80.8 million Full Year 2018 Expanded European Operations • The Company has strengthened its dedicated team in Europe in order to manage GNL’s European portfolio, continue to develop relationships with tenants, evaluate overseas real estate markets and source potential acquisitions Acquisitions • Acquired 23 buildings for over $478 million during 2018 • The properties were acquired at a weighted - average cap rate of 7.70% and going - in cap rate of 7.21% (2) , with a weighted - average remaining lease term of 11.6 years
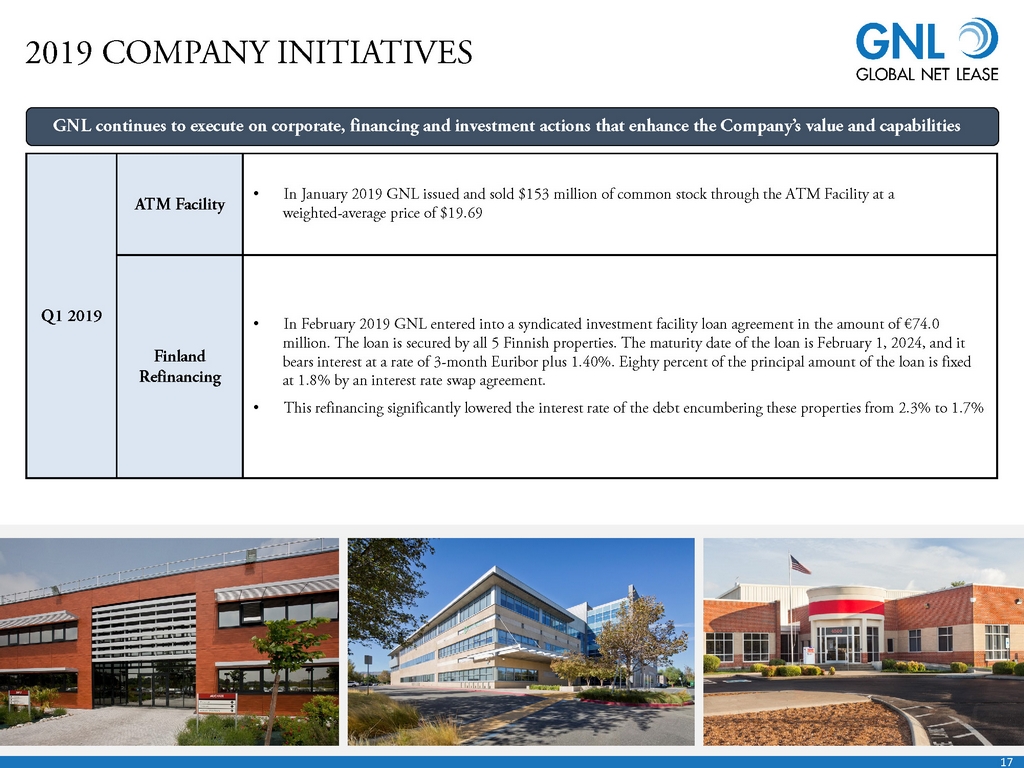
17 2019 COMPANY INITIATIVES Q1 2019 ATM Facility • In January 2019 GNL issued and sold $153 million of common stock through the ATM Facility at a weighted - average price of $19.69 Finland Refinancing • In February 2019 GNL entered into a syndicated investment facility loan agreement in the amount of €74.0 million. The loan is secured by all 5 Finnish properties. The maturity date of the loan is February 1, 2024, and it bears interest at a rate of 3 - month Euribor plus 1.40%. Eighty percent of the principal amount of the loan is fixed at 1.8% by an interest rate swap agreement. • This refinancing significantly lowered the interest rate of the debt encumbering these properties from 2.3% to 1.7% GNL continues to execute on corporate, financing and investment actions that enhance the Company’s value and capabilities

18 $1,136 $1,375 $1,503 $1,341 $1,496 $135 $139 $136 $134 $136 $1,047 $983 $984 $1,140 $1,140 $582 $686 $742 $646 $646 $0 $500 $1,000 $1,500 $2,000 $2,500 $3,000 $3,500 $4,000 Q1 2018 Q2 2018 Q3 2018 Q4 2018 PF Q4 2018 Equity Preferred Equity Mortgage Debt Line of Credit GNL CAPITAL STRUCTURE GNL continued to improve its capital structure throughout 2018 by extending debt maturities, maintaining a low cost of debt and optimizing the debt structure for continued future growth Debt Maturity and Interest Expense by Quarter (1) GNL Capital Structure by Quarter (1) (in millions) (years) (WAVG interest expense) 1. As of December 31, 2018 2. Pro - Forma Q4 2018 capital structure represents solely the actual debt balances and the preferred and common shares outstanding f rom 12/31/2018, and then applies the closing price of the preferred and common shares from February 22, 2019. (2) 3.6 3.3 3.8 4.2 2.8% 3.1% 3.0% 3.1% 0.0% 1.0% 2.0% 3.0% 4.0% 5.0% 0.0 0.5 1.0 1.5 2.0 2.5 3.0 3.5 4.0 4.5 Q1 2018 Q2 2018 Q3 2018 Q4 2018 Weighted-Average Maturity Weighted-Average Interest

19 PERFORMANCE METRICS 1. Includes a one - time $7.4 million reserve for an anticipated resolution with our former European service provider. 2. Adjusted Funds from Operations (“AFFO”). See “Non - GAAP measures” on pages 26 - 28 for a description of AFFO and pages 29 - 30 for a reconciliation of AFFO to net income, the most directly comparable GAAP Financial measure. Q4 2017 Q1 2018 Q2 2018 Q3 2018 Q4 2018 2018 Rental Income $62.6 million $63.8 million $65.6 million $68.7 million ($65.7 million excluding lease termination fee) $67.3 million $265.3 million ($262.3 million excluding lease termination fee) Net Income (Loss) (1) $8.4 million $4.8 million $7.7 million $2.6 million ($4.3 million) $10.9 million AFFO (2) $35.2 million $35.1 million $35.5 million $39.6 million ($36.6 million excluding lease termination fee) $37.1 million $147.3 million ($144.3 million excluding lease termination fee) Dividends Paid to Common Shareholders $36.1 million $35.8 million $35.8 million $36.7 million $39.1 million $147.4 million Weighted - Average Shares Outstanding 67.3 million 67.3 million 67.3 million 69.4 million 74.0 million 69.7 million Q4 2018 Financials: Key Takeaways GNL acquired $212 million of properties in Q4 2018 • Acquisition timing was concentrated in the second half of the quarter • A full quarter run - rate of these acquisitions would have provided $3.8 million in rental income vs. $1.2 million received, resul ting in a $2.5 million step - up from Q4’s rental income of $67.3 million The company issued 4.0 million shares of common equity at $20.20 per share on November 28, 2018 • GNL will continue to use its equity raise proceeds to fund new acquisitions
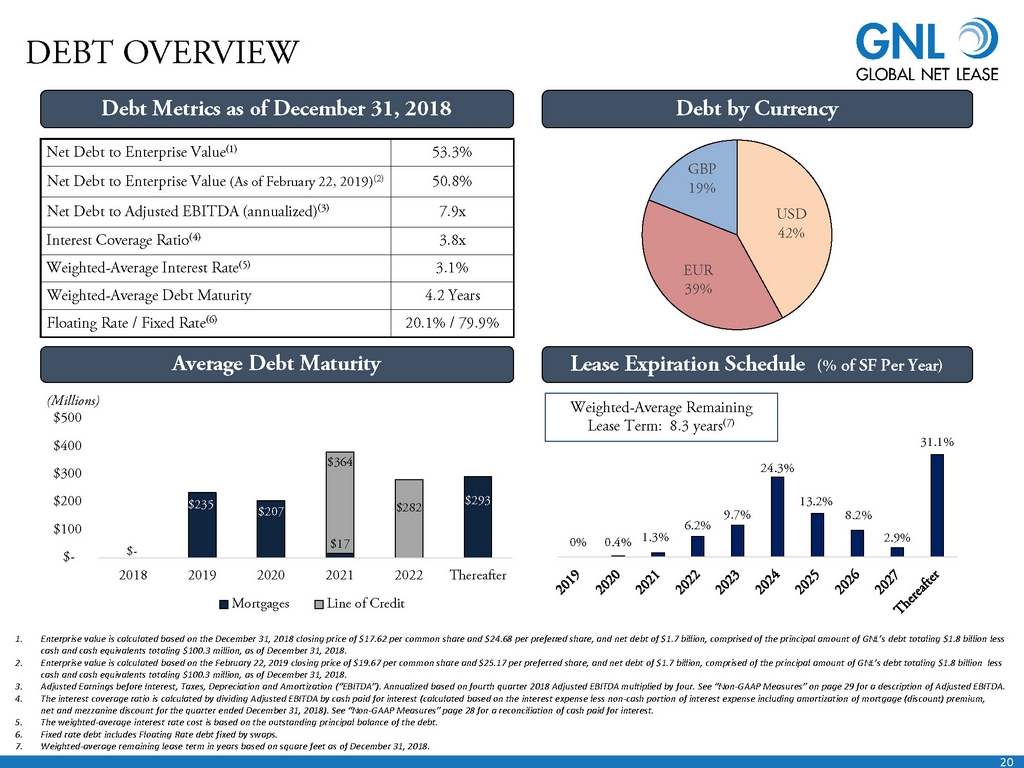
20 0% 0.4% 1.3% 6.2% 9.7% 24.3% 13.2% 8.2% 2.9% 31.1% DEBT OVERVIEW Net Debt to Enterprise Value (1) 53.3% Net Debt to Enterprise Value (As of February 22, 2019) (2) 50.8% Net Debt to Adjusted EBITDA (annualized) (3) 7.9x Interest Coverage Ratio (4) 3.8x Weighted - Average Interest Rate (5) 3.1% Weighted - Average Debt Maturity 4.2 Years Floating Rate / Fixed Rate (6) 20.1% / 79.9% Debt Metrics as of December 31, 2018 Debt by Currency Average Debt Maturity 1. Enterprise value is calculated based on the December 31, 2018 closing price of $17.62 per common share and $24.68 per preferr ed share, and net debt of $1.7 billion, comprised of the principal amount of GNL’s debt totaling $1.8 billion less cash and cash equivalents totaling $100.3 million , as of December 31, 2018. 2. Enterprise value is calculated based on the February 22, 2019 closing price of $19.67 per common share and $25.17 per preferr ed share, and net debt of $1.7 billion, comprised of the principal amount of GNL’s debt totaling $1.8 billion less cash and cash equivalents totaling $100.3 million, as of December 31, 2018. 3. Adjusted Earnings before Interest, Taxes, Depreciation and Amortization (“EBITDA ”). Annualized based on fourth quarter 2018 Adjusted EBITDA multiplied by four. See “Non - GAAP Measures” on page 29 for a description of Adjusted EBITDA. 4. The interest coverage ratio is calculated by dividing Adjusted EBITDA by cash paid for interest (calculated based on the inte res t expense less non - cash portion of interest expense including amortization of mortgage (discount) premium, net and mezzanine discount for the quarter ended December 31, 2018). See “Non - GAAP Measures” page 28 for a reconciliation of cash paid for interest. 5. The weighted - average interest rate cost is based on the outstanding principal balance of the debt. 6. Fixed rate debt includes Floating Rate debt fixed by swaps. 7. Weighted - average remaining lease term in years based on square feet as of December 31, 2018. (Millions) Weighted - Average Remaining Lease Term: 8.3 years (7) Lease Expiration Schedule (% of SF Per Year) $ - $235 $207 $17 $293 $364 $282 $- $100 $200 $300 $400 $500 2018 2019 2020 2021 2022 Thereafter Mortgages Line of Credit USD 42% EUR 39% GBP 19%
21 COMPREHENSIVE HEDGING PROGRAM Hedging Foreign Currency Exchange Risk (“Cash Flow Hedging Instruments”) • Provides protection against unfavorable movements in EUR and GBP versus the U.S. Dollar (“USD”) associated with the Company’s foreign property operations Interest Rate Swaps: Fixing Interest on Floating Rate Debt • Cost effective tools that mitigate against adverse fluctuations in interest rates; effectively acting to convert variable rate debt into fixed rate debt resulting in reduced exposure to variability in cash flows related to interest payments Net Investment Hedges: Asset – Liability Matching • Matches the value of assets with liabilities in the same currency (EUR or GBP), creating a “natural hedge” on the value of GNL assets against movement in FX rates vs USD GNL continues to employ a comprehensive hedging program, with a number of components designed to limit the impact of currency and interest rate movements to its European portfolio
22 The statements in this presentation that are not historical facts may be forward - looking statements . These forward - looking statements involve risks and uncertainties that could cause actual results or events to be materially different . In addition, words such as “may,” “will,” “seeks,” “anticipates,” “believes,” “estimates,” “expects,” “plans,” “intends,” “would,” or similar expressions indicate a forward - looking statement, although not all forward - looking statements contain these identifying words . Any statements referring to the future value of an investment in GNL, as well as the success that GNL may have in executing its business plan, are also forward - looking statements . There are a number of risks, uncertainties and other important factors that could cause GNL’s actual results to differ materially from those contemplated by such forward - looking statements, including those risks, uncertainties and other important factors set forth in the “Risk Factors” and “Management’s Discussion and Analysis of Financial Condition and Results of Operations” sections of GNL’s Annual Report on Form 10 - K for the year ended December 31 , 2017 filed with the SEC on February 28 , 2018 , GNL's Quarterly Report on Form 10 - Q for the three months ended March 31 , 2018 filed with the SEC on May 8 , 2018 , GNL's Quarterly Report on Form 10 - Q for the three months ended June 30 , 2018 filed with the SEC on August 8 , 2018 , GNL's Quarterly Report on Form 10 - Q for the three months ended September 30 , 2018 , filed with the SEC on November 7 , 2018 , as such risks, uncertainties and other important factors may be updated from time to time in GNL’s subsequent reports . Further, forward looking statements speak only as of the date they are made, and GNL undertakes no obligation to update or revise forward - looking statements to reflect changed assumptions, the occurrence of unanticipated events or changes to future operating results over time, except as required by law . This presentation contains certain statements that are the Company’s and Management’s hopes, intentions, beliefs, expectations, or projections of the future and might be considered to be forward - looking statements under Federal Securities laws . Prospective investors are cautioned that any such forward - looking statements are not guarantees of future performance, and involve risks and uncertainties . The company’s actual future results may differ significantly from the matters discussed in these forward - looking statements, and we may not release revisions to these forward - looking statements to reflect changes after we’ve made the statements . FORWARD LOOKING STATEMENTS
23 RISK FACTORS The following are some of the risks and uncertainties, although not all risks and uncertainties, that could cause our actual results to differ materially from those presented in our forward - looking statements . All of our executive officers are also officers, managers, employees or holders of a direct or indirect controlling interest in the Advisor and other entities affiliated with AR Global Investments, LLC ("AR Global") . As a result, our executive officers, the Advisor and its affiliates face conflicts of interest, including significant conflicts created by the Advisor's compensation arrangements with us and other investment programs advised by AR Global affiliates and conflicts in allocating time among these investment programs and us . These conflicts could result in unanticipated actions . • Because investment opportunities that are suitable for us may also be suitable for other investment programs advised by affiliates of AR Global, the Advisor and its affiliates face conflicts of interest relating to the purchase of properties and other investments and these conflicts may not be resolved in our favor . • We are obligated to pay fees which may be substantial to the Advisor and its affiliates . • We depend on tenants for our rental revenue and, accordingly, our rental revenue is dependent upon the success and economic viability of our tenants . • Increases in interest rates could increase the amount of our debt payments . • Adverse changes in exchange rates may reduce the net income and cash flow associated with our properties located outside of the United States ("U . S . ") . • The Advisor may not be able to identify a sufficient number of property acquisitions satisfying our investment objectives on a timely basis and on acceptable terms and prices, or at all . • We may be unable to continue to raise additional debt or equity financing on attractive terms, or at all, and there can be no assurance we will be able to fund future acquisitions . • We may be unable to repay, refinance, restructure or extend our indebtedness as it becomes due . • Adverse changes in exchange rates may reduce the value of our properties located outside of the United States ("U . S . ") .

24 RISK FACTORS (CONTINUED) • Provisions in in our credit facility, may limit our ability to pay dividends on our common stock, $ 0 . 01 par value per share ("“Common Stock"”), our 7 . 25 % Series A Cumulative Redeemable Preferred Stock, $ 0 . 01 par value per share ("“Series A Preferred Stock"”) or any other stock we may issue, and, if we are not able to increase the amount of cash we have available to pay dividends, including through additional cash flows we expect to generate from completing acquisitions, or otherwise maintain compliance with our credit facility, we may have to reduce dividend payments or identify other sources to fund the payment of dividends at their current levels . • There can be no assurance we will complete acquisitions on a timely basis or on acceptable terms and conditions, if at all . • We may be unable to pay or maintain cash dividends or increase dividends over time . • We may not generate cash flows sufficient to pay dividends to our stockholders or fund our operations, and, as such, we may be forced to borrow at unfavorable rates to pay dividends to our stockholders or fund our operations . • Any dividends that we pay on our Common Stock, Series A Preferred Stock or any other stock we may issue may exceed cash flow from operations, reducing the amount of capital available to invest in properties and other permitted investments . • We are subject to risks associated with our international investments, including risks associated with compliance with and changes in foreign laws, fluctuations in foreign currency exchange rates and inflation . • We are subject to risks associated with any dislocations or liquidity disruptions that may exist or occur in the credit markets of the U . S . and Europe from time to time . • We may fail to continue to qualify, as a real estate investment trust for U . S . federal income tax purposes ("REIT"), which would result in higher taxes, may adversely affect operations and would reduce the trading price of our Common Stock and Series A Preferred Stock and our cash available for dividends . • We may be exposed to risks due to a lack of tenant diversity, investment types and geographic diversity . • We are exposed to changes in general economic, business and political conditions, including the possibility of intensified international hostilities, acts of terrorism, and changes in conditions of U . S . or international lending, capital and financing markets, including as a result of the U . K . 's potential or actual withdrawal from the European Union or any other events that create, or give the impression they could create, economic or political instability in Europe, which may cause the revenue derived from, and the market value of, properties located in the United Kingdom and continental Europe to decline .
25 PROJECTIONS • This presentation includes estimated projections of future operating results . These projections were not prepared in accordance with published guidelines of the SEC or the guidelines established by the American Institute of Certified Public Accountants for preparation and presentation of financial projections . This information is not fact and should not be relied upon as being necessarily indicative of future results ; the projections were prepared in good faith by management and are based on numerous assumptions that may prove to be wrong . Important factors that may affect actual results and cause the projections to not be achieved include, but are not limited to, risks and uncertainties relating to the company and other factors described in the “Risk Factors” and “Management’s Discussion and Analysis of Financial Condition and Results of Operations” sections of GNL’s Annual Report on Form 10 - K for the year ended December 31 , 2017 filed with the SEC on February 28 , 2018 , GNL's Quarterly Report on Form 10 - Q for the three months ended March 31 , 2018 filed with the SEC on May 8 , 2018 , GNL's Quarterly Report on Form 10 - Q for the three months ended June 30 , 2018 filed with the SEC on August 8 , 2018 , GNL's Quarterly Report on Form 10 - Q for the three months ended September 30 , 2018 , filed with the SEC on November 7 , 2018 . The projections also reflect assumptions as to certain business decisions that are subject to change . As a result, actual results may differ materially from those contained in the estimates . Accordingly, there can be no assurance that the estimates will be realized . • This presentation also contains estimates and information concerning our industry, including market position, market size, and growth rates of the markets in which we participate, that are based on industry publications and reports . This information involves a number of assumptions and limitations, and you are cautioned not to give undue weight to these estimates . We have not independently verified the accuracy or completeness of the data contained in these industry publications and reports . The industry in which we operate is subject to a high degree of uncertainty and risk due to variety of factors, including those described in the “Risk Factors” and “Management’s Discussion and Analysis of Financial Condition and Results of Operations” sections of GNL’s Annual Report on Form 10 - K for the year ended December 31 , 2017 filed with the SEC on February 28 , 2018 , GNL's Quarterly Report on Form 10 - Q for the three months ended March 31 , 2018 filed with the SEC on May 8 , 2018 , GNL's Quarterly Report on Form 10 - Q for the three months ended June 30 , 2018 filed with the SEC on August 8 , 2018 , GNL's Quarterly Report on Form 10 - Q for the three months ended September 30 , 2018 , filed with the SEC on November 7 , 2018 . These and other factors could cause results to differ materially from those expressed in these publications and reports .
26 DEFINITIONS • Due to certain unique operating characteristics of real estate companies, as discussed below, the National Association of Real Estate Investment Trusts ("NAREIT"), an industry trade group, has promulgated a measure known as funds from operations ("FFO"), which we believe to be an appropriate supplemental measure to reflect the operating performance of a REIT . FFO is not equivalent to net income or loss as determined under accounting principles generally accepted in the United States ("GAAP") . • We define FFO, a non - GAAP measure, consistent with the standards established over time by the Board of Governors of NAREIT, as restated in a White Paper approved by the Board of Governors of NAREIT effective in December 2018 (the "White Paper") . The White Paper defines FFO as net income or loss computed in accordance with GAAP, excluding depreciation and amortization related to real estate, gains and losses from the sale of certain real estate assets, gains and losses from change in control and impairment write - downs of certain real estate assets and investments in entities when the impairment is directly attributable to decreases in the value of depreciable real estate held by the entity . Adjustments for unconsolidated partnerships and joint ventures are calculated to reflect FFO . Our FFO calculation complies with NAREIT's definition . • The historical accounting convention used for real estate assets requires straight - line depreciation of buildings and improvements, and straight - line amortization of intangibles, which implies that the value of a real estate asset diminishes predictably over time, especially if not adequately maintained or repaired and renovated as required by relevant circumstances or as requested or required by lessees for operational purposes in order to maintain the value disclosed . We believe that, because real estate values historically rise and fall with market conditions, including inflation, interest rates, unemployment and consumer spending, presentations of operating results for a REIT using historical accounting for depreciation and certain other items may be less informative . Historical accounting for real estate involves the use of GAAP . Any other method of accounting for real estate such as the fair value method cannot be construed to be any more accurate or relevant than the comparable methodologies of real estate valuation found in GAAP . Nevertheless, we believe that the use of FFO, which excludes the impact of real estate related depreciation and amortization, among other things, provides a more complete understanding of our performance to investors and to management, and when compared year over year, reflects the impact on our operations from trends in occupancy rates, rental rates, operating costs, general and administrative expenses, and interest costs, which may not be immediately apparent from net income . However, FFO, core funds from operations ("Core FFO") and adjusted funds from operations (“AFFO”), as described below, should not be construed to be more relevant or accurate than the current GAAP methodology in calculating net income or in its applicability in evaluating our operating performance . The method utilized to evaluate the value and performance of real estate under GAAP should be construed as a more relevant measure of operational performance and considered more prominently than the non - GAAP FFO, Core FFO and AFFO measures and the adjustments to GAAP in calculating FFO, Core FFO and AFFO . Other REITs may not define FFO in accordance with the current NAREIT definition (as we do) or may interpret the current NAREIT definition differently than we do or calculate Core FFO or AFFO differently than we do . Consequently, our presentation of FFO, Core FFO and AFFO may not be comparable to other similarly titled measures presented by other REITs . • We consider FFO, Core FFO and AFFO useful indicators of our performance . Because FFO calculations exclude such factors as depreciation and amortization of real estate assets and gains or losses from sales of operating real estate assets (which can vary among owners of identical assets in similar conditions based on historical cost accounting and useful - life estimates), FFO facilitates comparisons of operating performance between periods and between other REITs in our peer group .
27 DEFINITIONS (CONTINUED) • Changes in the accounting and reporting promulgations under GAAP (for acquisition fees and expenses from a capitalization/depreciation model to an expensed - as - incurred model) that were put into effect in 2009 and other changes to GAAP accounting for real estate subsequent to the establishment of NAREIT's definition of FFO have prompted an increase in cash - settled expenses, specifically acquisition fees and expenses for all industries as items that are expensed under GAAP . • In calculating Core FFO, we start with FFO, then we exclude certain non - core items such as acquisition, transaction and other costs, as well as certain other costs that are considered to be non - core, such as debt extinguishment costs, fire loss and other costs related to damages at our properties . The purchase of properties, and the corresponding expenses associated with that process, is a key operational feature of our core business plan to generate operational income and cash flows in order to make dividend payments to stockholders . In evaluating investments in real estate, we differentiate the costs to acquire the investment from the operations derived from the investment . We also add back non - cash write - offs of deferred financing costs and prepayment penalties incurred with the early extinguishment of debt which are included in net income but are considered financing cash flows when paid in the statement of cash flows . We consider these write - offs and prepayment penalties to be capital transactions and not indicative of operations . By excluding expensed acquisition, transaction and other costs as well as non - core costs, we believe Core FFO provides useful supplemental information that is comparable for each type of real estate investment and is consistent with management's analysis of the investing and operating performance of our properties . • In calculating AFFO, we start with Core FFO, then we exclude certain income or expense items from AFFO that we consider more reflective of investing activities, other non - cash income and expense items and the income and expense effects of other activities that are not a fundamental attribute of our business plan . These items include early extinguishment of debt (adjustment included in Core FFO) and unrealized gain and loss, which may not ultimately be realized, such as gain or loss on derivative instruments, gain or loss on foreign currency transactions, and gain or loss on investments . In addition, by excluding non - cash income and expense items such as amortization of above - market and below - market leases intangibles, amortization of deferred financing costs, straight - line rent and equity - based compensation from AFFO, we believe we provide useful information regarding income and expense items which have a direct impact on our ongoing operating performance . We also include the realized gain or loss on foreign currency exchange contracts for AFFO as such items are part of our ongoing operations and affect the current operating performance of the Company . By providing AFFO, we believe we are presenting useful information that can be used to better assess the sustainability of our ongoing operating performance without the impacts of transactions that are not related to the ongoing profitability of our portfolio of properties . AFFO presented by us may not be comparable to AFFO reported by other REITs that define AFFO differently . • In calculating AFFO, we exclude certain expenses, which under GAAP are characterized as operating expenses in determining operating net income . All paid and accrued merger, acquisition, transaction and other costs (including prepayment penalties for debt extinguishment) and certain other expenses negatively impact our operating performance during the period in which expenses are incurred or properties are acquired will also have negative effects on returns to investors, but are not reflective of our on - going performance . AFFO that excludes such costs and expenses would only be comparable to companies that did not have such activities . Further, under GAAP, certain contemplated non - cash fair value and other non - cash adjustments are considered operating non - cash adjustments to net income . In addition, as discussed above, we view gains and losses from fair value adjustments as items which are unrealized and may not ultimately be realized and not reflective of ongoing operations and are therefore typically adjusted for when assessing operating performance .
28 DEFINITIONS (CONTINUED) • Excluding income and expense items detailed above from our calculation of AFFO provides information consistent with management's analysis of the operating performance of the Company . Additionally, fair value adjustments, which are based on the impact of current market fluctuations and underlying assessments of general market conditions, but can also result from operational factors such as rental and occupancy rates, may not be directly related or attributable to our current operating performance . By excluding such changes that may reflect anticipated and unrealized gains or losses, we believe AFFO provides useful supplemental information . • As a result, we believe that the use of FFO, Core FFO and AFFO, together with the required GAAP presentations, provide a more complete understanding of our performance including relative to our peers and a more informed and appropriate basis on which to make decisions involving operating, financing, and investing activities . • We believe that earnings before interest, taxes, depreciation and amortization (“EBITDA”) adjusted for acquisition and transaction - related expenses, other non - cash items and including our pro - rata share from unconsolidated joint ventures ("Adjusted EBITDA") is an appropriate measure of our ability to incur and service debt . Adjusted EBITDA should not be considered as an alternative to cash flows from operating activities, as a measure of our liquidity or as an alternative to net income as an indicator of our operating activities . Other REITs may calculate Adjusted EBITDA differently and our calculation should not be compared to that of other REITs . • NOI is a non - GAAP financial measure equal to net income (loss), the most directly comparable GAAP financial measure, less discontinued operations, interest, other income and income from preferred equity investments and investment securities, plus corporate general and administrative expense, acquisition and transaction - related expenses, depreciation and amortization, other non - cash expenses and interest expense . NOI is adjusted to include our pro rata share of NOI from unconsolidated joint ventures . We use NOI internally as a performance measure and believe NOI provides useful information to investors regarding our financial condition and results of operations because it reflects only those income and expense items that are incurred at the property level . Therefore, we believe NOI is a useful measure for evaluating the operating performance of our real estate assets and to make decisions about resource allocations . Further, we believe NOI is useful to investors as a performance measure because, when compared across periods, NOI reflects the impact on operations from trends in occupancy rates, rental rates, operating costs and acquisition activity on an unlevered basis, providing perspective not immediately apparent from net income . NOI excludes certain components from net income in order to provide results that are more closely related to a property's results of operations . For example, interest expense is not necessarily linked to the operating performance of a real estate asset and is often incurred at the corporate level as opposed to the property level . In addition, depreciation and amortization, because of historical cost accounting and useful life estimates, may distort operating performance at the property level . NOI presented by us may not be comparable to NOI reported by other REITs that define NOI differently . We believe that in order to facilitate a clear understanding of our operating results, NOI should be examined in conjunction with net income (loss) as presented in our consolidated financial statements . NOI should not be considered as an alternative to net income (loss) as an indication of our performance or to cash flows as a measure of our liquidity . • Cash NOI, is a non - GAAP financial measure that is intended to reflect the performance of our properties . We define Cash NOI as net operating income (which is separately defined herein) excluding amortization of above/below market lease intangibles and straight - line adjustments that are included in GAAP lease revenues . We believe that Cash NOI is a helpful measure that both investors and management can use to evaluate the current financial performance of our properties and it allows for comparison of our operating performance between periods and to other REITs . Cash NOI should not be considered as an alternative to net income, as an indication of our financial performance, or to cash flows as a measure of liquidity or our ability to fund all needs . The method by which we calculate and present Cash NOI may not be directly comparable to the way other REITs present Cash NOI .
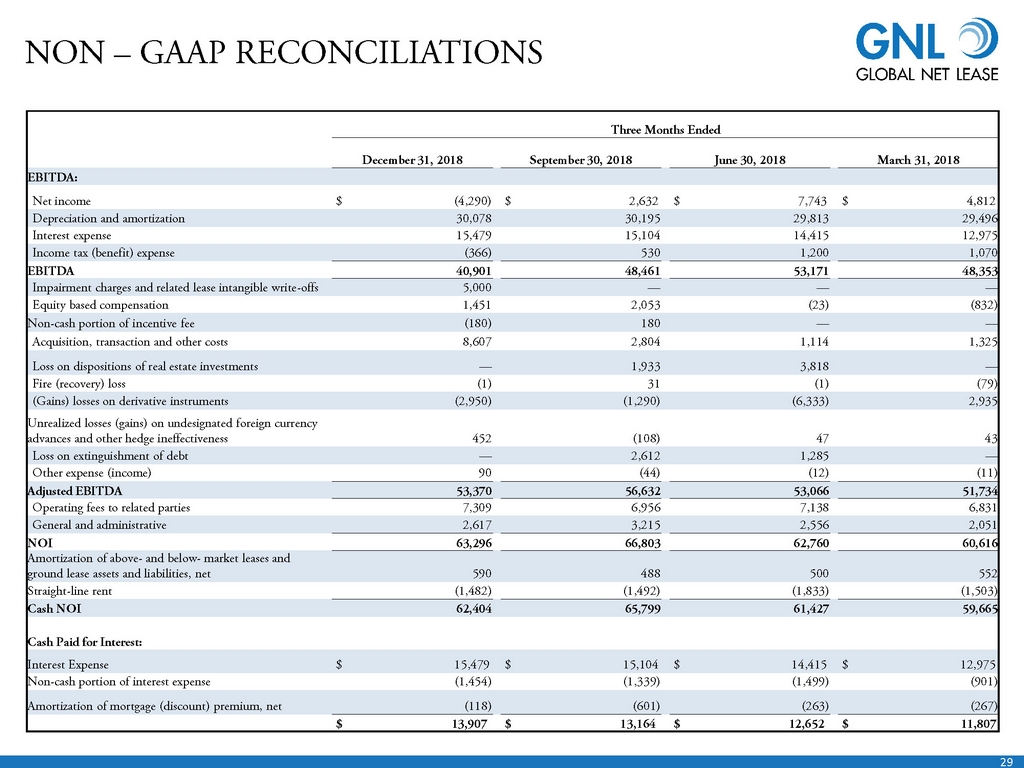
29 NON – GAAP RECONCILIATIONS Three Months Ended December 31, 2018 September 30, 2018 June 30, 2018 March 31, 2018 EBITDA: Net income $ (4,290) $ 2,632 $ 7,743 $ 4,812 Depreciation and amortization 30,078 30,195 29,813 29,496 Interest expense 15,479 15,104 14,415 12,975 Income tax (benefit) expense (366) 530 1,200 1,070 EBITDA 40,901 48,461 53,171 48,353 Impairment charges and related lease intangible write - offs 5,000 — — — Equity based compensation 1,451 2,053 (23) (832) Non - cash portion of incentive fee (180) 180 — — Acquisition, transaction and other costs 8,607 2,804 1,114 1,325 Loss on dispositions of real estate investments — 1,933 3,818 — Fire (recovery) loss (1) 31 (1) (79) (Gains) losses on derivative instruments (2,950) (1,290) (6,333) 2,935 Unrealized losses (gains) on undesignated foreign currency advances and other hedge ineffectiveness 452 (108) 47 43 Loss on extinguishment of debt — 2,612 1,285 — Other expense (income) 90 (44) (12) (11) Adjusted EBITDA 53,370 56,632 53,066 51,734 Operating fees to related parties 7,309 6,956 7,138 6,831 General and administrative 2,617 3,215 2,556 2,051 NOI 63,296 66,803 62,760 60,616 Amortization of above - and below - market leases and ground lease assets and liabilities, net 590 488 500 552 Straight - line rent (1,482) (1,492) (1,833) (1,503) Cash NOI 62,404 65,799 61,427 59,665 Cash Paid for Interest: Interest Expense $ 15,479 $ 15,104 $ 14,415 $ 12,975 Non - cash portion of interest expense (1,454) (1,339) (1,499) (901) Amortization of mortgage (discount) premium, net (118) (601) (263) (267) $ 13,907 $ 13,164 $ 12,652 $ 11,807

30 FFO AND AFFO RECONCILIATIONS Three Months Ended December 31, 2018 September 30, 2018 June 30, 2018 March 31, 2018 December 31, 2017 Funds from operations (FFO): Net (loss) income attributable to common stockholders (in accordance with GAAP) $ (6,744) $ 177 $ 5,288 $ 2,361 $ 5,998 Impairment charges 5,000 — — — — Depreciation and amortization 30,078 30,195 29,813 29,496 28,558 Proportionate share of adjustments for non - controlling interest to arrive at FFO — — — — (3) Loss on dispositions of real estate investments (1) — 1,933 3,818 — — FFO (as defined by NAREIT) attributable to stockholders 28,334 32,305 38,919 31,857 34,553 Acquisition, transaction and other costs (2) 8,607 2,804 1,114 1,325 (301) Loss on extinguishment of debt (3) — 2,612 1,285 — — Fire (recovery) loss (1) 31 (1) (79) (150) Proportionate share of adjustments for non - controlling interest to arrive at Core FFO — — — — 1 Core FFO attributable to stockholders 36,940 37,752 41,317 33,103 34,103 Non - cash equity based compensation 1,451 2,053 (23) (832) (1,177) Non - cash portion of incentive fee (180) 180 — — — Non - cash portion of interest expense 1,454 1,339 1,499 901 1,399 Amortization of above and below - market leases and ground lease assets and liabilities, net 590 488 500 552 533 Straight - line rent (1,482) (1,492) (1,833) (1,503) (1,550) Unrealized losses (gains) on undesignated foreign currency advances and other hedge ineffectiveness 452 (108) 47 43 (86) Eliminate unrealized losses (gains) on foreign currency transactions (4) (2,206) (1,215) (6,256) 2,550 1,681 Amortization of mortgage discounts and premiums, net 118 601 263 267 262 Adjusted funds from operations (AFFO) attributable to stockholders (5) $ 37,137 $ 39,598 $ 35,514 $ 35,081 $ 35,165 Basic weighted - average shares outstanding 73,554 69,442 67,292 67,287 67,287 Diluted weighted - average shares outstanding 74,001 69,442 67,292 67,287 67,287 FFO per share $ 0.38 $ 0.47 $ 0.58 $ 0.47 $ 0.51 Core FFO per share $ 0.50 $ 0.52 $ 0.61 $ 0.49 $ 0.51 Dividends declared $ 39,119 $ 36,769 $ 35,828 $ 35,833 $ 35,955 1. Loss on dispositions of real estate investments for the year ended December 31, 2016 is net of $1.5 million of tax recognized on the sale of Hotel Winston, The Netherlands property. 2. For the year ended December 31, 2018, acquisition, transaction and other costs are comprised of expenses incurred in connecti on with litigation related to the termination of the Former Service Provider totaling $10.3 million, of which $7.4 million relates to a reserve recorded for the anticipated settlement of this litigation and $2.9 million relates t o l egal costs. 3. For the year ended December 31, 2018, includes non - cash write - off of deferred financing costs of $1.5 million and prepayment pen alties paid on early extinguishment of debt of $2.4 million. 4. For the year ended December 31, 2018, gains on derivative instruments were $7.6 million which were comprised of unrealized ga ins of $7.1 million and realized gains of $0.5 million. For the year ended December 31, 2017, losses on derivative instruments were $8.3 million which were comprised of unrealized losses of $10.2 million and realized gains of $1. 9 m illion. 5. FFO for the year ended December 31, 2018 includes income from a lease termination fee of $3.0 million, which is recorded in r ent al income in the unaudited consolidated statements of operations, related to a real estate asset sold during the third quarter of 2018.

INVESTOR INQUIRIES 1 - 866 - 902 - 0063 investorrelations@globalnetlease.com www.GlobalNetLease.com