Exhibit 99.1
| PRO FORMA VALUATION REPORT FS BANCORP, INC. Mountlake Terrace, Washington PROPOSED HOLDING COMPANY FOR: 1st Security Bank of Washington Dated As Of: September 2, 2011 Prepared By: RP® Financial, LC. 1100 North Glebe Road Suite 1100 Arlington, Virginia 22201 |
| RP® FINANCIAL, LC. | |
| Serving the Financial Services Industry Since 1988 |
September 2, 2011
Board of Directors
1st Security Bank of Washington
6920 220th Street SW, Suite 300
Mountlake Terrace, Washington 98043-2172
Members of the Board of Directors:
At your request, we have completed and hereby provide an independent appraisal (“Appraisal”) of the estimated pro forma market value of the common stock which is to be offered in connection with the plan of conversion described below. This Appraisal is furnished pursuant to the conversion regulations issued by the Office of Thrift Supervision (“OTS”) and reissued by the Office of the Comptroller of the Currency (“OCC”), and applicable interpretations thereof. Such Valuation Guidelines are relied upon by the Federal Reserve Board (“FRB”), the Federal Deposit Insurance Corporation (“FDIC”) and the Washington Department of Financial Institutions (“DFI”) in the absence of separate written valuation guidelines. Specifically, this Appraisal has been prepared in accordance with the “Guidelines for Appraisal Reports for the Valuation of Savings and Loan Associations Converting from Mutual to Stock Form of Organization” as set forth by the OTS, and applicable regulatory interpretations thereof.
Description of Plan of Conversion
The Board of Trustees of 1st Security Bank of Washington (“1st Security” or the “Bank”) adopted a plan of conversion on July 10, 2008. On August 18, 2011, the board of directors voted to move forward with the plan of conversion. Pursuant to the plan of conversion, the Bank will convert from the mutual savings bank form of organization to a stock savings bank form and become a wholly owned subsidiary of FS Bancorp (“FS Bancorp” or the “Company”) a newly formed Washington corporation. The Company will own all of the outstanding shares of the Bank. FS Bancorp will offer shares of common stock to eligible depositors of 1st Security, to certain newly-formed stock benefit plans for officers, trustees and employees and others. Following the completion of the offering, FS Bancorp will be a bank holding company, and its primary regulator will be the Federal Reserve.
Pursuant to the plan of conversion, the Company will offer its stock in a subscription offering to Eligible Account Holders of the Bank, Tax-Qualified Employee Stock Benefit Plans, Supplemental Eligible Account Holders, and Other Members. To the extent that shares remain available for purchase after satisfaction of all subscriptions received in the subscription offering, the shares may be offered for sale in a direct or syndicated community offering.
At this time, no other activities are contemplated for FS Bancorp other than the ownership of the Bank, a loan to the newly-formed ESOP and reinvestment of the proceeds that are retained by the Company. In the future, FS Bancorp may acquire or organize other operating subsidiaries, diversify into other banking-related activities, pay dividends to shareholders and/or repurchase its stock, although there are no specific plans to undertake such activities at the present time.
Washington Headquarters | |
| Three Ballston Plaza | Telephone: (703) 528-1700 |
| 1100 North Glebe Road, Suite 1100 | Fax No.: (703) 528-1788 |
| Arlington, VA 22201 | Toll-Free No.: (866) 723-0594 |
| www.rpfinancial.com | E-Mail: mail@rpfinancial.com |
Board of Directors
September 2, 2011
Page 2
RP® Financial, LC.
RP® Financial, LC. (“RP Financial”) is a financial consulting firm serving the financial services industry nationwide that, among other things, specializes in financial valuations and analyses of business enterprises and securities, including the pro forma valuation for savings institutions converting from mutual-to-stock form. The background and experience of RP Financial is detailed in Exhibit V-1. For its appraisal services, RP Financial is being compensated on a fixed fee basis for the original appraisal and for any subsequent updates, and such fees are payable regardless of the valuation conclusion or the completion of the conversion offering transaction. We believe that we are independent of the Company, the Bank, and the other parties engaged by the Bank or the Company to assist in the stock conversion process.
Valuation Methodology
In preparing the Appraisal, we have reviewed FS Bancorp’s and the Bank’s regulatory applications, including the prospectus as filed with the as filed with the FRB, the Washington Department of Financial Institutions and the Securities and Exchange Commission (“SEC”). We have conducted a financial analysis of the Bank, that has included due diligence related discussions with 1st Security’s management; Moss Adams LLP, the Bank’s independent auditor; Silver, Freedman & Taff, L.L.P., 1st Security’s conversion counsel; and Keefe Bruyette & Woods, Inc., which has been retained as the financial and marketing advisor in connection with the stock offering. All conclusions set forth in the Appraisal were reached independently from such discussions. In addition, where appropriate, we have considered information based on other available published sources that we believe are reliable. While we believe the information and data gathered from all these sources are reliable, we cannot guarantee the accuracy and completeness of such information.
We have investigated the competitive environment within which 1st Security operates and have assessed the Bank’s relative strengths and weaknesses. We have monitored all material regulatory and legislative actions affecting financial institutions, generally, and analyzed the potential impact of such developments on 1st Security and the industry as a whole; to the extent we were aware of such matters. We have analyzed the potential effects of the stock conversion on the Bank’s operating characteristics and financial performance as they relate to the pro forma market value of FS Bancorp. We have reviewed the economy and demographic characteristics of the primary market area in which the Bank currently operates. We have compared 1st Security’s financial performance and condition with publicly-traded thrift institutions evaluated and selected in accordance with the Valuation Guidelines, as well as all publicly-traded thrifts and thrift holding companies. We have reviewed conditions in the securities markets in general and the market for thrifts and thrift holding companies, including the market for new issues. We have excluded from such analyses thrifts subject to announced or rumored acquisition, and/or institutions that exhibit other unusual characteristics.
Board of Directors
September 2, 2011
Page 3
The Appraisal is based on 1st Security’s representation that the information contained in the regulatory applications and additional information furnished to us by the Bank and its independent auditors, legal counsel, investment bankers and other authorized agents are truthful, accurate and complete. We did not independently verify the financial statements and other information provided by the Bank, or its independent auditors, legal counsel, investment bankers and other authorized agents nor did we independently value the assets or liabilities of the Bank. The valuation considers 1st Security only as a going concern and should not be considered as an indication of the Bank’s liquidation or control value.
Our appraised value is predicated on a continuation of the current operating environment for the Bank and the Company and for all thrifts and their holding companies. Changes in the local, state and national economy, the federal and state legislative and regulatory environments for financial institutions and mutual holding companies, the stock market, interest rates, and other external forces (such as natural disasters or significant world events) may occur from time to time, often with great unpredictability, and may materially impact the value of thrift stocks as a whole or the Bank’s value alone. It is our understanding that 1st Security intends to remain an independent institution and there are no current plans for selling control as a converted institution. To the extent that such factors can be foreseen, they have been factored into our analysis.
The estimated pro forma market value is defined as the price at which the Company’s stock, immediately upon completion of the offering, would change hands between a willing buyer and a willing seller, neither being under any compulsion to buy or sell and both having reasonable knowledge of relevant facts.
Valuation Conclusion
It is our opinion that, as of September 2, 2011, the estimated aggregate pro forma market value of the shares to be issued immediately following the conversion equaled $24,500,000 at the midpoint, equal to 2,450,000 shares offered at a per share value of $10.00. Pursuant to conversion guidelines, the 15% offering range indicates a minimum value of $20,825,000 and a maximum value of $28,175,000. Based on the $10.00 per share offering price determined by the Board, this valuation range equates to total shares outstanding of 2,082,500 at the minimum and 2,817,500 at the maximum. In the event the appraised value is subject to an increase, the aggregate pro forma market value may be increased up to a supermaximum value of $32,401,250 without a resolicitation. Based on the $10.00 per share offering price, the supermaximum value would result in total shares outstanding of 3,240,125.
Limiting Factors and Considerations
The valuation is not intended, and must not be construed, as a recommendation of any kind as to the advisability of purchasing shares of the common stock. Moreover, because such valuation is determined in accordance with applicable regulatory guidelines and is necessarily based upon estimates and projections of a number of matters, all of which are subject to change from time to time, no assurance can be given that persons who purchase shares of common stock in the conversion will thereafter be able to buy or sell such shares at prices related to the foregoing valuation of the estimated pro forma market value thereof. The appraisal reflects only a valuation range as of this date for the pro forma market value of FS Bancorp immediately upon issuance of the stock and does not take into account any trading activity with respect to the purchase and sale of common stock in the secondary market on the date of issuance of such securities or at anytime thereafter following the completion of the public stock offering.
Board of Directors
September 2, 2011
Page 4
The valuation prepared by RP Financial in accordance with applicable regulatory guidelines was based on the consolidated financial condition and operations of FS Bancorp as of or for the periods ended June 30, 2011, the date of the financial data included in the prospectus.
RP Financial is not a seller of securities within the meaning of any federal and state securities laws and any report prepared by RP Financial shall not be used as an offer or solicitation with respect to the purchase or sale of any securities. RP Financial maintains a policy which prohibits RP Financial, its principals or employees from purchasing stock of its financial institution clients.
The valuation will be updated as provided for in the conversion regulations and guidelines. These updates will consider, among other things, any developments or changes in the financial performance and condition of FS Bancorp, management policies, and current conditions in the equity markets for thrift stocks, both existing issues and new issues. These updates may also consider changes in other external factors which impact value including, but not limited to: various changes in the federal and state legislative and regulatory environments for financial institutions, the stock market and the market for thrift stocks, and interest rates. Should any such new developments or changes be material, in our opinion, to the valuation of the shares, appropriate adjustments to the estimated pro forma market value will be made. The reasons for any such adjustments will be explained in the update at the date of the release of the update. The valuation will also be updated at the completion of FS Bancorp’s stock offering.
| Respectfully submitted, | ||
| RP® FINANCIAL, LC. | ||
| /s/ James J. Oren | ||
| James J. Oren | ||
| Director | ||
RP® Financial, LC.
TABLE OF CONTENTS
1st Security Bank of Washington
Mountlake Terrace, Washington
| PAGE | |||||
| DESCRIPTION | NUMBER | ||||
| CHAPTER ONE | OVERVIEW AND FINANCIAL ANALYSIS | ||||
| Introduction | I.1 | ||||
| Plan of Conversion | I.1 | ||||
| Strategic Overview | I.2 | ||||
| Balance Sheet Trends | I.4 | ||||
| Income and Expense Trends | I.7 | ||||
| Interest Rate Risk Management | I.11 | ||||
| Lending Activities and Strategy | I.11 | ||||
| Asset Quality | I.17 | ||||
| Funding Composition and Strategy | I.17 | ||||
| Subsidiaries | I.18 | ||||
| Legal Proceedings | I.18 | ||||
| CHAPTER TWO | MARKET AREA | ||||
| Introduction | II.1 | ||||
| National Economic Factors | II.2 | ||||
| Interest Rate Environment | II.3 | ||||
| Market Area Demographics | II.5 | ||||
| Summary of Local Economy | II.7 | ||||
| Real Estate Trends in the Puget Sound | II.8 | ||||
| Employment Sectors | II.8 | ||||
| Unemployment Data and Trends | II.9 | ||||
| Market Area Deposit Characteristics/Competition | II.10 | ||||
| Market Area Counties Deposit Competitors | II.11 | ||||
| Summary | II.13 | ||||
| CHAPTER THREE | PEER GROUP ANALYSIS | ||||
| Peer Group Selection | III.1 | ||||
| Financial Condition | III.6 | ||||
| Income and Expense Components | III.9 | ||||
| Loan Composition | III.12 | ||||
| Credit Risk | III.14 | ||||
| Interest Rate Risk | III.14 | ||||
| Summary | III.17 | ||||
RP® Financial, LC.
TABLE OF CONTENTS
1st Security Bank of Washington
Mountlake Terrace, Washington
(continued)
| PAGE | ||||||
| DESCRIPTION | NUMBER | |||||
| CHAPTER FOUR | VALUATION ANALYSIS | |||||
| Introduction | IV.1 | |||||
| Appraisal Guidelines | IV.1 | |||||
| RP Financial Approach to the Valuation | IV.1 | |||||
| Valuation Analysis | IV.2 | |||||
| 1. | Financial Condition | IV.2 | ||||
| 2. | Profitability, Growth and Viability of Earnings | IV.4 | ||||
| 3. | Asset Growth | IV.6 | ||||
| 4. | Primary Market Area | IV.6 | ||||
| 5. | Dividends | IV.8 | ||||
| 6. | Liquidity of the Shares | IV.9 | ||||
| 7. | Marketing of the Issue | IV.9 | ||||
| A. | The Public Market | IV.9 | ||||
| B. | The New Issue Market | IV.14 | ||||
| C. | The Acquisition Market | IV.16 | ||||
| 8. | Management | IV.16 | ||||
| 9. | Effect of Government Regulation and Regulatory Reform | IV.18 | ||||
| Summary of Adjustments | IV.18 | |||||
| Valuation Approaches | IV.18 | |||||
| 1. | Price-to-Earnings (“P/E”) | IV.20 | ||||
| 2. | Price-to-Book (“P/B”) | IV.21 | ||||
| 3. | Price-to-Assets (“P/A”) | IV.23 | ||||
| Comparison to Recent Offerings | IV.23 | |||||
| Valuation Conclusion | IV.24 | |||||
RP® Financial, LC.
LIST OF TABLES
1st Security Bank of Washington
Mountlake Terrace, Washington
| TABLE | ||||||
| NUMBER | DESCRIPTION | PAGE | ||||
| 1.1 | Historical Balance Sheets | I.5 | ||||
| 1.2 | Historical Income Statements | I.8 | ||||
| 2.1 | Summary Demographic/Economic Information | II.6 | ||||
| 2.2 | Primary Market Area Employment Sectors | II.9 | ||||
| 2.3 | Market Area Unemployment Trends | II.10 | ||||
| 2.4 | Deposit Summary | II.11 | ||||
| 2.5 | Market Area Counties Deposit Competitors | II.12 | ||||
| 3.1 | Peer Group of Publicly-Traded Thrifts | III.3 | ||||
| 3.2 | Balance Sheet Composition and Growth Rates | III.7 | ||||
| 3.3 | Inc as a % of Average Assets and Yields, Costs, Spreads | III.10 | ||||
| 3.4 | Loan Portfolio Composition and Related Information | III.13 | ||||
| 3.5 | Credit Risk Measures and Related Information | III.15 | ||||
| 3.6 | Interest Rate Risk Measures and Net Interest Income Volatility | III.16 | ||||
| 4.1 | Market Area Unemployment Rates | IV.8 | ||||
| 4.2 | Pricing Characteristics and After-Market Trends | IV.15 | ||||
| 4.3 | Market Pricing Comparatives | IV.17 | ||||
| 4.4 | Valuation Adjustments | IV.18 | ||||
| 4.5 | Derivation of Core Earnings | IV.21 | ||||
| 4.6 | Public Market Pricing | IV.22 | ||||
| RP® Financial, LC. | OVERVIEW AND FINANCIAL ANALYSIS I.1 |
I. OVERVIEW AND FINANCIAL ANALYSIS
Introduction
1st Security is a Washington-chartered mutual savings bank headquartered in Mountlake Terrace, Snohomish County, Washington. The Bank serves the Seattle-Tacoma-Bellevue metropolitan area through its main office in Mountlake Terrace and six branch offices, all of which are located in the greater Seattle-Tacoma region. The Bank’s offices are located in four different counties, as shown in a map provided in Exhibit I-1. 1st Security is a member of the Federal Home Loan Bank (“FHLB”) system, and its deposits are insured up to the regulatory maximums by the Federal Deposit Insurance Corporation (“FDIC”). At June 30, 2011, 1st Security had $272.8 million in assets, $241.5 million in deposits and total equity of $26.0 million, equal to 9.52% of total assets. 1st Security’s audited financial statements are included by reference as Exhibit I-2.
Plan of Conversion
On July 10, 2008, the Board of Directors of the Bank adopted a plan of conversion, incorporated herein by reference, in which the Bank will convert from a Washington-chartered mutual savings bank to a Washington-chartered stock savings bank and become a wholly-owned subsidiary of FS Bancorp, Inc. (“FS Bancorp” or the “Company”), a newly formed Washington corporation. On August 18, 2011, the Board of Directors voted to move forward with the plan of conversion. FS Bancorp will offer 100% of its common stock to qualifying depositors of the Bank in a subscription offering and, if necessary, to members of the general public through a community offering and/or a syndicated community offering. Going forward, FS Bancorp will own 100% of the Bank’s stock, and the Bank will initially be the Company’s sole subsidiary. A portion of the net proceeds received from the sale of common stock will be used to purchase all of the then to be issued and outstanding capital stock of the Bank and the balance of the net proceeds will be retained by the Company.
At this time, no other activities are contemplated for the Company other than the ownership of the Bank, extending a loan to the newly-formed employee stock ownership plan (the “ESOP”) and reinvestment of the proceeds that are retained by the Company. In the future, FS Bancorp may acquire or organize other operating subsidiaries, diversify into other banking-related activities, pay dividends or repurchase its stock, although there are no specific plans to undertake such activities at the present time.
| RP® Financial, LC. | OVERVIEW AND FINANCIAL ANALYSIS I.2 |
Strategic Overview
The Bank has been serving the greater Puget Sound area, along Interstate 5 (the “I-5 corridor”), since 1936, and was originally chartered as a credit union. In 2000, after serving the same Select Employee Groups (“SEGs”) for 64 years, 1st Security implemented an expansion plan and completed three mergers with other credit unions. On April 1, 2004, 1st Security converted from a credit union to a mutual savings bank with the goal of becoming more competitive with commercial banks and thrifts in the local market area. Management also wanted to broaden the products and services offered and eventually be able to raise capital for expansion purposes. Accordingly, the Bank has upgraded its systems, delivery channels, policies and procedures and personnel in key positions.
Over the past several years, the Bank has been working through certain regulatory matters which have led to enforcement actions. The Bank believes that the identified compliance deficiencies have been addressed and that such regulatory enforcement actions will be terminated in the near term future. The Bank’s general business strategies for the future include expanding the loan and deposit customer base, pursuing efficiencies in both internal operations and the branch office network, emphasizing lower cost core deposits to manage funding costs, and continuing to maintain high asset quality, leverage the increased capital base and improve earnings.
The loan portfolio contains a significant balance of indirect home improvement (“replacement-contracting”) loans. This type of lending was a core strategy for many years prior to the charter conversion to a mutual savings bank in 2004. The Bank also historically was very active in automobile lending, however in recent periods such lending has been de-emphasized. As a replacement for automobile lending, the Bank has expanded the loan portfolio in the areas of commercial real estate and commercial business loans. Going forward, the Bank has identified several different opportunities that will change the profile of the loan portfolio and enhance earnings. First, the Bank plans to explore the enhancement the replacement contracting business program by expanding its relationships in new states. Second, the Bank plans to take advantage of some of the market dislocation that has occurred over the past several years and offer construction loans in the primary market area on a selective basis to local contractors and individual borrowers. Third, the Bank is planning to boost non-interest operating income by developing a mortgage banking program. Finally, the Bank will once again begin to originate 1-4 family residential mortgages after having outsourced this function to a third party for the past several years.
| RP® Financial, LC. | OVERVIEW AND FINANCIAL ANALYSIS I.3 |
Similar to many savings banks, time deposits constitute the largest portion of the deposit base, with borrowings utilized to a limited extent to supplement the deposit funds, as well as assist in managing funding costs and interest rate risk. Such borrowings have typically been limited mostly to FHLB advances with fixed rate terms. While lending has been a continuous focus for the Bank, in recent years the cash and investments portfolio has fluctuated with loan demand and funding sources. The cash and investment portfolio currently includes balances of investments such as U.S. agencies and municipal bonds.
1st Security’s earnings are largely dependent upon net interest income, non-interest income. In recent periods, income has been negatively impacted by asset quality deterioration which required an increase in provisions for loan losses and reserve levels. The Bank’s relatively high operating expenses are due primarily to the high costs associated with the indirect lending program. Recent actions taken to improve profitability have included closing or selling unprofitable branches.
The equity from the stock offering will reduce certain risks and increase liquidity, earnings, growth capacity and the overall financial strength at the Bank. For example, interest rate risk and funding costs will be reduced by an enhanced interest-earning assets to interest-bearing liabilities (“IEA/IBL”) ratio. The new capital will enable the Bank to consider expansion opportunities as well, such as the establishment or acquisition of additional banking offices in current or nearby markets. The projected use of proceeds is highlighted below.
● | The Company. The Company is expected to retain up to 50% of the net conversion proceeds. At present, funds at the holding company level are expected to be initially invested primarily into short-term investment grade securities or a deposit at the Bank. Over time, the funds may be utilized for various corporate purposes, which may include acquisitions, additional equity investments in the Bank, repurchases of common stock, and the payment of regular and/or special cash dividends. |
● | The Bank. A minimum of 50% of the net conversion proceeds will be infused into the Bank. Cash proceeds (i.e., net proceeds less deposits withdrawn to fund stock purchases) infused into the Bank will initially be invested in short term securities and over time become part of general funds, pending deployment into loans and investment securities. |
| RP® Financial, LC. | OVERVIEW AND FINANCIAL ANALYSIS I.4 |
Balance Sheet Trends
Table 1.1 shows the Bank’s historical balance sheet data since year end 2006. Total assets peaked at $292.3 million at December 31, 2010, but have declined since then as management used loan repayments and prepayments to pay down borrowings in light of low loan demand. Most of the asset growth achieved during the four and a half year period shown occurred between 2008 and 2010, funded by deposit and borrowings growth. Between year-end 2006 and June 30, 2011, assets grew by only 1.4% annually, with such funds invested in cash and equivalents and investment securities which was mostly offset by a decline in loans receivable. Total loans declined primarily as a result of a loan securitization transaction completed in fiscal 2008, whereby approximately $50 million of the Bank’s portfolio of long-term fixed rate residential loans were securitized and sold. Balance sheet funding trended towards an increasing proportion of deposits, as both borrowings and equity declined. Equity declined at a 6.3% annual rate due to losses recorded from fiscal 2007 to 2009. A summary of 1st Security’s key operating ratios for the past three and one-half years is presented in Exhibit I-3.
1st Security has recorded a steady decline in the loans to assets ratio since 2007, with the ratio dropping from 90.4% at December 31, 2007 to 77.1% as of June 30, 2011. The decline is attributable to the previously mentioned loan securitization transaction, and a combination of low loan demand and a slowdown in origination activity during the real estate declines and economic downturn that has occurred during this period. The decline in loans has been replaced by an increase in short-term, low yielding investment securities (included in “cash and equivalents” in Table 1.1). The Bank experienced an increase in OREO beginning in 2009 and OREO balances have held steady since that time, amounting to 2.1% of assets at June 30, 2011. Other assets consisted of fixed assets, mortgage servicing rights, and other miscellaneous items, which have remained in the range of 5.0% and 6.0% of total assets since 2006.
| RP® Financial, LC. | OVERVIEW AND FINANCIAL ANALYSIS I.5 |
Table 1.1
1st Security Bank of Washington, Mountlake Terrace, Washington
Historical Balance Sheet Data
| 12/31/06- | ||||||||||||||||||||||||||||||||||||||||||||||||||||
| 06/30/11 | ||||||||||||||||||||||||||||||||||||||||||||||||||||
| As of December 31, | At June 30, | Annual. | ||||||||||||||||||||||||||||||||||||||||||||||||||
| 2006 | 2007 | 2008 | 2009 | 2010 | 2011 | Growth Rate | ||||||||||||||||||||||||||||||||||||||||||||||
| Amount | Pct(1) | Amount | Pct(1) | Amount | Pct(1) | Amount | Pct(1) | Amount | Pct(1) | Amount | Pct(1) | Pct | ||||||||||||||||||||||||||||||||||||||||
| ($000) | (%) | ($000) | (%) | ($000) | (%) | ($000) | (%) | ($000) | (%) | ($000) | (%) | (%) | ||||||||||||||||||||||||||||||||||||||||
| Total Amount of: | ||||||||||||||||||||||||||||||||||||||||||||||||||||
| Assets | $ | 256,385 | 100.00 | % | $ | 263,066 | 100.00 | % | $ | 255,368 | 100.00 | % | $ | 281,836 | 100.00 | % | $ | 292,334 | 100.00 | % | $ | 272,784 | 100.00 | % | 1.39 | % | ||||||||||||||||||||||||||
| Loans Receivable (net) | 218,078 | 85.06 | % | 237,807 | 90.40 | % | 222,974 | 87.31 | % | 231,441 | 82.12 | % | 230,822 | 78.96 | % | 210,184 | 77.05 | % | -0.82 | % | ||||||||||||||||||||||||||||||||
| Cash and Equivalents | 7,158 | 2.79 | % | 5,898 | 2.24 | % | 14,457 | 5.66 | % | 28,534 | 10.12 | % | 35,250 | 12.06 | % | 30,341 | 11.12 | % | 37.84 | % | ||||||||||||||||||||||||||||||||
| Investment Securities | 15,503 | 6.05 | % | 4,621 | 1.76 | % | 2,834 | 1.11 | % | 603 | 0.21 | % | 7,642 | 2.61 | % | 11,689 | 4.29 | % | -6.08 | % | ||||||||||||||||||||||||||||||||
| FHLB Stock | 1,797 | 0.70 | % | 1,797 | 0.68 | % | 1,797 | 0.70 | % | 1,797 | 0.64 | % | 1,797 | 0.61 | % | 1,797 | 0.66 | % | 0.00 | % | ||||||||||||||||||||||||||||||||
| Other Real Estate Owned | 0 | 0.00 | % | 0 | 0.00 | % | 0 | 0.00 | % | 5,484 | 1.95 | % | 3,701 | 1.27 | % | 5,925 | 2.17 | % | NM | |||||||||||||||||||||||||||||||||
| Mortgage Servicing Rights | 264 | 0.10 | % | 198 | 0.08 | % | 461 | 0.18 | % | 340 | 0.12 | % | 245 | 0.08 | % | 197 | 0.07 | % | -6.30 | % | ||||||||||||||||||||||||||||||||
| Fixed Assets | 8,955 | 3.49 | % | 11,302 | 4.30 | % | 10,643 | 4.17 | % | 9,721 | 3.45 | % | 9,249 | 3.16 | % | 9,040 | 3.31 | % | 0.21 | % | ||||||||||||||||||||||||||||||||
| Other Assets | 4,630 | 1.81 | % | 1,442 | 0.55 | % | 2,201 | 0.86 | % | 3,916 | 1.39 | % | 3,628 | 1.24 | % | 3,611 | 1.32 | % | -5.37 | % | ||||||||||||||||||||||||||||||||
| Deposits | $ | 204,816 | 79.89 | % | $ | 208,863 | 79.40 | % | $ | 216,056 | 84.61 | % | $ | 230,985 | 81.96 | % | $ | 243,957 | 83.45 | % | $ | 241,475 | 88.52 | % | 3.73 | % | ||||||||||||||||||||||||||
| FHLB Advances, Other Borrowed Funds | 13,400 | 5.23 | % | 19,800 | 7.53 | % | 9,400 | 3.68 | % | 25,900 | 9.19 | % | 21,900 | 7.49 | % | 3,900 | 1.43 | % | -23.99 | % | ||||||||||||||||||||||||||||||||
| Other Liabilities | 3,391 | 1.32 | % | 2,714 | 1.03 | % | 2,050 | 0.80 | % | 1,636 | 0.58 | % | 1,682 | 0.58 | % | 1,432 | 0.52 | % | -17.43 | % | ||||||||||||||||||||||||||||||||
| Equity | $ | 34,779 | 13.57 | % | $ | 31,689 | 12.05 | % | $ | 27,862 | 10.91 | % | $ | 23,315 | 8.27 | % | $ | 24,795 | 8.48 | % | $ | 25,977 | 9.52 | % | -6.28 | % | ||||||||||||||||||||||||||
Accumulated other Comprehensive Gain/(Loss) | ($ | 1,032 | ) | -0.40 | % | $ | 6 | 0.00 | % | ($ | 16 | ) | -0.01 | % | $ | 11 | 0.00 | % | ($ | 111 | ) | -0.04 | % | $ | 63 | 0.02 | % | |||||||||||||||||||||||||
| Loans/Deposits | 106.48 | % | 113.86 | % | 103.20 | % | 100.20 | % | 94.62 | % | 87.04 | % | ||||||||||||||||||||||||||||||||||||||||
| Offices Open | 12 | 12 | 12 | 8 | 6 | 6 | ||||||||||||||||||||||||||||||||||||||||||||||
(1) Ratios are as a percent of ending assets.
Source: Audited and unaudited financial statements; RP Financial calculations.
| RP® Financial, LC. | OVERVIEW AND FINANCIAL ANALYSIS I.6 |
The intent of the Bank’s investment policy is to provide adequate liquidity and to generate a favorable return within the context of supporting 1st Security’s overall credit and interest rate risk objectives. Given the Bank’s historical lending focus, the investment securities portfolio was typically modest in size through fiscal 2009, ranging from a high of 6.75% of assets at year end 2006 to a low of 0.85% of assets at December 31, 2009. Since that date the investment portfolio has expanded as the Bank has experienced an increase in investable funds due to the decline in the loan portfolio, and sought to improve earning asset yields in the prevailing low interest rate environment. Concurrent with the increase in the investment securities portfolio through June 30, 2011 has been an increase in cash and short-term overnight funds. As of June 30, 2011, investment securities consisted of: U.S. federal agency securities ($9.8 million), municipal bonds ($1.4 million) and mortgage-backed securities ($0.4 million), all of which were held as available-for-sale (“AFS”). Beyond these investments, the Bank held $1.8 million of FHLB stock at June 30, 2011. Cash and cash equivalents, utilized for daily operations, totaled $30.3 million at that date. The level of cash and investments maintained by the Bank has also been affected by available liquidity from changes to the balances of borrowings and deposits that have occurred since in recent periods. Exhibit I-4 provides historical detail of the Bank’s investment portfolio.
The Bank’s seven office locations (the headquarters office and six full-service depository branch locations), include four owned offices and three leased offices. The headquarters office in Mountlake Terrace is a 35,000 square foot, three story building with a net book value of approximately $3.4 million at June 30, 2011. There are no retail deposit services at this location. This office, along with investment in the other branch offices (including land, buildings, and furniture, fixtures and equipment), totaled $9.0 million, or 3.31% of assets as of June 30, 2011. This represents a notable level of investment in fixed assets, reducing the level of interest earning assets on the balance sheet.
1st Security’s funding has been derived primarily from deposits since 2006, with the deposits/assets ratio ranging from 79.4% to 88.5% during the period shown in Table 1.1. From year end 2006 through June 30, 2011, the Bank’s deposits decreased at an annual rate of 3.7%, with deposits increasing steadily between fiscal 2007 and fiscal 2010. Even though deposits have remained more or less flat during the first six months of 2011, they replaced borrowings as a funding source and had peaked at 88.5% of assets by June 30, 2011. In comparison to the deposit base of a traditional savings institution, 1st Security maintains a relatively high concentration of deposits in core transaction and savings account deposits. Core deposits comprised 56.1% of the Bank’s deposits at June 30, 2011, versus 53.8% of total deposits at year end 2008.
1st Security has borrowed funds to support asset size and manage funding costs and interest rate risk throughout the period of time shown in Table 1.1. Borrowings peaked at $25.9 million, or 9.2% of assets, at December 31, 2009, and have since been paid down to $3.9 million, or 1.4% of assets. Much of the paydown occurred during the first six months of 2011 with the Bank using excess liquidity to reduce the balance. Borrowings are generally limited to fixed-rate, fixed-maturity instruments and have also included short-term overnight FHLB advances at certain times.
| RP® Financial, LC. | OVERVIEW AND FINANCIAL ANALYSIS I.7 |
Since year end 2006, net losses and the adjustment for accumulated other comprehensive income translated into an annual equity shrinkage rate of 6.28%. The decline in assets and profitability recorded during the first six months of 2011 resulted in an increase in the equity-to-assets ratio from 8.48% at year end 2010 to 9.52% at June 30, 2011. All of the Bank’s equity is tangible, and the Bank maintained surpluses relative to all of its regulatory capital requirements at June 30, 2011. The net stock proceeds will strengthen the Bank’s equity position and support growth opportunities. The pro forma return of equity (“ROE”) is expected to initially decline given the increased equity position.
Income and Expense Trends
Table 1.2 presents the Bank’s income and expense trends over the past five and one-half years. Losses were incurred in fiscal years 2007 through 2009, while the net results have improved in recent periods as evidenced by the net income of $1.6 million recorded for fiscal 2010 and $1.9 million, or 0.69% of average assets, for the trailing twelve months ended June 30, 2011. The largest loss recorded during this period was a $4.6 million loss in fiscal 2009. Reported income has been affected to varying degrees by net gains or losses on sale, such as gains or loss on the sale of loans and branch offices. Net interest income and operating expenses represent the primary components of the Bank’s income statement. Other revenues for the Bank largely are derived from customer service fees on loans and deposits and other charges for bank services. Loan loss provisions drove the losses between fiscal 2008 and 2009, having been incurred to address issues in the consumer lending operations (which typically require establishment of reserves for expected loan chargeoffs), and, in 2008, an adverse classification of a single construction/land development loan.
The Bank’s net interest income to average assets ratio declined slightly from a high of 5.04% in fiscal 2010 to 4.96% for the twelve months ended June 30, 2011, with this ratio supported by the higher yielding loan portfolio, and a deposit base with a high proportion of lower cost core deposit funds. The decline in the net interest income ratio during the past six months is attributable to declining asset yields and loan shrinkage. Since fiscal 2006, the net interest income ratio has improved from 4.40% to 4.96% for the twelve months ended June 30, 2011, as although the income on earning assets declined by 28 basis points (from 6.53% to 6.25% of average assets), the Bank’s cost of funds declined by a greater 85 basis points due to the recent low interest rate environment. The Bank’s interest rate spreads and yields and costs for the past three and one-half years are set forth in Exhibits I-3 and I-5.
| RP® Financial, LC. | OVERVIEW AND FINANCIAL ANALYSIS I.8 |
Table 1.2
1st Security Bank of Washington
Historical Income Statements
| 12 Months Ended | ||||||||||||||||||||||||||||||||||||||||||||||||
| For the Fiscal Year Ended December 31, | June 30, | |||||||||||||||||||||||||||||||||||||||||||||||
| 2006 | 2007 | 2008 | 2009 | 2010 | 2011 | |||||||||||||||||||||||||||||||||||||||||||
| Amount | Pct(1) | Amount | Pct(1) | Amount | Pct(1) | Amount | Pct(1) | Amount | Pct(1) | Amount | Pct(1) | |||||||||||||||||||||||||||||||||||||
| ($000) | (%) | ($000) | (%) | ($000) | (%) | ($000) | (%) | ($000) | (%) | ($000) | (%) | |||||||||||||||||||||||||||||||||||||
| Interest Income | $ | 16,951 | 6.53 | % | $ | 17,619 | 6.83 | % | $ | 16,899 | 6.89 | % | $ | 16,404 | 6.28 | % | $ | 17,333 | 6.49 | % | $ | 17,129 | 6.25 | % | ||||||||||||||||||||||||
| Interest Expense | (5,536 | ) | -2.13 | % | (6,942 | ) | -2.69 | % | (5,798 | ) | -2.36 | % | (4,521 | ) | -1.73 | % | (3,886 | ) | -1.46 | % | ($ | 3,520 | ) | -1.28 | % | |||||||||||||||||||||||
| Net Interest Income | $ | 11,415 | 4.40 | % | $ | 10,677 | 4.14 | % | $ | 11,102 | 4.52 | % | $ | 11,883 | 4.55 | % | $ | 13,447 | 5.04 | % | $ | 13,609 | 4.96 | % | ||||||||||||||||||||||||
| Provision for Loan Losses | (246 | ) | -0.09 | % | (578 | ) | -0.22 | % | (4,937 | ) | -2.01 | % | (7,067 | ) | -2.70 | % | (3,480 | ) | -1.30 | % | ($ | 2,605 | ) | -0.95 | % | |||||||||||||||||||||||
| Net Interest Income after Provisions | $ | 11,169 | 4.30 | % | $ | 10,099 | 3.91 | % | $ | 6,164 | 2.51 | % | $ | 4,816 | 1.84 | % | $ | 9,967 | 3.73 | % | $ | 11,004 | 4.01 | % | ||||||||||||||||||||||||
| Other Income | $ | 3,319 | 1.28 | % | $ | 3,358 | 1.30 | % | $ | 3,025 | 1.23 | % | $ | 3,091 | 1.18 | % | $ | 2,661 | 1.00 | % | $ | 2,471 | 0.90 | % | ||||||||||||||||||||||||
| Operating Expense | (14,263 | ) | -5.49 | % | (13,326 | ) | -5.16 | % | (12,882 | ) | -5.25 | % | (13,879 | ) | -5.31 | % | (12,032 | ) | -4.51 | % | ($ | 11,790 | ) | -4.30 | % | |||||||||||||||||||||||
| Net Operating Income | $ | 224 | 0.09 | % | $ | 131 | 0.05 | % | ($ | 3,692 | ) | -1.50 | % | ($ | 5,972 | ) | -2.28 | % | $ | 596 | 0.22 | % | $ | 1,685 | 0.61 | % | ||||||||||||||||||||||
| Gain(Loss) on Sale of Branch & Other Assets | ($ | 13 | ) | 0.00 | % | ($ | 25 | ) | -0.01 | % | $ | 0 | 0.00 | % | $ | 1,335 | 0.51 | % | $ | 1,006 | 0.38 | % | $ | 209 | 0.08 | % | ||||||||||||||||||||||
| Gain(Loss) on Sale of Investment Securities | $ | 0 | 0.00 | % | $ | 0 | 0.00 | % | $ | 0 | 0.00 | % | $ | 63 | 0.02 | % | $ | 0 | 0.00 | % | $ | 0 | 0.00 | % | ||||||||||||||||||||||||
| Gain(Loss) on Sale of Loans | 1,122 | 0.43 | % | 32 | 0.01 | % | 15 | 0.01 | % | 0 | 0.00 | % | 0 | 0.00 | % | 0 | 0.00 | % | ||||||||||||||||||||||||||||||
| Other Non-Operating Items | 485 | 0.19 | % | (3,721 | ) | -1.44 | % | 194 | 0.08 | % | 0 | 0.00 | % | 0 | 0.00 | % | 0 | 0.00 | % | |||||||||||||||||||||||||||||
| Investment Security Impairment | 0 | 0.00 | % | (275 | ) | -0.11 | % | (321 | ) | -0.13 | % | 0 | 0.00 | % | 0 | 0.00 | % | 0 | 0.00 | % | ||||||||||||||||||||||||||||
| Total Non-Operating Income/(Expense) | $ | 1,594 | 0.61 | % | ($ | 3,989 | ) | -1.55 | % | ($ | 112 | ) | -0.05 | % | $ | 1,398 | 0.53 | % | $ | 1,006 | 0.38 | % | $ | 209 | 0.08 | % | ||||||||||||||||||||||
| Net Income Before Tax | $ | 1,819 | 0.70 | % | ($ | 3,858 | ) | -1.49 | % | ($ | 3,804 | ) | -1.55 | % | ($ | 4,574 | ) | -1.75 | % | $ | 1,602 | 0.60 | % | $ | 1,894 | 0.69 | % | |||||||||||||||||||||
| Income Tax Provision (Benefit) | (573 | ) | -0.22 | % | (271 | ) | -0.11 | % | 0 | 0.00 | % | 0 | 0.00 | % | 0 | 0.00 | % | $ | 0 | 0.00 | % | |||||||||||||||||||||||||||
| Net Income (Loss) | $ | 1,246 | 0.48 | % | ($ | 4,129 | ) | -1.60 | % | ($ | 3,804 | ) | -1.55 | % | ($ | 4,574 | ) | -1.75 | % | $ | 1,602 | 0.60 | % | $ | 1,894 | 0.69 | % | |||||||||||||||||||||
| Adjusted Earnings | ||||||||||||||||||||||||||||||||||||||||||||||||
| Net Income | $ | 1,246 | 0.48 | % | ($ | 4,129 | ) | -1.60 | % | ($ | 3,804 | ) | -1.55 | % | ($ | 4,574 | ) | -1.75 | % | $ | 1,602 | 0.60 | % | $ | 1,894 | 0.69 | % | |||||||||||||||||||||
| Add(Deduct): Net Gain/(Loss) on Sale | (1,594 | ) | -0.61 | % | 3,989 | 1.55 | % | 112 | 0.05 | % | (1,398 | ) | -0.53 | % | (1,006 | ) | -0.38 | % | ($ | 209 | ) | -0.08 | % | |||||||||||||||||||||||||
| Tax Effect (2) | 542 | 0.21 | % | (1,356 | ) | -0.53 | % | (38 | ) | -0.02 | % | 475 | 0.18 | % | 342 | 0.13 | % | $ | 71 | 0.03 | % | |||||||||||||||||||||||||||
| Adjusted Earnings | $ | 194 | 0.07 | % | ($ | 1,496 | ) | -0.58 | % | ($ | 3,730 | ) | -1.52 | % | ($ | 5,497 | ) | -2.10 | % | $ | 938 | 0.35 | % | $ | 1,756 | 0.64 | % | |||||||||||||||||||||
| Expense Coverage Ratio | 80.0 | % | 80.1 | % | 86.2 | % | 85.6 | % | 111.8 | % | 115.4 | % | ||||||||||||||||||||||||||||||||||||
| Efficiency Ratio | 96.8 | % | 94.9 | % | 91.2 | % | 92.7 | % | 74.7 | % | 73.3 | % | ||||||||||||||||||||||||||||||||||||
| Effective Tax Rate (Benefit) | 31.5 | % | 7.0 | % | 0.0 | % | 0.0 | % | 0.0 | % | 0.0 | % | ||||||||||||||||||||||||||||||||||||
| (1) | Ratios are as a percent of average assets |
| (2) | Assumes a 34% effective tax rate for federal & state income taxes. |
| Source: Audited & unaudited financial statements & RP Financial calculations | |
| RP® Financial, LC. | OVERVIEW AND FINANCIAL ANALYSIS I.9 |
Non-interest operating income (“other income”) has contributed significantly to the Bank’s bottom line since 2006, but has steadily decreased both in dollar terms and as a percent of average assets, totaling $2.5 million, or 0.90% of average assets for the 12 months ended June 30, 2011. Non-interest operating income is dependent upon the level of banking activities, with fees and charges on transaction deposit accounts constituting the primary source of non-interest income for the Bank. The contribution realized from service fees and charges to non-interest operating income is supported by the Bank’s relatively high concentration of deposits maintained in transaction accounts. The level of non-interest income has declined in recent periods in part due to regulatory changes that occurred in mid-2010 that affected the level of non-sufficient fees that can be charged on deposit accounts, along with the overall reduction in loan origination activity, as the Bank is no longer generating as much fee income. Thus, the ratio of non-interest income to average assets has declined to 0.90% of average assets for the 12 months ended June 30, 2011 versus 1.30% of average assets generated during fiscal 2007.
Operating expenses represent the other major component of the Bank’s income statement, and ranged from a high of 5.49% of average assets during 2006 to a low of 4.30% of average assets for the twelve months ended June 30, 2011. Overall, the Bank’s operating expenses are relatively high in comparison to industry norms and reflect in part the staffing and operating costs associated with the consumer loan operations, which require a significant number of employees to support. The Bank also recently added staffing to implement the construction lending and residential mortgage lending programs. Since 2006, however, operating expenses have been reduced by closing or consolidating branch offices, which has reduce the level of employees and related costs. Some upward pressure will be placed on the Bank’s expenses and expense ratio following the stock offering, due to expenses associated with operating as a publicly-traded company, including expenses related to the stock benefit plans. At the same time, the increase in equity realized from the stock offering will increase the Bank’s capacity to leverage operating expenses through pursuing a more aggressive growth strategy.
| RP® Financial, LC. | OVERVIEW AND FINANCIAL ANALYSIS I.10 |
Because the net interest income ratio has increased and the operating expense ratio has declined since fiscal 2006, the Bank’s expense coverage ratio (net interest income divided by operating expenses) has increased to 1.15x from 0.80x over the past four and a half years. In addition, 1st Security’s efficiency ratio (operating expenses / (net interest income + other operating income)) of 73.3% during the 12 months ended June 30, 2011 was much more favorable than the 96.8% efficiency ratio recorded in fiscal 2006. The reduction in the efficiency ratio is an indication of strengthening core earnings. Going forward, the Bank believes the efficiency ratio could further improve with continued efforts to control operating expenses and reinvestment of the offering proceeds.
As noted earlier, loan loss provisions were elevated during 2008 and 2009 and remained elevated in 2010 and to date due to an increase in non-performing loans. For trailing twelve months ended June 30, 2011, loan loss provisions were $2.6 million, which is lower than the $7.1 million in fiscal 2009 but substantially higher than the level of $0.3 million recorded in 2006, before the financial crisis started. As of June 30, 2011, 1st Security maintained an allowance for loan losses of $4.8 million, equal to 2.5x non-accruing loans and 2.25% of gross loans receivable. Exhibit I-6 sets forth the Bank’s allowance for loan loss activity during the past two and one-half years.
Non-operating items have had a varying impact on the Bank’s income statement in recent years. Net gains on loan sales, restructuring costs, and the sale of branches have accounted for most of the non-operating activity since 2006. For the trailing twelve months ended June 30, 2011, non-operating items were limited to gains on the sale of branches and totaled only $0.2 million, or 0.08% of average assets. Importantly, any non-operating or non-recurring items will be excluded from the Bank’s income statement for the trailing twelve months ended June 30, 2011 in the calculation of adjusted net income for valuation purposes.
The Bank’s tax expense has been zero since fiscal 2008 as a result of prior period adjustments. As result of the net losses incurred in fiscal years 2007 through 2009, 1st Security had a net deferred tax asset of approximately $3.5 million as of June 30, 2011, of which there was a 100% reserve established at that date. The Bank’s marginal effective statutory tax rate approximates 34%, and this is the rate utilized to calculate the net reinvestment benefit from the offering proceeds. While the net deferred tax asset is fully reserved on the balance sheet, the Bank expects to review this status in connection with the December 31, 2011 fiscal year audit. There is a possibility that a portion of the deferred tax asset reserve may be reversed, resulting in an increase to the Bank’s equity account. This would imply that the Bank would then be subject to income taxes for financial reporting purposes. However, due to the uncertainty of this scenario, both in timing and amount, we have not included any impact of a reversal of all or a portion of the deferred tax valuation allowance in our pro forma valuation analysis.
| RP® Financial, LC. | OVERVIEW AND FINANCIAL ANALYSIS I.11 |
Interest Rate Risk Management
The Bank’s balance sheet is liability-sensitive in the shorter-term and, thus, the net interest margin will typically be adversely affected during periods of rising and higher interest rates, as well as in the interest rate environment that prevailed during 2006 and the first half of 2007 in which the yield curve was inverted due to short-term interest rates increasing to levels that exceed the yields earned on longer-term Treasury bonds. As of June 30, 2011 the interest rate risk analysis provided by a third party indicated that a 2.0% instantaneous and sustained increase in interest rates would result in a 0.71% increase in the Bank’s net interest income (see Exhibit I-7).
The Bank pursues a number of strategies to manage interest rate risk, particularly with respect to seeking to limit the repricing mismatch between interest rate sensitive assets and liabilities. The Bank manages interest rate risk from the asset side of the balance sheet by maintaining high liquidity, originating adjustable rate mortgages and other floating rate loans, and diversifying into shorter-term types of lending, such as the home renovation, other consumer and construction lending. As of June 30, 2011, loans with adjustable rates comprised approximately 28.6% of net loans receivable (see Exhibit I-8). On the liability side of the balance sheet, management of interest rate risk has been pursued by maintaining a high concentration of deposits in lower cost and less interest-rate sensitive transaction and savings accounts. Transaction and savings accounts comprised 56.1% of the Bank’s deposits at June 30, 2011. The infusion of stock proceeds will serve to further limit the Bank’s interest rate risk exposure, as most of the net proceeds will be redeployed into interest-earning assets and the increase in the Bank’s capital will lessen the proportion of interest rate sensitive liabilities funding assets.
Lending Activities and Strategy
Historically, the Bank’s primary emphasis was the origination of consumer loans (primarily “replacement-contracting” loans and automobile secured loans), 1-4 family residential first mortgages, and 2nd mortgage/home equity loan products. The consumer loans were originated on an “indirect” basis, using home contractors or automobile dealers as loan sources. More recently, while maintaining the indirect replacement-contracting consumer lending program, the Bank has shifted away from automobile lending. With regard to commercial lending, the Bank intends to continue to originate non-mortgage commercial business loans and commercial real estate loans. 1st Security also plans to grow its portfolio of construction loans, and will bring 1-4 family residential mortgage originations back in-house. To implement the construction and residential mortgage lending strategies, the Bank recently hired experienced management in these areas. This strategy is expected to improve overall profitability, stability of earnings, increase the products per customer and increase the assets per employee (given the larger average loan size relative to indirect fixture secured and automobile loans). Details of the Bank’s loan portfolio composition are shown in Exhibit I-9, while Exhibit I-10 provides details of the Bank’s loan portfolio by contractual maturity date.
| RP® Financial, LC. | OVERVIEW AND FINANCIAL ANALYSIS I.12 |
Indirect Consumer Lending
Indirect consumer loans (indirect home renovation loans) represent the largest portion of the loan portfolio and have traditionally been the mainstay of the Bank’s lending strategy as a continuation of a lending operation from its days as a credit union. Such loans totaled $87.2 million, or 40.7% of total loans as of June 30, 2011. Indirect home renovation loans are originated through a network of approximately 150 home improvement contractors located in Washington, Oregon, Idaho, and Montana. Approximately 20 dealers are responsible for 50% of the loan volume, and the home renovation contractors are currently concentrated in the areas of replacement windows, siding, HVAC systems and roofing. These loans are originated by the dealers using loan applications provided by 1st Security. The loans are processed through loan origination software by the Bank, with approximately 50% of the loan applications receiving an automatic approval based on the information provided. A borrower’s FICO score is utilized as an important indicator of credit risk, and the Bank has emphasized originations of loans to higher credit score borrowers over the past 2-3 years. This has led to a lower level of loan chargeoffs in recent periods. Home renovation loans are generally secured by a lien against the property where the goods are installed and carry terms of up to 10 years with fixed rates of interest. The average loan balance was $13,000 as of June 30, 2011.
The decline in home prices experienced in the Bank’s market area over the past couple of years has resulted in a lower level of demand for home renovation loans, as homeowners are less likely to invest in existing homes if the amount owed on the property exceeds the current fair value. Thus, the Bank has experienced a modest decline in the balances of such loans, and going forward, the Bank intends to build new relationships with contractors doing business in California and Texas to replace a portion of the lost volume resulting from the slowdown in the Pacific Northwest economy. The Bank will test those markets with a selected number of contractors, and should this expanded market for home renovation lending be deemed attractive, the Bank intends to add additional loan sources in those states. Terms and conditions of loans to be originated in California and Texas will be similar to loans currently originated.
| RP® Financial, LC. | OVERVIEW AND FINANCIAL ANALYSIS I.13 |
Other Consumer Lending
1st Security also offers non-mortgage consumer loans secured by automobiles, boats, RVs, loans secured by deposits, and unsecured consumer loans. Automobile loans represent a prior lending focus whereby indirect loans were originated through a dealer network throughout the Northwest for new and used cars. However, this practice has been ceased, and auto loans are currently only originated at branch office locations. Thus, the balance of auto loans has declined substantially in recent years, and totaled $8.9 million as of June 30, 2011. Such balances are expected to continue to decline over the near term future. Auto loans currently originated by the branches generally carry fixed rates and terms of up to seven years. Recreational vehicle loans (boat and RV loans) represent a secondary consumer lending focus of the Bank, with the balances increasing in recent periods as a replacement for the reduction in auto loans. As of June 30, 2011, boat and RV loans equaled $25.3 million, or 11.8% of total loans. Boat and RV loans are originated directly to the owner of the security, and carry terms of up to 15 years and fixed rates. 1st Security originates a small number of other consumer loans, including home improvement, loans on deposit and other consumer loans, which totaled $3.1 million as of June 30, 2011. These loans generally carry fixed as well and terms up to five years.
Commercial Business Lending
1st Security originates commercial business loans to small- and mid-sized businesses local to the Bank’s Puget Sound market area, including loans to fund working capital that are secured by accounts receivable, inventory or property, plant and equipment. These loans may be fixed-rate but are usually adjustable-rate loans indexed to either the prime rate of interest or the LIBOR rate, plus a margin. Due to the current interest rate environment, these loans are generally originated with a floor of approximately 5.50%. Loan fees are generally charged at origination depending on the credit quality and account relationships of the borrower. The Bank structures some commercial business loans as lines of credit with terms of 12 months and interest only during the term, while other loans may reprice on an annual basis and amortize over a two to five year period. Loan-to-value ratios for these types of loans are generally limited to 80%. The typical business loan customer has annual revenue of up to $25 million.
| RP® Financial, LC. | OVERVIEW AND FINANCIAL ANALYSIS I.14 |
A portion of the commercial business loan portfolio consists of “warehouse lines of credit lending” to local mortgage banking companies, a business line that was commenced in 2010. The Bank currently maintains lines of credit totaling $6.5 million as of June 30, 2011 to a total of eight mortgage banking companies who use the funds to fund loan commitments. Outstanding balances as of June 30, 2011 were approximately $3.5 million. The mortgage bankers then sell the loans in the secondary market and repay the loans made by the Bank. These warehouse lines are secured by the underlying residential mortgage loans and carry variable rates based on prime with a floor of 5.5%. Following completion of the Conversion, the Bank’s legal lending limit will be increased, allowing the Bank to provide additional financing to the mortgage banking companies.
Commercial Real Estate and Multi Family Lending
1st Security originates real estate loans to a variety of commercial businesses, along with a modest amount of loans secured by multi-family property. These loans are generally priced at a higher rate of interest, have larger balances and involve a greater risk profile than 1-4 residential mortgage loans. Payments on commercial real estate loans are usually dependent on successful operations and management of the property. The Bank will generally require and obtain loan guarantees from financially capable borrowers.
Both fixed- and adjustable-rate commercial real estate mortgage loans are offered, secured by a wide variety of commercial properties located primarily across the Puget Sound region, including retail centers, warehouses, office buildings, and some multi-family residences. Loans originated are generally adjustable rate loans with balloon payments due after five to ten years. The loan interest rates are generally indexed to the prime rate of interest or a short-term LIBOR rate. Terms to maturity extend from 10 to 25 years. Commercial real estate loans are originated at loan-to-value ratios (“LTV”) generally not above 80%. In addition, personal guarantees are obtained from the primary borrowers on substantially all credits.
The Bank enhanced its commercial lending team in 2008 with personnel that are experienced in commercial real estate lending in the Puget Sound region, including lenders that maintain borrower relationships that assist in building the Bank’s commercial real estate loan portfolio. 1st Security has maintained a portfolio balance of such loans of approximately 12% of total loans since that time. The Chief Lending Officer has over 23 years of commercial lending experience in the northwestern U.S. region.
| RP® Financial, LC. | OVERVIEW AND FINANCIAL ANALYSIS I.15 |
2nd Mortgage/Home Equity Lending
1st Security has been active in 2nd mortgage and home equity lending in the geographic footprint served by the branches, and currently these loans are sourced by the branch offices. This lending activity is expected to continue, recognizing the risk in this type of lending given that home values have declined and remain precarious. Home equity lines of credit generally have adjustable rates tied to the prime rate of interest with terms of up to 20 years and maximum combined LTV ratios of up to 90%, including any underlying first mortgage. These loans totaled $12.9 million, or 83.7% of total second position loans at June 30, 2011. The Bank also maintains a smaller portfolio of fixed rate, fixed term 2nd mortgage loans, which are underwritten as amortizing loans with terms of up to 20 years. These loans equaled $2.5 million as of June 30, 2011. Historically the Bank has priced these loans competitively in the local market area.
Residential Real Estate Lending
1st Security historically engaged in the origination of first mortgage loans secured by traditional 1-4 family residential owner-occupied property, with such loans both retained in portfolio and selectively sold into the secondary market, generally on a servicing retained basis. In mid-2007, the Bank shifted from in-house originations to a private label outsourcing arrangement whereby the Bank refers loan customers to the third party originator and receives a fee for the referral. The third party originator then processed the entire loan application, performed the underwriting, and funded the loan, while 1st Security had the option to invest in the loan. This origination structure allowed the Bank to devote additional internal resources to commercial and consumer lending. The private label outsourcing arrangement also allowed the Bank’s name to remain active in the local residential lending market.
Going forward, the Bank intends to establish a mortgage banking operation within the Bank by reintroducing in-house originations of residential mortgage loans, primarily for sale into the secondary market. To achieve this goal, the Bank intends to hire residential lending specialists with regional market area experience who will focus their efforts on generating mortgage loans. New originations will carry primarily fixed rates with 15 to 30 year terms and will conform to secondary market guidelines that enable their sale. The loans will be originated with maximum LTVs of 90%, although LTVs over 80% will require private mortgage insurance. The majority of fixed-rate production will be sold in the secondary market such as Wells Fargo, U.S. Bancorp or Citibank on a servicing retained basis. The Bank expects to realize gains of approximately 1.5% on the sale of these mortgages. A minor portion of the fixed rate loan originations may be placed into portfolio by the Bank based on cashflow needs and loan portfolio balance targets.
| RP® Financial, LC. | OVERVIEW AND FINANCIAL ANALYSIS I.16 |
Construction/Land Loans
Historically, 1st Security has originated construction loans secured by commercial real estate and, to a lesser extent, one- to four-family residences, along with loans secured by tracts of land for development. This type of lending has been modest over the last several years as the real estate markets have declined, demand for new construction declined and many builders experienced cash flow problems; as of June 30, 2011 construction/land loans totaled $6.3 million, or 2.9% of loans. Credit risk is managed by limiting lending activities within the primary market area and to known builders and developers in the regional market area. These loans are also attractive due to the relatively short average duration and attractive yields. Representing a lending initiative for the Bank, 1st Security intends to increase the volumes of the residential construction lending program and has hired a team of four construction lenders who ran a successful construction lending operation at another local institution. This team has expertise in acquisition, development and construction (“ADC”) lending in the Puget Sound market. The Bank is implementing this strategy to take advantage of what it sees as unmet demand for quality construction and ADC loans after many other banks abandoned this segment because of previous overexposure.
Residential construction loans to be originated will include loans to builders for speculative construction loans along with loans to the ultimate homeowner for construction of their primary residence. These loans will consist of generally have variable rates of interest, terms of up to 2 years (but most typically 9-12 months) and LTV ratios up to 75%. Construction loans are generally interest-only during the construction period. At the end of the construction period, the loans are paid off by the borrower, or may convert to permanent financing. LTVs range from 80% to 100%.
Exhibit I-11 provides a summary of the Bank’s lending activities since fiscal 2008. Lending volumes have fluctuated over this time period, with total originations falling from a high of $139.7 million during 2008 to $72.9 million for the trailing twelve months ended June 30, 2011. Within the loan categories, indirect consumer loans accounted for the majority of the loan volume, followed by commercial business loans and warehouse lines of credit. Originations of real estate mortgages has been very low during this period. No loans were purchased during this period, and no loans have been sold since fiscal 2009.
| RP® Financial, LC. | OVERVIEW AND FINANCIAL ANALYSIS I.17 |
Asset Quality
Asset quality issues at 1st Security have been centered around the real estate portfolio, but the quality of the real estate portfolio has improved significantly in recent periods. At June 30, 2011, the Bank recorded total NPLs of $1.9 million, down from $6.2 million at December 31, 2010. As shown in Exhibit I-12, the Bank’s portfolio of NPLs consisted of approximately equal proportions of home equity lines of credit (31.8%), consumer loans (26.5%), and commercial business loans (29.4%). Previous problems in the construction and commercial real estate portfolios had been resolved by June 30, 2011. Non-performing assets, which includes NPLs, accruing loans past due 90 days or more, OREO, and restructured loans, peaked at $13.1 million, or 4.6% of assets at year end 2009, and had declined to approximately $8.0 million, or 2.9% by June 30, 2011, with the majority comprised of OREO totaling $5.9 million. The Bank’s policy is to charge off non-performing consumer loans immediately; otherwise, the level of non-performing loans would be higher historically.
1st Security has established detailed asset classification policies and procedures which are consistent with regulatory guidelines. Detailed asset classifications are reviewed quarterly by senior management and the Board. Pursuant to these procedures, when needed, the Bank establishes additional valuation allowances to cover anticipated losses in classified or non-classified assets. At June 30, 2011, the Bank maintained valuation allowances of $4.8 million, equal to 2.25% of net loans receivable and 2.5x non-accruing loans.
Funding Composition and Strategy
Deposits have consistently accounted for the major portion of the Bank’s IBL and at June 30, 2011 deposits equaled 98.4% of total IBL. Exhibit I-13 sets forth the Bank’s deposit composition for the past two and one-half years and Exhibit I-14 provides the interest rate and maturity composition of the certificate of deposit (“CD”) portfolio at June 30, 2011. Transaction and savings account deposits constitute the largest portion of the Bank’s deposit base, with the proportion of such deposits increasing since 2008 due to much lower rates on longer-term CDs. Transaction, money market and savings account deposits equaled $135.5 million, or 56.1% of total deposits, at June 30, 2011, versus $116.1 million, or 53.7% of total deposits, at December 31, 2008. The largest portion of the core deposit base consists of money market accounts, which totaled $88.9 million, or 36.8% of total deposits.
| RP® Financial, LC. | OVERVIEW AND FINANCIAL ANALYSIS I.18 |
The balance of the Bank’s deposits consists of CDs, with 1st Security’s current CD composition reflecting a higher concentration of short-term CDs (maturities of one year or less). As of June 30, 2011, the CD portfolio totaled $105.9 million, or 43.9% of total deposits, and 47.8% of the CDs were scheduled to mature in one year or less. As of June 30, 2011, jumbo CDs (balances exceeding $100,000) amounted to $61.3 million, or 58% of total CDs. The Bank maintained $10.1 million of brokered CDs as of June 30, 2011. As noted above, the balances of CDs in recent years has been affected by offering rates, which increases the attractiveness of those deposits relative to lower yielding transaction and savings account deposits.
Borrowings have served as an alternative funding source for the Bank to facilitate management of funding costs and interest rate risk. 1st Security maintained $3.9 million of FHLB advances at June 30, 2011 with a weighted average rate of 4.49%, which consisted of advances that had fixed interest rates with maturity dates extending out several years. Exhibit I-15 provides further detail of the Bank’s borrowings activities during the past three and one-half years. The overall level of borrowings has declined during 2011, reflecting the previously described increase in deposit funds and the reduction in the asset base in 2011.
Subsidiaries
1st Security currently has one inactive subsidiary, with an investment of $4,900 as of June 30, 2008.
Legal Proceedings
The Bank is not involved in any pending legal proceedings other than routine legal proceedings occurring in the ordinary course of business which, in the aggregate, are believed by management to be immaterial to the financial condition of the Bank.
| RP® Financial, LC. | MARKET AREA II.1 |
II. MARKET AREA
Introduction
1st Security conducts operations out of the main office and six branch offices in the Puget Sound region of Washington State. The main office is located in Mountlake Terrace, in Snohomish County, Washington, north of the city of Seattle. The branches extend to King and Pierce Counties to the south and Kitsap Counties to the west. A map of the branch office network is presented in Exhibit I-1, while descriptions of the office facilities are contained in Exhibit II-1.
The primary market area for business operations is the Seattle-Tacoma-Bellevue, WA Metropolitan Statistical Area (the “Seattle MSA”), while Kitsap County is part of the Bremerton-Silverdale Metropolitan Statistical Area (the “Bremerton-Silverdale MSA”). The overall region is typically known as the “Puget Sound” region. The population of the Seattle MSA was an estimated 3.4 million in 2010, approximately one-half of the state’s population, representing a large population base for potential business. The Seattle MSA has a well-developed urban area in the western portion of the state along Puget Sound, with the central and eastern portions remaining undeveloped, rural and mountainous.
In recent years, the economy in the Bank’s operating markets has experienced a downturn, reflecting the impact of the nationwide recession. Unemployment rates have increased, and real estate prices have diminished from peak levels. However, long-term growth trends are still favorable as the market area continues to maintain a highly educated and motivated workforce, and the Puget Sound region remains a desirable place to live. Future growth opportunities for 1st Security depend on the growth and stability of the regional economy, demographic growth trends, and the nature and intensity of the competitive environment. These factors have been briefly examined in the following pages to help determine the growth potential that exists for the Bank and the relative economic health of 1st Security’s market area. The growth potential and the stability provided by the market area have a direct bearing on the market value of the Bank.
| RP® Financial, LC. | MARKET AREA II.2 |
| National Economic Factors |
The business potential of a financial institution is partially dependent on the future operating environment and growth opportunities for the banking industry and the economy as a whole. The national economy experienced a severe downturn during 2008 and 2009, as the fallout of the housing crisis caused the wider economy to falter, with most significant indicators of economic activity declining by substantial amounts. The overall economic recession was the worst since the great depression of the 1930s. Approximately 8 million jobs were lost during the recession, as consumers cut back on spending, causing a reduction in the need for many products and services. Total personal wealth declined notably due to the housing crisis and the drop in real estate values. As measured by the nation’s gross domestic product (“GDP”), the recession officially ended in the fourth quarter of 2009, after the national GDP expanded for two consecutive quarters (1.6% annualized growth in the third quarter of 2009 and 5.0% annualized growth in fourth quarter of 2009). The economic expansion has continued since that date, with GDP growth of 2.8% for calendar year 2010 and1.8% for the first quarter of 2011. The initial estimate of second quarter GDP growth showed that the economy expanded at a meager 1.3% annual rate, however. Notably, a large portion of GDP growth during 2009 and into 2010 has been generated through federal stimulus programs, bringing into question the sustainability of the recovery without government support.
The economic recession caused the inflation rate to decrease notably during 2009. Inflation averaged 3.85% for all of 2008 and a negative 0.34% for all of 2009, indicating a deflationary period. There was a decline in prices during eight of the 12 months during 2009. Reflecting a measure of recovery of the economy, the national annualized inflation rate was 1.64% for 2010 and an annualized rate of 2.8% for the first half of 2011. The national unemployment rate also revealed a modest recovery over the past 12 months. The reduction in employment during the recession led to fears of a prolonged period of economic stagnation, as consumers were unwilling or unable to increase spending. The unemployment rate totaled 9.2% as of June 2011, a slight decline from 9.4% as of December 2010, but still high compared to recent historical levels. There remains significant uncertainty about the near term future, particularly in terms of the speed at which the economy will recover, the impact of the housing crisis on longer term economic growth, and the near-term future performance of the real estate industry, including both residential and commercial real estate prices, all of which have the potential to impact future economic growth. The current and projected size of government spending and deficits also has the ability to impact the longer-term economic performance of the country.
The northwestern section of the United States is not immune to national economic trends as the regional residential and commercial real estate markets have felt the impact of the nationwide recession, with lowered housing prices and an almost complete shutdown of the construction industry. In particular, job losses in rural areas such as served by the Bank have caused a notable portion of loan delinquencies and foreclosures.
| RP® Financial, LC. | MARKET AREA II.3 |
The major stock exchange indices have reflected the recent improvement in the downturn in the national economy, reporting significant volatility and an upward trend over the past 12 months. As an indication of the changes in the nation’s stock markets over the last 12 months, as of June 30, 2011, the Dow Jones Industrial Average closed at 12,414.34, an increase of 27.0% from June 30, 2010, while the NASDAQ Composite Index stood at 2,773.52, an increase of 31.5% over the same time period. The Standard & Poors 500 Index totaled 1,320.64 as of June 30, 2011, an increase of 28.1% from June 30, 2010.
Regarding factors that most directly impact the banking and financial services industries, in the past year the number of housing foreclosures have reached historical highs, median home values have declined by double digits in most areas of the country, and the housing construction industry has been decimated. These factors have led to substantial losses at many financial institutions, and subsequent failures of institutions. Despite efforts by the federal and state governments to limit the impact of the housing crisis, there remain concerns about a “double-dip” housing recession, whereby another wave of foreclosures occur. Therefore, the Bank will employ strict, prudent underwriting for such loans being placed into its portfolio, and will work to aggressively resolve substandard credits.
| Interest Rate Environment |
In terms of interest rates, through the first half of 2004, in a reaction to try to avoid a significant slowdown of the economy, the Federal Reserve lowered key market interest rates to historical lows not seen since the 1950s, with the federal funds rate equal to 1.00% and the discount rate equal to 2.00%. Beginning in June 2004, the Fed began slowly, but steadily increasing the federal funds and overnight interest rates in order to ward off any possibility of inflation. Through June 2006, the Fed had increased interest rates a total of 17 times, and as of June 2006, the Fed Funds rate was 5.25%, up from 1.00% in early 2004, while the Discount Rate stood at 6.25%, up from 2.00% in early 2004. The Fed then held these two interest rates steady until mid-2007, at which time the downturn in the economy was evident, and the Fed began reacting to the increasingly negative economic news. Beginning in August 2007 and through December 2008, the Fed decreased market interest rates a total of 12 times in an effort to stimulate the economy, both for personal and business spending.
| RP® Financial, LC. | MARKET AREA II.4 |
As of January 2009, the Discount Rate had been lowered to 0.50%, and the Federal Funds rate target was 0.00% to 0.25%. These historically low rates were intended to enable a faster recovery of the housing industry, while at the same time lower business borrowing costs, and such rates have remained in effect through early 2010. In February 2010, the Fed increased the discount rate to 0.75%, reflecting a slight change to monetary strategy. The effect of the interest rate decreases since mid-2008 has been most evident in short term rates, which decreased more than longer term rates, increasing the slope of the yield curve. This low interest rate environment has been maintained as part of a strategy to stimulate the economy by keeping both personal and business borrowing costs as low as possible. The strategy has achieved its goals, as borrowing costs for residential housing have been at historical lows, and the prime rate of interest remains at a low level. As of June 30, 2011, one- and ten-year U.S. government bonds were yielding 0.19% and 3.18%, respectively, compared to 0.32% and 2.97%, respectively, as of June 30, 2010. This has had a positive impact on the net interest margins of many financial institutions, as they rely on a spread between the yields on longer term assets and the costs of shorter term funding sources. However, institutions who originate substantial volumes of prime-based loans have given up some of this pickup in yield as the prime rate declined from 5.00% as of June 30, 2008 to 3.25% as of June 30, 2011.
Based on the consensus outlook of 53 economists surveyed by The Wall Street Journal in July 2011, economic growth is expected to bounce back in the second half of 2011 to annualized growth rate of 3.1% and remain around 3.0% through 2012. Most of the economists expect that the unemployment rate will decrease in 2011, but the pace of job growth will only serve to bring the unemployment rate down slowly. On average, the economists expect that the unemployment rate will be 8.8% by the end of 2011 and 8.1% by the end of 2012, with the economy adding around 2.2 million jobs over the next twelve months. On average, the economists did not expect the Federal Reserve to begin raising its target rate until the first half of 2012 and the yield on the 10-year Treasury would reach 3.55% by December 2011 and 4.24% by the end of 2012. Inflation pressures were forecasted to recede going into 2012, as the price of oil was expected to settle around $100 a barrel. The economists also forecasted home prices would decline 2.4% in 2011, as measured by the Federal Housing Finance Agency index. Housing starts were forecasted to tick up through 2012, but remain at historically depressed levels. Historical interest rate data is presented in Exhibit II-2.
| RP® Financial, LC. | MARKET AREA II.5 |
Market Area Demographics
Table 2.1 presents information regarding the demographic and economic trends for the Bank’s market area from 2000 to 2010 and projected through 2015, with additional data shown in Exhibit II-3. Data for the nation, the state of Washington and the Seattle MSA are included for comparative purposes. The size and scope of the market area is evidenced by the demographic data, which shows that as of 2010 the total population of the Seattle MSA was 3.46 million, approximately 51% of the state population. Most of the population base is concentrated along the western border of the region, against Puget Sound, resulting in a relatively urban market area for 1st Security. Between 2000 and 2010 the annual population growth rate of the Seattle MSA was slightly lower than the state rate and higher than the national rate, indicating a moderately growing area, with the more “suburban” counties of Pierce and Snohomish reporting higher growth rates and Kitsap County reporting the slowest growth rate, 0.6%, for the Bank’s market area. The slower growth in King County reflects the more developed characteristic of western King County, which is one of the older regions in the state. In most comparative areas, growth in households has paralleled trends with respect to population, as household growth rates for Kitsap County increased at a 0.8% annual rate compared to higher rates for the other counties.
The 2010 median household income and per capita income levels in King and Snohomish Counties were higher than the state and national averages, while Pierce County and Kitsap County reported income levels slightly below the Washington state average. Additional data regarding market area income levels is presented in Exhibit II-3. King and Snohomish Counties contain a larger percentage of higher income white-collar professional employment. For example, the King County (the highest income levels) median household income was 124% of the state average and 138% of the national average. Household income distribution patterns provide support for earlier statements regarding the nature of the Bank’s market as approximately 69% of King County households had income levels in excess of $50,000 annually in 2009 while the ratio was 60% for the state of Washington and 55% for the national average. In 2009, the city of Seattle was ranked as the seventh most educated city in the country, with a large concentration of residents that hold college degrees. Seattle’s relatively high income coupled with high education levels for a major city, results in King County placing among the 100 wealthiest counties in the United States, which will favorably influence demand for the products and services offered by financial services providers operating in the market.
| RP® Financial, LC. | MARKET AREA II.6 |
Table 2.1
1st Security Bank of Washington
Summary Demographic/Economic Information
| Growth | Growth | |||||||||||||||||||
| Year | Rate | Rate | ||||||||||||||||||
| 2000 | 2010 | 2015 | 2000-2010 | 2010-2015 | ||||||||||||||||
| (%) | (%) | |||||||||||||||||||
| Population(000) | ||||||||||||||||||||
| United States | 281,422 | 311,213 | 323,209 | 1.0 | % | 0.8 | % | |||||||||||||
| Washington | 5,894 | 6,756 | 7,176 | 1.4 | % | 1.2 | % | |||||||||||||
| Seattle MSA | 3,044 | 3,462 | 3,672 | 1.3 | % | 1.2 | % | |||||||||||||
| King County | 1,737 | 1,937 | 2,054 | 1.1 | % | 1.2 | % | |||||||||||||
| Pierce County | 701 | 813 | 861 | 1.5 | % | 1.2 | % | |||||||||||||
| Snohomish County | 606 | 713 | 758 | 1.6 | % | 1.2 | % | |||||||||||||
| Kitsap County | 232 | 247 | 251 | 0.6 | % | 0.3 | % | |||||||||||||
| Households(000) | ||||||||||||||||||||
| United States | 105,480 | 116,761 | 121,360 | 1.0 | % | 0.8 | % | |||||||||||||
| Washington | 2,271 | 2,612 | 2,778 | 1.4 | % | 1.2 | % | |||||||||||||
| Seattle MSA | 1,197 | 1,370 | 1,456 | 1.4 | % | 1.2 | % | |||||||||||||
| King County | 711 | 797 | 847 | 1.2 | % | 1.2 | % | |||||||||||||
| Pierce County | 261 | 304 | 323 | 1.6 | % | 1.2 | % | |||||||||||||
| Snohomish County | 225 | 268 | 286 | 1.8 | % | 1.3 | % | |||||||||||||
| Kitsap County | 86 | 93 | 95 | 0.8 | % | 0.4 | % | |||||||||||||
| Median Household Income($) | ||||||||||||||||||||
| United States | $ | 42,164 | $ | 54,442 | $ | 61,189 | 2.6 | % | 2.4 | % | ||||||||||
| Washington | $ | 45,770 | $ | 60,311 | $ | 68,768 | 2.8 | % | 2.7 | % | ||||||||||
| Seattle MSA | $ | 51,488 | $ | 69,015 | $ | 80,645 | 3.0 | % | 3.2 | % | ||||||||||
| King County | $ | 53,383 | $ | 75,693 | $ | 88,138 | 3.6 | % | 3.1 | % | ||||||||||
| Pierce County | $ | 45,197 | $ | 57,879 | $ | 65,288 | 2.5 | % | 2.4 | % | ||||||||||
| Snohomish County | $ | 53,219 | $ | 68,912 | $ | 79,010 | 2.6 | % | 2.8 | % | ||||||||||
| Kitsap County | $ | 46,848 | $ | 60,066 | $ | 66,635 | 2.5 | % | 2.1 | % | ||||||||||
| Per Capita Income($) | ||||||||||||||||||||
| United States | $ | 21,587 | $ | 26,739 | $ | 30,241 | 2.2 | % | 2.5 | % | ||||||||||
| Washington | $ | 22,973 | $ | 28,691 | $ | 33,252 | 2.2 | % | 3.0 | % | ||||||||||
| Seattle MSA | $ | 26,332 | $ | 33,821 | $ | 39,415 | 2.5 | % | 3.1 | % | ||||||||||
| King County | $ | 29,521 | $ | 38,562 | $ | 45,291 | 2.7 | % | 3.3 | % | ||||||||||
| Pierce County | $ | 20,948 | $ | 25,542 | $ | 29,389 | 2.0 | % | 2.8 | % | ||||||||||
| Snohomish County | $ | 23,417 | $ | 30,372 | $ | 34,880 | 2.6 | % | 2.8 | % | ||||||||||
| Kitsap County | $ | 22,317 | $ | 26,450 | $ | 30,570 | 1.7 | % | 2.9 | % | ||||||||||
| 2010 HH Income Dist.(%) | $ | 25,000 | $ | 50,000 | $ | 100,000 | $ | 100,000 | + | |||||||||||
| United States | 20.8 | % | 24.7 | % | 35.7 | % | 18.8 | % | ||||||||||||
| Washington | 17.5 | % | 22.8 | % | 39.2 | % | 20.5 | % | ||||||||||||
| Seattle MSA | 14.0 | % | 19.1 | % | 39.9 | % | 27.0 | % | ||||||||||||
| King County | 13.6 | % | 17.2 | % | 38.3 | % | 31.1 | % | ||||||||||||
| Pierce County | 17.3 | % | 23.9 | % | 41.9 | % | 16.9 | % | ||||||||||||
| Snohomish County | �� | 11.8 | % | 19.3 | % | 42.6 | % | 26.4 | % | |||||||||||
| Kitsap County | 16.1 | % | 24.2 | % | 41.7 | % | 18.0 | % | ||||||||||||
| Source: SNL Financial, LC. | ||||||||||||||||||||
| RP® Financial, LC. | MARKET AREA II.7 |
Summary of Local Economy
The Puget Sound region dominates the economy of the Pacific Northwest. Key employment sectors include aerospace, military, information technology, clean technology, biotechnology, education, logistics, international trade and tourism. The region is well known for the long-term presence of The Boeing Corporation and Microsoft, two major industry leaders. The workforce is generally highly educated. Washington’s geographic proximity to the Pacific Rim and a deepwater port have made it a center for international trade as well, which contributes significantly to the regional economy (one in three jobs in Washington is tied to foreign exports). The Washington ports handle 6% of all U. S. exports and 7% of all U.S. imports, and the top five trading partners with Washington include Japan, Canada, China, Korea and Ireland. Tourism has also developed into a major industry for the area, due to the scenic beauty, temperate climate, and easy accessibility.
King County, the location of the city of Seattle, has the largest employment base and overall level of economic activity. King County’s largest employers include The Boeing Company, Microsoft Corporation, and the University of Washington. Companies that are headquartered in King County include Alaska Airlines, Amazon.com, Attachmate, Costco, Starbucks and Microsoft. Pierce County’s economy is also well diversified with the presence of military related government employment (Fort Lewis Army Base and McChord Air Force Base), along with health care (the Franciscan Health System and the Multicare Health System). In addition, there is a large employment base in the economic sectors of shipping (the Port of Tacoma) and aerospace employment (Boeing). Snohomish County to the north has an economy based on aerospace employment (Boeing), military (the Everett Naval Station) along with additional employment concentrations in biotechnology, electronics/computers, and wood products. Eight of the largest employers in the state are headquartered in King County.
The United States Navy is a key element for Kitsap County’s economy. The United States Navy is the largest employer in the county, with installations at Puget Sound Naval Shipyard, Naval Undersea Warfare Center Keyport and Naval Base Kitsap (which comprises former Naval Submarine Base Bangor, and Naval Station Bremerton). The largest private employers in the county are the Harrison Medical Center, Wal-Mart, and Port Madison Enterprises.
| RP® Financial, LC. | MARKET AREA II.8 |
Real Estate Trends in the Puget Sound
After a period of rapid growth of residential and commercial real estate, the Seattle MSA has the highest portion of troubled loans in the country. A partner at Foresight Analytics attributes the Seattle area’s sharp drop-off in loan performance to the market entering its economic downturn behind other parts of the country. Additionally, a sizeable amount of new construction hit the Puget Sound area market just as the local economy really weakened. In mid-2008, the Seattle area ranked 39th among metropolitan areas in troubled loans and in the second quarter of 2009, the Seattle MSA had the nation’s highest rate of delinquent loans at 32.7%, double the national delinquency rate of 16.3%.
Contributing to the sharp rise in delinquent loans was a spike in troubled residential real estate development loans, as the Seattle MSA leads the nation with just under 45% of residential land and construction loans delinquent, which is nearly double the national rate of 24.2%. However, outside of single-family loans, the Seattle MSA market is more in line with the rest of the country. Foresight Analytics ranks the Seattle MSA 16th in commercial mortgage delinquencies, with 4.8% of commercial mortgages delinquent, which compares with a national delinquency rate of 4.1%.
Given the high level of delinquent loans haunting the Washington-based banks, financial institution failures can be expected. It is likely that the overbuilt nature of the real estate market in some areas will impact the Bank.
Employment Sectors
Employment data, presented in Table 2.2 on the next page indicates that similar to many larger, developed areas of the country, services are the most prominent sector for the state of Washington and the four market area counties, comprising approximately 34% of total employment. Additional detail is presented in Exhibit II-4. The next largest component of the economy of the market area, on average, is government, at 20.8%, reflecting the military bases throughout the Bank’s market area. Wholesale and retail trade, at 13.5% on average, was another large component of the market area, reflecting the trade employment in the ports of the Puget Sound region. Government employment was highest in Kitsap and Pierce Counties, reflecting the military bases previously mentioned, with such employment related to the presence of Boeing. Manufacturing employment is highest in Snohomish County, the location of Boeing’s largest manufacturing and assembly plant, while information-related employment is highest in King County, due to the impact of Microsoft and other information technology employers. King County’s levels of employment in the different sectors resembled that of the economy of Washington, which was provided for comparative purposes. This data indicates that Bank’s market area has a relatively diversified economic base, such that a downturn in any one industry will likely not have a large impact on the regional economy. This diversification provides a level of stability that is a positive factor for financial institutions such as 1st Security.
| RP® Financial, LC. | MARKET AREA II.9 |
Table 2.2
1st Security Bank of Washington
Primary Market Area Employment Sectors
(Percent of Labor Force)(1)
| Washington | Snohomish | King | Pierce | Kitsap | ||||||||||||||||
| Employment Sector | State | County | County | County | County | |||||||||||||||
| (% of Total Employment) | ||||||||||||||||||||
| Services | 35.1 | % | 31.2 | % | 37.8 | % | 34.2 | % | 33.8 | % | ||||||||||
| Manufacturing | 7.3 | % | 16.9 | % | 7.4 | % | 4.4 | % | 1.6 | % | ||||||||||
| Wholesale/Retail Trade | 13.5 | % | 14.3 | % | 13.1 | % | 13.6 | % | 12.9 | % | ||||||||||
| Government | 16.5 | % | 14.1 | % | 11.9 | % | 24.8 | % | 32.2 | % | ||||||||||
| Finance/Insurance/Real Esate | 9.0 | % | 8.7 | % | 10.3 | % | 8.7 | % | 7.8 | % | ||||||||||
| Construction | 5.8 | % | 7.4 | % | 5.1 | % | 6.7 | % | 5.4 | % | ||||||||||
| Arts/Entertainment/Rec. | 2.4 | % | 2.2 | % | 2.8 | % | 1.9 | % | 2.5 | % | ||||||||||
| Transportation/Utility | 3.0 | % | 1.7 | % | 3.5 | % | 3.4 | % | 1.3 | % | ||||||||||
| Agriculture | 2.2 | % | 0.7 | % | 0.2 | % | 0.5 | % | 0.5 | % | ||||||||||
| Other | 5.1 | % | 2.8 | % | 7.8 | % | 1.7 | % | 2.1 | % | ||||||||||
| Total | 100.0 | % | 100.0 | % | 100.0 | % | 100.0 | % | 100.0 | % | ||||||||||
| (1) As of 2009 | ||||||||||||||||||||
| Source: REIS DataSource. | ||||||||||||||||||||
Unemployment Data and Trends
Table 2.3 provides unemployment data which shows that the unemployment rates in the Bank’s four county market area and the state of Washington have all increased over the last 12 months, compared to a decrease for the nation as a whole. While King and Kitsap Counties reported unemployment rates lower than the national and state unemployment rates, Snohomish and Pierce counties exceeded the state rate, indicating additional weakness to those sections of the market area. The lower unemployment rates in Kitsap and King Counties are reflective of the somewhat more favorable position of the local economies in those areas.
| RP® Financial, LC. | MARKET AREA II.10 |
Table 2.3
1st Security Bank of Washington
Market Area Unemployment Trends
| July 2010 | July 2011 | |||||||
| Region | Unemployment | Unemployment | ||||||
| United States | 9.5 | % | 9.1 | % | ||||
| Washington | 8.6 | % | 9.0 | % | ||||
| Seattle MSA | 8.6 | % | 9.1 | % | ||||
| Snohomish County | 9.4 | % | 10.0 | % | ||||
| King County | 8.1 | % | 8.6 | % | ||||
| Pierce County | 9.0 | % | 9.6 | % | ||||
| Kitsap County | 7.1 | % | 7.7 | % | ||||
| Source: U.S. Bureau of Labor Statistics. | ||||||||
Market Area Deposit Characteristics/Competition
Table 2.4 displays deposit market trends and deposit market share for commercial banks and savings institutions in the market area from June 30, 2006 to June 30, 2010. Deposit growth trends are important indicators of a market area’s current and future prospects for growth. The table indicates that commercial banks hold a large portion of the statewide deposit base, 88.2% as of June 30, 2010. Since June 30, 2006, commercial banks have increased their deposits at a greater rate than savings institutions, 6.5% on an annual basis versus an annualized net decline of 13.4% for savings institutions.
Within the Bank’s four county market area, the table indicates that annualized deposit growth rates in the Bank’s market range from a low of 0.1% per year over the last four years in Kitsap County to a high of 3.5% for Pierce County. Similar to statewide figures, commercial banks hold in excess of 85% of total financial institution deposits in all four market area counties. The county deposit growth rate figures indicate that all market area counties except for Kitsap County are increasing at rates close to the state average except for Kitsap County. In all four market area counties, savings institutions experienced decreases in deposit balances and market share, primarily due to the failure of Washington Mutual, a large thrift that failed in 2009.
| RP® Financial, LC. | MARKET AREA II.11 |
Table 2.4
1st Security Bank of Washington
Deposit Summary
| As of June 30, | ||||||||||||||||||||||||||||
| 2006 | 2010 | Deposit | ||||||||||||||||||||||||||
| Market | No. of | Market | No. of | Growth Rate | ||||||||||||||||||||||||
| Deposits | Share | Branches | Deposits | Share | Branches | 2006-2010 | ||||||||||||||||||||||
| (Dollars in Thousands) | (%) | |||||||||||||||||||||||||||
| Washington | $ | 99,586,000 | 100.0 | % | 1,871 | $ | 109,218,692 | 100.0 | % | 1,891 | 2.3 | % | ||||||||||||||||
| Commercial Banks | 76,640,000 | 77.0 | % | 1,484 | 96,341,512 | 88.2 | % | 1,703 | 5.9 | % | ||||||||||||||||||
| Savings Institutions | 22,946,000 | 23.0 | % | 387 | 12,877,180 | 11.8 | % | 188 | -13.4 | % | ||||||||||||||||||
| Snohomish County | $ | 8,075,408 | 100.0 | % | 180 | $ | 8,842,804 | 100.0 | % | 186 | 2.3 | % | ||||||||||||||||
| Commercial Banks | 5,786,884 | 71.7 | % | 141 | 7,589,894 | 85.8 | % | 169 | 7.0 | % | ||||||||||||||||||
| Savings Institutions | 2,288,524 | 28.3 | % | 39 | 1,252,910 | 14.2 | % | 17 | -14.0 | % | ||||||||||||||||||
| 1st Security Bank | 53,574 | 0.7 | % | 5 | 103,785 | 1.2 | % | 3 | 18.0 | % | ||||||||||||||||||
| King County | $ | 47,373,091 | 100.0 | % | 526 | $ | 51,453,127 | 100.0 | % | 540 | 2.1 | % | ||||||||||||||||
| Commercial Banks | 36,355,822 | 76.7 | % | 389 | 45,710,792 | 88.8 | % | 485 | 5.9 | % | ||||||||||||||||||
| Savings Institutions | 11,017,269 | 23.3 | % | 137 | 5,742,335 | 11.2 | % | 55 | -15.0 | % | ||||||||||||||||||
| 1st Security Bank | 64,569 | 0.1 | % | 4 | 78,875 | 0.2 | % | 2 | 5.1 | % | ||||||||||||||||||
| Pierce County | $ | 8,126,385 | 100.0 | % | 199 | $ | 9,322,735 | 100.0 | % | 200 | 3.5 | % | ||||||||||||||||
| Commercial Banks | 6,526,293 | 80.3 | % | 156 | 8,819,650 | 94.6 | % | 184 | 7.8 | % | ||||||||||||||||||
| Savings Institutions | 1,600,092 | 19.7 | % | 43 | 503,085 | 5.4 | % | 16 | -25.1 | % | ||||||||||||||||||
| 1st Security Bank | 48,055 | 0.6 | % | 3 | 28,826 | 0.3 | % | 1 | -12.0 | % | ||||||||||||||||||
| Kitsap County | $ | 2,289,660 | 100.0 | % | 74 | $ | 2,301,538 | 100.0 | % | 66 | 0.1 | % | ||||||||||||||||
| Commercial Banks | 1,807,605 | 78.9 | % | 61 | 2,138,457 | 92.9 | % | 61 | 4.3 | % | ||||||||||||||||||
| Savings Institutions | 482,055 | 21.1 | % | 13 | 163,081 | 7.1 | % | 5 | -23.7 | % | ||||||||||||||||||
| 1st Security Bank | 9,006 | 0.4 | % | 1 | 23,606 | 1.0 | % | 1 | 27.2 | % | ||||||||||||||||||
| Source: FDIC. | ||||||||||||||||||||||||||||
Since June 30, 2006, 1st Security has recorded increases in deposits in three of the four market area counties, with annual increases ranging from 5.1% in King County to 27.2% in Kitsap County. The Bank’s deposits declined in Pierce County, due to the closure of certain offices in that county between 2006 and 2011. The Bank’s market shares of deposits ranged from 0.3% in Pierce County to a high of 1.2% in Snohomish County.
Market Area Counties Deposit Competitors
As detailed in the data showing competitor deposits (see Table 2.5), significant competitors for the Bank consist of large nationwide and superregional banks, including Bank of America, Wells Fargo and JPMorgan Chase, all of which maintain a strong presence in the regional market. This factor, however, allows 1st Security to position itself as a community bank, locally owned and managed.
| RP® Financial, LC. | MARKET AREA II.12 |
As of June 30, 2010, 1st Security maintained relatively small deposit market shares in the Seattle MSA counties, representative of the overall large size of the deposit base and indicating that future deposit gains and market share gains are possible. In the smaller markets such as Kitsap County, the Bank still reported a relatively small market share of 1.0% (however, the Bank only has one office location in Kitsap County).
Table 2.5
1st Security Bank of Washington
Market Area Counties Deposit Competitors
| Snohomish County, WA | Bank of America (16.3%) | ||
| JPMorgan Chase Bank (10.7%) | |||
| Union Bank NA (10.4%) | |||
| Cascade Bank (9.1%) | |||
| 1st Security (1.2%) | |||
| King County, WA | Bank of America (29.9%) | ||
| Wells Fargo (12.6%) | |||
| US Bank NA (11.5%) | |||
| JPMorgan Chase Bank (9.4%) | |||
| 1st Security (0.2%) | |||
| Pierce County, WA | Columbia State Bank (18.1%) | ||
| Wells Fargo (14.6%) | |||
| Keybank NA (14.3%) | |||
| Bank of America, NA (13.4%) | |||
| 1st Security (0.3%) | |||
| Kitsap County, WA | Kitsap Bank (22.5%) | ||
| Bank of America, NA (21.0%) | |||
| JPMorgan Chase Bank (12.3%) | |||
| Wells Fargo (9.0%) | |||
| 1st Security (1.0%) | |||
| Source: FDIC. |
| RP® Financial, LC. | MARKET AREA II.13 |
Summary
The overall condition of the primary market area can be characterized as positive, with growth potential in all four market area counties based on regional population and economic projections. The overall total population base within the Bank’s market area provides the potential for additional banking customers. In addition, income levels are relatively high and growing in line with national averages, indicating an increasing amount of personal wealth for residents. Considering these local demographic and economic trends and the number of formidable competitors in the market area, the competition for deposits is expected to remain substantial, precipitating the need for 1st Security to pay competitive deposit rates, provide high quality service and to continue to provide electronic banking capabilities to increase local market share.
| RP® Financial, LC. | PEER GROUP ANALYSIS |
III.1 |
III. PEER GROUP ANALYSIS
This chapter presents an analysis of 1st Security’s operations versus a group of comparable savings institutions (the “Peer Group”). The Peer Group was selected from the universe of all publicly-traded savings institutions in a manner consistent with the regulatory valuation guidelines. The basis of the pro forma market valuation of 1st Security is derived from the pricing ratios of the Peer Group institutions, incorporating valuation adjustments for key differences relative to the Peer Group. Since no Peer Group can be exactly comparable to 1st Security, key areas examined for differences are: financial condition; profitability, growth and viability of earnings; asset growth; primary market area; dividends; liquidity of the shares; marketing of the issue; management; and effect of government regulations and regulatory reform.
Peer Group Selection
The Peer Group selection process is governed by the general parameters set forth in the regulatory valuation guidelines. Accordingly, the Peer Group is comprised of only those publicly-traded savings institutions whose common stock is either listed on a national exchange (NYSE or AMEX), or is NASDAQ-listed, since trading activity for such stocks is regularly reported and generally more frequent than for non-publicly traded and closely-held institutions. Institutions that are not listed on a national exchange or on NASDAQ are inappropriate, since the trading activity for thinly-traded or closely-held stocks is typically highly irregular in terms of frequency and price and thus may not be a reliable indicator of market value. We have also excluded from the Peer Group those companies under acquisition or subject to rumored acquisition, mutual holding companies, and recent conversions, because their pricing ratios are distorted and/or have limited trading history. A recent listing of the universe of all publicly-traded savings institutions is included as Exhibit III-1.
Ideally, the Peer Group, which must have at least 10 members to comply with the regulatory valuation guidelines, should be comprised of locally- or regionally-based institutions with comparable resources, strategies and financial characteristics. There are approximately 140 publicly-traded institutions nationally and, thus, it is typically the case that the Peer Group will be comprised of institutions with relatively comparable characteristics. Valuation adjustments will be applied to account for the differences that exist between the converting institution and the Peer Group. Since 1st Security will be a fully public company upon completion of the offering, we considered only fully public companies to be viable candidates for inclusion in the Peer Group.
| RP® Financial, LC. | PEER GROUP ANALYSIS |
III.2 |
From the universe of publicly-traded thrifts, we selected ten institutions with characteristics similar to those of 1st Security. In the selection process, we applied two “screens” to the universe of all public companies that were eligible for consideration:
| o | Screen #1 Washington institutions with assets less than $1 billion (In-state Peers). Two companies met the criteria for Screen #1 and both were included in the Peer Group. |
| o | Screen #2 Other institutions with assets less than $400 million and positive core earnings, excluding those in the northeast and mid-Atlantic regions of the country (National Peers). The northeast and mid-Atlantic regions of the U.S. were excluded because the economic downturn was not as severe in these areas, and this has influenced the pricing ratios of public thrifts operating in these areas. The remaining eight companies met the criteria for Screen #2. |
Exhibit III-1 provides financial and public market pricing characteristics of all publicly-traded thrifts, while Exhibit III-2 provides financial and public market pricing characteristics of the Peer Group selection screens. Table 3.1 shows the general characteristics of each of the 10 Peer Group companies and Exhibit III-3 provides summary demographic and deposit market share data for the primary market areas served by each of the Peer Group companies. While there are expectedly some differences between the Peer Group companies and 1st Security, we believe that the Peer Group companies, on average, provide a good basis for valuation subject to valuation adjustments. The following sections compare the Bank’s financial condition, income and expense trends, loan composition, credit risk and interest rate risk to that of the Peer Group using the most recent publicly available financial information.
A summary description of the key comparable characteristics of each of the Peer Group companies relative to 1st Security’s characteristics is detailed below.
| o | Athens Bancshares, Inc. of TN. Athens Bancshares conducts operations out of 7 offices in southeastern Tennessee, serving suburban areas north of Chattanooga. Athens reported the second highest GAAP equity to assets of all Peer Group members, and operates with a similar level of loans receivable as the Bank. Athens recorded a very high level of non-interest income relative to the Bank and the Peer Group. |
| o | Eagle Bancorp of MT. Eagle Bancorp operates out of 6 offices in southwestern Montana. Eagle maintains a relatively high level of MBS and relatively low level of cash and equivalents relative to the Bank and the Peer Group, and, like Athens, recorded a high capital ratio. Eagle funds operations with a higher proportion of borrowings, on average, than the Peer Group. Earnings at Eagle were derived from significant levels of non-operating income, and although Eagle’s NPAs/assets ratio was lower than the Bank’s the Bank recorded higher reserve levels. |
| RP® Financial, LC. | PEER GROUP ANALYSIS |
III.3 |
Table 3.1
Peer Group of Publicly-Traded Thrifts
September 2, 2011
Peer Group of Publicly-Traded Thrifts
September 2, 2011
| Operating | Total | Fiscal | Conv. | Stock | Market | ||||||||||||||||||||||||
| Ticker | Financial Institution | Exchange | Primary Market | Strategy(1) | Assets(2) | Offices | Year | Date | Price | Value | |||||||||||||||||||
| ($) | ($Mil) | ||||||||||||||||||||||||||||
| RVSB | Riverview Bancorp, Inc. of WA | NASDAQ | Vancouver, WA | Thrift | $ | 886 | 17 | 03-31 | 10/97 | $ | 2.61 | $ | 59 | ||||||||||||||||
| TSBK | Timberland Bancorp, Inc. of WA | NASDAQ | Hoquiam, WA | Thrift | $ | 735 | 22 | 09-30 | 01/98 | $ | 5.05 | $ | 36 | ||||||||||||||||
| LSBI | LSB Financial Corp. of Lafayette IN | NASDAQ | Lafayette, IN | Thrift | $ | 360 | 5 | 12-31 | 02/95 | $ | 13.30 | $ | 21 | ||||||||||||||||
| FABK | First Advantage Bancorp of TN | NASDAQ | Clarksville, TN | Thrift | $ | 350 | 5 | 12-31 | 11/07 | $ | 12.70 | $ | 52 | ||||||||||||||||
| EBMT | Eagle Bancorp Montana of MT | NASDAQ | Helena, MT | Thrift | $ | 331 | 6 | 06-30 | 04/10 | $ | 10.46 | $ | 41 | ||||||||||||||||
| LABC | Louisiana Bancorp, Inc. of LA | NASDAQ | Metairie, LA | Thrift | $ | 320 | 3 | 12-31 | 07/07 | $ | 16.03 | $ | 55 | ||||||||||||||||
| JXSB | Jacksonville Bancorp Inc. of IL | NASDAQ | Jacksonville, IL | Thrift | $ | 305 | 7 | 12-31 | 07/10 | $ | 13.70 | $ | 26 | ||||||||||||||||
| AFCB | Athens Bancshares, Inc. of TN | NASDAQ | Athens, TN | Thrift | $ | 283 | 7 | 12-31 | 01/10 | $ | 12.70 | $ | 35 | ||||||||||||||||
| FFNM | First Federal of Northern Michigan of MI | NASDAQ | Alpena, MI | Thrift | $ | 219 | 8 | 12-31 | 04/05 | $ | 3.75 | $ | 11 | ||||||||||||||||
| FFDF | FFD Financial Corp. of Dover OH | NASDAQ | Dover, OH | Thrift | $ | 211 | M | 5 | 06-30 | 04/96 | $ | 15.00 | $ | 15 | |||||||||||||||
| NOTES: | (1) | Operating strategies are: Thrift=Traditional Thrift, M.B.=Mortgage Banker, R.E.=Real Estate Developer, Div.=Diversified and Ret.=Retail Banking. |
| (2) | Most recent quarter end available (E=Estimated and P=Pro Forma). | |
| Source: SNL Financial, LC. | ||
| RP® Financial, LC. | PEER GROUP ANALYSIS |
III.4 |
| o | FFD Financial Corp. of Dover OH. FFD Financial operates out of 5 offices in Dover, which is located in central Ohio between Columbus and Pittsburgh, Pennsylvania. With $211 million in assets, FFD is the smallest Peer Group member. It recorded the highest asset growth and the lowest equity/assets ratio in the Peer Group. FFD has a similar strategy of originating commercial business loans, and its portfolio of commercial business loans was equal in proportion to the Bank’s. Asset quality at FFD was slightly favorable relative to the Peer Group and the Bank. |
| o | First Advantage Bancorp of TN. First Advantage operates out of 5 offices in north central Tennessee. First Advantage recorded the highest not worth among all Peer Group members (19.3% vs. a median of 12.5% for the Peer group). Like Eagle, First Advantage maintains a greater wholesale leveraging strategy than the other Peer Group members by using borrowings to fund investments. The loan portfolio for First Advantage had significantly higher ratios of construction loans than the Peer Group and the Bank, but First Advantage also recorded substantially below average NPA/Assets ratios. |
| o | First Fed of Northern Michigan. First Fed operates 8 offices in northern Michigan. Reflecting the relatively poor economic conditions in that part of the country, First Fed reported the lowest earnings of all Peer Group members and asset quality measures that were less favorable, on average, than the Peer Group and the Bank. Like the other Peer Group members, First Fed’s loan portfolio mix was more reflective a traditional thrift than the Bank’s. |
| o | Jacksonville Bancorp, Inc. of IL. Jacksonville is a 7-office institution with a market area in the suburbs west of Springfield, in central Illinois. Jacksonville has a relatively low loans-to-deposits ratio, and has been reinvesting funds into MBS. Jacksonville recorded the highest reported and core earnings of all the Peer Group members, which is largely a function of non-interest sources of income. Jacksonville also recorded the highest consumer loan ratio of all the Peer Group members, although at 5.2% it is much lower than the ratio of 45.7% recorded by the Bank. Jacksonville’s asset quality measures were moderately better than the Bank’s and the Peer Group average. |
| o | LSB Financial Corp. of IN. LSB operates out of 5 offices in an around Lafayette, a town in central Indiana northwest of Indianapolis. LSB has the highest loans to assets ratio among Peer Group members, with a loan portfolio consisting primarily of 1-4 family residential and commercial real estate/multi-family residential mortgages. LSB maintains the second highest ratio of non-residential mortgages in the Peer Group, with the higher risk of this portfolio reflected in the highest loan loss provisions and second highest NPA/Assets ratio of all Peer Group members. LSB’s earnings were comparable to Peer Group averages. |
| o | Louisiana Bancorp, Inc. of LA. Louisiana Bancorp is the southernmost member of the Peer Group and operates out of three offices in the New Orleans/Metairie area of Louisiana. Louisiana Bancorp’s balance sheet is characterized by wholesale funding (it maintains the highest borrowings level among all the Peer Group companies), which has largely been reinvested into MBS and investments (it maintains the highest ratio of MBS & investments). The loans to assets ratio is among the lowest at 57.9%. Nevertheless, Louisiana Bancorp recorded stronger than average earnings due to very low loss provisions and low operating expenses, which is reflective of its low loan ratio and focus on purchasing low risk MBS and investment securities. This strategy of low risk investments has also resulted in more favorable asset quality measures for all the Peer Group companies. |
| RP® Financial, LC. | PEER GROUP ANALYSIS |
III.5 |
| o | Riverview Bancorp. Inc. of WA. Riverview is the largest Peer Group member and operates out of 17 offices in the Vancouver area of southwest Washington State. Riverview reported relatively high ratios of loans/assets deposit funding, along with the highest level of intangible assets of all Peer Group members. Riverview was less profitable than the Peer Group, on average, due to higher loan loss provisions and operating expenses. Riverview reported the lowest investment in 1-4 family mortgage loans but had the highest concentration of commercial real estate/multi-family mortgages, resulting in the highest risk-weighted assets-to-assets ratio. Riverview’s asset quality ratios on balance were somewhat less favorable than the Peer Group and the Bank’s averages. |
| o | Timberland Bancorp, Inc. of WA. Timberland recorded the second largest asset base in the Peer Group and operates from 22 offices in Seattle, Olympia, and southern suburbs of Seattle. Timberland maintained the highest ratio of cash and equivalents, which serves to offset their relatively high ratios of commercial real estate/multi-family residential mortgages and construction loans relative to the Peer Group. However, earnings at Timberland have been negatively impacted by relatively higher levels of loan loss reserves and operating expenses compared to the Peer Group. Timberland also recorded the least favorable asset quality among all of the Peer Group members, with NPAs/Assets exceeding 8.0% versus an average of 3.2% for all the Peer Group members. |
In aggregate, the median Peer Group company maintained a higher ratio of tangible equity than the industry average (13.4% of assets versus 10.1% for all non-MHC public companies), generated a similar core earnings ratio (0.37% ROAA versus 0.31% for all non-MHC public companies), and earned a slightly lower core ROE (2.77% ROE versus 3.02% for all non-MHC public companies). Overall, the Peer Group’s average P/B ratio and average P/Core earnings multiple were below the respective averages for all non-MHC publicly-traded thrifts.
| RP® Financial, LC. | PEER GROUP ANALYSIS |
III.6 |
| All Fully-Conv. | ||||||||
| Publicly-Traded | Peer Group | |||||||
| Financial Characteristics (Medians) | ||||||||
| Assets ($Mil) | $ | 902 | $ | 400 | ||||
| Market capitalization ($Mil) | $ | 59.7 | $ | 35.1 | ||||
| Tangible Equity/assets (%) | 10.10 | % | 13.35 | % | ||||
| Core Return on average assets (%) | 0.31 | % | 0.37 | % | ||||
| Core Return on average equity (%) | 3.02 | % | 2.77 | % | ||||
Pricing Ratios (Medians)(1) | ||||||||
| Price/earnings (x) | 14.61 | x | 17.27 | x | ||||
| Price/book (%) | 79.54 | % | 69.11 | % | ||||
| Price/assets (%) | 8.06 | % | 7.94 | % | ||||
(1) Based on market prices as of September 2, 2011.
Ideally, the Peer Group companies would be comparable to 1st Security in terms of all of the selection criteria, but the universe of publicly-traded thrifts does not provide for an appropriate number of such companies. However, in general, the companies selected for the Peer Group were fairly comparable to 1st Security, as will be highlighted in the following comparative analysis.
Financial Condition
Table 3.2 shows comparative balance sheet measures for 1st Security and the Peer Group, reflecting the expected similarities and some differences given the selection procedures outlined above. The Bank’s and the Peer Group’s ratios reflect balances as of June 30, 2011, unless indicated otherwise for the Peer Group companies. 1st Security’s tangible equity-to-assets ratio of 9.5% was below the Peer Group’s median tangible equity to assets ratio of 11.4%. The Bank’s pro forma capital position will increase with the addition of stock proceeds, providing the Bank with an equity-to-assets ratio that will exceed the Peer Group’s ratio. The increase in the Bank’s pro forma capital position will be favorable from a risk perspective and in terms of future earnings potential that could be realized through leverage and lower funding costs. At the same time, the Bank’s higher pro forma capitalization will initially depress return on equity. Both 1st Security’s and the Peer Group’s capital ratios reflected capital surpluses with respect to the regulatory capital requirements, with the Peer Group’s ratios currently exceeding the Bank’s ratios. On a pro forma basis, the Bank’s regulatory surpluses will become more significant.
| RP® Financial, LC. | PEER GROUP ANALYSIS |
III.7 |
Table 3.2
Balance Sheet Composition and Growth Rates
Comparable Institution Analysis
As of June 30, 2011
Balance Sheet Composition and Growth Rates
Comparable Institution Analysis
As of June 30, 2011
| Balance Sheet as a Percent of Assets | |||||||||||||||||||||||||||||||||||||||||
| Cash & | MBS & | Borrowed | Subd. | Net | Goodwill | Tng Net | |||||||||||||||||||||||||||||||||||
| Equivalents | Invest | BOLI | Loans | Deposits | Funds | Debt | Worth | & Intang | Worth | ||||||||||||||||||||||||||||||||
| 1st Security Bank of WA | |||||||||||||||||||||||||||||||||||||||||
| June 30, 2011 | 11.1 | % | 5.0 | % | 0.0 | % | 77.1 | % | 88.5 | % | 1.4 | % | 0.0 | % | 9.5 | % | 0.0 | % | 9.5 | % | |||||||||||||||||||||
| All Public Companies | |||||||||||||||||||||||||||||||||||||||||
| Averages | 6.2 | % | 21.4 | % | 1.5 | % | 65.9 | % | 73.5 | % | 12.5 | % | 0.5 | % | 12.4 | % | 0.7 | % | 11.7 | % | |||||||||||||||||||||
| Medians | 4.7 | % | 19.7 | % | 1.6 | % | 67.8 | % | 73.2 | % | 11.1 | % | 0.0 | % | 11.5 | % | 0.1 | % | 10.6 | % | |||||||||||||||||||||
| State of WA | |||||||||||||||||||||||||||||||||||||||||
| Averages | 12.5 | % | 10.6 | % | 1.5 | % | 68.6 | % | 75.0 | % | 10.7 | % | 0.5 | % | �� | 13.1 | % | 1.1 | % | 12.0 | % | ||||||||||||||||||||
| Medians | 13.0 | % | 10.7 | % | 1.8 | % | 66.6 | % | 75.9 | % | 8.1 | % | 0.0 | % | 12.2 | % | 0.8 | % | 11.8 | % | |||||||||||||||||||||
| Comparable Group | |||||||||||||||||||||||||||||||||||||||||
| Averages | 6.1 | % | 17.6 | % | 1.3 | % | 69.9 | % | 75.3 | % | 9.5 | % | 0.4 | % | 13.8 | % | 0.5 | % | 13.3 | % | |||||||||||||||||||||
| Medians | 4.7 | % | 18.2 | % | 1.6 | % | 70.3 | % | 78.8 | % | 7.1 | % | 0.0 | % | 12.5 | % | 0.1 | % | 11.4 | % | |||||||||||||||||||||
| Comparable Group | |||||||||||||||||||||||||||||||||||||||||
| AFCB | Athens Bancshares, Inc. of TN | 6.4 | % | 15.8 | % | 3.2 | % | 71.3 | % | 77.4 | % | 3.5 | % | 0.0 | % | 17.7 | % | 0.1 | % | 17.6 | % | ||||||||||||||||||||
| EBMT | Eagle Bancorp Montana of MT | 2.9 | % | 31.7 | % | 2.1 | % | 56.6 | % | 63.2 | % | 18.4 | % | 1.6 | % | 15.9 | % | 0.0 | % | 15.9 | % | ||||||||||||||||||||
| FFDF | FFD Financial Corp. of Dover OH (1) | 7.3 | % | 4.0 | % | 0.0 | % | 85.7 | % | 83.8 | % | 6.6 | % | 0.0 | % | 8.9 | % | 0.0 | % | 8.9 | % | ||||||||||||||||||||
| FABK | First Advantage Bancorp of TN | 5.4 | % | 20.5 | % | 0.1 | % | 69.8 | % | 64.3 | % | 15.2 | % | 0.0 | % | 19.3 | % | 0.0 | % | 19.3 | % | ||||||||||||||||||||
| FFNM | First Federal of N. Michigan of MI | 1.8 | % | 24.4 | % | 0.6 | % | 66.4 | % | 71.3 | % | 16.8 | % | 0.0 | % | 11.0 | % | 0.2 | % | 10.8 | % | ||||||||||||||||||||
| JXSB | Jacksonville Bancorp Inc. of IL | 1.8 | % | 34.5 | % | 1.4 | % | 57.4 | % | 84.2 | % | 1.4 | % | 0.0 | % | 12.7 | % | 0.9 | % | 11.8 | % | ||||||||||||||||||||
| LSBI | LSB Financial Corp. of Lafayette IN | 3.7 | % | 4.2 | % | 1.9 | % | 87.0 | % | 84.4 | % | 5.0 | % | 0.0 | % | 10.1 | % | 0.0 | % | 10.1 | % | ||||||||||||||||||||
| LABC | Louisiana Bancorp, Inc. of LA | 4.0 | % | 36.3 | % | 0.0 | % | 57.9 | % | 59.9 | % | 20.4 | % | 0.0 | % | 18.4 | % | 0.0 | % | 18.4 | % | ||||||||||||||||||||
| RVSB | Riverview Bancorp, Inc. of WA | 10.0 | % | 1.8 | % | 1.8 | % | 76.5 | % | 83.9 | % | 0.3 | % | 2.6 | % | 12.2 | % | 2.9 | % | 9.3 | % | ||||||||||||||||||||
| TSBK | Timberland Bancorp, Inc. of WA | 18.0 | % | 2.4 | % | 1.9 | % | 70.9 | % | 80.2 | % | 7.6 | % | 0.0 | % | 11.7 | % | 0.8 | % | 10.9 | % | ||||||||||||||||||||
| Balance Sheet Annual Growth Rates | Regulatory Capital | ||||||||||||||||||||||||||||||||||||||||
| MBS, Cash & | Borrows. | Net | Tng Net | ||||||||||||||||||||||||||||||||||||||
| Assets | Investments | Loans | Deposits | &Subdebt | Worth | Worth | Tangible | Core | Reg.Cap. | ||||||||||||||||||||||||||||||||
| 1st Security Bank of WA | |||||||||||||||||||||||||||||||||||||||||
| June 30, 2011 | -2.07 | % | 40.59 | % | -7.69 | % | 2.72 | % | -79.37 | % | 8.03 | % | 8.03 | % | 11.31 | % | 11.31 | % | 12.57 | % | |||||||||||||||||||||
| All Public Companies | |||||||||||||||||||||||||||||||||||||||||
| Averages | 1.41 | % | 7.71 | % | -0.47 | % | 3.49 | % | -17.49 | % | 1.96 | % | 1.65 | % | 10.89 | % | 10.83 | % | 18.90 | % | |||||||||||||||||||||
| Medians | 0.36 | % | 6.47 | % | -2.88 | % | 1.76 | % | -12.19 | % | 1.66 | % | 1.61 | % | 9.91 | % | 9.91 | % | 17.33 | % | |||||||||||||||||||||
| State of WA | |||||||||||||||||||||||||||||||||||||||||
| Averages | -4.05 | % | 25.17 | % | -10.49 | % | -2.38 | % | -29.97 | % | 13.03 | % | 15.38 | % | 12.47 | % | 12.47 | % | 18.84 | % | |||||||||||||||||||||
| Medians | -2.82 | % | 20.47 | % | -7.61 | % | -1.95 | % | -30.06 | % | 1.34 | % | 1.61 | % | 12.47 | % | 12.47 | % | 17.10 | % | |||||||||||||||||||||
| Comparable Group | |||||||||||||||||||||||||||||||||||||||||
| Averages | 0.44 | % | 12.08 | % | 0.29 | % | 2.43 | % | -12.11 | % | 7.36 | % | 4.22 | % | 12.64 | % | 12.64 | % | 19.16 | % | |||||||||||||||||||||
| Medians | 1.03 | % | 10.04 | % | 1.09 | % | 2.84 | % | -8.34 | % | 1.59 | % | 1.04 | % | 13.61 | % | 13.61 | % | 16.60 | % | |||||||||||||||||||||
| Comparable Group | |||||||||||||||||||||||||||||||||||||||||
| AFCB | Athens Bancshares, Inc. of TN | 0.51 | % | -3.05 | % | 1.79 | % | 0.16 | % | 8.20 | % | 0.01 | % | 0.16 | % | 13.61 | % | 13.61 | % | 20.97 | % | ||||||||||||||||||||
| EBMT | Eagle Bancorp Montana of MT | 1.64 | % | -4.92 | % | 5.68 | % | 5.68 | % | -8.74 | % | 0.10 | % | 0.10 | % | 16.78 | % | 16.78 | % | NA | |||||||||||||||||||||
| FFDF | FFD Financial Corp. of Dover OH (1) | 5.76 | % | 43.75 | % | 2.27 | % | 7.51 | % | -7.93 | % | 3.47 | % | 3.47 | % | NA | NA | NA | |||||||||||||||||||||||
| FABK | First Advantage Bancorp of TN | 1.56 | % | -9.34 | % | 6.76 | % | 3.30 | % | -6.12 | % | -0.46 | % | -0.46 | % | 14.08 | % | 14.08 | % | 19.57 | % | ||||||||||||||||||||
| FFNM | First Federal of N. Michigan of MI | -3.54 | % | 23.52 | % | -11.56 | % | -1.09 | % | -14.80 | % | 2.41 | % | 3.78 | % | 10.04 | % | 10.04 | % | 16.53 | % | ||||||||||||||||||||
| JXSB | Jacksonville Bancorp Inc. of IL | 2.75 | % | 7.54 | % | 0.40 | % | -2.25 | % | 49.39 | % | 48.61 | % | NM | 9.75 | % | 9.75 | % | 15.66 | % | |||||||||||||||||||||
| LSBI | LSB Financial Corp. of Lafayette IN | -4.94 | % | 17.08 | % | -6.17 | % | 1.02 | % | -56.10 | % | 5.31 | % | 5.31 | % | 9.90 | % | 9.90 | % | 14.60 | % | ||||||||||||||||||||
| LABC | Louisiana Bancorp, Inc. of LA | -2.30 | % | -15.05 | % | 9.01 | % | 2.38 | % | -5.77 | % | -12.35 | % | -12.35 | % | 14.31 | % | 14.31 | % | 30.21 | % | ||||||||||||||||||||
| RVSB | Riverview Bancorp, Inc. of WA | 2.57 | % | 48.71 | % | -3.00 | % | 3.81 | % | -52.63 | % | 25.71 | % | 36.88 | % | NA | NA | NA | |||||||||||||||||||||||
| TSBK | Timberland Bancorp, Inc. of WA | 0.35 | % | 12.55 | % | -2.22 | % | 3.79 | % | -26.57 | % | 0.76 | % | 1.04 | % | NA | NA | 16.60 | % | ||||||||||||||||||||||
(1) Financial information is for the quarter ending March 31, 2011.
Source: SNL Financial, LC. and RP® Financial, LC. calculations. The information provided in this table has been obtained from sources we believe are reliable, but we cannot guarantee the accuracy or completeness of such information.
Copyright (c) 2011 by RP® Financial, LC.
| RP® Financial, LC. | PEER GROUP ANALYSIS |
III.8 |
The interest-earning asset compositions for the Bank and the Peer Group were somewhat similar, with loans constituting the bulk of interest-earning assets for both. The Bank’s loans-to-assets ratio of 77.1% modestly exceeded the Peer Group ratio of 70.3%. Some of the difference was reflected in the Peer Group’s higher proportion of MBS and investments to assets, as measured at 18.2% versus 5.0% for the Bank. The Bank made up the remainder by of the difference by recording a higher ratio of cash and equivalents (11.1% of assets) than the Peer Group (4.7% of assets). Overall, 1st Security’s and the Peer Group’s ratios of interest-earning assets to assets were 93.2% and 94.8%, respectively.
1st Security’s and the Peer Group’s funding liabilities reflected similar funding strategies. Both the Bank and the Peer Group relied primarily on deposits for funding, with deposits representing 88.5% and 78.8% of assets, respectively. The Peer Group relied more heavily on borrowings (7.1% of assets) than the Bank (1.4% of assets). The Bank’s total interest-bearing liabilities of 89.9% exceeded the Peer Group median of 85.6% due to the Bank’s lower equity-to-assets ratio. Following the increase in capital provided by the net proceeds of the stock offering, the Bank’s ratio of interest-bearing liabilities as a percent of assets will be lower than the Peer Group’s ratio.
A key measure of balance sheet strength for a thrift institution is its IEA/IBL ratio. Presently, the Bank’s IEA/IBL ratio of 103.7% is lower than the Peer Group’s ratio of 110.2%, which indicates that the Bank currently has lower earnings power than the Peer Group. The additional capital realized from stock proceeds will provide 1st Security with additional capital and an IEA/IBL ratio that exceeds the Peer Group ratio, as stock proceeds will be deployed into interest-earning assets increase and the asset base will increase, thereby lowering the ratio of interest bearing liabilities.
Table 3.2 also displays annual growth rates for key balance sheet items. 1st Security’s and the Peer Group’s growth rates are for the 12 month period from June 30, 2010 to June 30, 2011. During this period, the Bank recorded modest asset shrinkage of 2.7% versus slight asset growth of 1.0% recorded by the Peer Group. In practical terms, however, neither the Bank nor the Peer Group experienced significant changes in total assets during this period. Growth rate differences within the balance sheet were more significant. The Bank experienced a reallocation of assets from loans to MBS, cash and investments, as limited loan demand and economic conditions warranted such reinvestment of cash flows. The Peer Group experienced a similar trend, but was able to achieve low loan growth. Funding trends were very similar for the Bank and Peer Group, as both used deposit inflows to pay down borrowings, with the Bank’s borrowings declining to a greater extent than the Peer Group’s.
| RP® Financial, LC. | PEER GROUP ANALYSIS |
III.9 |
1st Security recorded higher equity growth than the Peer Group due to higher earnings and the lack of capital strategies such as dividend payments and stock repurchases. The increase in equity realized from stock proceeds will likely depress the Bank’s equity growth rate initially following the stock offering. Dividend payments and stock repurchases, pursuant to regulatory limitations and guidelines could also potentially slow the Bank’s equity growth rate in the longer term following the stock offering.
Income and Expense Components
Table 3.3 displays statements of operations for the Bank and the Peer Group, with the income ratios based on earnings for the twelve months ended June 30, 2011, unless otherwise indicated for the Peer Group companies. 1st Security reported net income of 0.69% of average assets compared to median net income of 0.57% for the Peer Group. The higher net interest income, higher non-interest operating income and lower taxes recorded by the Bank more than offset its higher loss provisions and higher operating expenses relative to the Peer Group.
The Bank’s stronger net interest income ratio was realized through maintenance of a higher interest income ratio of 6.25% versus 4.92% for the Peer Group. 1st Security’s higher interest income ratio was supported by its very large proportion of consumer loans, which resulted in a weighted average asset yield of 6.80% versus 5.26% yielded by the more traditional loan portfolios of the Peer Group. Interest expense ratios were nearly equal at 1.28% and 1.26% for the Bank and the Peer Group, respectively, as reflected in their nearly equal cost of funds. Overall, 1st Security recorded net interest income of 4.96% versus 3.61% for the Peer Group.
In another key area of core earnings strength, the Bank’s advantage in net interest income was nearly erased by its higher operating expenses of 4.30% versus a median of 3.29% for the Peer Group. The Bank’s relatively high operating expense are attributable in large part to the consumer lending program, which carries higher administrative costs to operate, and to a relatively high cost branch network. On a post-offering basis, the Bank’s operating expenses can be expected to increase with the addition of stock benefit plans and certain expenses that result from being a publicly-traded company, with such expenses already impacting the Peer Group’s operating expenses. At the same time, 1st Security’s capacity to leverage operating expenses will be greater than the Peer Group’s leverage capacity following the increase in capital realized from the infusion of net stock proceeds.
| RP® Financial, LC. | PEER GROUP ANALYSIS |
III.10 |
Table 3.3
Income as Percent of Average Assets and Yields, Costs, Spreads
Comparable Institution Analysis
For the 12 Months Ended June 30, 2011
Income as Percent of Average Assets and Yields, Costs, Spreads
Comparable Institution Analysis
For the 12 Months Ended June 30, 2011
| Net Interest Income | Other Income | ||||||||||||||||||||||||||||||||||||||||
| Loss | NII | Total | |||||||||||||||||||||||||||||||||||||||
| Net | Provis. | After | Loan | R.E. | Other | Other | |||||||||||||||||||||||||||||||||||
| Income | Income | Expense | NII | on IEA | Provis. | Fees | Oper. | Income | Income | ||||||||||||||||||||||||||||||||
| 1st Security Bank of WA | |||||||||||||||||||||||||||||||||||||||||
| June 30, 2011 | 0.69 | % | 6.25 | % | 1.28 | % | 4.96 | % | 0.95 | % | 4.01 | % | 0.00 | % | 0.00 | % | 0.90 | % | 0.90 | % | |||||||||||||||||||||
| All Public Companies | |||||||||||||||||||||||||||||||||||||||||
| Averages | 0.10 | % | 4.43 | % | 1.38 | % | 3.05 | % | 0.65 | % | 2.41 | % | 0.02 | % | -0.09 | % | 0.85 | % | 0.78 | % | |||||||||||||||||||||
| Medians | 0.41 | % | 4.42 | % | 1.36 | % | 3.07 | % | 0.37 | % | 2.61 | % | 0.00 | % | -0.01 | % | 0.65 | % | 0.59 | % | |||||||||||||||||||||
| State of WA | |||||||||||||||||||||||||||||||||||||||||
| Averages | -0.26 | % | 4.89 | % | 1.48 | % | 3.42 | % | 1.08 | % | 2.34 | % | 0.05 | % | -0.35 | % | 1.22 | % | 0.92 | % | |||||||||||||||||||||
| Medians | 0.14 | % | 4.84 | % | 1.66 | % | 3.47 | % | 0.95 | % | 2.30 | % | 0.01 | % | -0.36 | % | 0.94 | % | 0.89 | % | |||||||||||||||||||||
| Comparable Group | |||||||||||||||||||||||||||||||||||||||||
| Averages | 0.54 | % | 4.89 | % | 1.30 | % | 3.59 | % | 0.50 | % | 3.10 | % | 0.00 | % | -0.03 | % | 0.80 | % | 0.76 | % | |||||||||||||||||||||
| Medians | 0.57 | % | 4.92 | % | 1.26 | % | 3.61 | % | 0.41 | % | 3.14 | % | 0.00 | % | 0.00 | % | 0.92 | % | 0.83 | % | |||||||||||||||||||||
| Comparable Group | |||||||||||||||||||||||||||||||||||||||||
| AFCB | Athens Bancshares, Inc. of TN | 0.59 | % | 5.18 | % | 1.34 | % | 3.84 | % | 0.72 | % | 3.13 | % | 0.00 | % | 0.00 | % | 1.59 | % | 1.59 | % | ||||||||||||||||||||
| EBMT | Eagle Bancorp Montana of MT | 0.73 | % | 4.52 | % | 1.23 | % | 3.28 | % | 0.29 | % | 3.00 | % | -0.10 | % | -0.04 | % | 0.55 | % | 0.40 | % | ||||||||||||||||||||
| FFDF | FFD Financial Corp. of Dover OH (1) | 0.70 | % | 5.15 | % | 1.53 | % | 3.62 | % | 0.43 | % | 3.19 | % | 0.00 | % | 0.00 | % | 0.24 | % | 0.24 | % | ||||||||||||||||||||
| FABK | First Advantage Bancorp of TN | 0.54 | % | 5.10 | % | 1.27 | % | 3.83 | % | 0.39 | % | 3.43 | % | 0.00 | % | 0.00 | % | 0.43 | % | 0.43 | % | ||||||||||||||||||||
| FFNM | First Federal of N. Michigan of MI | 0.06 | % | 4.97 | % | 1.26 | % | 3.71 | % | 0.25 | % | 3.47 | % | 0.00 | % | 0.00 | % | 0.95 | % | 0.95 | % | ||||||||||||||||||||
| JXSB | Jacksonville Bancorp Inc. of IL | 1.00 | % | 4.60 | % | 1.14 | % | 3.46 | % | 0.31 | % | 3.15 | % | 0.12 | % | 0.00 | % | 1.04 | % | 1.16 | % | ||||||||||||||||||||
| LSBI | LSB Financial Corp. of Lafayette IN | 0.49 | % | 4.93 | % | 1.34 | % | 3.59 | % | 1.00 | % | 2.59 | % | 0.00 | % | -0.14 | % | 0.90 | % | 0.77 | % | ||||||||||||||||||||
| LABC | Louisiana Bancorp, Inc. of LA | 0.74 | % | 4.81 | % | 1.74 | % | 3.08 | % | 0.02 | % | 3.05 | % | 0.00 | % | -0.10 | % | 0.37 | % | 0.27 | % | ||||||||||||||||||||
| RVSB | Riverview Bancorp, Inc. of WA | 0.38 | % | 4.92 | % | 0.86 | % | 4.06 | % | 0.62 | % | 3.44 | % | 0.00 | % | -0.05 | % | 0.94 | % | 0.89 | % | ||||||||||||||||||||
| TSBK | Timberland Bancorp, Inc. of WA | 0.14 | % | 4.72 | % | 1.26 | % | 3.47 | % | 0.95 | % | 2.52 | % | -0.02 | % | 0.00 | % | 0.94 | % | 0.93 | % | ||||||||||||||||||||
| G&A/Other Exp. | Non-Op. Items | Yields, Costs, and Spreads | |||||||||||||||||||||||||||||||||||
| MEMO: | MEMO: | ||||||||||||||||||||||||||||||||||||
| G&A | Goodwill | Net | Extrao. | Yield | Cost | Yld-Cost | Assets/ | Effective | |||||||||||||||||||||||||||||
| Expense | Amort. | Gains | Items | On Assets | Of Funds | Spread | FTE Emp. | Tax Rate | |||||||||||||||||||||||||||||
| 1st Security Bank of WA | |||||||||||||||||||||||||||||||||||||
| June 30, 2011 | 4.30 | % | 0.00 | % | 0.08 | % | 0.00 | % | 6.80 | % | 1.45 | % | 5.35 | % | $ | 3,453 | 0.00 | % | |||||||||||||||||||
| All Public Companies | |||||||||||||||||||||||||||||||||||||
| Averages | 2.92 | % | 0.06 | % | 0.10 | % | 0.00 | % | 4.75 | % | 1.59 | % | 3.16 | % | $ | 5,867 | 29.76 | % | |||||||||||||||||||
| Medians | 2.86 | % | 0.00 | % | 0.06 | % | 0.00 | % | 4.70 | % | 1.58 | % | 3.19 | % | $ | 4,965 | 30.31 | % | |||||||||||||||||||
| State of WA | |||||||||||||||||||||||||||||||||||||
| Averages | 3.50 | % | 0.01 | % | 0.11 | % | 0.00 | % | 5.31 | % | 1.69 | % | 3.62 | % | $ | 6,912 | 29.73 | % | |||||||||||||||||||
| Medians | 3.43 | % | 0.01 | % | 0.08 | % | 0.00 | % | 5.19 | % | 1.80 | % | 3.74 | % | $ | 7,001 | 32.25 | % | |||||||||||||||||||
| Comparable Group | |||||||||||||||||||||||||||||||||||||
| Averages | 3.31 | % | 0.02 | % | 0.24 | % | 0.00 | % | 5.23 | % | 1.53 | % | 3.70 | % | $ | 3,504 | 29.56 | % | |||||||||||||||||||
| Medians | 3.29 | % | 0.00 | % | 0.21 | % | 0.00 | % | 5.26 | % | 1.49 | % | 3.73 | % | $ | 3,368 | 31.14 | % | |||||||||||||||||||
| �� | |||||||||||||||||||||||||||||||||||||
| Comparable Group | |||||||||||||||||||||||||||||||||||||
| AFCB | Athens Bancshares, Inc. of TN | 3.91 | % | 0.03 | % | 0.00 | % | 0.00 | % | 5.55 | % | 1.66 | % | 3.90 | % | $ | 3,015 | 24.01 | % | ||||||||||||||||||
| EBMT | Eagle Bancorp Montana of MT | 3.02 | % | 0.00 | % | 0.67 | % | 0.00 | % | 4.95 | % | 1.48 | % | 3.47 | % | NM | 30.47 | % | |||||||||||||||||||
| FFDF | FFD Financial Corp. of Dover OH (1) | 2.73 | % | 0.00 | % | 0.36 | % | 0.00 | % | 5.30 | % | 1.70 | % | 3.61 | % | NM | 34.26 | % | |||||||||||||||||||
| FABK | First Advantage Bancorp of TN | 3.39 | % | 0.00 | % | 0.34 | % | 0.00 | % | 5.33 | % | 1.59 | % | 3.74 | % | $ | 4,075 | 32.62 | % | ||||||||||||||||||
| FFNM | First Federal of N. Michigan of MI | 4.27 | % | 0.13 | % | 0.05 | % | 0.00 | % | 5.36 | % | 1.42 | % | 3.93 | % | $ | 2,576 | NM | |||||||||||||||||||
| JXSB | Jacksonville Bancorp Inc. of IL | 3.20 | % | 0.00 | % | 0.22 | % | 0.00 | % | 4.92 | % | 1.31 | % | 3.61 | % | $ | 2,932 | 25.50 | % | ||||||||||||||||||
| LSBI | LSB Financial Corp. of Lafayette IN | 2.96 | % | 0.00 | % | 0.33 | % | 0.00 | % | 5.21 | % | 1.49 | % | 3.72 | % | $ | 3,955 | 33.88 | % | ||||||||||||||||||
| LABC | Louisiana Bancorp, Inc. of LA | 2.41 | % | 0.00 | % | 0.16 | % | 0.00 | % | 4.91 | % | 2.18 | % | 2.72 | % | $ | 5,003 | 31.14 | % | ||||||||||||||||||
| RVSB | Riverview Bancorp, Inc. of WA | 3.80 | % | 0.01 | % | 0.03 | % | 0.00 | % | 5.57 | % | 0.98 | % | 4.59 | % | $ | 3,721 | 32.25 | % | ||||||||||||||||||
| TSBK | Timberland Bancorp, Inc. of WA | 3.43 | % | 0.02 | % | 0.19 | % | 0.00 | % | 5.17 | % | 1.43 | % | 3.74 | % | $ | 2,753 | 21.94 | % | ||||||||||||||||||
(1) Financial information is for the quarter ending March 31, 2011.
Source: SNL Financial, LC. and RP® Financial, LC. calculations. The information provided in this table has been obtained from sources we believe are reliable, but we cannot guarantee the accuracy or completeness of such information.
Copyright (c) 2011 by RP® Financial, LC.
| RP® Financial, LC. | PEER GROUP ANALYSIS |
III.11 |
When viewed together, net interest income and operating expenses provide considerable insight into a thrift’s earnings strength, since those sources of income and expenses are typically the most prominent components of earnings and are generally more predictable than losses and gains realized from the sale of assets or other non-recurring activities. In this regard, as measured by their expense coverage ratios (net interest income divided by operating expenses), the Bank’s earnings were nearly equal to the Peer Group’s, based on respective expense coverage ratios of 1.15x for 1st Security and 1.10x for the Peer Group. A ratio less than 1.00x indicates that an institution depends on non-interest operating income to achieve profitable operations.
Sources of non-interest operating income provided a marginally greater contribution to the Bank’s earnings (0.90%), representing a slight advantage over the Peer Group (0.83%). Taking non-interest operating income into account in comparing the Bank’s and the Peer Group’s earnings, 1st Security’s and the Peer Group’s efficiency ratios (operating expenses, net of amortization of intangibles, as a percent of the sum of non-interest operating income and net interest income) were nearly the same at 73.4% (Bank) and 74.1% (Peer Group).
Recurring loan loss provisions had a larger impact on the Bank’s earnings, with loan loss provisions established by the Bank and the Peer Group equaling 0.95% and 0.41% of average assets, respectively. The impact of loan loss provisions on the Bank’s and the Peer Group’s earnings, particularly when taking into consideration the prevailing credit market environment for mortgage based lenders, were indicative of asset quality factors facing the overall thrift industry in the current operating environment, and are indicative of the higher risk loan portfolio profile maintained by the Bank.
For the 12 months ended June 30, 2011, the Bank and the Peer Group reported net non-operating gains of 0.08% and 0.21% of average assets, respectively. The Bank’s gains were attributable to a branch sale that occurred during the 12 month period. Typically, gains and losses generated from non-operating items are viewed as non-recurring in nature, particularly to the extent that such gains and losses result from the sale of investments or other assets that are not considered to be part of an institution’s core operations. Comparatively, to the extent that gains have been derived through selling fixed rate loans into the secondary market, such gains may be considered to be an ongoing activity for an institution and, therefore, warrant some consideration as a core earnings factor for an institution. However, loan sale gains are still viewed as a more volatile source of income than income generated through the net interest margin and non-interest operating income. Extraordinary items were not a factor in either the Bank’s or the Peer Group’s earnings.
| RP® Financial, LC. | PEER GROUP ANALYSIS |
III.12 |
Reporting profitable operations, the Peer Group reported an average effective tax rate of 31.1%, while the net loss recorded by 1st Security in past periods resulted in tax loss carryforwards for the Bank, thus the Bank recorded no taxes during the twelve months ended June 30, 2011. As indicated in the prospectus, the Bank’s effective marginal tax rate is assumed to equal 34.0% when calculating the after tax return on conversion proceeds.
Loan Composition
Table 3.4 presents data related to the Bank’s and the Peer Group’s loan portfolio compositions (including the investment in MBS). The Bank’s loan portfolio composition reflected that of a non-traditional thrift strategy, with a much lower concentration of 1-4 family permanent mortgage loans and MBS than maintained by the Peer Group (10.5% of assets versus a median of 37.4% for the Peer Group). The Peer Group reported higher ratios of both MBS and 1-4 family loans than the Bank. Loans serviced for others equaled 17.8% and 35.9% of the Bank’s and the Peer Group’s assets, respectively, thereby indicating a greater influence of loan servicing income on the Peer Group’s earnings.
Diversification into higher risk and higher yielding types of lending was significantly greater for the Bank than the Peer Group companies on average. Consumer loans represented the most significant area of lending diversification for the Bank (45.7% of assets), followed by commercial business loans (10.4% of assets) and non-residential mortgages (9.8% of assets). The Peer Group’s lending diversification consisted primarily of commercial real estate/multi-family loans (26.3% of assets), followed by construction/land loans (4.8% of assets) and commercial business loans (4.1% of assets). 1st Security’s higher concentration of assets in loans and greater diversification into higher risk types of loans translated into a higher risk weighted assets-to-assets ratio for the Bank (84.0% versus 70.2% for the Peer Group).
| RP® Financial, LC. | PEER GROUP ANALYSIS |
III.13 |
Table 3.4
Loan Portfolio Composition and Related Information
Comparable Institution Analysis
As of June 30, 2011
Loan Portfolio Composition and Related Information
Comparable Institution Analysis
As of June 30, 2011
| Portfolio Composition as a Percent of Assets | |||||||||||||||||||||||||||||||||||||
| 1-4 | Constr. | 5+Unit | Commerc. | RWA/ | Serviced | Servicing | |||||||||||||||||||||||||||||||
| Institution | MBS | Family | & Land | Comm RE | Business | Consumer | Assets | For Others | Assets | ||||||||||||||||||||||||||||
| (%) | (%) | (%) | (%) | (%) | (%) | (%) | ($000) | ($000) | |||||||||||||||||||||||||||||
| 1st Security Bank of WA | 0.16 | % | 10.36 | % | 2.31 | % | 9.84 | % | 10.42 | % | 45.70 | % | 83.95 | % | $ | 48,550 | $ | 0 | |||||||||||||||||||
| All Public Companies | |||||||||||||||||||||||||||||||||||||
| Averages | 13.02 | % | 33.76 | % | 3.68 | % | 22.90 | % | 4.52 | % | 1.92 | % | 63.56 | % | $ | 737,798 | $ | 6,714 | |||||||||||||||||||
| Medians | 10.95 | % | 32.83 | % | 2.58 | % | 22.22 | % | 3.30 | % | 0.47 | % | 63.85 | % | $ | 39,360 | $ | 99 | |||||||||||||||||||
| State of WA | |||||||||||||||||||||||||||||||||||||
| Averages | 8.66 | % | 28.50 | % | 7.45 | % | 30.20 | % | 2.63 | % | 1.00 | % | 68.94 | % | $ | 136,142 | $ | 745 | |||||||||||||||||||
| Medians | 8.19 | % | 27.46 | % | 5.28 | % | 30.32 | % | 2.77 | % | 0.58 | % | 72.03 | % | $ | 120,000 | $ | 364 | |||||||||||||||||||
| Comparable Group | |||||||||||||||||||||||||||||||||||||
| Averages | 7.64 | % | 27.60 | % | 6.04 | % | 30.17 | % | 5.05 | % | 1.79 | % | 69.61 | % | $ | 137,319 | $ | 860 | |||||||||||||||||||
| Medians | 5.98 | % | 31.37 | % | 4.76 | % | 26.29 | % | 4.09 | % | 0.97 | % | 70.21 | % | $ | 116,970 | $ | 763 | |||||||||||||||||||
| Comparable Group | |||||||||||||||||||||||||||||||||||||
| AFCB | Athens Bancshares, Inc. of TN | 2.96 | % | 33.78 | % | 7.10 | % | 23.52 | % | 4.06 | % | 3.59 | % | 68.40 | % | $ | 89,850 | $ | 0 | ||||||||||||||||||
| EBMT | Eagle Bancorp Montana of MT | 8.96 | % | 29.86 | % | 4.21 | % | 16.87 | % | 3.16 | % | 2.86 | % | 64.57 | % | $ | 343,750 | $ | 2,142 | ||||||||||||||||||
| FFDF | FFD Financial Corp. of Dover OH (1) | 3.00 | % | 32.88 | % | 1.12 | % | 40.02 | % | 10.43 | % | 2.84 | % | 78.99 | % | $ | 98,930 | $ | 732 | ||||||||||||||||||
| FABK | First Advantage Bancorp of TN | 12.21 | % | 18.45 | % | 15.16 | % | 27.82 | % | 8.55 | % | 0.82 | % | 74.02 | % | $ | 1,320 | $ | 0 | ||||||||||||||||||
| FFNM | First Federal of N. Michigan of MI | 11.39 | % | 34.40 | % | 3.35 | % | 24.75 | % | 3.77 | % | 0.66 | % | 64.82 | % | $ | 148,340 | $ | 969 | ||||||||||||||||||
| JXSB | Jacksonville Bancorp Inc. of IL | 14.83 | % | 19.13 | % | 0.83 | % | 22.19 | % | 7.70 | % | 5.15 | % | 67.62 | % | $ | 147,200 | $ | 794 | ||||||||||||||||||
| LSBI | LSB Financial Corp. of Lafayette IN | 0.70 | % | 36.28 | % | 5.30 | % | 42.24 | % | 4.11 | % | 0.42 | % | 74.26 | % | $ | 113,940 | $ | 1,042 | ||||||||||||||||||
| LABC | Louisiana Bancorp, Inc. of LA | 20.73 | % | 35.91 | % | 0.13 | % | 22.03 | % | 0.12 | % | 0.21 | % | 48.36 | % | $ | 14,170 | $ | 93 | ||||||||||||||||||
| RVSB | Riverview Bancorp, Inc. of WA | 0.20 | % | 14.96 | % | 10.23 | % | 46.74 | % | 5.77 | % | 0.26 | % | 83.04 | % | $ | 120,000 | $ | 364 | ||||||||||||||||||
| TSBK | Timberland Bancorp, Inc. of WA | 1.46 | % | 20.38 | % | 12.99 | % | 35.54 | % | 2.77 | % | 1.11 | % | 72.03 | % | $ | 295,690 | $ | 2,463 | ||||||||||||||||||
(1) Financial information is for the quarter ending March 31, 2011.
| Source: | SNL Financial LC. and RP® Financial, LC. calculations. The information provided in this table has been obtained from sources we believe are reliable, but we cannot guarantee the accuracy or completeness of such information. |
Copyright (c) 2011 by RP® Financial, LC.
| RP® Financial, LC. | PEER GROUP ANALYSIS |
III.14 |
Credit Risk
Overall, based on a comparison of credit quality measures, the Bank’s credit risk exposure was considered to be somewhat less favorable than the Peer Group’s, with the Bank’s higher ratio of NPAs/Assets offset in part by higher reserves. As shown in Table 3.5, the Bank’s non-performing assets/assets and non-performing loans/loans ratios equaled 2.92% and 0.91%, respectively, versus comparable measures of 2.12% and 2.22% for the Peer Group. The Bank’s and Peer Group’s general loss reserves as a percent of non-performing loans equaled 247.0% and 72.0%, respectively. Loss reserves maintained as percent of net loans receivable equaled 2.25% for the Bank, versus 1.68% for the Peer Group. Net loan charge-offs were higher at the Bank, based on ratios of 1.86% and 0.29% of net loans receivable, respectively. As noted in the Loan Composition discussion, the Bank’s higher concentration of loans and greater diversification into higher risk types of loans translated into a higher risk weighted assets-to-assets ratio in comparison to the Bank’s ratio, resulting in an implied higher risk loan portfolio.
Interest Rate Risk
Table 3.6 reflects various key ratios highlighting the relative interest rate risk exposure of the Bank versus the Peer Group. In terms of balance sheet composition, 1st Security’s interest rate risk characteristics were considered to be somewhat less favorable than the Peer Group’s. For example, the Bank’s equity-to-assets and IEA/IBL ratios were lower than the comparable Peer Group ratios, thereby implying more dependence on the yield-cost spread to sustain the net interest margin for the Bank. At the same time, the Bank’s higher level of non-interest earning assets represented a slight disadvantage for the Bank with respect to managing interest rate risk. On a pro forma basis, the infusion of stock proceeds can be expected to provide the Bank with at least comparable and probably more favorable balance sheet interest rate risk characteristics than currently maintained by the Peer Group, particularly with respect to the increases that will be realized in Bank’s equity-to-assets and IEA/IBL ratios.
| RP® Financial, LC. | PEER GROUP ANALYSIS |
III.15 |
Table 3.5
Credit Risk Measures and Related Information
Comparable Institution Analysis
As of June 30, 2011 or Most Recent Date Available
Credit Risk Measures and Related Information
Comparable Institution Analysis
As of June 30, 2011 or Most Recent Date Available
| NPAs & | Rsrves/ | ||||||||||||||||||||||||||||||||
| REO/ | 90+Del/ | NPLs/ | Rsrves/ | Rsrves/ | NPAs & | Net Loan | NLCs/ | ||||||||||||||||||||||||||
| Institution | Assets | Assets | Loans | Loans | NPLs | 90+Del | Chargoffs | Loans | |||||||||||||||||||||||||
| (%) | (%) | (%) | (%) | (%) | (%) | ($000) | (%) | ||||||||||||||||||||||||||
| 1st Security Bank of WA | 2.17 | % | 2.92 | % | 0.91 | % | 2.25 | % | 246.99 | % | 60.64 | % | $ | 3,993 | 1.86 | % | |||||||||||||||||
| All Public Companies | |||||||||||||||||||||||||||||||||
| Averages | 0.59 | % | 3.92 | % | 4.77 | % | 1.80 | % | 61.03 | % | 49.70 | % | $ | 1,346 | 0.66 | % | |||||||||||||||||
| Medians | 0.23 | % | 2.71 | % | 3.40 | % | 1.48 | % | 41.45 | % | 35.65 | % | $ | 459 | 0.31 | % | |||||||||||||||||
| State of WA | |||||||||||||||||||||||||||||||||
| Averages | 1.69 | % | 7.50 | % | 7.79 | % | 2.17 | % | 38.12 | % | 22.75 | % | $ | 3,056 | 2.35 | % | |||||||||||||||||
| Medians | 1.93 | % | 6.82 | % | 7.94 | % | 2.21 | % | 27.85 | % | 21.17 | % | $ | 3,452 | 2.48 | % | |||||||||||||||||
| Comparable Group | |||||||||||||||||||||||||||||||||
| Averages | 0.83 | % | 3.23 | % | 3.06 | % | 1.68 | % | 86.98 | % | 58.66 | % | $ | 561 | 0.56 | % | |||||||||||||||||
| Medians | 0.29 | % | 2.12 | % | 2.22 | % | 1.68 | % | 71.99 | % | 51.51 | % | $ | 242 | 0.29 | % | |||||||||||||||||
| Comparable Group | |||||||||||||||||||||||||||||||||
| AFCB | Athens Bancshares, Inc. of TN | 0.23 | % | 2.71 | % | 3.39 | % | 2.20 | % | 65.00 | % | 59.33 | % | $ | 145 | 0.29 | % | ||||||||||||||||
| EBMT | Eagle Bancorp Montana of MT | 0.36 | % | 1.24 | % | 1.55 | % | 0.95 | % | 61.25 | % | 43.69 | % | $ | 6 | 0.01 | % | ||||||||||||||||
| FFDF | FFD Financial Corp. of Dover OH (1) | 0.00 | % | 1.53 | % | 1.71 | % | 1.18 | % | 78.98 | % | 76.87 | % | $ | 493 | 1.07 | % | ||||||||||||||||
| FABK | First Advantage Bancorp of TN | 0.04 | % | 0.92 | % | 1.25 | % | 1.58 | % | 126.73 | % | 121.24 | % | $ | 223 | 0.37 | % | ||||||||||||||||
| FFNM | First Federal of N. Michigan of MI | 2.11 | % | 4.71 | % | 3.62 | % | 1.48 | % | 40.98 | % | 21.25 | % | $ | 422 | 1.12 | % | ||||||||||||||||
| JXSB | Jacksonville Bancorp Inc. of IL | 0.18 | % | 1.27 | % | 1.86 | % | 1.77 | % | 95.30 | % | 81.68 | % | $ | 260 | -0.30 | % | ||||||||||||||||
| LSBI | LSB Financial Corp. of Lafayette IN | 0.04 | % | 5.92 | % | 6.36 | % | 2.20 | % | 34.51 | % | 33.02 | % | $ | 194 | 0.24 | % | ||||||||||||||||
| LABC | Louisiana Bancorp, Inc. of LA | 0.35 | % | 0.57 | % | 0.37 | % | 0.92 | % | 249.57 | % | 94.73 | % | $ | 0 | 0.00 | % | ||||||||||||||||
| RVSB | Riverview Bancorp, Inc. of WA | 3.07 | % | 5.10 | % | 2.58 | % | 2.32 | % | 89.66 | % | 35.59 | % | $ | 459 | 0.27 | % | ||||||||||||||||
| TSBK | Timberland Bancorp, Inc. of WA | 1.93 | % | 8.35 | % | 7.94 | % | 2.21 | % | 27.85 | % | 19.20 | % | $ | 3,408 | 2.53 | % | ||||||||||||||||
(1) Financial information is for the quarter ending March 31, 2011.
| Source: | Audited and unaudited financial statements, corporate reports and offering circulars, and RP® Financial, LC. calculations. The information provided in this table has been obtained from sources we believe are reliable, but we cannot guarantee the accuracy or completeness of such information. |
Copyright (c) 2011 by RP® Financial, LC.
| RP® Financial, LC. | PEER GROUP ANALYSIS |
III.16 |
Table 3.6
Interest Rate Risk Measures and Net Interest Income Volatility
Comparable Institution Analysis
As of June 30, 2011 or Most Recent Date Available
Interest Rate Risk Measures and Net Interest Income Volatility
Comparable Institution Analysis
As of June 30, 2011 or Most Recent Date Available
| Balance Sheet Measures | |||||||||||||||||||||||||||||||||||||
| Non-Earn. | Quarterly Change in Net Interest Income | ||||||||||||||||||||||||||||||||||||
| Equity/ | IEA/ | Assets/ | |||||||||||||||||||||||||||||||||||
| Institution | Assets | IBL | Assets | 6/30/2011 | 3/31/2011 | 12/31/2010 | 9/30/2010 | 6/30/2010 | 3/31/2010 | ||||||||||||||||||||||||||||
| (%) | (%) | (%) | (change in net interest income is annualized in basis points) | ||||||||||||||||||||||||||||||||||
| 1st Security Bank of WA | 9.5 | % | 103.7 | % | 6.8 | % | -17 | -60 | 30 | 30 | 8 | 54 | |||||||||||||||||||||||||
| All Public Companies | 11.6 | % | 107.6 | % | 6.6 | % | 4 | 0 | 1 | 0 | 1 | 6 | |||||||||||||||||||||||||
| State of WA | 11.9 | % | 106.3 | % | 8.4 | % | 1 | 1 | 12 | -1 | 2 | -6 | |||||||||||||||||||||||||
| Comparable Group | |||||||||||||||||||||||||||||||||||||
| Averages | 13.3 | % | 110.2 | % | 6.4 | % | 5 | 4 | 6 | 4 | 10 | 12 | |||||||||||||||||||||||||
| Medians | 11.4 | % | 108.5 | % | 6.4 | % | 0 | 5 | 2 | 4 | 11 | 12 | |||||||||||||||||||||||||
| Comparable Group | |||||||||||||||||||||||||||||||||||||
| AFCB | Athens Bancshares, Inc. of TN | 17.6 | % | 115.6 | % | 6.5 | % | -2 | 9 | 28 | 2 | 9 | 21 | ||||||||||||||||||||||||
| EBMT | Eagle Bancorp Montana of MT | 15.9 | % | 109.6 | % | 8.9 | % | -2 | 17 | -5 | 12 | 0 | NA | ||||||||||||||||||||||||
| FFDF | FFD Financial Corp. of Dover OH (1) | 8.9 | % | 107.4 | % | 2.9 | % | NA | -15 | 18 | 1 | 5 | 35 | ||||||||||||||||||||||||
| FABK | First Advantage Bancorp of TN | 19.3 | % | 120.4 | % | 4.3 | % | 9 | 10 | 11 | 5 | 13 | 12 | ||||||||||||||||||||||||
| FFNM | First Federal of N. Michigan of MI | 10.8 | % | 105.1 | % | 7.4 | % | 20 | 0 | 5 | 16 | 15 | 27 | ||||||||||||||||||||||||
| JXSB | Jacksonville Bancorp Inc. of IL | 11.8 | % | 109.5 | % | 6.3 | % | 27 | 13 | -4 | 11 | 23 | -1 | ||||||||||||||||||||||||
| LSBI | LSB Financial Corp. of Lafayette IN | 10.1 | % | 106.1 | % | 5.1 | % | 0 | 17 | -7 | 19 | 18 | 17 | ||||||||||||||||||||||||
| LABC | Louisiana Bancorp, Inc. of LA | 18.4 | % | 122.2 | % | 1.8 | % | -6 | -5 | -3 | -5 | 1 | -4 | ||||||||||||||||||||||||
| RVSB | Riverview Bancorp, Inc. of WA | 9.3 | % | 101.9 | % | 11.6 | % | -5 | -6 | 13 | -22 | 20 | -3 | ||||||||||||||||||||||||
| TSBK | Timberland Bancorp, Inc. of WA | 10.9 | % | 104.1 | % | 8.7 | % | 0 | 1 | -2 | -3 | -7 | 1 | ||||||||||||||||||||||||
(1) Financial information is for the quarter ending March 31, 2011.
NA=Change is greater than 100 basis points during the quarter.
| Source: | SNL Financial LC. and RP® Financial, LC. calculations. The information provided in this table has been obtained from sources we believe are reliable, but we cannot guarantee the accuracy or completeness of such information. |
Copyright (c) 2011 by RP® Financial, LC.
| RP® Financial, LC. | PEER GROUP ANALYSIS |
III.17 |
To analyze interest rate risk associated with the net interest margin, we reviewed quarterly changes in net interest income as a percent of average assets for 1st Security and the Peer Group. In general, the relative fluctuations in the Bank’s net interest income to average assets ratio were considered to be higher than the Peer Group which supports the conclusion that 1st Security maintains a higher degree of interest rate risk exposure in the net interest margin. The stability of the Bank’s net interest margin should be enhanced by the infusion of stock proceeds, as the increase in capital will reduce the level of interest rate sensitive liabilities funding 1st Security’s assets.
Summary
Based on the above analysis, RP Financial concluded that the Peer Group forms a reasonable basis for determining the pro forma market value of the Bank. Such general characteristics as asset size, capital position, interest-earning asset composition, funding composition, core earnings measures, loan composition, credit quality and exposure to interest rate risk all tend to support the reasonability of the Peer Group from a financial standpoint. Those areas where differences exist will be addressed in the form of valuation adjustments to the extent necessary.
| RP® Financial, LC. | VALUATION ANALYSIS IV.1 |
IV. VALUATION ANALYSIS
| Introduction |
This chapter presents the valuation analysis and methodology, prepared pursuant to the regulatory valuation guidelines, and valuation adjustments and assumptions used to determine the estimated pro forma market value of the common stock to be issued in conjunction with the Bank’s conversion transaction.
Appraisal Guidelines
The regulatory written appraisal guidelines reissued by the OCC specify the market value methodology for estimating the pro forma market value of an institution pursuant to a mutual-to-stock conversion. Pursuant to this methodology: (1) a peer group of comparable publicly-traded institutions is selected; (2) a financial and operational comparison of the subject company to the peer group is conducted to discern key differences; and (3) a valuation analysis in which the pro forma market value of the subject company is determined based on the market pricing of the peer group as of the date of valuation, incorporating valuation adjustments for key differences. In addition, the pricing characteristics of recent conversions, both at conversion and in the aftermarket, must be considered.
RP Financial Approach to the Valuation
The valuation analysis herein complies with such regulatory approval guidelines. Accordingly, the valuation incorporates a detailed analysis based on the Peer Group, discussed in Chapter III, which constitutes “fundamental analysis” techniques. Additionally, the valuation incorporates a “technical analysis” of recently completed stock conversions, including closing pricing and aftermarket trading of such offerings. It should be noted that these valuation analyses cannot possibly fully account for all the market forces which impact trading activity and pricing characteristics of a particular stock on a given day.
The pro forma market value determined herein is a preliminary value for the Company’s to-be-issued stock. Throughout the conversion process, RP Financial will: (1) review changes in 1st Security’s operations and financial condition; (2) monitor 1st Security’s operations and financial condition relative to the Peer Group to identify any fundamental changes; (3) monitor the external factors affecting value including, but not limited to, local and national economic conditions, interest rates, and the stock market environment, including the market for thrift stocks; and (4) monitor pending conversion offerings (including those in the offering phase), both regionally and nationally. If material changes should occur during the conversion process, RP Financial will evaluate if updated valuation reports should be prepared reflecting such changes and their related impact on value, if any. RP Financial will also prepare a final valuation update at the closing of the offering to determine if the prepared valuation analysis and resulting range of value continues to be appropriate.
| RP® Financial, LC. | VALUATION ANALYSIS IV.2 |
The appraised value determined herein is based on the current market and operating environment for the Bank and for all thrifts. Subsequent changes in the local and national economy, the legislative and regulatory environment, the stock market, interest rates, and other external forces (such as natural disasters or major world events), which may occur from time to time (often with great unpredictability) may materially impact the market value of all thrift stocks, including 1st Security’s value, or 1st Security’s value alone. To the extent a change in factors impacting the Bank’s value can be reasonably anticipated and/or quantified, RP Financial has incorporated the estimated impact into the analysis.
| Valuation Analysis |
A fundamental analysis discussing similarities and differences relative to the Peer Group was presented in Chapter III. The following sections summarize the key differences between the Bank and the Peer Group and how those differences affect the pro forma valuation. Emphasis is placed on the specific strengths and weaknesses of the Bank relative to the Peer Group in such key areas as financial condition, profitability, growth and viability of earnings, asset growth, primary market area, dividends, liquidity of the shares, marketing of the issue, management, and the effect of government regulations and/or regulatory reform. We have also considered the market for thrift stocks, in particular new issues, to assess the impact on value of the Bank coming to market at this time.
1. Financial Condition
The financial condition of an institution is an important determinant in pro forma market value because investors typically look to such factors as liquidity, equity, asset composition and quality, and funding sources in assessing investment attractiveness. The similarities and differences in the Bank’s and the Peer Groups’ financial strengths are noted as follows:
■ | Overall A/L Composition. Loans funded by retail deposits were the primary components of both 1st Security’s and the Peer Group’s balance sheets. The Bank’s interest-earning asset composition exhibited a higher concentration of loans and a substantially higher degree of diversification into higher risk and higher yielding types of loans (primarily consumer loans). In comparison to the Peer Group, the Bank’s interest-earning asset composition provided for a higher yield earned on interest-earning assets and a higher risk weighted assets-to-assets ratio. 1st Security’s funding composition indicated a higher proportion of deposits and a lower proportion of borrowings than the comparable Peer Group ratios, resulting in a lower cost of funds than the Peer Group. As a percent of assets, 1st Security maintained a somewhat lower level of interest-earning assets and higher level of interest-bearing liabilities compared to the Peer Group’s ratios, which resulted in a higher IEA/IBL ratio for the Peer Group compared to the Bank. After factoring in the impact of the net stock proceeds, the Bank’s IEA/IBL ratio will be more in line with the Peer Group’s ratio. On balance, RP Financial concluded that asset/liability composition was a neutral factor in our adjustment for financial condition. |
| RP® Financial, LC. | VALUATION ANALYSIS IV.3 |
■ | Credit Quality. The Bank’s ratio of REO was higher than the Peer Group average, while total NPAs as a percent of total assets were lower than the comparable Peer Group average. Loss reserves as a percent loans and reserve coverage ratios were higher for 1st Security. Net loan charge-offs were higher for 1st Security, while the Bank’s risk weighted assets-to-assets ratio was higher than the Peer Group ratio. 1st Security reported higher loan diversification into higher risk loans (commercial business and consumer) than the Peer Group. The perceived credit risk in 1st Security’s loan portfolio was deemed to be higher than the Peer Group based on loan composition. Overall, RP Financial concluded that credit quality was a moderately negative factor in our adjustment for financial condition. |
■ | Balance Sheet Liquidity. 1st Security operated with a somewhat lower level of cash and investment securities relative to the Peer Group (16.1% of assets versus 23.7% for the Peer Group). Following the infusion of stock proceeds, the Bank’s cash and investments ratio is expected to increase as the proceeds will be initially deployed into investments. The Bank’s future borrowing capacity was considered to be greater than the Peer Group, given the lower level of borrowings currently maintained. Overall, RP Financial concluded that balance sheet liquidity was a neutral factor in our adjustment for financial condition. |
■ | Funding Liabilities. 1st Security’s interest-bearing funding composition reflected a higher concentration of deposits and a lower concentration of borrowings relative to the comparable Peer Group ratios. 1st Security’s funding costs were lower than the Peer Group average. The Bank maintained a modest balance of brokered deposits. Total interest-bearing liabilities as a percent of assets were higher for the Bank compared to the Peer Group’s ratio, which was attributable to 1st Security’s lower equity position. Following the stock offering, the increase in the Bank’s equity position should provide 1st Security with a lower ratio of interest-bearing liabilities as a percent of assets. Overall, RP Financial concluded that funding liabilities were a neutral factor in our adjustment for financial condition. |
■ | Equity. The Peer Group currently operates with a higher equity-to-assets ratio than the Bank. Following the stock offering, 1st Security’s pro forma equity position is expected to exceed the Peer Group’s equity-to-assets ratio. The increase in the Bank’s pro forma capital position will result in a greater leverage potential for the Bank and reduce the level of interest-bearing liabilities utilized to fund assets. At the same time, the Bank’s equity ratio will likely result in a lower ROE. On balance, RP Financial concluded that equity strength was a neutral factor in our adjustment for financial condition. |
| RP® Financial, LC. | VALUATION ANALYSIS IV.4 |
On balance, 1st Security’s pro forma financial condition was comparable to the Peer Group’s after considering the above factors and, thus, no valuation adjustment was applied for the Bank’s financial condition.
2. Profitability, Growth and Viability of Earnings
Earnings are a key factor in determining pro forma market value, as the level and risk characteristics of an institution’s earnings stream and the prospects and ability to generate future earnings heavily influence the multiple that the investment community will pay for earnings. The major factors considered in the valuation are described below.
■ | Reported Earnings. For the 12 months ended June 30, 2011, 1st Security reported net income of $1,894,000, or 0.69% of average assets, versus average and median net income of 0.54% and 0.57% of average assets for the Peer Group. The Bank recorded higher levels of net interest income, non-interest operating income and operating expenses, resulting in a higher core earnings stream. Funding costs were similar between the Bank and the Peer Group. 1st Security’s higher reported net income ratio was largely due to the absence of a tax liability in the income statement, a result of the deferred tax asset that is fully reserved on the balance sheet. Non-operating items had only a minimal impact on the Peer Group’s earnings (a 0.08% of average assets gain). Reinvestment and leveraging of stock proceeds into interest-earning assets will serve to increase the Bank’s bottom line income, with the benefit of reinvesting proceeds expected to be somewhat offset by higher operating expenses associated with operating as a publicly-traded company. The Bank’s higher reserve coverage ratios, which have been established due to higher provisions in the most recent three years, have impacted the income statement through higher loan loss provisions. However, the Peer Group can also be expected to experience expenses related to loan loss provisions and problem assets. On balance, RP Financial concluded that the Bank’s reported earnings were a slightly negative factor in our adjustment for profitability, growth and viability of earnings. |
■ | Core Earnings. As noted above, 1st Security’s income statement was impacted by the lack of a tax liability and from a limited level of non-operating gains. The Peer Group reported a higher level of non-operating gains (0.24% of average assets on average). In comparison to the Peer Group, the Bank operates with a higher net interest income ratio, a higher yield/cost spread, a higher operating expense ratio and a higher level of non-interest operating income. For valuation purposes, we assumed core net income would include the impact of an expected tax burden, should the deferred tax valuation allowance be removed (in whole or in part) from the balance sheet. Thus, we determined that the Bank’s core net income for the 12 months ended June 30, 2011 approximated $1.1 million, utilizing a 34% effective tax rate. The Bank’s ratios for net interest income and operating expenses translated into an expense coverage ratio that was more favorable than the Peer Group’s ratio (equal to 1.15x for the Bank and 1.08x for the Peer Group). Similarly, the Bank’s efficiency ratio of 73.4% was more favorable than the Peer Group’s efficiency ratio of 76.6%. Total loss provisions had a larger impact on the Bank’s income statement, and as noted above, the current levels of NPAs and/or the reserve coverage ratios for both the Bank and Peer Group will remain as a potential negative factor in future earnings as additional loan loss reserves may be incurred. |
| RP® Financial, LC. | VALUATION ANALYSIS IV.5 |
Overall, the core earnings potential of the Bank will be impacted by the expected earnings benefits the Bank should realize from the redeployment of stock proceeds into interest-earning assets and the expenses associated with the ESOP and operations as a publicly-traded company. Based on the current core earnings rate of the Bank, RP Financial concluded that this was a moderately downward factor in our adjustment for profitability, growth and viability of earnings.
■ | Interest Rate Risk. Quarterly changes in the Bank’s and the Peer Group’s net interest income to average assets ratios indicated that a higher degree of volatility was associated with the Bank’s net interest income ratios. Other measures of interest rate risk, such as equity and IEA/IBL ratios were less favorable for the Bank compared to the Peer Group thereby indicating a higher dependence on the yield-cost spread to sustain net interest income. On a pro forma basis, the infusion of stock proceeds can be expected to provide the Bank with equity-to-assets and IEA/ILB ratios that will be more in line with the Peer Group ratios, as well as enhance the stability of the Bank’s net interest income ratio through the reinvestment of stock proceeds into interest-earning assets. On balance, RP Financial concluded that interest rate risk was a slightly negative factor in our adjustment for profitability, growth and viability of earnings. |
■ | Credit Risk. Loan loss provisions were a larger factor in the Bank’s most recent 12 month earnings stream (0.95% of average assets versus 0.50% of average assets for the Peer Group). In terms of future exposure to credit quality related losses, 1st Security maintained a higher concentration of assets in loans, and lending diversification into higher risk types of loans was greater for the Bank. The risk weighed assets-to-assets ratio was also higher for the Bank. Credit quality measures on balance were somewhat favorable for 1st Security, in terms of NPA ratios and reserve coverage ratios. Taking these factors into consideration, RP Financial concluded that credit risk was a moderately negative factor in our adjustment for profitability, growth and viability of earnings. |
■ | Earnings Growth Potential. The Bank maintained a higher interest rate spread than the Peer Group, which would tend to provide for a higher level of net interest income ratio going forward based on the prevailing interest rate environment. The infusion of stock proceeds will provide 1st Security with slightly greater growth potential through leverage than currently maintained by the Peer Group. The Bank’s higher operating expense ratio is viewed as an unfavorable characteristic to sustain earnings during periods when net interest income ratios come under pressure as the result of adverse changes in interest rates. Overall, earnings growth potential was considered to be a slightly negative factor in our adjustment for profitability, growth and viability of earnings. |
■ | Return on Equity. For the most recent 12 month period, the Bank’s ROE on a reported basis (7.60%) was higher than the Peer Group’s ROE, although reported earnings were greatly enhanced by the lack of a tax liability. Based on a core earnings estimate of $1.1 million, the Bank’s core ROE for the 12 months ended June 30, 2011 was 4.46% which also was above the Peer Group average. Following the increase in equity that will be realized from the infusion of net stock proceeds into the Bank, 1st Security’s pro forma ROE on a core earnings basis can be expected to be lower than the Peer Group’s ratio. Accordingly, this was a moderately negative factor in the adjustment for profitability, growth and viability of earnings. |
| RP® Financial, LC. | VALUATION ANALYSIS IV.6 |
On balance, 1st Security’s pro forma core earnings strength was considered to be less favorable than the Peer Group’s and, thus a moderate downward valuation adjustment was applied for profitability, growth and viability of earnings.
3. Asset Growth
1st Security’s assets decreased at an annual rate of 2.07% during the most recent 12 month period, while the Peer Group’s assets increased at an annual rate of 0.44% on average over the same time period. The Bank’s slightly asset shrinkage reflected a continuation of fluctuation in assets recorded over the past four and one-half fiscal years, as assets increased in fiscal 2007, 2009 and 2010, and decreased in fiscal 2008 and for the most recent 12 month period. Six of the 10 Peer Group companies reported increases in assets, with loans receivable increasing slightly, on average and cash and investments increasing at a faster pace. For 1st Security, loans decreased while cash and investments increased substantially. On a pro forma basis, 1st Security’s tangible equity-to-assets ratio is expected to exceed the Peer Group’s tangible equity-to-assets ratio, indicating a moderate amount of additional leverage capacity for the Bank. On balance, we concluded that a slightly upward valuation adjustment was warranted for asset growth.
4. Primary Market Area
The general condition of an institution’s market area has an impact on value, as future success is in part dependent upon opportunities for profitable activities in the local markets served. 1st Security serves a portion of the Seattle-Tacoma metropolitan area through six office locations in four counties. The market area served is mainly urban and suburban in nature with a total population of the four county market area of 3.7 million. The strength of the region’s economy hinges primarily on a diversified mix of high tech, government, manufacturing and services industries. In recent years, the economies in the Bank’s operating markets have experienced a downturn similar to the rest of the nation, with increases in unemployment, home values, home loan delinquencies, bankruptcies and other adverse reactions to the lower level of economic activity. The region also experienced somewhat of a “bubble economy” in the areas of land development and construction. However, the Pacific Northwest region typically lags the nation in terms of an economic cycle, and thus the expectations are that the Bank’s market area will take longer to recover from the current economic downturn. The demographic characteristics of the Bank’s market areas have also fostered a highly competitive banking environment, in which the Bank competes against other community banks as well as institutions with a regional or national presence.
| RP® Financial, LC. | VALUATION ANALYSIS IV.7 |
The Peer Group companies operate in a mix of urban, suburban and rural markets, with four of the Peer Group markets having relatively large population bases in large metropolitan areas, although the Bank’s home office county of Snohomish has a larger population base than all Peer Group members. The remaining six Peer Group members are headquartered in counties with relatively small populations. Thus, the markets served by the Peer Group companies, on average, reflect lower population bases for potential customers. In addition, the Bank’s home office county recorded greater historical population growth from 2000 to 2010 that all but two of the Peer Group companies, with such trends expected to continue through 2015. 1st Security’s home office county also recorded higher per capita income compared to all of the Peer Group members, with the Snohomish County per capita income well above the state of Washington average. The average and median deposit market shares maintained by the Peer Group companies was well above the Bank’s market share of deposits in Snohomish County, an indication of the larger size of the Bank’s market area in terms of population and economic activity. The degree of competition faced by the Peer Group companies was viewed to be similar to that faced by 1st Security, while the growth potential in the markets served by the Peer Group companies was viewed to be somewhat less favorable. Summary demographic and deposit market share data for the Bank and the Peer Group companies is provided in Exhibit III-3. As shown in Table 4.1, July 2011 unemployment rates for six of the markets served by the Peer Group companies were lower than the comparable unemployment rate for Snohomish County. On balance, we concluded that a slight downward adjustment was appropriate for the Bank’s market area.
| RP® Financial, LC. | VALUATION ANALYSIS IV.8 |
Table 4.1
Market Area Unemployment Rates
1st Security and the Peer Group Companies(1)
| July 2011 | ||||||
| County | Unemployment | |||||
| 1st Security Bank- WA | Snohomish | 10.0 | % | |||
| Peer Group Average | 9.4 | % | ||||
| Athens Bancshares Corp. – TN | McMinn | 11.6 | % | |||
| Eagle Bancorp Montana - MT | Lewis and Clark | 5.8 | ||||
| FFD Financial Corp. - OH | Tuscawaras | 9.1 | ||||
| First Advantage Bancorp - TN | Montgomery | 9.5 | ||||
| First Federal of N. Michigan – MI | Alpena | 10.8 | ||||
| Jacksonville Bancorp, Inc. – IL | Morgan | 8.8 | ||||
| LSB Financial Corp. - IN | Tippecanoe | 8.1 | ||||
| Louisiana Bancorp, Inc. – LA | Jefferson | 7.2 | ||||
| Riverview Bancorp, Inc. - WA | Clark | 10.1 | ||||
| Timberland Bancorp, Inc. - WA | Gray’s Harbor | 12.6 | ||||
| (1) Unemployment rates are not seasonally adjusted. | ||||||
| Source: U.S. Bureau of Labor Statistics. | ||||||
5. Dividends
At this time the Bank has not established a dividend policy. Future declarations of dividends by the Board of Directors will depend upon a number of factors, including investment opportunities, growth objectives, financial condition, profitability, tax considerations, minimum capital requirements, regulatory limitations, stock market characteristics and general economic conditions.
Five of the 10 Peer Group companies pay regular cash dividends, with implied dividend yields ranging from 1.57% to 4.53%. The average dividend yield on the stocks of the Peer Group institutions equaled 1.26% as of September 2, 2011. As of September 2, 2011, 63% of all publicly-traded thrifts had adopted cash dividend policies (see Exhibit IV-1), exhibiting an average yield of 3.17%. The dividend paying thrifts generally maintain higher than average profitability ratios, facilitating their ability to pay cash dividends.
The Bank has not established a definitive dividend policy prior to converting. The Bank will have the capacity to pay a dividend comparable to the Peer Group’s average dividend yield based on pro forma capitalization. On balance, we concluded that no adjustment was warranted for this factor.
| RP® Financial, LC. | VALUATION ANALYSIS IV.9 |
6. Liquidity of the Shares
The Peer Group is by definition composed of companies that are traded in the public markets. All ten of the Peer Group members trade on the NASDAQ. Typically, the number of shares outstanding and market capitalization provides an indication of how much liquidity there will be in a particular stock. The market capitalization of the Peer Group companies ranged from $10.8 million to $58.7 million as of September 2, 2011, with average and median market values of $35.1 million and $35.4 million, respectively. The shares issued and outstanding to the public shareholders of the Peer Group members ranged from 1.0 million to 22.5 million, with average and median shares outstanding of 5.1 million and 3.2 million, respectively. The Bank’s stock offering is expected to have a pro forma market value and number of shares outstanding that will be less than the average and median market values indicated for the Peer Group companies. Like the Peer Group companies, the Bank’s stock is expected to be quoted on the NASDAQ Capital Market following the stock offering. Overall, we anticipate that the Bank’s public stock will have a similar trading market as the Peer Group companies on average and, therefore, concluded that no adjustment was necessary for this factor.
7. Marketing of the Issue
We believe that three separate markets exist for thrift stocks, including those coming to market such as 1st Security (1) the after-market for public companies, in which trading activity is regular and investment decisions are made based upon financial condition, earnings, capital, ROE, dividends and future prospects; (2) the new issue market in which converting thrifts are evaluated on the basis of the same factors, but on a pro forma basis without the benefit of prior operations as a fully-converted publicly-held company and stock trading history; and (3) the acquisition market for thrift franchises in Washington. All three of these markets were considered in the valuation of the Bank’s to-be-issued stock.
A. The Public Market
The value of publicly-traded thrift stocks is easily measurable, and is tracked by most investment houses and related organizations. Exhibit IV-1 provides pricing and financial data on all publicly-traded thrifts. In general, thrift stock values react to market stimuli such as interest rates, inflation, perceived industry health, projected rates of economic growth, regulatory issues and stock market conditions in general. Exhibit IV-2 displays historical stock market trends for various indices and includes historical stock price index values for thrifts and commercial banks. Exhibit IV-3 displays historical stock price indices for thrifts only.
| RP® Financial, LC. | VALUATION ANALYSIS IV.10 |
In terms of assessing general stock market conditions, the performance of the overall stock market has been mixed in recent quarters. The broader stock market started 2011 on an upswing, fueled by reports of manufacturing activity picking up in December. Weaker than expected job growth reflected in the December employment report pulled stocks lower to close out the first week in 2011. A favorable fourth quarter earnings report by J.P. Morgan and data confirming strength in the manufacturing sector helped stocks to rebound in mid-January, with the DJIA moving to its highest close since June 2008. The positive trend in the broader stock market was sustained in late-January, which was followed by a one day sell-off as political unrest in Egypt rattled markets around the world. The DJIA ended up 2.7% for the month of January, which was its strongest January in 14 years. Stocks continued to trade higher through the first two weeks of February, as the DJIA closed higher for eight consecutive trading sessions. Strong manufacturing data for January, merger news and some favorable fourth quarter earnings reports helped to sustain the rally in the broader stock market. News that Egypt’s President resigned further boosted stocks heading into mid-February. A strong report on manufacturing activity in the Mid-Atlantic region lifted the DJIA to a fresh two and one-half year high in mid-February, which was followed by a sell-off as stocks tumbled worldwide on worries over escalating violence in Libya. Stocks recovered in late-February, as oil prices stabilized. Volatility was evident in the broader stock market in early-March, as investors reacted to some strong economic reports mixed with concerns about Middle East tensions and surging oil prices. The DJIA closed below 12000 in the second week of March, as financial markets around the world were shaken by escalating turmoil in the Middle East and surprisingly downbeat economic news out of China. Stocks climbed to close out the second week of March, as some companies benefited from expectations that the rebuilding efforts in Japan following the earthquake and tsunami would positively impact their earnings. Announcements by some large banks of intentions to increase dividends, gains in energy companies and encouraging earnings news coming out of the technology sector contributed to gains in the broader market heading into late-March. Telecom stocks led the market higher in late-March, based on expectations of more consolidation in that sector. Overall, the DJIA gained 6.4% in the first quarter, which was its best first quarter performance in twelve years.
| RP® Financial, LC. | VALUATION ANALYSIS IV.11 |
Stocks started out the second quarter of 2011 with gains, as investors were heartened by the March employment report which showed signs of stronger job creation and the lowest unemployment rate in two years. Investors exercised caution in early-April ahead of the potential shutdown of the U.S. Government, which provided for a narrow trading range in the broader stock market. Worries about the high cost of raw materials undercutting growth prospects and some favorable economic reports translated into a mixed stock market performance in mid-April. Strong first quarter earnings reports posted by some large technology stocks helped to lift the DJIA to a multi-year high going into the second half of April. Stocks rose following the Federal Reserve’s late-April meeting, based on indications that the Federal Reserve would not be increasing rates anytime soon. Disappointing earnings reports and lackluster economic data pressure stocks lower ahead of the April employment report. Stronger than expected job growth reflected in April employment data, along with a pick-up in deal activity, helped stocks to rebound heading into mid-May. Worries about Greece’s debt problems and a slowdown in the global economic recovery pulled stocks lower in mid-May. A general downward trend prevailed in the broader stock market during the second half of May 2011 into the first half of June, as the Dow Jones Industrial Average (“DJIA”) declined for six consecutive weeks. Mounting evidence that the economic recovery was losing steam and renewed concerns about a possible Greek default were noted factors contributing to the sell-off in the broader stock market. Stocks rebounded heading into the second half of June, as worries over Greece’s debt crisis eased following a pledge by European leaders to head off a debt default by Greece. More signs of progress regarding Greece’s debt crisis and an accord reached by Bank of America with investors that purchased mortgage-backed securities issued by Countrywide helped the DJIA to close out a volatile second quarter on a four day winning streak. Overall, the DJIA ended up 1.8% for the second quarter.
| RP® Financial, LC. | VALUATION ANALYSIS IV.12 |
The rally in the broader stock market continued at the start of the third quarter of 2011, as the DJIA approached a new high for 2011 amid indications the U.S. economy was possibly regaining momentum following a surprising jump in June manufacturing activity. Stocks reversed course following the disappointing employment report for June, which raised fresh doubt about the strength of the U.S. economy. Deepening concerns about the euro-zone debt crisis and the fiscal and economic woes of the U.S. further depressed stocks heading into mid-July. Volatility was evident in the broader stock market heading into the second half of July, as investors weighed generally favorable second earnings reports against threatened debt defaults in the U.S. and Europe. Stocks closed out July posting their biggest weekly drop in over a year on continuing debt-ceiling worries. Signs of a weakening global economy accelerated the selloff in the broader stock market at the beginning of August. The downgrade of the U.S.’s credit rating sparked a global selloff on August 8th, pushing the DJIA to its sharpest one-day decline since the financial crisis in 2008. Stocks rebounded the following day on hopes that the Federal Reserve would take some action to avert a meltdown in the financial markets. Significant volatility continued to prevail in the stock market throughout the week, with the DJIA swinging higher or lower by over 400 points for four consecutive trading days. Stocks concluded the volatile week closing higher, which was supported by a favorable report for July retail sales. Volatile trading continue over the last two full weeks of trading in August, with the DJIA closing lower for the fourth consecutive week ended August 19th while rebounding modestly for the first time in August during the week ended August 26th. For the week ended September 2, 2011 the market continued to show volatility, with the DJIA declining by 1.3% for the week, however on three of the five trading days the DJIA experienced a change of more than 100 points. As of September 2, 2011, the DJIA closed at 11240.26, an increase of 8.9% from one year ago and a decrease of 2.9% year-to-date, and the NASDAQ closed at 2480.33, an increase of 12.7% from one year ago and a decrease of 6.5% year-to-date. The Standard & Poor’s 500 Index closed at 1173.97 on September 2, 2011, an increase of 7.7% from one year ago and a decrease of 6.7% year-to-date.
The market for thrift stocks has been somewhat uneven in recent quarters, but in general has underperformed the broader stock market. Thrift stocks rallied along with the broader stock market at the start of 2011, as investors were encouraged by data that suggested the economic recovery was strengthening. A strong fourth quarter earnings report posted by J.P. Morgan supported gains in the financial sector in mid-January, which was followed by a downturn heading into late-January as some large banks reported weaker than expected earnings. Thrift stocks traded higher along with the broader stock market into mid-February, as financial stocks benefitted from some favorable fourth quarter earnings reports coming out of the financial sector. Financial stocks also benefitted from a rally in mortgage insurer stocks, which surged on a government proposal to shrink the size of FHA. Thrift stocks faltered along with the broader market heading into late-February, as investors grew wary of mounting violence in Libya. A report that December home prices fell to new lows in eleven major metropolitan areas further contributed to the pullback in thrift prices. Thrift prices rebounded along with the broader market in late-February. Higher oil prices and profit taking pressured thrift stocks lower in early-March. News that Bank of America was planning to increase its dividend lifted financial stocks in general in the second week of March, which was followed by a downturn amid a pullback in the broader stock market. Thrift stocks advanced on announced plans by some large banks to increase their dividends following the Federal Reserve’s completion of its “stress test”, which was followed by a slight pullback in thrift stocks heading into late-March. Home sales data for February showing sharp drop-offs in new and existing home sales contributed to decline in thrift prices. An upward revision to fourth quarter GDP helped thrift stocks to rebound slightly in late-March.
| RP® Financial, LC. | VALUATION ANALYSIS IV.13 |
The favorable employment report for March 2011 helped thrift stocks advance along with the broader stock at the start of the second quarter of 2011. Financial stocks outpaced the broader market in early-April, based on improving conditions for the larger banks and then eased lower on growing concerns about the potential shutdown of the U.S. Government. Mixed first quarter earnings reports, which included lower first quarter revenues reported by nation’s largest banks, pressured thrift stocks lower going into the second half of April. The Federal Reserve’s announcement that it will keep interest rates low for the foreseeable future helped to lift thrift stocks in late-April. Thrift stocks lagged the broader stock market heading into mid-May, as weak housing data continued to weigh on the sector. Most notably, home prices fell 3% in the first quarter of 2011, the steepest drop since 2008. Moody’s continued negative outlook on the American banking system weighed on thrift stocks as well in mid-May. After trading in a narrow range during the second half of May 2011, bank and thrift stocks led the broader market lower in early-June as economic data suggested that the recovery was losing momentum. A drop-off in home sales in April hurt the thrift sector as well. Thrift stocks edged higher in mid-June, following a report that housing starts rose in May. Concerns about the economic outlook depressed thrift stocks heading into late-June, which was followed by a late-June and early-July rally. Thrift stocks participated in the rally led by bank stocks on news of Bank of America’s mortgage-backed securities settlement and the Federal Reserve a higher-than-expected interchange fee cap.
The thrift sector paralleled trends in the boarder stock at start of the third quarter of 2011, initially rallying on upbeat economic data showing an unexpected increase in June manufacturing activity followed by a pullback on the disappointing employment for June. Second quarter earnings reports for thrifts were generally better compared to the year period, which along with U.S. debt worries, provided for a narrow range for thrift stocks through mid-July. Thrift stocks followed the broader market lower in-late July, which was largely related to the ongoing debt stalemate in Washington. Financial stocks plunged following the downgrade of the U.S.’s credit rating, as fears about the health of the U.S. banking system returned to the market. The volatility that prevailed in the broader stock market during the week that followed the downgrade of U.S. debt was particularly evident in the financial sector, with bank and thrift stocks underperforming the broader stock market. Notably, bank and thrift stocks diverged from the broader stock market at the end of the week, as a weak reading for consumer sentiment pressured bank and thrift stocks lower. Into the latter half of August, the overall market experienced periodic relief from the sharp declines that occurred early on in the month as volatility appeared to be decreasing. The initial recovery from the losses experienced early in the month was very sharp, a typical characteristic of oversold market conditions. The overall market experienced moderate fluctuations heading into the first week of September. On September 2, 2011, the SNL Index for all publicly-traded thrifts closed at 453.20, a decrease of 14.8% from one year ago and a decrease of 23.5% year-to-date.
| RP® Financial, LC. | VALUATION ANALYSIS IV.14 |
B. The New Issue Market
In addition to thrift stock market conditions in general, the new issue market for converting thrifts is also an important consideration in determining the Bank’s pro forma market value. The new issue market is separate and distinct from the market for seasoned thrift stocks in that the pricing ratios for converting issues are computed on a pro forma basis, specifically: (1) the numerator and denominator are both impacted by the conversion offering amount, unlike existing stock issues in which price change affects only the numerator; and (2) the pro forma pricing ratio incorporates assumptions regarding source and use of proceeds, effective tax rates, stock plan purchases, etc. which impact pro forma financials, whereas pricing for existing issues are based on reported financials. The distinction between pricing of converting and existing issues is perhaps no clearer than in the case of the price/book (“P/B”) ratio in that the P/B ratio of a converting thrift will typically result in a discount to book value whereas in the current market for existing thrifts the P/B ratio may reflect a premium to book value. Therefore, it is appropriate to also consider the market for new issues, both at the time of the conversion and in the aftermarket.
As shown in Table 4.2, three standard conversions and one second-step conversions have been completed during the past three months. The recently completed standard conversion offerings are the most relevant to 1st Security. All three of these offerings closed their offerings at the supermaximum of the offering range. The average closing pro forma price/tangible book ratio of these three recent standard conversion offerings equaled 66.5%, and on average, these offerings reflected price appreciation of 11.5% after the first week of trading. As of September 2, 2011, the three recent standard conversion offerings reflected a 9.3% increase in price on average.
| RP® Financial, LC. | VALUATION ANALYSIS IV.15 |
Table 4.2
Pricing Characteristics and After-Market Trends
Recent Conversions Completed in Last 3 Months
| Institutional Information | Pre-Conversion Data | Offering Information | Contribution to | Insider Purchases | |||||||||||||||||||||||||||||||||||||||||||||||||||||||||
| Financial Info. | Asset Quality | Char. Found. | % Off Incl. Fdn.+Merger Shares | ||||||||||||||||||||||||||||||||||||||||||||||||||||||||||
| Excluding Foundation | % of | Benefit Plans | |||||||||||||||||||||||||||||||||||||||||||||||||||||||||||
| Conversion | Equity/ | NPAs/ | Res. | Gross | % | % of | Exp./ | Public Off. | Recog. | Stk | Mgmt.& | ||||||||||||||||||||||||||||||||||||||||||||||||||
| Institution | Date | Ticker | Assets | Assets | Assets | Cov. | Proc. | Offer | Mid. | Proc. | Form | Excl. Fdn. | ESOP | Plans | Option | Dirs. | |||||||||||||||||||||||||||||||||||||||||||||
| ($Mil) | (%) | (%) | (%) | ($Mil.) | (%) | (%) | (%) | (%) | (%) | (%) | (%) | (%)(2) | |||||||||||||||||||||||||||||||||||||||||||||||||
| Standard Conversions | |||||||||||||||||||||||||||||||||||||||||||||||||||||||||||||
| IF Bancorp, Inc. - IL* | 7/8/11 | IROQ-NASDAQ | $ | 409 | 9.15 | % | 1.04 | % | 73 | % | $ | 45.0 | 100 | % | 132 | % | 3.7 | % | C/S | 0%/7 | % | 8.0 | % | 4.0 | % | 10.0 | % | 4.4 | % | ||||||||||||||||||||||||||||||||
| State Investors Bancorp, Inc. - LA* | 7/7/11 | SIBC-NASDAQ | $ | 214 | 10.03 | % | 1.03 | % | 75 | % | $ | 29.1 | 100 | % | 132 | % | 3.9 | % | NA | NA | 8.0 | % | 4.0 | % | 10.0 | % | 6.8 | % | |||||||||||||||||||||||||||||||||
| First Connecticut Bancorp, Inc. - CT* | 6/30/11 | FBNK-NASDAQ | $ | 1,455 | 6.60 | % | 1.49 | % | 96 | % | $ | 171.9 | 100 | % | 132 | % | 2.0 | % | C/S | 0%/4 | % | 8.0 | % | 4.0 | % | 10.0 | % | 1.2 | % | ||||||||||||||||||||||||||||||||
| Averages - Standard Conversions: | $ | 693 | 8.59 | % | 1.19 | % | 82 | % | $ | 82.0 | 100 | % | 132 | % | 3.2 | % | N.A. | N.A. | 8.0 | % | 4.0 | % | 10.0 | % | 4.1 | % | |||||||||||||||||||||||||||||||||||
| Medians - Standard Conversions: | $ | 409 | 9.15 | % | 1.04 | % | 75 | % | $ | 45.0 | 100 | % | 132 | % | 3.7 | % | N.A. | N.A. | 8.0 | % | 4.0 | % | 10.0 | % | 4.4 | % | |||||||||||||||||||||||||||||||||||
| Second Step Conversions | |||||||||||||||||||||||||||||||||||||||||||||||||||||||||||||
| Naugatuck Valley Fin. Corp., - CT* | 6/30/11 | NVSL-NASDAQ | $ | 564 | 9.30 | % | 3.13 | % | 39 | % | $ | 33.4 | 60 | % | 108 | % | 5.4 | % | N.A. | N.A. | 6.0 | % | 3.2 | % | 7.9 | % | 1.6 | % | |||||||||||||||||||||||||||||||||
| Averages - All Conversions: | $ | 529 | 8.77 | % | 1.67 | % | 71 | % | $ | 69.8 | 90 | % | 126 | % | 3.8 | % | N.A. | N.A. | 7.5 | % | 3.8 | % | 9.5 | % | 3.5 | % | |||||||||||||||||||||||||||||||||||
| Medians - All Conversions: | $ | 487 | 9.23 | % | 1.27 | % | 74 | % | $ | 39.2 | 100 | % | 132 | % | 3.8 | % | N.A. | N.A. | 8.0 | % | 4.0 | % | 10.0 | % | 3.0 | % | |||||||||||||||||||||||||||||||||||
| Institutional Information | Pro Forma Data | Post-IPO Pricing Trends | |||||||||||||||||||||||||||||||||||||||||||||||||||||||||||||||||||
| Pricing Ratios(3)(6) | Financial Charac. | Closing Price: | |||||||||||||||||||||||||||||||||||||||||||||||||||||||||||||||||||
| Initial | First | After | After | ||||||||||||||||||||||||||||||||||||||||||||||||||||||||||||||||||
| Conversion | Div. | Core | Core | Core | IPO | Trading | % | First | % | First | % | Thru | % | ||||||||||||||||||||||||||||||||||||||||||||||||||||||||
| Institution | Date | Ticker | Yield | P/TB | P/E | P/A | ROA | TE/A | ROE | Price | Day | Chge | Week(4) | Chge | Month(5) | Chge | 9/2/11 | Chge | |||||||||||||||||||||||||||||||||||||||||||||||||||
| (%) | (%) | (x) | (%) | (%) | (%) | (%) | ($) | ($) | (%) | ($) | (%) | ($) | (%) | ($) | (%) | ||||||||||||||||||||||||||||||||||||||||||||||||||||||
| Standard Conversions | |||||||||||||||||||||||||||||||||||||||||||||||||||||||||||||||||||||
| IF Bancorp, Inc. - IL* | 7/8/11 | IROQ-NASDAQ | 0.00 | % | 63.4 | % | 22.4 | x | 10.7 | % | 0.5 | % | 17.0 | % | 2.8 | % | $ | 10.00 | $ | 11.67 | 16.7 | % | $ | 11.65 | 16.5 | % | $ | 10.85 | 8.5 | % | $ | 10.81 | 8.1 | % | |||||||||||||||||||||||||||||||||||
| State Investors Bancorp, Inc. - LA* | 7/7/11 | SIBC-NASDAQ | 0.00 | % | 63.3 | % | 42.1 | x | 12.2 | % | 0.3 | % | 19.3 | % | 1.5 | % | $ | 10.00 | $ | 11.85 | 18.5 | % | $ | 11.66 | 16.6 | % | $ | 11.60 | 16.0 | % | $ | 11.50 | 15.0 | % | |||||||||||||||||||||||||||||||||||
| First Connecticut Bancorp, Inc. - CT* | 6/30/11 | FBNK-NASDAQ | 0.00 | % | 72.9 | % | 121.1 | x | 11.2 | % | 0.1 | % | 15.3 | % | 0.6 | % | $ | 10.00 | $ | 11.08 | 10.8 | % | $ | 11.16 | 11.6 | % | $ | 11.11 | 11.1 | % | $ | 10.47 | 4.7 | % | |||||||||||||||||||||||||||||||||||
| Averages - Standard Conversions: | 0.00 | % | 66.5 | % | 61.9 | x | 11.4 | % | 0.3 | % | 17.2 | % | 1.6 | % | $ | 10.00 | $ | 11.53 | 15.3 | % | $ | 11.49 | 14.9 | % | $ | 11.19 | 11.9 | % | $ | 10.93 | 9.3 | % | |||||||||||||||||||||||||||||||||||||
| Medians - Standard Conversions: | 0.00 | % | 63.4 | % | 42.1 | x | 11.2 | % | 0.3 | % | 17.0 | % | 1.5 | % | $ | 10.00 | $ | 11.67 | 16.7 | % | $ | 11.65 | 16.5 | % | $ | 11.11 | 11.1 | % | $ | 10.81 | 8.1 | % | |||||||||||||||||||||||||||||||||||||
| Second Step Conversions | |||||||||||||||||||||||||||||||||||||||||||||||||||||||||||||||||||||
| Naugatuck Valley Fin. Corp., - CT* | 6/30/11 | NVSL-NASDAQ | 0.00 | % | 69.2 | % | 30.48 | 9.5 | % | 0.3 | % | 13.7 | % | 2.3 | % | $ | 8.00 | $ | 7.90 | -1.3 | % | $ | 7.80 | -2.5 | % | $ | 8.15 | 1.9 | % | $ | 7.58 | -5.3 | % | ||||||||||||||||||||||||||||||||||||
| Averages - All Conversions: | 0.00 | % | 67.2 | % | 54.0 | x | 10.9 | % | 0.3 | % | 16.3 | % | 1.8 | % | $ | 9.50 | $ | 10.63 | 11.2 | % | $ | 10.57 | 10.6 | % | $ | 10.43 | 9.4 | % | $ | 10.09 | 5.6 | % | |||||||||||||||||||||||||||||||||||||
| Medians - All Conversions: | 0.00 | % | 66.3 | % | 36.3 | x | 10.9 | % | 0.3 | % | 16.1 | % | 1.9 | % | $ | 10.00 | $ | 11.38 | 13.8 | % | $ | 11.41 | 14.1 | % | $ | 10.98 | 9.8 | % | $ | 10.64 | 6.4 | % | |||||||||||||||||||||||||||||||||||||
| Note: * - Appraisal performed by RP Financial; BOLD = RP Fin. Did the business plan, “NT” - Not Traded; “NA” - Not Applicable, Not Available; C/S-Cash/Stock. | |||||||
| (1) | Non-OTS regulated thrift. | (5) | Latest price if offering is more than one week but less than one month old. | (9) | Former credit union. | ||
| (2) | As a percent of MHC offering for MHC transactions. | (6) | Mutual holding company pro forma data on full conversion basis. | ||||
| (3) | Does not take into account the adoption of SOP 93-6. | (7) | Simultaneously completed acquisition of another financial institution. | ||||
| (4) | Latest price if offering is less than one week old. | (8) | Simultaneously converted to a commercial bank charter. | September 2, 2011 | |||
| RP® Financial, LC. | VALUATION ANALYSIS IV.16 |
Shown in Table 4.3 are the current pricing ratios for the four companies that have completed fully-converted offerings during the past three months, all of which are traded on NASDAQ. The current average P/TB ratio of the three publicly-traded recent standard conversions equaled 72.53%, based on closing stock prices as of September 2, 2011.
C. The Acquisition Market
Also considered in the valuation was the potential impact on 1st Security’s stock price of recently completed and pending acquisitions of other thrift institutions operating in Washington. As shown in Exhibit IV-4, there were five Washington thrift acquisitions completed from the beginning of 2000 through September 2, 2011, although there have been no such acquisitions announced since 2007. To the extent that acquisition speculation may impact the Bank’s offering, we have largely taken this into account in selecting companies for the Peer Group which operate in markets that have experienced a comparable level of acquisition activity as the Bank’s market and, thus, are subject to the same type of acquisition speculation that may influence 1st Security’s stock. However, since converting thrifts are subject to a three-year regulatory moratorium from being acquired, acquisition speculation in 1st Security’s stock would tend to be less compared to the stocks of the Peer Group companies.
In determining our valuation adjustment for marketing of the issue, we considered trends in both the overall thrift market, the new issue market including the new issue market for thrift conversions and the local acquisition market for thrift stocks. Taking these factors and trends into account, RP Financial concluded that a slight downward adjustment was appropriate in the valuation analysis for purposes of marketing of the issue.
8. Management
The Bank’s management team appears to have experience and expertise in all of the key areas of the Bank’s operations. Exhibit IV-5 provides summary resumes of the Bank’s Board of Directors and senior management. The Board and senior management have been effective in implementing an operating strategy that can be well managed by the Bank’s present organizational structure. The Bank currently does not have any senior management positions that are vacant.
| RP® Financial, LC. | VALUATION ANALYSIS IV.17 |
Table 4.3
Market Pricing Comparatives
Prices As of September 2, 2011
| Market | Per Share Data | |||||||||||||||||||||||||||||||||||||
| Capitalization | Core | Book | ||||||||||||||||||||||||||||||||||||
| Price/ | Market | 12 Month | Value/ | Pricing Ratios(3) | ||||||||||||||||||||||||||||||||||
| Financial Institution | Share(1) | Value | EPS(2) | Share | P/E | P/B | P/A | P/TB | P/Core | |||||||||||||||||||||||||||||
| ($) | ($Mil) | ($) | ($) | (x) | (%) | (%) | (%) | (x) | ||||||||||||||||||||||||||||||
| All Public Companies | $ | 9.92 | $ | 242.30 | ($ | 0.05 | ) | $ | 13.11 | 17.83 | x | 76.05 | % | 9.47 | % | 81.46 | % | 19.48 | x | |||||||||||||||||||
| Converted Last 3 Months (no MHC) | $ | 10.09 | $ | 81.44 | $ | 0.26 | $ | 14.22 | 27.53 | x | 70.78 | % | 11.56 | % | 70.79 | % | 26.59 | x | ||||||||||||||||||||
| Converted Last 3 Months (no MHC) | ||||||||||||||||||||||||||||||||||||||
| FBNK | First Connecticut Bancorp, Inc. of CT | $ | 10.47 | $ | 187.20 | $ | 0.08 | $ | 13.72 | NM | 76.31 | % | 11.67 | % | 76.31 | % | NM | |||||||||||||||||||||
| IROQ | IF Bancorp, Inc. of IL | 10.81 | 52.01 | 0.45 | 15.78 | 18.96 | x | 68.50 | % | 11.61 | % | 68.50 | % | 24.02 | x | |||||||||||||||||||||||
| NVSL | Naugatuck Valley Fin. Corp. of CT | 7.58 | 53.08 | 0.26 | 11.57 | 36.10 | x | 65.51 | % | 8.96 | % | 65.57 | % | 29.15 | x | |||||||||||||||||||||||
| SIBC | State Investors Bancorp, Inc. of LA | 11.50 | 33.47 | 0.24 | 15.80 | NM | 72.78 | % | 14.01 | % | 72.78 | % | NM | |||||||||||||||||||||||||
| Dividends(4) | Financial Characteristics(6) | |||||||||||||||||||||||||||||||||||||||||||||
| Amount/ | Payout | Total | Equity/ | Tang Eq/ | NPAs/ | Reported | Core | |||||||||||||||||||||||||||||||||||||||
| Financial Institution | Share | Yield | Ratio(5) | Assets | Assets | Assets | Assets | ROA | ROE | ROA | ROE | |||||||||||||||||||||||||||||||||||
| ($) | (%) | (%) | ($Mil) | (%) | (%) | (%) | (%) | (%) | (%) | (%) | ||||||||||||||||||||||||||||||||||||
| All Public Companies | $ | 0.21 | 1.97 | % | 28.72 | % | $ | 2,613 | 11.87 | % | 11.19 | % | 3.92 | % | 0.09 | % | 0.68 | % | 0.01 | % | -0.21 | % | ||||||||||||||||||||||||
| Converted Last 3 Months (no MHC) | $ | 0.03 | 0.40 | % | 14.29 | % | $ | 721 | 15.08 | % | 15.08 | % | 1.74 | % | 0.33 | % | 2.81 | % | 0.29 | % | 3.48 | % | ||||||||||||||||||||||||
| Converted Last 3 Months (no MHC) | ||||||||||||||||||||||||||||||||||||||||||||||
| FBNK | First Connecticut Bancorp, Inc. of CT | $ | 0.00 | 0.00 | % | 0.00 | % | $ | 1,604 | 15.29 | % | 15.29 | % | 1.39 | % | 0.20 | % | NM | 0.09 | % | NM | |||||||||||||||||||||||||
| IROQ | IF Bancorp, Inc. of IL | 0.00 | 0.00 | % | 0.00 | % | 448 | 16.95 | % | 16.95 | % | 1.36 | % | 0.61 | % | NM | 0.48 | % | NM | |||||||||||||||||||||||||||
| NVSL | Naugatuck Valley Fin. Corp. of CT | 0.12 | 1.58 | % | 57.14 | % | 593 | 8.83 | % | 8.81 | % | 2.93 | % | 0.25 | % | 2.81 | % | 0.31 | % | 3.48 | % | |||||||||||||||||||||||||
| SIBC | State Investors Bancorp, Inc. of LA | 0.00 | 0.00 | % | 0.00 | % | 239 | 19.25 | % | 19.25 | % | 1.28 | % | 0.24 | % | NM | 0.29 | % | NM | |||||||||||||||||||||||||||
| (1) | Average of High/Low or Bid/Ask price per share. |
| (2) | EPS (estimate core basis) is based on actual trailing 12 month data, adjusted to omit non-operating items on a tax-effected basis. |
| (3) | P/E = Price to earnings; P/B = Price to book; P/A = Price to assets; P/TB = Price to tangible book value; and P/Core = Price to core earnings. |
| (4) | Indicated 12 month dividend, based on last quarterly dividend declared. |
| (5) | Indicated 12 month dividend as a percent of trailing 12 month estimated core earnings. |
| (6) | ROA (return on assets) and ROE (return on equity) are indicated ratios based on trailing 12 month common earnings and average common equity and total assets balances. |
| (7) | Excludes from averages and medians those companies the subject of actual or rumored acquisition activities or unusual operating characteristics. |
| Source: SNL Financial, LC. and RP® Financial, LC. calculations. The information provided in this report has been obtained from sources we believe are reliable, but we cannot guarantee the accuracy or completeness of such information. | |
Copyright (c) 2011 by RP® Financial, LC. | |
| RP® Financial, LC. | VALUATION ANALYSIS IV.18 |
Similarly, the returns, equity positions and other operating measures of the Peer Group companies are indicative of well-managed financial institutions, which have Boards and management teams that have been effective in implementing competitive operating strategies. Therefore, on balance, we concluded no valuation adjustment relative to the Peer Group was appropriate for this factor.
9. Effect of Government Regulation and Regulatory Reform
In summary, as a fully-converted OCC regulated institution, 1st Security will operate in substantially the same regulatory environment as the Peer Group members -- all of whom are adequately capitalized institutions and are operating with no apparent restrictions. Exhibit IV-6 reflects the Bank’s pro forma regulatory capital ratios. On balance, no adjustment has been applied for the effect of government regulation and regulatory reform.
| Summary of Adjustments |
Overall, based on the factors discussed above, we concluded that the Bank’s pro forma market value should reflect the following valuation adjustments relative to the Peer Group:
Table 4.4
Valuation Adjustments
1st Security Bank of Washington
| Key Valuation Parameters: | Valuation Adjustment | |
| Financial Condition | No Adjustment | |
| Profitability, Growth and Viability of Earnings | Moderate Downward | |
| Asset Growth | Slight Upward | |
| Primary Market Area | Slight Downward | |
| Dividends | No Adjustment | |
| Liquidity of the Shares | No Adjustment | |
| Marketing of the Issue | Slight Downward | |
| Management | No Adjustment | |
| Effect of Govt. Regulations and Regulatory Reform | No Adjustment |
| Valuation Approaches |
In applying the accepted valuation methodology promulgated by the OCC and adopted by the FRB, i.e., the pro forma market value approach, we considered the three key pricing ratios in valuing the Bank’s to-be-issued stock -- price/earnings (“P/E”), price/book (“P/B”), and price/assets (“P/A”) approaches -- all performed on a pro forma basis including the effects of the stock proceeds. In computing the pro forma impact of the conversion and the related pricing ratios, we have incorporated the valuation parameters disclosed in the Bank’s prospectus for the effective tax rate, stock benefit plan assumptions and expenses (summarized in Exhibits IV-7 and IV-8).
| RP® Financial, LC. | VALUATION ANALYSIS IV.19 |
In our estimate of value, we assessed the relationship of the pro forma pricing ratios relative to the Peer Group and recent conversion offerings.
RP Financial’s valuation placed an emphasis on the following:
● | P/E Approach. The P/E approach is generally the best indicator of long-term value for a stock. Given the similarities between the Bank’s and the Peer Group’s earnings composition and overall financial condition, the P/E approach was carefully considered in this valuation. At the same time, recognizing that (1) the earnings multiples will be evaluated on a pro forma basis for the Bank; and (2) the Peer Group on average has had the opportunity to realize the benefit of reinvesting and leveraging the offering proceeds, we also gave weight to the other valuation approaches. |
● | P/B Approach. P/B ratios have generally served as a useful benchmark in the valuation of thrift stocks, particularly in the context of an initial public offering, as the earnings approach involves assumptions regarding the use of proceeds. RP Financial considered the P/B approach to be a valuable indicator of pro forma value, taking into account the pricing ratios under the P/E and P/A approaches. We have also modified the P/B approach to exclude the impact of intangible assets (i.e., price/tangible book value or “P/TB”), in that the investment community frequently makes this adjustment in its evaluation of this pricing approach. |
● | P/A Approach. P/A ratios are generally a less reliable indicator of market value, as investors typically assign less weight to assets and attribute greater weight to book value and earnings. Furthermore, this approach as set forth in the regulatory valuation guidelines does not take into account the amount of stock purchases funded by deposit withdrawals, thus understating the pro forma P/A ratio. At the same time, the P/A ratio is an indicator of franchise value, and, in the case of highly capitalized institutions, high P/A ratios may limit the investment community’s willingness to pay market multiples for earnings or book value when ROE is expected to be low. |
The Bank will adopt Statement of Position (“SOP”) 93-6, which will cause earnings per share computations to be based on shares issued and outstanding excluding unreleased ESOP shares. For purposes of preparing the pro forma pricing analyses, we have reflected all shares issued in the offering, including all ESOP shares, to capture the full dilutive impact, particularly since the ESOP shares are economically dilutive, receive dividends and can be voted. However, we did consider the impact of the adoption of SOP 93-6 in the valuation.
| RP® Financial, LC. | VALUATION ANALYSIS IV.20 |
Based on the application of the three valuation approaches, taking into consideration the valuation adjustments discussed above, RP Financial concluded that as of September 2, 2011, the pro forma market value of the Bank’s full conversion offering equaled $24,500,000 at the midpoint, equal to 2,450,000 shares at $10.00 per share. The $10.00 per share price was determined by the 1st Security board of directors.
1. Price-to-Earnings (“P/E”). The application of the P/E valuation method requires calculating the Bank’s pro forma market value by applying a valuation P/E multiple to the pro forma earnings base. In attempting to apply this technique, we considered both reported earnings and a recurring earnings base, that is, earnings adjusted to exclude any one-time non-operating items, plus the estimated after-tax earnings benefit of the reinvestment of the net proceeds. The Bank reported net income of $1,894,000 for the 12 months ended June 30, 2011. 1st Security’s income statement for the latest fiscal year included gains on the sale of former branch offices in the amount of $209,000. This income was excluded from the core earnings calculation. In addition, as described in Section One, as result of the net losses incurred in fiscal years 2007 through 2009, 1st Security had a net deferred tax asset of approximately $3.5 million as of June 30, 2011, of which there was a 100% reserve established at that date. The Bank’s marginal effective statutory tax rate approximates 34%, and this is the rate utilized to calculate the net reinvestment benefit from the offering proceeds. While the net deferred tax asset is fully reserved on the balance sheet, the Bank expects to review this status in connection with the December 31, 2011 fiscal year audit. There is a possibility that a portion of the deferred tax asset reserve may be reversed, resulting in an increase to the Bank’s equity account. This would imply that the Bank would then be subject to income taxes for financial reporting purposes. For valuation purposes, we assumed core net income would include the impact of an expected tax burden, should the deferred tax valuation allowance be removed (in whole or in part) from the balance sheet. As shown below, on a tax affected basis, assuming an effective marginal tax rate of 34.0% for the earnings adjustments, the Bank’s core earnings were determined to equal $1,112,000 for the 12 months ended June 30, 2011. (Note: see Exhibit IV-9 for the adjustments applied to the Peer Group’s earnings in the calculation of core earnings).
| RP® Financial, LC. | VALUATION ANALYSIS IV.21 |
Table 4.5
Derivation of Core Earnings
1st Security Bank of Washington
| Amount | |||||
| ($000) | |||||
| Net income (loss), 12 Mths Ended 6/30/2011 | $ | 1,894 | |||
| Less: Gain on sale of Branch Offices (1) | (138 | ) | |||
| Less: Tax Impact at 34% | (644 | ) | |||
| Core earnings estimate | $ | 1,112 | |||
| (1) | Tax effected at 34.0%. | ||||
Based on the Bank’s reported and estimated core earnings and incorporating the impact of the pro forma assumptions discussed previously, the Bank’s pro forma reported and core P/E multiples at the $24.5 million midpoint value equaled 14.11 times and 25.68 times, respectively, which provided for a discount of 17.39% and a premium of 35.94% relative to the Peer Group’s average reported and core P/E multiples of 17.08 times and 18.89 times, respectively (see Table 4.6). In comparison to the Peer Group’s median reported and core earnings multiples which equaled 17.27 times and 19.71 times, respectively, the Bank’s pro forma reported and core P/E multiples at the midpoint value indicated a discount of 18.30% and a premium of 30.29%, respectively. At the top of the super range, the Bank’s reported and core P/E multiples equaled 19.16 times and 35.62 times, respectively. In comparison to the Peer Group’s average reported and core P/E multiples, the Bank’s P/E multiples at the top of the super range reflected a premium of 12.18% and a premium of 88.57%, respectively. In comparison to the Peer Group’s median reported and core P/E multiples, the Bank’s P/E multiples at the top of the super range reflected premiums of 10.94% and 80.72%, respectively.
2. Price-to-Book (“P/B”). The application of the P/B valuation method requires calculating the Bank’s pro forma market value by applying a valuation P/B ratio, as derived from the Peer Group’s P/B ratio, to the Bank’s pro forma book value. Based on the $24.5 million midpoint valuation, the Bank’s pro forma P/B and P/TB ratios both equaled 53.88% (see Table 4.6). In comparison to the average P/B and P/TB ratios for the Peer Group of 67.44% and 70.29%, the Bank’s ratios reflected a discount of 20.11% on a P/B basis and a discount of 23.35% on a P/TB basis. In comparison to the Peer Group’s median P/B and P/TB ratios of 69.11% and 72.48%, the Bank’s pro forma P/B and P/TB ratios at the midpoint value reflected discounts of 22.04% on a P/B basis and 25.66% on a P/TB basis. At the top of the super range, the Bank’s P/B and P/TB ratios both equaled 61.88%. In comparison to the Peer Group’s average P/B and P/TB ratios, the Bank’s P/B and P/TB ratios at the top of the super range reflected discounts of 8.24% and 11.96%, respectively. In comparison to the Peer Group’s median P/B and P/TB ratios, the Bank’s P/B and P/TB ratios at the top of the super range reflected discounts of 10.46% and 14.62%, respectively. RP Financial considered the resulting discounts under the P/B approach to be reasonable, given the nature of the calculation of the P/B ratio.
| RP® Financial, LC. | VALUATION ANALYSIS IV.22 |
Table 4.6
Public Market Pricing
1st Security Bank of Washington and the Comparables
As of September 2, 2011
Public Market Pricing
1st Security Bank of Washington and the Comparables
As of September 2, 2011
| Market | Per Share Data | ||||||||||||||||||||||||||||||||||||
| Capitalization | Core | Book | |||||||||||||||||||||||||||||||||||
| Price/ | Market | 12 Month | Value/ | Pricing Ratios(3) | |||||||||||||||||||||||||||||||||
| Share(1) | Value | EPS(2) | Share | P/E | P/B | P/A | P/TB | P/Core | |||||||||||||||||||||||||||||
| ($) | ($Mil) | ($) | ($) | (x) | (%) | (%) | (%) | (x) | |||||||||||||||||||||||||||||
| 1st Security Bank of Washington | |||||||||||||||||||||||||||||||||||||
| Superrange | $ | 10.00 | $ | 32.40 | $ | 0.28 | $ | 16.16 | 19.16 | x | 61.88 | % | 10.83 | % | 61.88 | % | 35.62 | x | |||||||||||||||||||
| Maximum | $ | 10.00 | $ | 28.18 | $ | 0.33 | 17.27 | 16.43 | x | 57.90 | % | 9.54 | % | 57.90 | % | 30.19 | x | ||||||||||||||||||||
| Midpoint | $ | 10.00 | $ | 24.50 | $ | 0.39 | 18.56 | 14.11 | x | 53.88 | % | 8.38 | % | 53.88 | % | 25.68 | x | ||||||||||||||||||||
| Minimum | $ | 10.00 | $ | 20.83 | $ | 0.47 | 20.30 | 11.86 | x | 49.26 | % | 7.20 | % | 49.26 | % | 21.37 | x | ||||||||||||||||||||
| All Non-MHC Public Companies(7) | |||||||||||||||||||||||||||||||||||||
| Averages | $ | 10.30 | $ | 270.74 | ($ | 0.09 | ) | $ | 14.14 | 16.62 | x | 71.78 | % | 8.78 | % | 76.57 | % | 18.97 | x | ||||||||||||||||||
| Medians | $ | 10.76 | $ | 59.66 | $ | 0.32 | $ | 13.66 | 15.01 | x | 73.23 | % | 8.12 | % | 76.67 | % | 18.64 | x | |||||||||||||||||||
| All Non-MHC State of WA(7) | |||||||||||||||||||||||||||||||||||||
| Averages | $ | 6.83 | $ | 347.62 | ($ | 0.40 | ) | $ | 13.11 | 16.70 | x | 53.76 | % | 6.91 | % | 60.77 | % | 17.91 | x | ||||||||||||||||||
| Medians | $ | 5.05 | $ | 58.65 | ($ | 0.13 | ) | $ | 9.99 | 16.70 | x | 50.55 | % | 6.62 | % | 55.31 | % | 17.91 | x | ||||||||||||||||||
| Comparable Group Averages | |||||||||||||||||||||||||||||||||||||
| Averages | $ | 10.53 | $ | 35.05 | $ | 0.47 | $ | 15.03 | 17.08 | x | 67.44 | % | 9.48 | % | 70.29 | % | 18.89 | x | |||||||||||||||||||
| Medians | $ | 12.70 | $ | 35.36 | $ | 0.44 | $ | 16.86 | 17.28 | x | 69.11 | % | 7.94 | % | 72.48 | % | 19.71 | x | |||||||||||||||||||
| Peer Group | |||||||||||||||||||||||||||||||||||||
| AFCB | Athens Bancshares, Inc. of TN | $ | 12.70 | $ | 35.13 | $ | 0.61 | $ | 18.16 | 20.82 | x | 69.93 | % | 12.40 | % | 70.48 | % | 20.82 | x | ||||||||||||||||||
| EBMT | Eagle Bancorp Montana of MT | $ | 10.46 | $ | 40.99 | $ | 0.24 | $ | 13.39 | 17.15 | x | 78.12 | % | 12.38 | % | 78.12 | % | NM | |||||||||||||||||||
| FFDF | FFD Financial Corp. of Dover OH | $ | 15.00 | $ | 15.18 | $ | 0.93 | $ | 18.50 | 10.56 | x | 81.08 | % | 7.21 | % | 81.08 | % | 16.13 | x | ||||||||||||||||||
| FABK | First Advantage Bancorp of TN | $ | 12.70 | $ | 51.90 | $ | 0.27 | $ | 16.58 | 27.61 | x | 76.60 | % | 14.81 | % | 76.60 | % | NM | |||||||||||||||||||
| FFNM | First Fed of N. Michigan of MI | $ | 3.75 | $ | 10.82 | $ | 0.02 | $ | 8.34 | NM | 44.96 | % | 4.94 | % | 45.84 | % | NM | ||||||||||||||||||||
| JXSB | Jacksonville Bancorp, Inc. of IL | $ | 13.70 | $ | 26.45 | $ | 1.34 | $ | 20.06 | 8.73 | x | 68.30 | % | 8.68 | % | 73.46 | % | 10.22 | x | ||||||||||||||||||
| LSBI | LSB Fin. Corp. of Lafayette IN | $ | 13.30 | $ | 20.67 | $ | 0.64 | $ | 23.38 | 11.47 | x | 56.89 | % | 5.74 | % | 56.89 | % | 20.78 | x | ||||||||||||||||||
| LABC | Louisiana Bancorp, Inc. of LA | $ | 16.03 | $ | 55.11 | $ | 0.60 | $ | 17.13 | 22.90 | x | 93.58 | % | 17.21 | % | 93.58 | % | 26.72 | x | ||||||||||||||||||
| RVSB | Riverview Bancorp, Inc. of WA | $ | 2.61 | $ | 58.65 | $ | 0.14 | $ | 4.80 | 17.40 | x | 54.38 | % | 6.62 | % | 71.51 | % | 18.64 | x | ||||||||||||||||||
| TSBK | Timberland Bancorp, Inc. of WA | $ | 5.05 | $ | 35.58 | ($ | 0.13 | ) | $ | 9.99 | NM | 50.55 | % | 4.84 | % | 55.31 | % | NM | |||||||||||||||||||
| Dividends(4) | Financial Characteristics(6) | ||||||||||||||||||||||||||||||||||||||||||||
| Amount/ | Payout | Total | Equity/ | Tang. Eq./ | NPAs/ | Reported | Core | ||||||||||||||||||||||||||||||||||||||
| Share | Yield | Ratio(5) | Assets | Assets | Assets | Assets | ROA | ROE | ROA | ROE | |||||||||||||||||||||||||||||||||||
| ($) | (%) | (%) | ($Mil) | (%) | (%) | (%) | (%) | (%) | (%) | (%) | |||||||||||||||||||||||||||||||||||
| 1st Security Bank of Washington | |||||||||||||||||||||||||||||||||||||||||||||
| Superrange | $ | 0.00 | 0.00 | % | 0.00 | % | $ | 299 | 17.50 | % | 17.50 | % | 2.65 | % | 0.57 | % | 3.23 | % | 0.30 | % | 1.74 | % | |||||||||||||||||||||||
| Maximum | $ | 0.00 | 0.00 | % | 0.00 | % | 295 | 16.47 | % | 16.47 | % | 2.68 | % | 0.58 | % | 3.52 | % | 0.32 | % | 1.92 | % | ||||||||||||||||||||||||
| Midpoint | $ | 0.00 | 0.00 | % | 0.00 | % | 292 | 15.56 | % | 15.56 | % | 2.71 | % | 0.59 | % | 3.82 | % | 0.33 | % | 2.10 | % | ||||||||||||||||||||||||
| Minimum | $ | 0.00 | 0.00 | % | 0.00 | % | 289 | 14.63 | % | 14.63 | % | 2.74 | % | 0.61 | % | 4.15 | % | 0.34 | % | 2.30 | % | ||||||||||||||||||||||||
| All Non-MHC Public Companies(7) | |||||||||||||||||||||||||||||||||||||||||||||
| Averages | $ | 0.21 | 1.91 | % | 28.63 | % | $ | 2,773 | 11.62 | % | 10.97 | % | 3.70 | % | 0.06 | % | 0.48 | % | -0.03 | % | -0.44 | % | |||||||||||||||||||||||
| Medians | $ | 0.16 | 1.45 | % | 0.00 | % | $ | 902 | 11.37 | % | 10.10 | % | 2.65 | % | 0.41 | % | 3.36 | % | 0.31 | % | 3.02 | % | |||||||||||||||||||||||
| All Non-MHC State of WA(7) | |||||||||||||||||||||||||||||||||||||||||||||
| Averages | $ | 0.05 | 0.34 | % | 13.79 | % | $ | 3,317 | 13.14 | % | 12.13 | % | 7.50 | % | -0.14 | % | -1.38 | % | -0.21 | % | -1.95 | % | |||||||||||||||||||||||
| Medians | $ | 0.00 | 0.00 | % | 0.00 | % | $ | 886 | 12.18 | % | 12.18 | % | 6.82 | % | 0.00 | % | 0.00 | % | -0.12 | % | -1.06 | % | |||||||||||||||||||||||
| Comparable Group Averages | |||||||||||||||||||||||||||||||||||||||||||||
| Averages | $ | 0.17 | 1.26 | % | 21.20 | % | $ | 400 | 13.80 | % | 13.35 | % | 3.23 | % | 0.52 | % | 4.01 | % | 0.37 | % | 2.77 | % | |||||||||||||||||||||||
| Medians | $ | 0.10 | 0.79 | % | 19.11 | % | $ | 326 | 12.44 | % | 11.47 | % | 2.12 | % | 0.57 | % | 3.64 | % | 0.35 | % | 2.93 | % | |||||||||||||||||||||||
| Peer Group | |||||||||||||||||||||||||||||||||||||||||||||
| AFCB | Athens Bancshares, Inc. of TN | $ | 0.20 | 1.57 | % | 32.79 | % | $ | 283 | 17.73 | % | 17.61 | % | 2.71 | % | 0.60 | % | 3.37 | % | 0.60 | % | 3.37 | % | ||||||||||||||||||||||
| EBMT | Eagle Bancorp Montana of MT | $ | 0.29 | 2.77 | % | 47.54 | % | $ | 331 | 15.85 | % | 15.85 | % | 1.24 | % | 0.72 | % | 4.51 | % | 0.28 | % | 1.78 | % | ||||||||||||||||||||||
| FFDF | FFD Financial Corp. of Dover OH | $ | 0.68 | 4.53 | % | 47.89 | % | $ | 211 | 8.89 | % | 8.89 | % | 1.53 | % | 0.70 | % | 7.79 | % | 0.46 | % | 5.10 | % | ||||||||||||||||||||||
| FABK | First Advantage Bancorp of TN | $ | 0.20 | 1.57 | % | 43.48 | % | $ | 350 | 19.34 | % | 19.34 | % | 0.92 | % | 0.54 | % | 2.79 | % | 0.32 | % | 1.64 | % | ||||||||||||||||||||||
| FFNM | First Fed of N. Michigan of MI | $ | 0.00 | 0.00 | % | 0.00 | % | $ | 219 | 10.99 | % | 10.80 | % | 4.71 | % | 0.07 | % | 0.61 | % | 0.03 | % | 0.24 | % | ||||||||||||||||||||||
| JXSB | Jacksonville Bancorp, Inc. of IL | $ | 0.30 | 2.19 | % | 19.11 | % | $ | 305 | 12.70 | % | 11.92 | % | 1.27 | % | 1.00 | % | 8.72 | % | 0.85 | % | 7.44 | % | ||||||||||||||||||||||
| LSBI | LSB Fin. Corp. of Lafayette IN | $ | 0.00 | 0.00 | % | 0.00 | % | $ | 360 | 10.10 | % | 10.10 | % | 5.92 | % | 0.48 | % | 5.08 | % | 0.27 | % | 2.80 | % | ||||||||||||||||||||||
| LABC | Louisiana Bancorp, Inc. of LA | $ | 0.00 | 0.00 | % | 0.00 | % | $ | 320 | 18.39 | % | 18.39 | % | 0.57 | % | 0.74 | % | 3.90 | % | 0.64 | % | 3.34 | % | ||||||||||||||||||||||
| RVSB | Riverview Bancorp, Inc. of WA | $ | 0.00 | 0.00 | % | 0.00 | % | $ | 886 | 12.23 | % | 9.59 | % | 5.10 | % | 0.39 | % | 3.28 | % | 0.37 | % | 3.06 | % | ||||||||||||||||||||||
| TSBK | Timberland Bancorp, Inc. of WA | $ | 0.00 | 0.00 | % | NM | $ | 735 | 11.74 | % | 11.01 | % | 8.35 | % | 0.00 | % | 0.00 | % | -0.12 | % | -1.06 | % | |||||||||||||||||||||||
| (1) | Average of High/Low or Bid/Ask price per share. |
| (2) | EPS (estimate core basis) is based on actual trailing 12 month data, adjusted to omit non-operating items on a tax-effected basis, and is shown on a pro forma basis where appropriate. |
| (3) | P/E = Price to earnings; P/B = Price to book; P/A = Price to assets; P/TB = Price to tangible book value; and P/Core = Price to core earnings. |
| (4) | Indicated 12 month dividend, based on last quarterly dividend declared. |
| (5) | Indicated 12 month dividend as a percent of trailing 12 month estimated core earnings. |
| (6) | ROA (return on assets) and ROE (return on equity) are indicated ratios based on trailing 12 month common earnings and average common equity and total assets balances. |
| (7) | Excludes from averages and medians those companies the subject of actual or rumored acquisition activities or unusual operating characteristics. |
| Source: Corporate reports, offering circulars, and RP Financial, LC. calculations. The information provided in this report has been obtained from sources we believe are reliable, but we cannot guarantee the accuracy or completeness of such information. | |
Copyright (c) 2011 by RP® Financial, LC. | |
| RP® Financial, LC. | VALUATION ANALYSIS IV.23 |
3. Price-to-Assets (“P/A”). The P/A valuation methodology determines market value by applying a valuation P/A ratio to the Bank’s pro forma asset base, conservatively assuming no deposit withdrawals are made to fund stock purchases. In all likelihood there will be deposit withdrawals, which results in understating the pro forma P/A ratio which is computed herein. At the $24.5 million midpoint of the valuation range, the Bank’s value equaled 8.38% of pro forma assets. Comparatively, the Peer Group companies exhibited an average P/A ratio of 9.48%, which implies a discount of 11.60% has been applied to the Bank’s pro forma P/A ratio. In comparison to the Peer Group’s median P/A ratio of 7.94%, the Bank’s pro forma P/A ratio at the midpoint value reflects a premium of 5.54%.
| Comparison to Recent Offerings |
As indicated at the beginning of this chapter, RP Financial’s analysis of recent conversion offering pricing characteristics at closing and in the aftermarket has been limited to a “technical” analysis and, thus, the pricing characteristics of recent conversion offerings can not be a primary determinate of value. Particular focus was placed on the P/TB approach in this analysis, since the P/E multiples do not reflect the actual impact of reinvestment and the source of the stock proceeds (i.e., external funds vs. deposit withdrawals). As discussed previously, there have been three recently completed standard conversion offerings, IF Bancorp, Inc. of IL, State Investors Bancorp, Inc. of LA and First Connecticut Bancorp, Inc. of CT. In comparison to the average closing pro forma P/TB ratio of these offerings, 66.5%, the Bank’s P/TB ratio of 53.88% at the midpoint value reflects an implied discount of 18.98%. At the top of the superrange, the Bank’s pro forma P/TB ratio of 61.88% reflects an implied discount of 6.95% relative to the average closing pro forma P/TB ratio. The three recent standard conversions that are traded on NASDAQ reported an average P/TB ratio, based on closing stock prices as of September 2, 2011, of 72.53%.
| RP® Financial, LC. | VALUATION ANALYSIS IV.24 |
| Valuation Conclusion |
Based on the foregoing, it is our opinion that, as of September 2, 2011, the estimated aggregate pro forma market value of the shares to be issued immediately following the conversion, equaled $24,500,000 at the midpoint, equal to 2,450,000 shares offered at a per share value of $10.00. Pursuant to conversion guidelines, the 15% valuation range indicates a minimum value of $20,825,000 and a maximum value of $28,175,000. Based on the $10.00 per share offering price determined by the Board, this valuation range equates to total shares outstanding of 2,082,500 at the minimum and 2,817,500 at the maximum. In the event the appraised value is subject to an increase, the aggregate pro forma market value may be increased up to a supermaximum value of $32,401,250 without a resolicitation. Based on the $10.00 per share offering price, the supermaximum value would result in total shares outstanding of 3,240,125. The pro forma valuation calculations relative to the Peer Group are shown in Table 4.6 and are detailed in Exhibit IV-7 and Exhibit IV-8.
EXHIBITS
RP® Financial, LC.
LIST OF EXHIBITS
| Exhibit | ||||
| Number | Description | |||
| I-1 | Map of Branch Office Network | |||
| I-2 | Audited Financial Statements | |||
| I-3 | Key Operating Ratios | |||
| I-4 | Investment Portfolio Composition | |||
| I-5 | Yields and Costs | |||
| I-6 | Loan Loss Allowance Activity | |||
| I-7 | Interest Rate Risk Analysis | |||
| I-8 | Fixed Rate and Adjustable Rate Loans | |||
| I-9 | Loan Portfolio Composition | |||
| I-10 | Contractual Maturity By Loan Type | |||
| I-11 | Loan Origination Activity | |||
| I-12 | Non-Performing Assets | |||
| I-13 | Deposit Composition | |||
| I-14 | CDs by Rate and Maturity | |||
| I-15 | Borrowings Activity | |||
| II-1 | Description of Office Facilities | |||
| II-2 | Historical Interest Rates | |||
| II-3 | Market Area Demographic/Economic Information | |||
| II-4 | Market Area Employment by Sector | |||
LIST OF EXHIBITS (continued)
| Exhibit | |||
| Number | Description | ||
| III-1 | General Characteristics of Publicly-Traded Institutions | ||
| III-2 | Public Market Pricing of Publicly-Traded Institutions – Northwest Region | ||
| < $400-Million in | |||
| III-3 | Peer Group Summary Demographic and Deposit Market Share Data | ||
| IV-1 | Stock Prices: September 2, 2011 | ||
| IV-2 | Historical Stock Price Indices | ||
| IV-3 | Historical Thrift Stock Indices | ||
| IV-4 | Market Area Acquisition Activity | ||
| IV-5 | Director and Senior Management Summary Resumes | ||
| IV-6 | Pro Forma Regulatory Capital Ratios | ||
| IV-7 | Pro Forma Analysis Sheet | ||
| IV-8 | Pro Forma Effect of Conversion Proceeds | ||
| IV-9 | Peer Group Core Earnings Analysis | ||
| V-1 | Firm Qualifications Statement | ||
EXHIBIT I-1
1st Security Bank of Washington
Map of Branch Office Network
Office Locations
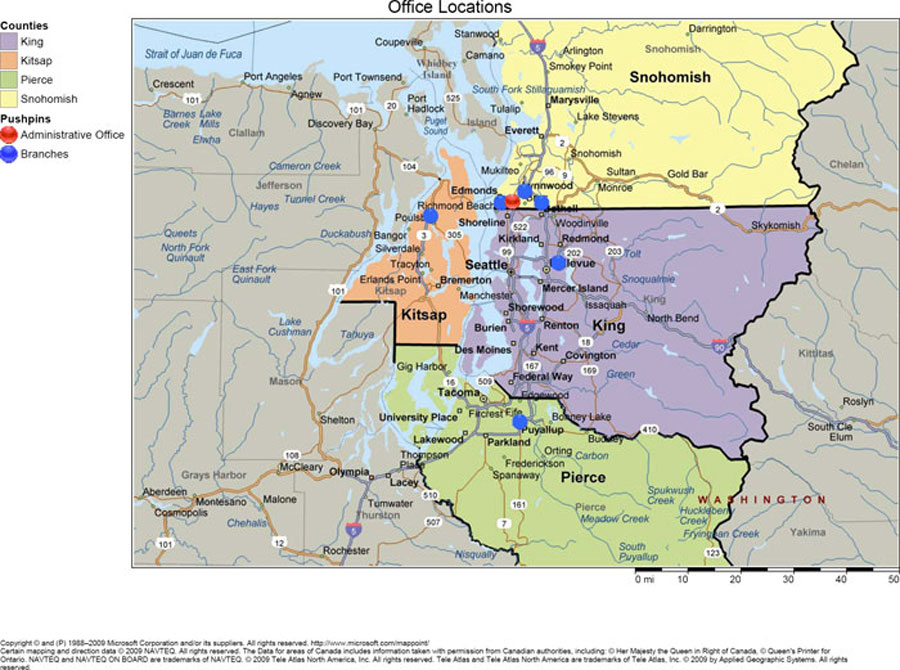
Copyright © and (P) 1988–2009 Microsoft Corporation and/or its suppliers. All rights reserved. http://www.microsoft.com/mappoint/
Certain mapping and direction data © 2009 NAVTEQ. All rights reserved. The Data for areas of Canada includes information taken with permission from Canadian authorities, including: © Her Majesty the Queen in Right of Canada, © Queen’s Printer for Ontario. NAVTEQ and NAVTEQ ON BOARD are trademarks of NAVTEQ. © 2009 Tele Atlas North America, Inc. All rights reserved. Tele Atlas and Tele Atlas North America are trademarks of Tele Atlas, Inc. © 2009 by Applied Geographic Systems. All rights reserved.
EXHIBIT I-2
1st Security Bank of Washington
Audited Financial Statements
[Incorporated by Reference]
Exhibit I-3
1st Security Bank of Washington
Key Operating Ratios
Six Months Ended June 30, | Years Ended December 31, | |||||||||||||||||||||||||||
| 2011 | 2010 | 2010 | 2009 | 2008 | 2007 | 2006 | ||||||||||||||||||||||
| Selected Financial Ratios and Other Data: | ||||||||||||||||||||||||||||
Performance ratios(1): | ||||||||||||||||||||||||||||
| Return on assets (ratio of net income (loss) to average total assets) | 0.37 | % | 0.27 | % | 0.60 | % | (1.75 | )% | (1.55 | )% | (1.60 | )% | 0.48 | % | ||||||||||||||
| Return on equity (ratio of net income (loss) to average equity) | 3.94 | % | 2.96 | % | 6.54 | % | (16.84 | )% | (11.95 | )% | (11.82 | )% | 3.65 | % | ||||||||||||||
| Yield on average interest-earning assets | 6.42 | % | 6.75 | % | 6.86 | % | 6.62 | % | 7.30 | % | 7.28 | % | 7.04 | % | ||||||||||||||
| Rate paid on average interest-bearing liabilities | 1.42 | % | 1.82 | % | 1.75 | % | 2.12 | % | 2.99 | % | 3.50 | % | 2.85 | % | ||||||||||||||
| Interest rate spread information: | ||||||||||||||||||||||||||||
| Average during period | 5.00 | % | 4.93 | % | 5.11 | % | 4.50 | % | 4.31 | % | 3.79 | % | 4.19 | % | ||||||||||||||
| End of period | 5.04 | % | 4.73 | % | 4.64 | % | 4.20 | % | 4.58 | % | 3.78 | % | 4.19 | % | ||||||||||||||
Net interest margin(2) | 5.15 | % | 5.16 | % | 5.32 | % | 4.79 | % | 4.80 | % | 4.41 | % | 4.74 | % | ||||||||||||||
| Operating expense to average total assets | 4.15 | % | 4.47 | % | 4.49 | % | 5.32 | % | 5.24 | % | 6.69 | % | 5.54 | % | ||||||||||||||
Average interest-earning assets to average interest-bearing liabilities | 112.13 | % | 114.40 | % | 113.98 | % | 116.01 | % | 119.50 | % | 121.83 | % | 124.06 | % | ||||||||||||||
Efficiency ratio(3) | 72.95 | % | 68.24 | % | 69.86 | % | 84.29 | % | 89.41 | % | 125.15 | % | 86.26 | % | ||||||||||||||
| Asset quality ratios: | ||||||||||||||||||||||||||||
Non-performing assets to total assets at end of period(4) | 2.92 | % | 4.27 | % | 3.45 | % | 4.64 | % | 0.99 | % | 0.08 | % | 0.10 | % | ||||||||||||||
Non-performing loans to total gross loans(4) | 0.91 | % | 2.67 | % | 2.66 | % | 3.12 | % | 1.09 | % | 0.08 | % | 0.10 | % | ||||||||||||||
Allowance for loan losses to non-performing loans(4) | 246.99 | % | 100.11 | % | 93.70 | % | 99.34 | % | 225.00 | % | 1499.45 | % | 1181.66 | % | ||||||||||||||
| Allowance for loan losses to loans receivable, net | 2.30 | % | 2.72 | % | 2.56 | % | 3.20 | % | 2.51 | % | 1.15 | % | 1.24 | % | ||||||||||||||
| Capital ratios: | ||||||||||||||||||||||||||||
| Equity to total assets at end of period | 9.52 | % | 8.63 | % | 8.48 | % | 8.27 | % | 10.91 | % | 12.05 | % | 13.57 | % | ||||||||||||||
| Average equity to average assets | 9.31 | % | 9.07 | % | 9.13 | % | 10.40 | % | 12.95 | % | 13.50 | % | 13.27 | % | ||||||||||||||
| Other data: | ||||||||||||||||||||||||||||
| Number of full service offices | 6 | 6 | 6 | 8 | 12 | 12 | 12 | |||||||||||||||||||||
| Full-time equivalent employees | 79 | 80 | 79 | 84 | 112 | 125 | 130 | |||||||||||||||||||||
| (1) | Performance ratios for the six month periods ended June 30, 2011 and 2010 are annualized as appropriate. |
| (2) | Net interest income divided by average interest earning assets. |
| (3) | Total non-interest expense as a percentage of net interest income and total other non-interest income, excluding net securities transactions. |
| (4) | Non-performing assets consists of non-accruing loans accruing loans more than 90 days past due, foreclosed real estate and other repossessed assets. |
Exhibit I-4
1st Security Bank of Washington
Investment Portfolio Composition
| June 30, 2011 | December 31, | |||||||||||||||||||||||||||||||
| 2010 | 2009 | 2008 | ||||||||||||||||||||||||||||||
Book Value | Fair Value | Book Value | Fair Value | Book Value | Fair Value | Book Value | Fair Value | |||||||||||||||||||||||||
| (Dollars in thousands) | ||||||||||||||||||||||||||||||||
| Available-for-sale: | ||||||||||||||||||||||||||||||||
| Federal agency securities | $ | 9,802 | $ | 9,833 | $ | 6,175 | $ | 6,086 | $ | - | $ | - | $ | 1,475 | $ | 1,472 | ||||||||||||||||
| Municipal Bonds | 1,400 | 1,409 | 1,144 | 1,103 | - | - | - | - | ||||||||||||||||||||||||
| Mortgage-backed | 424 | 447 | 434 | 453 | 592 | 603 | 1,375 | 1,362 | ||||||||||||||||||||||||
| Total available-for-sale | 11,626 | 11,689 | 7,753 | 7,642 | 592 | 603 | 2,850 | 2,834 | ||||||||||||||||||||||||
| Federal Home Loan Bank stock | 1,797 | 1,797 | 1,797 | 1,797 | 1,797 | 1,797 | 1,797 | 1,797 | ||||||||||||||||||||||||
| Total securities available-for-sale | $ | 13,423 | $ | 13,486 | $ | 9,550 | $ | 9,439 | $ | 2,389 | $ | 2,400 | $ | 4,647 | $ | 4,631 | ||||||||||||||||
Exhibit I-5
1st Security Bank of Washington
Yields and Costs
At June 30, 2011 | Six Months Ended June 30, | |||||||||||||||||||||||||||
2011 | 2010 | |||||||||||||||||||||||||||
Yield/ Rate | Average Balance Outstanding | Interest Earned Paid | Yield/ Rate | Average Balance Outstanding | Interest Earned Paid | Yield/ Rate | ||||||||||||||||||||||
| (Dollars in thousand) | ||||||||||||||||||||||||||||
| Interest-earning assets: | ||||||||||||||||||||||||||||
Loans receivable, net (1) | 7.70 | % | $ | 218,462 | $ | 8,150 | 7.46 | % | $ | 232,215 | $ | 8,442 | 7.27 | % | ||||||||||||||
| Mortgage-backed securities | 2.82 | 429 | 6 | 2.80 | 587 | 8 | 2.73 | |||||||||||||||||||||
| Investment securities | 1.45 | 9,530 | 78 | 1.64 | --- | --- | --- | |||||||||||||||||||||
| Federal Home Loan Bank stock | --- | 1,797 | --- | --- | 1,797 | --- | --- | |||||||||||||||||||||
| Other | 0.19 | 27,355 | 29 | 0.21 | 16,119 | 17 | 0.21 | |||||||||||||||||||||
Total interest-earning assets (1) | 6.46 | 257,573 | 8,263 | 6.42 | 250,718 | 8,467 | 6.75 | |||||||||||||||||||||
| Interest-bearing liabilities: | ||||||||||||||||||||||||||||
| Savings and money market | 0.86 | 100,471 | 442 | 0.88 | 71,205 | 330 | 0.93 | |||||||||||||||||||||
| Interest-bearing checking | 0.61 | 17,546 | 53 | 0.60 | 20,697 | 102 | 0.99 | |||||||||||||||||||||
| Certificates of deposit | 1.97 | 107,591 | 1,044 | 1.94 | 117,125 | 1,434 | 2.45 | |||||||||||||||||||||
| Borrowings | 4.51 | 4,099 | 88 | 4.29 | 10,137 | 127 | 2.51 | |||||||||||||||||||||
| Total interest-bearing liabilities | 1.42 | 229,707 | 1,627 | 1.42 | 219,164 | 1,993 | 1.82 | |||||||||||||||||||||
| Net interest income | $ | 6,636 | $ | 6,474 | ||||||||||||||||||||||||
| Net interest rate spread | 5.04 | % | 5.00 | % | 4.93 | % | ||||||||||||||||||||||
| Net earning assets | $ | 27,866 | $ | 31,554 | ||||||||||||||||||||||||
| Net yield on average interest-earning assets | 5.18 | % | 5.15 | % | 5.16 | % | ||||||||||||||||||||||
Average interest-earning assets to average interest-bearing liabilities | 112.13 | % | 114.40 | % | ||||||||||||||||||||||||
| (1) | The average loans receivable, net balances include non-accruing loans. |
Exhibit I-5(continued)
1st Security Bank of Washington
Yields and Costs
| Years Ended December 31, | ||||||||||||||||||||||||||||||||||||
| 2010 | 2009 | 2008 | ||||||||||||||||||||||||||||||||||
| Average Balance Outstanding | Interest Earned Paid | Yield/ Rate | Average Balance Outstanding | Interest Earned Paid | Yield/ Rate | Average Balance Outstanding | Interest Earned Paid | Yield/ Rate | ||||||||||||||||||||||||||||
| (Dollars in thousands) | ||||||||||||||||||||||||||||||||||||
| Interest-earning assets: | ||||||||||||||||||||||||||||||||||||
Loans receivable, net (1) | $ | 236,238 | $ | 17,270 | 7.31 | % | $ | 231,965 | $ | 16,289 | 7.02 | % | $ | 216,383 | $ | 16,251 | 7.51 | % | ||||||||||||||||||
| Mortgage-backed securities | 546 | 15 | 2.75 | 988 | 38 | 3.85 | 3,135 | 347 | 11.07 | |||||||||||||||||||||||||||
| Investment securities | 1,390 | 19 | 1.37 | 1,267 | 52 | 4.10 | 4,035 | 181 | 4.49 | |||||||||||||||||||||||||||
| Federal Home Loan Bank stock | 1,797 | --- | --- | 1,797 | --- | --- | 1,797 | 17 | 0.95 | |||||||||||||||||||||||||||
| Other | 12,585 | 29 | 0.23 | 11,807 | 25 | 0.21 | 5,999 | 103 | 1.72 | |||||||||||||||||||||||||||
Total interest-earning assets (1) | 252,556 | 17,333 | 6.86 | 247,824 | 16,404 | 6.62 | 231,349 | 16,899 | 7.30 | |||||||||||||||||||||||||||
| Interest-bearing liabilities: | ||||||||||||||||||||||||||||||||||||
| Savings and money market | 76,065 | 711 | 0.94 | 74,407 | 705 | 0.95 | 78,100 | 1,204 | 1.54 | |||||||||||||||||||||||||||
| Interest-bearing checking | 19,798 | 187 | 0.94 | 20,977 | 246 | 1.17 | 13,644 | 235 | 1.72 | |||||||||||||||||||||||||||
| Certificates of deposit | 118,217 | 2,770 | 2.34 | 101,802 | 3,281 | 3.22 | 91,069 | 3,930 | 4.32 | |||||||||||||||||||||||||||
| Borrowings | 7,499 | 218 | 2.91 | 16,436 | 289 | 1.76 | 10,779 | 429 | 3.98 | |||||||||||||||||||||||||||
| Total interest-bearing liabilities | 221,579 | 3,886 | 1.75 | 213,622 | 4,521 | 2.12 | 193,592 | 5,798 | 2.99 | |||||||||||||||||||||||||||
| Net interest income | $ | 13,447 | $ | 11,883 | $ | 11,101 | ||||||||||||||||||||||||||||||
| Net interest rate spread | 5.11 | % | 4.50 | % | 4.31 | % | ||||||||||||||||||||||||||||||
| Net earning assets | $ | 30,977 | $ | 34,202 | $ | 37,757 | ||||||||||||||||||||||||||||||
| Net yield on average interest-earning assets | 5.32 | % | 4.79 | % | 4.80 | % | ||||||||||||||||||||||||||||||
Average interest-earning assets to average interest-bearing liabilities | 113.98 | % | 116.01 | % | 119.50 | % | ||||||||||||||||||||||||||||||
| (1) | The average loans receivable, net balances include non-accruing loans. |
Exhibit I-6
1st Security Bank of Washington
Loan Loss Allowance Activity
| Six Months Ended June 30, | Years Ended December 31, | |||||||||||||||||||||||||||
| 2011 | 2010 | 2010 | 2009 | 2008 | 2007 | 2006 | ||||||||||||||||||||||
| (Dollars in thousands) | ||||||||||||||||||||||||||||
| Balance at beginning of period: | $ | 5,905 | $ | 7,405 | $ | 7,405 | $ | 5,598 | $ | 2,744 | $ | 2,706 | $ | 2,719 | ||||||||||||||
| Charge-offs: | ||||||||||||||||||||||||||||
| Real estate loans | ||||||||||||||||||||||||||||
| One- to four-family | --- | --- | 32 | --- | --- | --- | --- | |||||||||||||||||||||
| Home equity | 117 | 60 | 163 | 160 | 18 | 1 | 18 | |||||||||||||||||||||
| Commercial | 612 | --- | --- | --- | --- | --- | --- | |||||||||||||||||||||
| Construction | --- | 1,328 | 1,529 | 1,436 | 843 | --- | --- | |||||||||||||||||||||
| Total real estate loans | 729 | 1,388 | 1,724 | 1,596 | 861 | 1 | 18 | |||||||||||||||||||||
| Consumer loans | ||||||||||||||||||||||||||||
| Indirect home improvement | 1,301 | 1,190 | 2,490 | 2,195 | 1,006 | 600 | 355 | |||||||||||||||||||||
| Automobile | 253 | 370 | 637 | 1,380 | 615 | 427 | 292 | |||||||||||||||||||||
| Recreational | 148 | 292 | 413 | 545 | 93 | 108 | 125 | |||||||||||||||||||||
| Home improvement | 15 | 31 | 76 | 35 | 11 | 13 | 67 | |||||||||||||||||||||
| Other | 46 | 123 | 178 | 174 | 112 | 61 | 152 | |||||||||||||||||||||
| Total consumer loans | 1,763 | 2,006 | 3,794 | 4,329 | 1,837 | 1,209 | 991 | |||||||||||||||||||||
| Commercial business loans | --- | 74 | 175 | --- | --- | --- | --- | |||||||||||||||||||||
| Total charge-offs | 2,492 | 3,468 | 5,693 | 5,925 | 2,698 | 1,210 | 1,009 | |||||||||||||||||||||
| Recoveries: | ||||||||||||||||||||||||||||
| Real estate loans | ||||||||||||||||||||||||||||
| Home equity | --- | --- | --- | --- | 60 | --- | --- | |||||||||||||||||||||
| Total real estate loans | --- | --- | --- | --- | 60 | --- | --- | |||||||||||||||||||||
| Consumer loans | ||||||||||||||||||||||||||||
| Indirect home improvement | 220 | 152 | 351 | 262 | 269 | 214 | 143 | |||||||||||||||||||||
| Automobile | 120 | 170 | 275 | 305 | 178 | 295 | 390 | |||||||||||||||||||||
| Recreational | 39 | 52 | 70 | 53 | 36 | 70 | 88 | |||||||||||||||||||||
| Home improvement | 1 | --- | --- | 1 | 1 | 16 | 6 | |||||||||||||||||||||
| Other | 13 | 9 | 17 | 44 | 71 | 129 | 123 | |||||||||||||||||||||
| Total consumer loans | 393 | 383 | 713 | 665 | 555 | 724 | 750 | |||||||||||||||||||||
| Commercial business loans | --- | --- | --- | --- | --- | --- | --- | |||||||||||||||||||||
| Total recoveries | 393 | 383 | 713 | 665 | 615 | 724 | 750 | |||||||||||||||||||||
| Net charge-offs | 2,099 | 3,085 | 4,980 | 5,260 | 2,083 | 486 | 259 | |||||||||||||||||||||
| Additions charged to operations | 1,030 | 1,905 | 3,480 | 7,067 | 4,937 | 578 | 246 | |||||||||||||||||||||
| Reclassification for off-balance sheet contingencies | --- | --- | --- | --- | --- | (54 | ) | --- | ||||||||||||||||||||
| Balance at end of period | $ | 4,836 | $ | 6,225 | $ | 5,905 | $ | 7,405 | $ | 5,598 | $ | 2,744 | $ | 2,706 | ||||||||||||||
| Net charge-offs during the period to average loans outstanding during the period | 0.96 | % | 1.33 | % | 2.11 | % | 2.27 | % | 1.00 | % | 0.21 | % | 0.12 | % | ||||||||||||||
| Net charge-offs during the period to average non-performing assets | 25.68 | % | 26.83 | % | 47.40 | % | 89.36 | % | 148.57 | % | 195.18 | % | 146.33 | % | ||||||||||||||
| Allowance as a percentage of non-performing loans | 246.99 | % | 100.11 | % | 93.70 | % | 99.34 | % | 225.00 | % | 1499.45 | % | 1181.66 | % | ||||||||||||||
| Allowance as a percentage of loans receivable, net (end of period) | 2.30 | % | 2.72 | % | 2.56 | % | 3.20 | % | 2.51 | % | 1.15 | % | 1.24 | % | ||||||||||||||
Exhibit I-7
1st Security Bank of Washington
Interest Rate Risk Analysis
June 30, 2011 | ||||||||||||
| Change in | ||||||||||||
| Interest | ||||||||||||
| Rates in | Net Interest Income | |||||||||||
| Basis | ||||||||||||
| Points | $ Amount | $ Change | % Change | |||||||||
Dollars in thousands | ||||||||||||
| 200bp | $ | 13,485 | $ | 96 | 0.71 | % | ||||||
| 100bp | $ | 13,350 | $ | (40 | ) | (0.30 | )% | |||||
| 0bp | $ | 13,390 | − | --- | ||||||||
| (100)bp | $ | 13,849 | $ | 459 | 3.43 | % | ||||||
Exhibit I-8
1st Security Bank of Washington
Fixed Rate and Adjustable Rate Loans
| June 30, 2011 | 2010 | 2009 | December 31, 2008 | 2007 | 2006 | |||||||||||||||||||||||||||||||||||||||||||
| Amount | Percent | Amount | Percent | Amount | Percent | Amount | Percent | Amount | Percent | Amount | Percent | |||||||||||||||||||||||||||||||||||||
| (Dollars in thousands) | ||||||||||||||||||||||||||||||||||||||||||||||||
| Fixed-rate loans: | ||||||||||||||||||||||||||||||||||||||||||||||||
| Real estate loans: | ||||||||||||||||||||||||||||||||||||||||||||||||
| Commercial | $ | 14,223 | 6.63 | % | $ | 16,333 | 6.90 | % | $ | 15,729 | 6.59 | % | $ | 16,449 | 7.20 | % | $ | 15,852 | 6.58 | % | $ | 8,959 | 4.06 | % | ||||||||||||||||||||||||
| Multi-family | 1,168 | 0.54 | 1,159 | 0.49 | 409 | 0.17 | 405 | 0.17 | 968 | 0.40 | 592 | 0.27 | ||||||||||||||||||||||||||||||||||||
| One- to four-family | 6,305 | 2.94 | 6,585 | 2.79 | 4,552 | 1.91 | 6,159 | 2.70 | 57,610 | 23.93 | 64,919 | 29.39 | ||||||||||||||||||||||||||||||||||||
| Home equity | 2,516 | 1.17 | 2,784 | 1.18 | 3,839 | 1.61 | 5,399 | 2.36 | 6,616 | 2.75 | 6,812 | 3.08 | ||||||||||||||||||||||||||||||||||||
| Construction and development | 1,825 | 0.85 | 1,556 | 0.66 | 501 | 0.21 | 105 | 0.05 | 110 | 0.05 | 196 | 0.09 | ||||||||||||||||||||||||||||||||||||
| Total real estate loans | 26,037 | 12.13 | 28,417 | 12.02 | 25,030 | 10.49 | 28,517 | 12.48 | 81,156 | 33.71 | 81,478 | 36.89 | ||||||||||||||||||||||||||||||||||||
| Consumer | 124,650 | 58.10 | 135,752 | 57.39 | 137,231 | 57.53 | 126,221 | 55.29 | 116,329 | 48.32 | 108,756 | 49.23 | ||||||||||||||||||||||||||||||||||||
| Commercial business | 2,422 | 1.14 | 1,049 | 0.45 | 870 | 0.36 | 454 | 0.20 | 165 | 0.07 | - | --- | ||||||||||||||||||||||||||||||||||||
| Total fixed-rate loans | 153,109 | 71.37 | 165,218 | 69.86 | 163,131 | 68.38 | 155,192 | 67.97 | 197,650 | 82.10 | 190,234 | 86.12 | ||||||||||||||||||||||||||||||||||||
| Adjustable-rate loans: | ||||||||||||||||||||||||||||||||||||||||||||||||
| Real estate loans: | ||||||||||||||||||||||||||||||||||||||||||||||||
| Commercial | 11,452 | 5.34 | 11,728 | 4.96 | 13,370 | 5.61 | 9,423 | 4.13 | 1,457 | 0.61 | 1,495 | 0.67 | ||||||||||||||||||||||||||||||||||||
| Multi-family | --- | --- | --- | --- | --- | --- | 3 | 0.01 | 4 | 0.01 | --- | --- | ||||||||||||||||||||||||||||||||||||
| One- to four-family | 6,528 | 3.04 | 6,633 | 2.80 | 3,681 | 1.54 | 810 | 0.35 | 2,946 | 1.22 | 2,765 | 1.25 | ||||||||||||||||||||||||||||||||||||
| Home equity | 12,923 | 6.03 | 12,871 | 5.44 | 12,609 | 5.29 | 13,290 | 5.83 | 13,105 | 5.44 | 15,788 | 7.15 | ||||||||||||||||||||||||||||||||||||
| Construction and development | 4,479 | 2.09 | 8,249 | 3.49 | 16,889 | 7.08 | 23,756 | 10.40 | 6,410 | 2.66 | 2,405 | 1.09 | ||||||||||||||||||||||||||||||||||||
| Total real estate loans | 35,382 | 16.50 | 39,481 | 16.69 | 46,549 | 19.52 | 47,282 | 20.72 | 23,922 | 9.94 | 22,453 | 10.16 | ||||||||||||||||||||||||||||||||||||
| Consumer | 10 | 0.01 | 13 | 0.01 | 24 | 0.01 | 54 | 0.02 | 151 | 0.06 | 564 | 0.26 | ||||||||||||||||||||||||||||||||||||
| Commercial business | 26,008 | 12.12 | 31,792 | 13.44 | 28,829 | 12.09 | 25,764 | 11.29 | 19,032 | 7.90 | 7,649 | 3.46 | ||||||||||||||||||||||||||||||||||||
| Total adjustable-rate loans | 61,400 | 28.63 | 71,286 | 30.14 | 75,402 | 31.62 | 73,100 | 32.03 | 43,105 | 17.90 | 30,666 | 13.88 | ||||||||||||||||||||||||||||||||||||
| Total gross loans receivable | 214,509 | 100.00 | % | 236,504 | 100.00 | % | 238,533 | 100.00 | % | 228,292 | 100.00 | % | 240,755 | 100.00 | % | 220,900 | 100.00 | % | ||||||||||||||||||||||||||||||
| Less: | ||||||||||||||||||||||||||||||||||||||||||||||||
| Deferred fees and discounts | 511 | 223 | 313 | 280 | (204 | ) | (116 | ) | ||||||||||||||||||||||||||||||||||||||||
| Allowance for losses | (4,836 | ) | (5,905 | ) | (7,405 | ) | (5,598 | ) | (2,744 | ) | (2,706 | ) | ||||||||||||||||||||||||||||||||||||
| Total loans receivable, net | $ | 210,184 | $ | 230,822 | $ | 231,441 | $ | 222,974 | $ | 237,807 | $ | 218,078 | ||||||||||||||||||||||||||||||||||||
Exhibit I-9
1st Security Bank of Washington
Loan Portfolio Composition
| December 31, | ||||||||||||||||||||||||||||||||||||||||||||||||
| June 30, 2011 | 2010 | 2009 | 2008 | 2007 | 2006 | |||||||||||||||||||||||||||||||||||||||||||
| Amount | Percent | Amount | Percent | Amount | Percent | Amount | Percent | Amount | Percent | Amount | Percent | |||||||||||||||||||||||||||||||||||||
| (Dollars in thousands) | ||||||||||||||||||||||||||||||||||||||||||||||||
| Real estate loans: | ||||||||||||||||||||||||||||||||||||||||||||||||
| Commercial | $ | 25,675 | 11.97 | % | $ | 28,061 | 11.86 | % | $ | 29,099 | 12.20 | % | $ | 25,872 | 11.33 | % | $ | 17,309 | 7.19 | % | $ | 10,454 | 4.73 | % | ||||||||||||||||||||||||
| Multi-family | 1,168 | 0.54 | 1,159 | 0.49 | 409 | 0.17 | 408 | 0.18 | 972 | 0.41 | 592 | 0.27 | ||||||||||||||||||||||||||||||||||||
| One- to four-family | 12,833 | 5.98 | 13,218 | 5.59 | 8,233 | 3.45 | 6,969 | 3.05 | 60,556 | 25.15 | 67,684 | 30.64 | ||||||||||||||||||||||||||||||||||||
| Home equity | 15,439 | 7.20 | 15,655 | 6.62 | 16,448 | 6.90 | 18,689 | 8.19 | 19,721 | 8.19 | 22,600 | 10.23 | ||||||||||||||||||||||||||||||||||||
| Construction and development | 6,304 | 2.94 | 9,805 | 4.15 | 17,390 | 7.29 | 23,861 | 10.45 | 6,520 | 2.71 | 2,601 | 1.18 | ||||||||||||||||||||||||||||||||||||
| Total real estate loans | 61,419 | 28.63 | 67,898 | 28.71 | 71,579 | 30.01 | 75,799 | 33.20 | 105,078 | 43.65 | 103,931 | 47.05 | ||||||||||||||||||||||||||||||||||||
| Consumer Loans: | ||||||||||||||||||||||||||||||||||||||||||||||||
| Indirect home improvement | 87,232 | 40.67 | 94,833 | 40.10 | 89,883 | 37.68 | 75,203 | 32.94 | 69,559 | 28.89 | 62,099 | 28.11 | ||||||||||||||||||||||||||||||||||||
| Recreational | 25,341 | 11.81 | 24,105 | 10.19 | 18,011 | 7.55 | 12,165 | 5.33 | 11,727 | 4.87 | 13,182 | 5.97 | ||||||||||||||||||||||||||||||||||||
| Automobile | 8,927 | 4.16 | 12,645 | 5.35 | 23,359 | 9.79 | 30,514 | 13.37 | 25,991 | 10.80 | 28,473 | 12.89 | ||||||||||||||||||||||||||||||||||||
| Home improvement | 1,070 | 0.50 | 1,295 | 0.55 | 1,725 | 0.72 | 2,203 | 0.96 | 2,952 | 1.23 | 1,005 | 0.45 | ||||||||||||||||||||||||||||||||||||
| Other | 2,090 | 0.97 | 2,887 | 1.21 | 4,277 | 1.80 | 6,190 | 2.71 | 6,251 | 2.59 | 4,561 | 2.07 | ||||||||||||||||||||||||||||||||||||
| Total consumer loans | 124,660 | 58.11 | 135,765 | 57.40 | 137,255 | 57.54 | 126,275 | 55.31 | 116,480 | 48.38 | 109,320 | 49.49 | ||||||||||||||||||||||||||||||||||||
| Commercial business loans | 28,430 | 13.26 | 32,841 | 13.89 | 29,699 | 12.45 | 26,218 | 11.49 | 19,197 | 7.97 | 7,649 | 3.46 | ||||||||||||||||||||||||||||||||||||
| Total gross loans receivable | 214,509 | 100.00 | % | 236,504 | 100.00 | % | 238,533 | 100.00 | % | 228,292 | 100.00 | % | 240,755 | 100.00 | % | 220,900 | 100.00 | % | ||||||||||||||||||||||||||||||
| Less: | ||||||||||||||||||||||||||||||||||||||||||||||||
| Deferred fees and discounts | 511 | 223 | 313 | 280 | (204 | ) | (116 | ) | ||||||||||||||||||||||||||||||||||||||||
| Allowance for losses | (4,836 | ) | (5,905 | ) | (7,405 | ) | (5,598 | ) | (2,744 | ) | (2,706 | ) | ||||||||||||||||||||||||||||||||||||
| Total loans receivable, net | $ | 210,184 | $ | 230,822 | $ | 231,441 | $ | 222,974 | $ | 237,807 | $ | 218,078 | ||||||||||||||||||||||||||||||||||||
Exhibit I-10
1st Security Bank of Washington
Contractual Maturity by Loan Type
| Real Estate | ||||||||||||||||||||||||||||||||||||||||||||||||||||||||||||||||
| One- to Four Family | Home Equity | Multi-family | Commercial | Construction and Development | Consumer | Commercial Business | Total | |||||||||||||||||||||||||||||||||||||||||||||||||||||||||
| Amount | Weighted Average Rate | Amount | Weighted Average Rate | Amount | Weighted Average Rate | Amount | Weighted Average Rate | Amount | Weighted Average Rate | Amount | Weighted Average Rate | Amount | Weighted Average Rate | Amount | Weighted Average Rate | |||||||||||||||||||||||||||||||||||||||||||||||||
| (Dollars in thousands) | ||||||||||||||||||||||||||||||||||||||||||||||||||||||||||||||||
| Due During Years Ending December 31, | ||||||||||||||||||||||||||||||||||||||||||||||||||||||||||||||||
2011(1) | $ | 393 | 4.00 | % | $ | 12,875 | 6.02 | % | $ | --- | --- | % | $ | 6,087 | 6.57 | % | $ | 6,742 | 6.01 | % | $ | 2,729 | 10.41 | % | $ | 27,583 | 5.24 | % | $ | 56,409 | 5.89 | % | ||||||||||||||||||||||||||||||||
| 2012 | 7,064 | 5.40 | --- | --- | 381 | 6.57 | 1,520 | 7.00 | 1,902 | 6.00 | 2,576 | 9.06 | 91 | 6.22 | 13,534 | 6.40 | ||||||||||||||||||||||||||||||||||||||||||||||||
| 2013 | 10 | 9.79 | 6 | 7.75 | --- | --- | 3,591 | 3.11 | --- | --- | 5,215 | 9.19 | 506 | 6.44 | 9,328 | 6.70 | ||||||||||||||||||||||||||||||||||||||||||||||||
| 2014 and 2015 | 505 | 6.25 | --- | --- | 690 | 6.00 | 12,978 | 5.20 | --- | --- | 10,967 | 8.98 | 4,661 | 5.48 | 29,801 | 6.67 | ||||||||||||||||||||||||||||||||||||||||||||||||
| 2016 to 2020 | 1,613 | 4.36 | 352 | 7.12 | 13 | 5.55 | 3,885 | 4.96 | 1,161 | 6.64 | 51,554 | 9.46 | --- | --- | 58,578 | 8.95 | ||||||||||||||||||||||||||||||||||||||||||||||||
| 2021 to 2025 | 388 | 5.95 | 2,339 | 8.16 | 5 | 6.33 | --- | --- | --- | --- | 51,423 | 7.27 | --- | --- | 54,155 | 7.30 | ||||||||||||||||||||||||||||||||||||||||||||||||
| 2026 and following | 3,245 | 5.16 | 83 | 7.75 | 70 | 5.55 | --- | --- | --- | --- | 11,301 | 7.50 | --- | --- | 14,699 | 6.98 | ||||||||||||||||||||||||||||||||||||||||||||||||
| Total | $ | 13,218 | 5.22 | % | $ | 15,655 | 6.37 | % | $ | 1,159 | 6.16 | % | $ | 28,061 | 5.30 | % | $ | 9,805 | 6.08 | % | $ | 135,765 | 8.43 | % | $ | 32,841 | 5.29 | % | $ | 236,504 | 7.20 | % | ||||||||||||||||||||||||||||||||
| (1) | Includes demand loans, loans having no stated maturity and overdraft loans. |
Exhibit I-11
1st Security Bank of Washington
Loan Origination Activity
| Six Months Ended, June 30, | Years Ended December 31, | |||||||||||||||||||
| 2011 | 2010 | 2010 | 2009 | 2008 | ||||||||||||||||
| (In thousands) | ||||||||||||||||||||
Originations by type: | ||||||||||||||||||||
| Fixed-rate: | ||||||||||||||||||||
| One- to four-family | $ | --- | $ | 1,202 | $ | 2,378 | $ | 7,331 | $ | 6,668 | ||||||||||
| Home equity | --- | --- | --- | 148 | 647 | |||||||||||||||
| Multi-family | 14 | 731 | 759 | 6 | 8 | |||||||||||||||
| Commercial | 443 | 2,028 | 3,037 | 3,813 | 251 | |||||||||||||||
| Construction and development | - | --- | --- | 404 | --- | |||||||||||||||
| Consumer | 14,629 | 28,772 | 53,043 | 63,047 | 68,042 | |||||||||||||||
| Commercial business (excluding warehouse lines) | 1,725 | 270 | 384 | 476 | 570 | |||||||||||||||
| Total fixed-rate | 16,811 | 33,003 | 59,601 | 75,225 | 76,186 | |||||||||||||||
| Adjustable- rate: | ||||||||||||||||||||
| One- to four-family | --- | --- | 1,221 | 2,582 | 3,024 | |||||||||||||||
| Home equity | 2,164 | 1,768 | 5,266 | 4,743 | 5,176 | |||||||||||||||
| Multi-family | --- | --- | --- | --- | --- | |||||||||||||||
| Commercial | 48 | 3 | 555 | 1,122 | 13,480 | |||||||||||||||
| Construction and development | --- | 595 | 775 | 3,471 | 16,131 | |||||||||||||||
| Consumer | --- | --- | 3 | 11 | 6 | |||||||||||||||
| Commercial business (excluding warehouse lines) | 3,763 | 4,285 | 15,380 | 23,853 | 25,674 | |||||||||||||||
| Warehouse lines, net | 6,501 | 11,416 | 11,940 | 8,199 | --- | |||||||||||||||
| Total adjustable-rate | 12,476 | 18,067 | 35,140 | 43,981 | 63,491 | |||||||||||||||
| Total loans originated | 29,287 | 51,070 | 94,741 | 119,206 | 139,677 | |||||||||||||||
| Sales and repayments: | ||||||||||||||||||||
| One- to four-family | --- | --- | --- | 6,429 | 6,669 | |||||||||||||||
| Total loans sold | --- | --- | --- | 6,429 | 6,669 | |||||||||||||||
| Mortgage-backed securities | --- | --- | --- | --- | 48,635 | |||||||||||||||
| Total sales | --- | --- | --- | 6,429 | 55,304 | |||||||||||||||
| Total principal repayments | 51,282 | 54,982 | 96,770 | 102,536 | 96,836 | |||||||||||||||
| Total reductions | 51,282 | 54,982 | 96,770 | 108,965 | 152,140 | |||||||||||||||
| Net increase (decrease) | $ | (21,995 | ) | $ | (3,912 | ) | $ | (2,029 | ) | $ | 10,241 | $ | (12,463 | ) | ||||||
Exhibit I-12
1st Security Bank of Washington
Non-Performing Assets
| June 30, | December 31, | |||||||||||||||||||||||
| 2011 | 2010 | 2009 | 2008 | 2007 | 2006 | |||||||||||||||||||
| Non-accruing loans: | (Dollars in thousands) | |||||||||||||||||||||||
| Real estate loans: | ||||||||||||||||||||||||
| One- to four-family | $ | 234 | $ | 211 | $ | --- | $ | --- | $ | --- | $ | --- | ||||||||||||
| Home equity | 605 | 574 | 40 | 87 | 10 | 22 | ||||||||||||||||||
| Commercial | --- | 1,201 | --- | --- | --- | --- | ||||||||||||||||||
| Construction and development | --- | 2,175 | 6,758 | 1,953 | --- | --- | ||||||||||||||||||
| Total real estate loans | 839 | 4,161 | 6,798 | 2,040 | 10 | 22 | ||||||||||||||||||
| Consumer loans: | ||||||||||||||||||||||||
| Indirect home improvement | 421 | 522 | 276 | 308 | 117 | 127 | ||||||||||||||||||
| Automobile | 37 | 54 | 35 | 62 | 50 | 37 | ||||||||||||||||||
| Recreational | 1 | 38 | 119 | 32 | 3 | 29 | ||||||||||||||||||
| Home improvement | 37 | 75 | 3 | --- | --- | --- | ||||||||||||||||||
| Other | 8 | 3 | 60 | 16 | 3 | 14 | ||||||||||||||||||
| Total consumer loans | 504 | 692 | 493 | 418 | 173 | 207 | ||||||||||||||||||
| Commercial business loans | 558 | 1,387 | --- | --- | --- | --- | ||||||||||||||||||
| Total non-accruing loans | 1,901 | 6,240 | 7,291 | 2,458 | 183 | 229 | ||||||||||||||||||
| Accruing loans delinquent more than 90 days: | ||||||||||||||||||||||||
| Home equity | 57 | 62 | 163 | 30 | --- | --- | ||||||||||||||||||
| Total accruing loans delinquent more than 90 days | 57 | 62 | 163 | 30 | --- | --- | ||||||||||||||||||
| Real estate owned | 5,925 | 3,701 | 5,484 | --- | --- | --- | ||||||||||||||||||
| Repossessed automobiles, recreational vehicles | 92 | 78 | 130 | 44 | 16 | 26 | ||||||||||||||||||
| Total non-performing assets | $ | 7,975 | $ | 10,081 | $ | 13,068 | $ | 2,532 | $ | 199 | $ | 255 | ||||||||||||
| Restructured loans | $ | 1,538 | $ | 1,538 | $ | --- | $ | --- | $ | --- | $ | --- | ||||||||||||
| Total non-performing assets as a percentage of total assets | 2.92 | % | 3.45 | % | 4.64 | % | 0.99 | % | 0.08 | % | 0.10 | % | ||||||||||||
Exhibit I-13
1st Security Bank of Washington
Deposit Composition
| December 31, | ||||||||||||||||||||||||||||||||
| June 30, 2011 | 2010 | 2009 | 2008 | |||||||||||||||||||||||||||||
| Amount | Percent of Total | Amount | Percent of Total | Amount | Percent of Total | Amount | Percent of Total | |||||||||||||||||||||||||
| (Dollars in thousands) | ||||||||||||||||||||||||||||||||
| Transactions and Savings Deposits: | ||||||||||||||||||||||||||||||||
| Interest-bearing checking | $ | 17,303 | 7.16 | % | $ | 19,458 | 7.98 | % | $ | 22,764 | 9.86 | % | $ | 13,928 | 6.45 | % | ||||||||||||||||
| Noninterest-bearing checking | 17,212 | 7.13 | 18,547 | 7.58 | 25,126 | 10.88 | 20,072 | 9.29 | ||||||||||||||||||||||||
| Savings | 12,118 | 5.02 | 12,961 | 5.31 | 16,858 | 7.30 | 26,312 | 12.18 | ||||||||||||||||||||||||
| Money market | 88,930 | 36.83 | 81,470 | 33.40 | 53,611 | 23.21 | 55,799 | 25.83 | ||||||||||||||||||||||||
| Total transaction and savings deposits | 135,563 | 56.14 | 132,436 | 54.27 | 118,359 | 51.25 | 116,111 | 53.75 | ||||||||||||||||||||||||
| Certificates: | ||||||||||||||||||||||||||||||||
| 0.00 – 1.99% | 71,617 | 29.66 | 74,366 | 30.49 | 38,303 | 16.58 | 114 | 0.05 | ||||||||||||||||||||||||
| 2.00 – 3.99% | 31,051 | 12.86 | 33,006 | 13.53 | 59,618 | 25.81 | 64,901 | 30.04 | ||||||||||||||||||||||||
| 4.00 – 5.99% | 3,023 | 1.25 | 3,720 | 1.53 | 14,290 | 6.18 | 34,435 | 15.93 | ||||||||||||||||||||||||
| 6.00 – 7.99% | --- | --- | --- | --- | 18 | 0.01 | 130 | 0.06 | ||||||||||||||||||||||||
| 8.00 – 9.99% | 221 | 0.09 | 429 | 0.18 | 397 | 0.17 | 365 | 0.17 | ||||||||||||||||||||||||
| 10.00 and over | --- | --- | --- | --- | --- | --- | --- | --- | ||||||||||||||||||||||||
| Total certificates | 105,912 | 43.86 | 111,521 | 45.73 | 112,626 | 48.75 | 99,945 | 46.25 | ||||||||||||||||||||||||
| Total deposits | $ | 241,475 | 100.00 | % | $ | 243,957 | 100.00 | % | $ | 230,985 | 100.00 | % | $ | 216,056 | 100.00 | % | ||||||||||||||||
Exhibit I-14
1st Security Bank of Washington
CDs by Rate and Maturity
0.00- 1.99% | 2.00- 3.99% | 4.00- 5.99% | 6.00- 7.99% | 8.00- 9.99% | 10.00% or greater | Total | Percent of Total | |||||||||||||||||||||||||
(Dollars in thousands) | ||||||||||||||||||||||||||||||||
Certificate accounts maturing in quarter ending: | ||||||||||||||||||||||||||||||||
| September 30, 2011 | $ | 15,621 | $ | 1,394 | $ | 157 | $ | --- | $ | 181 | $ | --- | $ | 17,353 | 16.38 | % | ||||||||||||||||
| December 31, 2011 | 6,700 | 1,263 | 1,583 | --- | 34 | --- | 9,580 | 9.05 | ||||||||||||||||||||||||
| March 31, 2012 | 6,646 | 434 | 293 | --- | 6 | --- | 7,379 | 6.97 | ||||||||||||||||||||||||
| June 30, 2012 | 8,975 | 7,374 | 9 | --- | --- | --- | 16,358 | 15.44 | ||||||||||||||||||||||||
| September 30, 2012 | 11,668 | 133 | 14 | --- | --- | --- | 11,815 | 11.16 | ||||||||||||||||||||||||
| December 31, 2012 | 18,910 | 1,079 | 385 | --- | --- | --- | 20,374 | 19.24 | ||||||||||||||||||||||||
| March 31, 2013 | 576 | 423 | 80 | --- | --- | --- | 1,079 | 1.02 | ||||||||||||||||||||||||
| June 30, 2013 | 1,149 | 81 | --- | --- | --- | --- | 1,230 | 1.16 | ||||||||||||||||||||||||
| September 30, 2013 | 127 | 766 | 128 | --- | --- | --- | 1,021 | 0.96 | ||||||||||||||||||||||||
| December 31, 2013 | 192 | 1,819 | 203 | --- | --- | --- | 2,214 | 2.09 | ||||||||||||||||||||||||
| March 31, 2014 | 206 | 322 | 171 | --- | --- | --- | 699 | 0.66 | ||||||||||||||||||||||||
| June 30, 2014 | 339 | 432 | --- | --- | --- | --- | 771 | 0.73 | ||||||||||||||||||||||||
| Thereafter | 508 | 15,531 | --- | --- | --- | --- | 16,039 | 15.14 | ||||||||||||||||||||||||
| Total | $ | 71,617 | $ | 31,051 | $ | 3,023 | $ | --- | $ | 221 | $ | --- | $ | 105,912 | 100.00 | % | ||||||||||||||||
| Percent of total | 67.62 | % | 29.32 | % | 2.85 | % | --- | % | 0.21 | % | --- | % | 100.00 | % | ||||||||||||||||||
Exhibit I-15
1st Security Bank of Washington
Borrowing Activity
Six Months Ended June 30, | Years Ended December 31, | |||||||||||||||||||
| 2011 | 2010 | 2010 | 2009 | 2008 | ||||||||||||||||
| (Dollars in thousands) | ||||||||||||||||||||
| Maximum balance: | ||||||||||||||||||||
| Federal Home Loan Bank advances | $ | 21,900 | $ | 15,900 | $ | 23,900 | $ | 11,900 | $ | 30,400 | ||||||||||
| Fed Funds Purchased | $ | --- | $ | --- | $ | --- | $ | 600 | $ | 897 | ||||||||||
| Federal Reserve Bank | $ | --- | $ | 15,000 | $ | 37,000 | $ | 30,000 | $ | --- | ||||||||||
| Average balances: | ||||||||||||||||||||
| Federal Home Loan Bank advances | $ | 4,099 | $ | 5,535 | $ | 4,879 | $ | 6,404 | $ | 10,796 | ||||||||||
Fed Funds Purchased | $ | --- | $ | --- | $ | --- | $ | 5 | $ | 4 | ||||||||||
| Federal Reserve Bank | $ | --- | $ | 4,602 | $ | 2,620 | $ | 10,027 | $ | --- | ||||||||||
| Weighted average interest rate: | ||||||||||||||||||||
| Federal Home Loan Bank advances | 4.29 | % | 4.37 | % | 4.31 | % | 4.13 | % | 3.97 | % | ||||||||||
Fed Funds Purchased | --- | % | --- | % | --- | % | 1.27 | % | 3.37 | % | ||||||||||
| Federal Reserve Bank | --- | % | 0.26 | % | 0.29 | % | 0.25 | % | --- | % | ||||||||||
| June 30, 2011 | December 31, | |||||||||||||||
| 2010 | 2009 | 2008 | ||||||||||||||
| (Dollars in thousands) | ||||||||||||||||
| Balance outstanding at end of period: | ||||||||||||||||
| Federal Home Loan Bank advances | $ | 3,900 | $ | 21,900 | $ | 5,900 | $ | 9,400 | ||||||||
| Fed Funds Purchased | --- | --- | --- | --- | ||||||||||||
Federal Reserve Bank | --- | --- | 20,000 | --- | ||||||||||||
| Total borrowings | $ | 3,900 | $ | 21,900 | $ | 25,900 | $ | 9,400 | ||||||||
| Weighted average interest rate of: | ||||||||||||||||
Federal Home Loan Bank advances | 4.49 | % | 1.42 | % | 4.41 | % | 3.00 | % | ||||||||
| Fed Funds Purchased | --- | --- | --- | --- | ||||||||||||
Federal Reserve Bank | --- | --- | 0.25 | % | --- | |||||||||||
Exhibit II-1
1st Security Bank of Washington
Description of Office Facilities
| Location | Square Footage | Owned or Leased | Lease Expiration Date | Net Book Value at June 30, 2011 | |||||||||||
| (In thousands) | |||||||||||||||
| Canyon Park | 2,997 | Leased | May 2015(1) | $ | 27 | ||||||||||
22020 17th Ave SE, Suite 100 Bothell, WA 98021 | |||||||||||||||
| Edmonds | 1,080 | Owned | --- | 319 | |||||||||||
620 Edmonds Way Edmonds, WA 98020 | |||||||||||||||
| Lynnwood | 3,000 | Leased | June 2020 | 236 | |||||||||||
19002 33rd Ave W Lynnwood, WA 98036 | |||||||||||||||
| Mountlake Terrace (Admin) | 39,535 | Owned | --- | 3,436 | |||||||||||
6920 220th St SW Mountlake Terrace, WA 98043 | |||||||||||||||
| Poulsbo | 2,223 | Owned | --- | 2,988 | |||||||||||
21650 Market Place Poulsbo, WA 98370 | |||||||||||||||
| Puyallup | 2,474 | Owned | --- | 1,503 | |||||||||||
307 W Stewart St Puyallup, WA 98371 | |||||||||||||||
| Overlake | 2,331 | Leased | June 2016(2) | 394 | |||||||||||
14808 NE 24th St, Suite D Redmond, WA 98052 | |||||||||||||||
(1) Lease provides for one five-year renewal.
(2) Lease provides for two five-year renewals.
Exhibit II-2
Historical Interest Rates (1)
| Prime | 90 Day | One Year | 10 Year | |||||||||||||||
Year/Qtr. Ended | Rate | T-Bill | T-Bill | T-Bond | ||||||||||||||
| 2003: | Quarter 1 | 4.25 | % | 1.14 | % | 1.19 | % | 3.83 | % | |||||||||
| Quarter 2 | 4.00 | % | 0.90 | % | 1.09 | % | 3.54 | % | ||||||||||
| Quarter 3 | 4.00 | % | 0.95 | % | 1.15 | % | 3.96 | % | ||||||||||
| Quarter 4 | 4.00 | % | 0.95 | % | 1.26 | % | 4.27 | % | ||||||||||
| 2004: | Quarter 1 | 4.00 | % | 0.95 | % | 1.20 | % | 3.86 | % | |||||||||
| Quarter 2 | 4.00 | % | 1.33 | % | 2.09 | % | 4.62 | % | ||||||||||
| Quarter 3 | 4.75 | % | 1.70 | % | 2.16 | % | 4.12 | % | ||||||||||
| Quarter 4 | 5.25 | % | 2.22 | % | 2.75 | % | 4.24 | % | ||||||||||
| 2005: | Quarter 1 | 5.75 | % | 2.80 | % | 3.43 | % | 4.51 | % | |||||||||
| Quarter 2 | 6.00 | % | 3.12 | % | 3.51 | % | 3.98 | % | ||||||||||
| Quarter 3 | 6.75 | % | 3.55 | % | 4.01 | % | 4.34 | % | ||||||||||
| Quarter 4 | 7.25 | % | 4.08 | % | 4.38 | % | 4.39 | % | ||||||||||
| 2006: | Quarter 1 | 7.75 | % | 4.63 | % | 4.82 | % | 4.86 | % | |||||||||
| Quarter 2 | 8.25 | % | 5.01 | % | 5.21 | % | 5.15 | % | ||||||||||
| Quarter 3 | 8.25 | % | 4.88 | % | 4.91 | % | 4.64 | % | ||||||||||
| Quarter 4 | 8.25 | % | 5.02 | % | 5.00 | % | 4.71 | % | ||||||||||
| 2007: | Quarter 1 | 8.25 | % | 5.04 | % | 4.90 | % | 4.65 | % | |||||||||
| Quarter 2 | 8.25 | % | 4.82 | % | 4.91 | % | 5.03 | % | ||||||||||
| Quarter 3 | 7.75 | % | 3.82 | % | 4.05 | % | 4.59 | % | ||||||||||
| Quarter 4 | 7.25 | % | 3.36 | % | 3.34 | % | 3.91 | % | ||||||||||
| 2008: | Quarter 1 | 5.25 | % | 1.38 | % | 1.55 | % | 3.45 | % | |||||||||
| Quarter 2 | 5.00 | % | 1.90 | % | 2.36 | % | 3.99 | % | ||||||||||
| Quarter 3 | 5.00 | % | 0.92 | % | 1.78 | % | 3.85 | % | ||||||||||
| Quarter 4 | 3.25 | % | 0.11 | % | 0.37 | % | 2.25 | % | ||||||||||
| 2009: | Quarter 1 | 3.25 | % | 0.21 | % | 0.57 | % | 2.71 | % | |||||||||
| Quarter 2 | 3.25 | % | 0.19 | % | 0.56 | % | 3.53 | % | ||||||||||
| Quarter 3 | 3.25 | % | 0.14 | % | 0.40 | % | 3.31 | % | ||||||||||
| Quarter 4 | 3.25 | % | 0.06 | % | 0.47 | % | 3.85 | % | ||||||||||
| 2010: | Quarter 1 | 3.25 | % | 0.16 | % | 0.41 | % | 3.84 | % | |||||||||
| Quarter 2 | 3.25 | % | 0.18 | % | 0.32 | % | 2.97 | % | ||||||||||
| Quarter 3 | 3.25 | % | 0.16 | % | 0.27 | % | 2.53 | % | ||||||||||
| Quarter 4 | 3.25 | % | 0.12 | % | 0.29 | % | 3.30 | % | ||||||||||
| 2011: | Quarter 1 | 3.25 | % | 0.09 | % | 0.30 | % | 3.47 | % | |||||||||
| Quarter 2 | 3.25 | % | 0.03 | % | 0.19 | % | 3.18 | % | ||||||||||
| September 2, 2011 | 3.25 | % | 0.02 | % | 0.10 | % | 2.02 | % | ||||||||||
| (1) End of period data. | ||||||||||||||||||
| Source: SNL Financial, LC. | ||||||||||||||||||
EXHIBIT II-3
1st Security Bank of Washington
Market Area Demographic/Economic Information
| Demographic Summary: US | ||||||||||||||||||||
Base 2000 | Current 2010 | Projected 2015 | % Change 2000 - 2010 | % Change 2010 - 2015 | ||||||||||||||||
| Total Population (actual) | 281,421,906 | 311,212,863 | 323,209,391 | 10.59 | 3.85 | |||||||||||||||
| 0-14 Age Group (%) | 21.41 | 20.08 | 20.13 | 3.73 | 4.12 | |||||||||||||||
| 15-34 Age Group (%) | 28.10 | 27.22 | 26.97 | 7.13 | 2.89 | |||||||||||||||
| 35-54 Age Group (%) | 29.43 | 28.03 | 26.02 | 5.33 | (3.60 | ) | ||||||||||||||
| 55-69 Age Group (%) | 12.01 | 15.54 | 17.31 | 43.07 | 15.64 | |||||||||||||||
| 70+ Age Group (%) | 9.05 | 9.12 | 9.57 | 11.52 | 8.98 | |||||||||||||||
| Median Age (actual) | 35.30 | 37.00 | 37.30 | 4.82 | 0.81 | |||||||||||||||
| Female Population (actual) | 143,368,343 | 158,066,879 | 164,008,125 | 10.25 | 3.76 | |||||||||||||||
| Male Population (actual) | 138,053,563 | 153,145,984 | 159,201,266 | 10.93 | 3.95 | |||||||||||||||
| Population Density (#/ sq miles) | 79.52 | 88.00 | 91.40 | 10.59 | 3.85 | |||||||||||||||
| Diversity Index (actual) | 54.60 | 61.00 | 63.40 | 11.72 | 3.93 | |||||||||||||||
| Black (%) | 12.32 | 12.47 | 12.47 | 11.95 | 3.92 | |||||||||||||||
| Asian (%) | 3.64 | 4.52 | 4.93 | 37.44 | 13.25 | |||||||||||||||
| White (%) | 75.14 | 71.93 | 70.71 | 5.86 | 2.10 | |||||||||||||||
| Hispanic (%) | 12.55 | 16.23 | 17.80 | 43.08 | 13.90 | |||||||||||||||
| Pacific Islander (%) | 0.14 | 0.16 | 0.16 | 26.20 | 2.93 | |||||||||||||||
| American Indian/Alaska Native (%) | 0.88 | 0.94 | 0.95 | 18.14 | 4.63 | |||||||||||||||
| Multiple races (%) | 2.43 | 2.99 | 3.22 | 36.35 | 11.72 | |||||||||||||||
| Other (%) | 5.46 | 6.99 | 7.55 | 41.57 | 12.29 | |||||||||||||||
| Population 25+ w/ Education Attainment (actual) | 182,211,639 | 205,370,648 | NA | 12.71 | NA | |||||||||||||||
| < 9th Grade (%) | 7.55 | 6.26 | NA | (6.48 | ) | NA | ||||||||||||||
| Some High School (%) | 12.05 | 8.49 | NA | (20.61 | ) | NA | ||||||||||||||
| High School Graduate (%) | 28.63 | 29.55 | NA | 16.35 | NA | |||||||||||||||
| Some College (%) | 21.05 | 19.91 | NA | 6.61 | NA | |||||||||||||||
| Associate Degree (%) | 6.32 | 7.75 | NA | 38.19 | NA | |||||||||||||||
| Bachelors Degree (%) | 15.54 | 17.67 | NA | 28.15 | NA | |||||||||||||||
| Graduate Degree (%) | 8.86 | 10.36 | NA | 31.85 | NA | |||||||||||||||
| Total Households (actual) | 105,480,101 | 116,761,140 | 121,359,604 | 10.69 | 3.94 | |||||||||||||||
| < $25K Households (%) | 28.67 | 20.78 | 17.21 | (19.76 | ) | (13.94 | ) | |||||||||||||
| $25-49K Households (%) | 29.34 | 24.73 | 19.96 | (6.70 | ) | (16.10 | ) | |||||||||||||
| $50-99K Households (%) | 29.70 | 35.65 | 38.10 | 32.90 | 11.08 | |||||||||||||||
| $100-$199K Households (%) | 9.92 | 15.35 | 20.29 | 71.27 | 37.39 | |||||||||||||||
| $200K+ Households (%) | 2.37 | 3.48 | 4.43 | 62.64 | 32.30 | |||||||||||||||
| < 25K Disposable Inc. Households (%) | NA | 25.14 | NA | NA | NA | |||||||||||||||
| $25-49K Disposable Inc. Households (%) | NA | 31.81 | NA | NA | NA | |||||||||||||||
| $50-99K Disposable Inc. Households (%) | NA | 32.05 | NA | NA | NA | |||||||||||||||
| $100-199K Disposable Inc. Households (%) | NA | 9.07 | NA | NA | NA | |||||||||||||||
| $200K+ Disposable Inc. Households (%) | NA | 1.92 | NA | NA | NA | |||||||||||||||
| Average Household Income ($) | 56,644 | 70,173 | 79,340 | 23.88 | 13.06 | |||||||||||||||
| Median Household Income ($) | 42,164 | 54,442 | 61,189 | 29.12 | 12.39 | |||||||||||||||
| Per Capita Income ($) | 21,587 | 26,739 | 30,241 | 23.87 | 13.10 | |||||||||||||||
| < $35K Net Worth HHs (%) | NA | 34.96 | NA | NA | NA | |||||||||||||||
| $35-99K Net Worth HHs (%) | NA | 16.38 | NA | NA | NA | |||||||||||||||
| $100-249K Net Worth HHs (%) | NA | 19.13 | NA | NA | NA | |||||||||||||||
| $250-499K Net Worth HHs (%) | NA | 12.97 | NA | NA | NA | |||||||||||||||
| $500K+ Net Worth HHs (%) | NA | 16.56 | NA | NA | NA | |||||||||||||||
| Median Household Net Worth ($) | NA | 93,084 | NA | NA | NA | |||||||||||||||
| Average Household Net Worth ($) | NA | 418,865 | NA | NA | NA | |||||||||||||||
| Total Owner Occupied Housing Units (actual) | 69,815,753 | 76,868,769 | 80,072,859 | 10.10 | 4.17 | |||||||||||||||
| < $100K in Value HUs (%) | 44.57 | 27.39 | 21.82 | (32.34 | ) | (17.01 | ) | |||||||||||||
| $100-199K in Value HUs (%) | 35.18 | 34.48 | 31.82 | 7.91 | (3.86 | ) | ||||||||||||||
| $200-299K in Value HUs (%) | 11.17 | 17.08 | 18.53 | 68.27 | 13.06 | |||||||||||||||
| $300-499K in Value HUs (%) | 6.12 | 12.49 | 15.57 | 124.59 | 29.83 | |||||||||||||||
| $500-749K in Value HUs (%) | 1.71 | 5.07 | 6.11 | 226.81 | 25.56 | |||||||||||||||
| $750-999K in Value HUs (%) | 0.60 | 2.10 | 3.25 | 283.43 | 61.43 | |||||||||||||||
| $1M+ in Value HUs (%) | 0.64 | 1.39 | 2.89 | 140.29 | 115.95 | |||||||||||||||
| Renter Occupied Housing Units (actual) | 35,664,348 | 39,892,371 | 41,286,745 | 11.86 | 3.50 | |||||||||||||||
| Vacant Occupied Housing Units (actual) | 10,424,540 | 15,846,596 | 18,246,660 | 52.01 | 15.15 | |||||||||||||||
| Unemployment Rate (%) | 5.8 | 10.8 | 8.8 | 107.37 | (15.44 | ) | ||||||||||||||
Source: ESRI
Demographic data is provided by ESRI based primarily on US Census data. For non-census year data, ESRI uses samples and projections to estimate the demographic data. SNL performs calculations on the underlying data provided by ESRI for some of the data presented on this page.
Copyright 2011, SNL Financial LC
| Demographic Summary: Washington | ||||||||||||||||||||
Base 2000 | Current 2010 | Projected 2015 | % Change 2000 - 2010 | % Change 2010 - 2015 | ||||||||||||||||
| Total Population (actual) | 5,894,121 | 6,756,150 | 7,175,641 | 14.63 | 6.21 | |||||||||||||||
| 0-14 Age Group (%) | 21.29 | 19.60 | 19.69 | 5.53 | 6.65 | |||||||||||||||
| 15-34 Age Group (%) | 28.15 | 27.61 | 27.39 | 12.43 | 5.34 | |||||||||||||||
| 35-54 Age Group (%) | 30.90 | 28.58 | 26.42 | 6.01 | (1.80 | ) | ||||||||||||||
| 55-69 Age Group (%) | 11.41 | 15.89 | 17.57 | 59.53 | 17.48 | |||||||||||||||
| 70+ Age Group (%) | 8.24 | 8.32 | 8.94 | 15.71 | 14.04 | |||||||||||||||
| Median Age (actual) | 35.30 | 37.10 | 37.30 | 5.10 | 0.54 | |||||||||||||||
| Female Population (actual) | 2,959,821 | 3,394,873 | 3,606,961 | 14.70 | 6.25 | |||||||||||||||
| Male Population (actual) | 2,934,300 | 3,361,277 | 3,568,680 | 14.55 | 6.17 | |||||||||||||||
| Population Density (#/ sq miles) | 88.57 | 101.50 | 107.80 | 14.63 | 6.21 | |||||||||||||||
| Diversity Index (actual) | 42.00 | 50.60 | 53.80 | 20.48 | 6.32 | |||||||||||||||
| Black (%) | 3.23 | 3.61 | 3.75 | 28.12 | 10.46 | |||||||||||||||
| Asian (%) | 5.47 | 6.92 | 7.68 | 45.00 | 17.94 | |||||||||||||||
| White (%) | 81.81 | 77.68 | 75.99 | 8.84 | 3.90 | |||||||||||||||
| Hispanic (%) | 7.49 | 10.61 | 11.91 | 62.41 | 19.23 | |||||||||||||||
| Pacific Islander (%) | 0.41 | 0.47 | 0.47 | 33.49 | 5.80 | |||||||||||||||
| American Indian/Alaska Native (%) | 1.58 | 1.66 | 1.65 | 20.26 | 5.58 | |||||||||||||||
| Multiple races (%) | 3.62 | 4.34 | 4.63 | 37.40 | 13.34 | |||||||||||||||
| Other (%) | 3.88 | 5.32 | 5.81 | 56.88 | 16.17 | |||||||||||||||
| Population 25+ w/ Education Attainment (actual) | 3,827,507 | 4,503,749 | NA | 17.67 | NA | |||||||||||||||
| < 9th Grade (%) | 4.32 | 4.25 | NA | 15.86 | NA | |||||||||||||||
| Some High School (%) | 8.60 | 6.37 | NA | (12.83 | ) | NA | ||||||||||||||
| High School Graduate (%) | 24.91 | 24.75 | NA | 16.90 | NA | |||||||||||||||
| Some College (%) | 26.41 | 24.03 | NA | 7.07 | NA | |||||||||||||||
| Associate Degree (%) | 8.03 | 9.83 | NA | 44.02 | NA | |||||||||||||||
| Bachelors Degree (%) | 18.41 | 19.83 | NA | 26.71 | NA | |||||||||||||||
| Graduate Degree (%) | 9.32 | 10.94 | NA | 38.17 | NA | |||||||||||||||
| Total Households (actual) | 2,271,398 | 2,611,662 | 2,777,964 | 14.98 | 6.37 | |||||||||||||||
| < $25K Households (%) | 24.73 | 17.52 | 13.69 | (18.55 | ) | (16.90 | ) | |||||||||||||
| $25-49K Households (%) | 29.66 | 22.77 | 17.55 | (11.76 | ) | (18.00 | ) | |||||||||||||
| $50-99K Households (%) | 33.05 | 39.20 | 38.77 | 36.39 | 5.21 | |||||||||||||||
| $100-$199K Households (%) | 10.39 | 17.39 | 25.74 | 92.37 | 57.48 | |||||||||||||||
| $200K+ Households (%) | 2.17 | 3.13 | 4.25 | 65.82 | 44.36 | |||||||||||||||
| < 25K Disposable Inc. Households (%) | NA | 20.46 | NA | NA | NA | |||||||||||||||
| $25-49K Disposable Inc. Households (%) | NA | 29.81 | NA | NA | NA | |||||||||||||||
| $50-99K Disposable Inc. Households (%) | NA | 36.81 | NA | NA | NA | |||||||||||||||
| $100-199K Disposable Inc. Households (%) | NA | 10.96 | NA | NA | NA | |||||||||||||||
| $200K+ Disposable Inc. Households (%) | NA | 1.96 | NA | NA | NA | |||||||||||||||
| Average Household Income ($) | 58,653 | 73,128 | 84,725 | 24.68 | 15.86 | |||||||||||||||
| Median Household Income ($) | 45,770 | 60,311 | 68,768 | 31.77 | 14.02 | |||||||||||||||
| Per Capita Income ($) | 22,973 | 28,691 | 33,252 | 24.89 | 15.90 | |||||||||||||||
| < $35K Net Worth HHs (%) | NA | 32.38 | NA | NA | NA | |||||||||||||||
| $35-99K Net Worth HHs (%) | NA | 15.34 | NA | NA | NA | |||||||||||||||
| $100-249K Net Worth HHs (%) | NA | 18.47 | NA | NA | NA | |||||||||||||||
| $250-499K Net Worth HHs (%) | NA | 15.11 | NA | NA | NA | |||||||||||||||
| $500K+ Net Worth HHs (%) | NA | 18.70 | NA | NA | NA | |||||||||||||||
| Median Household Net Worth ($) | NA | 112,030 | NA | NA | NA | |||||||||||||||
| Average Household Net Worth ($) | NA | 447,397 | NA | NA | NA | |||||||||||||||
| Total Owner Occupied Housing Units (actual) | 1,467,009 | 1,674,990 | 1,784,225 | 14.18 | 6.52 | |||||||||||||||
| < $100K in Value HUs (%) | 21.05 | 8.30 | 5.87 | (55.01 | ) | (24.67 | ) | |||||||||||||
| $100-199K in Value HUs (%) | 45.69 | 24.97 | 16.22 | (37.61 | ) | (30.81 | ) | |||||||||||||
| $200-299K in Value HUs (%) | 19.28 | 26.94 | 24.70 | 59.48 | (2.32 | ) | ||||||||||||||
| $300-499K in Value HUs (%) | 10.11 | 23.96 | 30.85 | 170.71 | 37.17 | |||||||||||||||
| $500-749K in Value HUs (%) | 2.43 | 10.56 | 10.75 | 396.74 | 8.44 | |||||||||||||||
| $750-999K in Value HUs (%) | 0.75 | 3.25 | �� | 7.31 | 394.18 | 139.52 | ||||||||||||||
| $1M+ in Value HUs (%) | 0.69 | 2.03 | 4.30 | 237.39 | 125.73 | |||||||||||||||
| Renter Occupied Housing Units (actual) | 804,389 | 936,672 | 993,739 | 16.45 | 6.09 | |||||||||||||||
| Vacant Occupied Housing Units (actual) | 179,677 | 258,462 | 290,566 | 43.85 | 12.42 | |||||||||||||||
| Unemployment Rate (%) | 6.2 | 9.9 | 8.3 | 85.86 | (12.37 | ) | ||||||||||||||
Source: ESRI
Demographic data is provided by ESRI based primarily on US Census data. For non-census year data, ESRI uses samples and projections to estimate the demographic data. SNL performs calculations on the underlying data provided by ESRI for some of the data presented on this page.
% Change values are calculated using the underlying actual data.
| Demographic Summary: Snohomish, WA | ||||||||||||||||||||
Base 2000 | Current 2010 | Projected 2015 | % Change 2000 - 2010 | % Change 2010 - 2015 | ||||||||||||||||
| Total Population (actual) | 606,024 | 712,514 | 757,883 | 17.57 | 6.37 | |||||||||||||||
| 0-14 Age Group (%) | 22.90 | 21.16 | 21.26 | 8.64 | 6.87 | |||||||||||||||
| 15-34 Age Group (%) | 27.66 | 26.97 | 26.91 | 14.64 | 6.15 | |||||||||||||||
| 35-54 Age Group (%) | 32.62 | 30.51 | 28.15 | 9.96 | (1.84 | ) | ||||||||||||||
| 55-69 Age Group (%) | 10.21 | 14.59 | 16.31 | 68.05 | 18.91 | |||||||||||||||
| 70+ Age Group (%) | 6.61 | 6.77 | 7.36 | 20.40 | 15.63 | |||||||||||||||
| Median Age (actual) | 34.60 | 36.30 | 36.30 | 4.91 | 0.00 | |||||||||||||||
| Female Population (actual) | 302,815 | 357,116 | 380,586 | 17.93 | 6.57 | |||||||||||||||
| Male Population (actual) | 303,209 | 355,398 | 377,297 | 17.21 | 6.16 | |||||||||||||||
| Population Density (#/ sq miles) | 290.09 | 341.10 | 362.80 | 17.57 | 6.37 | |||||||||||||||
| Diversity Index (actual) | 32.90 | 45.30 | 49.20 | 37.69 | 8.61 | |||||||||||||||
| Black (%) | 1.67 | 2.55 | 2.87 | 79.31 | 19.79 | |||||||||||||||
| Asian (%) | 5.78 | 8.55 | 9.72 | 73.82 | 20.98 | |||||||||||||||
| White (%) | 85.63 | 79.55 | 77.44 | 9.23 | 3.55 | |||||||||||||||
| Hispanic (%) | 4.72 | 7.99 | 9.26 | 99.12 | 23.21 | |||||||||||||||
| Pacific Islander (%) | 0.28 | 0.37 | 0.37 | 55.13 | 5.03 | |||||||||||||||
| American Indian/Alaska Native (%) | 1.36 | 1.48 | 1.48 | 28.23 | 6.19 | |||||||||||||||
| Multiple races (%) | 3.36 | 4.35 | 4.69 | 52.24 | 14.75 | |||||||||||||||
| Other (%) | 1.92 | 3.15 | 3.43 | 93.17 | 15.77 | |||||||||||||||
| Population 25+ w/ Education Attainment (actual) | 388,997 | 468,863 | NA | 20.53 | NA | |||||||||||||||
| < 9th Grade (%) | 2.60 | 2.63 | NA | 22.23 | NA | |||||||||||||||
| Some High School (%) | 8.22 | 6.15 | NA | (9.78 | ) | NA | ||||||||||||||
| High School Graduate (%) | 25.91 | 26.45 | NA | 23.06 | NA | |||||||||||||||
| Some College (%) | 29.73 | 26.21 | NA | 6.28 | NA | |||||||||||||||
| Associate Degree (%) | 9.09 | 10.85 | NA | 43.74 | NA | |||||||||||||||
| Bachelors Degree (%) | 17.55 | 19.33 | NA | 32.79 | NA | |||||||||||||||
| Graduate Degree (%) | 6.90 | 8.37 | NA | 46.14 | NA | |||||||||||||||
| Total Households (actual) | 224,852 | 268,239 | 286,226 | 19.30 | 6.71 | |||||||||||||||
| < $25K Households (%) | 17.89 | 11.80 | 8.64 | (21.30 | ) | (21.92 | ) | |||||||||||||
| $25-49K Households (%) | 28.13 | 19.25 | 13.72 | (18.34 | ) | (23.96 | ) | |||||||||||||
| $50-99K Households (%) | 39.73 | 42.59 | 40.28 | 27.88 | 0.91 | |||||||||||||||
| $100-$199K Households (%) | 12.54 | 23.43 | 33.41 | 122.90 | 52.19 | |||||||||||||||
| $200K+ Households (%) | 1.72 | 2.93 | 3.95 | 103.66 | 44.11 | |||||||||||||||
| < 25K Disposable Inc. Households (%) | NA | 14.12 | NA | NA | NA | |||||||||||||||
| $25-49K Disposable Inc. Households (%) | NA | 27.98 | NA | 1,153.58 | NA | |||||||||||||||
| $50-99K Disposable Inc. Households (%) | NA | 42.41 | NA | NA | NA | |||||||||||||||
| $100-199K Disposable Inc. Households (%) | NA | 13.64 | NA | NA | NA | |||||||||||||||
| $200K+ Disposable Inc. Households (%) | NA | 1.85 | NA | NA | NA | |||||||||||||||
| Average Household Income ($) | 62,386 | 79,981 | 91,618 | 28.20 | 14.55 | |||||||||||||||
| Median Household Income ($) | 53,219 | 68,912 | 79,010 | 29.49 | 14.65 | |||||||||||||||
| Per Capita Income ($) | 23,417 | 30,372 | 34,880 | 29.70 | 14.84 | |||||||||||||||
| < $35K Net Worth HHs (%) | NA | 25.83 | NA | NA | NA | |||||||||||||||
| $35-99K Net Worth HHs (%) | NA | 15.17 | NA | NA | NA | |||||||||||||||
| $100-249K Net Worth HHs (%) | NA | 19.76 | NA | NA | NA | |||||||||||||||
| $250-499K Net Worth HHs (%) | NA | 18.16 | NA | NA | NA | |||||||||||||||
| $500K+ Net Worth HHs (%) | NA | 21.08 | NA | NA | NA | |||||||||||||||
| Median Household Net Worth ($) | NA | 156,028 | NA | NA | NA | |||||||||||||||
| Average Household Net Worth ($) | NA | 487,194 | NA | NA | NA | |||||||||||||||
| Total Owner Occupied Housing Units (actual) | 152,382 | 180,654 | 193,143 | 18.55 | 6.91 | |||||||||||||||
| < $100K in Value HUs (%) | 9.12 | 6.62 | 5.09 | (13.89 | ) | (17.78 | ) | |||||||||||||
| $100-199K in Value HUs (%) | 48.02 | 11.54 | 7.28 | (71.51 | ) | (32.59 | ) | |||||||||||||
| $200-299K in Value HUs (%) | 29.57 | 29.54 | 18.56 | 18.43 | (32.81 | ) | ||||||||||||||
| $300-499K in Value HUs (%) | 10.88 | 36.56 | 45.81 | 298.58 | 33.95 | |||||||||||||||
| $500-749K in Value HUs (%) | 1.74 | 11.74 | 12.85 | 698.87 | 17.01 | |||||||||||||||
| $750-999K in Value HUs (%) | 0.34 | 2.70 | 7.40 | 836.66 | 192.77 | |||||||||||||||
| $1M+ in Value HUs (%) | 0.34 | 1.29 | 3.01 | 353.29 | 148.82 | |||||||||||||||
| Renter Occupied Housing Units (actual) | 72,470 | 87,585 | 93,083 | 20.86 | 6.28 | |||||||||||||||
| Vacant Occupied Housing Units (actual) | 11,353 | 18,045 | 23,607 | 58.94 | 30.82 | |||||||||||||||
| Unemployment Rate (%) | 5.0 | 8.9 | 7.5 | 112.57 | (12.28 | ) | ||||||||||||||
Source: ESRI
Demographic data is provided by ESRI based primarily on US Census data. For non-census year data, ESRI uses samples and projections to estimate the demographic data. SNL performs calculations on the underlying data provided by ESRI for some of the data presented on this page.
% Change values are calculated using the underlying actual data.
| Demographic Summary: King, WA | ||||||||||||||||||||
Base 2000 | Current 2010 | Projected 2015 | % Change 2000 - 2010 | % Change 2010 - 2015 | ||||||||||||||||
| Total Population (actual) | 1,737,034 | 1,936,894 | 2,053,695 | 11.51 | 6.03 | |||||||||||||||
| 0-14 Age Group (%) | 18.79 | 17.68 | 17.66 | 4.90 | 5.89 | |||||||||||||||
| 15-34 Age Group (%) | 29.90 | 28.24 | 28.41 | 5.33 | 6.66 | |||||||||||||||
| 35-54 Age Group (%) | 32.70 | 30.85 | 28.40 | 5.20 | (2.38 | ) | ||||||||||||||
| 55-69 Age Group (%) | 10.81 | 15.35 | 17.02 | 58.38 | 17.54 | |||||||||||||||
| 70+ Age Group (%) | 7.80 | 7.88 | 8.51 | 12.55 | 14.61 | |||||||||||||||
| Median Age (actual) | 35.70 | 37.80 | 37.90 | 5.88 | 0.26 | |||||||||||||||
| Female Population (actual) | 872,577 | 972,845 | 1,031,604 | 11.49 | 6.04 | |||||||||||||||
| Male Population (actual) | 864,457 | 964,049 | 1,022,091 | 11.52 | 6.02 | |||||||||||||||
| Population Density (#/ sq miles) | 817.04 | 911.00 | 966.00 | 11.51 | 6.03 | |||||||||||||||
| Diversity Index (actual) | 47.30 | 56.40 | 59.90 | 19.24 | 6.21 | |||||||||||||||
| Black (%) | 5.40 | 6.01 | 6.23 | 23.90 | 10.03 | |||||||||||||||
| Asian (%) | 10.81 | 13.88 | 15.58 | 43.15 | 19.03 | |||||||||||||||
| White (%) | 75.73 | 70.05 | 67.44 | 3.14 | 2.07 | |||||||||||||||
| Hispanic (%) | 5.48 | 8.23 | 9.39 | 67.44 | 20.96 | |||||||||||||||
| Pacific Islander (%) | 0.52 | 0.61 | 0.61 | 31.98 | 6.17 | |||||||||||||||
| American Indian/Alaska Native (%) | 0.92 | 0.93 | 0.92 | 12.85 | 4.73 | |||||||||||||||
| Multiple races (%) | 4.06 | 4.80 | 5.11 | 31.79 | 13.05 | |||||||||||||||
| Other (%) | 2.56 | 3.73 | 4.11 | 62.35 | 16.88 | |||||||||||||||
| Population 25+ w/ Education Attainment (actual) | 1,188,740 | 1,341,522 | NA | 12.85 | NA | |||||||||||||||
| < 9th Grade (%) | 3.42 | 3.44 | NA | 13.31 | NA | |||||||||||||||
| Some High School (%) | 6.31 | 4.70 | NA | (15.94 | ) | NA | ||||||||||||||
| High School Graduate (%) | 19.17 | 18.26 | NA | 7.48 | NA | |||||||||||||||
| Some College (%) | 23.62 | 20.83 | NA | (0.48 | ) | NA | ||||||||||||||
| Associate Degree (%) | 7.51 | 8.43 | NA | 26.61 | NA | |||||||||||||||
| Bachelors Degree (%) | 26.62 | 28.24 | NA | 19.70 | NA | |||||||||||||||
| Graduate Degree (%) | 13.33 | 16.10 | NA | 36.29 | NA | |||||||||||||||
| Total Households (actual) | 710,916 | 797,056 | 846,777 | 12.12 | 6.24 | |||||||||||||||
| < $25K Households (%) | 19.98 | 13.55 | 9.67 | (23.99 | ) | (24.14 | ) | |||||||||||||
| $25-49K Households (%) | 26.51 | 17.15 | 11.96 | (27.46 | ) | (25.91 | ) | |||||||||||||
| $50-99K Households (%) | 34.79 | 38.26 | 35.11 | 23.29 | (2.51 | ) | ||||||||||||||
| $100-$199K Households (%) | 14.92 | 24.57 | 34.73 | 84.64 | 50.18 | |||||||||||||||
| $200K+ Households (%) | 3.81 | 6.48 | 8.53 | 90.89 | 39.89 | |||||||||||||||
| < 25K Disposable Inc. Households (%) | NA | 15.84 | NA | NA | NA | |||||||||||||||
| $25-49K Disposable Inc. Households (%) | NA | 23.11 | NA | 742.10 | NA | |||||||||||||||
| $50-99K Disposable Inc. Households (%) | NA | 40.14 | NA | NA | NA | |||||||||||||||
| $100-199K Disposable Inc. Households (%) | NA | 16.92 | NA | NA | NA | |||||||||||||||
| $200K+ Disposable Inc. Households (%) | NA | 3.99 | NA | NA | NA | |||||||||||||||
| Average Household Income ($) | 71,101 | 92,740 | 108,808 | 30.43 | 17.33 | |||||||||||||||
| Median Household Income ($) | 53,383 | 75,693 | 88,138 | 41.79 | 16.44 | |||||||||||||||
| Per Capita Income ($) | 29,521 | 38,562 | 45,291 | 30.63 | 17.45 | |||||||||||||||
| < $35K Net Worth HHs (%) | NA | 29.64 | NA | NA | NA | |||||||||||||||
| $35-99K Net Worth HHs (%) | NA | 14.32 | NA | NA | NA | |||||||||||||||
| $100-249K Net Worth HHs (%) | NA | 15.72 | NA | NA | NA | |||||||||||||||
| $250-499K Net Worth HHs (%) | NA | 14.26 | NA | NA | NA | |||||||||||||||
| $500K+ Net Worth HHs (%) | NA | 26.07 | NA | NA | NA | |||||||||||||||
| Median Household Net Worth ($) | NA | 144,117 | NA | NA | NA | |||||||||||||||
| Average Household Net Worth ($) | NA | 633,686 | NA | NA | NA | |||||||||||||||
| Total Owner Occupied Housing Units (actual) | 425,436 | 471,278 | 500,866 | 10.78 | 6.28 | |||||||||||||||
| < $100K in Value HUs (%) | 6.74 | 4.23 | 3.07 | (30.45 | ) | (22.95 | ) | |||||||||||||
| $100-199K in Value HUs (%) | 34.39 | 11.65 | 6.56 | (62.46 | ) | (40.15 | ) | |||||||||||||
| $200-299K in Value HUs (%) | 30.08 | 22.31 | 15.81 | (17.86 | ) | (24.68 | ) | |||||||||||||
| $300-499K in Value HUs (%) | 20.00 | 32.38 | 34.80 | 79.37 | 14.21 | |||||||||||||||
| $500-749K in Value HUs (%) | 5.49 | 18.93 | 17.92 | 282.29 | 0.62 | |||||||||||||||
| $750-999K in Value HUs (%) | 1.78 | 6.02 | 13.14 | 274.21 | 131.81 | |||||||||||||||
| $1M+ in Value HUs (%) | 1.52 | 4.47 | 8.70 | 226.32 | 106.73 | |||||||||||||||
| Renter Occupied Housing Units (actual) | 285,480 | 325,778 | 345,911 | 14.12 | 6.18 | |||||||||||||||
| Vacant Occupied Housing Units (actual) | 31,321 | 58,439 | 61,667 | 86.58 | 5.52 | |||||||||||||||
| Unemployment Rate (%) | 4.5 | 7.7 | 6.5 | 95.25 | (12.49 | ) | ||||||||||||||
Source: ESRI
Demographic data is provided by ESRI based primarily on US Census data. For non-census year data, ESRI uses samples and projections to estimate the demographic data. SNL performs calculations on the underlying data provided by ESRI for some of the data presented on this page.
% Change values are calculated using the underlying actual data.
| Demographic Summary: Pierce, WA | ||||||||||||||||||||
Base 2000 | Current 2010 | Projected 2015 | % Change 2000 - 2010 | % Change 2010 - 2015 | ||||||||||||||||
| Total Population (actual) | 700,820 | 812,577 | 860,874 | 15.95 | 5.94 | |||||||||||||||
| 0-14 Age Group (%) | 22.65 | 20.61 | 20.80 | 5.51 | 6.90 | |||||||||||||||
| 15-34 Age Group (%) | 28.76 | 28.58 | 28.28 | 15.24 | 4.80 | |||||||||||||||
| 35-54 Age Group (%) | 30.39 | 28.35 | 26.16 | 8.16 | (2.23 | ) | ||||||||||||||
| 55-69 Age Group (%) | 10.87 | 14.86 | 16.62 | 58.50 | 18.48 | |||||||||||||||
| 70+ Age Group (%) | 7.33 | 7.60 | 8.15 | 20.18 | 13.62 | |||||||||||||||
| Median Age (actual) | 34.10 | 35.60 | 35.70 | 4.40 | 0.28 | |||||||||||||||
| Female Population (actual) | 352,263 | 409,045 | 433,658 | 16.12 | 6.02 | |||||||||||||||
| Male Population (actual) | 348,557 | 403,532 | 427,216 | 15.77 | 5.87 | |||||||||||||||
| Population Density (#/ sq miles) | 417.43 | 484.00 | 512.80 | 15.95 | 5.94 | |||||||||||||||
| Diversity Index (actual) | 44.30 | 51.30 | 53.90 | 15.80 | 5.07 | |||||||||||||||
| Black (%) | 6.95 | 7.02 | 7.00 | 17.10 | 5.61 | |||||||||||||||
| Asian (%) | 5.08 | 5.90 | 6.34 | 34.82 | 13.70 | |||||||||||||||
| White (%) | 78.39 | 75.33 | 74.17 | 11.43 | 4.31 | |||||||||||||||
| Hispanic (%) | 5.51 | 8.44 | 9.70 | 77.54 | 21.73 | |||||||||||||||
| Pacific Islander (%) | 0.85 | 0.95 | 0.95 | 30.21 | 6.28 | |||||||||||||||
| American Indian/Alaska Native (%) | 1.42 | 1.53 | 1.56 | 24.90 | 7.76 | |||||||||||||||
| Multiple races (%) | 5.11 | 6.01 | 6.40 | 36.32 | 12.77 | |||||||||||||||
| Other (%) | 2.20 | 3.25 | 3.58 | 71.21 | 16.92 | |||||||||||||||
| Population 25+ w/ Education Attainment (actual) | 442,665 | 528,814 | NA | 19.46 | NA | |||||||||||||||
| < 9th Grade (%) | 3.36 | 3.05 | NA | 8.38 | NA | |||||||||||||||
| Some High School (%) | 9.77 | 7.04 | NA | (13.94 | ) | NA | ||||||||||||||
| High School Graduate (%) | 29.78 | 30.12 | NA | 20.84 | NA | |||||||||||||||
| Some College (%) | 28.42 | 25.99 | NA | 9.25 | NA | |||||||||||||||
| Associate Degree (%) | 8.08 | 10.56 | NA | 56.26 | NA | |||||||||||||||
| Bachelors Degree (%) | 13.68 | 15.35 | NA | 34.07 | NA | |||||||||||||||
| Graduate Degree (%) | 6.92 | 7.89 | NA | 36.21 | NA | |||||||||||||||
| Total Households (actual) | 260,800 | 304,467 | 323,465 | 16.74 | 6.24 | |||||||||||||||
| < $25K Households (%) | 24.19 | 17.28 | 13.52 | (16.59 | ) | (16.90 | ) | |||||||||||||
| $25-49K Households (%) | 30.99 | 23.91 | 18.06 | (9.94 | ) | (19.73 | ) | |||||||||||||
| $50-99K Households (%) | 34.39 | 41.92 | 42.77 | 42.31 | 8.39 | |||||||||||||||
| $100-$199K Households (%) | 8.90 | 15.28 | 23.34 | 100.45 | 62.33 | |||||||||||||||
| $200K+ Households (%) | 1.53 | 1.61 | 2.31 | 22.91 | 51.81 | |||||||||||||||
| < 25K Disposable Inc. Households (%) | NA | 19.99 | NA | NA | NA | |||||||||||||||
| $25-49K Disposable Inc. Households (%) | NA | 32.28 | NA | 1,659.74 | NA | |||||||||||||||
| $50-99K Disposable Inc. Households (%) | NA | 37.81 | NA | NA | NA | |||||||||||||||
| $100-199K Disposable Inc. Households (%) | NA | 8.88 | NA | NA | NA | |||||||||||||||
| $200K+ Disposable Inc. Households (%) | NA | 1.02 | NA | NA | NA | |||||||||||||||
| Average Household Income ($) | 54,972 | 66,677 | 76,622 | 21.29 | 14.92 | |||||||||||||||
| Median Household Income ($) | 45,197 | 57,879 | 65,288 | 28.06 | 12.80 | |||||||||||||||
| Per Capita Income ($) | 20,948 | 25,542 | 29,389 | 21.93 | 15.06 | |||||||||||||||
| < $35K Net Worth HHs (%) | NA | 33.95 | NA | NA | NA | |||||||||||||||
| $35-99K Net Worth HHs (%) | NA | 15.86 | NA | NA | NA | |||||||||||||||
| $100-249K Net Worth HHs (%) | NA | 19.03 | NA | NA | NA | |||||||||||||||
| $250-499K Net Worth HHs (%) | NA | 15.59 | NA | NA | NA | |||||||||||||||
| $500K+ Net Worth HHs (%) | NA | 15.57 | NA | NA | NA | |||||||||||||||
| Median Household Net Worth ($) | NA | 100,911 | NA | NA | NA | |||||||||||||||
| Average Household Net Worth ($) | NA | 367,197 | NA | NA | NA | |||||||||||||||
| Total Owner Occupied Housing Units (actual) | 165,598 | 192,241 | 204,923 | 16.09 | 6.60 | |||||||||||||||
| < $100K in Value HUs (%) | 20.31 | 7.85 | 5.68 | (55.10 | ) | (22.98 | ) | |||||||||||||
| $100-199K in Value HUs (%) | 58.26 | 28.31 | 16.19 | (43.59 | ) | (39.05 | ) | |||||||||||||
| $200-299K in Value HUs (%) | 13.72 | 33.99 | 31.91 | 187.59 | 0.05 | |||||||||||||||
| $300-499K in Value HUs (%) | 6.03 | 20.10 | 31.26 | 286.95 | 65.79 | |||||||||||||||
| $500-749K in Value HUs (%) | 1.11 | 6.60 | 7.42 | 593.06 | 19.92 | |||||||||||||||
| $750-999K in Value HUs (%) | 0.22 | 2.19 | 5.19 | 1,047.81 | 152.96 | |||||||||||||||
| $1M+ in Value HUs (%) | 0.36 | 0.96 | 2.37 | 213.56 | 162.16 | |||||||||||||||
| Renter Occupied Housing Units (actual) | 95,202 | 112,226 | 118,542 | 17.88 | 5.63 | |||||||||||||||
| Vacant Occupied Housing Units (actual) | 16,260 | 26,072 | 31,536 | 60.34 | 20.96 | |||||||||||||||
| Unemployment Rate (%) | 6.5 | 12.0 | 10.1 | 113.24 | (12.84 | ) | ||||||||||||||
Source: ESRI
Demographic data is provided by ESRI based primarily on US Census data. For non-census year data, ESRI uses samples and projections to estimate the demographic data. SNL performs calculations on the underlying data provided by ESRI for some of the data presented on this page.
% Change values are calculated using the underlying actual data.
| Demographic Summary: Kitsap, WA | ||||||||||||||||||||
Base 2000 | Current 2010 | Projected 2015 | % Change 2000 - 2010 | % Change 2010 - 2015 | ||||||||||||||||
| Total Population (actual) | 231,969 | 247,319 | 251,360 | 6.62 | 1.63 | |||||||||||||||
| 0-14 Age Group (%) | 22.07 | 19.34 | 19.35 | (6.60 | ) | 1.71 | ||||||||||||||
| 15-34 Age Group (%) | 26.77 | 27.38 | 27.44 | 9.04 | 1.85 | |||||||||||||||
| 35-54 Age Group (%) | 31.99 | 27.94 | 25.36 | (6.88 | ) | (7.74 | ) | |||||||||||||
| 55-69 Age Group (%) | 11.40 | 17.03 | 18.59 | 59.27 | 10.97 | |||||||||||||||
| 70+ Age Group (%) | 7.77 | 8.32 | 9.26 | 14.15 | 13.09 | |||||||||||||||
| Median Age (actual) | 35.70 | 37.70 | 37.60 | 5.60 | (0.27 | ) | ||||||||||||||
| Female Population (actual) | 114,459 | 122,447 | 124,492 | 6.98 | 1.67 | |||||||||||||||
| Male Population (actual) | 117,510 | 124,872 | 126,868 | 6.26 | 1.60 | |||||||||||||||
| Population Density (#/ sq miles) | 585.78 | 624.60 | 634.80 | 6.62 | 1.63 | |||||||||||||||
| Diversity Index (actual) | 34.30 | 37.90 | 39.70 | 10.50 | 4.75 | |||||||||||||||
| Black (%) | 2.87 | 2.74 | 2.67 | 1.90 | (1.08 | ) | ||||||||||||||
| Asian (%) | 4.39 | 4.78 | 4.97 | 15.89 | 5.72 | |||||||||||||||
| White (%) | 84.27 | 82.94 | 82.25 | 4.94 | 0.78 | |||||||||||||||
| Hispanic (%) | 4.14 | 5.34 | 5.99 | 37.55 | 13.97 | |||||||||||||||
| Pacific Islander (%) | 0.78 | 0.78 | 0.78 | 6.70 | 1.35 | |||||||||||||||
| American Indian/Alaska Native (%) | 1.62 | 1.66 | 1.68 | 9.49 | 2.28 | |||||||||||||||
| Multiple races (%) | 4.64 | 5.31 | 5.66 | 21.90 | 8.41 | |||||||||||||||
| Other (%) | 1.43 | 1.79 | 2.00 | 33.54 | 13.74 | |||||||||||||||
| Population 25+ w/ Education Attainment (actual) | 148,704 | 164,369 | NA | 10.53 | NA | |||||||||||||||
| < 9th Grade (%) | 2.18 | 2.23 | NA | 12.95 | NA | |||||||||||||||
| Some High School (%) | 7.05 | 5.38 | NA | (15.67 | ) | NA | ||||||||||||||
| High School Graduate (%) | 25.42 | 24.55 | NA | 6.75 | NA | |||||||||||||||
| Some College (%) | 30.97 | 28.08 | NA | 0.24 | NA | |||||||||||||||
| Associate Degree (%) | 9.05 | 11.36 | NA | 38.80 | NA | |||||||||||||||
| Bachelors Degree (%) | 17.00 | 18.32 | NA | 19.11 | NA | |||||||||||||||
| Graduate Degree (%) | 8.33 | 10.08 | NA | 33.71 | NA | |||||||||||||||
| Total Households (actual) | 86,416 | 93,321 | 95,148 | 7.99 | 1.96 | |||||||||||||||
| < $25K Households (%) | 22.50 | 16.09 | 12.49 | (22.79 | ) | (20.82 | ) | |||||||||||||
| $25-49K Households (%) | 31.01 | 24.21 | 18.19 | (15.68 | ) | (23.38 | ) | |||||||||||||
| $50-99K Households (%) | 34.86 | 41.72 | 42.17 | 29.22 | 3.07 | |||||||||||||||
| $100-$199K Households (%) | 9.82 | 16.11 | 24.47 | 77.10 | 54.86 | |||||||||||||||
| $200K+ Households (%) | 1.81 | 1.88 | 2.68 | 12.02 | 45.32 | |||||||||||||||
| < 25K Disposable Inc. Households (%) | NA | 19.05 | NA | NA | NA | |||||||||||||||
| $25-49K Disposable Inc. Households (%) | NA | 32.69 | NA | 1,715.80 | NA | |||||||||||||||
| $50-99K Disposable Inc. Households (%) | NA | 37.48 | NA | NA | NA | |||||||||||||||
| $100-199K Disposable Inc. Households (%) | NA | 9.60 | NA | NA | NA | |||||||||||||||
| $200K+ Disposable Inc. Households (%) | NA | 1.18 | NA | NA | NA | |||||||||||||||
| Average Household Income ($) | 57,892 | 68,589 | 79,076 | 18.48 | 15.29 | |||||||||||||||
| Median Household Income ($) | 46,848 | 60,066 | 66,635 | 28.21 | 10.94 | |||||||||||||||
| Per Capita Income ($) | 22,317 | 26,450 | 30,570 | 18.52 | 15.58 | |||||||||||||||
| < $35K Net Worth HHs (%) | NA | 31.08 | NA | NA | NA | |||||||||||||||
| $35-99K Net Worth HHs (%) | NA | 15.11 | NA | NA | NA | |||||||||||||||
| $100-249K Net Worth HHs (%) | NA | 19.52 | NA | NA | NA | |||||||||||||||
| $250-499K Net Worth HHs (%) | NA | 16.01 | NA | NA | NA | |||||||||||||||
| $500K+ Net Worth HHs (%) | NA | 18.28 | NA | NA | NA | |||||||||||||||
| Median Household Net Worth ($) | NA | 120,365 | NA | NA | NA | |||||||||||||||
| Average Household Net Worth ($) | NA | 409,989 | NA | NA | NA | |||||||||||||||
| Total Owner Occupied Housing Units (actual) | 58,279 | 62,483 | 63,813 | 7.21 | 2.13 | |||||||||||||||
| < $100K in Value HUs (%) | 20.76 | 6.26 | 4.03 | (67.66 | ) | (34.27 | ) | |||||||||||||
| $100-199K in Value HUs (%) | 52.21 | 28.58 | 15.61 | (41.31 | ) | (44.22 | ) | |||||||||||||
| $200-299K in Value HUs (%) | 14.88 | 29.83 | 27.06 | 114.88 | (7.37 | ) | ||||||||||||||
| $300-499K in Value HUs (%) | 8.87 | 19.25 | 30.20 | 132.71 | 60.20 | |||||||||||||||
| $500-749K in Value HUs (%) | 2.23 | 10.05 | 10.08 | 383.15 | 2.40 | |||||||||||||||
| $750-999K in Value HUs (%) | 0.71 | 4.18 | 8.00 | 534.47 | 95.33 | |||||||||||||||
| $1M+ in Value HUs (%) | 0.33 | 1.84 | 5.02 | 491.75 | 179.27 | |||||||||||||||
| Renter Occupied Housing Units (actual) | 28,137 | 30,838 | 31,335 | 9.60 | 1.61 | |||||||||||||||
| Vacant Occupied Housing Units (actual) | 6,228 | 9,126 | 11,223 | 46.53 | 22.98 | |||||||||||||||
| Unemployment Rate (%) | 6.0 | 9.1 | 7.6 | 78.11 | (16.21 | ) | ||||||||||||||
Source: ESRI
Demographic data is provided by ESRI based primarily on US Census data. For non-census year data, ESRI uses samples and projections to estimate the demographic data. SNL performs calculations on the underlying data provided by ESRI for some of the data presented on this page.
% Change values are calculated using the underlying actual data.
EXHIBIT II-4
1st Security Bank of Washington
Market Area Employment Data by Sector
Market Area Employment Data by Sector
| CA25N Total full-time and part-time employment by NAICS industry 1/ | |||||||
| Bureau of Economic Analysis |
| Fips | Area | LineCode | Description | 2006 | 2007 | 2008 | 2009 | |||||||||||||||
| 53000 | Washington | Employment by place of work (number of jobs) | ||||||||||||||||||||
| 53000 | Washington | 10 | Total employment | 3796256 | 3924717 | 3957397 | 3826315 | |||||||||||||||
| 53000 | Washington | By type | ||||||||||||||||||||
| 53000 | Washington | 20 | Wage and salary employment | 3080441 | 3154787 | 3190631 | 3053450 | |||||||||||||||
| 53000 | Washington | 40 | Proprietors employment | 715815 | 769930 | 766766 | 772865 | |||||||||||||||
| 53000 | Washington | 50 | Farm proprietors employment | 30089 | 34673 | 34699 | 34522 | |||||||||||||||
| 53000 | Washington | 60 | Nonfarm proprietors employment 2/ | 685726 | 735257 | 732067 | 738343 | |||||||||||||||
| 53000 | Washington | By industry | ||||||||||||||||||||
| 53000 | Washington | 70 | Farm employment | 73585 | 74835 | 81862 | 85042 | |||||||||||||||
| 53000 | Washington | 80 | Nonfarm employment | 3722671 | 3849882 | 3875535 | 3741273 | |||||||||||||||
| 53000 | Washington | 90 | Private employment | 3117932 | 3240026 | 3249059 | 3110993 | |||||||||||||||
| 53000 | Washington | 100 | Forestry, fishing, and related activities | 38057 | 37946 | 37471 | 37867 | |||||||||||||||
| 53000 | Washington | 200 | Mining | 6080 | 6541 | 7174 | 7962 | |||||||||||||||
| 53000 | Washington | 300 | Utilities | 5035 | 5116 | 5521 | 5699 | |||||||||||||||
| 53000 | Washington | 400 | Construction | 263070 | 279311 | 268459 | 223603 | |||||||||||||||
| 53000 | Washington | 500 | Manufacturing | 300974 | 310531 | 307369 | 280888 | |||||||||||||||
| 53000 | Washington | 600 | Wholesale trade | 138603 | 142365 | 143533 | 136087 | |||||||||||||||
| 53000 | Washington | 700 | Retail trade | 403892 | 407545 | 402933 | 382284 | |||||||||||||||
| 53000 | Washington | 800 | Transportation and warehousing | 112540 | 116622 | 115478 | 109355 | |||||||||||||||
| 53000 | Washington | 900 | Information | 108853 | 113462 | 116527 | 114740 | |||||||||||||||
| 53000 | Washington | 1000 | Finance and insurance | 149727 | 156044 | 160405 | 163586 | |||||||||||||||
| 53000 | Washington | 1100 | Real estate and rental and leasing | 174634 | 185403 | 183176 | 179197 | |||||||||||||||
| 53000 | Washington | 1200 | Professional, scientific, and technical services | 247353 | 270712 | 280267 | 274503 | |||||||||||||||
| 53000 | Washington | 1300 | Management of companies and enterprises | 34964 | 36030 | 36167 | 33644 | |||||||||||||||
| 53000 | Washington | 1400 | Administrative and waste management services | 195377 | 202261 | 195836 | 179429 | |||||||||||||||
| 53000 | Washington | 1500 | Educational services | 63537 | 64480 | 67039 | 67569 | |||||||||||||||
| 53000 | Washington | 1600 | Health care and social assistance | 349308 | 361738 | 373702 | 383507 | |||||||||||||||
| 53000 | Washington | 1700 | Arts, entertainment, and recreation | 84657 | 88787 | 91679 | 91311 | |||||||||||||||
| 53000 | Washington | 1800 | Accommodation and food services | 245227 | 252948 | 254747 | 242668 | |||||||||||||||
| 53000 | Washington | 1900 | Other services, except public administration | 196044 | 202184 | 201576 | 197094 | |||||||||||||||
| 53000 | Washington | 2000 | Government and government enterprises | 604739 | 609856 | 626476 | 630280 | |||||||||||||||
| 53000 | Washington | 2001 | Federal, civilian | 69335 | 68733 | 70075 | 72866 | |||||||||||||||
| 53000 | Washington | 2002 | Military | 77001 | 77285 | 81110 | 81107 | |||||||||||||||
| 53000 | Washington | 2010 | State and local | 458403 | 463838 | 475291 | 476307 | |||||||||||||||
| 53000 | Washington | 2011 | State government | 146217 | 147837 | 151634 | 151380 | |||||||||||||||
| 53000 | Washington | 2012 | Local government | 312186 | 316001 | 323657 | 324927 | |||||||||||||||
| Legend / Footnotes: | |||||||
| 1/ The estimates of employment for 2001-2006 are based on the 2002 North American Industry Classification System (NAICS). The estimates for 2007 forward are based on the 2007 NAICS. | |||||||
| 2/ Excludes limited partners. | |||||||
| Last updated: April 21, 2011 |
| CA25N Total full-time and part-time employment by NAICS industry 1/ | |||||||
| Bureau of Economic Analysis |
| Fips | Area | LineCode | Description | 2006 | 2007 | 2008 | 2009 | |||||||||||||||
| 53061 | Snohomish | Employment by place of work (number of jobs) | ||||||||||||||||||||
| 53061 | Snohomish | 10 | Total employment | 316283 | 339900 | 340272 | 326310 | |||||||||||||||
| 53061 | Snohomish | By type | ||||||||||||||||||||
| 53061 | Snohomish | 20 | Wage and salary employment | 257541 | 276537 | 277421 | 263179 | |||||||||||||||
| 53061 | Snohomish | 40 | Proprietors employment | 58742 | 63363 | 62851 | 63131 | |||||||||||||||
| 53061 | Snohomish | 50 | Farm proprietors employment | 1326 | 1526 | 1518 | 1511 | |||||||||||||||
| 53061 | Snohomish | 60 | Nonfarm proprietors employment 2/ | 57416 | 61837 | 61333 | 61620 | |||||||||||||||
| 53061 | Snohomish | By industry | ||||||||||||||||||||
| 53061 | Snohomish | 70 | Farm employment | 1996 | 2118 | 2147 | 2139 | |||||||||||||||
| 53061 | Snohomish | 80 | Nonfarm employment | 314287 | 337782 | 338125 | 324171 | |||||||||||||||
| 53061 | Snohomish | 90 | Private employment | 270045 | 293465 | 292590 | 278029 | |||||||||||||||
| 53061 | Snohomish | 100 | Forestry, fishing, and related activities | 1374 | 1297 | 1301 | 1194 | |||||||||||||||
| 53061 | Snohomish | 200 | Mining | 391 | 440 | 488 | 568 | |||||||||||||||
| 53061 | Snohomish | 300 | Utilities | 129 | 156 | 170 | 163 | |||||||||||||||
| 53061 | Snohomish | 400 | Construction | 28680 | 32168 | 29581 | 24271 | |||||||||||||||
| 53061 | Snohomish | 500 | Manufacturing | 51507 | 56424 | 57783 | 55002 | |||||||||||||||
| 53061 | Snohomish | 600 | Wholesale trade | 8856 | 9804 | 9706 | 9531 | |||||||||||||||
| 53061 | Snohomish | 700 | Retail trade | 37703 | 39512 | 39827 | 37189 | |||||||||||||||
| 53061 | Snohomish | 800 | Transportation and warehousing | 5192 | 5697 | 5584 | 5369 | |||||||||||||||
| 53061 | Snohomish | 900 | Information | 5889 | 6647 | 6247 | 5708 | |||||||||||||||
| 53061 | Snohomish | 1000 | Finance and insurance | 13047 | 13852 | 13937 | 13991 | |||||||||||||||
| 53061 | Snohomish | 1100 | Real estate and rental and leasing | 13955 | 15011 | 14696 | 14310 | |||||||||||||||
| 53061 | Snohomish | 1200 | Professional, scientific, and technical services | 15100 | 17298 | 17740 | 17319 | |||||||||||||||
| 53061 | Snohomish | 1300 | Management of companies and enterprises | 1532 | 1673 | 1673 | 1681 | |||||||||||||||
| 53061 | Snohomish | 1400 | Administrative and waste management services | 15498 | 17728 | 16777 | 15199 | |||||||||||||||
| 53061 | Snohomish | 1500 | Educational services | 3682 | 3816 | 3762 | 4008 | |||||||||||||||
| 53061 | Snohomish | 1600 | Health care and social assistance | 24913 | 26673 | 27833 | 28548 | |||||||||||||||
| 53061 | Snohomish | 1700 | Arts, entertainment, and recreation | 6279 | 6800 | 7140 | 7188 | |||||||||||||||
| 53061 | Snohomish | 1800 | Accommodation and food services | 19854 | 21184 | 21051 | 19900 | |||||||||||||||
| 53061 | Snohomish | 1900 | Other services, except public administration | 16464 | 17285 | 17294 | 16890 | |||||||||||||||
| 53061 | Snohomish | 2000 | Government and government enterprises | 44242 | 44317 | 45535 | 46142 | |||||||||||||||
| 53061 | Snohomish | 2001 | Federal, civilian | 2344 | 2338 | 2322 | 2348 | |||||||||||||||
| 53061 | Snohomish | 2002 | Military | 7359 | 7098 | 6894 | 6750 | |||||||||||||||
| 53061 | Snohomish | 2010 | State and local | 34539 | 34881 | 36319 | 37044 | |||||||||||||||
| 53061 | Snohomish | 2011 | State government | 5398 | 5315 | 5530 | 5551 | |||||||||||||||
| 53061 | Snohomish | 2012 | Local government | 29141 | 29566 | 30789 | 31493 | |||||||||||||||
| Legend / Footnotes: | |||||||
| 1/ The estimates of employment for 2001-2006 are based on the 2002 North American Industry Classification System (NAICS). The estimates for 2007 forward are based on the 2007 NAICS. | |||||||
| 2/ Excludes limited partners. | |||||||
| Last updated: April 21, 2011 |
| CA25N Total full-time and part-time employment by NAICS industry 1/ | |||||||
| Bureau of Economic Analysis |
| Fips | Area | LineCode | Description | 2006 | 2007 | 2008 | 2009 | |||||||||||||||
| 53033 | King | Employment by place of work (number of jobs) | ||||||||||||||||||||
| 53033 | King | 10 | Total employment | 1480374 | 1524600 | 1542584 | 1479629 | |||||||||||||||
| 53033 | King | By type | ||||||||||||||||||||
| 53033 | King | 20 | Wage and salary employment | 1222588 | 1246921 | 1265008 | 1198521 | |||||||||||||||
| 53033 | King | 40 | Proprietors employment | 257786 | 277679 | 277576 | 281108 | |||||||||||||||
| 53033 | King | 50 | Farm proprietors employment | 1377 | 1603 | 1599 | 1591 | |||||||||||||||
| 53033 | King | 60 | Nonfarm proprietors employment 2/ | 256409 | 276076 | 275977 | 279517 | |||||||||||||||
| 53033 | King | By industry | ||||||||||||||||||||
| 53033 | King | 70 | Farm employment | 2055 | 2264 | 2422 | 2429 | |||||||||||||||
| 53033 | King | 80 | Nonfarm employment | 1478319 | 1522336 | 1540162 | 1477200 | |||||||||||||||
| 53033 | King | 90 | Private employment | 1307729 | 1350558 | 1364775 | 1300849 | |||||||||||||||
| 53033 | King | 100 | Forestry, fishing, and related activities | 3498 | 3474 | 3542 | 3427 | |||||||||||||||
| 53033 | King | 200 | Mining | 1416 | 1657 | 1860 | 2251 | |||||||||||||||
| 53033 | King | 300 | Utilities | 1019 | 839 | 961 | 1038 | |||||||||||||||
| 53033 | King | 400 | Construction | 89082 | 94642 | 93131 | 75334 | |||||||||||||||
| 53033 | King | 500 | Manufacturing | 118858 | 121609 | 119401 | 110054 | |||||||||||||||
| 53033 | King | 600 | Wholesale trade | 68513 | 69796 | 70925 | 66363 | |||||||||||||||
| 53033 | King | 700 | Retail trade | 137905 | 135374 | 134582 | 127455 | |||||||||||||||
| 53033 | King | 800 | Transportation and warehousing | 54126 | 55835 | 55076 | 51468 | |||||||||||||||
| 53033 | King | 900 | Information | 77784 | 81468 | 85516 | 85621 | |||||||||||||||
| 53033 | King | 1000 | Finance and insurance | 71803 | 73403 | 74890 | 74770 | |||||||||||||||
| 53033 | King | 1100 | Real estate and rental and leasing | 77447 | 80477 | 80005 | 78019 | |||||||||||||||
| 53033 | King | 1200 | Professional, scientific, and technical services | 135546 | 147214 | 153919 | 148128 | |||||||||||||||
| 53033 | King | 1300 | Management of companies and enterprises | 25131 | 25835 | 25795 | 23887 | |||||||||||||||
| 53033 | King | 1400 | Administrative and waste management services | 88624 | 91905 | 89310 | 79007 | |||||||||||||||
| 53033 | King | 1500 | Educational services | 29753 | 30160 | 31678 | 31723 | |||||||||||||||
| 53033 | King | 1600 | Health care and social assistance | 123886 | 127074 | 131689 | 135704 | |||||||||||||||
| 53033 | King | 1700 | Arts, entertainment, and recreation | 38982 | 41022 | 42394 | 42167 | |||||||||||||||
| 53033 | King | 1800 | Accommodation and food services | 94075 | 96615 | 97481 | 93251 | |||||||||||||||
| 53033 | King | 1900 | Other services, except public administration | 70281 | 72159 | 72620 | 71182 | |||||||||||||||
| 53033 | King | 2000 | Government and government enterprises | 170590 | 171778 | 175387 | 176351 | |||||||||||||||
| 53033 | King | 2001 | Federal, civilian | 21394 | 21356 | 21627 | 22136 | |||||||||||||||
| 53033 | King | 2002 | Military | 7110 | 6989 | 7293 | 7440 | |||||||||||||||
| 53033 | King | 2010 | State and local | 142086 | 143433 | 146467 | 146775 | |||||||||||||||
| 53033 | King | �� | 2011 | State government | 55592 | 55866 | 56929 | 57378 | ||||||||||||||
| 53033 | King | 2012 | Local government | 86494 | 87567 | 89538 | 89397 | |||||||||||||||
| Legend / Footnotes: | |||||||
| 1/ The estimates of employment for 2001-2006 are based on the 2002 North American Industry Classification System (NAICS). The estimates for 2007 forward are based on the 2007 NAICS. | |||||||
| 2/ Excludes limited partners. | |||||||
| Last updated: April 21, 2011 |
| CA25N Total full-time and part-time employment by NAICS industry 1/ | |||||||
| Bureau of Economic Analysis |
| Fips | Area | LineCode | Description | 2006 | 2007 | 2008 | 2009 | |||||||||||||||
| 53053 | Pierce | Employment by place of work (number of jobs) | ||||||||||||||||||||
| 53053 | Pierce | 10 | Total employment | 374825 | 391072 | 393176 | 382995 | |||||||||||||||
| 53053 | Pierce | By type | ||||||||||||||||||||
| 53053 | Pierce | 20 | Wage and salary employment | 310724 | 322578 | 325121 | 314495 | |||||||||||||||
| 53053 | Pierce | 40 | Proprietors employment | 64101 | 68494 | 68055 | 68500 | |||||||||||||||
| 53053 | Pierce | 50 | Farm proprietors employment | 1182 | 1336 | 1334 | 1328 | |||||||||||||||
| 53053 | Pierce | 60 | Nonfarm proprietors employment 2/ | 62919 | 67158 | 66721 | 67172 | |||||||||||||||
| 53053 | Pierce | By industry | ||||||||||||||||||||
| 53053 | Pierce | 70 | Farm employment | 1802 | 1866 | 1862 | 1877 | |||||||||||||||
| 53053 | Pierce | 80 | Nonfarm employment | 373023 | 389206 | 391314 | 381118 | |||||||||||||||
| 53053 | Pierce | 90 | Private employment | 288255 | 302560 | 299266 | 286061 | |||||||||||||||
| 53053 | Pierce | 100 | Forestry, fishing, and related activities | 1120 | 1033 | 1031 | 1008 | |||||||||||||||
| 53053 | Pierce | 200 | Mining | 374 | 440 | 469 | 513 | |||||||||||||||
| 53053 | Pierce | 300 | Utilities | 693 | 741 | 808 | 847 | |||||||||||||||
| 53053 | Pierce | 400 | Construction | 30161 | 32907 | 30641 | 25755 | |||||||||||||||
| 53053 | Pierce | 500 | Manufacturing | 20497 | 20658 | 19909 | 16906 | |||||||||||||||
| 53053 | Pierce | 600 | Wholesale trade | 12000 | 12882 | 12913 | 12417 | |||||||||||||||
| 53053 | Pierce | 700 | Retail trade | 41064 | 42819 | 41771 | 39561 | |||||||||||||||
| 53053 | Pierce | 800 | Transportation and warehousing | 13094 | 13255 | 12900 | 12342 | |||||||||||||||
| 53053 | Pierce | 900 | Information | 4288 | 4263 | 4215 | 3828 | |||||||||||||||
| 53053 | Pierce | 1000 | Finance and insurance | 13047 | 14045 | 14576 | 15106 | |||||||||||||||
| 53053 | Pierce | 1100 | Real estate and rental and leasing | 17300 | 18738 | 18320 | 18299 | |||||||||||||||
| 53053 | Pierce | 1200 | Professional, scientific, and technical services | 15564 | 16831 | 16960 | 17001 | |||||||||||||||
| 53053 | Pierce | 1300 | Management of companies and enterprises | 1254 | 1281 | 1480 | 1265 | |||||||||||||||
| 53053 | Pierce | 1400 | Administrative and waste management services | 19218 | 20262 | 19320 | 18215 | |||||||||||||||
| 53053 | Pierce | 1500 | Educational services | 6883 | 6953 | 7016 | 6992 | |||||||||||||||
| 53053 | Pierce | 1600 | Health care and social assistance | 39081 | 40717 | 41808 | 43105 | |||||||||||||||
| 53053 | Pierce | 1700 | Arts, entertainment, and recreation | 6859 | 7126 | 7374 | 7370 | |||||||||||||||
| 53053 | Pierce | 1800 | Accommodation and food services | 24230 | 25147 | 25355 | 23794 | |||||||||||||||
| 53053 | Pierce | 1900 | Other services, except public administration | 21528 | 22462 | 22400 | 21737 | |||||||||||||||
| 53053 | Pierce | 2000 | Government and government enterprises | 84768 | 86646 | 92048 | 95057 | |||||||||||||||
| 53053 | Pierce | 2001 | Federal, civilian | 10534 | 10288 | 10824 | 11748 | |||||||||||||||
| 53053 | Pierce | 2002 | Military | 29551 | 31091 | 34489 | 36606 | |||||||||||||||
| 53053 | Pierce | 2010 | State and local | 44683 | 45267 | 46735 | 46703 | |||||||||||||||
| 53053 | Pierce | 2011 | State government | 11636 | 11856 | 12291 | 12093 | |||||||||||||||
| 53053 | Pierce | 2012 | Local government | 33047 | 33411 | 34444 | 34610 | |||||||||||||||
| Legend / Footnotes: | |||||||
| 1/ The estimates of employment for 2001-2006 are based on the 2002 North American Industry Classification System (NAICS). The estimates for 2007 forward are based on the 2007 NAICS. | |||||||
| 2/ Excludes limited partners. | |||||||
| Last updated: April 21, 2011 |
| CA25N Total full-time and part-time employment by NAICS industry 1/ | |||||||
| Bureau of Economic Analysis |
| Fips | Area | LineCode | Description | 2006 | 2007 | 2008 | 2009 | |||||||||||||||
| 53035 | Kitsap | Employment by place of work (number of jobs) | ||||||||||||||||||||
| 53035 | Kitsap | 10 | Total employment | 127200 | 128084 | 128551 | 124816 | |||||||||||||||
| 53035 | Kitsap | By type | ||||||||||||||||||||
| 53035 | Kitsap | 20 | Wage and salary employment | 101873 | 101206 | 101837 | 97957 | |||||||||||||||
| 53035 | Kitsap | 40 | Proprietors employment | 25327 | 26878 | 26714 | 26859 | |||||||||||||||
| 53035 | Kitsap | 50 | Farm proprietors employment | 528 | 615 | 613 | 610 | |||||||||||||||
| 53035 | Kitsap | 60 | Nonfarm proprietors employment 2/ | 24799 | 26263 | 26101 | 26249 | |||||||||||||||
| 53035 | Kitsap | By industry | ||||||||||||||||||||
| 53035 | Kitsap | 70 | Farm employment | 598 | 669 | 671 | 672 | |||||||||||||||
| 53035 | Kitsap | 80 | Nonfarm employment | 126602 | 127415 | 127880 | 124144 | |||||||||||||||
| 53035 | Kitsap | 90 | Private employment | 86318 | 87639 | 87302 | 83956 | |||||||||||||||
| 53035 | Kitsap | 100 | Forestry, fishing, and related activities | 471 | 469 | 472 | 461 | |||||||||||||||
| 53035 | Kitsap | 200 | Mining | 150 | 181 | 186 | 236 | |||||||||||||||
| 53035 | Kitsap | 300 | Utilities | 159 | 177 | 216 | 224 | |||||||||||||||
| 53035 | Kitsap | 400 | Construction | 8034 | 8485 | 8056 | 6678 | |||||||||||||||
| 53035 | Kitsap | 500 | Manufacturing | 2267 | 2019 | 2022 | 1982 | |||||||||||||||
| 53035 | Kitsap | 600 | Wholesale trade | 2008 | 1927 | 1943 | 1749 | |||||||||||||||
| 53035 | Kitsap | 700 | Retail trade | 15589 | 15352 | 15320 | 14375 | |||||||||||||||
| 53035 | Kitsap | 800 | Transportation and warehousing | 1379 | 1408 | 1465 | 1440 | |||||||||||||||
| 53035 | Kitsap | 900 | Information | 1944 | 1881 | 1843 | 1694 | |||||||||||||||
| 53035 | Kitsap | 1000 | Finance and insurance | 3551 | 3750 | 3826 | 3853 | |||||||||||||||
| 53035 | Kitsap | 1100 | Real estate and rental and leasing | 5777 | 6052 | 5947 | 5829 | |||||||||||||||
| 53035 | Kitsap | 1200 | Professional, scientific, and technical services | 7559 | 8169 | 8231 | 8497 | |||||||||||||||
| 53035 | Kitsap | 1300 | Management of companies and enterprises | 212 | 225 | 207 | 176 | |||||||||||||||
| 53035 | Kitsap | 1400 | Administrative and waste management services | 5837 | 5498 | 5263 | 4858 | |||||||||||||||
| 53035 | Kitsap | 1500 | Educational services | 1760 | 1748 | 1840 | 1827 | |||||||||||||||
| 53035 | Kitsap | 1600 | Health care and social assistance | 12396 | 12927 | 13210 | 13462 | |||||||||||||||
| 53035 | Kitsap | 1700 | Arts, entertainment, and recreation | 2938 | 3094 | 3130 | 3074 | |||||||||||||||
| 53035 | Kitsap | 1800 | Accommodation and food services | 7666 | 7506 | 7499 | 7133 | |||||||||||||||
| 53035 | Kitsap | 1900 | Other services, except public administration | 6621 | 6771 | 6626 | 6408 | |||||||||||||||
| 53035 | Kitsap | 2000 | Government and government enterprises | 40284 | 39776 | 40578 | 40188 | |||||||||||||||
| 53035 | Kitsap | 2001 | Federal, civilian | 15036 | 14772 | 14958 | 15563 | |||||||||||||||
| 53035 | Kitsap | 2002 | Military | 11742 | 11496 | 12196 | 11232 | |||||||||||||||
| 53035 | Kitsap | 2010 | State and local | 13506 | 13508 | 13424 | 13393 | |||||||||||||||
| 53035 | Kitsap | 2011 | State government | 2282 | 2240 | 2293 | 2295 | |||||||||||||||
| 53035 | Kitsap | 2012 | Local government | 11224 | 11268 | 11131 | 11098 | |||||||||||||||
| Legend / Footnotes: | |||||||
| 1/ The estimates of employment for 2001-2006 are based on the 2002 North American Industry Classification System (NAICS). The estimates for 2007 forward are based on the 2007 NAICS. | |||||||
| 2/ Excludes limited partners. | |||||||
| Last updated: April 21, 2011 |
EXHIBIT III-1
1st Security Bank of Washington
General Characteristics of Publicly-Traded Institutions
1st Security Bank of Washington
General Characteristics of Publicly-Traded Institutions
| RP FINANCIAL, LC. | |
| Financial Services Industry Consultants | |
| 1100 North Glebe Road, Suite 1100 | |
| Arlington, Virginia 22201 | |
| (703) 528-1700 |
Exhibit III-l
Characteristics of Publicly-Traded Thrifts
September 2, 2011
| Primary | Operating | Total | Fiscal | Conv. | Stock | Market | ||||||||||||||||||||||||||||
| Ticker | Financial Institution | Exchg. | Market | Strat (1) | Assets (2) | Offices | Year | Date | Price | Value | ||||||||||||||||||||||||
| ($Mil) | ($) | ($Mil) | ||||||||||||||||||||||||||||||||
| California Companies | ||||||||||||||||||||||||||||||||||
| BOFI | Bofi Holding, Inc. Of CA (3) | NASDAQ | San Diego, CA | Thrift | 1,940 | 1 | 06-30 | 03/05 | 14.08 | 147 | ||||||||||||||||||||||||
| PROV | Provident Fin. Holdings of CA (3) | NASDAQ | Riverside, CA | M.B. | 1,315 | 14 | 06-30 | 06/96 | 8.25 | 94 | ||||||||||||||||||||||||
| KFFG | Kaiser Federal Fin Group of CA (3) | NASDAQ | Covina, CA | Thrift | 902 | M | 9 | 06-30 | 11/10 | 11.91 | 114 | |||||||||||||||||||||||
| FPTB | First PacTrust Bancorp of CA (3) | NASDAQ | Chula Vista, CA | Thrift | 882 | 9 | 12-31 | 08/02 | 11.37 | 131 | ||||||||||||||||||||||||
| BYFC | Broadway Financial Corp. of CA (3) | NASDAQ | Los Angeles, CA | Thrift | 447 | 5 | 12-31 | 01/96 | 1.48 | 3 | ||||||||||||||||||||||||
| Florida Companies | ||||||||||||||||||||||||||||||||||
| BKU | BankUnited, Inc. (3) | NYSE | Thrift | 10,846 | 0 | / | 22.97 | 2,234 | ||||||||||||||||||||||||||
| BBX | BankAtlantic Bancorp Inc of FL (3) | NYSE | FortLauderdaleFL | M.B. | 3,864 | 101 | 12-31 | 11/83 | 0.77 | 60 | ||||||||||||||||||||||||
| Mid-Atlantic Companies | ||||||||||||||||||||||||||||||||||
| HCBK | Hudson City Bancorp, Inc of NJ (3) | NASDAQ | Paramus, NJ | Thrift | 51,781 | 135 | 12-31 | 06/05 | 5.77 | 3,039 | ||||||||||||||||||||||||
| NYB | New York Community Bcrp of NY (3) | NYSE | Westbury, NY | Thrift | 40,601 | 281 | 12-31 | 11/93 | 12.07 | 5,280 | ||||||||||||||||||||||||
| AF | Astoria Financial Corp. of NY (3) | NYSE | Lake Success, NY | Thrift | 17,120 | 85 | 12-31 | 11/93 | 9.16 | 902 | ||||||||||||||||||||||||
| ISBC | Investors Bcrp MHC of NJ(43.0) | NASDAQ | Short Hills, NJ | Thrift | 10,206 | 83 | 06-30 | 10/05 | 13.20 | 1,488 | ||||||||||||||||||||||||
| NWBI | Northwest Bancshares Inc of PA (3) | NASDAQ | Warren, PA | Thrift | 8,088 | 172 | 06-30 | 12/09 | 11.23 | 1,160 | ||||||||||||||||||||||||
| PFS | Provident Fin. Serv. Inc of NJ (3) | NYSE | Jersey City, NJ | Thrift | 6,794 | M | 83 | 12-31 | 01/03 | 11.44 | 687 | |||||||||||||||||||||||
| BNCL | Beneficial Mut MHC of PA(43.7) | NASDAQ | Philadelphia, PA | Thrift | 4,712 | 65 | 12-31 | 07/07 | 7.26 | 586 | ||||||||||||||||||||||||
| FFIC | Flushing Fin. Corp. of NY (3) | NASDAQ | Lake Success, NY | Thrift | 4,323 | 19 | 12-31 | 11/95 | 10.61 | 334 | ||||||||||||||||||||||||
| WSFS | WSFS Financial Corp. of DE (3) | NASDAQ | Wilmington, DE | Div. | 4,152 | 38 | 12-31 | 11/86 | 33.62 | 289 | ||||||||||||||||||||||||
| DCOM | Dime Community Bancshars of NY (3) | NASDAQ | Brooklyn, NY | Thrift | 4,093 | 25 | 12-31 | 06/96 | 11.00 | 385 | ||||||||||||||||||||||||
| TRST | TrustCo Bank Corp NY of NY (3) | NASDAQ | Glenville, NY | Thrift | 4,070 | 133 | 12-31 | / | 4.37 | 338 | ||||||||||||||||||||||||
| PBNY | Provident NY Bncrp, Inc. of NY (3) | NASDAQ | Montebello, NY | Thrift | 2,976 | 37 | 09-30 | 01/04 | 6.03 | 229 | ||||||||||||||||||||||||
| KRNY | Kearny Fin Cp MHC of NJ (25.1) | NASDAQ | Fairfield, NJ | Thrift | 2,904 | 40 | 06-30 | 02/05 | 8.20 | 556 | ||||||||||||||||||||||||
| ORIT | Oritani Financial Corp of NJ (3) | NASDAQ | Twnship of WA NJ | Thrift | 2,587 | 23 | 06-30 | 06/10 | 12.01 | 667 | ||||||||||||||||||||||||
| NFBK | Northfield Bcp MHC of NY(43.4) | NASDAQ | Avenel, NY | Thrift | 2,308 | 19 | 12-31 | 11/07 | 12.15 | 515 | ||||||||||||||||||||||||
| OCFC | OceanFirst Fin. Corp of NJ (3) | NASDAQ | Toms River, NJ | Thrift | 2,239 | 23 | 12-31 | 07/96 | 11.25 | 212 | ||||||||||||||||||||||||
| ESBF | ESB Financial Corp. of PA (3) | NASDAQ | Ellwood City, PA | Thrift | 1,968 | 24 | 12-31 | 06/90 | 10.77 | 160 | ||||||||||||||||||||||||
| ROMA | Roma Fin Corp MHC of NJ (26.2) | NASDAQ | Robbinsville, NJ | Thrift | 1,892 | 27 | 12-31 | 07/06 | 8.19 | 248 | ||||||||||||||||||||||||
| PVSA | Parkvale Financial Corp of PA (3) | NASDAQ | Monroeville, PA | Thrift | 1,801 | M | 47 | 06-30 | 07/87 | 17.80 | 99 | |||||||||||||||||||||||
| ABBC | Abington Bancorp, Inc. of PA (3) | NASDAQ | Jenkintown, PA | Thrift | 1,177 | 20 | 12-31 | 06/07 | 7.86 | 159 | ||||||||||||||||||||||||
| CSBK | Clifton Svg Bp MHC of NJ(35.8) | NASDAQ | Clifton, NJ | Thrift | 1,135 | 12 | 03-31 | 03/04 | 9.50 | 248 | ||||||||||||||||||||||||
| ESSA | ESSA Bancorp, Inc. of PA (3) | NASDAQ | Stroudsburg, PA | Thrift | 1,103 | 18 | 09-30 | 04/07 | 10.76 | 134 | ||||||||||||||||||||||||
| FXCB | Fox Chase Bancorp, Inc. of PA (3) | NASDAQ | Hatboro, PA | Thrift | 1,088 | 11 | 12-31 | 06/10 | 12.20 | 178 | ||||||||||||||||||||||||
| CBNJ | Cape Bancorp, Inc. of NJ (3) | NASDAQ | Cape My Ct Hs, NJ | Thrift | 1,068 | 17 | 12-31 | 02/08 | 7.60 | 101 | ||||||||||||||||||||||||
| BFED | Beacon Federal Bancorp of NY (3) | NASDAQ | East Syracuse NY | Thrift | 1,041 | 8 | 12-31 | 10/07 | 13.50 | 86 | ||||||||||||||||||||||||
| SVBI | Severn Bancorp, Inc. of MD (3) | NASDAQ | Annapolis, MD | Thrift | 937 | 4 | 12-31 | / | 3.03 | 31 | ||||||||||||||||||||||||
| OSHC | Ocean Shore Holding Co. of NJ (3) | NASDAQ | Ocean City, NJ | Thrift | 860 | 10 | 12-31 | 12/09 | 11.05 | 81 | ||||||||||||||||||||||||
| HARL | Harleysville Svgs Fin Cp of PA (3) | NASDAQ | Harleysville, PA | Thrift | 858 | 8 | 09-30 | 08/87 | 14.10 | 53 | ||||||||||||||||||||||||
| THRD | TF Fin. Corp. of Newtown PA (3) | NASDAQ | Newtown, PA | Thrift | 692 | 14 | 12-31 | 07/94 | 21.14 | 60 | ||||||||||||||||||||||||
| CARV | Carver Bancorp, Inc. of NY (3) | NASDAQ | New York, NY | Thrift | 678 | 9 | 03-31 | 10/94 | 0.69 | 2 | ||||||||||||||||||||||||
| MLVF | Malvern Fed Bncp MHC PA (44.6) | NASDAQ | Paoli, PA | Thrift | 674 | 9 | 09-30 | 05/08 | 7.45 | 45 | ||||||||||||||||||||||||
| FSBI | Fidelity Bancorp, Inc. of PA (3) | NASDAQ | Pittsburgh, PA | Thrift | 667 | 13 | 09-30 | 06/88 | 9.48 | 29 | ||||||||||||||||||||||||
| ONFC | Oneida Financial Corp. of NY (3) | NASDAQ | Oneida, NY | Thrift | 658 | 13 | 12-31 | 07/10 | 8.77 | 63 | ||||||||||||||||||||||||
| BCSB | BCSB Bancorp, Inc. of MD (3) | NASDAQ | Baltimore, MD | Thrift | 630 | 18 | 09-30 | 04/08 | 12.40 | 40 | ||||||||||||||||||||||||
| COBK | Colonial Financial Serv. of NJ (3) | NASDAQ | Bridgeton, NJ | Thrift | 601 | 9 | 12-31 | 07/10 | 12.05 | 50 | ||||||||||||||||||||||||
| GCBC | Green Co Bcrp MHC of NY (44.1) | NASDAQ | Catskill, NY | Thrift | 548 | 14 | 06-30 | 12/98 | 18.84 | 78 | ||||||||||||||||||||||||
| MGYR | Magyar Bancorp MHC of NJ (44.7) | NASDAQ | NW Brunswick, NJ | Thrift | 526 | 6 | 09-30 | 01/06 | 3.56 | 21 | ||||||||||||||||||||||||
| ESBK | Elmira Svgs Bank, FSB of NY (3) | NASDAQ | Elmira, NY | Thrift | 500 | 11 | 12-31 | 03/85 | 15.85 | 31 | ||||||||||||||||||||||||
| PBIP | Prudential Bncp MHC PA (25.5) | NASDAQ | Philadelphia, PA | Thrift | 498 | 7 | 09-30 | 03/05 | 5.18 | 52 | ||||||||||||||||||||||||
| LSBK | Lake Shore Bnp MHC of NY(39.4) | NASDAQ | Dunkirk, NY | Thrift | 483 | 10 | 12-31 | 04/06 | 10.00 | 59 | ||||||||||||||||||||||||
| BFSB | Brooklyn Fed MHC of NY (28.2) | NASDAQ | Brooklyn, NY | Thrift | 470 | 5 | 09-30 | 04/05 | 0.79 | 10 | ||||||||||||||||||||||||
| ALLB | Alliance Bancorp, Inc. of PA (3) | NASDAQ | Broomall, PA | Thrift | 467 | 9 | 12-31 | 01/11 | 10.16 | 56 | ||||||||||||||||||||||||
| NECB | NE Comm Bncrp MHC of NY (44.6) | NASDAQ | White Plains, NY | Thrift | 444 | 7 | 12-31 | 07/06 | 6.62 | 85 | ||||||||||||||||||||||||
| STND | Standard Financial Corp. of PA (3) | NASDAQ | Monroeville, PA | Thrift | 438 | 12 | 09-30 | 10/10 | 14.75 | 51 | ||||||||||||||||||||||||
| PBHC | Pathfinder BC MHC of NY (36.3) | NASDAQ | Oswego, NY | Thrift | 419 | 14 | 12-31 | 11/95 | 9.10 | 23 | ||||||||||||||||||||||||
| WSB | WSB Holdings, Inc. of Bowie MD (3) | NASDAQ | Bowie, MD | Thrift | 390 | 5 | 12-31 | 08/88 | 2.47 | 20 | ||||||||||||||||||||||||
| RP FINANCIAL, LC. | |
| Financial Services Industry Consultants | |
| 1100 North Glebe Road, Suite 1100 | |
| Arlington, Virginia 22201 | |
| (703) 528-1700 | |
Exhibit III-l
Characteristics of Publicly-Traded Thrifts
September 2, 2011
| Ticker | Financial Institution | Exchg. | Primary Market | Operating Strat(l) | Total Assets(2) | Offices | Fiscal Year | Conv. Date | Stock Price | Market Value | ||||||||||||||||||||
| ($Mil) | ($) | ($Mil) | ||||||||||||||||||||||||||||
| Mid-Atlantic Companies (continued) | ||||||||||||||||||||||||||||||
| OBAF | OBA Financial Serv. Inc of MD (3) | NASDAQ | Germantown, MD | Thrift | 356 | M | 5 | 06-30 | 01/10 | 14.30 | 66 | |||||||||||||||||||
| MSBF | MSB Fin Corp MHC of NJ (40.3) | NASDAQ | Millington, NJ | Thrift | 349 | M | 5 | 06-30 | 01/07 | 5.19 | 27 | |||||||||||||||||||
| FFCO | FedFirst Financial Corp of PA (3) | NASDAQ | Monessen, PA | Thrift | 346 | 9 | 12-31 | 09/10 | 13.49 | 40 | ||||||||||||||||||||
| CMSB | CMS Bancorp Inc of W Plains NY (3) | NASDAQ | White Plains, NY | Thrift | 248 | 6 | 09-30 | 04/07 | 8.10 | 15 | ||||||||||||||||||||
| WVFC | WVS Financial Corp. of PA (3) | NASDAQ | Pittsburgh, PA | Thrift | 247 | M | 6 | 06-30 | 11/93 | 9.00 | 19 | |||||||||||||||||||
| Mid-West Companies | ||||||||||||||||||||||||||||||
| FBC | Flagstar Bancorp, Inc. of MI (3) | NYSE | Troy, MI | Thrift | 13,017 | M | 176 | 12-31 | 04/97 | 0.59 | 327 | |||||||||||||||||||
| TFSL | TFS Fin Corp MHC of OH (26.4) | NASDAQ | Cleveland, OH | Thrift | 10,879 | 39 | 09-30 | 04/07 | 8.35 | 2,575 | ||||||||||||||||||||
| CFFN | Capitol Federal Fin Inc. of KS (3) | NASDAQ | Topeka, KS | Thrift | 9,603 | 47 | 09-30 | 12/10 | 10.48 | 1,755 | ||||||||||||||||||||
| ABCW | Anchor BanCorp Wisconsin of WI (3) | NASDAQ | Madison, WI | M.B. | 3,395 | M | 57 | 03-31 | 07/92 | 0.59 | 13 | |||||||||||||||||||
| FPFC | First Place Fin. Corp. of OH (3) | NASDAQ | Warren, OH | Thrift | 3,153 | J | 47 | 06-30 | 01/99 | 0.85 | 14 | |||||||||||||||||||
| BKHU | Bank Mutual Corp of WI (3) | NASDAQ | Milwaukee, WI | Thrift | 2,523 | 80 | 12-31 | 10/03 | 2.89 | 134 | ||||||||||||||||||||
| UCFC | United Community Fin. of OH (3) | NASDAQ | Youngstown, OH | Thrift | 2,102 | 38 | 12-31 | 07/98 | 1.14 | 35 | ||||||||||||||||||||
| FDEF | First Defiance Fin. Corp of OH (3) | NASDAQ | Defiance, OH | Thrift | 2,046 | 33 | 12-31 | 10/95 | 12.96 | 126 | ||||||||||||||||||||
| WSBF | Waterstone Fin MHC of WI (26.2) | NASDAQ | Wauwatosa, WI | Thrift | 1,723 | 10 | 12-31 | 10/05 | 2.60 | 81 | ||||||||||||||||||||
| BFIN | BankFinancial Corp. of IL (3) | NASDAQ | Burr Ridge, IL | Thrift | 1,663 | 21 | 12-31 | 06/05 | 7.24 | 153 | ||||||||||||||||||||
| MFSF | MutualFirst Fin. Inc. of IN (3) | NASDAQ | Muncie, IN | Thrift | 1,447 | M | 33 | 12-31 | 12/99 | 7.52 | 53 | |||||||||||||||||||
| PULB | Pulaski Fin Cp of St. Louis MO (3) | NASDAQ | St. Louis, MO | Thrift | 1,332 | 12 | 09-30 | 12/98 | 6.50 | 68 | ||||||||||||||||||||
| NASB | NASB Fin, Inc. of Grandview MO (3) | NASDAQ | Grandview, MO | Thrift | 1,257 | 9 | 09-30 | 09/85 | 10.21 | 80 | ||||||||||||||||||||
| HFFC | HF Financial Corp. of SD (3) | NASDAQ | Sioux Falls, SD | Thrift | 1,191 | 33 | 06-30 | 04/92 | 8.27 | 58 | ||||||||||||||||||||
| CITZ | CFS Bancorp, Inc of Munster IN (3) | NASDAQ | Munster, IN | Thrift | 1,144 | M | 22 | 12-31 | 07/98 | 5.23 | 57 | |||||||||||||||||||
| CASH | Meta Financial Group of IA (3) | NASDAQ | Storm Lake, IA | Thrift | 1,074 | 12 | 09-30 | 09/93 | 18.32 | 57 | ||||||||||||||||||||
| HFBC | HopFed Bancorp, Inc. of KY (3) | NASDAQ | Hopkinsville, KY | Thrift | 1,062 | 18 | 12-31 | 02/98 | 7.40 | 54 | ||||||||||||||||||||
| HMNF | HMN Financial, Inc. of MN (3) | NASDAQ | Rochester, MN | Thrift | 807 | 15 | 12-31 | 06/94 | 2.00 | 9 | ||||||||||||||||||||
| PVFC | PVF Capital Corp. of Solon OH (3) | NASDAQ | Solon, OH | R.E. | 777 | M | 18 | 06-30 | 12/92 | 1.55 | 40 | |||||||||||||||||||
| CHEV | Cheviot Fin Cp MHC of OH (38. 5) | NASDAQ | Cincinnati, OH | Thrift | 597 | 6 | 12-31 | 01/04 | 8.62 | 76 | ||||||||||||||||||||
| FCLF | First Clover Leaf Fin Cp of IL (3) | NASDAQ | Edwardsville, IL | Thrift | 567 | 4 | 12-31 | 07/06 | 6.40 | 50 | ||||||||||||||||||||
| CZWI | Citizens Comm Bncorp Inc of WI (3) | NASDAQ | Eau Claire, WI | Thrift | 552 | 27 | 09-30 | 11/06 | 5.44 | 28 | ||||||||||||||||||||
| FSFG | First Savings Fin. Grp. of IN (3) | NASDAQ | Clarkaville, IN | Thrift | 524 | 12 | 09-30 | 12/08 | 15.40 | 36 | ||||||||||||||||||||
| UCBA | United Comm Bncp MHC IN (40.7) | NASDAQ | Lawrenceburg, IN | Thrift | 476 | M | 9 | 06-30 | 03/06 | 5.81 | 46 | |||||||||||||||||||
| LPSB | LaPorte Bancrp MHC of IN (45.0) | NASDAQ | La Porte, IN | Thrift | 461 | 8 | 12-31 | 10/07 | 9.00 | 41 | ||||||||||||||||||||
| IROQ | IF Bancorp, Inc. of IL (3) | NASDAQ | Watseka, IL | Thrift | 448 | P | 5 | 06-30 | 07/11 | 10.81 | 52 | |||||||||||||||||||
| FCAP | First Capital, Inc. of IN (3) | NASDAQ | Corydon, IN | Thrift | 445 | 13 | 12-31 | 01/99 | 18.41 | 51 | ||||||||||||||||||||
| FFFD | North Central Bancshares of LA (3) | NASDAQ | Fort Dodge, IA | Div. | 443 | 11 | 12-31 | 03/96 | 17.25 | 23 | ||||||||||||||||||||
| WAYN | Wayne Savings Bancshares of OH (3) | NASDAQ | Wooster, OH | Thrift | 412 | 11 | 03-31 | 01/03 | 8.40 | 25 | ||||||||||||||||||||
| RIVR | River Valley Bancorp of IN (3) | NASDAQ | Madison, IN | Thrift | 400 | 10 | 12-31 | 12/96 | 16.10 | 24 | ||||||||||||||||||||
| LSBI | LSB Fin. Corp. of Lafayette IN (3) | NASDAQ | Lafayette, IN | Thrift | 360 | 5 | 12-31 | 02/95 | 13.30 | 21 | ||||||||||||||||||||
| WBKC | Wolverine Bancorp, Inc. of MI (3) | NASDAQ | Midland, MI | Thrift | 306 | 5 | 12-31 | 01/11 | 14.00 | 35 | ||||||||||||||||||||
| JXSB | Jacksonville Bancorp Inc of IL (3) | NASDAQ | Jacksonville, IL | Thrift | 305 | 7 | 12-31 | 07/10 | 13.70 | 26 | ||||||||||||||||||||
| CFBK | Central Federal Corp. of OH (3) | NASDAQ | Fairlawn, OH | Thrift | 278 | 4 | 12-31 | 12/98 | 0.75 | 3 | ||||||||||||||||||||
| KFFB | KY Fst Fed Bp MHC of KY (39.3) | NASDAQ | Hazard, KY | Thrift | 229 | M | 4 | 06-30 | 03/05 | 8.09 | 63 | |||||||||||||||||||
| FFNM | First Fed of N. Michigan of MI (3) | NASDAQ | Alpena, MI | Thrift | 219 | 8 | 12-31 | 04/05 | 3.75 | 11 | ||||||||||||||||||||
| FFDF | FFD Financial Corp of Dover OH (3) | NASDAQ | Dover, OH | Thrift | 211 | M | 5 | 06-30 | 04/96 | 15.00 | 15 | |||||||||||||||||||
| PFED | Park Bancorp of Chicago IL (3) | NASDAQ | Chicago, IL | Thrift | 208 | 5 | 12-31 | 08/96 | 2.92 | 3 | ||||||||||||||||||||
| FBSI | First Bancshares, Inc. of MO (3) | NASDAQ | Mntn Grove, MO | Thrift | 204 | M | 11 | 06-30 | 12/93 | 6.95 | 11 | |||||||||||||||||||
| New England Companies | ||||||||||||||||||||||||||||||
| PBCT | Peoples United Financial of CT (3) | NASDAQ | Bridgeport, CT | Div. | 25,323 | 340 | 12-31 | 04/07 | 11.40 | 4,047 | ||||||||||||||||||||
| BHLB | Berkshire Hills Bancorp of MA (3) | NASDAQ | Pittsfield, MA | Thrift | 3,225 | 44 | 12-31 | 06/00 | 19.24 | 322 | ||||||||||||||||||||
| BRKL | Brookline Bancorp, Inc. of MA (3) | NASDAQ | Brookline, MA | Thrift | 3,114 | 20 | 12-31 | 07/02 | 7.82 | 462 | ||||||||||||||||||||
| EBSB | Meridian Fn Serv MHC MA (41.4) | NASDAQ | East Boston, MA | Thrift | 1,924 | 25 | 12-31 | 01/08 | 11.88 | 264 | ||||||||||||||||||||
| RCKB | Rockville Fin New, Inc. of CT (3) | NASDAQ | Vrn Rockville CT | Thrift | 1,747 | 22 | 12-31 | 03/11 | 9.50 | 280 | ||||||||||||||||||||
| UBNK | United Financial Bncrp of MA (3) | NASDAQ | W Springfield MA | Thrift | 1,610 | 24 | 12-31 | 12/07 | 14.17 | 228 | ||||||||||||||||||||
| FBNK | First Connecticut Bncorp of CT (3) | NASDAQ | Farmington, CT | Thrift | 1,604 | P | 19 | 12-31 | 06/11 | 10.47 | 187 | |||||||||||||||||||
| WFD | WestField Fin. Inc. of MA (3) | NASDAQ | WestField, MA | Thrift | 1,241 | M | 11 | 12-31 | 01/07 | 6.90 | 192 | |||||||||||||||||||
| HIFS | Hingham Inst. for Sav. of MA (3) | NASDAQ | Hingham, MA | Thrift | 1,067 | 10 | 12-31 | 12/88 | 46.94 | 100 | ||||||||||||||||||||
| NHTB | NH Thrift Bancshares of NH (3) | NASDAQ | Newport, NH | Thrift | 1,031 | 27 | 12-31 | 05/86 | 12.81 | 74 | ||||||||||||||||||||
| SIFI | SI Financial Group, Inc. of CT (3) | NASDAQ | Willimantic, CT | Thrift | 949 | 21 | 12-31 | 01/11 | 9.43 | 100 | ||||||||||||||||||||
| RP FINANCIAL, LC. | |
| Financial Services Industry Consultants | |
| 1100 North Glebe Road, Suite 1100 | |
| Arlington, Virginia 22201 | |
| (703) 528-1700 |
Exhibit III-l
Characteristics of Publicly-Traded Thrifts
September 2, 2011
Characteristics of Publicly-Traded Thrifts
September 2, 2011
| Primary | Operating | Total | Fiscal | Conv. | Stock | Market | |||||||||||||||||||||||||
| Ticker | Financial Institution | Exchg. | Market | Strat(l) | Assets(2) | Offices | Year | Date | Price | Value | |||||||||||||||||||||
| ($Mil) | ($) | ($Mil) | |||||||||||||||||||||||||||||
| New England Companies (continued) | |||||||||||||||||||||||||||||||
| NVSL | Naugatuck Valley Fin Crp of CT (3) | NASDAQ | Naugatuck, CT | Thrift | 593 | P | 10 | 12-31 | 06/11 | 7.58 | 53 | ||||||||||||||||||||
| CBNK | Chicopee Bancorp, Inc. of MA (3) | NASDAQ | Chicopee, MA | Thrift | 580 | 8 | 12-31 | 07/06 | 14.00 | 82 | |||||||||||||||||||||
| HBNK | Hampden Bancorp, Inc. of MA (3) | NASDAQ | Springfield, MA | Thrift | 575 | M | 9 | 06-30 | 01/07 | 12.58 | 86 | ||||||||||||||||||||
| PEOP | Peoples Fed Bancshrs Inc of MA (3) | NASDAQ | Brighton, MA | Thrift | 538 | 6 | 09-30 | 07/10 | 14.00 | 100 | |||||||||||||||||||||
| CEBK | Central Bncrp of Somerville MA (3) | NASDAQ | Somerville, MA | Thrift | 497 | 11 | 03-31 | 10/86 | 17.50 | 29 | |||||||||||||||||||||
| PSBH | PSB Hldgs Inc MHC of CT (42.9) | NASDAQ | Putnam, CT | Thrift | 477 | M | 8 | 06-30 | 10/04 | 5.06 | 33 | ||||||||||||||||||||
| NFSB | Newport Bancorp, Inc. of RI (3) | NASDAQ | Newport, RI | Thrift | 454 | 6 | 12-31 | 07/06 | 13.05 | 46 | |||||||||||||||||||||
| MFLR | Mayflower Bancorp, Inc. of MA (3) | NASDAQ | Middleboro, MA | Thrift | 247 | M | 8 | 04-30 | 12/87 | 8.35 | 17 | ||||||||||||||||||||
| North-West Companies | |||||||||||||||||||||||||||||||
| WFSL | Washington Federal, Inc. of WA (3) | NASDAQ | Seattle, WA | Thrift | 13,323 | 163 | 09-30 | 11/82 | 13.92 | 1,537 | |||||||||||||||||||||
| FFNW | First Fin NW, Inc of Renton WA (3) | NASDAQ | Renton, WA | Thrift | 1,151 | 1 | 12-31 | 10/07 | 4.63 | 87 | |||||||||||||||||||||
| RVSB | Riverview Bancorp, Inc. of WA (3) | NASDAQ | Vancouver, WA | Thrift | 886 | 17 | 03-31 | 10/97 | 2.61 | 59 | |||||||||||||||||||||
| TSBK | Timberland Bancorp, Inc. of WA (3) | NASDAQ | Hoquiam, WA | Thrift | 735 | 22 | 09-30 | 01/98 | 5.05 | 36 | |||||||||||||||||||||
| ANCB | Anchor Bancorp of Aberdeen, WA (3) | NASDAQ | Aberdeen, wa | Thrift | 490 | M | 15 | 06-30 | 01/11 | 7.95 | 19 | ||||||||||||||||||||
| South-East Companies | |||||||||||||||||||||||||||||||
| FFCH | First Fin. Holdings Inc. of SC (3) | NASDAQ | Charleston, SC | Thrift | 3,222 | 67 | 09-30 | 11/83 | 5.82 | 96 | |||||||||||||||||||||
| CSBC | Citizens South Bnkg Corp of NC (3) | NASDAQ | Gastonia, NC | Thrift | 1,118 | 21 | 12-31 | 10/02 | 4.15 | 48 | |||||||||||||||||||||
| FRNK | Franklin Financial Corp. of VA (3) | NASDAQ | Glen Allen, VA | Thrift | 1,101 | P | 9 | 09-30 | 04/11 | 11.14 | 159 | ||||||||||||||||||||
| HBOS | Heritage Fin Group, Inc of GA (3) | NASDAQ | Albany, GA | Thrift | 964 | 16 | 12-31 | 11/10 | 10.89 | 95 | |||||||||||||||||||||
| CHFN | Charter Fin Corp MHC GA (49.0) | NASDAQ | West Point, GA | Thrift | 956 | 17 | 09-30 | 09/10 | 8.46 | 157 | |||||||||||||||||||||
| ACFC | Atlantic Coast Fin. Corp of GA (3) | NASDAQ | Waycross, GA | Thrift | 802 | 12 | 12-31 | 02/11 | 2.69 | 7 | |||||||||||||||||||||
| HBCP | Home Bancorp Inc. Lafayette LA (3) | NASDAQ | Lafayette, LA | Thrift | 700 | M | 18 | 12-31 | 10/08 | 14.11 | 113 | ||||||||||||||||||||
| FFBH | First Fed. Bancshares of AR (3) | NASDAQ | Harrison, AR | Thrift | 616 | 18 | 12-31 | 05/96 | 6.00 | 116 | |||||||||||||||||||||
| JFBI | Jefferson Bancshares Inc of TN (3) | NASDAQ | Morristown, TN | Thrift | 578 | M | 12 | 06-30 | 07/03 | 2.83 | 19 | ||||||||||||||||||||
| CFFC | Community Fin. Corp. of VA (3) | NASDAQ | Staunton, VA | Thrift | 523 | 11 | 03-31 | 03/88 | 3.07 | 13 | |||||||||||||||||||||
| OFED | Oconee Fed Fn Cp MHC SC (35.0) | NASDAQ | Seneca, SC | Thrift | 377 | M | 5 | 06-30 | 01/11 | 10.95 | 70 | ||||||||||||||||||||
| FABK | First Advantage Bancorp of TN (3) | NASDAQ | Clarksville, TN | Thrift | 350 | 5 | 12-31 | 11/07 | 12.70 | 52 | |||||||||||||||||||||
| LABC | Louisiana Bancorp, Inc. of LA (3) | NASDAQ | Metairie, LA | Thrift | 320 | 3 | 12-31 | 07/07 | 16.03 | 55 | |||||||||||||||||||||
| AFCB | Athens Bancshares, Inc. of TN (3) | NASDAQ | Athens, TN | Thrift | 283 | 7 | 12-31 | 01/10 | 12.70 | 35 | |||||||||||||||||||||
| SIBC | State Investors Bancorp of LA (3) | NASDAQ | Metairie, LA | Thrift | 239 | P | 4 | 12-31 | 07/11 | 11.50 | 33 | ||||||||||||||||||||
| HFBL | Home Federal Bancorp Inc of LA (3) | NASDAQ | Shreveport, LA | Thrift | 233 | 5 | 06-30 | 12/10 | 13.30 | 41 | |||||||||||||||||||||
| South-West Companies | |||||||||||||||||||||||||||||||
| VPFG | Viewpoint Financial Group of TX (3) | NASDAQ | Plano, TX | Thrift | 2,964 | 24 | 12-31 | 07/10 | 11.34 | 395 | |||||||||||||||||||||
| OABC | OmniAmerican Bancorp Inc of TX (3) | NASDAQ | Fort Worth, TX | Thrift | 1,328 | 16 | 12-31 | 01/10 | 13.83 | 161 | |||||||||||||||||||||
| SPBC | SP Bancorp, Inc. of Plano, TX (3) | NASDAQ | Plano, TX | Thrift | 266 | 8 | 12-31 | 11/10 | 11.35 | 20 | |||||||||||||||||||||
| Western Companies (Excl CA) | |||||||||||||||||||||||||||||||
| TBNK | Territorial Bancorp, Inc of HI (3) | NASDAQ | Honolulu, HI | Thrift | 1,488 | M | 25 | 12-31 | 07/09 | 19.06 | 221 | ||||||||||||||||||||
| EBMT | Eagle Bancorp Montanta of MT (3) | NASDAQ | Helena, MT | Thrift | 331 | 6 | 06-30 | 04/10 | 10.46 | 41 | |||||||||||||||||||||
| Other Areas | |||||||||||||||||||||||||||||||
| NOTES: | (1) | Operating strategies are: Thrift-Traditional Thrift, M.B.-Mortgage Banker, R.E.-Real Estate Developer, Div.-Diversified, and Ret.-Retail Banking. |
| (2) | Most recent quarter end available (E-Estimated, and P-Pro Forma) |
Source: SNL Financial, LC.
Date of Last Update: 09/02/11
EXHIBIT III-2
1st Security Bank of Washington
Public Market Pricing of Publicly-Traded Institutions – Northwest Region
< $400-Million in Assets
< $400-Million in Assets
| RP FINANCIAL, LC. | |
| Financial Services Industry Consultants | |
| 1100 North Glebe Road, Suite 1100 | |
| Arlington, Virginia 22201 | |
| (703) 528-1700 |
Exhibit III-2
Market Pricing Comparatives
Prices As of September 2, 2011
| Market | Per share Data | ||||||||||||||||||||||||||||||||||||||||
| Capitalization | Core | Book | Pricing Ratios(3) | Dividends(4) | Financial Characteristics(6) | ||||||||||||||||||||||||||||||||||||
| Price/ | Market | 12-Mth | Value/ | Amount/ | Payout | Total | Equity/ | Tng Eq/ | NPAs/ | Reported | Core | ||||||||||||||||||||||||||||||
| Financial Institution | Share(1) | Value | EPS(2) | Share | P/E | P/B | P/A | P/TB | P/CORE | Share | Yield | Ratio(5) | Assets | Assets | Assets | Assets | ROA | ROE | ROA | ROE | |||||||||||||||||||||
| ($) | ($Mil) | ($) | ($) | (x) | (%) | (%) | (%) | (x) | ($) | (%) | (%) | ($Mil) | (%) | (%) | (%) | (%) | (%) | (%) | (%) | ||||||||||||||||||||||
| All Public Companies | 9.92 | 242.30 | -0.05 | 13.11 | 17. 83 | 76.05 | 9.47 | 81.46 | 19.48 | 0.21 | 1.97 | 28.72 | 2,613 | 11.87 | 11.19 | 3.92 | 0.09 | 0.68 | 0.01 | -0.21 | |||||||||||||||||||||
| Special Selection Grouping(8) | 6.83 | 347.62 | -0.40 | 13.11 | 16.70 | 53.76 | 6.91 | 60.77 | 17.91 | 0.05 | 0.34 | 13.79 | 3,317 | 13.14 | 12.13 | 7.50 | -0.14 | -1.38 | -0.21 | -1.95 | |||||||||||||||||||||
| Comparable Group | |||||||||||||||||||||||||||||||||||||||||
| Special Comparative Group(8) | |||||||||||||||||||||||||||||||||||||||||
| ANCB Anchor Bancorp of Aberdeen, WA | 7.95 | 19.49 | -2.26 | 24.37 | NM | 32.62 | 3.97 | 32.62 | NM | 0.00 | 0.00 | NM | 490 | 12.18 | 12.18 | NA | -1.10 | -10.44 | -1.15 | -10.92 | |||||||||||||||||||||
| FFNW First Fin NW, Inc of Renton WA | 4.63 | 87.07 | -0.54 | 9.53 | NM | 48.58 | 7.56 | 48.58 | NM | 0.00 | 0.00 | NM | 1,151 | 15.56 | 15.56 | 11.28 | -0.72 | -4.96 | -0.83 | -5.70 | |||||||||||||||||||||
| RVSB Riverview Bancorp, Inc. of WA | 2.61 | 58.65 | 0.14 | 4.80 | 17.40 | 54.38 | 6.62 | 71.51 | 18.64 | 0.00 | 0.00 | 0.00 | 886 | 12.23 | 9.59 | 5.10 | 0.39 | 3.28 | 0.37 | 3.06 | |||||||||||||||||||||
| TSBK Timberland Bancorp, Inc. of WA | 5.05 | 35.58 | -0.13 | 9.99 | NM | 50.55 | 4.84 | 55.31 | NM | 0.00 | 0.00 | NM | 735 | 11.74 | 11.01 | 8.35 | 0.00 | 0.00 | -0.12 | -1.06 | |||||||||||||||||||||
| WFSL Washington Federal, Inc. of WA | 13.92 | 1537.30 | 0.81 | 16.84 | 16.00 | 82.66 | 11.54 | 95.80 | 17.19 | 0.24 | 1.72 | 27.59 | 13,323 | 13.96 | 12.28 | 5.28 | 0.71 | 5.21 | 0.66 | 4.85 | |||||||||||||||||||||
| (1) | Average of High/Low or Bid/Ask price per share. |
| (2) | EPS (estimate core basis) is based on actual trailing twelve month data, adjusted to omit non-operating items on a tax effected basis. |
| (3) | P/E = Price to earnings, P/B = Price to book, P/A = Price to assets, P/TB = Price to tangible book value, and P/CORE = Price to estimated core earnings. |
| (4) | Indicated twelve month dividend, based on last quarterly dividend declared. |
| (5) | Indicated dividend as a percent of trailing twelve month estimated core earnings. |
| (6) | ROA (return on assets) and ROE (return on equity) are indicated ratios based on trailing twelve month earnings and average equity and assets balances. |
| (7) | Excludes from averages those companies the subject of actual or rumored acquisition activities or unusual operating characteristics. |
| (8) | Includes North-West Companies, |
| Source: | SNL Financial, LC. and RP Financial, LC. calculations. The information provided in this report has been obtained from sources we believe are reliable, but we cannot guarantee the accuracy or completeness of such information. |
Copyright (c) 2010 by RP Financial, LC.
| RP FINANCIAL, LC. | |
| Financial Services Industry Consultants | |
| 1100 North Glebe Road, Suite 1100 | |
| Arlington, Virginia 22201 | |
| (703) 528-1700 |
Exhibit III-2
Market Pricing Comparatives
Prices As of September 2, 2011
| Market | Per Share Data | ||||||||||||||||||||||||||||||||||||||||
| Capitalization | Core | Book | Pricing Ratios(3) | Dividends(4) | Financial Characteristics(6) | ||||||||||||||||||||||||||||||||||||
| Price/ | Market | 12-Mth | Value/ | Amount/ | Payout | Total | Equity/ | Tng Eq/ | NPAs/ | Reported | Core | ||||||||||||||||||||||||||||||
| Financial Institution | Share(1) | Value | EPS(2) | Share | P/E | P/B | P/A | P/TB | P/CORE | Share | Yield | Ratio(5) | Assets | Assets | Assets | Assets | ROA | ROE | ROA | ROE | |||||||||||||||||||||
| ($) | ($Mil) | ($) | ($) | (x) | (%) | (%) | (%) | (x) | ($) | (%) | (%) | ($Mil) | (%) | (%) | (%) | (%) | (%) | (%) | (%) | ||||||||||||||||||||||
| All Public Companies | 9.92 | 242.30 | -0.05 | 13.11 | 17.83 | 76.05 | 9.47 | 81.46 | 19.48 | 0.21 | 1.97 | 28.72 | 2,613 | 11.87 | 11.19 | 3.92 | 0.09 | 0.68 | 0.01 | -0.21 | |||||||||||||||||||||
| Special Selection Grouping(8) | 8.70 | 19.04 | -0.50 | 12.88 | 18.60 | 67.80 | 9.85 | 71.52 | 21.43 | 0.17 | 1.59 | 25.17 | 228 | 11.35 | 10.82 | 3.01 | -0.10 | -2.35 | -0.24 | -3.64 | |||||||||||||||||||||
| Comparable Group | |||||||||||||||||||||||||||||||||||||||||
| Special Comparative Group(8) | |||||||||||||||||||||||||||||||||||||||||
| CMSB CMS Bancorp Inc of W Plains NY | 8.10 | 15.09 | -0.05 | 11.84 | NM | 68.41 | 6.10 | 68.41 | NM | 0.00 | 0.00 | 0.00 | 248 | 8.91 | 8.91 | 3.24 | 0.12 | 1.38 | -0.04 | -0.43 | |||||||||||||||||||||
| FFDF FFD Financial Corp of Dover OH | 15.00 | 15.18 | 0.93 | 18.50 | 10.56 | 81.08 | 7.21 | 81.08 | 16.13 | 0.68 | 4.53 | 47.89 | 211 | 8.89 | 8.89 | 1.53 | 0.70 | 7.79 | 0.46 | 5.10 | |||||||||||||||||||||
| FBSI First Bancshares, Inc. of MO | 6.95 | 10.78 | -2.45 | 12.58 | NM | 55.25 | 5.28 | 55.51 | NM | 0.00 | 0.00 | NM | 204 | 9.56 | 9.52 | 4.17 | -1.80 | -17.26 | -1.81 | -17.40 | |||||||||||||||||||||
| FFNM First Fed of N. Michigan of MI | 3.75 | 10.82 | 0.02 | 8.34 | NM | 44.96 | 4.94 | 45.84 | NM | 0.00 | 0.00 | 0.00 | 219 | 10.99 | 10.80 | 4.71 | 0.07 | 0.61 | 0.03 | 0.24 | |||||||||||||||||||||
| HFBL Home Federal Bancorp Inc of LA | 13.30 | 40.51 | 0.16 | 16.80 | 20.78 | 79.17 | 17.36 | 79.17 | NM | 0.24 | 1.80 | 37.50 | 233 | 21.93 | 21.93 | 0.08 | 0.91 | 4.19 | 0.23 | 1.05 | |||||||||||||||||||||
| KFFB KY Fst Fed Bp MHC of KY (39.3) | 8.09 | 25.27 | 0.18 | 7.53 | NM | 107.44 | 27.39 | 143.44 | NM | 0.40 | 4.94 | NM | 229 | 25.49 | 20.40 | 2.85 | 0.62 | 2.54 | 0.59 | 2.40 | |||||||||||||||||||||
| MFLR Mayflower Bancorp, Inc. of MA | 8.35 | 17.33 | 0.40 | 10.20 | 13.05 | 81.86 | 7.02 | 81.86 | 20.88 | 0.24 | 2.87 | 37.50 | 247 | 8.58 | 8.58 | NA | 0.53 | 6.34 | 0.33 | 3.96 | |||||||||||||||||||||
| PFED Park Bancorp of Chicago IL | 2.92 | 3.48 | -4.73 | 13.42 | NM | 21.76 | 1.67 | 21.76 | NM | 0.00 | 0.00 | NM | 208 | 7.69 | 7.69 | 8.22 | -2.57 | -28.94 | -2.67 | -30.09 | |||||||||||||||||||||
| SIBC State Investors Bancorp of LA | 11.50 | 33.47 | 0.24 | 15.80 | NM | 72.78 | 14.01 | 72.78 | NM | 0.00 | 0.00 | 0.00 | 239 | 0.00 | 0.00 | 1.28 | 0.24 | NM | 0.29 | NM | |||||||||||||||||||||
| WVFC WVS Financial Corp. of PA | 9.00 | 18.52 | 0.33 | 13.78 | 30.00 | 65.31 | 7.49 | 65.31 | 27.27 | 0.16 | 1.78 | 53.33 | 247 | 11.46 | 11.46 | 0.97 | 0.20 | 2.19 | 0.22 | 2.41 | |||||||||||||||||||||
| (1) | Average of High/Low or Bid/Ask price per share. |
| (2) | EPS (estimate core basis) is based on actual trailing twelve month data, adjusted to omit non-operating items on a tax effected basis. |
| (3) | P/E = Price to earnings; P/B = Price to book; P/A = Price to assets; P/TB = Price to tangible book value; and P/CORE = Price to estimated core earnings. |
| (4) | Indicated twelve month dividend, based on last quarterly dividend declared. |
| (5) | Indicated dividend as a percent of trailing twelve month estimated core earnings. |
| (6) | ROA (return on assets) and ROE (return on equity) are indicated ratios based on trailing twelve month earnings and average equity and assets balances. |
| (7) | Excludes from averages those companies the subject of actual or rumored acquisition activities or unusual operating characteristics. |
| (8) | Includes Assets less than $250 Million; |
| Source: | SNL Financial, LC. and RP Financial, LC. calculations. The information provided in this report has been obtained from sources we believe are reliable, but we cannot guarantee the accuracy or completeness of such information. |
Copyright (c) 2010 by RP Financial, LC.
| RP FINANCIAL, LC. | |
| Financial Services Industry Consultants | |
| 1100 North Glebe Road, Suite 1100 | |
| Arlington, Virginia 22201 | |
| (703) 528-1700 |
Exhibit III-2 Market Pricing Comparatives Prices As of September 2, 2011 | ||||||||||||||||||||||||||||||||||||||||||
| Market | Per Share Data | |||||||||||||||||||||||||||||||||||||||||
| Capitalization | Core | Book | Pricing Ratios (3) | Dividends(4) | Financial Characteristics (6) | |||||||||||||||||||||||||||||||||||||
| Price/ | Market | 12-Mth | Value/ | Amount/ | Payout | Total | Equity/ | Tng Eq/ | NPAs/ | Reported | Core | |||||||||||||||||||||||||||||||
| Financial Institution | Share(1) | Value | EPS (2) | Share | P/E | P/B | P/A | P/TB | P/CORE | Share | Yield | Ratio (5) | Assets | Assets | Assets | Assets | ROA | ROE | ROA | ROE | ||||||||||||||||||||||
| ($) | ($Mil) | ($) | ($) | (X) | (%) | (%) | (%) | (x) | ($) | (%) | (%) | ($Mil) | (%) | (%) | (%) | (%) | (%) | (%) | (%) | |||||||||||||||||||||||
| All Public Companies | 9.92 | 242.30 | -0.05 | 13.11 | 17.83 | 76.05 | 9.47 | 81.46 | 19.48 | 0.21 | 1.97 | 28.72 | 2,613 | 11.87 | 11.19 | 3.92 | 0.09 | 0.68 | 0.01 | -0.21 | ||||||||||||||||||||||
| Special Selection Grouping(8) | 10.51 | 29.79 | 0.34 | 14.56 | 19.68 | 71.26 | 9.53 | 75.16 | 19.60 | 0.18 | 1.82 | 24.82 | 403 | 12.69 | 12.32 | 4.19 | 0.29 | 1.37 | 0.25 | 0.94 | ||||||||||||||||||||||
| Comparable Group | ||||||||||||||||||||||||||||||||||||||||||
| Special Comparative Group(8) | ||||||||||||||||||||||||||||||||||||||||||
| ALLB | Alliance Bancorp, Inc. of PA | 10.16 | 55.62 | 0.40 | 15.70 | 26.05 | 64.71 | 11.91 | 64.71 | 25.40 | 0.20 | 1.97 | 51.28 | 467 | 18.40 | 18.40 | 4.59 | 0.47 | 3.36 | 0.48 | 3.45 | |||||||||||||||||||||
| AFCB | Athens Bancshares, Inc. of TN | 12.70 | 35.13 | 0.61 | 18.16 | 20.82 | 69.93 | 12.40 | 70.48 | 20.82 | 0.20 | 1.57 | 32.79 | 283 | 17.73 | 17.61 | 2.71 | 0.60 | 3.37 | 0.60 | 3.37 | |||||||||||||||||||||
| BYFC | Broadway Financial Corp. of CA | 1.48 | 2.58 | -1.71 | 8.27 | NM | 17.90 | 0.58 | 17.90 | NM | 0.04 | 2.70 | NM | 447 | 6.87 | 6.87 | 17.14 | -0.59 | -8.93 | -0.60 | -9.20 | |||||||||||||||||||||
| BFSB | Brooklyn Fed MHC of NY (28.2) | 0.79 | 2.87 | -0.24 | 3.16 | NM | 25.00 | 2.17 | 25.00 | NM | 0.04 | 5.06 | NM | 470 | 8.66 | 8.66 | 24.93 | -1.01 | -11.78 | -0.65 | -7.64 | |||||||||||||||||||||
| CEBK | Central Bncrp of Somerville MA | 17.50 | 29.42 | 0.04 | 22.26 | NM | 78.62 | 5.92 | 83.61 | NM | 0.20 | 1.14 | 55.56 | 497 | 9.48 | 9.07 | 3.49 | 0.12 | 1.30 | 0.01 | 0.14 | |||||||||||||||||||||
| CFBK | Central Federal Corp. of OH | 0.75 | 3.10 | -1.41 | 1.26 | NM | 59.52 | 1.11 | 60.98 | NM | 0.00 | 0.00 | NM | 278 | 4.43 | 4.39 | 3.73 | -1.87 | -34.69 | -2.07 | -38.21 | |||||||||||||||||||||
| EBMT | Eagle Bancorp Montanta of MT | 10.46 | 40.99 | 0.24 | 13.39 | 17.15 | 78.12 | 12.38 | 78.12 | NM | 0.29 | 2.77 | 47.54 | 331 | 15.85 | 15.85 | 1.24 | 0.72 | 4.51 | 0.28 | 1.78 | |||||||||||||||||||||
| ESBK | Elmira Svgs Bank, FSB of NY | 15.85 | 31.18 | 1.25 | 20.31 | 8.90 | 78.04 | 6.24 | 115.02 | 12.68 | 0.80 | 5.05 | 44.94 | 500 | 11.71 | 9.38 | 0.99 | 0.70 | 6.14 | 0.49 | 4.31 | |||||||||||||||||||||
| FFCO | FedFirst Financial Corp of PA | 13.49 | 40.35 | 0.31 | 19.99 | NM | 67.48 | 11.66 | 68.97 | NM | 0.12 | 0.89 | NM | 346 | 17.30 | 16.99 | 0.99 | 0.14 | 0.85 | 0.27 | 1.65 | |||||||||||||||||||||
| FABK | First Advantage Bancorp of TN | 12.70 | 51.90 | 0.27 | 16.58 | 27.61 | 76.60 | 14.81 | 76.60 | NM | 0.20 | 1.57 | 43.48 | 350 | 19.34 | 19.34 | 0.92 | 0.54 | 2.79 | 0.32 | 1.64 | |||||||||||||||||||||
| FCAP | First Capital, Inc. of IN | 18.41 | 51.29 | 1.18 | 17.78 | 13.74 | 103.54 | 11.53 | 116.37 | 15.60 | 0.76 | 4.13 | 56.72 | 445 | 11.15 | 10.05 | 1.97 | 0.83 | 7.70 | 0.73 | 6.78 | |||||||||||||||||||||
| IROQ | IF Bancorp, Inc. of IL | 10.81 | 52.01 | 0.45 | 15.78 | 18.96 | 68.50 | 11.61 | 68.50 | 24.02 | 0.00 | 0.00 | 0.00 | 448 | 0.00 | 0.00 | 1.36 | 0.61 | NM | 0.48 | NM | |||||||||||||||||||||
| JXSB | Jacksonville Bancorp Inc of IL | 13.70 | 26.45 | 1.34 | 20.06 | 8.73 | 68.30 | 8.68 | 73.46 | 10.22 | 0.30 | 2.19 | 19.11 | 305 | 12.70 | 11.92 | 1.27 | 1.00 | 8.72 | 0.85 | 7.44 | |||||||||||||||||||||
| LSBI | LSB Fin. Corp. of Lafayette IN | 13.30 | 20.67 | 0.64 | 23.38 | 11.47 | 56.89 | 5.74 | 56.89 | 20.78 | 0.00 | 0.00 | 0.00 | 360 | 10.10 | 10.10 | 5.92 | 0.48 | 5.08 | 0.27 | 2.80 | |||||||||||||||||||||
| LPSB | LaPorte Bancrp MHC of IN(45.0) | 9.00 | 18.60 | 0.44 | 11.49 | 15.79 | 78.33 | 8.95 | 94.44 | 20.45 | 0.00 | 0.00 | 0.00 | 461 | 11.42 | 9.66 | 1.75 | 0.58 | 5.12 | 0.45 | 3.95 | |||||||||||||||||||||
| LSBK | Lake Shore Bnp MHC of NY(39.4) | 10.00 | 24.48 | 0.46 | 9.95 | 16.39 | 100.50 | 12.29 | 100.50 | 21.74 | 0.28 | 2.80 | 45.90 | 483 | 12.22 | 12.22 | 0.58 | 0.76 | 6.32 | 0.57 | 4.77 | |||||||||||||||||||||
| LABC | Louisiana Bancorp, Inc. of LA | 16.03 | 55.11 | 0.60 | 17.13 | 22.90 | 93.58 | 17.21 | 93.58 | 26.72 | 0.00 | 0.00 | 0.00 | 320 | 18.39 | 18.39 | 0.57 | 0.74 | 3.90 | 0.64 | 3.34 | |||||||||||||||||||||
| MSBF | MSB Fin Corp MHC of NJ (40.3) | 5.19 | 11.08 | 0.14 | 7.84 | 37.07 | 66.20 | 7.68 | 66.20 | 37.07 | 0.12 | 2.31 | NM | 349 | 11.60 | 11.60 | 8.27 | 0.20 | 1.80 | 0.20 | 1.80 | |||||||||||||||||||||
| NECB | NE Comm Bncrp MHC of NY (44.6) | 6.62 | 39.40 | 0.32 | 8.40 | 30.09 | 78.81 | 19.07 | 80.15 | 20.69 | 0.12 | 1.81 | 54.55 | 444 | 24.20 | 23.89 | 9.31 | 0.59 | 2.61 | 0.86 | 3.79 | |||||||||||||||||||||
| NFSB | Newport Bancorp, Inc. of RI | 13.05 | 45.53 | 0.54 | 14.58 | 23.30 | 89.51 | 10.03 | 89.51 | 24.17 | 0.00 | 0.00 | 0.00 | 454 | 11.21 | 11.21 | 0.29 | 0.43 | 3.91 | 0.42 | 3.77 | |||||||||||||||||||||
| FFFD | North Central Bancshares of IA | 17.25 | 23.37 | 1.40 | 30.01 | 12.23 | 57.48 | 5.28 | 58.43 | 12.32 | 0.04 | 0.23 | 2.84 | 443 | 0.00 | 0.00 | 4.52 | 0.42 | 3.85 | 0.42 | 3.82 | |||||||||||||||||||||
| OBAF | OBA Financial Serv. Inc of MD | 14.30 | 65.81 | 0.17 | 17.57 | NM | 81.39 | 18.49 | 81.39 | NM | 0.00 | 0.00 | 0.00 | 356 | 22.71 | 22.71 | 0.97 | 0.23 | 1.03 | 0.21 | 0.97 | |||||||||||||||||||||
| OFED | Oconee Fed Fn Cp MHC SC (35.0) | 10.95 | 24.32 | 0.53 | 12.50 | 37.76 | 87.60 | 18.44 | 87.60 | 20.66 | 0.40 | 3.65 | NM | 377 | 21.05 | 21.05 | 1.31 | 0.49 | 2.62 | 0.90 | 4.78 | |||||||||||||||||||||
| PSBH | PSB Hldgs Inc MHC of CT (42.9) | 5.06 | 14.16 | 0.32 | 7.19 | 25.30 | 70.38 | 6.93 | 83.36 | 15.81 | 0.16 | 3.16 | NM | 477 | 9.85 | 8.44 | 2.18 | 0.27 | 2.89 | 0.43 | 4.62 | |||||||||||||||||||||
| PBHC | Pathfinder BC MHC of NY (36.3) | 9.10 | 8.21 | 0.67 | 10.52 | 11.97 | 86.50 | 5.41 | 101.34 | 13.58 | 0.12 | 1.32 | 15.79 | 419 | 7.75 | 6.90 | 1.39 | 0.46 | 6.03 | 0.41 | 5.31 | |||||||||||||||||||||
| PBIP | Prudential Bncp MHC PA (25.5) | 5.18 | 15.70 | -0.03 | 5.55 | NM | 93.33 | 10.43 | 93.33 | NM | 0.00 | 0.00 | NM | 498 | 11.18 | 11.18 | 2.80 | -0.10 | -0.90 | -0.06 | -0.54 | |||||||||||||||||||||
| RIVR | River Valley Bancorp of IN | 16.10 | 24.38 | 0.78 | 18.49 | 12.58 | 87.07 | 6.10 | 87.36 | 20.64 | 0.84 | 5.22 | 65.63 | 400 | 8.25 | 8.23 | 4.92 | 0.50 | 6.01 | 0.30 | 3.66 | |||||||||||||||||||||
| SPBC | SP Bancorp, Inc. of Plano, TX | 11.35 | 19.58 | -0.05 | 18.84 | 19.57 | 60.24 | 7.36 | 60.24 | NM | 0.00 | 0.00 | 0.00 | 266 | 12.22 | 12.22 | 4.28 | 0.41 | 3.80 | -0.04 | -0.33 | |||||||||||||||||||||
| STND | Standard Financial Corp. of PA | 14.75 | 51.30 | 0.93 | 22.25 | 22.01 | 66.29 | 11.72 | 75.56 | 15.86 | 0.00 | 0.00 | 0.00 | 438 | 17.68 | 15.85 | 0.85 | 0.55 | 3.67 | 0.76 | 5.10 | |||||||||||||||||||||
| UCBA | United Comm Bncp MHC IN (40.7) | 5.81 | 18.53 | -0.16 | 6.81 | NM | 85.32 | 9.57 | 91.50 | NM | 0.44 | 7.57 | NM | 476 | 11.22 | 10.54 | 5.02 | -0.20 | -1.71 | -0.26 | -2.28 | |||||||||||||||||||||
| WSB | WSB Holdings, Inc. of Bowie MD | 2.47 | 19.75 | -0.06 | 6.62 | NM | 37.31 | 5.06 | 37.31 | NM | 0.00 | 0.00 | NM | 390 | 13.56 | 13.56 | 10.18 | -0.28 | -2.15 | -0.12 | -0.92 | |||||||||||||||||||||
| WAYN | Wayne Savings Bancshares of OH | 8.40 | 25.23 | 0.66 | 13.15 | 12.17 | 63.88 | 6.13 | 67.25 | 12.73 | 0.24 | 2.86 | 34.78 | 412 | 9.60 | 9.16 | 2.54 | 0.51 | 5.39 | 0.48 | 5.15 | |||||||||||||||||||||
| WBKC | Wolverine Bancorp, Inc. of MI | 14.00 | 35.11 | 0.23 | 25.59 | NM | 54.71 | 11.48 | 54.71 | NM | 0.00 | 0.00 | 0.00 | 306 | 20.99 | 20.99 | 5.43 | 0.23 | 1.37 | 0.19 | 1.09 | |||||||||||||||||||||
| (1) | Average of High/Low or Bid/Ask price per share. |
| (2) | EPS (estimate core basis) is based on actual trailing twelve month data, adjusted to omit non-operating items on a tax effected basis. |
| (3) | P/E = Price to earnings; P/B = Price to book; P/A = Price to assets; P/TB = Price to tangible book value; and P/CORE = Price to estimated core earnings. |
| (4) | Indicated twelve month dividend, based on last quarterly dividend declared. |
| (5) | Indicated dividend as a percent of trailing twelve month estimated core earnings. |
| (6) | ROA (return on assets) and ROE (return on equity) are indicated ratios based on trailing twelve month earnings and average equity and assets balances. |
| (7) | Excludes from averages those companies the subject of actual or rumored acquisition activities or unusual operating characteristics. |
| (8) | Includes Assets $250-$500 Million; |
| Source: | SNL Financial, LC. and RP Financial, LC. calculations. The information provided in this report has been obtained from sources we believe are reliable, but we cannot guarantee the accuracy or completeness of such information. |
Copyright (c) 2010 by RP Financial, LC.
| Exhibit III-3 | ||||||||||||||||
| 1st Security Bank of Washington | ||||||||||||||||
| Peer Group Market Area Comparative Analysis |
| Proj. | Per Capita Income | Deposit | Unemployment | |||||||||||||||||||||||||||||||||||
| Population | Pop. | 2000-2010 | 2010-2015 | % State | Market | Rate | ||||||||||||||||||||||||||||||||
| Institution | County | 2000 | 2010 | 2015 | % Change | % Change | Amount | Average | Share(1) | 7/31/2011 | ||||||||||||||||||||||||||||
| (000) | (000) | (000) | (%) | (%) | ($) | (%) | (%) | (%) | ||||||||||||||||||||||||||||||
| Athens Bancshares, Inc. of TN | McMinn | 49 | 53 | 54 | 7.2 | % | 3.0 | % | $ | 20,206 | 82.87 | % | 19.84 | % | 11.6 | % | ||||||||||||||||||||||
| Eagle Bancorp of MT | Lewis and Clark | 56 | 62 | 65 | 11.2 | % | 5.5 | % | 23,233 | 113.28 | % | 9.01 | % | 5.8 | % | |||||||||||||||||||||||
| FFD Financial Corp of Dover OH | Tuscawaras | 91 | 92 | 92 | 0.9 | % | -0.2 | % | 20,646 | 79.57 | % | 14.12 | % | 9.1 | % | |||||||||||||||||||||||
| First Advantage Bancorp of TN | Montgomery | 135 | 164 | 175 | 21.4 | % | 7.2 | % | 22,987 | 94.27 | % | 11.54 | % | 9.5 | % | |||||||||||||||||||||||
| First Federal of Northern MI | Alpena | 31 | 29 | 28 | -6.2 | % | -3.2 | % | 20,569 | 78.31 | % | 26.38 | % | 10.8 | % | |||||||||||||||||||||||
| Jacksonville Bancorp, Inc. of IL | Morgan | 37 | 35 | 35 | -3.3 | % | -1.8 | % | 22,470 | 79.59 | % | 26.06 | % | 8.8 | % | |||||||||||||||||||||||
| LSB Financial Corp. of Lafayette, LA | Tippecanoe | 149 | 169 | 180 | 13.2 | % | 6.7 | % | 24,477 | 127.82 | % | 15.00 | % | 8.1 | % | |||||||||||||||||||||||
| Louisiana Bancorp, Inc. of LA | Jefferson | 455 | 435 | 430 | -4.4 | % | -1.2 | % | 21,827 | 113.98 | % | 1.83 | % | 7.2 | % | |||||||||||||||||||||||
| Riverview Bancorp, Inc. of WA | Clark | 345 | 438 | 475 | 26.9 | % | 8.5 | % | 27,004 | 94.12 | % | 11.68 | % | 10.1 | % | |||||||||||||||||||||||
| Timberland Bancorp, Inc. of WA | Grays Harbor | 67 | 72 | 73 | 7.3 | % | 1.3 | % | 20,370 | 71.00 | % | 22.01 | % | 12.6 | % | |||||||||||||||||||||||
| Averages: | 142 | 155 | 161 | 7.4 | % | 2.6 | % | $ | 22,379 | 93.48 | % | 15.75 | % | 9.4 | % | |||||||||||||||||||||||
| Medians: | 79 | 82 | 82 | 7.3 | % | 2.1 | % | $ | 22,149 | 88.49 | % | 14.56 | % | 9.3 | % | |||||||||||||||||||||||
| 1st Security | Snohomish | 606 | 713 | 758 | 17.6 | % | 6.4 | % | $ | 30,372 | 105.86 | % | 1.39 | % | 10.0 | % | ||||||||||||||||||||||
(1) Total institution deposits in headquarters county as percent of total county deposits as of June 30, 2010.
Source: SNL Financial, LC.
EXHIBIT IV-1
1st Security Bank of Washington
Stock Prices: As of September 2, 2011
1st Security Bank of Washington
Stock Prices: As of September 2, 2011
| RP FINANCIAL, LC. | |
| Financial Services Industry Consultants | |
| 1100 North Glebe Road, Suite 1100 | |
| Arlington, Virginia 222011 | |
| (703) 528-1700 |
Exhibit IV-1A
Weekly Thrift Market Line - Part One
Prices As Of September 2, 2011| Market Capitalization | Price Change Data | Current Per Share Financials | ||||||||||||||||||||||||||||||||||||||||
| Tangible | ||||||||||||||||||||||||||||||||||||||||||
| Shares | Market | 52 Week (1) | % Change From | Trailing | 12 Mo. | Book | Book | |||||||||||||||||||||||||||||||||||
| Price/ | Outst- | Capital- | Last | Last | 52 Wks | MostRcnt | 12 Mo. | Core | Value/ | Value/ | Assets/ | |||||||||||||||||||||||||||||||
| Financial Institution | Share(1) | anding | ization(9) | High | Low | Week | Week | Ago(2) | YrEnd(2) | EPS(3) | EPS(3) | Share | Share(4) | Share | ||||||||||||||||||||||||||||
| ($) | (000) | ($Mil) | ($) | ($) | ($) | (%) | (%) | (%) | ($) | ($) | ($) | ($) | ($) | |||||||||||||||||||||||||||||
Market Averages. All Public Companies (no MHC) | �� | |||||||||||||||||||||||||||||||||||||||||
| All Public Companies(117) | 10.30 | 32,745 | 270.7 | 13.06 | 8.57 | 10.46 | -0.45 | 2.09 | -6.50 | 0.03 | -0.09 | 14.14 | 13.25 | 134.44 | ||||||||||||||||||||||||||||
| NYSE Traded Companies(6) | 9.50 | 220,914 | 1,581.6 | 14.08 | 8.65 | 9.54 | -1.31 | -28.84 | -34.38 | 0.33 | 0.49 | 9.74 | 7.35 | 94.05 | ||||||||||||||||||||||||||||
| NASDAQ Listed OTC Companies(111) | 10.34 | 22,291 | 197.9 | 13.00 | 8.57 | 10.51 | -0.40 | 3.80 | -4.95 | 0.01 | -0.12 | 14.39 | 13.58 | 136.68 | ||||||||||||||||||||||||||||
| California Companies(5) | 9.42 | 8,939 | 97.7 | 12.17 | 7.38 | 9.39 | -0.68 | 11.45 | -9.17 | 0.57 | 0.09 | 12.90 | 12.82 | 145.61 | ||||||||||||||||||||||||||||
| Florida Companies(2) | 11.87 | 87,692 | 1,147.0 | 15.75 | 10.01 | 11.26 | 6.18 | -22.14 | -23.98 | -0.20 | 0.60 | 7.76 | 7.32 | 80.49 | ||||||||||||||||||||||||||||
| Mid-Atlantic Companies(36) | 11.01 | 47,843 | 437.8 | 14.41 | 9.49 | 11.20 | -1.59 | 0.59 | -11.03 | 0.14 | 0.12 | 14.18 | 12.76 | 138.17 | ||||||||||||||||||||||||||||
| Mid-West Companies(33) | 8.25 | 30,230 | 104.5 | 10.66 | 6.71 | 8.37 | 0.53 | -3.97 | -6.11 | -0.28 | -0.56 | 13.64 | 13.01 | 147.25 | ||||||||||||||||||||||||||||
| New England Companies(17) | 13.87 | 33,805 | 376.8 | 16.41 | 11.14 | 14.33 | -1.63 | 15.04 | 0.23 | 0.70 | 0.67 | 15.57 | 14.09 | 133.47 | ||||||||||||||||||||||||||||
| North-West Companies(5) | 6.83 | 32,242 | 347.6 | 9.22 | 5.81 | 6.83 | 1.19 | 12.51 | 2.67 | -0.32 | -0.40 | 13.11 | 12.24 | 105.13 | ||||||||||||||||||||||||||||
| South-East Companies(14) | 9.30 | 6,843 | 59.0 | 11.80 | 8.00 | 9.29 | 0.13 | -5.53 | -7.70 | -0.61 | -0.63 | 14.52 | 14.39 | 116.84 | ||||||||||||||||||||||||||||
| South-West Companies(3) | 12.17 | 16,075 | 192.0 | 14.16 | 9.54 | 12.10 | 0.77 | 21.07 | 6.69 | 0.48 | 0.16 | 15.93 | 15.92 | 117.72 | ||||||||||||||||||||||||||||
| Western Companies (Excl CA)(2) | 14.76 | 7,756 | 131.0 | 16.55 | 12.72 | 15.22 | -2.74 | 13.13 | -3.84 | 0.85 | 0.64 | 16.51 | 16.51 | 106.43 | ||||||||||||||||||||||||||||
| Thrift Strategy(110) | 10.29 | 30,197 | 245.8 | 12.99 | 8.56 | 10.46 | -0.62 | 2.23 | -5.72 | 0.02 | -0.07 | 14.15 | 13.30 | 131.72 | ||||||||||||||||||||||||||||
| Mortgage Banker Strategy(3) | 3.20 | 37,077 | 55.7 | 4.08 | 2.14 | 3.14 | 1.40 | 5.78 | -23.31 | -0.55 | -1.56 | 4.30 | 4.19 | 107.06 | ||||||||||||||||||||||||||||
| Real Estate Strategy(l) | 1.55 | 25,670 | 39.8 | 2.23 | 1.27 | 1.45 | 6.90 | -13.41 | -14.84 | -0.38 | -0.58 | 2.90 | 2.90 | 30.28 | ||||||||||||||||||||||||||||
| Diversified Strategy(3) | 20.76 | 121,656 | 1,453.3 | 28.08 | 17.94 | 20.54 | 1.36 | -1.55 | -14.80 | 1.29 | 1.16 | 27.42 | 24.09 | 293.50 | ||||||||||||||||||||||||||||
| Companies Issuing Dividends(73) | 11.90 | 39,466 | 404.6 | 15.17 | 9.98 | 12.15 | -1.73 | 3.37 | -8.17 | 0.59 | 0.48 | 14.95 | 13.78 | 141.67 | ||||||||||||||||||||||||||||
| Companies Without Dividends(44) | 7.76 | 22,052 | 57.8 | 9.69 | 6.33 | 7.77 | 1.60 | 0.05 | -3.85 | -0.85 | -0.99 | 12.86 | 12.41 | 122.93 | ||||||||||||||||||||||||||||
| Equity/Assets <6%(8) | 1.02 | 18,505 | 14.8 | 3.33 | 0.76 | 0.98 | 5.47 | -43.65 | -33.72 | -4.36 | -4.73 | 4.64 | 4.24 | 167.40 | ||||||||||||||||||||||||||||
| Equity/Assets 6-12%(55) | 10.48 | 30,698 | 149.4 | 13.79 | 8.61 | 10.66 | -0.44 | -0.50 | -7.17 | 0.25 | 0.06 | 14.70 | 13.90 | 169.94 | ||||||||||||||||||||||||||||
| Equity/Assets >12%(54) | 11.36 | 36,827 | 433.5 | 13.59 | 9.59 | 11.51 | -1.25 | 10.98 | -2.12 | 0.39 | 0.39 | 14.83 | 13.78 | 92.44 | ||||||||||||||||||||||||||||
| Converted Last 3 Mths (no MHC)(4) | 10.09 | 8,151 | 81.4 | 11.16 | 9.21 | 10.10 | 0.02 | 10.19 | 9.98 | 0.29 | 0.26 | 14.22 | 14.22 | 87.38 | ||||||||||||||||||||||||||||
| Actively Traded Companies(4) | 21.05 | 32,693 | 440.7 | 27.53 | 16.59 | 22.40 | -2.32 | 12.99 | -8.67 | 0.93 | 0.86 | 21.96 | 20.96 | 278.38 | ||||||||||||||||||||||||||||
| Market Value Below $20 Million(17) | 4.71 | 4,750 | 11.4 | 7.27 | 3.82 | 4.63 | 3.72 | -23.40 | -15.20 | -2.25 | -2.55 | 10.32 | 10.16 | 159.56 | ||||||||||||||||||||||||||||
| Holding Company Structure(111) | 9.88 | 34,228 | 281.6 | 12.59 | 8.25 | 9.99 | -0.39 | 1.71 | -6.63 | -0.07 | -0.18 | 13.81 | 12.94 | 128.88 | ||||||||||||||||||||||||||||
| Assets Over $1 Billion(55) | 10.62 | 64,738 | 533.9 | 14.34 | 9.27 | 10.95 | -1.55 | -5.40 | -16.10 | 0.37 | 0.22 | 13.28 | 11.98 | 129.35 | ||||||||||||||||||||||||||||
| Assets $500 Million-$l Billion(30) | 8.74 | 7,250 | 55.1 | 10.97 | 6.96 | 8.74 | 0.46 | 4.42 | -2.35 | -0.85 | -0.86 | 13.44 | 12.86 | 133.83 | ||||||||||||||||||||||||||||
| Assets $250-$500 Million(23) | 12.13 | 3,172 | 35.0 | 13.68 | 9.52 | 12.17 | -0.39 | 17.05 | 6.61 | 0.53 | 0.38 | 17.27 | 16.58 | 150.81 | ||||||||||||||||||||||||||||
| Assets less than $250 Million(9) | 8.76 | 2,066 | 18.4 | 10.61 | 7.25 | 8.70 | 3.01 | 0.40 | 3.17 | -0.40 | -0.57 | 13.47 | 13.45 | 124.55 | ||||||||||||||||||||||||||||
| Goodwill Companies(70) | 10.14 | 38,425 | 368.5 | 13.41 | 8.45 | 10.28 | -0.93 | 0.93 | -7.81 | -0.04 | -0.11 | 14.07 | 12.59 | 140.05 | ||||||||||||||||||||||||||||
| Non-Goodwill Companies(46) | 10.75 | 24,512 | 128.7 | 12.72 | 8.94 | 10.94 | -0.32 | 5.59 | -3.17 | 0.19 | 0.01 | 14.32 | 14.32 | 124.82 | ||||||||||||||||||||||||||||
| Acquirors of FSLIC Cases(1) | 13.92 | 110,438 | 1.537.3 | 18.53 | 13.73 | 14.52 | -4.13 | -4.07 | -17.73 | 0.87 | 0.81 | 16.84 | 14.53 | 120.64 | ||||||||||||||||||||||||||||
| (1) | Average of high/low or bid/ask price per share. |
| (2) | Or since offering price if converted or first listed in the past 52 weeks. Percent change figures are actual year-to-date and are not annualized |
| (3) | EPS (earnings per share) is based on actual trailing twelve month data and is not shown on a pro forma basis. |
| (4) | Excludes intangibles (such as goodwill, value of core deposits, etc.). |
| (5) | ROA (return on assets) and ROE (return on equity) are indicated ratios based on trailing twelve month common earnings and average common equity and assets balances. |
| (6) | Annualized, based on last regular quarterly cash dividend announcement. |
| (7) | Indicated dividend as a percent of trailing twelve month earnings. |
| (8) | Excluded from averages due to actual or rumored acquisition activities or unusual operating characteristics. |
| (9) | For MHC institutions, market value reflects share price multiplied by public (non-MHC) shares. |
| * | Parentheses following market averages indicate the number of institutions included in the respective averages. All figures have been adjusted for stock splits, stock dividends, and secondary offerings. |
| Source: | SNL Financial, LC. and RP Financial, LC. calculations. The information provided in this table has been obtained from sources we believe are reliable, but we cannot guarantee the accuracy or completeness of such information. |
Copyright (c) 2010 by RP Financial, LC.
| RP FINANCIAL, LC. | |
| Financial Services Industry Consultants | |
| 1100 North Glebe Road, Suite 1100 | |
| Arlington, Virginia 222011 | |
| (703) 528-1700 |
Exhibit IV-1A (continued)
Weekly Thrift Market Line - Part One
Prices As Of September 2, 2011
| Market Capitalization | Price Change Data | Current Per Share Financials | ||||||||||||||||||||||||||||||||||||||||
| Shares | Market | 52 Week (1) | % Change From | Trailing | 12 Mo. | Book | Book | |||||||||||||||||||||||||||||||||||
| Price/ | Outst- | Capital- | Last | Last | 52 Wks | MostRcnt | 12 Mo. | Core | Value/ | Value/ | Assets/ | |||||||||||||||||||||||||||||||
| Financial Institution | Share(1) | anding | ization(9) | High | Low | Week | Week | Ago(2) | YrEnd(2) | EPS(3) | EPS(3) | Share | Share(4) | Share | ||||||||||||||||||||||||||||
| ($) | (000) | ($Mil) | ($) | ($) | ($) | (%) | (%) | (%) | ($) | ($) | ($) | ($) | ($) | |||||||||||||||||||||||||||||
| Market Averages. MHC Institutions | ||||||||||||||||||||||||||||||||||||||||||
| All Public Companies(25) | 8.11 | 34,239 | 107.2 | 10.23 | 6.93 | 8.35 | -2.71 | -3.68 | -5.67 | 0.19 | 0s | 8.19 | 7.64 | 70.80 | ||||||||||||||||||||||||||||
| NASDAQ Listed OTC Companies(25) | 8.11 | 34,239 | 107.2 | 10.23 | 6.93 | 8.35 | -2.71 | -3.68 | -5.67 | 0.19 | 0.13 | 8.19 | 7.64 | 70.80 | ||||||||||||||||||||||||||||
| Mid-Atlantic Companies(15) | 8.27 | 28,522 | 109.6 | 10.53 | 7.02 | 8.57 | -3.57 | -4.25 | -7.13 | 0.17 | 0.16 | 8.17 | 7.78 | 77.16 | ||||||||||||||||||||||||||||
| Mid-West Companies(6) | 7.08 | 61,454 | 131.9 | 8.87 | 6.13 | 7.12 | -0.72 | -8.89 | -10.57 | 0.13 | -0.06 | 7.51 | 6.57 | 58.10 | ||||||||||||||||||||||||||||
| New England Companies(2) | 8.47 | 14,385 | 63.2 | 10.14 | 6.43 | 8.88 | -2.85 | 16.86 | 11.35 | 0.43 | 0.41 | 8.53 | 7.66 | 79.75 | ||||||||||||||||||||||||||||
| South-East Companies(2) | 9.71 | 12,470 | 60.6 | 12.37 | 9.20 | 9.93 | -2.47 | -4.58 | 2.28 | 0.23 | 0.21 | 9.98 | 9.85 | 55.40 | ||||||||||||||||||||||||||||
| Thrift Strategy(25) | 8.11 | 34,239 | 107.2 | 10.23 | 6.93 | 8.35 | -2.71 | -3.68 | -5.67 | 0.19 | 0.13 | 8.19 | 7.64 | 70.80 | ||||||||||||||||||||||||||||
| Companies Issuing Dividends(17) | 8.34 | 15,374 | 49.8 | 10.41 | 7.06 | 8.56 | -2.56 | -3.87 | -4.14 | 0.19 | 0.19 | 8.42 | 7.87 | 70.75 | ||||||||||||||||||||||||||||
| Companies Without Dividends(8) | 7.63 | 71,970 | 222.2 | 9.87 | 6.67 | 7.92 | -3.00 | -3.30 | -8.71 | 0.18 | 0.02 | 7.73 | 7.18 | 70.89 | ||||||||||||||||||||||||||||
| Equity/Assets 6-12%(15) | 7.63 | 18,063 | 69.6 | 9.62 | 6.30 | 7.82 | -2.28 | -4.51 | -7.73 | 0.19 | 0.10 | 8.04 | 7.55 | 83.46 | ||||||||||||||||||||||||||||
| Equity /Assets >12%(10) | 8.90 | 61,200 | 169.9 | 11.26 | 7.98 | 9.23 | -3.41 | -2.30 | -2.23 | 0.19 | 0.18 | 8.43 | 7.78 | 49.71 | ||||||||||||||||||||||||||||
| Market Value Below $20 Million(1) | 0.79 | 12,883 | 2.9 | 3.73 | 0.36 | 0.80 | -1.25 | -77.43 | -38.76 | -0.37 | -0.24 | 3.16 | 3.16 | 36.48 | ||||||||||||||||||||||||||||
| Holding Company Structure(23) | 8.23 | 35,292 | 111.2 | 10.33 | 7.00 | 8.47 | -2.58 | -2.64 | -5.29 | 0.20 | 0.14 | 8.30 | 7.73 | 71.72 | ||||||||||||||||||||||||||||
| Assets Over $l Billion(9) | 8.98 | 86,989 | 272.6 | 11.26 | 8.11 | 9.63 | -5.98 | -6.39 | -10.00 | 0.20 | 0.05 | 7.60 | 7.03 | 60.69 | ||||||||||||||||||||||||||||
| Assets $500 Million-$l Billion(5) | 9.39 | 8,698 | 38.0 | 11.34 | 7.97 | 9.33 | -1.13 | 0.23 | -4.60 | 0.10 | 0.01 | 8.96 | 8.64 | 90.46 | ||||||||||||||||||||||||||||
| Assets $250-$500 Million(10) | 6.77 | 7,460 | 17.7 | 8.84 | 5.51 | 6.85 | -1.07 | -1.86 | -2.04 | 0.23 | 0.25 | 8.34 | 7.82 | 73.19 | ||||||||||||||||||||||||||||
| Assets less than $250 Million(1) | 8.09 | 7,741 | 25.3 | 10.40 | 6.51 | 8.15 | -0.74 | -19.82 | -12.54 | 0.19 | 0.18 | 7.53 | 5.64 | 29.54 | ||||||||||||||||||||||||||||
| Goodwill Companies(16) | 8.29 | 47,834 | 152.0 | 10.15 | 7.08 | 8.70 | -3.98 | -0.56 | -4.61 | 0.24 | 0.14 | 8.02 | 7.19 | 66.95 | ||||||||||||||||||||||||||||
| Non-Goodwill Companies(9) | 7.74 | 7,050 | 17.8 | 10.39 | 6.62 | 7.64 | -0.16 | -9.92 | -7.78 | 0.09 | 0.10 | 8.53 | 8.53 | 78.50 | ||||||||||||||||||||||||||||
| MHC Institutions(25) | 8.11 | 34,239 | 107.2 | 10.23 | 6.93 | 8.35 | -2.71 | -3.68 | -5.67 | 0.19 | 0.13 | 8.19 | 7.64 | 70.80 | ||||||||||||||||||||||||||||
| (1) | Average of high/low or bid/ask price per share. |
| (2) | Or since offering price if converted or first listed in the past 52 weeks. Percent change figures are actual year-to-date and are not annualized |
| (3) | EPS (earnings per share) is based on actual trailing twelve month data and is not shown on a pro forma basis. |
| (4) | Excludes intangibles (such as goodwill, value of core deposits, etc.). |
| (5) | ROA (return on assets) and ROE (return on equity) are indicated ratios based on trailing twelve month common earnings and average common equity and assets balances. |
| (6) | Annualized, based on last regular quarterly cash dividend announcement. |
| (7) | Indicated dividend as a percent of trailing twelve month earnings. |
| (8) | Excluded from averages due to actual or rumored acquisition activities or unusual operating characteristics. |
| (9) | For MHC institutions, market value reflects share price multiplied by public (non-MHC) shares. |
| * | Parentheses following market averages indicate the number of institutions included in the respective averages. All figures have been adjusted for stock splits, stock dividends, and secondary offerings. |
| Source: | SNL Financial, LC. and RP Financial, LC. calculations. The information provided in this table has been obtained from sources we believe are reliable, but we cannot guarantee the accuracy or completeness of such information. |
Copyright (c) 2010 by RP Financial, LC.
| RP FINANCIAL, LC. | |
Financial Services Industry Consultants 1100 North Glebe Road, Suite 1100 Arlington, Virginia 222011 (703) 528-1700 | |
Exhibit IV-1A (continued)
Weekly Thrift Market Line - Part One
Prices As Of September 2, 2011
| Current Per Share Financials | ||||||||||||||||||||||||||||||
| Market Capitalization | Price Change Data | Tangible | ||||||||||||||||||||||||||||
| Shares | Market | 52 week (1) | % Change From | Trailing | 12 Mo. | Book | Book | |||||||||||||||||||||||
| Price/ | Outst- | Capital- | Last | Last | 52 Wks | MostRcnt | 12 Mo. | Core | Value/ | Value/ | Assets/ | |||||||||||||||||||
| Financial Institution | Share(l) | anding | ization(9) | High | Low | Week | Week | Ago(2) | YrEnd(2) | EPS(3) | EPS(3) | Share | Share(4) | Share | ||||||||||||||||
| ($) | (000) | ($Mil) | ($) | ($) | ($) | (%) | (%) | (%) | ($) | ($) | ($) | ($) | ($) | |||||||||||||||||
| NYSE Traded Companies | ||||||||||||||||||||||||||||||
| AF | Astoria Financial Corp. of NY* | 9.16 | 98,488 | 902.2 | 15.25 | 9.08 | 9.51 | -3.68 | -26.07 | -34.15 | 0.91 | 0.87 | 12.98 | 11.10 | 173.83 | |||||||||||||||
| BBX | BankAtlantic Bancorp Inc of FL* | 0.77 | 78,134 | 60.2 | 1.59 | 0.60 | 0.72 | 6.94 | -29.36 | -33.04 | -0.91 | -0.56 | 0.33 | 0.15 | 49.45 | |||||||||||||||
| BKU | BankUnited, Inc.* | 22.97 | 97,250 | 2,233.8 | 29.90 | 19.41 | 21.79 | 5.42 | -14.93 | -14.93 | 0.51 | 1.76 | 15.18 | 14.48 | 111.53 | |||||||||||||||
| PBC | Flagstar Bancorp, Inc. of MI* | 0.59 | 554,163 | 327.0 | 2.75 | 0.45 | 0.64 | -7.81 | -76.11 | -63.80 | -0.59 | -0.96 | 1.78 | 1.78 | 23.49 | |||||||||||||||
| NYB | New York Community Bcrp of NY* | 12.07 | 437,414 | 5,279.6 | 19.33 | 11.48 | 12.50 | -3.44 | -24.75 | -35.97 | 1.21 | 0.98 | 12.71 | 7.00 | 92.82 | |||||||||||||||
| PFS | Provident Fin. Serv. Inc of NJ* | 11.44 | 60,034 | 686.8 | 15.66 | 10.87 | 12.08 | -5.30 | -1.80 | -24.39 | 0.86 | 0.86 | 15.43 | 9.57 | 113.17 | |||||||||||||||
| NASDAQ Listed OTC Companies | ||||||||||||||||||||||||||||||
| ABBC | Abington Bancorp, Inc. of PA(8)* | 7.86 | 20,246 | 159.1 | 13.23 | 7.58 | 8.16 | -3.68 | -22.56 | -34.12 | 0.39 | 0.39 | 10.68 | 10.68 | 58.12 | |||||||||||||||
| ALLB | Alliance Bancorp, Inc. of PA* | 10.16 | 5,474 | 55.6 | 11.70 | 8.54 | 10.86 | -6.45 | 7.51 | -8.96 | 0.39 | 0.40 | 15.70 | 15.70 | 85.31 | |||||||||||||||
| ABCW | Anchor BanCorp Wisconsin of WI* | 0.59 | 21,678 | 12.8 | 1.90 | 0.52 | 0.62 | -4.84 | -6.35 | -50.83 | -1.90 | -3.53 | 0.15 | 0.00 | 156.60 | |||||||||||||||
| ANCB | Anchor Bancorp of Aberdeen, WA* | 7.95 | 2,451 | 19.5 | 11.28 | 7.18 | 7.65 | 3.92 | -20.50 | -20.50 | -2.16 | -2.26 | 24.37 | 24.37 | 200.05 | |||||||||||||||
| AFCB | Athens Bancshares, Inc. of TN* | 12.70 | 2,766 | 35.1 | 14.05 | 9.56 | 12.00 | 5.83 | 16.51 | 1.68 | 0.61 | 0.61 | 18.16 | 18.02 | 102.45 | |||||||||||||||
| ACFC | Atlantic Coast Fin. Corp of GA* | 2.69 | 2,629 | 7.1 | 12.40 | 2.22 | 2.77 | -2.89 | -78.02 | -69.88 | -4.68 | -5.27 | 20.57 | 20.54 | 304.97 | |||||||||||||||
| BCSB | BCSB Bancorp, Inc. of MD* | 12.40 | 3,192 | 39.6 | 14.25 | 9.50 | 12.40 | 0.00 | 25.51 | 9.73 | 0.23 | 0.24 | 16.12 | 16.10 | 197.23 | |||||||||||||||
| BKMU | Bank Mutual Corp of WI* | 2.89 | 46,229 | 133.6 | 5.70 | 2.86 | 3.10 | -6.77 | -44.32 | -39.54 | -2.72 | -2.91 | 5.76 | 5.74 | 54.58 | |||||||||||||||
| BFIN | BankFinancial Corp. of IL* | 7.24 | 21,073 | 152.6 | 10.11 | 7.06 | 7.80 | -7.18 | -20.09 | -25.74 | -0.21 | -0.17 | 11.88 | 10.60 | 78.91 | |||||||||||||||
| BFED | Beacon Federal Bancorp of NY* | 13.50 | 6,359 | 85.8 | 14.99 | 10.00 | 13.47 | 0.22 | 31.32 | 14.41 | 0.92 | 1.00 | 17.84 | 17.84 | 163.75 | |||||||||||||||
| BNCL | Beneficial Mut MHC of PA(43.7) | 7.26 | 80,718 | 261.8 | 9.40 | 7.15 | 7.82 | -7.16 | -14.39 | -17.78 | -0.26 | -0.22 | 7.73 | 6.17 | 58.38 | |||||||||||||||
| BHLB | Berkshire Hills Bancorp of MA* | 19.24 | 16,721 | 321.7 | 24.14 | 17.50 | 20.65 | -6.83 | 5.25 | -12.98 | 0.70 | 1.00 | 26.61 | 15.09 | 192.90 | |||||||||||||||
| BOFI | Bofi Holding, Inc. Of CA* | 14.08 | 10,436 | 146.9 | 16.90 | 11.44 | 13.83 | 1.81 | 16.65 | -9.22 | 1.94 | 1.57 | 13.67 | 13.67 | 185.90 | |||||||||||||||
| BYFC | Broadway Financial Corp. of CA* | 1.48 | 1,745 | 2.6 | 3.77 | 1.41 | 1.57 | -5.73 | -38.33 | -39.09 | -1.66 | -1.71 | 8.27 | 8.27 | 256.20 | |||||||||||||||
| BRKL | Brookline Bancorp, Inc. of MA* | 7.82 | 59,074 | 462.0 | 11.68 | 7.12 | 7.75 | 0.90 | -16.72 | -27.93 | 0.49 | 0.50 | 8.48 | 7.60 | 52.72 | |||||||||||||||
| BFSB | Brooklyn Fed MHC of NY (28.2) | 0.79 | 12,883 | 2.9 | 3.73 | 0.36 | 0.80 | -1.25 | -77.43 | -38.76 | -0.37 | -0.24 | 3.16 | 3.16 | 36.48 | |||||||||||||||
| CITZ | CFS Bancorp, Inc of Munster IN* | 5.23 | 10,868 | 56.8 | 6.10 | 4.27 | 5.45 | -4.04 | 14.19 | 0.00 | 0.30 | 0.27 | 10.47 | 10.46 | 105.27 | |||||||||||||||
| CMSB | CMS Bancorp Inc of W Plains NY* | 8.10 | 1,863 | 15.1 | 10.65 | 7.04 | 7.64 | 6.02 | -23.94 | -17.85 | 0.16 | -0.05 | 11.84 | 11.84 | 132.86 | |||||||||||||||
| CBNJ | Cape Bancorp, Inc. of NJ* | 7.60 | 13,314 | 101.2 | 10.40 | 7.25 | 8.45 | -10.06 | -1.30 | -10.59 | 0.87 | 0.93 | 10.85 | 9.13 | 80.20 | |||||||||||||||
| CFFN | Capitol Federal Fin Inc. of KS* | 10.48 | 167,498 | 1,755.4 | 12.70 | 10.16 | 10.57 | -0.85 | -7.17 | -12.01 | 0.22 | 0.38 | 11.55 | 11.55 | 57.33 | |||||||||||||||
| CARV | Carver Bancorp, Inc. of NY* | 0.69 | 2,489 | 1.7 | 5.80 | 0.31 | 0.65 | 6.15 | -81.40 | -63.87 | -17.44 | -17.43 | 1.89 | -0.02 | 272.54 | |||||||||||||||
| CEBK | Central Bncrp of Somerville MA* | 17.50 | 1,681 | 29.4 | 20.88 | 10.28 | 17.39 | 0.63 | 70.73 | 27.00 | 0.36 | 0.04 | 22.26 | 20.93 | 295.80 | |||||||||||||||
| CFBK | Central Federal Corp. of OH* | 0.75 | 4,128 | 3.1 | 2.26 | 0.45 | 0.74 | 1.35 | -25.00 | 47.06 | -1.28 | -1.41 | 1.26 | 1.23 | 67.29 | |||||||||||||||
| CHFN | Charter Fin Corp MHC GA (49.0) | 8.46 | 18,592 | 96.9 | 11.24 | 7.50 | 8.90 | -4.94 | -18.65 | -4.94 | 0.16 | -0.11 | 7.47 | 7.20 | 51.41 | |||||||||||||||
| CHEV | Cheviot Fin Cp MHC of OH (38.5) | 8.62 | 8,865 | 29.4 | 9.50 | 8.00 | 8.90 | -3.15 | 4.61 | -3.15 | 0.27 | 0.21 | 8.05 | 6.75 | 67.36 | |||||||||||||||
| CBNK | Chicopee Bancorp, Inc. of MA* | 14.00 | 5,867 | 82.1 | 14.70 | 11.08 | 14.00 | 0.00 | 25.56 | 10.67 | 0.13 | 0.10 | 15.52 | 15.52 | 98.86 | |||||||||||||||
| CZWI | Citizens Comm Bncorp Inc of WI* | 5.44 | 5,123 | 27.9 | 6.77 | 3.51 | 5.40 | 0.74 | 29.52 | 37.72 | -1.43 | -1.29 | 10.33 | 10.22 | 107.69 | |||||||||||||||
| CSBC | Citizens South Bnkg Corp of NC* | 4.15 | 11,506 | 47.7 | 5.46 | 3.00 | 3.85 | 7.79 | -15.82 | -4.38 | -0.14 | 0.17 | 6.45 | 6.31 | 97.17 | |||||||||||||||
| CSBK | Clifton Svg Bp MHC of NJ(35.8)(8) | 9.50 | 26,138 | 91.3 | 12.18 | 8.08 | 9.96 | -4.62 | 14.18 | -12.12 | 0.32 | 0.32 | 6.93 | 6.93 | 43.42 | |||||||||||||||
| COBK | Colonial Financial Serv. of NJ* | 12.05 | 4,188 | 50.5 | 13.09 | 9.40 | 11.95 | 0.84 | 22.34 | -1.23 | 0.73 | 0.71 | 17.15 | 17.15 | 143.55 | |||||||||||||||
| CFFC | Community Fin. Corp. of VA* | 3.07 | 4,362 | 13.4 | 4.28 | 2.72 | 3.07 | 0.00 | -23.25 | -11.78 | 0.08 | 0.08 | 8.67 | 8.67 | 119.98 | |||||||||||||||
| DCOM | Dime Community Bancshars of NY* | 11.00 | 34,957 | 384.5 | 15.89 | 10.40 | 11.51 | -4.43 | -13.45 | -24.61 | 1.30 | 1.34 | 9.93 | 8.34 | 117.08 | |||||||||||||||
| ESBF | ESB Financial Corp. of PA* | 10.77 | 14,841 | 159.8 | 14.35 | 10.32 | 11.86 | -9.19 | -1.82 | -20.40 | 1.05 | 1.06 | 12.03 | 9.18 | 132.59 | |||||||||||||||
| ESSA | ESSA Bancorp, Inc. of PA* | 10.76 | 12,411 | 133.5 | 13.49 | 10.44 | 11.02 | -2.36 | -7.88 | -18.61 | 0.36 | 0.32 | 13.26 | 13.11 | 88.84 | |||||||||||||||
| EBMT | Eagle Bancorp Montanta of MT* | 10.46 | 3,919 | 41.0 | 11.81 | 8.98 | 10.65 | -1.78 | 14.07 | -3.42 | 0.61 | 0.24 | 13.39 | 13.39 | 84.48 | |||||||||||||||
| ESBK | Elmira Svgs Bank, FSB of NY* | 15.85 | 1,967 | 31.2 | 18.50 | 13.14 | 15.85 | 0.00 | 3.19 | -13.15 | 1.78 | 1.25 | 20.31 | 13.78 | 254.06 | |||||||||||||||
| FFDF | FFD Financial Corp of Dover OH* | 15.00 | 1,012 | 15.2 | 16.49 | 13.00 | 15.50 | -3.23 | 4.17 | 5.34 | 1.42 | 0.93 | 18.50 | 18.50 | 208.09 | |||||||||||||||
| FFCO | FedFirst Financial Corp of PA* | 13.49 | 2,991 | 40.3 | 16.50 | 9.82 | 13.55 | -0.44 | 37.37 | -1.96 | 0.16 | 0.31 | 19.99 | 19.56 | 115.65 | |||||||||||||||
| FSBI | Fidelity Bancorp, Inc. of PA* | 9.48 | 3,063 | 29.0 | 12.02 | 5.05 | 9.20 | 3.04 | 70.50 | 67.20 | 0.18 | 0.49 | 14.25 | 13.38 | 217.92 | |||||||||||||||
| FABK | First Advantage Bancorp of TN* | 12.70 | 4,087 | 51.9 | 13.89 | 10.60 | 12.75 | -0.39 | 17.05 | 4.70 | 0.46 | 0.27 | 16.58 | 16.58 | 85.75 | |||||||||||||||
| FBSI | First Bancshares, Inc. of MO* | 6.95 | 1,551 | 10.8 | 9.49 | 5.12 | 6.96 | -0.14 | -18.24 | 3.58 | -2.43 | -2.45 | 12.58 | 12.52 | 131.65 | |||||||||||||||
| FCAP | First Capital, Inc. of IN* | 18.41 | 2,786 | 51.3 | 18.82 | 14.50 | 18.13 | 1.54 | 22.33 | 10.64 | 1.34 | 1.18 | 17.78 | 15.82 | 159.72 | |||||||||||||||
| FCLF | First Clover Leaf Fin Cp of IL* | 6.40 | 7,864 | 50.3 | 7.57 | 5.27 | 6.50 | -1.54 | 16.36 | -5.60 | 0.44 | 0.37 | 10.01 | 8.44 | 72.06 | |||||||||||||||
| FBNK | First Connecticut Bncorp of CT* | 10.47 | 17,880 | 187.2 | 11.50 | 10.24 | 10.57 | -0.95 | 4.70 | 4.70 | 0.18 | 0.08 | 13.72 | 13.72 | 89.70 | |||||||||||||||
| FDEF | First Defiance Fin. Corp of OH* | 12.96 | 9,724 | 126.0 | 15.51 | 9.50 | 13.69 | -5.33 | 36.42 | 8.91 | 1.02 | 0.55 | 23.92 | 17.44 | 210.38 | |||||||||||||||
| FFNM | First Fed of N. Michigan of MI* | 3.75 | 2,884 | 10.8 | 4.01 | 2.26 | 3.69 | 1.63 | 45.35 | 33.93 | 0.05 | 0.02 | 8.34 | 8.18 | 75.91 | |||||||||||||||
| FFBH | First Fed. Bancshares of AR(8)* | 6.00 | 19,303 | 115.8 | 19.50 | 4.70 | 6.00 | 0.00 | -33.26 | -19.89 | -0.52 | -0.57 | 4.30 | 4.30 | 31.93 | |||||||||||||||
| FFNW | First Fin NW, Inc of Renton WA* | 4.63 | 18,805 | 87.1 | 6.43 | 3.21 | 4.30 | 7.67 | 12.65 | 15.75 | -0.47 | -0.54 | 9.53 | 9.53 | 61.23 | |||||||||||||||
| FFCH | First Fin. Holdings Inc. of SC* | 5.82 | 16,527 | 96.2 | 13.19 | 5.26 | 5.59 | 4.11 | -38.41 | -49.44 | -2.86 | -2.74 | 12.20 | 11.83 | 194.93 | |||||||||||||||
| FPTB | First PacTrust Bancorp of CA* | 11.37 | 11,536 | 131.2 | 16.73 | 9.16 | 11.53 | -1.39 | 18.19 | -14.32 | 0.54 | 0.30 | 13.91 | 13.91 | 76.48 | |||||||||||||||
| FPFC | First Place Fin. Corp. of OH* | 0.85 | 16,974 | 14.4 | 3.88 | 0.52 | 0.67 | 26.87 | -77.09 | -67.43 | -2.10 | -2.91 | 10.76 | 10.24 | 185.73 | |||||||||||||||
| FSFG | First Savings Fin. Grp. of IN* | 15.40 | 2,365 | 36.4 | 18.49 | 13.05 | 15.69 | -1.85 | 15.18 | 4.05 | 1.57 | 1.65 | 24.52 | 21.07 | 221.39 | |||||||||||||||
| FFIC | Flushing Fin. Corp. of NY* | 10.61 | 31,520 | 334.4 | 15.15 | 10.51 | 11.21 | -5.35 | -3.89 | -24.21 | 1.28 | 1.32 | 12.85 | 12.31 | 137.16 | |||||||||||||||
| RP FINANCIAL, LC. | |
Financial Services Industry Consultants 100 North Glebe Road, Suite 1100 Arlington, Virginia 222011 (703) 528-1700 | |
Exhibit IV-1A (continued)
Weekly Thrift Market Line - Part One
Prices As Of September 2, 2011
| Current Per Share Financials | ||||||||||||||||||||||||||||||
| Market Capitalization | Price Change Data | Tangible | ||||||||||||||||||||||||||||
| Shares | Market | 52 week (1) | % Change From | Trailing | 12 Mo. | Book | Book | |||||||||||||||||||||||
| Price/ | Outst- | Capital- | Last | Last | 52 Wks | MostRcnt | 12 Mo. | Core | Value/ | Value/ | Assets/ | |||||||||||||||||||
| Financial Institution | Share(l) | anding | ization(9) | High | Low | Week | Week | Ago(2) | YrEnd(2) | EPS(3) | EPS(3) | Share | Share(4) | Share | ||||||||||||||||
| ($) | (000) | ($Mil) | ($) | ($) | ($) | (%) | (%) | (%) | ($) | ($) | ($) | ($) | ($) | |||||||||||||||||
| NASDAQ Listed OTC Companies (continued) | ||||||||||||||||||||||||||||||
| FXCB | Fox Chase Bancorp, Inc. of PA* | 12.20 | 14,559 | 177.6 | 14.03 | 9.30 | 12.53 | -2.63 | 27.48 | 2.95 | 0.28 | 0.20 | 14.41 | 14.41 | 74.74 | |||||||||||||||
| FRNK | Franklin Financial Corp. of VA* | 11.14 | 14,303 | 159.3 | 12.49 | 11.09 | 11.40 | -2.28 | 11.40 | 11.40 | -0.07 | 0.20 | 17.44 | 17.44 | 76.96 | |||||||||||||||
| GCBC | Green Co Bcrp MHC of NY (44.1) | 18.84 | 4,146 | 34.2 | 19.97 | 16.28 | 17.65 | 6.74 | 9.22 | -3.24 | 1.28 | 1.24 | 11.60 | 11.60 | 132.06 | |||||||||||||||
| HFFC | HF Financial Corp. of SD* | 8.27 | 6,974 | 57.7 | 11.24 | 8.26 | 8.75 | -5.49 | -15.01 | -23.43 | 0.10 | 0.22 | 13.54 | 12.92 | 170.82 | |||||||||||||||
| HMNF | HMN Financial, Inc. of MN* | 2.00 | 4,388 | 8.8 | 4.11 | 1.50 | 1.86 | 7.53 | -48.05 | -28.83 | -5.24 | -5.54 | 9.81 | 9.81 | 184.00 | |||||||||||||||
| HBNK | Hampden Bancorp, Inc. of MA* | 12.58 | 6,799 | 85.5 | 13.80 | 9.81 | 12.60 | -0.16 | 24.55 | 11.03 | 0.28 | 0.24 | 13.66 | 13.66 | 84.57 | |||||||||||||||
| HARL | Harleyaville Svgs Fin Cp of PA* | 14.10 | 3,748 | 52.8 | 15.74 | 11.57 | 14.14 | -0.28 | -9.03 | -4.79 | 1.50 | 1.68 | 15.09 | 15.09 | 228.81 | |||||||||||||||
| HBOS | Heritage Fin Group, Inc of GA* | 10.89 | 8,711 | 94.9 | 13.52 | 9.32 | 11.76 | -7.40 | 0.83 | -12.32 | 0.14 | 0.62 | 14.01 | 13.51 | 110.62 | |||||||||||||||
| HIFS | Hingham Inst. for Sav. of MA* | 46.94 | 2,124 | 99.7 | 57.50 | 37.08 | 52.10 | -9.90 | 23.72 | 5.48 | 5.34 | 5.34 | 36.54 | 36.54 | 502.16 | |||||||||||||||
| HBCP | Home Bancorp Inc. Lafayette LA* | 14.11 | 8,035 | 113.4 | 16.19 | 12.86 | 13.91 | 1.44 | 7.55 | 2.10 | 0.58 | 0.66 | 16.50 | 16.29 | 87.18 | |||||||||||||||
| HFBL | Home Federal Bancorp Inc of LA* | 13.30 | 3,046 | 40.5 | 14.00 | 9.60 | 13.30 | 0.00 | 24.88 | 15.65 | 0.64 | 0.16 | 16.80 | 16.80 | 76.60 | |||||||||||||||
| HFBC | HopFed Bancorp, Inc. of KY* | 7.40 | 7,345 | 54.4 | 9.77 | 7.01 | 7.50 | -1.33 | -16.76 | -18.14 | 0.07 | -0.31 | 12.67 | 12.58 | 144.63 | |||||||||||||||
| HCBK | Hudson City Bancorp, Inc of NJ* | 5.77 | 526,708 | 3,039.1 | 13.26 | 5.38 | 5.92 | -2.53 | -51.18 | -54.71 | -0.41 | -0.40 | 9.28 | 8.98 | 98.31 | |||||||||||||||
| IROQ | IF Bancorp, Inc. of IL* | 10.81 | 4,811 | 52.0 | 11.79 | 10.70 | 10.86 | -0.46 | 8.10 | 8.10 | 0.57 | 0.45 | 15.78 | 15.78 | 93.10 | |||||||||||||||
| ISBC | Investors Bcrp MHC of NJ(43.0) | 13.20 | 112,716 | 660.6 | 15.09 | 10.80 | 14.19 | -6.98 | 20.11 | 0.61 | 0.63 | 0.58 | 8.34 | 8.08 | 90.55 | |||||||||||||||
| JXSB | Jacksonville Bancorp Inc of IL* | 13.70 | 1,931 | 26.5 | 13.98 | 9.79 | 13.70 | 0.00 | 42.71 | 27.09 | 1.57 | 1.34 | 20.06 | 18.65 | 157.90 | |||||||||||||||
| JFBI | Jefferson Bancshares Inc of TN* | 2.83 | 6,635 | 18.8 | 5.02 | 2.70 | 2.99 | -5.35 | -20.28 | -12.65 | -3.54 | -3.74 | 8.41 | 8.10 | 87.04 | |||||||||||||||
| KFFB | KY Fst Fed Bp MHC of KY (39.3) | 8.09 | 7,741 | 25.3 | 10.40 | 6.51 | 8.15 | -0.74 | -19.82 | -12.54 | 0.19 | 0.18 | 7.53 | 5.64 | 29.54 | |||||||||||||||
| KFFG | Kaiser Federal Fin Group of CA* | 11.91 | 9,559 | 113.8 | 14.70 | 9.58 | 11.93 | -0.17 | 7.69 | 2.85 | 0.87 | 0.87 | 16.25 | 15.83 | 94.36 | |||||||||||||||
| KRNY | Kearny Fin Cp MHC of NJ (25.1) | 8.20 | 67,851 | 147.0 | 10.43 | 7.99 | 8.60 | -4.65 | -8.28 | -4.65 | 0.12 | 0.14 | 7.19 | 5.58 | 42.80 | |||||||||||||||
| LSBI | LSB Fin. Corp. of Lafayette IN* | 13.30 | 1,554 | 20.7 | 16.36 | 8.90 | 13.75 | -3.27 | 37.11 | -2.06 | 1.16 | 0.64 | 23.38 | 23.38 | 231.57 | |||||||||||||||
| LPSB | LaPorte Bancrp MHC of IN(45.0) | 9.00 | 4,586 | 18.6 | 10.01 | 7.00 | 8.20 | 9.76 | 27.66 | -0.44 | 0.57 | 0.44 | 11.49 | 9.53 | 100.59 | |||||||||||||||
| LSBK | Lake Shore Bnp MHC of NY (39.4) | 10.00 | 5,939 | 24.5 | 14.00 | 7.95 | 10.00 | 0.00 | 25.79 | 8.34 | 0.61 | 0.46 | 9.95 | 9.95 | 81.40 | |||||||||||||||
| LABC | Louisiana Bancorp, Inc. of LA* | 16.03 | 3,438 | 55.1 | 16.66 | 13.92 | 15.90 | 0.82 | 10.63 | 9.79 | 0.70 | 0.60 | 17.13 | 17.13 | 93.14 | |||||||||||||||
| MSBF | MSB Fin Corp MHC of NJ (40.3) | 5.19 | 5,173 | 11.1 | 7.94 | 4.23 | 5.03 | 3.18 | -24.78 | -12.03 | 0.14 | 0.14 | 7.84 | 7.84 | 67.56 | |||||||||||||||
| MGYR | Magyar Bancorp MHC of NJ(44.7) | 3.56 | 5,783 | 9.2 | 7.00 | 3.02 | 3.70 | -3.78 | 3.49 | -11.00 | -0.02 | -0.10 | 7.68 | 7.68 | 91.04 | |||||||||||||||
| MLVF | Malvern Fed Bncp MHC PA(44.6) | 7.45 | 6,103 | 20.3 | 8.99 | 5.05 | 7.49 | -0.53 | 2.48 | -0.67 | -1.19 | -1.19 | 9.98 | 9.98 | 110.43 | |||||||||||||||
| MFLR | Mayflower Bancorp, Inc. of MA* | 8.35 | 2,076 | 17.3 | 10.35 | 6.50 | 8.29 | 0.72 | 0.60 | -7.22 | 0.64 | 0.40 | 10.20 | 10.20 | 118.92 | |||||||||||||||
| EBSB | Meridian Fn Serv MHC MA (41.4) | 11.88 | 22,241 | 112.3 | 14.30 | 10.25 | 12.76 | -6.90 | 10.31 | 0.76 | 0.66 | 0.49 | 9.87 | 9.25 | 86.50 | |||||||||||||||
| CASH | Meta Financial Group of IA* | 18.32 | 3,117 | 57.1 | 34.77 | 11.90 | 19.40 | -5.57 | -45.65 | 32.95 | 1.58 | 2.54 | 25.04 | 24.59 | 344.72 | |||||||||||||||
| MFSF | MutualFirst Fin. Inc. of IN* | 7.52 | 6,987 | 52.5 | 10.50 | 6.97 | 7.70 | -2.34 | 7.74 | -19.14 | 0.65 | 0.31 | 14.18 | 13.58 | 207.13 | |||||||||||||||
| NASB | NASB Fin, Inc. of Grandview MO* | 10.21 | 7,868 | 80.3 | 19.12 | 9.25 | 10.09 | 1.19 | -26.28 | -39.08 | -2.02 | -4.78 | 18.38 | 18.06 | 159.76 | |||||||||||||||
| NECB | NE Comm Bncrp MHC of NY (44.6) | 6.62 | 12,797 | 39.4 | 6.90 | 5.55 | 6.71 | -1.34 | 9.78 | 18.21 | 0.22 | 0.32 | 8.40 | 8.26 | 34.71 | |||||||||||||||
| NHTB | NH Thrift Bancshares of NH* | 12.81 | 5,774 | 74.0 | 13.79 | 10.10 | 12.53 | 2.23 | 25.22 | 2.07 | 1.34 | 0.78 | 14.89 | 9.94 | 178.56 | |||||||||||||||
| NVSL | Naugatuck Valley Fin Crp of CT* | 7.58 | 7,002 | 53.1 | 9.09 | 4.71 | 7.47 | 1.47 | 12.97 | 12.13 | 0.21 | 0.26 | 11.57 | 11.56 | 84.64 | |||||||||||||||
| NFSB | Newport Bancorp, Inc. of RI* | 13.05 | 3,489 | 45.5 | 14.60 | 11.43 | 13.75 | -5.09 | 8.75 | 8.75 | 0.56 | 0.54 | 14.58 | 14.58 | 130.10 | |||||||||||||||
| FFFD | North Central Bancshares of IA* | 17.25 | 1,355 | 23.4 | 18.75 | 12.11 | 17.41 | -0.92 | 15.00 | 3.36 | 1.41 | 1.40 | 30.01 | 29.52 | 326.66 | |||||||||||||||
| NFBK | Northfield Bcp MHC of NY (43.4) | 12.15 | 42,371 | 231.8 | 14.42 | 10.51 | 13.35 | -8.99 | 9.16 | -8.78 | 0.37 | 0.33 | 9.40 | 9.02 | 54.46 | |||||||||||||||
| NWBI | Northwest Bancshares Inc of PA* | 11.23 | 103,266 | 1,159.7 | 13.36 | 10.24 | 11.73 | -4.26 | 0.54 | -4.67 | 0.59 | 0.60 | 11.88 | 10.19 | 78.32 | |||||||||||||||
| OBAF | OBA Financial Serv. Inc of MD* | 14.30 | 4,602 | 65.8 | 15.10 | 11.02 | 14.04 | 1.85 | 30.00 | 3.47 | 0.18 | 0.17 | 17.57 | 17.57 | 77.35 | |||||||||||||||
| OSHC | Ocean Shore Holding Co. of NJ* | 11.05 | 7,297 | 80.6 | 13.25 | 10.35 | 11.03 | 0.18 | 4.25 | -3.49 | 0.72 | 0.74 | 14.09 | 14.09 | 117.89 | |||||||||||||||
| OCFC | OceanFirst Fin. Corp of NJ* | 11.25 | 18,846 | 212.0 | 14.69 | 11.24 | 11.81 | -4.74 | -1.32 | -12.59 | 1.13 | 0.99 | 11.32 | 11.32 | 118.81 | |||||||||||||||
| OFED | Oconee Fed Fn Cp MHC SC (35.0) | 10.95 | 6,348 | 24.3 | 13.50 | 10.90 | 10.95 | 0.00 | 9.50 | 9.50 | 0.29 | 0.53 | 12.50 | 12.50 | 59.38 | |||||||||||||||
| OABC | OmniAmerican Bancorp Inc of TX* | 13.83 | 11,662 | 161.3 | 15.93 | 11.10 | 13.89 | -0.43 | 24.26 | 2.07 | 0.19 | 0.12 | 17.26 | 17.26 | 113.88 | |||||||||||||||
| ONFC | Oneida Financial Corp. of NY* | 8.77 | 7,162 | 62.8 | 9.20 | 7.06 | 8.51 | 3.06 | 13.16 | 11.72 | 0.80 | 0.81 | 12.31 | 8.80 | 91.89 | |||||||||||||||
| ORIT | Oritani Financial Corp of NJ* | 12.01 | 55,513 | 666.7 | 13.47 | 9.58 | 12.90 | -6.90 | 23.94 | -1.88 | 0.51 | 0.52 | 11.63 | 11.63 | 46.61 | |||||||||||||||
| PSBH | PSB Hldgs Inc MHC of CT (42.9) | 5.06 | 6,529 | 14.2 | 5.98 | 2.60 | 5.00 | 1.20 | 23.41 | 21.93 | 0.20 | 0.32 | 7.19 | 6.07 | 73.00 | |||||||||||||||
| PVFC | PVF Capital Corp. of Solon OH* | 1.55 | 25,670 | 39.8 | 2.23 | 1.27 | 1.45 | 6.90 | -13.41 | -14.84 | -0.38 | -0.58 | 2.90 | 2.90 | 30.28 | |||||||||||||||
| PFED | Park Bancorp of Chicago IL* | 2.92 | 1,193 | 3.5 | 5.07 | 2.12 | 2.39 | 22.18 | -31.62 | -18.89 | -4.55 | -4.73 | 13.42 | 13.42 | 174.58 | |||||||||||||||
| PVSA | Parkvale Financial Corp of PA(8)* | 17.80 | 5,583 | 99.4 | 22.39 | 5.75 | 18.21 | -2.25 | 176.83 | 93.90 | -2.71 | 1.17 | 16.50 | 11.51 | 322.64 | |||||||||||||||
| PBHC | Pathfinder BC MHC of NY (36.3) | 9.10 | 2,486 | 8.2 | 10.25 | 6.03 | 10.08 | -9.72 | 35.01 | 7.06 | 0.76 | 0.67 | 10.52 | 8.98 | 168.36 | |||||||||||||||
| PEOP | Peoples Fed Bancshrs Inc of MA* | 14.00 | 7,142 | 100.0 | 14.91 | 10.48 | 13.90 | 0.72 | 33.33 | 7.61 | -0.02 | 0.45 | 16.44 | 16.44 | 75.31 | |||||||||||||||
| PBCT | Peoples United Financial of CT* | 11.40 | 355,010 | 4,047.1 | 14.49 | 10.50 | 10.98 | 3.83 | -10.38 | -18.63 | 0.45 | 0.45 | 14.63 | 9.15 | 71.33 | |||||||||||||||
| PROV | Provident Fin. Holdings of CA* | 8.25 | 11,419 | 94.2 | 8.74 | 5.30 | 8.08 | 2.10 | 53.06 | 13.95 | 1.16 | -0.58 | 12.41 | 12.41 | 115.12 | |||||||||||||||
| PBNY | Provident NY Bncrp, Inc. of NY* | 6.03 | 38,006 | 229.2 | 11.09 | 6.01 | 6.33 | -4.74 | -27.09 | -42.52 | 0.46 | 0.30 | 11.29 | 6.93 | 78.30 | |||||||||||||||
| PBIP | Prudential Bncp MHC PA (25.5) | 5.18 | 10,023 | 15.7 | 8.00 | 5.17 | 5.49 | -5.65 | -27.65 | -14.38 | -0.05 | -0.03 | 5.55 | 5.55 | 49.66 | |||||||||||||||
| PULB | Pulaski Fin Cp of St. Louis MO* | 6.50 | 10,477 | 68.1 | 7.82 | 6.15 | 6.60 | -1.52 | 1.56 | -14.25 | 0.67 | 0.31 | 8.37 | 7.99 | 127.10 | |||||||||||||||
| RIVR | River Valley Bancorp of IN* | 16.10 | 1,514 | 24.4 | 17.13 | 13.49 | 16.20 | -0.62 | 5.37 | 0.63 | 1.28 | 0.78 | 18.49 | 18.43 | 264.15 | |||||||||||||||
| RVSB | Riverview Bancorp, Inc. of WA* | 2.61 | 22,472 | 58.7 | 3.34 | 1.71 | 2.70 | -3.33 | 45.00 | -4.04 | 0.15 | 0.14 | 4.80 | 3.65 | 39.41 | |||||||||||||||
| RCKB | Rockville Fin New, Inc. of CT* | 9.50 | 29,507 | 280.3 | 10.87 | 6.92 | 9.61 | -1.14 | 21.17 | 17.87 | 0.17 | 0.31 | 11.26 | 11.22 | 59.20 | |||||||||||||||
| ROMA | Roma Fin Corp MHC of NJ (26.2) | 8.19 | 30,321 | 68.2 | 11.25 | 8.19 | 9.09 | -9.90 | -22.07 | -22.74 | 0.18 | 0.13 | 7.07 | 7.01 | 62.39 | |||||||||||||||
| SIFI | SI Financial Group, Inc. of CT* | 9.43 | 10,576 | 99.7 | 10.53 | 6.11 | 9.25 | 1.95 | 31.70 | -4.07 | 0.26 | 0.22 | 12.29 | 11.90 | 89.75 | |||||||||||||||
| SPBC | SP Bancorp, Inc. of Plano, TX* | 11.35 | 1,725 | 19.6 | 12.50 | 8.71 | 10.82 | 4.90 | 13.50 | 21.00 | 0.58 | -0.05 | 18.84 | 18.84 | 154.21 | |||||||||||||||
| SVBI | Severn Bancorp, Inc. of MD* | 3.03 | 10,067 | 30.5 | 5.69 | 2.25 | 3.08 | -1.62 | -15.36 | -12.17 | -0.10 | -0.15 | 7.72 | 7.69 | 93.11 | |||||||||||||||
| STND | Standard Financial Corp. of PA* | 14.75 | 3,478 | 51.3 | 17.03 | 10.90 | 15.08 | -2.19 | 47.50 | 6.50 | 0.67 | 0.93 | 22.25 | 19.52 | 125.85 | |||||||||||||||
| RP FINANCIAL, LC. | |
| Financial Services Industry Consultants | |
| 1100 North Glebe Road, Suite 1100 | |
| Arlington, Virginia 222011 | |
| (703) 528-1700 |
Exhibit IV-1A (continued)
Weekly Thrift Market Line - Part One
Prices As Of September 2, 2011
Weekly Thrift Market Line - Part One
Prices As Of September 2, 2011
| Current Per Share Financials | |||||||||||||||||||||||||||||||||||||||||||
| Market Capitalization | Price Change Data | Tangible | |||||||||||||||||||||||||||||||||||||||||
| Shares | Market | 52 Week (1) | % Change From | Trailing | 12 Mo. | Book | Book | ||||||||||||||||||||||||||||||||||||
| Price/ | Outst- | Capital- | Last | Last | 52 Wks | MostRcnt | 12 Mo. | Core | Value/ | Value/ | Assets/ | ||||||||||||||||||||||||||||||||
| Financial Institution | Share(1) | anding | ization(9) | High | Low | Week | Week | Ago(2) | YrEnd(2) | EPS(3) | EPS(3) | Share | Share(4) | Share | |||||||||||||||||||||||||||||
| ($) | (000) | ($Mil) | ($) | ($) | ($) | (%) | (%) | (%) | ($) | ($) | ($) | ($) | ($) | ||||||||||||||||||||||||||||||
| NASDAQ Listed OTC Companies (continued) | |||||||||||||||||||||||||||||||||||||||||||
| SIBC | State Investors Bancorp of LA* | 11.50 | 2,910 | 33.5 | 12.25 | 11.20 | 11.50 | 0.00 | 15.00 | 15.00 | 0.20 | 0.24 | 15.80 | 15.80 | 82.08 | ||||||||||||||||||||||||||||
| THRD | TF Fin. Corp. of Newtown PA* | 21.14 | 2,822 | 59.7 | 22.86 | 19.05 | 21.21 | -0.33 | 3.73 | -0.42 | 1.06 | 0.79 | 26.73 | 25.12 | 245.06 | ||||||||||||||||||||||||||||
| TFSL | TFS Fin Corp MHC of OH (26.4) | 8.35 | 308,442 | 678.0 | 11.07 | 7.76 | 8.60 | -2.91 | -13.83 | -7.43 | -0.03 | -0.03 | 5.73 | 5.70 | 35.27 | ||||||||||||||||||||||||||||
| TBNK | Territorial Bancorp, Inc of HI* | 19.06 | 11,593 | 221.0 | 21.29 | 16.46 | 19.79 | -3.69 | 12.18 | -4.27 | 1.08 | 1.04 | 19.62 | 19.62 | 128.38 | ||||||||||||||||||||||||||||
| TSBK | Timberland Bancorp, Inc. of WA* | 5.05 | 7,045 | 35.6 | 6.50 | 3.20 | 4.96 | 1.81 | 29.49 | 39.89 | 0.00 | -0.13 | 9.99 | 9.13 | 104.33 | ||||||||||||||||||||||||||||
| TRST | TrustCo Bank Corp NY of NY* | 4.37 | 77,367 | 338.1 | 6.66 | 3.93 | 4.30 | 1.63 | -18.62 | -31.07 | 0.39 | 0.37 | 3.48 | 3.47 | 52.61 | ||||||||||||||||||||||||||||
| UCBA | United Comm Bncp MHC IN (40.7) | 5.81 | 7,840 | 18.5 | 8.13 | 5.29 | 6.24 | -6.89 | -19.86 | -19.86 | -0.12 | -0.16 | 6.81 | 6.35 | 60.71 | ||||||||||||||||||||||||||||
| UCFC | United Community Fin. of OH* | 1.14 | 30,969 | 35.3 | 1.62 | 0.87 | 1.00 | 14.00 | -6.56 | -14.93 | -0.84 | -1.07 | 5.91 | 5.90 | 67.89 | ||||||||||||||||||||||||||||
| UBNK | United Financial Bncrp of MA* | 14.17 | 16,099 | 228.1 | 16.76 | 12.95 | 15.13 | -6.35 | 4.65 | -7.20 | 0.65 | 0.64 | 14.15 | 13.61 | 99.98 | ||||||||||||||||||||||||||||
| VPFG | ViewPoint Financal Group of TX* | 11.34 | 34,839 | 395.1 | 14.05 | 8.82 | 11.59 | -2.16 | 25.44 | -2.99 | 0.67 | 0.40 | 11.68 | 11.66 | 85.07 | ||||||||||||||||||||||||||||
| WSB | WSB Holdings, Inc. of Bowie MD* | 2.47 | 7,995 | 19.7 | 3.48 | 2.11 | 2.40 | 2.92 | 2.49 | 7.39 | -0.14 | -0.06 | 6.62 | 6.62 | 48.81 | ||||||||||||||||||||||||||||
| WSFS | WSFS Financial Corp. of DE* | 33.62 | 8,604 | 289.3 | 50.99 | 31.20 | 33.23 | 1.17 | -9.28 | -29.13 | 2.01 | 1.62 | 37.62 | 33.60 | 482.51 | ||||||||||||||||||||||||||||
| WVFC | WVS Financial Corp. of PA* | 9.00 | 2,058 | 18.5 | 13.17 | 8.37 | 9.01 | -0.11 | -12.62 | -0.99 | 0.30 | 0.33 | 13.78 | 13.78 | 120.22 | ||||||||||||||||||||||||||||
| WFSL | Washington Federal, Inc. of WA* | 13.92 | 110,438 | 1,537.3 | 18.53 | 13.73 | 14.52 | -4.13 | -4.07 | -17.73 | 0.87 | 0.81 | 16.84 | 14.53 | 120.64 | ||||||||||||||||||||||||||||
| WSBF | Waterstone Fin MHC of WI (26.2) | 2.60 | 31,250 | 21.3 | 4.10 | 2.19 | 2.61 | -0.38 | -32.11 | -20.00 | -0.10 | -1.00 | 5.47 | 5.45 | 55.15 | ||||||||||||||||||||||||||||
| WAYN | Wayne Savings Bancshares of OH* | 8.40 | 3,004 | 25.2 | 9.93 | 7.52 | 8.46 | -0.71 | 5.66 | -6.46 | 0.69 | 0.66 | 13.15 | 12.49 | 137.05 | ||||||||||||||||||||||||||||
| WFD | Westfield Fin. Inc. of MA* | 6.90 | 27,871 | 192.3 | 9.45 | 6.63 | 7.64 | -9.69 | -10.16 | -25.41 | 0.11 | 0.01 | 7.87 | 7.87 | 44.52 | ||||||||||||||||||||||||||||
| WBKC | Wolverine Bancorp, Inc. of MI* | 14.00 | 2,508 | 35.1 | 15.18 | 11.00 | 14.10 | -0.71 | 40.00 | 40.00 | 0.29 | 0.23 | 25.59 | 25.59 | 121.92 | ||||||||||||||||||||||||||||
| RP FINANCIAL, LC. | |
| Financial Services Industry Consultants | |
| 1100 North Glebe Road, Suite 1100 | |
| Arlington, Virginia 22201 | |
| (703) 528-1700 |
Exhibit IV-1B
Weekly Thrift Market Line - Part Two
Prices As Of September 2, 2011
Weekly Thrift Market Line - Part Two
Prices As Of September 2, 2011
| Key Financial Ratios | Asset Quality Ratios | Pricing Ratios | Divident Data(6) | |||||||||||||||||||||||||||||||||||||||||||||||||||
| Tang. | Price/ | Price/ | Ind. | Divi- | ||||||||||||||||||||||||||||||||||||||||||||||||||
| Equity/ | Equity/ | Reported Earnings | Core Earnings | NPAS | Resvs/ | Resvs/ | Price/ | Price/ | Price/ | Tang. | Core | Div./ | dend | Payout | ||||||||||||||||||||||||||||||||||||||||
| Financial Institution | Assets | Assets | ROA(5) | ROE(5) | ROI(5) | ROA(5) | ROE(5) | Assets | NPAS | Loans | Earning | Book | Assets | Book | Earnings | Share | Yield | Ratio(7) | ||||||||||||||||||||||||||||||||||||
| (%) | (%) | (%) | (%) | (%) | (%) | (%) | (%) | (%) | (%) | (x) | (%) | (%) | (%) | (x) | ($) | (%) | (%) | |||||||||||||||||||||||||||||||||||||
| Market Averages. All Public Companies (no MHCs) | ||||||||||||||||||||||||||||||||||||||||||||||||||||||
| All Public Companies (117) | 11.96 | 11.33 | 0.06 | 0.48 | 3.74 | -0.03 | -0.44 | 3.70 | 53.30 | 1.82 | 16.62 | 71.78 | 8.78 | 76.57 | 18.97 | 0.21 | 1.91 | 28.63 | ||||||||||||||||||||||||||||||||||||
| NYSE Traded Companies (6) | 9.44 | 7.39 | -0.17 | -0.47 | 7.42 | -0.18 | -2.63 | 4.91 | 32.30 | 2.11 | 11.11 | 109.58 | 8.84 | 113.25 | 12.30 | 0.43 | 3.43 | 56.48 | ||||||||||||||||||||||||||||||||||||
| NASDAQ Listed OTC Companies (111) | 12.10 | 11.55 | 0.07 | 0.53 | 3.59 | -0.02 | -0.33 | 3.63 | 54.33 | 1.80 | 16.89 | 69.66 | 8.78 | 74.84 | 19.39 | 0.20 | 1.83 | 27.85 | ||||||||||||||||||||||||||||||||||||
| California Companies (5) | 11.35 | 11.28 | 0.65 | 5.49 | 9.97 | 0.25 | 1.51 | 6.42 | 31.41 | 2.35 | 12.28 | 68.48 | 8.56 | 68.87 | 20.19 | 0.17 | 2.04 | 12.64 | ||||||||||||||||||||||||||||||||||||
| Florida Companies (2) | 7.14 | 6.68 | -0.58 | 3.75 | 2.22 | 0.28 | 12.94 | 7.18 | 24.87 | 3.15 | NM | 192.33 | 11.08 | 158.63 | 13.05 | 0.28 | 1.22 | 0.00 | ||||||||||||||||||||||||||||||||||||
| Mid-Atlantic Companies (36) | 11.91 | 10.88 | 0.34 | 4.82 | 5.44 | 0.33 | 4.72 | 3.21 | 45.55 | 1.55 | 15.26 | 76.54 | 9.21 | 88.35 | 16.09 | 0.28 | 2.61 | 35.45 | ||||||||||||||||||||||||||||||||||||
| Mid-West Companies (33) | 9.83 | 9.46 | -0.41 | -5.07 | 2.46 | -0.64 | -7.27 | 4.80 | 40.33 | 2.46 | 12.52 | 56.92 | 5.85 | 59.66 | 18.80 | 0.20 | 1.89 | 24.79 | ||||||||||||||||||||||||||||||||||||
| New England Companies (17) | 14.15 | 13.12 | 0.44 | 3.97 | 4.00 | 0.44 | 3.83 | 1.47 | 85.89 | 1.09 | 21.76 | 86.18 | 12.04 | 96.02 | 22.14 | 0.28 | 2.12 | 35.13 | ||||||||||||||||||||||||||||||||||||
| North-West Companies (5) | 12.69 | 11.68 | -0.14 | -1.38 | -5.06 | -0.21 | -1.95 | 7.50 | 22.75 | 2.16 | 16.70 | 53.76 | 6.91 | 60.77 | 17. 91 | 0.05 | 0.34 | 13.79 | ||||||||||||||||||||||||||||||||||||
| South-East Companies (14) | 14.42 | 14.31 | -0.23 | -5.42 | 2.33 | -0.23 | -5.50 | 2.95 | 88.36 | 1.59 | 25.80 | 62.57 | 10.02 | 63.24 | 24.88 | 0.08 | 0.80 | 16.25 | ||||||||||||||||||||||||||||||||||||
| South-West Companies (3) | 13.70 | 13.69 | 0.47 | 3.78 | 4.13 | 0.19 | 1.41 | 2.84 | 37.82 | 1.08 | 18.25 | 79.15 | 10.94 | 79.21 | 28.35 | 0.07 | 0.59 | 9.95 | ||||||||||||||||||||||||||||||||||||
| Western Companies (Excl CA) (2) | 15.57 | 15.57 | 0.79 | 5.04 | 5.75 | 0.56 | 3.57 | 0.75 | 42.94 | 0.60 | 17.40 | 87.63 | 13.61 | 87.63 | 18.33 | 0.33 | 2.33 | 40.44 | ||||||||||||||||||||||||||||||||||||
| Thrift Strategy (110) | 12.20 | 11.60 | 0.08 | 0.41 | 3.86 | 0.01 | -0.33 | 3.44 | 54.51 | 1.72 | 16.71 | 70.40 | 8.96 | 76.38 | 18.94 | 0.22 | 1.96 | 29.33 | ||||||||||||||||||||||||||||||||||||
| Mortgage Banker Strategy (3) | 3.85 | 3.69 | -0.57 | 9.76 | 14.06 | -1.16 | -4.88 | 11.10 | 33.87 | 4.34 | 7.11 | 149.91 | 3.03 | 66.48 | NM | 0.04 | 0.48 | 10.34 | ||||||||||||||||||||||||||||||||||||
| Real Estate Strategy (1) | 9.58 | 9.58 | -1.16 | -12.10 | -24.52 | -1.78 | -18.47 | 9.39 | 40.93 | 5.11 | NM | 53.45 | 5.12 | 53.45 | NM | 0.00 | 0.00 | 0.00 | ||||||||||||||||||||||||||||||||||||
| Diversified Strategy (3) | 12.50 | 9.99 | 0.51 | 3.90 | 6.03 | 0.48 | 3.58 | 3.26 | 36.70 | 1.64 | 18.10 | 74.92 | 9.41 | 94.36 | 19.47 | 0.38 | 2.40 | 13.36 | ||||||||||||||||||||||||||||||||||||
| Companies Issuing Dividends (73) | 12.27 | 11.44 | 0.41 | 3.59 | 5.37 | 0.34 | 2.96 | 2.65 | 56.62 | 1.54 | 16.22 | 78.53 | 9.80 | 86.77 | 18.54 | 0.35 | 3.12 | 41.80 | ||||||||||||||||||||||||||||||||||||
| Companies Without Dividends (44) | 11.47 | 11.16 | -0.50 | -5.40 | 0.33 | -0.60 | -6.86 | 5.42 | 47.96 | 2.27 | 18.10 | 60.78 | 7.16 | 59.14 | 20.58 | 0.00 | 0.00 | 0.00 | ||||||||||||||||||||||||||||||||||||
| Equity/Assets <6% (8) | 2.53 | 2.32 | -2.10 | -21.82 | 0.00 | -2.25 | -24.48 | 11.77 | 35.93 | 4.39 | NM | 62.59 | 0.77 | 26.89 | NM | 0.01 | 0.39 | 0.00 | ||||||||||||||||||||||||||||||||||||
| Equity/Assets 6-12% (55) | 8.91 | 8.53 | -0.04 | -0.17 | 4.48 | -0.19 | -1.75 | 4.00 | 45.39 | 1.85 | 13.42 | 67.75 | 6.01 | 72.16 | 17.24 | 0.25 | 2.18 | 28.63 | ||||||||||||||||||||||||||||||||||||
| Equity/Assets >12% (54) | 16.46 | 15.51 | 0.45 | 3.08 | 3.08 | 0.45 | 3.08 | 2.45 | 63.46 | 1.43 | 19.93 | 77.09 | 12.78 | 85.04 | 20.86 | 0.21 | 1.84 | 28.63 | ||||||||||||||||||||||||||||||||||||
| Converted Last 3 Mths (no MHC) (4) | 16.29 | 16.29 | 0.33 | 2.81 | 2.88 | 0.29 | 3.48 | 1.74 | 51.35 | 1.20 | 27.53 | 70.78 | 11.56 | 70.79 | 26.59 | 0.03 | 0.40 | 14.29 | ||||||||||||||||||||||||||||||||||||
| Actively Traded Companies (4) | 8.75 | 8.19 | 0.13 | 1.66 | 6.56 | 0.10 | 1.44 | 3.11 | 46.63 | 1.52 | 12.40 | 84.36 | 7.45 | 89.27 | 12.99 | 0.41 | 2.11 | 33.96 | ||||||||||||||||||||||||||||||||||||
| Market Value Below $20 Million (17) | 7.23 | 7.15 | -1.01 | -9.11 | 3.23 | -1.18 | -10.76 | 7.28 | 31.69 | 2.82 | 22.31 | 44.18 | 3.50 | 44.89 | 25.66 | 0.07 | 0.70 | 19.82 | ||||||||||||||||||||||||||||||||||||
| Holding Company Structure (111) | 12.07 | 11.43 | 0.03 | 0.11 | 3.53 | -0.06 | -0.83 | 3.72 | 53.97 | 1.84 | 16.89 | 71.27 | 8.84 | 75.95 | 19.26 | 0.21 | 1.94 | 28.94 | ||||||||||||||||||||||||||||||||||||
| Assets Over $1 Billion (55) | 11.70 | 10.75 | 0.18 | 2.05 | 4.85 | 0.07 | 0.82 | 3.47 | 49.68 | 1.81 | 14.33 | 79.77 | 9.25 | 86.31 | 18.08 | 0.30 | 2.74 | 34.12 | ||||||||||||||||||||||||||||||||||||
| Assets $500 Million-$1 Billion (30) | 11.50 | 11.03 | -0.30 | -2.02 | 0.45 | -0.31 | -2.25 | 4.63 | 40.67 | 1.81 | 20.27 | 62.50 | 7.80 | 66.73 | 20.73 | 0.11 | 1.02 | 25.62 | ||||||||||||||||||||||||||||||||||||
| Assets $250-$500 Million (23) | 13.16 | 12.83 | 0.33 | 1.41 | 5.03 | 0.23 | 0.53 | 3.52 | 64.64 | 1.95 | 17.39 | 68.68 | 9.28 | 72.04 | 18.61 | 0.18 | 1.40 | 23.93 | ||||||||||||||||||||||||||||||||||||
| Assets less than $250 Million (9) | 11.92 | 11.89 | -0.18 | -2.96 | 4.33 | -0.33 | -4.39 | 3.03 | 82.14 | 1.57 | 18.60 | 63.40 | 7.90 | 63.53 | 21.43 | 0.15 | 1.22 | 25.17 | ||||||||||||||||||||||||||||||||||||
| Goodwill Companies (70) | 11.10 | 10.05 | 0.03 | 0.60 | 4.37 | 0.00 | 0.18 | 3.56 | 50.25 | 1.80 | 15.84 | 72.98 | 8.10 | 81.07 | 17.96 | 0.26 | 2.41 | 34.64 | ||||||||||||||||||||||||||||||||||||
| Non-Goodwill Companies (46) | 13.40 | 13.40 | 0.13 | 0.63 | 2.82 | -0.03 | -1.01 | 3.92 | 58.64 | 1.85 | 17.96 | 71.37 | 9.99 | 71.37 | 21.17 | 0.15 | 1.20 | 20.02 | ||||||||||||||||||||||||||||||||||||
| Acquirors of FSLIC Cases (1) | 13.96 | 12.28 | 0.71 | 5.21 | 6.25 | 0.66 | 4.85 | 5.28 | 23.14 | 1.87 | 16.00 | 82.66 | 11.54 | 95.80 | 17.19 | 0.24 | 1.72 | 27.59 | ||||||||||||||||||||||||||||||||||||
| (1) | Average of high/low or bid/ask price per share. |
| (2) | Or since offering price if converted or first listed in the past 52 weeks. Percent change figures are actual year-to-date and are not annualized |
| (3) | EPS (earnings per share) is based on actual trailing twelve month data and is not shown on a pro forma basis. |
| (4) | Excludes intangibles (such as goodwill, value of core deposits, etc.). |
| (5) | ROA (return on assets) and ROE (return on equity) are indicated ratios based on trailing twelve month common earnings and average common equity and assets balances, ROI (return on investment) is current EPS divided by current price. |
| (6) | Annualized, based on last regular quarterly cash dividend announcement. |
| (7) | Indicated dividend as a percent of trailing twelve month earnings. |
| (8) | Excluded from averages due to actual or rumored acquisition activities or unusual operating characteristics. |
| * | Parentheses following market averages indicate the number of institutions included in the respective averages. All figures have been adjusted for stock splits, stock dividends, and secondary offerings. |
| Source: | SNL Financial, LC. and RP Financial, LC. calculations. The information provided in this table has been obtained from sources we believe are reliable, but we cannot guarantee the accuracy or completeness of such information. |
Copyright (c) 2010 by RP Financial, LC.
| RP FINANCIAL, LC. | |
| Financial Services Industry Consultants | |
| 1100 North Glebe Road, Suite 1100 | |
| Arlington, Virginia 22201 | |
| (703) 528-1700 | |
Exhibit IV-1B (continued)
Weekly Thrift Market Line - Part Two
Prices As Of September 2, 2011
| Key Financial Ratios | Asset Quality Ratios | Pricing Ratios | Dividend Data(6) | ||||||||||||||||||||||||||||||||||
| Tang. | Price/ | Price/ | Ind. | Divi- | |||||||||||||||||||||||||||||||||
| Equity/ | Equity/ | Reported Earnings | Core Earnings | NPAs | Resvs/ | Resvs/ | Price/ | Price/ | Price/ | Tang. | Core | Div./ | dend | Payout | |||||||||||||||||||||||
| Financial Institution | Assets | Assets | ROA(5) | ROE(5) | ROI(5) | ROA(5) | ROE(5) | Assets | NPAs | Loans | Earning | Book | Assets | Book | Earnings | Share | Yield | Ratio(7) | |||||||||||||||||||
| (%) | (%) | (%) | (%) | (%) | (%) | (%) | (%) | (%) | (%) | (X) | (%) | (%) | (%) | (x) | ($) | (%) | (%) | ||||||||||||||||||||
| Market Averages. MHC Institutions | |||||||||||||||||||||||||||||||||||||
| All Public Companies (25) | 12.97 | 12.15 | 0.23 | 1.59 | 1.62 | 0.16 | 0.78 | 5.09 | 30.45 | 1.69 | 24.40 | 96.17 | 12.76 | 104.07 | 22.64 | 0.18 | 2.26 | 29.47 | |||||||||||||||||||
| NASDAQ Listed OTC Companies (25) | 12.97 | 12.15 | 0.23 | 1.59 | 1.62 | 0.16 | 0.78 | 5.09 | 30.45 | 1.69 | 24.40 | 96.17 | 12.76 | 104.07 | 22.64 | 0.18 | 2.26 | 29.47 | |||||||||||||||||||
| Mid-Atlantic Companies (15) | 12.02 | 11.46 | 0.18 | 1.18 | 1.36 | 0.19 | 1.26 | 6.29 | 31.59 | 1.88 | 23.43 | 96.08 | 11.68 | 102.10 | 23.98 | 0.16 | 1.93 | 39.30 | |||||||||||||||||||
| Mid-West Companies (6) | 14.37 | 12.81 | 0.21 | 1.17 | 0.92 | -0.10 | -1.99 | 4.69 | 26.72 | 1.50 | 23.86 | 95.24 | 14.51 | 108.55 | 20.45 | 0.22 | 3.01 | 0.00 | |||||||||||||||||||
| New England Companies (2) | 10.63 | 9.61 | 0.53 | 4.87 | 4.75 | 0.51 | 4.85 | 2.61 | 22.86 | 1.00 | 21.65 | 95.37 | 10.33 | 105.90 | 20.03 | 0.08 | 1.58 | 0.00 | |||||||||||||||||||
| South-East Companies (2) | 17.79 | 17.56 | 0.39 | 2.44 | 2.27 | 0.35 | 1.62 | 1.99 | 41.09 | 1.60 | 37.76 | 100.43 | 17.45 | 102.55 | 20.66 | 0.30 | 3.01 | 0.00 | |||||||||||||||||||
| Thrift Strategy (25) | 12.97 | 12.15 | 0.23 | 1.59 | 1.62 | 0.16 | 0.78 | 5.09 | 30.45 | 1.69 | 24.40 | 96.17 | 12.76 | 104.07 | 22.64 | 0.18 | 2.26 | 29.47 | |||||||||||||||||||
| Companies Issuing Dividends (17) | 13.77 | 12.86 | 0.27 | 1.58 | 1.99 | 0.27 | 1.61 | 5.59 | 30.14 | 1.82 | 26.45 | 95.27 | 13.36 | 103.74 | 22.70 | 0.27 | 3.39 | 47.16 | |||||||||||||||||||
| Companies Without Dividends (8) | 11.38 | 10.74 | 0.17 | 1.62 | 0.92 | -0.08 | -0.89 | 4.34 | 30.91 | 1.46 | 18.25 | 97.98 | 11.55 | 104.72 | 22.49 | 0.00 | 0.00 | 0.00 | |||||||||||||||||||
| Equity/Assets 6-12% (15) | 10.02 | 9.52 | 0.16 | 1.34 | 1.46 | 0.03 | 0.15 | 6.29 | 28.64 | 1.75 | 21.97 | 89.17 | 9.00 | 94.84 | 21.30 | 0.17 | 2.28 | 14.10 | |||||||||||||||||||
| Equity/Assets >12% (10) | 17.89 | 16.55 | 0.36 | 2.01 | 1.88 | 0.36 | 1.81 | 3.30 | 33.17 | 1.58 | 29.27 | 107.84 | 19.02 | 119.44 | 24.98 | 0.20 | 2.22 | 55.10 | |||||||||||||||||||
| Market Value Below $20 Million (1) | 8.66 | 8.66 | -1.01 | -11.78 | 0.00 | -0.65 | -7.64 | 24.93 | 17.64 | 6.96 | NM | 25.00 | 2.17 | 25.00 | NM | 0.04 | 5.06 | 0.00 | |||||||||||||||||||
| Holding Company Structure (23) | 13.05 | 12.20 | 0.25 | 1.70 | 1.74 | 0.17 | 0.83 | 5.21 | 30.88 | 1.71 | 24.40 | 96.29 | 12.86 | 104.53 | 22.64 | 0.19 | 2.36 | 29.47 | |||||||||||||||||||
| Assets Over $1 Billion (9) | 13.18 | 12.26 | 0.27 | 2.14 | 1.16 | 0.04 | -0.24 | 4.12 | 34.51 | 1.61 | 23.93 | 115.62 | 15.47 | 125.27 | 27.94 | 0.10 | 1.04 | 21.62 | |||||||||||||||||||
| Assets $500 Million-$l Billion (5) | 10.55 | 10.11 | 0.15 | 1.11 | -0.94 | 0.01 | -0.09 | 5.58 | 33.36 | 1.54 | 23.32 | 100.75 | 10.84 | 105.72 | 15.19 | 0.30 | 2.65 | 54.69 | |||||||||||||||||||
| Assets $250-$500 Million (10) | 12.77 | 12.26 | 0.21 | 1.30 | 3.38 | 0.29 | 1.86 | 5.75 | 28.83 | 1.84 | 24.91 | 77.20 | 10.09 | 82.34 | 21.43 | 0.17 | 2.77 | 29.06 | |||||||||||||||||||
| Assets less than $250 Million (1) | 25.49 | 20.40 | 0.62 | 2.54 | 2.35 | 0.59 | 2.40 | 2.85 | 13.53 | 0.00 | NM | 107.44 | 27.39 | 143.44 | NM | 0.40 | 4.94 | 0.00 | |||||||||||||||||||
| Goodwill Companies (16) | 13.77 | 12.55 | 0.33 | 2.52 | 2.28 | 0.19 | 1.06 | 3.84 | 35.48 | 1.57 | 23.36 | 103.25 | 14.39 | 115.10 | 22.05 | 0.17 | 2.19 | 22.53 | |||||||||||||||||||
| Non-Goodwill Companies (9) | 11.37 | 11.37 | 0.03 | -0.26 | 0.11 | 0.10 | 0.20 | 7.42 | 21.11 | 1.94 | 26.49 | 82.01 | 9.49 | 82.01 | 23.67 | 0.21 | 2.39 | 50.29 | |||||||||||||||||||
| MHC Institutions (25) | 12.97 | 12.15 | 0.23 | 1.59 | 1.62 | 0.16 | 0.78 | 5.09 | 30.45 | 1.69 | 24.40 | 96.17 | 12.76 | 104.07 | 22.64 | 0.18 | 2.26 | 29.47 | |||||||||||||||||||
| (1) | Average of high/low or bid/ask price per share. |
| (2) | Or since offering price if converted or first listed in the past 52 weeks. Percent change figures are actual year-to-date and are not annualized |
| (3) | EPS (earnings per share) is based on actual trailing twelve month data and is not shown on a pro forma basis. |
| (4) | Excludes intangibles (such as goodwill, value of core deposits, etc.). |
| (5) | ROA (return on assets) and ROE (return on equity) are indicated ratios based on trailing twelve month common earnings and average common equity and assets balances, ROI (return on investment) is current EPS divided by current price. |
| (6) | Annualized, based on last regular quarterly cash dividend announcement. |
| (7) | Indicated dividend as a percent of trailing twelve month earnings. |
| (8) | Excluded from averages due to actual or rumored acquisition activities or unusual operating characteristics. |
| * | Parentheses following market averages indicate the number of institutions included in the respective averages. All figures have been adjusted for stock splits, stock dividends, and secondary offerings. |
| Source: | SNL Financial, LC. and RP Financial, LC. calculations. The information provided in this table has been obtained from sources we believe are reliable, but we cannot guarantee the accuracy or completeness of such information. |
Copyright (c) 2010 by RP Financial, LC.
| RP FINANCIAL, LC. | |
Financial Services Industry Consultants 1100 North Glebe Road, Suite 1100 Arlington, Virginia 22201 (703) 528-1700 | |
Exhibit IV-1B (continued)
Weekly Thrift Market Line - Part Two
Prices As Of September 2, 2011
| Key Financial Ratios | Asset Quality Ratios | ||||||||||||||||||||||||||||||||||||||||
| Tang. | |||||||||||||||||||||||||||||||||||||||||
| Equity/ | Equity/ | Reported Earnings | Core Earnings | NPAs | Resvs/ | Resvs/ | |||||||||||||||||||||||||||||||||||
| Financial Institution | Assets | Assets | ROA(5) | ROE(5) | ROI(5) | ROA(5) | ROE(5) | Assets | NPAs | Loans | |||||||||||||||||||||||||||||||
| (%) | (%) | (%) | (%) | (%) | (%) | (%) | (%) | (%) | (%) | ||||||||||||||||||||||||||||||||
| NYSE Traded Companies | |||||||||||||||||||||||||||||||||||||||||
| AF | Astoria Financial Corp. of NY* | 7.47 | 6.46 | 0.49 | 7.17 | 9.93 | 0.47 | 6.85 | 2.99 | 35.75 | 1.35 | ||||||||||||||||||||||||||||||
| BBX | BankAtlantic Bancorp Inc of FL* | 0.67 | 0.30 | -1.61 | NM | NM | -0.99 | NM | 14.33 | 24.87 | 4.82 | ||||||||||||||||||||||||||||||
| BKU | BankUnited, Inc. * | 13.61 | 13.07 | 0.45 | 3.75 | 2.22 | 1.56 | 12.94 | 0.03 | NA | 1.48 | ||||||||||||||||||||||||||||||
| FBC | Flagstar Bancorp, Inc. of MI* | 7.58 | 7.58 | -2.39 | -28.50 | NM | -3.88 | -46.38 | 8.48 | 25.53 | 2.83 | ||||||||||||||||||||||||||||||
| NYB | New York Community Bcrp of NY* | 13.69 | 8.04 | 1.28 | 9.60 | 10.02 | 1.04 | 7.77 | 1.54 | 24.86 | 0.53 | ||||||||||||||||||||||||||||||
| PFS | Provident Fin. Serv. Inc of NJ* | 13.63 | 8.92 | 0.76 | 5.64 | 7.52 | 0.76 | 5.64 | 2.08 | 50.47 | 1.62 | ||||||||||||||||||||||||||||||
| NASDAQ Listed OTC Companies | |||||||||||||||||||||||||||||||||||||||||
| ABBC | Abington Bancorp, Inc. of PA(8)* | 18.38 | 18.38 | 0.64 | 3.70 | 4.96 | 0.64 | 3.70 | 4.27 | 8.68 | 0.66 | ||||||||||||||||||||||||||||||
| ALLB | Alliance Bancorp, Inc. of PA* | 18.40 | 18.40 | 0.47 | 3.36 | 3.84 | 0.48 | 3.45 | 4.59 | 24.69 | 1.81 | ||||||||||||||||||||||||||||||
| ABCW | Anchor BanCorp Wisconsin of WI* | 0.10 | 0.00 | -1.07 | NM | NM | -1.99 | NM | 13.94 | 30.71 | 5.45 | ||||||||||||||||||||||||||||||
| ANCB | Anchor Bancorp of Aberdeen, WA* | 12.18 | 12.18 | -1.10 | -10.44 | -27.17 | -1.15 | -10.92 | NA | NA | 2.17 | ||||||||||||||||||||||||||||||
| AFCB | Athens Bancshares, Inc. of TN* | 17.73 | 17.61 | 0.60 | 3.37 | 4.80 | 0.60 | 3.37 | 2.71 | 59.33 | 2.20 | ||||||||||||||||||||||||||||||
| ACFC | Atlantic Coast Fin. Corp of GA* | 6.74 | 6.74 | -1.45 | -23.82 | NM | -1.64 | -26.82 | 7.65 | 22.31 | 2.30 | ||||||||||||||||||||||||||||||
| BCSB | BCSB Bancorp, Inc. of MD* | 8.17 | 8.16 | 0.12 | 1.29 | 1.85 | 0.12 | 1.34 | 2.29 | 26.84 | 1.05 | ||||||||||||||||||||||||||||||
| BKMU | Bank Mutual Corp of WI* | 10.55 | 10.52 | -4.32 | -37.01 | NM | -4.62 | -39.59 | 6.30 | 27.31 | 2.82 | ||||||||||||||||||||||||||||||
| BFIN | BankFinancial Corp. of IL* | 15.06 | 13.65 | -0.28 | -1.74 | -2.90 | -0.22 | -1.41 | 4.76 | 29.02 | 1.75 | ||||||||||||||||||||||||||||||
| BFED | Beacon Federal Bancorp of NY* | 10.89 | 10.89 | 0.56 | 5.32 | 6.81 | 0.61 | 5.79 | 1.34 | 118.30 | 2.01 | ||||||||||||||||||||||||||||||
| BNCL | Beneficial Mut MHC of PA(43.7) | 13.24 | 10.86 | -0.43 | -3.34 | -3.58 | -0.37 | -2.83 | 2.92 | 37.32 | 1.88 | ||||||||||||||||||||||||||||||
| BHLB | Berkshire Hills Bancorp of MA* | 13.79 | 8.32 | 0.40 | 2.94 | 3.64 | 0.58 | 4.20 | 0.63 | 176.65 | 1.30 | ||||||||||||||||||||||||||||||
| BOFI | Bofi Holding, Inc. Of CA* | 7.35 | 7.35 | 1.22 | 14.66 | 13.78 | 0.99 | 11.87 | 1.69 | 23.47 | 0.55 | ||||||||||||||||||||||||||||||
| BYFC | Broadway Financial Corp. of CA* | 3.23 | 3.23 | -0.59 | -8.93 | NM | -0.60 | -9.20 | 17.14 | 29.03 | 5.58 | ||||||||||||||||||||||||||||||
| BRKL | Brookline Bancorp, Inc. of MA* | 16.08 | 14.66 | 1.02 | 5.81 | 6.27 | 1.04 | 5.92 | 0.65 | 151.68 | 1.19 | ||||||||||||||||||||||||||||||
| BFSB | Brooklyn Fed MHC of NY (28.2) | 8.66 | 8.66 | -1.01 | -11.78 | NM | -0.65 | -7.64 | 24.93 | 17.64 | 6.96 | ||||||||||||||||||||||||||||||
| CITZ | CFS Bancorp, Inc of Munster IN* | 9.95 | 9.94 | 0.29 | 2.89 | 5.74 | 0.26 | 2.60 | 7,79 | 19.40 | 2.31 | ||||||||||||||||||||||||||||||
| CMSB | CMS Bancorp, Inc. of W Plains NY* | 8.91 | 8.91 | 0.12 | 1.38 | 1.98 | -0.04 | -0.43 | 3.24 | 14.66 | 0.66 | ||||||||||||||||||||||||||||||
| CBNJ | Cape Bancorp, Inc. of NJ* | 13.53 | 11.64 | 1.09 | 8.49 | 11.45 | 1.16 | 9.07 | 5.73 | 21.80 | 1.73 | ||||||||||||||||||||||||||||||
| CFFN | Capitol Federal Fin Inc. of KS* | 20.15 | 20.15 | 0.40 | 2.36 | 2.10 | 0.69 | 4.08 | 0.70 | 22.04 | 0.29 | ||||||||||||||||||||||||||||||
| CARV | Carver Bancorp, Inc. of NY* | 0.69 | -0.01 | -5.88 | NM | NM | -5.88 | NM | 17.08 | 20.51 | 4.23 | ||||||||||||||||||||||||||||||
| CEBK | Central Bncrp of Somerville MA* | 7.53 | 7.11 | 0.12 | 1.30 | 2.06 | 0.01 | 0.14 | 3.49 | 25.46 | 1.06 | ||||||||||||||||||||||||||||||
| CFBK | Central Federal Corp. of OH* | 1.87 | 1.83 | -1.87 | -34.69 | NM | -2.07 | -38.21 | 3.73 | 77.70 | 4.44 | ||||||||||||||||||||||||||||||
| CHFN | Charter Fin Corp MHC GA (49.0) | 14.53 | 14.08 | 0.28 | 2.26 | 1.89 | -0.19 | -1.55 | 2.66 | 64.46 | 2.86 | ||||||||||||||||||||||||||||||
| CHEV | Cheviot Fin Cp MHC of OH (38.5) | 11. 95 | 10.22 | 0.53 | 3.41 | 3.13 | 0.41 | 2.65 | NA | NA | 0.34 | ||||||||||||||||||||||||||||||
| CBNK | Chicopee Bancorp, Inc. of MA* | 15.70 | 15.70 | 0.13 | 0.82 | 0.93 | 0.10 | 0.63 | 1.01 | 75.44 | 1.00 | ||||||||||||||||||||||||||||||
| CZWI | Citizens Comm Bncorp Inc of WI* | 9.59 | 9.50 | -1.27 | -13.90 | -26.29 | -1.15 | -12.54 | 2.65 | 31.83 | 1.08 | ||||||||||||||||||||||||||||||
| CSBC | Citizens South Bnkg Corp of NC* | 6.64 | 6.50 | -0.15 | -1.71 | -3.37 | 0.18 | 2.07 | 3.38 | 33.75 | 1.69 | ||||||||||||||||||||||||||||||
| CSBK | Clifton Svg Bp MHC of NJ(35.8)(8) | 15.96 | 15.96 | 0.74 | 4.69 | 3.37 | 0.74 | 4.69 | 0.40 | 41.92 | 0.44 | ||||||||||||||||||||||||||||||
| COBK | Colonial Financial Serv. of NJ* | 11.95 | 11.95 | 0.52 | 4.63 | 6.06 | 0.50 | 4.50 | 4.84 | 14.03 | 1.31 | ||||||||||||||||||||||||||||||
| CFFC | Community Fin. Corp. of VA* | 7.23 | 7.23 | 0.07 | 0.70 | 2.61 | 0.07 | 0.70 | 7.95 | 17.72 | 1.54 | ||||||||||||||||||||||||||||||
| DCOM | Dime Community Bancshars of NY* | 8.48 | 7.22 | 1.11 | 13.77 | 11.82 | 1.15 | 14.19 | 0.87 | 54.33 | 0.57 | ||||||||||||||||||||||||||||||
| ESBF | ESB Financial Corp. of PA* | 9.07 | 7.08 | 0.80 | 9.04 | 9.75 | 0.81 | 9.12 | 0.83 | 40.82 | 1.03 | ||||||||||||||||||||||||||||||
| ESSA | ESSA Bancorp, Inc. of PA* | 14.93 | 14.78 | 0.41 | 2.65 | 3.35 | 0.37 | 2.36 | 1.73 | 43.09 | 1.10 | ||||||||||||||||||||||||||||||
| EBMT | Eagle Bancorp Montanta of MT* | 15.85 | 15.85 | 0.72 | 4.51 | 5.83 | 0.28 | 1.78 | 1.24 | 43.69 | 0.95 | ||||||||||||||||||||||||||||||
| ESBK | Elmira Svgs Bank, FSB of NY* | 7.99 | 5.57 | 0.70 | 6.14 | 11.23 | 0.49 | 4.31 | 0.99 | 57.52 | 0.94 | ||||||||||||||||||||||||||||||
| FFDF | FFD Financial Corp of Dover OH* | 8.89 | 8.89 | 0.70 | 7.79 | 9.47 | 0.46 | 5.10 | 1.53 | 76.87 | 1.18 | ||||||||||||||||||||||||||||||
| FFCO | FedFirst Financial Corp of PA* | 17.28 | 16.98 | 0.14 | 0.85 | 1.19 | 0.27 | 1.65 | 0.99 | 87.49 | 1.23 | ||||||||||||||||||||||||||||||
| FSBI | Fidelity Bancorp, Inc. of PA* | 6.54 | 6.16 | 0.08 | 1.12 | 1.90 | 0.22 | 3.04 | 3.54 | 23.97 | 1.62 | ||||||||||||||||||||||||||||||
| FABK | First Advantage Bancorp of TN* | 19.34 | 19.34 | 0.54 | 2.79 | 3.62 | 0.32 | 1.64 | 0.92 | 121.24 | 1.58 | ||||||||||||||||||||||||||||||
| FBSI | First Bancshares, Inc. of MO* | 9.56 | 9.52 | -1.80 | -17.26 | NM | -1.81 | -17.40 | 4.17 | 30.44 | 2.56 | ||||||||||||||||||||||||||||||
| FCAP | First Capital, Inc. of IN* | 11.13 | 10.03 | 0.83 | 7.70 | 7.28 | 0.73 | 6.78 | 1.97 | 51.90 | 1.55 | ||||||||||||||||||||||||||||||
| FCLF | First Clover Leaf Fin Cp of IL* | 13.89 | 11.97 | 0.61 | 4.44 | 6.88 | 0.51 | 3.73 | 3.50 | 24.27 | 1.24 | ||||||||||||||||||||||||||||||
| FBNK | First Connecticut Bncorp of CT* | 15.30 | 15.30 | 0.20 | NM | 1.72 | 0.09 | NM | 1.39 | 70.22 | 1.33 | ||||||||||||||||||||||||||||||
| FDEF | First Defiance Fin. Corp of OH* | 11.37 | 8.55 | 0.49 | 3.96 | 7.87 | 0.26 | 2.14 | 2.35 | 84.16 | 2.77 | ||||||||||||||||||||||||||||||
| FFNM | First Fed of N. Michigan of MI* | 10.99 | 10.80 | 0.07 | 0.61 | 1.33 | 0.03 | 0.24 | 4.71 | 21.25 | 1.48 | ||||||||||||||||||||||||||||||
| FFBH | First Fed. Bancshares of AR(8)* | 13.47 | 13.47 | -1.62 | -21.14 | -8.67 | -1.77 | -23.17 | 15.13 | 31.73 | 7.80 | ||||||||||||||||||||||||||||||
| FFNW | First Fin NW, Inc of Renton WA* | 15.56 | 15.56 | -0.72 | -4.96 | -10.15 | -0.83 | -5.70 | 11.28 | 13.08 | 2.21 | ||||||||||||||||||||||||||||||
| FFCH | First Fin. Holdings Inc. of SC* | 6.26 | 6.08 | -1.43 | -15.39 | NM | -1.37 | -14.75 | 2.76 | 62.46 | 2.26 | ||||||||||||||||||||||||||||||
| FPTB | First PacTrust Bancorp of CA* | 18.19 | 18.19 | 0.72 | 4.96 | 4.75 | 0.40 | 2.76 | 4.82 | 19.84 | 1.24 | ||||||||||||||||||||||||||||||
| FPFC | First Place Fin. Corp. of OH* | 5.79 | 5.53 | -1.10 | -13.16 | NM | -1.52 | -18.23 | 4.42 | 32.78 | 1.78 | ||||||||||||||||||||||||||||||
| FSFG | First Savings Fin. Grp. of IN* | 11.08 | 9.67 | 0.72 | 6.70 | 10.19 | 0.76 | 7.05 | NA | NA | 1.25 | ||||||||||||||||||||||||||||||
| FFIC | Flushing Fin. Corp. of NY* | 9.37 | 9.01 | 0.94 | 10.28 | 12.06 | 0.97 | 10.60 | 3.56 | 19.08 | 0.91 | ||||||||||||||||||||||||||||||
| FXCB | Fox Chase Bancorp, Inc. of PA* | 19.28 | 19.28 | 0.36 | 1.97 | 2.30 | 0.26 | 1.41 | 3.04 | 37.66 | 1.91 | ||||||||||||||||||||||||||||||
| Pricing Ratios | Dividend Data(6) | ||||||||||||||||||||||||||||||||
| Price/ | Price/ | Ind. | Divi- | ||||||||||||||||||||||||||||||
| Price/ | Price/ | Price/ | Tang. | Core | Div./ | dend | Payout | ||||||||||||||||||||||||||
| Financial Institution | Earning | Book | Assets | Book | Earnings | Share | Yield | Ratio(7) | |||||||||||||||||||||||||
| (X) | (%) | (%) | (%) | (x) | ($) | (%) | (%) | ||||||||||||||||||||||||||
| NYSE Traded Companies | |||||||||||||||||||||||||||||||||
| AF | Astoria Financial Corp. of NY* | 10.07 | 70.57 | 5.27 | 82.52 | 10.53 | 0.52 | 5.68 | 57.14 | ||||||||||||||||||||||||
| BBX | BankAtlantic Bancorp Inc of FL* | NM | 233.33 | 1.56 | NM | NM | 0.00 | 0.00 | NM | ||||||||||||||||||||||||
| BKU | BankUnited, Inc. * | NM | 151.32 | 20.60 | 158.63 | 13.05 | 0.56 | 2.44 | NM | ||||||||||||||||||||||||
| FBC | Flagstar Bancorp, Inc. of MI* | NM | 33.15 | 2.51 | 33.15 | NM | 0.00 | 0.00 | NM | ||||||||||||||||||||||||
| NYB | New York Community Bcrp of NY* | 9.98 | 94.96 | 13.00 | 172.43 | 12.32 | 1.00 | 8.29 | NM | ||||||||||||||||||||||||
| PFS | Provident Fin. Serv. Inc of NJ* | 13.30 | 74.14 | 10.11 | 119.54 | 13.30 | 0.48 | 4.20 | 55.81 | ||||||||||||||||||||||||
| NASDAQ Listed OTC Companies | |||||||||||||||||||||||||||||||||
| ABBC | Abington Bancorp, Inc. of PA(8)* | 20.15 | 73.60 | 13.52 | 73.60 | 20.15 | 0.24 | 3.05 | 61.54 | ||||||||||||||||||||||||
| ALLB | Alliance Bancorp, Inc. of PA* | 26.05 | 64.71 | 11.91 | 64.71 | 25.40 | 0.20 | 1.97 | 51.28 | ||||||||||||||||||||||||
| ABCW | Anchor BanCorp Wisconsin of WI* | NM | NM | 0.38 | NM | NM | 0.00 | 0.00 | NM | ||||||||||||||||||||||||
| ANCB | Anchor Bancorp of Aberdeen, WA* | NM | 32.62 | 3.97 | 32.62 | NM | 0.00 | 0.00 | NM | ||||||||||||||||||||||||
| AFCB | Athens Bancshares, Inc. of TN* | 20.82 | 69.93 | 12.40 | 70.48 | 20.82 | 0.20 | 1.57 | 32.79 | ||||||||||||||||||||||||
| ACFC | Atlantic Coast Fin. Corp of GA* | NM | 13.08 | 0.88 | 13.10 | NM | 0.00 | 0.00 | NM | ||||||||||||||||||||||||
| BCSB | BCSB Bancorp, Inc. of MD* | NM | 76.92 | 6.29 | 77.02 | NM | 0.00 | 0.00 | 0.00 | ||||||||||||||||||||||||
| BKMU | Bank Mutual Corp of WI* | NM | 50.17 | 5.29 | 50.35 | NM | 0.04 | 1.38 | NM | ||||||||||||||||||||||||
| BFIN | BankFinancial Corp. of IL* | NM | 60.94 | 9.18 | 68.30 | NM | 0.28 | 3.87 | NM | ||||||||||||||||||||||||
| BFED | Beacon Federal Bancorp of NY* | 14.67 | 75.67 | 8.24 | 75.67 | 13.50 | 0.20 | 1.48 | 21.74 | ||||||||||||||||||||||||
| BNCL | Beneficial Mut MHC of PA(43.7) | NM | 93.92 | 12.44 | 117.67 | NM | 0.00 | 0.00 | NM | ||||||||||||||||||||||||
| BHLB | Berkshire Hills Bancorp of MA* | 27.49 | 72.30 | 9.97 | 127.50 | 19.24 | 0.64 | 3.33 | NM | ||||||||||||||||||||||||
| BOFI | Bofi Holding, Inc. Of CA* | 7.26 | 103.00 | 7.57 | 103.00 | 8.97 | 0.00 | 0.00 | 0.00 | ||||||||||||||||||||||||
| BYFC | Broadway Financial Corp. of CA* | NM | 17.90 | 0.58 | 17.90 | NM | 0.04 | 2.70 | NM | ||||||||||||||||||||||||
| BRKL | Brookline Bancorp, Inc. of MA* | 15.96 | 92.22 | 14.83 | 102.89 | 15.64 | 0.34 | 4.35 | 69.39 | ||||||||||||||||||||||||
| BFSB | Brooklyn Fed MHC of NY (28.2) | NM | 25.00 | 2.17 | 25.00 | NM | 0.04 | 5.06 | NM | ||||||||||||||||||||||||
| CITZ | CFS Bancorp, Inc of Munster IN* | 17.43 | 49.95 | 4.97 | 50.00 | 19.37 | 0.04 | 0.76 | 13.33 | ||||||||||||||||||||||||
| CMSB | CMS Bancorp, Inc. of W Plains NY* | NM | 68.41 | 6.10 | 68.41 | NM | 0.00 | 0.00 | 0.00 | ||||||||||||||||||||||||
| CBNJ | Cape Bancorp, Inc. of NJ* | 8.74 | 70.05 | 9.48 | 83.24 | 8.17 | 0.00 | 0.00 | 0.00 | ||||||||||||||||||||||||
| CFFN | Capitol Federal Fin Inc. of KS* | NM | 90.74 | 18.28 | 90.74 | 27.58 | 0.30 | 2.86 | NM | ||||||||||||||||||||||||
| CARV | Carver Bancorp, Inc. of NY* | NM | 36.51 | 0.25 | NM | NM | 0.00 | 0.00 | NM | ||||||||||||||||||||||||
| CEBK | Central Bncrp of Somerville MA* | NM | 78.62 | 5.92 | 83.61 | NM | 0.20 | 1.14 | 55.56 | ||||||||||||||||||||||||
| CFBK | Central Federal Corp. of OH* | NM | 59.52 | 1.11 | 60.98 | NM | 0.00 | 0.00 | NM | ||||||||||||||||||||||||
| CHFN | Charter Fin Corp MHC GA (49.0) | NM | 113.25 | 16.46 | 117.50 | NM | 0.20 | 2.36 | NM | ||||||||||||||||||||||||
| CHEV | Cheviot Fin Cp MHC of OH (38.5) | 31.93 | 107.08 | 12.80 | 127.70 | NM | 0.48 | 5.57 | NM | ||||||||||||||||||||||||
| CBNK | Chicopee Bancorp, Inc. of MA* | NM | 90.21 | 14.16 | 90.21 | NM | 0.00 | 0.00 | 0.00 | ||||||||||||||||||||||||
| CZWI | Citizens Comm Bncorp Inc of WI* | NM | 52.66 | 5.05 | 53.23 | NM | 0.00 | 0.00 | NM | ||||||||||||||||||||||||
| CSBC | Citizens South Bnkg Corp of NC* | NM | 64.34 | 4.27 | 65.77 | 24.41 | 0.04 | 0.96 | NM | ||||||||||||||||||||||||
| CSBK | Clifton Svg Bp MHC of NJ(35.8)(8) | 29.69 | 137.09 | 21.88 | 137.09 | 29.69 | 0.24 | 2.53 | NM | ||||||||||||||||||||||||
| COBK | Colonial Financial Serv. of NJ* | 16.51 | 70.26 | 8.39 | 70.26 | 16 97 | 0.00 | 0.00 | 0.00 | ||||||||||||||||||||||||
| CFFC | Community Fin. Corp. of VA* | 38.38 | 35.41 | 2.56 | 35.41 | 38.38 | 0.00 | 0.00 | 0.00 | ||||||||||||||||||||||||
| DCOM | Dime Community Bancshars of NY* | 8.46 | 110.78 | 9.40 | 131.89 | 8.21 | 0.56 | 5.09 | 43.08 | ||||||||||||||||||||||||
| ESBF | ESB Financial Corp. of PA* | 10.26 | 89.53 | 8.12 | 117.32 | 10.16 | 0.40 | 3.71 | 38.10 | ||||||||||||||||||||||||
| ESSA | ESSA Bancorp, Inc. of PA* | 29.89 | 81.15 | 12.11 | 82.07 | 33.63 | 0.20 | 1.86 | 55.56 | ||||||||||||||||||||||||
| EBMT | Eagle Bancorp Montanta of MT* | 17.15 | 78.12 | 12.38 | 78.12 | NM | 0.29 | 2.77 | 47.54 | ||||||||||||||||||||||||
| ESBK | Elmira Svgs Bank, FSB of NY* | 8.90 | 78.04 | 6.24 | 115.02 | 12.68 | 0.80 | 5.05 | 44.94 | ||||||||||||||||||||||||
| FFDF | FFD Financial Corp of Dover OH* | 10.56 | 81.08 | 7.21 | 81.08 | 16.13 | 0.68 | 4.53 | 47.89 | ||||||||||||||||||||||||
| FFCO | FedFirst Financial Corp of PA* | NM | 67.48 | 11.66 | 68.97 | NM | 0.12 | 0.89 | NM | ||||||||||||||||||||||||
| FSBI | Fidelity Bancorp, Inc. of PA* | NM | 66.53 | 4.35 | 70.85 | 19.35 | 0.08 | 0.84 | 44.44 | ||||||||||||||||||||||||
| FABK | First Advantage Bancorp of TN* | 27.61 | 76.60 | 14.81 | 76.60 | NM | 0.20 | 1.57 | 43.48 | ||||||||||||||||||||||||
| FBSI | First Bancshares, Inc. of MO* | NM | 55.25 | 5.28 | 55.51 | NM | 0.00 | 0.00 | NM | ||||||||||||||||||||||||
| FCAP | First Capital, Inc. of IN* | 13.74 | 103.54 | 11.53 | 116.37 | 15.60 | 0.76 | 4.13 | 56.72 | ||||||||||||||||||||||||
| FCLF | First Clover Leaf Fin Cp of IL* | 14.55 | 63.94 | 8.88 | 75.83 | 17.30 | 0.24 | 3.75 | 54.55 | ||||||||||||||||||||||||
| FBNK | First Connecticut Bncorp of CT* | NM | 76.31 | 11.67 | 76.31 | NM | 0.00 | 0.00 | 0.00 | ||||||||||||||||||||||||
| FDEF | First Defiance Fin. Corp of OH* | 12.71 | 54.18 | 6.16 | 74.31 | 23.56 | 0.00 | 0.00 | 0.00 | ||||||||||||||||||||||||
| FFNM | First Fed of N. Michigan of MI* | NM | 44.96 | 4.94 | 45.84 | NM | 0.00 | 0.00 | 0.00 | ||||||||||||||||||||||||
| FFBH | First Fed. Bancshares of AR(8)* | NM | 139.53 | 18.79 | 139.53 | NM | 0.20 | 3.33 | NM | ||||||||||||||||||||||||
| FFNW | First Fin NW, Inc of Renton WA* | NM | 48.58 | 7.56 | 48.58 | NM | 0.00 | 0.00 | NM | ||||||||||||||||||||||||
| FFCH | First Fin. Holdings Inc. of SC* | NM | 47.70 | 2.99 | 49.20 | NM | 0.20 | 3.44 | NM | ||||||||||||||||||||||||
| FPTB | First PacTrust Bancorp of CA* | 21.06 | 81.74 | 14.87 | 81.74 | 37.90 | 0.46 | 4.05 | NM | ||||||||||||||||||||||||
| FPFC | First Place Fin. Corp. of OH* | NM | 7.90 | 0.46 | 8.30 | NM | 0.00 | 0.00 | NM | ||||||||||||||||||||||||
| FSFG | First Savings Fin. Grp. of IN* | 9.81 | 62.81 | 6.96 | 73.09 | 9.33 | 0.00 | 0.00 | 0.00 | ||||||||||||||||||||||||
| FFIC | Flushing Fin. Corp. of NY* | 8.29 | 82.57 | 7.74 | 86.19 | 8.04 | 0.52 | 4.90 | 40.63 | ||||||||||||||||||||||||
| FXCB | Fox Chase Bancorp, Inc. of PA* | NM | 84.66 | 16.32 | 84.66 | NM | 0.08 | 0.66 | 28.57 | ||||||||||||||||||||||||
| RP FINANCIAL, LC. | |
Financial Services Industry Consultants 1100 North Glebe Road, Suite 1100 Arlington, Virginia 22201 (703) 528-1700 |
Exhibit IV-1B (continued)
Weekly Thrift Market Line - Part Two
Prices As Of September 2, 2011
Weekly Thrift Market Line - Part Two
Prices As Of September 2, 2011
| Key Financial Ratios | Asset Quality Ratios | Pricing Ratios | Dividend Data(6) | ||||||||||||||||||||||||||||||||||||
| Equity/ | Tang. Equity/ | Reported Earnings | Core Earnings | NPAs | Resvs/ | Resvs/ | Price/ | Price/ | Price/ | Price/ Tang. | Price/ Core | Ind. Div./ | Divi-dend | Payout | |||||||||||||||||||||||||
| Financial Institution | Assets | Assets | ROA(5) | ROE(5) | ROI(5) | ROA(5) | ROE(5) | Assets | NPAs | Loans | Earning | Book | Assets | Book | Earnings | Share | Yield | Ratio (7) | |||||||||||||||||||||
| (%) | (%) | (%) | (%) | (%) | (%) | (%) | (%) | (%) | (%) | (X) | (%) | (%) | (%) | (x) | ($) | (%) | (%) | ||||||||||||||||||||||
| NASDAQ Listed OTC Companies (continued) | |||||||||||||||||||||||||||||||||||||||
| FRNK | Franklin Financial Corp. of VA* | 22.66 | 22.66 | -0.09 | NM | -0.63 | 0.26 | NM | 4.21 | 28.61 | 2.71 | NM | 63.88 | 14.48 | 63.88 | NM | 0.00 | 0.00 | NM | ||||||||||||||||||||
| GCBC | Green Co Bcrp MHC of NY (44.1) | 8.78 | 8.78 | 1.00 | 11.48 | 6.79 | 0.96 | 11.12 | NA | NA | 1.66 | 14.72 | 162.41 | 14.27 | 162.41 | 15.19 | 0.70 | 3.72 | 54.69 | ||||||||||||||||||||
| HFFC | HF Financial Corp. of SD* | 7.93 | 7.59 | 0.06 | 0.74 | 1.21 | 0.12 | 1.62 | 3.37 | 35.70 | 1.71 | NM | 61.08 | 4.84 | 64.01 | 37.59 | 0.45 | 5.44 | NM | ||||||||||||||||||||
| HMNF | HMN Financial, Inc. of MN* | 5.33 | 5.33 | -2.58 | -30.52 | NM | -2.73 | -32.27 | NA | NA | 4.40 | NM | 20.39 | 1.09 | 20.39 | NM | 0.00 | 0.00 | NM | ||||||||||||||||||||
| HBNK | Hampden Bancorp, Inc. of MA* | 16.15 | 16.15 | 0.33 | 2.03 | 2.23 | 0.28 | 1. 74 | 2.52 | 35.01 | NA | NM | 92.09 | 14.88 | 92.09 | NM | 0.12 | 0.95 | 42.86 | ||||||||||||||||||||
| HARL | Harleysville Svgs Fin Cp of PA* | 6.59 | 6.59 | 0.65 | 10.35 | 10.64 | 0.73 | 11.59 | NA | NA | 0.52 | 9.40 | 93.44 | 6.16 | 93.44 | 8.39 | 0.76 | 5.39 | 50.67 | ||||||||||||||||||||
| HBOS | Heritage Fin Group, Inc of GA* | 12.66 | 12.27 | 0.15 | 1. 25 | 1.29 | 0.67 | 5.53 | 1.82 | 37.60 | 1.30 | NM | 77.73 | 9.84 | 80.61 | 17.56 | 0.12 | 1.10 | NM | ||||||||||||||||||||
| HIFS | Hingham Inst. for Sav. of MA* | 7.28 | 7.28 | 1.12 | 15.51 | 11.38 | 1.12 | 15.51 | 0.92 | 75.47 | 0.87 | 8.79 | 128.46 | 9.35 | 128.46 | 8.79 | 1.00 | 2.13 | 18.73 | ||||||||||||||||||||
| HBCP | Home Bancorp Inc. Lafayette LA* | 18.93 | 18.73 | 0.66 | 3.52 | 4.11 | 0.76 | 4.01 | 0.30 | 189.49 | 0.90 | 24.33 | 85.52 | 16.18 | 86.62 | 21.38 | 0.00 | 0.00 | 0.00 | ||||||||||||||||||||
| HFBL | Home Federal Bancorp Inc of LA* | 21.93 | 21. 93 | 0.91 | 4.19 | 4.81 | 0.23 | 1.05 | 0.08 | 408.74 | 0.63 | 20.78 | 79.17 | 17.36 | 79.17 | NM | 0.24 | 1.80 | 37.50 | ||||||||||||||||||||
| HFBC | HopFed Bancorp, Inc. of KY* | 8.76 | 8.70 | 0.05 | 0.46 | 0.95 | -0.21 | -2.02 | 2.17 | 59.81 | 2.33 | NM | 58.41 | 5.12 | 58.82 | NM | 0.32 | 4.32 | NM | ||||||||||||||||||||
| HCBK | Hudson City Bancorp, Inc of NJ* | 9.44 | 9.16 | -0.38 | -4.11 | -7.11 | -0.37 | -4.01 | 1.81 | 26.95 | 0.86 | NM | 62.18 | 5.87 | 64.25 | NM | 0.32 | 5.55 | NM | ||||||||||||||||||||
| IROQ | IF Bancorp, Inc. of IL* | 16.95 | 16.95 | 0.61 | NM | 5.27 | 0.48 | NM | 1.36 | 50.28 | 1.15 | 18.96 | 68.50 | 11.61 | 68.50 | 24.02 | 0.00 | 0.00 | 0.00 | ||||||||||||||||||||
| ISBC | Investors Bcrp MHC of NJ(43.0) | 9.21 | 8.95 | 0.75 | 7.81 | 4.77 | 0.69 | 7.19 | 1.71 | 61.24 | 1.24 | 20.95 | 158.27 | 14.58 | 163.37 | 22.76 | 0.00 | 0.00 | 0.00 | ||||||||||||||||||||
| JXSB | Jacksonville Bancorp Inc of IL* | 12.70 | 11.92 | 1.00 | 8.72 | 11.46 | 0.85 | 7.44 | 1.27 | 81.68 | 1.77 | 8.73 | 68.30 | 8.68 | 73.46 | 10.22 | 0.30 | 2.19 | 19.11 | ||||||||||||||||||||
| JFBI | Jefferson Bancshares Inc of TN* | 9.66 | 9.34 | -3.75 | -38.44 | NM | -3.97 | -40.61 | 4.68 | 29.18 | 1.81 | NM | 33.65 | 3.25 | 34.94 | NM | 0.00 | 0.00 | NM | ||||||||||||||||||||
| KFFB | KY Fst Fed Bp MHC of KY (39.3) | 25.49 | 20.40 | 0.62 | 2.54 | 2.35 | 0.59 | 2.40 | 2.85 | 13.53 | NA | NM | 107.44 | 27.39 | 143.44 | NM | 0.40 | 4.94 | NM | ||||||||||||||||||||
| KFFG | Kaiser Federal Fin Group of CA* | 17.22 | 16.85 | 0.94 | 7.02 | 7.30 | 0.94 | 7.02 | 3.39 | 38.67 | 1.61 | 13.69 | 73.29 | 12.62 | 75.24 | 13.69 | 0.24 | 2.02 | 27.59 | ||||||||||||||||||||
| KRNY | Kearny Fin Cp MHC of NJ (25.1) | 16.80 | 13.55 | 0.30 | 1.69 | 1.46 | 0.35 | 1.97 | NA | NA | 0.93 | NM | 114.05 | 19.16 | 146.95 | NM | 0.20 | 2.44 | NM | ||||||||||||||||||||
| LSBI | LSB Fin. Corp. of Lafayette IN* | 10.10 | 10.10 | 0.48 | 5.08 | 8.72 | 0.27 | 2.80 | 5.92 | 33.02 | 2.20 | 11.47 | 56.89 | 5.74 | 56.89 | 20.78 | 0.00 | 0.00 | 0.00 | ||||||||||||||||||||
| LPSB | LaPorte Bancrp MHC of IN(45.0) | 11.42 | 9.66 | 0.58 | 5.12 | 6.33 | 0.45 | 3.95 | 1. 75 | 41.76 | 1. 25 | 15.79 | 78.33 | 8.95 | 94.44 | 20.45 | 0.00 | 0.00 | 0.00 | ||||||||||||||||||||
| LSBK | Lake Shore Bnp MHC of NY(39.4) | 12.22 | 12.22 | 0.76 | 6.32 | 6.10 | 0.57 | 4.77 | 0.58 | 43.24 | 0.44 | 16.39 | 100.50 | 12.29 | 100.50 | 21.74 | 0.28 | 2.80 | 45.90 | ||||||||||||||||||||
| LABC | Louisiana Bancorp, Inc. of LA* | 18.39 | 18.39 | 0.74 | 3.90 | 4.37 | 0.64 | 3.34 | 0.57 | 94.73 | 0.92 | 22.90 | 93.58 | 17.21 | 93.58 | 26.72 | 0.00 | 0.00 | 0.00 | ||||||||||||||||||||
| MSBF | MSB Fin Corp MHC of NJ (40.3) | 11. 60 | 11.60 | 0.20 | 1.80 | 2.70 | 0.20 | 1.80 | 8.27 | 11.29 | NA | 37.07 | 66.20 | 7.68 | 66.20 | 37.07 | 0.12 | 2.31 | NM | ||||||||||||||||||||
| MGYR | Magyar Bancorp MHC of NJ(44.7) | 8.44 | 8.44 | -0.02 | -0.26 | -0.56 | -0.11 | -1.31 | 8.66 | 8.09 | 0.96 | NM | 46.35 | 3.91 | 46.35 | NM | 0.00 | 0.00 | NM | ||||||||||||||||||||
| MLVF | Malvern Fed Bncp MHC PA(44.6) | 9.04 | 9.04 | -1.05 | -11.34 | -15.97 | -1.05 | -11.34 | 5.42 | 27.52 | 1.90 | NM | 74.65 | 6.75 | 74.65 | NM | 0.12 | 1.61 | NM | ||||||||||||||||||||
| MFLR | Mayflower Bancorp, Inc. of MA* | 8.58 | 8.58 | 0.53 | 6.34 | 7.66 | 0.33 | 3.96 | NA | NA | 0.94 | 13.05 | 81.86 | 7.02 | 81.86 | 20.88 | 0.24 | 2.87 | 37.50 | ||||||||||||||||||||
| EBSB | Meridian Fn Serv MHC MA. (41.4) | 11.41 | 10.77 | 0.80 | 6.85 | 5.56 | 0.59 | 5.08 | 3.03 | 18.63 | 0.89 | 18.00 | 120.36 | 13.73 | 128.43 | 24.24 | 0.00 | 0.00 | 0.00 | ||||||||||||||||||||
| CASH | Meta Financial Group of IA* | 7.26 | 7.14 | 0.46 | 6.77 | 8.62 | 0.74 | 10.89 | 1. 92 | 23.62 | 1.54 | 11.59 | 73.16 | 5.31 | 74.50 | 7.21 | 0.52 | 2.84 | 32.91 | ||||||||||||||||||||
| MFSF | MutualFirst Fin. Inc. of IN* | 6.85 | 6.58 | 0.31 | 3.44 | 8.64 | 0.15 | 1.64 | 2.67 | 41.76 | 1.65 | 11.57 | 53.03 | 3.63 | 55.38 | 24.26 | 0.24 | 3.19 | 36.92 | ||||||||||||||||||||
| NASB | NASF Fin, Inc. of Grandview MO* | 11.50 | 11.33 | -1.18 | -10.09 | -19.78 | -2.80 | -23.88 | 8.49 | 67.33 | 6.52 | NM | 55.55 | 6.39 | 56.53 | NM | 0.90 | 8.81 | NM | ||||||||||||||||||||
| NECB | NE Comm Bncrp MHC of NY (44.6) | 24.20 | 23.89 | 0.59 | 2.61 | 3.32 | 0.86 | 3.79 | 9.31 | 18.37 | 2.02 | 30.09 | 78.81 | 19.07 | 80.15 | 20.69 | 0.12 | 1. 81 | 54.55 | ||||||||||||||||||||
| NHTB | NH Thrift Bancshares of NH* | 8.34 | 5.73 | 0.77 | 8.27 | 10.46 | 0.45 | 4.81 | 0.93 | 105.67 | 1.40 | 9.56 | 86.03 | 7.17 | 128.87 | 16.42 | 0.52 | 4.06 | 38.81 | ||||||||||||||||||||
| NVSL | Naugatuck Valley Fin Crp of CT* | 13.67 | 13.66 | 0.25 | 2.81 | 2.77 | 0.31 | 3.48 | 2.93 | 41.36 | 1.46 | 36.10 | 65.51 | 8.96 | 65.57 | 29.15 | 0.12 | 1.58 | 57.14 | ||||||||||||||||||||
| NFSB | Newport Bancorp, Inc. of RI* | 11.21 | 11.21 | 0.43 | 3.91 | 4.29 | 0.42 | 3.77 | 0.29 | 282.96 | 1.03 | 23.30 | 89.51 | 10.03 | 89.51 | 24.17 | 0.00 | 0.00 | 0.00 | ||||||||||||||||||||
| FFFD | North Central Bancshares of IA* | 9.19 | 9.05 | 0.42 | 3.85 | 8.17 | 0.42 | 3.82 | 4.52 | 29.33 | 1.82 | 12.23 | 57.48 | 5.28 | 58.43 | 12.32 | 0.04 | 0.23 | 2.84 | ||||||||||||||||||||
| NFBK | Northfield Bcp MHC of NY(43.4) | 17.26 | 16.68 | 0.69 | 3.93 | 3.05 | 0.62 | 3.51 | 3.20 | 31.89 | 2.61 | 32.84 | 129.26 | 22.31 | 134.70 | 36.82 | 0.24 | 1. 98 | 64.86 | ||||||||||||||||||||
| NWBI | Northwest Bancshares Inc of PA* | 15.17 | 13.30 | 0.75 | 4.72 | 5.25 | 0.76 | 4.80 | 2.45 | 38.37 | 1.37 | 19.03 | 94.53 | 14.34 | 110.21 | 18.72 | 0.44 | 3.92 | 74.58 | ||||||||||||||||||||
| OBAF | OBA Financial Serv. Inc of MD* | 22.71 | 22.71 | 0.23 | 1.03 | 1.26 | 0.21 | 0.97 | 0.97 | 63.16 | NA | NM | 81.39 | 18.49 | 81.39 | NM | 0.00 | 0.00 | 0.00 | ||||||||||||||||||||
| OSHC | Ocean Shore Holding Co. of NJ* | 11. 95 | 11.95 | 0.63 | 5.21 | 6.52 | 0.64 | 5.35 | 0.70 | 67.43 | 0.61 | 15.35 | 78.42 | 9.37 | 78.42 | 14.93 | 0.24 | 2.17 | 33.33 | ||||||||||||||||||||
| OCFC | OceanFirst Fin. Corp of NJ* | 9.53 | 9.53 | 0.95 | 10.49 | 10.04 | 0.83 | 9.19 | 2.36 | 38.19 | 1.31 | 9.96 | 99.38 | 9.47 | 99.38 | 11.36 | 0.48 | 4.27 | 42.48 | ||||||||||||||||||||
| OFED | Oconee Fed Fn Cp MHC SC (35.0) | 21.05 | 21.05 | 0.49 | 2.62 | 2.65 | 0.90 | 4.78 | 1.31 | 17.72 | 0.33 | 37.76 | 87.60 | 18.44 | 87.60 | 20.66 | 0.40 | 3.65 | NM | ||||||||||||||||||||
| OABC | OmniAmerican Bancorp Inc of TX* | 15.16 | 15.16 | 0.18 | 1.11 | 1.37 | 0.12 | 0.70 | 3.54 | 18.37 | 1.29 | NM | 80.13 | 12.14 | 80.13 | NM | 0.00 | 0.00 | 0.00 | ||||||||||||||||||||
| ONFC | Oneida Financial Corp. of NY* | 13.40 | 9.96 | 0.88 | 6.93 | 9.12 | 0.89 | 7.02 | 0.88 | 53.21 | 1.08 | 10.96 | 71.24 | 9.54 | 99.66 | 10.83 | 0.48 | 5.47 | 60.00 | ||||||||||||||||||||
| ORIT | Oritani Financial Corp of NJ* | 24.95 | 24.95 | 1.12 | 4.39 | 4.25 | 1.14 | 4.48 | 1.40 | 67.75 | 1.56 | 23.55 | 103.27 | 25.77 | 103.27 | 23.10 | 0.40 | 3.33 | NM | ||||||||||||||||||||
| PSBH | PSB Hldgs Inc MHC of CT (42.9) | 9.85 | 8.44 | 0.27 | 2.89 | 3.95 | 0.43 | 4.62 | 2.18 | 27.09 | 1.10 | 25.30 | 70.38 | 6.93 | 83.36 | 15.81 | 0.16 | 3.16 | NM | ||||||||||||||||||||
| PVFC | PVF Capital Corp. of Solon OH* | 9.58 | 9.58 | -1.16 | -12.10 | -24.52 | -1.78 | -18.47 | 9.39 | 40.93 | 5.11 | NM | 53.45 | 5.12 | 53.45 | NM | 0.00 | 0.00 | NM | ||||||||||||||||||||
| PFED | Park Bancorp of Chicago IL* | 7.69 | 7.69 | -2.57 | -28.94 | NM | -2.67 | -30.09 | 8.22 | 34.03 | 4.20 | NM | 21.76 | 1.67 | 21.76 | NM | 0.00 | 0.00 | NM | ||||||||||||||||||||
| PVSA | Parkvale Financial Corp of PA(8) * | 5.11 | 3.62 | -0.83 | -11.94 | -15.22 | 0.36 | 5.16 | 2.04 | 51.69 | 1.87 | NM | 107.88 | 5.52 | 154.65 | 15.21 | 0.08 | 0.45 | NM | ||||||||||||||||||||
| PBHC | Pathfinder BC MHC of NY (36.3) | 6.25 | 5.38 | 0.46 | 6.03 | 8.35 | 0.41 | 5.31 | 1.39 | 68.63 | 1.38 | 11.97 | 86.50 | 5.41 | 101.34 | 13.58 | 0.12 | 1.32 | 15.79 | ||||||||||||||||||||
| PEOP | Peoples Fed Bancshrs Inc of MA* | 21.83 | 21.83 | -0.03 | -0.14 | -0.14 | 0.59 | 3.11 | 1.17 | 53.49 | 0.83 | NM | 85.16 | 18.59 | 85.16 | 31.11 | 0.00 | 0.00 | NM | ||||||||||||||||||||
| PBCT | Peoples United Financial of CT* | 20.51 | 13.90 | 0.67 | 3.03 | 3.95 | 0.67 | 3.03 | 2.82 | 25.18 | 0.99 | 25.33 | 77.92 | 15.98 | 124.59 | 25.33 | 0.63 | 5.53 | NM | ||||||||||||||||||||
| PROV | Provident Fin. Holdings of CA* | 10.78 | 10.78 | 0.97 | 9.76 | 14.06 | -0.49 | -4.88 | 5.04 | 46.04 | 2.76 | 7.11 | 66.48 | 7.17 | 66.48 | NM | 0.12 | 1.45 | 10.34 | ||||||||||||||||||||
| PBNY | Provident NY Bncrp, Inc. of NY* | 14.42 | 9.37 | 0.59 | 4.11 | 7.63 | 0.38 | 2.68 | 2.04 | 48.42 | 1.74 | 13.11 | 53.41 | 7.70 | 87.01 | 20.10 | 0.24 | 3.98 | 52.17 | ||||||||||||||||||||
| PBIP | Prudential Bncp MHC PA (25.5) | 11.18 | 11.18 | -0.10 | -0.90 | -0.97 | -0.06 | -0.54 | 2.80 | 22.26 | 1.30 | NM | 93.33 | 10.43 | 93.33 | NM | 0.00 | 0.00 | NM | ||||||||||||||||||||
| PULB | Pulaski Fin Cp of St. Louis MO* | 6.59 | 6.31 | 0.50 | 5.98 | 10.31 | 0.23 | 2.77 | 5.61 | 34.49 | 2.32 | 9.70 | 77.66 | 5.11 | 81.35 | 20.97 | 0.38 | 5.85 | 56.72 | ||||||||||||||||||||
| RIVR | River Valley Bancorp of IN* | 7.00 | 6.98 | 0.50 | 6.01 | 7.95 | 0.30 | 3.66 | 4.92 | 19.49 | 1.36 | 12.58 | 87.07 | 6.10 | 87.36 | 20.64 | 0.84 | 5.22 | 65.63 | ||||||||||||||||||||
| RVSB | Riverview Bancorp, Inc. of WA* | 12.18 | 9.54 | 0.39 | 3.28 | 5.75 | 0.37 | 3.06 | 5.10 | 35.59 | 2.32 | 17.40 | 54.38 | 6.62 | 71.51 | 18.64 | 0.00 | 0.00 | 0.00 | ||||||||||||||||||||
| RCKB | Rockville Fin New, Inc. of CT* | 19.02 | 18.97 | 0.29 | 2.16 | 1.79 | 0.53 | 3.93 | 0.74 | 117.82 | 1.06 | NM | 84.37 | 16.05 | 84.67 | 30.65 | 0.26 | 2.74 | NM | ||||||||||||||||||||
| ROMA | Roma Fin Corp MHC of NJ (26.2) | 11.33 | 11.25 | 0.31 | 2.53 | 2.20 | 0.22 | 1.83 | NA | NA | 1.15 | NM | 115.84 | 13.13 | 116.83 | NM | 0.32 | 3.91 | NM | ||||||||||||||||||||
| SIFI | SI Financial Group, Inc. of CT* | 13.69 | 13.32 | 0.30 | 2.73 | 2.76 | 0.25 | 2.31 | 1. 54 | 32.65 | 0.76 | 36.27 | 76.73 | 10.51 | 79.24 | NM | 0.12 | 1.27 | 46.15 | ||||||||||||||||||||
| SPBC | SP Bancorp, Inc. of Plano, TX* | 12.22 | 12.22 | 0.41 | 3.80 | 5.11 | -0.04 | -0.33 | 4.28 | 16.31 | 0.93 | 19.57 | 60.24 | 7.36 | 60.24 | NM | 0.00 | 0.00 | 0.00 | ||||||||||||||||||||
| SVBI | Severn Bancorp. Inc. of MD* | 8.29 | 8.26 | -0.10 | -0.95 | -3.30 | -0.16 | -1.43 | 13.00 | 25.52 | 4.05 | NM | 39.25 | 3.25 | 39.40 | NM | 0.00 | 0.00 | NM | ||||||||||||||||||||
| STND | Standard Financial Corp. of PA* | 17.68 | 15.85 | 0.55 | 3.67 | 4.54 | 0.76 | 5.10 | 0.85 | 122.45 | 1.54 | 22.01 | 66.29 | 11. 72 | 75.56 | 15.86 | 0.00 | 0.00 | 0.00 | ||||||||||||||||||||
| SIBC | State Investors Bancorp of LA* | 19.25 | 19.25 | 0.24 | NM | 1.74 | 0.29 | NM | 1.28 | 43.53 | 0.87 | NM | 72.78 | 14.01 | 72.78 | NM | 0.00 | 0.00 | 0.00 | ||||||||||||||||||||
| THRD | TF Fin. Corp. of Newtown PA* | 10.91 | 10.32 | 0.43 | 4.03 | 5.01 | 0.32 | 3.00 | NA | NA | 1.79 | 19.94 | 79.09 | 8.63 | 84.16 | 26.76 | 0.20 | 0.95 | 18.87 | ||||||||||||||||||||
| RP FINANCIAL, LC. | |
| Financial Services Industry Consultants 1100 North Glebe Road, Suite 1100 Arlington, Virginia 22201 (703) 528-1700 |
Exhibit IV-1B (continued)
Weekly Thrift Market Line - Part Two
Prices As Of September 2, 2011
Weekly Thrift Market Line - Part Two
Prices As Of September 2, 2011
| Key Financial Ratios | Asset Quality Ratios | Pricing Ratios | Dividend Data(6) | ||||||||||||||||||||||||||||||||||||
| Equity/ | Tang. Equity/ | Reported Earnings | Core Earnings | NPAs | Resvs/ | Resvs/ | Price/ | Price/ | Price/ | Price/ Tang. | Price/ Core | Ind. Div./ | Divi-dend | Payout | |||||||||||||||||||||||||
| Financial Institution | Assets | Assets | ROA(5) | ROE(5) | ROI(5) | ROA(5) | ROE(5) | Assets | NPAs | Loans | Earning | Book | Assets | Book | Earnings | Share | Yield | Ratio (7) | |||||||||||||||||||||
| (%) | (%) | (%) | (%) | (%) | (%) | (%) | (%) | (%) | (%) | (X) | (%) | (%) | (%) | (X) | ($) | (%) | (%) | ||||||||||||||||||||||
| NASDAQ Listed OTC Companies (continued) | |||||||||||||||||||||||||||||||||||||||
| TFSL | TFS Fin Corp MHC of OH (26.4) | 16.25 | 16.18 | -0.08 | -0.53 | -0.36 | -0.08 | -0.53 | 3.57 | 38.81 | 1.56 | NM | 145.72 | 23.67 | 146.49 | NM | 0.00 | 0.00 | NM | ||||||||||||||||||||
| TBNK | Territorial Bancorp, Inc of HI* | 15.28 | 15.28 | 0.87 | 5.57 | 5.67 | 0.83 | 5.36 | 0.25 | 42.18 | 0.24 | 17.65 | 97.15 | 14.85 | 97.15 | 18.33 | 0.36 | 1. 89 | 33.33 | ||||||||||||||||||||
| TSBK | Timberland Bancorp, Inc. of WA* | 9.58 | 8.82 | 0.00 | 0.00 | 0.00 | -0.12 | -1.06 | 8.35 | 19.20 | 2.21 | NM | 50.55 | 4.84 | 55.31 | NM | 0.00 | 0.00 | NM | ||||||||||||||||||||
| TRST | TrustCo Bank Corp NY of NY* | 6.61 | 6.60 | 0.77 | 11.61 | 8.92 | 0.73 | 11.01 | 1.34 | 83.79 | 1.88 | 11.21 | 125.57 | 8.31 | 125.94 | 11.81 | 0.26 | 5.95 | 66.67 | ||||||||||||||||||||
| UCBA | United Comm Bncp MHC IN (40.7) | 11.22 | 10.54 | -0.20 | -1.71 | -2.07 | -0.26 | -2.28 | 5.02 | 20.32 | 1. 74 | NM | 85.32 | 9.57 | 91.50 | NM | 0.44 | 7.57 | NM | ||||||||||||||||||||
| UCFC | United Community Fin. of OH* | 8.71 | 8.69 | -1.18 | -13.68 | NM | -1.50 | -17.43 | 10.15 | 21.67 | 2.96 | NM | 19.29 | 1.68 | 19.32 | NM | 0.00 | 0.00 | NM | ||||||||||||||||||||
| UBNK | United Financial Bncrp of MA* | 14.15 | 13.69 | 0.66 | 4.67 | 4.59 | 0.65 | 4.60 | 0.96 | 68.36 | 0.96 | 21. 80 | 100.14 | 14.17 | 104.11 | 22.14 | 0.36 | 2.54 | 55.38 | ||||||||||||||||||||
| VPFG | ViewPoint Financal Group of TX* | 13.73 | 13.71 | 0.81 | 6.45 | 5.91 | 0.48 | 3.85 | 0.69 | 78.79 | 1.03 | 16.93 | 97.09 | 13.33 | 97.26 | 28.35 | 0.20 | 1. 76 | 29.85 | ||||||||||||||||||||
| WSB | WSB Holdings, Inc. of Bowie MD* | 13.56 | 13.56 | -0.28 | -2.15 | -5.67 | -0.12 | -0.92 | 10.18 | 23.41 | 3.51 | NM | 37.31 | 5.06 | 37.31 | NM | 0.00 | 0.00 | NM | ||||||||||||||||||||
| WSFS | WSFS Financial Corp. of DE* | 7.80 | 7.02 | 0.44 | 4.81 | 5.98 | 0.35 | 3.87 | 2.44 | 55.60 | 2.10 | 16.73 | 89.37 | 6.97 | 100.06 | 20.75 | 0.48 | 1.43 | 23.88 | ||||||||||||||||||||
| WVFC | WVS Financial Corp. of PA* | 11.46 | 11.46 | 0.20 | 2.19 | 3.33 | 0.22 | 2.41 | 0.97 | 27.60 | NA | 30.00 | 65.31 | 7.49 | 65.31 | 27.27 | 0.16 | 1. 78 | 53.33 | ||||||||||||||||||||
| WFSL | Washington Federal, Inc. of WA* | 13.96 | 12.28 | 0.71 | 5.21 | 6.25 | 0.66 | 4.85 | 5.28 | 23.14 | 1.87 | 16.00 | 82.66 | 11.54 | 95.80 | 17.19 | 0.24 | 1. 72 | 27.59 | ||||||||||||||||||||
| WSBF | Waterstone Fin MHC of WI (26.2) | 9.92 | 9.89 | -0.17 | -1.81 | -3.85 | -1. 72 | -18.15 | 10.28 | 19.19 | 2.62 | NM | 47.53 | 4.71 | 47.71 | NM | 0.00 | 0.00 | NM | ||||||||||||||||||||
| WAYN | Wayne Savings Bancshares of OH* | 9.60 | 9.16 | 0.51 | 5.39 | 8.21 | 0.48 | 5.15 | 2.54 | 30.86 | 1.35 | 12.17 | 63.88 | 6.13 | 67.25 | 12.73 | 0.24 | 2.86 | 34.78 | ||||||||||||||||||||
| WFD | Westfield Fin. Inc. of MA* | 17.68 | 17.68 | 0.25 | 1. 32 | 1.59 | 0.02 | 0.12 | 1.55 | 36.88 | 1. 30 | NM | 87.67 | 15.50 | 87.67 | NM | 0.24 | 3.48 | NM | ||||||||||||||||||||
| WBKC | Wolverine Bancorp, Inc. of MI* | 20.99 | 20.99 | 0.23 | 1.37 | 2.07 | 0.19 | 1. 09 | 5.43 | 61.07 | 4.00 | NM | 54.71 | 11.48 | 54.71 | NM | 0.00 | 0.00 | 0.00 | ||||||||||||||||||||
Exhibit IV-2
Historical Stock Price Indices (1)
| SNL | SNL | |||||||||||||||||||||
| NASDAQ | Thrift | Bank | ||||||||||||||||||||
Year/Qtr. Ended | DJIA | S&P 500 | Composite | Index | Index | |||||||||||||||||
| 2003: | Quarter 1 | 7,992.1 | 848.2 | 1,341.2 | 1,096.2 | 401.0 | ||||||||||||||||
| Quarter 2 | 8,985.4 | 974.5 | 1,622.8 | 1,266.6 | 476.1 | |||||||||||||||||
| Quarter 3 | 9,275.1 | 996.0 | 1,786.9 | 1,330.9 | 490.9 | |||||||||||||||||
| Quarter 4 | 10,453.9 | 1,112.0 | 2,003.4 | 1,482.3 | 548.6 | |||||||||||||||||
| 2004: | Quarter 1 | 10,357.7 | 1,126.2 | 1,994.2 | 1,585.3 | 562.2 | ||||||||||||||||
| Quarter 2 | 10,435.5 | 1,140.8 | 2,047.8 | 1,437.8 | 546.6 | |||||||||||||||||
| Quarter 3 | 10,080.3 | 1,114.6 | 1,896.8 | 1,495.1 | 556.0 | |||||||||||||||||
| Quarter 4 | 10,783.0 | 1,211.9 | 2,175.4 | 1,605.6 | 595.1 | |||||||||||||||||
| 2005: | Quarter 1 | 10,503.8 | 1,180.6 | 1,999.2 | 1,516.6 | 551.0 | ||||||||||||||||
| Quarter 2 | 10,275.0 | 1,191.3 | 2,057.0 | 1,577.1 | 563.3 | |||||||||||||||||
| Quarter 3 | 10,568.7 | 1,228.8 | 2,151.7 | 1,527.2 | 546.3 | |||||||||||||||||
| Quarter 4 | 10,717.5 | 1,248.3 | 2,205.3 | 1,616.4 | 582.8 | |||||||||||||||||
| 2006: | Quarter 1 | 11,109.3 | 1,294.8 | 2,339.8 | 1,661.1 | 595.5 | ||||||||||||||||
| Quarter 2 | 11,150.2 | 1,270.2 | 2,172.1 | 1,717.9 | 601.1 | |||||||||||||||||
| Quarter 3 | 11,679.1 | 1,335.9 | 2,258.4 | 1,727.1 | 634.0 | |||||||||||||||||
| Quarter 4 | 12,463.2 | 1,418.3 | 2,415.3 | 1,829.3 | 658.6 | |||||||||||||||||
| 2007: | Quarter 1 | 12,354.4 | 1,420.9 | 2,421.6 | 1,703.6 | 634.4 | ||||||||||||||||
| Quarter 2 | 13,408.6 | 1,503.4 | 2,603.2 | 1,645.9 | 622.6 | |||||||||||||||||
| Quarter 3 | 13,895.6 | 1,526.8 | 2,701.5 | 1,523.3 | 595.8 | |||||||||||||||||
| Quarter 4 | 13,264.8 | 1,468.4 | 2,652.3 | 1,058.0 | 492.9 | |||||||||||||||||
| 2008: | Quarter 1 | 12,262.9 | 1,322.7 | 2,279.1 | 1,001.5 | 442.5 | ||||||||||||||||
| Quarter 2 | 11,350.0 | 1,280.0 | 2,293.0 | 822.6 | 332.2 | |||||||||||||||||
| Quarter 3 | 10,850.7 | 1,166.4 | 2,082.3 | 760.1 | 414.8 | |||||||||||||||||
| Quarter 4 | 8,776.4 | 903.3 | 1,577.0 | 653.9 | 268.3 | |||||||||||||||||
| 2009: | Quarter 1 | 7,608.9 | 797.9 | 1,528.6 | 542.8 | 170.1 | ||||||||||||||||
| Quarter 2 | 8,447.0 | 919.3 | 1,835.0 | 538.8 | 227.6 | |||||||||||||||||
| Quarter 3 | 9,712.3 | 1,057.1 | 2,122.4 | 561.4 | 282.9 | |||||||||||||||||
| Quarter 4 | 10,428.1 | 1,115.1 | 2,269.2 | 587.0 | 260.8 | |||||||||||||||||
| 2010: | Quarter 1 | 10,856.6 | 1,169.4 | 2,398.0 | 626.3 | 301.1 | ||||||||||||||||
| Quarter 2 | 9,774.0 | 1,030.7 | 2,109.2 | 564.5 | 257.2 | |||||||||||||||||
| Quarter 3 | 10,788.1 | 1,141.2 | 2,368.6 | 541.0 | 255.0 | |||||||||||||||||
| Quarter 4 | 11,577.5 | 1,257.6 | 2,652.9 | 592.1 | 290.1 | |||||||||||||||||
| 2010: | Quarter 1 | 12,319.7 | 1,325.8 | 2,781.1 | 578.1 | 293.1 | ||||||||||||||||
| Quarter 2 | 12,414.3 | 1,320.6 | 2,773.5 | 540.8 | 266.8 | |||||||||||||||||
| As of Sept. 2, 2011 | 11,240.3 | 1,174.0 | 2,480.3 | 453.2 | 211.4 | |||||||||||||||||
| (1) End of period data. | ||||||||||||||||||||||
| Source: SNL Financial, LC. | ||||||||||||||||||||||
Exhibit IV-3
SNL Index Values
| Index Values | ||||||||||||||||||||||||||||
| Aug. 31, | July 31, | Dec. 31, | Aug. 31, | Price Appreciation (%) | ||||||||||||||||||||||||
| 2011 | 2011 | 2010 | 2010 | 1 Month | YTD | LTM | ||||||||||||||||||||||
| All Pub. Traded Thrifts | 478.0 | 518.4 | 592.1 | 522.9 | -7.78 | % | -19.27 | % | -8.57 | % | ||||||||||||||||||
| MHC Index | 2,658.4 | 2,740.5 | 2,668.9 | 2,515.1 | -3.00 | % | -0.40 | % | 5.70 | % | ||||||||||||||||||
| Stock Exchange Indexes | ||||||||||||||||||||||||||||
| NYSE AMEX Thrifts | NA | NA | 364.3 | 313.8 | NA | NA | NA | |||||||||||||||||||||
| NYSE Thrifts | 94.0 | 101.3 | 132.2 | 111.3 | -7.18 | % | -28.91 | % | -15.55 | % | ||||||||||||||||||
| OTC Thrifts | 1,293.7 | 1,405.7 | 1,531.2 | 1,373.5 | -7.97 | % | -15.51 | % | -5.81 | % | ||||||||||||||||||
| Geographic Indexes | ||||||||||||||||||||||||||||
| Mid-Atlantic Thrifts | 1,980.2 | 2,173.2 | 2,669.6 | 2,303.6 | -8.88 | % | -25.82 | % | -14.04 | % | ||||||||||||||||||
| Midwestern Thrifts | 1,401.6 | 1,501.8 | 1,636.7 | 1,629.6 | -6.67 | % | -14.36 | % | -13.99 | % | ||||||||||||||||||
| New England Thrifts | 1,495.4 | 1,588.4 | 1,665.6 | 1,455.8 | -5.86 | % | -10.22 | % | 2.72 | % | ||||||||||||||||||
| Southeastern Thrifts | 191.2 | 204.9 | 217.3 | 204.6 | -6.67 | % | -12.02 | % | -6.56 | % | ||||||||||||||||||
| Southwestern Thrifts | 359.4 | 375.2 | 340.0 | 287.7 | -4.22 | % | 5.71 | % | 24.91 | % | ||||||||||||||||||
| Western Thrifts | 49.7 | 54.8 | 53.9 | 45.3 | -9.42 | % | -7.93 | % | 9.60 | % | ||||||||||||||||||
| Asset Size Indexes | ||||||||||||||||||||||||||||
| Less than $250M | 745.7 | 781.4 | 751.8 | 799.0 | -4.57 | % | -0.81 | % | -6.67 | % | ||||||||||||||||||
| $250M to $500M | 2,715.8 | 2,790.8 | 2,657.7 | 2,374.5 | -2.69 | % | 2.19 | % | 14.37 | % | ||||||||||||||||||
| $500M to $1B | 1,126.9 | 1,199.4 | 1,177.5 | 1,079.2 | -6.04 | % | -4.30 | % | 4.42 | % | ||||||||||||||||||
| $1B to $5B | 1,378.5 | 1,457.5 | 1,513.3 | 1,299.1 | -5.42 | % | -8.91 | % | 6.11 | % | ||||||||||||||||||
| Over $5B | 222.0 | 244.2 | 294.2 | 261.2 | -9.08 | % | -24.55 | % | -15.01 | % | ||||||||||||||||||
| Pink Indexes | ||||||||||||||||||||||||||||
| Pink Thrifts | 142.5 | 145.9 | 142.6 | 143.4 | -2.37 | % | -0.07 | % | -0.61 | % | ||||||||||||||||||
| Less than $75M | 415.7 | 424.7 | 412.6 | 422.7 | -2.13 | % | 0.74 | % | -1.67 | % | ||||||||||||||||||
| Over $75M | 143.2 | 146.6 | 143.3 | 144.0 | -2.37 | % | -0.12 | % | -0.55 | % | ||||||||||||||||||
| Comparative Indexes | ||||||||||||||||||||||||||||
| Dow Jones Industrials | 11,613.5 | 12,143.2 | 11,577.5 | 10,014.7 | -4.36 | % | 0.31 | % | 15.96 | % | ||||||||||||||||||
| S&P 500 | 1,218.9 | 1,292.3 | 1,257.6 | 1,049.3 | -5.68 | % | -3.08 | % | 16.16 | % | ||||||||||||||||||
All SNL indexes are market-value weighted; i.e., an institution’s effect on an index is proportionate to that institution’s market capitalization. All SNL thrift indexes, except for the SNL MHC Index, began at 100 on March 30, 1984. The SNL MHC Index began at 201.082 on Dec. 31, 1992, the level of the SNL Thrift Index on that date. On March 30, 1984, the S&P 500 closed at 159.2 and the Dow Jones Industrial stood at 1,164.9.
Mid-Atlantic: DE, DC, MD, NJ, NY, PA, PR; Midwest: IA, IL, IN, KS, KY, MI, MN, MO, ND, NE, OH, SD, WI;
New England: CT, MA, ME, NH, RI, VT; Southeast: AL, AR, FL, GA, MS, NC, SC, TN, VA, WV;
Southwest: CO, LA, NM, OK, TX, UT; West: AZ, AK, CA, HI, ID, MT, NV, OR, WA, WY
Source: SNL Financial.
RP® Financial, LC.
Exhibit IV-4
Washington State Thrift Acquisitions 2000-Present
| Target Financials at Announcement | Deal Terms and Pricing at Announcement | |||||||||||||||||||||||||||||||||||||||||||||||||||||||||||||
| Total | NPAs/ | Rsrvs/ | Deal | Value/ | Prem/ | |||||||||||||||||||||||||||||||||||||||||||||||||||||||||
| Announce | Complete | Assets | E/A | ROAA | ROAE | Assets | NPLs | Value | Share | P/B | P/TB | P/E | P/A | Cdeps | ||||||||||||||||||||||||||||||||||||||||||||||||
| Date | Date | Buyer Short Name | Target Name | ($000) | (%) | (%) | (%) | (%) | (%) | ($M) | ($) | (%) | (%) | (x) | (%) | (%) | ||||||||||||||||||||||||||||||||||||||||||||||
| 07/02/2007 | 02/01/2008 | Washington Federal Inc. | WA | First Mutual Bancshares, Inc. | WA | 1,056,847 | 6.85 | 1.02 | 15.25 | 0.19 | 493.34 | 189.8 | 27.050 | 250.00 | 250.00 | 17.01 | 17.96 | 21.09 | ||||||||||||||||||||||||||||||||||||||||||||
| 06/04/2006 | 11/30/2006 | Sterling Financial Corp. | WA | FirstBank NW Corp. | WA | 846,003 | 9.35 | 1.03 | 11.16 | 0.14 | 689.66 | 169.6 | 27.159 | 207.76 | 272.68 | 19.26 | 20.04 | 23.25 | ||||||||||||||||||||||||||||||||||||||||||||
| 02/12/2006 | 07/05/2006 | Sterling Financial Corp. | WA | Lynnwood Financial Group | WA | 435,651 | 10.22 | 2.69 | 26.47 | 0.00 | NA | 63.8 | NA | 143.35 | 143.35 | 7.41 | 14.65 | 12.51 | ||||||||||||||||||||||||||||||||||||||||||||
| 06/24/2004 | 10/15/2004 | KeyCorp | OH | EverTrust Financial Group, Inc. | WA | 770,072 | 11.76 | 0.96 | 7.63 | 0.56 | 227.69 | 195.0 | 25.602 | 194.69 | 194.69 | 26.95 | 25.32 | 23.09 | ||||||||||||||||||||||||||||||||||||||||||||
| 05/19/2003 | 08/31/2003 | Washington Federal Inc. | WA | United Savings & Loan Bank | WA | 311,446 | 13.43 | 1.10 | 8.36 | 0.50 | 131.91 | 65.0 | 1,595.090 | 155.39 | 155.39 | 19.36 | 20.87 | 10.98 | ||||||||||||||||||||||||||||||||||||||||||||
| Averages: | 684,004 | 10.32 | 1.36 | 13.77 | 0.28 | 385.65 | 136.6 | 190.24 | 203.22 | 18.00 | 19.77 | 18.18 | ||||||||||||||||||||||||||||||||||||||||||||||||||
| Medians: | 770,072 | 10.22 | 1.03 | 11.16 | 0.19 | 360.52 | 169.6 | 194.69 | 194.69 | 19.26 | 20.04 | 21.09 | ||||||||||||||||||||||||||||||||||||||||||||||||||
Source: SNL Financial, LC.
Exhibit IV-5
1st Security Bank of Washington
Director and Senior Management Summary Resumes
Ted A. Leech, Chairman of the Board, is retired from Univar Corporation. From January 2003 to February 2005, Mr. Leech was Vice President of Business Development where he conducted feasibility studies and investigated potential investments in China, Hong Kong, Singapore, Australia, Malaysia, Indonesia and Brazil. Prior to that Mr. Leech was Senior Vice President of Administration for Univar USA where he was responsible for accounting, payables/receivables, information systems, treasury, legal, human resources and internal audit. As a result of his professional experiences, Mr. Leech brings strong leadership, management, finance, accounting and human resource skills to our board. Mr. Leech’s expertise also qualifies him as a financial expert, which was the basis of his selection as chairman of the Audit Committee.
Joseph C. Adams is a director and has been the Chief Executive Officer of 1st Security Bank of Washington since July 2004. He joined 1st Security Bank of Washington in April 2003 as its Chief Financial Officer. Mr. Adams served as Supervisory Committee Chairperson from 1993 to 1999 when the bank was Washington’s Credit Union. Mr. Adams is a lawyer having worked for Deloitte as a tax consultant, K&L Gates as a lawyer and then at Univar USA as a lawyer and Director, Regulatory Affairs. Mr. Adams received a Masters Degree equivalent from the Pacific Coast Banking School. Mr. Adams’ legal and accounting backgrounds, as well as his duties as Chief Executive Officer of 1st Security Bank of Washington, bring a special knowledge of the financial, economic and regulatory challenges faced by the Bank which makes him as well suited to educating the Board on these matters.
Judith A. Cochrane, from May 2006 until her retirement in February 2011, was the Vice President, Public Finance for Seattle-Northwest Securities Corporation. Prior to that, Ms. Cochrane was Vice President/Manager, Municipal Trading and Underwriting for BancAmerica Securities, LLC., where she was employed for 23 years Ms. Cochrane is an arbitrator for Financial Industry Regulatory Authority (FINRA). She also served as Managing Director for Bank of America, in charge of Northwest Capital Markets. Ms. Cochrane is now retired from Seattle Northwest as of February 2011. Ms. Cochrane’s professional experience brings depth to the Board in the areas of finance and the capital markets.
Michael J. Mansfield joined the Board of Directors in September 2008. Mr. Mansfield spent 16 years with Deloitte & Touche before joining Moss Adams in 1995 where he was a partner for more than 10 years. During his time with Moss Adams, Mr. Mansfield served as the lead of the Business Owner Succession Services Practice in the Seattle office and he served as a member of the firm’s Tax Committee. He provided taxation, business and financial accounting services to a variety of clients in the financial services, construction, manufacturing and distribution, and service industries. In January 2008, Mr. Mansfield left Moss Adams to start Family Fortunes, LLC., a consulting company aimed at assisting individuals and business owners develop and execute strategic plans, with the goals of enhancing value proposition and creating a legacy vision for families and business owners. In addition, Mr. Mansfield is a minority owner/part-time CFO for Pacific Pile & Marine, L.P., a construction company, and Columbia Pacific Finance, LLC, a financial services company. Mr. Mansfield’s 26 years of experience as a public accountant, together with his experience running small businesses, has provided him with strong leadership, management, financial and administrative skills, which brings valuable knowledge and skills to our organization.
Exhibit IV-5 (cont.)
1st Security Bank of Washington
Director and Senior Management Summary Resumes
Margaret R. Piesik was a senior manager for Microsoft Corporation in its PowerPoint Presentation Division. Ms. Piesik worked at Microsoft for 11 years until retiring in 1998. She served on the board of directors of the Providence Hospital Foundation from 2001 to 2003 and since 2004 has served as the President of Swedish Medical Center Service League. She is a co-owner of White Barn Farm, a family owned organic flower and vegetable farm. She previously served on the boards of Providence Hospital Foundation and the Kirkland Performance Center. Ms. Piesik is also active in local organizations such as Swedish Hospital Service League and participates in the Grow A Row program for local food banks. Ms. Piesik’s managerial experience, together with her various board experiences and active participation in the local community, brings valuable knowledge and skills to our organization.
Joseph P. Zavaglia, since February 2008, has been the owner and operator of Zavaglia Consulting, L.L.C., which provides retail banking and small business advisory services to community banks. He also runs the Heart of Italy, an Italian cooking school. In addition, Mr. Zavaglia works part time for Pacific Coast Banking School, serving as the Director of Extension Programs, and for the Washington Bankers Association, overseeing their Executive Development Program. Mr. Zavaglia started his career with Rainier Bank in 1975 in branch operations and was ultimately promoted to manager, overseeing up to 13 branches. From 1987 until 2003, he served as a Senior Vice President and Regional Manager with Security Pacific Bank, which acquired Rainier Bank in 1987, and then with Bank of America, which acquired Security Pacific Bank in 1992. In February 2003, Mr. Zavaglia joined First Mutual Bank as its Executive Vice President, Retail Banking Group manager. He resigned in 2008 to begin his consulting company and cooking school. Mr. Zavaglia has formerly held Series 6, 63, and 26 securities licenses and his state insurance license for life and disabilities. He has been a member of the administrative board of Pacific Coast Banking School for the past 9 years, and is a 1986 graduate of the program. He was a member of the Pete Gross House Board for 14 years, is chair of the Italian Studies board at the University of Washington, is past State Board Chair for the March of Dimes where he served for 15 years, and is a former mentor in the Seattle University mentorship program and a former member of the Dean’s advisory board for the School of Business at Seattle University. Mr. Zavaglia is a member of the athletic Hall of Fame, a Regent, and a member of the Hall of Fame selection committee at Seattle University. Additionally, he is a member of the Advisory Board for the Dean of the College of Education at Western Washington University. Mr. Zavaglia’s extensive banking experience, together with his numerous board experiences, educational background and active participation in the local community, brings valuable knowledge, experience and skills to our organization
Exhibit IV-5 (continued)
1st Security Bank of Washington
Director and Senior Management Summary Resumes
Matthew Mullet, age 32, joined 1st Security Bank of Washington in July 2011 and was appointed Chief Financial Officer in September 2011. Mr. Mullet started his banking career in June 2000 as a financial examiner with the Washington Department of Financial Institutions, Division of Banks, where he worked until October 2004. From October 2004 until August 2010, Mr. Mullet was employed at Golf Savings Bank, Seattle, WA, where he served in several financial capacities, including as Chief Financial Officer from May 2007 until August 2010. In August 2010, Golf Savings Bank was merged with Sterling Savings Bank, where Mr. Mullet held the position as Senior Vice President of the Home Loan Division until resigning and commencing work at 1st Security Bank of Washington.
Steven L. Haynes, age 61, joined 1st Security Bank of Washington as Chief Lending Officer in November 2005, after a 23 year career at US Bank or USB. His responsibilities currently include commercial, consumer and real estate lending. Mr. Haynes held several senior lending positions at USB in commercial lending- middle-market, national and international and credit review. He left as a Senior Vice President - Commercial Lending. Prior to USB, Mr. Haynes held international and middle-market lending positions at Rainier Bank and Bank of America. He has been involved in downtown associations and arts related boards in Seattle and Bellevue. He currently is a member of the Woodland Park Zoo Board where he is chair of the Audit Committee and member of the Executive and Finance Committees.
Drew B. Ness, age 46, joined 1st Security Bank of Washington as Chief Operating Officer in September 2008. Mr. Ness has 18 years of diverse banking experience, including retail branch sales and service, branch network management, and national customer service training experience. He served as Vice President and Manager of the Corporate Deposit Operations Department for Washington Federal Savings, Seattle Washington from February 2008 until August 2008, following its acquisition of First Mutual Bank. Mr. Ness served as Vice-President and Administrative/Operations Manager of the Retail Banking Group at First Mutual Bank, Bellevue, Washington from June 2004 through February 2008, and as Bank Account Executive and Premier Banking Client Manager at Bank of America, Newport Beach, California from June 2002 through June 2004.
Exhibit IV-6
1st Security Bank of Washington
Pro Forma Regulatory Capital Ratios
| Pro Forma at June 30, 2011 | ||||||||||||||||||||||||||||||||||||||||
At June 30, 2011 | 2,082,500 shares Sold at $10.00 per Share (Minimum of Range) | 2,450,000 Shares Sold at $10.00 per Share (Midpoint of Range) | 2,817,500 Shares Sold at $10.00 per Share (Maximum of Range) | 3,240,125 Shares Sold at $10.00 per Share (Maximum of Range, as Adjusted) | ||||||||||||||||||||||||||||||||||||
| Amount | Percent of Assets(1) | Amount | Percent of Assets | Amount | Percent of Assets | Amount | Percent of Assets | Amount | Percent of Assets | |||||||||||||||||||||||||||||||
| (Dollars in thousands) | ||||||||||||||||||||||||||||||||||||||||
Equity capital under generally accepted accounting principles (“GAAP”) | $ | 25,977 | 9.52 | % | $ | 33,719 | 11.95 | % | $ | 35,240 | 12.41 | % | $ | 36,761 | 12.86 | % | $ | 38,510 | 13.38 | % | ||||||||||||||||||||
Tier I leverage | $ | 25,894 | 9.37 | % | $ | 33,636 | 11.77 | % | $ | 35,157 | 12.23 | % | $ | 36,678 | 12.68 | % | $ | 38,427 | 13.18 | % | ||||||||||||||||||||
Requirement | 11,053 | 4.00 | 11,430 | 4.00 | 11,502 | 4.00 | 11,575 | 4.00 | 11,658 | 4.00 | ||||||||||||||||||||||||||||||
Excess | $ | 14,841 | 5.37 | % | $ | 22,206 | 7.77 | % | $ | 23,655 | 8.23 | % | $ | 25,103 | 8.68 | % | $ | 26,769 | 9.18 | % | ||||||||||||||||||||
Tier I risk based | $ | 25,894 | 11.31 | % | $ | 33,636 | 14.57 | % | $ | 35,157 | 15.20 | % | $ | 36,678 | 15.84 | % | $ | 38,427 | 16.56 | % | ||||||||||||||||||||
Requirement | 9,160 | 4.00 | 9,235 | 4.00 | 9,250 | 4.00 | 9,264 | 4.00 | 9,281 | 4.00 | ||||||||||||||||||||||||||||||
Excess | $ | 16,734 | 7.31 | % | $ | 24,401 | 10.57 | % | $ | 25,907 | 11.20 | % | $ | 27,414 | 11.84 | % | $ | 29,146 | 12.56 | % | ||||||||||||||||||||
Total risk based | $ | 28,781 | 12.57 | % | $ | 36,523 | 15.82 | % | $ | 38,044 | 16.45 | % | $ | 39,565 | 17.08 | % | $ | 41,314 | 17.81 | % | ||||||||||||||||||||
Risk based requirement | 18,320 | 8.00 | 18,471 | 8.00 | 18,500 | 8.00 | 18,529 | 8.00 | 18,562 | 8.00 | ||||||||||||||||||||||||||||||
Excess | $ | 10,461 | 4.57 | % | $ | 18,052 | 7.82 | % | $ | 19,544 | 8.45 | % | $ | 21,036 | 9.08 | % | $ | 22,752 | 9.81 | % | ||||||||||||||||||||
| Reconciliation of capital infused into 1st Security Bank of Washington: | ||||||||||||||||||||||||||||||||||||||||
Net proceeds infused | $ | 9,407 | $ | 11,223 | $ | 13,038 | $ | 15,125 | ||||||||||||||||||||||||||||||||
| Common stock acquired by employee stock ownership plan | (1,666 | ) | (1,960 | ) | (2,254 | ) | (2,592 | ) | ||||||||||||||||||||||||||||||||
Pro forma increase in GAAP and regulatory capital | $ | 7,741 | $ | 9,262 | $ | 10,784 | $ | 12,533 | ||||||||||||||||||||||||||||||||
(1) Adjusted total or adjusted risk-weighted assets, as appropriate.
| EXHIBIT IV-7 | |||||||||||||
| PRO FORMA ANALYSIS SHEET | |||||||||||||
| 1st Security Bank of Washington | |||||||||||||
| Prices as of September 2, 2011 |
| Subject at | Peer Group | Washington Companies | All Public Thrifts | |||||||||||||||||||||||||||||
Valuation Pricing Multiples | Symbol | Midpoint | Mean | Median | Mean | Median | Mean | Median | ||||||||||||||||||||||||
| Price-earnings multiple | = | P/E | 14.11 | x | 17.08 | x | 17.27 | x | 16.70 | x | 16.70 | x | 16.62 | x | 15.01 | x | ||||||||||||||||
| Price-core earnings multiple | = | P/CE | 25.68 | x | 18.89 | x | 19.71 | x | 17.91 | x | 17.91 | x | 18.97 | x | 18.64 | x | ||||||||||||||||
| Price-book ratio | = | P/B | 53.88 | % | 67.44 | % | 69.11 | % | 53.76 | % | 50.55 | % | 71.78 | % | 73.23 | % | ||||||||||||||||
| Price-tangible book ratio | = | P/TB | 53.88 | % | 70.29 | % | 72.48 | % | 60.77 | % | 55.31 | % | 76.57 | % | 76.67 | % | ||||||||||||||||
| Price-assets ratio | = | P/A | 8.38 | % | 9.48 | % | 7.94 | % | 6.91 | % | 6.62 | % | 8.78 | % | 8.12 | % | ||||||||||||||||
Valuation Parameters | % of | % of Offering | |||||||||||||
| Offering | + Foundation | ||||||||||||||
| Pre-Conversion Earnings (Y) | $ | 1,894,000 | (12 Mths 6/11) | ESOP Stock as % of Offering (E) | 8.0000 | % | 8.0000 | % | |||||||
| Pre-Conversion Core Earnings | $ | 1,112,100 | (12 Mths 6/11) | Cost of ESOP Borrowings (S) | 0.00 | % | |||||||||
| Pre-Conversion Book Value (B) | $ | 25,977,000 | (6/11) | ESOP Amortization (T) | 10.00 | years | |||||||||
| Intangibles | $ | 0 | (6/11) | RRP Stock as % of Offering (M) | 4.0000 | % | 4.00% | ||||||||
| Pre-Conv. Tang. Book Value (B) | $ | 25,977,000 | (6/11) | Stock Programs Vesting (N) | 5.00 | years | |||||||||
| Pre-Conversion Assets (A) | $ | 272,784,000 | (6/11) | Fixed Expenses | $ | 1,764,000 | |||||||||
| Reinvest. Rate: (5 Yr Treas)@6/11 | 1.760 | % | Subscr/Dir Comm Exp (Mdpnt) | $ | 291,000 | 1.30% | |||||||||
| Tax rate (TAX) | 34.00 | % | Total Expenses (Midpoint) | $ | 2,055,000 | ||||||||||
| A-T Reinvestment Rate(R) | 1.162 | % | Syndicate Expenses (Mdpnt) | $ | 0 | 0.00% | |||||||||
| Est. Conversion Expenses (1)(X) | 8.39 | % | Syndicate Amount | $ | 0 | ||||||||||
| Insider Purchases | $ | 735,000 | Percent Sold (PCT) | 100.00 | % | ||||||||||
| Price/Share | $ | 10.00 | MHC Assets | $ | 0 | ||||||||||
| Foundation Cash Contrib. (FC) | $ | 0 | Options as % of Offering (O1) | 10.0000 | % | 10.00% | |||||||||
| Found. Stk Contrib (% of Total Shrs (FS) | 0.0000 | % | Estimated Option Value (O2) | 28.10 | % | ||||||||||
| Foundation Tax Benefit (Z) | $ | 0 | Option Vesting Period (O3) | 5.00 | years | ||||||||||
| Foundation Amount (Mdpt.) | $ | 0 | % of Options taxable (O4) | 25.00 | % | ||||||||||
| Payoff of FHLB Advances (PA) | $ | 0 | @Minimum | ||||||||||||
| Payoff of FHLB Advances (PA) | $ | 0 | @Mid, Max, Smax | ||||||||||||
| Weighted Average Rate of Adv. | 0.00 | % | |||||||||||||
Calculation of Pro Forma Value After Conversion | |||||||||
| 1. V= | P/E * (Y) | V= | $ | 24,500,000 | |||||
| 1 - P/E * PCT * ((1-X-E-M-FC-FS)*R - (1-TAX)*E/T - (1-TAX)*M/N)-(1-(TAX*O4))*(O1*O2)/O3) | |||||||||
| 1. V= | P/E * (Y) | V= | $ | 24,500,000 | |||||
| 1 - P/Core E * PCT * ((1-X-E-M-FC-FS)*R - (1-TAX)*E/T - (1-TAX)*M/N)-(1-(TAX*O4))*(O1*O2)/O3) | |||||||||
| 2. V= | P/B * (B+Z) | V= | $ | 24,500,000 | |||||
| 1 - P/B * PCT * (1-X-E-M-FC-FS) | |||||||||
| 2. V= | P/TB * (TB+Z) | V= | $ | 24,500,000 | |||||
| 1 - P/TB * PCT * (1-X-E-M-FC-FS) | |||||||||
| 3. V= | P/A * (A+Z+PA) | V= | $ | 24,500,000 | |||||
| 1 - P/A * PCT * (1-X-E-M-FC-FS) | |||||||||
| Market Value | Market Value | ||||||||||||||||||||||||||||
| Shares Issued | Shares Sold | Foundation | Total Shares | Price Per | of Stock Sold | of Stock Issued | |||||||||||||||||||||||
| Valuation Conclusion | to MHC | to Public | Shares | Issued | Share | in Offering | in Reorganization | ||||||||||||||||||||||
| Supermaximum | 0 | 3,240,125 | 0 | 3,240,125 | $ | 10.00 | $ | 32,401,250 | $ | 32,401,250 | |||||||||||||||||||
| Maximum | 0 | 2,817,500 | 0 | 2,817,500 | 10.00 | 28,175,000 | $ | 28,175,000 | |||||||||||||||||||||
| Midpoint | 0 | 2,450,000 | 0 | 2,450,000 | 10.00 | 24,500,000 | $ | 24,500,000 | |||||||||||||||||||||
| Minimum | 0 | 2,082,500 | 0 | 2,082,500 | 10.00 | 20,825,000 | $ | 20,825,000 | |||||||||||||||||||||
| Shares Issued | Shares Sold | Foundation | Total Shares | ||||||||||||||||||||||||||
| Valuation Conclusion | to MHC | to Public | Shares | Issued | |||||||||||||||||||||||||
| Supermaximum | 0.000 | % | 100.000 | % | 0.000 | % | 100.000 | % | |||||||||||||||||||||
| Maximum | 0.000 | % | 100.000 | % | 0.000 | % | 100.000 | % | |||||||||||||||||||||
| Midpoint | 0.000 | % | 100.000 | % | 0.000 | % | 100.000 | % | |||||||||||||||||||||
| Minimum | 0.000 | % | 100.000 | % | 0.000 | % | 100.000 | % | |||||||||||||||||||||
(1) Estimated offering expenses at midpoint of the offering.
Exhibit IV-8
PRO FORMA EFFECT OF CONVERSION PROCEEDS
1st Security Bank of Washington
At the Minimum of the Range
| 1. | Market Value of Shares Sold In Offering: | $ | 20,825,000 | ||
| Market Value of Shares Issued to Foundation: | 0 | ||||
| Total Market Value of Company: | $ | 20,825,000 | |||
| 2. | Offering Proceeds of Shares Sold In Offering | $ | 20,825,000 | ||
| Less: Estimated Offering Expenses | 2,010,000 | ||||
| Net Conversion Proceeds | $ | 18,815,000 | |||
| 3. | Estimated Additional Equity and Income from Offering Proceeds | ||||
| Net Conversion Proceeds | $ | 18,815,000 | |||
| Less: Cash Contribution to Foundation | 0 | ||||
| Less: Non-Cash ESOP Stock Purchases (1) | (1,666,000 | ) | |||
| Less: Non-Cash MRP Stock Purchases (2) | (833,000 | ) | |||
| Net Conversion Proceeds Reinvested | $ | 16,316,000 | |||
| Estimated After-Tax Reinvestment Rate | 1.16 | % | |||
| Earnings from Reinvestment of Proceeds | $ | 189,527 | |||
| Less: Estimated cost of ESOP borrowings(1) | 0 | ||||
| Less: Amortization of ESOP borrowings(1) | (109,956 | ) | |||
| Less: Stock Programs Vesting (2) | (109,956 | ) | |||
| Less: Option Plan Vesting (3) | (107,088 | ) | |||
| Net Earnings Increase | ($ | 137,474 | ) | ||
| Net | |||||||||||||||||
| Before | Earnings | After | |||||||||||||||
| 4. | Pro Forma Earnings | Conversion | Increase | Conversion | |||||||||||||
| 12 Months ended June 30, 2011 (reported) | $ | 1,894,000 | ($ | 137,474 | ) | $ | 1,756,526 | ||||||||||
| 12 Months ended June 30, 2011 (core) | $ | 1,112,100 | ($ | 137,474 | ) | $ | 974,626 | ||||||||||
| Before | Net Equity | Tax Benefit | After | ||||||||||||||
| 5. | Pro Forma Net Worth | Conversion | Proceeds | of Foundation | Conversion | ||||||||||||
| June 30, 2011 | $ | 25,977,000 | $ | 16,316,000 | $ | 0 | $ | 42,293,000 | |||||||||
| June 30, 2011 (Tangible) | $ | 25,977,000 | $ | 16,316,000 | $ | 0 | $ | 42,293,000 | |||||||||
| Before | Net Cash | Tax Benefit | After | ||||||||||||||
| 6. | Pro Forma Assets | Conversion | Proceeds | of Foundation | Conversion | ||||||||||||
| June 30, 2011 | $ | 272,784,000 | $ | 16,316,000 | $ | 0 | $ | 289,100,000 | |||||||||
| (1) | ESOP stock (8% of offering) amortized over 10 years, amortization expense is tax effected at 34%. |
| (2) | Stock programs (4% of offering) amortized over 5 years, amortization expense is tax effected at 34%. |
| (3) | Option valuation based on Black-Scholes model, 5 year vesting, and assuming 25% taxable. |
Exhibit IV-8
PRO FORMA EFFECT OF CONVERSION PROCEEDS
1st Security Bank of Washington
At the Midpoint of the Range
| 1. | Market Value of Shares Sold In Offering: | $ | 24,500,000 | ||
| Market Value of Shares Issued to Foundation: | 0 | ||||
| Total Market Value of Company: | $ | 24,500,000 | |||
| 2. | Offering Proceeds of Shares Sold In Offering | $ | 24,500,000 | ||
| Less: Estimated Offering Expenses | 2,055,000 | ||||
| Net Conversion Proceeds | $ | 22,445,000 | |||
| 3. | Estimated Additional Equity and Income from Offering Proceeds | ||||
| Net Conversion Proceeds | $ | 22,445,000 | |||
| Less: Cash Contribution to Foundation | 0 | ||||
| Less: Non-Cash ESOP Stock Purchases (1) | (1,960,000 | ) | |||
| Less: Non-Cash MRP Stock Purchases (2) | (980,000 | ) | |||
| Net Conversion Proceeds Reinvested | $ | 19,505,000 | |||
| Estimated After-Tax Reinvestment Rate | 1.16 | % | |||
| Earnings from Reinvestment of Proceeds | $ | 226,570 | |||
| Less: Estimated cost of ESOP borrowings(1) | 0 | ||||
| Less: Amortization of ESOP borrowings(1) | (129,360 | ) | |||
| Less: Stock Programs Vesting (2) | (129,360 | ) | |||
| Less: Option Plan Vesting (3) | (125,986 | ) | |||
| Net Earnings Increase | ($ | 158,136 | ) | ||
| Net | |||||||||||||||||
| Before | Earnings | After | |||||||||||||||
| 4. | Pro Forma Earnings | Conversion | Increase | Conversion | |||||||||||||
| 12 Months ended June 30, 2011 (reported) | $ | 1,894,000 | ($ | 158,136 | ) | $ | 1,735,864 | ||||||||||
| 12 Months ended June 30, 2011 (core) | $ | 1,112,100 | ($ | 158,136 | ) | $ | 953,964 | ||||||||||
| Before | Net Capital | Tax Benefit | After | ||||||||||||||
| 5. | Pro Forma Net Worth | Conversion | Proceeds | of Foundation | Conversion | ||||||||||||
| June 30, 2011 | $ | 25,977,000 | $ | 19,505,000 | $ | 0 | $ | 45,482,000 | |||||||||
| June 30, 2011 (Tangible) | $ | 25,977,000 | $ | 19,505,000 | $ | 0 | $ | 45,482,000 | |||||||||
| Before | Net Cash | Tax Benefit | After | ||||||||||||||
| 6. | Pro Forma Assets | Conversion | Proceeds | of Foundation | Conversion | ||||||||||||
| June 30, 2011 | $ | 272,784,000 | $ | 19,505,000 | $ | 0 | $ | 292,289,000 | |||||||||
| (1) | ESOP stock (8% of offering) amortized over 10 years, amortization expense is tax effected at 34%. |
| (2) | Stock programs (4% of offering) amortized over 5 years, amortization expense is tax effected at 34%. |
| (3) | Option valuation based on Black-Scholes model, 5 year vesting, and assuming 25% taxable. |
Exhibit IV-8
PRO FORMA EFFECT OF CONVERSION PROCEEDS
1st Security Bank of Washington
At the Maximum of the Range
| 1. | Market Value of Shares Sold In Offering: | $ | 28,175,000 | ||
| Market Value of Shares Issued to Foundation: | 0 | ||||
| Total Market Value of Company: | $ | 28,175,000 | |||
| 2. | Offering Proceeds of Shares Sold In Offering | $ | 28,175,000 | ||
| Less: Estimated Offering Expenses | 2,100,000 | ||||
| Net Conversion Proceeds | $ | 26,075,000 | |||
| 3. | Estimated Additional Equity and Income from Offering Proceeds | ||||
| Net Conversion Proceeds | $ | 26,075,000 | |||
| Less: Cash Contribution to Foundation | 0 | ||||
| Less: Non-Cash ESOP Stock Purchases (1) | (2,254,000 | ) | |||
| Less: Non-Cash MRP Stock Purchases (2) | (1,127,000 | ) | |||
| Net Conversion Proceeds Reinvested | $ | 22,694,000 | |||
| Estimated After-Tax Reinvestment Rate | 1.16 | % | |||
| Earnings from Reinvestment of Proceeds | $ | 263,614 | |||
| Less: Estimated cost of ESOP borrowings(1) | 0 | ||||
| Less: Amortization of ESOP borrowings(1) | (148,764 | ) | |||
| Less: Stock Programs Vesting (2) | (148,764 | ) | |||
| Less: Option Plan Vesting (3) | (144,884 | ) | |||
| Net Earnings Increase | ($ | 178,799 | ) | ||
| Net | |||||||||||||||||
| Before | Earnings | After | |||||||||||||||
| 4. | Pro Forma Earnings | Conversion | Increase | Conversion | |||||||||||||
| 12 Months ended June 30, 2011 (reported) | $ | 1,894,000 | ($ | 178,799 | ) | $ | 1,715,201 | ||||||||||
| 12 Months ended June 30, 2011 (core) | $ | 1,112,100 | ($ | 178,799 | ) | $ | 933,301 | ||||||||||
| Before | Net Capital | Tax Benefit | After | ||||||||||||||
| 5. | Pro Forma Net Worth | Conversion | Proceeds | of Foundation | Conversion | ||||||||||||
| June 30, 2011 | $ | 25,977,000 | $ | 22,694,000 | $ | 0 | $ | 48,671,000 | |||||||||
| June 30, 2011 (Tangible) | $ | 25,977,000 | $ | 22,694,000 | $ | 0 | $ | 48,671,000 | |||||||||
| Before | Net Cash | Tax Benefit | After | ||||||||||||||
| 6. | Pro Forma Assets | Conversion | Proceeds | of Foundation | Conversion | ||||||||||||
| June 30, 2011 | $ | 272,784,000 | $ | 22,694,000 | $ | 0 | $ | 295,478,000 | |||||||||
| (1) | ESOP stock (8% of offering) amortized over 10 years, amortization expense is tax effected at 34%. |
| (2) | Stock programs (4% of offering) amortized over 5 years, amortization expense is tax effected at 34%. |
| (3) | Option valuation based on Black-Scholes model, 5 year vesting, and assuming 25% taxable. |
Exhibit IV-8
PRO FORMA EFFECT OF CONVERSION PROCEEDS
1st Security Bank of Washington
At the Supermaximum Value
| 1. | Market Value of Shares Sold In Offering: | $ | 32,401,250 | ||
| Market Value of Shares Issued to Foundation: | 0 | ||||
| Total Market Value of Company: | $ | 32,401,250 | |||
| 2. | Offering Proceeds of Shares Sold In Offering | $ | 32,401,250 | ||
| Less: Estimated Offering Expenses | 2,152,000 | ||||
| Net Conversion Proceeds | $ | 30,249,250 | |||
| 3. | Estimated Additional Equity and Income from Offering Proceeds | ||||
| Net Conversion Proceeds | $ | 30,249,250 | |||
| Less: Cash Contribution to Foundation | 0 | ||||
| Less: Non-Cash ESOP Stock Purchases (1) | (2,592,100 | ) | |||
| Less: Non-Cash MRP Stock Purchases (2) | (1,296,050 | ) | |||
| Net Conversion Proceeds Reinvested | $ | 26,361,100 | |||
| Estimated After-Tax Reinvestment Rate | 1.16 | % | |||
| Earnings from Reinvestment of Proceeds | $ | 306,211 | |||
| Less: Estimated cost of ESOP borrowings(1) | 0 | ||||
| Less: Amortization of ESOP borrowings(1) | (171,079 | ) | |||
| Less: Stock Programs Vesting (2) | (171,079 | ) | |||
| Less: Option Plan Vesting (3) | (166,617 | ) | |||
| Net Earnings Increase | ($ | 202,564 | ) | ||
| Net | |||||||||||||||||
| Before | Earnings | After | |||||||||||||||
| 4. | Pro Forma Earnings | Conversion | Increase | Conversion | |||||||||||||
| 12 Months ended June 30, 2011 (reported) | $ | 1,894,000 | ($ | 202,564 | ) | $ | 1,691,436 | ||||||||||
| 12 Months ended June 30, 2011 (core) | $ | 1,112,100 | ($ | 202,564 | ) | $ | 909,536 | ||||||||||
| Before | Net Capital | Tax Benefit | After | ||||||||||||||
| 5. | Pro Forma Net Worth | Conversion | Proceeds | of Foundation | Conversion | ||||||||||||
| June 30, 2011 | $ | 25,977,000 | $ | 26,361,100 | $ | 0 | $ | 52,338,100 | |||||||||
| June 30, 2011 (Tangible) | $ | 25,977,000 | $ | 26,361,100 | $ | 0 | $ | 52,338,100 | |||||||||
| Before | Net Cash | Tax Benefit | After | ||||||||||||||
| 6. | Pro Forma Assets | Conversion | Proceeds | of Foundation | Conversion | ||||||||||||
| June 30, 2011 | $ | 272,784,000 | $ | 26,361,100 | $ | 0 | $ | 299,145,100 | |||||||||
| (1) | ESOP stock (8% of offering) amortized over 10 years, amortization expense is tax effected at 34%. |
| (2) | Stock programs (4% of offering) amortized over 5 years, amortization expense is tax effected at 34%. |
| (3) | Option valuation based on Black-Scholes model, 5 year vesting, and assuming 25% taxable. |
EXHIBIT IV-9
1st Security Bank of Washington
Peer Group Core Earnings Analysis
RP® Financial, LC.
Core Earnings Analysis
Comparable Institution Analysis
For the 12 Months Ended June 30, 2011
| Less: | Estimated | |||||||||||||||||||||||||||||
| Net Income | Less: Net | Tax Effect | Extraordinary | Core Income | Estimated | |||||||||||||||||||||||||
Comparable Group | to Common | Gains(Loss) | @ 34% | Items | to Common | Shares | Core EPS | |||||||||||||||||||||||
| ($000) | ($000) | ($000) | ($000) | ($000) | (000) | ($) | ||||||||||||||||||||||||
| AFCB | Athens Bancshares, Inc. of TN | $ | 1,680 | $ | 0 | $ | 0 | $ | 0 | $ | 1,680 | 2,766 | $ | 0.61 | ||||||||||||||||
| EBMT | Eagle Bancorp Montana of MT | $ | 2,410 | ($ | 2,206 | ) | $ | 750 | $ | 0 | $ | 954 | 3,919 | $ | 0.24 | |||||||||||||||
| FFDF | FFD Financial Corp. of Dover OH (1) | $ | 1,435 | ($ | 742 | ) | $ | 252 | $ | 0 | $ | 945 | 1,012 | $ | 0.93 | |||||||||||||||
| FABK | First Advantage Bancorp of TN | $ | 1,882 | ($ | 1,170 | ) | $ | 398 | $ | 0 | $ | 1,110 | 4,087 | $ | 0.27 | |||||||||||||||
| FFNM | First Federal of N. Michigan of MI | $ | 141 | ($ | 116 | ) | $ | 39 | $ | 0 | $ | 64 | 2,884 | $ | 0.02 | |||||||||||||||
| JXSB | Jacksonville Bancorp Inc. of IL | $ | 3,027 | ($ | 680 | ) | $ | 231 | $ | 0 | $ | 2,578 | 1,931 | $ | 1.34 | |||||||||||||||
| LSBI | LSB Financial Corp. of Lafayette IN | $ | 1,810 | ($ | 1,235 | ) | $ | 420 | $ | 0 | $ | 995 | 1,554 | $ | 0.64 | |||||||||||||||
| LABC | Louisiana Bancorp, Inc. of LA | $ | 2,406 | ($ | 527 | ) | $ | 179 | $ | 0 | $ | 2,058 | 3,438 | $ | 0.60 | |||||||||||||||
| RVSB | Riverview Bancorp, Inc. of WA | $ | 3,264 | ($ | 297 | ) | $ | 101 | $ | 0 | $ | 3,068 | 22,472 | $ | 0.14 | |||||||||||||||
| TSBK | Timberland Bancorp, Inc. of WA | $ | (32 | ) | ($ | 1,364 | ) | $ | 464 | $ | 0 | ($ | 932 | ) | 7,045 | ($ | 0.13 | ) | ||||||||||||
(1) Financial information is for the quarter ending March 31, 2011.
| Source: | SNL Financial, LC. and RP® Financial, LC. calculations. The information provided in this table has been obtained from sources we believe are reliable, but we cannot guarantee the accuracy or completeness of such information. |
Copyright (c) 2011 by RP® Financial, LC.
EXHIBIT V-1
RP® Financial, LC.
Firm Qualifications Statement
| RP® FINANCIAL, LC. | |
| Serving the Financial Services Industry Since 1988 |
| FIRM QUALIFICATION STATEMENT |
RP® Financial (“RP®) provides financial and management consulting, merger advisory and valuation services to the financial services industry nationwide. We offer a broad array of services, high quality and prompt service, hands-on involvement by principals and senior staff, careful structuring of strategic initiatives and sophisticated valuation and other analyses consistent with industry practices and regulatory requirements. Our staff maintains extensive background in financial and management consulting, valuation and investment banking. Our clients include commercial banks, thrifts, credit unions, mortgage companies, insurance companies and other financial services companies.
STRATEGIC PLANNING SERVICES |
RP®’s strategic planning services are designed to provide effective feasible plans with quantifiable results. We analyze strategic options to enhance shareholder value, achieve regulatory approval or realize other objectives. Such services involve conducting situation analyses; establishing mission/vision statements, developing strategic goals and objectives; and identifying strategies to enhance franchise and/or market value, capital management, earnings enhancement, operational matters and organizational issues. Strategic recommendations typically focus on: capital formation and management, asset/liability targets, profitability, return on equity and stock pricing. Our proprietary financial simulation models provide the basis for evaluating the impact of various strategies and assessing their feasibility and compatibility with regulations.
MERGER ADVISORY SERVICES |
RP®’s merger advisory services include targeting potential buyers and sellers, assessing acquisition merit, conducting due diligence, negotiating and structuring merger transactions, preparing merger business plans and financial simulations, rendering fairness opinions, preparing mark-to-market analyses, valuing intangible assets and supporting the implementation of post-acquisition strategies. Our merger advisory services involve transactions of financially healthy companies and failed bank deals. RP® is also expert in de novo charters and shelf charters. Through financial simulations, comprehensive data bases, valuation proficiency and regulatory familiarity, RP®’s merger advisory services center on enhancing shareholder returns.
VALUATION SERVICES |
RP®’s extensive valuation practice includes bank and thrift mergers, thrift mutual-to-stock conversions, goodwill impairment, insurance company demutualizations, ESOPs, subsidiary companies, merger accounting and other purposes. We are highly experienced in performing appraisals which conform to regulatory guidelines and appraisal standards. RP® is the nation’s leading valuation firm for thrift mutual-to-stock conversions, with appraised values ranging up to $4 billion.
OTHER CONSULTING SERVICES |
RP® offers other consulting services including evaluating the impact of regulatory changes (TARP, etc.), branching and diversification strategies, feasibility studies and special research. We assist banks/thrifts in preparing CRA plans and evaluating wealth management activities on a de novo or merger basis. Our other consulting services are facilitated by proprietary valuation and financial simulation models.
| KEY PERSONNEL (Years of Relevant Experience & Contact Information) |
| Ronald S. Riggins, Managing Director (30) | (703) 647-6543 | rriggins@rpfinancial.com |
| William E. Pommerening, Managing Director (27) | (703) 647-6546 | wpommerening@rpfinancial.com |
| Gregory E. Dunn, Director (28) | (703) 647-6548 | gdunn@rpfinancial.com |
| James P. Hennessey, Director (25) | (703) 647-6544 | jhennessey@rpfinancial.com |
| James J. Oren, Director (24) | (703) 647-6549 | joren@rpfinancial.com |
| Timothy M. Biddle, Senior Vice President (21) | (703) 647-6552 | tbiddle@rpfinancial.com |
| Janice Hollar, Senior Vice President (29) | (703) 647-6554 | jhollar@rpfinancial.com |
| Washington Headquarters | |
| Rosslyn Center | Telephone: (703) 528-1700 |
| 1100 North Glebe Road, Suite 1100 | Fax No.: (703) 528-1788 |
| Arlington, VA 22201 | Toll-Free No.: (866) 723-0594 |
| www.rpfinancial.com | E-Mail: mail@rpfinancial.com |