| FREE WRITING PROSPECTUS | ||
| FILED PURSUANT TO RULE 433 | ||
| REGISTRATION FILE NO.: 333-227784-04 | ||
September 19, 2019 FREE WRITING PROSPECTUS STRUCTURAL AND COLLATERAL TERM SHEET $807,336,117 (Approximate Total Mortgage Pool Balance) $698,345,000 (Approximate Offered Certificates) UBS 2019-C17 UBS Commercial Mortgage Securitization Corp. Depositor UBS AG Wells Fargo Bank, National Association Rialto Mortgage Finance, LLC Ladder Capital Finance LLC Rialto Real Estate Fund III Debt, LP CIBC Inc. Sponsors and Mortgage Loan Sellers UBS Securities LLC Wells Fargo Securities Co-Lead Managers and Joint Bookrunners CIBC World Academy Bancroft Brean Capital Drexel Hamilton Markets Securities Capital, LLC Co-Managers The depositor has filed a registration statement (including a prospectus) with the Securities and Exchange Commission (“SEC”) (SEC File No. 333-227784) for the offering to which this communication relates. Before you invest, you should read the prospectus in the registration statement and other documents the depositor has filed with the SEC for more complete information about the depositor, the issuing entity and this offering. You may get these documents for free by visiting EDGAR on the SEC Web site at www.sec.gov. Alternatively, the depositor, any underwriter, or any dealer participating in the offering will arrange to send you the prospectus after filing if you request it by calling toll free 1-877-713-1030 (8 a.m. 5 p.m. EST). The offered certificates referred to in these materials and the asset pool backing them are subject to modification or revision (including the possibility that one or more classes of certificates may be split, combined or eliminated at any time prior to issuance or availability of a final prospectus) and are offered on a “when, as and if issued” basis.
STATEMENT REGARDING THIS FREE WRITING PROSPECTUS
Nothing in this document constitutes an offer of securities for sale in any jurisdiction where the offer or sale is not permitted. The information contained herein is preliminary as of the date hereof, supersedes any such information previously delivered to you and will be superseded by any such information subsequently delivered prior to the time of sale and ultimately by the final prospectus relating to the offered certificates. These materials are subject to change, completion, supplement or amendment from time to time.
This free writing prospectus has been prepared by the underwriters for information purposes only and does not constitute, in whole or in part, a prospectus for the purposes of Directive 2003/71/EC (as amended) and/or Part VI of the Financial Services and Markets Act 2000, as amended, or other offering document.
STATEMENT REGARDING ASSUMPTIONS AS TO SECURITIES, PRICING ESTIMATES AND OTHER INFORMATION
This free writing prospectus contains certain forward-looking statements. If and when included in this free writing prospectus, the words “expects”, “intends”, “anticipates”, “estimates” and analogous expressions and all statements that are not historical facts, including statements about our beliefs or expectations, are intended to identify forward-looking statements. Any forward-looking statements are made subject to risks and uncertainties which could cause actual results to differ materially from those stated. Those risks and uncertainties include, among other things, declines in general economic and business conditions, increased competition, changes in demographics, changes in political and social conditions, regulatory initiatives and changes in customer preferences, many of which are beyond our control and the control of any other person or entity related to this offering. The forward- looking statements made in this free writing prospectus are made as of the date stated on the cover. We have no obligation to update or revise any forward-looking statement.
The attached information contains certain tables and other statistical analyses (the “Computational Materials”) that have been prepared in reliance upon information furnished by the Mortgage Loan Sellers. Numerous assumptions were used in preparing the Computational Materials, which may or may not be reflected herein. As such, no assurance can be given as to the Computational Materials’ accuracy, appropriateness or completeness in any particular context; or as to whether the Computational Materials and/or the assumptions upon which they are based reflect present market conditions or future market performance. The Computational Materials should not be construed as either projections or predictions or as legal, tax, financial or accounting advice. You should consult your own counsel, accountant and other advisors as to the legal, tax, business, financial and related aspects of a purchase of the offered certificates. Any weighted average lives, yields and principal payment periods shown in the Computational Materials are based on prepayment and/or loss assumptions, and changes in such prepayment and/or loss assumptions may dramatically affect such weighted average lives, yields and principal payment periods. In addition, it is possible that prepayments or losses on the underlying assets will occur at rates higher or lower than the rates shown in the attached Computational Materials. The specific characteristics of the offered certificates may differ from those shown in the Computational Materials due to differences between the final underlying assets and the preliminary underlying assets used in preparing the Computational Materials. The principal amount and designation of any security described in the Computational Materials are subject to change prior to issuance. None of UBS Securities LLC, Wells Fargo Securities, LLC, CIBC World Markets Corp., Academy Securities, Inc., Bancroft Capital, LLC, Brean Capital, LLC or Drexel Hamilton, LLC or any of their respective affiliates, make any representation or warranty as to the actual rate or timing of payments or losses on any of the underlying assets or the payments or yield on the offered certificates. The information in this presentation is based upon management forecasts and reflects prevailing conditions and management’s views as of this date, all of which are subject to change. In preparing this presentation, we have relied upon and assumed, without independent verification, the accuracy and completeness of all information available from public sources or which was provided to us by or on behalf of the Mortgage Loan Sellers or which was otherwise reviewed by us.
Wells Fargo Securities is the trade name for the capital markets and investment banking services of Wells Fargo & Company and its subsidiaries, including but not limited to Wells Fargo Securities, LLC, a member of NYSE, FINRA, NFA and SIPC, Wells Fargo Prime Services, LLC, a member of FINRA, NFA and SIPC, and Wells Fargo Bank, N.A. Wells Fargo Securities, LLC and Wells Fargo Prime Services, LLC are distinct entities from affiliated banks and thrifts.
IMPORTANT NOTICE REGARDING THE OFFERED CERTIFICATES
The offered certificates described herein are not suitable investments for all investors. In particular, you should not purchase any class of offered certificates unless you understand and are able to bear the prepayment, credit, liquidity and market risks associated with such class of certificates. For those reasons and for the reasons set forth under the heading “Risk Factors” in the Preliminary Prospectus, the yield to maturity and the aggregate amount and timing of distributions on the offered certificates are subject to material variability from period to period and give rise to the potential for significant loss over the life of such certificates. The interaction of these factors and their effects are impossible to predict and are likely to change from time to time. As a result, an investment in the offered certificates involves substantial risks and uncertainties and should be considered only by sophisticated institutional investors with substantial investment experience with similar types of securities and who have conducted appropriate due diligence on the mortgage loans and the certificates. Potential investors are advised and encouraged to review the Preliminary Prospectus in full and to consult with their legal, tax, accounting and other advisors prior to making any investment in the offered certificates described in this free writing prospectus.
This free writing prospectus is not to be construed as an offer to sell or the solicitation of any offer to buy any security in any jurisdiction where such an offer or solicitation would be illegal. The information contained in this free writing prospectus may not pertain to any securities that will actually be sold. The information contained in this free writing prospectus may be based on assumptions regarding market conditions and other matters as reflected in this free writing prospectus. We make no representations regarding the reasonableness of such assumptions or the likelihood that any of such assumptions will coincide with actual market conditions or events, and this free writing prospectus should not be relied upon for such purposes. The underwriters and their respective affiliates, officers, directors, partners and employees, including persons involved in the preparation or issuance of this free writing prospectus may, from time to time, have long or short positions in, and buy or sell, the offered certificates mentioned in this free writing prospectus or derivatives thereof (including options). Information contained in this free writing prospectus is current as of the date appearing on this free writing prospectus only. None
2
of UBS Securities LLC, Wells Fargo Securities, LLC, CIBC World Markets Corp., Academy Securities, Inc., Bancroft Capital, LLC, Brean Capital, LLC or Drexel Hamilton, LLC, provides accounting, tax or legal advice.
The issuing entity will be relying upon an exclusion or exemption from the definition of “investment company” under the Investment Company Act of 1940, as amended (the “Investment Company Act”), contained in Section 3(c)(5) of the Investment Company Act or Rule 3a-7 under the Investment Company Act, although there may be additional exclusions or exemptions available to the issuing entity. The issuing entity is being structured so as not to constitute a “covered fund” for purposes of the Volcker Rule under the Dodd-Frank Act (both as defined in “Risk Factors—Other Risks Relating to the Certificates—Legal and Regulatory Provisions Affecting Investors Could Adversely Affect the Liquidity of the Offered Certificates” in the Preliminary Prospectus). See also “Legal Investment” in the Preliminary Prospectus.
The information contained herein supersedes any previous such information delivered to any prospective investor and will be superseded by information delivered to such prospective investor prior to the time of sale.
IMPORTANT NOTICE RELATING TO AUTOMATICALLY-GENERATED EMAIL DISCLAIMERS
Any legends, disclaimers or other notices that may appear at the bottom of any email communication to which this free writing prospectus is attached relating to (1) these materials not constituting an offer (or a solicitation of an offer), (2) any representation that these materials are accurate or complete and may not be updated or (3) these materials possibly being confidential, are not applicable to these materials and should be disregarded. Such legends, disclaimers or other notices have been automatically generated as a result of these materials having been sent via Bloomberg or another system.
3
UBS 2019-C17
| TRANSACTION HIGHLIGHTS |
Capitalized terms used but not defined herein have the meanings assigned to them in the preliminary prospectus expected to be dated September 19, 2019 relating to the offered certificates (hereinafter referred to as the “Preliminary Prospectus”).
| KEY FEATURES OF SECURITIZATION |
| Offering Terms: | |
| Co-Lead Managers and Joint Bookrunners: | UBS Securities LLC Wells Fargo Securities, LLC |
| Co-Managers: | CIBC World Markets Corp. Academy Securities, Inc. Bancroft Capital, LLC Brean Capital, LLC Drexel Hamilton, LLC |
| Mortgage Loan Sellers: | UBS AG, by and through its branch office at 1285 Avenue of the Americas, New York, New York (“UBS AG”) (29.6%), Wells Fargo Bank, National Association (“WFB”) (17.9%), Rialto Mortgage Finance, LLC (“RMF”) (16.8%), Ladder Capital Finance LLC (“LCF”) (13.7%), Rialto Real Estate Fund III – Debt, LP (“RREF”) (12.6%) and CIBC Inc. (“CIBC”) (9.4%) |
| Master Servicer: | Wells Fargo Bank, National Association |
| Operating Advisor: | Pentalpha Surveillance LLC |
| Asset Representations Reviewer: | Pentalpha Surveillance LLC |
| Special Servicer: | Rialto Capital Advisors, LLC |
| Trustee: | Wilmington Trust, National Association |
| Certificate Administrator: | Wells Fargo Bank, National Association |
| Rating Agencies: | Fitch Ratings, Inc., Kroll Bond Rating Agency, Inc. and Moody’s Investors Service, Inc. |
| U.S. Credit Risk Retention: | RREF, the retaining sponsor, intends to satisfy the U.S. credit risk retention requirement through the purchase by one or more of its “majority-owned affiliate” (as defined in the credit risk retention rules), from the underwriters and initial purchasers, on the Closing Date, of (i) an “eligible horizontal residual interest” comprised of the Class NR-RR certificates that are not part of the VRR Interest and (ii) an “eligible vertical interest” comprised of a certain percentage of the certificate balance, notional amount or percentage interest in each class of certificates (other than the Class R certificates) (the “VRR Interest”). The aggregate estimated fair value of the “eligible horizontal residual interest” will equal approximately 1.26627% of the estimated fair value of all of the certificates (other than the Class R certificates) issued by the issuing entity and the VRR Interest will consist of the portion of each class of certificates (other than the Class R certificates) necessary to satisfy the credit risk retention rules.
As RREF is retaining its right to sell the “eligible horizontal residual interest” to a subsequent third party purchaser in accordance with the provisions of the credit risk retention rules, the pooling and servicing agreement will include the required provisions applicable to an operating advisor necessary for the securitization to comply with the credit risk retention rules utilizing the “third party purchaser” option. See “Operating Advisor” below.
For further discussion on the manner in which the U.S. credit risk retention requirements will be satisfied see “Credit Risk Retention” in the Preliminary Prospectus. |
| EU Credit Risk Retention: | None of the sponsors, the depositor, the issuing entity, the underwriters or any other person is required or intends to retain a material net economic interest in the securitization constituted by the issue of the Offered Certificates, or to take any other action in respect of such securitization, in a manner prescribed or contemplated by the European Union’s Securitization Regulation (Regulation (EU) 2017/2402). In particular, no person undertakes to take any action which may be required by any investor for the purposes of their compliance with such regulations or similar requirements. |
| Determination Date: | The 11th day of each month, or if such 11th day is not a business day, the succeeding business day, commencing in November 2019. |
| Distribution Date: | The 4th business day following the Determination Date in each month, commencing in November 2019. |
| Cut-off Date: | The mortgage loans will be considered part of the trust fund as of their respective cut-off dates. The cut-off date with respect to each mortgage loan is the respective due date for the monthly debt service payment that is due in October 2019 (or, in the case of any mortgage loan that has its first due date after October 2019, the date that would have been its due date in October 2019 under the terms of that mortgage loan if a monthly debt service payment were scheduled to be due in that month). |
| Closing Date: | On or about October 15, 2019 |
| Settlement Terms: | DTC, Euroclear and Clearstream, same day funds, with accrued interest. |
| ERISA Eligible: | All of the offered certificates are expected to be ERISA eligible. |
| SMMEA Eligible: | None of the offered certificates will be SMMEA eligible. |
| Day Count: | 30/360 |
| Tax Treatment: | REMIC |
| Rated Final Distribution Date: | October 2052 |
| Minimum Denominations: | $10,000 (or $1,000,000 with respect to the Class X-A and Class X-B Certificates) and in each case in multiples of $1 thereafter. |
| Clean-up Call: | 1.0% |
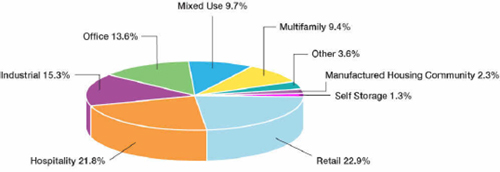
| Distribution of Collateral by Property Type |
THE INFORMATION IN THIS STRUCTURAL AND COLLATERAL TERM SHEET IS NOT COMPLETE AND MAY BE AMENDED PRIOR TO THE TIME OF SALE. THIS TERM SHEET IS NOT AN OFFER TO SELL THESE SECURITIES AND IT IS NOT A SOLICITATION OF AN OFFER TO BUY THESE SECURITIES IN ANY JURISDICTION WHERE THE OFFER OR SALE IS NOT PERMITTED.
4
UBS 2019-C17
| TRANSACTION HIGHLIGHTS |
| Mortgage Loan Sellers | Number of Mortgage Loans | Number of Mortgaged Properties | Aggregate Cut-off Date Balance | % of Initial Outstanding Pool Balance(1) |
| UBS AG(2) | 15 | 36 | $238,744,883 | 29.6% |
| Wells Fargo Bank, National Association(2) | 8 | 8 | $144,400,000 | 17.9% |
| Rialto Mortgage Finance, LLC | 16 | 18 | $135,288,112 | 16.8% |
| Ladder Capital Finance LLC | 14 | 15 | $110,703,370 | 13.7% |
| Rialto Real Estate Fund III – Debt, LP(3) | 11 | 13 | $102,069,753 | 12.6% |
| CIBC Inc. | 6 | 7 | $76,130,000 | 9.4% |
| Total | 70 | 97 | $807,336,117 | 100.0% |
| Pooled Collateral Facts: | |
| Initial Outstanding Pool Balance: | $807,336,117 |
| Number of Mortgage Loans: | 70 |
| Number of Mortgaged Properties: | 97 |
| Average Mortgage Loan Cut-off Date Balance: | $11,533,373 |
| Average Mortgaged Property Cut-off Date Balance: | $8,323,053 |
| Weighted Average Mortgage Rate: | 4.276% |
| Weighted Average Mortgage Loan Original Term to Maturity Date or ARD (months)(4): | 119 |
| Weighted Average Mortgage Loan Remaining Term to Maturity Date or ARD (months)(4): | 118 |
| Weighted Average Mortgage Loan Seasoning (months): | 2 |
| % of Mortgage Loans Secured by a Property or a Portfolio of Mortgaged Properties Leased to a Single Tenant: | 14.4% |
| Credit Statistics | |
| Weighted Average Mortgage Loan U/W NCF DSCR(5): | 1.92x |
| Weighted Average Mortgage Loan Cut-off Date LTV(5)(6): | 63.4% |
| Weighted Average Mortgage Loan Maturity Date or ARD LTV(4)(5)(6): | 56.3% |
| Weighted Average U/W NOI Debt Yield(5): | 10.8% |
| Amortization Overview | |
| % Mortgage Loans which pay Interest Only followed by Amortization through Maturity Date: | 34.3% |
| % Mortgage Loans which pay Interest Only through Maturity Date or ARD: | 33.7% |
| % Mortgage Loans with Amortization through Maturity Date: | 32.0% |
| Weighted Average Remaining Amortization Term (months)(7): | 355 |
| Loan Structural Features | |
| % Mortgage Loans with Upfront or Ongoing Tax Reserves: | 75.0% |
| % Mortgage Loans with Upfront or Ongoing Replacement Reserves(8): | 77.9% |
| % Mortgage Loans with Upfront or Ongoing Insurance Reserves: | 59.4% |
| % Mortgage Loans with Upfront or Ongoing TI/LC Reserves(9): | 81.3% |
| % Mortgage Loans with Upfront Engineering Reserves: | 29.9% |
| % Mortgage Loans with Upfront or Ongoing Other Reserves: | 48.7% |
| % Mortgage Loans with In Place Hard Lockboxes: | 45.7% |
| % Mortgage Loans with Cash Traps Triggered at DSCR Levels ≥ 1.05x: | 77.3% |
| % Mortgage Loans with Defeasance Only After a Lockout Period and Prior to an Open Period: | 87.6% |
| % Mortgage Loans with Prepayment with a Yield Maintenance Charge Only After a Lockout Period and Prior to an Open Period: | 9.0% |
| % Mortgage Loans with Prepayment with a Yield Maintenance Charge or Defeasance After a Prepayment with a Yield Maintenance Charge Period Prior to an Open Period: | 2.1% |
| % Mortgage Loans with Prepayment with a Yield Maintenance Charge or Defeasance After a Lockout Period and Prior to an Open Period: | 1.0% |
| % Mortgage Loans with Prepayment with a Yield Maintenance Charge Prior to an Open Period: | 0.3% |
Please see footnotes on the following page.
THE INFORMATION IN THIS STRUCTURAL AND COLLATERAL TERM SHEET IS NOT COMPLETE AND MAY BE AMENDED PRIOR TO THE TIME OF SALE. THIS TERM SHEET IS NOT AN OFFER TO SELL THESE SECURITIES AND IT IS NOT A SOLICITATION OF AN OFFER TO BUY THESE SECURITIES IN ANY JURISDICTION WHERE THE OFFER OR SALE IS NOT PERMITTED.
5
UBS 2019-C17
| TRANSACTION HIGHLIGHTS |
| (1) | Unless otherwise indicated, all references to “% of Initial Outstanding Pool Balance” in this Term Sheet reflect a percentage of the aggregate principal balance of the mortgage pool as of the Cut-off Date, after application of all payments of principal due during or prior to October 2019. |
| (2) | With respect to the mortgage loan secured by the mortgaged property identified on Annex A-1 to the Preliminary Prospectus as Grand Canal Shoppes, representing approximately 6.2% of the Initial Pool Balance, such mortgage loan is part of a whole loan that was co-originated by Morgan Stanley Bank, N.A., WFB, JPMorgan Chase Bank, National Association and Goldman Sachs Bank USA and partly sold to UBS AG. Both UBS AG and WFB will be contributing their respective notes to the securitization. The “Number of Mortgage Loans” and the “Number of Mortgaged Properties” shown in the table above for UBS AG do not include the notes for which UBS AG is acting as mortgage loan seller; however, the “Aggregate Cut-off Date Balance” and the “% of Initial Outstanding Pool Balance” shown in the table above for UBS AG do include these notes. |
| (3) | Rialto Real Estate Fund III – Debt, LP acquired each of the mortgage loans it is selling to the depositor from BSPRT CMBS Finance, LLC. Such mortgage loans were re underwritten pursuant to Rialto Real Estate Fund III – Debt, LP’s underwriting guidelines. |
| (4) | For any mortgage loan with an anticipated repayment date, calculated to or as of, as applicable, that anticipated repayment date. |
| (5) | With respect to any mortgage loan that is part of a whole loan, unless otherwise indicated, LTV, DSCR and Debt Yield calculations in this Term Sheet include any relatedpari passu companion loans and exclude any subordinate companion loans, as applicable. Additionally, LTV, DSCR and Debt Yield figures in this Term Sheet are calculated for mortgage loans without regard to any additional indebtedness that may be incurred at a future date. See “Description of the Mortgage Pool—Mortgage Pool Characteristics” in the Preliminary Prospectus and Annex A-1 to the Preliminary Prospectus. |
| (6) | The Cut-off Date LTV and Maturity Date or ARD LTV for the following mortgage loans is based on an appraised value for one or more mortgaged properties that is not an “As-Is” appraised value. |
With respect to the mortgage loan identified on Annex A-1 to the Preliminary Prospectus as 600 & 620 National Avenue, the Cut-off Date LTV and Maturity Date or ARD LTV are based on the appraiser’s “Market Value As Stabilized”, $197,000,000, which assumes the tenant has taken possession, free rent has expired, the tenant has commenced paying unabated rent and all outstanding tenant improvements and leasing commissions have been reserved. As of the time of origination of the 600 & 620 National Avenue Whole Loan, Google has taken possession of its space and is paying rent, and all outstanding tenant improvements and leasing commissions have been reserved. The Cut-off Date LTV and Maturity Date or ARD LTV based on the “As-Is” appraised value are 74.5% and 74.5%, respectively.
With respect to the mortgage loan secured by the portfolio of mortgaged properties identified on Annex A-1 to the Preliminary Prospectus as CIRE Equity Retail & Industrial Portfolio, the Cut-off Date LTV, Maturity Date or ARD LTV, and appraised value are based on the “As-Is Portfolio Value” conclusion of $198,100,000, which includes a portfolio premium to the portfolio properties if sold together on a bulk basis. The sum of the “As-Is” appraised values on a stand-alone basis is $188,710,000. The Cut-off Date LTV and Maturity Date or ARD LTV based on the appraised value representing the sum of the “As-Is” appraised values are 68.1% and 68.1%, respectively.
With respect to the mortgage loan identified on Annex A-1 to the Preliminary Prospectus as Ambler Yards, the Cut-off Date LTV, Maturity Date or ARD LTV, and appraised value are based on the “As-Complete Value” conclusion of $31,730,000, which assumes the lease-up costs for recently signed leases are escrowed and available to any potential purchaser at closing. The “As-Is” appraised value is $31,100,000. The Cut-off Date LTV and Maturity Date or ARD LTV based on the “As-Is” appraised values are 74.9% and 64.4%, respectively.
With respect to the mortgage loan identified on Annex A-1 to the Preliminary Prospectus as Blackmore Marketplace, the Cut-off Date LTV, Maturity Date or ARD LTV, and appraised value are based on the “As-Complete Value” conclusion of $34,600,000, as of August 1, 2019. The “As-Is” appraised value is $33,200,000. The Cut-off Date LTV and Maturity Date or ARD LTV based on the “As-Is” appraised values are 69.6% and 58.7%, respectively.
| (7) | Excludes mortgage loans that are interest-only for the full loan term to maturity or to the related anticipated repayment date. |
| (8) | Includes FF&E Reserves. |
| (9) | Represents the percent of the allocated aggregate principal balance of the mortgage pool as of the Cut-off Date of only the office, retail, industrial, and mixed use properties. |
THE INFORMATION IN THIS STRUCTURAL AND COLLATERAL TERM SHEET IS NOT COMPLETE AND MAY BE AMENDED PRIOR TO THE TIME OF SALE. THIS TERM SHEET IS NOT AN OFFER TO SELL THESE SECURITIES AND IT IS NOT A SOLICITATION OF AN OFFER TO BUY THESE SECURITIES IN ANY JURISDICTION WHERE THE OFFER OR SALE IS NOT PERMITTED.
6
UBS 2019-C17
| STRUCTURE OVERVIEW |
OFFERED CERTIFICATES
| Class(1) | Ratings(2) (Fitch/KBRA/Moody’s) | Approx. Initial Certificate Principal Balance or Notional Amount(3) | Approx. Initial Available Certificate Principal Balance or Notional Amount(3) | Approx. Initial Retained Certificate Principal Balance or Notional Amount(3)(4) | Initial Subordination Levels | Expected Weighted Average Life (years)(5) | Principal Window (months)(5) | Certificate Principal to Value Ratio(6) | Underwritten NOI Debt Yield(7) |
| Class A-1 | AAAsf / AAA(sf) / Aaa(sf) | $29,683,000 | $28,574,000 | $1,109,000 | 30.000%(8) | 2.77 | 1 - 57 | 44.4% | 15.4% |
| Class A-2 | AAAsf / AAA(sf) / Aaa(sf) | $8,978,000 | $8,642,000 | $336,000 | 30.000%(8) | 4.83 | 57 - 58 | 44.4% | 15.4% |
| Class A-SB | AAAsf / AAA(sf) / Aaa(sf) | $51,293,000 | $49,377,000 | $1,916,000 | 30.000%(8) | 7.29 | 58 - 114 | 44.4% | 15.4% |
| Class A-3 | AAAsf / AAA(sf) / Aaa(sf) | (9) | (9) | (9) | 30.000%(8) | (9) | (9) | 44.4% | 15.4% |
| Class A-4 | AAAsf / AAA(sf) / Aaa(sf) | (9) | (9) | (9) | 30.000%(8) | (9) | (9) | 44.4% | 15.4% |
| Class X-A(10) | AAAsf / AAA(sf) / Aaa(sf) | $565,135,000(11) | $544,031,000 | $21,104,000 | N/A | N/A | N/A | N/A | N/A |
| Class X-B(10) | A-sf / AAA(sf) / NR | $133,210,000(11) | $128,235,000 | $4,975,000 | N/A | N/A | N/A | N/A | N/A |
| Class A-S | AAAsf / AAA(sf) / Aa2(sf) | $60,550,000 | $58,289,000 | $2,261,000 | 22.500% | 9.92 | 119 - 119 | 49.2% | 13.9% |
| Class B | AA-sf / AA(sf) / NR | $36,330,000 | $34,973,000 | $1,357,000 | 18.000% | 9.92 | 119 - 119 | 52.0% | 13.2% |
| Class C | A-sf / A(sf) / NR | $36,330,000 | $34,973,000 | $1,357,000 | 13.500% | 9.93 | 119 - 120 | 54.9% | 12.5% |
NON-OFFERED CERTIFICATES(12)
| Class(1) | Ratings(2) (Fitch/KBRA/Moody’s) | Approx. Initial Certificate Principal Balance or Notional Amount(3) | Approx. Initial Available Certificate Principal Balance or Notional Amount(3) | Approx. Initial Retained Certificate Principal Balance or Notional Amount(3)(4) | Initial Subordination Levels | Expected Weighted Average Life (years)(5) | Principal Window (months)(5) | Certificate Principal to Value Ratio(6) | Underwritten NOI Debt Yield(7) |
| Class X-D(10) | BBB-sf / BBB(sf) / NR | $43,395,000(11) | $41,774,000 | $1,621,000 | N/A | N/A | N/A | N/A | N/A |
| Class X-F(10) | BBsf / BB+(sf) / NR | $17,155,000(11) | $16,514,000 | $641,000 | N/A | N/A | N/A | N/A | N/A |
| Class X-G(10) | Bsf / BB-(sf) / NR | $9,083,000(11) | $8,743,000 | $340,000 | N/A | N/A | N/A | N/A | N/A |
| Class D | BBBsf / A-(sf) / NR | $23,211,000 | $22,344,000 | $867,000 | 10.625% | 10.00 | 120 - 120 | 56.7% | 12.1% |
| Class E | BBB-sf / BBB(sf) / NR | $20,184,000 | $19,430,000 | $754,000 | 8.125% | 10.00 | 120 - 120 | 58.3% | 11.7% |
| Class F | BBsf / BB+(sf) / NR | $17,155,000 | $16,514,000 | $641,000 | 6.000% | 10.00 | 120 - 120 | 59.6% | 11.5% |
| Class G | Bsf / BB-(sf) / NR | $9,083,000 | $8,743,000 | $340,000 | 4.875% | 10.00 | 120 - 120 | 60.3% | 11.3% |
| Class NR-RR | NR / NR / NR | $39,358,117 | $37,888,117 | $1,470,000 | 0.000% | 10.00 | 120 - 120 | 63.4% | 10.8% |
Please see footnotes on the following page.
THE INFORMATION IN THIS STRUCTURAL AND COLLATERAL TERM SHEET IS NOT COMPLETE AND MAY BE AMENDED PRIOR TO THE TIME OF SALE. THIS TERM SHEET IS NOT AN OFFER TO SELL THESE SECURITIES AND IT IS NOT A SOLICITATION OF AN OFFER TO BUY THESE SECURITIES IN ANY JURISDICTION WHERE THE OFFER OR SALE IS NOT PERMITTED.
7
UBS 2019-C17
| STRUCTURE OVERVIEW |
| (1) | Theper annum pass-through rates applicable to the Class A-1, Class A-2, Class A-SB, Class A-3, Class A-4, Class A-S, Class B, Class C, Class D, Class E, Class F, Class G and Class NR-RR Certificates (collectively, the “principal balance certificates”) will, in each case, equal one of: (i) a fixed rateper annum, (ii) a variable rateper annum equal to the weighted average of the net mortgage interest rates on the mortgage loans for the related distribution date adjusted as necessary to a 30/360 basis (the “WAC Rate”), (iii) a variable rateper annum equal to the lesser of (a) a fixed rate and (b) the WAC Rate or (iv) a variable rateper annum equal to the WAC Rate minus a specified percentage. |
| (2) | Ratings shown are those of Fitch Ratings, Inc. (“Fitch”), Kroll Bond Rating Agency, Inc. (“KBRA”) and Moody’s Investors Service, Inc. (“Moody’s”). Certain nationally recognized statistical rating organizations that were not hired by the depositor may use information they receive pursuant to Rule 17g-5 under the Securities Exchange Act of 1934, as amended, or otherwise to rate the certificates. There can be no assurance as to what ratings a non-hired nationally recognized statistical rating organization would assign. See “Risk Factors—Other Risks Relating to the Certificates—Nationally Recognized Statistical Rating Organizations May Assign Different Ratings to the Certificates; Ratings of the Certificates Reflect Only the Views of the Applicable Rating Agencies as of the Dates Such Ratings Were Issued; Ratings May Affect ERISA Eligibility; Ratings May Be Downgraded” and “Ratings” in the Preliminary Prospectus. Fitch, KBRA and Moody’s have informed us that the “sf” designation in their ratings represents an identifier for structured finance product ratings. |
| (3) | Approximate; subject to a permitted variance of plus or minus 5% on the Closing Date, including in connection with any variation in the portion of the certificate balances and notional amounts of the classes comprising the VRR Interest following the calculation of the actual fair value of the certificates (other than the Class R certificates) issued by the issuing entity, and further subject to the discussion in footnote (9) below. In addition, the notional amounts of each class of Class X Certificates may vary depending upon the final pricing of all classes of principal balance certificates whose certificate balances comprise such notional amounts and, if as a result of such pricing the pass-through rate of the Class X Certificates, as applicable, would be equal to zero, such class of certificates may not be issued on the Closing Date of this securitization. |
| (4) | On the Closing Date, the certificates (other than the Class R certificates) (collectively, the “VRR Interest”) with the Initial Certificate Principal Balances or Notional Amounts, as applicable, set forth in the above table under “Approx. Initial Retained Certificate Principal Balance or Notional Amount” are expected to be sold by theunderwriters and the initial purchasersto RREF or a majority-owned affiliate of RREF as described in “Credit Risk Retention—General” in the Preliminary Prospectus. |
| (5) | The principal window is expressed in months following the Closing Date and reflects the period during which distributions of principal would be received under the assumptions set forth in the following sentence. The expected weighted average life and principal window figures set forth above are based on the following assumptions, among others: (i) no defaults or subsequent losses on the mortgage loans; (ii) no extensions of maturity dates of the mortgage loans; (iii) payment in full on the stated maturity date or on the anticipated repayment date; and (iv) no prepayments of the mortgage loans prior to maturity or the anticipated repayment date. See the structuring assumptions set forth under “Yield and Maturity Considerations—Weighted Average Life” in the Preliminary Prospectus. |
| (6) | “Certificate Principal to Value Ratio” for any class of principal balance certificates is calculated as the product of (a) the weighted average Cut-off Date LTV Ratio of the mortgage pool, multiplied by (b) a fraction, the numerator of which is the total initial certificate balance of such class of principal balance certificates and all other classes of principal balance certificates that are senior to such class, and the denominator of which is the total initial certificate balance of all the principal balance certificates. The Certificate Principal to Value Ratios of the Class A-1, Class A-2, Class A-SB, Class A-3 and Class A-4 Certificates are calculated in the aggregate for those classes as if they were a single class. |
| (7) | “Underwritten NOI Debt Yield” for any class of principal balance certificates is calculated as the product of (a) the weighted average UW NOI Debt Yield for the mortgage pool, multiplied by (b) a fraction, the numerator of which is the total initial certificate balance of all the principal balance certificates, and the denominator of which is the total initial certificate balance of such class of principal balance certificates and all other classes of principal balance certificates, if any, that are senior to such class. The Underwritten NOI Debt Yields of the Class A-1, Class A-2, Class A-SB, Class A-3 and Class A-4 Certificates are calculated in the aggregate for those classes as if they were a single class. |
| (8) | The initial subordination levels for the Class A-1, Class A-2, Class A-SB, Class A-3 and Class A-4 Certificates represent the approximate credit support for those classes in the aggregate. |
| (9) | The exact initial certificate balances of the Class A-3 and Class A-4 certificates are unknown and will be determined based on the final pricing of those classes of certificates. However, the respective initial certificate balances, assumed final distribution date, weighted average lives and principal windows of the Class A-3 and Class A-4 certificates are expected to be within the applicable ranges reflected in the following chart. The aggregate initial certificate balance of the Class A-3 and Class A-4 certificates is expected to be approximately $475,181,000, subject to a variance of plus or minus 5%. |
Class of | Expected Range of | Expected Range of Assumed | Expected Range of | Expected Range of Principal |
| Class A-3 | $75,000,000 - $230,000,000 | June 2029 / Aug 2029 | 9.64 / 9.72 | 114-116 / 114-118 |
| Class A-4 | $245,181,000 - $400,181,000 | Sept 2029 / Sept 2029 | 9.83 / 9.87 | 116-119 / 118-119 |
| (10) | The pass-through rate for the Class X-A certificates for any distribution date will be aper annum rate equal to the excess, if any, of (a) the WAC Rate, over (b) the weighted average of the pass-through rates on the Class A-1, Class A-2, Class A-SB, Class A-3 and Class A-4 certificates for the related distribution date, weighted on the basis of their respective certificate balances outstanding immediately prior to that distribution date. The pass-through rate for the Class X-B certificates for any distribution date will be aper annum rate equal to the excess, if any, of (a) the WAC Rate, over (b) the weighted average of the pass-through rates on the Class A-S, Class B and Class C certificates for the related distribution date, weighted on the basis of their respective certificate balances outstanding immediately prior to that distribution date. The pass-through rate for the Class X-D certificates for any distribution date will be aper annumrate equal to the excess, if any, of (a) the WAC Rate, over (b) the weighted average of the pass-through rates on the Class D and Class E certificates for the related distribution date, weighted on the basis of their respective certificate balances outstanding immediately prior to that distribution date. The pass-through rate for the Class X-F certificates for any distribution date will be aper annum rate equal to the excess, if any, of (a) the WAC Rate, over (b) the pass-through rate on the Class F certificate for the related distribution date. The pass-through rate for the Class X-G certificates for any distribution date will be aper annum rate equal to the excess, if any, of (a) the WAC Rate, over (b) the pass-through rate on the Class G certificate for the related distribution date. |
| (11) | The Class X-A, Class X-B, Class X-D, Class X-F and Class X-G certificates (collectively, the “Class X Certificates”) are notional amount certificates and will not be entitled to distributions of principal. The notional amount of the Class X-A certificates will be equal to the aggregate certificate balance of the Class A-1, Class A-2, Class A-SB, Class A-3 and Class A-4 certificates. The notional amount of the Class X-B certificates will be equal to the aggregate certificate balance of the Class A-S, Class B and Class C certificates. The notional amount of the Class X-D will be equal to the aggregate certificate balance of the Class D and Class E certificates. The notional amount of the Class X-F will be equal to the certificate balance of the Class F certificates. The notional amount of the Class X-G will be equal to the certificate balance of the Class G certificates. |
| (12) | Not offered pursuant to the Preliminary Prospectus or this Term Sheet. Information provided in this Term Sheet regarding the characteristics of these certificates is provided only to enhance your understanding of the offered certificates. The non-offered certificates also include the Class Z and Class R certificates, which do not have a certificate balance, notional amount, pass-through rate, rating or rated final distribution date, and which are not shown in the chart. The Class Z certificates represent the entitlement to distributions of excess interest accrued on the mortgage loans with an anticipated repayment date, as further described in the Preliminary Prospectus. The Class R certificates represent the beneficial ownership of the residual interest in each of the real estate mortgage investment conduits, as further described in the Preliminary Prospectus. |
THE INFORMATION IN THIS STRUCTURAL AND COLLATERAL TERM SHEET IS NOT COMPLETE AND MAY BE AMENDED PRIOR TO THE TIME OF SALE. THIS TERM SHEET IS NOT AN OFFER TO SELL THESE SECURITIES AND IT IS NOT A SOLICITATION OF AN OFFER TO BUY THESE SECURITIES IN ANY JURISDICTION WHERE THE OFFER OR SALE IS NOT PERMITTED.
8
UBS 2019-C17
| STRUCTURE OVERVIEW |
| Class A-2 Principal Paydown(1) |
| Class | Mortgage Loan Seller | Mortgage Loan | Property Type | Cut-off Date Balance | Remaining Term to Maturity (Mos.) | Cut-off Date LTV Ratio | U/W NCF DSCR | U/W NOI Debt Yield |
| A-2 | RMF | New Hampshire Self Storage Portfolio | Self Storage | $8,250,000 | 58 | 57.2% | 1.92x | 9.0% |
| (1) | This table reflects the mortgage loan whose balloon payment will be applied to pay down the Class A-2 certificates, assuming (i) that none of the mortgage loans experience prepayments (prior to maturity or anticipated repayment date, as applicable), defaults or losses, (ii) there are no extensions of maturity dates or anticipated repayment dates, as applicable and (iii) each mortgage loan is paid in full on its stated maturity date. See “Yield and Maturity Considerations—Yield Considerations” in the Preliminary Prospectus |
THE INFORMATION IN THIS STRUCTURAL AND COLLATERAL TERM SHEET IS NOT COMPLETE AND MAY BE AMENDED PRIOR TO THE TIME OF SALE. THIS TERM SHEET IS NOT AN OFFER TO SELL THESE SECURITIES AND IT IS NOT A SOLICITATION OF AN OFFER TO BUY THESE SECURITIES IN ANY JURISDICTION WHERE THE OFFER OR SALE IS NOT PERMITTED.
9
UBS 2019-C17
| STRUCTURE OVERVIEW |
| Principal Distributions: | Payments in respect of principal of the certificates will be distributed, first, to the Class A-SB Certificates, until the certificate balance of such class is reduced to the planned principal balance for the related Distribution Date set forth on Annex E to the Preliminary Prospectus, then, to the Class A-1, Class A-2, Class A-3, Class A-4, Class A-SB, Class A-S, Class B, Class C, Class D, Class E, Class F, Class G and Class NR-RR Certificates, in that order, until the certificate balance of each such class is reduced to zero. Notwithstanding the foregoing, if the aggregate certificate balances of the Class A-S, Class B, Class C, Class D, Class E, Class F, Class G and Class NR-RR Certificates have been reduced to zero as a result of the allocation of mortgage loan losses to those certificates distributions in respect of principal of the certificates will be distributed,first, to the Class A-1, Class A-2, Class A-SB, Class A-3 and Class A-4 Certificates, on apro rata basis, based on the certificate principal balance of each such class, then, to the extent of any recoveries on realized losses, to the Class A-S, Class B, Class C, Class D, Class E, Class F, Class G and Class NR-RR Certificates, in that order, in each case until the certificate balance of each such class is reduced to zero (or previously allocated realized losses have been fully reimbursed).
The Class X Certificates will not be entitled to receive distributions of principal; however, (i) the notional amount of the Class X-A Certificates will be reduced by the aggregate amount of principal distributions and realized losses, if any, allocated to the Class A-1, Class A-2, Class A-SB, Class A-3 and Class A-4 Certificates, (ii) the notional amount of the Class X-B Certificates will be reduced by the aggregate amount of principal distributions and realized losses, if any, allocated to the Class A-S, Class B and Class C Certificates, (iii) the notional amount of the Class X-D Certificates will be reduced by the aggregate amount of principal distributions and realized losses, if any, allocated to the Class D and Class E Certificates, (iv) the notional amount of the Class X-F Certificates will be reduced by the principal distributions and realized losses if any, allocated to the Class F Certificates and (v) the notional amount of the Class X-G Certificates will be reduced by the principal distributions and realized losses if any, allocated to the Class G Certificates.
|
| Interest Distributions: | On each Distribution Date, interest accrued for each class of the certificates at the applicable pass-through rate will be distributed in the following order of priority, to the extent of available funds:first, to the Class A-1, Class A-2, Class A-SB, Class A-3, Class A-4, Class X-A, Class X-B, Class X-D, Class X-F and Class X-G Certificates, on apro rata basis, based on the accrued and unpaid interest on each such class and then, to the Class A-S, Class B, Class C, Class D, Class E, Class F, Class G and Class NR-RR Certificates, in that order, in each case until the interest payable to each such class is paid in full.
Theper annum pass-through rates applicable to the Class A-1, Class A-2, Class A-SB, Class A-3, Class A-4, Class A-S, Class B, Class C, Class D, Class E, Class F, Class G and Class NR-RR Certificates for each Distribution Date will equal one of: (i) a fixed rateper annum, (ii) the WAC Rate, (iii) a variable rate equal to the lesser of (a) a fixed rate and (b) the WAC Rate, or (iv) a variable rate equal to the WAC Rate less a specified percentage.
As further described in the Preliminary Prospectus, theper annum pass-through rate on the Class X-A Certificates will generally be equal to the excess, if any, of (a) the WAC Rate, over (b) the weighted average of the pass-through rates of the Class A-1, Class A-2, Class A-SB, Class A-3 and Class A-4 Certificates, weighted on the basis of their respective certificate balances outstanding immediately prior to that Distribution Date as described in the Preliminary Prospectus. Theper annum pass-through rate on the Class X-B Certificates will generally be equal to the excess, if any, of (a) the WAC Rate, over (b) the weighted average of the pass-through rates of the Class A-S, Class B and Class C Certificates, weighted on the basis of their respective certificate balances outstanding immediately prior to that Distribution Date as described in the Preliminary Prospectus. Theper annum pass-through rate on the Class X-D Certificates will generally be equal to the excess, if any, of (a) the WAC Rate, over (b) the weighted average of the pass-through rates of the Class D and Class E Certificates, weighted on the basis of their respective certificate balances outstanding immediately prior to that Distribution Date as described in the Preliminary Prospectus. Theper annum pass-through rate on the Class X-F Certificates will generally be equal to the excess, if any, of (a) the WAC Rate, over (b) the pass-through rate of the Class F Certificates as described in the Preliminary Prospectus. Theper annum pass-through rate on the Class X-G Certificates will generally be equal to the excess, if any, of (a) the WAC Rate, over (b) the pass-through rate of the Class G Certificates as described in the Preliminary Prospectus. |
THE INFORMATION IN THIS STRUCTURAL AND COLLATERAL TERM SHEET IS NOT COMPLETE AND MAY BE AMENDED PRIOR TO THE TIME OF SALE. THIS TERM SHEET IS NOT AN OFFER TO SELL THESE SECURITIES AND IT IS NOT A SOLICITATION OF AN OFFER TO BUY THESE SECURITIES IN ANY JURISDICTION WHERE THE OFFER OR SALE IS NOT PERMITTED.
10
UBS 2019-C17
| STRUCTURE OVERVIEW |
| Prepayment Interest Shortfalls: | Prepayment interest shortfalls will be allocatedpro ratabased on interest entitlements, in reduction of the interest otherwise payable with respect to each of the interest-bearing classes of certificates. |
| Realized Loss Allocation: | On each distribution date, immediately following the distributions to be made to the Certificateholders on that date, the certificate administrator is required to calculate the amount, if any, by which (i) the aggregate stated principal balance of the mortgage loans, including any REO loans, expected to be outstanding immediately following that distribution date is less than (ii) the then-aggregate Certificate Balance of the Principal Balance Certificates after giving effect to distributions of principal on that distribution date. Such amount will be applied to the Class NR-RR, Class G, Class F, Class E, Class D, Class C, Class B and Class A-S certificates, in that order, in each case until the related Certificate Balance has been reduced to zero, and then to the Class A-1, Class A-2, Class A-SB, Class A-3 and Class A-4 certificates,pro rata based upon their respective Certificate Balances, until their respective Certificate Balances have been reduced to zero. |
| Prepayment Premiums/Yield Maintenance Charges: | If any yield maintenance charge or prepayment premium is collected during any particular collection period with respect to any mortgage loan, then on the distribution date corresponding to that collection period, the certificate administrator will pay that yield maintenance charge or prepayment premium, net of any liquidation fees or workout fees payable therefrom, in the following manner: (a) to the holders of each of the Class A-1, Class A-2, Class A-SB, Class A-3, Class A-4, Class A-S, Class B, Class C, Class D and Class E certificates, the product of (x) such yield maintenance charge or prepayment premium, (y) the related Base Interest Fraction for such class, and (z) a fraction, the numerator of which is equal to the amount of principal distributed to such class for that distribution date, and the denominator of which is the total amount of principal distributed to such classes of Principal Balance Certificates for that distribution date, (b) to the holders of the Class X-A certificates, the excess, if any, of (x) the product of (1) such yield maintenance charge or prepayment premium and (2) a fraction, the numerator of which is equal to the amount of principal distributed to the Class A-1, Class A-2, Class A-SB, Class A-3 and Class A-4 certificates for that distribution date, and the denominator of which is the total amount of principal distributed to the Class A-1, Class A-2, Class A-SB, Class A-3, Class A-4, Class A-S, Class B, Class C, Class D and Class E certificates for that distribution date, over (y) the amount of such yield maintenance charge or prepayment premium distributed to the Class A-1, Class A-2, Class A-SB, Class A-3 and Class A-4 Certificates as described above, and (c) to the holders of the Class X-B certificates, any remaining portion of such yield maintenance charge or prepayment premium not distributed as described above.
No prepayment premiums or yield maintenance charges will be distributed to the holders of the Class X-D, Class X-F, Class X-G, Class F, Class G, Class NR-RR, Class Z or Class R Certificates.
“Base Interest Fraction” means, with respect to any principal prepayment of any mortgage loan that provides for the payment of a yield maintenance charge or prepayment premium, and with respect to any class of Principal Balance Certificates, a fraction (A) the numerator of which is the greater of (x) zero and (y) the difference between (i) the pass-through rate on that class, and (ii) the applicable discount rate and (B) the denominator of which is the difference between (i) the mortgage interest rate on the related mortgage loan and (ii) the applicable discount rate;provided,however, that: under no circumstances will the Base Interest Fraction be greater than one; if the applicable discount rate is greater than or equal to the mortgage interest rate on the related mortgage loan and is greater than or equal to the pass-through rate on that class, then the Base Interest Fraction will equal zero; and if the applicable discount rate is greater than or equal to the mortgage interest rate on the related mortgage loan and is less than the pass-through rate on that class, then the Base Interest Fraction will be equal to 1.0.
Consistent with the foregoing, the Base Interest Fraction is equal to:
(Pass-Through Rate - Discount Rate)
|
THE INFORMATION IN THIS STRUCTURAL AND COLLATERAL TERM SHEET IS NOT COMPLETE AND MAY BE AMENDED PRIOR TO THE TIME OF SALE. THIS TERM SHEET IS NOT AN OFFER TO SELL THESE SECURITIES AND IT IS NOT A SOLICITATION OF AN OFFER TO BUY THESE SECURITIES IN ANY JURISDICTION WHERE THE OFFER OR SALE IS NOT PERMITTED.
11
UBS 2019-C17
| STRUCTURE OVERVIEW |
| Whole Loans: | The mortgaged properties identified on Annex A-1 to the Preliminary Prospectus as Grand Canal Shoppes, Phoenix Industrial Portfolio II, 600 & 620 National Avenue, 10000 Santa Monica Boulevard, Global Data Center, The Chantilly Office Portfolio, Smoke Tree Village and Smoke Tree Commons, CIRE Equity Retail & Industrial Portfolio, Gatlin Retail Portfolio, Ambler Yards, Blackmore Marketplace, Maui Portfolio, Landing at Fancher Creek, Courtyard by Marriott Secaucus and Meidinger Tower each secure both a mortgage loan to be included in the trust fund and one or more other mortgage loans that will not be included in the trust fund, each of which will bepari passu or subordinate in right of payment with the related mortgage loan included in the trust fund. We refer to each such group of mortgage loans as a “whole loan”. The Phoenix Industrial Portfolio II whole loan, the 600 & 620 National Avenue whole loan, the Global Data Center whole loan, The Chantilly Office Portfolio whole loan, the Smoke Tree Village and Smoke Tree Commons whole loan, the Gatlin Retail Portfolio whole loan, the Ambler Yards whole loan, the Blackmore Marketplace whole loan and the Courtyard by Marriott Secaucus whole loan will be principally serviced under the PSA for the UBS 2019-C17 securitization (each, a “Serviced Whole Loan”). The Grand Canal Shoppes whole loan is serviced under the pooling and servicing agreement for the MSC 2019-H7 securitization. The 10000 Santa Monica Boulevard whole loan is serviced under the trust and servicing agreement for the NCMS 2019-10K securitization. The CIRE Equity Retail & Industrial Portfolio whole loan is serviced under the pooling and servicing agreement for the Benchmark 2019-B12 securitization. The Maui Portfolio whole loan and the Meidinger Tower whole loan are each serviced under the pooling and servicing agreement for the BBCMS 2019-C4 securitization. The Landing at Fancher Creek whole loan (the “Servicing Shift Whole Loan”) is expected to initially be serviced under the UBS 2019-C17 PSA until the date of securitization of the related controllingpari passu note (the “Servicing Shift Securitization Date”), after which such whole loan will be serviced under the pooling and servicing agreement related to the securitization of the related controllingpari passu note (the “Servicing Shift PSA”). The master servicer and special servicer under the Servicing Shift PSA will be identified in a notice, report or statement to holders of the UBS 2019-C17 certificates after the securitization of the related controllingpari passu note.
As of the Closing Date, thepari passucompanion loans in the whole loans are expected to be held by the party identified below under “Overview of Mortgage Pool Characteristics—Pari Passu Companion Loan Summary”.
|
| Control Rights and Directing Certificateholder: | The “Directing Certificateholder” (i) with respect to the Servicing Shift Mortgage Loan, will be the related Loan-Specific Directing Certificateholder, and (ii) with respect to the Serviced Mortgage Loan (other than the Servicing Shift Mortgage Loan), will be the Controlling Class Certificateholder (or its representative) selected by more than 50% of the Controlling Class Certificateholders, by Certificate Balance, as determined by the certificate registrar from time to time;provided,however, that (for the purposes of clause (ii) above in this definition) (1) absent that selection, (2) until a Directing Certificateholder is so selected, or (3) upon receipt of a notice from a majority of the Controlling Class Certificateholders, by Certificate Balance, that a Directing Certificateholder is no longer designated, the Controlling Class Certificateholder that owns the largest aggregate Certificate Balance of the Controlling Class (or its representative) will be the Directing Certificateholder;provided,however, that (i) in the case of this clause (3), in the event no one holder owns the largest aggregate Certificate Balance of the Controlling Class, then there will be no Directing Certificateholder until appointed in accordance with the terms of the PSA, and (ii) the certificate administrator and the other parties to the PSA will be entitled to assume that the identity of the Directing Certificateholder has not changed until such parties receive written notice of a replacement of the Directing Certificateholder from a party holding the requisite interest in the Controlling Class (as confirmed by the certificate registrar), or the resignation of the then-current Directing Certificateholder.
The Directing Certificateholder will be entitled to direct the Special Servicer to take, or refrain from taking certain actions with respect to each Serviced Mortgage Loan and any related Serviced Companion Loans. Furthermore, the Directing Certificateholder will also have the right to receive notice and consent to certain material actions that the Master Servicer and the Special Servicer proposes to take with respect to each Serviced Mortgage Loan and any related Serviced Companion Loans.
It is expected that RREF III-D UBSCM 2019-C17 MOA-HRR, LLC, or its affiliate, will be the initial Directing Certificateholder with respect to each Serviced Mortgage Loan (other than the Servicing Shift Mortgage Loan) and any related Serviced Companion Loans. |
THE INFORMATION IN THIS STRUCTURAL AND COLLATERAL TERM SHEET IS NOT COMPLETE AND MAY BE AMENDED PRIOR TO THE TIME OF SALE. THIS TERM SHEET IS NOT AN OFFER TO SELL THESE SECURITIES AND IT IS NOT A SOLICITATION OF AN OFFER TO BUY THESE SECURITIES IN ANY JURISDICTION WHERE THE OFFER OR SALE IS NOT PERMITTED.
12
UBS 2019-C17
| STRUCTURE OVERVIEW |
With respect to the Servicing Shift Whole Loan, prior to the Servicing Shift Securitization Date, the rights of the Directing Certificateholder described above will be subject to the control rights of the related controllingpari passu companion loan as described below.
Notwithstanding any contrary description set forth above, with respect to the Phoenix Industrial Portfolio II mortgage loan, the 600 & 620 National Avenue mortgage loan, the Global Data Center mortgage loan, The Chantilly Office Portfolio mortgage loan, the Smoke Tree Village and Smoke Tree Commons mortgage loan, the Gatlin Retail Portfolio mortgage loan, the Ambler Yards mortgage loan, the Blackmore Marketplace mortgage loan and the Courtyard by Marriott Secaucus mortgage loan, the holder of the relatedpari passu companion loan (or its representative, including any directing certificateholder under any securitization of suchpari passu companion loan(s)) will have consultation rights with respect to asset status reports and material special servicing actions involving the related whole loan, as provided for in the related intercreditor agreement and as described in the Preliminary Prospectus, and those rights will be in addition to the rights of the directing certificateholder in this transaction described above.
Notwithstanding any contrary description set forth above, with respect to the Grand Canal Shoppes mortgage loan, the 10000 Santa Monica Boulevard mortgage loan, the CIRE Equity Retail & Industrial Portfolio mortgage loan, the Maui Portfolio mortgage loan and the Meidinger Tower mortgage loan, in general the related whole loan will be serviced under the pooling and servicing agreement or trust and servicing agreement as indicated in the “Pari Passu Companion Loan Summary” table below, which grants the related directing certificateholder (or, in the case of the Servicing Shift Whole Loan prior to the securitization of the related controllingpari passunote, the related controlling noteholder) under the related securitization control rights that may include the right to approve or disapprove various material servicing actions involving the related whole loan. The directing certificateholder for this securitization (so long as no Consultation Termination Event has occurred and is occurring) will nonetheless have the right to be consulted on a non-binding basis with respect to such actions. For purposes of the servicing of the related whole loan, the occurrence and continuance of a Control Termination Event or Consultation Termination Event under this securitization will not limit the control or other rights of the directing certificateholder (or equivalent) under the related securitization.
Notwithstanding any contrary description set forth above, with respect to the Landing at Fancher Creek mortgage loan, in general, the related whole loan will be serviced (i) prior to the Servicing Shift Securitization Date, under the pooling and servicing agreement for this securitization and (ii) after the Servicing Shift Securitization Date, under the Servicing Shift PSA, which grants, or is expected to grant, to the related controlling noteholder or its representative control rights that include the right to approve or disapprove various material servicing actions involving the related whole loan. The Directing Certificateholder for this securitization (so long as no Consultation Termination Event has occurred and is occurring) will nonetheless have the right to be consulted on a non-binding basis with respect to such actions. For purposes of the servicing of the Servicing Shift Whole Loan, the occurrence and continuance of a Control Termination Event or Consultation Termination Event under this securitization will not limit the control or other rights of the controlling noteholder, and the securitization of the related controllingpari passu companion loan will not limit the consultation rights of the Directing Certificateholder under this securitization.
For a description of the directing holder for each Non-Serviced Whole Loan, see “Description of the Mortgage Pool—The Whole Loans” and “Pooling and Servicing Agreement—The Directing Certificateholder—Rights of the Directing Certificateholder appointed by the Controlling Class with respect to Non-Serviced Mortgage Loans or the Servicing Shift Whole Loan” in the Preliminary Prospectus.
| |
| Control Eligible Certificates: | Class G and Class NR-RR Certificates. |
| Controlling Class: | The “Controlling Class” will be, as of any time of determination, the most subordinate class of Control Eligible Certificates then-outstanding that has an aggregate Certificate Balance (as notionally reduced by any Cumulative Appraisal Reduction Amounts (as defined below) allocable to such class) at least equal to 25% of the initial Certificate Balance of that class;provided,however, that if at any time the Certificate Balances of the certificates other than the Control Eligible Certificates have been reduced to zero as a result of principal payments on the mortgage loans, then the Controlling Class will be the most subordinate class of |
THE INFORMATION IN THIS STRUCTURAL AND COLLATERAL TERM SHEET IS NOT COMPLETE AND MAY BE AMENDED PRIOR TO THE TIME OF SALE. THIS TERM SHEET IS NOT AN OFFER TO SELL THESE SECURITIES AND IT IS NOT A SOLICITATION OF AN OFFER TO BUY THESE SECURITIES IN ANY JURISDICTION WHERE THE OFFER OR SALE IS NOT PERMITTED.
13
UBS 2019-C17
| STRUCTURE OVERVIEW |
Control Eligible Certificates that has a Certificate Balance greater than zero without regard to any Cumulative Appraisal Reduction Amounts. The Controlling Class as of the Closing Date will be the Class NR-RR certificates. | |
| Appraised-Out Class: | An “Appraised-Out Class” is any class of Control Eligible Certificates that is determined at any time of determination to no longer be the Controlling Class as a result of the application of any Appraisal Reduction Amounts or Collateral Deficiency Amounts to notionally reduce the Certificate Balance of the constituent classes. No Appraised-Out Class may exercise any direction, control, consent and/or similar rights of the Controlling Class until such time, if any, as such class is reinstated as the Controlling Class, and the rights of the Controlling Class will be exercised by the next most senior class of Control Eligible Certificates that is not an Appraised-Out Class, if any, during such period. |
| Remedies Available to Holders of an Appraised-Out Class: | The holder of the majority (by Certificate Balance) of an Appraised-Out Class will have the right, at its sole expense, to require the Special Servicer to order a second appraisal of any mortgage loan (or Serviced Whole Loan) for which an appraisal reduction event has occurred or as to which there exists a Collateral Deficiency Amount (such holders, the “Requesting Holders”). The Special Servicer will use its reasonable best efforts to ensure that such appraisal is delivered within 30 days from receipt of the Requesting Holders’ written request and will ensure that such appraisal is prepared on an “as-is” basis by an MAI appraiser. Upon receipt of such supplemental appraisal, the Special Servicer will be required to determine, in accordance with the Servicing Standard, whether, based on its assessment of such supplemental appraisal, any recalculation of the applicable Appraisal Reduction Amount or Collateral Deficiency Amount, as applicable, is warranted and, if so warranted, will recalculate such Appraisal Reduction Amount or Collateral Deficiency Amount, as applicable, based upon such supplemental appraisal and receipt of information requested by the Special Servicer from the Master Servicer. If required by any such recalculation, the applicable Appraised-Out Class will be reinstated as the Controlling Class and each other Appraised-Out Class will, if applicable, have its related Certificate Balance notionally restored to the extent required by such recalculation of the Appraisal Reduction Amount or Collateral Deficiency Amount, if applicable. The Certificate Administrator, the Operating Advisor and the Master Servicer will be entitled to conclusively rely on the Special Servicer’s calculation or determination of any Collateral Deficiency Amount. |
| Control Rights: | Subject to the rights of the holder of the related controllingpari passu companion loan or Subordinate Companion Loan, as applicable, with respect to a Servicing Shift Whole Loan, prior to a Control Termination Event, the Directing Certificateholder appointed by the Controlling Class Certificateholder will have certain consent and consultation rights under the PSA with respect to certain major decisions and other matters. A “Control Termination Event” will occur when (i) the Class G certificates have a Certificate Balance (taking into account the application of any Cumulative Appraisal Reduction Amounts to notionally reduce the Certificate Balance of such class) of less than 25% of the initial Certificate Balance of such class; or (ii) a holder of the Class G certificates is the majority Controlling Class Certificateholder and has irrevocably waived its right, in writing, to exercise any of the rights of the Controlling Class Certificateholder and such rights have not been reinstated to a successor Controlling Class Certificateholder;provided that no Control Termination Event may occur with respect to a Loan-Specific Directing Certificateholder and the term “Control Termination Event” will not be applicable to a Loan-Specific Directing Certificateholder;provided, further,that a Control Termination Event will not be deemed continuing in the event that the Certificate Balances of the Certificates other than the Control Eligible Certificates have been reduced to zero as a result of principal payments on the mortgage loans.
After the occurrence of a Control Termination Event but prior to the occurrence of a Consultation Termination Event, the Directing Certificateholder appointed by the Controlling Class Certificateholder will not have any consent rights, but such Directing Certificateholder will have certain non-binding consultation rights under the PSA with respect to certain major decisions and other matters. A “Consultation Termination Event” will occur when (i) there is no class of Control Eligible Certificates that has a then-outstanding Certificate Balance at least equal to 25% of the initial Certificate Balance of that class, in each case, without regard to the application of any Cumulative Appraisal Reduction Amounts; or (ii) a holder of the Class G certificates is the majority Controlling Class Certificateholder and has irrevocably waived its right, in writing, to exercise any of the rights of the Controlling Class Certificateholder and such rights have not been reinstated to a successor Controlling Class |
THE INFORMATION IN THIS STRUCTURAL AND COLLATERAL TERM SHEET IS NOT COMPLETE AND MAY BE AMENDED PRIOR TO THE TIME OF SALE. THIS TERM SHEET IS NOT AN OFFER TO SELL THESE SECURITIES AND IT IS NOT A SOLICITATION OF AN OFFER TO BUY THESE SECURITIES IN ANY JURISDICTION WHERE THE OFFER OR SALE IS NOT PERMITTED.
14
UBS 2019-C17
| STRUCTURE OVERVIEW |
Certificateholder (providedthat no Consultation Termination Event resulting solely from the operation of clause (ii) will be deemed to have existed or be in continuance with respect to a successor holder of the Class G certificates that has not irrevocably waived its right to exercise any of the rights of the Controlling Class Certificateholder);provided,further, that no Consultation Termination Event may occur with respect to a Loan-Specific Directing Certificateholder and the term “Consultation Termination Event” will not be applicable to a Loan-Specific Directing Certificateholder;provided,further, that a Consultation Termination Event will not be deemed continuing in the event that the Certificate Balances of the certificates other than the Control Eligible Certificates have been reduced to zero as a result of principal payments on the mortgage loans.
After the occurrence of a Consultation Termination Event, the Directing Certificateholder appointed by the Controlling Class Certificateholder will not have any consent or consultation rights, except with respect to any rights expressly set forth in the PSA.
Notwithstanding the proviso to the definitions of “Control Termination Event” and “Consultation Termination Event,” a Control Termination Event and a Consultation Termination Event will be deemed to have occurred with respect to any Excluded Loan with respect to the Directing Certificateholder or the holder of the majority of the Controlling Class, and neither the Directing Certificateholder nor any Controlling Class Certificateholder will have any consent or consultation rights with respect to the servicing of such Excluded Loan.
An “Excluded Loan” means (a) with respect to the Directing Certificateholder or the holder of the majority of the Controlling Class, a mortgage loan or whole loan with respect to which, as of any date of determination, the Directing Certificateholder or the holder of the majority of the Controlling Class is a Borrower Party or (b) with respect to the Risk Retention Consultation Party or the holder of the majority of the VRR Interest, a mortgage loan or whole loan with respect to which, as of any date of determination, the Risk Retention Consultation Party or the holder of the majority of the VRR Interest is a Borrower Party. As of the Closing Date, it is expected that there will be no Excluded Loans with respect to this securitization.
“Borrower Party” means a borrower, a mortgagor, a manager of a mortgaged property, a mezzanine lender under a mezzanine loan that has been accelerated or as to which foreclosure or enforcement proceedings have been commenced against the equity collateral pledged to secure the related mezzanine loan, or any Borrower Party Affiliate.
“Borrower Party Affiliate” means, with respect to a borrower, a mortgagor, a manager of a mortgaged property or a mezzanine lender under a mezzanine loan that has been accelerated or as to which foreclosure or enforcement proceedings have been commenced against the equity collateral pledged to secure the related mezzanine loan, (a) any other person controlling or controlled by or under common control with such borrower, mortgagor, manager or mezzanine lender under a mezzanine loan that has been accelerated or as to which foreclosure or enforcement proceedings have been commenced against the equity collateral pledged to secure the related mezzanine loan, as applicable, or (b) any other person owning, directly or indirectly, 25% or more of the beneficial interests in such borrower, mortgagor, manager or mezzanine lender under a mezzanine loan that has been accelerated or as to which foreclosure or enforcement proceedings have been commenced against the equity collateral pledged to secure the related mezzanine loan, as applicable. For the purposes of this definition, “control” when used with respect to any specified person means the power to direct the management and policies of such person, directly or indirectly, whether through the ownership of voting securities, by contract or otherwise and the terms “controlling” and “controlled” have meanings correlative to the foregoing.
Notwithstanding any of the foregoing to the contrary, if any mortgage loan is part of a whole loan, the consent and/or consultation rights of a Controlling Class Certificateholder with respect thereto may be limited as described in the Preliminary Prospectus. In particular, with respect to each Non-Serviced Whole Loan, the Directing Certificateholder will only have certain consultation rights with respect to certain “major decisions” and other matters related to such whole loan, in each case only prior to a Control Termination Event or Consultation Termination Event, as applicable, and the controlling noteholder (or its representative) will be entitled to similar consent and/or consultation rights with respect to such whole loan. |
THE INFORMATION IN THIS STRUCTURAL AND COLLATERAL TERM SHEET IS NOT COMPLETE AND MAY BE AMENDED PRIOR TO THE TIME OF SALE. THIS TERM SHEET IS NOT AN OFFER TO SELL THESE SECURITIES AND IT IS NOT A SOLICITATION OF AN OFFER TO BUY THESE SECURITIES IN ANY JURISDICTION WHERE THE OFFER OR SALE IS NOT PERMITTED.
15
UBS 2019-C17
| STRUCTURE OVERVIEW |
| Operating Advisor Consultation Event: | An “Operating Advisor Consultation Event” will occur when the Certificate Balance of the Class NR-RR Certificates (taking into account the application of any Cumulative Appraisal Reduction Amounts to notionally reduce the Certificate Balances of such classes) is 25% or less of the initial Certificate Balances of such class. |
| Appointment and Replacement of Special Servicer: | The Directing Certificateholder will appoint the initial Special Servicer as of the Closing Date. Prior to the occurrence and continuance of a Control Termination Event, the Directing Certificateholder generally may replace the Special Servicer with or without cause at any time.
Upon the occurrence and during the continuance of a Control Termination Event, the Directing Certificateholder appointed by the Controlling Class Certificateholder will no longer have the right to replace the Special Servicer and such replacement will occur based on a vote of holders of all voting eligible classes of certificates as described in “Replacement of Special Servicer by Vote of Certificateholders” below.
The Operating Advisor may also recommend the replacement of the Special Servicer at any time as described in “Operating Advisor” below.
|
| Replacement of Special Servicer by Vote of Certificateholders: | After the occurrence and during the continuance of a Control Termination Event, upon (a) the written direction of holders of Principal Balance Certificates evidencing not less than 25% of the Voting Rights (taking into account the application of any Cumulative Appraisal Reduction Amounts to notionally reduce the Certificate Balances) of the Principal Balance Certificates requesting a vote to replace the Special Servicer with a new special servicer, (b) payment by such requesting holders to the Certificate Administrator of all reasonable fees and expenses (including any legal fees and any Rating Agency fees and expenses) to be incurred by the Certificate Administrator in connection with administering such vote (which fees and expenses will not be additional trust fund expenses), and (c) delivery by such holders to the Certificate Administrator and the Trustee of Rating Agency Confirmation from each Rating Agency (such Rating Agency Confirmation will be obtained at the expense of the holders of certificates requesting such vote) and confirmation from the applicable rating agencies that the contemplated appointment or replacement will not result in the downgrade, withdrawal or qualification of the then-current ratings of any class of any related Serviced Pari Passu Companion Loan Securities, the Certificate Administrator will be required to post such notice on the Certificate Administrator’s website and concurrently by mail and conduct the solicitation of votes of all certificates in such regard, which requisite affirmative votes must be received within 180 days of the posting of such notice. Upon the written direction of holders of Principal Balance Certificates evidencing at least 66-2/3% of a Certificateholder Quorum, the Trustee will be required to terminate all of the rights and obligations of the Special Servicer under the PSA and replace the Special Servicer with a qualified replacement special servicer designated by such holders of certificates, subject to indemnification, right to outstanding fees, reimbursement of Advances and other rights set forth in the PSA, which survive such termination.
A “Certificateholder Quorum” means, the holders of certificates evidencing at least 50% of the aggregate Voting Rights (taking into account the application of Realized Losses and, other than with respect to the termination of the Asset Representations Reviewer, the application of any Cumulative Appraisal Reduction Amounts to notionally reduce the Certificate Balance of the certificates) of all classes of certificates entitled to principal on an aggregate basis.
With respect to each Serviced Whole Loan, any holder of a relatedpari passucompanion loan, following a Servicer Termination Event with respect to the related Special Servicer that remains unremedied and affects such holder, will be entitled to direct the Trustee (and the Trustee will be required) to terminate the Special Servicer solely with respect to such Serviced Whole Loan. A replacement special servicer will be selected by the Trustee or, prior to a Control Termination Event, by the Directing Certificateholder;providedthat any successor special servicer appointed to replace the Special Servicer with respect to such whole loan can generally not be the entity (or its affiliate) that was terminated at the direction of the holder of the relatedpari passucompanion loan, without the prior written consent of such holder of the related Serviced Companion Loan.
With respect to any Non-Serviced Whole Loan, the UBS Commercial Mortgage Trust 2019-C17, as holder of the related mortgage loan, has the right to terminate the Special Servicer under the related pooling and servicing agreement if a servicer termination event occurs, with respect to such special servicer that affects the trust in its capacity as such holder. |
THE INFORMATION IN THIS STRUCTURAL AND COLLATERAL TERM SHEET IS NOT COMPLETE AND MAY BE AMENDED PRIOR TO THE TIME OF SALE. THIS TERM SHEET IS NOT AN OFFER TO SELL THESE SECURITIES AND IT IS NOT A SOLICITATION OF AN OFFER TO BUY THESE SECURITIES IN ANY JURISDICTION WHERE THE OFFER OR SALE IS NOT PERMITTED.
16
UBS 2019-C17
| STRUCTURE OVERVIEW |
| Such rights may be exercised by the Directing Certificateholder prior to a Control Termination Event. The successor special servicer will be selected pursuant to the applicable pooling and servicing agreement by the related directing holder prior to a control termination event under such pooling and servicing agreement. | |
| Workout and Liquidation Fees: | The Special Servicer will also be entitled to (i) liquidation fees generally equal to 1.0% (or, if such rate would result in an aggregate liquidation fee less than $25,000, then the liquidation fee rate will be equal to such rate as would result in an aggregate liquidation fee equal to $25,000) of liquidation proceeds and certain other collections in respect of a Specially Serviced Loan and REO Property and of amounts received in respect of mortgage loan repurchases by the related mortgage loan sellers (less any Excess Modification Fees paid by or on behalf of the related borrower with respect to the related mortgage loan (including a Serviced Companion Loan) or REO Property and received by the Special Servicer within the prior 12 months); and (ii) workout fees generally equal to 1.0% (of interest and principal payments made in respect of a rehabilitated mortgage loan (and any related Serviced Companion Loan)), subject to a floor of $25,000 with respect to any mortgage loan, whole loan or related REO Property, subject to certain adjustments and exceptions as described in the Preliminary Prospectus under “Pooling and Servicing Agreement—Servicing and Other Compensation and Payment of Expenses—Special Servicing Compensation”. |
| Special Servicer Compensation: | The special servicing fee for each distribution date is calculated based on the outstanding principal balance of each Serviced Mortgage Loan that is a Specially Serviced Loan (and any related Serviced Companion Loan) or as to which the related mortgaged property has become an REO Property at the special servicing fee rate, which will be a rate equal to the greater of aper annumrate of 0.25000% and theper annum rate that would result in a special servicing fee of $3,500. The special servicing fee will be payable monthly,first, from liquidation proceeds, insurance and condemnation proceeds, and other collections in respect of the related Specially Serviced Loan or REO Property and,then, from general collections on all the mortgage loans (other than a Non-Serviced Mortgage Loan) and any REO Properties.
With respect to any Non-Serviced Mortgage Loan, the related special servicer under the related other pooling and servicing agreement pursuant to which such mortgage loan is being serviced will be entitled to similar compensation as that described above with respect to such Non-Serviced Mortgage Loan under such other pooling and servicing agreement as further described in the Preliminary Prospectus, although any related fees may accrue at a different rate and there may be a higher (or no) cap on liquidation and workout fees.
|
| Risk Retention Consultation Party: | A risk retention consultation party may be appointed by the holder or holders of more than 50% of the VRR Interest by Certificate Balance. Such holder or holders will have a continuing right to appoint, remove or replace the risk retention consultation party in its sole discretion. This right may be exercised at any time and from time to time.
Except with respect to an Excluded Loan as to such party, the risk retention consultation party will be entitled to consult with the Special Servicer, upon request of the risk retention consultation party, with respect to certain material servicing actions proposed by the Special Servicer with respect to Specially Serviced Mortgage Loans. See “Pooling and Servicing Agreement—The Risk Retention Consultation Party” in the Preliminary Prospectus.
|
| Operating Advisor: | The Operating Advisor will initially be Pentalpha Surveillance LLC. The Operating Advisor will have certain review and consultation rights relating to the performance of the Special Servicer and with respect to its actions taken in connection with the resolution and/or liquidation of Specially Serviced Loans. With respect to each mortgage loan or Serviced Whole Loan (in each case, other than a Non-Serviced Mortgage Loan or Servicing Shift Whole Loan), the Operating Advisor will be responsible for:
● reviewing the actions of the Special Servicer with respect to any Specially Serviced Loan to the extent described in the Preliminary Prospectus and required under the PSA;
● reviewing (i) all reports by the Special Servicer made available to Privileged Persons on the Certificate Administrator’s website and (ii) each Asset Status Report (after the occurrence and during the continuance of an Operating Advisor Consultation Event) and Final Asset Status Report; |
THE INFORMATION IN THIS STRUCTURAL AND COLLATERAL TERM SHEET IS NOT COMPLETE AND MAY BE AMENDED PRIOR TO THE TIME OF SALE. THIS TERM SHEET IS NOT AN OFFER TO SELL THESE SECURITIES AND IT IS NOT A SOLICITATION OF AN OFFER TO BUY THESE SECURITIES IN ANY JURISDICTION WHERE THE OFFER OR SALE IS NOT PERMITTED.
17
UBS 2019-C17
| STRUCTURE OVERVIEW |
● reviewing for accuracy and consistency with the PSA the mathematical calculations and the corresponding application of the non-discretionary portion of the applicable formulas required to be utilized in connection with Appraisal Reduction Amounts, Collateral Deficiency Amounts and net present value calculations used in the Special Servicer’s determination of what course of action to take in connection with the workout or liquidation of a Specially Serviced Loan; and
● preparing an annual report (if any mortgage loan (other than any Non-Serviced Mortgage Loan or Servicing Shift Mortgage Loan) or Serviced Whole Loan (other than a Servicing Shift Whole Loan) was a Specially Serviced Loan at any time during the prior calendar year or if the Operating Advisor was entitled to consult with the Special Servicer with respect to any major decision during the prior calendar year) that sets forth whether the Operating Advisor believes, in its sole discretion exercised in good faith, that the Special Servicer is operating in compliance with the Servicing Standard with respect to its performance of its duties under the PSA with respect to Specially Serviced Loans (and, after the occurrence and continuance of an Operating Advisor Consultation Event, with respect to major decisions on non-Specially Serviced Loans) during the prior calendar year on an “platform-level basis”. The Operating Advisor will identify (1) which, if any, standards the Operating Advisor believes, in its sole discretion exercised in good faith, the Special Servicer has failed to comply and (2) any material deviations from the Special Servicer’s obligations under the PSA with respect to the resolution or liquidation of any Specially Serviced Loan or REO Property (other than with respect to any REO Property related to any Non-Serviced Mortgage Loan or Servicing Shift Mortgage Loan). In preparing any Operating Advisor Annual Report, the Operating Advisor will not be required to (i) report on instances of non-compliance with, or deviations from, the Servicing Standard or the Special Servicer’s obligations under the PSA that the Operating Advisor determines, in its sole discretion exercised in good faith, to be immaterial or (ii) provide or obtain a legal opinion, legal review or legal conclusion.
With respect to each mortgage loan (other than any Non-Serviced Mortgage Loan) or Serviced Whole Loan, after the Operating Advisor has received notice that an Operating Advisor Consultation Event has occurred and is continuing, in addition to the duties described above, the Operating Advisor will be required to perform the following additional duties:
● to consult (on a non-binding basis) with the Special Servicer in respect of Asset Status Reports; and
● to consult (on a non-binding basis) with the Special Servicer with respect to “major decisions” processed by the Special Servicer.
In addition, if at any time the Operating Advisor determines, in its sole discretion exercised in good faith, that (1) the Special Servicer is not performing its duties as required under the PSA or is otherwise not acting in accordance with the Servicing Standard and (2) the replacement of the Special Servicer would be in the best interest of the Certificateholders as a collective whole, then the Operating Advisor will have the right to recommend the replacement of the Special Servicer and will submit its formal recommendation to the Trustee and the Certificate Administrator (along with its rationale, its proposed replacement special servicer and other relevant information justifying its recommendation).*
The Operating Advisor’s recommendation to replace the Special Servicer must be confirmed within 180 days of the report being posted to the Certificate Administrator’s internet website by an affirmative vote of holders of Certificates evidencing at least a majority of a quorum of Certificateholders (which, for this purpose, is the holders of Certificates that (i) evidence at least 20% of the Voting Rights (taking into account the application of any appraisal reduction amounts to notionally reduce the respective Certificate Balances) of all Principal Balance Certificates on an aggregate basis, and (ii) consist of at least three Certificateholders or certificate owners that are not affiliated with each other). In the event the holders of Principal Balance Certificates evidencing at least a majority of a quorum of Certificateholders elect to remove and replace the Special Servicer (which requisite affirmative votes must be received within 180 days of the posting of the notice of the Operating Advisor’s recommendation to replace the Special Servicer to the Certificate Administrator’s website), the Certificate Administrator will be required to receive a Rating Agency Confirmation from each of the Rating |
THE INFORMATION IN THIS STRUCTURAL AND COLLATERAL TERM SHEET IS NOT COMPLETE AND MAY BE AMENDED PRIOR TO THE TIME OF SALE. THIS TERM SHEET IS NOT AN OFFER TO SELL THESE SECURITIES AND IT IS NOT A SOLICITATION OF AN OFFER TO BUY THESE SECURITIES IN ANY JURISDICTION WHERE THE OFFER OR SALE IS NOT PERMITTED.
18
UBS 2019-C17
| STRUCTURE OVERVIEW |
| Agencies at that time, and confirmation from the applicable rating agencies that such replacement will not result in the downgrade, withdrawal or qualification of the then-current ratings of any class of any related Serviced Pari Passu Companion Loan Securities.
| |
| Asset Representations Reviewer: | The Asset Representations Reviewer will be required to review certain delinquent mortgage loans after a specified delinquency threshold has been met and the required percentage of Certificateholders vote to direct a review as described below. The Asset Representations Reviewer will be entitled to the Asset Representations Reviewer Fee with respect to such review. See “Pooling and Servicing Agreement—The Asset Representations Reviewer” in the Preliminary Prospectus.
The Certificate Administrator will be required to notify Certificateholders if the specified delinquency threshold has been met as described in the Preliminary Prospectus under “Pooling and Servicing Agreement—The Asset Representations Reviewer”.
If Certificateholders evidencing not less than 5.0% of the Voting Rights request a vote to commence an Asset Review, and if subsequently (i) a majority of those Certificateholders who cast votes and (ii) a majority of an Asset Review Quorum authorizes an Asset Review within 150 days of the request for a vote, the Asset Representations Reviewer will be required to conduct an Asset Review of delinquent loans.
The Asset Representations Reviewer may be terminated and replaced without cause. Upon (i) the written direction of Certificateholders evidencing not less than 25% of the Voting Rights (without regard to the application of any Cumulative Appraisal Reduction Amounts) requesting a vote to terminate and replace the Asset Representations Reviewer with a proposed successor Asset Representations Reviewer that is an eligible Asset Representations Reviewer, and (ii) payment by such holders to the Certificate Administrator of the reasonable fees and expenses to be incurred by the Certificate Administrator in connection with administering such vote, the Certificate Administrator will be required to promptly provide notice to all Certificateholders and the Asset Representations Reviewer of such request by posting such notice on its website, and by mailing such notice to all Certificateholders and the Asset Representations Reviewer. Upon the written direction of Certificateholders evidencing at least 75% of a Certificateholder Quorum (without regard to the application of any Cumulative Appraisal Reduction Amounts), the Trustee will be required to terminate all of the rights and obligations of the Asset Representations Reviewer under the PSA (other than any rights or obligations that accrued prior to the date of such termination and other than indemnification rights (arising out of events occurring prior to such termination)) by written notice to the Asset Representations Reviewer, and the proposed successor asset representations reviewer will be appointed. See “Pooling and Servicing Agreement—The Asset Representations Reviewer” in the Preliminary Prospectus.
An “Asset Review Quorum” means, in connection with any solicitation of votes to authorize an Asset Review as described above, the holders of certificates evidencing at least 5.0% of the aggregate Voting Rights represented by all certificates that have Voting Rights.
|
| Dispute Resolution Provisions: | The mortgage loan sellers will be subject to the dispute resolution provisions set forth in the PSA to the extent those provisions are triggered with respect to any mortgage loan sold to the depositor by a mortgage loan seller, and such mortgage loan seller will be obligated under the related mortgage loan purchase agreement to comply with all applicable provisions and to take part in any mediation or arbitration proceedings that may result. Generally, in the event that a Repurchase Request is not “Resolved” within 180 days after the related mortgage loan seller receives such Repurchase Request, then the Enforcing Servicer will be required to send a notice to the first Certificateholder (or beneficial owner) to deliver a Certificateholder repurchase request with respect to the mortgage loan (the “Initial Requesting Certificateholder”) (if any) and to the Certificate Administrator (which will be required to make such notice available to Certificateholders via the Certificate Administrator’s website) indicating the Enforcing Servicer’s intended course of action with respect to the Repurchase Request. If (a) the Enforcing Servicer’s intended course of action with respect to the Repurchase Request does not involve pursuing further action to exercise rights against the related mortgage loan seller with respect to the Repurchase Request and the Initial Requesting Certificateholder, if any, or any other Certificateholder or certificate owner wishes to exercise its right to refer the matter to mediation (including nonbinding arbitration) or arbitration, or (b) the Enforcing Servicer’s intended course of action is to pursue further action to exercise rights against the related mortgage loan seller with respect |
THE INFORMATION IN THIS STRUCTURAL AND COLLATERAL TERM SHEET IS NOT COMPLETE AND MAY BE AMENDED PRIOR TO THE TIME OF SALE. THIS TERM SHEET IS NOT AN OFFER TO SELL THESE SECURITIES AND IT IS NOT A SOLICITATION OF AN OFFER TO BUY THESE SECURITIES IN ANY JURISDICTION WHERE THE OFFER OR SALE IS NOT PERMITTED.
19
UBS 2019-C17
| STRUCTURE OVERVIEW |
to the Repurchase Request but the Initial Requesting Certificateholder, if any, or any other Certificateholder or certificate owner does not agree with the dispute resolution method selected by the Enforcing Servicer, then the Initial Requesting Certificateholder, if any, or such other Certificateholder or certificate owner may deliver a written notice to the Enforcing Servicer within 30 days from the date the Proposed Course of Action Notice is posted on the certificate administrator’s website indicating its intent to exercise its right to refer the matter to either mediation or arbitration.
“Resolved” means, with respect to a Repurchase Request, (i) that the related Material Defect has been cured, (ii) the related mortgage loan has been repurchased in accordance with the related mortgage loan purchase agreement, (iii) a mortgage loan has been substituted for the related mortgage loan in accordance with the related mortgage loan purchase agreement, (iv) the applicable mortgage loan seller has made a loss of value payment, (v) a contractually binding agreement is entered into between the Enforcing Servicer, on behalf of the issuing entity, and the related mortgage loan seller that settles the related mortgage loan seller’s obligations under the related mortgage loan purchase agreement, or (vi) the related mortgage loan is no longer property of the issuing entity as a result of a sale or other disposition in accordance with the PSA. See “Pooling and Servicing Agreement—Dispute Resolution Provisions” in the Preliminary Prospectus. | |
| Credit Risk Retention: | RREF is expected to act as the “retaining sponsor” for this securitization and intends to satisfy the U.S. credit risk retention requirement through the purchase by one or more of its “majority-owned affiliates” (as defined in the credit risk retention rules), from the underwriters and initial purchasers, on the Closing Date, of (i) an “eligible horizontal residual interest” comprised of the Class NR-RR certificates that are not part of the VRR Interest and (ii) an “eligible vertical interest” comprised of a certain percentage of the certificate balance, notional amount or percentage interest in each class of certificates (other than the Class R certificates). The aggregate estimated fair value of the “eligible horizontal residual interest” will equal approximately 1.26627% of the estimated fair value of all of the certificates (other than the Class R certificates) issued by the issuing entity and the VRR Interest will consist of the portion of each class of certificates (other than the Class R certificates) necessary to satisfy the credit risk retention rules.
RREF, in its capacity as the “retaining sponsor” for this transaction, will be required to comply with the hedging, transfer and financing restrictions applicable to a “retaining sponsor” under the credit risk retention rules, which generally prohibit the transfer of the applicable Certificates, other than to a majority owned affiliate of RREF, until October 15, 2024. After that date, transfers of the Class NR-RR certificates (other than the portion of each such class that is part of the VRR Interest) are permitted under certain circumstances, in accordance with the credit risk retention rules, to a successor “third party purchaser”. The restrictions on hedging and transfer under the credit risk retention rules as in effect on the Closing Date of this transaction will expire on and after the date that is the latest of (i) the date on which the total unpaid principal balance of the mortgage loans has been reduced to 33% of the aggregate principal balance of the mortgage loans as of the Cut-off Date; (ii) the date on which the total unpaid principal obligations under the Certificates has been reduced to 33% of the aggregate total unpaid principal obligations under the Certificates as of the Closing Date; or (iii) two years after the Closing Date.
For additional information, see “Credit Risk Retention” in the Preliminary Prospectus.
The PSA will include the required provisions applicable to an operating advisor necessary for the securitization to comply with the credit risk retention rules utilizing the “third party purchaser” option. See “Operating Advisor” above.
Notwithstanding any references in this Term Sheet to the credit risk retention rules, the Retaining Sponsor, a successor third party purchaser and other risk retention related matters, in the event the credit risk retention rules (or any relevant portion thereof) are repealed or determined by applicable regulatory agencies to be no longer applicable to this securitization transaction, none of the Retaining Sponsor, a successor third party purchaser or any other party will be required to comply with or act in accordance with the credit risk retention rules (or such relevant portion thereof).
For additional information, see“Credit Risk Retention” in the Preliminary Prospectus. |
THE INFORMATION IN THIS STRUCTURAL AND COLLATERAL TERM SHEET IS NOT COMPLETE AND MAY BE AMENDED PRIOR TO THE TIME OF SALE. THIS TERM SHEET IS NOT AN OFFER TO SELL THESE SECURITIES AND IT IS NOT A SOLICITATION OF AN OFFER TO BUY THESE SECURITIES IN ANY JURISDICTION WHERE THE OFFER OR SALE IS NOT PERMITTED.
20
UBS 2019-C17
| STRUCTURE OVERVIEW |
| Liquidated Loan Waterfall: | Upon liquidation of any mortgage loan, all net liquidation proceeds related to the mortgage loan (other than any related Companion Loan) will be applied so that amounts allocated as a recovery of accrued and unpaid interest will not, in the first instance, include any delinquent interest that was not advanced as a result of Appraisal Reduction Amounts or accrued on the portion of the stated principal balance thereof equal to any related Collateral Deficiency Amount in effect from time to time and as to which no advance was made. After the adjusted interest amount is so allocated, any remaining liquidation proceeds will be allocated to offset certain advances and to pay principal on the mortgage loan until the unpaid principal amount of the mortgage loan has been reduced to zero. Any remaining liquidation proceeds will then be allocated to pay delinquent interest that was not advanced as a result of Appraisal Reduction Amounts or that accrued on the portion of the stated principal balance thereof equal to any related Collateral Deficiency Amount in effect from time to time and as to which no advance was made. |
| Investor Communications: | The Certificate Administrator is required to include on any Form 10-D any written request received from a Certificateholder or Certificate Owner to communicate with other Certificateholders or Certificate Owner related to Certificateholders or Certificate Owner exercising their rights under the terms of the PSA. Any Certificateholder wishing to communicate with other Certificateholders or Certificate Owner regarding the exercise of its rights under the terms of the PSA will be able to deliver a written request signed by an authorized representative of the requesting investor to the Certificate Administrator. |
| Deal Website: | The Certificate Administrator will be required to maintain a deal website which will include, among other items: (a) summaries of Final Asset Status Reports prepared by the Special Servicer, (b) inspection reports, (c) appraisals, (d) various “special notices” described in the Preliminary Prospectus, (e) the “Investor Q&A Forum”, (f) a voluntary “Investor Registry” and (g) the “Risk Retention Special Notices” tab. Investors may access the deal website following execution of a certification and confidentiality agreement. |
THE INFORMATION IN THIS STRUCTURAL AND COLLATERAL TERM SHEET IS NOT COMPLETE AND MAY BE AMENDED PRIOR TO THE TIME OF SALE. THIS TERM SHEET IS NOT AN OFFER TO SELL THESE SECURITIES AND IT IS NOT A SOLICITATION OF AN OFFER TO BUY THESE SECURITIES IN ANY JURISDICTION WHERE THE OFFER OR SALE IS NOT PERMITTED.
21
UBS 2019-C17
| OVERVIEW OF MORTGAGE POOL CHARACTERISTICS |
| Distribution of Cut-off Date Balances | |||||||||||||||||||||
| WeightedAverages(1) | |||||||||||||||||||||
| Rangeof Cut-off Date Balances | Numberof Mortgage Loans | Aggregate Cut-off Date Balance | % of Initial | Mortgage Rate | Stated Remaining Term (Mos.)(5) | U/W NCF DSCR(2) | Cut-offDate LTV Ratio(2)(3) | MaturityDate or ARD LTV Ratio(2)(3)(5) | |||||||||||||
| $875,000 | - | $3,500,000 | 11 | $21,509,910 | 2.7 | % | 4.648% | 119 | 1.74x | 66.8% | 56.4% | ||||||||||
| $3,500,001 | - | $8,500,000 | 24 | $144,017,567 | 17.8 | % | 4.394% | 115 | 1.97x | 61.8% | 53.6% | ||||||||||
| $8,500,001 | - | $13,500,000 | 12 | $135,351,475 | 16.8 | % | 4.486% | 118 | 1.79x | 65.4% | 56.8% | ||||||||||
| $13,500,001 | - | $18,500,000 | 12 | $184,303,917 | 22.8 | % | 4.261% | 119 | 1.78x | 67.1% | 58.7% | ||||||||||
| $18,500,001 | - | $23,500,000 | 3 | $61,468,336 | 7.6 | % | 4.604% | 118 | 1.37x | 66.8% | 57.6% | ||||||||||
| $23,500,001 | - | $28,500,000 | 4 | $98,400,000 | 12.2 | % | 4.168% | 117 | 2.58x | 55.1% | 52.6% | ||||||||||
| $28,500,001 | - | $38,500,000 | 1 | $32,950,297 | 4.1 | % | 3.750% | 119 | 1.93x | 64.2% | 50.6% | ||||||||||
| $38,500,001 | - | $43,500,000 | 2 | $78,950,000 | 9.8 | % | 4.074% | 120 | 1.67x | 72.1% | 67.4% | ||||||||||
| $43,500,001 | - | $50,384,615 | 1 | $50,384,615 | 6.2 | % | 3.741% | 117 | 2.46x | 46.3% | 46.3% | ||||||||||
| Total/Weighted Average | 70 | $807,336,117 | 100.0 | % | 4.276% | 118 | 1.92x | 63.4% | 56.3% | ||||||||||||
| Distribution of Mortgage Rates | |||||||||||||||||||||
| WeightedAverages(1) | |||||||||||||||||||||
| Range of Mortgage Rates | Numberof Mortgage Loans | Aggregate Cut-off Date Balance | % of Initial Outstanding Pool Balance(1) | Mortgage Rate | Stated Remaining Term (Mos.)(5) | U/W NCF DSCR(2) | Cut-offDate LTV Ratio(2)(3) | MaturityDate or ARD LTV Ratio(2)(3)(5) | |||||||||||||
| 3.5000% | - | 3.8000% | 6 | $148,260,120 | 18.4 | % | 3.723% | 118 | 2.17x | 57.7% | 54.2% | ||||||||||
| 3.8001% | - | 4.0000% | 6 | $76,633,480 | 9.5 | % | 3.948% | 119 | 1.77x | 68.7% | 58.8% | ||||||||||
| 4.0001% | - | 4.2000% | 11 | $171,190,000 | 21.2 | % | 4.116% | 118 | 2.25x | 60.2% | 55.1% | ||||||||||
| 4.2001% | - | 4.4000% | 11 | $109,268,041 | 13.5 | % | 4.295% | 119 | 1.94x | 64.5% | 58.1% | ||||||||||
| 4.4001% | - | 4.6000% | 16 | $128,006,878 | 15.9 | % | 4.485% | 115 | 1.70x | 68.3% | 59.6% | ||||||||||
| 4.6001% | - | 4.8000% | 10 | $94,712,633 | 11.7 | % | 4.700% | 118 | 1.50x | 65.5% | 54.7% | ||||||||||
| 4.8001% | - | 5.0000% | 6 | $50,775,405 | 6.3 | % | 4.902% | 118 | 1.66x | 64.5% | 54.2% | ||||||||||
| 5.0001% | - | 5.7500% | 4 | $28,489,560 | 3.5 | % | 5.461% | 118 | 1.80x | 63.8% | 55.6% | ||||||||||
| Total/Weighted Average | 70 | $807,336,117 | 100.0 | % | 4.276% | 118 | 1.92x | 63.4% | 56.3% | ||||||||||||
| Property Type Distribution(1) | |||||||||||||||||||||||||||
| WeightedAverages(1) | |||||||||||||||||||||||||||
| Property Type | Number of Mortgaged Properties | Aggregate Cut-Off Date Balance | % of Initial Outstanding Pool Balance(1) | Number of Units/Rooms/ Pads/ NRA/Beds/Acres | Cut-off Date Balance per Unit/Room/Pad/ Acres/ NRA(2) | Mortgage Rate | Stated Remaining Term (Mos.)(5) | Occupancy | U/W NCF DSCR(2) | Cut-off Date LTV Ratio(2)(3) | MaturityDate or ARD LTV Ratio(2)(3)(5) | ||||||||||||||||
| Retail | 30 | $185,197,010 | 22.9 | % | 3,266,975 | $408 | 4.198% | 118 | 93.4% | 1.92x | 59.3% | 54.0% | |||||||||||||||
| Anchored | 15 | $84,160,694 | 10.4 | % | 2,186,085 | $120 | 4.371% | 118 | 90.2% | 1.66x | 64.5% | 56.6% | |||||||||||||||
| Specialty Retail | 1 | $50,384,615 | 6.2 | % | 759,891 | $1,000 | 3.741% | 117 | 94.0% | 2.46x | 46.3% | 46.3% | |||||||||||||||
| Unanchored | 4 | $18,365,451 | 2.3 | % | 169,607 | $364 | 4.106% | 119 | 99.3% | 2.04x | 55.6% | 46.6% | |||||||||||||||
| Single Tenant | 7 | $16,930,000 | 2.1 | % | 80,639 | $262 | 4.642% | 119 | 100.0% | 1.81x | 69.8% | 69.8% | |||||||||||||||
| Shadow Anchored | 3 | $15,356,250 | 1.9 | % | 70,753 | $260 | 4.365% | 118 | 94.2% | 1.53x | 66.6% | 56.0% | |||||||||||||||
| Hospitality | 19 | $176,133,019 | 21.8 | % | 1,789 | $122,107 | 4.529% | 119 | 80.1% | 1.98x | 66.3% | 54.1% | |||||||||||||||
| Limited Service | 14 | $129,743,212 | 16.1 | % | 1,263 | $123,365 | 4.512% | 119 | 79.9% | 1.98x | 65.7% | 52.9% | |||||||||||||||
| Extended Stay | 3 | $29,871,913 | 3.7 | % | 277 | $108,141 | 4.330% | 119 | 78.6% | 1.99x | 69.4% | 58.3% | |||||||||||||||
| Full Service | 1 | $8,289,474 | 1.0 | % | 147 | $193,878 | 5.750% | 116 | 94.7% | 2.16x | 63.2% | 56.8% | |||||||||||||||
| Select Service | 1 | $8,228,420 | 1.0 | % | 102 | $80,671 | 4.300% | 118 | 74.5% | 1.88x | 68.6% | 55.2% | |||||||||||||||
| Industrial | 18 | $123,288,187 | 15.3 | % | 4,668,618 | $40 | 4.175% | 119 | 97.6% | 1.88x | 65.9% | 58.1% | |||||||||||||||
| Warehouse | 14 | $94,031,610 | 11.6 | % | 3,909,505 | $35 | 4.148% | 119 | 96.8% | 1.86x | 67.5% | 59.6% | |||||||||||||||
| Manufacturing | 2 | $16,112,856 | 2.0 | % | 560,000 | $38 | 4.529% | 120 | 100.0% | 1.48x | 68.3% | 58.2% | |||||||||||||||
| Flex | 1 | $8,250,000 | 1.0 | % | 86,613 | $95 | 3.500% | 118 | 100.0% | 2.96x | 46.6% | 46.6% | |||||||||||||||
| Warehouse/Distribution | 1 | $4,893,721 | 0.6 | % | 112,500 | $53 | 4.650% | 119 | 100.0% | 1.60x | 59.1% | 48.1% | |||||||||||||||
| Office | 10 | $110,123,336 | 13.6 | % | 1,201,956 | $443 | 4.109% | 118 | 92.7% | 2.15x | 63.9% | 59.7% | |||||||||||||||
| Suburban | 7 | $66,300,000 | 8.2 | % | 606,082 | $582 | 3.886% | 118 | 94.5% | 2.52x | 60.7% | 60.2% | |||||||||||||||
| CBD | 2 | $22,850,000 | 2.8 | % | 544,283 | $73 | 4.214% | 118 | 87.7% | 1.86x | 69.3% | 61.7% | |||||||||||||||
| Medical | 1 | $20,973,336 | 2.6 | % | 51,591 | $407 | 4.700% | 119 | 92.7% | 1.29x | 68.5% | 55.9% | |||||||||||||||
| Mixed Use | 6 | $78,325,890 | 9.7 | % | 590,298 | $284 | 4.307% | 119 | 94.5% | 1.55x | 69.2% | 61.3% | |||||||||||||||
| Retail/Office | 3 | $48,045,000 | 6.0 | % | 217,117 | $284 | 4.050% | 119 | 95.1% | 1.61x | 68.4% | 62.5% | |||||||||||||||
| Multifamily/Retail | 2 | $16,980,890 | 2.1 | % | 126,976 | $435 | 4.688% | 119 | 94.8% | 1.43x | 68.1% | 56.4% | |||||||||||||||
| Industrial/Office | 1 | $13,300,000 | 1.6 | % | 246,205 | $95 | 4.750% | 116 | 91.6% | 1.49x | 73.4% | 63.1% | |||||||||||||||
| Multifamily | 8 | $76,017,243 | 9.4 | % | 1,499 | $296,051 | 4.206% | 118 | 92.3% | 1.87x | 57.4% | 52.4% | |||||||||||||||
| Garden | 7 | $51,017,243 | 6.3 | % | 1,218 | $57,471 | 4.233% | 119 | 93.9% | 1.65x | 66.1% | 58.6% | |||||||||||||||
| High Rise | 1 | $25,000,000 | 3.1 | % | 281 | $782,918 | 4.150% | 115 | 89.0% | 2.34x | 39.8% | 39.8% | |||||||||||||||
| Other | 2 | $29,210,526 | 3.6 | % | 203,880 | $28,102 | 4.526% | 118 | 85.6% | 2.27x | 61.9% | 61.0% | |||||||||||||||
| Data Center | 1 | $25,000,000 | 3.1 | % | 203,702 | $182 | 4.320% | 118 | 100.0% | 2.29x | 61.7% | 61.7% | |||||||||||||||
| Golf Course | 1 | $4,210,526 | 0.5 | % | 178 | $193,878 | 5.750% | 116 | N/A | 2.16x | 63.2% | 56.8% | |||||||||||||||
| Manufactured Housing Community | 1 | $18,200,000 | 2.3 | % | 254 | $71,654 | 3.943% | 118 | 98.0% | 1.42x | 64.1% | 58.1% | |||||||||||||||
| Self Storage | 3 | $10,840,905 | 1.3 | % | 174,842 | $65 | 4.492% | 72 | 87.0% | 1.85x | 57.6% | 53.9% | |||||||||||||||
| Total/Weighted Average | 97 | $807,336,117 | 100.0 | % | 4.276% | 118 | 91.2%(6) | 1.92x | 63.4% | 56.3% | |||||||||||||||||
Please see footnotes on page 25.
THE INFORMATION IN THIS STRUCTURAL AND COLLATERAL TERM SHEET IS NOT COMPLETE AND MAY BE AMENDED PRIOR TO THE TIME OF SALE. THIS TERM SHEET IS NOT AN OFFER TO SELL THESE SECURITIES AND IT IS NOT A SOLICITATION OF AN OFFER TO BUY THESE SECURITIES IN ANY JURISDICTION WHERE THE OFFER OR SALE IS NOT PERMITTED.
22
UBS 2019-C17
| OVERVIEW OF MORTGAGE POOL CHARACTERISTICS |
| Geographic Distribution(1) | |||||||||||||||||||
| WeightedAverages(1) | |||||||||||||||||||
| State/Location | Number of Mortgaged Properties | Aggregate Cut-off Date Balance | % of Initial Outstanding Pool Balance(1) | Mortgage Rate | Stated Remaining Term (Mos.)(5) | U/W NCF DSCR(2) | Cut-offDate LTV Ratio(2)(3) | MaturityDate or ARD LTV Ratio(2)(3)(5) | |||||||||||
| California | 15 | $165,923,894 | 20.6 | % | 4.184% | 118 | 1.90x | 60.0% | 55.4% | ||||||||||
| California – Southern(4) | 9 | $93,876,461 | 11.6 | % | 4.447% | 117 | 1.82x | 55.7% | 50.3% | ||||||||||
| California – Northern(4) | 6 | $72,047,433 | 8.9 | % | 3.842% | 119 | 2.00x | 65.6% | 62.1% | ||||||||||
| Michigan | 10 | $65,117,625 | 8.1 | % | 4.406% | 119 | 1.81x | 67.8% | 57.9% | ||||||||||
| Pennsylvania | 4 | $53,658,243 | 6.6 | % | 4.496% | 118 | 1.90x | 66.9% | 61.3% | ||||||||||
| Nevada | 1 | $50,384,615 | 6.2 | % | 3.741% | 117 | 2.46x | 46.3% | 46.3% | ||||||||||
| Wisconsin | 4 | $45,334,528 | 5.6 | % | 4.010% | 119 | 1.74x | 67.9% | 55.9% | ||||||||||
| Tennessee | 5 | $43,901,283 | 5.4 | % | 4.091% | 120 | 1.99x | 67.5% | 54.2% | ||||||||||
| Florida | 6 | $40,462,342 | 5.0 | % | 4.111% | 119 | 2.03x | 71.9% | 60.6% | ||||||||||
| New York | 3 | $40,278,560 | 5.0 | % | 4.645% | 119 | 1.43x | 66.2% | 59.3% | ||||||||||
| New York City(4) | 3 | $40,278,560 | 5.0 | % | 4.645% | 119 | 1.43x | 66.2% | 59.3% | ||||||||||
| Other | 49 | $302,275,028 | 37.4 | % | 4.388% | 117 | 1.93x | 63.9% | 56.7% | ||||||||||
| Total/Weighted Average | 97 | $807,336,117 | 100.0 | % | 4.276% | 118 | 1.92x | 63.4% | 56.3% | ||||||||||
| Distribution of Cut-off Date LTV Ratios(2)(3) | |||||||||||||||||||||
| WeightedAverages(1) | |||||||||||||||||||||
| Range of Cut-off Date LTV Ratios | Numberof Mortgage Loans | Aggregate Cut-off Date Balance | % of Initial Outstanding Pool Balance(1) | Mortgage Rate | Stated Remaining Term (Mos.)(5) | U/W NCF DSCR(2) | Cut-offDate LTV Ratio(2)(3) | MaturityDate or ARD LTV Ratio(2)(3)(5) | |||||||||||||
| 39.8% | - | 45.0% | 3 | $55,325,208 | 6.9 | % | 4.110% | 116 | 2.85x | 42.4% | 40.9% | ||||||||||
| 45.1% | - | 50.0% | 2 | $58,634,615 | 7.3 | % | 3.707% | 117 | 2.53x | 46.3% | 46.3% | ||||||||||
| 50.1% | - | 55.0% | 1 | $3,750,000 | 0.5 | % | 4.100% | 119 | 2.10x | 50.7% | 46.1% | ||||||||||
| 55.1% | - | 60.0% | 11 | $77,715,810 | 9.6 | % | 4.530% | 112 | 1.83x | 58.4% | 49.1% | ||||||||||
| 60.1% | - | 65.0% | 18 | $233,526,011 | 28.9 | % | 4.373% | 118 | 1.94x | 63.6% | 57.5% | ||||||||||
| 65.1% | - | 70.0% | 28 | $254,822,332 | 31.6 | % | 4.264% | 119 | 1.73x | 68.5% | 60.3% | ||||||||||
| 70.1% | - | 76.8% | 7 | $123,562,140 | 15.3 | % | 4.306% | 119 | 1.61x | 73.7% | 62.5% | ||||||||||
| Total/Weighted Average | 70 | $807,336,117 | 100.0 | % | 4.276% | 118 | 1.92x | 63.4% | 56.3% | ||||||||||||
| Distribution of Maturity Date or ARD LTV Ratios(2)(3)(5) | |||||||||||||||||||||
| WeightedAverages(1) | |||||||||||||||||||||
| Range of LTV Ratios at Maturity or ARD | Numberof Mortgage Loans | Aggregate Cut-off Date Balance | % of Initial Outstanding Pool Balance(1) | Mortgage Rate | Stated Remaining Term (Mos.)(5) | U/W NCF DSCR(2) | Cut-offDate LTV Ratio(2)(3) | MaturityDate or ARD LTV Ratio(2)(3)(5) | |||||||||||||
| 32.2% | - | 40.0% | 2 | $31,325,208 | 3.9 | % | 4.079% | 116 | 2.27x | 40.8% | 38.3% | ||||||||||
| 40.1% | - | 50.0% | 12 | $135,700,426 | 16.8 | % | 4.090% | 118 | 2.49x | 50.6% | 45.7% | ||||||||||
| 50.1% | - | 55.0% | 16 | $167,707,329 | 20.8 | % | 4.457% | 119 | 1.75x | 64.2% | 52.6% | ||||||||||
| 55.1% | - | 60.0% | 15 | $161,336,905 | 20.0 | % | 4.448% | 115 | 1.69x | 66.4% | 56.9% | ||||||||||
| 60.1% | - | 65.0% | 17 | $255,386,250 | 31.6 | % | 4.237% | 119 | 1.83x | 69.2% | 63.3% | ||||||||||
| 65.1% | - | 70.0% | 8 | $55,880,000 | 6.9 | % | 3.977% | 119 | 1.89x | 69.9% | 69.9% | ||||||||||
| Total/Weighted Average | 70 | $807,336,117 | 100.0 | % | 4.276% | 118 | 1.92x | 63.4% | 56.3% | ||||||||||||
| Distribution of Underwritten NCF Debt Service Coverage Ratios(2) | |||||||||||||||||||||
| WeightedAverages(1) | |||||||||||||||||||||
| Range of Underwritten NCF Debt Service Coverage Ratios | Numberof Mortgage Loans | Aggregate Cut-off Date Balance | % of Initial Outstanding Pool Balance(1) | Mortgage Rate | Stated Remaining Term (Mos.)(5) | U/W NCF DSCR(2) | Cut-offDate LTV Ratio(2)(3) | MaturityDate or ARD LTV Ratio(2)(3)(5) | |||||||||||||
| 1.29x | - | 1.34x | 2 | $32,473,336 | 4.0 | % | 4.530% | 119 | 1.31x | 68.0% | 56.2% | ||||||||||
| 1.35x | - | 1.44x | 8 | $131,625,890 | 16.3 | % | 4.470% | 119 | 1.41x | 67.4% | 59.3% | ||||||||||
| 1.45x | - | 1.54x | 7 | $79,158,560 | 9.8 | % | 4.501% | 118 | 1.50x | 69.1% | 59.0% | ||||||||||
| 1.55x | - | 1.64x | 9 | $57,588,740 | 7.1 | % | 4.260% | 119 | 1.60x | 66.6% | 56.5% | ||||||||||
| 1.65x | - | 1.74x | 1 | $3,475,622 | 0.4 | % | 4.750% | 119 | 1.66x | 68.1% | 55.6% | ||||||||||
| 1.75x | - | 1.84x | 8 | $38,692,736 | 4.8 | % | 4.792% | 119 | 1.78x | 67.4% | 58.3% | ||||||||||
| 1.85x | - | 1.94x | 9 | $122,402,251 | 15.2 | % | 4.044% | 115 | 1.91x | 66.2% | 58.7% | ||||||||||
| 1.95x | - | 2.04x | 5 | $40,025,208 | 5.0 | % | 4.173% | 119 | 1.97x | 57.6% | 49.3% | ||||||||||
| 2.05x | - | 2.24x | 11 | $117,830,650 | 14.6 | % | 4.286% | 119 | 2.11x | 67.8% | 58.7% | ||||||||||
| 2.25x | - | 2.44x | 6 | $94,328,509 | 11.7 | % | 4.230% | 117 | 2.33x | 56.7% | 55.6% | ||||||||||
| 2.45x | - | 3.60x | 4 | $89,734,615 | 11.1 | % | 3.868% | 117 | 2.82x | 47.2% | 46.2% | ||||||||||
| Total/Weighted Average | 70 | $807,336,117 | 100.0 | % | 4.276% | 118 | 1.92x | 63.4% | 56.3% | ||||||||||||
Please see footnotes on page 25.
THE INFORMATION IN THIS STRUCTURAL AND COLLATERAL TERM SHEET IS NOT COMPLETE AND MAY BE AMENDED PRIOR TO THE TIME OF SALE. THIS TERM SHEET IS NOT AN OFFER TO SELL THESE SECURITIES AND IT IS NOT A SOLICITATION OF AN OFFER TO BUY THESE SECURITIES IN ANY JURISDICTION WHERE THE OFFER OR SALE IS NOT PERMITTED.
23
UBS 2019-C17
| OVERVIEW OF MORTGAGE POOL CHARACTERISTICS |
| Distribution of Original Terms to Maturity or ARD(5) | |||||||||||||||||||
| WeightedAverages(1) | |||||||||||||||||||
| Original Terms to Maturity | Numberof Mortgage Loans | Aggregate Cut-off Date Balance | % of Initial Outstanding Pool Balance(1) | Mortgage Rate | Stated Remaining Term (Mos.)(5) | U/W NCF DSCR(2) | Cut-offDate LTV Ratio(2)(3) | MaturityDate or ARD LTV Ratio(2)(3)(5) | |||||||||||
| 60 | 1 | $8,250,000 | 1.0 | % | 4.490% | 58 | 1.92x | 57.2% | 57.2% | ||||||||||
| 120 | 69 | $799,086,117 | 99.0 | % | 4.274% | 118 | 1.92x | 63.5% | 56.3% | ||||||||||
| Total/Weighted Average | 70 | $807,336,117 | 100.0 | % | 4.276% | 118 | 1.92x | 63.4% | 56.3% | ||||||||||
| Distribution of Remaining Terms to Maturity or ARD(5) | |||||||||||||||||||||
| WeightedAverages(1) | |||||||||||||||||||||
| Range of Remaining Terms to Maturity | Numberof Mortgage Loans | Aggregate Cut-off Date Balance | % of Initial Outstanding Pool Balance(1) | Mortgage Rate | Stated Remaining Term (Mos.)(5) | U/W NCF DSCR(2) | Cut-offDate LTV Ratio(2)(3) | MaturityDate or ARD LTV Ratio(2)(3)(5) | |||||||||||||
| 58 | - | 60 | 1 | $8,250,000 | 1.0 | % | 4.490% | 58 | 1.92x | 57.2% | 57.2% | ||||||||||
| 115 | - | 120 | 69 | $799,086,117 | 99.0 | % | 4.274% | 118 | 1.92x | 63.5% | 56.3% | ||||||||||
| Total/Weighted Average | 70 | $807,336,117 | 100.0 | % | 4.276% | 118 | 1.92x | 63.4% | 56.3% | ||||||||||||
| Distribution of Underwritten NOI Debt Yields(2) | |||||||||||||||||||||
WeightedAverages(1) | |||||||||||||||||||||
| Range of Underwritten NOI Debt Yields | Number of Mortgage Loans | Aggregate Cut-off Date Balance | % of Initial Outstanding Pool Balance(1) | Mortgage Rate | Stated Remaining Term (Mos.)(5) | U/W NCF DSCR(2) | Cut-off Date LTV Ratio(2)(3) | Maturity Date or ARD LTV Ratio(2)(3)(5) | |||||||||||||
| 6.8% | - | 8.0% | 3 | $56,450,000 | 7.0 | % | 3.815% | 119 | 1.88x | 67.9% | 67.9% | ||||||||||
| 8.1% | - | 8.5% | 6 | $63,823,336 | 7.9 | % | 4.352% | 119 | 1.45x | 67.2% | 59.5% | ||||||||||
| 8.6% | - | 9.0% | 7 | $37,175,000 | 4.6 | % | 4.407% | 105 | 1.62x | 65.1% | 61.8% | ||||||||||
| 9.1% | - | 9.5% | 5 | $63,700,000 | 7.9 | % | 4.545% | 117 | 1.45x | 62.5% | 54.9% | ||||||||||
| 9.6% | - | 10.0% | 10 | $193,625,865 | 24.0 | % | 4.073% | 118 | 1.96x | 60.5% | 55.5% | ||||||||||
| 10.1% | - | 10.5% | 6 | $52,480,890 | 6.5 | % | 4.496% | 117 | 1.71x | 69.0% | 60.5% | ||||||||||
| 10.6% | - | 11.0% | 4 | $62,619,144 | 7.8 | % | 4.594% | 118 | 2.00x | 62.2% | 57.8% | ||||||||||
| 11.1% | - | 11.5% | 5 | $49,741,824 | 6.2 | % | 3.855% | 119 | 2.06x | 61.4% | 50.1% | ||||||||||
| 11.6% | - | 12.5% | 2 | $17,531,978 | 2.2 | % | 4.854% | 118 | 1.79x | 69.0% | 56.7% | ||||||||||
| 12.6% | - | 13.0% | 7 | $52,265,069 | 6.5 | % | 4.448% | 118 | 1.89x | 62.3% | 50.1% | ||||||||||
| 13.1% | - | 16.8% | 15 | $157,923,010 | 19.6 | % | 4.331% | 119 | 2.35x | 62.9% | 53.3% | ||||||||||
| Total/Weighted Average | 70 | $807,336,117 | 100.0 | % | 4.276% | 118 | 1.92x | 63.4% | 56.3% | ||||||||||||
| Amortization Types | |||||||||||||||||||
| WeightedAverages(1) | |||||||||||||||||||
| Amortization Type | Numberof Mortgage Loans | Aggregate Cut-off Date Balance | % of Initial Outstanding Pool Balance(1) | Mortgage Rate | Stated Remaining Term (Mos.)(5) | U/W NCF DSCR(2) | Cut-offDate LTV Ratio(2)(3) | MaturityDate or ARD LTV Ratio(2)(3)(5) | |||||||||||
| Partial IO | 21 | $277,079,250 | 34.3 | % | 4.377% | 118 | 1.60x | 68.0% | 59.7% | ||||||||||
| Amortizing | 28 | $258,482,252 | 32.0 | % | 4.407% | 119 | 1.83x | 65.3% | 52.0% | ||||||||||
| Full IO | 14 | $254,844,615 | 31.6 | % | 4.009% | 115 | 2.36x | 56.1% | 56.1% | ||||||||||
| Full IO, ARD | 7 | $16,930,000 | 2.1 | % | 4.642% | 119 | 1.81x | 69.8% | 69.8% | ||||||||||
| Total/Weighted Average | 70 | $807,336,117 | 100.0 | % | 4.276% | 118 | 1.92x | 63.4% | 56.3% | ||||||||||
| Loan Purposes | |||||||||||||||||||
| WeightedAverages(1) | |||||||||||||||||||
| Loan Purpose | Numberof Mortgage Loans | Aggregate Cut-off Date Balance | % of Initial Outstanding Pool Balance(1) | Mortgage Rate | Stated Remaining Term (Mos.)(5) | U/W NCF DSCR(2) | Cut-offDate LTV Ratio(2)(3) | MaturityDate or ARD LTV Ratio(2)(3)(5) | |||||||||||
| Refinance | 47 | $581,730,098 | 72.1 | % | 4.278% | 118 | 1.84x | 62.8% | 54.6% | ||||||||||
| Acquisition | 22 | $201,606,020 | 25.0 | % | 4.285% | 116 | 1.95x | 67.7% | 62.8% | ||||||||||
| Recapitalization | 1 | $24,000,000 | 3.0 | % | 4.150% | 116 | 3.60x | 44.4% | 44.4% | ||||||||||
| Total/Weighted Average | 70 | $807,336,117 | 100.0 | % | 4.276% | 118 | 1.92x | 63.4% | 56.3% | ||||||||||
Please see footnotes on page 25.
THE INFORMATION IN THIS STRUCTURAL AND COLLATERAL TERM SHEET IS NOT COMPLETE AND MAY BE AMENDED PRIOR TO THE TIME OF SALE. THIS TERM SHEET IS NOT AN OFFER TO SELL THESE SECURITIES AND IT IS NOT A SOLICITATION OF AN OFFER TO BUY THESE SECURITIES IN ANY JURISDICTION WHERE THE OFFER OR SALE IS NOT PERMITTED.
24
UBS 2019-C17
| OVERVIEW OF MORTGAGE POOL CHARACTERISTICS |
| (1) | All numerical information concerning the mortgage loans is approximate and, in the case of mortgage loans secured by multiple properties, is based on allocated loan amounts with respect to such properties. All weighted average information regarding the mortgage loans reflects the weighting of the mortgage loans based on their outstanding principal balances as of the Cut-off Date or, in the case of mortgage loans secured by multiple properties, allocated loan amounts. The sum of numbers and percentages in columns may not match the “Total/Weighted Average” due to rounding. |
| (2) | With respect to any mortgage loan that is part of a whole loan, unless otherwise indicated, Balance per Unit/Room/Pad/NRA/acre, LTV, DSCR and Debt Yield calculations in this Term Sheet include any relatedpari passu companion loans and exclude any subordinate companion loans, as applicable. Additionally, Balance per Unit/Room/Pad/NRA/acre, LTV, DSCR and Debt Yield figures in this Term Sheet are calculated for mortgage loans without regard to any additional indebtedness that may be incurred at a future date. |
| (3) | The Cut-off Date LTV and Maturity Date or ARD LTV for the following mortgage loans is based on an appraised value for one or more mortgaged properties that is not an “As-Is” appraised value. |
With respect to the mortgage loan identified on Annex A-1 to the Preliminary Prospectus as 600 & 620 National Avenue, the Cut-off Date LTV, Maturity Date or ARD LTV are based on the appraiser’s “Market Value As Stabilized”, $197,000,000, which assumes the tenant has taken possession, free rent has expired, the tenant has commenced paying unabated rent and all outstanding tenant improvements and leasing commissions have been reserved. As of the time of origination of the 600 & 620 National Avenue Whole Loan, Google has taken possession of its space and is paying rent, and all outstanding tenant improvements and leasing commissions have been reserved. The Cut-off Date LTV and Maturity Date or ARD LTV based on the “As-Is” appraised value are 74.5% and 74.5%, respectively.
With respect to the mortgage loan secured by the portfolio of mortgaged properties identified on Annex A-1 to the Preliminary Prospectus as CIRE Equity Retail & Industrial Portfolio, the Cut-off Date LTV, Maturity Date or ARD LTV, and appraised value are based on the “As-Is Portfolio Value” conclusion of $198,100,000, which includes a portfolio premium to the portfolio properties if sold together on a bulk basis. The sum of the “As-Is” appraised values on a stand-alone basis is $188,710,000. The Cut-off Date LTV and Maturity Date or ARD LTV based on the appraised value representing the sum of the “As-Is” appraised values are 68.1% and 68.1%, respectively.
With respect to the mortgage loan identified on Annex A-1 to the Preliminary Prospectus as Ambler Yards, the Cut-off Date LTV, Maturity Date or ARD LTV, and appraised value are based on the “As-Complete Value” conclusion of $31,730,000, which assumes the lease-up costs for recently signed leases are escrowed and available to any potential purchaser at closing. The “As-Is” appraised value is $31,100,000. The Cut-off Date LTV and Maturity Date or ARD LTV based on the “As-Is” appraised values are 74.9% and 64.4%, respectively.
With respect to the mortgage loan identified on Annex A-1 to the Preliminary Prospectus as Blackmore Marketplace, the Cut-off Date LTV, Maturity Date or ARD LTV, and appraised value are based on the “As-Complete Value” conclusion of $34,600,000, as of August 1, 2019. The “As-Is” appraised value is $33,200,000. The Cut-off Date LTV and Maturity Date or ARD LTV based on the “As-Is” appraised values are 69.6% and 58.7%, respectively.
| (4) | “California—Northern” includes zip codes above 93600, and “California—Southern” includes zip codes at or below 93600. “New York City” includes zip codes at 10001 through 11697. |
| (5) | With respect to an ARD loan, refers to the term through the related anticipated repayment date. |
| (6) | With regards to total pool Occupancy in the Property Type Distribution, Maui Portfolio – Maui Nui Golf Course is being excluded from the total. |
THE INFORMATION IN THIS STRUCTURAL AND COLLATERAL TERM SHEET IS NOT COMPLETE AND MAY BE AMENDED PRIOR TO THE TIME OF SALE. THIS TERM SHEET IS NOT AN OFFER TO SELL THESE SECURITIES AND IT IS NOT A SOLICITATION OF AN OFFER TO BUY THESE SECURITIES IN ANY JURISDICTION WHERE THE OFFER OR SALE IS NOT PERMITTED.
25
UBS 2019-C17
| OVERVIEW OF MORTGAGE POOL CHARACTERISTICS |
| Ten Largest Mortgage Loans | |||||||||||||||||||||
| Mortgage Loan | Mortgage Loan Seller | City,State | Property Type | Cut-off Date Balance | % of Initial Outstanding Pool Balance | Cut-offDate Balance per Room/NRA(1) | Cut-off Date LTV Ratio(1) | U/W NCF DSCR(1) | U/W NOI Debt Yield(1) | ||||||||||||
| Grand Canal Shoppes | WFB/UBS AG | Las Vegas, NV | Retail | $50,384,615 | 6.2% | $1,000 | 46.3 | % | 2.46x | 9.6% | |||||||||||
| Phoenix Industrial Portfolio II | UBS AG | Various, Various | Industrial | $40,000,000 | 5.0% | $28 | 74.2 | % | 1.41x | 9.8% | |||||||||||
| 600 & 620 National Avenue | WFB | Mountain View, CA | Office | $38,950,000 | 4.8% | $913 | 70.0 | %(2) | 1.93x | 7.2% | |||||||||||
| Phoenix Industrial Portfolio I | UBS AG | Various, Various | Industrial | $32,950,297 | 4.1% | $28 | 64.2 | % | 1.93x | 11.3% | |||||||||||
| 10000 Santa Monica Boulevard | UBS AG | Los Angeles, CA | Multifamily | $25,000,000 | 3.1% | $782,918 | 39.8 | % | 2.34x | 9.9% | |||||||||||
| Global Data Center | WFB | Collegeville, PA | Other | $25,000,000 | 3.1% | $182 | 61.7 | % | 2.29x | 10.6% | |||||||||||
| Waramaug Florida Hotel Portfolio | RREF | Various, FL | Hospitality | $24,400,000 | 3.0% | $114,554 | 74.4 | % | 2.10x | 13.5% | |||||||||||
| The Chantilly Office Portfolio | UBS AG | Chantilly, VA | Office | $24,000,000 | 3.0% | $108 | 44.4 | % | 3.60x | 16.8% | |||||||||||
| Fresenius Salt Lake | LCF | Salt Lake City, UT | Office | $20,973,336 | 2.6% | $407 | 68.5 | % | 1.29x | 8.2% | |||||||||||
| Centrepointe Plaza | RMF | Colton, CA | Retail | $20,500,000 | 2.5% | $178 | 63.1 | % | 1.43x | 9.1% | |||||||||||
| Total/Weighted Average | $302,158,248 | 37.4% | 60.5 | % | 2.08x | 10.4% | |||||||||||||||
| (1) | With respect to any mortgage loan that is part of a whole loan, unless otherwise indicated, all LTV Ratio, U/W NCF DSCR, Debt Yield and Balance per Room/NRA calculations in this Term Sheet include any relatedpari passu companion loans and exclude any subordinate companion loans, as applicable. Additionally, LTV Ratio, U/W NCF DSCR, Debt Yield and Balance per Room/NRA figures in this Term Sheet are calculated for mortgage loans without regard to any additional indebtedness that may be incurred at a future date. |
| (2) | With respect to the mortgage loan identified on Annex A-1 to the Preliminary Prospectus as 600 & 620 National Avenue, the Cut-off Date LTV, Maturity Date or ARD LTV are based on the appraiser’s “Market Value As Stabilized”, which assumes the tenant has taken possession, free rent has expired, the tenant has commenced paying unabated rent and all outstanding tenant improvements and leasing commissions have been reserved. As of the time of origination of the 600 & 620 National Avenue Whole Loan, Google has taken possession of its space and is paying rent, and all outstanding tenant improvements and leasing commissions have been reserved. The Cut-off Date LTV and Maturity Date or ARD LTV based on the “As-Is” appraised values are 74.5% and 74.5%, respectively. |
| Subordinate Debt Summary | ||||||||||||||||||
| MortgageLoan | MortgageLoan Cut-off Date Balance | PariPassu Companion Loan(s) Cut-off Date Balance | Subordinate Debt Cut-off Date Balance | Trust U/W NCF DSCR | Total Mortgage Debt U/W NCF DSCR(1) | Trust Cut-off Date LTV Ratio | Total Mortgage Debt Cut-off Date LTV Ratio(1) | Trust U/W NOI Debt Yield | Total Mortgage Debt U/W NOI Debt Yield(1) | |||||||||
| Grand Canal Shoppes | $50,384,615 | $709,615,385 | $215,000,000 | 2.46x | 1.67x | 46.3% | 59.5% | 9.6% | 7.5% | |||||||||
| 10000 Santa Monica Boulevard | $25,000,000 | $195,000,000 | $130,000,000 | 2.34x | 1.47x | 39.8% | 63.3% | 9.9% | 6.2% | |||||||||
| (1) | Total Mortgage Debt U/W NCF DSCR, Total Mortgage Debt Cut-off Date LTV Ratio and Total Mortgage Debt U/W NOI Debt Yield calculations include any relatedpari passu companion loan(s), and related subordinate companion loan(s) and excludes related mezzanine loan(s), if any. |
THE INFORMATION IN THIS STRUCTURAL AND COLLATERAL TERM SHEET IS NOT COMPLETE AND MAY BE AMENDED PRIOR TO THE TIME OF SALE. THIS TERM SHEET IS NOT AN OFFER TO SELL THESE SECURITIES AND IT IS NOT A SOLICITATION OF AN OFFER TO BUY THESE SECURITIES IN ANY JURISDICTION WHERE THE OFFER OR SALE IS NOT PERMITTED.
26
UBS 2019-C17
| OVERVIEW OF MORTGAGE POOL CHARACTERISTICS |
| Pari Passu Companion Loan Summary |
| Mortgage Loan | Note(s) | Original Balance | Holder of Note(1) | Lead Servicer for Whole Loan (Y/N) | Master Servicer Under Lead Securitization | Special Servicer Under Lead Securitization |
| Grand Canal Shoppes | A-2-3, A-2-5 | $50,384,615 | UBS 2019-C17 | No | Midland Loan Services, a Division of PNC Bank, National Association | LNR Partners, LLC |
| A-1-2, A-2-1 | $100,000,000 | BANK 2019-BNK19 | No | |||
| A-1-1 (controlling), A-1-6 | $70,000,000 | MSC 2019-H7 | Yes | |||
| A-4-1 | $60,000,000 | CGCMT 2019-GC41 | No | |||
| A-1-7, A-1-8, A-2-2-1 | $40,000,000 | BANK 2019-BNK20(2) | No | |||
| A-3-1 | $50,000,000 | BMARK 2019-B12 | No | |||
| A-2-2-2 | $30,000,000 | CSAIL 2019-C17(3) | No | |||
| A-3-2, A-3-3, A-3-5 | $100,384,615 | JPMorgan Chase Bank, N.A. | No | |||
| A-3-4 | $25,000,000 | Cantor Commercial Real Estate Lending, L.P. | No | |||
| A-4-3 | $20,000,000 | CGCMT 2019-GC42(4) | No | |||
| A-4-2, A-4-4, A-4-5 | $95,384,615 | Goldman Sachs Bank USA | No | |||
| A-1-3, A-1-4, A-1-5 | $93,846,154 | Morgan Stanley Bank, N.A. | No | |||
| A-2-4 | $25,000,000 | UBS AG | No | |||
| B(5) | $215,000,000 | CPPIB Credit Investments II Inc. | No | |||
| Total | $975,000,000 | |||||
| Phoenix Industrial Portfolio II | A-1 (controlling), A-2, A-5 | $40,000,000 | UBS 2019-C17 | Yes | Wells Fargo Bank, National Association | Rialto Capital Advisors, LLC |
| A-3, A-4, A-6 | $28,000,000 | UBS AG | No | |||
| Total | $68,000,000 | |||||
| 600 & 620 National Avenue | A-1-1 (controlling) | $38,950,000 | UBS 2019-C17 | Yes | Wells Fargo Bank, National Association | Rialto Capital Advisors, LLC |
| A-2-1, A-2-2, A-2-3 | $68,950,000 | JPMorgan Chase Bank, N.A. | No | |||
| A-1-2 | $30,000,000 | WFB | No | |||
| Total | $137,900,000 | |||||
| 10000 Santa Monica Boulevard | A-5, A-8 | $25,000,000 | UBS 2019-C17 | No | KeyBank National Association | KeyBank National Association |
| A-3, A-4, A-6 | $50,000,000 | BMARK 2019-B12 | No | |||
| A-7 | $10,000,000 | BBCMS 2019-C4 | No | |||
| A-2 | $35,000,000 | Natixis Real Estate Capital LLC | No | |||
| A-1 (controlling) | $100,000,000 | NCMS 2019-10K | Yes | |||
| A-B(5) | $130,000,000 | NCMS 2019-10K | No | |||
| Total | $350,000,000 | |||||
| Global Data Center | A-1 (controlling) | $25,000,000 | UBS 2019-C17 | Yes | Wells Fargo Bank, National Association | Rialto Capital Advisors, LLC |
| A-2 | $12,000,000 | WFB | No | |||
| Total | $37,000,000 | |||||
| The Chantilly Office Portfolio | A-2 (controlling), A-3 | $24,000,000 | UBS 2019-C17 | Yes | Wells Fargo Bank, National Association | Rialto Capital Advisors, LLC |
| A-1 | $22,350,000 | WFCM 2019-C51 | No | |||
| Total | $46,350,000 | |||||
| Smoke Tree Village and Smoke Tree Commons | A-1-1 (controlling) | $15,000,000 | UBS 2019-C17 | Yes | Wells Fargo Bank, National Association | Rialto Capital Advisors, LLC |
| A-2 | $10,000,000 | WFCM 2019-C52 | No | |||
| A-1-2 | $10,500,000 | RMF | No | |||
| Total | $35,500,000 | |||||
| CIRE Equity Retail & Industrial Portfolio | A-5-1 | $15,000,000 | UBS 2019-C17 | No | Midland Loan Services, a Division of PNC Bank, National Association | Midland Loan Services, a Division of PNC Bank, National Association |
| A-1 (controlling), A-2-1 | $50,000,000 | BMARK 2019-B12 | Yes | |||
| A-2-2, A-3 | $27,160,000 | CGCMT 2019-GC41 | No | |||
| A-4 | $22,000,000 | WFCM 2019-C51 | No | |||
| A-6 | $9,440,000 | BBCMS 2019-C4 | No | |||
| A-5-2 | $5,000,000 | UBS AG | No | |||
| Total | $128,600,000 | |||||
| Gatlin Retail Portfolio | A-1 (controlling) | $13,775,000 | UBS 2019-C17 | Yes | Wells Fargo Bank, National Association | Rialto Capital Advisors, LLC |
| A-2 | $10,000,000 | BSPRT CMBS Finance, LLC | No | |||
| Total | $23,775,000 | |||||
| Ambler Yards | A-2 (controlling) | $13,300,000 | UBS 2019-C17 | Yes | Wells Fargo Bank, National Association | Rialto Capital Advisors, LLC |
| A-1 | $10,000,000 | BBCMS 2019-C4 | No | |||
| Total | $23,300,000 | ||||
| Blackmore Marketplace | A-1 (controlling) | $13,100,000 | UBS 2019-C17 | Yes | Wells Fargo Bank, National Association | Rialto Capital Advisors, LLC |
| A-2 | $10,000,000 | CSAIL 2019-C17(3) | No | |||
| Total | $23,100,000 | |||||
| Maui Portfolio | A-2 | $12,500,000 | UBS 2019-C17 | No | Wells Fargo Bank, National Association | Rialto Capital Advisors, LLC |
| A-1 (controlling) | $16,000,000 | BBCMS 2019-C4 | Yes | |||
| Total | $28,500,000 | |||||
| Landing at Fancher Creek | A-2 | $11,500,000 | UBS 2019-C17 | No | Wells Fargo Bank, National Association(6) | Rialto Capital Advisors, LLC(6) |
| A-1 (controlling) | $20,000,000 | WFB | Yes | |||
| Total | $31,500,000 | |||||
| Courtyard by Marriott Secaucus | A-1 (controlling) | $10,000,000 | UBS 2019-C17 | Yes | Wells Fargo Bank, National Association | Rialto Capital Advisors, LLC |
| A-2 | $5,000,000 | BSPRT CMBS Finance, LLC | No | |||
| Total | $15,000,000 |
THE INFORMATION IN THIS STRUCTURAL AND COLLATERAL TERM SHEET IS NOT COMPLETE AND MAY BE AMENDED PRIOR TO THE TIME OF SALE. THIS TERM SHEET IS NOT AN OFFER TO SELL THESE SECURITIES AND IT IS NOT A SOLICITATION OF AN OFFER TO BUY THESE SECURITIES IN ANY JURISDICTION WHERE THE OFFER OR SALE IS NOT PERMITTED.
27
UBS 2019-C17
| OVERVIEW OF MORTGAGE POOL CHARACTERISTICS |
| Pari Passu Companion Loan Summary |
| Mortgage Loan | Note(s) | Original Balance | Holder of Note(1) | Lead Servicer for Whole Loan (Y/N) | Master Servicer Under Lead Securitization | Special Servicer Under Lead Securitization |
| Meidinger Tower | A-2 | $9,000,000 | UBS 2019-C17 | No | Wells Fargo Bank, National Association | Rialto Capital Advisors, LLC |
| A-1 (controlling) | $19,000,000 | BBCMS 2019-C4 | Yes | |||
| Total | $28,000,000 |
| (1) | Identifies the expected holder as of the Closing Date. |
| (2) | The BANK 2019-BNK20 securitization transaction is expected to close on or about September 26, 2019. |
| (3) | The CSAIL 2019-C17 securitization transaction is expected to close on or about September 25, 2019. |
| (4) | The GSMS 2019-C42 securitization transaction is expected to close on or about September 27, 2019. |
| (5) | The related whole loan will be serviced pursuant to the indicated pooling and servicing agreement or trust and servicing agreement, as applicable. However, so long as no “control appraisal period” (or similar term) has occurred and is continuing, the holder of the related subordinate companion loan will be the controlling noteholder and will have the right to approve certain modifications and consent to certain actions taken with respect to the related whole loan. If a control appraisal period has occurred and is continuing, the holder of the note indicated as the “controlling” note will be the controlling noteholder. |
| (6) | The Landing at Fancher Creek Whole Loan is expected to initially be serviced under the UBS 2019-C17 pooling and servicing agreement until the securitization of the related controllingpari passu Note A-1, after which the Landing at Fancher Creek Whole Loan will be serviced under the pooling and servicing agreement related to the securitization of the related controllingpari passu Note A-1 (the “Landing at Fancher Creek Servicing Shift PSA”). The master servicer and special servicer under the Landing at Fancher Creek Servicing Shift PSA will be identified in a notice, report or statement to holders of the UBS 2019-C17 certificates after the securitization of the related controllingpari passu Note A-1. |
THE INFORMATION IN THIS STRUCTURAL AND COLLATERAL TERM SHEET IS NOT COMPLETE AND MAY BE AMENDED PRIOR TO THE TIME OF SALE. THIS TERM SHEET IS NOT AN OFFER TO SELL THESE SECURITIES AND IT IS NOT A SOLICITATION OF AN OFFER TO BUY THESE SECURITIES IN ANY JURISDICTION WHERE THE OFFER OR SALE IS NOT PERMITTED.
28
UBS 2019-C17
| OVERVIEW OF MORTGAGE POOL CHARACTERISTICS |
| Previous Securitization History(1) | ||||||
| Mortgage Loan | Mortgage Loan Seller | City, State | Property Type | Cut-off Date Balance | % of Initial Outstanding Pool Balance | Previous Securitization(s) |
| Grand Canal Shoppes | WFB/UBS AG | Las Vegas, NV | Retail | $50,384,615 | 6.2% | GSMS 2012-SHOP |
| Phoenix Industrial Portfolio II | UBS AG | Various, Various | Industrial | $40,000,000 | 5.0% | SGCP 2018-FL1 |
| Phoenix Industrial Portfolio I | UBS AG | Various, Various | Industrial | $32,950,297 | 4.1% | SGCP 2018-FL1 |
| Centrepointe Plaza | RMF | Colton, CA | Retail | $20,500,000 | 2.5% | NSTAR 2016-1A |
| Chelmsford MHC | LCF | Chelmsford, MA | Manufactured Housing Community | $18,200,000 | 2.3% | DBUBS 2011-LC2A |
| SpringHill Suites Corona Riverside | RMF | Corona, CA | Hospitality | $15,015,357 | 1.9% | BX 2017-SLCT |
| Gateway Tower | UBS AG | St Louis, MO | Office | $13,850,000 | 1.7% | JPMCC 2010-C1 |
| Maui Portfolio | UBS AG | Various, HI | Various | $12,500,000 | 1.5% | COMM 2014-CR19 |
| Comfort Inn & Suites - Seattle | UBS AG | SeaTac, WA | Hospitality | $11,585,000 | 1.4% | CFCRE 2017-C8 |
| Courtyard by Marriott Secaucus | RREF | Secaucus, NJ | Hospitality | $10,000,000 | 1.2% | BSPRT 2018-FL3 |
| Meidinger Tower | UBS AG | Louisville, KY | Office | $9,000,000 | 1.1% | MLMT 2005-CKI1; CMAC 1998-C2 |
| Springhill Suites Auburn Hills | RREF | Lake Orion, MI | Hospitality | $8,228,420 | 1.0% | COMM 2014-UBS6 |
| Walgreens Douglasville | LCF | Douglasville, GA | Retail | $4,650,000 | 0.6% | COMM 2010-C1 |
| Walgreens Tupelo | LCF | Tupelo, MS | Retail | $4,450,000 | 0.6% | COMM 2010-C1 |
| Walgreens Lexington | LCF | Lexington, SC | Retail | $4,050,000 | 0.5% | COMM 2010-C1 |
| (1) | Includes mortgage loans for which all or a portion of the previously existing debt was most recently securitized in one or more conduit securitizations, based on information provided by the related borrower or obtained through searches of a third-party database. The information has not otherwise been confirmed by the mortgage loan sellers. |
THE INFORMATION IN THIS STRUCTURAL AND COLLATERAL TERM SHEET IS NOT COMPLETE AND MAY BE AMENDED PRIOR TO THE TIME OF SALE. THIS TERM SHEET IS NOT AN OFFER TO SELL THESE SECURITIES AND IT IS NOT A SOLICITATION OF AN OFFER TO BUY THESE SECURITIES IN ANY JURISDICTION WHERE THE OFFER OR SALE IS NOT PERMITTED.
29
3327 & 3377 Las Vegas Boulevard South Las Vegas, NV 89109 | Collateral Asset Summary – Loan No. 1 Grand Canal Shoppes | Cut-off Date Balance: Cut-off Date LTV Ratio: UW NCF DSCR: UW NOI Debt Yield: | $50,384,615 46.3% 2.46x 9.6% |

THE INFORMATION IN THIS STRUCTURAL AND COLLATERAL TERM SHEET IS NOT COMPLETE AND MAY BE AMENDED PRIOR TO THE TIME OF SALE. THIS TERM SHEET IS NOT AN OFFER TO SELL THESE SECURITIES AND IT IS NOT A SOLICITATION OF AN OFFER TO BUY THESE SECURITIES IN ANY JURISDICTION WHERE THE OFFER OR SALE IS NOT PERMITTED.
30
3327 & 3377 Las Vegas Boulevard South Las Vegas, NV 89109 | Collateral Asset Summary – Loan No. 1 Grand Canal Shoppes | Cut-off Date Balance: Cut-off Date LTV Ratio: UW NCF DSCR: UW NOI Debt Yield: | $50,384,615 46.3% 2.46x 9.6% |
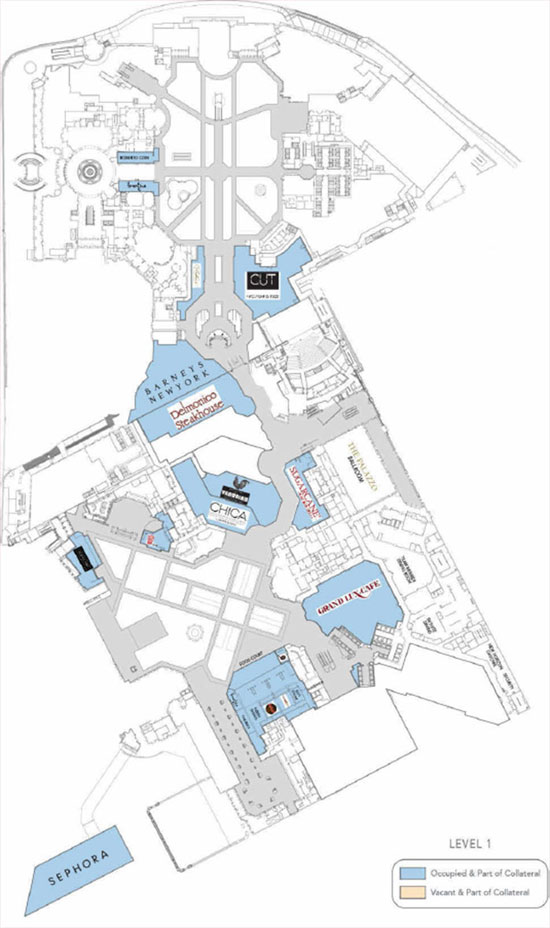
THE INFORMATION IN THIS STRUCTURAL AND COLLATERAL TERM SHEET IS NOT COMPLETE AND MAY BE AMENDED PRIOR TO THE TIME OF SALE. THIS TERM SHEET IS NOT AN OFFER TO SELL THESE SECURITIES AND IT IS NOT A SOLICITATION OF AN OFFER TO BUY THESE SECURITIES IN ANY JURISDICTION WHERE THE OFFER OR SALE IS NOT PERMITTED.
31
3327 & 3377 Las Vegas Boulevard South Las Vegas, NV 89109 | Collateral Asset Summary – Loan No. 1 Grand Canal Shoppes | Cut-off Date Balance: Cut-off Date LTV Ratio: UW NCF DSCR: UW NOI Debt Yield: | $50,384,615 46.3% 2.46x 9.6% |
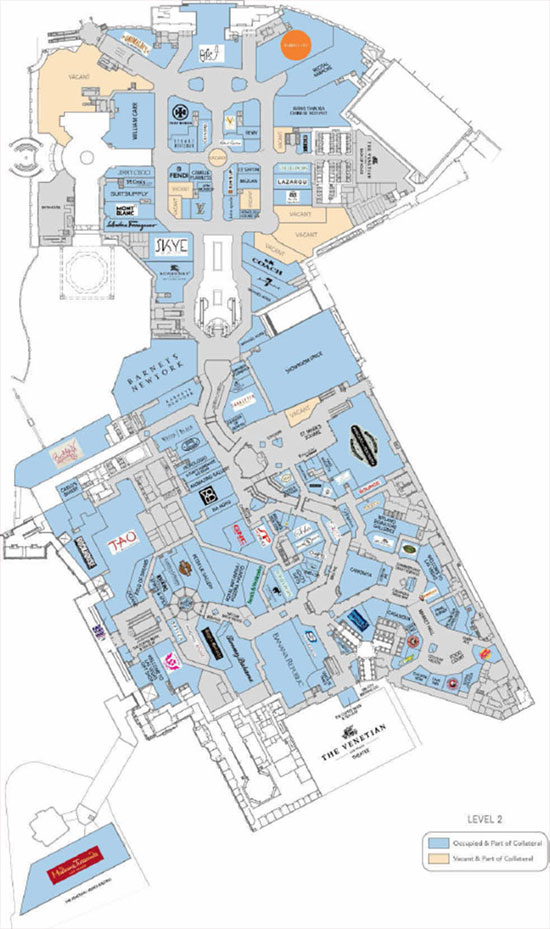
THE INFORMATION IN THIS STRUCTURAL AND COLLATERAL TERM SHEET IS NOT COMPLETE AND MAY BE AMENDED PRIOR TO THE TIME OF SALE. THIS TERM SHEET IS NOT AN OFFER TO SELL THESE SECURITIES AND IT IS NOT A SOLICITATION OF AN OFFER TO BUY THESE SECURITIES IN ANY JURISDICTION WHERE THE OFFER OR SALE IS NOT PERMITTED.
32
3327 & 3377 Las Vegas Boulevard South Las Vegas, NV 89109 | Collateral Asset Summary – Loan No. 1 Grand Canal Shoppes | Cut-off Date Balance: Cut-off Date LTV Ratio: UW NCF DSCR: UW NOI Debt Yield: | $50,384,615 46.3% 2.46x 9.6% |
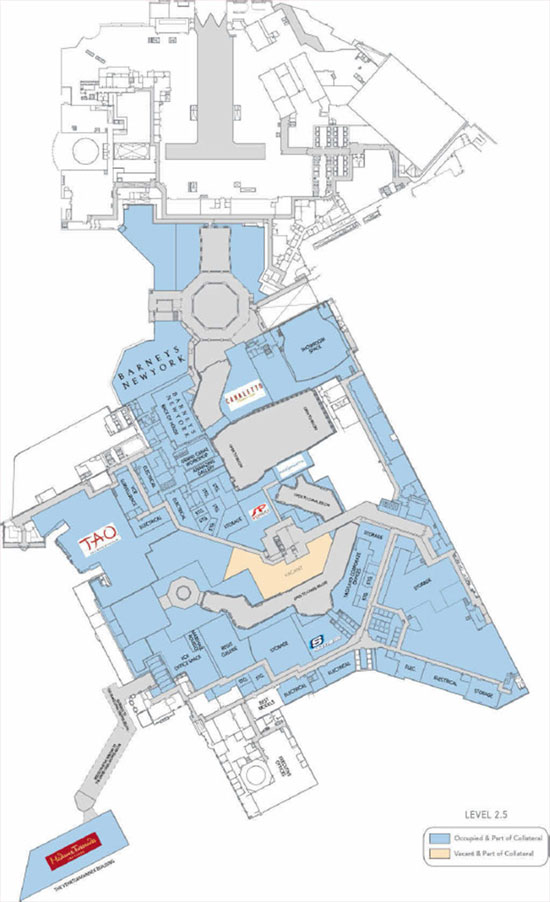
THE INFORMATION IN THIS STRUCTURAL AND COLLATERAL TERM SHEET IS NOT COMPLETE AND MAY BE AMENDED PRIOR TO THE TIME OF SALE. THIS TERM SHEET IS NOT AN OFFER TO SELL THESE SECURITIES AND IT IS NOT A SOLICITATION OF AN OFFER TO BUY THESE SECURITIES IN ANY JURISDICTION WHERE THE OFFER OR SALE IS NOT PERMITTED.
33
3327 & 3377 Las Vegas Boulevard South Las Vegas, NV 89109 | Collateral Asset Summary – Loan No. 1 Grand Canal Shoppes | Cut-off Date Balance: Cut-off Date LTV Ratio: UW NCF DSCR: UW NOI Debt Yield: | $50,384,615 46.3% 2.46x 9.6% |
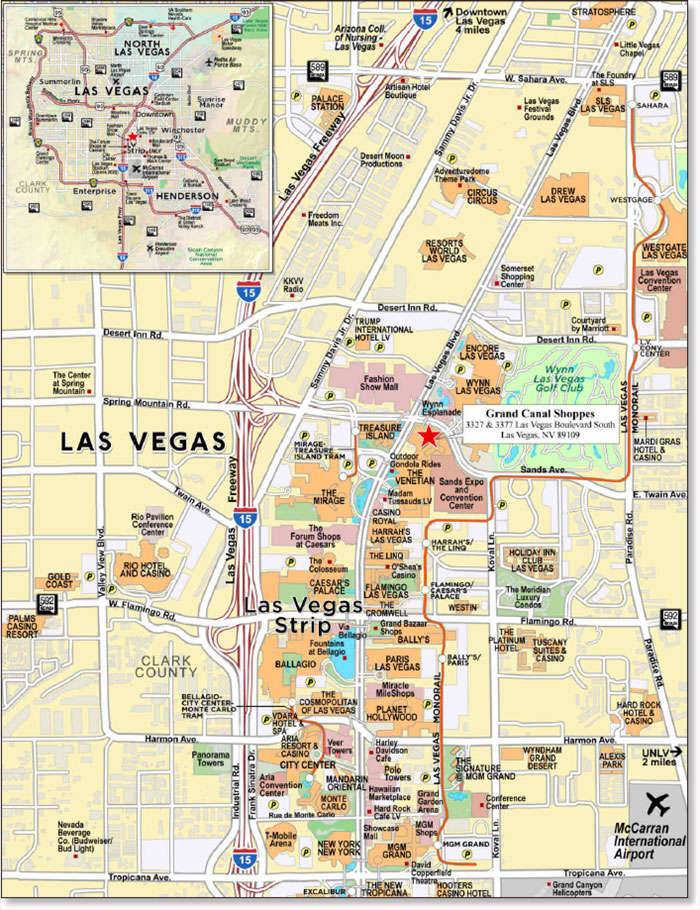
THE INFORMATION IN THIS STRUCTURAL AND COLLATERAL TERM SHEET IS NOT COMPLETE AND MAY BE AMENDED PRIOR TO THE TIME OF SALE. THIS TERM SHEET IS NOT AN OFFER TO SELL THESE SECURITIES AND IT IS NOT A SOLICITATION OF AN OFFER TO BUY THESE SECURITIES IN ANY JURISDICTION WHERE THE OFFER OR SALE IS NOT PERMITTED.
34
3327 & 3377 Las Vegas Boulevard South Las Vegas, NV 89109 | Collateral Asset Summary – Loan No. 1 Grand Canal Shoppes | Cut-off Date Balance: Cut-off Date LTV Ratio: UW NCF DSCR: UW NOI Debt Yield: | $50,384,615 46.3% 2.46x 9.6% |
| Mortgage Loan Information | Mortgaged Property Information | ||||||
| Mortgage Loan Seller(1): | WFB; UBS AG | Single Asset/Portfolio: | Single Asset | ||||
Credit Assessment (Fitch/KBRA/Moody’s): | BBB-/A-/Baa2 | Location: | Las Vegas, NV 89109 | ||||
| General Property Type: | Retail | ||||||
| Original Balance(2): | $50,384,615 | Detailed Property Type: | Specialty Retail | ||||
| Cut-off Date Balance(2): | $50,384,615 | Title Vesting: | Fee Simple/Leasehold | ||||
| % of Initial Pool Balance: | 6.2% | Year Built/Renovated: | 1999/2007 | ||||
| Loan Purpose: | Refinance | Size(7): | 759,891 SF | ||||
| Borrower Sponsors: | Brookfield Properties REIT Inc.; Nuveen Real Estate | Cut-off Date Balance per SF(2): | $1,000 | ||||
| Maturity Date Balance per SF(2): | $1,000 | ||||||
| Mortgage Rate(3): | 3.7408% | Property Manager: | Brookfield Properties Retail Inc. | ||||
| Note Date: | 6/3/2019 | (borrower-related) | |||||
| First Payment Date: | 8/1/2019 | ||||||
| Maturity Date: | 7/1/2029 | ||||||
| Original Term to Maturity | 120 months | ||||||
| Original Amortization Term: | 0 months | ||||||
| IO Period: | 120 months | ||||||
| Seasoning: | 3 months | Underwriting and Financial Information | |||||
| Prepayment Provisions(4): | LO (27); DEF (88); O (5) | UW NOI: | $73,021,709 | ||||
| Lockbox/Cash Mgmt Status: | Hard/Springing | UW NOI Debt Yield(2): | 9.6% | ||||
| Additional Debt Type(2)(5): | Pari Passu/Subordinate Debt | UW NOI Debt Yield at Maturity(2): | 9.6% | ||||
| Additional Debt Balance(2)(5): | $709,615,385/$215,000,000 | UW NCF DSCR(2): | 2.46x | ||||
| Future Debt Permitted (Type): | No (N/A) | Most Recent NOI: | $71,465,811 (3/31/2019 TTM) | ||||
| Reserves(6) | 2nd Most Recent NOI: | $71,326,473 (12/31/2018) | |||||
| Type | Initial | Monthly | Cap | 3rd Most Recent NOI: | $74,425,947 (12/31/2017) | ||
| RE Tax: | $0 | Springing | N/A | Most Recent Occupancy: | 94.0% (5/31/2019) | ||
| Insurance: | $0 | Springing | N/A | 2nd Most Recent Occupancy: | 93.3% (12/31/2018) | ||
| Replacements: | $0 | Springing | $386,928 | 3rd Most Recent Occupancy: | 93.0% (12/31/2017) | ||
| TI/LC: | $12,309,694 | Springing | $2,321,544 | Appraised Value (as of): | $1,640,000,000 (4/3/2019) | ||
| Ground Rent Reserve: | $0 | Springing | N/A | Cut-off Date LTV Ratio(2): | 46.3% | ||
| Gap Rent Reserve: | $1,218,246 | $0 | N/A | Maturity Date LTV Ratio(2): | 46.3% | ||
| Sources and Uses | ||||||
| Sources | Proceeds | % of Total | Uses | Proceeds | % of Total | |
| Senior Loan Amount(2): | $760,000,000 | 77.9% | Loan Payoff: | $627,284,452 | 64.3% | |
| Subordinate Companion Loan(2): | $215,000,000 | 22.1% | Reserves: | $13,527,940 | 1.4% | |
| Closing Costs: | $1,143,041 | 0.1% | ||||
| Return of Equity: | $333,044,567 | 34.2% | ||||
| Total Sources: | $975,000,000 | 100.0% | Total Uses: | $975,000,000 | 100.0% | |
| (1) | The Grand Canal Shoppes Whole Loan (as defined below) was co-originated by Morgan Stanley Bank, N.A. (“MSBNA”), JPMorgan Chase Bank, National Association (“JPMCB”), Goldman Sachs Bank USA (“GS”) and Wells Fargo Bank, N.A. (“WFB”) on June 3, 2019. WFB is contributing the non-controlling Note A-2-3 and UBS AG is contributing the non-controlling Note A-2-5, which have an aggregate original principal balance of $50,384,615. |
| (2) | The Grand Canal Shoppes Mortgage Loan (as defined below) is part of the Grand Canal Shoppes Whole Loan, which is comprised of 24pari passu senior promissory notes with an aggregate original principal balance of $760,000,000 (the “Senior Notes”, and collectively the “Grand Canal Shoppes Senior Loan”) and one promissory note that is subordinate to the Senior Notes with an original principal balance of $215,000,000 (the “Grand Canal Shoppes Subordinate Companion Loan”, and together with the Grand Canal Shoppes Senior Loan, the “Grand Canal Shoppes Whole Loan”). The Cut-off Date Balance per SF, Maturity Date Balance per SF, UW NOI Debt Yield, UW NOI Debt Yield at Maturity, UW NCF DSCR, Cut-off Date LTV Ratio and Maturity Date LTV Ratio numbers presented above are based on the aggregate principal balance of the promissory notes comprising the Grand Canal Shoppes Senior Notes, without regard to the Grand Canal Shoppes Subordinate Companion Loan. The Cut-off Date Balance per SF, Maturity Date Balance per SF, UW NOI Debt Yield, UW NOI Debt Yield at Maturity, UW NCF DSCR, Cut-off Date LTV Ratio and LTV Ratio at Maturity numbers based on the combined balance of the entire Grand Canal Shoppes Whole Loan are $1,283, $1,283, 7.5%, 7.5%, 1.67x, 59.5% and 59.5%, respectively. |
| (3) | Reflects the Senior Notes only. The Grand Canal Shoppes Subordinate Companion Loan accrues interest at the rate of 6.25%per annum. |
| (4) | Defeasance of the Grand Canal Shoppes Whole Loan is permitted at any time after the earlier to occur of (a) the end of the two-year period commencing on the closing date of the securitization of the last Grand Canal Shoppes Whole Loan promissory note to be securitized and (b) June 3, 2022. The assumed defeasance lockout period of 27 payments is based on the closing date of this transaction in October 2019. |
| (5) | See “The Mortgage Loan” and “Additional Secured Indebtedness (not including trade debts)” below for further discussion of additional debt. |
| (6) | See “Escrows and Reserves” below for further discussion of reserve requirements. |
| (7) | Size excludes the 84,743 SF space currently leased to Barneys New York. This space is included in the collateral; however, the related mortgage loan documents permit the right to obtain a free release with respect to such space. See “Release of Barneys parcel.” As such, no value or rental income has been attributed to this space. |
THE INFORMATION IN THIS STRUCTURAL AND COLLATERAL TERM SHEET IS NOT COMPLETE AND MAY BE AMENDED PRIOR TO THE TIME OF SALE. THIS TERM SHEET IS NOT AN OFFER TO SELL THESE SECURITIES AND IT IS NOT A SOLICITATION OF AN OFFER TO BUY THESE SECURITIES IN ANY JURISDICTION WHERE THE OFFER OR SALE IS NOT PERMITTED.
35
3327 & 3377 Las Vegas Boulevard South Las Vegas, NV 89109 | Collateral Asset Summary – Loan No. 1 Grand Canal Shoppes | Cut-off Date Balance: Cut-off Date LTV Ratio: UW NCF DSCR: UW NOI Debt Yield: | $50,384,615 46.3% 2.46x 9.6% |
The Mortgage Loan.The largest mortgage loan (the “Grand Canal Shoppes Mortgage Loan”) is part of the Grand Canal Shoppes Whole Loan evidenced by (i) 24pari passu notes comprising the Grand Canal Shoppes Senior Loan with an aggregate original principal balance of $760,000,000 and an aggregate outstanding principal balance as of the Cut-off Date of $760,000,000 and (ii) the Grand Canal Shoppes Subordinate Companion Loan with an original principal balance of $215,000,000 and an outstanding principal balance as of the Cut-off Date of $215,000,000, secured by a first mortgage encumbering the fee and leasehold interest in a 759,891 SF retail center located in Las Vegas, Nevada (the “Grand Canal Shoppes Property”). The Grand Canal Shoppes Mortgage Loan represents the non-controlling Note A-2-3 and Note A-2-5 with an aggregate original principal balance of $50,384,615. The non-controlling Note A-1-1 and Note A-1-6 with an aggregate original principal balance of $70,000,000 have been contributed to the MSC 2019-H7 securitization trust, the non-controlling Note A-1-2 and Note A-2-1 with an aggregate original principal balance of $100,000,000 have been contributed to the BANK 2019-BNK19 securitization trust, the non-controlling Note A-2-2-2 with an original principal balance of $30,000,000 is being contributed to the CSAIL 2019-C17 securitization trust, the non-controlling Note A-3-1 with an original principal balance of $50,000,000 has been contributed to the Benchmark 2019-B12 securitization trust, and the non-controlling Note A-4-1 with an original principal balance of $60,000,000 has been contributed to the CGCMT 2019-GC41 securitization trust. The remaining Grand Canal Shoppes Senior Notes (together with Note A-1-1, Note A-1-6, Note A-1-2, Note A-2-1, Note A-2-2-2, Note A-3-1, Note A-4-1, and excluding the Grand Canal Shoppes Mortgage Loan, collectively, the “Grand Canal Shoppes Non-Serviced Pari Passu Companion Loans”) are expected to be contributed to future securitization transactions or may be otherwise transferred at any time. The mortgage loan seller provides no assurance that the non-securitizedpari passunotes will not be split further. The Grand Canal Shoppes Whole Loan is being serviced pursuant to the pooling and servicing agreement for the MSC 2019-H7 securitization trust. See “Description of the Mortgage Pool—The Whole Loans—The Non-Serviced AB Whole Loans—The Grand Canal Shoppes Whole Loan” and “Pooling and Servicing Agreement” in the Preliminary Prospectus.
| Grand Canal Shoppes Whole Loan Summary | ||||
| Notes | Original Principal Balance | Cut-off Date Balance | Anticipated Note Holder | Controlling Piece |
| Grand Canal Shoppes Mortgage Loan | ||||
| A-2-3 & A-2-5 | $50,384,615 | $50,384,615 | UBS 2019-C17 | No |
| Grand Canal Shoppes Non-Serviced Pari Passu Companion Loans | ||||
| A-1-1 | $60,000,000 | $60,000,000 | MSC 2019-H7 | No(1) |
| A-1-2 | $50,000,000 | $50,000,000 | BANK 2019-BNK19 | No |
| A-1-3 | $40,000,000 | $40,000,000 | MSBNA | No |
| A-1-4 | $40,000,000 | $40,000,000 | MSBNA | No |
| A-1-5 | $13,846,154 | $13,846,154 | MSBNA | No |
| A-1-6 | $10,000,000 | $10,000,000 | MSC 2019-H7 | No |
| A-1-7 | $10,000,000 | $10,000,000 | BANK 2019-BNK20(1) | No |
| A-1-8 | $10,000,000 | $10,000,000 | BANK 2019-BNK20(1) | No |
| A-2-1 | $50,000,000 | $50,000,000 | BANK 2019-BNK19 | No |
| A-2-2-1 | $20,000,000 | $20,000,000 | BANK 2019-BNK20(2) | No |
| A-2-2-2 | $30,000,000 | $30,000,000 | CSAIL 2019-C17(3) | No |
| A-2-4 | $25,000,000 | $25,000,000 | UBS AG | No |
| A-3-1 | $50,000,000 | $50,000,000 | Benchmark 2019-B12 | No |
| A-3-2 | $50,000,000 | $50,000,000 | JPMCB | No |
| A-3-3 | $40,000,000 | $40,000,000 | JPMCB | No |
| A-3-4 | $25,000,000 | $25,000,000 | Cantor Commercial Real Estate Lending, L.P. | No |
| A-3-5 | $10,384,615 | $10,384,615 | JPMCB | No |
| A-4-1 | $60,000,000 | $60,000,000 | CGCMT 2019-GC41 | No |
| A-4-2 | $60,000,000 | $60,000,000 | GS | No |
| A-4-3 | $20,000,000 | $20,000,000 | GSMS 2019-GC42(4) | No |
| A-4-4 | $25,000,000 | $25,000,000 | GS | No |
| A-4-5 | $10,384,615 | $10,384,615 | GS | No |
| Grand Canal Shoppes Subordinate Companion Loan | ||||
| B | $215,000,000 | $215,000,000 | Third party holder | Yes(5) |
| Total | $975,000,000 | $975,000,000 | ||
| (1) | Promissory Notes A-1-7 and A-1-8 are currently held by WFB, or an affiliated entity, and are expected to be contributed to BANK 2019-BNK20, which is expected to close on or about September 26, 2019. |
| (2) | Promissory Note A-2-1 is currently held by Morgan Stanley Capital Holdings LLC, or an affiliated entity, and is expected to be contributed to BANK 2019-BNK20, which is expected to close on or about September 26, 2019. |
| (3) | Promissory Note A-2-2-1 is currently held by UBS AG, or an affiliated entity, and is expected to be contributed to CSAIL 2019-C17, which is expected to close on or about September 25, 2019. |
| (4) | Promissory Note A-4-3 is currently held by GS, or an affiliated entity, and is expected to be contributed to GSMS 2019-GC42, which is expected to close on or about September 27, 2019. |
| (5) | The holder of the Grand Canal Shoppes Subordinate Companion Loan will have the right to appoint the special servicer of the Grand Canal Shoppes Whole Loan and to direct certain decisions with respect to the Grand Canal Shoppes Whole Loan, unless a control appraisal event exists under the related co-lender agreement. The Grand Canal Shoppes Whole Loan is being serviced pursuant to the pooling and servicing agreement for the MSC 2019-H7 securitization. |
Proceeds of the Grand Canal Shoppes Whole Loan were used to refinance existing securitized mortgage debt, fund upfront reserves, pay closing costs, and return equity to the Grand Canal Shoppes Borrowers (as defined below).
THE INFORMATION IN THIS STRUCTURAL AND COLLATERAL TERM SHEET IS NOT COMPLETE AND MAY BE AMENDED PRIOR TO THE TIME OF SALE. THIS TERM SHEET IS NOT AN OFFER TO SELL THESE SECURITIES AND IT IS NOT A SOLICITATION OF AN OFFER TO BUY THESE SECURITIES IN ANY JURISDICTION WHERE THE OFFER OR SALE IS NOT PERMITTED.
36
3327 & 3377 Las Vegas Boulevard South Las Vegas, NV 89109 | Collateral Asset Summary – Loan No. 1 Grand Canal Shoppes | Cut-off Date Balance: Cut-off Date LTV Ratio: UW NCF DSCR: UW NOI Debt Yield: | $50,384,615 46.3% 2.46x 9.6% |
The Borrowers and the Borrower Sponsors. The borrowers are Grand Canal Shops II, LLC and The Shoppes at the Palazzo, LLC, each organized as a Delaware limited liability company and each structured to be bankruptcy remote with two independent directors (collectively, the “Grand Canal Shoppes Borrowers”). Legal counsel to the Grand Canal Shoppes Borrowers delivered a non-consolidation opinion in connection with the origination of the Grand Canal Shoppes Mortgage Loan. The Grand Canal Shoppes Borrowers and a predecessor entity of one of the borrower sponsors filed for bankruptcy in 2009 and emerged from bankruptcy in 2009-2010. See “Description of the Mortgage Pool—Default History, Bankruptcy Issues and Other Proceedings” in the Preliminary Prospectus.
The borrower sponsors are Brookfield Properties REIT Inc. and Nuveen Real Estate, and the nonrecourse carveout guarantor is BPR Nimbus LLC (the ”Grand Canal Shoppes Guarantor”), an affiliate of Brookfield Properties REIT Inc.
Brookfield Properties REIT Inc. ranks among the largest retail real estate companies in the United States. Its portfolio of mall properties spans the nation, encompassing 170 locations across 42 states and representing over 146 million SF of retail space. The company is focused on managing, leasing and redeveloping retail properties.
Nuveen Real Estate is the investment management arm of Teachers Insurance and Annuity Association. Nuveen Real Estate manages various funds and mandates, across both public and private investments, spanning both debt and equity. Nuveen Real Estate has over 80 years of real estate investing experience and more than 500 employees located across over 20 cities throughout the United States, Europe and Asia Pacific.
The Property. The Grand Canal Shoppes Property is a 759,891 SF specialty retail center that predominantly comprises the first-, second-, and third-levels of the Venetian Hotel and Casino and Palazzo Resort and Casino. The Grand Canal Shoppes Property opened in 1999, with an expansion in conjunction with the completion of The Palazzo in 2007, and is anchored by an 84,743 SF, three level Barneys New York, currently slated to close at the end of its lease term by January 2020. Barneys New York filed for bankruptcy in August 2019, with plans to close several other stores in order to support a sale process. The Barneys Parcel (as defined below) was part of the collateral for the Grand Canal Shoppes Whole Loan at loan origination, but the Grand Canal Shoppes Borrowers have the right to obtain a free release of the Barneys Parcel. At origination, no value or rental income was attributed to the Barneys Parcel.
The Venetian Hotel and Casino and Palazzo Resort and Casino are luxury hotels and casino resorts situated within the southeast quadrant of Las Vegas Boulevard and Sands Avenue. Each of the Venetian Hotel and Casino and the Palazzo Resort and Casino are owned and operated by Las Vegas Sands Corporation. The overall resort complex is the largest on The Strip (as defined below), and includes 4,049 rooms within The Venetian, 3,068 rooms/suites within The Palazzo, and 225,000 SF of gaming space (combined), none of which are collateral for the Grand Canal Shoppes Whole Loan. The Grand Canal Shoppes Property is physically connected to the Venetian Hotel and Casino and the Palazzo Resort and Casino, which combine to create a large hotel and resort complex with over 7,000 hotel rooms, 2.3 million SF of meeting space,one million SF of retail space, and more than 30 restaurants. In addition, the Grand Canal Shoppes Property is within walking distance to over 140,000 hotel rooms.
The Grand Canal Shoppes Property is situated across 21.1 acres of land along the central portion of Las Vegas Boulevard (“The Strip”). The Grand Canal Shoppes Property is a shopping, entertainment, and dining venue in Las Vegas featuring a unique Venetian-inspired setting with luxury retailers and restaurant concepts. Attractions include a gondola ride through the canals of the Grand Canal Shoppes Property as well as showroom/theater space for live performances.
The Grand Canal Shoppes Property is 94.0% leased as of May 31, 2019. According to the appraisal, the Grand Canal Shoppes Property generates average mall shop sales of over $1,000 PSF. The Grand Canal Shoppes Property generated $427.6 million in gross sales with comparable in line sales of $1,182 PSF as of the trailing twelve months ended February 28, 2019. The Grand Canal Shoppes Property generates over 60% of its top line revenue from food and entertainment offerings, including restaurants such as Tao Asian Bistro, which features a night and beach club, Grand Lux Café, Sushi Samba, Delmonico Steakhouse, Cut by Wolfgang Puck, Smith & Wollensky, Verdugo West Brewery, Xiang Tian Xia Chinese Hot Pot and Recital Karaoke, among others. Luxury retailers at the Grand Canal Shoppes Property include Louis Vuitton, Salvatore Ferragamo, Fendi and Jimmy Choo.
From 2015 through January 2019, capital expenditures, inclusive of development capital and landlord work, of approximately $20.3 million ($26.70 PSF) were invested in the Grand Canal Shoppes Property. In addition, there is a planned renovation and redevelopment of the common areas within the shopping areas above The Palazzo. Ownership is budgeting approximately $12.0 million to improve lighting and finishes in an attempt to maintain existing tenants and attract new tenants to this portion of the Grand Canal Shoppes Property. According to management, renovations are expected to begin in September 2019. In addition, renovation, new finishes and lighting are expected to be completed in conjunction with a proposed 27,422 SF international food hall, which is expected to be completed in 2020. Such renovation and redevelopment, as well as development of the new food hall, are not required by or reserved for under the related mortgage loan documents, and we cannot assure you that any such renovation, redevelopment, or food hall development will be completed.
The following table presents asummary of historical tenant sales at the Grand Canal Shoppes Property.
| Historical Tenant Sales Summary(1) | ||||||
| 2015 | 2016 | 2017 | 2018 | TTM February 2019 Sales | TTM February 2019 Sales PSF | |
| Anchor/Major Sales | $129,599,970 | $129,282,829 | $130,862,228 | $138,705,093 | $140,317,346 | $1,046 |
| Comparable In-Line Sales | $200,973,916 | $207,912,708 | $223,524,143 | $244,916,086 | $244,795,176 | $1,154 |
| Comparable Food Court Sales | $17,055,210 | $19,744,070 | $21,275,466 | $23,538,795 | $23,688,945 | $1,580 |
| (1) | Information as provided by the borrower sponsor and only includes tenants reporting sales. |
The Grand Canal Shoppes Property is anchored by 18 major tenants that, in the aggregate, generate approximately $140.3 million in annual sales as of TTM February 2019.Since 2015, theGrand Canal ShoppesProperty’s sales performance has steadily increased year-over-year, growing 21.4% over this period. Furthermore, comparable sales have consistently exceeded $1,100 PSF reaching $1,182 PSF as of TTM February 2019.
THE INFORMATION IN THIS STRUCTURAL AND COLLATERAL TERM SHEET IS NOT COMPLETE AND MAY BE AMENDED PRIOR TO THE TIME OF SALE. THIS TERM SHEET IS NOT AN OFFER TO SELL THESE SECURITIES AND IT IS NOT A SOLICITATION OF AN OFFER TO BUY THESE SECURITIES IN ANY JURISDICTION WHERE THE OFFER OR SALE IS NOT PERMITTED.
37
3327 & 3377 Las Vegas Boulevard South Las Vegas, NV 89109 | Collateral Asset Summary – Loan No. 1 Grand Canal Shoppes | Cut-off Date Balance: Cut-off Date LTV Ratio: UW NCF DSCR: UW NOI Debt Yield: | $50,384,615 46.3% 2.46x 9.6% |
The first floor of Barneys New York and the casino level (ground floor) space are leased by the Grand Canal Shoppes Borrowers, pursuant to air rights ground leases, which do not include the underlying land. The casino level space consists of restaurants and retail shops contained on the casino levels (ground floor) of the Venetian Hotel and Casino and the Palazzo Resort and Casino. The ground lease for the casino level of the Venetian Hotel and Casino portion of the Grand Canal Shoppes Property expires in 2093, and the ground lease for the casino level of the Palazzo Resort and Casino portion of the Grand Canal Shoppes Property expires in 2097. Each of the annual rents for these leases is $1 and the Grand Canal Shoppes Borrowers have the option to purchase the premises for $1 on the respective expiration dates. The remaining collateral, except for the Walgreens air rights lease space, is owned in fee. A portion of the fee is located at the ground level (the retail annex), with the majority fee located on levels 2 and 3. The collateral is part of a vertical subdivision;i.e. the fee ownership is solely of the designated space on the ground level and levels 2 and 3 and does not include the land. A reciprocal easement agreement governs the relationship among the owner of the Grand Canal Shoppes Property, and the owners of other interests in the complex that includes the Venetian Hotel and Casino and the Palazzo Resort and Casino. The Walgreens air rights lease space refers to the air rights above the Walgreens space (the Walgreens space itself is owned by a third party), for which the lease expires in 2064 with one, 40 year extension option. The Walgreens air rights space is currently occupied by Buddy V's Ristorante and Carlo’s Bakery (12,839 SF, 1.5% of underwritten base rent). The Venetian Hotel and Casino subleases a portion of the air rights parcel from the Grand Canal Shoppes Borrowers pursuant to a separate sublease. The Venetian Hotel and Casino is responsible under its sublease for an amount equal to 80.68% of the ground rent under the Walgreens air rights lease.
Pursuant to the reciprocal easement and ground lease documents, transfers (other than to a lender in connection with foreclosure or delivery of a deed-in-lieu of foreclosure of a mortgage secured by the Grand Canal Shoppes Property or the first subsequent transferee from the lender) of the Grand Canal Shoppes Property are subject to certain transfer restrictions. Additionally, under such documents, Venetian Casino Resort, LLC has the right to cure certain defaults of the Grand Canal Shoppes Borrowers under the Grand Canal Shoppes Whole Loan. See also “Right of First Offer/Right of First Refusal” below.
| Historical and Current Occupancy(1) | ||||||
| 2014 | 2015 | 2016 | 2017 | 2018 | Current(2) | |
| The Venetian Hotel and Casino | 95.1% | 92.6% | 98.3% | 95.7% | 99.1% | 97.1% |
| Palazzo Resort and Casino | 88.2% | 89.5% | 86.2% | 88.4% | 83.0% | 86.2% |
| Total/Wtd. Avg. | 92.6% | 91.5% | 93.9% | 93.0% | 93.3% | 94.0% |
| (1) | Historical occupancy provided by the borrower sponsor. |
| (2) | Current occupancy is based on the May 31, 2019 UW rent roll. |
THE INFORMATION IN THIS STRUCTURAL AND COLLATERAL TERM SHEET IS NOT COMPLETE AND MAY BE AMENDED PRIOR TO THE TIME OF SALE. THIS TERM SHEET IS NOT AN OFFER TO SELL THESE SECURITIES AND IT IS NOT A SOLICITATION OF AN OFFER TO BUY THESE SECURITIES IN ANY JURISDICTION WHERE THE OFFER OR SALE IS NOT PERMITTED.
38
3327 & 3377 Las Vegas Boulevard South Las Vegas, NV 89109 | Collateral Asset Summary – Loan No. 1 Grand Canal Shoppes | Cut-off Date Balance: Cut-off Date LTV Ratio: UW NCF DSCR: UW NOI Debt Yield: | $50,384,615 46.3% 2.46x 9.6% |
The following table presents certain information relating to the tenancy at the Grand Canal Shoppes Property:
| Tenant Summary(1) | |||||||||||||
| Tenant Name | Credit Rating (Fitch/Moody’s/ S&P)(2) | Tenant NRSF | % of NRSF | Annual UW Base Rent(3) | % of Total Annual UW Base Rent | Annual UW Base Rent PSF(4) | TTM February 2019 Sales | Occ. Cost %(5) | Term. Option | Lease Expiration | |||
| $ | PSF | ||||||||||||
| Major Tenants | |||||||||||||
| Emporio D'Gondola(6) | NR/NR/NR | 922 | 0.1% | $4,051,692 | 6.0% | $4,394.46 | N/A | N/A | N/A | N | 5/31/2029 | ||
| The Venetian Resort (Showroom/Theater) | BBB-/NR/BBB- | 38,920 | 5.1% | $4,051,619 | 6.0% | $104.10 | N/A | N/A | N/A | N | 5/31/2029 | ||
| Regis Galerie(7) | NR/NR/NR | 28,099 | 3.7% | $2,367,955 | 3.5% | $84.27 | $7,010,021 | $249 | 33.8% | N | Various | ||
| Sephora | NR/NR/A+ | 10,074 | 1.3% | $2,299,995 | 3.4% | $228.31 | N/A | N/A | N/A | N | 7/31/2021 | ||
| Welcome to Las Vegas(8) | NR/NR/NR | 14,234 | 1.9% | $2,000,502 | 3.0% | $140.54 | $6,612,970 | $465 | 30.3% | N | Various | ||
| Grand Lux Cafe | NR/NR/NR | 19,100 | 2.5% | $1,463,633 | 2.2% | $76.63 | $21,992,535 | $1,151 | 6.7% | N | 12/31/2029 | ||
| CUT By Wolfgang Puck | NR/NR/NR | 12,247 | 1.6% | $1,261,441 | 1.9% | $103.00 | $14,171,737 | $1,157 | 8.9% | N | 5/31/2028 | ||
| Mercato Della Pescheria | NR/NR/NR | 16,479 | 2.2% | $1,131,448 | 1.7% | $68.66 | $9,158,574 | $556 | 12.4% | N | 11/30/2025 | ||
| Bellusso Jewelry | NR/NR/NR | 2,999 | 0.4% | $1,068,964 | 1.6% | $356.44 | $8,173,547 | $2,725 | 13.1% | N | 11/30/2022 | ||
| Golden Gai | NR/NR/NR | 12,820 | 1.7% | $1,034,959 | 1.5% | $80.73 | N/A | N/A | N/A | N | 12/31/2029 | ||
| TAO Asian Bistro | NR/NR/NR | 15,175 | 2.0% | $980,002 | 1.5% | $64.58 | $35,724,404 | $2,354 | 2.7% | N | 1/31/2025 | ||
| Peter Lik Gallery | NR/NR/NR | 4,394 | 0.6% | $979,686 | 1.5% | $222.96 | $3,859,320 | $878 | 25.4% | N | 8/31/2021 | ||
| Smith & Wollensky | NR/NR/NR | 14,751 | 1.9% | $942,502 | 1.4% | $63.89 | N/A | N/A | N/A | N | 6/30/2028 | ||
| Michael Kors(9) | BBB-/NR/BBB- | 4,066 | 0.5% | $917,907 | 1.4% | $225.75 | $3,264,594 | $803 | 28.1% | N | Various | ||
| Recital Karaoke | NR/NR/NR | 14,062 | 1.9% | $897,999 | 1.3% | $63.86 | N/A | N/A | N/A | N | 2/28/2029 | ||
| Total Major Tenants | 208,342 | 27.4% | $25,450,304 | 38.0% | $122.16 | ||||||||
| Other Tenants | 506,286 | 66.6% | $41,584,578 | 62.0% | $82.14 | ||||||||
| Vacant | 45,263 | 6.0% | $0 | 0.0% | $0.00 | ||||||||
| Collateral Total | 759,891 | 100.0% | $67,034,881 | 100.0% | $93.80 | ||||||||
| (1) | Information is based on the underwritten rent roll.Tenants are listed in order of annual underwritten base rent. |
| (2) | Certain ratings are those of the parent company whether or not the parent guarantees the lease. |
| (3) | Annual UW Base Rent reflects the following: (a) in-place leases based on the May 2019 rent roll and (b) contractual rent steps of $2,184,628 through May 31, 2020. |
| (4) | Annual UW Base Rent PSF excludes vacant space. |
| (5) | Occ. Cost % is based on the underwritten rent as of the May 31, 2019 rent roll divided by the most recently reported sales. |
| (6) | This tenant operates as the gondola attraction at the Grand Canal Shoppes Property. |
| (7) | Regis Galerie has 8,406 SFexpiring on December 31, 2020, 4,654 SF expiring on February 29, 2020 and 15,039 SF expiring on May 31, 2025. |
| (8) | TheWelcome to Las Vegas lease is expected to commence on February 1, 2020. Gap rent was reserved by the lender at origination. 10,239 SF expires on December 31, 2020 and the remaining 3,995 SF expires on January 31, 2030. |
| (9) | Michael Kors has 3,733 SFexpiring on January 31, 2026 and 333 SF expiring on March 31, 2020. |
THE INFORMATION IN THIS STRUCTURAL AND COLLATERAL TERM SHEET IS NOT COMPLETE AND MAY BE AMENDED PRIOR TO THE TIME OF SALE. THIS TERM SHEET IS NOT AN OFFER TO SELL THESE SECURITIES AND IT IS NOT A SOLICITATION OF AN OFFER TO BUY THESE SECURITIES IN ANY JURISDICTION WHERE THE OFFER OR SALE IS NOT PERMITTED.
39
3327 & 3377 Las Vegas Boulevard South Las Vegas, NV 89109 | Collateral Asset Summary – Loan No. 1 Grand Canal Shoppes | Cut-off Date Balance: Cut-off Date LTV Ratio: UW NCF DSCR: UW NOI Debt Yield: | $50,384,615 46.3% 2.46x 9.6% |
The following table presents certain information relating to the lease rollover at the Grand Canal Shoppes Property:
| Lease Rollover Schedule(1)(2) | ||||||||
| Year | # of Leases Rolling | SF Rolling | Approx. % of Total SF Rolling | Approx. Cumulative % of SF Rolling | UW Base Rent PSF Rolling(3) | Total UW Base Rent Rolling(4) | Approx. % of Total Rent Rolling | Approx. Cumulative % of Total Rent Rolling |
| MTM | 3 | 2,080 | 0.3% | 0.3% | $0.00 | $0 | 0.0% | 0.0% |
| 2019 | 17 | 39,567 | 5.2% | 5.5% | $61.58 | $2,436,560 | 3.6% | 3.6% |
| 2020 | 26 | 80,052 | 10.5% | 16.0% | $55.90 | $4,475,224 | 6.7% | 10.3% |
| 2021 | 16 | 28,634 | 3.8% | 19.8% | $200.74 | $5,748,002 | 8.6% | 18.9% |
| 2022 | 13 | 35,084 | 4.6% | 24.4% | $133.50 | $4,683,674 | 7.0% | 25.9% |
| 2023 | 20 | 41,038 | 5.4% | 29.8% | $133.79 | $5,490,655 | 8.2% | 34.1% |
| 2024 | 23 | 60,412 | 8.0% | 37.8% | $105.63 | $6,381,261 | 9.5% | 43.6% |
| 2025 | 22 | 146,378 | 19.3% | 57.0% | $71.87 | $10,519,793 | 15.7% | 59.3% |
| 2026 | 9 | 29,721 | 3.9% | 60.9% | $92.59 | $2,751,933 | 4.1% | 63.4% |
| 2027 | 3 | 6,142 | 0.8% | 61.7% | $139.93 | $859,431 | 1.3% | 64.7% |
| 2028 | 9 | 48,011 | 6.3% | 68.1% | $102.91 | $4,940,574 | 7.4% | 72.0% |
| 2029 | 27 | 185,418 | 24.4% | 92.5% | $97.34 | $18,048,649 | 26.9% | 99.0% |
| 2030 & Beyond | 2 | 12,091 | 1.6% | 94.0% | $57.82 | $699,125 | 1.0% | 100.0% |
| Vacant | 0 | 45,263 | 6.0% | 100.0% | $0.00 | $0 | 0.0% | 100.0% |
| Total/Wtd. Avg. | 190 | 759,891 | 100.0% | $93.80 | $67,034,881 | 100.0% | ||
| (1) | Information is based on the underwritten rent roll. |
| (2) | Certain tenants may have lease termination options that are exercisable prior to the stated expiration date of the subject lease or leases, which are not considered in the lease rollover schedule. |
| (3) | Wtd. Avg. UW Base Rent PSF Rolling excludes vacant space. |
| (4) | Total UW Base Rent Rolling reflects the following: (a) in-place leases based on the May 2019 rent roll and (b) contractual rent steps of $2,184,628 through May 31, 2020. |
The Market. The Grand Canal Shoppes Property is located in Las Vegas, Nevada along The Strip. The Grand Canal Shoppes Property’s tenant mix of retail, restaurants, and entertainment offerings benefits from Las Vegas’s tourists, convention center attendees, and residents. The Grand Canal Shoppes Property is adjacent to the Sands Expo Convention Center, a 1.8 million SF meeting and convention center. Additionally, Las Vegas has various developments in process that are expected to be completed in 2020 and beyond. The most notable of these developments are the MSG Sphere, an 18,000 seat performance venue being developed by Madison Square Garden and Las Vegas Sands east of the Grand Canal Shoppes Property, the construction of the 65,000 seat Las Vegas Stadium, the new home of the NFL’s Oakland Raiders, which is expected to also double as a live entertainment and convention venue, and the Las Vegas Convention Center District redevelopment with a 1.4 million SF expansion. We cannot assure you whether or when such developments will be completed.
Primary access to the Grand Canal Shoppes Property is provided by Interstate 15, the region’s primary north-south route, which is situated approximately one mile west of the Grand Canal Shoppes Property, with access gained via Spring Mountain Road/Sands Avenue. The Grand Canal Shoppes Property is located approximately 3 miles north of the McCarran International Airport and has direct access to Citizen Area Transit, which has over 41 routes running throughout the region. According to the appraisal, there were over 42.1 million visitors traveling to Las Vegas, and convention visitors exceeding 6.5 million in 2018. According to the appraisal, the estimated 2018 population within a five-, seven- and ten-mile radius of the Grand Canal Shoppes Property was 410,151, 911,414 and 1,661,641, respectively. The estimated 2018 average household income within a five-, seven- and ten-mile radius was $54,257, $60,146 and $70,983, respectively.
The Grand Canal Shoppes Property is located in the Southeast submarket of the Las Vegas retail market. According to the appraisal, as of the fourth quarter of 2018, the vacancy rate in the Southeast submarket was approximately 14.5%, with average asking rents of $19.41 PSF and inventory of approximately 5.1 million SF. According to the appraisal, as of the fourth quarter of 2018, the vacancy rate in the Las Vegas retail market was approximately 13.4%, with average asking rents of $22.34 PSF and inventory of approximately 29.9 million SF. The appraiser concluded to a market rent of $98.23 PSF for the space at the Grand Canal Shoppes Property.
THE INFORMATION IN THIS STRUCTURAL AND COLLATERAL TERM SHEET IS NOT COMPLETE AND MAY BE AMENDED PRIOR TO THE TIME OF SALE. THIS TERM SHEET IS NOT AN OFFER TO SELL THESE SECURITIES AND IT IS NOT A SOLICITATION OF AN OFFER TO BUY THESE SECURITIES IN ANY JURISDICTION WHERE THE OFFER OR SALE IS NOT PERMITTED.
40
3327 & 3377 Las Vegas Boulevard South Las Vegas, NV 89109 | Collateral Asset Summary – Loan No. 1 Grand Canal Shoppes | Cut-off Date Balance: Cut-off Date LTV Ratio: UW NCF DSCR: UW NOI Debt Yield: | $50,384,615 46.3% 2.46x 9.6% |
The following table presents certain competitive properties to the Grand Canal Shoppes Property:
| Competitive Property Summary | |||||||
| Property, Location | Type | Year Built/ Renovated | Size (SF) | Occ. | Inline Sales PSF | Anchor Tenants | Distance to Subject (mi.) |
Grand Canal Shoppes Property Las Vegas, NV | Fashion/Specialty | 1999/2007 | 759,891 | 94.0%(1) | $1,182(2) | TAO Nightclub, Theater, Grand Lux Café, Mercato Della Pescheria, TAO Asian Bistro, Recital Karaoke, Madame Tussaud Las Vegas, Verdugo West Brewery, Golden Gai | N/A |
| Primary Competition | |||||||
| Forum Shops at Caesars Las Vegas, NV | Fashion/Specialty | 1992/1997, 2004 | 650,000 | 99% | $1,400 - $1,700 | Upscale/themed retail project at Caesars with 1-2 levels | 0.5 |
Wynn Las Vegas Retail Las Vegas, NV | Fashion/Specialty | 2005/2008 | 150,000 | 95% | $2,000 - $3,000 | Upscale retail areas located within The Wynn Las Vegas and Wynn Encore | 0.3 |
The Shops at Crystals Las Vegas, NV | Fashion/Specialty | 2009/N/A | 360,000 | 94% | $1,200 - $1,400 | Upscale specialty retail center with 3-levels on Las Vegas Strip part of City Center | 1.1 |
Miracle Mile Shops Las Vegas, NV | Fashion/Specialty | 2000/2008, 2016
| 494,000 | 93% | $825 - $875 | Mid-Tier specialty retail center with 1 and 2 stories at Planet Hollywood | 1.0 |
Fashion Show Mall Las Vegas, NV(3) | Super-Regional Center | 1981/Various | 1,875,400 | 95% | $825 - $875 | Neiman Marcus, Dillard's, Macy's, Saks, Forever 21, Nordstrom, Dick's Sporting Goods | 0.3 |
| Secondary Competition | |||||||
| The Linq Promenade Las Vegas, NV | Fashion/Specialty | 2014/N/A | 268,000 | 93% | - - - | Retail and entertainment specialty center including a number of restaurants and performance venues | 0.4 |
| Bellagio Shops Las Vegas, NV | Fashion/Specialty | 1998/N/A | - | 100% | - - - | Upscale shopping area located within Bellagio Resort and Casino | 0.8 |
The Showcase Las Vegas, NV | Specialty Retail | 1997/2003, 2009 | 347,281 | 97% | - - - | Coca-Cola, Ross, Hard Rock, M&M's, Adidas | 1.6 |
| Las Vegas Premium Outlets Las Vegas, NV | Outlet Center | 2003/N/A | 676,113 | 100% | $1,400 - $1,600 | Last Call Neiman Marcus, Off 5th Saks 5th Avenue, Nike | 3.5 |
Source: Appraisal
| (1) | Occupancy as of May 31, 2019. |
| (2) | Comparable inline sales PSF shown as of February 28, 2019. |
| (3) | Owned by an affiliate of the Grand Canal Shoppes Borrowers. |
Operating History and Underwritten Net Cash Flow. The following table presents certain information relating to the historical operating performance and the Underwritten Net Cash Flow at the Grand Canal Shoppes Property:
| Cash Flow Analysis | ||||||
| 2016 | 2017 | 2018 | 3/31/2019 TTM | UW | UW PSF | |
| Rents in Place | $68,255,204 | $67,507,328 | $66,471,558 | $66,941,590 | $64,850,253 | $85.34 |
| Contractual Rent Steps | $0 | $0 | $0 | $0 | $2,184,628 | $2.87 |
| Gross Potential Rent(1) | $68,255,204 | $67,507,328 | $66,471,558 | $66,941,590 | $67,034,881 | $88.22 |
| Other Income(2) | $12,765,993 | $12,203,223 | $10,872,872 | $10,365,738 | $10,455,366 | $13.76 |
| Total Recoveries | $31,633,869 | $27,875,777 | $25,766,223 | $25,166,107 | $26,539,087 | $34.92 |
| Less Vacancy & Credit Loss(3) | $0 | $0 | $0 | $0 | $0 | $0.00 |
| Effective Gross Income | $112,655,066 | $107,586,327 | $103,110,653 | $102,473,435 | $104,029,334 | $136.90 |
| Total Expenses(4) | $33,296,436 | $33,160,381 | $31,784,180 | $31,007,624 | $31,007,624 | $40.81 |
| Net Operating Income | $79,358,630 | $74,425,947 | $71,326,473 | $71,465,811 | $73,021,709 | $96.09 |
| Capital Expenditures | $0 | $0 | $0 | $0 | $0 | $0.00 |
| TI/LC | $0 | $0 | $0 | $0 | $2,023,806 | $2.66 |
| Net Cash Flow | $79,358,630 | $74,425,947 | $71,326,473 | $71,465,811 | $70,997,903 | $93.43 |
| Occupancy % | 93.9% | 93.0% | 93.3% | 94.0% | 94.0% | |
| NOI DSCR(5) | 2.75x | 2.58x | 2.47x | 2.48x | 2.53x | |
| NCF DSCR(5) | 2.75x | 2.58x | 2.47x | 2.48x | 2.46x | |
| NOI Debt Yield(5) | 10.4% | 9.8% | 9.4% | 9.4% | 9.6% | |
| NCF Debt Yield(5) | 10.4% | 9.8% | 9.4% | 9.4% | 9.3% | |
| (1) | UW Gross Potential Rent reflects the following: (a) in-place leases based on the May 2019 rent roll and (b) contractual rent steps of $2,184,628 through May 31, 2020, and excludes any rent associated with the Barneys New York space. The increase from 3/31/2019 TTM to UW Net Operating Income is due to recent leasing activity and contractual rent steps. |
| (2) | Other Income includes vending income, enterprise income, advertising revenue sponsorship income, specialty leasing income, overage rent and percent in lieu. |
| (3) | The underwritten economic vacancy is 6.0%. The Grand Canal Shoppes Property is 94.0% leased as of May 2019. |
| (4) | Total Expenses includes the Walgreens ground/air rights lease rent of which $133,475, 19.32% of the annual ground lease payment, was underwritten. The Venetian Hotel and Casino is responsible under its sublease for the remaining 80.68% of the ground rent under the Walgreens lease. |
| (5) | Debt service coverage ratios and debt yields are based on the Grand Canal Shoppes Senior Loan and exclude the Grand Canal Shoppes Subordinate Companion Loan. |
THE INFORMATION IN THIS STRUCTURAL AND COLLATERAL TERM SHEET IS NOT COMPLETE AND MAY BE AMENDED PRIOR TO THE TIME OF SALE. THIS TERM SHEET IS NOT AN OFFER TO SELL THESE SECURITIES AND IT IS NOT A SOLICITATION OF AN OFFER TO BUY THESE SECURITIES IN ANY JURISDICTION WHERE THE OFFER OR SALE IS NOT PERMITTED.
41
3327 & 3377 Las Vegas Boulevard South Las Vegas, NV 89109 | Collateral Asset Summary – Loan No. 1 Grand Canal Shoppes | Cut-off Date Balance: Cut-off Date LTV Ratio: UW NCF DSCR: UW NOI Debt Yield: | $50,384,615 46.3% 2.46x 9.6% |
Escrows and Reserves. The Grand Canal Shoppes Borrowers deposited in escrow at origination $1,218,246 for outstanding gap rents.
Real Estate Taxes and Insurance Reserves– During the continuance of a Cash Management Period (as defined below), the Grand Canal Shoppes Borrowers are required to reserve monthly 1/12 of the estimated property taxes and 1/12 of the estimated insurance premiums,provided that the monthly insurance reserve requirement is waived if the Grand Canal Shoppes Borrowers provide the lender with evidence that (a) the insurance policies required to be maintained by the Grand Canal Shoppes Borrowers are maintained pursuant to blanket policies that comply with the requirements of the related mortgage loan documents and (b) the insurance premiums payable in connection with such policies have been prepaid for not less than one year in advance (or, for the period of coverage under the policies as to which certificates are delivered at origination, such period, if less than one year).
Recurring Replacements Reserve– During the continuance of a Cash Management Period, the Grand Canal Shoppes Borrowers are required to deposit $16,122 monthly for a recurring replacements reserve. However, the Grand Canal Shoppes Borrowers will not be required to make any portion of the monthly recurring replacement deposit if the amount then on deposit in the recurring replacements reserve is equal to or exceeds $386,928.
TI/LC Reserve– The related mortgage loan documents provide for (i) an upfront reserve of $12,309,694 for unfunded tenant improvements and leasing commissions, including for the following major tenants at the Grand Canal Shoppes Property: $1,177,693 for Recital Karaoke, $1,472,330 for Verdugo West Brewery, $967,269 for Golden Gai, $63,000 for CUT By Wolfgang Puck, $882,000 for Smith & Wollensky and $20,000 for Once and (ii) during the continuance of a Cash Management Period, an ongoing monthly TI/LC reserve in an amount equal to $96,731. However, the Grand Canal Shoppes Borrowers will not be required to make any portion of the monthly TI/LC reserve deposit if the amount then on deposit in the TI/LC reserve is equal to or exceeds $2,321,544.
Ground Rent Reserve– During the continuance of a Cash Management Period, the Grand Canal Shoppes Borrowers are required to reserve monthly 1/12 of the annual amounts due by each of the Grand Canal Shoppes Borrowers, as applicable, under the Ground Leases (as defined below).
Notwithstanding the foregoing, the Grand Canal Shoppes Borrowers’ obligations to make any monthly deposits into the real estate taxes and insurance reserves, recurring replacement reserve, TI/LC reserve and/or ground rent reserve as applicable, is deemed to be satisfied to the extent there are sufficient funds to make such deposits in the cash management account, in which case no actual payment from the Grand Canal Shoppes Borrowers is required.
Lockbox and Cash Management. The Grand Canal Shoppes Whole Loan is structured with a hard lockbox and springing cash management. The Grand Canal Shoppes Borrowers are required to direct each tenant of the Grand Canal Shoppes Property to deposit all funds (other than Non-Core Income (as defined below)) directly into the lockbox account, and to deposit any funds received by the Grand Canal Shoppes Borrowers and property manager, notwithstanding such direction, into the lockbox account within two business days of receipt. Within two business days of written notification of the commencement of a Cash Management Period, the Grand Canal Shoppes Borrowers are required to establish a lender-controlled cash management account with a cash management bank, into which all funds in the lockbox account will be required to be deposited periodically so long as a Cash Management Period is continuing. So long as a Cash Management Period is continuing, funds in the cash management account are required to be applied (i) to make deposits into the real estate taxes and insurance reserves (if then required) as described above under “Escrows”, (ii) to make deposits into the ground rent reserve as described above under “Escrows”, (iii) to pay debt service on the Grand Canal Shoppes Whole Loan, (iv)provided that no event of default under the Grand Canal Shoppes Whole Loan is continuing as to which the lender has initiated an enforcement action, to pay operating expenses set forth in the annual budget (which is required to be approved by the lender) and extraordinary operating or capital expenses reasonably approved by the lender, (v) to make deposits into the recurring replacements reserve and the TI/LC reserve, as described above under “Escrows”, (vi) in the event a Cash Sweep Period is continuing, to deposit any excess amount remaining in the lockbox account into an excess cash flow account to be held by the lender as additional security for the Grand Canal Shoppes Whole Loan during the continuance of the Cash Sweep Period (provided that so long as no event of default exists as to which the lender has initiated an enforcement action, funds in such reserve may be applied to operating expenses) and (vii) if no Cash Sweep Period and no event of default under the Grand Canal Shoppes Whole Loan are continuing, all remaining funds in the lockbox account are required to be disbursed to the Grand Canal Shoppes Borrowers.
A “Cash Sweep Period” will commence upon (i) an event of default under the Grand Canal Shoppes Whole Loan and ending if such event of default is cured or waived or (ii) the determination that the debt yield of the Grand Canal Shoppes Whole Loan is less than 6.0% as of the end of any calendar year and ending upon the date that such debt yield is equal to or in excess of 6.0% for two consecutive calendar quarters.
A “Cash Management Period” will commence upon (i) an event of default under the Grand Canal Shoppes Whole Loan and ending if such event of default is cured or waived or (ii) the determination that the debt yield of the Grand Canal Shoppes Whole Loan is less than 6.5% as of the end of any calendar year and ending upon the date that such debt yield is equal to or in excess 6.5% for two consecutive calendar quarters.
“Non-Core Income” means (i) certainde minimis amounts of rents received directly by the Grand Canal Shoppes Borrowers from miscellaneous revenue items such as holiday photos and change retrieved from fountains (but excluding rent from Seasonal Leases (as defined below)) and (ii) certain rents generated pursuant to multi-property sponsorship and advertising programs which are directly attributable to the Grand Canal Shoppes Property. “Seasonal Leases” means leases and/or license agreements having a maximum term of one year or less.
Additional Secured Indebtedness (not including trade debts).In addition to the Grand Canal Shoppes Mortgage Loan, the Grand Canal Shoppes Property also secures the Grand Canal Shoppes Non-Serviced Pari Passu Companion Loans, which have an aggregate Cut-off Date principal balance of $709,615,385, and the Grand Canal Shoppes Subordinate Companion Loan, which has a Cut-off Date principal balance of $215,000,000. The Grand Canal Shoppes Non-Serviced Pari Passu Companion Loans accrue interest at the same rate as the Grand Canal Shoppes Mortgage Loan. The Grand Canal Shoppes Subordinate Companion Loan accrues interest at the rate of 6.2500% per annum. The Grand Canal Shoppes Senior Loan is generally senior in right of payment to the Grand Canal Shoppes Subordinate Companion Loan. The holders of the Grand Canal Shoppes Mortgage Loan, the Grand Canal Shoppes Non-Serviced Pari Passu Companion Loans, and the Grand Canal Shoppes Subordinate Companion Loan have entered into a co-lender agreement, which sets forth the allocation of collections on the Grand Canal Shoppes Whole Loan. See “Description of the Mortgage Pool—The Whole Loans—The Non-Serviced AB Whole Loans—The Grand Canal Shoppes Whole Loan” in the Preliminary Prospectus.
THE INFORMATION IN THIS STRUCTURAL AND COLLATERAL TERM SHEET IS NOT COMPLETE AND MAY BE AMENDED PRIOR TO THE TIME OF SALE. THIS TERM SHEET IS NOT AN OFFER TO SELL THESE SECURITIES AND IT IS NOT A SOLICITATION OF AN OFFER TO BUY THESE SECURITIES IN ANY JURISDICTION WHERE THE OFFER OR SALE IS NOT PERMITTED.
42
3327 & 3377 Las Vegas Boulevard South Las Vegas, NV 89109 | Collateral Asset Summary – Loan No. 1 Grand Canal Shoppes | Cut-off Date Balance: Cut-off Date LTV Ratio: UW NCF DSCR: UW NOI Debt Yield: | $50,384,615 46.3% 2.46x 9.6% |
Mezzanine Loans and Preferred Equity. None.
Release of Barneys Parcel. The Grand Canal Shoppes Borrowers may obtain the release of a portion of the Grand Canal Shoppes Property comprised of the approximately 84,743 square foot, three level space currently demised to Barneys New York (the “Barneys Parcel”) pursuant to a lease, which is expected to expire on January 31, 2020, upon a bona fide sale to a third party not affiliated with the Grand Canal Shoppes Borrowers or the Grand Canal Shoppes Guarantor,provided that, among other things, and in accordance with the related mortgage loan documents: (i) no event of default under the related mortgage loan documents has occurred and is continuing, (ii) the lender has received reasonably satisfactory evidence that all portions of the Barneys Parcel owned by the Grand Canal Shoppes Borrowers in fee simple have been legally subdivided from all portions of the Grand Canal Shoppes Property remaining after the release, (iii) upon request by the lender, the Grand Canal Shoppes Borrowers deliver a legal opinion stating that the release does not constitute a “significant modification” of the Grand Canal Shoppes Whole Loan under Section 1001 of the Internal Revenue Code of 1986 or otherwise cause a tax to be imposed on a “prohibited transaction” by any REMIC trust, (iv) following such release, the loan-to-value ratio (as determined by the lender in its sole discretion using only the portion of the remaining Grand Canal Shoppes Property which constitutes acceptable real estate collateral under the Code for a REMIC trust) is equal to or less than 125% (provided that the Grand Canal Shoppes Borrowers may prepay the “qualified amount” as that term is defined in the Internal Revenue Service Revenue Procedure 2010-30, as the same may be amended, modified or supplemented from time to time, in order to meet the foregoing loan-to-value ratio). From and after the release of the Barneys Parcel, without the prior consent of the lender, neither the Grand Canal Shoppes Borrowers nor any of their affiliates may solicit, cause or facilitate the relocation of any existing tenant at the Grand Canal Shoppes Property to the Barneys Parcel.
Ground/Air Rights Leases. The Grand Canal Shoppes Borrowers have air rights ground leases (which do not include the underlying land) with Venetian Casino Resort, LLC, as lessor, for portions of the retail and restaurant space on the casino level of each of the Venetian Hotel and the Palazzo Hotel portions of the Grand Canal Shoppes Property. The ground lease for the retail and restaurant space on the casino level of the Venetian Hotel is for an 89-year term commencing on May 14, 2004 and expiring on May 13, 2093 with no extension options. The ground lease for the retail and restaurant space on the casino level of the Palazzo Hotel is for an 89-year term commencing on February 29, 2008 and expiring on February 28, 2097 with no extension options. Each of the annual rents for these ground leases is $1 and the Grand Canal Shoppes Borrowers have the option to purchase the premises for $1 on the respective expiration dates.
The air rights above the space leased to Walgreens Co. and used as a Walgreen’s store are leased by a third party to the Grand Canal Shoppes Borrowers, as tenants for a 60-year term commencing on March 1, 2004 and expiring February 28, 2064 with one 40-year extension option (such lease, together with the ground leases of the casino level restaurant/retail of the Venetian Hotel and Casino and the Palazzo Casino level restaurant/retail, the “Ground Leases”). The annual ground rent under the Walgreens air rights lease was initially $600,000; however, it escalates annually each year after the seventh lease year (which commenced March 1, 2011) by the same percentage that the consumer price index has increased from the prior year, not to exceed a 2.00% increase in any year. The Venetian Casino Resort, LLC subleases a portion of the Walgreens air rights from the Grand Canal Shoppes Borrowers and is responsible under the sublease for paying an amount equal to 80.68% of the rent under the prime lease. The sublease is coterminous with the Walgreens air rights lease.
Right of First Offer/Right of First Refusal.A transfer of either the Grand Canal Shoppes portion or the Palazzo Shoppes portion of the Grand Canal Shoppes Property (other than to a lender in connection with foreclosure or delivery of a deed-in-lieu of foreclosure of a mortgage secured by the Grand Canal Shoppes Property or the first subsequent transferee from the lender) is subject to a right of first offer in favor of Venetian Casino Resort, LLC.
Additionally, in the case of acceleration of the Grand Canal Shoppes Whole Loan, Venetian Casino Resort, LLC has the right, subject to the satisfaction of certain financial covenants, to purchase the Grand Canal Shoppes Whole Loan at a price equal to (a) the principal balance of the Grand Canal Shoppes Whole Loan, (b) accrued and unpaid interest up to (but excluding) the date of purchase, (c) all other amounts owed under the related mortgage loan documents, including, without limitation (but only to the extent so owed) (1) any unreimbursed advances made by the servicer, with interest at the applicable rate, (2) any servicing and special servicing fees, (3) any exit fees, (4) any prepayment, yield maintenance or similar premiums and (5) if the date of purchase is not a scheduled payment date, accrued and unpaid interest, from the date of purchase up to (but excluding) the scheduled payment date next succeeding the date of purchase and (d) all reasonable fees and expenses incurred by the lender in connection with the purchase.
Terrorism Insurance. The related mortgage loan documents require that the comprehensive “special perils” insurance policy required to be maintained by the Grand Canal Shoppes Borrowers provide coverage in an amount equal to the “full replacement cost” of the Grand Canal Shoppes Property. The related mortgage loan documents also require business income insurance covering no less than the 24-month period commencing at the time of casualty, together with a 12-month extended period of indemnity. Notwithstanding the foregoing, for so long as the Terrorism Risk Insurance Act of 2002, as extended and modified by the Terrorism Risk Insurance Program Reauthorization Act of 2007 and by the Terrorism Risk Insurance Program Reauthorization Act of 2015 (“TRIPRA”) is in effect (including any extensions thereof or if another federal governmental program is in effect relating to “acts of terrorism” which provides substantially similar protections as TRIPRA), and covers both domestic and foreign acts of terrorism, the lender is required to accept terrorism insurance which insures against “covered acts” as defined by TRIPRA (or such other program);provided, however, that the Grand Canal Shoppes Borrowers will not be obligated to pay terrorism insurance premiums in excess of two times the premium for the “special perils” and business income coverage on a stand-alone basis (excluding any earthquake insurance or terrorism insurance components of such policies) in any policy year.See “Risk Factors—Risks Relating to the Mortgage Loans—Terrorism Insurance May Not Be Available for All Mortgaged Properties” in the Preliminary Prospectus.
THE INFORMATION IN THIS STRUCTURAL AND COLLATERAL TERM SHEET IS NOT COMPLETE AND MAY BE AMENDED PRIOR TO THE TIME OF SALE. THIS TERM SHEET IS NOT AN OFFER TO SELL THESE SECURITIES AND IT IS NOT A SOLICITATION OF AN OFFER TO BUY THESE SECURITIES IN ANY JURISDICTION WHERE THE OFFER OR SALE IS NOT PERMITTED.
43
| Various | Collateral Asset Summary – Loan No. 2 Phoenix Industrial Portfolio II | Cut-off Date Balance: Cut-off Date LTV Ratio: UW NCF DSCR: UW NOI Debt Yield: | $40,000,000 74.2% 1.41x 9.8% |
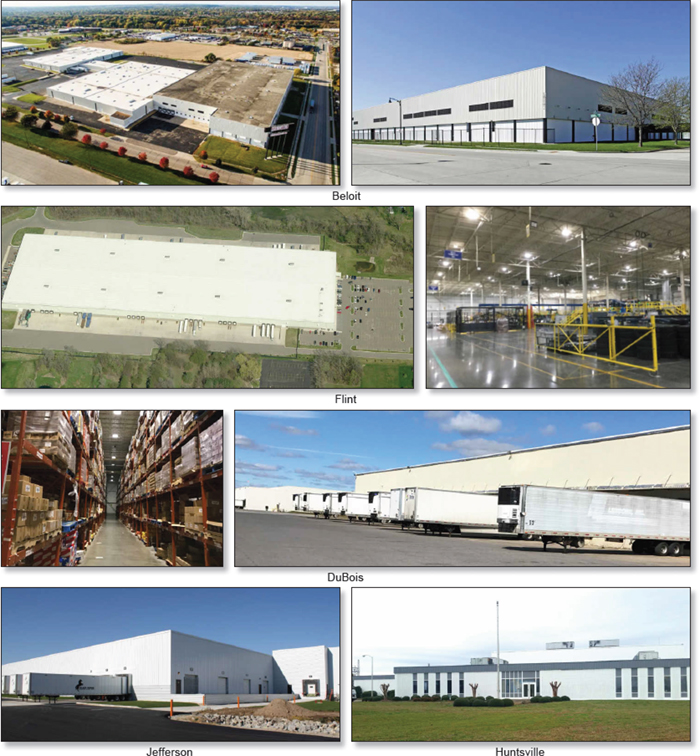
THE INFORMATION IN THIS STRUCTURAL AND COLLATERAL TERM SHEET IS NOT COMPLETE AND MAY BE AMENDED PRIOR TO THE TIME OF SALE. THIS TERM SHEET IS NOT AN OFFER TO SELL THESE SECURITIES AND IT IS NOT A SOLICITATION OF AN OFFER TO BUY THESE SECURITIES IN ANY JURISDICTION WHERE THE OFFER OR SALE IS NOT PERMITTED.
44
| Various | Collateral Asset Summary – Loan No. 2 Phoenix Industrial Portfolio II | Cut-off Date Balance: Cut-off Date LTV Ratio: UW NCF DSCR: UW NOI Debt Yield: | $40,000,000 74.2% 1.41x 9.8% |
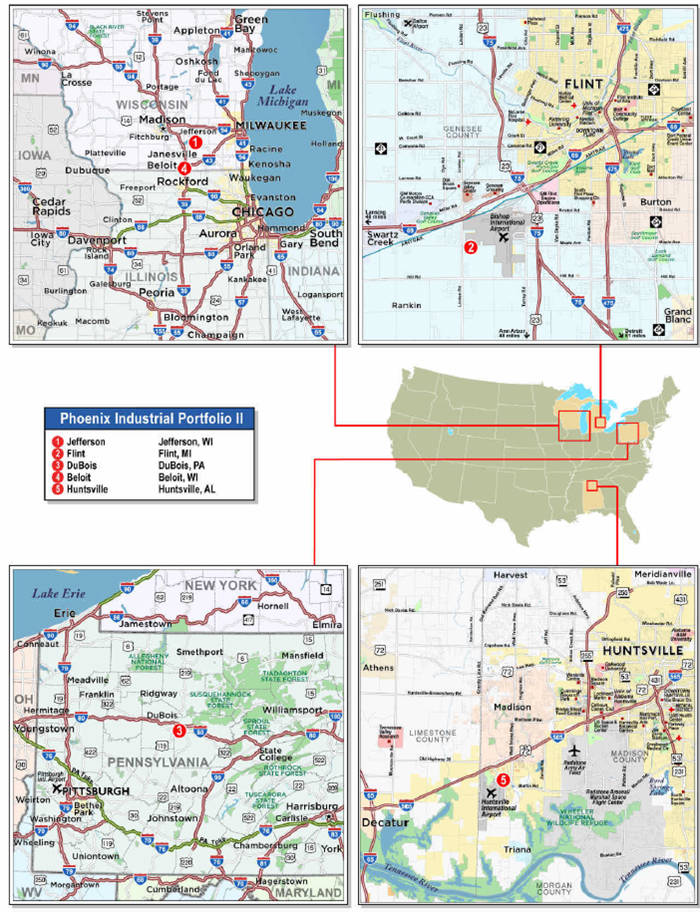
THE INFORMATION IN THIS STRUCTURAL AND COLLATERAL TERM SHEET IS NOT COMPLETE AND MAY BE AMENDED PRIOR TO THE TIME OF SALE. THIS TERM SHEET IS NOT AN OFFER TO SELL THESE SECURITIES AND IT IS NOT A SOLICITATION OF AN OFFER TO BUY THESE SECURITIES IN ANY JURISDICTION WHERE THE OFFER OR SALE IS NOT PERMITTED.
45
| Various | Collateral Asset Summary – Loan No. 2 Phoenix Industrial Portfolio II | Cut-off Date Balance: Cut-off Date LTV Ratio: UW NCF DSCR: UW NOI Debt Yield: | $40,000,000 74.2% 1.41x 9.8% |
| Mortgage Loan Information | Property Information | |||||||
| Mortgage Loan Seller: | UBS AG | Single Asset/Portfolio: | Portfolio | |||||
Credit Assessment (Fitch/KBRA/Moody’s): | NR/NR/NR | Location: | Various | |||||
| General Property Type: | Industrial | |||||||
| Original Balance(1): | $40,000,000 | Detailed Property Type: | Various | |||||
| Cut-off Date Balance(1): | $40,000,000 | Title Vesting: | Fee Simple | |||||
| % of Initial Pool Balance: | 5.0% | Year Built/Renovated: | Various/Various | |||||
| Loan Purpose: | Refinance | Size: | 2,390,648 SF | |||||
| Borrower Sponsor: | Phoenix Investors | Cut-off Date Balance per SF(1): | $28 | |||||
| Mortgage Rate: | 4.4500% | Maturity Date Balance per SF(1): | $25 | |||||
| Note Date: | 9/10/2019 | Property Manager: | Phoenix Investors (borrower-related) | |||||
| First Payment Date: | 11/6/2019 | |||||||
| Maturity Date: | 10/6/2029 | |||||||
| Original Term to Maturity: | 120 months | |||||||
| Original Amortization Term: | 360 months | |||||||
| IO Period: | 36 months | Underwriting and Financial Information | ||||||
| Seasoning: | 0 months | UW NOI(3): | $6,684,731 | |||||
| Prepayment Provisions(2): | LO (24); DEF (90); O (6) | UW NOI Debt Yield(1): | 9.8% | |||||
| Lockbox/Cash Mgmt Status: | Hard/Springing | UW NOI Debt Yield at Maturity(1): | 11.2% | |||||
| Additional Debt Type(1): | Pari Passu | UW NCF DSCR(1): | 1.89x (IO) | 1.41 (P&I) | ||||
| Additional Debt Balance(1): | $28,000,000 | Most Recent NOI(3): | $7,027,527 (6/30/2019 TTM) | |||||
| Future Debt Permitted (Type): | No (N/A) | 2nd Most Recent NOI: | $6,960,523 (12/31/2018) | |||||
| Reserves(4) | 3rd Most Recent NOI(5): | N/A | ||||||
| Type | Initial | Monthly | Cap | Most Recent Occupancy(3): | 93.8% (6/30/2019) | |||
| RE Tax: | $261,385 | $62,502 | N/A | 2nd Most Recent Occupancy: | 97.4% (12/31/2018) | |||
| Insurance: | $159,062 | $13,255 | N/A | 3rd Most Recent Occupancy(5): | N/A | |||
| Replacements: | $0 | $19,922 | $481,308 | Appraised Value (as of): | $91,700,000 (Various) | |||
| TI/LC: | $0 | $199,221 | $1,500,000(4) | Cut-off Date LTV Ratio(1): | 74.2% | |||
| Required Repairs: | $283,040 | $0 | N/A | Maturity Date LTV Ratio(1): | 64.8% | |||
| Sources and Uses | ||||||
| Sources | Proceeds | % of Total | Uses | Proceeds | % of Total | |
| Loan Amount(1): | $68,000,000 | 97.1% | Loan Payoff: | $44,943,190 | 64.2% | |
| Borrower Equity: | $2,041,860 | 2.9% | Reserves: | $703,487 | 1.0% | |
| Closing Costs: | $563,718 | 0.8% | ||||
| Partnership Buyout: | $23,831,465 | 34.0% | ||||
| Total Sources: | $70,041,860 | 100.0% | Total Uses: | $70,041,860 | 100.0% | |
| (1) | The Phoenix Industrial Portfolio II Mortgage Loan (as defined below) is part of the Phoenix Industrial Portfolio II Whole Loan (as defined below), which is comprised of sixpari passu promissory notes with an aggregate original principal balance of $68,000,000. The Cut-off Date Balance per SF, Maturity Date Balance per SF, UW NOI Debt Yield, UW NOI Debt Yield at Maturity, UW NCF DSCR, Cut-off Date LTV Ratio and Maturity Date LTV Ratio presented above are based on the aggregate principal balance of the promissory notes comprising the Phoenix Industrial Portfolio II Whole Loan. |
| (2) | Partial release of excess land is permitted. See “Release of Property” below for further discussion. |
| (3) | The Phoenix Industrial Portfolio II Properties (as defined below) have a physical occupancy of 99.5% as of June 30, 2019. Staples Contract & Commercial (“Staples”) (5.7% of portfolio NRA, 6.9% of gross potential rent) has exercised its termination option effective April 30, 2020 and is currently negotiating with the borrower sponsor on a lease extension. The Staples lease has been underwritten as vacant. |
| (4) | See “Escrows and Reserves” below for further discussion of reserve requirements. |
| (5) | The borrower sponsor acquired the Phoenix Industrial Portfolio II Properties in 2017. As such, prior operating performance and occupancy information is not available. |
The Mortgage Loan. The second largest mortgage loan (the “Phoenix Industrial Portfolio II Mortgage Loan”) is part of a whole loan (the “Phoenix Industrial Portfolio II Whole Loan”) evidenced by six promissory notes with an aggregate original principal balance of $68,000,000. The Phoenix Industrial Portfolio II Whole Loan is secured by a first priority fee mortgage encumbering a 2,390,648 SF portfolio of five industrial warehouse properties located in Wisconsin, Pennsylvania, Michigan and Alabama (each, a “Phoenix Industrial Portfolio II Property”, and collectively, the “Phoenix Industrial Portfolio II Properties”). Promissory Notes A-1, A-2 and A-5, with an aggregate original balance of $40,000,000, represent the Phoenix Industrial Portfolio II Mortgage Loan, and will be contributed to the UBS 2019-C17 Trust. The below table summarizes the Phoenix Industrial Portfolio II Whole Loan, including the remaining promissory notes, which are currently held by UBS AG and may otherwise be transferred at any time. The mortgage loan seller provides no assurances that the non-securitizedpari passu notes will not be split further. The Phoenix Industrial Portfolio II Whole Loan will be serviced pursuant to the pooling and servicing agreement for the UBS 2019-C17 Trust. See “Description of the Mortgage Pool—The Whole Loans—The Serviced Pari Passu Whole Loans” and “Pooling and Servicing Agreement” in the Preliminary Prospectus.
THE INFORMATION IN THIS STRUCTURAL AND COLLATERAL TERM SHEET IS NOT COMPLETE AND MAY BE AMENDED PRIOR TO THE TIME OF SALE. THIS TERM SHEET IS NOT AN OFFER TO SELL THESE SECURITIES AND IT IS NOT A SOLICITATION OF AN OFFER TO BUY THESE SECURITIES IN ANY JURISDICTION WHERE THE OFFER OR SALE IS NOT PERMITTED.
46
| Various | Collateral Asset Summary – Loan No. 2 Phoenix Industrial Portfolio II | Cut-off Date Balance: Cut-off Date LTV Ratio: UW NCF DSCR: UW NOI Debt Yield: | $40,000,000 74.2% 1.41x 9.8% |
| Phoenix Industrial Portfolio II Whole Loan Summary | ||||
| Note | Original Balance | Cut-off Date Balance | Anticipated Note Holder | Controlling Piece |
| Note A-1 | $20,000,000 | $20,000,000 | UBS 2019-C17 | Yes |
| Note A-2 | $15,000,000 | $15,000,000 | UBS 2019-C17 | No |
| Note A-3 | $15,000,000 | $15,000,000 | UBS AG | No |
| Note A-4 | $10,000,000 | $10,000,000 | UBS AG | No |
| Note A-5 | $5,000,000 | $5,000,000 | UBS 2019-C17 | No |
| Note A-6 | $3,000,000 | $3,000,000 | UBS AG | No |
| Total | $68,000,000 | $68,000,000 | ||
The proceeds of the Phoenix Industrial Portfolio II Whole Loan and additional borrower equity were used to refinance existing debt on the Phoenix Industrial Portfolio II Properties, fund reserves, pay closing costs, and recapitalize the ownership structure.
The Borrowers and the Borrower Sponsor.The borrowers are Phoenix Beloit Industrial Investors LLC, Phoenix Jefferson Industrial Investors LLC, Phoenix Flint Industrial Investors LLC, Phoenix Huntsville Industrial Investors LLC, and Phoenix DuBois Industrial Investors LLC (collectively, the “Phoenix Industrial Portfolio II Borrowers”), each a Delaware limited liability company structured to be bankruptcy remote with one independent director. The Phoenix Industrial Portfolio II Borrowers are owned and managed by Phoenix Fund Two Holdco LLC, which is owned and managed by Phoenix Fund Two, LLC, which is owned by Irrevocable Children's Trust dated 7/22/91 (38.0%), Irrevocable Children's Trust No. 2 dated 7/22/91 (38.0%), David M. Marks (20.0%), Ryan J. Trost (2.0%) and Hilltop Holdings MKE, LLC (2.0%). Legal counsel to the Phoenix Industrial Portfolio II Borrowers delivered a non-consolidation opinion in connection with the origination of the Phoenix Industrial Portfolio II Whole Loan. The non-recourse guarantors of the Phoenix Industrial Portfolio II Whole Loan are Irrevocable Children's Trust dated 7/22/91 and Irrevocable Children's Trust No. 2 dated 7/22/91. The borrower sponsor of the Phoenix Industrial Portfolio II Whole Loan is Phoenix Investors, which is the affiliated management company of the guarantors’ investments.
Phoenix Investors is a national commercial real estate firm based in Milwaukee, WI whose core business is the revitalization of former manufacturing facilities throughout the U.S. Phoenix Investors’ affiliated companies hold interests in approximately 27 million SF of industrial, retail, office, and single tenant net-leased properties across 25 states. Phoenix Investors specializes in the renovation and repositioning of large, former single tenant industrial facilities throughout the U.S. that were previously owned by major corporate clients, real estate investment trusts or financial institutions.
The Properties.The Phoenix Industrial Portfolio II Whole Loan is secured by five industrial properties totaling 2,390,648 SF located in Wisconsin (42.1% of NRA), Pennsylvania (25.6% of NRA), Michigan (19.2%ofNRA) and Alabama (13.1% of NRA). The Phoenix Industrial Portfolio II Properties are 93.8% occupied as of June 30, 2019 by 10 tenants. The borrower sponsor acquired the Phoenix Industrial Portfolio II Properties in 2017 for a purchase price of approximately $60.4 million. Since acquisition, the borrower sponsor has invested approximately $14.4 million in capital improvements and other/soft costs on the Phoenix Industrial Portfolio II Properties.
Flint (19.2% of NRA; 24.4% of ALA): The Flint property is a 460,000 SF industrial building located in Flint, Michigan. Situated on 57.3 acres, the Flint property has 51 loading docks, four drive-in doors, column spacing of 50 feet by 50 feet, ceiling heights of 29 to 32 feet and 300 parking spaces (0.7 per 1,000 SF). The Flint property was constructed in 2006 as a build-to-suit for Android Industries and approximately 2% of the space is finished office space. Android Industries has a current expiration date of June 30, 2025 and pays underwritten base rent of $4.76 PSF with annual rent escalations of 2% on July 1st of each year. Android Industries is an automotive manufacturer and supplier and utilizes its space at the Flint property to manufacture parts as a supplier and partner to General Motors. Android Industries has one, five-year renewal option remaining and has no termination options. Since acquisition, the borrower sponsor has invested $590,000 at the Flint property for heating/HVAC and generators. According to the borrower sponsor, Android Industries has invested over $30.0 million at the facility on equipment and infrastructure.
Beloit (17.3% of NRA; 21.2% of ALA): The Beloit property is a 413,903 SF industrial warehouse building located in Beloit, Wisconsin. The improvements were constructed in 1974 and renovated in 2011 and includes approximately 1% of finished office space. The Beloit property is situated on 24.8 acres with 143 parking spaces (0.3 per 1,000 SF). The Beloit property has 33 loading docks, eight drive-in doors and ceiling heights of 21 to 41 feet. The Beloit property is 67.0% leased by four tenants, all of which utilize their space for warehousing and logistics, and has physical occupancy of 100.0%. The largest tenants at the Beloit property are Bay Valley Foods (34.1% of property NRA, 48.0% of property underwritten base rent) and Axium Foods, Inc. (24.1% of property NRA, 33.3% of property underwritten base rent). Staples (33.0% of property NRA, 31.7% of property gross potential rent) has exercised its termination option effective April 30, 2020 and is currently negotiating with the borrower sponsor on a lease extension. As such, the Staples lease has been underwritten as vacant. Since acquisition, the borrower sponsor has replaced the roof at the Beloit property at a cost of $465,300.
DuBois (25.6% of NRA; 20.9% of ALA): The DuBois property consists of two adjacent parcels located in DuBois, Pennsylvania. Built in 1961 on a 24.7-acre site, the improvements of the 891 Beaver Drive building include a 410,000 SF industrial warehouse building, of which approximately 8% is office space. Built in 1988 on a 30.4-acre site, the improvements of the 851 Beaver Drive building include a 202,800 SF industrial warehouse building, of which approximately 69% of the space is refrigerated or freezer space and 4% is office space. The two buildings on the DuBois property have a total of 80 loading docks, two drive-in doors, and ceiling heights ranging from 16 feet to 32 feet, and is served by 426 parking spaces (0.7 per 1,000 SF). DuBois Logistics, LLC has leased 100.0% of both buildings at the DuBois property since February 2010 and utilizes the space to distribute both dry goods and refrigerated/frozen goods. The DuBois Logistics, LLC lease is guaranteed by its parent company, C&S Wholesale Grocers, Inc. and provide for a lease expiration in February 2025. DuBois Logistics, LLC pays underwritten base rent of $2.14 PSF at the 891 Beaver Drive building and $3.06 PSF at the 851 Beaver Drive building, with annual rent escalations on March 1st of each year at both buildings. DuBois Logistics, LLC has one five-year renewal option remaining and no termination options.
Jefferson (24.8% of NRA; 20.9% of ALA): The Jefferson property consists of two contiguous parcels located in Jefferson, Wisconsin. Built between 1995 and 2014 on a total of 32.3 acres, the improvements include two industrial warehouse buildings totaling 591,840 SF, of which approximately 1% is finished office space. The Jefferson property has 24 loading docks, 13 drive-in doors and ceiling heights of 24 to 25 feet, and is served by 123 parking spaces (0.2 per 1,000 SF). Generac Power Systems, Inc. has leased 100.0% of the Jefferson property since December 2013. Its parent company, Generac Holdings (“Generac”), is a manufacturer of backup power generation products based in southeastern Wisconsin. With seven corporate and manufacturing facilities in the Wisconsin region, Generac utilizes its space at the Jefferson property for the logistics management and warehousing of product components and finished products. The Generac lease provides for a lease expiration in November 2023 and requires underwritten base rent of $2.43 PSF with annual
THE INFORMATION IN THIS STRUCTURAL AND COLLATERAL TERM SHEET IS NOT COMPLETE AND MAY BE AMENDED PRIOR TO THE TIME OF SALE. THIS TERM SHEET IS NOT AN OFFER TO SELL THESE SECURITIES AND IT IS NOT A SOLICITATION OF AN OFFER TO BUY THESE SECURITIES IN ANY JURISDICTION WHERE THE OFFER OR SALE IS NOT PERMITTED.
47
| Various | Collateral Asset Summary – Loan No. 2 Phoenix Industrial Portfolio II | Cut-off Date Balance: Cut-off Date LTV Ratio: UW NCF DSCR: UW NOI Debt Yield: | $40,000,000 74.2% 1.41x 9.8% |
rent escalations of 2% on December 1st of each year. Generac has invested in customized racking and equipment at the Jefferson property and is currently negotiating to extend its lease through November 2031. Generac Power Systems, Inc. has one five-year renewal option remaining and no termination options. Since acquisition, the borrower sponsor has replaced the roof at the Jefferson property at a cost of $37,810.
Huntsville (13.1% of NRA; 12.5% of ALA): The Huntsville property is a 312,105 SF industrial warehouse building located in Huntsville, Alabama. The improvements were constructed in 1976 and renovated in 2017 and includes approximately 8% of finished office space. The Huntsville property is situated on 40.3 acres with 350 parking spaces (1.1 per 1,000 SF). The Huntsville property has 16 loading docks, two drive-in doors, and ceiling heights of 24 to 29 feet. The Huntsville property is 95.9% occupied by Boneal Aerospace, Inc. (39.9% of property NRA, 45.8% of property underwritten base rent), Intercept Industries, Ltd. (33.6% of property NRA, 38.6% of property underwritten base rent) and Custom Assembly, Inc. (22.4% of property NRA, 15.6% of property underwritten base rent). Since acquisition, the borrower sponsor has repainted the Huntsville property at a cost of $130,900.
The following table presents certain information relating to the Phoenix Industrial Portfolio II Properties:
| Portfolio Summary(1) | ||||||||||
| Property | City, State | Net Rentable Area (SF) | Year Built/ Renovated | UW NCF | Allocated Cut-off Date Balance | % of Allocated Cut-off Date Balance | Appraisal Value | LTV | Ceiling Heights (ft.) | Loading Bays |
| Flint | Flint, MI | 460,000 | 2006/N/A | $1,866,615 | $16,610,687 | 24.4% | $22,400,000 | 74.2% | 29 - 32 | 55 |
| DuBois | DuBois, PA | 612,800 | 1961; 1988/N/A | $1,280,560 | $14,237,732 | 20.9% | $19,200,000 | 74.2% | 16 - 32 | 82 |
| Jefferson | Jefferson, WI | 591,840 | 1995-2014/N/A | $1,147,440 | $14,237,732 | 20.9% | $19,200,000 | 74.2% | 24 - 25 | 37 |
| Huntsville | Huntsville, AL | 312,105 | 1976/2017 | $863,543 | $8,527,808 | 12.5% | $11,500,000 | 74.2% | 24 - 29 | 18 |
| Beloit | Beloit, WI | 413,903 | 1974/2011 | $653,354 | $14,386,041 | 21.2% | $19,400,000 | 74.2% | 21 - 41 | 41 |
| Total/Wtd. Avg. | 2,390,648 | $5,811,511 | $68,000,000 | 100.0% | $91,700,000 | 74.2% | 233 | |||
| (1) | Information is based on the appraisal. |
The following table presents certain information relating to the leases at the Phoenix Industrial Portfolio II Properties:
| Tenant Summary(1) | ||||||||
| Tenant Name | Credit Rating (Fitch/Moody's/S&P)(2) | Property | Tenant SF | Approximate % of SF | Annual UW Base Rent | % of Total Annual UW Base Rent | Annual UW Base Rent PSF(3) | Lease Expiration |
| DuBois Logistics, LLC(4) | NR/NR/NR | DuBois | 612,800 | 25.6% | $1,497,968 | 20.5% | $2.44 | 2/28/2025 |
| Generac Power Systems, Inc.(5) | NR/NR/NR | Jefferson | 591,840 | 24.8% | $1,435,584 | 19.6% | $2.43 | 11/30/2023 |
| Android Industries | NR/NR/NR | Flint | 460,000 | 19.2% | $2,191,819 | 30.0% | $4.76 | 6/30/2025 |
| Bay Valley Foods | NR/Ba3/BB- | Beloit | 140,947 | 5.9% | $563,788 | 7.7% | $4.00 | 5/31/2020 |
| Boneal Aerospace, Inc.(6) | NR/NR/NR | Huntsville | 124,630 | 5.2% | $462,377 | 6.3% | $3.71 | 3/31/2022 |
| Intercept Industries, Ltd.(7) | NR/NR/NR | Huntsville | 104,825 | 4.4% | $389,344 | 5.3% | $3.71 | 1/31/2021 |
| Axium Foods, Inc.(8) | NR/NR/NR | Beloit | 99,670 | 4.2% | $390,838 | 5.3% | $3.92 | 8/31/2020 |
| Custom Assembly, Inc(9) | NR/NR/NR | Huntsville | 70,000 | 2.9% | $157,500 | 2.2% | $2.25 | 11/30/2019 |
| Foal, LLC | NR/NR/NR | Beloit | 18,511 | 0.8% | $78,672 | 1.1% | $4.25 | 1/31/2020 |
| SSB Manufacturing Company | NR/NR/NR | Beloit | 18,175 | 0.8% | $141,631 | 1.9% | $7.79 | 11/30/2021 |
| Subtotal/Wtd. Avg. | 2,241,398 | 93.8% | $7,309,521 | 100.0% | $3.26 | |||
| Vacant(10) | 149,250 | 6.2% | $0 | 0.0% | $0.00 | |||
| Total/Wtd. Avg. | 2,390,648 | 100.0% | $7,309,521 | 100.0% | $3.26 |
| ||
| (1) | Information is based on the underwritten rent roll. |
| (2) | Certain ratings are those of the parent company or government entity whether or not the parent guarantees the lease. |
| (3) | Wtd. Avg. Annual UW Base Rent PSF excludes vacant space. |
| (4) | Ryder Truck Rental, Inc. subleases an immaterial amount of space at the DuBois property for $1 per year. |
| (5) | Generac Power Systems, Inc. is currently negotiating with the borrower sponsor on a lease extension through November 2031. |
| (6) | Boneal Aerospace, Inc. may terminate its lease on February 29, 2020 by providing notice on or before November 11, 2019 and paying a termination fee of $111,462. |
| (7) | Intercept Industries, Ltd. is currently negotiating with the borrower sponsor on a lease extension through January 2026. |
| (8) | Axium Foods, Inc. is currently negotiating with the borrower sponsor to extend its lease and downsize its footprint. The reduced space is in negotiations to be leased to Lyons, a subsidiary of Tru Aseptics. |
| (9) | Custom Assembly, Inc and the borrower sponsor have the mutual right to terminate the current lease with 30 days’ notice. The tenant is currently negotiating with the borrower sponsor on a lease extension through November 2024, as well as an expansion to take over the vacant 12,650 SF at the Huntsville property. |
| (10) | Includes Staples (5.7% of portfolio NRA, 6.9% of gross potential rent), which has exercised its termination option effective April 30, 2020 and is currently negotiating with the borrower sponsor on a lease extension. |
THE INFORMATION IN THIS STRUCTURAL AND COLLATERAL TERM SHEET IS NOT COMPLETE AND MAY BE AMENDED PRIOR TO THE TIME OF SALE. THIS TERM SHEET IS NOT AN OFFER TO SELL THESE SECURITIES AND IT IS NOT A SOLICITATION OF AN OFFER TO BUY THESE SECURITIES IN ANY JURISDICTION WHERE THE OFFER OR SALE IS NOT PERMITTED.
48
| Various | Collateral Asset Summary – Loan No. 2 Phoenix Industrial Portfolio II | Cut-off Date Balance: Cut-off Date LTV Ratio: UW NCF DSCR: UW NOI Debt Yield: | $40,000,000 74.2% 1.41x 9.8% |
The following table presents certain information relating to the lease rollover schedule at the Phoenix Industrial Portfolio II Properties:
| Lease Rollover Schedule(1)(2) | ||||||||
| Year | # of Leases Rolling | SF Rolling | Approx. % of Total SF Rolling | Approx. Cumulative % of SF Rolling | UW Base Rent PSF Rolling(3) | Total UW Base Rent Rolling | Approx. % of Total Base Rent Rolling | Approx. Cumulative % of Total Base Rent Rolling |
| MTM | 0 | 0 | 0.0% | 0.0% | $0.00 | $0 | 0.0% | 0.0% |
| 2019 | 1 | 70,000 | 2.9% | 2.9% | $2.25 | $157,500 | 2.2% | 2.2% |
| 2020 | 4 | 259,128 | 10.8% | 13.8% | $3.99 | $1,033,298 | 14.1% | 16.3% |
| 2021 | 2 | 123,000 | 5.1% | 18.9% | $4.32 | $530,975 | 7.3% | 23.6% |
| 2022 | 1 | 124,630 | 5.2% | 24.1% | $3.71 | $462,377 | 6.3% | 29.9% |
| 2023 | 1 | 591,840 | 24.8% | 48.9% | $2.43 | $1,435,584 | 19.6% | 49.5% |
| 2024 | 0 | 0 | 0.0% | 48.9% | $0.00 | $0 | 0.0% | 49.5% |
| 2025 | 3 | 1,072,800 | 44.9% | 93.8% | $3.44 | $3,689,787 | 50.5% | 100.0% |
| 2026 | 0 | 0 | 0.0% | 93.8% | $0.00 | $0 | 0.0% | 100.0% |
| 2027 | 0 | 0 | 0.0% | 93.8% | $0.00 | $0 | 0.0% | 100.0% |
| 2028 | 0 | 0 | 0.0% | 93.8% | $0.00 | $0 | 0.0% | 100.0% |
| 2029 | 0 | 0 | 0.0% | 93.8% | $0.00 | $0 | 0.0% | 100.0% |
| 2030 & Beyond | 0 | 0 | 0.0% | 93.8% | $0.00 | $0 | 0.0% | 100.0% |
| Vacant | 0 | 149,250 | 6.2% | 100.0% | $0.00 | $0 | 0.0% | 100.0% |
| Total/Wtd. Avg. | 12 | 2,390,648 | 100.0% | $3.26 | $7,309,521 | 100.0% | ||
| (1) | Information is based on the underwritten rent roll. |
| (2) | Certain tenants may have lease termination options that are exercisable prior to the originally stated expiration date of the subject lease, which are not considered in the lease rollover schedule. |
| (3) | Wtd. Avg. UW Base Rent PSF Rolling excludes vacant space. |
The Markets. The Phoenix Industrial Portfolio II Properties are located in Wisconsin (42.1% of ALA), Michigan (24.4% of ALA), Pennsylvania (20.9% of ALA) and Alabama (12.5% of ALA).
Flint, Michigan (24.4% of ALA): The Flint property is located in Flint, Genesee county, Michigan, approximately 69.5 miles northwest of Detroit. Major employers in the area include General Motors, University of Michigan Flint and other regional and local healthcare and medical centers. The Flint property is located near the intersection of Interstate 75 (6.2 miles east) and Interstate 69 (4.1 miles west), providing close proximity to serve the manufacturing and automobile industry in the greater Michigan area. The sole tenant at the Flint property, Android Industries, is an automotive manufacturer and supplier and utilizes its space at the Flint property to manufacture parts as a supplier to and partner of General Motors, specifically its truck plant located 7.2 miles east of the Flint property. In 2018 and 2019, Android Industries was presented with the General Motors Supplier of the Year award, which recognizes outstanding suppliers across General Motors’ global supply chain.
Beloit, Wisconsin (21.2% of ALA): The Beloit property is located in Beloit, Rock county, Wisconsin, approximately 97.6 miles northwest of Chicago and 72.8 miles southwest of Milwaukee. The Beloit property’s geographical location on the Illinois-Wisconsin border, midway between Lake Michigan and the Mississippi River, puts Beloit in the center of the United States Midwest, offering access to markets and suppliers. Additionally, the Beloit property is located immediately southwest of the intersection of Interstate 90 (1.2 miles), which extends to Boston, MA in the east and Seattle, WA in the west, and Interstate 43 (0.5 miles). Regional access to Wisconsin and Illinois communities are provided by numerous regional routes nearby.
DuBois, Pennsylvania (20.9% of ALA): The DuBois property is located in DuBois, Pennsylvania county, Pennsylvania, approximately 102 miles northeast of Pittsburgh and 181 miles east of Cleveland. Interstate 80 extends to San Francisco, CA in the west and Teaneck, New Jersey in the east, making it the second longest highway in the United States, as well as one of the busiest, and is located immediately north of the DuBois property (2.3 miles). According to the appraisal, the central business district in which the DuBois property is located in, has seen redevelopment and re-use of building improvements for commercial purposes. A portion of the neighborhood near the Interstate 80 interchange has seen the most concentrated growth in recent years, and has included some new industrial buildings, a new hotel, a Walmart and other retail properties, and some new office development. The parent company of the sole tenant at the DuBois property, C&S Wholesale Grocers, Inc. is a privately held wholesale grocers with an extensive supply chain and logistics operations, supplying independent supermarkets, chain stores, and institutions with over 140,000 different products.
Jefferson, Wisconsin (20.9% of ALA): The Jefferson property is located in Jefferson, Jefferson county, Wisconsin, approximately 33.3 miles east of Madison and 52.5 miles west of Milwaukee. Major employers in the area include Trek Bicycle, Nasco International, and Generac Power Systems, Inc. The Jefferson property provides close proximity to Interstate 90 (25.8 miles east), and Interstate 94 (7.8 miles north), which connects the Great Lakes and northern Great Plains regions. The sole tenant at the Jefferson property, Generac Power Systems, Inc., is a manufacturer of backup power generation products based in southeastern Wisconsin and utilizes its space at the Jefferson property to coordinate with Generac’s six corporate and manufacturing facilities in the Wisconsin region, In 2017, Generac and the Wisconsin Economic Development Corporation announced tax credits through 2021 to support Generac’s expansion as well as investments of more than $73 million to renovate its facilities across Wisconsin.
Huntsville, Alabama (12.5% of ALA):The Huntsville property is located in Huntsville, Madison county, Alabama, approximately 90.1 miles north of Birmingham and 120 miles south of Nashville. The largest employers in the Huntsville metropolitan statistical area include US Army/Redstone Arsenal, Huntsville Hospital System, NASA/Marshall Space Flight Center, Huntsville City Schools, and the Boeing Company. The Huntsville property is located 10.5 miles northeast of Cummings Research Park, the second and fourth largest technology and research park in the United States and world, respectively.
THE INFORMATION IN THIS STRUCTURAL AND COLLATERAL TERM SHEET IS NOT COMPLETE AND MAY BE AMENDED PRIOR TO THE TIME OF SALE. THIS TERM SHEET IS NOT AN OFFER TO SELL THESE SECURITIES AND IT IS NOT A SOLICITATION OF AN OFFER TO BUY THESE SECURITIES IN ANY JURISDICTION WHERE THE OFFER OR SALE IS NOT PERMITTED.
49
| Various | Collateral Asset Summary – Loan No. 2 Phoenix Industrial Portfolio II | Cut-off Date Balance: Cut-off Date LTV Ratio: UW NCF DSCR: UW NOI Debt Yield: | $40,000,000 74.2% 1.41x 9.8% |
Additionally, the Huntsville property is located immediately south of Interstate 565 (2.7 miles), which connects Huntsville with Decatur, and approximately 10.5 miles east of Interstate 65, which provides access to Nashville and Birmingham.
The following table presents market information with respect to the Phoenix Industrial Portfolio II Properties:
| Market Overview | ||||||||||
| Property | Year Built/ Renovated | Size (SF)(1) | Market | In-Place Vacancy(1) | Market Vacancy | Appraisal Concluded Vacancy | Market Inventory(2) | UW Base Rent PSF(1) | Appraisal Market Rent PSF | % Below Market Rent |
| Flint | 2006/N/A | 460,000 | Flint | 0.0% | 3.5% | 4.0% | 29,712,481 | $4.76 | $4.70 | 1.4% |
| DuBois | 1961; 1988/N/A | 612,800 | Clearfield County | 0.0% | 1.9% | 0.0% | 5,357,791 | $2.44 | $2.75 | (11.1%) |
| Jefferson | 1995-2014/N/A | 591,840 | Jefferson | 0.0% | 3.0% | 1.0% | 12,541,913 | $2.43 | $2.75 | (11.8%) |
| Huntsville | 1976/2017 | 312,105 | Huntsville | 4.1% | 8.3% | 8.4% | 34,392,147 | $3.37 | $3.75 | (10.1%) |
| Beloit(3) | 1974/2011 | 413,903 | Rock County | 33.0% | 1.6% | 5.0% | 22,885,991 | $4.24 | $4.00 | 5.9% |
| Total/Wtd. Avg.(3) | 2,390,648 | 6.2% | 3.3% | 3.0% | 104,890,323 | $3.26 | $3.47 | (5.8%) | ||
Source:Appraisal
| (1) | Based on the underwritten rent roll. |
| (2) | Based on third party market research reports. |
| (3) | Physical occupancy at the Beloit property is 100.0%. Staples (33.0% of property NRA, 31.7% of property gross potential rent) has exercised its termination option effective April 30, 2020 and is currently negotiating with the borrower sponsor on a lease extension. As such, the Staples lease has been underwritten as vacant. Including the Staples lease, the Phoenix Industrial Portfolio II Properties have Wtd. Avg. UW Base Rent PSF of $3.30, which is 6.1% below market. |
The following table presents demographic information with respect to the Phoenix Industrial Portfolio II Properties:
| Demographics Overview | |||||||
| Property | City, State | Allocated Loan Amount | % of Allocated Loan Amount | UW NCF | % of UW NCF | Estimated 2019 Population 5-mile Radius | Estimated 2019 Median Household Income 5-mile Radius |
| Flint | Flint, MI | $16,610,687 | 24.4% | $1,866,615 | 32.1% | 77,658 | $44,754 |
| DuBois | DuBois, PA | $14,237,732 | 20.9% | $1,280,560 | 22.0% | 20,409 | $52,337 |
| Jefferson | Jefferson, WI | $14,237,732 | 20.9% | $1,147,440 | 19.7% | 15,408 | $56,713 |
| Huntsville | Huntsville, AL | $8,527,808 | 12.5% | $863,543 | 14.9% | 44,783 | $85,915 |
| Beloit | Beloit, WI | $14,386,041 | 21.2% | $653,354 | 11.2% | 58,164 | $47,526 |
| Total/Wtd. Avg. | $68,000,000 | 100.0% | $5,811,511 | 100.0% | 44,391 | $54,594 | |
Source:Third party market research reports
THE INFORMATION IN THIS STRUCTURAL AND COLLATERAL TERM SHEET IS NOT COMPLETE AND MAY BE AMENDED PRIOR TO THE TIME OF SALE. THIS TERM SHEET IS NOT AN OFFER TO SELL THESE SECURITIES AND IT IS NOT A SOLICITATION OF AN OFFER TO BUY THESE SECURITIES IN ANY JURISDICTION WHERE THE OFFER OR SALE IS NOT PERMITTED.
50
| Various | Collateral Asset Summary – Loan No. 2 Phoenix Industrial Portfolio II | Cut-off Date Balance: Cut-off Date LTV Ratio: UW NCF DSCR: UW NOI Debt Yield: | $40,000,000 74.2% 1.41x 9.8% |
Operating History and Underwritten Net Cash Flow. The following table presents certain information relating to the historical operating performance and the Underwritten Net Cash Flow at the Phoenix Industrial Portfolio II Properties:
| Cash Flow Analysis | |||||||||||||
| 2016(1) | 2017(1) | 2018 | 6/30/2019 TTM | UW | UW PSF | ||||||||
| Gross Potential Rent(2) | N/A | N/A | $7,567,781 | $7,718,146 | $7,903,358 | $3.31 | |||||||
| Total Recoveries | N/A | N/A | $1,356,217 | $1,557,669 | $2,109,698 | $0.88 | |||||||
| Other Income | N/A | N/A | $0 | $0 | $0 | $0.00 | |||||||
| Less Vacancy & Credit Loss(3) | N/A | N/A | $0 | $0 | ($881,322) | ($0.37) | |||||||
| Effective Gross Income | N/A | N/A | $8,923,998 | $9,275,816 | $9,131,734 | $3.82 | |||||||
| Total Operating Expenses | N/A | N/A | $1,963,475 | $2,248,289 | $2,447,004 | $1.02 | |||||||
| Net Operating Income | N/A | N/A | $6,960,523 | $7,027,527 | $6,684,731 | $2.80 | |||||||
| TI/LC | N/A | N/A | $0 | $0 | $513,774 | $0.21 | |||||||
| Capital Expenditures | N/A | N/A | $0 | $0 | $359,446 | $0.15 | |||||||
| Net Cash Flow | N/A | N/A | $6,960,523 | $7,027,527 | $5,811,511 | $2.43 | |||||||
| Occupancy %(3) | N/A | N/A | 97.4% | 99.5% | 91.2% | ||||||||
| NOI DSCR (P&I)(4) | N/A | N/A | 1.69x | 1.71x | 1.63x | ||||||||
| NCF DSCR (P&I)(4) | N/A | N/A | 1.69x | 1.71x | 1.41x | ||||||||
| NOI Debt Yield(4) | N/A | N/A | 10.2% | 10.3% | 9.8% | ||||||||
| NCF Debt Yield(4) | N/A | N/A | 10.2% | 10.3% | 8.5% | ||||||||
| (1) | The borrower sponsor acquired the Phoenix Industrial Portfolio II Properties in 2017. As such, prior operating performance information is not available. |
| (2) | UW Gross Potential Rent is based on the underwritten rent roll and includes (i) rent steps of $127,197 through October 1, 2020 and (ii) vacancy gross up of $593,838. |
| (3) | UW Occupancy % is based on the economic vacancy of 8.8%. The Phoenix Industrial Portfolio II Properties has leased and physical occupancy of 93.8% and 99.5%, as of June 30, 2019, respectively. |
| (4) | Debt service coverage ratios and debt yields are based on the Phoenix Industrial Portfolio II Whole Loan. |
Escrows and Reserves.At origination of the Phoenix Industrial Portfolio II Whole Loan, the Phoenix Industrial Portfolio II Borrowers deposited (i) $261,385 for real estate taxes, (ii) $159,062 for insurance premiums and (iii) $283,040 for deferred maintenance. The Phoenix Industrial Portfolio II Borrowers are required to escrow monthly (i) 1/12 of the annual estimated tax payments,provided, however, that such monthly tax payments related to the Flint property and DuBois property are waived if (a) no event of default has occurred and is continuing, (b) the Android Industries lease and the DuBois Logistics, LLC lease demises the entirety of each the Flint property and DuBois property, respectively, (c) the Android Industries lease and the DuBois Logistics, LLC lease are in full force and effect, (d) the then current term under each of the Android Industries lease and the DuBois Logistics, LLC lease is scheduled to expire no earlier than 12 months, six months, or three months after the date on which the next installment of taxes are due if such taxes are due and payable annually, semi-annually, or quarterly, respectively, (e) no Material Tenant Trigger Event (as defined below) with respect to Android Industries and DuBois Logistics, LLC has occurred and is continuing, (f) each of Android Industries and DuBois Logistics, LLC pays taxes in a timely manner directly to government authorities, among other requirements, (ii) 1/12 of the annual estimated insurance premiums, currently equal to $13,255, (iii) $19,922 for replacement reserves, subject to a cap of $481,308, and (iv) for TI/LC in the amount of (a) $199,221 on each monthly payment date through and including October 6, 2020 or (b) $49,805 on each monthly payment date thereafter, subject to a cap of $1,500,000. Notwithstanding the above, monthly tax escrows currently equal to $62,502, which exclude the Flint property and DuBois property.
Lockbox and Cash Management. The Phoenix Industrial Portfolio II Whole Loan has a hard lockbox with springing cash management upon the occurrence and continuance of a Cash Management Trigger Event (as defined below). Pursuant to the related mortgage loan documents, during the continuance of a Cash Management Trigger Event, all excess funds on deposit in the cash management account (after payment of required monthly reserve deposits, debt service payment and cash management bank fees) will be applied as follows: (a) if a Material Tenant Trigger Event has occurred and is continuing, to a Material Tenant (as defined below) rollover reserve and (b) if a Cash Sweep Trigger Event (as defined below) has occurred and is continuing (but not a Material Tenant Trigger Event), to the lender-controlled excess cash flow account or (c) if no Material Tenant Trigger Event or Cash Sweep Trigger Event has occurred and is continuing, to the Phoenix Industrial Portfolio II Borrowers.
A “Cash Management Trigger Event” will occur upon (i) an event of default under the related mortgage loan documents, (ii) any bankruptcy action involving the Phoenix Industrial Portfolio II Borrowers, the guarantor, the key principal or the property manager, (iii) the trailing 12-month period debt service coverage ratio falling below 1.20x, (iv) any indictment for fraud or misappropriation of funds by the Phoenix Industrial Portfolio II Borrowers, the guarantor, the key principal or the property manager, or any officer of the aforementioned or (v) a Material Tenant Trigger Event. A Cash Management Trigger Event will continue until, in regard to clause (i) above, the cure of such event of default and acceptance of such cure by the lender, in regard to clause (ii) above, the filing is discharged, stayed or dismissed within 45 days for the Phoenix Industrial Portfolio II Borrowers, guarantor or key principal, or within 120 days for the property manager, and the lender’s determination that such filing does not materially affect the obligations of the Phoenix Industrial Portfolio II Borrowers, the guarantor, the key principal or the property manager under the applicable related mortgage loan documents or management agreement, as applicable, in regard to clause (iii) above, the trailing 12-month debt service coverage ratio is at least 1.25x for two consecutive calendar quarters, in regard to clause (iv) above, the dismissal of the applicable indictment with prejudice or the acquittal of the applicable person with respect to the related charge or the replacement of the property manager with a qualified manager pursuant to the related mortgage loan documents, or in regard to clause (v) above, the cure of such Material Tenant Trigger Event.
A “Material Tenant Trigger Event” will occur (i) if a Material Tenant gives notice of its intention to terminate or cancel or not to extend or renew its lease, (ii) on or prior to the date on which a Material Tenant is required under its lease to notify the Phoenix Industrial Portfolio II Borrowers of its election to extend or renew its lease, if such Material Tenant fails to give such notice, (iii) if an event of default under a Material Tenant lease occurs and continues beyond any applicable notice and cure period, (iv) if a bankruptcy action of a Material Tenant or guarantor of any Material Tenant lease occurs, (v) if a Material Tenant lease is terminated or is no longer in full force and effect,providedthat, with respect to any partial termination of a Material Tenant lease,
THE INFORMATION IN THIS STRUCTURAL AND COLLATERAL TERM SHEET IS NOT COMPLETE AND MAY BE AMENDED PRIOR TO THE TIME OF SALE. THIS TERM SHEET IS NOT AN OFFER TO SELL THESE SECURITIES AND IT IS NOT A SOLICITATION OF AN OFFER TO BUY THESE SECURITIES IN ANY JURISDICTION WHERE THE OFFER OR SALE IS NOT PERMITTED.
51
| Various | Collateral Asset Summary – Loan No. 2 Phoenix Industrial Portfolio II | Cut-off Date Balance: Cut-off Date LTV Ratio: UW NCF DSCR: UW NOI Debt Yield: | $40,000,000 74.2% 1.41x 9.8% |
such partial termination relates to no less than 20% of (x) the total net rentable square footage at the applicable Phoenix Industrial Portfolio II Property or (y) the total in-place base rent at the applicable Phoenix Industrial Portfolio II Property or (vi) if a Material Tenant “goes dark”, vacates, ceases to occupy or ceases to conduct business in the ordinary course at the Phoenix Industrial Portfolio II Properties or a portion thereof constituting no less than 20% of the total net rentable square footage at the applicable Phoenix Industrial Portfolio II Property for a period in excess of 12 consecutive calendar months (other than temporary cessation of operations in connection with remodeling, renovation or restoration of their leased premises). A Material Tenant Trigger Event will end (a) with respect to clause (i) above, on the date that (1) the applicable Material Tenant revokes or rescinds all termination or cancellation notices, (2) the applicable Material Tenant lease is extended on terms satisfying the requirements of the related mortgage loan documents or (3) all or substantially all of the applicable Material Tenant space is leased to a replacement tenant, and such replacement tenant and its lease satisfy the requirements of the related mortgage loan documents, (b) with respect to clauses (ii) above, on the date that (1) the applicable Material Tenant lease is extended on terms satisfying the requirements of the related mortgage loan documents or (2) all or substantially all of the applicable Material Tenant space is leased to a replacement tenant, and such replacement tenant and its lease satisfy the requirements of the related mortgage loan documents, (c) with respect to clause (iii) above, after a cure of the applicable event of default, (d) with respect to clause (iv) above, after an affirmation of the Material Tenant lease in the applicable bankruptcy proceeding and confirmation that the Material Tenant is actually paying all rents and other amounts under its lease (or, if applicable, the discharge or dismissal of the applicable Material Tenant lease guarantor from the applicable bankruptcy proceeding;provided that such bankruptcy (after dismissal or discharge) does not have an adverse effect on such Material Tenant lease guarantor’s ability to perform its obligations under its lease guaranty), (e) with respect to clause (v) above, all or substantially all of the applicable Material Tenant space is leased to a replacement tenant, and such replacement tenant and its lease satisfy the requirements of the related mortgage loan documents or (f) with respect to clause (vi) above, the Material Tenant re-commences its normal business operations at the Phoenix Industrial Portfolio II Properties or a portion thereof constituting more than 20% of the total net rentable square footage at the applicable Phoenix Industrial Portfolio II Property.
A “Material Tenant” means (i) DuBois Logistics, LLC, (ii) Generac Power Systems, Inc., (iii) Android Industries or (iv) any other tenant at the Phoenix Industrial Portfolio II Properties that, together with its affiliates, either (a) leases no less than 20% of the total rentable square footage at the applicable Phoenix Industrial Portfolio II Property or (b) accounts for no less than 20% of the total in-place base rent at the applicable Phoenix Industrial Portfolio II Property.
A “Cash Sweep Trigger Event” will occur upon (i) an event of default under the related mortgage loan documents, (ii) any bankruptcy action involving the Phoenix Industrial Portfolio II Borrowers, the guarantor, the key principal or the property manager or (iii) the trailing 12-month period debt service coverage ratio falling below 1.15x. A Cash Sweep Trigger Event will continue until, in regard to clause (i) above, the cure of such event of default and acceptance of such cure by the lender, in regard to clause (ii) above, the filing is discharged, stayed or dismissed within 45 days for the Phoenix Industrial Portfolio II Borrowers, key principal or guarantor, or within 120 days for the property manager, and the lender’s determination that such filing does not materially affect the obligations of the Phoenix Industrial Portfolio II Borrowers, the guarantor, the key principal or the property manager under the applicable related mortgage loan documents or management agreement, as applicable, or in regard to clause (iii) above, the trailing 12-month debt service coverage ratio is at least 1.20x for two consecutive calendar quarters.
Additional Secured Indebtedness (not including trade debts). None.
Mezzanine Loans and Preferred Equity. None.
Release of Property. The Huntsville property includes approximately 17.7 acres of excess land that is currently unimproved (the “Huntsville Outparcel”). As of August 19, 2019, the appraisal concluded an “as is” value of $600,000 for the Huntsville Outparcel and $1,820,000 for Huntsville property (excluding the Huntsville Outparcel). The Phoenix Industrial Portfolio II Borrowers may obtain the release of the Huntsville Outparcel,provided that, among other conditions, (i) no event of default under the related mortgage loan documents is continuing and (ii) the Phoenix Industrial Portfolio II Borrowers provide written evidence reasonably acceptable to the lender in all respects that (a) the Huntsville Outparcel is not necessary for the operation of the Huntsville property, (b) the Huntsville Outparcel is vacant, non-income producing and unimproved, (c) the intended use of the Huntsville Outparcel will not have a material adverse effect on the applicable Phoenix Industrial Portfolio II Borrower or the remaining Huntsville property, and (d) any construction and/or development contemplated to be performed in, over or under the Huntsville Outparcel will not materially disrupt the remaining Huntsville property, among other requirements as listed in the related mortgage loan documents. See “Description of the Mortgage Pool—Certain Terms of the Mortgage Loans—Releases; Partial Releases” in the Preliminary Prospectus.
Terrorism Insurance.The Phoenix Industrial Portfolio II Borrowers are required to obtain and maintain property insurance, commercial general liability insurance, and business income or rental loss insurance that covers perils of terrorism and acts of terrorism, both foreign and domestic.
THE INFORMATION IN THIS STRUCTURAL AND COLLATERAL TERM SHEET IS NOT COMPLETE AND MAY BE AMENDED PRIOR TO THE TIME OF SALE. THIS TERM SHEET IS NOT AN OFFER TO SELL THESE SECURITIES AND IT IS NOT A SOLICITATION OF AN OFFER TO BUY THESE SECURITIES IN ANY JURISDICTION WHERE THE OFFER OR SALE IS NOT PERMITTED.
52
(THIS PAGE INTENTIONALLY LEFT BLANK)
53
600 & 620 National Avenue Mountain View, CA 94043 | Collateral Asset Summary – Loan No. 3 600 & 620 National Avenue | Cut-off Date Balance: Cut-off Date LTV Ratio: UW NCF DSCR: UW NOI Debt Yield: | $38,950,000 70.0% 1.93x 7.2% |
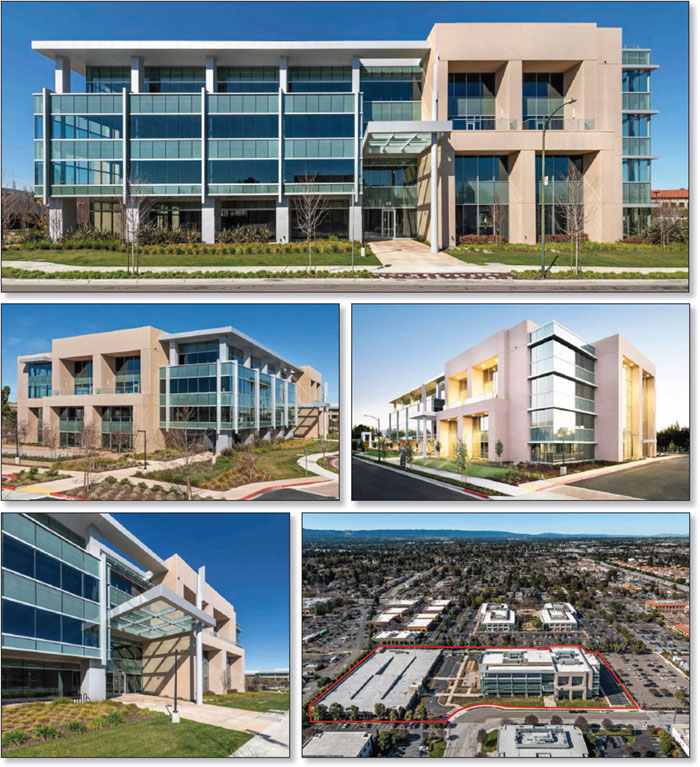
THE INFORMATION IN THIS STRUCTURAL AND COLLATERAL TERM SHEET IS NOT COMPLETE AND MAY BE AMENDED PRIOR TO THE TIME OF SALE. THIS TERM SHEET IS NOT AN OFFER TO SELL THESE SECURITIES AND IT IS NOT A SOLICITATION OF AN OFFER TO BUY THESE SECURITIES IN ANY JURISDICTION WHERE THE OFFER OR SALE IS NOT PERMITTED.
54
600 & 620 National Avenue Mountain View, CA 94043 | Collateral Asset Summary – Loan No. 3 600 & 620 National Avenue | Cut-off Date Balance: Cut-off Date LTV Ratio: UW NCF DSCR: UW NOI Debt Yield: | $38,950,000 70.0% 1.93x 7.2% |
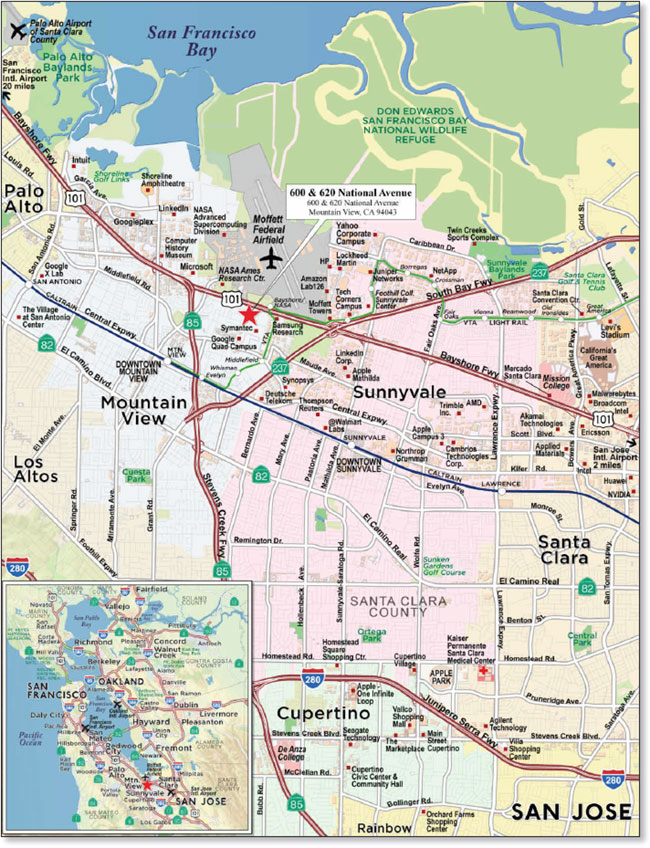
THE INFORMATION IN THIS STRUCTURAL AND COLLATERAL TERM SHEET IS NOT COMPLETE AND MAY BE AMENDED PRIOR TO THE TIME OF SALE. THIS TERM SHEET IS NOT AN OFFER TO SELL THESE SECURITIES AND IT IS NOT A SOLICITATION OF AN OFFER TO BUY THESE SECURITIES IN ANY JURISDICTION WHERE THE OFFER OR SALE IS NOT PERMITTED.
55
600 & 620 National Avenue Mountain View, CA 94043 | Collateral Asset Summary – Loan No. 3 600 & 620 National Avenue | Cut-off Date Balance: Cut-off Date LTV Ratio: UW NCF DSCR: UW NOI Debt Yield: | $38,950,000 70.0% 1.93x 7.2% |
| Mortgage Loan Information | Mortgaged Property Information | ||||||
| Mortgage Loan Seller(1): | WFB | Single Asset/Portfolio: | Single Asset | ||||
Credit Assessment (Fitch/KBRA/Moody’s): | NR/NR/NR | Location: | Mountain View, CA 94043 | ||||
| General Property Type: | Office | ||||||
| Original Balance(2): | $38,950,000 | Detailed Property Type: | Suburban | ||||
| Cut-off Date Balance(2): | $38,950,000 | Title Vesting: | Fee Simple | ||||
| % of Initial Pool Balance: | 4.8% | Year Built/Renovated: | 2017/N/A | ||||
| Loan Purpose: | Acquisition | Size: | 151,064 SF | ||||
| Borrower Sponsors: | Brett Michael Lipman; Farshid Steve Shokouhi | Cut-off Date Balance per SF(2): | $913 | ||||
| Maturity Date Balance per SF(2): | $913 | ||||||
| Mortgage Rate: | 3.6880% | Property Manager: | Preylock Holdings, Inc. (borrower-related); Davis Property (Management sub-manager) | ||||
| Note Date: | 9/11/2019 | ||||||
| First Payment Date: | 10/11/2019 | ||||||
| Maturity Date: | 9/11/2029 | ||||||
| Original Term to Maturity | 120 months | ||||||
| Original Amortization Term: | 0 months | Underwriting and Financial Information | |||||
| IO Period: | 120 months | UW NOI: | $9,964,007 | ||||
| Seasoning: | 1 month | UW NOI Debt Yield(2): | 7.2% | ||||
| Prepayment Provisions(3): | LO (25); DEF (90); O (5) | UW NOI Debt Yield at Maturity(2): | 7.2% | ||||
| Lockbox/Cash Mgmt Status: | Hard/Springing | UW NCF DSCR(2): | 1.93x | ||||
| Additional Debt Type(2): | Pari Passu | Most Recent NOI(5): | N/A | ||||
| Additional Debt Balance(2): | $98,950,000 | 2nd Most Recent NOI(5): | N/A | ||||
| Future Debt Permitted (Type): | No (N/A) | 3rd Most Recent NOI(5): | N/A | ||||
| Reserves(4) | Most Recent Occupancy: | 100.0% (10/1/2019) | |||||
| Type | Initial | Monthly | Cap | 2nd Most Recent Occupancy(5): | N/A | ||
| RE Tax: | $0 | Springing | N/A | 3rd Most Recent Occupancy(5): | N/A | ||
| Insurance: | $0 | Springing | N/A | Appraised Value (as of)(6)(7): | $197,000,000 (8/19/2019) | ||
| Replacements: | $75,532 | $3,147 | $75,532 | Cut-off Date LTV Ratio(2)(6): | 70.0% | ||
| Outstanding TI/LC: | $12,085,120 | $0 | N/A | Maturity Date LTV Ratio(2)(6): | 70.0% | ||
| Sources and Uses | ||||||
| Sources | Proceeds | % of Total | Uses | Proceeds | % of Total | |
| Loan Amount(2): | $137,900,000 | 70.2% | Purchase Price: | $190,000,000 | 96.7% | |
| Borrower Equity: | $58,663,716 | 29.8% | Seller Credits(8): | ($12,993,370) | (6.6%) | |
| Reserves: | $12,160,652 | 6.2% | ||||
| Closing Costs: | $7,396,434 | 3.8% | ||||
| Total Sources: | $196,563,716 | 100.0% | Total Uses: | $196,563,716 | 100.0% | |
| (1) | The 600 & 620 National Avenue Whole Loan was co-originated by JPMorgan Chase Bank, National Association (“JPMCB”) and WFB on September 11, 2019. |
| (2) | The 600 & 620 National Avenue Mortgage Loan (as defined below) is part of the 600 & 620 National Avenue Whole Loan (as defined below), which is comprised of fivepari passupromissory notes with an aggregate original principal balance of $137,900,000. The Cut-off Date Balance per SF, Maturity Date Balance per SF, UW NOI Debt Yield, UW NOI Debt Yield at Maturity, UW NCF DSCR, Cut-off Date LTV Ratio and Maturity Date LTV Ratio numbers presented above are based on the 600 & 620 National Avenue Whole Loan. |
| (3) | Defeasance of the 600 & 620 National Avenue Whole Loan is permitted at any time after the earlier to occur of (a) the end of the two-year period commencing on the closing date of the securitization of the last 600 & 620 National Whole Loan promissory note to be securitized and (b) September 11, 2022. The assumed defeasance lockout period of 25 payments is based on the expected closing date of this transaction in October 2019. |
| (4) | See “Escrows and Reserves” below for further discussion of reserve requirements. |
| (5) | Historical operating statements and occupancy are not applicable, as the first generation tenant is currently completing its buildout at the 600 & 620 National Avenue Property. |
| (6) | The Appraised Value, Cut-off Date LTV Ratio and Maturity Date LTV Ratio are based on the appraiser’s “Market Value As Stabilized”, which assumes the tenant has taken possession, free rent has expired, the tenant has commenced paying unabated rent and all outstanding tenant improvements and leasing commissions have been reserved. As of the time of origination of the 600 & 620 National Avenue Whole Loan, Google has taken possession of its space and is paying rent, and all outstanding tenant improvements and leasing commissions have been reserved. The appraisal also concluded to a “Market Value As-Is” of $185,000,000 as of August 19, 2019, which equates to a Cut-off Date LTV Ratio and Maturity Date LTV Ratio of 74.5% and 74.5%, respectively. |
| (7) | The appraisal concluded to a “Hypothetical Value As if Dark” of $152,500,000 as of August 19, 2019. |
| (8) | The majority of Seller Credits ($12,085,120) relate to outstanding tenant improvements and leasing commissions for Google, which were reserved for at the time of origination of the 600 & 620 National Avenue Whole Loan. |
The Mortgage Loan.The third largest mortgage loan (the “600 & 620 National Avenue Mortgage Loan”) is part of a whole loan (the “600 & 620 National Avenue Whole Loan”) evidenced by fivepari passu promissory notes with an aggregate original principal balance of $137,900,000. The 600 & 620 National Avenue Whole Loan is secured by a first priority fee mortgage encumbering a 151,064 SF single tenant office located in Mountain View, California (the “600 & 620 National Avenue Property”). The 600 & 620 National Avenue Mortgage Loan represents the controlling Note A-1-1 with an original principal balance of $38,950,000. The below table summarizes the 600 & 620 National Avenue Whole Loan, including the remaining promissory notes, which are currently held by WFB and JPMCB and may otherwise be transferred at any time. The mortgage loan seller provides no assurances that the non-securitizedpari passunotes will not be split further. The 600 & 620 National Avenue Whole Loan will be serviced pursuant to the pooling and servicing agreement for the UBS 2019-C17 Trust. See “Description of the Mortgage Pool—The Whole Loans—The Serviced Pari Passu Whole Loans” and “Pooling and Servicing Agreement” in the Preliminary Prospectus.
THE INFORMATION IN THIS STRUCTURAL AND COLLATERAL TERM SHEET IS NOT COMPLETE AND MAY BE AMENDED PRIOR TO THE TIME OF SALE. THIS TERM SHEET IS NOT AN OFFER TO SELL THESE SECURITIES AND IT IS NOT A SOLICITATION OF AN OFFER TO BUY THESE SECURITIES IN ANY JURISDICTION WHERE THE OFFER OR SALE IS NOT PERMITTED.
56
600 & 620 National Avenue Mountain View, CA 94043 | Collateral Asset Summary – Loan No. 3 600 & 620 National Avenue | Cut-off Date Balance: Cut-off Date LTV Ratio: UW NCF DSCR: UW NOI Debt Yield: | $38,950,000 70.0% 1.93x 7.2% |
| 600 & 620 National Avenue Whole Loan Summary | ||||
| Notes | Original Principal Balance | Cut-off Date Balance | Anticipated Note Holder | Controlling Piece |
| A-1-1 | $38,950,000 | $38,950,000 | UBS 2019-C17 | Yes |
| A-1-2 | $30,000,000 | $30,000,000 | WFB | No |
| A-2-1 | $30,000,000 | $30,000,000 | JPMCB | No |
| A-2-2 | $30,000,000 | $30,000,000 | JPMCB | No |
| A-2-3 | $8,950,000 | $8,950,000 | JPMCB | No |
| Total | $137,900,000 | $137,900,000 | ||
The Borrower and the Borrower Sponsors. The borrower is Preylock Mountain View, LLC (the “600 & 620 National Avenue Borrower”), a Delaware limited liability company structured to be bankruptcy remote with two independent directors. Legal counsel to the 600 & 620 National Avenue Borrower delivered a non-consolidation opinion in connection with the origination of the 600 & 620 National Avenue Whole Loan. The borrower sponsors and nonrecourse carveout guarantors are Brett Michael Lipman and Farshid Steve Shokouhi, both managing partners at Preylock Real Estate Holdings (“Preylock”) a real estate acquisition and management company. Founded in Los Angeles, California in 2016, Preylock’s current portfolio comprises approximately 3.0 million SF of office space in California and Washington.
Prior to founding Preylock, Mr. Lipman was most recently a portfolio manager and a partner at RMA Real Estate Investment Advisors (“RMA”), a real estate private equity fund. At RMA, he was responsible for portfolio management, asset management and sourcing direct real estate investment opportunities. Prior to joining RMA, Mr. Lipman worked for JP Morgan, most recently on the Global Real Assets platform, a large institutional real estate investor. Previously, Mr. Shokouhi was the Managing Principal of the Kalimian Organization, a real estate family office based in New York. Mr. Shokouhi focused on the firm’s business development and asset repositioning, as well as assembling a management team.
The Property. The 600 & 620 National Avenue Property is a 151,064 SF, four-story, LEED Gold Certified, Class A office building located in Mountain View, California within the northern portion of Silicon Valley. Constructed in 2017 and situated on a 4.8-acre site, the 600 & 620 National Avenue Property contains large floor plates of approximately 38,000 SF and up to 16-foot ceiling heights. The building is 100.0% leased to Google LLC (“Google”), which has taken possession of its space and, according to the appraisal, is expected to spend approximately $200 PSF on tenant improvements (in addition to the $80 PSF in tenant improvements provided for by the 600 & 620 National Avenue Borrower). While not yet in physical occupancy, Google has commenced paying unabated rent at the 600 & 620 National Avenue Property. The 600 & 620 National Avenue Property contains 105 surface parking spaces in addition to a two-story parking structure with 344 parking spaces, resulting in a total parking ratio of approximately 3.0 spaces per 1,000 SF of NRA.
Major Tenant.Alphabet Inc., the holding company of Google, is a global technology company focused on online search, advertising, operating systems, platforms and enterprise services. The primary revenue driver for Google is online advertising, but other Google initiatives include Chrome, Android, Maps, Earth, Apps, Fiber, Music, Glass and self-driving automobiles. Alphabet Inc. (NASDAQ: GOOG) is rated ‘Aa2’ and ‘AA+’ by Moody’s and S&P, respectively. Google’s lease at the 600 & 620 National Avenue Property runs through May 31, 2029 with three, five-year renewal options and no termination options. The entity on Google’s lease at the 600 & 620 National Avenue Property is Google LLC. The 600 & 620 National Avenue Property is included within a Superfund Site that is being actively remediated, and, while mitigation measures have been incorporated into the design and construction of the improvements, Google’s lease provides for tenant remedies, including lease termination, if conditions are determined by governmental order to be hazardous to human health (see “Description of the Mortgage Pool – Environmental Conditions” in the Preliminary Prospectus).
Google has a signed lease at the 600 & 620 National Avenue Property but has not yet taken occupancy. Google has taken possession of its space, commenced paying unabated rent and, as of September 2019, is expected to take occupancy by the third quarter of 2020. There is no assurance that Google will take occupancy by the estimated date noted herein.
The following table presents certain information relating to the tenancy at the 600 & 620 National Avenue Property:
| Tenant Summary | ||||||||
| Tenant Name | Credit Rating (Fitch/Moody’s/S&P)(1) | Tenant SF | Approximate % of SF | Annual UW Rent(2) | % of Total Annual UW Rent | Annual UW Rent PSF(2) | Termination Option (Y/N) | Lease Expiration |
| Google LLC(3) | NR/Aa2/AA+ | 151,064 | 100.0% | $8,973,204 | 100.0% | $59.40 | N | 5/31/2029(4) |
| Vacant | 0 | 0.0% | $0 | 0.0% | $0.00 | |||
| Total/Wtd. Avg. | 151,064 | 100.0% | $8,973,204 | 100.0% | $59.40 | |||
| (1) | The ratings shown above are those of Alphabet Inc., Google’s parent company. The entity on Google’s lease is Google LLC. |
| (2) | Annual UW Rent PSF and Annual UW Rent reflect the tenant’s current contractual rental rate, and the tenant’s lease is structured with 3% contractual annual rent increases. The lender’s underwriting provides separate credit for straight-line rent averaging through the lease term due to the tenant’s investment grade nature. The total effective underwritten rent, inclusive of rent averaging credit, is $68.55 PSF (see “Underwritten Net Cash Flow” section below). |
| (3) | Google has taken procession of its space and commenced paying unabated rent but has not yet taken occupancy of the 600 & 620 National Avenue Property. |
| (4) | Google has three, five-year renewal options with 12 months’ notice at 95% of the prevailing fair market rental rate. |
THE INFORMATION IN THIS STRUCTURAL AND COLLATERAL TERM SHEET IS NOT COMPLETE AND MAY BE AMENDED PRIOR TO THE TIME OF SALE. THIS TERM SHEET IS NOT AN OFFER TO SELL THESE SECURITIES AND IT IS NOT A SOLICITATION OF AN OFFER TO BUY THESE SECURITIES IN ANY JURISDICTION WHERE THE OFFER OR SALE IS NOT PERMITTED.
57
600 & 620 National Avenue Mountain View, CA 94043 | Collateral Asset Summary – Loan No. 3 600 & 620 National Avenue | Cut-off Date Balance: Cut-off Date LTV Ratio: UW NCF DSCR: UW NOI Debt Yield: | $38,950,000 70.0% 1.93x 7.2% |
The following table presents certain information relating to the lease rollover at the 600 & 620 National Avenue Property:
| Lease Rollover Schedule(1) | ||||||||
| Year | # of Leases Rolling | SF Rolling | Approx. % of Total SF Rolling | Approx. Cumulative % of SF Rolling | UW Base Rent PSF Rolling | Total UW Base Rent Rolling | Approx. % of Total Rent Rolling | Approx. Cumulative % of Total Rent Rolling |
| MTM | 0 | 0 | 0.0% | 0.0% | $0 | $0 | 0.0% | 0.0% |
| 2019 | 0 | 0 | 0.0% | 0.0% | $0 | $0 | 0.0% | 0.0% |
| 2020 | 0 | 0 | 0.0% | 0.0% | $0 | $0 | 0.0% | 0.0% |
| 2021 | 0 | 0 | 0.0% | 0.0% | $0 | $0 | 0.0% | 0.0% |
| 2022 | 0 | 0 | 0.0% | 0.0% | $0 | $0 | 0.0% | 0.0% |
| 2023 | 0 | 0 | 0.0% | 0.0% | $0 | $0 | 0.0% | 0.0% |
| 2024 | 0 | 0 | 0.0% | 0.0% | $0 | $0 | 0.0% | 0.0% |
| 2025 | 0 | 0 | 0.0% | 0.0% | $0 | $0 | 0.0% | 0.0% |
| 2026 | 0 | 0 | 0.0% | 0.0% | $0 | $0 | 0.0% | 0.0% |
| 2027 | 0 | 0 | 0.0% | 0.0% | $0 | $0 | 0.0% | 0.0% |
| 2028 | 0 | 0 | 0.0% | 0.0% | $0 | $0 | 0.0% | 0.0% |
| 2029 | 1 | 151,064 | 100.0% | 100.0% | $59.40 | $8,973,204 | 100.0% | 100.0% |
| 2030 & Beyond | 0 | 0 | 0.0% | 100.0% | $0 | $0 | 0.0% | 100.0% |
| Vacant | 0 | 0 | 0.0% | 100.0% | $0 | $0 | 0.0% | 100.0% |
| Total/Wtd. Avg. | 1 | 151,064 | 100.0% | $59.40 | $8,973,204 | 100.0% | ||
| (1) | Information is based on the underwritten rent roll. |
The Market. The 600 & 620 National Avenue Property is located in Mountain View, Santa Clara County, California, approximately 11.4 miles northwest of the San Jose central business district, with primary access provided by US Highway 101, State Highway 237 and State Highway 85. US Highway 101 is the major north-south route through the western bay area, providing northern access to San Francisco and southern access to San Jose. Access to the CalTrain and The Valley Transportation Authority light rail is available approximately one mile south of the 600 & 620 National Avenue Property. In addition, the 600 & 620 National Avenue Property is located approximately 3.3 miles southeast of The Googleplex (the corporate headquarters complex of Google and its parent company Alphabet Inc.) and 1.5 miles west of Moffett Park.
According to the appraisal, San Mateo and Santa Clara Counties are located within Silicon Valley, which has a large concentration of high-technology and research & development employers. Per the appraisal, Silicon Valley’s top employers are Apple Inc. (approximately 25,000 employees) and Alphabet Inc. (approximately 20,000 employees) and include Tesla Inc. (approximately 10,000 employees) and Facebook Inc. (approximately 9,385 employees). Apple’s headquarters in Cupertino is approximately 7.6 miles southwest of the 600 & 620 National Avenue Property, and Facebook’s headquarters in Menlo Park is approximately 9.3 miles to the northeast. According to a third party market research provider, the estimated 2018 population within a three- and five-mile radius of the 600 & 620 National Avenue Property was approximately 157,190 and 344,619, respectively; and the estimated 2018 average household income within the same radii was approximately $160,022 and $179,509, respectively.
According to a third party market research report, the 600 & 620 National Avenue Property is situated within the South Moffett Triangle submarket of the San Jose Office Market. As of September 11, 2019, the South Moffett Triangle submarket reported a total inventory of approximately 3.4 million SF with a 1.0% vacancy rate, which has decreased from 7.2% in 2018 and averaged 6.6% from 2013 through 2018.
The appraiser identified six leases negotiated in competitive buildings in the marketplace totaling approximately 1.0 million SF with direct rents ranging from $56.16 to $96.00 PSF, net, with an average of $69.86 PSF, net. The appraiser concluded to a market rent for the 600 & 620 National Avenue Property of $66.00 PSF, triple net.
THE INFORMATION IN THIS STRUCTURAL AND COLLATERAL TERM SHEET IS NOT COMPLETE AND MAY BE AMENDED PRIOR TO THE TIME OF SALE. THIS TERM SHEET IS NOT AN OFFER TO SELL THESE SECURITIES AND IT IS NOT A SOLICITATION OF AN OFFER TO BUY THESE SECURITIES IN ANY JURISDICTION WHERE THE OFFER OR SALE IS NOT PERMITTED.
58
600 & 620 National Avenue Mountain View, CA 94043 | Collateral Asset Summary – Loan No. 3 600 & 620 National Avenue | Cut-off Date Balance: Cut-off Date LTV Ratio: UW NCF DSCR: UW NOI Debt Yield: | $38,950,000 70.0% 1.93x 7.2% |
The following table presents certain information relating to the appraisal’s market rent conclusion for the 600 & 620 National Avenue Property:
| Market Rent Summary | |
| Single Tenant Office | |
| Market Rent (PSF) | $66.00 |
| Lease Term (Years) | 10 |
| Concessions | 6 months |
| Lease Type (Reimbursements) | Net |
| Rent Increase Projection | 3.0%per annum |
| Source:Appraisal |
The following table presents information relating to comparable office property sales for the 600 & 620 National Avenue Property:
| Comparable Property Sale Summary | ||||||
| Property Name/Location | Sale Date | Year Built/ Renovated | Total NRA (SF) | Total Occupancy | Sale Price | Sale Price PSF |
600 & 620 National Avenue Mountain View, CA | Sept. 2019 | 2017/N/A | 151,064 | 100.0% | $190,000,000 | $1,258 |
Grove 221 Sunyvale, CA | Mar. 2019 | 2019/N/A | 154,987 | 100.0% | $183,000,000 | $1,181 |
3170 Porter Drive Palo Alto, CA | Jan. 2019 | 2017/N/A | 96,626 | 100.0% | $100,250,000 | $1,038 |
Middlefield Station Mountain View, CA | Sept. 2018 | 2012/N/A | 99,880 | 100.0% | $80,000,000 | $801 |
Castro Station Mountain View, CA | Aug. 2018 | 2014/N/A | 114,809 | 94.0% | $179,650,000 | $1,565 |
385 Sherman Palo Alto, CA | Jan. 2018 | 2016/N/A | 67,974 | 100.0% | $138,000,000 | $2,030 |
Source:Appraisal; borrower sponsor
The following table presents certain information relating to comparable office leases for the 600 & 620 National Avenue Property:
| Comparable Leases Summary | |||||||||
| Property Name/Location | Year Built/ Renovated | Total GLA (SF) | Occupancy | Distance from Subject | Tenant Name | Lease Date/Term | Lease Area (SF) | Annual Base Rent PSF | Lease Type |
| 600 & 620 National Avenue Property | 2017/N/A | 151,064 | 100.0% | - | Google LLC | June 2019/ 10.0 Yrs | 151,064 | $59.40(1) | Triple Net |
Pathline Park 925 W Maude Avenue & Sunnyvale, California | 2020/N/A | 242,550 | 100.0% | 6.6 miles | Proofpoint | November 2020/ 11.0 Yrs | 242,000 | $57.00 | Net |
600 Clyde 600 Clyde Avenue Mountain View, California | 2020/N/A | 189,974 | 100.0% | 4.4 miles | Google LLC | May 2020/ 11.0 Yrs | 189,974 | $56.16 | Net |
899 W Evelyn Avenue Mountain View, California | 2013/N/A | 75,475 | 100.0% | 5.8 miles | Confluent | September 2019/ 10.0 Yrs | 75,475 | $96.00 | Net |
Grove 221 221 N Mathilda Avenue Sunnyvale, California | 2018/N/A | 154,987 | 100.0% | 2.3 miles | 23andMe | March 2019/ 12.8 Yrs | 154,987 | $61.80 | Net |
2240 El Camino Real Mountain View, California | 1986/N/A | 141,392 | NAV | 5.7 miles | Udacity | September 2018/ 7.0 Yrs | 39,800 | $70.20 | Net |
Ameswell Mountain View 750 Moffett Boulevard Mountain View, California | 2020/N/A | 216,700 | 0.0% | 5.8 miles | Available | N/A | 216,700 | $78.00 | Net |
Source:Appraisal
| (1) | Information is based on the underwritten rent roll. |
THE INFORMATION IN THIS STRUCTURAL AND COLLATERAL TERM SHEET IS NOT COMPLETE AND MAY BE AMENDED PRIOR TO THE TIME OF SALE. THIS TERM SHEET IS NOT AN OFFER TO SELL THESE SECURITIES AND IT IS NOT A SOLICITATION OF AN OFFER TO BUY THESE SECURITIES IN ANY JURISDICTION WHERE THE OFFER OR SALE IS NOT PERMITTED.
59
600 & 620 National Avenue Mountain View, CA 94043 | Collateral Asset Summary – Loan No. 3 600 & 620 National Avenue | Cut-off Date Balance: Cut-off Date LTV Ratio: UW NCF DSCR: UW NOI Debt Yield: | $38,950,000 70.0% 1.93x 7.2% |
Underwritten Net Cash Flow.The following table presents certain information relating to the Underwritten Net Cash Flow at the 600 & 620 National Avenue Property:
| Cash Flow Analysis | |||||
| 2016(1) | 2017(1) | 2018(1) | UW | UW PSF | |
| Rents in Place | N/A | N/A | N/A | $8,973,204 | $59.40 |
| Straight Line Rent Averaging | N/A | N/A | N/A | $1,382,728 | $9.15 |
| Gross Potential Rent | N/A | N/A | N/A | $10,355,932 | $68.55 |
| Total Recoveries | N/A | N/A | N/A | $2,708,238 | $17.93 |
| Less Vacancy & Credit Loss(2) | N/A | N/A | N/A | ($391,925) | ($2.59) |
| Effective Gross Income | N/A | N/A | N/A | $12,672,245 | $83.89 |
| Total Expenses | N/A | N/A | N/A | $2,708,238 | $17.93 |
| Net Operating Income | N/A | N/A | N/A | $9,964,007 | $65.96 |
| Capital Expenditures(3) | N/A | N/A | N/A | $0 | $0.00 |
| TI/LC | N/A | N/A | N/A | $0 | $0.00 |
| Net Cash Flow | N/A | N/A | N/A | $9,964,007 | $65.96 |
| Occupancy %(2) | N/A | N/A | N/A | 97.0% | |
| NOI DSCR(4) | N/A | N/A | N/A | 1.93x | |
| NCF DSCR(4) | N/A | N/A | N/A | 1.93x | |
| NOI Debt Yield(4) | N/A | N/A | N/A | 7.2% | |
| NCF Debt Yield(4) | N/A | N/A | N/A | 7.2% | |
| (1) | The 600 & 620 National Avenue Property was constructed in 2017 and the first generation tenant is completing its buildout; therefore, historical operating information is not available. |
| (2) | The underwritten economic vacancy is 3.0%. The 600 & 620 National Avenue Property is 100.0% leased as of October 1, 2019. |
| (3) | The borrower sponsors deposited $75,532 ($0.50 PSF) into an upfront capital expenditures reserve, to be replenished if the balance falls below $75,532 (see “Escrows and Reserves” section below). |
| (4) | Debt service coverage ratios and debt yields are based the 600 & 620 National Avenue Whole Loan. |
Escrows and Reserves.At origination of the 600 & 620 National Avenue Whole Loan, the 600 & 620 National Avenue Borrowers deposited (i) $75,532 for capital expenditures and (ii) $12,085,120 for unfunded tenant improvements and leasing commissions related to Google.
Real Estate Taxes – The related mortgage loan documents do not require ongoing monthly escrows for real estate taxes as long as (i) no event of default has occurred and is continuing; (ii) the Google lease obligates Google to directly pay taxes; (iii) Google actually pays all taxes directly; (iv) the Google lease remains in full force and effect and neither Google nor the 600 & 620 National Avenue Borrower defaults under any of their obligations under the lease beyond any applicable notice or cure periods; and (v) the 600 & 620 National Avenue Borrower delivers evidence that all taxes have been paid within 30 days after payment thereof.
Insurance– The related mortgage loan documents do not require ongoing monthly escrows for insurance premiums as long as (i) no event of default has occurred and is continuing; (ii) the 600 & 620 National Avenue Borrower or an affiliate provides the lender with evidence that the 600 & 620 National Avenue Property’s insurance coverage is included in a blanket policy and such policy is in full force and effect; and (iii) the 600 & 620 National Avenue Borrower pays all applicable insurance premiums and provides the lender with evidence of timely payment of insurance premiums/renewals.
Recurring Replacements Reserve– The related mortgage loan documents provide an ongoing monthly replacement reserve of $3,147, which the lender may require the 600 & 620 National Avenue Borrower to increase (not more than once per year) if the lender reasonably determines such increase is necessary to maintain the proper operation of the 600 & 620 National Avenue Property. However, the 600 & 620 National Avenue Borrowers will not be required to make any portion of the monthly replacement reserve deposit if the amount then on deposit in the replacement reserve is equal to or exceeds $75,532.
Lockbox and Cash Management. The 600 & 620 National Avenue Whole Loan has a hard lockbox with springing cash management upon the occurrence and continuance of a Cash Trap Event Period (as defined below). Pursuant to the related mortgage loan documents, during the continuance of a Cash Trap Event Period, all funds in the cash management account are required to be applied (i) to make deposits into the tax and insurance escrows (if any are then required) as described above in “Escrows and Reserves”, (ii) to pay any interest accruing at the default rate and late payment charges, (iii) to pay debt service on the 600 & 620 National Avenue Whole Loan, (iv) to make deposits into the replacement reserve (if then required), as described above under “Escrows and Reserves,” (v) any other amounts then due and payable under the related mortgage loan documents, and (vi) funds disbursed to the borrower sufficient to pay monthly operating expenses (collectively, the “Waterfall Items”). During a Cash Trap Event Period, any excess funds remaining after satisfaction of the Waterfall Items are required to be swept to an excess cash flow subaccount to be held by the lender as additional security for the 600 & 620 National Avenue Whole Loan during the continuance of the Cash Trap Event Period.
A “Cash Trap Event Period” will commence upon the earlier of (i) the occurrence of an event of default under the related mortgage loan documents, (ii) the net cash flow debt service coverage ratio (based on a hypothetical 30-year amortization term) being less than 1.20x at the end of any calendar quarter or (iii) the occurrence of a Major Tenant Event Period (as defined below). A Cash Trap Event Period will end upon the occurrence of the following: with regard to clause (i), the cure of such event of default or the waiver by the lender of such event of default; with regard to clause (ii), (x) the amortizing net cash flow debt service coverage ratio being equal to or greater than 1.25x for two consecutive calendar quarters; or with regard to clause (iii), a Major Tenant Event Period Cure (as defined below).
THE INFORMATION IN THIS STRUCTURAL AND COLLATERAL TERM SHEET IS NOT COMPLETE AND MAY BE AMENDED PRIOR TO THE TIME OF SALE. THIS TERM SHEET IS NOT AN OFFER TO SELL THESE SECURITIES AND IT IS NOT A SOLICITATION OF AN OFFER TO BUY THESE SECURITIES IN ANY JURISDICTION WHERE THE OFFER OR SALE IS NOT PERMITTED.
60
600 & 620 National Avenue Mountain View, CA 94043 | Collateral Asset Summary – Loan No. 3 600 & 620 National Avenue | Cut-off Date Balance: Cut-off Date LTV Ratio: UW NCF DSCR: UW NOI Debt Yield: | $38,950,000 70.0% 1.93x 7.2% |
A “Major Tenant Event Period” will commence upon the earlier of (i) the 600 & 620 National Avenue Borrower committing a monetary or material non-monetary default under the Google lease beyond any applicable notice and cure period, (ii) Google going dark, vacating or otherwise failing to occupy 50% or more of its space or giving notice thereof, (iii) any bankruptcy or insolvency of Google or Alphabet, Inc., (iv) Google failing to renew or extend the term of its lease for at least five years at least 24 months prior to its lease expiration date (Google’s lease has a 12-month renewal notice period) or (v) Alphabet Inc.’s, as the parent entity to Google, long-term debt credit rating being downgraded below “BBB-” (or equivalent rating) by any one of Fitch, Moody’s or S&P. A “Major Tenant Event Period Cure” will occur upon the following: with regard to clause (i), the lender receiving satisfactory evidence that such default has been cured to Google’s satisfaction, including receipt of a satisfactory estoppel; with regard to clause (ii), (x) a Major Tenant Re-Leasing Event (as defined below) or (y) Google having resumed occupancy of and normal business operations in at least 51% of its space for two consecutive calendar quarters; with regard to clause (iii), (x) a Major Tenant Re-Leasing Event or (y) the bankruptcy proceedings having been terminated in a manner reasonably satisfactory to the lender, the Google lease being affirmed and the terms of such lease being reasonably satisfactory to the lender; with regard to clause (iv), (x) a Major Tenant Re-Leasing Event or (y) Google having renewed or extended the term of its lease for at least five years pursuant to the terms of the lease on terms reasonably acceptable to the lender; or with regard to clause (v), (x) a Major Tenant Re-Leasing Event or (y) the long-term debt credit rating for Alphabet, Inc. having been upgraded to BBB-/Baa3/BBB- or higher by Fitch/Moody’s/S&P.
A “Major Tenant Re-Leasing Event” will occur upon one or more replacement tenants under replacement leases, each being satisfactory to the lender, covering all of the space currently occupied by Google in accordance with its lease with (i) such replacement tenants having taken occupancy of such space, conducting normal business operations and paying full unabated rent; (ii) all tenant improvements, leasing commissions or other similar landlord obligations having been paid or reserved; and (iii) delivery of a satisfactory estoppel.
Right of First Offer.A sale of the 600 & 620 National Avenue Property is subject to a 30-day right of first offer (“ROFO”) in favor of Google, LLC. The ROFO is not extinguished upon foreclosure and remains subordinate to the related mortgage loan documents pursuant to a subordination non disturbance agreement.
Terrorism Insurance. The related mortgage loan documents require that the comprehensive “all risk” insurance policy required to be maintained by the 600 & 620 National Avenue Borrowers provide coverage in an amount equal to the “full replacement cost” of the 600 & 620 National Avenue Property. The related mortgage loan documents also require business income insurance covering no less than the 18-month period commencing at the time of casualty, together with a six-month extended period of indemnity. Notwithstanding the foregoing, for so long as the Terrorism Risk Insurance Act of 2002, as extended and modified by the Terrorism Risk Insurance Program Reauthorization Act of 2007 and by the Terrorism Risk Insurance Program Reauthorization Act of 2015 (“TRIPRA”) is in effect (including any extensions thereof or if another federal governmental program is in effect relating to “acts of terrorism” which provides substantially similar protections as TRIPRA), and covers both domestic and foreign acts of terrorism, the lender is required to accept terrorism insurance which insures against “covered acts” as defined by TRIPRA (or such other program);provided,however, that the 600 & 620 National Avenue Borrowers will not be obligated to pay terrorism insurance premiums in excess of two times the premium for the “special perils” and business income coverage on a stand-alone basis in any policy year.See “Risk Factors—Risks Relating to the Mortgage Loans—Terrorism Insurance May Not Be Available for All Mortgaged Properties” in the Preliminary Prospectus.
THE INFORMATION IN THIS STRUCTURAL AND COLLATERAL TERM SHEET IS NOT COMPLETE AND MAY BE AMENDED PRIOR TO THE TIME OF SALE. THIS TERM SHEET IS NOT AN OFFER TO SELL THESE SECURITIES AND IT IS NOT A SOLICITATION OF AN OFFER TO BUY THESE SECURITIES IN ANY JURISDICTION WHERE THE OFFER OR SALE IS NOT PERMITTED.
61
| Various | Collateral Asset Summary – Loan No. 4 Phoenix Industrial Portfolio I | Cut-off Date Balance: Cut-off Date LTV Ratio: UW NCF DSCR: UW NOI Debt Yield: | $32,950,297 64.2% 1.93x 11.3% |
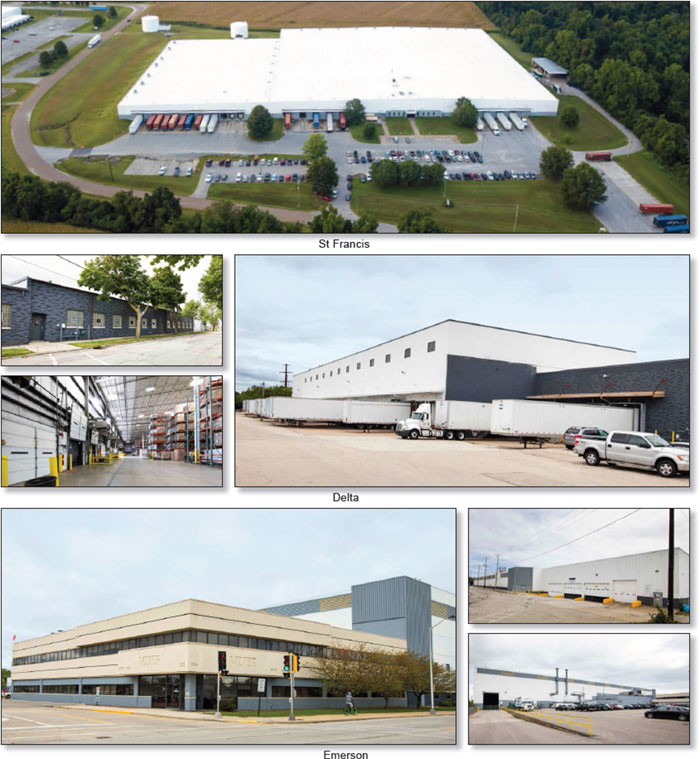
THE INFORMATION IN THIS STRUCTURAL AND COLLATERAL TERM SHEET IS NOT COMPLETE AND MAY BE AMENDED PRIOR TO THE TIME OF SALE. THIS TERM SHEET IS NOT AN OFFER TO SELL THESE SECURITIES AND IT IS NOT A SOLICITATION OF AN OFFER TO BUY THESE SECURITIES IN ANY JURISDICTION WHERE THE OFFER OR SALE IS NOT PERMITTED.
62
| Various | Collateral Asset Summary – Loan No. 4 Phoenix Industrial Portfolio I | Cut-off Date Balance: Cut-off Date LTV Ratio: UW NCF DSCR: UW NOI Debt Yield: | $32,950,297 64.2% 1.93x 11.3% |
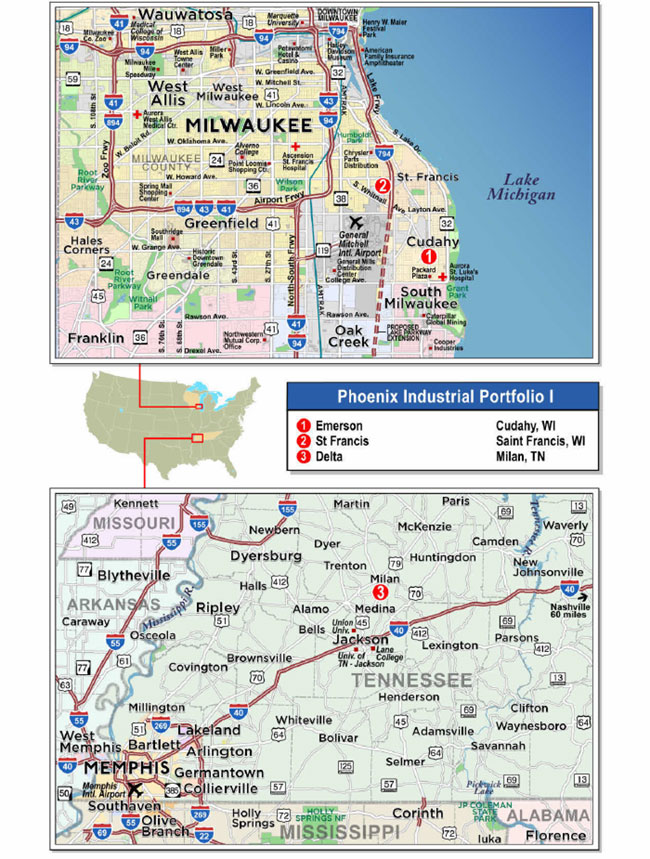
THE INFORMATION IN THIS STRUCTURAL AND COLLATERAL TERM SHEET IS NOT COMPLETE AND MAY BE AMENDED PRIOR TO THE TIME OF SALE. THIS TERM SHEET IS NOT AN OFFER TO SELL THESE SECURITIES AND IT IS NOT A SOLICITATION OF AN OFFER TO BUY THESE SECURITIES IN ANY JURISDICTION WHERE THE OFFER OR SALE IS NOT PERMITTED.
63
| Various | Collateral Asset Summary – Loan No. 4 Phoenix Industrial Portfolio I | Cut-off Date Balance: Cut-off Date LTV Ratio: UW NCF DSCR: UW NOI Debt Yield: | $32,950,297 64.2% 1.93x 11.3% |
| Mortgage Loan Information | Property Information | ||||||
| Mortgage Loan Seller: | UBS AG | Single Asset/Portfolio: | Portfolio | ||||
Credit Assessment (Fitch/KBRA/Moody’s): | NR/NR/NR | Location: | Various | ||||
| General Property Type: | Industrial | ||||||
| Original Balance: | $33,000,000 | Detailed Property Type: | Warehouse | ||||
| Cut-off Date Balance: | $32,950,297 | Title Vesting: | Fee Simple/Leasehold | ||||
| % of Initial Pool Balance: | 4.1% | Year Built/Renovated: | Various/Various | ||||
| Loan Purpose: | Refinance | Size: | 1,181,569 SF | ||||
| Borrower Sponsor: | Phoenix Investors | Cut-off Date Balance per SF: | $28 | ||||
| Mortgage Rate: | 3.7500% | Maturity Date Balance per SF: | $22 | ||||
| Note Date: | 8/9/2019 | Property Manager: | Phoenix Investors (borrower-related) | ||||
| First Payment Date: | 10/6/2019 | ||||||
| Maturity Date: | 9/6/2029 | ||||||
| Original Term to Maturity: | 120 months | ||||||
| Original Amortization Term: | 360 months | ||||||
| IO Period: | 0 months | ||||||
| Seasoning: | 1 month | ||||||
| Prepayment Provisions: | LO (25); DEF (89); O (6) | Underwriting and Financial Information | |||||
| Lockbox/Cash Mgmt Status: | Hard/Springing | UW NOI: | $3,736,511 | ||||
| Additional Debt Type: | N/A | UW NOI Debt Yield: | 11.3% | ||||
| Additional Debt Balance: | N/A | UW NOI Debt Yield at Maturity: | 14.4% | ||||
| Future Debt Permitted (Type): | No (N/A) | UW NCF DSCR: | 1.93x | ||||
| Reserves(1) | Most Recent NOI: | $3,752,302 (5/31/2019 TTM) | |||||
| Type | Initial | Monthly | Cap | 2nd Most Recent NOI: | $3,678,472 (12/31/2018) | ||
| RE Tax: | $239,610 | $38,339 | N/A | 3rd Most Recent NOI: | $3,561,170 (12/31/2017) | ||
| Insurance: | $30,321 | $4,798 | N/A | Most Recent Occupancy: | 100.0% (5/31/2019) | ||
| Replacements: | $0 | $9,846 | $236,313 | 2nd Most Recent Occupancy: | 100.0% (12/31/2018) | ||
| Required Repairs: | $37,156 | $0 | N/A | 3rd Most Recent Occupancy: | 100.0% (12/31/2017) | ||
| TI/LC: | $500,000 | Springing | $500,000 | Appraised Value (as of): | $51,300,000 (Various) | ||
| Ground Rent: | $0 | $2,408 | N/A | Cut-off Date LTV Ratio: | 64.2% | ||
| Environmental Insurance: | $57,142 | $0 | N/A | Maturity Date LTV Ratio: | 50.6% | ||
| Sources and Uses | ||||||
| Sources | Proceeds | % of Total | Uses | Proceeds | % of Total | |
| Loan Amount: | $33,000,000 | 100.0% | Loan Payoff: | $28,848,783 | 87.4% | |
| Reserves: | $864,229 | 2.6% | ||||
| Closing Costs: | $629,036 | 1.9% | ||||
| Return of Equity: | $2,657,953 | 8.1% | ||||
| Total Sources: | $33,000,000 | 100.0% | Total Uses: | $33,000,000 | 100.0% | |
| (1) | See “Escrows and Reserves” below for further discussion of reserve requirements. |
The Mortgage Loan. The fourth largest mortgage loan (the “Phoenix Industrial Portfolio I Mortgage Loan”) is evidenced by two promissory notes with an aggregate original principal balance of $33,000,000, which are collectively secured by a first priority deed of trust and first priority fee and leasehold mortgage encumbering a 1,181,569 SF portfolio of three industrial warehouse properties located in Wisconsin and Tennessee (each a “Phoenix Industrial Portfolio I Property”, and collectively, the “Phoenix Industrial Portfolio I Properties”). The proceeds of the Phoenix Industrial Portfolio I Mortgage Loan were used to refinance existing debt on the Phoenix Industrial Portfolio I Properties, fund upfront reserves, pay closing costs and return equity to the borrower sponsor.
The Borrowers and the Borrower Sponsor.The borrowers are Phoenix Milan Industrial Investors LLC, Phoenix St. Francis Industrial Investors LLC and Phoenix Cudahy Industrial Investors LLC (collectively, the “Phoenix Industrial Portfolio I Borrowers”), each a Delaware limited liability company structured to be bankruptcy remote with one independent director. The Phoenix Industrial Portfolio I Borrowers are owned and managed by Phoenix Fund One Holdco Three LLC, which is owned and managed by Phoenix Fund One, LLC, which is owned by Irrevocable Children’s Trust dated 7/22/91 (39.0%), Irrevocable Children’s Trust No. 2 dated 7/22/91 (39.0%), David M. Marks (20.0%), and Hilltop Holdings MKE, LLC (2.0%). Legal counsel to the Phoenix Industrial Portfolio I Borrowers delivered a non-consolidation opinion in connection with the origination of the Phoenix Industrial Portfolio I Mortgage Loan. The non-recourse guarantors of the Phoenix Industrial Portfolio I Mortgage Loan are Irrevocable Children’s Trust dated 7/22/91 and Irrevocable Children’s Trust No. 2 dated 7/22/91. The borrower sponsor of the Phoenix Industrial Portfolio I Mortgage Loan is Phoenix Investors, which is the affiliated management company of the guarantors’ investments.
THE INFORMATION IN THIS STRUCTURAL AND COLLATERAL TERM SHEET IS NOT COMPLETE AND MAY BE AMENDED PRIOR TO THE TIME OF SALE. THIS TERM SHEET IS NOT AN OFFER TO SELL THESE SECURITIES AND IT IS NOT A SOLICITATION OF AN OFFER TO BUY THESE SECURITIES IN ANY JURISDICTION WHERE THE OFFER OR SALE IS NOT PERMITTED.
64
| Various | Collateral Asset Summary – Loan No. 4 Phoenix Industrial Portfolio I | Cut-off Date Balance: Cut-off Date LTV Ratio: UW NCF DSCR: UW NOI Debt Yield: | $32,950,297 64.2% 1.93x 11.3% |
Phoenix Investors is a national commercial real estate firm based in Milwaukee, WI whose core business is the revitalization of former manufacturing facilities throughout the U.S. Phoenix Investors’ affiliated companies hold interests in approximately 27 million SF of industrial, retail, office, and single tenant net-leased properties across 25 states. Phoenix Investors specializes in the renovation and repositioning of large, former single tenant industrial facilities throughout the U.S. that were previously owned by major corporate clients, real estate investment trusts or financial institutions.
The Properties.The Phoenix Industrial Portfolio I Mortgage Loan is secured by three warehouse properties totaling 1,181,569 SF located in Wisconsin (70.6% of NRA) and Tennessee (29.4% of NRA). The Phoenix Industrial Portfolio I Properties are 100.0% occupied as of May 31, 2019 by four tenants, of which three tenants totaling 74.6% of NRA and 76.8% of underwritten base rent are investment grade tenants or subtenants (including Caterpillar Global Mining LLC (“Caterpillar”), a subtenant of Manesis 3 PL LLC). The borrower sponsor acquired the Phoenix Industrial Portfolio I Properties in 2016 for a purchase price of approximately $28.4 million. Since acquisition, the borrower sponsor has invested approximately $2.2 million in capital improvements, along with an additional approximately $4.0 million in other/soft costs on the Phoenix Industrial Portfolio I Properties.
Emerson (36.9% of NRA; 50.9% of ALA): The Emerson property is a 435,695 SF industrial building located in Cudahy, Wisconsin. The improvements were constructed in 1952 and renovated in 1995 and 1996. In 1996, a 34,097 SF office addition was added to the Emerson property, which was partially renovated in 2016 and 2017, for a total of approximately 13.2% of office space. The Emerson property is situated on a 13.30-acre site with 308 surface parking spaces (0.71 per 1,000 SF). The Emerson property contains seven loading docks, four drive-in doors and 13 bridge cranes. The Emerson property has ceiling heights ranging from 18 feet to 36 feet and clear heights ranging from 16 feet to 32 feet. The Emerson property is 100.0% occupied as of May 31, 2019 by Vilter Manufacturing LLC (Emerson Climate Technologies, Inc.) (Moody’s/S&P: A2/A) through July 2027 and currently pays a base rent of $4.17 PSF, which increases to $4.24 PSF in August 2020. Vilter Manufacturing LLC has two, five-year renewal options remaining and has a termination option with an effective date of July 31, 2024, and a notice date on or before January 31, 2024 with no termination fee. Since acquisition, the borrower sponsor has invested approximately $1.1 million at the Emerson property for roofing, asphalt paving, refinishing the concrete flooring, painting, lighting and windows.
St Francis (33.8% of NRA; 35.6% of ALA): The St Francis property consists of two industrial buildings totaling 398,987 SF, of which approximately 8.5% is office and related finished space, located in St. Francis, Wisconsin. The Iowa Avenue building containing 300,230 SF was constructed in 1940 and expanded in 1970 and 1992. The Kansas Avenue building containing 98,757 SF was constructed in 1997. The St Francis property is situated on a 19.33-acre site with 298 surface parking spaces (0.75 per 1,000 SF). The St Francis property contains 32 dock doors and seven drive-in doors. The St Francis property has ceiling heights ranging from 24 feet to 25 feet. The Iowa Avenue building is 100.0% occupied as of May 31, 2019 by Nova Wildcat Shur-Line LLC (“Shur-Line”) through November 2026 and currently pays a base rent of $3.05 PSF, which increases to $3.11 PSF in December 2019. Shur-Line has no renewal options and has a termination option with an effective date of December 31, 2021, a notice date on or before July 4, 2021 along with a termination fee equal to six months of base rent then in effect. The Kansas Avenue building is 100.0% occupied as of May 31, 2019 by Manesis 3 PL LLC, which is currently subleased to Caterpillar (Fitch/Moody’s/S&P: A/A3/A) (NYSE: CAT) on a coterminous basis with the primary lease. Manesis 3 PL LLC leases 98,757 SF through April 2021 and currently pays a base rent of $5.00 PSF, which increases to $5.15 PSF in May 2020. Manesis 3 PL LLC has one, three-year renewal option remaining and has no termination options. Since acquisition, the borrower sponsor has invested $304,850 at the St Francis property for heating/HVAC, painting and tenant improvements.
The St Francis property is situated on three land parcels, two of which are subject to ground leases. The Iowa Avenue building (25.4% of NRA) is situated on a 9.78-acre owned parcel and is 100.0% leased to Shur-Line. Shur-Line also subleases the 2.86-acre parking ground lease parcel for overflow parking. The parking lot lease extends through December 31, 2066, inclusive of all options, and 100% of the parking lot ground rent is reimbursed to the landlord by Shur-Line. The Kansas Avenue building (8.4% of NRA) is situated on a 6.68-acre ground leased parcel and is 100.0% leased to Manesis 3 PL LLC (which subleases to Caterpillar). The ground lease extends through December 31, 2066, inclusive of all options. Manesis 3 PL LLC reimburses the landlord for one-half of the ground rent.
Delta (29.4% of NRA; 13.5% of ALA): The Delta property is a 346,887 SF industrial building located in Milan, Tennessee. The improvements were constructed in 1989 with an addition in 1992, renovated in 2019 and includes approximately 1.3% of office/breakroom space. The Delta property is situated on a 29.26-acre site with 130 surface parking spaces (0.37 per 1,000 SF). The Delta property contains warehouse clearance of 20 feet to 28 feet, 14 overhead dock doors and two drive-in doors. The Delta property includes 51,000 SF of mezzanine space (not included in the NRA) used for packing, a 5,100 SF open storage shed (not included in the NRA) and two 350,000 gallon above-ground water tanks used for fire safety. The Delta property is 100.0% occupied as of May 31, 2019 by Delta Faucet Company (Fitch/Moody’s/S&P: BBB-/Baa3/BBB) through February 2022 and currently pays a base rent of $2.07 PSF, which increases to $2.13 PSF in December 2019. Delta Faucet Company has one, five-year renewal option remaining and has no termination options. Since acquisition, the borrower sponsor has invested $811,800 at the Delta property for roofing and painting.
The following table presents certain information relating to the Phoenix Industrial Portfolio I Properties:
| Portfolio Summary(1) | ||||||||||
| Property | City, State | Net Rentable Area (SF) | Year Built | Acreage | Allocated Original Balance | % of Allocated Original Balance | Appraisal Value | LTV | Ceiling Heights (ft.) | Loading Bays |
| Emerson | Cudahy, WI | 435,695 | 1952 | 13.30 | $16,790,000 | 50.9% | $26,000,000 | 64.6% | 18.0 - 36.0 | 7 |
| St Francis | St. Francis, WI | 398,987 | 1940; 1997 | 19.33 | $11,750,000 | 35.6% | $18,200,000 | 64.6% | 24.0 - 25.0 | 39 |
| Delta | Milan, TN | 346,887 | 1989-1992 | 29.26 | $4,460,000 | 13.5% | $7,100,000 | 62.8% | 20.0 - 28.0 | 16 |
| Total/Wtd. Avg. | 1,181,569 | 61.88 | $33,000,000 | 100.0% | $51,300,000 | 64.3% | 62 | |||
| (1) | Information is based on the appraisal. |
THE INFORMATION IN THIS STRUCTURAL AND COLLATERAL TERM SHEET IS NOT COMPLETE AND MAY BE AMENDED PRIOR TO THE TIME OF SALE. THIS TERM SHEET IS NOT AN OFFER TO SELL THESE SECURITIES AND IT IS NOT A SOLICITATION OF AN OFFER TO BUY THESE SECURITIES IN ANY JURISDICTION WHERE THE OFFER OR SALE IS NOT PERMITTED.
65
| Various | Collateral Asset Summary – Loan No. 4 Phoenix Industrial Portfolio I | Cut-off Date Balance: Cut-off Date LTV Ratio: UW NCF DSCR: UW NOI Debt Yield: | $32,950,297 64.2% 1.93x 11.3% |
The following table presents certain information relating to the leases at the Phoenix Industrial Portfolio I Properties:
| Tenant Summary(1) | |||||||
| Tenant Name | Credit Rating (Fitch/Moody’s/S&P)(2) | Tenant SF | Approximate % of SF | Annual UW Base Rent | % of Total Annual UW Base Rent | Annual UW Base Rent PSF | Lease Expiration |
| Vilter Manufacturing LLC(3) | NR/A2/A | 435,695 | 36.9% | $1,845,352 | 45.8% | $4.24 | 7/31/2027 |
| Delta Faucet Company | BBB-/Baa3/BBB | 346,887 | 29.4% | $738,869 | 18.4% | $2.13 | 2/28/2022 |
| Shur-Line(4) | NR/NR/NR | 300,230 | 25.4% | $934,158 | 23.2% | $3.11 | 11/30/2026 |
| Manesis 3 PL LLC(5) | A/A3/A | 98,757 | 8.4% | $508,141 | 12.6% | $5.15 | 4/30/2021 |
| Subtotal/Wtd. Avg. | 1,181,569 | 100.0% | $4,026,520 | 100.0% | $3.41 | ||
| Vacant | 0 | 0.0% | $0 | 0.0% | $0.00 | ||
| Total/Wtd. Avg. | 1,181,569 | 100.0% | $4,026,520 | 100.0% | $3.41 | ||
| (1) | Information is based on the underwritten rent roll. |
| (2) | Certain ratings are those of the parent company or government entity whether or not the parent guarantees the lease. |
| (3) | Vilter Manufacturing LLC may terminate on July 31, 2024 by providing notice on or before January 31, 2024. Such termination is not subject to a termination fee. |
| (4) | Shur-Line may terminate on December 31, 2021 by providing notice on or before July 4, 2021 along with the payment of a termination fee equal to six months of base rent then in effect. |
| (5) | Manesis 3 PL LLC subleases its space to Caterpillar. Caterpillar subleases the space on a coterminous basis with the primary lease. The credit rating shown is for the parent company of Caterpillar. Daniel A. Manesis is the guarantor of the primary lease. |
The following table presents certain information relating to the lease rollover schedule at the Phoenix Industrial Portfolio I Properties:
| Lease Rollover Schedule(1)(2) | ||||||||
| Year | # of Leases Rolling | SF Rolling | Approx. % of Total SF Rolling | Approx. Cumulative % of SF Rolling | UW Base Rent PSF Rolling | Total UW Base Rent Rolling | Approx. % of Total Base Rent Rolling | Approx. Cumulative % of Total Base Rent Rolling |
| MTM | 0 | 0 | 0.0% | 0.0% | $0.00 | $0 | 0.0% | 0.0% |
| 2019 | 0 | 0 | 0.0% | 0.0% | $0.00 | $0 | 0.0% | 0.0% |
| 2020 | 0 | 0 | 0.0% | 0.0% | $0.00 | $0 | 0.0% | 0.0% |
| 2021 | 1 | 98,757 | 8.4% | 8.4% | $5.15 | $508,141 | 12.6% | 12.6% |
| 2022 | 1 | 346,887 | 29.4% | 37.7% | $2.13 | $738,869 | 18.4% | 31.0% |
| 2023 | 0 | 0 | 0.0% | 37.7% | $0.00 | $0 | 0.0% | 31.0% |
| 2024 | 0 | 0 | 0.0% | 37.7% | $0.00 | $0 | 0.0% | 31.0% |
| 2025 | 0 | 0 | 0.0% | 37.7% | $0.00 | $0 | 0.0% | 31.0% |
| 2026 | 1 | 300,230 | 25.4% | 63.1% | $3.11 | $934,158 | 23.2% | 54.2% |
| 2027 | 1 | 435,695 | 36.9% | 100.0% | $4.24 | $1,845,352 | 45.8% | 100.0% |
| 2028 | 0 | 0 | 0.0% | 100.0% | $0.00 | $0 | 0.0% | 100.0% |
| 2029 | 0 | 0 | 0.0% | 100.0% | $0.00 | $0 | 0.0% | 100.0% |
| 2030 & Beyond | 0 | 0 | 0.0% | 100.0% | $0.00 | $0 | 0.0% | 100.0% |
| Vacant | 0 | 0 | 0.0% | 100.0% | $0.00 | $0 | 0.0% | 100.0% |
| Total/Wtd. Avg. | 4 | 1,181,569 | 100.0% | $3.41 | $4,026,520 | 100.0% | ||
| (1) | Information is based on the underwritten rent roll. |
| (2) | Certain tenants may have lease termination options that are exercisable prior to the originally stated expiration date of the subject lease, which are not considered in the lease rollover schedule. |
Environmental.According to the Phase I environmental assessment dated August 8, 2019, there is no evidence of any recognized or historical recognized environmental conditions at the Delta property. The Phase I environmental assessment dated August 5, 2019 identified a recognized environmental condition at the Emerson property related to an open Wisconsin emergency repair program. No further action or investigation is warranted at this time beyond continued regulatory compliance. In addition, the Phase I environmental assessment dated August 5, 2019 identified a recognized environmental condition at the St Francis property related to soil and groundwater contamination at the southern adjacent property in connection with historical operations of Newell Operating Company (“Newell”), the previous fee owner and responsible party identified by the related environmental consultant. Active groundwater remediation and vapor mitigation systems are in place, with Newell responsible for continued monitoring as part of ongoing remediation. Newell has agreed to indemnify the Phoenix Industrial Portfolio I Borrowers for any matters related to the contamination. At origination, the Phoenix Industrial Portfolio I Borrowers obtained an environmental insurance policy with an aggregate $3.0 million limit for liability and cleanup costs related to the identified environmental concerns and additionally escrowed $57,142 to extend such environmental insurance policy in the event that a maturity default occurs. See “Description of the Mortgage Pool—Mortgage Pool Characteristics—Environmental Considerations” in the Preliminary Prospectus.
The Markets. The Emerson property is located in Cudahy, Wisconsin, approximately one mile from both Interstate 794 as well as General Mitchell International Airport and approximately 7.9 miles south of the Milwaukee central business district. The St Francis property is located in St. Francis, Wisconsin, adjacent to Interstate 794, approximately 1.2 miles north of General Mitchell International Airport and approximately 5.6 miles south of the Milwaukee central business district. The Emerson property and St Francis property are approximately 3.0 miles apart. The Delta property is located in Milan, Tennessee, approximately 94.3 miles northeast of Memphis and 125.0 miles west of Nashville, Tennessee.
According to a third party market research report, the estimated 2019 population within a one-, three- and five-mile radius of the Emerson property was approximately 12,816, 54,413 and 146,706, respectively; and the estimated 2019 average household income within the same radii was approximately
THE INFORMATION IN THIS STRUCTURAL AND COLLATERAL TERM SHEET IS NOT COMPLETE AND MAY BE AMENDED PRIOR TO THE TIME OF SALE. THIS TERM SHEET IS NOT AN OFFER TO SELL THESE SECURITIES AND IT IS NOT A SOLICITATION OF AN OFFER TO BUY THESE SECURITIES IN ANY JURISDICTION WHERE THE OFFER OR SALE IS NOT PERMITTED.
66
| Various | Collateral Asset Summary – Loan No. 4 Phoenix Industrial Portfolio I | Cut-off Date Balance: Cut-off Date LTV Ratio: UW NCF DSCR: UW NOI Debt Yield: | $32,950,297 64.2% 1.93x 11.3% |
$69,516, $70,693 and $71,645, respectively. According to a third party market research report, the estimated 2019 population within a one-, three- and five-mile radius of the St Francis property was approximately 14,993, 93,507 and 242,961, respectively; and the estimated 2019 average household income within the same radii was approximately $71,938, $66,679 and $64,617, respectively. According to a third party market research report, the estimated 2019 population within a one-, three- and five-mile radius of the Delta property was approximately 666, 6,781 and 14,052, respectively; and the estimated 2019 average household income within the same radii was approximately $70,792, $62,423 and $65,778, respectively.
According to the appraisal, the Emerson property and the St Francis property are situated within the Milwaukee SE industrial submarket of the Milwaukee market. As of the second quarter of 2019, the Milwaukee SE industrial submarket reported a total inventory of approximately 28.3 million SF with a 3.9% vacancy rate. The submarket reported an average asking rent of $4.98 PSF. According to the appraisal, the Delta property is located in Gibson County, which is not located within a specific industrial market. Gibson County has similar attributes as Fayette County, within the Fayette County industrial submarket. As of the first quarter of 2019, the Fayette County industrial submarket reported a total inventory of approximately 4.7 million SF with a 0.2% vacancy rate. The submarket reported an average asking rent of $4.51 PSF.
The appraisal for the Emerson property identified seven directly competitive industrial properties totaling approximately 1,624,479 SF with rents ranging from $3.23 to $5.25 PSF, on a triple net basis. The appraisal concluded a market rental rate of $3.90 PSF on a triple net basis for industrial space.
The following table presents recent leasing data at comparable industrial properties with respect to the Emerson property:
| Comparable Leases Summary | |||||||||
| Property Name/Address | Year Built/ Renovated | Occ. | Size (SF) | Tenant Name | Lease Size (SF) | Lease Date | Lease Term (Yrs.) | Base Rent/SF | Lease Type |
| Emerson 5555 South Packard Avenue Cudahy, WI | 1952/1995-1996; 2016-2017 | 100.0%(1) | 435,695(1) | Vilter Manufacturing LLC(1) | 435,695(1) | Aug 1999(1) | 28.0(1) | $4.24(1) | NNN(1) |
| 5201 International Drive Cudahy, WI | 2018/N/A | NAV | 153,300 | Wetzel Brothers | 153,000 | Jul 2018 | 10.3 | $5.25 | NNN |
| 5211 South 3rd Street Milwaukee, WI | 1971/2011 | 100.0% | 360,000 | Ryder Integrated Logistics | 360,000 | Apr 2018 | 3.0 | $3.23 | NNN |
| 16800 West Ryerson Road New Berlin, WI | 1976/1992 | 100.0% | 134,600 | Letterhead Press LPI | 134,600 | Aug 2017 | 10.5 | $3.53 | NNN |
| 7624 South 10th Street Oak Creek, WI | 1970/2000 | 100.0% | 100,240 | AIM Logistics | 100,240 | Jul 2017 | 5.0 | $3.50 | NNN |
| 5401 West Donges Bay Road Mequon, WI | 1971/1976 | NAV | 442,188 | Almo Distributing Wisconsin, I | 280,395 | Jul 2017 | 3.2 | $3.50 | NNN |
| 1333 South Grandview Parkway Sturtevant, WI | 1994/NAV | 100.0% | 209,151 | Johnson Fitness & Wellness | 209,151 | Jul 2017 | 5.3 | $4.10 | NNN |
| 4107 West Orchard Street Milwaukee, WI | 1942/NAV | 100.0% | 225,000 | Steele Solutions | 225,000 | Apr 2017 | -- | $3.50 | NNN |
Source:Appraisal
| (1) | Based on the underwritten rent roll. |
THE INFORMATION IN THIS STRUCTURAL AND COLLATERAL TERM SHEET IS NOT COMPLETE AND MAY BE AMENDED PRIOR TO THE TIME OF SALE. THIS TERM SHEET IS NOT AN OFFER TO SELL THESE SECURITIES AND IT IS NOT A SOLICITATION OF AN OFFER TO BUY THESE SECURITIES IN ANY JURISDICTION WHERE THE OFFER OR SALE IS NOT PERMITTED.
67
| Various | Collateral Asset Summary – Loan No. 4 Phoenix Industrial Portfolio I | Cut-off Date Balance: Cut-off Date LTV Ratio: UW NCF DSCR: UW NOI Debt Yield: | $32,950,297 64.2% 1.93x 11.3% |
The appraisal for the St Francis property identified four directly competitive industrial properties totaling approximately 1,236,339 SF with rents ranging from $3.23 to $4.10 PSF, on a triple net basis. The appraisal concluded a market rental rate of $3.75 PSF on a triple net basis for industrial space.
The following table presents recent leasing data at comparable industrial properties with respect to the St Francis property:
| Comparable Leases Summary | |||||||||
| Property Name/Address | Year Built/ Renovated | Occ. | Size (SF) | Tenant Name | Lease Size (SF) | Lease Date | Lease Term (Yrs.) | Base Rent/SF | Lease Type |
| St Francis 4051 South Iowa Avenue & 4120 South Kansas Avenue St. Francis, WI | 1940; 1997/1970; 1992 | 100.0%(1) | 398,987(1) | Shur-Line(1) | 300,230(1) | Dec 2016(1) | 10.0(1) | $3.11(1) | NNN(1) |
| 5211 South 3rd Street Milwaukee, WI | 1971/2011 | 100.0% | 360,000 | Ryder Integrated Logistics | 360,000 | Apr 2018 | 3.0 | $3.23 | NNN |
| 5401 West Donges Bay Road Mequon, WI | 1971/1976 | NAV | 442,188 | Almo Distributing Wisconsin, I | 280,395 | Jul 2017 | 3.2 | $3.50 | NNN |
| 1333 South Grandview Parkway Sturtevant, WI | 1994/NAV | 100.0% | 209,151 | Johnson Fitness & Wellness | 209,151 | Jul 2017 | 5.3 | $4.10 | NNN |
| 4107 West Orchard Street Milwaukee, WI | 1942/NAV | 100.0% | 225,000 | Steele Solutions | 225,000 | Apr 2017 | -- | $3.50 | NNN |
Source:Appraisal
| (1) | Based on the underwritten rent roll. |
The appraisal for the Delta property identified four directly competitive industrial properties totaling approximately 2,157,996 SF with rents ranging from $2.55 to $3.05 PSF, on a triple net basis. The appraisal concluded a market rental rate of $2.20 PSF on a triple net basis for industrial space.
The following table presents recent leasing data at comparable industrial properties with respect to the Delta property:
| Comparable Leases Summary | |||||||||
| Property Name/Address | Year Built/ Renovated | Occ. | Size (SF) | Tenant Name | Lease Size (SF) | Lease Date | Lease Term (Yrs.) | Base Rent/SF | Lease Type |
| Delta 4931 Denton Fly Road Milan, TN | 1989-1992/2019 | 100.0%(1) | 346,887(1) | Delta Faucet Company(1) | 346,887(1) | Dec 2016(1) | 5.3(1) | $2.13(1) | NNN(1) |
| Chickasaw - Building D 6100 East Holmes Road Memphis, TN | 2000/N/A | 100.0% | 829,464 | Barrett Distribution | 829,464 | Feb 2019 | 5.0 | $2.65 | NNN |
| Memphis Distribution Center Building J 5750 Challenge Drive Memphis, TN | 1997/N/A | NAV | 420,000 | Dohmen Life Science Services | 260,000 | Jul 2018 | 5.0 | $3.05 | NNN |
| Hickory Hill Industrial Park Building 105 5838 Advantage Cv Memphis, TN | 1979/N/A | 100.0% | 200,000 | VonDrehle Corporation | 200,000 | Nov 2017 | 5.0 | $2.65 | NNN |
| Summit I 5155 Lamar Avenue Memphis, TN | 2002/N/A | NAV | 708,532 | Nike | 708,000 | May 2016 | 3.3 | $2.55 | NNN |
Source:Appraisal
| (1) | Based on the underwritten rent roll. |
THE INFORMATION IN THIS STRUCTURAL AND COLLATERAL TERM SHEET IS NOT COMPLETE AND MAY BE AMENDED PRIOR TO THE TIME OF SALE. THIS TERM SHEET IS NOT AN OFFER TO SELL THESE SECURITIES AND IT IS NOT A SOLICITATION OF AN OFFER TO BUY THESE SECURITIES IN ANY JURISDICTION WHERE THE OFFER OR SALE IS NOT PERMITTED.
68
| Various | Collateral Asset Summary – Loan No. 4 Phoenix Industrial Portfolio I | Cut-off Date Balance: Cut-off Date LTV Ratio: UW NCF DSCR: UW NOI Debt Yield: | $32,950,297 64.2% 1.93x 11.3% |
Operating History and Underwritten Net Cash Flow. The following table presents certain information relating to the historical operating performance and the Underwritten Net Cash Flow at the Phoenix Industrial Portfolio I Properties:
| Cash Flow Analysis | ||||||
| 2016(1) | 2017 | 2018 | 5/31/2019 TTM | UW | UW PSF | |
| Gross Potential Rent(2) | N/A | $3,770,816 | $3,863,829 | $3,879,984 | $4,136,395 | $3.50 |
| Total Recoveries | N/A | $639,374 | $596,359 | $647,221 | $706,138 | $0.60 |
| Other Income | N/A | $3,427 | $17,216 | $21,550 | $18,149 | $0.02 |
| Less Vacancy & Credit Loss(3) | N/A | $0 | $0 | $0 | ($242,127) | ($0.20) |
| Effective Gross Income | N/A | $4,413,617 | $4,477,404 | $4,548,754 | $4,618,555 | $3.91 |
| Total Operating Expenses | N/A | $852,447 | $798,932 | $796,453 | $882,044 | $0.75 |
| Net Operating Income | N/A | $3,561,170 | $3,678,472 | $3,752,302 | $3,736,511 | $3.16 |
| TI/LC | N/A | $0 | $0 | $0 | $116,405 | $0.10 |
| Capital Expenditures | N/A | $0 | $0 | $0 | $86,463 | $0.07 |
| Net Cash Flow | N/A | $3,561,170 | $3,678,472 | $3,752,302 | $3,533,643 | $2.99 |
| Occupancy %(3) | N/A | 100.0% | 100.0% | 100.0% | 95.0% | |
| NOI DSCR | N/A | 1.94x | 2.01x | 2.05x | 2.04x | |
| NCF DSCR | N/A | 1.94x | 2.01x | 2.05x | 1.93x | |
| NOI Debt Yield | N/A | 10.8% | 11.2% | 11.4% | 11.3% | |
| NCF Debt Yield | N/A | 10.8% | 11.2% | 11.4% | 10.7% | |
| (1) | The Phoenix Industrial Portfolio I Borrowers acquired the Phoenix Industrial Portfolio I Properties in December 2016. As such, 2016 historical operating performance information is not available. |
| (2) | UW Gross Potential Rent is based on the underwritten rent roll and includes (i) rent steps of $81,201 through September 2020 and (ii) $109,875 in straight-line rent associated with Vilter Manufacturing LLC ($87,225) and Delta Faucet Company ($22,650). |
| (3) | UW Occupancy % is based on the economic vacancy of 5.0%. The Phoenix Industrial Portfolio I Properties are 100.0% leased as of May 31, 2019. |
Escrows and Reserves.At origination of the Phoenix Industrial Portfolio I Mortgage Loan, the Phoenix Industrial Portfolio I Borrowers deposited (i) $239,610 for real estate taxes, (ii) $30,321 for insurance premiums, (iii) $37,156 for deferred maintenance, (iv) $500,000 for tenant allowances, tenant improvements and leasing commissions (“TI/LC”) and (v) $57,142 in connection with an environmental insurance policy. The Phoenix Industrial Portfolio I Borrowers are required to escrow monthly (i) 1/12 of the annual estimated tax payments, currently equal to $38,339, (ii) 1/12 of the annual estimated insurance premiums, currently equal to $4,798, (iii) $9,846 for replacement reserves, subject to a cap of $236,313, (iv) $24,616 for TI/LC, subject to a cap of $500,000 (including the initial deposit therefor) and (v) 1/12 of the annual estimated ground rent, currently equal to $2,408.
Lockbox and Cash Management. The Phoenix Industrial Portfolio I Mortgage Loan has a hard lockbox with springing cash management upon the occurrence and continuance of a Cash Management Trigger Event (as defined below). Pursuant to the related mortgage loan documents, during the continuance of a Cash Management Trigger Event, all excess funds on deposit in the cash management account (after payment of required monthly reserve deposits, debt service payment and cash management bank fees) will be applied as follows: (a) if a Material Tenant Trigger Event (as defined below) has occurred and is continuing, to a Material Tenant (as defined below) rollover reserve and (b) if a Cash Sweep Trigger Event (as defined below) has occurred and is continuing (but not a Material Tenant Trigger Event), to the lender-controlled excess cash flow account or (c) if no Material Tenant Trigger Event or Cash Sweep Trigger Event has occurred and is continuing, to the Phoenix Industrial Portfolio I Borrowers.
A “Cash Management Trigger Event” will occur upon (i) an event of default under the related mortgage loan documents, (ii) any bankruptcy action involving the Phoenix Industrial Portfolio I Borrowers, the guarantor, the key principal or the property manager, (iii) the trailing 12-month period debt service coverage ratio falling below 1.15x (provided,however, that, for so long as the Material Tenant Occupancy Condition (as defined below) is satisfied, the calculation of the debt service coverage ratio for the applicable period will be made without deducting (a) the replacement reserves contributions for such period (butprovided,further, that as of the date of determination, the amount of the replacement reserves on deposit in the replacement reserves account is equal to, or greater than, $236,313), or (b) the TI/LC contributions for such period (butprovided,further, that as of the date of determination, the amount of TI/LCs on deposit in the TI/LC account is equal to, or greater than, $500,000)), (iv) any indictment for fraud or misappropriation of funds by the Phoenix Industrial Portfolio I Borrowers, the guarantor, the key principal or the property manager, or any officer of the aforementioned or (v) a Material Tenant Trigger Event. A Cash Management Trigger Event will continue until, in regard to clause (i) above, the cure of such event of default and acceptance of such cure by the lender, in regard to clause (ii) above, the filing is discharged, stayed or dismissed within 45 days for the Phoenix Industrial Portfolio I Borrowers, guarantor or key principal, or within 120 days for the property manager, and the lender’s determination that such filing does not materially affect the obligations of the Phoenix Industrial Portfolio I Borrowers, the guarantor, the key principal or the property manager under the applicable related mortgage loan documents or management agreement, as applicable, in regard to clause (iii) above, the trailing 12-month debt service coverage ratio is at least 1.20x for two consecutive calendar quarters (provided,however, that for so long as the Material Tenant Occupancy Condition is satisfied, the calculation of the debt service coverage ratio for the applicable period for the purpose of determining whether a Cash Management Trigger Event cure has occurred will be made without deducting (a) the replacement reserves contributions for such period (butprovided,further, that as of the date of determination, the amount of the replacement reserves on deposit in the replacement reserves account is equal to, or greater than, $236,313), or (b) the TI/LC contributions for such period (butprovided,further, that as of the date of determination, the amount of TI/LCs on deposit in the TI/LC account is equal to, or greater than, $500,000)), in regard to clause (iv) above, the dismissal of the applicable indictment with prejudice or the acquittal of the applicable person with respect to the related charge or the replacement of the property manager with a qualified manager pursuant to the related mortgage loan documents, or in regard to clause (v) above, the cure of such Material Tenant Trigger Event.
THE INFORMATION IN THIS STRUCTURAL AND COLLATERAL TERM SHEET IS NOT COMPLETE AND MAY BE AMENDED PRIOR TO THE TIME OF SALE. THIS TERM SHEET IS NOT AN OFFER TO SELL THESE SECURITIES AND IT IS NOT A SOLICITATION OF AN OFFER TO BUY THESE SECURITIES IN ANY JURISDICTION WHERE THE OFFER OR SALE IS NOT PERMITTED.
69
| Various | Collateral Asset Summary – Loan No. 4 Phoenix Industrial Portfolio I | Cut-off Date Balance: Cut-off Date LTV Ratio: UW NCF DSCR: UW NOI Debt Yield: | $32,950,297 64.2% 1.93x 11.3% |
A “Material Tenant Occupancy Condition” means receipt by the lender of written evidence reasonably acceptable to the lender in all respects that the Emerson property, the Delta property and the Iowa Avenue portion of the St Francis property are each occupied by a single tenant. The Material Tenant Occupancy Condition will be deemed unsatisfied after such time as a release of either the Emerson property or the Delta property has occurred pursuant to the terms of the related mortgage loan documents.
A “Material Tenant Trigger Event” will occur (i) if a Material Tenant gives notice of its intention to terminate or cancel or not to extend or renew its lease, (ii) on or prior to the date on which a Material Tenant is required under its lease to notify the Phoenix Industrial Portfolio I Borrowers of its election to extend or renew its lease, if such Material Tenant fails to give such notice, (iii) if an event of default under a Material Tenant lease occurs and continues beyond any applicable notice and cure period, (iv) if a bankruptcy action of a Material Tenant or guarantor of any Material Tenant lease occurs, (v) if a Material Tenant lease is terminated or is no longer in full force and effect,providedthat, with respect to any partial termination of a Material Tenant lease, such partial termination relates to no less than 20% of (x) the total net rentable square footage at the applicable Phoenix Industrial Portfolio I Property or (y) the total in-place base rent at the applicable Phoenix Industrial Portfolio I Property or (vi) if a Material Tenant “goes dark”, vacates, ceases to occupy or ceases to conduct business in the ordinary course at the applicable Phoenix Industrial Portfolio I Property or a portion thereof constituting no less than 20% of the total net rentable square footage or at least 20% of the total in-place base rent at the applicable Phoenix Industrial Portfolio I Property for a period in excess of 12 consecutive calendar months (other than temporary cessation of operations in connection with remodeling, renovation or restoration of their leased premises). A Material Tenant Trigger Event will end (a) with respect to clause (i) above, on the date that (1) the applicable Material Tenant revokes or rescinds all termination or cancellation notices, (2) the applicable Material Tenant lease is extended on terms satisfying the requirements of the related mortgage loan documents or (3) all or substantially all of the applicable Material Tenant space is leased to a replacement tenant, and such replacement tenant and its lease satisfy the requirements of the Phoenix Industrial Portfolio I Mortgage Loan documents, (b) with respect to clauses (ii) above, on the date that (1) the applicable Material Tenant lease is extended on terms satisfying the requirements of the related mortgage loan documents or (2) all or substantially all of the applicable Material Tenant space is leased to a replacement tenant, and such replacement tenant and its lease satisfy the requirements of the related mortgage loan documents, (c) with respect to clause (iii) above, after a cure of the applicable event of default, (d) with respect to clause (iv) above, after an affirmation of the Material Tenant lease in the applicable bankruptcy proceeding and confirmation that the Material Tenant is actually paying all rents and other amounts under its lease (or, if applicable, the discharge or dismissal of the applicable Material Tenant lease guarantor from the applicable bankruptcy proceeding;provided that such bankruptcy (after dismissal or discharge) does not have an adverse effect on such Material Tenant lease guarantor’s ability to perform its obligations under its lease guaranty), (e) with respect to clause (v) above, all or substantially all of the applicable Material Tenant space is leased to a replacement tenant, and such replacement tenant and its lease satisfy the requirements of the related mortgage loan documents or (f) with respect to clause (vi) above, the Material Tenant re-commences its normal business operations at the Phoenix Industrial Portfolio I Properties or a portion thereof constituting more than 20% of the total net rentable square footage at the applicable Phoenix Industrial Portfolio I Property.
A “Material Tenant” means (i) Vilter Manufacturing LLC, (ii) Delta Faucet Company, (iii) Shur-Line or (iv) any other tenant at the Phoenix Industrial Portfolio I Properties that, together with its affiliates, either (a) leases no less than 20% of the total rentable square footage at the applicable Phoenix Industrial Portfolio I Property or (b) accounts for no less than 20% of the total in-place base rent at the applicable Phoenix Industrial Portfolio I Property.
A “Cash Sweep Trigger Event” will occur upon (i) an event of default under the related mortgage loan documents, (ii) any bankruptcy action involving the Phoenix Industrial Portfolio I Borrowers, the guarantor, the key principal or the property manager or (iii) the trailing 12-month period debt service coverage ratio falling below 1.10x (provided,however, that for so long as the Material Tenant Occupancy Condition is satisfied, such calculation of the debt service coverage ratio for the applicable period will be made without deducting (1) the replacement reserves contributions for such period (butprovided,further, that as of the date of determination, the amount of the replacement reserves on deposit in the replacement reserves account is equal to, or greater than, $236,313), or (2) the TI/LC contributions for such period (butprovided,further, that as of the date of determination, the amount of TI/LCs on deposit in the TI/LC account is equal to, or greater than, $500,000)). A Cash Sweep Trigger Event will continue until, in regard to clause (i) above, the cure of such event of default and acceptance of such cure by the lender, in regard to clause (ii) above, the filing is discharged, stayed or dismissed within 45 days for the Phoenix Industrial Portfolio I Borrowers, key principal or guarantor, or within 120 days for the property manager, and the lender’s determination that such filing does not materially affect the obligations of the Phoenix Industrial Portfolio I Borrowers, the guarantor, the key principal or the property manager under the applicable related mortgage loan documents or management agreement, as applicable, or in regard to clause (iii) above, the trailing 12-month debt service coverage ratio is at least 1.15x for two consecutive calendar quarters (provided,however, that for so long as the Material Tenant Occupancy Condition is satisfied, the calculation of the debt service coverage ratio for the applicable period for the purpose of determining whether a Cash Sweep Trigger Event cure has occurred will be made without deducting (1) the replacement reserves contributions for such period (butprovided,further, that as of the date of determination, the amount of the replacement reserves on deposit in the replacement reserves account is equal to, or greater than, $236,313), or (2) the TI/LC contributions for such period (butprovided,further, that as of the date of determination, the amount of TI/LCs on deposit in the TI/LC account is equal to, or greater than, $500,000)).
Additional Secured Indebtedness (not including trade debts). None.
Mezzanine Loans and Preferred Equity. None.
Release of Property. The Phoenix Industrial Portfolio I Borrowers may obtain the release of one or more of the Phoenix Industrial Portfolio I Properties,provided that, among other conditions, (i) no event of default under the related mortgage loan documents is continuing, (ii) the Phoenix Industrial Portfolio I Borrowers partially defease the Phoenix Industrial Portfolio I Mortgage Loan in an amount equal to 115% of the allocated loan amount for the applicable property being released (the “Release Amount”), (iii) the debt service coverage ratio for the remaining properties following the release based on the trailing 12 months is no less than the greater of (a) the debt service coverage ratio immediately preceding such release and (b) 1.88x (provided,however, that for so long as the Material Tenant Occupancy Condition is satisfied, such calculation of the debt service coverage ratio for the applicable period will be made without deducting (a) the replacement reserves contributions for such period (butprovided, further, that as of the date of determination, the amount of the replacement reserves on deposit in the replacement reserves account is equal to, or greater than, $236,313), or (b) the TI/LC contributions for such period (butprovided, further, that as of the date of determination, the amount of TI/LCs on deposit in the TI/LC account is equal to, or greater than, $500,000)), (iv) the loan-to-value ratio for the remaining properties following the release does not exceed the lesser of (a) the loan-to-value ratio immediately preceding such release and (b) 64.3% and (v) if, as of the date of its calculation, the ratio of (a) the sum of the outstanding principal amount of the Phoenix Industrial Portfolio I Mortgage Loan as of the date of such calculation to (b) the fair market value of the Phoenix Industrial Portfolio I Properties (the “REMIC LTV”) exceeds 125% immediately after the property being released, no release will be permitted unless the balance of the Phoenix Industrial Portfolio I Mortgage Loan is paid down by the greater of (I) the Release Amount or (II) the least of the following amounts: (x) if the released property is sold, the net proceeds
THE INFORMATION IN THIS STRUCTURAL AND COLLATERAL TERM SHEET IS NOT COMPLETE AND MAY BE AMENDED PRIOR TO THE TIME OF SALE. THIS TERM SHEET IS NOT AN OFFER TO SELL THESE SECURITIES AND IT IS NOT A SOLICITATION OF AN OFFER TO BUY THESE SECURITIES IN ANY JURISDICTION WHERE THE OFFER OR SALE IS NOT PERMITTED.
70
| Various | Collateral Asset Summary – Loan No. 4 Phoenix Industrial Portfolio I | Cut-off Date Balance: Cut-off Date LTV Ratio: UW NCF DSCR: UW NOI Debt Yield: | $32,950,297 64.2% 1.93x 11.3% |
of the sale of the released property, (y) the fair market value of the released property at the time of such release, or (z) an amount such that the REMIC LTV after such release is not greater than the REMIC LTV of the Phoenix Industrial Portfolio I Properties immediately prior to such release. See, “Description of the Mortgage Pool—Certain Terms of the Mortgage Loans—Releases; Partial Releases” in the Preliminary Prospectus.
Terrorism Insurance.The Phoenix Industrial Portfolio I Borrowers are required to obtain and maintain property insurance, commercial general liability insurance, and business income or rental loss insurance that covers perils of terrorism and acts of terrorism, both foreign and domestic.
THE INFORMATION IN THIS STRUCTURAL AND COLLATERAL TERM SHEET IS NOT COMPLETE AND MAY BE AMENDED PRIOR TO THE TIME OF SALE. THIS TERM SHEET IS NOT AN OFFER TO SELL THESE SECURITIES AND IT IS NOT A SOLICITATION OF AN OFFER TO BUY THESE SECURITIES IN ANY JURISDICTION WHERE THE OFFER OR SALE IS NOT PERMITTED.
71
10000 Santa Monica Boulevard Los Angeles, CA 90067 | Collateral Asset Summary – Loan No.5 10000 Santa Monica Boulevard | Cut-off Date Balance: Cut-off Date LTV Ratio: UW NCF DSCR: UW NOI Debt Yield: | $25,000,000 39.8% 2.34x 9.9% |

THE INFORMATION IN THIS STRUCTURAL AND COLLATERAL TERM SHEET IS NOT COMPLETE AND MAY BE AMENDED PRIOR TO THE TIME OF SALE. THIS TERM SHEET IS NOT AN OFFER TO SELL THESE SECURITIES AND IT IS NOT A SOLICITATION OF AN OFFER TO BUY THESE SECURITIES IN ANY JURISDICTION WHERE THE OFFER OR SALE IS NOT PERMITTED.
72
10000 Santa Monica Boulevard Los Angeles, CA 90067 | Collateral Asset Summary – Loan No.5 10000 Santa Monica Boulevard | Cut-off Date Balance: Cut-off Date LTV Ratio: UW NCF DSCR: UW NOI Debt Yield: | $25,000,000 39.8% 2.34x 9.9% |
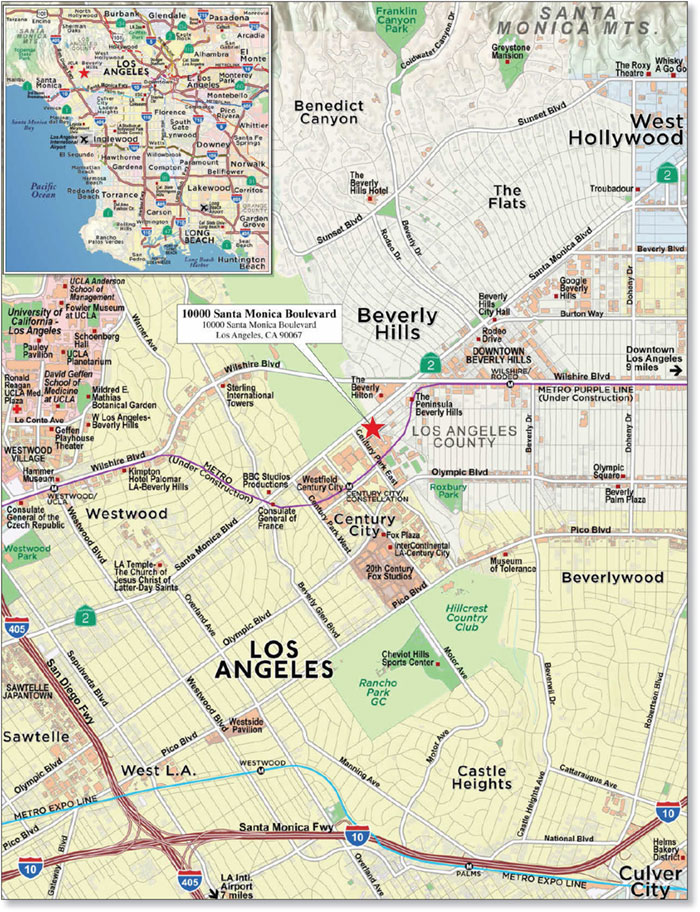
THE INFORMATION IN THIS STRUCTURAL AND COLLATERAL TERM SHEET IS NOT COMPLETE AND MAY BE AMENDED PRIOR TO THE TIME OF SALE. THIS TERM SHEET IS NOT AN OFFER TO SELL THESE SECURITIES AND IT IS NOT A SOLICITATION OF AN OFFER TO BUY THESE SECURITIES IN ANY JURISDICTION WHERE THE OFFER OR SALE IS NOT PERMITTED.
73
10000 Santa Monica Boulevard Los Angeles, CA 90067 | Collateral Asset Summary – Loan No.5 10000 Santa Monica Boulevard | Cut-off Date Balance: Cut-off Date LTV Ratio: UW NCF DSCR: UW NOI Debt Yield: | $25,000,000 39.8% 2.34x 9.9% |
| Mortgage Loan Information | Property Information | |||||
| Mortgage Loan Seller(1): | UBS AG | Single Asset/Portfolio: | Single Asset | |||
Credit Assessment (Fitch/KBRA/Moody’s): | BBB/A/Aa3 | Location: | Los Angeles, CA 90067 | |||
| General Property Type: | Multifamily | |||||
| Original Balance(2): | $25,000,000 | Detailed Property Type: | High Rise | |||
| Cut-off Date Balance(2): | $25,000,000 | Title Vesting: | Fee Simple | |||
| % of Initial Pool Balance: | 3.1% | Year Built/Renovated: | 2017/N/A | |||
| Loan Purpose: | Refinance | Size: | 281 Units | |||
| Borrower Sponsors(3): | Sonny Kahn; Russell Galbut; Bruce A. Menin | Cut-off Date Balance per Unit(2): | $782,918 | |||
| Mortgage Rate: | 4.1500% | Maturity Date Balance per Unit(2): | $782,918 | |||
| Note Date: | 4/12/2019 | Property Manager: | CH Management Services, LLC. (borrower-related) | |||
| First Payment Date: | 6/6/2019 | |||||
| Maturity Date: | 5/6/2029 | |||||
| Original Term to Maturity: | 120 months | Underwriting and Financial Information | ||||
| Original Amortization Term: | 0 months | UW NOI(4): | $21,716,388 | |||
| IO Period: | 120 months | UW NOI Debt Yield(2): | 9.9% | |||
| Seasoning: | 5 months | UW NOI Debt Yield at Maturity(2): | 9.9% | |||
| Prepayment Provisions: | LO (29); DEF (87); O (4) | UW NCF DSCR(2): | 2.34x | |||
| Lockbox/Cash Mgmt Status: | Soft/In-Place | Most Recent NOI: | $20,208,605 (1/31/2019 TTM) | |||
| Additional Debt Type(2)(5): | Pari Passu/Subordinate Debt | 2nd Most Recent NOI: | $19,472,435 (12/31/2018) | |||
| Additional Debt Balance(2)(5): | $195,000,000/$130,000,000 | 3rd Most Recent NOI(4): | $2,562,152 (12/31/2017) | |||
| Future Debt Permitted (Type): | No (N/A) | Most Recent Occupancy: | 89.0% (4/9/2019) | |||
| Reserves(6) | 2nd Most Recent Occupancy(7): | 89.7% (12/31/2018) | ||||
| Type | Initial | Monthly | Cap | 3rd Most Recent Occupancy(4)(7): | 68.8% (12/31/2017) | |
| RE Tax: | $890,641 | $222,660 | N/A | Appraised Value (as of): | $553,000,000 (3/25/2019) | |
| Insurance: | $0 | Springing | N/A | Cut-off Date LTV Ratio(2): | 39.8% | |
| Replacements: | $0 | $6,814 | $250,000 | Maturity Date LTV Ratio(2): | 39.8% | |
| Sources and Uses | ||||||
| Sources | Proceeds | % of Total | Uses | Proceeds | % of Total | |
| Loan Amount(2): | $350,000,000 | 100.0% | Loan Payoff: | $339,715,633 | 97.1% | |
| Closing Costs: | $1,738,818 | 0.5% | ||||
| Reserves: | $890,641 | 0.3% | ||||
| Return of Equity: | $7,654,907 | 2.2% | ||||
| Total Sources: | $350,000,000 | 100.0% | Total Uses: | $350,000,000 | 100.0% | |
| (1) | The 10000 Santa Monica Boulevard Whole Loan (as defined below) was originated by Natixis Real Estate Capital LLC (“NREC”) and acquired by UBS AG. UBS AG has re-underwritten such mortgage loan in accordance with the procedures described under “Transaction Parties—The Sponsors and Mortgage Loan Sellers—UBS AG, New York Branch” in the Preliminary Prospectus. |
| (2) | The 10000 Santa Monica Boulevard Mortgage Loan (as defined below) is part of the 10000 Santa Monica Boulevard Whole Loan, which is comprised of eight seniorpari passu promissory notes with an aggregate original principal balance of $220,000,000 and a subordinate companion note with an original principal balance of $130,000,000. The Cut-off Date Balance per Unit, Maturity Date Balance per Unit, UW NOI Debt Yield, UW NOI Debt Yield at Maturity, UW NCF DSCR, Cut-off Date LTV Ratio and Maturity Date LTV Ratio numbers presented above are based on the original principal balance of the 10000 Santa Monica Boulevard Senior Notes (as defined below), without regard to the 10000 Santa Monica Boulevard Subordinate Loan (as defined below). The Cut-off Date Balance per Unit, Maturity Date Balance per Unit, UW NOI Debt Yield, UW NOI Debt Yield at Maturity, UW NCF DSCR, Cut-off Date LTV Ratio and Maturity Date LTV Ratio based on the 10000 Santa Monica Boulevard Whole Loan (including the 10000 Santa Monica Boulevard Subordinate Loan) are $1,245,552, $1,245,552, 6.2%, 6.2%, 1.47x, 63.3% and 63.3%, respectively. |
| (3) | See “The Borrower and the Borrower Sponsors” below for further discussion of the borrower sponsors. |
| (4) | The 10000 Santa Monica Boulevard Property was constructed and completed in 2017; as such, historical operating performance information prior to 2017 is unavailable. 3rd Most Recent NOI and 3rd Most Recent Occupancy represents the 10000 Santa Monica Boulevard Property’s operating performance while in lease-up. UW NOI is based on the underwritten rent roll dated April 9, 2019. |
| (5) | See “The Mortgage Loan” and “Additional Secured Indebtedness (not including trade debts)” below for further discussion of additional debt. |
| (6) | See “Escrows and Reserves” below for further discussion of reserve requirements. |
| (7) | 2nd Most Recent Occupancy and 3rd Most Recent Occupancy are based on the average monthly occupancy for the last quarter of each respective year. |
The Mortgage Loan. The fifth largest mortgage loan (the “10000 Santa Monica Boulevard Mortgage Loan”) is part of a whole loan (the “10000 Santa Monica Boulevard Whole Loan”), evidenced by eight seniorpari passu promissory notes with an aggregate original principal balance of $220,000,000 (the ”10000 Santa Monica Boulevard Senior Notes”) and one subordinate companion note with an original principal balance of $130,000,000 (the “10000 Santa Monica Boulevard Subordinate Loan”). The 10000 Santa Monica Boulevard Whole Loan is secured by a first priority fee mortgage encumbering a 41-story, 281-unit, Class A high-rise residential tower located at 10000 Santa Monica Boulevard in Los Angeles, California (the ”10000 Santa Monica Boulevard Property”). Promissory Notes A-5 and A-8, with an aggregate original balance of $25,000,000, represent the 10000 Santa Monica Boulevard Mortgage Loan, and will be contributed to the UBS 2019-C17 Trust. The below table summarizes the 10000 Santa Monica Boulevard Whole Loan, including the remaining promissory notes, which are currently held by NREC and may otherwise be transferred at any time. The mortgage loan seller provides no assurances that the non-securitizedpari passu note will not be split further. The 10000 Santa Monica Boulevard Whole Loan is serviced pursuant to the pooling and servicing agreement for the NCMS 2019-10K Trust. See “Description of the Mortgage Pool—The Whole Loans—The Non-Serviced AB Whole Loans—The 10000 Santa Monica Boulevard Whole Loan” and “Pooling and Servicing Agreement” in the Preliminary Prospectus.
THE INFORMATION IN THIS STRUCTURAL AND COLLATERAL TERM SHEET IS NOT COMPLETE AND MAY BE AMENDED PRIOR TO THE TIME OF SALE. THIS TERM SHEET IS NOT AN OFFER TO SELL THESE SECURITIES AND IT IS NOT A SOLICITATION OF AN OFFER TO BUY THESE SECURITIES IN ANY JURISDICTION WHERE THE OFFER OR SALE IS NOT PERMITTED.
74
10000 Santa Monica Boulevard Los Angeles, CA 90067 | Collateral Asset Summary – Loan No.5 10000 Santa Monica Boulevard | Cut-off Date Balance: Cut-off Date LTV Ratio: UW NCF DSCR: UW NOI Debt Yield: | $25,000,000 39.8% 2.34x 9.9% |
| 10000 Santa Monica Boulevard Whole Loan Summary | ||||
| Note | Original Balance | Cut-off Date Balance | Anticipated Note Holder | Controlling Piece |
| Note A-1 | $100,000,000 | $100,000,000 | NCMS 2019-10K | No |
| Note A-2 | $35,000,000 | $35,000,000 | NREC | No |
| Note A-3 | $25,000,000 | $25,000,000 | BMARK 2019-B12 | No |
| Note A-4 | $20,000,000 | $20,000,000 | BMARK 2019-B12 | No |
| Note A-5 | $15,000,000 | $15,000,000 | UBS 2019-C17 | No |
| Note A-6 | $5,000,000 | $5,000,000 | BMARK 2019-B12 | No |
| Note A-7 | $10,000,000 | $10,000,000 | BBCMS 2019-C4 | No |
| Note A-8 | $10,000,000 | $10,000,000 | UBS 2019-C17 | No |
| 10000 Santa Monica Boulevard Subordinate Loan | $130,000,000 | $130,000,000 | NCMS 2019-10K | Yes |
| Total | $350,000,000 | $350,000,000 | ||
The 10000 Santa Monica Boulevard Borrower (as defined below) utilized proceeds of the 10000 Santa Monica Boulevard Whole Loan to pay off previously existing debt, fund reserves, pay closing costs and return equity to the 10000 Santa Monica Boulevard Borrower.
The Borrower and the Borrower Sponsors. The borrower for the 10000 Santa Monica Boulevard Whole Loan is SM 10000 Property, LLC (the “10000 Santa Monica Boulevard Borrower”), a Delaware limited liability company. A non-consolidation opinion was delivered in connection with the origination of the 1000 Santa Monica Boulevard Whole Loan. The recourse carveout guarantors for the 10000 Santa Monica Boulevard Whole Loan are (i) Sonny Kahn, solely in his capacity as trustee of the SK Business Trust, a Florida Trust, (ii) Russell Galbut, solely in his capacity as trustee of the RF Business Trust, a Florida Trust, and (iii) Bruce A. Menin, solely in his capacity as trustee of the Menin 1998 Business Trust, a New York Trust. In the event that the trust for whom the applicable individual is acting as a trustee (each such individual, an “10000 Santa Monica Boulevard Individual Guarantor”) is voluntarily or involuntarily revoked, terminated or otherwise ceases to exist, then such 10000 Santa Monica Boulevard Individual Guarantor will be required to become a recourse carve-out guarantor and personally liable under the related mortgage loan documents. See “Description of the Mortgage Pool—Non-Recourse Carveout Limitations” in the Preliminary Prospectus for additional information.
The Property. Built in 2017, the 10000 Santa Monica Boulevard Property is a 41-story, 281-unit, Class A residential tower located at 10000 Santa Monica Boulevard in Los Angeles, California. As of April 9, 2019, the 10000 Santa Monica Boulevard Property was 89.0% occupied, with a weighted average contract rent of $13,013 per unit per month. The unit mix is comprised of six (2.1%) one-bedroom units, 258 (91.8%) two-bedroom units, 13 (4.6%) three-bedroom units, two (0.7%) four-bedroom units and two (0.7%) furnished penthouse units, totaling 468,123 SF of net rentable space.
The table below shows the unit mix at the 10000 Santa Monica Boulevard Property:
| 10000 Santa Monica Boulevard Property Unit Mix Summary(1) | ||||||||
| Unit Type | No. of Units | % of Total Units | Occupied Units | Occ. (%) | Avg. Unit Size per Unit (SF) | Total Size (SF) | Avg. Asking Monthly Rent Per Unit | Avg. Asking Monthly Rent PSF |
| 1 BD / 1.5 BA | 6 | 2.1% | 6 | 100.0% | 1,126 | 6,754 | $9,000 | $8.00 |
| 2 BD / 2.5 BA(2) | 241 | 85.8% | 217 | 90.0% | 1,599 | 385,390 | $11,514 | $7.20 |
| 2 BD / 2.5 BA (Penthouse Level) | 17 | 6.0% | 15 | 88.2% | 2,090 | 35,533 | $24,309 | $11.51 |
| 3 BD / 2.5 BA (Penthouse Level) | 8 | 2.8% | 7 | 87.5% | 2,072 | 16,572 | $24,676 | $11.93 |
| 3 BD / 3.5 BA | 5 | 1.8% | 2 | 40.0% | 1,982 | 9,911 | $21,000 | $10.55 |
| 4 BD / 4.5 BA | 2 | 0.7% | 2 | 100.0% | 3,227 | 6,453 | $31,750 | $9.84 |
| Furnished Penthouse | 2 | 0.7% | 1 | 50.0% | 3,755 | 7,510 | $57,750 | $15.21 |
| Total/Wtd. Avg. | 281 | 100.0% | 250 | 89.0% | 1,666 | 468,123 | $13,013 | $7.69 |
| (1) | Information is based on the underwritten rent roll. |
| (2) | Four of the 2 BD / 2.5 BA units are non-revenue model and guest units, which are underwritten as vacant. |
The 10000 Santa Monica Boulevard Property is a modern all-glass structure composed of four crystalline quadrants crowned with an angled roof, giving it a distinctive appearance in the Los Angeles skyline. Sitting at 41 stories, the 10000 Santa Monica Boulevard Property offers unobstructed views of the Pacific Ocean, downtown Los Angeles and the Hollywood Hills. The 10000 Santa Monica Boulevard Property’s entrance, featuring twelve-foot ice blue yellow-wood hedges along a private drive from Santa Monica Boulevard, offers privacy from the busy urban environment surrounding the 10000 Santa Monica Boulevard Property. The 10000 Santa Monica Boulevard Property has won numerous awards, including Los Angeles Architectural Award of Excellence (2017) from the Los Angeles Business Council and the Los Angeles Business Journal’s 2017 Gold Award, Best Multi-Family Project.
The 10000 Santa Monica Boulevard Property features amenities including over 75,000 SF of indoor and outdoor amenity spaces. Outdoor amenities include a private one-acre park, an outdoor heated pool with cabanas and poolside chaise lounges, an outdoor chef’s kitchen with large Viking grills, a fire pit, a lighted tennis court, an outdoor theatre and a 2,000 SF dog run. Culture and entertainment amenities include a curated art collection on all amenity floors, including a commissioned art installation in the main lobby by Jacob Hashimoto, works by noted Los Angeles photographer Jeffrey Milstein and a collection of post-modern and contemporary works by Aaron Wexler, Adam Katseff and Suzan Etkins. The 10000 Santa Monica Boulevard Property includes a resident lounge with a full service bar, separate private dining room and catering kitchen, a private screening room featuring sophisticated projection equipment, a four-screen video wall, a game room with gaming console and Ultra HD television with Apple TV, two fully-equipped glass-enclosed boardrooms, an indoor 75-foot lap pool with towel service and pool runners, exercise rooms with industry-leading personal trainers, spa treatment facilities, a rooftop terrace (for penthouse suites only) and a kid’s studio. Unit amenities include 10-16’ ceiling heights, floor-to-ceiling windows with silent, motorized
THE INFORMATION IN THIS STRUCTURAL AND COLLATERAL TERM SHEET IS NOT COMPLETE AND MAY BE AMENDED PRIOR TO THE TIME OF SALE. THIS TERM SHEET IS NOT AN OFFER TO SELL THESE SECURITIES AND IT IS NOT A SOLICITATION OF AN OFFER TO BUY THESE SECURITIES IN ANY JURISDICTION WHERE THE OFFER OR SALE IS NOT PERMITTED.
75
10000 Santa Monica Boulevard Los Angeles, CA 90067 | Collateral Asset Summary – Loan No.5 10000 Santa Monica Boulevard | Cut-off Date Balance: Cut-off Date LTV Ratio: UW NCF DSCR: UW NOI Debt Yield: | $25,000,000 39.8% 2.34x 9.9% |
window blinds, wide-plank hardwood flooring, custom Italian cabinetry, quartz countertops, premium European appliances, walk-in closets, and Ecobee3 smart Wi-Fi thermostats with hands-free temperature controls.
The 10000 Santa Monica Boulevard Property features personalized services provided by professionally trained house staff. Technology services include CHARLEY, a robot butler available to deliver mini-bar items directly to each residence, and a proprietary “app” for various functionalities, such as guest access, package notifications, community updates, rent payment, maintenance requests and amenity and service reservations. The house staff includes a 24-hour doorman, a concierge, a valet service, an on-call personal chauffer, personal attendants, a porter and a butler. In-house services include complimentary daily continental breakfast and cafe with full beverage menu in the lounge, a laundry and dry cleaning service, a private wait staff, personal shopping, housekeeping, a childcare service, car wash services, interior design consultants and a package delivery service.
The 10000 Santa Monica Boulevard Property received LEED Gold certification from the U.S. Green Building Council, the neighborhood’s first multifamily high-rise to achieve this certification. The 10000 Santa Monica Boulevard Property was made of materials with a combined recycled content of over 20%. Its irrigation system, rain harvesting tanks and native flora allow the 10000 Santa Monica Boulevard Property to use 50% less water than comparable buildings.
The amenity space at the 10000 Santa Monica Boulevard Property is operated by an affiliate of the 10000 Santa Monica Boulevard Borrower, pursuant to a lease between the 10000 Santa Monica Boulevard Borrower and such affiliate (the “Club Lease”). The initial term of the Club Lease expires on December 31, 2019, and automatically renews on a year-to-year basis unless either party elects not to renew. Such affiliated lessee also holds the liquor license for the 10000 Santa Monica Boulevard Property. The 10000 Santa Monica Boulevard Borrower has assigned its rights under the Club Lease to the lender, and the operating lessee has subordinated its rights arising from the Club Lease to the lender’s security interests under the related mortgage loan documents. Upon foreclosure, the lender can terminate the Club Lease and the operating lessee has agreed to attorn to the lender (or other purchaser in foreclosure). In addition, there is a cooperation agreement between the 10000 Santa Monica Boulevard Borrower, the operating lessee and the lender by which the liquor license can be more easily transferred to the lender. The amenity space currently operates at a loss exceeding $100,000 per month.
The following table presents historical occupancy percentages at the 10000 Santa Monica Boulevard Property:
| Historical Occupancy(1) | ||||||||
| 1Q 2017 | 2Q 2017 | 3Q 2017 | 4Q 2017 | 1Q 2018 | 2Q 2018 | 3Q 2018 | 4Q 2018 | 4/9/2019(2) |
| 14.5% | 39.9% | 56.2% | 68.8% | 79.5% | 83.4% | 87.5% | 89.7% | 89.0% |
| (1) | Historical Occupancy is the average of monthly physical occupancy as provided by the 10000 Santa Monica Boulevard Borrower. The development of the 10000 Santa Monica Boulevard Property was constructed and completed in 2017 with lease-up commencing in January 2017. |
| (2) | Information is based on the underwritten rent roll. |
The Market. The 10000 Santa Monica Boulevard Property is located at the intersection of the Beverly Hills and Century City neighborhoods of Los Angeles, on the corner of Santa Monica Boulevard and Moreno Drive. Santa Monica Boulevard is one of the most trafficked east-west arterials through Los Angeles (22,200 cars per day near the 10000 Santa Monica Boulevard Property, according to an industry report), connecting Santa Monica, West Los Angeles, Beverly Hills, West Hollywood and Hollywood. Nearby land is predominantly used for major high-rise office buildings, including the SunAmerica Tower, the Annenberg Foundation, Constellation Place (formerly MGM Tower) and 1900 Avenue of the Stars, with law firms, talent agencies, and financial institutions making up the bulk of the tenancy. The 10000 Santa Monica Boulevard Property is within walking distance of several large employers, including O’Melveny & Myers LLP, Creative Artists Agency, Morgan Stanley & Co. LLC, Sidley Austin LLP, Wells Fargo Advisors, McKinsey & Company, Bain & Company, Inc., UBS Investment Bank, Bloomberg and Natixis. Cedars-Sinai Medical Center is also an important local employer and user of local office space.
According to a third party market research report, the 2019 average household income within a one-, three- and five-mile radius of the 10000 Santa Monica Boulevard Property is $188,587, $137,993 and $129,858, respectively. The 2019 estimated median owner-occupied housing values within a
one-, three- and five-mile radius of the 10000 Santa Monica Boulevard Property are $1,942,638, $1,307,704 and $1,211,495, respectively.
According to a third party market research report, the 10000 Santa Monica Boulevard Property is located in the Los Angeles multifamily market, which has one of the highest rates of renter households of any U.S. metropolitan area, with approximately half of all households renting their homes. The current vacancy rate in the Los Angeles metropolitan area is 3.9%, the lowest rate recorded since 2001. According to a third-party market research report, the 10000 Santa Monica Boulevard Property is located within the Beverly Hills submarket. As of fourth quarter 2018, the submarket contained 37,802 units with a reported vacancy rate of 3.7%, reflecting a decrease from the year-end 2017 vacancy of 4.1%. The submarket reported a 2018 average effective rent of $2,914 per unit per month, increasing by 2.1% from year-end 2017. Through year 2018, the submarket delivered 176 units and absorbed 315 units. As of fourth quarter 2018, there were 1,688 units under construction in the Beverly Hills submarket.
THE INFORMATION IN THIS STRUCTURAL AND COLLATERAL TERM SHEET IS NOT COMPLETE AND MAY BE AMENDED PRIOR TO THE TIME OF SALE. THIS TERM SHEET IS NOT AN OFFER TO SELL THESE SECURITIES AND IT IS NOT A SOLICITATION OF AN OFFER TO BUY THESE SECURITIES IN ANY JURISDICTION WHERE THE OFFER OR SALE IS NOT PERMITTED.
76
10000 Santa Monica Boulevard Los Angeles, CA 90067 | Collateral Asset Summary – Loan No.5 10000 Santa Monica Boulevard | Cut-off Date Balance: Cut-off Date LTV Ratio: UW NCF DSCR: UW NOI Debt Yield: | $25,000,000 39.8% 2.34x 9.9% |
Comparable rental properties to the 10000 Santa Monica Boulevard Property based on unit mix are shown in the tables below:
| One-Bedroom Comparable Rentals Summary | |||||
| Property Name/Location | Distance to Subject | Avg. Unit Size (SF)(1) | Asking Monthly Rent per Unit(1) | Asking Monthly Rent PSF(1) | |
| 10000 Santa Monica Boulevard (6 Units) | – | 2017 | 1,126 | $9,000 | $8.00 |
| 8500 Burton | 3.2 miles | 2012 | 1,015 | $6,514 | $6.42 |
| 1221 Ocean Avenue | 8.6 miles | 1971 | 1,082 | $10,400 | $9.61 |
| Wilshire Victoria | 1.9 miles | 2010 | 1,283 | $7,662 | $5.97 |
| Circa LA | 9.2 miles | 2018 | 798 | $3,365 | $4.22 |
| Atelier | 13.0 miles | 2017 | 715 | $3,130 | $4.38 |
| Vision on Wilshire | 3.2 miles | 2018 | 855 | $5,329 | $6.23 |
| The Argyle House | 6.8 miles | 2018 | 871 | $4,995 | $5.73 |
| Columbia Square | 6.5 miles | 2016 | 752 | $4,755 | $6.32 |
| Two-Bedroom Comparable Rentals Summary | |||||
| Property Name/Location | Distance to Subject | Avg. Unit Size (SF)(1) | Asking Monthly Rent per Unit(1) | Asking Monthly Rent PSF(1) | |
| 10000 Santa Monica Boulevard (241 Units) | – | 2017 | 1,599 | $11,514 | $7.20 |
| 10000 Santa Monica Boulevard (17 Penthouse Units) | – | 2017 | 2,090 | $24,309 | $11.51 |
| 8500 Burton | 3.2 miles | 2012 | 1,783 | $9,340 | $5.24 |
| 1221 Ocean Avenue | 8.6 miles | 1971 | 1,742 | $13,100 | $7.52 |
| Wilshire Victoria | 1.9 miles | 2010 | 1,725 | $10,895 | $6.32 |
| Circa LA | 9.2 miles | 2018 | 1,602 - 2,288 | $5,751 - $13,590 | $3.59 - $5.94 |
| Atelier | 13.0 miles | 2017 | 1,126 | $5,630 | $5.00 |
| Vision on Wilshire | 3.2 miles | 2018 | 1,448 | $8,148 | $5.63 |
| The Argyle House | 6.8 miles | 2018 | 1,269 | $7,070 | $5.57 |
| Three-Bedroom Comparable Rentals Summary | |||||
| Property Name/Location | Distance to Subject | Avg. Unit Size (SF)(1) | Asking Monthly Rent per Unit(1) | Asking Monthly Rent PSF(1) | |
| 10000 Santa Monica Boulevard (5 Units) | – | 2017 | 1,982 | $21,000 | $10.55 |
| 10000 Santa Monica Boulevard (8 Penthouse Units) | – | 2017 | 2,072 | $24,676 | $11.93 |
| 8500 Burton | 3.2 miles | 2012 | 4,000 | $40,000 | $10.00 |
| 1221 Ocean Avenue | 8.6 miles | 1971 | 1,679 | $27,100 | $16.14 |
| Circa LA | 9.2 miles | 2018 | 2,900 - 3,842 | $17,590 - $23,515 | $6.07 - $6.12 |
| Four-Bedroom and Furnished Penthouse Comparable Rentals Summary | |||||
| Property Name/Location | Distance to Subject | Avg. Unit Size (SF)(1) | Asking Monthly Rent per Unit(1) | Asking Monthly Rent PSF(1) | |
| 10000 Santa Monica Boulevard (2 Units) | – | 2017 | 3,227 | $31,750 | $9.84 |
| 10000 Santa Monica Boulevard (2 Furnished Penthouse Units) | – | 2017 | 3,755 | $57,750 | $15.21 |
Source:Appraisal
| (1) | Information for the 10000 Santa Monica Boulevard Property is based on the underwritten rent roll. |
THE INFORMATION IN THIS STRUCTURAL AND COLLATERAL TERM SHEET IS NOT COMPLETE AND MAY BE AMENDED PRIOR TO THE TIME OF SALE. THIS TERM SHEET IS NOT AN OFFER TO SELL THESE SECURITIES AND IT IS NOT A SOLICITATION OF AN OFFER TO BUY THESE SECURITIES IN ANY JURISDICTION WHERE THE OFFER OR SALE IS NOT PERMITTED.
77
10000 Santa Monica Boulevard Los Angeles, CA 90067 | Collateral Asset Summary – Loan No.5 10000 Santa Monica Boulevard | Cut-off Date Balance: Cut-off Date LTV Ratio: UW NCF DSCR: UW NOI Debt Yield: | $25,000,000 39.8% 2.34x 9.9% |
Operating History and Underwritten Net Cash Flow. The following table presents certain information relating to the historical operating performance and the Underwritten Net Cash Flow at the 10000 Santa Monica Boulevard Property:
| Cash Flow Analysis | ||||||
| 2016(1) | 2017 | 2018 | 1/31/2019 TTM | UW | UW Per Unit | |
| Gross Potential Rent(2) | N/A | $44,835,286 | $44,090,052 | $44,185,296 | $44,558,268 | $158,570 |
| Total Other Income(3) | N/A | $1,417,768 | $3,572,711 | $3,644,138 | $3,644,138 | $12,968 |
| Less Vacancy & Concessions | N/A | ($28,006,280) | ($8,284,550) | ($7,622,593) | ($6,333,314) | ($22,538) |
| Effective Gross Income | N/A | $18,246,774 | $39,378,213 | $40,206,841 | $41,869,092 | $149,000 |
| Total Operating Expenses(4) | N/A | $15,684,622 | $19,905,778 | $19,998,236 | $20,152,705 | $71,718 |
| Net Operating Income | N/A | $2,562,152 | $19,472,435 | $20,208,605 | $21,716,388 | $77,283 |
| Capital Expenditures | N/A | $0 | $0 | $0 | $56,200 | $200 |
| Net Cash Flow | N/A | $2,562,152 | $19,472,435 | $20,208,605 | $21,660,188 | $77,083 |
| Occupancy %(5) | N/A | 68.8% | 89.7% | 89.0% | 88.5% | |
| NOI DSCR(6) | N/A | 0.28x | 2.10x | 2.18x | 2.35x | |
| NCF DSCR(6) | N/A | 0.28x | 2.10x | 2.18x | 2.34x | |
| NOI Debt Yield(6) | N/A | 1.2% | 8.9% | 9.2% | 9.9% | |
| NCF Debt Yield(6) | N/A | 1.2% | 8.9% | 9.2% | 9.8% | |
| (1) | The 10000 Santa Monica Boulevard Property was constructed and completed in 2017; as such, historical operating performance information prior to 2017 is unavailable. |
| (2) | UW Gross Potential Rent is based on the underwritten rent roll as of April 9, 2019 and is comprised of in-place base rents and vacant gross up of $5,520,000 (including four non-revenue model and guest units ($552,000)). |
| (3) | Total Other Income includes parking income and late fees among others. |
| (4) | Total Operating Expenses are inclusive of club services. The 10000 Santa Monica Boulevard Property’s rental rates and the associated value are dependent in part on the availability and maintenance of the amenity space; accordingly, the costs of providing Club Services were considered in underwriting operating expenses. Club Services were underwritten based on the 1/31/2019 TTM. |
| (5) | 2017 and 2018 Occupancy are based on the average monthly occupancy for the last quarter of each respective year. UW Occupancy % is based on the underwritten economic vacancy of 11.5%. The 10000 Santa Monica Boulevard Property was 89.0% leased as of April 9, 2019. |
| (6) | Debt service coverage ratios and debt yields are based solely on the 10000 Santa Monica Boulevard Senior Notes (excluding the 10000 Santa Monica Boulevard Subordinate Loan). |
Escrows and Reserves.The 10000 Santa Monica Boulevard Borrower deposited in escrow at origination $890,641 for annual real estate taxes. The 10000 Santa Monica Boulevard Borrower is required to escrow monthly (i) 1/12 of the annual estimated tax payments, currently equal to $222,660, (ii) 1/12 of the annual estimated insurance premiums,provided, however, that such escrow is waived so long as a blanket insurance policy is in full force and effect, and (iii) $6,814 for replacement reserves,provided that the amount of funds in the replacement reserve is (a) not more than $250,000 and (b) less than $81,711 in the aggregate.
Lockbox and Cash Management. The 10000 Santa Monica Boulevard Whole Loan has a soft lockbox with in-place cash management.
The 10000 Santa Monica Boulevard Borrower is required (and is required to cause the property manager) to, deposit all amounts received by the 10000 Santa Monica Boulevard Borrower or property manager constituting rents into the lockbox account within two business days after receipt. The lender has been granted a first priority security interest in the lockbox account (except for any funds collected by the 10000 Santa Monica Boulevard Borrower for and on behalf of the private club operating at the 10000 Santa Monica Boulevard Property while no event of default under the related mortgage loan documents is continuing and the Club Lease (as defined below) is in effect). Notwithstanding the foregoing, to the extent the club collects any revenues on behalf of the 10000 Santa Monica Boulevard Borrower for services at the 10000 Santa Monica Boulevard Property (such as housekeeping and laundry services), the related mortgage loan documents provide that such amounts may be held by the club until a monthly reconciliation is made between the 10000 Santa Monica Boulevard Borrower and the club operator. Following any such reconciliation, the club operator is required to deliver such amounts to the lockbox account. On each business day, all funds on deposit in the lockbox account (except for the required minimum balance) are required to be transferred to an eligible account established by lender (the “Cash Management Account”) and applied in accordance with the priority of payments set forth below. The lender has been granted a first priority security interest in the Cash Management Account (except for any funds collected by the 10000 Santa Monica Boulevard Borrower for and on behalf of the club while no event of default is continuing and the Club Lease is in effect).
On each payment date, all funds on deposit in the Cash Management Account are required to be applied in accordance with the related mortgage loan documents. To the extent there is a Cash Sweep Period (as defined below) continuing, all amounts following payment of debt service, required reserves and operating expenses are required to be held in an excess cash flow account as additional collateral for the 10000 Santa Monica Boulevard Whole Loan (unless the Cash Sweep Period is caused solely by a Debt Yield Trigger Event (as defined below), in which case the lender is required to apply such funds to the monthly deposits for taxes and insurance to the extent not otherwise funded). All funds on deposit in the Cash Management Account during an event of default may be applied by lender in such order and priority as lender determines.
A “Cash Sweep Period” will (i) commence upon the occurrence of (a) an event of default under the related mortgage loan documents, (b) any bankruptcy action of the 10000 Santa Monica Boulevard Borrower or property manager, (c) a Debt Yield Trigger Event, (d) a Club Revenues Trigger Event (as defined below), or (e) a Short-Term Lease Excess Event (as defined below); and will (ii) end upon (a) with respect to an event of default, such event of default is no longer continuing, (b) with respect to a bankruptcy action of the property manager, if such bankruptcy action is involuntary, such action is discharged or dismissed, or if the 10000 Santa Monica Boulevard Borrower replaces the property manager with a qualified manager in accordance with the related mortgage loan documents, (c) with respect to a Debt Yield Trigger Event, the achievement of a debt yield of at least 5.75% for two consecutive calendar quarters based on the trailing 12 months, (d) with respect to a Club Revenues Trigger Event, the achievement of a Club Revenues Debt Yield of 5.30% or higher for two consecutive calendar quarters based upon the trailing 12-month period, or (e) with respect to a Short-Term Lease Excess Event, the aggregate of annualized actual in place rents under short-term leases and month-to-month leases is less than 22% of the aggregate annualized actual in place rents from the 10000 Santa Monica Boulevard Property as of the first day of each of two consecutive calendar quarters.
THE INFORMATION IN THIS STRUCTURAL AND COLLATERAL TERM SHEET IS NOT COMPLETE AND MAY BE AMENDED PRIOR TO THE TIME OF SALE. THIS TERM SHEET IS NOT AN OFFER TO SELL THESE SECURITIES AND IT IS NOT A SOLICITATION OF AN OFFER TO BUY THESE SECURITIES IN ANY JURISDICTION WHERE THE OFFER OR SALE IS NOT PERMITTED.
78
10000 Santa Monica Boulevard Los Angeles, CA 90067 | Collateral Asset Summary – Loan No.5 10000 Santa Monica Boulevard | Cut-off Date Balance: Cut-off Date LTV Ratio: UW NCF DSCR: UW NOI Debt Yield: | $25,000,000 39.8% 2.34x 9.9% |
A “Debt Yield Trigger Event” means a debt yield of less than 5.75% on any date of determination for the calendar quarter immediately preceding the date of such determination, based upon the trailing 12-month period immediately preceding such date of determination, as determined by the lender in its sole but good faith discretion.
A “Club Revenues Trigger Event” means a debt yield (recalculated on a pro-forma basis by adding to the numerator an amount equal to the positive or negative club net operating income during the trailing 12-month period) (the “Club Revenues Debt Yield”) of less than 5.30% on any date of determination for the calendar quarter immediately preceding the date of such determination, based upon the trailing 12-month period immediately preceding such date of determination, as determined by the lender in its sole but good faith discretion.
A “Short-Term Lease Excess Event” means the occurrence of each of the following: (1) the aggregate of annualized actual in place rents under short-term leases (i.e., leases with an initial term of less than six months) and month-to-month leases (i.e., leases with an initial term of greater than six months that have expired, with the tenants remaining in occupancy on a month-to-month basis) exceeds 22% of the aggregate annualized actual in place rents from the 10000 Santa Monica Boulevard Property as of the first day of any calendar quarter, (2) the 10000 Santa Monica Boulevard Borrower enters into at least one short-term lease on or after such first day of such calendar quarter, and (3) the aggregate of annualized actual in place rents under short-term leases and month-to-month leases again exceeds 22% of the aggregate annualized actual in place rents from the 10000 Santa Monica Boulevard Property as of the first day of the next succeeding calendar quarter.
Additional Secured Indebtedness (not including trade debts). The 10000 Santa Monica Boulevard Subordinate Loan, which has an original principal value of $130.0 million, is subordinate to the 10000 Santa Monica Boulevard Senior Notes and accrues interest at a rate of 4.1500%per annum. The 10000 Santa Monica Boulevard Subordinate Loan is coterminous with the 10000 Santa Monica Boulevard Senior Notes. The holders of the 10000 Santa Monica Boulevard Senior Notes and the 10000 Santa Monica Boulevard Subordinate Loan have entered into a co-lender agreement which sets forth the allocation of collections on the 10000 Santa Monica Boulevard Whole Loan. Based on the 10000 Santa Monica Boulevard Whole Loan, the cumulative Cut-off Date LTV Ratio, cumulative UW NCF DSCR and cumulative UW NOI Debt Yield are 63.3%, 1.47x, and 6.2%, respectively.
Mezzanine Loan and Preferred Equity. None.
Release of Property. Not permitted.
Terrorism Insurance.The 10000 Santa Monica Boulevard Borrower, at its sole cost, is required to obtain and maintain comprehensive “all-risk” or “special form” insurance that includes, but is not limited to, loss caused by any type of windstorm or hail on the improvements and the personal property, in an amount equal to 100% of the actual replacement value (exclusive of costs of excavations, foundations, underground utilities and footings) with a waiver of depreciation, with a deductible that may not exceed $50,000. The related mortgage loan documents also require business income insurance on an actual loss sustained basis with no time limitation, commencing at the time of casualty, together with a 12-month extended period of indemnity. The property and business income insurance described above are required to cover losses resulting from perils and acts of terrorism on terms (including amounts) consistent with those required under the related mortgage loan documents. See “Risk Factors—Terrorism Insurance May Not Be Available for All Mortgaged Properties” in the Preliminary Prospectus.
THE INFORMATION IN THIS STRUCTURAL AND COLLATERAL TERM SHEET IS NOT COMPLETE AND MAY BE AMENDED PRIOR TO THE TIME OF SALE. THIS TERM SHEET IS NOT AN OFFER TO SELL THESE SECURITIES AND IT IS NOT A SOLICITATION OF AN OFFER TO BUY THESE SECURITIES IN ANY JURISDICTION WHERE THE OFFER OR SALE IS NOT PERMITTED.
79
101 Troutman Road Collegeville, PA 19426 | Collateral Asset Summary – Loan No. 6 Global Data Center | Cut-off Date Balance: Cut-off Date LTV Ratio: UW NCF DSCR: UW NOI Debt Yield: | $25,000,000 61.7% 2.29x 10.6% |
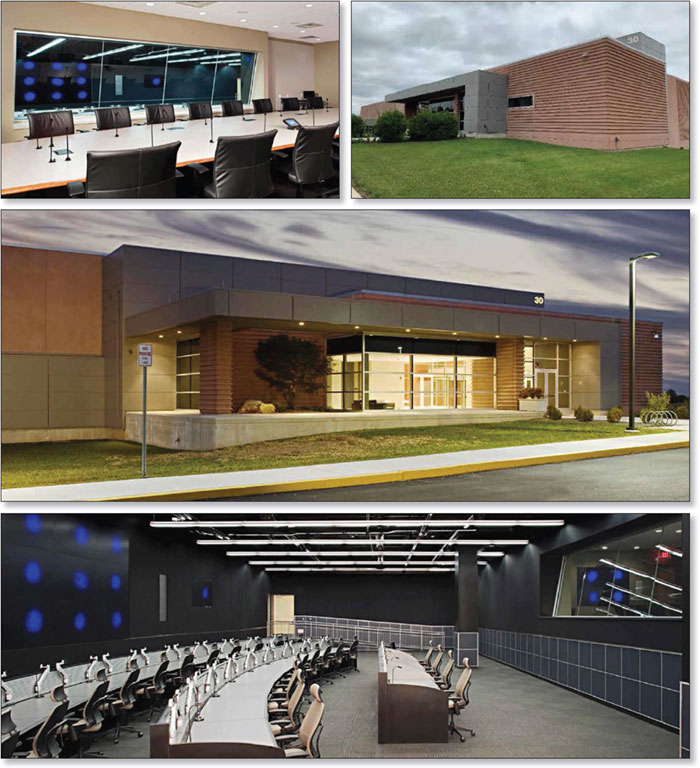
THE INFORMATION IN THIS STRUCTURAL AND COLLATERAL TERM SHEET IS NOT COMPLETE AND MAY BE AMENDED PRIOR TO THE TIME OF SALE. THIS TERM SHEET IS NOT AN OFFER TO SELL THESE SECURITIES AND IT IS NOT A SOLICITATION OF AN OFFER TO BUY THESE SECURITIES IN ANY JURISDICTION WHERE THE OFFER OR SALE IS NOT PERMITTED.
80
101 Troutman Road Collegeville, PA 19426 | Collateral Asset Summary – Loan No. 6 Global Data Center | Cut-off Date Balance: Cut-off Date LTV Ratio: UW NCF DSCR: UW NOI Debt Yield: | $25,000,000 61.7% 2.29x 10.6% |

THE INFORMATION IN THIS STRUCTURAL AND COLLATERAL TERM SHEET IS NOT COMPLETE AND MAY BE AMENDED PRIOR TO THE TIME OF SALE. THIS TERM SHEET IS NOT AN OFFER TO SELL THESE SECURITIES AND IT IS NOT A SOLICITATION OF AN OFFER TO BUY THESE SECURITIES IN ANY JURISDICTION WHERE THE OFFER OR SALE IS NOT PERMITTED.
81
101 Troutman Road Collegeville, PA 19426 | Collateral Asset Summary – Loan No. 6 Global Data Center | Cut-off Date Balance: Cut-off Date LTV Ratio: UW NCF DSCR: UW NOI Debt Yield: | $25,000,000 61.7% 2.29x 10.6% |
| Mortgage Loan Information | Property Information | ||||||
| Mortgage Loan Seller: | WFB | Single Asset/Portfolio: | Single Asset | ||||
| Credit Assessment (Fitch/KBRA/Moody’s): | NR/NR/NR | Location: | Collegeville, PA 19426 | ||||
| General Property Type: | Other | ||||||
| Original Balance(1): | $25,000,000 | Detailed Property Type: | Data Center | ||||
| Cut-off Date Balance(1): | $25,000,000 | Title Vesting: | Fee Simple | ||||
| % of Initial Pool Balance: | 3.1% | Year Built/Renovated: | 2009/N/A | ||||
| Loan Purpose: | Refinance | Size: | 203,702 SF | ||||
| Borrower Sponsor: | GI Manager LLC | Cut-off Date Balance per SF(1): | $182 | ||||
| Mortgage Rate: | 4.3200% | Maturity Date Balance per SF(1): | $182 | ||||
| Note Date: | 8/6/2019 | Property Manager: | Self-managed | ||||
| First Payment Date: | 9/11/2019 | ||||||
| Maturity Date: | 8/11/2029 | ||||||
| Original Term to Maturity: | 120 months | ||||||
| Original Amortization Term: | 0 months | Underwriting and Financial Information | |||||
| IO Period: | 120 months | UW NOI(3): | $3,920,496 | ||||
| Seasoning: | 2 months | UW NOI Debt Yield(1): | 10.6% | ||||
| Prepayment Provisions: | LO (26); DEF (87); O (7) | UW NOI Debt Yield at Maturity(1): | 10.6% | ||||
| Lockbox/Cash Mgmt Status: | Hard/In Place | UW NCF DSCR(1): | 2.29x | ||||
| Additional Debt Type(1): | Pari Passu | Most Recent NOI(3): | $3,414,848 (7/31/2019 TTM) | ||||
| Additional Debt Balance(1): | $12,000,000 | 2nd Most Recent NOI: | $3,209,356 (12/31/2018) | ||||
| Future Debt Permitted (Type): | No (N/A) | 3rd Most Recent NOI: | N/A | ||||
| Reserves(2) | Most Recent Occupancy: | 100.0% (10/1/2019) | |||||
| Type | Initial | Monthly | Cap | 2nd Most Recent Occupancy: | 100.0% (12/31/2018) | ||
| RE Tax: | $0 | Springing | N/A | 3rd Most Recent Occupancy: | 100.0% (12/31/2017) | ||
| Insurance: | $0 | Springing | N/A | Appraised Value (as of)(4): | $60,000,000 (6/13/2019) | ||
| Replacements: | $0 | $0 | N/A | Cut-off Date LTV Ratio(1): | 61.7% | ||
| TI/LC: | $0 | $0 | N/A | Maturity Date LTV Ratio(1): | 61.7% | ||
Sources and Uses | ||||||
Sources | Proceeds | % of Total |
| Uses | Proceeds | % of Total |
Loan Amount(1): | $37,000,000 | 100.0% |
| Loan Payoff: | $32,935,248 | 89.0% |
|
|
|
| Closing Costs: | $444,267 | 1.2% |
|
|
|
| Return of Equity: | $3,620,485 | 9.8% |
Total Sources: | $37,000,000 | 100.0% |
| Total Uses: | $37,000,000 | 100.0% |
| (1) | The Global Data Center Mortgage Loan (as defined below) is part of the Global Data Center Whole Loan (as defined below), which is comprised of two pari passu promissory notes with an aggregate original principal balance of $37,000,000. The Cut-off Date Balance per SF, Maturity Date Balance per SF, UW NOI Debt Yield, UW NOI Debt Yield at Maturity, UW NCF DSCR, Cut-off Date LTV Ratio and Maturity Date LTV Ratio presented above are based on the aggregate principal balance of the promissory notes comprising the Global Data Center Whole Loan. |
| (2) | See “Escrows and Reserves” below for further discussion of reserve requirements. |
| (3) | See “Operating History and Net Cash Flow” section below for details regarding the increase from Most Recent NOI to UW NOI. |
| (4) | The appraisal also concluded to a “Hypothetical Market Value As Dark” of $37,000,000 as of June 13, 2019. |
The Mortgage Loan. The sixth largest mortgage loan (the “Global Data Center Mortgage Loan”) is part of a whole loan (the “Global Data Center Whole Loan”) evidenced by two pari passu promissory notes with an aggregate original principal balance of $37,000,000. The Global Data Center Whole Loan is secured by a first priority fee mortgage encumbering a two-story data center located in Collegeville, Pennsylvania (the “Global Data Center Property”). Promissory Note A-1, with an original principal balance of $25,000,000, represents the Global Data Center Mortgage Loan, and will be contributed to the UBS 2019-C17 Trust. The non-controlling Note A-2, with an original principal balance of $12,000,000 (the “Global Data Center Serviced Pari Passu Companion Loan”), is currently held by WFB and is expected to be contributed to future securitization trusts or may be otherwise transferred at any time. The mortgage loan seller provides no assurances that the non-securitized pari passu notes will not be split further. The Global Data Center Whole Loan will be serviced pursuant to the pooling and servicing agreement for the UBS 2019-C17 securitization trust. See “Description of the Mortgage Pool—The Whole Loans—The Serviced Pari Passu Whole Loans“ and “Pooling and Servicing Agreement” in the Preliminary Prospectus.
The Global Data Center Whole Loan Summary | ||||
Note | Original Balance | Cut-off Date Balance | Note Holder | Controlling Piece |
A-1 | $25,000,000 | $25,000,000 | UBS 2019-C17 | Yes |
A-2 | $12,000,000 | $12,000,000 | WFB | No |
Total | $37,000,000 | $37,000,000 |
|
|
THE INFORMATION IN THIS STRUCTURAL AND COLLATERAL TERM SHEET IS NOT COMPLETE AND MAY BE AMENDED PRIOR TO THE TIME OF SALE. THIS TERM SHEET IS NOT AN OFFER TO SELL THESE SECURITIES AND IT IS NOT A SOLICITATION OF AN OFFER TO BUY THESE SECURITIES IN ANY JURISDICTION WHERE THE OFFER OR SALE IS NOT PERMITTED.
82
101 Troutman Road Collegeville, PA 19426 | Collateral Asset Summary – Loan No. 6 Global Data Center | Cut-off Date Balance: Cut-off Date LTV Ratio: UW NCF DSCR: UW NOI Debt Yield: | $25,000,000 61.7% 2.29x 10.6% |
The Borrower and the Borrower Sponsor. The borrower of the Global Data Center Whole Loan is Tare Collegeville LLC (the “Global Data Center Borrower”), a single-purpose Delaware limited liability company with one independent director. The borrower sponsor is GI Manager LLC, a Delaware limited liability company, and the nonrecourse carve-out guarantors are GI Manager L.P. and GI Tare LP, each a Delaware limited partnership (collectively, the “Guarantor”). The related mortgage loan documents require that the Guarantor maintain (i) a minimum annualized EBITDA of not less than $15,000,000, and (ii) either (a) a minimum net worth of not less than $35,000,000, or (b) liquidity of no less than $3,000,000.
The Global Data Center Borrower is wholly owned by Richard A. Magnuson, the founder and executive Managing Director of GI Partners. GI Partners is an alternative investment management firm with approximately $16 billion in capital commitments from institutional investors around the world. GI Partners' Real Estate team currently manages approximately $8.8 billion across five real estate investment vehicles, encompassing both asset and entity level strategies. GI Partners capabilities include acquisitions, dispositions, asset and portfolio management, reporting and risk management. Mr. Magnuson is also the co-founder and Chairman Emeritus of Digital Realty Trust, Inc., a leading global provider of data centers and internet peering points. Further, GI Partners owns Flexential Corp (“Flexential”) (the master tenant at the Global Data Center Property), and Mr. Magnuson has investment responsibilities for, and currently sits on the board of, Flexential.
The Property. The Global Data Center Property is a two-story data center building totaling 203,702 SF situated approximately 27.7 miles northwest of downtown Philadelphia, Pennsylvania. The Global Data Center Property is a Tier III, 2N+1, facility which was designed to support 74,995 SF of raised floor area to accommodate 7.0 MW of uninterrupted power supply capacity at 85% load. The Global Data Center Property is currently configured with 63,544 SF of raised floor space and a critical IT load of 4.6 MW. In addition to the raised floor area, the Global Data Center Property contains 31,184 SF of office space and 97,523 SF of mechanical and storage space. At full design, the Global Data Center Property is capable of accommodating 36 power distribution units (versus the 24 that are currently installed), and 120,000 gallons of onsite diesel fuel storage (versus the current 80,000 gallons of storage). In addition, the Global Data Center Property contains solar panels, which produce up to 340 kilowatts in power generation.
The Global Data Center Property was constructed in 2009 by the global pharmaceutical company GlaxoSmithKline (“GSK”) and originally served as the company’s global corporate data center. In November 2017, GI Partners acquired the Global Data Center Property for $65.0 million as part of a partial sale-leaseback transaction, with the master tenant, Flexential (which is owned by GI Partners), contributing $12.0 million toward the purchase price. GI Partners executed a triple-net master lease with Flexential for 100.0% of the Global Data Center Property for a 13-year term through November 2030. Concurrently, Flexential executed a sublease agreement with GSK for 2,540 kW (approximately 55% of the current leasable power at the Global Data Center Property) along with approximately 20,000 SF of office and storage space for an initial term of 10 years through November 2027. The remaining 45% of the Global Data Center Property is operated and leased as colocation data center space, whereby Flexential leases space in smaller increments such as cabinets and cages and owns the critical mechanical and electrical infrastructure.
Major Tenant.
Flexential Corp (203,702 SF, 100.0% of NRA, 100.0% of underwritten base rent). Flexential, formerly Peak 10 Inc., was rebranded when the company acquired Via West in 2017 for $1.675 billion. The two companies operated geographically diverse data center portfolio’s with very little overlap. After the merger, Flexential is now a leading data center provider in secondary markets and is focused on serving needs in those markets. As of 2019, Flexential operated approximately 3.1 million SF of data center space with approximately 169 MW of critical IT load. Flexential employs approximately 1,000 professionals to serve nearly 4,200 clients from 41 data centers in 21 markets in the U.S., Europe, and Asia-Pacific. Flexential’s lease expires November 30, 2030, and has two options to renew (the first for 7 years and the second for 9 years and 11 months) at 95% of the market rental rate. Flexential is owned by GI Partners and is affiliated with the Global Data Center Borrower (see “The Borrower and the Borrower Sponsor” section above).
Flexential subleases 2,540 kW of leasable power (approximately 55% of the current total leasable power at the Global Data Center Property) along with 20,000 SF of office and storage space to GSK (the former owner of the building; rated A-/A2/A+ by Fitch/Moody’s/S&P) through November 30, 2027 with two, five-year renewal options. GSK’s total annual sublease rent is currently $5,059,641 (approximately $166/kW per month; approximately 1.19x Flexential’s underwritten base rent) with annual increases of approximately 2.2%. Established in 2000, GSK is a British multinational pharmaceutical company and was the world’s sixth largest pharmaceutical company. GSK’s 281-acre research and development campus is located adjacent to the Global Data Center Property.
The following table presents certain information relating to the leases at the Global Data Center Property:
Tenant Summary(1) | ||||||||
Tenant Name | Credit Rating (Fitch/Moody’s/S&P)(2) | Tenant SF | Approximate % of SF | Annual UW Rent(3) | % of Total Annual UW Rent | Annual UW Rent PSF(3) | Monthly UW Rent per kW(3)(4) | Lease Expiration |
Flexential Corp(5) | NR/B3/B- | 203,702 | 100.0% | $4,240,000 | 100.0% | $20.81 | $76.81 | 11/30/2030(6) |
Vacant |
| 0 | 0.0% | $0 | 0.0% | $0.00 | $0.00 |
|
Total/Wtd. Avg. |
| 203,702 | 100.0% | $4,240,000 | 100.0% | $20.81 | $76.81 |
|
| (1) | Information is based on the underwritten rent roll. |
| (2) | The ratings shown are for Flexential Corp. The entity on the lease is Peak 10, Inc., which was rebranded to Flexential when the company acquired Via West in 2017. |
| (3) | Annual UW Rent, Annual UW Rent PSF and Monthly UW Rent per kW are inclusive of Flexential’s contractual rental rate increase in November 2020. Flexential’s current contractual annual rent is $3,532,269 ($17.34 PSF; $63.99/kW/month), which increases to $3,885,595 ($19.07 PSF; $70.39/kW/month) in November 2019 and $4,240,000 ($20.81 PSF; $76.81/kW/month) in November 2020. The appraiser concluded to a market rent for the Global Data Center Property of $80.00/kW/month. |
| (4) | Based on current total leasable power of approximately 4.6 MW. |
| (5) | Flexential subleases 2,540 kW of leasable power (approximately 55% of the current total leasable power at the Global Data Center Property) along with 20,000 SF of office and storage space to GSK (the former owner of the building) through November 30, 2027 with two, five-year renewal options. GSK’s total annual sublease rent is currently $5,059,641 (approximately $166/kW per month) with annual increases of approximately 2.2%. |
| (6) | Flexential has two renewal options with at least 12 months’ notice (the first option for seven years and the second for nine years and 11 months). |
THE INFORMATION IN THIS STRUCTURAL AND COLLATERAL TERM SHEET IS NOT COMPLETE AND MAY BE AMENDED PRIOR TO THE TIME OF SALE. THIS TERM SHEET IS NOT AN OFFER TO SELL THESE SECURITIES AND IT IS NOT A SOLICITATION OF AN OFFER TO BUY THESE SECURITIES IN ANY JURISDICTION WHERE THE OFFER OR SALE IS NOT PERMITTED.
83
101 Troutman Road Collegeville, PA 19426 | Collateral Asset Summary – Loan No. 6 Global Data Center | Cut-off Date Balance: Cut-off Date LTV Ratio: UW NCF DSCR: UW NOI Debt Yield: | $25,000,000 61.7% 2.29x 10.6% |
The following table presents certain information relating to the lease rollover schedule at the Global Data Center Property:
Lease Rollover Schedule(1)(2) | ||||||||
Year | # of Leases Rolling | SF Rolling | Annual UW Rent PSF Rolling(3) | Approx. % of Total SF Rolling | Approx. Cumulative % of SF Rolling | Total UW Rent Rolling | Approx. % of Total Rent Rolling | Approx. Cumulative % of Total Rent Rolling |
MTM | 0 | 0 | $0.00 | 0.0% | 0.0% | $0 | 0.0% | 0.0% |
2019 | 0 | 0 | $0.00 | 0.0% | 0.0% | $0 | 0.0% | 0.0% |
2020 | 0 | 0 | $0.00 | 0.0% | 0.0% | $0 | 0.0% | 0.0% |
2021 | 0 | 0 | $0.00 | 0.0% | 0.0% | $0 | 0.0% | 0.0% |
2022 | 0 | 0 | $0.00 | 0.0% | 0.0% | $0 | 0.0% | 0.0% |
2023 | 0 | 0 | $0.00 | 0.0% | 0.0% | $0 | 0.0% | 0.0% |
2024 | 0 | 0 | $0.00 | 0.0% | 0.0% | $0 | 0.0% | 0.0% |
2025 | 0 | 0 | $0.00 | 0.0% | 0.0% | $0 | 0.0% | 0.0% |
2026 | 0 | 0 | $0.00 | 0.0% | 0.0% | $0 | 0.0% | 0.0% |
2027 | 0 | 0 | $0.00 | 0.0% | 0.0% | $0 | 0.0% | 0.0% |
2028 | 0 | 0 | $0.00 | 0.0% | 0.0% | $0 | 0.0% | 0.0% |
2029 | 0 | 0 | $0.00 | 0.0% | 0.0% | $0 | 0.0% | 0.0% |
2030 & Beyond | 1 | 203,702 | $20.81 | 100.0% | 100.0% | $4,240,000 | 100.0% | 100.0% |
Vacant | 0 | 0 | $0.00 | 0.0% | 100.0% | $0 | 0.0% | 100.0% |
Total/Wtd. Avg. | 1 | 203,702 | $20.81 | 100.0% |
| $4,240,000 | 100.0% |
|
| (1) | Information is based on the underwritten rent roll. |
| (2) | Wtd. Avg. Annual UW Rent PSF Rolling excludes vacant space. |
The Market. The Global Data Center Property is located in Collegeville, Montgomery County, Pennsylvania, approximately 27.7 miles northwest of Philadelphia, Pennsylvania. The Global Data Center Property is located approximately 1.4 miles south of Pfizer’s pharmaceutical division and 1.3 miles south of Dow Chemical’s global research and development campus. The Global Data Center Property is also adjacent to GSK’s 281-acre research and development campus.
The Global Data Center Property is located approximately 1.2 miles south of Route 422, which connects to Interstate 76 and provides direct access southbound to Philadelphia. According to the appraisal, Philadelphia is considered a second tier data market, which is in-line with Flexential’s business plan. Pennsylvania also recently passed the Computer Data Center Equipment Incentive Program, which provides a tax refund for sales and use tax paid on qualified computer data center equipment utilized within a facility certified for participation in the program. This policy is expected to stimulate new investment activity across Pennsylvania. Additionally, the Global Data Center Property is located less than 100 miles from the major data center market of Northern New Jersey/New York and less than 200 miles from Northern Virginia, the largest data center market in the United States.
According to a third party market research report, the Global Data Center Property is located within the Norristown/Valley Forge submarket. As of the third quarter of 2019, the submarket reported an inventory of 515 office buildings totaling approximately 7.7 million SF with a 7.0% vacancy rate and average asking rents of $22.28 PSF, triple net.
The appraiser identified 30 comparable data center leases in primary and secondary markets across the United States ranging in size from 800 to 10,000 kW, with an average of 3,777 kW of critical IT load, in comparison to the Global Data Center Property’s current capacity of 4,600 kW of critical IT load. The comparable properties demonstrated rental rates ranging from $52.75 to $164.06 per kW per month, with a weighted average of $97.95 per kW per month. Of the 30 comparable properties, the appraiser considered four properties to be the most comparable to the Global Data Center Property in terms of infrastructure and configuration, which had rental rates ranging from $103.00 to $164.06 per kW per month. The appraiser also concluded to five other properties as the most comparable to the Global Data Center Property in terms of location, which had rental rates ranging from $72.82 to $108.00 per kW per month, with an average of $90.96 per kW per month. The appraiser concluded to a market rent of $80.00 kW per month for the Global Data Center Property.
THE INFORMATION IN THIS STRUCTURAL AND COLLATERAL TERM SHEET IS NOT COMPLETE AND MAY BE AMENDED PRIOR TO THE TIME OF SALE. THIS TERM SHEET IS NOT AN OFFER TO SELL THESE SECURITIES AND IT IS NOT A SOLICITATION OF AN OFFER TO BUY THESE SECURITIES IN ANY JURISDICTION WHERE THE OFFER OR SALE IS NOT PERMITTED.
84
101 Troutman Road Collegeville, PA 19426 | Collateral Asset Summary – Loan No. 6 Global Data Center | Cut-off Date Balance: Cut-off Date LTV Ratio: UW NCF DSCR: UW NOI Debt Yield: | $25,000,000 61.7% 2.29x 10.6% |
Operating History and Underwritten Net Cash Flow. The following table presents certain information relating to the historical operating performance and the Underwritten Net Cash Flow at The Global Data Center Property:
Cash Flow Analysis | ||||||||||||
| 2016(1) |
| 2017(1) |
| 2018 |
| 7/31/2019 TTM(2) |
| UW(2) |
| UW PSF |
|
Base Rent | N/A |
| N/A |
| $3,209,356 |
| $3,414,848 |
| $4,240,000 |
| $20.81 |
|
Total Recoveries | N/A |
| N/A |
| $563,558 |
| $565,997 |
| $602,945 |
| $2.96 |
|
Less Vacancy & Credit Loss(3) | N/A |
| N/A |
| $0 |
| $0 |
| ($212,000) |
| ($1.04) |
|
Effective Gross Income | N/A |
| N/A |
| $3,772,914 |
| $3,980,845 |
| $4,630,945 |
| $22.73 |
|
Total Operating Expenses | N/A |
| N/A |
| $563,558 |
| $565,997 |
| $710,450 |
| $3.49 |
|
Net Operating Income | N/A |
| N/A |
| $3,209,356 |
| $3,414,848 |
| $3,920,496 |
| $19.25 |
|
Capital Expenditures | N/A |
| N/A |
| $0 |
| $0 |
| $40,740 |
| $0.20 |
|
TI/LC | N/A |
| N/A |
| $0 |
| $0 |
| $155,200 |
| $0.76 |
|
Net Cash Flow | N/A |
| N/A |
| $3,209,356 |
| $3,414,848 |
| $3,724,555 |
| $18.28 |
|
|
|
|
|
|
|
|
|
|
|
|
|
|
Occupancy %(3) | N/A |
| N/A |
| 100.0% |
| 100.0% |
| 95.0% |
|
|
|
NOI DSCR(4) | N/A |
| N/A |
| 1.97x |
| 2.10x |
| 2.41x |
|
|
|
NCF DSCR(4) | N/A |
| N/A |
| 1.97x |
| 2.10x |
| 2.29x |
|
|
|
NOI Debt Yield(4) | N/A |
| N/A |
| 8.7% |
| 9.2% |
| 10.6% |
|
|
|
NCF Debt Yield(4) | N/A |
| N/A |
| 8.7% |
| 9.2% |
| 10.1% |
|
|
|
|
|
|
|
|
|
|
|
|
|
|
|
|
| (1) | Historical cash flows prior to 2018 are not available due to the borrower sponsor’s 2017 acquisition of the Global Data Center Property, prior to which a lease was not in-place. |
| (2) | The increase in Net Operating Income from 7/31/2019 TTM to UW is attributable to Flexential’s contractual rent increase in November 2020, which was included in the underwritten cash flow. Flexential’s current contractual annual rent is $3,532,269 ($17.34 PSF; $63.99/kW/month) and increases to $3,885,595 ($19.07 PSF; $70.39/kW/month) in November 2019 and $4,240,000 ($20.81 PSF; $76.81/kW/month) in November 2020. |
| (3) | The underwritten economic vacancy is 5.0%. The Global Data Center Property was 100.0% physically occupied as of October 1, 2019. |
| (4) | Debt service coverage ratios and debt yields are based on the Global Data Center Whole Loan. |
Escrows and Reserves.
Real Estate Taxes – The related mortgage loan documents do not require ongoing monthly escrows for real estate taxes as long as (i) no event of default has occurred and is continuing and (ii) the Flexential lease remains in full effect, Flexential pays all applicable taxes prior to delinquency and the Global Data Center Borrower provides the lender with evidence of payment no later than 30 days after the delinquency date.
Insurance – The related mortgage loan documents do not require ongoing monthly escrows for insurance premiums as long as (i) no event of default has occurred and is continuing; (ii) the Global Data Center Borrower provides the lender with evidence that the Global Data Center Property’s insurance coverage is included in a blanket policy and such policy is in full force and effect; and (iii) the Global Data Center Borrower pays all applicable insurance premiums and provides the lender with evidence of renewals and payment no more than 15 days after the delinquency date of such policy.
Lockbox and Cash Management. The Global Data Center Whole Loan is structured with a hard lockbox, which is already in place, and in-place cash management. The Global Data Center Borrower is required to direct tenants to pay rent directly into such lockbox account and all rents received directly by the Global Data Center Borrower or the property manager are required to be deposited into the lockbox account within one business day of receipt. Funds in the lockbox account are required to be swept on each business day to a lender-controlled cash management account. Prior to a Cash Trap Event Period (as defined below), any excess cash flow after satisfaction of the waterfall items outlined in the related mortgage loan documents is required to be distributed to the Global Data Center Borrower. During a Cash Trap Event Period, any excess cash flow is required to be swept to an excess cash flow subaccount controlled by the lender as additional security for the Global Data Center Whole Loan during the continuance of the Cash Trap Event Period.
A “Cash Trap Event Period” will commence upon the earlier of (i) the occurrence of an event of default under the related mortgage loan documents or (ii) the occurrence of a Major Tenant Event Period (as defined below). A Cash Trap Event Period will end upon the occurrence of the following: With regard to clause (i), the cure of such event of default and with regard to clause (ii), the termination of such Major Tenant Event Period.
A “Major Tenant Event Period” will commence upon the following; provided that “Flexential”, as used below, will also apply to any successors or assignees of Flexential: (i) an event of default under the related mortgage loan documents with respect to the payment of base rent under the Flexential lease beyond the expiration of any cure period; (ii) Flexential ceases operations and management of the space operated and managed by Flexential at the time of origination; or (iii) Flexential files, as a debtor, a voluntary petition under the Bankruptcy Code or any other creditors rights laws, or otherwise becomes involved, as a debtor, in a bankruptcy proceeding or other proceeding under Creditors Rights Laws. A “Major Tenant Event Cure” will occur upon the occurrence of the following: with regard to clauses (i)-(iii), a Major Tenant Re-Tenanting Event (as defined below); with regard to clause (i), the lender having received satisfactory evidence that the subject default is cured; with regard to clause (ii), Flexential resuming operations and management of the space operated and managed by Flexential at the time of origination; and with regard to clause (iii), the bankruptcy proceeding or other proceeding under Creditors Rights Laws having been terminated and the related lease having been either (a) affirmed without modification, or (b) affirmed with modification, provided that the modified terms are reasonably satisfactory to the lender.
A “Major Tenant Re-Tenanting Event” means the lender has received satisfactory evidence of the following: (i) the applicable space has been leased to one or more replacement tenants reasonably satisfactory to the lender with a total rent equal to or greater than the rent paid by Flexential at the time of origination, for a term of at least five years, and on terms reasonably satisfactory to the lender (all of the Flexential space is not required to be leased as long as the amount of rent collected from one or more replacement tenants reasonably acceptable to the lender is equal to or greater than the rent paid by Flexential at the time of origination); (ii) such tenant has taken occupancy and commenced operations and management of the applicable space (in a
THE INFORMATION IN THIS STRUCTURAL AND COLLATERAL TERM SHEET IS NOT COMPLETE AND MAY BE AMENDED PRIOR TO THE TIME OF SALE. THIS TERM SHEET IS NOT AN OFFER TO SELL THESE SECURITIES AND IT IS NOT A SOLICITATION OF AN OFFER TO BUY THESE SECURITIES IN ANY JURISDICTION WHERE THE OFFER OR SALE IS NOT PERMITTED.
85
101 Troutman Road Collegeville, PA 19426 | Collateral Asset Summary – Loan No. 6 Global Data Center | Cut-off Date Balance: Cut-off Date LTV Ratio: UW NCF DSCR: UW NOI Debt Yield: | $25,000,000 61.7% 2.29x 10.6% |
manner similar to how Flexential operated and managed its space at the time of origination); (iii) such tenant is paying full, unabated rent (or any rent concessions have been reserved for by the lender after taking into consideration the loan-to-value ratio); and (iv) all tenant improvement costs and leasing commissions provided in such replacement lease have been paid (or reserved for by the lender after taking into consideration the loan-to-value ratio), such evidence to include, without limitation, a satisfactory estoppel affirming the foregoing.
Additional Secured Indebtedness (not including trade debts). None.
Mezzanine Loan and Preferred Equity. None.
Release of Property. Not permitted.
Terrorism Insurance. The related mortgage loan documents require that the “all risk” insurance policy required to be maintained by the Global Data Center Borrower provide coverage for terrorism in an amount equal to the full replacement cost of the Global Data Center Property, as well as business interruption insurance covering no less than the 18-month period following the occurrence of a casualty event, together with a 6-month extended period of indemnity (provided that if TRIPRA or a similar statute is not in effect, the Global Data Center Borrower will not be obligated to pay terrorism insurance premiums in excess of 1.5 times the premium for the casualty and business interruption coverage on a stand-alone basis).
THE INFORMATION IN THIS STRUCTURAL AND COLLATERAL TERM SHEET IS NOT COMPLETE AND MAY BE AMENDED PRIOR TO THE TIME OF SALE. THIS TERM SHEET IS NOT AN OFFER TO SELL THESE SECURITIES AND IT IS NOT A SOLICITATION OF AN OFFER TO BUY THESE SECURITIES IN ANY JURISDICTION WHERE THE OFFER OR SALE IS NOT PERMITTED.
86
(THIS PAGE INTENTIONALLY LEFT BLANK)
87
| Various, FL | Collateral Asset Summary – Loan No. 7 Waramaug Florida Hotel Portfolio | Cut-off Date Balance: Cut-off Date LTV Ratio: UW NCF DSCR: UW NOI Debt Yield: | $24,400,000 74.4% 2.10x 13.5% |
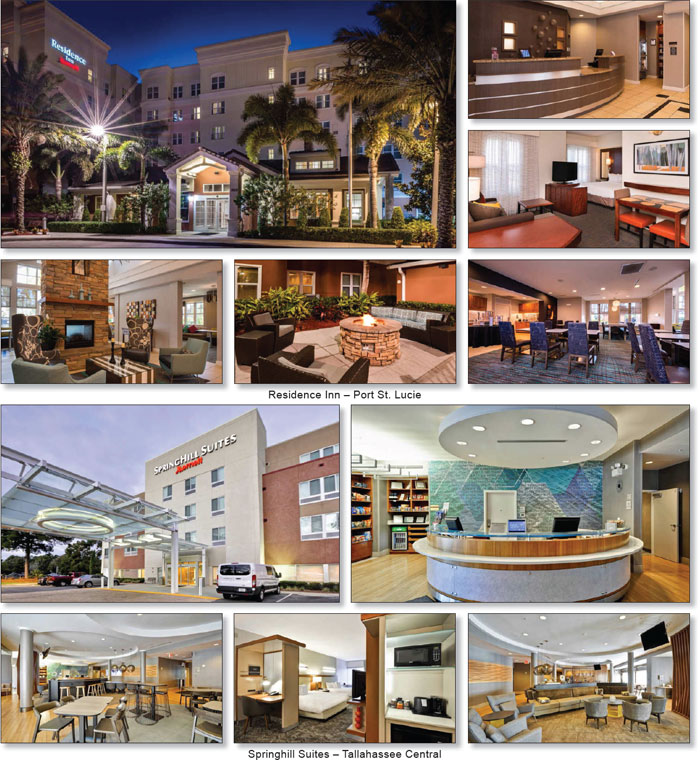
THE INFORMATION IN THIS STRUCTURAL AND COLLATERAL TERM SHEET IS NOT COMPLETE AND MAY BE AMENDED PRIOR TO THE TIME OF SALE. THIS TERM SHEET IS NOT AN OFFER TO SELL THESE SECURITIES AND IT IS NOT A SOLICITATION OF AN OFFER TO BUY THESE SECURITIES IN ANY JURISDICTION WHERE THE OFFER OR SALE IS NOT PERMITTED.
88
| Various, FL | Collateral Asset Summary – Loan No. 7 Waramaug Florida Hotel Portfolio | Cut-off Date Balance: Cut-off Date LTV Ratio: UW NCF DSCR: UW NOI Debt Yield: | $24,400,000 74.4% 2.10x 13.5% |
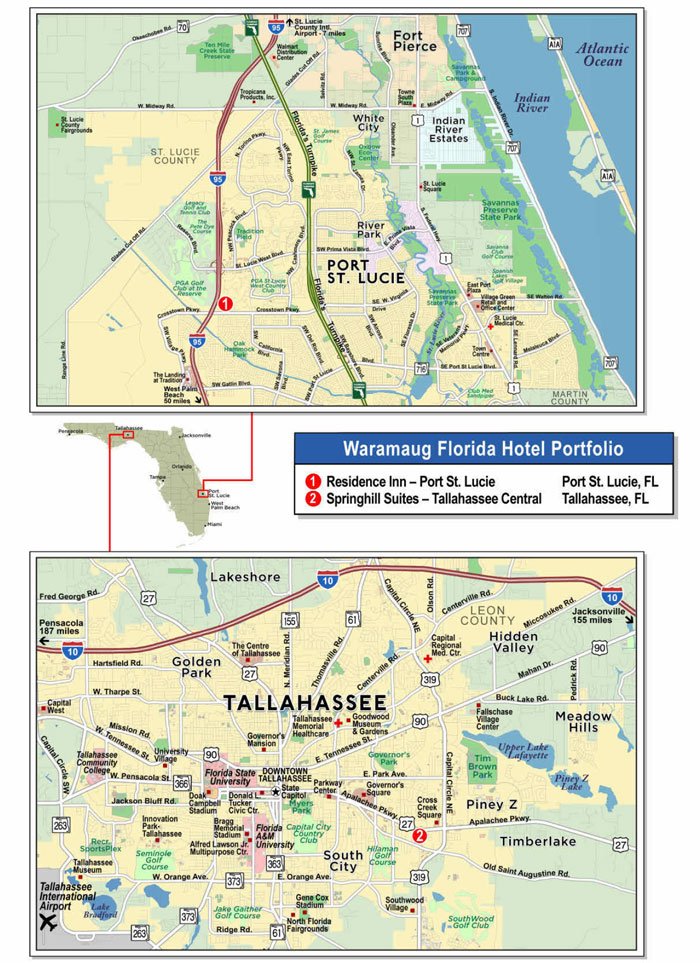
THE INFORMATION IN THIS STRUCTURAL AND COLLATERAL TERM SHEET IS NOT COMPLETE AND MAY BE AMENDED PRIOR TO THE TIME OF SALE. THIS TERM SHEET IS NOT AN OFFER TO SELL THESE SECURITIES AND IT IS NOT A SOLICITATION OF AN OFFER TO BUY THESE SECURITIES IN ANY JURISDICTION WHERE THE OFFER OR SALE IS NOT PERMITTED.
89
| Various, FL | Collateral Asset Summary – Loan No. 7 Waramaug Florida Hotel Portfolio | Cut-off Date Balance: Cut-off Date LTV Ratio: UW NCF DSCR: UW NOI Debt Yield: | $24,400,000 74.4% 2.10x 13.5% |
| Mortgage Loan Information | Property Information | ||||||
| Mortgage Loan Seller(1): | RREF | Single Asset/Portfolio: | Portfolio | ||||
Credit Assessment (Fitch/KBRA/Moody’s): | NR/NR/NR | Location: | Various, FL | ||||
| General Property Type: | Hospitality | ||||||
| Original Balance: | $24,400,000 | Detailed Property Type: | Various | ||||
| Cut-off Date Balance: | $24,400,000 | Title Vesting: | Fee Simple | ||||
| % of Initial Pool Balance: | 3.0% | Year Built/Renovated: | Various/2016 | ||||
| Loan Purpose: | Acquisition | Size: | 213 Rooms | ||||
| Borrower Sponsors: | Leslie Ng; Paul A. Nussbaum | Cut-off Date Balance per Room: | $114,554 | ||||
| Mortgage Rate: | 4.0500% | Maturity Date Balance per Room: | $99,212 | ||||
| Note Date: | 8/23/2019 | Property Manager: | Interstate Management Company, | ||||
| First Payment Date: | 10/6/2019 | LLC (borrower-related) | |||||
| Maturity Date: | 9/6/2029 | ||||||
| Original Term to Maturity: | 120 months | ||||||
| Original Amortization Term: | 360 months | Underwriting and Financial Information | |||||
| IO Period: | 36 months | UW NOI: | $3,297,751 | ||||
| Seasoning: | 1 month | UW NOI Debt Yield: | 13.5% | ||||
| Prepayment Provisions: | LO (25); DEF (91); O (4) | UW NOI Debt Yield at Maturity: | 15.6% | ||||
| Lockbox/Cash Mgmt Status: | Springing/Springing | UW NCF DSCR: | 2.95x (IO) 2.10x (P&I) | ||||
| Additional Debt Type: | N/A | Most Recent NOI: | $3,321,098 (6/30/2019 TTM) | ||||
| Additional Debt Balance: | N/A | 2nd Most Recent NOI: | $3,350,575 (12/31/2018) | ||||
| Future Debt Permitted (Type): | No (N/A) | 3rd Most Recent NOI: | $3,152,280 (12/31/2017) | ||||
| Reserves(2) | Most Recent Occupancy: | 85.3% (6/30/2019) | |||||
| Type | Initial | Monthly | Cap | 2nd Most Recent Occupancy: | 86.2% (12/31/2018) | ||
| RE Tax: | $218,149 | $31,164 | N/A | 3rd Most Recent Occupancy: | 85.6% (12/31/2017) | ||
| Insurance: | $116,710 | $10,610 | N/A | Appraised Value (as of): | $32,800,000 (Various) | ||
| FF&E: | $0 | $14,081 | N/A | Cut-off Date LTV Ratio: | 74.4% | ||
| PIP Reserve: | $2,755,015(3) | Springing | N/A | Maturity Date LTV Ratio: | 64.4% | ||
| Sources and Uses | ||||||
| Sources | Proceeds | % of Total | Uses | Proceeds | % of Total | |
| Loan Amount: | $24,400,000 | 67.4% | Purchase Price: | $32,250,000 | 89.1% | |
| Borrower Equity: | $11,775,362 | 32.6% | Reserves: | $3,089,874 | 8.5% | |
| Closing Costs: | $835,488 | 2.3% | ||||
| Total Sources: | $36,175,362 | 100.0% | Total Uses: | $36,175,362 | 100.0% | |
| (1) | The Waramaug Florida Hotel Portfolio Mortgage Loan (as defined below) was originated by BSPRT CMBS Finance, LLC and acquired by RREF. RREF has re-underwritten such mortgage loan in accordance with the procedures described under “Transaction Parties—The Sponsors and Mortgage Loan Sellers—Rialto Real Estate Fund III - Debt, LP” in the Preliminary Prospectus. |
| (2) | See“Escrows and Reserves” below for further discussion of reserve requirements. |
| (3) | There is an upfront $2,755,015 reserve which will be used to complete a property improvement plan (“PIP”) required by Marriott International Inc. (“Marriott”). |
The Mortgage Loan.The seventh largest mortgage loan (the “Waramaug Florida Hotel Portfolio Mortgage Loan”) is evidenced by a promissory note with an original principal balance of $24,400,000, which is secured by a first priority fee mortgage encumbering two hospitality properties totaling 213 rooms consisting of a 125-room extended stay hotel (the “Residence Inn - Port St. Lucie Property”) and an 88-room limited service hotel (the “Springhill Suites - Tallahassee Central Property” and together with the Residence Inn - Port St. Lucie Property, the “Waramaug Florida Hotel Portfolio Properties”) located in Port St. Lucie, Florida and Tallahassee, Florida, respectively. The proceeds of the Waramaug Florida Hotel Portfolio Mortgage Loan along with borrower equity of $11,775,362 were used to acquire the Waramaug Florida Hotel Portfolio Properties for a purchase price of $32,250,000, fund reserves and pay closing costs.
The Borrowers and the Borrower Sponsors. The borrowers are Waramaug PSL LLC and Waramaug Tallahassee LLC (collectively, the “Waramaug Florida Hotel Portfolio Borrowers”). Each of the Waramaug Florida Hotel Portfolio Borrowers is a Delaware limited liability company and special purpose entity. The guarantors and borrower sponsors are Leslie Ng and Paul A. Nussbaum of Waramaug Hospitality. Waramaug Hospitality is a hotel focused investor, with a current hotel portfolio of 37 properties, the majority of which are limited and select-service hotels.
The Properties.The Waramaug Florida Hotel Portfolio Properties are comprised of two hospitality properties totaling 213 rooms, one of which is located in Port St. Lucie, Florida (125 rooms) and the other is located in Tallahassee, Florida (88 rooms).
THE INFORMATION IN THIS STRUCTURAL AND COLLATERAL TERM SHEET IS NOT COMPLETE AND MAY BE AMENDED PRIOR TO THE TIME OF SALE. THIS TERM SHEET IS NOT AN OFFER TO SELL THESE SECURITIES AND IT IS NOT A SOLICITATION OF AN OFFER TO BUY THESE SECURITIES IN ANY JURISDICTION WHERE THE OFFER OR SALE IS NOT PERMITTED.
90
| Various, FL | Collateral Asset Summary – Loan No. 7 Waramaug Florida Hotel Portfolio | Cut-off Date Balance: Cut-off Date LTV Ratio: UW NCF DSCR: UW NOI Debt Yield: | $24,400,000 74.4% 2.10x 13.5% |
Residence Inn - Port St. Lucie
The Residence Inn - Port St. Lucie Property, built in 2009, is a 125-room extended stay hotel located in Port St. Lucie along I-95, directly across from the PGA Village & Golf Resort. The Residence Inn - Port St. Lucie Property offers a 24-hour reception desk, free high speed Wi-Fi, complimentary breakfast buffet, complimentary “Inn The Mix” happy hour, free parking, fitness center, outdoor pool, onsite business center, and 640 SF of meeting space. The Residence Inn - Port St. Lucie Property also offers a practice putting green on the premises. All guestrooms are suites featuring full kitchens complete with refrigerator, stove, and dishware, en suite bathrooms, black-out shades, hair dryer, flat-screen TVs, work desk with lamp, and living rooms containing sleeper sofas, armchair, and dinette. The previous owner spent approximately $2.1 million ($16,607 per room) in capital improvements at the Residence Inn - Port St. Lucie Property inclusive of an approximately $1.5 million ($12,361 per room) PIP in 2016 and improvements to the Residence Inn - Port St. Lucie Property such as HVAC and television upgrades. A new 15-year franchise agreement with Marriott commenced as of origination and expires in August 2034.
Springhill Suites - Tallahassee Central
The Springhill Suites - Tallahassee Central Property, built in 2008, is an 88-room limited service hotel located in Tallahassee along Hwy-27. The Springhill Suites - Tallahassee Central Property offers a 24-hour reception desk, free high speed Wi-Fi, complimentary breakfast, convenience store, free parking, fitness center, outdoor pool, onsite business center, and 520 SF of meeting space. All guestrooms are suites featuring en suite bathrooms, black-out shades, hair dryer, flat-screen TVs, work desk with lamp, microwaves and mini refrigerators, and coffee or tea makers, and living rooms containing sleeper sofas. Since 2016, the previous owner spent approximately $1,233,366 ($14,016 per room) in capital improvements at the Springhill Suites - Tallahassee Central Property inclusive of an approximately $993,909 ($11,294 per room) PIP in 2016 and other improvements to the Springhill Suites - Tallahassee Central Property such as technology and HVAC upgrades. A new 15-year franchise agreement with Marriott commenced as of origination and expires in August 2034.
Marriott operates, franchises, and licenses hotel, residential, and timeshare properties worldwide. It operates its properties under the JW Marriott, The Ritz-Carlton, Ritz-Carlton Reserve, W Hotels, The Luxury Collection, St. Regis, EDITION, Bulgari, Marriott Hotels, Sheraton, Delta Hotels, Marriott Executive Apartments, Marriott Vacation Club, Westin, Renaissance, Le Méridien, Autograph Collection, Gaylord Hotels, Tribute Portfolio, Design Hotels, Courtyard, Residence Inn, Fairfield by Marriott, SpringHill Suites, Four Points, TownePlace Suites, Aloft, AC Hotels by Marriott, Protea Hotels, Element, and Moxy brand names. As of August 5, 2019, Marriott operated approximately 7,000 properties under 30 hotel brands in 132 countries and territories. Marriott was founded in 1927 and is headquartered in Bethesda, Maryland.
A summary of the individual Waramaug Florida Hotel Portfolio Properties is provided below:
| Portfolio Overview | |||||||||
| Property | City, State | Rooms | Year Built/ Renovated | Allocated Cut-Off Date Balance | % of Allocated Cut-off Date Balance | As Is Appraised Value | UW NCF | % of UW NCF | Current Franchise Expiration Date |
| Residence Inn - Port St. Lucie | Port St. Lucie, FL | 125 | 2009/2016 | $14,400,000 | 59.0% | $19,000,000 | $1,707,761 | 57.7% | Aug 2034 |
| Springhill Suites - Tallahassee Central | Tallahassee, FL | 88 | 2008/2016 | $10,000,000 | 41.0% | $13,800,000 | $1,251,055 | 42.3% | Aug 2034 |
| Total/Wtd. Avg. | 213 | $24,400,000 | 100.0% | $32,800,000 | $2,958,816 | 100.0% | |||
Historical occupancy, ADR, and RevPAR of the Residence Inn - Port St. Lucie Property and its related competitive set are set forth in the following table:
| Historical Occupancy, ADR, RevPAR(1) | |||||||||
Competitive Set(2) | Residence Inn - Port St. Lucie Property | Penetration Factor | |||||||
| Year | Occupancy | ADR | RevPAR | Occupancy | ADR | RevPAR | Occupancy | ADR | RevPAR |
| 2017 | 73.3% | $114.01 | $83.62 | 87.7% | $117.11 | $102.66 | 119.5% | 102.7% | 122.8% |
| 2018 | 69.9% | $112.48 | $78.68 | 88.2% | $117.45 | $103.55 | 126.0% | 104.4% | 131.6% |
| 6/30/2019 TTM | 71.1% | $112.14 | $79.77 | 86.2% | $117.51 | $101.25 | 121.1% | 104.8% | 126.9% |
Source:Industry Report
| (1) | The variances between the underwriting, the appraisal and the industry report data with respect to Occupancy, ADR and RevPAR at Residence Inn - Port St. Lucie Property are attributable to differing reporting methodologies, and/or timing differences. |
| (2) | The competitive set includes Holiday Inn - Port St Lucie, Springhill Suites Port St Lucie, Hampton Inn Port St Lucie West, Hilton Garden Inn PGA Village Port St Lucie, Holiday Inn Express & Suites Port St Lucie West and Homewood Suites by Hilton Port St Lucie Tradition. |
THE INFORMATION IN THIS STRUCTURAL AND COLLATERAL TERM SHEET IS NOT COMPLETE AND MAY BE AMENDED PRIOR TO THE TIME OF SALE. THIS TERM SHEET IS NOT AN OFFER TO SELL THESE SECURITIES AND IT IS NOT A SOLICITATION OF AN OFFER TO BUY THESE SECURITIES IN ANY JURISDICTION WHERE THE OFFER OR SALE IS NOT PERMITTED.
91
| Various, FL | Collateral Asset Summary – Loan No. 7 Waramaug Florida Hotel Portfolio | Cut-off Date Balance: Cut-off Date LTV Ratio: UW NCF DSCR: UW NOI Debt Yield: | $24,400,000 74.4% 2.10x 13.5% |
Historical occupancy, ADR, and RevPAR of the Springhill Suites - Tallahassee Central Property and its related competitive set are set forth in the following table:
| Historical Occupancy, ADR, RevPAR(1) | |||||||||
Competitive Set(2) | Springhill Suites - Tallahassee Central Property | Penetration Factor | |||||||
| Year | Occupancy | ADR | RevPAR | Occupancy | ADR | RevPAR | Occupancy | ADR | RevPAR |
| 2017 | 68.1% | $116.99 | $79.66 | 82.2% | $124.05 | $101.94 | 120.7% | 106.0% | 128.0% |
| 2018 | 68.7% | $120.98 | $83.14 | 83.1% | $127.38 | $105.84 | 120.9% | 105.3% | 127.3% |
| 6/30/2019 TTM | 72.6% | $127.15 | $92.31 | 83.9% | $135.48 | $113.67 | 115.6% | 106.6% | 123.1% |
Source:Industry Report
| (1) | The variances between the underwriting, the appraisal and the industry report data with respect to Occupancy, ADR and RevPAR at Springhill Suites - Tallahassee Central Property are attributable to differing reporting methodologies, and/or timing differences. |
| (2) | The competitive set includes Courtyard Tallahassee Downtown Capitol, Wyndham Garden Hotel Tallahassee Capitol, Hampton Inn Tallahassee Central, Comfort Suites Tallahassee Downtown, Hilton Garden Inn Tallahassee Central and Fairfield Inn & Suites Tallahassee Central. |
The Market.
Residence Inn - Port St. Lucie
The Residence Inn - Port St. Lucie Property is located along Fountainview Boulevard in Port St. Lucie, Florida. The Residence Inn - Port St. Lucie Property is located approximately 1.8 miles east of PGA Golf Club Village, a 35-acre, 54-hole golf complex. The Residence Inn - Port St. Lucie Property is located in close proximity to I-95. The Residence Inn - Port St. Lucie Property is located across the street from a retail center that includes a Walmart Supercenter, AMC theater, Starbucks, Walgreens, Staples and Ross along with other retailers.
Port St. Lucie is also home to the New York Mets spring training facility located at First Data Field, which is located approximately 1.6 miles north of the property. Port St. Lucie has been home for the Mets spring training since 1988. The Port St. Lucie County Commission recently approved a $57 million renovation of First Data Field that would keep the Mets in Port St. Lucie for the next 25 years. Work is expected to be completed by 2021.
According to a third party market research report, the estimated 2019 population within a one-, three- and five-mile radius of the Residence Inn - Port St. Lucie Property is 3,274, 54,657 and 126,341, respectively. The estimated 2019 median household income within the same one-, three- and five-mile radius is $52,821, $55,211 and $52,832, respectively.
Springhill Suites - Tallahassee Central
The Springhill Suites - Tallahassee Central Property is located along Highway-27 in Tallahassee, Florida, which is the state capital. The Springhill Suites - Tallahassee Central Property is located 3.1 miles east of downtown Tallahassee and 3.5 miles east of Florida State University. The Springhill Suites - Tallahassee Central Property is also located 1.4 miles southeast of Governor’s Square Mall.
According to the Florida State University’s website there is a current enrollment of 41,717 students as of 2018. Florida State University sits on a 1,633-acre campus with 384 buildings and has a total of 14,079 employees. The Springhill Suites - Tallahassee Central Property also has seen consistent corporate demand from accounts such as Accenture, the Florida Department of Transportation, General Dynamics, North Highland Company and Ernst and Young.
According to a third party market research report, the estimated 2019 population within a one-, three- and five-mile radius of the Springhill Suites - Tallahassee Central Property is 9,593, 55,900 and 137,083, respectively. The estimated 2019 median household income within the same one-, three- and five-mile radius is $46,413, $52,095 and $43,873, respectively.
THE INFORMATION IN THIS STRUCTURAL AND COLLATERAL TERM SHEET IS NOT COMPLETE AND MAY BE AMENDED PRIOR TO THE TIME OF SALE. THIS TERM SHEET IS NOT AN OFFER TO SELL THESE SECURITIES AND IT IS NOT A SOLICITATION OF AN OFFER TO BUY THESE SECURITIES IN ANY JURISDICTION WHERE THE OFFER OR SALE IS NOT PERMITTED.
92
| Various, FL | Collateral Asset Summary – Loan No. 7 Waramaug Florida Hotel Portfolio | Cut-off Date Balance: Cut-off Date LTV Ratio: UW NCF DSCR: UW NOI Debt Yield: | $24,400,000 74.4% 2.10x 13.5% |
The following tables present year-end occupancy, estimated ADR and estimated RevPAR relating to each Waramaug Florida Hotel Portfolio Property’s primary competitive set:
| Competitive Property Summary | |||||||
| Property Name | No. of Rooms | Commercial Demand | Meeting & Group Demand | Leisure Demand | 2018 Occupancy | 2018 ADR | 2018 RevPAR |
| Residence Inn - Port St Lucie | 125 | 50% | 30% | 20% | 88.2% | $117.45 | $103.55 |
| Holiday Inn Port St. Lucie | 142 | 30% | 30% | 40% | 55%-60% | $105-$110 | $60-$65 |
| SpringHill Suites by Marriott Port St. Lucie | 103 | 50% | 25% | 25% | 60%-65% | $120-$125 | $70-$75 |
| Hampton Inn & Suites Port St. Lucie, West | 72 | 40% | 25% | 35% | 75%-80% | $110-$115 | $85-$90 |
| Hilton Garden Inn at PGA Village/Port St. Lucie | 130 | 30% | 30% | 40% | 70%-75% | $115-$120 | $80-$85 |
| Holiday Inn Express & Suites Port St. Lucie West | 93 | 40% | 15% | 45% | 70%-75% | $95-$100 | $65-$70 |
| Homewood Suites by Hilton Port St. Lucie-Tradition | 111 | 50% | 30% | 20% | 85%-90% | $120-$125 | $100-$105 |
| Total/Wtd. Avg. | 776 | 41% | 27% | 32% | 72.93% | $113.52 | $82.79 |
Source:Appraisal
| Competitive Property Summary | |||||||
| Property Name | No. of Rooms | Commercial Demand | Meeting & Group Demand | Leisure Demand | 2018 Occupancy | 2018 ADR | 2018 RevPAR |
| Springhill Suites - Tallahassee Central | 88 | 40% | 15% | 45% | 83.1% | $127.38 | $105.84 |
| Wyndham Garden Tallahassee Capitol | 147 | 40% | 15% | 45% | 50%-55% | $100-$105 | $55-$60 |
| Courtyard Tallahassee Downtown/Capitol | 154 | 45% | 15% | 40% | 65%-70% | $120-$125 | $75-$80 |
| Hampton Inn Tallahassee-Central | 78 | 45% | 10% | 45% | 80%-85% | $125-$130 | $100-$105 |
| Comfort Suites Tallahassee Downtown | 64 | 40% | 10% | 50% | 70%-75% | $115-$120 | $85-$90 |
| Hilton Garden Inn Tallahassee | 85 | 45% | 15% | 40% | 75%-80% | $130-$135 | $100-$105 |
| Fairfield Inn & Suites Tallahassee Central | 97 | 45% | 10% | 45% | 75%-80% | $130-$135 | $95-$100 |
| Tru by Hilton Tallahassee Central | 90 | 40% | 10% | 50% | 60%-65% | $125-$130 | $75-$80 |
| Holiday Inn Tallahassee E Capitol - Univ | 103 | 40% | 15% | 45% | 45%-50% | $130-$135 | $55-$60 |
| Total/Wtd. Avg. | 906 | 42% | 13% | 45% | 69.50% | $122.29 | $84.99 |
Source:Appraisal
THE INFORMATION IN THIS STRUCTURAL AND COLLATERAL TERM SHEET IS NOT COMPLETE AND MAY BE AMENDED PRIOR TO THE TIME OF SALE. THIS TERM SHEET IS NOT AN OFFER TO SELL THESE SECURITIES AND IT IS NOT A SOLICITATION OF AN OFFER TO BUY THESE SECURITIES IN ANY JURISDICTION WHERE THE OFFER OR SALE IS NOT PERMITTED.
93
| Various, FL | Collateral Asset Summary – Loan No. 7 Waramaug Florida Hotel Portfolio | Cut-off Date Balance: Cut-off Date LTV Ratio: UW NCF DSCR: UW NOI Debt Yield: | $24,400,000 74.4% 2.10x 13.5% |
Operating History and Underwritten Net Cash Flow.The following table presents certain information relating to the historical operating performance and the Underwritten Net Cash Flow at the Waramaug Florida Hotel Portfolio Properties:
| Cash Flow Analysis | ||||||
| 2016 | 2017 | 2018 | 6/30/2019 TTM | UW | UW per Room | |
| Occupancy | 78.7% | 85.6% | 86.2% | 85.3% | 85.3% | |
| ADR | $113.28 | $118.91 | $121.21 | $124.68 | $124.68 | |
| RevPAR | $89.13 | $101.76 | $104.49 | $106.38 | $106.38 | |
| Rooms Revenue | $6,948,558 | $7,911,509 | $8,123,905 | $8,270,850 | $8,270,850 | $38,830 |
| Food & Beverage | $18,587 | $27,392 | $33,881 | $34,105 | $34,105 | $160 |
| Other Income | $113,213 | $130,005 | $159,045 | $143,884 | $143,884 | $676 |
| Total Revenue | $7,080,358 | $8,068,906 | $8,316,831 | $8,448,839 | $8,448,839 | $39,666 |
| Total Expenses | $4,607,988 | $4,916,626 | $4,966,256 | $5,127,741 | $5,151,088 | $24,184 |
| Net Operating Income | $2,472,370 | $3,152,280 | $3,350,575 | $3,321,098 | $3,297,751 | $15,482 |
| FF&E | $283,214 | $322,756 | $332,673 | $337,954 | $337,954 | $1,587 |
| Net Cash Flow | $2,189,156 | $2,829,524 | $3,017,902 | $2,983,144 | $2,959,797 | $13,896 |
| NOI DSCR (P&I) | 1.76x | 2.24x | 2.38x | 2.36x | 2.34x | |
| NCF DSCR (P&I) | 1.56x | 2.01x | 2.15x | 2.12x | 2.10x | |
| NOI Debt Yield | 10.1% | 12.9% | 13.7% | 13.6% | 13.5% | |
| NCF Debt Yield | 9.0% | 11.6% | 12.4% | 12.2% | 12.1% | |
Escrows and Reserves.At origination of the Waramaug Florida Hotel Portfolio Mortgage Loan, the Waramaug Florida Hotel Portfolio Borrower deposited (i) $218,149 for real estate taxes, (ii) $116,710 for insurance premiums and (iii) $2,755,015 for a required PIP (“Scheduled PIP”). On a monthly basis, the Waramaug Florida Hotel Portfolio Borrower is required to deposit monthly (i) real estate tax reserves in an amount equal to 1/12 of the real estate taxes that the lender estimates will be payable during the next twelve months (initially $31,164), (ii) insurance premiums in an amount equal to 1/12 of the insurance that the lender estimates will be payable during the next twelve months (initially $10,610);provided,however, that the Waramaug Florida Hotel Portfolio Borrower will have no obligation to make the monthly insurance deposit with respect to any policies so long as it satisfies certain conditions set forth in the related mortgage loan documents, (iii) FF&E reserves in an amount equal to 1/12 of 4.0% of the total revenue from the Waramaug Florida Hotel Portfolio Properties, which will be split (a) 2% to the FF&E reserve and 2% to PIP completion reserve in years 1-3 and (b) commencing on monthly payment date occurring in October 2022 and on each monthly payment date thereafter, FF&E reserves, in an amount equal to 4% or greater of gross rents for property or projected gross rents for the property.
Lockbox and Cash Management. The Waramaug Florida Hotel Portfolio Mortgage Loan is structured with a springing hard lockbox and springing cash management upon the occurrence of a Cash Sweep Period (as defined below). Additionally, during the continuance of a Cash Sweep Period, all excess cash flow is required to be swept into a lender controlled excess cash flow account.
A “Cash Sweep Period” will commence upon any of (A) the occurrence and continuance of an event of default under the related mortgage loan documents; (B) the debt service coverage ratio being less than 1.30x; (C) the occurrence of a PIP True-Up Event (Scheduled PIP) (as defined below); (D) the occurrence of a PIP True-Up Event (New PIP) (as defined below), and (E) October 6, 2020 if the Scheduled PIP is not then complete; and (ii) expiring upon (v) with regard to any Cash Sweep Period commenced in connection with clause (A) above, upon the cure (if applicable) of such event of default; (w) with regard to any Cash Sweep Period commenced in connection with clause (B) above, upon the date that the debt service coverage ratio is equal to or greater than 1.35x for two (2) consecutive calendar quarters and; (x) with regard to any Cash Sweep Period commenced in connection with clause (C) above, upon the occurrence of a PIP True-Up Event (Scheduled PIP) Cure; (y) with regard to any Cash Sweep Period commenced in connection with clause (D) above, upon the occurrence of a PIP True-Up Event (New PIP) Cure; and (z) with regard to any Cash Sweep Period commenced in connection with clause (E) above, upon the Waramaug Florida Hotel Portfolio Borrowers will have completed the Scheduled PIP, excluding the requirement to completing such Scheduled PIP by October 6, 2020. Notwithstanding the foregoing, a Cash Sweep Period will not be deemed to expire in the event that a Cash Sweep Period then exists for any other reason.
A “PIP True-Up Event (New PIP)” means the Waramaug Florida Hotel Portfolio Borrowers’ failure to make a deposit into the PIP reserve account.
A “PIP True-Up Event (New PIP) Cure” occurs when the lender determines that the sum of the FF&E Reserve Funds (as defined below) plus the PIP Reserve Funds (as defined below) with respect to the New PIP (as defined below) that has yet to be completed as of such date (as determined by the lender in its reasonable discretion after taking into account any portion of the New PIP with respect to which the lender has received satisfactory evidence that the same has previously been performed and paid for by the Waramaug Florida Hotel Portfolio Borrowers in accordance with the terms hereof and the related franchise agreement or has been waived in writing by franchisor) is an amount greater than or equal to one hundred ten percent (110%) of the estimated costs required to complete such New PIP that has yet to be completed as of such date. The Waramaug Florida Hotel Portfolio Borrowers will (1) cooperate with the lender and provide the lender with information as reasonably necessary (including, without limitation, budgets, plans, specifications, and purchase orders) in order for the lender to make such determination; and (2) permit the lender and the lender’s agents and representatives (including, without limitation, the lender’s engineer, architect and/or inspector) or other third-parties to enter on the Waramaug Florida Hotel Portfolio Properties to inspect the status of the New PIP; and (3) reimburse the lender for all actual costs and expenses in connection with such determination.
A “PIP True-Up Event (Scheduled PIP)” means the Waramaug Florida Hotel Portfolio Borrowers’ failure to make a deposit into the PIP reserve account.
THE INFORMATION IN THIS STRUCTURAL AND COLLATERAL TERM SHEET IS NOT COMPLETE AND MAY BE AMENDED PRIOR TO THE TIME OF SALE. THIS TERM SHEET IS NOT AN OFFER TO SELL THESE SECURITIES AND IT IS NOT A SOLICITATION OF AN OFFER TO BUY THESE SECURITIES IN ANY JURISDICTION WHERE THE OFFER OR SALE IS NOT PERMITTED.
94
| Various, FL | Collateral Asset Summary – Loan No. 7 Waramaug Florida Hotel Portfolio | Cut-off Date Balance: Cut-off Date LTV Ratio: UW NCF DSCR: UW NOI Debt Yield: | $24,400,000 74.4% 2.10x 13.5% |
A “PIP True-Up Event (Scheduled PIP) Cure” occurs when the lender determines that the sum of the FF&E Reserve Funds plus the PIP Reserve Funds with respect to the remaining scheduled PIP is an amount greater than or equal to 110% of the estimated costs required to complete the remaining scheduled PIP. The Waramaug Florida Hotel Portfolio Borrowers will (1) cooperate with the lender and provide the lender with information as reasonably necessary (including, without limitation, budgets, plans, specifications, and purchase orders) in order for the lender to make such determination; and (2) permit the lender and the lender’s agents and representatives (including, without limitation, the lender’s engineer, architect and/or inspector) or other third-parties to enter on the Waramaug Florida Hotel Portfolio Properties to inspect the status of the Scheduled PIP; and (3) reimburse the lender for all actual costs and expenses in connection with such determination.
A “Scheduled PIP” the Waramaug Florida Hotel Portfolio Borrowers’ failure to complete the property improvements plan 12 months from the effective.
“PIP Reserve Funds” means amounts held in the PIP reserve account.
“FF&E Reserve Funds” commencing on the monthly payment date occurring in October 2019, and on each monthly payment date thereafter through and including the monthly payment date occurring in September 2022, for FF&E costs, an amount equal to 1/12 of 2% of the greater of (x) gross rents for the Waramaug Florida Hotel Portfolio Properties or (y) the projected rents for the Waramaug Florida Hotel Portfolio Properties for the current calendar year. Commencing with the monthly payment date occurring in October 2022, and on each monthly payment thereafter, for the FF&E costs, an amount equal to 1/12 of 4% of the greater of (x) gross rents for the Waramaug Florida Hotel Portfolio Properties or (y) the projected rents for the Waramaug Florida Hotel Portfolio Properties for the current calendar year.
A “New PIP” means on the date that any PIP other than the Scheduled PIP is imposed by franchisor pursuant to the franchise agreement.
Additional Secured Indebtedness (not including trade debts). None.
Mezzanine Loan and Preferred Equity. None.
Release of Property. The Waramaug Florida Hotel Portfolio Borrowers are permitted to obtain the release of a given property (a “Release Property”) from the collateral in connection with a third-party, arms-length sale of the Release Property,provided that there is (i) noevent of default under therelated mortgage loan documentshas occurred or would occur as a result of the release, (ii) the remaining collateral has a loan-to-value ratio no greater than the lesser of the loan-to-value ratio in-place at origination (68.9%) or the loan-to-value ratio in-place immediately prior to the release, (iii)the remaining collateral has a debt service coverage ratio no less than the greater of the debt service coverage ratio in-place at closing (2.10x) or the in-place debt service coverage ratio immediately prior to the release, (iv)the remaining collateral has a debt yield no less than the greater of the debt yield in-place at closing (12.0%) orthe debt yield in-place immediately prior to the release, (v) payment of a release price and any prepayment penalty associated with the payment of the release price which, will be equal to the greater of (x) the net sales proceeds for the property being released and (y) 115% of the loan amount allocated to the Release Propertyand (v)payment of all other costs and expenses of the lender in connection with the release.
Terrorism Insurance. The Waramaug Hotel Portfolio Borrowers are required to obtain and maintain property insurance, commercial general liability insurance and business income or rental loss insurance that covers foreign and domestic perils and acts of terrorism.
THE INFORMATION IN THIS STRUCTURAL AND COLLATERAL TERM SHEET IS NOT COMPLETE AND MAY BE AMENDED PRIOR TO THE TIME OF SALE. THIS TERM SHEET IS NOT AN OFFER TO SELL THESE SECURITIES AND IT IS NOT A SOLICITATION OF AN OFFER TO BUY THESE SECURITIES IN ANY JURISDICTION WHERE THE OFFER OR SALE IS NOT PERMITTED.
95
| Various Chantilly, VA 20151 | Collateral Asset Summary – Loan No. 8 The Chantilly Office Portfolio | Cut-off Date Balance: Cut-off Date LTV Ratio: UW NCF DSCR: UW NOI Debt Yield: | $24,000,000 44.4% 3.60x 16.8% |
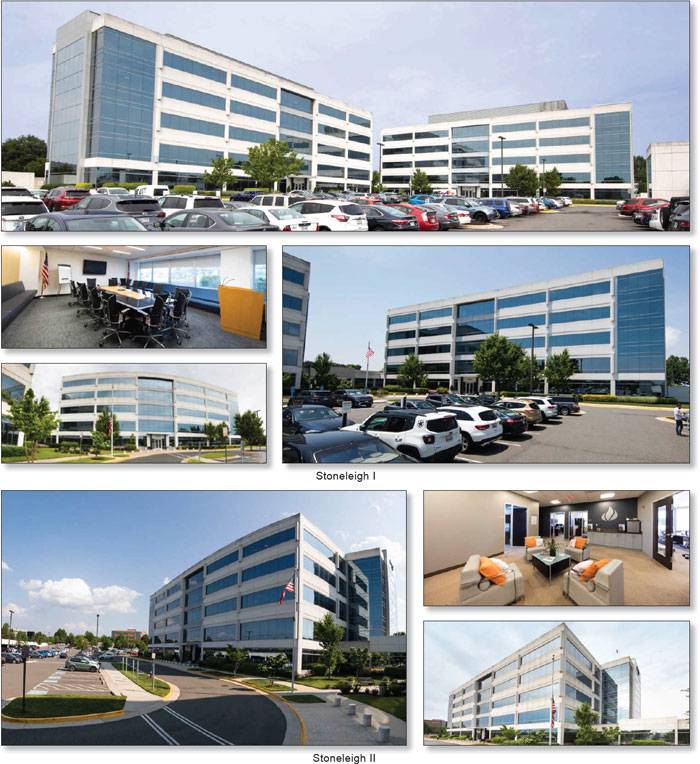
THE INFORMATION IN THIS STRUCTURAL AND COLLATERAL TERM SHEET IS NOT COMPLETE AND MAY BE AMENDED PRIOR TO THE TIME OF SALE. THIS TERM SHEET IS NOT AN OFFER TO SELL THESE SECURITIES AND IT IS NOT A SOLICITATION OF AN OFFER TO BUY THESE SECURITIES IN ANY JURISDICTION WHERE THE OFFER OR SALE IS NOT PERMITTED.
96
| Various Chantilly, VA 20151 | Collateral Asset Summary – Loan No. 8 The Chantilly Office Portfolio | Cut-off Date Balance: Cut-off Date LTV Ratio: UW NCF DSCR: UW NOI Debt Yield: | $24,000,000 44.4% 3.60x 16.8% |
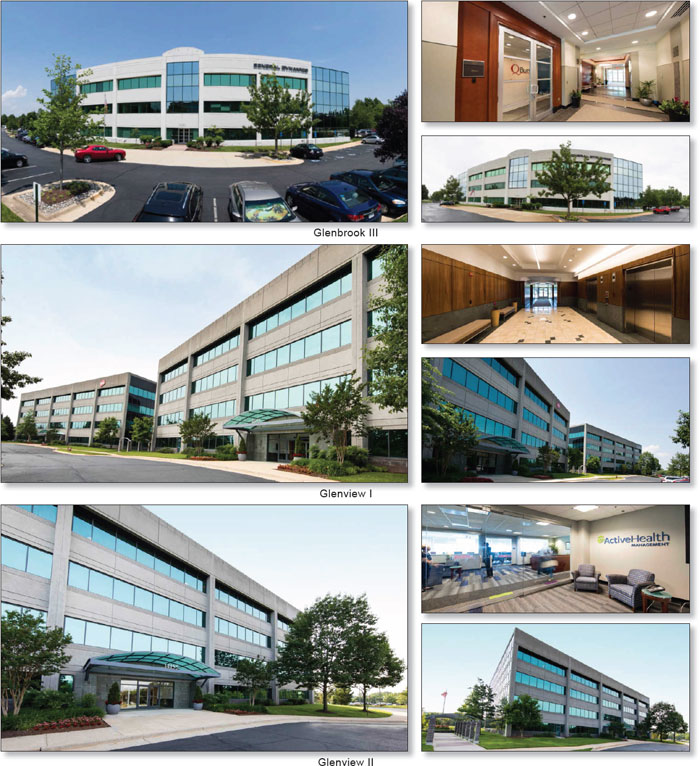
THE INFORMATION IN THIS STRUCTURAL AND COLLATERAL TERM SHEET IS NOT COMPLETE AND MAY BE AMENDED PRIOR TO THE TIME OF SALE. THIS TERM SHEET IS NOT AN OFFER TO SELL THESE SECURITIES AND IT IS NOT A SOLICITATION OF AN OFFER TO BUY THESE SECURITIES IN ANY JURISDICTION WHERE THE OFFER OR SALE IS NOT PERMITTED.
97
| Various Chantilly, VA 20151 | Collateral Asset Summary – Loan No. 8 The Chantilly Office Portfolio | Cut-off Date Balance: Cut-off Date LTV Ratio: UW NCF DSCR: UW NOI Debt Yield: | $24,000,000 44.4% 3.60x 16.8% |
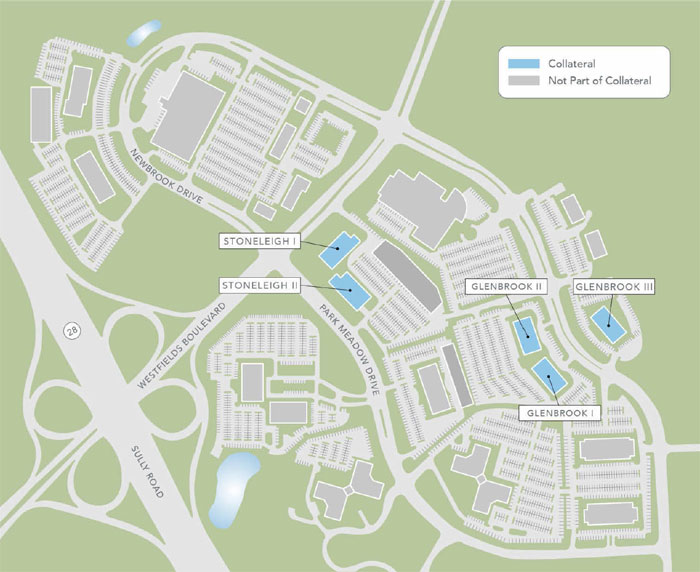
THE INFORMATION IN THIS STRUCTURAL AND COLLATERAL TERM SHEET IS NOT COMPLETE AND MAY BE AMENDED PRIOR TO THE TIME OF SALE. THIS TERM SHEET IS NOT AN OFFER TO SELL THESE SECURITIES AND IT IS NOT A SOLICITATION OF AN OFFER TO BUY THESE SECURITIES IN ANY JURISDICTION WHERE THE OFFER OR SALE IS NOT PERMITTED.
98
| Various Chantilly, VA 20151 | Collateral Asset Summary – Loan No. 8 The Chantilly Office Portfolio | Cut-off Date Balance: Cut-off Date LTV Ratio: UW NCF DSCR: UW NOI Debt Yield: | $24,000,000 44.4% 3.60x 16.8% |
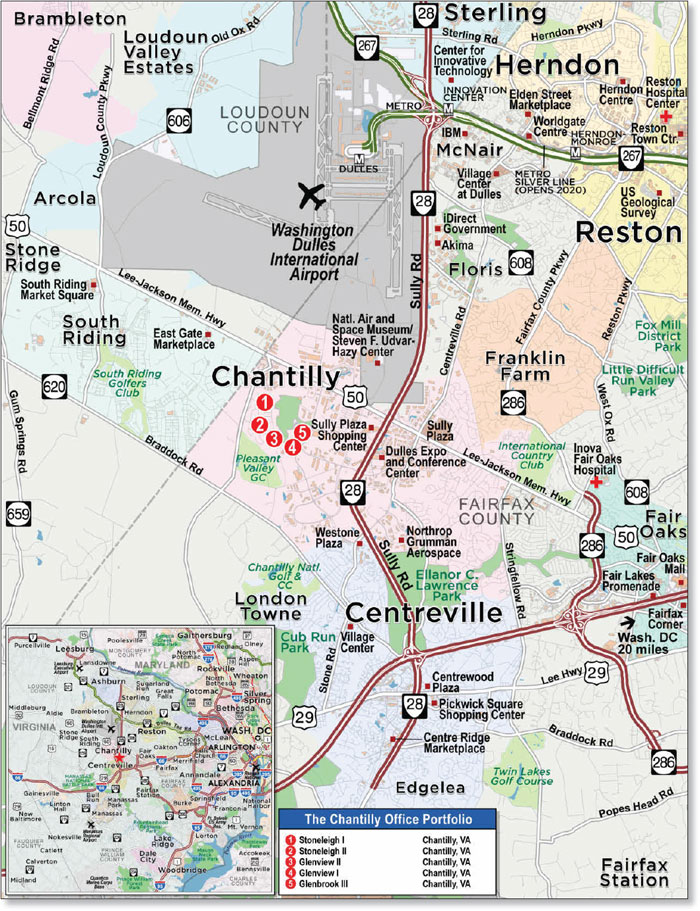
THE INFORMATION IN THIS STRUCTURAL AND COLLATERAL TERM SHEET IS NOT COMPLETE AND MAY BE AMENDED PRIOR TO THE TIME OF SALE. THIS TERM SHEET IS NOT AN OFFER TO SELL THESE SECURITIES AND IT IS NOT A SOLICITATION OF AN OFFER TO BUY THESE SECURITIES IN ANY JURISDICTION WHERE THE OFFER OR SALE IS NOT PERMITTED.
99
| Various Chantilly, VA 20151 | Collateral Asset Summary – Loan No. 8 The Chantilly Office Portfolio | Cut-off Date Balance: Cut-off Date LTV Ratio: UW NCF DSCR: UW NOI Debt Yield: | $24,000,000 44.4% 3.60x 16.8% |
| Mortgage Loan Information | Property Information | |||||
| Mortgage Loan Seller: | UBS AG | Single Asset/Portfolio: | Portfolio | |||
Credit Assessment (Fitch/KBRA/Moody’s): | NR/NR/NR | Location: | Chantilly, VA 20151 | |||
| General Property Type: | Office | |||||
| Original Balance(1): | $24,000,000 | Detailed Property Type: | Suburban | |||
| Cut-off Date Balance(1): | $24,000,000 | Title Vesting: | Fee Simple | |||
| % of Initial Pool Balance: | 3.0% | Year Built/Renovated: | Various/N/A | |||
| Loan Purpose: | Recapitalization | Size: | 429,126 SF | |||
| Borrower Sponsor: | RMR Office Property Fund LP | Cut-off Date Balance per SF(1): | $108 | |||
| Mortgage Rate: | 4.1500% | Maturity Date Balance per SF(1): | $108 | |||
| Note Date: | 5/16/2019 | Property Manager: | Self-managed | |||
| First Payment Date: | 7/6/2019 | |||||
| Maturity Date: | 6/6/2029 | |||||
| Original Term to Maturity: | 120 months | |||||
| Original Amortization Term: | 0 months | |||||
| IO Period: | 120 months | |||||
| Seasoning: | 4 months | Underwriting and Financial Information | ||||
| Prepayment Provisions: | LO (28); DEF (85); O (7) | UW NOI(3): | $7,786,425 | |||
| Lockbox/Cash Mgmt Status: | Hard/Springing | UW NOI Debt Yield(1): | 16.8% | |||
| Additional Debt Type(1): | Pari Passu | UW NOI Debt Yield at Maturity(1): | 16.8% | |||
| Additional Debt Balance(1): | $22,350,000 | UW NCF DSCR(1): | 3.60x | |||
| Future Debt Permitted (Type): | No (N/A) | Most Recent NOI(3): | $6,211,845 (2/28/2019 TTM) | |||
| Reserves(2) | 2nd Most Recent NOI(3): | $6,479,354 (12/31/2018) | ||||
| Type | Initial | Monthly | Cap | 3rd Most Recent NOI(3): | $7,031,577 (12/31/2017) | |
| RE Tax: | $0 | Springing | N/A | Most Recent Occupancy(3)(4): | 86.2% (5/31/2019) | |
| Insurance: | $0 | Springing | N/A | 2nd Most Recent Occupancy(3): | 77.4% (12/31/2018) | |
| Replacements: | $0 | Springing | $257,476 | 3rd Most Recent Occupancy(3): | 85.4% (12/31/2017) | |
| TI/LC: | $0 | Springing | N/A | Appraised Value (as of)(5): | $104,500,000 (3/28/2019) | |
| TATILC Funds: | $1,481,290 | $0 | N/A | Cut-off Date LTV Ratio(1)(5): | 44.4% | |
| Rent Concession Funds: | $593,341 | $0 | N/A | Maturity Date LTV Ratio(1)(5): | 44.4% | |
| Sources and Uses | ||||||
| Sources | Proceeds | % of Total | Uses | Proceeds | % of Total | |
| Loan Amount(1): | $46,350,000 | 100.0% | Reserves: | $2,074,631 | 4.5% | |
| Closing Costs: | $444,476 | 1.0% | ||||
| Return of Equity(6): | $43,830,893 | 94.6% | ||||
| Total Sources: | $46,350,000 | 100.0% | Total Uses: | $46,350,000 | 100.0% | |
| (1) | The Chantilly Office Portfolio Mortgage Loan (as defined below) is part of The Chantilly Office Portfolio Whole Loan (as defined below), which is comprised of threepari passupromissory notes with an aggregate original principal balance of $46,350,000. The Cut-off Date Balance per SF, Maturity Date Balance per SF, UW NOI Debt Yield, UW NOI Debt Yield at Maturity, UW NCF DSCR, Cut-off Date LTV Ratio and Maturity Date LTV Ratio presented above are based on the aggregate principal balance of the promissory notes comprising The Chantilly Office Portfolio Whole Loan. |
| (2) | See “Escrows and Reserves” below for further discussion of reserve requirements. |
| (3) | Since acquisition in September 2017, the borrower sponsor has executed 62,686 SF (14.6% of NRA and 15.0% of underwritten base rent) of new and expanded leases totaling $1,747,647 of underwritten base rent and 94,982 SF (22.1% of NRA and 26.0% of underwritten base rent) of lease extensions totaling $3,024,562 of underwritten base rent. UW NOI is based on the underwritten rent roll. |
| (4) | Tetra Tech, Inc. leasing 20,020 SF (4.7% of NRA) at The Chantilly Office Portfolio Properties (as defined below) has yet to take occupancy as the space is currently being built out. Omniplex World Services (1.0% of NRA, 1.2% of underwritten base rent) has exercised its termination option effective February 29, 2020. Excluding both of these spaces, The Chantilly Office Portfolio Properties are 80.5% occupied. |
| (5) | The Chantilly Office Portfolio Properties have an “as-is” appraised value of $104,500,000 as of March 28, 2019 and an “as-stabilized” appraised value of $121,700,000 as of March 28, 2020 and March 28, 2022. The Cut-off Date LTV Ratio and Maturity Date LTV Ratio based on The Chantilly Office Portfolio Whole Loan and the “as-stabilized” appraised value are 38.1% and 38.1%, respectively. |
| (6) | An affiliate of the borrower sponsor acquired The Chantilly Office Portfolio Properties in September 2017 as part of a six-asset portfolio for $71.8 million. The borrower sponsor subsequently acquired from the affiliate and recapitalized five of the six properties at an allocated purchase price of approximately $71.2 million ($165.89 PSF) in September 2018. At origination of The Chantilly Office Portfolio Whole Loan, the borrower sponsor had cash equity in The Chantilly Office Portfolio Properties of approximately $29.0 million ($67.47 PSF). |
The Mortgage Loan. The eighth largest mortgage loan (“The Chantilly Office Portfolio Mortgage Loan”) is part of a whole loan (“The Chantilly Office Portfolio Whole Loan”) evidenced by threepari passu promissory notes with an aggregate original principal balance of $46,350,000. The Chantilly Office Portfolio Whole Loan is secured by a first priority fee mortgage encumbering a portfolio of five office buildings totaling 429,126 SF located in Chantilly, Virginia (collectively, “The Chantilly Office Portfolio Properties”). Promissory Notes A-2 and A-3, with an aggregate original principal balance of $24,000,000, represent The Chantilly Office Portfolio Mortgage Loan and will be included in the UBS 2019-C17 Trust. The below table summarizes The Chantilly Office Portfolio Whole Loan, including the remainingpari passupromissory note comprising The Chantilly Office Portfolio Whole Loan. The Chantilly Office Portfolio Whole Loan will be serviced pursuant to the pooling and servicing agreement for the UBS 2019-C17 Trust. See “Description of the Mortgage Pool—The Whole Loans—The Serviced Pari Passu Whole Loans” and “Pooling and Servicing Agreement” in the Preliminary Prospectus.
THE INFORMATION IN THIS STRUCTURAL AND COLLATERAL TERM SHEET IS NOT COMPLETE AND MAY BE AMENDED PRIOR TO THE TIME OF SALE. THIS TERM SHEET IS NOT AN OFFER TO SELL THESE SECURITIES AND IT IS NOT A SOLICITATION OF AN OFFER TO BUY THESE SECURITIES IN ANY JURISDICTION WHERE THE OFFER OR SALE IS NOT PERMITTED.
100
| Various Chantilly, VA 20151 | Collateral Asset Summary – Loan No. 8 The Chantilly Office Portfolio | Cut-off Date Balance: Cut-off Date LTV Ratio: UW NCF DSCR: UW NOI Debt Yield: | $24,000,000 44.4% 3.60x 16.8% |
| The Chantilly Office Portfolio Whole Loan Summary | ||||
| Note | Original Balance | Cut-off Date Balance | Anticipated Note Holder | Controlling Piece |
| Note A-1 | $22,350,000 | $22,350,000 | WFCM 2019-C51 | No |
| Note A-2 | $14,000,000 | $14,000,000 | UBS 2019-C17 | Yes |
| Note A-3 | $10,000,000 | $10,000,000 | UBS 2019-C17 | No |
| Total | $46,350,000 | $46,350,000 | ||
The proceeds of The Chantilly Office Portfolio Whole Loan were used to fund reserves, pay closing costs and return equity to the borrower sponsor.
The Borrower and Borrower Sponsor. The borrower is RMR Office OPF Chantilly LP (“The Chantilly Office Portfolio Borrower”), a single purpose Delaware limited partnership structured to be bankruptcy remote. Legal counsel to The Chantilly Office Portfolio Borrower delivered a non-consolidation opinion in connection with the origination of The Chantilly Office Portfolio Whole Loan. The nonrecourse carve-out guarantor and borrower sponsor of The Chantilly Office Portfolio Whole Loan is RMR Office Property Fund LP.
RMR Office Property Fund LP is a subsidiary of The RMR Group Inc. (NASDAQ: RMR) (“RMR”), an alternative asset management company founded in 1986 to invest in real estate and manage real estate related businesses. RMR’s business primarily consists of providing management services to five publicly traded real estate investment trusts, three real estate related operating companies, one real estate securities mutual fund, and one firm specializing in commercial real estate finance. As of December 31, 2018, RMR had approximately $30.0 billion of total assets under management, including more than 1,500 properties, and employed approximately 600 real estate professionals in more than 30 offices throughout the United States; and the companies managed by RMR collectively had approximately 50,000 employees. RMR Office Property Fund LP is a private, open-end core fund focused on the acquisition, ownership and leasing of a diverse portfolio of office properties throughout the U.S.
The Properties. The Chantilly Office Portfolio Properties are comprised of (i) two freestanding five-story class A office buildings situated on a 10.1-acre parcel totaling 109,598 SF (“Stoneleigh I”) and 106,547 SF (“Stoneleigh II”, and together with Stoneleigh I, the “Stoneleigh Properties”), (ii) two freestanding four-story class A office buildings situated on a 9.3-acre parcel totaling 76,760 SF (“Glenview I”) and 77,427 SF (“Glenview II”) and (iii) a freestanding three story class A office building situated on a 4.6-acre parcel adjacent to Glenview I and Glenview II totaling 58,794 SF (“Glenbrook III”, and together with Glenview I and Glenview II, the “Newbrook Properties”). The Stoneleigh Properties were built in 2006 and provide for 828 parking spaces (3.83 spaces per 1,000 SF of NRA). The Newbrook Properties were built in 2000 and provide for 951 parking spaces (4.47 spaces per 1,000 SF of NRA). The Chantilly Office Portfolio Properties are located within 0.3 miles of each other in Chantilly, Virginia, approximately 25 miles west of Washington, D.C.
| Portfolio Summary | ||||||
| Property | Net Rentable Area (SF) | Occupancy | Year Built | Appraisal Value | Allocated Cut-off Date Balance(1) | LTV(1) |
| Stoneleigh I | 109,598 | 64.0% | 2006 | $26,874,518 | $11,840,000 | 44.1% |
| Stoneleigh II | 106,547 | 100.0% | 2006 | $26,125,482 | $11,510,000 | 44.1% |
| Glenview I | 76,760 | 94.3%(2) | 2000 | $18,562,391 | $8,290,000 | 44.7% |
| Glenview II | 77,427 | 87.5%(3) | 2000 | $18,719,130 | $8,360,000 | 44.7% |
| Glenbrook III | 58,794 | 90.4% | 2000 | $14,218,478 | $6,350,000 | 44.7% |
| Total/Wtd. Avg. | 429,126 | 86.2%(4) | $104,500,000 | $46,350,000 | 44.4% | |
| (1) | Based on The Chantilly Office Portfolio Whole Loan. |
| (2) | Includes one tenant, Tetra Tech, Inc., leasing 20,020 SF (4.7% of portfolio NRA) that has yet to take occupancy as the space is currently being built out. Excluding this space, the Glenview I property is 68.2% occupied. |
| (3) | Includes one tenant, Omniplex World Services (1.0% of portfolio NRA, 1.2% of underwritten base rent), which has exercised its termination option effective February 29, 2020. Excluding this space, the Glenview II property is 81.9% occupied. |
| (4) | Includes Tetra Tech, Inc. at the Glenview I property, which has yet to take occupancy as the space is currently being built out, and Omniplex World Services at the Glenview II property, which has exercised its termination option effective February 29, 2020. Excluding these spaces, The Chantilly Office Portfolio Properties are 80.5% occupied. |
An affiliate of the borrower sponsor acquired The Chantilly Office Portfolio Properties in September 2017 as part of a six-asset portfolio for $71.8 million. The borrower sponsor subsequently acquired from the affiliate and recapitalized five of the six properties at an allocated purchase price of approximately $71.2 million in September 2018 and subsequently invested capital improvements of approximately $1.6 million. As of May 31, 2019, The Chantilly Office Portfolio Properties were 86.2% leased to 15 national, regional, and local tenants. Investment grade tenants account for 17.6% of net rentable area and 19.3% of underwritten base rent. National tenants, including Aetna Life Insurance, First American Title, and WEX, Inc., account for 47.2% of net rentable area and 53.0% of underwritten base rent. Eleven tenants totaling 290,413 SF (67.7% of NRA, 79.8% of underwritten base rent) have either extended their lease terms or expanded their spaces.
Major Tenants.
AECOM Management Services, Inc. (71,383 SF, 16.6% of NRA, 19.4% of underwritten base rent). AECOM Management Services, Inc. (“AECOM”) (Moody’s/S&P: Ba3/BB) (NYSE: ACM) is an engineering firm that provides planning, consulting, architectural and engineering design services to commercial and government clients worldwide in markets such as transportation, facilities, environmental, energy, water and government. According to an industry publication, AECOM is the second largest general architectural and engineering design firm in the world, ranked by 2017 design revenue. In addition, AECOM is ranked by an industry publication as the leading firm in a number of design end markets, including transportation and general building. AECOM operated in over 150 countries with over 87,000 employees and reported revenues of approximately $20.2 billion as of fiscal year 2018. AECOM has been a tenant at The Chantilly Office Portfolio Properties since July 2006 and currently occupies 71,383 SF across seven suites at The Chantilly Office Portfolio Properties. The lease related to four suites at the Stoneleigh Properties totaling 50,066 SF (11.7% of NRA, 14.4% of underwritten base rent) have a current expiration date of September 30, 2020 and provide for two, five-year renewal options. The lease related to one suite at the Stoneleigh Properties
THE INFORMATION IN THIS STRUCTURAL AND COLLATERAL TERM SHEET IS NOT COMPLETE AND MAY BE AMENDED PRIOR TO THE TIME OF SALE. THIS TERM SHEET IS NOT AN OFFER TO SELL THESE SECURITIES AND IT IS NOT A SOLICITATION OF AN OFFER TO BUY THESE SECURITIES IN ANY JURISDICTION WHERE THE OFFER OR SALE IS NOT PERMITTED.
101
| Various Chantilly, VA 20151 | Collateral Asset Summary – Loan No. 8 The Chantilly Office Portfolio | Cut-off Date Balance: Cut-off Date LTV Ratio: UW NCF DSCR: UW NOI Debt Yield: | $24,000,000 44.4% 3.60x 16.8% |
totaling 12,770 SF (3.0% of NRA, 2.8% of underwritten base rent) has a current expiration date of October 31, 2021 and has no renewal options. The lease related to one suite at the Glenbrook III Property totaling 5,184 SF (1.2% of NRA, 1.3% of underwritten base rent) has a current expiration date of October 31, 2021 and has no renewal options. The lease related to one suite at the Stoneleigh Properties totaling 3,363 SF (0.8% of NRA, 0.9% of underwritten base rent) has a current expiration date of November 30, 2022 and has no renewal options. Underwritten base rents for AECOM’s seven suites range from $25.49 to $33.45 PSF with a weighted average underwritten base rent of $31.60 PSF. With respect to AECOM’s lease at the Glenbrook III property (5,184 SF), AECOM has a contract with the Open Source Enterprise of the U.S. government. In the event the U.S. government does not renew or irrevocably terminates its contract, the scope of the contract, or the funding received by AECOM pursuant to the contract is reduced to the extent that the premises are no longer required by AECOM, after 12 months from the lease commencement, AECOM may at any time terminate the lease effective as of the last day of any calendar month, upon 120 days' notice, along with payment of a termination fee equal to the sum of (i) the amount of annual fixed rent that would have been payable by tenant during the three months immediately following the early termination date and (ii) the unamortized portion of the tenant improvement and brokerage commissions.
The Teaching Company, LLC (49,529 SF, 11.5% of NRA, 14.6% of underwritten base rent).The Teaching Company, LLC (“TTC”), headquartered at one of the Stoneleigh Properties, owns The Great Courses brand, which was founded in 1990 and publishes teaching videos. The company provides unlimited access to learning experiences available on a wide variety of internet-connected devices, with each series taught by award-winning lecturers. Course subject matters include topics such as economics and finance, mathematics, science, history, and literature, among many others. TTC has been a tenant at The Chantilly Office Portfolio Properties since June 2008 and currently occupies three suites totaling 49,529 SF at the Stoneleigh Properties. TTC’s leases have a current expiration date of June 30, 2021 and have an underwritten base rent of $34.42 PSF. TTC’s leases have no renewal options and no termination options.
General Dynamics Information Technology, Inc. (40,627 SF, 9.5% of NRA, 10.8% of underwritten base rent).General Dynamics Information Technology, Inc. (“GDIT”) (Moody’s/S&P: A2/A+) (NYSE: GD) is a global aerospace and defense company that offers a broad portfolio of products and services in business aviation, combat vehicles, weapons systems and munitions, information technology services, C4ISR (command, control, communications, computers, intelligence, surveillance and reconnaissance) solutions, and shipbuilding and ship repair. On April 3, 2018, GDIT completed its acquisition of CSRA Inc. for $9.7 billion, creating a provider of IT solutions to the defense, intelligence, and federal civilian markets. GDIT reported revenues of approximately $36.2 billion as of December 31, 2018. GDIT has been a tenant at The Chantilly Office Portfolio Properties since September 1999 and currently occupies 40,627 SF across two suites at The Chantilly Office Portfolio Properties. The lease related to one suite at the Glenbrook III Property totaling 20,627 SF (4.8% of NRA, 5.3% of underwritten base rent) has a current expiration date of December 31, 2020, an underwritten base rent of $29.97 PSF, and one, three-year renewal option remaining. The lease related to one suite at the Glenview I & II Properties totaling 20,000 SF (4.7% of NRA, 5.5% of underwritten base rent) has a current expiration date of January 31, 2021, an underwritten base rent of $32.07 PSF, and no renewal options. GDIT’s leases have no termination options.
| Tenant Summary | |||||||
| Tenant Name | Credit Rating (Fitch/Moody's/S&P)(1) | Tenant SF | Approximate % of SF | Annual UW Base Rent | % of Total Annual UW Base Rent | Annual UW Base Rent PSF(2) | Lease Expiration |
| AECOM Management Services, Inc.(3)(4) | NR/Ba3/BB | 71,383 | 16.6% | $2,255,792 | 19.4% | $31.60 | 9/30/2020 |
| The Teaching Company, LLC | NR/NR/NR | 49,529 | 11.5% | $1,704,788 | 14.6% | $34.42 | 6/30/2021 |
| General Dynamics Information Technology, Inc.(5) | NR/A2/A+ | 40,627 | 9.5% | $1,259,591 | 10.8% | $31.00 | 12/31/2020 |
| WEX, Inc. | NR/Ba3/BB- | 32,342 | 7.5% | $1,008,397 | 8.7% | $31.18 | 12/31/2022 |
| Community Management Corporation | NR/NR/NR | 31,556 | 7.4% | $1,058,388 | 9.1% | $33.54 | 7/31/2021 |
| Subtotal | 225,437 | 52.5% | $7,286,957 | 62.6% | $32.32 | ||
| Other Tenants | 144,515 | 33.7% | $4,359,070 | 37.4% | $30.16 | ||
| Vacant | 59,174 | 13.8% | $0 | 0.0% | $0.00 | ||
| Total/Wtd. Avg. | 429,126 | 100.0% | $11,646,028 | 100.0% | $31.48 | ||
| (1) | Certain ratings are those of the parent company or government entity whether or not the parent guarantees the lease. |
| (2) | Wtd. Avg. Annual UW Base Rent PSF excludes vacant space. |
| (3) | Four suites totaling 50,066 SF (11.7% of NRA) have a current expiration date of September 30, 2020 with two, five-year renewal options, two suites totaling 17,954 SF (4.2% of NRA) have a current expiration date of October 31, 2021 with no renewal options, and one suite totaling 3,363 SF (0.8% of NRA) has a current expiration date of November 30, 2022 with no renewal options. |
| (4) | With respect to AECOM’s lease at the Glenbrook III property (5,184 SF; 1.2% of NRA), AECOM has a contract with the Open Source Enterprise of the U.S. government. In the event the U.S. government does not renew or irrevocably terminates its contract, the scope of the contract, or the funding received by AECOM pursuant to the contract is reduced to the extent that the premises are no longer required by AECOM, after 12 months from the lease commencement, AECOM may at any time terminate the lease effective as of the last day of any calendar month, upon 120 days' notice, along with payment of a termination fee equal to the sum of (i) the amount of annual fixed rent that would have been payable by tenant during the three months immediately following the early termination date and (ii) the unamortized portion of the tenant improvement and brokerage commissions. |
| (5) | One suite totaling 20,627 SF (4.8 % of NRA) has a current expiration date of December 31, 2020 with one, three-year renewal option and one suite totaling 20,000 SF (4.7% of NRA) has a current expiration date of January 31, 2021 with no renewal options. |
THE INFORMATION IN THIS STRUCTURAL AND COLLATERAL TERM SHEET IS NOT COMPLETE AND MAY BE AMENDED PRIOR TO THE TIME OF SALE. THIS TERM SHEET IS NOT AN OFFER TO SELL THESE SECURITIES AND IT IS NOT A SOLICITATION OF AN OFFER TO BUY THESE SECURITIES IN ANY JURISDICTION WHERE THE OFFER OR SALE IS NOT PERMITTED.
102
| Various Chantilly, VA 20151 | Collateral Asset Summary – Loan No. 8 The Chantilly Office Portfolio | Cut-off Date Balance: Cut-off Date LTV Ratio: UW NCF DSCR: UW NOI Debt Yield: | $24,000,000 44.4% 3.60x 16.8% |
The following table presents certain information relating to the lease rollover schedule at The Chantilly Office Portfolio Properties:
| Lease Rollover Schedule(1)(2) | ||||||||
| Year | # of Leases Rolling | SF Rolling | Approx. % of Total SF Rolling | Approx. Cumulative % of SF Rolling | UW Base Rent PSF Rolling(3) | Total UW Base Rent Rolling | Approx. % of Total Base Rent Rolling | Approx. Cumulative % of Total Base Rent Rolling |
| MTM(4) | 2 | 3,235 | 0.8% | 0.8% | $0.00 | $0 | 0.0% | 0.0% |
| 2019 | 1 | 10,701 | 2.5% | 3.2% | $30.66 | $328,093 | 2.8% | 2.8% |
| 2020(5) | 4 | 87,868 | 20.5% | 23.7% | $32.41 | $2,847,614 | 24.5% | 27.3% |
| 2021 | 9 | 135,691 | 31.6% | 55.3% | $32.16 | $4,363,178 | 37.5% | 64.7% |
| 2022 | 4 | 64,885 | 15.1% | 70.5% | $29.89 | $1,939,415 | 16.7% | 81.4% |
| 2023 | 0 | 0 | 0.0% | 70.5% | $0.00 | $0 | 0.0% | 81.4% |
| 2024(6) | 4 | 67,572 | 15.7% | 86.2% | $32.08 | $2,167,728 | 18.6% | 100.0% |
| 2025 | 0 | 0 | 0.0% | 86.2% | $0.00 | $0 | 0.0% | 100.0% |
| 2026 | 0 | 0 | 0.0% | 86.2% | $0.00 | $0 | 0.0% | 100.0% |
| 2027 | 0 | 0 | 0.0% | 86.2% | $0.00 | $0 | 0.0% | 100.0% |
| 2028 | 0 | 0 | 0.0% | 86.2% | $0.00 | $0 | 0.0% | 100.0% |
| 2029 | 0 | 0 | 0.0% | 86.2% | $0.00 | $0 | 0.0% | 100.0% |
| 2030 & Beyond | 0 | 0 | 0.0% | 86.2% | $0.00 | $0 | 0.0% | 100.0% |
| Vacant | 0 | 59,174 | 13.8% | 100.0% | $0.00 | $0 | 0.0% | 100.0% |
| Total/Wtd. Avg. | 24 | 429,126 | 100.0% | $31.48 | $11,646,028 | 100.0% | ||
| (1) | Information is based on the underwritten rent roll. |
| (2) | Certain tenants may have lease termination options that are exercisable prior to the originally stated expiration date of the subject lease, which are not considered in the lease rollover schedule. |
| (3) | Wtd. Avg. UW Base Rent PSF Rolling excludes vacant space. |
| (4) | MTM represents building amenity space comprised of a cafeteria space, a fitness center, and a conference meeting center. |
| (5) | Includes one tenant leasing 4,370 SF (1.0% of NRA, 1.2% of underwritten base rent), which has exercised its termination option effective February 29, 2020. |
| (6) | Includes one tenant leasing 20,020 SF (4.7% of NRA and 4.9% of underwritten base rent) at The Chantilly Office Portfolio Properties that has yet to take occupancy as the space is currently being built out. |
The Market. The Chantilly Office Portfolio Properties are located in Chantilly, Fairfax County, Virginia, approximately 27.2 miles west of Washington, D.C. and approximately 8.6 miles south of Dulles International Airport. The Chantilly Office Portfolio Properties are located immediately off State Route 28, which provides access to Interstate 66, approximately 2.8 miles to the south. The neighborhood is predominately a commercial district with numerous business and industrial parks that line the State Highway 50 and Route 28 corridors. State Highway 50, located approximately 1.7 miles to the north of The Chantilly Office Portfolio Properties, extends east and west and provides access to Cincinnati and Arlington. Route 28 traverses the western edge of Fairfax County into Loudoun County.
The Chantilly Office Portfolio Properties are adjacent to The Field at Commonwealth, a newly constructed 167,270 SF retail center anchored by a Wegman's supermarket that was completed in 2018 and several local and chain restaurants including Lazy Dog Restaurant and Bar, The Habit Burger Grill, Chipotle Mexican Grill, and Peet's Coffee & Tea. Within a short drive of The Chantilly Office Portfolio Properties are several additional retailers including Walmart Supercenter, Costco Wholesale, Lowe’s Home Improvement and Target.
Due to the presence of major government agencies such as the National Reconnaissance Office headquarters, the FBI's Chantilly office, and CIA training facilities, many major defense contractors, engineering firms, and aerospace firms have offices in Chantilly including General Dynamics, Boeing, Northrup Grumman, Booz Allen Hamilton, Raytheon, and the Aerospace Corporation. Additionally, according to the appraisal, the Northern Virginia office market has become a major market for technology firms due to the strength of the region’s technology labor market.
In November 2018, Amazon announced plans to open an ‘HQ2’ in Crystal City, Virginia, approximately 27.0 miles east of The Chantilly Office Portfolio Properties. The headquarters expansion is projected to bring in approximately 25,000 jobs and approximately 4.0 million SF of office space over the next 10 years according to the appraisal. Amazon’s 4.0 million SF requirement accounts for 33.0% of Crystal City’s existing office inventory, and its projected 25,000 employees would comprise 11.0% of the Washington D.C. region’s technology labor market. Furthermore, Amazon’s HQ2 is expected to generate approximately 50,000 additional jobs in indirect industries and in retail, housing, and services, according to the appraisal.
According to a third party market research report, the estimated 2019 population within a one-, three- and five-mile radius of The Chantilly Office Portfolio Properties is 7,309, 95,647 and 204,742, respectively. The 2019 estimated population within a five-mile radius increased by 40.8% from 2000 to 2019, in comparison to a 30.5% increase for the Washington-Arlington-Alexandria, DC-VA-MD-WV metropolitan statistical area (“MSA”) over the same period. The 2019 estimated average household income within the same one-, three- and five-mile radius was $161,259, $151,659 and $175,062, respectively. The 2019 estimated average household income within a five-mile radius is 24.8% higher than the average household income for the Washington-Arlington-Alexandria, DC-VA-MD-WV MSA.
According to a third party market research report, The Chantilly Office Portfolio Properties are situated within the Route 28 Corridor South office submarket. The Route 28 Corridor South office submarket contains approximately 14.7 million SF of office space with a vacancy rate of 15.5% and an average asking rental rate of $26.34 PSF NNN as of the fourth quarter of 2018. The Route 28 Corridor South office submarket experienced positive year to date net absorption of 43,948 SF at the end of the fourth quarter of 2018.
The appraisal identified five competitive properties built between 1997 and 2008 ranging in size from approximately 114,126 SF to 316,081 SF. The appraiser’s competitive set reported rent from $27.00 PSF to $34.84 PSF, with a weighted average rent of $28.50 PSF. The appraisals indicated a market rent of $32.00 PSF for office space at the Stoneleigh Properties and $28.00 PSF for office space at the Newbrook Properties.
THE INFORMATION IN THIS STRUCTURAL AND COLLATERAL TERM SHEET IS NOT COMPLETE AND MAY BE AMENDED PRIOR TO THE TIME OF SALE. THIS TERM SHEET IS NOT AN OFFER TO SELL THESE SECURITIES AND IT IS NOT A SOLICITATION OF AN OFFER TO BUY THESE SECURITIES IN ANY JURISDICTION WHERE THE OFFER OR SALE IS NOT PERMITTED.
103
| Various Chantilly, VA 20151 | Collateral Asset Summary – Loan No. 8 The Chantilly Office Portfolio | Cut-off Date Balance: Cut-off Date LTV Ratio: UW NCF DSCR: UW NOI Debt Yield: | $24,000,000 44.4% 3.60x 16.8% |
The following table presents recent leasing data at competitive office buildings with respect to The Chantilly Office Portfolio Properties:
| Comparable Office Leases | ||||||||
| Property Name/Address | Year Built/ Renovated | Size (SF) | Occupancy (%) | Tenant Name | Lease Size (SF) | Lease Date | Lease Term (Yrs) | Rent/SF |
Greens I & II 15049 & 15059 Conference Chantilly, VA | 1997/N/A | 289,567 | 93.0% | Liberty Mutual Insurance Able Vets Deloitte NES | 4,597 21,144 19,577 9,457 | Sep 2018 Sep 2017 Oct 2016 Aug 2016 | 5.4 5.4 11.0 7.4 | $30.00 $29.00 $28.30 $28.75 |
Penrose Center 14425 Penrose Place Chantilly, VA | 2008/N/A | 145,921 | 100.0% | Kudu Dynamics LLC Arena Technologies | 20,864 8,052 | Jun 2018 Jan 2016 | 5.3 6.0 | $33.00 $28.00 |
Ridgeview I 14900 Conference Center Drive Chantilly, VA | 1999/N/A | 127,115 | 100.0% | Solers | 52,698 | Jan 2018 | 6.3 | $27.00 |
Commonwealth Centre I & II 14370 & 14360 Newbrook Drive Chantilly, VA | 2007/N/A | 316,081 | 100.0% | GSA-FBI CACI International | 32,015 220,551 | Jul 2017 Jan 2016 | 9.4 13.1 | $34.84 $27.50 |
Corporate Pointe 3 14280 Park Meadow Drive Chantilly, VA | 1999/N/A | 114,126 | 74.0% | ADDX Corporation | 7,300 | Apr 2017 | 7.5 | $27.50 |
Source:Appraisal
Operating History and Underwritten Net Cash Flow.The following table presents certain information relating to the historical operating performance and the Underwritten Net Cash Flow at The Chantilly Office Portfolio Properties:
| Cash Flow Analysis | |||||||||||||
| 2016 | 2017(1) | 2018(1) | 2/28/2019 TTM(1) | UW | UW PSF | ||||||||
| Gross Potential Rent(2)(3) | $11,904,956 | $10,713,849 | $10,227,482 | $10,153,472 | $13,490,811 | $31.44 | |||||||
| Total Recoveries | $1,006,379 | $744,732 | $589,919 | $592,326 | $768,690 | $1.79 | |||||||
| Other Income | $95,083 | $105,240 | $148,734 | $131,104 | $134,403 | $0.31 | |||||||
| Less Vacancy & Credit Loss | $0 | $0 | $0 | $0 | ($1,814,888) | ($4.23) | |||||||
| Effective Gross Income | $13,006,418 | $11,563,821 | $10,966,136 | $10,876,903 | $12,579,017 | $29.31 | |||||||
| Total Operating Expenses | $4,836,348 | $4,532,245 | $4,486,782 | $4,665,057 | $4,792,591 | $11.17 | |||||||
| Net Operating Income | $8,170,070 | $7,031,577 | $6,479,354 | $6,211,845 | $7,786,425 | $18.14 | |||||||
| Capital Expenditures | $0 | $0 | $0 | $0 | $85,825 | $0.20 | |||||||
| TI/LC | $0 | $0 | $0 | $0 | $673,181 | $1.57 | |||||||
| Net Cash Flow | $8,170,070 | $7,031,577 | $6,479,354 | $6,211,845 | $7,027,419 | $16.38 | |||||||
| Occupancy %(4) | 91.5% | 85.4% | 77.4% | 86.2% | 86.2% | ||||||||
| NOI DSCR(5) | 4.19x | 3.61x | 3.32x | 3.19x | 3.99x | ||||||||
| NCF DSCR(5) | 4.19x | 3.61x | 3.32x | 3.19x | 3.60x | ||||||||
| NOI Debt Yield(5) | 17.6% | 15.2% | 14.0% | 13.4% | 16.8% | ||||||||
| NCF Debt Yield(5) | 17.6% | 15.2% | 14.0% | 13.4% | 15.2% | ||||||||
| (1) | Since acquisition in September 2017, the borrower sponsor has executed 62,686 SF (14.6% of NRA and 15.0% of underwritten base rent) of new and expanded leases totaling $1,747,647 of underwritten base rent and 94,982 SF (22.1% of NRA and 26.0% of underwritten base rent) of lease extensions totaling $3,024,562 of underwritten base rent. |
| (2) | Gross Potential Rent declined from 2016 to 2017 due to Aetna Life Insurance vacating suite 300 (20,358 SF) of the Glenview II property. Gross Potential Rent increased from 2/18/2019 TTM to UW due to two tenants leasing 40,378 SF (9.4% of portfolio NRA) totaling $1,151,216 of underwritten base rent (9.9% of underwritten base rent) at The Chantilly Office Portfolio Properties that had yet to take occupancy as the spaces were being built out. One of the two tenants, Redfin, leasing 20,358 SF (4.7% of NRA), has since taken occupancy of its space. |
| (3) | UW Gross Potential Rent is based on the underwritten rent roll as of May 31, 2019 and includes (i) contractual rent steps through July 2020 totaling $347,801, (ii) straight line rent for investment grade tenant, Aetna Life Insurance, totaling $29,896 and (iii) vacant gross up of $1,814,888. |
| (4) | UW Occupancy % is based on underwritten economic vacancy of 12.7%. The Chantilly Office Portfolio Properties were 86.2% physically occupied as of May 31, 2019. |
| (5) | Debt service coverage ratios and debt yields are based on The Chantilly Office Portfolio Whole Loan. |
Escrows and Reserves. The Chantilly Office Portfolio Borrower deposited in escrow at origination (i) $1,481,290 for outstanding tenant allowances, tenant improvements and leasing commissions with respect to Redfin ($952,788), Aetna Life Insurance ($248,260), Tetra Tech, Inc. ($209,663) and TTC ($70,579) and (ii) $593,341 for outstanding free rents, rent abatements or other rent concessions with respect to Redfin ($186,615) and Tetra Tech, Inc. ($406,726). The Chantilly Office Portfolio Borrower is required to escrow monthly (i) 1/12 of the annual real estate taxes, (ii) 1/12 of the annual insurance premiums, (iii) $7,152 for replacement reserves, subject to a cap of $257,476 and (iv) $53,641 for tenant improvements and leasing commissions,provided, however, that the above monthly escrow condition (i), (ii), (iii) and (iv) will not be required so long as (a) no event of default under the related mortgage loan documents has occurred or is continuing, (b) all of The Chantilly Office Portfolio Properties maintain a debt yield of at least 9.0% and (c) all of The Chantilly Office Portfolio Properties maintain a debt service coverage ratio for the immediately preceding 12-month period of at least 2.00x.
THE INFORMATION IN THIS STRUCTURAL AND COLLATERAL TERM SHEET IS NOT COMPLETE AND MAY BE AMENDED PRIOR TO THE TIME OF SALE. THIS TERM SHEET IS NOT AN OFFER TO SELL THESE SECURITIES AND IT IS NOT A SOLICITATION OF AN OFFER TO BUY THESE SECURITIES IN ANY JURISDICTION WHERE THE OFFER OR SALE IS NOT PERMITTED.
104
| Various Chantilly, VA 20151 | Collateral Asset Summary – Loan No. 8 The Chantilly Office Portfolio | Cut-off Date Balance: Cut-off Date LTV Ratio: UW NCF DSCR: UW NOI Debt Yield: | $24,000,000 44.4% 3.60x 16.8% |
Lockbox and Cash Management.The Chantilly Office Portfolio Whole Loan is structured with a hard lockbox and springing cash management. The Chantilly Office Portfolio Borrower was required at origination of The Chantilly Office Portfolio Whole Loan to deliver written instructions to tenants directing them to deposit all rents payable under such leases directly into a lender-controlled lockbox account. The related mortgage loan documents require that all rents received by The Chantilly Office Portfolio Borrower or the property manager be deposited into the lockbox account within two business days of receipt. Funds in the lockbox account, absent the occurrence and continuance of a Cash Management Trigger Event (as defined below), are required to be transferred daily to a borrower operating account. Upon the first occurrence of a Cash Management Trigger Event, The Chantilly Office Portfolio Borrower is required to establish a cash management account under the sole control of the lender, to which, during a Cash Management Trigger Event, all amounts in the lockbox account are required to be automatically transferred daily for the payment, among other things, of the debt service, monthly escrows, default interest and late payment charges. Absent the continuance of a Cash Sweep Trigger Event (as defined below), any remaining funds after such disbursements are required to be distributed to The Chantilly Office Portfolio Borrower. Upon a Cash Sweep Trigger Event, all remaining excess cash flow will be escrowed in an excess cash flow reserve account (provided, however, that if a Cash Sweep Trigger Event has occurred solely as a result of a Material Tenant Trigger Event (as defined below), then such amount will be applied to a Material Tenant (as defined below) reserve account).
A “Cash Management Trigger Event” will commence upon (i) an event of default under the related mortgage loan documents, (ii) the date on which The Chantilly Office Portfolio Borrower, the guarantor, the key principal or the property manager becomes insolvent or a debtor in a bankruptcy action, (iii) the debt service coverage ratio for the immediately preceding 12-month period falling below 1.75x, (iv) an indictment for fraud or misappropriation of funds by The Chantilly Office Portfolio Borrower, the guarantor or the property manager (provided, that in the case of a third party manager, such indictment is related to The Chantilly Office Portfolio Properties) or (v) a Material Tenant Trigger Event. A Cash Management Trigger Event will end upon the occurrence of: with regard to clause (i) above, the cure of such event of default; with regard to clause (ii) above, such bankruptcy action petition having been discharged, stayed, or dismissed within 90 days of such filing for The Chantilly Office Portfolio Borrower, the key principal or the guarantor, or within 120 days of such filing for the property manager, among other conditions; with regard to clause (iii) above, the debt service coverage ratio being at least 1.80x for two consecutive calendar quarters; with regard to clause (iv) above, (a) the dismissal of the applicable indictment, (b) the acquittal of each applicable person with respect to the related charge(s) or (c) the replacement of the property manager with a qualified manager under a replacement property management agreement; or with regard to clause (v) above, the cure of such Material Tenant Trigger Event.
A “Cash Sweep Trigger Event” will commence upon (i) an event of default under the related mortgage loan documents, (ii) the date on which The Chantilly Office Portfolio Borrower, the key principal, the guarantor, or the property manager becomes insolvent or a debtor in a bankruptcy action or (iii) the debt service coverage ratio for the immediately preceding 12-month period falling below 1.75x. A Cash Sweep Trigger Event will end with upon the occurrence of: with regard to clause (i) above, the cure of such event of default; with regard to clause (ii) above, such bankruptcy action petition having been discharged, stayed, or dismissed within 90 days of such filing for The Chantilly Office Portfolio Borrower, the key principal, the guarantor or the property manager, among other conditions; or with regard to clause (iii) above, the debt service coverage ratio being at least 1.80x for two consecutive calendar quarters.
A “Material Tenant Trigger Event” will commence upon (i) a Material Tenant giving notice of its intent to terminate or not to extend or renew its lease, (ii) on or prior to six months prior to the expiration date of a Material Tenant’s lease, the related Material Tenant failing to extend or renew its lease (iii) on or prior to the date on which a Material Tenant is required under its lease to provide notification of its election to renew its lease, such Material Tenant failing to give such notice, (iv) a monetary or material non-monetary event of default under a Material Tenant lease that continues beyond any applicable notice and cure period, (v) any Material Tenant or any guarantor of the applicable Material Tenant lease becoming insolvent or a debtor in any bankruptcy action,
(vi) a Material Tenant lease being terminated, in whole or in part, or being no longer in full force and effect;provided that with respect to a partial termination, such partial termination relates to a portion of a Material Tenant’s space that (a) makes up 20% or more of the total net rentable square footage or (b) is responsible for 20% or more of the total base rent of The Chantilly Office Portfolio Properties or (vii) any Material Tenant “going dark”, vacating or ceasing to occupy or conduct business at its space or a portion thereof constituting 20% or more of the total net rentable area at The Chantilly Office Portfolio Properties. A Material Tenant Trigger Event will end upon the occurrence of: with regard to clause (i) above, (a) the revocation or rescission by the applicable Material Tenant of all termination or cancellation notices with respect to such Material Tenant lease, (b) an acceptable Material Tenant lease extension with respect to the applicable Material Tenant space, or (c) all of the applicable Material Tenant space being leased to a replacement tenant; with regard to clauses (ii) and (iii) above, (x) an acceptable Material Tenant lease extension with respect to such Material Tenant space or (y) all of the applicable Material Tenant space being leased to a replacement tenant; with regard to clause (iv) above, a cure of the applicable event of default under the applicable Material Tenant lease; with regard to clause (v) above, an affirmation of the Material Tenant lease in the applicable bankruptcy proceeding and confirmation that the Material Tenant is actually paying all rents and other amounts due under its lease; with regard to clause (vi) above, all of the applicable Material Tenant space being leased to a replacement tenant; or with regard to clause (vii) above, the applicable Material Tenant having re-opened for business or the applicable Material Tenant space being leased to an acceptable replacement tenant at The Chantilly Office Portfolio Properties or a portion thereof constituting 20% or more of the total net rentable area at The Chantilly Office Portfolio Properties. Notwithstanding anything to the contrary with regard to clauses (i), (ii), (iii) and (iv) above, in lieu of a lease extension or replacement tenant with respect to all of the applicable Material Tenant space, a Material Tenant Trigger Event will end upon execution of an extension or replacement lease for at least 65% of the applicable Material Tenant spaceprovided that the base rent per annum payable therefor is no less than 100% of the base rent previously payable.
A “Material Tenant” means any tenant whose leases, either individually or when taken together with any other lease with the same tenant or affiliate tenant, (x) cover no less than 20% of the NRA at The Chantilly Office Portfolio Properties or (y) require the payment of base rent that is no less than 20% of the total in-place base rent at The Chantilly Office Portfolio Properties.
Additional Secured Indebtedness (not including trade debts).None.
Mezzanine Loan and Preferred Equity. None.
THE INFORMATION IN THIS STRUCTURAL AND COLLATERAL TERM SHEET IS NOT COMPLETE AND MAY BE AMENDED PRIOR TO THE TIME OF SALE. THIS TERM SHEET IS NOT AN OFFER TO SELL THESE SECURITIES AND IT IS NOT A SOLICITATION OF AN OFFER TO BUY THESE SECURITIES IN ANY JURISDICTION WHERE THE OFFER OR SALE IS NOT PERMITTED.
105
| Various Chantilly, VA 20151 | Collateral Asset Summary – Loan No. 8 The Chantilly Office Portfolio | Cut-off Date Balance: Cut-off Date LTV Ratio: UW NCF DSCR: UW NOI Debt Yield: | $24,000,000 44.4% 3.60x 16.8% |
Release of Property. Not permitted.
Terrorism Insurance. The related mortgage loan documents require that the “all risk” insurance policy required to be maintained by The Chantilly Office Portfolio Borrower provides coverage for terrorism in an amount equal to the full replacement cost of The Chantilly Office Portfolio Properties, as well as business interruption insurance covering no less than the 18-month period following the occurrence of a casualty event, together with a 12-month extended period of indemnity.
THE INFORMATION IN THIS STRUCTURAL AND COLLATERAL TERM SHEET IS NOT COMPLETE AND MAY BE AMENDED PRIOR TO THE TIME OF SALE. THIS TERM SHEET IS NOT AN OFFER TO SELL THESE SECURITIES AND IT IS NOT A SOLICITATION OF AN OFFER TO BUY THESE SECURITIES IN ANY JURISDICTION WHERE THE OFFER OR SALE IS NOT PERMITTED.
106
(THIS PAGE INTENTIONALLY LEFT BLANK)
107
3702 S. State Street | Collateral Asset Summary – Loan No. 9 Fresenius Salt Lake | Cut-off Date Balance: | $20,973,336 |
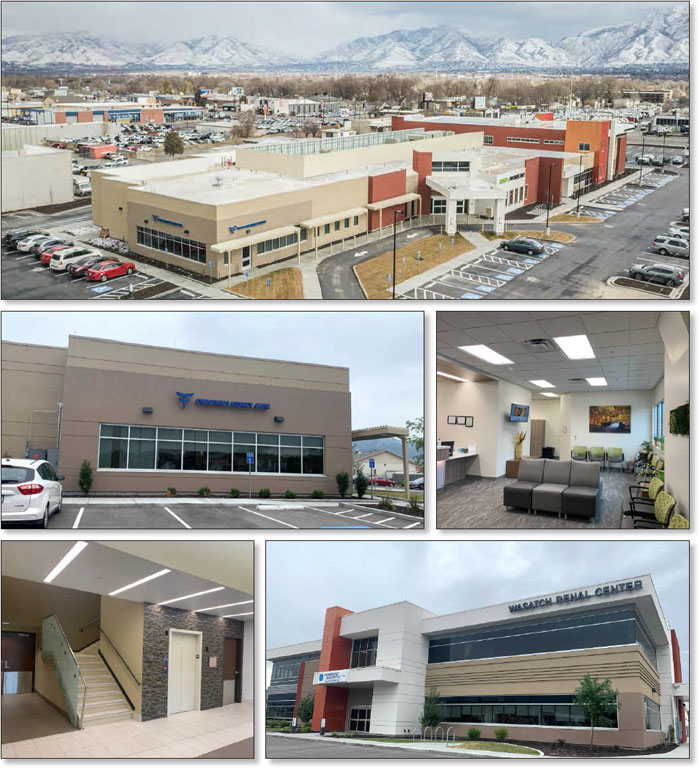
THE INFORMATION IN THIS STRUCTURAL AND COLLATERAL TERM SHEET IS NOT COMPLETE AND MAY BE AMENDED PRIOR TO THE TIME OF SALE. THIS TERM SHEET IS NOT AN OFFER TO SELL THESE SECURITIES AND IT IS NOT A SOLICITATION OF AN OFFER TO BUY THESE SECURITIES IN ANY JURISDICTION WHERE THE OFFER OR SALE IS NOT PERMITTED.
108
3702 S. State Street | Collateral Asset Summary – Loan No. 9 Fresenius Salt Lake | Cut-off Date Balance: | $20,973,336 |
THE INFORMATION IN THIS STRUCTURAL AND COLLATERAL TERM SHEET IS NOT COMPLETE AND MAY BE AMENDED PRIOR TO THE TIME OF SALE. THIS TERM SHEET IS NOT AN OFFER TO SELL THESE SECURITIES AND IT IS NOT A SOLICITATION OF AN OFFER TO BUY THESE SECURITIES IN ANY JURISDICTION WHERE THE OFFER OR SALE IS NOT PERMITTED.
109
3702 S. State Street | Collateral Asset Summary – Loan No. 9 Fresenius Salt Lake | Cut-off Date Balance: | $20,973,336 |
Mortgage Loan Information |
| Property Information | ||||
Mortgage Loan Seller: | Ladder Capital Finance LLC |
| Single Asset/Portfolio: | Single Asset | ||
Credit Assessment (Fitch/KBRA/Moody’s): | NR/NR/NR |
| Location: | Salt Lake City, UT 84115 | ||
| General Property Type: | Office | ||||
Original Balance: | $21,000,000 |
| Detailed Property Type: | Medical | ||
Cut-off Date Balance: | $20,973,336 |
| Title Vesting: | Fee Simple | ||
% of Initial Pool Balance: | 2.6% |
| Year Built/Renovated: | 2018/N/A | ||
Loan Purpose: | Refinance |
| Size: | 51,591 SF | ||
Borrower Sponsors: | Donald Morris; Ruth Indahyung; Sanjiv Anand; Arasu Gopinath; Sey Lau; Jeff Barklow; David Tien; Kevin Jansen; Landon Dickson |
| Cut-off Date Balance per SF: | $407 | ||
Maturity Date Balance per SF: | $331 | |||||
Property Manager: | Coaction Asset Management | |||||
Mortgage Rate: | 4.7000% |
|
| |||
Note Date: | 9/6/2019 |
|
|
| ||
First Payment Date: | 10/6/2019 |
|
|
| ||
Maturity Date: | 9/6/2029 |
|
|
| ||
Original Term to Maturity: | 120 months |
|
|
| ||
Original Amortization Term: | 360 months |
| Underwriting and Financial Information | |||
IO Period: | 0 months |
| UW NOI(2): | $1,709,565 | ||
Seasoning: | 1 month |
| UW NOI Debt Yield: | 8.2% | ||
Prepayment Provisions: | LO (25); DEF (92); O (3) |
| UW NOI Debt Yield at Maturity: | 10.0% | ||
Lockbox/Cash Mgmt Status: | Hard/In Place |
| UW NCF DSCR: | 1.29x | ||
Additional Debt Type: | N/A |
| Most Recent NOI(2): | $1,571,386 (6/30/2019 TTM) | ||
Additional Debt Balance: | N/A |
| 2nd Most Recent NOI(3): | N/A | ||
Future Debt Permitted (Type): | No (N/A) |
| 3rd Most Recent NOI(3): | N/A | ||
Reserves(1) |
| Most Recent Occupancy(4): | 92.7% (7/17/2019) | |||
Type | Initial | Monthly | Cap |
| 2nd Most Recent Occupancy(3): | N/A |
RE Tax: | $164,730 | $13,728 | N/A |
| 3rd Most Recent Occupancy(3): | N/A |
Insurance: | $13,805 | $1,534 | N/A |
| Appraised Value (as of): | $30,600,000 (7/25/2019) |
Replacements: | $0 | $645 | N/A |
| Cut-off Date LTV Ratio: | 68.5% |
TI/LC: | $0 | $860 | N/A |
| Maturity Date LTV Ratio: | 55.9% |
Sources and Uses | |||||||||||
Sources |
| Proceeds |
| % of Total |
| Uses |
| Proceeds |
| % of Total |
|
Loan Amount: |
| $21,000,000 |
| 100.0% |
| Loan Payoff: |
| $20,522,698 |
| 97.7% |
|
|
|
|
|
|
| Reserves: |
| $178,535 |
| 0.9% |
|
|
|
|
|
|
| Closing Costs: |
| $292,746 |
| 1.4% |
|
|
|
|
|
|
| Return of Equity: |
| $6,021 |
| 0.0% |
|
Total Sources: |
| $21,000,000 |
| 100.0% |
| Total Uses: |
| $21,000,000 |
| 100.0% |
|
(1) | See “Escrows and Reserves” below for further discussion of reserve requirements. |
(2) | See “Cash Flow Analysis” below. |
(3) | The Fresenius Salt Lake Property (as defined below) was built in 2018. As such, there are no historical financials and historical occupancy. |
(4) | The Fresenius Salt Lake Property is 92.7% leased as of July 17, 2019 with all tenants paying full unabated rent. Two tenants totaling 19.1% of net rentable area are not yet in occupancy in their respective spaces. At loan origination, the borrower sponsors executed a partial recourse guaranty for the last dollar portion of the principal balance in an amount equal to $4,200,000. The partial recourse guaranty will terminate upon the first to occur of: (i) the finalization of a joint venture agreement between Fresenius (as defined below) and Utah Vascular Clinic (13.3% of NRA) with Fresenius assuming the lease, or (ii) Fresenius Medical Care and Utah Vascular Clinic (totaling in the aggregate 19.1% of NRA) each take occupancy in all of their respective tenant spaces and deliver an acceptable estoppel certificate. |
The Mortgage Loan. The ninth largest mortgage loan (the “Fresenius Salt Lake Mortgage Loan”) is evidenced by a promissory note with an original principal balance of $21,000,000, which is secured a by first priority fee mortgage encumbering a two-story Class A medical office building located in Salt Lake City, Utah (the “Fresenius Salt Lake Property”). The proceeds of the Fresenius Salt Lake Mortgage Loan were used to refinance existing debt on the Fresenius Salt Lake Property, fund reserves, pay closing costs, and return $6,021 of equity to the borrower sponsors.
The Borrower and the Borrower Sponsors. The borrower is South State Investments, LLC (the “Fresenius Salt Lake Borrower”), a single purpose multi-member Utah limited liability company, with a single purpose managing member, 3702 South Management, LLC, a single-member Delaware limited liability company with one independent director. A non-consolidation opinion was delivered in connection with the origination of the Fresenius Salt Lake Mortgage Loan. The borrower sponsors and the non-recourse carveouts guarantors of the Fresenius Salt Lake Mortgage Loan are Arasu Gopinath, Donald Morris, Jeff Barklow, Landon Dickson, Sanjiv Anand, Sey Lau, David Tien, Kevin Jansen and Ruth Indahyung (collectively, the “Borrower Sponsors”). The Borrower Sponsors also delivered a partial recourse guaranty for the last dollar portion of the principal balance in an amount equal to $4,200,000. See “Description of the Mortgage Pool—Tenant Issues—Lease Expirations and Terminations” in the Preliminary Prospectus.
THE INFORMATION IN THIS STRUCTURAL AND COLLATERAL TERM SHEET IS NOT COMPLETE AND MAY BE AMENDED PRIOR TO THE TIME OF SALE. THIS TERM SHEET IS NOT AN OFFER TO SELL THESE SECURITIES AND IT IS NOT A SOLICITATION OF AN OFFER TO BUY THESE SECURITIES IN ANY JURISDICTION WHERE THE OFFER OR SALE IS NOT PERMITTED.
110
3702 S. State Street | Collateral Asset Summary – Loan No. 9 Fresenius Salt Lake | Cut-off Date Balance: | $20,973,336 |
The Borrower Sponsors are a group of nine nephrologists who are the founders of the Nephrology Associates of Utah, a chain of renal clinics in Utah. In 2014, this group of doctors were selected by Fresenius as the primary physician group to lead an expansion plan in the State of Utah. Fresenius purchased the practice in 2013, and converted the physicians to salaried employees. Fresenius offered the physicians an opportunity to contribute the proceeds of the buyout towards multiple built-to-suit medical properties to house the Nephrology Associates of Utah as well as multiple Fresenius-branded medical tenants. Fresenius connected the Borrower Sponsors with Coaction Asset Management Group, LLC, who is the property developer and asset manager for the Fresenius Salt Lake Property and has completed 12 similar projects with Fresenius.
The Property. The Fresenius Salt Lake Property is a 51,591 SF, two-story Class A medical office building located in Salt Lake City, Utah. Built in 2018, the Fresenius Salt Lake Property is located on an approximately 4.2-acre site. The Fresenius Salt Lake Property is located in South Salt Lake, approximately five miles south of the Salt Lake City central business district. The Fresenius Salt Lake Property is comprised of eight built-to-suit medical offices and includes a full reception area, wood-finished waiting areas and as well as patient rooms, dialysis administration booths, testing labs, office support areas and storage areas. The Fresenius Salt Lake Property also features conference and meeting areas, as well as training centers for dialysis personnel and support staff and features a 238 space surface parking lot, which equates to a parking ratio of 4.61 spaces per 1,000 SF. As of July 17, 2019, the Fresenius Salt Lake Property was 92.7% leased by seven medical office tenants. The weighted average remaining lease term of the tenants is 13.1 years.
Four of the seven tenants have leases guaranteed by Fresenius Medical Care Holdings, Inc (Moody’s: Baa3), a wholly owned subsidiary of Fresenius Medical Care AG & Co (Fitch/Moody’s/S&P: BBB-/Baa3/BBB) (“Fresenius”). The four Fresenius-related tenants have executed 15-year leases (approximately 13.6 years remaining) with annual rent increases of 2%. Fresenius is the largest dialysis provider in the United States. Founded in 1912, Fresenius has a network includes more than 2,400 dialysis centers nationwide in addition to outpatient vascular labs and urgent care centers; intensive and emergency care; a specialty pharmacy and laboratory; and a manufacturing and distribution division offering a comprehensive line of dialysis equipment, disposable products and renal pharmaceuticals. Employing 67,000 employees, physicians and business partners, the Fresenius network encompasses more than 200 principal research investigators across 250 dialysis research sites, with access to more than 183,000 active end-stage rental disease patients and 390,000 active chronic kidney disease patients.
The following table presents certain information relating to the leases at the Fresenius Salt Lake Property:
Tenant Summary | |||||||||||||||
Tenant Name |
| Credit Rating |
| Tenant SF |
| Approximate % of SF |
| Annual UW Base Rent |
| % of Total Annual |
| Annual UW Base Rent PSF(2) |
| Lease Expiration |
|
Wasatch Artificial Kidney |
| BBB-/Baa3/BBB |
| 13,640 |
| 26.4% |
| $501,000 |
| 30.9% |
| $36.73 |
| 3/31/2033 |
|
FMC - Nephrology Associates |
| BBB-/Baa3/BBB |
| 11,031 |
| 21.4% |
| $374,944 |
| 23.1% |
| $33.99 |
| 3/31/2033 |
|
Fresenius Management Services |
| BBB-/Baa3/BBB |
| 7,140 |
| 13.8% |
| $244,119 |
| 15.1% |
| $34.19 |
| 3/31/2033 |
|
Utah Vascular Clinic(3) |
| NR/NR/NR |
| 6,851 |
| 13.3% |
| $212,933 |
| 13.1% |
| $31.08 |
| 1/4/2033 |
|
Utah Imaging |
| NR/NR/NR |
| 4,572 |
| 8.9% |
| $115,052 |
| 7.1% |
| $25.16 |
| 1/4/2028 |
|
Fresenius Medical Care(4) |
| BBB-/Baa3/BBB |
| 3,013 |
| 5.8% |
| $96,838 |
| 6.0% |
| $32.14 |
| 3/31/2033 |
|
Eco Apothecary |
| NR/NR/NR |
| 1,596 |
| 3.1% |
| $76,665 |
| 4.7% |
| $48.04 |
| 1/4/2033 |
|
Subtotal/Wtd. Avg. |
|
|
| 47,843 |
| 92.7% |
| $1,621,552 |
| 100.0% |
| $33.89 |
|
|
|
Vacant |
|
|
| 3,748 |
| 7.3% |
| $0 |
| 0.0% |
| $0.00 |
|
|
|
Total/Wtd. Avg. |
|
|
| 51,591 |
| 100.0% |
| $1,621,552 |
| 100.0% |
| $33.89 |
|
|
|
(1) | Certain ratings are those of Fresenius, which is the parent of Fresenius Medical Care Holdings, Inc., who guarantees the leases of Wasatch Artificial Kidney, FMC - Nephrology Associates, Fresenius Management Services and Fresenius Medical Care. |
(2) | Wtd. Avg. Annual UW Base Rent PSF excludes vacant space. |
(3) | Utah Vascular Clinic has a signed lease and is paying rent. Buildout of the space will commence upon finalization of a joint venture agreement with Fresenius, which is expected to be complete October 31, 2019. At loan origination, the Borrower Sponsors executed a partial recourse guaranty for the last dollar portion of the principal balance in an amount equal to $4,200,000 which terminates upon the first to occur of (i) completion of the joint venture agreement or (ii) Utah Vascular Clinic and Fresenius Medical Care each taking occupancy of all of the space demised pursuant to their leases and delivering an acceptable estoppel certificate. |
(4) | Fresenius Medical Care has a signed lease and is paying rent, but is not fully utilizing their space. |
THE INFORMATION IN THIS STRUCTURAL AND COLLATERAL TERM SHEET IS NOT COMPLETE AND MAY BE AMENDED PRIOR TO THE TIME OF SALE. THIS TERM SHEET IS NOT AN OFFER TO SELL THESE SECURITIES AND IT IS NOT A SOLICITATION OF AN OFFER TO BUY THESE SECURITIES IN ANY JURISDICTION WHERE THE OFFER OR SALE IS NOT PERMITTED.
111
3702 S. State Street | Collateral Asset Summary – Loan No. 9 Fresenius Salt Lake | Cut-off Date Balance: | $20,973,336 |
The following table presents certain information relating to the lease rollover schedule at the Fresenius Salt Lake Property:
Lease Rollover Schedule(1)(2) | |||||||||||||||||
Year |
| # of |
| SF Rolling |
| Approx. % of |
| Approx. |
| UW Base Rent |
| Total UW Base Rent Rolling |
| Approx. % of |
| Approx. |
|
MTM |
| 0 |
| 0 |
| 0.0% |
| 0.0% |
| $0.00 |
| $0 |
| 0.0% |
| 0.0% |
|
2019 |
| 0 |
| 0 |
| 0.0% |
| 0.0% |
| $0.00 |
| $0 |
| 0.0% |
| 0.0% |
|
2020 |
| 0 |
| 0 |
| 0.0% |
| 0.0% |
| $0.00 |
| $0 |
| 0.0% |
| 0.0% |
|
2021 |
| 0 |
| 0 |
| 0.0% |
| 0.0% |
| $0.00 |
| $0 |
| 0.0% |
| 0.0% |
|
2022 |
| 0 |
| 0 |
| 0.0% |
| 0.0% |
| $0.00 |
| $0 |
| 0.0% |
| 0.0% |
|
2023 |
| 0 |
| 0 |
| 0.0% |
| 0.0% |
| $0.00 |
| $0 |
| 0.0% |
| 0.0% |
|
2024 |
| 0 |
| 0 |
| 0.0% |
| 0.0% |
| $0.00 |
| $0 |
| 0.0% |
| 0.0% |
|
2025 |
| 0 |
| 0 |
| 0.0% |
| 0.0% |
| $0.00 |
| $0 |
| 0.0% |
| 0.0% |
|
2026 |
| 0 |
| 0 |
| 0.0% |
| 0.0% |
| $0.00 |
| $0 |
| 0.0% |
| 0.0% |
|
2027 |
| 0 |
| 0 |
| 0.0% |
| 0.0% |
| $0.00 |
| $0 |
| 0.0% |
| 0.0% |
|
2028 |
| 1 |
| 4,572 |
| 8.9% |
| 8.9% |
| $25.16 |
| $115,052 |
| 7.1% |
| 7.1% |
|
2029 |
| 0 |
| 0 |
| 0.0% |
| 8.9% |
| $0.00 |
| $0 |
| 0.0% |
| 7.1% |
|
2030 & Beyond |
| 6 |
| 43,271 |
| 83.9% |
| 92.7% |
| $34.82 |
| $1,506,499 |
| 92.9% |
| 100.0% |
|
Vacant |
| 0 |
| 3,748 |
| 7.3% |
| 100.0% |
| $0.00 |
| $0 |
| 0.0% |
| 100.0% |
|
Total/Wtd. Avg. |
| 7 |
| 51,591 |
| 100.0% |
|
|
| $33.89 |
| $1,621,552 |
| 100.0% |
|
|
|
(1) | Information is based on the underwritten rent roll. |
(2) | Certain tenants may have lease termination options that are exercisable prior to the originally stated expiration date of the subject lease, which are not considered in the Lease Rollover Schedule. |
(3) | Wtd. Avg. UW Base Rent PSF Rolling excludes vacant space. |
The Market. The Fresenius Salt Lake Property is situated in Salt Lake City, Utah along State Street, one of the major arterials for the area. Primary access to the area is provided by Interstate 15 (less than one mile west of the Fresenius Salt Lake Property), a major highway that crosses the metro area in a north/south direction providing access to the Salt Lake City central business district, which is approximately five miles north. The Salt Lake Airport is located approximately 12 miles northwest of the Fresenius Salt Lake Property. According to the appraisal, unemployment in Salt Lake City in 2018 was 3.1%, below the national average at 3.7% and the largest employers in the Salt Lake City MSA were University of Utah, Intermountain Health Care Inc. and Walmart employing approximately 20,000, 19,999 and 4,999 people respectively.
According to the appraisal, the 2018 population within a one-, three- and five-mile radius of the Fresenius Salt Lake Property was 18,528, 144,998 and 388,480 respectively; while the 2018-estimated average household income within the same radii was approximately $56,146, $69,785 and $83,654 respectively. Also according to the appraisal, between 2018 and 2023, the population within the one-, three- and five-mile radius of the Fresenius Salt Lake Property is expected to grow at compound annual growth rates of 1.8%, 1.3% and 1.0%, respectively.
According to the appraisal, as of the end of 2018, the Salt Lake County medical office market reported a total Class A inventory of eight buildings, comprising approximately 694,000 SF of office space with a 4.1% vacancy rate. The appraisal concluded to market rents of $35.00 PSF and market vacancy of 5.0%, which are 3.3% greater and 2.3% lower than to the underwritten base rent of $33.89 PSF and leased vacancy of 7.3%, respectively at the Fresenius Salt Lake Property.
THE INFORMATION IN THIS STRUCTURAL AND COLLATERAL TERM SHEET IS NOT COMPLETE AND MAY BE AMENDED PRIOR TO THE TIME OF SALE. THIS TERM SHEET IS NOT AN OFFER TO SELL THESE SECURITIES AND IT IS NOT A SOLICITATION OF AN OFFER TO BUY THESE SECURITIES IN ANY JURISDICTION WHERE THE OFFER OR SALE IS NOT PERMITTED.
112
3702 S. State Street | Collateral Asset Summary – Loan No. 9 Fresenius Salt Lake | Cut-off Date Balance: | $20,973,336 |
The following table presents recent leasing data at competitive office buildings with respect to the Fresenius Salt Lake Property:
Comparable Office Leases | |||||||||||||||||
Property Name/Address |
| Year Built |
| Size (SF) |
| Occupancy |
| Tenant Name |
| Lease Size (SF) |
| Lease Term (Yrs.) |
| Rent/SF |
| Lease Type |
|
Fresenius Salt Lake Property |
| 2018 |
| 51,591(1) |
| 92.7%(1) |
| Various(1) |
| 51,591(1) |
| 13.1(1) |
| $33.89(1) |
| Triple Net |
|
3592 West 9000 South |
| 2016 |
| 25,056 |
| 100.0% |
| IASIS Healthcare |
| 25,056 |
| 15.0 |
| $30.08 |
| Net |
|
CHG Healthcare Phase II |
| 2019 |
| 154,000 |
| 100.0% |
| CHG Healthcare |
| 154,000 |
| 12.0 |
| $32.00 |
| Full Service |
|
Fresenius Dialysis Center |
| 2016 |
| 9,655 |
| 100.0% |
| Fresenius |
| 9,655 |
| 15.0 |
| $33.71 |
| Absolute Net |
|
Fresenius Orem |
| 2017 |
| 9,691 |
| 100.0% |
| Fresenius Health Care |
| 9,691 |
| 15.0 |
| $38.78 |
| Triple Net |
|
IASIS Healthcare |
| 2018 |
| 4,522 |
| 100.0% |
| Jordan Valley Medical |
| 4,522 |
| 12.0 |
| $28.00 |
| Triple Net |
|
Source: Appraisal
(1) | Based on the underwritten rent roll. |
Operating History and Underwritten Net Cash Flow. The following table presents certain information relating to the historical operating performance and the Underwritten Net Cash Flow at the Fresenius Salt Lake Property:
Cash Flow Analysis | |||||||||||||
|
| 2016(1) |
| 2017(1) |
| 2018(1) |
| 6/30/2019 TTM |
| UW |
| UW PSF |
|
Gross Potential Rent(2) |
| N/A |
| N/A |
| N/A |
| $1,571,712 |
| $1,862,143 |
| $36.09 |
|
Total Recoveries |
| N/A |
| N/A |
| N/A |
| $320,378 |
| $294,537 |
| $5.71 |
|
Other Income(3) |
| N/A |
| N/A |
| N/A |
| $3,026 |
| $0 |
| $0.00 |
|
Less Vacancy & Credit Loss |
| N/A |
| N/A |
| N/A |
| $0 |
| ($152,578) |
| ($2.96) |
|
Effective Gross Income |
| N/A |
| N/A |
| N/A |
| $1,895,116 |
| $2,004,102 |
| $38.85 |
|
Total Operating Expenses |
| N/A |
| N/A |
| N/A |
| $323,730 |
| $294,537 |
| $5.71 |
|
Net Operating Income(2) |
| N/A |
| N/A |
| N/A |
| $1,571,386 |
| $1,709,565 |
| $33.14 |
|
Capital Expenditures |
| N/A |
| N/A |
| N/A |
| $0 |
| $7,739 |
| $0.15 |
|
TI/LC |
| N/A |
| N/A |
| N/A |
| $0 |
| $10,318 |
| $0.20 |
|
Net Cash Flow |
| N/A |
| N/A |
| N/A |
| $1,571,386 |
| $1,691,508 |
| $32.79 |
|
|
|
|
|
|
|
|
|
|
|
|
|
|
|
Occupancy %(4) |
| N/A |
| N/A |
| N/A |
| 92.7% |
| 92.9% |
|
|
|
NOI DSCR |
| N/A |
| N/A |
| N/A |
| 1.20x |
| 1.31x |
|
|
|
NCF DSCR |
| N/A |
| N/A |
| N/A |
| 1.20x |
| 1.29x |
|
|
|
NOI Debt Yield |
| N/A |
| N/A |
| N/A |
| 7.5% |
| 8.2% |
|
|
|
NCF Debt Yield |
| N/A |
| N/A |
| N/A |
| 7.5% |
| 8.1% |
|
|
|
(1) | The Fresenius Salt Lake Property was built in 2018. As such, there are limited historical financials and historical occupancy. |
(2) | UW Gross Potential Rent includes (i) contractual rent steps through March 2020 totaling $25,538 and (ii) straight line rent for investment grade tenants, or leases guaranteed by investment grade tenants, totaling $109,411. This accounts for the increase in net operating income between 6/30/2019 TTM and UW. |
(3) | Other Income consists of miscellaneous income. |
(4) | UW Occupancy % is based on underwritten economic vacancy of 7.1%. The Fresenius Salt Lake Property was 92.7% leased as of July 17, 2019. |
Escrows and Reserves. The Fresenius Salt Lake Borrower deposited in escrow at origination (i) $164,730 for real estate taxes and (ii) $13,805 for insurance premiums. The Fresenius Salt Lake Borrower is required to escrow monthly (i) 1/12 of the real estate taxes, currently $13,728 (ii) 1/12 of the insurance premiums, currently $1,534, (iii) $645 for replacement reserves and (iv) $860 for tenant improvements and leasing commissions.
Lockbox and Cash Management. A hard lockbox and upfront cash management is in place with respect to the Fresenius Salt Lake Mortgage Loan. Provided that no Cash Sweep Event Period (as defined below) exists, all excess cash flow in the lockbox after payment of all sums due and payable under the related mortgage loan documents will be remitted to the Fresenius Salt Lake Borrower. During a Cash Sweep Event Period, all excess cash flow in the lockbox after payment of all sums due and payable under the related mortgage loan documents will be retained by the lender as additional collateral.
A “Cash Sweep Event Period” will commence upon the earlier of: (i) an event of default under the related mortgage loan documents, (ii) an event of default under the management agreement; (iii) the debt service coverage ratio for the Fresenius Salt Lake Property falling below 1.20x; (iv) any tenant occupying
THE INFORMATION IN THIS STRUCTURAL AND COLLATERAL TERM SHEET IS NOT COMPLETE AND MAY BE AMENDED PRIOR TO THE TIME OF SALE. THIS TERM SHEET IS NOT AN OFFER TO SELL THESE SECURITIES AND IT IS NOT A SOLICITATION OF AN OFFER TO BUY THESE SECURITIES IN ANY JURISDICTION WHERE THE OFFER OR SALE IS NOT PERMITTED.
113
3702 S. State Street | Collateral Asset Summary – Loan No. 9 Fresenius Salt Lake | Cut-off Date Balance: | $20,973,336 |
more than 20% of the Fresenius Salt Lake Property or any tenant affiliated or guaranteed by Fresenius (“Significant Tenant”) terminates its lease, vacates, surrenders or ceases to conduct, or gives notice of its intent to vacate, surrender or cease to conduct its normal business operations at substantially all of its leased premises (including subleases substantially all of its leased premises); (v) the senior unsecured debt rating of any Significant Tenant (or such Significant Tenant’s parent company) is downgraded below BBB- by S&P or the equivalent of such rating by any other rating agency; (vi) any Significant Tenant fails to renew its lease on or before the date that is twelve months prior to its expiration date; or (vii) any Significant Tenant (or such Significant Tenant’s parent company) will become insolvent or a debtor in any bankruptcy action. A Cash Sweep Event Period will end: with regard to clause (i), on the date on which a cure of the event of default under the related mortgage loan documents which gave rise to such Cash Sweep Event Period is accepted by the lender in its sole and absolute discretion; with regard to clause (ii), on (a) the date on which the event of default under the management agreement has been cured to the lender’s satisfaction, or (b) the date on which the Fresenius Salt Lake Borrower has entered into a replacement management agreement with a qualified manager in accordance with the terms of the related mortgage loan documents; with regard to clause (iii), upon the net cash flow debt service coverage ratio being at least 1.25x for two consecutive calendar quarters; with regard to clause (iv) through clause (vii), upon the occurrence of a Cash Sweep Significant Trigger Event Cure (as defined below).
A “Cash Sweep Significant Trigger Event Cure” means with respect to clause (iv), either (a) the date on which the applicable Significant Tenant has reopened for business and conducted normal business operations at substantially all of its demised premises (or rescinded its notice and been open for business and conducting normal business operations) and paid full unabated rent for two consecutive quarters, together with delivery of an acceptable estoppel certificate or (b) a re-tenanting of the applicable Significant Tenant’s space to one or more tenants under one or more leases satisfactory to lender in accordance with the terms of the loan agreement, and each such replacement tenant has accepted possession and is in occupancy of its space and paying full, unabated rent with completion of all landlord obligations, to be confirmed by delivery of an acceptable estoppel certificate (a “Re-Tenanting Event”) With respect to clause (v), the date on which, as applicable, the applicable party has its senior unsecured debt rating restored to at least BBB- by S&P or the equivalent of such rating by any other rating agency and has maintained such rating for two consecutive quarters, the applicable party becomes solvent to lender’s satisfaction for two consecutive quarters or is no longer a debtor in a bankruptcy case, or the occurrence of a Re-Tenanting Event; with respect to clause (vi), if the applicable Significant Tenant renews or replaces its lease pursuant to a renewal right set forth in such lease or in accordance with the loan agreement, or the occurrence of a Re-Tenanting Event; and with respect to clause (vii), the date on which either the applicable Significant Tenant or parent company becomes solvent to lender’s satisfaction for two consecutive quarters or is no longer a debtor in a bankruptcy action and has affirmed its lease pursuant to a final court order, or the occurrence of a Re-Tenanting Event.
Additional Secured Indebtedness (not including trade debts). None.
Mezzanine Loan and Preferred Equity. None.
Release of Property. Not permitted.
Terrorism Insurance. The Fresenius Salt Lake Borrower is required to obtain and maintain property insurance, commercial general liability insurance, and business income insurance that covers perils of terrorism and acts of terrorism, both foreign and domestic.
THE INFORMATION IN THIS STRUCTURAL AND COLLATERAL TERM SHEET IS NOT COMPLETE AND MAY BE AMENDED PRIOR TO THE TIME OF SALE. THIS TERM SHEET IS NOT AN OFFER TO SELL THESE SECURITIES AND IT IS NOT A SOLICITATION OF AN OFFER TO BUY THESE SECURITIES IN ANY JURISDICTION WHERE THE OFFER OR SALE IS NOT PERMITTED.
114
(THIS PAGE INTENTIONALLY LEFT BLANK)
115
1040-1100 South Mt. Vernon Avenue Colton, CA 92324 | Collateral Asset Summary – Loan No. 10 Centrepointe Plaza | Cut-off Date Balance: Cut-off Date LTV Ratio: UW NCF DSCR: UW NOI Debt Yield: | $20,500,000 63.1% 1.43x 9.1% |
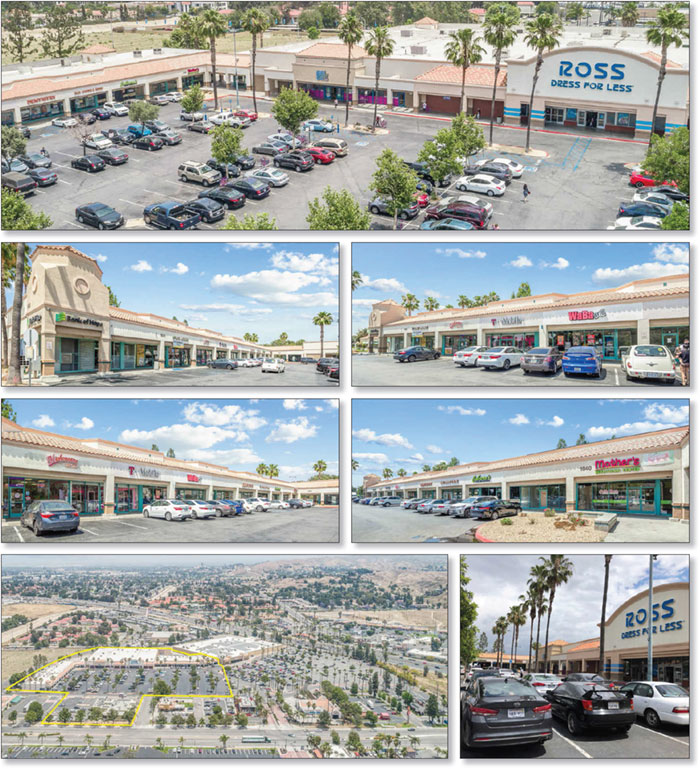
THE INFORMATION IN THIS STRUCTURAL AND COLLATERAL TERM SHEET IS NOT COMPLETE AND MAY BE AMENDED PRIOR TO THE TIME OF SALE. THIS TERM SHEET IS NOT AN OFFER TO SELL THESE SECURITIES AND IT IS NOT A SOLICITATION OF AN OFFER TO BUY THESE SECURITIES IN ANY JURISDICTION WHERE THE OFFER OR SALE IS NOT PERMITTED.
116
1040-1100 South Mt. Vernon Avenue Colton, CA 92324 | Collateral Asset Summary – Loan No. 10 Centrepointe Plaza | Cut-off Date Balance: Cut-off Date LTV Ratio: UW NCF DSCR: UW NOI Debt Yield: | $20,500,000 63.1% 1.43x 9.1% |
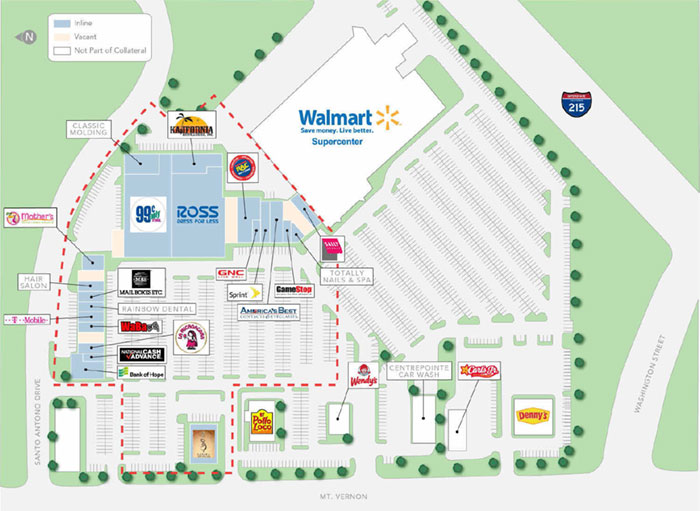
THE INFORMATION IN THIS STRUCTURAL AND COLLATERAL TERM SHEET IS NOT COMPLETE AND MAY BE AMENDED PRIOR TO THE TIME OF SALE. THIS TERM SHEET IS NOT AN OFFER TO SELL THESE SECURITIES AND IT IS NOT A SOLICITATION OF AN OFFER TO BUY THESE SECURITIES IN ANY JURISDICTION WHERE THE OFFER OR SALE IS NOT PERMITTED.
117
1040-1100 South Mt. Vernon Avenue Colton, CA 92324 | Collateral Asset Summary – Loan No. 10 Centrepointe Plaza | Cut-off Date Balance: Cut-off Date LTV Ratio: UW NCF DSCR: UW NOI Debt Yield: | $20,500,000 63.1% 1.43x 9.1% |

THE INFORMATION IN THIS STRUCTURAL AND COLLATERAL TERM SHEET IS NOT COMPLETE AND MAY BE AMENDED PRIOR TO THE TIME OF SALE. THIS TERM SHEET IS NOT AN OFFER TO SELL THESE SECURITIES AND IT IS NOT A SOLICITATION OF AN OFFER TO BUY THESE SECURITIES IN ANY JURISDICTION WHERE THE OFFER OR SALE IS NOT PERMITTED.
118
1040-1100 South Mt. Vernon Avenue Colton, CA 92324 | Collateral Asset Summary – Loan No. 10 Centrepointe Plaza | Cut-off Date Balance: Cut-off Date LTV Ratio: UW NCF DSCR: UW NOI Debt Yield: | $20,500,000 63.1% 1.43x 9.1% |
| Mortgage Loan Information | Mortgaged Property Information | ||||||
| Mortgage Loan Seller: | Rialto Mortgage Finance, LLC | Single Asset/Portfolio: | Single Asset | ||||
Credit Assessment (Fitch/KBRA/Moody’s): | NR/NR/NR | Location: | Colton, CA 92324 | ||||
| General Property Type: | Retail | ||||||
| Original Balance: | $20,500,000 | Detailed Property Type: | Anchored | ||||
| Cut-off Date Balance: | $20,500,000 | Title Vesting: | Fee Simple | ||||
| % of Initial Pool Balance: | 2.5% | Year Built/Renovated: | 1992/2006, 2018 | ||||
| Loan Purpose: | Refinance | Size: | 115,424 SF | ||||
| Borrower Sponsor: | Ming Yang Lee | Cut-off Date Balance per SF: | $178 | ||||
| Mortgage Rate: | 4.8500% | Maturity Date Balance per SF: | $153 | ||||
| Note Date: | 7/1/2019 | Property Manager: | Westmar Property Management, Inc. | ||||
| First Payment Date: | 8/6/2019 | ||||||
| Maturity Date: | 7/6/2029 | ||||||
| Original Term to Maturity | 120 months | ||||||
| Original Amortization Term: | 360 months | ||||||
| IO Period: | 24 months | ||||||
| Seasoning: | 3 months | ||||||
| Prepayment Provisions: | LO (27); DEF (88); O (5) | Underwriting and Financial Information | |||||
| Lockbox/Cash Mgmt Status: | Springing/Springing | UW NOI(5): | $1,865,361 | ||||
| Additional Debt Type: | N/A | UW NOI Debt Yield: | 9.1% | ||||
| Additional Debt Balance: | N/A | UW NOI Debt Yield at Maturity: | 10.6% | ||||
| Future Debt Permitted (Type): | No (N/A) | UW NCF DSCR: | 1.43x | ||||
| Reserves(1) | Most Recent NOI(5): | $1,569,957 (4/30/2019 TTM) | |||||
| Type | Initial | Monthly | Cap | 2nd Most Recent NOI: | $1,554,946 (12/31/2018) | ||
| RE Tax: | $104,832 | $24,960 | N/A | 3rd Most Recent NOI: | $1,666,169 (12/31/2017) | ||
| Insurance: | $15,389 | $4,885 | N/A | Most Recent Occupancy: | 93.0% (6/27/2019) | ||
| Replacements: | $0 | $1,250 | N/A | 2nd Most Recent Occupancy: | 87.0% (12/31/2018) | ||
| TI/LC: | $850,000 | $25,000(2) | N/A | 3rd Most Recent Occupancy: | 91.0% (12/31/2017) | ||
| Unfunded TI/LC: | $39,935 | $0 | N/A | Appraised Value (as of): | $32,500,000 (4/7/2019) | ||
| Free Rent(3): | $35,819 | $0 | N/A | Cut-off Date LTV Ratio: | 63.1% | ||
| Mother’s Nutrition Restoration Funds(4): | $85,400 | $0 | N/A | Maturity Date LTV Ratio: | 54.4% | ||
| Sources and Uses | ||||||
| Sources | Proceeds | % of Total | Uses | Proceeds | % of Total | |
| Loan Amount: | $20,500,000 | 95.8% | Loan Payoff: | $20,114,844 | 94.0% | |
| Borrower Equity: | 902,795 | 4.2% | Reserves: | $1,131,375 | 5.3% | |
| Closing Costs: | $156,576 | 0.7% | ||||
| Total Sources: | $21,402,795 | 100.0% | Total Uses: | $21,402,795 | 100.0% | |
| (1) | See“Escrows and Reserves” below for further discussion of reserve requirements. |
| (2) | The monthly TI/LC reserve of $25,000 is required through and including the payment date in July 2021. |
| (3) | Initial free rent includes free rent for Mother’s Nutrition (free rent period through August 6, 2019), Brotherhood Pharmacy (free rent period through September 6, 2019), and Eyebrow Threading (free rent period through December 6, 2019). |
| (4) | A fire in April 2018 caused damage to the unit occupied by tenant Mother’s Nutrition. The reserve covers the outstanding costs related to the completion of the restoration of the unit as of the Centrepointe Plaza Mortgage Loan (as defined below) origination date. The restoration was completed, and the space was turned over to Mother’s Nutrition on August 26, 2019. |
| (5) | The UW NOI increased more than 15% compared to the Most Recent NOI due to the fact that four tenants, Kalifornia Distilleries, Classic Molding, Brotherhood Pharmacy, and Eyebrow Threading (totaling 15,972 SF), started their leases after March 2019 with total rents of $234,213 annually. |
The Mortgage Loan.The tenth largest mortgage loan (the “Centrepointe Plaza Mortgage Loan”) is evidenced by a promissory note with an original principal balance of $20,500,000, which is secured by a first priority fee mortgage encumbering an anchored retail property known as Centrepointe Plaza (the “Centrepointe Plaza Property”). The proceeds of Centrepointe Plaza Mortgage Loan, together with approximately $902,795 in borrower sponsor equity, were used to refinance the Centrepointe Plaza Property, fund reserves and pay closing costs.
The Borrower and the Borrower Sponsor. The borrower is Centrepointe – JMYL L.P. (the “Centrepointe Plaza Borrower”), a California limited partnership. Legal counsel to Centrepointe Plaza Borrower delivered a non-consolidation opinion in connection with the origination of Centrepointe Plaza Mortgage Loan. The Centrepointe Plaza Borrower is owned 99.0% owned by limited partners and 1.0% owned by Centre Management Corp., general partner. The limited partners are comprised of Ming Yang Lee (78.864%) and 1996 Hong Ling Lee and Tsu Ho Lee Revocable Trust (20.136%). Hong Ling Lee and Tsu Ho Lee are the trustees and equal beneficiaries of the 1996 Hong Ling Lee and Tsu Ho Lee Revocable Trust. Ming Yang Lee solely owns Centre Management Corp.
The non-recourse carveout guarantor of the Centrepointe Plaza Mortgage Loan is Ming Yang Lee. Mr. Lee is an independent real estate developer, adviser, investor, and entrepreneur, involved in negotiating and structuring of deals for new and existing investment entities. Mr. Lee has developed
THE INFORMATION IN THIS STRUCTURAL AND COLLATERAL TERM SHEET IS NOT COMPLETE AND MAY BE AMENDED PRIOR TO THE TIME OF SALE. THIS TERM SHEET IS NOT AN OFFER TO SELL THESE SECURITIES AND IT IS NOT A SOLICITATION OF AN OFFER TO BUY THESE SECURITIES IN ANY JURISDICTION WHERE THE OFFER OR SALE IS NOT PERMITTED.
119
1040-1100 South Mt. Vernon Avenue Colton, CA 92324 | Collateral Asset Summary – Loan No. 10 Centrepointe Plaza | Cut-off Date Balance: Cut-off Date LTV Ratio: UW NCF DSCR: UW NOI Debt Yield: | $20,500,000 63.1% 1.43x 9.1% |
approximately 200,000 SF of ground-up retail and has performed value-add repositioning and re-tenanting on 300,000 SF of retail space in Southern California. Currently, Mr. Lee is a consultant with the City of Murrieta, California planning the South Madison Retail Corridor, and he has previously served for over eight years on the International Council of Shopping Centers (ICSC) Next Gen Committee for Southern California. Mr. Lee was previously the sponsor of a securitized property that went into special servicing. See “Description of the Mortgage Pool—Default History, Bankruptcy Issues and Other Proceedings” in the Preliminary Prospectus.
Ming Yang Lee provided an additional guaranty in the amount of $4,100,000 in the event shadow anchor Walmart (i) fails to be in actual physical occupancy of all or a material portion of its parcel, (ii) vacates, discontinues its normal business operations or otherwise “goes dark” at all or a material portion of its parcel (other than in connection with renovations or necessary repairs), or (iii) is subject to a bankruptcy action.
The Property.The Centrepointe Plaza Property is an 115,424 SF anchored retail property located in Colton, California, within San Bernardino County, approximately 6.7 miles northeast of the Riverside central business district and 58 miles east of the Los Angeles central business district. Built in 1992 and renovated in 2006 and 2018, the Centrepointe Plaza Property consists of four, one-story buildings and one outparcel situated on a 9.56-acre site along South Mount Vernon Avenue. Parking is provided via 548 surface parking spaces (approximately 4.75 spaces per 1,000 SF). As of June 27, 2019, the Centrepointe Plaza Property was 93.0% leased to 23 national, regional and local tenants. The Centrepointe Plaza Property is anchored by Ross Dress for Less (30,187 SF) and 99 Cents Only Stores (21,934 SF). The Centrepointe Plaza Property is also shadow anchored by a 145,000 SF corporate-owned Walmart Supercenter.
Major Tenants.
Ross Dress for Less(30,187 SF, 26.2% of NRA, 20.2% ofunderwritten base rent). Ross Dress for Less (Moody’s/S&P: A2/A-) operates as a subsidiary of Ross Stores, Inc., which is located in Dublin, California. Ross Dress for Less is the largest off-price apparel and home fashion chain in the United States with 1,523 locations in 39 states, the District of Columbia, and Guam. Ross Dress for Less offers first-quality, in-season, name brand and designer apparel, accessories, footwear, and home. The company also currently operates 249 dd’s DISCOUNTS in 18 states. As of fiscal year 2018, the company reported sales of approximately $15.0 billion. Ross Dress for Less has been a tenant at the Centrepointe Plaza Property since 2006 under a lease that commenced November 10, 2006 and expires January 31, 2022, with three, five-year renewal options remaining and no termination options.
99 Cents Only Stores (21,934 SF, 19.0% of NRA, 12.0% of underwritten base rent). 99 Cents Only Stores was founded in 1982 and is the leading operator of value stores in California and the southwestern United States. The company currently operates 391 stores located in California, Texas, Arizona and Nevada offering an assortment of name brand merchandise and seasonal product offerings. 99 Cents Only Stores has been a tenant at the Centrepointe Plaza Property since 2006 under a lease that commenced December 27, 2006 and expires January 31, 2026, with three, five-year renewal options remaining an no termination options.
The following table presents a summary regarding the largest tenants at Centrepointe Plaza Property.
| Tenant Summary(1) | ||||||||
| Tenant Name | Credit Rating (Fitch/Moody’s/S&P)(2) | Tenant SF | Approximate % of SF | Annual UW Base Rent | % of Annual UW Base Rent | Annual UW Base Rent PSF(3) | Lease Expiration | |
| Anchor Tenants | ||||||||
| Ross Dress For Less | NR/A2/A- | 30,187 | 26.2% | $390,225 | 20.2% | $12.93 | 1/31/2022 | |
| 99 Cents Only Stores | NR/NR/NR | 21,934 | 19.0% | $231,623 | 12.0% | $10.56 | 1/31/2026 | |
| Total Anchor Tenants | 52,121 | 45.2% | $621,848 | 32.2% | $11.93 | |||
| Major Tenants | ||||||||
| Sayaka Japanese Restaurant | NR/NR/NR | 8,615 | 7.5% | $253,281 | 13.1% | $29.40 | 2/28/2028 | |
| Kalifornia Distilleries | NR/NR/NR | 7,318 | 6.3% | $112,404 | 5.8% | $15.36 | 3/20/2029 | |
| Classic Molding | NR/NR/NR | 5,789 | 5.0% | $49,000 | 2.5% | $8.46 | 2/28/2021 | |
| Total Major Tenants | 21,722 | 18.8% | $414,685 | 21.5% | $19.09 | |||
| Other Tenants | 33,555 | 29.1% | $892,167 | 46.3% | $26.59 | |||
| Vacant | 8,026 | 7.0% | $0 | 0.0% | $0.00 | |||
| Total/Wtd. Avg. | 115,424 | 100.0% | $1,928,701 | 100.0% | $17.96 | |||
| (1) | Information is based on the underwritten rent roll. |
| (2) | Certain ratings are those of the parent company whether or not the parent guarantees the lease. |
| (3) | Wtd. Avg. Annual UW Rent PSF excludes vacant space. |
THE INFORMATION IN THIS STRUCTURAL AND COLLATERAL TERM SHEET IS NOT COMPLETE AND MAY BE AMENDED PRIOR TO THE TIME OF SALE. THIS TERM SHEET IS NOT AN OFFER TO SELL THESE SECURITIES AND IT IS NOT A SOLICITATION OF AN OFFER TO BUY THESE SECURITIES IN ANY JURISDICTION WHERE THE OFFER OR SALE IS NOT PERMITTED.
120
1040-1100 South Mt. Vernon Avenue Colton, CA 92324 | Collateral Asset Summary – Loan No. 10 Centrepointe Plaza | Cut-off Date Balance: Cut-off Date LTV Ratio: UW NCF DSCR: UW NOI Debt Yield: | $20,500,000 63.1% 1.43x 9.1% |
The following table presents certain information relating to the lease rollover at Centrepointe Plaza Property:
| Lease Rollover Schedule(1)(2) | ||||||||
| Year | # of Leases Rolling | SF Rolling | Approx. % of Total SF Rolling | Approx. Cumulative % of SF Rolling | UW Base Rent PSF Rolling(3) | Total UW Base Rent Rolling | Approx. % of Total Rent Rolling | Approx. Cumulative % of Total Rent Rolling |
| MTM | 0 | 0 | 0.0% | 0.0% | $0.00 | $0 | 0.0% | 0.0% |
| 2019 | 0 | 0 | 0.0% | 0.0% | $0.00 | $0 | 0.0% | 0.0% |
| 2020 | 2 | 2,000 | 1.7% | 1.7% | $30.63 | $61,262 | 3.2% | 3.2% |
| 2021 | 3 | 10,339 | 9.0% | 10.7% | $16.97 | $175,502 | 9.1% | 12.3% |
| 2022 | 3 | 32,737 | 28.4% | 39.1% | $14.76 | $483,159 | 25.1% | 37.3% |
| 2023 | 2 | 4,045 | 3.5% | 42.6% | $27.73 | $112,166 | 5.8% | 43.1% |
| 2024 | 4 | 10,195 | 8.8% | 51.4% | $23.08 | $235,276 | 12.2% | 55.3% |
| 2025 | 2 | 2,920 | 2.5% | 53.9% | $22.79 | $66,547 | 3.5% | 58.8% |
| 2026 | 4 | 26,029 | 22.6% | 76.5% | $13.53 | $352,302 | 18.3% | 77.1% |
| 2027 | 1 | 3,200 | 2.8% | 79.2% | $24.00 | $76,800 | 4.0% | 81.0% |
| 2028 | 1 | 8,615 | 7.5% | 86.7% | $29.40 | $253,281 | 13.1% | 94.2% |
| 2029 | 1 | 7,318 | 6.3% | 93.0% | $15.36 | $112,404 | 5.8% | 100.0% |
| 2030 & Beyond | 0 | 0 | 0.0% | 93.0% | $0.00 | $0 | 0.0% | 100.0% |
| Vacant | 0 | 8,026 | 7.0% | 100.0% | $0.00 | $0 | 0.0% | 100.0% |
| Total/Wtd. Avg. | 23 | 115,424 | 100.0% | $17.96 | $1,928,701 | 100.0% | ||
| (1) | Information is based on the underwritten rent roll. |
| (2) | Certain tenants may have lease termination options that are exercisable prior to the stated expiration date of the subject lease or leases, which are not considered in the lease rollover schedule. |
| (3) | Wtd. Avg. UW Base Rent PSF Rolling excludes vacant space. |
The Market. The Centrepointe Plaza Property is located in located in Colton, San Bernardino County, within the Riverside-San Bernardino-Ontario, CA metropolitan statistical area (the “Riverside MSA”). The City of Colton is located at the south-central portion of San Bernardino County and is known as a center for new business, residential and employment opportunities. Health care/social assistance, retail trade, and educational services drive the top three industries within the area. Major employers within the Riverside MSA include University of California, Riverside, Riverside Unified School District, City of Riverside, Pacific Bell – AT&T and Kaiser Permanente.
The Centrepointe Plaza Property is located approximately 6.7 miles northeast of the Riverside central business district and 58 miles east of the Los Angeles central business district. The Centrepointe Plaza Property is situated just off of Interstate 215, along South Mount Vernon Avenue. The surrounding neighborhood consists of a mixture of residential and retail development. Commercial developments within the neighborhood are primarily concentrated along Interstate 10 and Interstate 215. Major retailers within the immediate area include Best Buy, Staples, Sam’s Club, Costco, Home Depot and Marshalls. According to the appraisal, the 2018 estimated population within a one-, three- and five-mile radius of the Centrepointe Plaza Property is 11,568, 76,706 and 232,470, respectively. The 2018 estimated average household income within the same radii was $57,128, $70,857 and $64,065, respectively.
According to the appraisal, the Centrepointe Plaza Property is located within the Inland Empire retail market which contained approximately 112.2 million SF of retail space as of fourth quarter 2018. The Inland Empire retail market reported a vacancy rate of 8.3% with an average rental rate of $24.36 per SF. The Inland Empire retail market reported positive net absorption of 204,796 SF during the fourth quarter 2018. There was 259,886 SF of retail space under construction in two buildings and deliveries totaling 361,381 SF as of fourth quarter 2018.
According to the appraisal, the Centrepointe Plaza Property is located within the East End retail submarket which contained approximately 40.0 million SF of retail space as of fourth quarter 2018. The East End retail submarket reported a vacancy rate of 8.3% with an average rental rate of $24.84 per SF. The East End retail submarket reported negative net absorption of 62,420 SF during the fourth quarter 2018. There was 178,268 SF of retail space under construction in one building and deliveries totaling 361,381 SF as of fourth quarter 2018.
THE INFORMATION IN THIS STRUCTURAL AND COLLATERAL TERM SHEET IS NOT COMPLETE AND MAY BE AMENDED PRIOR TO THE TIME OF SALE. THIS TERM SHEET IS NOT AN OFFER TO SELL THESE SECURITIES AND IT IS NOT A SOLICITATION OF AN OFFER TO BUY THESE SECURITIES IN ANY JURISDICTION WHERE THE OFFER OR SALE IS NOT PERMITTED.
121
1040-1100 South Mt. Vernon Avenue Colton, CA 92324 | Collateral Asset Summary – Loan No. 10 Centrepointe Plaza | Cut-off Date Balance: Cut-off Date LTV Ratio: UW NCF DSCR: UW NOI Debt Yield: | $20,500,000 63.1% 1.43x 9.1% |
The following table presents competitive retail properties with respect to Centrepointe Plaza Property:
| Competitive Property Summary | ||||||
| Property Name | Type | Year Built/Renovated | Size (SF) | Occupancy | Anchor Tenants | Distance to Subject |
| Centrepointe Plaza | Retail | 1992/2006, 2018 | 115,424(1) | 93.0%(1) | Ross Dress for Less, 99 Cents Only Stores | N/A |
| Highland Avenue Plaza | Retail | 1993/N/A | 373,392 | 98.0% | Super Walmart, Ross Dress For Less | 13.1 miles |
| Pavilion at Redlands | Retail | 1993/N/A | 253,508 | 96.0% | N/A | 6.2 miles |
| Tri-City Centre | Retail | 1987/N/A | 157,000 | 98.0% | Curacao, 24 Hour Fitness | 4.0 miles |
| Inland Empire Center | Retail | 1990/N/A | 316,216 | 82.0% | Cardenas Markets, Regency Theaters, Toys R Us | 8.7 miles |
| Summit Heights Gateway Center | Retail | 2003/N/A | 248,402 | 80.0% | Kohl’s, Marshall’s, PetSmart | 19.0 miles |
Source: Appraisal
| (1) | Information is based on the underwritten rent roll. |
Operating History and Underwritten Net Cash Flow. The following table presents certain information relating to the historical operating performance and the Underwritten Net Cash Flow at Centrepointe Plaza Property:
| Cash Flow Analysis(1) | |||||
| 2017 | 2018 | 4/30/2019 TTM | UW | UW PSF | |
| Base Rent(2) | $1,756,214 | $1,633,591 | $1,689,241 | $2,150,581 | $18.63 |
| Total Recoveries | $480,174 | $548,863 | $510,634 | $656,145 | $5.68 |
| Other Income(3) | $5,531 | $4,710 | $4,710 | $4,710 | $0.04 |
| Less Vacancy & Credit Loss | $0 | $0 | $0 | ($269,144) | ($2.33) |
| Effective Gross Income | $2,241,920 | $2,187,164 | $2,204,585 | $2,542,291 | $22.03 |
| Total Expenses | $575,751 | $632,218 | $634,629 | $676,931 | $5.86 |
| Net Operating Income(4) | $1,666,169 | $1,554,946 | $1,569,957 | $1,865,361 | $16.16 |
| Capital Expenditures | $0 | $0 | $0 | $15,005 | $0.13 |
| TI/LC | $0 | $0 | $0 | $0 | $0.00 |
| Net Cash Flow | $1,666,169 | $1,554,946 | $1,569,957 | $1,850,355 | $16.03 |
| Occupancy % | 91.0% | 87.0% | 85.9% | 93.0% | |
| NOI DSCR | 1.28x | 1.20x | 1.21x | 1.44x | |
| NCF DSCR | 1.28x | 1.20x | 1.21x | 1.43x | |
| NOI Debt Yield | 8.1% | 7.6% | 7.7% | 9.1% | |
| NCF Debt Yield | 8.1% | 7.6% | 7.7% | 9.0% | |
| (1) | The Centrepointe Plaza Property was acquired in May 2016; therefore, the 2016 cash flow statements are not available. |
| (2) | UW Base Rent is based on the rent roll dated June 27, 2019 and includes (i) rent steps through August 1, 2020 totaling $12,294 and (ii) vacancy gross up totaling $221,880. |
| (3) | Other Income includes late fees, assignment fee and miscellaneous income. |
| (4) | The UW Net Operating Income increased more than 15% compared to the 4/30/2019 TTM Net Operating Income due to the fact that four tenants, Kalifornia Distilleries, Classic Molding, Brotherhood Pharmacy, and Eyebrow Threading (totaling 15,972 SF), started their leases after March 2019 with total rents of $234,213 annually. |
Escrows and Reserves. At origination, the Centrepointe Plaza Borrower deposited (i) $104,832 into a real estate tax escrow, (ii) $15,389 into an insurance escrow, (iii) $850,000 into a tenant improvement and leasing commission escrow, (iv) $39,935 into an unfunded tenant improvement and leasing commission escrow, (v) $35,819 into a free rent escrow with respect to three tenants, and (vi) $85,400 into the Mother’s Nutrition restoration escrow. On a monthly basis the Centrepointe Plaza Borrower is required to deposit (i) 1/12 of the annual estimated tax payments, which currently equates to $24,960, (ii) 1/12 of the annual estimated insurance premiums, which currently equates to $4,885; (iii) $1,250 for replacement reserves, and (iv) $25,000 for tenant improvement and leasing commission through and including the payment date in July 2021.
Lockbox and Cash Management. The related mortgage loan documents provide for a springing lockbox and springing cash management. During the occurrence and continuance of a Cash Management Trigger Event (as defined below), the Centrepointe Plaza Borrower is required to instruct tenants to deposit rents and other amounts due into the lockbox account and funds in the lockbox account are required to be transferred to the cash management account within one business day. All funds in the cash management account are required to be applied on each monthly payment date in accordance with the related mortgage loan documents. Pursuant to the related mortgage loan documents, all excess funds on deposit (after payment of monthly reserve deposits; debt service payment and cash management bank fees) will be applied as follows: (a) to the extent a Cash Sweep Event (as defined below) period is not in effect, to the Centrepointe Plaza Borrower, (b) if a Cash Sweep Event is in effect due to the existence of a Critical Tenant Trigger Event (as defined below) to the Critical Tenant TI/LC account until the applicable Critical Tenant Trigger Event Cure (as defined below) has occurred and (c) if a Cash Sweep Event is in effect but a Critical Tenant Trigger Event is not in effect and a Co-Tenancy Trigger Event (as defined below) is in effect, then to the lender controlled excess cash flow account.
A “Cash Management Trigger Event” will occur upon (i) an event of default under the related mortgage loan documents, (ii) the Centrepointe Plaza Borrower’s second late debt service payment in a consecutive 12-month period, (iii) any bankruptcy of the Centrepointe Plaza Borrower, guarantor or manager, (iv) a debt service coverage ratio based on the trailing 12-month period falling below 1.20x, (v) a Critical Tenant Trigger Event, or (vi) a Co-
THE INFORMATION IN THIS STRUCTURAL AND COLLATERAL TERM SHEET IS NOT COMPLETE AND MAY BE AMENDED PRIOR TO THE TIME OF SALE. THIS TERM SHEET IS NOT AN OFFER TO SELL THESE SECURITIES AND IT IS NOT A SOLICITATION OF AN OFFER TO BUY THESE SECURITIES IN ANY JURISDICTION WHERE THE OFFER OR SALE IS NOT PERMITTED.
122
1040-1100 South Mt. Vernon Avenue Colton, CA 92324 | Collateral Asset Summary – Loan No. 10 Centrepointe Plaza | Cut-off Date Balance: Cut-off Date LTV Ratio: UW NCF DSCR: UW NOI Debt Yield: | $20,500,000 63.1% 1.43x 9.1% |
Tenancy Trigger Event. A Cash Management Trigger Event will continue until, in regard to clause (i) above, when such event of default has been curedor waived, in regard to clause (ii) above, when the Centrepointe Plaza Borrower makes (12) twelve consecutive monthly debt service payments, in regard to clause (iii) above, when such bankruptcy petition has been discharged, stayed, or dismissed within 30 days of such filing among other conditions for the Centrepointe Plaza Borrower or guarantor and within 120 days for the property manager (or, solely with respect to the bankruptcy of the property manager, when the Centrepointe Plaza Borrower has replaced the property manager with a qualified property manager acceptable to the lender), in regard to clause (v) above, the date the trailing 12-month amortizing net operating income debt service coverage ratio is greater than 1.20x for two consecutive calendar quarters; in regard to clause (vi) above, the date a Critical Tenant Trigger Event Cure has occurred and in regard to (vii) above, the date a Co-Tenancy Trigger Event Cure has occurred.
A “Cash Sweep Event” will occur upon (i) an event of default under the related mortgage loan documents, (ii) any bankruptcy action of the Centrepointe Plaza Borrower, guarantor or manager, (iii) a debt service coverage ratio based on the trailing 12-month period falling below 1.10x, (iv) a Critical Tenant Trigger Event, or (v) a Co-Tenancy Trigger Event. A Cash Sweep Event will continue until, in regard to clause (i) above, when such event of default has been cured or waived, in regard to clause (ii), (iii) or (iv) when such bankruptcy petition has been discharged, stayed, or dismissed within 30 days of such filing among other conditions for the Centrepointe Plaza Borrower or guarantor and within 120 days for the property manager (or, solely with respect to the bankruptcy of the property manager, when the Centrepointe Plaza Borrower has replaced the property manager with a qualified property manager acceptable to the lender), in regard to clause (v) above, the date the trailing 12-month amortizing net operating income debt service coverage ratio is greater than 1.10x for two consecutive calendar quarters; in regard to clause (vi) above, the date a Critical Tenant Trigger Event Cure has occurred and in regard to (vii) above, the date a Co-Tenancy Trigger Event Cure has occurred.
A “Critical Tenant” means Ross Dress for Less (“Ross”), 99 Cents Only Stores (“99 Cents”), Sayaka Japanese Restaurant (“Sayaka”), and any other tenant occupying all or any portion of any Critical Tenant space;provided,however, that with respect to any replacement tenant taking occupancy of the Sayaka space in connection with a Critical Tenant Space Re-tenanting Event (as defined below), any such replacement tenant or tenants will only constitute a Critical Tenant to the extent that the portion of the Sayaka space demised to any replacement tenant(s) equals or exceeds 1/3 of the rentable square footage of the Sayaka space (and each related lease, a “Critical Tenant Lease”).
A “Critical Tenant Trigger Event” will occur upon each occurrence of any of the following (i) the earlier to occur of (a) the date on which the related Critical Tenant gives notice of its intention to not extend or renew its lease, (b) on or prior to the date that is 12 months prior to the expiration date under the Critical Tenant Lease, the related Critical Tenant fails to give notice of its election to renew its lease, or (c) on or prior to the date on which the Critical Tenant is required under its lease to notify landlord of its election to renew its lease, if the Critical Tenant fails to give such notice, (ii) an event of default under the Critical Tenant Lease exists, (iii) a bankruptcy action of the Critical Tenant occurs, (iv) if the Critical Tenant fails to be in actual occupancy of its leased premises, discontinues its normal business operations or goes dark, or (v) Ross and/or the guarantor of its lease is downgraded below “BBB-” or the equivalent by any credit reporting agency. A Critical Tenant Trigger Event will end (a) with respect to clause (i) above, the date that (1) a Critical Tenant Lease extension is executed and delivered by the Centrepointe Plaza Borrower and the related Critical Tenant, and (x) all related tenant improvements costs, leasing commissions and other material costs and expenses have been deposited into the Critical Tenant TI/LC account and the lender has received an executed estoppel certificate from the related tenant confirming matters set forth in this clause, or (y) an amount sufficient to cover any such costs and expenses as reasonably determined by the lender have been deposited into the Critical Tenant TI/LC account, or (2) a Critical Tenant Space Re-tenanting Event has occurred, (b) with respect to clause (ii) above, after a cure of applicable event of default, (c) with respect to clause (iii) above, after an affirmation that the Critical Tenant is actually paying all rents and other amounts under its lease, (d) with respect to clause (iv) above, the Critical Tenant resumes actual physical occupancy, re-commences its normal business operations at all or its leased premises for a period of at least ninety (90) consecutive days or a Critical Tenant Space Re-tenanting Event has occurred, and (e ) with respect to clause (vi) above, the date the credit rating of the related Critical Tenant is no longer rated less than a “BBB-” or the equivalent by any credit reporting agency.
A “Critical Tenant Space Re-tenanting Event” will occur if all of the following conditions have been satisfied (i) the Critical Tenant space is leased to one or more replacement tenants for a term of at least five (5) years pursuant to one or more leases (a) in accordance with the terms within the related mortgage loan documents, (b) on terms acceptable to the lender, and (c) leased to the tenant or tenants (1) all of the related Critical Tenant space or (2) solely with respect to the Sayaka space, at least 80% of the rentable square footage of the Sayaka space (x) so long as the lease(s) provide for a base rent, additional rent and other amounts payable by the tenant(s) in aggregate, equal to or greater than the amounts payable under the Sayaka lease, immediately prior to the occurrence of the related Critical Tenant Trigger Event and (y)providedthat, the Centrepointe Plaza Borrower desires to lease the Sayaka space to more than one replacement tenant, the Centrepointe Plaza Borrower is required to obtain lender’s prior written consent prior to leasing the space to multiple tenant, (ii) all tenant improvement costs, leasing commissions and other material costs and expenses relating to the re-letting of the space have been paid in full, (iii) each replacement tenant (A) has accepted possession and is in actual, physical occupancy and open for business and conducting normal business operations at the related Critical Tenant space and is paying full, unabated rent, and (iv) the lender has received a fully executed copy of the lease, an officer’s certificate, an estoppel certificate from the related tenant confirming, among other things, the matters set forth in clause (ii) and (iii).
A “Co-Tenancy Trigger Event” will occur upon (i) any Critical Tenant having a Co-Tenancy Right (as defined below) (each such Critical Tenant, a “Co-Tenancy Tenant”), (a) having exercised, or commenced the exercise of, any of its Co-Tenancy Rights and/or taken any action in furtherance of, and/or (b) having given notice to the Centrepointe Plaza Borrower and/or manager of its intent to exercise any of its Co-Tenancy Rights, and/or (ii) the occurrence of any event, or the existence of any state of facts, which upon giving notice, the passage of time and/or otherwise, would permit the Co-Tenancy Tenant to exercise one or more Co-Tenancy Rights under its lease, in each case whether or not such notice has been given and whether or not such time has passed in full or in part and whether or not such Co-Tenancy Tenant has or has not exercised (or commenced the exercise of) any Co-Tenancy Right or taken any action in the furtherance of.
A “Co-Tenancy Space” means any space demised to a Co-Tenancy Tenant pursuant to its lease.
THE INFORMATION IN THIS STRUCTURAL AND COLLATERAL TERM SHEET IS NOT COMPLETE AND MAY BE AMENDED PRIOR TO THE TIME OF SALE. THIS TERM SHEET IS NOT AN OFFER TO SELL THESE SECURITIES AND IT IS NOT A SOLICITATION OF AN OFFER TO BUY THESE SECURITIES IN ANY JURISDICTION WHERE THE OFFER OR SALE IS NOT PERMITTED.
123
1040-1100 South Mt. Vernon Avenue Colton, CA 92324 | Collateral Asset Summary – Loan No. 10 Centrepointe Plaza | Cut-off Date Balance: Cut-off Date LTV Ratio: UW NCF DSCR: UW NOI Debt Yield: | $20,500,000 63.1% 1.43x 9.1% |
A “Co-Tenancy Right” means the right of any Co-Tenancy Tenant under its lease to take any of the following actions (i) cease operations at its leased premises, (ii) terminate or cancel its lease, (iii) shorten the term of its lease, (iv) delay or postpone (a) the rent commencement date, (b) the date to open for business, and/or (c) the date to take occupancy or assume possession of its leased premises, (v) have the rent payable under the lease reduced, prorated, abated and/or calculated using an alternative basis, in either case, due to the occurrence of one or more of the following: (A) one or more identified tenants or types of tenants (e.g. a required co-tenant, as defined within the Ross lease) at the Centrepointe Plaza Property (or any portion thereof) has gone dark, ceased operations, failed to timely open for business or vacated the Centrepointe Plaza Property (or any portion thereof), (B) in the event a specified percentage of the total square footage of the Centrepointe Plaza Property is not leased to one or more identified tenants or types of tenants (e.g. the existence of a reduced occupancy period or a secondary reduced occupancy period, as defined within the Ross lease) in occupancy, and open for business at their respective leased premises, (C) the occupancy of all or any portion of the Centrepointe Plaza Property has fallen below a specified level set forth in any lease, and/or (D) the existence of any other fact, circumstance and/or condition which gives a tenant pursuant to its lease the right to exercise any of the foregoing Co-Tenancy Rights.
A “Co-Tenancy Space Re-Tenanting Event” will occur with respect to any Co-Tenancy Space, the date upon which all of the following conditions have been satisfied; (i) the related Co-Tenancy Space has been leased to one or more replacement tenants for a minimum non-cancelable term of at least five years pursuant to one or more leases, which leases are acceptable to lender and generally contain terms and conditions substantially similar to the terms in the standard form of the lease, (ii) all tenant improvement costs, leasing commissions and other material costs and expensed relating to the re-letting of the Co-Tenancy Space have been paid in full, (iii) each replacement tenant (A) has accepted possession and is actual, physical occupancy, and is open for business and conducting normal business operations at all of its leased space at the related Co-Tenancy Space, and (B) is paying full, unabated rent, and (iv) the lender has received a fully executed copy of the lease, among other things.
Additional Secured Indebtedness (not including trade debts). None.
Mezzanine Loan and Preferred Equity. None.
Release of Property. Not permitted.
Terrorism Insurance. The Centrepointe Plaza Borrower is required to obtain and maintain property insurance, commercial general liability insurance, and business income or rental loss insurance that covers perils of terrorism and acts of terrorism, both foreign and domestic.
THE INFORMATION IN THIS STRUCTURAL AND COLLATERAL TERM SHEET IS NOT COMPLETE AND MAY BE AMENDED PRIOR TO THE TIME OF SALE. THIS TERM SHEET IS NOT AN OFFER TO SELL THESE SECURITIES AND IT IS NOT A SOLICITATION OF AN OFFER TO BUY THESE SECURITIES IN ANY JURISDICTION WHERE THE OFFER OR SALE IS NOT PERMITTED.
124
(THIS PAGE INTENTIONALLY LEFT BLANK)
125
3780-3858 Nostrand Avenue Brooklyn, NY 11235 | Collateral Asset Summary – Loan No. 11 Nostrand Place | Cut-off Date Balance: Cut-off Date LTV Ratio: UW NCF DSCR: UW NOI Debt Yield: | $19,995,000 68.9% 1.39x 8.6% |
| Mortgage Loan Information | Mortgaged Property Information | |||||||
| Mortgage Loan Seller(1): | RREF | Single Asset/Portfolio: | Single Asset | |||||
Credit Assessment (Fitch/KBRA/Moody’s): | NR/NR/NR | Location: | Brooklyn, NY 11235 | |||||
| General Property Type: | Mixed Use | |||||||
| Original Balance: | $19,995,000 | Detailed Property Type: | Retail/Office | |||||
| Cut-off Date Balance: | $19,995,000 | Title Vesting: | Fee Simple | |||||
| % of Initial Pool Balance: | 2.5% | Year Built/Renovated: | 1959/2018 | |||||
| Loan Purpose: | Acquisition | Size: | 70,293 SF | |||||
| Borrower Sponsors: | Christopher Wild; Elliot Sasson | Cut-off Date Balance per SF: | $284 | |||||
| Mortgage Rate: | 4.2500% | Maturity Date Balance per SF: | $259 | |||||
| Note Date: | 8/22/2019 | Property Manager: | East Coast Management, LLC (borrower-related) | |||||
| First Payment Date: | 10/6/2019 | |||||||
| Maturity Date: | 9/6/2029 | |||||||
| Original Term to Maturity: | 120 months | |||||||
| Original Amortization Term: | 360 months | |||||||
| IO Period: | 60 months | |||||||
| Seasoning: | 1 month | |||||||
| Prepayment Provisions: | LO (25); DEF (91); O (4) | |||||||
| Lockbox/Cash Mgmt Status: | Hard/Springing | |||||||
| Additional Debt Type: | N/A | Underwriting and Financial Information | ||||||
| Additional Debt Balance: | N/A | UW NOI(3): | $1,711,645 | |||||
| Future Debt Permitted (Type): | No (N/A) | UW NOI Debt Yield: | 8.6% | |||||
| Reserves | UW NOI Debt Yield at Maturity: | 9.4% | ||||||
| Type | Initial | Monthly | Cap | UW NCF DSCR: | 1.91x (IO) | 1.39x (P&I) | ||
| RE Tax: | $221,976 | $55,494 | N/A | Most Recent NOI(3): | $1,486,896 (5/31/2019 TTM) | |||
| Replacements: | $0 | $937 | N/A | 2nd Most Recent NOI: | $1,543,425 (12/31/2018) | |||
| Deferred Maintenance: | $300,625 | $0 | N/A | 3rd Most Recent NOI: | $1,345,470 (12/31/2017) | |||
| TI/LC: | $400,000 | Springing(2) | $400,000 | Most Recent Occupancy: | 94.4% (5/13/2019) | |||
| VankaVstanka Static Reserve: | $39,286 | $0 | N/A | 2nd Most Recent Occupancy: | 90.0% (12/31/2018) | |||
| Silver Star Expansion Reserve: | $110,020 | $0 | N/A | 3rd Most Recent Occupancy: | 81.0% (12/31/2017) | |||
| Silver Star Gap Rent Reserve: | $45,842 | $0 | N/A | Appraised Value (as of): | $29,000,000 (6/24/2019) | |||
| Silver Star TILC/Rent Credit: | $100,000 | $0 | N/A | Cut-off Date LTV Ratio: | 68.9% | |||
| Outstanding Leasing Commissions: | $66,373 | $0 | N/A | Maturity Date LTV Ratio: | 62.8% | |||
| Sources and Uses | ||||||
| Sources | Proceeds | % of Total | Uses | Proceeds | % of Total | |
| Loan Amount: | $19,995,000 | 68.7% | Purchase Price: | $26,781,806 | 92.0% | |
| Borrower Equity: | $9,112,955 | 31.3% | Reserves: | $1,284,123 | 4.4% | |
| Closing Costs: | $1,042,025 | 3.6% | ||||
| Total Sources: | $29,107,955 | 100.0% | Total Uses: | $29,107,955 | 100.0% | |
| (1) | The Nostrand Place Mortgage Loan (as defined below) was originated by BSPRT CMBS Finance, LLC and acquired by RREF. RREF has re-underwritten such mortgage loan in accordance with the procedures described under “Transaction Parties—The Sponsors and Mortgage Loan Sellers—Rialto Real Estate Fund III – Debt, LP” in the Preliminary Prospectus. |
| (2) | If the TI/LC reserve balance falls below $350,000, it will be replenished by a monthly deposit amount of $5,858. |
| (3) | UW NOI is greater than Most Recent NOI mainly due to (i) underwritten rent steps totaling $5,148 through August 1, 2020 and (ii) four tenants (AJR Tax, Big Mike’s Barber Shop, MSJR Corp. and A Friendly Face) that have executed leases at the Nostrand Place Property (as defined below) in the second half of 2019, totaling $165,388 in base rent. |
The Mortgage Loan.The eleventh largest mortgage loan (the “Nostrand Place Mortgage Loan”) is evidenced by a promissory note with an original principal balance of $19,995,000, which is secured by a first priority fee mortgage encumbering a mixed use retail and office property located in Brooklyn, New York (the “Nostrand Place Property”). The proceeds of the Nostrand Place Mortgage Loan, together with $9,112,955 in borrower sponsors equity, were used to purchase the Nostrand Place Property, pay closing costs, and fund reserves.
The Borrower and the Borrower Sponsors. The borrower is ECA Buligo Nostrand Partners, LP (the “Nostrand Place Borrower”), a single-purpose Delaware limited partnership structured to be bankruptcy-remote. The borrower sponsors and non-recourse guarantors of the Nostrand Place Mortgage Loan are Christopher Wild and Elliot Sasson.
The Property.The Nostrand Place Property was built in 1959 and renovated in 2018 and is comprised of five adjacent one- and two-story buildings along Nostrand Avenue in the Sheepshead Bay section of Brooklyn. The majority of the buildings have ground floor retail and second story office space, although one building is comprised entirely of office space. In addition, the Nostrand Place Property contains a below-grade parking garage. The Nostrand Place Property is approximately 61% retail and 39% office. The Nostrand Place Property has a total of 86 parking spaces.
THE INFORMATION IN THIS STRUCTURAL AND COLLATERAL TERM SHEET IS NOT COMPLETE AND MAY BE AMENDED PRIOR TO THE TIME OF SALE. THIS TERM SHEET IS NOT AN OFFER TO SELL THESE SECURITIES AND IT IS NOT A SOLICITATION OF AN OFFER TO BUY THESE SECURITIES IN ANY JURISDICTION WHERE THE OFFER OR SALE IS NOT PERMITTED.
126
3780-3858 Nostrand Avenue Brooklyn, NY 11235 | Collateral Asset Summary – Loan No. 11 Nostrand Place | Cut-off Date Balance: Cut-off Date LTV Ratio: UW NCF DSCR: UW NOI Debt Yield: | $19,995,000 68.9% 1.39x 8.6% |
The Nostrand Place Property has experienced recent new and renewal leasing, with 43,379 SF (61.7% of NRA; 62.5% of underwritten base rent) of new or renewal leases signed at the Nostrand Place Property since 2017. The largest tenant at the Nostrand Place Property, Silver Star (12.8% of NRA; 10.0% of underwritten base rent), has been at the Nostrand Place Property since 2004 with a lease expiration in 2037 (its lease was extended an additional 20 years in 2017). Silver Star is in the process of expanding its space by 3,617 SF, increasing its footprint at the Nostrand Place Property to 8,974 SF.
Major Tenants.
Silver Star(8,974SF, 12.8% of NRA, 10.0% ofunderwritten base rent). Silver Star is a local supermarket founded in 1968. Originally specializing mainly in quality meats, Silver Star has incorporated deli, grocery, cooked foods and produce into its product selection. Silver Star has leased ground floor retail space at the Nostrand Place Property since 2004 and is in the process of expanding their space by 3,617 SF to a total of 8,974 SF to be used for a prepared food section. Silver Star is planning a full store renovation in connection with the expansion.
Aurora Energy Advisors LLC (5,670 SF, 8.1% of NRA, 7.2% of underwritten base rent). Aurora Energy Advisors LLC (“Aurora”) is a full-service energy management and consulting firm specializing in strategies designed to manage energy costs for real estate owners and property managers. Aurora offers services that work in tandem to craft long-term energy plans. Aurora occupies second floor office space and has been at the Nostrand Place Property since 2017.
Bogoraz Law Group (3,300 SF, 4.7% of NRA, 4.3% of underwritten base rent).Bogoraz Law Group is a Brooklyn based law firm specializing in personal injury. Bogoraz Law Group’s areas of expertise include: construction and work site accidents, medical malpractice, trip and fall accidents, automobile accidents, defective product accidents, and social security disability, amongst others. Bogoraz Law Group has leased second floor office space at the Nostrand Place Property since 2017.
Billmed Management LLC (3,101 SF, 4.4% of NRA, 3.4% of underwritten base rent).Billmed Management LLC (“Billmed”) provides up-to-date billing services for the medical community, serving medical office clients single physician offices to large multispecialty groups. Billmed offers 24-hour direct access to billing files in addition to handling collections and posting of all claims. Billmed has leased second floor office space at the Nostrand Place Property since 2014. Billmed recently extend its lease by an additional five years through 2024.
Chopstix (3,081 SF, 4.4% of NRA, 6.9% of underwritten base rent).Chopstix is an authentic Chinese cuisine restaurant that provides in house dining options, catering, and delivery. Chopstix has leased the ground floor retail space at the Nostrand Place Property since 2005.
The following table presents a summary regarding the largest tenants at the Nostrand Place Property:
| Tenant Summary(1) | ||||||||
| Tenant Name | Credit Rating (Fitch/Moody’s/S&P) | Tenant SF | Approximate % of SF | Annual UW Base Rent | % of Annual UW Base Rent | Annual UW Base Rent PSF(2) | Lease Expiration | |
| Major Tenants | ||||||||
| Silver Star | NR/NR/NR | 8,974 | 12.8% | $273,004 | 10.0% | $30.42 | 5/31/2037 | |
| Aurora Energy Advisors LLC | NR/NR/NR | 5,670 | 8.1% | $198,280 | 7.2% | $34.97 | 3/31/2024 | |
| Bogoraz Law Group | NR/NR/NR | 3,300 | 4.7% | $117,150 | 4.3% | $35.50 | 9/30/2027 | |
| Billmed Management LLC | NR/NR/NR | 3,101 | 4.4% | $93,030 | 3.4% | $30.00 | 12/31/2024 | |
| Chopstix | NR/NR/NR | 3,081 | 4.4% | $187,877 | 6.9% | $60.98 | 4/30/2024 | |
| Total Major Tenants | 24,126 | 34.3% | $869,341 | 31.7% | $36.03 | |||
| Other Tenants | 42,225 | 60.1% | $1,871,586 | 68.3% | $44.32 | |||
| Vacant | 3,942 | 5.6% | $0 | 0.0% | $0.00 | |||
| Total/Wtd. Avg. | 70,293 | 100.0% | $2,740,927 | 100.0% | $41.31 | |||
| (1) | Information is based on the underwritten rent roll. |
| (2) | Wtd. Avg. Annual UW Base Rent PSF excludes vacant space. |
THE INFORMATION IN THIS STRUCTURAL AND COLLATERAL TERM SHEET IS NOT COMPLETE AND MAY BE AMENDED PRIOR TO THE TIME OF SALE. THIS TERM SHEET IS NOT AN OFFER TO SELL THESE SECURITIES AND IT IS NOT A SOLICITATION OF AN OFFER TO BUY THESE SECURITIES IN ANY JURISDICTION WHERE THE OFFER OR SALE IS NOT PERMITTED.
127
3780-3858 Nostrand Avenue Brooklyn, NY 11235 | Collateral Asset Summary – Loan No. 11 Nostrand Place | Cut-off Date Balance: Cut-off Date LTV Ratio: UW NCF DSCR: UW NOI Debt Yield: | $19,995,000 68.9% 1.39x 8.6% |
The following table presents certain information relating to the lease rollover schedule at the Nostrand Place Property:
| Lease Rollover Schedule(1)(2) | ||||||||
| Year | # of Leases Rolling | SF Rolling | Approx. % of Total SF Rolling | Approx. Cumulative % of SF Rolling | UW Base Rent PSF Rolling(3) | Total UW Base Rent Rolling | Approx. % of Total Rent Rolling | Approx. Cumulative % of Total Rent Rolling |
| MTM | 0 | 0 | 0.0% | 0.0% | $0.00 | $0 | 0.0% | 0.0% |
| 2019 | 0 | 0 | 0.0% | 0.0% | $0.00 | $0 | 0.0% | 0.0% |
| 2020 | 5 | 5,308 | 7.6% | 7.6% | $41.97 | $222,789 | 8.1% | 8.1% |
| 2021 | 3 | 6,638 | 9.4% | 17.0% | $39.58 | $262,703 | 9.6% | 17.7% |
| 2022 | 4 | 7,207 | 10.3% | 27.2% | $69.62 | $501,786 | 18.3% | 36.0% |
| 2023 | 6 | 9,054 | 12.9% | 40.1% | $44.07 | $398,992 | 14.6% | 50.6% |
| 2024 | 5 | 14,198 | 20.2% | 60.3% | $40.13 | $569,729 | 20.8% | 71.4% |
| 2025 | 1 | 2,091 | 3.0% | 63.3% | $36.50 | $76,322 | 2.8% | 74.1% |
| 2026 | 1 | 2,740 | 3.9% | 67.2% | $25.00 | $68,500 | 2.5% | 76.6% |
| 2027 | 2 | 4,153 | 5.9% | 73.1% | $35.81 | $148,710 | 5.4% | 82.1% |
| 2028 | 1 | 1,651 | 2.3% | 75.5% | $34.53 | $57,009 | 2.1% | 84.2% |
| 2029 | 2 | 1,300 | 1.8% | 77.3% | $39.69 | $51,597 | 1.9% | 86.0% |
| 2029 & Beyond | 2 | 12,011 | 17.1% | 94.4% | $31.87 | $382,791 | 14.0% | 100.0% |
| Vacant | 0 | 3,942 | 5.6% | 100.0% | $0.00 | $0 | 0.0% | 100.0% |
| Total/Wtd. Avg. | 32 | 70,293 | 100.0% | $41.31 | $2,740,927 | 100.0% | ||
| (1) | Information is based on the underwritten rent roll. |
| (2) | Certain tenants may have lease termination options that are exercisable prior to the stated expiration date of the subject lease or leases, which are not considered in the lease rollover schedule. |
| (3) | Wtd. Avg. UW Base Rent PSF Rolling excludes vacant space |
The Market. The Nostrand Place Property is located in the Sheepshead Bay neighborhood of Brooklyn, NY. Sheepshead Bay is a waterfront community proximate to Manhattan Beach, Brighton Beach, and Coney Island, with an array of recreational activities. Named for the bay that separates the mainland of Brooklyn from the eastern portion of Coney Island, Sheepshead Bay lies to the north of the bay, east of Gravesend and south of Midwood.
The Nostrand Place Property is located on Nostrand Avenue (3780-3858 Nostrand Avenue) and has been repositioned to include a diverse tenant mix. Neighboring tenants, such as Aldi (across the street), Blink Fitness, Party City, Payless Shoes and an assortment of restaurants, help drive additional traffic to the corridor. Located just off the Belt Parkway and a few blocks north of the Sheepshead Bay Emmons Avenue waterfront, the Nostrand Place Property has access to other areas of Brooklyn and Manhattan. Additionally, Sheepshead Bay is serviced by the Brighton Beach bound B and Q trains, as well as the express bus, BM3.
Mainly comprised of locally owned retail stores and markets, Sheepshead Bay is known for its waterfront along Emmons Avenue where several seafood and ethnic restaurants are located. Beyond the array of cuisine and affordable living options, Sheepshead Bay’s historical draw has been the attractive assortment of waterfront and open spaces, including the Holocaust Memorial Park.
According to a third party market research report, the Nostrand Place Property is located in the South Brooklyn retail submarket, which is comprised of 43,000,400 SF and has average asking rents of $42.82 PSF with an average vacancy rate of 3.2%. The South Brooklyn office submarket is comprised of 19,647,640 SF and has average asking rents of $35.06 PSF with an average vacancy rate of 11.3%.
According to a third party market research report, the estimated 2019 population within a one-, three- and five-mile radius of the Nostrand Place Property is 87,977, 558,974 and 1,327,257, respectively. The estimated 2019 median household income within the same one-, three- and five-mile radius is $60,493, $58,891 and $55,577, respectively.
THE INFORMATION IN THIS STRUCTURAL AND COLLATERAL TERM SHEET IS NOT COMPLETE AND MAY BE AMENDED PRIOR TO THE TIME OF SALE. THIS TERM SHEET IS NOT AN OFFER TO SELL THESE SECURITIES AND IT IS NOT A SOLICITATION OF AN OFFER TO BUY THESE SECURITIES IN ANY JURISDICTION WHERE THE OFFER OR SALE IS NOT PERMITTED.
128
3780-3858 Nostrand Avenue Brooklyn, NY 11235 | Collateral Asset Summary – Loan No. 11 Nostrand Place | Cut-off Date Balance: Cut-off Date LTV Ratio: UW NCF DSCR: UW NOI Debt Yield: | $19,995,000 68.9% 1.39x 8.6% |
Operating History and Underwritten Net Cash Flow. The following table presents certain information relating to the historical operating performance and the Underwritten Net Cash Flow at the Nostrand Place Property:
| Cash Flow Analysis | ||||||
| 2016 | 2017 | 2018 | 5/31/2019 TTM | UW | UW PSF | |
| Base Rent(1) | $2,059,047 | $2,282,082 | $2,575,666 | $2,543,506 | $2,893,347 | $41.16 |
| Total Recoveries | $336,824 | $260,177 | $266,831 | $271,958 | $261,414 | $3.72 |
| Other Income(2) | $0 | $24,835 | $24,301 | $24,301 | $32,026 | $0.46 |
| Less Vacancy & Credit Loss | ($56,881) | ($13,652) | ($111,646) | ($187,426) | ($316,071) | ($4.50) |
| Effective Gross Income | $2,338,991 | $2,553,443 | $2,755,152 | $2,652,339 | $2,870,716 | $40.84 |
| Total Expenses | $1,220,500 | $1,207,973 | $1,211,727 | $1,165,443 | $1,159,071 | $16.49 |
| Net Operating Income(3) | $1,118,491 | $1,345,470 | $1,543,425 | $1,486,896 | $1,711,645 | $24.35 |
| Replacement Reserves | $11,247 | $11,247 | $11,247 | $11,247 | $11,247 | $0.16 |
| TI/LC | $98,410 | $98,410 | $98,410 | $98,410 | $98,410 | $1.40 |
| TI//LC Upfront Credit | ($40,000) | ($40,000) | ($40,000) | ($40,000) | ($40,000) | ($0.57) |
| Net Cash Flow | $1,048,834 | $1,275,812 | $1,473,768 | $1,417,239 | $1,641,988 | $23.36 |
| Occupancy % | 72.0% | 81.0% | 90.0% | 94.4%(4) | 94.9% | |
| NOI DSCR (P&I) | 0.95x | 1.14x | 1.31x | 1.26x | 1.45x | |
| NCF DSCR (P&I) | 0.89x | 1.08x | 1.25x | 1.20x | 1.39x | |
| NOI Debt Yield | 5.6% | 6.7% | 7.7% | 7.4% | 8.6% | |
| NCF Debt Yield | 5.2% | 6.4% | 7.4% | 7.1% | 8.2% | |
| (1) | UW Base Rent is based on the rent roll dated May 13, 2019 and includes rent steps totaling $5,148 through August 1, 2020. |
| (2) | Other Income consists of parking income. |
| (3) | Underwritten Net Operating Income is greater than 5/31/2019 TTM Net Operating Income mainly due to (i) underwritten rent steps totaling $5,148 through August 1, 2020 and (ii) four tenants (AJR Tax, Big Mike’s Barber Shop, MSJR Corp. and A Friendly Face) that have executed leases at the Nostrand Place Property in the second half of 2019, totaling $165,388 in base rent. |
| (4) | Occupancy % is as of May 13, 2019. |
THE INFORMATION IN THIS STRUCTURAL AND COLLATERAL TERM SHEET IS NOT COMPLETE AND MAY BE AMENDED PRIOR TO THE TIME OF SALE. THIS TERM SHEET IS NOT AN OFFER TO SELL THESE SECURITIES AND IT IS NOT A SOLICITATION OF AN OFFER TO BUY THESE SECURITIES IN ANY JURISDICTION WHERE THE OFFER OR SALE IS NOT PERMITTED.
129
270 Littleton Road Chelmsford, MA 01824 | Collateral Asset Summary – Loan No. 12 Chelmsford MHC | Cut-off Date Balance: Cut-off Date LTV Ratio: UW NCF DSCR: UW NOI Debt Yield: | $18,200,000 64.1% 1.42x 8.1% |
| Mortgage Loan Information | Property Information | |||||
| Mortgage Loan Seller: | LCF | Single Asset/Portfolio: | Single Asset | |||
| Credit Assessment (Fitch/KBRA/Moody’s): | NR/NR/NR | Location: | Chelmsford, MA 01824 | |||
| General Property Type: | Manufactured Housing Community | |||||
| Original Balance: | $18,200,000 | Detailed Property Type: | Manufactured Housing Community | |||
| Cut-off Date Balance: | $18,200,000 | Title Vesting: | Fee Simple | |||
| % of Initial Pool Balance: | 2.3% | Year Built/Renovated: | 1974/N/A | |||
| Loan Purpose: | Refinance | Size: | 254 Pads | |||
| Borrower Sponsor: | Ross H. Partrich | Cut-off Date Balance per Pad: | $71,654 | |||
| Mortgage Rate: | 3.9430% | Maturity Date Balance per Pad: | $64,964 | |||
| Note Date: | 8/1/2019 | Property Manager: | Newbury Management Company (borrower-related) | |||
| First Payment Date: | 9/6/2019 | |||||
| Maturity Date: | 8/6/2029 | |||||
| Original Term to Maturity: | 120 months | |||||
| Original Amortization Term: | 360 months | Underwriting and Financial Information | ||||
| IO Period: | 60 months | UW NOI(4): | $1,480,935 | |||
| Seasoning: | 2 months | UW NOI Debt Yield: | 8.1% | |||
| Prepayment Provisions: | LO (26); DEF (90); O (4) | UW NOI Debt Yield at Maturity: | 9.0% | |||
| Lockbox/Cash Mgmt Status: | Springing/Springing | UW NCF DSCR: | 2.02x (IO) 1.42x (P&I) | |||
| Additional Debt Type: | N/A | Most Recent NOI(4): | $1,396,252 (5/31/2019 TTM) | |||
| Additional Debt Balance: | N/A | 2nd Most Recent NOI(4): | $1,383,670 (12/31/2018) | |||
| Future Debt Permitted (Type)(1): | Yes (Mezzanine) | 3rd Most Recent NOI(4): | $1,339,278 (12/31/2017) | |||
| Reserves | Most Recent Occupancy: | 98.0% (7/23/2019) | ||||
| Type | Initial | Monthly | Cap | 2nd Most Recent Occupancy: | 98.0% (12/31/2018) | |
| RE Tax: | $23,865 | $11,933 | N/A | 3rd Most Recent Occupancy: | 98.8% (12/31/2017) | |
| Insurance: | $0 | Springing(2) | N/A | Appraised Value (as of): | $28,400,000 (6/25/2019) | |
| Replacements: | $0 | $1,058 | N/A | Cut-off Date LTV Ratio: | 64.1% | |
| Environmental Insurance(3): | $86,000 | $0 | N/A | Maturity Date LTV Ratio: | 58.1% | |
| Sources and Uses | ||||||
| Sources | Proceeds | % of Total | Uses | Proceeds | % of Total | |
| Loan Amount: | $18,200,000 | 100.0% | Loan Payoff: | $7,919,613 | 43.5% | |
| Reserves: | $109,865 | 0.6% | ||||
| Closing Costs: | $371,389 | 2.0% | ||||
| Return of Equity: | $9,799,132 | 53.8% | ||||
| Total Sources: | $18,200,000 | 100.0% | Total Uses: | $18,200,000 | 100.0% | |
| (1) | Mezzanine debt is permitted if, among other conditions, (a) the combined loan-to-value ratio is not greater than the lesser of 70.0% and the related loan-to-value ratio at origination (64.1%), (b) the combined debt service coverage ratio must be at least equal to the greater of 1.25x and the related debt service coverage ratio at origination (1.42x), and (c) rating agency confirmation is obtained with respect to the Series 2019-C17 certificates (but only if required under the Series 2019-C17 pooling and servicing agreement). |
| (2) | The Chelmsford MHC Property (as defined below) is covered by a blanket policy maintained by the borrower sponsor. Insurance escrows are deferred while the blanket coverage is in place. |
| (3) | In March 2019, an above-ground storage tank (for heating oil) leaked. The claim is covered by an environmental insurance policy. The reserve amount equals the deductible under the environmental insurance policy plus the amount necessary to complete the installation of secondary containment for any above ground storage heating oil/kerosene tanks that currently do not have secondary containment. |
| (4) | See “Operating History and Underwritten Net Cash Flow” section below for further discussion of NOI. |
The Mortgage Loan. The twelfth largest mortgage loan (the “Chelmsford MHC Mortgage Loan”) is evidenced by a promissory note with an original principal balance of $18,200,000, which is secured by a first priority fee mortgage encumbering a 254-pad, manufactured housing community property located in Chelmsford, Massachusetts (the “Chelmsford MHC Property”). The proceeds of the Chelmsford MHC Mortgage Loan were used to refinance the Chelmsford MHC Property, fund reserves, pay closing costs, and return equity to the borrower sponsor.
The Borrower and the Borrower Sponsor. The borrower is Chelmsford Group, LLC (the “Chelmsford MHC Borrower”), a single-purpose Delaware limited liability company. The borrower sponsor and nonrecourse carve-out guarantor is Ross H. Partrich, who is the key principal of RHP Properties (“RHP”). Mr. Partrich owns and manages a total of 254 manufactured housing communities with over 63,659 housing units and sites spanning 27 states, with a combined value of approximately $4.0 billion. RHP employs more than 950 professionals at its Farmington Hills, Michigan corporate headquarters, regional offices, and on-site management properties across the country. RHP is the largest private owner of manufactured home communities in the country.
The Property. The Chelmsford MHC Property consists of a 254-pad manufactured housing community located on a 37.8-acre site. The Chelmsford MHC Property is located in Middlesex County, approximately 22.7 miles southwest of Boston and 5.1 miles northwest of Lowell, Massachusetts. The Chelmsford MHC Property amenities include a playground and an on-site office. The Chelmsford MHC Property also has 530 parking spaces, providing a total of 2.1 parking spaces/pad.
THE INFORMATION IN THIS STRUCTURAL AND COLLATERAL TERM SHEET IS NOT COMPLETE AND MAY BE AMENDED PRIOR TO THE TIME OF SALE. THIS TERM SHEET IS NOT AN OFFER TO SELL THESE SECURITIES AND IT IS NOT A SOLICITATION OF AN OFFER TO BUY THESE SECURITIES IN ANY JURISDICTION WHERE THE OFFER OR SALE IS NOT PERMITTED.
130
270 Littleton Road Chelmsford, MA 01824 | Collateral Asset Summary – Loan No. 12 Chelmsford MHC | Cut-off Date Balance: Cut-off Date LTV Ratio: UW NCF DSCR: UW NOI Debt Yield: | $18,200,000 64.1% 1.42x 8.1% |
The Market. The Chelmsford MHC Property is located within Middlesex County, located approximately 22.7 miles southwest of Boston. According to the appraisal, the Chelmsford MHC Property is located within the Boston metropolitan market. The Boston metropolitan statistical area has a population of 4.8 million, making it the 10th most populated metropolitan area in the United States. The Chelmsford MHC Property is located within Middlesex County, which has an estimated 2019 population of 1,604,994, making it the most populous county in Massachusetts. The Chelmsford MHC Property is located 4.8 miles southwest of Lowell General Hospital with 445 beds and employs more than 3,500 people.
According to the appraisal, the estimated 2018 population within a one-, three- and five-mile radius of the Chelmsford MHC Property was 4,243, 35,779 and 118,676 respectively, and the 2018 estimated average household income within the same one-, three- and five-mile radius is $132,778, $149,732 and $122,894, respectively.
Comparable rental properties to the Chelmsford MHC Property are shown in the table below:
| Competitive Property Summary(1) | |||||
| Property Name/Location | Year Built | Distance to Subject | Number of Units | Property Occupancy | Avg. Monthly Rent per Pad |
Chelmsford MHC Property 270 Littleton Road Chelmsford, MA | 1974 | -- | 254 | 98.8%(2) | $702(2)
|
Lakeside Mobile Home Court 54 Oak Street Billerica, MA | 1965 | 6.5 miles | 230 | 100.0% | $421
|
Meadowbrook MHC 2 Rebecca Avenue Hudson, MA | 1970 | 16.6 miles | 193 | 98.4% | $551
|
Val’s Mobile Home Park 547 Boston Post Road Marlborough, MA | 1964 | 17.4 miles | 120 | 95.0% | $750
|
Jo-Len Village 303 Boston Post Road E Marlborough, MA | 1985 | 17.5 miles | 126 | 97.7% | $745
|
Suburban Village Mobile Home Park 18 Maple St Pepperell, MA | 1970 | 13.7 miles | 60 | 97.0% | $564
|
Post Post Road MHC 181 Boston Post Road E Marlborough, MA | 1955 | 17.6 miles | 109 | 100.0% | $745 |
| (1) | Source:Appraisal |
| (2) | Information obtained from the borrower rent roll. |
Operating History and Underwritten Net Cash Flow. The following table presents certain information relating to the historical operating performance and the Underwritten Net Cash Flow at the Chelmsford MHC Property:
| Cash Flow Analysis | ||||||
| 2016 | 2017 | 2018 | 5/31/2019 TTM | UW | UW per Pad | |
| Gross Potential Rent(1) | $1,986,865 | $2,006,110 | $2,055,933 | $2,083,774 | $2,140,577 | $8,427 |
| Total Other Income(2) | $39,745 | $39,714 | $38,271 | $38,723 | $38,723 | $152 |
| Less Vacancy & Credit Loss | ($15,731) | ($41,469) | ($43,548) | ($53,233) | ($43,810)(3) | ($172) |
| Effective Gross Income | $2,010,879 | $2,004,355 | $2,050,656 | $2,069,264 | $2,135,490 | $8,407 |
| Total Operating Expenses | $656,890 | $665,077 | $666,986 | $673,012 | $654,556 | $2,577 |
| Net Operating Income | $1,353,989 | $1,339,278 | $1,383,670 | $1,396,252 | $1,480,935 | $5,830 |
| Capital Expenditures | $0 | $0 | $0 | $0 | $12,700 | $50 |
| Net Cash Flow | $1,353,989 | $1,339,278 | $1,383,670 | $1,396,252 | $1,468,235 | $5,780 |
| Occupancy %(3) | 98.8% | 98.8% | 98.0% | 98.8% | 98.0% | |
| NOI DSCR (P&I) | 1.31x | 1.29x | 1.34x | 1.35x | 1.43x | |
| NCF DSCR (P&I) | 1.31x | 1.29x | 1.34x | 1.35x | 1.42x | |
| NOI Debt Yield | 7.4% | 7.4% | 7.6% | 7.7% | 8.1% | |
| NCF Debt Yield | 7.4% | 7.4% | 7.6% | 7.7% | 8.1% | |
| (1) | UW Gross Potential Rent is underwritten to the July 23, 2019 rent roll for the 254 pads, which reflects physical occupancy of 98.8%. |
| (2) | Total Other Income includes miscellaneous fees and space tax recovery income. |
| (3) | Vacancy is underwritten to 2.0%. |
THE INFORMATION IN THIS STRUCTURAL AND COLLATERAL TERM SHEET IS NOT COMPLETE AND MAY BE AMENDED PRIOR TO THE TIME OF SALE. THIS TERM SHEET IS NOT AN OFFER TO SELL THESE SECURITIES AND IT IS NOT A SOLICITATION OF AN OFFER TO BUY THESE SECURITIES IN ANY JURISDICTION WHERE THE OFFER OR SALE IS NOT PERMITTED.
131
830 Allonby Road Fayetteville, NC 28314 | Collateral Asset Summary – Loan No. 13 Eagle Point Village Apartments | Cut-off Date Balance: Cut-off Date LTV Ratio: UW NCF DSCR: UW NOI Debt Yield: | $17,400,000 65.7% 1.48x 9.1% |
| Mortgage Loan Information | Property Information | |||||||
| Mortgage Loan Seller: | RMF | Single Asset/Portfolio: | Single Asset | |||||
| Credit Assessment (Fitch/KBRA/Moody’s): | NR/NR/NR | Location: | Fayetteville, NC 28314 | |||||
| General Property Type: | Multifamily | |||||||
| Original Balance: | $17,400,000 | Detailed Property Type: | Garden | |||||
| Cut-off Date Balance: | $17,400,000 | Title Vesting: | Fee Simple | |||||
| % of Initial Pool Balance: | 2.2% | Year Built/Renovated: | 2006/N/A | |||||
| Loan Purpose: | Refinance | Size: | 300 Units | |||||
| Borrower Sponsor: | Roy E. Carroll II | Cut-off Date Balance per Unit: | $58,000 | |||||
| Mortgage Rate: | 4.2000% | Maturity Date Balance per Unit: | $51,645 | |||||
| Note Date: | 7/30/2019 | Property Manager: | RE Carroll Management Company (borrower-related) | |||||
| First Payment Date: | 9/6/2019 | |||||||
| Maturity Date: | 8/6/2029 | |||||||
| Original Term to Maturity: | 120 months | |||||||
| Original Amortization Term: | 360 months | Underwriting and Financial Information | ||||||
| IO Period: | 48 months | UW NOI: | $1,587,540 | |||||
| Seasoning: | 2 months | UW NOI Debt Yield: | 9.1% | |||||
| Prepayment Provisions: | LO (26); DEF (89); O (5) | UW NOI Debt Yield at Maturity: | 10.2% | |||||
| Lockbox/Cash Mgmt Status: | Springing/Springing | UW NCF DSCR: | 2.04x (IO) | 1.48x (P&I) | ||||
| Additional Debt Type: | N/A | Most Recent NOI(1): | $1,590,276 (7/31/2019 TTM) | |||||
| Additional Debt Balance: | N/A | 2nd Most Recent NOI(1): | $1,532,435 (12/31/2018) | |||||
| Future Debt Permitted (Type): | No (N/A) | 3rd Most Recent NOI(1): | $1,252,931 (12/31/2017) | |||||
| Reserves | Most Recent Occupancy: | 93.3% (9/6/2019) | ||||||
| Type | Initial | Monthly | Cap | 2nd Most Recent Occupancy: | 93.3% (12/31/2018) | |||
| RE Tax: | $207,625 | $24,717 | N/A | 3rd Most Recent Occupancy: | 85.5% (12/31/2017) | |||
| Insurance: | $35,213 | $3,726 | N/A | Appraised Value (as of): | $26,500,000 (5/15/2019) | |||
| Replacements: | $0 | $6,250 | $300,000 | Cut-off Date LTV Ratio: | 65.7% | |||
| TI/LC: | $0 | $0 | N/A | Maturity Date LTV Ratio: | 58.5% | |||
| Sources and Uses | ||||||
| Sources | Proceeds | % of Total | Uses | Proceeds | % of Total | |
| Loan Amount: | $17,400,000 | 100.0% | Loan Payoff: | $15,738,481 | 90.5% | |
| Reserves: | $242,839 | 1.4% | ||||
| Closing Costs: | $142,601 | 0.8% | ||||
| Return of Equity: | $1,276,079 | 7.3% | ||||
| Total Sources: | $17,400,000 | 100.0% | Total Uses: | $17,400,000 | 100.0% | |
| (1) | The increase from 3rd Most Recent NOI to Most Recent NOI is mainly attributed to the replacement of the property manager in 2016, which helped increase occupancy and net operating income. |
The Mortgage Loan. The thirteenth largest mortgage loan (the “Eagle Point Village Apartments Mortgage Loan”) is evidenced by a promissory note in the original principal amount of $17,400,000, which is secured by a first priority fee mortgage encumbering a 300-unit garden style multifamily property located in Fayetteville, North Carolina (the “Eagle Point Village Apartments Property”). The proceeds of the Eagle Point Village Apartments Mortgage Loan were primarily used to refinance existing debt on the Eagle Point Village Apartments Property, pay closing costs, fund reserves and return equity to the borrower sponsor.
The Borrower and the Borrower Sponsor. The borrower is Eagle Point Village Apartments, LLC (the “Eagle Point Village Apartments Borrower”), a single-purpose North Carolina limited liability company structured to be bankruptcy remote. The Eagle Point Village Apartments Borrower is 100.0% owned by Lockhaven Village, LLC, a North Carolina limited liability company, which is further owned by Carroll Investment Properties, Inc. (99.5%) and BMH Holdings, LLC (0.5%). Carroll Investment Properties, Inc., a North Carolina Corporation, is solely owned by Roy E. Carroll, II. BMH Holdings, LLC, a North Carolina limited liability company, is entirely owned by Roy E. Carroll, II Family Limited Partnership, which is collectively owned by Brittany S. Carroll (33.0%), Madison E. Carroll (33.0%), Hayleigh R. Carroll (33.0%) and Roy E. Carroll, II (1.0%). Roy E. Carroll, II is the general partner and Brittany S. Carroll, Madison E. Carroll and Hayleigh R. Carroll are the limited partners of Roy E. Carroll, II Family Limited Partnership. The borrower sponsor of the Eagle Point Village Apartments Mortgage Loan is Roy E. Carroll II.
Roy E. Carroll, II is the, founder, chairman and CEO of The Carroll Companies in Greensboro, North Carolina. Mr. Carroll has over 30 years of experience of real estate development, and has over $1.6 billion in real estate assets that he owns or currently has under development without outside equity or partners. The subsidiaries of The Carroll Companies are CIP Construction, RE Carroll Management Company, BEE Safe Storage, Alaris Homes and SNAP Publications.
The Property. The Eagle Point Village Apartments Property is a 300-unit, garden style multifamily property located in Fayetteville, North Carolina. The Eagle Point Village Apartments Property was constructed in 2006 and consists of 15 three-story apartment buildings, 15 single-story detached garage buildings, a leasing office, a clubhouse, a fitness center building, and a maintenance building, situated on an 18.12-acre site. The Eagle Point Village
THE INFORMATION IN THIS STRUCTURAL AND COLLATERAL TERM SHEET IS NOT COMPLETE AND MAY BE AMENDED PRIOR TO THE TIME OF SALE. THIS TERM SHEET IS NOT AN OFFER TO SELL THESE SECURITIES AND IT IS NOT A SOLICITATION OF AN OFFER TO BUY THESE SECURITIES IN ANY JURISDICTION WHERE THE OFFER OR SALE IS NOT PERMITTED.
132
830 Allonby Road Fayetteville, NC 28314 | Collateral Asset Summary – Loan No. 13 Eagle Point Village Apartments | Cut-off Date Balance: Cut-off Date LTV Ratio: UW NCF DSCR: UW NOI Debt Yield: | $17,400,000 65.7% 1.48x 9.1% |
Apartments Property’s residential unit mix includes 60 one-bedroom units, 180 two-bedroom units, and 60 three-bedroom units, with an average unit size of 1,032 SF. The Eagle Point Village Apartments feature 554 surface parking spaces, resulting in a parking ratio of 1.8 spaces per unit. As of September 6, 2019, the Eagle Point Village Apartments Property was 93.3% occupied.
Community amenities include a clubhouse, swimming pool, lounge, movie theatre, 24-hour fitness center, cyber café, playground, pet park, detached garages, storage units, controlled access gate and grilling areas. Unit amenities include premium flat-panel cabinetry, kitchen islands in select units, a built-in microwave, ceiling fans, EnergyStar appliances, washer/ dryer connections and electric heating & air conditioning. Select units also features a patio or sunroom.
The table below shows the apartment mix at the Eagle Point Village Apartments Property:
| Eagle Point Village Apartments Property Unit Mix Summary(1) | ||||||
| Unit Type | No. of Units | % of Total Units | Avg. Unit Size (SF) | No. of Occupied Units | Occupancy (%) | Avg. In Place Monthly Rent Per Unit |
| 1 BR / 1 BA | 60 | 20.0% | 727 | 58 | 96.7% | $672 |
| 2 BR / 2 BA | 180 | 60.0% | 993 | 165 | 91.7% | $762 |
| 3 BR / 2 BA | 60 | 20.0% | 1,456 | 57 | 95.0% | $880 |
| Total/Wtd. Avg. | 300 | 100.0% | 1,032 | 280 | 93.3% | $767 |
| (1) | Information is based on the underwritten rent roll. |
The Market. The Eagle Point Village Apartments Property is located in Fayetteville, Cumberland County, North Carolina, within the Fayetteville metropolitan statistical area (the “Fayetteville MSA”). According to the appraisal, the Fayetteville MSA is comprised of Cumberland and Hoke counties and is anchored by Fayetteville. Fayetteville is the largest metropolitan area in southern North Carolina with a population of 388,155 as of 2018. The Fayetteville MSA’s economy is driven by the military and defense-related sectors. Fayetteville is home to Fort Bragg and Pope Air Force Base. Fort Bragg covers 161,047 acres and is currently the largest U.S. Army installation and home to the 82nd Airborne Division, the U.S. Army Special Operation Command, the U.S. Army Forces Command, and the U.S. Reserve Command. Fort Bragg and Pope Field contributes approximately $4.5 billion annually to the region’s economy. Other major employers include the Department of Defense, Cumberland County School District, Cape Fear Valley Health Systems, Walmart Associates, Inc. and Cumberland County.
The Eagle Point Village Apartments Property is located within one mile of U.S. Route 401 along Cliffdale Road and Allonby Road. The neighborhood surrounding the Eagle Point Village Apartments Property is comprised of a mix of residential and commercial development. The major thoroughfares are generally lined with retail, office, and other commercial uses. The major super regional mall in the area is Cross Creek Mall, which is located approximately 3.3 miles northwest of the Eagle Point Village Apartments Property along a commercial artery at the intersection of Morganton Road and Skibo Road. Other major retailers in close proximity to the Eagle Point Village Apartments include Sam’s Club, Walmart Supercenter, Lowe’s Home Improvement, Target, Barnes and Nobles, Best Buy, and AMC Market Fair 15.
According to the appraisal, the 2018 estimated population within a one-, three- and five-mile radius of the Eagle Point Village Apartments Property is 10,800, 65,107 and 138,107, respectively, with an average household income within a one-, three- and five-mile radius of the Eagle Point Village Apartments Property is approximately $48,082, $55,772 and $62,370, respectively.
According to a third party market research report, the Eagle Point Village Apartments Property is located within the West Cumberland County multifamily submarket, which contained approximately 11,838 units as of year to date 2019. The West Cumberland County multifamily reported a 3.8% vacancy rate as of year to date 2019, down from 5.1% as of 2018. The average asking rent per unit for the West Cumberland County multifamily submarket was $849 as of year to date 2019.
THE INFORMATION IN THIS STRUCTURAL AND COLLATERAL TERM SHEET IS NOT COMPLETE AND MAY BE AMENDED PRIOR TO THE TIME OF SALE. THIS TERM SHEET IS NOT AN OFFER TO SELL THESE SECURITIES AND IT IS NOT A SOLICITATION OF AN OFFER TO BUY THESE SECURITIES IN ANY JURISDICTION WHERE THE OFFER OR SALE IS NOT PERMITTED.
133
830 Allonby Road Fayetteville, NC 28314 | Collateral Asset Summary – Loan No. 13 Eagle Point Village Apartments | Cut-off Date Balance: Cut-off Date LTV Ratio: UW NCF DSCR: UW NOI Debt Yield: | $17,400,000 65.7% 1.48x 9.1% |
Comparable rental properties to the Eagle Point Village Apartments Property are shown in the table below:
| Eagle Point Village Apartments Property Comparable Rentals Summary | |||||||
Address City, State | Year Built | Occupancy | Distance to Subject | Number of Units | Unit Type | Avg. Unit Size (SF) | Avg. Monthly Rent per Unit |
Eagle Point Village Apartments 830 Allonby Road Fayetteville, NC | 2006 | 93.3%(1) | — | 300(1) | One Bedroom Two Bedroom Three Bedroom | 727 993 1,456 | $672 $762 $880 |
Crescent Commons 812 Crescent Commons Way Fayetteville, NC | 2002 | 95.1% | 1.0 mile | 288 | One Bedroom Two Bedroom Three Bedroom | 756 - 826 991 - 1,170 1,236 - 1,304 | $635 - $700 $735 - $815 $880 - $910 |
Cliff Creek 775 C.L. Tart Circle Fayetteville, NC | 2013 | 95.0% | 1.7 miles | 182 | One Bedroom Two Bedroom Three Bedroom | 816 - 835 1,134 - 1,153 1,322 | $835 $960 $1,070 |
Chason Ridge 600 Scotia Lane Fayetteville, NC | 1993 | 97.0% | 1.6 miles | 252 | One Bedroom Two Bedroom Three Bedroom | 815 - 846 1,026 - 1,105 1,325 | $728 - $736 $733 - $760 $840 |
The Regency Luxury Apartments 505 Regency Drive Fayetteville, NC | 1996 | 97.3% | 0.2 miles | 186 | One Bedroom Two Bedroom Three Bedroom | 834 - 850 1,379 | $805 - $825 $950 $1,090 |
Hidden Creek Village 6719 Cliffdale Road Fayetteville, NC | 2005 | 93.0% | 0.2 miles | 352 | One Bedroom Two Bedroom Three Bedroom | 685 - 771 950 - 1,035 1,456 | $574 - $624 $654 - $700 $816 |
Legacy at Cross Creek 570 Castle Rising Road Fayetteville, NC | 2003 | 95.6% | 2.6 miles | 360 | One Bedroom Two Bedroom Three Bedroom | 823 - 850 1,085 - 1,188 1,443 | $760 - $785 $820 - $885 $1,000 |
Source:Appraisal
| (1) | Based on the underwritten rent roll. |
Operating History and Underwritten Net Cash Flow. The following table presents certain information relating to the historical and forecasted operating performance and the Underwritten Net Cash Flow at the Eagle Point Village Apartments Property:
| Cash Flow Analysis | ||||||
| 2016 | 2017 | 2018 | 7/31/2019 TTM | UW | UW Per Unit | |
| Gross Potential Rent(1) | $2,830,529 | $2,682,503 | $2,666,702 | $2,695,656 | $2,769,860 | $9,233 |
| Total Other Income(2) | $275,221 | $327,422 | $374,052 | $401,352 | $401,352 | $1,338 |
| Less Vacancy & Concessions(3) | ($792,254) | ($563,336) | ($273,412) | ($244,896) | ($319,100) | ($1,064) |
| Effective Gross Income | $2,313,496 | $2,446,589 | $2,767,343 | $2,852,112 | $2,852,112 | $9,507 |
| Total Operating Expenses | $1,144,681 | $1,193,658 | $1,234,908 | $1,261,836 | $1,264,572 | $4,215 |
| Net Operating Income(4) | $1,168,815 | $1,252,931 | $1,532,435 | $1,590,276 | $1,587,540 | $5,292 |
| Capital Expenditures | $0 | $0 | $0 | $0 | $75,000 | $250 |
| Net Cash Flow | $1,168,815 | $1,252,931 | $1,532,435 | $1,590,276 | $1,512,540 | $5,042 |
| Occupancy % | 76.6% | 85.5% | 93.3% | 94.5% | 93.3% | |
| NOI DSCR (P&I) | 1.14x | 1.23x | 1.50x | 1.56x | 1.55x | |
| NCF DSCR (P&I) | 1.14x | 1.23x | 1.50x | 1.56x | 1.48x | |
| NOI Debt Yield | 6.7% | 7.2% | 8.8% | 9.1% | 9.1% | |
| NCF Debt Yield | 6.7% | 7.2% | 8.8% | 9.1% | 8.7% | |
| (1) | UW Gross Potential Rent is underwritten to the September 6, 2019 rent roll, which reflects physical occupancy of 93.3% and includes the gross up of 20 vacant units based on the appraisal’s concluded market rents of $191,888. |
| (2) | Total Other income includes (i) ratio utility billing system income of $97,751 and (ii) other income of $303,601, which consists of facilities maintenance fee, cable royalty income, washer/dryer rent, application fees, late fees, storage income and other miscellaneous income. |
| (3) | The underwritten economic vacancy is 11.5%. The Eagle Point Village Apartments Property was 93.3% leased as of September 6, 2019. |
| (4) | The increase in Net Operating Income from 2016 through 7/31/2019 TTM is attributed to the replacement of the property manager in 2016, which helped increase occupancy and net operating income. |
THE INFORMATION IN THIS STRUCTURAL AND COLLATERAL TERM SHEET IS NOT COMPLETE AND MAY BE AMENDED PRIOR TO THE TIME OF SALE. THIS TERM SHEET IS NOT AN OFFER TO SELL THESE SECURITIES AND IT IS NOT A SOLICITATION OF AN OFFER TO BUY THESE SECURITIES IN ANY JURISDICTION WHERE THE OFFER OR SALE IS NOT PERMITTED.
134
(THIS PAGE INTENTIONALLY LEFT BLANK)
135
5701 Time Square Boulevard Amarillo, TX 79119 | Collateral Asset Summary – Loan No. 14 The Black Building | Cut-off Date Balance: Cut-off Date LTV Ratio: UW NCF DSCR: UW NOI Debt Yield: | $16,650,000 71.5% 1.63x 9.8% |
| Mortgage Loan Information | Property Information | |||||||
| Mortgage Loan Seller: | CIBC | Single Asset/Portfolio: | Single Asset | |||||
Credit Assessment (Fitch/KBRA/Moody’s): | NR/NR/NR | Location: | Amarillo, TX 79119 | |||||
| General Property Type: | Mixed Use | |||||||
| Original Balance(1): | $16,650,000 | Detailed Property Type: | Retail/Office | |||||
| Cut-off Date Balance(1): | $16,650,000 | Title Vesting: | Fee Simple | |||||
| % of Initial Pool Balance: | 2.1% | Year Built/Renovated: | 2017/N/A | |||||
| Loan Purpose: | Refinance | Size: | 124,023 SF | |||||
| Borrower Sponsor: | Perry Williams | Cut-off Date Balance per SF: | $134 | |||||
| Mortgage Rate: | 3.9800% | Maturity Date Balance per SF: | $116 | |||||
| Note Date: | 9/11/2019 | Property Manager: | W Real Estate Management, LLC (borrower-related)
| |||||
| First Payment Date: | 11/1/2019 | |||||||
| Maturity Date: | 10/1/2029 | |||||||
| Original Term to Maturity: | 120 months | |||||||
| Original Amortization Term: | 360 months | Underwriting and Financial Information | ||||||
| IO Period: | 36 months | UW NOI(1): | $1,635,584 | |||||
| Seasoning: | 0 months | UW NOI Debt Yield: | 9.8% | |||||
| Prepayment Provisions: | LO (24); DEF (93); O (3) | UW NOI Debt Yield at Maturity: | 11.4% | |||||
| Lockbox/Cash Mgmt Status: | Springing/Springing | UW NCF DSCR: | 2.31x (IO) | 1.63x (P&I) | ||||
| Additional Debt Type: | N/A | Most Recent NOI(2): | $1,393,312 (6/30/2019 TTM) | |||||
| Additional Debt Balance: | N/A | 2nd Most Recent NOI(2): | $1,004,986 (12/31/2018) | |||||
| Future Debt Permitted (Type): | No (N/A) | 3rd Most Recent NOI: | $1,121,731 (12/31/2017) | |||||
| Reserves | Most Recent Occupancy: | 96.8% (8/12/2019) | ||||||
| Type | Initial | Monthly | Cap | 2nd Most Recent Occupancy: | 98.1% (12/31/2018) | |||
| RE Tax: | $174,474 | $17,447 | N/A | 3rd Most Recent Occupancy: | 99.7% (12/31/2017) | |||
| Insurance: | $39,543 | $5,649 | N/A | Appraised Value (as of): | $23,300,000 (8/15/2019) | |||
| Replacements: | $0 | $1,550 | N/A | Cut-off Date LTV Ratio: | 71.5% | |||
| TI/LC: | $0 | $7,751 | $575,000 | Maturity Date LTV Ratio: | 61.8% | |||
| Sources and Uses | ||||||
| Sources | Proceeds | % of Total | Uses | Proceeds | % of Total | |
| Loan Amount: | $16,650,000 | 100.0% | Loan Payoff: | $10,313,815 | 61.9% | |
| Note Payoff(3): | $4,521,026 | 27.2% | ||||
| Reserves: | $214,016 | 1.3% | ||||
| Closing Costs: | $363,174 | 2.2% | ||||
| Return of Equity: | $1,237,969 | 7.4% | ||||
| Total Sources: | $16,650,000 | 100.0% | Total Uses: | $16,650,000 | 100.0% | |
| (1) | The increase in Most Recent NOI to UW NOI is primarily attributed to (i) $243,411 in increased rental collection from Verdure who, as a borrower-sponsor affiliated tenant, underpaid rent as it was ramping up its membership and began paying its contractual rent as of January 2019 and (ii) $70,999 in increased rental rates for five borrower sponsor-affiliated tenants that recently signed lease amendments. |
| (2) | The increase in 2nd Most Recent NOI to Most Recent NOI is primarily attributed to $493,801 in increased rental collection from Verdure who, as a borrower-sponsor affiliated tenant, underpaid rent as it was ramping up its membership. |
| (3) | Five unsecured loans totaling $4,521,026 made by a borrower sponsor-affiliated entity to The Black Building Borrower (as defined below) were paid off at origination. |
The Mortgage Loan. The fourteenth largest mortgage loan (“The Black Building Mortgage Loan”) is evidenced by a promissory note with an original principal balance of $16,650,000, which is secured by a first priority fee mortgage encumbering a three-story, mixed-use building totaling 124,023 SF located in Amarillo, Texas (“The Black Building Property”). The proceeds of The Black Building Mortgage Loan were used to pay off existing debt, pay closing costs, fund reserves and return equity to the borrower sponsor.
The Borrower and Borrower Sponsor. The borrower is W Group Holdings, LLC (“The Black Building Borrower”), a single purpose Texas limited liability company. The Black Building Borrower is managed and controlled by the borrower sponsor, Perry Williams, and majority owned, indirectly, by Mr. Williams’ four children through family trusts. Mr. Williams is the owner of The Williams Group, an Amarillo-based real estate owner and developer founded in 1954. The Williams Group is a conglomerate of various vertically integrated real estate focused companies with over 65 years of experience in construction including large tract development, mixed use lifestyle development, strip center development and build-to-suit projects.
The Property. The Black Building Property is a three-story, mixed-use building totaling 124,023 SF located in Amarillo, Texas and part of a master planned, live-work-play community developed by the borrower sponsor (“Town Square Village”). Town Square Village is a 20- to 30-year development plan covering up to four square miles in southwest Amarillo. The Black Building Property was developed in phases beginning in 2014 and completed in 2017. The Black Building Property consists of 76,241 SF of retail space, which is 100.0% occupied by Verdure, a luxury fitness center, and 47,782 SF of office space, which is 91.6% occupied by 15 tenants. Excluded from the square footage is the outdoor pool deck. In addition, there are 243 open air parking spaces and 50 sub-surface garage parking spaces. As of August 12, 2019, The Black Building Property was 96.8% leased.
THE INFORMATION IN THIS STRUCTURAL AND COLLATERAL TERM SHEET IS NOT COMPLETE AND MAY BE AMENDED PRIOR TO THE TIME OF SALE. THIS TERM SHEET IS NOT AN OFFER TO SELL THESE SECURITIES AND IT IS NOT A SOLICITATION OF AN OFFER TO BUY THESE SECURITIES IN ANY JURISDICTION WHERE THE OFFER OR SALE IS NOT PERMITTED.
136
5701 Time Square Boulevard Amarillo, TX 79119 | Collateral Asset Summary – Loan No. 14 The Black Building | Cut-off Date Balance: Cut-off Date LTV Ratio: UW NCF DSCR: UW NOI Debt Yield: | $16,650,000 71.5% 1.63x 9.8% |
Verdure (61.5% of NRA) and six office tenants (13.6% of NRA) are borrower sponsor-affiliated and recently executed 15-year lease extensions. All of the borrower sponsor-affiliated leases are guaranteed by the borrower sponsor and P Dub Land Holdings, the third largest tenant and one of the sponsor-affiliated tenants. The borrower sponsor and P Dub Land Holdings (collectively, the “Lease Guarantors”) are required to maintain a combined liquidity of $3 million until The Black Building Mortgage Loan is paid in full. See “Description of the Mortgage Pool—Tenant Issues—Affiliated Leases” in the Preliminary Prospectus.
The borrower sponsor developed The Black Building Property for approximately $15.4 million, excluding land costs which were part of a larger land acquisition 20 years ago. In addition, the borrower sponsor, through affiliates, invested approximately $11.6 million to complete the buildout of the fitness center for a total cost basis of approximately $27.0 million.
Major Tenants.
Verdure (76,241 SF, 61.5% of NRA, 59.8% of underwritten base rent). Verdure is a membership-based health and fitness center with amenities that include fitness equipment, locker rooms, fitness instructors and trainers, group exercise classes, pilates, racquetball, basketball/volleyball court, simulated golf, rock climbing, indoor shooting range, pole vaulting, batting cages, boxing, indoor track, multiple outdoor swimming pools, a lazy river, hot tubs, steam rooms, saunas, kid zone/child care, lifestyle café and the Awaken Spa at Verdure. Verdure invested approximately $11.6 million into their three-story buildout. As of July 31 2019, there are approximately 10,592 active members, an increase of 42% over 2018. Verdure is a borrower sponsor-affiliated tenant and recently signed a lease extension out to June 2034 with two, five-year renewal options remaining. Verdure pays a weighted-average rental rate of $14.55 PSF, calculated based on $15.00 PSF for the main gym space (72,848 SF) and $5.00 PSF for the utility space (3,393 SF). Verdure pays a fixed additional rental rate of $5.00 PSF on the 72,848 SF gym space for expense reimbursements and also reimburses overage expenses over a 2017 base year. The Verdure lease is guaranteed by the Lease Guarantors. In addition, in the event that Verdure goes dark, its lease is cancelled, terminated or surrendered, Verdure goes bankrupt or beginning 12 months prior to lease expiration, excess cash will be swept into a reserve account for the purpose of re-tenanting the Verdure premises.
Coldwell Banker (10,436 SF, 8.4% of NRA, 9.7% of underwritten base rent).Founded in 1966, Coldwell Banker First Equity (“Coldwell Banker”) is a full service real estate brokerage company in Amarillo with approximately 55 agents. Over the years, Coldwell Banker has participated in numerous commercial real estate transactions in Amarillo, including: Chase Tower (originally the American National Bank/SPS tower), Westgate Mall, The Ambassador Hotel (originally the Sheraton Hotel), 1800 Washington, several Amarillo subdivisions (Lawndale, Oakdale, Westcliff Park, parts of Sleepyhollow), and numerous other office/retail/multi-family projects in the city. Coldwell Banker was the first tenant to occupy The Black Building, taking possession in March 2015 prior to completion of much of The Black Building’s construction. Coldwell Banker signed a 10-year lease through February of 2025 with one, five-year renewal option remaining. The tenant pays a fixed rental rate of $17.25 PSF, gross.
P Dub Land Holdings (4,857 SF, 3.9% of NRA, 5.5% of underwritten base rent).P Dub Land Holdings is a borrower sponsor-affiliated company that was formed to strategically purchase and hold land primarily for agricultural purposes and investment opportunities. P Dub Land Holdings is one of six total office tenants (16,916 SF, 13.6% of NRA, 18.1% of underwritten base rent) that are affiliated with the borrower sponsor and each such tenant represents a different function in the borrower sponsor’s real estate development operation. The borrower sponsor affiliated office tenants all signed lease extensions through May 31, 2034 each with one, ten-year renewal options remaining. Five of the borrower sponsor-affiliated office tenants (13,661 SF, 11.0% of NRA, 15.5% of underwritten base rent), including P Dub Land Holdings pay a fixed rental rate of $21.00 PSF, NNN while a sixth borrower sponsor-affiliated tenant (3,255 SF, 2.6% of NRA, 2.6% of underwritten base rent) pays a fixed rental rate of $15.00 PSF and the six borrower sponsor-affiliated office leases are guaranteed by the Lease Guarantors. P Dub Land Holdings is paying rent on its leased space while completing its build out.
The following table presents certain information relating to the leases at The Black Building Property:
| Tenant Summary(1) | |||||||
| Tenant Name | Credit Rating (Fitch/Moody's/S&P) | Tenant SF | Approximate % of SF | Annual UW Base Rent | % of Total Annual UW Base Rent | Annual UW Base Rent PSF(2) | Lease Expiration |
| Verdure | NR/NR/NR | 76,241 | 61.5% | $1,109,307 | 59.8% | $14.55 | 6/30/2034 |
| Coldwell Banker | NR/NR/NR | 10,436 | 8.4% | $180,021 | 9.7% | $17.25 | 2/28/2025 |
| P Dub Land Holdings | NR/NR/NR | 4,857 | 3.9% | $101,997 | 5.5% | $21.00 | 5/31/2034 |
| Other Tenants | 28,466 | 23.0% | $464,969 | 25.0% | $17.46(3) | ||
| Vacant | 4,023 | 3.2% | $0 | 0.0% | $0.00 | ||
| Total/Wtd. Avg. | 124,023 | 100.0% | $1,856,294 | 100.0% | $15.71 | ||
| (1) | Information is based on the underwritten rent roll. |
| (2) | Wtd. Avg. Annual UW Base Rent PSF excludes vacant space and the tenant 4141, LLC, which prepaid rent for its entire lease term. No income was underwritten for 4141, LLC. |
| (3) | Excludes the tenant 4141, LLC. |
THE INFORMATION IN THIS STRUCTURAL AND COLLATERAL TERM SHEET IS NOT COMPLETE AND MAY BE AMENDED PRIOR TO THE TIME OF SALE. THIS TERM SHEET IS NOT AN OFFER TO SELL THESE SECURITIES AND IT IS NOT A SOLICITATION OF AN OFFER TO BUY THESE SECURITIES IN ANY JURISDICTION WHERE THE OFFER OR SALE IS NOT PERMITTED.
137
5701 Time Square Boulevard Amarillo, TX 79119 | Collateral Asset Summary – Loan No. 14 The Black Building | Cut-off Date Balance: Cut-off Date LTV Ratio: UW NCF DSCR: UW NOI Debt Yield: | $16,650,000 71.5% 1.63x 9.8% |
The following table presents certain information relating to the lease rollover schedule at The Black Building Property:
| Lease Rollover Schedule(1) | ||||||||
| Year | # of Leases Rolling | SF Rolling | Approx. % of Total SF Rolling | Approx. Cumulative % of SF Rolling | UW Base Rent PSF Rolling(2) | Total UW Base Rent Rolling | Approx. % of Total Base Rent Rolling | Approx. Cumulative % of Total Base Rent Rolling |
| MTM | 2 | 3,159 | 2.5% | 2.5% | $7.00 | $22,113 | 1.2% | 1.2% |
| 2019 | 0 | 0 | 0.0% | 2.5% | $0.00 | $0 | 0.0% | 1.2% |
| 2020 | 1 | 3,696 | 3.0% | 5.5% | $22.00 | $81,312 | 4.4% | 5.6% |
| 2021 | 2 | 3,248 | 2.6% | 8.1% | $16.00 | $51,968 | 2.8% | 8.4% |
| 2022 | 1 | 208 | 0.2% | 8.3% | $16.00 | $3,328 | 0.2% | 8.6% |
| 2023 | 0 | 0 | 0.0% | 8.3% | $0.00 | $0 | 0.0% | 8.6% |
| 2024 | 0 | 0 | 0.0% | 8.3% | $0.00 | $0 | 0.0% | 8.6% |
| 2025 | 1 | 10,436 | 8.4% | 16.7% | $17.25 | $180,021 | 9.7% | 18.2% |
| 2026 | 1 | 4,267 | 3.4% | 20.2% | $17.00 | $72,539 | 3.9% | 22.2% |
| 2027 | 0 | 0 | 0.0% | 20.2% | $0.00 | $0 | 0.0% | 22.2% |
| 2028 | 0 | 0 | 0.0% | 20.2% | $0.00 | $0 | 0.0% | 22.2% |
| 2029 | 0 | 0 | 0.0% | 20.2% | $0.00 | $0 | 0.0% | 22.2% |
| 2030 & Beyond | 8 | 94,986 | 76.6% | 96.8% | $15.51(3) | $1,445,013 | 77.8% | 100.0% |
| Vacant | 0 | 4,023 | 3.2% | 100.0% | $0.00 | $0 | 0.0% | 100.0% |
| Total/Wtd. Avg. | 16 | 124,023 | 100.0% | $15.71 | $1,856,294 | 100.0% | ||
| (1) | Information is based on the underwritten rent roll. |
| (2) | Wtd. Avg. UW Base Rent PSF Rolling excludes vacant space and the tenant 4141, LLC, which prepaid rent for its entire lease term. No income was underwritten for 4141, LLC. |
| (3) | Excludes the tenant 4141, LLC. |
The Market. The Black Building Property is located within the Amarillo, Texas metropolitan statistical area (the “Amarillo MSA”). According to the appraisal, the population of the Amarillo MSA is approximately 274,164 and the top three industries are health care/social assistance, retail trade and accommodation/food services, which represent a combined total of 35% of the workforce. According to the Federal Reserve Bank of St. Louis, as of July 2019, the unemployment rate of the Amarillo MSA is approximately 2.8%.
The Black Building Property is located in southwest Amarillo, Texas and is part of Town Square Village, a master planned, live-work-play community developed by the borrower sponsor. Town Square Village is a 20- to 30-year plan covering up to four square miles in southwest Amarillo. As currently built, the development includes (i) a 480-unit residential apartment complex with ground floor retail, (ii) a 89,000 SF movie theater and arcade; (iii) a 51,000 SF, multi-tenant retail building; and (iv) a 14,000 SF, 24-hour emergency clinic.
Primary access to the neighborhood area of The Black Building Property is provided by SH 335, Interstate 40, Interstate 27 and State Highway 6. State Highway 287 merges with Interstate 40 east of Amarillo, and connects Amarillo to Wichita Falls and Fort Worth. Interstate 40 connects Amarillo to Oklahoma City to the east and Albuquerque to the west. Local access to The Black Building Property is provided by Hillside Road, a four-lane, east-west primarily commercial corridor which bounds the building to the south.
Growth in the neighborhood area has occurred primarily along commercial thoroughfares such as Hillside Road, Soncy Road, Interstate 40, and SH 335. Land uses within the neighborhood area consist of a mixture of commercial and residential development, with residential development increasing over the years. The most notable new multifamily developments include Town Square Village and Colonies at Hillside. Residential subdivisions in the neighborhood include Hillside Terrace, Greenways, the Colonies, and Coulter Acres. To accommodate the growth trends in the immediate area, the Texas Department of Transportation is undertaking a $47 million project to relocate and expand Texas State Highway Loop 335 near The Black Building Property. Loop 335 is a highway loop that encircles the City of Amarillo, connecting to every major highway in the city. The project is designed to upgrade Loop 335 into a freeway-type highway that will serve the growing neighborhood and reduce traffic congestion.
According to a third party market research report, the estimated 2019 population within a one-, three- and five-mile radius of The Black Building Property was 5,488, 43,303 and 95,504, respectively, and the 2019 estimated average household income within the same one-, three- and five-mile radius was $112,698, $99,051 and $82,832, respectively.
According to a third party report, The Black Building Property is located within the Amarillo office market. As of the second quarter of 2019, the Amarillo office market had a total inventory of approximately 7.38 million SF with an average vacancy rate of 6.2% and a market rental rate of $15.54 PSF. The vacancy rate has not exceeded 6.5% over the last 10 years.
According to a third party report, The Black Building Property is located within the Amarillo retail market. As of the second quarter of 2019, the Amarillo retail market had a total inventory of approximately 14.69 million SF with an average vacancy rate of 3.8% and a market rental rate of $13.85 PSF. The vacancy rate has not exceeded 4.0% over the last 10 years.
The appraisal identified four comparable retail properties and five office properties and concluded a market rent of $12.50 PSF NNN for the Verdure retail space and $20.00 PSF NNN for the office space.
THE INFORMATION IN THIS STRUCTURAL AND COLLATERAL TERM SHEET IS NOT COMPLETE AND MAY BE AMENDED PRIOR TO THE TIME OF SALE. THIS TERM SHEET IS NOT AN OFFER TO SELL THESE SECURITIES AND IT IS NOT A SOLICITATION OF AN OFFER TO BUY THESE SECURITIES IN ANY JURISDICTION WHERE THE OFFER OR SALE IS NOT PERMITTED.
138
5701 Time Square Boulevard Amarillo, TX 79119 | Collateral Asset Summary – Loan No. 14 The Black Building | Cut-off Date Balance: Cut-off Date LTV Ratio: UW NCF DSCR: UW NOI Debt Yield: | $16,650,000 71.5% 1.63x 9.8% |
The following table presents recent leasing data at competitive retail and office buildings with respect to The Black Building Property:
| Comparable Leases | ||||||||||
| Property Name/Address | Year Built/ Renovated | Size (SF) | Tenant Name | Tenant Type | Lease Size (SF) | Lease Date | Lease Term (Yrs.) | Rent PSF | Lease Type | |
| The Black Building 5701 Time Square Blvd Amarillo, TX | 2017/N/A | 124,023(1) | Verdure(1) Various | Retail Office | 76,241(1) Various | Sept 2016(1) Various | 17.8(1) Various | $14.55(1) $7.00-$22.00 | NNN Various | |
| 10721 W Charleston Blvd Las Vegas, NV | 2010/N/A | 145,020 | Lifetime Fitness | Retail | 145,020 | Jun 2015 | 20.0 | $20.39 | Absolute Net | |
| 300 Summit Blvd Broomfield, CO | 2003/2017 | 83,550 | Lifetime Fitness | Retail | 83,550 | N/A | 25.0 | $14.00 | Absolute Net | |
| 4410 Royal Pine Drive Colorado Springs, CO | 2008/N/A | 174,057 | Lifetime Fitness | Retail | 174,057 | N/A | 25.0 | $13.47 | NNN | |
| 647 SW 19th St Moore, OK 73160 | 2013/N/A | 33,656 | LA Fitness | Retail | 33,656 | Dec 2014 | 20.0 | $12.27 | Absolute Net | |
| Princeton Park 7820 Hillside Amarillo, TX | 2016/N/A | 30,000 | Various | Office | 100 | N/A | 5.0-10.0 | $20.00 | NNN | |
| The Amarillo Tower 600 S Tyler St Amarillo, TX | 1971/N/A | 313,229 | N/A | Office | 1,500 | N/A | 5.0 | $16.50 | Full Service | |
| Wells Fargo Center 905 S Fillmore St Amarillo, TX | 1982/N/A | N/A | N/A | Office | 3,000 | N/A | 5.0 | $14.50 | Full Service | |
| WHA Medical Office Building 1301 S Coulter St Amarillo, TX | 2001/N/A | 75,000 | N/A | Office | 5,000 | N/A | 5.0 | $19.50 | Full Service | |
| 8th& Buchanan 790 S Buchanan St Amarillo, TX | 2017/N/A | 119,000 | N/A | Office | 117,600 | N/A | N/A | $22.00 | NNN | |
Source:Appraisal
| (1) | Based on the underwritten rent roll. |
Operating History and Underwritten Net Cash Flow.The following table presents certain information relating to the historical operating performance and the Underwritten Net Cash Flow at The Black Building Property:
| Cash Flow Analysis | ||||||
| 2016(1) | 2017 | 2018 | 6/30/2019 TTM | UW | UW PSF | |
| Rents In Place(2) | N/A | $1,161,177 | $1,069,116 | $1,435,014 | $1,856,294 | $14.97 |
| Vacant Income(3) | N/A | $0 | $0 | $0 | $80,460 | $0.65 |
| Gross Potential Rent | N/A | $1,161,177 | $1,069,116 | $1,435,014 | $1,936,754 | $15.62 |
| Total Recoveries | N/A | $488,770 | $546,729 | $569,730 | $569,730 | $4.59 |
| Less Vacancy & Credit Loss(4) | N/A | $0 | $0 | $0 | ($175,454) | ($1.41) |
| Other Income | N/A | $1,600 | $2,075 | $2,150 | $2,150 | $0.02 |
| Effective Gross Income | N/A | $1,651,547 | $1,617,920 | $2,006,894 | $2,333,180 | $18.81 |
| Total Operating Expenses | N/A | $529,816 | $612,934 | $613,582 | $697,596 | $5.62 |
| Net Operating Income | N/A | $1,121,731 | $1,004,986 | $1,393,312 | $1,635,584 | $13.19 |
| Capital Expenditures | N/A | $0 | $0 | $0 | $18,603 | $0.15 |
| TI/LC | N/A | $0 | $0 | $0 | $62,012 | $0.50 |
| Net Cash Flow | N/A | $1,121,731 | $1,004,986 | $1,393,312 | $1,554,969 | $12.54 |
| Occupancy %(4) | N/A | 99.7% | 98.1% | 96.8% | 93.0% | |
| NOI DSCR (P&I) | N/A | 1.18x | 1.06x | 1.46x | 1.72x | |
| NCF DSCR (P&I) | N/A | 1.18x | 1.06x | 1.46x | 1.63x | |
| NOI Debt Yield | N/A | 6.7% | 6.0% | 8.4% | 9.8% | |
| NCF Debt Yield | N/A | 6.7% | 6.0% | 8.4% | 9.3% | |
| (1) | The Black Building Property was completed in 2017. |
| (2) | UW Rents In Place is based on leases in place. |
| (3) | UW Vacant Income is based on the appraisal’s concluded market rent of $20.00 PSF for the vacant office space. |
| (4) | UW Vacancy & Credit Loss is based on 6% vacancy and 1% credit loss, which is more conservative than actual and in-line with the appraisal’s conclusion. As of August 12, 2019, The Black Building Property was 96.8% leased. |
THE INFORMATION IN THIS STRUCTURAL AND COLLATERAL TERM SHEET IS NOT COMPLETE AND MAY BE AMENDED PRIOR TO THE TIME OF SALE. THIS TERM SHEET IS NOT AN OFFER TO SELL THESE SECURITIES AND IT IS NOT A SOLICITATION OF AN OFFER TO BUY THESE SECURITIES IN ANY JURISDICTION WHERE THE OFFER OR SALE IS NOT PERMITTED.
139
10-12 Celina Avenue Nashua, NH 03063 | Collateral Asset Summary – Loan No. 15 10-12 Celina Avenue | Cut-off Date Balance: Cut-off Date LTV Ratio: UW NCF DSCR: UW NOI Debt Yield: | $16,510,000 64.7% 2.17x 9.8% |
| Mortgage Loan Information | Property Information | ||||||
| Mortgage Loan Seller: | CIBC | Single Asset/Portfolio: | Single Asset | ||||
Credit Assessment (Fitch/KBRA/Moody’s): | NR/NR/NR | Location: | Nashua, NH 03063 | ||||
| General Property Type: | Industrial | ||||||
| Original Balance: | $16,510,000 | Detailed Property Type: | Warehouse | ||||
| Cut-off Date Balance: | $16,510,000 | Title Vesting: | Fee Simple | ||||
| % of Initial Pool Balance: | 2.0% | Year Built/Renovated: | 1979/1997 | ||||
| Loan Purpose: | Acquisition | Size: | 321,800 SF | ||||
| Borrower Sponsor: | Global Gate Capital Partners Limited | Cut-off Date Balance per SF: | $51 | ||||
| Mortgage Rate: | 4.1800% | Maturity Date Balance per SF: | $51 | ||||
| Note Date: | 7/30/2019 | Property Manager: | Waterside 303 Corp.
| ||||
| First Payment Date: | 9/1/2019 | ||||||
| Maturity Date: | 8/1/2029 | ||||||
| Original Term to Maturity: | 120 months | ||||||
| Original Amortization Term: | 0 months | Underwriting and Financial Information | |||||
| IO Period: | 120 months | UW NOI: | $1,610,146 | ||||
| Seasoning: | 2 months | UW NOI Debt Yield: | 9.8% | ||||
| Prepayment Provisions: | LO (26); DEF (89); O (5) | UW NOI Debt Yield at Maturity: | 9.8% | ||||
| Lockbox/Cash Mgmt Status: | Springing/Springing | UW NCF DSCR: | 2.17x | ||||
| Additional Debt Type: | N/A | Most Recent NOI: | $1,596,085 (12/31/2018) | ||||
| Additional Debt Balance: | N/A | 2nd Most Recent NOI: | $1,533,613 (12/31/2017) | ||||
| Future Debt Permitted (Type): | No (N/A) | 3rd Most Recent NOI: | $1,633,568 (12/31/2016) | ||||
| Reserves | Most Recent Occupancy: | 100.0% (10/1/2019) | |||||
| Type | Initial | Monthly | Cap | 2nd Most Recent Occupancy: | 100.0% (12/31/2018) | ||
| RE Tax: | $111,965 | $37,322 | N/A | 3rd Most Recent Occupancy: | 100.0% (12/31/2017) | ||
| Insurance: | $11,404 | $3,801 | N/A | Appraised Value (as of): | $25,500,000 (5/29/2019) | ||
| Replacements: | $0 | $2,682 | N/A | Cut-off Date LTV Ratio: | 64.7% | ||
| TI/LC: | $0 | $1,877 | N/A | Maturity Date LTV Ratio: | 64.7% | ||
| Sources and Uses | ||||||
| Sources | Proceeds | % of Total | Uses | Proceeds | % of Total | |
| Loan Amount: | $16,510,000 | 64.4% | Purchase Price: | $25,000,000 | 97.4% | |
| Borrower Equity: | $9,144,410 | 35.6% | Reserves: | $123,369 | 0.5% | |
| Closing Costs: | $531,040 | 2.1% | ||||
| Total Sources: | $25,654,410 | 100.0% | Total Uses: | $25,654,410 | 100.0% | |
The Mortgage Loan. The fifteenth largest mortgage loan (the “10-12 Celina Avenue Mortgage Loan”) is evidenced by a promissory note with an original principal balance of $16,510,000, which is secured by a first priority fee mortgage encumbering a two-story, industrial warehouse property totaling 321,800 SF located in Nashua, New Hampshire (the “10-12 Celina Avenue Property”). The proceeds of the 10-12 Celina Avenue Mortgage Loan, along with borrower equity of $9.2 million, were used to acquire the 10-12 Celina Avenue Property, pay closing costs and fund reserves.
The Borrower and Borrower Sponsor. The borrower is GGC 10-12 Celina Ave LLC (the “10-12 Celina Avenue Borrower”), a single purpose Delaware limited liability company. The borrower sponsor is Global Gate Capital Partners Limited (“Global Gate”), an investment firm that specializes in real estate, private equity and wealth management. Global Gate has approximately $3 billion in assets under management with over $1 billion of capital invested into real estate over the past five years.
The Property. The 10-12 Celina Avenue Property is a two-story, 321,800 SF industrial warehouse property located at 10-12 Celina Avenue in Nashua, New Hampshire, which sits along the New Hampshire-Massachusetts border. Situated on a 24.62-acre site, the 10-12 Celina Avenue Property has a clear height of 30 feet for the majority of the space, 47 loading docks, 130 trailer storage spaces and 160 parking spaces for cars. The 10-12 Celina Avenue Property is located approximately 3.9 miles from US Route 3 which is a four to six lane highway running through Nashua to the city of Manchester to the north and the Massachusetts border to the south. US Route 3 also provides connections to I-93, I-495 and I-95. The 10-12 Celina Avenue Property is 100.0% leased as of October 1, 2019 to the United States Postal Service (“USPS”), which operates a regional distribution hub at its leased premises.
The 10-12 Celina Avenue Property was completed in 1979 and renovated in 1997. Emery Worldwide Airlines (“Emery”), a third party logistics contractor for USPS, occupied the 10-12 Celina Avenue Property from 1997 until Emery was acquired by USPS in 2001. The USPS facility located at the 10-12 Celina Avenue Property specializes in the processing of small, medium, and large-size priority mail (1-3 day shipping) packages and does not handle any letter mail.
THE INFORMATION IN THIS STRUCTURAL AND COLLATERAL TERM SHEET IS NOT COMPLETE AND MAY BE AMENDED PRIOR TO THE TIME OF SALE. THIS TERM SHEET IS NOT AN OFFER TO SELL THESE SECURITIES AND IT IS NOT A SOLICITATION OF AN OFFER TO BUY THESE SECURITIES IN ANY JURISDICTION WHERE THE OFFER OR SALE IS NOT PERMITTED.
140
10-12 Celina Avenue Nashua, NH 03063 | Collateral Asset Summary – Loan No. 15 10-12 Celina Avenue | Cut-off Date Balance: Cut-off Date LTV Ratio: UW NCF DSCR: UW NOI Debt Yield: | $16,510,000 64.7% 2.17x 9.8% |
Major Tenant.
United States Postal Service (321,800 SF, 100.0% of NRA, 100.0% of underwritten base rent). The United States Postal Service is an independent agency of the United States federal government responsible for delivery of mail, packages, food, and supplies to all addresses in the United States and its insular areas and associated states. According to USPS, there are over 7.5 million individuals employed by USPS who handle approximately 485 million pieces of mail per day. USPS receives no tax dollars and funds operations through the sale of postage, products and services. Through its predecessor, Emery, USPS has occupied the 10-12 Celina Avenue Property for over 20 years. USPS’s most recent lease commenced on March 6, 2008. USPS’s lease term has been extended twice, most recently in February 2017 to extend the lease term through February 29, 2028. The USPS lease has no extension or termination options. In the event that USPS goes dark, files for bankruptcy or fails to utilize at least 75% of the 10-12 Celina Avenue Property, or its lease is cancelled, terminated or surrendered, or beginning 20 months prior to lease expiration, excess cash will be swept into a reserve account for the purpose of re-tenanting the USPS leased premises.
The following table presents certain information relating to the lease at the 10-12 Celina Avenue Property:
| Tenant Summary(1) | |||||||
| Tenant Name | Credit Rating (Fitch/Moody’s/S&P) | Tenant SF | Approximate % of SF | Annual UW Base Rent | % of Total Annual UW Base Rent | Annual UW Base Rent PSF | Lease Expiration |
| United States Postal Service | AAA/Aaa/AA+ | 321,800 | 100.0% | $1,734,144 | 100.0% | $5.39 | 2/29/2028 |
| Vacant | 0 | 0.0% | $0 | 0.0% | $0.00 | ||
| Total/Wtd. Avg. | 321,800 | 100.0% | $1,734,144 | 100.0% | $5.39 | ||
| (1) | Information is based on the underwritten rent roll. |
The following table presents certain information relating to the lease rollover schedule at the 10-12 Celina Avenue Property:
| Lease Rollover Schedule(1) | ||||||||
| Year | # of Leases Rolling | SF Rolling | Approx. % of Total SF Rolling | Approx. Cumulative % of SF Rolling | UW Base Rent PSF Rolling | Total UW Base Rent Rolling | Approx. % of Total Base Rent Rolling | Approx. Cumulative % of Total Base Rent Rolling |
| MTM | 0 | 0 | 0.0% | 0.0% | $0.00 | $0 | 0.0% | 0.0% |
| 2019 | 0 | 0 | 0.0% | 0.0% | $0.00 | $0 | 0.0% | 0.0% |
| 2020 | 0 | 0 | 0.0% | 0.0% | $0.00 | $0 | 0.0% | 0.0% |
| 2021 | 0 | 0 | 0.0% | 0.0% | $0.00 | $0 | 0.0% | 0.0% |
| 2022 | 0 | 0 | 0.0% | 0.0% | $0.00 | $0 | 0.0% | 0.0% |
| 2023 | 0 | 0 | 0.0% | 0.0% | $0.00 | $0 | 0.0% | 0.0% |
| 2024 | 0 | 0 | 0.0% | 0.0% | $0.00 | $0 | 0.0% | 0.0% |
| 2025 | 0 | 0 | 0.0% | 0.0% | $0.00 | $0 | 0.0% | 0.0% |
| 2026 | 0 | 0 | 0.0% | 0.0% | $0.00 | $0 | 0.0% | 0.0% |
| 2027 | 0 | 0 | 0.0% | 0.0% | $0.00 | $0 | 0.0% | 0.0% |
| 2028 | 1 | 321,800 | 100.0% | 100.0% | $5.39 | $1,734,144 | 100.0% | 100.0% |
| 2029 | 0 | 0 | 0.0% | 100.0% | $0.00 | $0 | 0.0% | 100.0% |
| 2030 & Beyond | 0 | 0 | 0.0% | 100.0% | $0.00 | $0 | 0.0% | 100.0% |
| Vacant | 0 | 0 | 0.0% | 100.0% | $0.00 | $0 | 0.0% | 100.0% |
| Total/Wtd. Avg. | 1 | 321,800 | 100.0% | $5.39 | $1,734,144 | 100.0% | ||
| (1) | Information is based on the underwritten rent roll. |
The Market. The 10-12 Celina Avenue Property is located in the city of Nashua in Southern New Hampshire near the New Hampshire-Massachusetts border. According to the appraisal, Southern New Hampshire region is located in the northern section of the Greater Boston combined statistical area. Southern New Hampshire is home to the City of Manchester, the business capital of New Hampshire, and the City of Concord, the state capital. The Southern New Hampshire region is the most populous area in the state of New Hampshire, with a population of 1.1 million residents and accounting for 84.2 percent of the total state population. Southern New Hampshire’s regional economy benefits from its skilled workforce, high quality of life and proximity to the Boston metropolitan area. The three largest non-farm employment sectors for Southern New Hampshire are trade, transportation and utilities, education and health services and professional and business services. The five largest employers in Southern New Hampshire are Fidelity Investments, Hannaford Bros. Co., Elliot Hospital, BAE Systems Electronic Solutions and Genesis Healthcare.
According to a third party market research report, the estimated 2019 population within a three- and five-mile radius of the 10-12 Celina Avenue Property was 21,626 and 81,718, respectively, and the 2019 estimated average household income within the same three- and five-mile radius was $92,319 and $79,724, respectively.
According to a third party report, the 10-12 Celina Avenue Property is located within the Hillsborough, NH industrial market. As of the first quarter of 2019, the Hillsborough, NH industrial market had a total inventory of approximately 41.3 million SF with an average vacancy rate of 5.7% and a market rental rate of $7.77 PSF.
THE INFORMATION IN THIS STRUCTURAL AND COLLATERAL TERM SHEET IS NOT COMPLETE AND MAY BE AMENDED PRIOR TO THE TIME OF SALE. THIS TERM SHEET IS NOT AN OFFER TO SELL THESE SECURITIES AND IT IS NOT A SOLICITATION OF AN OFFER TO BUY THESE SECURITIES IN ANY JURISDICTION WHERE THE OFFER OR SALE IS NOT PERMITTED.
141
10-12 Celina Avenue Nashua, NH 03063 | Collateral Asset Summary – Loan No. 15 10-12 Celina Avenue | Cut-off Date Balance: Cut-off Date LTV Ratio: UW NCF DSCR: UW NOI Debt Yield: | $16,510,000 64.7% 2.17x 9.8% |
The appraisal identified six comparable industrial properties and concluded a market rent of $5.50 PSF NNN.
The following table presents recent leasing data at competitive industrial buildings with respect to the 10-12 Celina Avenue Property:
| Comparable Leases | ||||||||
| Property Name/Address | Year Built/ Renovated | Size (SF) | Tenant Name | Lease Size (SF) | Lease Date | Lease Term (Yrs.) | Rent PSF | Lease Type |
| 10-12 Celina Avenue Nashua, NH | 1979/1997 | 321,800(1) | United States Postal Service(1) | 321,800(1) | Feb 2017(1) | 10(1) | $5.39(1) | NNN |
1 Progress Drive Dover, NH | 1977/N/A | 121,350 | Tradeport USA, LLC | 34,500 | Jan 2019 | 5 | $4.50 | NNN |
Methuen Industrial Center 14 Aegean Drive Methuen, MA | 2001/N/A | 234,268 | Crown Cork & Seal | 85,414 | Apr 2018 | 3 | $6.85 | NNN |
66 Saratoga Boulevard Devens, MA | 1997/N/A | 816,375 | Quiet Logistics | 275,392 | Jan 2018 | 5 | $5.50 | NNN |
150 Ocean Avenue Greenland, NH | 1980/2015 | 367,147 | Cole Haan | 367,147 | Jan 2017 | 11 | $5.20 | NNN |
52 Pettengill Road Londonderry, NH | 2015/N/A | 614,240 | UPS/Pratt & Whitney | 614,240 | Jun 2015 | 15 | $4.75 | NNN |
683 Route 3A Bow, NH | 2013/N/A | 243,584 | Excel | 243,584 | Nov 2013 | 10 | $5.75 | NNN |
Source:Appraisal
| (1) | Based on the underwritten rent roll. |
Operating History and Underwritten Net Cash Flow.The following table presents certain information relating to the historical operating performance and the Underwritten Net Cash Flow at the 10-12 Celina Avenue Property:
| Cash Flow Analysis | ||||||
| 2015(1) | 2016 | 2017 | 2018 | UW | UW PSF | |
| Gross Potential Rent(2) | N/A | $1,609,000 | $1,609,000 | $1,676,042 | $1,734,144 | $5.39 |
| Total Recoveries | N/A | $674,630 | $753,472 | $692,360 | $755,039 | $2.35 |
| Less Vacancy & Credit Loss(3) | N/A | $0 | $0 | $0 | ($124,459) | ($0.39) |
| Other Income | N/A | $0 | $113 | $0 | $0 | $0.00 |
| Effective Gross Income | N/A | $2,283,630 | $2,362,585 | $2,368,402 | $2,364,724 | $7.35 |
| Total Operating Expenses | N/A | $650,062 | $828,972 | $772,318 | $754,578 | $2.34 |
| Net Operating Income | N/A | $1,633,568 | $1,533,613 | $1,596,085 | $1,610,146 | $5.00 |
| Capital Expenditures | N/A | $0 | $0 | $0 | $32,180 | $0.10 |
| TI/LC | N/A | $0 | $0 | $0 | $56,846 | $0.18 |
| Net Cash Flow | N/A | $1,633,568 | $1,533,613 | $1,596,085 | $1,521,120 | $4.73 |
| Occupancy %(3) | N/A | 100.0% | 100.0% | 100.0% | 95.0% | |
| NOI DSCR | N/A | 2.33x | 2.19x | 2.28x | 2.30x | |
| NCF DSCR | N/A | 2.33x | 2.19x | 2.28x | 2.17x | |
| NOI Debt Yield | N/A | 9.9% | 9.3% | 9.7% | 9.8% | |
| NCF Debt Yield | N/A | 9.9% | 9.3% | 9.7% | 9.2% | |
| (1) | Limited operating history due to the recent acquisition of the 10-12 Celina Avenue Property. |
| (2) | UW Gross Potential Rent based on the average contractual rent through USPS’ lease term. |
| (3) | UW Vacancy & Credit Loss is based on 5%, which is more conservative than actual. |
THE INFORMATION IN THIS STRUCTURAL AND COLLATERAL TERM SHEET IS NOT COMPLETE AND MAY BE AMENDED PRIOR TO THE TIME OF SALE. THIS TERM SHEET IS NOT AN OFFER TO SELL THESE SECURITIES AND IT IS NOT A SOLICITATION OF AN OFFER TO BUY THESE SECURITIES IN ANY JURISDICTION WHERE THE OFFER OR SALE IS NOT PERMITTED.
142
| TRANSACTION CONTACT INFORMATION |
UBS Securities LLC | |
| David Schell | Tel. (212) 713-3375 |
| Nicholas Galeone | Tel. (212) 713-8832 |
| Siho Ham | Tel. (212) 713-1278 |
| Wells Fargo Securities | |
AJ Sfarra
Brigid Mattingly
Alex Wong
Nicholas Cerulo | Tel. (212) 214-5613
Tel. (312) 269-3062
Tel. (212) 214-5615
Tel. (212) 214-5619 |
THE INFORMATION IN THIS STRUCTURAL AND COLLATERAL TERM SHEET IS NOT COMPLETE AND MAY BE AMENDED PRIOR TO THE TIME OF SALE. THIS TERM SHEET IS NOT AN OFFER TO SELL THESE SECURITIES AND IT IS NOT A SOLICITATION OF AN OFFER TO BUY THESE SECURITIES IN ANY JURISDICTION WHERE THE OFFER OR SALE IS NOT PERMITTED.
143