| FREE WRITING PROSPECTUS | ||
| FILED PURSUANT TO RULE 433 | ||
| REGISTRATION FILE NO.: 333-227784-05 | ||
December 4, 2019 FREE WRITING PROSPECTUS STRUCTURAL AND COLLATERAL TERM SHEET $743,567,549 (Approximate Total Mortgage Pool Balance)$657,127,000(Approximate Offered Certificates) UBS 2019-C18 UBS Commercial Mortgage Securitization Corp.DepositorUBS AG Wells Fargo Bank, National Association Rialto Real Estate Fund IV – Debt, LP Cantor Commercial Real Estate Lending, L.P. Natixis Real Estate Capital LLC Societe Generale Financial CorporationSponsors and Mortgage Loan SellersUBS Securities LLC Société Générale Cantor Fitzgerald & Co. Wells Fargo SecuritiesCo-Lead Managers and Joint BookrunnersNatixis Academy Securities Bancroft Capital, LLC Brean Capital Drexel Hamilton, LLCCo-ManagersThe depositor has filed a registration statement (including a prospectus) with the Securities and Exchange Commission (‘‘SEC’’) (SEC File No. 333-227784) for the offering to which this communication relates. Before you invest, you should read the prospectus in the registration statement and other documents the depositor has filed with the SEC for more complete information about the depositor, the issuing entity and this offering. You may get these documents for free by visiting EDGAR on the SEC Web site at www.sec.gov. Alternatively, the depositor, any underwriter, or any dealer participating in the offering will arrange to send you the prospectus after filing if you request it by calling toll free 1-877-713-1030 (8 a.m. – 5 p.m. EST). The offered certificates referred to in these materials and the asset pool backing them are subject to modification or revision (including the possibility that one or more classes of certificates may be split, combined or eliminated at any time prior to issuance or availability of a final prospectus) and are offered on a “when, as and if issued” basis.
1
STATEMENT REGARDING THIS FREE WRITING PROSPECTUS
Nothing in this document constitutes an offer of securities for sale in any jurisdiction where the offer or sale is not permitted. The information contained herein is preliminary as of the date hereof, supersedes any such information previously delivered to you and will be superseded by any such information subsequently delivered prior to the time of sale and ultimately by the final prospectus relating to the offered certificates. These materials are subject to change, completion, supplement or amendment from time to time.
This free writing prospectus has been prepared by the underwriters for information purposes only and does not constitute, in whole or in part, a prospectus for the purposes of Directive 2003/71/EC (as amended) and/or Part VI of the Financial Services and Markets Act 2000, as amended, or other offering document.
STATEMENT REGARDING ASSUMPTIONS AS TO SECURITIES, PRICING ESTIMATES AND OTHER INFORMATION
This free writing prospectus contains certain forward-looking statements. If and when included in this free writing prospectus, the words “expects”, “intends”, “anticipates”, “estimates” and analogous expressions and all statements that are not historical facts, including statements about our beliefs or expectations, are intended to identify forward-looking statements. Any forward-looking statements are made subject to risks and uncertainties which could cause actual results to differ materially from those stated. Those risks and uncertainties include, among other things, declines in general economic and business conditions, increased competition, changes in demographics, changes in political and social conditions, regulatory initiatives and changes in customer preferences, many of which are beyond our control and the control of any other person or entity related to this offering. The forward- looking statements made in this free writing prospectus are made as of the date stated on the cover. We have no obligation to update or revise any forward-looking statement.
The attached information contains certain tables and other statistical analyses (the “Computational Materials”) that have been prepared in reliance upon information furnished by the Mortgage Loan Sellers. Numerous assumptions were used in preparing the Computational Materials, which may or may not be reflected herein. As such, no assurance can be given as to the Computational Materials’ accuracy, appropriateness or completeness in any particular context; or as to whether the Computational Materials and/or the assumptions upon which they are based reflect present market conditions or future market performance. The Computational Materials should not be construed as either projections or predictions or as legal, tax, financial or accounting advice. You should consult your own counsel, accountant and other advisors as to the legal, tax, business, financial and related aspects of a purchase of the offered certificates. Any weighted average lives, yields and principal payment periods shown in the Computational Materials are based on prepayment and/or loss assumptions, and changes in such prepayment and/or loss assumptions may dramatically affect such weighted average lives, yields and principal payment periods. In addition, it is possible that prepayments or losses on the underlying assets will occur at rates higher or lower than the rates shown in the attached Computational Materials. The specific characteristics of the offered certificates may differ from those shown in the Computational Materials due to differences between the final underlying assets and the preliminary underlying assets used in preparing the Computational Materials. The principal amount and designation of any security described in the Computational Materials are subject to change prior to issuance. None of UBS Securities LLC, Wells Fargo Securities, LLC, SG Americas Securities, LLC, Cantor Fitzgerald & Co., Natixis Securities Americas LLC, Academy Securities, Inc., Bancroft Capital, LLC, Brean Capital, LLC or Drexel Hamilton, LLC or any of their respective affiliates, make any representation or warranty as to the actual rate or timing of payments or losses on any of the underlying assets or the payments or yield on the offered certificates. The information in this presentation is based upon management forecasts and reflects prevailing conditions and management’s views as of this date, all of which are subject to change. In preparing this presentation, we have relied upon and assumed, without independent verification, the accuracy and completeness of all information available from public sources or which was provided to us by or on behalf of the Mortgage Loan Sellers or which was otherwise reviewed by us.
Wells Fargo Securities is the trade name for the capital markets and investment banking services of Wells Fargo & Company and its subsidiaries, including but not limited to Wells Fargo Securities, LLC, a member of NYSE, FINRA, NFA and SIPC, Wells Fargo Prime Services, LLC, a member of FINRA, NFA and SIPC, and Wells Fargo Bank, N.A. Wells Fargo Securities, LLC and Wells Fargo Prime Services, LLC are distinct entities from affiliated banks and thrifts.
IMPORTANT NOTICE REGARDING THE OFFERED CERTIFICATES
The offered certificates described herein are not suitable investments for all investors. In particular, you should not purchase any class of offered certificates unless you understand and are able to bear the prepayment, credit, liquidity and market risks associated with such class of certificates. For those reasons and for the reasons set forth under the heading “Risk Factors” in the Preliminary Prospectus, the yield to maturity and the aggregate amount and timing of distributions on the offered certificates are subject to material variability from period to period and give rise to the potential for significant loss over the life of such certificates. The interaction of these factors and their effects are impossible to predict and are likely to change from time to time. As a result, an investment in the offered certificates involves substantial risks and uncertainties and should be considered only by sophisticated institutional investors with substantial investment experience with similar types of securities and who have conducted appropriate due diligence on the mortgage loans and the certificates. Potential investors are advised and encouraged to review the Preliminary Prospectus in full and to consult with their legal, tax, accounting and other advisors prior to making any investment in the offered certificates described in this free writing prospectus.
This free writing prospectus is not to be construed as an offer to sell or the solicitation of any offer to buy any security in any jurisdiction where such an offer or solicitation would be illegal. The information contained in this free writing prospectus may not pertain to any securities that will actually be sold. The information contained in this free writing prospectus may be based on assumptions regarding market conditions and other matters as reflected in this free writing prospectus. We make no representations regarding the reasonableness of such assumptions or the likelihood that any of such assumptions will coincide with actual market conditions or events, and this free writing prospectus should not be relied upon for such purposes. The underwriters and their respective affiliates, officers, directors, partners and employees, including persons involved in the preparation or issuance of this free writing prospectus may, from time to time, have long or short positions in, and buy or sell, the offered certificates mentioned in this free writing prospectus or derivatives thereof (including options). Information contained in this free writing prospectus is current as of the date appearing on this free writing prospectus only. None of UBS Securities LLC, Wells Fargo Securities, LLC, SG Americas Securities, LLC, Cantor Fitzgerald & Co., Natixis Securities Americas LLC, Academy Securities, Inc., Bancroft Capital, LLC, Brean Capital, LLC or Drexel Hamilton, LLC provides accounting, tax or legal advice.
2
The issuing entity will be relying upon an exclusion or exemption from the definition of “investment company” under the Investment Company Act of 1940, as amended (the “Investment Company Act”), contained in Section 3(c)(5) of the Investment Company Act or Rule 3a-7 under the Investment Company Act, although there may be additional exclusions or exemptions available to the issuing entity. The issuing entity is being structured so as not to constitute a “covered fund” for purposes of the Volcker Rule under the Dodd-Frank Act (both as defined in “Risk Factors—Other Risks Relating to the Certificates—Legal and Regulatory Provisions Affecting Investors Could Adversely Affect the Liquidity of the Offered Certificates” in the Preliminary Prospectus). See also “Legal Investment” in the Preliminary Prospectus.
The information contained herein supersedes any previous such information delivered to any prospective investor and will be superseded by information delivered to such prospective investor prior to the time of sale.
IMPORTANT NOTICE RELATING TO AUTOMATICALLY-GENERATED EMAIL DISCLAIMERS
Any legends, disclaimers or other notices that may appear at the bottom of any email communication to which this free writing prospectus is attached relating to (1) these materials not constituting an offer (or a solicitation of an offer), (2) any representation that these materials are accurate or complete and may not be updated or (3) these materials possibly being confidential, are not applicable to these materials and should be disregarded. Such legends, disclaimers or other notices have been automatically generated as a result of these materials having been sent via Bloomberg or another system.
3
UBS 2019-C18
Capitalized terms used but not defined herein have the meanings assigned to them in the preliminary prospectus expected to be dated December 4, 2019 relating to the offered certificates (hereinafter referred to as the “Preliminary Prospectus”).
| KEY FEATURES OF SECURITIZATION |
| Offering Terms: | |
| Co-Lead Managers and Joint Bookrunners: | UBS Securities LLC Wells Fargo Securities, LLC SG Americas Securities, LLC Cantor Fitzgerald & Co. |
| Co-Managers: | Natixis Securities Americas LLC Academy Securities, Inc. Bancroft Capital, LLC Brean Capital, LLC Drexel Hamilton, LLC |
| Mortgage Loan Sellers: | UBS AG, by and through its branch office at 1285 Avenue of the Americas, New York, New York (“UBS AG”) (45.1%), Wells Fargo Bank, National Association (“WFB”) (14.8%), Rialto Real Estate Fund IV – Debt, LP (“RREF”) (13.1%), Cantor Commercial Real Estate Lending, L.P. (“CCRE”) (12.9%), Natixis Real Estate Capital LLC (“Natixis”) (8.4%) and Societe Generale Financial Corporation (“SG”) (5.7%) |
| Master Servicer: | Wells Fargo Bank, National Association |
| Operating Advisor: | Park Bridge Lender Services LLC |
| Asset Representations Reviewer: | Park Bridge Lender Services LLC |
| Special Servicer: | Rialto Capital Advisors, LLC |
| Trustee: | Wilmington Trust, National Association |
| Certificate Administrator: | Wells Fargo Bank, National Association |
| Rating Agencies: | Fitch Ratings, Inc., Kroll Bond Rating Agency, Inc. and Moody’s Investors Service, Inc. |
| U.S. Credit Risk Retention: | RREF, the retaining sponsor, intends to satisfy the U.S. credit risk retention requirement through the purchase by one or more of its “majority-owned affiliates” (as defined in the credit risk retention rules), from the underwriters and initial purchasers, on the Closing Date, of (i) an “eligible horizontal residual interest” comprised of the Class NR-RR certificates that are not part of the VRR Interest and (ii) an “eligible vertical interest” comprised of a certain percentage of the certificate balance, notional amount or percentage interest in each class of certificates (other than the Class R certificates) (the “VRR Interest”). The aggregate estimated fair value of the “eligible horizontal residual interest” will equal approximately 0.81279% of the estimated fair value of all of the certificates (other than the Class R certificates) issued by the issuing entity and the VRR Interest will consist of the portion of each class of certificates (other than the Class R certificates) necessary to satisfy the credit risk retention rules. As RREF is retaining its right to sell the “eligible horizontal residual interest” to a subsequent third party purchaser in accordance with the provisions of the credit risk retention rules, the pooling and servicing agreement will include the required provisions applicable to an operating advisor necessary for the securitization to comply with the credit risk retention rules utilizing the “third party purchaser” option. See “Operating Advisor” below. For further discussion on the manner in which the U.S. credit risk retention requirements will be satisfied see “Credit Risk Retention” in the Preliminary Prospectus. |
| EU Credit Risk Retention: | None of the sponsors, the depositor, the issuing entity, the underwriters or any other person is required or intends to retain a material net economic interest in the securitization constituted by the issue of the Offered Certificates, or to take any other action in respect of such securitization, in a manner prescribed or contemplated by the European Union’s Securitization Regulation (Regulation (EU) 2017/2402). In particular, no person undertakes to take any action which may be required by any investor for the purposes of their compliance with such regulations or similar requirements. |
| Determination Date: | The 11th day of each month, or if such 11th day is not a business day, the succeeding business day, commencing in January 2020. |
| Distribution Date: | The 4th business day following the Determination Date in each month, commencing in January 2020. |
| Cut-off Date: | The mortgage loans will be considered part of the trust fund as of their respective cut-off dates. The cut-off date with respect to each mortgage loan is the respective due date for the monthly debt service payment that is due in December 2019 (or, in the case of any mortgage loan that has its first due date after December 2019, the date that would have been its due date in December 2019 under the terms of that mortgage loan if a monthly debt service payment were scheduled to be due in that month). |
| Closing Date: | On or about December 20, 2019 |
| Settlement Terms: | DTC, Euroclear and Clearstream, same day funds, with accrued interest. |
| ERISA Eligible: | All of the offered certificates are expected to be ERISA eligible. |
| SMMEA Eligible: | None of the offered certificates will be SMMEA eligible. |
| Day Count: | 30/360 |
| Tax Treatment: | REMIC |
| Rated Final Distribution Date: | December 2052 |
| Minimum Denominations: | $10,000 (or $1,000,000 with respect to the Class X-A and Class X-B Certificates) and in each case in multiples of $1 thereafter. |
| Clean-up Call: | 1.0% |
| Distribution of Collateral by Property Type |

THE INFORMATION IN THIS STRUCTURAL AND COLLATERAL TERM SHEET IS NOT COMPLETE AND MAY BE AMENDED PRIOR TO THE TIME OF SALE. THIS TERM SHEET IS NOT AN OFFER TO SELL THESE SECURITIES AND IT IS NOT A SOLICITATION OF AN OFFER TO BUY THESE SECURITIES IN ANY JURISDICTION WHERE THE OFFER OR SALE IS NOT PERMITTED.
4
UBS 2019-C18
| TRANSACTION HIGHLIGHTS |
| Mortgage Loan Sellers | Number of Mortgage Loans | Number of Mortgaged Properties | Aggregate Cut-off Date Balance | % of Initial Outstanding Pool Balance(1) | ||||
| UBS AG | 19 | 80 | $335,051,250 | 45.1% | ||||
| Wells Fargo Bank, National Association | 8 | 8 | $110,349,639 | 14.8% | ||||
| Rialto Real Estate Fund IV – Debt, LP(2) | 12 | 19 | $97,310,000 | 13.1% | ||||
| Cantor Commercial Real Estate Lending, L.P. | 9 | 10 | $96,128,049 | 12.9% | ||||
| Natixis Real Estate Capital LLC | 3 | 6 | $62,128,611 | 8.4% | ||||
| Societe Generale Financial Corporation | 4 | 4 | $42,600,000 | 5.7% | ||||
| Total | 55 | 127 | $743,567,549 | 100.0% | ||||
| Pooled Collateral Facts: | |
| Initial Outstanding Pool Balance: | $743,567,549 |
| Number of Mortgage Loans: | 55 |
| Number of Mortgaged Properties: | 127 |
| Average Mortgage Loan Cut-off Date Balance: | $13,519,410 |
| Average Mortgaged Property Cut-off Date Balance: | $5,854,863 |
| Weighted Average Mortgage Rate: | 3.966% |
| Weighted Average Mortgage Loan Original Term to Maturity Date or ARD (months)(3): | 114 |
| Weighted Average Mortgage Loan Remaining Term to Maturity Date or ARD (months)(3): | 113 |
| Weighted Average Mortgage Loan Seasoning (months): | 1 |
| % of Mortgage Loans Secured by a Property or a Portfolio of Mortgaged Properties Leased to a Single Tenant: | 12.2% |
| Credit Statistics | |
| Weighted Average Mortgage Loan U/W NCF DSCR(4): | 2.33x |
| Weighted Average Mortgage Loan Cut-off Date LTV(4)(5): | 59.5% |
| Weighted Average Mortgage Loan Maturity Date or ARD LTV(3)(4)(5): | 53.2% |
| Weighted Average U/W NOI Debt Yield(4): | 11.4% |
| Amortization Overview | |
| % Mortgage Loans which pay Interest Only through Maturity Date or ARD(3): | 48.6% |
| % Mortgage Loans with Amortization through Maturity Date: | 28.7% |
| % Mortgage Loans which pay Interest Only followed by Amortization through Maturity Date: | 22.8% |
| Weighted Average Remaining Amortization Term (months)(6): | 341 |
| Loan Structural Features | |
| % Mortgage Loans with Upfront or Ongoing Tax Reserves: | 66.4% |
| % Mortgage Loans with Upfront or Ongoing Replacement Reserves(7): | 69.9% |
| % Mortgage Loans with Upfront or Ongoing Insurance Reserves: | 62.3% |
| % Mortgage Loans with Upfront or Ongoing TI/LC Reserves(8): | 63.1% |
| % Mortgage Loans with Upfront Engineering Reserves: | 46.8% |
| % Mortgage Loans with Upfront or Ongoing Other Reserves: | 51.9% |
| % Mortgage Loans with In Place Hard Lockboxes: | 55.0% |
| % Mortgage Loans with Cash Traps Triggered at DSCR Levels ≥ 1.05x: | 84.7% |
| % Mortgage Loans with Defeasance Only After a Lockout Period and Prior to an Open Period: | 79.3% |
| % Mortgage Loans with Prepayment with a Yield Maintenance Charge Only After a Lockout Period and Prior to an Open Period: | 12.0% |
| % Mortgage Loans with Prepayment with a Yield Maintenance Charge or Defeasance After a Lockout Period and Prior to an Open Period: | 4.4% |
| % Mortgage Loans with Prepayment with a Yield Maintenance Charge or Defeasance After a Prepayment with a Yield Maintenance Charge Period Prior to an Open Period: | 4.3% |
Please see footnotes on the following page.
THE INFORMATION IN THIS STRUCTURAL AND COLLATERAL TERM SHEET IS NOT COMPLETE AND MAY BE AMENDED PRIOR TO THE TIME OF SALE. THIS TERM SHEET IS NOT AN OFFER TO SELL THESE SECURITIES AND IT IS NOT A SOLICITATION OF AN OFFER TO BUY THESE SECURITIES IN ANY JURISDICTION WHERE THE OFFER OR SALE IS NOT PERMITTED.
5
UBS 2019-C18
| TRANSACTION HIGHLIGHTS |
| (1) | Unless otherwise indicated, all references to “% of Initial Outstanding Pool Balance” in this Term Sheet reflect a percentage of the aggregate principal balance of the mortgage pool as of the Cut-off Date, after application of all payments of principal due during or prior to December 2019. |
| (2) | Rialto Real Estate Fund IV – Debt, LP acquired each of the mortgage loans it is selling to the depositor from BSPRT CMBS Finance, LLC, Ladder Capital Finance LLC, or CIBC Inc. Such mortgage loans were re-underwritten pursuant to Rialto Real Estate Fund IV – Debt, LP’s underwriting guidelines. |
| (3) | For any mortgage loan with an anticipated repayment date, calculated to or as of, as applicable, that anticipated repayment date. |
| (4) | With respect to any mortgage loan that is part of a whole loan, unless otherwise indicated, LTV, DSCR and Debt Yield calculations in this Term Sheet include any relatedpari passu companion loans and exclude any subordinate companion loans, as applicable. Additionally, LTV, DSCR and Debt Yield figures in this Term Sheet are calculated for mortgage loans without regard to any additional indebtedness that may be incurred at a future date. See “Description of the Mortgage Pool—Mortgage Pool Characteristics” in the Preliminary Prospectus and Annex A-1 to the Preliminary Prospectus. |
| (5) | The Cut-off Date LTV and Maturity Date or ARD LTV for the following mortgage loans are based on an appraised value for one or more mortgaged properties that is not an “As-Is” appraised value. |
With respect to the mortgage loan secured by the portfolio of mortgaged properties identified on Annex A-1 to the Preliminary Prospectus as Wyndham National Hotel Portfolio, the Cut-off Date LTV, Maturity Date or ARD LTV, and appraised value are based on the aggregate sum of the available "As-Is" and “As-Complete” appraised value of $215,000,000, as of August 1, 2019, which assumes the completion of all renovations for which the lender reserved for at origination. The sum of the “As-Is” appraised values on a stand-alone basis is $209,900,000. The Cut-off Date LTV and Maturity Date or ARD LTV based on the appraised value representing the sum of the “As-Is” appraised values are 69.1% and 47.8%, respectively.
With respect to the mortgage loan identified on Annex A-1 to the Preliminary Prospectus as Holiday Inn Express Lincoln CA, the Cut-off Date LTV, Maturity Date or ARD LTV, and appraised value are based on the “As-Complete Value” appraised value of $15,000,000, as of October 1, 2020, which assumes the completion of all renovations for which the lender reserved for at origination. The “As-Is” appraised value is $13,400,000. The Cut-off Date LTV and Maturity Date or ARD LTV based on the “As-Is” appraised values are 67.2% and 60.3%, respectively.
With respect to the mortgage loan identified on Annex A-1 to the Preliminary Prospectus as 530 West 136th Street, the Cut-off Date LTV, Maturity Date or ARD LTV, and appraised value are based on the "As-Stabilized" appraised value of $10,400,000, as of September 13, 2019, which assumes the completion of all renovations for which the lender reserved for at origination. The "As-Is" appraised value is $10,300,000 as of September 13, 2019. The Cut-off Date LTV and Maturity Date or ARD LTV based on the "As-Is" appraised values are 63.3% and 63.3%, respectively.
With respect to the mortgage loan identified on Annex A-1 to the Preliminary Prospectus as BNSF Logistics, the Cut-off Date LTV, Maturity Date or ARD LTV, and appraised value are based on the “As-Complete Value” appraised value of $8,300,000, as of November 3, 2019, which assumes the completion of all renovations for which the lender reserved for at origination. The “As-Is” appraised value is $7,000,000. The Cut-off Date LTV and Maturity Date or ARD LTV based on the “As-Is” appraised values are 77.1% and 65.8%, respectively.
With respect to the mortgage loan identified on Annex A-1 to the Preliminary Prospectus as Brickyard Plaza, the Cut-off Date LTV, Maturity Date or ARD LTV, and appraised value are based on the conclusion of $6,400,000, which assumes the lease-up costs for recently signed leases are escrowed and available to any potential purchaser at origination. The “As-Is” appraised value is $5,150,000. The Cut-off Date LTV and Maturity Date or ARD LTV based on the “As-Is” appraised values are 77.7% and 77.7%, respectively.
| (6) | Excludes mortgage loans that are interest-only for the full loan term to maturity or the related anticipated repayment date. |
| (7) | Includes FF&E Reserves. |
| (8) | Represents the percent of the allocated aggregate principal balance of the mortgage pool as of the Cut-off Date of only the office, retail, industrial, mixed use properties and the mortgage loan identified on Annex A-1 to the Preliminary Prospectus as Chroma Apartments. |
THE INFORMATION IN THIS STRUCTURAL AND COLLATERAL TERM SHEET IS NOT COMPLETE AND MAY BE AMENDED PRIOR TO THE TIME OF SALE. THIS TERM SHEET IS NOT AN OFFER TO SELL THESE SECURITIES AND IT IS NOT A SOLICITATION OF AN OFFER TO BUY THESE SECURITIES IN ANY JURISDICTION WHERE THE OFFER OR SALE IS NOT PERMITTED.
6
UBS 2019-C18
| STRUCTURE OVERVIEW |
OFFERED CERTIFICATES
| Class(1) | Ratings(2) (Fitch/KBRA/Moody’s) | Approx. Initial Certificate Principal Balance or Notional Amount(3) | Approx. Initial Available Certificate Principal Balance or Notional Amount(3) | Approx. Initial Retained Certificate Principal Balance or Notional Amount(3)(4) | Initial Subordination Levels | Expected Weighted Average Life (years)(5) | Principal Window (months)(5) | Certificate Principal to Value Ratio(6) | Underwritten NOI Debt Yield(7) |
| Class A-1 | AAAsf / AAA(sf) / Aaa(sf) | $29,089,000 | $27,865,000 | $1,224,000 | 30.000%(8) | 2.81 | 1 - 58 | 41.7% | 16.3% |
| Class A-2 | AAAsf / AAA(sf) / Aaa(sf) | $69,160,000 | $66,250,000 | $2,910,000 | 30.000%(8) | 4.88 | 58 - 60 | 41.7% | 16.3% |
| Class A-SB | AAAsf / AAA(sf) / Aaa(sf) | $35,630,000 | $34,130,000 | $1,500,000 | 30.000%(8) | 7.21 | 60 - 111 | 41.7% | 16.3% |
| Class A-3 | AAAsf / AAA(sf) / Aaa(sf) | (9) | (9) | (9) | 30.000%(8) | (9) | (9) | 41.7% | 16.3% |
| Class A-4 | AAAsf / AAA(sf) / Aaa(sf) | (9) | (9) | (9) | 30.000%(8) | (9) | (9) | 41.7% | 16.3% |
| Class X-A(10) | AAAsf / AAA(sf) / Aaa(sf) | $520,497,000(11) | $498,596,000 | $21,901,000 | N/A | N/A | N/A | N/A | N/A |
| Class X-B(10) | A-sf / AAA(sf) / NR | $136,630,000(11) | $130,880,000 | $5,750,000 | N/A | N/A | N/A | N/A | N/A |
| Class A-S | AAAsf / AAA(sf) / Aa2(sf) | $72,498,000 | $69,447,000 | $3,051,000 | 20.250% | 9.99 | 120 - 120 | 47.5% | 14.3% |
| Class B | AA-sf / AA(sf) / NR | $33,460,000 | $32,052,000 | $1,408,000 | 15.750% | 9.99 | 120 - 120 | 50.2% | 13.5% |
| Class C | A-sf / A(sf) / NR | $30,672,000 | $29,381,000 | $1,291,000 | 11.625% | 9.99 | 120 - 120 | 52.6% | 12.9% |
NON-OFFERED CERTIFICATES(12)
| Class(1) | Ratings(2) (Fitch/KBRA/Moody’s) | Approx. Initial Certificate Amount(3) | Approx. Initial Available Certificate Principal Balance or Notional Amount(3) | Approx. Initial Retained Certificate Principal Balance or Notional Amount(3)(4) | Initial Subordination Levels | Expected Weighted Average Life (years)(5) | Principal Window (months)(5) | Certificate Value Ratio(6) | Underwritten NOI Debt Yield(7) |
| Class X-D(10) | BBB-sf / BBB(sf) / NR | $36,249,000(11) | $34,723,000 | $1,526,000 | N/A | N/A | N/A | N/A | N/A |
| Class X-F(10) | BB-sf / BB(sf) / NR | $14,872,000(11) | $14,246,000 | $626,000 | N/A | N/A | N/A | N/A | N/A |
| Class X-G(10) | B-sf / B(sf) / NR | $7,435,000(11) | $7,122,000 | $313,000 | N/A | N/A | N/A | N/A | N/A |
| Class D | BBBsf / BBB+(sf) / NR | $20,448,000 | $19,587,000 | $861,000 | 8.875% | 9.99 | 120 - 120 | 54.3% | 12.5% |
| Class E | BBB-sf / BBB(sf) / NR | $15,801,000 | $15,136,000 | $665,000 | 6.750% | 9.99 | 120 - 120 | 55.5% | 12.2% |
| Class F | BB-sf / BB(sf) / NR | $14,872,000 | $14,246,000 | $626,000 | 4.750% | 9.99 | 120 - 120 | 56.7% | 12.0% |
| Class G | B-sf / B(sf) / NR | $7,435,000 | $7,122,000 | $313,000 | 3.750% | 9.99 | 120 - 120 | 57.3% | 11.8% |
| Class NR-RR | NR / NR / NR | $27,884,548 | $26,710,548 | $1,174,000 | 0.000% | 9.99 | 120 - 120 | 59.5% | 11.4% |
Please see footnotes on the following page.
THE INFORMATION IN THIS STRUCTURAL AND COLLATERAL TERM SHEET IS NOT COMPLETE AND MAY BE AMENDED PRIOR TO THE TIME OF SALE. THIS TERM SHEET IS NOT AN OFFER TO SELL THESE SECURITIES AND IT IS NOT A SOLICITATION OF AN OFFER TO BUY THESE SECURITIES IN ANY JURISDICTION WHERE THE OFFER OR SALE IS NOT PERMITTED.
7
UBS 2019-C18
| STRUCTURE OVERVIEW |
| (1) | Theper annum pass-through rates applicable to the Class A-1, Class A-2, Class A-SB, Class A-3, Class A-4, Class A-S, Class B, Class C, Class D, Class E, Class F, Class G and Class NR-RR Certificates (collectively, the “principal balance certificates”) will, in each case, equal one of: (i) a fixed rateper annum, (ii) a variable rateper annum equal to the weighted average of the net mortgage interest rates on the mortgage loans for the related distribution date adjusted as necessary to a 30/360 basis (the “WAC Rate”), (iii) a variable rateper annum equal to the lesser of (a) a fixed rate and (b) the WAC Rate or (iv) a variable rateper annum equal to the WAC Rate minus a specified percentage. |
| (2) | Ratings shown are those of Fitch Ratings, Inc. (“Fitch”), Kroll Bond Rating Agency, Inc. (“KBRA”) and Moody’s Investors Service, Inc. (“Moody’s”). Certain nationally recognized statistical rating organizations that were not hired by the depositor may use information they receive pursuant to Rule 17g-5 under the Securities Exchange Act of 1934, as amended, or otherwise to rate the certificates. There can be no assurance as to what ratings a non-hired nationally recognized statistical rating organization would assign. See “Risk Factors—Other Risks Relating to the Certificates—Nationally Recognized Statistical Rating Organizations May Assign Different Ratings to the Certificates; Ratings of the Certificates Reflect Only the Views of the Applicable Rating Agencies as of the Dates Such Ratings Were Issued; Ratings May Affect ERISA Eligibility; Ratings May Be Downgraded” and “Ratings” in the Preliminary Prospectus. Fitch, KBRA and Moody’s have informed us that the “sf” designation in their ratings represents an identifier for structured finance product ratings. |
| (3) | Approximate; subject to a permitted variance of plus or minus 5% on the Closing Date, including in connection with any variation in the portion of the certificate balances and notional amounts of the classes comprising the VRR Interest following the calculation of the actual fair value of the certificates (other than the Class R certificates) issued by the issuing entity, and further subject to the discussion in footnote (9) below. In addition, the notional amounts of each class of Class X Certificates may vary depending upon the final pricing of all classes of principal balance certificates whose certificate balances comprise such notional amounts and, if as a result of such pricing the pass-through rate of the Class X Certificates, as applicable, would be equal to zero, such class of certificates may not be issued on the Closing Date of this securitization. |
| (4) | On the Closing Date, the certificates (other than the Class R certificates) (collectively, the “VRR Interest”) with the Initial Certificate Principal Balances or Notional Amounts, as applicable, set forth in the above table under “Approx. Initial Retained Certificate Principal Balance or Notional Amount” are expected to be sold by theunderwriters and the initial purchasersto RREF or a majority-owned affiliate of RREF as described in “Credit Risk Retention—General” in the Preliminary Prospectus. |
| (5) | The principal window is expressed in months following the Closing Date and reflects the period during which distributions of principal would be received under the assumptions set forth in the following sentence. The expected weighted average life and principal window figures set forth above are based on the following assumptions, among others: (i) no defaults or subsequent losses on the mortgage loans; (ii) no extensions of maturity dates of the mortgage loans; (iii) payment in full on the stated maturity date or on the anticipated repayment date; and (iv) no prepayments of the mortgage loans prior to maturity or the anticipated repayment date. See the structuring assumptions set forth under “Yield and Maturity Considerations—Weighted Average Life” in the Preliminary Prospectus. |
| (6) | “Certificate Principal to Value Ratio” for any class of principal balance certificates is calculated as the product of (a) the weighted average Cut-off Date LTV Ratio of the mortgage pool, multiplied by (b) a fraction, the numerator of which is the total initial certificate balance of such class of principal balance certificates and all other classes of principal balance certificates that are senior to such class, and the denominator of which is the total initial certificate balance of all the principal balance certificates. The Certificate Principal to Value Ratios of the Class A-1, Class A-2, Class A-SB, Class A-3 and Class A-4 Certificates are calculated in the aggregate for those classes as if they were a single class. |
| (7) | “Underwritten NOI Debt Yield” for any class of principal balance certificates is calculated as the product of (a) the weighted average UW NOI Debt Yield for the mortgage pool, multiplied by (b) a fraction, the numerator of which is the total initial certificate balance of all the principal balance certificates, and the denominator of which is the total initial certificate balance of such class of principal balance certificates and all other classes of principal balance certificates, if any, that are senior to such class. The Underwritten NOI Debt Yields of the Class A-1, Class A-2, Class A-SB, Class A-3 and Class A-4 Certificates are calculated in the aggregate for those classes as if they were a single class. |
| (8) | The initial subordination levels for the Class A-1, Class A-2, Class A-SB, Class A-3 and Class A-4 Certificates represent the approximate credit support for those classes in the aggregate. |
| (9) | The exact initial certificate balances of the Class A-3 and Class A-4 certificates are unknown and will be determined based on the final pricing of those classes of certificates. However, the respective initial certificate balances, assumed final distribution date, weighted average lives and principal windows of the Class A-3 and Class A-4 certificates are expected to be within the applicable ranges reflected in the following chart. The aggregate initial certificate balance of the Class A-3 and Class A-4 certificates is expected to be approximately $386,618,000 subject to a variance of plus or minus 5%. In the event that the Class A-3 Certificates are issued at $386,618,000, the Class A-4 Certificates will not be issued. |
Class of Certificates | Expected Range of Approximate Initial Certificate Balance | Expected Range of Assumed Final Distribution Date | Expected Range of Weighted Average Life (Years) | Expected Range of Principal Window (Months) | ||||
| Class A-3 | $25,000,000 - $386,618,000 | Mar 2029 / Dec 2029 | 9.24 / 9.87 | 111-111 / 111-120 | ||||
| Class A-4 | $211,618,000 - $361,618,000 | Dec 2029 / Dec 2029 | 9.91 / 9.96 | 111-120 / 119-120 |
| (10) | The pass-through rate for the Class X-A certificates for any distribution date will be aper annum rate equal to the excess, if any, of (a) the WAC Rate, over (b) the weighted average of the pass-through rates on the Class A-1, Class A-2, Class A-SB, Class A-3 and Class A-4 certificates for the related distribution date, weighted on the basis of their respective certificate balances outstanding immediately prior to that distribution date. The pass-through rate for the Class X-B certificates for any distribution date will be aper annum rate equal to the excess, if any, of (a) the WAC Rate, over (b) the weighted average of the pass-through rates on the Class A-S, Class B and Class C certificates for the related distribution date, weighted on the basis of their respective certificate balances outstanding immediately prior to that distribution date. The pass-through rate for the Class X-D certificates for any distribution date will be aper annumrate equal to the excess, if any, of (a) the WAC Rate, over (b) the weighted average of the pass-through rates on the Class D and Class E certificates for the related distribution date, weighted on the basis of their respective certificate balances outstanding immediately prior to that distribution date. The pass-through rate for the Class X-F certificates for any distribution date will be aper annum rate equal to the excess, if any, of (a) the WAC Rate, over (b) the pass-through rate on the Class F certificate for the related distribution date. The pass-through rate for the Class X-G certificates for any distribution date will be aper annum rate equal to the excess, if any, of (a) the WAC Rate, over (b) the pass-through rate on the Class G certificates for the related distribution date. |
| (11) | The Class X-A, Class X-B, Class X-D, Class X-F and Class X-G certificates (collectively, the “Class X Certificates”) are notional amount certificates and will not be entitled to distributions of principal. The notional amount of the Class X-A certificates will be equal to the aggregate certificate balance of the Class A-1, Class A-2, Class A-SB, Class A-3 and Class A-4 certificates. The notional amount of the Class X-B certificates will be equal to the aggregate certificate balance of the Class A-S, Class B and Class C certificates. The notional amount of the Class X-D will be equal to the aggregate certificate balance of the Class D and Class E certificates. The notional amount of the Class X-F will be equal to the certificate balance of the Class F certificates. The notional amount of the Class X-G will be equal to the certificate balance of the Class G certificates. |
| (12) | Not offered pursuant to the Preliminary Prospectus or this Term Sheet. Information provided in this Term Sheet regarding the characteristics of these certificates is provided only to enhance your understanding of the offered certificates. The non-offered certificates also include the Class Z and Class R certificates, which do not have a certificate balance, notional amount, pass-through rate, rating or rated final distribution date, and which are not shown in the chart. The Class Z certificates represent the entitlement to distributions of excess interest accrued on the mortgage loans with an anticipated repayment date, as further described in the Preliminary Prospectus. The Class R certificates represent the beneficial ownership of the residual interest in each of the real estate mortgage investment conduits, as further described in the Preliminary Prospectus. |
THE INFORMATION IN THIS STRUCTURAL AND COLLATERAL TERM SHEET IS NOT COMPLETE AND MAY BE AMENDED PRIOR TO THE TIME OF SALE. THIS TERM SHEET IS NOT AN OFFER TO SELL THESE SECURITIES AND IT IS NOT A SOLICITATION OF AN OFFER TO BUY THESE SECURITIES IN ANY JURISDICTION WHERE THE OFFER OR SALE IS NOT PERMITTED.
8
UBS 2019-C18
| STRUCTURE OVERVIEW |
| Class A-2 Principal Paydown(1) |
| Class | Mortgage Loan Seller | Mortgage Loan | Property Type | Cut-off Dates Balance | Remaining Term to Maturity (Mos.) | Cut-off Date LTV Ratio | U/W NCF DSCR | U/W NOI Debt Yield |
| A-2 | UBS AG | 225 Bush | Office | $35,000,000 | 59 | 34.6% | 3.85x | 13.4% |
| A-2 | UBS AG | United Healthcare Office | Office | $26,800,000 | 58 | 66.7% | 1.56x | 10.2% |
| A-2 | WFB | CubeSmart Penn's Landing | Self Storage | $8,550,000 | 60 | 66.4% | 1.97x | 9.4% |
| (1) | This table reflects the mortgage loan whose balloon payment will be applied to pay down the Class A-2 certificates, assuming (i) that none of the mortgage loans experience prepayments (prior to maturity or anticipated repayment date, as applicable), defaults or losses, (ii) there are no extensions of maturity dates or anticipated repayment dates, as applicable and (iii) each mortgage loan is paid in full on its stated maturity date. See “Yield and Maturity Considerations—Yield Considerations” in the Preliminary Prospectus. |
THE INFORMATION IN THIS STRUCTURAL AND COLLATERAL TERM SHEET IS NOT COMPLETE AND MAY BE AMENDED PRIOR TO THE TIME OF SALE. THIS TERM SHEET IS NOT AN OFFER TO SELL THESE SECURITIES AND IT IS NOT A SOLICITATION OF AN OFFER TO BUY THESE SECURITIES IN ANY JURISDICTION WHERE THE OFFER OR SALE IS NOT PERMITTED.
9
UBS 2019-C18
| STRUCTURE OVERVIEW |
| Principal Distributions: | Payments in respect of principal of the certificates will be distributed, first, to the Class A-SB Certificates, until the certificate balance of such class is reduced to the planned principal balance for the related Distribution Date set forth on Annex E to the Preliminary Prospectus, then, to the Class A-1, Class A-2, Class A-3, Class A-4, Class A-SB, Class A-S, Class B, Class C, Class D, Class E, Class F, Class G and Class NR-RR Certificates, in that order, until the certificate balance of each such class is reduced to zero. Notwithstanding the foregoing, if the aggregate certificate balances of the Class A-S, Class B, Class C, Class D, Class E, Class F, Class G and Class NR-RR Certificates have been reduced to zero as a result of the allocation of mortgage loan losses to those certificates distributions in respect of principal of the certificates will be distributed,first, to the Class A-1, Class A-2, Class A-SB, Class A-3 and Class A-4 Certificates, on apro ratabasis, based on the certificate principal balance of each such class, then, to the extent of any recoveries on realized losses, to the Class A-S, Class B, Class C, Class D, Class E, Class F, Class G and Class NR-RR Certificates, in that order, in each case until the certificate balance of each such class is reduced to zero (or previously allocated realized losses have been fully reimbursed).
The Class X Certificates will not be entitled to receive distributions of principal; however, (i) the notional amount of the Class X-A Certificates will be reduced by the aggregate amount of principal distributions and realized losses, if any, allocated to the Class A-1, Class A-2, Class A-SB, Class A-3 and Class A-4 Certificates, (ii) the notional amount of the Class X-B Certificates will be reduced by the aggregate amount of principal distributions and realized losses, if any, allocated to the Class A-S, Class B and Class C Certificates, (iii) the notional amount of the Class X-D Certificates will be reduced by the aggregate amount of principal distributions and realized losses, if any, allocated to the Class D and Class E Certificates, (iv) the notional amount of the Class X-F Certificates will be reduced by the principal distributions and realized losses if any, allocated to the Class F Certificates and (v) the notional amount of the Class X-G Certificates will be reduced by the principal distributions and realized losses if any, allocated to the Class G Certificates.
|
| Interest Distributions: | On each Distribution Date, interest accrued for each class of the certificates at the applicable pass-through rate will be distributed in the following order of priority, to the extent of available funds:first, to the Class A-1, Class A-2, Class A-SB, Class A-3, Class A-4, Class X-A, Class X-B, Class X-D, Class X-F and Class X-G Certificates, on apro rata basis, based on the accrued and unpaid interest on each such class and then, to the Class A-S, Class B, Class C, Class D, Class E, Class F, Class G and Class NR-RR Certificates, in that order, in each case until the interest payable to each such class is paid in full.
Theper annum pass-through rates applicable to the Class A-1, Class A-2, Class A-SB, Class A-3, Class A-4, Class A-S, Class B, Class C, Class D, Class E, Class F, Class G and Class NR-RR Certificates for each Distribution Date will equal one of: (i) a fixed rateper annum, (ii) the WAC Rate, (iii) a variable rate equal to the lesser of (a) a fixed rate and (b) the WAC Rate, or (iv) a variable rate equal to the WAC Rate less a specified percentage.
As further described in the Preliminary Prospectus, theper annum pass-through rate on the Class X-A Certificates will generally be equal to the excess, if any, of (a) the WAC Rate, over (b) the weighted average of the pass-through rates of the Class A-1, Class A-2, Class A-SB, Class A-3 and Class A-4 Certificates, weighted on the basis of their respective certificate balances outstanding immediately prior to that Distribution Date as described in the Preliminary Prospectus. Theper annum pass-through rate on the Class X-B Certificates will generally be equal to the excess, if any, of (a) the WAC Rate, over (b) the weighted average of the pass-through rates of the Class A-S, Class B and Class C Certificates, weighted on the basis of their respective certificate balances outstanding immediately prior to that Distribution Date as described in the Preliminary Prospectus. Theper annum pass-through rate on the Class X-D Certificates will generally be equal to the excess, if any, of (a) the WAC Rate, over (b) the weighted average of the pass-through rates of the Class D and Class E Certificates, weighted on the basis of their respective certificate balances outstanding immediately prior to that Distribution Date as described in the Preliminary Prospectus. Theper annum pass-through rate on the Class X-F Certificates will generally be equal to the excess, if any, of (a) the WAC Rate, over (b) the pass-through rate of the Class F Certificates as described in the Preliminary Prospectus. Theper annum pass-through rate on the Class X-G Certificates will generally be equal to the excess, if any, of (a) the WAC Rate, over (b) the pass-through rate of the Class G Certificates as described in the Preliminary Prospectus. |
THE INFORMATION IN THIS STRUCTURAL AND COLLATERAL TERM SHEET IS NOT COMPLETE AND MAY BE AMENDED PRIOR TO THE TIME OF SALE. THIS TERM SHEET IS NOT AN OFFER TO SELL THESE SECURITIES AND IT IS NOT A SOLICITATION OF AN OFFER TO BUY THESE SECURITIES IN ANY JURISDICTION WHERE THE OFFER OR SALE IS NOT PERMITTED.
10
UBS 2019-C18
| STRUCTURE OVERVIEW |
| Prepayment Interest Shortfalls: | Prepayment interest shortfalls will be allocatedpro ratabased on interest entitlements, in reduction of the interest otherwise payable with respect to each of the interest-bearing classes of certificates. |
| Realized Loss Allocation: | On each distribution date, immediately following the distributions to be made to the Certificateholders on that date, the certificate administrator is required to calculate the amount, if any, by which (i) the aggregate stated principal balance of the mortgage loans, including any REO loans, expected to be outstanding immediately following that distribution date is less than (ii) the then-aggregate Certificate Balance of the Principal Balance Certificates after giving effect to distributions of principal on that distribution date. Such amount will be applied to the Class NR-RR, Class G, Class F, Class E, Class D, Class C, Class B and Class A-S certificates, in that order, in each case until the related Certificate Balance has been reduced to zero, and then to the Class A-1, Class A-2, Class A-SB, Class A-3 and Class A-4 certificates,pro rata based upon their respective Certificate Balances, until their respective Certificate Balances have been reduced to zero. |
| Prepayment Premiums/Yield Maintenance Charges: | If any yield maintenance charge or prepayment premium is collected during any particular collection period with respect to any mortgage loan, then on the distribution date corresponding to that collection period, the certificate administrator will pay that yield maintenance charge or prepayment premium, net of any liquidation fees or workout fees payable therefrom, in the following manner: (a) to the holders of each of the Class A-1, Class A-2, Class A-SB, Class A-3, Class A-4, Class A-S, Class B, Class C, Class D and Class E certificates, the product of (x) such yield maintenance charge or prepayment premium, (y) the related Base Interest Fraction for such class, and (z) a fraction, the numerator of which is equal to the amount of principal distributed to such class for that distribution date, and the denominator of which is the total amount of principal distributed to such classes of Principal Balance Certificates for that distribution date, (b) to the holders of the Class X-A certificates, the excess, if any, of (x) the product of (1) such yield maintenance charge or prepayment premium and (2) a fraction, the numerator of which is equal to the amount of principal distributed to the Class A-1, Class A-2, Class A-SB, Class A-3 and Class A-4 certificates for that distribution date, and the denominator of which is the total amount of principal distributed to the Class A-1, Class A-2, Class A-SB, Class A-3, Class A-4, Class A-S, Class B, Class C, Class D and Class E certificates for that distribution date, over (y) the amount of such yield maintenance charge or prepayment premium distributed to the Class A-1, Class A-2, Class A-SB, Class A-3 and Class A-4 Certificates as described above, and (c) to the holders of the Class X-B certificates, any remaining portion of such yield maintenance charge or prepayment premium not distributed as described above.
No prepayment premiums or yield maintenance charges will be distributed to the holders of the Class X-D, Class X-F, Class X-G, Class F, Class G, Class NR-RR, Class Z or Class R Certificates.
“Base Interest Fraction” means, with respect to any principal prepayment of any mortgage loan that provides for the payment of a yield maintenance charge or prepayment premium, and with respect to any class of Principal Balance Certificates, a fraction (A) the numerator of which is the greater of (x) zero and (y) the difference between (i) the pass-through rate on that class, and (ii) the applicable discount rate and (B) the denominator of which is the difference between (i) the mortgage interest rate on the related mortgage loan and (ii) the applicable discount rate;provided,however, that: under no circumstances will the Base Interest Fraction be greater than one; if the applicable discount rate is greater than or equal to the mortgage interest rate on the related mortgage loan and is greater than or equal to the pass-through rate on that class, then the Base Interest Fraction will equal zero; and if the applicable discount rate is greater than or equal to the mortgage interest rate on the related mortgage loan and is less than the pass-through rate on that class, then the Base Interest Fraction will be equal to 1.0.
Consistent with the foregoing, the Base Interest Fraction is equal to:
(Pass-Through Rate - Discount Rate)
|
THE INFORMATION IN THIS STRUCTURAL AND COLLATERAL TERM SHEET IS NOT COMPLETE AND MAY BE AMENDED PRIOR TO THE TIME OF SALE. THIS TERM SHEET IS NOT AN OFFER TO SELL THESE SECURITIES AND IT IS NOT A SOLICITATION OF AN OFFER TO BUY THESE SECURITIES IN ANY JURISDICTION WHERE THE OFFER OR SALE IS NOT PERMITTED.
11
UBS 2019-C18
| STRUCTURE OVERVIEW |
| Whole Loans: | The mortgaged properties identified on Annex A-1 to the Preliminary Prospectus as 225 Bush, Chroma Apartments, Wyndham National Hospitality Portfolio, 3 Columbus Circle, ILPT Industrial Portfolio, DoubleTree New York Times Square West Leased Fee, United Healthcare Office, 4041 Central, Century Plaza Towers, Crimson Retail Portfolio, Redwood Technology Center, 7105 - 7115 37th Avenue, Shoppes at Parma, Global Payments, Inc. and Airport Square, each secure both a mortgage loan to be included in the trust fund and one or more other mortgage loans that will not be included in the trust fund, each of which will bepari passu or subordinate in right of payment with the related mortgage loan included in the trust fund. We refer to each such group of mortgage loans as a “whole loan”. The Chroma Apartments whole loan, the Wyndham National Hospitality Portfolio whole loan, the United Healthcare Office whole loan, the 4041 Central whole loan, the Redwood Technology Center whole loan and the 7105 - 7115 37th Avenue whole loan will be principally serviced under the PSA for the UBS 2019-C18 securitization (each, a “Serviced Whole Loan”). The 225 Bush whole loan is serviced under the pooling and servicing agreement for the Benchmark 2019-B14 securitization. The 3 Columbus Circle whole loan is serviced under the pooling and servicing agreement for the Benchmark 2019-B10 securitization. The ILPT Industrial Portfolio whole loan is serviced under the pooling and servicing agreement for the MSC 2019-L3 securitization. The Century Plaza Towers whole loan is serviced under the trust and servicing agreement for the CPTS 2019-CPT securitization. The Crimson Retail Portfolio whole loan and Redwood Technology Center whole loan are each expected to be serviced under the pooling and servicing agreement for the CSAIL 2019-C18 securitization. The Global Payments, Inc. whole loan is serviced under the pooling and servicing agreement for the WFCM 2019-C54 securitization. The Airport Square whole loan is expected to be serviced under the pooling and servicing agreement for the CF 2019-CF3 securitization. The DoubleTree New York Times Square West Leased Fee whole loan and Shoppes at Parma whole loan (each, a “Servicing Shift Whole Loan” and collectively, the “Servicing Shift Whole Loans”) are each expected to initially be serviced under the UBS 2019-C18 PSA until the date of securitization of the related controllingpari passu note (each, a “Servicing Shift Securitization Date”), after which the related whole loan will be serviced under the pooling and servicing agreement related to the securitization of the related controllingpari passu note (each, a “Servicing Shift PSA”). The master servicer and special servicer under the related Servicing Shift PSA will be identified in a notice, report or statement to holders of the UBS 2019-C18 certificates after the securitization of the related controllingpari passu note.
As of the Closing Date, thepari passucompanion loans in the whole loans are expected to be held by the party identified below under “Overview of Mortgage Pool Characteristics—Pari Passu Companion Loan Summary”.
|
| Control Rights and Directing Certificateholder: | The “Directing Certificateholder” (i) with respect to a Servicing Shift Mortgage Loan, will be the related Loan-Specific Directing Certificateholder, and (ii) with respect to each Serviced Mortgage Loan (other than a Servicing Shift Mortgage Loan), will be the Controlling Class Certificateholder (or its representative) selected by more than 50% of the Controlling Class Certificateholders, by Certificate Balance, as determined by the certificate registrar from time to time;provided,however, that (for the purposes of clause (ii) above in this definition) (1) absent that selection, (2) until a Directing Certificateholder is so selected, or (3) upon receipt of a notice from a majority of the Controlling Class Certificateholders, by Certificate Balance, that a Directing Certificateholder is no longer designated, the Controlling Class Certificateholder that owns the largest aggregate Certificate Balance of the Controlling Class (or its representative) will be the Directing Certificateholder;provided,however, that (i) in the case of this clause (3), in the event no one holder owns the largest aggregate Certificate Balance of the Controlling Class, then there will be no Directing Certificateholder until appointed in accordance with the terms of the PSA, and (ii) the certificate administrator and the other parties to the PSA will be entitled to assume that the identity of the Directing Certificateholder has not changed until such parties receive written notice of a replacement of the Directing Certificateholder from a party holding the requisite interest in the Controlling Class (as confirmed by the certificate registrar), or the resignation of the then-current Directing Certificateholder.
The Directing Certificateholder will be entitled to direct the Special Servicer to take, or refrain from taking certain actions with respect to each Serviced Mortgage Loan and any related Serviced Companion Loans. Furthermore, the Directing Certificateholder will also have the right to receive notice and consent to certain material actions that the Master Servicer and the Special Servicer proposes to take with respect to each Serviced Mortgage Loan and any related Serviced Companion Loans. |
THE INFORMATION IN THIS STRUCTURAL AND COLLATERAL TERM SHEET IS NOT COMPLETE AND MAY BE AMENDED PRIOR TO THE TIME OF SALE. THIS TERM SHEET IS NOT AN OFFER TO SELL THESE SECURITIES AND IT IS NOT A SOLICITATION OF AN OFFER TO BUY THESE SECURITIES IN ANY JURISDICTION WHERE THE OFFER OR SALE IS NOT PERMITTED.
12
UBS 2019-C18
| STRUCTURE OVERVIEW |
It is expected that RREF IV-D UBSCM 2019-C18 MOA-HRR, LLC, or its affiliate, will be the initial Directing Certificateholder with respect to each Serviced Mortgage Loan (other than a Servicing Shift Mortgage Loan) and any related Serviced Companion Loans.
With respect to the DoubleTree New York Times Square West Leased Fee mortgage loan and the 7105 - 7115 37th Avenue mortgage loan, the rights of the Directing Certificateholder will be subject to the rights of the holder of the related subordinate companion loan. For a description of the rights of the holder of the subordinate companion loans with respect to the DoubleTree New York Times Square West Leased Fee whole loan and the 7105 - 7115 37th Avenue whole loan (each, a “Serviced AB Whole Loan” and collectively, the “Serviced AB Whole Loans”), see “Description of the Mortgage Pool—The Whole Loans—The Serviced AB Whole Loans—The DoubleTree New York Times Square West Leased Fee Whole Loan” and “—The 7105 - 7115 37th Avenue Whole Loan” in the Preliminary Prospectus. With respect to the DoubleTree New York Times Square West Leased Fee mortgage loan, the rights of the Directing Certificateholder described above will be subject to the consultation rights of the holders of the relatedpari passucompanion loans as described below. With respect to the Servicing Shift Whole Loans, prior to the related Servicing Shift Securitization Date, the rights of the Directing Certificateholder described above will be, in each such case, subject to the control rights of the related controllingpari passu companion loan as described below.
Notwithstanding any contrary description set forth above, with respect to the Chroma Apartments mortgage loan, the Wyndham National Hospitality Portfolio mortgage loan, the United Healthcare Office mortgage loan, the 4041 Central mortgage loan and the Redwood Technology Center mortgage loan, the holder of the relatedpari passu companion loan (or its representative, including any directing certificateholder under any securitization of suchpari passu companion loan(s)) will have consultation rights with respect to asset status reports and material special servicing actions involving the related whole loan, as provided for in the related intercreditor agreement and as described in the Preliminary Prospectus, and those rights will be in addition to the rights of the directing certificateholder in this transaction described above.
Notwithstanding any contrary description set forth above, with respect to the 225 Bush mortgage loan, the 3 Columbus Circle mortgage loan, the ILPT Industrial Portfolio mortgage loan, the Century Plaza Towers mortgage loan, the Crimson Retail Portfolio Tower mortgage loan, the Global Payments, Inc. mortgage loan and the Airport Square mortgage loan, in general the related whole loan will be serviced under the pooling and servicing agreement or trust and servicing agreement as indicated in the “Pari Passu Companion Loan Summary” table below, which grants the related directing certificateholder (or, in the case of a Servicing Shift Whole Loan prior to the securitization of the related controllingpari passunote, the related controlling noteholder) under the related securitization control rights that may include the right to approve or disapprove various material servicing actions involving the related whole loan. The directing certificateholder for this securitization (so long as no Consultation Termination Event has occurred and is occurring) will nonetheless have the right to be consulted on a non-binding basis with respect to such actions. For purposes of the servicing of the related whole loan, the occurrence and continuance of a Control Termination Event or Consultation Termination Event under this securitization will not limit the control or other rights of the directing certificateholder (or equivalent) under the related securitization.
Notwithstanding any contrary description set forth above, with respect to the DoubleTree New York Times Square West Leased Fee mortgage loan and Shoppes at Parma mortgage loan, in general, the related whole loan will be serviced (i) prior to the applicable Servicing Shift Securitization Date, under the pooling and servicing agreement for this securitization and (ii) after the applicable Servicing Shift Securitization Date, under the related Servicing Shift PSA, which grants, or is expected to grant, to the related controlling noteholder or its representative control rights that include the right to approve or disapprove various material servicing actions involving the related whole loan. The Directing Certificateholder for this securitization (so long as no Consultation Termination Event has occurred and is occurring) will nonetheless have the right to be consulted on a non-binding basis with respect to such actions. For purposes of the servicing of each Servicing Shift Whole Loan, the occurrence and continuance of a Control Termination Event or Consultation Termination Event under this securitization will not limit the control or other rights of the controlling noteholder, and the securitization of each related controllingpari passu companion loan will not limit the consultation rights of the Directing Certificateholder under this securitization. |
THE INFORMATION IN THIS STRUCTURAL AND COLLATERAL TERM SHEET IS NOT COMPLETE AND MAY BE AMENDED PRIOR TO THE TIME OF SALE. THIS TERM SHEET IS NOT AN OFFER TO SELL THESE SECURITIES AND IT IS NOT A SOLICITATION OF AN OFFER TO BUY THESE SECURITIES IN ANY JURISDICTION WHERE THE OFFER OR SALE IS NOT PERMITTED.
13
UBS 2019-C18
| STRUCTURE OVERVIEW |
| For a description of the directing holder for each Non-Serviced Whole Loan, see “Description of the Mortgage Pool—The Whole Loans” and “Pooling and Servicing Agreement—The Directing Certificateholder—Rights of the Directing Certificateholder appointed by the Controlling Class with respect to Non-Serviced Mortgage Loans or a Servicing Shift Whole Loan” in the Preliminary Prospectus. | |
| Control Eligible Certificates: | Class G and Class NR-RR Certificates. |
| Controlling Class: | The “Controlling Class” will be, as of any time of determination, the most subordinate class of Control Eligible Certificates then-outstanding that has an aggregate Certificate Balance (as notionally reduced by any Cumulative Appraisal Reduction Amounts (as defined below) allocable to such class) at least equal to 25% of the initial Certificate Balance of that class;provided,however, that if at any time the Certificate Balances of the certificates other than the Control Eligible Certificates have been reduced to zero as a result of principal payments on the mortgage loans, then the Controlling Class will be the most subordinate class of Control Eligible Certificates that has a Certificate Balance greater than zero without regard to any Cumulative Appraisal Reduction Amounts. The Controlling Class as of the Closing Date will be the Class NR-RR certificates. |
| Appraised-Out Class: | An “Appraised-Out Class” is any class of Control Eligible Certificates that is determined at any time of determination to no longer be the Controlling Class as a result of the application of any Appraisal Reduction Amounts or Collateral Deficiency Amounts to notionally reduce the Certificate Balance of the constituent classes. No Appraised-Out Class may exercise any direction, control, consent and/or similar rights of the Controlling Class until such time, if any, as such class is reinstated as the Controlling Class, and the rights of the Controlling Class will be exercised by the next most senior class of Control Eligible Certificates that is not an Appraised-Out Class, if any, during such period.
With respect to each Serviced AB Whole Loan, the holder of the related controlling subordinate companion loan may in certain circumstances post collateral to avoid a change of control as described in “Description of the Mortgage Pool—The Whole Loans—The Serviced AB Whole Loans—The DoubleTree New York Times Square West Leased Fee Whole Loan” and “—The 7105 - 7115 37th Avenue Whole Loan” in the Preliminary Prospectus.
|
| Remedies Available to Holders of an Appraised-Out Class: | The holder of the majority (by Certificate Balance) of an Appraised-Out Class will have the right, at its sole expense, to require the Special Servicer to order a second appraisal of any mortgage loan (or Serviced Whole Loan) for which an appraisal reduction event has occurred or as to which there exists a Collateral Deficiency Amount (such holders, the “Requesting Holders”). The Special Servicer will use its reasonable best efforts to ensure that such appraisal is delivered within 30 days from receipt of the Requesting Holders’ written request and will ensure that such appraisal is prepared on an “as-is” basis by an MAI appraiser. Upon receipt of such supplemental appraisal, the Special Servicer will be required to determine, in accordance with the Servicing Standard, whether, based on its assessment of such supplemental appraisal, any recalculation of the applicable Appraisal Reduction Amount or Collateral Deficiency Amount, as applicable, is warranted and, if so warranted, will recalculate such Appraisal Reduction Amount or Collateral Deficiency Amount, as applicable, based upon such supplemental appraisal and receipt of information requested by the Special Servicer from the Master Servicer. If required by any such recalculation, the applicable Appraised-Out Class will be reinstated as the Controlling Class and each other Appraised-Out Class will, if applicable, have its related Certificate Balance notionally restored to the extent required by such recalculation of the Appraisal Reduction Amount or Collateral Deficiency Amount, if applicable. The Certificate Administrator, the Operating Advisor and the Master Servicer will be entitled to conclusively rely on the Special Servicer’s calculation or determination of any Collateral Deficiency Amount. |
| Control Rights: | Subject to the rights of the holder of the related controllingpari passu companion loan or subordinate companion loan, as applicable, with respect to a Servicing Shift Whole Loan, prior to a Control Termination Event, the Directing Certificateholder appointed by the Controlling Class Certificateholder will have certain consent and consultation rights under the PSA with respect to certain major decisions and other matters. A “Control Termination Event” will occur when (i) the Class G certificates have a Certificate Balance (taking into account the application of any Cumulative Appraisal Reduction Amounts to notionally reduce the Certificate Balance of such class) of less than 25% of the initial Certificate |
THE INFORMATION IN THIS STRUCTURAL AND COLLATERAL TERM SHEET IS NOT COMPLETE AND MAY BE AMENDED PRIOR TO THE TIME OF SALE. THIS TERM SHEET IS NOT AN OFFER TO SELL THESE SECURITIES AND IT IS NOT A SOLICITATION OF AN OFFER TO BUY THESE SECURITIES IN ANY JURISDICTION WHERE THE OFFER OR SALE IS NOT PERMITTED.
14
UBS 2019-C18
| STRUCTURE OVERVIEW |
Balance of such class; or (ii) a holder of the Class G certificates is the majority Controlling Class Certificateholder and has irrevocably waived its right, in writing, to exercise any of the rights of the Controlling Class Certificateholder and such rights have not been reinstated to a successor Controlling Class Certificateholder;provided that no Control Termination Event may occur with respect to a Loan-Specific Directing Certificateholder and the term “Control Termination Event” will not be applicable to a Loan-Specific Directing Certificateholder;provided, further,that a Control Termination Event will not be deemed continuing in the event that the Certificate Balances of the Certificates other than the Control Eligible Certificates have been reduced to zero as a result of principal payments on the mortgage loans.
After the occurrence of a Control Termination Event but prior to the occurrence of a Consultation Termination Event, the Directing Certificateholder appointed by the Controlling Class Certificateholder will not have any consent rights, but such Directing Certificateholder will have certain non-binding consultation rights under the PSA with respect to certain major decisions and other matters. A “Consultation Termination Event” will occur when (i) there is no class of Control Eligible Certificates that has a then-outstanding Certificate Balance at least equal to 25% of the initial Certificate Balance of that class, in each case, without regard to the application of any Cumulative Appraisal Reduction Amounts; or (ii) a holder of the Class G certificates is the majority Controlling Class Certificateholder and has irrevocably waived its right, in writing, to exercise any of the rights of the Controlling Class Certificateholder and such rights have not been reinstated to a successor Controlling Class Certificateholder (providedthat no Consultation Termination Event resulting solely from the operation of clause (ii) will be deemed to have existed or be in continuance with respect to a successor holder of the Class G certificates that has not irrevocably waived its right to exercise any of the rights of the Controlling Class Certificateholder);provided,further, that no Consultation Termination Event may occur with respect to a Loan-Specific Directing Certificateholder and the term “Consultation Termination Event” will not be applicable to a Loan-Specific Directing Certificateholder;provided,further, that a Consultation Termination Event will not be deemed continuing in the event that the Certificate Balances of the certificates other than the Control Eligible Certificates have been reduced to zero as a result of principal payments on the mortgage loans.
After the occurrence of a Consultation Termination Event, the Directing Certificateholder appointed by the Controlling Class Certificateholder will not have any consent or consultation rights, except with respect to any rights expressly set forth in the PSA.
Notwithstanding the proviso to the definitions of “Control Termination Event” and “Consultation Termination Event,” a Control Termination Event and a Consultation Termination Event will be deemed to have occurred with respect to any Excluded Loan with respect to the Directing Certificateholder or the holder of the majority of the Controlling Class, and neither the Directing Certificateholder nor any Controlling Class Certificateholder will have any consent or consultation rights with respect to the servicing of such Excluded Loan.
An “Excluded Loan” means (a) with respect to the Directing Certificateholder or the holder of the majority of the Controlling Class, a mortgage loan or whole loan with respect to which, as of any date of determination, the Directing Certificateholder or the holder of the majority of the Controlling Class is a Borrower Party or (b) with respect to the Risk Retention Consultation Party or the holder of the majority of the VRR Interest, a mortgage loan or whole loan with respect to which, as of any date of determination, the Risk Retention Consultation Party or the holder of the majority of the VRR Interest is a Borrower Party. As of the Closing Date, it is expected that there will be no Excluded Loans with respect to this securitization.
“Borrower Party” means a borrower, a mortgagor, a manager of a mortgaged property, a mezzanine lender under a mezzanine loan that has been accelerated or as to which foreclosure or enforcement proceedings have been commenced against the equity collateral pledged to secure the related mezzanine loan, or any Borrower Party Affiliate.
“Borrower Party Affiliate” means, with respect to a borrower, a mortgagor, a manager of a mortgaged property or a mezzanine lender under a mezzanine loan that has been accelerated or as to which foreclosure or enforcement proceedings have been commenced against the equity collateral pledged to secure the related mezzanine loan, (a) any other |
THE INFORMATION IN THIS STRUCTURAL AND COLLATERAL TERM SHEET IS NOT COMPLETE AND MAY BE AMENDED PRIOR TO THE TIME OF SALE. THIS TERM SHEET IS NOT AN OFFER TO SELL THESE SECURITIES AND IT IS NOT A SOLICITATION OF AN OFFER TO BUY THESE SECURITIES IN ANY JURISDICTION WHERE THE OFFER OR SALE IS NOT PERMITTED.
15
UBS 2019-C18
| STRUCTURE OVERVIEW |
person controlling or controlled by or under common control with such borrower, mortgagor, manager or mezzanine lender under a mezzanine loan that has been accelerated or as to which foreclosure or enforcement proceedings have been commenced against the equity collateral pledged to secure the related mezzanine loan, as applicable, or (b) any other person owning, directly or indirectly, 25% or more of the beneficial interests in such borrower, mortgagor, manager or mezzanine lender under a mezzanine loan that has been accelerated or as to which foreclosure or enforcement proceedings have been commenced against the equity collateral pledged to secure the related mezzanine loan, as applicable. For the purposes of this definition, “control” when used with respect to any specified person means the power to direct the management and policies of such person, directly or indirectly, whether through the ownership of voting securities, by contract or otherwise and the terms “controlling” and “controlled” have meanings correlative to the foregoing. Notwithstanding any of the foregoing to the contrary, if any mortgage loan is part of a whole loan, the consent and/or consultation rights of a Controlling Class Certificateholder with respect thereto may be limited as described in the Preliminary Prospectus. In particular, with respect to each Non-Serviced Whole Loan, the Directing Certificateholder will only have certain consultation rights with respect to certain “major decisions” and other matters related to such whole loan, in each case only prior to a Control Termination Event or Consultation Termination Event, as applicable, and the controlling noteholder (or its representative) will be entitled to similar consent and/or consultation rights with respect to such whole loan. | |
| Operating Advisor Consultation Event: | An “Operating Advisor Consultation Event” will occur when the Certificate Balance of the Class NR-RR Certificates (taking into account the application of any Cumulative Appraisal Reduction Amounts to notionally reduce the Certificate Balances of such classes) is reduced to 25% or less of the initial Certificate Balances of such class. |
| Appointment and Replacement of Special Servicer: | The Directing Certificateholder will appoint the initial Special Servicer as of the Closing Date. Prior to the occurrence and continuance of a Control Termination Event, the Directing Certificateholder generally may replace the Special Servicer with or without cause at any time.
Upon the occurrence and during the continuance of a Control Termination Event, the Directing Certificateholder appointed by the Controlling Class Certificateholder will no longer have the right to replace the Special Servicer and such replacement will occur based on a vote of holders of all voting eligible classes of certificates as described in “Replacement of Special Servicer by Vote of Certificateholders” below.
Notwithstanding the foregoing, with respect to a Serviced AB Whole Loan, prior to the occurrence of a Control Appraisal Period with respect to the related subordinate companion loan, and with respect to a Servicing Shift Whole Loan, the Directing Certificateholder appointed by the Controlling Class Certificateholder will not be entitled to exercise the above-described rights and the holder of such subordinate companion loan will be entitled to replace the Special Servicer with or without cause in accordance with the PSA and the related intercreditor agreement. However, during a Control Appraisal Period with respect to a Serviced AB Whole Loan, the Directing Certificateholder appointed by the Controlling Class Certificateholder will have generally similar (although not necessarily identical) rights (including the rights described above) with respect to such Serviced AB Whole Loan as it does for the other mortgage loans in the issuing entity. See “Description of the Mortgage Pool—The Whole Loans—The Serviced AB Whole Loans—The DoubleTree New York Times Square West Leased Fee Whole Loan” and “—The 7105 - 7115 37th Avenue Whole Loan” in the Preliminary Prospectus.
The Operating Advisor may also recommend the replacement of the Special Servicer at any time as described in “Operating Advisor” below.
|
| Replacement of Special Servicer by Vote of Certificateholders: | After the occurrence and during the continuance of a Control Termination Event, upon (a) the written direction of holders of Principal Balance Certificates evidencing not less than 25% of the Voting Rights (taking into account the application of any Cumulative Appraisal Reduction Amounts to notionally reduce the Certificate Balances) of the Principal Balance Certificates requesting a vote to replace the Special Servicer with a new special servicer, (b) payment by such requesting holders to the Certificate Administrator of all reasonable fees and expenses (including any legal fees and any Rating Agency fees and expenses) to be incurred by the Certificate Administrator in connection with administering such vote (which fees and expenses will not be additional trust fund expenses), and (c) delivery by such holders to the Certificate Administrator and the Trustee of Rating Agency Confirmation from |
THE INFORMATION IN THIS STRUCTURAL AND COLLATERAL TERM SHEET IS NOT COMPLETE AND MAY BE AMENDED PRIOR TO THE TIME OF SALE. THIS TERM SHEET IS NOT AN OFFER TO SELL THESE SECURITIES AND IT IS NOT A SOLICITATION OF AN OFFER TO BUY THESE SECURITIES IN ANY JURISDICTION WHERE THE OFFER OR SALE IS NOT PERMITTED.
16
UBS 2019-C18
| STRUCTURE OVERVIEW |
each Rating Agency (such Rating Agency Confirmation will be obtained at the expense of the holders of certificates requesting such vote) and confirmation from the applicable rating agencies that the contemplated appointment or replacement will not result in the downgrade, withdrawal or qualification of the then-current ratings of any class of any related Serviced Pari Passu Companion Loan Securities, the Certificate Administrator will be required to post such notice on the Certificate Administrator’s website and concurrently by mail and conduct the solicitation of votes of all certificates in such regard, which requisite affirmative votes must be received within 180 days of the posting of such notice. Upon the written direction of holders of Principal Balance Certificates evidencing at least 66-2/3% of a Certificateholder Quorum, the Trustee will be required to terminate all of the rights and obligations of the Special Servicer under the PSA and replace the Special Servicer with a qualified replacement special servicer designated by such holders of certificates, subject to indemnification, right to outstanding fees, reimbursement of Advances and other rights set forth in the PSA, which survive such termination.
A “Certificateholder Quorum” means, the holders of certificates evidencing at least 50% of the aggregate Voting Rights (taking into account the application of Realized Losses and, other than with respect to the termination of the Asset Representations Reviewer, the application of any Cumulative Appraisal Reduction Amounts to notionally reduce the Certificate Balance of the certificates) of all classes of certificates entitled to principal on an aggregate basis.
With respect to each Serviced Whole Loan, any holder of a relatedpari passucompanion loan, following a Servicer Termination Event with respect to the related Special Servicer that remains unremedied and affects such holder, will be entitled to direct the Trustee (and the Trustee will be required) to terminate the Special Servicer solely with respect to such Serviced Whole Loan. A replacement special servicer will be selected by the Trustee or, prior to a Control Termination Event, by the Directing Certificateholder;providedthat any successor special servicer appointed to replace the Special Servicer with respect to such whole loan can generally not be the entity (or its affiliate) that was terminated at the direction of the holder of the relatedpari passucompanion loan, without the prior written consent of such holder of the related Serviced Companion Loan.
With respect to any Non-Serviced Whole Loan, the UBS Commercial Mortgage Trust 2019-C18, as holder of the related mortgage loan, has the right to terminate the Special Servicer under the related pooling and servicing agreement if a servicer termination event occurs, with respect to such special servicer that affects the trust in its capacity as such holder. Such rights may be exercised by the Directing Certificateholder prior to a Control Termination Event. The successor special servicer will be selected pursuant to the applicable pooling and servicing agreement by the related directing holder prior to a control termination event under such pooling and servicing agreement.
| |
| Workout and Liquidation Fees: | The Special Servicer will also be entitled to (i) liquidation fees generally equal to 1.0% (or, if such rate would result in an aggregate liquidation fee less than $25,000, then the liquidation fee rate will be equal to such rate as would result in an aggregate liquidation fee equal to $25,000) of liquidation proceeds and certain other collections in respect of a Specially Serviced Loan and REO Property and of amounts received in respect of mortgage loan repurchases by the related mortgage loan sellers (less any Excess Modification Fees paid by or on behalf of the related borrower with respect to the related mortgage loan (including a Serviced Companion Loan) or REO Property and received by the Special Servicer within the prior 12 months); and (ii) workout fees generally equal to 1.0% (of interest and principal payments made in respect of a rehabilitated mortgage loan (and any related Serviced Companion Loan)), subject to a floor of $25,000 with respect to any mortgage loan, whole loan or related REO Property, subject to certain adjustments and exceptions as described in the Preliminary Prospectus under “Pooling and Servicing Agreement—Servicing and Other Compensation and Payment of Expenses—Special Servicing Compensation”. |
| Special Servicer Compensation: | The special servicing fee for each distribution date is calculated based on the outstanding principal balance of each Serviced Mortgage Loan that is a Specially Serviced Loan (and any related Serviced Companion Loan) or as to which the related mortgaged property has become an REO Property at the special servicing fee rate, which will be a rate equal to the greater of aper annumrate of 0.25000% and theper annum rate that would result in a special servicing fee of $3,500. The special servicing fee will be payable monthly,first, from liquidation proceeds, insurance and condemnation proceeds, and other collections in |
THE INFORMATION IN THIS STRUCTURAL AND COLLATERAL TERM SHEET IS NOT COMPLETE AND MAY BE AMENDED PRIOR TO THE TIME OF SALE. THIS TERM SHEET IS NOT AN OFFER TO SELL THESE SECURITIES AND IT IS NOT A SOLICITATION OF AN OFFER TO BUY THESE SECURITIES IN ANY JURISDICTION WHERE THE OFFER OR SALE IS NOT PERMITTED.
17
UBS 2019-C18
| STRUCTURE OVERVIEW |
respect of the related Specially Serviced Loan or REO Property and,then, from general collections on all the mortgage loans (other than a Non-Serviced Mortgage Loan) and any REO Properties.
With respect to any Non-Serviced Mortgage Loan, the related special servicer under the related other pooling and servicing agreement pursuant to which such mortgage loan is being serviced will be entitled to similar compensation as that described above with respect to such Non-Serviced Mortgage Loan under such other pooling and servicing agreement as further described in the Preliminary Prospectus, although any related fees may accrue at a different rate and there may be a higher (or no) cap on liquidation and workout fees.
| |
| Risk Retention Consultation Party: | A risk retention consultation party may be appointed by the holder or holders of more than 50% of the VRR Interest by Certificate Balance. Such holder or holders will have a continuing right to appoint, remove or replace the risk retention consultation party in its sole discretion. This right may be exercised at any time and from time to time.
Except with respect to an Excluded Loan as to such party, the risk retention consultation party will be entitled to consult with the Special Servicer, upon request of the risk retention consultation party, with respect to certain material servicing actions proposed by the Special Servicer with respect to Specially Serviced Mortgage Loans. See “Pooling and Servicing Agreement—The Risk Retention Consultation Party” in the Preliminary Prospectus.
|
| Operating Advisor: | The Operating Advisor will initially be Park Bridge Lender Services LLC. The Operating Advisor will have certain review and consultation rights relating to the performance of the Special Servicer and with respect to its actions taken in connection with the resolution and/or liquidation of Specially Serviced Loans. With respect to each mortgage loan or Serviced Whole Loan (in each case, other than a Non-Serviced Mortgage Loan or Servicing Shift Whole Loan), the Operating Advisor will be responsible for:
● reviewing the actions of the Special Servicer with respect to any Specially Serviced Loan to the extent described in the Preliminary Prospectus and required under the PSA;
● reviewing (i) all reports by the Special Servicer made available to Privileged Persons on the Certificate Administrator’s website and (ii) each Asset Status Report (after the occurrence and during the continuance of an Operating Advisor Consultation Event) and Final Asset Status Report;
● reviewing for accuracy and consistency with the PSA the mathematical calculations and the corresponding application of the non-discretionary portion of the applicable formulas required to be utilized in connection with Appraisal Reduction Amounts, Collateral Deficiency Amounts and net present value calculations used in the Special Servicer’s determination of what course of action to take in connection with the workout or liquidation of a Specially Serviced Loan; and
● preparing an annual report (if any mortgage loan (other than any Non-Serviced Mortgage Loan or Servicing Shift Mortgage Loan) or Serviced Whole Loan (other than a Servicing Shift Whole Loan) was a Specially Serviced Loan at any time during the prior calendar year or if the Operating Advisor was entitled to consult with the Special Servicer with respect to any major decision during the prior calendar year) that sets forth whether the Operating Advisor believes, in its sole discretion exercised in good faith, that the Special Servicer is operating in compliance with the Servicing Standard with respect to its performance of its duties under the PSA with respect to Specially Serviced Loans (and, after the occurrence and continuance of an Operating Advisor Consultation Event, with respect to major decisions on non-Specially Serviced Loans) during the prior calendar year on an “platform-level basis”. The Operating Advisor will identify (1) which, if any, standards the Operating Advisor believes, in its sole discretion exercised in good faith, the Special Servicer has failed to comply and (2) any material deviations from the Special Servicer’s obligations under the PSA with respect to the resolution or liquidation of any Specially Serviced Loan or REO Property (other than with respect to any REO Property related to any Non-Serviced Mortgage Loan or Servicing Shift Mortgage Loan). In preparing any Operating Advisor Annual Report, the Operating Advisor will not be required to (i) report on instances of non-compliance with, or deviations from, the Servicing Standard or the Special |
THE INFORMATION IN THIS STRUCTURAL AND COLLATERAL TERM SHEET IS NOT COMPLETE AND MAY BE AMENDED PRIOR TO THE TIME OF SALE. THIS TERM SHEET IS NOT AN OFFER TO SELL THESE SECURITIES AND IT IS NOT A SOLICITATION OF AN OFFER TO BUY THESE SECURITIES IN ANY JURISDICTION WHERE THE OFFER OR SALE IS NOT PERMITTED.
18
UBS 2019-C18
| STRUCTURE OVERVIEW |
Servicer’s obligations under the PSA that the Operating Advisor determines, in its sole discretion exercised in good faith, to be immaterial or (ii) provide or obtain a legal opinion, legal review or legal conclusion.
With respect to each mortgage loan (other than any Non-Serviced Mortgage Loan) or Serviced Whole Loan, after the Operating Advisor has received notice that an Operating Advisor Consultation Event has occurred and is continuing, in addition to the duties described above, the Operating Advisor will be required to perform the following additional duties:
● to consult (on a non-binding basis) with the Special Servicer in respect of Asset Status Reports; and
● to consult (on a non-binding basis) with the Special Servicer with respect to “major decisions” processed by the Special Servicer.
In addition, if at any time the Operating Advisor determines, in its sole discretion exercised in good faith, that (1) the Special Servicer is not performing its duties as required under the PSA or is otherwise not acting in accordance with the Servicing Standard and (2) the replacement of the Special Servicer would be in the best interest of the Certificateholders as a collective whole, then the Operating Advisor will have the right to recommend the replacement of the Special Servicer and will submit its formal recommendation to the Trustee and the Certificate Administrator (along with its rationale, its proposed replacement special servicer and other relevant information justifying its recommendation).*
The Operating Advisor’s recommendation to replace the Special Servicer must be confirmed within 180 days of the report being posted to the Certificate Administrator’s internet website by an affirmative vote of holders of Certificates evidencing at least a majority of a quorum of Certificateholders (which, for this purpose, is the holders of Certificates that (i) evidence at least 20% of the Voting Rights (taking into account the application of any appraisal reduction amounts to notionally reduce the respective Certificate Balances) of all Principal Balance Certificates on an aggregate basis, and (ii) consist of at least three Certificateholders or certificate owners that are not affiliated with each other). In the event the holders of Principal Balance Certificates evidencing at least a majority of a quorum of Certificateholders elect to remove and replace the Special Servicer (which requisite affirmative votes must be received within 180 days of the posting of the notice of the Operating Advisor’s recommendation to replace the Special Servicer to the Certificate Administrator’s website), the Certificate Administrator will be required to receive a Rating Agency Confirmation from each of the Rating Agencies at that time, and confirmation from the applicable rating agencies that such replacement will not result in the downgrade, withdrawal or qualification of the then-current ratings of any class of any related Serviced Pari Passu Companion Loan Securities.
| |
| Asset Representations Reviewer: | The Asset Representations Reviewer will be required to review certain delinquent mortgage loans after a specified delinquency threshold has been met and the required percentage of Certificateholders vote to direct a review as described below. The Asset Representations Reviewer will be entitled to the Asset Representations Reviewer Fee with respect to such review. See “Pooling and Servicing Agreement—The Asset Representations Reviewer” in the Preliminary Prospectus.
The Certificate Administrator will be required to notify Certificateholders if the specified delinquency threshold has been met as described in the Preliminary Prospectus under “Pooling and Servicing Agreement—The Asset Representations Reviewer”.
If Certificateholders evidencing not less than 5.0% of the Voting Rights request a vote to commence an Asset Review, and if subsequently (i) a majority of those Certificateholders who cast votes and (ii) a majority of an Asset Review Quorum authorizes an Asset Review within 150 days of the request for a vote, the Asset Representations Reviewer will be required to conduct an Asset Review of delinquent loans.
The Asset Representations Reviewer may be terminated and replaced without cause. Upon (i) the written direction of Certificateholders evidencing not less than 25% of the Voting Rights (without regard to the application of any Cumulative Appraisal Reduction Amounts) requesting a vote to terminate and replace the Asset Representations Reviewer with a proposed successor Asset Representations Reviewer that is an eligible Asset Representations Reviewer, and (ii) payment by such holders to the Certificate Administrator |
THE INFORMATION IN THIS STRUCTURAL AND COLLATERAL TERM SHEET IS NOT COMPLETE AND MAY BE AMENDED PRIOR TO THE TIME OF SALE. THIS TERM SHEET IS NOT AN OFFER TO SELL THESE SECURITIES AND IT IS NOT A SOLICITATION OF AN OFFER TO BUY THESE SECURITIES IN ANY JURISDICTION WHERE THE OFFER OR SALE IS NOT PERMITTED.
19
UBS 2019-C18
| STRUCTURE OVERVIEW |
of the reasonable fees and expenses to be incurred by the Certificate Administrator in connection with administering such vote, the Certificate Administrator will be required to promptly provide notice to all Certificateholders and the Asset Representations Reviewer of such request by posting such notice on its website, and by mailing such notice to all Certificateholders and the Asset Representations Reviewer. Upon the written direction of Certificateholders evidencing at least 75% of a Certificateholder Quorum (without regard to the application of any Cumulative Appraisal Reduction Amounts), the Trustee will be required to terminate all of the rights and obligations of the Asset Representations Reviewer under the PSA (other than any rights or obligations that accrued prior to the date of such termination and other than indemnification rights (arising out of events occurring prior to such termination)) by written notice to the Asset Representations Reviewer, and the proposed successor asset representations reviewer will be appointed. See “Pooling and Servicing Agreement—The Asset Representations Reviewer” in the Preliminary Prospectus.
An “Asset Review Quorum” means, in connection with any solicitation of votes to authorize an Asset Review as described above, the holders of certificates evidencing at least 5.0% of the aggregate Voting Rights represented by all certificates that have Voting Rights.
| |
| Dispute Resolution Provisions: | The mortgage loan sellers will be subject to the dispute resolution provisions set forth in the PSA to the extent those provisions are triggered with respect to any mortgage loan sold to the depositor by a mortgage loan seller, and such mortgage loan seller will be obligated under the related mortgage loan purchase agreement to comply with all applicable provisions and to take part in any mediation or arbitration proceedings that may result. Generally, in the event that a Repurchase Request is not “Resolved” within 180 days after the related mortgage loan seller receives such Repurchase Request, then the Enforcing Servicer will be required to send a notice to the first Certificateholder (or beneficial owner) to deliver a Certificateholder repurchase request with respect to the mortgage loan (the “Initial Requesting Certificateholder”) (if any) and to the Certificate Administrator (which will be required to make such notice available to Certificateholders via the Certificate Administrator’s website) indicating the Enforcing Servicer’s intended course of action with respect to the Repurchase Request. If (a) the Enforcing Servicer’s intended course of action with respect to the Repurchase Request does not involve pursuing further action to exercise rights against the related mortgage loan seller with respect to the Repurchase Request and the Initial Requesting Certificateholder, if any, or any other Certificateholder or certificate owner wishes to exercise its right to refer the matter to mediation (including nonbinding arbitration) or arbitration, or (b) the Enforcing Servicer’s intended course of action is to pursue further action to exercise rights against the related mortgage loan seller with respect to the Repurchase Request but the Initial Requesting Certificateholder, if any, or any other Certificateholder or certificate owner does not agree with the dispute resolution method selected by the Enforcing Servicer, then the Initial Requesting Certificateholder, if any, or such other Certificateholder or certificate owner may deliver a written notice to the Enforcing Servicer within 30 days from the date the Proposed Course of Action Notice is posted on the certificate administrator’s website indicating its intent to exercise its right to refer the matter to either mediation or arbitration.
“Resolved” means, with respect to a Repurchase Request, (i) that the related Material Defect has been cured, (ii) the related mortgage loan has been repurchased in accordance with the related mortgage loan purchase agreement, (iii) a mortgage loan has been substituted for the related mortgage loan in accordance with the related mortgage loan purchase agreement, (iv) the applicable mortgage loan seller has made a loss of value payment, (v) a contractually binding agreement is entered into between the Enforcing Servicer, on behalf of the issuing entity, and the related mortgage loan seller that settles the related mortgage loan seller’s obligations under the related mortgage loan purchase agreement, or (vi) the related mortgage loan is no longer property of the issuing entity as a result of a sale or other disposition in accordance with the PSA. See “Pooling and Servicing Agreement—Dispute Resolution Provisions” in the Preliminary Prospectus.
|
| Credit Risk Retention: | RREF is expected to act as the “retaining sponsor” for this securitization and intends to satisfy the U.S. credit risk retention requirement through the purchase by one or more of its “majority-owned affiliates” (as defined in the credit risk retention rules), from the underwriters and initial purchasers, on the Closing Date, of (i) an “eligible horizontal residual interest” comprised of the Class NR-RR certificates that are not part of the VRR Interest and (ii) an “eligible vertical interest” comprised of a certain percentage of the certificate balance, notional amount or percentage interest in each class of certificates (other than the Class R certificates). The |
THE INFORMATION IN THIS STRUCTURAL AND COLLATERAL TERM SHEET IS NOT COMPLETE AND MAY BE AMENDED PRIOR TO THE TIME OF SALE. THIS TERM SHEET IS NOT AN OFFER TO SELL THESE SECURITIES AND IT IS NOT A SOLICITATION OF AN OFFER TO BUY THESE SECURITIES IN ANY JURISDICTION WHERE THE OFFER OR SALE IS NOT PERMITTED.
20
UBS 2019-C18
| STRUCTURE OVERVIEW |
aggregate estimated fair value of the “eligible horizontal residual interest” will equal approximately 0.81279% of the estimated fair value of all of the certificates (other than the Class R certificates) issued by the issuing entity and the VRR Interest will consist of the portion of each class of certificates (other than the Class R certificates) necessary to satisfy the credit risk retention rules.
RREF, in its capacity as the “retaining sponsor” for this transaction, will be required to comply with the hedging, transfer and financing restrictions applicable to a “retaining sponsor” under the credit risk retention rules, which generally prohibit the transfer of the applicable Certificates, other than to a majority owned affiliate of RREF, until December 20, 2024. After that date, transfers of the Class NR-RR certificates (other than the portion of each such class that is part of the VRR Interest) are permitted under certain circumstances, in accordance with the credit risk retention rules, to a successor “third party purchaser”. The restrictions on hedging and transfer under the credit risk retention rules as in effect on the Closing Date of this transaction will expire on and after the date that is the latest of (i) the date on which the total unpaid principal balance of the mortgage loans has been reduced to 33% of the aggregate principal balance of the mortgage loans as of the Cut-off Date; (ii) the date on which the total unpaid principal obligations under the Certificates has been reduced to 33% of the aggregate total unpaid principal obligations under the Certificates as of the Closing Date; or (iii) two years after the Closing Date.
For additional information, see “Credit Risk Retention” in the Preliminary Prospectus.
The PSA will include the required provisions applicable to an operating advisor necessary for the securitization to comply with the credit risk retention rules utilizing the “third party purchaser” option. See “Operating Advisor” above.
Notwithstanding any references in this Term Sheet to the credit risk retention rules, the Retaining Sponsor, a successor third party purchaser and other risk retention related matters, in the event the credit risk retention rules (or any relevant portion thereof) are repealed or determined by applicable regulatory agencies to be no longer applicable to this securitization transaction, none of the Retaining Sponsor, a successor third party purchaser or any other party will be required to comply with or act in accordance with the credit risk retention rules (or such relevant portion thereof).
For additional information, see“Credit Risk Retention” in the Preliminary Prospectus.
| |
| Liquidated Loan Waterfall: | Upon liquidation of any mortgage loan, all net liquidation proceeds related to the mortgage loan (other than any related Companion Loan) will be applied so that amounts allocated as a recovery of accrued and unpaid interest will not, in the first instance, include any delinquent interest that was not advanced as a result of Appraisal Reduction Amounts or accrued on the portion of the stated principal balance thereof equal to any related Collateral Deficiency Amount in effect from time to time and as to which no advance was made. After the adjusted interest amount is so allocated, any remaining liquidation proceeds will be allocated to offset certain advances and to pay principal on the mortgage loan until the unpaid principal amount of the mortgage loan has been reduced to zero. Any remaining liquidation proceeds will then be allocated to pay delinquent interest that was not advanced as a result of Appraisal Reduction Amounts or that accrued on the portion of the stated principal balance thereof equal to any related Collateral Deficiency Amount in effect from time to time and as to which no advance was made. |
| Investor Communications: | The Certificate Administrator is required to include on any Form 10-D any written request received from a Certificateholder or Certificate Owner to communicate with other Certificateholders or Certificate Owner related to Certificateholders or Certificate Owner exercising their rights under the terms of the PSA. Any Certificateholder wishing to communicate with other Certificateholders or Certificate Owner regarding the exercise of its rights under the terms of the PSA will be able to deliver a written request signed by an authorized representative of the requesting investor to the Certificate Administrator. |
| Deal Website: | The Certificate Administrator will be required to maintain a deal website which will include, among other items: (a) summaries of Final Asset Status Reports prepared by the Special Servicer, (b) inspection reports, (c) appraisals, (d) various “special notices” described in the Preliminary Prospectus, (e) the “Investor Q&A Forum”, (f) a voluntary “Investor Registry” and (g) the “Risk Retention Special Notices” tab. Investors may access the deal website following execution of a certification and confidentiality agreement. |
THE INFORMATION IN THIS STRUCTURAL AND COLLATERAL TERM SHEET IS NOT COMPLETE AND MAY BE AMENDED PRIOR TO THE TIME OF SALE. THIS TERM SHEET IS NOT AN OFFER TO SELL THESE SECURITIES AND IT IS NOT A SOLICITATION OF AN OFFER TO BUY THESE SECURITIES IN ANY JURISDICTION WHERE THE OFFER OR SALE IS NOT PERMITTED.
21
UBS 2019-C18
| OVERVIEW OF MORTGAGE POOL CHARACTERISTICS |
| Distribution of Cut-off Date Balances | ||||||||||||||||||
| Weighted Averages(1) | ||||||||||||||||||
| Range of Cut-off Date Balances | Number of Mortgage Loans | Aggregate Cut-off Date Balance | % of Initial Outstanding Pool Balance(1) | Mortgage Rate | Stated Remaining Term (Mos.)(5) | U/W NCF DSCR(3) | Cut-off Date LTV Ratio(3)(4) | Maturity Date or ARD LTV Ratio(2)(3)(5) | ||||||||||
| $861,000 | - | $5,000,000 | 10 | $28,645,841 | 3.9% | 4.311% | 120 | 1.88x | 61.7% | 50.4% | ||||||||
| $5,000,001 | - | $10,000,000 | 15 | $116,560,000 | 15.7% | 4.180% | 115 | 1.98x | 63.6% | 57.6% | ||||||||
| $10,000,001 | - | $15,000,000 | 15 | $199,995,000 | 26.9% | 4.005% | 120 | 2.03x | 61.3% | 53.5% | ||||||||
| $15,000,001 | - | $20,000,000 | 4 | $70,684,861 | 9.5% | 3.875% | 119 | 2.46x | 61.3% | 52.9% | ||||||||
| $20,000,001 | - | $25,000,000 | 2 | $46,781,847 | 6.3% | 3.724% | 119 | 2.44x | 67.4% | 59.7% | ||||||||
| $25,000,001 | - | $30,000,000 | 5 | $144,800,000 | 19.5% | 3.709% | 106 | 2.99x | 48.9% | 48.4% | ||||||||
| $30,000,001 | - | $35,000,000 | 4 | $136,100,000 | 18.3% | 4.056% | 104 | 2.34x | 60.8% | 52.9% | ||||||||
| Total/Weighted Average | 55 | $743,567,549 | 100.0% | 3.966% | 113 | 2.33x | 59.5% | 53.2% | ||||||||||
| Distribution of Mortgage Rates | ||||||||||||||||||
| Weighted Averages(1) | ||||||||||||||||||
| Range of Mortgage Rates | Number of Mortgage Loans | Aggregate Cut-off Date Balance | % of Initial Outstanding Pool Balance(1) | Mortgage Rate | Stated Remaining Term (Mos.)(5) | U/W NCF DSCR(3) | Cut-off Date LTV Ratio(3)(4) | Maturity Date or ARD LTV Ratio(2)(3)(5) | ||||||||||
| 2.6533% | - | 3.5000% | 7 | $146,095,000 | 19.6% | 3.174% | 105 | 3.68x | 43.1% | 42.8% | ||||||||
| 3.5001% | - | 3.7000% | 4 | $76,131,847 | 10.2% | 3.640% | 119 | 2.24x | 58.8% | 54.1% | ||||||||
| 3.7001% | - | 3.9000% | 7 | $88,006,250 | 11.8% | 3.806% | 120 | 2.41x | 65.2% | 59.3% | ||||||||
| 3.9001% | - | 4.1000% | 10 | $146,540,000 | 19.7% | 3.962% | 118 | 2.07x | 61.3% | 56.3% | ||||||||
| 4.1001% | - | 4.3000% | 10 | $95,505,841 | 12.8% | 4.173% | 120 | 1.74x | 65.5% | 53.4% | ||||||||
| 4.3001% | - | 4.5000% | 5 | $49,678,611 | 6.7% | 4.383% | 119 | 1.80x | 68.7% | 55.4% | ||||||||
| 4.5001% | - | 4.7000% | 5 | $60,450,000 | 8.1% | 4.599% | 111 | 1.80x | 63.0% | 59.0% | ||||||||
| 4.7001% | - | 5.1900% | 7 | $81,160,000 | 10.9% | 4.907% | 99 | 1.76x | 65.4% | 53.2% | ||||||||
| Total/Weighted Average | 55 | $743,567,549 | 100.0% | 3.966% | 113 | 2.33x | 59.5% | 53.2% | ||||||||||
| Property Type Distribution(1) | ||||||||||||||||||||||||||||
| Weighted Averages(1) | ||||||||||||||||||||||||||||
| Property Type | Number of Mortgaged Properties | Aggregate Cut-Off Date Balance | % of Initial Outstanding Pool Balance(1) | Number of Units/Rooms/ Pads/ NRA/Beds/Acres | Cut-off Date Balance per Unit/Room/Pad/ Acres/ NRA(2) | Mortgage Rate | Stated Remaining Term (Mos.)(5) | Occupancy | U/W NCF DSCR(3) | Cut-off Date LTV Ratio(3)(4) | Maturity Date or ARD LTV Ratio(2)(3)(5) | |||||||||||||||||
| Office | 16 | $186,232,688 | 25.0% | 4,960,074 | $315 | 3.867% | 98 | 90.7% | 2.60x | 54.2% | 49.8% | |||||||||||||||||
| CBD | 4 | $107,931,847 | 14.5% | 4,141,794 | $386 | 3.493% | 97 | 90.4% | 3.18x | 46.6% | 43.3% | |||||||||||||||||
| Suburban | 9 | $62,238,049 | 8.4% | 729,091 | $188 | 4.416% | 93 | 89.0% | 1.81x | 66.2% | 61.7% | |||||||||||||||||
| Medical | 2 | $13,395,000 | 1.8% | 34,473 | $389 | 4.278% | 120 | 100.0% | 1.74x | 58.0% | 49.3% | |||||||||||||||||
| Flex | 1 | $2,667,792 | 0.4% | 54,716 | $49 | 4.104% | 119 | 96.8% | 1.55x | 57.7% | 35.1% | |||||||||||||||||
| Multifamily | 19 | $153,865,000 | 20.7% | 2,579 | $129,488 | 4.104% | 119 | 88.0% | 1.77x | 66.0% | 61.5% | |||||||||||||||||
| Mid Rise | 6 | $85,725,000 | 11.5% | 543 | $188,417 | 4.116% | 119 | 96.7% | 1.70x | 65.8% | 63.3% | |||||||||||||||||
| Garden | 13 | $68,140,000 | 9.2% | 2,036 | $55,351 | 4.090% | 120 | 77.0% | 1.85x | 66.1% | 59.2% | |||||||||||||||||
| Hospitality | 57 | $150,778,611 | 20.3% | 5,169 | $87,065 | 4.367% | 120 | 76.2% | 2.20x | 62.6% | 49.6% | |||||||||||||||||
| Limited Service | 54 | $109,628,611 | 14.7% | 4,773 | $80,491 | 4.460% | 120 | 77.3% | 2.24x | 63.6% | 50.0% | |||||||||||||||||
| Select Service | 2 | $26,650,000 | 3.6% | 258 | $104,311 | 4.254% | 120 | 73.7% | 1.97x | 58.9% | 48.2% | |||||||||||||||||
| Full Service | 1 | $14,500,000 | 2.0% | 138 | $105,072 | 3.874% | 120 | 72.2% | 2.39x | 62.5% | 49.4% | |||||||||||||||||
| Retail | 14 | $87,341,250 | 11.7% | 1,757,022 | $127 | 3.798% | 120 | 95.3% | 2.19x | 61.0% | 52.4% | |||||||||||||||||
| Anchored | 5 | $49,396,500 | 6.6% | 1,373,851 | $77 | 3.953% | 120 | 92.6% | 1.81x | 66.3% | 52.5% | |||||||||||||||||
| Single Tenant | 7 | $20,944,750 | 2.8% | 299,653 | $107 | 3.717% | 120 | 100.0% | 2.34x | 58.2% | 54.6% | |||||||||||||||||
| Shadow Anchored | 1 | $13,000,000 | 1.7% | 35,800 | $363 | 3.295% | 120 | 96.4% | 3.38x | 45.0% | 45.0% | |||||||||||||||||
| Unanchored | 1 | $4,000,000 | 0.5% | 47,718 | $84 | 3.946% | 119 | 100.0% | 2.23x | 62.5% | 62.5% | |||||||||||||||||
| Industrial | 15 | $68,600,000 | 9.2% | 10,052,433 | $25 | 3.434% | 120 | 94.7% | 3.31x | 57.8% | 52.6% | |||||||||||||||||
| Warehouse/Distribution | 14 | $61,100,000 | 8.2% | 9,899,163 | $22 | 3.397% | 120 | 94.1% | 3.34x | 57.0% | 51.2% | |||||||||||||||||
| Flex | 1 | $7,500,000 | 1.0% | 153,270 | $49 | 3.730% | 120 | 100.0% | 3.05x | 63.9% | 63.9% | |||||||||||||||||
| Mixed Use | 2 | $46,500,000 | 6.3% | 154,728 | $168,387 | 3.843% | 120 | 95.1% | 2.30x | 58.4% | 56.2% | |||||||||||||||||
| Multifamily/Retail | 1 | $30,000,000 | 4.0% | 115 | $260,870 | 3.470% | 120 | 95.7% | 2.71x | 51.1% | 51.1% | |||||||||||||||||
| Office/Retail | 1 | $16,500,000 | 2.2% | 154,613 | $236 | 4.522% | 119 | 94.1% | 1.55x | 71.6% | 65.5% | |||||||||||||||||
| Other | 1 | $28,000,000 | 3.8% | 612 | $94,771 | 3.661% | 120 | 92.1% | 2.53x | 43.7% | 43.7% | |||||||||||||||||
| Leased Fee | 1 | $28,000,000 | 3.8% | 612 | $94,771 | 3.661% | 120 | 92.1% | 2.53x | 43.7% | 43.7% | |||||||||||||||||
| Manufactured Housing Community | 2 | $13,700,000 | 1.8% | 130 | $122,233 | 3.681% | 120 | 94.9% | 2.19x | 58.4% | 57.5% | |||||||||||||||||
| Self Storage | 1 | $8,550,000 | 1.1% | 59,000 | $145 | 4.650% | 60 | 92.9% | 1.97x | 66.4% | 66.4% | |||||||||||||||||
| Total/Weighted Average | 127 | $743,567,549 | 100.0% | 3.966% | 113 | 88.5% | 2.33x | 59.5% | 53.2% | |||||||||||||||||||
Please see footnotes on page 25.
THE INFORMATION IN THIS STRUCTURAL AND COLLATERAL TERM SHEET IS NOT COMPLETE AND MAY BE AMENDED PRIOR TO THE TIME OF SALE. THIS TERM SHEET IS NOT AN OFFER TO SELL THESE SECURITIES AND IT IS NOT A SOLICITATION OF AN OFFER TO BUY THESE SECURITIES IN ANY JURISDICTION WHERE THE OFFER OR SALE IS NOT PERMITTED.
22
UBS 2019-C18
| OVERVIEW OF MORTGAGE POOL CHARACTERISTICS |
| Geographic Distribution(1) | ||||||||||||||||
| Weighted Averages(1) | ||||||||||||||||
| State/Location | Number of Mortgaged Properties | Aggregate Cut-off Date Balance | % of Initial Outstanding Pool Balance(1) | Mortgage Rate | Stated Remaining Term (Mos.)(5) | U/W NCF DSCR(3) | Cut-off Date LTV Ratio(3)(4) | Maturity Date or ARD LTV Ratio(2)(3)(5) | ||||||||
| New York | 8 | $127,233,538 | 17.1% | 3.872% | 117 | 2.39x | 51.7% | 51.3% | ||||||||
| New York City(8) | 7 | $126,925,000 | 5.0% | 3.870% | 117 | 2.39x | 51.7% | 51.3% | ||||||||
| California | 9 | $111,592,559 | 15.0% | 3.605% | 101 | 3.08x | 48.6% | 47.2% | ||||||||
| California – Northern(8) | 5 | $67,336,552 | 9.1% | 3.844% | 88 | 2.85x | 50.2% | 47.8% | ||||||||
| California – Southern(8) | 4 | $44,256,007 | 6.0% | 3.241% | 120 | 3.41x | 46.3% | 46.2% | ||||||||
| Missouri | 7 | $56,198,472 | 7.6% | 4.006% | 119 | 2.01x | 64.9% | 61.1% | ||||||||
| Pennsylvania | 9 | $48,679,799 | 6.5% | 4.079% | 109 | 1.96x | 65.6% | 55.5% | ||||||||
| Georgia | 4 | $38,759,750 | 5.2% | 3.643% | 120 | 2.93x | 59.3% | 58.7% | ||||||||
| Tennessee | 7 | $37,859,553 | 5.1% | 4.021% | 120 | 2.02x | 67.1% | 55.1% | ||||||||
| Other | 83 | $323,243,878 | 43.5% | 4.135% | 114 | 2.12x | 63.7% | 53.5% | ||||||||
| Total/Weighted Average | 127 | $743,567,549 | 100.0% | 3.966% | 113 | 2.33x | 59.5% | 53.2% | ||||||||
| Distribution of Cut-off Date LTV Ratios(2)(3) | ||||||||||||||||||
| Weighted Averages(1) | ||||||||||||||||||
| Range of Cut-off Date LTV Ratios | Number of Mortgage Loans | Aggregate Cut-off Date Balance | % of Initial Outstanding Pool Balance(1) | Mortgage Rate | Stated Remaining Term (Mos.)(5) | U/W NCF DSCR(3) | Cut-off Date LTV Ratio(3)(4) | Maturity Date or ARD LTV Ratio(2)(3)(5) | ||||||||||
| 34.6% | - | 45.0% | 5 | $126,000,000 | 16.9% | 3.180% | 103 | 3.83x | 39.5% | 39.5% | ||||||||
| 45.1% | - | 50.0% | 2 | $32,700,000 | 4.4% | 3.932% | 112 | 2.82x | 45.8% | 45.4% | ||||||||
| 50.1% | - | 55.0% | 4 | $58,150,000 | 7.8% | 3.767% | 120 | 2.51x | 51.4% | 49.1% | ||||||||
| 55.1% | - | 60.0% | 6 | $49,862,792 | 6.7% | 4.389% | 120 | 1.94x | 58.5% | 48.4% | ||||||||
| 60.1% | - | 65.0% | 18 | $170,110,000 | 22.9% | 3.958% | 120 | 2.17x | 62.7% | 57.2% | ||||||||
| 65.1% | - | 70.0% | 13 | $192,306,660 | 25.9% | 4.361% | 108 | 1.84x | 67.2% | 57.5% | ||||||||
| 70.1% | - | 74.2% | 7 | $114,438,097 | 15.4% | 4.106% | 119 | 1.66x | 72.6% | 61.6% | ||||||||
| Total/Weighted Average | 55 | $743,567,549 | 100.0% | 3.966% | 113 | 2.33x | 59.5% | 53.2% | ||||||||||
| Distribution of Maturity Date or ARD LTV Ratios(2)(3)(5) | ||||||||||||||||||
| Weighted Averages(1) | ||||||||||||||||||
| Range of LTV Ratios at Maturity or ARD | Number of Mortgage Loans | Aggregate Cut-off Date Balance | % of Initial Outstanding Pool Balance(1) | Mortgage Rate | Stated Remaining Term (Mos.)(5) | U/W NCF DSCR(3) | Cut-off Date LTV Ratio(3)(4) | Maturity Date or ARD LTV Ratio(2)(3)(5) | ||||||||||
| 34.6% | - | 40.0% | 5 | $95,167,792 | 12.8% | 3.200% | 97 | 4.05x | 39.4% | 37.4% | ||||||||
| 40.1% | - | 50.0% | 15 | $217,823,611 | 29.3% | 4.144% | 119 | 2.25x | 56.4% | 46.2% | ||||||||
| 50.1% | - | 55.0% | 9 | $101,493,049 | 13.6% | 3.852% | 120 | 2.18x | 59.4% | 52.3% | ||||||||
| 55.1% | - | 60.0% | 7 | $69,976,847 | 9.4% | 3.911% | 119 | 1.77x | 68.0% | 57.2% | ||||||||
| 60.1% | - | 65.0% | 13 | $187,271,250 | 25.2% | 4.147% | 111 | 2.02x | 66.6% | 62.9% | ||||||||
| 65.1% | - | 70.0% | 6 | $71,835,000 | 9.7% | 4.182% | 112 | 1.83x | 69.1% | 67.7% | ||||||||
| Total/Weighted Average | 55 | $743,567,549 | 100.0% | 3.966% | 113 | 2.33x | 59.5% | 53.2% | ||||||||||
| Distribution of Underwritten NCF Debt Service Coverage Ratios(2) | ||||||||||||||||||
| Weighted Averages(1) | ||||||||||||||||||
| Range of Underwritten NCF Debt Service Coverage Ratios | Number of Mortgage Loans | Aggregate Cut-off Date Balance | % of Initial Outstanding Pool Balance(1) | Mortgage Rate | Stated Remaining Term (Mos.)(5) | U/W NCF DSCR(3) | Cut-off Date LTV Ratio(3)(4) | Maturity Date or ARD LTV Ratio(2)(3)(5) | ||||||||||
| 1.40x | - | 1.55x | 7 | $63,342,792 | 8.5% | 4.290% | 120 | 1.48x | 67.9% | 59.9% | ||||||||
| 1.56x | - | 1.65x | 4 | $48,050,000 | 6.5% | 4.597% | 85 | 1.58x | 66.3% | 57.4% | ||||||||
| 1.66x | - | 1.75x | 9 | $111,480,896 | 15.0% | 4.164% | 119 | 1.72x | 68.4% | 57.5% | ||||||||
| 1.76x | - | 1.85x | 8 | $94,075,250 | 12.7% | 4.054% | 119 | 1.82x | 66.3% | 59.1% | ||||||||
| 1.86x | - | 1.95x | 3 | $53,640,000 | 7.2% | 4.689% | 120 | 1.94x | 63.4% | 48.3% | ||||||||
| 1.96x | - | 2.05x | 4 | $41,500,000 | 5.6% | 4.139% | 108 | 1.97x | 63.6% | 55.4% | ||||||||
| 2.06x | - | 2.25x | 5 | $48,128,611 | 6.5% | 4.180% | 119 | 2.14x | 64.7% | 55.0% | ||||||||
| 2.26x | - | 2.45x | 5 | $53,300,000 | 7.2% | 3.813% | 120 | 2.36x | 61.7% | 56.6% | ||||||||
| 2.46x | - | 2.65x | 1 | $28,000,000 | 3.8% | 3.661% | 120 | 2.53x | 43.7% | 43.7% | ||||||||
| 2.66x | - | 2.85x | 2 | $42,700,000 | 5.7% | 3.434% | 120 | 2.73x | 51.4% | 51.4% | ||||||||
| 2.86x | - | 5.05x | 7 | $159,350,000 | 21.4% | 3.350% | 105 | 3.74x | 44.4% | 44.4% | ||||||||
| Total/Weighted Average | 55 | $743,567,549 | 100.0% | 3.966% | 113 | 2.33x | 59.5% | 53.2% | ||||||||||
Please see footnotes on page 25.
THE INFORMATION IN THIS STRUCTURAL AND COLLATERAL TERM SHEET IS NOT COMPLETE AND MAY BE AMENDED PRIOR TO THE TIME OF SALE. THIS TERM SHEET IS NOT AN OFFER TO SELL THESE SECURITIES AND IT IS NOT A SOLICITATION OF AN OFFER TO BUY THESE SECURITIES IN ANY JURISDICTION WHERE THE OFFER OR SALE IS NOT PERMITTED.
23
UBS 2019-C18
| OVERVIEW OF MORTGAGE POOL CHARACTERISTICS |
| Distribution of Original Terms to Maturity or ARD(2)(5) | ||||||||||||||||
| Weighted Averages(1) | ||||||||||||||||
| Original Terms to Maturity | Number of Mortgage Loans | Aggregate Cut-off Date Balance | % of Initial Outstanding Pool Balance(1) | Mortgage Rate | Stated Remaining Term (Mos.)(5) | U/W NCF DSCR(3) | Cut-off Date LTV Ratio(3)(4) | Maturity Date or ARD LTV Ratio(2)(3)(5) | ||||||||
| 60 | 3 | $70,350,000 | 9.5% | 4.105% | 59 | 2.75x | 50.7% | 49.6% | ||||||||
| 120 | 52 | $673,217,549 | 90.5% | 3.951% | 119 | 2.28x | 60.5% | 53.6% | ||||||||
| Total/Weighted Average | 55 | $743,567,549 | 100.0% | 3.966% | 113 | 2.33x | 59.5% | 53.2% | ||||||||
| Distribution of Remaining Terms to Maturity or ARD(2)(5) | ||||||||||||||||||
| Weighted Averages(1) | ||||||||||||||||||
| Range of Remaining Terms to Maturity | Number of Mortgage Loans | Aggregate Cut-off Date Balance | % of Initial Outstanding Pool Balance(1) | Mortgage Rate | Stated Remaining Term (Mos.)(5) | U/W NCF DSCR(3) | Cut-off Date LTV Ratio(3)(4) | Maturity Date or ARD LTV Ratio(2)(3)(5) | ||||||||||
| 58 | - | 61 | 3 | $70,350,000 | 9.5% | 4.105% | 59 | 2.75x | 50.7% | 49.6% | ||||||||
| 111 | - | 120 | 52 | $673,217,549 | 90.5% | 3.951% | 119 | 2.28x | 60.5% | 53.6% | ||||||||
| Total/Weighted Average | 55 | $743,567,549 | 100.0% | 3.966% | 113 | 2.33x | 59.5% | 53.2% | ||||||||||
| Distribution of Underwritten NOI Debt Yields(4) | ||||||||||||||||||
Weighted Averages(1) | ||||||||||||||||||
| Range of Underwritten NOI Debt Yields | Number of Mortgage Loans | Aggregate Cut-off Date Balance | % of Initial Outstanding Pool Balance(1) | Mortgage Rate | Stated Remaining Term (Mos.)(5) | U/W NCF DSCR(3) | Cut-off Date LTV Ratio(3)(4) | Maturity Date or ARD LTV Ratio(2)(3)(5) | ||||||||||
| 7.2% | - | 8.5% | 7 | $91,665,000 | 12.3% | 4.054% | 119 | 1.81x | 64.9% | 64.3% | ||||||||
| 8.6% | - | 9.0% | 3 | $22,724,000 | 3.1% | 3.955% | 120 | 1.83x | 68.6% | 61.3% | ||||||||
| 9.1% | - | 9.5% | 5 | $49,361,000 | 6.6% | 3.963% | 110 | 2.31x | 51.9% | 51.1% | ||||||||
| 9.6% | - | 10.0% | 9 | $105,195,000 | 14.1% | 3.858% | 120 | 2.17x | 61.5% | 58.2% | ||||||||
| 10.1% | - | 10.5% | 3 | $63,126,847 | 8.5% | 4.351% | 93 | 1.66x | 67.2% | 58.4% | ||||||||
| 10.6% | - | 11.0% | 4 | $55,349,299 | 7.4% | 4.025% | 120 | 1.74x | 71.9% | 60.7% | ||||||||
| 11.1% | - | 11.5% | 3 | $41,550,000 | 5.6% | 4.116% | 120 | 1.72x | 63.3% | 48.9% | ||||||||
| 11.6% | - | 12.0% | 2 | $25,000,000 | 3.4% | 3.654% | 120 | 2.64x | 55.4% | 50.4% | ||||||||
| 12.1% | - | 13.0% | 5 | $61,067,792 | 8.2% | 3.957% | 116 | 2.52x | 55.8% | 50.1% | ||||||||
| 13.1% | - | 13.5% | 5 | $98,250,000 | 13.2% | 3.562% | 98 | 3.37x | 46.1% | 44.3% | ||||||||
| 13.6% | - | 17.4% | 9 | $130,278,611 | 17.5% | 4.102% | 119 | 2.74x | 58.2% | 45.2% | ||||||||
| Total/Weighted Average | 55 | $743,567,549 | 100.0% | 3.966% | 113 | 2.33x | 59.5% | 53.2% | ||||||||||
| Amortization Types | ||||||||||||||||
| Weighted Averages(1) | ||||||||||||||||
| Amortization Type | Number of Mortgage Loans | Aggregate Cut-off Date Balance | % of Initial Outstanding Pool Balance(1) | Mortgage Rate | Stated Remaining Term (Mos.)(5) | U/W NCF DSCR(3) | Cut-off Date LTV Ratio(3)(4) | Maturity Date or ARD LTV Ratio(2)(3)(5) | ||||||||
| Full IO | 20 | $349,265,000 | 47.0% | 3.627% | 111 | 2.92x | 52.0% | 52.0% | ||||||||
| Amortizing | 19 | $213,171,299 | 28.7% | 4.235% | 120 | 1.87x | 65.6% | 49.7% | ||||||||
| Partial IO | 13 | $169,346,250 | 22.8% | 4.322% | 110 | 1.69x | 66.8% | 59.0% | ||||||||
| Full IO, ARD | 3 | $11,785,000 | 1.6% | 4.019% | 119 | 2.16x | 69.5% | 69.5% | ||||||||
| Total/Weighted Average | 55 | $743,567,549 | 100.0% | 3.966% | 113 | 2.33x | 59.5% | 53.2% | ||||||||
| Loan Purposes | ||||||||||||||||
| Weighted Averages(1) | ||||||||||||||||
| Loan Purpose | Number of Mortgage Loans | Aggregate Cut-off Date Balance | % of Initial Outstanding Pool Balance(1) | Mortgage Rate | Stated Remaining Term (Mos.)(5) | U/W NCF DSCR(3) | Cut-off Date LTV Ratio(3)(4) | Maturity Date or ARD LTV Ratio(2)(3)(5) | ||||||||
| Refinance | 39 | $542,907,688 | 73.0% | 3.954% | 111 | 2.28x | 59.2% | 53.8% | ||||||||
| Acquisition | 14 | $154,103,611 | 20.7% | 4.282% | 120 | 2.02x | 63.3% | 53.1% | ||||||||
| Recapitalization | 1 | $30,000,000 | 4.0% | 2.653% | 119 | 5.05x | 39.2% | 39.2% | ||||||||
| Refinance/Acquisition | 1 | $16,556,250 | 2.2% | 3.786% | 119 | 1.83x | 72.5% | 61.5% | ||||||||
| Total/Weighted Average | 55 | $743,567,549 | 100.0% | 3.966% | 113 | 2.33x | 59.5% | 53.2% | ||||||||
Please see footnotes on page 25
THE INFORMATION IN THIS STRUCTURAL AND COLLATERAL TERM SHEET IS NOT COMPLETE AND MAY BE AMENDED PRIOR TO THE TIME OF SALE. THIS TERM SHEET IS NOT AN OFFER TO SELL THESE SECURITIES AND IT IS NOT A SOLICITATION OF AN OFFER TO BUY THESE SECURITIES IN ANY JURISDICTION WHERE THE OFFER OR SALE IS NOT PERMITTED.
24
UBS 2019-C18
| OVERVIEW OF MORTGAGE POOL CHARACTERISTICS |
| (1) | Unless otherwise indicated, all references to “% of Initial Outstanding Pool Balance” in this Term Sheet reflect a percentage of the aggregate principal balance of the mortgage pool as of the Cut-off Date, after application of all payments of principal due during or prior to December 2019. |
| (2) | For any mortgage loan with an anticipated repayment date, calculated to or as of, as applicable, that anticipated repayment date. |
| (3) | With respect to any mortgage loan that is part of a whole loan, unless otherwise indicated, LTV, DSCR and Debt Yield calculations in this Term Sheet include any relatedpari passu companion loans and exclude any subordinate companion loans, as applicable. Additionally, LTV, DSCR and Debt Yield figures in this Term Sheet are calculated for mortgage loans without regard to any additional indebtedness that may be incurred at a future date. See “Description of the Mortgage Pool—Mortgage Pool Characteristics” in the Preliminary Prospectus and Annex A-1 to the Preliminary Prospectus. |
| (4) | The Cut-off Date LTV and Maturity Date or ARD LTV for the following mortgage loans are based on an appraised value for one or more mortgaged properties that is not an “As-Is” appraised value. |
With respect to the mortgage loan secured by the portfolio of mortgaged properties identified on Annex A-1 to the Preliminary Prospectus as Wyndham National Hotel Portfolio, the Cut-off Date LTV, Maturity Date or ARD LTV, and appraised value are based on the aggregate sum of the available “As-Is” and “As-Complete” appraised value of $215,000,000, as of August 1, 2019, which assumes the completion of all renovations for which the lender reserved for at origination. The sum of the “As-Is” appraised values on a stand-alone basis is $209,900,000. The Cut-off Date LTV and Maturity Date or ARD LTV based on the appraised value representing the sum of the “As-Is” appraised values are 69.1% and 47.8%, respectively.
With respect to the mortgage loan identified on Annex A-1 to the Preliminary Prospectus as Holiday Inn Express Lincoln, CA the Cut-off Date LTV, Maturity Date or ARD LTV, and appraised value are based on the “As-Complete Value” appraised value of $15,000,000, as of October 1, 2020, which assumes the completion of all renovations for which the lender reserved for at origination. The “As-Is” appraised value is $13,400,000. The Cut-off Date LTV and Maturity Date or ARD LTV based on the “As-Is” appraised values are 67.2% and 60.3%, respectively.
With respect to the mortgage loan identified on Annex A-1 to the Preliminary Prospectus as 530 West 136th Street, the Cut-off Date LTV, Maturity Date or ARD LTV, and appraised value are based on the “As-Stabilized” appraised value of $10,400,000, as of September 13, 2019, which assumes the completion of all renovations for which the lender reserved for at origination. The “As-Is” appraised value is $10,300,000 as of September 13, 2019. The Cut-off Date LTV and Maturity Date or ARD LTV based on the “As-Is” appraised values are 63.3% and 63.3%, respectively.
With respect to the mortgage loan identified on Annex A-1 to the Preliminary Prospectus as BNSF Logistics, the Cut-off Date LTV, Maturity Date or ARD LTV, and appraised value are based on the “As-Complete Value” appraised value of $8,300,000, as of November 3, 2019, which assumes the completion of all renovations for which the lender reserved for at origination. The “As-Is” appraised value is $7,000,000. The Cut-off Date LTV and Maturity Date or ARD LTV based on the “As-Is” appraised values are 77.1% and 65.8%, respectively.
With respect to the mortgage loan identified on Annex A-1 to the Preliminary Prospectus as Brickyard Plaza, the Cut-off Date LTV, Maturity Date or ARD LTV, and appraised value are based on the conclusion of $6,400,000, which assumes the lease-up costs for recently signed leases are escrowed and available to any potential purchaser at origination. The “As-Is” appraised value is $5,150,000. The Cut-off Date LTV and Maturity Date or ARD LTV based on the “As-Is” appraised values are 77.7% and 77.7%, respectively.
| (5) | Excludes mortgage loans that are interest-only for the full loan term to maturity or anticipated repayment date. |
| (6) | Includes FF&E Reserves. |
| (7) | Represents the percent of the allocated aggregate principal balance of the mortgage pool as of the Cut-off Date of only the office, retail, industrial, mixed use properties and the mortgage loan identified on Annex A-1 to the Preliminary Prospectus as Chroma Apartments. |
| (8) | “California—Northern” includes zip codes above 93600, and “California—Southern” includes zip codes at or below 93600. “New York City” includes zip codes at 10001 through 11697. |
THE INFORMATION IN THIS STRUCTURAL AND COLLATERAL TERM SHEET IS NOT COMPLETE AND MAY BE AMENDED PRIOR TO THE TIME OF SALE. THIS TERM SHEET IS NOT AN OFFER TO SELL THESE SECURITIES AND IT IS NOT A SOLICITATION OF AN OFFER TO BUY THESE SECURITIES IN ANY JURISDICTION WHERE THE OFFER OR SALE IS NOT PERMITTED.
25
UBS 2019-C18
| OVERVIEW OF MORTGAGE POOL CHARACTERISTICS |
| Ten Largest Mortgage Loans | |||||||||
| Mortgage Loan | Mortgage Loan Seller | City, State | Property Type | Cut-off Date Balance | % of Initial Outstanding Pool Balance | Cut-off Date Balance per Room/NRA(1) | Cut-off Date LTV Ratio(1) | U/W NCF DSCR(1) | U/W NOI Debt Yield(1) |
| 225 Bush | UBS AG | San Francisco, CA | Office | $35,000,000 | 4.7% | $351 | 34.6% | 3.85x | 13.4% |
| Chroma Apartments | WFB | St. Louis, MO | Multifamily | $35,000,000 | 4.7% | $212,766 | 68.5% | 1.81x | 7.4% |
| Wyndham National Hotel Portfolio(2) | UBS AG | Various, Various | Hospitality | $35,000,000 | 4.7% | $38,884 | 67.4% | 1.94x | 16.1% |
| Phoenix Industrial Portfolio III | UBS AG | Various, Various | Industrial | $31,100,000 | 4.2% | $18 | 74.2% | 1.70x | 10.6% |
| 3 Columbus Circle | Natixis | New York, NY | Office | $30,000,000 | 4.0% | $650 | 45.4% | 2.91x | 12.3% |
| ILPT Industrial Portfolio | UBS AG | Various, Various | Industrial | $30,000,000 | 4.0% | $26 | 39.2% | 5.05x | 14.8% |
| Orfali Portfolio | UBS AG | New York, NY | Mixed Use | $30,000,000 | 4.0% | $260,870 | 51.1% | 2.71x | 9.7% |
| Doubletree New York Times Square West Leased Fee | UBS AG | New York, NY | Other | $28,000,000 | 3.8% | $94,771 | 43.7% | 2.53x | 9.4% |
| United Healthcare Office | UBS AG | Las Vegas, NV | Office | $26,800,000 | 3.6% | $229 | 66.7% | 1.56x | 10.2% |
| AVR Atlanta Airport SpringHill Gateway | CCRE | Atlanta, GA | Hospitality | $23,850,000 | 3.2% | $162,245 | 61.9% | 3.12x | 13.3% |
| Total/Weighted Average | $304,750,000 | 41.0% | 55.2% | 2.71x | 11.7% | ||||
| (1) | With respect to any mortgage loan that is part of a whole loan, unless otherwise indicated, all LTV Ratio, U/W NCF DSCR, Debt Yield and Balance per Room/NRA calculations in this Term Sheet include any related pari passu companion loans and exclude any subordinate companion loans, as applicable. Additionally, LTV Ratio, U/W NCF DSCR, Debt Yield and Balance per Room/NRA figures in this Term Sheet are calculated for mortgage loans without regard to any additional indebtedness that may be incurred at a future date. |
| (2) | With respect to the mortgage loan secured by the portfolio of mortgaged properties identified on Annex A-1 to the Preliminary Prospectus as Wyndham National Hotel Portfolio, the Cut-off Date LTV, Maturity Date or ARD LTV, and appraised value are based on the aggregate sum of the available “As-Is” and “As-Complete” appraised value of $215,000,000, as of August 1, 2019, which assumes the completion of all renovation for which the lender reserved for at closing. The sum of the “As-Is” appraised values on a stand-alone basis is $209,900,000. The Cut-off Date LTV and Maturity Date or ARD LTV based on the appraised value representing the sum of the “As-Is” appraised values are 69.1% and 47.8%, respectively. |
| Existing Mezzanine Debt Summary | ||||||||
| Mortgage Loan | Mortgage Loan Cut-off Date Balance | Mezzanine Debt Cut-off Date Balance | Trust U/W NCF DSCR(1) | Total Debt U/W NCF DSCR(2) | Trust Cut-off Date LTV Ratio(1) | Total Debt Cut-off Date LTV Ratio(2) | Trust U/W NOI Debt Yield(1) | Total Debt U/W NOI Debt Yield(2) |
| Chroma Apartments | $35,000,000 | $10,100,000 | 1.81x | 1.20x | 68.5% | 82.3% | 7.4% | 6.2% |
| United Healthcare Office | $26,800,000 | $6,000,000 | 1.56x | 1.30x | 66.7% | 75.2% | 10.2% | 9.0% |
| (1) | With respect to any mortgage loan that is part of a whole loan, the Trust U/W NCF DSCR, Trust Cut-off Date LTV Ratio and Trust U/W NOI Debt Yield include the relatedpari passucompanion loan(s) and exclude any related subordinate companion loan(s) and the related mezzanine loan(s). |
| (2) | Total Debt U/W NCF DSCR, Total Debt Cut-off Date LTV Ratio and Total Debt U/W NOI Debt Yield calculations include any relatedpari passu companion loan(s), related subordinate companion loan(s) and/or related mezzanine loan(s). |
| Subordinate Debt Summary | ||||||||||||||||||
| Mortgage Loan | Mortgage Loan Cut-off Date Balance | Pari Passu Companion Loan(s) Cut-off Date Balance | Subordinate Debt Cut-off Date Balance | Trust U/W NCF DSCR | Total Mortgage Debt U/W NCF DSCR(1) | Trust Cut-off Date LTV Ratio | Total Mortgage Debt Cut-off Date LTV Ratio(1) | Trust U/W NOI Debt Yield | Total Mortgage Debt U/W NOI Debt Yield(1) | |||||||||
| 225 Bush | $35,000,000 | $168,600,000 | $146,400,000 | 3.85x | 2.24x | 34.6% | 59.4% | 13.4% | 7.8% | |||||||||
| 3 Columbus Circle | $30,000,000 | $460,000,000 | $105,000,000 | 2.91x | 2.40x | 45.4% | 55.1% | 12.3% | 10.2% | |||||||||
| ILPT Industrial Portfolio | $30,000,000 | $184,400,000 | $135,600,000 | 5.05x | 2.47x | 39.2% | 64.0% | 14.8% | 9.1% | |||||||||
| Doubletree New York Times Square West Leased Fee | $28,000,000 | $30,000,000 | $32,000,000 | 2.53x | 1.59x | 43.7% | 67.9% | 9.4% | 6.1% | |||||||||
| Century Plaza Towers | $20,000,000 | $880,000,000 | $300,000,000 | 4.08x | 3.06x | 39.1% | 52.1% | 13.5% | 10.1% | |||||||||
| 7105 - 7115 37th Avenue | $14,500,000 | $0 | $2,000,000 | 1.68x | 1.48x | 63.3% | 72.1% | 8.0% | 7.1% | |||||||||
| (1) | Total Mortgage Debt U/W NCF DSCR, Total Mortgage Debt Cut-off Date LTV Ratio and Total Mortgage Debt U/W NOI Debt Yield calculations include any relatedpari passu companion loan(s), and related subordinate companion loan(s) and excludes related mezzanine loan(s), if any. |
THE INFORMATION IN THIS STRUCTURAL AND COLLATERAL TERM SHEET IS NOT COMPLETE AND MAY BE AMENDED PRIOR TO THE TIME OF SALE. THIS TERM SHEET IS NOT AN OFFER TO SELL THESE SECURITIES AND IT IS NOT A SOLICITATION OF AN OFFER TO BUY THESE SECURITIES IN ANY JURISDICTION WHERE THE OFFER OR SALE IS NOT PERMITTED.
26
UBS 2019-C18
| OVERVIEW OF MORTGAGE POOL CHARACTERISTICS |
| Pari Passu Companion Loan Summary |
| Mortgage Loan | Note(s) | Original Balance | Holder of Note(1) | Lead Servicer for Whole Loan (Y/N) | Master Servicer Under Lead Securitization | Special Servicer Under Lead Securitization |
| 225 Bush | A-4 | $35,000,000 | UBS 2019-C18 | No | Midland Loan Services, a Division of PNC Bank, National Association. | Midland Loan Services, a Division of PNC Bank, National Association. |
| A-1 (controlling), A-6 | $60,000,000 | BMARK 2019-B14 | Yes | |||
| A-2 | $50,000,000 | COMM 2019-GC44(2) | No | |||
| A-3 | $30,000,000 | UBS AG | No | |||
| A-5 | $28,600,000 | DBR Investments Co. Limited | No | |||
| B(8) | $146,400,000 | BMARK 2019-B14 | No | |||
| Total | $350,000,000 | |||||
| Chroma Apartments | A-1 (controlling) | $35,000,000 | UBS 2019-C18 | Yes | Wells Fargo Bank, National Association | Rialto Capital Advisors, LLC |
| A-2 | $15,000,000 | WFB | No | |||
| Total | $50,000,000 | |||||
| Wyndham National Hospitality Portfolio | A-1 (controlling), A-8 | $35,000,000 | UBS 2019-C18 | Yes | Wells Fargo Bank, National Association | Rialto Capital Advisors, LLC |
| A-2, A-3, A-4, A-5, A-6, A-7, A-9, A-10, A-11, A-12 | $110,000,000 | UBS AG | No | |||
| Total | $145,000,000 | |||||
| 3 Columbus Circle | A-1-6 | $30,000,000 | UBS 2019-C18 | No | KeyBank National Association | LNR Partners, LLC |
| A-1-3, A-2-4 | $100,000,000 | BMARK 2019-B11 | No | |||
| A-1-1 (controlling), A-2-1 | $75,000,000 | BMARK 2019-B10 | Yes | |||
| A-1-2-A | $50,000,000 | JPMCC 2019-COR5 | No | |||
| A-1-2-B, A-1-7 | $50,000,000 | BMARK 2019-B12 | No | |||
| A-1-5 | $50,000,000 | CSAIL 2019-C16 | No | |||
| A-2-2, A-2-3 | $50,000,000 | CF 2019-CF1 | No | |||
| A-1-4-B, A-1-8 | $37,500,000 | BMARK 2019-B13 | No | |||
| A-1-4-A | $25,000,000 | CF 2019-CF3(7) | No | |||
| A-2-5-A | $12,500,000 | MSC 2019-H7 | No | |||
| A-2-5-B | $10,000,000 | MSC 2019-H6 | No | |||
| B-1(8), B-2 | $105,000,000 | BMARK 2019-B10 | No | |||
| Total | $595,000,000 | |||||
| ILPT Industrial Portfolio | A-6, A-7 | $30,000,000 | UBS 2019-C18 | No | Wells Fargo Bank, National Association | Situs Holdings, LLC |
| A-3, A-4 | $64,320,000 | Bank of America National Association | No | |||
| A-1 (controlling) | $50,000,000 | MSC 2019-L3 | Yes | |||
| A-2 | $35,760,000 | Morgan Stanley Mortgage Capital Holdings LLC | No | |||
| A-5, A-8 | $34,320,000 | CSAIL 2019-C18(3) | No | |||
| B-1-A(8), B-1-B, B-1-C, B-1-D, B-2-A, B-2-B, B-2-C, B-2-D, B-3-A, B-3-B, B-3-C, B-3-D(8) | $135,600,000 | Third Party Investor | No | |||
| Total | $350,000,000 | |||||
| Doubletree New York Times Square West Leased Fee | A-1, A-4 | $28,000,000 | UBS 2019-C18 | No | Wells Fargo Bank, National Association(4) | Rialto Capital Advisors, LLC(4) |
| A-2 (controlling), A-3 | $30,000,000 | UBS AG | Yes | |||
| B(8) | $32,000,000 | UBS AG | No | |||
| Total | $90,000,000 | |||||
| United Healthcare Office | A-1 (controlling), A-4, A-5 | $26,800,000 | UBS 2019-C18 | Yes | Wells Fargo Bank, National Association | Rialto Capital Advisors, LLC |
| A-2, A-3 | $20,000,000 | CSAIL 2019-C18(3) | No | |||
| Total | $46,800,000 | |||||
| 4041 Central | A-1 (controlling) | $23,000,000 | UBS 2019-C18 | Yes | Wells Fargo Bank, National Association | Rialto Capital Advisors, LLC |
| A-2 | $19,500,000 | WFB | No | |||
| Total | $42,500,000 | |||||
| Century Plaza Towers | A-3-C4 | $20,000,000 | UBS 2019-C18 | No | Wells Fargo Bank, National Association | CWCapital Asset Management LLC |
| A-1-S1 (controlling), A-1-S2, A-1-S3, A-2-S1, A-2-S2, A-2-S3, A-3-S1, A-3-S2, A-3-S3, A-2-C1, A-2-C3, A-2-C4, A-3-C1, A-3-C3 | $525,000,000 | CPTS 2019-CPT | Yes | |||
| A-2-C2, A-2-C5, A-2-C6, A-2-C7, A-3-C2, A-3-C5 | $105,000,000 | BANK 2019-BNK23(5) | No | |||
| A-1-C3, A-1-C8 | $62,500,000 | JPMDB 2019-COR6 | No | |||
| A-1-C1, A-1-C2, A-1-C4, A-1-C5, A-1-C6, A-1-C7 | $187,500,000 | DBR Investments Co. Limited | No | |||
| B-1, B-2, B-3(8) | $300,000,000 | CPTS 2019-CPT | No | |||
| Total | $1,200,000,000 | |||||
| Crimson Retail Portfolio | A-2 | $16,556,250 | UBS 2019-C18 | No | Midland Loan Services, a Division of PNC Bank, National Association | Rialto Capital Advisors, LLC |
| A-1 (controlling) | $16,556,250 | CSAIL 2019-C18(3) | Yes | |||
| Total | $33,112,500 | |||||
| Redwood Technology Center | A-3 (controlling), A-4, A-5 | $16,500,000 | UBS 2019-C18 | Yes | Wells Fargo Bank, National Association | Rialto Capital Advisors, LLC |
| A-1, A-2 | $20,000,000 | CSAIL 2019-C18(3) | No | |||
| Total | $36,500,000 | |||||
| Shoppes at Parma | A-2-A | $14,000,000 | UBS 2019-C18 | No | Wells Fargo Bank, National Association(6) | Rialto Capital Advisors, LLC(6) |
| A-1-A (controlling), A-3-A | $43,075,000 | Tuebor TRS II LLC | Yes | |||
| Total | $57,075,000 | |||||
| Global Payments, Inc. | A-2 | $10,000,000 | UBS 2019-C18 | No | Wells Fargo Bank, National Association | LNR Partners, LLC |
| A-1 (controlling) | $19,167,000 | WFCM 2019-C54 | Yes | |||
| Total | $29,167,000 | |||||
| Airport Square | A-2 | $5,000,000 | UBS 2019-C18 | No | Midland Loan Services, a Division of PNC Bank, National Association | Midland Loan Services, a Division of PNC Bank, National Association |
| A-1 (controlling) | $20,000,000 | CF 2019-CF3(7) | Yes | |||
| Total | $25,000,000 |
Please see footnotes on the following page.
THE INFORMATION IN THIS STRUCTURAL AND COLLATERAL TERM SHEET IS NOT COMPLETE AND MAY BE AMENDED PRIOR TO THE TIME OF SALE. THIS TERM SHEET IS NOT AN OFFER TO SELL THESE SECURITIES AND IT IS NOT A SOLICITATION OF AN OFFER TO BUY THESE SECURITIES IN ANY JURISDICTION WHERE THE OFFER OR SALE IS NOT PERMITTED.
27
UBS 2019-C18
| OVERVIEW OF MORTGAGE POOL CHARACTERISTICS |
| (1) | Identifies the expected holder as of the Closing Date. |
| (2) | The COMM 2019-GC44 securitization transaction is expected to close on or about December 12, 2019. |
| (3) | The CSAIL 2019-C18 securitization transaction is expected to close on or about December 12, 2019. |
| (4) | The Doubletree New York Times Square West Leased Fee Whole Loan is expected to initially be serviced under the UBS 2019-C18 pooling and servicing agreement until the securitization of the related controllingpari passu Note A-2, after which the Doubletree New York Times Square West Leased Fee Whole Loan will be serviced under the pooling and servicing agreement related to the securitization of the related controllingpari passu Note A-2 (the “Doubletree New York Times Square West Leased Fee Servicing Shift PSA”). The master servicer and special servicer under the Doubletree New York Times Square West Leased Fee Servicing Shift PSA will be identified in a notice, report or statement to holders of the UBS 2019-C18 certificates after the securitization of the related controllingpari passu Note A-2. |
| (5) | The BANK 2019-BNK23 securitization transaction is expected to close on or about December 10, 2019. |
| (6) | The Shoppes at Parma Whole Loan is expected to initially be serviced under the UBS 2019-C18 pooling and servicing agreement until the securitization of the related controllingpari passuNote A-1-A, after which the Shoppes at Parma Whole Loan will be serviced under the pooling and servicing agreement related to the securitization of the related controllingpari passu Note A-1-A (the “Shoppes at Parma Servicing Shift PSA”). The master servicer and special servicer under the Shoppes at Parma Servicing Shift PSA will be identified in a notice, report or statement to holders of the UBS 2019-C18 certificates after the securitization of the related controllingpari passu Note A-1-A. |
| (7) | The CF 2019-CF3 securitization transaction is expected to close on or about December 20, 2019. |
| (8) | The related whole loan will be serviced pursuant to the indicated pooling and servicing agreement or trust and servicing agreement, as applicable. However, so long as no “control appraisal period” (or similar term) has occurred and is continuing, the holder of the related subordinate companion loan will be the controlling noteholder and will have the right to approve certain modifications and consent to certain actions taken with respect to the related whole loan. If a control appraisal period has occurred and is continuing, the holder of the note indicated as the “controlling” note will be the controlling noteholder. |
THE INFORMATION IN THIS STRUCTURAL AND COLLATERAL TERM SHEET IS NOT COMPLETE AND MAY BE AMENDED PRIOR TO THE TIME OF SALE. THIS TERM SHEET IS NOT AN OFFER TO SELL THESE SECURITIES AND IT IS NOT A SOLICITATION OF AN OFFER TO BUY THESE SECURITIES IN ANY JURISDICTION WHERE THE OFFER OR SALE IS NOT PERMITTED.
28
UBS 2019-C18
| OVERVIEW OF MORTGAGE POOL CHARACTERISTICS |
| Previous Securitization History(1) | ||||||
| Mortgaged Property | Mortgage Loan Seller | City, State | Property Type | Cut-off Date Balance | % of Initial Outstanding Pool Balance | Previous Securitization(s) |
| 225 Bush | UBS AG | San Francisco, CA | Office | $35,000,000 | 4.7% | GSMS 2016-GS4; GSMS 2017-GS5 |
| 3 Columbus Circle | Natixis | New York, NY | Office | $30,000,000 | 4.0% | CGCMT 2015-GC29 |
| United Healthcare Office | UBS AG | Las Vegas, NV | Office | $26,800,000 | 3.6% | JPMBB 2014-C26 |
| Century Plaza Towers | WFB | Los Angeles, CA | Office | $20,000,000 | 2.7% | MSC 2014-CPT |
| Westmont Red Roof Inn Portfolio II | Natixis | Various, Various | Hospitality | $17,628,611 | 2.4% | CGCMT 2008-C7 |
| Shelbourne Square | UBS AG | Reading, PA | Retail | $13,550,000 | 1.8% | MLCFC 2006-2 |
| Little Elm(2) | UBS AG | Little Elm, TX | Retail | $11,013,500 | 1.5% | UBSBB 2012-C2 |
| Apple Inc. Boulder | UBS AG | Boulder, CO | Office | $8,900,000 | 1.2% | LNCR 2018-CRE1 |
| 1900 Evans Road | UBS AG | Melbourne, FL | Retail | $7,500,000 | 1.0% | BSCMS 2005-PWR7 |
| Six Sentry Office Portfolio | UBS AG | Blue Bell, PA | Office | $6,150,000 | 0.8% | WBCMT 2003-C7 |
| Days Inn by Wyndham - Florence | UBS AG | Florence, KY | Hospitality | $4,700,000 | 0.6% | HCC 2007-1A |
| (1) | Includes mortgage loans for which all or a portion of the previously existing debt was most recently securitized in one or more conduit securitizations, based on information provided by the related borrower or obtained through searches of a third-party database. The information has not otherwise been confirmed by the mortgage loan sellers. |
| (2) | Part of collateral for the Crimson Retail Portfolio loan. |
THE INFORMATION IN THIS STRUCTURAL AND COLLATERAL TERM SHEET IS NOT COMPLETE AND MAY BE AMENDED PRIOR TO THE TIME OF SALE. THIS TERM SHEET IS NOT AN OFFER TO SELL THESE SECURITIES AND IT IS NOT A SOLICITATION OF AN OFFER TO BUY THESE SECURITIES IN ANY JURISDICTION WHERE THE OFFER OR SALE IS NOT PERMITTED.
29
225 Bush Street San Francisco, CA 94104 | Collateral Asset Summary – Loan No. 1 225 Bush | Cut-off Date Balance: Cut-off Date LTV Ratio: UW NCF DSCR: UW NOI Debt Yield: | $35,000,000 34.6% 3.85x 13.4% |
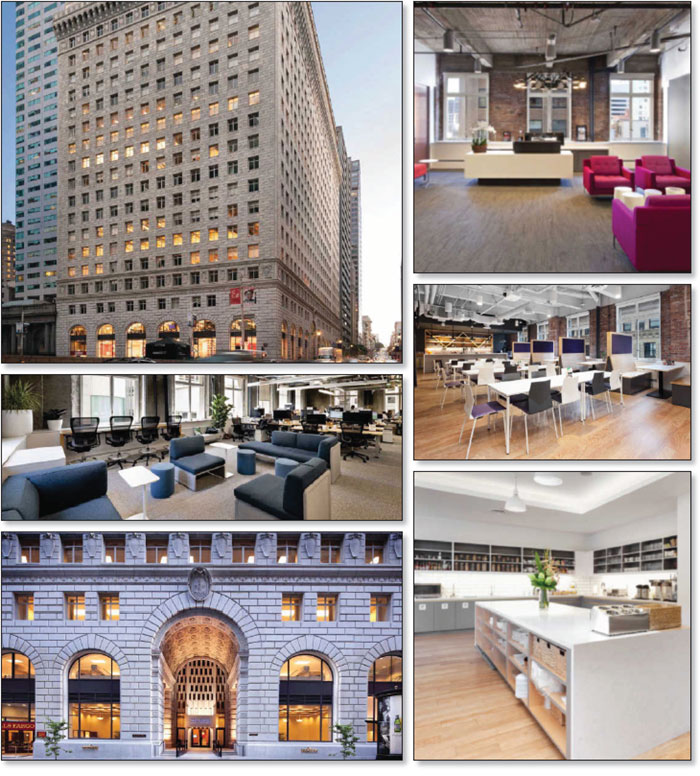
THE INFORMATION IN THIS STRUCTURAL AND COLLATERAL TERM SHEET IS NOT COMPLETE AND MAY BE AMENDED PRIOR TO THE TIME OF SALE. THIS TERM SHEET IS NOT AN OFFER TO SELL THESE SECURITIES AND IT IS NOT A SOLICITATION OF AN OFFER TO BUY THESE SECURITIES IN ANY JURISDICTION WHERE THE OFFER OR SALE IS NOT PERMITTED.
30
225 Bush Street San Francisco, CA 94104 | Collateral Asset Summary – Loan No. 1 225 Bush | Cut-off Date Balance: Cut-off Date LTV Ratio: UW NCF DSCR: UW NOI Debt Yield: | $35,000,000 34.6% 3.85x 13.4% |
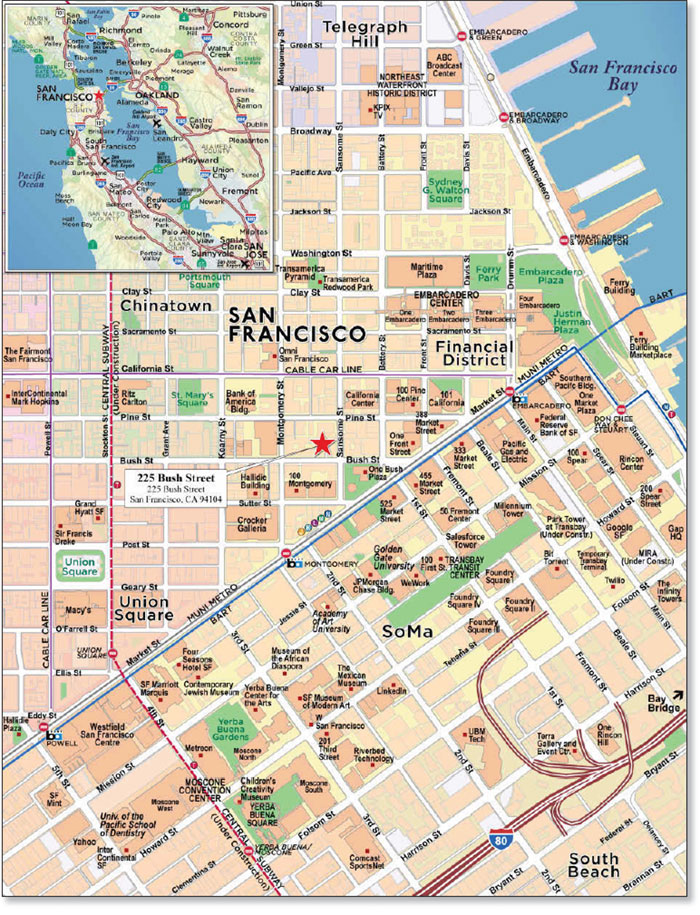
THE INFORMATION IN THIS STRUCTURAL AND COLLATERAL TERM SHEET IS NOT COMPLETE AND MAY BE AMENDED PRIOR TO THE TIME OF SALE. THIS TERM SHEET IS NOT AN OFFER TO SELL THESE SECURITIES AND IT IS NOT A SOLICITATION OF AN OFFER TO BUY THESE SECURITIES IN ANY JURISDICTION WHERE THE OFFER OR SALE IS NOT PERMITTED.
31
225 Bush Street San Francisco, CA 94104 | Collateral Asset Summary – Loan No. 1 225 Bush | Cut-off Date Balance: Cut-off Date LTV Ratio: UW NCF DSCR: UW NOI Debt Yield: | $35,000,000 34.6% 3.85x 13.4% |
| Mortgage Loan Information | Mortgaged Property Information | ||||||
| Mortgage Loan Seller(1): | UBS AG | Single Asset/Portfolio: | Single Asset | ||||
Credit Assessment (Fitch/KBRA/Moody’s): | BBB-/A/Baa3 | Location: | San Francisco, CA 94104 | ||||
| General Property Type: | Office | ||||||
| Original Balance(2): | $35,000,000 | Detailed Property Type: | CBD | ||||
| Cut-off Date Balance(2): | $35,000,000 | Title Vesting: | Fee Simple | ||||
| % of Initial Pool Balance: | 4.7% | Year Built/Renovated: | 1922, 1955/2010-2013 | ||||
| Loan Purpose: | Refinance | Size: | 579,987 SF | ||||
| Borrower Sponsor: | Kylli Inc. | Cut-off Date Balance per SF(2): | $351 | ||||
| Mortgage Rate: | 3.3030% | Maturity Date Balance per SF(2): | $351 | ||||
| Note Date: | 10/11/2019 | Property Manager: | 225 Bush Street Partners LLC (borrower-related)
| ||||
| First Payment Date: | 12/6/2019 | ||||||
| Maturity Date: | 11/6/2024 | ||||||
| Original Term to Maturity | 60 months | ||||||
| Original Amortization Term: | 0 months | ||||||
| IO Period: | 60 months | ||||||
| Seasoning: | 1 month | Underwriting and Financial Information | |||||
| Prepayment Provisions(3): | LO (25); DEF (29); O (6) | UW NOI(5): | $27,263,666 | ||||
| Lockbox/Cash Mgmt Status: | Hard/Springing | UW NOI Debt Yield(2): | 13.4% | ||||
| Additional Debt Type(2): | Pari Passu/ Subordinate Debt | UW NOI Debt Yield at Maturity(2): | 13.4% | ||||
| Additional Debt Balance(2): | $168,600,000 / $146,400,000 | UW NCF DSCR(2): | 3.85x | ||||
| Future Debt Permitted (Type): | No (N/A) | Most Recent NOI(5)(6): | $24,512,257 (8/31/2019 TTM) | ||||
| Reserves(4) | 2nd Most Recent NOI(6): | $25,674,474 (12/31/2018) | |||||
| Type | Initial | Monthly | Cap | 3rd Most Recent NOI(6): | $24,788,393 (12/31/2017) | ||
| RE Tax: | $3,012,292 | $376,536 | N/A | Most Recent Occupancy: | 97.8% (9/30/2019) | ||
| Insurance: | $838,031 | $119,719 | N/A | 2nd Most Recent Occupancy: | 92.5% (12/31/2018) | ||
| Replacements: | $0 | $9,666 | $231,995 | 3rd Most Recent Occupancy: | 92.0% (12/31/2017) | ||
| TI/LC: | $0 | $96,665 | $3,479,922 | Appraised Value (as of): | $589,000,000 (9/5/2019) | ||
| Outstanding TI/LC: | $4,097,106 | $0 | N/A | Cut-off Date LTV Ratio(2): | 34.6% | ||
| Free Rent: | $886,122 | $0 | N/A | Maturity Date LTV Ratio(2): | 34.6% | ||
| Sources and Uses | ||||||
| Sources | Proceeds | % of Total | Uses | Proceeds | % of Total | |
| Loan Amount(2): | $350,000,000 | 100.0% | Loan Payoff: | $241,210,092 | 68.9% | |
| Reserves: | $8,833,550 | 2.5% | ||||
| Closing Costs: | $3,591,605 | 1.0% | ||||
| Return of Equity: | $96,364,753 | 27.5% | ||||
| Total Sources: | $350,000,000 | 100.0% | Total Uses: | $350,000,000 | 100.0% | |
| (1) | The 225 Bush Whole Loan (as defined below) was originated by Deutsche Bank AG, New York Branch on October 11, 2019. UBS AG subsequently acquired Notes A-3 and A-4 and has re-underwritten such mortgage loan in accordance with the procedures described under “Transaction Parties—The Sponsors and Mortgage Loan Sellers—UBS AG, New York Branch” in the Preliminary Prospectus. |
| (2) | The 225 Bush Mortgage Loan (as defined below) is part of the 225 Bush Whole Loan, which is comprised of six seniorpari passupromissory notes with an aggregate original principal balance of $203,600,000 and a subordinate companion note with an original principal balance of $146,400,000. The Cut-off Date Balance per SF, Maturity Date Balance per SF, UW NOI Debt Yield, UW NOI Debt Yield at Maturity, UW NCF DSCR, Cut-off Date LTV Ratio and Maturity Date LTV Ratio presented above are based on the 225 Bush Senior Notes (as defined below). The Cut-off Date Balance per SF, Maturity Date Balance per SF, UW NOI Debt Yield, UW NOI Debt Yield at Maturity, UW NCF DSCR, Cut-off Date LTV Ratio and Maturity Date LTV Ratio based on the 225 Bush Whole Loan are $603, $603, 7.8%, 7.8%, 2.24x, 59.4% and 59.4%, respectively. |
| (3) | Defeasance of the 225 Bush Whole Loan is permitted at any time after the earlier to occur of (a) the end of the two-year period commencing on the closing date of the securitization of the last 225 Bush Whole Loan promissory note to be securitized and (b) October 11, 2022. The assumed defeasance lockout period of 25 payments is based on the expected closing date of the UBS 2019-C18 securitization in December 2019. |
| (4) | See “Escrows and Reserves” below for further discussion of reserve requirements. |
| (5) | The increase in UW NOI from Most Recent NOI is primarily attributed to new leases at the 225 Bush Property (as defined below), including recent leasing for tenants Handshake ($4,815,904 in underwritten base rent) and SunRun ($3,692,280 in underwritten base rent). |
| (6) | Historical NOI fluctuations year-over-year are due to tenant rent abatements associated with new leases. |
The Mortgage Loan.The largest mortgage loan (the “225 Bush Mortgage Loan”) is part of a whole loan (the “225 Bush Whole Loan”) evidenced by six seniorpari passu promissory notes with an aggregate original principal balance of $203,600,000 (collectively, the “225 Bush Senior Notes) and one subordinate companion note with an original principal balance of $146,400,000 (the “225 Bush Subordinate Note”). The 225 Bush Whole Loan is secured by a first priority fee mortgage encumbering a 579,987 SF, Class A, office building with ground floor retail located in San Francisco, California (the “225 Bush Property”). Promissory Note A-4, with an original principal balance of $35,000,000, represents the 225 Bush Mortgage Loan, and will be contributed to the UBS 2019-C18 Trust. The below table summarizes the 225 Bush Whole Loan, including the remaining promissory notes, which are currently held by the entities listed below or are expected to be contributed to one or more future securitization transactions and may otherwise be transferred at any time. The mortgage loan seller provides no assurances that the non-securitized notes will not be split further. The 225 Bush Whole Loan is serviced
THE INFORMATION IN THIS STRUCTURAL AND COLLATERAL TERM SHEET IS NOT COMPLETE AND MAY BE AMENDED PRIOR TO THE TIME OF SALE. THIS TERM SHEET IS NOT AN OFFER TO SELL THESE SECURITIES AND IT IS NOT A SOLICITATION OF AN OFFER TO BUY THESE SECURITIES IN ANY JURISDICTION WHERE THE OFFER OR SALE IS NOT PERMITTED.
32
225 Bush Street San Francisco, CA 94104 | Collateral Asset Summary – Loan No. 1 225 Bush | Cut-off Date Balance: Cut-off Date LTV Ratio: UW NCF DSCR: UW NOI Debt Yield: | $35,000,000 34.6% 3.85x 13.4% |
pursuant to the pooling and servicing agreement for the Benchmark 2019-B14 Trust. See “Description of the Mortgage Pool—The Whole Loans—The Non-Serviced AB Whole Loans—The 225 Bush Whole Loan” and “Pooling and Servicing Agreement” in the Preliminary Prospectus.
| 225 Bush Whole Loan Summary | ||||
| Notes | Original Principal Balance | Cut-off Date Balance | Anticipated Note Holder | Controlling Piece |
| A-1 | $50,000,000 | $50,000,000 | Benchmark 2019-B14 | No(1) |
| A-2 | $50,000,000 | $50,000,000 | COMM 2019-GC44(2) | No |
| A-3 | $30,000,000 | $30,000,000 | UBS AG | No |
| A-4 | $35,000,000 | $35,000,000 | UBS 2019-C18 | No |
| A-5 | $28,600,000 | $28,600,000 | DBR Investments Co. Limited | No |
| A-6 | $10,000,000 | $10,000,000 | Benchmark 2019-B14 | No |
| B | $146,400,000 | $146,400,000 | Benchmark 2019-B14 | Yes(1) |
| Total | $350,000,000 | $350,000,000 | ||
| (1) | The initial controlling note is Note B, so long as no control appraisal period with respect to the 225 Bush Whole Loan has occurred and is continuing. If and for so long as a control appraisal period with respect to the 225 Bush Whole Loan has occurred and is continuing, then the controlling note will be Note A-1. See “Description of the Mortgage Pool—The Whole Loans—The Non-Serviced AB Whole Loans—The 225 Bush Whole Loan” in the Preliminary Prospectus. |
| (2) | Promissory Note A-2 is currently held by DBR Investments Co. Limited, or an affiliated entity, and is expected to be contributed to COMM 2019-GC44, which is expected to close on or about December 12, 2019. |
The Borrower and the Borrower Sponsor. The borrower is 225 Bush Street Owners LLC (the “225 Bush Borrower”), a Delaware limited liability company structured to be bankruptcy remote with two independent directors. Legal counsel to the 225 Bush Borrower delivered a non-consolidation opinion in connection with the origination of the 225 Bush Whole Loan. The borrower sponsor and nonrecourse carveout guarantor is Kylli Inc.
Kylli Inc. is a full-service real estate investment management company focused on the acquisition, development and management of assets in the San Francisco Bay Area. Kylli Inc. is a wholly-owned subsidiary of Genzon Investment Group Co., Ltd., which is a privately-held full service investment company headquartered in Shenzhen, China. Kylli Inc.’s assets in the United States, include (i) over 500,000 SF of office space under management in San Francisco, (ii) 767,000 SF of office space under construction in Burlingame, California fully leased to Facebook and (iii) over 48 acres of developable land in Santa Clara, California.
The Property. The 225 Bush Property is a Class A, 22-story, 579,987 SF office building with ground floor retail located in the North Financial District neighborhood of San Francisco, California. The 225 Bush Property was originally constructed in two phases in 1922 and 1955. Formerly known as the “Standard Oil Building,” the 225 Bush Property was developed by John D. Rockefeller as the headquarters for Standard Oil and later became the headquarters of Chevron. The 225 Bush Property was designed by George W. Kelham and modeled after the Federal Reserve Bank of New York in Manhattan’s financial district. The 225 Bush Property features 26,000 SF floor plates, a fitness center with locker rooms and showers and 110 subterranean valet parking spaces, and is situated on a 0.88-acre site at the corner of Bush Street and Sansome Street, one block north of Market Street.
The borrower sponsor purchased the 225 Bush Property in 2014 for $350.0 million and thereafter invested approximately $5.0 million in building system upgrades and approximately $23.0 million in tenant improvements. Historical investments include a $1.1 million renovation of the east and west lobbies in 2009 that included new lighting, interior paneling, carpeting, artwork, furniture, security desks, and the installation of new street-level property signage. From 2010 to 2013, the 225 Bush Property underwent a $12.8 million renovation that consisted of a full renovation of the terra cotta brick façade, including waterproofing, repairs of the terra cotta brick, refurbishing and painting of the steel windows and storefronts, as well as lobby renovations and the installation of the 13th floor fitness center. The borrower sponsor has plans to execute a $7.0 million modernization of the building’s elevator systems, which is expected to commence before the end of 2019 and be completed in 2022; however, the 225 Bush Borrower is under no obligation to conduct the modernization and no amounts were reserved therefor under the 225 Bush Whole Loan.
As of September 30, 2019, the 225 Bush Property was 97.8% leased to 32 office tenants and an investment grade retail tenant, Target, which occupies 20,677 SF of ground floor retail space. The 225 Bush Property’s 10 largest tenants occupy 77.8% of NRA and no tenant occupies more than 14.5% of the total NRA.
Major Tenants.
Twitch Interactive (84,035 SF, 14.5% of NRA, 14.2% of underwritten base rent). Twitch Interactive (“Twitch”) is a wholly-owned subsidiary of Amazon.com, Inc. (“Amazon”) (Moody’s/Fitch/S&P: A3/A+/AA-). Twitch is a live social media entertainment company that has developed a platform allowing people to create and live-stream their own original entertainment to a global audience. Twitch is a platform for channels relating to cooking, fitness, music, the arts, talk shows and other genres. According to the Twitch website, in 2018, Twitch viewers watched over 505 billion minutes of original content. Additionally, the Twitch platform has over 3 million unique broadcasters each month on average, over 15 million average daily visitors and over a 1.3 million average viewership at any given moment. Twitch has been in occupancy at the 225 Bush Property since May 2013, originally occupying 26,351 SF (6th floor) under a five-year lease. In November 2014, Twitch executed a six-year renewal, expanding its premises by 25,653 SF (8th floor) and 26,457 SF (9th floor) for a total footprint of 78,461 SF (not including storage space). Twitch has one, five-year renewal option remaining as well as a right of first offer to lease the entire 2nd, 5th, 7th and 10th floors. Amazon fully guarantees Twitch’s lease.
LiveRamp, Inc (76,724 SF, 13.2% of NRA, 15.4% of underwritten base rent). LiveRamp, Inc (“LiveRamp”) provides an identity resolution software platform to companies that enables customers to use their offline customer data in online advertising. According to LiveRamp’s financial statements, as of March 2019, LiveRamp reported an annual revenue $285.62 million. Subscription revenue was $237 million, up 38%, and contributed 83% of total revenue. LiveRamp has been in occupancy at the 225 Bush Property since May 2015, originally occupying 25,891 SF (17th floor) under a seven-year lease. LiveRamp expanded at the 225 Bush Property in August 2016 by 25,809 SF (16th floor) and once more in July 2017 by an additional 25,024 SF (15th floor), for a total footprint of 76,724 SF. LiveRamp has one, five-year renewal option remaining for the entirety of its space.
THE INFORMATION IN THIS STRUCTURAL AND COLLATERAL TERM SHEET IS NOT COMPLETE AND MAY BE AMENDED PRIOR TO THE TIME OF SALE. THIS TERM SHEET IS NOT AN OFFER TO SELL THESE SECURITIES AND IT IS NOT A SOLICITATION OF AN OFFER TO BUY THESE SECURITIES IN ANY JURISDICTION WHERE THE OFFER OR SALE IS NOT PERMITTED.
33
225 Bush Street San Francisco, CA 94104 | Collateral Asset Summary – Loan No. 1 225 Bush | Cut-off Date Balance: Cut-off Date LTV Ratio: UW NCF DSCR: UW NOI Debt Yield: | $35,000,000 34.6% 3.85x 13.4% |
Benefit Cosmetics, LLC (61,917 SF, 10.7% of NRA, 6.0% of underwritten base rent). Benefit Cosmetics, LLC (“Benefit Cosmetics”) is a wholly-owned subsidiary of Moët Hennessy – Louis Vuitton, which is a multinational luxury goods conglomerate headquartered in Paris, France. According to the appraisal, Benefit Cosmetics has indicated that it will not be extending its lease at the end of its term in August 2020. Benefit Cosmetics is currently in occupancy and paying full rent at $35.90 PSF, which is approximately 60.1% below the appraisal’s concluded market rent for the Benefit Cosmetics space of $90.00 PSF.
The following table presents certain information relating to the tenancy at the 225 Bush Property:
| Tenant Summary(1) | |||||||
| Tenant Name | Credit Rating (Fitch/Moody’s/S&P)(2) | Tenant SF | Approximate % of SF | Annual UW Base Rent(3) | % of Total Annual UW Base Rent(3) | Annual UW Base Rent PSF(3)(4) | Lease Expiration |
| Twitch Interactive(5) | A+/A3/AA- | 84,035 | 14.5% | $5,431,516 | 14.1% | $64.63 | 8/18/2021 |
| LiveRamp, Inc | NR/NR/NR | 76,724 | 13.2% | $5,916,052 | 15.4% | $77.11 | 5/4/2022 |
| Benefit Cosmetics, LLC(6)(7) | NR/NR/NR | 61,917 | 10.7% | $2,230,250 | 5.8% | $36.02 | 8/31/2020 |
| Handshake | NR/NR/NR | 52,735 | 9.1% | $4,815,905 | 12.5% | $91.32 | 7/30/2027 |
| SunRun | NR/NR/NR | 43,850 | 7.6% | $3,692,280 | 9.6% | $84.20 | 5/31/2024 |
| Knotel | NR/NR/NR | 26,664 | 4.6% | $2,169,650 | 5.6% | $81.37 | 7/14/2026 |
| Jewish Vocational Services(8) | NR/NR/NR | 26,497 | 4.6% | $1,287,068 | 3.4% | $48.57 | 2/28/2021 |
| Mesosphere, Inc. | NR/NR/NR | 26,339 | 4.5% | $2,151,615 | 5.6% | $81.69 | 4/30/2023 |
| HEAP, Inc. | NR/NR/NR | 26,333 | 4.5% | $1,983,402 | 5.2% | $75.32 | 8/21/2023 |
| General Assembly Space, Inc. | NR/NR/NR | 26,320 | 4.5% | $1,759,938 | 4.6% | $66.87 | 8/29/2024 |
| Total Major Tenants | 451,414 | 77.8% | $31,437,674 | 81.8% | $69.64 | ||
| Other Tenants(9) | 115,919 | 20.0% | $6,972,697 | 18.2% | $60.15 | ||
| Vacant | 12,654 | 2.2% | $0 | 0.0% | $0.00 | ||
| Total/Wtd. Avg. | 579,987 | 100.0% | $38,410,371 | 100.0% | $67.70 | ||
| (1) | Information is based on the underwritten rent roll. |
| (2) | Certain ratings are those of the parent company whether or not the parent guarantees the lease. |
| (3) | Includes rent steps through November 2021 equal to $1,055,382. |
| (4) | Wtd. Avg. Annual UW Base Rent PSF excludes vacant space. |
| (5) | The Tenant SF for Twitch includes 5,574 SF of storage space with an average base rent of $11.39 PSF. |
| (6) | According to the appraisal, Benefit Cosmetics has indicated that it will not be extending its lease at the end of its term in August 2020. Benefit Cosmetics is currently in occupancy and paying full underwritten base rent at $36.02 PSF, which is approximately 60.0% below the appraisal’s concluded market rent for the Benefit Cosmetics space of $90.00 PSF. |
| (7) | The Tenant SF for Benefit Cosmetics includes 1,787 SF of storage space with an average base rent of $17.84 PSF. |
| (8) | The Tenant SF for Jewish Vocational Services includes 305 SF of storage space with a base rent of $12.00 PSF. |
| (9) | Other Tenants is inclusive of 8,766 SF of conference room and fitness center space and 3,957 SF of storage and antenna space with no attributable underwritten base rent. |
THE INFORMATION IN THIS STRUCTURAL AND COLLATERAL TERM SHEET IS NOT COMPLETE AND MAY BE AMENDED PRIOR TO THE TIME OF SALE. THIS TERM SHEET IS NOT AN OFFER TO SELL THESE SECURITIES AND IT IS NOT A SOLICITATION OF AN OFFER TO BUY THESE SECURITIES IN ANY JURISDICTION WHERE THE OFFER OR SALE IS NOT PERMITTED.
34
225 Bush Street San Francisco, CA 94104 | Collateral Asset Summary – Loan No. 1 225 Bush | Cut-off Date Balance: Cut-off Date LTV Ratio: UW NCF DSCR: UW NOI Debt Yield: | $35,000,000 34.6% 3.85x 13.4% |
The following table presents certain information relating to the lease rollover at the 225 Bush Property:
| Lease Rollover Schedule(1)(2) | ||||||||
| Year | # of Leases Rolling | SF Rolling | Approx. % of Total SF Rolling | Approx. Cumulative % of SF Rolling | UW Base Rent PSF Rolling(3)(4) | Total UW Base Rent Rolling(4) | Approx. % of Total UW Base Rent Rolling(4) | Approx. Cumulative % of Total UW Base Rent Rolling(4) |
| MTM | 0 | 0 | 0.0% | 0.0% | $0.00 | $0 | 0.0% | 0.0% |
| 2019 | 0 | 0 | 0.0% | 0.0% | $0.00 | $0 | 0.0% | 0.0% |
| 2020 | 10 | 67,403 | 11.6% | 11.6% | $38.07 | $2,566,272 | 6.7% | 6.7% |
| 2021 | 14 | 141,317 | 24.4% | 36.0% | $62.58 | $8,843,195 | 23.0% | 29.7% |
| 2022 | 6 | 92,117 | 15.9% | 51.9% | $75.53 | $6,957,189 | 18.1% | 47.8% |
| 2023 | 7 | 56,632 | 9.8% | 61.6% | $77.35 | $4,380,324 | 11.4% | 59.2% |
| 2024 | 13 | 94,693 | 16.3% | 78.0% | $76.90 | $7,282,249 | 19.0% | 78.2% |
| 2025 | 1 | 20,677 | 3.6% | 81.5% | $65.25 | $1,349,174 | 3.5% | 81.7% |
| 2026 | 1 | 26,664 | 4.6% | 86.1% | $81.37 | $2,169,650 | 5.6% | 87.3% |
| 2027 | 2 | 52,735 | 9.1% | 95.2% | $91.32 | $4,815,905 | 12.5% | 99.9% |
| 2028 | 0 | 0 | 0.0% | 95.2% | $0.00 | $0 | 0.0% | 99.9% |
| 2029 | 0 | 0 | 0.0% | 95.2% | $0.00 | $0 | 0.0% | 99.9% |
| 2030 & Beyond(5) | 12 | 15,095 | 2.6% | 97.8% | $3.07 | $46,412 | 0.1% | 100.0% |
| Vacant | 0 | 12,654 | 2.2% | 100.0% | $0.00 | $0 | 0.0% | 100.0% |
| Total/Wtd. Avg. | 66 | 579,987 | 100.0% | $67.70 | $38,410,371 | 100.0% | ||
| (1) | Information is based on the underwritten rent roll. |
| (2) | Certain tenants may have lease termination options that are exercisable prior to the originally stated expiration date of the subject lease, which are not considered in the lease rollover schedule. |
| (3) | Wtd. Avg. UW Base Rent PSF Rolling excludes vacant space. |
| (4) | Includes rent steps through November 2021 equal to $1,055,382. |
| (5) | 2030 & Beyond is inclusive of 8,766 SF of conference room and fitness center space and 3,957 SF of storage and antenna space that have no underwritten rent. |
The Market. The 225 Bush Property is located in San Francisco’s North Financial District on the corner of Sansome Street and Bush Street, one block from the South of Market neighborhood. The 225 Bush Property is approximately 0.5 miles east of Union Square, which features major international retailers such as Nike, Apple, Gucci, Macy’s and Louis Vuitton and approximately 0.1 miles from the popular dining corridor known as Belden Place. In addition, the 225 Bush Property is within walking distance to the Montgomery BART station (0.3 miles), MUNI light rail, bus system stops and the Transbay Terminal development.
As of the second quarter of 2019, the North Financial District office submarket consisted of approximately 30.3 million SF of office space with an overall market vacancy of 5.2% and average asking rents of approximately $67.81 PSF.
The appraisal identified six directly competitive office rent comparables located in the Financial District submarket. Comparable buildings were built between 1912 and 2000 and range in size from 47,733 SF to 485,000 SF. Direct asking rents at the comparable properties ranged between $77.00 and $92.00 PSF (full service leases) with a weighted average of approximately $86.29 PSF. The 225 Bush Property’s in-place weighted average office rent is $68.89 PSF, which is lower than the appraisal’s concluded office market rent, which ranges from $75.00 PSF to $90.00 PSF. The 225 Bush Property’s in-place weighted average office rent is approximately 18.1% below the weighted average concluded office market rent.
The following table presents certain information relating to the appraisal’s market rent conclusion for the 225 Bush Property:
| Market Rent Summary | |
| Floor(s) | Rent PSF |
| Partial Floor | $75.00 |
| Full Floor | $85.00 |
| Benefit Cosmetics Space | $90.00 |
| Source:Appraisal |
THE INFORMATION IN THIS STRUCTURAL AND COLLATERAL TERM SHEET IS NOT COMPLETE AND MAY BE AMENDED PRIOR TO THE TIME OF SALE. THIS TERM SHEET IS NOT AN OFFER TO SELL THESE SECURITIES AND IT IS NOT A SOLICITATION OF AN OFFER TO BUY THESE SECURITIES IN ANY JURISDICTION WHERE THE OFFER OR SALE IS NOT PERMITTED.
35
225 Bush Street San Francisco, CA 94104 | Collateral Asset Summary – Loan No. 1 225 Bush | Cut-off Date Balance: Cut-off Date LTV Ratio: UW NCF DSCR: UW NOI Debt Yield: | $35,000,000 34.6% 3.85x 13.4% |
The following table presents certain information relating to comparable office leases for the 225 Bush Property:
| Comparable Leases Summary | ||||||||
| Property Name | Year Built/ Renovated | # of Stories | Total GLA (SF) | Lease Date | Lease Term (mos.) | Lease Size (SF) | Tenant Name | Annual Base Rent PSF |
| 225 Bush Property | 1922, 1955/2010-2013 | 22 | 579,987 | Various | Various | Various | Various | $70.41(1) |
| 150 California | 2000/N/A | 23 | 249,510 | Dec-19 | 84 | 19,541 | City National Bank | $77.00 |
| 330-332 Pine Street | 1912/2012 | 9 | 47,733 | Feb-19 | 62 | 6,345 | Auto List | $80.00 |
| The Landmark at One Market | 1917/2000 | 11 | 434,396 | Oct-19 | 88 | 62,408 | Duane Morris, LLP | $92.00 |
| Embarcadero Center West | 1988/N/A | 30 | 485,000 | Oct-18 | 96 | 1,559 | Opus Bank | $84.00 |
| 150 Spear Street | 1981/N/A | 18 | 264,551 | Sep-18 | 123 | 10,152 | RMA | $78.00 |
| 353 Sacramento | 1982/N/A | 23 | 284,751 | Apr-18 | 66 | 11,022 | Crew App | $82.00 |
Source:Appraisal
| (1) | Information is based on the underwritten rent roll and excludes the Annual Base Rent PSF of the conference room space, fitness center space, storage space and antenna space. |
Underwritten Net Cash Flow.The following table presents certain information relating to the historical operating performance and the Underwritten Net Cash Flow at the 225 Bush Property:
| Cash Flow Analysis | ||||||
| 2016 | 2017 | 2018 | 8/31/2019 TTM | UW | UW PSF | |
| Gross Potential Rent(1)(2) | $32,955,563 | $32,773,764 | $33,530,722 | $33,115,349 | $39,090,176 | $67.40 |
| Total Recoveries | $3,060,722 | $2,256,601 | $2,572,270 | $2,655,316 | $4,439,738 | $7.65 |
| Other Income | $833,678 | $776,575 | $679,963 | $760,436 | $476,903 | $0.82 |
| Less Vacancy & Credit Loss(3) | $0 | $0 | $0 | $0 | ($2,176,496) | ($3.75) |
| Effective Gross Income | $36,849,963 | $35,806,940 | $36,782,955 | $36,531,101 | $41,830,321 | $72.12 |
| Total Operating Expenses | $11,423,601 | $11,018,547 | $11,108,481 | $12,018,844 | $14,566,655 | $25.12 |
| Net Operating Income(4)(5) | $25,426,362 | $24,788,393 | $25,674,474 | $24,512,257 | $27,263,666 | $47.01 |
| Capital Expenditures | $0 | $0 | $0 | $0 | $115,997 | $0.20 |
| TI/LC | $0 | $0 | $0 | $0 | $869,981 | $1.50 |
| Net Cash Flow | $25,426,362 | $24,788,393 | $25,674,474 | $24,512,257 | $26,277,688 | $45.31 |
| Occupancy %(3) | 93.4% | 92.0% | 92.5% | 92.6% | 95.0% | |
| NOI DSCR(6) | 3.73x | 3.64x | 3.77x | 3.60x | 4.00x | |
| NCF DSCR(6) | 3.73x | 3.64x | 3.77x | 3.60x | 3.85x | |
| NOI Debt Yield(6) | 12.5% | 12.2% | 12.6% | 12.0% | 13.4% | |
| NCF Debt Yield(6) | 12.5% | 12.2% | 12.6% | 12.0% | 12.9% | |
| (1) | UW Gross Potential Rent is based on the in place rent roll as of September 30, 2019 and inclusive of Benefit Cosmetics, which has indicated that it will not be extending its lease at the end of its term in August 2020. Benefit Cosmetics is currently in occupancy and paying full rent at $35.90 PSF, which is approximately 60.1% below the appraisal’s concluded market rent for the Benefit Cosmetics space of $90.00 PSF. |
| (2) | UW Gross Potential Rent is based on the underwritten rent roll and includes (i) rent steps of $1,055,382 through November 2021, (ii) straight line rent of $66,371 for Target and Twitch over the 225 Bush Whole Loan term and (iii) vacancy gross up of $613,434. |
| (3) | The underwritten economic vacancy is 5.0%. The 225 Bush Property is 97.8% leased as of September 30, 2019. |
| (4) | Historical Net Operating Income fluctuations year-over-year are due to tenant rent abatements associated with new leases. |
| (5) | The increase in UW Net Operating Income from 8/31/2019 TTM Net Operating Income is primarily attributed to new leases at the 225 Bush Property (as defined below), including recent leasing for tenants Handshake ($4,815,904 in underwritten base rent) and SunRun ($3,692,280 in underwritten base rent). |
| (6) | Debt service coverage ratios and debt yields are based on the 225 Bush Senior Notes and exclude the 225 Bush Subordinate Note. |
Escrows and Reserves.At origination of the 225 Bush Whole Loan, the 225 Bush Borrower deposited into escrow (i) $3,012,292 for real estate taxes, (ii) $838,031 for insurance premiums, (iii) $4,097,106 for outstanding tenant improvements and leasing commission obligations in connection with five leases and (iv) $886,122 for free rent in connection with two leases. The 225 Bush Borrower is required to escrow monthly (i) 1/12 of the annual estimated tax payments, currently equal to $376,536, (ii) 1/12 of the annual estimated insurance premiums, currently equal to $119,719, (iii) $9,666 for replacement reserves, subject to a cap of $231,995 and (iv) $96,665 for tenant improvements and leasing commission obligations, subject to a cap of $3,479,922.
Lockbox and Cash Management. The 225 Bush Whole Loan is structured with a hard lockbox and springing cash management. The 225 Bush Borrower is required to direct all existing tenants of the 225 Bush Property to directly deposit all rents into a clearing account controlled by the lender. If no Trigger Period (as defined below) exists, the funds in the clearing account will be swept on a daily basis into the 225 Bush Borrower’s operating account and, if a Trigger Period exists, such funds are required to be swept on a daily basis into a deposit account controlled by the lender. During a Trigger Period, funds in the deposit account are required to be applied and disbursed in accordance with the related whole loan documents. During a Trigger Period, all excess cash after payment of the monthly debt service on the 225 Bush Whole Loan, all required reserves and budgeted operating expenses, and certain other items in the payment waterfall described in the related whole loan documents will be reserved as additional collateral for the 225 Bush Whole Loan. Under certain circumstances and for limited purposes described in the related whole loan documents, the 225 Bush Borrower may request disbursements of such excess cash flow.
THE INFORMATION IN THIS STRUCTURAL AND COLLATERAL TERM SHEET IS NOT COMPLETE AND MAY BE AMENDED PRIOR TO THE TIME OF SALE. THIS TERM SHEET IS NOT AN OFFER TO SELL THESE SECURITIES AND IT IS NOT A SOLICITATION OF AN OFFER TO BUY THESE SECURITIES IN ANY JURISDICTION WHERE THE OFFER OR SALE IS NOT PERMITTED.
36
225 Bush Street San Francisco, CA 94104 | Collateral Asset Summary – Loan No. 1 225 Bush | Cut-off Date Balance: Cut-off Date LTV Ratio: UW NCF DSCR: UW NOI Debt Yield: | $35,000,000 34.6% 3.85x 13.4% |
A “Trigger Period” means the occurrence and continuation of (i) an event of default or (ii) a Low DSCR Period (as defined below). A Trigger Period may be cured in accordance with the following conditions: with respect to a Trigger Period caused solely by (a) clause (i) above, the acceptance of a cure by the lender of the related event of default and (b) with respect to a Trigger Period caused solely by clause (ii) above, the debt service coverage ratio being at least 1.60x as of the last day of any calendar quarter.
A “Low DSCR Period” will commence if and when the debt service coverage ratio on the 225 Bush Whole Loan, as of the last day of any calendar quarter, is less than 1.55x and end if and when such event is cured as described above.
Additional Secured Indebtedness (not including trade debts).The 225 Bush Subordinate Note has an outstanding principal balance as of the Cut-off Date of $146,400,000, and accrues interest at a fixed rate of 3.3030%per annum. The 225 Bush Subordinate Note has a five-year term and is interest-only for the full term. For additional information, see “Description of the Mortgage Pool—The Whole Loans—The Non-Serviced AB Whole Loans—The 225 Bush Whole Loan” in the Preliminary Prospectus.
Mezzanine Loan and Preferred Equity.None.
Release of Property. Not permitted.
Terrorism Insurance. The 225 Bush Borrower is required to obtain and maintain property insurance, commercial general liability insurance, and business income or rental loss insurance that covers perils of terrorism and acts of terrorism, both foreign and domestic.
THE INFORMATION IN THIS STRUCTURAL AND COLLATERAL TERM SHEET IS NOT COMPLETE AND MAY BE AMENDED PRIOR TO THE TIME OF SALE. THIS TERM SHEET IS NOT AN OFFER TO SELL THESE SECURITIES AND IT IS NOT A SOLICITATION OF AN OFFER TO BUY THESE SECURITIES IN ANY JURISDICTION WHERE THE OFFER OR SALE IS NOT PERMITTED.
37
4001-4041 Chouteau Avenue St. Louis, MO 63110 | Collateral Asset Summary – Loan No. 2 Chroma Apartments | Cut-off Date Balance: Cut-off Date LTV Ratio: UW NCF DSCR: UW NOI Debt Yield: | $35,000,000 68.5% 1.81x 7.4% |
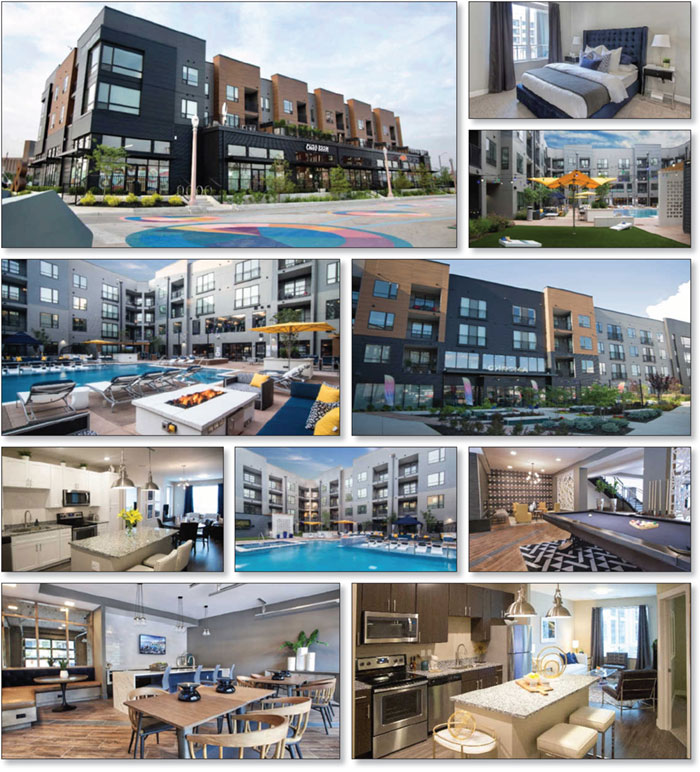
THE INFORMATION IN THIS STRUCTURAL AND COLLATERAL TERM SHEET IS NOT COMPLETE AND MAY BE AMENDED PRIOR TO THE TIME OF SALE. THIS TERM SHEET IS NOT AN OFFER TO SELL THESE SECURITIES AND IT IS NOT A SOLICITATION OF AN OFFER TO BUY THESE SECURITIES IN ANY JURISDICTION WHERE THE OFFER OR SALE IS NOT PERMITTED.
38
4001-4041 Chouteau Avenue St. Louis, MO 63110 | Collateral Asset Summary – Loan No. 2 Chroma Apartments | Cut-off Date Balance: Cut-off Date LTV Ratio: UW NCF DSCR: UW NOI Debt Yield: | $35,000,000 68.5% 1.81x 7.4% |
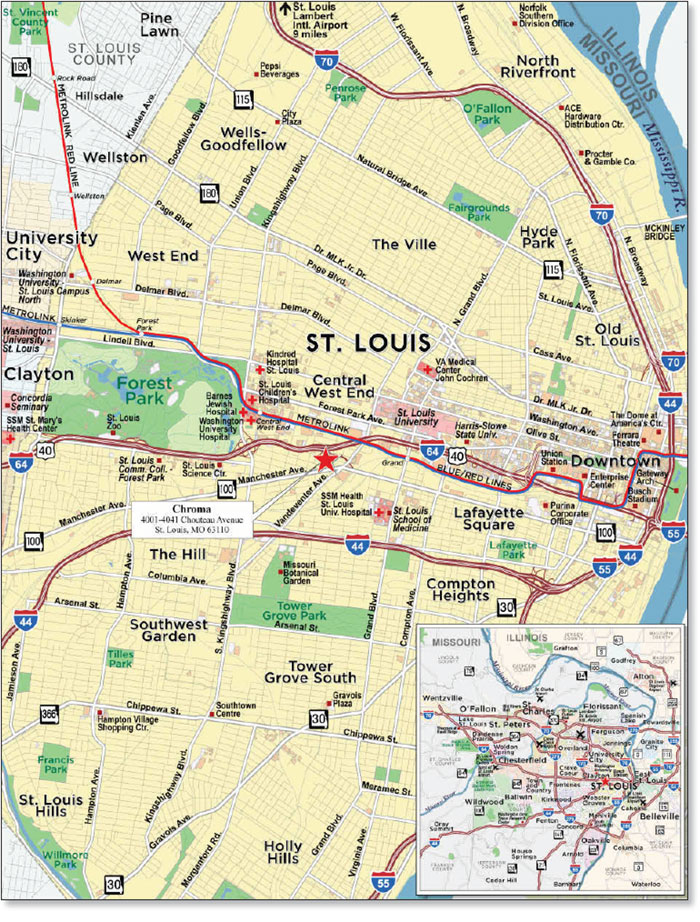
THE INFORMATION IN THIS STRUCTURAL AND COLLATERAL TERM SHEET IS NOT COMPLETE AND MAY BE AMENDED PRIOR TO THE TIME OF SALE. THIS TERM SHEET IS NOT AN OFFER TO SELL THESE SECURITIES AND IT IS NOT A SOLICITATION OF AN OFFER TO BUY THESE SECURITIES IN ANY JURISDICTION WHERE THE OFFER OR SALE IS NOT PERMITTED.
39
4001-4041 Chouteau Avenue St. Louis, MO 63110 | Collateral Asset Summary – Loan No. 2 Chroma Apartments | Cut-off Date Balance: Cut-off Date LTV Ratio: UW NCF DSCR: UW NOI Debt Yield: | $35,000,000 68.5% 1.81x 7.4% |
| Whole Loan Information | Property Information | ||||||
| Whole Loan Seller: | WFB | Single Asset/Portfolio: | Single Asset | ||||
Credit Assessment (Fitch/KBRA/Moody’s): | NR/NR/NR | Location: | St. Louis, MO 63110 | ||||
| General Property Type: | Multifamily | ||||||
| Original Balance(1): | $35,000,000 | Detailed Property Type: | Mid Rise | ||||
| Cut-off Date Balance(1): | $35,000,000 | Title Vesting: | Fee Simple | ||||
| % of Initial Pool Balance: | 4.7% | Year Built/Renovated: | 2018/N/A | ||||
| Loan Purpose: | Refinance | Size: | 235 Units | ||||
| Borrower Sponsors: | Philip G. Hulse; Philip G. Hulse Revocable Trust; Kevin Morrell; Kevin J. Morrell Revocable Trust; Howard J. Smith; Howard J. Smith Revocable Trust | Cut-off Date Balance per Unit(1)(2): | $212,766 | ||||
| Maturity Date Balance per Unit(1): | $212,766 | ||||||
Property Manager: | The Koman Group, L.L.C. | ||||||
| Mortgage Rate: | 3.9620% | ||||||
| Note Date: | 11/4/2019 | ||||||
| First Payment Date: | 12/11/2019 | ||||||
| Maturity Date: | 11/11/2029 | ||||||
| Original Term to Maturity: | 120 months | ||||||
| Original Amortization Term: | 0 months | ||||||
| IO Period: | 120 months | ||||||
| Seasoning: | 1 month | ||||||
| Prepayment Provisions: | LO (25); DEF (91); O (4) | Underwriting and Financial Information | |||||
| Lockbox/Cash Mgmt Status: | Hard/Springing | UW NOI(4): | $3,722,173 | ||||
| Additional Debt Type(1)(2): | Pari Passu / Mezzanine Debt | UW NOI Debt Yield(1)(2): | 7.4% | ||||
| Additional Debt Balance(1)(2): | $15,000,000 / $10,100,000 | UW NOI Debt Yield at Maturity(1): | 7.4% | ||||
| Future Debt Permitted (Type): | No (N/A) | UW NCF DSCR(1)(2): | 1.81x | ||||
| Reserves(3) | Most Recent NOI(4): | $3,669,660 (9/30/2019 T-1 Ann.) | |||||
| Type | Initial | Monthly | Cap | 2nd Most Recent NOI(4): | $1,551,010 (9/30/2019 TTM) | ||
| RE Tax: | $16,800 | $3,360 | N/A | 3rd Most Recent NOI(4): | N/A | ||
| Insurance: | $0 | Springing | N/A | Most Recent Occupancy: | 95.3% (10/30/2019) | ||
| Replacements: | $0 | $4,243 | $101,844 | 2nd Most Recent Occupancy(4): | N/A | ||
| Leasing: | $0 | $2,451 | $58,827 | 3rd Most Recent Occupancy(4): | N/A | ||
| Outstanding TI/LC: | $564,659 | $0 | N/A | Appraised Value (as of): | $73,000,000 (8/23/2019) | ||
| Rent Concession: | $70,382 | $0 | N/A | Cut-off Date LTV Ratio(1)(2): | 68.5% | ||
| Gap Rent: | $22,368 | $0 | N/A | Maturity Date LTV Ratio(1): | 68.5% | ||
| Sources and Uses | ||||||
| Sources | Proceeds | % of Total | Uses | Proceeds | % of Total | |
| Whole Loan Amount: | $50,000,000 | 83.2% | Loan Payoff: | $40,652,589 | 67.6% | |
| Mezzanine Loan: | $10,100,000 | 16.8% | Partnership Buyout: | $14,500,000 | 24.1% | |
| Reserves: | $674,209 | 1.1% | ||||
| Closing Costs: | $906,578 | 1.5% | ||||
| Return of Equity: | $3,366,624 | 5.6% | ||||
| Total Sources: | $60,100,000 | 100.0% | Total Uses: | $60,100,000 | 100.0% | |
| (1) | The Chroma Apartments Mortgage Loan (as defined below) is part of the Chroma Apartments Whole Loan (as defined below). The Cut-off Date Balance per Unit, Maturity Date Balance per Unit, UW NOI Debt Yield, UW NOI Debt Yield at Maturity, UW NCF DSCR, Cut-off Date LTV Ratio and Maturity Date LTV Ratio presented above are based on the Chroma Apartments Whole Loan. |
| (2) | The equity interest in the Chroma Apartments Borrower (as defined below) has been pledged to secure mezzanine indebtedness with an aggregate outstanding principal balance of $10,100,000 (the “Chroma Apartments Mezzanine Loan”). The Cut-off Date Balance per Unit, UW NOI Debt Yield, UW NCF DSCR, and Cut-off Date LTV Ratio based on the Chroma Apartments Whole Loan and the Chroma Apartments Mezzanine Loan are $255,745, 6.2%, 1.20x, and 82.3%, respectively. See “Additional Secured Indebtedness (not including trade debts)” below. |
| (3) | See “Escrows and Reserves” below for discussion of reserve requirements. |
| (4) | Prior historical operating history and occupancy is not available, as the Chroma Apartments Property (as defined below) was built in 2018. |
The Mortgage Loan. The second largest mortgage loan (the “Chroma Apartments Mortgage Loan”) is part of a whole loan (the “Chroma Apartments Whole Loan”), evidenced by twopari passu promissory notes with an aggregate original principal balance of $50,000,000. The Chroma Apartments Whole Loan is secured by a first priority fee mortgage encumbering 235-unit mid-rise apartment building located in St. Louis, Missouri (the “Chroma Apartments Property”). The controlling promissory Note A-1, with an original balance of $35,000,000, represents the Chroma Apartments Mortgage Loan, and will be contributed to the UBS 2019-C18 Trust. The non-controlling Note A-2 is currently held by Wells Fargo Bank, National Association and is expected to be contributed to a future securitization trust or may be otherwise transferred at any time. The mortgage loan seller provides no assurance that the non-securitized note will not be split further. The Chroma Apartments Whole Loan will be serviced pursuant to the pooling and servicing agreement for the UBS 2019-C18 Trust. See “Description of the Mortgage Pool—The Serviced Pari Passu Whole Loans” and “Pooling and Servicing Agreement” in the Preliminary Prospectus.
THE INFORMATION IN THIS STRUCTURAL AND COLLATERAL TERM SHEET IS NOT COMPLETE AND MAY BE AMENDED PRIOR TO THE TIME OF SALE. THIS TERM SHEET IS NOT AN OFFER TO SELL THESE SECURITIES AND IT IS NOT A SOLICITATION OF AN OFFER TO BUY THESE SECURITIES IN ANY JURISDICTION WHERE THE OFFER OR SALE IS NOT PERMITTED.
40
4001-4041 Chouteau Avenue St. Louis, MO 63110 | Collateral Asset Summary – Loan No. 2 Chroma Apartments | Cut-off Date Balance: Cut-off Date LTV Ratio: UW NCF DSCR: UW NOI Debt Yield: | $35,000,000 68.5% 1.81x 7.4% |
| Chroma Apartments Whole Loan Summary | ||||
| Note | Original Balance | Cut-off Date Balance | Anticipated Note Holder | Controlling Piece |
| A-1 | $35,000,000 | $35,000,000 | UBS 2019-C18 | Yes |
| A-2 | $15,000,000 | $15,000,000 | Wells Fargo Bank, N.A. | No |
| Total | $50,000,000 | $50,000,000 | ||
The Borrower and the Borrower Sponsors.The borrower is GS Chroma PH I, LLC (the “Chroma Apartments Borrower”), a Delaware limited liability company and single-purpose entity with one independent director. Legal counsel to the Chroma Apartments Borrower delivered a non-consolidation opinion in connection with the origination of the Chroma Apartments Whole Loan. The borrower sponsors and non-recourse carveout guarantors are Philip G. Hulse, Philip G. Hulse Revocable Trust, Kevin Morrell, Kevin J. Morrell Revocable Trust, Howard J. Smith and Howard J. Smith Revocable Trust.
Messrs. Hulse and Morrell serve as Managing Principal/CEO and Principal, respectively, of Green Street, a full-service real estate development company founded by Mr. Hulse in 2008 and located in St. Louis. With over 30 years of real estate experience, Mr. Hulse has raised more than $75 million in private equity, and has leveraged more than $250 million in private and public financing to support local real estate projects. Mr. Morrell, who specializes in working with investors and developing business opportunities at Green Street, also co-founded Midwest Aerials & Equipment, a large privately owned construction equipment rental company, which was sold in 2011. Mr. Smith is the co-founder of Smith NMTC Associates, LLC, a St. Louis-based firm that aims to revitalize and stabilize underserved communities through capital funding structures for projects that bring affordable homeownership and other benefits to these neighborhoods. Mr. Smith has approximately 30 years’ experience in real estate development law, finance and construction.
The Property. The Chroma Apartments Property is a four-story, class A multifamily building comprising 235 apartment units and located in St. Louis, Missouri. Built in 2018 and situated on a 4.0-acre parcel, the Chroma Apartments Property contains a four-story parking structure with 383 spaces (in addition to seven surface parking spaces), resulting in a parking ratio of approximately 1.7 spaces per unit. The Chroma Apartments Property also contains six street-level commercial spaces totaling 19,609 SF, which were 81.9% leased to five tenants as of October 30, 2019 (Salon Lofts, Chao Baan, Takashima Record Bar, Seoul Taco and Sweetwaters Coffee & Tea). The commercial units were underwritten separately from base rent and account for approximately 9.5% of underwritten effective gross income. See “Operating History and Underwritten Net Cash Flow” below.
The Chroma Apartments Property comprises 70 studio units, 111 one-bedroom/one-bathroom units, 50 two-bedroom/two-bathroom units, and four three-bedroom/two-bathroom units. Unit amenities at the Chroma Apartments Property include nine-foot ceilings, in-unit washers & dryers, vinyl plank flooring, stainless steel appliances, and private balconies in select units. Common area amenities at the Chroma Apartments Property include a courtyard with outdoor swimming pool and hot tub, fitness center, bike room, and business center. As of October 30, 2019, the multifamily units at the Chroma Apartments Property were 95.3% occupied.
The Chroma Apartments Property’s real estate taxes are currently abated through 2033 pursuant to Chapter 353, which locks assessed value at the predevelopment level. See “Operating History and Underwritten Net Cash Flow” below.
The table below shows the unit mix at the Chroma Apartments Property:
| Unit Type | No. of Units | % of Total Units | Avg. Unit Size (SF) | Avg. Monthly UW Rent | Appraiser’s Monthly Market Rent |
| Studio | 70 | 29.8% | 546 | $1,116 | $1,200 |
| 1 BD / 1 BA | 111 | 47.2% | 713 | $1,429 | $1,550 |
| 2 BD / 2 BA | 50 | 21.3% | 1,147 | $2,312 | $2,400 |
| 3 BD / 2 BA | 4 | 1.7% | 1,483 | $3,063 | $3,300 |
| Total/Wtd. Avg. | 235 | 100.0% | 769 | $1,551 | $1,656 |
| Source:Underwritten rent roll and appraisal. |
The Market. The Chroma Apartments Property is located in the Forest Park Southeast neighborhood of the City of St. Louis, approximately three miles west of the St. Louis central business district, and is situated within The Grove entertainment district. According to the appraisal, the surrounding neighborhood has seen consistent revitalization of its commercial corridor along Manchester Avenue with bars, restaurants, music venues and offices. Primary highway access to the area is provided by Interstate 64, a major arterial that crosses the St. Louis metropolitan statistical area in an east/west direction; and access to the Chroma Apartments Property from Interstate 64 is provided by South Vandeventer Avenue. Public transportation is provided by Metro Transit – St. Louis, which provides access to the City of St. Louis and St. Louis County through the light rail (MetroLink), bus (MetroBus), and call-a-ride services. The nearest MetroLink station is the Cortex station, which is approximately one half mile northwest of the Chroma Apartments Property. In addition, the St. Louis Lambert International Airport is located approximately 15 miles northwest of the Chroma Apartments Property.
The Chroma Apartments Property is situated in close proximity to Shriners Hospital for Children (0.9 miles northwest of the Chroma Apartments Property), Barnes-Jewish Hospital (1.2 miles northwest), and Washington University Hospital (1.2 miles northwest). In addition, SSM Saint Louis University Hospital is located less than one mile southeast of the Chroma Apartments Property. SSM announced a $550 million development of a new hospital building to be located immediately north of the current facilities. The 316-bed, 802,000 SF replacement hospital and new outpatient care center has broken ground and is expected for completion in late 2020. The new outpatient care center is expected to expand outpatient surgery services and provide additional clinical space.
According to the appraisal, the top employers in the area operate within the healthcare, government and education sectors, and major employers in the area include BJC Healthcare, SSM Health Care System, Washington University, Saint Louis University and the City of St. Louis. The Chroma Apartments Property is located less than one mile southeast of the CORTEX District, a 240-acre research and technology focused campus managed and operated by the Center of Research Technology and Entrepreneurial Exchange (known as CORTEX). The CORTEX District was founded in 2002 and focuses on the development of bioscience and technologic research, development and commercialization, and spurring the entrepreneurial ecosystem in the St. Louis area.
THE INFORMATION IN THIS STRUCTURAL AND COLLATERAL TERM SHEET IS NOT COMPLETE AND MAY BE AMENDED PRIOR TO THE TIME OF SALE. THIS TERM SHEET IS NOT AN OFFER TO SELL THESE SECURITIES AND IT IS NOT A SOLICITATION OF AN OFFER TO BUY THESE SECURITIES IN ANY JURISDICTION WHERE THE OFFER OR SALE IS NOT PERMITTED.
41
4001-4041 Chouteau Avenue St. Louis, MO 63110 | Collateral Asset Summary – Loan No. 2 Chroma Apartments | Cut-off Date Balance: Cut-off Date LTV Ratio: UW NCF DSCR: UW NOI Debt Yield: | $35,000,000 68.5% 1.81x 7.4% |
According to the appraisal, as of 2019, the estimated population within a three- and five-mile radius of the Chroma Apartments Property was 162,119 and 350,353, respectively; and the median household income within the same radii was $44,283 and $46,236, respectively.
According to a third party market report, the Chroma Apartments Property is situated within the St. Louis City South submarket. As of the second quarter of 2019, the submarket reported total inventory of 9,963 multifamily units with an 11.6% vacancy rate and average asking rent of $1,016 (average asking rent of $1,490 per unit for Class A properties). According to a third party market research provider, as of November 2019, within a one-mile radius of Chroma Apartments Property, there were approximately 7,194 multifamily units with a 10.8% vacancy rate.
The appraiser identified eight comparable properties totaling 1,037 units within 2.1 miles of the Chroma Apartments Property. The comparable properties reported a weighted average vacancy rate of 14.3%; however, two of the eight properties were delivered in 2019 and are still in lease-up, and the weighted average vacancy rate excluding the properties still in lease-up is approximately 3.0%.
Comparable rental properties to the Chroma Apartments Property are shown in the table below:
| Chroma Apartments Property Comparable Rentals Summary | ||||||||
| Property Name/Location | Year Built/Renovated | No. of Units | Occupancy | Distance to Subject | Unit Type | Unit Size (SF) | Monthly Rent | |
| Chroma Apartments Property(1) | 2018/N/A | 235 | 95.3% | – | Studio 1BR/1BA 2BR/2BA 3BR/2BA | 546 713 1,147 1,483 | $1,116 $1,429 $2,312 $3,063 | |
Aventura at Forest Park 4431 Chouteau Ave. St. Louis, MO 63110 | 2013/N/A | 155 | 99.0% | 0.5 | 1BR/1BA 2BR/2BA | 801 1,104 | $1,425 $1,777 | |
Grand Flats Apartments 2232-2254 S. Grand Blvd. St. Louis, MO 63104 | 2019/N/A | 124 | 71.0%(2) | 1.4 | Studio 1BR/1BA 2BR/2BA | 548 645 1,020 | $1,055 $1,425 $1,855 | |
Gateway Lofts 4240 Manchester Avenue St. Louis, MO 63110 | 2018/N/A | 55 | 96.4% | 0.6 | Studio 1BR/1BA 2BR/2BA | 422 711 1,248 | $775 $1,375 $1,688 | |
Encore at Forest Park 5714 Highlands Plaza Dr St. Louis, MO 63110 | 2018/N/A | 183 | 94.0% | 1.8 | Studio 1BR/1BA 2BR/2BA 3BR/2BA | 572 747 1,161 1,622 | $1,356 $1,667 $2,193 $3,319 | |
The Orion 4567 W Pine Blvd St. Louis, MO 63108 | 2015/N/A | 177 | 96.0% | 0.8 | 1BR/1BA 2BR/2BA 3BR/2BA | 732 1,170 1,407 | $1,973 $2,579 $4,350 | |
4321Grove 4321 Manchester Avenue St. Louis, MO 63110 | 2016/N/A | 20 | 95.0% | 0.5 | 1BR/1BA 2BR/2BA | 665 965 | $1,190 $1,555 | |
Tribeca STL 5510 Pershing Ave St. Louis, MO 63112 | 2018/N/A | 160 | 100.0% | 2.1 | Studio 1BR/1BA 2BR/2BA 3BR/2BA | 541 663 869 1,119 | $1,250 $1,606 $2,054 $3,000 | |
Woodward Lofts 1519 Tower Grove Ave. St. Louis, MO 63110 | 1926/2019 | 163 | 45.1%(3) | 0.6 | 1BR/1BA 1BR/1.5BA 2BR/2BA 3BR/2BA | 832 760 1,148 1,795 | $1,387 $1,500 $2,024 $2,500 | |
Source:Appraisal, unless otherwise noted.
| (1) | Information for the Chroma Apartments Property is based on the underwritten rent roll. |
| (2) | According to the appraisal, the Grand Flats Apartments property was delivered at the end of June 2019. Occupancy shown was obtained from a third party market research provider in November 2019. |
| (3) | According to the appraisal, the Woodward Lofts property had its first move-in in January 2019 with construction completing in March 2019. Occupancy shown was obtained from a third party market research provider in November 2019. |
THE INFORMATION IN THIS STRUCTURAL AND COLLATERAL TERM SHEET IS NOT COMPLETE AND MAY BE AMENDED PRIOR TO THE TIME OF SALE. THIS TERM SHEET IS NOT AN OFFER TO SELL THESE SECURITIES AND IT IS NOT A SOLICITATION OF AN OFFER TO BUY THESE SECURITIES IN ANY JURISDICTION WHERE THE OFFER OR SALE IS NOT PERMITTED.
42
4001-4041 Chouteau Avenue St. Louis, MO 63110 | Collateral Asset Summary – Loan No. 2 Chroma Apartments | Cut-off Date Balance: Cut-off Date LTV Ratio: UW NCF DSCR: UW NOI Debt Yield: | $35,000,000 68.5% 1.81x 7.4% |
Operating History and Underwritten Net Cash Flow. The following table presents certain information relating to the operating performance and the Underwritten Net Cash Flow at the Chroma Apartments Property:
| Cash Flow Analysis | ||||||
| 2017(1) | 2018(1) | 9/30/2019 TTM | 9/30/2019 T-1 Annualized | UW | UW Per Unit | |
| Gross Potential Rent | N/A | N/A | $2,839,626 | $4,028,976 | $4,374,120 | $18,613 |
| Retail Rent and CAM Income | N/A | N/A | $15,391 | $53,880 | $497,532(2) | $2,117 |
| Parking Income | N/A | N/A | $166,675 | $231,696 | $231,696 | $986 |
| Utilities and Cable/Internet | N/A | N/A | $221,182 | $303,060 | $303,060 | $1,290 |
| Other Income(3) | N/A | N/A | $106,164 | $273,624 | $141,000 | $600 |
| Less Concessions | N/A | N/A | ($347,225) | ($29,160) | ($29,160) | ($124) |
| Less Vacancy | N/A | N/A | $0 | $0 | ($289,740)(4) | ($1,233) |
| Effective Gross Income | N/A | N/A | $3,001,813 | $4,862,076 | $5,228,508 | $22,249 |
| Management Fee | N/A | N/A | $210,908 | $254,736 | $262,761 | $1,118 |
| Taxes | N/A | N/A | $22,500 | $30,000 | $38,396(5) | $163 |
| Insurance | N/A | N/A | $170,316 | $128,412 | $117,124 | $498 |
| Other Operating Expenses | N/A | N/A | $1,047,079 | $1,079,268 | $1,088,054 | $4,630 |
| Net Operating Income | N/A | N/A | $1,551,010 | $3,369,660 | $3,722,173 | $15,839 |
| Capital Expenditures | N/A | N/A | $0 | $0 | $62,670 | $267 |
| TI/LC | N/A | N/A | $0 | $0 | $22,388 | $95 |
| Net Cash Flow | N/A | N/A | $1,551,010 | $3,369,660 | $3,637,115 | $15,477 |
| Occupancy % | N/A | N/A | N/A | 95.3%(6) | 93.4% | |
| NOI DSCR(7) | N/A | N/A | 0.77x | 1.67x | 1.85x | |
| NCF DSCR(7) | N/A | N/A | 0.77x | 1.67x | 1.81x | |
| NOI Debt Yield(7) | N/A | N/A | 3.1% | 6.7% | 7.4% | |
| NCF Debt Yield(7) | N/A | N/A | 3.1% | 6.7% | 7.3% | |
| (1) | The Chroma Apartments Property was constructed in 2018; as such, prior historical operating performance information is not available. |
| (2) | The increase in Retail Rent and CAM Income in UW financials is due to all five retail leases having been signed since March 2019. While all underwritten retail tenants have executed leases, certain retail tenants are not yet open for business and/or paying rent. All underwritten retail tenants are expected to commence paying rent by March 2020, and the Chroma Apartments Borrower deposited upfront reserves for rent abatements and gap rent (see“Escrows and Reserves” below). |
| (3) | Other Income includes pet fees, storage income, office suite income, guest suite income, early termination charges, admin fees and other miscellaneous income. |
| (4) | UW Occupancy % is based on the underwritten economic vacancy of 6.6%. The Chroma Apartments Property was 95.3% occupied as of October 30, 2019. |
| (5) | The Chroma Apartments Property’s real estate taxes are currently abated through 2033 pursuant to Chapter 353, which locks assessed value at the predevelopment level. According to the appraisal, the estimated unabated 2019 real estate taxes for the Chroma Apartments Property are approximately $799,948. |
| (6) | The occupancy rate shown for 9/30/2019 T-1 Annualized is as of October 30, 2019. |
| (7) | Debt service coverage ratios and debt yields are based on the Chroma Apartments Whole Loan. |
Escrows and Reserves.The Chroma Apartments Borrower deposited in escrow at origination (i) $16,800 for real estate taxes, (ii) $564,659 for outstanding TI/LCs related to five retail tenants (Salon Lofts, Takashima Record Bar, Seoul Taco, Sweetwaters Coffee & Tea and Chao Baan), (iii) $70,382 for future rent abatements under existing leases related to three retail tenants (Salon Lofts, Takashima Record Bar and Seoul Taco) and (iv) $22,368 for a gap rent reserve related to retail leases.
The Chroma Apartments Borrower is required to escrow monthly (i) 1/12 of the annual estimated tax payments, currently equal to $3,360, (ii) $4,243 for replacement reserves (approximately $217 per unit annually), subject to a cap of $101,844 and (iii) $2,451 for general TI/LCs, subject to a cap of $58,827. The Chroma Apartments Borrower is not required to deposit ongoing insurance reserves as long as (i) no event of default has occurred and is continuing, (ii) the Chroma Apartments Borrower provides the lender with evidence that the Chroma Apartments Property’s insurance coverage is included in a blanket policy and such policy is in full force and effect, and (iii) the Chroma Apartments Borrower provides the lender with evidence of timely payment of the insurance premiums and renewals (and in no event later than 10 business days prior to expiration).
Lockbox and Cash Management. The related whole loan documents require that the Chroma Apartments Borrower establish and maintain a lender-controlled lockbox account, which is already in-place, and that the Chroma Apartments Borrower (i) direct all retail tenants to pay rent directly into such lockbox account and (ii) collect all rents from residential tenants and deposit such rents into the lockbox account. The related whole loan documents also require that all rents received by the Chroma Apartments Borrower or the property manager be deposited into the lockbox account within one business day of receipt. During a Cash Trap Event Period (as defined below), all funds in the lockbox account are required to be swept into the cash management account controlled by the lender and, on each payment date, all funds in the cash management account are required to be applied in accordance with the related whole loan documents. During a Cash Trap Event Period, any excess cash flow remaining after satisfaction of the waterfall items are required to be swept to an excess cash flow subaccount to be held by the lender as additional security for the Chroma Apartments Whole Loan during the continuance of the Cash Trap Event Period.
A “Cash Trap Event Period” will commence upon the earlier of the following: (i) an event of default, (ii) the net cash flow debt service coverage ratio, inclusive of the Chroma Apartments Mezzanine Loan (see “Mezzanine Loan and Preferred Equity” below; the “Chroma Total Debt DSCR”), being less than (a) 1.05x with respect to the 12-month period commencing on December 1, 2019 and continuing through November 30, 2020, (b) 1.10x with respect
THE INFORMATION IN THIS STRUCTURAL AND COLLATERAL TERM SHEET IS NOT COMPLETE AND MAY BE AMENDED PRIOR TO THE TIME OF SALE. THIS TERM SHEET IS NOT AN OFFER TO SELL THESE SECURITIES AND IT IS NOT A SOLICITATION OF AN OFFER TO BUY THESE SECURITIES IN ANY JURISDICTION WHERE THE OFFER OR SALE IS NOT PERMITTED.
43
4001-4041 Chouteau Avenue St. Louis, MO 63110 | Collateral Asset Summary – Loan No. 2 Chroma Apartments | Cut-off Date Balance: Cut-off Date LTV Ratio: UW NCF DSCR: UW NOI Debt Yield: | $35,000,000 68.5% 1.81x 7.4% |
to the 12-month period commencing on December 1, 2020 and continuing through November 30, 2021, and (c) for each period thereafter, 1.15x, or (iii) a default under the Chroma Apartments Mezzanine Loan.
A Cash Trap Event Period will end upon the occurrence of the following: with regard to clause (i) above, the cure of such event of default; with regard to clause (ii)(a) above, the Chroma Total Debt DSCR being equal to or greater than 1.10x for two consecutive calendar quarters; with regard to clause (ii)(b) above, the Chroma Total Debt DSCR being equal to or greater than 1.15x for two consecutive calendar quarters; with respect to clause (ii)(c) above, the Chroma Total Debt DSCR being equal to or greater than 1.20x for two consecutive calendar quarters; and with regard to clause (iii) above, the cure of such default.
Additional Secured Indebtedness (not including trade debts). None.
Mezzanine Loan and Preferred Equity. The Chroma Apartments Mezzanine Loan has an original principal amount of $10,100,000 and is secured by the direct equity ownership in the Chroma Apartments Borrower. The Chroma Apartments Mezzanine Loan is held by SMHF Cayman Hotel, LLC, which is related to Sound Mark Partners, LLC. The Chroma Apartments Mezzanine Loan accrues interest at a rate of 10.0000%per annum and is coterminous with the Chroma Apartments Whole Loan. Including the Chroma Apartments Whole Loan and the Chroma Apartments Mezzanine Loan, the total Cut-off Date LTV Ratio, total UW NCF DSCR and total UW NOI Debt Yield are 82.3%, 1.20x and 6.2%, respectively. The lenders of The Chroma Apartments Whole Loan and the Chroma Apartments Mezzanine Loan have entered into an intercreditor agreement.
Release of Property. Not permitted.
Terrorism Insurance.The related whole loan documents require that the “all risk” insurance policy required to be maintained by the borrower provides coverage for terrorism in an amount equal to the full replacement cost of the Chroma Apartments Property, as well as business interruption insurance covering no less than the 18-month period following the occurrence of a casualty event, together with a 6-month extended period of indemnity.
THE INFORMATION IN THIS STRUCTURAL AND COLLATERAL TERM SHEET IS NOT COMPLETE AND MAY BE AMENDED PRIOR TO THE TIME OF SALE. THIS TERM SHEET IS NOT AN OFFER TO SELL THESE SECURITIES AND IT IS NOT A SOLICITATION OF AN OFFER TO BUY THESE SECURITIES IN ANY JURISDICTION WHERE THE OFFER OR SALE IS NOT PERMITTED.
44
| Various | Collateral Asset Summary – Loan No. 3 Wyndham National Hotel Portfolio | Cut-off Date Balance: Cut-off Date LTV Ratio: UW NCF DSCR: UW NOI Debt Yield: | $35,000,000 67.4% 1.94x 16.1% |
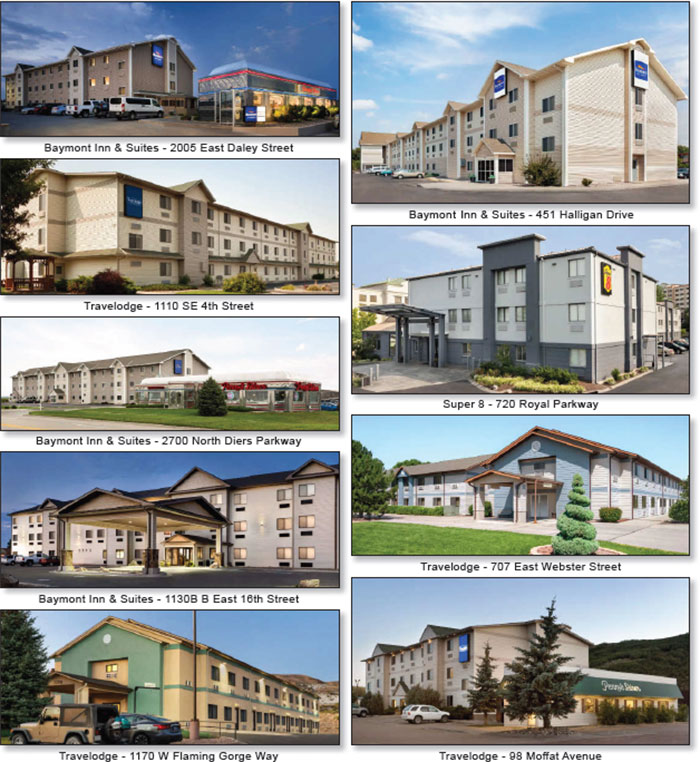
THE INFORMATION IN THIS STRUCTURAL AND COLLATERAL TERM SHEET IS NOT COMPLETE AND MAY BE AMENDED PRIOR TO THE TIME OF SALE. THIS TERM SHEET IS NOT AN OFFER TO SELL THESE SECURITIES AND IT IS NOT A SOLICITATION OF AN OFFER TO BUY THESE SECURITIES IN ANY JURISDICTION WHERE THE OFFER OR SALE IS NOT PERMITTED.
45
| Various | Collateral Asset Summary – Loan No. 3 Wyndham National Hotel Portfolio | Cut-off Date Balance: Cut-off Date LTV Ratio: UW NCF DSCR: UW NOI Debt Yield: | $35,000,000 67.4% 1.94x 16.1% |
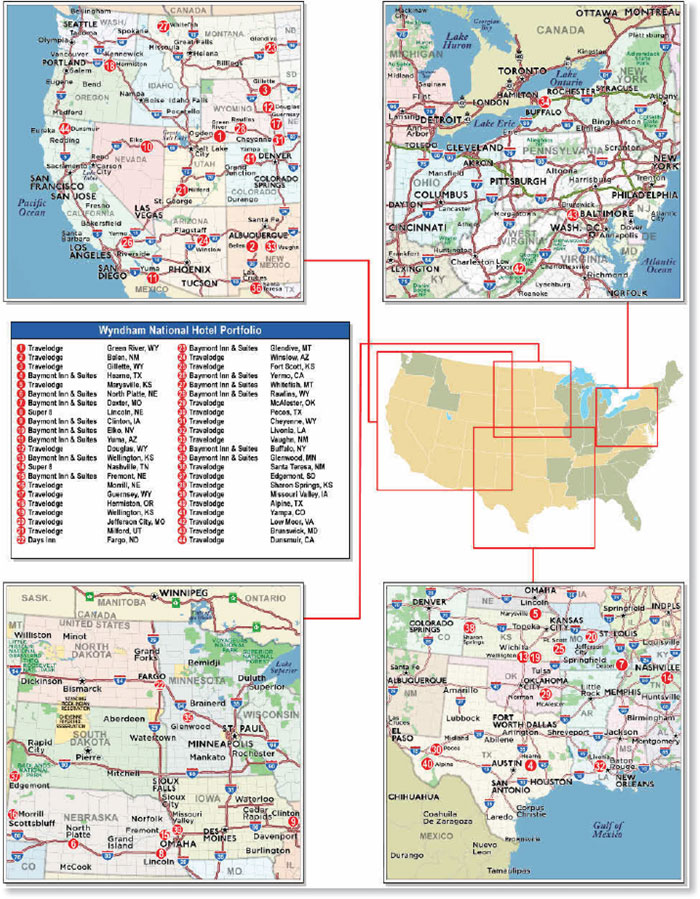
THE INFORMATION IN THIS STRUCTURAL AND COLLATERAL TERM SHEET IS NOT COMPLETE AND MAY BE AMENDED PRIOR TO THE TIME OF SALE. THIS TERM SHEET IS NOT AN OFFER TO SELL THESE SECURITIES AND IT IS NOT A SOLICITATION OF AN OFFER TO BUY THESE SECURITIES IN ANY JURISDICTION WHERE THE OFFER OR SALE IS NOT PERMITTED.
46
| Various | Collateral Asset Summary – Loan No. 3 Wyndham National Hotel Portfolio | Cut-off Date Balance: Cut-off Date LTV Ratio: UW NCF DSCR: UW NOI Debt Yield: | $35,000,000 67.4% 1.94x 16.1% |
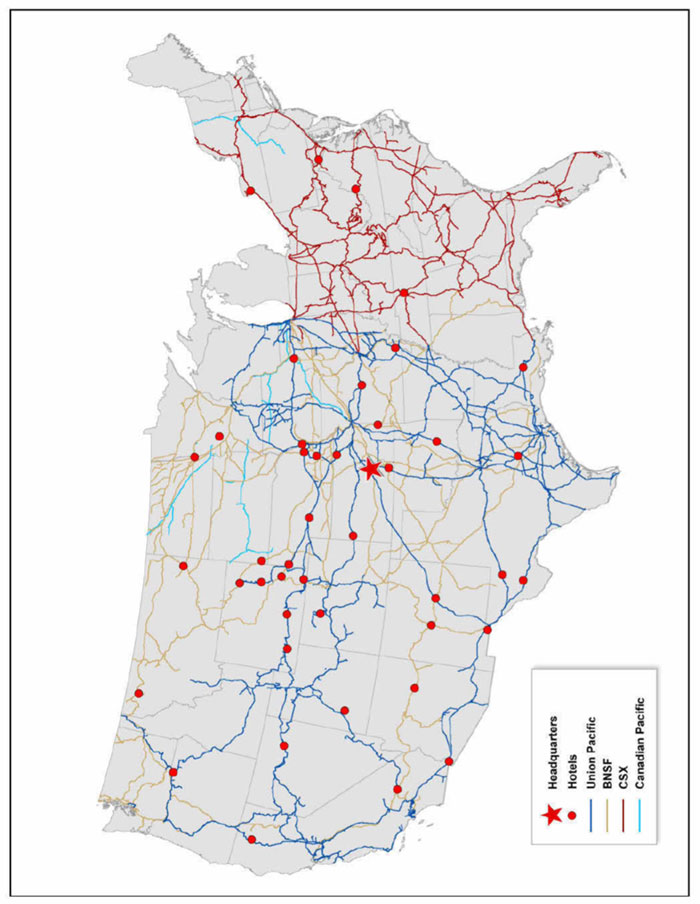
THE INFORMATION IN THIS STRUCTURAL AND COLLATERAL TERM SHEET IS NOT COMPLETE AND MAY BE AMENDED PRIOR TO THE TIME OF SALE. THIS TERM SHEET IS NOT AN OFFER TO SELL THESE SECURITIES AND IT IS NOT A SOLICITATION OF AN OFFER TO BUY THESE SECURITIES IN ANY JURISDICTION WHERE THE OFFER OR SALE IS NOT PERMITTED.
47
| Various | Collateral Asset Summary – Loan No. 3 Wyndham National Hotel Portfolio | Cut-off Date Balance: Cut-off Date LTV Ratio: UW NCF DSCR: UW NOI Debt Yield: | $35,000,000 67.4% 1.94x 16.1% |
| Mortgage Loan Information | Property Information | |||||
| Mortgage Loan Seller: | UBS AG | Single Asset/Portfolio: | Portfolio | |||
Credit Assessment (Fitch/KBRA/Moody’s): | NR/NR/NR | Location: | Various | |||
| General Property Type: | Hospitality | |||||
| Original Balance(1): | $35,000,000 | Detailed Property Type: | Limited Service | |||
| Cut-off Date Balance(1): | $35,000,000 | Title Vesting(4): | Various | |||
| % of Initial Pool Balance: | 4.7% | Year Built/Renovated: | Various | |||
| Loan Purpose: | Acquisition | Size: | 3,729 Rooms | |||
| Borrower Sponsors: | Tom Vukota; Vukota Capital Management Ltd. | Cut-off Date Balance per Room(1): | $38,884 | |||
| Maturity Date Balance per Room(1): | $26,916 | |||||
| Mortgage Rate: | 4.8500% | Property Manager: | Avantic Lodging Enterprises, Inc. (borrower-related) | |||
| Note Date: | 11/27/2019 | |||||
| First Payment Date: | 1/6/2020 | |||||
| Maturity Date: | 12/6/2029 | |||||
| Original Term to Maturity: | 120 months | |||||
| Original Amortization Term: | 270 months | |||||
| IO Period: | 0 months | |||||
| Seasoning: | 0 months | |||||
| Prepayment Provisions(2): | LO (24); YM2 (92); O (4) | Underwriting and Financial Information | ||||
| Lockbox/Cash Mgmt Status: | Hard/Springing | UW NOI: | $23,369,629 | |||
| Additional Debt Type(1): | Pari Passu | UW NOI Debt Yield(1): | 16.1% | |||
| Additional Debt Balance(1): | $110,000,000 | UW NOI Debt Yield at Maturity(1): | 23.3% | |||
| Future Debt Permitted (Type): | No (N/A) | UW NCF DSCR(1): | 1.94x | |||
| Reserves(3) | Most Recent NOI: | $23,034,823 (8/31/2019 TTM) | ||||
| Type | Initial | Monthly | Cap | 2nd Most Recent NOI: | $24,470,573 (12/31/2018) | |
| RE Tax: | $436,502 | $160,955 | N/A | 3rd Most Recent NOI(5): | $23,384,056 (12/31/2017) | |
| Insurance: | $790,391 | $116,681 | N/A | Most Recent Occupancy: | 71.7% (8/31/2019) | |
| FF&E: | $0 | $235,965 | N/A | 2nd Most Recent Occupancy: | 73.2% (12/31/2018) | |
| Immediate Repairs: | $2,014,340 | $0 | N/A | 3rd Most Recent Occupancy: | 70.2% (12/31/2017) | |
| PIP Funds: | $7,417,247 | $0 | N/A | Appraised Value (as of): | $215,000,000 (8/1/2019) | |
| Railroad Contract Renewal Funds: | $7,000,000 | $0 | N/A | Cut-off Date LTV Ratio(1): | 67.4% | |
| Post-Closing Obligations Funds: | $500,000 | $0 | N/A | Maturity Date LTV Ratio(1): | 46.7% | |
| Sources and Uses | ||||||
| Sources | Proceeds | % of Total | Uses | Proceeds | % of Total | |
| Loan Amount(1): | $145,000,000 | 59.7% | Purchase Price(6): | $215,500,000 | 88.7% | |
| Borrower Equity: | $97,876,778 | 40.3% | Reserves: | $18,158,480 | 7.5% | |
| Closing Costs: | $9,218,299 | 3.8% | ||||
| Total Sources: | $242,876,778 | 100.0% | Total Uses: | $242,876,778 | 100.0% | |
| (1) | The Wyndham National Hotel Portfolio Mortgage Loan (as defined below) is part of the Wyndham National Hotel Portfolio Whole Loan (as defined below), which is comprised of 12pari passupromissory notes with an aggregate original principal balance of $145,000,000. The Cut-off Date Balance per Room, Maturity Date Balance per Room, UW NOI Debt Yield, UW NOI Debt Yield at Maturity, UW NCF DSCR, Cut-off Date LTV Ratio and Maturity Date LTV Ratio presented above are based on the Wyndham National Hotel Portfolio Whole Loan. |
| (2) | Partial release is permitted. See “Release of Property” below for further discussion of release requirements. |
| (3) | See “Escrows and Reserves” below for further discussion of reserve requirements. |
| (4) | The Wyndham National Hotel Portfolio Whole Loan is secured by the borrower’s fee simple interest in 43 properties and fee simple/leasehold interest in the Travelodge - 2307 Wyoming Avenue property. |
| (5) | The Days Inn - 3431 14th Avenue and Baymont Inn & Suites - 6390 US-93 properties were acquired by the seller in October and November 2017, respectively. As such, 3rd Most Recent NOI represents the 2017 full-year operating performance of 42 properties and partial-year operating performance of the aforementioned properties. |
| (6) | Includes one property with an allocated purchase price of $3,000,000 that is not collateral for the Wyndham National Hotel Portfolio Whole Loan. |
The Mortgage Loan.The third largest mortgage loan (the “Wyndham National Hotel Portfolio Mortgage Loan”) is part of a whole loan (the “Wyndham National Hotel Portfolio Whole Loan”) evidenced by 12pari passu promissory notes with an aggregate original principal balance of $145,000,000. The Wyndham National Hotel Portfolio Whole Loan is secured by a first priority fee/leasehold mortgage encumbering a 44-property, limited service hospitality portfolio totaling 3,729 rooms located across 23 states (each, a “Wyndham National Hotel Portfolio Property”, and collectively, the “Wyndham National Hotel Portfolio Properties” or the “Wyndham National Hotel Portfolio”). Promissory Notes A-1 and A-8, with an aggregate original principal balance of $35,000,000, represent the Wyndham National Hotel Portfolio Mortgage Loan, and will be included in the UBS 2019-C18 Trust. The below table summarizes the Wyndham National Hotel Portfolio Whole Loan, including the remaining promissory notes, which are currently held by UBS AG and may otherwise be transferred at any time. The mortgage loan seller provides no assurances that the non-securitized notes will not be split further. The Wyndham National Hotel Portfolio Whole Loan will be serviced pursuant to the pooling and servicing agreement for the UBS 2019-C18 Trust. See “Description of the Mortgage Pool—The Whole Loans—The Serviced Pari Passu Whole Loans” and “Pooling and Servicing Agreement” in the Preliminary Prospectus.
THE INFORMATION IN THIS STRUCTURAL AND COLLATERAL TERM SHEET IS NOT COMPLETE AND MAY BE AMENDED PRIOR TO THE TIME OF SALE. THIS TERM SHEET IS NOT AN OFFER TO SELL THESE SECURITIES AND IT IS NOT A SOLICITATION OF AN OFFER TO BUY THESE SECURITIES IN ANY JURISDICTION WHERE THE OFFER OR SALE IS NOT PERMITTED.
48
| Various | Collateral Asset Summary – Loan No. 3 Wyndham National Hotel Portfolio | Cut-off Date Balance: Cut-off Date LTV Ratio: UW NCF DSCR: UW NOI Debt Yield: | $35,000,000 67.4% 1.94x 16.1% |
| Wyndham National Hotel Portfolio Whole Loan Summary | ||||
| Note | Original Balance | Cut-off Date Balance | Anticipated Note Holder | Controlling Piece |
| A-1 | $25,000,000 | $25,000,000 | UBS 2019-C18 | Yes |
| A-2 | $20,000,000 | $20,000,000 | UBS AG | No |
| A-3 | $20,000,000 | $20,000,000 | UBS AG | No |
| A-4 | $20,000,000 | $20,000,000 | UBS AG | No |
| A-5 | $10,000,000 | $10,000,000 | UBS AG | No |
| A-6 | $10,000,000 | $10,000,000 | UBS AG | No |
| A-7 | $10,000,000 | $10,000,000 | UBS AG | No |
| A-8 | $10,000,000 | $10,000,000 | UBS 2019-C18 | No |
| A-9 | $5,000,000 | $5,000,000 | UBS AG | No |
| A-10 | $5,000,000 | $5,000,000 | UBS AG | No |
| A-11 | $5,000,000 | $5,000,000 | UBS AG | No |
| A-12 | $5,000,000 | $5,000,000 | UBS AG | No |
| Total | $145,000,000 | $145,000,000 | ||
The Borrower and the Borrower Sponsors. The borrower is Lodging Enterprises, LLC (the “Wyndham National Hotel Portfolio Borrower”), a Delaware limited liability company structured to be bankruptcy remote with two independent directors. The borrower sponsors and non-recourse carevout guarantors of the Wyndham National Hotel Portfolio Whole Loan are Tom Vukota and Vukota Capital Management Ltd. The Wyndham National Hotel Portfolio Borrower is wholly owned by VCM Lodging Enterprises, LP, which is the legal and beneficial owner of Avantic Lodging Enterprises, Inc., the property manager of the Wyndham National Hotel Portfolio (the “Property Manager”). At loan origination, VCM Lodging Enterprises, LP pledged 100% of its interest in the Property Manager to the lender as additional collateral for the Wyndham National Hotel Portfolio Whole Loan (the “Equity Pledge”). The lender may not exercise its rights under the pledge agreement unless a Collective Bargaining Springing Event (as defined below) has occurred. The related mortgage loan documents provide (i) recourse to the borrower sponsors in an amount equal to $72,500,000 (the “Vukota Payment Guaranty”), as described in “Additional Recourse” below, and (ii) recourse to the guarantors for losses to the lender in connection with a breach of certain backward-looking single purpose entity representations (determined without giving effect to exceptions to such representations contained in the related mortgage loan documents) made by the Wyndham National Hotel Portfolio Borrower (the “SPE Recourse Obligations”). The non-consolidation opinion of counsel to the Wyndham National Hotel Portfolio Borrower delivered at origination provided no opinion regarding the substantive consolidation of the assets and liabilities of the Wyndham National Hotel Portfolio Borrower or its managing member with those of any one or more related parties to the extent of the existence of the Equity Pledge, the Vukota Payment Guaranty, the LOC Obligations (as defined below) or the SPE Recourse Obligations. See “Description of the Mortgage Pool—Single Purpose Entity Covenants” in the Preliminary Prospectus.
Tom Vukota is the founder and CEO of Vukota Capital Management, and has over 20 years of real estate investment and asset management experience. Founded in 2010, Vukota Capital Management is an investment firm with real estate, private equity, and public market investment platforms. Including its affiliated companies, Vukota Capital Management manages over $600 million on behalf of high net worth individuals, advisors, and institutions, and employs a staff of over 30 corporate professionals and over 170 site-level employees. The real estate arm of Vukota Capital Management is a vertically integrated investment platform focused on multifamily and medical office assets in the United States with over $500 million in assets under management.
The Properties.The Wyndham National Hotel Portfolio is comprised of 44 limited service hospitality properties totaling 3,729 rooms. The hotels range in size from 21 to 192 rooms with an average count of 85 rooms. The portfolio benefits from geographic diversity across 23 states, in addition to an overall granular property mix. No individual portfolio property accounts for greater than 5.1% of total rooms or 7.6% of underwritten net cash flow. The Wyndham National Hotel Portfolio Properties were built between 1978 and 2015, with an average year built of 2001. Renovations have occurred at 18 of the Wyndham National Hotel Portfolio Properties since 2014, representing 50.3% of the portfolio based on underwritten net cash flow.
Since 2014, approximately $18.9 million ($5,081 per room) was spent on FF&E and capital improvements at the Wyndham National Hotel Portfolio Properties. At loan origination, approximately $7.4 million was escrowed in connection with the scheduled property improvement plans (“PIP”), which represents 115% of the estimated cost of the current brand mandated PIP work at the Wyndham National Hotel Portfolio Properties.
A summary of the Wyndham National Hotel Portfolio Properties is provided below:
| Portfolio Overview | |||||||||||
| Property Flag | No. of Properties | Rooms | % of Total Rooms | Allocated Cut-Off Date Balance | % of Allocated Cut-off Date Balance | As Is Appraised Value | LTV | UW NCF | % of UW NCF | UW NCF DSCR | UW NOI Debt Yield |
| Travelodge | 27 | 2,064 | 55.3% | $83,972,042 | 57.9% | $115,700,000 | 72.6% | $11,568,932 | 56.3% | 1.88x | 15.6% |
| Baymont Inn & Suites | 14 | 1,356 | 36.4% | $50,688,843 | 35.0% | $83,300,000 | 60.9% | $7,415,185 | 36.1% | 2.00x | 16.7% |
| Super 8 | 2 | 235 | 6.3% | $8,799,000 | 6.1% | $13,500,000 | 65.2% | $1,349,146 | 6.6% | 2.10x | 17.2% |
| Days Inn | 1 | 74 | 2.0% | $1,540,116 | 1.1% | $2,500,000 | 61.6% | $204,680 | 1.0% | 1.82x | 16.7% |
| Total/Wtd. Avg. | 44 | 3,729 | 100.0% | $145,000,000 | 100.0% | $215,000,000 | 67.4% | $20,537,942 | 100.0% | 1.94x | 16.1% |
THE INFORMATION IN THIS STRUCTURAL AND COLLATERAL TERM SHEET IS NOT COMPLETE AND MAY BE AMENDED PRIOR TO THE TIME OF SALE. THIS TERM SHEET IS NOT AN OFFER TO SELL THESE SECURITIES AND IT IS NOT A SOLICITATION OF AN OFFER TO BUY THESE SECURITIES IN ANY JURISDICTION WHERE THE OFFER OR SALE IS NOT PERMITTED.
49
| Various | Collateral Asset Summary – Loan No. 3 Wyndham National Hotel Portfolio | Cut-off Date Balance: Cut-off Date LTV Ratio: UW NCF DSCR: UW NOI Debt Yield: | $35,000,000 67.4% 1.94x 16.1% |
Based on the trailing 12-month period ending August 31, 2019, the Wyndham National Hotel Portfolio Properties as a whole outperformed their competitive set with occupancy and RevPAR penetration rates each in excess of 100.0%. On an individual property basis, 81.8% and 34.1% of the Wyndham National Hotel Portfolio Properties, based on property count, outperformed their competitive set with occupancy and RevPAR penetration rates in excess of 100.0%, respectively.
Occupancy, ADR, and RevPAR of the Wyndham National Hotel Portfolio Properties in relation to their respective competitive sets are provided below:
| Historical Occupancy, ADR, RevPAR(1) | |||||||||||
Competitive Set | Wyndham National Hotel Portfolio | Penetration Factor | |||||||||
| Year | Occupancy | ADR | RevPAR | Occupancy | ADR | RevPAR | Occupancy | ADR | RevPAR | ||
| 2018 | 44.4% | $76.53 | $33.95 | 70.7% | $55.35 | $39.13 | 159.4% | 72.3% | 115.3% | ||
| 8/31/2019 TTM | 55.8% | $73.99 | $41.00 | 71.7% | $57.97 | $41.56 | 128.5% | 78.4% | 101.4% | ||
Source:Industry Report
| (1) | The variances between the underwriting, the appraisal and the industry report data with respect to Occupancy, ADR and RevPAR at Wyndham National Hotel Portfolio Properties are attributable to differing reporting methodologies, and/or timing differences. |
The Wyndham National Hotel Portfolio Properties operate under franchise agreements with subsidiaries of Wyndham Hotel & Resorts, Inc. (“Wyndham”), all of which were renewed for 15-year terms upon acquisition and have an expiration date of January 1, 2035. The franchise agreements stipulate a combined royalty and system assessment feeper annum of $16,778 per hotel, payable in equal monthly installments.
Wyndham is a global hotel franchisor company, operating in over 80 countries and territories under 20 brand names. As of year-end 2018, Wyndham had 440 company-owned and/or managed properties (67,100 rooms) and 8,717 franchised properties (742,800 rooms), for a total of 9,157 properties (809,900 rooms). Wyndham’s portfolio of global brands includes Super 8, Days Inn, Ramada, La Quinta, Howard Johnson, Baymont Inn & Suites, Travelodge, Microtel, Wyndham Garden, TRYP, and Wyndham Grand. Approximately 62% and 31% of its franchised hotels operate within the economy and midscale segments, respectively.
Each Wyndham National Hotel Portfolio Property, with the exception of the Travelodge - 1177 E 16th Street property, benefits from corporate contracts with one of four North American railway companies, Union Pacific Railroad Company (“Union Pacific”) (Moody’s/S&P: Baa1/A-), BNSF Railway Company (“BNSF”) (Moody’s/S&P: A3/A+), CSX Transportation, Inc. (“CSX”) (Moody’s/S&P: Baa1/BBB+), and Canadian Pacific Railway Company (“Canadian Pacific”) (S&P: BBB+) (each, a “Railway Company”, and collectively, the “Railway Companies”). The contracts set a required minimum number of room nights reserved at a stipulated rate, most of which have adjustment factors related to inflation. Most contracts also feature certain provisions that prevent railway crew employees from staying at a competing hotel within a predefined radius. The current contracts in place at the Wyndham National Hotel Portfolio Properties guarantee a minimum of 2,296 room nights daily, representing 61.6% of the total available room nights. Based on a weighted average contract negotiated rate of $48.50 per room night, the current contracts in place at the Wyndham National Hotel Portfolio Properties represent 71.9% of total room revenue.
| Rail Contract Overview | ||||||||||
| Railway Company | No. of Properties | No. of Rooms | Minimum Daily Guaranteed Rooms | % of Total Rooms | Age of Contract (years) | Remaining Term of Contract (years) | Negotiated Rate Per Room | UW Occupancy | UW ADR | UW RevPAR |
| Union Pacific | 27 | 2,321 | 1,386 | 37.2% | 17.9 | 1.7 | $46.69 | 70.9% | $56.44 | $40.01 |
| BNSF | 11 | 1,058 | 762 | 20.4% | 17.7 | 4.5 | $49.12 | 76.7% | $56.48 | $43.35 |
| CSX | 3 | 158 | 89 | 2.4% | 5.1 | 3.8 | $68.86 | 74.9% | $83.58 | $62.64 |
| Canadian Pacific | 2 | 112 | 59 | 1.6% | 11.8 | 1.9 | $52.17 | 65.2% | $69.32 | $45.20 |
| No Contract | 1 | 80 | 0 | 0.0% | N/A | N/A | N/A | 31.0% | $52.12 | $16.15 |
| Total/Wtd. Avg. | 44 | 3,729 | 2,296 | 61.6% | 17.1 | 2.6 | $48.50 | 71.7% | $57.97 | $41.56 |
Amenities available at most of the Wyndham National Hotel Portfolio Properties include meeting rooms, fitness centers, self-service guest laundry, high-speed internet, and private lounges dedicated to the railway crew members. Certain hotels feature computer workstations, entertainment game rooms, oversized vehicle parking, dedicated locker rooms, and other amenities. The rooms at the Wyndham National Hotel Portfolio Properties were specifically designed to comply with “Dark and Quiet” requirements as stipulated in the contracts. Such “Dark and Quiet” specifications include noise abatement measures, and light-proofing measures such as custom curtains and blackout drapes that seal from wall to center and door sweeps, and more. Each room is equipped with an individual HVAC unit, remote guest detection/energy management system, and television set with cable and/or satellite service. Additionally, 27 of the 44 Wyndham National Hotel Portfolio Properties are serviced by a 24-hour on-site restaurant, Penny’s Diner.
The current Railway Company contracts typically have an initial term of five years, with renewal options. Two contracts have been in place for over 33 years, 13 contracts have been in place for over 20 years, and 16 contracts have been in place for over 10 years, for a weighted average age across the Wyndham National Hotel Portfolio of 17.1 years. All of the contracts that have previously reached an expiration date have been renewed, with the exception of one. The current contracts have a staggered expiration profile, with 42.1% and 10.5% of the guaranteed room nights expiring in 2020 and 2022, respectively. Nine of the current contracts have early termination options. At loan origination, an upfront $7.0 million Rail Contract Renewal Reserve was escrowed.
As of the trailing 12-month period ending August 31, 2019, the Wyndham National Hotel Portfolio Properties had an ADR of $57.97 per room night, which is 21.6% below the ADR of the competitive set of $73.99 per room night. The Wyndham National Hotel Portfolio has a weighted average contract negotiated rate of $48.50 per room night, which is 34.4% below the ADR of competitive set. The competitive set had RevPAR of $41.00 per room night as of the trailing 12-month period ending August 31, 2019, which represents a 20.8% increase since year-end 2018, demonstrating market fundamentals if the Railway Company contracts were no longer applicable. Further, while the contracts provide stable and reliable revenue, as indicated by the length of
THE INFORMATION IN THIS STRUCTURAL AND COLLATERAL TERM SHEET IS NOT COMPLETE AND MAY BE AMENDED PRIOR TO THE TIME OF SALE. THIS TERM SHEET IS NOT AN OFFER TO SELL THESE SECURITIES AND IT IS NOT A SOLICITATION OF AN OFFER TO BUY THESE SECURITIES IN ANY JURISDICTION WHERE THE OFFER OR SALE IS NOT PERMITTED.
50
| Various | Collateral Asset Summary – Loan No. 3 Wyndham National Hotel Portfolio | Cut-off Date Balance: Cut-off Date LTV Ratio: UW NCF DSCR: UW NOI Debt Yield: | $35,000,000 67.4% 1.94x 16.1% |
existence of the contracts, and are diversified by Railway Company and region, the Wyndham National Hotel Portfolio Whole Loan is structured to include multiple triggers related to the weighted average term of the contracts across the portfolio. Additionally, the total revenue derived by the contracts is based on actually utilized room nights, as well as possible events that may negatively impact the demand by Railway Companies. See “Escrows and Reserves” and “Lockbox and Cash Management” below for further discussion of the current contracts.
The Markets.The Wyndham National Hotel Portfolio’s largest room count concentrations by state are Wyoming (six hotels), Kansas (five hotels), Nebraska (four hotels), and New Mexico (three hotels), which collectively comprise 49.9% of the total rooms and 51.8% of the UW NCF. The Wyndham National Hotel Portfolio Properties are strategically located in close proximity to high volume railroad hubs and switching terminals, as well as major highways. Demand at the Wyndham National Hotel Portfolio Properties are supplemented by walk-in and transient guest business.
A summary of the Wyndham National Hotel Portfolio Properties based on geographical distribution is provided below:
| Distribution By State | ||||||||||
| State | No. of Properties | No. of Rooms | % of Total Rooms | Allocated Whole Loan Cut-Off Date Balance | % of Allocated Whole Loan Cut-off Date Balance | UW Occupancy | UW ADR | UW RevPAR | Appraised Value | LTV |
| AZ | 2 | 191 | 5.1% | $8,837,401 | 6.1% | 93.5% | $50.02 | $46.79 | $12,400,000 | 71.3% |
| CA | 2 | 86 | 2.3% | $1,460,602 | 1.0% | 70.4% | $61.82 | $43.53 | $2,600,000 | 56.2% |
| CO | 1 | 37 | 1.0% | $323,123 | 0.2% | 44.1% | $80.55 | $35.48 | $900,000 | 35.9% |
| IA | 2 | 164 | 4.4% | $5,445,903 | 3.8% | 69.3% | $54.59 | $37.81 | $7,200,000 | 75.6% |
| KS | 5 | 449 | 12.0% | $13,325,515 | 9.2% | 59.2% | $57.01 | $33.74 | $20,700,000 | 64.4% |
| LA | 1 | 60 | 1.6% | $2,953,199 | 2.0% | 80.9% | $57.90 | $46.86 | $4,200,000 | 70.3% |
| MD | 1 | 25 | 0.7% | $800,000 | 0.6% | 51.7% | $102.43 | $52.92 | $800,000 | 100.0% |
| MN | 1 | 56 | 1.5% | $602,118 | 0.4% | 62.9% | $65.54 | $41.25 | $1,900,000 | 31.7% |
| MO | 2 | 210 | 5.6% | $8,408,177 | 5.8% | 75.7% | $52.58 | $39.78 | $14,400,000 | 58.4% |
| MT | 2 | 138 | 3.7% | $6,026,296 | 4.2% | 72.1% | $72.47 | $52.23 | $8,200,000 | 73.5% |
| ND | 1 | 74 | 2.0% | $1,540,116 | 1.1% | 86.1% | $56.56 | $48.71 | $2,500,000 | 61.6% |
| NE | 4 | 464 | 12.4% | $16,736,213 | 11.5% | 73.1% | $52.11 | $38.08 | $23,900,000 | 70.0% |
| NM | 3 | 274 | 7.3% | $15,593,338 | 10.8% | 89.6% | $50.94 | $45.67 | $18,400,000 | 84.7% |
| NV | 1 | 119 | 3.2% | $4,198,199 | 2.9% | 66.6% | $52.10 | $34.70 | $6,500,000 | 64.6% |
| NY | 1 | 56 | 1.5% | $1,278,229 | 0.9% | 67.5% | $72.84 | $49.15 | $3,800,000 | 33.6% |
| OK | 1 | 61 | 1.6% | $2,140,661 | 1.5% | 82.3% | $50.62 | $41.63 | $3,700,000 | 57.9% |
| OR | 1 | 86 | 2.3% | $4,070,808 | 2.8% | 84.0% | $54.25 | $45.57 | $6,500,000 | 62.6% |
| SD | 1 | 55 | 1.5% | $2,214,626 | 1.5% | 73.9% | $58.22 | $43.01 | $3,100,000 | 71.4% |
| TN | 1 | 103 | 2.8% | $4,667,147 | 3.2% | 82.0% | $74.68 | $61.26 | $8,000,000 | 58.3% |
| TX | 3 | 241 | 6.5% | $9,051,526 | 6.2% | 76.9% | $61.95 | $47.63 | $16,600,000 | 54.5% |
| UT | 1 | 75 | 2.0% | $2,417,701 | 1.7% | 60.6% | $56.60 | $34.29 | $3,400,000 | 71.1% |
| VA | 1 | 30 | 0.8% | $3,376,813 | 2.3% | 70.0% | $107.83 | $75.47 | $3,700,000 | 91.3% |
| WY | 6 | 675 | 18.1% | $29,532,288 | 20.4% | 62.1% | $60.90 | $37.81 | $41,600,000 | 71.0% |
| Total/Wtd. Avg. | 44 | 3,729 | 100.0% | $145,000,000 | 100.0% | 71.7% | $57.97 | $41.56 | $215,000,000 | 67.4% |
THE INFORMATION IN THIS STRUCTURAL AND COLLATERAL TERM SHEET IS NOT COMPLETE AND MAY BE AMENDED PRIOR TO THE TIME OF SALE. THIS TERM SHEET IS NOT AN OFFER TO SELL THESE SECURITIES AND IT IS NOT A SOLICITATION OF AN OFFER TO BUY THESE SECURITIES IN ANY JURISDICTION WHERE THE OFFER OR SALE IS NOT PERMITTED.
51
| Various | Collateral Asset Summary – Loan No. 3 Wyndham National Hotel Portfolio | Cut-off Date Balance: Cut-off Date LTV Ratio: UW NCF DSCR: UW NOI Debt Yield: | $35,000,000 67.4% 1.94x 16.1% |
Operating History and Underwritten Net Cash Flow.The following table presents certain information relating to the historical operating performance and the Underwritten Net Cash Flow at the Wyndham National Hotel Portfolio Properties:
| Cash Flow Analysis | ||||||||||||
| 2016 | 2017(1) | 2018 | 8/31/2019 TTM | UW | UW per Room | |||||||
| Occupancy | 67.8% | 70.2% | 73.2% | 71.7% | 71.7% | |||||||
| ADR | $59.88 | $55.75 | $55.75 | $57.97 | $57.97 | |||||||
| RevPAR | $40.58 | $39.11 | $40.79 | $41.56 | $41.56 | |||||||
| Rooms Revenue | $51,930,201 | $51,630,984 | $55,521,726 | $56,569,076 | $56,569,076 | $15,170 | ||||||
| Food & Beverage | $11,640,026 | $11,375,976 | $11,171,202 | $10,814,397 | $10,814,397 | $2,900 | ||||||
| Other Income | $2,760,149 | $3,281,739 | $3,353,940 | $3,408,708 | $3,408,708 | $914 | ||||||
| Total Revenue | $66,330,376 | $66,288,699 | $70,046,868 | $70,792,181 | $70,792,181 | $18,984 | ||||||
| Total Expenses | $40,731,077 | $42,904,643 | $45,576,295 | $47,757,359 | $47,422,552 | $12,717 | ||||||
| Net Operating Income | $25,599,299 | $23,384,056 | $24,470,573 | $23,034,823 | $23,369,629 | $6,267 | ||||||
| FF&E | $1,557,912 | $1,548,929 | $1,665,659 | $1,698,245 | $2,831,687 | $759 | ||||||
| Net Cash Flow | $24,041,387 | $21,835,127 | $22,804,914 | $21,336,578 | $20,537,942 | $5,508 | ||||||
| NOI DSCR | 2.42x | 2.21x | 2.31x | 2.17x | 2.20x | |||||||
| NCF DSCR | 2.27x | 2.06x | 2.15x | 2.01x | 1.94x | |||||||
| NOI Debt Yield | 17.7% | 16.1% | 16.9% | 15.9% | 16.1% | |||||||
| NCF Debt Yield | 16.6% | 15.1% | 15.7% | 14.7% | 14.2% | |||||||
| (1) | The Days Inn - 3431 14th Avenue and Baymont Inn & Suites - 6390 US-93 properties were acquired by the seller in October and November 2017, respectively. As such, 2017 represents the full-year operating performance of 42 properties and partial-year operating performance of the aforementioned properties. |
Escrows and Reserves.At origination of the Wyndham National Hotel Portfolio Whole Loan, the Wyndham National Hotel Portfolio Borrower deposited into escrow (i) $436,502 for real estate taxes, (ii) $790,391 for insurance premiums, (iii) $2,014,340 for immediate repairs, (iv) $7,417,247 for scheduled PIP work, (v) $7,000,000 for rail contract renewals, and (vi) $500,000 related to the Wyndham National Hotel Portfolio Borrower’s obligation to satisfy the Post-Closing Outstanding Covenant (as defined below), and upon satisfaction of such covenant, such amount will be released to the Wyndham National Hotel Portfolio Borrower. On a monthly basis, the Wyndham National Hotel Portfolio Borrower is required to deposit monthly into escrow (i) 1/12 of the annual estimated tax payments (initially $160,955), (ii) 1/12 of the annual estimated insurance premiums (initially $116,681), and (iii) $235,965 for replacement reserves.
During the continuance of a Cash Management Trigger Event (as defined below) for the Wyndham National Hotel Portfolio Whole Loan, funds in the cash management account are required to be applied on each monthly payment date to fund the required reserve deposits as described above, to pay debt service on the Wyndham National Hotel Portfolio Whole Loan, to pay operating expenses, if a PIP Trigger Event (as defined below) is then continuing, to deposit into the PIP reserve until the amount of funds on deposit is equal to the sum of the applicable Individual Property PIP Caps (as defined below), and provided a Cash Sweep Trigger Event (as defined below) is not then continuing, to disburse the remainder to the Wyndham National Hotel Portfolio Borrower (or, during the continuance of a Cash Sweep Trigger Event, (i) if a Collective Bargaining Cash Sweep Trigger Event (as defined below) is then continuing, into a collective bargaining cash sweep account, or (ii) if a UP15 Renewal Cash Sweep Trigger Event (as defined below) is then continuing, into a railroad contract renewal account, or (iii) if a 50% Weighted Average Cash Sweep Trigger Event (as defined below) is then continuing, 50% of such excess cash flow is required to be deposited into the railroad contract renewal account and the remaining 50% is disbursed to the Wyndham National Hotel Portfolio Borrower,provided however, that if any other Cash Sweep Trigger Event is then continuing, the remaining 50% is required to be deposited into an account to be held by the lender as additional security for the Wyndham National Hotel Portfolio Whole Loan (the “Excess Cash Flow Account”), or (iv) if a 100% Weighted Average Cash Sweep Trigger Event (as defined below) is then continuing, into the Excess Cash Flow Account.
Lockbox and Cash Management. The Wyndham National Hotel Portfolio Whole Loan is structured with a hard lockbox and springing cash management upon the occurrence of a Cash Management Trigger Event.
A “Cash Management Trigger Event” will occur upon (i) an event of default, (ii) any bankruptcy action involving the Wyndham National Hotel Portfolio Borrower, the guarantor, or the Property Manager, (iii) the debt service coverage ratio (“DSCR”) for the trailing 12-month period, based on actual debt service due and payable during such period, falling below 1.90x, (iv) any indictment for fraud or misappropriation of funds by the Wyndham National Hotel Portfolio Borrower, the guarantor, or an affiliated Property Manager,providedthat in the case of a Property Manager, such indictment is related to the Wyndham National Hotel Portfolio Properties, or any director or officer of such parties, (v) a PIP Trigger Event, (vi) a Rail RevPAR Cash Sweep Trigger Event (as defined below), (vii) a Collective Bargaining Cash Sweep Trigger Event, (viii) a UP15 Renewal Cash Sweep Trigger Event, (ix) a 50% Weighted Average Cash Sweep Trigger Event, (x) a 100% Weighted Average Cash Sweep Trigger Event, or (xi) the Wyndham National Hotel Portfolio Borrower breaches the Post-Closing Outstanding Covenant, as determined by the lender in its sole and absolute discretion exercised in good faith.
A Cash Management Trigger Event will continue until, in regard to clause (i) above, the cure of such event of default and acceptance of such cure by the lender, in regard to clause (ii) above, the filing being discharged, stayed or dismissed within 90 days for the Wyndham National Hotel Portfolio Borrower or guarantor, or 120 days for the Property Manager, and the lender’s determination that such filing does not materially affect the obligations of the Wyndham National Hotel Portfolio Borrower, guarantor, or Property Manager under the related whole loan documents or management agreement, as applicable, in regard to clause (iii) above, the DSCR for the trailing 12-month period, based on actual debt service due and payable during such period, being at least 1.90x for two consecutive calendar quarters after giving effect to any Debt Service Coverage Cure Prepayment (as defined below) in accordance with the related whole loan documents, in regard to clause (iv) above, (a) the dismissal of the applicable indictment, (b) the acquittal of each applicable person with respect to the related charge(s) or (c) as to the Property Manager, such Property Manager is replaced with a qualified manager under a replacement
THE INFORMATION IN THIS STRUCTURAL AND COLLATERAL TERM SHEET IS NOT COMPLETE AND MAY BE AMENDED PRIOR TO THE TIME OF SALE. THIS TERM SHEET IS NOT AN OFFER TO SELL THESE SECURITIES AND IT IS NOT A SOLICITATION OF AN OFFER TO BUY THESE SECURITIES IN ANY JURISDICTION WHERE THE OFFER OR SALE IS NOT PERMITTED.
52
| Various | Collateral Asset Summary – Loan No. 3 Wyndham National Hotel Portfolio | Cut-off Date Balance: Cut-off Date LTV Ratio: UW NCF DSCR: UW NOI Debt Yield: | $35,000,000 67.4% 1.94x 16.1% |
property management agreement, in regard to clause (v) above, the cure of such PIP Trigger Event, in regard to clause (vi) above, the RevPAR based on the Railway Company contracts is greater than $27.61, in regard to clause (vii) above, if as of the first anniversary of the occurrence of the Collective Bargaining Cash Sweep Trigger Event, the occupancy based on the Railway Company contracts is not less than 42.45%, in regard to clause (viii) above, the occurrence of an Initial Release Event (as defined below), in regard to clause (ix) above, the Weighted Average Remaining Term (as defined below) is greater than 2.6 years, in regard to clause (x) above, the Weighted Average Remaining Term is greater than 2.3 years, or in regard to clause (xi) above, the satisfaction of the Post-Closing Outstanding Covenant, as determined by the lender in its sole and absolute discretion exercised in good faith.
A “Cash Sweep Trigger Event” will occur upon (i) an event of default, (ii) any bankruptcy action involving the Wyndham National Hotel Portfolio Borrower, the guarantor, or the Property Manager, (iii) the DSCR for the trailing 12-month period, based on actual debt service due and payable during such period, falling below 1.85x, (iv) a PIP Trigger Event, (v) a Rail RevPAR Cash Sweep Trigger Event, (vi) a Collective Bargaining Cash Sweep Trigger Event, (vii) a UP15 Renewal Cash Sweep Trigger Event, (viii) a 50% Weighted Average Cash Sweep Trigger Event, (ix) a 100% Weighted Average Cash Sweep Trigger Event, or (x) the Wyndham National Hotel Portfolio Borrower breaches the Post-Closing Outstanding Covenant, as determined by the lender in its sole and absolute discretion exercised in good faith.
A Cash Sweep Trigger Event will continue until, in regard to clause (i) above, the cure of such event of default and acceptance of such cure by the lender, in regard to clause (ii) above, the filing being discharged, stayed or dismissed within 90 days for the Wyndham National Hotel Portfolio Borrower or guarantor, or 120 days for the Property Manager, and the lender’s determination that such filing does not materially affect the obligations of the Wyndham National Hotel Portfolio Borrower, guarantor, or Property Manager under the related whole loan documents or management agreement, as applicable, in regard to clause (iii) above, the DSCR for the trailing 12-month period, based on actual debt service due and payable during such period, being at least 1.85x for two consecutive calendar quarters after giving effect to any Debt Service Coverage Cure Prepayment in accordance with the related whole loan documents, in regard to clause (iv) above, the cure of such PIP Trigger Event, in regard to clause (v) above, the RevPAR based on the Railway Company contracts is greater than $27.61, in regard to clause (vi) above, if as of the first anniversary of the occurrence of the Collective Bargaining Cash Sweep Trigger Event, the occupancy based on the Railway Company contracts is not less than 42.45% (provided that the Wyndham National Hotel Portfolio Borrower is entitled to receive funds on deposit in the related collective bargaining cash sweep account if such occupancy test is otherwise satisfied on the third or any subsequent anniversary of the occurrence of the Collective Bargaining Cash Sweep Trigger Event and no other Cash Sweep Trigger Event exists), in regard to clause (vii) above, the occurrence of an Initial Release Event, in regard to clause (viii) above, the Weighted Average Remaining Term is greater than 2.6 years, in regard to clause (ix) above, the Weighted Average Remaining Term is greater than 2.3 years, or in regard to clause (x) above, the satisfaction of the Post-Closing Outstanding Covenant, as determined by the lender in its sole and absolute discretion exercised in good faith.
A “Debt Service Coverage Cure Prepayment” means a partial prepayment of the Wyndham National Hotel Portfolio Whole Loan in an amount that when applied to the outstanding balance of the Wyndham National Hotel Portfolio Whole Loan, with respect to a cure of a Cash Management Trigger Event or Cash Sweep Trigger Event, would result in a DSCR equal to the requisite DSCR to cure the applicable Cash Management Trigger Event or Cash Sweep Trigger Event. Any Debt Service Coverage Cure Prepayment prior to September 6, 2029 is required to be accompanied by a yield maintenance premium.
A “PIP Trigger Event” means (i) any franchisor giving notice of its intention to terminate, cancel, or not extend or renew any franchise agreement, (ii) any event of default by the Wyndham National Hotel Portfolio Borrower, or affiliate of the Wyndham National Hotel Portfolio Borrower, or the franchisor beyond any applicable cure period, (iii) any bankruptcy action of the franchisor, or (iv) the franchisor giving notice to the Wyndham National Hotel Portfolio Borrower of its requirement to enter into any PIP.
An “Individual Property PIP Cap” means (i) as of any date, an amount equal to 115% of the estimated cost to complete the PIP for the applicable Wyndham National Hotel Portfolio Property, or (ii) if a PIP Trigger Event pursuant to clauses (i) and (ii) of its definition has occurred and is continuing and the Wyndham National Hotel Portfolio Borrower has not entered into a replacement franchise agreement, an amount equal to 120% of the allocated loan amount for the applicable Wyndham National Hotel Portfolio Property, until the Wyndham National Hotel Portfolio Borrower has entered into a replacement franchise agreement or extension or renewal of such applicable existing franchise agreement.
A “Rail RevPAR Cash Sweep Trigger Event” means at any time the RevPAR based on actual occupancy under the Railway Company contracts is less than $27.61.
A “Collective Bargaining Cash Sweep Trigger Event” means any Railway Company entering into an agreement with the International Association of Sheet Metal, Air, Rail and Transportation Workers – Transportation Division permitting a reduction of train crew size to less than two.
A “UP15 Renewal Cash Sweep Trigger Event” means July 6, 2020, if the Initial Release Event has not occurred prior to such date.
An “Initial Release Event” means the first monthly payment date that the UP15 Railroad Contract has been renewed for term such that the Weighted Average Remaining Term, as determined by the lender, exceeds three years.
A “UP15 Railroad Contract” means the lodging facility agreement dated November 1, 2015 between Union Pacific and the Wyndham National Hotel Portfolio Borrower, covering 15 Wyndham National Hotel Portfolio Properties as detailed in the related whole loan documents.
A “Weighted Average Remaining Term” means the weighted average term remaining on the contracts with the Railway Companies at any given time, weighted by the number of guaranteed contractual rooms per night for each Railway Company contract, expressed in years.
A “50% Weighted Average Cash Sweep Trigger Event” means at any time following November 27, 2020, the Weighted Average Remaining Term is greater than 2.3 years but less than or equal to 2.6 years.
A “100% Weighted Average Cash Sweep Trigger Event” means at any time following November 27, 2020, the Weighted Average Remaining Term is less than or equal to 2.3 years.
The “Post-Closing Outstanding Covenant” means on or prior December 4, 2019, the Wyndham National Hotel Portfolio Borrower is required to cause Tom Vukota and Vukota Capital Management Ltd., a Bahamian international business company, to execute and/or deliver new amended and restated recourse
THE INFORMATION IN THIS STRUCTURAL AND COLLATERAL TERM SHEET IS NOT COMPLETE AND MAY BE AMENDED PRIOR TO THE TIME OF SALE. THIS TERM SHEET IS NOT AN OFFER TO SELL THESE SECURITIES AND IT IS NOT A SOLICITATION OF AN OFFER TO BUY THESE SECURITIES IN ANY JURISDICTION WHERE THE OFFER OR SALE IS NOT PERMITTED.
53
| Various | Collateral Asset Summary – Loan No. 3 Wyndham National Hotel Portfolio | Cut-off Date Balance: Cut-off Date LTV Ratio: UW NCF DSCR: UW NOI Debt Yield: | $35,000,000 67.4% 1.94x 16.1% |
guaranty, payment guaranty, and environmental guaranty, among other documents as detailed in the related whole loan documents, providing joint and several liability thereunder.
Additional Recourse. If a Collective Bargaining Springing Event occurs, the guarantors collectively will have liability for up to $72,500,000 of the Wyndham National Hotel Portfolio Borrower’s obligations with respect to the Wyndham National Hotel Portfolio Whole Loan, and the Wyndham National Hotel Portfolio Borrower is required to cause the guarantor to deliver within 30 days of the occurrence of such event, a letter of credit in the amount of $25,000,000 to secure such obligations of the guarantors (“LOC Obligations”).
A “Collective Bargaining Springing Event” means either (a) a Collective Bargaining Cash Sweep Trigger Event has occurred and the occupancy based on the Railway Company contracts is less than 42.45%, or (b) a Collective Bargaining Cash Sweep Trigger event occurs at any time following the monthly payment date in June 2029 (regardless of whether the occupancy based on the Railway Company contracts is less than 42.45%).
Additional Secured Indebtedness (not including trade debts). None.
Mezzanine Loan and Preferred Equity. None.
Release of Property. After the monthly payment date occurring in January 2022 (the “Permitted Release Date”), the Wyndham National Hotel Portfolio Borrower may obtain the release of one or more of the Wyndham National Hotel Portfolio Properties,provided that, among other conditions, (i) no event of default under the related whole loan documents is continuing, (ii) the Wyndham National Hotel Portfolio Borrower prepays the Wyndham National Hotel Portfolio Whole Loan in an amount equal to 120% of the allocated loan amount for the applicable property being released (the “Release Amount”), together with a yield maintenance premium if such release occurs on or prior to the monthly payment date occurring in September 2029, (iii) the DSCR for the remaining properties following the release based on the trailing 12 months is no less than the greater of (a) the DSCR immediately preceding such release and (b) 1.94x, (iv) the loan-to-value ratio for the remaining properties following the release does not exceed the lesser of (a) the loan-to-value ratio immediately preceding such release and (b) 67.4%, (v) the debt yield (based on net cash flow) for the remaining properties following the release is no less than the greater of (a) the debt yield (based on net cash flow) immediately preceding such release and (b) 14.2%, and (vi) if, as of the date of its calculation, the ratio of (a) the sum of the outstanding principal amount of the Wyndham National Hotel Portfolio Whole Loan as of the date of such calculation to (b) the fair market value of the Wyndham National Hotel Portfolio Properties (the “REMIC LTV”) exceeds 125% immediately after the property being released, no release will be permitted unless the balance of the Wyndham National Hotel Portfolio Whole Loan is paid down by the greater of (I) the Release Amount or (II) the least of the following amounts: (x) if the released property is sold, the net proceeds of the sale of the released property, (y) the fair market value of the released property at the time of such release, or (z) an amount such that the REMIC LTV after such release is not greater than the REMIC LTV of the Wyndham National Hotel Portfolio Properties immediately prior to such release.
Notwithstanding the foregoing, the Wyndham National Hotel Portfolio Borrower may obtain the release of an individual Wyndham National Hotel Portfolio Property at any time without satisfying the above described DSCR test, loan-to-value test, and debt yield test, (a) if such release would cure an event of default that relates solely to such individual Wyndham National Hotel Portfolio Property, (ii) in connection with the exercise by the relevant Railway Company to relocate the lodging facility at the Travelodge - 108 6th Avenue property, or (iii) in connection with the exercise by the relevant Railway Company to purchase the lodging facility at the Baymont Inn & Suites - 100 15th Street Southeast property.
At any time,the Wyndham National Hotel Portfolio Borrower may obtain the free release ofany outparcel at the Travelodge - 4000 Siskiyou Avenue as identified in the related whole loan documents,provided, (i) no building or utility facilities necessary for the operation or continued use of the remaining property are located on such applicable outparcel, (ii) such outparcel is vacant, non-income producing, and unimproved, and (iii) upon the release of such outparcel, the Wyndham National Hotel Portfolio Whole Loan continues to comply with REMIC requirements. See, “Description of the Mortgage Pool—Certain Terms of the Mortgage Loans—Releases; Partial Releases” in the Preliminary Prospectus.
Terrorism Insurance. The Wyndham National Hotel Portfolio Borrower is required to obtain and maintain property insurance, commercial general liability insurance and business income or rental loss insurance that covers foreign and domestic perils and acts of terrorism.
THE INFORMATION IN THIS STRUCTURAL AND COLLATERAL TERM SHEET IS NOT COMPLETE AND MAY BE AMENDED PRIOR TO THE TIME OF SALE. THIS TERM SHEET IS NOT AN OFFER TO SELL THESE SECURITIES AND IT IS NOT A SOLICITATION OF AN OFFER TO BUY THESE SECURITIES IN ANY JURISDICTION WHERE THE OFFER OR SALE IS NOT PERMITTED.
54
| Various | Collateral Asset Summary – Loan No. 4 Phoenix Industrial Portfolio III | Cut-off Date Balance: Cut-off Date LTV Ratio: UW NCF DSCR: UW NOI Debt Yield: | $31,100,000 74.2% 1.70x 10.6% |
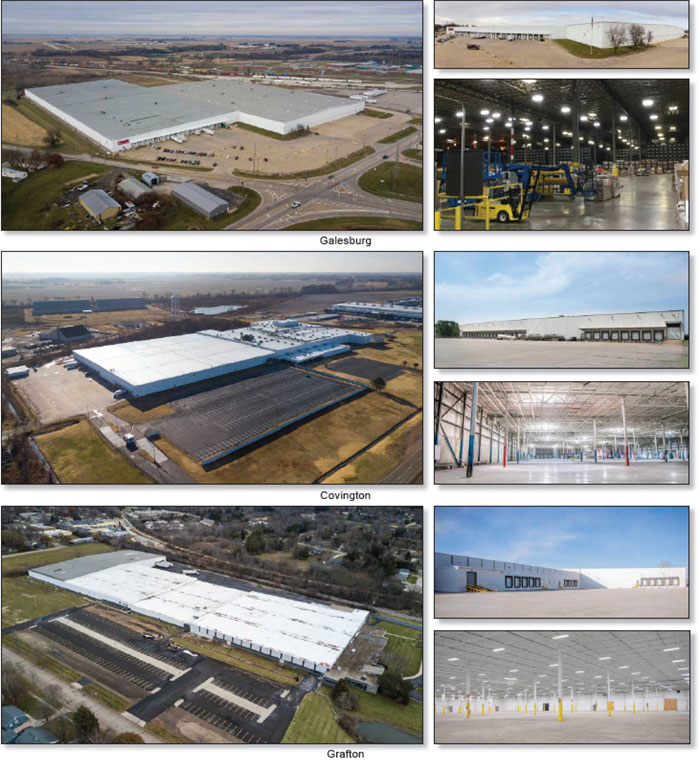
THE INFORMATION IN THIS STRUCTURAL AND COLLATERAL TERM SHEET IS NOT COMPLETE AND MAY BE AMENDED PRIOR TO THE TIME OF SALE. THIS TERM SHEET IS NOT AN OFFER TO SELL THESE SECURITIES AND IT IS NOT A SOLICITATION OF AN OFFER TO BUY THESE SECURITIES IN ANY JURISDICTION WHERE THE OFFER OR SALE IS NOT PERMITTED.
55
| Various | Collateral Asset Summary – Loan No. 4 Phoenix Industrial Portfolio III | Cut-off Date Balance: Cut-off Date LTV Ratio: UW NCF DSCR: UW NOI Debt Yield: | $31,100,000 74.2% 1.70x 10.6% |
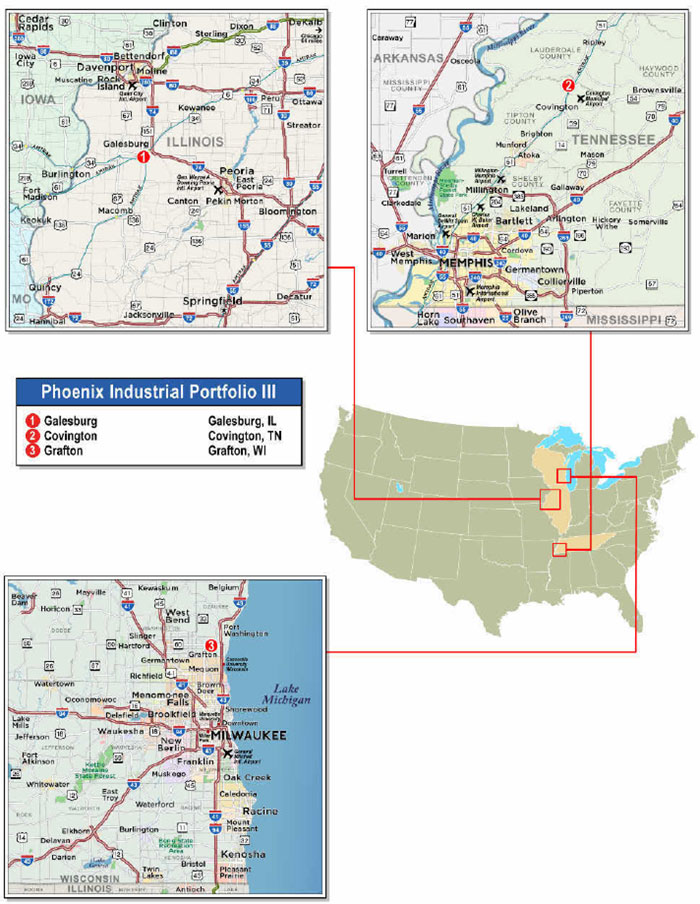
THE INFORMATION IN THIS STRUCTURAL AND COLLATERAL TERM SHEET IS NOT COMPLETE AND MAY BE AMENDED PRIOR TO THE TIME OF SALE. THIS TERM SHEET IS NOT AN OFFER TO SELL THESE SECURITIES AND IT IS NOT A SOLICITATION OF AN OFFER TO BUY THESE SECURITIES IN ANY JURISDICTION WHERE THE OFFER OR SALE IS NOT PERMITTED.
56
| Various | Collateral Asset Summary – Loan No. 4 Phoenix Industrial Portfolio III | Cut-off Date Balance: Cut-off Date LTV Ratio: UW NCF DSCR: UW NOI Debt Yield: | $31,100,000 74.2% 1.70x 10.6% |
| Mortgage Loan Information | Property Information | |||||||
| Mortgage Loan Seller: | UBS AG | Single Asset/Portfolio: | Portfolio | |||||
Credit Assessment (Fitch/KBRA/Moody’s): | NR/NR/NR | Location: | Various | |||||
| General Property Type: | Industrial | |||||||
| Original Balance: | $31,100,000 | Detailed Property Type: | Warehouse/Distribution | |||||
| Cut-off Date Balance: | $31,100,000 | Title Vesting: | Fee Simple | |||||
| % of Initial Pool Balance: | 4.2% | Year Built/Renovated: | Various/Various | |||||
| Loan Purpose: | Refinance | Size: | 1,690,127 SF | |||||
| Borrower Sponsor: | Phoenix Investors | Cut-off Date Balance per SF: | $18 | |||||
| Mortgage Rate: | 4.1150% | Maturity Date Balance per SF: | $16 | |||||
| Note Date: | 11/25/2019 | Property Manager: | Phoenix Investors (borrower-related) | |||||
| First Payment Date: | 1/6/2020 | |||||||
| Maturity Date: | 12/6/2029 | |||||||
| Original Term to Maturity: | 120 months | |||||||
| Original Amortization Term: | 360 months | |||||||
| IO Period: | 24 months | |||||||
| Seasoning: | 0 months | |||||||
| Prepayment Provisions(1): | LO (24); DEF (90); O (6) | Underwriting and Financial Information | ||||||
| Lockbox/Cash Mgmt Status: | Hard/Springing | UW NOI: | $3,285,179 | |||||
| Additional Debt Type: | N/A | UW NOI Debt Yield: | 10.6% | |||||
| Additional Debt Balance: | N/A | UW NOI Debt Yield at Maturity: | 12.5% | |||||
| Future Debt Permitted (Type): | No (N/A) | UW NCF DSCR: | 2.37x (IO) | 1.70x (P&I) | ||||
| Reserves(2) | Most Recent NOI(3): | N/A | ||||||
| Type | Initial | Monthly | Cap | 2nd Most Recent NOI(3): | N/A | |||
| RE Tax: | $175,008 | $20,663 | N/A | 3rd Most Recent NOI(3): | N/A | |||
| Insurance: | $102,657 | $12,830 | N/A | Most Recent Occupancy(4): | 89.2% (Various) | |||
| Replacements: | $0 | $14,068 | $337,578 | 2nd Most Recent Occupancy(3): | N/A | |||
| TI/LC: | $500,000 | Springing | $500,000 | 3rd Most Recent Occupancy(3): | N/A | |||
| Required Repairs: | $142,250 | $0 | N/A | Appraised Value (as of): | $41,940,000 (Various) | |||
| Blick Art Work Funds: | $500,000 | $0 | N/A | Cut-off Date LTV Ratio: | 74.2% | |||
| VFI Abatement Funds: | $1,000,000 | $0 | N/A | Maturity Date LTV Ratio: | 62.7% | |||
| Sources and Uses | ||||||
| Sources | Proceeds | % of Total | Uses | Proceeds | % of Total | |
| Loan Amount: | $31,100,000 | 100.0% | Loan Payoff: | $19,882,169 | 63.9% | |
| Reserves: | $2,419,915 | 7.8% | ||||
| Closing Costs: | $420,303 | 1.4% | ||||
| Partnership Buyout: | $3,329,433 | 10.7% | ||||
| Return of Equity: | $5,048,180 | 16.2% | ||||
| Total Sources: | $31,100,000 | 100.0% | Total Uses: | $31,100,000 | 100.0% | |
| (1) | Partial release is permitted. See “Release of Property” below for further discussion. |
| (2) | See “Escrows and Reserves” below for further discussion of reserve requirements. |
| (3) | The borrower sponsor acquired the Phoenix Industrial Portfolio III Properties between 2015 and 2019. As such, prior operating performance and occupancy information is not available. |
| (4) | Most Recent Occupancy is as of October 24, 2019 for the Galesburg property and Grafton property and September 30, 2019 for the Covington property. |
The Mortgage Loan. The fourth largest mortgage loan (the “Phoenix Industrial Portfolio III Mortgage Loan”) is evidenced by two promissory notes with an aggregate original principal balance of $31,100,000, which are collectively secured by a first priority fee mortgage encumbering a 1,690,127 SF portfolio of three industrial warehouse properties located in Tennessee, Illinois and Wisconsin (each, a “Phoenix Industrial Portfolio III Property”, and collectively, the “Phoenix Industrial Portfolio III Properties”). The proceeds of the Phoenix Industrial Portfolio III Mortgage Loan were used to refinance existing debt on the Phoenix Industrial Portfolio III Properties, fund reserves, pay closing costs, fund a partnership buyout and return equity to the borrower sponsor.
The Borrowers and the Borrower Sponsor.The borrowers are Phoenix Galesburg I Industrial Investors LLC, Phoenix Grafton Industrial Investors LLC and Phoenix Covington Industrial Investors LLC (collectively, the “Phoenix Industrial Portfolio III Borrowers”), each a Delaware limited liability company structured to be bankruptcy remote with one independent director. Legal counsel to the Phoenix Industrial Portfolio III Borrowers delivered a non-consolidation opinion in connection with the origination of the Phoenix Industrial Portfolio III Mortgage Loan. The non-recourse guarantors of the Phoenix Industrial Portfolio III Mortgage Loan are Irrevocable Children’s Trust dated 7/22/91 and Irrevocable Children’s Trust No. 2 dated 7/22/91. The borrower sponsor of the Phoenix Industrial Portfolio III Mortgage Loan is Phoenix Investors, which is the affiliated management company of the guarantors’ investments.
THE INFORMATION IN THIS STRUCTURAL AND COLLATERAL TERM SHEET IS NOT COMPLETE AND MAY BE AMENDED PRIOR TO THE TIME OF SALE. THIS TERM SHEET IS NOT AN OFFER TO SELL THESE SECURITIES AND IT IS NOT A SOLICITATION OF AN OFFER TO BUY THESE SECURITIES IN ANY JURISDICTION WHERE THE OFFER OR SALE IS NOT PERMITTED.
57
| Various | Collateral Asset Summary – Loan No. 4 Phoenix Industrial Portfolio III | Cut-off Date Balance: Cut-off Date LTV Ratio: UW NCF DSCR: UW NOI Debt Yield: | $31,100,000 74.2% 1.70x 10.6% |
Phoenix Investors is a national commercial real estate firm based in Milwaukee, Wisconsin whose core business is the revitalization of former manufacturing facilities throughout the United States. Phoenix Investors’ affiliated companies hold interests in approximately 27 million SF of industrial, retail, office, and single tenant net-leased properties across 25 states. Phoenix Investors specializes in the renovation and repositioning of large, former single tenant industrial facilities throughout the United States that were previously owned by major corporate clients, real estate investment trusts or financial institutions.
The Properties.The Phoenix Industrial Portfolio III Mortgage Loan is secured by three industrial warehouse properties totaling 1,690,127 SF located in Illinois (50.6% of NRA), Tennessee (28.9% of NRA) and Wisconsin (20.5% of NRA). The Phoenix Industrial Portfolio III Properties were 89.2% occupied as of October 24, 2019 for the Galesburg and Grafton properties and September 30, 2019 for the Covington property, by seven tenants. The borrower sponsor acquired the Phoenix Industrial Portfolio III Properties between 2015 and 2019 for a purchase price of approximately $17.0 million. Since acquisition, the borrower sponsor has invested approximately $8.5 million in capital improvements and other/soft costs on the Phoenix Industrial Portfolio III Properties.
Galesburg (50.6% of NRA; 34.6% of ALA): The Galesburg property is an 855,659 SF industrial warehouse building located in Galesburg, Illinois. The improvements were constructed in 1979, renovated in 1988 and include approximately 0.8% of office space. The Galesburg property is situated on a 68.3-acre site with 208 surface parking spaces (0.2 per 1,000 SF) for vehicles and 290 surface parking spaces (0.3 per 1,000 SF) for trailers, the latter of which are partially rented to Venture Logistics on a month-to-month basis. The Galesburg property has 33 loading docks, 14 truck doors, 47 loading doors, column spacing of 50 feet by 50 feet, and an average clear ceiling height of 30 feet (which can climb to 36 feet). As of October 24, 2019, the Galesburg property was 88.0% leased by two tenants. The vacant space (12.0% of property NRA) is currently used as flex space, at a fee, for current tenants to occupy on a month-to-month, as-needed basis. The largest tenant, Blick Art Materials, LLC (76.3% of property NRA, 79.6% of property underwritten base rent), has been at the Galesburg property since 2005 and signed an agreement in September 2019 to expand its space from 550,000 SF to 653,091 SF through December 2034. Blick Art Materials, LLC pays an underwritten base rent of $1.54 PSF and has one, five-year renewal option remaining. Blick Art Materials, LLC has a termination option with an effective date of January 1, 2030, subject to a notice date on or before March 31, 2029 and payment of a termination fee of approximately $567,408. Since acquisition in June 2019, the borrower sponsor has budgeted to invest approximately $1.2 million in capital improvements at the Galesburg property.
Covington (28.9% of NRA; 32.9% of ALA): The Covington property is a 488,130 SF industrial warehouse building located in Covington, Tennessee. The improvements were constructed in 1988, renovated in 1995 and include approximately 5.0% of office space. The Covington property is situated on a 53.4-acre site with 460 surface parking spaces (0.9 per 1,000 SF). The Covington property has 32 dock-high doors, three grade-level doors, column spacing of 40 feet by 48 feet, and a clear ceiling height of 33 feet. As of September 30, 2019, the Covington property was 100.0% leased by two tenants, VF Imagewear, Inc. (59.9% of property NRA, 62.9% of property underwritten base rent) and CSC Sugar (40.1% of property NRA, 37.1% of property underwritten base rent). The largest tenant, VF Imagewear, Inc., is a subsidiary of V.F. Corporation (NYSE: VFC) (Moody’s/S&P: A3/A). VF Imagewear, Inc. recently signed a 10-year lease with a term from November 2019 through October 2029. VF Imagewear, Inc. pays an underwritten base rent of $3.01 PSF and has three termination options (November 2023, November 2025 and November 2027) with 180 days’ notice and no termination fee. Since acquisition in May 2018, the borrower sponsor has budgeted to invest approximately $5.3 million in capital improvements at the Covington property. To date, the borrower sponsor has invested approximately $3.3 million in capital improvements at the Covington property.
Grafton (20.5% of NRA; 32.5% of ALA): The Grafton property is a 346,338 SF industrial warehouse building located in Grafton, Wisconsin. The improvements were constructed from 1956 to 1979, renovated from 2016 to 2019 and include minimal office space. The Grafton property is situated on a 27.9-acre site with 450 surface parking spaces (1.3 per 1,000 SF). The Grafton property has 28 loading doors, five truck doors and clear ceiling heights ranging from 16 feet to 24.5 feet. As of October 24, 2019, the Grafton property was 77.1% leased by three tenants, Guy & O’Neil, LLC (48.4% of property NRA, 65.1% of property underwritten base rent), Midwest Assembly Warehouse & Distribution, LLC (20.4% of property NRA, 26.3% of property underwritten base rent) and RJK Investments, Inc. (8.2% of property NRA, 8.6% of property underwritten base rent). The largest tenant, Guy & O’Neil, LLC has been at the Grafton property since August 2017 pursuant to a lease with an expiration date of July 31, 2024. Guy & O’Neil, LLC pays an underwritten base rent of $3.35 PSF and has no renewal or termination options. When the Grafton property was acquired by the borrower sponsor in December 2015, the Grafton property was fully vacant. Since acquisition, the borrower sponsor has budgeted to invest approximately $5.4 million in capital improvements at the Grafton property. To date, the borrower sponsor has invested approximately $5.3 million, which includes the demolition of obsolete interior areas, a new roof, installation of an early suppression, fast response sprinkler system throughout the building, plumbing, HVAC and electrical upgrades, tenant improvements and other property upgrades and alterations.
The following table presents certain information relating to the Phoenix Industrial Portfolio III Properties:
| Portfolio Summary(1) | ||||||||||
| Property | City, State | Net Rentable Area (SF) | Year Built/ Renovated | UW NCF | Allocated Cut-off Date Balance | % of Allocated Cut-off Date Balance | Appraisal Value | LTV | Ceiling Heights (ft.) | Loading Bays |
| Galesburg | Galesburg, IL | 855,659 | 1979/1988 | $1,078,067 | $10,752,000 | 34.6% | $14,500,000 | 74.2% | 30 | 47 |
| Covington | Covington, TN | 488,130 | 1988/1995 | $1,244,256 | $10,233,000 | 32.9% | $13,800,000 | 74.2% | 33 | 32 |
| Grafton | Grafton, WI | 346,338 | 1956-1979/2016-2019 | $749,420 | $10,115,000 | 32.5% | $13,640,000 | 74.2% | 16 - 24.5 | 28 |
| Total/Wtd. Avg. | 1,690,127 | $3,071,744 | $31,100,000 | 100.0% | $41,940,000 | 74.2% | 107 | |||
| (1) | Information is based on the appraisal. |
THE INFORMATION IN THIS STRUCTURAL AND COLLATERAL TERM SHEET IS NOT COMPLETE AND MAY BE AMENDED PRIOR TO THE TIME OF SALE. THIS TERM SHEET IS NOT AN OFFER TO SELL THESE SECURITIES AND IT IS NOT A SOLICITATION OF AN OFFER TO BUY THESE SECURITIES IN ANY JURISDICTION WHERE THE OFFER OR SALE IS NOT PERMITTED.
58
| Various | Collateral Asset Summary – Loan No. 4 Phoenix Industrial Portfolio III | Cut-off Date Balance: Cut-off Date LTV Ratio: UW NCF DSCR: UW NOI Debt Yield: | $31,100,000 74.2% 1.70x 10.6% |
The following table presents certain information relating to the leases at the Phoenix Industrial Portfolio III Properties:
| Tenant Summary(1) | ||||||||
| Tenant Name | Credit Rating (Fitch/Moody’s/S&P)(2) | Property | Tenant SF | Approximate % of SF | Annual UW Base Rent | % of Total Annual UW Base Rent | Annual UW Base Rent PSF(3) | Lease Expiration |
| Blick Art Materials, LLC(4) | NR/NR/NR | Galesburg | 653,091 | 38.6% | $1,007,354 | 28.6% | $1.54 | 12/31/2034 |
| VF Imagewear, Inc.(5) | NR/A3/A | Covington | 292,261 | 17.3% | $879,706 | 24.9% | $3.01 | 10/31/2029 |
| CSC Sugar | NR/NR/NR | Covington | 195,869 | 11.6% | $519,445 | 14.7% | $2.65 | 6/30/2026 |
| Guy & O’Neil, LLC | NR/NR/NR | Grafton | 167,699 | 9.9% | $561,372 | 15.9% | $3.35 | 7/31/2024 |
| Olson Packaging Services, Inc. | NR/NR/NR | Galesburg | 100,000 | 5.9% | $258,000 | 7.3% | $2.58 | 4/30/2020 |
| Midwest Assembly Warehouse & Distribution, LLC | NR/NR/NR | Grafton | 70,766 | 4.2% | $227,159 | 6.4% | $3.21 | 2/28/2022 |
| RJK Investments, Inc. | NR/NR/NR | Grafton | 28,466 | 1.7% | $74,040 | 2.1% | $2.60 | 6/30/2024 |
| Subtotal/Wtd. Avg. | 1,508,152 | 89.2% | $3,527,075 | 100.0% | $2.34 | |||
| Vacant | 181,975 | 10.8% | $0 | 0.0% | $0.00 | |||
| Total/Wtd. Avg. | 1,690,127 | 100.0% | $3,527,075 | 100.0% | $2.34 | |||
| (1) | Information is based on the underwritten rent roll. |
| (2) | Certain ratings are those of the parent company whether or not the parent guarantees the lease. |
| (3) | Wtd. Avg. Annual UW Base Rent PSF excludes vacant space. |
| (4) | Blick Art Materials, LLC may terminate its lease on January 1, 2030 by providing notice on or before March 31, 2029 and paying a termination fee of $567,408. |
| (5) | VF Imagewear, Inc. may terminate its lease three times, in November 2023, November 2025 and November 2027, in each case with 180 days’ notice and no termination fee. |
The following table presents certain information relating to the lease rollover schedule at the Phoenix Industrial Portfolio III Properties:
| Lease Rollover Schedule(1)(2) | ||||||||
| Year | # of Leases Rolling | SF Rolling | Approx. % of Total SF Rolling | Approx. Cumulative % of SF Rolling | UW Base Rent PSF Rolling(3) | Total UW Base Rent Rolling | Approx. % of Total Base Rent Rolling | Approx. Cumulative % of Total Base Rent Rolling |
| MTM | 0 | 0 | 0.0% | 0.0% | $0.00 | $0 | 0.0% | 0.0% |
| 2019 | 0 | 0 | 0.0% | 0.0% | $0.00 | $0 | 0.0% | 0.0% |
| 2020 | 1 | 100,000 | 5.9% | 5.9% | $2.58 | $258,000 | 7.3% | 7.3% |
| 2021 | 0 | 0 | 0.0% | 5.9% | $0.00 | $0 | 0.0% | 7.3% |
| 2022 | 2 | 70,766 | 4.2% | 10.1% | $3.21 | $227,159 | 6.4% | 13.8% |
| 2023 | 0 | 0 | 0.0% | 10.1% | $0.00 | $0 | 0.0% | 13.8% |
| 2024 | 2 | 196,165 | 11.6% | 21.7% | $3.24 | $635,412 | 18.0% | 31.8% |
| 2025 | 0 | 0 | 0.0% | 21.7% | $0.00 | $0 | 0.0% | 31.8% |
| 2026 | 2 | 195,869 | 11.6% | 33.3% | $2.65 | $519,445 | 14.7% | 46.5% |
| 2027 | 0 | 0 | 0.0% | 33.3% | $0.00 | $0 | 0.0% | 46.5% |
| 2028 | 0 | 0 | 0.0% | 33.3% | $0.00 | $0 | 0.0% | 46.5% |
| 2029 | 1 | 292,261 | 17.3% | 50.6% | $3.01 | $879,706 | 24.9% | 71.4% |
| 2030 & Beyond | 1 | 653,091 | 38.6% | 89.2% | $1.54 | $1,007,354 | 28.6% | 100.0% |
| Vacant | 0 | 181,975 | 10.8% | 100.0% | $0.00 | $0 | 0.0% | 100.0% |
| Total/Wtd. Avg. | 9 | 1,690,127 | 100.0% | $2.34 | $3,527,075 | 100.0% | ||
| (1) | Information is based on the underwritten rent roll. |
| (2) | Certain tenants may have lease termination options that are exercisable prior to the originally stated expiration date of the subject lease, which are not considered in the lease rollover schedule. |
| (3) | Wtd. Avg. UW Base Rent PSF Rolling excludes vacant space. |
The Markets. The Phoenix Industrial Portfolio III Properties are located in Illinois (34.6% of ALA), Tennessee (32.9% of ALA) and Wisconsin (32.5% of ALA).
Galesburg, Illinois (34.6% of ALA): The Galesburg property is located in Galesburg, Knox county, Illinois, approximately 2.3 miles southwest of downtown Galesburg, approximately 107.0 miles northwest of Springfield, approximately 121.0 miles southeast of Cedar Rapids, Iowa, and approximately 178.0 miles southwest of Chicago. Access to the Galesburg property is provided by South Linwood Road, U.S. Route 34 and Interstate 74. South Linwood Road connects the Galesburg property to West Main Street, which leads to U.S. Route 34 as well as downtown Galesburg (2.3 miles northeast). Major employers in the area include BNSF, Galesburg Public Schools, Galesburg Cottage Hospital, OSF St. Mary Medical Center, and the largest tenant at the Galesburg property, Blick Art Materials, LLC. According to the appraisal, from 2017 to 2018, a total of 39 new retail or business development projects have come to Galesburg. Amtrak, the national passenger rail system, provides service from Chicago four times a day. Galesburg Transit provides bus service in the city via four routes: Gold Express Loop, Green Central Loop, Red West Loop, and Blue East Loop. BNSF provides rail freight to Galesburg and operates a large hump yard 1.9 miles south of Galesburg.
THE INFORMATION IN THIS STRUCTURAL AND COLLATERAL TERM SHEET IS NOT COMPLETE AND MAY BE AMENDED PRIOR TO THE TIME OF SALE. THIS TERM SHEET IS NOT AN OFFER TO SELL THESE SECURITIES AND IT IS NOT A SOLICITATION OF AN OFFER TO BUY THESE SECURITIES IN ANY JURISDICTION WHERE THE OFFER OR SALE IS NOT PERMITTED.
59
| Various | Collateral Asset Summary – Loan No. 4 Phoenix Industrial Portfolio III | Cut-off Date Balance: Cut-off Date LTV Ratio: UW NCF DSCR: UW NOI Debt Yield: | $31,100,000 74.2% 1.70x 10.6% |
Covington, Tennessee (32.9% of ALA): The Covington property is located in Covington, Tipton county, Tennessee, approximately 42.6 miles northeast of Memphis and 184.0 miles southwest of Nashville. The Covington property has direct access to U.S. Route 51, which connects the Covington property to Memphis. Memphis International Airport is approximately 51.4 miles southwest of the Covington property. According to a third party market research report, Memphis International Airport is the largest economic driver in the state, injecting over $20 billion a year into the region’s economy. Memphis International Airport is the second-busiest cargo airport in the world. In addition, the Port of Memphis is the fifth-largest inland port in the U.S. Major private employers in Covington include Unilever (Breyer’s) located on the south side of the Covington property, Charms, LP, Wal-Mart Stores, The Delfield Company and Baptist Memorial Hospital.
Grafton, Wisconsin (32.5% of ALA): The Grafton property is located in Grafton, Ozaukee county, Wisconsin, approximately 22.0 miles north of Milwaukee and 90.5 miles south of Green Bay. Access to the Grafton property is provided by Highway I-43, which is approximately 2.7 miles east of the Grafton property, connecting the Grafton property with Milwaukee and Green Bay. The Port of Milwaukee, owned by the city government, is one of over a dozen intermodal facilities along Wisconsin’s eastern coast. The port handles a variety of cargo, including bulk commodities, grain, fertilizers and fuel, and is connected to Union Pacific and Canadian Pacific Class I railways. Fortune 1,000 companies headquartered in Milwaukee include Johnson Controls, Northwestern Mutual, Kohl’s, Harley-Davidson, and WEC Energy Group. According to a third party market research report, there is a concentration of financial institutions specializing in mutual funds and transaction processing, and a number of paper manufacturers, publishers, and printing companies. Milwaukee also serves as the headquarters of American Signal Corp., the Koss Corp., Harken, Lesaffre Yeast Corp., Master Lock, and Manpower.
The following table presents market information with respect to the Phoenix Industrial Portfolio III Properties:
| Market Overview | ||||||||||
| Property | Year Built/ Renovated | Size (SF)(1) | Market | In-Place Vacancy(1) | Market Vacancy(2) | Appraisal Concluded Vacancy | Market Inventory (SF)(2) | UW Base Rent PSF(1)(3) | Appraisal Market Rent PSF | % Below Market Rent |
| Galesburg | 1979/1988 | 855,659 | Galesburg | 12.0% | 2.7% | 5.0% | 4,118,560 | $1.68 | $2.18 | (22.9%) |
| Covington | 1988/1995 | 488,130 | Memphis | 0.0% | 5.5% | 5.0% | 274,642,042 | $2.87 | $2.95 | (2.8%) |
| Grafton | 1956-1979/2016-2019 | 346,338 | Milwaukee | 22.9% | 4.3% | 5.0% | 247,934,558 | $3.23 | $3.14 | 2.9% |
| Total/Wtd. Avg. | 1,690,127 | 10.8% | 3.8% | 5.0% | 526,695,160 | $2.34 | $2.60 | (10.0%) | ||
Source:Appraisal
| (1) | Based on the underwritten rent roll. |
| (2) | Based on third party market research reports. |
| (3) | Wtd. Avg. UW Base Rent PSF excludes vacant space. |
The following table presents demographic information with respect to the Phoenix Industrial Portfolio III Properties:
| Demographics Overview | |||||||
| Property | City, State | Allocated Loan Amount | % of Allocated Loan Amount | UW NCF | % of UW NCF | Estimated 2019 Population 5-mile Radius | Estimated 2019 Average Household Income 5-mile Radius |
| Galesburg | Galesburg, IL | $10,752,000 | 34.6% | $1,078,067 | 35.1% | 32,689 | $52,498 |
| Covington | Covington, TN | $10,233,000 | 32.9% | $1,244,256 | 40.5% | 8,367 | $53,967 |
| Grafton | Grafton, WI | $10,115,000 | 32.5% | $749,420 | 24.4% | 43,417 | $117,815 |
| Total/Wtd. Avg. | $31,100,000 | 100.0% | $3,071,744 | 100.0% | 28,175 | $74,225 | |
Source:Third party market research reports
THE INFORMATION IN THIS STRUCTURAL AND COLLATERAL TERM SHEET IS NOT COMPLETE AND MAY BE AMENDED PRIOR TO THE TIME OF SALE. THIS TERM SHEET IS NOT AN OFFER TO SELL THESE SECURITIES AND IT IS NOT A SOLICITATION OF AN OFFER TO BUY THESE SECURITIES IN ANY JURISDICTION WHERE THE OFFER OR SALE IS NOT PERMITTED.
60
| Various | Collateral Asset Summary – Loan No. 4 Phoenix Industrial Portfolio III | Cut-off Date Balance: Cut-off Date LTV Ratio: UW NCF DSCR: UW NOI Debt Yield: | $31,100,000 74.2% 1.70x 10.6% |
Operating History and Underwritten Net Cash Flow. The following table presents certain information relating to the historical operating performance and the Underwritten Net Cash Flow at the Phoenix Industrial Portfolio III Properties:
| Cash Flow Analysis | |||||
| 2016(1) | 2017(1) | 2018(1) | UW | UW PSF | |
| Gross Potential Rent(2) | N/A | N/A | N/A | $4,133,720 | $2.45 |
| Total Recoveries | N/A | N/A | N/A | $1,213,519 | $0.72 |
| Other Income | N/A | N/A | N/A | $29,719 | $0.02 |
| Less Vacancy & Credit Loss(3) | N/A | N/A | N/A | ($634,152) | ($0.38) |
| Effective Gross Income | N/A | N/A | N/A | $4,742,806 | $2.81 |
| Total Operating Expenses | N/A | N/A | N/A | $1,457,626 | $0.86 |
| Net Operating Income | N/A | N/A | N/A | $3,285,179 | $1.94 |
| TI/LC | N/A | N/A | N/A | $129,932 | $0.08 |
| Capital Expenditures | N/A | N/A | N/A | $83,504 | $0.05 |
| Net Cash Flow | N/A | N/A | N/A | $3,071,744 | $1.82 |
| Occupancy %(3) | N/A | N/A | N/A | 88.1% | |
| NOI DSCR (P&I) | N/A | N/A | N/A | 1.82x | |
| NCF DSCR (P&I) | N/A | N/A | N/A | 1.70x | |
| NOI Debt Yield | N/A | N/A | N/A | 10.6% | |
| NCF Debt Yield | N/A | N/A | N/A | 9.9% | |
| (1) | The borrower sponsor acquired the Phoenix Industrial Portfolio III Properties between 2015 and 2019. As such, prior operating performance information is not available. |
| (2) | UW Gross Potential Rent is based on the underwritten rent roll and includes (i) rent steps of $184,593 through December 1, 2020, (ii) straight line rent for investment grade tenant, VF Imagewear, Inc., totaling $74,451 and (iii) vacancy gross up of $532,194. |
| (3) | UW Occupancy % is based on the economic vacancy of 11.9%. The Phoenix Industrial Portfolio III Properties are 89.2% leased as of October 24, 2019 for the Galesburg property and Grafton property and September 30, 2019 for the Covington property. |
Escrows and Reserves.At origination of the Phoenix Industrial Portfolio III Mortgage Loan, the Phoenix Industrial Portfolio III Borrowers deposited into escrow (i) $175,008 for real estate taxes, (ii) $102,657 for insurance premiums, (iii) $142,250 for deferred maintenance, (iv) $500,000 for tenant allowances, tenant improvement costs and leasing commissions (“TI/LC”), (v) $500,000 for work and/or repairs at the Galesburg property with respect to the Blick Art Materials, LLC tenant space and (vi) $1,000,000 for outstanding free rents, rent abatements and/or work and repairs at the Covington property with respect to the VF Imagewear, Inc. tenant space. The Phoenix Industrial Portfolio III Borrowers are required to escrow monthly (i) 1/12 of the annual estimated tax payments, currently equal to $20,663, (ii) 1/12 of the annual estimated insurance premiums, currently equal to $12,830, (iii) $14,068 for replacement reserves, subject to a cap of $337,578 and (iv) when the amount in the TI/LC reserve account is less than $500,000, $11,410 for TI/LC, subject to a cap of $500,000.
Lockbox and Cash Management. The Phoenix Industrial Portfolio III Mortgage Loan has a hard lockbox with springing cash management upon the occurrence and continuance of a Cash Management Trigger Event (as defined below). Pursuant to the related mortgage loan documents, during the continuance of a Cash Management Trigger Event, all excess funds on deposit in the cash management account (after payment of required monthly reserve deposits, debt service payment and cash management bank fees) will be applied as follows: (a) if a Material Tenant Trigger Event (as defined below) has occurred and is continuing, to a Material Tenant (as defined below) rollover reserve and (b) if a Cash Sweep Trigger Event (as defined below) has occurred and is continuing (but not a Material Tenant Trigger Event), to the lender-controlled excess cash flow account or (c) if no Material Tenant Trigger Event or Cash Sweep Trigger Event has occurred and is continuing, to the Phoenix Industrial Portfolio III Borrowers.
A “Cash Management Trigger Event” will occur upon (i) an event of default under the related mortgage loan documents, (ii) any bankruptcy action involving the Phoenix Industrial Portfolio III Borrowers, the guarantor, the key principal or the property manager, (iii) the trailing 12-month period debt service coverage ratio falling below 1.25x, (iv) any indictment for fraud or misappropriation of funds by the Phoenix Industrial Portfolio III Borrowers, the guarantor, the key principal or the property manager, or any officer of the aforementioned or (v) a Material Tenant Trigger Event. A Cash Management Trigger Event will continue until, in regard to clause (i) above, the cure of such event of default and acceptance of such cure by the lender, in regard to clause (ii) above, the filing is discharged, stayed or dismissed within 45 days for the Phoenix Industrial Portfolio III Borrowers, guarantor or key principal, or within 120 days for the property manager, and the lender’s determination that such filing does not materially affect the obligations of the Phoenix Industrial Portfolio III Borrowers, the guarantor, the key principal or the property manager under the related mortgage loan documents or management agreement, as applicable, in regard to clause (iii) above, the trailing 12-month debt service coverage ratio is at least 1.30x for two consecutive calendar quarters, in regard to clause (iv) above, the dismissal of the applicable indictment with prejudice or the acquittal of the applicable person with respect to the related charge or the replacement of the property manager with a qualified manager pursuant to the related mortgage loan documents, or in regard to clause (v) above, the cure of such Material Tenant Trigger Event.
A “Material Tenant Trigger Event” will occur (i) if a Material Tenant gives notice of its intention to terminate or cancel or not to extend or renew its lease, (ii) on or prior to the date on which a Material Tenant is required under its lease to notify the Phoenix Industrial Portfolio III Borrowers of its election to extend or renew its lease, if such Material Tenant fails to give such notice, (iii) if an event of default under a Material Tenant lease occurs and continues beyond any applicable notice and cure period, (iv) if a bankruptcy action of a Material Tenant or guarantor of any Material Tenant lease occurs, (v) if a Material Tenant lease is terminated or is no longer in full force and effect or (vi) if a Material Tenant “goes dark”, vacates, ceases to occupy or ceases to conduct business in the ordinary course at the Phoenix Industrial Portfolio III Properties or a portion thereof for a period in excess of 12 consecutive calendar months (other than temporary cessation of operations in connection with remodeling, renovation or restoration of their leased premises). A Material Tenant Trigger Event will end (a) with respect to clause (i) above, on the date that (1) the applicable Material Tenant revokes or rescinds all termination or cancellation notices, (2) the applicable Material Tenant lease is extended on terms satisfying the requirements of the related mortgage loan
THE INFORMATION IN THIS STRUCTURAL AND COLLATERAL TERM SHEET IS NOT COMPLETE AND MAY BE AMENDED PRIOR TO THE TIME OF SALE. THIS TERM SHEET IS NOT AN OFFER TO SELL THESE SECURITIES AND IT IS NOT A SOLICITATION OF AN OFFER TO BUY THESE SECURITIES IN ANY JURISDICTION WHERE THE OFFER OR SALE IS NOT PERMITTED.
61
| Various | Collateral Asset Summary – Loan No. 4 Phoenix Industrial Portfolio III | Cut-off Date Balance: Cut-off Date LTV Ratio: UW NCF DSCR: UW NOI Debt Yield: | $31,100,000 74.2% 1.70x 10.6% |
documents or (3) all or substantially all of the applicable Material Tenant space is leased to a replacement tenant, and such replacement tenant and its lease satisfy the requirements of the related mortgage loan documents, (b) with respect to clauses (ii) above, on the date that (1) the applicable Material Tenant lease is extended on terms satisfying the requirements of the related mortgage loan documents or (2) all or substantially all of the applicable Material Tenant space is leased to a replacement tenant, and such replacement tenant and its lease satisfy the requirements of the related mortgage loan documents, (c) with respect to clause (iii) above, after a cure of the applicable event of default, (d) with respect to clause (iv) above, after an affirmation of the Material Tenant lease in the applicable bankruptcy proceeding and confirmation that the Material Tenant is actually paying all rents and other amounts under its lease (or, if applicable, the discharge or dismissal of the applicable Material Tenant lease guarantor from the applicable bankruptcy proceeding;provided that such bankruptcy (after dismissal or discharge) does not have an adverse effect on such Material Tenant lease guarantor’s ability to perform its obligations under its lease guaranty), (e) with respect to clause (v) above, all or substantially all of the applicable Material Tenant space is leased to a replacement tenant, and such replacement tenant and its lease satisfy the requirements of the related mortgage loan documents or (f) with respect to clause (vi) above, the Material Tenant re-commences its normal business operations at the applicable Phoenix Industrial Portfolio III Property.
A “Material Tenant” means (i) Blick Art Materials, LLC, (ii) VF Imagewear, Inc., or (iii) any other tenant at the Phoenix Industrial Portfolio III Properties that, together with its affiliates, either (a) leases no less than 20% of the total rentable square footage at the applicable Phoenix Industrial Portfolio III Property or (b) accounts for no less than 20% of the total in-place base rent at the applicable Phoenix Industrial Portfolio III Property.
A “Cash Sweep Trigger Event” will occur upon (i) an event of default under the related mortgage loan documents, (ii) any bankruptcy action involving the Phoenix Industrial Portfolio III Borrowers, the guarantor, the key principal or the property manager or (iii) the trailing 12-month period debt service coverage ratio falling below 1.20x. A Cash Sweep Trigger Event will continue until, in regard to clause (i) above, the cure of such event of default and acceptance of such cure by the lender, in regard to clause (ii) above, the filing is discharged, stayed or dismissed within 45 days for the Phoenix Industrial Portfolio III Borrowers, key principal or guarantor, or within 120 days for the property manager, and the lender’s determination that such filing does not materially affect the obligations of the Phoenix Industrial Portfolio III Borrowers, the guarantor, the key principal or the property manager under the related mortgage loan documents or management agreement, as applicable, or in regard to clause (iii) above, the trailing 12-month debt service coverage ratio is at least 1.25x for two consecutive calendar quarters.
Additional Secured Indebtedness (not including trade debts). None.
Mezzanine Loans and Preferred Equity. None.
Release of Property. The Phoenix Industrial Portfolio III Borrowers may obtain the release of one or more of the Phoenix Industrial Portfolio III Properties,provided that, among other conditions, (i) no event of default under the related mortgage loan documents is continuing, (ii) the Phoenix Industrial Portfolio III Borrowers partially defease the Phoenix Industrial Portfolio III Mortgage Loan in an amount equal to 115% of the allocated loan amount for the applicable property being released (the “Release Amount”), (iii) the debt service coverage ratio for the remaining properties following the release based on the trailing 12 months is no less than the greater of (a) the debt service coverage ratio immediately preceding such release and (b) 1.66x, (iv) the loan-to-value ratio for the remaining properties following the release does not exceed the lesser of (a) the loan-to-value ratio immediately preceding such release and (b) 74.2% and (v) if, as of the date of its calculation, the ratio of (a) the sum of the outstanding principal amount of the Phoenix Industrial Portfolio III Mortgage Loan to (b) the fair market value of the Phoenix Industrial Portfolio III Properties (the “REMIC LTV”) exceeds 125% immediately after the property being released, no release will be permitted unless the balance of the Phoenix Industrial Portfolio III Mortgage Loan is paid down by the greater of (I) the Release Amount or (II) the least of the following amounts: (x) if the released property is sold, the net proceeds of the sale of the released property, (y) the fair market value of the released property at the time of such release, or (z) an amount such that the REMIC LTV after such release is not greater than the REMIC LTV of the Phoenix Industrial Portfolio III Properties immediately prior to such release. See, “Description of the Mortgage Pool—Certain Terms of the Mortgage Loans—Releases; Partial Releases” in the Preliminary Prospectus.
Terrorism Insurance.The Phoenix Industrial Portfolio III Borrowers are required to obtain and maintain property insurance, commercial general liability insurance, and business income or rental loss insurance that covers perils of terrorism and acts of terrorism, both foreign and domestic.
THE INFORMATION IN THIS STRUCTURAL AND COLLATERAL TERM SHEET IS NOT COMPLETE AND MAY BE AMENDED PRIOR TO THE TIME OF SALE. THIS TERM SHEET IS NOT AN OFFER TO SELL THESE SECURITIES AND IT IS NOT A SOLICITATION OF AN OFFER TO BUY THESE SECURITIES IN ANY JURISDICTION WHERE THE OFFER OR SALE IS NOT PERMITTED.
62
3 Columbus Circle New York, NY 10019 | Collateral Asset Summary – Loan No. 5 3 Columbus Circle | Cut-off Date Balance: Cut-off Date LTV Ratio: UW NCF DSCR: UW NOI Debt Yield: | $30,000,000 45.4% 2.91x 12.3% |
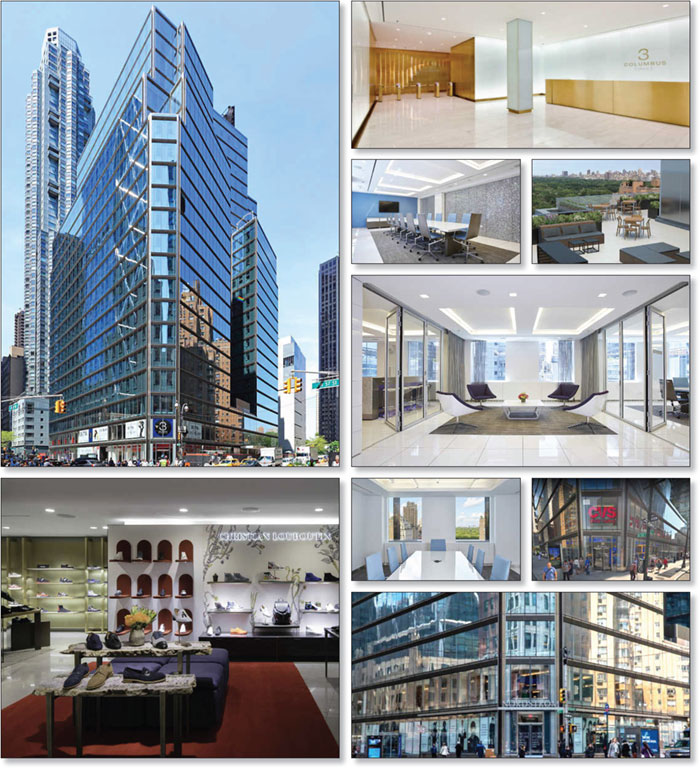
THE INFORMATION IN THIS STRUCTURAL AND COLLATERAL TERM SHEET IS NOT COMPLETE AND MAY BE AMENDED PRIOR TO THE TIME OF SALE. THIS TERM SHEET IS NOT AN OFFER TO SELL THESE SECURITIES AND IT IS NOT A SOLICITATION OF AN OFFER TO BUY THESE SECURITIES IN ANY JURISDICTION WHERE THE OFFER OR SALE IS NOT PERMITTED.
63
3 Columbus Circle New York, NY 10019 | Collateral Asset Summary – Loan No. 5 3 Columbus Circle | Cut-off Date Balance: Cut-off Date LTV Ratio: UW NCF DSCR: UW NOI Debt Yield: | $30,000,000 45.4% 2.91x 12.3% |
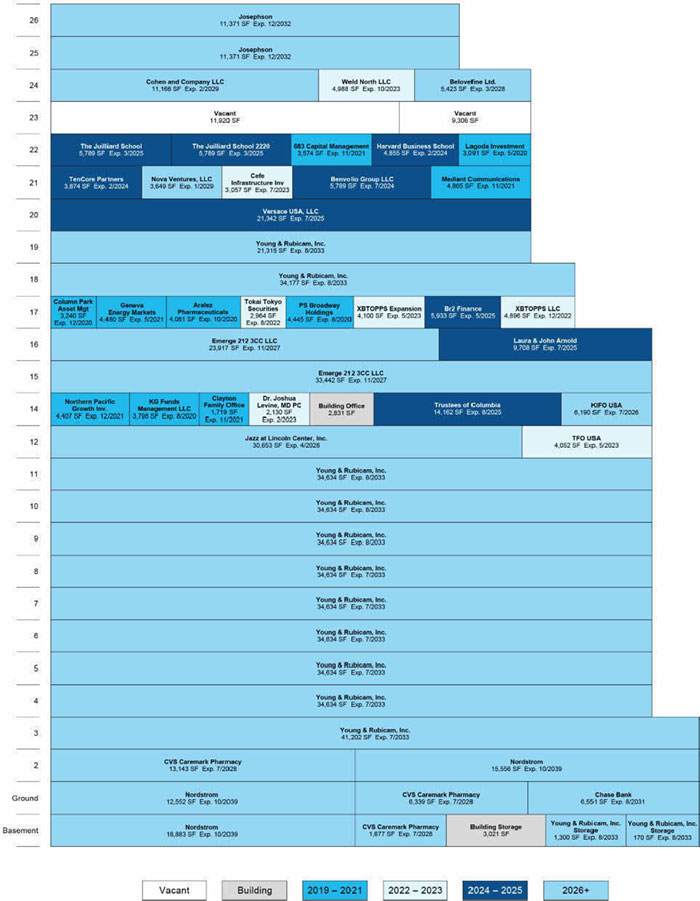
THE INFORMATION IN THIS STRUCTURAL AND COLLATERAL TERM SHEET IS NOT COMPLETE AND MAY BE AMENDED PRIOR TO THE TIME OF SALE. THIS TERM SHEET IS NOT AN OFFER TO SELL THESE SECURITIES AND IT IS NOT A SOLICITATION OF AN OFFER TO BUY THESE SECURITIES IN ANY JURISDICTION WHERE THE OFFER OR SALE IS NOT PERMITTED.
64
3 Columbus Circle New York, NY 10019 | Collateral Asset Summary – Loan No. 5 3 Columbus Circle | Cut-off Date Balance: Cut-off Date LTV Ratio: UW NCF DSCR: UW NOI Debt Yield: | $30,000,000 45.4% 2.91x 12.3% |
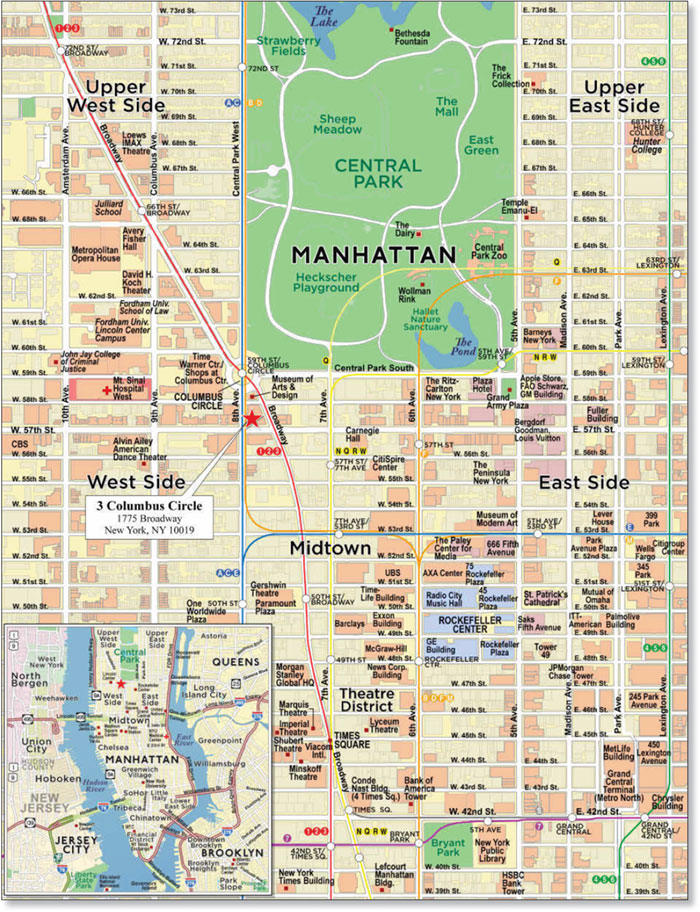
THE INFORMATION IN THIS STRUCTURAL AND COLLATERAL TERM SHEET IS NOT COMPLETE AND MAY BE AMENDED PRIOR TO THE TIME OF SALE. THIS TERM SHEET IS NOT AN OFFER TO SELL THESE SECURITIES AND IT IS NOT A SOLICITATION OF AN OFFER TO BUY THESE SECURITIES IN ANY JURISDICTION WHERE THE OFFER OR SALE IS NOT PERMITTED.
65
3 Columbus Circle New York, NY 10019 | Collateral Asset Summary – Loan No. 5 3 Columbus Circle | Cut-off Date Balance: Cut-off Date LTV Ratio: UW NCF DSCR: UW NOI Debt Yield: | $30,000,000 45.4% 2.91x 12.3% |
| Mortgage Loan Information | Mortgaged Property Information | ||||||
| Mortgage Loan Seller(1): | Natixis | Single Asset/Portfolio: | Single Asset | ||||
Credit Assessment (Fitch/KBRA/Moody’s): | BBB-/A/Baa1 | Location: | New York, NY 10019 | ||||
| General Property Type: | Office | ||||||
| Original Balance(2): | $30,000,000 | Detailed Property Type: | CBD | ||||
| Cut-off Date Balance(2): | $30,000,000 | Title Vesting: | Fee Simple | ||||
| % of Initial Pool Balance: | 4.0% | Year Built/Renovated: | 1927/2010-2013 | ||||
| Loan Purpose: | Refinance | Size: | 753,713 SF | ||||
| Borrower Sponsor: | Joseph Moinian | Cut-off Date Balance per SF(2): | $650 | ||||
| Mortgage Rate: | 3.9140% | Maturity Date Balance per SF(2): | $650 | ||||
| Note Date: | 3/12/2019 | Property Manager: | Columbus Property Management | ||||
| First Payment Date: | 4/11/2019 | LLC (borrower-related) | |||||
| Maturity Date: | 3/11/2029 | ||||||
| Original Term to Maturity | 120 months | ||||||
| Original Amortization Term: | 0 months | ||||||
| IO Period: | 120 months | ||||||
| Seasoning: | 9 months | ||||||
| Prepayment Provisions(3): | LO (33); DEF (82); O (5) | Underwriting and Financial Information | |||||
| Lockbox/Cash Mgmt Status: | Hard/In Place | UW NOI(5): | $60,497,452 | ||||
| Additional Debt Type(2): | Pari Passu/ Subordinate Debt | UW NOI Debt Yield(2): | 12.3% | ||||
| Additional Debt Balance(2): | $460,000,000 / $105,000,000 | UW NOI Debt Yield at Maturity(2): | 12.3% | ||||
| Future Debt Permitted (Type): | No (N/A) | UW NCF DSCR(2): | 2.91x | ||||
| Reserves(4) | Most Recent NOI(5): | $40,091,035 (12/31/2018) | |||||
| Type | Initial | Monthly | Cap | 2nd Most Recent NOI: | $34,698,749 (12/31/2017) | ||
| RE Tax: | $0 | Springing | N/A | 3rd Most Recent NOI: | $35,192,550 (12/31/2016) | ||
| Insurance: | $0 | Springing | N/A | Most Recent Occupancy: | 97.2% (1/1/2019) | ||
| Replacements: | $0 | Springing | $1,000,000 | 2nd Most Recent Occupancy(5): | 91.9% (12/31/2017) | ||
| TI/LC: | $0 | Springing | $5,000,000 | 3rd Most Recent Occupancy(5): | 98.4% (12/31/2016) | ||
| Free Rent: | $847,794 | $0 | N/A | Appraised Value (as of): | $1,080,000,000 (1/1/2019) | ||
| Outstanding TI/LC: | $1,820,891 | $0 | N/A | Cut-off Date LTV Ratio(2): | 45.4% | ||
| Young & Rubicam: | $0 | Springing | $40,000,000 | Maturity Date LTV Ratio(2): | 45.4% | ||
| Sources and Uses | ||||||
| Sources | Proceeds | % of Total | Uses | Proceeds | % of Total | |
| Senior Loan Amount(2): | $490,000,000 | 80.5% | Loan Payoff(6): | $371,671,992 | 61.1% | |
| Subordinate Companion Loan(2): | $105,000,000 | 17.2% | Young & Rubicam Condo Purchase(7): | $215,600,000 | 35.4% | |
| Borrower Equity: | $13,763,711 | 2.3% | Closing Costs: | $18,823,034 | 3.1% | |
| Reserves: | $2,668,685 | 0.4% | ||||
| Total Sources: | $608,763,711 | 100.0% | Total Uses: | $608,763,711 | 100.0% | |
| (1) | The 3 Columbus Circle Whole Loan (as defined below) was originated by JPMorgan Chase Bank, National Association (“JPMCB”). |
| (2) | The 3 Columbus Circle Mortgage Loan (as defined below) is part of the 3 Columbus Circle Whole Loan (as defined below), which is comprised of 16pari passu senior promissory notes with an aggregate original principal balance of $490,000,000 (the “3 Columbus Circle Senior Notes”, and collectively the “3 Columbus Circle Senior Loan”) and two promissory notes that are subordinate to the 3 Columbus Circle Senior Notes with an aggregate original principal balance of $105,000,000 (collectively, the “3 Columbus Circle Subordinate Companion Loans”, and together with the 3 Columbus Circle Senior Loan, the “3 Columbus Circle Whole Loan”). The Cut-off Date Balance per SF, Maturity Date Balance per SF, UW NOI Debt Yield, UW NOI Debt Yield at Maturity, UW NCF DSCR, Cut-off Date LTV Ratio and Maturity Date LTV Ratio presented above are based on the aggregate principal balance of the promissory notes comprising the 3 Columbus Circle Senior Loan, without regard to the 3 Columbus Circle Subordinate Companion Loans. The Cut-off Date Balance per SF, Maturity Date Balance per SF, UW NOI Debt Yield, UW NOI Debt Yield at Maturity, UW NCF DSCR, Cut-off Date LTV Ratio and Maturity Date LTV Ratio based on the combined balance of the entire 3 Columbus Circle Whole Loan are $789, $789, 10.2%, 10.2%, 2.40x, 55.1% and 55.1%, respectively. See “The Mortgage Loan” and “Additional Secured Indebtedness (not including trade debts)” below for further discussion of additional debt. |
| (3) | Defeasance of the 3 Columbus Circle Whole Loan is permitted at any time after the earlier to occur of (a) the end of the two-year period commencing on the closing date of the securitization of the last 3 Columbus Circle Whole Loan promissory note to be securitized and (b) the third anniversary of the first payment date. The assumed defeasance lockout period of 33 payments is based on the expected closing date of the UBS 2019-C18 securitization in December 2019. |
| (4) | See “Escrows and Reserves” below for further discussion of reserve requirements. |
| (5) | The increase in UW NOI from Most Recent NOI is primarily attributable to (i) an additional 214,372 SF lease executed with Young & Rubicam, Inc. on floors three through eight, accounting for approximately $16.3 million in underwritten base rent and (ii) rent steps through January 2020 or average rent over the 3 Columbus Circle Whole Loan term for investment grade tenants. |
| (6) | Includes approximately $21.7 million in defeasance costs. |
| (7) | In conjunction with the origination of the 3 Columbus Circle Whole Loan, The Moinian Group executed a sale leaseback of floors three through eight to Young & Rubicam, Inc. See “The Property” below for further discussion. |
THE INFORMATION IN THIS STRUCTURAL AND COLLATERAL TERM SHEET IS NOT COMPLETE AND MAY BE AMENDED PRIOR TO THE TIME OF SALE. THIS TERM SHEET IS NOT AN OFFER TO SELL THESE SECURITIES AND IT IS NOT A SOLICITATION OF AN OFFER TO BUY THESE SECURITIES IN ANY JURISDICTION WHERE THE OFFER OR SALE IS NOT PERMITTED.
66
3 Columbus Circle New York, NY 10019 | Collateral Asset Summary – Loan No. 5 3 Columbus Circle | Cut-off Date Balance: Cut-off Date LTV Ratio: UW NCF DSCR: UW NOI Debt Yield: | $30,000,000 45.4% 2.91x 12.3% |
The Mortgage Loan.The fifth largest mortgage loan (the “3 Columbus Circle Mortgage Loan”) is part of a whole loan (the “3 Columbus Circle Whole Loan”) evidenced by (i) 16pari passu notes with an aggregate original principal balance of $490,000,000 and (ii) the 3 Columbus Circle Subordinate Companion Loans with an aggregate original principal balance of $105,000,000. The 3 Columbus Circle Whole Loan is secured by a first mortgage encumbering the borrower’s fee interest in a 21 condominium unit, 753,713 SF Class A office building located on Broadway between West 57th and 58th Streets in New York, New York (the “3 Columbus Circle Property”). Promissory Note A-1-6, with an original principal balance of $30,000,000, represents the 3 Columbus Circle Mortgage Loan, and will be contributed to the UBS 2019-C18 Trust. The below table summarizes the 3 Columbus Circle Whole Loan, including the remainingpari passu promissory notes comprising the 3 Columbus Circle Senior Loan, which are currently held by the entities listed below or are expected to be contributed to one or more future securitization transactions and may otherwise be transferred at any time. The mortgage loan seller provides no assurances that the non-securitized note will not be split further. The 3 Columbus Circle Whole Loan is serviced pursuant to the pooling and servicing agreement for the BMARK 2019-B10 Trust. See “Description of the Mortgage Pool—The Whole Loans—The Non-Serviced AB Whole Loans—The 3 Columbus Circle Whole Loan” and “Pooling and Servicing Agreement” in the Preliminary Prospectus.
| 3 Columbus Circle Whole Loan Summary | |||||
| Note | Original Balance | Cut-off Date Balance | Anticipated Note Holder | Controlling Piece | |
| 3 Columbus Circle Mortgage Loan | |||||
| A-1-6 | $30,000,000 | $30,000,000 | UBS 2019-C18 | No | |
| 3 Columbus Circle Non-Serviced Pari Passu Companion Loans | |||||
| A-1-1, A-2-1 | $75,000,000 | $75,000,000 | BMARK 2019-B10 | No(1) | |
| A-1-2-A | $50,000,000 | $50,000,000 | JPMCC 2019-COR5 | No | |
| A-1-2-B, A-1-7 | $50,000,000 | $50,000,000 | BMARK 2019-B12 | No | |
| A-1-3, A-2-4 | $100,000,000 | $100,000,000 | BMARK 2019-B11 | No | |
| A-1-4-B, A-1-8 | $37,500,000 | $37,500,000 | BMARK 2019-B13 | No | |
| A-1-4-A | $25,000,000 | $25,000,000 | CCRE | No | |
| A-1-5 | $50,000,000 | $50,000,000 | CSAIL 2019-C16 | No | |
| A-2-2, A-2-3 | $50,000,000 | $50,000,000 | CF 2019-CF1 | No | |
| A-2-5-A | $12,500,000 | $12,500,000 | MSC 2019-H7 | No | |
| A-2-5-B | $10,000,000 | $10,000,000 | MSC 2019-H6 | No | |
| 3 Columbus Circle Subordinate Companion Loans | |||||
| B-1 | $51,450,000 | $51,450,000 | BMARK 2019-B10 | Yes(1) | |
| B-2 | $53,550,000 | $53,550,000 | BMARK 2019-B10 | No | |
| Total | $595,000,000 | $595,000,000 | |||
| (1) | The initial controlling note is Note B-1, so long as no control appraisal period with respect to the 3 Columbus Circle Whole Loan has occurred and is continuing. If and for so long as a control appraisal period with respect to the 3 Columbus Circle Whole Loan has occurred and is continuing, then the controlling note will be Note A-1-1. See “Description of the Mortgage Pool—The Whole Loans—The Non-Serviced AB Whole Loans—The 3 Columbus Circle Whole Loan” in the Preliminary Prospectus. |
The Borrowers and the Borrower Sponsor. The borrowers are 3 Columbus Circle LLC – Series A, 3 Columbus Circle LLC – Series B (each a “series” of 3 Columbus Circle LLC formed under the Delaware General Corporation Law) and 3 Columbus Circle LLC (collectively, the “3 Columbus Circle Borrowers”), each a Delaware limited liability company structured to be a single purpose bankruptcy-remote entity with 3 Columbus Circle LLC having two independent directors in its organizational structure. Two of the 3 Columbus Circle Borrowers, 3 Columbus Circle LLC – Series A and 3 Columbus Circle LLC – Series B, own a portion of the 3 Columbus Circle Property as tenants-in-common. See “Description of the Mortgage Pool—Mortgage Pool Characteristics—Tenancies-in-Common; Crowd Funding; Diversified Ownership” in the Preliminary Prospectus.
The borrower sponsor and nonrecourse carve-out guarantor is Joseph Moinian, the key principal of The Moinian Group (“Moinian”). Founded in 1982, Moinian is a private real estate acquisition, ownership, development and management company. Joseph Moinian is the nonrecourse carve-out guarantor for the 3 Columbus Circle Whole Loan. Moinian has acquired commercial properties throughout the country, focusing on major cities such as New York, Chicago, Dallas and Los Angeles. Moinian develops, owns and operates properties across every asset category, including office, hotel, retail, condos and rental apartments. Notable New York City investments include The Oskar, The Sky, 17 Battery North & South and 535-545 Fifth Avenue, with a portfolio of more than 20.0 million SF.
The Property. The 3 Columbus Circle Property is a Class A, 26-story, 753,713 SF office building with ground-floor retail located in the Midtown neighborhood of Manhattan, New York. The 3 Columbus Circle Property occupies the entire city block bounded by Broadway, Eighth Avenue, West 57th Street and West 58th Street, and features panoramic views of Central Park, the Hudson River and New York City. The 3 Columbus Circle Property serves as the national headquarters for its largest tenant, Young & Rubicam, Inc. (“Young & Rubicam”) (49.8% of NRA; rated BBB+/BBB by Fitch and S&P), and approximately 72.0% and 78.8% of NRA and underwritten base rent, respectively, is leased to investment grade tenants, including Nordstrom’s first men’s store in Manhattan, CVS Caremark Pharmacy, Chase Bank, Versace and AT&T Corp., among others.
The 3 Columbus Circle Property’s bottom five floors were originally constructed in 1904 and underwent a 22-story expansion by Shreve, Lamb and Harmon in 1927, the architectural firm that designed the Empire State Building. From 2010 to 2013, the 3 Columbus Circle Property underwent an approximately $82.5 million building-wide renovation, including an approximately $44.0 million energy-efficient glass façade surrounding the building’s original foundation. In addition to the façade, the lobby received an approximately $1.0 million expansion and renovation that widened the existing entrance on Broadway and replaced the existing lobby walls with 12-foot glass walls. The retail space received approximately $3.0 million in capital improvements, including floor-to-ceiling windows and fully redesigned restrooms. The 3 Columbus Circle Property features modern building systems, 12 passenger elevators, a loading dock and office terraces on multiple floors. The 3 Columbus Circle Property has earned an Energy Star designation and LEED Silver certification.
THE INFORMATION IN THIS STRUCTURAL AND COLLATERAL TERM SHEET IS NOT COMPLETE AND MAY BE AMENDED PRIOR TO THE TIME OF SALE. THIS TERM SHEET IS NOT AN OFFER TO SELL THESE SECURITIES AND IT IS NOT A SOLICITATION OF AN OFFER TO BUY THESE SECURITIES IN ANY JURISDICTION WHERE THE OFFER OR SALE IS NOT PERMITTED.
67
3 Columbus Circle New York, NY 10019 | Collateral Asset Summary – Loan No. 5 3 Columbus Circle | Cut-off Date Balance: Cut-off Date LTV Ratio: UW NCF DSCR: UW NOI Debt Yield: | $30,000,000 45.4% 2.91x 12.3% |
Moinian acquired the 3 Columbus Circle Property in 2004 for approximately $250 million. In 2011, when the building was 33.3% occupied, Moinian sold a 48.9% interest in the building to SL Green, and together, the companies began an extensive multi-year redevelopment plan to reposition the building to a Class A asset. In 2012, while the redevelopment was underway, a 214,372 SF condominium interest covering floors three to eight was sold to Young & Rubicam for approximately $143.6 million. Renovations were completed in 2013 and the 3 Columbus Circle Property was leased up to 97.2% as of January 1, 2019. In 2018, Moinian repurchased SL Green’s interest in the 3 Columbus Circle Property for $227.5 million and, in conjunction with the origination of the 3 Columbus Circle Whole Loan, Moinian repurchased Young & Rubicam’s condominium interest for $215.6 million. In conjunction with the repurchase of the Young & Rubicam condominium interest, a new lease to Young & Rubicam was simultaneously executed with an initial base rent of $76.00 PSF and a lease expiration of July 2033.
As of January 1, 2019, the 3 Columbus Circle Property was 97.2% leased to a diversified roster of 40 tenants, including a mix of 32 office tenants, five telecom tenants and three investment grade rated retail tenants. The 3 Columbus Circle Property’s ten largest tenants occupy approximately 610,518 SF (81.0% of NRA) and have a weighted average remaining lease term of approximately 12.5 years.
Major Tenants.
Young & Rubicam (375,236 SF, 49.8% of NRA, 39.9% of underwritten base rent). Young & Rubicam, a subsidiary of WPP (LSE: WPP) (Fitch/S&P: BBB+/BBB), is a marketing and communications company specializing in advertising, digital and social media, sales promotion, direct marketing and brand identity consulting. Young & Rubicam’s clients include a variety of companies including Campbell’s Soup Company, Colgate-Palmolive, Virgin Atlantic, Revlon, LG and Land Rover. Founded in 1923 and headquartered at the 3 Columbus Circle Property, Young & Rubicam has more than 190 offices in 95 countries. WPP is a global company in communications, commerce and technology services with over 150 subsidiaries. As of 2018, WPP reported £15.6 billion in revenue. Young & Rubicam has been in occupancy of the 3 Columbus Circle Property since 2012 and currently occupies floors 9, 10, 11, 18 and 19 through August 2033 and floors three through eight through July 2033, both with two, ten-year renewal options.
Emerge 212 3CC LLC (57,359 SF, 7.6% of NRA, 4.7% of underwritten base rent). Emerge 212 3CC LLC (“Emerge212”), a subsidiary of SL Green Realty Corp. (NYSE: SLG) (Moody’s/Fitch/S&P: Baa3/BBB/BBB-), was founded in 1999 and is an operator of full-service office suites. Emerge212 provides fully-furnished, privately leased, flexible office space, providing tenants the ability to grow and contract along with business needs. In addition to office space, tenants receive full-service amenities such as cafe areas, charging stations, conference rooms and event space. Emerge212 is located exclusively in New York with locations at 3 Columbus Circle, 125 Park Avenue and 1185 Avenue of the Americas. SL Green Realty Corp. is a self-managed real estate investment trust and a large commercial landlord in New York City. As of 2018, SL Green Realty Corp. reported approximately $1.2 billion in total revenue and approximately $12.8 billion in total assets. Emerge212 has been a tenant at the 3 Columbus Circle Property since 2013, currently occupies floors 15 and 16 through November 2027 and licenses its space as shared workspace.
Nordstrom (46,991 SF, 6.2% of NRA, 19.6% of underwritten base rent). Nordstrom (Moody’s/Fitch/S&P: Baa1/BBB+/BBB+) (NYSE: JWN) is an upscale apparel and shoe retailer, serving customers through multiple retail channels, discount stores, boutiques, catalogs and the Internet. The store at the 3 Columbus Circle Property serves as Nordstrom’s first men’s store and its first store in Manhattan. Nordstrom opened its flagship women’s store across the street at Central Park Tower in October 2019. In addition to its online business which reaches 96 countries, Nordstrom operates 380 stores in 40 U.S. states and Canada. As of the fiscal year ended February 2, 2019, Nordstrom reported approximately $15.5 billion in net sales and approximately $7.9 billion in total assets. Nordstrom occupies the largest retail space on the ground floor, as well as space on the second floor, through October 2039 and has two, ten-year renewal options.
THE INFORMATION IN THIS STRUCTURAL AND COLLATERAL TERM SHEET IS NOT COMPLETE AND MAY BE AMENDED PRIOR TO THE TIME OF SALE. THIS TERM SHEET IS NOT AN OFFER TO SELL THESE SECURITIES AND IT IS NOT A SOLICITATION OF AN OFFER TO BUY THESE SECURITIES IN ANY JURISDICTION WHERE THE OFFER OR SALE IS NOT PERMITTED.
68
3 Columbus Circle New York, NY 10019 | Collateral Asset Summary – Loan No. 5 3 Columbus Circle | Cut-off Date Balance: Cut-off Date LTV Ratio: UW NCF DSCR: UW NOI Debt Yield: | $30,000,000 45.4% 2.91x 12.3% |
The following table presents certain information relating to the tenancy at the 3 Columbus Circle Property:
| Tenant Summary(1) | |||||||||
| Tenant Name | Type | Credit Rating (Fitch/Moody’s/S&P)(2) | Tenant NRSF | % of NRSF | Annual UW Base Rent PSF(3) | Annual UW Base Rent(3) | % of Total Annual UW Base Rent(3) | Lease Expiration | Renewal / Extension Options |
| Young & Rubicam, Inc.(4) | Office | BBB+/NR/BBB | 375,236 | 49.8% | $72.06 | $27,040,366 | 39.9% | 7/31/2033 | 2, 10-Year |
| Emerge 212 3CC LLC | Office | BBB/Baa3/BBB- | 57,359 | 7.6% | $55.00 | $3,154,745 | 4.7% | 11/30/2027 | None |
| Nordstrom(5) | Retail | BBB+/Baa1/BBB+ | 46,991 | 6.2% | $282.15 | $13,258,518 | 19.6% | 10/31/2039 | 2, 10-Year |
| Jazz at Lincoln Center, Inc. | Office | NR/NR/NR | 30,653 | 4.1% | $52.00 | $1,593,956 | 2.4% | 4/30/2028 | 1, 5-Year |
| Josephson(6) | Office | NR/NR/NR | 22,742 | 3.0% | $100.00 | $2,274,200 | 3.4% | 12/31/2032 | 1, 5-Year |
| Versace USA, Inc. | Office | BBB-/NR/BBB- | 21,342 | 2.8% | $75.00 | $1,600,650 | 2.4% | 7/31/2025 | 1, 5-Year |
| CVS Caremark Pharmacy | Retail | NR/Baa2/BBB | 21,159 | 2.8% | $193.20 | $4,087,919 | 6.0% | 7/31/2028 | 1, 10-Year |
| Trustees of Columbia(7) | Office | NR/Aaa/AAA | 14,162 | 1.9% | $77.77 | $1,101,323 | 1.6% | 8/31/2025 | None |
| Cohen and Company LLC | Office | NR/NR/NR | 11,166 | 1.5% | $83.00 | $926,778 | 1.4% | 2/28/2029 | 1, 5-Year |
| Laura & John Arnold(8) | Office | NR/NR/NR | 9,708 | 1.3% | $56.00 | $543,648 | 0.8% | 7/31/2025 | None |
| Total Major Office and Retail | 610,518 | 81.0% | $91.04 | $55,582,102 | 82.0% | ||||
| Other Occupied Office and Retail(9) | 121,646 | 16.1% | $99.39 | $12,090,370 | 17.8% | ||||
| Total Occupied Office and Retail | 732,164 | 97.1% | $92.43 | $67,672,472 | 99.9% | ||||
| Telecom | 218 | 0.1% | $328.03 | $71,510 | 0.1% | ||||
| Total Occupied | 732,382 | 97.2% | $92.50 | $67,743,982 | 100.0% | ||||
| Vacant | 21,331 | 2.8% | $0 | 0.0% | |||||
| Total | 753,713 | 100.0% | $67,743,982 | 100.0% | |||||
| (1) | Information is based on the underwritten rent roll. |
| (2) | Certain ratings are those of the parent company whether or not the parent guarantees the lease. |
| (3) | Annual UW Base Rent PSF, Annual UW Base Rent and % of Total Annual UW Base Rent includes rent steps through January 2020 and average rent over the 3 Columbus Circle Whole Loan term for investment grade tenants, including Young & Rubicam, Inc., Emerge 212 3CC LLC, Nordstrom, CVS Caremark Pharmacy, Chase Bank, Trustees of Columbia and AT&T Corp. |
| (4) | Young & Rubicam, Inc. leases 375,236 SF, of which (i) 214,372 SF is leased for $76.00 PSF and is set to expire July 2033, (ii) 124,760 SF is leased for $68.60 PSF and is set to expire August 2033, (iii) 34,634 SF is leased for $62.00 PSF and is set to expire in August 2033 and (iv) 1,300 SF is leased for $32.50 PSF and is set to expire in August 2033. |
| (5) | Nordstrom leases 46,991 SF, of which (i) 43,018 SF is leased for $241.25 underwritten base rent PSF and (ii) 3,973 SF is leased for $725.00 underwritten base rent PSF. |
| (6) | Josephson is an affiliate of the 3 Columbus Circle Borrowers and its leased space serves as headquarters for affiliates of the 3 Columbus Circle Borrowers. |
| (7) | Trustees of Columbia leases 14,162 SF, of which (i) 6,031 SF is leased for $76.53 underwritten base rent PSF, (ii) 5,020 SF is leased for $78.79 underwritten base rent PSF and (iii) 3,111 SF is leased for $78.51 underwritten base rent PSF. |
| (8) | Laura & John Arnold has the right to cancel its lease at the end of any month occurring between March 1, 2020 and March 1, 2023, with no less than nine months’ prior notice and the payment of a termination fee equal to the then unamortized portion of the transaction costs. |
| (9) | Other Occupied Office and Retail is inclusive of a 2,831 SF management office with no attributable underwritten base rent. Subleases account for 20,015 SF (2.7% of NRA). |
| (10) | Vacant space includes 21,231 SF of office space and 100 SF of storage space. |
THE INFORMATION IN THIS STRUCTURAL AND COLLATERAL TERM SHEET IS NOT COMPLETE AND MAY BE AMENDED PRIOR TO THE TIME OF SALE. THIS TERM SHEET IS NOT AN OFFER TO SELL THESE SECURITIES AND IT IS NOT A SOLICITATION OF AN OFFER TO BUY THESE SECURITIES IN ANY JURISDICTION WHERE THE OFFER OR SALE IS NOT PERMITTED.
69
3 Columbus Circle New York, NY 10019 | Collateral Asset Summary – Loan No. 5 3 Columbus Circle | Cut-off Date Balance: Cut-off Date LTV Ratio: UW NCF DSCR: UW NOI Debt Yield: | $30,000,000 45.4% 2.91x 12.3% |
The following table presents certain information relating to the lease rollover at the 3 Columbus Circle Property:
| Lease Rollover Schedule(1) | ||||||||
| Year | # of Leases Rolling | SF Rolling | Approx. % of Total SF Rolling | Approx. Cumulative % of SF Rolling | UW Base Rent PSF Rolling | Total UW Base Rent Rolling | Approx. % of Total Rent Rolling | Approx. Cumulative % of Total Rent Rolling |
| MTM | 0 | 0 | 0.0% | 0.0% | $0.00 | $0 | 0.0% | 0.0% |
| 2019 | 0 | 0 | 0.0% | 0.0% | $0.00 | $0 | 0.0% | 0.0% |
| 2020 | 5 | 18,655 | 2.5% | 2.5% | $78.46 | $1,463,746 | 2.2% | 2.2% |
| 2021 | 5 | 19,013 | 2.5% | 5.0% | $83.35 | $1,584,749 | 2.3% | 4.5% |
| 2022 | 3 | 7,861 | 1.0% | 6.0% | $87.38 | $686,928 | 1.0% | 5.5% |
| 2023 | 5 | 18,327 | 2.4% | 8.5% | $80.93 | $1,483,170 | 2.2% | 7.7% |
| 2024 | 3 | 14,518 | 1.9% | 10.4% | $82.74 | $1,201,163 | 1.8% | 9.5% |
| 2025 | 5 | 60,820 | 8.1% | 18.5% | $73.90 | $4,494,341 | 6.6% | 16.1% |
| 2026 | 1 | 6,190 | 0.8% | 19.3% | $84.14 | $520,827 | 0.8% | 16.9% |
| 2027 | 1 | 57,359 | 7.6% | 26.9% | $55.00 | $3,154,745 | 4.7% | 21.5% |
| 2028 | 3 | 57,235 | 7.6% | 34.5% | $107.32 | $6,142,196 | 9.1% | 30.6% |
| 2029 | 2 | 14,815 | 2.0% | 36.5% | $82.75 | $1,225,996 | 1.8% | 32.4% |
| 2030 & Beyond(2) | 11 | 457,589 | 60.7% | 97.2% | $100.06 | $45,786,121 | 67.6% | 100.0% |
| Vacant | 0 | 21,331 | 2.8% | 100.0% | $0.00 | $0 | 0.0% | 100.0% |
| Total/Wtd. Avg. | 44 | 753,713 | 100.0% | $92.50 | $67,743,982 | 100.0% | ||
| (1) | Information is based on the underwritten rent roll. |
| (2) | 2030 & Beyond is inclusive of a 2,831 SF management office and a 3,021 SF storage space that have no underwritten base rent. |
The Market. The 3 Columbus Circle Property is located in the Midtown West office submarket, proximate to other prominent buildings in Columbus Circle including the former Time Warner Center and the Museum of Arts and Design. Nordstrom opened its flagship women’s store across the street at Central Park Tower in October 2019. The Columbus Circle neighborhood benefits from nearby attractions including Central Park, Rockefeller Center, Radio City Music Hall, Lincoln Center for the Performing Arts and the Museum of Modern Art. In particular, the 3 Columbus Circle Property benefits from its location on Broadway, which is a major artery connecting the southern tip of Manhattan to Upper Manhattan. The 3 Columbus Circle Property’s frontage along Broadway, 8th Avenue, West 57th Street and West 58th Street provides its retail tenants with access to the pedestrian traffic in the area. The 3 Columbus Circle Property is accessible by public and vehicular transportation including three subway lines within one block, New York Penn Station with an approximately ten minute drive and LaGuardia Airport with an approximately 20 minute drive.
The 3 Columbus Circle Property is located in Manhattan, New York, in the Midtown West submarket within the greater Midtown office market. The Midtown West submarket contains approximately 31.0 million SF of office inventory and is bordered by 72nd Street to the north, 42nd Street to the south, Seventh Avenue to the east and the Hudson River to the west. New York City’s largest employers include a diverse group of multinational corporations representing a variety of industries including healthcare, financial services, retail and education. Fifty-three of the nation’s Fortune 500 corporations are headquartered in the New York region including Verizon, J.P. Morgan Chase, Citigroup, IBM, MetLife, PepsiCo, American International Group, Morgan Stanley, New York Life Insurance, Goldman Sachs Group, TIAA, American Express and Time Warner.
As of the fourth quarter of 2018, the greater Midtown Class A office market consisted of approximately 181.1 million SF of office space with an overall market vacancy of 9.3% and average asking rents of approximately $75.03 PSF. The Midtown West Class A submarket totaled approximately 24.5 million SF with average vacancy of 6.9% and average market asking rents of $76.87 PSF. The overall Midtown office market achieved 23.7 million SF in leasing activity in 2018 with overall and direct absorption levels totaling 7.3 million SF and 8.1 million SF, respectively.
The appraisal identified seven directly competitive Class A office rent comparables in the Midtown West submarket. Comparable buildings were built between 1950 and 2009 and range in size from 242,505 SF to 790,000 SF. Direct asking rents at the comparable properties ranged between $65.00 and $108.00 PSF with a weighted average of approximately $82.47 PSF. The 3 Columbus Circle Property’s in-place weighted average office rent is $71.11 PSF, which compares favorably to the appraisal’s concluded office market rent, ranging between $77.00 and $100.00 PSF.
THE INFORMATION IN THIS STRUCTURAL AND COLLATERAL TERM SHEET IS NOT COMPLETE AND MAY BE AMENDED PRIOR TO THE TIME OF SALE. THIS TERM SHEET IS NOT AN OFFER TO SELL THESE SECURITIES AND IT IS NOT A SOLICITATION OF AN OFFER TO BUY THESE SECURITIES IN ANY JURISDICTION WHERE THE OFFER OR SALE IS NOT PERMITTED.
70
3 Columbus Circle New York, NY 10019 | Collateral Asset Summary – Loan No. 5 3 Columbus Circle | Cut-off Date Balance: Cut-off Date LTV Ratio: UW NCF DSCR: UW NOI Debt Yield: | $30,000,000 45.4% 2.91x 12.3% |
The following table presents certain information relating to the appraisal’s market rent conclusion for the 3 Columbus Circle Property:
| Floor(s) | Appraisal’s Concluded Office Market Rent PSF |
| 3, 5-15 | $77.00 |
| 4 | $80.00 |
| 16-18 | $85.00 |
| 19, 23-24 | $93.00 |
| 20-22 | $90.00 |
| 25-26 | $100.00 |
| Source:Appraisal |
The following table presents information relating to comparable office property sales for the 3 Columbus Circle Property:
| Comparable Office Leases | ||||||
| Property | NRA | Direct Available SF | Sublease Available SF | % Occupied | Direct Asking Rent Low | Direct Asking Rent High |
| 40 West 57th Street | 604,936 | 10,900 | 2,715 | 98.2% | $87.00 | $87.00 |
| 1740 Broadway | 412,704 | 0 | 0 | 100.0% | N/A | N/A |
| 810 Seventh Avenue | 603,000 | 76,678 | 22,437 | 87.3% | $65.00 | $75.00 |
| 888 Seventh Avenue | 790,000 | 0 | 19,500 | 100.0% | N/A | N/A |
| 1350 Avenue of the Americas | 424,000 | 65,099 | 6,783 | 84.7% | $78.00 | $95.00 |
| 1370 Avenue of the Americas | 339,000 | 50,362 | 11,636 | 85.1% | $75.00 | $108.00 |
| 1755 Broadway | 242,505 | 0 | 0 | 100.0% | N/A | N/A |
| Total/Wtd. Avg. | 3,416,145 | 203,039 | 63,071 | 94.1% | $76.27 | $88.66 |
Source:Appraisal
Underwritten Net Cash Flow.The following table presents certain information relating to the Underwritten Net Cash Flow at the 3 Columbus Circle Property:
| Cash Flow Analysis(1) | |||||
| 2016 | 2017 | 2018 | UW | UW PSF | |
| Rents in Place(2)(3) | $41,873,116 | $43,763,738 | $48,360,889 | $67,743,982 | $89.88 |
| Straight Line Rent Averaging(2) | $0 | $0 | $0 | $4,169,665 | $5.53 |
| Vacant Income | $0 | $0 | $0 | $1,977,018 | $2.62 |
| Gross Potential Rent | $41,873,116 | $43,763,738 | $48,360,889 | $73,890,665 | $98.04 |
| Total Recoveries(3) | $2,954,447 | $3,436,707 | $4,969,121 | $7,102,216 | $9.42 |
| Total Other Income(3) | $5,333,639 | $3,752,429 | $3,994,225 | $10,130 | $0.01 |
| Less Vacancy & Credit Loss | $0 | $0 | $0 | ($1,587,003) | ($2.11) |
| Effective Gross Income | $50,161,202 | $50,952,874 | $57,324,235 | $79,416,007 | $105.37 |
| Total Expenses | $14,968,652 | $16,254,125 | $17,233,200 | $18,918,555 | $25.10 |
| Net Operating Income(4) | $35,192,550 | $34,698,749 | $40,091,035 | $60,497,452 | $80.27 |
| Capital Expenditures | $0 | $0 | $0 | $150,743 | $0.20 |
| TI/LC | $0 | $0 | $0 | $3,752,630 | $4.98 |
| Net Cash Flow | $35,192,550 | $34,698,749 | $40,091,035 | $56,594,080 | $75.09 |
| Occupancy % | 98.4% | 91.9% | 98.0% | 97.2%(5) | |
| NOI DSCR(6) | 1.81x | 1.78x | 2.06x | 3.11x | |
| NCF DSCR(6) | 1.81x | 1.78x | 2.06x | 2.91x | |
| NOI Debt Yield(6) | 7.2% | 7.1% | 8.2% | 12.3% | |
| NCF Debt Yield(6) | 7.2% | 7.1% | 8.2% | 11.5% | |
| (1) | Certain items such as straight line rent, interest expense, interest income, lease cancellation income, depreciation, amortization, debt service payments and any other non-recurring or non-operating items were excluded from the historical presentation and are not considered for the underwritten cash flow. |
| (2) | UW Rents in Place is inclusive of rent steps through January 2020 and straight line rent for investment grade tenants over the 3 Columbus Circle Whole Loan term, accounting for approximately $4.2 million in UW Gross Potential Rent. Historical base rent does not include rent from Young & Rubicam. |
| (3) | Total Other Income from 2016 to 2018 included a condominium charge to Young & Rubicam for its share in building expenses. UW Rents in Place and UW Total Recoveries reflect Young & Rubicam paying reimbursements under its lease. |
| (4) | The increase in UW Net Operating Income from 2018 Net Operating Income is primarily attributable to (i) an additional 214,372 SF lease executed with Young & Rubicam on floors three through eight, accounting for approximately $16.3 million in underwritten base rent and (ii) rent steps through January 2020. |
| (5) | Based on the underwritten rent roll dated January 1, 2019. |
| (6) | Debt service coverage ratios and debt yields are based the 3 Columbus Circle Senior Loan. |
THE INFORMATION IN THIS STRUCTURAL AND COLLATERAL TERM SHEET IS NOT COMPLETE AND MAY BE AMENDED PRIOR TO THE TIME OF SALE. THIS TERM SHEET IS NOT AN OFFER TO SELL THESE SECURITIES AND IT IS NOT A SOLICITATION OF AN OFFER TO BUY THESE SECURITIES IN ANY JURISDICTION WHERE THE OFFER OR SALE IS NOT PERMITTED.
71
3 Columbus Circle New York, NY 10019 | Collateral Asset Summary – Loan No. 5 3 Columbus Circle | Cut-off Date Balance: Cut-off Date LTV Ratio: UW NCF DSCR: UW NOI Debt Yield: | $30,000,000 45.4% 2.91x 12.3% |
Escrows and Reserves.The 3 Columbus Circle Borrowers deposited in escrow at origination (i) approximately $1,820,891 into an outstanding tenant improvements and leasing commission reserve in connection with three leases and (ii) approximately $847,794 into a free rent reserve in connection with four leases.
On each due date, the 3 Columbus Circle Borrowers are required to fund the following reserves with respect to the 3 Columbus Circle Whole Loan: (i) a tax reserve in an amount equal to 1/12 of the amount that the lender estimates will be necessary to pay taxes over the then succeeding 12-month period (such reserve has been conditionally waived so long as the borrower has provided satisfactory evidence that taxes have been paid meeting the requirements of the related whole loan documents) and (ii) an insurance reserve in an amount equal to 1/12 of the amount that the lender estimates will be necessary to cover premiums over the then succeeding 12-month period (such reserve has been conditionally waived so long as the borrower maintains a blanket policy meeting the requirements of the related whole loan documents).
During the continuance of a Cash Sweep Event (as defined below), the 3 Columbus Circle Borrowers are required to deposit into a replacement reserve, on a monthly basis, an amount equal to $12,500 for replacement reserves (approximately $0.20 PSF annually), subject to a cap of $1,000,000 (approximately $1.33 PSF).
During the continuance of a Cash Sweep Event, the 3 Columbus Circle Borrowers are required to deposit into a TI/LC reserve, on a monthly basis, an amount equal to $62,900 for tenant improvement and leasing commission obligations (approximately $1.00 PSF annually), subject to a cap of $5,000,000 (approximately $6.63 PSF).
During the continuance of a Cash Sweep Event caused by a Tenant Trigger (as defined below), the 3 Columbus Circle Borrowers are required to deposit into a Young & Rubicam reserve an amount equal to all excess cash flow in the cash management account to cover expenses anticipated to be incurred in connection with re-leasing the Young & Rubicam space, subject to a cap of $40,000,000 (approximately $106.60 PSF of Young & Rubicam space).
Lockbox and Cash Management. The 3 Columbus Circle Whole Loan is structured with a hard lockbox and in place cash management. The 3 Columbus Circle Borrowers were required at origination to deliver tenant direction letters instructing all tenants to deposit rents into a lockbox account controlled by the lender. All funds in the lockbox account are required to be swept each business day into a cash management account controlled by the lender and disbursed on each payment date in accordance with the related whole loan documents. All funds on deposit in the cash management account following the occurrence and during the continuance of a Cash Sweep Event following payment of debt service, required reserves and operating expenses are required to be deposited into the Young & Rubicam reserve or, to the extent the Cash Sweep Event is caused by a DSCR Trigger Event (as defined below), into the excess cash flow reserve, and in each case to be held and disbursed in accordance with the terms of the related whole loan documents. During the continuance of an event of default, the lender may apply such funds in such order and priority as the lender determines. The lender has been granted a first priority security interest in the cash management account.
A “Cash Sweep Event” means the occurrence and continuation of (i) an event of default, (ii) any bankruptcy action of the 3 Columbus Circle Borrowers or property manager, (iii) a DSCR Trigger Event or (iv) a Tenant Trigger.
A Cash Sweep Event may be cured in accordance with the following conditions: with respect to a Cash Sweep Event caused solely by (a) clause (i) above, the acceptance of a cure by the lender of the related event of default, (b) clause (ii) above if borrowers have replaced the manager with a qualified manager under a replacement management agreement within 90 days in accordance with the related whole loan documents, (c) clause (iii) above, a DSCR Cure Event (as defined below) has taken place, (d) clause (iv) above, if the Cash Sweep Event is caused solely by the occurrence of (x) a Tenant BK Trigger (as defined below), Young & Rubicam or its parent company affirming the Young & Rubicam lease in the applicable bankruptcy proceeding, (y) a Tenant Vacancy Trigger (as defined below), the replacement of Young & Rubicam with an acceptable replacement tenant pursuant to lease(s) approved in accordance with the terms of the related whole loan documents and such tenant has accepted possession of its premises under the lease(s), with all tenant improvement costs and free rent amounts reserved with the lender, or (z) any Tenant Trigger, upon the satisfaction of the Tenant Escrow Requirement (as defined below) (in which case, the borrowers are deemed to have cured any existing Tenant Trigger immediately upon such date). Each cure is also subject to the following conditions: (1) no other event of default may have occurred and be continuing; and (2) the borrowers pay the lender’s reasonable expenses in connection with such cure. Notwithstanding the foregoing, in no event will the 3 Columbus Circle Borrowers have the right to cure a Cash Sweep Event occurring from a borrower bankruptcy.
A “DSCR Trigger Event” means the debt service coverage ratio on the 3 Columbus Circle Whole Loan (as calculated in the related whole loan documents) based on the trailing three-month period immediately preceding the date of determination is less than 1.30x.
A “DSCR Cure Event” means the debt service coverage ratio on the 3 Columbus Circle Whole Loan (as calculated in the related whole loan documents), based on the trailing three-month period immediately preceding the date of determination, is at least 1.30x for two consecutive quarters.
A “Tenant Trigger” means either (i) a bankruptcy or certain insolvency actions of Young & Rubicam or its parent company (a “Tenant BK Trigger”) or (ii) if Young & Rubicam vacates, abandons or “goes dark” in 85% or more of its leased space (and no sub-tenant is then in occupancy of any of the space) (a “Tenant Vacancy Trigger”).
A “Tenant Escrow Requirement” means the balance of the Young & Rubicam reserve has reached the cap of $40,000,000.
Additional Secured Indebtedness (not including trade debts).The 3 Columbus Circle Subordinate Companion Loans, which have an aggregate original principal balance of $105.0 million, are subordinate to the 3 Columbus Circle Senior Notes and accrue interest at a rate of 3.9140%per annum. The 3 Columbus Circle Subordinate Companion Loans are coterminous with the 3 Columbus Circle Senior Notes. The holders of the 3 Columbus Circle Senior Notes and the 3 Columbus Circle Subordinate Companion Loans have entered into a co-lender agreement which sets forth the allocation of collections on the 3 Columbus Circle Whole Loan. Based on the 3 Columbus Circle Whole Loan, the cumulative Cut-off Date LTV Ratio, cumulative UW NCF DSCR and cumulative UW NOI Debt Yield are 55.1%, 2.40x and 10.2%, respectively. See “Description of the Mortgage Pool—The Whole Loans—The Non-Serviced AB Whole Loans—The 3 Columbus Circle Whole Loan” in the Preliminary Prospectus.
THE INFORMATION IN THIS STRUCTURAL AND COLLATERAL TERM SHEET IS NOT COMPLETE AND MAY BE AMENDED PRIOR TO THE TIME OF SALE. THIS TERM SHEET IS NOT AN OFFER TO SELL THESE SECURITIES AND IT IS NOT A SOLICITATION OF AN OFFER TO BUY THESE SECURITIES IN ANY JURISDICTION WHERE THE OFFER OR SALE IS NOT PERMITTED.
72
3 Columbus Circle New York, NY 10019 | Collateral Asset Summary – Loan No. 5 3 Columbus Circle | Cut-off Date Balance: Cut-off Date LTV Ratio: UW NCF DSCR: UW NOI Debt Yield: | $30,000,000 45.4% 2.91x 12.3% |
Mezzanine Loans and Preferred Equity. None.
Release of Property. Not permitted.
Terrorism Insurance. The related whole loan documents require that the “all-risk” insurance policy required to be maintained by the 3 Columbus Circle Borrowers provides coverage for terrorism in an amount equal to the original principal balance of the 3 Columbus Circle Whole Loan (with a replacement cost endorsement), plus business interruption coverage in an amount equal to 100% of the projected gross income for the applicable property until the completion of restoration or the expiration of 24 months, with a 6-month extended period of indemnity. The “all-risk” policy containing terrorism insurance is required to contain a deductible that is acceptable to the lender and is no greater than $100,000. However, if the Terrorism Risk Insurance Program Reauthorization Act of 2015 (TRIPRA) is no longer in effect, the 3 Columbus Circle Borrowers will not be required to spend more than two times the then-current premium for a separate “all-risk” or equivalent policy (including business interruption coverage) for terrorism coverage (but will be required to purchase the maximum coverage available for such amount). See “Risk Factors—Risks Relating to the Mortgage Loans—Terrorism Insurance May Not Be Available for All Mortgaged Properties” in the Preliminary Prospectus.
THE INFORMATION IN THIS STRUCTURAL AND COLLATERAL TERM SHEET IS NOT COMPLETE AND MAY BE AMENDED PRIOR TO THE TIME OF SALE. THIS TERM SHEET IS NOT AN OFFER TO SELL THESE SECURITIES AND IT IS NOT A SOLICITATION OF AN OFFER TO BUY THESE SECURITIES IN ANY JURISDICTION WHERE THE OFFER OR SALE IS NOT PERMITTED.
73
Various | Collateral Asset Summary – Loan No. 6 ILPT Industrial Portfolio | Cut-off Date Balance: Cut-off Date LTV Ratio: UW NCF DSCR: UW NOI Debt Yield: | $30,000,000 39.2% 5.05x 14.8% |
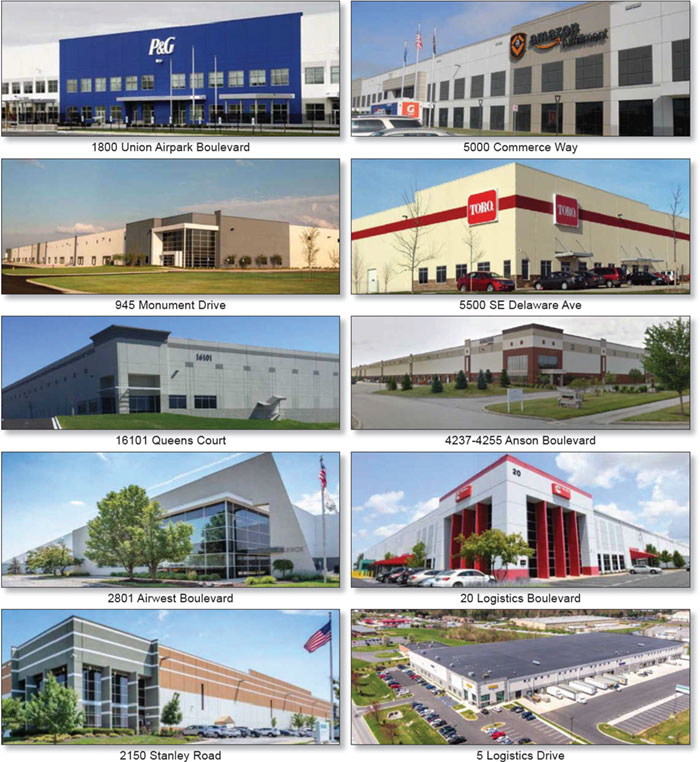
THE INFORMATION IN THIS STRUCTURAL AND COLLATERAL TERM SHEET IS NOT COMPLETE AND MAY BE AMENDED PRIOR TO THE TIME OF SALE. THIS TERM SHEET IS NOT AN OFFER TO SELL THESE SECURITIES AND IT IS NOT A SOLICITATION OF AN OFFER TO BUY THESE SECURITIES IN ANY JURISDICTION WHERE THE OFFER OR SALE IS NOT PERMITTED.
74
Various | Collateral Asset Summary – Loan No. 6 ILPT Industrial Portfolio | Cut-off Date Balance: Cut-off Date LTV Ratio: UW NCF DSCR: UW NOI Debt Yield: | $30,000,000 39.2% 5.05x 14.8% |
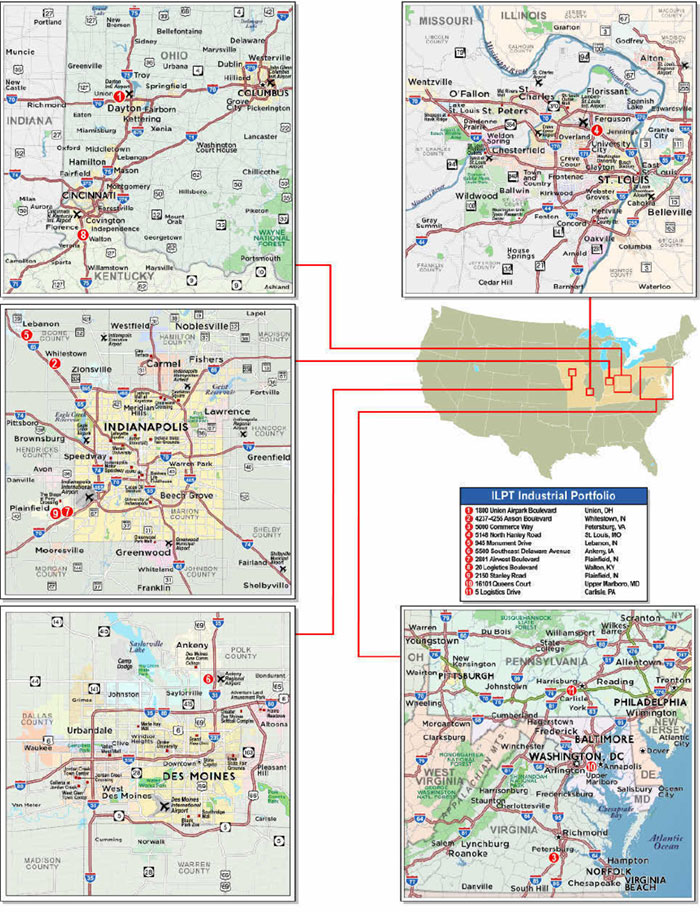
THE INFORMATION IN THIS STRUCTURAL AND COLLATERAL TERM SHEET IS NOT COMPLETE AND MAY BE AMENDED PRIOR TO THE TIME OF SALE. THIS TERM SHEET IS NOT AN OFFER TO SELL THESE SECURITIES AND IT IS NOT A SOLICITATION OF AN OFFER TO BUY THESE SECURITIES IN ANY JURISDICTION WHERE THE OFFER OR SALE IS NOT PERMITTED.
75
Various | Collateral Asset Summary – Loan No. 6 ILPT Industrial Portfolio | Cut-off Date Balance: Cut-off Date LTV Ratio: UW NCF DSCR: UW NOI Debt Yield: | $30,000,000 39.2% 5.05x 14.8% |
Mortgage Loan Information |
| Property Information | |||||
Mortgage Loan Seller(1): | UBS AG |
| Single Asset/Portfolio: | Portfolio | |||
Credit Assessment (Fitch/KBRA/Moody’s): | BBB-/BBB+/Baa1 |
| Location: | Various | |||
| General Property Type: | Industrial | |||||
Original Balance(2): | $30,000,000 |
| Detailed Property Type: | Warehouse Distribution | |||
Cut-off Date Balance(2): | $30,000,000 |
| Title Vesting: | Fee Simple | |||
% of Initial Pool Balance: | 4.0% |
| Year Built/Renovated: | Various/Various | |||
Loan Purpose: | Recapitalization |
| Size: | 8,209,036 SF | |||
Borrower Sponsor: | Industrial Logistics Properties Trust |
| Cut-off Date Balance per SF(2): | $26 | |||
Mortgage Rate(3): | 2.65326% |
| Maturity Date Balance per SF(2): | $26 | |||
Note Date: | 10/21/2019 |
| Property Manager: | The RMR Group LLC (borrower-related) | |||
First Payment Date: | 12/7/2019 |
|
| ||||
Maturity Date: | 11/7/2029 |
|
|
| |||
Original Term to Maturity: | 120 months |
| Underwriting and Financial Information | ||||
Original Amortization Term: | 0 months |
| UW NOI(7): | $31,836,916 | |||
IO Period: | 120 months |
| UW NOI Debt Yield(2): | 14.8% | |||
Seasoning: | 1 month |
| UW NOI Debt Yield at Maturity(2): | 14.8% | |||
Prepayment Provisions(4): | LO (25); DEF or YM1 (88); O (7) |
| UW NCF DSCR(2): | 5.05x | |||
Lockbox/Cash Mgmt Status: | Hard/Springing |
| Most Recent NOI(7): | $28,890,150 (12/31/2018) | |||
Additional Debt Type(2)(5): | Pari Passu / Subordinate Debt |
| 2nd Most Recent NOI: | $27,259,856 (12/31/2017) | |||
Additional Debt Balance(2)(5): | $184,400,000 / $135,600,000 |
| 3rd Most Recent NOI(8): | $16,319,258 (12/31/2016) | |||
Future Debt Permitted (Type): | No (N/A) |
| Most Recent Occupancy(9): | 100.0% (9/1/2019) | |||
Reserves(6) |
| 2nd Most Recent Occupancy(9): | NAV | ||||
Type | Initial | Monthly | Cap |
| 3rd Most Recent Occupancy(9): | NAV | |
RE Tax: | $0 | Springing | N/A |
| Appraised Value (as of)(10): | $547,000,000 (Various) | |
Insurance: | $0 | Springing | N/A |
| Cut-off Date LTV Ratio(2)(10): | 39.2% | |
Toro Expansion Funds: | $6,134,904 | $0 | N/A |
| Maturity Date LTV Ratio(2)(10): | 39.2% | |
|
|
|
|
|
|
|
|
Sources and Uses | ||||||
Sources | Proceeds | % of Total |
| Uses | Proceeds | % of Total |
Loan Amount(2): | $350,000,000 | 100.0% |
| Equity Recapitalization(11): | $340,254,888 | 97.2% |
|
|
|
| Reserves: | $6,134,904 | 1.8% |
|
|
|
| Closing Costs: | $3,610,208 | 1.0% |
Total Sources: | $350,000,000 | 100.0% |
| Total Uses: | $350,000,000 | 100.0% |
| (1) | The ILPT Industrial Portfolio Whole Loan was co-originated by Morgan Stanley Bank, N.A. (“MSBNA”), Bank of America, N.A. (“BANA”) and UBS AG. |
| (2) | The ILPT Industrial Portfolio Mortgage Loan (as defined below) is part of the ILPT Industrial Portfolio Whole Loan (as defined below), which is comprised of eightpari passu senior promissory notes with an aggregate original principal balance of $214,400,000 (the “Senior Notes”, and collectively, the “ILPT Industrial Portfolio Senior Loan”) and 12 promissory notes that are subordinate to the Senior Notes with an original principal balance of $135,600,000 (collectively, the “ILPT Industrial Portfolio Subordinate Companion Loan”, and together with the ILPT Industrial Portfolio Senior Loan, the “ILPT Industrial Portfolio Whole Loan”). The Cut-off Date Balance per SF, Maturity Date Balance per SF, UW NOI Debt Yield, UW NOI Debt Yield at Maturity, UW NCF DSCR, Cut-off Date LTV Ratio and Maturity Date LTV Ratio presented above are based on the aggregate principal balance of the promissory notes comprising the ILPT Industrial Portfolio Senior Loan, without regard to the ILPT Industrial Portfolio Subordinate Companion Loan. The Cut-off Date Balance per SF, Maturity Date Balance per SF, UW NOI Debt Yield, UW NOI Debt Yield at Maturity, UW NCF DSCR, Cut-off Date LTV Ratio and Maturity Date LTV Ratio based on the combined balance of the entire ILPT Industrial Portfolio Whole Loan are $43, $43, 9.1%, 9.1%, 2.47x, 64.0% and 64.0%, respectively. |
| (3) | Reflects the Senior Notes only. The ILPT Industrial Portfolio Subordinate Companion Loan accrues interest at the rate of 4.4000%per annum. |
| (4) | Defeasance or prepayment of the ILPT Industrial Portfolio Whole Loan is permitted at any time after the earlier to occur of (a) the end of the two-year period commencing on the closing date of the securitization of the last ILPT Industrial Portfolio Whole Loan promissory note to be securitized and (b) October 21, 2022. The assumed defeasance and prepayment lockout period of 25 payments is based on the closing date of this transaction in December 2019. |
| (5) | See “The Mortgage Loan” and “Additional Secured Indebtedness (not including trade debts)” below for further discussion of additional debt. |
| (6) | See “Escrows and Reserves” below for further discussion of reserve requirements. |
| (7) | The increase in UW NOI from Most Recent NOI is primarily attributed to (i) $442,662 of rent steps, (ii) $955,208 in straight line rent taken and (iii) recent leasing, including Transamerica Auto Parts ($966,999 in base rent) and SKF USA ($709,343 in base rent). |
| (8) | 3rd Most Recent NOI excludes the 5500 Southeast Delaware Avenue property and includes partial year information for seven of the properties as historical financial information was unavailable due to ILPT (as defined below) acquiring a majority of the portfolio over the last twelve months. 2016 NOI includes full year information for the 1800 Union Airpark Boulevard property, 5000 Commerce Way property and the 945 Monument Drive property. |
| (9) | Historical occupancy was not provided by the borrower sponsor. Based on the underwritten rent roll dated September 1, 2019, the ILPT Industrial Portfolio Properties were 100.0% occupied. |
| (10) | The Appraised Value is based on the aggregate “as-is” appraised values. The appraised value based on a portfolio appraised value is $575.0 million, resulting in a Cut-off Date LTV Ratio and Maturity Date LTV Ratio of 37.3% and 37.3%, respectively. |
| (11) | The borrower sponsor acquired the ILPT Industrial Portfolio Properties primarily from September 2018 to April 2019 for a combined purchase price of approximately $555.0 million and expects to use the proceeds of the ILPT Industrial Portfolio Mortgage Loan to reduce outstanding borrowings under its $750 million unsecured revolving credit facility. |
The Mortgage Loan. The sixth largest mortgage loan (the “ILPT Industrial Portfolio Mortgage Loan”) is part of the ILPT Industrial Portfolio Whole Loan evidenced by (i) eightpari passupromissory notes comprising the ILPT Industrial Portfolio Senior Loan with an aggregate original principal balance of $214,400,000 and (ii) the ILPT Industrial Portfolio Subordinate Companion Loan with an original principal balance of $135,600,000. The ILPT Industrial Portfolio Whole Loan is secured by a first priority fee mortgage encumbering 11 industrial properties located in eight states (each, an “ILPT Industrial Portfolio Property”, and collectively, the “ILPT Industrial Portfolio Properties” or the “ILPT Industrial Portfolio”). Promissory Notes A-6 and A-7, with an
THE INFORMATION IN THIS STRUCTURAL AND COLLATERAL TERM SHEET IS NOT COMPLETE AND MAY BE AMENDED PRIOR TO THE TIME OF SALE. THIS TERM SHEET IS NOT AN OFFER TO SELL THESE SECURITIES AND IT IS NOT A SOLICITATION OF AN OFFER TO BUY THESE SECURITIES IN ANY JURISDICTION WHERE THE OFFER OR SALE IS NOT PERMITTED.
76
Various | Collateral Asset Summary – Loan No. 6 ILPT Industrial Portfolio | Cut-off Date Balance: Cut-off Date LTV Ratio: UW NCF DSCR: UW NOI Debt Yield: | $30,000,000 39.2% 5.05x 14.8% |
aggregate original balance of $30,000,000, represent the ILPT Industrial Portfolio Mortgage Loan, and will be contributed to the UBS 2019-C18 Trust. The below table summarizes the ILPT Industrial Portfolio Whole Loan, including the remaining promissory notes not yet securitized, which are currently held by UBS AG, MSBNA and BANA and may otherwise be transferred at any time. The mortgage loan seller provides no assurances that the non-securitized note will not be split further. The ILPT Industrial Portfolio Whole Loan is being serviced pursuant to the pooling and servicing agreement for the MSC 2019-L3 securitization trust. See “Description of the Mortgage Pool—The Non-Serviced AB Whole Loans—The ILPT Industrial Portfolio Whole Loan” and “Pooling and Servicing Agreement” in the Preliminary Prospectus.
ILPT Industrial Portfolio Whole Loan Summary | ||||
Note | Original Balance | Cut-off Date Balance | Anticipated Note Holder | Controlling Piece |
A-1 | $50,000,000 | $50,000,000 | MSC 2019-L3 | No(1) |
A-2 | $35,760,000 | $35,760,000 | BANK 2019-BNK23(2) | No |
A-3 | $39,240,000 | $39,240,000 | BANK 2019-BNK23(2) | No |
A-4 | $25,080,000 | $25,080,000 | BANA | No |
A-5 | $25,000,000 | $25,000,000 | CSAIL 2019-C18(3) | No |
A-6 | $20,000,000 | $20,000,000 | UBS 2019-C18 | No |
A-7 | $10,000,000 | $10,000,000 | UBS 2019-C18 | No |
A-8 | $9,320,000 | $9,320,000 | CSAIL 2019-C18(3) | No |
B-1-A | $24,240,000 | $24,240,000 | Third Party Investor | Yes(1) |
B-1-B | $20,000,000 | $20,000,000 | No | |
B-1-C | $5,200,000 | $5,200,000 | No | |
B-1-D | $4,800,000 | $4,800,000 | No | |
B-2-A | $18,180,000 | $18,180,000 | No | |
B-2-B | $15,000,000 | $15,000,000 | No | |
B-2-C | $3,900,000 | $3,900,000 | No | |
B-2-D | $3,600,000 | $3,600,000 | No | |
B-3-A | $18,180,000 | $18,180,000 | No | |
B-3-B | $15,000,000 | $15,000,000 | No | |
B-3-C | $3,900,000 | $3,900,000 | No | |
B-3-D | $3,600,000 | $3,600,000 | No | |
Total | $350,000,000 | $350,000,000 |
|
|
| (1) | The initial controlling note is Note B-1-A, so long as no control appraisal period with respect to the ILPT Industrial Portfolio Whole Loan has occurred and is continuing. If and for so long as a control appraisal period with respect to the ILPT Industrial Portfolio Whole Loan has occurred and is continuing, then the controlling note will be Note A-1. See “Description of the Mortgage Pool—The Whole Loans—The Non-Serviced AB Whole Loans—The ILPT Industrial Portfolio Whole Loan” in the Preliminary Prospectus. |
| (2) | Promissory Notes A-2 and A-3 are currently held by MSBNA and BANA, or an affiliated entity, and are expected to be contributed to BANK 2019-BNK23, which is expected to close on or about December 10, 2019. |
| (3) | Promissory Notes A-5 and A-8 are currently held by UBS AG, or an affiliated entity, and are expected to be contributed to CSAIL 2019-C18, which is expected to close on or about December 12, 2019. |
The Borrowers and the Borrower Sponsor.The borrowers are The Industrial Fund St. Louis LLC, The Industrial Fund PA LLC, The Industrial Fund MS LLC and The Industrial Fund Ankeny LLC (collectively, the “ILPT Industrial Portfolio Borrowers”), each a Delaware limited liability company structured to be bankruptcy remote with two independent directors. The borrower sponsor of the ILPT Industrial Portfolio Whole Loan is Industrial Logistics Properties Trust (“ILPT”). The obligations of ILPT for any guaranteed obligations for which the related whole loan documents provide full recourse (consisting generally of bankruptcy related events) are capped at 15% of the outstanding principal balance of the ILPT Industrial Portfolio Whole Loan.
ILPT is a real estate investment trust (“REIT”) formed to own and lease industrial and logistics properties throughout the United States. As of June 30, 2019, ILPT owned 298 industrial and logistics properties with approximately 42.4 million rentable SF, which were approximately 99.3% leased to 265 tenants with a weighted average remaining lease term of approximately 9.8 years. As of June 30, 2019, approximately 58% of ILPT’s annualized rental revenues come from 72 industrial and logistics properties with approximately 25.6 million SF located in 29 states on the U.S. mainland and approximately 42% of ILPT’s annualized rental revenues come from 226 properties (buildings, leasable land parcels and easements) with approximately 16.8 million SF located on the island of Oahu, Hawaii, most of which are long-term ground leases to tenants that have constructed buildings and operate businesses on land owned by ILPT. See “Description of Mortgage Pool–Litigation and Other Considerations” in the Preliminary Prospectus.
The Properties.The ILPT Industrial Portfolio consists of a total of 11 industrial properties containing a total of 8,209,036 SF located across eight states. The ILPT Industrial Portfolio Properties are located in Indiana (four properties, 40.2% of NRA), Ohio (one property, 21.8% of NRA), Virginia (one property, 12.4% of NRA), Missouri (one property, 5.3% of NRA), Iowa (one property; 7.8% of NRA), Kentucky (one property; 7.4% of NRA), Maryland (one property; 2.7% of NRA) and Pennsylvania (one property; 2.5% of NRA). The ILPT Industrial Portfolio Properties were built between 2001 and 2016, with seven of the 11 properties built between 2012 and 2016. The ILPT Industrial Portfolio Properties range in size from 205,090 SF to 1,791,246 SF. As of September 1, 2019, the ILPT Industrial Portfolio Properties were 100.0% leased by a mix of national and local tenants.
The largest tenant, Amazon.com, Inc. (“Amazon”), occupies approximately 25.0% of the ILPT Industrial Portfolio SF and contributes approximately 24.5% of UW base rent. The second largest tenant, Procter & Gamble, occupies approximately 21.8% of the ILPT Industrial Portfolio SF and contributes approximately 19.5% of underwritten base rent. Excluding Amazon and Procter & Gamble, no single tenant accounts for more than 11.4% of underwritten base rent or more than 11.7% of the ILPT Industrial Portfolio SF. The largest amount of lease rollover occurs in 2024, when leases comprising approximately 43.3% of the ILPT Industrial Portfolio SF and 36.0% of underwritten base rent expire. The weighted average remaining lease term at the
THE INFORMATION IN THIS STRUCTURAL AND COLLATERAL TERM SHEET IS NOT COMPLETE AND MAY BE AMENDED PRIOR TO THE TIME OF SALE. THIS TERM SHEET IS NOT AN OFFER TO SELL THESE SECURITIES AND IT IS NOT A SOLICITATION OF AN OFFER TO BUY THESE SECURITIES IN ANY JURISDICTION WHERE THE OFFER OR SALE IS NOT PERMITTED.
77
Various | Collateral Asset Summary – Loan No. 6 ILPT Industrial Portfolio | Cut-off Date Balance: Cut-off Date LTV Ratio: UW NCF DSCR: UW NOI Debt Yield: | $30,000,000 39.2% 5.05x 14.8% |
ILPT Industrial Portfolio is approximately 6.5 years as of November 2019, and approximately 15.8% of the ILPT Industrial Portfolio SF and 24.2% of underwritten base rent rolls after the maturity of the ILPT Industrial Portfolio Whole Loan.
The following table presents certain information relating to the ILPT Industrial Portfolio Properties:
ILPT Industrial Portfolio Summary(1) | |||||||||
Property | Location | Allocated Whole | % of | Net | Occ. % | Year | UW NCF | % of UW | Appraised |
1800 Union Airpark Boulevard | Union, OH | $60,466,179 | 17.3% | 1,791,246 | 100.0% | 2014 | $5,405,373 | 18.5% | $94,500,000 |
4237-4255 Anson Boulevard | Whitestown, IN | $46,709,324 | 13.3% | 1,036,573 | 100.0% | 2006 | $4,011,976 | 13.8% | $73,000,000 |
5000 Commerce Way | Petersburg, VA | $44,597,806 | 12.7% | 1,016,065 | 100.0% | 2012 | $3,363,076 | 11.5% | $69,700,000 |
5142 and 5148 North Hanley Road | St. Louis, MO | $39,478,976 | 11.3% | 430,986 | 100.0% | 2016 | $3,392,341 | 11.6% | $61,700,000 |
945 Monument Drive | Lebanon, IN | $32,760,512 | 9.4% | 962,500 | 100.0% | 2014 | $2,619,946 | 9.0% | $51,200,000 |
2801 Airwest Boulevard | Plainfield, IN | $27,513,711 | 7.9% | 804,586 | 100.0% | 2001 | $2,146,008 | 7.4% | $43,000,000 |
20 Logistics Boulevard | Walton, KY | $26,297,989 | 7.5% | 603,586 | 100.0% | 2006 | $2,036,817 | 7.0% | $41,100,000 |
5500 SE Delaware Avenue | Ankeny, IA | $20,795,247 | 5.9% | 644,104 | 100.0% | 2012 | $2,602,967 | 8.9% | $32,500,000 |
2150 Stanley Road | Plainfield, IN | $19,323,583 | 5.5% | 493,500 | 100.0% | 2007 | $1,475,711 | 5.1% | $30,200,000 |
16101 Queens Court | Upper Marlboro, MD | $18,875,686 | 5.4% | 220,800 | 100.0% | 2016 | $1,206,483 | 4.1% | $29,500,000 |
5 Logistics Drive | Carlisle, PA | $13,180,987 | 3.8% | 205,090 | 100.0% | 2016 | $880,759 | 3.0% | $20,600,000 |
Total/Wtd. Avg. | $350,000,000 | 100.0% | 8,209,036 | 100.0% |
| $29,141,457 | 100.0% | $547,000,000 | |
| (1) | Information is based on the underwritten rent roll. |
| (2) | Based on the appraisals dated August 31, 2019 to September 5, 2019. |
The following table presents a summary of amenity information relating to the ILPT Industrial Portfolio Properties:
ILPT Industrial Portfolio Amenity Summary(1) | ||||||
Property | Year Built | Net Rentable | Tenant | Dock Doors / | Clear Height | Parking |
1800 Union Airpark Boulevard | 2014 | 1,791,246 | Procter & Gamble | 230 / 2 | 36’ | 756 |
4237-4255 Anson Boulevard | 2006 | 1,036,573 | Amazon | 80 / 4 | 36’ | 1,560 |
5000 Commerce Way | 2012 | 1,016,065 | Amazon | 75 / 2 | 32’ | 952 |
5142 and 5148 North Hanley Road | 2016 | 430,986 | SKF USA | 24 / 7 | 31’ | 385 |
945 Monument Drive | 2014 | 962,500 | Subaru of America Distribution | 96 / 6 | 34’ | 260 |
2801 Airwest Boulevard | 2001 | 804,586 | Whirlpool Corporation | 71 / 4 | 32’- 34’ | 345 |
20 Logistics Boulevard | 2006 | 603,586 | Cummins, Inc. | 70 / 3 | 32’ | 192 |
5500 SE Delaware Avenue | 2012 | 644,104 | The Toro Company | 56 / 3 | 28’ | 45 |
2150 Stanley Road | 2007 | 493,500 | Siemens Corporation; M D Logistics, Inc. | 57 / 4 | 36’ | 174 |
16101 Queens Court | 2016 | 220,800 | La-Z-Boy Incorporated | 29 / 2 | 32’ | 171 |
5 Logistics Drive | 2016 | 205,090 | Transamerica Auto Parts (“TAP”) | 28 / 2 | 32’ | 141 |
Total/Wtd. Avg. |
| 8,209,036 |
|
|
|
|
Source:Appraisals
THE INFORMATION IN THIS STRUCTURAL AND COLLATERAL TERM SHEET IS NOT COMPLETE AND MAY BE AMENDED PRIOR TO THE TIME OF SALE. THIS TERM SHEET IS NOT AN OFFER TO SELL THESE SECURITIES AND IT IS NOT A SOLICITATION OF AN OFFER TO BUY THESE SECURITIES IN ANY JURISDICTION WHERE THE OFFER OR SALE IS NOT PERMITTED.
78
Various | Collateral Asset Summary – Loan No. 6 ILPT Industrial Portfolio | Cut-off Date Balance: Cut-off Date LTV Ratio: UW NCF DSCR: UW NOI Debt Yield: | $30,000,000 39.2% 5.05x 14.8% |
The following table presents certain information relating to the leases at the ILPT Industrial Portfolio Properties:
Tenant Summary(1) | ||||||||
Tenant Name | Credit Rating | Property | Tenant SF | % of SF | Annual UW | % of Total | Annual | Lease |
Amazon | A+/A3/AA- | Various(3) | 2,052,638 | 25.0% | $8,122,434 | 24.5% | $3.96 | Various(3) |
Procter & Gamble | NR/Aa3/AA- | 1800 Union Airpark Boulevard | 1,791,246 | 21.8% | $6,456,575 | 19.5% | $3.60 | 10/31/2024 |
Subaru of America Distribution | NR/NR/NR | 945 Monument Drive | 962,500 | 11.7% | $2,994,750 | 9.0% | $3.11 | 5/31/2024 |
Whirlpool Corporation | BBB/Baa1/BBB | 2801 Airwest Boulevard | 804,586 | 9.8% | $2,465,221 | 7.4% | $3.06 | 1/31/2024 |
The Toro Company(4) | NR/Baa3/BBB | 5500 SE Delaware Avenue | 644,104 | 7.8% | $2,873,813 | 8.7% | $4.46 | 10/31/2034(4) |
Cummins, Inc. | NR/A2/A+ | 20 Logistics Boulevard | 603,586 | 7.4% | $2,334,949 | 7.1% | $3.87 | 10/31/2021 |
SKF USA | BBB+/Baa1/NR | 5142 and 5148 North Hanley Road | 430,986 | 5.3% | $3,782,146 | 11.4% | $8.78 | 10/31/2038 |
Siemens Corporation | A/A1/NR | 2150 Stanley Road | 320,070 | 3.9% | $1,154,836 | 3.5% | $3.61 | 9/30/2028 |
La-Z-Boy Incorporated | NR/NR/NR | 16101 Queens Court | 220,800 | 2.7% | $1,364,544 | 4.1% | $6.18 | 1/31/2031 |
Transamerica Auto Parts (“TAP”) | NR/NR/NR | 5 Logistics Drive | 205,090 | 2.5% | $990,585 | 3.0% | $4.83 | 3/31/2025 |
M D Logistics, Inc. | NR/NR/NR | 2150 Stanley Road | 173,430 | 2.1% | $563,648 | 1.7% | $3.25 | 6/30/2027(5) |
Vacant |
|
| 0 | 0.0% | $0 | 0.0% | $0.00 |
|
Total/Wtd. Avg. |
|
| 8,209,036 | 100.0% | $33,103,501 | 100.0% | $4.03 |
|
| (1) | Information is based on the underwritten rent roll. |
| (2) | Certain ratings are those of the parent company whether or not the parent guarantees the lease. |
| (3) | Amazon is a tenant at the 5000 Commerce Way property (1,016,065 SF; expiring September 30, 2027) and the 4237-4255 Anson Boulevard property (1,036,573 SF; expiring April 30, 2021). |
| (4) | The Toro Company is currently in the process of expanding into an additional 194,000 SF, at which time its lease term will extend for 15 years. The Toro Company has the right to terminate its lease if the expansion date has not occurred within 270 days after November 1, 2019. The Toro Company may exercise its right to terminate its lease by giving notice no later than 30 days after the expiration of such 270-day period. At origination, the lender reserved $6,134,904 into a Toro Expansion Reserve, which will be used to pay the remaining project costs associated with the expansion. The expansion space is included in the table above. |
| (5) | M D Logistics, Inc. has the one-time right to terminate its lease effective June 30, 2022, upon providing notice by September 30, 2021 and paying a termination fee of $546,399. |
The following table presents certain information relating to the lease rollover schedule at the ILPT Industrial Portfolio Properties:
Lease Rollover Schedule(1)(2) | ||||||||
Year | # of | SF Rolling | Approx. % of | Approx. | UW Base Rent | Total UW Base | Approx. % of | Approx. |
MTM | 0 | 0 | 0.0% | 0.0% | $0.00 | $0 | 0.0% | 0.0% |
2019 | 0 | 0 | 0.0% | 0.0% | $0.00 | $0 | 0.0% | 0.0% |
2020 | 0 | 0 | 0.0% | 0.0% | $0.00 | $0 | 0.0% | 0.0% |
2021 | 2 | 1,640,159 | 20.0% | 20.0% | $4.01 | $6,579,367 | 19.9% | 19.9% |
2022 | 0 | 0 | 0.0% | 20.0% | $0.00 | $0 | 0.0% | 19.9% |
2023 | 0 | 0 | 0.0% | 20.0% | $0.00 | $0 | 0.0% | 19.9% |
2024 | 4 | 3,558,332 | 43.3% | 63.3% | $3.35 | $11,916,546 | 36.0% | 55.9% |
2025 | 1 | 205,090 | 2.5% | 65.8% | $4.83 | $990,585 | 3.0% | 58.9% |
2026 | 0 | 0 | 0.0% | 65.8% | $0.00 | $0 | 0.0% | 58.9% |
2027 | 2 | 1,189,495 | 14.5% | 80.3% | $3.73 | $4,441,664 | 13.4% | 72.3% |
2028 | 1 | 320,070 | 3.9% | 84.2% | $3.61 | $1,154,836 | 3.5% | 75.8% |
2029 | 0 | 0 | 0.0% | 84.2% | $0.00 | $0 | 0.0% | 75.8% |
2030 & Beyond | 4 | 1,295,890 | 15.8% | 100.0% | $6.19 | $8,020,503 | 24.2% | 100.0% |
Vacant | 0 | 0 | 0.0% | 100.0% | $0.00 | $0 | 0.0% | 100.0% |
Total/Wtd. Avg. | 14 | 8,209,036 | 100.0% |
| $4.03 | $33,103,501 | 100.0% |
|
| (1) | Information is based on the underwritten rent roll. |
| (2) | Certain tenants may have lease termination options that are exercisable prior to the originally stated expiration date of the subject lease, which are not considered in the lease rollover schedule. |
The Markets. The ILPT Industrial Portfolio Properties are located across eight states. The ILPT Industrial Portfolio Properties are located in Indiana (four properties, 40.2% of NRA), Ohio (one property, 21.8% of NRA), and Virginia (one property, 12.4% of NRA), with the five remaining ILPT Industrial Portfolio Properties located in Missouri, Iowa, Kentucky, Maryland and Pennsylvania.
THE INFORMATION IN THIS STRUCTURAL AND COLLATERAL TERM SHEET IS NOT COMPLETE AND MAY BE AMENDED PRIOR TO THE TIME OF SALE. THIS TERM SHEET IS NOT AN OFFER TO SELL THESE SECURITIES AND IT IS NOT A SOLICITATION OF AN OFFER TO BUY THESE SECURITIES IN ANY JURISDICTION WHERE THE OFFER OR SALE IS NOT PERMITTED.
79
Various | Collateral Asset Summary – Loan No. 6 ILPT Industrial Portfolio | Cut-off Date Balance: Cut-off Date LTV Ratio: UW NCF DSCR: UW NOI Debt Yield: | $30,000,000 39.2% 5.05x 14.8% |
The following table presents the geographical distribution of the ILPT Industrial Portfolio Properties:
ILPT Industrial Portfolio Geographic Distribution(1) | ||||||||
State | ALA | % of ALA | NRA (SF) | Occupancy | Annual UW | Annual UW | % of Annual | Appraised |
Indiana | $126,307,130 | 36.1% | 3,297,159 | 100.0% | $11,422,873 | $3.46 | 34.5% | $197,400,000 |
Ohio | $60,466,179 | 17.3% | 1,791,246 | 100.0% | $6,456,575 | $3.60 | 19.5% | $94,500,000 |
Virginia | $44,597,806 | 12.7% | 1,016,065 | 100.0% | $3,878,016 | $3.82 | 11.7% | $69,700,000 |
Missouri | $39,478,976 | 11.3% | 430,986 | 100.0% | $3,782,146 | $8.78 | 11.4% | $61,700,000 |
Kentucky | $26,297,989 | 7.5% | 603,586 | 100.0% | $2,334,949 | $3.87 | 7.1% | $41,100,000 |
Iowa | $20,795,247 | 5.9% | 644,104 | 100.0% | $2,873,813 | $4.46 | 8.7% | $32,500,000 |
Maryland | $18,875,686 | 5.4% | 220,800 | 100.0% | $1,364,544 | $6.18 | 4.1% | $29,500,000 |
Pennsylvania | $13,180,987 | 3.8% | 205,090 | 100.0% | $990,585 | $4.83 | 3.0% | $20,600,000 |
Total/Wtd. Avg. | $350,000,000 | 100.0% | 8,209,036 | 100.0% | $33,103,501 | $4.03 | 100.0% | $547,000,000 |
| (1) | Based on the underwritten rent roll. |
| (2) | Based on the appraisals dated August 31, 2019 to September 5, 2019. |
The following table presents submarket information for the ILPT Industrial Portfolio Properties:
ILPT Industrial Portfolio Submarket Summary | ||||||
Property | State | Submarket | NRA (SF) | Vacancy Rate | Wtd. Avg. | Under |
1800 Union Airpark Boulevard | OH | Northwest | 113,345,685 | 4.3% | $4.48 | 2,536,131 |
4237-4255 Anson Boulevard | IN | Indianapolis Far Boone County Industrial | 23,211,042 | 5.3% | $4.42 | 3,397,082 |
5000 Commerce Way | VA | Dinwiddie County Industrial | 4,251,769 | 2.3% | $5.39 | 0 |
5142 and 5148 North Hanley Road | MO | North St. Louis County – Airport Industrial | 306,000,000 | 5.1% | $5.44 | 3,300,000 |
945 Monument Drive | IN | Indianapolis Far Boone County Industrial | 23,211,042 | 5.3% | $4.42 | 3,397,082 |
2801 Airwest Boulevard | IN | Indianapolis Plainfield Industrial | 42,994,858 | 4.5% | $4.59 | 1,897,965 |
20 Logistics Boulevard | KY | Northern Kentucky | 73,085,428 | 2.9% | $4.59 | 6,356,231 |
5500 SE Delaware Avenue | IA | Des Moines Northwest Industrial | 10,744,905 | 1.9% | $6.11 | 185,900 |
2150 Stanley Road | IN | Indianapolis Plainfield Industrial | 42,994,858 | 4.5% | $4.59 | 1,897,965 |
16101 Queens Court | MD | Bowie Industrial | 5,500,000 | 6.9% | $8.90 | 0 |
5 Logistics Drive | PA | Central PA | 130,626,700 | 7.0% | $4.64 | 7,244,588 |
Source:Appraisals
THE INFORMATION IN THIS STRUCTURAL AND COLLATERAL TERM SHEET IS NOT COMPLETE AND MAY BE AMENDED PRIOR TO THE TIME OF SALE. THIS TERM SHEET IS NOT AN OFFER TO SELL THESE SECURITIES AND IT IS NOT A SOLICITATION OF AN OFFER TO BUY THESE SECURITIES IN ANY JURISDICTION WHERE THE OFFER OR SALE IS NOT PERMITTED.
80
Various | Collateral Asset Summary – Loan No. 6 ILPT Industrial Portfolio | Cut-off Date Balance: Cut-off Date LTV Ratio: UW NCF DSCR: UW NOI Debt Yield: | $30,000,000 39.2% 5.05x 14.8% |
Operating History and Underwritten Net Cash Flow. The following table presents certain information relating to the historical operating performance and the Underwritten Net Cash Flow at the ILPT Industrial Portfolio Properties:
Cash Flow Analysis | |||||||||||
|
| 2016(1) |
| 2017 |
| 2018 |
| UW |
| UW PSF |
|
Gross Potential Rent |
| $16,490,561 |
| $27,070,602 |
| $28,111,926 |
| $33,103,501 |
| $4.03 |
|
Total Recoveries |
| $4,184,720 |
| $6,235,383 |
| $6,901,354 |
| $7,400,766 |
| $0.90 |
|
Other Income |
| $162,138 |
| $322,484 |
| $322,484 |
| $331,034 |
| $0.04 |
|
Less Vacancy & Credit Loss |
| $0 |
| $0 |
| $0 |
| ($1,012,607) |
| ($0.12) |
|
Effective Gross Income |
| $20,837,420 |
| $33,628,469 |
| $35,335,764 |
| $39,822,695 |
| $4.85 |
|
Total Operating Expenses |
| $4,518,161 |
| $6,368,613 |
| $6,445,614 |
| $7,985,779 |
| $0.97 |
|
Net Operating Income(2) |
| $16,319,258 |
| $27,259,856 |
| $28,890,150 |
| $31,836,916 |
| $3.88 |
|
TI/LC |
| $0 |
| $0 |
| $0 |
| $2,038,736 |
| $0.25 |
|
Capital Expenditures |
| $584,669 |
| $509,338 |
| $0 |
| $656,723 |
| $0.08 |
|
Net Cash Flow |
| $15,734,589 |
| $26,750,518 |
| $28,890,150 |
| $29,141,457 |
| $3.55 |
|
|
|
|
|
|
|
|
|
|
|
|
|
Occupancy %(3) |
| NAV |
| NAV |
| NAV |
| 97.5% |
|
|
|
NOI DSCR(4) |
| 2.83x |
| 4.73x |
| 5.01x |
| 5.52x |
|
|
|
NCF DSCR(4) |
| 2.73x |
| 4.64x |
| 5.01x |
| 5.05x |
|
|
|
NOI Debt Yield(4) |
| 7.6% |
| 12.7% |
| 13.5% |
| 14.8% |
|
|
|
NCF Debt Yield(4) |
| 7.3% |
| 12.5% |
| 13.5% |
| 13.6% |
|
|
|
| (1) | 2016 operating performance excludes the 5500 Southeast Delaware Avenue property and includes partial year information for seven of the properties as historical financial information was unavailable due to ILPT acquiring a majority of the portfolio over the last twelve months. 2016 operating history includes full-year information for the 1800 Union Airpark Boulevard property, 5000 Commerce Way property and the 945 Monument Drive property. |
| (2) | The increase in UW Net Operating Income from 2018 Net Operating Income is primarily attributed to (i) $442,662 of rent steps, (ii) $955,208 in straight line rent taken and (iii) recent leasing, including Transamerica Auto Parts ($966,999 in base rent) and SKF USA ($709,343 in base rent). |
| (3) | Historical occupancy was not provided by the borrower sponsor. Based on the underwritten rent roll dated September 1, 2019, the ILPT Industrial Portfolio was 100.0% occupied. |
| (4) | Debt service coverage ratios and debt yields are based on the ILPT Industrial Portfolio Senior Loan and exclude the ILPT Industrial Portfolio Subordinate Companion Loan. |
Escrows and Reserves.At origination of the ILPT Industrial Portfolio Whole Loan, the ILPT Industrial Portfolio Borrowers deposited $6,134,904 for the payment of capital expenditures to be incurred in connection with the expansion of the premises demised pursuant to The Toro Company lease. The ILPT Industrial Portfolio Borrowers are required to escrow monthly (i) 1/12 of the annual estimated tax payments,provided, however, that such monthly tax payments are waived during the continuance of a Cash Management Sweep Period (as defined below) provided that the ILPT Industrial Portfolio Borrowers will not be required to reserve amounts with the lender that are paid directly by a tenant under a lease that is in full force and effect and as to which no event of default by the tenant is continuing and (ii) 1/12 of the annual estimated insurance premiums,provided, however, that such monthly insurance premiums are waived during the continuance of a Cash Management Sweep Period (unless the ILPT Industrial Portfolio Borrowers maintain acceptable blanket insurance policies, which comply with the requirements under the related whole loan documents, and the insurance premiums payable in connection therewith have been prepaid for not less than one year in advance, or, for the period of coverage under the insurance policies as to which certificates are delivered at ILPT Industrial Portfolio Whole Loan origination, if less than one year).
Lockbox and Cash Management. The ILPT Industrial Portfolio Whole Loan is structured with a hard lockbox and springing cash management. The ILPT Industrial Portfolio Borrowers are required to direct each tenant at the portfolio to deposit funds directly into the lockbox account, and to deposit any funds received by the ILPT Industrial Portfolio Borrowers and property manager, notwithstanding such direction, into the lockbox account within two business days of receipt. If no Cash Management Sweep Period exists, amounts on deposit in the lockbox account are required to be disbursed to the ILPT Industrial Portfolio Borrowers’ operating account on each business day. Upon the first occurrence of a Cash Management Sweep Period, the lender is required to establish, and the ILPT Industrial Portfolio Borrowers are required to cooperate in establishing, a lender-controlled cash management account. If a Cash Management Sweep Period exists, funds on deposit in the lockbox account are required to be transferred to such cash management account, and applied to make monthly deposits to the tax reserve and insurance reserve as described above under “Escrows and Reserves”, to pay debt service on the ILPT Industrial Portfolio Whole Loan, to pay approved operating expenses in accordance with the annual budget (which is required to be reasonably approved by the lender during the continuance of a Cash Management Sweep Period) and to pay extraordinary expenses approved by the lender, and to pay any remainder (i) during a Cash Management Sweep Period caused by a Partial Debt Yield Event (as defined below), 50% into the cash trap account, and 50% to the ILPT Industrial Portfolio Borrowers or (ii) during any Cash Management Sweep Period not caused solely by a Partial Debt Yield Event, 100% into the cash trap account. In each case, the amounts deposited in the cash trap account (such amounts, the “Cash Trap Funds”) are required to be held as additional collateral for the ILPT Industrial Portfolio Whole Loan during the continuance of the Cash Management Sweep Period;provided that, so long as no event of default is continuing under the ILPT Industrial Portfolio Whole Loan, funds in the cash trap account are required to be applied to pay any shortfalls in debt service and to make deposits into the tax and insurance reserves to the extent amounts on deposit in the cash management account are insufficient, and, if requested by the ILPT Industrial Portfolio Borrowers, to pay tenant improvements costs and allowances and leasing commissions for leases approved or deemed approved by the lender, capital expenditures set forth in the approved annual budget, management fees not to exceed 3.0% of operating income for the properties, and (subject to an annual cap of $100,000) REIT distributions to owners of the ILPT Industrial Portfolio Borrowers.
A “Cash Management Sweep Period” means a period commencing upon the earlier of (i) an event of default under the related whole loan documents, (ii) a Debt Yield Event (as defined below) or (iii) Partial Debt Yield Event.
A “Debt Yield Event” will commence if the debt yield for the ILPT Industrial Portfolio Whole Loan is less than 6.75% at the end of two consecutive calendar quarters and will end if (i) the debt yield for the ILPT Industrial Portfolio Whole Loan is equal to or greater than 6.75% for two consecutive calendar quarters or (ii) the borrowers have delivered to the lender a letter of credit in accordance with the related whole loan documents in a face amount such that, if applied to reduce the principal balance of the ILPT Industrial Portfolio Whole Loan, would result in a debt yield of at least 6.75%.
THE INFORMATION IN THIS STRUCTURAL AND COLLATERAL TERM SHEET IS NOT COMPLETE AND MAY BE AMENDED PRIOR TO THE TIME OF SALE. THIS TERM SHEET IS NOT AN OFFER TO SELL THESE SECURITIES AND IT IS NOT A SOLICITATION OF AN OFFER TO BUY THESE SECURITIES IN ANY JURISDICTION WHERE THE OFFER OR SALE IS NOT PERMITTED.
81
Various | Collateral Asset Summary – Loan No. 6 ILPT Industrial Portfolio | Cut-off Date Balance: Cut-off Date LTV Ratio: UW NCF DSCR: UW NOI Debt Yield: | $30,000,000 39.2% 5.05x 14.8% |
A “Partial Debt Yield Event” will commence if the debt yield for the ILPT Industrial Portfolio Whole Loan is less than 7.25% at the end of two consecutive calendar quarters (and a Debt Yield Event does not exist) and will end if (i) the debt yield for the ILPT Industrial Portfolio Whole Loan is equal to or greater than 7.25% for two consecutive calendar quarters, (ii) the ILPT Industrial Portfolio Borrowers have delivered to the lender a letter of credit in accordance with the related whole loan documents in a face amount such that, if applied to reduce the principal balance of the ILPT Industrial Portfolio Whole Loan, would result in a debt yield of at least 7.25% or (iii) the amount of funds on deposit in the Cash Trap Funds are equal to, or in excess of, an amount equal to (x) $2.50 times (y) the rentable square footage of all vacant space at the ILPT Industrial Portfolio Properties.
Additional Secured Indebtedness (not including trade debts). The ILPT Industrial Portfolio Subordinate Companion Loan accrues interest at a rate of 4.4000%per annumand is held by a third party investor. The ILPT Industrial Portfolio Senior Loan is generally senior in right of payment to the ILPT Industrial Portfolio Subordinate Companion Loan. The holders of the ILPT Industrial Portfolio Senior Loan and the ILPT Industrial Portfolio Subordinate Companion Loan have entered into a co-lender agreement that sets forth the allocation of collections on the ILPT Industrial Portfolio Whole Loan. The Cut-off Date Balance PSF, Cut-off Date LTV Ratio, UW NCF DSCR and UW NOI Debt Yield based on the ILPT Industrial Portfolio Whole Loan are $43, 64.0%, 2.47x and 9.1% respectively. See “Description of the Mortgage Pool—The Non-Serviced AB Whole Loan—The ILPT Industrial Portfolio Whole Loan” in the Preliminary Prospectus.
Mezzanine Loans and Preferred Equity. Not permitted.
Release of Property. The ILPT Industrial Portfolio Borrowers may obtain the release of a property (without payment of a yield maintenance premium) solely in connection with a casualty or condemnation, as follows. In the event that no event of default exists and a casualty or condemnation occurs as to which either (i)(a) the net proceeds of such casualty or condemnation are greater than 25% of the Casualty Release Value (as defined below) of the property (the “Affected Property”), and (b) the ILPT Industrial Portfolio Borrowers, after using commercially reasonable efforts are unable to satisfy conditions to restoration requiring that restoration be commenced as soon as reasonably practicable but no later than 90 days after net proceeds are made available to the borrowers, and the Affected Property and use thereof after restoration will be in compliance with legal requirements, the Bond Lease (as defined below), if applicable, any major lease at the Affected Property and other documents applicable to the Affected Property and (c) the lender does not make net proceeds available to the ILPT Industrial Portfolio Borrowers for restoration or (ii) the net proceeds of such casualty or condemnation are greater than 60% of the Casualty Release Value, then the ILPT Industrial Portfolio Borrowers may, on or prior to the second monthly payment date following the application of said net proceeds, prepay the ILPT Industrial Portfolio Whole Loan and obtain the release of the Affected Property. Such prepayment is subject to certain conditions set forth in the related whole loan documents, including, among others: (i) payment of an amount equal to (1) the greater of (A) the Casualty Release Value applicable to the Affected Property and (B) the amount required to be paid under REMIC rules less (2) the portion of the net proceeds applied to the principal amount of the ILPT Industrial Portfolio Whole Loan applicable to such Affected Property (or zero if the amount in clause (2) is equal to or greater than the amount in clause (1)), (ii) transfer and conveyance of the Affected Property to a person other than the ILPT Industrial Portfolio Borrowers or any other loan party and (iii) payment of any additional amount required in order to satisfy REMIC requirements.
The “Casualty Release Value” for each of the ILPT Industrial Portfolio Properties, as set forth in the related whole loan documents is as follows: 945 Monument Drive – $32,760,512; 16101 Queens Court – $18,875,686; 4237-4255 Anson Boulevard – $46,709,324; 5500 Southeast Delaware Avenue – $20,795,247; 5 Logistics Drive – $13,180,987; 1800 Union Airpark Boulevard – $60,466,179; 2150 Stanley Road –$19,323,583; 20 Logistics Boulevard – $26,297,989; 5142 & 5148 North Hanley Road – $39,478,976; 2801 Airwest Boulevard – $27,513,711; 5000 Commerce Way –$44,597,806.
Right of First Offer/Right of First Refusal.With respect to each of the ILPT Industrial Portfolio Properties leased to Amazon, Amazon has both a right of first offer (“ROFO”) and a right of first refusal (“ROFR”) in connection with any offer for sale either of any such property or of a portfolio comprised solely of properties leased by the borrower to Amazon. The ROFO and ROFR do not apply to transfers to any affiliates of the ILPT Industrial Portfolio Borrowers, transfers to any joint venture or partnership with the ILPT Industrial Portfolio Borrowers, or transfers in connection with any debt or equity financing, pursuant to a foreclosure or deed in lieu thereof.
Additionally, The Toro Company has a ROFO with respect to the ILPT Industrial Portfolio Property leased by it. Such ROFO is personal to The Toro Company and terminates automatically if the tenant transfers the lease. The ROFO does not apply to (i) any portfolio sale where the total sale price is over $500,000,000, (ii) any transfer in connection with any financing (or a foreclosure sale or deed in lieu thereof), (iii) a transfer to any entity that is a successor to the ILPT Industrial Portfolio Borrowers by merger or to a party whose property is managed by the ILPT Industrial Portfolio Borrowers’ property manager or (iv) a simultaneous tax-free exchange.
Ground Lease and Tax Abatement.With respect to the 5142 & 5148 North Hanley Road property (the “North Hanley Property”), in connection with the development of the North Hanley Property and in order to incentivize the sole tenant, SKF USA (“SKF”), to locate at the property, a fee interest in the property was obtained by St. Louis County. St. Louis County ground leased the North Hanley Property (the “Bond Lease”) to a predecessor of the ILPT Industrial Portfolio Borrowers (the “Predecessor Entity”), bonds were issued by St. Louis County (the “County Bonds”) to the Predecessor Entity as payment for its costs in constructing the property, and the Predecessor Entity, SKF, and St. Louis County entered into a performance agreement (the “Performance Agreement”). The related borrower has succeeded to the rights of the Predecessor Entity under the County Bonds, the Bond Lease and the Performance Agreement. The rent payable by the ILPT Industrial Portfolio Borrowers to the County under the Bond Lease is equal to the principal and interest payments due to the ILPT Industrial Portfolio Borrowers under the County Bonds and, therefore the rental payments to be made by the applicable borrower and bond payments owed to such borrower offset each other. During the term of the Bond Lease, the ILPT Industrial Portfolio Borrowers are entitled to purchase all or any portion of the North Hanley Property back from the County and terminate the Bond Lease, in return for tender and cancellation of all outstanding County Bonds. The ILPT Industrial Portfolio Borrowers are also required to repurchase the North Hanley Property and terminate the Bond Lease, upon expiration of the Bond Lease or completion of the final bond payment, in each case in return for tender and cancellation of all outstanding County Bonds. The Bond Lease expires on the earlier of (i) the date the SKF lease is terminated and (ii) December 31 of the 10th calendar year following the completion date (as defined in the Bond Lease,provided that it is deemed to be not later than December 31, 2016). According to the appraisal, the improvements at the property were completed in 2015, which would result in a final expiration date of December 31, 2025 for the Bond Lease.
In connection with the above arrangements, the related borrower is exempt from payment of real property taxes during the term of the Bond Lease. Under the Performance Agreement, in lieu of real property taxes, the related borrower and SKF are jointly liable to make contributions to a special allocation fund in St. Louis, Missouri. The contributions amount is dependent on the number of jobs offered by SKF during each annual test period (a 90-day period ending on September 30 of each year), and said amount begins increasing once SKF employs less than 388 full time employees. If SKF offers less than 350 jobs, (i) the contributions amount increases to equal 100% of the unabated real property taxes that would have otherwise been paid and (ii) the County Bonds structure and Bond Lease are effectively terminated as SKF is required to purchase the fee interest in the North Hanley Property (in return for tender and
THE INFORMATION IN THIS STRUCTURAL AND COLLATERAL TERM SHEET IS NOT COMPLETE AND MAY BE AMENDED PRIOR TO THE TIME OF SALE. THIS TERM SHEET IS NOT AN OFFER TO SELL THESE SECURITIES AND IT IS NOT A SOLICITATION OF AN OFFER TO BUY THESE SECURITIES IN ANY JURISDICTION WHERE THE OFFER OR SALE IS NOT PERMITTED.
82
Various | Collateral Asset Summary – Loan No. 6 ILPT Industrial Portfolio | Cut-off Date Balance: Cut-off Date LTV Ratio: UW NCF DSCR: UW NOI Debt Yield: | $30,000,000 39.2% 5.05x 14.8% |
cancellation of the County Bonds) by December 31 of such year. SKF is obligated under its lease to pay both the unabated taxes (when due) and the contribution payments, as applicable. Accordingly, no real estate taxes or contribution payments were underwritten. According to the appraisal, estimated unabated taxes following the expiration of the tax abatement, which is assumed to occur on December 31, 2025, are expected to be $754,225 in 2026. The County Bonds have been pledged to the lender to secure the ILPT Industrial Portfolio Whole Loan. See “Description of the Mortgage Pool—Real Estate and Other Tax Considerations” in the Preliminary Prospectus.
Letter of Credit.The ILPT Industrial Portfolio Borrowers have the right to deliver a letter of credit meeting the requirements of the related whole loan documents in lieu of deposits previously made to the Toro Expansion Reserve. In addition, a letter of credit may be delivered to cure a Debt Yield Event or Partial Debt Yield Event as described above under “Lockbox and Cash Management”.
Terrorism Insurance.The related whole loan documents require that the “all risk” insurance policy required to be maintained by the ILPT Industrial Portfolio Borrowers provide coverage for terrorism in an amount equal to the full replacement cost of the ILPT Industrial Portfolio and 18 months of business interruption insurance;provided that for so long as the Terrorism Risk Insurance Act of 2002, as extended and modified by the Terrorism Risk Insurance Program Reauthorization Act of 2015 (“TRIPRA”) (including any extensions thereof or if another federal governmental program is in effect relating to “acts of terrorism” which provides substantially similar protections as TRIPRA), is in effect and continues to cover both foreign and domestic acts of terrorism, the lender is required to accept terrorism insurance with coverage against “covered acts” within the meaning of TRIPRA (or such other program).
THE INFORMATION IN THIS STRUCTURAL AND COLLATERAL TERM SHEET IS NOT COMPLETE AND MAY BE AMENDED PRIOR TO THE TIME OF SALE. THIS TERM SHEET IS NOT AN OFFER TO SELL THESE SECURITIES AND IT IS NOT A SOLICITATION OF AN OFFER TO BUY THESE SECURITIES IN ANY JURISDICTION WHERE THE OFFER OR SALE IS NOT PERMITTED.
83
Various New York, NY 10022 | Collateral Asset Summary – Loan No. 7 Orfali Portfolio | Cut-off Date Balance: Cut-off Date LTV Ratio: UW NCF DSCR: UW NOI Debt Yield: | $30,000,000 51.1% 2.71x 9.7% |

THE INFORMATION IN THIS STRUCTURAL AND COLLATERAL TERM SHEET IS NOT COMPLETE AND MAY BE AMENDED PRIOR TO THE TIME OF SALE. THIS TERM SHEET IS NOT AN OFFER TO SELL THESE SECURITIES AND IT IS NOT A SOLICITATION OF AN OFFER TO BUY THESE SECURITIES IN ANY JURISDICTION WHERE THE OFFER OR SALE IS NOT PERMITTED.
84
Various New York, NY 10022 | Collateral Asset Summary – Loan No. 7 Orfali Portfolio | Cut-off Date Balance: Cut-off Date LTV Ratio: UW NCF DSCR: UW NOI Debt Yield: | $30,000,000 51.1% 2.71x 9.7% |
THE INFORMATION IN THIS STRUCTURAL AND COLLATERAL TERM SHEET IS NOT COMPLETE AND MAY BE AMENDED PRIOR TO THE TIME OF SALE. THIS TERM SHEET IS NOT AN OFFER TO SELL THESE SECURITIES AND IT IS NOT A SOLICITATION OF AN OFFER TO BUY THESE SECURITIES IN ANY JURISDICTION WHERE THE OFFER OR SALE IS NOT PERMITTED.
85
Various New York, NY 10022 | Collateral Asset Summary – Loan No. 7 Orfali Portfolio | Cut-off Date Balance: Cut-off Date LTV Ratio: UW NCF DSCR: UW NOI Debt Yield: | $30,000,000 51.1% 2.71x 9.7% |
Mortgage Loan Information |
| Property Information | ||||
Mortgage Loan Seller: | UBS AG |
| Single Asset/Portfolio: | Single Asset | ||
Credit Assessment (Fitch/KBRA/Moody’s): | NR/NR/NR |
| Location: | New York, NY 10022 | ||
| General Property Type: | Mixed Use | ||||
Original Balance: | $30,000,000 |
| Detailed Property Type: | Multifamily/Retail | ||
Cut-off Date Balance: | $30,000,000 |
| Title Vesting: | Fee Simple | ||
% of Initial Pool Balance: | 4.0% |
| Year Built/Renovated: | 1910/1985-2011 | ||
Loan Purpose: | Refinance |
| Size(1): | 115 Units | ||
Borrower Sponsors: | Jacob Orfali; Joseph Moinian |
| Cut-off Date Balance per Unit: | $260,870 | ||
Mortgage Rate: | 3.4700% |
| Maturity Date Balance per Unit: | $260,870 | ||
Note Date: | 11/20/2019 |
| Property Manager: | Orfali Group LLC | ||
First Payment Date: | 1/6/2020 |
|
| |||
Maturity Date: | 12/6/2029 |
|
|
| ||
Original Term to Maturity: | 120 months |
|
|
| ||
Original Amortization Term: | 0 months |
|
| |||
IO Period: | 120 months |
| Underwriting and Financial Information | |||
Seasoning: | 0 months |
| UW NOI(4): | $2,917,259 | ||
Prepayment Provisions: | LO (24); DEF (89); O (7) |
| UW NOI Debt Yield: | 9.7% | ||
Lockbox/Cash Mgmt Status: | Springing/Springing |
| UW NOI Debt Yield at Maturity: | 9.7% | ||
Additional Debt Type: | N/A |
| UW NCF DSCR: | 2.71x | ||
Additional Debt Balance: | N/A |
| Most Recent NOI(4): | $2,564,584 (9/30/2019 TTM) | ||
Future Debt Permitted (Type)(2): | Yes (Mezzanine) |
| 2nd Most Recent NOI: | $2,433,390 (12/31/2018) | ||
Reserves(3) |
| 3rd Most Recent NOI: | $2,681,194 (12/31/2017) | |||
Type | Initial | Monthly | Cap |
| Most Recent Occupancy(5): | 95.7% (9/24/2019) |
RE Tax: | $0 | Springing | N/A |
| 2nd Most Recent Occupancy(5): | 95.0% (12/31/2018) |
Insurance: | $0 | Springing | N/A |
| 3rd Most Recent Occupancy(5): | 95.0% (12/31/2017) |
Replacements: | $0 | Springing | N/A |
| Appraised Value (as of): | $58,700,000 (9/17/2019) |
TI/LC: | $0 | Springing | N/A |
| Cut-off Date LTV Ratio: | 51.1% |
Deferred Maintenance: | $69,625 | $0 | N/A |
| Maturity Date LTV Ratio: | 51.1% |
Sources and Uses | ||||||
Sources | Proceeds | % of Total |
| Uses | Proceeds | % of Total |
Loan Amount: | $30,000,000 | 100.0% |
| Payoff: | $16,328,257 | 54.4% |
|
|
|
| Reserves: | $69,625 | 0.2% |
|
|
|
| Closing Costs: | $739,388 | 2.5% |
|
|
|
| Return of Equity: | $12,862,730 | 42.9% |
Total Sources: | $30,000,000 | 100.0% |
| Total Uses: | $30,000,000 | 100.0% |
| (1) | The Orfali Portfolio Properties (as defined below) are comprised of 115 multifamily units totaling 49,789 SF and 7,535 SF of commercial space. |
| (2) | See “Additional Secured Indebtedness (not including trade debts)” below for further discussion of additional permitted debt. |
| (3) | See “Escrows and Reserves” below for further discussion of reserve requirements. |
| (4) | The increase in UW NOI from Most Recent NOI is primarily attributed to $177,480 in vacancy gross up. |
| (5) | Represents occupancy of the residential units. As of the commercial rent roll dated October 1, 2019, the occupancy of the commercial space is 100.0%. |
The Mortgage Loan. The seventh largest mortgage loan (the “Orfali Portfolio Mortgage Loan”) is evidenced by two promissory notes with an aggregate original principal balance of $30,000,000, which is secured by a first priority fee mortgage encumbering seven mixed use multifamily and retail buildings located in the Upper East Side of New York, New York (collectively, the “Orfali Portfolio Properties”). The proceeds of the Orfali Portfolio Mortgage Loan were used to pay off existing debt encumbering the Orfali Portfolio Properties, pay closing costs, fund reserves and return cash equity to the borrower sponsors.
The Borrower and the Borrower Sponsors. The borrower is First Sigma DE LLC (the “Orfali Portfolio Borrower”), a single-purpose Delaware limited liability company structured to be bankruptcy remote with one independent director. Legal counsel to the Orfali Portfolio Borrower delivered a non-consolidation opinion in connection with the origination of the Orfali Portfolio Mortgage Loan. The Orfali Portfolio Borrower is wholly owned by First Sigma Capital Inc., which is 50.0% owned by Jacob Orfali and 50.0% owned by Joseph Moinian, each of which are the borrower sponsors and non-recourse carveout guarantors of the Orfali Portfolio Mortgage Loan.
Jacob Orfali is a developer, investor, and long-term owner of real estate within the New York City tri-state area. The CEO of The Orfali Group, Jacob Orfali has over 35 years of experience in real estate investment and development across a variety of property types, including office, multifamily, hotel, and retail. Joseph Moinian is the founder and CEO of the Moinian Group, a New York City-based developer, investor and long-term owner of real estate nationwide, with ownership and operation of a portfolio in excess of 20 million SF. The Moinian Group holds a portfolio of assets in cities across the United States,
THE INFORMATION IN THIS STRUCTURAL AND COLLATERAL TERM SHEET IS NOT COMPLETE AND MAY BE AMENDED PRIOR TO THE TIME OF SALE. THIS TERM SHEET IS NOT AN OFFER TO SELL THESE SECURITIES AND IT IS NOT A SOLICITATION OF AN OFFER TO BUY THESE SECURITIES IN ANY JURISDICTION WHERE THE OFFER OR SALE IS NOT PERMITTED.
86
Various New York, NY 10022 | Collateral Asset Summary – Loan No. 7 Orfali Portfolio | Cut-off Date Balance: Cut-off Date LTV Ratio: UW NCF DSCR: UW NOI Debt Yield: | $30,000,000 51.1% 2.71x 9.7% |
including New York, Chicago, Dallas and Los Angeles, such as 3 Columbus Circle, 450-460 Park Avenue, Sky (605 West 42nd Street), Ocean Luxury Residences (1 West Street) and the W NY Downtown hotel (123 Washington Street).
The Properties. The Orfali Portfolio Properties are comprised of seven contiguous, five-story walk-up midrise multifamily apartment buildings, of which four are mixed use multifamily and retail, totaling 115 residential units and eight commercial spaces totaling 7,535 SF. Situated on 0.404 acres of land in the Upper East Side neighborhood, the Orfali Portfolio Properties are located at the southeast intersection of East 60th Street and 1st Avenue. The Orfali Portfolio Properties were built in 1910 and renovated in stages from 1985 to 2011. The residential multifamily units include 98 furnished studio, one-bedroom, and two-bedroom units, which are offered as short-term corporate rentals, and 17 unfurnished studio and one-bedroom units, which are leased to long-term tenants and subject to New York City rent regulations. As of September 24, 2019, the residential units at the Orfali Portfolio Properties are 95.7% leased, and as of October 1, 2019, the eight ground-floor commercial spaces are 100.0% occupied by seven tenants. The commercial spaces include three restaurants, a Dunkin Donuts, an eyewear and optician store, and a drop off laundry cleaner as well as operation of a coin-metered laundry room.
Portfolio Summary(1) | |||||||||
Property | No. of | % of Total | Occupancy | Avg Size Per | Total Size | Avg Monthly | Commercial | % of Total | UW Annual |
345 East 60th Street | 19 | 16.5% | 89.5% | 397 | 7,550 | $2,753 | 0 | 0.0% | $0.00 |
347 East 60th Street | 16 | 13.9% | 100.0% | 472 | 7,550 | $3,020 | 0 | 0.0% | $0.00 |
349 East 60th Street | 16 | 13.9% | 81.3% | 394 | 6,300 | $2,474 | 0 | 0.0% | $0.00 |
1097 1st Avenue | 16 | 13.9% | 100.0% | 517 | 8,266 | $2,981 | 1,900 | 25.2% | $111.63 |
1099 1st Avenue | 16 | 13.9% | 100.0% | 433 | 6,923 | $2,800 | 1,730 | 23.0% | $137.44 |
1101 1st Avenue | 16 | 13.9% | 100.0% | 396 | 6,336 | $2,585 | 2,209 | 29.3% | $77.00 |
1103 1st Avenue | 16 | 13.9% | 100.0% | 429 | 6,864 | $2,108 | 1,696 | 22.5% | $113.72 |
Total/Wtd. Avg. | 115 | 100.0% | 95.7% | 433 | 49,789 | $2,676 | 7,535 | 100.0% | $107.87 |
| (1) | Information is based on the underwritten rent roll and borrower-provided rent roll. |
| (2) | Includes gross up of vacant units based on appraisal concluded market rent. |
| (3) | Represents the UW Annual Rent PSF of the commercial space. |
Unit Mix Summary(1) | |||||||
Unit Type | No. of Units | % of Total | Occupancy | Avg Size Per | Total Size (SF) | Avg Monthly | Avg Market |
Studio | 84 | 73.0% | 94.0% | 430 | 36,091 | $2,899 | $2,958 |
Rent Regulated Studio | 12 | 10.4% | 100.0% | 419 | 5,032 | $258 | $2,958 |
Rent Regulated 1 BD / 1 BA | 5 | 4.3% | 100.0% | 434 | 2,170 | $347 | $3,547 |
1 BD / 1 BA | 8 | 7.0% | 100.0% | 487 | 3,893 | $3,588 | $3,547 |
2 BD / 1 BA | 6 | 5.2% | 100.0% | 434 | 2,603 | $5,128 | $5,029 |
Total/Wtd. Avg. | 115 | 100.0% | 95.7% | 433 | 49,789 | $2,676 | $3,133 |
| (1) | Information is based on the underwritten rent roll. |
| (2) | Includes gross up of vacant units based on appraisal concluded market rent. |
| (3) | Based on the appraisal. |
The 98 furnished short-term rentals consist of studio, one-bedroom and two-bedroom units, with a weighted average unit size of 435 SF. Unit amenities include a full kitchen and bathroom, individually controlled air conditioning units, LED flat screen TV, and furnishings such as furniture and houseware. Amenities at the Orfali Portfolio Properties include coin-operated laundry facilities, private courtyard garden, and a full-time doorman and on-site management. Leases for the short-term rentals typically range from one month to one year, and according to the rent roll dated September 24, 2019, the short-term rental units have an average rental term of 2 months. According to the borrower sponsors, the Orfali Portfolio Properties have had residential occupancy of 95.0% since 2008 and typical tenants of these furnished units include corporate relocations, summer interns, diplomats, charitable organizations (such as Doctors Without Borders), as well as a variety of other miscellaneous tenants in need of short term rentals. According to the appraisal, the monthly market rent of traditional unfurnished units is $2,605 per unit, compared to the monthly market rent of furnished short-term rental units at $3,133 per unit. This represents an average premium of 20.3% over traditional unfurnished units, with greater premiums in larger units compared to studio units.
The 17 rent-regulated units consist of studio and one-bedroom units, with a weighted average unit size of 424 SF. Nine of the units are rent controlled and eight are rent stabilized. The tenants in the rent-regulated units pay weighted average monthly rent of $284 per unit, which is 90.9% below appraisal concluded market rent of $3,131 per unit. The rent-regulated units represent 14.8% of the total residential units and 1.3% of the underwritten effective gross income.
THE INFORMATION IN THIS STRUCTURAL AND COLLATERAL TERM SHEET IS NOT COMPLETE AND MAY BE AMENDED PRIOR TO THE TIME OF SALE. THIS TERM SHEET IS NOT AN OFFER TO SELL THESE SECURITIES AND IT IS NOT A SOLICITATION OF AN OFFER TO BUY THESE SECURITIES IN ANY JURISDICTION WHERE THE OFFER OR SALE IS NOT PERMITTED.
87
Various New York, NY 10022 | Collateral Asset Summary – Loan No. 7 Orfali Portfolio | Cut-off Date Balance: Cut-off Date LTV Ratio: UW NCF DSCR: UW NOI Debt Yield: | $30,000,000 51.1% 2.71x 9.7% |
The following table presents certain information relating to the commercial leases at the Orfali Portfolio Properties:
Commercial Tenant Summary(1) | |||||||
Tenant Name |
Credit Rating |
Tenant SF |
Approximate |
Annual UW | Annual UW | % of Total |
Lease |
John & Tony Pizza Corp | NR/NR/NR | 1,900 | 25.2% | $212,103 | $111.63 | 26.1% | 6/30/2023 |
Ming’s Clean & Fresh Inc(2) | NR/NR/NR | 1,449 | 19.2% | $91,812 | $63.36 | 11.3% | 3/31/2022 |
Phaya Cuisine Inc | NR/NR/NR | 865 | 11.5% | $151,796 | $175.49 | 18.7% | 12/31/2023 |
Legacy Brands Isa Llc Dba Dunkin | NR/NR/NR | 865 | 11.5% | $85,972 | $99.39 | 10.6% | 12/31/2022 |
RN Trading Inc | NR/NR/NR | 848 | 11.3% | $100,161 | $118.11 | 12.3% | 6/30/2023 |
Quantum Leap Natural Restaurant | NR/NR/NR | 848 | 11.3% | $92,700 | $109.32 | 11.4% | 7/31/2028 |
MC Optical | NR/NR/NR | 760 | 10.1% | $78,286 | $103.01 | 9.6% | 3/14/2021 |
Total/Wtd. Avg. |
| 7,535 | 100.0% | $812,830 | $107.87 | 100.0% |
|
| (1) | Information is based on the retail underwritten rent roll dated October 1, 2019. |
| (2) | Ming’s Clean & Fresh Inc leases retail space of 949 SF at $73.99 PSF at 1101 1st Avenue and operates the 500 SF coin-metered laundry room at 345 East 60th Street for $1,800 per month, which provides for annual rent steps of 3.0% commencing in December 2019. |
The Market. The Orfali Portfolio Properties are located in New York, New York, within the Upper East Side neighborhood. Located at the southeast intersection of 60th Street and First Avenue and two blocks from the East River, the Orfali Portfolio Properties offer easy access to the Upper East Side to the north and Midtown East to the south. According to the appraisal, the surrounding area is underscored by multifamily residential buildings, ranging from single-family townhouses, low and mid-rise walk-ups, to luxury high-rise towers.
Prominent institutions within a ten-block radius include The Rockefeller University, Hunter College, New York Presbyterian/Weil Cornell Medical Center, and Memorial Sloan Kettering Cancer Center. Other notable attractions include Central Park, which is located six avenues west, and the United Nations, which is located 12 blocks south. Major retailers and department stores are primarily located along avenues throughout the Upper East Side and Midtown East neighborhoods, including Bloomingdale’s, Apple Fifth Avenue, Nike, Victoria’s Secret, T.J. Maxx, and Sephora. The presence of restaurants, supermarkets, boutiques, gyms, specialty fitness facilities, hotels, and art galleries offer a wide range of options for residents.
The 4, 5, 6, N, R and W subway lines stop at Lexington Avenue and 59th Street and the F and Q subway lines stop at Lexington Avenue and 63rd Street. Additionally, the Orfali Portfolio Properties are located within one block of the Ed Koch Queensboro bridge, which connects Manhattan to Roosevelt Island and Queens, and within two blocks of FDR Drive, a major freeway traversing the entire east side of Manhattan. According to a third party market research report, the intersection of East 60th Street and First Avenue had a traffic count of 45,149 vehicles per day in 2018.
According to a third party market research provider, the estimated 2019 population within a one-, three-, and five-mile radius of the Orfali Portfolio Properties is approximately 176,468, 1,341,116, and 3,041,345, respectively; and the estimated 2019 average household income within the same radii is approximately $196,043, $154,836, and $128,868, respectively.
As of the second quarter of 2019, the New York City multifamily submarket consisted of 219,294 traditional unfurnished units and had average monthly asking rents of $3,783 per unit, with a vacancy rate of 4.5%. As of the second quarter of 2019, the Upper East Side multifamily submarket consisted of 16,744 traditional unfurnished units and had average monthly asking rents of $4,426 per unit, with a vacancy rate of 2.9%.
As of the second quarter of 2019, the average rent and vacancy of Manhattan retail is $485.00 PSF and 14.7%, respectively. As of the second quarter of 2019, the average rent and vacancy of Upper East Side retail is $233.00 PSF and 8.5%, respectively. The appraisal concluded market rent for ground floor retail of $110.00 PSF and ground floor corner retail of $115.00 PSF.
THE INFORMATION IN THIS STRUCTURAL AND COLLATERAL TERM SHEET IS NOT COMPLETE AND MAY BE AMENDED PRIOR TO THE TIME OF SALE. THIS TERM SHEET IS NOT AN OFFER TO SELL THESE SECURITIES AND IT IS NOT A SOLICITATION OF AN OFFER TO BUY THESE SECURITIES IN ANY JURISDICTION WHERE THE OFFER OR SALE IS NOT PERMITTED.
88
Various New York, NY 10022 | Collateral Asset Summary – Loan No. 7 Orfali Portfolio | Cut-off Date Balance: Cut-off Date LTV Ratio: UW NCF DSCR: UW NOI Debt Yield: | $30,000,000 51.1% 2.71x 9.7% |
The appraisal identified 16 comparable properties that offer furnished corporate housing in New York, New York.
Furnished Corporate Housing(1) | ||||||
Property | Unit Type | Avg Size (SF)(2)(3) | Monthly Asking | Monthly Asking | Term | Building Type |
Orfali Portfolio Properties | Studio | 430 | $2,899 | $80.96 | 1 to 12 Months | Walk-Up |
| 1 BD / 1 BA | 487 | $3,588 | $88.46 | 1 to 12 Months | Walk-Up |
| 2 BD / 1 BA | 434 | $5,128 | $141.85 | 1 to 12 Months | Walk-Up |
149 East 39th Street | Studio | 400 | $3,900 | $117.00 | 30 Days | Elevator |
| 1 BD / 1 BA | 750 | $4,900 | $78.40 | 30 Days | Elevator |
| 2 BD / 1 BA | 1,200 | $10,000 | $100.00 | 30 Days | Elevator |
468 W 146th Street | Studio | 299 | $2,400 | $96.32 | 6 Months | Walk-Up |
354 East 50th Street | Studio | 350 | $3,000 | $102.86 | 30 Days | Elevator |
| 1 BD / 1 BA | 625 | $5,400 | $103.68 | 30 Days | Elevator |
| 2 BD / 1 BA | 1,000 | $6,480 | $77.76 | 30 Days | Elevator |
429 East 52 Street | Studio | 375 | $3,100 | $99.20 | 30 Days | Walk-Up |
300 East 62nd Street | 1 BD / 1 BA | 650 | $5,000 | $92.31 | 12 Months | Elevator |
| 2 BD / 2 BA | 1,225 | $8,500 | $83.27 | 12 Months | Elevator |
East 54st Street (Third Ave) | 1 BD / 1 BA | 455 | $3,100 | $81.76 | 30 Days | Elevator |
130 East 63rd Street | 1 BD / 1 BA | 650 | $5,500 | $101.54 | 30 Days | Elevator |
360 East 65th | 1 BD / 1 BA | 756 | $5,500 | $87.30 | 2 to 6 Months | Elevator |
201 East 86th Street | 1 BD / 1 BA | 705 | $5,539 | $94.28 | 3 Months | Elevator |
130 West 15th Street | Studio | 550 | $4,685 | $102.22 | 3 Months | Elevator |
225 East 63rd Street | Studio | 494 | $5,150 | $125.10 | 2 to 6 Months | Elevator |
450 West 42nd Street | Studio | 549 | $4,488 | $98.10 | 3 Months | Elevator |
299 Chrystie | 1 BD / 1 BA | 705 | $5,539 | $94.28 | 3 Months | Elevator |
500 2nd Avenue | 2 BD / 1.5 BA | 953 | $6,901 | $86.90 | 2 to 6 Months | Elevator |
400 East 58th Street | 2 BD / 2 BA | 1,194 | $7,519 | $75.57 | 2 to 6 Months | Elevator |
400 East 84th Street | 2 BD / 2 BA | 1,050 | $8,549 | $97.70 | 2 to 6 Months | Elevator |
| (1) | Source:Appraisal. |
| (2) | Information for the Orfali Portfolio Properties is based on the underwritten rent roll. |
| (3) | Excludes the 17 rent-regulated units for the Orfali Portfolio Properties. |
Operating History and Underwritten Net Cash Flow. The following table presents certain information relating to the historical operating performance and the Underwritten Net Cash Flow at the Orfali Portfolio Properties:
Cash Flow Analysis | |||||||||||||
|
| 2016 |
| 2017 |
| 2018 |
| 9/30/2019 TTM |
| UW |
| UW Per Unit |
|
Gross Potential Rent(1) |
| $2,616,651 |
| $2,913,724 |
| $2,768,629 |
| $2,804,037 |
| $3,693,508 |
| $32,117 |
|
Other Rental Income(2) |
| $719,413 |
| $778,830 |
| $727,693 |
| $783,318 |
| $772,188 |
| $6,715 |
|
Other Income |
| $463,311 |
| $367,725 |
| $357,868 |
| $360,275 |
| $387,295 |
| $3,368 |
|
Less Vacancy & Credit Loss |
| $0 |
| $0 |
| $0 |
| $0 |
| ($401,567) |
| ($3,492) |
|
Effective Gross Income |
| $3,799,376 |
| $4,060,278 |
| $3,854,190 |
| $3,947,630 |
| $4,451,425 |
| $38,708 |
|
Total Operating Expenses |
| $1,409,768 |
| $1,379,084 |
| $1,420,800 |
| $1,383,046 |
| $1,534,166 |
| $13,341 |
|
Net Operating Income |
| $2,389,608 |
| $2,681,194 |
| $2,433,390 |
| $2,564,584 |
| $2,917,259 |
| $25,367 |
|
Replacement Reserves(3) |
| $0 |
| $0 |
| $0 |
| $0 |
| $60,562 |
| $527 |
|
Net Cash Flow |
| $2,389,608 |
| $2,681,194 |
| $2,433,390 |
| $2,564,584 |
| $2,856,697 |
| $24,841 |
|
|
|
|
|
|
|
|
|
|
|
|
|
|
|
Occupancy %(4) |
| 95.0% |
| 95.0% |
| 95.0% |
| 95.0% |
| 90.3% |
|
|
|
NOI DSCR |
| 2.26x |
| 2.54x |
| 2.31x |
| 2.43x |
| 2.76x |
|
|
|
NCF DSCR |
| 2.26x |
| 2.54x |
| 2.31x |
| 2.43x |
| 2.71x |
|
|
|
NOI Debt Yield |
| 8.0% |
| 8.9% |
| 8.1% |
| 8.5% |
| 9.7% |
|
|
|
NCF Debt Yield |
| 8.0% |
| 8.9% |
| 8.1% |
| 8.5% |
| 9.5% |
|
|
|
| (1) | UW Gross Potential Rent is based on the residential underwritten rent roll and includes $177,480 in vacancy gross up. |
| (2) | Other Rental Income is underwritten to the retail rent roll, with a vacancy adjustment of 5.0%. |
| (3) | Includes replacement reserves for residential and commercial spaces and tenant improvements and leasing commissions for the commercial spaces. |
| (4) | UW Occupancy represents the underwritten economic vacancy of 9.7%, which is underwritten to the appraisal concluded vacancy. As of the rent rolls dated September 24, 2019 and October 1, 2019, residential occupancy was 95.7% and retail occupancy was 100.0%, respectively. |
THE INFORMATION IN THIS STRUCTURAL AND COLLATERAL TERM SHEET IS NOT COMPLETE AND MAY BE AMENDED PRIOR TO THE TIME OF SALE. THIS TERM SHEET IS NOT AN OFFER TO SELL THESE SECURITIES AND IT IS NOT A SOLICITATION OF AN OFFER TO BUY THESE SECURITIES IN ANY JURISDICTION WHERE THE OFFER OR SALE IS NOT PERMITTED.
89
Various New York, NY 10022 | Collateral Asset Summary – Loan No. 7 Orfali Portfolio | Cut-off Date Balance: Cut-off Date LTV Ratio: UW NCF DSCR: UW NOI Debt Yield: | $30,000,000 51.1% 2.71x 9.7% |
Escrows and Reserves.The Orfali Portfolio Borrower deposited in escrow at origination $69,625 for immediate repairs. On each monthly payment date during the continuance of a Cash Sweep Trigger Event (as defined below), the Orfali Portfolio Borrower is required to escrow monthly (i) 1/12 of the annual estimated tax payments, (ii) 1/12 of the annual estimated insurance premiums, (iii) $2,521 for replacement reserves, and (iv) $628 for rollover reserves. All excess cash flow will be deposited into an account designated by the Orfali Portfolio Borrower,provided, however, that during the continuance of a Cash Sweep Trigger Event, all excess cash flow is required to be held by the lender as additional security for the Orfali Portfolio Mortgage Loan.
Lockbox and Cash Management. The Orfali Portfolio Mortgage Loan has a springing lockbox with springing cash management upon the occurrence and continuance of a Cash Management Trigger Event (as defined below).
A “Cash Management Trigger Event” will occur upon (i) an event of default, (ii) any bankruptcy action involving the Orfali Portfolio Borrower, the guarantor, or the property manager, (iii) the debt service coverage ratio for the trailing 12-month period, based on actual debt service due and payable during such period, falling below 1.25x, or (iv) any indictment for fraud or misappropriation of funds by the Orfali Portfolio Borrower, the guarantor, or the property manager,providedthat in the case of a third party property manager, such indictment is related to the Orfali Portfolio Property, or any director or officer of such parties. A Cash Management Trigger Event will continue until, in regard to clause (i) above, the cure of such event of default and acceptance of such cure by the lender, in regard to clause (ii) above, the filing being discharged, stayed or dismissed within 45 days for the Orfali Portfolio Borrower or guarantor, or 120 days for the property manager, and the lender’s determination that such filing does not materially affect the obligations of the Orfali Portfolio Borrower, guarantor, or property manager under the related mortgage loan documents or management agreement, as applicable, in regard to clause (iii) above, the debt service coverage for the trailing 12-month period, based on actual debt service due and payable during such period, being at least 1.30x for two consecutive calendar quarters, or in regard to clause (iv) above, (a) the dismissal of the applicable indictment, (b) the acquittal of each applicable person with respect to the related charge(s) or (c) as to the property manager, such property manager is replaced with a qualified manager under a replacement property management agreement.
A “Cash Sweep Trigger Event” will occur upon (i) an event of default, (ii) any bankruptcy action involving the Orfali Portfolio Borrower, the guarantor, or the property manager, or (iii) the debt service coverage ratio for the trailing 12-month period, based on actual debt service due and payable during such period, falling below 1.15x. A Cash Sweep Trigger Event will continue until, in regard to clause (i) above, the cure of such event of default and acceptance of such cure by the lender, in regard to clause (ii) above, the filing being discharged, stayed or dismissed within 45 days for the Orfali Portfolio Borrower or guarantor, or 120 days for the property manager, and the lender’s determination that such filing does not materially affect the obligations of the Orfali Portfolio Borrower, guarantor, or property manager under the related mortgage loan documents or management agreement, as applicable, or in regard to clause (iii) above, the debt service coverage for the trailing 12-month period, based on actual debt service due and payable during such period, being at least 1.25x for two consecutive calendar quarters.
Additional Secured Indebtedness (not including trade debts). None.
Mezzanine Loans and Preferred Equity. The Orfali Portfolio Borrower is permitted to obtain a mezzanine loan upon satisfaction of certain conditions including, among others, (i) no event of default has occurred; (ii) the combined loan-to-value ratio does not exceed 51.1%; (iii) the combined debt service coverage ratio based on the trailing twelve month period immediately preceding the date of determination is not less than 2.43x; (iv) the mezzanine lender enters into an intercreditor agreement acceptable to lender; and (v) the Orfali Portfolio Borrower delivers a rating agency confirmation.
Release of Property. Not permitted.
Terrorism Insurance.The Orfali Portfolio Borrower is required to obtain and maintain property insurance, commercial general liability insurance, and business income or rental loss insurance that covers perils of terrorism and acts of terrorism, both foreign and domestic.
THE INFORMATION IN THIS STRUCTURAL AND COLLATERAL TERM SHEET IS NOT COMPLETE AND MAY BE AMENDED PRIOR TO THE TIME OF SALE. THIS TERM SHEET IS NOT AN OFFER TO SELL THESE SECURITIES AND IT IS NOT A SOLICITATION OF AN OFFER TO BUY THESE SECURITIES IN ANY JURISDICTION WHERE THE OFFER OR SALE IS NOT PERMITTED.
90
350 West 40th Street New York, NY 10018 | Collateral Asset Summary – Loan No. 8 DoubleTree New York Times Square West Leased Fee | Cut-off Date Balance: Cut-off Date LTV Ratio: UW NCF DSCR: UW NOI Debt Yield: | $28,000,000 43.7% 2.53x 9.4% |

THE INFORMATION IN THIS STRUCTURAL AND COLLATERAL TERM SHEET IS NOT COMPLETE AND MAY BE AMENDED PRIOR TO THE TIME OF SALE. THIS TERM SHEET IS NOT AN OFFER TO SELL THESE SECURITIES AND IT IS NOT A SOLICITATION OF AN OFFER TO BUY THESE SECURITIES IN ANY JURISDICTION WHERE THE OFFER OR SALE IS NOT PERMITTED.
91
350 West 40th Street New York, NY 10018 | Collateral Asset Summary – Loan No. 8 DoubleTree New York Times Square West Leased Fee | Cut-off Date Balance: Cut-off Date LTV Ratio: UW NCF DSCR: UW NOI Debt Yield: | $28,000,000 43.7% 2.53x 9.4% |

THE INFORMATION IN THIS STRUCTURAL AND COLLATERAL TERM SHEET IS NOT COMPLETE AND MAY BE AMENDED PRIOR TO THE TIME OF SALE. THIS TERM SHEET IS NOT AN OFFER TO SELL THESE SECURITIES AND IT IS NOT A SOLICITATION OF AN OFFER TO BUY THESE SECURITIES IN ANY JURISDICTION WHERE THE OFFER OR SALE IS NOT PERMITTED.
92
350 West 40th Street New York, NY 10018 | Collateral Asset Summary – Loan No. 8 DoubleTree New York Times Square West Leased Fee | Cut-off Date Balance: Cut-off Date LTV Ratio: UW NCF DSCR: UW NOI Debt Yield: | $28,000,000 43.7% 2.53x 9.4% |
| Mortgage Loan Information | Mortgaged Property Information | ||||||
| Mortgage Loan Seller: | UBS AG | Single Asset/Portfolio: | Single Asset | ||||
Credit Assessment (Fitch/KBRA/Moody’s): | BBB-/A-/NR | Location: | New York, NY 10018 | ||||
| General Property Type(3): | Other | ||||||
| Original Balance(1): | $28,000,000 | Detailed Property Type(3): | Leased Fee | ||||
| Cut-off Date Balance(1): | $28,000,000 | Title Vesting: | Fee Simple | ||||
| % of Initial Pool Balance: | 3.8% | Year Built/Renovated: | 2017/N/A | ||||
| Loan Purpose: | Refinance | Size: | 612 Rooms | ||||
| Borrower Sponsor: | Sam Chang | Cut-off Date Balance per Room(1): | $94,771 | ||||
| Mortgage Rate: | 3.66072% | Maturity Date Balance per Room(1): | $94,771 | ||||
| Note Date: | 11/25/2019 | Property Manager: | Self-managed | ||||
| First Payment Date: | 1/6/2020 | ||||||
| Maturity Date: | 12/6/2029 | ||||||
| Original Term to Maturity | 120 months | ||||||
| Original Amortization Term: | 0 months | Underwriting and Financial Information | |||||
| IO Period: | 120 months | UW NOI(4): | (a) $5,454,725 | (b) $16,443,880 | |||
| Seasoning: | 0 months | UW NOI Debt Yield(1)(4): | (a) 9.4% | (b) 28.4% | |||
| Prepayment Provisions: | LO (6); YM1 (107); O (7) | UW NOI Debt Yield at Maturity(1)(4): | (a) 9.4% | (b) 28.4% | |||
| Lockbox/Cash Mgmt Status: | N/A | UW NCF DSCR(1)(4): | (a) 2.53x | (b) 6.85x | |||
| Additional Debt Type(1): | Pari Passu/ Subordinate Debt | Most Recent NOI(5): | $16,549,016 | ||||
| Additional Debt Balance(1): | $30,000,000 / $32,000,000 | 2nd Most Recent NOI(5): | $17,834,908 | ||||
| Future Debt Permitted (Type): | No (N/A) | 3rd Most Recent NOI(5): | $12,929,350 | ||||
| Reserves(2) | Most Recent Occupancy(6): | 92.1% (9/30/2019) | |||||
| Type | Initial | Monthly | Cap | 2nd Most Recent Occupancy(6): | 95.4% | ||
| RE Tax: | $0 | Springing | N/A | 3rd Most Recent Occupancy(6): | 86.9% | ||
| Insurance: | $0 | Springing | N/A | Appraised Value (as of)(7): | $132,600,000 (10/1/2019) | ||
| Replacements: | $0 | $0 | N/A | Cut-off Date LTV Ratio(1)(7): | (a) 43.7% | (b) 16.7% | |
| TI/LC: | $0 | $0 | N/A | Maturity Date LTV Ratio(1)(7): | (a) 43.7% | (b) 16.7% | |
| Sources and Uses(8) | ||||||
| Sources | Proceeds | % of Total | Uses | Proceeds | % of Total | |
| Loan Amount(1): | $90,000,000 | 42.9% | Payoff: | $205,326,015 | 97.8% | |
| Leasehold Mortgage Loan: | $120,000,000 | 57.1% | Closing Costs: | $4,030,547 | 1.9% | |
| Return of Equity: | $643,438 | 0.3% | ||||
| Total Sources: | $210,000,000 | 100.0% | Total Uses: | $210,000,000 | 100.0% | |
| (1) | The DoubleTree New York Times Square West Leased Fee Mortgage Loan (as defined below) is part of the DoubleTree New York Times Square West Leased Fee Whole Loan (as defined below), which is comprised of (i) four seniorpari passu promissory notes with an aggregate principal balance of $58,000,000 (the “Senior Loan”) and (ii) a subordinate companion note with an original principal balance of $32,000,000 (the “Subordinate Companion Loan”). The Cut-off Date Balance per Room, Maturity Date Balance per Room, UW NOI Debt Yield, UW NOI Debt Yield at Maturity, UW NCF DSCR, Cut-off Date LTV Ratio and Maturity Date LTV Ratio presented above are based on the aggregate principal balance of the Senior Loan, without regard to the Subordinate Companion Loan. Including the Subordinate Companion Loan, the Cut-off Date Balance per Room, Maturity Date Balance per Room, UW NOI Debt Yield, UW NOI Debt Yield at Maturity, UW NCF DSCR, Cut-off Date LTV Ratio and Maturity Date LTV Ratio are $147,059, $147,059, 6.1%, 6.1%, 1.59x, 67.9% and 67.9%, respectively. |
| (2) | See “Escrows and Reserves” below for further discussion of reserve requirements. |
| (3) | The DoubleTree New York Times Square West Leased Fee Whole Loan is secured by the borrower’s fee simple interest in a land parcel (the “Fee” or the “DoubleTree New York Times Square West Leased Fee Property”), beneath a 36-story, 612-room, full-service DoubleTree by Hilton New York Times Square West Hotel (the “Leasehold” or the “Improvement”) located at 350 West 40th Street in Times Square, New York, New York. |
| (4) | Underwriting and Financial Information is based on (a) the average annual ground lease payment due under the ground lease over the next 15-year period described below under “The Property,” and (b) the underwritten “look-through” of Leasehold (non-collateral) net operating income of $16,443,880, as described below under “Operating History and Underwritten Net Cash Flow”. |
| (5) | Historical NOI performance based on the “look-through” of Leasehold (non-collateral) net operating income, as described below under “Operating History and Underwritten Net Cash Flow”. At loan origination, the Fee (collateral) and Leasehold (non-collateral) interests were bifurcated and a newly created 49-year ground lease was executed. |
| (6) | Historical occupancy is based on the “look-through” of Leasehold (non-collateral) hotel occupancy. |
| (7) | The Cut-off Date LTV Ratio and Maturity Date LTV Ratio are based on the Senior Loan and (a) the “as-is” Fee appraised value as of October 1, 2019 of $132,600,000, and (b) the “as-stabilized” Fee and Leasehold (non-collateral) appraised value of $347,000,000, which reflects the value the Improvement (non-collateral) operating at stabilized market conditions, plus the value of the Fee (collateral). |
| (8) | See “The Mortgage Loan” below for further discussion of sources and uses. |
THE INFORMATION IN THIS STRUCTURAL AND COLLATERAL TERM SHEET IS NOT COMPLETE AND MAY BE AMENDED PRIOR TO THE TIME OF SALE. THIS TERM SHEET IS NOT AN OFFER TO SELL THESE SECURITIES AND IT IS NOT A SOLICITATION OF AN OFFER TO BUY THESE SECURITIES IN ANY JURISDICTION WHERE THE OFFER OR SALE IS NOT PERMITTED.
93
350 West 40th Street New York, NY 10018 | Collateral Asset Summary – Loan No. 8 DoubleTree New York Times Square West Leased Fee | Cut-off Date Balance: Cut-off Date LTV Ratio: UW NCF DSCR: UW NOI Debt Yield: | $28,000,000 43.7% 2.53x 9.4% |
The Mortgage Loan.The eighth largest mortgage loan (the “DoubleTree New York Times Square West Leased Fee Mortgage Loan”) is part of the DoubleTree New York Times Square West Leased Fee Whole Loan evidenced by (i) fourpari passunotes comprising the Senior Loan with an aggregate original principal balance of $58,000,000 and an aggregate outstanding principal balance as of the Cut-off Date of $58,000,000 and (ii) the Subordinate Companion Loan with an original principal balance of $32,000,000 and an outstanding principal balance as of the Cut-off Date of $32,000,000. The DoubleTree New York Times Square West Leased Fee Whole Loan is secured by a first priority lien on the Leased Fee Borrower’s (as defined below) fee simple interest in a land parcel, beneath a 36-story, 612-room, full-service DoubleTree by Hilton New York Times Square West Hotel located at 350 West 40th Street in Times Square, New York, New York. The Improvement will not be collateral for the DoubleTree New York Times Square West Leased Fee Whole Loan. The Leased Fee Borrower is an affiliate of an entity that holds technical legal title to the Improvement. However, since the Improvement has been 100.0% leased to the ground lessee pursuant to the Ground Lease (as defined below), the Leased Fee Borrower will only receive the rental income from the Ground Lease and not from the operation of any of the Improvement. Therefore, the Improvement is referred to as not being collateral for the DoubleTree New York Times Square West Leased Fee Whole Loan.
Promissory Notes A-1 and A-4, with an aggregate original principal balance of $28,000,000, represent the DoubleTree New York Times Square West Leased Fee Mortgage Loan, and will be included in the UBS 2019-C18 Trust. Promissory Notes A-2 and A-3, with an aggregate original principal balance of $30,000,000, represent the (“Non-Serviced Pari Passu Companion Loan”). The below table summarizes the DoubleTree New York Times Square West Leased Fee Whole Loan, including the remaining promissory notes, which are currently held by UBS AG and may otherwise be transferred at any time. The mortgage loan seller provides no assurances that the non-securitized notes will not be split further. The DoubleTree New York Times Square West Leased Fee Whole Loan will be serviced pursuant to the pooling and servicing agreement for the UBS 2019-C18 Trust until the controllingpari passuPromissory Note A-2 is securitized, whereupon the DoubleTree New York Times Square West Leased Fee Whole Loan will be serviced pursuant to the pooling and servicing agreement for such future securitization. See “Description of the Mortgage Pool—The Whole Loans—The Serviced AB Whole Loans—The DoubleTree New York Times Square West Leased Fee Whole Loan” and “Pooling and Servicing Agreement” in the Preliminary Prospectus.
| DoubleTree New York Times Square West Leased Fee Whole Loan Summary | ||||
| Note | Original Balance | Cut-off Date Balance | Anticipated Note Holder | Controlling Piece |
| A-1 | $25,000,000 | $25,000,000 | UBS 2019-C18 | No |
| A-2 | $20,000,000 | $20,000,000 | UBS AG | No(1) |
| A-3 | $10,000,000 | $10,000,000 | UBS AG | No |
| A-4 | $3,000,000 | $3,000,000 | UBS 2019-C18 | No |
| B | $32,000,000 | $32,000,000 | UBS AG | Yes(1) |
| Total | $90,000,000 | $90,000,000 | ||
| (1) | The initial controlling note is Note B, so long as no control appraisal period with respect to the DoubleTree New York Times Square West Leased Fee Whole Loan has occurred and is continuing. If and for so long as a control appraisal period with respect to the DoubleTree New York Times Square West Leased Fee Whole Loan has occurred and is continuing, then the controlling note will be Note A-2. See “Description of the Mortgage Pool—The Whole Loans—The Serviced AB Whole Loans—The DoubleTree New York Times Square West Leased Fee Whole Loan” in the Preliminary Prospectus. |
At loan origination, the Fee (collateral) and Leasehold (non-collateral) interests were bifurcated and a newly created 49-year ground lease was executed. Simultaneously with the origination of the DoubleTree New York Times Square West Leased Fee Whole Loan, a mortgage loan, secured by the Leasehold interest (non-collateral), in the amount of $120.0 million (the “Leasehold Mortgage Loan”) was provided by Goldman Sachs Bank USA (the “Leasehold Mortgage Lender”) to the borrower sponsor. The maturity date of the Leasehold Mortgage Loan is November 25, 2021. Pursuant to the Leasehold Mortgage Loan, the borrower sponsor also pledged as additional collateral to the Leasehold Mortgage Lender 100.0% of the equity interests of the sole member in the Leased Fee Borrower (as defined below). The proceeds of the DoubleTree New York Times Square West Leased Fee Whole Loan and the Leasehold Mortgage Loan with an original principal amount of $120,000,000, were used to pay off existing debt on the DoubleTree New York Times Square West Leased Fee Property, pay closing costs, and return equity to the borrower sponsor. An affiliate of the borrower sponsor acquired the Improvement and is the Leasehold owner/ground tenant.
The Borrower and the Borrower Sponsor. The borrower is NYHK Fiona LLC (the “Leased Fee Borrower”), a Delaware limited liability company structured to be bankruptcy-remote with two independent directors. Legal counsel to the Leased Fee Borrower delivered a non-consolidation opinion in connection with the origination of the DoubleTree New York Times Square West Leased Fee Whole Loan. The Leased Fee Borrower is directly owned by Sam Chang, the borrower sponsor and non-recourse carveout guarantor of the DoubleTree New York Times Square West Leased Fee Whole Loan.
Sam Chang is the founder, Chairman and CEO of McSam Hotel Group, LLC based in Great Neck, New York. Since 1997, Mr. Chang has developed and operated more than 50 properties, including hotels and residential and commercial properties in the New York metropolitan area. Mr. Chang has been approved for franchise licenses by a variety of hotel franchise companies and their affiliates including Hilton Hotel Corporation, InterContinental Hotels Group, Hilton International, Inc., Hyatt Hotels Corporation, Carlson Hotels Worldwide, Starwood Hotels and Resorts Worldwide, Inc., Wyndham Worldwide Corporation, and Choice Hotels International. McSam Hotel Group, LLC currently operates 36 properties, has 13 properties under construction, and two properties under development totaling 9,231 rooms for a variety of national hotel chains. See “Description of the Mortgage Pool—Litigation and Other Considerations” and “—Default History, Bankruptcy Issues and Other Proceedings” in the Preliminary Prospectus.
The Property.The DoubleTree New York Times Square West Leased Fee Property consists of a square-shaped parcel of land totaling 9,875 SF situated along the northwesterly corner of Ninth Avenue and West 40th Street in Times Square, New York, New York. The collateral does not include the Improvement constructed on such parcel of land. The Improvement consists of a 36-story, 612-room full-service DoubleTree by Hilton New York Times Square West Hotel. Built in 2017, the DoubleTree New York Times Square West Leased Fee Property’s guestroom configuration consists of 375 king rooms and 237 double rooms, and each guestroom includes a 40-inch HDTV, premium cable, a mini-refrigerator, coffeemaker, and desk and chair. Hotel amenities include a full-service restaurant and bar (serving breakfast, lunch, and dinner) with indoor, lounge, and outdoor garden seating, a rooftop bar and lounge on the 37th floor featuring views of the New York City skyline, two meeting and banquet spaces totaling 900 SF (which can accommodate up to 75 people), a business center, fitness center, and market pantry. Parking is provided by an off-site valet through a third party operator.
THE INFORMATION IN THIS STRUCTURAL AND COLLATERAL TERM SHEET IS NOT COMPLETE AND MAY BE AMENDED PRIOR TO THE TIME OF SALE. THIS TERM SHEET IS NOT AN OFFER TO SELL THESE SECURITIES AND IT IS NOT A SOLICITATION OF AN OFFER TO BUY THESE SECURITIES IN ANY JURISDICTION WHERE THE OFFER OR SALE IS NOT PERMITTED.
94
350 West 40th Street New York, NY 10018 | Collateral Asset Summary – Loan No. 8 DoubleTree New York Times Square West Leased Fee | Cut-off Date Balance: Cut-off Date LTV Ratio: UW NCF DSCR: UW NOI Debt Yield: | $28,000,000 43.7% 2.53x 9.4% |
At loan origination, the Improvement is encumbered by a 49-year ground lease, with no termination option, to an affiliate of the Leased Fee Borrower, with an initial ground rent of $5.4 million, with annual increases of 1.0% thereafter commencing in year 11.
The DoubleTree by Hilton New York Times Square West Hotel operates under a franchise agreement with Hilton Franchise Holdings LLC, which is a subsidiary of Hilton Worldwide Holdings Inc. (“Hilton”), which has an expiration date of June 30, 2038. The franchise agreement stipulates a monthly royalty fee of 4.0% of gross room revenue and a monthly program fee of 4.0% of gross room revenue. The program fee is subject to increase, but such increase is limited to 1.0% of the gross room revenue, and the program fee will not exceed 5% of gross room revenue.
Hilton is a global hospitality company, operating in 117 countries and territories under 17 brand names. As of the third quarter of 2019, Hilton had 771 company-owned and/or managed properties (242,410 rooms) and 5,209 franchised properties (712,445 rooms), for a total of 5,980 properties (954,855 rooms). Hilton’s portfolio of global brands includes Waldorf Astoria Hotels & Resorts, Conrad Hotels & Resorts, Curio Collection by Hilton, Hilton Hotels & Resorts, Embassy Suites by Hilton, Homewood Suites by Hilton, DoubleTree by Hilton, Hilton Garden Inn, Hampton by Hilton, and LXR Hotels & Resorts. As of the third quarter of 2019, there are 580 hotels operating under the DoubleTree brand across 46 countries and territories.
The Market. The DoubleTree New York Times Square West Leased Fee Property is located within Times Square of the Midtown West neighborhood of Manhattan, proximate to the Theater District and Hudson Yards. The Times Square neighborhood is bounded by West 53rd Street to the north; West 40th Street to the south; Sixth Avenue to the east; and Eighth Avenue to the west. The Theater District is generally between Sixth Avenue and Eighth Avenue from the low-West 40s to the low-West 50s, centralized around Broadway. Times Square is a small land area of significant consequence. According to a third party market research report, though it comprises only 0.1% of New York City’s land area, Times Square supports nearly 10% of the city’s jobs and generates 15% of its economic output. With over 180,000 workers, over 19,000 hotel rooms, and approximately 31 million SF of office space, the district is a major commercial, retail and entertainment center.
New York City is one of the nation's premier tourist destinations. According to a third party market information provider, New York City has been breaking records of visitors for the past five years: 56.5 million in 2014, 58.5 million in 2015, 60.5 million in 2016, 62.8 million in 2017, and 65.0 million in 2018. In 2018, visitors spent $13.5 billion on lodging with additional spending of $32.7 billion on food & beverage, shopping, transportation, and recreation and entertainment. According to a third party market information provider, the Times Square district had approximately 377,306 daily visitors in 2018. On its busiest days, daily traffic in this neighborhood can exceed 450,000 pedestrians. A true “24/7” neighborhood, statistics indicate average daily pedestrian traffic in the center of Times Square at 85,000 persons between 7pm and 1am.
Other prominent attractions within an approximately one-mile radius of the DoubleTree New York Times Square West Leased Fee Property include the Jacob Javits Convention Center, Central Park, Columbus Circle, Madison Square Garden, Empire State Building, Grand Central Terminal, Bryant Park, and Intrepid Sea, Air & Space Museum. Bounded by 34th Street to the north, 12th Avenue to the west, 30th Street to the south, and 10th Avenue to the east, Hudson Yards is a 28-acre LEED GOLD Neighborhood Development, which, upon completion, is expected to provide approximately 18.2 million SF of mixed-use office, residential and hotel space. Proposed offerings at Hudson Yards include more than 100 shops, a collection of restaurants, approximately 4,000 residences, affordable housing, and 14 acres of public open space. Certain phases of the Hudson Yards development have already opened in 2016 and 2019.
The heart of Midtown, Times Square is a hub in the MTA subway network with multiple subway stations within the district boundaries. There are local and express service subway stations along Sixth Avenue (B, D, F, M), Seventh Avenue/Broadway (N, Q, R, W), Seventh Avenue (No. 1, 2, 3), Eighth Avenue (A, C, E) and 42nd Street (S and No. 7). The No. 7 train extends to West 34th Street and Eleventh Avenue, linking Midtown Manhattan to the 28-acre Hudson Yards. The DoubleTree New York Times Square West Leased Fee Property is located adjacent to the Port Authority bus terminal, which provides access to New York and New Jersey. The PATH train provides access from West 33rd Street and south along Sixth Avenue to the New Jersey cities of Newark, Hoboken and Jersey City. Penn Station, one of the busiest rail hubs in the world serving Amtrak, New Jersey Transit, Long Island Railroad, and the MTA subway network, is located at 33rd Street and 8th Avenue. Annual subway ridership within the Times Square district reached approximately 93.3 million, or over 255,000 passengers per day.
According to the appraisal, the DoubleTree by Hilton New York Times Square West Hotel’s defined primary competitive marketplace includes eight properties, including DoubleTree by Hilton New York Times Square South, Fairfield Inn & Suites by Marriott Manhattan Times Square, Four Points by Sheraton Midtown Times Square, Yotel New York, Crowne Plaza HY36 Midtown Manhattan, Hilton Garden Inn New York Times Square South, AC Hotel by Marriott New York Times Square, and Distrikt Hotel, Tapestry Collection by Hilton. The eight primary competitors range in size from 155 to 713 rooms and collectively contain an aggregate of 2,371 rooms.
THE INFORMATION IN THIS STRUCTURAL AND COLLATERAL TERM SHEET IS NOT COMPLETE AND MAY BE AMENDED PRIOR TO THE TIME OF SALE. THIS TERM SHEET IS NOT AN OFFER TO SELL THESE SECURITIES AND IT IS NOT A SOLICITATION OF AN OFFER TO BUY THESE SECURITIES IN ANY JURISDICTION WHERE THE OFFER OR SALE IS NOT PERMITTED.
95
350 West 40th Street New York, NY 10018 | Collateral Asset Summary – Loan No. 8 DoubleTree New York Times Square West Leased Fee | Cut-off Date Balance: Cut-off Date LTV Ratio: UW NCF DSCR: UW NOI Debt Yield: | $28,000,000 43.7% 2.53x 9.4% |
Primary competitive properties to the non-collateral Improvement are shown in the table below:
| Competitive Property Summary | ||||||||
| Hotel | No. of Rooms | Segmentation | Estimated 2018 | |||||
| Commercial | Meeting & Group | Leisure | Occupancy | Average Daily Rate | RevPAR | |||
| DoubleTree by Hilton New York Times Square West | 612 | 40.0% | 15.0% | 45.0% | 95.4%(1) | $196.37(1) | $187.35(1) | |
| DoubleTree by Hilton New York Times Square South | 224 | 40.0% | 10.0% | 50.0% | 90% - 95% | $210 - $220 | $200 - $210 | |
| Fairfield Inn & Suites by Marriott Manhattan Times Square | 244 | 40.0% | 10.0% | 50.0% | 90% - 95% | $220 - $230 | $210 - $220 | |
| Four Points by Sheraton Midtown Times Square | 244 | 40.0% | 10.0% | 50.0% | 90% - 95% | $220 - $230 | $200 - $210 | |
| Yotel New York | 713 | 25.0% | 15.0% | 60.0% | 90% - 95% | $190 - $200 | $170 - $180 | |
| Crowne Plaza HY36 Midtown Manhattan | 251 | 45.0% | 10.0% | 45.0% | 85% - 90% | $230 - $240 | $200 - $210 | |
| Hilton Garden Inn New York Times Square South | 250 | 50.0% | 10.0% | 40.0% | 95% - 100% | $200 - $210 | $200 - $210 | |
| AC Hotel by Marriott New York Times Square | 290 | 50.0% | 15.0% | 35.0% | 80% - 85% | $260 - $270 | $210 - $220 | |
| Distrikt Hotel, Tapestry Collection by Hilton | 155 | 40.0% | 10.0% | 50.0% | 90% - 95% | $190 - $200 | $170 - $180 | |
| Total/Wtd. Avg.(2) | 2,371 | 38.3% | 12.1% | 49.6% | 91.3% | $216.91 | $196.27 | |
Source: Appraisal
| (1) | Based on the borrower-provided operating statements as of December 31, 2018. |
| (2) | Excludes the DoubleTree by Hilton New York Times Square West Hotel. |
Operating History and Underwritten Net Cash Flow. The following table presents certain information relating to the historical operating performance and the Underwritten Net Cash Flow at the DoubleTree New York Times Square West Leased Fee Property:
| Cash Flow Analysis | |||
| Revenues | In Place Contractual Ground Rent | Year 15 Contractual Ground Rent | UW Ground Rent(1) |
| Base Rent | $5,400,000 | $5,675,454 | $5,454,725 |
| Total Gross Potential Income | $5,400,000 | $5,675,454 | $5,454,725 |
| Less: Vacancy | $0 | $0 | $0 |
| Effective Gross Income | $5,400,000 | $5,675,454 | $5,454,725 |
| Total Expenses | $0 | $0 | $0 |
| Net Operating Income | $5,400,000 | $5,675,454 | $5,454,725 |
| Net Cash Flow | $5,400,000 | $5,675,454 | $5,454,725 |
| (1) | Reflects average ground rent payment over a 15-year period. At loan origination, the Improvement is encumbered by a 49-year ground lease, to an affiliate of the Leased Fee Borrower, with an initial ground rent of $5.4 million, 1.0% annual increases thereafter commencing in year 11. |
The following table presents certain information relating to the net cash flow of the non-collateral Improvement:
| Look-Through of Leasehold Interest (Non-Collateral) | |||||
| 2017 | 2018 | 9/30/2019 TTM | UW Look-Through | UW per Room | |
| Occupancy | 86.9% | 95.4% | 92.1% | 92.1% | |
| ADR | $188.70 | $196.37 | $199.97 | $199.97 | |
| RevPAR | $164.06 | $187.35 | $184.08 | $184.08 | |
| Rooms Revenue | $32,632,039 | $41,849,728 | $41,119,878 | $41,119,878 | $67,189 |
| Other Departmental Revenue | $596,106 | $624,114 | $545,907 | $545,907 | $892 |
| Other Income | $213,770 | $501,631 | $686,813 | $686,813 | $1,122 |
| Total Revenue | $33,441,914 | $42,975,474 | $42,352,597 | $42,352,597 | $69,204 |
| Total Expenses | $20,512,564 | $25,140,565 | $25,803,581 | $25,908,717 | $42,335 |
| Net Operating Income | $12,929,350 | $17,834,908 | $16,549,016 | $16,443,880 | $26,869 |
| FF&E | $665,773 | $1,244,720 | $1,268,345 | $1,694,104 | $2,768 |
| Net Cash Flow | $12,263,578 | $16,590,188 | $15,280,671 | $14,749,776 | $24,101 |
| NOI DSCR(1) | 6.01x | 8.28x | 7.69x | 7.64x | |
| NCF DSCR(1) | 5.70x | 7.71x | 7.10x | 6.85x | |
| NOI Debt Yield(1) | 22.3% | 30.7% | 28.5% | 28.4% | |
| NCF Debt Yield(1) | 21.1% | 28.6% | 26.3% | 25.4% | |
| (1) | Debt service coverage ratios and debt yields are based on the Senior Loan and exclude the Subordinate Companion Loan. |
THE INFORMATION IN THIS STRUCTURAL AND COLLATERAL TERM SHEET IS NOT COMPLETE AND MAY BE AMENDED PRIOR TO THE TIME OF SALE. THIS TERM SHEET IS NOT AN OFFER TO SELL THESE SECURITIES AND IT IS NOT A SOLICITATION OF AN OFFER TO BUY THESE SECURITIES IN ANY JURISDICTION WHERE THE OFFER OR SALE IS NOT PERMITTED.
96
350 West 40th Street New York, NY 10018 | Collateral Asset Summary – Loan No. 8 DoubleTree New York Times Square West Leased Fee | Cut-off Date Balance: Cut-off Date LTV Ratio: UW NCF DSCR: UW NOI Debt Yield: | $28,000,000 43.7% 2.53x 9.4% |
Escrows and Reserves.The Leased Fee Borrower is not required to make monthly escrow deposits for real estate taxes and insurance reserves as long as (i) no event of default under the related whole loan documents has occurred and is continuing, (ii) the ground lease remains in full force and effect, (iii) the ground lessee is responsible, pursuant to the terms of the ground lease, for the direct payment or reimbursement of all taxes and insurance premiums and no default has occurred under the ground lease, (iv) the ground lease has not been terminated nor has the Leased Fee Borrower accepted a surrender thereof, and (v) the lender receives evidence satisfactory to the lender that all taxes and insurance premiums have been paid in a timely manner.
Lockbox and Cash Management.Not applicable.
Additional Secured Indebtedness (not including trade debts). In addition to the DoubleTree New York Times Square West Leased Fee Mortgage Loan, the DoubleTree New York Times Square West Leased Fee Property also secures the Non-Serviced Pari Passu Companion Loan, which has an aggregate Cut-off Date principal balance of $30,000,000, and the Subordinate Companion Loan, which has a Cut-off Date principal balance of $32,000,000. The Non-Serviced Pari Passu Companion Loan accrues interest at the same rate as the DoubleTree New York Times Square West Leased Fee Mortgage Loan. The Subordinate Companion Loan accrues interest at the rate of 3.9090%per annum. The holders of the DoubleTree New York Times Square West Leased Fee Mortgage Loan, the Non-Serviced Pari Passu Companion Loan, and the Subordinate Companion Loan have entered into a co-lender agreement, which sets forth the allocation of collections on the DoubleTree New York Times Square West Leased Fee Whole Loan. See “Description of the Mortgage Pool—The Whole Loans—The Serviced AB Whole Loans—The DoubleTree New York Times Square West Leased Fee Whole Loan” in the Preliminary Prospectus.
Mezzanine Loan and Preferred Equity. There is no mezzanine loan or preferred equity; however, as described above under “The Mortgage Loan”, the collateral for the Leasehold Mortgage Loan also includes a pledge of 100% of the equity interests of the sole member in the Leased Fee Borrower to the Leasehold Mortgage Lender. In connection with the origination of the Leasehold Mortgage Loan, the Leasehold Mortgage Lender and UBS AG, as the lender under the DoubleTree New York Times Square West Leased Fee Whole Loan, have entered into an intercreditor agreement, whereby UBS AG is the senior lender thereunder and the Leasehold Mortgage Lender is the junior lender thereunder. Pursuant to the intercreditor agreement, the Leasehold Mortgage Lender is provided certain notice, cure and purchase option rights with respect to the DoubleTree New York Times Square West Leased Fee Whole Loan that are typically provided to mezzanine lenders.
Release of Property. Not permitted.
Terrorism Insurance.The Leased Fee Borrower is required to obtain and maintain property insurance, commercial general liability insurance, and business income or rental loss insurance that covers perils of terrorism and acts of terrorism, both foreign and domestic.
THE INFORMATION IN THIS STRUCTURAL AND COLLATERAL TERM SHEET IS NOT COMPLETE AND MAY BE AMENDED PRIOR TO THE TIME OF SALE. THIS TERM SHEET IS NOT AN OFFER TO SELL THESE SECURITIES AND IT IS NOT A SOLICITATION OF AN OFFER TO BUY THESE SECURITIES IN ANY JURISDICTION WHERE THE OFFER OR SALE IS NOT PERMITTED.
97
2716 North Tenaya Way Las Vegas, NV 89128 | Collateral Asset Summary – Loan No. 9 United Healthcare Office | Cut-off Date Balance: Cut-off Date LTV Ratio: UW NCF DSCR: UW NOI Debt Yield: | $26,800,000 66.7% 1.56x 10.2% |
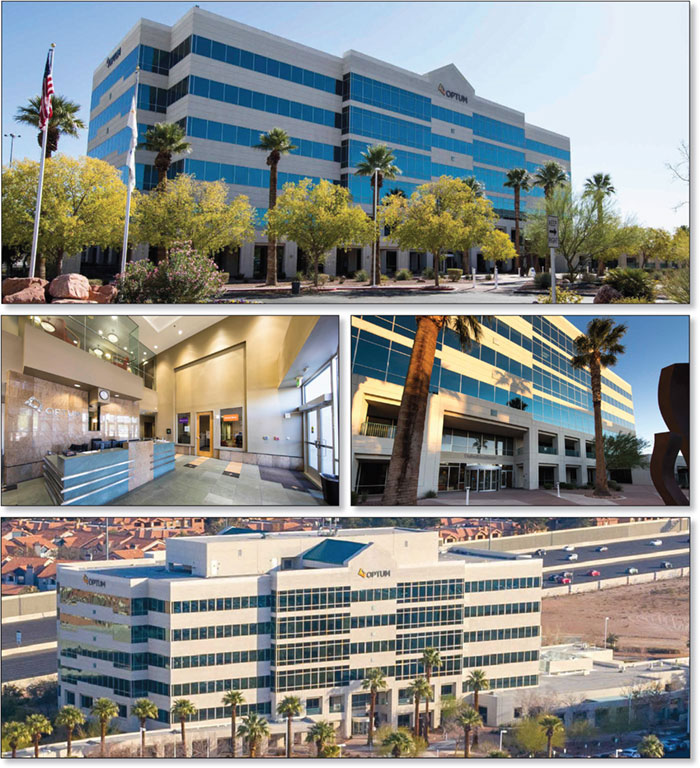
THE INFORMATION IN THIS STRUCTURAL AND COLLATERAL TERM SHEET IS NOT COMPLETE AND MAY BE AMENDED PRIOR TO THE TIME OF SALE. THIS TERM SHEET IS NOT AN OFFER TO SELL THESE SECURITIES AND IT IS NOT A SOLICITATION OF AN OFFER TO BUY THESE SECURITIES IN ANY JURISDICTION WHERE THE OFFER OR SALE IS NOT PERMITTED.
98
2716 North Tenaya Way Las Vegas, NV 89128 | Collateral Asset Summary – Loan No. 9 United Healthcare Office | Cut-off Date Balance: Cut-off Date LTV Ratio: UW NCF DSCR: UW NOI Debt Yield: | $26,800,000 66.7% 1.56x 10.2% |
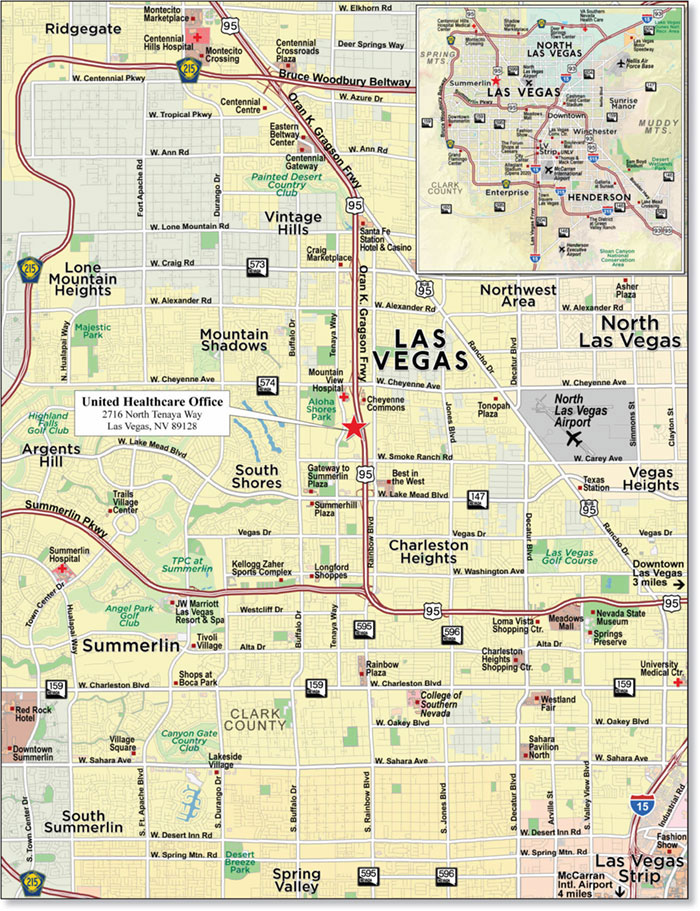
THE INFORMATION IN THIS STRUCTURAL AND COLLATERAL TERM SHEET IS NOT COMPLETE AND MAY BE AMENDED PRIOR TO THE TIME OF SALE. THIS TERM SHEET IS NOT AN OFFER TO SELL THESE SECURITIES AND IT IS NOT A SOLICITATION OF AN OFFER TO BUY THESE SECURITIES IN ANY JURISDICTION WHERE THE OFFER OR SALE IS NOT PERMITTED.
99
2716 North Tenaya Way Las Vegas, NV 89128 | Collateral Asset Summary – Loan No. 9 United Healthcare Office | Cut-off Date Balance: Cut-off Date LTV Ratio: UW NCF DSCR: UW NOI Debt Yield: | $26,800,000 66.7% 1.56x 10.2% |
| Mortgage Loan Information | Mortgaged Property Information | |||||||
| Mortgage Loan Seller: | UBS AG | Single Asset/Portfolio: | Single Asset | |||||
Credit Assessment (Fitch/KBRA/Moody’s): | NR/NR/NR | Location: | Las Vegas, NV 89128 | |||||
| General Property Type: | Office | |||||||
| Original Balance(1): | $26,800,000 | Detailed Property Type: | Suburban | |||||
| Cut-off Date Balance(1): | $26,800,000 | Title Vesting: | Fee Simple | |||||
| % of Initial Pool Balance: | 3.6% | Year Built/Renovated: | 1998/2016 | |||||
| Loan Purpose: | Refinance | Size: | 204,123 SF | |||||
| Borrower Sponsors: | Quynh Palomino; Lloyd W. Kendall, Jr. | Cut-off Date Balance per SF(1): | $229 | |||||
| Mortgage Rate: | 4.97948% | Maturity Date Balance per SF(1): | $219 | |||||
| Note Date: | 10/4/2019 | Property Manager(4): | Self-managed | |||||
| First Payment Date: | 11/6/2019 | |||||||
| Maturity Date: | 10/6/2024 | |||||||
| Original Term to Maturity | 60 months | |||||||
| Original Amortization Term: | 360 months | |||||||
| IO Period: | 24 months | Underwriting and Financial Information | ||||||
| Seasoning: | 2 months | UW NOI(5): | $4,766,342 | |||||
| Prepayment Provisions: | LO (26); DEF (30); O (4) | UW NOI Debt Yield(1): | 10.2% | |||||
| Lockbox/Cash Mgmt Status: | Hard/Springing | UW NOI Debt Yield at Maturity(1): | 10.7% | |||||
| Additional Debt Type(1)(2): | Pari Passu/ Mezzanine | UW NCF DSCR(1): | 1.99x (IO) | 1.56x (P&I) | ||||
| Additional Debt Balance(1)(2): | $20,000,000 / $6,000,000 | Most Recent NOI(5): | $4,424,860 (7/31/2019 TTM) | |||||
| Future Debt Permitted (Type): | No (N/A) | 2nd Most Recent NOI: | $4,344,538 (12/31/2018) | |||||
| Reserves(3) | 3rd Most Recent NOI: | $4,222,082 (12/31/2017) | ||||||
| Type | Initial | Monthly | Cap | Most Recent Occupancy: | 100.0% (9/30/2019) | |||
| RE Tax: | $0 | Springing | N/A | 2nd Most Recent Occupancy: | 100.0% (12/31/2018) | |||
| Insurance: | $0 | Springing | N/A | 3rd Most Recent Occupancy: | 100.0% (12/31/2017) | |||
| Replacements: | $0 | $3,402 | N/A | Appraised Value (as of): | $70,200,000 (8/23/2019) | |||
| TI/LC: | $0 | $29,768 | N/A | Cut-off Date LTV Ratio(1): | 66.7% | |||
| Material Tenant Rollover: | $1,000,000 | Springing | N/A | Maturity Date LTV Ratio(1): | 63.7% | |||
| Sources and Uses | ||||||
| Sources | Proceeds | % of Total | Uses | Proceeds | % of Total | |
| Loan Amount(1): | $46,800,000 | 88.5% | Loan Payoff(6): | $42,166,575 | 79.8% | |
| Mezzanine Loan(2): | $6,000,000 | 11.4% | Mezzanine Loan Payoff: | $9,080,774 | 17.2% | |
| Borrower Equity: | $53,020 | 0.1% | Reserves: | $1,000,000 | 1.9% | |
| Closing Costs: | $605,671 | 1.1% | ||||
| Total Sources: | $52,853,020 | 100.0% | Total Uses: | $52,853,020 | 100.0% | |
| (1) | The United Healthcare Office Mortgage Loan (as defined below) is part of the United Healthcare Office Whole Loan (as defined below), which is comprised of fivepari passu promissory notes with an aggregate original principal balance of $46,800,000. The Cut-off Date Balance per SF, Maturity Date Balance per SF, UW NOI Debt Yield, UW NOI Debt Yield at Maturity, UW NCF DSCR, Cut-off Date LTV Ratio and Maturity Date LTV Ratio presented above are based on the aggregate principal balance of the promissory notes comprising the United Healthcare Office Whole Loan. The Cut-off Date Balance per SF, Maturity Date Balance per SF, UW NOI Debt Yield, UW NOI Debt Yield at Maturity, UW NCF DSCR, Cut-off Date LTV Ratio and Maturity Date LTV Ratio based on the United Healthcare Office Whole Loan and the United Healthcare Office Mezzanine Loan (as defined below) are $259, $248, 9.0%, 9.4%, 1.30x, 75.2% and 72.3%, respectively. |
| (2) | The United Healthcare Office Whole Loan was originated concurrently with a mezzanine loan with an original principal balance of $6,000,000 (the “United Healthcare Office Mezzanine Loan”). See “Mezzanine Loans and Preferred Equity” below for further discussion of additional debt. |
| (3) | See “Escrows and Reserves” below for further discussion of reserve requirements. |
| (4) | The United Healthcare Office Borrower (as defined below) has entered into the asset management agreement with an affiliate, Clear Vista Management (US), LLC (the “Asset Manager”) pursuant to which Asset Manager provides certain administrative services related to the property (i.e., preparation of budget, cash management services, rent collections, maintaining books and records and similar accounting and financial services). The United Healthcare Office Property (as defined below) property level management (such as maintenance, etc.) is managed by UnitedHealthcare (as defined below) pursuant to the terms of the UnitedHealthcare lease. |
| (5) | The increase in UW NOI from Most Recent NOI is primarily attributable to (i) $133,873 of rent steps through October 1, 2020 and (ii) straight line rent underwritten to the average rent steps for the remaining lease term expiring December 31, 2025. |
| (6) | The United Healthcare Office Property secured a mortgage loan that was previously securitized in JPMBB 2014-C26. |
The Mortgage Loan.The ninth largest mortgage loan (the “United Healthcare Office Mortgage Loan”) is part of a whole loan (the “United Healthcare Office Whole Loan”) evidenced by fivepari passu promissory notes with an aggregate original principal balance of $46,800,000. The United Healthcare Office Whole Loan is secured by a first priority fee mortgage encumbering a 204,123 SF Class A suburban office building located in Las Vegas, Nevada (the “United Healthcare Office Property”). Promissory Notes A-1, A-4 and A-5, with an aggregate original principal balance of $26,800,000, represent the United Healthcare Office Mortgage Loan, and will be contributed to the UBS 2019-C18 Trust. The below table summarizes the United Healthcare Office Whole Loan. The United Healthcare Office Whole Loan will be serviced pursuant to the pooling and servicing agreement for the UBS 2019-C18 Trust. See “Description of the Mortgage Pool—The Whole Loans—The Serviced Pari Passu Whole Loans” and “Pooling and Servicing Agreement” in the Preliminary Prospectus.
THE INFORMATION IN THIS STRUCTURAL AND COLLATERAL TERM SHEET IS NOT COMPLETE AND MAY BE AMENDED PRIOR TO THE TIME OF SALE. THIS TERM SHEET IS NOT AN OFFER TO SELL THESE SECURITIES AND IT IS NOT A SOLICITATION OF AN OFFER TO BUY THESE SECURITIES IN ANY JURISDICTION WHERE THE OFFER OR SALE IS NOT PERMITTED.
100
2716 North Tenaya Way Las Vegas, NV 89128 | Collateral Asset Summary – Loan No. 9 United Healthcare Office | Cut-off Date Balance: Cut-off Date LTV Ratio: UW NCF DSCR: UW NOI Debt Yield: | $26,800,000 66.7% 1.56x 10.2% |
| United Healthcare Office Whole Loan Summary | ||||
| Notes | Original Principal Balance | Cut-off Date Balance | Anticipated Note Holder | Controlling Piece |
| A-1 | $10,000,000 | $10,000,000 | UBS 2019-C18 | Yes |
| A-2 | $10,000,000 | $10,000,000 | CSAIL 2019-C18(1) | No |
| A-3 | $10,000,000 | $10,000,000 | CSAIL 2019-C18(1) | No |
| A-4 | $10,000,000 | $10,000,000 | UBS 2019-C18 | No |
| A-5 | $6,800,000 | $6,800,000 | UBS 2019-C18 | No |
| Total | $46,800,000 | $46,800,000 | ||
| (1) | Promissory Notes A-2 and A-3 are currently held by, UBS AG, or an affiliated entity, and are expected to be contributed to CSAIL 2019-C18, which is expected to close on or about December 12, 2019. |
The Borrower and the Borrower Sponsor. The borrower is 2716 N. Tenaya Loan 1, LLC (the “United Healthcare Office Borrower”), a Delaware limited liability company structured to be bankruptcy remote with one independent director. Legal counsel to the United Healthcare Office Borrower delivered a non-consolidation opinion in connection with the origination of the United Healthcare Office Whole Loan. The borrowing entity is 100% owned and managed by 2716 N. Tenaya Loan 2, LLC (the “Mezzanine Borrower”), which is owned by Quynh Palomino (12.4%) through Quyp Holdings, LLC and by various entities and individuals (87.6%), of which none own more than 10.0%. The Mezzanine Borrower is managed by Virtua Partners (US), LLC (“Virtua Partners”), which is majority owned and controlled by Quynh Palomino and Lloyd W. Kendall, Jr.
The borrower sponsors and nonrecourse carveout guarantors are Quynh Palomino and Lloyd W. Kendall, Jr., who are both principals at Virtua Partners. Virtua Partners is a global private equity firm specializing in commercial real estate. Virtua Partners sponsors a variety of investment funds and commercial real estate projects across the United States and currently has 16 million SF of assets under management or development.
The Property. The United Healthcare Office Property is a 204,123 SF, Class A, suburban office building located in Las Vegas, Nevada. The United Healthcare Office Property consists of one, six-story building situated on an approximately 9.6-acre site. Built in 1998 and renovated in 2016, the United Healthcare Office Property has been 100.0% occupied by United HealthCare Services, Inc. (“UnitedHealthcare”) and its predecessors since the original construction in 1998. The United Healthcare Office Property features 908 parking spaces (4.4 spaces per 1,000 SF), including a five-story above ground parking garage with 727 spaces.
UnitedHealthcare leases the United Healthcare Office Property under an absolute net lease at a current underwritten base rent of $22.61 PSF, with 3% annual increases, through December 2025 and has three, five-year renewal options remaining with no termination options. Since its most recent lease renewal in 2014, UnitedHealthcare has spent approximately $3.3 million in renovations at the United Healthcare Office Property. The renovations included installation of a credit union on the first floor, re-demising the 2nd through 6th floors with new finishes throughout, and fully upgraded bathrooms. In addition, UnitedHealthcare constructed an additional 245 space covered parking lot on the parcel to the south of the United Healthcare Office Property at its own expense. The parcel with the additional parking belongs to UnitedHealthcare and is not a part of the collateral.
UnitedHealthcare is an operating division of UnitedHealth Group (NYSE: UNH) (Fitch/Moody’s: A-/A3). UnitedHealth Group, based in Minnetonka, Minnesota, is a leader in the health and well-being industry, serving approximately 70 million Americans and 85 million other individuals in 19 other countries. Founded in 1977, UnitedHealth Group employs more than 260,000 people globally. UnitedHealth Group has two business platforms: health benefits operating under UnitedHealthcare and health services operating under Optum. UnitedHealthcare provides health care benefits to an array of customers and markets. Optum is a health services business serving the broad health care marketplace, including payers, care providers, employers, governments, life sciences companies and consumers, through its OptumHealth, OptumInsight and OptumRx businesses. UnitedHealth Group is ranked number 6 on the 2019 Fortune 500 list, and has over $226.2 billion in annual revenue as of year-end 2018. UnitedHealthcare accounted for approximately 81% of UnitedHealth Group’s revenues and 53% of UnitedHealth Group’s net operating income in 2018.
In February 2008, UnitedHealthcare expanded its footprint in Nevada when its parent company, UnitedHealth Group, acquired Sierra Health Services, Inc.. The United Healthcare Office Property, and the adjacent smaller office building at 2720 North Tenaya Way, serve as UnitedHealthcare’s regional headquarters. The campus serves as the operations center for the company's business lines in Nevada, UnitedHealthcare’s insurance business, and Optum.
The following table presents certain information relating to the tenancy at the United Healthcare Office Property:
| Tenant Summary(1) | |||||||
| Tenant Name | Credit Rating (Fitch/Moody's/S&P)(2) | Tenant SF | Approximate % of SF | Annual UW Rent | % of Total Annual UW Rent | Annual UW Rent PSF | Lease Expiration |
| UnitedHealthcare | A-/A3/NR | 204,123 | 100.0% | $4,614,373 | 100.0% | $22.61 | 12/31/2025 |
| Vacant | 0 | 0.0% | $0 | 0.0% | $0.00 | ||
| Total/Wtd. Avg. | 204,123 | 100.0% | $4,614,373 | 100.0% | $22.61 | ||
| (1) | Information is based on the underwritten rent roll. |
| (2) | Ratings are of UnitedHealth Group, the parent company of the tenant, UnitedHealthcare. |
THE INFORMATION IN THIS STRUCTURAL AND COLLATERAL TERM SHEET IS NOT COMPLETE AND MAY BE AMENDED PRIOR TO THE TIME OF SALE. THIS TERM SHEET IS NOT AN OFFER TO SELL THESE SECURITIES AND IT IS NOT A SOLICITATION OF AN OFFER TO BUY THESE SECURITIES IN ANY JURISDICTION WHERE THE OFFER OR SALE IS NOT PERMITTED.
101
2716 North Tenaya Way Las Vegas, NV 89128 | Collateral Asset Summary – Loan No. 9 United Healthcare Office | Cut-off Date Balance: Cut-off Date LTV Ratio: UW NCF DSCR: UW NOI Debt Yield: | $26,800,000 66.7% 1.56x 10.2% |
The following table presents certain information relating to the lease rollover at the United Healthcare Office Property:
| Lease Rollover Schedule(1) | ||||||||
| Year | # of Leases Rolling | SF Rolling | Approx. % of Total SF Rolling | Approx. Cumulative % of SF Rolling | UW Base Rent PSF Rolling | Total UW Base Rent Rolling | Approx. % of Total Rent Rolling | Approx. Cumulative % of Total Rent Rolling |
| MTM | 0 | 0 | 0.0% | 0.0% | $0.00 | $0 | 0.0% | 0.0% |
| 2019 | 0 | 0 | 0.0% | 0.0% | $0.00 | $0 | 0.0% | 0.0% |
| 2020 | 0 | 0 | 0.0% | 0.0% | $0.00 | $0 | 0.0% | 0.0% |
| 2021 | 0 | 0 | 0.0% | 0.0% | $0.00 | $0 | 0.0% | 0.0% |
| 2022 | 0 | 0 | 0.0% | 0.0% | $0.00 | $0 | 0.0% | 0.0% |
| 2023 | 0 | 0 | 0.0% | 0.0% | $0.00 | $0 | 0.0% | 0.0% |
| 2024 | 0 | 0 | 0.0% | 0.0% | $0.00 | $0 | 0.0% | 0.0% |
| 2025 | 1 | 204,123 | 100.0% | 100.0% | $22.61 | $4,614,373 | 100.0% | 100.0% |
| 2026 | 0 | 0 | 0.0% | 100.0% | $0.00 | $0 | 0.0% | 100.0% |
| 2027 | 0 | 0 | 0.0% | 100.0% | $0.00 | $0 | 0.0% | 100.0% |
| 2028 | 0 | 0 | 0.0% | 100.0% | $0.00 | $0 | 0.0% | 100.0% |
| 2029 | 0 | 0 | 0.0% | 100.0% | $0.00 | $0 | 0.0% | 100.0% |
| 2030 & Beyond | 0 | 0 | 0.0% | 100.0% | $0.00 | $0 | 0.0% | 100.0% |
| Vacant | 0 | 0 | 0.0% | 100.0% | $0.00 | $0 | 0.0% | 100.0% |
| Total/Wtd. Avg. | 1 | 204,123 | 100.0% | $22.61 | $4,614,373 | 100.0% | ||
| (1) | Information is based on the underwritten rent roll. |
The Market. The United Healthcare Office Property is located in the northern section of the City of Las Vegas, Nevada, in Clark County, approximately 9.5 miles northwest of downtown Las Vegas and the Las Vegas Medical District, and approximately 16.5 miles northwest of McCarran International Airport. The property is located immediately west of U.S. Highway 95 (“US 95”), which travels north/south directly through Las Vegas and provides connections to both Carson City and Reno via US 50 and Interstate 80, respectively. US 95 intersects with Interstate 15, just north of the Las Vegas central business district, approximately 6.5 miles southeast of the United Healthcare Office Property. Due to the proximity of the major thoroughfares to this neighborhood, travel time to the City of Las Vegas central business district is approximately 20 minutes, with travel to McCarran International Airport taking approximately 30 minutes. Direct access to the United Healthcare Office Property is provided by North Tenaya Way, which according to a third party market research report, experiences an average daily traffic count of 19,784 vehicles at its intersection with Peak Drive, less than 0.5 miles north of the United Healthcare Office Property.
The United Healthcare Office Property is located in the Las Vegas Technology Center. The immediate surrounding area consists primarily of office and medical office uses, including Mountain View Hospital and Sierra Health Medical Center, located just northeast of the United Healthcare Office Property. According to the appraisal, the presence of these two major facilities has resulted in the development of a “medical corridor” along Tenaya Way between Cheyenne Avenue and Smoke Ranch Road. Located along this corridor are several clinics, medical office buildings and other hospital support services. In 2017, Mountain View Hospital completed a $90 million, multi-phase campus expansion, to include the addition of 64 beds, expansion and renovation of Women’s Services and addition of a Level III NICU, expansion of Emergency Department services and a new Medical Office Building. In addition, retailers within a two-mile radius of the United Healthcare Office Property include Walmart, Ross, Target, Hobby Lobby, Best Buy, TJ Maxx, Marshalls, Bed, Bath & Beyond, Stein Mart, and JOANN Fabrics.
Las Vegas is the largest populated city in Nevada and the county seat of Clark County. According to a third party market research report, the 2019 estimated population of the Las Vegas-Henderson-Paradise, NV metropolitan statistical area (“Las Vegas MSA”) is 2,268,633 and accounts for 73.8% of Nevada’s total 2019 estimated population. The population of the Las Vegas MSA increased 1.8% annually from 2010 to 2019, and it is expected to grow 1.5% annually through 2024. This compares to the population growth for the State of Nevada at 1.5% and 1.4%, respectively. According to a third party market research report, the 2019 estimated population and average household income within a three- and five-mile radius of the United Healthcare Office Property are 191,272 and 425,889 people and $72,267 and $78,837, respectively.
According to a third party market research report, the United Healthcare Office Property is situated within the Las Vegas office market and Northwest Las Vegas office submarket. As of the third quarter of 2019, the Las Vegas market reported a total inventory of approximately 66.0 million SF with an 11.6% vacancy rate and asking rent of $23.15 PSF. As of the third quarter of 2019, the Northwest Las Vegas submarket reported a total inventory of approximately 10.6 million SF, making it Las Vegas’s third largest submarket, with a 12.1% vacancy rate and asking rent of $23.48 PSF. The Las Vegas market and Northwest Las Vegas submarket has rent growth of 1.9% and 1.6% over the trailing 12-month period, respectively.
THE INFORMATION IN THIS STRUCTURAL AND COLLATERAL TERM SHEET IS NOT COMPLETE AND MAY BE AMENDED PRIOR TO THE TIME OF SALE. THIS TERM SHEET IS NOT AN OFFER TO SELL THESE SECURITIES AND IT IS NOT A SOLICITATION OF AN OFFER TO BUY THESE SECURITIES IN ANY JURISDICTION WHERE THE OFFER OR SALE IS NOT PERMITTED.
102
2716 North Tenaya Way Las Vegas, NV 89128 | Collateral Asset Summary – Loan No. 9 United Healthcare Office | Cut-off Date Balance: Cut-off Date LTV Ratio: UW NCF DSCR: UW NOI Debt Yield: | $26,800,000 66.7% 1.56x 10.2% |
The following table presents certain information relating to comparable office leases for the United Healthcare Office Property:
| Comparable Leases Summary | |||||||
| Property Name | Year Built | NRA (SF) | Proximity (miles) | Lease Date | Rent Steps | Anchor Tenant | Rent PSF |
| United Healthcare Office Property | 1998 | 204,123(1) | N/A | Jul 2014(1) | 3.0%/yr. | UnitedHealthcare | $22.61(1) |
| Corporate Pointe II | 2001 | 41,390 | 5.7 | Mar 2018 | 3.0%/yr. | Wyndham Worldwide | $20.10 |
| Hughes Airport Center | 1999 | 40,288 | 11.0 | Oct 2017 | 3.0%/yr. | Alorica Inc. | $16.80 |
| Aristocrat Technologies | 2018 | 180,000 | 7.4 | Apr 2018 | 3.0%/yr. | Aristocrat | $22.20 |
| Southwest Corporate Campus | 2007 | 222,268 | 9.4 | Jan 2016 | 1.7%/yr. | IGT | $20.40 |
Source:Appraisal
| (1) | Information is based on the underwritten rent roll. |
Underwritten Net Cash Flow.The following table presents certain information relating to the historical operating performance and the Underwritten Net Cash Flow at the United Healthcare Office Property:
| Cash Flow Analysis | |||||||||||||
| 2016 | 2017 | 2018 | 7/31/2019 TTM | UW | UW PSF | ||||||||
| Gross Potential Rent(1) | $4,099,810 | $4,222,805 | $4,349,489 | $4,425,602 | $5,026,071 | $24.62 | |||||||
| Total Recoveries | $24,228 | $4,879 | $19,514 | $19,733 | $168,521 | $0.83 | |||||||
| Other Income | $0 | $0 | $0 | $0 | $0 | $0.00 | |||||||
| Less Vacancy & Credit Loss(2) | $0 | $0 | $0 | $0 | ($259,730) | ($1.27) | |||||||
| Effective Gross Income | $4,124,038 | $4,227,683 | $4,369,003 | $4,445,335 | $4,934,863 | $24.18 | |||||||
| Total Operating Expenses | $24,228 | $5,601 | $24,465 | $20,475 | $168,521 | $0.83 | |||||||
| Net Operating Income | $4,099,810 | $4,222,082 | $4,344,538 | $4,424,860 | $4,766,342 | $23.35 | |||||||
| Capital Expenditures | $0 | $0 | $0 | $0 | $30,618 | $0.15 | |||||||
| TI/LC | $0 | $0 | $0 | $0 | $39,427 | $0.19 | |||||||
| Net Cash Flow | $4,099,810 | $4,222,082 | $4,344,538 | $4,424,860 | $4,696,297 | $23.01 | |||||||
| Occupancy %(2) | 100.0% | 100.0% | 100.0% | 100.0% | 100.0% | ||||||||
| NOI DSCR (P&I)(3) | 1.36x | 1.40x | 1.44x | 1.47x | 1.58x | ||||||||
| NCF DSCR (P&I)(3) | 1.36x | 1.40x | 1.44x | 1.47x | 1.56x | ||||||||
| NOI Debt Yield(3) | 8.8% | 9.0% | 9.3% | 9.5% | 10.2% | ||||||||
| NCF Debt Yield(3) | 8.8% | 9.0% | 9.3% | 9.5% | 10.0% | ||||||||
| (1) | UW Gross Potential Rent is based on the underwritten rent roll and includes (i) $133,873 of rent steps through October 1, 2020 and (ii) straight line rent underwritten to the average rent steps for the remaining lease term expiring December 31, 2025. |
| (2) | The underwritten economic vacancy is 5.0%. The United Healthcare Office Property is 100.0% leased as of September 30, 2019. |
| (3) | Debt service coverage ratios and debt yields are based the United Healthcare Office Whole and exclude the United Healthcare Office Mezzanine Loan. |
Escrows and Reserves.At origination of the United Healthcare Office Whole Loan, the United Healthcare Office Borrower deposited into escrow $1,000,000 for material tenant rollover funds. The United Healthcare Office Borrower is required to escrow monthly (i) $3,402 for replacement reserves and (ii) $29,768 for tenant improvements and leasing commissions.
Taxes Escrow –The requirement to make monthly deposits of 1/12 of the annual estimated tax payments is waivedprovidedthat (i) no event of default has occurred, (ii) no Cash Sweep Trigger Event (as defined below) has occurred, (iii) the UnitedHealthcare lease is in full force and effect, (iv) UnitedHealthcare is not bankrupt or insolvent, (v) UnitedHealthcare has not expressed its intent to terminate, cancel or default under its lease, (vi) UnitedHealthcare pays all taxes related to the property directly to the applicable authority and (vii) UnitedHealthcare has made and continues to make all payments relating to the obligations to pay taxes.
Insurance Escrow –The requirement to make monthly deposits of 1/12 of the annual estimated insurance premiums is waivedprovided that (i) no event of default has occurred, (ii) no Cash Sweep Trigger Event has occurred, (iii) the UnitedHealthcare lease is in full force and effect, (iv) UnitedHealthcare is not bankrupt or insolvent, (v) UnitedHealthcare has not expressed its intent to terminate, cancel or default under its lease, (vi) UnitedHealthcare maintains the insurance requirements under the related Whole Loan agreement and (vii) UnitedHealthcare has performed and continues to perform obligations to maintain insurance required under its lease.
Material Tenant Rollover Reserve – During a Material Tenant Trigger Event (as defined below), on a monthly basis, the United Healthcare Office Borrower is required to deposit with the lender all Material Tenant (as defined below) excess cash flow for tenant allowances, tenant improvement costs and leasing commissions.
Lockbox and Cash Management. The United Healthcare Office Whole Loan is structured with a hard lockbox and springing cash management upon the occurrence and continuance of a Cash Management Trigger Event (as defined below). Pursuant to the related whole loan documents, during the continuance of a Cash Management Trigger Event, all excess funds on deposit in the cash management account (after payment of required monthly reserve deposits, debt service payment on both the United Healthcare Office Whole Loan and United Healthcare Office Mezzanine Loan, and cash
THE INFORMATION IN THIS STRUCTURAL AND COLLATERAL TERM SHEET IS NOT COMPLETE AND MAY BE AMENDED PRIOR TO THE TIME OF SALE. THIS TERM SHEET IS NOT AN OFFER TO SELL THESE SECURITIES AND IT IS NOT A SOLICITATION OF AN OFFER TO BUY THESE SECURITIES IN ANY JURISDICTION WHERE THE OFFER OR SALE IS NOT PERMITTED.
103
2716 North Tenaya Way Las Vegas, NV 89128 | Collateral Asset Summary – Loan No. 9 United Healthcare Office | Cut-off Date Balance: Cut-off Date LTV Ratio: UW NCF DSCR: UW NOI Debt Yield: | $26,800,000 66.7% 1.56x 10.2% |
management bank fees) will be applied as follows: (a) if a Material Tenant Trigger Event has occurred and is continuing, to a Material Tenant rollover reserve, (b) if a Cash Sweep Trigger Event has occurred and is continuing (but not a Material Tenant Trigger Event), to the lender-controlled excess cash flow account, (c) if a Collateral Support Trigger Event (as defined below) has occurred and is continuing, to a collateral support reserve or (d) if no Material Tenant Trigger Event, Cash Sweep Trigger Event or Collateral Support Trigger Event has occurred and is continuing, to the United Healthcare Office Borrower.
A “Cash Management Trigger Event” means a period commencing upon the earlier of (i) an event of default under the related United Healthcare Office Whole Loan or United Healthcare Office Mezzanine Loan documents, (ii) any bankruptcy action involving the United Healthcare Office Borrower, the guarantor, the key principal or the property manager, (iii) the trailing 12-month period debt service coverage ratio falling below 1.10x, (iv) any indictment for fraud or misappropriation of funds by the United Healthcare Office Borrower, the guarantor, the key principal or an affiliated or third party property manager, or any director or officer of the aforementioned, (v) a Material Tenant Trigger Event or (vi) a Collateral Support Trigger Event.
A “Material Tenant Trigger Event” means a period commencing upon the earlier of (i) a Material Tenant giving notice of its intention to terminate or cancel or not to extend or renew its lease, (ii) on or prior to the date that is 12 months prior to the then-applicable expiration date under its Material Tenant lease, the Material Tenant does not extend or renew such Material Tenant lease, (iii) on or prior to the date a Material Tenant is required under its Material Tenant lease to notify the United Healthcare Office Borrower of its election to extend or renew its lease, such Material Tenant not giving notice, (iv) an event of default under a Material Tenant lease occurring and continuing beyond any applicable notice and cure period, (v) a bankruptcy action of a Material Tenant or guarantor of any Material Tenant lease occurring, (vi) a Material Tenant lease being terminated or is no longer in full force and effect,provided that, with respect to any partial termination of a Material Tenant lease, such partial termination relates to no less than 20% of (x) the total net rentable square footage at the United Healthcare Office Property or (y) the total in-place base rent at the United Healthcare Office Property, (vii) a Material Tenant “going dark”, vacating, ceasing to occupy or ceasing to conduct business in the ordinary course at the United Healthcare Office Property or a portion thereof constituting no less than 20% of the total net rentable square footage at the United Healthcare Office Property (other than temporary cessation of operations in connection with remodeling, renovation or restoration of their leased premises) or (viii) the long term unsecured debt rating of a Material Tenant or guarantor of any Material Tenant is downgraded below investment grade.
A “Material Tenant” means (i) UnitedHealthcare or (ii) any other tenant at the United Healthcare Office Property that, together with its affiliates, either (a) leases no less than 20% of the total rentable square footage or (b) accounts for no less than 20% of the total in-place base rent.
A “Cash Sweep Trigger Event” will occur upon (i) an event of default under the related United Healthcare Office Whole Loan or United Healthcare Office Mezzanine Loan documents, (ii) any bankruptcy action involving the United Healthcare Office Borrower, the guarantor, the key principal or the property manager, (iii) the trailing 12-month period DSCR falling below 1.10x or (iv) a Collateral Support Trigger Event.
A “Collateral Support Trigger Event” means the failure of the United Healthcare Office Borrower to prepay or defease the United Healthcare Office Whole Loan on or prior to April 6, 2023 (18 months prior to the United Healthcare Office Whole Loan maturity date).
Additional Secured Indebtedness (not including trade debts).None.
Mezzanine Loans and Preferred Equity.At origination, UBS AG provided a $6.0 million mezzanine loan secured by 100.0% of the equity interests in the borrower, which is now held by a third party investor. The United Healthcare Office Mezzanine Loan is coterminous with the United Healthcare Office Whole Loan, has an interest rate of 10.0000%per annum and is interest-only throughout the term. The Cut-off Date Loan PSF, Cut-off Date LTV, UW NCF DSCR and UW NOI Debt Yield based on the United Healthcare Office Whole Loan and the United Healthcare Office Mezzanine Loan are $259, 75.2%, 1.30x and 9.0%, respectively. See “Description of the Mortgage Pool—Additional Indebtedness—Mezzanine Indebtedness” in the Preliminary Prospectus.
Release of Property. Not permitted.
Terrorism Insurance. The United Healthcare Office Borrower is required to obtain and maintain property insurance, commercial general liability insurance, and business income or rental loss insurance that covers perils of terrorism and acts of terrorism, both foreign and domestic.
THE INFORMATION IN THIS STRUCTURAL AND COLLATERAL TERM SHEET IS NOT COMPLETE AND MAY BE AMENDED PRIOR TO THE TIME OF SALE. THIS TERM SHEET IS NOT AN OFFER TO SELL THESE SECURITIES AND IT IS NOT A SOLICITATION OF AN OFFER TO BUY THESE SECURITIES IN ANY JURISDICTION WHERE THE OFFER OR SALE IS NOT PERMITTED.
104
2091 Convention Center Concourse Atlanta, GA 30337 | Collateral Asset Summary – Loan No. 10 AVR Atlanta Airport | Cut-off Date Balance: Cut-off Date LTV: U/W NCF DSCR: U/W NOI Debt Yield: | $23,850,000 61.9% 3.12x 13.3% |
THE INFORMATION IN THIS STRUCTURAL AND COLLATERAL TERM SHEET IS NOT COMPLETE AND MAY BE AMENDED PRIOR TO THE TIME OF SALE. THIS TERM SHEET IS NOT AN OFFER TO SELL THESE SECURITIES AND IT IS NOT A SOLICITATION OF AN OFFER TO BUY THESE SECURITIES IN ANY JURISDICTION WHERE THE OFFER OR SALE IS NOT PERMITTED.
105
2091 Convention Center Concourse Atlanta, GA 30337 | Collateral Asset Summary – Loan No. 10 AVR Atlanta Airport | Cut-off Date Balance: Cut-off Date LTV: U/W NCF DSCR: U/W NOI Debt Yield: | $23,850,000 61.9% 3.12x 13.3% |
THE INFORMATION IN THIS STRUCTURAL AND COLLATERAL TERM SHEET IS NOT COMPLETE AND MAY BE AMENDED PRIOR TO THE TIME OF SALE. THIS TERM SHEET IS NOT AN OFFER TO SELL THESE SECURITIES AND IT IS NOT A SOLICITATION OF AN OFFER TO BUY THESE SECURITIES IN ANY JURISDICTION WHERE THE OFFER OR SALE IS NOT PERMITTED.
106
2091 Convention Center Concourse Atlanta, GA 30337 | Collateral Asset Summary – Loan No. 10 AVR Atlanta Airport | Cut-off Date Balance: Cut-off Date LTV: U/W NCF DSCR: U/W NOI Debt Yield: | $23,850,000 61.9% 3.12x 13.3% |
| Mortgage Loan Information | Property Information | |||||
| Mortgage Loan Seller: | CCRE | Single Asset/Portfolio: | Single Asset | |||
| Credit Assessment (Fitch/KBRA/Moody’s): | NR/NR/NR | Location: | Atlanta, GA 30337 | |||
| General Property Type: | Hospitality | |||||
| Original Balance: | $23,850,000 | Detailed Property Type: | Limited Service | |||
| Cut-off Date Balance: | $23,850,000 | Title Vesting(1): | Fee Simple | |||
| % of Initial Pool Balance: | 3.2% | Year Built/Renovated: | 2009/2018 | |||
| Loan Purpose: | Refinance | Size: | 147 Rooms | |||
| Borrower Sponsor(1): | Allan V. Rose | Cut-off Date Balance per SF: | $162,245 | |||
| Mortgage Rate: | 3.7850% | Maturity Date Balance per SF: | $162,245 | |||
| Note Date: | 11/27/2019 | Property Manager: | Springhill SMC, LLC | |||
| First Payment Date: | 1/1/2020 | |||||
| Maturity Date: | 12/1/2029 | |||||
| Original Term to Maturity: | 120 months | |||||
| Original Amortization Term: | 0 months | |||||
| IO Period: | 120 months | Underwriting and Financial Information | ||||
| Seasoning: | 0 months | UW NOI: | $3,161,344 | |||
| Prepayment Provisions: | LO (24); DEF (92); O (4) | UW NOI Debt Yield: | 13.3% | |||
| Lockbox/Cash Mgmt Status: | Hard/Springing | UW NOI Debt Yield at Maturity: | 13.3% | |||
| Additional Debt Type: | N/A | UW NCF DSCR: | 3.12x | |||
| Additional Debt Balance: | N/A | Most Recent NOI: | $3,207,322 (9/30/2019 TTM) | |||
| Future Debt Permitted (Type): | No (N/A) | 2nd Most Recent NOI: | $2,736,161 (12/31/2018) | |||
| Reserves(2) | 3rd Most Recent NOI: | $2,955,791 (12/31/2017) | ||||
| Type | Initial | Monthly | Cap | Most Recent Occupancy: | 85.9% (9/30/2019) | |
| RE Tax: | $0 | Springing | N/A | 2nd Most Recent Occupancy: | 79.9% (12/31/2018) | |
| Insurance: | $0 | Springing | N/A | 3rd Most Recent Occupancy: | 82.3% (12/31/2017) | |
| FF&E: | $0 | Springing | N/A | Appraised Value (as of): | $38,500,000 (10/1/2019) | |
| Immediate Repairs: | $2,188 | $0 | N/A | Cut-off Date LTV Ratio: | 61.9% | |
| PDDO Agreement: | $0 | Springing | N/A | Maturity Date LTV Ratio: | 61.9% | |
| Sources and Uses | ||||||
| Sources | Proceeds | % of Total | Uses | Proceeds | % of Total | |
| Loan Amount: | $23,850,000 | 100.0% | Loan Payoff: | $16,976,243 | 71.2% | |
| Reserves: | $2,188 | 0.0% | ||||
| Closing Costs: | $357,792 | 1.5% | ||||
| Return of Equity: | $6,513,777 | 27.3% | ||||
| Total Sources: | $23,850,000 | 100.0% | Total Uses: | $23,850,000 | 100.0% | |
| (1) | The AVR SpringHill Gateway Borrower Guarantor (as defined below) has the sole and exclusive right to operate the AVR SpringHill Gateway Property (as defined below) pursuant to a 50-year occupancy agreement with the borrower College Park Business and Industrial Development Authority (“BIDA” and the “AVR SpringHill Gateway Borrower”). The borrower is BIDA, the owner of the fee simple interest in the AVR SpringHill Gateway Property. See “The Borrower and the Borrower Sponsor” and “The Parcel Design, Development and Occupancy Agreement” below. |
| (2) | See “Escrows and Reserves” below for further discussion of reserve requirements. |
The Mortgage Loan. The tenth largest mortgage loan (the “AVR SpringHill Gateway Mortgage Loan”) is evidenced by a promissory note with an original principal balance of $23,850,000, which is secured by a first priority fee mortgage encumbering a 147-room limited service hotel located in Atlanta, Georgia (the “AVR SpringHill Gateway Property”). Loan proceeds were used to refinance existing debt of approximately $15.2 million, fund reserves, pay closing costs and return equity to the AVR SpringHill Gateway Borrower Sponsor.
The Borrower and the Borrower Sponsor. The borrower is College Park Business and Industrial Development Authority. The borrower guarantor is AVR Gateway S, LLC (the “AVR SpringHill Gateway Borrower Guarantor”), a single purpose Delaware limited liability company structured to be bankruptcy remote with one independent director in its organizational structure. Legal counsel to the AVR SpringHill Gateway Borrower Guarantor delivered a non-consolidation opinion in connection with the origination of the AVR SpringHill Gateway Mortgage Loan. The AVR SpringHill Gateway Borrower Guarantor has the sole and exclusive right to operate the AVR SpringHill Gateway Property pursuant to a 50-year occupancy agreement, specifically, the Parcel Design, Development and Operating Agreement (the “PDDO Agreement”) between the AVR SpringHill Gateway Borrower Guarantor and BIDA. BIDA is the owner of the fee simple interest in the AVR SpringHill Gateway Property, which is part of a “public-private partnership” with the City of College Park, acting through BIDA. Pursuant to the PDDO Agreement, the AVR SpringHill Gateway Borrower Guarantor has rights in the AVR SpringHill Gateway Property that are similar to leasehold interest rights. See “The Parcel Design, Development and Operating Agreement” below.
Allan V. Rose is the borrower sponsor and guarantor of certain nonrecourse carve-outs under the AVR SpringHill Gateway Mortgage Loan (the “AVR SpringHill Gateway Borrower Sponsor”).
THE INFORMATION IN THIS STRUCTURAL AND COLLATERAL TERM SHEET IS NOT COMPLETE AND MAY BE AMENDED PRIOR TO THE TIME OF SALE. THIS TERM SHEET IS NOT AN OFFER TO SELL THESE SECURITIES AND IT IS NOT A SOLICITATION OF AN OFFER TO BUY THESE SECURITIES IN ANY JURISDICTION WHERE THE OFFER OR SALE IS NOT PERMITTED.
107
2091 Convention Center Concourse Atlanta, GA 30337 | Collateral Asset Summary – Loan No. 10 AVR Atlanta Airport | Cut-off Date Balance: Cut-off Date LTV: U/W NCF DSCR: U/W NOI Debt Yield: | $23,850,000 61.9% 3.12x 13.3% |
Allan V. Rose is the owner and chief executive officer of AVR Realty (“AVR”), a privately held real estate development and management company. AVR was founded over 45 years ago and has built, acquired and developed more than 30 million SF of commercial and residential space. AVR’s portfolio includes office complexes, shopping centers, corporate and industrial parks, apartment complexes, residential communities and hotels. AVR currently owns a portfolio of 23 hospitality properties totaling over 5,000 rooms, including the adjacent Atlanta Airport Marriott Gateway and Renaissance Atlanta Airport Gateway.
The Property. The AVR SpringHill Gateway Property is a six-story, 147-room limited service hotel located in Atlanta, Georgia. The AVR SpringHill Gateway Property is situated on a 2.49-acre site and includes 152 surface parking spaces. The AVR SpringHill Gateway Borrower Sponsor acquired the property in 2014 for $22.0 million. Additionally, the AVR SpringHill Gateway Borrower Sponsor invested approximately $2.4 million ($16,588 per room) to complete a soft goods renovation from August 2017 to October 2018, which included improvements to all guest rooms, public space, corridors and stairwells, restrooms, fitness room, and the conversion of a prior pool area to meeting space. The AVR SpringHill Gateway Property is located in the Gateway Center, which is a 28.82-acre master planned parcel owned by BIDA adjacent to the Hartsfield-Jackson Atlanta International Airport. Additionally, the AVR Springhill Gateway Property has an ATL SkyTrain station connected to its lobby via an exterior walkway. The ATL SkyTrain connects the AVR SpringHill Gateway Property to the Hartsfield-Jackson Atlanta International Airport and the rental car center.
The AVR SpringHill Gateway Property features 147 guestrooms and is comprised of 99 standard kings and 48 queens. All of the guestrooms at the AVR SpringHill Gateway Property feature a work desk and chair, one or two night stands, a dresser, flat screen televisions, sofa chair, mini refrigerator, microwave, iron and ironing board, a separate living area with a pull-out sofa, a safe, and a coffee maker. The suites have a separate living area with a sofa. The AVR SpringHill Gateway Property offers complimentary wireless internet access in all guestrooms, with higher speeds available for purchase. Amenities at the AVR SpringHill Gateway Property include a complimentary breakfast area, fitness center, guest laundry facilities, business center, and approximately 2,050 SF of dedicated meeting space.
The AVR SpringHill Gateway Property operates under a management agreement with Springhill SMC, LLC, a subsidiary of Marriott International, that expires on December 31, 2039 with two ten-year renewal options remaining (the “Marriott Management Agreement”).
According to the AVR SpringHill Gateway Borrower Sponsor, the AVR SpringHill Gateway Property’s top five corporate accounts for 2019 are Scheduling Institute, Delta Airline, Inc., United Continental Holdings, BMW, and General Dynamics Corp.
| Property Summary | |||||||
| Property Name | # Rooms | Commercial Demand | Leisure Demand | Meeting & Group Demand | Estimated 2018 Occupancy(1)(2) | Estimated 2018 ADR(1)(2) | Estimated 2018 RevPAR(1)(2) |
| AVR SpringHill Gateway Property | 147 | 50% | 25% | 25% | 78% | $147.29 | $115.32 |
| Hyatt Place Atlanta North | 150 | 60% | 25% | 15% | 80% - 85% | $120 - $125 | $100 - $105 |
| Hyatt Place Atlanta South | 123 | 60% | 25% | 15% | 85% - 90% | $115 - $120 | $95 - $100 |
| Drury Inn & Suites Atlanta Airport | 151 | 55% | 30% | 15% | 75% - 80% | $110 - $115 | $85 - $90 |
| Hilton Garden Inn Atlanta Airport/Millenium Center | 200 | 60% | 15% | 25% | 80% - 85% | $125 - $130 | $105 - $110 |
| Hampton Inn & Suites Atlanta Airport West/Camp Creek Parkway | 119 | 60% | 30% | 10% | 80% - 85% | $95 - $100 | $75 - $80 |
| Hampton Inn & Suites Atlanta Airport North I-85 | 105 | 65% | 25% | 10% | 80% - 85% | $110 - $115 | $85 - $90 |
| Fairfield Inn & Suites by Marriott Atlanta Airport North | 85 | 65% | 30% | 5% | 85% - 90% | $100 - $105 | $85 - $90 |
| Total/Wtd. Avg. | 1,080 | 59% | 25% | 16% | 82.5% | $117.14 | $96.60 |
Source:Appraisal
| (1) | The variances between the underwriting, the appraisal and the industry report data with respect to Estimated 2018 Occupancy, Estimated 2018 ADR and Estimated 2018 RevPAR at the AVR SpringHill Gateway Property are attributable to variances in reporting methodologies and/or timing differences. |
| (2) | Estimated 2018 Occupancy, Estimated 2018 ADR and Estimated 2018 RevPAR are based on the appraisal’s estimated 2018 year-end figures. |
The Market. The AVR SpringHill Gateway Property is located in Atlanta, Georgia, adjacent to the Hartsfield-Jackson Atlanta International Airport. The AVR SpringHill Gateway Property is located in the Gateway Center, which is comprised of the Georgia International Convention Center (“GICC”), three full service hotels (including AVR Renaissance Gateway and Atlanta Airport Marriott Gateway (both owned by an affiliate of the AVR SpringHill Gateway Borrower Guarantor)), a Class-A office building, the BMW Training Center and the Gateway Center Arena, as well as dining options. The Gateway Center is the first stop on the Hartsfield-Jackson Atlanta International Airport’s SkyTrain system, which connects the airport and the Metropolitan Atlanta Rapid Transit Authority to the Gateway Center and the newly developed rental car center. Additionally, the AVR SpringHill Gateway Property is located 9.3 miles south of downtown Atlanta and is within one mile of Interstate 85, Interstate 285 and Route 29.
The main demand driver for the AVR SpringHill Gateway Property is the Hartsfield-Jackson Atlanta International Airport, which is the primary airport in Atlanta. The Hartsfield-Jackson Atlanta International Airport has averaged approximately 104.2 million passengers annually since 2015 with an annual compound growth rate of 2.8%. The Hartsfield-Jackson Atlanta International Airport is currently undergoing a $6 billion expansion that will be completed in phases over the next 20 years and will include renovations of the domestic terminal and concourses, a new hotel, and a new parking deck adjacent to the GICC, which will have parking for at least 5,200 vehicles.
Additional local demand generators include GICC, which opened in 2009 and is the second largest convention center in the state of Georgia. GICC is directly connected to the Hartsfield-Jackson Atlanta International Airport and has 440,400 SF of exhibit halls, 270,288 SF of ballrooms, 8,320 SF meeting rooms and 2,600 SF of boardrooms that can be rented. Additionally, Delta Air Lines has its headquarters on the north side of the Hartsfield-Jackson Atlanta International Airport off Delta Boulevard and BMW has a 53,000 SF training facility adjacent to the GICC, which was developed for $17.0 million and opened in July 2019. Finally, the Gateway Center Arena, which opened in November 2019, is a 100,000 SF, 5,000 seat arena that will host the Atlanta Hawks’ G-League team, the WNBA’s Atlanta Dream and the College Park Skyhawks, along with concerts and other events
THE INFORMATION IN THIS STRUCTURAL AND COLLATERAL TERM SHEET IS NOT COMPLETE AND MAY BE AMENDED PRIOR TO THE TIME OF SALE. THIS TERM SHEET IS NOT AN OFFER TO SELL THESE SECURITIES AND IT IS NOT A SOLICITATION OF AN OFFER TO BUY THESE SECURITIES IN ANY JURISDICTION WHERE THE OFFER OR SALE IS NOT PERMITTED.
108
2091 Convention Center Concourse Atlanta, GA 30337 | Collateral Asset Summary – Loan No. 10 AVR Atlanta Airport | Cut-off Date Balance: Cut-off Date LTV: U/W NCF DSCR: U/W NOI Debt Yield: | $23,850,000 61.9% 3.12x 13.3% |
The appraisal determined 2018 market demand segmentation of 52% commercial, 26% meeting and group and 22% leisure. The AVR SpringHill Gateway Property had 2018 demand segmentation of 50% commercial, 25% meeting and group and 25% leisure.
The primary competitive set for the hotel consists of seven hotels, which range in size from 85 to 200 rooms and collectively contain an aggregate of 933 rooms. There are currently four hotels under construction totaling 1,262 rooms. These hotels include a 222 room AC Hotel Atlanta Airport Gateway expected to open in January 2020, a 400 room Sheraton Atlanta Airport expected to open in January 2022, a 541-room Hilton Airport expected to open in January 2022, and a 99 room Home2 Suites Airport North expected to open in January 2020.
According to a third party market research report, the AVR SpringHill Gateway Property’s occupancy, ADR, and RevPAR were 85.6%, $153.37 and $131.34 respectively, during the trailing 12-months ending on September 31, 2019, resulting in penetration rates of 102.0%, 138.8% and 141.7%, respectively, against its competitive set.
| AVR SpringHill Gateway Property Historical Occupancy, ADR, RevPAR | |||||||||
| AVR SpringHill Gateway | Competitive Set(1) | Penetration Factor | |||||||
| Year | Occupancy | ADR | RevPAR | Occupancy | ADR | RevPAR | Occupancy | ADR | RevPAR |
| 2016 | 80.9% | $148.40 | $120.02 | 85.4% | $101.25 | $86.48 | 94.7% | 146.6% | 138.8% |
| 2017 | 81.8% | $152.07 | $124.43 | 84.0% | $105.04 | $88.20 | 97.4% | 144.8% | 141.1% |
| 2018(2) | 78.3% | $147.29 | $115.32 | 83.5% | $110.66 | $92.37 | 93.8% | 133.1% | 124.8% |
| 9/30/2019 TTM | 85.6% | $153.37 | $131.34 | 83.9% | $110.48 | $92.72 | 102.0% | 138.8% | 141.7% |
Source:Third party market research report
| (1) | The AVR SpringHill Gateway Property’s competitive set includes Hyatt Place Atlanta Airport South, Drury Inn & Suites Atlanta Airport, Country Inn & Suites Atlanta Airport North, Hyatt Place Atlanta Airport North, Hilton Garden Inn Atlanta Airport Millenium Center, and Hampton Inn & Suites Atlanta Airport West Camp Creek Parkway. |
| (2) | The AVR SpringHill Gateway Property underwent a soft goods renovation from August 2017 to October 2018. The renovation included improvements to all guest rooms, which were completed from January 2018 to April 2018. As a result, Occupancy, ADR, and RevPar decreased from the prior year. |
Operating History and Underwritten Net Cash Flow. The following table presents certain information relating to the historical operating performance and the Underwritten Net Cash Flow at the AVR SpringHill Gateway Property:
| Cash Flow Analysis | |||||||||||||
| 2016 | 2017 | 2018 | 9/30/2019 TTM | UW | UW per Room(1) | ||||||||
| Occupancy | 81.3% | 82.3% | 79.9% | 85.9% | 85.9% | ||||||||
| ADR | $147.62 | $151.15 | $144.42 | $152.84 | $152.84 | ||||||||
| RevPAR | $119.99 | $124.43 | $115.32 | $131.34 | $131.34 | ||||||||
| Rooms Revenue | $6,455,962 | $6,676,198 | $6,187,497 | $7,046,970 | $7,046,970 | $47,939 | |||||||
| Other Income | $480,605 | $491,763 | $568,177 | $690,973 | $690,973 | $4,700 | |||||||
| Total Revenue | $6,936,567 | $7,167,962 | $6,755,673 | $7,737,944 | $7,737,944 | $52,639 | |||||||
| Total Expenses(2) | $4,167,905 | $4,212,170 | $4,019,512 | $4,530,622 | $4,576,600 | $31,133 | |||||||
| Net Operating Income | $2,768,662 | $2,955,791 | $2,736,161 | $3,207,322 | $3,161,344 | $21,506 | |||||||
| FF&E | $0 | $0 | $0 | $0 | $309,518 | $2,106 | |||||||
| Net Cash Flow | $2,768,662 | $2,955,791 | $2,736,161 | $3,207,322 | $2,851,826 | $19,400 | |||||||
| NOI DSCR | 3.02x | 3.23x | 2.99x | 3.50x | 3.45x | ||||||||
| NCF DSCR | 3.02x | 3.23x | 2.99x | 3.50x | 3.12x | ||||||||
| NOI Debt Yield | 11.6% | 12.4% | 11.5% | 13.4% | 13.3% | ||||||||
| NCF Debt Yield | 11.6% | 12.4% | 11.5% | 13.4% | 12.0% | ||||||||
| (1) | Based on 147 guest rooms. |
| (2) | Taxes are underwritten to the 10-year average of the PILOT payments due. |
Escrows and Reserves. At origination of the AVR SpringHill Gateway Mortgage Loan, the AVR SpringHill Gateway Borrower Guarantor deposited $2,188 for immediate repairs.
Tax Escrow – The requirement to make monthly deposits of 1/12 of the estimated annual taxes is waivedprovidedthat (i) certain Marriott tax escrow waiver conditions set forth in the related mortgage loan documents are satisfied (including Marriott paying taxes prior to delinquency and AVR SpringHill Gateway Borrower Guarantor delivering receipts for the payment of such taxes promptly upon the receipt of same from Marriott), or (ii) the AVR SpringHill Gateway Borrower Guarantor provides evidence reasonably satisfactory to the lender that all taxes and other charges have been paid prior to the related due date and there is no event of default and/or Cash Trap Period continuing. Monthly deposits into the tax reserve are currently waived.
Insurance Escrow –The requirement to make monthly deposits of 1/12 of the annual estimated insurance premiums is waivedprovided that (i) certain Marriott insurance escrow waiver conditions set forth in the related mortgage loan documents are satisfied (including Marriott maintaining insurance coverages required by the related mortgage loan documents and the AVR SpringHill Gateway Borrower Guarantor delivering evidence of payment for
THE INFORMATION IN THIS STRUCTURAL AND COLLATERAL TERM SHEET IS NOT COMPLETE AND MAY BE AMENDED PRIOR TO THE TIME OF SALE. THIS TERM SHEET IS NOT AN OFFER TO SELL THESE SECURITIES AND IT IS NOT A SOLICITATION OF AN OFFER TO BUY THESE SECURITIES IN ANY JURISDICTION WHERE THE OFFER OR SALE IS NOT PERMITTED.
109
2091 Convention Center Concourse Atlanta, GA 30337 | Collateral Asset Summary – Loan No. 10 AVR Atlanta Airport | Cut-off Date Balance: Cut-off Date LTV: U/W NCF DSCR: U/W NOI Debt Yield: | $23,850,000 61.9% 3.12x 13.3% |
insurance policies), or (ii) the AVR SpringHill Gateway Borrower Guarantor maintains a blanket insurance policy acceptable to the lender and there is no event of default and/or cash management period continuing. Monthly deposits into the insurance reserve are currently waived.
FF&E Reserve –The requirement to make monthly deposits of 1/12 of 4% of gross income for the prior calendar year is waivedprovidedthat in the event that the Marriott Management Agreement is in full force and effect and the AVR SpringHill Gateway Borrower Guarantor provides evidence reasonably satisfactory to the lender that all FF&E funds have been deposited into the FF&E reserve described in the Marriott Management Agreement. Monthly deposits into the FF&E reserve are currently waived.
PDDO Agreement Reserve – The requirement to make monthly deposits of 1/12 of the estimated annual PDDO Agreement payments is waivedprovidedthat in the event that the Marriott Management Agreement or a future acceptable agreement is in full force and effect and the AVR SpringHill Gateway Borrower Guarantor provides evidence reasonably satisfactory to the lender that all PDDO Agreement payments have been made. Monthly deposits into the PDDO Agreement reserve are currently waived.
Lockbox and Cash Management. The AVR SpringHill Gateway Property is structured with a hard lockbox and springing cash management. In place cash management and a full excess cash flow sweep is required upon the commencement of a Cash Trap Period (as defined below).
A “Cash Trap Period” will occur upon (i) the occurrence of any event of default until cured; (ii) any bankruptcy action of the AVR SpringHill Gateway Borrower, the AVR SpringHill Gateway Borrower Guarantor, the carve-out guarantor or the property manager has occurred until, in the case of the property manager only, the AVR SpringHill Gateway Borrower Guarantor replaces the property manager with a qualified manager under an acceptable replacement management agreement; (iii) the failure of the AVR SpringHill Gateway Borrower Guarantor after the end of two consecutive calendar quarters to maintain a debt service coverage ratio of at least 1.60x until the debt service coverage ratio is at least 1.65x for two consecutive calendar quarters; or (iv) the earlier of (a) 12 months prior the expiration of the Marriott Management Agreement or (b) such time the AVR SpringHill Gateway Borrower Guarantor receives notice from the manager of termination of the Marriott Management Agreement until the AVR SpringHill Gateway Borrower Guarantor has either (a)(x) entered into a replacement franchise agreement with a qualified franchisor, or (y) delivered evidence reasonably satisfactory to the lender that the manager has renewed or extended the management agreement for a term satisfactory to lender of not less than three years past the maturity date; and (b) if the replacement franchise agreement or renewed or extended existing management agreement requires the borrower to enter into a PIP, the total costs of the PIP have been deposited into a reserve with lender.
Parcel Design, Development and Occupancy Agreement. The AVR SpringHill Gateway Property is part of a master planned, mixed-use project owned by BIDA. As long as BIDA owns the fee simple interest in the AVR SpringHill Gateway Property, it is tax exempt from both real and personal property taxes. As a result, in 2008, the AVR SpringHill Gateway Property became subject to the 50-year PDDO Agreement.
Pursuant to the terms of the PDDO Agreement, the AVR SpringHill Gateway Borrower Guarantor has the exclusive right to develop and operate the AVR SpringHill Gateway Property and has an option to purchase the fee simple interest in the AVR SpringHill Gateway Property any time after 2038 at the purchase price equal to the sum of (i) all outstanding financings related to the AVR SpringHill Gateway Property and (ii) 10% of the then-current market value of the land (not including the value of the improvements or personal property). The AVR SpringHill Gateway Borrower Guarantor is not permitted to transfer its interest in the PDDO Agreement without the prior written consent of BIDA, which consent is not to be unreasonably withheld. The transfer restriction does not apply to the exercise of remedies by lender.
There is also a PILOT agreement in place between BIDA and the AVR SpringHill Gateway Borrower Guarantor until 2057. The AVR SpringHill Gateway Borrower Guarantor is obligated to make certain rental payments to BIDA, comprised of (i) the monthly debt service payments under the AVR SpringHill Gateway Mortgage Loan, (ii) fixed annual “Administrative Fee” in the amount of $175,000, (iii) PILOT payments in accordance with a schedule outlined in the PILOT agreement, (iv) SkyTrain fees, and (v) a “Financing Fee,” which equates to approximately 1/8 of 1.0% of the outstanding principal balance of the AVR SpringHill Gateway Mortgage Loan.
The AVR SpringHill Gateway Mortgage Loan is structured with BIDA being the borrower entity (with limited obligations relating to the AVR SpringHill Gateway Property). As collateral for the AVR SpringHill Gateway Mortgage Loan, BIDA has granted to the lender a first priority lien in its fee simple interest in the AVR SpringHill Gateway Property and has issued a bond in the principal amount of the AVR SpringHill Gateway Mortgage Loan, which bond is payable to the lender. Additionally, the AVR SpringHill Gateway Borrower Guarantor has guaranteed BIDA’s payment and performance under the AVR SpringHill Gateway Mortgage Loan, and, as collateral for its guaranty, the AVR SpringHill Gateway Borrower Guarantor has pledged its security interest and assigned to lender all of its rights and interests in the PDDO Agreement and the related bonds.
Additional Secured Indebtedness (not including trade debts).None.
Mezzanine Loan.None.
Release of Property. Not permitted.
Terrorism Insurance. The AVR SpringHill Gateway Borrower Guarantor is required to obtain insurance against acts of terrorism for loss resulting from perils and acts of terrorism in amounts and with terms and conditions applicable to commercial property, general liability, business income and umbrella liability insurance required pursuant to the related mortgage loan documents.
THE INFORMATION IN THIS STRUCTURAL AND COLLATERAL TERM SHEET IS NOT COMPLETE AND MAY BE AMENDED PRIOR TO THE TIME OF SALE. THIS TERM SHEET IS NOT AN OFFER TO SELL THESE SECURITIES AND IT IS NOT A SOLICITATION OF AN OFFER TO BUY THESE SECURITIES IN ANY JURISDICTION WHERE THE OFFER OR SALE IS NOT PERMITTED.
110
4041 North Central Avenue Phoenix, AZ 85012 | Collateral Asset Summary – Loan No. 11 4041 Central | Cut-off Date Balance: Cut-off Date LTV Ratio: UW NCF DSCR: UW NOI Debt Yield: | $22,931,847 73.1% 1.73x 10.1% |
| Mortgage Loan Information | Mortgaged Property Information | ||||||
| Mortgage Loan Seller: | WFB | Single Asset/Portfolio: | Single Asset | ||||
Credit Assessment (Fitch/KBRA/Moody’s): | NR/NR/NR | Location: | Phoenix, AZ 85012 | ||||
| General Property Type: | Office | ||||||
| Original Balance(1): | $23,000,000 | Detailed Property Type: | CBD | ||||
| Cut-off Date Balance(1): | $22,931,847 | Title Vesting: | Fee Simple | ||||
| % of Initial Pool Balance: | 3.1% | Year Built/Renovated: | 1980/2016 | ||||
| Loan Purpose: | Refinance | Size: | 406,453 SF | ||||
| Borrower Sponsor: | Zaya S. Younan | Cut-off Date Balance per SF(1): | $104 | ||||
| Mortgage Rate: | 3.6600% | Maturity Date Balance per SF(1): | $82 | ||||
| Note Date: | 10/3/2019 | Property Manager: | Younan Properties, Inc. | ||||
| First Payment Date: | 11/11/2019 | (borrower-related) | |||||
| Maturity Date: | 10/11/2029 | ||||||
| Original Term to Maturity | 120 months | ||||||
| Original Amortization Term: | 360 months | ||||||
| IO Period: | 0 months | Underwriting and Financial Information | |||||
| Seasoning: | 2 months | UW NOI(4): | $4,299,487 | ||||
| Prepayment Provisions(2): | LO (26); DEF (87); O (7) | UW NOI Debt Yield(1): | 10.1% | ||||
| Lockbox/Cash Mgmt Status: | Hard/In Place | UW NOI Debt Yield at Maturity(1): | 12.9% | ||||
| Additional Debt Type(1): | Pari Passu | UW NCF DSCR(1): | 1.73x | ||||
| Additional Debt Balance(1): | $19,442,218 | Most Recent NOI(4): | $3,962,776 (9/30/2019 TTM) | ||||
| Future Debt Permitted (Type): | No (N/A) | 2nd Most Recent NOI(4): | $2,840,480 (12/31/2018) | ||||
| Reserves | 3rd Most Recent NOI: | $2,455,428 (12/31/2017) | |||||
| Type | Initial | Monthly | Cap | Most Recent Occupancy: | 68.1% (10/1/2019) | ||
| RE Tax: | $68,387 | $68,387 | N/A | 2nd Most Recent Occupancy: | 73.9% (12/31/2018) | ||
| Insurance: | $219,773 | $19,979 | N/A | 3rd Most Recent Occupancy: | 78.0% (12/31/2017) | ||
| Replacements: | $0 | $6,774(3) | $243,864(3) | Appraised Value (as of): | $58,000,000 (9/9/2019) | ||
| TI/LC: | $2,250,000 | $33,817 | $4,000,000 | Cut-off Date LTV Ratio(1): | 73.1% | ||
| Common Area Reserve: | $250,000 | $0 | N/A | Maturity Date LTV Ratio(1): | 57.5% | ||
| Sources and Uses | ||||||
| Sources | Proceeds | % of Total | Uses | Proceeds | % of Total | |
| Loan Amount(1): | $42,500,000 | 100.0% | Loan Payoff: | $27,791,608 | 65.4% | |
| Reserves: | $2,788,160 | 6.6% | ||||
| Closing Costs: | $1,042,728 | 2.5% | ||||
| Return of Equity: | $10,877,504 | 25.6% | ||||
| Total Sources: | $42,500,000 | 100.0% | Total Uses: | $42,500,000 | 100.0% | |
| (1) | The 4041 Central Mortgage Loan (as defined below) is part of the 4041 Central Whole Loan (as defined below), which is comprised of twopari passu promissory notes with an aggregate original principal balance of $42,500,000. The Cut-off Date Balance per SF, Maturity Date Balance per SF, UW NOI Debt Yield, UW NOI Debt Yield at Maturity, UW NCF DSCR, Cut-off Date LTV Ratio and Maturity Date LTV Ratio presented above are based on the aggregate principal balance of the promissory notes comprising 4041 Central Whole Loan. |
| (2) | Defeasance of the 4041 Central Whole Loan is permitted at any time after the earlier to occur of (a) the end of the two-year period commencing on the closing date of the securitization of the last 4041 Central Whole Loan promissory note to be securitized and (b) November 11, 2022. The assumed defeasance lockout period of 26 payments is based on the expected closing date of this transaction in December 2019. |
| (3) | The lender may require the 4041 Central Borrower (as defined below) to increase the replacements reserve (not more than once per year) if the lender reasonably determines such increase is necessary to maintain the proper operation of the 4041 Central Property. Replacement reserves are required beyond the cap upon (i) the occurrence and continuance of an event of default or (ii) if the 4041 Central Property is not being adequately maintained by the 4041 Central Borrower (as reasonably determined by the lender based on the annual site inspections). |
| (4) | See “Operating History and Underwritten Net Cash Flow” section for a discussion of the increase from 2nd Most Recent NOI to the Most Recent NOI and from the Most Recent NOI to UW NOI. |
The Mortgage Loan.The eleventh largest mortgage loan (the “4041 Central Mortgage Loan”) is part of a whole loan (the “4041 Central Whole Loan”) evidenced by twopari passu notes with an aggregate original principal balance of $42,500,000 and an outstanding principal balance as of the Cut-off Date of $42,374,066, secured by a first mortgage encumbering the fee interest in a 406,453 SF office building located in Phoenix, Arizona (the “4041 Central Property”). The 4041 Central Mortgage Loan represents the controlling Note A-1 in the original principal balance of $23,000,000. The below table summarizes the 4041 Central Whole Loan, including the remaining promissory note, which is currently held by the entities listed below or are expected to be contributed to one or more future securitization transactions and may otherwise be transferred at any time. The mortgage loan seller provides no assurances that the non-securitized note will not be split further. The 4041 Central Whole Loan will be serviced pursuant to the pooling and servicing agreement for the UBS 2019-C18 Trust. See“Description of the Mortgage Pool—The Whole Loans—The Serviced Pari Passu Whole Loans” and “Pooling and Servicing Agreement”in the Preliminary Prospectus.
THE INFORMATION IN THIS STRUCTURAL AND COLLATERAL TERM SHEET IS NOT COMPLETE AND MAY BE AMENDED PRIOR TO THE TIME OF SALE. THIS TERM SHEET IS NOT AN OFFER TO SELL THESE SECURITIES AND IT IS NOT A SOLICITATION OF AN OFFER TO BUY THESE SECURITIES IN ANY JURISDICTION WHERE THE OFFER OR SALE IS NOT PERMITTED.
111
4041 North Central Avenue Phoenix, AZ 85012 | Collateral Asset Summary – Loan No. 11 4041 Central | Cut-off Date Balance: Cut-off Date LTV Ratio: UW NCF DSCR: UW NOI Debt Yield: | $22,931,847 73.1% 1.73x 10.1% |
| 4041 Central Whole Loan Summary | ||||
| Notes | Original Principal Balance | Cut-off Date Balance | Anticipated Note Holder | Controlling Piece |
| A-1 | $23,000,000 | $22,931,847 | UBS 2019-C18 | Yes |
| A-2 | $19,500,000 | $19,442,218 | WFB | No |
| Total | $42,500,000 | $42,374,066 | ||
The Borrower and the Borrower Sponsor. The borrower is 4041 Central Plaza, LLC (the “4041 Central Borrower”), a Delaware limited liability company and single purpose entity with one independent director. Legal counsel to the 4041 Central Borrower delivered a non-consolidation opinion in connection with the origination of the 4041 Central Whole Loan. The borrower sponsor is Zaya S. Younan, and the non-recourse carve-out guarantors of the 4041 Central Whole Loan are Zaya S. Younan and the Zaya and Sherry Younan Family Trust.
Mr. Younan is the founder, Chairman and CEO of Younan Properties, a commercial real estate investment management company headquartered in Los Angeles. Founded in 2002, Younan Properties acquires, repositions and manages class A high-rise and mid-level office buildings in the United States. Younan Properties’ current portfolio includes 32 office properties located in Chicago, Colorado Springs, Dallas, Houston, Los Angeles and Phoenix.Mr. Younan reported multiple foreclosures and discounted pay offs that occurred prior to 2014. See “Description of the Mortgage Pool— Loan Purpose; Default History, Bankruptcy Issues and Other Proceedings” in the Preliminary Prospectus.
The Property. The 4041 Central Property comprises five office buildings totaling 406,453 SF and an adjacent nine-story parking structure, located in Phoenix, Arizona. The 4041 Central Property’s five buildings comprise the 20-story main tower, which contains 321,517 SF and four, one- and two-story garden buildings surrounding the main tower, which contain 84,936 SF in the aggregate. The 4041 Central Property is situated on an approximately 5.7-acre site and includes 1,483 garage parking spaces, resulting in a parking ratio of approximately 3.6 spaces per 1,000 SF of net rentable area.
Constructed in 1980 and renovated in 2014-2016, the 4041 Central Property was 68.1% leased as of October 1, 2019 to 12 tenants across various industries, including government, public services and technology. Approximately 58.2% of the NRA and 87.6% of underwritten base rent at the 4041 Central Property is attributed to investment grade tenants or tenants that are subsidiaries of investment grade-rated entities.
Since 2014, the borrower sponsor has spent approximately $3,075,000 on capital improvements, including modernization of elevators, new key card access system, updated chiller controls, new roofs and floor renovations. Approximately $380,000 in additional renovation work is planned, which includes parking automation and tower lobby and other common area renovations. An amount equal to $250,000 was reserved upfront at the time of origination of the 4041 Central Whole Loan for the common area renovation work, which is expected to be completed on or before October 2021.
Major Tenants.
U.S. Government GSA (“GSA”; two separate leases; in aggregate, 153,030 SF, 37.7% of NRA, 62.0% of underwritten base rent, September 2028/June 2029 lease expirations). GSA (Fitch/Moody’s/S&P: AAA/Aaa/AA+) has been a tenant at the 4041 Central Property since June 2009 and has two distinct leases, “GSA Lease 1” and “GSA Lease 2” (with the entity on both leases being the General Services Administration):
| ● | GSA Lease 1 (116,507 SF, 28.7% of NRA, 46.4% of underwritten base rent, June 2029 lease expiration).GSA Lease 1 includes approximately 75,239 SF occupied by the Internal Revenue Service (local office serving the Phoenix region) and approximately 41,268 SF occupied by the Department of Homeland Security (“DHS”) and Immigration and Customs Enforcement (“ICE”). GSA Lease 1 includes space on the 5th, 13th and 16th through 20th floors of the main tower and portions of one garden building. GSA Lease 1 may be terminated at any time with 90 days’ prior written notice. GSA Lease 1 has been in effect since June 2009 and was recently renewed in June 2019 for a 10-year term with no renewal options. |
| ● | GSA Lease 2 (36,523 SF, 9.0% of NRA, 15.6% of underwritten base rent, September 2028 lease expiration).GSA Lease 2 includes approximately 16,305 SF occupied by DHS and ICE and 16,305 SF occupied by the Small Business Administration. GSA Lease 2 includes space on the 8th through 10th floors of the main tower. After September 2023, GSA Lease 2 may be terminated with 90 days’ prior written notice. GSA took occupancy in the GSA Lease 2 space in October 2018 with a lease expiration in September 2028 with no renewal options. |
Maricopa County (two separate leases; in aggregate, 83,420 SF, 20.5% of NRA, 25.5% of underwritten base rent, June 2023 lease expiration).Maricopa County (Fitch/Moody’s/S&P: AAA/Aaa/AAA) has been a tenant at the 4041 Central Property since July 2006 and encompasses two distinct leases with the Department of Public Health and the Superintendent of Schools (with the entity on both leases being Maricopa County). Both Maricopa County leases at the 4041 Central Property were renewed in July 2018.
| ● | Maricopa County Department of Public Health (“DPH”)(50,810 SF; 12.5% of NRA, 15.6% of underwritten base rent). The DPH office at the 4041 Central Property includes the office of community health innovation, epidemiology, healthcare innovation and performance improvement. The DPH currently occupies portions of the 6th, 7th and 14th floors of the main office tower and a portion of one garden building. The lease with the DPH may be terminated by the tenant at the end of each fiscal year (June 30th of each year) due to non-appropriation of funds. The lease has no remaining renewal options following its June 2023 expiration. |
| ● | Maricopa County Superintendent of Schools (“SOS”) (32,610 SF, 8.0% of net rentable area, 10.0% of underwritten base rent). The office of the SOS is statutorily responsible to provide services supporting school governing board elections, bond and override elections, appointments, school finance, and maintain home-school and private school records. The office of the SOS currently occupies portions of the 11th and 12th floors of the main tower. The lease with the SOS may be terminated by the tenant: (i) at the end of each fiscal year due to non-appropriation of funds or (ii) in no less than 7,500 SF intervals at any time after June 30, 2020, with 90 days’ written notice. The lease has no remaining renewal options following its June 2023 expiration. |
THE INFORMATION IN THIS STRUCTURAL AND COLLATERAL TERM SHEET IS NOT COMPLETE AND MAY BE AMENDED PRIOR TO THE TIME OF SALE. THIS TERM SHEET IS NOT AN OFFER TO SELL THESE SECURITIES AND IT IS NOT A SOLICITATION OF AN OFFER TO BUY THESE SECURITIES IN ANY JURISDICTION WHERE THE OFFER OR SALE IS NOT PERMITTED.
112
4041 North Central Avenue Phoenix, AZ 85012 | Collateral Asset Summary – Loan No. 11 4041 Central | Cut-off Date Balance: Cut-off Date LTV Ratio: UW NCF DSCR: UW NOI Debt Yield: | $22,931,847 73.1% 1.73x 10.1% |
The following table presents certain information relating to the tenancy at the 4041 Central Property:
| Tenant Summary | ||||||||
| Tenant Name | Credit Rating (Fitch/Moody's/ S&P)(1) | Tenant SF | Approximate % of SF | Annual UW Base Rent(1) | % of Total Annual UW Base Rent | Annual UW Base Rent PSF(1) | Termination Option (Y/N) | Lease Expiration |
| Major Tenants | ||||||||
| GSA Lease 1 | AAA/Aaa/AA+ | 116,507 | 28.7% | $3,049,009 | 46.4% | $26.17 | Y(2) | 6/11/2029 |
| GSA Lease 2 | AAA/Aaa/AA+ | 36,523 | 9.0% | $1,027,227 | 15.6% | $28.13 | Y(3) | 9/30/2028 |
| Total GSA | 153,030 | 37.7% | $4,076,236(4) | 62.0% | $26.64(4) | |||
| Maricopa County Dept. of Public Health | AAA/Aaa/AAA | 50,810 | 12.5% | $1,021,635 | 15.6% | $20.11 | Y(5) | 6/30/2023 |
| Maricopa County SOS | AAA/Aaa/AAA | 32,610 | 8.0% | $655,688 | 10.0% | $20.11 | Y(6) | 6/30/2023 |
| Total Maricopa County | 83,420 | 20.5% | $1,677,324(7) | 25.5% | $20.11(7) | |||
| Native American Community Health Center | NR/NR/NR | 34,023 | 8.4% | $753,138 | 11.5% | $22.14 | N | 10/31/2024(8) |
| Total Major Tenants | 270,473 | 66.5% | $6,506,698 | 99.0% | $24.06 | |||
| Non-Major Tenants | 6,242 | 1.5% | $62,860 | 1.0% | $10.07 | |||
| Vacant Space | 129,738 | 31.9% | $0 | 0.0% | $0.00 | |||
| Total/Wtd. Avg. | 406,453 | 100.0% | $6,569,558 | 100.0% | $23.74 | |||
| (1) | Annual UW Rent and Annual UW Rent PSF include contractual rent steps through November 2020 totaling $5,209 and straight-line rent averaging for the investment grade tenants through the lesser of their remaining lease terms totaling $159,105. |
| (2) | GSA Lease 1 may be terminated by the GSA by giving 90 days’ prior notice in writing to the 4041 Central Borrower. |
| (3) | After September 2023, the GSA Lease 2 lease may be terminated by the GSA by giving 90 days’ prior notice in writing to the 4041 Central Borrower. |
| (4) | Annual UW Rent and Annual UW Rent PSF for GSA includes straight-line rent averaging through the lease term. GSA’s current base rent is $26.06 per square foot. |
| (5) | The lease with theMaricopa County Dept. of Public Health may be terminated by the tenant, without any penalty, at the end of each fiscal year (June 30th of each year) due to non-appropriation of funds. |
| (6) | The lease with theMaricopa County SOS may be terminated by the tenant: (i) without penalty, at the end of each fiscal year (June 30th of each year) due to non-appropriation of funds or (ii) in no less than 7,500 square foot intervals at any time after June 30, 2020, with 90 days’ written notice. |
| (7) | Annual UW Rent and Annual UW Rent PSF for Maricopa County includes straight-line rent averaging through the lease term. Maricopa County’s current base rent is $19.25 per square foot. |
| (8) | Native American Community Health Center has one, 5-year option to extend its lease for its 25,770 square foot space and two, 5-year options to extend its lease for its 8,253 square foot space, each at the at the fair market rental rate. |
The following table presents certain information relating to the lease rollover at the 4041 Central Property:
| Lease Rollover Schedule(1)(2) | ||||||||
| Year | # of Leases Rolling | SF Rolling | Approx. % of Total SF Rolling | Approx. Cumulative % of SF Rolling | UW Base Rent PSF Rolling(3) | Total UW Base Rent Rolling | Approx. % of Total UW Base Rent Rolling | Approx. Cumulative % of Total UW Base Rent Rolling |
| MTM | 2 | 2 | 0.0% | 0.0% | $0.00 | $0 | 0.0% | 0.0% |
| 2019 | 1 | 2,530 | 0.6% | 0.6% | $8.06 | $20,400 | 0.3% | 0.3% |
| 2020 | 1 | 1,858 | 0.5% | 1.1% | $0.00 | $0 | 0.0% | 0.3% |
| 2021 | 0 | 0 | 0.0% | 1.1% | $0.00 | $0 | 0.0% | 0.3% |
| 2022 | 2 | 1,364 | 0.3% | 1.4% | $23.61 | $32,200 | 0.5% | 0.8% |
| 2023 | 3 | 83,908 | 20.6% | 22.1% | $20.11 | $1,687,584 | 25.7% | 26.5% |
| 2024 | 1 | 34,023 | 8.4% | 30.4% | $22.14 | $753,138 | 11.5% | 38.0% |
| 2025 | 0 | 0 | 0.0% | 30.4% | $0.00 | $0 | 0.0% | 38.0% |
| 2026 | 0 | 0 | 0.0% | 30.4% | $0.00 | $0 | 0.0% | 38.0% |
| 2027 | 0 | 0 | 0.0% | 30.4% | $0.00 | $0 | 0.0% | 38.0% |
| 2028 | 1 | 36,523 | 9.0% | 39.4% | $28.13 | $1,027,227 | 15.6% | 53.6% |
| 2029 | 1 | 116,507 | 28.7% | 68.1% | $26.17 | $3,049,009 | 46.4% | 100.0% |
| 2030 & Beyond | 0 | 0 | 0.0% | 68.1% | $0.00 | $0 | 0.0% | 100.0% |
| Vacant | 0 | 129,738 | 31.9% | 100.0% | $0.00 | $0 | 0.0% | 100.0% |
| Total/Wtd. Avg. | 12 | 406,453 | 100.0% | $23.74 | $6,569,558 | 100.0% | ||
| (1) | Information obtained from the underwritten rent roll. |
| (2) | Certain tenants may have lease termination options that are exercisable prior to the originally stated expiration date of the subject lease and that are not considered in the Lease Expiration Schedule. |
| (3) | Total/Wtd. Avg. Total UW Base Rent Rolling excludes vacant space. |
THE INFORMATION IN THIS STRUCTURAL AND COLLATERAL TERM SHEET IS NOT COMPLETE AND MAY BE AMENDED PRIOR TO THE TIME OF SALE. THIS TERM SHEET IS NOT AN OFFER TO SELL THESE SECURITIES AND IT IS NOT A SOLICITATION OF AN OFFER TO BUY THESE SECURITIES IN ANY JURISDICTION WHERE THE OFFER OR SALE IS NOT PERMITTED.
113
4041 North Central Avenue Phoenix, AZ 85012 | Collateral Asset Summary – Loan No. 11 4041 Central | Cut-off Date Balance: Cut-off Date LTV Ratio: UW NCF DSCR: UW NOI Debt Yield: | $22,931,847 73.1% 1.73x 10.1% |
The Market. The 4041 Central Property is located in Phoenix, Maricopa County, Arizona, approximately 2.4 miles north of Interstate 10 (provides access eastbound to Scottsdale and Tempe, Arizona), 2.5 miles east of Interstate 17 (which provides north-south access through Phoenix), 3.4 miles north of the downtown Phoenix central business district and 6.6 miles northwest of the Phoenix Sky Harbor International Airport. The 4041 Central Property is situated approximately 0.3 miles southwest of the intersection of E Indian School Road and N 3rd Street, which, according to a third party market research provider, had a daily traffic count of approximately 47,578 vehicles as of 2018.
Park Central Mall, an approximately 500,000 SF mall and office center, is located approximately 0.8 miles southwest of the 4041 Central Property. According to the appraisal, Park Central Mall is currently being renovated to a retail and office space that will feature creative office space, a medical health science center and a hotel. Park Central received a grant from the City of Phoenix to create an urban park on the property, which is expected to include a splash pad, fire pits, seating areas and an outdoor entertainment venue and plans to provide space for local artists and provide the atrium for entertainment events during non-operating office hours. According to the appraisal, the first phase of renovations began in 2018 and delivery of the retail and office space is planned for late 2019, with the remaining renovations slated for completion in 2021.
According to a third party market research report, the estimated 2019 population within a three- and five-mile radius of the 4041 Central Property was approximately 184,568 and 459,010, respectively; and the estimated 2019 average household income within the same radii was approximately $69,288 and $65,943, respectively.
According to a third party market research report, the 4041 Central Property is situated within the Midtown submarket of the Phoenix Office Market. As of October 16, 2019, the Midtown submarket reported a total inventory of approximately 13.1 million SF with a 17.5% vacancy rate and average asking rent of $24.88 per square foot, gross. Within a five-mile radius of the 4041 Central Property, as of October 16, 2019, there were 2,278 office properties totaling approximately 53.2 million SF with a 13.1% vacancy rate, per a third-party market research provider.
The following table presents certain information relating to the appraiser’s market rent conclusions for the 4041 Central Property:
| Market Rent Summary | ||||
| Office Tower | GSA | Low-Rise Office | Deli | |
| Market Rent (PSF) | $21.50 | $26.00 | $21.00 | $9.00 |
| Lease Term (Years) | 5 | 10 | 5 | 3 |
| Lease Type (Reimbursements) | MG | Gross | MG | Gross |
| Rent Increase Projection | $0.50per annum | Flat | $0.50per annum | $0.50per annum |
Source:Appraisal | ||||
The table below presents certain information relating to comparable sales pertaining to the 4041 Central Property identified by the appraiser:
| Comparable Property Sale Summary | ||||||||
| Property Name | Location | Year Built/ Renovated | Occupancy | Rentable Area (SF) | Sale Date | Sale Price | Adjusted Sale Price | Adjusted Sale Price (PSF) |
| Great American Tower | Phoenix, AZ | 1985/NAP | 86% | 344,527 | Nov-16 | $49,000,000 | $49,000,000 | $142.22 |
| CBIZ Plaza | Phoenix, AZ | 1980/NAP | 77% | 266,321 | Feb-17 | $26,000,000 | $30,000,000 | $112.65 |
| Central Arts Plaza | Phoenix, AZ | 1991/NAP | 72% | 482,108 | Jan-18 | $80,700,000 | $79,000,000 | $163.86 |
| 2020 on Central | Phoenix, AZ | 1985/2015 | 84% | 247,645 | Mar-19 | $23,888,888 | $24,638,888 | $99.49 |
| Clarendon Place | Phoenix, AZ | 1984/2017 | 96% | 91,353 | Jun-19 | $13,650,000 | $13,650,000 | $149.42 |
| Valley Commerce Center | Phoenix, AZ | 1984/NAP | 84% | 215,663 | Sep-19 | $27,950,000 | $27,950,000 | $129.60 |
Source:Appraisal
THE INFORMATION IN THIS STRUCTURAL AND COLLATERAL TERM SHEET IS NOT COMPLETE AND MAY BE AMENDED PRIOR TO THE TIME OF SALE. THIS TERM SHEET IS NOT AN OFFER TO SELL THESE SECURITIES AND IT IS NOT A SOLICITATION OF AN OFFER TO BUY THESE SECURITIES IN ANY JURISDICTION WHERE THE OFFER OR SALE IS NOT PERMITTED.
114
4041 North Central Avenue Phoenix, AZ 85012 | Collateral Asset Summary – Loan No. 11 4041 Central | Cut-off Date Balance: Cut-off Date LTV Ratio: UW NCF DSCR: UW NOI Debt Yield: | $22,931,847 73.1% 1.73x 10.1% |
The following table presents certain information relating to comparable high-rise office leases related to 4041 Central Property:
| Comparable High-Rise Office Leases | ||||||||||
| Property Name/Location | Year Built/ Renovated | Total GLA (SF) | Distance from Subject | Occ. % | Tenant | Tenant Size (SF) | Lease Start Date | Lease Term | Annual Base Rent PSF | Lease Type |
4041 Central (subject) 4041 North Central Avenue Phoenix, AZ | 1980/2016 | 406,453 | - | 68.1% | ||||||
Security Title Plaza 3636 North Central Avenue Phoenix, AZ | 1983/N/A | 219,032 | 0.4 miles | 89% | CAVCO GLHN Architects Arizona Children’s Assoc. | 14,994 1,913 44,380 | Aug-18 Jun-18 Jun-18 | 10.0 Yrs 5.4 Yrs 6.5 Yrs | $22.50 $20.00 $23.00 | MG MG MG |
3300 Tower 3300 North Central Avenue Phoenix, AZ | 1978/N/A | 363,655 | 0.7 miles | 67% | AZ Dep of Education Jordin, Baker, Hickman & Houston | 69,555 14,146 | Jun-19 Nov-17 | 5.7 Yrs 2.3 Yrs | $18.53 $24.00 | FSG MG |
Great American Tower 3200 North Central Avenue Phoenix, AZ | 1986/N/A | 338,411 | 0.7 miles | 85% | Crossroads Law The Kenrich Group Trafficade Service Hynes Benefit Consulting | 3,082 4,074 950 1,584 | Apr-19 Apr-19 Feb-19 Feb-19 | 4.3 Yrs 5.0 Yrs 3.2 Yrs 5.5 Yrs | $25.00 $23.89 $25.50 $24.00 | MG MG MG MG |
Phoenix Corporate Center 3003 North Central Avenue Phoenix, AZ | 1964/2006 | 457,595 | 1.1 miles | 68% | Arizona Supreme Court VIP Mortgage Hyland Software Mountain Park Health | 17,453 6,605 13,632 34,506 | Feb-19 Sep-18 Jun-18 Apr-18 | 7.6 Yrs 5.3 Yrs 5.7 Yrs 11.0 Yrs | $21.00 $21.00 $22.00 $21.00 | MG MG MG MG |
2800 Tower 2800 North Central Avenue Phoenix, AZ | 1988/N/A | 359,949 | 1.2 miles | 65% | Solar Mosaic Miller, Pitt, Feldman, et al Advanced Structural Engineering Skanska USA | 10,767 3,155 8,101 6,498 | Mar-19 Oct-18 Sep-18 May-18 | 3.3 Yrs 3.3 Yrs 3.0 Yrs 6.6 Yrs | $27.00 $23.00 $23.00 $23.59 | MG MG MG MG |
2700 Tower 2700 North Central Avenue Phoenix, AZ | 1985/N/A | 222,873 | 1.3 miles | 72% | AZ Coalition BenefitMall | 5,700 10,049 | Oct-18 May-18 | 6.4 Yrs 5.3 Yrs | $24.50 $21.00 | MG MG |
Source:Appraisal
The following table presents certain information relating to comparable low-rise office leases related to 4041 Central Property:
| Comparable Low-Rise Office Leases | ||||||||||
| Property Name/Location | Year Built/ Renovated | Total GLA (SF) | Distance from Subject | Occ. % | Tenant | Tenant Size (SF) | Lease Start Date | Lease Term | Annual Base Rent PSF | Lease Type |
4041 Central (subject) 4041 North Central Avenue Phoenix, AZ | 1980/2016 | 406,453 | - | 68.1% | ||||||
Clarendon Place 300 West Clarendon Avenue Phoenix, AZ | 1984/2017 | 91,353 | 0.6 miles | 100% | First Strategic Arizona Vulva Clinic Pepid LLC Veritas Funding | 2,879 3,550 9,130 2,585 | Feb-19 Jan-19 Oct-18 Sep-18 | 2.9 Yrs 4.0 Yrs 5.0 Yrs 3.3 Yrs | $20.00 $21.00 $20.50 $22.00 | MG MG MG MG |
Siete Square (II) 3707 North 7th Street Phoenix, AZ | 1983/1997 | 54,072 | 0.7 miles | 82% | Undisclosed Undisclosed | 3,097 4,428 | Sep-18 Jul-18 | 3.0 Yrs 1.0 Yrs | $18.50 $19.50 | MG FSG |
Siete Square (I & IV) 3737 & 3877 North 7th Street Phoenix, AZ | 1983/N/A | 115,769 | 0.6 miles | 82% | Arizona Legal Support Services | 2,543 | Sep-19 | 5.0 Yrs | $21.50 | MG |
Valley Commerce Center 4745-4747 North 7th Street Phoenix, AZ | 1984/N/A | 215,663 | 1.5 miles | 80% | Fredenberg Beams ABI Document Support The Young Center for Immigrant Children’s Rights | 1,232 1,920 5,371 | May-19 Jan-19 Oct-18 | 3.3 Yrs 3.3 Yrs 2.5 Yrs | $23.50 $23.50 $23.00 | MG MG MG |
Paragon Plaza 5333 North 7th Avenue Phoenix, AZ | 1984/N/A | 63,936 | 2.3 miles | 85% | Family Involvement Center Law Firm Landmark Capital Corporation Bureau Veritas North America | 8,200 1,800 2,482 1,339 | Aug-19 Mar-19 Mar-18 Jan-18 | 3.2 Yrs 5.0 Yrs 3.3 Yrs 3.0 Yrs | $19.75 $20.00 $20.50 $21.50 | MG MG MG MG |
Source:Appraisal
THE INFORMATION IN THIS STRUCTURAL AND COLLATERAL TERM SHEET IS NOT COMPLETE AND MAY BE AMENDED PRIOR TO THE TIME OF SALE. THIS TERM SHEET IS NOT AN OFFER TO SELL THESE SECURITIES AND IT IS NOT A SOLICITATION OF AN OFFER TO BUY THESE SECURITIES IN ANY JURISDICTION WHERE THE OFFER OR SALE IS NOT PERMITTED.
115
4041 North Central Avenue Phoenix, AZ 85012 | Collateral Asset Summary – Loan No. 11 4041 Central | Cut-off Date Balance: Cut-off Date LTV Ratio: UW NCF DSCR: UW NOI Debt Yield: | $22,931,847 73.1% 1.73x 10.1% |
Operating History and Underwritten Net Cash Flow.The following table presents certain information relating to the historical operating performance and the Underwritten Net Cash Flow at the 4041 Central Property:
| Cash Flow Analysis | ||||||
| 2016 | 2017 | 2018(1) | 9/30/2019 TTM(1)(2) | UW(2) | UW PSF | |
| Rents in Place | $4,897,163 | $4,776,672 | $5,182,994 | $6,331,542 | $6,405,243 | $15.76 |
| Straight Line Rent Averaging(3) | $0 | $0 | $0 | $0 | $164,315 | $0.40 |
| Grossed Up Vacant Space | $0 | $0 | $0 | $0 | $2,755,125 | $6.78 |
| Total Recoveries | $262,891 | $258,189 | $248,176 | $188,621 | $188,621 | $0.46 |
| Parking Income | $415,953 | $355,120 | $237,640 | $225,420 | $225,420 | $0.55 |
| Other Income(4) | $3,849 | $2,113 | $725 | $826 | $826 | $0.00 |
| Less Vacancy & Credit Loss | $0 | $0 | $0 | $0 | ($2,755,125)(5) | ($6.78) |
| Effective Gross Income | $5,579,856 | $5,392,094 | $5,669,535 | $6,746,409 | $6,984,424 | $17.18 |
| Total Operating Expenses | $2,786,134 | $2,936,666 | $2,829,055 | $2,783,632 | $2,684,938 | $6.61 |
| Net Operating Income | $2,793,722 | $2,455,428 | $2,840,480 | $3,962,776 | $4,299,487 | $10.58 |
| Capital Expenditures | $0 | $0 | $0 | $0 | $73,162 | $0.18 |
| TI/LC | $0 | $0 | $0 | $0 | $181,453 | $0.45 |
| Net Cash Flow | $2,793,722 | $2,455,428 | $2,840,480 | $3,962,776 | $4,044,872 | $9.95 |
| Occupancy % | 76.0% | 78.0% | 73.9% | 68.1% | 68.1%(5) | |
| NOI DSCR(6) | 1.20x | 1.05x | 1.22x | 1.70x | 1.84x | |
| NCF DSCR(6) | 1.20x | 1.05x | 1.22x | 1.70x | 1.73x | |
| NOI Debt Yield(6) | 6.6% | 5.8% | 6.7% | 9.3% | 10.1% | |
| NCF Debt Yield(6) | 6.6% | 5.8% | 6.7% | 9.3% | 9.5% | |
| (1) | The increase in Net Operating Income from 2018 to 9/30/2019 TTM was driven by (i) two new leases totaling approximately 16.0% of underwritten base rent commencing between October 2018 and June 2019 (including GSA Lease 2 in October 2018) and (ii) the renewal of both Maricopa County leases in July 2018 (25.5% of underwritten base rent). |
| (2) | The increase in Net Operating Income from 9/30/2019 TTM to UW was driven by (i) two renewal leases totaling approximately 46.6% of underwritten base rent commencing between June 2019 and January 2020 (including the GSA Lease 1 renewal in June 2019) and (ii) the inclusion of contractual rent steps through November 2020 totaling $5,209 and straight-line rent averaging for the investment grade tenants through the lesser of their remaining lease terms totaling $159,105. |
| (3) | Represents contractual rent steps through November 2020 and straight-line rent averaging for the investment grade tenants over their remaining lease terms (see “Tenant Summary” table above). |
| (4) | Other Income is primarily composed of rent paid by Federal Express Corporation and United Parcel Service plus miscellaneous items. |
| (5) | The underwritten economic vacancy is 29.5%. The 4041 Central Property was 68.1% leased as of October 1, 2019. |
| (6) | The debt service coverage ratios and debt yields are based on the 4041 Central Whole Loan. |
THE INFORMATION IN THIS STRUCTURAL AND COLLATERAL TERM SHEET IS NOT COMPLETE AND MAY BE AMENDED PRIOR TO THE TIME OF SALE. THIS TERM SHEET IS NOT AN OFFER TO SELL THESE SECURITIES AND IT IS NOT A SOLICITATION OF AN OFFER TO BUY THESE SECURITIES IN ANY JURISDICTION WHERE THE OFFER OR SALE IS NOT PERMITTED.
116
| 2029 & 2049 Century Park East Los Angeles, CA 90067 | Collateral Asset Summary – Loan No. 12 Century Plaza Towers | Cut-off Date Balance: Cut-off Date LTV Ratio: UW NCF DSCR: UW NOI Debt Yield: | $20,000,000 39.1% 4.08x 13.5% |
| Mortgage Loan Information | Property Information | |||||
| Mortgage Loan Seller(1): | WFB | Single Asset/Portfolio: | Single Asset | |||
Credit Assessment (Fitch/KBRA/Moody’s): | BBB-/A+/Baa1 | Location: | Los Angeles, CA 90067 | |||
| General Property Type: | Office | |||||
| Original Balance(2): | $20,000,000 | Detailed Property Type: | CBD | |||
| Cut-off Date Balance(2): | $20,000,000 | Title Vesting: | Fee Simple | |||
| % of Initial Pool Balance: | 2.7% | Year Built/Renovated: | 1975/2015 | |||
| Loan Purpose: | Refinance | Size: | 2,401,641 SF | |||
| Borrower Sponsors: | SPF JVP LLC; Luminance | Cut-off Date Balance per SF(2): | $375 | |||
| Acquisition Venture LLC | Maturity Date Balance per SF(2): | $375 | ||||
| Mortgage Rate: | 3.0045% | Property Manager: | CBRE, Inc. | |||
| Note Date: | 10/21/2019 | |||||
| First Payment Date: | 12/9/2019 | |||||
| Maturity Date: | 11/9/2029 | |||||
| Original Term to Maturity: | 120 months | |||||
| Original Amortization Term: | 0 months | Underwriting and Financial Information | ||||
| IO Period: | 120 months | UW NOI: | $121,145,756 | |||
| Seasoning: | 1 month | UW NOI Debt Yield(2): | 13.5% | |||
| Prepayment Provisions: | YM1 (25); DEF/YM1 (90); O (5) | UW NOI Debt Yield at Maturity(2): | 13.5% | |||
| Lockbox/Cash Mgmt Status: | Hard/Springing | UW NCF DSCR(2): | 4.08x | |||
| Additional Debt Type(2)(3): | Pari Passu/ Subordinate Debt | Most Recent NOI: | $83,342,918 (9/30/2019 TTM) | |||
| Additional Debt Balance(2)(3): | $880,000,000 / $300,000,000 | 2nd Most Recent NOI: | $89,024,555 (12/31/2018) | |||
| Future Debt Permitted (Type)(4): | Yes (Mezzanine) | 3rd Most Recent NOI: | $83,200,132 (12/31/2017) | |||
| Reserves | Most Recent Occupancy: | 92.9% (10/1/2019) | ||||
| Type | Initial | Monthly | Cap | 2nd Most Recent Occupancy: | 83.5% (12/31/2018) | |
| RE Tax: | $0 | Springing(5) | N/A | 3rd Most Recent Occupancy: | 84.6% (12/31/2017) | |
| Insurance: | $0 | Springing(5) | N/A | Appraised Value (as of): | $2,302,000,000 (9/24/2019) | |
| Outstanding TI/LC(6): | $71,223,945 | $0 | N/A | Cut-off Date LTV Ratio(2): | 39.1% | |
| Free Rent Funds(6): | $29,545,735 | $0 | N/A | Maturity Date LTV Ratio(2): | 39.1% | |
| Sources and Uses | ||||||
| Sources | Proceeds | % of Total | Uses | Proceeds | % of Total | |
| Loan Amount(2): | $1,200,000,000 | 100.0% | Loan Payoff: | $823,449,563 | 68.6% | |
| Reserves: | $100,769,680 | 8.4% | ||||
| Closing Costs: | $2,834,724 | 0.2% | ||||
| Return of Equity: | $272,946,032 | 22.7% | ||||
| Total Sources: | $1,200,000,000 | 100.0% | Total Uses: | $1,200,000,000 | 100.0% | |
| (1) | The Century Plaza Towers Whole Loan was co-originated by Wells Fargo Bank, National Association (“WFB”), Deutsche Bank AG, New York Branch (“DBNY”), and Morgan Stanley Bank, N.A. (“MSBNA”). |
| (2) | The Century Plaza Tower Mortgage Loan (as defined below) is part of the Century Plaza Towers Whole Loan (as defined below), which is comprised of 29pari passu senior promissory notes with an aggregate original principal balance of $900,000,000 (the “Century Plaza Towers Senior Notes”, and collectively, the “Century Plaza Towers Senior Loan”) and three promissory notes that are subordinate to the Century Plaza Towers Senior Notes with an aggregate original principal balance of $300,000,000 (collectively, the “Century Plaza Towers Subordinate Companion Loans”, and together with the Century Plaza Towers Senior Loan, the “Century Plaza Towers Whole Loan”). The Cut-off Date Balance per SF, Maturity Date Balance per SF, UW NOI Debt Yield, UW NOI Debt Yield at Maturity, UW NCF DSCR, Cut-off Date LTV Ratio and Maturity Date LTV Ratio presented above are based on the Century Plaza Towers Senior Loan. The Cut-off Date Balance per SF, Maturity Date Balance per SF, UW NOI Debt Yield, UW NOI Debt Yield at Maturity, UW NCF DSCR, Cut-off Date LTV Ratio and Maturity Date LTV Ratio based on the Century Plaza Towers Whole Loan are $500, $500, 10.1%, 10.1%, 3.06x, 52.1% and 52.1%, respectively. |
| (3) | The Century Plaza Towers Non-Serviced Pari Passu Companion Loans accrue interest at the same rate as the Century Plaza Towers Mortgage Loan. The Century Plaza Towers Subordinate Companion Loans accrue interest at a fixed rate of 3.0045%per annum, have a 120-month term, and are interest only for the full term. |
| (4) | The holders of 100% of the equity interests in the Century Plaza Towers Borrower (as defined below) have the one-time right to obtain a single mezzanine loan, subordinate to the Century Plaza Towers Whole Loan and secured by a pledge of 100% of the ownership interests in the Century Plaza Towers Borrower,provided, among other conditions: (i) the aggregate loan-to-value ratio of the Century Plaza Towers Whole Loan and the mezzanine loan is equal to or less than 52.1% (or if a Century Plaza Tower Conversion and Transfer (as defined below) has occurred, 51.5%), (ii) the aggregate debt service coverage ratio of the Century Plaza Towers Whole Loan and the mezzanine loan is equal to or greater than 3.12x (or if a Century Plaza Tower Conversion and Transfer has occurred, 3.18x), (iii) the aggregate debt yield of the Century Plaza Towers Whole Loan and the mezzanine loan is equal to or greater than 9.5% (or if a Century Plaza Tower Conversion and Transfer has occurred, 9.7%), (iv) the mezzanine loan is coterminous with the Century Plaza Towers Whole Loan and (v) entry into a customary intercreditor agreement acceptable to the lender and each rating agency rating securities backed by a portion of the Century Plaza Towers Whole Loan. |
| (5) | During a Trigger Period (as defined herein), the related whole loan documents require (i) ongoing monthly insurance reserves in an amount equal to 1/12 of the insurance premiums that the lender estimates will be payable for the renewal of the coverage upon expiration thereof, provided, that so long as insurance is maintained by the Century Plaza Towers Borrower under one or more blanket policies approved by the lender, the Century Plaza Towers Borrower is not required to make ongoing monthly insurance reserve deposits applicable to such blanket policy, and (ii) ongoing monthly real estate tax reserves in an amount equal to 1/12 of the real estate taxes that the lender estimates will be payable during the next 12 months. A “Trigger Period” will be continuing during any period when there exists (i) an uncured event of default under the Century Plaza Towers Whole Loan or under a mezzanine loan (if one is incurred as described further below) or (ii) a Low Debt Yield Period (as defined herein). A “Low Debt Yield Period” will commence if the aggregate debt yield on the Century Plaza Towers Whole Loan and any related mezzanine loan is less than 5.0% at the end of two consecutive calendar quarters and will end if such combined debt yield exceeds 5.0% for two consecutive calendar quarters. |
| (6) | The Century Plaza Towers Borrower deposited approximately $71,223,945 into a TI/LC reserve for approved leasing expenses and approximately $29,545,735 into a free rent reserve for any outstanding free rent, abated rent and bridge rent. |
THE INFORMATION IN THIS STRUCTURAL AND COLLATERAL TERM SHEET IS NOT COMPLETE AND MAY BE AMENDED PRIOR TO THE TIME OF SALE. THIS TERM SHEET IS NOT AN OFFER TO SELL THESE SECURITIES AND IT IS NOT A SOLICITATION OF AN OFFER TO BUY THESE SECURITIES IN ANY JURISDICTION WHERE THE OFFER OR SALE IS NOT PERMITTED.
117
| 2029 & 2049 Century Park East Los Angeles, CA 90067 | Collateral Asset Summary – Loan No. 12 Century Plaza Towers | Cut-off Date Balance: Cut-off Date LTV Ratio: UW NCF DSCR: UW NOI Debt Yield: | $20,000,000 39.1% 4.08x 13.5% |
The Mortgage Loan. The twelfth largest mortgage loan (the “Century Plaza Towers Mortgage Loan”) is part of a whole loan (the “Century Plaza Towers Whole Loan”) evidenced by (i) 29pari passunotes with an aggregate original principal balance of $900,000,000 and (ii) the Century Plaza Towers Subordinate Companion Loans with an aggregate original principal balance of $300,000,000. The Century Plaza Towers Whole Loan is secured by a first priority fee mortgage encumbering an office property in Los Angeles, California (the “Century Plaza Towers Property”). Promissory NoteA-3-C4, with an original principal balance of $20,000,000, represents the Century Plaza Towers Mortgage Loan, and will be contributed to the UBS 2019-C18 Trust. The remaining Century Plaza Towers Senior Notes (collectively, the “Century Plaza Towers Non-ServicedPari PassuCompanion Loans”), the Century Plaza Towers Non-ServicedPari Passu Companion Loans evidenced by promissory Notes A-1-S1, A-1-S2, A-1-S3, A-2-S1, A-2-S2, A-2-S3, A-3-S1, A-3-S2, A-3-S3, A-2-C1, A-2-C3, A-2-C4, A-3-C1, and A-3-C3, with an aggregate original principal balance of $525,000,000, and the entire Century Plaza Towers Subordinate Companion Loans are expected to be contributed to the CPTS 2019-CPT Trust. The Century Plaza Towers Non-ServicedPari Passu Companion Loans evidenced by Notes A-2-C2, A-2-C5, A-2-C6, A-2-C7, A-3-C2, and A-3-C5, with an aggregate original principal balance of $105,000,000, are expected to be contributed to the BANK 2019-BNK23 Trust. The Century Plaza Towers Whole Loan will be serviced pursuant to the trust and servicing agreement for the CPTS 2019-CPT Trust. The remaining Century Plaza Towers Non-ServicedPari Passu Companion Loans, with an aggregate original principal balance of $250,000,000, are expected to be contributed to future securitization trusts or may be otherwise transferred at any time. The mortgage loan seller provides no assurances that the non-securitized note will not be split further. See “Description of the Mortgage Pool—The Whole Loans—The Non-Serviced AB Whole Loans—The Century Plaza Towers Whole Loan” and “Pooling and Servicing Agreement” in the Preliminary Prospectus.
| Century Plaza Towers Whole Loan Summary | ||||
| Notes | Original Balance | Cut-off Date Balance | Anticipated Note Holder | Controlling Piece |
| Century Plaza Towers Mortgage Loan | ||||
| A-3-C4 | $20,000,000 | $20,000,000 | UBS 2019-C18 | No |
| Century Plaza Towers Non-Serviced Pari Passu Companion Loans | ||||
| A-1-S1, A-1-S2, A-1-S3, A-2-S1, A-2-S2, A-2-S3, A-3-S1, A-3-S2, A-3-S3, A-2-C1, A-2-C3, A-2-C4, A-3-C1, A-3-C3 | $525,000,000 | $525,000,000 | CPTS 2019-CPT | Yes(1) |
| A-2-C2,A-2-C5, A-2-C6, A-2-C7, A-3-C2, A-3-C5 | $105,000,000 | $105,000,000 | BANK 2019-BNK23 | No |
| A-1-C1, A-1-C2, A-1-C3, A-1-C4, A-1-C5, A-1-C6, A-1-C7, A-1-C8 | $250,000,000 | $250,000,000 | DBRI | No |
| Century Plaza Towers Subordinate Companion Loans | ||||
| B-1, B-2, B-3 | $300,000,000 | $300,000,000 | CPTS 2019-CPT | Yes(1) |
| Total | $1,200,000,000 | $1,200,000,000 | ||
| (1) | No single promissory note comprising a part of the Century Plaza Towers Whole Loan is the related control note; however, the CPTS 2019-CPT Trust is the related controlling note holder, and a party designated under the related trust and servicing agreement is entitled to exercise the rights thereof. |
The Borrower and Borrower Sponsor. The borrower is One Hundred Towers L.L.C. (the “Century Plaza Towers Borrower”), a Delaware limited liability company with two independent directors. SPF JVP LLC and Luminance Acquisition Venture LLC are the borrower sponsors (the “Century Plaza Towers Borrower Sponsor”). There is no non-recourse carveout guarantor or separate environmental indemnitor with respect to the Century Plaza Towers Whole Loan. The Century Plaza Towers Borrower Sponsor is a joint venture between (i) the Commingled Pension Trust Fund (Strategic Property) of JP Morgan Chase Bank, N.A. and (ii) a joint venture between an institutional account managed by Hines and Hines Investment Management Holdings Limited Partnership (together with Hines, “Hines JV”). Hines JV is a privately owned global real estate investment, development and management firm, founded in 1957, with a presence in 219 cities in 23 countries and assets under management for which Hines provides both fiduciary investment management services and third party property-level services.
The Property. The Century Plaza Towers Property consists of two Class A, 44-story office towers which contain 2,401,641 SF of office space and a lower level retail concourse. In addition, the Century Plaza Towers Property has an underground garage containing a total of 6,566 parking spaces (of which 5,910 spaces are part of the collateral for the Century Plaza Towers Whole Loan). The Century Plaza Towers Property was originally developed in 1975 by Aluminum Company of America (Alcoa) and was designed by Minoru Yamasaki.
The Century Plaza Towers Property includes 26,000 SF column-free flexible floor plates. The Century Plaza Towers Property underwent an $80.0 million renovation in 2008 and has had approximately $48.0 million of capital expenditures invested since 2014, including a multi-year program currently underway to fully renovate all restrooms, multi-tenant corridors, and elevator lobbies; nearly $28.0 million has been invested since 2015. Together with the property located at 2000 Avenue of the Stars (which is also owned by the borrower sponsor), the Century Plaza Towers Property is part of Century Park, a 14-acre campus that includes a four-acre park, restaurants, cafes, and other amenity retail. The Century Plaza Towers Property is 92.9% leased as of October 1, 2019 to 122 tenants across approximately 1.2 million SF of office space in the north tower, approximately 1.2 million SF of office space in the south tower and approximately 39,500 SF of ground floor retail and amenity space. The largest tenants include Bank of America & Merrill Lynch (“Bank of America”) (6.2% of NRA / 6.5% of GPR / $56.98 gross rent PSF, rated A2/A-/A+ by Moody’s/S&P/Fitch), Manatt Phelps (4.8% of NRA / 5.5% of GPR / $62.26 gross rent PSF, #105 in AmLaw based on gross revenue), JP Morgan (4.1% of NRA / 4.2% of GPR / $57.00 gross rent PSF, rated A2/A-/AA- by Moody’s/S&P/Fitch), Kirkland & Ellis (3.6% of NRA / 4.5% of GPR / $68.79 gross rent PSF, #1 in a 2019 magazine ranking of law firms based on gross revenue), Greenberg Glusker (3.5% of NRA / 4.2% of GPR / $66.00 gross rent PSF).
The Century Plaza Towers Property benefits from tenant diversity, with 122 distinct tenants, none of which account for more than 6.2% of NRA or 6.5% of the total underwritten base rent. As of October 1, 2019, the weighted average original lease term for all tenants collectively at the Century Plaza Towers Property was 10.8 years, and the weighted average remaining lease term is 7.6 years. The five largest tenants at the Century Plaza Towers Property comprise 532,463 SF, representing approximately 22.2% of NRA and approximately 24.9% of underwritten base rent. The ten largest tenants comprise 915,155 SF, representing approximately 38.1% of NRA and approximately 42.6% of underwritten base rent. As of October 1, 2019, the weighted average remaining lease term for the five largest tenants is 10.9 years.
THE INFORMATION IN THIS STRUCTURAL AND COLLATERAL TERM SHEET IS NOT COMPLETE AND MAY BE AMENDED PRIOR TO THE TIME OF SALE. THIS TERM SHEET IS NOT AN OFFER TO SELL THESE SECURITIES AND IT IS NOT A SOLICITATION OF AN OFFER TO BUY THESE SECURITIES IN ANY JURISDICTION WHERE THE OFFER OR SALE IS NOT PERMITTED.
118
| 2029 & 2049 Century Park East Los Angeles, CA 90067 | Collateral Asset Summary – Loan No. 12 Century Plaza Towers | Cut-off Date Balance: Cut-off Date LTV Ratio: UW NCF DSCR: UW NOI Debt Yield: | $20,000,000 39.1% 4.08x 13.5% |
Major Tenants.
Bank of America (149,508 SF, 6.2% of NRA, 6.5% of underwritten base rent).Bank of America (NYSE: BAC) is an investment and retail banking institution and financial services company based in Charlotte, North Carolina. It is the second largest banking institution in the United States by total assets. The institution’s corporate and investment banking division operates under the name Bank of America Merrill Lynch. Bank of America occupies four suites in the south tower on the 1st, 2nd, 11th and 12th floors totaling 98,059 SF. Bank of America has signed a lease for an additional 26,664 SF on the 13th floor of the south tower and is expected to begin paying rent and take occupancy in January 2020. Merrill Lynch occupies one suite in the north tower totaling 24,785 SF. The firm pays approximately $54.42 to $60.57 of gross rent PSF across the north tower and south tower. Bank of America has been at the Century Plaza Towers Property since 1994. With respect to the additional space on the 13th floor of the south tower, we cannot assure you that Bank of America will begin paying rent or take occupancy as expected or at all. Bank of America has the right to terminate its lease as of September 30, 2026 upon written notice prior to September 30, 2025 and payment of a termination fee.
Manatt Phelps (116,366 SF, 4.8% of NRA, 5.5% of underwritten base rent).Manatt, Phelps & Phillips LLC (“Manatt Phelps”) is a Los Angeles-based law firm that has practices focused on banking, entertainment, media, technology, retail and consumer products, and real estate and energy. Founded in 1965, Manatt Phelps employs over 450 attorneys across Los Angeles, New York, Palo Alto, San Francisco, Orange County, Chicago, Washington, D.C. and Boston. The firm is ranked #105 in AmLaw based on gross revenue. Manatt Phelps has signed a lease for five suites in the south tower on the 4th, 14th, 15th, 16th and 17th floors totaling 116,366 SF and is expected to begin paying rent and take occupancy in stages starting in March 2020, with full occupancy of the space expected by May 2020. Manatt Phelps’s contractual rent under its leases is approximately $62.26 gross rent PSF. We cannot assure you that Manatt Phelps will begin paying rent or take occupancy as expected or at all. Manatt Phelps has the right to terminate its lease on the 4th floor on the last day of the 5th year or 10th year of its lease term.
JP Morgan (97,726 SF, 4.1% of NRA, 4.2% of underwritten base rent).Founded in 1871, JP Morgan (NYSE: JPM) is a commercial, investment and retail banking institution founded by J.P. Morgan. Headquartered in New York City, JP Morgan is the largest bank in the United States. JP Morgan occupies four suites in the north tower on the 37th, 38th, 39th and 41st floors totaling 97,726 SF and pays $57.00 gross rent PSF. JP Morgan has been at the Century Plaza Towers Property since 2011. JP Morgan is an affiliate of the Century Plaza Towers Borrower.
Kirkland & Ellis (85,664 SF, 3.6% of NRA, 4.5% of underwritten base rent).Founded in 1909 in Chicago, Kirkland & Ellis, LLP (“Kirkland & Ellis”) is an international law firm that employs over 2,300 attorneys in 15 offices throughout Asia, Europe, and the United States. Kirkland & Ellis focuses on private equity, M&A, and other corporate transactions, litigation, white collar and government disputes, restructuring and intellectual property matters. Kirkland & Ellis is ranked #1 in a 2019 magazine ranking of law firms by gross revenue. Kirkland & Ellis has not yet taken occupancy and is expected to occupy three suites in the south tower on the 37th, 38th, and 39th floors totaling 85,664 SF starting in January 2020. Kirkland & Ellis is expected to pay $68.79 gross rent PSF starting in January 2020. We cannot assure you that Kirkland & Ellis will begin paying rent or take occupancy as expected or at all. Kirkland & Ellis has a one-time right to terminate its lease as of January 1, 2032 upon written notice on or before January 1, 2031 and the payment of a termination fee.
Greenberg Glusker (83,199 SF, 3.5% of NRA, 4.2% of underwritten base rent).With nearly 100 attorneys, Greenberg Glusker is one of the largest single-office, full-service law firms in California with offices only in Century City. Greenberg Glusker focuses on bankruptcy, reorganization & capital recovery, corporate, finance & securities, digital media and technology, entertainment, environment, real estate, litigation, and taxation. Greenberg Glusker has signed a lease for three suites in the south tower on the 26th, 27th and 31st floors totaling 83,199 SF and is expected to being paying rent and take occupancy in March 2020. The firm is expected to pay $66.00 gross rent PSF starting in March 2020. We cannot assure you Greenberg Glusker will begin paying rent or take occupancy as expected or at all. Greenberg Glusker has a one-time right to terminate its lease as of March 1, 2032 upon written notice on or before March 1, 2031 and the payment of a termination fee.
THE INFORMATION IN THIS STRUCTURAL AND COLLATERAL TERM SHEET IS NOT COMPLETE AND MAY BE AMENDED PRIOR TO THE TIME OF SALE. THIS TERM SHEET IS NOT AN OFFER TO SELL THESE SECURITIES AND IT IS NOT A SOLICITATION OF AN OFFER TO BUY THESE SECURITIES IN ANY JURISDICTION WHERE THE OFFER OR SALE IS NOT PERMITTED.
119
| 2029 & 2049 Century Park East Los Angeles, CA 90067 | Collateral Asset Summary – Loan No. 12 Century Plaza Towers | Cut-off Date Balance: Cut-off Date LTV Ratio: UW NCF DSCR: UW NOI Debt Yield: | $20,000,000 39.1% 4.08x 13.5% |
The following table presents certain information relating to the leases at the Century Plaza Towers Property:
| Tenant Summary(1) | |||||||||
| Tenant Name | Credit Rating (Fitch/Moody's/ S&P)(2) | Net Rentable Area (SF) | Approximate % of Net Rentable Area (SF) | Annual UW Base Rent | % of Total Annual UW Base Rent | Annual UW Base Rent PSF(3) | Lease Expiration | Renewal Options | Termination Option |
| Bank of America(4) | A+/A2/A- | 149,508 | 6.2% | $8,518,731 | 6.5% | $56.98 | Various | 2 x 5 year | Y |
| Manatt Phelps(5) | NR/NR/NR | 116,366 | 4.8% | $7,245,253 | 5.5% | $62.26 | 4/30/2035 | 2 x 5 year | Y |
| JP Morgan | AA-/A2/A- | 97,726 | 4.1% | $5,570,382 | 4.2% | $57.00 | 8/31/2021 | 2 x 5 year | N |
| Kirkland & Ellis(6) | NR/NR/NR | 85,664 | 3.6% | $5,892,759 | 4.5% | $68.79 | 12/31/2034 | 2 x 5 year | Y |
| Greenberg Glusker(7) | NR/NR/NR | 83,199 | 3.5% | $5,491,134 | 4.2% | $66.00 | 2/28/2035 | 2 x 5 year | Y |
| Venable LLP | NR/NR/NR | 81,817 | 3.4% | $4,720,841 | 3.6% | $57.70 | 12/31/2025 | 1 x 5 year | N |
| Westfield(8) | NR/NR/NR | 81,124 | 3.4% | $4,242,785 | 3.2% | $52.30 | 4/30/2028 | 2 x 5 year | Y |
| Seyfarth Shaw | NR/NR/NR | 80,160 | 3.3% | $6,293,362 | 4.8% | $78.51 | 8/31/2021 | 2 x 5 year | N |
| Proskauer Rose(9) | NR/NR/NR | 70,195 | 2.9% | $4,019,709 | 3.1% | $57.26 | 10/31/2030 | 2 x 5 year | Y |
| Mitchell Silberberg Knupp(10) | NR/NR/NR | 69,396 | 2.9% | $3,913,934 | 3.0% | $56.40 | 6/30/2034 | 2 x 5 year | Y |
| Total Major Tenants | 915,155 | 38.1% | $55,908,890 | 42.6% | $61.09 | ||||
| Other Tenants | 1,315,465 | 54.8% | $75,260,840 | 57.4% | $57.21 | ||||
| Vacant | 171,021 | 7.1% | $0 | 0.0% | $0.00 | ||||
| Total/Wtd. Avg. | 2,401,641 | 100.0% | $131,169,730 | 100.0% | $58.80 | ||||
| (1) | Information is based on the underwritten rent roll. |
| (2) | Certain ratings are those of the parent company, whether or not the parent guarantees the lease. |
| (3) | Wtd. Avg. Annual UW Base Rent PSF excludes vacant space. |
| (4) | The NRA of Bank of America includes 124,723 SF occupied by Bank of America on floors 1 through 14 and 24,785 SF occupied by Merrill Lynch on floors 25 through 33. In addition, the NRA for Bank of America includes 26,664 SF, as to which Bank of America is expected to begin paying rent and taking occupancy in January 2020. With respect to the additional space on the 13th floor of the south tower, we cannot assure you that Bank of America will begin paying rent or take occupancy as expected or at all. Bank of America has various lease expiration dates: (i) 106,890 SF with a lease expiration date of September 30, 2029, (ii) 17,833 SF with a lease expiration date of September 30, 2024 and (iii) 24,785 SF related to the Merrill Lynch space, with a lease expiration date of June 30, 2022. Bank of America has the right to terminate its lease as of September 30, 2026 upon written notice on or before September 30, 2025 and the payment of a termination fee in the amount of $1,908,666. |
| (5) | Manatt Phelps is expected to begin paying rent and take occupancy in stages in March 2020, with full occupancy of the space expected in May 2020. We cannot assure you that Manatt Phelps will begin paying rent or take occupancy as expected or at all. |
| (6) | Kirkland & Ellis is expected to begin paying rent and take occupancy in January 2020. We cannot assure you that Kirkland & Ellis will begin paying rent or take occupancy as expected or at all. Kirkland & Ellis has a one-time right to terminate its lease as of January 1, 2032 upon written notice on or before 1 January 1, 2031 and the payment of a termination fee. |
| (7) | Greenberg Glusker has signed a lease for three suites in the south tower on the 26th, 27th and 31st floors totaling 83,199 SF and is expected to being paying rent and take occupancy in March 2020. The firm is expected to pay $66.00 gross rent PSF starting in March 2020. We cannot assure you Greenberg Glusker will begin paying rent or take occupancy as expected or at all.Greenberg Glusker has a one-time right to terminate its lease as of March 1, 2032 upon written notice on or before March 1, 2031 and the payment of a termination fee. |
| (8) | Westfield has a one-time right to terminate its lease on April 30, 2025, with 15 months’ prior notice and the payment of a termination fee. |
| (9) | Proskauer Rosehas a one-time right to terminate its lease on October 31, 2025, upon written notice on or before October 31, 2024 and the payment of a termination fee. |
| (10) | Mitchell Silberberg Knupphas a one-time right to terminate its lease on June 30, 2029, upon written notice on or before June 30, 2028 and the payment of a termination fee. |
THE INFORMATION IN THIS STRUCTURAL AND COLLATERAL TERM SHEET IS NOT COMPLETE AND MAY BE AMENDED PRIOR TO THE TIME OF SALE. THIS TERM SHEET IS NOT AN OFFER TO SELL THESE SECURITIES AND IT IS NOT A SOLICITATION OF AN OFFER TO BUY THESE SECURITIES IN ANY JURISDICTION WHERE THE OFFER OR SALE IS NOT PERMITTED.
120
| 2029 & 2049 Century Park East Los Angeles, CA 90067 | Collateral Asset Summary – Loan No. 12 Century Plaza Towers | Cut-off Date Balance: Cut-off Date LTV Ratio: UW NCF DSCR: UW NOI Debt Yield: | $20,000,000 39.1% 4.08x 13.5% |
The following table presents certain information relating to the lease rollover schedule at the Century Plaza Towers Property:
| Lease Rollover Schedule(1)(2) | ||||||||
| Year | # of Leases Rolling | SF Rolling | Approx. % of Total SF Rolling | Approx. Cumulative % of SF Rolling | UW Base Rent PSF Rolling(3) | Total UW Base Rent Rolling | Approx. % of Total UW Base Rent Rolling | Approx. Cumulative % of Total UW Base Rent Rolling |
| MTM | 1 | 691 | 0.0% | 0.0% | $27.01 | $18,664 | 0.0% | 0.0% |
| 2019 | 1 | 714 | 0.0% | 0.1% | $37.80 | $26,989 | 0.0% | 0.0% |
| 2020 | 23 | 96,896 | 4.0% | 4.1% | $50.13 | $4,857,092 | 3.7% | 3.7% |
| 2021 | 22 | 276,557 | 11.5% | 15.6% | $63.47 | $17,553,318 | 13.4% | 17.1% |
| 2022 | 14 | 122,719 | 5.1% | 20.7% | $58.72 | $7,206,505 | 5.5% | 22.6% |
| 2023 | 11 | 89,979 | 3.7% | 24.5% | $56.38 | $5,073,213 | 3.9% | 26.5% |
| 2024 | 15 | 224,254 | 9.3% | 33.8% | $60.00 | $13,455,101 | 10.3% | 36.7% |
| 2025 | 11 | 258,081 | 10.7% | 44.5% | $57.45 | $14,826,378 | 11.3% | 48.0% |
| 2026 | 4 | 76,664 | 3.2% | 47.7% | $59.56 | $4,565,856 | 3.5% | 51.5% |
| 2027 | 4 | 79,651 | 3.3% | 51.1% | $58.43 | $4,654,199 | 3.5% | 55.1% |
| 2028 | 2 | 98,484 | 4.1% | 55.2% | $53.30 | $5,249,665 | 4.0% | 59.1% |
| 2029 | 9 | 257,405 | 10.7% | 65.9% | $56.29 | $14,489,056 | 11.0% | 70.1% |
| 2030 | 5 | 152,406 | 6.3% | 72.2% | $61.99 | $9,448,208 | 7.2% | 77.3% |
| 2030 & Beyond(4) | 6 | 496,119 | 20.7% | 92.9% | $59.96 | $29,745,487 | 22.7% | 100.0% |
| Vacant | 0 | 171,021 | 7.1% | 100.0% | $0.00 | $0 | 0.0% | 100.0% |
| Total/Wtd. Avg. | 128 | 2,401,641 | 100.0% | $58.80 | $131,169,730 | 100.0% | ||
| (1) | Information is based on the underwritten rent roll. |
| (2) | Certain tenants may have lease termination options that are exercisable prior to the originally stated expiration date of the related lease and that are not considered in the lease rollover schedule. |
| (3) | Wtd. Avg. UW Base Rent PSF Rolling excludes vacant space. |
| (4) | Includes amenity space. |
The Market. The Century Plaza Towers Property is located in the Century City district of the city of Los Angeles. Century City is an urban center in Los Angeles, and is considered the “CBD” of the Westside Los Angeles market. Century City contains in excess of 10 million SF of office space in addition to a “super” regional mall (Century City Shopping Center), major hotels and condominium developments. The southern portion of Century City includes 20th Century Fox Studios. Century City is a part of the West Los Angeles area, and the Century Plaza Towers Property is situated at the east corner of Santa Monica Boulevard and Century Park East. The location is approximately 10 miles west of downtown Los Angeles, five miles east of Santa Monica and the Pacific Ocean, and seven miles north of the Los Angeles International Airport. West Los Angeles is generally within the boundaries north of Venice Boulevard, east of Bundy Drive/Centinela Avenue, south of Sunset Boulevard, and west of La Cienega Boulevard. West Los Angeles includes other affluent neighborhoods and residential communities of Bel Air, Beverly Hills, Brentwood, and West Hollywood.
The Century Plaza Towers Property is located in the Century City submarket of West Los Angeles, California. Situated between Beverly Hills to the east, Westwood, Brentwood, and Santa Monica to the west, and the residential neighborhoods of Bel Air, Holmby Hills, and Hollywood Hills to the north, Century City is located near the Westside’s amenities and housing communities. The Century Plaza Towers Property has access to the Santa Monica (I-10) and San Diego (I-405) Freeways and several additional east-west thoroughfares including Santa Monica Boulevard and Olympic Boulevard. Century City is the largest office submarket in terms of total inventory within the larger West Los Angeles market area. The Century City office market contains approximately 10.4 million SF of office inventory as of the second quarter of 2019. Approximately 20 professional office buildings with an average age of 42 years comprise the Century City office market. The micro-submarket generally appeals to more traditional, high-rise occupants, many of which have ties to the entertainment industry. The Century City office submarket has experienced an average annual net absorption of approximately 119,000 SF over the past five years. Over the past decade, net absorption was approximately 6,200 SF annually, which corresponds to the significant losses which occurred as a result of the “great recession”. The submarket achieved positive absorption of more than 1.8 million SF during the five-year period from 2003 to 2007. As of year-end 2018, positive absorption totaled 71,900 SF and is currently positive through the first half of 2019 at 112,611 SF.
THE INFORMATION IN THIS STRUCTURAL AND COLLATERAL TERM SHEET IS NOT COMPLETE AND MAY BE AMENDED PRIOR TO THE TIME OF SALE. THIS TERM SHEET IS NOT AN OFFER TO SELL THESE SECURITIES AND IT IS NOT A SOLICITATION OF AN OFFER TO BUY THESE SECURITIES IN ANY JURISDICTION WHERE THE OFFER OR SALE IS NOT PERMITTED.
121
| 2029 & 2049 Century Park East Los Angeles, CA 90067 | Collateral Asset Summary – Loan No. 12 Century Plaza Towers | Cut-off Date Balance: Cut-off Date LTV Ratio: UW NCF DSCR: UW NOI Debt Yield: | $20,000,000 39.1% 4.08x 13.5% |
The following chart provides a statistical overview of the overall West Los Angeles office market as of second quarter 2019:
| West Los Angeles - Market Statistics | |||||
| Market | Total Inventory (SF) | Overall Vacancy | Direct Vacancy | YTD Direct Net Absorption | Weighted Average Rental Rate |
| Century City | 10,383,273 | 6.9% | 6.1% | 112,611 | $52.72 |
| Beverly Hills | 6,477,694 | 10.8% | 10.2% | 38,654 | $64.62 |
| Brentwood | 3,329,333 | 10.6% | 9.7% | 3,206 | $48.78 |
| Culver City | 4,845,469 | 21.8% | 21.0% | 137,290 | $49.37 |
| Hollywood | 3,504,226 | 12.9% | 10.4% | -62,987 | $53.87 |
| Marina del Rey/Venice | 1,342,454 | 12.1% | 11.7% | 97,740 | $61.09 |
| Miracle Mile | 4,390,712 | 17.9% | 17.3% | -15,601 | $48.92 |
| Olympic Corridor | 2,535,449 | 13.9% | 12.1% | -164,243 | $64.73 |
| Playa Vista | 3,606,568 | 13.3% | 10.6% | 291,186 | $62.58 |
| Santa Monica | 8,939,166 | 11.5% | 9.6% | 297,996 | $74.38 |
| West Hollywood | 2,669,054 | 9.1% | 6.9% | 59,386 | $54.28 |
| Westside Other | 3,386,487 | 10.2% | 10.0% | -53,075 | $46.55 |
| Westwood | 3,147,809 | 14.5% | 13.0% | 13,268 | $59.58 |
| Total West Los Angeles Market | 58,557,694 | 12.2% | 10.9% | 755,431 | $57.03 |
Source:Appraisal
Operating History and Underwritten Net Cash Flow.The following table presents certain information relating to the historical operating performance and the Underwritten Net Cash Flow at the Century Plaza Towers Property:
| Cash Flow Analysis | ||||||
| 2016 | 2017 | 2018 | 9/30/2019 TTM | UW | UW PSF | |
| Gross Potential Rent | $93,728,374 | $96,736,098 | $101,042,428 | $97,138,295 | $145,509,506 | $60.59 |
| Total Recoveries | $2,366,196 | $3,084,229 | $4,320,460 | $4,341,561 | $3,618,229 | $1.51 |
| Other Income | $17,845,028 | $17,558,759 | $19,954,557 | $19,410,804 | $18,203,977 | $7.58 |
| Less Vacancy & Credit Loss | $0 | $0 | $0 | $0 | ($8,715,744) | ($3.63) |
| Effective Gross Income | $113,939,597 | $117,379,087 | $125,317,446 | $120,890,660 | $158,615,968 | $66.04 |
| Real Estate Taxes | $7,612,013 | $7,958,382 | $8,149,815 | $8,306,243 | $8,272,735 | $3.44 |
| Insurance | $2,985,305 | $2,788,578 | $2,735,450 | $2,685,527 | $2,678,997 | $1.12 |
| Other Expenses | $22,558,934 | $23,431,996 | $25,407,626 | $26,555,972 | $26,518,479 | $11.04 |
| Total Operating Expenses | $33,156,253 | $34,178,955 | $36,292,891 | $37,547,742 | $37,470,212 | $15.60 |
| Net Operating Income(1) | $80,783,345 | $83,200,132 | $89,024,555 | $83,342,918 | $121,145,756 | $50.44 |
| Capital Expenditures | $0 | $0 | $0 | $0 | $480,328 | $0.20 |
| TI/LC | $0 | $0 | $0 | $0 | $8,415,062 | $3.50 |
| Net Cash Flow | $80,783,345 | $83,200,132 | $89,024,555 | $83,342,918 | $112,250,366 | $46.74 |
| Occupancy % | 87.0% | 84.6% | 83.5% | 92.9%(2) | 92.8%(2) | |
| NOI DSCR(3) | 2.95x | 3.03x | 3.25x | 3.04x | 4.41x | |
| NCF DSCR(3) | 2.95x | 3.03x | 3.25x | 3.04x | 4.08x | |
| NOI Debt Yield(3) | 9.0% | 9.2% | 9.9% | 9.3% | 13.5% | |
| NCF Debt Yield(3) | 9.0% | 9.2% | 9.9% | 9.3% | 12.5% | |
| (1) | The increase in UW Net Operating Income from 9/30/2019 TTM to UW Net Operating Income is primarily attributed to (i) $2,354,778 in straight line rent taken through the earlier of the loan term or the lease term for 13 tenants, (ii) $3,269,254 of rent steps taken through October 2020 and (iii)new leasing that has been executed in 2019, accounting for 20.6% of NRA and 24.6% of UW Gross Potential Rent. |
| (2) | The underwritten economic vacancy is 5.2%. The Century Plaza Towers Property was 92.9% leased as of October 1, 2019. |
| (3) | Debt service coverage ratios and debt yields are based on the Century Plaza Towers Senior Loan and exclude the Century Plaza Towers Subordinate Companion Loans. |
Transfer of Development Credits. If no event of default has occurred and is continuing under the Century Plaza Towers Whole Loan documents, the Century Plaza Towers Borrower has the right to convert the windowless top two floors (43rd and 44th floors) of each of the two towers comprising the Century Plaza Towers Property (the “Conversion Space”) into non-occupiable space and to transfer the development credits associated with the Conversion Space in connection with the anticipated commencement of the construction of an additional building at the adjacent 2000 Avenue of the Stars parcel owned by an affiliate of the Century Plaza Towers Borrower or to a third party in connection with a sale of the 2000 Avenue of the Stars parcel to a third party (the “Century Plaza Towers Conversion and Transfer”), provided that the Century Plaza Towers Borrower satisfies certain conditions set forth in the Century Plaza Towers Whole Loan documents, including, among others, (A) such Century Plaza Towers Conversion and Transfer is not reasonably
THE INFORMATION IN THIS STRUCTURAL AND COLLATERAL TERM SHEET IS NOT COMPLETE AND MAY BE AMENDED PRIOR TO THE TIME OF SALE. THIS TERM SHEET IS NOT AN OFFER TO SELL THESE SECURITIES AND IT IS NOT A SOLICITATION OF AN OFFER TO BUY THESE SECURITIES IN ANY JURISDICTION WHERE THE OFFER OR SALE IS NOT PERMITTED.
122
| 2029 & 2049 Century Park East Los Angeles, CA 90067 | Collateral Asset Summary – Loan No. 12 Century Plaza Towers | Cut-off Date Balance: Cut-off Date LTV Ratio: UW NCF DSCR: UW NOI Debt Yield: | $20,000,000 39.1% 4.08x 13.5% |
expected to have a material adverse effect on the Century Plaza Towers Property and is on terms and conditions that are commercially reasonable and at arm’s length, (B) the Century Plaza Towers Borrower either (1) prepays the Century Plaza Towers Whole Loan in the amount of (i) $30,000,000, plus (ii) if prior to the open prepayment date, a prepayment premium (the “Prepayment Premium”) equal to the greater of 1.00% and a yield maintenance premium on the amount prepaid (the “Conversion Prepayment Amount”) or (2) if the transfer of the development rights is to an affiliate of the Century Plaza Towers Borrower, the Century Plaza Towers Borrower deposits with the lender cash or a letter of credit as collateral for the Century Plaza Towers Whole Loan in the amount of (i) $30,000,000, plus (ii) 105% of the Prepayment Premium that would be due if the prepayment were made as of such date and (C) the Century Plaza Towers Conversion and Transfer complies with any REMIC requirements. If the Century Plaza Towers Borrower transfers the development rights to an affiliate and deposits cash or a letter of credit as collateral for the Century Plaza Towers Whole Loan, the Century Plaza Towers Borrower may return the development rights to the Century Plaza Towers Borrower along with the delivery of a clean date down endorsement to the lender, in which case the lender is required to return the cash or letter of credit (as applicable) to the Century Plaza Towers Borrower. If the Century Plaza Towers Borrower’s affiliate is granted a permit to begin work on the proposed project at the 2000 Avenue of the Stars parcel or if such permit is not granted within five years after transfer of the development credits and the development credits have not been transferred back to the Century Plaza Towers Borrower as described above, then the Century Plaza Towers Borrower is required to promptly prepay the outstanding principal balance of the Century Plaza Towers Whole Loan in an amount equal to the Conversion Prepayment Amount (with any cash deposit applied to such prepayment, provided that the Century Plaza Towers Borrower must promptly pay the lender any difference between such cash deposit and the Conversion Prepayment Amount).
THE INFORMATION IN THIS STRUCTURAL AND COLLATERAL TERM SHEET IS NOT COMPLETE AND MAY BE AMENDED PRIOR TO THE TIME OF SALE. THIS TERM SHEET IS NOT AN OFFER TO SELL THESE SECURITIES AND IT IS NOT A SOLICITATION OF AN OFFER TO BUY THESE SECURITIES IN ANY JURISDICTION WHERE THE OFFER OR SALE IS NOT PERMITTED.
123
| Various | Collateral Asset Summary – Loan No. 13 Westmont Red Roof Inn Portfolio II | Cut-off Date Balance: Cut-off Date LTV Ratio: UW NCF DSCR: UW NOI Debt Yield: | $17,628,611 66.3% 2.06x 16.1% |
| Mortgage Loan Information | Property Information | |||||||
| Mortgage Loan Seller: | Natixis | Single Asset/Portfolio: | Portfolio | |||||
| Credit Assessment (Fitch/KBRA/Moody’s): | NR/NR/NR | Location: | Various | |||||
| General Property Type: | Hospitality | |||||||
| Original Balance: | $17,692,093 | Detailed Property Type: | Limited Service | |||||
| Cut-off Date Balance: | $17,628,611 | Title Vesting: | Fee Simple | |||||
| % of Initial Pool Balance: | 2.4% | Year Built/Renovated: | Various | |||||
| Loan Purpose: | Acquisition | Size: | 463 Rooms | |||||
| Borrower Sponsor: | R&R Real Estate Investment Trust | Cut-off Date Balance per Room: | $38,075 | |||||
| Mortgage Rate: | 4.3400% | Maturity Date Balance per Room: | $27,877 | |||||
| Note Date: | 9/25/2019 | Property Manager: | R-West Management, LLC (borrower-related) | |||||
| First Payment Date: | 11/5/2019 | |||||||
| Maturity Date: | 10/5/2029 | |||||||
| Original Term to Maturity: | 120 months | |||||||
| Original Amortization Term: | 300 months | Underwriting and Financial Information | ||||||
| IO Period: | 0 months | UW NOI: | $2,832,366 | |||||
| Seasoning: | 2 months | UW NOI Debt Yield: | 16.1% | |||||
| Prepayment Provisions: | LO (26); DEF (90); O (4) | UW NOI Debt Yield at Maturity: | 21.9% | |||||
| Lockbox/Cash Mgmt Status: | Hard/Springing | UW NCF DSCR: | 2.06x | |||||
| Additional Debt Type: | N/A | Most Recent NOI: | $2,863,217 (6/30/2019 TTM) | |||||
| Additional Debt Balance: | N/A | 2nd Most Recent NOI: | $3,068,116 (12/31/2018) | |||||
| Future Debt Permitted (Type): | No (N/A) | 3rd Most Recent NOI: | $2,752,445 (12/31/2017) | |||||
| Reserves | Most Recent Occupancy: | 77.9% (6/30/2019) | ||||||
| Type | Initial | Monthly | Cap | 2nd Most Recent Occupancy: | 79.5% (12/31/2018) | |||
| RE Tax: | $80,168 | $28,551 | N/A | 3rd Most Recent Occupancy: | 77.8% (12/31/2017) | |||
| Insurance: | $35,804 | $8,951 | N/A | Appraised Value (as of): | $26,600,000 (Various) | |||
| FF&E: | $1,745,322 | $36,546(1) | N/A | Cut-off Date LTV Ratio: | 66.3% | |||
| Deferred Maintenance: | $20,625 | $0 | N/A | Maturity Date LTV Ratio: | 48.5% | |||
| Sources and Uses | ||||||
| Sources | Proceeds | % of Total | Uses | Proceeds | % of Total | |
| Loan Amount: | $17,692,093 | 66.4% | Purchase Price: | $24,500,000 | 91.9% | |
| Borrower Equity: | $8,966,066 | 33.6% | Reserves: | $1,881,919 | 7.1% | |
| Closing Costs: | $276,240 | 1.0% | ||||
| Total Sources: | $26,658,159 | 100.0% | Total Uses: | $26,658,159 | 100.0% | |
| (1) | Westmont Red Roof Inn Portfolio II Borrowers (as defined below) are required to deposit with lender on each payment date an amount equal to 5.0% of actual rents for the second prior month. |
The Mortgage Loan. The thirteenth largest mortgage loan (the “Westmont Red Roof Inn Portfolio II Mortgage Loan”) is evidenced by a promissory note with an original principal balance of $17,692,093, which is secured by a first priority fee mortgage encumbering a 463-room limited service hospitality portfolio consisting of a 108-room hospitality property located in St. Clairsville, Ohio (the “Red Roof Inn St. Clairsville Property”), a 125-room hospitality property located in Tempe, Arizona (the “Red Roof PLUS+ Phoenix Airport Property”), a 111-room hospitality property located in West Springfield, Massachusetts (the “Red Roof PLUS+ West Springfield Property”) and a 119-room hospitality property located in Naperville, Illinois (the “Red Roof PLUS+ Chicago Naperville Property”, collectively, the “Westmont Red Roof Inn Portfolio II Properties”). The proceeds of the Westmont Red Roof Inn Portfolio II Mortgage Loan, together with $8,966,066 in borrower equity, were primarily used to purchase the Westmont Red Roof Inn Portfolio II Properties, fund reserves and pay closing costs.
The Borrowers and the Borrower Sponsor. The borrowers are RRI Naperville LP, RRI St Clairsville LP, RRI Springfield LP and RRI Tempe LP (collectively, the “Westmont Red Roof Inn Portfolio II Borrowers”), each a single-purpose Delaware limited partnership structured to be bankruptcy remote. The Westmont Red Roof Inn Portfolio II Borrowers are 100.0% owned by R&R Real Estate Investment Trust, the guarantor of the Westmont Red Roof Inn Portfolio II Mortgage Loan.
R&R Real Estate Investment Trust is a Westmont Hospitality Group (“Westmont”) sponsored publicly traded Canadian REIT. Westmont is a privately held hospitality organization with ownership interests in and managed more than 1,000 hotels, and has a current portfolio encompassing more than 250 hotels in the US, Canada, Europe, and Japan. Westmont is one of the largest franchisees and co-owners of InterContinental Hotel Group hotels and Hilton hotels worldwide. Westmont has a diversified portfolio ranging from budget to mid-market business and large conference hotels to boutique hotels and luxury resorts. Westmont’s portfolio includes the Battery Wharf Hotel Boston, Park Hyatt Washington, D.C., Hyatt Regency Clearwater Beach, Marriott Manhattan Beach, Threadneedles Hotel London, Hotel Des Indes The Hague, Hotel Montalembert Paris, and the Hotel Royal Riviera Cap-Ferrat. In 2007, Westmont joined with Citibank to purchase Red Roof Inn from Accor for approximately $1.3 billion, which included the franchise company as well as approximately 230 corporate owned hotels. Westmont is the owner of the Red Roof brand, with the Westmont Red Roof Inn Portfolio II Properties representing corporate-owned properties. Westmont formed an affiliated management company to manage the Red Roof Inns. Westmont currently owns 127 Red Roof
THE INFORMATION IN THIS STRUCTURAL AND COLLATERAL TERM SHEET IS NOT COMPLETE AND MAY BE AMENDED PRIOR TO THE TIME OF SALE. THIS TERM SHEET IS NOT AN OFFER TO SELL THESE SECURITIES AND IT IS NOT A SOLICITATION OF AN OFFER TO BUY THESE SECURITIES IN ANY JURISDICTION WHERE THE OFFER OR SALE IS NOT PERMITTED.
124
| Various | Collateral Asset Summary – Loan No. 13 Westmont Red Roof Inn Portfolio II | Cut-off Date Balance: Cut-off Date LTV Ratio: UW NCF DSCR: UW NOI Debt Yield: | $17,628,611 66.3% 2.06x 16.1% |
Inns. As of June 30, 2019, R&R Real Estate Investment Trust reported total assets valued at $70.7 million, liquidity of $8.2 million, and a net worth of $16.9 million. R&R Real Estate Investment Trust’s 2018 annual revenue totaled $15.5 million, and annual net income totaled $5.2 million.
The Properties. The Westmont Red Roof Inn Portfolio II Properties are comprised of three Red Roof PLUS+ hotels and one Red Roof Inn. Red Roof Inn is an economy hotel brand. Red Roof was founded in 1973 in Columbus, Ohio and has continuously operated since then. Launched in early-2014, Red Roof PLUS+ is an upscale economy lodging offering, providing guests with higher-quality furnishing, amenities, and services than a Red Roof Inn. At present, Red Roof has over 580 properties in the U.S., Brazil and Japan. Red Roof’s portfolio of brands includes Red Roof Inn (514 properties), Red Roof Plus+ (71 properties), HomeTowne Suites by Red Roof (54 properties) and The Red Collection (3 properties). Red Roof has experienced an extended period of growth since 2012, having increased its property count from approximately 350 to approximately 580. At present, 115 Red Roof properties are corporately owned. Red Roof is particularly noted for being pet friendly with one pet permitted per room. In 2018, USA Today awarded Red Roof Inn the best budget hotel brand.
The following table provides a summary of the individual Westmont Red Roof Inn Portfolio II Properties:
| Portfolio Summary | ||||||||||
| Property | City, State | Rooms | Year Built/ Renovated | Occ. % | Allocated Cut-off | % of Allocated Loan Amount | UW NCF | % of UW NCF | Appraisal Value | Current Franchise Expiration Date |
| Red Roof Inn St. Clairsville | St. Clairsville, OH | 108 | 1983/2014 | 88.8% | $5,699,476 | 32.3% | $706,209 | 29.5% | $8,600,000 | 9/25/2039 |
| Red Roof PLUS+ Phoenix Airport | Tempe, AZ | 125 | 1999/2016 | 76.9% | $4,970,473 | 28.2% | $690,863 | 28.9% | $7,500,000 | 9/25/2039 |
| Red Roof PLUS+ West Springfield | West Springfield, MA | 111 | 1988/2012 | 73.9% | $3,512,468 | 19.9% | $555,792 | 23.2% | $5,300,000 | 9/25/2039 |
| Red Roof PLUS+ Chicago Naperville | Naperville, IL | 119 | 1989/2012 | 72.8% | $3,446,195 | 19.5% | $440,951 | 18.4% | $5,200,000 | 9/25/2039 |
| Total/Wtd. Avg. | 463 | 77.9% | $17,628,611 | 100.0% | $2,393,814 | 100.0% | $26,600,000 | |||
Red Roof Inn St. Clairsville Property: The Red Roof Inn St. Clairsville Property is two-story, 108-room, limited service hotel situated on a 3.53-acre site at 68301 Red Roof Lane in St. Clairsville, Ohio. The Red Roof Inn St. Clairsville Property comprises two exterior-corridor buildings that were built in 1983, most recently renovated in 2014, and is currently branded as a Red Roof Inn. Amenities at the Red Roof Inn St. Clairsville Property include complimentary coffee, high-speed internet, guest laundry, and vending machines. Since 2015, approximately $292,573 ($2,709 per room) has been invested in capital improvements at the Red Roof Inn St. Clairsville Property. The major expenses included new soft goods and case goods, repairs to the flooring, exterior building repairs, and new signage. The Westmont Red Roof Inn Portfolio II Borrowers plan to invest an additional $357,947($3,314 per room) in capital expenditures at the Red Roof Inn St. Clairsville Property, which was reserved at origination of the Westmont Red Roof Inn Portfolio II Mortgage Loan and is expected to be completed in 2019. The main improvements will consist of upgrading case goods, mattresses and bedding, soft goods, and the bathroom.
A summary of the Red Roof Inn St. Clairsville Property’s historical performance is provided below:
| Red Roof Inn St. Clairsville Property - Historical Occupancy, ADR, RevPAR(1) | |||||||||
| Red Roof Inn St. Clairsville Property | Competitive Set(2) | Penetration Factor | |||||||
| Year | Occupancy | ADR | RevPAR | Occupancy | ADR | RevPAR | Occupancy | ADR | RevPAR |
| 2016 | 58.3% | $54.45 | $31.76 | 48.0% | $79.45 | $38.11 | 121.6% | 68.5% | 83.3% |
| 2017 | 87.7% | $52.79 | $46.31 | 69.4% | $77.70 | $53.94 | 126.3% | 67.9% | 85.8% |
| 2018 | 91.0% | $60.24 | $54.81 | 71.6% | $84.06 | $60.18 | 127.1% | 71.7% | 91.1% |
| 6/30/2019 TTM | 88.8% | $62.19 | $55.25 | 69.8% | $81.19 | $56.67 | 127.3% | 76.6% | 97.5% |
Source:Third party market research report
| (1) | The variances between the underwriting, the industry report and the appraisal with respect to Occupancy, ADR and RevPAR at the Red Roof Inn St. Clairsville Property are attributable to variances in reporting methodologies and/or timing differences. |
| (2) | The Competitive Set for 2016, 2017 and 2018 includes Days Inn St Clairsville, Wingate by Wyndham St Clairsville Wheeling, Super 8 St Clairsville Wheeling Area, Best Western St Clairsville Inn & Suites, Comfort Inn St Clairsville and Microtel Inn & Suites by Wyndham St Clairsville. The Comp Set for TTM 6/2019 includes Days Inn St Clairsville, Wingate by Wyndham St Clairsville Wheeling, Super 8 St Clairsville Wheeling Area, Americas Best Value Inn St Clairsville Wheeling, Best Western St Clairsville Inn & Suites, Comfort Inn St Clairsville, Microtel Inn & Suites by Wyndham St Clairsville and Sleep Inn & Suites Belmont St Clairsville. |
Red Roof PLUS+ Phoenix Airport Property: The Red Roof PLUS+ Phoenix Airport Property is a three-story, 125-room, upper-tier, economy, limited service hotel situated on a 3.08-acre site at 2135 West 15th Street in Tempe, Arizona. The Red Roof PLUS+ Phoenix Airport Property is comprised of one interior-corridor building that was built in 1999, most recently renovated in 2016, and is currently branded as a Red Roof PLUS+. Amenities at the Red Roof PLUS+ Phoenix Airport Property include an outdoor swimming pool, complimentary coffee, high-speed internet, and vending machines. Since 2015, approximately $1.5 million ($12,008 per room) has been invested in capital improvements at the Red Roof PLUS+ Phoenix Airport Property. The major expense was interior guestroom and flooring renovations, case goods, and soft goods upgrades completed in late 2016. The Westmont Red Roof Inn Portfolio II Borrowers plan to invest an additional $609,707 ($4,878 per room) in capital expenditures at the Red Roof PLUS+ Phoenix Airport Property, which amount was reserved at origination of the Westmont Red Roof Inn Portfolio II Mortgage Loan. The main improvements will consist of upgrading case goods, mattresses and bedding, soft goods, the exterior and the bathroom.
THE INFORMATION IN THIS STRUCTURAL AND COLLATERAL TERM SHEET IS NOT COMPLETE AND MAY BE AMENDED PRIOR TO THE TIME OF SALE. THIS TERM SHEET IS NOT AN OFFER TO SELL THESE SECURITIES AND IT IS NOT A SOLICITATION OF AN OFFER TO BUY THESE SECURITIES IN ANY JURISDICTION WHERE THE OFFER OR SALE IS NOT PERMITTED.
125
| Various | Collateral Asset Summary – Loan No. 13 Westmont Red Roof Inn Portfolio II | Cut-off Date Balance: Cut-off Date LTV Ratio: UW NCF DSCR: UW NOI Debt Yield: | $17,628,611 66.3% 2.06x 16.1% |
A summary of the Red Roof PLUS+ Phoenix Airport Property’s historical performance is provided below:
| Red Roof PLUS+ Phoenix Airport Property - Historical Occupancy, ADR, RevPAR(1) | |||||||||
| Red Roof PLUS+ Phoenix Airport Property | Competitive Set(2) | Penetration Factor | |||||||
| Year | Occupancy | ADR | RevPAR | Occupancy | ADR | RevPAR | Occupancy | ADR | RevPAR |
| 2016 | 66.5% | $59.23 | $39.39 | 69.6% | $65.68 | $45.71 | 95.6% | 90.2% | 86.2% |
| 2017 | 71.8% | $63.10 | $45.30 | 70.9% | $66.31 | $47.04 | 101.2% | 95.2% | 96.3% |
| 2018 | 76.9% | $65.34 | $50.23 | 71.4% | $67.20 | $47.99 | 107.6% | 97.2% | 104.7% |
| 6/30/2019 TTM | 76.9% | $65.74 | $50.58 | 72.2% | $70.19 | $50.70 | 106.5% | 93.7% | 99.8% |
Source:Third party market research report
| (1) | The variances between the underwriting, the industry report and the appraisal with respect to Occupancy, ADR and RevPAR at the Red Roof PLUS+ Phoenix Airport Property are attributable to variances in reporting methodologies and/or timing differences. |
| (2) | The Competitive Set includes La Quinta Inns & Suites Phoenix Sky Harbor Airport, Econo Lodge Phoenix Airport, Motel 6 Phoenix Tempe Priest Drive ASU and Ramada Tempe At Arizona Mills Mall. |
Red Roof PLUS+ West Springfield Property: The Red Roof PLUS+ West Springfield Property is a two-story, 111-room, upper-tier, economy, limited service hotel situated on a 3.04-acre site at 1254 Riverdale Street in West Springfield, Massachusetts. The Red Roof PLUS+ West Springfield Property comprises two exterior-corridor buildings that were built in 1988, most recently renovated in 2012, and is currently branded as a Red Roof PLUS+. Amenities at the Red Roof PLUS+ West Springfield Property include complimentary coffee, high-speed internet, guest laundry, and vending machines. Since 2015, approximately $286,678 ($2,583 per room) has been invested in capital improvements at the Red Roof PLUS+ West Springfield Property, the majority of which was invested in 2015. The major expenses included new mini-refrigerators, resurfacing and restriping the parking lot, ADA improvements, exterior repairs, and furniture upgrades. The Westmont Red Roof Inn Portfolio II Borrowers plan to invest an additional $464,660 ($4,186 per room) in capital expenditures at the Red Roof PLUS+ West Springfield Property, which amount was reserved at origination of the Westmont Red Roof Inn Portfolio II Mortgage Loan. The main improvements will consist of upgrading case goods, mattresses and bedding, soft goods, exterior and the bathroom.
A summary of the Red Roof PLUS+ West Springfield Property’s historical performance is provided below:
| Red Roof PLUS+ West Springfield Property - Historical Occupancy, ADR, RevPAR(1) | |||||||||
| Red Roof PLUS+ West Springfield Property | Competitive Set(2) | Penetration Factor | |||||||
| Year | Occupancy | ADR | RevPAR | Occupancy | ADR | RevPAR | Occupancy | ADR | RevPAR |
| 2016 | 77.6% | $71.70 | $55.66 | 47.5% | $74.58 | $35.44 | 163.4% | 96.1% | 157.0% |
| 2017 | 79.0% | $75.80 | $59.89 | 55.5% | $77.07 | $42.81 | 142.3% | 98.4% | 139.9% |
| 2018 | 78.1% | $81.85 | $63.94 | 63.6% | $82.28 | $52.30 | 122.9% | 99.5% | 122.2% |
| 6/30/2019 TTM | 73.8% | $76.54 | $56.52 | 56.3% | $79.60 | $44.80 | 131.2% | 96.2% | 126.2% |
Source:Third party market research report
| (1) | The variances between the underwriting, the industry report and the appraisal with respect to Occupancy, ADR and RevPAR at the Red Roof PLUS+ West Springfield Property are attributable to variances in reporting methodologies and/or timing differences. |
| (2) | The Competitive Set includes Quality Inn West Springfield, Motel 6 Springfield Chicopee, Super 8 West Springfield Route 5 and Comfort Inn & Suites West Springfield. |
Red Roof PLUS+ Chicago Naperville Property: The Red Roof PLUS+ Chicago Naperville Property is a three-story, 119-room, upper-tier, economy, limited service hotel situated on a 2.1-acre site at 1698 West Diehl Road in Naperville, Illinois. The Red Roof PLUS+ Chicago Naperville Property comprises two exterior-corridor buildings that were built in 1989, most recently renovated in 2012, and is currently branded as a Red Roof PLUS+. Amenities at the Red Roof PLUS+ Chicago Naperville Property include complimentary coffee, high-speed internet, guest laundry, and vending machines. Since 2015, approximately $350,450 ($2,945 per room) has been invested in capital improvements at the Red Roof PLUS+ Chicago Naperville Property. The major expenses included resurfacing and restriping the parking lot, and other exterior repairs. The Westmont Red Roof Inn Portfolio II Borrowers plan to invest an additional $313,008 ($2,630 per room) in capital expenditures at the Red Roof PLUS+ Chicago Naperville Property, which was reserved at origination of the Westmont Red Roof Inn Portfolio II Mortgage Loan and is expected to be completed in 2019. The main improvements will consist of upgrading case goods, mattresses and bedding, soft goods, and improvements to the bathroom and exterior.
THE INFORMATION IN THIS STRUCTURAL AND COLLATERAL TERM SHEET IS NOT COMPLETE AND MAY BE AMENDED PRIOR TO THE TIME OF SALE. THIS TERM SHEET IS NOT AN OFFER TO SELL THESE SECURITIES AND IT IS NOT A SOLICITATION OF AN OFFER TO BUY THESE SECURITIES IN ANY JURISDICTION WHERE THE OFFER OR SALE IS NOT PERMITTED.
126
| Various | Collateral Asset Summary – Loan No. 13 Westmont Red Roof Inn Portfolio II | Cut-off Date Balance: Cut-off Date LTV Ratio: UW NCF DSCR: UW NOI Debt Yield: | $17,628,611 66.3% 2.06x 16.1% |
A summary of the Red Roof PLUS+ Chicago Naperville Property’s historical performance is provided below:
| Red Roof PLUS+ Chicago Naperville Property - Historical Occupancy, ADR, RevPAR(1) | |||||||||
| Red Roof PLUS+ Chicago Naperville Property | Competitive Set(2) | Penetration Factor | |||||||
| Year | Occupancy | ADR | RevPAR | Occupancy | ADR | RevPAR | Occupancy | ADR | RevPAR |
| 2016 | 74.2% | $61.45 | $45.59 | 59.0% | $53.25 | $31.40 | 125.8% | 115.4% | 145.2% |
| 2017 | 74.1% | $59.75 | $44.26 | 64.6% | $55.81 | $36.03 | 114.7% | 107.1% | 122.8% |
| 2018 | 73.3% | $58.55 | $42.89 | 56.7% | $52.56 | $29.78 | 129.3% | 111.4% | 144.0% |
| 6/30/2019 TTM | 72.8% | $60.96 | $44.39 | 70.5% | $54.19 | $38.20 | 103.3% | 112.5% | 116.2% |
Source:Third party market research report
| (1) | The variances between the underwriting, the industry report and the appraisal with respect to Occupancy, ADR and RevPAR at the Red Roof PLUS+ Chicago Naperville Property are attributable to variances in reporting methodologies and/or timing differences. |
| (2) | The Competitive Set for 2016 includes Motel 6 Naperville, Model 6 Chicago Southwest Aurora, Best Western Naperville Inn, Extended Stay America Chicago Naperville and Super 8 Aurora Naperville Area. The Competitive Set for 2017, 2018 and 6/30/2019 TTM includes Motel 6 Naperville, Sleep Inn Naperville, Extended Stay America Chicago Naperville and Super 8 Aurora Naperville Area. |
The Market. The Westmont Red Roof Inn Portfolio II Properties are located in four cities throughout Ohio, Arizona, Massachusetts and Illinois.
St. Clairsville, Belmont County, Ohio: Belmont County is between Pittsburgh, Pennsylvania and Columbus, Ohio. Nearby attractions include the Carnegie Natural History Museum, the Columbus Zoo and Aquarium and Jamboree in the Hills concert site. The neighborhood contains large retail stores such as Kroger, Walmart, Sam’s Club, Lowe’s Home Improvement and Macy’s. The neighborhood also has restaurants such as Buffalo Wild Wings, Longhorn Steakhouse, Outback Steakhouse, Pizza Hut and Starbucks.
Tempe, Maricopa County, Arizona: The Phoenix CBSA is the financial, governmental, cultural, and transportation center for the region. Tourism is one of the main industries in the greater Phoenix area. In addition, several companies have made plans to add locations to the Phoenix CBSA, including Nationwide Reality Investors’ plan to break ground on the first phase of a 134-acre mixed use development which will include several commercial office buildings, a 460,000 SF regional headquarters building for Nationwide Reality Investors, as well as numerous retail and restaurant options. Phase 1 is expected to bring in approximately 2,200 employees to the area by the end of 2020. The Phoenix Sky Harbor International Airport is located 3.8 miles northwest of the Red Roof PLUS+ Phoenix Airport Property. The Red Roof PLUS+ Phoenix Airport Property is also situated in proximity with Phoenix Convention Center, Tempe Diablo Stadium and Arizona State University.
Springfield, Hampden County, Massachusetts: According to a third-party market research report, the Springfield CBSA has a population of approximately 629,005 residents and a total land area of 1,179 square miles in 2018. The City of Springfield is the third largest city in the Commonwealth of Massachusetts, behind Boston and Worcester, and has an estimated population of 154,960. Springfield is home to 25 colleges and universities including: University of Massachusetts, Amherst College, Mount Holyoke College, Westfield State University, Smith College, Springfield College and American International College. The Red Roof PLUS+ West Springfield Property is located along Riverdale Street adjacent to Interstate 91 and south of Interstate 90 in the city of West Springfield, Massachusetts. The surrounding area features several in-line shopping centers, restaurants, and local businesses. The shopping centers in neighborhood include, Costco Wholesale, ALDI, Kohl’s West Springfield, Five Below, and auto dealerships owned by the Bertera Auto Dealer Group. Furthermore, restaurants in close proximity to the Red Roof PLUS+ West Springfield Property include On the Border Mexican Grill & Cantina, Chili’s Grill & Bar, Longhorn Steakhouse, Pizza Hut and Carrabba’s Italian Grill.
Chicago, Du Page County, Illinois: The Red Roof PLUS+ Chicago Naperville Property is situated along the south side of Diehl Road adjacent to an Extended Stay America. The surrounding area features several in-line shopping centers, offices, and an industrial park. Naperville is a city in DuPage and a suburb of the greater Chicago market. The city is located 28 miles west of Chicago and approximately 25 miles southwest of O’Hare International Airport. The city is known for its historic district, parks, and the Naperville Riverwalk, a 1.75-mile brick path with bridges, fountains, meeting and event spaces, outdoor sculpture and artwork, and recreational facilities. McDowell Grove, a 465-acre nature park positioned on the DuPage River, is located 1.2 miles from the property. Much of the lodging demand in the area comes from commercial/corporate demand. Major demand generators within the Naperville area include AT&T, BP, ConAgra Foods, DeVry, Edwards Hospital, GE, GM, IBM, Volvo, Nokia, Nissan and Lowes Regional Office. Historically, Chicago has been seen as the business hub of the Midwest, with its suburbs, including Naperville, playing a big part in the city’s success. Within the Red Roof PLUS+ Chicago Naperville Property’s submarket, there are 144 buildings containing nearly 13.2 million SF of office space. This office space accounts for approximately 13% of the Chicago non-CBD office market. Another strong source of lodging demand comes from leisure. Notable leisure attractions in the neighborhood include the Naper Settlement, Brookfield Zoo, Downtown Chicago, Country Lakes Golf Course, Hollywood Casino, Morton Arboretum, Wheaton College and Centennial Beach.
THE INFORMATION IN THIS STRUCTURAL AND COLLATERAL TERM SHEET IS NOT COMPLETE AND MAY BE AMENDED PRIOR TO THE TIME OF SALE. THIS TERM SHEET IS NOT AN OFFER TO SELL THESE SECURITIES AND IT IS NOT A SOLICITATION OF AN OFFER TO BUY THESE SECURITIES IN ANY JURISDICTION WHERE THE OFFER OR SALE IS NOT PERMITTED.
127
| Various | Collateral Asset Summary – Loan No. 13 Westmont Red Roof Inn Portfolio II | Cut-off Date Balance: Cut-off Date LTV Ratio: UW NCF DSCR: UW NOI Debt Yield: | $17,628,611 66.3% 2.06x 16.1% |
Operating History and Underwritten Net Cash Flow. The following table presents certain information relating to the historical operating performance and the Underwritten Net Cash Flow at the Westmont Red Roof Inn Portfolio II Properties:
| Cash Flow Analysis | |||||
| 2017 | 2018 | 6/30/2019 TTM | UW | UW Per Room | |
| Occupancy | 77.8% | 79.5% | 77.9% | 76.8% | |
| ADR | $62.70 | $66.21 | $66.03 | $66.68 | |
| RevPAR | $48.78 | $52.66 | $51.45 | $51.21 | |
| Rooms Revenue | $8,243,154 | $8,899,637 | $8,695,245 | $8,653,458 | $18,690 |
| Other Income | $94,650 | $110,841 | $111,712 | $117,573 | $254 |
| Total Revenue | $8,337,804 | $9,010,478 | $8,806,957 | $8,771,031 | $18,944 |
| Total Expenses | $5,585,359 | $5,942,362 | $5,943,740 | $5,938,665 | $12,826 |
| Net Operating Income | $2,752,445 | $3,068,116 | $2,863,217 | $2,832,366 | $6,117 |
| FF&E | $333,513 | $360,419 | $352,278 | $438,552 | $947 |
| Net Cash Flow | $2,418,932 | $2,707,697 | $2,510,939 | $2,393,814 | $5,170 |
| NOI DSCR | 2.37x | 2.64x | 2.47x | 2.44x | |
| NCF DSCR | 2.08x | 2.33x | 2.16x | 2.06x | |
| NOI Debt Yield | 15.6% | 17.4% | 16.2% | 16.1% | |
| NCF Debt Yield | 13.7% | 15.4% | 14.2% | 13.6% | |
THE INFORMATION IN THIS STRUCTURAL AND COLLATERAL TERM SHEET IS NOT COMPLETE AND MAY BE AMENDED PRIOR TO THE TIME OF SALE. THIS TERM SHEET IS NOT AN OFFER TO SELL THESE SECURITIES AND IT IS NOT A SOLICITATION OF AN OFFER TO BUY THESE SECURITIES IN ANY JURISDICTION WHERE THE OFFER OR SALE IS NOT PERMITTED.
128
| Various | Collateral Asset Summary – Loan No. 14 Crimson Retail Portfolio | Cut-off Date Balance: Cut-off Date LTV Ratio: UW NCF DSCR: UW NOI Debt Yield: | $16,556,250 72.5% 1.83x 10.8% |
| Mortgage Loan Information | Mortgaged Property Information | |||||||
| Mortgage Loan Seller: | UBS AG | Single Asset/Portfolio: | Portfolio | |||||
| Credit Assessment (Fitch/KBRA/Moody’s): | NR/NR/NR | Location: | Various | |||||
| General Property Type: | Retail | |||||||
| Original Balance(1): | $16,556,250 | Detailed Property Type: | Various | |||||
| Cut-off Date Balance(1): | $16,556,250 | Title Vesting: | Fee Simple | |||||
| % of Initial Pool Balance: | 2.2% | Year Built/Renovated: | Various/Various | |||||
| Loan Purpose(2): | Acquisition/Refinance | Size: | 318,378 SF | |||||
| Borrower Sponsor: | Pamela Day | Cut-off Date Balance per SF(1): | $104 | |||||
| Mortgage Rate: | 3.7860% | Maturity Date Balance per SF(1): | $88 | |||||
| Note Date: | 10/24/2019 | Property Manager: | Crimson Property Management, LLC | |||||
| First Payment Date: | 12/6/2019 | (borrower-related) | ||||||
| Maturity Date: | 11/6/2029 | |||||||
| Original Term to Maturity | 120 months | |||||||
| Original Amortization Term: | 360 months | |||||||
| IO Period: | 30 months | |||||||
| Seasoning: | 1 month | |||||||
| Prepayment Provisions(3): | LO (25); DEF (88); O (7) | |||||||
| Lockbox/Cash Mgmt Status: | Hard/Springing | |||||||
| Additional Debt Type(1): | Pari Passu | Underwriting and Financial Information | ||||||
| Additional Debt Balance(1): | $16,556,250 | UW NOI(5): | $3,592,496 | |||||
| Future Debt Permitted (Type): | No (N/A) | UW NOI Debt Yield(1): | 10.8% | |||||
| Reserves | UW NOI Debt Yield at Maturity(1): | 12.8% | ||||||
| Type | Initial | Monthly | Cap | UW NCF DSCR(1): | 2.66x (IO) | 1.83x (P&I) | ||
| RE Tax: | $94,740 | $66,968 | N/A | Most Recent NOI(5)(6): | $2,982,313 (Various) | |||
| Insurance: | $24,585 | $10,976 | N/A | 2nd Most Recent NOI(5): | $2,900,897 (12/31/2018) | |||
| Replacements: | $0 | $3,980 | $334,397 | 3rd Most Recent NOI(5): | $2,493,598 (12/31/2017) | |||
| TI/LC: | $215,000 | $15,919 | $1,146,161 | Most Recent Occupancy: | 95.5% (9/1/2019) | |||
| Deferred Maintenance: | $233,219 | $0 | N/A | 2nd Most Recent Occupancy(7): | 94.3% (12/31/2018) | |||
| TA/TI/LC: | $545,000 | $0 | N/A | 3rd Most Recent Occupancy(7): | 93.8% (12/31/2017) | |||
| Rent Concession Funds: | $23,688 | $0 | N/A | Appraised Value (as of): | $45,700,000 (Various) | |||
| Environmental Program Deductible(4): | $12,500 | $0 | N/A | Cut-off Date LTV Ratio(1): | 72.5% | |||
| Environmental Program Annual Registration(4): | $1,250 | $125 | N/A | Maturity Date LTV Ratio(1): | 61.5% | |||
| Sources and Uses | ||||||
| Sources | Proceeds | % of Total | Uses | Proceeds | % of Total | |
| Loan Amount(1): | $33,112,500 | 95.9% | Purchase Price(2): | $29,000,000 | 84.0% | |
| Borrower Equity: | $1,419,855 | 4.1% | Payoff(2): | $3,306,875 | 9.6% | |
| Reserves: | $1,149,982 | 3.3% | ||||
| Closing Costs: | $1,075,498 | 3.1% | ||||
| Total Sources: | $34,532,355 | 100.0% | Total Uses: | $34,532,355 | 100.0% | |
| (1) | The Crimson Retail Portfolio Mortgage Loan (as defined below) is part of the Crimson Retail Portfolio Whole Loan (as defined below), which is comprised of twopari passu promissory notes with an aggregate original principal balance of $33,112,500. The Cut-off Date Balance per SF, Maturity Date Balance per SF, UW NOI Debt Yield, UW NOI Debt Yield at Maturity, UW NCF DSCR, Cut-off Date LTV Ratio and Maturity Date LTV Ratio presented above are based on the Crimson Retail Portfolio Whole Loan. |
| (2) | At origination, the borrower sponsor acquired the Little Elm property and refinanced existing debt on the remaining three properties. |
| (3) | The Crimson Retail Portfolio Borrower (as defined below) may obtain a release of an individual property after the lockout period and before May 6, 2029, subject to, among other things: (i) defeasance in an amount equal to the greater of (a) with respect to the Little Elm property and the JoAnn Fabrics property, 120% of the allocated loan amount and (b) with respect to any other property, 115% of the allocated loan amount, (ii) the DSCR after the release is no less than the greater of (a) the DSCR prior to the release and (b) the DSCR as of the origination date, (iii) the LTV ratio after the release is no more than the lesser of (a) the LTV ratio prior to the release and (b) the LTV ratio as of the origination date and (iv) the debt yield after release is no less than the greater of (a) the debt yield prior to the release and (b) the debt yield as of the origination date. See “Description of the Mortgage Pool—Certain Terms of the Mortgage Loans – Partial Releases” in the Preliminary Prospectus. |
| (4) | The South Plaza property is currently enrolled in the dry cleaning solvent cleanup program (the “Environmental Program”) established by the dry cleaning contamination cleanup act. |
| (5) | The borrower sponsor acquired the Little Elm property at origination and the remaining properties in August 2019. As such, complete prior historical performance is not available. Most Recent NOI, 2nd Most Recent NOI and 3rd Most Recent NOI are comprised of the Little Elm property and South Plaza property only. UW NOI includes all four properties. |
| (6) | Most Recent NOI represents the trailing twelve months ending March 31, 2019 and annualized trailing seven months ending July 31, 2019 for the Little Elm property and South Plaza property, respectively. |
| (7) | The borrower sponsor acquired the Little Elm property at origination and the remaining properties in August 2019. As such, complete prior historical occupancies are not available. 2nd Most Recent Occupancy for the Little Elm property and South Plaza property is as of September 30, 2018 and June 30, 2018, respectively. Historical occupancy for the JoAnn Fabrics property was not available. |
THE INFORMATION IN THIS STRUCTURAL AND COLLATERAL TERM SHEET IS NOT COMPLETE AND MAY BE AMENDED PRIOR TO THE TIME OF SALE. THIS TERM SHEET IS NOT AN OFFER TO SELL THESE SECURITIES AND IT IS NOT A SOLICITATION OF AN OFFER TO BUY THESE SECURITIES IN ANY JURISDICTION WHERE THE OFFER OR SALE IS NOT PERMITTED.
129
| Various | Collateral Asset Summary – Loan No. 14 Crimson Retail Portfolio | Cut-off Date Balance: Cut-off Date LTV Ratio: UW NCF DSCR: UW NOI Debt Yield: | $16,556,250 72.5% 1.83x 10.8% |
The Mortgage Loan.The fourteenth largest mortgage loan (the “Crimson Retail Portfolio Mortgage Loan”) is part of a whole loan (the “Crimson Retail Portfolio Whole Loan”) evidenced by twopari passu promissory notes with an aggregate original principal balance of $33,112,500. The Crimson Retail Portfolio Whole Loan is secured by a first priority fee mortgage encumbering two anchored and two single-tenant shadow anchored retail properties totaling 318,378 SF located in Texas (one property), Florida (one property), and Georgia (two properties) (collectively, the “Crimson Retail Portfolio Properties” or the “Crimson Retail Portfolio”). The Promissory Note A-2, with an original principal balance of $16,556,250, represents the Crimson Retail Portfolio Mortgage Loan, and will be contributed to the UBS 2019-C18 Trust. The Crimson Retail Portfolio Whole Loan will be serviced pursuant to the pooling and servicing agreement for the CSAIL 2019-C18 Trust. See “Description of the Mortgage Pool—The Whole Loans—The Non-Serviced Pari Passu Whole Loans” and “Pooling and Servicing Agreement” in the Preliminary Prospectus.
| Crimson Retail Portfolio Whole Loan Summary | ||||
| Note | Original Balance | Cut-off Date Balance | Anticipated Note Holder | Controlling Piece |
| A-1 | $16,556,250 | $16,556,250 | CSAIL 2019-C18(1) | Yes |
| A-2 | $16,556,250 | $16,556,250 | UBS 2019-C18 | No |
| Total | $33,112,500 | $33,112,500 | ||
| (1) | Promissory Note A-1 is currently held by UBS AG, or an affiliated entity, and is expected to be contributed to CSAIL 2019-C18, which is expected to close on or about December 12, 2019. |
The Borrower and the Borrower Sponsor. The borrower is Crimson 1031 Portfolio, LLC (the “Crimson Retail Portfolio Borrower”), a Delaware limited liability company structured to be bankruptcy remote with one independent director. The Crimson Retail Portfolio Borrower is 100.0% owned by Crimson Master Manager, LLC, which is owned by Crimson EHOF 12444 Venice Partnership, LP (52%), Crimson EHOF 12575 Venice Partnership, LP (34%), and Crimson 1031, LLC (14%). Legal counsel to the Crimson Retail Portfolio Borrower delivered a non-consolidation opinion in connection with the origination of the Crimson Retail Portfolio Whole Loan. The borrower sponsor and non-recourse carveout guarantor for the Crimson Retail Portfolio Whole Loan is Pamela Day.
Ms. Day is an entrepreneur who has built several companies from the ground up including Crimson Holdings, a family of real estate companies and funds. The Crimson Companies is a full-service real estate investment, development and management company. Crimson Holdings has acquired or developed assets across multifamily, retail, office, and hospitality property types. Crimson Holding's projects are self-managed through Crimson Property Management, and fund administration is performed through Crimson Fund Advisors. Ms. Day serves as the Managing Partner for Crimson Fund Advisors and Investment Manager for all Crimson Funds and individual investments. Ms. Day has managed the firm’s investments and investment strategy since its inception in 2002. In addition to her 25 years of experience in real estate, Ms. Day has also built several financial technology companies such as Blazent, an enterprise software company, and Paladin Trust, a financial management trust company.
The Properties.The Crimson Retail Portfolio is comprised of two anchored and two single tenant shadow anchored retail properties, developed between 1974 and 2007 totaling 318,378 SF. The Crimson Retail Portfolio is 95.5% occupied as of September 1, 2019 by a mixture of 45 national, regional and local tenants. Anchor tenants at the Crimson Retail Portfolio Properties include Hobby Lobby (17.4% of Crimson Retail Portfolio NRA; 12.0% of Crimson Retail Portfolio underwritten base rent), Winn Dixie (16.2% of Crimson Retail Portfolio NRA; 6.6% of portfolio underwritten base rent), 24 Hour Fitness (9.8% of Crimson Retail Portfolio NRA; 17.7% of Crimson Retail Portfolio underwritten base rent), Beall’s Outlet (6.9% of Crimson Retail Portfolio NRA; 5.1% of Crimson Retail Portfolio underwritten base rent), JoAnn Fabrics (6.8% of Crimson Retail Portfolio NRA; 6.2% of portfolio underwritten base rent) and Office Depot (6.3% of Crimson Retail Portfolio NRA; 6.6% of portfolio underwritten base rent). No other tenant accounts for more than 3.4% of Crimson Retail Portfolio NRA or 3.2% of portfolio underwritten base rent.
The following table presents certain information relating to the Crimson Retail Portfolio Properties:
| Portfolio Summary | |||||||||
| Property | City, State | NRA (SF)(1) | Year Built/ Renovated | UW NCF | % of UW NCF | Occ. %(1)(2) | Allocated Whole Loan | % of ALA | Appraised Value |
| Little Elm | Little Elm, TX | 149,654 | 2007/N/A | $2,112,105 | 62.5% | 94.7% | $22,027,000 | 66.5% | $30,400,000 |
| South Plaza | Brooksville, FL | 127,224 | 1974, 1977, 1980/N/A | $855,890 | 25.3% | 95.0% | $6,666,000 | 20.1% | $9,200,000 |
| JoAnn Fabrics | Athens, GA | 21,500 | 2003/2019 | $200,075 | 5.9% | 100.0% | $2,282,000 | 6.9% | $3,150,000 |
| Office Depot | Athens, GA | 20,000 | 2003/N/A | $212,831 | 6.3% | 100.0% | $2,137,500 | 6.5% | $2,950,000 |
| Total/Wtd. Avg. | 318,378 | $3,380,901 | 100.0% | 95.5% | $33,112,500 | 100.0% | $45,700,000 | ||
Source:Appraisals
| (1) | Information is based on the underwritten rent roll. |
| (2) | Winn Dixie (40.6% of NRA at the South Plaza property) has executed a lease amendment to lease an additional 2,500 SF of space at the South Plaza property with rent of $9.83 PSF for its liquor sales operations. Including such space, the South Plaza property and Crimson Retail Portfolio has leased occupancy of 96.9% and 96.3%, respectively. |
Little Elm (47.0 % of NRA; 66.5% of ALA) – The Little Elm property is a 149,654 SF shopping center located in Little Elm, Texas. The Little Elm property was built in 2007 and consists of two buildings situated on a 17.3-acre site with 809 parking spaces (5.4 spaces per 1,000 SF). As of September 1, 2019, the Little Elm property was 94.7% leased to 25 tenants. The Little Elm property is anchored by Hobby Lobby and 24 Hour Fitness. The largest tenant, Hobby Lobby (37.0% of NRA; 19.7% of underwritten base rent), occupies 55,405 SF and has been at the Little Elm property since 2008 with a current base rent of $8.25 PSF expiring in April 2023 and has three, five-year renewal options remaining. The second largest tenant, 24 Hour Fitness (20.8% of NRA; 28.9% of underwritten base rent), occupies 31,175 SF and has been at the Little Elm property since 2008 with a current base rent of $21.48 PSF expiring in June 2023 and has four, five-year renewal options remaining. The third largest tenant, Dollar Tree (6.7% of NRA; 5.2% of underwritten base rent), occupies 10,000 SF and has been at the Little Elm property since 2008 with a current base rent of $12.00 PSF expiring in April 2023 and has one, five-year renewal option remaining.
THE INFORMATION IN THIS STRUCTURAL AND COLLATERAL TERM SHEET IS NOT COMPLETE AND MAY BE AMENDED PRIOR TO THE TIME OF SALE. THIS TERM SHEET IS NOT AN OFFER TO SELL THESE SECURITIES AND IT IS NOT A SOLICITATION OF AN OFFER TO BUY THESE SECURITIES IN ANY JURISDICTION WHERE THE OFFER OR SALE IS NOT PERMITTED.
130
| Various | Collateral Asset Summary – Loan No. 14 Crimson Retail Portfolio | Cut-off Date Balance: Cut-off Date LTV Ratio: UW NCF DSCR: UW NOI Debt Yield: | $16,556,250 72.5% 1.83x 10.8% |
South Plaza (40.0% of NRA; 20.1% of ALA) – The South Plaza property is a 127,224 SF shopping center located in Brooksville, Florida. The South Plaza property was built in phases in 1974, 1977 and 1980 and consists of four buildings situated on an 11.9-acre site with 492 parking spaces (3.9 spaces per 1,000 SF). As of September 1, 2019, the South Plaza property has physical occupancy of 95.0% by 19 tenants and leased occupancy of 96.9%. The South Plaza property is anchored by Winn Dixie and Bealls Outlet. The largest tenant, Winn Dixie (40.6% of NRA; 25.3% of underwritten base rent), currently occupies 51,700 SF and has been at the South Plaza property since 1992 with a current base rent of $4.85 PSF expiring in September 2029 and has four, five-year renewal options remaining. Winn Dixie reported sales of $216 PSF in 2018, which results in an occupancy cost of 3.1%. Winn Dixie executed a lease amendment in August 2019 to expand into the adjacent 2,500 SF vacant space for the Winn Dixie Liquor Store. The borrower sponsor is required to deliver the space by March 31, 2020 and the lease will be co-terminous with the main store lease. The second largest tenant, Bealls Outlet (17.2% of NRA; 19.4% of underwritten base rent), occupies 21,910 SF and has been at the South Plaza property since 2010 with a current base rent of $8.79 PSF expiring in April 2022 and has two, five-year renewal options remaining. The third largest tenant, Focus Fit (8.5% of NRA; 7.2% of underwritten base rent), occupies 10,800 SF and has been at the South Plaza property since September 2017 with a current base rent of $6.58 PSF expiring in August 2028 and has two, four-year renewal options remaining.
JoAnn Fabrics (6.8% of NRA; 6.9% of ALA) – The JoAnn Fabrics property is a 21,500 SF single-tenant freestanding retail property located in a shopping center anchored by Target (non-collateral) in Athens, Georgia. The JoAnn Fabrics property was built in 2003 and consists of one building situated on a 2.9-acre site with 84 parking spaces (3.9 spaces per 1,000 SF). As of September 1, 2019, the JoAnn Fabrics property was 100.0% leased to JoAnn Fabrics. JoAnn Fabrics has been at the JoAnn Fabrics property since 2019 with a current base rent of $11.00 PSF expiring in January 2030 and has three, five-year renewal options remaining.
Office Depot (6.3% of NRA; 6.5% of ALA) – The Office Depot property is a 20,000 SF single-tenant freestanding retail property located in a shopping center anchored by Target (non-collateral) in Athens, Georgia. The Office Depot property was built in 2003 and consists of one building situated on a 2.1-acre site with 88 parking spaces (4.4 spaces per 1,000 SF). As of September 1, 2019, the Office Depot property was 100.0% leased to Office Depot. Office Depot has been at the Office Depot property since 2004 with a current base rent of $12.50 PSF expiring in February 2024 and has two, five-year renewal options remaining. JoAnn Fabrics and Office Depot are located within the same shopping center.
The following table presents a summary regarding the largest tenants at Crimson Retail Portfolio Properties:
| Tenant Summary(1) | |||||||||||
| Tenant Name | Property | Credit Rating (Fitch/Moody’s/S&P)(2) | Tenant SF | % of SF | Annual UW Base Rent | % of Annual UW Base Rent | Annual UW Base Rent PSF(3) | Most Recently Reported Sales | Occ. Cost %(5) | Lease Expiration | |
| $(4) | PSF | ||||||||||
| Anchor Tenants | |||||||||||
| Hobby Lobby | Little Elm | NR/NR/NR | 55,405 | 17.4% | $457,091 | 12.0% | $8.25 | $6,790,338 | $123 | 12.4% | 4/30/2023 |
| Winn Dixie(6) | South Plaza | NR/NR/NR | 51,700 | 16.2% | $250,745 | 6.6% | $4.85 | $11,172,490 | $216 | 3.1% | 9/9/2029 |
| 24 Hour Fitness | Little Elm | NR/Caa1/NR | 31,175 | 9.8% | $669,639 | 17.7% | $21.48 | N/A | N/A | N/A | 6/30/2023 |
| Bealls Outlet | South Plaza | NR/NR/NR | 21,910 | 6.9% | $192,589 | 5.1% | $8.79 | N/A | N/A | N/A | 4/30/2022 |
| JoAnn Fabrics | JoAnn Fabrics | NR/NR/NR | 21,500 | 6.8% | $236,500 | 6.2% | $11.00 | N/A | N/A | N/A | 1/31/2030 |
| Office Depot | Office Depot | NR/NR/NR | 20,000 | 6.3% | $250,000 | 6.6% | $12.50 | N/A | N/A | N/A | 2/29/2024 |
| Total Anchor Tenants | 201,690 | 63.3% | $2,056,564 | 54.2% | $10.20 | ||||||
| Major Tenants | |||||||||||
| Focus Fit | South Plaza | NR/NR/NR | 10,800 | 3.4% | $71,064 | 1.9% | $6.58 | N/A | N/A | N/A | 8/31/2028 |
| Dollar Tree | Little Elm | NR/Baa3/NR | 10,000 | 3.1% | $120,000 | 3.2% | $12.00 | N/A | N/A | N/A | 4/30/2023 |
| Total Major Tenants | 20,800 | 6.5% | $191,064 | 5.0% | $9.19 | ||||||
| Other Tenants | 81,504 | 25.6% | $1,546,256 | 40.8% | $18.97 | ||||||
| Vacant | 14,384 | 4.5% | $0 | 0.0% | $0.00 | ||||||
| Total/Wtd. Avg. | 318,378 | 100.0% | $3,793,884 | 100.0% | $12.48 | ||||||
| (1) | Information is based on the underwritten rent roll. |
| (2) | Certain ratings are those of the parent company whether or not the parent guarantees the lease. |
| (3) | Wtd. Avg. Annual UW Rent PSF excludes vacant space. |
| (4) | Most Recently Reported Sales $ reflects the 12-month period ending May 31, 2019 for Hobby Lobby and December 31, 2018 for Winn Dixie. |
| (5) | Occ. Cost % is based on the contractual rent as of the underwritten rent roll and underwritten reimbursements divided by the respective year’s reported sales. |
| (6) | Winn Dixie (40.6% of NRA at the South Plaza property) has executed a lease amendment to lease an additional 2,500 SF of space at the South Plaza property with rent of $9.83 PSF for its liquor sales operations. Including such space, Winn Dixie accounts for 17.0% of Crimson Retail Portfolio NRA and 7.2% of Crimson Retail Portfolio underwritten base rent. |
THE INFORMATION IN THIS STRUCTURAL AND COLLATERAL TERM SHEET IS NOT COMPLETE AND MAY BE AMENDED PRIOR TO THE TIME OF SALE. THIS TERM SHEET IS NOT AN OFFER TO SELL THESE SECURITIES AND IT IS NOT A SOLICITATION OF AN OFFER TO BUY THESE SECURITIES IN ANY JURISDICTION WHERE THE OFFER OR SALE IS NOT PERMITTED.
131
| Various | Collateral Asset Summary – Loan No. 14 Crimson Retail Portfolio | Cut-off Date Balance: Cut-off Date LTV Ratio: UW NCF DSCR: UW NOI Debt Yield: | $16,556,250 72.5% 1.83x 10.8% |
The following table presents certain information relating to the lease rollover at Crimson Retail Portfolio Properties:
| Lease Rollover Schedule(1)(2) | ||||||||
| Year | # of Leases Rolling | SF Rolling | Approx. % of Total SF Rolling | Approx. Cumulative % of SF Rolling | UW Base Rent PSF Rolling(3) | Total UW Base Rent Rolling | Approx. % of Total Rent Rolling | Approx. Cumulative % of Total Rent Rolling |
| MTM | 3 | 6,795 | 2.1% | 2.1% | $18.51 | $125,794 | 3.3% | 3.3% |
| 2019 | 1 | 1,120 | 0.4% | 2.5% | $25.85 | $28,952 | 0.8% | 4.1% |
| 2020 | 6 | 8,867 | 2.8% | 5.3% | $20.41 | $180,980 | 4.8% | 8.8% |
| 2021 | 3 | 3,740 | 1.2% | 6.4% | $22.99 | $85,990 | 2.3% | 11.1% |
| 2022 | 8 | 38,611 | 12.1% | 18.6% | $12.30 | $474,848 | 12.5% | 23.6% |
| 2023 | 13 | 122,017 | 38.3% | 56.9% | $13.75 | $1,677,858 | 44.2% | 67.9% |
| 2024 | 7 | 35,244 | 11.1% | 68.0% | $17.02 | $599,953 | 15.8% | 83.7% |
| 2025 | 1 | 2,400 | 0.8% | 68.7% | $16.00 | $38,400 | 1.0% | 84.7% |
| 2026 | 0 | 0 | 0.0% | 68.7% | $0.00 | $0 | 0.0% | 84.7% |
| 2027 | 0 | 0 | 0.0% | 68.7% | $0.00 | $0 | 0.0% | 84.7% |
| 2028 | 1 | 10,800 | 3.4% | 72.1% | $6.58 | $71,064 | 1.9% | 86.6% |
| 2029 | 2 | 52,900 | 16.6% | 88.7% | $5.17 | $273,545 | 7.2% | 93.8% |
| 2030 & Beyond | 1 | 21,500 | 6.8% | 95.5% | $11.00 | $236,500 | 6.2% | 100.0% |
| Vacant(4) | 0 | 14,384 | 4.5% | 100.0% | $0.00 | $0 | 0.0% | 100.0% |
| Total/Wtd. Avg. | 46 | 318,378 | 100.0% | $12.48 | $3,793,884 | 100.0% | ||
| (1) | Information is based on the underwritten rent roll. |
| (2) | Certain tenants may have lease termination options that are exercisable prior to the stated expiration date of the subject lease or leases, which are not considered in the lease rollover schedule. |
| (3) | Wtd. Avg. UW Base Rent PSF Rolling excludes vacant space. |
| (4) | Winn Dixie (40.6% of NRA at the South Plaza property) has executed a lease amendment to lease an additional 2,500 SF of space at the South Plaza property with rent of $9.83 PSF and lease expiration in September 2029 for its liquor sales operations. Per the executed lease amendment, the borrower sponsor is required to complete landlord’s work and deliver the space on or before March 31, 2020. Such space has been underwritten as vacant. |
The Market. The Crimson Retail Portfolio is located in Little Elm, Texas (66.5% of ALA, 47.0% of NRA), Brooksville, Florida (20.1% of ALA, 40.0% of NRA), and Athens, Georgia (13.3% of ALA, 13.0% of NRA).
Little Elm, Texas – The Little Elm property is located approximately 5.6 miles northwest of downtown Frisco and approximately 33.0 miles north of downtown Dallas. According to the appraisal, the Little Elm property is located in the main trade area of Little Elm, along El Dorado Parkway, which is a major thoroughfare bisecting the neighborhood as well as the primary access to Denton and Frisco in an east to west direction. The Little Elm property is located at the intersection of El Dorado Parkway and Farm to Market Road 423, which has an average daily traffic count of 27,921 vehicles, according to a third party market research report. Other national retailers at the intersection include Walmart Supercenter, Lowe's Home Improvement, Walgreen's, and CVS Pharmacy, in addition to food and service-oriented providers such as Chase Bank, Wells Fargo Bank, Starbucks, Applebee’s, Wendy’s and Taco Bell. The Little Elm property is located in the East Lewisville submarket, which has inventory of approximately 1.9 million SF of retail space and as of the second quarter of 2019, had vacancy and asking rent of 2.8% and $20.30 PSF, respectively. Compared to asking rent of $14.17 PSF as of the second quarter of 2016, asking rent in the East Lewisville submarket exhibited a compounded average growth rate of 12.7%. Over the last three years, the East Lewisville submarket had average quarterly vacancy of 3.9%.
Brooksville, Florida – The South Plaza property is located approximately 44.2 miles north of downtown Tampa. According to the appraisal, the South Plaza property is located in the main trade area of Brooksville and the surrounding area of the South Plaza property is small town and rural in nature. The South Plaza property is located at the northwest intersection of Brooksville’s main thoroughfares, South Broad Street and Cortez Boulevard, which has an average daily traffic count of 18,213 vehicles, according to a third party market research report. Other national retailers in the area include Walmart Supercenter, Dollar Tree, Walgreen's, Publix Supermarket, Harbor Freight Tools, and Wawa, in addition to food and service-oriented providers such as Bank of America, PNC Bank, Burger King, Applebee’s, Dunkin Donuts and Domino’s Pizza. The South Plaza property is located in the Hernando County Retail submarket, which has inventory of approximately 9.4 million SF and as of the first quarter of 2019, had vacancy and asking rent of 5.0% and $12.18 PSF, respectively. Compared to asking rent of $10.83 PSF as of the first quarter of 2016, asking rent in the Hernando County Retail submarket exhibited a compounded average growth rate of 4.0%. Over the last three years, the Hernando County Retail submarket had average quarterly vacancy of 4.9%.
Athens, Georgia – The JoAnn Fabrics property and Office Depot property are freestanding retail properties located in Athens Marketplace, a shopping center anchored by the only Target in Athens (non-collateral), approximately 8.7 miles west of downtown Athens and 65.7 miles northeast of Atlanta. The next closest Target location is 22.4 miles west of the Athens Marketplace in Bethlehem. Other retailers in the Athens Marketplace include Game Stop, CVS Pharmacy, Hardee’s, and Catherines, none of which are collateral for the Crimson Retail Portfolio Whole Loan. The JoAnn Fabrics property and Office Depot property are located along Atlanta Highway, which is the primary commercial and retail corridor of Athens. Access to the area is also serviced by public transit bus. A public bus stop is located adjacent to the entrance of the Athens Marketplace. Bus route 20 connects downtown Athens and University of Georgia to Beechwood Shopping Center, St. Mary’s Hospital, Athens Marketplace (including the JoAnn Fabrics property and Office Depot property), and Georgia Square Mall. Located 1.9 miles west of the JoAnn Fabrics property and Office Depot property, Georgia Square Mall is a two-floor 673,000 SF shopping mall anchored by JCPenney, Belk, and Sears. University of Georgia, which is located 4.3 miles east of the JoAnn Fabrics property and Office Depot property just outside of downtown Athens, is the largest employer in Athens. As of the fall of 2018, the University of Georgia had enrollment of approximately 38,652 students in addition to approximately 10,741 employees.
The JoAnn Fabrics property and Office Depot property are located in the Westside Athens submarket, which has inventory of approximately 3.5 million SF and as of the second quarter of 2019, had vacancy and asking rent of 7.5% and $15.61 PSF, respectively. Compared to asking rent of $12.82 PSF as of
THE INFORMATION IN THIS STRUCTURAL AND COLLATERAL TERM SHEET IS NOT COMPLETE AND MAY BE AMENDED PRIOR TO THE TIME OF SALE. THIS TERM SHEET IS NOT AN OFFER TO SELL THESE SECURITIES AND IT IS NOT A SOLICITATION OF AN OFFER TO BUY THESE SECURITIES IN ANY JURISDICTION WHERE THE OFFER OR SALE IS NOT PERMITTED.
132
| Various | Collateral Asset Summary – Loan No. 14 Crimson Retail Portfolio | Cut-off Date Balance: Cut-off Date LTV Ratio: UW NCF DSCR: UW NOI Debt Yield: | $16,556,250 72.5% 1.83x 10.8% |
the second quarter of 2016, asking rent in the Westside Athens submarket exhibited a compounded average growth rate of 6.8%. Over the last three years, the Westside Athens submarket had average quarterly vacancy of 6.8%.
The following table presents certain market and demographic information with respect to Crimson Retail Portfolio Properties:
| Market and Demographics Summary | |||||||
| Property Name | NRA (SF)(1) | 5-Miles Radius Population(2) | 5-Miles Radius Average Household Income(2) | In-Place UW Base Rent PSF(1) | Market Rent PSF | Occ. %(1) | Market Vacancy |
| Little Elm | 149,654 | 158,470 | $149,552 | $16.34 | $17.29 | 94.7% | 95.0% |
| South Plaza | 127,224 | 26,427 | $64,571 | $8.21 | $8.61 | 95.0% | 95.0% |
| JoAnn Fabrics | 21,500 | 99,090 | $70,397 | $11.00 | $12.50 | 100.0% | 95.0% |
| Office Depot | 20,000 | 99,518 | $70,102 | $12.50 | $12.50 | 100.0% | 95.0% |
| Total/Wtd. Avg. | 318,378 | 97,992 | $105,257 | $12.48 | $13.20 | 95.5% | 95.0% |
Source: Appraisals
| (1) | Information is based on the underwritten rent roll, including rent increases through December 1, 2020. |
| (2) | Based on third party market research reports. |
Operating History and Underwritten Net Cash Flow. The following table presents certain information relating to the historical operating performance and the Underwritten Net Cash Flow at the Crimson Retail Portfolio Property:
| Cash Flow Analysis(1) | ||||||
| 2016 | 2017 | 2018 | TTM(2) | UW | UW PSF | |
| Base Rent(3) | $2,105,149 | $2,947,765 | $3,139,447 | $3,129,649 | $4,092,984 | $12.86 |
| Total Recoveries | $915,620 | $909,508 | $1,033,154 | $1,078,385 | $1,427,871 | $4.48 |
| Other Income | $16,468 | $4,965 | $1,843 | $2,913 | $0 | $0.08 |
| Less Vacancy & Credit Loss | $0 | $0 | $0 | $0 | ($403,674) | ($1.27) |
| Effective Gross Income | $3,037,237 | $3,862,238 | $4,174,445 | $4,210,947 | $5,117,181 | $16.07 |
| Total Expenses | $1,010,922 | $1,368,640 | $1,273,548 | $1,228,634 | $1,524,685 | $4.79 |
| Net Operating Income | $2,026,315 | $2,493,598 | $2,900,897 | $2,982,313 | $3,592,496 | $11.28 |
| Capital Expenditures | $0 | $0 | $0 | $0 | $47,757 | $0.15 |
| TI/LC | $0 | $0 | $0 | $0 | $163,838 | $0.51 |
| Net Cash Flow | $2,026,315 | $2,493,598 | $2,900,897 | $2,982,313 | $3,380,901 | $10.62 |
| Occupancy %(4) | 89.5% | 93.8% | 94.3% | 94.7% | 92.7%(5) | |
| NOI DSCR (P&I)(6) | 1.10x | 1.35x | 1.57x | 1.61x | 1.94x | |
| NCF DSCR (P&I)(6) | 1.10x | 1.35x | 1.57x | 1.61x | 1.83x | |
| NOI Debt Yield(6) | 6.1% | 7.5% | 8.8% | 9.0% | 10.8% | |
| NCF Debt Yield(6) | 6.1% | 7.5% | 8.8% | 9.0% | 10.2% | |
| (1) | The borrower sponsor acquired the Little Elm property at origination and the remaining Crimson Retail Portfolio Properties in August 2019. As such, complete prior historical performance is not available. 2016 represents the Little Elm property only. 2017, 2018 and TTM are comprised of the Little Elm property and South Plaza property only. UW includes all four properties. |
| (2) | TTM represents trailing 12 months ending March 31, 2019 for the Little Elm property and annualized trailing seven months ending July 31, 2019 for the South Plaza property. |
| (3) | UW Base Rent includes (i) contractual rent steps through December 1, 2020 totaling $20,604, (ii) straight line rent for investment grade tenant, Allstate Insurance totaling $365 and (iii) vacancy gross up totaling $298,735. |
| (4) | The borrower sponsor acquired the Little Elm property at origination and the remaining properties in August 2019. As such, complete prior historical occupancies are not available. 2018 Occupancy % for the Little Elm property and South Plaza property is as of September 30, 2018 and June 30, 2018, respectively. Historical occupancy for the JoAnn Fabrics property was not available. |
| (5) | UW Occupancy % is based on the economic vacancy of 7.3%. As of September 1, 2019, the Crimson Retail Portfolio Properties were 95.5% occupied. Winn Dixie (40.6% of NRA at the South Plaza property) has executed a lease amendment to lease an additional 2,500 SF of space at the South Plaza property with rent of $9.83 PSF for its liquor sales operations. Including such space, the South Plaza property and Crimson Retail Portfolio have leased occupancies of 96.9% and 96.3%, respectively. |
| (6) | Debt service coverage ratios and debt yields are based on the Crimson Retail Portfolio Whole Loan. |
THE INFORMATION IN THIS STRUCTURAL AND COLLATERAL TERM SHEET IS NOT COMPLETE AND MAY BE AMENDED PRIOR TO THE TIME OF SALE. THIS TERM SHEET IS NOT AN OFFER TO SELL THESE SECURITIES AND IT IS NOT A SOLICITATION OF AN OFFER TO BUY THESE SECURITIES IN ANY JURISDICTION WHERE THE OFFER OR SALE IS NOT PERMITTED.
133
1383 and 1385 North McDowell Petaluma, CA 94954 | Collateral Asset Summary – Loan No. 15 Redwood Technology Center | Cut-off Date Balance: Cut-off Date LTV Ratio: UW NCF DSCR: UW NOI Debt Yield: | $16,500,000 71.6% 1.55x 9.7% |
| Mortgage Loan Information | Property Information | |||||||
| Mortgage Loan Seller: | UBS AG | Single Asset/Portfolio: | Single Asset | |||||
Credit Assessment (Fitch/KBRA/Moody’s): | NR/NR/NR | Location: | Petaluma, CA 94954 | |||||
| General Property Type: | Mixed Use | |||||||
| Original Balance(1): | $16,500,000 | Detailed Property Type: | Office/Retail | |||||
| Cut-off Date Balance(1): | $16,500,000 | Title Vesting: | Fee Simple | |||||
| % of Initial Pool Balance: | 2.2% | Year Built/Renovated: | 2007-2014/N/A | |||||
| Loan Purpose: | Refinance | Size: | 154,611 SF | |||||
| Borrower Sponsor: | Matthew T. White | Cut-off Date Balance per SF(1): | $236 | |||||
| Mortgage Rate: | 4.5220% | Maturity Date Balance per SF(1): | $216 | |||||
| Note Date: | 11/8/2019 | Property Manager: | Basin Street Properties (borrower-related) | |||||
| First Payment Date: | 12/6/2019 | |||||||
| Maturity Date: | 11/6/2029 | |||||||
| Original Term to Maturity: | 120 months | |||||||
| Original Amortization Term: | 360 months | Underwriting and Financial Information | ||||||
| IO Period: | 60 months | UW NOI: | $3,555,746 | |||||
| Seasoning: | 1 month | UW NOI Debt Yield(1): | 9.7% | |||||
| Prepayment Provisions: | LO (25); DEF (90); O (5) | UW NOI Debt Yield at Maturity(1): | 10.6% | |||||
| Lockbox/Cash Mgmt Status: | Springing/Springing | UW NCF DSCR(1): | 2.06x (IO) | 1.55x (P&I) | ||||
| Additional Debt Type(1): | Pari Passu | Most Recent NOI: | $3,349,009 (8/31/2019 TTM) | |||||
| Additional Debt Balance(1): | $20,000,000 | 2nd Most Recent NOI: | $3,321,634 (12/31/2018) | |||||
| Future Debt Permitted (Type): | No (N/A) | 3rd Most Recent NOI: | $3,101,321 (12/31/2017) | |||||
| Reserves | Most Recent Occupancy(3): | 94.1% (7/31/2019) | ||||||
| Type | Initial | Monthly | Cap | 2nd Most Recent Occupancy: | 94.1% (12/31/2018) | |||
| RE Tax: | $17,459 | $8,730 | N/A | 3rd Most Recent Occupancy: | 97.0% (12/31/2017) | |||
| Insurance: | $26,719 | $3,107 | N/A | Appraised Value (as of): | $51,000,000 (10/8/2019) | |||
| Replacements: | $0 | $2,577 | $77,306 | Cut-off Date LTV Ratio(1): | 71.6% | |||
| TI/LC: | $750,000(2) | $19,327 | N/A | Maturity Date LTV Ratio(1): | 65.5% | |||
| Sources and Uses | ||||||
| Sources | Proceeds | % of Total | Uses | Proceeds | % of Total | |
| Loan Amount(1): | $36,500,000 | 100.0% | Loan Payoff: | $31,267,364 | 85.7% | |
| Preferred Equity Payoff: | $3,725,054 | 10.2% | ||||
| Reserves: | $794,178 | 2.2% | ||||
| Closing Costs: | $711,984 | 2.0% | ||||
| Return of Equity: | $1,420 | 0.0% | ||||
| Total Sources: | $36,500,000 | 100.0% | Total Uses: | $36,500,000 | 100.0% | |
| (1) | The Redwood Technology Center Mortgage Loan (as defined below) is part of the Redwood Technology Center Whole Loan (as defined below), which is comprised of fivepari passu promissory notes with an aggregate original principal balance of $36,500,000. The Cut-off Date Balance per SF, Maturity Date Balance per SF, UW NOI Debt Yield, UW NOI Debt Yield at Maturity, UW NCF DSCR, Cut-off Date LTV Ratio and Maturity Date LTV Ratio presented above are based on the Redwood Technology Center Whole Loan. |
| (2) | Ciena Corporation has leased suite 1385-200 (18,773 SF, 12.1% of NRA, 13.8% of underwritten base rent) since July 2016, but has not moved in and is not occupying such space. The space is currently in its shell condition, however, Ciena Corporation continues to pay contractual rent on such space. The lease provides for an expiration date in January 2025. At origination, the Redwood Technology Center Borrower (as defined below) escrowed $750,000 ($39.95 PSF of such dark space) into a TI/LC reserve (of which $250,000 may only be disbursed either in connection with improvements to such unutilized space, or following the re-leasing of the Ciena Corporation space in accordance with the related whole loan documents). |
| (3) | The largest tenant at the Redwood Technology Center Property (as defined below), Ciena Corporation, leases 57,673 SF (37.3% of NRA); however, the tenant is currently dark in 18,773 SF and continues to pay contractual rent on such space. Taking into account such dark space, the Redwood Technology Center Property has a physical occupancy of 81.9%. |
The Mortgage Loan. The fifteenth largest mortgage loan (the “Redwood Technology Center Mortgage Loan”) is part of a whole loan (the “Redwood Technology Center Whole Loan”) evidenced by fivepari passu promissory notes with an aggregate original principal balance of $36,500,000. The Redwood Technology Center Whole Loan is secured by a first priority fee mortgage encumbering a 154,611 SF Class A suburban office park located in Petaluma, California (the “Redwood Technology Center Property”). Promissory Notes A-3, A-4 and A-5, with an aggregate original principal balance of $16,500,000, represent the Redwood Technology Center Mortgage Loan, and will be included in the UBS 2019-C18 Trust. The below table summarizes the Redwood Technology Center Whole Loan. The Redwood Technology Center Whole Loan will be serviced pursuant to the pooling and servicing agreement for the UBS 2019-C18 Trust. See “Description of the Mortgage Pool—The Whole Loans—The Serviced Pari Passu Whole Loans” and “Pooling and Servicing Agreement” in the Preliminary Prospectus.
THE INFORMATION IN THIS STRUCTURAL AND COLLATERAL TERM SHEET IS NOT COMPLETE AND MAY BE AMENDED PRIOR TO THE TIME OF SALE. THIS TERM SHEET IS NOT AN OFFER TO SELL THESE SECURITIES AND IT IS NOT A SOLICITATION OF AN OFFER TO BUY THESE SECURITIES IN ANY JURISDICTION WHERE THE OFFER OR SALE IS NOT PERMITTED.
134
1383 and 1385 North McDowell Petaluma, CA 94954 | Collateral Asset Summary – Loan No. 15 Redwood Technology Center | Cut-off Date Balance: Cut-off Date LTV Ratio: UW NCF DSCR: UW NOI Debt Yield: | $16,500,000 71.6% 1.55x 9.7% |
| Redwood Technology Center Whole Loan Summary | ||||
| Note | Original Balance | Cut-off Date Balance | Anticipated Note Holder | Controlling Piece |
| A-1 | $10,000,000 | $10,000,000 | CSAIL 2019-C18(1) | No |
| A-2 | $10,000,000 | $10,000,000 | CSAIL 2019-C18(1) | No |
| A-3 | $6,500,000 | $6,500,000 | UBS 2019-C18 | Yes |
| A-4 | $5,000,000 | $5,000,000 | UBS 2019-C18 | No |
| A-5 | $5,000,000 | $5,000,000 | UBS 2019-C18 | No |
| Total | $36,500,000 | $36,500,000 | ||
| (1) | Promissory Notes A-1 and A-2 are currently held by UBS AG, or an affiliated entity, and are expected to be contributed to CSAIL 2019-C18, which is expected to close on or about December 12, 2019. |
The Borrower and Borrower Sponsor. The borrower is Redwood Tech DE SPE LLC (the “Redwood Technology Center Borrower”), a Delaware limited liability company structured to be bankruptcy remote with one independent director. The borrower sponsor of the Redwood Technology Center Whole Loan is Matthew T. White.
Mr. White is the chairman and chief executive officer of Basin Street Properties. Basin Street Properties is a private owner and operator of commercial real estate in Northern California and Northern Nevada. Primarily centered on its office investments, Basin Street Properties has expanded its portfolio over time to include selected retail, multi-family, hospitality and mixed-use projects in its core markets. Founded in 1974 and headquartered in Reno, Nevada, Basin Street Properties delivers a range of real estate services, including development, property management, construction management, financial and asset management, and property acquisition and disposition. See “Description of Mortgage Pool–Default History, Bankruptcy Issues and Other Proceedings” in the Preliminary Prospectus.
The Property. The Redwood Technology Center Property is a 154,611 SF Class A suburban office park located at 1383 and 1385 North McDowell Avenue and 1201 Redwood Way in Petaluma, California. The Redwood Technology Center Property consists of two, three-story, office buildings and a two-level full-service health club operated as Synergy Health Club built in phases between 2007 and 2014. The health club includes full men’s and women’s locker rooms as well as various fitness studios and weight rooms. The health club has two outdoor pools (a 25-yard lap pool and a recreation pool), saunas, steam rooms and an outdoor whirlpool. The Redwood Technology Center Property is situated on a 12.8-acre site and contains 765 parking spaces (4.9 spaces per 1,000 SF).
The 1383 North McDowell Avenue building is a 57,546 SF, Class A, multi-tenant office building constructed in 2007. The building is 84.1% leased as of July 31, 2019, with the largest tenant, Ciena Corporation, occupying 18,895 SF, or approximately 32.8% of the building NRA. The 1385 North McDowell Avenue building is a 56,065 SF, Class A, multi-tenant office building constructed in 2014. The building is 100.0% leased as of July 31, 2019, of which 69.2% is also leased to Ciena Corporation. The 1201 Redwood Way building is a 41,000 SF athletic facility, which is 100.0% leased as of July 31, 2019 to Santa Rosa Memorial Hospital through December 31, 2030. Santa Rosa Memorial Hospital (operating at the Redwood Technology Center Property as Synergy Health Club) is owned and operated by Providence St. Joseph Health (Fitch/Moody’s/S&P: AA-/Aa3/AA-). As of July 31, 2019, the Redwood Technology Center Property was 94.1% leased to 11 tenants, including two antenna tenants. The two buildings at 1383 and 1385 North McDowell Avenue are connected via a sky bridge.
Major Tenants.
Ciena Corporation (57,673 SF, 37.3% of NRA, 42.3% of underwritten base rent). Ciena Corporation (NYSE: CIEN), founded in 1992 and based in Hanover, Maryland, is a networking systems, services and software company, providing solutions that enable a wide range of network operators to deploy and manage next-generation networks that deliver services to businesses and consumers. With over 6,500 professionals, Ciena Corporation serves more than 1,500 customers in over 80 countries. Ciena Corporation has been a tenant at the Redwood Technology Center Property since its construction in 2007 and has expanded its footprint at the Redwood Technology Center Property on three separate occasions. Ciena Corporation leases 57,673 SF (37.3% of NRA) across four suites through January 2025 at a current average underwritten base rent of $32.03 PSF with one, five-year renewal option remaining and no termination options. Ciena Corporation leases the top floors of the buildings located at 1383 and 1385 North McDowell Avenue, which are connected via a sky bridge. Additionally, Ciena Corporation’s space includes outdoor balcony and patio space in both buildings, which do not have net rentable area included in the rent roll and no rent has been allocated to such space. With regard to its two suites at the 1383 North McDowell Avenue building, Ciena Corporation has the right of first offer to lease space adjacent to its current suites and/or in the adjacent building. Ciena Corporation has leased suite 1385-200 (18,773 SF, 12.1% of NRA, 13.8% of underwritten base rent) since July 2016, but has not moved in and is not occupying such space. The space is currently in its shell condition, however, Ciena Corporation continues to pay contractual rent on such space. The lease provides for an expiration date in January 2025.
Santa Rosa Memorial Hospital (41,000 SF, 26.5% of NRA, 25.5% of underwritten base rent).Santa Rosa Memorial Hospital operates Synergy Health Club, a health club offering training and studio classes. The health club features, among other things, executive locker rooms and laundry service, FitKids Zone supervised childcare and youth programs, heart rate training technology, heated outdoor pools with a three-story waterslide and whirlpool, kadence indoor cycling studio, and massage and spa services. Santa Rosa Memorial Hospital is a unit of Providence St. Joseph Health, an integrated Catholic healthcare delivery system that provides healthcare services throughout California, West Texas and Eastern New Mexico. Santa Rosa Memorial Hospital, leases 41,000 SF through December 2030 at a current underwritten base rent of $27.15 PSF with three, five-year renewal options remaining and one, four-year renewal option remaining.
THE INFORMATION IN THIS STRUCTURAL AND COLLATERAL TERM SHEET IS NOT COMPLETE AND MAY BE AMENDED PRIOR TO THE TIME OF SALE. THIS TERM SHEET IS NOT AN OFFER TO SELL THESE SECURITIES AND IT IS NOT A SOLICITATION OF AN OFFER TO BUY THESE SECURITIES IN ANY JURISDICTION WHERE THE OFFER OR SALE IS NOT PERMITTED.
135
1383 and 1385 North McDowell Petaluma, CA 94954 | Collateral Asset Summary – Loan No. 15 Redwood Technology Center | Cut-off Date Balance: Cut-off Date LTV Ratio: UW NCF DSCR: UW NOI Debt Yield: | $16,500,000 71.6% 1.55x 9.7% |
The following table presents certain information relating to the leases at the Redwood Technology Center Property:
| Tenant Summary(1) | |||||||
| Tenant Name | Credit Rating (Fitch/Moody's/S&P)(2) | Tenant SF | Approximate % of SF | Annual UW Base Rent | % of Total Annual UW Base Rent | Annual UW Base Rent PSF(3) | Lease Expiration |
| Ciena Corporation(4) | NR/NR/BB+ | 57,673 | 37.3% | $1,847,010 | 42.3% | $32.03 | 1/31/2025 |
| Santa Rosa Memorial Hospital | AA-/Aa3/AA- | 41,000 | 26.5% | $1,113,306 | 25.5% | $27.15 | 12/31/2030 |
| Friedmans Home Improvement | NR/NR/NR | 17,287 | 11.2% | $506,652 | 11.6% | $29.31 | 4/30/2022 |
| Other Tenants(5) | 29,476 | 19.1% | $900,358 | 20.6% | $30.55 | ||
| Vacant | 9,175 | 5.9% | $0 | 0.0% | $0.00 | ||
| Total/Wtd. Avg. | 154,611 | 100.0% | $4,367,326 | 100.0% | $30.03 | ||
| (1) | Information is based on the underwritten rent roll. |
| (2) | Certain ratings are those of the parent company whether or not the parent guarantees the lease. |
| (3) | Wtd. Avg. Annual UW Base Rent PSF excludes vacant space. |
| (4) | Ciena Corporation has leased suite 1385-200 (18,773 SF, 12.1% of NRA, 13.8% of underwritten base rent) since July 2016, but has not moved in and is not occupying such space. The space is currently in its shell condition, however, Ciena Corporation continues to pay contractual rent on such space. The lease provides for an expiration date in January 2025. At origination, the Redwood Technology Center Borrower escrowed $750,000 ($39.95 PSF of such dark space) into a TI/LC reserve (of which $250,000 may only be disbursed either in connection with improvements to such unutilized space, or following the re-leasing of the Ciena Corporation space in accordance with the related whole loan documents). |
| (5) | Includes two antenna tenants, New Cingular Wireless PCS LLC and Sprint Spectrum, which have no attributable net rentable square footage. |
The following table presents certain information relating to the lease rollover schedule at the Redwood Technology Center Property:
| Lease Rollover Schedule(1)(2) | ||||||||
| Year | # of Leases Rolling | SF Rolling | Approx. % of Total SF Rolling | Approx. Cumulative % of SF Rolling | UW Base Rent PSF Rolling(3) | Total UW Base Rent Rolling | Approx. % of Total UW Base Rent Rolling | Approx. Cumulative % of Total UW Base Rent Rolling |
| MTM | 0 | 0 | 0.0% | 0.0% | $0.00 | $0 | 0.0% | 0.0% |
| 2019 | 0 | 0 | 0.0% | 0.0% | $0.00 | $0 | 0.0% | 0.0% |
| 2020 | 3 | 17,466 | 11.3% | 11.3% | $29.39 | $513,331 | 11.8% | 11.8% |
| 2021(4) | 3 | 4,812 | 3.1% | 14.4% | $32.14 | $154,659 | 3.5% | 15.3% |
| 2022 | 1 | 17,287 | 11.2% | 25.6% | $29.31 | $506,652 | 11.6% | 26.9% |
| 2023(5) | 1 | 0 | 0.0% | 25.6% | $0.00 | $24,720 | 0.6% | 27.5% |
| 2024 | 0 | 0 | 0.0% | 25.6% | $0.00 | $0 | 0.0% | 27.5% |
| 2025 | 5 | 64,871 | 42.0% | 67.5% | $31.67 | $2,054,658 | 47.0% | 74.5% |
| 2026 | 0 | 0 | 0.0% | 67.5% | $0.00 | $0 | 0.0% | 74.5% |
| 2027 | 0 | 0 | 0.0% | 67.5% | $0.00 | $0 | 0.0% | 74.5% |
| 2028 | 0 | 0 | 0.0% | 67.5% | $0.00 | $0 | 0.0% | 74.5% |
| 2029 | 0 | 0 | 0.0% | 67.5% | $0.00 | $0 | 0.0% | 74.5% |
| 2030 & Beyond | 1 | 41,000 | 26.5% | 94.1% | $27.15 | $1,113,306 | 25.5% | 100.0% |
| Vacant | 0 | 9,175 | 5.9% | 100.0% | $0.00 | $0 | 0.0% | 100.0% |
| Total/Wtd. Avg. | 14 | 154,611 | 100.0% | $30.03 | $4,367,326 | 100.0% | ||
| (1) | Information is based on the underwritten rent roll. |
| (2) | Certain tenants may have lease termination options that are exercisable prior to the originally stated expiration date of the subject lease, which are not considered in the lease rollover schedule. |
| (3) | Wtd. Avg. UW Base Rent PSF Rolling excludes vacant space. |
| (4) | Includes antenna tenant, New Cingular Wireless PCS LLC, which has a lease expiration in May 2021, but does not have attributable net rentable square footage. |
| (5) | Includes antenna tenant, Sprint Spectrum, which has a lease expiration in December 2023, but does not have attributable net rentable square footage. |
The Market. The Redwood Technology Center Property is located in Petaluma, California, within the North McDowell subarea of Sonoma County, approximately 42.4 miles from downtown San Francisco. According to the appraisal, the Redwood Technology Center Property is located along North McDowell Avenue, adjacent to an interexchange with U.S. Highway 101, with prominent freeway visibility. U.S. Highway 101 travels north to Oregon and Washington and south to San Francisco and Los Angeles. McDowell Avenue runs parallel to U.S. Highway 101 as it travels south toward central Petaluma, with a number of neighborhood and community shopping centers along the way. According to the appraisal, the Redwood Technology Center Property is one of the few Class A office properties in the area.
Petaluma is proximate to multiple demand generators in the San Francisco Bay Area. Major employers within Sonoma County are Kaiser Permanente, Graton Resort and Casino, and Sutter Health. The North McDowell Avenue corridor contains business park complexes, featuring office and light industrial uses, and is home to both professional service firms and a number of major telecommunication and technology companies. Major tenants within the Redwood Technology Park include CrossCheck, Tellabs, Dow Pharmaceutical, Enphase Energy, Clover Stornetta, Digilock, SolarCity and Broadcom. The area is also home to several hotels, restaurants, and retail stores, including Kohl's, Michael's Crafts, Starbucks, Applebee’s, IHOP, Lagunitas Brewing Company, and Beyond the Glory Sports Bar.
THE INFORMATION IN THIS STRUCTURAL AND COLLATERAL TERM SHEET IS NOT COMPLETE AND MAY BE AMENDED PRIOR TO THE TIME OF SALE. THIS TERM SHEET IS NOT AN OFFER TO SELL THESE SECURITIES AND IT IS NOT A SOLICITATION OF AN OFFER TO BUY THESE SECURITIES IN ANY JURISDICTION WHERE THE OFFER OR SALE IS NOT PERMITTED.
136
1383 and 1385 North McDowell Petaluma, CA 94954 | Collateral Asset Summary – Loan No. 15 Redwood Technology Center | Cut-off Date Balance: Cut-off Date LTV Ratio: UW NCF DSCR: UW NOI Debt Yield: | $16,500,000 71.6% 1.55x 9.7% |
According to a third party market research report, the estimated 2019 population and average household income within a five-mile radius of the Redwood Technology Center Property was 102,942 and $116,946, respectively. According to a third party market research report, the estimated 2019 population and average household income within Sonoma County was 507,036 and $111,637, respectively.
According to a third party market research report, as of the third quarter of 2019, the Santa Rosa - CA office market contained approximately 16.8 million SF of office space with an overall vacancy rate of 5.4% and asking rent of $23.82 PSF. For office space within the Petaluma/Cotati/Rohnert submarket, the inventory reported was approximately 3.6 million SF with a vacancy of 9.7% and asking rent of $23.30 PSF.
The appraisal concluded market rents of $27.00 PSF for health club space, $31.00 PSF for office space, and $34.00 PSF for high quality office space, compared to in-place rent of $27.15 PSF for health club space, $29.14 PSF for office space, and $32.03 PSF for high quality office space at the Redwood Technology Center Property. According to the appraisal, the Redwood Technology Center Property’s competitive set consists of the six properties detailed in the table below.
The following table presents recent leasing data at competitive office and retail buildings with respect to the Redwood Technology Center Property:
| Comparable Leases | ||||||||
| Property Name | Year Built/ Renovated | Size (SF) | Proximity (miles) | Tenant Name | Tenant SF | Lease Start Date | Lease Term (Yrs.) | Rent PSF |
| Redwood Technology Center | 2007-2014/N/A | 154,611(1) | -- | Sutter West Bay Medical(1) | 7,198(1) | Nov 2017(1) | 8.0(1) | $28.85(1) |
| Theatre Square Office | 2007/N/A | 34,605 | 3.9 | ReMax Interactive Brokers | 883 833 | Aug 2019 July 2019 | 6.0 4.0 | $28.70 $32.16 |
| Petaluma Marina Business Center | 1991/N/A | 116,300 | 4.8 | RMC GeoScience Wine Library Larry Hilbloom Foundation | 1,236 843 2,701 | June 2019 June 2019 March 2019 | 4.0 3.0 5.0 | $28.20 $30.60 $29.04 |
| North Bay Center | 1991/N/A | 45,377 | 6.5 | Kaiser Foundation Health | 16,548 | Oct 2018 | 5.0 | $33.12 |
| 4 Hamilton Landing | 1930/N/A | 57,289 | 19.3 | Meritage Medical Network Marin Individual Practice Assoc. | 22,266 22,266 | March 2019 Feb 2019 | 5.0 3.6 | $38.16 $37.18 |
| Waterfront Office Building | 2005/N/A | 50,755 | 4.0 | Accelitas | 4,826 | Dec 2018 | 4.0 | $28.80 |
| Fountain Grove Executive Center | 2008/N/A | 63,292 | 16.9 | Morgan Stanley | 21,000 | Oct 2019 | 8.0 | $32.64 |
Source:Appraisal
| (1) | Based on the underwritten rent roll. |
Operating History and Underwritten Net Cash Flow.The following table presents certain information relating to the historical operating performance and the Underwritten Net Cash Flow at the Redwood Technology Center Property:
| Cash Flow Analysis | ||||||
| 2016 | 2017 | 2018 | 8/31/2019 TTM | UW | UW PSF | |
| Gross Potential Rent(1) | $3,513,312 | $3,954,922 | $4,171,234 | $4,178,118 | $4,651,751 | $30.09 |
| Total Recoveries | $262,698 | $322,615 | $337,651 | $359,107 | $450,096 | $2.91 |
| Other Income | $13,890 | $14,296 | $19,664 | $20,288 | $20,288 | $0.13 |
| Less Vacancy & Credit Loss | $0 | $0 | $0 | $62 | ($284,425) | ($1.84) |
| Effective Gross Income | $3,789,900 | $4,291,833 | $4,528,549 | $4,557,575 | $4,837,710 | $31.29 |
| Total Operating Expenses | $1,142,470 | $1,190,512 | $1,206,915 | $1,208,566 | $1,281,963 | $8.29 |
| Net Operating Income | $2,647,430 | $3,101,321 | $3,321,634 | $3,349,009 | $3,555,746 | $23.00 |
| Capital Expenditures | $0 | $0 | $0 | $0 | $23,192 | $0.15 |
| TI/LC | $0 | $0 | $0 | $0 | $89,320 | $0.58 |
| Net Cash Flow | $2,647,430 | $3,101,321 | $3,321,634 | $3,349,009 | $3,443,234 | $22.27 |
| Occupancy %(2) | 98.2% | 97.0% | 94.1% | 94.1% | 94.4% | |
| NOI DSCR (P&I)(3) | 1.19x | 1.39x | 1.49x | 1.51x | 1.60x | |
| NCF DSCR (P&I)(3) | 1.19x | 1.39x | 1.49x | 1.51x | 1.55x | |
| NOI Debt Yield(3) | 7.3% | 8.5% | 9.1% | 9.2% | 9.7% | |
| NCF Debt Yield(3) | 7.3% | 8.5% | 9.1% | 9.2% | 9.4% | |
| (1) | UW Gross Potential Rent is based on the underwritten rent roll and includes (i) rent steps of $52,610 through December 2020, (ii) vacancy gross up of $284,425 and (iii) $44,389 from two roof antenna tenants. |
| (2) | UW Occupancy % is based on the economic vacancy of 5.6%. The Redwood Technology Center Property is 94.1% leased as of July 31, 2019. The largest tenant at the Redwood Technology Center Property, Ciena Corporation, leases 57,673 SF (37.3% of NRA); however, the tenant is currently dark in 18,773 SF (12.1% of NRA) and continues to pay contractual rent on such space. Taking into account such dark space, the Redwood Technology Center Property has a physical occupancy of 81.9%. |
| (3) | Debt service coverage ratios and debt yields are based on the Redwood Technology Center Whole Loan. |
THE INFORMATION IN THIS STRUCTURAL AND COLLATERAL TERM SHEET IS NOT COMPLETE AND MAY BE AMENDED PRIOR TO THE TIME OF SALE. THIS TERM SHEET IS NOT AN OFFER TO SELL THESE SECURITIES AND IT IS NOT A SOLICITATION OF AN OFFER TO BUY THESE SECURITIES IN ANY JURISDICTION WHERE THE OFFER OR SALE IS NOT PERMITTED.
137