Issuer Free Writing Prospectus
Filed Pursuant to Rule 433
Registration Statement No.: 333-172366
 |  |
Free Writing Prospectus
Structural and Collateral Term Sheet
$1,091,143,971
(Approximate Aggregate Cut-off Date Balance of Mortgage Pool)
$763,800,000
(Approximate Aggregate Principal Balance of Offered Certificates)
WFRBS Commercial Mortgage Trust 2011-C5
as Issuing Entity
Wells Fargo Commercial Mortgage Securities, Inc.
as Depositor
The Royal Bank of Scotland
Wells Fargo Bank, National Association
Basis Real Estate Capital II, LLC
C-III Commercial Mortgage LLC
General Electric Capital Corporation
as Sponsors and Mortgage Loan Sellers
Commercial Mortgage Pass-Through Certificates
Series 2011-C5
October 24, 2011
| WELLS FARGO SECURITIES | RBS | |
Co-Lead Manager and Co-Bookrunner | Co-Lead Manager and Co-Bookrunner | |
Citigroup | Goldman, Sachs & Co. | |
| Co-Manager | Co-Manager |
STATEMENT REGARDING THIS FREE WRITING PROSPECTUS
The depositor has filed a registration statement (including a prospectus) with the Securities and Exchange Commission (‘‘SEC’’) (SEC File No. 333-172366) for the offering to which this communication relates. Before you invest, you should read the prospectus in the registration statement and other documents the depositor has filed with the SEC for more complete information about the depositor, the issuing entity and this offering. You may get these documents for free by visiting EDGAR on the SEC Web site at www.sec.gov. Alternatively, the depositor, any underwriter, or any dealer participating in the offering will arrange to send you the prospectus after filing if you request it by calling toll free 1-800-745-2063 (8 a.m. – 5 p.m. EST) or by emailing wfs.cmbs@wellsfargo.com.
Nothing in this document constitutes an offer of securities for sale in any other jurisdiction where the offer or sale is not permitted. The information contained herein is preliminary as of the date hereof, supersedes any such information previously delivered to you and will be superseded by any such information subsequently delivered and ultimately by the final prospectus relating to the securities. These materials are subject to change, completion, supplement or amendment from time to time.
STATEMENT REGARDING ASSUMPTIONS AS TO SECURITIES, PRICING ESTIMATES AND OTHER INFORMATION
The attached information contains certain tables and other statistical analyses (the “Computational Materials”) which have been prepared in reliance upon information furnished by the Mortgage Loan Sellers. Numerous assumptions were used in preparing the Computational Materials, which may or may not be reflected herein. As such, no assurance can be given as to the Computational Materials’ accuracy, appropriateness or completeness in any particular context; or as to whether the Computational Materials and/or the assumptions upon which they are based reflect present market conditions or future market performance. The Computational Materials should not be construed as either projections or predictions or as legal, tax, financial or accounting advice. You should consult your own counsel, accountant and other advisors as to the legal, tax, business, financial and related aspects of a purchase of these securities. Any weighted average lives, yields and principal payment periods shown in the Computational Materials are based on prepayment and/or loss assumptions, and changes in such prepayment and/or loss assumptions may dramatically affect such weighted average lives, yields and principal payment periods. In addition, it is possible that prepayments or losses on the underlying assets will occur at rates higher or lower than the rates shown in the attached Computational Materials. The specific characteristics of the securities may differ from those shown in the Computational Materials due to differences between the final underlying assets and the preliminary underlying assets used in preparing the Computational Materials. The principal amount and designation of any security described in the Computational Materials are subject to change prior to issuance. None of Wells Fargo Securities, LLC (“WFS”), RBS Securities Inc. (“RBSSI”), Citigroup Global Markets Inc., Goldman, Sachs & Co. or any of their respective affiliates make any representation or warranty as to the actual rate or timing of payments or losses on any of the underlying assets or the payments or yield on the securities. The information in this presentation is based upon management forecasts and reflects prevailing conditions and management’s views as of this date, all of which are subject to change. In preparing this presentation, we have relied upon and assumed, without independent verification, the accuracy and completeness of all information available from public sources or which was provided to us by or on behalf of the Mortgage Loan Sellers or which was otherwise reviewed by us.
This free writing prospectus contains certain forward-looking statements. If and when included in this free writing prospectus, the words “expects”, “intends”, “anticipates”, “estimates” and analogous expressions and all statements that are not historical facts, including statements about our beliefs or expectations, are intended to identify forward-looking statements. Any forward-looking statements are made subject to risks and uncertainties which could cause actual results to differ materially from those stated. Those risks and uncertainties include, among other things, declines in general economic and business conditions, increased competition, changes in demographics, changes in political and social conditions, regulatory initiatives and changes in customer preferences, many of which are beyond our control and the control of any other person or entity related to this offering. The forward-looking statements made in this free writing prospectus are made as of the date stated on the cover. We have no obligation to update or revise any forward-looking statement.
Wells Fargo Securities is the trade name for certain capital markets and investment banking services of Wells Fargo & Company and its subsidiaries, including Wells Fargo Securities, LLC, member FINRA and SIPC, and Wells Fargo Bank, National Association.
RBS is a trade name for the investment banking business of RBSSI. Securities, syndicated loan arranging, financial advisory and other investment banking activities are performed by RBSSI and their securities affiliates. Lending, derivatives and other commercial banking activities are performed by The Royal Bank of Scotland plc and their banking affiliates. RBSSI is a member of SIPC, FINRA and the NYSE.
IRS CIRCULAR 230 NOTICE
THIS TERM SHEET IS NOT INTENDED OR WRITTEN TO BE USED, AND CANNOT BE USED, FOR THE PURPOSE OF AVOIDING U.S. FEDERAL, STATE OR LOCAL TAX PENALTIES. THIS TERM SHEET IS WRITTEN AND PROVIDED BY THE DEPOSITOR IN CONNECTION WITH THE PROMOTION OR MARKETING BY THE DEPOSITOR AND THE CO-LEAD BOOKRUNNING MANAGERS OF THE TRANSACTION OR MATTERS ADDRESSED HEREIN. INVESTORS SHOULD SEEK ADVICE BASED ON THEIR PARTICULAR CIRCUMSTANCES FROM AN INDEPENDENT TAX ADVISOR.
IMPORTANT NOTICE REGARDING THE OFFERED CERTIFICATES
The Offered Certificates referred to in these materials and the asset pool backing them are subject to modification or revision (including the possibility that one or more classes of certificates may be split, combined or eliminated at any time prior to issuance or availability of a final prospectus) and are offered on a “when, as and if issued” basis. Prospective investors should understand that, when considering the purchase of the Offered Certificates, a contract of sale will come into being no sooner than the date on which the relevant class of certificates has been priced and the underwriters have confirmed the allocation of certificates to be made to investors; any “indications of interest” expressed by any prospective investor, and any “soft circles” generated by the underwriters, will not create binding contractual obligations for such prospective investors, on the one hand, or the underwriters, the depositor or any of their respective agents or affiliates, on the other hand.
As a result of the foregoing, a prospective investor may commit to purchase certificates that have characteristics that may change, and each prospective investor is advised that all or a portion of the certificates referred to in these materials may be issued without all or certain of the characteristics described in these materials. The underwriters’ obligation to sell certificates to any prospective investor is conditioned on the certificates and the transaction having the characteristics described in these materials. If the underwriters determine that a condition is not satisfied in any material respect, such prospective investor will be notified, and neither the depositor nor the underwriters will have any obligation to such prospective investor to deliver any portion of the Offered Certificates which such prospective investor has committed to purchase, and there will be no liability between the underwriters, the depositor or any of their respective agents or affiliates, on the one hand, and such prospective investor, on the other hand, as a consequence of the non-delivery.
Each prospective investor has requested that the underwriters provide to such prospective investor information in connection with such prospective investor’s consideration of the purchase of the certificates described in these materials. These materials are being provided to each prospective investor for informative purposes only in response to such prospective investor’s specific request. The underwriters described in these materials may from time to time perform investment banking services for, or solicit investment banking business from, any company named in these materials. The underwriters and/or their affiliates or respective employees may from time to time have a long or short position in any security or contract discussed in these materials.
The information contained herein supersedes any previous such information delivered to any prospective investor and will be superseded by information delivered to such prospective investor prior to the time of sale.
IMPORTANT NOTICE RELATING TO AUTOMATICALLY-GENERATED EMAIL DISCLAIMERS
Any legends, disclaimers or other notices that may appear at the bottom of any email communication to which this free writing prospectus is attached relating to (1) these materials not constituting an offer (or a solicitation of an offer), (2) no representation that these materials are accurate or complete and may not be updated or (3) these materials possibly being confidential, are not applicable to these materials and should be disregarded. Such legends, disclaimers or other notices have been automatically generated as a result of these materials having been sent via Bloomberg or another system.
THE INFORMATION IN THIS STRUCTURAL AND COLLATERAL TERM SHEET IS NOT COMPLETE AND MAY BE AMENDED PRIOR TO THE TIME OF SALE. THIS TERM SHEET IS NOT AN OFFER TO SELL THESE SECURITIES AND IT IS NOT A SOLICITATION OF AN OFFER TO BUY THESE SECURITIES IN ANY JURISDICTION WHERE THE OFFER OR SALE IS NOT PERMITTED.
2
| WFRBS Commercial Mortgage Trust 2011-C5 | Certificate Structure |
I. Certificate Structure
| Class | Expected Ratings (Fitch/Moody’s)(1) | Approximate Initial Certificate Balance or Notional Amount(2) | Approx. Initial Credit Support(3) | Pass- Through Rate Description | Weighted Average Life (Years)(4) | Expected Principal Window(4) | Certificate Principal to Value Ratio(5) | Certificate Principal U/W NOI Debt Yield(6) | ||||||||||||||
| Offered Certificates | ||||||||||||||||||||||
| A-1 | AAA(sf)/Aaa(sf) | $66,527,000 | 30.000% | (7) | 2.45 | 12/2011 – 7/2016 | 43.5% | 16.0% | ||||||||||||||
| A-2 | AAA(sf)/Aaa(sf) | $118,410,000 | 30.000% | (7) | 4.75 | 7/2016 – 11/2016 | 43.5% | 16.0% | ||||||||||||||
| A-3 | AAA(sf)/Aaa(sf) | $107,908,000 | 30.000% | (7) | 7.42 | 11/2016 – 7/2021 | 43.5% | 16.0% | ||||||||||||||
| A-4 | AAA(sf)/Aaa(sf) | $470,955,000 | 30.000% | (7) | 9.72 | 7/2021 – 9/2021 | 43.5% | 16.0% | ||||||||||||||
| Non-Offered Certificates | ||||||||||||
| X-A | AAA(sf)/Aaa(sf) | $849,728,000(8) | N/A | Variable(9) | N/A | N/A | N/A | N/A | ||||
| X-B | NR/Aaa(sf) | $241,415,970(10) | N/A | Variable(11) | N/A | N/A | N/A | N/A | ||||
| A-S | AAA(sf)/Aaa(sf) | $85,928,000 | 22.125% | (7) | 9.81 | 9/2021 – 9/2021 | 48.4% | 14.4% | ||||
| B | AA(sf)/Aa2(sf) | $54,557,000 | 17.125% | (7) | 9.86 | 9/2021 – 10/2021 | 51.5% | 13.5% | ||||
| C | A(sf)/A2(sf) | $40,918,000 | 13.375% | (7) | 9.90 | 10/2021 – 10/2021 | 53.8% | 12.9% | ||||
| D | BBB+(sf)/Baa1(sf) | $25,915,000 | 11.000% | (7) | 9.90 | 10/2021 – 10/2021 | 55.3% | 12.6% | ||||
| E | BBB-(sf)/Baa3(sf) | $49,101,000 | 6.500% | (7) | 9.92 | 10/2021 – 11/2021 | 58.1% | 12.0% | ||||
| F | BB(sf)/Ba2(sf) | $17,731,000 | 4.875% | (7) | 9.98 | 11/2021 – 11/2021 | 59.1% | 11.8% | ||||
| G | B(sf)/B2(sf) | $16,367,000 | 3.375% | (7) | 9.98 | 11/2021 – 11/2021 | 60.0% | 11.6% | ||||
| H | NR/NR | $36,826,970 | 0.000% | (7) | 9.98 | 11/2021 – 11/2021 | 62.1% | 11.2% | ||||
Notes: | ||
| (1) | The expected ratings presented are those of Fitch, Inc. (“Fitch”) and Moody’s Investors Service, Inc. (“Moody’s”) which the depositor hired to rate the rated offered certificates. One or more other nationally recognized statistical ratings organizations that were not hired by the depositor may use information they receive pursuant to Rule 17g-5 under the Securities Exchange Act of 1934, as amended (the “Exchange Act”), to rate or provide market reports and/or published commentary related to the offered certificates. We cannot assure you as to what ratings a non-hired nationally recognized statistical ratings organization would assign or that its reports will not express differing, possibly negative, views of the mortgage loans and/or the offered certificates. See “Risk Factors—Risks Related to the Offered Certificates—Ratings of the Certificates Have Substantial Limitations” and “Ratings” in the free writing prospectus, dated October 24, 2011 (the “Free Writing Prospectus”). Fitch, Inc. and Moody’s Investors Service, Inc. have indicated generally that the “(sf)” designation in their ratings is an identifier for structured finance product ratings. For general information about ratings definitions and the “(sf)” designation, prospective investors may register and log onto www.moodys.com and www.fitchratings.com. We and the underwriters have not verified, do not adopt and accept no responsibility for any statements made by the rating agencies on those websites. | |
(2) | The principal balances and notional amounts set forth in the table are approximate. The actual initial principal balances and notional amounts may be larger or smaller depending on the aggregate cut-off date principal balance of the mortgage loans definitively included in the pool of mortgage loans, which aggregate cut-off date principal balance may be as much as 5% larger or smaller than the amount presented in the Free Writing Prospectus. | |
(3) | The approximate initial credit support with respect to the Class A-1, A-2, A-3 and A-4 Certificates represents the approximate credit enhancement for the Class A-1, A-2, A-3 and A-4 Certificates in the aggregate. | |
(4) | Weighted Average Lives and Expected Principal Windows are calculated based on an assumed prepayment rate of 0% CPR and the “Structuring Assumptions” described under “Glossary” in the Free Writing Prospectus. | |
(5) | The Certificate Principal to Value Ratio for each Class of Certificates (other than the Class A-1, A-2, A-3 and A-4 Certificates) is calculated by dividing the aggregate principal balance of such class of certificates and all classes of certificates senior to such class by the aggregate appraised value of $1,755,784,000 (calculated as described in the Free Writing Prospectus) for the mortgaged properties securing the mortgage loans. The Certificate Principal to Value Ratios for each of the Class A-1, A-2, A-3 and A-4 Certificates are calculated by dividing the aggregate principal balance of the Class A-1, A-2, A-3 and A-4 Certificates by such aggregate appraised value. However, excess mortgaged property value associated with a mortgage loan will not be available to offset losses on any other mortgage loan (unless such mortgage loans are cross-collateralized). | |
| (6) | The Certificate Principal U/W NOI Debt Yield for each Class of Certificates (other than the Class A-1, A-2, A-3 and A-4 Certificates) is calculated by dividing the underwritten net operating income for the mortgage pool of $122,198,104 (calculated as described in the Free Writing Prospectus) by the aggregate certificate balance of such class of certificates and all classes of certificates senior to such class of certificates. The Underwritten NOI Debt Yield for each of the Class A-1, A-2, A-3 and A-4 Certificates is calculated by dividing such mortgage pool underwritten net operating income by the aggregate principal balance of the Class A-1, A-2, A-3 and A-4 Certificates. However, cash flow from each mortgaged property supports only the related mortgage loan and will not be available to support any other mortgage loan (unless such mortgage loans are cross-collateralized). | |
(7) | The pass-through rates for the Class A-1, A-2, A-3, A-4, A-S, B, C, D, E, F, G and H Certificates in each case will be one of the following: (i) a fixed rate per annum, (ii) the WAC Rate (as defined in the Free Writing Prospectus) for the related distribution date, (iii) a variable rate per annum equal to the lesser of (a) a fixed rate and (b) the WAC Rate for the related distribution date or (iv) a variable rate per annum equal to the WAC Rate for the related distribution date minus a specified percentage. | |
| (8) | The Class X-A Certificates are notional amount certificates. The Notional Amount of the Class X-A Certificates will be equal to the aggregate principal balance of the Class A-1, A-2, A-3, A-4 and A-S Certificates outstanding from time to time. The Class X-A Certificates will not be entitled to distributions of principal. | |
(9) | The pass-through rate for the Class X-A Certificates for any distribution date will equal the excess, if any, of (a) the WAC Rate for the related distribution date, over (b) the weighted average of the pass-through rates on the Class A-1, A-2, A-3, A-4 and A-S Certificates for the related distribution date, weighted on the basis of their respective aggregate principal balances outstanding immediately prior to that distribution date. | |
(10) | The Class X-B Certificates are notional amount certificates. The Notional Amount of the Class X-B Certificates will be equal to the aggregate principal balance of the Class B, C, D, E, F, G and H Certificates outstanding from time to time. The Class X-B Certificates will not be entitled to distributions of principal. | |
| (11) | The pass-through rate for the Class X-B Certificates for any distribution date will equal the excess, if any, of (a) the WAC Rate for the related distribution date, over (b) the weighted average of the pass-through rates on the Class B, C, D, E, F, G and H Certificates for the related distribution date, weighted on the basis of their respective aggregate principal balances outstanding immediately prior to that distribution date. | |
THE INFORMATION IN THIS STRUCTURAL AND COLLATERAL TERM SHEET IS NOT COMPLETE AND MAY BE AMENDED PRIOR TO THE TIME OF SALE. THIS TERM SHEET IS NOT AN OFFER TO SELL THESE SECURITIES AND IT IS NOT A SOLICITATION OF AN OFFER TO BUY THESE SECURITIES IN ANY JURISDICTION WHERE THE OFFER OR SALE IS NOT PERMITTED.
3
| WFRBS Commercial Mortgage Trust 2011-C5 | Transaction Highlights |
II. Transaction Highlights
Mortgage Loan Sellers:
Mortgage Loan Seller | Number of Mortgage Loans | Number of Mortgaged Properties | Aggregate Cut-off Date Balance | % of Cut-off Date Pool Balance | |||||||||||
The Royal Bank of Scotland(1) | 21 | 28 | $ 741,132,025 | 67.9 | % | ||||||||||
| Wells Fargo Bank, National Association | 18 | 33 | 152,584,580 | 14.0 | |||||||||||
| Basis Real Estate Capital II, LLC | 12 | 13 | 88,774,741 | 8.1 | |||||||||||
| C-III Commercial Mortgage LLC | 13 | 13 | 55,675,107 | 5.1 | |||||||||||
General Electric Capital Corporation | 11 | 11 | 52,977,517 | 4.9 | |||||||||||
| Total | 75 | 98 | $ | 1,091,143,971 | 100.0 | % | |||||||||
| (1) | The mortgage loan seller referred to herein as The Royal Bank of Scotland is comprised of two affiliated companies: The Royal Bank of Scotland plc and RBS Financial Products Inc. With respect to the mortgage loans being sold to the trust by The Royal Bank of Scotland (a) 18 mortgage loans, having an aggregate cut-off date principal balance of $664,662,678 and representing 60.9% of the aggregate principal balance of the pool of mortgage loans as of the cut-off date, are being sold to the trust only by The Royal Bank of Scotland plc and (b) 3 mortgage loans, having an aggregate cut-off date principal balance of $76,469,347 and representing 7.0% of the aggregate principal balance of the pool of mortgage loans as of the cut-off date are being sold to the trust only by RBS Financial Products Inc. |
Loan Pool:
| Cut-off Date Balance: | $1,091,143,971 | |||
| Number of Mortgage Loans: | 75 | |||
| Average Cut-off Date Balance per Mortgage Loan: | $14,548,586 | |||
| Number of Mortgaged Properties: | 98 | |||
Average Cut-off Date Balance per Mortgaged Property(1): | $11,134,122 | |||
| Weighted Average Mortgage Interest Rate: | 5.744% | |||
| Ten Largest Mortgage Loans as % of Cut-off Date Pool Balance: | 57.0% | |||
| Weighted Average Original Term to Maturity (months): | 112 | |||
| Weighted Average Remaining Term to Maturity (months): | 110 | |||
Weighted Average Original Amortization Term (months)(2): | 345 | |||
Weighted Average Remaining Amortization Term (months)(2): | 343 | |||
Weighted Average Seasoning (months): | 2 |
| (1) | Information regarding mortgage loans secured by multiple properties is based on an allocation according to relative appraised values or the allocated loan amounts or property-specific release prices set forth in related loan documents. | |
| (2) | Excludes any mortgage loan that does not amortize. |
Credit Statistics:
Weighted Average U/W Net Cash Flow DSCR(1): | 1.47x | |||
Weighted Average U/W Net Operating Income Debt Yield Ratio(1): | 11.2% | |||
Weighted Average Cut-off Date Loan-to-Value Ratio(1): | 63.0% | |||
Weighted Average Balloon Loan-to-Value Ratio(1): | 53.8% | |||
| % of Mortgage Loans with Additional Debt: | 9.4% | |||
% of Mortgage Loans with Single Tenants(2): | 6.8% | |||
| (1) | Information regarding mortgage loans secured by multiple properties is based on an allocation according to relative appraised values or the allocated loan amounts or property-specific release prices set forth in related loan documents. | |
| (2) | Excludes mortgage loans that are secured by multiple single-tenant properties. |
THE INFORMATION IN THIS STRUCTURAL AND COLLATERAL TERM SHEET IS NOT COMPLETE AND MAY BE AMENDED PRIOR TO THE TIME OF SALE. THIS TERM SHEET IS NOT AN OFFER TO SELL THESE SECURITIES AND IT IS NOT A SOLICITATION OF AN OFFER TO BUY THESE SECURITIES IN ANY JURISDICTION WHERE THE OFFER OR SALE IS NOT PERMITTED.
4
| WFRBS Commercial Mortgage Trust 2011-C5 | Transaction Highlights |
Loan Structural Features:
Amortization: Based on the Cut-off Date Balance, 97.5% of the mortgage pool (73 mortgage loans) has scheduled amortization, as follows:
83.3% (67 mortgage loans) requires amortization during the entire loan term
14.3% (6 mortgage loans) provides for an interest-only period followed by an amortization period
Interest-Only: Based on the Cut-off Date Balance, 2.5% of the mortgage pool (2 mortgage loans) provides for interest-only payments during the entire loan term.
Hard Lockboxes: Based on the Cut-off Date Balance, 82.4% of the mortgage pool (38 mortgage loans) has hard lockboxes in place.
Reserves: The mortgage loans require amounts to be escrowed monthly as follows (excluding any mortgage loans with springing provisions):
| Real Estate Taxes: | 86.0% of the pool |
| Insurance Premiums: | 54.9% of the pool |
| Capital Replacements: | 87.6% of the pool |
| TI/LC: | 79.6% of the pool* |
* The percentage of Cut-off Date Balance for loans with TI/LC reserves is based on the aggregate principal balance allocable to office, retail, mixed-use and industrial properties. | |
Call Protection/Defeasance: Based on the Cut-off Date Balance, the mortgage pool has the following call protection and defeasance features:
89.3% of the mortgage pool (61 mortgage loans) features a lockout period, then defeasance only until an open period
9.9% of the mortgage pool (13 mortgage loans) features a lockout period, then greater of a prepayment premium or yield maintenance until an open period
0.8% of the mortgage pool (1 mortgage loan) features a lockout period, then the greater of a prepayment premium or yield maintenance, then defeasance until an open period
Please refer to Annex A-1 to the Free Writing Prospectus for further description of individual loan call protection.
THE INFORMATION IN THIS STRUCTURAL AND COLLATERAL TERM SHEET IS NOT COMPLETE AND MAY BE AMENDED PRIOR TO THE TIME OF SALE. THIS TERM SHEET IS NOT AN OFFER TO SELL THESE SECURITIES AND IT IS NOT A SOLICITATION OF AN OFFER TO BUY THESE SECURITIES IN ANY JURISDICTION WHERE THE OFFER OR SALE IS NOT PERMITTED.
5
| WFRBS Commercial Mortgage Trust 2011-C5 | Issue Characteristics |
III. Issue Characteristics
| Securities Offered: | $763,800,000 approximate monthly pay, multi-class, commercial mortgage REMIC pass-through certificates consisting of four classes (Classes A-1, A-2, A-3 and A-4), which are offered pursuant to a registration statement filed with the SEC. | |
| Mortgage Loan Sellers: | The Royal Bank of Scotland (“RBS”); Wells Fargo Bank, National Association (“WFB”); Basis Real Estate Capital II, LLC (“Basis”); C-III Commercial Mortgage LLC (“CIIICM”); and General Electric Capital Corporation (“GECC”). | |
| Co-lead Bookrunning Managers: | Wells Fargo Securities, LLC and RBS Securities Inc. | |
| Co-Managers: | Citigroup Global Markets Inc. and Goldman, Sachs & Co. | |
| Rating Agencies: | Fitch, Inc. and Moody’s Investors Service, Inc. | |
| Master Servicer: | Wells Fargo Bank, National Association | |
| Special Servicer: | Midland Loan Services, a division of PNC Bank, National Association | |
| Certificate Administrator: | Wells Fargo Bank, National Association | |
| Trustee: | Deutsche Bank Trust Company Americas | |
| Trust Advisor: | TriMont Real Estate Advisors, Inc. | |
| Cut-off Date: | The Cut-off Date with respect to each mortgage loan is the due date for the monthly debt service payment that is due in November 2011 (or, in the case of any mortgage loan that has its first due date in December 2011, the date that would have been its due date in November 2011 under the terms of that mortgage loan if a monthly debt service payment were scheduled to be due in that month). | |
| Expected Closing Date: | On or about November 22, 2011. | |
| Determination Dates: | The 11th day of each month (or if that day is not a business day, the next succeeding business day), commencing in December 2011. | |
| Distribution Dates: | The fourth business day following the Determination Date in each month, commencing in December 2011. | |
| Rated Final Distribution Date: | The Distribution Date in November 2044. | |
| Interest Accrual Period: | With respect to any Distribution Date, the calendar month preceding the month in which such Distribution Date occurs. | |
| Day Count: | The Offered Certificates will accrue interest on a 30/360 basis. | |
| Minimum Denominations: | $25,000 for each Class of Offered Certificates. Investments may also be made in any whole dollar denomination in excess of the applicable minimum denomination. | |
| Clean-up Call: | 1% | |
| Delivery: | DTC, Euroclear and Clearstream Banking. | |
| ERISA/SMMEA Status: | Each Class of Offered Certificates is expected to be eligible for exemptive relief under ERISA. No Class of Offered Certificates will be SMMEA eligible. | |
| Risk Factors: | THE CERTIFICATES INVOLVE CERTAIN RISKS AND MAY NOT BE SUITABLE FOR ALL INVESTORS. SEE THE “RISK FACTORS” SECTION OF THE FREE WRITING PROSPECTUS. | |
| Bond Analytics Information: | The Certificate Administrator will generally be required to make distribution date settlements, CREFC reports and certain supplemental reports (other than confidential information) available to certain financial modeling and data provision services, including Bloomberg L.P., Trepp LLC, Intex Solutions, Inc., Markit Group Limited and BlackRock Financial Management Inc. |
THE INFORMATION IN THIS STRUCTURAL AND COLLATERAL TERM SHEET IS NOT COMPLETE AND MAY BE AMENDED PRIOR TO THE TIME OF SALE. THIS TERM SHEET IS NOT AN OFFER TO SELL THESE SECURITIES AND IT IS NOT A SOLICITATION OF AN OFFER TO BUY THESE SECURITIES IN ANY JURISDICTION WHERE THE OFFER OR SALE IS NOT PERMITTED.
6
| WFRBS Commercial Mortgage Trust 2011-C5 | Characteristics of the Mortgage Pool |
IV. Characteristics of the Mortgage Pool
A. Ten Largest Mortgage Loans
Mortgage Loan Seller | Mortgage Loan Name | City | State | Number of Mortgage Loans / Mortgaged Properties | Mortgage Loan Cut-off Date Balance ($) | % of Cut- off Date Balance (%) | Property Type | Number of SF or Rooms | Cut-off Date Balance Per SF or Room ($) | Cut-off Date LTV Ratio (%) | Balloon LTV Ratio (%) | U/W NCF DSCR (x) | U/W NOI Debt Yield (%) | |||||||||||||||||||||
| RBS | The Domain | Austin | TX | 1 / 1 | $207,550,029 | 19.0 | % | Retail | 878,974 | $236 | 53.4 | % | 44.6 | % | 1.35 | x | 9.7 | % | ||||||||||||||||
| RBS | Puck Building | New York | NY | 1 / 1 | 85,000,000 | 7.8 | Mixed Use | 206,693 | 411 | 60.7 | 56.3 | 1.25 | 8.5 | |||||||||||||||||||||
| RBS | Arbor Walk and Palms Crossing | Various | TX | 1 / 2 | 81,547,453 | 7.5 | Retail | 792,758 | 103 | 68.5 | 57.4 | 1.38 | 10.4 | |||||||||||||||||||||
| RBS | Village of Rochester Hills | Rochester Hills | MI | 1 / 1 | 51,000,000 | 4.7 | Retail | 254,596 | 200 | 65.7 | 58.0 | 1.60 | 11.6 | |||||||||||||||||||||
| RBS | Renaissance North Hills | Raleigh | NC | 1 / 1 | 47,411,949 | 4.3 | Hospitality | 229 | 207,039 | 69.7 | 59.1 | 1.63 | 13.0 | |||||||||||||||||||||
| RBS | Madonna Plaza | San Luis Obispo | CA | 1 / 1 | 40,000,000 | 3.7 | Retail | 318,514 | 126 | 68.0 | 57.4 | 1.28 | 9.6 | |||||||||||||||||||||
| RBS | Sugarland Crossing | Sterling | VA | 1 / 1 | 29,918,786 | 2.7 | Retail | 256,623 | 117 | 72.1 | 61.2 | 1.41 | 10.8 | |||||||||||||||||||||
| RBS | 919 Congress | Austin | TX | 1 / 1 | 27,918,559 | 2.6 | Office | 164,718 | 169 | 68.9 | 58.0 | 1.32 | 9.9 | |||||||||||||||||||||
| RBS | Patriot Tech Center | Spring Garden Township | PA | 1 / 1 | 27,477,803 | 2.5 | Industrial | 1,539,290 | 18 | 60.2 | 51.2 | 1.31 | 11.5 | |||||||||||||||||||||
| RBS | Ascent Hotel Portfolio | Various | Various | 1 / 4 | 24,468,913 | 2.2 | Hospitality | 325 | 75,289 | 60.1 | 46.7 | 1.79 | 15.1 | |||||||||||||||||||||
| Top Three Total / Weighted Average | 3 / 4 | $374,097,482 | 34.3 | % | 58.4 | % | 50.0 | % | 1.33 | x | 9.6 | % | ||||||||||||||||||||||
| Top Five Total / Weighted Average | 5 / 6 | $472,509,430 | 43.3 | % | 60.3 | % | 51.8 | % | 1.39 | x | 10.1 | % | ||||||||||||||||||||||
| Top Ten Total / Weighted Average | 10 / 14 | $622,293,491 | 57.0 | % | 61.7 | % | 52.7 | % | 1.39 | x | 10.4 | % | ||||||||||||||||||||||
B. Mortgage Loans with Additional Secured and Mezzanine Financing(1)
| Loan No. | Mortgage Loan Seller | Mortgage Loan Name | Mortgage Loan Cut-off Date Balance ($) | % of Cut- off Date Balance (%) | Non-Trust Mortgage Loan Cut-off Date Balance ($) | Mezzanine Debt Cut-off Date Balance ($) | Total Debt Interest Rate (%) | Mortgage Loan U/W NCF DSCR (x) | Total Debt U/W NCF DSCR (x) | Mortgage Loan Cut- off Date U/W NOI Debt Yield (%) | Total Debt Cut-off Date U/W NOI Debt Yield (%) | Mortgage Loan Cut-off Date LTV Ratio (%) | Total Debt Cut-off Date LTV Ratio (%) | |||||||||||||||||||||||||
| 2 | RBS | Puck Building(2) | $85,000,000 | 7.8 | % | $0 | $10,000,000 | 5.842 | % | 1.25 | x | 1.06 | x | 8.5 | % | 7.6 | % | 60.7 | % | 67.9 | % | |||||||||||||||||
| 14 | WFB | Overlook at the Rim(3) | 18,000,000 | 1.6 | 0 | 5,000,000 | 4.650 | 3.12 | 1.99 | 15.0 | 11.7 | 54.8 | 70.0 | |||||||||||||||||||||||||
| Total/Weighted Average | $103,000,000 | 9.4 | % | $0 | $15,000,000 | 1.58 | x | 1.22 | x | 9.6 | % | 8.4 | % | 59.7 | % | 68.3 | % | |||||||||||||||||||||
| (1) | In addition, the borrowers under certain of the mortgage loans also have incurred unsecured additional debt as described in the Free Writing Prospectus. |
| (2) | For mortgage loan #2 (Puck Building), the mezzanine loan bears interest at an interest rate that increases to 12.000% after 36 months following origination. The combined U/W NCF DSCR based on the mortgage loan and the mezzanine loan assuming a 10.000% rate for the life of the mezzanine loan is 1.06x and the combined U/W NCF DSCR based on the mortgage loan and the mezzanine loan assuming a 12.000% rate for the life of the mezzanine loan is 1.03x. |
| (3) | For mortgage loan #14 (Overlook at the Rim), the mezzanine loan has an interest rate that increases to 10.000% if the mezzanine loan is not paid off on or prior to December 31, 2011. The combined U/W NCF DSCR based on the mortgage loan and the mezzanine loan assuming a 4.650% rate for the life of the mezzanine loan is 2.44x and the combined U/W NCF DSCR based on the mortgage loan and the mezzanine loan assuming a 10.000% rate for the life of the mezzanine loan is 1.95x. In addition, if the mezzanine debt is not retired on or prior to December 31, 2011, all excess cash flow after all debt service payments will be applied toward amortizing the mezzanine debt. |
THE INFORMATION IN THIS STRUCTURAL AND COLLATERAL TERM SHEET IS NOT COMPLETE AND MAY BE AMENDED PRIOR TO THE TIME OF SALE. THIS TERM SHEET IS NOT AN OFFER TO SELL THESE SECURITIES AND IT IS NOT A SOLICITATION OF AN OFFER TO BUY THESE SECURITIES IN ANY JURISDICTION WHERE THE OFFER OR SALE IS NOT PERMITTED.
7
| WFRBS Commercial Mortgage Trust 2011-C5 | Characteristics of the Mortgage Pool |
| C. Previous Securitization History(1) | |
| Loan No. | Mortgage Loan Seller | Mortgage Loan Name | City | State | Property Type | Mortgage Loan Cut-off Date Balance ($) | % of Cut-off Date Balance (%) | Previous Securitization | ||||||||
| 2 | RBS | Puck Building | New York | NY | Mixed Use | $85,000,000 | 7.8% | Various(2) | ||||||||
| 4 | RBS | Village of Rochester Hills | Rochester Hills | MI | Retail | 51,000,000 | 4.7 | CSFB 2002-CP5 | ||||||||
| 7 | RBS | Sugarland Crossing | Sterling | VA | Retail | 29,918,786 | 2.7 | JPMCC 2002-CIBC4 | ||||||||
| 8 | RBS | 919 Congress | Austin | TX | Office | 27,918,559 | 2.6 | GCCFC 2005-GG3 | ||||||||
| 11 | RBS | Torrance Plaza East | Torrance | CA | Office | 21,082,280 | 1.9 | LBUBS 2001-C7 | ||||||||
| 12 | WFB | Flagship Storage Portfolio - Indiana | Indianapolis | IN | Self Storage | 20,247,005 | 1.9 | Various(3) | ||||||||
| 13 | WFB | PetSmart | Phoenix | AZ | Industrial | 19,950,045 | 1.8 | BSCMS 2002-TOP8 | ||||||||
| 16 | RBS | Residence Inn Atlanta Midtown | Atlanta | GA | Hospitality | 15,432,583 | 1.4 | GCCFC 2006-GG7 | ||||||||
| 17 | RBS | Torrance Plaza West | Torrance | CA | Office | 15,387,067 | 1.4 | LBUBS 2001-C7 | ||||||||
| 21 | RBS | Brookwood Village | Erie | PA | Multifamily | 12,225,727 | 1.1 | CSFB 2002-CKPI | ||||||||
| 22 | WFB | Del Monte Portfolio | Various | Various | Industrial | 11,267,922 | 1.0 | Various(4) | ||||||||
| 24 | Basis | H-Mart Portfolio | Various | Various | Retail | 11,072,477 | 1.0 | Various(5) | ||||||||
| 25 | WFB | Flagship Storage Portfolio - Ohio | Various | OH | Self Storage | 10,672,067 | 1.0 | Various(6) | ||||||||
| 29 | RBS | Silver Springs Pointe | Oklahoma City | OK | Retail | 8,800,000 | 0.8 | WBCMT 2002-C1 | ||||||||
| 30 | RBS | Poughkeepsie Galleria II | Poughkeepsie | NY | Retail | 8,464,724 | 0.8 | FUNB 2001-C3 | ||||||||
| 31 | WFB | Sprint Center | Rio Rancho | NM | Office | 8,438,918 | 0.8 | SBM7 2001-C2 | ||||||||
| 32 | CIIICM | Hampton Inn Jacksonville | Jacksonville | FL | Hospitality | 7,318,278 | 0.7 | FUBOA 2001-C1 | ||||||||
| 33 | RBS | Dayton Park | Dayton | MN | Manufactured Housing Community | 7,244,455 | 0.7 | ASC 1996-D2 | ||||||||
| 35 | Basis | 354 Mountain View Drive | Colchester | VT | Office | 6,978,388 | 0.6 | BACM 2006-5 | ||||||||
| 37 | CIIICM | 1680-1700 East Touhy Avenue | Des Plaines | IL | Industrial | 6,692,023 | 0.6 | BACM 2001-PB1 | ||||||||
| 38 | Basis | 356 Mountain View Drive | Colchester | VT | Office | 6,305,472 | 0.6 | BACM 2006-5 | ||||||||
| 41 | GECC | American Self Storage - Palo Alto | East Palo Alto | CA | Self Storage | 5,982,007 | 0.5 | BACM 2004-5 | ||||||||
| 44 | WFB | Boardwalk Apartments | Houston | TX | Multifamily | 5,734,989 | 0.5 | DLJMA 1996-CF2 | ||||||||
| 46 | GECC | Boulder Bins Self Storage | Boulder | CO | Self Storage | 5,483,506 | 0.5 | Various(7) | ||||||||
| 47 | GECC | Ross Valley Self Storage | Kentfield | CA | Self Storage | 5,383,806 | 0.5 | BACM 2004-5 | ||||||||
| 49 | GECC | Lock It San Diego Self Storage | San Diego | CA | Self Storage | 4,985,638 | 0.5 | DLJCM 2000-CKP1 | ||||||||
| 50 | GECC | Burlington Self Storage | West Palm Beach | FL | Self Storage | 4,461,000 | 0.4 | CD 2005-CD1 | ||||||||
| 55 | CIIICM | Royal Highlander | Peoria | IL | Manufactured Housing Community | 3,888,500 | 0.4 | JPMCC 2006-LDP8 | ||||||||
| 57 | GECC | Country Estates MHC | Grants Pass | OR | Manufactured Housing Community | 3,678,873 | 0.3 | BACM 2006-4 | ||||||||
| 58 | Basis | 180 West Washington Office | Chicago | IL | Office | 3,596,363 | 0.3 | LBCMT 1999-C1 | ||||||||
| 59 | GECC | Castle Rock Self Storage | Castle Rock | CO | Self Storage | 3,494,612 | 0.3 | LBUBS 2004-C6 | ||||||||
| 60 | CIIICM | American Mini Storage I & II | Sierra Vista | AZ | Self Storage | 3,447,588 | 0.3 | BACM 2001-PB1 | ||||||||
| 62 | CIIICM | Mimi’s Plaza | Tustin | CA | Retail | 2,997,674 | 0.3 | BSCMS 2001-TOP4 | ||||||||
| 65 | CIIICM | Mill Creek Village | Buford | GA | Retail | 2,698,047 | 0.2 | JPMCC 2001-CIBC3 | ||||||||
| 66 | Basis | New Market Square | Varina | VA | Retail | 2,689,372 | 0.2 | LBUBS 2001-C7 |
THE INFORMATION IN THIS STRUCTURAL AND COLLATERAL TERM SHEET IS NOT COMPLETE AND MAY BE AMENDED PRIOR TO THE TIME OF SALE. THIS TERM SHEET IS NOT AN OFFER TO SELL THESE SECURITIES AND IT IS NOT A SOLICITATION OF AN OFFER TO BUY THESE SECURITIES IN ANY JURISDICTION WHERE THE OFFER OR SALE IS NOT PERMITTED.
8
| WFRBS Commercial Mortgage Trust 2011-C5 | Characteristics of the Mortgage Pool |
| Previous Securitization History (cont’d) | ||||||||||||||||
| Loan No. | Mortgage Loan Seller | Mortgage Loan Name | City | State | Property Type | Mortgage Loan Cut-off Date Balance ($) | % of Cut-off Date Balance (%) | Previous Securitization | ||||||||
| 67 | CIIICM | Pecan Valley Estates | Bossier City | LA | Manufactured Housing Community | $2,598,119 | 0.2% | DLJCM 2000-CF1 | ||||||||
| 68 | WFB | Metro Storage | Taylor | MI | Self Storage | 2,446,219 | 0.2 | WBCMT 2005-C18 | ||||||||
| 70 | CIIICM | First American Self Storage - River Oaks | River Oaks | TX | Self Storage | 2,158,473 | 0.2 | BSCMS 2006-TOP22 | ||||||||
| 72 | WFB | 2 Claire Road | East Brunswick Township | NJ | Industrial | 2,144,368 | 0.2 | CSFB 2001-CK6 | ||||||||
| 73 | WFB | Georgetown South Apartments | Sharpsville | PA | Multifamily | 2,089,268 | 0.2 | MSDWC 2001-TOP3 | ||||||||
| (1) | The table above represents the most recent securitization with respect to the mortgaged property securing the related mortgage loan, based on information provided by the related borrower or obtained through TREPP searches. The information has not otherwise been confirmed by the mortgage loan sellers. |
| (2) | The debt on the mortgaged property was securitized in two separate transactions: CCMSC 1997-1 and MLMT 2003-KEY1. |
| (3) | The debt on seven of the eight mortgaged properties was securitized in one transaction: LBUBS 2004-C8 (8270 Michigan Road, 2251 Shadeland Avenue, 5425 North Tacoma Avenue, 9685 Fall Creek Road, 3601 West 96th Street, 551 East Stover Avenue and 920 County Line Road). |
| (4) | The debt on one of the three mortgaged properties (Del Monte – Mendota) was securitized in a previous transaction: MSDWC 2001-TOP5. |
| (5) | The debt on one of the two mortgaged properties (H Mart – Carrollton) was securitized in three separate transactions: GSMS 2005-FL7A, GSMS 2006-FL8A and CGCMT 2006-FL2. |
| (6) | The debt on two of the seven mortgaged properties (1500 Brush Road and 23640 Lakeland Boulevard) was securitized in one transaction: LBUBS 2000-C5. |
| (7) | The debt on the mortgaged property was securitized in two separate transactions: BACM 2004-5 and FULB 1997-C1. |
THE INFORMATION IN THIS STRUCTURAL AND COLLATERAL TERM SHEET IS NOT COMPLETE AND MAY BE AMENDED PRIOR TO THE TIME OF SALE. THIS TERM SHEET IS NOT AN OFFER TO SELL THESE SECURITIES AND IT IS NOT A SOLICITATION OF AN OFFER TO BUY THESE SECURITIES IN ANY JURISDICTION WHERE THE OFFER OR SALE IS NOT PERMITTED.
9
| WFRBS Commercial Mortgage Trust 2011-C5 | Characteristics of the Mortgage Pool |
D. Mortgage Loans with Scheduled Balloon Payments and Related Classes
Class A-2(1)
| Loan No. | Mortgage Loan Seller | Mortgage Loan Name | State | Property Type | Mortgage Loan Cut-off Date Balance ($) | % of Cut-off Date Balance (%) | Mortgage Loan Balance at Maturity ($) | % of Class A-2 Certificate Principal Balance (%) | Units/ SF/ Rooms | Loan per Unit/ SF/ Room | U/W NCF DSCR (x) | U/W NOI Debt Yield (%) | Cut-off Date LTV Ratio (%) | Balloon LTV Ratio (%) | Rem. IO Period (mos.) | Rem. Term to Maturity (mos.) | ||||||||||||||||||||||||||||||
| 14 | WFB | Overlook at the Rim | TX | Office | $18,000,000 | 1.6 | % | $18,000,000 | 15.2 | % | 145,025 | $124 | 3.12 | x | 15.0 | % | 54.8 | % | 54.8 | % | 56 | 56 | ||||||||||||||||||||||||
| 16 | RBS | Residence Inn Atlanta Midtown | GA | Hospitality | 15,432,583 | 1.4 | 13,918,463 | 11.8 | 160 | 96,454 | 1.49 | 12.6 | 59.4 | 53.5 | 0 | 57 | ||||||||||||||||||||||||||||||
| 19 | WFB | 24 Hour Fitness - Pleasanton | CA | Retail | 13,539,491 | 1.2 | 11,509,162 | 9.7 | 56,206 | 241 | 1.42 | 12.2 | 66.5 | 56.6 | 0 | 58 | ||||||||||||||||||||||||||||||
| 22 | WFB | Del Monte Portfolio | Various | Industrial | 11,267,922 | 1.0 | 9,480,882 | 8.0 | 724,600 | 16 | 1.35 | 12.8 | 46.4 | 39.0 | 0 | 57 | ||||||||||||||||||||||||||||||
| 31 | WFB | Sprint Center | NM | Office | 8,438,918 | 0.8 | 7,106,999 | 6.0 | 94,730 | 89 | 1.66 | 15.6 | 56.6 | 47.7 | 0 | 57 | ||||||||||||||||||||||||||||||
| 32 | CIIICM | Hampton Inn Jacksonville | FL | Hospitality | 7,318,278 | 0.7 | 6,696,322 | 5.7 | 118 | 62,019 | 1.54 | 14.1 | 69.7 | 63.8 | 0 | 57 | ||||||||||||||||||||||||||||||
| 34 | Basis | Westchase Corporate Park | TX | Office | 6,987,393 | 0.6 | 6,555,289 | 5.5 | 176,977 | 39 | 1.34 | 11.5 | 69.9 | 65.6 | 0 | 58 | ||||||||||||||||||||||||||||||
| 35 | Basis | 354 Mountain View Drive | VT | Office | 6,978,388 | 0.6 | 6,491,324 | 5.5 | 59,523 | 117 | 1.63 | 12.7 | 66.5 | 61.8 | 0 | 57 | ||||||||||||||||||||||||||||||
| 36 | Basis | Hilton Garden Inn | WI | Hospitality | 6,819,062 | 0.6 | 6,140,309 | 5.2 | 128 | 53,274 | 1.75 | 14.5 | 69.6 | 62.7 | 0 | 56 | ||||||||||||||||||||||||||||||
| 37 | CIIICM | 1680-1700 East Touhy Avenue | IL | Industrial | 6,692,023 | 0.6 | 6,091,177 | 5.1 | 252,000 | 27 | 1.95 | 17.2 | 57.7 | 52.5 | 0 | 59 | ||||||||||||||||||||||||||||||
| 38 | Basis | 356 Mountain View Drive | VT | Office | 6,305,472 | 0.6 | 5,865,375 | 5.0 | 50,949 | 124 | 1.43 | 10.7 | 70.8 | 65.9 | 0 | 57 | ||||||||||||||||||||||||||||||
| 50 | GECC | Burlington Self Storage | FL | Self Storage | 4,461,000 | 0.4 | 4,290,882 | 3.6 | 69,861 | 64 | 1.41 | 10.1 | 73.7 | 70.9 | 22 | 58 | ||||||||||||||||||||||||||||||
| 55 | CIIICM | Royal Highlander | IL | Manufactured Housing Community | 3,888,500 | 0.4 | 3,650,024 | 3.1 | 280 | 13,888 | 1.47 | 11.2 | 70.7 | 66.4 | 0 | 60 | ||||||||||||||||||||||||||||||
| 57 | GECC | Country Estates MHC | OR | Manufactured Housing Community | 3,678,873 | 0.3 | 3,325,272 | 2.8 | 104 | 35,374 | 1.37 | 10.4 | 67.8 | 61.2 | 0 | 56 | ||||||||||||||||||||||||||||||
| 66 | Basis | New Market Square | VA | Retail | 2,689,372 | 0.2 | 2,509,357 | 2.1 | 40,200 | 67 | 1.67 | 12.8 | 64.0 | 59.7 | 0 | 56 | ||||||||||||||||||||||||||||||
| Total/Weighted Average | $122,497,276 | 11.2 | % | $111,630,834 | 94.3 | % | 1.76 | x | 13.2 | % | 62.0 | % | 56.6 | % | 9 | 57 | ||||||||||||||||||||||||||||||
| (1) | The table above presents the mortgage loans whose balloon payments would be applied to pay down the principal balance of the Class A-2 Certificates, assuming a 0% CPR and applying the “Structuring Assumptions” described in the Free Writing Prospectus, including the assumptions that (i) none of the mortgage loans in the pool experience prepayments, defaults or losses; (ii) there are no extensions of maturity dates of any mortgage loans in the pool; and (iii) each mortgage loan in the pool is paid in full on its stated maturity date. Each class of Certificates, including the Class A-2 Certificates, evidences undivided ownership interests in the entire pool of mortgage loans. |
THE INFORMATION IN THIS STRUCTURAL AND COLLATERAL TERM SHEET IS NOT COMPLETE AND MAY BE AMENDED PRIOR TO THE TIME OF SALE. THIS TERM SHEET IS NOT AN OFFER TO SELL THESE SECURITIES AND IT IS NOT A SOLICITATION OF AN OFFER TO BUY THESE SECURITIES IN ANY JURISDICTION WHERE THE OFFER OR SALE IS NOT PERMITTED.
10
| WFRBS Commercial Mortgage Trust 2011-C5 | Characteristics of the Mortgage Pool |
Class A-3(1) | |||||||||||||||||||||||||||||||||||||||||||||||
| Loan No. | Mortgage Loan Seller | Mortgage Loan Name | State | Property Type | Mortgage Loan Cut-off Date Balance ($) | % of Cut-off Date Balance (%) | Mortgage Loan Balance at Maturity ($) | % of Class A-3 Certificate Principal Balance (%) | Units/ SF/ Rooms | Loan per Unit/ SF/ Room | U/W NCF DSCR (x) | U/W NOI Debt Yield (%) | Cut-off Date LTV Ratio (%) | Balloon LTV Ratio (%) | Rem. IO Period (mos.) | Rem. Term to Maturity (mos.) | |||||||||||||||||||||||||||||||
| 20 | WFB | Merit Medical Systems | UT | Mixed Use | $12,984,987 | 1.2 | % | $10,775,582 | 10.0 | % | 193,449 | 67 | 1.43 | x | 13.0 | % | 65.3 | % | 54.1 | % | 0 | 101 | |||||||||||||||||||||||||
| 21 | RBS | Brookwood Village | PA | Multifamily | 12,225,727 | 1.1 | 10,991,152 | 10.2 | 135 | 90,561 | 1.37 | 9.8 | 73.8 | 66.4 | 0 | 82 | |||||||||||||||||||||||||||||||
| 48 | RBS | Candlewood Suites Houston, TX | TX | Hospitality | 4,994,401 | 0.5 | 4,345,908 | 4.0 | 81 | 61,659 | 1.49 | 13.5 | 62.4 | 54.3 | 0 | 83 | |||||||||||||||||||||||||||||||
| Total/Weighted Average | $30,205,116 | 2.8 | % | $26,112,643 | 24.2 | % | 1.42 | x | 11.8 | % | 68.3 | % | 59.1 | % | 0 | 90 | |||||||||||||||||||||||||||||||
| (1) | The table above presents the mortgage loans whose balloon payments would be applied to pay down the principal balance of the Class A-3 Certificates, assuming a 0% CPR and applying the “Structuring Assumptions” described in the Free Writing Prospectus, including the assumptions that (i) none of the mortgage loans in the pool experience prepayments, defaults or losses; (ii) there are no extensions of maturity dates of any mortgage loans in the pool; and (iii) each mortgage loan in the pool is paid in full on its stated maturity date. Each class of Certificates, including the Class A-3 Certificates, evidences undivided ownership interests in the entire pool of mortgage loans. |
THE INFORMATION IN THIS STRUCTURAL AND COLLATERAL TERM SHEET IS NOT COMPLETE AND MAY BE AMENDED PRIOR TO THE TIME OF SALE. THIS TERM SHEET IS NOT AN OFFER TO SELL THESE SECURITIES AND IT IS NOT A SOLICITATION OF AN OFFER TO BUY THESE SECURITIES IN ANY JURISDICTION WHERE THE OFFER OR SALE IS NOT PERMITTED.
11
| WFRBS Commercial Mortgage Trust 2011-C5 | Characteristics of the Mortgage Pool |
E. Property Type Distribution
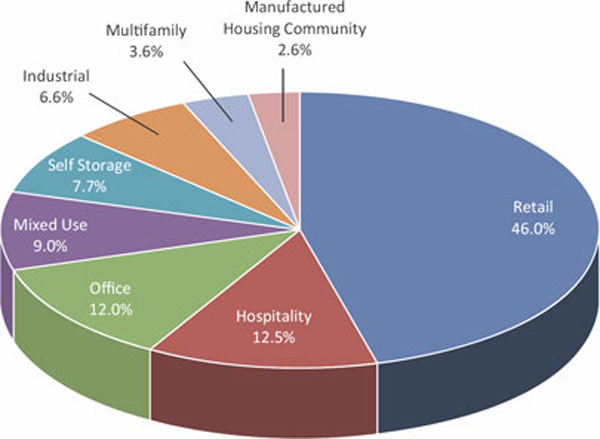
| Property Type | Number of Mortgaged Properties | Aggregate Cut- off Date Balance ($)(1) | % of Cut-off Date Balance (%) | Weighted Average Cut-off Date LTV Ratio (%) | Weighted Average Balloon LTV Ratio (%) | Weighted Average U/W NCF DSCR (x) | Weighted Average U/W NOI Debt Yield (%) | Weighted Average U/W NCF Debt Yield (%) | Weighted Average Mortgage Rate (%) | |||||||||||||||||||||||||||
| Retail | 20 | $ | 501,891,318 | 46.0 | % | 61.7 | % | 52.3 | % | 1.43 | x | 10.5 | % | 9.9 | % | 5.630 | % | |||||||||||||||||||
| Anchored | 9 | 238,178,634 | 21.8 | 67.8 | 58.1 | 1.46 | 10.8 | 10.1 | 5.741 | |||||||||||||||||||||||||||
| Regional Mall | 2 | 216,014,753 | 19.8 | 53.4 | 44.6 | 1.37 | 9.8 | 9.2 | 5.430 | |||||||||||||||||||||||||||
| Single Tenant | 4 | 27,599,449 | 2.5 | 69.9 | 58.1 | 1.44 | 11.9 | 11.3 | 5.779 | |||||||||||||||||||||||||||
| Unanchored | 5 | 20,098,482 | 1.8 | 67.0 | 57.3 | 1.61 | 12.7 | 11.9 | 6.259 | |||||||||||||||||||||||||||
| Hospitality | 12 | 136,855,466 | 12.5 | 66.0 | 55.1 | 1.61 | 13.6 | 12.2 | 6.026 | |||||||||||||||||||||||||||
| Limited Service | 10 | 78,296,786 | 7.2 | 63.7 | 53.1 | 1.61 | 13.9 | 12.5 | 6.031 | |||||||||||||||||||||||||||
| Full Service | 1 | 47,411,949 | 4.3 | 69.7 | 59.1 | 1.63 | 13.0 | 11.7 | 5.941 | |||||||||||||||||||||||||||
| Extended Stay | 1 | 11,146,732 | 1.0 | 67.1 | 52.7 | 1.55 | 13.7 | 12.4 | 6.357 | |||||||||||||||||||||||||||
| Office | 10 | 130,975,264 | 12.0 | 64.6 | 56.7 | 1.66 | 12.0 | 10.9 | 5.605 | |||||||||||||||||||||||||||
| Suburban | 8 | 99,460,342 | 9.1 | 63.5 | 56.5 | 1.76 | 12.5 | 11.3 | 5.576 | |||||||||||||||||||||||||||
| CBD | 2 | 31,514,922 | 2.9 | 68.3 | 57.3 | 1.35 | 10.4 | 9.5 | 5.699 | |||||||||||||||||||||||||||
| Mixed Use | 2 | 97,984,987 | 9.0 | 61.3 | 56.0 | 1.27 | 9.1 | 8.8 | 5.505 | |||||||||||||||||||||||||||
| Office/Retail | 1 | 85,000,000 | 7.8 | 60.7 | 56.3 | 1.25 | 8.5 | 8.4 | 5.353 | |||||||||||||||||||||||||||
| Office/Warehouse/Medical | 1 | 12,984,987 | 1.2 | 65.3 | 54.1 | 1.43 | 13.0 | 11.6 | 6.500 | |||||||||||||||||||||||||||
| Self Storage | 31 | 84,302,538 | 7.7 | 66.5 | 55.0 | 1.54 | 11.8 | 11.4 | 5.996 | |||||||||||||||||||||||||||
| Self Storage | 31 | 84,302,538 | 7.7 | 66.5 | 55.0 | 1.54 | 11.8 | 11.4 | 5.996 | |||||||||||||||||||||||||||
| Industrial | 8 | 71,863,557 | 6.6 | 54.8 | 45.2 | 1.36 | 12.4 | 10.6 | 6.017 | |||||||||||||||||||||||||||
| Warehouse | 5 | 37,909,990 | 3.5 | 50.2 | 41.6 | 1.40 | 13.0 | 11.2 | 5.968 | |||||||||||||||||||||||||||
| Flex | 3 | 33,953,567 | 3.1 | 60.0 | 49.3 | 1.32 | 11.7 | 9.8 | 6.071 | |||||||||||||||||||||||||||
| Multifamily | 7 | 39,072,575 | 3.6 | 72.7 | 62.6 | 1.36 | 10.4 | 9.8 | 5.861 | |||||||||||||||||||||||||||
| Garden | 5 | 27,522,575 | 2.5 | 72.1 | 61.3 | 1.39 | 10.9 | 10.1 | 5.867 | |||||||||||||||||||||||||||
| Student Housing | 2 | 11,550,000 | 1.1 | 74.3 | 65.6 | 1.27 | 9.2 | 9.0 | 5.846 | |||||||||||||||||||||||||||
| Manufactured Housing Community | 8 | 28,198,265 | 2.6 | 66.6 | 58.4 | 1.47 | 11.3 | 10.9 | 6.267 | |||||||||||||||||||||||||||
| Manufactured Housing Community | 8 | 28,198,265 | 2.6 | 66.6 | 58.4 | 1.47 | 11.3 | 10.9 | 6.267 | |||||||||||||||||||||||||||
| Total/ Weighted Average | 98 | $ | 1,091,143,971 | 100.0 | % | 63.0 | % | 53.8 | % | 1.47 | x | 11.2 | % | 10.4 | % | 5.744 | % | |||||||||||||||||||
| (1) | Because this table presents information relating to the mortgaged properties and not the mortgage loans, the information for mortgage loans secured by more than one mortgaged property is based on allocated amounts (allocating the mortgage loan principal balance to each of those properties according to the relative appraised values of the mortgaged properties or the allocated loan amounts or property-specific release prices set forth in the related mortgage loan documents). |
THE INFORMATION IN THIS STRUCTURAL AND COLLATERAL TERM SHEET IS NOT COMPLETE AND MAY BE AMENDED PRIOR TO THE TIME OF SALE. THIS TERM SHEET IS NOT AN OFFER TO SELL THESE SECURITIES AND IT IS NOT A SOLICITATION OF AN OFFER TO BUY THESE SECURITIES IN ANY JURISDICTION WHERE THE OFFER OR SALE IS NOT PERMITTED.
12
| WFRBS Commercial Mortgage Trust 2011-C5 | Characteristics of the Mortgage Pool |
F. Geographic Distribution*
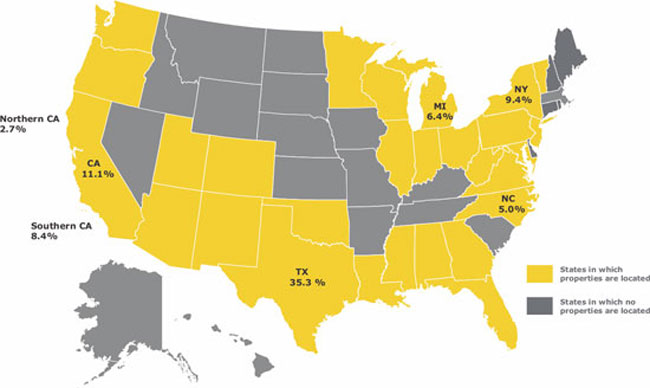
Location(1) | Number of Mortgaged Properties | Aggregate Cut-off Date Balance ($)(2) | % of Cut- off Date Balance | Weighted Average Cut-off Date LTV Ratio (%) | Weighted Average Balloon LTV Ratio (%) | Weighted Average U/W NCF DSCR (x) | Weighted Average U/W NOI Debt Yield (%) | Weighted Average U/W NCF Debt Yield (%) | Weighted Average Mortgage Rate (%) | ||||||||||||||||||||||||||
| Texas | 13 | $ | 385,037,285 | 35.3 | % | 59.9 | % | 50.7 | % | 1.44 | x | 10.3 | % | 9.6 | % | 5.512 | % | ||||||||||||||||||
| California | 11 | 121,383,751 | 11.1 | 64.5 | 54.1 | 1.44 | 11.1 | 10.4 | 5.802 | ||||||||||||||||||||||||||
| Southern | 7 | 92,147,049 | 8.4 | 65.1 | 55.1 | 1.40 | 10.8 | 9.9 | 5.884 | ||||||||||||||||||||||||||
| Northern | 4 | 29,236,701 | 2.7 | 62.4 | 51.1 | 1.56 | 12.4 | 11.9 | 5.542 | ||||||||||||||||||||||||||
| New York | 3 | 102,939,924 | 9.4 | 60.7 | 55.0 | 1.32 | 9.3 | 9.0 | 5.430 | ||||||||||||||||||||||||||
| Michigan | 9 | 69,845,283 | 6.4 | 66.6 | 57.5 | 1.58 | 11.8 | 11.3 | 5.896 | ||||||||||||||||||||||||||
| North Carolina | 3 | 55,055,499 | 5.0 | 69.4 | 58.8 | 1.61 | 12.9 | 11.7 | 5.998 | ||||||||||||||||||||||||||
Other States(3) | 59 | 356,882,229 | 32.7 | 64.9 | 55.2 | 1.50 | 12.3 | 11.2 | 5.996 | ||||||||||||||||||||||||||
| Total/ Weighted Average | 98 | $ | 1,091,143,971 | 100.0 | % | 63.0 | % | 53.8 | % | 1.47 | x | 11.2 | % | 10.4 | % | 5.744 | % | ||||||||||||||||||
| * | The Mortgaged Properties are located in 28 states. |
| (1) | For purposes of determining whether a mortgaged property is in Northern California or Southern California, Northern California includes areas with zip codes above 93600 and Southern California includes areas with zip codes of 93600 and below. |
(2) | Because this table presents information relating to the mortgaged properties and not the mortgage loans, the information for mortgage loans secured by more than one mortgaged property is based on allocated amounts (allocating the mortgage loan principal balance to each of those properties according to the relative appraised values of the mortgaged properties or the allocated loan amounts or property-specific release prices set forth in the related mortgage loan documents). |
| (3) | Includes 23 other states. |
THE INFORMATION IN THIS STRUCTURAL AND COLLATERAL TERM SHEET IS NOT COMPLETE AND MAY BE AMENDED PRIOR TO THE TIME OF SALE. THIS TERM SHEET IS NOT AN OFFER TO SELL THESE SECURITIES AND IT IS NOT A SOLICITATION OF AN OFFER TO BUY THESE SECURITIES IN ANY JURISDICTION WHERE THE OFFER OR SALE IS NOT PERMITTED.
13
| WFRBS Commercial Mortgage Trust 2011-C5 | Characteristics of the Mortgage Pool |
| G. | Characteristics of the Mortgage Pool |
| CUT-OFF DATE BALANCE | LOAN PURPOSE | |||||||||||||||
Range of Cut-off Date Balances ($) | Number of Mortgage Loans | Aggregate Cut- off Date Balance | % of Cut-off Date Balance | Loan Purpose | Number of Mortgage Loans | Aggregate Cut- off Date Balance | % of Cut-off Date Balance | |||||||||
| 1,290,156 - 2,000,000 | 2 | $ | 2,933,706 | 0.3% | Refinance | 58 | $ | 945,746,647 | 86.7% | |||||||
| 2,000,001 - 3,000,000 | 12 | 30,158,865 | 2.8 | Acquisition | 17 | 145,397,323 | 13.3 | |||||||||
| 3,000,001 - 4,000,000 | 7 | 25,314,408 | 2.3 | Total: | 75 | $ | 1,091,143,971 | 100.0% | ||||||||
| 4,000,001 - 5,000,000 | 7 | 31,363,271 | 2.9 | |||||||||||||
| 5,000,001 - 6,000,000 | 8 | 46,073,301 | 4.2 | MORTGAGE RATE | ||||||||||||
| 6,000,001 - 7,000,000 | 6 | 39,964,774 | 3.7 | Number of | ||||||||||||
| 7,000,001 - 8,000,000 | 2 | 14,562,733 | 1.3 | Range of Mortgage Rates | Mortgage | Aggregate Cut- | % of Cut-off | |||||||||
| 8,000,001 - 9,000,000 | 3 | 25,703,642 | 2.4 | (%) | Loans | off Date Balance | Date Balance | |||||||||
| 9,000,001 - 10,000,000 | 3 | 28,498,200 | 2.6 | 4.650 - 4.750 | 1 | $ | 18,000,000 | 1.6% | ||||||||
| 10,000,001 - 15,000,000 | 8 | 97,897,775 | 9.0 | 4.751 - 5.000 | 2 | 19,706,840 | 1.8 | |||||||||
| 15,000,001 - 20,000,000 | 5 | 85,050,518 | 7.8 | 5.001 - 5.250 | 1 | 8,800,000 | 0.8 | |||||||||
| 20,000,001 - 30,000,000 | 6 | 151,113,346 | 13.8 | 5.251 - 5.500 | 12 | 436,823,939 | 40.0 | |||||||||
| 30,000,001 - 50,000,000 | 2 | 87,411,949 | 8.0 | 5.501 - 5.750 | 9 | 83,226,262 | 7.6 | |||||||||
| 50,000,001 - 70,000,000 | 1 | 51,000,000 | 4.7 | 5.751 - 6.000 | 13 | 234,558,341 | 21.5 | |||||||||
| 80,000,001 - 90,000,000 | 2 | 166,547,453 | 15.3 | 6.001 - 6.250 | 16 | 163,606,873 | 15.0 | |||||||||
| 90,000,001 - 207,550,029 | 1 | 207,550,029 | 19.0 | 6.251 - 6.500 | 15 | 102,574,053 | 9.4 | |||||||||
Total: | 75 | $ | 1,091,143,971 | 100.0% | 6.501 - 6.750 | 6 | 23,847,661 | 2.2 | ||||||||
Average: | $14,548,586 | Total: | 75 | $ | 1,091,143,971 | 100.0% | ||||||||||
| Weighted Average: | 5.744% | |||||||||||||||
| UNDERWRITTEN NOI DEBT SERVICE COVERAGE RATIO | ||||||||||||||||
| Number of | UNDERWRITTEN NOI DEBT YIELD | |||||||||||||||
Range of U/W NOI | Mortgage | Aggregate Cut- | % of Cut-off | Number of | ||||||||||||
| DSCRs (x) | Loans | off Date Balance | Date Balance | Range of U/W NOI | Mortgage | Aggregate Cut- | % of Cut-off | |||||||||
| 1.27 - 1.30 | 3 | $ | 96,359,989 | 8.8% | Debt Yields (%) | Loans | off Date Balance | Date Balance | ||||||||
| 1.31 - 1.40 | 4 | 51,977,155 | 4.8 | 8.5 - 9.0 | 1 | $ | 85,000,000 | 7.8% | ||||||||
| 1.41 - 1.50 | 15 | 363,165,919 | 33.3 | 9.1 - 10.0 | 6 | 299,244,316 | 27.4 | |||||||||
| 1.51 - 1.60 | 17 | 241,470,724 | 22.1 | 10.1 - 11.0 | 13 | 190,048,113 | 17.4 | |||||||||
| 1.61 - 1.70 | 15 | 146,424,654 | 13.4 | 11.1 - 12.0 | 18 | 223,719,323 | 20.5 | |||||||||
| 1.71 - 1.80 | 5 | 29,974,757 | 2.7 | 12.1 - 13.0 | 18 | 148,890,181 | 13.6 | |||||||||
| 1.81 - 1.90 | 6 | 67,449,734 | 6.2 | 13.1 - 14.0 | 8 | 53,731,383 | 4.9 | |||||||||
| 1.91 - 2.00 | 5 | 49,366,616 | 4.5 | 14.1 - 15.0 | 7 | 47,913,127 | 4.4 | |||||||||
| 2.01 - 2.25 | 3 | 18,154,422 | 1.7 | 15.1 - 16.0 | 3 | 35,905,505 | 3.3 | |||||||||
| 2.76 - 3.00 | 1 | 8,800,000 | 0.8 | 17.1 - 17.2 | 1 | 6,692,023 | 0.6 | |||||||||
| 3.01 - 3.17 | 1 | 18,000,000 | 1.6 | Total: | 75 | $ | 1,091,143,971 | 100.0% | ||||||||
Total: | 75 | $ | 1,091,143,971 | 100.0% | Weighted Average: | 11.2% | ||||||||||
Weighted Average: | 1.58x | |||||||||||||||
| UNDERWRITTEN NCF DEBT YIELD | ||||||||||||||||
| UNDERWRITTEN NCF DEBT SERVICE COVERAGE RATIO | Number of | |||||||||||||||
| Number of | Range of U/W NCF | Mortgage | Aggregate Cut- | % of Cut-off | ||||||||||||
| Range of U/W NCF | Mortgage | Aggregate Cut- | % of Cut-off | Debt Yields (%) | Loans | off Date Balance | Date Balance | |||||||||
| DSCRs (x) | Loans | off Date Balance | Date Balance | 8.4 - 9.0 | 3 | $ | 130,625,000 | 12.0% | ||||||||
| 1.20 | 1 | $ | 5,734,989 | 0.5% | 9.1 - 10.0 | 12 | 416,508,864 | 38.2 | ||||||||
| 1.21 - 1.30 | 6 | 160,831,442 | 14.7 | 10.1 - 11.0 | 22 | 202,207,568 | 18.5 | |||||||||
| 1.31 - 1.40 | 16 | 444,239,181 | 40.7 | 11.1 - 12.0 | 16 | 195,533,999 | 17.9 | |||||||||
| 1.41 - 1.50 | 21 | 193,069,335 | 17.7 | 12.1 - 13.0 | 15 | 72,615,094 | 6.7 | |||||||||
| 1.51 - 1.60 | 12 | 112,912,011 | 10.3 | 13.1 - 14.0 | 5 | 48,961,422 | 4.5 | |||||||||
| 1.61 - 1.70 | 7 | 73,570,907 | 6.7 | 14.1 - 15.0 | 1 | 18,000,000 | 1.6 | |||||||||
| 1.71 - 1.80 | 4 | 40,708,454 | 3.7 | 15.1 - 15.6 | 1 | 6,692,023 | 0.6 | |||||||||
| 1.81 - 1.90 | 5 | 26,585,628 | 2.4 | Total: | 75 | $ | 1,091,143,971 | 100.0% | ||||||||
| 1.91 - 2.00 | 1 | 6,692,023 | 0.6 | Weighted Average: | 10.4% | |||||||||||
| 2.51 - 3.00 | 1 | 8,800,000 | 0.8 | |||||||||||||
| 3.01 - 3.12 | 1 | 18,000,000 | 1.6 | |||||||||||||
Total/Weighted Average: | 75 | $ | 1,091,143,971 | 100.0% | ||||||||||||
Weighted Average: | 1.47x | |||||||||||||||
THE INFORMATION IN THIS STRUCTURAL AND COLLATERAL TERM SHEET IS NOT COMPLETE AND MAY BE AMENDED PRIOR TO THE TIME OF SALE. THIS TERM SHEET IS NOT AN OFFER TO SELL THESE SECURITIES AND IT IS NOT A SOLICITATION OF AN OFFER TO BUY THESE SECURITIES IN ANY JURISDICTION WHERE THE OFFER OR SALE IS NOT PERMITTED.
14
| WFRBS Commercial Mortgage Trust 2011-C5 | Characteristics of the Mortgage Pool |
| ORIGINAL TERM TO MATURITY | CUT-OFF DATE LOAN-TO-VALUE RATIO | |||||||||||||||||
| Number of | Number of | |||||||||||||||||
| Range of Original Terms to | Mortgage | Aggregate Cut- | % of Cut-off | Range of Cut-off Date LTV | Mortgage | Aggregate Cut- | % of Cut-off | |||||||||||
| Maturity (months) | Loans | off Date Balance | Date Balance | Ratios (%) | Loans | off Date Balance | Date Balance | |||||||||||
| 60 | 15 | $ | 122,497,276 | 11.2% | 46.4 - 50.0 | 4 | $ | 37,654,114 | 3.5% | |||||||||
| 61 - 84 | 2 | 17,220,129 | 1.6 | 50.1 - 55.0 | 4 | 242,814,753 | 22.3 | |||||||||||
| 85 - 120 | 58 | 951,426,566 | 87.2 | 55.1 - 60.0 | 9 | 54,046,277 | 5.0 | |||||||||||
Total: | 75 | $ | 1,091,143,971 | 100.0% | 60.1 - 65.0 | 11 | 174,921,276 | 16.0 | ||||||||||
Weighted Average: | 112 | 65.1 - 70.0 | 33 | 467,368,931 | 42.8 | |||||||||||||
| 70.1 - 75.0 | 14 | 114,338,620 | 10.5 | |||||||||||||||
| REMAINING TERM TO MATURITY | Total: | 75 | $ | 1,091,143,971 | 100.0% | |||||||||||||
Weighted Average: | 63.0% | |||||||||||||||||
| Number of | ||||||||||||||||||
| Range of Remaining Terms | Mortgage | Aggregate Cut- | % of Cut-off | BALLOON LOAN-TO-VALUE RATIO | ||||||||||||||
| to Maturity (months) | Loans | off Date Balance | Date Balance | |||||||||||||||
| 56 - 60 | 15 | $ | 122,497,276 | 11.2% | Number of | |||||||||||||
| 61 - 84 | 2 | 17,220,129 | 1.6 | Range of Balloon LTV | Mortgage | Aggregate Cut- | % of Cut-off | |||||||||||
| 85 - 120 | 58 | 951,426,566 | 87.2 | Ratios (%) | Loans | off Date Balance | Date Balance | |||||||||||
Total: | 75 | $ | 1,091,143,971 | 100.0% | 39.0 - 40.0 | 3 | $ | 35,549,364 | 3.3% | |||||||||
Weighted Average: | 110 | 40.1 - 45.0 | 4 | 216,973,656 | 19.9 | |||||||||||||
| 45.1 - 50.0 | 8 | 58,672,849 | 5.4 | |||||||||||||||
| ORIGINAL AMORTIZATION TERM | 50.1 - 55.0 | 21 | 195,104,401 | 17.9 | ||||||||||||||
| 55.1 - 60.0 | 21 | 444,458,075 | 40.7 | |||||||||||||||
| Range of Original | Number of | 60.1 - 65.0 | 12 | 100,892,533 | 9.2 | |||||||||||||
| Amortization Terms | Mortgage | Aggregate Cut- | % of Cut-off | 65.1 - 70.0 | 5 | 35,032,092 | 3.2 | |||||||||||
| (months) | Loans | off Date Balance | Date Balance | 70.1 - 70.9 | 1 | 4,461,000 | 0.4 | |||||||||||
| Non-Amortizing | 2 | $ | 26,800,000 | 2.5% | Total: | 75 | $ | 1,091,143,971 | 100.0% | |||||||||
| 240 | 5 | 40,565,209 | 3.7 | Weighted Average: | 53.8% | |||||||||||||
| 241 - 300 | 20 | 178,729,321 | 16.4 | |||||||||||||||
| 301 - 360 | 48 | 845,049,441 | 77.4 | AMORTIZATION TYPE | ||||||||||||||
Total: | 75 | $ | 1,091,143,971 | 100.0% | ||||||||||||||
Weighted Average:* | 345 | Number of | ||||||||||||||||
| * | Excludes the non-amortizing loans. | Mortgage | Aggregate Cut- | % of Cut-off | ||||||||||||||
| Type of Amortization | Loans | off Date Balance | Date Balance | |||||||||||||||
REMAINING AMORTIZATION TERM(1) | Amortizing Balloon | 67 | $ | 908,562,971 | 83.3% | |||||||||||||
| Interest-only, Amortizing | ||||||||||||||||||
| Range of Remaining | Number of | Balloon | 6 | 155,781,000 | 14.3 | |||||||||||||
| Amortization Terms | Mortgage | Aggregate Cut- | % of Cut-off | Interest-only, Balloon | 2 | 26,800,000 | 2.5 | |||||||||||
| (months) | Loans | off Date Balance | Date Balance | Total: | 75 | $ | 1,091,143,971 | 100.0% | ||||||||||
| Non-Amortizing | 2 | $ | 26,800,000 | 2.5% | ||||||||||||||
| 237 - 240 | 5 | 40,565,209 | 3.7 | ORIGINAL TERM OF INTEREST-ONLY PERIOD FOR PARTIAL IO LOANS* | ||||||||||||||
| 241 - 300 | 20 | 178,729,321 | 16.4 | |||||||||||||||
| 301 - 360 | 48 | 845,049,441 | 77.4 | Number of | ||||||||||||||
Total: | 75 | $ | 1,091,143,971 | 100.0% | Mortgage | Aggregate Cut- | % of Cut-off | |||||||||||
Weighted Average:(2) | 343 | IO Term (months) | Loans | off Date Balance | Date Balance | |||||||||||||
| (1) | The remaining amortization term shown for any mortgage loan that is interest-only for part of its term does not include the number of months in its interest-only period and reflects only the number of months as of the commencement of amortization remaining from the end of such interest-only period. | 19 - 24 | 5 | $ | 70,781,000 | 6.5% | ||||||||||||
| 49 - 60 | 1 | 85,000,000 | 7.8 | |||||||||||||||
| Total: | 6 | $ | 155,781,000 | 14.3% | ||||||||||||||
| Weighted Average: | 44 | |||||||||||||||||
(2) | Excludes the non-amortizing loans. | * | Excludes non-amortizing loans and amortizing loans that do not provide for a partial interest-only period. | |||||||||||||||
| LOCKBOXES | ||||||||||||||||||
| SEASONING | ||||||||||||||||||
| Number of | ||||||||||||||||||
| Mortgage | Aggregate Cut- | % of Cut-off | Number of | |||||||||||||||
| Type of Lockbox | Loans | off Date Balance | Date Balance | Mortgage | Aggregate Cut- | % of Cut-off | ||||||||||||
| Hard/Springing Cash Management | 29 | $ | 794,102,922 | 72.8% | Seasoning (months) | Loans | off Date Balance | Date Balance | ||||||||||
| Hard/Upfront Cash Management | 9 | 104,933,345 | 9.6 | 0 | 5 | $ | 103,718,500 | 9.5% | ||||||||||
| None | 21 | 102,728,816 | 9.4 | 1 - 3 | 59 | 842,517,226 | 77.2 | |||||||||||
| Soft/Springing Cash Management | 6 | 35,310,513 | 3.2 | 4 | 11 | 144,908,245 | 13.3 | |||||||||||
| Springing (With Established | Total: | 75 | $ | 1,091,143,971 | 100.0% | |||||||||||||
| Account) | 7 | 31,537,259 | 2.9 | Weighted Average: | 2 | |||||||||||||
| Springing (Without Established | ||||||||||||||||||
| Account) | 3 | 22,531,116 | 2.1 | |||||||||||||||
Total: | 75 | $ | 1,091,143,971 | 100.0% | ||||||||||||||
| PREPAYMENT PROVISION SUMMARY | ||||||||||||||||||
| Number of | % of Cut- | |||||||||||||||||
| Mortgage | Aggregate Cut- | off Date | ||||||||||||||||
| Prepayment Provision | Loans | off Date Balance | Balance | |||||||||||||||
| Lockout/ Defeasance/ Open | 61 | $ | 974,384,643 | 89.3% | ||||||||||||||
| Lockout/ YM%/ Open | 13 | 108,294,603 | 9.9 | |||||||||||||||
| Lockout/ YM%/ Defeasance/ Open | 1 | 8,464,724 | 0.8 | |||||||||||||||
Total: | 75 | $ | 1,091,143,971 | 100.0% | ||||||||||||||
THE INFORMATION IN THIS STRUCTURAL AND COLLATERAL TERM SHEET IS NOT COMPLETE AND MAY BE AMENDED PRIOR TO THE TIME OF SALE. THIS TERM SHEET IS NOT AN OFFER TO SELL THESE SECURITIES AND IT IS NOT A SOLICITATION OF AN OFFER TO BUY THESE SECURITIES IN ANY JURISDICTION WHERE THE OFFER OR SALE IS NOT PERMITTED.
15
| WFRBS Commercial Mortgage Trust 2011-C5 | Certain Terms and Conditions |
V. Certain Terms and Conditions
| Interest Entitlements: | The interest entitlement of each Class of Offered Certificates on each Distribution Date generally will be the interest accrued during the related Interest Accrual Period on the related Certificate Principal Balance or Notional Amount at the related pass-through rate, net of any prepayment interest shortfalls allocated to that Class for such Distribution Date as described below. If prepayment interest shortfalls arise from voluntary prepayments (without special servicer consent) on non-specially serviced mortgage loans during any collection period, the Master Servicer is required to make a compensating interest payment to offset those shortfalls, generally up to an amount equal to the portion of its master servicing fees that accrues at three basis points per annum. The remaining amount of prepayment interest shortfalls will be allocated to reduce the interest otherwise distributable on all Classes of Certificates (other than the Class X-A and Class X-B Certificates), pro rata, based on their respective amounts of accrued interest for the related Distribution Date. If a Class receives less than the entirety of its interest entitlement on any Distribution Date, then the shortfall will be added to its interest entitlement for the next succeeding Distribution Date. Interest entitlements on the Class B, C, D and E Certificates, in that order, may be reduced by certain Trust Advisor expenses. |
| Principal Distribution Amount: | The Principal Distribution Amount for each Distribution Date generally will be the aggregate amount of principal received or advanced in respect of the mortgage loans, net of any nonrecoverable advances and interest thereon that are reimbursed to the Master Servicer, the Special Servicer or the Trustee during the related collection period. Nonrecoverable advances and interest thereon are reimbursable from principal collections and advances before reimbursement from other amounts. The Principal Distribution Amount may also be reduced, with a corresponding loss to the Class E, D, C, B and A-S Certificates, then to the Class A-1, A-2, A-3 and A-4 Certificates (with any losses on the Class A-1, A-2, A-3 and A-4 Certificates allocated pro rata according to their respective Certificate Principal Balances immediately prior to that Distribution Date), in that order, in connection with certain Trust Advisor expenses to the extent that interest entitlements on the Class B, C, D and E Certificates are insufficient to absorb the effect of the expense on any particular Distribution Date. |
| Distributions: | On each Distribution Date, funds available for distribution from the mortgage loans, net of specified trust fees, expenses and reimbursements will generally be distributed in the following amounts and order of priority (in each case to the extent of remaining available funds): |
1. Class A-1, A-2, A-3, A-4, X-A and X-B Certificates: To interest on the Class A-1, A-2, A-3, A-4, X-A and X-B Certificates, pro rata, according to their respective interest entitlements. | |
2. Class A-1, A-2, A-3 and A-4 Certificates: To principal on the Class A-1, A-2, A-3 and A-4 Certificates in the following amounts and order of priority: (i) first, to principal on the Class A-1 Certificates until their Certificate Principal Balance is reduced to zero, up to the Principal Distribution Amount for such Distribution Date; (ii) second, to principal on the Class A-2 Certificates until their Certificate Principal Balance is reduced to zero, up to the remainder of the Principal Distribution Amount for such Distribution Date; (iii) third, to principal on the Class A-3 Certificates until their Certificate Principal Balance is reduced to zero, up to the remainder of the Principal Distribution Amount for such Distribution Date; (iv) fourth, to principal on the Class A-4 Certificates until their Certificate Principal Balance is reduced to zero, up to the remainder of the Principal Distribution Amount for such Distribution Date. However, if the Certificate Principal Balance of each and every Class of Principal Balance Certificates other than the Class A-1, A-2, A-3 and A-4 Certificates has been reduced to zero as a result of the allocation of Mortgage Loan losses and expenses and any of the Class A-1, A-2, A-3 and/or A-4 Certificates remain outstanding, then the Principal Distribution Amount will be distributed on the Class A-1, A-2, A-3 and A-4 Certificates, pro rata, based on their respective outstanding Certificate Principal Balances, until their Certificate Principal Balances have been reduced to zero. | |
3. Class A-1, A-2, A-3 and A-4 Certificates: To reimburse the holders of the Class A-1, A-2, A-3 and A-4 Certificates, pro rata, for any previously unreimbursed losses (other than certain Trust Advisor expenses) on the mortgage loans that were previously allocated in reduction of the Certificate Principal Balances of such Classes. |
THE INFORMATION IN THIS STRUCTURAL AND COLLATERAL TERM SHEET IS NOT COMPLETE AND MAY BE AMENDED PRIOR TO THE TIME OF SALE. THIS TERM SHEET IS NOT AN OFFER TO SELL THESE SECURITIES AND IT IS NOT A SOLICITATION OF AN OFFER TO BUY THESE SECURITIES IN ANY JURISDICTION WHERE THE OFFER OR SALE IS NOT PERMITTED.
16
| WFRBS Commercial Mortgage Trust 2011-C5 | Certain Terms and Conditions |
4. Class A-S Certificates: To make distributions on the Class A-S Certificates as follows: (a) first, to interest on Class A-S Certificates in the amount of the interest entitlement for that Class; (b) next, to the extent of the portion of the Principal Distribution Amount remaining after distributions in respect of principal to each Class with a higher distribution priority (in this case, the Class A-1, A-2, A-3 and A-4 Certificates), to principal on Class A-S Certificates until their Certificate Principal Balance is reduced to zero; and (c) next, to reimburse the holders of the Class A-S Certificates for any previously unreimbursed losses (other than certain Trust Advisor expenses) on the mortgage loans that were previously allocated to that Class in reduction of its Certificate Principal Balance. | |
5. After the Class A-1, A-2, A-3, A-4 and A-S Certificates are paid all amounts to which they are entitled, the remaining funds available for distribution will be used to pay interest, principal and loss reimbursement amounts (other than certain Trust Advisor expenses) on the Class B, C, D, E, F, G and H Certificates sequentially in that order in a manner analogous to the Class A-S Certificates. | |
| Allocation of Yield Maintenance and Prepayment Premiums: | If any yield maintenance charges and prepayment premiums are collected during any particular collection period with respect to any mortgage loan, then on the distribution date corresponding to that collection period, the certificate administrator will pay a portion of the yield maintenance charges and prepayment premiums (net of liquidation fees payable therefrom) in the following manner: (1) pro rata, between the (x) the group (the “YM Group A”) of the Class A-1, A-2, A-3, A-4, A-S and X-A Certificates, and (y) the group (the “YM Group B” and, collectively with the YM Group A, the “YM Groups”) of the Class B, C, D, E and X-B Certificates, based upon the aggregate amount of principal distributed to the classes of principal balance certificates in each YM Group for that distribution date, and (2) among the classes of certificates in each YM Group, in the following manner, up to an amount equal to the product of (a) the yield maintenance or prepayment premium allocated to such YM Group, (b) the related Base Interest Fraction (as defined in the Free Writing Prospectus), and (c) a fraction, which in no event may be greater than 1.0, the numerator of which is equal to the amount of principal distributed to the holder(s) of such class for that distribution date, and the denominator of which is the aggregate amount of principal distributed to all the certificates in that YM Group for that distribution date. Any yield maintenance charges or prepayment premium allocated to such YM Group remaining after such distributions will be distributed to the Class X-A and/or Class X-B Certificates, as applicable, in such YM Group. |
No prepayment premiums or yield maintenance charges will be distributed to the holders of the Class F, G, H or R Certificates. The holders of the Class X-B Certificates will be entitled to all prepayment premiums and yield maintenance charges collected after the Class A-1, A-2, A-3, A-4, A-S, B, C, D and E Certificates are retired. For a description of when prepayment premiums and yield maintenance charges are generally required on the mortgage loans, see Annex A-1 to the Free Writing Prospectus. See also “Certain Legal Aspects of Mortgage Loans — Enforceability of Certain Provisions” in the Free Writing Prospectus. Prepayment premiums and yield maintenance charges will be distributed on each Distribution Date only to the extent they are actually received on the mortgage loans as of the related Determination Date. | |
| Realized Losses: | The Certificate Principal Balances of the Class A-1, A-2, A-3, A-4, A-S, B, C, D, E, F, G and H Certificates will be reduced without distribution on any Distribution Date as a write-off to the extent of any losses realized on the mortgage loans allocated to such Class on such Distribution Date. Such losses (other than certain Trust Advisor expenses) will be applied in the following order, in each case until the related Certificate Principal Balance is reduced to zero: first, to Class H; second, to Class G; third, to Class F; fourth, to Class E; fifth, to Class D; sixth, to Class C; seventh, to Class B; eighth, to Class A-S; and, finally, pro rata, to Classes A-1, A-2, A-3 and A-4 based on their outstanding Certificate Principal Balances. Certain Trust Advisor expenses (if not absorbed by reductions of interest entitlements on Classes E, D, C and B) will be applied as write-offs in a similar manner, except that such write-offs will be applied only to the Class E, D, C, B, A-S and A-1, A-2, A-3 and A-4 Certificates (with any write-offs on the Class A-1, A-2, A-3 and A-4 Certificates to be allocated pro rata according to their respective Certificate Principal Balances immediately prior to that Distribution Date). The notional amount of the Class X-A Certificates will be reduced by the amount of all losses that are allocated to the Class A-1, A-2, A-3, A-4 or A-S Certificates as write-offs in reduction of their Certificate Principal Balances. The notional amount of the Class X-B Certificates will be reduced by the amount of all losses that are allocated to the Class B, C, D, E, F, G or H Certificates as write-offs in reduction of their Certificate Principal Balances. |
| Debt Service Advances: | The Master Servicer or, if the Master Servicer fails to do so, the Trustee, will be obligated to advance delinquent debt service payments (other than balloon payments and default interest) and assumed debt service payments on the mortgage loans, except to the extent they are deemed |
THE INFORMATION IN THIS STRUCTURAL AND COLLATERAL TERM SHEET IS NOT COMPLETE AND MAY BE AMENDED PRIOR TO THE TIME OF SALE. THIS TERM SHEET IS NOT AN OFFER TO SELL THESE SECURITIES AND IT IS NOT A SOLICITATION OF AN OFFER TO BUY THESE SECURITIES IN ANY JURISDICTION WHERE THE OFFER OR SALE IS NOT PERMITTED.
17
| WFRBS Commercial Mortgage Trust 2011-C5 | Certain Terms and Conditions |
non-recoverable from collections on the related mortgage loan. In addition, if an Appraisal Reduction Amount exists for a given mortgage loan, the interest portion of any debt service advance for such mortgage loan will be reduced, which will have the effect of reducing the amount of interest available for distribution to the Certificates in reverse alphabetical order of their Class designations (except that interest payments on the Class A-1, A-2, A-3, A-4, X-A and X-B Certificates would be affected on a pari passu basis). | |
| Servicing Advances: | The Master Servicer or, if the Master Servicer fails to do so, the Trustee, will be obligated to make servicing advances, including the payment of delinquent property taxes, insurance premiums and ground rent, except to the extent that those advances are deemed non-recoverable from collections on the related mortgage loan. |
| Appraisal Reduction Amounts: | An Appraisal Reduction Amount generally will be created in the amount, if any, by which the principal balance of a required appraisal loan (which is a mortgage loan with respect to which certain defaults, modifications or insolvency events have occurred as further described in the Free Writing Prospectus) plus other amounts overdue or advanced in connection with such mortgage loan exceeds 90% of the appraised value of the related mortgaged property plus certain escrows and reserves (including letters of credit) held with respect to the mortgage loan. |
A mortgage loan will cease to be a required appraisal loan when the same has ceased to be a specially serviced mortgage loan (if applicable), has been brought current for at least three consecutive months and no other circumstances exist that would cause such mortgage loan to be a required appraisal loan. | |
Appraisal Reduction Amounts will affect the amount of debt service advances on the related mortgage loan. Appraisal Reduction Amounts will also be taken into account in the determination of the identity of the Class whose majority constitutes the “majority subordinate certificateholder” and is entitled to appoint the subordinate class representative. | |
| Clean-Up Call and Exchange Termination: | On each Distribution Date occurring after the aggregate unpaid principal balance of the mortgage loans is reduced below 1% of the initial aggregate principal balance of the mortgage loans of the Cut-off Date, certain specified persons will have the option to purchase all of the remaining mortgage loans (and all property acquired through exercise of remedies in respect of any mortgage loan) at the price specified in the Free Writing Prospectus. Exercise of the option will terminate the trust and retire the then-outstanding certificates. |
If the aggregate Certificate Principal Balances of each of the Class A-1, A-2, A-3, A-4, A-S, B, C, D and E Certificates have been reduced to zero, the trust may also be terminated in connection with an exchange of all the then-outstanding certificates, including the Class X-B Certificates, for the mortgage loans and REO properties then remaining in the issuing entity, but all of the holders of those Classes of outstanding certificates would have to voluntarily participate in the exchange. | |
| Liquidated Loan Waterfall: | Following the liquidation of any loan or property, the net liquidation proceeds generally will be applied (after reimbursement of advances and certain trust fund expenses), first, as a recovery of accrued interest, other than delinquent interest that was not advanced as a result of Appraisal Reduction Amounts, and then as a recovery of principal until all principal has been recovered. Any liquidation proceeds remaining thereafter will be applied as a recovery to delinquent interest that was not advanced as a result of Appraisal Reduction Amounts. |
| Majority Subordinate Certificateholder and Subordinate Class Representative: | A subordinate class representative may be appointed by the “majority subordinate certificate-holder”, which will be the holder(s) of a majority of: (a) during a “subordinate control period”, the most subordinate class among the Class F, G and H Certificates that has a Certificate Principal Balance, as notionally reduced by any Appraisal Reduction Amounts allocable to that class, that is at least equal to 25% of its total initial principal balance and (b) during a “collective consultation period”, the most subordinate class among the Class F, G and H Certificates that has a total principal balance, without regard to Appraisal Reduction Amounts, that is at least equal to 25% of its initial Certificate Principal Balance. The majority subordinate certificateholder will have a continuing right to appoint, remove or replace the subordinate class representative in its sole discretion. This right may be exercised at any time and from time to time. The majority subordinate certificateholder may elect under certain circumstances to opt-out from its rights under the Pooling and Servicing Agreement. See “Servicing of the Mortgage Loans and Administration of the Trust Fund”- The Majority Subordinate Certificateholder and the Subordinate Class Representative” in the Free Writing Prospectus. |
| Control and Consultation: | The rights of various parties to replace the Special Servicer and approve or consult with respect to |
THE INFORMATION IN THIS STRUCTURAL AND COLLATERAL TERM SHEET IS NOT COMPLETE AND MAY BE AMENDED PRIOR TO THE TIME OF SALE. THIS TERM SHEET IS NOT AN OFFER TO SELL THESE SECURITIES AND IT IS NOT A SOLICITATION OF AN OFFER TO BUY THESE SECURITIES IN ANY JURISDICTION WHERE THE OFFER OR SALE IS NOT PERMITTED.
18
| WFRBS Commercial Mortgage Trust 2011-C5 | Certain Terms and Conditions |
| major actions of the Special Servicer will vary according to defined periods. A “subordinate control period” will exist when the Class F Certificates have a Certificate Principal Balance, net of any Appraisal Reduction Amounts allocable to that class, that is not less than 25% of the initial principal balance of that class. In general, during a subordinate control period, (i) the subordinate class representative will be entitled to grant or withhold approval of asset status reports prepared, and material servicing actions proposed, by the Special Servicer, and (ii) the subordinate class representative will be entitled to terminate and replace the special servicer with or without cause. A “collective consultation period” will exist when the Class F Certificates have a Certificate Principal Balance that both (i) as notionally reduced by any Appraisal Reduction Amounts allocable to that class, is less than 25% of its initial principal balance and (ii) without regard to any Appraisal Reduction Amounts allocable to that class, is 25% or more of its initial Certificate Principal Balance. In general, during a collective consultation period, the Special Servicer will be required to consult with each of the subordinate class representative and the Trust Advisor in connection with asset status reports and material special servicing actions. A “senior consultation period” will exist when either the Class F Certificates have an aggregate principal balance, without regard to any Appraisal Reduction Amounts allocable to that class, that is less than 25% of its initial principal balance or an opt-out by a majority subordinate certificateholder is in effect. In general, during a senior consultation period, the Special Servicer must seek to consult with the Trust Advisor in connection with asset status reports and material special servicing actions, and no subordinate class representative will be recognized or have any right to terminate the Special Servicer or approve, direct, or consult with respect to servicing matters. During any “subordinate control period”, the majority subordinate certificateholder will be entitled to terminate the Special Servicer, with or without cause, and appoint itself or another person as the successor special servicer. It will be a condition to such appointment that Fitch and Moody’s confirm that the appointment would not result in a qualification, downgrade or withdrawal of any of their then-current ratings of certificates. | |
| Replacement of Special Servicer by General Vote of Certificateholders: | During any “collective consultation period” or “senior consultation period”, the Special Servicer may be terminated and replaced upon the affirmative direction of certificate owners holding not less than 75% of the appraisal-reduced voting rights of all certificates, following a proposal from certificate owners holding not less than 25% of the appraisal-reduced voting rights of all certificates. The certificateholders who initiate a vote on a termination and replacement of the Special Servicer without cause must cause Fitch and Moody’s to confirm the then-current ratings of the certificates (or decline to review the matter) and cause the payment of the fees and expenses incurred in the replacement. |
| Appraisal Remedy: | Solely for purposes of determining whether a “subordinate control period” is in effect, whenever the Special Servicer obtains an appraisal or updated appraisal under the pooling and servicing agreement, the subordinate class representative will have the right (at its expense) to direct the Special Servicer to hire a qualified appraiser to prepare a second appraisal of the mortgaged property. The Special Servicer must thereafter determine whether, based on its assessment of such second appraisal, any recalculation of the Appraisal Reduction Amount is warranted. The Appraisal Reduction Amount, whether based on the first or the second appraisal, will become effective following the second appraisal, except that the Appraisal Reduction Amount based on the first appraisal shall become effective if the subordinate class representative declines to demand a second appraisal within a specified number of business days, or if a second appraisal is not received within 90 days after the direction of the subordinate class representative. |
| Sale of Defaulted Assets: | There will be no “fair value” purchase option. Instead, the pooling and servicing agreement will authorize the Special Servicer to sell defaulted mortgage loans to the highest bidder in a manner generally similar to sales of REO properties. The subordinate class representative will have certain preferential rights, including a right of first refusal other than during a “senior consultation period”, in respect of sales of defaulted mortgage loans and REO properties as described in the Free Writing Prospectus. Provisions for the sale of defaulted mortgage loans do not limit the rights granted to any mezzanine lender to purchase the related mortgage loan under the applicable intercreditor agreement. |
| Age of Appraisals: | Appraisals must be no more than 9 months old for purposes of determining Appraisal Reduction Amounts, market value in connection with REO sales, etc. Required appraisals may consist of updates of prior appraisals. Internal valuations by the Special Servicer are permitted if the principal balance of a mortgage loan is less than $2,000,000. |
| Trust Advisor: | The Trust Advisor will perform certain review duties that will generally include a limited annual review of and report regarding the Special Servicer to the Certificate Administrator. The review and report generally will be based on: (a) during a subordinate control period, each final asset |
THE INFORMATION IN THIS STRUCTURAL AND COLLATERAL TERM SHEET IS NOT COMPLETE AND MAY BE AMENDED PRIOR TO THE TIME OF SALE. THIS TERM SHEET IS NOT AN OFFER TO SELL THESE SECURITIES AND IT IS NOT A SOLICITATION OF AN OFFER TO BUY THESE SECURITIES IN ANY JURISDICTION WHERE THE OFFER OR SALE IS NOT PERMITTED.
19
| WFRBS Commercial Mortgage Trust 2011-C5 | Certain Terms and Conditions |
status report delivered to the Trust Advisor by the Special Servicer, (b) during a collective consultation period or senior consultation period, any asset status reports and additional information delivered to the Trust Advisor by the Special Servicer and/or, (c) during a senior consultation period, a meeting with the Special Servicer to conduct a limited review of the Special Servicer’s operational practices on a platform basis in light of the servicing standard. In addition, during any collective consultation period or senior consultation period, the Special Servicer must seek to consult with the Trust Advisor in connection with material special servicing actions with respect to specially serviced mortgage loans. Furthermore, under certain circumstances, but only during a senior consultation period, the Trust Advisor may recommend the replacement of the Special Servicer, in which case the Certificate Administrator will deliver notice of such recommendation to the certificateholders, and certificateholders with specified percentages of the voting rights may direct the replacement of the Special Servicer at their expense. The Trust Advisor may be removed and replaced without cause upon the affirmative direction of certificates owners holding not less than 75% of the appraisal-reduced voting rights of all certificates, following a proposal from certificate owners holding not less than 25% of the appraisal-reduced voting rights of all certificates. The certificateholders who initiate a vote on a termination and replacement of the Trust Advisor without cause must cause Fitch and Moody’s to confirm the then-current ratings of the certificates (or decline to review the matter) and cause the payment of the fees and expenses incurred in the replacement. During any “subordinate control period”, the proposed replacement trust advisor will be subject to the subordinate class representative’s consent (such consent not to be unreasonably withheld). If a proposed termination and replacement of the Trust Advisor is not consummated within 180 days following the initial request of the certificateholders who requested a vote, the proposed termination and replacement shall have no further force or effect. The Trust Advisor will be discharged from its duties if and when the Class A-1, A-2, A-3, A-4, A-S, B, C, D and E Certificates are retired. | |
| Certain Fee Offsets: | If a workout fee is earned by the Special Servicer following a loan default, then certain limitations will apply to the collection and retention of a modification fee from the borrower. The modification fee generally must not exceed 1% of the principal balance of the loan as modified. In addition, if the loan re-defaults within a specified period of months and other conditions are satisfied, any subsequent workout or liquidation fee on that loan must be reduced by a portion of the previously-collected modification fee. |
| Deal Website: | The Certificate Administrator will be required to maintain a deal website which will include, among other items: (a) summaries of asset status reports prepared by the Special Servicer, (b) inspection reports, (c) appraisals, (d) various “special notices” described in the Free Writing Prospectus, (e) the “Investor Q&A Forum” and (f) a voluntary “Investor Registry”. Investors may access the deal website following execution of a certification and confidentiality agreement. |
| Initial Majority Subordinate Certificateholder: | It is expected that Rialto Real Estate Fund, LP or an affiliate thereof, or investment funds managed, advised or represented thereby, will be the initial majority subordinate certificateholder. |
THE INFORMATION IN THIS STRUCTURAL AND COLLATERAL TERM SHEET IS NOT COMPLETE AND MAY BE AMENDED PRIOR TO THE TIME OF SALE. THIS TERM SHEET IS NOT AN OFFER TO SELL THESE SECURITIES AND IT IS NOT A SOLICITATION OF AN OFFER TO BUY THESE SECURITIES IN ANY JURISDICTION WHERE THE OFFER OR SALE IS NOT PERMITTED.
20
| THE DOMAIN |
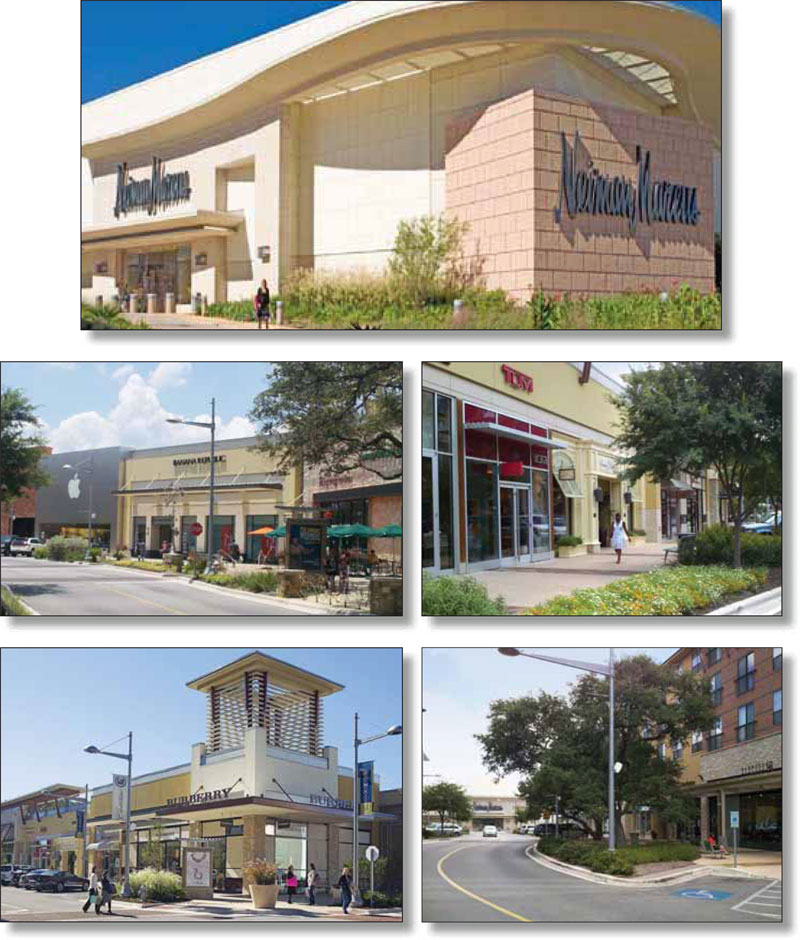
THE INFORMATION IN THIS STRUCTURAL AND COLLATERAL TERM SHEET IS NOT COMPLETE AND MAY BE AMENDED PRIOR TO THE TIME OF SALE. THIS TERM SHEET IS NOT AN OFFER TO SELL THESE SECURITIES AND IT IS NOT A SOLICITATION OF AN OFFER TO BUY THESE SECURITIES IN ANY JURISDICTION WHERE THE OFFER OR SALE IS NOT PERMITTED.
21
| THE DOMAIN |
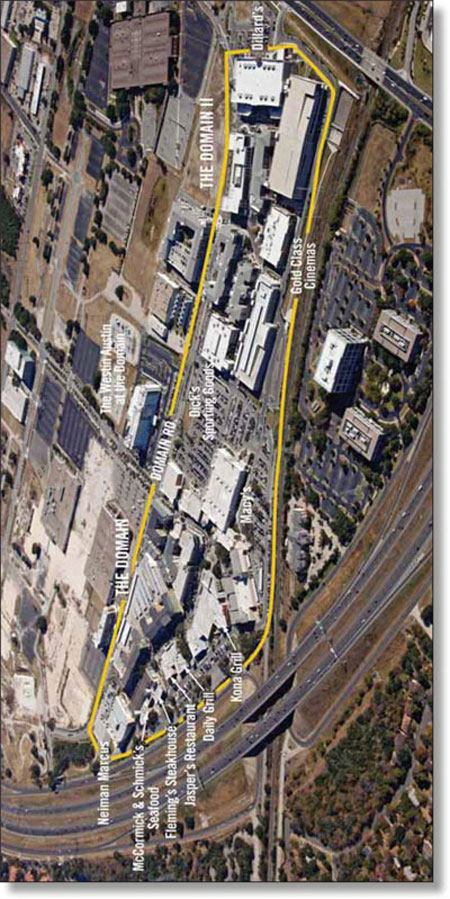
THE INFORMATION IN THIS STRUCTURAL AND COLLATERAL TERM SHEET IS NOT COMPLETE AND MAY BE AMENDED PRIOR TO THE TIME OF SALE. THIS TERM SHEET IS NOT AN OFFER TO SELL THESE SECURITIES AND IT IS NOT A SOLICITATION OF AN OFFER TO BUY THESE SECURITIES IN ANY JURISDICTION WHERE THE OFFER OR SALE IS NOT PERMITTED.
22
| THE DOMAIN |

THE INFORMATION IN THIS STRUCTURAL AND COLLATERAL TERM SHEET IS NOT COMPLETE AND MAY BE AMENDED PRIOR TO THE TIME OF SALE. THIS TERM SHEET IS NOT AN OFFER TO SELL THESE SECURITIES AND IT IS NOT A SOLICITATION OF AN OFFER TO BUY THESE SECURITIES IN ANY JURISDICTION WHERE THE OFFER OR SALE IS NOT PERMITTED.
23
| The Domain | ||||||||
| Loan Information | Property Information | |||||||
| Mortgage Loan Seller: | The Royal Bank of Scotland | Single Asset/Portfolio: | Single Asset | |||||
| Credit Assessment (Fitch/Moody’s): | NAP | Property Type: | Retail | |||||
| Original Principal Balance: | $208,200,000 | Specific Property Type: | Regional Mall | |||||
| Cut-off Date Principal Balance: | $207,550,029 | Location: | Austin, TX | |||||
| % of Initial Pool Balance: | 19.0% | Size(3): | 878,974 SF | |||||
| Loan Purpose: | Refinance | Cut-off Date Principal | ||||||
| Borrower Name: | The Domain Mall, LLC and The Domain Mall II, LLC | Balance Per Unit/SF: | $236.13 | |||||
| Sponsor: | Simon Property Group, Inc. | Year Built/Renovated: | 2007 (phase I) 2010 (phase II) | |||||
| Mortgage Rate: | 5.436% | Occupancy %(4): | 86.4% | |||||
| Note Date: | July 28, 2011 | Occupancy % Source Date: | June 27, 2011 | |||||
| Anticipated Repayment Date: | NAP | Title Vesting: | Fee | |||||
| Maturity Date: | August 1, 2021 | Property Manager: | Simon Management Associates (Texas), LLC | |||||
| IO Period: | None | |||||||
| Loan Term (Original): | 120 months | 3rd Most Recent NOI (As of): | $13,993,526 (12/31/2009) | |||||
| Seasoning: | 3 months | 2nd Most Recent NOI (As of): | $18,173,303 (12/31/2010) | |||||
| Amortization Term (Original): | 360 months | Most Recent NOI (As of): | $18,374,301 (TTM 8/31/2011) | |||||
| Loan Amortization Type: | Amortizing Balloon | |||||||
| Interest Accrual Method: | Actual/360 | U/W Revenues: | $32,233,248 | |||||
| Call Protection: | L(27),D(89),O(4) | U/W Expenses: | $12,000,735 | |||||
| Lockbox Type: | Hard/Springing Cash Management | U/W NOI: | $20,232,513 | |||||
| Additional Debt: | None | U/W NCF: | $18,976,642 | |||||
| Additional Debt Type: | NAP | U/W NOI DSCR: | 1.44x | |||||
| U/W NCF DSCR: | 1.35x | |||||||
| Escrows and Reserves: | U/W NOI Debt Yield: | 9.7% | ||||||
| U/W NCF Debt Yield: | 9.1% | |||||||
Type: | Initial | Monthly | Cap (If Any) | As-Is Appraised Value: | $389,000,000 | |||
| Taxes | $2,493,582 | $356,226 | NAP | As-Is Appraisal Valuation Date: | June 27, 2011 | |||
Insurance(1) | $0 | Springing | NAP | Cut-off Date LTV Ratio: | 53.4% | |||
| Replacement Reserve | $0 | $14,650 | $660,000 | LTV Ratio at Maturity or ARD: | 44.6% | |||
| General TI/LC Reserve | $0 | $90,006 | $3,000,000 | |||||
Tenant Specific Reserve(2) | $3,086,814 | $0 | NAP | |||||
| (1) | The monthly insurance escrow will be waived as long as no event of default has occurred and is continuing and the insurance required to be maintained by the borrower is effected under an acceptable blanket policy. |
| (2) | The borrower deposited $2,142,846 in an upfront reserve to cover outstanding tenant improvements and leasing commissions and $943,968 to cover rent that has not yet commenced for specific tenants. See “Escrows” below. |
| (3) | Includes Neiman Marcus (80,000 square feet) and Dick’s Sporting Goods (80,400 square feet), both of which own their own stores and are subject to ground leases with the borrower. |
| (4) | Includes 35,289 square feet of space associated with the Hanger Orthopedic tenant which is subject to mandatory expansion rights under its lease, but not yet occupied. See “The Property” below. |
The Mortgage Loan. The mortgage loan (“The Domain Mortgage Loan”) is evidenced by a promissory note secured by a first mortgage encumbering a regional mall and certain related office parcels located in Austin, Texas (“The Domain Property”). The Domain Mortgage Loan was originated on July 28, 2011 by The Royal Bank of Scotland. The Domain Mortgage Loan had an original principal balance of $208,200,000, has an outstanding principal balance as of the Cut-off Date of $207,550,029 and accrues interest at a rate of 5.436% per annum. The Domain Mortgage Loan had an initial term of 120 months, has a remaining term of 117 months as of the Cut-off Date, and requires payments of interest and principal based on a 30-year amortization schedule. The Domain Mortgage Loan matures on August 1, 2021. The proceeds from The Domain Mortgage Loan, along with proceeds from the Arbor Walk and Palms Crossing Mortgage Loan, were used to refinance existing debt on The Domain Property, the Arbor Walk Property and the Palms Crossing Property totaling $260 million, fund upfront reserves of approximately $5.6 million and pay closing and other costs of approximately $907,365. The Royal Bank of Scotland allocated $156 million of the $260 million to the refinancing of the existing debt on phase I of The Domain Property. Phase II of The Domain Property was unencumbered and constructed with borrower equity at a reported cost of approximately $150.7 million.
Following the lockout period, the borrower has the right to defease The Domain Mortgage Loan in whole, but not in part, on any payment date before May 1, 2021; provided, however, that The Domain Mortgage Loan is prepayable without penalty on or after May 1, 2021.
THE INFORMATION IN THIS STRUCTURAL AND COLLATERAL TERM SHEET IS NOT COMPLETE AND MAY BE AMENDED PRIOR TO THE TIME OF SALE. THIS TERM SHEET IS NOT AN OFFER TO SELL THESE SECURITIES AND IT IS NOT A SOLICITATION OF AN OFFER TO BUY THESE SECURITIES IN ANY JURISDICTION WHERE THE OFFER OR SALE IS NOT PERMITTED.
24
| THE DOMAIN |
The Property. Located in Austin, Texas, The Domain Property is a mixed-use project that was developed by the sponsor in two phases comprising approximately 1.2 million square feet of retail, office, lodging and multifamily use. Phase I (535,708 square feet) was completed in March 2007 and phase II (343,266 square feet) was completed in February 2010. The collateral for The Domain Mortgage Loan consists of 878,974 square feet, which is comprised of 710,675 square feet of retail space and 168,299 square feet of office space. The Domain Property is anchored by Macy’s (140,000 square feet), Neiman Marcus (80,000 square feet), Dick’s Sporting Goods (80,400 square feet), Dillard’s (206,308 square feet) and an eight screen Gold Class Cinemas. Macy’s and Dillard’s are not included as part of the collateral for The Domain Mortgage Loan. However both tenants do contribute a small portion (approximately 3%) to the underwritten expense reimbursements. The 168,299 square foot office component is anchored by Hanger Orthopedic, a subsidiary of Hanger Orthopedic Group (NYSE: HGR), which is a provider of prosthetic and orthotic services in the United States. The lease with Hanger Orthopedic consists of 75,165 square feet, of which, approximately 39,876 square feet (3.5% of annual U/W base rent) is occupied with mandatory expansion rights whereby approximately 18,000 square feet (1.6% of annual U/W base rent) must be taken by August 1, 2012 and an additional 17,289 square feet (1.5% of annual U/W base rent) must be taken by August 1, 2013. There is a $2,402,763 reserve for Hanger Orthopedic. See “Escrows” below.
Located adjacent to The Domain Property, but not included as part of the collateral for The Domain Mortgage Loan, is Austin’s first Aloft hotel, a Westin hotel and 828 residential units in two projects. Constructed in 2009, the Villages at the Domain project consist of 438 residential units. The Residences at the Domain project consists of 390 residential units and were built in 2007. The portions of the retail space at The Domain Property located in the same buildings as the Villages at the Domain project and the Residences at the Domain project are subject to condominium regimes whereby the related condominium association governs the management, repair, replacement and maintenance of the common areas in the related condominium. Specifically, the phase I condominium association includes, along with certain parking facilities, all of the buildings in the Residence at the Domain project and one building in the Villages at the Domain project while the phase II condominium association includes, along with certain parking facilities, the remainder of the buildings in the Villages at the Domain project. The retail portions of each building, plus certain parking facilities, constitute the retail units in each condominium regime while the residential portions of each building constitute the residential units. The owners of the retail units and the owners of the residential units each represent 50% of the members of the board of their respective condominium association. Any decision or resolution by either board requires a majority of the votes cast with respect to such decision or resolution.
The phase I tenants had 2010 year-end, comparable in-line average sales (tenants occupying less than 10,000 square feet) of $605 per square foot and average total mall sales of $452 per square foot. Occupancy costs for tenants occupying less than 10,000 square feet averaged 10.0% for year-end 2010. As of June 27, 2011, The Domain Property was 86.4% leased by approximately 113 tenants. Full year sales for the phase II tenants are not yet available.
THE INFORMATION IN THIS STRUCTURAL AND COLLATERAL TERM SHEET IS NOT COMPLETE AND MAY BE AMENDED PRIOR TO THE TIME OF SALE. THIS TERM SHEET IS NOT AN OFFER TO SELL THESE SECURITIES AND IT IS NOT A SOLICITATION OF AN OFFER TO BUY THESE SECURITIES IN ANY JURISDICTION WHERE THE OFFER OR SALE IS NOT PERMITTED.
25
| THE DOMAIN |
The following table presents certain information relating to the tenancies at The Domain Property:
Major Tenants
| Tenant Name | Credit Rating (Fitch/ Moody’s/ S&P)(1) | Tenant NRSF | % of NRSF | Annual U/W Base Rent PSF | Annual U/W Base Rent | % of Total Annual U/W Base Rent | Sales PSF(2) | Occupancy Cost(2) | Lease Expiration Date(9) |
Anchor Tenants - Not Part of Collateral | |||||||||
Dillard’s(3) | BB/B2/BB- | 206,308 | ANCHOR OWNED – NOT PART OF THE COLLATERAL | ||||||
Macy’s(3) | BBB-/Ba1/BBB- | 140,000 | ANCHOR OWNED – NOT PART OF THE COLLATERAL | ||||||
Anchor Tenants - Collateral | |||||||||
Dick’s Sporting Goods(4) | NR/NR/NR | 80,400 | 9.1% | $19.70 | $1,583,880 | 8.4% | NAV | NAV | 1/31/2020 |
Neiman Marcus(5) | CCC/NR/B+ | 80,000 | 9.1% | $3.88 | $310,000 | 1.6% | $289 | NAV | 3/31/2027 |
| Total Anchor Tenants - Collateral | 160,400 | 18.2% | $11.81 | $1,893,880 | 10.0% | ||||
| Other Major Retail Tenants - Collateral | |||||||||
| Gold Class Cinemas | NR/NR/NR | 37,321 | 4.2% | $16.00 | $597,136 | 3.2% | NAV | NAV | 1/31/2026 |
Forever 21(6) | NR/NR/NR | 31,691 | 3.6% | $25.22 | $799,225 | 4.2% | $215 | 11.5% | 1/31/2020 |
| Maggiano’s Little Italy | NR/Ba2/BBB- | 14,986 | 1.7% | $30.40 | $455,579 | 2.4% | NAV | NAV | 2/29/2020 |
Zara(7) | NR/NR/NR | 11,797 | 1.3% | (7) | (7) | (7) | $217 | 12.0% | 5/31/2019 |
| Total Other Major Retail Tenants - Collateral | 95,795 | 10.9% | $19.33 | $1,851,940 | 9.8% | ||||
| Major Office Tenants – Collateral | |||||||||
Hanger Orthopedic(8) | NR/B3/BB | 75,165 | 8.6% | $16.50 | $1,240,223 | 6.6% | NAP | NAP | 7/31/2023 |
| Total Office Majors Tenant | 75,165 | 8.6% | $16.50 | $1,240,223 | 6.6% | ||||
| Non-Major Retail Tenants – Collateral | 356,312 | 40.5% | $35.32 | $12,586,188 | 66.6% | ||||
| Non-Major Office Tenants – Collateral | 71,675 | 8.2% | $18.65 | $1,336,822 | 7.1% | ||||
| Occupied Collateral Total | 759,347 | 86.4% | $24.90 | $18,909,053 | 100.0% | ||||
| Vacant Retail Space | 98,168 | 11.2% | |||||||
| Vacant Office Space | 21,459 | 2.4% | |||||||
| Vacant Space | 119,627 | 13.6% | |||||||
| Collateral Total | 878,974 | 100.0% | |||||||
| (1) | Certain ratings are those of the parent company whether or not the parent guarantees the lease. |
| (2) | Sales per square foot and occupancy costs are for the full year ending December 31, 2010. Full year sales are not available for tenants located in The Domain Property phase II. |
| (3) | Does not serve as collateral for The Domain Mortgage Loan. However, Dillard’s and Macy’s are each subject to a construction, operation and reciprocal easement agreement and contribute to common area maintenance in amounts equal to $0.35 per square foot and $1.00 per square foot per annum, respectively. |
| (4) | In addition to base rent, Dick’s Sporting Goods pays 3.0% of annual gross sales in excess of $40,000,000. |
| (5) | In addition to base rent, Neiman Marcus pays 2.5% of annual gross sales in excess of $15,000,000. |
| (6) | In addition to base rent, Forever 21 pays 5.0% of annual gross sales in excess of $15,671,073. |
| (7) | Zara pays 12% of annual gross sales in lieu of base rent. |
| (8) | Approximately 39,876 square feet (3.5% of annual U/W base rent) of the Hanger Orthopedic space is occupied. The lease is structured with a mandatory expansion whereby approximately 18,000 square feet (1.6% of annual U/W base rent) must be taken by August 1, 2012 and an additional 17,289 square feet (1.5% of annual U/W base rent) must be taken by August 1, 2013. There is a $2,402,763 reserve for Hanger Orthopedic. See “Escrows” below. |
| (9) | Dick’s Sporting Goods has three 5-year extension options remaining. Neiman Marcus has four 5-year extension options remaining. Gold Class Cinemas has four 5-year extension options remaining. Maggiano’s Little Italy has three 5-year extension options remaining. Hanger Orthopedic has two 5-year extension options remaining. |
THE INFORMATION IN THIS STRUCTURAL AND COLLATERAL TERM SHEET IS NOT COMPLETE AND MAY BE AMENDED PRIOR TO THE TIME OF SALE. THIS TERM SHEET IS NOT AN OFFER TO SELL THESE SECURITIES AND IT IS NOT A SOLICITATION OF AN OFFER TO BUY THESE SECURITIES IN ANY JURISDICTION WHERE THE OFFER OR SALE IS NOT PERMITTED.
26
| THE DOMAIN |
The following table presents certain information relating to the lease rollover schedule at The Domain Property:
Lease Expiration Schedule*
Year Ending December 31, | No. of Leases Expiring | Expiring NRSF | % of Total NRSF | Cumulative of Total NRSF | Cumulative % of Total NRSF | Annual U/W Base Rent | % of Annual U/W Base Rent | Annual U/W Base Rent PSF | ||||||||
| MTM | 0 | 0 | 0.0% | 0 | 0.0% | $0 | 0.0% | $0.00 | ||||||||
| 2011 | 1 | 9 | 0.0% | 9 | 0.0% | $46,350 | 0.2% | $5,150.00 | ||||||||
| 2012 | 4 | 24,121 | 2.7% | 24,130 | 2.7% | $551,460 | 2.9% | $22.86 | ||||||||
| 2013 | 4 | 27,459 | 3.1% | 51,589 | 5.9% | $590,268 | 3.1% | $21.50 | ||||||||
| 2014 | 2 | 9,017 | 1.0% | 60,606 | 6.9% | $156,065 | 0.8% | $17.31 | ||||||||
| 2015 | 5 | 19,053 | 2.2% | 79,659 | 9.1% | $648,512 | 3.4% | $34.04 | ||||||||
| 2016 | 4 | 12,588 | 1.4% | 92,247 | 10.5% | $227,303 | 1.2% | $18.06 | ||||||||
| 2017 | 30 | 124,493 | 14.2% | 216,740 | 24.7% | $5,141,167 | 27.2% | $41.30 | ||||||||
| 2018 | 24 | 84,686 | 9.6% | 301,426 | 34.3% | $3,592,262 | 19.0% | $42.42 | ||||||||
| 2019 | 2 | 19,355 | 2.2% | 320,781 | 36.5% | $226,740 | 1.2% | $11.71 | ||||||||
| 2020 | 20 | 189,520 | 21.6% | 510,301 | 58.1% | $4,514,172 | 23.9% | $23.82 | ||||||||
| 2021 | 13 | 55,349 | 6.3% | 565,650 | 64.4% | $998,368 | 5.3% | $18.04 | ||||||||
| Thereafter | 4 | 193,697 | 22.0% | 759,347 | 86.4% | $2,216,386 | 11.7% | $11.44 | ||||||||
| Vacant | 0 | 119,627 | 13.6% | 878,974 | 100.0% | $0 | 0.0% | $0.00 | ||||||||
| Total / Weighted Average | 113 | 878,974 | 100.0% | $18,909,053 | 100.0% | $24.90 |
* Source: Information obtained from the underwritten rent roll.
The following table presents historical occupancy percentages at The Domain Property:
Historical Occupancy Percentages*
12/31/2006(1) | 12/31/2007(1) | 12/31/2008(2)(3) | 12/31/2009(2)(3) | 12/31/2010(2) | ||||
| NAP | NAP | 93% | 94% | 91% | ||||
| * Source: Information provided by the borrower. | ||||||||
| (1) | Phase I was completed in 2007 and phase II was completed in 2010. | |||||||
| (2) | Occupancy excludes office space. | |||||||
| (3) | Occupancies exclude phase II of The Domain Property as it was not completed until 2010. | |||||||
Historical Average Base Rent (PSF)*
12/31/2008 | 12/31/2009 | 12/31/2010 | ||||||
$24.90(1) | $25.19(1) | $20.24(1) | ||||||
| * Source: Information provided by the borrower. | ||||||||
| (1) | Base Rent PSF calculation is based on borrower provided base rental figures and total square footage of 535,708 square feet (2008), 535,708 square feet (2009) and 878,974 square feet (2010). | |||||||
THE INFORMATION IN THIS STRUCTURAL AND COLLATERAL TERM SHEET IS NOT COMPLETE AND MAY BE AMENDED PRIOR TO THE TIME OF SALE. THIS TERM SHEET IS NOT AN OFFER TO SELL THESE SECURITIES AND IT IS NOT A SOLICITATION OF AN OFFER TO BUY THESE SECURITIES IN ANY JURISDICTION WHERE THE OFFER OR SALE IS NOT PERMITTED.
27
| THE DOMAIN |
Operating History and Underwritten Net Cash Flow. The following table presents certain information relating to the historical operating performance and the Underwritten Net Cash Flow at The Domain Property:
Cash Flow Analysis
2008(1) | 2009(1) | 2010 | TTM 8/31/2011 | U/W | U/W $ per SF | |||||||
| Base Rent | $13,338,588 | $13,495,221 | $17,791,602 | $17,248,653 | $18,909,053 | $21.51 | ||||||
| Grossed Up Vacant Space | 0 | 0 | 0 | 0 | 5,363,572 | 6.10 | ||||||
| Percentage Rent | 526,750 | 485,176 | 1,064,752 | 2,109,790 | 1,524,885 | 1.73 | ||||||
| Total Reimbursables | 4,994,435 | 5,353,979 | 6,323,595 | 6,442,210 | 6,632,970 | 7.55 | ||||||
| Other Income | 4,160,654 | 4,333,575 | 5,055,236 | 5,166,340 | 5,166,340 | 5.88 | ||||||
| Less Vacancy & Credit Loss | (269,352) | (806,102) | (6,652) | 88,642 | (5,363,572) | (6.10) | ||||||
| Effective Gross Income | $22,751,075 | $22,861,849 | $30,228,533 | $31,055,635 | $32,233,248 | $36.67 | ||||||
| Total Operating Expenses | $8,513,595 | $8,868,323 | $12,055,230 | $12,681,334 | $12,000,735 | $13.65 | ||||||
Net Operating Income(2) | $14,237,480 | $13,993,526 | $18,173,303 | $18,374,301 | $20,232,513 | $23.02 | ||||||
| TI/LC | 0 | 0 | 0 | 0 | 1,080,076 | 1.23 | ||||||
| Capital Expenditures | 0 | 0 | 0 | 0 | 175,795 | 0.20 | ||||||
| Net Cash Flow | $14,237,480 | $13,993,526 | $18,173,303 | $18,374,301 | $18,976,642 | $21.59 | ||||||
| NOI DSCR | 1.01x | 0.99x | 1.29x | 1.30x | 1.44x | |||||||
| NCF DSCR | 1.01x | 0.99x | 1.29x | 1.30x | 1.35x | |||||||
| NOI DY | 6.9% | 6.7% | 8.8% | 8.9% | 9.7% | |||||||
| NCF DY | 6.9% | 6.7% | 8.8% | 8.9% | 9.1% |
| (1) | Does not include phase II of The Domain Property as it was not completed until February 2010. |
| (2) | Underwritten NOI is higher than prior years due to several factors including, but not limited to, the completion of phase II of The Domain Property (343,266 square feet) and new leasing activity as well as including contractual rent increases through December 2011 for several tenants. The majority of the new leasing activity is related to the mandatory expansion of the Hanger Orthopedic lease. There is a $3,086,814 reserve for total new leasing activity. See “Escrows” below. |
Appraisal. According to the appraisal performed by Cushman & Wakefield, Inc., The Domain Property had an “as-is” appraised value of $389,000,000 as of an effective date of June 27, 2011.
Environmental Matters. According to a Phase I environmental site assessment performed by Partner Engineering and Science, Inc. on July 8, 2011, on The Domain Property, there was no evidence of any recognized environmental conditions.
Market Overview and Competition. The Domain Property is located in Austin, Texas, eight miles north of the Austin central business district. The Domain Property is located at the confluence of U.S Highway 183, Mopac Expressway (Loop 1), and Capital of Texas Highway (Loop 360) in north-central Austin in an established commercial district. The Mopac expressway (Loop 10) provides the primary connection to The Domain Property and to surrounding residential and office markets, as well as access from downtown Austin, the University of Texas, and the government district.
Per the appraisal, between 2000 and 2010 the population within a five mile radius of The Domain Property increased at an annual compound rate of 1.41%. Within a three and five mile radius of The Domain Property, the 2010 population was 109,581 and 277,124, respectively. The 2010 average household income within a five mile radius of The Domain was approximately $72,061.
The Domain Property is situated within the Central/Downtown submarket, one of three submarkets which comprise the Austin retail market in Austin, Texas. According to Reis, the Central/Downtown retail submarket, containing 7.3 million square feet, was 5.8% vacant with an average rental asking rate of $19.97 per square foot as of the first quarter 2011.
According to the appraisal, The Domain Property is located in the North Central submarket of the Austin office market. The average office asking rate for the North Central submarket was $21.80 per square foot as of the first quarter of 2011. The vacancy rate for this office submarket was 20.5% during the same period.
THE INFORMATION IN THIS STRUCTURAL AND COLLATERAL TERM SHEET IS NOT COMPLETE AND MAY BE AMENDED PRIOR TO THE TIME OF SALE. THIS TERM SHEET IS NOT AN OFFER TO SELL THESE SECURITIES AND IT IS NOT A SOLICITATION OF AN OFFER TO BUY THESE SECURITIES IN ANY JURISDICTION WHERE THE OFFER OR SALE IS NOT PERMITTED.
28
| THE DOMAIN |
The following table presents certain information relating to some comparable retail centers provided in the appraisal performed by Cushman & Wakefield for The Domain Property.
Retail Competitive Set*
The Domain (Subject) | Barton Creek Square(1) | Lakeline Mall(1) | Hill Country Galleria | |
| Market | Austin, TX | Austin, TX | Austin, TX | Bee Cave, TX |
| Distance from Subject | -- | 11.0 miles | 7.0 miles | 15.0 miles |
| Property Type | Regional Mall | Super-Regional | Super-Regional | Lifestyle Center |
| Year Built/Renovated | 2007/2010 | 1981/2004 | 1995/NAP | 2006/2009 |
| Anchors | Macy’s, Neiman Marcus, Dillard’s, Dick’s Sporting Goods, Forever 21 | Dillard’s, Macy’s, Nordstrom, Sears, JC Penney | Dillard’s, Sears, JC Penney, Macy’s | Dillard’s, Dick’s Sporting Goods |
| Total GLA | 1,056,544 SF | 1,430,332 SF | 1,102,655 SF | 625,245 SF |
| Total Occupancy | 86% | 98% | 98% | 70% |
* Source: Cushman & Wakefield appraisal.
| (1) | Barton Creek Square and Lakeline Mall are owned by the sponsor of The Domain Property. |
The Borrower. The Domain Mortgage Loan has two borrowing entities, The Domain Mall, LLC and The Domain Mall II, LLC (each, a “borrowing entity” and collectively, the “borrower”). Each borrowing entity is a Delaware limited liability company and a single-purpose entity with two independent directors. Legal counsel to the borrower delivered a non-consolidation opinion in connection with the origination of The Domain Mortgage Loan. Simon Property Group, L.P., the indirect owner of each borrowing entity, is the guarantor of certain nonrecourse carveouts under The Domain Mortgage Loan. Under the terms of the nonrecourse carveout guaranty, The Domain Mortgage Loan becomes fully recourse to the nonrecourse carveout guarantor if the borrower files a voluntary bankruptcy petition but not if the nonrecourse carveout guarantor joins in an involuntary bankruptcy petition against the borrower.
The Sponsor. Simon Property Group, Inc. (“SPG”) is a real estate company in the United States and is publicly traded on the New York Stock Exchange under the symbol SPG. SPG currently owns or has an interest in 391 properties comprising 261 million square feet of gross leasable area in North America, Europe and Asia. SPG employs over 5,000 people worldwide and is headquartered in Indianapolis, Indiana.
Escrows. The loan documents provide for upfront escrows at closing in the amount of: $2,493,582 for real estate taxes. In connection with the origination of The Domain Mortgage Loan, the borrower was required to deposit (i) $2,142,846 for outstanding tenant improvements and leasing commissions associated with the following new leases: $254,400 for Lululemon, $225,720 for Southern Thread, $127,500 for Maggiano’s Little Italy, and $1,535,226 for Hanger Orthopedic and (ii) $943,968 to cover rent that had not yet commenced with the following new leases: $17,743 for Lululemon, $35,818 for Papyrus, $22,870 for Hatbox, and $867,537 for Hanger Orthopedic. These funds will be released to the borrower when the lender has received an acceptable estoppel confirming (i) acceptance of the leased premises without exception and (ii) the amount and commencement date of rent payments.
The loan documents provide for ongoing monthly escrows in the amount of: $356,226 for real estate taxes (subject to adjustment per lender’s estimate), $14,650 for replacement reserves (subject to a cap of $660,000), and $90,006 for tenant improvements and leasing commissions (subject to a cap of $3,000,000). No monthly insurance escrow is required so long as (i) no event of default has occurred or is continuing under The Domain Mortgage Loan and (ii) the insurance required to be maintained by the borrower is effected pursuant to an acceptable blanket policy.
Lockbox and Cash Management. The Domain Mortgage Loan requires a lender-controlled lockbox account, which is already in place, and that the borrower direct tenants to pay their rents directly to such lockbox account. The loan documents also require that all rents received by the borrower or the property manager be deposited into the lockbox account within two business days after receipt. Prior to the occurrence of a Lockbox Event (as defined below), all funds on deposit in the lockbox account are swept into the borrower’s operating account on a daily basis. During a Lockbox Event all funds on deposit in the lockbox account are swept on a weekly basis (or daily during the continuance of an event of default) to a cash management account under the control of the lender.
A “Lockbox Event” will commence upon any of the following events occurring: (i) the occurrence and continuance of an event of default, (ii) the commencement of any bankruptcy action against the borrower or property manager, or (iii) if, as of the last day of any calendar quarter during The Domain Mortgage Loan term, the debt service coverage ratio is less than 1.25x for two consecutive calendar quarters.
Property Management. The Domain Property is currently managed by Simon Management Associates (Texas), LLC, an affiliate of SPG and the borrower, pursuant to two management agreements. According to the management agreements, the property manager is entitled to a base management fee in an amount equal to 3.0% of total revenues excluding property taxes and marketing fund contributions. The borrower may not surrender, terminate, or cancel the management agreements or otherwise replace the manager or enter into any management agreement without prior written consent from the lender.
THE INFORMATION IN THIS STRUCTURAL AND COLLATERAL TERM SHEET IS NOT COMPLETE AND MAY BE AMENDED PRIOR TO THE TIME OF SALE. THIS TERM SHEET IS NOT AN OFFER TO SELL THESE SECURITIES AND IT IS NOT A SOLICITATION OF AN OFFER TO BUY THESE SECURITIES IN ANY JURISDICTION WHERE THE OFFER OR SALE IS NOT PERMITTED.
29
| THE DOMAIN |
Assumption. The borrower has the right to transfer The Domain Property without lender consent (other than during the period that is 60 days prior to or after the date of a securitization), in whole only, and the owner of the borrower has the right to transfer more than 50% of the aggregate ownership interests in the borrower to one or more Qualified Transferees (as defined below) in one or a series of related transactions, subject to customary conditions set forth in the loan documents, including but not limited to: (i) payment of an assumption fee of $500,000 and other fees including rating agencies’ fees (subject to a cap of $25,000), (ii) no event of default has occurred and is continuing under The Domain Mortgage Loan, (iii) the organizational documents of the transferee are acceptable to Fitch and Moody’s, (iv) the lender receives written confirmation from Fitch and Moody’s that the assumption will not, in and of itself, result in a downgrade, qualification or withdrawal of the then current ratings assigned to any class of Series 2011-C5 Certificates and (v) the transferee and all other entities controlled directly or indirectly by principals of the transferee must not have been party to any bankruptcy proceedings, voluntary or involuntary within seven years prior to the date of the proposed transfer.
A “Qualified Transferee” is an entity (a)(i) that owns and operates at least five regional malls totaling at least 10,000,000 square feet of gross leasable area in the aggregate, or (ii) that has a net worth in excess of $1,000,000,000 or (iii) for which Fitch and Moody’s confirm that a transfer to such person will not, in and of itself, result in a downgrade, qualification or withdrawal of the then current ratings assigned to any class of Series 2011-C5 Certificates, and (b) that satisfies other credit worthiness and experiential criteria set forth in the loan documents.
Release. The borrower may make transfers of certain immaterial or non-income producing portions of The Domain Property from the lien of the mortgage upon the satisfaction of certain conditions, including but not limited to: (i) no event of default shall have occurred and be continuing, and (ii) immediately after the transfer and release, either (a) a loan to value test, or (b) the borrower pays down the principal balance of The Domain Mortgage Loan (which prepayment shall not be subject to any prepayment penalty of any kind) by the amount specified in the loan documents.
Real Estate Substitution. Not permitted.
Subordinate and Mezzanine Indebtedness. Not permitted.
Other Additional Financing. SPG is permitted to pledge its indirect interests in the borrower in connection with a corporate-level financing securing all or substantially all of SPG’s assets. However, foreclosure on such pledge is an event of default under the loan documents if any person or entity other than an institutional lender becomes the owner of 50% or more of the borrower or SPG or controls the direct or indirect interests in the borrower or SPG.
Ground Lease. None.
Terrorism Insurance. The loan documents require that the “all risk” insurance policy maintained by the borrower provide coverage for terrorism in an amount equal to the full replacement cost of The Domain Property as well as business interruption insurance covering no less than the 18-month period from the date of a casualty event.
THE INFORMATION IN THIS STRUCTURAL AND COLLATERAL TERM SHEET IS NOT COMPLETE AND MAY BE AMENDED PRIOR TO THE TIME OF SALE. THIS TERM SHEET IS NOT AN OFFER TO SELL THESE SECURITIES AND IT IS NOT A SOLICITATION OF AN OFFER TO BUY THESE SECURITIES IN ANY JURISDICTION WHERE THE OFFER OR SALE IS NOT PERMITTED.
30
(THIS PAGE INTENTIONALLY LEFT BLANK)
31
| PUCK BUILDING |
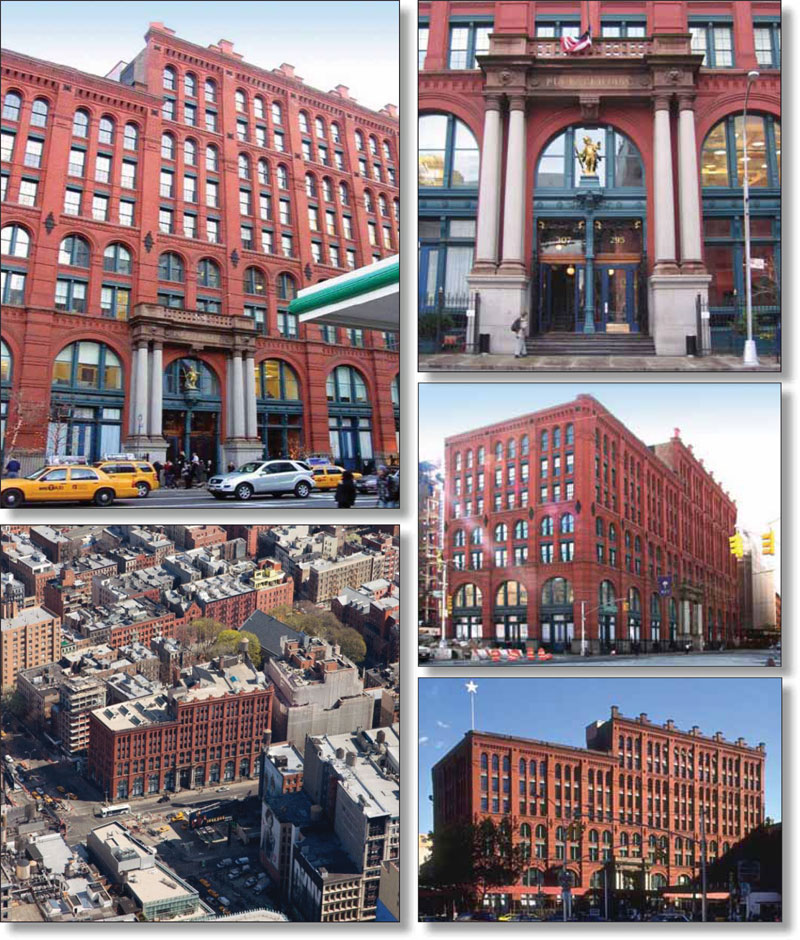
THE INFORMATION IN THIS STRUCTURAL AND COLLATERAL TERM SHEET IS NOT COMPLETE AND MAY BE AMENDED PRIOR TO THE TIME OF SALE. THIS TERM SHEET IS NOT AN OFFER TO SELL THESE SECURITIES AND IT IS NOT A SOLICITATION OF AN OFFER TO BUY THESE SECURITIES IN ANY JURISDICTION WHERE THE OFFER OR SALE IS NOT PERMITTED.
32
| PUCK BUILDING |
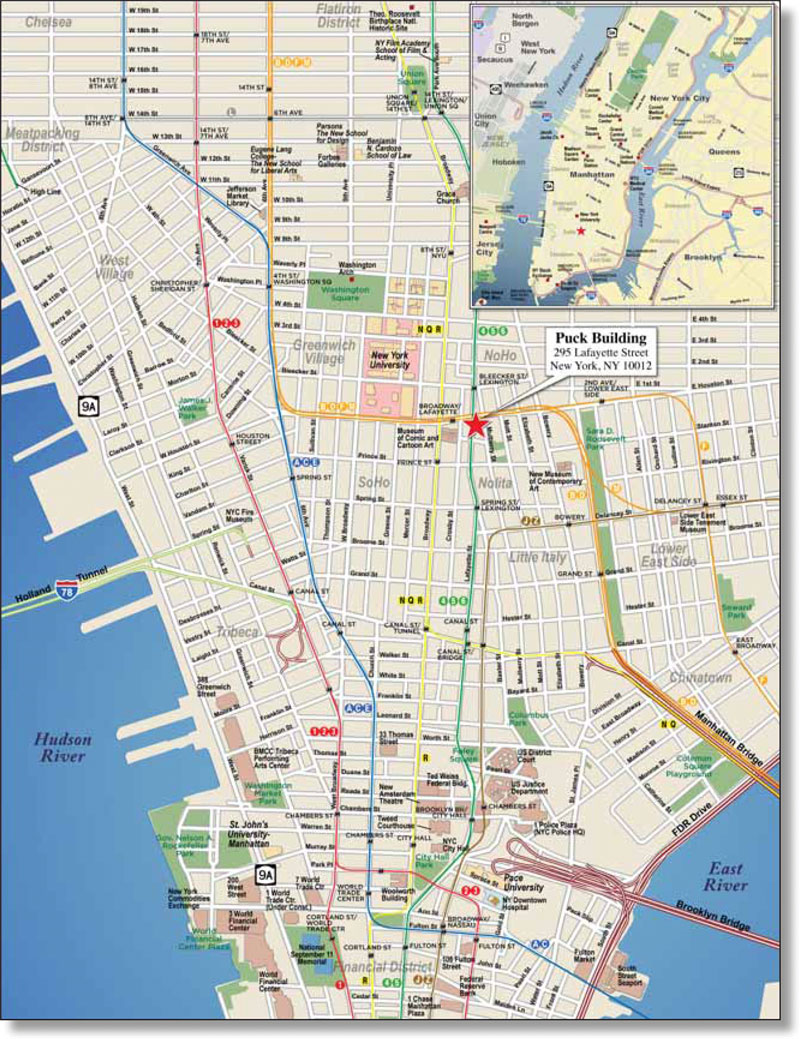
THE INFORMATION IN THIS STRUCTURAL AND COLLATERAL TERM SHEET IS NOT COMPLETE AND MAY BE AMENDED PRIOR TO THE TIME OF SALE. THIS TERM SHEET IS NOT AN OFFER TO SELL THESE SECURITIES AND IT IS NOT A SOLICITATION OF AN OFFER TO BUY THESE SECURITIES IN ANY JURISDICTION WHERE THE OFFER OR SALE IS NOT PERMITTED.
33
| Puck Building | ||||||||
| Loan Information | Property Information | |||||||
| Mortgage Loan Seller: | The Royal Bank of Scotland | Single Asset/Portfolio: | Single Asset | |||||
| Credit Assessment (Fitch/Moody’s): | NAP | Property Type: | Mixed Use | |||||
| Original Principal Balance: | $85,000,000 | Specific Property Type: | Office/Retail | |||||
| Cut-off Date Principal Balance: | $85,000,000 | Location: | New York, NY | |||||
| % of Initial Pool Balance: | 7.8% | Size: | 206,693 SF | |||||
| Loan Purpose: | Refinance | Cut-off Date Principal | ||||||
| Borrower Name: | New Puck, LLC | Balance Per Unit/SF: | $411.24 | |||||
| Sponsor: | Kushner Companies | Year Built/Renovated: | 1885/2011 | |||||
| Mortgage Rate: | 5.353% | Occupancy %: | 94.2% | |||||
| Note Date: | June 24, 2011 | Occupancy % Source Date: | June 15, 2011 | |||||
| Anticipated Repayment Date: | NAP | Title Vesting: | Fee | |||||
| Maturity Date: | July 1, 2021 | Property Manager: | Kadima Management Associates, L.L.C. | |||||
| IO Period: | 60 months | |||||||
| Loan Term (Original): | 120 months | 3rd Most Recent NOI (As of): | $2,530,442 (12/31/2008) | |||||
| Seasoning: | 4 months | 2nd Most Recent NOI (As of): | $3,146,633 (12/31/2009) | |||||
| Amortization Term (Original): | 360 months | Most Recent NOI (As of): | $3,149,684 (12/31/2010) | |||||
| Loan Amortization Type: | Interest-only, Amortizing Balloon | |||||||
| Interest Accrual Method: | Actual/360 | U/W Revenues: | $9,969,507 | |||||
| Call Protection: | L(28),D(88),O(4) | U/W Expenses: | $2,756,968 | |||||
| Lockbox Type: | Hard/Springing Cash Management | U/W NOI: | $7,212,539 | |||||
Additional Debt(1): | Yes | U/W NCF: | $7,098,240 | |||||
Additional Debt Type(1): | Mezzanine | U/W NOI DSCR(4): | 1.27x | |||||
U/W NCF DSCR(4): | 1.25x | |||||||
| Escrows and Reserves: | U/W NOI Debt Yield: | 8.5% | ||||||
| U/W NCF Debt Yield: | 8.4% | |||||||
Type: | Initial | Monthly | Cap (If Any) | As-Is Appraised Value: | $140,000,000 | |||
| Taxes | $137,735 | $68,868 | NAP | As-Is Appraisal Valuation Date: | June 1, 2011 | |||
| Insurance | $74,957 | $10,708 | NAP | Cut-off Date LTV Ratio: | 60.7% | |||
| Deferred Maintenance | $15,065 | $0 | NAP | LTV Ratio at Maturity or ARD: | 56.3% | |||
| Condominium Common Charges | $2,000 | Springing | NAP | |||||
| Replacement Reserves | $0 | $5,167 | NAP | |||||
Tenant Specific TI/LC(2) | $7,543,655 | $0 | NAP | |||||
Leasing Reserves(3) | $2,000,000 | $11,167 | NAP | |||||
| (1) | The equity interests in the borrower have been pledged to secure mezzanine indebtedness with a balance as of the Cut-off Date of $10,000,000 (the “Puck Building Mezzanine Loan”). As of the Cut-off Date, taking into account both the Puck Building Mortgage Loan and the Puck Building Mezzanine Loan, the total debt U/W NCF DSCR is 1.06x, the total debt LTV ratio is 67.9%, and the total debt NCF Debt Yield is 7.5%. See description of additional debt under “Subordinate and Mezzanine Indebtedness” below. All LTV, DSCR, debt yield, and Cut-off Date Principal Balance per square foot numbers presented in the table above are based solely on the $85,000,000 senior financing. All U/W NOI DSCR and U/W NCF DSCR figures are based on the amortizing debt service of the Puck Building Mortgage Loan. |
| (2) | The borrower deposited $5,134,556 in an upfront reserve to cover outstanding tenant improvements and leasing commissions and $2,409,099 to cover rent concessions associated with leases with Recreational Equipment, Inc. (“REI”), Axiom Global Inc. (“Axiom”) and Thrive Capital Partners (“Thrive”). See “Escrows” below. |
| (3) | The borrower deposited $2,000,000 in an upfront reserve for future leasing costs associated with current vacant space. Monthly escrows in the amount of $11,167 will be collected for ongoing tenant improvements and leasing reserves. See “Escrows” below. |
| (4) | All NOI DSCR and NCF DSCR figures presented in the table above are based on the amortizing debt service. The U/W NOI DSCR and U/W NCF DSCR figures based on the interest-only debt service payments due on the Puck Building Mortgage Loan for the first twelve months are 1.56x and 1.53x, respectively. |
The Mortgage Loan. The mortgage loan (the “Puck Building Mortgage Loan”) is evidenced by a promissory note secured by a first mortgage encumbering a Class B mixed used building located in Manhattan, New York (the “Puck Building Property”). The Puck Building Mortgage Loan was originated on June 24, 2011 by The Royal Bank of Scotland. The Puck Building Mortgage Loan had an original principal balance of $85,000,000, has an outstanding principal balance as of the Cut-off Date of $85,000,000 and accrues interest at a rate of 5.353% per annum. The Puck Building Mortgage Loan had an initial term of 120 months, has a remaining term of 116 months as of the Cut-off Date, a 60-month interest-only period and requires payments of interest and principal based on a 30-year amortization schedule thereafter. The Puck Building Mortgage Loan matures on July 1, 2021. The proceeds from the Puck Building Mortgage Loan and the Puck Building Mezzanine Loan were used to refinance existing debt on the Puck Building Property totaling $80.0 million, fund upfront reserves of approximately $9.8 million, pay closing and other costs of approximately $1.3 million, and return approximately $3.9 million of equity to the sponsor.
Following the lockout period, the borrower has the right to defease the Puck Building Mortgage Loan in whole, but not in part, on any payment date prior to April 1, 2021; and, as such, the Puck Building Mortgage Loan is prepayable without penalty on any payment date on or after April 1, 2021.
THE INFORMATION IN THIS STRUCTURAL AND COLLATERAL TERM SHEET IS NOT COMPLETE AND MAY BE AMENDED PRIOR TO THE TIME OF SALE. THIS TERM SHEET IS NOT AN OFFER TO SELL THESE SECURITIES AND IT IS NOT A SOLICITATION OF AN OFFER TO BUY THESE SECURITIES IN ANY JURISDICTION WHERE THE OFFER OR SALE IS NOT PERMITTED.
34
| PUCK BUILDING |
The Property. The Puck Building Property is a pre-war 238,952 square foot mixed used building located in New York City. The Puck Building Property is located in SoHo bounded by East Houston Street, Lafayette Street, Mulberry Street, and Jersey Street. The Puck Building Property was originally built as a seven story building fronting East Houston Street in 1885. A nine story addition fronting Jersey Street was built in 1892. The Puck Building Property is on the National Register of Historic Places and has been designated as a landmark by the New York City Landmarks Preservation Commission.
In May 2011, the Puck Building Property was bifurcated into two condominiums: a 206,693 square foot commercial condominium, consisting of the ground floor retail, basement, sub-basement and first six floors of office space; and a 32,259 square foot residential condominium, consisting of the eighth and ninth floors and air rights for the construction of a penthouse atop the ninth floor. The collateral for the Puck Building Mortgage Loan is comprised of the 206,693 square foot commercial condominium.
The Puck Building Property was 94.2% leased to five tenants as of June 15, 2011. Historical occupancy has been 100%, however the Puck Building Property operated without the separation of the condominiums consisting of office space and large scale events planning space (ground floor and a portion of the seventh floor). In 2010-2011, the sponsor repositioned the Puck Building Property by converting the seventh floor ballroom into office space, giving the Puck Building Property a total of 162,298 square feet of office space. The ground level, basement and sub-basement are comprised of retail space (44,395 square feet).
Historically, the ground floor of the Puck Building Property was operated by the sponsor and used for event space. With the repositioning of the retail space, the sponsor signed a new lease with Recreational Equipment, Inc. (“REI”) in late 2010 for 37,900 square feet (ground floor and basement). REI is expected to open for business in November 2011 and this location will serve as REI’s flagship New York City metropolitan area store and its only store in Manhattan. The new REI lease increases the Puck Building Property revenue by approximately $4,179,600. Additionally, the sponsor also signed new leases with Axiom Global Inc. and Thrive Capital Partners, which increase the Puck Building Property’s annual revenue by $1,024,744 and $215,700, respectively.
The following table presents certain information relating to the tenancies at the Puck Building Property:
Major Tenants
| Tenant Name | Credit Rating (Fitch/ Moody’s /S&P)(1) | Tenant NRSF | % of NRSF | Annual U/W Base Rent PSF | Annual U/W Base Rent | % of Total Annual U/W Base Rent | Lease Expiration Date |
| Office Tenants | |||||||
New York University(2) | NR/Aa3/AA- | 75,544 | 36.5% | $23.91 | $1,806,450 | 19.5% | 6/5/2019 |
| Swanke Hayden Connell & Partners, LLP | NR/NR/NR | 58,727 | 28.4% | $34.47 | $2,024,441 | 21.9% | 4/30/2016 |
Axiom Global Inc.(3) | NR/NR/NR | 18,299 | 8.9% | $56.00 | $1,024,744 | 11.1% | 8/1/2021 |
Thrive Capital Partners(3) | NR/NR/NR | 4,314 | 2.1% | $50.00 | $215,700 | 2.3% | 6/1/2016 |
| Total Office Tenants | 156,884 | 75.9% | $32.33 | $5,071,335 | 54.8% | ||
| Retail Tenant | |||||||
REI (3) | NR/NR/NR | 37,900 | 18.3% | $110.28 | $4,179,600 | 45.2% | 10/31/2026 |
| Total Retail Tenants | 37,900 | 18.3% | $110.28 | $4,179,600 | 45.2% | ||
| Occupied Collateral Total | 194,784 | 94.2% | $47.49 | $9,250,935 | 100.0% | ||
| Vacant Space | 11,909 | 5.8% | |||||
| Collateral Total | 206,693 | 100.0% | |||||
| (1) | Credit ratings of the tenant or parent company whether or not the parent guarantees the lease. |
| (2) | Annual U/W base rent is averaged over the loan term due to investment grade ratings. Includes approximately 544 square feet of storage space. |
| (3) | REI, Axiom Global Inc. and Thrive Capital Partners have executed leases and are anticipated to take occupancy in November 2011, April 2012 and December 2011, respectively. At closing, the borrower deposited $5,134,556 in an upfront reserve to cover outstanding tenant improvements and leasing commissions and $2,409,099 to cover rent concessions associated with these leases. See “Escrows” below. |
THE INFORMATION IN THIS STRUCTURAL AND COLLATERAL TERM SHEET IS NOT COMPLETE AND MAY BE AMENDED PRIOR TO THE TIME OF SALE. THIS TERM SHEET IS NOT AN OFFER TO SELL THESE SECURITIES AND IT IS NOT A SOLICITATION OF AN OFFER TO BUY THESE SECURITIES IN ANY JURISDICTION WHERE THE OFFER OR SALE IS NOT PERMITTED.
35
| PUCK BUILDING |
The following table presents certain information relating to the lease rollover schedule at the Puck Building Property:
Lease Expiration Schedule*
Year Ending December 31, | No. of Leases Expiring | Expiring NRSF | % of Total NRSF | Cumulative of Total NRSF | Cumulative % of Total NRSF | Annual U/W Base Rent | Annual U/W Base Rent PSF | |||||||
| MTM | 0 | 0 | 0.0% | 0 | 0.0% | $0 | $0.00 | |||||||
| 2011 | 0 | 0 | 0.0% | 0 | 0.0% | $0 | $0.00 | |||||||
| 2012 | 0 | 0 | 0.0% | 0 | 0.0% | $0 | $0.00 | |||||||
| 2013 | 0 | 0 | 0.0% | 0 | 0.0% | $0 | $0.00 | |||||||
| 2014 | 0 | 0 | 0.0% | 0 | 0.0% | $0 | $0.00 | |||||||
| 2015 | 0 | 0 | 0.0% | 0 | 0.0% | $0 | $0.00 | |||||||
| 2016 | 2 | 63,041 | 30.5% | 63,041 | 30.5% | $2,240,141 | $35.53 | |||||||
| 2017 | 0 | 0 | 0.0% | 63,041 | 30.5% | $0 | $0.00 | |||||||
| 2018 | 0 | 0 | 0.0% | 63,041 | 30.5% | $0 | $0.00 | |||||||
| 2019 | 1 | 75,544 | 36.5% | 138,585 | 67.0% | $1,806,450 | $23.91 | |||||||
| 2020 | 0 | 0 | 0.0% | 138,585 | 67.0% | $0 | $0.00 | |||||||
| 2021 | 1 | 18,299 | 8.9% | 156,884 | 75.9% | $1,024,744 | $56.00 | |||||||
| Thereafter | 1 | 37,900 | 18.3% | 194,784 | 94.2% | $4,179,600 | $110.28 | |||||||
| Vacant | 0 | 11,909 | 5.8% | 206,693 | 100.0% | $0 | $0.00 | |||||||
| Total / Weighted Average | 5 | 206,693 | 100.0% | $9,250,935 | $47.49 |
* Source: Information obtained from the underwritten rent roll.
The following table presents historical occupancy percentages at the Puck Building Property:
Historical Occupancy Percentages*
12/31/2008 | 12/31/2009 | 12/31/2010 | ||||
100% | 100% | 100% | ||||
| * | Source: Information provided by the borrower. Repositioning of the Puck Building Property occurred in 2011. Historical occupancies are not reflective of new configuration. | |||||
Operating History and Underwritten Net Cash Flow. The following table presents certain information relating to the historical operating performance and the Underwritten Net Cash Flow at the Puck Building Property:
Cash Flow Analysis
| 2008 | 2009 | 2010 | U/W | U/W $ per SF | |||||||
| Base Rent | $4,779,984 | $4,834,291 | $5,306,858 | $9,250,935 | $44.76 | ||||||
| Grossed Up Vacant Space | 0 | 0 | 0 | 812,325 | 3.93 | ||||||
| Total Reimbursables | 533,124 | 645,724 | 673,133 | 508,572 | 2.46 | ||||||
| Other Income | 150,427 | 512,742 | 190,992 | 210,000 | 1.02 | ||||||
| Less Vacancy & Credit Loss | 0 | (133,855) | (3,500) | (812,325) | (3.93) | ||||||
| Effective Gross Income | $5,463,535 | $5,858,902 | $6,167,483 | $9,969,507 | $48.23 | ||||||
| Total Operating Expenses | $2,933,093 | $2,712,269 | $3,017,799 | $2,756,968 | $13.34 | ||||||
Net Operating Income(1) | $2,530,442 | $3,146,633 | $3,149,684 | $7,212,539 | $34.89 | ||||||
| TI/LC | 0 | 0 | 0 | 62,625 | 0.30 | ||||||
| Capital Expenditures | 0 | 0 | 0 | 51,674 | 0.25 | ||||||
| Net Cash Flow | $2,530,442 | $3,146,633 | $3,149,684 | $7,098,240 | $34.34 | ||||||
NOI DSCR(2) | 0.44x | 0.55x | 0.55x | 1.27x | |||||||
NCF DSCR(2) | 0.44x | 0.55x | 0.55x | 1.25x | |||||||
| NOI DY | 3.0% | 3.7% | 3.7% | 8.5% | |||||||
| NCF DY | 3.0% | 3.7% | 3.7% | 8.4% |
| (1) | Underwritten NOI is greater than historical NOIs due to the repositioning of the Puck Building Property as described under “The Property” above and the related new leases signed in 2010 and 2011: REI (37,900 square feet, 45.2% of U/W base rent), Axiom Global Inc. (18,299 square feet, 11.1% of U/W base rent) and Thrive Capital Partners (4,314 square feet, 2.3% of U/W base rent). |
| (2) | All NOI DSCR and NCF DSCR figures presented in the table above are based on the amortizing debt service. The U/W NOI DSCR and U/W NCF DSCR figures based on the interest-only debt service payments due on the Puck Building Mortgage Loan for the first twelve months are 1.56x and 1.53x, respectively. |
Appraisal. According to the appraisal performed by Cushman & Wakefield, Inc., the Puck Building Property had an “as-is” appraised value of $140,000,000 as of an effective date of June 1, 2011.
Environmental Matters. According to a Phase I environmental site assessment performed by EMG on June 24, 2011 on the Puck Building Property, there are no recommendations for further action.
THE INFORMATION IN THIS STRUCTURAL AND COLLATERAL TERM SHEET IS NOT COMPLETE AND MAY BE AMENDED PRIOR TO THE TIME OF SALE. THIS TERM SHEET IS NOT AN OFFER TO SELL THESE SECURITIES AND IT IS NOT A SOLICITATION OF AN OFFER TO BUY THESE SECURITIES IN ANY JURISDICTION WHERE THE OFFER OR SALE IS NOT PERMITTED.
36
| PUCK BUILDING |
Market Overview and Competition. The Puck Building Property is classified as class B office space by Cushman & Wakefield. According to Cushman & Wakefield, the Puck Building Property is located in the SoHo office submarket, which is the smallest submarket of Midtown South’s office market and contains approximately 3.9 million square feet. At the end of the first quarter 2011, the SoHo office submarket reported overall vacancy of 4.0% and average asking rents of $45.84 per square foot. Class C vacancy makes up approximately 71.4% of all vacant space in the SoHo office submarket, with the remaining 28.6% consisting of Class B.
The Puck Building Property also contains 44,395 square feet of retail space located on the ground floor, basement and sub-basement. According to CoStar, the SoHo retail submarket contains approximately 10 million square feet. At the end of the first quarter 2011, the SoHo retail submarket reported a vacancy rate of 2.0% and average asking rents of $125.08 per square foot.
The following table presents certain information relating to some comparable office buildings provided in the appraisal performed by Cushman & Wakefield for the Puck Building Property.
Competitive Set*
| Puck Building (Subject) | 148 Lafayette Street | 270 Lafayette Street | 72 Spring Street | 110 Greene Street | 503-511 Broadway | 524 Broadway | 555 Broadway | |
| Approximate Distance from Subject | -- | 0.4 miles | 381 feet | 0.2 miles | 0.3 miles | 0.3 miles | 0.3 miles | 0.2 miles |
| Year Built/ Renovated | 1885/2011 | 1930/NAV | 1919/NAV | 1907/NAV | 1920/NAV | 1900/NAV | 1911/NAV | 1889/NAV |
| # of Stories | 7 and 9 | 12 | 15 | 12 | 16 | 5 | 11 | 12 |
| Size (SF) | 206,693 SF | 129,200 SF | 182,000 SF | 120,000 SF | 150,000 SF | 124,000 SF | 130,000 SF | 192,000 SF |
| Direct Occupancy | 94% | 100% | 96% | 91% | 100% | 100% | 92% | 100% |
* Source: Cushman & Wakefield appraisal.
The Borrower. The borrower is a Delaware limited liability company and a single-purpose entity with two independent directors. Legal counsel to the borrower delivered a non-consolidation opinion in connection with the origination of the Puck Building Mortgage Loan. Charles Kushner, whose wife, son and various trusts for the benefit of his family members are indirect owners of the borrower, and George Gellert, an indirect owner of the borrower, are the guarantors of certain nonrecourse carveouts under the Puck Building Mortgage Loan. Under the terms of the nonrecourse carveout guaranty, the Puck Building Mortgage Loan becomes fully recourse to the nonrecourse carveout guarantors if, among other circumstances, the borrower files a voluntary bankruptcy petition or any nonrecourse carveout guarantor joins in an involuntary bankruptcy petition against the borrower.
The Sponsor. Founded in 1954, the Kushner Companies is a diversified real estate organization headquartered in New York City with an office in Florham Park, NJ. The Kushner Companies is involved in the ownership, management, development and redevelopment of numerous properties, consisting of nearly eight million square feet of office, industrial, and retail space, over 5,000 apartments and vacant land suitable for development located throughout New York, New Jersey, Pennsylvania and Illinois.
Charles Kushner, the chairman of the Kushner Companies and one of the carveout guarantors of the Puck Building Mortgage Loan, pled guilty on August 18, 2004 to 16 counts of assisting in the filing of false tax returns, one count of retaliating against a cooperating witness and one count of making false statements to the Federal Election Commission and was sentenced to two years in prison. Mr. Kushner was released from prison in 2006. Although we have been informed that Mr. Kushner has relinquished his management and day-to-day operation of the Kushner Companies to his son, Jared Kushner, he remains chairman of the company.
Escrows. The loan documents provide for upfront escrows at closing in the amount of: $5,134,556 for outstanding tenant improvements and leasing commissions and $2,409,099 to cover rent concessions associated with leases with REI, Axiom and Thrive, $137,735 for real estate taxes, $74,957 for insurance, $2,000,000 for future leasing costs associated with currently vacant space, $15,065 for deferred maintenance, and $2,000 for condominium common charges. The loan documents provide for ongoing monthly escrows in the amount of: $68,868 (subject to adjustment per lender’s estimate) for real estate taxes, $10,708 (subject to adjustment per lender’s estimate) for insurance premiums, $11,167 for ongoing tenant improvements and leasing commissions, and $5,167 (subject to adjustment per lender’s estimate) for replacement reserves. The ongoing, monthly insurance escrow amount will be waived provided that the insurance provided is covered by an acceptable blanket policy and the borrower deposits and maintains three months of insurance premiums in the tax and insurance subaccount. During a Cash Management Period (as defined below), the loan documents provide for ongoing, monthly escrows in an amount equal to the monthly condominium common charges.
On each payment date occurring during the continuance of a Lease Sweep Period (as defined below) (provided that no Cash Management Period is then continuing (other than a Cash Management Period triggered solely as a result of a Lease Sweep Period)), all monthly residual cash after payment of the monthly required payments will be swept into a special rollover reserve account, which sweep will continue until the termination of the Lease Sweep Period.
A “Lease Sweep Period” will commence on the first payment date following the occurrence of any of the following: (i) nine months prior to the stated expiration (including any renewal term) of any Major Lease (as defined below); (ii) upon the date required under a Major Lease by which the tenant is required to give notice of its exercise of a renewal option (and such renewal has not been so exercised); (iii) upon the early termination or early cancellation of any Major Lease; (iv) if any Major Tenant (as defined below) has discontinued its business or has given notice that it intends to discontinue its business; (v) upon the occurrence and continuance of
THE INFORMATION IN THIS STRUCTURAL AND COLLATERAL TERM SHEET IS NOT COMPLETE AND MAY BE AMENDED PRIOR TO THE TIME OF SALE. THIS TERM SHEET IS NOT AN OFFER TO SELL THESE SECURITIES AND IT IS NOT A SOLICITATION OF AN OFFER TO BUY THESE SECURITIES IN ANY JURISDICTION WHERE THE OFFER OR SALE IS NOT PERMITTED.
37
| PUCK BUILDING |
a default under any Major Lease by the applicable tenant; and (vi) upon a bankruptcy or commencement of an insolvency proceeding of the applicable tenant under any Major Lease.
A “Major Lease” is any lease at the Puck Building Property that covers 50,000 or more rentable square feet.
A “Major Tenant” is any tenant under a Major Lease, or under one or more leases (leased by such tenant and/or its affiliates), which taken together cover in the aggregate 50,000 or more rentable square feet.
Lockbox and Cash Management. The Puck Building Mortgage Loan requires a lender-controlled lockbox account, which is already in place, and that the borrower direct tenants to pay their rents directly to such lockbox account. The loan documents also require that all rents received by the borrower or the property manager be deposited into the lockbox account within one business day after receipt. Prior to the occurrence of a Cash Management Period or an event of default, all funds on deposit in the lockbox account are swept into the borrower’s operating account on a daily basis. During a Cash Management Period, all funds on deposit in the lockbox account are swept on a daily basis to a cash management account under the control of the lender.
A “Cash Management Period” will commence (i) upon the stated maturity date if the Puck Building Mortgage Loan has not been repaid in full, (ii) if an event of default has occurred and is continuing under the Puck Building Mortgage Loan, (iii) if an event of default has occurred and is continuing under the Puck Building Mezzanine Loan, (iv) if, as the last day of each calendar quarter during the term of the Puck Building Mortgage Loan, the total debt service coverage ratio is less than 1.05x during any period in which the Puck Building Mezzanine Loan remains outstanding or 1.25x during any period in which the Puck Building Mezzanine Loan has been repaid in full, or (v) upon the commencement of a Lease Sweep Period.
Property Management. The Puck Building Property is currently managed by Kadima Management Associates, L.L.C., an affiliate of the borrower, pursuant to a management agreement. According to the management agreement, the property manager is entitled to a base management fee in an amount equal to 4.0% of total revenues. The borrower may not surrender, terminate, cancel, extend or renew the management agreement or otherwise replace the manager or enter into any management agreement without prior written consent from the lender.
Assumption. The borrower has a one-time right to transfer the Puck Building Property, in whole only, subject to customary conditions set forth in the loan documents, including but not limited to: (i) payment of an assumption fee of 1.00% of the outstanding principal balance of the Puck Building Mortgage Loan, (ii) no default or event of default has occurred or is continuing under the Puck Building Mortgage Loan, (iii) the borrower has submitted to the lender true, correct and complete copies of any and all information and documents requested, (iv) lender’s receipt of a letter confirming that the transfer will not result in any qualification, withdrawal or downgrading of the respective ratings from Fitch and Moody’s assigned to the Series 2011-C5 certificates, (v) all of the lender’s reasonable costs and expenses have been paid in connection to the transfer, (vi) replacement guarantors and indemnitors have executed and delivered all documents required by the lender and in form and substance required by the lender, (vii) the Puck Building Mezzanine Loan has been repaid in full, and (viii) counsel to the transferee borrower and replacement guarantors and indemnitors have delivered any opinions (including a new substantive non-consolidation opinion) on matters required by and in form substance satisfactory to the lender.
Release. Not permitted.
Real Estate Substitution. Not permitted.
Subordinate and Mezzanine Indebtedness. BCA CM LLC (the “Puck Building Mezzanine Lender”) has made a $10,000,000 mezzanine loan (the “Puck Building Mezzanine Loan”) to the 100% owner of the borrower under the Puck Building Mortgage Loan, New Puck Investors, LLC, a Delaware limited liability company, which is secured by a pledge by New Puck Investors, LLC, of all of its limited liability interests in the borrower under the Puck Building Mortgage Loan.
The Puck Building Mezzanine Loan requires monthly interest-only payments based on an interest rate of 10.000% per annum for the first three years and 12.000% thereafter. The Puck Building Mezzanine Loan matures on July 1, 2021, the same date as the Puck Building Mortgage Loan. The Puck Building Mezzanine Loan is subject to an intercreditor agreement (the “Puck Building Mezzanine Intercreditor Agreement”) which provides, among other things, that before it takes any enforcement action under the Puck Building Mortgage Loan, the Puck Building Mortgage Loan lender must provide to the Puck Building Mezzanine Lender written notice of any defaults which would permit the Puck Building Mortgage Loan lender to commence an enforcement action and that the Puck Building Mortgage Loan lender must permit the Puck Building Mezzanine Lender an opportunity to cure such default. Additionally, the Puck Building Mezzanine Intercreditor Agreement provides that, among other things, the Puck Building Mezzanine Loan is subordinate to the Puck Building Mortgage Loan and that no payments will be made on the Puck Building Mezzanine Loan from funds derived from the Puck Building Property upon an event of default under the Puck Building Mortgage Loan. Under the terms of the Puck Building Mezzanine Intercreditor Agreement, the Puck Building Mezzanine Lender has cure rights with respect to the Puck Building Mortgage Loan and the right to purchase, in whole but not in part, the Puck Building Mortgage Loan if the Puck Building Mortgage Loan is transferred to special servicing, is accelerated or becomes the subject of an enforcement action. The rights of the Puck Building Mezzanine Lender are further described under “Description of the Mortgage Pool-Property Financing and Mezzanine and Similar Financing” in the Free Writing Prospectus.
Ground Lease. None.
Terrorism Insurance. The loan documents require that the “all risk” insurance policy required to be maintained by the borrower provide coverage for terrorism in an amount equal to the full replacement cost of the Puck Building Property as well as business interruption insurance covering no less than the 18-month period following the occurrence of a casualty event.
THE INFORMATION IN THIS STRUCTURAL AND COLLATERAL TERM SHEET IS NOT COMPLETE AND MAY BE AMENDED PRIOR TO THE TIME OF SALE. THIS TERM SHEET IS NOT AN OFFER TO SELL THESE SECURITIES AND IT IS NOT A SOLICITATION OF AN OFFER TO BUY THESE SECURITIES IN ANY JURISDICTION WHERE THE OFFER OR SALE IS NOT PERMITTED.
38
(THIS PAGE INTENTIONALLY LEFT BLANK)
39
40
| ARBOR WALK AND PALMS CROSSING |
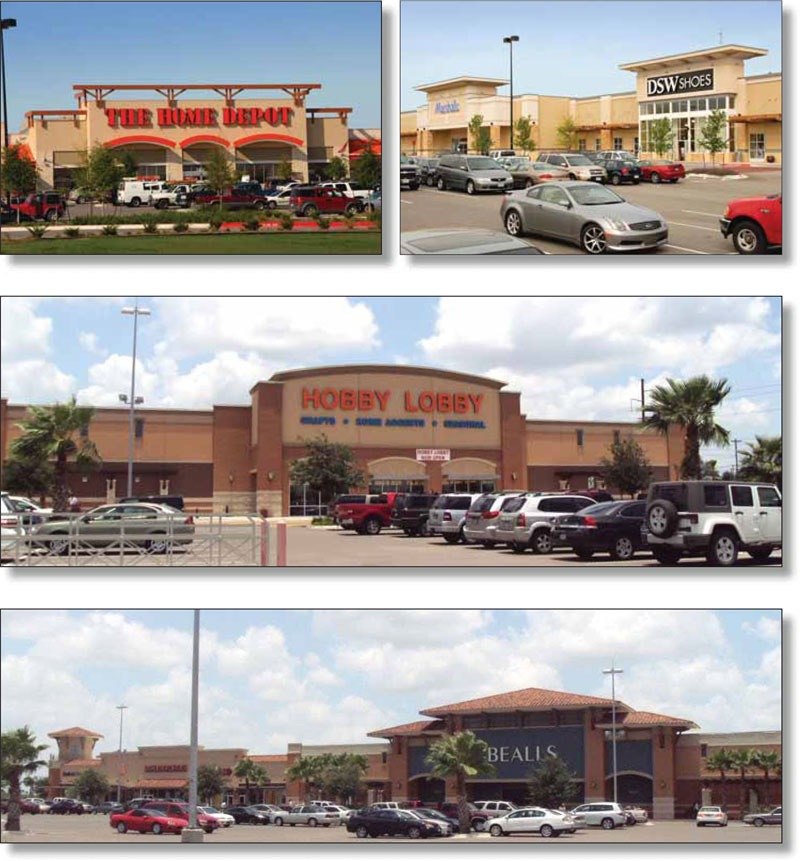
THE INFORMATION IN THIS STRUCTURAL AND COLLATERAL TERM SHEET IS NOT COMPLETE AND MAY BE AMENDED PRIOR TO THE TIME OF SALE. THIS TERM SHEET IS NOT AN OFFER TO SELL THESE SECURITIES AND IT IS NOT A SOLICITATION OF AN OFFER TO BUY THESE SECURITIES IN ANY JURISDICTION WHERE THE OFFER OR SALE IS NOT PERMITTED.
41
| ARBOR WALK AND PALMS CROSSING |
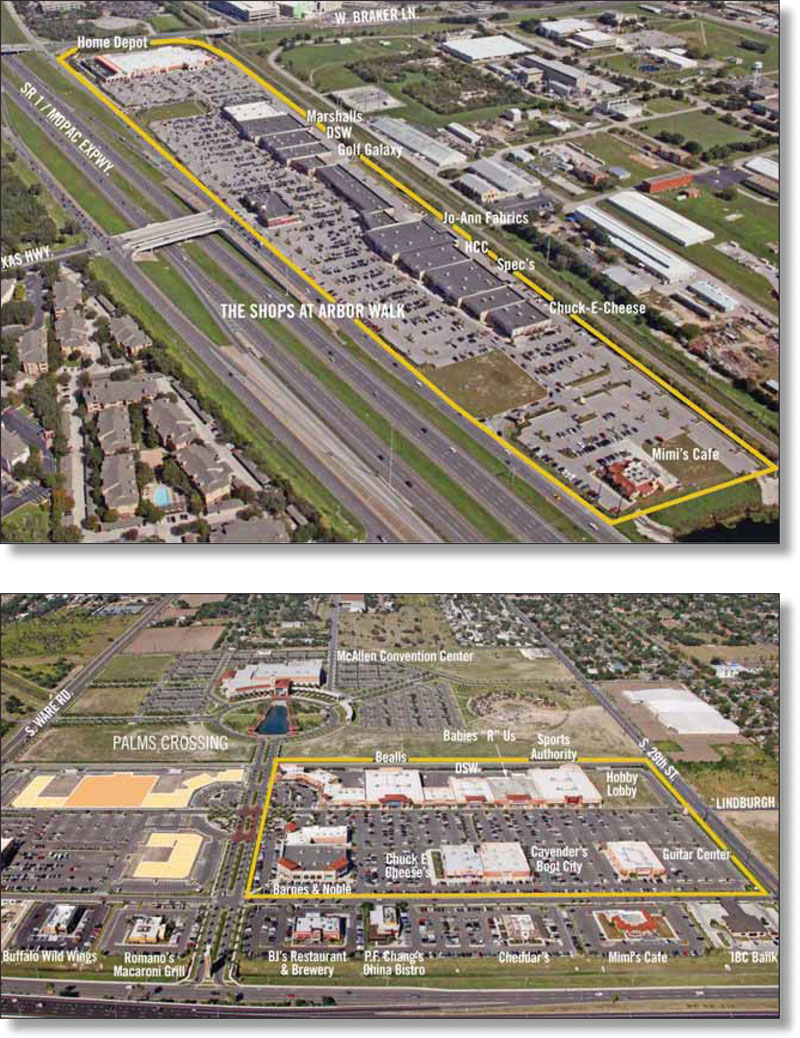
THE INFORMATION IN THIS STRUCTURAL AND COLLATERAL TERM SHEET IS NOT COMPLETE AND MAY BE AMENDED PRIOR TO THE TIME OF SALE. THIS TERM SHEET IS NOT AN OFFER TO SELL THESE SECURITIES AND IT IS NOT A SOLICITATION OF AN OFFER TO BUY THESE SECURITIES IN ANY JURISDICTION WHERE THE OFFER OR SALE IS NOT PERMITTED.
42
| ARBOR WALK AND PALMS CROSSING |
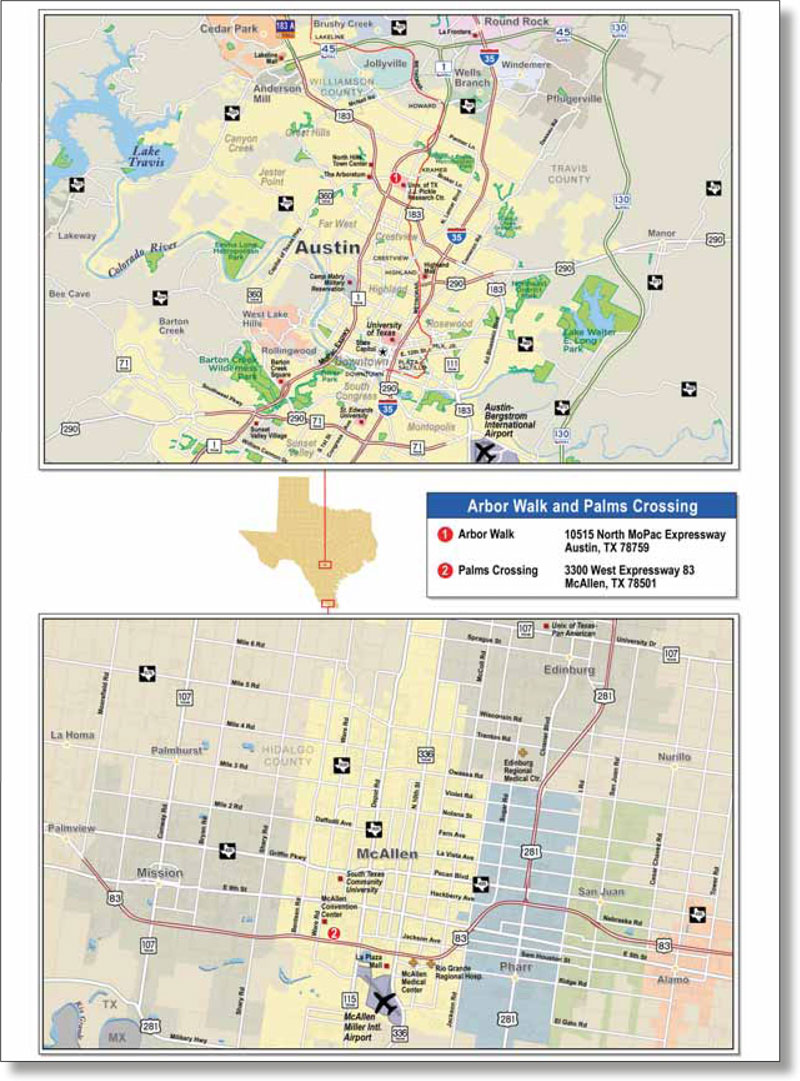
THE INFORMATION IN THIS STRUCTURAL AND COLLATERAL TERM SHEET IS NOT COMPLETE AND MAY BE AMENDED PRIOR TO THE TIME OF SALE. THIS TERM SHEET IS NOT AN OFFER TO SELL THESE SECURITIES AND IT IS NOT A SOLICITATION OF AN OFFER TO BUY THESE SECURITIES IN ANY JURISDICTION WHERE THE OFFER OR SALE IS NOT PERMITTED.
43
| Arbor Walk and Palms Crossing | ||||||||
| Loan Information | Property Information | |||||||
| Mortgage Loan Seller: | The Royal Bank of Scotland | Single Asset/Portfolio: | Portfolio | |||||
| Credit Assessment (Fitch/Moody’s): | NAP | Property Type: | Retail | |||||
| Original Principal Balance: | $81,800,000 | Specific Property Type: | Anchored | |||||
| Cut-off Date Principal Balance: | $81,547,453 | Location: | Various, TX | |||||
| % of Initial Pool Balance: | 7.5% | Size(3): | 792,758 SF | |||||
| Loan Purpose: | Refinance | Cut-off Date Principal Balance | ||||||
| Borrower Name: | Palms Crossing Town Center, LLC; Arbor Walk Mall, LLC | Per Unit/SF: | $102.87 | |||||
| Sponsor: | Simon Property Group, Inc. | Year Built/Renovated: | 2006/NAP; 2007/NAP | |||||
| Mortgage Rate: | 5.486% | Occupancy %: | 97.3% | |||||
| Note Date: | July 28, 2011 | Occupancy % Source Date: | June 27, 2011 | |||||
| Anticipated Repayment Date: | NAP | Title Vesting(4): | Various | |||||
| Maturity Date: | August 1, 2021 | Property Manager: | Simon Management Associates (Texas), LLC | |||||
| IO Period: | None | |||||||
| Loan Term (Original): | 120 months | 3rd Most Recent NOI (As of): | $8,673,523 (12/31/2009) | |||||
| Seasoning: | 3 months | 2nd Most Recent NOI (As of): | $8,680,115 (12/31/2010) | |||||
| Amortization Term (Original): | 360 months | Most Recent NOI (As of): | $8,914,678 (TTM 5/31/2011) | |||||
| Loan Amortization Type: | Amortizing Balloon | |||||||
| Interest Accrual Method: | Actual/360 | U/W Revenues: | $14,003,563 | |||||
| Call Protection: | L(27),D(89),O(4) | U/W Expenses: | $5,562,224 | |||||
| Lockbox Type: | Hard/Springing Cash Management | U/W NOI: | $8,441,339 | |||||
| Additional Debt: | None | U/W NCF: | $7,679,417 | |||||
| Additional Debt Type: | NAP | U/W NOI DSCR: | 1.52x | |||||
| U/W NCF DSCR: | 1.38x | |||||||
| Escrows and Reserves: | U/W NOI Debt Yield: | 10.4% | ||||||
| U/W NCF Debt Yield: | 9.4% | |||||||
Type: | Initial | Monthly | Cap (If Any) | As-Is Appraised Value: | $119,000,000 | |||
| Taxes | $1,270,810 | $181,544 | NAP | As-Is Appraisal Valuation Date: | June and July 2011 | |||
Insurance(1) | $0 | Springing | NAP | Cut-off Date LTV Ratio: | 68.5% | |||
| Replacement Reserves | $0 | $16,516 | $600,000 | LTV Ratio at Maturity or ARD: | 57.4% | |||
| TI/LC | $990,000 | $52,735 | $2,300,000 | |||||
Ground Lease Reserve(2) | $0 | Springing | NAP | |||||
| (1) | Monthly insurance escrow requirements are waived provided no trigger event has occurred and is continuing and the borrower provides satisfactory evidence that the mortgaged property is insured in accordance with the loan documents. |
| (2) | Upon commencement of a Lockbox Event (as defined below), borrower is required to fund a ground lease reserve monthly in the amount of monthly ground lease payments (both base and additional rents). The estimated monthly payment amount if triggered is $141,667. |
| (3) | Includes Home Depot (149,405 square feet), Chuck E. Cheese (15,000 square feet) and four outparcels (28,749 square feet), all of which own their own stores and are subject to ground leases with the borrower. |
| (4) | The Arbor Walk Property is a leasehold interest and the Palms Crossing Property is a fee interest. |
The Mortgage Loan. The mortgage loan (the “Arbor Walk and Palms Crossing Mortgage Loan”) is evidenced by a promissory note that is secured by first mortgages encumbering two anchored retail power centers located in Austin, Texas (the “Arbor Walk Property”) and McAllen, Texas (the “Palms Crossing Property”). The Arbor Walk and Palms Crossing Mortgage Loan was originated on July 28, 2011 by The Royal Bank of Scotland. The Arbor Walk and Palms Crossing Mortgage Loan had an original principal balance of $81,800,000, has an outstanding principal balance as of the Cut-off Date of $81,547,453 and accrues interest at a rate of 5.486% per annum. The mortgage loan had an initial term of 120 months, has a remaining term of 117 months as of the Cut-off Date and requires payments of interest and principal based on a 30-year amortization schedule. The mortgage loan matures on August 1, 2021. The proceeds from the Arbor Walk and Palms Crossing Mortgage Loan, along with the proceeds from The Domain Property, were used to refinance existing debt of approximately $260.0 million, pay closing costs of approximately $446,000 and fund upfront reserves of approximately $2.3 million. The Royal Bank of Scotland allocated $104.0 million of the $260.0 million to the refinancing of the existing debt on the Arbor Walk Property and the Palms Crossing Property.
Following the lockout period, the borrower has the right to defease the mortgage loan in whole, or in part (see partial defeasance provisions below), on any due date before May 1, 2021; provided, however, that the Arbor Walks and Palms Crossing Mortgage Loan is prepayable without penalty on or after May 1, 2021.
THE INFORMATION IN THIS STRUCTURAL AND COLLATERAL TERM SHEET IS NOT COMPLETE AND MAY BE AMENDED PRIOR TO THE TIME OF SALE. THIS TERM SHEET IS NOT AN OFFER TO SELL THESE SECURITIES AND IT IS NOT A SOLICITATION OF AN OFFER TO BUY THESE SECURITIES IN ANY JURISDICTION WHERE THE OFFER OR SALE IS NOT PERMITTED.
44
| ARBOR WALK AND PALMS CROSSING |
The Properties. The Arbor Walk Property is an anchored retail power center situated on approximately 45.8 acres of land approximately eight miles north of the Austin, Texas central business district. The Arbor Walk Property is anchored by Home Depot (18.8% of NRA), Marshalls (4.8% of NRA), and Jo-Ann Fabrics (4.4% of NRA). A portion of the center is subject to a ground lease with the University of Texas at Austin that expires in May 2056. The Arbor Walk Property contains 464,699 square feet, of which, 286,545 square feet is considered to be net rentable area and 178,154 square feet is building square footage attributed to the Home Depot and four outparcel ground leases. The Arbor Walk Property was built by Simon Property Group, Inc. in 2006.
The Palms Crossing Property is an anchored retail power center situated on an approximately 29.5 acre parcel of land located in Central McAllen, Texas. The Palms Crossing Property was developed in 2007 by the Simon Property Group, Inc. and features 328,059 square feet of net rentable area, currently 100.0% leased by 32 tenants. Chuck E. Cheese ground leases 15,000 square feet of the NRA and Hobby Lobby (6.9% of NRA), the anchor tenant, was an expansion of the property that was completed in June 2011. Other major tenants include Sports Authority (6.4% of NRA) and Beall’s (6.3% of NRA).
| Property Name | Property Type | Location | Allocated Cut- off Date Principal Balance | Occupancy(1) | Year Built/ Renovated | Net Rentable Area (SF) | Cut-off Date Principal Balance PSF | Appraised Value |
| Arbor Walk | Retail | Austin, TX | $43,266,008 | 95.4% | 2006/NAP | 464,699 | $93.11 | $62,000,000 |
| Palms Crossing | Retail | McAllen, TX | $38,281,445 | 100.0% | 2007/NAP | 328,059 | $116.69 | $57,000,000 |
| Total/Weighted Average | $81,547,453 | 97.3% | 792,758 | $102.87 | $119,000,000 |
| (1) | The Arbor Walk Property occupancy percentage includes 18,575 square feet of space that is leased (7,575 square foot pad to Firestone, 7,000 square foot pad to Lupe Tortilla, and 4,000 square feet of space to Carter’s) but not yet occupied. |
The following table presents certain information relating to the tenancies at the Arbor Walk Property and Palms Crossing Property:
Major Tenants
| Tenant Name | Mortgaged Property | Credit Rating (Fitch/ Moody’s/ S&P)(1) | Tenant NRSF | % of NRSF | Annual U/W Base Rent PSF | Annual U/W Base Rent | % of Total Annual U/W Base Rent | Sales PSF(2) | Occupancy Cost(2) | Lease Expiration Date | |
| Anchor Tenants - Collateral | |||||||||||
| Home Depot | Arbor Walk | BBB+/A3/BBB+ | 149,405 | 18.8% | $4.52 | $675,000 | 6.4% | NAV | NAV | 01/31/2037 | |
| Hobby Lobby | Palms Crossing | NAV/NAV/NAV | 55,000 | 6.9% | $8.75 | $481,250 | 4.6% | NAV | NAV | 05/01/2026 | |
| Sports Authority | Palms Crossing | NAV/NAV/B- | 50,593 | 6.4% | $15.50 | $784,191 | 7.5% | $86 | 20.3% | 01/31/2018 | |
| Beall’s | Palms Crossing | NAV/NAV/NAV | 50,038 | 6.3% | $8.00 | $400,304 | 3.8% | $116 | 10.2% | 01/31/2018 | |
| Total Anchor Tenants - Collateral | 305,036 | 38.5% | $7.67 | $2,340,746 | 22.3% | ||||||
| Other Major Tenants - Collateral | |||||||||||
| Marshalls | Arbor Walk | NR/NR/NR | 38,126 | 4.8% | $14.00 | $533,764 | 5.1% | $206 | 7.2% | 10/31/2016 | |
| Jo-Ann Fabrics | Arbor Walk | NA/B2/B | 35,000 | 4.4% | $13.00 | $455,000 | 4.3% | $156 | 11.7% | 01/31/2018 | |
| Babies R Us | Palms Crossing | B/B1/B | 30,623 | 3.9% | $11.63 | $356,092 | 3.4% | NAV | NAV | 01/31/2018 | |
| Sam Moon Trading Co. | Arbor Walk | NAV/NAV/NAV | 30,050 | 3.8% | $13.00 | $390,650 | 3.7% | $310 | 6.3% | 10/31/2020 | |
| Barnes & Noble | Palms Crossing | NAV/NAV/NAV | 27,000 | 3.4% | $15.60 | $421,200 | 4.0% | $221 | 7.1% | 03/01/2018 | |
| Spec’s Wines, Spirits | Arbor Walk | NAV/NAV/NAV | 25,000 | 3.2% | $16.75 | $418,750 | 4.0% | NAV | NAV | 04/30/2017 | |
| Total Other Major Tenants – Collateral | 185,799 | 23.4% | $13.86 | $2,575,456 | 24.5% | ||||||
| Non-Major Tenants | 280,338 | 35.4% | $19.91 | $5,581,119 | 53.2% | ||||||
Occupied Collateral Total(3) | 771,173 | 97.3% | $13.61 | $10,497,321 | 100.0% | ||||||
| Vacant Space | 21,585 | 2.7% | |||||||||
| Collateral Total | 792,758 | 100.0% | |||||||||
| (1) | Certain ratings are those of the parent company whether or not the parent guarantees the lease. |
| (2) | Sales per square foot and occupancy costs are as of the full-year ending December 31, 2010. |
| (3) | Includes 18,575 square feet of space that is leased (7,575 square foot pad to Firestone, 7,000 square foot pad to Lupe Tortilla, and 4,000 square feet of space to Carter’s) but not yet occupied. |
THE INFORMATION IN THIS STRUCTURAL AND COLLATERAL TERM SHEET IS NOT COMPLETE AND MAY BE AMENDED PRIOR TO THE TIME OF SALE. THIS TERM SHEET IS NOT AN OFFER TO SELL THESE SECURITIES AND IT IS NOT A SOLICITATION OF AN OFFER TO BUY THESE SECURITIES IN ANY JURISDICTION WHERE THE OFFER OR SALE IS NOT PERMITTED.
45
| ARBOR WALK AND PALMS CROSSING |
The following table presents certain information relating to the lease rollover schedule at the Arbor Walk and Palms Crossing Properties:
Lease Expiration Schedule*
Year Ending December 31, | No. of Leases Expiring | Expiring NRSF(1) | % of Total NRSF | Cumulative of Total NRSF | Cumulative % of Total NRSF | Annual U/W Base Rent | Annual U/W Base Rent PSF | |||||||
| MTM | 0 | 0 | 0.0% | 0 | 0.0% | $0 | $0.00 | |||||||
| 2011 | 1 | 1,184 | 0.1% | 1,184 | 0.1% | $31,968 | $27.00 | |||||||
| 2012 | 10 | 30,243 | 3.8% | 31,427 | 4.0% | $752,064 | $24.87 | |||||||
| 2013 | 11 | 24,450 | 3.1% | 55,877 | 7.0% | $616,900 | $25.23 | |||||||
| 2014 | 3 | 5,462 | 0.7% | 61,339 | 7.7% | $147,939 | $27.09 | |||||||
| 2015 | 2 | 4,264 | 0.5% | 65,603 | 8.3% | $96,801 | $22.70 | |||||||
| 2016 | 9 | 69,594 | 8.8% | 135,197 | 17.1% | $1,311,125 | $18.84 | |||||||
| 2017 | 6 | 98,798 | 12.5% | 233,995 | 29.5% | $1,707,058 | $17.28 | |||||||
| 2018 | 11 | 227,782 | 28.7% | 461,777 | 58.2% | $3,013,990 | $13.23 | |||||||
| 2019 | 1 | 3,123 | 0.4% | 464,900 | 58.6% | $74,952 | $24.00 | |||||||
| 2020 | 5 | 54,119 | 6.8% | 519,019 | 65.5% | $832,599 | $15.38 | |||||||
| 2021 | 1 | 4,000 | 0.5% | 523,019 | 66.0% | $84,000 | $21.00 | |||||||
| Thereafter | 8 | 248,154 | 31.3% | 771,173 | 97.3% | $1,827,925 | $7.37 | |||||||
| Vacant | 0 | 21,585 | 2.7% | 792,758 | 100.0% | $0 | $0.00 | |||||||
| Total / Weighted Average | 68 | 792,758 | 100.0% | $10,497,321 | $13.61 |
* Source: Information obtained from underwritten rent roll.
| (1) | Includes 18,575 square feet of space that is leased (7,575 square foot pad to Firestone, 7,000 square footpad to Lupe Tortilla, and 4,000 square feet of space to Carter’s) but not yet occupied. |
The following table presents historical occupancy percentages at the Arbor Walk Property:
Historical Occupancy Percentages*
12/31/2008 | 12/31/2009 | 12/31/2010 | ||
| 98% | 89% | 100% | ||
| * Source: Information obtained from borrower rent roll. | ||||
The following table presents historical occupancy percentages at the Palms Crossing Property:
Historical Occupancy Percentages*
12/31/2008 | 12/31/2009 | 12/31/2010 | ||
| 100% | 100% | 100% | ||
| * Source: Information obtained from borrower rent roll. | ||||
THE INFORMATION IN THIS STRUCTURAL AND COLLATERAL TERM SHEET IS NOT COMPLETE AND MAY BE AMENDED PRIOR TO THE TIME OF SALE. THIS TERM SHEET IS NOT AN OFFER TO SELL THESE SECURITIES AND IT IS NOT A SOLICITATION OF AN OFFER TO BUY THESE SECURITIES IN ANY JURISDICTION WHERE THE OFFER OR SALE IS NOT PERMITTED.
46
| ARBOR WALK AND PALMS CROSSING |
Operating History and Underwritten Net Cash Flow. The following table presents certain information relating to the historical operating performance and the Underwritten Net Cash Flow at the Arbor Walk Property and the Palms Crossing Property:
Cash Flow Analysis
2009 | 2010 | TTM 5/31/2011 | U/W | U/W $ per SF | ||||||
Base Rent | $9,651,387 | $9,471,798 | $9,826,904 | $10,497,320(1) | $13.24 | |||||
| Grossed Up Vacant Space | 0 | 0 | 0 | 461,823 | 0.58 | |||||
| Percentage Rent | 59,079 | 67,279 | 80,751 | 103,000 | 0.13 | |||||
| Total Reimbursables | 3,670,671 | 3,500,627 | 3,566,970 | 3,522,151 | 4.44 | |||||
| Other Income | 184,688 | 281,820 | 196,704 | 196,704 | 0.25 | |||||
| Less Vacancy & Credit Loss | (188,395) | 21,196 | (28,990) | (777,435) | (0.98) | |||||
| Effective Gross Income | $13,377,430 | $13,342,720 | $13,642,339 | $14,003,563 | $17.66 | |||||
| Total Operating Expenses | $4,703,907 | $4,662,605 | $4,727,661 | $5,562,224 | $7.02 | |||||
| Net Operating Income | $8,673,523 | $8,680,115 | $8,914,678 | $8,441,339 | $10.65 | |||||
| TI/LC | 0 | 0 | 0 | 642,001 | 0.81 | |||||
| Capital Expenditures | 0 | 0 | 0 | 119,921 | 0.15 | |||||
| Net Cash Flow | $8,673,523 | $8,680,115 | $8,914,678 | $7,679,417 | $9.69 | |||||
| NOI DSCR | 1.56x | 1.56x | 1.60x | 1.52x | ||||||
| NCF DSCR | 1.56x | 1.56x | 1.60x | 1.38x | ||||||
| NOI DY | 10.6% | 10.6% | 10.9% | 10.4% | ||||||
| NCF DY | 10.6% | 10.6% | 10.9% | 9.4% |
| (1) | Underwritten base rent is higher than prior years due to several factors, but not limited to, new leasing activity as well as the inclusion of contractual rent increases through December 2011 for several tenants. |
Appraisal. According to the appraisals performed by Cushman & Wakefield, the Arbor Walk Property had an “as-is" appraised value of $62,000,000 as of an effective date of June 27, 2011, and the Palms Crossing Property had an “as-is" appraised value of $57,000,000 as of an effective date of July 5, 2011.
Environmental Matters. According to the Phase I environmental site assessments performed by Partner Engineering and Science, Inc. both on July 8, 2011, there was no evidence of any recognized environmental conditions at the Arbor Walk Property or the Palms Crossing Property.
Market Overview and Competition. The Arbor Walk Property is located in Austin, Texas, eight miles north of the Austin central business district. The Arbor Walk Property is located at the southeast corner of the MoPac Expressway and Braker Lane in north-central Austin in an established commercial district. The Mopac expressway (Loop 10) provides the primary connection to the Arbor Walk Property and to surrounding residential and office markets, as well as access from downtown Austin, the University of Texas, and the government district.
Per the appraisal, between 2000 and 2010 the population within a five mile radius of the Arbor Walk Property increased at an annual compound rate of 0.98%. Within a three and five mile radius of the Arbor Walk Property, the 2010 population was 120,376 and 276,150, respectively. The 2010 average household income within a five mile radius of the Arbor Walk was approximately $72,901.
The Arbor Walk Property is situated within the Central/Downtown submarket, one of three submarkets which comprise the Austin retail market in Austin, Texas. According to Reis, the Central/Downtown submarket, containing 7.3 million square feet, was 5.8% vacant with an average rental asking rate of $19.97 per square foot as of the first quarter 2011.
The Palms Crossing Property is located in the city of McAllen, Texas, in the north central portion of the McAllen-Edinburg-Mission metropolitan statistical area (“MSA"). This MSA is located at the southern tip of Texas along the U.S.-Mexico border, which includes approximately 3.5 million people in both markets.
Per the appraisal, the 2010 population within a three and five mile radius of the Palms Crossing Property was 90,829 and 220,332, respectively. Additionally, compound annual population growth rates of 1.60% and 2.06% are projected between 2010 and 2015, higher than both state and national rates. The appraiser reports McAllen retail market average vacancy to be 15.0% and estimates local average rental asking rates of $12.50 per square foot for major tenants and $25.00 per square foot for in-line tenants. The primary competition is located along the major east/west artery through the region, Expressway 83, which connects McAllen to neighboring towns to the East (Brownsville and the Gulf cities) and West (Laredo).
47
| ARBOR WALK AND PALMS CROSSING |
The following table presents certain information relating to some comparable retail centers provided in the appraisal performed by Cushman & Wakefield for the Arbor Walk Property:
Arbor Walk Competitive Set*
Arbor Walk (Subject) | The Arboretum | Gateway Market | Great Hills Market | Great Hills Station | |
| Market | Austin, TX | Austin, TX | Austin, TX | Austin, TX | Austin, TX |
| Distance from Subject | -- | 1.0 mile | 0.5 miles | 1.0 mile | 1.0 mile |
| Property Type | Power Center | Lifestyle Center | Power Center | Power Center | Power Center |
| Year Built/Renovated | 2006/NAP | 1981/NAP | 1995/NAP | 1995/NAP | 1994/NAP |
| Anchors | Home Depot, Marshall’s, Sam Moon Trading, Jo Ann’s | Barnes and Noble | Best Buy, Crate & Barrel, Whole Foods, REI | TJ Maxx, Petco | Michael’s, Sprouts |
| Total GLA | 464,699 SF | 215,536 SF | 521,683 SF | 128,054 SF | 154,886 SF |
| Total Occupancy | 93% | 85% | 90% | 97% | 67% |
* Source: Cushman & Wakefield.
The following table presents certain information relating to some comparable retail centers provided in the appraisal performed by Cushman & Wakefield for the Palms Crossing Property:
Palms Crossing Competitive Set*
Palms Crossing (Subject) | Sharyland Towne Crossing | McAllen River Valley Center | Las Tiendas | Trenton Crossing | |
| Market | McAllen, TX | McAllen, TX | McAllen, TX | McAllen, TX | McAllen, TX |
| Distance from Subject | -- | 1.9 miles | 3.0 miles | 2.5 miles | 5.5 miles |
| Property Type | Power Center | Community Center | Power Center | Power Center | Power Center |
| Year Built/Renovated | 2007/NAP | 2007/NAP | 2003/NAP | 1993/NAP | 2005/NAP |
| Anchors | Beall’s, DSW Shoes, Barnes and Noble, Sports Authority, Hobby Lobby | Target, HEB, TJ Maxx, Ross, Petco | Best Buy | Academy, Conn’s, Marshall’s, Ross, Party City | Hobby Lobby, Ross, Beall’s, Marshall’s, PetSmart |
| Total GLA | 328,059 SF | 488,280 SF | 104,655 SF | 287,935 SF | 248,260 SF |
| Total Occupancy | 100% | 100% | 73% | 88% | 91% |
* Source: Cushman & Wakefield.
The Borrower. The Arbor Walk and Palms Crossing Mortgage Loan has two borrowing entities, Arbor Walk Mall, LLC and Palms Crossing Town Center, LLC (each, a “borrowing entity” and collectively, the “borrower”). Each borrowing entity is a Delaware limited liability company and a single-purpose entity with two independent directors. Legal counsel to the borrower delivered a non-consolidation opinion in connection with the origination of the Arbor Walk and Palms Crossing Mortgage Loan. Simon Property Group, L.P., the indirect owner of each borrowing entity, is the guarantor of certain nonrecourse carveouts under the Arbor Walk and Palms Crossing Mortgage Loan. Under the terms of the nonrecourse carveout guaranty, the Arbor Walk and Palms Crossing Mortgage Loan becomes fully recourse to the nonrecourse carveout guarantor if the borrower files a voluntary bankruptcy petition but not if the nonrecourse carveout guarantor joins in an involuntary bankruptcy petition against the borrower.
The Sponsor. Simon Property Group, Inc. (“SPG”) is a real estate company in the United States and is publicly traded on the New York Stock Exchange under the symbol SPG. SPG currently owns or has an interest in 391 properties comprising 261 million square feet of gross leasable area in North America, Europe and Asia. SPG employs over 5,000 people worldwide and is headquartered in Indianapolis, Indiana.
Escrows. The loan documents provide for upfront escrows at closing in the amount of: $1,270,810 for real estate taxes and $990,000 for tenant improvements and leasing commissions. The loan documents provide ongoing, monthly escrows in the amount of: $181,544 (subject to adjustment per lender’s estimate) for real estate taxes, $52,735 (subject to adjustment per lender’s estimate) for ongoing tenant improvements and leasing commissions, and $16,516 for replacement reserves. The tenant improvements and leasing commissions reserve is subject to a cap of $2,300,000 and the replacement reserve account is subject to a cap of $600,000. The ongoing, monthly insurance escrow has been waived and will continue to be so long as, among other things, the insurance provided remains covered by an acceptable blanket policy.
Upon the occurrence of a Lockbox Event (as defined below), the loan documents provide for an ongoing monthly payment into a ground lease escrow in the amount of one twelfth of estimated ground lease payments, under the terms of the ground lease (as described below), during the ensuing twelve month period.
Lockbox and Cash Management. The Arbor Walk and Palms Crossing Mortgage Loan requires a separate lender-controlled lockbox account for each of the Arbor Walk Property and the Palms Crossing Property, which are already in place, and requires the borrower to direct all tenants to pay their rents directly to such lockbox accounts. The loan documents also require that all rents received by the borrower or the property manager be deposited into the lockbox accounts within two business days after receipt
THE INFORMATION IN THIS STRUCTURAL AND COLLATERAL TERM SHEET IS NOT COMPLETE AND MAY BE AMENDED PRIOR TO THE TIME OF SALE. THIS TERM SHEET IS NOT AN OFFER TO SELL THESE SECURITIES AND IT IS NOT A SOLICITATION OF AN OFFER TO BUY THESE SECURITIES IN ANY JURISDICTION WHERE THE OFFER OR SALE IS NOT PERMITTED.
48
| ARBOR WALK AND PALMS CROSSING |
thereof. Prior to the occurrence of a Lockbox Event (as defined below), all funds on deposit in the lockbox accounts are swept into an account designated by the borrower on a daily basis, however the borrower has no right to make withdrawals from the lockbox accounts except as specified by loan documents. Upon the occurrence of a Lockbox Event, all funds on deposit in the lockbox account are swept on a weekly basis (or daily during the continuance of an event of default) to a cash management account under the control of the lender.
A “Lockbox Event” means: (i) the occurrence and continuance of an event of default, (ii) the commencement of any bankruptcy action against the borrower or property manager, or (iii) if, as of the last day of any calendar quarter during the Arbor Walk and Palms Crossing Mortgage Loan term, the debt service coverage ratio is less than 1.25x for two consecutive calendar quarters.
Property Management. The Arbor Walk Property and Palms Crossing Property are currently managed by Simon Management Associates (Texas), LLC, an affiliate of SPG and the borrower, pursuant to two management agreements. According to the management agreements, the property manager is entitled to a base management fee in an amount equal to 3.0% of total revenues. The borrower may not surrender, terminate, or cancel the management agreements or otherwise replace the managers or enter into any management agreement without prior written consent of the lender.
Assumption. The borrower has a right to transfer both the Arbor Walk Property and the Palms Crossing Property (collectively) without lender consent (other than during the period that is 60 days prior to or after the date of a securitization), in whole only, and the owner of the borrower has the right to transfer more than 50% aggregate ownership interests in the borrower to one or more Qualified Transferees (as defined below) in one or a series of related transactions, subject to customary conditions set forth in the loan documents, including but not limited to: (i) payment by the borrower of an assumption fee of $300,000 and other fees including rating agencies’ fees (subject to a cap of $25,000), (ii) no event of default has occurred and is continuing under the Arbor Walk and Palms Crossing Mortgage Loan, (iii) the organizational documents of the transferee are acceptable to Fitch and Moody’s, (iv) the lender receives written confirmation from Fitch and Moody’s that the assumption will not, in and of itself, result in a downgrade, qualification or withdrawal of the then current ratings assigned to any class of Series 2011-C5 Certificates, and (v) the transferee and all other entities controlled directly or indirectly by principals of the transferee must not have been party to any bankruptcy proceedings, voluntary or involuntary within seven years prior to the date of the proposed transfer.
A “Qualified Transferee” is an entity (a)(i) that owns and operates at least five regional malls totaling at least 10,000,000 square feet of gross leasable area in the aggregate, (ii) that has a net worth in excess of $1,000,000,000 or (iii) for which Fitch and Moody’s confirm that a transfer to such person will not, in and of itself, result in a downgrade, qualification or withdrawal of the then current ratings assigned to any class of Series 2011-C5 Certificates and (b) that satisfies other credit worthiness and experiential criteria.
Release. The borrower may obtain a release of certain immaterial or non-income producing portions of the Arbor Walk Property or the Palms Crossing Property from the lien of the mortgage upon the satisfaction of certain conditions including but not limited to: (i) no event of default shall have occurred and be continuing, (ii) a loan to value test or (iii) borrower must pay down the principal balance of the Arbor Walk and Palms Crossing Mortgage Loan (which prepayment shall not be subject to any prepayment penalty of any kind) in an amount further specified in the loan documents.
The borrower may obtain a release of either the Arbor Walk Property or the Palms Crossing Property in connection with a partial defeasance upon satisfaction of the following conditions: (i) the partial defeasance of the mortgage loan in an amount at least equal to 115% of the allocated loan amount for the individual mortgaged property to be released; provided, however that if the undefeased portion of the mortgage loan at the time of request for the partial defeasance is less than such amount, the defeasance will be in an amount equal to the remaining portion of the mortgage loan at the time of the partial release, (ii) the debt service coverage ratio of the remaining property must be greater than or equal to 1.30x, (iii) the loan to value ratio must be less than or equal to 67.8% if the remaining property is the Palms Crossing Property, (iv) the loan to value ratio must be less than or equal to 70.0% if the remaining property is the Arbor Walk Property, (v) the individual mortgaged property to be released is conveyed to someone other than the borrower, (vi) receipt of confirmation that the partial defeasance will not result in any ratings of the Series 2011-C5 Certificates being downgraded, qualified or withdrawn, and (vii) payment of all of the lender’s costs and expenses related to the partial release and partial defeasance.
Real Estate Substitution. Not permitted.
Subordinate and Mezzanine Indebtedness. None existing or permitted.
Other Additional Financing. SPG is permitted to pledge its indirect interests in the borrower in connection with a corporate-level financing securing all or substantially all of SPG’s assets. However, foreclosure on such pledge is an event of default under the loan documents if any person or entity other than an institutional lender becomes the owner of 50% or more of the borrower or SPG or controls the direct or indirect interests in the borrower or SPG.
Ground Lease. The Arbor Walk Property is subject to a ground lease with the University of Texas. The initial ground lease term began in December 2003 and expires in May 2056. The ground lease agreement does not contain any options to extend the lease. The fiscal year 2010 ground lease payment was $1,082,432. The rent under the ground lease for 2015 is $2,000,000 and commencing in 2016 and for each lease year thereafter, the rent is the sum of (i) prior year’s rent and (ii) increase equal to the
THE INFORMATION IN THIS STRUCTURAL AND COLLATERAL TERM SHEET IS NOT COMPLETE AND MAY BE AMENDED PRIOR TO THE TIME OF SALE. THIS TERM SHEET IS NOT AN OFFER TO SELL THESE SECURITIES AND IT IS NOT A SOLICITATION OF AN OFFER TO BUY THESE SECURITIES IN ANY JURISDICTION WHERE THE OFFER OR SALE IS NOT PERMITTED.
49
| ARBOR WALK AND PALMS CROSSING |
lesser of (x) 2% of prior year’s rent multiplied by the number of annual periods since the last increase in annual rent equal to 2% and (y) percentage increase in CPI for the calendar year immediately preceding the new lease year multiplied by factor of 1.5.
Terrorism Insurance. The loan documents require that the “all risk” insurance policy maintained by the borrower provide coverage for terrorism in an amount equal to the full replacement cost of the Arbor Walk Property and the Palms Crossing Property as well as business interruption insurance covering no less than the 18-month period from the date of a casualty event.
THE INFORMATION IN THIS STRUCTURAL AND COLLATERAL TERM SHEET IS NOT COMPLETE AND MAY BE AMENDED PRIOR TO THE TIME OF SALE. THIS TERM SHEET IS NOT AN OFFER TO SELL THESE SECURITIES AND IT IS NOT A SOLICITATION OF AN OFFER TO BUY THESE SECURITIES IN ANY JURISDICTION WHERE THE OFFER OR SALE IS NOT PERMITTED.
50
51
| VILLAGE OF ROCHESTER HILLS |
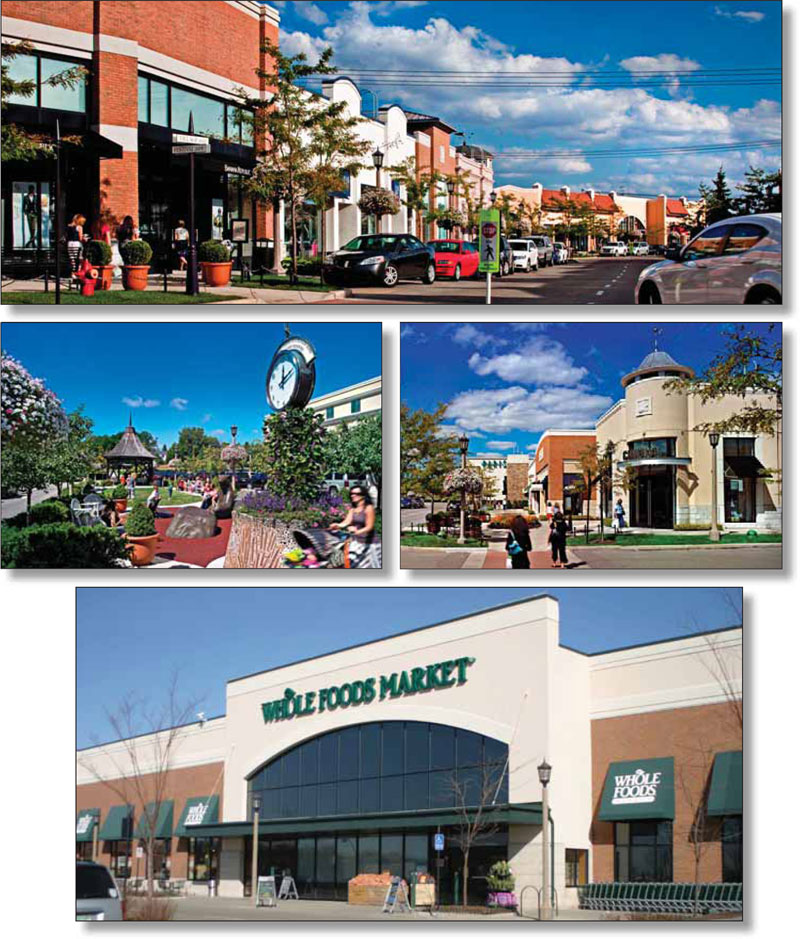
THE INFORMATION IN THIS STRUCTURAL AND COLLATERAL TERM SHEET IS NOT COMPLETE AND MAY BE AMENDED PRIOR TO THE TIME OF SALE. THIS TERM SHEET IS NOT AN OFFER TO SELL THESE SECURITIES AND IT IS NOT A SOLICITATION OF AN OFFER TO BUY THESE SECURITIES IN ANY JURISDICTION WHERE THE OFFER OR SALE IS NOT PERMITTED.
52
| VILLAGE OF ROCHESTER HILLS |
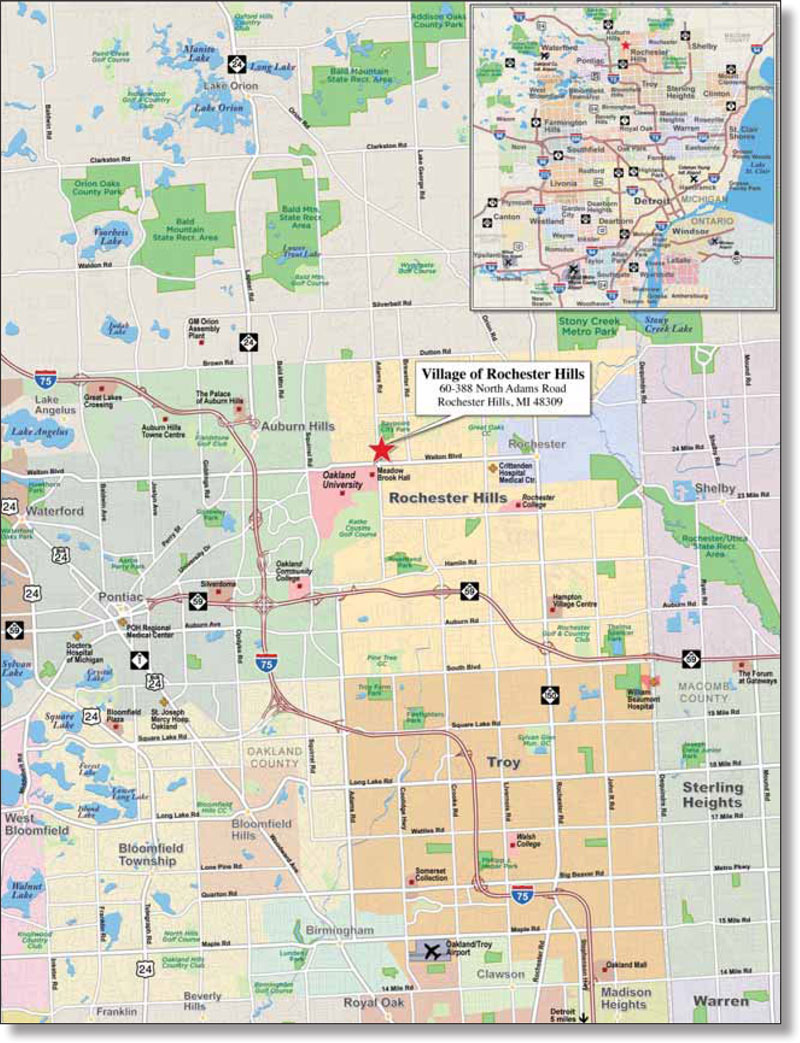
THE INFORMATION IN THIS STRUCTURAL AND COLLATERAL TERM SHEET IS NOT COMPLETE AND MAY BE AMENDED PRIOR TO THE TIME OF SALE. THIS TERM SHEET IS NOT AN OFFER TO SELL THESE SECURITIES AND IT IS NOT A SOLICITATION OF AN OFFER TO BUY THESE SECURITIES IN ANY JURISDICTION WHERE THE OFFER OR SALE IS NOT PERMITTED.
53
Village of Rochester Hills | ||||||||
| Loan Information | Property Information | |||||||
| Mortgage Loan Seller: | The Royal Bank of Scotland | Single Asset/Portfolio: | Single Asset | |||||
| Credit Assessment (Fitch/Moody’s): | NAP | Property Type: | Retail | |||||
| Original Principal Balance: | $51,000,000 | Specific Property Type: | Anchored | |||||
| Cut-off Date Principal Balance: | $51,000,000 | Location: | Rochester Hills, MI | |||||
| % of Initial Pool Balance: | 4.7% | Size: | 254,596 SF | |||||
| Loan Purpose: | Refinance | Cut-off Date Principal | ||||||
| Borrower Name: | VORH Associates, LLC | Balance Per Unit/SF: | $200.32 | |||||
| Sponsor: | Robert B. Aikens & Associates | Year Built/Renovated: | 2002/NAP | |||||
| Mortgage Rate: | 5.850% | Occupancy %: | 95.0% | |||||
| Note Date: | October 6, 2011 | Occupancy % Source Date: | September 8, 2011 | |||||
| Anticipated Repayment Date: | NAP | Title Vesting: | Fee | |||||
| Maturity Date: | November 1, 2021 | Property Manager: | Robert B. Aikens & Associates, LLC | |||||
| IO Period: | 24 months | |||||||
| Loan Term (Original): | 120 months | 3rd Most Recent NOI (As of): | $6,357,472 (12/31/2009) | |||||
| Seasoning: | None | 2nd Most Recent NOI (As of): | $6,172,548 (12/31/2010) | |||||
| Amortization Term (Original): | 360 months | Most Recent NOI (As of): | $6,041,149 (TTM 7/31/2011) | |||||
| Loan Amortization Type: | Interest-only, Amortizing Balloon | |||||||
| Interest Accrual Method: | Actual/360 | U/W Revenues: | $9,492,101 | |||||
| Call Protection: | L(24),D(92),O(4) | U/W Expenses: | $3,560,803 | |||||
| Lockbox Type: | Hard/Springing Cash Management | U/W NOI: | $5,931,298 | |||||
| Additional Debt: | None | U/W NCF: | $5,762,621 | |||||
| Additional Debt Type: | NAP | U/W NOI DSCR: | 1.64x | |||||
| U/W NCF DSCR: | 1.60x | |||||||
| Escrows and Reserves: | U/W NOI Debt Yield: | 11.6% | ||||||
| U/W NCF Debt Yield: | 11.3% | |||||||
Type: | Initial | Monthly | Cap (If Any) | As-Is Appraised Value: | $77,650,000 | |||
| Taxes | $199,670 | $96,960 | NAP | As-Is Appraisal Valuation Date: | August 26, 2011 | |||
| Insurance | $68,565 | $6,233 | NAP | Cut-off Date LTV Ratio: | 65.7% | |||
| Replacement Reserves | $0 | $4,243 | $150,000 | LTV Ratio at Maturity or ARD: | 58.0% | |||
TI/LC(1) | $2,909,368 | $21,216 | $500,000 | |||||
| (1) | See “Escrows” below for a description of the TI/LC reserve. |
The Mortgage Loan. The mortgage loan (the “Village of Rochester Hills Mortgage Loan”) is evidenced by a promissory note that is secured by a first mortgage encumbering an anchored retail lifestyle center located in Rochester Hills, Michigan (the “Village of Rochester Hills Property”). The Village of Rochester Hills Mortgage Loan was originated on October 6, 2011 by The Royal Bank of Scotland. The Village of Rochester Hills Mortgage Loan had an original principal balance of $51,000,000, has an outstanding principal balance as of the Cut-off Date of $51,000,000 and accrues interest at an interest rate of 5.850% per annum. The Village of Rochester Hills Mortgage Loan had an initial term of 120 months, has a remaining term of 120 months as of the Cut-off Date, a 24 month interest-only period and requires payments of interest and principal based on a 30-year amortization schedule thereafter. The Village of Rochester Hills Mortgage Loan matures on November 1, 2021. The proceeds from the Village of Rochester Hills Mortgage Loan were used to refinance existing debt of approximately $46.5 million that was securitized in the CSFB 2002-CP5 transaction, pay closing and other costs of approximately $990,000, fund $3.2 million in upfront reserves and return approximately $950,000 of equity to the borrower.
Following the lockout period, the borrower has the right to defease the Village of Rochester Hills Mortgage Loan in whole, but not in part, on any due date before August 1, 2021; and, as such, the Village of Rochester Hills Mortgage Loan is prepayable without penalty on or after August 1, 2021.
The Property. The Village of Rochester Hills Property is a 375,099 square foot Class A anchored retail lifestyle center that is anchored by Whole Foods (55,125 square feet) and Parisian (120,503 square feet; not part of the collateral for the loan). The Village of Rochester Hills Property is located in Rochester Hills, Oakland County, Michigan. The collateral for the Village of Rochester Mortgage Loan consists of 254,596 square feet. Per the appraisal, the 2010 median household income within a 1-mile and 3-mile radius of the Village of Rochester Hills Property was approximately $97,803 and $76,824, respectively.
The sponsor owned the mall previously located on the Village of Rochester Hills Property site (Meadowbrook Village Mall). In 1996, the sponsor demolished the Meadowbrook Village Mall and in 2002, opened the Village of Rochester Hills Property.
THE INFORMATION IN THIS STRUCTURAL AND COLLATERAL TERM SHEET IS NOT COMPLETE AND MAY BE AMENDED PRIOR TO THE TIME OF SALE. THIS TERM SHEET IS NOT AN OFFER TO SELL THESE SECURITIES AND IT IS NOT A SOLICITATION OF AN OFFER TO BUY THESE SECURITIES IN ANY JURISDICTION WHERE THE OFFER OR SALE IS NOT PERMITTED.
54
| VILLAGE OF ROCHESTER HILLS |
Parking is provided by 1,588 surface spaces resulting in a parking ratio of 6.27 spaces per every 1,000 square feet of net rentable area. As of September 8, 2011, the Village of Rochester Hills Property was 95.0% leased to approximately 47 tenants. The Village of Rochester Hills Property’s national mix of in-line tenants includes Abercrombie & Fitch, Banana Republic, Pottery Barn, White House/Black Market and Williams-Sonoma. For the trailing twelve month period ending July 31, 2011, comparable in-line sales for tenants that report averaged $295 per square foot.
The following table presents certain information relating to the tenancies at the Village of Rochester Hills Property:
Major Tenants
| Tenant Name | Credit Rating (Fitch/ Moody’s/ S&P)(1) | Tenant NRSF | % of NRSF | Annual U/W Base Rent PSF | Annual U/W Base Rent | % of Total Annual U/W Base Rent | Sales PSF(2) | Lease Expiration Date | ||||||||
| Anchor Tenants – Not Part of Collateral | ||||||||||||||||
Parisian(3) | NR/Caa2/B | 120,503 | ANCHOR OWNED – NOT PART OF THE COLLATERAL | |||||||||||||
Anchor Tenants – Collateral | ||||||||||||||||
| Whole Foods Market Group, Inc. | NR/NR/BB+ | 55,125 | 21.7% | $22.00 | $1,212,750 | 18.8% | NAV | 8/6/2028 | ||||||||
| Total Anchor Tenants – Collateral | 55,125 | 21.7% | $22.00 | $1,212,750 | 18.8% | |||||||||||
| Other Major Tenants - Collateral | ||||||||||||||||
| Abercrombie & Fitch | NR/NR/NR | 11,334 | 4.5% | $27.00 | $306,018 | 4.8% | $140 | 12/31/2012 | ||||||||
| Pottery Barn | NR/NR/NR | 10,496 | 4.1% | $23.76 | $249,406 | 3.9% | $280 | 1/31/2015 | ||||||||
| Talbots | NR/NR/NR | 10,237 | 4.0% | $29.00 | $296,873 | 4.6% | $151 | 1/31/2013 | ||||||||
| Gap | BBB-/Baa3/BB+ | 9,045 | 3.6% | $21.00 | $189,945 | 3.0% | $232 | 1/31/2016 | ||||||||
| Banana Republic | BBB-/Baa3/BB+ | 7,483 | 2.9% | $14.25 | $106,633 | 1.7% | $201 | 1/31/2012 | ||||||||
| Total Other Major Tenants - Collateral | 48,595 | 19.1% | $23.64 | $1,148,875 | 17.9% | |||||||||||
| Non-Major Tenants | 138,161 | 54.3% | $29.49 | $4,074,069 | 63.3% | |||||||||||
| Occupied Collateral Total | 241,881 | 95.0% | $26.61 | $6,435,694 | 100.0% | |||||||||||
| Vacant Space | 12,715 | 5.0% | ||||||||||||||
| Collateral Total | 254,596 | 100.0% | ||||||||||||||
| (1) | Certain ratings are those of the parent company whether or not the parent guarantees the lease. |
| (2) | Sales per square foot are as of the trailing twelve month period ending July 31, 2011. |
| (3) | Does not serve as part of the collateral for the Village of Rochester Hills Mortgage Loan, however, Parisian contributes to common area maintenance. |
THE INFORMATION IN THIS STRUCTURAL AND COLLATERAL TERM SHEET IS NOT COMPLETE AND MAY BE AMENDED PRIOR TO THE TIME OF SALE. THIS TERM SHEET IS NOT AN OFFER TO SELL THESE SECURITIES AND IT IS NOT A SOLICITATION OF AN OFFER TO BUY THESE SECURITIES IN ANY JURISDICTION WHERE THE OFFER OR SALE IS NOT PERMITTED.
55
| VILLAGE OF ROCHESTER HILLS |
The following table presents certain information relating to the lease rollover schedule at the Village of Rochester Hills Property:
Lease Expiration Schedule*
Year Ending December 31, | No. of Leases Expiring | Expiring NRSF | % of Total NRSF | Cumulative of Total NRSF | Cumulative % of Total NRSF | Annual U/W Base Rent | Annual U/W Base Rent PSF | |||||
| MTM | 0 | 0 | 0.0% | 0 | 0.0% | $0 | $0.00 | |||||
| 2011 | 0 | 0 | 0.0% | 0 | 0.0% | $0 | $0.00 | |||||
| 2012 | 15 | 52,588 | 20.7% | 52,588 | 20.7% | $1,369,049 | $26.03 | |||||
| 2013 | 11 | 46,774 | 18.4% | 99,362 | 39.0% | $1,384,086 | $29.59 | |||||
| 2014 | 1 | 1,816 | 0.7% | 101,178 | 39.7% | $77,180 | $42.50 | |||||
| 2015 | 4 | 21,446 | 8.4% | 122,624 | 48.2% | $555,508 | $25.90 | |||||
| 2016 | 4 | 19,759 | 7.8% | 142,383 | 55.9% | $528,273 | $26.74 | |||||
| 2017 | 2 | 11,495 | 4.5% | 153,878 | 60.4% | $353,491 | $30.75 | |||||
| 2018 | 3 | 10,685 | 4.2% | 164,563 | 64.6% | $324,320 | $30.35 | |||||
| 2019 | 1 | 4,026 | 1.6% | 168,589 | 66.2% | $88,572 | $22.00 | |||||
| 2020 | 2 | 9,433 | 3.7% | 178,022 | 69.9% | $315,743 | $33.47 | |||||
| 2021 | 3 | 8,734 | 3.4% | 186,756 | 73.4% | $226,722 | $25.96 | |||||
| Thereafter | 1 | 55,125 | 21.7% | 241,881 | 95.0% | $1,212,750 | $22.00 | |||||
| Vacant | 0 | 12,715 | 5.0% | 254,596 | 100.0% | $0 | $0.00 | |||||
| Total / Weighted Average | 47 | 254,596 | 100.0% | $6,435,694 | $26.61 |
* Source: Information obtained from underwritten rent roll.
The following table presents historical occupancy percentages at the Village of Rochester Hills Property:
Historical Occupancy Percentages*
12/31/2008(1) | 12/31/2009 | 12/31/2010 | ||
| 82% | 95% | 94% | ||
| * Source: Grubb & Ellis Landauer Valuation Advisory Services, LLC appraisal. | ||||
| (1) | Occupancy as of December 31, 2008 was lower as a result of the closing of a Farmer Jack Food Emporium when the parent company, The Great Atlantic & Pacific Tea Company, exited the Michigan market in 2007. Whole Foods opened in the Farmer Jack space in August 2008. |
Operating History and Underwritten Net Cash Flow. The following table presents certain information relating to the historical operating performance and the Underwritten Net Cash Flow at the Village of Rochester Hills Property:
Cash Flow Analysis
2008 | 2009 | 2010 | TTM 7/31/2011 | U/W | U/W $ per SF | ||||||||
| Base Rent | $6,017,207 | $6,848,190 | $6,562,270 | $6,457,717 | $6,435,694(1) | $25.28 | |||||||
| Grossed Up Vacant Space | 0 | 0 | 0 | 0 | 502,070 | 1.97 | |||||||
| Percentage Rent | 84,180 | 17,220 | 56,739 | 76,866 | 76,866 | 0.30 | |||||||
| Total Reimbursables | 2,852,237 | 2,979,545 | 2,861,078 | 2,740,851 | 2,835,536 | 11.14 | |||||||
| Other Income | 249,803 | 165,099 | 175,452 | 182,981 | 214,329 | 0.84 | |||||||
| Less Vacancy & Credit Loss | (26,028) | (7,258) | 18,986 | 2,096 | (572,394) | (2.25) | |||||||
| Effective Gross Income | $9,177,399 | $10,002,796 | $9,674,525 | $9,460,511 | $9,492,101 | $37.28 | |||||||
| Total Operating Expenses | $3,890,126 | $3,645,324 | $3,501,977 | $3,419,362 | $3,560,803 | $13.99 | |||||||
Net Operating Income | $5,287,273 | $6,357,472 | $6,172,548 | $6,041,149 | $5,931,298 | $23.30 | |||||||
| TI/LC | 90,000 | 90,000 | 90,000 | 114,964 | 117,758 | 0.46 | |||||||
| Capital Expenditures | 0 | 0 | 0 | 0 | 50,919 | 0.20 | |||||||
Net Cash Flow | $5,197,273 | $6,267,472 | $6,082,548 | $5,926,185 | $5,762,621 | $22.63 | |||||||
| NOI DSCR | 1.46x | 1.76x | 1.71x | 1.67x | 1.64x | ||||||||
| NCF DSCR | 1.44x | 1.74x | 1.68x | 1.64x | 1.60x | ||||||||
| NOI DY | 10.4% | 12.5% | 12.1% | 11.8% | 11.6% | ||||||||
| NCF DY | 10.2% | 12.3% | 11.9% | 11.6% | 11.3% |
| (1) | Contractual rent increases for several tenants were underwritten through January 2012. Includes rent associated with two tenants totalling 3,760 square feet of space that have signed leases and are anticipated to take occupancy in November 2011. |
Appraisal. According to the appraisal performed by Grubb & Ellis Landauer Advisory Services, LLC, the Village of Rochester Hills Property had an “as-is” appraised value of $77,650,000 as of an effective date of August 26, 2011.
THE INFORMATION IN THIS STRUCTURAL AND COLLATERAL TERM SHEET IS NOT COMPLETE AND MAY BE AMENDED PRIOR TO THE TIME OF SALE. THIS TERM SHEET IS NOT AN OFFER TO SELL THESE SECURITIES AND IT IS NOT A SOLICITATION OF AN OFFER TO BUY THESE SECURITIES IN ANY JURISDICTION WHERE THE OFFER OR SALE IS NOT PERMITTED.
56
| VILLAGE OF ROCHESTER HILLS |
Environmental Matters. According to the Phase I environmental site assessment performed by Nova Consulting Group, Inc. on September 6, 2011, there was no evidence of any recognized environmental conditions.
Market Overview and Competition. The Village of Rochester Hills Property is an anchored retail lifestyle center located in Rochester Hills, Michigan. Rochester Hills is a suburb of Detroit and is situated in Oakland County, approximately 33 miles north of the Detroit Central Business District. According to the appraisal, Oakland County is the fourth wealthiest county in the United States among counties with more than one million people. Primary access to the Village of Rochester Hills Property is provided by Interstate 75 to the west and MI-59 to the south.
The Village of Rochester Hills Property’s primary trade area encompasses a 10-mile radius, with a secondary trade area encompassing a 15-mile radius. Within a 10-mile and 15-mile radius of the Village of Rochester Hills Property, the 2010 population was 523,218 and 1,194,967, respectively. The population within a 10-mile radius of the Village of Rochester Hills Property grew at an annual rate of 3.1% over the ten-year period between 2000 and 2010 and the population is projected to grow at an annual rate of 1.0% over the next five years. Within the primary trade area, approximately 64% of households have 2011 estimated household incomes over $50,000 and 30% of households have 2011 estimated household incomes over $100,000.
The following table presents certain information relating to some comparable retail centers provided in the appraisal performed by Grubb & Ellis Landauer Valuation Advisory Services, LLC for the Village of Rochester Hills Property:
Competitive Set*
Village of Rochester Hills (Subject) | Somerset Collection | Great Lakes Crossing | The Mall at Partridge Creek | Lakeside Mall | Oakland Mall | |
| Market | Rochester Hills, MI | Troy, MI | Auburn Hills, MI | Clinton Township, MI | Sterling Heights, MI | Troy, MI |
| Distance from Subject | -- | 9.0 miles | 13.5 miles | 13.0 miles | 11.1 miles | 10.3 miles |
| Property Type | Anchored Retail Lifestyle Center | Regional Center | Super Regional Center | Regional Center | Super Regional Center | Super Regional Center |
| Year Built/Renovated | 2002/NAP | 1968/NAV | 1998/NAV | 2007/NAV | 1976/1999 | 1968/1991 |
| Anchors | Whole Foods, Parisian | Macy’s, Neiman Marcus, Saks Fifth Avenue | Bass Pro Shops, Bed Bath & Beyond, Burlington Coat Factory, Neiman Marcus Last Call | H&M, MJR Theatres, Nordstrom, Parisian | JC Penney, Lord & Taylor, Macy’s | JC Penney, Macy’s, Sears |
| Total GLA | 375,099 SF | 321,486 SF | 1,400,000 SF | 599,000 SF | 1,529,736 SF | 1,379,321 SF |
| Total Occupancy | 95% | 100% | 100% | 100% | 99% | 99% |
* Source: Grubb & Ellis Landauer Valuation Advisory Services, LLC & CoStar. |
The Borrower. The borrower is a Delaware limited liability company and a single-purpose entity with two independent directors. Legal counsel to the borrower delivered a non-consolidation opinion in connection with the origination of the Village of Rochester Hills Mortgage Loan. Meadowbrook Properties, Inc., an affiliate of the borrower, is the guarantor of certain nonrecourse carveouts under the Village of Rochester Hills Mortgage Loan. Under the terms of the nonrecourse carveout guaranty, the Village of Rochester Hills Mortgage Loan becomes fully recourse to the nonrecourse carveout guarantor if, among other circumstances, the borrower files a voluntary bankruptcy petition or the nonrecourse carveout guarantor joins in an involuntary bankruptcy petition against the borrower.
The Sponsor. Over the past 30 years, Robert B. Aikens & Associates has developed over 20 million square feet of retail, commercial and residential space across 14 projects. Their current portfolio includes four retail centers (including the Village of Rochester Hills Property) totaling approximately 1.2 million square feet and one 17,000 square foot office building located in the greater Detroit area.
Escrows. The loan documents provide for upfront escrows at closing in the amount of: $199,670 for real estate taxes, $68,565 for insurance and $2,909,368 for tenant improvements and leasing commissions ($409,368 for two specific tenants and $2,500,000 for future tenant improvements and leasing commissions). The loan documents provide for ongoing, monthly escrows in the amount of: $96,960 (subject to adjustment per lender’s estimate) for real estate taxes, $6,233 (subject to adjustment per lender’s estimate) for insurance premiums, $21,216 for ongoing tenant improvements and leasing commissions (subject to a cap of $500,000), and $4,243 (subject to a cap of $150,000) for replacement reserves.
On each payment date occurring during the continuance of a Lease Sweep Period (as defined below) (provided that no Cash Management Period (as defined below) is then continuing (other than a Cash Management Period triggered solely as a result of a Lease Sweep Period)), all monthly residual cash after payment of the monthly required payments will be swept into a special rollover reserve account, which sweep will continue until the termination of the Lease Sweep Period.
A “Lease Sweep Period” will commence: (i) upon the early termination or early cancellation of any Major Lease (as defined below), (ii) if any Major Tenant (as defined below) has discontinued its business or has given notice that it intends to discontinue its business, (iii) upon the occurrence and continuance of a default under any Major Lease by the applicable tenant, or (iv) upon a bankruptcy or insolvency proceeding of the applicable tenant under any Major Lease. A Lease Sweep Period will end upon the
THE INFORMATION IN THIS STRUCTURAL AND COLLATERAL TERM SHEET IS NOT COMPLETE AND MAY BE AMENDED PRIOR TO THE TIME OF SALE. THIS TERM SHEET IS NOT AN OFFER TO SELL THESE SECURITIES AND IT IS NOT A SOLICITATION OF AN OFFER TO BUY THESE SECURITIES IN ANY JURISDICTION WHERE THE OFFER OR SALE IS NOT PERMITTED.
57
| VILLAGE OF ROCHESTER HILLS |
earlier to occur of (x) the determination by lender that sufficient funds have been accumulated in the special rollover reserve subaccount to pay for all anticipated expenses in connection with the re-leasing of the space under the applicable Major Lease that gave rise to the subject Lease Sweep Period, or (y) the occurrence of any of the following: (1) with respect to a Lease Sweep Period caused by a matter described in clauses (i) or (ii) above, upon the earlier to occur of (A) the date on which the subject Major Tenant irrevocably exercises its renewal or extension option, or (B) the date on which all of the space demised under the subject Major Lease (or portion thereof) that gave rise to the subject Lease Sweep Period has been fully leased pursuant to a replacement lease; (2) with respect to a Lease Sweep Period caused by a matter described in clause (iii) above, if the subject Major Tenant default has been cured, and no other Major Tenant default has occurred for a period of six consecutive months following such cure; or (3) with respect to a Lease Sweep Period caused by a matter described in clause (iv) above, if the applicable Major Lease has been affirmed, assumed or assigned in a manner satisfactory to the lender.
A “Major Lease” means the Whole Foods lease and any lease at the Village of Rochester Hills Property that covers 55,000 or more rentable square feet.
A “Major Tenant” means any tenant under a Major Lease, or under one or more leases (leased by such tenant and/or its affiliates), which taken together cover in the aggregate 55,000 or more rentable square feet.
Lockbox and Cash Management. The Village of Rochester Hills Mortgage Loan requires a lender-controlled lockbox account, which is already in place, and that the borrower directs tenants to pay their rents directly to such lockbox account. The loan documents also require that all cash revenues relating to the Village of Rochester Hills Property and all other monies received by the borrower or the property manager be deposited into the lockbox account within two business days after receipt. Prior to the occurrence of a Cash Management Period, all funds on deposit in the lockbox account are swept into the borrower’s operating account on a daily basis. During a Cash Management Period all funds on deposit in the lockbox account are swept on a daily basis to a cash management account under the control of the lender.
A “Cash Management Period” will commence (i) upon the stated maturity date if the Village of Rochester Hills Mortgage Loan has not been repaid in full, (ii) if an event of default has occurred and is continuing under the Village of Rochester Hills Mortgage Loan, (iii) if, as of the last day of each calendar quarter during the term of the Village of Rochester Hills Mortgage Loan, the debt service coverage ratio is less than 1.10x, or (iv) upon the commencement of a Lease Sweep Period; and will end upon lender giving notice to the lockbox account bank that the sweeping of funds may cease, which notice shall be given by the lender if (1) the Village of Rochester Hills Mortgage Loan has been repaid in full or (2) the stated maturity date has not occurred and (A) with respect to the matter described in clause (ii) above, such event of default has been cured or (B) with respect to the matter described in clause (iii) above, the property has achieved a debt service coverage ratio of at least 1.10x for two consecutive calendar quarters or (C) with respect to the matter described in clause (iv) above, such Lease Sweep Period has ended.
Property Management. The Village of Rochester Hills Property is currently managed by Robert B. Aiken & Associates, LLC pursuant to a management agreement. According to the management agreement, the property manager is entitled to a base management fee in an amount equal to 5.0% of gross income collected excluding reimbursement revenue. The borrower may not surrender, terminate, cancel, extend or renew the management agreement or otherwise replace the manager or enter into any other management agreement without written consent from the lender. Under the terms of the loan documents, the property manager agreed that, during the continuance of a Cash Management Period, the property manager will not be entitled to any management fees otherwise payable under the management agreement which are in excess of 4.0% of gross income; provided, however, that upon the termination of such Cash Management Period, subject to certain conditions, any management fees payable under the management agreement in excess of 4.0% of gross income which had accrued during the continuance of such Cash Management Period may be paid to the property manager by the borrower.
Assumption. The borrower has the right to transfer the Village of Rochester Hills Property, subject to customary conditions set forth in the loan documents, including but not limited to: (i) no event of default has occurred and is continuing under the Village of Rochester Hills Mortgage Loan, (ii) payment by the borrower of an assumption fee equal to 0.5% of the outstanding principal balance of the Village of Rochester Hills Mortgage Loan, (iii) the borrower has submitted to the lender true, correct and complete copies of any and all information and documents requested, (iv) evidence satisfactory to the lender has been provided showing that the transferee borrower complies with the special purpose entity provisions, (v) the lender receives written confirmation from Fitch and Moody’s that the assumption will not, in and of itself, result in a downgrade, qualification or withdrawal of the then current ratings assigned to any class of Series 2011-C5 Certificates, (vi) all of the lender’s reasonable costs and expenses have been paid in connection to the transfer, (vii) replacement guarantors and indemnitors have indicated in writing in form and substance their readiness and ability to transfer and assume the Village of Rochester Hills Mortgage Loan, and (viii) the manager and proposed management agreement is satisfactory to the lender, Fitch and Moody’s.
Release. Not permitted.
Real Estate Substitution. Not permitted.
Subordinate and Mezzanine Indebtedness. Not permitted.
Ground Lease. None.
THE INFORMATION IN THIS STRUCTURAL AND COLLATERAL TERM SHEET IS NOT COMPLETE AND MAY BE AMENDED PRIOR TO THE TIME OF SALE. THIS TERM SHEET IS NOT AN OFFER TO SELL THESE SECURITIES AND IT IS NOT A SOLICITATION OF AN OFFER TO BUY THESE SECURITIES IN ANY JURISDICTION WHERE THE OFFER OR SALE IS NOT PERMITTED.
58
| VILLAGE OF ROCHESTER HILLS |
Terrorism Insurance. The loan documents require that the “all risk” insurance policy required to be maintained by the borrower provide coverage for terrorism in an amount equal to the full replacement cost of the Village of Rochester Hills Property. The coverage will have a deductible of no greater than $25,000. The loan documents also require business interruption insurance covering no less than the 18-month period following the occurrence of a casualty event.
THE INFORMATION IN THIS STRUCTURAL AND COLLATERAL TERM SHEET IS NOT COMPLETE AND MAY BE AMENDED PRIOR TO THE TIME OF SALE. THIS TERM SHEET IS NOT AN OFFER TO SELL THESE SECURITIES AND IT IS NOT A SOLICITATION OF AN OFFER TO BUY THESE SECURITIES IN ANY JURISDICTION WHERE THE OFFER OR SALE IS NOT PERMITTED.
59
| RENNAISSANCE NORTH HILLS |

THE INFORMATION IN THIS STRUCTURAL AND COLLATERAL TERM SHEET IS NOT COMPLETE AND MAY BE AMENDED PRIOR TO THE TIME OF SALE. THIS TERM SHEET IS NOT AN OFFER TO SELL THESE SECURITIES AND IT IS NOT A SOLICITATION OF AN OFFER TO BUY THESE SECURITIES IN ANY JURISDICTION WHERE THE OFFER OR SALE IS NOT PERMITTED.
60
| RENNAISSANCE NORTH HILLS |
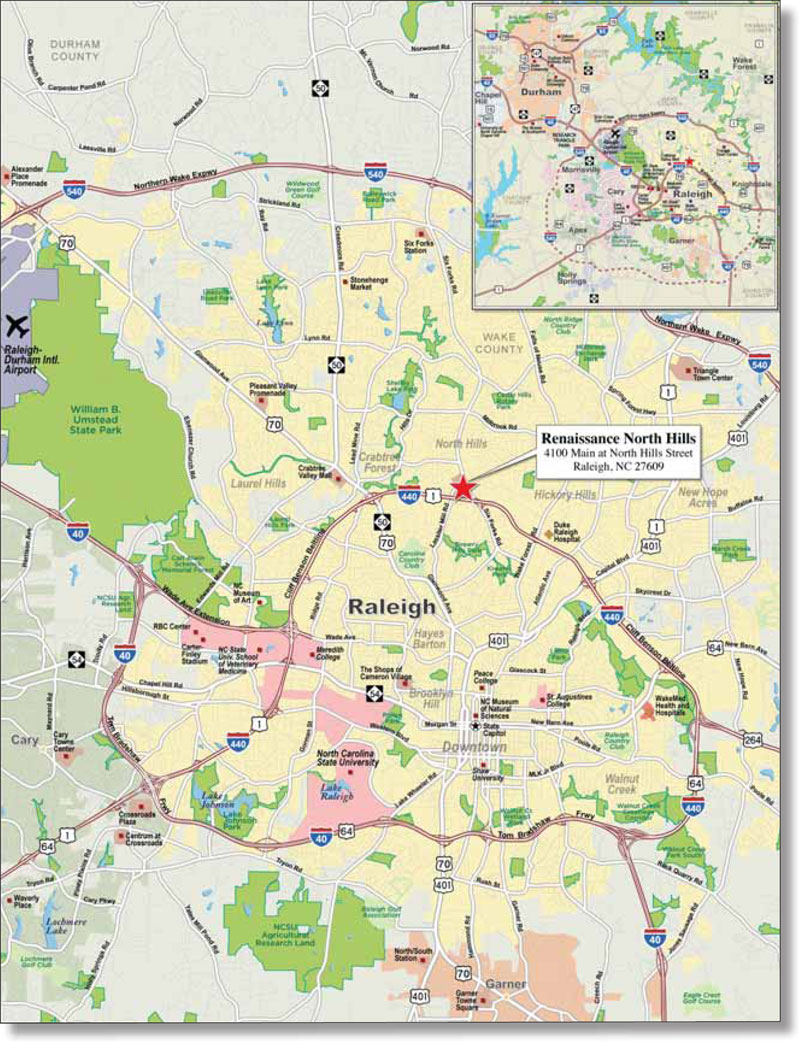
THE INFORMATION IN THIS STRUCTURAL AND COLLATERAL TERM SHEET IS NOT COMPLETE AND MAY BE AMENDED PRIOR TO THE TIME OF SALE. THIS TERM SHEET IS NOT AN OFFER TO SELL THESE SECURITIES AND IT IS NOT A SOLICITATION OF AN OFFER TO BUY THESE SECURITIES IN ANY JURISDICTION WHERE THE OFFER OR SALE IS NOT PERMITTED.
61
| Renaissance North Hills | |||||||
| Loan Information | Property Information | ||||||
| Mortgage Loan Seller: | The Royal Bank of Scotland | Single Asset/Portfolio: | Single Asset | ||||
Credit Assessment (Fitch/Moody’s): | NAP | Property Type: | Hospitality | ||||
| Original Principal Balance: | $47,500,000 | Specific Property Type: | Full Service | ||||
| Cut-off Date Principal Balance: | $47,411,949 | Location: | Raleigh, NC | ||||
| % of Initial Pool Balance: | 4.3% | Size: | 229 rooms | ||||
| Loan Purpose: | Refinance | Balance Per Room: | $207,039.08 | ||||
| Borrower Name: | Kane Concord Hotel, LLC | Year Built/Renovated: | 2008/NAP | ||||
| Sponsor: | Concord Hospitality and Kane Realty | Occupancy %: | 74.2% | ||||
| Mortgage Rate: | 5.941% | Occupancy % Source Date: | August 31, 2011 | ||||
| Note Date: | August 23, 2011 | Title Vesting: | Fee | ||||
| Anticipated Repayment Date: | NAP | ||||||
| Maturity Date: | September 1, 2021 | Property Manager: | Concord Hospitality Enterprises Company | ||||
| IO Period: | NAP | ||||||
| Loan Term (Original): | 120 months | 3rd Most Recent NOI (As of): | $3,697,789 (12/31/2009) | ||||
| Seasoning: | 2 months | 2nd Most Recent NOI (As of): | $5,393,227 (12/31/2010) | ||||
| Amortization Term (Original): | 360 months | Most Recent NOI (As of): | $5,968,669 (TTM 8/31/2011) | ||||
| Loan Amortization Type: | Amortizing Balloon | ||||||
| Interest Accrual Method: | Actual/360 | ||||||
| Call Protection: | L(26),D(90),O(4) | U/W Revenues: | $15,955,676 | ||||
| Lockbox Type: | Hard/Springing Cash Management | U/W Expenses: | $9,781,922 | ||||
| Additional Debt: | None | U/W NOI: | $6,173,754 | ||||
| Additional Debt Type: | NAP | U/W NCF: | $5,535,527 | ||||
| U/W NOI DSCR: | 1.82x | ||||||
| Escrows and Reserves: | U/W NCF DSCR: | 1.63x | |||||
| U/W NOI Debt Yield: | 13.0% | ||||||
Type: | Initial | Monthly | Cap (If Any) | U/W NCF Debt Yield: | 11.7% | ||
| Taxes | $252,636 | $21,685 | NAP | As-Is Appraised Value: | $68,000,000 | ||
| Insurance | $54,116 | $4,645 | NAP | As-Is Appraisal Valuation Date: | July 8, 2011 | ||
FF&E(1) | $0 | $51,337 | NAP | Cut-off Date LTV Ratio: | 69.7% | ||
Designated TI/LC(2) | $55,000 | $0 | NAP | LTV Ratio at Maturity or ARD: | 59.1% | ||
(1) | Ongoing monthly FF&E reserve in the amount of one-twelfth of 4.0% of annual gross revenue (initially $51,337 per month). See “Escrows” below. |
| (2) | Upfront leasing reserve associated with the Mia Francesca lease. See “Escrows” below. |
The Mortgage Loan. The mortgage loan (the “Renaissance North Hills Mortgage Loan”) is evidenced by a promissory note secured by a first mortgage encumbering a full service hotel located in Raleigh, North Carolina (the “Renaissance North Hills Property”). The Renaissance North Hills Mortgage Loan was originated on August 23, 2011 by The Royal Bank of Scotland. The Renaissance North Hills Mortgage Loan had an original principal balance of $47,500,000, has an outstanding principal balance as of the Cut-off Date of $47,411,949 and accrues interest at a rate of 5.941% per annum. The Renaissance North Hills Mortgage Loan had an initial term of 120 months, has a remaining term of 118 months as of the Cut-off Date and requires payments of interest and principal based on a 30-year amortization schedule. The Renaissance North Hills Mortgage Loan matures on September 1, 2021. The proceeds from the Renaissance North Hills Mortgage Loan were used to refinance existing debt of approximately $38.2 million, pay closing and other costs of approximately $500,651, and fund $361,752 in upfront reserves, resulting in a return of equity to the sponsors of approximately $8.4 million.
Following the lockout period, the borrower has the right to defease the Renaissance North Hills Mortgage Loan in whole, but not in part, on any payment date prior to the scheduled maturity date. In addition, the Renaissance North Hills Mortgage Loan is prepayable without penalty on any payment date on or after June 1, 2021.
The Property. The Renaissance North Hills Property is a 229-room full service hotel located at 4100 Main at North Hills Street in Raleigh, Wake County, North Carolina. Constructed in 2008, the ten-story Renaissance North Hills Property is a AAA Four Diamond lodging facility and the recent recipient of Marriott International, Inc.’s 2010 Hotel of the Year award.
The Renaissance North Hills Property features 8,623 square feet of meeting space inclusive of a 5,430 square foot ballroom. Amenities at the Renaissance North Hills Property include a restaurant and lounge, an indoor swimming pool and whirlpool, 24 hour business center, valet parking, guest laundry facility and free access to the adjacent gym. Additionally, a newly constructed and leased restaurant, Mia Francesca, opened on October 21, 2011. Mia Francesca commenced rent payments on September 1, 2011. The lease has a term of ten years and has two five-year renewal options.
THE INFORMATION IN THIS STRUCTURAL AND COLLATERAL TERM SHEET IS NOT COMPLETE AND MAY BE AMENDED PRIOR TO THE TIME OF SALE. THIS TERM SHEET IS NOT AN OFFER TO SELL THESE SECURITIES AND IT IS NOT A SOLICITATION OF AN OFFER TO BUY THESE SECURITIES IN ANY JURISDICTION WHERE THE OFFER OR SALE IS NOT PERMITTED.
62
| RENAISSANCE NORTH HILLS |
The Renaissance North Hills Property is centrally located within the North Hills mixed-use development in Raleigh, North Carolina, which consists of three city blocks of retail, restaurant and entertainment space (currently 97% occupied) and office space (currently 98% occupied).
The entire North Hills mixed-use development is subject to a condominium regime with the Renaissance North Hills Property constituting Unit 3 and having a 7% ownership interest in the condominium association. The condominium association governs the development, maintenance and use of the common areas in the mixed-use development. Although the borrower does not have control of the condominium association, generally any actions by the condominium association that would materially affect the rights of the borrower as the owner of Unit 3 will require the consent of both the borrower and the lender under the Renaissance North Hills Mortgage Loan. Additionally, certain actions, including but not limited to encumbering or conveying the general common areas and materially amending the related condominium declaration, require the consent of certain specified percentages of the voting interests in the condominium association together with the first lien holders of the affected units.
The Renaissance North Hills Property is situated at the intersection of I-440 (the inner Beltline) and Six Forks Road. The Renaissance North Hills Property is located approximately 6 miles north of the Raleigh central business district and 14 miles southeast of the Raleigh Durham International Airport. The Renaissance North Hills Property has access to Raleigh, Cary, Research Triangle Park, Chapel Hill and Durham via the I-440 inner Beltline. Directly across the street from the Renaissance North Hills Property is the CapTrust building, a 17-story 300,000 square foot office building that was opened in 2010 and is currently 83% occupied. The Six Forks Road corridor is one of the largest employment centers within the Raleigh market, therefore much of the room night demand at the Renaissance North Hills Property is commercial / corporate in nature.
Operating History and Underwritten Net Cash Flow. The following table presents certain information relating to the historical operating performance and the Underwritten Net Cash Flow at the Renaissance North Hills Property:
Cash Flow Analysis(1)
2009 | 2010 | TTM 8/31/2011 | U/W | U/W $ per Room | ||||||||
| Occupancy | 61.0% | 72.7% | 74.2% | 74.2% | ||||||||
| ADR | $137.68 | $153.04 | $162.25 | $162.25 | ||||||||
| RevPAR | $83.98 | $111.26 | $120.42 | $120.42 | ||||||||
| Total Revenue | $10,788,420 | $14,342,582 | $15,627,081 | $15,955,676 | $69,675 | |||||||
| Total Department Expenses | 4,021,450 | 5,182,405 | 5,597,191 | 5,597,254 | 24,442 | |||||||
| Gross Operating Profit | $6,766,970 | $9,160,177 | $10,029,890 | $10,358,422 | $45,233 | |||||||
| Total Undistributed Expenses | 2,753,165 | 3,449,621 | 3,742,014 | 3,877,916 | 16,934 | |||||||
| Profit Before Fixed Charges | $4,013,805 | $5,710,556 | $6,287,876 | $6,480,506 | $28,299 | |||||||
| Total Fixed Charges | 316,016 | 317,329 | 319,207 | 306,752 | 1,340 | |||||||
Net Operating Income(2) | $3,697,789 | $5,393,227 | $5,968,669 | $6,173,754 | $26,960 | |||||||
| FF&E | 0 | 23,241 | 103,697 | 638,227 | 2,787 | |||||||
| Net Cash Flow | $3,697,789 | $5,369,986 | $5,864,972 | $5,535,527 | $24,173 | |||||||
| NOI DSCR | 1.09x | 1.59x | 1.76x | 1.82x | ||||||||
| NCF DSCR | 1.09x | 1.58x | 1.73x | 1.63x | ||||||||
| NOI DY | 7.8% | 11.4% | 12.6% | 13.0% | ||||||||
| NCF DY | 7.8% | 11.3% | 12.4% | 11.7% | ||||||||
| (1) | The Renaissance North Hills Property opened in December 2008. |
| (2) | The U/W NOI is higher than the historical NOIs due to several factors including but not limited to new leasing as described above under “The Property”. |
Appraisal. According to the appraisal performed by HVS Consulting and Valuation Services, the Renaissance North Hills Property had an “as is” appraised value of $68,000,000 as of an effective date of July 8, 2011.
Environmental Matters. The Phase I environmental site assessment performed by AEI Consultants on July 19, 2011, on the Renaissance North Hills Property, identified two recognized environmental conditions (“REC”). One identified REC is in connection with an off-site leaking underground storage tank at an Exxon service station located approximately 1,000 feet north of the Renaissance North Hills Property. The second identified REC is in connection with the potential presence of residual contaminants at an off-site dry cleaning facility located approximately 1,500 feet to the north and upgradient of the Renaissance North Hills Property. AEI Consultants concluded that since remediation is ongoing at both sites, no further environmental investigation is recommended. However, AEI Consultants recommended that the borrower properly maintain records and documentation of these sites.
Market Overview and Competition. The Renaissance North Hills Property is located in Raleigh, Wake County, North Carolina. Raleigh is the second largest city in North Carolina and serves as the state capital. Raleigh, Durham and Chapel Hill make up the three primary cites of the Research Triangle metropolitan area. The Research Triangle metropolitan area enjoys a diverse economy, which includes the services, government, trade, technology, healthcare, higher education, and manufacturing sectors.
THE INFORMATION IN THIS STRUCTURAL AND COLLATERAL TERM SHEET IS NOT COMPLETE AND MAY BE AMENDED PRIOR TO THE TIME OF SALE. THIS TERM SHEET IS NOT AN OFFER TO SELL THESE SECURITIES AND IT IS NOT A SOLICITATION OF AN OFFER TO BUY THESE SECURITIES IN ANY JURISDICTION WHERE THE OFFER OR SALE IS NOT PERMITTED.
63
| RENAISSANCE NORTH HILLS |
Located approximately 17 miles northwest of the Renaissance North Hills Property, the Research Triangle Park is the largest research park in the world and home to more than 170 global companies including IBM, GlaxoSmithKline, and Cisco and is proximate to three major research universities: Duke University, University of North Carolina at Chapel Hill, and North Carolina State University.
According to the July 2011 Smith Travel Research Report, the Renaissance North Hills Property is located within the Raleigh-Durham-Chapel Hill, North Carolina lodging market. As of July 2011, the Raleigh-Durham-Chapel Hill, North Carolina area lodging market contained a total of 235 hotels with an inventory of 25,984 rooms. The Raleigh-Durham-Chapel Hill, North Carolina market’s trailing 12-month period through July 2011 had an aggregate occupancy level of 60.2% with an ADR of $80.75, reflecting a RevPAR of $48.64, up 7.8% over the previous corresponding trailing 12-month period. Gains in occupancy of 6.3% were coupled with a 1.5% increase in ADR.
The following table presents certain information relating to the competitive set provided in the Smith Travel Research report:
Subject and Market Historical Occupancy, ADR and RevPAR(1)
Competitive Set | Renaissance North Hills(2) | Penetration Factor | |||||||||||||||||
Year | Occupancy | ADR | RevPAR | Occupancy | ADR | RevPAR | Occupancy | ADR | RevPAR | ||||||||||
| TTM 7/31/2011 | 66.3% | $112.31 | $74.46 | 73.5% | $161.11 | $118.40 | 110.8% | 143.4% | 159.0% | ||||||||||
| TTM 7/31/2010 | 63.2% | $108.84 | $68.83 | 73.5% | $146.87 | $107.93 | 116.2% | 134.9% | 156.8% | ||||||||||
| TTM 7/31/2009 | 60.9% | $113.25 | $68.97 | 51.4% | $135.35 | $69.59 | 84.4% | 119.5% | 100.9% | ||||||||||
| (1) | Data provided by July 31, 2011 Smith Travel Research report. |
| (2) | The Renaissance North Hills Property opened in December 2008. |
The following table presents certain information relating to some comparable hotel properties provided in the appraisal performed by HVS Consulting and Valuation Service:
Competitive Set*
Renaissance North Hills (Subject) | Marriott Raleigh City Center | Umstead Hotel and Spa | Embassy Suites Raleigh Crabtree | Hilton North Raleigh | Marriott Raleigh Crabtree Valley | Sheraton Raleigh | ||||||||||
| Number of Rooms | 229 | 400 | 150 | 225 | 375 | 338 | 353 | |||||||||
| Occupancy | 74% | 66% | 59% | 71% | 67% | 58% | 61% | |||||||||
| ADR | $161 | $124 | $244 | $111 | $107 | $105 | $107 | |||||||||
| RevPAR | $118 | $82 | $144 | $79 | $72 | $61 | $65 | |||||||||
| Occupancy Penetration | 111% | 101% | 91% | 109% | 103% | 89% | 94% | |||||||||
| ADR Penetration | 143% | 95% | 188% | 85% | 82% | 81% | 82% | |||||||||
| RevPAR Penetration | 159% | 97% | 170% | 93% | 85% | 72% | 77% |
| * Source: July 31, 2011 Smith Travel Research Report and estimated 2010 figures from the HVS Consulting and Valuation Service appraisal. |
The Borrower. The borrower is a North Carolina limited liability company and a single purpose entity with two independent directors serving on the board of managers of each of the borrower’s non-member manager and single purpose equity member. Legal counsel for the borrower delivered a non-consolidation opinion in connection with the origination of the Renaissance North Hills Mortgage Loan. Mark G. Laport, John M. Kane, and Richard Branca, the indirect owners of the borrower, are the guarantors of certain nonrecourse carveouts under the Renaissance North Hills Mortgage Loan. Under the terms of the nonrecourse carveout guaranty, the Renaissance North Hills Mortgage Loan becomes fully recourse to the nonrecourse carveout guarantors if among other circumstances, the borrower files a voluntary bankruptcy petition or the nonrecourse carveout guarantors join in an involuntary bankruptcy petition against the borrower.
The Sponsors. Concord Hospitality and Kane Realty are joint sponsors of the Renaissance North Hills Mortgage Loan. Concord Hospitality is a private hotel owner/operator in the country and Kane Realty is a developer/redeveloper in the Raleigh/Durham area. Kane Realty was founded in 1978 and has had a total of 6.5 million square feet of development/redevelopment in the firm’s history. Kane Realty is also the owner/developer of the North Hills mixed-use development. Concord Hospitality’s portfolio consists of more than 80 hotels between owned and managed properties. In partnership with the industry’s leading brands, Concord has developed more than $1 billion of projects in many hotel segments.
Escrows. The loan documents provide for upfront escrows at closing in the amount of $252,636 for real estate taxes, $54,116 for insurance premiums and $55,000 for unpaid leasing costs associated with the new Mia Francesca lease. The loan documents provide for ongoing monthly escrows in the amount of $21,685 (subject to adjustment per lender’s estimate) for real estate taxes, $4,645 (subject to adjustment per lender’s estimate) for insurance premiums and one-twelfth of 4.0% of gross revenue (initially $51,337 per month) for FF&E reserves.
Lockbox and Cash Management. The Renaissance North Hills Mortgage Loan requires a lender-controlled lockbox account, which is already in place and that the borrower direct all tenants and credit card/banks to deliver all receipts into the lockbox account. The loan documents also require that all revenues received by the borrower or property manager be deposited into the lockbox account
THE INFORMATION IN THIS STRUCTURAL AND COLLATERAL TERM SHEET IS NOT COMPLETE AND MAY BE AMENDED PRIOR TO THE TIME OF SALE. THIS TERM SHEET IS NOT AN OFFER TO SELL THESE SECURITIES AND IT IS NOT A SOLICITATION OF AN OFFER TO BUY THESE SECURITIES IN ANY JURISDICTION WHERE THE OFFER OR SALE IS NOT PERMITTED.
64
| RENAISSANCE NORTH HILLS |
within one business day after receipt. Funds deposited will be swept by the clearing bank to the borrower unless a Cash Management Period (as defined below) has commenced, in which event funds will be swept daily into a lender controlled account and applied and distributed in the lender’s deposit account.
A “Cash Management Period” will commence upon any of the following: (i) an event of default, or (ii) if, as of the last day of each calendar quarter during the loan term, the debt service coverage ratio is less than 1.25x.
Property Management. The Renaissance North Hills Property is currently managed by Concord Hospitality Enterprises Company under a 25-year management agreement dated August 23, 2011. According to the management agreement, the manager is entitled to 3.0% of gross revenues of each operating year. The borrower may not extend, renew or cancel the management agreement or otherwise replace the manager or enter into any other management agreement without the prior written consent of the lender (which consent may not be reasonably withheld).
Assumption. The borrower has the right to transfer the Renaissance North Hills Property, subject to customary conditions set forth in the loan documents, including but not limited to: (i) no event of default has occurred and is continuing under the Renaissance North Hills Mortgage Loan, (ii) payment by the borrower of an assumption fee equal to 0.5% of the outstanding principal balance of the Renaissance North Hills Mortgage Loan for the first assumption and 1.0% of the outstanding principal balance of the Renaissance North Hills Mortgage Loan thereafter, (iii) the borrower has submitted to the lender true, correct and complete copies of any and all information and documents requested, (iv) evidence satisfactory to the lender has been provided showing that the transferee borrower complies with the special purpose entity provisions, (v) the lender receives written confirmation from Fitch and Moody’s that the assumption will not, in and of itself, result in a downgrade, qualification or withdrawal of the then current ratings assigned to any class of Series 2011-C5 Certificates, (vi) all of the lender’s reasonable costs and expenses have been paid in connection to the transfer, (vii) replacement guarantors and indemnitors have indicated in writing in form and substance reasonably satisfactory to the lender their readiness and ability to transfer and assume the Renaissance North Hills Mortgage Loan, (viii) the identity, experience, financial condition and creditworthiness of the transferee borrower and the replacement guarantors and indemnitors are satisfactory to the lender, and (ix) the manager and proposed management agreement is satisfactory to the lender, Fitch and Moody’s.
Release. Not permitted.
Real Estate Substitution. Not permitted.
Subordinate and Mezzanine Indebtedness. Not permitted.
Ground Lease. None.
Terrorism Insurance. The loan documents require that the “all risk” insurance policy required to be maintained by the borrower provide coverage for terrorism in an amount equal to the full replacement cost of the Renaissance North Hills Property, as well as business interruption insurance covering no less than the 18-month period following the occurrence of a casualty event.
THE INFORMATION IN THIS STRUCTURAL AND COLLATERAL TERM SHEET IS NOT COMPLETE AND MAY BE AMENDED PRIOR TO THE TIME OF SALE. THIS TERM SHEET IS NOT AN OFFER TO SELL THESE SECURITIES AND IT IS NOT A SOLICITATION OF AN OFFER TO BUY THESE SECURITIES IN ANY JURISDICTION WHERE THE OFFER OR SALE IS NOT PERMITTED.
65
| MADONNA PLAZA |
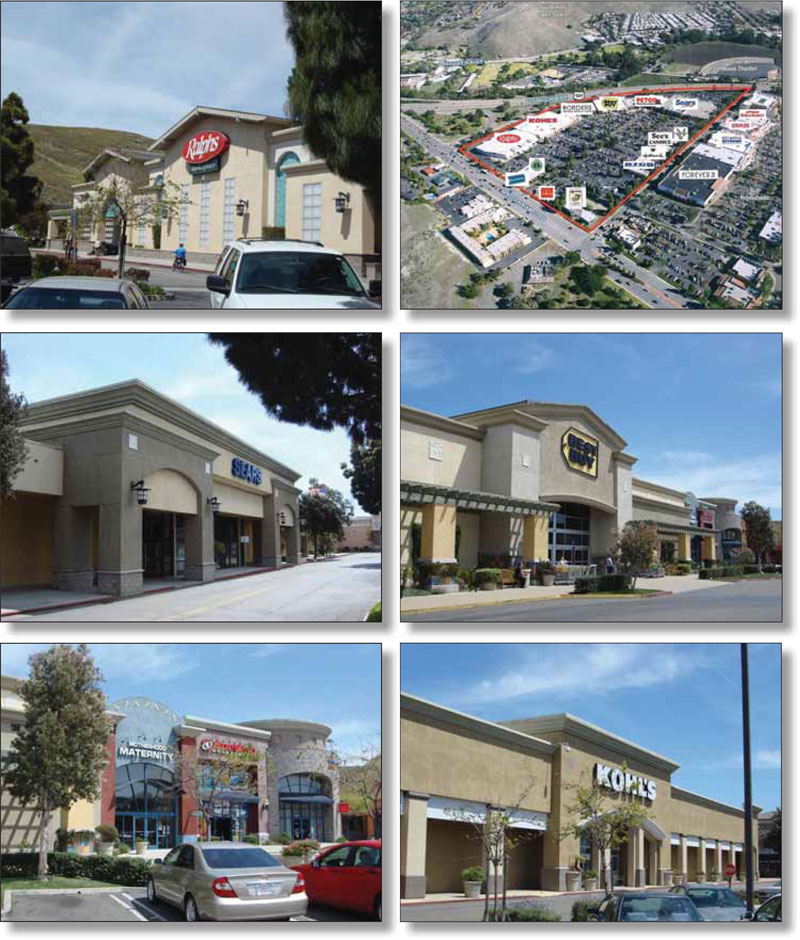
THE INFORMATION IN THIS STRUCTURAL AND COLLATERAL TERM SHEET IS NOT COMPLETE AND MAY BE AMENDED PRIOR TO THE TIME OF SALE. THIS TERM SHEET IS NOT AN OFFER TO SELL THESE SECURITIES AND IT IS NOT A SOLICITATION OF AN OFFER TO BUY THESE SECURITIES IN ANY JURISDICTION WHERE THE OFFER OR SALE IS NOT PERMITTED.
66
| MADONNA PLAZA |
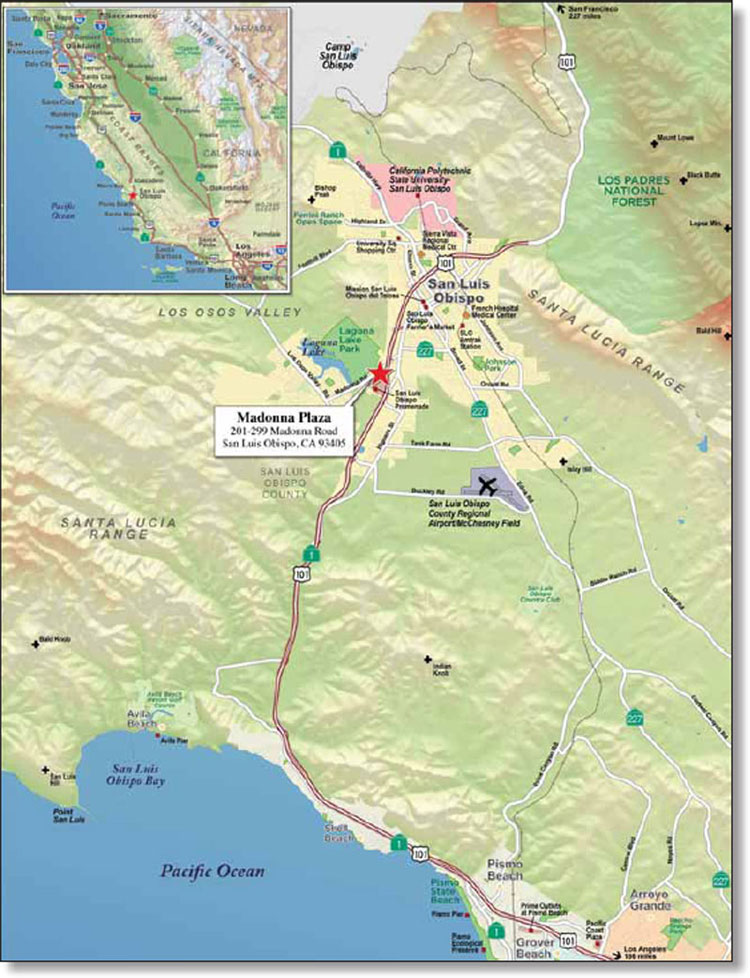
THE INFORMATION IN THIS STRUCTURAL AND COLLATERAL TERM SHEET IS NOT COMPLETE AND MAY BE AMENDED PRIOR TO THE TIME OF SALE. THIS TERM SHEET IS NOT AN OFFER TO SELL THESE SECURITIES AND IT IS NOT A SOLICITATION OF AN OFFER TO BUY THESE SECURITIES IN ANY JURISDICTION WHERE THE OFFER OR SALE IS NOT PERMITTED.
67
| Madonna Plaza | ||||||||
| Loan Information | Property Information | |||||||
| Mortgage Loan Seller: | The Royal Bank of Scotland | Single Asset/Portfolio: | Single Asset | |||||
| Credit Assessment (Fitch/Moody’s): | NAP | Property Type: | Retail | |||||
| Original Principal Balance: | $40,000,000 | Specific Property Type: | Anchored | |||||
| Cut-off Date Principal Balance: | $40,000,000 | Location: | San Luis Obispo, CA | |||||
| % of Initial Pool Balance: | 3.7% | Size(6): | 318,514 SF | |||||
| Loan Purpose: | Refinance | Cut-off Date Principal | ||||||
| Borrower Name: | Madonna Plaza SRT LP | Balance Per Unit/SF: | $125.58 | |||||
| Sponsor: | Schottenstein Property Group, Inc. | Year Built/Renovated: | 1968/2004 | |||||
| Mortgage Rate: | 5.800% | Occupancy %: | 92.9% | |||||
| Note Date: | October 12, 2011 | Occupancy % Source Date: | October 6, 2011 | |||||
| Anticipated Repayment Date: | NAP | Title Vesting: | Leasehold | |||||
| Maturity Date: | November 1, 2021 | Property Manager: | Schottenstein Property Group, LLC | |||||
| IO Period: | None | |||||||
| Loan Term (Original): | 120 months | 3rd Most Recent NOI (As of): | $2,866,209 (12/31/2009) | |||||
| Seasoning: | None | 2nd Most Recent NOI (As of): | $3,619,246 (12/31/2010) | |||||
| Amortization Term (Original): | 360 months | Most Recent NOI (As of): | $3,758,191 (TTM 4/30/2011) | |||||
| Loan Amortization Type: | Amortizing Balloon | |||||||
| Interest Accrual Method: | Actual/360 | U/W Revenues: | $5,574,321 | |||||
| Call Protection: | L(24),GRTR1% or YM(92),O(4) | U/W Expenses: | $1,750,768 | |||||
| Lockbox Type: | Hard/Springing Cash Management | U/W NOI: | $3,823,553 | |||||
| Additional Debt: | None | U/W NCF: | $3,603,720 | |||||
| Additional Debt Type: | NAP | U/W NOI DSCR: | 1.36x | |||||
| U/W NCF DSCR: | 1.28x | |||||||
| Escrows and Reserves: | U/W NOI Debt Yield: | 9.6% | ||||||
| U/W NCF Debt Yield: | 9.0% | |||||||
Type: | Initial | Monthly | Cap (If Any) | As-Is Appraised Value: | $58,800,000 | |||
Taxes(1) | $0 | Springing | NAP | As-Is Appraisal Valuation Date: | August 1, 2011 | |||
Insurance(2) | $0 | Springing | NAP | Cut-off Date LTV Ratio: | 68.0% | |||
Capex(3) | $0 | Springing | NAP | LTV Ratio at Maturity or ARD: | 57.4% | |||
Cash Collateral Reserve(4) | $2,750,000 | NAP | NAP | |||||
Ground Rent Reserve(5) | $116,575 | NAP | NAP | |||||
| (1) | Monthly real estate tax deposits are waived provided that no event of default has occurred and is continuing and the borrower has provided the lender with proof of payment. Monthly deposits will be required if the borrower does not pay any installment of real estate taxes when due more than one time in any twelve month period or more than three times during the loan term. |
| (2) | Monthly insurance deposits are waived so long as no event of default has occurred and is continuing and the insurance required to be maintained by the borrower is effected under an acceptable blanket policy. |
| (3) | Monthly ongoing capex reserves are waived initially. See “Escrows” below. |
| (4) | See “Escrows” below for a description of the Cash Collateral Reserve. |
| (5) | The borrower is required to make an additional deposit into the ground rent reserve on the 48th payment date and the 96th payment date occurring during the term of the Madonna Plaza Mortgage Loan in an amount that would cause the balance in the reserve to be equal to three months of ground rent as of the date of such deposit. |
| (6) | Includes McDonald’s (3,705 square feet), who owns its own stores on land subject to a ground lease with an affiliate of the borrower. |
The Mortgage Loan. The mortgage loan (the “Madonna Plaza Mortgage Loan”) is evidenced by a promissory note that is secured by a first mortgage encumbering an anchored retail center located in San Luis Obispo, California (the “Madonna Plaza Property”). The Madonna Plaza Mortgage Loan was originated on October 12, 2011 by The Royal Bank of Scotland. The Madonna Plaza Mortgage Loan had an original principal balance of $40,000,000, has an outstanding principal balance as of the Cut-off Date of $40,000,000 and accrues interest at an interest rate of 5.800% per annum. The Madonna Plaza Mortgage Loan had an initial term of 120 months, has a remaining term of 120 months as of the Cut-off Date and requires payments of interest and principal based on a 30-year amortization schedule. The Madonna Plaza Mortgage Loan matures on November 1, 2021. The proceeds from the Madonna Plaza Mortgage Loan were used to refinance existing debt of approximately $36.0 million, pay closing costs of approximately $680,000, fund approximately $2.9 million in upfront reserves and return approximately $421,000 to the sponsor.
Following the lockout period, the borrower has the right to voluntarily prepay the loan, in whole only, provided that the borrower pays the greater of a yield maintenance premium or a prepayment premium equal to 1% of the principal amount being prepaid. On or after August 1, 2021, the borrower may voluntarily prepay the loan, in whole only, without penalty.
THE INFORMATION IN THIS STRUCTURAL AND COLLATERAL TERM SHEET IS NOT COMPLETE AND MAY BE AMENDED PRIOR TO THE TIME OF SALE. THIS TERM SHEET IS NOT AN OFFER TO SELL THESE SECURITIES AND IT IS NOT A SOLICITATION OF AN OFFER TO BUY THESE SECURITIES IN ANY JURISDICTION WHERE THE OFFER OR SALE IS NOT PERMITTED.
68
| MADONNA PLAZA |
The Property. The Madonna Plaza Property is a 318,514 square foot, single-story, open-air retail center located in the city of San Luis Obispo, San Luis Obispo County, California. The Madonna Plaza Property is located along U.S. Highway 101 at Madonna Road, which is a main retail arterial within the area. Access to the Madonna Plaza Property is provided via two driveways along the east side of Madonna Road and four driveways along the north side of El Mercado.
The Madonna Plaza Property includes 14 buildings comprised of multiple parcels situated on a 27.86-acre site. The sponsor purchased the Madonna Plaza Property in June 2011 for approximately $58.5 million. The Madonna Plaza Property was originally constructed in phases between 1968 and 1984 and underwent a complete renovation in 2004. A redevelopment of a 6,259 square foot outparcel building was recently completed in 2010.
As of October 6, 2011, the Madonna Plaza Property is 92.9% leased by a variety of local, regional, and national tenants. The Madonna Plaza Property is anchored by Sears (75,400 square feet), Kohl’s (62,481 square feet), Ralphs (51,933 square feet) and Best Buy (30,000 square feet). Other major tenants include Petco and Big 5 Corporation. Parking for the Madonna Plaza Property consists of 1,495 surface spaces equating to a parking ratio of 4.7 spaces per 1,000 square feet of net rentable area.
The following table presents certain information relating to the tenancies at the Madonna Plaza Property:
Major Tenants
| Tenant Name | Credit Rating (Fitch/ Moody’s/ S&P)(1) | Tenant NRSF | % of NRSF | Annual U/W Base Rent PSF | Annual U/W Base Rent | % of Total Annual U/W Base Rent | Sales PSF(3) | Lease Expiration Date(4) | |
| Anchor Tenants – Collateral | |||||||||
| Sears, Roebuck and Co. | B/Ba3/B+ | 75,400 | 23.7% | $1.55 | $116,744 | 2.5% | $147 | 1/31/2013 | |
| Kohl’s Department Store | BBB+/Baa1/BBB+ | 62,481 | 19.6% | $21.16 | $1,322,152 | 28.8% | NAV | 1/31/2026 | |
| Ralphs Grocery Company | BBB/Baa2/BBB | 51,933 | 16.3% | $12.18 | $632,739 | 13.8% | $283 | 12/31/2020 | |
| Best Buy Stores, L.P. | BBB-/Baa2/BBB- | 30,000 | 9.4% | $17.69 | $530,665 | 11.6% | NAV | 1/31/2018 | |
| Total Anchor Tenants – Collateral | 219,814 | 69.0% | $11.84 | $2,602,300 | 56.6% | ||||
| Other Major Tenants - Collateral | |||||||||
| Petco Animals Supplies, Inc. | NR/B2/B | 20,100 | 6.3% | $16.42 | $330,000 | 7.2% | NAV | 1/31/2013 | |
| Big 5 Corporation | NR/NR/NR | 10,000 | 3.1% | $19.00 | $190,000 | 4.1% | $295 | 1/31/2015 | |
| Bank of America | A+/Baa1/A | 5,480 | 1.7% | $26.04 | $142,699 | 3.1% | NAV | MTM | |
| Total Other Major Tenants - Collateral | 35,580 | 11.2% | $18.63 | $662,699 | 14.4% | ||||
| Non-Major Tenants | 40,660 | 12.8% | $32.70 | $1,329,408 | 28.9% | ||||
Occupied Collateral Total(2) | 296,054 | 92.9% | $15.52 | $4,594,407 | 100.0% | ||||
| Vacant Space | 22,460 | 7.1% | |||||||
| Collateral Total | 318,514 | 100.0% | |||||||
| (1) | Certain ratings are those of the parent company whether or not the parent guarantees the lease. |
| (2) | Includes 2,294 square feet of space for Chipotle who has signed a lease, but has not yet taken occupancy. This represents approximately $103,230 of annual base rent. |
| (3) | Sales per square foot are for the full year ending December 31, 2010, with the exception of Sears whose sales are for the full year ending January 31, 2010. |
| (4) | Sears, Roebuck and Co. has one 5-year lease extension option remaining. Ralphs Grocery Company has six 5-year lease extension options remaining. Best Buy Stores, L.P. has three 5-year lease extension options remaining. Petco Animals Supplies, Inc. has two 5-year lease extension options remaining. |
THE INFORMATION IN THIS STRUCTURAL AND COLLATERAL TERM SHEET IS NOT COMPLETE AND MAY BE AMENDED PRIOR TO THE TIME OF SALE. THIS TERM SHEET IS NOT AN OFFER TO SELL THESE SECURITIES AND IT IS NOT A SOLICITATION OF AN OFFER TO BUY THESE SECURITIES IN ANY JURISDICTION WHERE THE OFFER OR SALE IS NOT PERMITTED.
69
| MADONNA PLAZA |
The following table presents certain information relating to the lease rollover schedule at the Madonna Plaza Property:
Lease Expiration Schedule*
Year Ending December 31, | No. of Leases Expiring | Expiring NRSF | % of Total NRSF | Cumulative of Total NRSF | Cumulative % of Total NRSF | Annual U/W Base Rent | Annual U/W Base Rent PSF |
| MTM | 2 | 7,213 | 2.3% | 7,213 | 2.3% | $210,286 | $29.15 |
| 2011 | 1 | 1,520 | 0.5% | 8,733 | 2.7% | $63,000 | $41.45 |
| 2012 | 0 | 0 | 0.0% | 8,733 | 2.7% | $0 | $0.00 |
| 2013 | 5 | 102,751 | 32.3% | 111,484 | 35.0% | $658,318 | $6.41 |
| 2014 | 3 | 9,168 | 2.9% | 120,652 | 37.9% | $276,299 | $30.14 |
| 2015 | 5 | 20,874 | 6.6% | 141,526 | 44.4% | $483,466 | $23.16 |
| 2016 | 1 | 1,200 | 0.4% | 142,726 | 44.8% | $42,480 | $35.40 |
| 2017 | 2 | 2,655 | 0.8% | 145,381 | 45.6% | $93,347 | $35.16 |
| 2018 | 1 | 30,000 | 9.4% | 175,381 | 55.1% | $530,665 | $17.69 |
| 2019 | 0 | 0 | 0.0% | 175,381 | 55.1% | $0 | $0.00 |
| 2020 | 1 | 51,933 | 16.3% | 227,314 | 71.4% | $632,739 | $12.18 |
| 2021 | 2 | 6,259 | 2.0% | 233,573 | 73.3% | $281,655 | $45.00 |
| Thereafter | 1 | 62,481 | 19.6% | 296,054 | 92.9% | $1,322,152 | $21.16 |
| Vacant | 0 | 22,460 | 7.1% | 318,514 | 100.0% | $0 | $0.00 |
| Total / Weighted Average | 24 | 318,514 | 100.0% | $4,594,407 | $15.52 |
* Source: Information obtained from underwritten rent roll.
The following table presents historical occupancy percentages at the Madonna Plaza Property:
Historical Occupancy Percentages*
12/31/2009 | 12/31/2010 | 10/06/2011 | ||
| NAV | NAV | 93% |
* Historical figures are not available as the Madonna Plaza Property was
acquired by the borrower in June 2011.
acquired by the borrower in June 2011.
Operating History and Underwritten Net Cash Flow. The following table presents certain information relating to the historical operating performance and the Underwritten Net Cash Flow at the Madonna Plaza Property:
Cash Flow Analysis
2008 | 2009 | 2010 | TTM 4/30/2011 | U/W | U/W $ per SF | |||||||
| Base Rent | $4,191,374 | $3,546,566 | $4,323,247 | $4,469,011 | $4,594,407(1) | $14.42 | ||||||
| Grossed Up Vacant Space | 0 | 0 | 0 | 0 | 581,714(2) | 1.83 | ||||||
| Percentage Rent | 156,244 | 102,624 | 90,353 | 84,640 | 84,640 | 0.27 | ||||||
| Total Reimbursables | 608,586 | 682,483 | 604,339 | 526,178 | 602,491 | 1.89 | ||||||
| Less Vacancy & Credit Loss | 0 | 0 | 0 | 0 | (288,931)(2) | (0.91) | ||||||
| Effective Gross Income | $4,956,204 | $4,331,673 | $5,017,939 | $5,079,829 | $5,574,321 | $17.50 | ||||||
| Total Operating Expenses | $1,663,238 | $1,465,464 | $1,398,693 | $1,321,638 | $1,750,768 | $5.50 | ||||||
Net Operating Income(3) | $3,292,966 | $2,866,209 | $3,619,246 | $3,758,191 | $3,823,553 | $12.00 | ||||||
| TI/LC | 0 | 0 | 0 | 0 | 137,983 | 0.43 | ||||||
| Capital Expenditures | 0 | 0 | 0 | 0 | 81,850 | 0.26 | ||||||
| Net Cash Flow | $3,292,966 | $2,866,209 | $3,619,246 | $3,758,191 | $3,603,720 | $11.31 | ||||||
| NOI DSCR | 1.17x | 1.02x | 1.29x | 1.33x | 1.36x | |||||||
| NCF DSCR | 1.17x | 1.02x | 1.29x | 1.33x | 1.28x | |||||||
| NOI DY | 8.2% | 7.2% | 9.0% | 9.4% | 9.6% | |||||||
| NCF DY | 8.2% | 7.2% | 9.0% | 9.4% | 9.0% |
| (1) | Underwritten base rent was averaged over the lesser of the loan term or lease term for Ralphs, Kohl’s and Best Buy due to their investment grade ratings. |
| (2) | The Madonna Plaza Property has vacant and dark space equal to 7.1% of the net rentable area, including a space with Borders Inc., representing approximately 5.5% of the net rentable area. The borrower has entered into a letter of intent with Sports Authority to lease the dark Borders space as well as additional space at the Madonna Plaza Property. Consistent with the appraisal of the mortgaged property, a 5% vacancy at the Madonna Plaza property was underwritten. Per the appraisal of the mortgaged property, the San Luis Obispo/Paso Robles retail submarket had a 1.7% vacancy rate as of the second quarter of 2011. The Madonna Plaza Property is currently 92.9% leased. Additionally, in order to mitigate potential risks associated with the Borders space, the lender has retained a $2,750,000 cash collateral reserve. See “Escrows” below. |
| (3) | The U/W NOI is higher than the historical NOIs due to several factors including but not limited to new leasing, some of which is described above in footnote 2 to the table captioned “Major Tenants” and footnotes 1 and 2 above. |
Appraisal. According to the appraisal performed by Cushman & Wakefield, the Madonna Plaza Property had an “as-is” appraised value of $58,800,000 as of August 1, 2011.
Environmental Matters. According to the Phase I environmental site assessment performed by Nova Consulting Group, Inc. on August 26, 2011, there was no evidence of any recognized environmental conditions.
THE INFORMATION IN THIS STRUCTURAL AND COLLATERAL TERM SHEET IS NOT COMPLETE AND MAY BE AMENDED PRIOR TO THE TIME OF SALE. THIS TERM SHEET IS NOT AN OFFER TO SELL THESE SECURITIES AND IT IS NOT A SOLICITATION OF AN OFFER TO BUY THESE SECURITIES IN ANY JURISDICTION WHERE THE OFFER OR SALE IS NOT PERMITTED.
70
| MADONNA PLAZA |
Market Overview and Competition. The Madonna Plaza Property is located at 201-299 Madonna Road, on the west side of U.S. Highway 101 in the city of San Luis Obispo, San Luis Obispo County, California, approximately three miles southwest of the San Luis Obispo’s downtown central business district. Madonna Road is the main arterial roadway through the neighborhood surrounding the Madonna Plaza Property and through southwestern San Luis Obispo. The road also provides a full freeway interchange with U.S. Highway 101 at the Madonna Plaza Property and links the Madonna Plaza Property to downtown San Luis Obispo and the nearby coastal communities of Morro Bay, Cambria, San Simeon, and Cayucos.
Per the appraisal, and as reported by the Traffic Division of the San Luis Obispo County Department of Public Works, the average daily traffic volume at the Madonna Plaza Property’s location is over 70,000 vehicles along U.S. Highway 101 and between 25,000 and 34,999 vehicles along Madonna Road. Per the appraisal, in 2010, the population within a five-mile radius of the Madonna Plaza Property was 59,223 with an average household income of $69,248.
According to the appraisal, the San Luis Obispo/Paso Robles retail market consisted of 13.8 million square feet of retail space divided into seven submarkets. As of the second quarter of 2011, the market was 3.8% vacant with an average rental rate of $20.70 per square foot. The Madonna Plaza Property is located in the Northwest San Luis Obispo (“SLO”) retail submarket. The SLO retail submarket, containing 1.3 million square feet of retail space, had the lowest vacancy rate of all the San Luis Obispo/Paso Robles retail submarkets at 1.7% as of the second quarter of 2011. The SLO retail submarket had an average rental rate of $28.73 per square foot during the same time period.
The following table presents certain information relating to some comparable retail centers provided in the appraisal performed by Cushman & Wakefield for The Madonna Plaza Property:
Competitive Set*
Madonna Plaza (Subject) | SLO Promenade | Laguna Village | Marigold Center | Irish Hills Plaza | |
| Market | San Luis Obispo, CA | San Luis Obispo, CA | San Luis Obispo, CA | San Luis Obispo, CA | San Luis Obispo, CA |
| Distance from Subject | -- | Adjacent | 0.7 miles | 1.3 miles | 2.1 miles |
| Property Type | Anchored Retail | Power Center | Neighborhood Center | Community Center | Power Center |
| Year Built/Renovated | 1968/2004 | 1986/2000 | 1986/NAP | 1995/NAP | 2000/2007 |
| Anchors | Ralphs, Kohl’s, Best Buy, Sears, Petco | Forever 21, Bed Bath & Beyond, Stapes, Cost Plus | CVS, Spenser’s Market | Vons, CVS, Michaels | Costco, Home Depot, Office Max, PetSmart, TJ Maxx |
| Total GLA | 318,514 SF | 210,314 SF | 102,393 SF | 173,337 SF | 355,722 SF |
| Total Occupancy | 93% | 99% | 99% | 93% | 92% |
* Source: Cushman & Wakefield appraisal.
The Borrower. The borrower is a California limited partnership and a single-purpose entity with two independent directors. Legal counsel to the borrower delivered a non-consolidation opinion in connection with the origination of the Madonna Plaza Mortgage Loan. Schottenstein Realty, LLC is the guarantor of certain nonrecourse carveouts under the Madonna Plaza Mortgage Loan. Under the terms of the nonrecourse carveout guaranty, the Madonna Plaza Mortgage Loan becomes fully recourse to the nonrecourse carveout guarantor if, among other circumstances, the borrower files a voluntary bankruptcy petition or the nonrecourse carveout guarantor joins in an involuntary bankruptcy petition against the borrower.
The Sponsor. Schottenstein Property Group, Inc. (“Schottenstein”) is an owner, operator, acquirer and redeveloper of community and neighborhood shopping centers in major population areas throughout the United States. Schottenstein properties are predominately anchored by national retail tenants including American Signature Inc., DSW, Inc., Bed, Bath & Beyond, Inc., Wal-Mart Stores, Inc., and TJX Companies. Schottenstein owns interest in a diverse portfolio of more than 156 properties in 27 states representing in excess of 21 million square feet of gross leasable area.
Escrows. The loan documents provided for upfront escrows at closing in the amount of: $116,575 for ground rent and $2,750,000 in connection with the dark space formerly occupied by Border’s, Inc. (the “Cash Collateral Funds”). The borrower is required to make an additional deposit into the ground rent reserve on the 48th payment date and the 96th payment date occurring during the term of the Madonna Plaza Mortgage Loan in an amount that would cause the balance in the reserve to be equal to three months of ground rent as of the date of such deposit.
The Cash Collateral Funds will be released, provided no event of default or monetary default exists, upon occurrence of the following: (i) the borrower has entered into one or more leases demising all or substantially all of the dark space formerly occupied by Border’s, Inc. for a term of no less than 5 years and (ii) the debt service coverage ratio of the Madonna Plaza Mortgage Loan is at least 1.25x. The lender has the right to use the Cash Collateral Funds on deposit to make a prepayment or principal (together with the applicable yield maintenance premium) on the Madonna Plaza Mortgage Loan during the continuance of a monetary event of default or if the debt becomes immediately due and payable pursuant to the loan documents.
The loan documents initially waive the requirement for monthly real estate tax, insurance and capex deposits, as set forth below. Monthly real estate tax deposits will be waived provided that no event of default has occurred and is continuing, the borrower has paid such real estate taxes when due and has provided the lender with proof of payment. If the borrower does not pay any installment of real estate taxes when due more than one time in any 12 month period or more than three times during the Madonna Plaza Mortgage Loan term, such monthly real estate tax deposits will be required for the remainder of the Madonna Plaza Mortgage
THE INFORMATION IN THIS STRUCTURAL AND COLLATERAL TERM SHEET IS NOT COMPLETE AND MAY BE AMENDED PRIOR TO THE TIME OF SALE. THIS TERM SHEET IS NOT AN OFFER TO SELL THESE SECURITIES AND IT IS NOT A SOLICITATION OF AN OFFER TO BUY THESE SECURITIES IN ANY JURISDICTION WHERE THE OFFER OR SALE IS NOT PERMITTED.
71
| MADONNA PLAZA |
Loan term. Monthly insurance deposits will be waived as long as no event of default has occurred and is continuing and the insurance required to be maintained by the borrower is effected under an acceptable blanket policy.
The borrower is not initially (and for the first 60 months of the term of the Madonna Plaza Mortgage Loan will not be) required to make monthly deposits in into a capex reserve. After the first 60 months of the Madonna Plaza Mortgage Loan term, the lender is allowed, once during the remaining term, to assess new capital needs at the Madonna Plaza Property as described further in the loan documents and may require monthly deposits into a capex reserve.
On each payment date occurring during the continuance of a Lease Sweep Period (as defined below), all monthly residual cash after payment of the monthly required payments will be swept into a special rollover reserve account, which sweep will continue until the termination of the Lease Sweep Period.
A “Lease Sweep Period” will commence: (i) upon the early termination, early surrender or early cancellation of any Major Lease (as defined below), (ii) if any tenant under a Major Lease has discontinued its business, (iii) upon the occurrence and continuance (beyond any applicable cure period) of a default under any Major Lease by the applicable tenant, or (iv) upon a bankruptcy or insolvency proceeding of the applicable tenant under any Major Lease.
A “Major Lease” is a lease with Ralphs Grocery Store or Kohl’s Department Stores, Inc.
Additionally, if a Material Lease (as defined below) is terminated and the debt service coverage ratio, as of the date that such termination payment is received, is less than 1.30x, the borrower will be required to deposit all such lease termination payments into a rollover reserve account.
A “Material Lease” is any lease covering more than 20,000 of net rentable square feet, or that provide the tenant with an option or other right to purchase all or any portion of the Madonna Plaza Property, or a lease to a tenant which is an affiliate of the borrower.
Lockbox and Cash Management The Madonna Plaza Mortgage Loan requires a lender-controlled lockbox account, which is already in place, and that the borrower directs tenants to pay their rents directly into such lockbox account. The loan documents also require that all cash revenues relating to the Madonna Plaza Property and all other monies received by the borrower or the property manager be deposited into the lockbox account within one business day after receipt. Prior to the occurrence of a Cash Management Period, all funds on deposit in the lockbox account are swept into the borrower’s operating account on a daily basis. During a Cash Management Period all funds on deposit in the lockbox account are swept on a daily basis to a cash management account under the control of the lender.
A “Cash Management Period” will exist: (i) if an event of default has occurred and is continuing under the Madonna Plaza Mortgage Loan or (ii) upon the commencement of a Lease Sweep Period.
Property Management. The Madonna Plaza Property is currently managed by Schottenstein Property Group LLC, an affiliate of the borrower. The manager is entitled to a management fee on a monthly basis, equal to 4.0% of gross income from the Madonna Plaza Property. The borrower may not surrender, terminate, cancel, extend or renew the management agreement or otherwise replace or enter into any other management agreement without prior written consent from the lender (which consent may not be unreasonably withheld) except as described in the immediately succeeding sentence. The borrower may enter into a new property management agreement, without the lender’s consent, to replace the property manager with: (i) so long as the borrower is controlled by a Schottenstein Individual (as defined in the loan documents), a property management company owned by a Schottenstein Person (as defined in the loan documents) and controlled by a Schottenstein Individual or (ii) a new manager that is an affiliate of a REIT in connection with a permitted transfer to a public or private real estate investment trust.
Assumption. The borrower has a right to transfer the Madonna Plaza Property, with the consent of the lender, subject to customary conditions set forth in the loan documents, including but not limited to: (i) no event of default has occurred and is continuing under the Madonna Plaza Mortgage Loan, (ii) the borrower has submitted to the lender true, correct and complete copies of any and all information and documents requested, (iii) evidence satisfactory to the lender has been provided showing that the transferee borrower and its affiliates as designated by the lender comply with the special purpose entity provisions of the Madonna Plaza Mortgage Loan, (iv) the borrower has delivered to the lender an assumption fee in the amount of 0.5% of the outstanding principal balance of the Madonna Plaza Property Mortgage Loan, (v) the lender receives written confirmation from Fitch and Moody’s that the assumption will not, in and of itself, result in a downgrade, qualification or withdrawal of the then current ratings assigned to any class of Series 2011-C5 Certificates, (vi) all of the lender’s reasonable costs and expenses have been paid in connection to the transfer, (vii) replacement guarantors and indemnitors have indicated in writing their readiness and ability to transfer and assume the Madonna Plaza Mortgage Loan, (viii) the identity, experience, financial condition and creditworthiness of the transferee borrower and the replacement guarantors and indemnitors are satisfactory to the lender, and (ix) the proposed manager and proposed management agreement is satisfactory to the lender, Fitch and Moody’s.
Additionally, a transfer of the direct or indirect interests in the borrower is permitted, without the consent of the lender, to various affiliates of the Schottenstein Property Group, Inc. provided certain conditions, including that the borrower continues to be controlled by a Schottenstein Person, described in the loan documents are met.
Release. Not permitted.
Real Estate Substitution. Not permitted.
THE INFORMATION IN THIS STRUCTURAL AND COLLATERAL TERM SHEET IS NOT COMPLETE AND MAY BE AMENDED PRIOR TO THE TIME OF SALE. THIS TERM SHEET IS NOT AN OFFER TO SELL THESE SECURITIES AND IT IS NOT A SOLICITATION OF AN OFFER TO BUY THESE SECURITIES IN ANY JURISDICTION WHERE THE OFFER OR SALE IS NOT PERMITTED.
72
| MADONNA PLAZA |
Subordinate and Mezzanine Indebtedness. Not permitted.
Ground Lease. The Madonna Plaza Property is subject to a ground lease with Charles A. Pasquini, Jr., Trustee of the Charles A. Pasquini, Jr. Separate Property Trust. The initial ground lease term began in January 1967 and expires in December 2086. The ground lease agreement does not contain any options to extend the lease.
For the primary term of the ground lease (January 1, 1967 through December 31, 2041), the annual ground lease payment is based on 11.50% of Ralphs Grocery Store’s minimum rent plus 10.25% of qualified rent (which includes minimum and percentage rent) received from tenants for the immediately preceding calendar year, excluding expense reimbursements. For the extended term (January 1, 2042 through December 31, 2086), the annual ground lease payment is based on the greater of (i) fair market value rent or (ii) (a) 12.00% of qualified rent and (b) 13.50% of the minimum rent payable under the Ralphs Grocery Store’s lease.
Terrorism Insurance. The loan documents require that the “all risk” insurance policy required to be maintained by the borrower provide coverage for terrorism in an amount equal to the full replacement cost of the Madonna Plaza Property, as well as business interruption insurance covering no less than the 18-month period following the occurrence of a casualty event. In the event that coverage for terrorism is excluded under such policy, the borrower shall obtain stand alone coverage for terrorism, provided such coverage is commercially and reasonably available and is required by lender for similar properties in similar locations.
THE INFORMATION IN THIS STRUCTURAL AND COLLATERAL TERM SHEET IS NOT COMPLETE AND MAY BE AMENDED PRIOR TO THE TIME OF SALE. THIS TERM SHEET IS NOT AN OFFER TO SELL THESE SECURITIES AND IT IS NOT A SOLICITATION OF AN OFFER TO BUY THESE SECURITIES IN ANY JURISDICTION WHERE THE OFFER OR SALE IS NOT PERMITTED.
73
| SUGARLAND CROSSING |
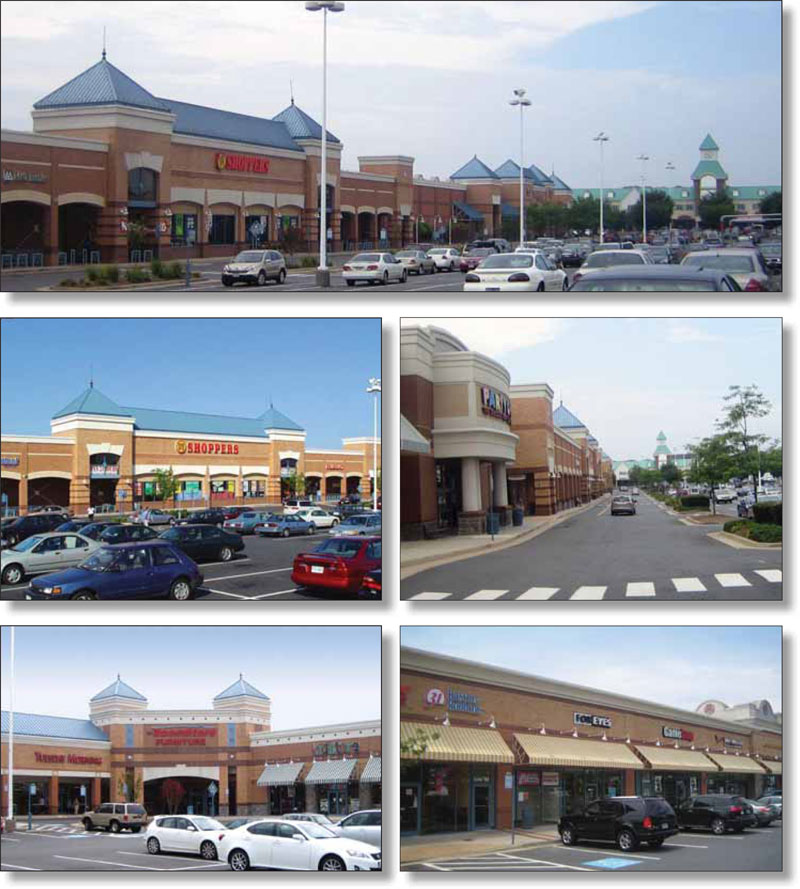
THE INFORMATION IN THIS STRUCTURAL AND COLLATERAL TERM SHEET IS NOT COMPLETE AND MAY BE AMENDED PRIOR TO THE TIME OF SALE. THIS TERM SHEET IS NOT AN OFFER TO SELL THESE SECURITIES AND IT IS NOT A SOLICITATION OF AN OFFER TO BUY THESE SECURITIES IN ANY JURISDICTION WHERE THE OFFER OR SALE IS NOT PERMITTED.
74
SUGARLAND CROSSING |
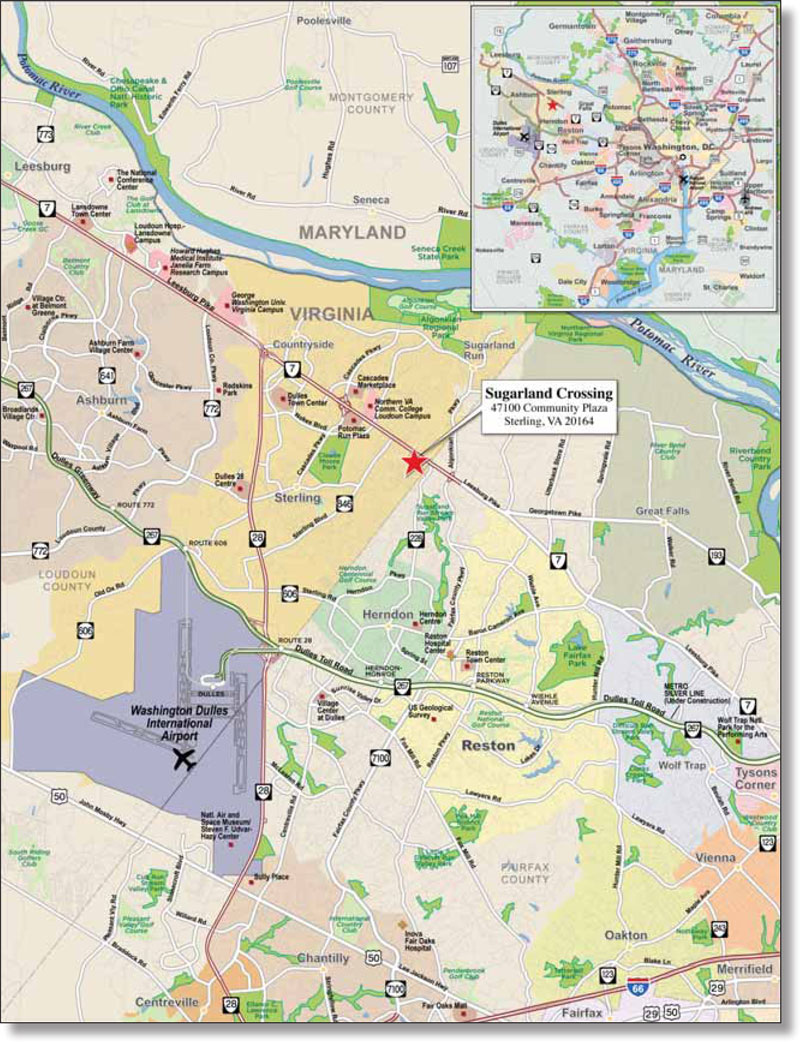
THE INFORMATION IN THIS STRUCTURAL AND COLLATERAL TERM SHEET IS NOT COMPLETE AND MAY BE AMENDED PRIOR TO THE TIME OF SALE. THIS TERM SHEET IS NOT AN OFFER TO SELL THESE SECURITIES AND IT IS NOT A SOLICITATION OF AN OFFER TO BUY THESE SECURITIES IN ANY JURISDICTION WHERE THE OFFER OR SALE IS NOT PERMITTED.
75
| Sugarland Crossing | |||||||
| Loan Information | Property Information | ||||||
| Mortgage Loan Seller: | The Royal Bank of Scotland | Single Asset/Portfolio: | Single Asset | ||||
| Credit Assessment (Fitch/Moody’s): | NAP | Property Type: | Retail | ||||
| Original Principal Balance: | $30,000,000 | Specific Property Type: | Anchored | ||||
| Cut-off Date Principal Balance: | $29,918,786 | Location: | Sterling, VA | ||||
| % of Initial Pool Balance: | 2.7% | Size: | 256,623 SF | ||||
| Loan Purpose: | Refinance | Cut-off Date Principal | |||||
| Borrower Name: | Sugarland Plaza Limited Partnership | Balance Per Unit/SF: | $116.59 | ||||
| Sponsor: | Combined Properties | Year Built/Renovated: | 1975/2000 | ||||
| Mortgage Rate: | 5.936% | Occupancy %: | 94.7% | ||||
| Note Date: | July 29, 2011 | Occupancy % Source Date: | July 28, 2011 | ||||
| Anticipated Repayment Date: | NAP | Title Vesting: | Fee | ||||
| Maturity Date: | August 1, 2021 | Property Manager: | Combined Properties, Incorporated | ||||
| IO Period: | None | ||||||
| Loan Term (Original): | 120 months | 3rd Most Recent NOI (As of): | $3,234,760 (12/31/2009) | ||||
| Seasoning: | 3 months | 2nd Most Recent NOI (As of): | $3,107,644 (12/31/2010) | ||||
| Amortization Term (Original): | 360 months | Most Recent NOI (As of): | $3,114,590 (TTM 5/31/2011) | ||||
| Loan Amortization Type: | Amortizing Balloon | ||||||
| Interest Accrual Method: | Actual/360 | U/W Revenues: | $4,274,567 | ||||
| Call Protection: | L(27),GRTR 1% or YM(89),O(4) | U/W Expenses: | $1,047,642 | ||||
| Lockbox Type: | Hard/Springing Cash Management | U/W NOI: | $3,226,925 | ||||
| Additional Debt: | None | U/W NCF: | $3,031,304 | ||||
| Additional Debt Type: | NAP | U/W NOI DSCR: | 1.51x | ||||
| U/W NCF DSCR: | 1.41x | ||||||
| Escrows and Reserves: | U/W NOI Debt Yield: | 10.8% | |||||
| U/W NCF Debt Yield: | 10.1% | ||||||
Type: | Initial | Monthly | Cap (If Any) | As-Is Appraised Value: | $41,500,000 | ||
| Taxes | $123,574 | $41,191 | NAP | As-Is Appraisal Valuation Date: | June 15, 2011 | ||
| Insurance | $10,042 | $3,347 | NAP | Cut-off Date LTV Ratio: | 72.1% | ||
| Capital Expenditures | $0 | $5,346 | NAP | LTV Ratio at Maturity or ARD: | 61.2% | ||
| TI/LC | $107,738 | $11,548 | NAP | ||||
| Deferred Maintenance | $13,750 | $0 | NAP | ||||
Tenant Reserve (1) | $2,000,000 | $0 | NAP | ||||
| (1) | See “Escrows” below for more details. |
The Mortgage Loan. The mortgage loan (the “Sugarland Crossing Mortgage Loan”) is evidenced by a promissory note that is secured by a first mortgage encumbering a retail center located in Sterling, Virginia (the “Sugarland Crossing Property”). The Sugarland Crossing Mortgage Loan was originated on July 29, 2011 by The Royal Bank of Scotland. The Sugarland Crossing Mortgage Loan had an original principal balance of $30,000,000, has an outstanding principal balance as of the Cut-off Date of $29,918,786 and accrues interest at an interest rate of 5.936% per annum. The Sugarland Crossing Mortgage Loan had an initial term of 120 months, has a remaining term of 117 months as of the Cut-off Date and requires payments of interest and principal based on a 30-year amortization schedule. The Sugarland Crossing Mortgage Loan matures on August 1, 2021. The proceeds from the Sugarland Crossing Mortgage Loan were used to refinance debt of approximately $20.9 million that was securitized in the JPMCC 2002-CIB4 transaction. Proceeds were also used to pay closing and other costs of approximately $540,731 and fund approximately $2.3 million in upfront reserves, resulting in a return of equity to the sponsor of approximately $6.3 million.
Following the lockout period, the borrower has the right to voluntarily prepay the loan, in whole or, only with respect to the reserve held for Patient First Corporation, in part, provided that the borrower pays the greater of a yield maintenance premium or a prepayment premium equal to 1% of the principal amount being prepaid. On or after May 1, 2021, the borrower may voluntarily prepay the loan, in whole or, only with respect to the reserve held for Patient First Corporation, in part, without penalty.
The Property. The Sugarland Crossing Property is a 256,623 square foot community shopping center located in Sterling, Loudoun County, Virginia. The Sugarland Crossing Property was 94.7% leased as of July 28, 2011 to 25 tenants and is anchored by Burlington Coat Factory, Shoppers Food Warehouse, and RoomStore Furniture. The Sugarland Crossing Property has 1,091 surface parking spaces and is comprised of four one-story retail buildings. The main building is L-shaped and contains the anchor and junior anchor tenants as well as in-line tenants. The three smaller buildings consist of a 10,800 square foot multi-tenant building and two free-standing pad buildings occupied by Chick-Fil-A and a PNC Bank branch. The Sugarland Crossing Property’s main building was developed in 1975 and extensively renovated and expanded in 2000 while the smaller buildings were constructed
THE INFORMATION IN THIS STRUCTURAL AND COLLATERAL TERM SHEET IS NOT COMPLETE AND MAY BE AMENDED PRIOR TO THE TIME OF SALE. THIS TERM SHEET IS NOT AN OFFER TO SELL THESE SECURITIES AND IT IS NOT A SOLICITATION OF AN OFFER TO BUY THESE SECURITIES IN ANY JURISDICTION WHERE THE OFFER OR SALE IS NOT PERMITTED.
76
| SUGARLAND CROSSING |
in 1989, 1999 and 2000. The renovation and expansion included a 30,000 square foot expansion of Shoppers Food Warehouse, major façade work, and the addition of 72,600 square feet of prime retail space.
The Sugarland Crossing Property is located on the south side of Route 7 (Harry Byrd Highway) between north Sterling Boulevard and Fairfax County Parkway. Route 7 is the primary east-west arterial that runs through northern Loudoun County. The Sugarland Crossing Property is located within Sterling, in eastern Loudoun County, Virginia. Per the appraisal, Loudoun County is one of the fastest growing counties in the United States and since 1990 has grown faster than any other Virginia jurisdiction. Sterling and its neighboring areas are densely populated communities that benefit from their close proximity to the Washington D.C. metropolitan area and Washington Dulles International Airport. Per the appraisal, from 2001 to 2010, Loudoun County’s population grew at an annual rate of 6.1% and is projected to grow 3.9% per annum through 2015. Per the appraisal, the 1-mile and 3-mile radius average household income was approximately $122,066 and $135,938, respectively.
The following table presents certain information relating to the tenancies at the Sugarland Crossing Property:
Major Tenants
| Tenant Name | Credit Rating (Fitch/ Moody’s/ S&P)(1) | Tenant NRSF | % of NRSF | Annual U/W Base Rent PSF | Annual U/W Base Rent | % of Total Annual U/W Base Rent | Sales PSF(2) | Occupancy Cost | Lease Expiration Date | |||||||
| Anchor Tenants – Collateral | ||||||||||||||||
| Burlington Coat Factory | CC/Caa1/B- | 77,444 | 30.2% | $5.03 | $389,194 | 11.7% | $113 | 7.5% | 8/31/2013 | |||||||
| Shoppers Food Warehouse | B+/B2/B+ | 61,241 | 23.9% | $12.25 | $750,202 | 22.6% | $277 | 5.7% | 1/31/2021 | |||||||
| The RoomStore Furniture | D/NR/NR | 35,000 | 13.6% | $12.40 | $434,000 | 13.1% | $94 | 17.1% | 12/31/2014 | |||||||
| Total Anchor Tenants – Collateral | 173,685 | 67.7% | $9.06 | $1,573,396 | 47.4% | |||||||||||
| Other Major Tenants - Collateral | ||||||||||||||||
| Party City | NR/B2/B | 12,500 | 4.9% | $15.21 | $190,125 | 5.7% | $208 | 9.4% | 11/30/2015 | |||||||
| Tuesday Morning | NR/NR/NR | 7,680 | 3.0% | $14.30 | $109,824 | 3.3% | $136 | 13.9% | 1/14/2012 | |||||||
Patient First Corporation(3) | NR/NR/NR | 6,600 | 2.6% | $30.00 | $198,000 | 6.0% | NAV | NAV | 2/28/2027 | |||||||
| Total Other Major Tenants – Collateral | 26,780 | 10.4% | $18.59 | $497,949 | 15.0% | |||||||||||
| Non-Major Tenants | 42,657 | 16.6% | $29.24 | $1,247,209 | 37.6% | |||||||||||
| Occupied Collateral Total | 243,122 | 94.7% | $13.65 | $3,318,554 | 100.0% | |||||||||||
| Vacant Space | 13,501 | 5.3% | ||||||||||||||
| Collateral Total | 256,623 | 100.0% | ||||||||||||||
| (1) | Certain ratings are those of the parent company whether or not the parent guarantees the lease. |
| (2) | Sales per square foot are for the full-year ending December 31, 2010, with the exception of Shoppers Food Warehouse whose sales per square foot are for the full-year ending March 31, 2011. |
| (3) | Patient First Corporation has an executed lease and is expected to take occupancy by year end 2011. There is a $2,000,000 reserve for Patient First Corporation. See “Escrows” below. |
THE INFORMATION IN THIS STRUCTURAL AND COLLATERAL TERM SHEET IS NOT COMPLETE AND MAY BE AMENDED PRIOR TO THE TIME OF SALE. THIS TERM SHEET IS NOT AN OFFER TO SELL THESE SECURITIES AND IT IS NOT A SOLICITATION OF AN OFFER TO BUY THESE SECURITIES IN ANY JURISDICTION WHERE THE OFFER OR SALE IS NOT PERMITTED.
77
| SUGARLAND CROSSING |
The following table presents certain information relating to the lease rollover schedule at the Sugarland Crossing Property:
Lease Expiration Schedule*
Year Ending December 31, | No. of Leases Expiring | Expiring NRSF | % of Total NRSF | Cumulative of Total NRSF | Cumulative % of Total NRSF | Annual U/W Base Rent | Annual U/W Base Rent PSF |
| MTM | 0 | 0 | 0.0% | 0 | 0.0% | $0 | $0.00 |
| 2011 | 1 | 2,500 | 1.0% | 2,500 | 1.0% | $40,000 | $16.00 |
| 2012 | 1 | 7,680 | 3.0% | 10,180 | 4.0% | $109,824 | $14.30 |
| 2013 | 6 | 84,521 | 32.9% | 94,701 | 36.9% | $643,897 | $7.62 |
| 2014 | 3 | 39,450 | 15.4% | 134,151 | 52.3% | $611,941 | $15.51 |
| 2015 | 6 | 27,677 | 10.8% | 161,828 | 63.1% | $602,902 | $21.78 |
| 2016 | 3 | 5,308 | 2.1% | 167,136 | 65.1% | $127,122 | $23.95 |
| 2017 | 0 | 0 | 0.0% | 167,136 | 65.1% | $0 | $0.00 |
| 2018 | 1 | 4,800 | 1.9% | 171,936 | 67.0% | $134,400 | $28.00 |
| 2019 | 0 | 0 | 0.0% | 171,936 | 67.0% | $0 | $0.00 |
| 2020 | 0 | 0 | 0.0% | 171,936 | 67.0% | $0 | $0.00 |
| 2021 | 3 | 64,586 | 25.2% | 236,522 | 92.2% | $850,468 | $13.17 |
Thereafter(1) | 1 | 6,600 | 2.6% | 243,122 | 94.7% | $198,000 | $30.00 |
| Vacant | 0 | 13,501 | 5.3% | 256,623 | 100.0% | $0 | $0.00 |
| Total / Weighted Average | 25 | 256,623 | 100.0% | $3,318,554 | $13.65 |
* Source: Information obtained from underwritten rent roll.
| (1) | Includes Patient First Corporation, who has an executed lease and is expected to take occupancy by year end 2011. There is a $2,000,000 reserve for Patient First Corporation. See “Escrows” below. |
The following table presents historical occupancy percentages at the Sugarland Crossing Property:
Historical Occupancy Percentages*
12/31/2008 | 12/31/2009 | 12/31/2010 | ||
| 95% | 97% | 95% |
* Source: Information provided by the borrower.
Operating History and Underwritten Net Cash Flow. The following table presents certain information relating to the historical operating performance and the Underwritten Net Cash Flow at the Sugarland Crossing Property:
Cash Flow Analysis
| 2008 | 2009 | 2010 | TTM 5/31/2011 | U/W | U/W $ per SF | |||||||||
| Base Rent | $3,344,344 | $3,247,844 | $3,271,506 | $3,222,206 | $3,318,554(1) | $12.93 | ||||||||
| Grossed Up Vacant Space | 0 | 0 | 0 | 0 | 364,527 | 1.42 | ||||||||
| Total Reimbursables | 845,880 | 933,915 | 997,415 | 1,009,222 | 925,773 | 3.61 | ||||||||
| Other Income | 27,385 | 142,335 | 31,117 | 30,572 | 30,240 | 0.12 | ||||||||
| Less Vacancy & Credit Loss | (49,339) | 0 | (41,502) | (41,502) | (364,527) | (1.42) | ||||||||
| Effective Gross Income | $4,168,270 | $4,324,094 | $4,258,536 | $4,220,498 | $4,274,567 | $16.66 | ||||||||
| Total Operating Expenses | $1,022,874 | $1,089,334 | $1,150,892 | $1,105,908 | $1,047,642 | $4.08 | ||||||||
Net Operating Income(2) | $3,145,396 | $3,234,760 | $3,107,644 | $3,114,590 | $3,226,925 | $12.57 | ||||||||
| TI/LC | 0 | 0 | 0 | 0 | 131,465 | 0.51 | ||||||||
| Capital Expenditures | 0 | 0 | 0 | 0 | 64,156 | 0.25 | ||||||||
| Net Cash Flow | $3,145,396 | $3,234,760 | $3,107,644 | $3,114,590 | $3,031,304 | $11.81 | ||||||||
| NOI DSCR | 1.47x | 1.51x | 1.45x | 1.45x | 1.51x | |||||||||
| NCF DSCR | 1.47x | 1.51x | 1.45x | 1.45x | 1.41x | |||||||||
| NOI DY | 10.5% | 10.8% | 10.4% | 10.4% | 10.8% | |||||||||
| NCF DY | 10.5% | 10.8% | 10.4% | 10.4% | 10.1% | |||||||||
| (1) | Contractual rent increases for several tenants were underwritten through February 2012. The rent for the Patient First Corporation executed lease was included in the underwriting. There is a $2,000,000 reserve for Patient First Corporation. See “Escrows” below. |
| (2) | The U/W NOI is higher than the historical NOIs due to several factors including but not limited to new leasing described in footnote 1 above. |
Appraisal. According to the appraisal performed by Cushman & Wakefield, the Sugarland Crossing Property had an “as-is” appraised value of $41,500,000 as of an effective date of June 15, 2011.
THE INFORMATION IN THIS STRUCTURAL AND COLLATERAL TERM SHEET IS NOT COMPLETE AND MAY BE AMENDED PRIOR TO THE TIME OF SALE. THIS TERM SHEET IS NOT AN OFFER TO SELL THESE SECURITIES AND IT IS NOT A SOLICITATION OF AN OFFER TO BUY THESE SECURITIES IN ANY JURISDICTION WHERE THE OFFER OR SALE IS NOT PERMITTED.
78
| SUGARLAND CROSSING |
Environmental Matters. According to the Phase I environmental site assessment performed by EBI Consulting on July 20, 2011, there was no evidence of any recognized environmental conditions, aside from the continued implementation of the existing Asbestos Operations and Maintenance plan.
Market Overview and Competition. The Sugarland Crossing Property is located in Sterling, Virginia in eastern Loudoun County, which is a Northern Virginia component of the Washington DC MSA. The Sugarland Crossing Property is located on Route 7, a major retail corridor and is approximately 25 miles northwest of Washington, D.C. and four miles northeast of Dulles International Airport. Loudoun County is approximately 517 square miles in size and its population as of the 2011 Census was 328,500. According to the appraisal, Loudoun County posted the highest per annum population growth (6.1%) of all the Washington D.C.’s suburban counties.
With the exception of a few neighborhood retail centers within the large planned communities, the majority of Loudoun County’s retail development is located either in Leesburg or along Route 7.
According to the appraisal, the Suburban Virginia retail market consisted of 39.5 million square feet of retail space divided into five submarkets. As of the first quarter of 2011, the market was 6.5% vacant with an average quoted rental rate of $27.49 per square foot. The Sugarland Crossing Property is located in the Loudoun County submarket, which consisted of 6.4 million square feet or 16.3% of the Suburban Virginia retail market. As of the first quarter of 2011, the submarket was 8.6% vacant with an average quoted rental rate of $25.13 per square foot.
The following table presents certain information relating to some comparable retail centers provided in the appraisal performed by Cushman & Wakefield for the Sugarland Crossing Property:
Competitive Set*
| Sugarland Crossing (Subject) | Sterling Plaza Center | Great Falls Plaza | Countryside Marketplace | Cascades Marketplace | Town Center at Sterling | Dulles 28 Centre | |
| Market | Sterling, VA | Sterling, VA | Sterling, VA | Sterling, VA | Sterling, VA | Sterling, VA | Sterling, VA |
| Distance from Subject | -- | 3.5 miles | 2.6 miles | 3.1 miles | 2.3 miles | 0.3 miles | 4.7 miles |
| Property Type | Community Center | Community Center | Neighborhood Center | Neighborhood Center | Power Center | Community Center | Lifestyle Center |
| Year Built/ Renovated | 1975/2000 | 1988/2000 | 1996/NAV | 1986/NAV | 1994/NAV | 1980/1994 | 2007/NAV |
| Anchors | Burlington Coat Factory, Shoppers Food Warehouse, The RoomStore Furniture, Party City | Safeway | Bloom, Rite Aid | Safeway, CVS | Home Depot, Giant Food, Gold’s Gym, Sports Authority | Giant Food | Wegman’s, Target, Petco |
| Total GLA | 256,623 SF | 89,310 SF | 89,598 SF | 148,296 SF | 513,834 SF | 190,068 SF | 410,000 SF |
| Total Occupancy | 93% | 98% | 98% | 93% | 100% | 88% | 96% |
* Source: Cushman & Wakefield & CoStar.
The Borrower. The borrower is a Maryland limited partnership and is generally a single-purpose entity. The sole general partner of the borrower, Sugarland Plaza, Inc., is a Maryland corporation and is a single-purpose entity with two independent directors. Legal counsel to the borrower delivered a non-consolidation opinion in connection with the origination of the Sugarland Crossing Mortgage Loan. The borrower is owned by Sugarland Plaza, Inc. (1%), Ronald S. Haft (59.4%) and Combined Holding Company LLC (39.6%). Combined Holding Company LLC is the guarantor of certain nonrecourse carveouts under the Sugarland Crossing Mortgage Loan. Under the terms of the nonrecourse carveout guaranty, the Sugarland Crossing Mortgage Loan becomes fully recourse to the nonrecourse carveout guarantor if, among other circumstances, the borrower files a voluntary bankruptcy petition or the nonrecourse carveout guarantor joins in an involuntary bankruptcy petition against the borrower.
The borrower is subject to two contingent indemnification agreements dated July 31, 1994, and August 13, 1997, (together, the “Sugarland Indemnification Agreements”). In general, under the Sugarland Indemnification Agreements and as part of the consideration for obtaining ownership interests in certain entities, including the borrower and the general partner of the borrower (all such entities, collectively, the “Haft Entities”), Mr. Haft, his father and the Haft Entities agreed to indemnify certain of Mr. Haft’s family members against any future liabilities relating to the Haft Entities and the properties owned and controlled by the Haft Entities (including the Sugarland Crossing Property). In connection with the Sugarland Indemnification Agreements, Mr. Haft delivered an indemnification agreement to the borrower and the general partner of the borrower (the “RSH Indemnity”), which provides that the borrower and the borrower’s general partner will be indemnified by Mr. Haft for any liability the borrower or such general partner may incur pursuant to the Sugarland Indemnification Agreements. The lender is a third party beneficiary of the RSH Indemnity. In addition, pursuant to the mortgage loan documents, any claim under a Sugarland Indemnification Agreement or any breach of the RSH Indemnity will be recourse to the nonrecourse carveout guarantor.
The Sponsor. Combined Properties was founded in 1984 by Ronald S. Haft. Mr. Haft created the company to acquire, manage and develop retail strip shopping centers. Combined Properties is a privately held, retail real estate company in the Washington, DC metropolitan area with an expanding presence in Southern California. Combined Properties’ $1 billion portfolio is comprised of 40 properties totaling approximately 5 million square feet and an approximate $500 million development pipeline.
THE INFORMATION IN THIS STRUCTURAL AND COLLATERAL TERM SHEET IS NOT COMPLETE AND MAY BE AMENDED PRIOR TO THE TIME OF SALE. THIS TERM SHEET IS NOT AN OFFER TO SELL THESE SECURITIES AND IT IS NOT A SOLICITATION OF AN OFFER TO BUY THESE SECURITIES IN ANY JURISDICTION WHERE THE OFFER OR SALE IS NOT PERMITTED.
79
| SUGARLAND CROSSING |
Escrows. The loan documents provide for upfront escrows at closing in the amount of: $123,574 for real estate taxes, $10,042 for insurance premiums, $13,750 for deferred maintenance, $107,738 for tenant improvements and leasing commissions and $2,000,000 in connection with the Patient First Corporation (the “Patient First Funds”). The lender is required to release the Patient First Funds, in increments of no less than $500,000 and no more than twice per year if, following among other things, delivery by borrower of a request therefor: (i) Patient First Corporation or a replacement tenant has taken occupancy, all contingencies under such leases to the payment of full rent (including the borrower’s contribution to the cost of any tenant improvement work) have been satisfied, each such tenant has begun to pay full rent under its respective lease and each such tenant has opened for business at the Sugarland Crossing Property; (ii) the Sugarland Crossing Property has achieved a debt service coverage ratio of 1.37x for one calendar quarter and (iii) no event of default is continuing. After the lockout period, upon the borrower’s request, the lender is required to apply the Patient First Funds to the prepayment of principal on the payment date following the delivery by borrower of such request, in increments of at least $500,000 (or so much of the Patient First Funds as then remain in escrow), provided that the borrower, on or prior to the payment date of application by lender of such funds to the prepayment of principal, pays to the lender an amount equal to the yield maintenance premium applicable to such principal being prepaid.
The loan documents provide for ongoing monthly escrows in the amount of: $41,191 for real estate taxes (subject to adjustment per lender’s estimate), $3,347 for insurance premiums (subject to adjustment per lender’s estimate), $11,548 for tenant improvements and leasing commissions and $5,346 for capital expenditures.
On each payment date occurring during the continuance of a Lease Sweep Period (as defined below) (provided that no event of default has occurred or is continuing), all monthly residual cash after payment of the monthly required payments will be swept into a special rollover reserve account (the “Special Rollover Reserve Account”), which sweep will continue until the termination of the Lease Sweep Period.
A “Lease Sweep Period” will commence on the first payment date following among other things: (a) the date that is twelve months prior to the end of the term of the lease with Shoppers Food Warehouse (including any renewal terms), if the Shoppers Food Warehouse has exercised its right not to have the automatic renewal thereunder take effect; (b) the date on which a tenant under an Anchor Lease (as defined below) discontinues its business at its premises or gives notice that it intends to discontinue its business at its premises; (c) the failure by a tenant under an Anchor Lease to pay when due any and all amounts due under its lease for a period of forty-five days past the date when such payment(s) are due (other than amount being contested under the terms of its Anchor Lease); (d) the occurrence of an insolvency proceeding with respect to a tenant under an Anchor Lease; or (e) the date that is six months prior to the end of the term of the lease with Burlington Coat Factory; and will end: (i) with respect to a Lease Sweep Period caused by a matter described in clauses (a) through (c) above, the date on which certain occupancy conditions have been satisfied with respect to the applicable leased premises and the Sugarland Crossing Property has achieved a debt service coverage ratio of 1.30x; (ii) with respect to a Lease Sweep Period caused by a matter described in clause (c) above, if the subject default has been cured, and no other monetary or material non-monetary default by such tenant has occurred for a period of four consecutive months following such cure; (iii) with respect to a Lease Sweep Period caused by a matter described in clause (d) above, if the insolvency proceeding with respect to such tenant has terminated or the Anchor Lease has been affirmed, assumed or assigned under such insolvency proceeding; (iv) with respect to a Lease Sweep Period caused by a matter described in clause (e) above, the earlier to occur of the date on which: (A) the Sugarland Crossing Property has achieved a debt service coverage ratio of 1.30x; or (B) $800,000 has accumulated in the Special Rollover Reserve Account during such Lease Sweep Period; or (v) with respect to any Lease Sweep Period, the date on which the debt has been repaid in full. An “Anchor Lease” means the lease with Shoppers Food Warehouse or a lease of the entirety of the Shoppers Food Warehouse space to one or two replacement tenants in accordance with the loan documents.
Lockbox and Cash Management. The Sugarland Crossing Mortgage Loan requires a lender-controlled lockbox account, which is already in place, and that the borrower directs tenants to pay their rents directly to such lockbox account. The loan documents also require that all cash revenues relating to the Sugarland Crossing Property and all other monies received by the borrower or the property manager be deposited into the lockbox account within three business days after receipt. Prior to the occurrence of a Cash Management Period (as defined below), all funds on deposit in the lockbox account are swept into the borrower’s operating account on a daily basis. During a Cash Management Period all funds on deposit in the lockbox account are swept on a daily basis to a cash management account under the control of the lender.
A “Cash Management Period” will commence upon (i) the occurrence of an event of default or (ii) the commencement of a Lease Sweep Period; and will end if: (a) the loan and all other obligations under the loan documents have been repaid in full; or (b) with respect to the matter described in clause (i) above, (1) the stated maturity date has not occurred and (2) such event of default has been cured and no other event of default has occurred and is continuing; or (c) with respect to the matter described in clause (ii) above, such Lease Sweep Period has ended.
Property Management. The Sugarland Crossing Property is currently managed by Combined Properties, Incorporated, an affiliate of the borrower. The manager is entitled to a management fee on a monthly basis, equal to 4.0% of gross income from the Sugarland Crossing Property. The borrower may not surrender, terminate or cancel the management agreement or otherwise replace or enter into any other management agreement without prior written consent from the lender (which consent may not be unreasonably withheld).
Assumption. The borrower has a right to transfer the Sugarland Crossing Property, with the consent of the lender, subject to customary conditions set forth in the loan documents, including but not limited to: (i) no event of default has occurred and is continuing under the Sugarland Crossing Mortgage Loan, (ii) the borrower has submitted to the lender true, correct and complete copies of any and all information and documents requested, (iii) evidence satisfactory to the lender has been provided showing that the transferee borrower complies with the special purpose entity provisions of the Sugarland Crossing Mortgage Loan, (iv) the lender receives written confirmation from Fitch and Moody’s that the assumption will not, in and of itself, result in a downgrade, qualification or withdrawal of the then current ratings assigned to any class of Series 2011-C5 Certificates, (v) all of the lender’s
THE INFORMATION IN THIS STRUCTURAL AND COLLATERAL TERM SHEET IS NOT COMPLETE AND MAY BE AMENDED PRIOR TO THE TIME OF SALE. THIS TERM SHEET IS NOT AN OFFER TO SELL THESE SECURITIES AND IT IS NOT A SOLICITATION OF AN OFFER TO BUY THESE SECURITIES IN ANY JURISDICTION WHERE THE OFFER OR SALE IS NOT PERMITTED.
80
| SUGARLAND CROSSING |
reasonable costs and expenses have been paid in connection to the transfer, (vi) replacement guarantors and indemnitors have indicated in writing their readiness and ability to transfer and assume the Sugarland Crossing Mortgage Loan, (vii) the experience, net worth, credit and background of the principals controlling the transferee borrower, the replacement guarantors and indemnitors are acceptable to the lender in its reasonable discretion, and the replacement guarantors and indemnitors (1) have never been convicted of a felony, (2) have never been the subject of a voluntary or involuntary (to the extent the same has not been discharged) bankruptcy proceeding, (3) have no outstanding judgments against such principals and replacement guarantors and indemnitors (which are not being appealed and/or have not been bonded over) and (viii) the manager and proposed management agreement is satisfactory to the lender, Fitch and Moody’s.
Release. Not permitted.
Real Estate Substitution. Not permitted.
Subordinate and Mezzanine Indebtedness. Not permitted.
Ground Lease. None.
Terrorism Insurance. The loan documents require that the “all risk” insurance policy required to be maintained by the borrower provide coverage for terrorism in an amount equal to the full replacement cost of the Sugarland Crossing Property, as well as business interruption insurance covering no less than the 18-month period following the occurrence of a casualty event. In the event that coverage for terrorism is excluded under such policy, the borrower shall obtain stand alone coverage for terrorism, provided such coverage is commercially and reasonably available and is required by lender for similar properties in similar locations.
THE INFORMATION IN THIS STRUCTURAL AND COLLATERAL TERM SHEET IS NOT COMPLETE AND MAY BE AMENDED PRIOR TO THE TIME OF SALE. THIS TERM SHEET IS NOT AN OFFER TO SELL THESE SECURITIES AND IT IS NOT A SOLICITATION OF AN OFFER TO BUY THESE SECURITIES IN ANY JURISDICTION WHERE THE OFFER OR SALE IS NOT PERMITTED.
81
| 919 CONGRESS |
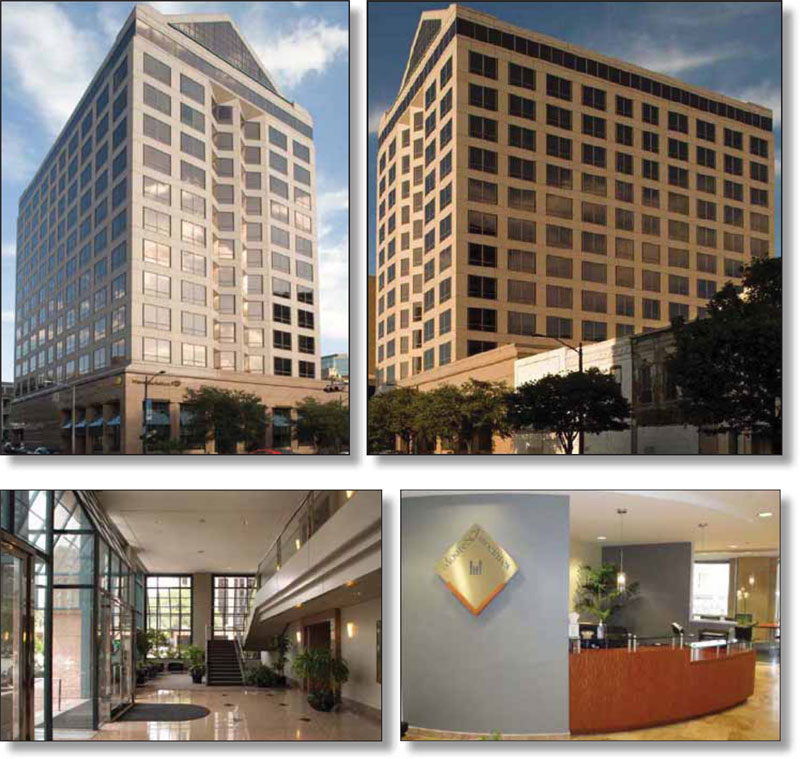
THE INFORMATION IN THIS STRUCTURAL AND COLLATERAL TERM SHEET IS NOT COMPLETE AND MAY BE AMENDED PRIOR TO THE TIME OF SALE. THIS TERM SHEET IS NOT AN OFFER TO SELL THESE SECURITIES AND IT IS NOT A SOLICITATION OF AN OFFER TO BUY THESE SECURITIES IN ANY JURISDICTION WHERE THE OFFER OR SALE IS NOT PERMITTED.
82
| 919 CONGRESS |

THE INFORMATION IN THIS STRUCTURAL AND COLLATERAL TERM SHEET IS NOT COMPLETE AND MAY BE AMENDED PRIOR TO THE TIME OF SALE. THIS TERM SHEET IS NOT AN OFFER TO SELL THESE SECURITIES AND IT IS NOT A SOLICITATION OF AN OFFER TO BUY THESE SECURITIES IN ANY JURISDICTION WHERE THE OFFER OR SALE IS NOT PERMITTED.
83
| 919 Congress | ||||||
| Loan Information | Property Information | |||||
| Mortgage Loan Seller: | The Royal Bank of Scotland | Single Asset/Portfolio: | Single Asset | |||
| Credit Assessment (Fitch/Moody’s): | NAP | Property Type: | Office | |||
| Original Principal Balance: | $28,000,000 | Specific Property Type: | CBD | |||
| Cut-off Date Principal Balance: | $27,918,559 | Location: | Austin, TX | |||
| % of Initial Pool Balance: | 2.6% | Size: | 164,718 SF | |||
| Loan Purpose: | Refinance | Cut-off Date Principal | ||||
| Borrower Name: | 919 Congress Avenue LLC | Balance Per Unit/SF: | $169.49 | |||
| Sponsors: | Moore & Associates, Inc.; Alfa Properties, Inc. | Year Built/Renovated: | 1984/NAP | |||
| Mortgage Rate: | 5.625% | Occupancy %: | 90.7% | |||
| Note Date: | July 6, 2011 | Occupancy % Source Date: | June 1, 2011 | |||
| Anticipated Repayment Date: | NAP | Title Vesting: | Fee and Leasehold | |||
| Maturity Date: | August 1, 2021 | Property Manager: | Moore & Associates, Inc. | |||
| IO Period: | None | |||||
| Loan Term (Original): | 120 months | 3rd Most Recent NOI (As of): | $2,605,952 (12/31/2009) | |||
| Seasoning: | 3 months | 2nd Most Recent NOI (As of): | $2,374,846 (12/31/2010) | |||
| Amortization Term (Original): | 360 months | Most Recent NOI (As of): | $2,388,937 (TTM 4/30/2011) | |||
| Loan Amortization Type: | Amortizing Balloon | |||||
| Interest Accrual Method: | Actual/360 | U/W Revenues: | $5,276,014 | |||
| Call Protection: | L(27),D(86),O(7) | U/W Expenses: | $2,503,768 | |||
| Lockbox Type: | Hard/Springing Cash Management | U/W NOI: | $2,772,246 | |||
| Additional Debt: | None | U/W NCF: | $2,556,463 | |||
| Additional Debt Type: | NAP | U/W NOI DSCR: | 1.43x | |||
| U/W NCF DSCR: | 1.32x | |||||
| Escrows and Reserves: | U/W NOI Debt Yield: | 9.9% | ||||
Type: | Initial | Monthly | Cap (If Any) | U/W NCF Debt Yield: | 9.2% | |
Taxes(1) | $512,973 | $73,282 | NAP | As-Is Appraised Value: | $40,500,000 | |
Insurance(1) | $21,898 | $3,650 | NAP | As-Is Appraisal Valuation Date: | May 25, 2011 | |
| Replacement Reserves | $0 | $2,745 | NAP | Cut-off Date LTV Ratio: | 68.9% | |
| Future TI/LC | $300,000 | $17,844 | $750,000 | LTV Ratio at Maturity or ARD: | 58.0% | |
| Outstanding TI/LC | $310,511 | $0 | NAP | |||
| Rent Concession Reserve | $280,461 | $0 | NAP | |||
Ground Rent Reserve(2) | $0 | $0 | NAP | |||
| (1) | Monthly payments are subject to adjustment per lender’s estimate of real estate taxes and insurance premiums. |
| (2) | Monthly payments are payable on each payment date during a Cash Management Period (as defined below). See “Escrows” below. |
The Mortgage Loan. The mortgage loan (the “919 Congress Mortgage Loan”) is evidenced by a promissory note that is secured by a first mortgage encumbering a Class A office building located in Austin, Texas (the “919 Congress Property”). The 919 Congress Mortgage Loan was originated on July 6, 2011 by The Royal Bank of Scotland. The 919 Congress Mortgage Loan had an original principal balance of $28,000,000, has an outstanding principal balance as of the Cut-off Date of $27,918,559 and accrues interest at an interest rate of 5.625% per annum. The 919 Congress Mortgage Loan had an initial term of 120 months, has a remaining term of 117 months as of the Cut-off Date and requires payments of principal and interest based on a 30-year amortization schedule. The 919 Congress Mortgage Loan matures on August 1, 2021. The proceeds from the 919 Congress Mortgage Loan were used to refinance existing debt of approximately $15.1 million that was securitized in the GCCFC 2005-GG3 transaction. Proceeds were also used to pay closing and other costs of approximately $534,552 and fund $1.4 million in upfront reserves, resulting in a return of equity to the sponsors of approximately $10.9 million.
Following the lockout period, the borrower has the right to defease the 919 Congress Mortgage Loan in whole, but not in part, on any payment date before February 1, 2021; provided, however, that the 919 Congress Mortgage Loan is prepayable without penalty on or after February 1, 2021.
The Property. The 919 Congress Property is a 15-story Class A office building containing approximately 164,718 rentable square feet and is located in downtown Austin, Texas. The Property was built in 1984 and is situated on a 0.508 acre site, approximately 0.085 acres of which is subject to a long-term ground lease that extends through December 31, 2080. See “Ground Lease” below. The 919 Congress Property is located one block south of the State Capital Complex and within walking distance to the entertainment areas of 6th Street, the Warehouse District and the 2nd Street Entertainment District. The collateral also includes a
THE INFORMATION IN THIS STRUCTURAL AND COLLATERAL TERM SHEET IS NOT COMPLETE AND MAY BE AMENDED PRIOR TO THE TIME OF SALE. THIS TERM SHEET IS NOT AN OFFER TO SELL THESE SECURITIES AND IT IS NOT A SOLICITATION OF AN OFFER TO BUY THESE SECURITIES IN ANY JURISDICTION WHERE THE OFFER OR SALE IS NOT PERMITTED.
84
| 919 CONGRESS |
six-level parking garage with 219 parking spaces reflecting an overall parking ratio of 1.3 spaces per every 1,000 square feet of net rentable area. As of June 2011, the 919 Congress Property was 90.7% occupied.
The following table represents certain information relating to the tenancies at the 919 Congress Property:
Major Tenants
| Tenant Name | Credit Rating (Fitch/Moody’s/ S&P)(1) | Tenant NRSF | % of NRSF | Annual U/W Base Rent PSF | Annual U/W Base Rent | % of Total Annual U/W Base Rent | Lease Expiration Date | |
| Major Tenants | ||||||||
| Plains Capital Corporation | NR/NR/NR | 17,510 | 10.6% | $18.49 | $323,786 | 12.0% | 3/31/2014 | |
| Fisher – Ross | NR/NR/NR | 12,153 | 7.4% | $18.00 | $218,754 | 8.1% | 12/31/2016 | |
| Entergy Gulf States, Inc. | NR/Baa3/BBB | 11,960 | 7.3% | $18.00 | $215,280 | 8.0% | 4/30/2016 | |
| Fowler Lawfirm, P.C. | NR/NR/NR | 9,735 | 5.9% | $17.14 | $166,878 | 6.2% | 12/31/2013 | |
| Sedgwick, Detert, Moran | NR/NR/NR | 9,237 | 5.6% | $18.17 | $167,869 | 6.2% | 7/31/2015 | |
| Total Major Tenants | 60,595 | 36.8% | $18.03 | $1,092,567 | 40.4% | |||
| Non-Major Tenants | 88,833 | 53.9% | $18.17 | $1,614,332 | 59.6% | |||
| Occupied Collateral Total | 149,428 | 90.7% | $18.12 | $2,706,899 | 100.0% | |||
| Vacant Space | 15,290 | 9.3% | ||||||
| Collateral Total | 164,718 | 100.0% |
| (1) | Credit ratings are of the tenant or parent company whether or not the parent guarantees a lease. |
The following tables present certain information relating to the lease rollover schedule at the 919 Congress Property:
Lease Expiration Schedule*
Year Ending December 31, | No. of Leases Expiring | Expiring NRSF | % of Total NRSF | Cumulative of Total NRSF | Cumulative % of Total NRSF | Annual U/W Base Rent | Annual U/W Base Rent PSF |
| MTM | 0 | 0 | 0.0% | 0 | 0.0% | $0 | $0.00 |
| 2011 | 1 | 954 | 0.6% | 954 | 0.6% | $0 | $0.00 |
| 2012 | 9 | 37,593 | 22.8% | 38,547 | 23.4% | $659,315 | $17.54 |
| 2013 | 7 | 24,364 | 14.8% | 62,911 | 38.2% | $448,895 | $18.42 |
| 2014 | 5 | 31,397 | 19.1% | 94,308 | 57.3% | $580,073 | $18.48 |
| 2015 | 3 | 16,139 | 9.8% | 110,447 | 67.1% | $297,615 | $18.44 |
| 2016 | 4 | 28,681 | 17.4% | 139,128 | 84.5% | $516,258 | $18.00 |
| 2017 | 2 | 10,300 | 6.3% | 149,428 | 90.7% | $204,743 | $19.88 |
| 2018 | 0 | 0 | 0.0% | 149,428 | 90.7% | $0 | $0.00 |
| 2019 | 0 | 0 | 0.0% | 149,428 | 90.7% | $0 | $0.00 |
| 2020 | 0 | 0 | 0.0% | 149,428 | 90.7% | $0 | $0.00 |
| 2021 | 0 | 0 | 0.0% | 149,428 | 90.7% | $0 | $0.00 |
| Thereafter | 0 | 0 | 0.0% | 149,428 | 90.7% | $0 | $0.00 |
| Vacant | 0 | 15,290 | 9.3% | 164,718 | 100.0% | $0 | $0.00 |
| Total / Weighted Average | 31 | 164,718 | 100.0% | $2,706,899 | $18.12 |
| * Source: Information obtained from the underwritten rent roll. |
The following table presents historical occupancy percentages at the 919 Congress Property:
Historical Occupancy Percentages*
12/31/2008 | 12/31/2009 | 12/31/2010 | ||
| 94% | 97% | 91% | ||
| * Source: CBRE appraisal. | ||||
THE INFORMATION IN THIS STRUCTURAL AND COLLATERAL TERM SHEET IS NOT COMPLETE AND MAY BE AMENDED PRIOR TO THE TIME OF SALE. THIS TERM SHEET IS NOT AN OFFER TO SELL THESE SECURITIES AND IT IS NOT A SOLICITATION OF AN OFFER TO BUY THESE SECURITIES IN ANY JURISDICTION WHERE THE OFFER OR SALE IS NOT PERMITTED.
85
| 919 CONGRESS |
Operating History and Underwritten Net Cash Flow. The following table presents certain information relating to the historical operating performance and the Underwritten Net Cash Flow at the 919 Congress Property:
Cash Flow Analysis
| 2008 | 2009 | 2010 | TTM 4/30/2011 | U/W | U/W $ per SF | |||||||
| Base Rent | $2,236,799 | $2,380,414 | $2,235,037 | $2,318,708 | $2,706,899(1) | $16.43 | ||||||
| Gross Up Vacant Space | 0 | 0 | 0 | 0 | 445,033 | 2.70 | ||||||
| Total Reimbursables | 2,199,104 | 2,388,654 | 2,157,824 | 2,151,174 | 2,208,279 | 13.41 | ||||||
| Other Income | 377,968 | 342,848 | 352,947 | 360,836 | 360,836 | 2.19 | ||||||
| Less Vacancy & Credit Loss | 0 | 0 | 0 | 0 | (445,033) | (2.70) | ||||||
| Effective Gross Income | $4,813,871 | $5,111,916 | $4,745,808 | $4,830,718 | $5,276,014 | $32.03 | ||||||
| Total Operating Expenses | $2,394,171 | $2,505,964 | $2,370,962 | $2,441,781 | $2,503,768 | $15.20 | ||||||
Net Operating Income(2) | $2,419,700 | $2,605,952 | $2,374,846 | $2,388,937 | $2,772,246 | $16.83 | ||||||
| TI/LC | 0 | 0 | 0 | 0 | 182,839 | 1.11 | ||||||
| Capital Expenditures | 0 | 0 | 0 | 0 | 32,944 | 0.20 | ||||||
| Net Cash Flow | $2,419,700 | $2,605,952 | $2,374,846 | $2,388,937 | $2,556,463 | $15.52 | ||||||
| NOI DSCR | 1.25x | 1.35x | 1.23x | 1.24x | 1.43x | |||||||
| NCF DSCR | 1.25x | 1.35x | 1.23x | 1.24x | 1.32x | |||||||
| NOI DY | 8.7% | 9.3% | 8.5% | 8.6% | 9.9% | |||||||
| NCF DY | 8.7% | 9.3% | 8.5% | 8.6% | 9.2% |
| (1) | Contractual rent increases for several leases were underwritten through December 2011. In some cases, tenants were given a rent concession in an amount that was reserved at closing by the borrower. |
| (2) | The U/W NOI is higher than the historical NOIs due to several factors including but not limited to free rent afforded to some tenants. All rent abatements for Entergy Gulf States, Inc., Texas Independent Producers, and the Law Office of Scott Cook expired September 30, 2011. These tenants are existing in-place tenants, were on full rent abatement, and began paying full rent on October 1, 2011, September 1, 2011, and October 1, 2011, respectively. |
Appraisal. According to the appraisals performed by CB Richard Ellis, the 919 Congress Property had an aggregate “as-is” appraised value of $40,500,000 as of an effective date of May 25, 2011.
Environmental Matters. According to the Phase I environmental site assessment performed by Nova Consulting Group, Inc. on June 10, 2011, there was no evidence of any recognized environmental conditions, aside from the continued implementation of existing the Asbestos Operations and Maintenance plan.
Market Overview and Competition. The 919 Congress Property is located on the southeast corner of Congress Avenue and East 10th Street in the central business district (“CBD”) of Austin, Texas. Congress Avenue is an office corridor in the Austin central business district and is located approximately one block from the State Capitol Complex. Access to the 919 Congress Property is provided via Interstate 35 (one mile east) and the MoPac Expressway (two miles west). Interstate 35 is a six-lane major highway that links north and south Austin with the CBD and the State Capitol Complex. The 919 Congress Property also has convenient access to the Austin-Bergstrom International Airport, located approximately eight miles southeast.
The 919 Congress Property is located in the Austin CBD submarket, which is the second largest submarket of Austin, comprising 16.1% of the area’s total inventory. CoStar reported a CBD submarket vacancy of 10.2% with asking rents of $32.68 per square foot gross as of the second quarter of 2011.
The following table presents certain information relating to some comparable office buildings provided in the appraisal performed by CBRE for the 919 Congress Property:
Competitive Set*
919 Congress (Subject) | 301 Congress | 816 Congress | 823 Congress | Austin Centre | Bank of America Center | One American Center | |
| Distance from Subject | -- | Less than 1 mile | Less than 1 mile | Less than 1 mile | Less than 1 mile | Less than 1 mile | Less than 1 mile |
| Property Type | CBD Office | CBD Office | CBD Office | CBD Office | CBD Office | CBD Office | CBD Office |
| Year Built/ Renovated | 1984/NAP | 1985/NAP | 1983/NAP | 1971/NAP | 1985/NAP | 1975/NAP | 1984/NAP |
| # of Stories | 15 | 21 | 20 | 16 | 16 | 26 | 32 |
| Total GLA | 164,718 SF | 418,338 SF | 422,726 SF | 181,381 SF | 343,664 SF | 261,609 SF | 507,014 SF |
| Total Occupancy | 93% | 83% | 81% | 85% | 82% | 93% | 80% |
| * Source: CBRE appraisal. |
THE INFORMATION IN THIS STRUCTURAL AND COLLATERAL TERM SHEET IS NOT COMPLETE AND MAY BE AMENDED PRIOR TO THE TIME OF SALE. THIS TERM SHEET IS NOT AN OFFER TO SELL THESE SECURITIES AND IT IS NOT A SOLICITATION OF AN OFFER TO BUY THESE SECURITIES IN ANY JURISDICTION WHERE THE OFFER OR SALE IS NOT PERMITTED.
86
| 919 CONGRESS |
The Borrower. The borrower is a Delaware limited liability company and a single purpose entity with an independent manager. Legal counsel to the borrower delivered a non-consolidation opinion in connection with the origination of the 919 Congress Mortgage Loan. MPRO LLC is the guarantor of certain nonrecourse careveouts under the 919 Congress Mortgage Loan. Under the terms of the nonrecourse carveout guaranty, the 919 Congress Mortgage Loan becomes fully recourse to the nonrecourse carveout guarantor if, among other circumstances, the borrower or MPRO LLC files a voluntary bankruptcy petition or the borrower or MPRO LLC solicits or consents to an involuntary bankruptcy petition against the borrower or MPRO LLC.
The Sponsors. The borrower is owned by owners and affiliates of Moore & Associates, Inc. and Alfa Properties, Inc. Moore & Associates, Inc. is an owner managed, full service commercial real investment, development and management company. The company owns, manages, and leases approximately three million square feet of commercial real estate worth approximately $750 million, occupied by more than 300 tenants. Alfa Properties, Inc. has developed and currently manages ownership interests and investments in Alabama, Georgia, Florida, Texas, Virginia, Maryland and the District of Columbia. As of December 2010, the company reported total assets of $272 million.
Escrows. The loan documents provide for upfront escrows at closing in the amount of $512,973 for real estate taxes, $21,898 for insurance premiums, $310,511 for unpaid tenant improvements and leasing commissions under existing leases, $300,000 for future tenant improvements and leasing commissions, and $280,461 for rent concessions associated with existing leases. The loan documents provide for ongoing monthly escrows in the amount of $73,282 for real estate taxes (subject to adjustment per lender’s estimate), $3,650 for insurance premiums (subject to adjustment per lender’s estimate), $2,745 for capital expenditures, and $17,844 for future tenant improvements and leasing commissions (subject to a cap of $750,000). During a Cash Management Period (as defined below), the loan documents provide for ongoing monthly escrows in the amount equal to the monthly ground rent due ($2,500).
A “Cash Management Period” will commence upon: (i) the occurrence and continuance of an event of default or (ii) if, as of the last day of any calendar quarter during the loan term, the debt service coverage ratio is less than 1.10x.
Lockbox and Cash Management. The 919 Congress Mortgage Loan requires a lender-controlled lockbox account, which is already in place, and that the borrower directs tenants to pay their rents directly to such lockbox account. The loan documents also require that all cash revenues relating to the 919 Congress Property and all other monies received by the borrower or the property manager be deposited into the lockbox account within two business days after receipt. Prior to the occurrence of a Cash Management Period, all funds on deposit in the lockbox account are swept into the borrower’s operating account on a daily basis. During a Cash Management Period all funds on deposit in the lockbox account are swept on a daily basis to a cash management account under the control of the lender.
Property Management. The 919 Congress Property is currently managed by Moore & Associates, Inc., an affiliate of the borrower, pursuant to a management agreement. The property manager is currently entitled to a base management fee in an amount equal to 3.0% of the gross receipts collected from the 919 Congress Property. The borrower may not surrender, terminate, cancel, extend, or renew (excluding automatic extensions or renewals which occur at the sole option of the property manager) the management agreement or otherwise replace the manager or enter into any other management agreement without written consent from the lender.
Assumption. The borrower has a one time right to transfer the 919 Congress Property, in whole only, with the consent of the lender, subject to customary conditions set forth in the loan documents, including but not limited to: (i) payment of an assumption fee of 1.00% of the outstanding principal balance of the 919 Congress Mortgage Loan, (ii) no event of default has occurred and is continuing under the 919 Congress Mortgage Loan, (iii) the borrower has submitted to the lender true, correct and complete copies of any and all information and documents requested, (iv) evidence satisfactory to the lender has been provided showing that the transferee borrower complies with the special purpose entity provisions, (v) the lender receives written confirmation from Fitch and Moody’s that the assumption will not, in and of itself, result in a downgrade, qualification or withdrawal of the then current ratings assigned to any class of Series 2011-C5 Certificates, (vi) all of the lender’s reasonable costs and expenses have been paid in connection to the transfer, (vii) replacement guarantors and indemnitors assume the obligations of the original guarantors and indemnitors, (viii) the identity, experience, financial condition and creditworthiness of the transferee borrower and the replacement guarantors and indemnitors are satisfactory to the lender, and (ix) the manager and proposed management agreement is satisfactory to the lender and Fitch and Moody’s.
Release. Not permitted.
Real Estate Substitution. Not permitted.
Subordinate and Mezzanine Indebtedness. Not permitted.
Ground Lease. A portion of the 919 Congress Property is subject to a ground lease with Peyton O. Abbott, as trustee of the Peyton O. Abbott Trust, and Geraldine J. Abbott, as trustee the of Peyton O. Abbott Trust. The initial ground lease term began in January 1982 and expires in December 2080. The ground lease agreement does not contain any options to extend the lease. The ground lease only encumbers 0.085 acres of the total 0.508 acre site (16.73%). The current base ground rent payment is $30,000 per year.
THE INFORMATION IN THIS STRUCTURAL AND COLLATERAL TERM SHEET IS NOT COMPLETE AND MAY BE AMENDED PRIOR TO THE TIME OF SALE. THIS TERM SHEET IS NOT AN OFFER TO SELL THESE SECURITIES AND IT IS NOT A SOLICITATION OF AN OFFER TO BUY THESE SECURITIES IN ANY JURISDICTION WHERE THE OFFER OR SALE IS NOT PERMITTED.
87
| 919 CONGRESS |
Terrorism Insurance. The loan documents require that the borrower maintain insurance coverage against loss or damage by terrorist acts in an amount equal to 100% of the full replacement cost of the 919 Congress Property, 100% of the business interruption coverage, and to the full general liability and umbrella liability limits, provided such coverage is available. In addition the borrower is required to maintain business interruption insurance covering no less than the 18-month period from the occurrence of a casualty event.
THE INFORMATION IN THIS STRUCTURAL AND COLLATERAL TERM SHEET IS NOT COMPLETE AND MAY BE AMENDED PRIOR TO THE TIME OF SALE. THIS TERM SHEET IS NOT AN OFFER TO SELL THESE SECURITIES AND IT IS NOT A SOLICITATION OF AN OFFER TO BUY THESE SECURITIES IN ANY JURISDICTION WHERE THE OFFER OR SALE IS NOT PERMITTED.
88
89
| PATRIOT TECH CENTER |
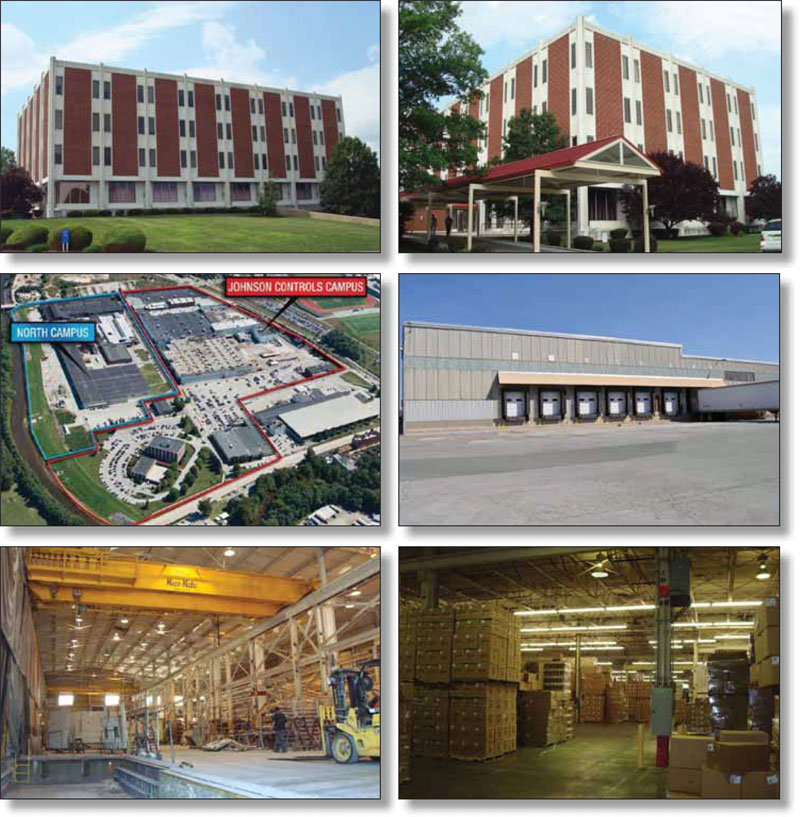
THE INFORMATION IN THIS STRUCTURAL AND COLLATERAL TERM SHEET IS NOT COMPLETE AND MAY BE AMENDED PRIOR TO THE TIME OF SALE. THIS TERM SHEET IS NOT AN OFFER TO SELL THESE SECURITIES AND IT IS NOT A SOLICITATION OF AN OFFER TO BUY THESE SECURITIES IN ANY JURISDICTION WHERE THE OFFER OR SALE IS NOT PERMITTED.
90
| PATRIOT TECH CENTER |
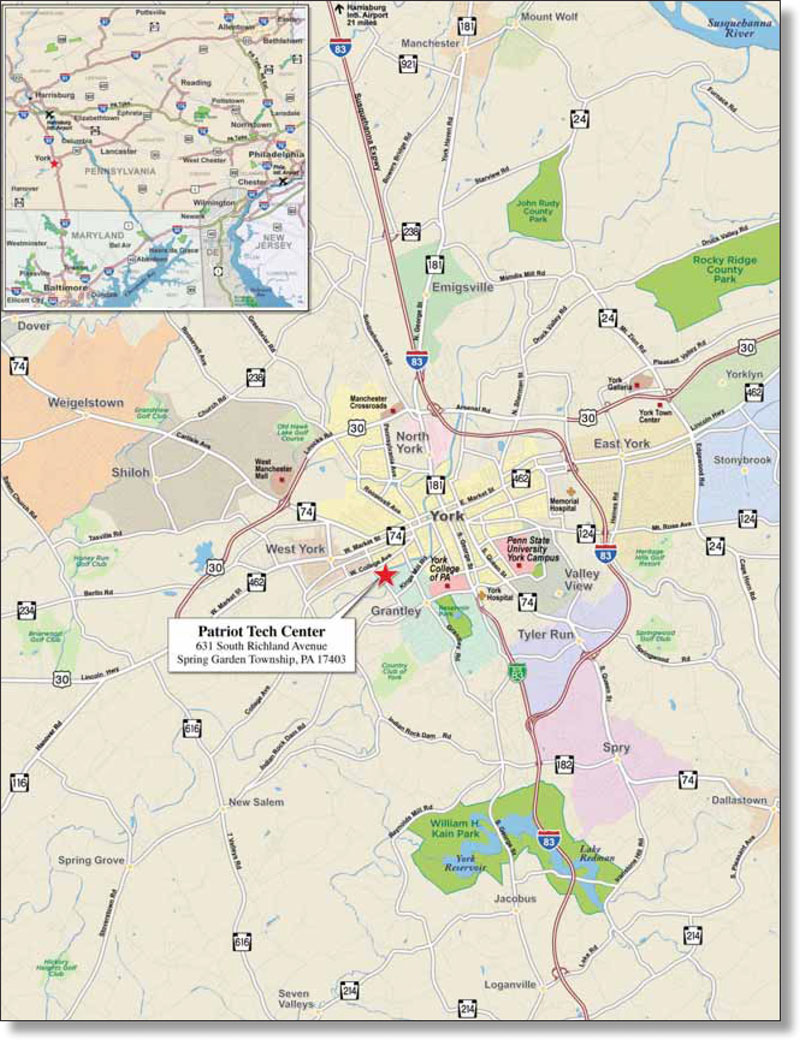
THE INFORMATION IN THIS STRUCTURAL AND COLLATERAL TERM SHEET IS NOT COMPLETE AND MAY BE AMENDED PRIOR TO THE TIME OF SALE. THIS TERM SHEET IS NOT AN OFFER TO SELL THESE SECURITIES AND IT IS NOT A SOLICITATION OF AN OFFER TO BUY THESE SECURITIES IN ANY JURISDICTION WHERE THE OFFER OR SALE IS NOT PERMITTED.
91
| Patriot Tech Center | |||||||
| Loan Information | Property Information | ||||||
| Mortgage Loan Seller: | The Royal Bank of Scotland | Single Asset/Portfolio: | Single Asset | ||||
| Credit Assessment (Fitch/Moody’s): | NAP | Property Type: | Industrial | ||||
| Original Principal Balance: | $27,500,000 | Specific Property Type(1): | Flex | ||||
| Cut-off Date Principal Balance: | $27,477,803 | Location: | Spring Garden Township, PA | ||||
| % of Initial Pool Balance: | 2.5% | Size: | 1,539,290 SF | ||||
| Loan Purpose: | Refinance | Cut-off Date Principal | |||||
| Borrower Name: | Patriot Richland Associates, L.P. | Balance Per Unit/SF: | $17.85 | ||||
| Sponsor: | Erik Kolar, Alan Werther, Michael Kolar, Geoffrey Gardner, and Timothy McKenna | Year Built/Renovated(2): | 1970/1985 | ||||
| Mortgage Rate: | 6.100% | Occupancy %: | 84.1% | ||||
| Note Date: | September 23, 2011 | Occupancy % Source Date: | September 19, 2011 | ||||
| Anticipated Repayment Date: | NAP | Title Vesting: | Fee | ||||
| Maturity Date: | October 1, 2021 | Property Manager: | CB Richard Ellis Inc. | ||||
| IO Period: | None | ||||||
| Loan Term (Original): | 120 months | 3rd Most Recent NOI (As of): | $3,313,707 (12/31/2009) | ||||
| Seasoning: | 1 month | 2nd Most Recent NOI (As of): | $3,156,870 (12/31/2010) | ||||
| Amortization Term (Original): | 360 months | Most Recent NOI (As of): | $2,841,385 (TTM 6/30/2011) | ||||
| Loan Amortization Type: | Amortizing Balloon | ||||||
| Interest Accrual Method: | Actual/360 | U/W Revenues: | $4,483,156 | ||||
| Call Protection: | L(25),D(91),O(4) | U/W Expenses: | $1,320,200 | ||||
| Lockbox Type: | Hard/Springing Cash Management | U/W NOI: | $3,162,956 | ||||
| Additional Debt: | None | U/W NCF: | $2,619,111 | ||||
| Additional Debt Type: | NAP | U/W NOI DSCR: | 1.58x | ||||
| U/W NCF DSCR: | 1.31x | ||||||
| Escrows and Reserves: | U/W NOI Debt Yield: | 11.5% | |||||
| U/W NCF Debt Yield: | 9.5% | ||||||
Type: | Initial | Monthly | Cap (If Any) | As-Is Appraised Value: | $45,650,000 | ||
| Taxes | $2,730 | $2,730 | NAP | As-Is Appraisal Valuation Date: | July 19, 2011 | ||
| Insurance | $23,858 | $7,953 | NAP | Cut-off Date LTV Ratio: | 60.2% | ||
| Capital Expenditures | $0 | $9,872 | $307,858 | LTV Ratio at Maturity or ARD: | 51.2% | ||
| TI/LC | $0 | $24,372 | NAP | ||||
| Deferred Maintenance | $62,725 | $0 | NAP | ||||
| (1) | The Patriot Tech Center Property contains 230,000 square feet of class B office space and 1,309,290 square feet of warehouse space. See “The Property” below. |
| (2) | Approximately 144,000 square feet of the improvements were constructed in the 1920’s. See “The Property” below. |
The Mortgage Loan. The mortgage loan (the “Patriot Tech Center Mortgage Loan”) is evidenced by a promissory note that is secured by a first mortgage encumbering an industrial facility located in Spring Garden Township, Pennsylvania (the “Patriot Tech Center Property”). The Patriot Tech Center Mortgage Loan was originated on September 23, 2011 by The Royal Bank of Scotland. The Patriot Tech Center Mortgage Loan had an original principal balance of $27,500,000, has an outstanding principal balance as of the Cut-off Date of $27,477,803 and accrues interest at an interest rate of 6.100% per annum. The Patriot Tech Center Mortgage Loan had an initial term of 120 months, has a remaining term of 119 months as of the Cut-off Date and requires payments of interest and principal based on a 30-year amortization schedule. The Patriot Tech Center Mortgage Loan matures on October 1, 2021. The proceeds from the Patriot Tech Center Mortgage Loan were used to refinance debt of approximately $26.1 million, pay closing and other costs of approximately $505,000 and fund approximately $89,000 in upfront reserves, resulting in a return of equity to the sponsor of approximately $780,000.
Following the lockout period, the borrower has the right to defease the mortgage loan in whole, but not in part, on any due date before July 1, 2021 (the “Open Date”). From and after the Open Date, the mortgage loan is prepayable without penalty.
The Property. The Patriot Tech Center Property is a 1,539,290 square foot industrial flex (warehouse/office) facility located in Spring Garden Township, Pennsylvania. The net rentable area at the Patriot Tech Center Property is comprised of 230,000 square feet of Class B office space (14.9% of the net rentable area) and 1,309,290 square feet (85.1% of the net rentable area) of warehouse, light manufacturing, flex and storage space. The Patriot Tech Center Property was 84.1% leased and 86.7% occupied as of September 19, 2011 to five tenants. The improvements consist of: two, four-story buildings; one, two-story building; and eight one-story buildings. The majority of the improvements were constructed in 1970 with the last building constructed in the mid 1990’s. Approximately 144,000 square feet was constructed in the 1920s. The Patriot Tech Center Property is divided into a multi-tenant North Campus (571,601 square feet) and a single-tenant South Campus (967,689 square feet). The South Campus is 97.9% leased (100% occupied) by Johnson Controls Incorporated (“JCI”). JCI (NYSE: JCI) reported on its Form 10-Q filed with the
THE INFORMATION IN THIS STRUCTURAL AND COLLATERAL TERM SHEET IS NOT COMPLETE AND MAY BE AMENDED PRIOR TO THE TIME OF SALE. THIS TERM SHEET IS NOT AN OFFER TO SELL THESE SECURITIES AND IT IS NOT A SOLICITATION OF AN OFFER TO BUY THESE SECURITIES IN ANY JURISDICTION WHERE THE OFFER OR SALE IS NOT PERMITTED.
92
| PATRIOT TECH CENTER |
Securities and Exchange Commission on August 3, 2011 assets as of June 30, 2011 of approximately $29.9 billion and equity of approximately $11.5 billion. JCI occupies the entire 230,000 square feet of office space at the Patriot Tech Center Property, which is located in South Campus. The borrower has advised the related mortgage loan seller that JCI has invested approximately $10.0 million in the mortgaged property over the last five years. The North Campus is 60.8% leased (64.2% occupied) occupied by four tenants: Gichner Holdings, Inc., Bickel’s Snack Food, Armorboard Packaging, and Marine Tech Wire and Cable.
The following table presents certain information relating to the tenancies at the Patriot Tech Center Property:
Major Tenants
| Tenant Name | Credit Rating (Fitch/ Moody’s/ S&P)(1) | Tenant NRSF | % of NRSF | Annual U/W Base Rent PSF | Annual U/W Base Rent | % of Total Annual U/W Base Rent | Lease Expiration Date | ||||||
| Occupied - Collateral | |||||||||||||
| JCI | BBB+/Baa1/BBB+ | 947,000 | 61.5% | $2.80 | $2,648,300 | 76.5% | 03/25/2018 | ||||||
Gichner(2) | NR/B3/B+ | 137,029(2) | 8.9% | $1.91 | $261,310 | 7.6% | (2) | ||||||
| Bickel’s Snack Food | NR/NR/NR | 116,000 | 7.5% | $2.32 | $268,830 | 7.8% | 06/30/2016 | ||||||
| Armorboard | NR/NR/NR | 50,500 | 3.3% | $2.50 | $126,250 | 3.6% | 06/30/2012 | ||||||
| Marine Tech Wire & Cable | NR/NR/NR | 44,266 | 2.9% | $3.50 | $154,931 | 4.5% | 06/30/2017 | ||||||
| Occupied Collateral Total | 1,294,795 | 84.1%(3) | $2.67 | $3,459,621 | 100.0% | ||||||||
| Vacant Space | 244,495 | 15.9% | |||||||||||
| Collateral Total | 1,539,290 | 100.0% | |||||||||||
| (1) | Certain ratings are those of the parent company whether or not the parent guarantees the lease. |
| (2) | Gichner’s space is comprised of three leases as follows: (i) a 104,738 square foot lease which expires July 31, 2012; (ii) a month-to-month lease on 12,000 square feet; and (iii) 20,291 square feet of space that is currently being subleased from JCI. Gichner’s rent obligation on the subletted space ends on July 31, 2012, however JCI’s lease on this space does not expire until March 25, 2018. |
| (3) | The Patriot Tech Center Property is 84.1% leased but is 86.7% occupied. 39,966 square feet is occupied by JCI and Marine Tech Wire & Cable but not leased to either tenant. |
The following table presents certain information relating to the lease rollover schedule at the Patriot Tech Center Property:
Lease Expiration Schedule*
Year Ending December 31, | No. of Leases Expiring | Expiring NRSF | % of Total NRSF | Cumulative of Total NRSF | Cumulative % of Total NRSF | Annual U/W Base Rent | Annual U/W Base Rent PSF |
MTM(1) | 1 | 12,000 | 0.8% | 12,000 | 0.8% | $24,000 | $2.00 |
| 2011 | 0 | 0 | 0.0% | 12,000 | 0.8% | $0 | $0.00 |
| 2012 | 2 | 155,238 | 10.1% | 167,238 | 10.9% | $312,832 | $2.02 |
| 2013 | 0 | 0 | 0.0% | 167,238 | 10.9% | $0 | $0.00 |
| 2014 | 0 | 0 | 0.0% | 167,238 | 10.9% | $0 | $0.00 |
| 2015 | 0 | 0 | 0.0% | 167,238 | 10.9% | $0 | $0.00 |
| 2016 | 1 | 116,000 | 7.5% | 283,238 | 18.4% | $268,830 | $2.32 |
| 2017 | 1 | 44,266 | 2.9% | 327,504 | 21.3% | $154,931 | $3.50 |
| 2018 | 1 | 967,291 | 62.8% | 1,294,795 | 84.1% | $2,699,028 | $2.79 |
| 2019 | 0 | 0 | 0.0% | 1,294,795 | 84.1% | $0 | $0.00 |
| 2020 | 0 | 0 | 0.0% | 1,294,795 | 84.1% | $0 | $0.00 |
| 2021 | 0 | 0 | 0.0% | 1,294,795 | 84.1% | $0 | $0.00 |
| Thereafter | 0 | 0 | 0.0% | 1,294,795 | 84.1% | $0 | $0.00 |
| Vacant | 0 | 244,495 | 15.9% | 1,539,290 | 100.0% | $0 | $0.00 |
| Total / Weighted Average | 6 | 1,539,290 | 100.0% | $3,459,621 | $2.67 |
| * Source: Information obtained from underwritten rent roll. |
| (1) | A 12,000 square foot portion of Gichner’s leased space is leased on a month-to-month basis. The lease covering the remainder of Gichner’s leased space expires in July 2012. The 20,291 square foot space that Gichner is occupying and subleasing from JCI is shown as expiring in 2018 in the above chart since JCI is leasing this space until March 2018. Gichner’s rent obligation on this space ends on July 31, 2012. |
The following table presents historical occupancy percentages at the Patriot Tech Center Property:
Historical Occupancy Percentages*
12/31/2008 | 12/31/2009 | 12/31/2010 | ||
| 83% | 84% | 73% |
| * | Source: Information provided by the borrower. With respect to December 31, 2008 to December 31, 2010, the total square footage of the property for the purposes of calculating occupancy was 1.56 million. In June 2011, Bickel’s Snack Foods expanded their leased space from 17,875 square feet to 116,000 square feet, increasing the amount of occupied space at the property. The current occupancy percentage, as of September 19, 2011, is 84.1%. |
THE INFORMATION IN THIS STRUCTURAL AND COLLATERAL TERM SHEET IS NOT COMPLETE AND MAY BE AMENDED PRIOR TO THE TIME OF SALE. THIS TERM SHEET IS NOT AN OFFER TO SELL THESE SECURITIES AND IT IS NOT A SOLICITATION OF AN OFFER TO BUY THESE SECURITIES IN ANY JURISDICTION WHERE THE OFFER OR SALE IS NOT PERMITTED.
93
| PATRIOT TECH CENTER |
Operating History and Underwritten Net Cash Flow. The following table presents certain information relating to the historical operating performance and the Underwritten Net Cash Flow at the Patriot Tech Center Property:
Cash Flow Analysis
| 2009 | 2010 | TTM 6/30/2011 | U/W | U/W $ per SF | ||||||
| Gross Potential Rent | $3,731,040 | $3,534,252 | $3,257,118 | $3,459,621 | $2.25 | |||||
| Grossed Up Vacant Space | 0 | 0 | 0 | 850,843 | 0.55 | |||||
| Total Reimbursables | 839,399 | 918,301 | 804,323 | 1,023,535 | 0.66 | |||||
| Other Income | 3,223 | 0 | 0 | 0 | 0.00 | |||||
| Less Vacancy & Credit Loss | 0 | 0 | 0 | (850,843) | (0.55) | |||||
| Effective Gross Income | $4,573,662 | $4,452,553 | $4,061,441 | $4,483,156 | $2.91 | |||||
| Total Operating Expenses | $1,259,955 | $1,295,683 | $1,220,056 | $1,320,200 | $0.86 | |||||
Net Operating Income(1) | $3,313,707 | $3,156,870 | $2,841,385 | $3,162,956 | $2.05 | |||||
| TI/LC | 0 | 0 | 0 | 312,951 | 0.20 | |||||
| Capital Expenditures | 0 | 0 | 0 | 230,894 | 0.15 | |||||
| Net Cash Flow | $3,313,707 | $3,156,870 | $2,841,385 | $2,619,111 | $1.70 | |||||
| NOI DSCR | 1.66x | 1.58x | 1.42x | 1.58x | ||||||
| NCF DSCR | 1.66x | 1.58x | 1.42x | 1.31x | ||||||
| NOI DY | 12.1% | 11.5% | 10.3% | 11.5% | ||||||
| NCF DY | 12.1% | 11.5% | 10.3% | 9.5% |
| (1) | The U/W NOI is higher than the historical NOIs due to several factors including but not limited to new leasing at the property. New leases signed in June 2011 include Bickel’s Snack Food (expanded from 17,875 square feet to 116,000 square feet) and Marine Tech Wire & Cable (44,266 square feet). |
Appraisal. According to the appraisal performed by CB Richard Ellis, the Patriot Tech Center Property had an “as-is” appraised value of $45,650,000 as of July 19, 2011.
Environmental Matters. The former owner of the Patriot Tech Center Property and its current owner, the borrower under the Patriot Tech Center Mortgage Loan, voluntarily entered the Patriot Tech Center Property into the Pennsylvania Department of Environmental Protection (“PADEP”) Act 2 Land Recycling Program, to address solvent impacted groundwater and soil and other contamination from historic operations. In April 2011, PADEP approved a remedy that will allow the borrower to receive a No Further Action (or Release of Liability) ruling from PADEP. The remedy requires the Patriot Tech Center Property to attain site specific standards. Ground water monitoring and natural attenuation have been utilized to meet the standards. The Release of Liability also requires imposition of a deed notice that will restrict the Patriot Tech Center Property to industrial or commercial use, require maintenance of paving over certain areas and other typical controls. According to the borrower, a final Act 2 report was submitted to PADEP in August 2011 illustrating that all of the agreed to standards have been attained. The borrower expects to receive a No Further Action letter from PADEP by mid-November.
The lender hired EBI Consulting (“EBI”), an environmental consulting firm, to evaluate all information provided in the Act 2 report and a new Phase I environmental site assessment. Based upon EBI’s review of the Act 2 environmental report, it is EBI’s opinion that the requirements for closure under the PADEP ACT 2 Program have been met.
Johnson Controls, Inc. (“JCI”), whose subsidiary was the former owner of the Patriot Tech Center Property, has accepted full responsibility and liability for the historic contamination being addressed by the PADEP Act 2 process. JCI also has agreed to indemnify the borrower for any other contamination arising from the historic operations of its subsidiary that become known by September 2012. JCI also currently leases and operates a portion of the Patriot Tech Center Property, and its lease requires JCI to indemnify the borrower for contamination caused by those operations with respect to the entirety of the portion of the Patriot Tech Center Property leased by JCI.
Additionally, according to the Phase I environmental site assessment performed by RT Environmental Services, Inc. (“RT”) on September 20, 2011, aside from the ongoing monitoring of the solvent impacted groundwater and soil, there were only minor outstanding environmental issues at the Patriot Tech Center Property. Minor issues include a small oil leak from a transformer on site, and a suggestion from RT to improve drum storage and labeling practices. RT noted that both of these minor issues can be remediated with typical repair and maintenance, the cost of which is considered non-material by RT.
The Patriot Tech Center Mortgage Loan becomes fully recourse to the nonrecourse guarantors if the borrower breaches certain representations, warranties and covenants related to environmental conditions at the Patriot Tech Center Property.
The borrower has in place an assignable environmental insurance policy with a term through 2017, which it purchased in 2007 when it acquired the Patriot Tech Center Property. The lender has been added as a named insured.
THE INFORMATION IN THIS STRUCTURAL AND COLLATERAL TERM SHEET IS NOT COMPLETE AND MAY BE AMENDED PRIOR TO THE TIME OF SALE. THIS TERM SHEET IS NOT AN OFFER TO SELL THESE SECURITIES AND IT IS NOT A SOLICITATION OF AN OFFER TO BUY THESE SECURITIES IN ANY JURISDICTION WHERE THE OFFER OR SALE IS NOT PERMITTED.
94
| PATRIOT TECH CENTER |
Market Overview and Competition. The Patriot Tech Center Property is located in Spring Garden Township, Pennsylvania, which is part of the Central Pennsylvania Industrial market. The Patriot Tech Center Property is located within two miles of Interstate 83, allowing for access to Interstate 81, Interstate 78, Interstate 76, Route 222, and Route 30. According to the CBRE appraisal, York County has a current reported population of 428,937, an increase of over 12% since 2000. Nearly 15% of the region’s 227,000 person salaried workforce remains employed in manufacturing, with the trade, transportation, and utility sectors representing another 16% in the aggregate. According to the Pennsylvania Department of Labor and Industry, the May 2011 unemployment rate in York County was 7.4%. According to the appraisal, the Central Pennsylvania industrial real estate market consists of 148.7 million square feet of industrial space, with overall occupancy of 88.3% and average rent per square foot of $3.51.
The Borrower. The borrower is a Pennsylvania limited partnership and a single-purpose entity with two independent directors. Legal counsel to the borrower delivered a non-consolidation opinion in connection with the origination of the Patriot Tech Center Mortgage Loan. The borrower is Patriot Richland Associates, L.P., which is owned by Kolar Investment Partners (67%), Werther Partners (12%), Michael & Beth Kolar (9%), as well as by several other individuals in smaller denominations. The general partner of borrower, Patriot Richland, Inc., a Pennsylvania corporation, owns a 0.1% interest in borrower and is 100% owned by Erik Kolar. Erik Kolar, Alan Werther, Michael Kolar, Geoffrey Gardner, and Timothy McKenna are the guarantors of certain nonrecourse carveouts under the Patriot Tech Center Mortgage Loan. Under the terms of the nonrecourse carveout guaranty, the Patriot Tech Center Mortgage Loan becomes fully recourse to the nonrecourse carveout guarantor if, among other circumstances, the borrower files a voluntary bankruptcy petition or the nonrecourse carveout guarantor joins in an involuntary bankruptcy petition against the borrower.
The Sponsors. The sponsors of the Patriot Tech Center Mortgage Loan, Erik Kolar, Alan Werther, Michael Kolar, Geoffrey Gardner, and Timothy McKenna, have a combined 40+ years of experience focusing on corporate real estate assets and have redeveloped more than 12 million square feet and completed over $1 billion in transactions. The sponsors are principals of Patriot Equities LP (“Patriot”), an entity which itself does not serve as a Sponsor or Guarantor for the Patriot Tech Center Mortgage Loan. Patriot’s strategy is to partner with corporate real estate executives and their advisors to acquire their corporate-owned property in order to allocate their capital and resources to core operations. Patriot has executed a variety of transactions including: build-to-suit properties, redevelopment of vacant office and industrial properties, acquisition and entitlement of raw land, sale and partial leasebacks, and portfolio acquisitions. The sponsors invest on a deal by deal basis with independent ownership structures for each transaction. Prior to starting Patriot in 2005, the sponsors worked at a firm called Preferred Real Estate Investments.
Escrows. The loan documents provide for upfront escrows at closing in the amount of: $2,730 for real estate taxes, $23,858 for insurance premiums, and $62,725 for deferred maintenance. The loan documents provide for ongoing monthly escrows in the amount of: $2,730 for real estate taxes (subject to adjustment per lender’s estimate), $7,953 for insurance premiums (subject to adjustment per lender’s estimate), $24,372 for tenant improvements and leasing commissions (increasing to $29,503 in month 25) and $9,872 for capital expenditures (subject to a cap of $307,858).
On each payment date occurring during the continuance of a Lease Sweep Period (as defined below) (provided that no other Cash Management Period is then continuing), all monthly residual cash after payment of the monthly required payments will be swept into a special rollover reserve account, which sweep will continue until the termination of the Lease Sweep Period.
A “Lease Sweep Period” will commence upon any of the following: (a) 12 months prior to the stated expiration (including any renewal term) of the JCI lease; (b) upon the early termination or early cancellation of the JCI lease; (c) upon the occurrence and continuance of a material default under the JCI lease by the applicable tenant or a default under the JCI lease (before any notice or cure period) by the tenant thereunder that gives the borrower (as landlord) the right to terminate the JCI lease or (d) upon a bankruptcy or insolvency proceeding of the applicable tenant under the JCI lease.
A Lease Sweep Period will end upon the occurrence of any following: (i) with respect to a Lease Sweep Period caused by clause (a) above, the JCI lease has been renewed or extended for no less than five years and consequently, DSCR for property is at least 1.10x; (ii) with respect to a Lease Sweep Period caused by clause (c) above, the JCI default has been cured and no other JCI default has occurred for a period of three consecutive months following such cure; (iii) with respect to a Lease Sweep Period caused by a major JCI insolvency proceeding, the JCI lease has been affirmed, assumed, or assigned in a manner acceptable to the lender.
Lockbox and Cash Management. The Patriot Tech Center Mortgage Loan requires a lender-controlled lockbox account, which is already in place, and that the borrower directs tenants to pay their rents directly to such lockbox account. The loan documents also require that all cash revenues relating to the Patriot Tech Center Property and all other monies received by the borrower or the property manager be deposited into the lockbox account within one business day after receipt. Prior to the occurrence of a Cash Management Period, all funds on deposit in the lockbox account are swept into the borrower’s operating account on a daily basis. During a Cash Management Period (as defined below) all funds on deposit in the lockbox account are swept on a daily basis to a cash management account under the control of the lender.
A “Cash Management Period” will commence upon (i) the occurrence of an event of default or (ii) if, as of any calculation date, the debt service coverage ratio is less than 1.10x or (iii) the commencement of a Lease Sweep Period; and will end upon the lender giving notice to the lockbox account bank that the sweeping of the funds may cease, which notice will be given by the lender if (1) the Patriot Tech Center Mortgage Loan and all other obligations under the loan documents have been repaid in full or (2) the stated maturity date has not occurred and (A) with respect to the matters described in clause (i) above, such event of default has been cured and no other event of default has occurred and is continuing or (B) with respect to the matter described in clause (ii) above, the debt service coverage ratio is at least 1.10x for two consecutive calculation dates or (C) with respect to the matter described in clause (iii) above, such Lease Sweep Period has ended.
THE INFORMATION IN THIS STRUCTURAL AND COLLATERAL TERM SHEET IS NOT COMPLETE AND MAY BE AMENDED PRIOR TO THE TIME OF SALE. THIS TERM SHEET IS NOT AN OFFER TO SELL THESE SECURITIES AND IT IS NOT A SOLICITATION OF AN OFFER TO BUY THESE SECURITIES IN ANY JURISDICTION WHERE THE OFFER OR SALE IS NOT PERMITTED.
95
| PATRIOT TECH CENTER |
Property Management. The Patriot Tech Center Property is currently managed by CB Richard Ellis, Inc. The manager is entitled to a management fee, on a monthly basis, equal to $3,000 per month, comprised of $1,480 (management fee portion) and $1,520 for the approximate annual salary allocation of the assigned personnel. The borrower may not surrender, terminate or cancel the management agreement or otherwise replace or enter into any other management agreement without prior written consent from the lender (which consent may not be unreasonably withheld).
Assumption. The borrower has a right to transfer the Patriot Tech Center Property, with the consent of the lender, subject to customary conditions set forth in the loan documents, including but not limited to: (i) no event of default has occurred and is continuing under the Patriot Tech Center Mortgage Loan, (ii) payment by the borrower of an assumption fee equal to 0.25% of the outstanding principal balance of the Patriot Tech Center Mortgage Loan for the first transfer, and 1.0% of the outstanding principal balance of the Patriot Tech Center Mortgage Loan for each transfer thereafter, (iii) the borrower has submitted to the lender true, correct and complete copies of any and all information and documents requested, (iv) evidence satisfactory to the lender has been provided showing that the transferee borrower complies with the special purpose entity provisions, (v) the lender receives written confirmation from Fitch and Moody’s that the assumption will not, in and of itself, result in a downgrade, qualification or withdrawal of the then current ratings assigned to any class of Series 2011-C5 Certificates, (vi) the identity, experience, financial condition and creditworthiness of the transferee borrower and the replacement guarantors and indemnitors are satisfactory to lender, and (vii) the manager and proposed management agreement are satisfactory to the lender, Fitch and Moody’s.
Release. Not permitted.
Real Estate Substitution. Not permitted.
Subordinate and Mezzanine Indebtedness. Not permitted.
Ground Lease. None.
Terrorism Insurance. The loan documents require the borrower to maintain an “all risk” insurance policy, with no exclusion for terrorism, in an amount equal to the full replacement cost of the Patriot Tech Center Property, as well as business interruption insurance covering no less than the 18-month period following the occurrence of a casualty event. In the event that coverage for terrorism is excluded under such policy or under the general liability and excess liability/umbrella policy, the borrower shall obtain stand alone coverage for terrorism, provided such coverage is available.
THE INFORMATION IN THIS STRUCTURAL AND COLLATERAL TERM SHEET IS NOT COMPLETE AND MAY BE AMENDED PRIOR TO THE TIME OF SALE. THIS TERM SHEET IS NOT AN OFFER TO SELL THESE SECURITIES AND IT IS NOT A SOLICITATION OF AN OFFER TO BUY THESE SECURITIES IN ANY JURISDICTION WHERE THE OFFER OR SALE IS NOT PERMITTED.
96
97
| ASCENT HOTEL PORTFOLIO |
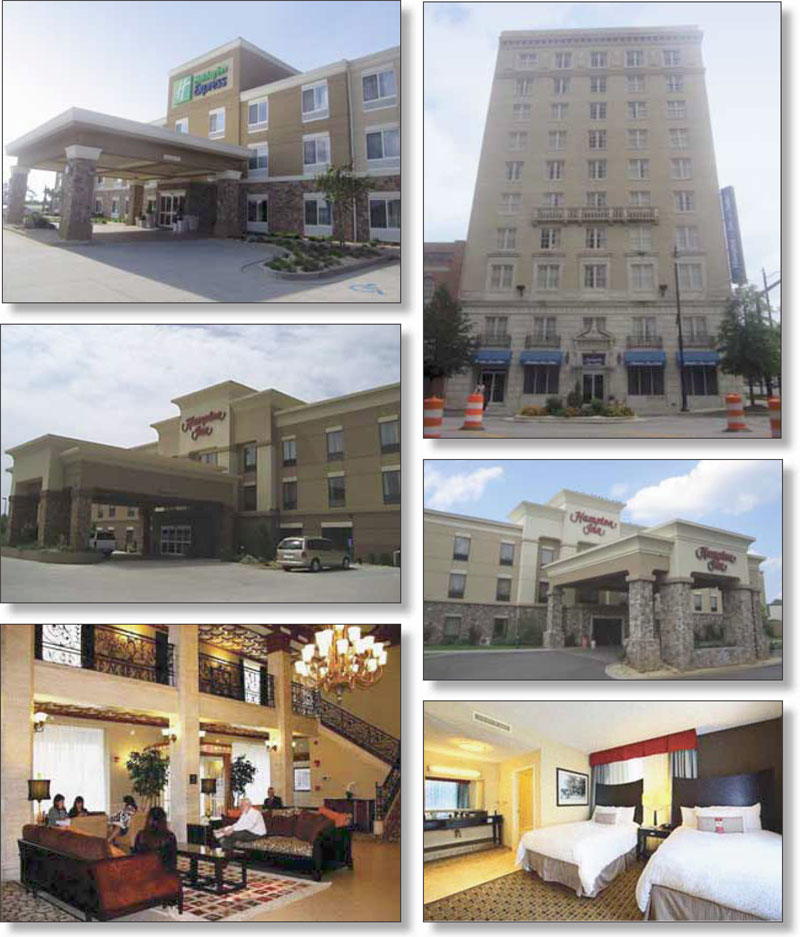
THE INFORMATION IN THIS STRUCTURAL AND COLLATERAL TERM SHEET IS NOT COMPLETE AND MAY BE AMENDED PRIOR TO THE TIME OF SALE. THIS TERM SHEET IS NOT AN OFFER TO SELL THESE SECURITIES AND IT IS NOT A SOLICITATION OF AN OFFER TO BUY THESE SECURITIES IN ANY JURISDICTION WHERE THE OFFER OR SALE IS NOT PERMITTED.
98
| ASCENT HOTEL PORTFOLIO |
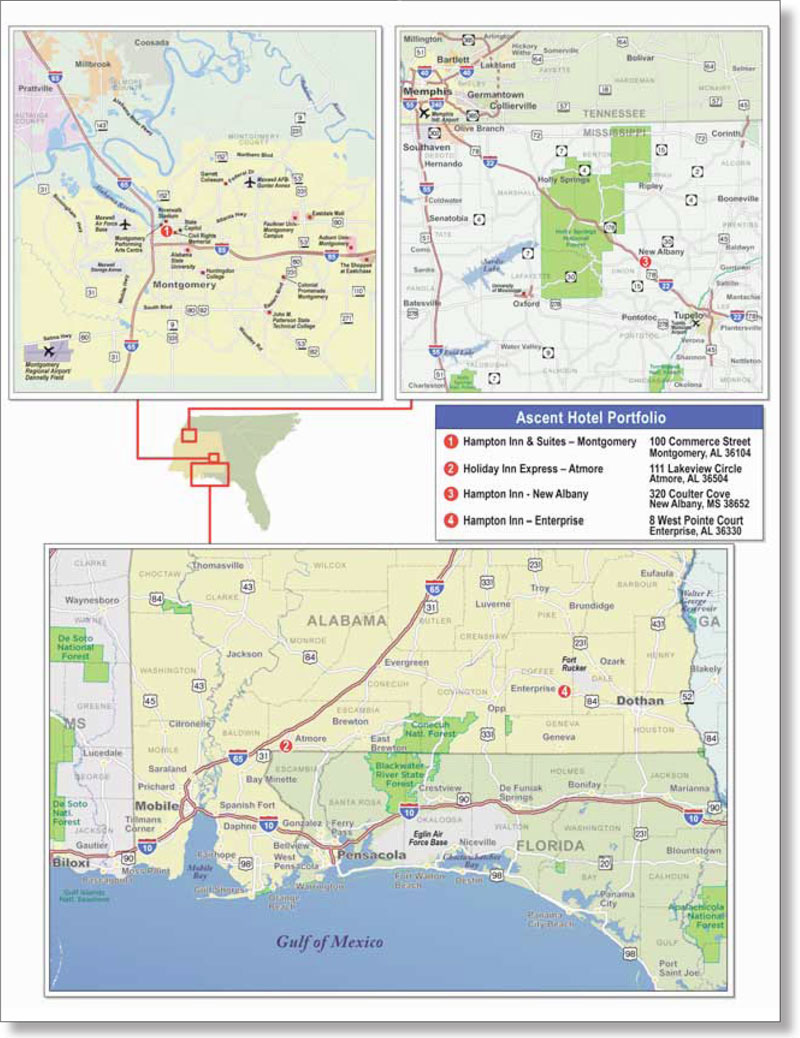
THE INFORMATION IN THIS STRUCTURAL AND COLLATERAL TERM SHEET IS NOT COMPLETE AND MAY BE AMENDED PRIOR TO THE TIME OF SALE. THIS TERM SHEET IS NOT AN OFFER TO SELL THESE SECURITIES AND IT IS NOT A SOLICITATION OF AN OFFER TO BUY THESE SECURITIES IN ANY JURISDICTION WHERE THE OFFER OR SALE IS NOT PERMITTED.
99
| Ascent Hotel Portfolio | |||||||
| Loan Information | Property Information | ||||||
Mortgage Loan Seller: | The Royal Bank of Scotland | Single Asset/Portfolio: | Portfolio | ||||
| Credit Assessment (Fitch/Moody’s): | NAP | Property Type: | Hospitality | ||||
| Original Principal Balance: | $24,500,000 | Specific Property Type: | Limited Service | ||||
| Cut-off Date Principal Balance: | $24,468,913 | Location: | Various | ||||
| % of Initial Pool Balance: | 2.2% | Size: | 325 rooms | ||||
| Loan Purpose: | Refinance | Cut-off Date Principal | |||||
Borrower Names(1): | Various | Balance Per Room: | $75,288.96 | ||||
| Sponsor: | John Ioan Tampa & Yagnesh Patel | Year Built/Renovated: | Various/NAP | ||||
| Mortgage Rate: | 6.030% | Occupancy %: | 70.4% | ||||
| Note Date: | September 16, 2011 | Occupancy % Source Date: | June 30, 2011 | ||||
| Anticipated Repayment Date: | NAP | Title Vesting: | Fee | ||||
| Maturity Date: | October 1, 2021 | Property Manager: | Ascent Hospitality Management Co., LLC | ||||
| IO Period: | None | ||||||
| Loan Term (Original): | 120 months | 3rd Most Recent NOI (As of): | $1,693,901 (12/31/2009) | ||||
| Seasoning: | 1 month | 2nd Most Recent NOI (As of): | $2,905,405 (12/31/2010) | ||||
| Amortization Term (Original): | 300 months | Most Recent NOI (As of): | $3,563,323 (TTM 6/30/2011) | ||||
| Loan Amortization Type: | Amortizing Balloon | ||||||
| Interest Accrual Method: | Actual/360 | U/W Revenues: | $7,623,501 | ||||
| Call Protection: | L(25),D(91),O(4) | U/W Expenses: | $3,917,494 | ||||
| Lockbox Type: | Hard/Springing Cash Management | U/W NOI: | $3,706,007 | ||||
| Additional Debt: | None | U/W NCF: | $3,401,282 | ||||
| Additional Debt Type: | NAP | U/W NOI DSCR: | 1.95x | ||||
| U/W NCF DSCR: | 1.79x | ||||||
| Escrows and Reserves: | U/W NOI Debt Yield: | 15.1% | |||||
| U/W NCF Debt Yield: | 13.9% | ||||||
Type: | Initial | Monthly | Cap (If Any) | As-Is Appraised Value: | $40,700,000 | ||
| Taxes | $148,677 | $14,868 | NAP | As-Is Appraisal Valuation Date: | Various | ||
| Insurance | $24,458 | $4,892 | NAP | Cut-off Date LTV Ratio: | 60.1% | ||
FF&E Reserve(2) | $11,578 | $11,578 | See Note (2) | LTV Ratio at Maturity or ARD: | 46.7% | ||
| Deferred Maintenance | $4,000 | $0 | NAP | ||||
Seasonality Reserve(3) | $125,000 | $13,900 | NAP | ||||
Environmental Reserve(4) | $12,625 | $0 | NAP | ||||
| (1) | Borrower names are: Enterprise Hospitality, L.L.C., New Albany Hospitality, L.L.C., P & T Hospitality, L.L.C., and Atmore Hospitality, L.L.C. |
| (2) | Monthly payments of one-twelfth of 4% of the preceding annual gross revenue, subject to a cap equal to the aggregate monthly FF&E reserves deposits collected for the immediately preceding 24 month period. See “Escrows” below. |
| (3) | Monthly payments (initially $13,900) will be waived if, as of the last day of any calendar quarter during the Ascent Hotel Portfolio Mortgage Loan term, the debt service coverage ratio is equal to or greater than 1.80x. See “Escrows” below. |
| (4) | This amount is equal to 125% of the amount required for asbestos remediation. The remediation is required to be completed on or before November 15, 2011. See “Environmental Matters” below. |
The Mortgage Loan. The mortgage loan (the “Ascent Hotel Portfolio Mortgage Loan”) is evidenced by a promissory note that is secured by a first mortgage encumbering four limited service hotels located in Alabama and Mississippi (the “Ascent Hotel Portfolio Properties”). The Ascent Hotel Portfolio Mortgage Loan was originated on September 16, 2011 by The Royal Bank of Scotland. The Ascent Hotel Portfolio Mortgage Loan had an original principal balance of $24,500,000, has an outstanding principal balance as of the Cut-off Date of $24,468,913 and accrues interest at an interest rate of 6.030% per annum. The Ascent Hotel Portfolio Mortgage Loan had an initial term of 120 months, has a remaining term of 119 months as of the Cut-off Date and requires payments of interest and principal based on a 25-year amortization schedule. The Ascent Hotel Portfolio Mortgage Loan matures on October 1, 2021. The proceeds from the Ascent Hotel Portfolio Mortgage Loan were used to refinance existing debt of approximately $23.6 million, pay closing costs of approximately $490,000, and fund approximately $326,000 in upfront reserves.
Following the lockout period, the borrower has the right to defease the Ascent Hotel Portfolio Mortgage Loan in whole, but not in part, on any due date before July 1, 2021. The Ascent Hotel Portfolio Mortgage Loan is prepayable without penalty on or after July 1, 2021.
The Properties. The Ascent Hotel Portfolio Mortgage Loan is secured by a fee interest in four limited service hotels in Alabama and Mississippi totaling 325 rooms. The Hampton Inn & Suites - Montgomery is an 86-room, limited service hotel located in Montgomery, Montgomery County, Alabama. The hotel is located in downtown Montgomery, in the northeast quadrant of the intersection formed by State Route 108 and Commerce Street. The sponsors purchased the ten-story building and substantially renovated and converted the former building, which served as a bank, into a Hampton Inn & Suites that opened in June 2008.
THE INFORMATION IN THIS STRUCTURAL AND COLLATERAL TERM SHEET IS NOT COMPLETE AND MAY BE AMENDED PRIOR TO THE TIME OF SALE. THIS TERM SHEET IS NOT AN OFFER TO SELL THESE SECURITIES AND IT IS NOT A SOLICITATION OF AN OFFER TO BUY THESE SECURITIES IN ANY JURISDICTION WHERE THE OFFER OR SALE IS NOT PERMITTED.
100
| ASCENT HOTEL PORTFOLIO |
Amenities include a 24-hour business center, fitness facility, complimentary breakfast dining area, guest laundry room and an on-site convenience store.
The Holiday Inn Express - Atmore is an 80-room, limited service hotel located in Atmore, Escambia County, Alabama. The hotel is located near the intersection formed by Highway 21 and Interstate 65, approximately 48 miles northeast of Mobile, Alabama. The sponsors developed the three-story hotel, which opened in April 2009. Amenities include an outdoor swimming pool, 24-hour business center, fitness facility, guest laundry room and a complimentary breakfast dining area.
The Hampton Inn – New Albany is an 84-room, limited service hotel located in New Albany, Union County, Mississippi. The hotel is located on Coutler Cove, in the northeast quadrant of the intersection formed by Interstate 22 and State Highway 30. The sponsors developed the three-story hotel, which opened in January 2010. Amenities include an indoor swimming pool, 24-hour business center, fitness facility, guest laundry room, market pantry and a complimentary breakfast dining area.
The Hampton Inn - Enterprise is an 75-room, limited service hotel located in Enterprise, Coffee County, Alabama. The hotel is located off Boll Weevil Circle (U.S. Highway 84), northeast of the intersection formed by Shellfield Road and Boll Weevil Circle. The U.S. Army Aviation Warfighting Center at Fort Rucker is located just east of Enterprise. The sponsors developed the three story hotel, which opened in May 2007. Amenities include an outdoor swimming pool, 24-hour business center, fitness facility, guest laundry room and a complimentary breakfast dining area.
The following table presents certain information relating to the Ascent Hotel Portfolio Properties:
| Property Name | Allocated Cut-off Date Principal Balance | % of Portfolio Cut-off Date Principal Balance | Rooms | Loan/ Room | Year Built | Appraised Value | ||
| Hampton Inn & Suites – Montgomery | $7,090,991 | 29.0% | 86 | $82,453 | 2008 | $11,800,000 | ||
| Holiday Inn Express – Atmore | $6,431,829 | 26.3% | 80 | $80,398 | 2009 | $10,700,000 | ||
| Hampton Inn - New Albany | $5,772,666 | 23.6% | 84 | $68,722 | 2010 | $9,600,000 | ||
| Hampton Inn – Enterprise | $5,173,427 | 21.1% | 75 | $68,979 | 2007 | $8,600,000 | ||
| Total/Weighted Average | $24,468,913 | 100.0% | 325 | $75,289 | $40,700,000 | |||
Operating History and Underwritten Net Cash Flow. The following table presents certain information relating to the historical operating performance and the Underwritten Net Cash Flow at the Ascent Hotel Portfolio Properties:
Cash Flow Analysis
2009(1) | 2010(1) | TTM 6/30/2011 | U/W | U/W $ per Room | ||||||||
| Occupancy | 53.6% | 60.2% | 70.4% | 70.4% | ||||||||
| ADR | $87.03 | $94.39 | $90.63 | $90.64 | ||||||||
| RevPAR | $46.62 | $56.86 | $63.84 | $63.84 | ||||||||
| Total Revenue | $4,140,459 | $6,779,323 | $7,622,425 | $7,623,501 | $23,457 | |||||||
| Total Department Expenses | 1,203,034 | 1,680,727 | 1,738,457 | 1,738,457 | 5,349 | |||||||
| Gross Operating Profit | $2,937,425 | $5,098,596 | $5,883,968 | $5,885,044 | $18,108 | |||||||
| Total Undistributed Expenses | 1,092,416 | 1,972,591 | 2,092,463 | 1,945,727 | 5,987 | |||||||
| Profit Before Fixed Charges | $1,845,009 | $3,126,005 | $3,791,505 | $3,939,317 | $12,121 | |||||||
| Total Fixed Charges | 151,108 | 220,600 | 228,182 | 233,310 | 718 | |||||||
Net Operating Income(2) | $1,693,901 | $2,905,405 | $3,563,323 | $3,706,007 | $11,403 | |||||||
| FF&E | 0 | 0 | 0 | 304,725 | 938 | |||||||
| Net Cash Flow | $1,693,901 | $2,905,405 | $3,563,323 | $3,401,282 | $10,465 | |||||||
| NOI DSCR | 0.89x | 1.53x | 1.88x | 1.95x | ||||||||
| NCF DSCR | 0.89x | 1.53x | 1.88x | 1.79x | ||||||||
| NOI DY | 6.9% | 11.9% | 14.6% | 15.1% | ||||||||
| NCF DY | 6.9% | 11.9% | 14.6% | 13.9% | ||||||||
| (1) | The Holiday Inn Express - Atmore and the Hampton Inn - New Albany opened in April 2009 and January 2010, respectively. |
| (2) | The U/W NOI is higher than the historical NOIs due to several factors including but not limited to one of the four properties having been built in 2010. |
Appraisal. According to the individual appraisals performed by HVS Consulting and Valuation Services, the Ascent Hotel Portfolio Properties had an aggregate “as-is” appraised value of $40,700,000 as of the appraisal effective dates ranging from August 8, 2011 to August 11, 2011.
THE INFORMATION IN THIS STRUCTURAL AND COLLATERAL TERM SHEET IS NOT COMPLETE AND MAY BE AMENDED PRIOR TO THE TIME OF SALE. THIS TERM SHEET IS NOT AN OFFER TO SELL THESE SECURITIES AND IT IS NOT A SOLICITATION OF AN OFFER TO BUY THESE SECURITIES IN ANY JURISDICTION WHERE THE OFFER OR SALE IS NOT PERMITTED.
101
| ASCENT HOTEL PORTFOLIO |
Environmental Matters. According to the Phase I environmental site assessment reports performed by EBI Consulting with dates ranging from August 22, 2011 to August 24, 2011, with respect to three of the Ascent Hotel Portfolio Properties, there are no recommendations for further action. With respect to the Hampton Inn & Suites - Montgomery property, EBI Consulting recommended the remediation and the implementation of an Asbestos O&M Plan related to a decommissioned boiler. At closing, 125% of the expected cost of this remediation was reserved. The remediation is required to be completed on or before November 15, 2011.
Market Overview and Competition. The Ascent Hotel Portfolio Properties are located in Alabama and Mississippi.
Hampton Inn – New Albany
Per the appraisal, the Hampton Inn – New Albany property is located in New Albany, Union County, Mississippi, approximately 60 miles southeast from the Memphis International Airport and 25 miles northwest from the Tupelo Regional Airport. The property opened in January 2010. According to the July 2011 Smith Travel Research Report, the property is located within the Mississippi lodging market. As of July 2011, the Mississippi area lodging market contained a total of 503 hotels with an inventory of 44,689 rooms. The Mississippi market’s trailing 12-month period through July 2011 had an aggregate occupancy level of 56.8% with an ADR of $77.56, reflecting a RevPar of $44.02, up 6.4% over the previous corresponding trailing 12-month period. Gains in occupancy of 4.8% were coupled with a 1.6% increase in ADR.
Subject and Market Historical Occupancy, ADR and RevPAR (New Albany, MS)
Competitive Set(1) | Hampton Inn - New Albany(1) | Penetration Factor | |||||||||||||||
Year | Occupancy | ADR | RevPAR | Occupancy | ADR | RevPAR | Occupancy | ADR | RevPAR | ||||||||
7/31/2011 TTM(2) | 65.3% | $85.15 | $55.60 | 59.5% | $84.40 | $50.18 | 91.1% | 99.1% | 90.3% | ||||||||
| (1) | Data provided by July 31, 2011 Smith Travel Research report. The Hampton Inn - New Albany opened in January 2010. |
| (2) | The Hampton Inn – New Albany opened in January 2010. |
According to the July 2011 Smith Travel Research Report, the Hampton Inn & Suites – Montgomery, the Holiday Inn Express – Atmore and the Hampton Inn – Enterprise are located within the Alabama South lodging market. As of July 2011, the Alabama South area lodging market contained a total of 314 hotels with an inventory of 21,348 rooms. The Alabama South market’s trailing 12-month period through July 2011 had an aggregate occupancy level of 51.0% with an ADR of $65.05, reflecting a RevPAR of $33.16, up 2.6% over the previous corresponding trailing 12-month period. Gains in occupancy of 1.8% were coupled with a 0.8% increase in ADR.
Hampton Inn & Suites - Montgomery
Per the appraisal, the Hampton Inn & Suites - Montgomery property is located in Montgomery, Montgomery County, Alabama approximately seven miles northeast of the Montgomery Regional Airport. The property opened in June 2008.
Subject and Market Historical Occupancy, ADR and RevPAR (Montgomery, AL)
Competitive Set(1) | Hampton Inn & Suites - Montgomery(1) | Penetration Factor | |||||||||||||||
Year | Occupancy | ADR | RevPAR | Occupancy | ADR | RevPAR | Occupancy | ADR | RevPAR | ||||||||
| 7/31/2011 TTM | 63.2% | $89.56 | $56.64 | 71.5% | $98.60 | $70.49 | 113.0% | 110.1% | 124.4% | ||||||||
| 7/31/2010 TTM | 63.3% | $90.38 | $57.23 | 59.4% | $91.86 | $54.60 | 93.9% | 101.6% | 95.4% | ||||||||
7/31/2009 TTM(2) | 63.2% | $95.53 | $60.35 | 41.7% | $95.79 | $39.95 | 66.0% | 100.3% | 66.2% | ||||||||
| (1) | Data provided by July 31, 2011 Smith Travel Research report. |
| (2) | The Hampton Inn & Suites – Montgomery opened in June 2008. |
Holiday Inn Express – Atmore
Per the appraisal, the Holiday Inn Express property is located in Atmore, Escambia County, Alabama approximately 50 miles northeast from the Mobile Regional Airport. The property opened in April 2009.
Subject and Market Historical Occupancy, ADR and RevPAR (Atmore, AL)
Competitive Set(1) | Holiday Inn Express – Atmore(1) | Penetration Factor | |||||||||||||||
Year | Occupancy | ADR | RevPAR | Occupancy | ADR | RevPAR | Occupancy | ADR | RevPAR | ||||||||
| 7/31/2011 TTM | 62.0% | $93.46 | $57.94 | 81.8% | $91.98 | $75.24 | 131.9% | 98.4% | 129.9% | ||||||||
7/31/2010 TTM(2) | 63.7% | $89.53 | $56.99 | 70.6% | $84.92 | $59.98 | 111.0% | 94.9% | 105.2% | ||||||||
| (1) | Data provided by July 31, 2011 Smith Travel Research report. The Holiday Inn Express – Atmore opened in April 2009. |
| (2) | The Holiday Inn Express – Atmore opened in April 2009. |
THE INFORMATION IN THIS STRUCTURAL AND COLLATERAL TERM SHEET IS NOT COMPLETE AND MAY BE AMENDED PRIOR TO THE TIME OF SALE. THIS TERM SHEET IS NOT AN OFFER TO SELL THESE SECURITIES AND IT IS NOT A SOLICITATION OF AN OFFER TO BUY THESE SECURITIES IN ANY JURISDICTION WHERE THE OFFER OR SALE IS NOT PERMITTED.
102
| ASCENT HOTEL PORTFOLIO |
Hampton Inn – Enterprise
Per the appraisal, the Hampton Inn - Enterprise property is located in Enterprise, Coffee County, Alabama approximately 32 miles west from the Dothan Regional Airport. The property opened in May 2007.
Subject and Market Historical Occupancy, ADR and RevPAR (Enterprise, AL)
Competitive Set(1) | Hampton Inn – Enterprise(1) | Penetration Factor | |||||||||||||||
Year | Occupancy | ADR | RevPAR | Occupancy | ADR | RevPAR | Occupancy | ADR | RevPAR | ||||||||
| 7/31/2011 TTM | 61.4% | $73.56 | $45.18 | 71.4% | $85.48 | $61.02 | 116.2% | 116.2% | 135.1% | ||||||||
| 7/31/2010 TTM | 66.8% | $71.29 | $47.63 | 73.1% | $85.00 | $62.15 | 109.4% | 119.2% | 130.5% | ||||||||
| 7/31/2009 TTM | 70.8% | $70.98 | $50.23 | 69.8% | $85.15 | $59.44 | 98.6% | 120.0% | 118.3% | ||||||||
| (1) | Data provided by July 31, 2011 Smith Travel Research report. |
The Borrower. The borrower is comprised of three Alabama limited liability companies and one Mississippi limited liability company, each of which is a single purpose entity and has two independent directors (collectively, the “Ascent Hotel Portfolio Borrower”). Legal counsel to the Ascent Hotel Portfolio Borrower delivered a non-consolidation opinion in connection with the origination of the Ascent Hotel Portfolio Mortgage Loan. “John” Ioan Tampa and Yagnesh Patel are the guarantors of certain nonrecourse carveouts under the Ascent Hotel Portfolio Mortgage Loan. Under the terms of the nonrecourse carveout guaranty, the Ascent Hotel Portfolio Mortgage Loan becomes fully recourse to the nonrecourse carveout guarantors if, among other circumstances, the Ascent Hotel Portfolio Borrower files a voluntary bankruptcy petition or the nonrecourse carveout guarantor joins in an involuntary bankruptcy petition against any Ascent Hotel Portfolio Borrower.
The Sponsors. The Ascent Hotel Portfolio Borrower is owned and controlled by “John” Ioan Tampa and Yagnesh Patel. John Tampa, President and co-founder of Ascent Hospitality, has over 15 years of experience in hospitality construction, development and management. Yagnesh Patel, CEO and co-founder of Ascent Hospitality, has over 15 years of experience in all aspects of hospitality development and management. Ascent Hospitality is an integrated hotel development and management company. The company’s current portfolio consists of 26 select service hotels located throughout the Midwest, northeast and southeast comprising over 2,500 rooms.
Escrows. The loan documents provide for upfront escrows at closing in the amount of $148,677 for real estate taxes, $24,458 for insurance premiums, $11,578 for an FF&E reserve, $4,000 for deferred maintenance, $125,000 for a seasonality reserve and $12,625 for an environmental reserve related to the remediation of asbestos at the Hampton Inn & Suites - Montgomery property.
The loan documents provide for ongoing monthly escrows in the amount of $14,868 for real estate taxes (subject to adjustment per lender’s estimate), $4,892 for insurance premiums (subject to adjustment per lender’s estimate). The loan documents provide for an ongoing FF&E reserve equal to one-twelfth of 4% of the preceding annual gross revenue, subject to a cap equal to the aggregate monthly FF&E reserves deposits collected for the immediately preceding 24 month period. The loan documents also provide for an ongoing seasonality reserve. Monthly payments (initially $13,900) for this reserve will be waived if, as of the last day of any calendar quarter during the Ascent Hotel Portfolio Mortgage Loan term, the debt service coverage ratio is equal to or greater than 1.80x.
Lockbox and Cash Management. The Ascent Hotel Portfolio Mortgage Loan requires a lender-controlled lockbox account, which is already in place. The Ascent Hotel Portfolio Mortgage Loan requires all revenue and credit card receipts payable with respect to the Ascent Hotel Portfolio Properties to be deposited directly into the lockbox account. The loan documents also require that all revenues received by the borrower or property manager be deposited into the lockbox account within three business days. Prior to the occurrence of a Cash Management Period (as defined below), all funds on deposit in the lockbox account are swept into the borrower’s operating account on a daily basis. During a Cash Management Period all funds on deposit in the lockbox account are swept on a daily basis to a cash management account under the control of the lender.
A “Cash Management Period” will commence upon: (i) the occurrence and continuance of an event of default or (ii) if, as of the last day of any calendar quarter during the loan term, the debt service coverage ratio is less than 1.20x. A Cash Management Period will also commence on December 31, 2017 if on or prior to that date, the borrower has not delivered evidence that it has renewed or replaced the franchise agreement applicable to the Ascent Hotel Portfolio Property located in Atmore, Alabama.
Property Management. The Ascent Hotel Portfolio Properties are currently managed by Ascent Hospitality Management Co., LLC, an affiliate of the Ascent Hotel Portfolio Borrower, based on 10-year management agreements each dated January 2, 2011. According to the management agreements, the manager is entitled to a base management fee equal to the greater of $54,000 per annum or 2.5% of gross revenues of each operating year. The Ascent Hotel Portfolio Borrower may not surrender, terminate, cancel, extend or renew the management agreements or otherwise replace the manager or enter into any other management agreements without the prior written consent of the lender.
THE INFORMATION IN THIS STRUCTURAL AND COLLATERAL TERM SHEET IS NOT COMPLETE AND MAY BE AMENDED PRIOR TO THE TIME OF SALE. THIS TERM SHEET IS NOT AN OFFER TO SELL THESE SECURITIES AND IT IS NOT A SOLICITATION OF AN OFFER TO BUY THESE SECURITIES IN ANY JURISDICTION WHERE THE OFFER OR SALE IS NOT PERMITTED.
103
| ASCENT HOTEL PORTFOLIO |
Assumption. The Ascent Hotel Portfolio Borrower has a one time right to transfer the Ascent Hotel Portfolio Properties, with the consent of the lender, subject to customary conditions set forth in the loan documents, including but not limited to: (i) payment of an assumption fee of 1.00% of the outstanding principal balance, (ii) no event of default has occurred and is continuing under the Ascent Hotel Portfolio Mortgage Loan, (iii) the Ascent Hotel Portfolio Borrower has submitted to the lender true, correct and complete copies of any and all information and documents requested, (iv) evidence satisfactory to the lender has been provided showing that the transferee borrower complies with the special purpose entity provisions, (v) the lender receives written confirmation from Fitch and Moody’s that the assumption will not, in and of itself, result in a downgrade, qualification or withdrawal of the then current ratings assigned to any class of Series 2011-C5 Certificates, (vi) all of the lender’s reasonable costs and expenses have been paid in connection to the transfer, (vii) replacement guarantors have assumed in writing the obligations of the nonrecourse guarantors under the nonrecourse carveout guaranty, (viii) the identity, experience, financial condition and creditworthiness of the transferee borrower and the replacement guarantors and indemnitors are satisfactory to the lender, and (ix) the manager and proposed management agreement is satisfactory to the lender, Fitch and Moody’s.
Release. Not permitted.
Real Estate Substitution. Not permitted.
Subordinate and Mezzanine Indebtedness. Not permitted.
Ground Lease. None.
Terrorism Insurance. The loan documents require that the “all risk” insurance policy maintained by the Ascent Hotel Portfolio Borrower provide coverage for terrorism in an amount equal to the full replacement cost of the Ascent Hotel Portfolio Properties, as well as business interruption insurance covering no less than the 12-month period following the occurrence of a casualty event.
THE INFORMATION IN THIS STRUCTURAL AND COLLATERAL TERM SHEET IS NOT COMPLETE AND MAY BE AMENDED PRIOR TO THE TIME OF SALE. THIS TERM SHEET IS NOT AN OFFER TO SELL THESE SECURITIES AND IT IS NOT A SOLICITATION OF AN OFFER TO BUY THESE SECURITIES IN ANY JURISDICTION WHERE THE OFFER OR SALE IS NOT PERMITTED.
104
105
| Torrance Plaza East | |||||||
| Loan Information | Property Information | ||||||
| Mortgage Loan Seller: | The Royal Bank of Scotland | Single Asset/Portfolio: | Single Asset | ||||
| Credit Assessment (Fitch/Moody’s): | NAP | Property Type: | Office | ||||
| Original Principal Balance: | $21,100,000 | Specific Property Type: | Suburban | ||||
| Cut-off Date Principal Balance: | $21,082,280 | Location: | Torrance, CA | ||||
| % of Initial Pool Balance: | 1.9% | Size: | 186,117 SF | ||||
| Loan Purpose: | Refinance | Cut-off Date Principal | |||||
| Borrower Name: | Muller-South Bay East LLC | Balance Per Unit/SF: | $113.27 | ||||
| Sponsor: | The Muller Company | Year Built/Renovated: | 1975/NAP | ||||
| Mortgage Rate: | 5.950% | Occupancy %: | 80.1% | ||||
| Note Date: | September 13, 2011 | Occupancy % Source Date: | September 12, 2011 | ||||
| Anticipated Repayment Date: | NAP | Title Vesting: | Fee | ||||
| Maturity Date: | October 1, 2021 | Property Manager: | The Muller Company, LLC | ||||
| IO Period: | None | ||||||
| Loan Term (Original): | 120 months | 3rd Most Recent NOI (As of): | $2,696,139 (12/31/2009) | ||||
| Seasoning: | 1 month | 2nd Most Recent NOI (As of): | $2,440,295 (12/31/2010) | ||||
| Amortization Term (Original): | 360 months | Most Recent NOI (As of): | $2,218,793 (TTM 6/30/2011) | ||||
| Loan Amortization Type: | Amortizing Balloon | ||||||
| Interest Accrual Method: | Actual/360 | U/W Revenues: | $3,845,462 | ||||
| Call Protection: | L(25),D(91),O(4) | U/W Expenses: | $1,460,899 | ||||
| Lockbox Type: | Hard/Springing Cash Management | U/W NOI: | $2,384,563 | ||||
| Additional Debt: | None | U/W NCF: | $2,160,111 | ||||
| Additional Debt Type: | NAP | U/W NOI DSCR: | 1.58x | ||||
| U/W NCF DSCR: | 1.43x | ||||||
| Escrows and Reserves: | U/W NOI Debt Yield: | 11.3% | |||||
| U/W NCF Debt Yield: | 10.2% | ||||||
Type: | Initial | Monthly | Cap (If Any) | As-Is Appraised Value: | $32,000,000 | ||
| Taxes | $161,150 | $23,021 | NAP | As-Is Appraisal Valuation Date: | July 28, 2011 | ||
| Insurance | $8,733 | $1,248 | NAP | Cut-off Date LTV Ratio: | 65.9% | ||
| Capital Expenditures | $4,188 | $4,188 | NAP | LTV Ratio at Maturity or ARD: | 55.8% | ||
| TI/LC | $18,858 | $18,858 | $500,000 | ||||
| Deferred Maintenance | $33,440 | $0 | NAP | ||||
Tenant & General Holdback(1) | $600,000 | $0 | NAP | ||||
| Free Rent & Outstanding TI | $346,840 | $0 | NAP | ||||
| (1) | Of the $600,000 reserved at closing, $200,000 is associated with a prospective tenant and $400,000 will be held until the debt service coverage ratio at the Torrance Plaza East Property is at least 1.40x for two consecutive quarters. |
The Torrance Plaza East mortgage loan is secured by a first mortgage encumbering a 186,117 square foot Class B suburban office building located in Torrance, California (the “Torrance Plaza East Property”). The Torrance Plaza East Property was 80.1% leased as of September 12, 2011. The improvements consist of eight, one to three-story buildings. The improvements were constructed in 1975 and consist of a wood and steel framed superstructure, with poured concrete floors, and flat/low-sloping built up roofing systems. Parking for the Torrance Plaza East Property is provided by 765 spaces in surrounding surface parking, resulting in a ratio of approximately 4.1 spaces per 1,000 square feet of net rentable area.
THE INFORMATION IN THIS STRUCTURAL AND COLLATERAL TERM SHEET IS NOT COMPLETE AND MAY BE AMENDED PRIOR TO THE TIME OF SALE. THIS TERM SHEET IS NOT AN OFFER TO SELL THESE SECURITIES AND IT IS NOT A SOLICITATION OF AN OFFER TO BUY THESE SECURITIES IN ANY JURISDICTION WHERE THE OFFER OR SALE IS NOT PERMITTED.
106
| TORRANCE PLAZA EAST |
The following table presents certain information relating to the tenancies at the Torrance Plaza East Property:
Major Tenants
| Tenant Name | Credit Rating (Fitch/ Moody’s/ S&P)(1) | Tenant NRSF | % of NRSF | Annual U/W Base Rent PSF | Annual U/W Base Rent | % of Total Annual U/W Base Rent | Lease Expiration Date | |
| Major Tenants | ||||||||
| Lifecare Systems, Inc. | NR/NR/NR | 17,875 | 9.6% | $34.78 | $621,661 | 16.6% | 12/31/2015 | |
| American Communications Group | NR/NR/NR | 13,207 | 7.1% | $25.44 | $335,986 | 9.0% | 4/30/2013 | |
| American Learning Foundation | NR/NR/NR | 7,936 | 4.3% | $22.20 | $176,179 | 4.7% | 6/30/2016 | |
| Piazza, Donnelly & Marlette | NR/NR/NR | 6,620 | 3.6% | $29.28 | $193,832 | 5.2% | 8/31/2014 | |
| Healthcare Business Solutions | NR/NR/NR | 6,501 | 3.5% | $21.60 | $140,422 | 3.7% | 1/31/2016 | |
| Total Major Tenants | 52,139 | 28.0% | $28.16 | $1,468,080 | 39.1% | |||
| Non-Major Tenants | 96,968 | 52.1% | $23.57 | $2,285,247 | 60.9% | |||
| Occupied Collateral Total | 149,107 | 80.1% | $25.17 | $3,753,327 | 100.0% | |||
| Vacant Space | 37,010 | 19.9% | ||||||
| Collateral Total | 186,117 | 100.0% | ||||||
| (1) | Certain ratings are those of the parent company whether or not the parent guarantees the lease. |
The following table presents certain information relating to the lease rollover schedule at the Torrance Plaza East Property:
Lease Expiration Schedule*
Year Ending December 31, | No. of Leases Expiring | Expiring NRSF | % of Total NRSF | Cumulative of Total NRSF | Cumulative % of Total NRSF | Annual U/W Base Rent | Annual U/W Base Rent PSF |
MTM(1) | 3 | 1,535 | 0.8% | 1,535 | 0.8% | $2,402 | $1.56 |
| 2011 | 4 | 5,499 | 3.0% | 7,034 | 3.8% | $131,336 | $23.88 |
| 2012 | 15 | 23,993 | 12.9% | 31,027 | 16.7% | $580,859 | $24.21 |
| 2013 | 9 | 25,872 | 13.9% | 56,899 | 30.6% | $634,068 | $24.51 |
| 2014 | 12 | 29,898 | 16.1% | 86,797 | 46.6% | $764,406 | $25.57 |
| 2015 | 5 | 27,569 | 14.8% | 114,366 | 61.4% | $847,354 | $30.74 |
| 2016 | 5 | 23,545 | 12.7% | 137,911 | 74.1% | $531,254 | $22.56 |
| 2017 | 3 | 11,196 | 6.0% | 149,107 | 80.1% | $261,648 | $23.37 |
| 2018 | 0 | 0 | 0.0% | 149,107 | 80.1% | $0 | $0.00 |
| 2019 | 0 | 0 | 0.0% | 149,107 | 80.1% | $0 | $0.00 |
| 2020 | 0 | 0 | 0.0% | 149,107 | 80.1% | $0 | $0.00 |
| 2021 | 0 | 0 | 0.0% | 149,107 | 80.1% | $0 | $0.00 |
| Thereafter | 0 | 0 | 0.0% | 149,107 | 80.1% | $0 | $0.00 |
| Vacant | 0 | 37,010 | 19.9% | 186,117 | 100.0% | $0 | $0.00 |
| Total / Weighted Average | 56 | 186,117 | 100.0% | $3,753,327 | $25.17 |
* Source: Information obtained from underwritten rent roll.
| (1) | Includes a fitness center (1,075 square feet) and a conference center (340 square feet) that do not pay rent. |
The following table presents historical occupancy percentages at the Torrance Plaza East Property:
Historical Occupancy Percentages*
12/31/2008 | 12/31/2009 | 12/31/2010 | ||
| 87% | 83% | 81% |
* Source: Information provided by the borrower.
THE INFORMATION IN THIS STRUCTURAL AND COLLATERAL TERM SHEET IS NOT COMPLETE AND MAY BE AMENDED PRIOR TO THE TIME OF SALE. THIS TERM SHEET IS NOT AN OFFER TO SELL THESE SECURITIES AND IT IS NOT A SOLICITATION OF AN OFFER TO BUY THESE SECURITIES IN ANY JURISDICTION WHERE THE OFFER OR SALE IS NOT PERMITTED.
107
| TORRANCE PLAZA EAST |
The following table presents certain information relating to the historical operating performance and the Underwritten Net Cash Flow at the Torrance Plaza East Property:
Cash Flow Analysis
| 2009 | 2010 | TTM 6/30/2011 | U/W | U/W $ per SF | ||||||
| Base Rent | $3,856,968 | $3,701,984 | $3,517,439 | $3,753,327(1) | $20.17 | |||||
| Grossed Up Vacant Space | 0 | 0 | 0 | 843,828 | 4.53 | |||||
| Total Reimbursables | 118,295 | 80,086 | 55,740 | 57,690 | 0.31 | |||||
| Other Income | 53,119 | 31,644 | 34,445 | 34,445 | 0.19 | |||||
| Less Vacancy & Credit Loss | (14,686) | (10,647) | (908) | (843,828) | (4.53) | |||||
| Effective Gross Income | $4,013,696 | $3,803,067 | $3,606,716 | $3,845,462 | $20.66 | |||||
| Total Operating Expenses | $1,317,557 | $1,362,772 | $1,387,923 | $1,460,899 | $7.85 | |||||
| Net Operating Income | $2,696,139 | $2,440,295 | $2,218,793 | $2,384,563 | $12.81 | |||||
| TI/LC | 217,652 | 404,793 | 300,955 | 174,200 | 0.94 | |||||
| Capital Expenditures | 51,150 | 71,666 | 0 | 50,252 | 0.27 | |||||
| Net Cash Flow | $2,427,337 | $1,963,836 | $1,917,838 | $2,160,111 | $11.61 | |||||
| NOI DSCR | 1.79x | 1.62x | 1.47x | 1.58x | ||||||
| NCF DSCR | 1.61x | 1.30x | 1.27x | 1.43x | ||||||
| NOI DY | 12.8% | 11.6% | 10.5% | 11.3% | ||||||
| NCF DY | 11.5% | 9.3% | 9.1% | 10.2% | ||||||
| (1) | Contractual rent increases were underwritten through December 31, 2011. |
THE INFORMATION IN THIS STRUCTURAL AND COLLATERAL TERM SHEET IS NOT COMPLETE AND MAY BE AMENDED PRIOR TO THE TIME OF SALE. THIS TERM SHEET IS NOT AN OFFER TO SELL THESE SECURITIES AND IT IS NOT A SOLICITATION OF AN OFFER TO BUY THESE SECURITIES IN ANY JURISDICTION WHERE THE OFFER OR SALE IS NOT PERMITTED.
108
109
| Flagship Storage Portfolio - Indiana | ||||||
| Loan Information | Property Information | |||||
| Mortgage Loan Seller: | Wells Fargo Bank, National Association | Single Asset/Portfolio: | Portfolio | |||
| Credit Assessment (Fitch/Moody’s): | NAP | Property Type: | Self Storage | |||
| Original Principal Balance: | $20,300,000 | Specific Property Type: | Self Storage | |||
| Cut-off Date Principal Balance: | $20,247,005 | Location: | Indianapolis, IN | |||
| % of Initial Pool Balance: | 1.9% | Size: | 521,387 SF | |||
| Loan Purpose: | Acquisition | Cut-off Date Principal Balance Per Unit/SF: | $38.83 | |||
| Borrower Name: | KAF Indiana Properties I, LLC | Year Built/Renovated: | Various/NAP | |||
Sponsor: | Flagship Properties II, LLC | Occupancy %: | 78.1% | |||
| Mortgage Rate: | 6.250% | Occupancy % Source Date: | July 17, 2011 | |||
| Note Date: | August 10, 2011 | Title Vesting: | Fee | |||
| Anticipated Repayment Date: | NAP | Property Manager: | StorKwik Management, LLC | |||
| Maturity Date: | September 1, 2021 | |||||
| IO Period: | None | 3rd Most Recent NOI (As of): | $2,339,639 (12/31/2009) | |||
| Loan Term (Original): | 120 months | 2nd Most Recent NOI (As of): | $2,350,369 (12/31/2010) | |||
| Seasoning: | 2 months | Most Recent NOI (As of): | $2,428,317 (6/30/2011) | |||
| Amortization Term (Original): | 300 months | |||||
| Loan Amortization Type: | Amortizing Balloon | U/W Revenues: | $3,908,991 | |||
| Interest Accrual Method: | Actual/360 | U/W Expenses: | $1,547,903 | |||
| Call Protection: | L(26),D(90),O(4) | U/W NOI: | $2,361,088 | |||
| Lockbox Type: | None | U/W NCF: | $2,282,879 | |||
| Additional Debt: | None | U/W NOI DSCR: | 1.47x | |||
| Additional Debt Type: | NAP | U/W NCF DSCR: | 1.42x | |||
| U/W NOI Debt Yield: | 11.7% | |||||
| Escrows and Reserves: | U/W NCF Debt Yield: | 11.3% | ||||
| As-Is Appraised Value: | $29,075,000 | |||||
Type: | Initial | Monthly | Cap (If Any) | As-Is Appraisal Valuation Date: | Various | |
| Taxes | $231,671 | $41,369 | NAP | Cut-off Date LTV Ratio: | 69.6% | |
Insurance(1) | $0 | Springing | NAP | LTV Ratio at Maturity or ARD: | 54.5% | |
Replacement Reserves Deferred Maintenance(2) | $150,000 $280,000 | $6,498 NAP | NAP NAP | |||
| (1) | Monthly insurance escrows are waived as long as no event of default has occurred and is continuing and the borrower provides satisfactory evidence that the properties are insured in accordance with the loan documents. |
| (2) | Initial reserve represents 126% of the estimate costs for immediate repair items as outlined by the engineer in the individual property condition reports. |
The Flagship Storage Portfolio - Indiana mortgage loan is secured by a first mortgage encumbering eight self storage properties together consisting of approximately 521,387 square feet and located in Indianapolis, Indiana (the “Flagship Storage Portfolio – Indiana Properties”). The Flagship Storage Portfolio - Indiana Properties were built between 1976 and 1999 and are comprised of 4,454 units ranging from 328 units to 810 units. As of July 17, 2011, the Flagship Storage Portfolio - Indiana Properties were 78.1% occupied.
THE INFORMATION IN THIS STRUCTURAL AND COLLATERAL TERM SHEET IS NOT COMPLETE AND MAY BE AMENDED PRIOR TO THE TIME OF SALE. THIS TERM SHEET IS NOT AN OFFER TO SELL THESE SECURITIES AND IT IS NOT A SOLICITATION OF AN OFFER TO BUY THESE SECURITIES IN ANY JURISDICTION WHERE THE OFFER OR SALE IS NOT PERMITTED.
110
| FLAGSHIP STORAGE PORTFOLIO - INDIANA |
The following table represents certain information relating to the Flagship Storage Portfolio - Indiana Properties:
| Property Name | Property Type | Location | Allocated Cut- off Date Principal Balance | Occupancy | Year Built/ Renovated | Net Rentable Area (SF) | Appraised Value | ||
| 8270 Michigan Road | Self Storage | Indianapolis, IN | $4,334,913 | 89.8% | 1999/NAP | 75,025 | $6,225,000 | ||
| 2251 Shadeland Avenue | Self Storage | Indianapolis, IN | $2,924,761 | 76.6% | 1992/NAP | 91,977 | $4,200,000 | ||
| 5425 North Tacoma Avenue | Self Storage | Indianapolis, IN | $2,646,212 | 74.0% | 1976/NAP | 61,932 | $3,800,000 | ||
| 9685 Fall Creek Road | Self Storage | Indianapolis, IN | $2,298,026 | 81.7% | 1999/NAP | 61,050 | $3,300,000 | ||
3601 West 96th Street | Self Storage | Indianapolis, IN | $2,176,161 | 82.2% | 1987/NAP | 43,800 | $3,125,000 | ||
| 551 East Stover Avenue | Self Storage | Indianapolis, IN | $2,158,752 | 67.6% | 1979/NAP | 80,198 | $3,100,000 | ||
| 920 County Line Road | Self Storage | Indianapolis, IN | $1,949,841 | 86.1% | 1997/NAP | 45,100 | $2,800,000 | ||
| 3912 North Glen Arm Road | Self Storage | Indianapolis, IN | $1,758,338 | 71.3% | 1976/NAP | 62,305 | $2,525,000 | ||
| Total/Weighted Average | $20,247,005 | 78.1% | 521,387 | $29,075,000 | |||||
The following table presents historical occupancy percentages at the Flagship Storage Portfolio - Indiana Properties:
Historical Occupancy Percentages*
12/31/2008 | 12/31/2009 | 12/31/2010 | ||
| 81% | 76% | 75% | ||
| * Source: Information provided by borrower. | ||||
The following table presents certain information relating to the historical operating performance and the Underwritten Net Cash Flow for the Flagship Storage Portfolio - Indiana Mortgage Loan:
Cash Flow Analysis
| 12/31/2009 | 12/31/2010 | TTM 6/30/2011 | U/W(1) | U/W $ per SF | ||||||
| Gross Potential Rent | $3,506,745 | $3,472,471 | $3,526,317 | $4,847,652 | $9.30 | |||||
| Less Concessions | 0 | 0 | 0 | 0 | 0 | |||||
| Other Income | 347,529 | 365,262 | 390,737 | 360,000 | 0.69 | |||||
| Less Vacancy & Credit Loss | 0 | 0 | 0 | (1,298,660) | (2.49) | |||||
| Effective Gross Income | $3,854,274 | $3,837,733 | $3,917,054 | $3,908,991 | $7.50 | |||||
| Total Operating Expenses | $1,514,635 | $1,487,364 | $1,488,737 | $1,547,903 | $2.97 | |||||
| Net Operating Income | $2,339,639 | $2,350,369 | $2,428,317 | $2,361,088 | $4.53 | |||||
| TI/LC | 0 | 0 | 0 | 0 | 0 | |||||
| Capital Expenditures | 0 | 0 | 0 | 78,208 | 0.15 | |||||
| Net Cash Flow | $2,339,639 | $2,350,369 | $2,428,317 | $2,282,879 | $4.38 | |||||
| NOI DSCR | 1.46x | 1.46x | 1.51x | 1.47x | ||||||
| NCF DSCR | 1.46x | 1.46x | 1.51x | 1.42x | ||||||
| NOI DY | 11.6% | 11.6% | 12.0% | 11.7% | ||||||
| NCF DY | 11.6% | 11.6% | 12.0% | 11.3% |
| (1) | Underwritten gross potential rent is higher than historical years due to historical figures representing gross potential rent net of vacancy. |
THE INFORMATION IN THIS STRUCTURAL AND COLLATERAL TERM SHEET IS NOT COMPLETE AND MAY BE AMENDED PRIOR TO THE TIME OF SALE. THIS TERM SHEET IS NOT AN OFFER TO SELL THESE SECURITIES AND IT IS NOT A SOLICITATION OF AN OFFER TO BUY THESE SECURITIES IN ANY JURISDICTION WHERE THE OFFER OR SALE IS NOT PERMITTED.
111
| PetSmart | ||||||
| Loan Information | Property Information | |||||
| Mortgage Loan Seller: | Wells Fargo Bank, National Association | Single Asset/Portfolio: | Single Asset | |||
| Credit Assessment (Fitch/Moody’s): | NAP | Property Type: | Industrial | |||
| Original Principal Balance: | $20,000,000 | Specific Property Type: | Warehouse | |||
| Cut-off Date Principal Balance: | $19,950,045 | Location: | Phoenix, AZ | |||
| % of Initial Pool Balance: | 1.8% | Size: | 620,213 SF | |||
| Loan Purpose: | Refinance | Cut-off Date Principal | ||||
| Borrower Name: | Labrador (AZ) LP | Balance Per Unit/SF: | $32.17 | |||
| Sponsor: | Corporate Property Associates 15 Incorporated; Corporate Property Associates 16 – Global Incorporated | Year Built/Renovated: | 1996/2001 | |||
| Mortgage Rate: | 6.500% | Occupancy %: | 100.0% | |||
| Note Date: | September 1, 2011 | Occupancy % Source Date: | November 1, 2011 | |||
| Anticipated Repayment Date: | NAP | Title Vesting: | Fee | |||
| Maturity Date: | September 1, 2021 | Property Manager: | Self Managed | |||
| IO Period: | None | |||||
| Loan Term (Original): | 120 months | 3rd Most Recent NOI (As of): | $2,674,075 (12/31/2008) | |||
| Seasoning: | 2 months | 2nd Most Recent NOI (As of): | $2,674,118 (12/31/2009) | |||
| Amortization Term (Original): | 300 months | Most Recent NOI (As of): | $2,675,651 (12/31/2010) | |||
| Loan Amortization Type: | Amortizing Balloon | |||||
| Interest Accrual Method: | Actual/360 | U/W Revenues: | $2,409,091 | |||
| Call Protection: | L(26),D(90),O(4) | U/W Expenses: | $73,227 | |||
Lockbox Type(1): | Hard/Upfront Cash Management | U/W NOI: | $2,335,864 | |||
| Additional Debt: | None | U/W NCF: | $2,018,553 | |||
| Additional Debt Type: | NAP | U/W NOI DSCR: | 1.44x | |||
| U/W NCF DSCR: | 1.25x | |||||
| Escrows and Reserves: | U/W NOI Debt Yield: | 11.7% | ||||
Type: | Initial | Monthly | Cap (If Any) | U/W NCF Debt Yield: | 10.1% | |
Taxes(2) | $0 | Springing | NAP | As-Is Appraised Value: | $40,000,000 | |
Insurance(2) | $0 | Springing | NAP | As-Is Appraisal Valuation Date: | July 15, 2011 | |
Replacement Reserves(3) | $0 | Springing | NAP | Cut-off Date LTV Ratio: | 49.9% | |
| LTV Ratio at Maturity or ARD: | 39.4% | |||||
| (1) | There is a springing cash trap for the following trigger events: (i) PetSmart does not exercise its 10-year renewal option, or if the borrower fails to enter into a new lease with a tenant acceptable to lender for a term not less than 5 years with an annual rent not less than $2,300,000 as of May 1, 2019; (ii) PetSmart is in monetary default under its lease for 30 days or more; (iii) PetSmart goes dark; (iv) PetSmart files for bankruptcy; (v) PetSmart gives notice that it is terminating its lease for all or any portion of its space; or (vi) any termination or cancellation of the PetSmart lease. The cash trap will terminate upon curing the related default, the re-occupancy or re-tenanting of the related space, or re-affirmation of the lease. |
| (2) | Monthly deposits for taxes and insurance are waived so long as, among other things, the PetSmart lease is in full force and effect and no event of default has occurred and is continuing. |
| (3) | Monthly deposits of $13,438 for replacement reserves are waived so long as no event of default has occurred and is continuing. |
The PetSmart mortgage loan is secured by a first mortgage encumbering a one-story warehouse distribution facility containing approximately 620,213 square feet, situated on a 34.4-acre parcel in Phoenix, Arizona (the “PetSmart Property”). The PetSmart Property, which was built in 1996 and renovated in 2001, contains 609,353 square feet of warehouse space and 10,860 square feet of office space and is located within the Southwest Phoenix Industrial area. The PetSmart Property is 100.0% leased to PetSmart with a lease expiring in December 2021, with one 10-year and two 5-year renewal options.
THE INFORMATION IN THIS STRUCTURAL AND COLLATERAL TERM SHEET IS NOT COMPLETE AND MAY BE AMENDED PRIOR TO THE TIME OF SALE. THIS TERM SHEET IS NOT AN OFFER TO SELL THESE SECURITIES AND IT IS NOT A SOLICITATION OF AN OFFER TO BUY THESE SECURITIES IN ANY JURISDICTION WHERE THE OFFER OR SALE IS NOT PERMITTED.
112
| PETSMART |
The following table represents certain information relating to the tenant at the PetSmart Property:
Major Tenant
| Tenant Name | Credit Rating (Fitch/Moody’s/ S&P)(1) | Tenant NRSF | % of NRSF | Annual U/W Base Rent PSF | Annual U/W Base Rent | % of Total Annual U/W Base Rent | Lease Expiration Date | ||
| Major Tenant | |||||||||
| PetSmart | NR/NR/BB | 620,213 | 100.0% | $4.32 | $2,676,768 | 100.0% | 12/31/2021(2) | ||
| Total Major Tenant- Collateral | 620,213 | 100.0% | $4.32 | $2,676,768 | 100.0% | ||||
| (1) | Credit ratings of the tenant or parent company whether or not the parent guarantees the lease. |
| (2) | PetSmart has the option to go dark with at least 60 days prior notice, but the lease shall remain in full force and effect until the lease expiration date. |
The following table presents certain information relating to the lease rollover schedule at the PetSmart Property:
Lease Expiration Schedule*
Year Ending December 31, | No. of Leases Expiring | Expiring NRSF | % of Total NRSF | Cumulative of Total NRSF | Cumulative % of Total NRSF | Annual U/W Base Rent | Annual U/W Base Rent PSF |
| MTM | 0 | 0 | 0.0% | 0 | 0.0% | $0 | $0.00 |
| 2011 | 0 | 0 | 0.0% | 0 | 0.0% | $0 | $0.00 |
| 2012 | 0 | 0 | 0.0% | 0 | 0.0% | $0 | $0.00 |
| 2013 | 0 | 0 | 0.0% | 0 | 0.0% | $0 | $0.00 |
| 2014 | 0 | 0 | 0.0% | 0 | 0.0% | $0 | $0.00 |
| 2015 | 0 | 0 | 0.0% | 0 | 0.0% | $0 | $0.00 |
| 2016 | 0 | 0 | 0.0% | 0 | 0.0% | $0 | $0.00 |
| 2017 | 0 | 0 | 0.0% | 0 | 0.0% | $0 | $0.00 |
| 2018 | 0 | 0 | 0.0% | 0 | 0.0% | $0 | $0.00 |
| 2019 | 0 | 0 | 0.0% | 0 | 0.0% | $0 | $0.00 |
| 2020 | 0 | 0 | 0.0% | 0 | 0.0% | $0 | $0.00 |
| 2021 | 1 | 620,213 | 100.0% | 620,213 | 100.0% | $2,676,768 | $4.32 |
| Thereafter | 0 | 0 | 0.0% | 620,213 | 100.0% | $0 | $0.00 |
| Vacant | 0 | 0 | 0.0% | 620,213 | 100.0% | $0 | $0.00 |
| Total / Weighted Average | 1 | 620,213 | 100.0% | $2,676,768 | $4.32 |
| * Source: Information obtained from the underwritten rent roll. |
The following table presents historical occupancy percentages at the PetSmart Property:
Historical Occupancy Percentages*
12/31/2008 | 12/31/2009 | 12/31/2010 | ||
| 100% | 100% | 100% | ||
* Source: Information obtained from borrower rent roll. | ||||
THE INFORMATION IN THIS STRUCTURAL AND COLLATERAL TERM SHEET IS NOT COMPLETE AND MAY BE AMENDED PRIOR TO THE TIME OF SALE. THIS TERM SHEET IS NOT AN OFFER TO SELL THESE SECURITIES AND IT IS NOT A SOLICITATION OF AN OFFER TO BUY THESE SECURITIES IN ANY JURISDICTION WHERE THE OFFER OR SALE IS NOT PERMITTED.
113
| PETSMART |
Cash Flow Analysis
2008 | 2009 | 2010 | U/W | U/W $ per SF | ||||||
| Gross Potential Rent | $2,676,768 | $2,676,768 | $2,676,768 | $2,676,768 | $4.32 | |||||
| Less Concessions | 0 | 0 | 0 | 0 | 0.00 | |||||
| Other Income | 0 | 0 | 0 | 0 | 0.00 | |||||
| Less Vacancy & Credit Loss | 0 | 0 | 0 | 267,677 | 0.43 | |||||
| Effective Gross Income | $2,676,768 | $2,676,768 | $2,676,768 | $2,409,091 | $3.88 | |||||
| Total Operating Expenses | $2,693 | $2,649 | $1,117 | $73,227 | $0.12 | |||||
| Net Operating Income | $2,674,075 | $2,674,118 | $2,675,651 | $2,335,864 | $3.77 | |||||
| TI/LC | 0 | 0 | 0 | 156,056 | 0.25 | |||||
| Capital Expenditures | 0 | 0 | 0 | 161,225 | 0.26 | |||||
| Net Cash Flow | $2,674,075 | $2,674,118 | $2,675,651 | $2,018,553 | $3.25 | |||||
| NOI DSCR | 1.65x | 1.65x | 1.65x | 1.44x | ||||||
| NCF DSCR | 1.65x | 1.65x | 1.65x | 1.25x | ||||||
| NOI DY | 13.4% | 13.4% | 13.4% | 11.7% | ||||||
| NCF DY | 13.4% | 13.4% | 13.4% | 10.1% |
THE INFORMATION IN THIS STRUCTURAL AND COLLATERAL TERM SHEET IS NOT COMPLETE AND MAY BE AMENDED PRIOR TO THE TIME OF SALE. THIS TERM SHEET IS NOT AN OFFER TO SELL THESE SECURITIES AND IT IS NOT A SOLICITATION OF AN OFFER TO BUY THESE SECURITIES IN ANY JURISDICTION WHERE THE OFFER OR SALE IS NOT PERMITTED.
114
115
| Overlook at the Rim | |||||||
| Loan Information | Property Information | ||||||
| Mortgage Loan Seller: | Wells Fargo Bank, National Association | Single Asset/Portfolio: | Single Asset | ||||
| Credit Assessment (Fitch/Moody’s): | NAP | Property Type: | Office | ||||
| Original Principal Balance: | $18,000,000 | Specific Property Type: | Suburban | ||||
| Cut-off Date Principal Balance: | $18,000,000 | Location: | San Antonio, TX | ||||
| % of Initial Pool Balance: | 1.6% | Size: | 145,025 SF | ||||
Loan Purpose(1): | Refinance | Cut-off Date Principal | |||||
| Borrower Name: | Cole of San Antonio TX, LLC | Balance Per Unit/SF: | $124.12 | ||||
| Sponsor: | Cole Corporate Income Trust, Inc. | Year Built/Renovated: | 2008/2011 | ||||
| Mortgage Rate: | 4.650% | Occupancy %: | 100.0% | ||||
| Note Date: | June 30, 2011 | Occupancy % Source Date: | November 1, 2011 | ||||
| Anticipated Repayment Date: | NAP | Title Vesting: | Fee | ||||
| Maturity Date: | July 1, 2016 | Property Manager: | Transwestern | ||||
| IO Period: | 60 months | ||||||
| Loan Term (Original): | 60 months | 3rd Most Recent NOI (As of): | NAV | ||||
| Seasoning: | 4 months | 2nd Most Recent NOI (As of): | NAV | ||||
| Amortization Term (Original): | None | Most Recent NOI (As of)(4): | NAV | ||||
| Loan Amortization Type: | Interest-only, Balloon | ||||||
| Interest Accrual Method: | Actual/360 | U/W Revenues: | $4,384,091 | ||||
| Call Protection: | L(28),D(28),O(4) | U/W Expenses: | $1,690,446 | ||||
| Lockbox Type: | Hard/Upfront Cash Management | U/W NOI: | $2,693,646 | ||||
Additional Debt(2): | Yes | U/W NCF: | $2,657,389 | ||||
Additional Debt Type(2): | Mezzanine | U/W NOI DSCR: | 3.17x | ||||
| U/W NCF DSCR: | 3.12x | ||||||
| Escrows and Reserves: | U/W NOI Debt Yield: | 15.0% | |||||
| U/W NCF Debt Yield: | 14.8% | ||||||
Type: | Initial | Monthly | Cap (If Any) | As-Is Appraised Value: | $32,850,000 | ||
| Taxes | $0 | $0 | NAP | As-Is Appraisal Valuation Date: | March 25, 2011 | ||
| Insurance | $0 | $0 | NAP | Cut-off Date LTV Ratio: | 54.8% | ||
| Replacement Reserves | $0 | $0 | NAP | LTV Ratio at Maturity or ARD: | 54.8% | ||
MiniMed TI/LC(3) | $1,012,480 | $0 | NAP | ||||
| (1) | The loan represents a recapitalization of the Sponsor’s purchase in February 2011. |
| (2) | The Overlook at the Rim borrower incurred mezzanine debt with a balance of $5,000,000 as of the Cut-off Date. The total debt Cut-off Date LTV ratio is 70.0%, the total debt U/W NCF DSCR is 2.44x based on the 4.650% initial interest rate and the total debt U/W NCF debt yield is 11.6%. The maturity date for the mezzanine debt is July 1, 2016. If the mezzanine debt is not retired on or before December 31, 2011, the interest rate on the mezzanine debt increases from 4.650% to 10.000%. The total debt U/W NCF DSCR is 1.95x based on the 10.000% interest rate. In addition, if the mezzanine debt is not retired on or before December 31, 2011, all excess cash flow after all debt service payments will be applied toward amortizing the mezzanine debt. |
| (3) | The MiniMed escrow shall be applied toward the borrower’s obligation to pay for a construction allowance as outlined in the MiniMed Distribution Center lease. |
| (4) | Property was acquired in February 2011, therefore historical operating statements were not available. |
The Overlook at the Rim mortgage loan is secured by a first mortgage encumbering a three-story office building containing approximately 145,025 square feet, situated on 13.4 acres located in San Antonio, Texas (the “Overlook at the Rim Property”). The Overlook at the Rim Property, which was constructed in 2008, is located within The Rim, an approximate three million square foot mixed use development, approximately 18 miles northwest of San Antonio central business district. The Overlook at the Rim Property is 100.0% occupied by MiniMed Distribution Corp., a wholly owned subsidiary of Medtronics, Inc., with a lease that expires on October 31, 2020, with two, five-year renewal options.
THE INFORMATION IN THIS STRUCTURAL AND COLLATERAL TERM SHEET IS NOT COMPLETE AND MAY BE AMENDED PRIOR TO THE TIME OF SALE. THIS TERM SHEET IS NOT AN OFFER TO SELL THESE SECURITIES AND IT IS NOT A SOLICITATION OF AN OFFER TO BUY THESE SECURITIES IN ANY JURISDICTION WHERE THE OFFER OR SALE IS NOT PERMITTED.
116
| OVERLOOK AT THE RIM |
The following table presents certain information relating to the tenancies at the Overlook at the Rim Property:
Major Tenant
| Tenant Name | Credit Rating (Fitch/ Moody’s/ S&P)(1) | Tenant NRSF | % of NRSF | Annual U/W Base Rent PSF | Annual U/W Base Rent | % of Total Annual U/W Base Rent | Lease Expiration Date | ||||||
| Major Tenant | |||||||||||||
| MiniMed Distribution Corporation | NR/A1/AA- | 145,025 | 100.0% | $19.00 | $2,755,475 | 100.0% | 10/31/2020(2) | ||||||
| Total Major Tenant - Collateral | 145,025 | 100.0% | $19.00 | $2,755,475 | 100.0% | ||||||||
| (1) | Certain ratings are those of the parent company whether or not the parent guarantees the lease. |
| (2) | The tenant has a one-time option to terminate 29,005 square feet effective October 2014 with nine months prior notice. |
The following table presents certain information relating to the lease rollover schedule at the Overlook at the Rim Property:
Lease Expiration Schedule*
Year Ending December 31, | No. of Leases Expiring | Expiring NRSF | % of Total NRSF | Cumulative of Total NRSF | Cumulative % of Total NRSF | Annual U/W Base Rent | Annual U/W Base Rent PSF |
| MTM | 0 | 0 | 0.0% | 0 | 0.0% | $0 | $0.00 |
| 2011 | 0 | 0 | 0.0% | 0 | 0.0% | $0 | $0.00 |
| 2012 | 0 | 0 | 0.0% | 0 | 0.0% | $0 | $0.00 |
| 2013 | 0 | 0 | 0.0% | 0 | 0.0% | $0 | $0.00 |
| 2014 | 0 | 0 | 0.0% | 0 | 0.0% | $0 | $0.00 |
| 2015 | 0 | 0 | 0.0% | 0 | 0.0% | $0 | $0.00 |
| 2016 | 0 | 0 | 0.0% | 0 | 0.0% | $0 | $0.00 |
| 2017 | 0 | 0 | 0.0% | 0 | 0.0% | $0 | $0.00 |
| 2018 | 0 | 0 | 0.0% | 0 | 0.0% | $0 | $0.00 |
| 2019 | 0 | 0 | 0.0% | 0 | 0.0% | $0 | $0.00 |
| 2020 | 1 | 145,025 | 100.0% | 145,025 | 100.0% | $2,755,475 | $19.00 |
| 2021 | 0 | 0 | 0.0% | 145,025 | 100.0% | $0 | $0.00 |
| Thereafter | 0 | 0 | 0.0% | 145,025 | 100.0% | $0 | $0.00 |
| Vacant | 0 | 0 | 0.0% | 145,025 | 100.0% | $0 | $0.00 |
| Total / Weighted Average | 1 | 145,025 | 100.0% | $2,755,475 | $19.00 |
| * Source: Information obtained from underwritten rent roll. |
The following table presents historical occupancy percentages at the Overlook at the Rim Property:
Historical Occupancy Percentages*
12/31/2008 | 12/31/2009 | 12/31/2010 | ||
| NAV | 100% | 100% |
| * | Source: Information obtained from borrower rent roll. MiniMed Distribution Corp.’s lease commenced on October 27, 2009. |
THE INFORMATION IN THIS STRUCTURAL AND COLLATERAL TERM SHEET IS NOT COMPLETE AND MAY BE AMENDED PRIOR TO THE TIME OF SALE. THIS TERM SHEET IS NOT AN OFFER TO SELL THESE SECURITIES AND IT IS NOT A SOLICITATION OF AN OFFER TO BUY THESE SECURITIES IN ANY JURISDICTION WHERE THE OFFER OR SALE IS NOT PERMITTED.
117
| OVERLOOK AT THE RIM |
The following table presents certain information relating to the Underwritten Net Cash Flow at the Overlook at the Rim Property:
Cash Flow Analysis
U/W(1) | U/W $ per SF | ||||
| Base Rent | $2,755,475 | $19.00 | |||
| Total Reimbursables | 1,672,900 | 11.54 | |||
| Other Income | 0 | 0.00 | |||
| Less Vacancy & Credit Loss | (44,284) | (0.31) | |||
| Effective Gross Income | $4,384,091 | $30.23 | |||
| Total Operating Expenses | $1,690,446 | $11.66 | |||
| Net Operating Income | $2,693,646 | $18.57 | |||
| TI/LC | 0 | 0.00 | |||
| Capital Expenditures | 36,256 | 0.25 | |||
| Net Cash Flow | $2,657,389 | $18.32 | |||
| NOI DSCR | 3.17x | ||||
| NCF DSCR | 3.12x | ||||
| NOI DY | 15.0% | ||||
| NCF DY | 14.8% |
| (1) | Property was acquired in February 2011; therefore, historical operating statements were not available. |
THE INFORMATION IN THIS STRUCTURAL AND COLLATERAL TERM SHEET IS NOT COMPLETE AND MAY BE AMENDED PRIOR TO THE TIME OF SALE. THIS TERM SHEET IS NOT AN OFFER TO SELL THESE SECURITIES AND IT IS NOT A SOLICITATION OF AN OFFER TO BUY THESE SECURITIES IN ANY JURISDICTION WHERE THE OFFER OR SALE IS NOT PERMITTED.
118
(THIS PAGE INTENTIONALLY LEFT BLANK)
119
| 8301 Professional Place | |||||||
| Loan Information | Property Information | ||||||
| Mortgage Loan Seller: | The Royal Bank of Scotland | Single Asset/Portfolio: | Single Asset | ||||
| Credit Assessment (Fitch/Moody’s): | NAP | Property Type: | Office | ||||
| Original Principal Balance: | $16,310,000 | Specific Property Type: | Suburban | ||||
| Cut-off Date Principal Balance: | $16,280,823 | Location: | Landover, MD | ||||
| % of Initial Pool Balance: | 1.5% | Size: | 137,000 SF | ||||
| Loan Purpose: | Acquisition | Cut-off Date Principal | |||||
| Borrower Name: | Metro East LLC | Balance Per Unit/SF: | $118.84 | ||||
| Sponsor: | William P. Angrick, III | Year Built/Renovated: | 1979/2007 | ||||
| Mortgage Rate: | 6.100% | Occupancy %: | 97.2% | ||||
| Note Date: | August 22, 2011 | Occupancy % Source Date: | June 1, 2011 | ||||
| Anticipated Repayment Date: | NAP | Title Vesting: | Fee | ||||
| Maturity Date: | September 1, 2021 | Property Manager: | Advance Realty Management, Inc. | ||||
| IO Period: | None | ||||||
| Loan Term (Original): | 120 months | 3rd Most Recent NOI (As of): | $2,067,584 (12/31/2009) | ||||
| Seasoning: | 2 months | 2nd Most Recent NOI (As of): | $2,120,509 (12/31/2010) | ||||
| Amortization Term (Original): | 360 months | Most Recent NOI (As of): | $2,257,154 (TTM 5/31/2011) | ||||
| Loan Amortization Type: | Amortizing Balloon | ||||||
| Interest Accrual Method: | Actual/360 | U/W Revenues: | $3,262,714 | ||||
| Call Protection: | L(26),D(90),O(4) | U/W Expenses: | $1,303,297 | ||||
| Lockbox Type: | Hard/Springing Cash Management | U/W NOI: | $1,959,417 | ||||
| Additional Debt: | No | U/W NCF: | $1,788,062 | ||||
| Additional Debt Type: | NAP | U/W NOI DSCR: | 1.65x | ||||
| U/W NCF DSCR: | 1.51x | ||||||
| Escrows and Reserves: | U/W NOI Debt Yield: | 12.0% | |||||
| U/W NCF Debt Yield: | 11.0% | ||||||
Type: | Initial | Monthly | Cap (If Any) | As-Is Appraised Value: | $23,800,000 | ||
| Taxes | $22,222 | $22,222 | NAP | As-Is Appraisal Valuation Date: | July 8, 2011 | ||
| Insurance | $4,875 | $2,437 | NAP | Cut-off Date LTV Ratio: | 68.4% | ||
| Capital Expenditures | $0 | $2,854 | NAP | LTV Ratio at Maturity or ARD: | 58.3% | ||
| TI/LC | $0 | $11,417 | NAP | ||||
The 8301 Professional Place mortgage loan is secured by a first mortgage encumbering a 137,000 square foot Class B suburban office building located in Landover, Maryland (the “8301 Professional Place Property”). The 8301 Professional Place Property was 97.2% leased to 4 tenants as of June 1, 2011. The improvements consist of one two-story building with a total net rentable area of 137,000 square feet. The 8301 Professional Place Property was constructed in 1979. From 2004 to 2007, approximately $2.7 million was spent renovating what was once a single tenant building, replacing the roof, and upgrading the HVAC system.
THE INFORMATION IN THIS STRUCTURAL AND COLLATERAL TERM SHEET IS NOT COMPLETE AND MAY BE AMENDED PRIOR TO THE TIME OF SALE. THIS TERM SHEET IS NOT AN OFFER TO SELL THESE SECURITIES AND IT IS NOT A SOLICITATION OF AN OFFER TO BUY THESE SECURITIES IN ANY JURISDICTION WHERE THE OFFER OR SALE IS NOT PERMITTED.
120
| 8301 PROFESSIONAL PLACE |
The following table presents certain information relating to the tenancies at the 8301 Professional Place Property:
Major Tenants
| Tenant Name | Credit Rating (Fitch/ Moody’s/ S&P)(1) | Tenant NRSF | % of NRSF | Annual U/W Base Rent PSF | Annual U/W Base Rent | % of Total Annual U/W Base Rent | Lease Expiration Date | |
| Major Tenants | ||||||||
| The Stop & Shop Supermarket | BBB/Baa3/BBB | 53,556 | 39.1% | $24.92 | $1,334,851 | 39.7% | 8/31/2016 | |
| Epilepsy Foundation of America | NR/NR/NR | 32,647 | 23.8% | $24.63 | $804,210 | 23.9% | 9/30/2016 | |
| The MITRE Corporation | NR/NR/NR | 30,940 | 22.6% | $26.45 | $818,346 | 24.4% | 10/13/2017 | |
| Genon Mid-Atlantic LLC | BB-/B3/B | 16,015 | 11.7% | $25.04 | $401,052 | 11.9% | 3/31/2017 | |
| Occupied Collateral Total | 133,158 | 97.2% | $25.22 | $3,358,459 | 100.0% | |||
| Vacant Space | 3,842 | 2.8% | ||||||
| Collateral Total | 137,000 | 100.0% | ||||||
| (1) | Certain ratings are those of the parent company whether or not the parent guarantees the lease. |
The following table presents certain information relating to the lease rollover schedule at the 8301 Professional Place Property:
Lease Expiration Schedule*
Year Ending December 31, | No. of Leases Expiring | Expiring NRSF | % of Total NRSF | Cumulative of Total NRSF | Cumulative % of Total NRSF | Annual U/W Base Rent | Annual U/W Base Rent PSF |
| MTM | 0 | 0 | 0.0% | 0 | 0.0% | $0 | $0.00 |
| 2011 | 0 | 0 | 0.0% | 0 | 0.0% | $0 | $0.00 |
| 2012 | 0 | 0 | 0.0% | 0 | 0.0% | $0 | $0.00 |
| 2013 | 0 | 0 | 0.0% | 0 | 0.0% | $0 | $0.00 |
| 2014 | 0 | 0 | 0.0% | 0 | 0.0% | $0 | $0.00 |
| 2015 | 0 | 0 | 0.0% | 0 | 0.0% | $0 | $0.00 |
| 2016 | 2 | 86,203 | 62.9% | 86,203 | 62.9% | $2,139,061 | $24.81 |
| 2017 | 2 | 46,955 | 34.3% | 133,158 | 97.2% | $1,219,398 | $25.97 |
| 2018 | 0 | 0 | 0.0% | 133,158 | 97.2% | $0 | $0.00 |
| 2019 | 0 | 0 | 0.0% | 133,158 | 97.2% | $0 | $0.00 |
| 2020 | 0 | 0 | 0.0% | 133,158 | 97.2% | $0 | $0.00 |
| 2021 | 0 | 0 | 0.0% | 133,158 | 97.2% | $0 | $0.00 |
| Thereafter | 0 | 0 | 0.0% | 133,158 | 97.2% | $0 | $0.00 |
| Vacant | 0 | 3,842 | 2.8% | 137,000 | 100.0% | $0 | $0.00 |
| Total / Weighted Average | 4 | 137,000 | 100.0% | $3,358,459 | $25.22 |
* Source: Information obtained from borrower rent roll.
The following table presents historical occupancy percentages at the 8301 Professional Place Property:
Historical Occupancy Percentages*
12/31/2008(1) | 12/31/2009(1) | 12/20/2010 | ||
| NAV | NAV | 97% | ||
| * Source: Information obtained from borrower rent roll. | ||||
(1) Historical figures are not available as the 8301 Professional Place Property was acquired by the borrower in August 2011. | ||||
THE INFORMATION IN THIS STRUCTURAL AND COLLATERAL TERM SHEET IS NOT COMPLETE AND MAY BE AMENDED PRIOR TO THE TIME OF SALE. THIS TERM SHEET IS NOT AN OFFER TO SELL THESE SECURITIES AND IT IS NOT A SOLICITATION OF AN OFFER TO BUY THESE SECURITIES IN ANY JURISDICTION WHERE THE OFFER OR SALE IS NOT PERMITTED.
121
| 8301 PROFESSIONAL PLACE |
The following table presents certain information relating to the historical operating performance and the Underwritten Net Cash Flow at the 8301 Professional Place Property:
Cash Flow Analysis
| 2009 | 2010 | TTM 5/31/2011 | U/W | U/W $ per SF | ||||||
| Base Rent | $3,069,474 | $3,191,649 | $3,241,547 | $3,358,459 | $24.51 | |||||
| Grossed Up Vacant Space | 0 | 0 | 0 | 84,524 | 0.62 | |||||
| Total Reimbursables | 235,001 | 272,556 | 279,762 | 257,286 | 1.88 | |||||
| Other Income | 16,404 | 21,845 | 6,477 | 6,477 | 0.05 | |||||
| Less Vacancy & Credit Loss | 0 | (3,252) | 0 | (444,032) | (3.24) | |||||
| Effective Gross Income | $3,320,879 | $3,482,798 | $3,527,786 | $3,262,714 | $23.82 | |||||
| Total Operating Expenses | $1,253,295 | $1,362,289 | $1,270,632 | $1,303,297 | $9.51 | |||||
| Net Operating Income | $2,067,584 | $2,120,509 | $2,257,154 | $1,959,417 | $14.30 | |||||
| TI/LC | 0 | 0 | 0 | 137,105 | 1.00 | |||||
| Capital Expenditures | 0 | 0 | 0 | 34,250 | 0.25 | |||||
| Net Cash Flow | $2,067,584 | $2,120,509 | $2,257,154 | $1,788,062 | $13.05 | |||||
| NOI DSCR | 1.74x | 1.79x | 1.90x | 1.65x | ||||||
| NCF DSCR | 1.74x | 1.79x | 1.90x | 1.51x | ||||||
| NOI DY | 12.7% | 13.0% | 13.9% | 12.0% | ||||||
| NCF DY | 12.7% | 13.0% | 13.9% | 11.0% |
THE INFORMATION IN THIS STRUCTURAL AND COLLATERAL TERM SHEET IS NOT COMPLETE AND MAY BE AMENDED PRIOR TO THE TIME OF SALE. THIS TERM SHEET IS NOT AN OFFER TO SELL THESE SECURITIES AND IT IS NOT A SOLICITATION OF AN OFFER TO BUY THESE SECURITIES IN ANY JURISDICTION WHERE THE OFFER OR SALE IS NOT PERMITTED.
122
| WFRBS Commercial Mortgage Trust 2011-C5 | Transaction Contact Information |
VI. Transaction Contact Information
Questions regarding this Structural and Collateral Term Sheet may be directed to any of the following individuals:
| Wells Fargo Securities, LLC | RBS Securities Inc. | ||
| Kara McShane | Tel. (212) 214-5617 | Craig Sedmak | Tel. (203) 897-2900 |
Fax (212) 214-8970 | Fax (203) 873-5011 | ||
| Brigid Mattingly | Tel. (312) 269-3062 | Adam Ansaldi | Tel. (203) 897-0881 |
| Fax (312) 658-0140 | Fax (203) 873-3542 | ||
| Matthew Orrino | Tel. (212) 214-5608 | Jim Barnard | Tel. (203) 897-4417 |
| Fax (212) 214-8970 | Fax (203) 873-4310 | ||
THE INFORMATION IN THIS STRUCTURAL AND COLLATERAL TERM SHEET IS NOT COMPLETE AND MAY BE AMENDED PRIOR TO THE TIME OF SALE. THIS TERM SHEET IS NOT AN OFFER TO SELL THESE SECURITIES AND IT IS NOT A SOLICITATION OF AN OFFER TO BUY THESE SECURITIES IN ANY JURISDICTION WHERE THE OFFER OR SALE IS NOT PERMITTED.
123