Exhibit 99.2

CION Investment Corporation Third Quarter 2024 Earnings Presentation

Disclosures and Forward - Looking Statements 2 The information contained in this earnings presentation should be viewed in conjunction with the earnings conference call of CION Investment Corporation (NYSE : CION) (“CION” or the “Company”) held on Thursday, November 7 , 2024 as well as the Company’s Quarterly Report on Form 10 - Q for the quarter ended September 30 , 2024 that was filed with the Securities and Exchange Commission (the “SEC”) on November 7 , 2024 . The information contained herein may not be used, reproduced or distributed to others, in whole or in part, for any other purpose without the prior written consent of the Company . This earnings presentation may contain forward - looking statements that involve substantial risks and uncertainties, including the impact of inflation and high interest rates on the business, future operating results, access to capital and liquidity of the Company and its portfolio companies . You can identify these statements by the use of forward - looking terminology such as “may,” “will,” “should,” “expect,” “anticipate,” “project,” “target,” “estimate,” “intend,” “continue,” or “believe” or the negatives thereof or other variations thereon or comparable terminology, including references to assumptions, forecasts of future results, shareholder diversification, institutional research coverage and availability and access to capital . You should read statements that contain these words carefully because they discuss the Company’s plans, strategies, prospects and expectations concerning its business, operating results, financial condition and other similar matters . These statements represent the Company’s belief regarding future events that, by their nature, are uncertain and outside of the Company’s control, such as the price at which the Company’s shares of common stock will trade on the NYSE . Any forward - looking statement made by the Company in this earnings presentation speaks only as of the date on which the Company makes it . Factors or events that could cause the Company’s actual results to differ, possibly materially from its expectations, include, but are not limited to, the risks, uncertainties and other factors the Company identifies in the sections entitled “Risk Factors” and “Forward - Looking Statements” in filings the Company makes with the SEC, and it is not possible for the Company to predict or identify all of them . The Company undertakes no obligation to update or revise publicly any forward - looking statements, whether as a result of new information, future events or otherwise, except as required by law . This earnings presentation does not constitute a prospectus and should under no circumstances be understood as an offer to sell or the solicitation of an offer to buy the Company’s common stock or any other securities nor will there be any sale of common stock or any other securities referred to in this earnings presentation in any state or jurisdiction in which such offer, solicitation or sale would be unlawful prior to the registration or qualification under the securities laws of such state or jurisdiction . Nothing in these materials should be construed as a recommendation to invest in any securities that may be issued by the Company or as legal, accounting or tax advice . An investment in securities of the type described herein presents certain risks . The Company is managed by CION Investment Management, LLC, an affiliate of the Company . Nothing contained herein shall be relied upon as a promise or representation whether as to past or future performance . The information contained in this earnings presentation is summary information that is intended to be considered in the context of other public announcements that the Company may make, by press release or otherwise, from time to time . The Company undertakes no duty or obligation to publicly update or revise the information contained in this earnings presentation, except as required by law . These materials contain information about the Company, certain of its personnel and affiliates and its historical performance . You should not view information related to past performance of the Company as indicative of its future results, the achievement of which cannot be assured . Past performance does not guarantee future results, which may vary . The value of investments and the income derived from investments will fluctuate and can go down as well as up . A loss of principal may occur .
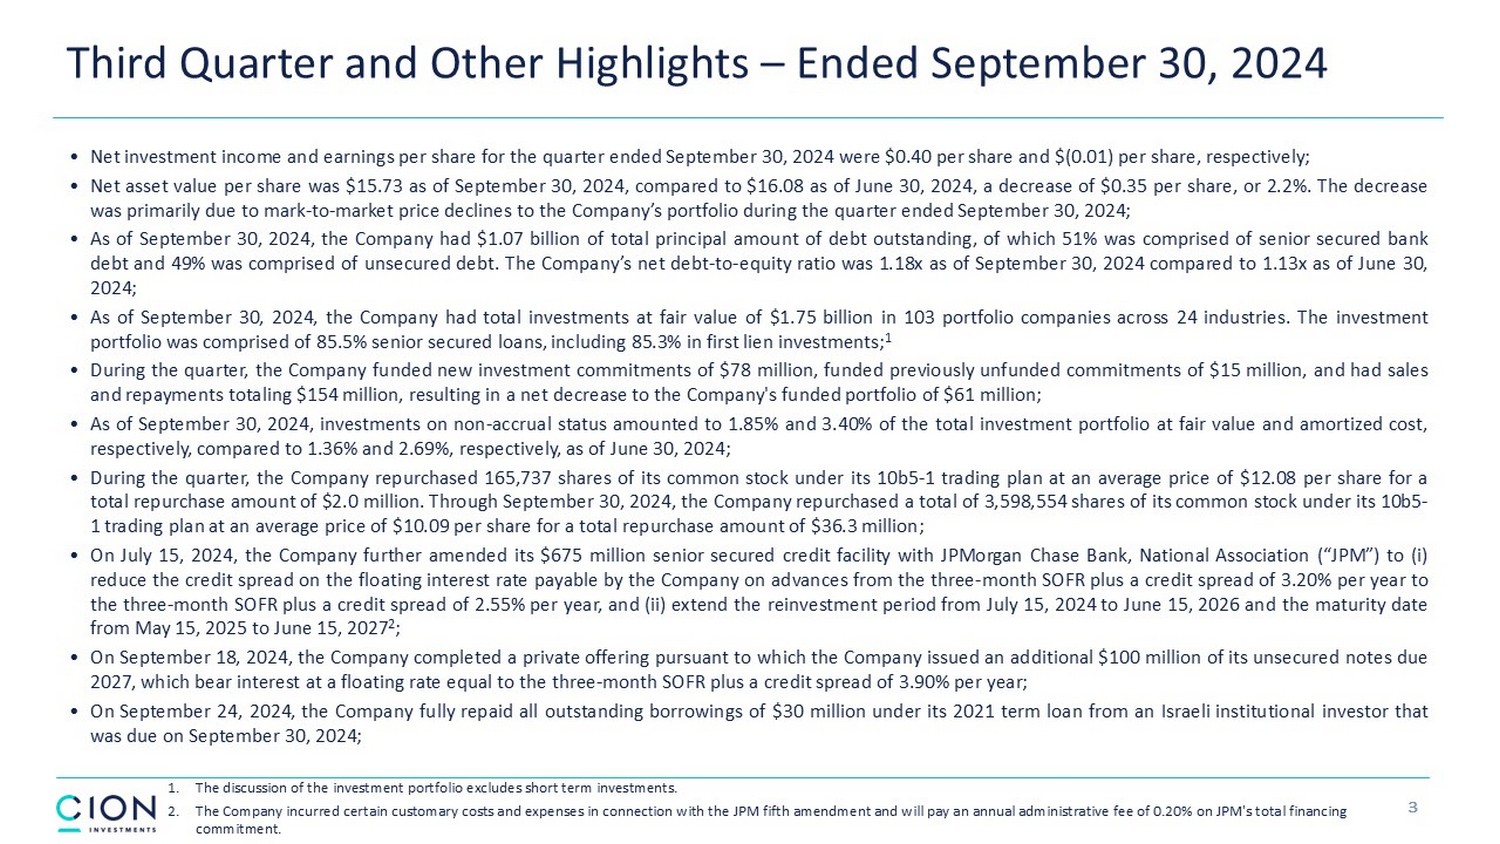
3 1. The discussion of the investment portfolio excludes short term investments. 2. The Company incurred certain customary costs and expenses in connection with the JPM fifth amendment and will pay an annual a dmi nistrative fee of 0.20% on JPM's total financing commitment. Third Quarter and Other Highlights – Ended September 30, 2024 • Net investment income and earnings per share for the quarter ended September 30 , 2024 were $ 0 . 40 per share and $ ( 0 . 01 ) per share, respectively ; • Net asset value per share was $ 15 . 73 as of September 30 , 2024 , compared to $ 16 . 08 as of June 30 , 2024 , a decrease of $ 0 . 35 per share, or 2 . 2 % . The decrease was primarily due to mark - to - market price declines to the Company’s portfolio during the quarter ended September 30 , 2024 ; • As of September 30 , 2024 , the Company had $ 1 . 07 billion of total principal amount of debt outstanding, of which 51 % was comprised of senior secured bank debt and 49 % was comprised of unsecured debt . The Company’s net debt - to - equity ratio was 1 . 18 x as of September 30 , 2024 compared to 1 . 13 x as of June 30 , 2024 ; • As of September 30 , 2024 , the Company had total investments at fair value of $ 1 . 75 billion in 103 portfolio companies across 24 industries . The investment portfolio was comprised of 85 . 5 % senior secured loans, including 85 . 3 % in first lien investments ; 1 • During the quarter, the Company funded new investment commitments of $ 78 million, funded previously unfunded commitments of $ 15 million, and had sales and repayments totaling $ 154 million, resulting in a net decrease to the Company's funded portfolio of $ 61 million ; • As of September 30 , 2024 , investments on non - accrual status amounted to 1 . 85 % and 3 . 40 % of the total investment portfolio at fair value and amortized cost, respectively, compared to 1 . 36 % and 2 . 69 % , respectively, as of June 30 , 2024 ; • During the quarter, the Company repurchased 165 , 737 shares of its common stock under its 10 b 5 - 1 trading plan at an average price of $ 12 . 09 per share for a total repurchase amount of $ 2 . 0 million . Through September 30 , 2024 , the Company repurchased a total of 3 , 598 , 554 shares of its common stock under its 10 b 5 - 1 trading plan at an average price of $ 10 . 09 per share for a total repurchase amount of $ 36 . 3 million ; • On July 15 , 2024 , the Company further amended its $ 675 million senior secured credit facility with JPMorgan Chase Bank, National Association (“JPM”) to (i) reduce the credit spread on the floating interest rate payable by the Company on advances from the three - month SOFR plus a credit spread of 3 . 20 % per year to the three - month SOFR plus a credit spread of 2 . 55 % per year, and (ii) extend the reinvestment period from July 15 , 2024 to June 15 , 2026 and the maturity date from May 15 , 2025 to June 15 , 2027 2 ; • On September 18 , 2024 , the Company completed a private offering pursuant to which the Company issued an additional $ 100 million of its unsecured notes due 2027 , which bear interest at a floating rate equal to the three - month SOFR plus a credit spread of 3 . 90 % per year ; • On September 24 , 2024 , the Company fully repaid all outstanding borrowings of $ 30 million under its 2021 term loan from an Israeli institutional investor that was due on September 30 , 2024 ;

4 Third Quarter and Other Highlights – Ended September 30, 2024 • On September 30 , 2024 , the Company entered into a 3 - year unsecured term loan agreement with an Israeli institutional investor under which the Company borrowed $ 30 million, which bears interest at a floating rate equal to the three - month SOFR plus a credit spread of 3 . 80 % per year ; and • On October 3 , 2024 , the Company completed a public baby bond offering in the U . S . pursuant to which the Company issued $ 172 . 5 million of its unsecured 7 . 50 % Notes due 2029 , which listed and commenced trading on the NYSE under the ticker symbol "CICB" on October 9 , 2024 . DISTRIBUTIONS • For the quarter ended September 30 , 2024 , the Company paid a quarterly base distribution totaling $ 19 . 2 million, or $ 0 . 36 per share ; and • On November 4 , 2024 , the Company’s co - chief executive officers declared a fourth quarter 2024 base distribution of $ 0 . 36 per share, payable on December 16 , 2024 to shareholders of record as of December 2 , 2024 .
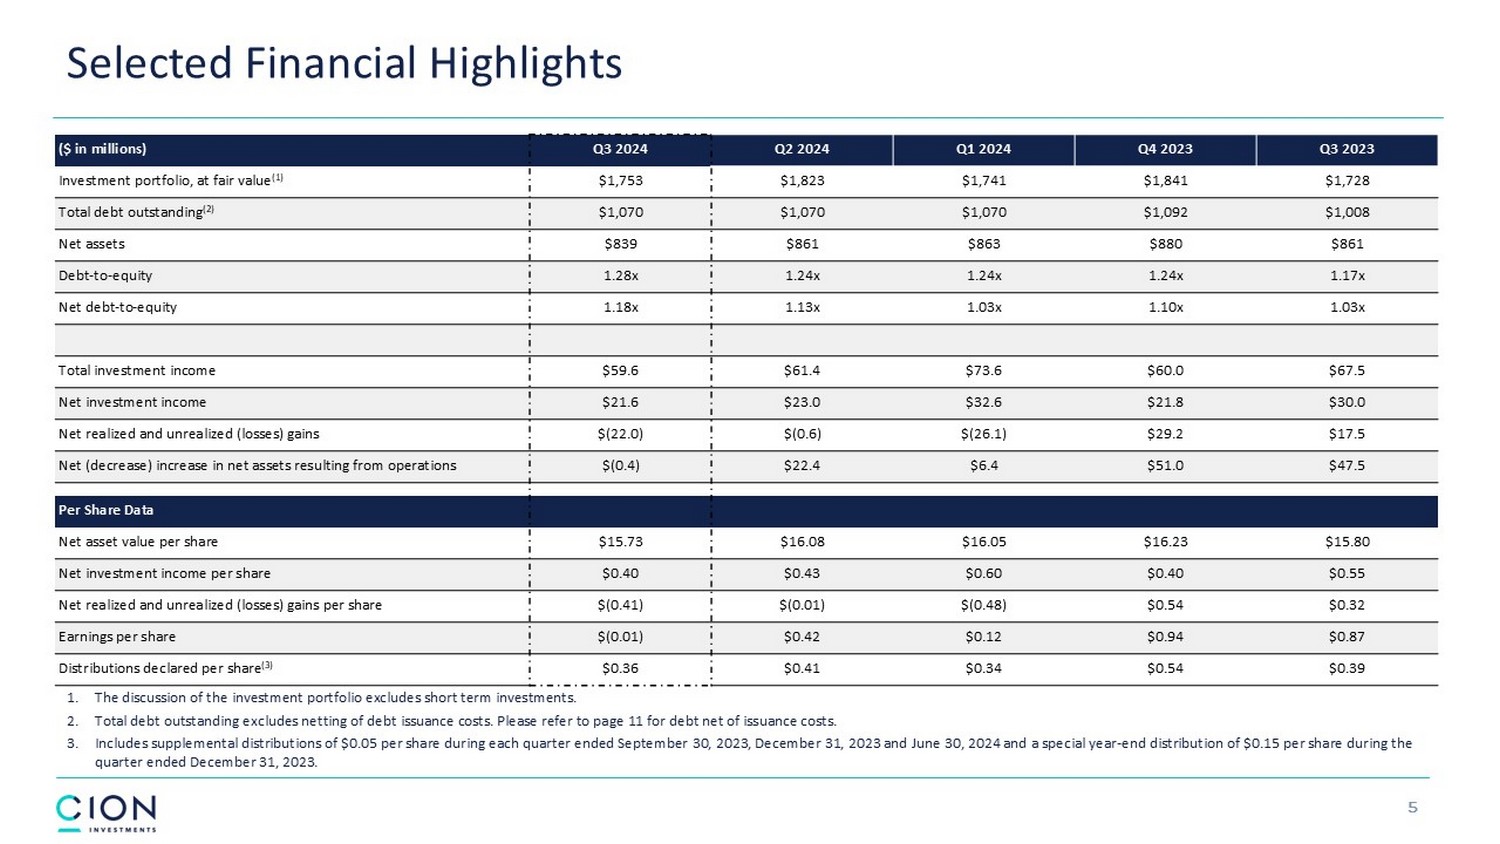
5 Selected Financial Highlights 1. The discussion of the investment portfolio excludes short term investments. 2. Total debt outstanding excludes netting of debt issuance costs. Please refer to page 11 for debt net of issuance costs. 3. Includes supplemental distributions of $ 0 . 05 per share during each quarter ended September 30 , 2023 , December 31 , 2023 and June 30 , 2024 and a special year - end distribution of $ 0 . 15 per share during the quarter ended December 31 , 2023 . Q3 2023 Q4 2023 Q1 2024 Q2 2024 Q3 2024 ($ in millions) $1,728 $1,841 $1,741 $1,823 $1,753 Investment portfolio, at fair value (1) $1,008 $1,092 $1,070 $1,070 $1,070 Total debt outstanding (2) $861 $880 $863 $861 $839 Net assets 1.17x 1.24x 1.24x 1.24x 1.28x Debt - to - equity 1.03x 1.10x 1.03x 1.13x 1.18x Net debt - to - equity $67.5 $60.0 $73.6 $61.4 $59.6 Total investment income $30.0 $21.8 $32.6 $23.0 $21.6 Net investment income $17.5 $29.2 $(26.1) $(0.6) $(22.0) Net realized and unrealized (losses) gains $47.5 $51.0 $6.4 $22.4 $(0.4) Net (decrease) increase in net assets resulting from operations Per Share Data $15.80 $16.23 $16.05 $16.08 $15.73 Net asset value per share $0.55 $0.40 $0.60 $0.43 $0.40 Net investment income per share $0.32 $0.54 $(0.48) $(0.01) $(0.41) Net realized and unrealized (losses) gains per share $0.87 $0.94 $0.12 $0.42 $(0.01) Earnings per share $0.39 $0.54 $0.34 $0.41 $0.36 Distributions declared per share (3)
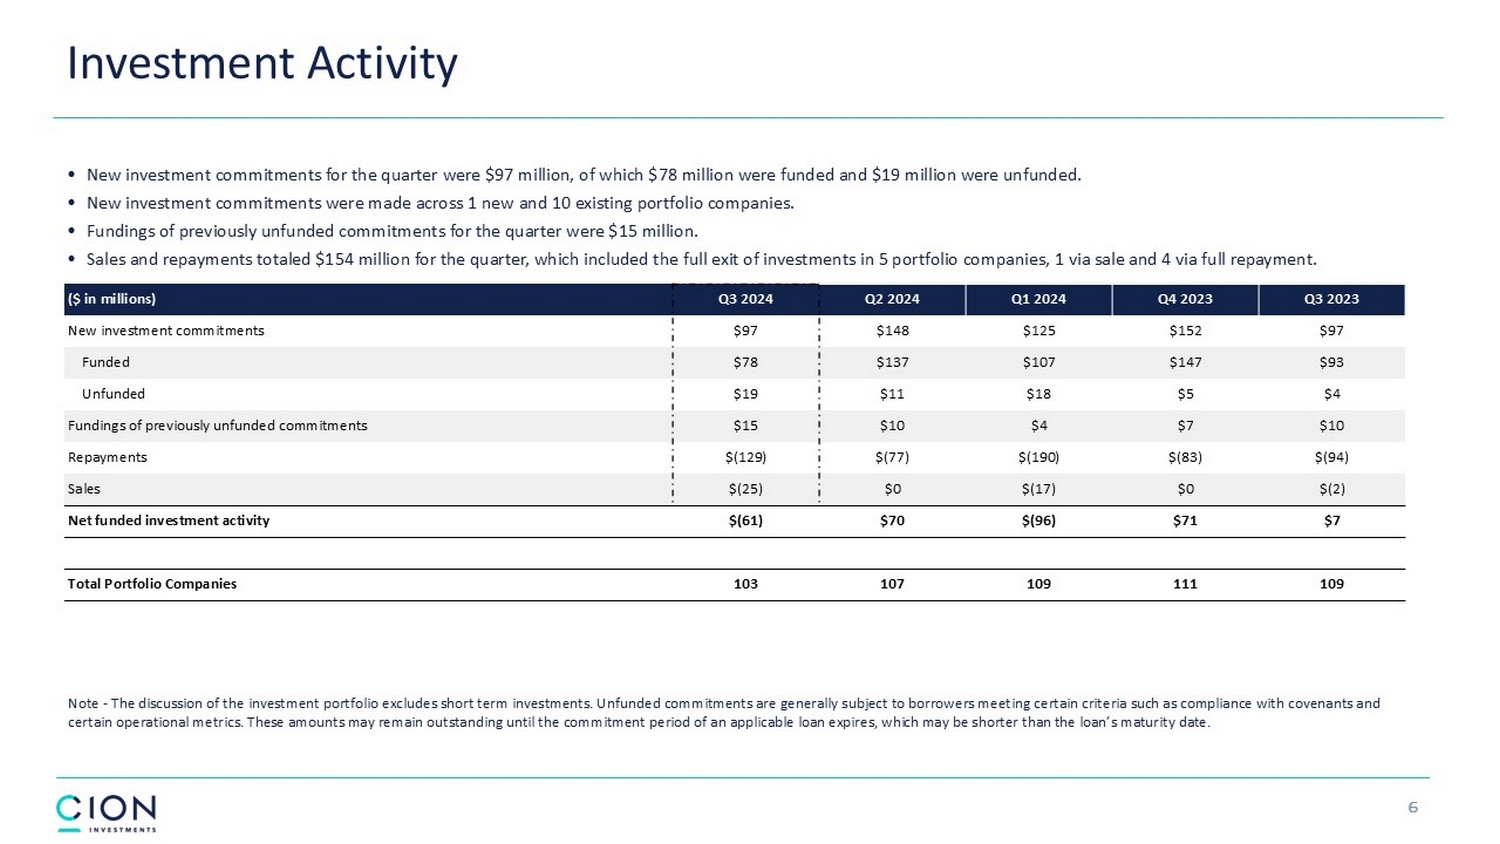
Investment Activity • New investment commitments for the quarter were $97 million, of which $78 million were funded and $19 million were unfunded. • New investment commitments were made across 1 new and 10 existing portfolio companies. • Fundings of previously unfunded commitments for the quarter were $15 million. • Sales and repayments totaled $154 million for the quarter, which included the full exit of investments in 5 portfolio compani es, 1 via sale and 4 via full repayment. Note - The discussion of the investment portfolio excludes short term investments. Unfunded commitments are generally subject to borrowers meeting certain criteria such as compliance with covenants and certain operational metrics. These amounts may remain outstanding until the commitment period of an applicable loan expires, whi ch may be shorter than the loan’s maturity date. 6 Q3 2023 Q4 2023 Q1 2024 Q2 2024 Q3 2024 ($ in millions) $97 $152 $125 $148 $97 New investment commitments $93 $147 $107 $137 $78 Funded $4 $5 $18 $11 $19 Unfunded $10 $7 $4 $10 $15 Fundings of previously unfunded commitments $(94) $(83) $(190) $(77) $(129) Repayments $(2) $0 $(17) $0 $(25) Sales $7 $71 $(96) $70 $(61) Net funded investment activity 109 111 109 107 103 Total Portfolio Companies
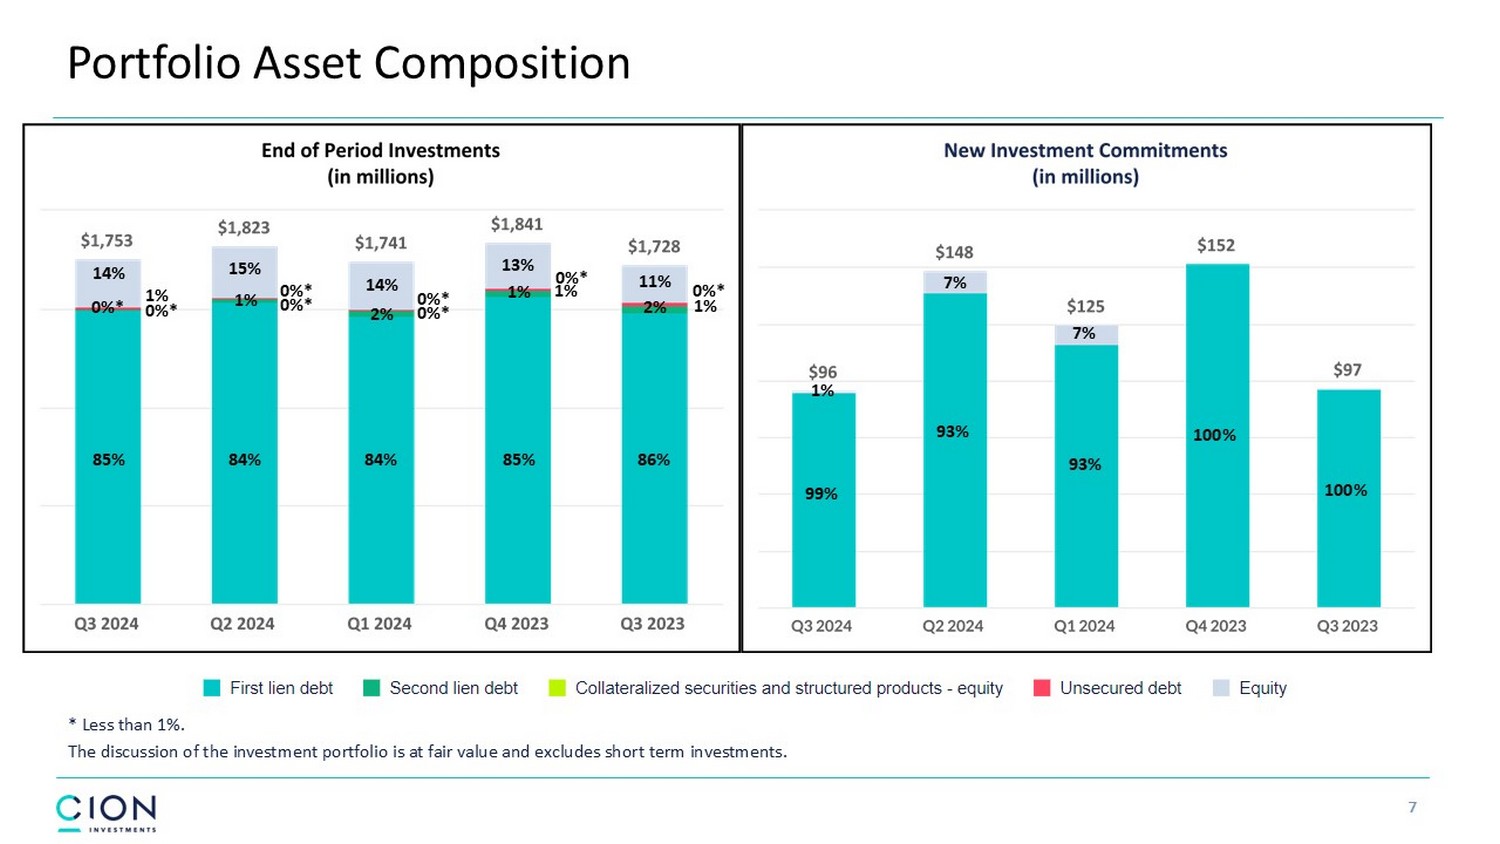
7 Portfolio Asset Composition * Less than 1%. The discussion of the investment portfolio is at fair value and excludes short term investments. 100% 100% 93% 7% 99% 1% 84% 14% 0%* 0%* 0%* 0%* 0%* 0%* 1% 1% 85% 1% 13% 86% 11% 2% 84% 1% 15% 14% 2% 1% 93% 7% 85% 0%* 0%*
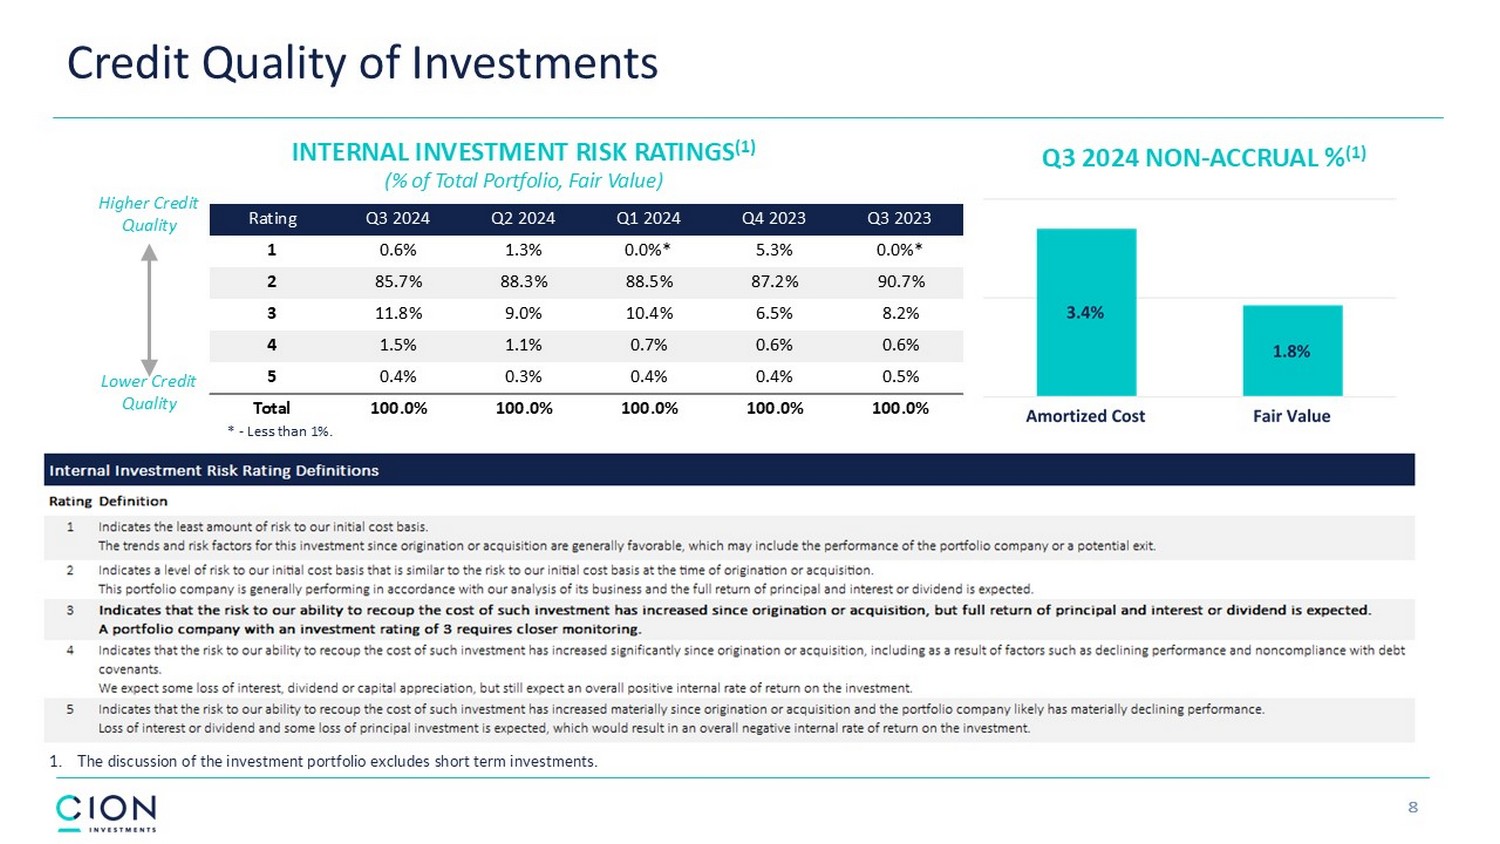
8 INTERNAL INVESTMENT RISK RATINGS (1) (% of Total Portfolio, Fair Value) Q3 2024 NON - ACCRUAL % (1) Higher Credit Quality Lower Credit Quality Credit Quality of Investments 1. The discussion of the investment portfolio excludes short term investments. * - Less than 1%. Q3 2023 Q4 2023 Q1 2024 Q2 2024 Q3 2024 Rating 0.0%* 5.3% 0.0%* 1.3% 0.6% 1 90.7% 87.2% 88.5% 88.3% 85.7% 2 8.2% 6.5% 10.4% 9.0% 11.8% 3 0.6% 0.6% 0.7% 1.1% 1.5% 4 0.5% 0.4% 0.4% 0.3% 0.4% 5 100.0% 100.0% 100.0% 100.0% 100.0% Total
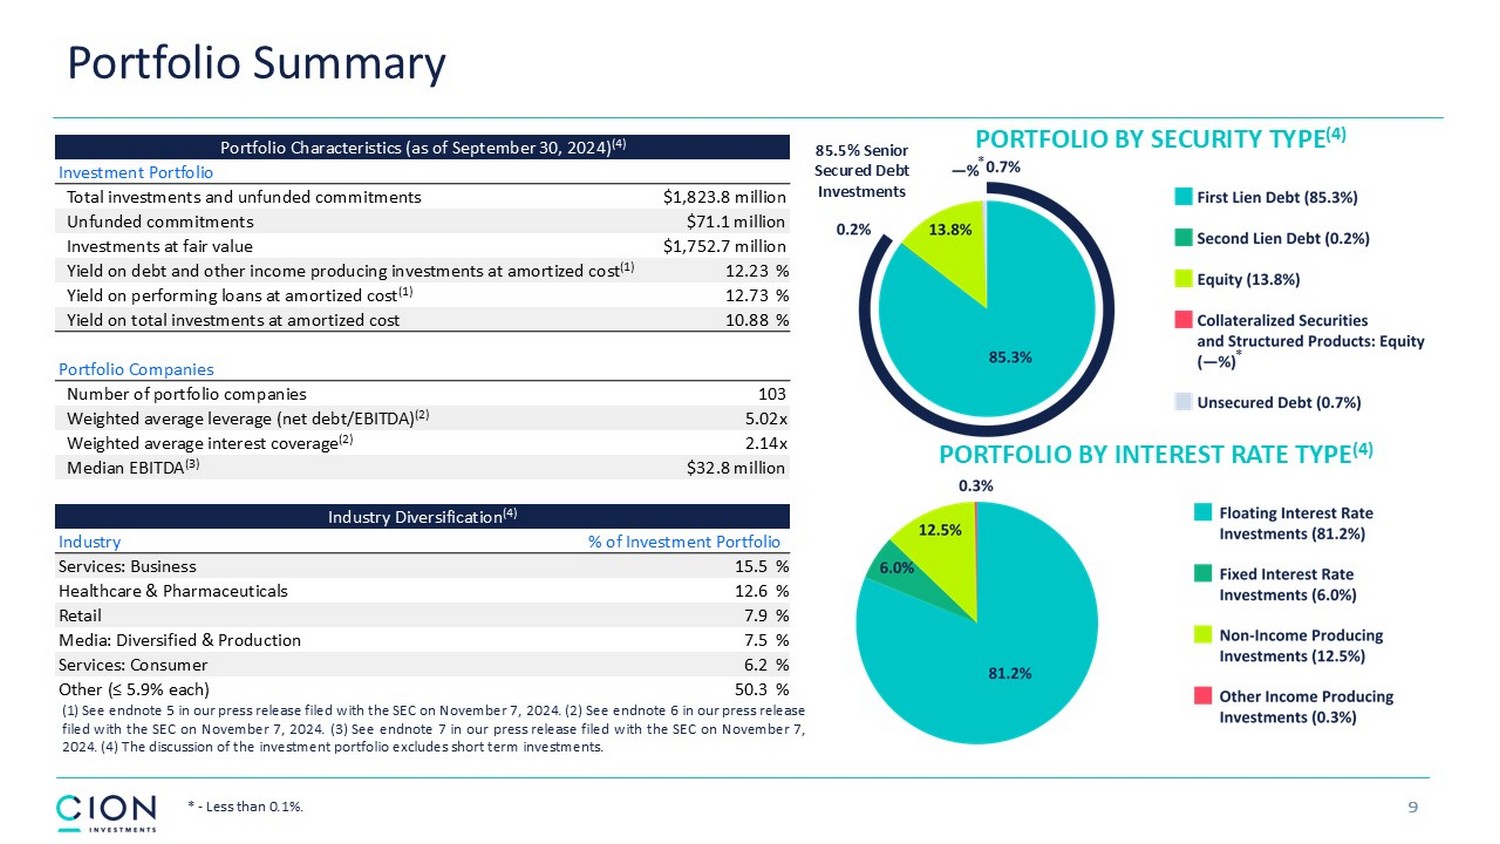
PORTFOLIO BY SECURITY TYPE (4) PORTFOLIO BY INTEREST RATE TYPE (4) Portfolio Summary 9 ( 1 ) See endnote 5 in our press release filed with the SEC on November 7 , 2024 . ( 2 ) See endnote 6 in our press release filed with the SEC on November 7 , 2024 . ( 3 ) See endnote 7 in our press release filed with the SEC on November 7 , 2024 . ( 4 ) The discussion of the investment portfolio excludes short term investments . Portfolio Characteristics (as of September 30, 2024) (4) Investment Portfolio $1,823.8 million Total investments and unfunded commitments $71.1 million Unfunded commitments $1,752.7 million Investments at fair value 12.23 % Yield on debt and other income producing investments at amortized cost (1) 12.73 % Yield on performing loans at amortized cost (1) 10.88 % Yield on total investments at amortized cost Portfolio Companies 103 Number of portfolio companies 5.02x Weighted average leverage (net debt/EBITDA) (2) 2.14x Weighted average interest coverage (2) $32.8 million Median EBITDA (3) Industry Diversification (4) % of Investment Portfolio Industry 15.5 % Services: Business 12.6 % Healthcare & Pharmaceuticals 7.9 % Retail 7.5 % Media: Diversified & Production 6.2 % Services: Consumer 50.3 % Other (≤ 5.9% each) 85.5% Senior Secured Debt Investments * - Less than 0.1%. * *
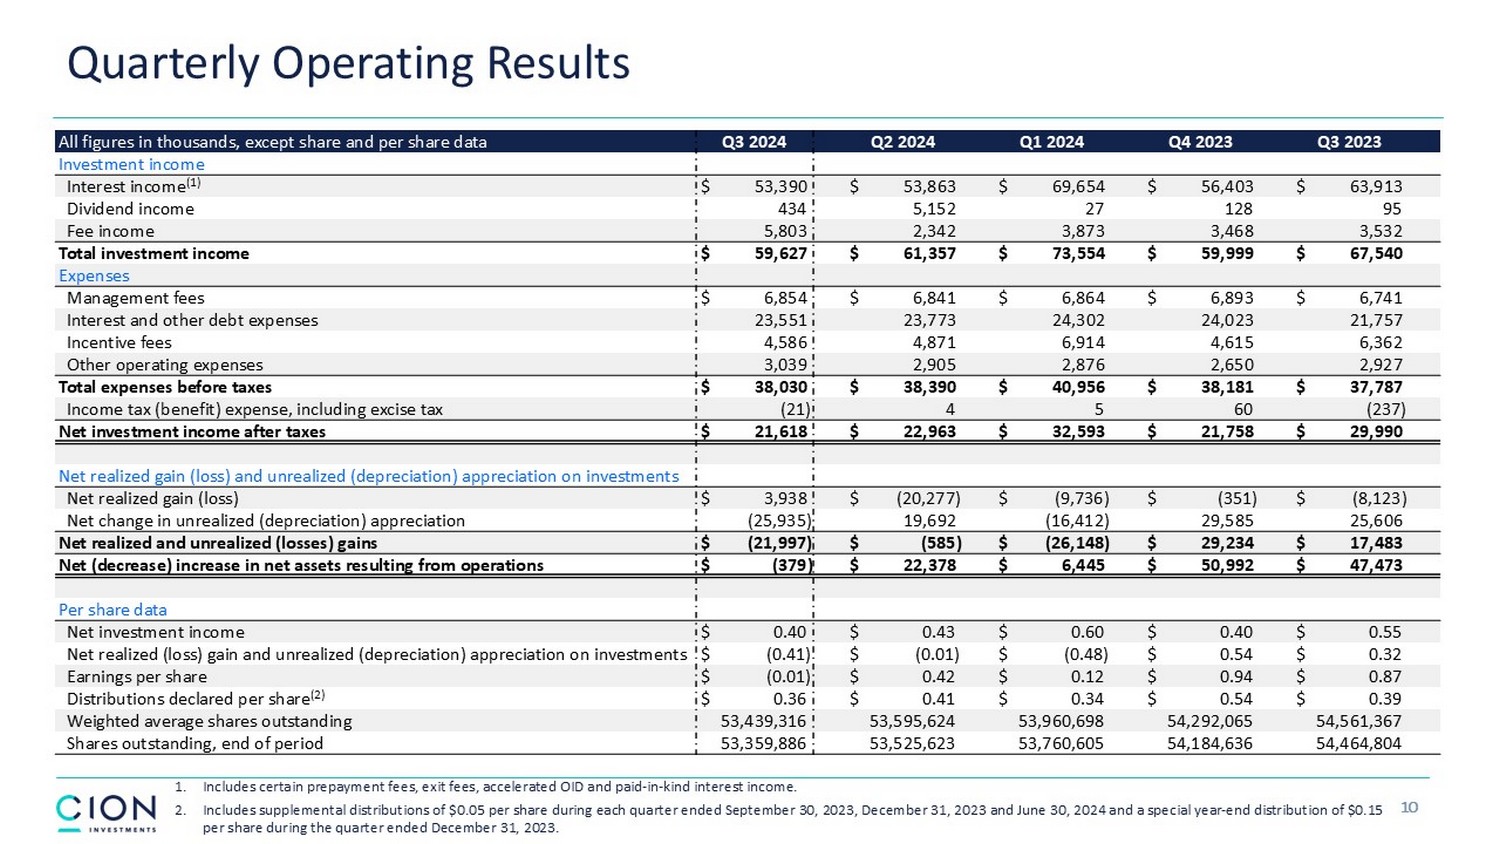
Quarterly Operating Results 10 Q3 2023 Q4 2023 Q1 2024 Q2 2024 Q3 2024 All figures in thousands, except share and per share data Investment income $ 63,913 $ 56,403 $ 69,654 $ 53,863 $ 53,390 Interest income (1) 95 128 27 5,152 434 Dividend income 3,532 3,468 3,873 2,342 5,803 Fee income $ 67,540 $ 59,999 $ 73,554 $ 61,357 $ 59,627 Total investment income Expenses $ 6,741 $ 6,893 $ 6,864 $ 6,841 $ 6,854 Management fees 21,757 24,023 24,302 23,773 23,551 Interest and other debt expenses 6,362 4,615 6,914 4,871 4,586 Incentive fees 2,927 2,650 2,876 2,905 3,039 Other operating expenses $ 37,787 $ 38,181 $ 40,956 $ 38,390 $ 38,030 Total expenses before taxes (237) 60 5 4 (21) Income tax (benefit) expense, including excise tax $ 29,990 $ 21,758 $ 32,593 $ 22,963 $ 21,618 Net investment income after taxes Net realized gain (loss) and unrealized (depreciation) appreciation on investments $ (8,123) $ (351) $ (9,736) $ (20,277) $ 3,938 Net realized gain (loss) 25,606 29,585 (16,412) 19,692 (25,935) Net change in unrealized (depreciation) appreciation $ 17,483 $ 29,234 $ (26,148) $ (585) $ (21,997) Net realized and unrealized (losses) gains $ 47,473 $ 50,992 $ 6,445 $ 22,378 $ (379) Net (decrease) increase in net assets resulting from operations Per share data $ 0.55 $ 0.40 $ 0.60 $ 0.43 $ 0.40 Net investment income $ 0.32 $ 0.54 $ (0.48) $ (0.01) $ (0.41) Net realized (loss) gain and unrealized (depreciation) appreciation on investments $ 0.87 $ 0.94 $ 0.12 $ 0.42 $ (0.01) Earnings per share $ 0.39 $ 0.54 $ 0.34 $ 0.41 $ 0.36 Distributions declared per share (2) 54,561,367 54,292,065 53,960,698 53,595,624 53,439,316 Weighted average shares outstanding 54,464,804 54,184,636 53,760,605 53,525,623 53,359,886 Shares outstanding, end of period 1. Includes certain prepayment fees, exit fees, accelerated OID and paid - in - kind interest income. 2. Includes supplemental distributions of $0.05 per share during each quarter ended September 30, 2023, December 31, 2023 and Ju ne 30, 2024 and a special year - end distribution of $0.15 per share during the quarter ended December 31, 2023.
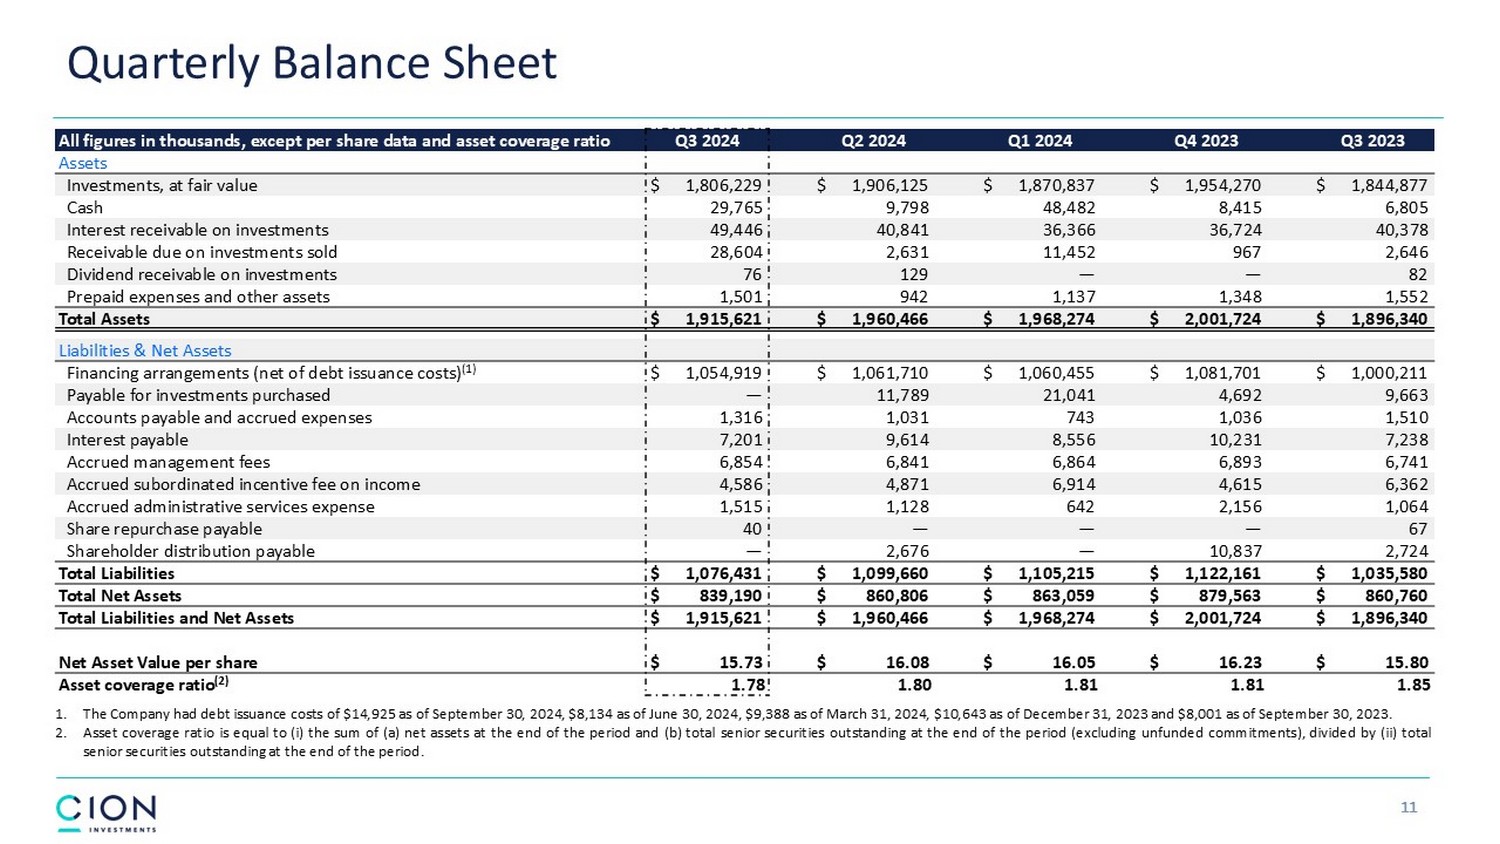
Quarterly Balance Sheet 11 Q3 2023 Q4 2023 Q1 2024 Q2 2024 Q3 2024 All figures in thousands, except per share data and asset coverage ratio Assets $ 1,844,877 $ 1,954,270 $ 1,870,837 $ 1,906,125 $ 1,806,229 Investments, at fair value 6,805 8,415 48,482 9,798 29,765 Cash 40,378 36,724 36,366 40,841 49,446 Interest receivable on investments 2,646 967 11,452 2,631 28,604 Receivable due on investments sold 82 — — 129 76 Dividend receivable on investments 1,552 1,348 1,137 942 1,501 Prepaid expenses and other assets $ 1,896,340 $ 2,001,724 $ 1,968,274 $ 1,960,466 $ 1,915,621 Total Assets Liabilities & Net Assets $ 1,000,211 $ 1,081,701 $ 1,060,455 $ 1,061,710 $ 1,054,919 Financing arrangements (net of debt issuance costs) (1) 9,663 4,692 21,041 11,789 — Payable for investments purchased 1,510 1,036 743 1,031 1,316 Accounts payable and accrued expenses 7,238 10,231 8,556 9,614 7,201 Interest payable 6,741 6,893 6,864 6,841 6,854 Accrued management fees 6,362 4,615 6,914 4,871 4,586 Accrued subordinated incentive fee on income 1,064 2,156 642 1,128 1,515 Accrued administrative services expense 67 — — — 40 Share repurchase payable 2,724 10,837 — 2,676 — Shareholder distribution payable $ 1,035,580 $ 1,122,161 $ 1,105,215 $ 1,099,660 $ 1,076,431 Total Liabilities $ 860,760 $ 879,563 $ 863,059 $ 860,806 $ 839,190 Total Net Assets $ 1,896,340 $ 2,001,724 $ 1,968,274 $ 1,960,466 $ 1,915,621 Total Liabilities and Net Assets $ 15.80 $ 16.23 $ 16.05 $ 16.08 $ 15.73 Net Asset Value per share 1.85 1.81 1.81 1.80 1.78 Asset coverage ratio (2) 1. The Company had debt issuance costs of $ 14 , 925 as of September 30 , 2024 , $ 8 , 134 as of June 30 , 2024 , $ 9 , 388 as of March 31 , 2024 , $ 10 , 643 as of December 31 , 2023 and $ 8 , 001 as of September 30 , 2023 . 2. Asset coverage ratio is equal to (i) the sum of (a) net assets at the end of the period and (b) total senior securities outstanding at the end of the period (excluding unfunded commitments), divided by (ii) total senior securities outstanding at the end of the period .
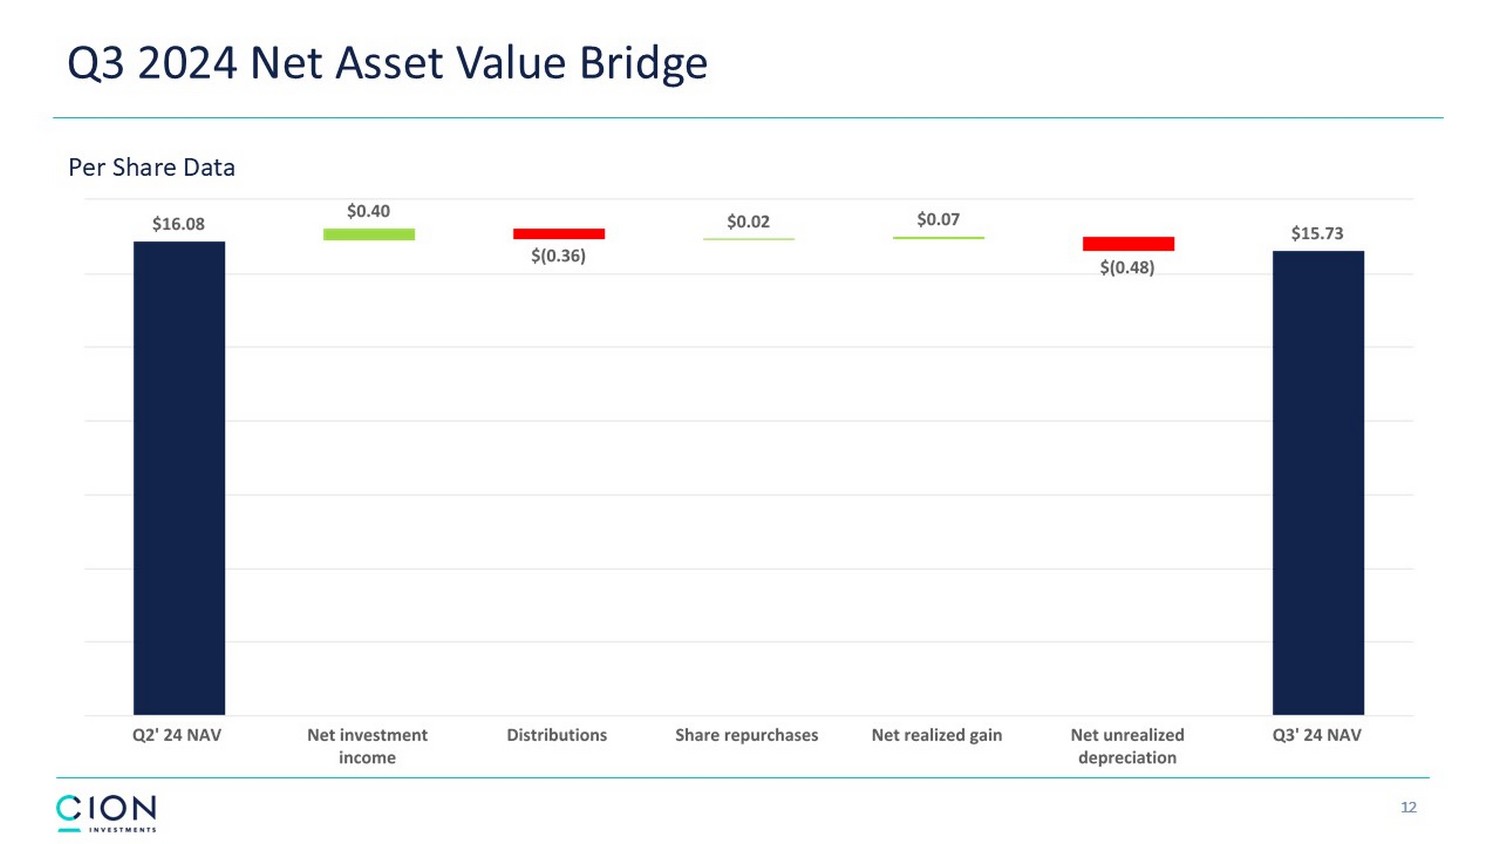
12 Q3 2024 Net Asset Value Bridge Per Share Data
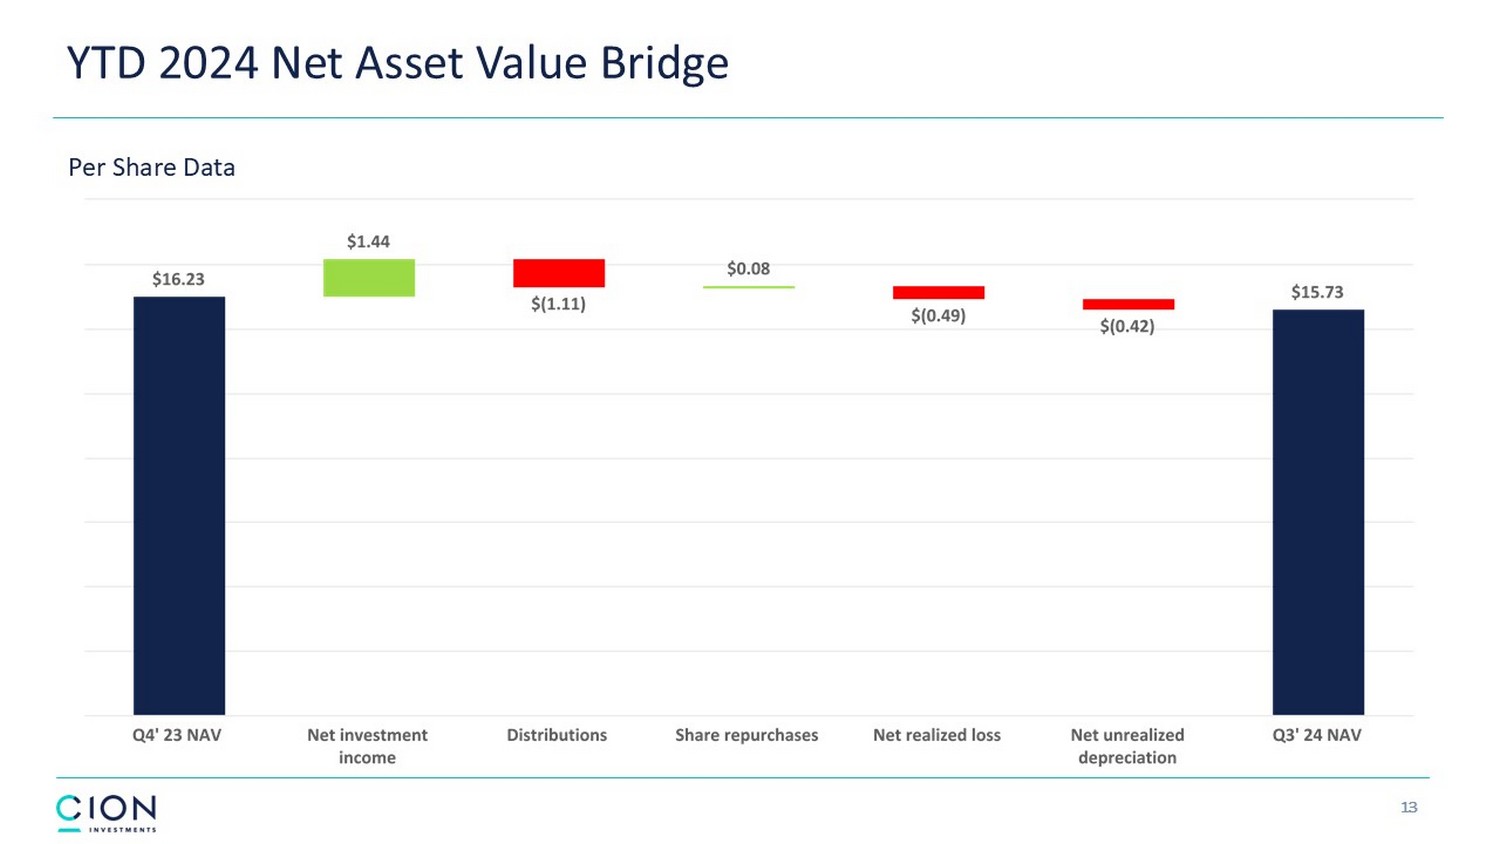
13 YTD 2024 Net Asset Value Bridge Per Share Data
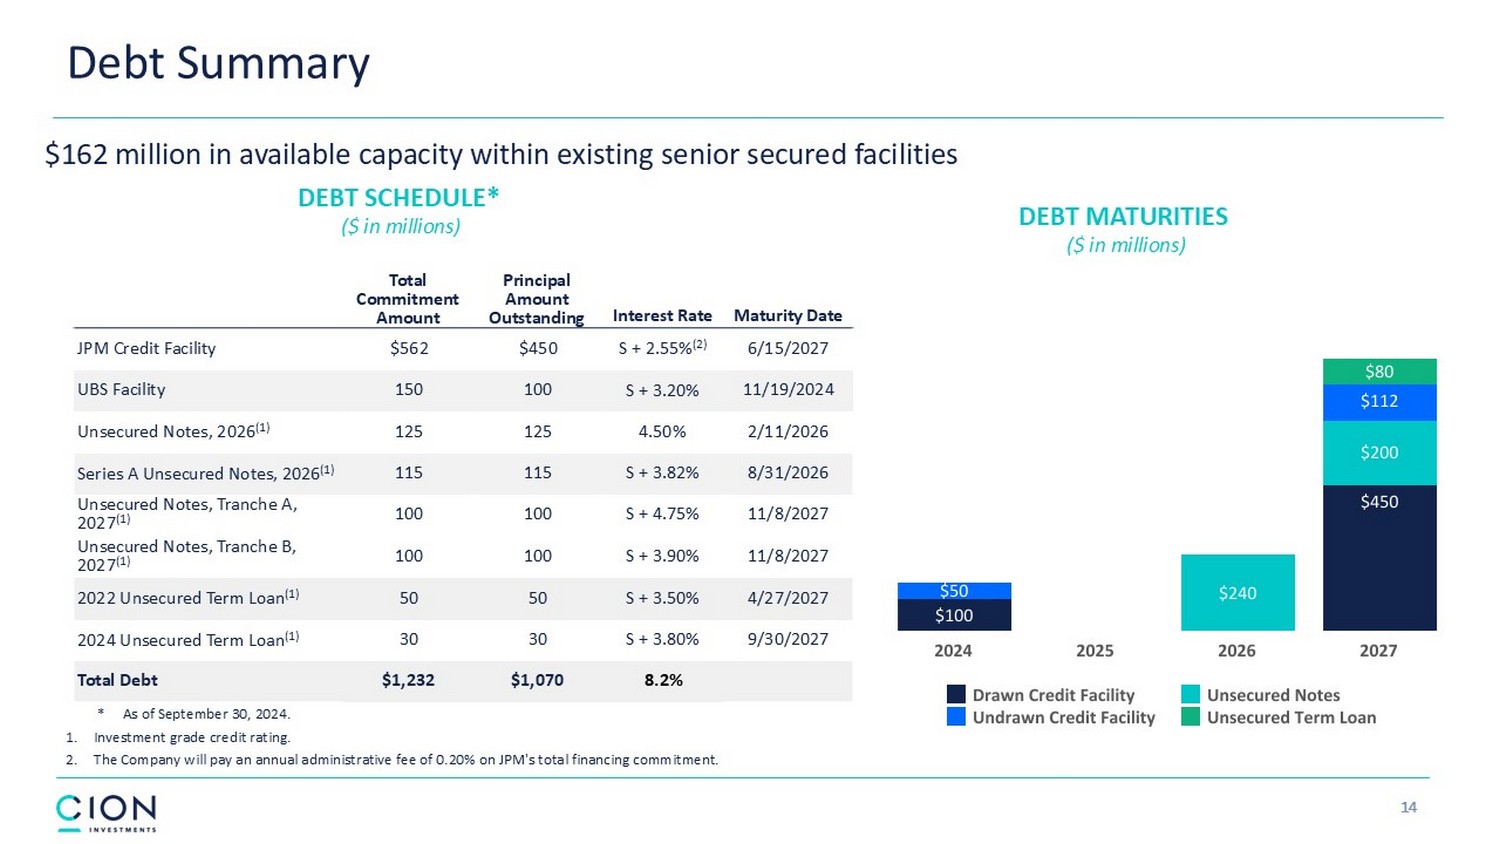
14 Maturity Date Interest Rate Principal Amount Outstanding Total Commitment Amount 6/15/2027 S + 2.55% (2) $450 $562 JPM Credit Facility 11/19/2024 S + 3.20% 100 150 UBS Facility 2/11/2026 4.50% 125 125 Unsecured Notes, 2026 (1) 8/31/2026 S + 3.82% 115 115 Series A Unsecured Notes, 2026 (1) 11/8/2027 S + 4.75% 100 100 Unsecured Notes, Tranche A, 2027 (1) 11/8/2027 S + 3.90% 100 100 Unsecured Notes, Tranche B, 2027 (1) 4/27/2027 S + 3.50% 50 50 2022 Unsecured Term Loan (1) 9/30/2027 S + 3.80% 30 30 2024 Unsecured Term Loan (1) 8.2% $1,070 $1,232 Total Debt Debt Summary DEBT MATURITIES ($ in millions) DEBT SCHEDULE* ($ in millions) $162 million in available capacity within existing senior secured facilities * As of September 30, 2024. 1. Investment grade credit rating. 2. The Company will pay an annual administrative fee of 0.20% on JPM's total financing commitment.
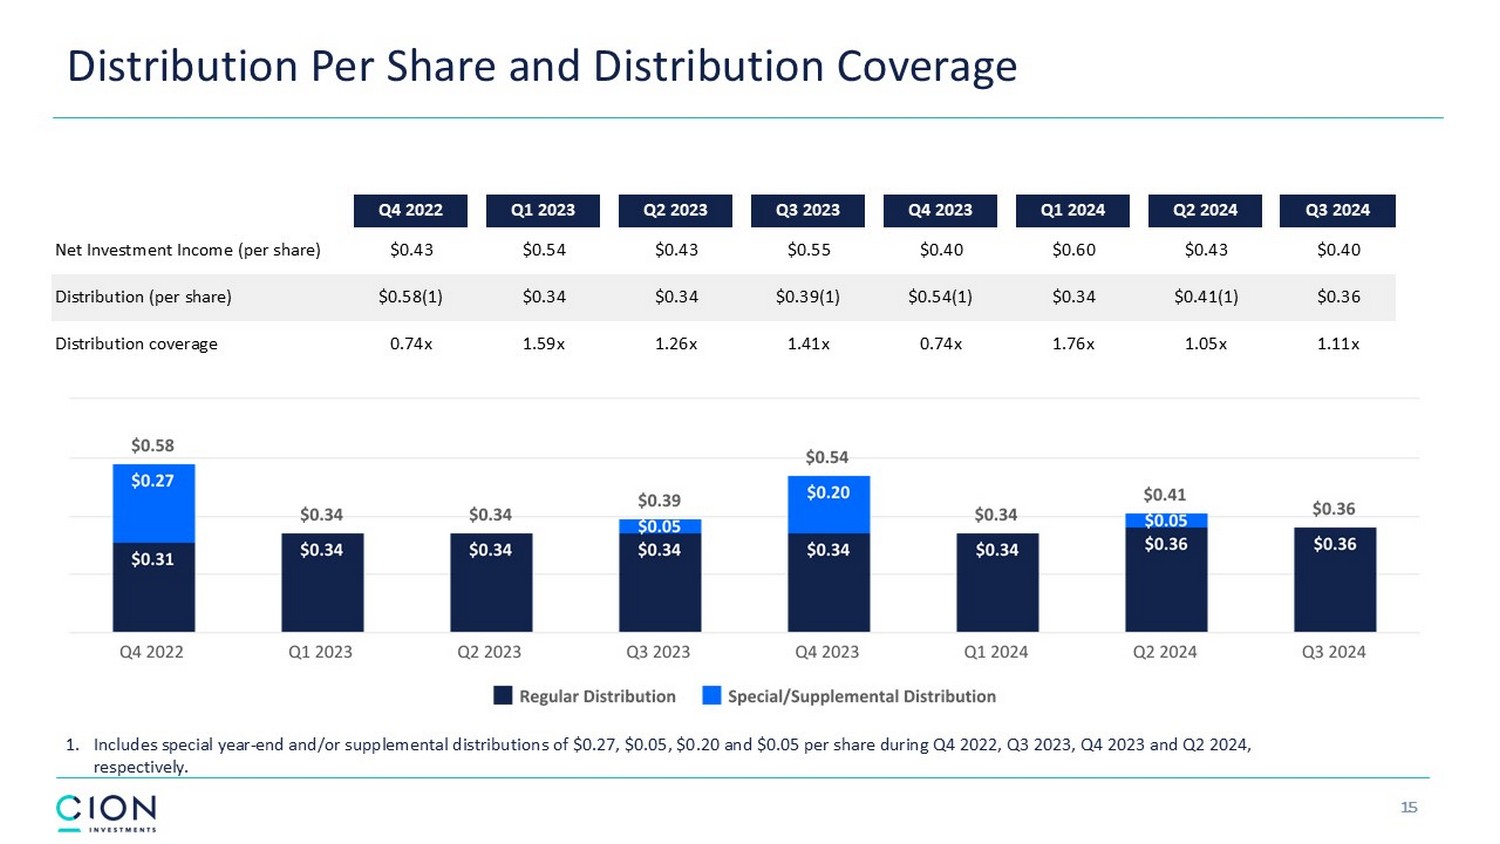
15 Distribution Per Share and Distribution Coverage 1 1. Includes special year - end and/or supplemental distributions of $0.27, $0.05, $0.20 and $0.05 per share during Q4 2022, Q3 2023, Q4 2023 and Q2 2024, respectively. Q3 2024 Q2 2024 Q1 2024 Q4 2023 Q3 2023 Q2 2023 Q1 2023 Q4 2022 $0.40 $0.43 $0.60 $0.40 $0.55 $0.43 $0.54 $0.43 Net Investment Income (per share) $0.36 $0.41(1) $0.34 $0.54(1) $0.39(1) $0.34 $0.34 $0.58(1) Distribution (per share) 1.11x 1.05x 1.76x 0.74x 1.41x 1.26x 1.59x 0.74x Distribution coverage